Value-based Adoption of Mobile Internet in Iran - DIVA
85
2010:025 MASTER'S THESIS Value-based Adoption of Mobile Internet in Iran Banafsheh Alborz Luleå University of Technology Master Thesis, Continuation Courses Marketing and e-commerce Department of Business Administration and Social Sciences Division of Industrial marketing and e-commerce 2010:025 - ISSN: 1653-0187 - ISRN: LTU-PB-EX--10/025--SE
-
Upload
khangminh22 -
Category
Documents
-
view
1 -
download
0
Transcript of Value-based Adoption of Mobile Internet in Iran - DIVA
2010:025
M A S T E R ' S T H E S I S
Value-based Adoption ofMobile Internet in Iran
Banafsheh Alborz
Luleå University of Technology
Master Thesis, Continuation Courses Marketing and e-commerce
Department of Business Administration and Social SciencesDivision of Industrial marketing and e-commerce
2010:025 - ISSN: 1653-0187 - ISRN: LTU-PB-EX--10/025--SE
Value-Base Adoption of Mobile Internet In Iran
Banafsheh Alborz
Luleå University of Technology
Master Thesis, Continuation Courses Marketing and e-commerce
Department of Business Administration and Social Sciences Division of Industrial marketing and e-commerce
١
Value-Base Adoption of Mobile Internet In Iran
Supervisors: Prof. Asa Wallstrom (LTU)
Prof. S. K. Chaharsooghi (TMU)
Referees: Dr. Amin naseri
Dr. Montazer
Prepared by: Banafsheh Alborz
Tarbiat Modares University Faculty of Engineering Department Industrial Engineering Luleå University of Technology
Department of Business Administration and Social Sciences
Division of Industrial Marketing and E-Commerce
MSc PROGRAM IN MARKETING AND ELECTRONIC COMMERCE Joint
2009
٢
Abstract
Regarding the ever-increasing number of cell phone subscribers, the situations of
businesses are changing to mobile form. The trend of switching fashion of business is from
traditional to electronic commerce and from that to mobile commerce. Mobile Internet
adoption is one of the fundamental steps to mobile commerce implementation. This research
studies the adoption of Mobile Internet as a one of new Information and Communication
Technology (ICT) from the value point of view.
While M-Internet principally provides the same services as stationary Internet, its
acceptance rate is lower than stationary Internet. The reason probably is the cost of its usage.
The adopters of M-Internet are individuals and the majority of them use it for personal
purpose and the cost of voluntary usage is tolerated by individuals. Thus, for studying the
adoption of M-Internet the famous Technology Acceptance Model (TAM) which has been
used for explaining traditional technologies is not appropriate for the reason that most of
those users and adopters are employees who use it for their work and the cost of requisite
adoption is suffered and supported by the organization.
To overcome this distinguishes among traditional technology and fresh one, we should
consider the perceived value from the customer's point of view and this is possible via the
Value-based model (VAM).This study applies the Value-based Adoption Model in M-
Internet. For doing so, a survey has been presented on M-Internet users, questionnaires were
distributed among them and the results analyzed based research questions. Finally, the
conclusions and implications were prepared.
Keywords: Value, Adoption, Mobile Internet, Value-based adoption Model

٣
Acknowledgment
This master thesis was written as a part of Marketing and E-Commerce master
program, at the division of industrial engineering in Tarbiat Modares University in Iran and
the division of industrial marketing and e-commerce in Lulea University of Technology in
Sweden.
In the first place, I appreciate the almighty God, for generously supporting me
throughout my life.
I would like to express my gratitude to my supervisors, Professor S. Kamal
Chaharsooghi (Tarbiat Modares University) and Professor Assa Wallstrom (Lulea University
of Technology) for their supporting and intellectual comments during this research.
Furthermore, I would like to show my sincere appreciation to Mr. Omid Bigdeli for his
support and luminous ideas.
Last but not least, I would like to express my fervent gratitude to my beloved parents,
brother and sister for the love, affection and support they have provided me in every step of
my life particularly during this stage of my education.
Banafsheh Alborz
March 2009
۴
List of abbreviations
AT Attitude
AVE Average Variance Extracted
BI Behavioral Intention
CPT Cumulative Prospect Theory
CPV Customer Perceived Value
DOI Diffusion of Innovation Theory
e-
commerce
Electronic Commerce
e-payment Electronic Payment
EUT Expected Utility Theory
1G First Generation
4GF Forth Generation
GPRS General Packet Radio Service
GSM Global System Mobile
HSDPA High Speed Downlink Packet
Access
hi-tech High Technology
ICT Information and Communication
Technology
IS Information System
IT Information Technology
ITU International Telecommunication
Union
IP Internet Protocol
Kbit/S Kilo bit per Second
ML Maximum Likelihood
Mbit/S Mega bit per Second
m-
commerce
Mobile Commerce
M-Internet Mobile Internet
m-payment Mobile Payment
۵
MMS Multi Media Sending
PLS Partial Least Squares
PBC Perceived Behavioral Control
PEOU Perceived Ease of Use
PU Perceived Usefulness
PCS Personal Communication Service
PDA Personal Digital Assistant
2G Second Generation
SMS Short Message Sending
SME Small & Medium Enterprise
Stdev Standard Deviation
SEM Structural Equation Modeling
SN Subjective Norms
TAM Technology Acceptance Model
TPB Theory of Planned Behavior
TRA Theory of Reasoned Action
3G Third Generation
3.5G Three point Five Generation
2.5G Two point Five Generation
UTAUT Unified Theory of Acceptance
and Use of Technology
US United States
VAM Value-based Adoption Model
WAP Wireless Application Protocol
MTN MTN Group is a South Africa-based multinational mobile telecommunications company,
operating in many African and Middle Eastern countries
۶
Table of Contents
Abstract ................................................................................................................................. 2
Acknowledgment ................................................................................................................... 3
List of abbreviations ............................................................................................................. 4
Chapter One: Introduction ............................................................................................... 10
1.1 Introduction…………… ...................................................................................................... 10
1.2 Outline of research…………. ............................................................................................... 21
1.3 Background…………………. .............................................................................................. 12
1.3.1 A brief history of the mobile phone and mobile Internet industry .......................................... 12
1.3.2 Brief history of mobile industry in Iran ............................................................................... 14
1.4 The definition of mobile commerce ...................................................................................... 14
1.5 Problem definition…………… ............................................................................................ 15
1.6 Research motivation…………… .......................................................................................... 17
2 Chapter Two: Literature review ..................................................................................... 22
2.1 Literature review of Mobile Internet ..................................................................................... 22
2.2 Literature review of value and perceived value ...................................................................... 25
2.3 Adoption and intention to adopt models ................................................................................ 29
2.3.1 Important factors and constructs of TRA, TPB and TAM ..................................................... 29
2.3.2 Theory of Reasoned Action (TRA) .................................................................................... 30
2.3.3 Theory of Planned Behavior (TPB) .................................................................................... 32
2.3.4 Technology Acceptance Model (TAM) .............................................................................. 32
2.4 Comparison between TRA, TPB and TAM ............................................................................ 34
2.5 Value-based adoption model ................................................................................................ 36
2.5.1 Value-based model...................... ..................................................................................... 36
2.5.1.1 Perceived benefits…………………. ........................................................................... 37 2.5.1.2 Perceived sacrifices……………….. ............................................................................ 40 3 Chapter Three: Research methodology .......................................................................... 42
3.1 Research purpose……………. ............................................................................................. 43
3.1.1 Exploratory Research…………….. .................................................................................... 43
3.1.2 Conclusive research……………….. .................................................................................. 44
3.1.2.1 Descriptive Research……………… ......................................................................................... 45 3.1.2.1.1 Cross-Sectional Design…………………….. ........................................................................ 45 3.1.2.1.2 Longitudinal Design………………………. .......................................................................... 45 3.1.2.2 Casual research…………………… ......................................................................................... 45
٧
3.2 Research Approach…………… ........................................................................................... 46
3.3 Research Strategy………….. ............................................................................................... 47
3.4 Data collection………………. ............................................................................................. 48
3.5 Sampling……………………. .............................................................................................. 49
3.6 Validity and Reliability…………… ...................................................................................... 49
4 Chapter Four: Analyze .................................................................................................... 54
4.1 Descriptive statistics………… ............................................................................................. 55
4.2 Partial least square…………… ............................................................................................ 58
4.3 PLS results…………………… ............................................................................................ 59
4.4 Model's overall Goodness of Fit ........................................................................................... 61
4.5 Disscusion………………….. .............................................................................................. 63
5 Chapter Five: Conclusion and implications ................................................................... 65
5.1 Conclusion……………………. ........................................................................................... 65
5.2 Contribution…………………. ............................................................................................. 66
5.3 Managerial implications ...................................................................................................... 66
5.4 Implication for Further Research .......................................................................................... 67
5.5 Research limitation .............. ............................................................................................... 67
References ............................................................................................................................ 69
Appendix .............................................................................................................................. 77
A: Questionnaire(Farsi) ...................................................................................................... 77
B: Questionnaire (English) ................................................................................................. 80
٨
List of Figures
Figure1. 1The outline of the research ………………………………………………………... 21
Figure1. 2 Trends of internet users in Iran ………………………………………………… 19
Figure2. 1 Customer delivered value ……….……………………………………………... 27 Figure2. 2 Theory of Reasoned Action (TRA) …………………………………………..… 31 Figure2. 3 Theory of Planned Behavior (TPB) …………………………………………..… 32 Figure2. 4 Technology Acceptance Model (TAM………………………………………….. 34 Figure2. 5 Value-based adoption model of technology…………………………………….. 37
Figure3. 1 Research Design………………………………………………………………… 43
Figure4. 1 Respondent's Gender………………………………………………….………… 55 Figure4. 2 Respondent's Age …………………………………………………….………… 56 Figure4. 3 Respondent's Usage Experience………………………………………………… 56 Figure4. 4 Respondent's M-Internet Services Usage ……….……………………………… 57 Figure4. 5 Respondent's Job …………………………………………………….………….57 Figure4. 6 Hypotheses Testing Results…………………………………………………….. 61 Figure4. 7 Testing Result of TAM…………………………………………………….…… 64
٩
List of Tables
Table1. 1Applications as a percentage of data revenues in European market ……………... 12 Table1. 2 Summary of mobile generation …………………………………………………..13 Table1. 3 Iran mobile cellular subscribers ………………………………………………… 18 Table1. 4 Iran Internet subscribers …………………………………………………............ 18 Table1.5 Classification of the m-commerce literature…………………………… …….… 19
Table3. 1 Relevant situation for different research strategies ................................................. 47 Table3. 2 Reliability and AVE ................................................................................................ 50 Table3. 3 Factor Loading, Residual and Weights ................................................................... 50 Table3. 4 Correlations of Latent Variables ............................................................................. 51 Table3. 5 Factor Structure Matrix of Loadings and Cross-Loadings ...................................... 52 Table3. 6 Measurement Mode(Loading)—Bootstrap ............................................................. 53 Table4. 1 Respondent's Gender .............................................................................................. 55 Table4. 2 Respondent's Age ................................................................................................... 55 Table4. 3 Respondent's Usage Experience ............................................................................. 56 Table4. 4 Respondent's M-Internet Services Usage ............................................................... 57 Table4. 5 Respondent's Job .................................................................................................... 57 Table4. 6 Structural Model-Bootstrap .................................................................................... 61

١٠
Chapter One
Introduction
Chapter One: Introduction
This chapter begins with and introduction followed by the research background to
give an idea about the topic. It will be followed by the problem definition, which will end with
an overall outline of the study.
1.1 Introduction
The worldwide progression of the Internet and the extensive growth of networks have
been made the Internet part of our daily life. From the 1990s onwards, we have been
١١
observant a great move in methods of doing business with appearance of electronic
commerce (Ngai & Gunasekaran, 2007). With the rapid acceptance of the internet and
electronic commerce, the adaptation of consumers to mobile devices, mobile commerce is set
to become one the most valuable growth market. The main reason for this express growth of
mobile commerce (m-commerce) is the almost rapid adoption of mobile Internet. The
progress of mobile network constructs business opportunities and provides value-added
services to customers. In recent years, access to the internet via mobile phones and other
devices is growing appreciably.
The internet has provided an easy and effective way of delivering information and
services to millions of users who are connected to "wire" network. Evidently, this “wired”
network addresses two major constraints: time and place. This limitation has raised the issue
of the mobile internet, which enables users to access information from any place at any time.
Though the mobile internet is expected to deliver great time and place flexibility to
individuals, they have been reluctant to adopt the mobile internet in practice (Cheong and
Park, 2005).
The main well-known model employed to explain the adoption and usage of
technology by individual is Technology Acceptance Model (TAM). TAM is parsimonious
model, asserting that all influences of external variables by usefulness and ease of use. But
TAM has its limitations to explaining the adoption of new Information and Communication
Technology (ICT) such as M-Internet. We aim to examine M-Internet adoption as a new ICT
from the consumer perspective, and not just from the technology user perspective (Kim et al.,
2007).
The fundamental assumption in examining consumer behavior is value maximization.
For value maximization we should know enough about perceived value as a cost-benefit
analyze, which is defined as the trade-off between total benefits (values) and total sacrifices
(costs).
A value-based model would be able to compare the benefits and the costs. The value-
based adoption model (VAM) combine the most related findings of technology adoption and
value literature and the outcome can help in understanding consumer’s adoption in Mobile
Internet.
١٢
The study as prepared as follows. In this chapter we have brief history of Mobile
Commerce and Mobile Internet, problem definition, research motivation, and outline of this
study. And in the next section we talk about literature of Mobile Internet, value, and adoption
model. And in following research methodology discusses the way of data gathering and
which method is accurate for this study value-based model and relevant concept. Finally in
last chapter we conclude the study with brief summery and conclusion.
1.2 Background
While mobile phone has not very elderly background, in following section is mentioned
a concise world history about mobile phone and mobile Internet industry and furthermore a
background of mobile phone and its services in Iran will performed.
1.2.1 A brief history of the mobile phone and mobile Internet industry
Mobile phone services were started in the US, Japan, Europe and other leading
industrialized countries in the early 1980s. By the end of 1999, most industrialized countries
had phone penetration rates that exceeded 30%, growth exceeded 20% a year and the rapid
flow of the mobile phone had become a global phenomenon with more than one billion
mobile phone subscribers in the world by September 2002. It began with business users in
their 30s and 40s and step by step expanded such that in countries with penetration rates
greater than 60% most people between the ages of 15 and 65 owned phones. Firms perceived
the parallel growth in mobile phone and Internet diffusion and realized the integration of
phones and the Internet was a foremost opportunity (Funk, 2007).
First, just as regulators began defining an open interface between phones and networks
in wire line systems beginning in the early 1980s (Brock, 1981; cited by Funk, 2007),
regulators also did this in mobile services first in the US and Scandinavia in the early 1980s
and secondly in the rest of Western Europe with global system mobile (GSM) in the late
1980s (Fransman, 2002; Funk, 2001, 2002; cited by Funk, 2007). As these open interfaces
became more prevalent, Japanese and Korean service providers were the only ones to offer
custom phones and thus retain control over the interface between mobile phones and the
network particularly in the setting of phone specifications (Funk, 2003, 2006) and this was
seen by many observers as a deficiency in these markets (Funk, 2002). Mobile internet
markets in Japan and Western Europe in 2003 was indicated in table 1.1:
١٣
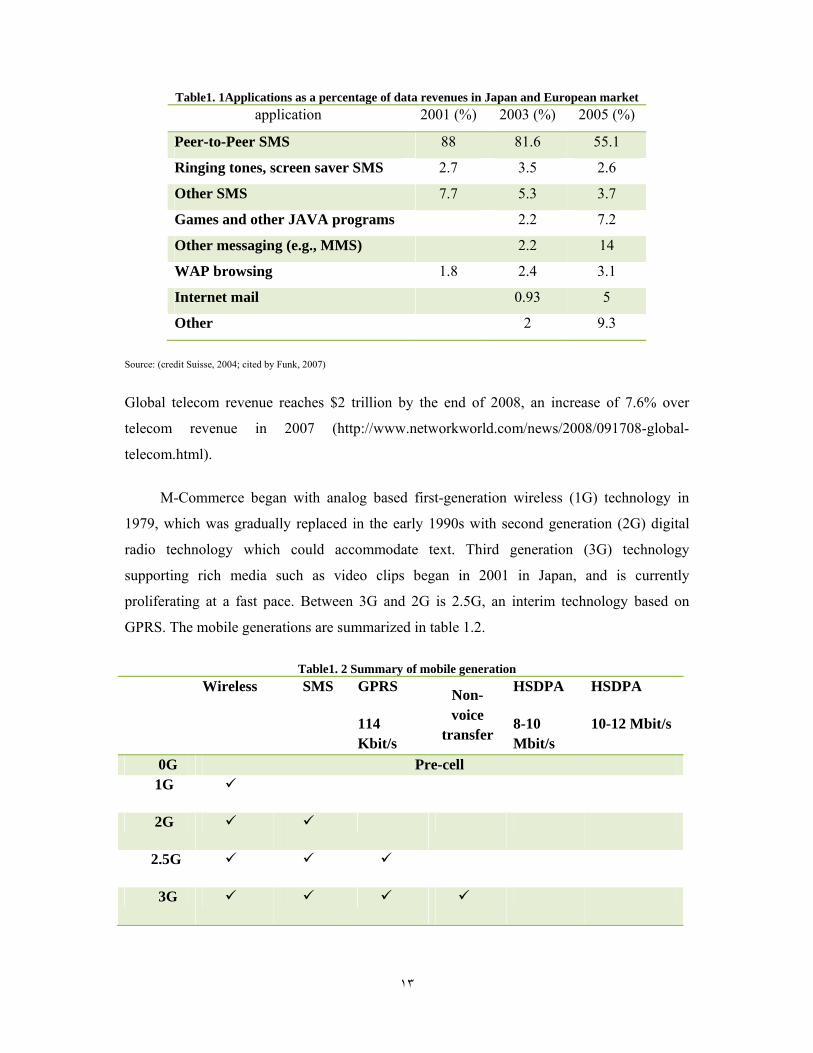
Table1. 1Applications as a percentage of data revenues in Japan and European market
application 2001 (%) 2003 (%) 2005 (%)
Peer-to-Peer SMS 88 81.6 55.1
Ringing tones, screen saver SMS 2.7 3.5 2.6
Other SMS 7.7 5.3 3.7
Games and other JAVA programs 2.2 7.2
Other messaging (e.g., MMS) 2.2 14
WAP browsing 1.8 2.4 3.1
Internet mail 0.93 5
Other 2 9.3
Source: (credit Suisse, 2004; cited by Funk, 2007)
Global telecom revenue reaches $2 trillion by the end of 2008, an increase of 7.6% over
telecom revenue in 2007 (http://www.networkworld.com/news/2008/091708-global-
telecom.html).
M-Commerce began with analog based first-generation wireless (1G) technology in
1979, which was gradually replaced in the early 1990s with second generation (2G) digital
radio technology which could accommodate text. Third generation (3G) technology
supporting rich media such as video clips began in 2001 in Japan, and is currently
proliferating at a fast pace. Between 3G and 2G is 2.5G, an interim technology based on
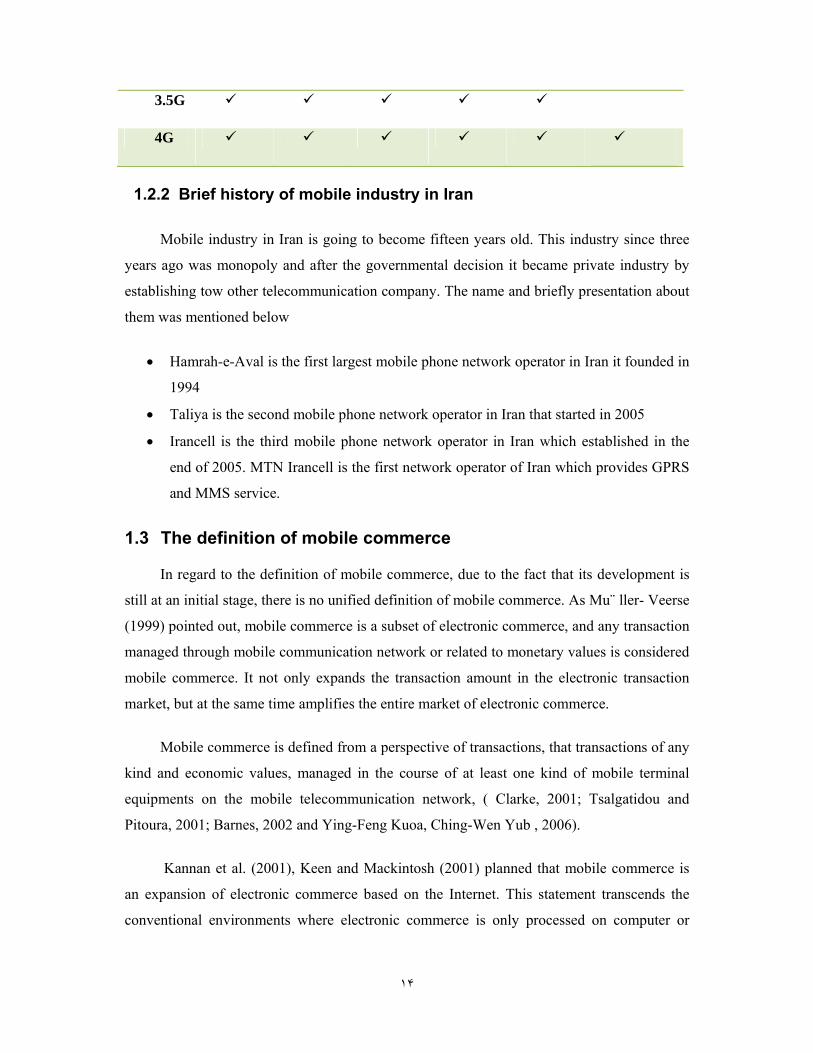
GPRS. The mobile generations are summarized in table 1.2.
Table1. 2 Summary of mobile generation Wireless SMS GPRS
114 Kbit/s
Non-voice
transfer
HSDPA
8-10 Mbit/s
HSDPA
10-12 Mbit/s
0G Pre-cell 1G
2G
2.5G
3G
١۴
3.5G
4G
1.2.2 Brief history of mobile industry in Iran
Mobile industry in Iran is going to become fifteen years old. This industry since three
years ago was monopoly and after the governmental decision it became private industry by
establishing tow other telecommunication company. The name and briefly presentation about
them was mentioned below
• Hamrah-e-Aval is the first largest mobile phone network operator in Iran it founded in
1994
• Taliya is the second mobile phone network operator in Iran that started in 2005
• Irancell is the third mobile phone network operator in Iran which established in the
end of 2005. MTN Irancell is the first network operator of Iran which provides GPRS
and MMS service.
1.3 The definition of mobile commerce
In regard to the definition of mobile commerce, due to the fact that its development is
still at an initial stage, there is no unified definition of mobile commerce. As Mu¨ ller- Veerse
(1999) pointed out, mobile commerce is a subset of electronic commerce, and any transaction
managed through mobile communication network or related to monetary values is considered
mobile commerce. It not only expands the transaction amount in the electronic transaction
market, but at the same time amplifies the entire market of electronic commerce.
Mobile commerce is defined from a perspective of transactions, that transactions of any
kind and economic values, managed in the course of at least one kind of mobile terminal
equipments on the mobile telecommunication network, ( Clarke, 2001; Tsalgatidou and
Pitoura, 2001; Barnes, 2002 and Ying-Feng Kuoa, Ching-Wen Yub , 2006).
Kannan et al. (2001), Keen and Mackintosh (2001) planned that mobile commerce is
an expansion of electronic commerce based on the Internet. This statement transcends the
conventional environments where electronic commerce is only processed on computer or
١۵
other related devices. Any electronic commerce transaction, processed by anyone, anywhere,
via wireless devices, is considered mobile commerce.
Mylonopoulos and Doukidis (2003) proposed a systematic definition, which views
mobile commerce as an interactive ecology system of individuals and corporations, and this
ecology system is built upon the social economic background and various succeeding
technologies. Through the applications of wireless and mobile technologies, it is a learning
process that the two parties jointly create brand new experiences within social interactions.
1.4 Problem definition
In recent years, due to the rapid development of mobile communication technologies,
we are able to rid of the inconvenience of the ‘wired’ environments, and pass on information
and commercial activities without any limitation of space and time. The comprehensible
benefits of mobile services are linked to mobility in space (Kuoa and Yub, 2006).
Mobile devices and services offer the opportunity to move around while maintaining
access to relevant services and staying (socially) connected (Jarvenpaa et al., 2003; cited by
Harry Bouwman a, 2007). The value of mobile services was a sign of concepts like anytime,
anyplace, which are mentioned in almost every paper discussing the potential of mobile
services. Pura (2005) argues value from a more general customer-related value perspective,
using concepts like social, emotional, conditional, monetary, convenience and epistemic
value in explaining behavioral intentions concerning the use of location-based mobile
services. These concepts are too general to capture the real added value of mobile services
and service bundles, leading to the superficial conclusion that emotional (positive feelings
and fun) and conditional value, i.e. the context in which the service will be used, predict the
behavioral intention to use location-based mobile services. Pagani (2004) mentions mobility,
availability (anytime, anyplace), and personalization as important benefits of (multimedia)
mobile services. The perceived flexibility that is provided by mobile technology is seen as
one of the most important benefits. And some of most major mobile technology is the Mobile
payment (m-payment) instead of e-payment.
The mobile Internet, unlike the fixed-line Internet, is asserted to be a closed
environment. In this sense, telecommunication operators acting as the access provider are
better positioned than content providers or banks to command the e-payment scheme they
١۶
prefer. Because the SIM card is pre installed in almost every handset, the telecommunication
operator can easily trace transaction records. Moreover, the telecommunication billing system
is capable of handling a large number of small transactions (i.e., micropayment). The benefit
for customers in adopting the telecommunication bill is that there would be no extra
installment costs if it were to become the de facto payment instrument over the mobile
Internet. The telecommunication bill should become a far more popular payment instrument
providing mobile commerce develops to a large extent (Yuntsai Chou et al., 2004).
While M-commerce is still in its infancy, its strategic implications to businesses are
endless. The benefits of M-commerce and existing M-commerce applications discussed in
this section serve as starting points for managers to explore how their organizations can use
wireless technology to achieve competitive advantage (Yuntsai Chou et al., 2004).
Mobile commerce value chain is essentially the aggregation of the conventional mobile
communication value chain and the Internet value chain (Kuoa and Yub, 2006). Companies
use the wireless Internet to run business transactions. M-commerce consumers can browse
through the catalog and order products online. It gives the impression that most companies
are likely to benefit directly from business on the wireless Internet, mainly for small and
medium-sized enterprises (SME’s). The portability of Mobile devices offers new business
applications outside the scale of fixed, desktop-based Internet contributions
(Mahatanankoon et al., 2005).
We discussed the definition of mobile commerce in pervious for better making sense of
necessity of mobile internet adoption.
Consumers' use of mobile communication devices is increasing rapidly. M-Internet is a
fast growing enabling technology for Mobile Commerce. However, even with its extra
special growth and although M-Internet basically provides the same services as stationary
Internet, its adoption rate in many countries is very low compared to that of stationary
Internet. Mobile Internet as a new information communication technology is one of major
tools of Mobile Commerce (M-Commerce) and its adoption is basic of M-commerce
adoption (Kim et al. 2007). In Iran the mobile Internet is in its infancy and the companies are
fond of investing on this service. The rate of acceptance of this service is not as well as
internet stationary acceptance. The companies crave to understand which parameters have an
effect on the user's intention to use of M-Internet. Hee-Woong Kim et al. (2007) has
١٧
investigated this problem in Singapore. It is noteworthy that Singaporeans are well-adopted
to this system. Therefore, Hee-Woong Kim et al. (2007) have developed a new model for M-
Internet from consumer point of view.
In Iran the M-Internet is a fresh technology which is provided by tow
telecommunication companies. These companies wish for discover how they can increase the
adoption intention of their subscribers to M-Internet? Because M-Internet is a new
technology that a user should pay for it not just monetary also spend some energy to learn its
manual. This research aims to examine M-Internet adoption as a new ICT from the consumer
perspective. Therefore, the research questions of this study are as follow:
1. Is usefulness positively related to perceived value?
2. Is enjoyment positively related to perceived value?
3. Is technicality negatively related to the perceived value?
4. Is perceived fee negatively related to perceived value?
5. Is perceived value positively related to adoption intention?
1.5 Research motivation
As we can see in a reason of the rapid expansion of new way of commerce and
information delivery system and go from side to side in non wired world we need to become
adopted with M-Internet. Mobile Internet adoption rate in developing countries is very low
compared to the stationary Internet. Global statistics forecasts that mobile penetration rates
will rise 46% in 2008 to 95% by 2013. Already subscribers in the 34 countries total over 2.1
billion users (based on operator statistics as of mid-2008) which accounts for half of the
world’s mobile users (based on ITU estimates). By 2013 the 34 countries will have grown to
4.3 billion mobile users and will account for around two thirds of global mobile users
(http://www.itu.int). IBM conducted a research which projects the mobile Internet services to
grow to US$ 80 Billion by 2011 with the number of users worldwide reaching one billion, up
by an amazing 191% from 2006 with year-on-year growth of 24.
(http://www.rncos.com/Blog/2008/08/Global-Mobile-Internet-Market-to-Reach-$80-Billion-
by-2011.html)
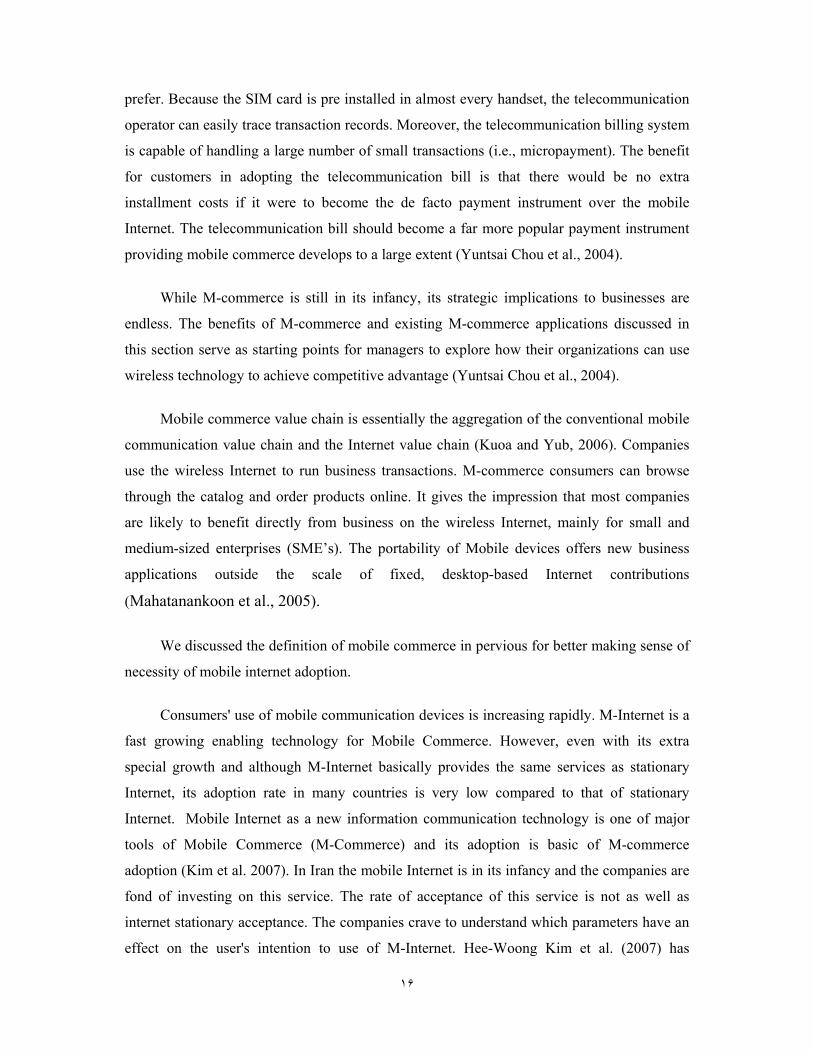
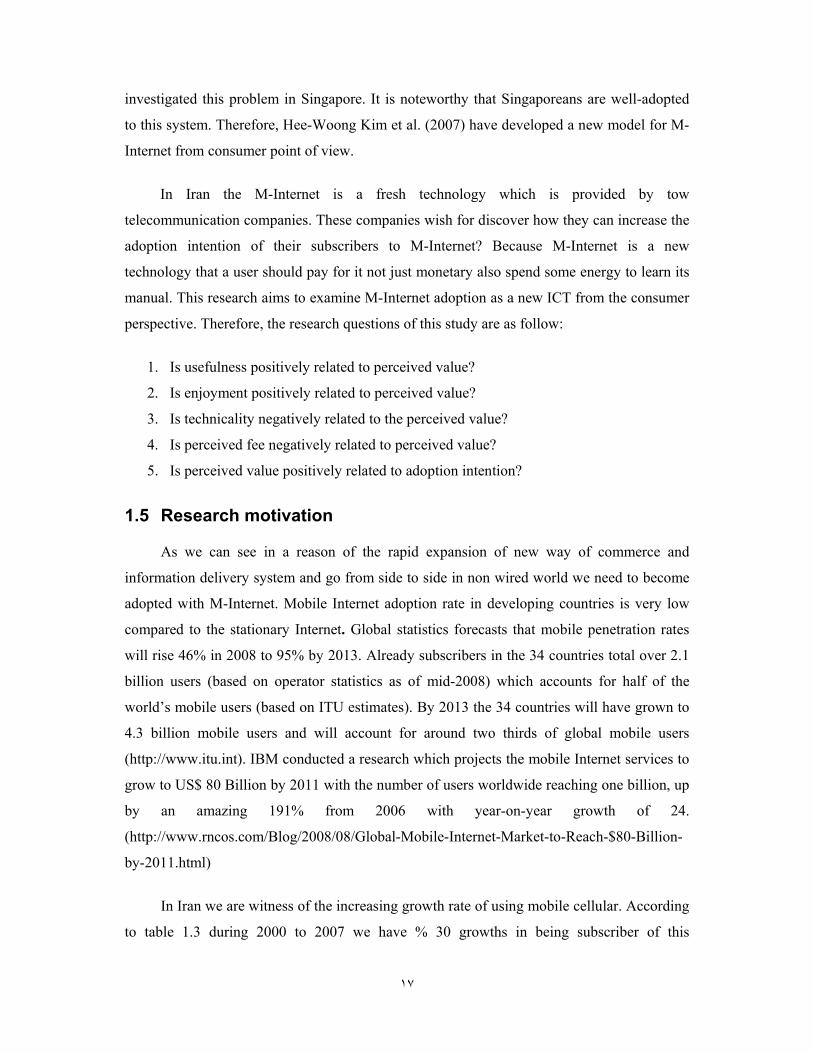
In Iran we are witness of the increasing growth rate of using mobile cellular. According
to table 1.3 during 2000 to 2007 we have % 30 growths in being subscriber of this
١٨
technology. And statistics shows that the Iranian people are going to be adopted with mobile
phone. Moreover, the statistical report related to the amount of the Internet user indicates in
2007 about 23million person is Internet user in Iran. The %36 increase in being user of the
Internet is able to prove that Internet is going to become part of the Iranian's life.
The combination of mobile phone and the Internet is perform M-Internet and it is new
technology in whole the world especially in developing country such as Iran. M-Internet is a
fresh service and estimating the adoption of it can help telecommunication companies to
serve it better by recognizing the adoption factors in Iran. Therefore, I motivate to investigate
the main factors in adaption of this service in Iran.
Table1. 3 Iran mobile cellular subscribers Mobile cellular subscribers (000s)
2000 2001 2002 2003 2004 2005 2006 2007
962.6 2'087.4 2'279.1 3'449.9 5'075.7 8'510.5 15'385.3 29'770.0
Per100
inhabitants
----- ----- ----- 5.06 7.38 12.24 21.83 41.81
Source: ITU World Telecommunication/ICT Indicators Database.2008
Table1. 4 Iran Internet subscribers
Internet Broadband
Subscribers
Subscribers
(000s)
Subscribers
per
100 inhab.
Users
(000s)
Users per
100 inhab.
Total
(000s)
Per 100
inhab.
2000 250.0 0.38 625.0 0.94 0.2
2001 402.0 0.60 1'005.0 1.50 0.7
2002 816.2 1.21 3'168.0 4.69 0.7
2003 816.2 1.21 4'800.0 7.04 0.7
2004 816.2 1.21 10'600.0 15.41 0.7
2005 816.2 1.21 12'300.0 17.69 0.7
2006 816.2 1.21 18'000.0 25.54
2007 23'000.0 32.30
Source: ITU World Telecommunication/ICT Indicators Database.2008
It i
and some
that is sh
increasin
the class
internet d
choosing
1. Mobilecases 1.1. Loca1.2 Mob 1.3Mobilgames 1.4 Mobi
1.5 Produ 1.6 Wirel 1.7 M-cocompanie
2. Wirele
2.1 Mobi
2.2 Mobi
3. Mobile
3.1 Agen
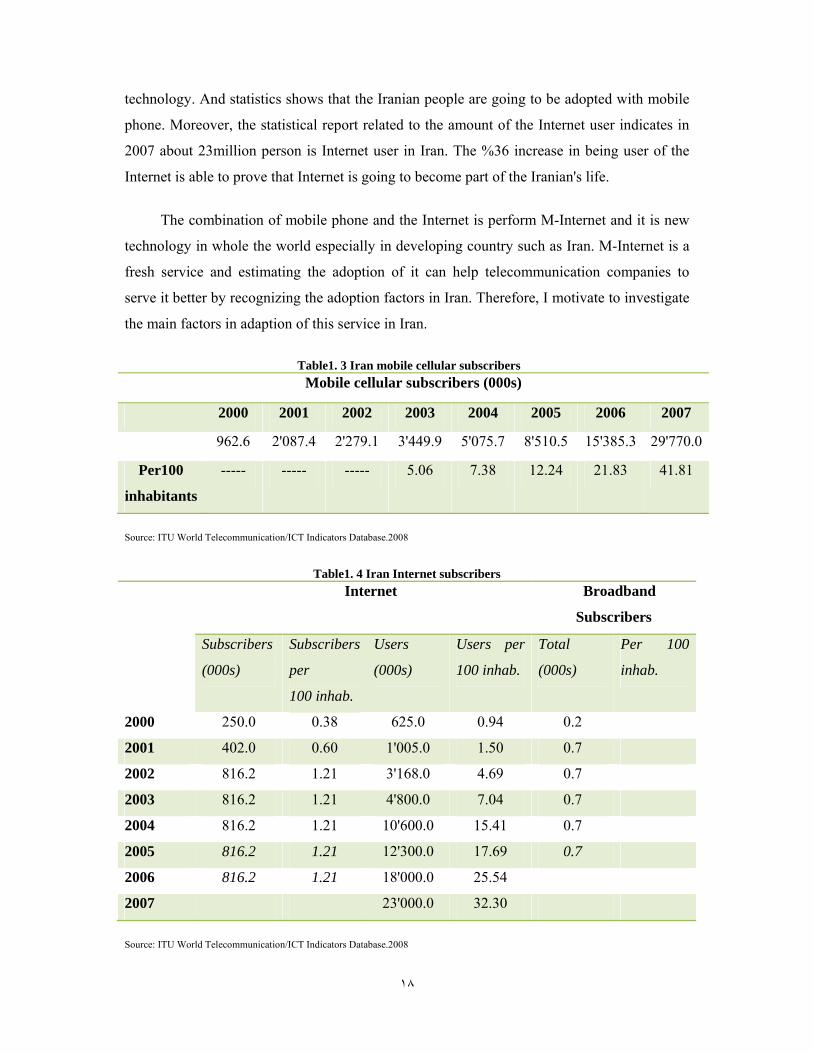
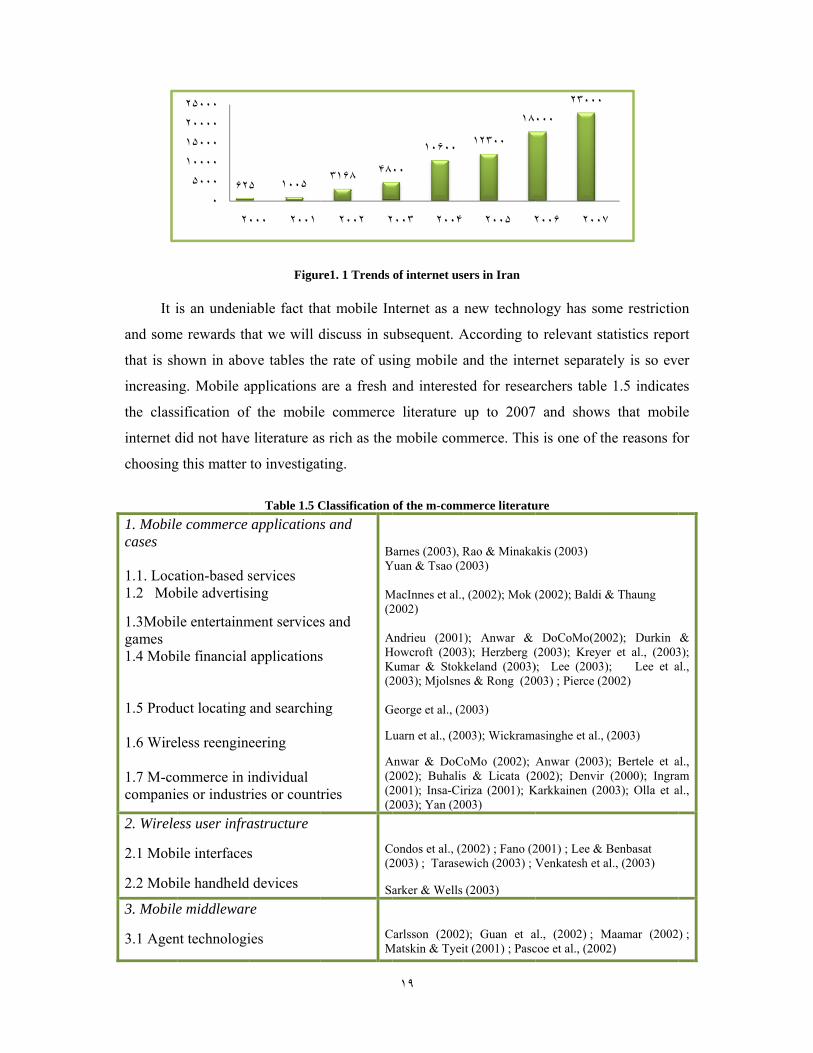
is an undeni
e rewards th
hown in abo
ng. Mobile a
sification of
did not have
g this matter
e commerce
ation-based sbile advertis
le entertainm
ile financial
uct locating
less reengine
ommerce in ies or industr
ess user infra
ile interfaces
ile handheld
e middlewar
nt technologi
۶٢٠
۵٠٠٠١٠٠٠٠١۵٠٠٠٢٠٠٠٠٢۵٠٠٠
٢
Figur
iable fact tha
hat we will d
ove tables th
applications
f the mobile
e literature as
to investigat
Table 1.5 Capplications
services ing
ment services
applications
and searchin
eering
individual ries or countr
astructure
s
d devices
re
ies
۵ ١٠٠۵
٠٠٠ ٢٠٠١
re1. 1 Trends
at mobile In
discuss in su
he rate of usi
are a fresh
e commerce
s rich as the
ting.
Classification s and
s and
s
ng
ries
BY M(2 AHK(2 G
L A(2(2(2
C(2
Sa
CM
٣١۶٨ ۴٨
٢٠٠٢ ٢
١٩
of internet us
nternet as a
ubsequent. A
ing mobile a
and intereste
e literature
mobile com
of the m-comm
Barnes (2003), RYuan & Tsao (2
MacInnes et al.,2002)
Andrieu (2001Howcroft (2003Kumar & Stokk2003); Mjolsne
George et al., (2
uarn et al., (20
Anwar & DoC2002); Buhalis2001); Insa-Cir2003); Yan (20
Condos et al., (22003) ; Tarase
arker & Wells
Carlsson (2002Matskin & Tyei
٠٠
١٠۶٠٠
٠٠٣ ٢٠٠۴
ers in Iran
new technol
According to
and the inte
ed for resea
up to 2007
mmerce. This
merce literatu
Rao & Minaka2003)
, (2002); Mok (
); Anwar & 3); Herzberg (keland (2003)
es & Rong (20
2003)
003); Wickrama
oMo (2002); As & Licata (2riza (2001); K
003)
2002) ; Fano (2ewich (2003) ; V
(2003)
2); Guan et ait (2001) ; Pasc
١٢٣٠٠
١٨
٢٠٠۵ ٢
logy has som
o relevant st
rnet separat
archers table
and shows
s is one of th
ure
akis (2003)
(2002); Baldi &
DoCoMo(200(2003); Kreyer); Lee (2003)003) ; Pierce (2
asinghe et al.,
Anwar (2003)2002); Denvir Karkkainen (20
2001) ; Lee & BVenkatesh et a
al., (2002) ; Mcoe et al., (2002
٠٠٠٢٣٠٠٠
٢٠٠۶ ٢٠٠٧
me restrictio
atistics repo
ely is so eve
1.5 indicate
s that mobi
he reasons fo
& Thaung
02); Durkin r et al., (2003); Lee et a2002)
(2003)
); Bertele et a(2000); Ingra
003); Olla et a
Benbasat al., (2003)
Maamar (20022)
٧
on
ort
er
es
le
or
& 3); al.,
al., am al.,
) ;
٢٠
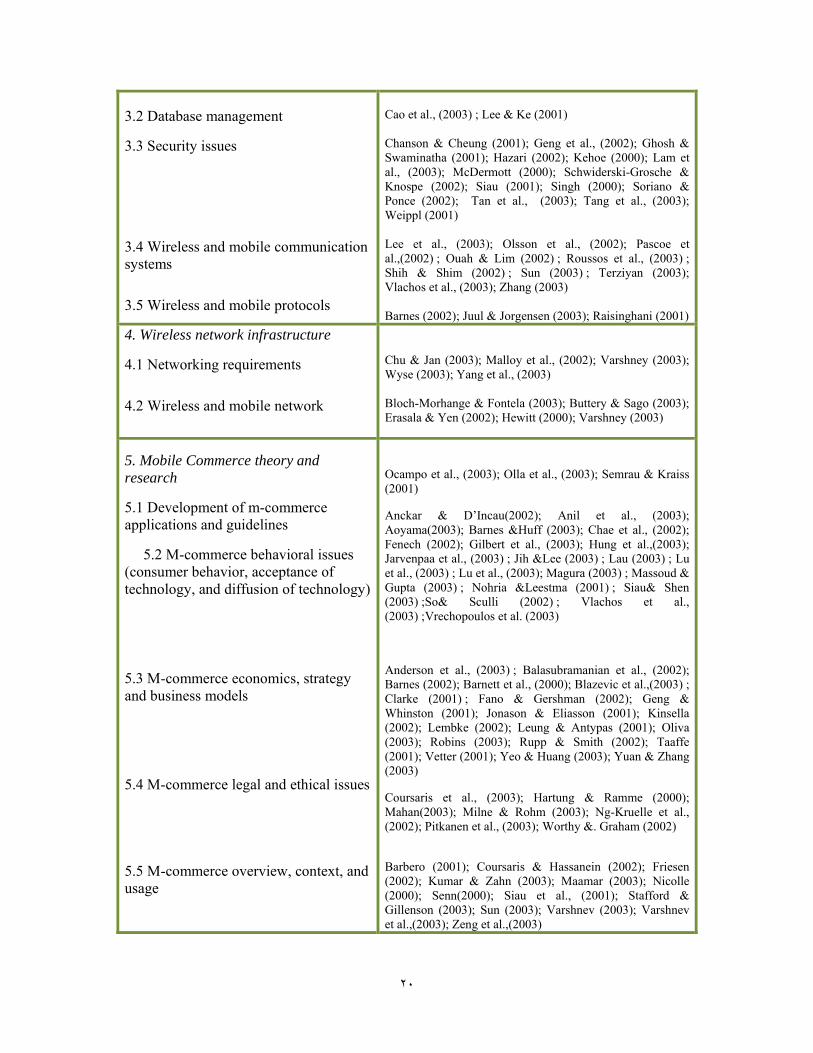
3.2 Database management
3.3 Security issues
3.4 Wireless and mobile communication systems
3.5 Wireless and mobile protocols
Cao et al., (2003) ; Lee & Ke (2001) Chanson & Cheung (2001); Geng et al., (2002); Ghosh & Swaminatha (2001); Hazari (2002); Kehoe (2000); Lam et al., (2003); McDermott (2000); Schwiderski-Grosche & Knospe (2002); Siau (2001); Singh (2000); Soriano & Ponce (2002); Tan et al., (2003); Tang et al., (2003); Weippl (2001) Lee et al., (2003); Olsson et al., (2002); Pascoe et al.,(2002) ; Ouah & Lim (2002) ; Roussos et al., (2003) ; Shih & Shim (2002) ; Sun (2003) ; Terziyan (2003); Vlachos et al., (2003); Zhang (2003) Barnes (2002); Juul & Jorgensen (2003); Raisinghani (2001)
4. Wireless network infrastructure
4.1 Networking requirements
4.2 Wireless and mobile network
Chu & Jan (2003); Malloy et al., (2002); Varshney (2003); Wyse (2003); Yang et al., (2003) Bloch-Morhange & Fontela (2003); Buttery & Sago (2003); Erasala & Yen (2002); Hewitt (2000); Varshney (2003)
5. Mobile Commerce theory and research
5.1 Development of m-commerce applications and guidelines
5.2 M-commerce behavioral issues (consumer behavior, acceptance of technology, and diffusion of technology)
5.3 M-commerce economics, strategy and business models
5.4 M-commerce legal and ethical issues
5.5 M-commerce overview, context, and usage
Ocampo et al., (2003); Olla et al., (2003); Semrau & Kraiss (2001)
Anckar & D’Incau(2002); Anil et al., (2003); Aoyama(2003); Barnes &Huff (2003); Chae et al., (2002); Fenech (2002); Gilbert et al., (2003); Hung et al.,(2003); Jarvenpaa et al., (2003) ; Jih &Lee (2003) ; Lau (2003) ; Lu et al., (2003) ; Lu et al., (2003); Magura (2003) ; Massoud & Gupta (2003) ; Nohria &Leestma (2001) ; Siau& Shen (2003) ;So& Sculli (2002) ; Vlachos et al., (2003) ;Vrechopoulos et al. (2003)
Anderson et al., (2003) ; Balasubramanian et al., (2002); Barnes (2002); Barnett et al., (2000); Blazevic et al.,(2003) ; Clarke (2001) ; Fano & Gershman (2002); Geng & Whinston (2001); Jonason & Eliasson (2001); Kinsella (2002); Lembke (2002); Leung & Antypas (2001); Oliva (2003); Robins (2003); Rupp & Smith (2002); Taaffe (2001); Vetter (2001); Yeo & Huang (2003); Yuan & Zhang (2003)
Coursaris et al., (2003); Hartung & Ramme (2000); Mahan(2003); Milne & Rohm (2003); Ng-Kruelle et al., (2002); Pitkanen et al., (2003); Worthy &. Graham (2002) Barbero (2001); Coursaris & Hassanein (2002); Friesen (2002); Kumar & Zahn (2003); Maamar (2003); Nicolle (2000); Senn(2000); Siau et al., (2001); Stafford & Gillenson (2003); Sun (2003); Varshnev (2003); Varshnev et al.,(2003); Zeng et al.,(2003)
Sou
An
Moreove
reasons, I
1.6 Ou
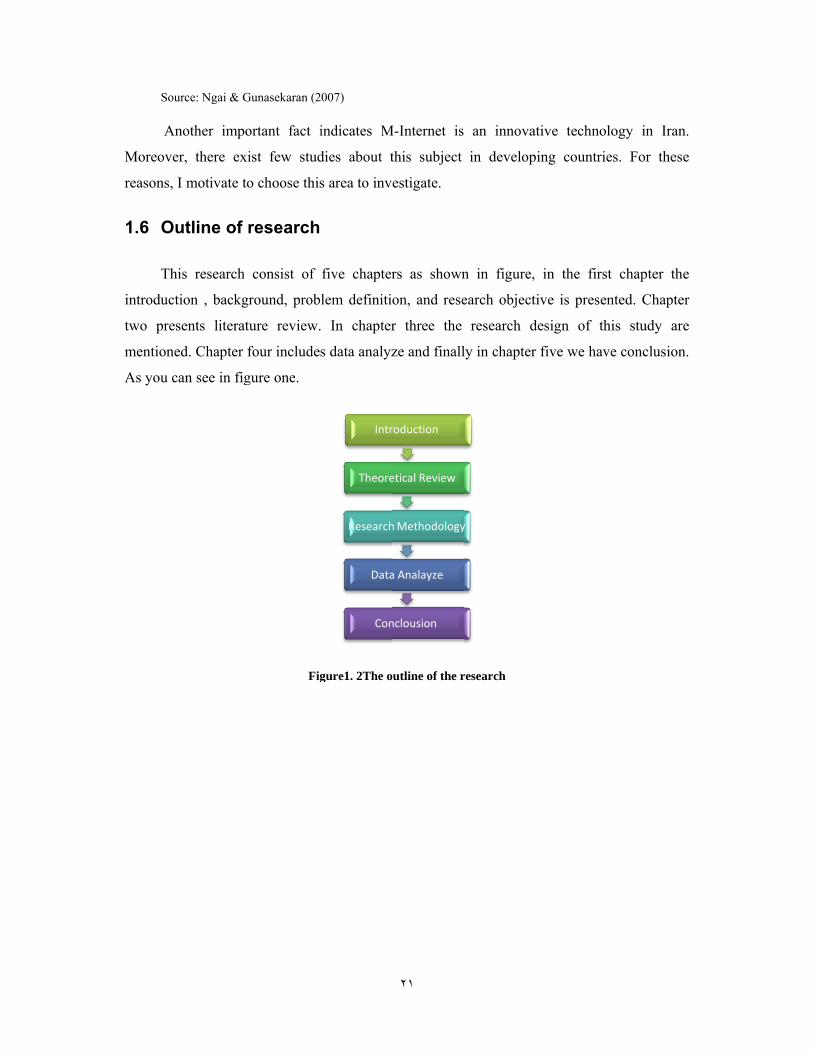
Th
introduct
two pres
mentione
As you c
urce: Ngai & G
nother impo
er, there exi
I motivate to
utline of r
is research
tion , backgr
sents literatu
ed. Chapter f
an see in fig
Gunasekaran (2
ortant fact i
ist few stud
o choose this
research
consist of
round, prob
ure review.
four includes
gure one.
Fig
007)
indicates M
dies about t
s area to inv
five chapter
lem definiti
In chapter
s data analyz
gure1. 2The o
Intr
Theore
Research
Data
Con
٢١
M-Internet is
this subject
estigate.
rs as shown
on, and rese
r three the
ze and finall
utline of the r
roduction
etical Review
h Methodology
a Analayze
nclousion
an innova
in develop
n in figure,
earch object
research d
ly in chapter
research
y
ative techno
ping countrie
in the firs
tive is presen
design of th
r five we hav
logy in Iran
es. For thes
st chapter th
nted. Chapte
his study ar
ve conclusion
n.
se
he
er
re
n.
٢٢
Chapter Two
Literature review
2 Chapter Two: Literature review
In this chapter the literature reviews concerning the Mobile Internet and value will be
illustrated. Then we will continue by presenting the popular intentional models. Finally, the selected
research model for intention to adopt Mobile Internet in Iran will be presented.
2.1 Literature review of Mobile Internet
By presenting the Internet-facilitated e-commerce, a new wave of technology-driven
commerce has started mobile commerce. Mobile Commerce, also recognized as M-
Commerce, essentially is any e-commerce done in a wireless environment, mainly by way of
the Internet. By the increasing of mobile technology, such as phones and personal digital
assistants (PDAs), m-commerce assures to introduce significant paradigm shift into the way
for certain activities that are conducted. Prepared by micro-browsers and other mobile
applications, the new range of mobile technologies recommend the Internet ‘in your pocket’
٢٣
for which the consumer possibilities are continuous, including banking, booking or buying
tickets, shopping and real-time news. The most concentration is on business-to-consumer
markets (Stuart J. Barnes, 2002).
Mobility and reach are the main specifications of Mobile Commerce that make it
different from other forms of e-commerce. Users can commence real-time contact with
commercial and other systems wherever they happen to be, this character leads it to mobility.
M-Commerce is presented in anytime, people can be reached it at any time, and that it means
accessibility. Mobile Internet is an enabling technology for M-Commerce. Mobile devices
generate an opportunity to bring new services to existing customers and attract new ones
(Hee-Woong Kim et al., 2007).
Mobile Internet is defined as follow, the first phase of Mobile Internet has begun by
second generation (2G) and the definition of mobile Internet service can be as an activity or
set of activities of intangible nature, which occur when the consumer is on movement, the
activity or serial of activities are supported mobile device and wireless communication
network, activities related to commerce transaction, data access, network service, and so on,
progressed with no time and space restriction; or planned to promote business operations and
the effectiveness of commercial procedures are within the coverage of mobile commerce by
a mobile telecommunication provider who makes use of a combination of mobile and Internet
networks, enabling activities between customers, and a provider of a service or a system
supporting the service (Van der Kar, 2004).
Mobile internet can divided to two subsets one is content or information services that
directed at making information in varied modalities available. Messaging services are another
division of mobile Internet services which can be either the exchange of text messages or
multimedia messages. Moreover, there exists a wide-ranging set of mobile commerce
services making potential transactions (Harry Bouwman a et al., 2007).
There is an undeniable fact that the use of wireless and mobile networks and devices is
growing. From the 1990s onwards, we have been observant a great switch in schemes of
doing business with the appearance of the electronic commerce (e-commerce). Academics,
businesses, and even individuals have been focusing on this new means of conducting
business online (E.W.T. Ngai a, and A. Gunasekaran b, 2007).
٢۴
It is noteworthy that cellular is the unavoidable prospect method for the personal
communication service system (PCS). This is crucial for wireless mobile communication and
will finally be included with the internet. Fresh initiatives to add mobility to the internet and
packet data services for the next generation cellular systems are being considered by many
mobile service providers, and providing a perfect support for IP-based packet switched
services is an important issue (Han-chieh chao et al., 2001).
Although the internet puts forward admission to information sources world-wide, we do
not expect to benefit from this access without being located at some regular and fixed access
point – home, office or school. On the other hand, the ever-increasing diversity of wireless
devices offering IP connectivity, such as digital cellular phones, and PDAs, is beginning to
change our view of internet access and use (Perkins, 1998). The second generation mobile
communications system and the subsequent generations will be the so-called Mobile Internet.
All communications and network systems will be included by the Internet (Wu, 1999; cited
by Han-chieh chao et al., 2001). By ever-growing number of mobile phone subscribers, usage
of mobile Internet services has increased in recent years. The services offered by M-Internet
can be classifies into 3Cs:
• Commerce
• Communication
• Contents
Commerce sorts from mobile banking and electronic ticketing to physical manufactured
goods acquisition. Communication services is defined services are such as interactive
services like Yahoo! Chat and others service like email. Contents consist of downloads, news,
traffic/stock updates and other time-sensitive, location-based services (Hee-Woong Kim et
al., 2007).
In many European countries mobile phone diffusion rates are now reaching saturation,
but massive opportunities exist for subscriber growth in less-developed regions such as in
South- East Asia and South America. Worldwide, month-on-month minutes of use continue
to grow considerably, but over 95% of subscriber usage remains
3 focused on voice-only communication (M, Pagani & C, H, Fine, 2008).
٢۵
2.2 Literature review of value and perceived value
Value has a historical concept in psychology, sociology, anthropology, political
science, economics, and other fields of social research (Rafaeli & Raban, 2003). On the other
hand, significant consideration has been specified in research to scrutinize of the economical
value (i.e., net profit, return on investment, etc.) rather than user-perceived cognitive value
(Ragowsky, Somers, & Adams, 2005). Rokheach (1973) set up the other concept of value
‘‘the concept of value, more than any other, is the core concept across all the social sciences”.
In addition, he noted that value ‘‘is the most important independent variable in the study of
attitude or behavior” (Rokeach, 1973; cited by Yair Levy, 2008).
Value theory with description indicates what value is, what people value, and what is
the ultimate purpose or principle of value in human behavior (Ragowsky, Ahituv, &
Neumann, 1996; Ragowsky et al., 2005). The importance of value theory has been mentioned
more and more by researchers in a variety of fields of research. Researchers have approached
with many different terms to clarify value, in general sepasrating by context the same basic
concept: consumption value (J.N. Sheth et al., 1991; cited by Hee-Woong Kim et al., 2007),
acquisition and transaction value (R. Thaler, 1985) service value, customer value (R.B.
woodruff, 1997), consumer value (M.B. Holbrook, 1999; cited by Hee-Woong Kim et al.,
2007) and perceived value (V.A. Zeithaml, 1988).
Utilitarian stand on a principle that customer value perceptions are a combination of the
acquisition value and transaction value of the product that acquisition value defined to
"Acquisition utility depends on the value of the good received compared to outlay", and
transaction utility is explained as "Transaction utility depends solely on the perceived merits
of the deal" (R. Thaler, 1985). A number of researchers have discriminated among overall
value, acquisition value and transaction value, but since the like explanation and
measurements have been applied to both acquisition value and overall value in the greater
part studies, we will use solely a general value term without any exact reference to
acquisition value (R. Thaler, 1985, D. Grewal et al., 1998).
Value states in monetary terms" the total functionality or performance of a product
offering in a given customer application" (Ž Anderson et al., 1993; Anderson and Narus,
1998; cited by James C. Anderson a, b, et al., 2000). Therefore, each product which was
offered can be viewed as having two fundamental characteristics: its value which delivers to
٢۶
customer and its price. Modeling the perceived value of a product merely on price is a
momentous but inadequate conceptualization in reason of the most time, customers mull over
attributes other than price, such as perceived quality of the product (Hee-Woong Kim et al.,
2007). Inappropriate explanations of the benefit and sacrifice components focus on perceived
quality and monetary price (T.Z. Chang, A.R. Wildt, 1994, W.B. Dodds et al., 1991, D.
Grewal et al., 1998). Value has been defined in vary of ways. In a good number of cases,
customer value has been uttered as a trade-off between customer-perceived quality and
customer-perceived price (W.S. DeSarbo et al., 2001).
According to Zeithaml the definition of Perceived quality is buyers' "judgment about a
product's overall excellence or superiority" (Zeithaml, 1988; cited by W.S. DeSarbo, et al.,
2001), and perceived price is illustrated as the consumers' subjective opinion of the objective
price of the product (W.S. DeSarbo et al., 2001).
Perceived value was divided into eight kinds of value: convenience, quality, success,
reputation, fun, beauty, virtue and faith (M.B. Holbrook, 1999; cited by Hee-Woong Kim et
al., 2007). The typology is complete in illumination the benefits that customers get from
consumption but they fail to take into account the costs associated with consumption (M.B.
Holbrook, 1999; cited by Hee-Woong Kim et al., 2007). Definition of perceived value is the
most broadly accepted, based upon which a consumer’s perceptions of what is received and
what is given discover out the consumer’s overall assessment of the value of a product (V.A.
Zeithaml, 1988).
Woodruff (1997) developed the concept of perceived customer value and demonstrated
it as a basis of competitive advantage. customer value is “a customer’s perceived preference
for and evaluation of those product attributes, attribute performance, and consequences
arising from use that make possible (or block) achieving the customer’s goal and purposes in
use situations” (R.B. Woodruff, 1997).
While investigators have a range of conceptions about perceived customer value, it can
be congregated in one overall definition: “Perceived value is the consumer’s overall
assessment of the utility of a product based on perceptions of what is received and what is
given” (Zeithaml, 1988; cited by Z. Chen and A.J. Dubinsky, 2003). Basically, value
represents a trade-off of outstanding “get and give-components,” which are perceived as
٢٧
benefits and sacrifices, correspondingly (Zeithaml, 1988; cited by Z. Chen and A.J.
Dubinsky, 2003).
The definition of perceived quality explains it as buyer's estimate of a product's
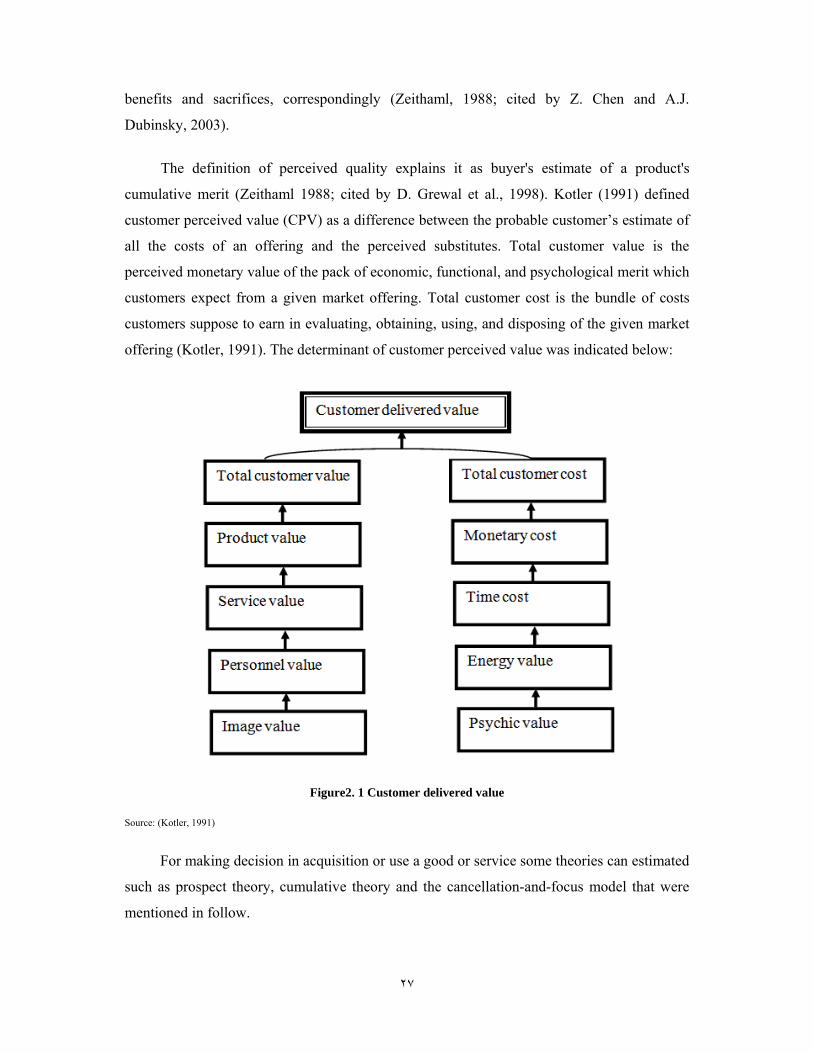
cumulative merit (Zeithaml 1988; cited by D. Grewal et al., 1998). Kotler (1991) defined
customer perceived value (CPV) as a difference between the probable customer’s estimate of
all the costs of an offering and the perceived substitutes. Total customer value is the
perceived monetary value of the pack of economic, functional, and psychological merit which
customers expect from a given market offering. Total customer cost is the bundle of costs
customers suppose to earn in evaluating, obtaining, using, and disposing of the given market
offering (Kotler, 1991). The determinant of customer perceived value was indicated below:
Figure2. 1 Customer delivered value
Source: (Kotler, 1991)
For making decision in acquisition or use a good or service some theories can estimated
such as prospect theory, cumulative theory and the cancellation-and-focus model that were
mentioned in follow.
٢٨
Prospect theory is known as a theory that explicates decisions among alternatives that
are involved in risk, alternatives with uncertain outcomes, where the likelihoods are known.
The model is descriptive: it tries to model real-life choices, rather than finest decisions. It
allows one to describe how people make choices in situations where they have to choose
between alternatives that involve risk (http://en.wikipedia.org/wiki/Prospect_theory). The
prospect theory was designed to illuminate the choices which made by individual customers.
In this theory, the value function is adopted and diverse over perceived achieve or loss
relative to a reference point, it essentially proposes that people choose the behavior that
directs to the highest payoff (Hee-Woong Kim et al., 2007).
The cumulative prospect theory (CPT) incorporates a number of aspects of cognitive
process of human beings: evaluation of gains and losses with respect to a reference point, loss
dislike, and judgmental alteration of possibility of almost impossible and confident outcomes
(K. Goda, H.P. Hong, 2007).
The cancellation-and-focus model is place on the degree of difference treatment of
shared and unique features when faced with a choice predicament. Cancellation-and-focus
model is able to explain a feature-matching contrast process for preference choices, in which
features shared by the option alternatives are cancelled, and outweigh is on the unique
features of the alternative which is the subject, or starting point, of the evaluation (Shu Li et
al., 2007).
The decision making under risk has drawn much attention in many different social
sciences, especially in economics and management. In economics, the microeconomic
problem concerning consumers and firms under the uncertainty condition must be solved on
the basis of the theory of the decision making under risk. Moreover, in management,
modeling the decision making under risk is a key problem of the risk management and
decision science (Ying He, Rui-Hua Huang, 2008).
These two research activities are mostly based on the Expected Utility Theory (EUT)
which was proposed by Von Neumann and Morgenstern (1944). The EUT had been
recognized as a normative theory and a descriptive theory before the occurrence of some
well-known decision inconsistency and investigational studies which faced the validity of the
EUT (Allais, 1953; Kahneman and Tversky, 1979; cited by Ying He, Rui-Hua Huang 2008).
٢٩
2.3 Adoption and intention to adopt models
Researchers have accomplished a bundle of researches by using various models for
considering and predicting customer’s intention to make use of new innovative products or
services.
Some of these practical models and related theories among these are more popular and
practical, according to Karami (2006) some more popular example of intentions models are
Triandis model planned by Triandis, (1980), Diffusion of innovation theory (DOI) planned by
Rogers, (1995), Theory of Reasoned Action (TRA) proposed by Fishbein and Ajzen, (1975),
Theory of Planned Behavior (TPB) proposed by Ajzen, (1991) (Karami, 2006). Technology
Acceptance Model (TAM) proposed by (Davis, 1986; cited by Davis et al., 1989), and finally
Venkatesh, Morris, Davis in 2003 have planned Unified Theory of Acceptance and Use of
Technology (UTAUT) (Venkatesh et al., 2003).
In the midst of these theories the most significant and applicable theories in studies
such this one are Theory of Reasoned Action, Theory of Planned Behavior and Technology
Acceptance Model. Three models are prominent as the most commonly applied - the
technology acceptance model (TAM), the theory of reasoned action (TRA), and the theory of
planned behavior (TPB). Several hundred studies are found applying one of these models to
give explanation end-users' adoption and acceptance of different kinds of ICT-systems and
applications. In following, the literature review will be presented for TRA, TPB and TRA
models.
Some determinants of these models are the same. And also there are some determinants
which used in one these models. First the expressions of these determinants will be
mentioned and afterward the models will be illustrated.
2.3.1 Important factors and constructs of TRA, TPB and TAM
• Behavioral Intention (BI): the strong point of one’s intention to make a behavior is
considered by Behavioral Intention (BI) (Davis et al., 1989).
٣٠
• Attitude (AT): defined as a person’s feeling about performing the specific behavior
which can be positive or negative and also it refers to individual estimate about
consequences of performing a behavior (Athyaman, 2002; cited by Karami, 2006).
• Enjoyment: enjoyment refers to the level which the activity of using the technology is
perceived to be enjoyable in its own right, separately from any performance
consequences that may be expected (Teo, 2001 cited by Karami, 2006)
• Perceived consequences: each act or behavior is perceived as having a potential
conclusion that can be either positive or negative. An individual’s preference of
behavior is based on the probability that an action will result a specific effect
(Triandis, 1979; cited by Karami, 2006).
• Innovativeness: innovativeness refers to the scale and rate of adoption of innovation
by an individual (Limayem at al., 2000; cited by Karami, 2006).
• Subjective Norms (SN): defined as a “person’s perception that most people who are
important to him think he/she should or should not act upon the behavior in question”.
(Fishbein and Ajzen ,1975; cited by Davis et al., 1989)
• Beliefs and Evaluation: beliefs are distinct as person’s subjective prospect which
performing the objective behavior will result in outcome and the Evaluation defined
as: “an implicit evaluative reaction to the result”. (Fishbein and Ajzen, 1975; cited by
Davis et al., 1989)
• Perceived Behavioral Control (PBC): is one's perception of the degree of complexity
of performing a behavior (Athyaman, 2002; cited by Karami, 2006).
• Perceived Usefulness (PU): People employ a new system only when they think that
the system is improved their performance. The degree to which an individual believes
that whether this system will facilitate his/her or not is defined as Perceived
Usefulness (Karami, 2006).
• Perceived Ease of Use (PEOU): Perceived Ease of Use is defined as a degree to
which an individual considers that running a specific system is easy and it’s not
complicated to use. (Davis et al., 1989; Karami, 2006)
2.3.2 Theory of Reasoned Action (TRA)
The Theory of Reasoned Action was designed by Ajzen and Fishbein, (1975). The
Theory of Reasoned Action (TRA) proposes that a person’s intentions to carry out (or not to
carry out) a behavior is the immediate determinant of that behavior. Intention is defined as
٣١
the individual’s decision to involve or not to involve in performing the action. In turn, the
person’s intentions are a function of the person’s attitude in the direction of the behavior, and
his/her subjective norms. Attitude towards the behavior is defined as “the evaluative
influence on the individual to performing the behavior”. Subjective norm is the perception of
how one ought to behave (Lorin.K. Leonarda et al., 2004).
The theory predicts intention to perform a behavior by consumer’s attitude toward that
behavior rather than by consumer’s attitude toward a product or service. This theory is
broadly practical model in social psychology which is afraid with the determinants of
intentionally planned behavior (Ajzen and Fishbein 1980; Fishbein and Ajzen 1975, cited
Davis et al 1989). According to TRA “a person’s performance of a specified behavior is
determined by his or her behavioral intention (BI) to perform the behavior and behavioral
intention is jointly determined by the person’s Attitude (AT) and Subjective Norms (SN)”
(Davis et al., 1989). This theory predicts and evaluates intention to do a behavior by
customer’s attitude to that behavior rather than by customer’s attitude toward a product or
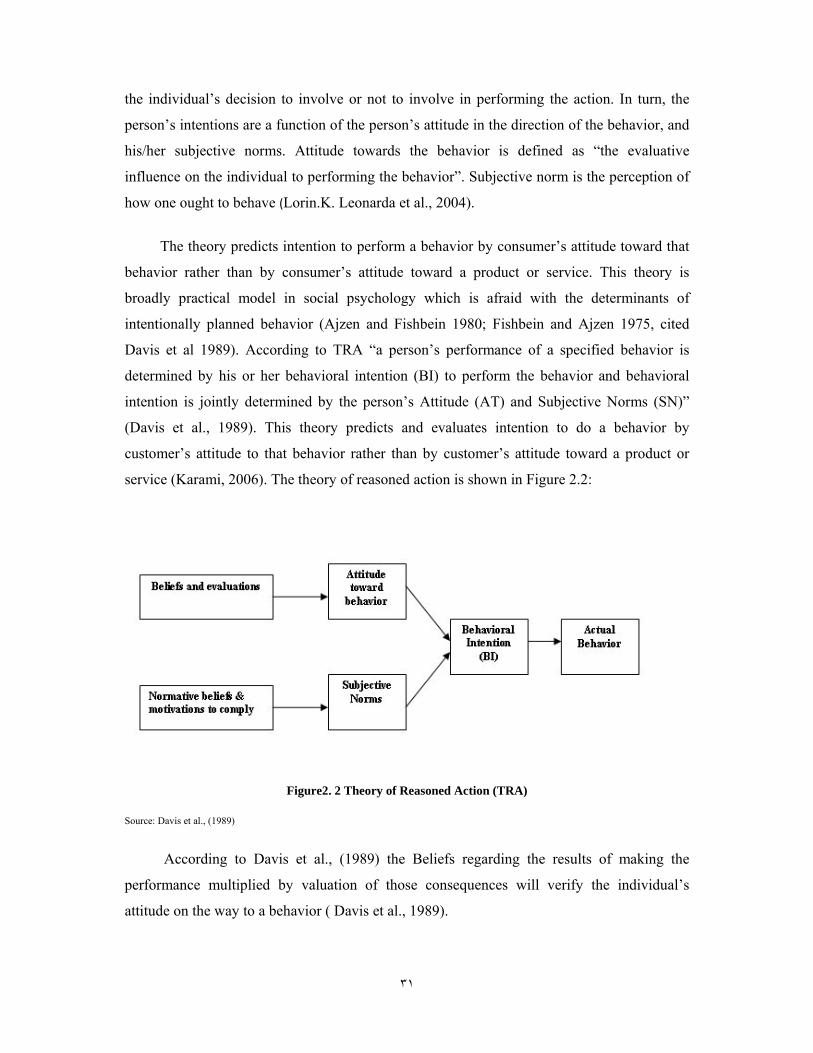
service (Karami, 2006). The theory of reasoned action is shown in Figure 2.2:
Figure2. 2 Theory of Reasoned Action (TRA)
Source: Davis et al., (1989)
According to Davis et al., (1989) the Beliefs regarding the results of making the
performance multiplied by valuation of those consequences will verify the individual’s
attitude on the way to a behavior ( Davis et al., 1989).
٣٢
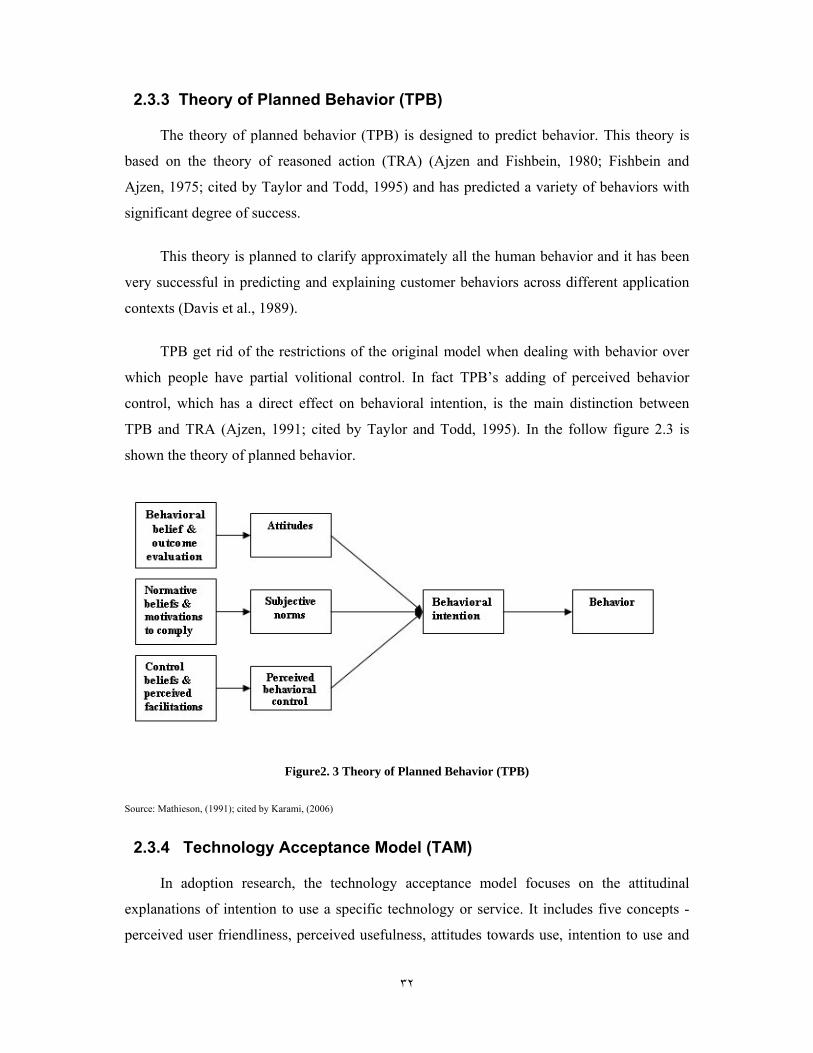
2.3.3 Theory of Planned Behavior (TPB)
The theory of planned behavior (TPB) is designed to predict behavior. This theory is
based on the theory of reasoned action (TRA) (Ajzen and Fishbein, 1980; Fishbein and
Ajzen, 1975; cited by Taylor and Todd, 1995) and has predicted a variety of behaviors with
significant degree of success.
This theory is planned to clarify approximately all the human behavior and it has been
very successful in predicting and explaining customer behaviors across different application
contexts (Davis et al., 1989).
TPB get rid of the restrictions of the original model when dealing with behavior over
which people have partial volitional control. In fact TPB’s adding of perceived behavior
control, which has a direct effect on behavioral intention, is the main distinction between
TPB and TRA (Ajzen, 1991; cited by Taylor and Todd, 1995). In the follow figure 2.3 is
shown the theory of planned behavior.
Figure2. 3 Theory of Planned Behavior (TPB)
Source: Mathieson, (1991); cited by Karami, (2006)
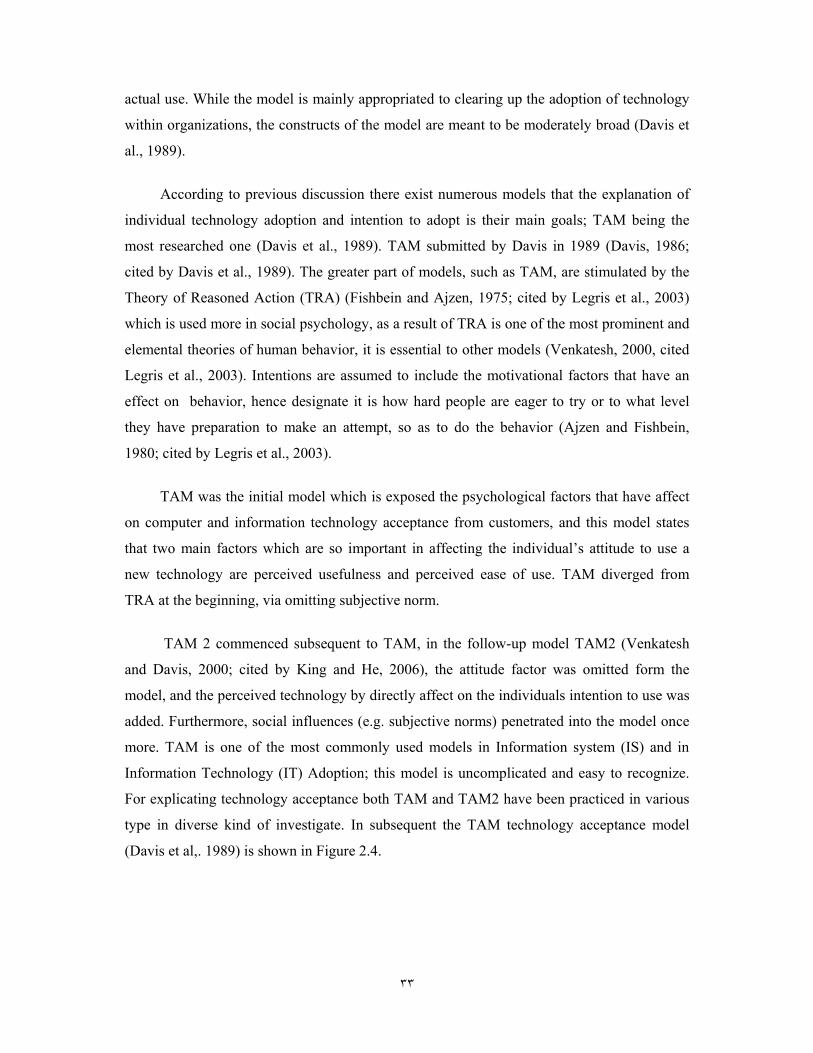
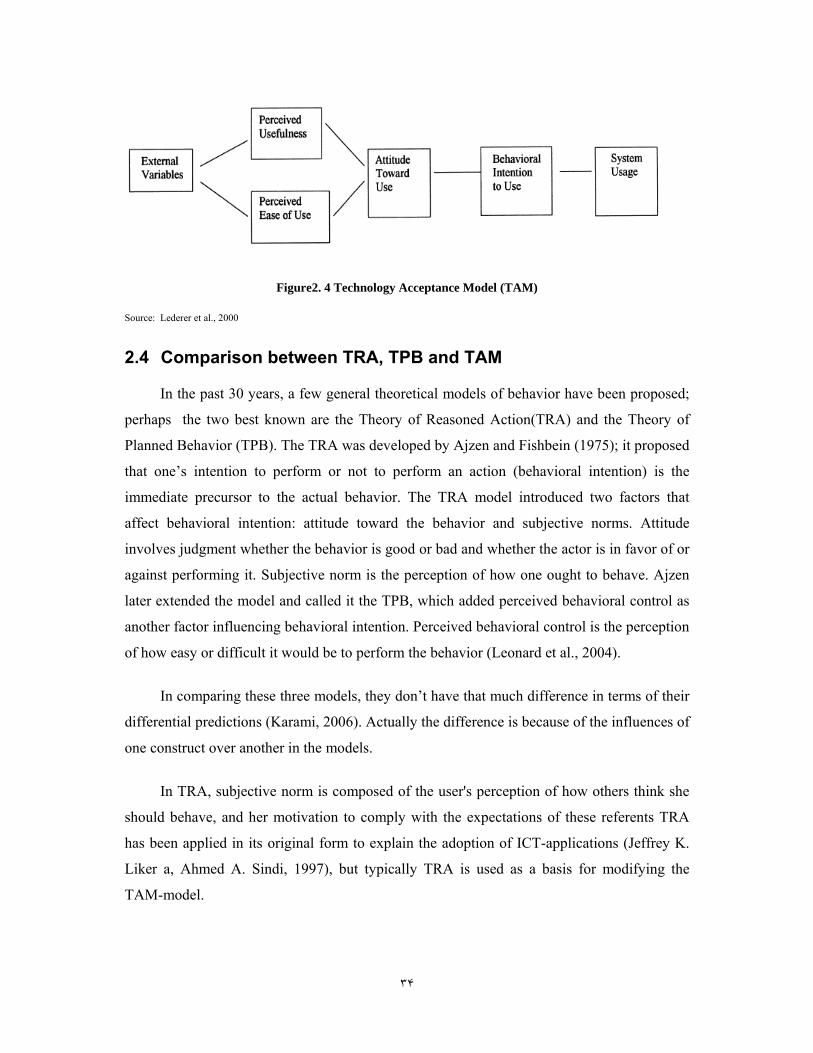
2.3.4 Technology Acceptance Model (TAM)
In adoption research, the technology acceptance model focuses on the attitudinal
explanations of intention to use a specific technology or service. It includes five concepts -
perceived user friendliness, perceived usefulness, attitudes towards use, intention to use and
٣٣
actual use. While the model is mainly appropriated to clearing up the adoption of technology
within organizations, the constructs of the model are meant to be moderately broad (Davis et
al., 1989).
According to previous discussion there exist numerous models that the explanation of
individual technology adoption and intention to adopt is their main goals; TAM being the
most researched one (Davis et al., 1989). TAM submitted by Davis in 1989 (Davis, 1986;
cited by Davis et al., 1989). The greater part of models, such as TAM, are stimulated by the
Theory of Reasoned Action (TRA) (Fishbein and Ajzen, 1975; cited by Legris et al., 2003)
which is used more in social psychology, as a result of TRA is one of the most prominent and
elemental theories of human behavior, it is essential to other models (Venkatesh, 2000, cited
Legris et al., 2003). Intentions are assumed to include the motivational factors that have an
effect on behavior, hence designate it is how hard people are eager to try or to what level
they have preparation to make an attempt, so as to do the behavior (Ajzen and Fishbein,
1980; cited by Legris et al., 2003).
TAM was the initial model which is exposed the psychological factors that have affect
on computer and information technology acceptance from customers, and this model states
that two main factors which are so important in affecting the individual’s attitude to use a
new technology are perceived usefulness and perceived ease of use. TAM diverged from
TRA at the beginning, via omitting subjective norm.
TAM 2 commenced subsequent to TAM, in the follow-up model TAM2 (Venkatesh
and Davis, 2000; cited by King and He, 2006), the attitude factor was omitted form the
model, and the perceived technology by directly affect on the individuals intention to use was
added. Furthermore, social influences (e.g. subjective norms) penetrated into the model once
more. TAM is one of the most commonly used models in Information system (IS) and in
Information Technology (IT) Adoption; this model is uncomplicated and easy to recognize.
For explicating technology acceptance both TAM and TAM2 have been practiced in various
type in diverse kind of investigate. In subsequent the TAM technology acceptance model
(Davis et al,. 1989) is shown in Figure 2.4.
٣۴
Figure2. 4 Technology Acceptance Model (TAM)
Source: Lederer et al., 2000
2.4 Comparison between TRA, TPB and TAM
In the past 30 years, a few general theoretical models of behavior have been proposed;
perhaps the two best known are the Theory of Reasoned Action(TRA) and the Theory of
Planned Behavior (TPB). The TRA was developed by Ajzen and Fishbein (1975); it proposed
that one’s intention to perform or not to perform an action (behavioral intention) is the
immediate precursor to the actual behavior. The TRA model introduced two factors that
affect behavioral intention: attitude toward the behavior and subjective norms. Attitude
involves judgment whether the behavior is good or bad and whether the actor is in favor of or
against performing it. Subjective norm is the perception of how one ought to behave. Ajzen
later extended the model and called it the TPB, which added perceived behavioral control as
another factor influencing behavioral intention. Perceived behavioral control is the perception
of how easy or difficult it would be to perform the behavior (Leonard et al., 2004).
In comparing these three models, they don’t have that much difference in terms of their
differential predictions (Karami, 2006). Actually the difference is because of the influences of
one construct over another in the models.
In TRA, subjective norm is composed of the user's perception of how others think she
should behave, and her motivation to comply with the expectations of these referents TRA
has been applied in its original form to explain the adoption of ICT-applications (Jeffrey K.
Liker a, Ahmed A. Sindi, 1997), but typically TRA is used as a basis for modifying the
TAM-model.
٣۵
According to the aforementioned point the theory of planned behavior was proposed as
an extension of the theory of reasoned action to account for conditions where individuals do
not have complete control over their behavior. However, this theory also included
determinants of the behavioral attitude and subjective norm. Models based upon TPB have
been applied to the explanation of different types of behavior, but when applied to the
adoption of ICT Models based upon TPB have been applied to the explanation of different
types of behavior, but when applied to the adoption of ICT systems or services, the model
contains five concepts - behavioral attitudes, subjective norm, behavioral control, intention to
use and actual use.
Davis (1986, 1989) planned the more valid adoption model for IT and IS adoption
which calls technology acceptance model. In point of fact all while of these three be capable
of be used in IT and computer acceptance research, TAM is more allied to IT adoption (Davis
et al 1989). Making available a foundation for tracing the influence of external factors on
internal beliefs, attitudes and intentions is the main factor of TAM (Davis et al., 1989).
According to Davis (1989) attitude in TAM and TRA forecasts intentions and intentions will
predict behavior or real custom. TRA has Subjective Norm element as one that concludes for
predicting intention however this element doesn’t exist in TAM.
TAM has supposed usefulness and perceived ease of use factors which was considered
that perceives usefulness has stronger consequence on attitudes and intention to use but in
TPB, Subjective Norms and Perceived behavioral control established to have affect on
intention and behavior. While we can consider TPB as a general model, on the other hand it
is still is a subset of TRA .In both TRA and TPB; beliefs have an effect on attitudes and
subjective norms is a construct in both of these model. In both of these models the definition
of attitude and intention are same. TAM constructed based on the PU and PEOU in TAM
model and is adapted from the measurement that was defined by Venkatesh and Davis (1996,
2000). TPB was developed stand on the constructs of attitude, perceived behavior control,
subjective norm, and intention to use.
TAM was defined the behavioral intention as perceived usefulness and attitude toward
using (Davis et al., 1989). In comparison between TAM and TPB, TAM is a rapid and
economical model rather than TPB (Mathieson, 1991; cited by in Karami, 2006).
٣۶
2.5 Value-based adoption model
Technology Acceptance Model (TAM) has been widely used to investigate and
forecast user acceptance also use based on perceived usefulness and ease of use (Davis,
1989). TAM posits that behavioral intention is a significant determinant of actual system use,
and that behavioral intention is determined by two salient beliefs, perceived usefulness and
perceived ease of use. The perceived usefulness refers to ‘‘the degree to which an individual
believes that using a particular system would enhance his/her job performance’’. The
perceived ease of use refers to ‘‘the degree to which an individual believes that using a
particular system would be free of physical and mental efforts (Dong-Hee Shin, 2007)
2.5.1 Value-based model
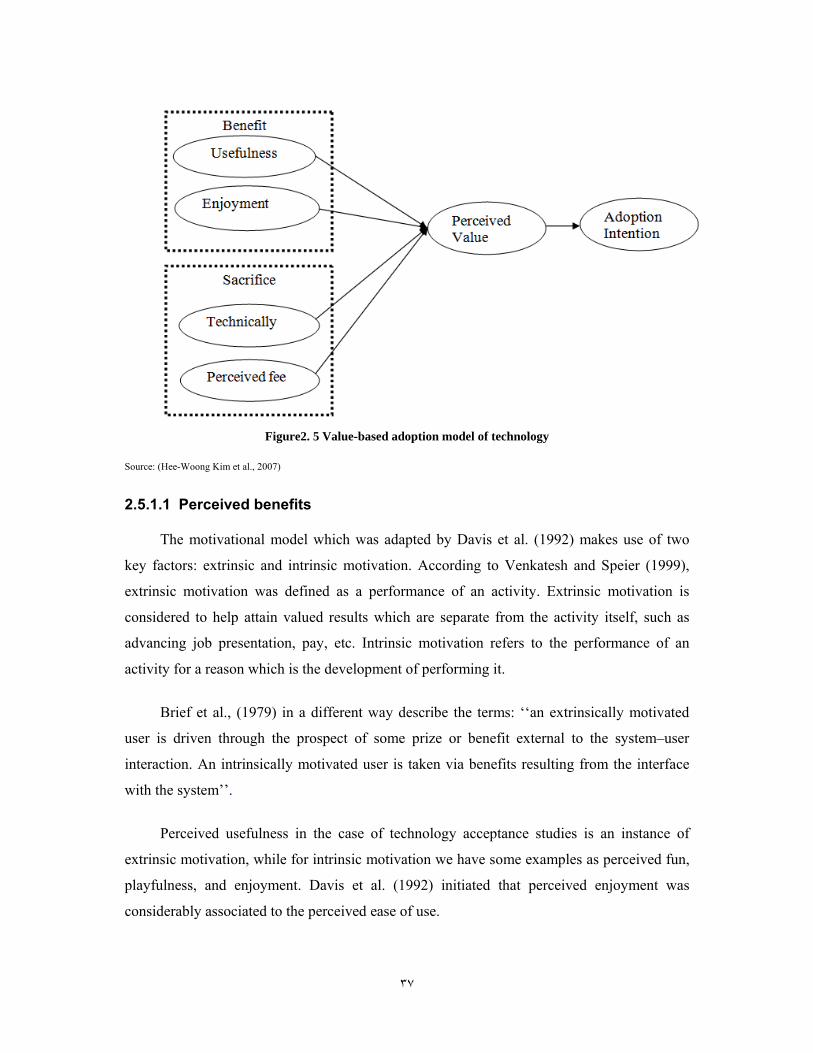
In this research, we study a Value-based Adoption Model (VAM) of M-Internet, as
shown in Fig.2.5. According to Hee-Woong Kim et al., (2007), for new technology adoption
the prior models are not adequate appropriate and the perceived value should consider in
adoption model. The main effective factors on perceived value are indicated in figure 2.5 and
will explain in section to come. The construct of adoption intention were adopted from
Agarwal and Karahanna (2000). For perceived value, the construct adopted from
Sirdeshmukh et al., (2002). While perceived value is defined as a comparison between cost
and benefit, this construct compares (1) cost and value, (2) attempt and benefit, and (3) time
spent being worthwhile and overall good value. Usefulness was adopted from Davis 1989 and
enjoyment was adopted from Agarwal and Karahanna (2000). Perceived fee was adapted
from Voss et al., 1998. In developing technicality as a new element we followed standard
psychometric scale development which is developed by Bagozzi and Philips (1982).
In the sections to come, all of the value-based model's constructs would explain and
the hypotheses at the end of this chapter are mentioned.
٣٧
Figure2. 5 Value-based adoption model of technology
Source: (Hee-Woong Kim et al., 2007)
2.5.1.1 Perceived benefits
The motivational model which was adapted by Davis et al. (1992) makes use of two
key factors: extrinsic and intrinsic motivation. According to Venkatesh and Speier (1999),
extrinsic motivation was defined as a performance of an activity. Extrinsic motivation is
considered to help attain valued results which are separate from the activity itself, such as
advancing job presentation, pay, etc. Intrinsic motivation refers to the performance of an
activity for a reason which is the development of performing it.
Brief et al., (1979) in a different way describe the terms: ‘‘an extrinsically motivated
user is driven through the prospect of some prize or benefit external to the system–user
interaction. An intrinsically motivated user is taken via benefits resulting from the interface
with the system’’.
Perceived usefulness in the case of technology acceptance studies is an instance of
extrinsic motivation, while for intrinsic motivation we have some examples as perceived fun,
playfulness, and enjoyment. Davis et al. (1992) initiated that perceived enjoyment was
considerably associated to the perceived ease of use.
٣٨
According to Nysveen et al., (2005), the consumers’ intention to make use of the mobile
services demonstrates the four overall influences on usage intention: motivational influences,
attitudinal influences, normative pressure, and perceived control.
Correspondingly, in mobile internet two of the significant factors of perceived gain is
the connection stability and geographic coverage (Fogelgren-Pedersen, 2005; cited by Dong-
Hee Shin, 2007). In addition according to the worldwide mobile Internet user survey, the
perceived enhanced utility of mobile services is the main value which encourages applying
mobile technology (Fife, 2005; cited by Dong-Hee Shin, 2007).
Despite the fact that these studies found the important perceived variables, they still do
not find mobile Internet particular variables. This means that, with all the findings, still we
have a followed question, ‘‘what are the peculiar variables to mobile Internet different from
other services?’’ Probably it featured with the contest of user behavior consideration as
happening in multiple, ad hoc, and even ever-present connection. Interaction of customers of
new technology may drift among devices; access of the similar function from several
different devices offers different possible association and interaction, also users may switch
between these, or apply a mass of devices though interacting. (Dong-Hee Shin, 2007)
Extrinsic motivation was defined as the presentation of an activity to attain a exact
purpose (e.g., rewards) while intrinsic motivation refers to no obvious corroboration other
than the process of performing the activity (F.D Davis et al., 1989; cited by Hee-Woong Kim
et al., 2007). Both extrinsic and intrinsic motivations have an influence on perceived value
and behavioral intention. In this study and according to value-based model, usefulness and
enjoyment are the benefit components of perceived value. Usefulness as an extrinsic and
cognitive benefit and ease of use as an intrinsic and affective benefit according to the
proposition of (L. Dube -Rioux, 1990; cited by Hee-Woong Kim et al., 2007) which is the
purchaser estimate of a product contains both cognitive and effective elements. Most of the
job on acceptance research in technology adaption has been conducted from an extrinsic
motivation point of view. Davis et al., (1989) explored that the extrinsic and intrinsic
motivations have affect on intention to use and usage of the computer in the work place; they
considered the perceived usefulness as an extrinsic source of motivation and perceived
enjoyment as an intrinsic cause of motivation. It was initiated that perceived enjoyment and
perceived usefulness mediated the influence of perceived ease of use on intention (Ji-Won
Moon, Young-Gul Kim, 2000).
٣٩
Usefulness is defined as the overall value which user perceives via using a fresh
technology (L. Dube -Rioux, 1990; cited by Hee-Woong Kim et al., 2007). Perceived
usefulness is districted here as "the degree to which a person believes that using a particular
system would enhance his or her job performance (Davis, 1989). Also, perceived usefulness
is defined as the degree to which an individual believes that using a particular system would
improve his or her job performance (Davis, 1991).
Firstly the conception of information quality was planned by (DeLone and McLean,
1992; cited by Dong-Hee Shin, 2007) who get reasons that for building the successful
information system a significant factor is the information quality. Additionally it was
developed the information quality as component of a determinant of system quality and
discussed that the information quality variables are practical predictors of the perceived ease
of use and the perceived usefulness (Later, Lin and Lu, 2000; cited Dong-Hee Shin, 2007).
In a number of TAM research, one of the customer satisfaction about the content or
services which provided by technologies is defined as perceived quality, the illustrations of
perceived quality include products, trust in the medium, and trust in the information, support,
and convenience, interestingly, perceived quality has been approached more on rather
tangential features of technology quality, such as customer services, convenience, or trust in
technologies than on real utilities or jobs of technologies, for the consumers, the technologies
and its utilities are in dissociable (Dong-Hee Shin, 2007).
As we said previously we have enjoyment as an intrinsic effective factor. As Kim et
al., stated the enjoyment and fun have a significant influence on technology acceptance and
this is because of this fact; persons who experience instant pleasure or joy from using a
technology to be individually enjoyable in its involved value of the technology, are more
prepare to adapt to that technology and use it more (Hee-Woong Kim et al., 2007). Sweeney
and Soutar (2001) mentioned that consumers judge products, not just in practical terms of
expected performance, value for money and usefulness; but also in terms of the enjoyment or
pleasure resultant from the product (emotional value) and the social consequences of what the
product communicates to others (social value) and emotional value defined as the utility
derived from feelings or sentimental states that a product generate and they have also shown
that the benefit element comprises perceived enjoyment, in addition to perceived usefulness.
According to Davis et al., 1989 enjoyment and fun have a significant effect on technology
acceptance beyond usefulness.
۴٠
2.5.1.2 Perceived sacrifices
Perceived sacrifices can divided both monetary and non-monetary (Thaler, R., 1985;
Zeithaml, V.A, 1988). Monetary payments consists of the real price of the product, and
commonly measured based on customer’s perception of price that they paid and non-
monetary costs usually include time attempt and other unsatisfactory costs for the purchase
and use of the product( Hee-Woong Kim et al., 2007). Technical factors and price have been
explored as the most prominent obstacle to M-Internet adoption as a result of several surveys
(Verchopoulos, 2002; cited by Hee-Woong Kim et al., 2007). For this explanation, we
hypnotize the technicality of M-Internet and perceived fee to test that these can be the
sacrifice components of perceived value. According, DeLone and McLean (1992) we define
system quality and technicality as the degree to which M-Internet is perceived as being
technically excellent in the process of providing services.
According to Davis (1991) the technicality of M-Internet is defined by user’s
observation of ease of use (whether using the system is free of physical, mental and learning
attempt), system reliability (whether the system is error-free, every time available and
secure), connectivity (whether connection is immediate and uncomplicated) and efficiency
(whether loading and response time is short). Ease of use has been broadly practiced as an
aspect of technicality which was defined as degree to which an individual believes that
making use of specific system would be free of physical and mental effort (Davis, 1991).
In contrast, according to Davis (1989), it can refer perceived ease of use as "the degree
to which a person believes that using a specific system would be free of effort," This follows
from the definition of "ease": "freedom from difficulty or great effort" (Davis, 1989). Ease of
use is an imperative concern for M-Internet. This is because M-Internet is more limited
compared to other systems, particularly for users of mobile phone when screen size and
handling complexity need mental and physical efforts, and it is more significant for fresh
adopters than experienced users (Hee-Woong Kim et al., 2007).
According to our previously discussion in above the monetary sacrifice factor is
defined as perceived fee and the fee formation of M-Internet consists of the pay-as-you-use
scheme and pricing on the base of subscription. The customers, who have no experience with
۴١
new technologies such as M-Internet, cannot referee whether the fee which tolerated to them
is high or low. In this situation, customers would compare the fee of M-Internet usage with
previously fixed prices of mobile phone calls and stationary Internet admission. As indicated
in marketing studies indicate perceived monetary prices and perceived value are negatively
related (Chang, Wildt, 1994; cited by Hee-Woong Kim et al., 2007). Consequently we put
forward relationship between perceived fee and perceived value.
Perceived value according to our definition reflects by comparing benefits with
sacrifices and for that reason it is an indicator of adoption intention. The relationship between
perceived value and adoption intention has been examined before by Hee-Woong Kim et al.,
(2007) and there is strong empirical support that perceived value affects perceptual intention
to use (Sweeney and Soutar 1997). We therefore hypothesize: Perceived value is positively
related to adoption intention. Finally we will test the assumptions have mentioned above
with survey based on questioner. According to our above discussion we aim to test 5
hypotheses:
1. Usefulness is positively related to perceived value.
2. Enjoyment is positively related to perceived value.
3. Technicality is negatively related to the perceived value.
4. Perceived fee is negatively related to perceived value.
5. Perceived value is positively related to adoption intention
۴٢
Chapter Three
Research methodology
3 Chapter Three: Research methodology
In the previous chapter related theories and the literature review of research area
were presented. This chapter will cover this study's research methodology.
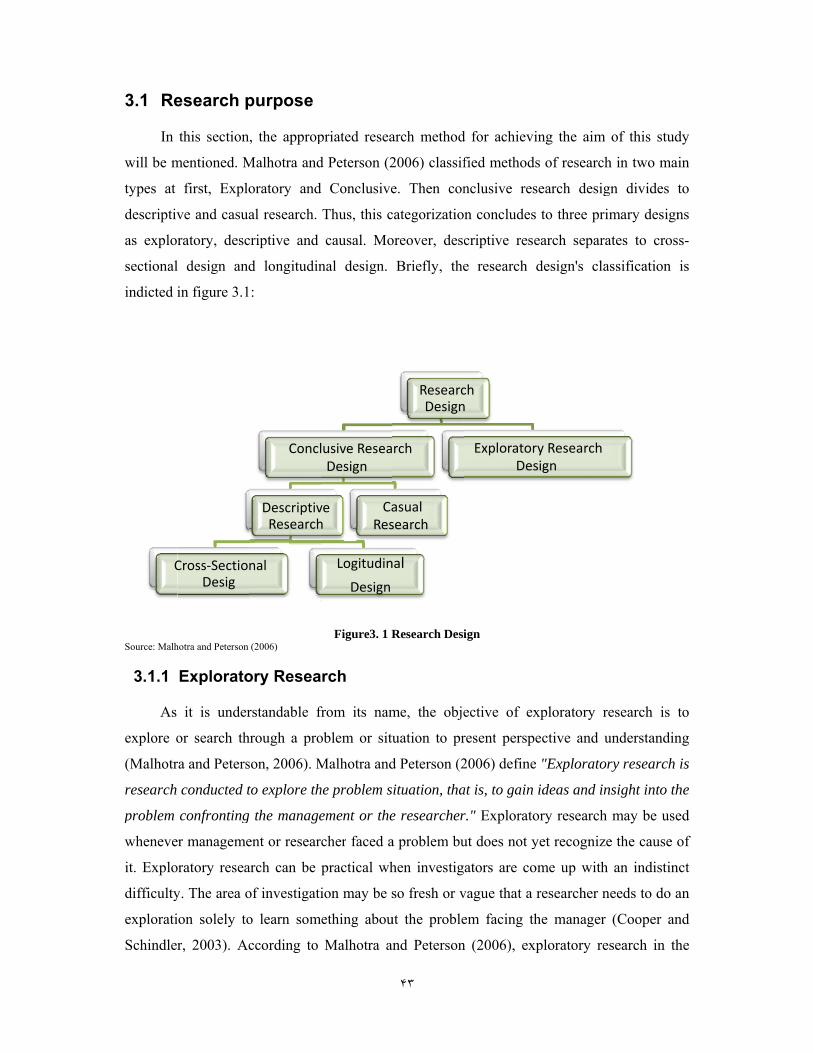
3.1 Re
In
will be m
types at
descriptiv
as explor
sectional
indicted i
Source: Malh
3.1.1
As
explore o
(Malhotr
research
problem
wheneve
it. Explo
difficulty
explorati
Schindler
C
esearch p
this section
mentioned. M
first, Explo
ve and casua
ratory, desc
l design and
in figure 3.1
hotra and Peterson
Explorato
it is under
or search th
ra and Peters
conducted t
confronting
r manageme
ratory resea
y. The area o
on solely to
r, 2003). Ac
Cross‐SectioDesig
purpose
, the approp
Malhotra and
oratory and
al research.
criptive and
d longitudin
:
(2006)
ory Resea
rstandable f
hrough a pro
son, 2006). M
to explore th
g the manage
ent or resear
arch can be
of investigati
o learn som
ccording to
Concl
DescriptivResearch
nal
priated resea
d Peterson (2
d Conclusive
Thus, this c
causal. Mo
nal design.
Figure3. 1 R
rch
from its nam
oblem or situ
Malhotra and
he problem s
ement or the
rcher faced a
practical wh
ion may be s
mething abou
Malhotra a
lusive ReseaDesign
ve h
Logitudin
Design
CaRes
۴٣
arch method
2006) classif
e. Then con
categorizatio
oreover, des
Briefly, the
Research Desi
me, the obje
uation to pr
d Peterson (2
ituation, tha
e researcher
a problem bu
hen investig
so fresh or v
ut the proble
and Peterson
ResearcDesign
rch
nal
asual search
d for achievi
fied methods
nclusive res
n concludes
criptive rese
e research
ign
ective of ex
resent perspe
2006) define
at is, to gain
r." Explorato
ut does not y
ators are co
vague that a
em facing th
n (2006), ex
ch n
ExploratorDes
ing the aim
s of research
search desig
s to three pri
earch separa
design's cla
xploratory r
ective and u
e "Explorato
ideas and in
ory research
yet recognize
ome up with
researcher n
he manager
xploratory re
ry Research sign
of this stud
h in two mai
gn divides t
imary design
ates to cros
assification
research is t
understandin
ry research
nsight into th
h may be use
e the cause o
h an indistin
needs to do a
(Cooper an
esearch in th
dy
in
to
ns
s-
is
to
ng
is
he
ed
of
ct
an
nd
he
۴۴
shape of in-depth interviews or focus groups could present useful visions. In other words,
usually exploratory research is conducted in the beginning phases of a scheme. Certainly,
exploratory research can be used at any stage in the research process when the researcher is
bewildered about the difficulty condition. Note that since exploratory research accomplished
on a small and non-representative samples, so the results should be measured as primary test
and should be used as building blocks for extra researches (Malhotra and Peterson, 2006).
According to Malhotra and Peterson (2006), exploratory research stands powerfully on
the oddity and insight of the researchers. In view of the fact that the process is greatly
flexible, exploratory research can promote from use of the following methods:
• Survey of expert/ experience survey.
• Pilot surveys.
• Case studies.
• Qualitative analysis of secondary data, including literature review.
• Qualitative research, such as focus groups and one-on-one in-depth interviews.
Malhotra and Peterson (2006) mentions that exploratory research could be used for any
of following process:
• To formulate a problem or define a problem more accurately.
• To recognize alternative courses of action.
• To expand hypothesis.
• To separate key variables and relationships for further examination.
• To gain insights for developing an approach to the dilemma.
• To set up priorities for further research.
3.1.2 Conclusive research
Malhotra and Peterson (2006) have stated a following definition about conclusive
research: "Conclusive research is research designated to assist the decision maker in
determining, evaluating, and selecting the best course of action in a given situation." It can
be used to validate the insights get from exploratory research. Conclusive research is based
on the assumption that the examiner has an exact understanding of the problem at hand. The
۴۵
purpose of conclusive research is to test exacting hypothesis and examine sole relationships
(Malhotra and Peterson, 2006).
3.1.2.1 Descriptive Research
According to the definition that Malhotra and Peterson (2006) described: "Descriptive
research is a type of conclusive research that has its major objective the description of
something (usually market characteristics or functions)." The majority commercial market
research is descriptive in nature. Descriptive research is chiefly valuable whenever research
questions relate to depicting a market experience such as recognizing relationships or market
forecasts (Malhotra and Peterson, 2006). Develop a profile of a target market, estimate the
frequency of products use as a basis for sales forecasts, determine the relationship between
product use and perception of product characteristics, and determine the degree to which
marketing variables are associated are a number of descriptive research aims (Malhotra and
Peterson, 2006).
3.1.2.1.1 Cross-Sectional Design
A cross-sectional, also called a sample survey, can be thought of as snapshot of the
marketplace taken at an exacting point in time. In this design, the chosen group of
respondents is considered only one time (Malhotra and Peterson, 2006).
3.1.2.1.2 Longitudinal Design
A longitudinal design presents a sequence of pictures, which track the changes that
happen over time. In this method, a fixed sample from the population is considered frequently
on the same variables (Malhotra and Peterson, 2006).
3.1.2.2 Causal research
Similar to descriptive research, causal (explanatory) research needs a planned and
structured design. Although descriptive research can determine the degree of relationship
between variables, it is usually not very appropriate for examining causal relationships.
Causal relations are those that engage cause-and-effect variables (Malhotra and Peterson,
2006).
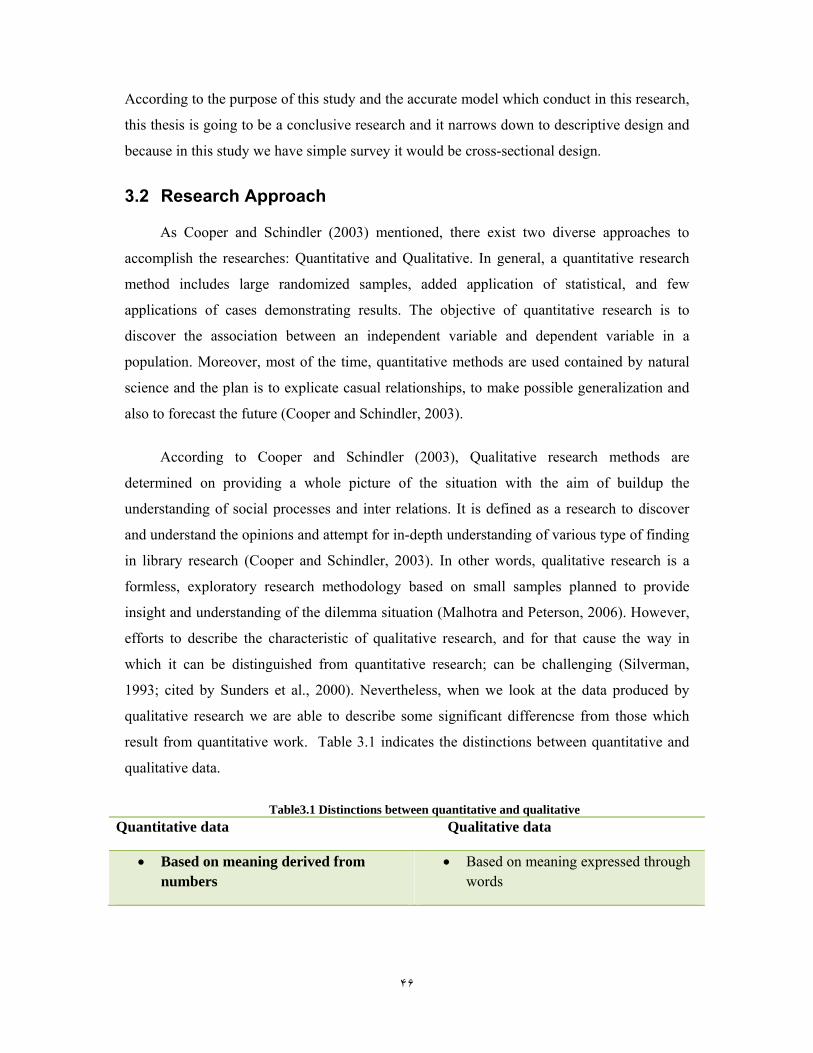
۴۶
According to the purpose of this study and the accurate model which conduct in this research,
this thesis is going to be a conclusive research and it narrows down to descriptive design and
because in this study we have simple survey it would be cross-sectional design.
3.2 Research Approach
As Cooper and Schindler (2003) mentioned, there exist two diverse approaches to
accomplish the researches: Quantitative and Qualitative. In general, a quantitative research
method includes large randomized samples, added application of statistical, and few
applications of cases demonstrating results. The objective of quantitative research is to
discover the association between an independent variable and dependent variable in a
population. Moreover, most of the time, quantitative methods are used contained by natural
science and the plan is to explicate casual relationships, to make possible generalization and
also to forecast the future (Cooper and Schindler, 2003).
According to Cooper and Schindler (2003), Qualitative research methods are
determined on providing a whole picture of the situation with the aim of buildup the
understanding of social processes and inter relations. It is defined as a research to discover
and understand the opinions and attempt for in-depth understanding of various type of finding
in library research (Cooper and Schindler, 2003). In other words, qualitative research is a
formless, exploratory research methodology based on small samples planned to provide
insight and understanding of the dilemma situation (Malhotra and Peterson, 2006). However,
efforts to describe the characteristic of qualitative research, and for that cause the way in
which it can be distinguished from quantitative research; can be challenging (Silverman,
1993; cited by Sunders et al., 2000). Nevertheless, when we look at the data produced by
qualitative research we are able to describe some significant differencse from those which
result from quantitative work. Table 3.1 indicates the distinctions between quantitative and
qualitative data.
Table3.1 Distinctions between quantitative and qualitative Quantitative data Qualitative data
• Based on meaning derived from numbers
• Based on meaning expressed through words
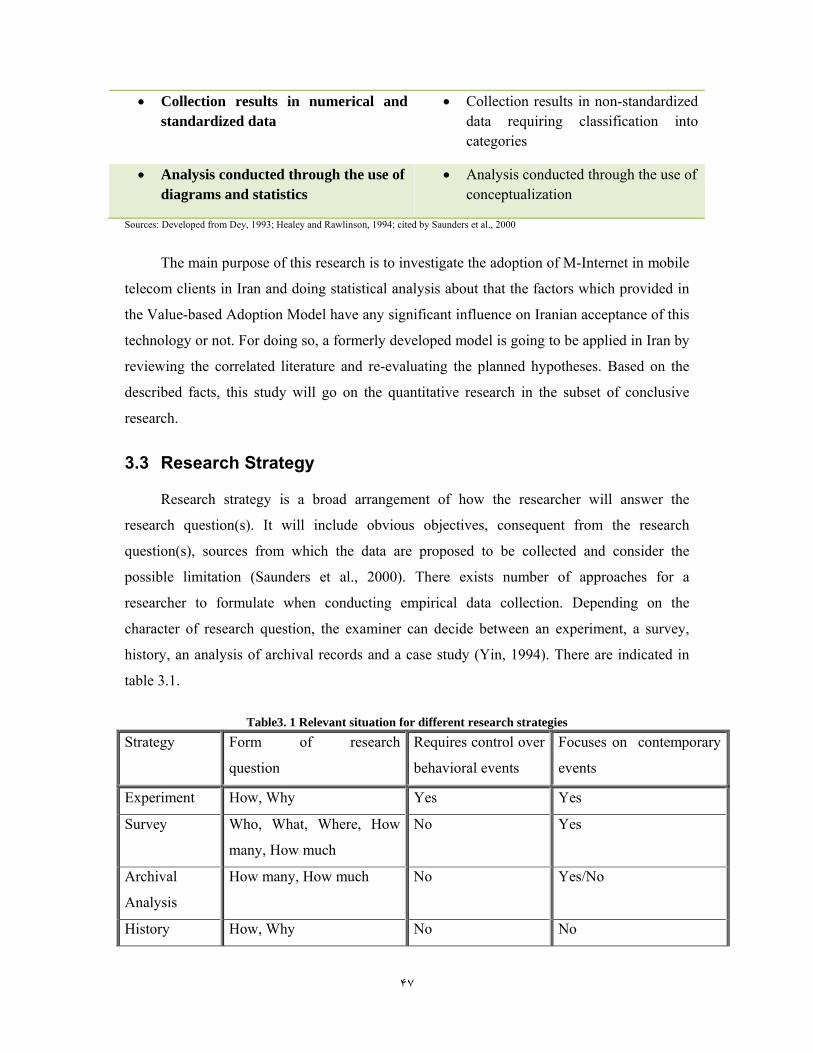
۴٧
• Collection results in numerical and standardized data
• Collection results in non-standardized data requiring classification into categories
• Analysis conducted through the use of diagrams and statistics
• Analysis conducted through the use of conceptualization
Sources: Developed from Dey, 1993; Healey and Rawlinson, 1994; cited by Saunders et al., 2000
The main purpose of this research is to investigate the adoption of M-Internet in mobile
telecom clients in Iran and doing statistical analysis about that the factors which provided in
the Value-based Adoption Model have any significant influence on Iranian acceptance of this
technology or not. For doing so, a formerly developed model is going to be applied in Iran by
reviewing the correlated literature and re-evaluating the planned hypotheses. Based on the
described facts, this study will go on the quantitative research in the subset of conclusive
research.
3.3 Research Strategy
Research strategy is a broad arrangement of how the researcher will answer the
research question(s). It will include obvious objectives, consequent from the research
question(s), sources from which the data are proposed to be collected and consider the
possible limitation (Saunders et al., 2000). There exists number of approaches for a
researcher to formulate when conducting empirical data collection. Depending on the
character of research question, the examiner can decide between an experiment, a survey,
history, an analysis of archival records and a case study (Yin, 1994). There are indicated in
table 3.1.
Table3. 1 Relevant situation for different research strategies Strategy Form of research
question
Requires control over
behavioral events
Focuses on contemporary
events
Experiment How, Why Yes Yes
Survey Who, What, Where, How
many, How much
No Yes
Archival
Analysis
How many, How much No Yes/No
History How, Why No No
۴٨
Case study How, Why No Yes
Source: (Yin, 1994)
According to Yin (1994), each of these strategies has certain advantages and
drawbacks, which are determined by three states which are mentioned in follow:
• The type of research question(s)
• The expand of control an investigator has over the actual behavioral events
• The degree of focus on current as opposed to historical events
There is no necessitate controlling behavioral events in this study that experiment
strategy emphasize, this makes disqualify experiment strategy as a research strategy for this
study. This investigation will has crucial point in up to date issues thus, history strategy do
not be suitable. In view of the fact that the intend of this study is to examine the relationship
of some variables and to test the hypothesizes, were defined in previous, among a vast
number of users that might be customer of different telecommunication companies, case
study seems to be inapt. As a final point, survey is useful when the aim of research is to
estimate about some outcomes. The survey technique is frequently linked with the deductive
approach. Survey is an conventional and common strategy in management and business
research area. Since this study aims to find out the factors that influence value-based adoption
of M-Internet from users' point of view, the strategy, which suits for this study is a survey.
For answering to the hypothesis question of this study, the main way is survey and I
distribute the questionnaires which is included about thirty questions. The value-based model
has examined in Singapore. I implement exactly the questionnaire that was allocated in
Singapore for testing that in different population.
3.4 Data collection
Data collection method is extremely influenced by the methodology which has chosen
(Sanders and Thornhill, 2000). Following to selecting a research strategy, the researcher
needs to decide about appropriate method to use for collecting data (Yin, 1994). According to
sunders et al. (2000), there exist two types of data, secondary and primary data. Data which
has already been collected, by other researchers for another principle, is called secondary data
۴٩
and primary data defined as data that an investigator collects on his\her own for a specific
reason (Saunders et al., 2000).
A questionnaire was used to collect empirical data for this research in order to
investigate the hypotheses regarding the factors which affect adoption of mobile Internet in
Iran. The questionnaire of this study was borrowed from literature and was distributed in
Singapore by Hee-Woong Kim et al., (2007) was replicated by translated into the Persian
language and to ensure that measurement scales were adapted appropriately to the current
context, some interviews were conducted with academic professionals and a few suggested
wording changes were done. After that, a pilot study was conducted with the translated
questionnaire was appropriate and the statements were generally understandable. The
Cronbach's alpha value was calculated for these questionnaires and, it was equal to 0.869, it
is over the recommended level of 0.70.
3.5 Sampling
The choice of sampling technique depends on the practicability and responsiveness of
collecting data to answer the research questions and to attend to the researchers' objectives
from the whole population (Sanders et al, 2000).The population of mobile subscribers are
divided through three telecommunication company as MCI(Hamrah-e-Aval), Taliya and
Irancell. The pioneer company which presents M-Internet is Irancell. It is essential to
consider that this service is a new born service in Iran almost we are witness of its launching
since last of 2005 and begin of 2006. We have not an abundant population of using mobile
internet in Iran. The population of interest was defined as two groups of M-Internet users in
Iran the users of Irancell and users of Hamrah-e-Aval telecommunication company which
present M-Internet. Moreover, it is fair to know that users of Hamrah-e-Aval Company are
fresh users, approximately in middle of 2008. The empirical data for this study was collected
solely among who used this service at least one-time and distributed in four subscribers
service office of Hamrah-e-Aval Co. and Irancell Co.
3.6 Validity and Reliability
According to Sunders, Lewis and Thornhill (2000) to reduce errors and receiving
wrong answers, attention has to be emphasized on two particular research steps; Reliability
and Validity. Reliability or external validity means that if the test is repeated under similar
condition, to what extent the findings are alike and reliable (Cooper and Schindler, 2003).
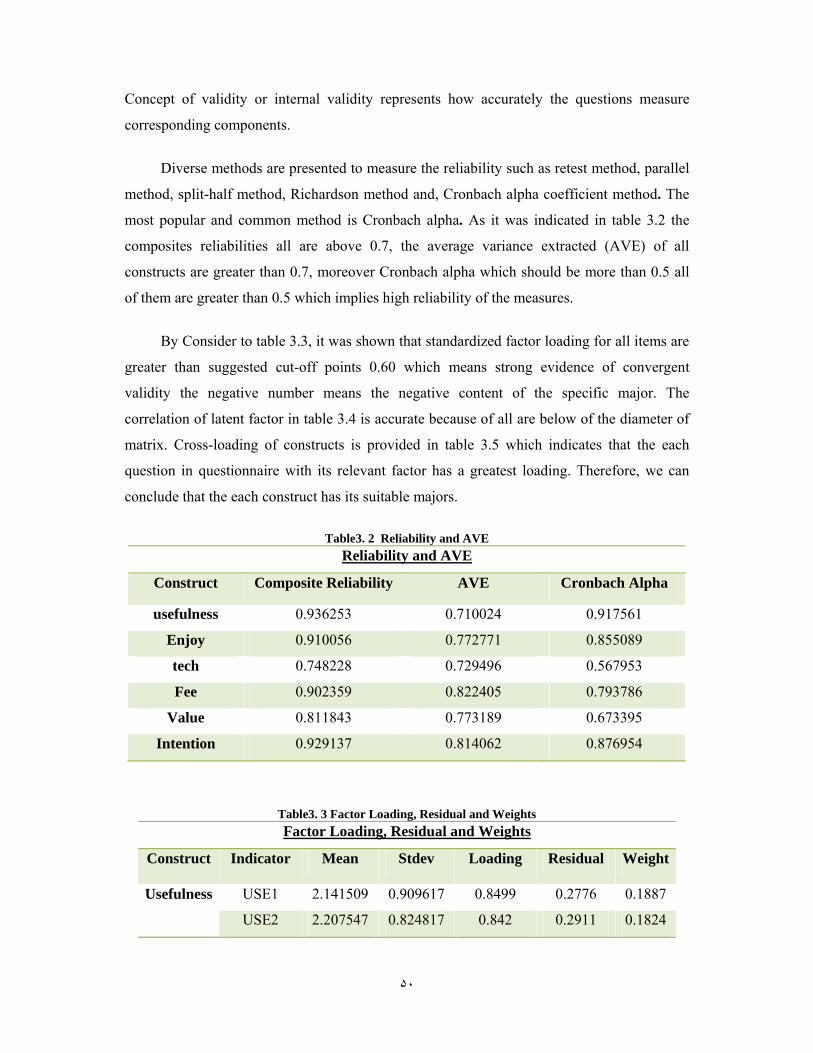
۵٠
Concept of validity or internal validity represents how accurately the questions measure
corresponding components.
Diverse methods are presented to measure the reliability such as retest method, parallel
method, split-half method, Richardson method and, Cronbach alpha coefficient method. The
most popular and common method is Cronbach alpha. As it was indicated in table 3.2 the
composites reliabilities all are above 0.7, the average variance extracted (AVE) of all
constructs are greater than 0.7, moreover Cronbach alpha which should be more than 0.5 all
of them are greater than 0.5 which implies high reliability of the measures.
By Consider to table 3.3, it was shown that standardized factor loading for all items are
greater than suggested cut-off points 0.60 which means strong evidence of convergent
validity the negative number means the negative content of the specific major. The
correlation of latent factor in table 3.4 is accurate because of all are below of the diameter of
matrix. Cross-loading of constructs is provided in table 3.5 which indicates that the each
question in questionnaire with its relevant factor has a greatest loading. Therefore, we can
conclude that the each construct has its suitable majors.
Table3. 2 Reliability and AVE
Table3. 3 Factor Loading, Residual and Weights Factor Loading, Residual and Weights
Construct Indicator Mean Stdev Loading Residual Weight
Usefulness USE1 2.141509 0.909617 0.8499 0.2776 0.1887
USE2 2.207547 0.824817 0.842 0.2911 0.1824
Reliability and AVE
Construct Composite Reliability AVE Cronbach Alpha
usefulness 0.936253 0.710024 0.917561
Enjoy 0.910056 0.772771 0.855089
tech 0.748228 0.729496 0.567953
Fee 0.902359 0.822405 0.793786
Value 0.811843 0.773189 0.673395
Intention 0.929137 0.814062 0.876954
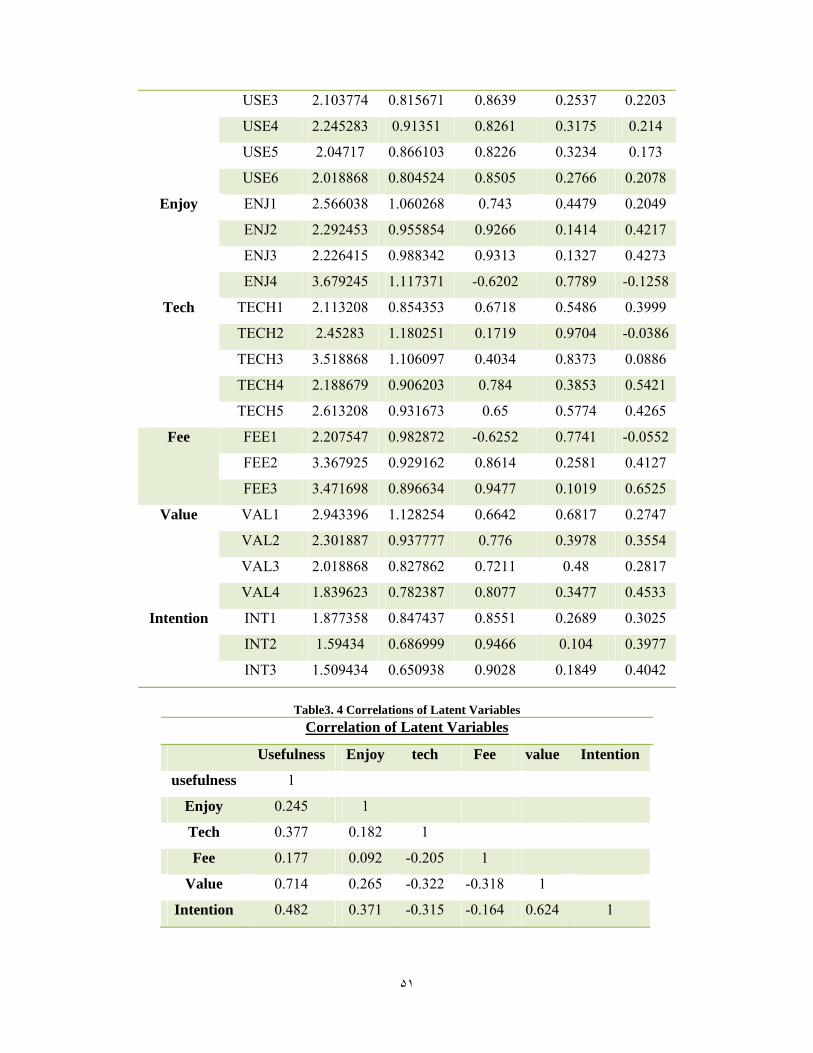
۵١
USE3 2.103774 0.815671 0.8639 0.2537 0.2203
USE4 2.245283 0.91351 0.8261 0.3175 0.214
USE5 2.04717 0.866103 0.8226 0.3234 0.173
USE6 2.018868 0.804524 0.8505 0.2766 0.2078
Enjoy ENJ1 2.566038 1.060268 0.743 0.4479 0.2049
ENJ2 2.292453 0.955854 0.9266 0.1414 0.4217
ENJ3 2.226415 0.988342 0.9313 0.1327 0.4273
ENJ4 3.679245 1.117371 -0.6202 0.7789 -0.1258
Tech TECH1 2.113208 0.854353 0.6718 0.5486 0.3999
TECH2 2.45283 1.180251 0.1719 0.9704 -0.0386
TECH3 3.518868 1.106097 0.4034 0.8373 0.0886
TECH4 2.188679 0.906203 0.784 0.3853 0.5421
TECH5 2.613208 0.931673 0.65 0.5774 0.4265
Fee FEE1 2.207547 0.982872 -0.6252 0.7741 -0.0552
FEE2 3.367925 0.929162 0.8614 0.2581 0.4127
FEE3 3.471698 0.896634 0.9477 0.1019 0.6525
Value VAL1 2.943396 1.128254 0.6642 0.6817 0.2747
VAL2 2.301887 0.937777 0.776 0.3978 0.3554
VAL3 2.018868 0.827862 0.7211 0.48 0.2817
VAL4 1.839623 0.782387 0.8077 0.3477 0.4533
Intention INT1 1.877358 0.847437 0.8551 0.2689 0.3025
INT2 1.59434 0.686999 0.9466 0.104 0.3977
INT3 1.509434 0.650938 0.9028 0.1849 0.4042
Table3. 4 Correlations of Latent Variables
Correlation of Latent Variables
Usefulness Enjoy tech Fee value Intention
usefulness 1
Enjoy 0.245 1
Tech 0.377 0.182 1
Fee 0.177 0.092 -0.205 1
Value 0.714 0.265 -0.322 -0.318 1
Intention 0.482 0.371 -0.315 -0.164 0.624 1
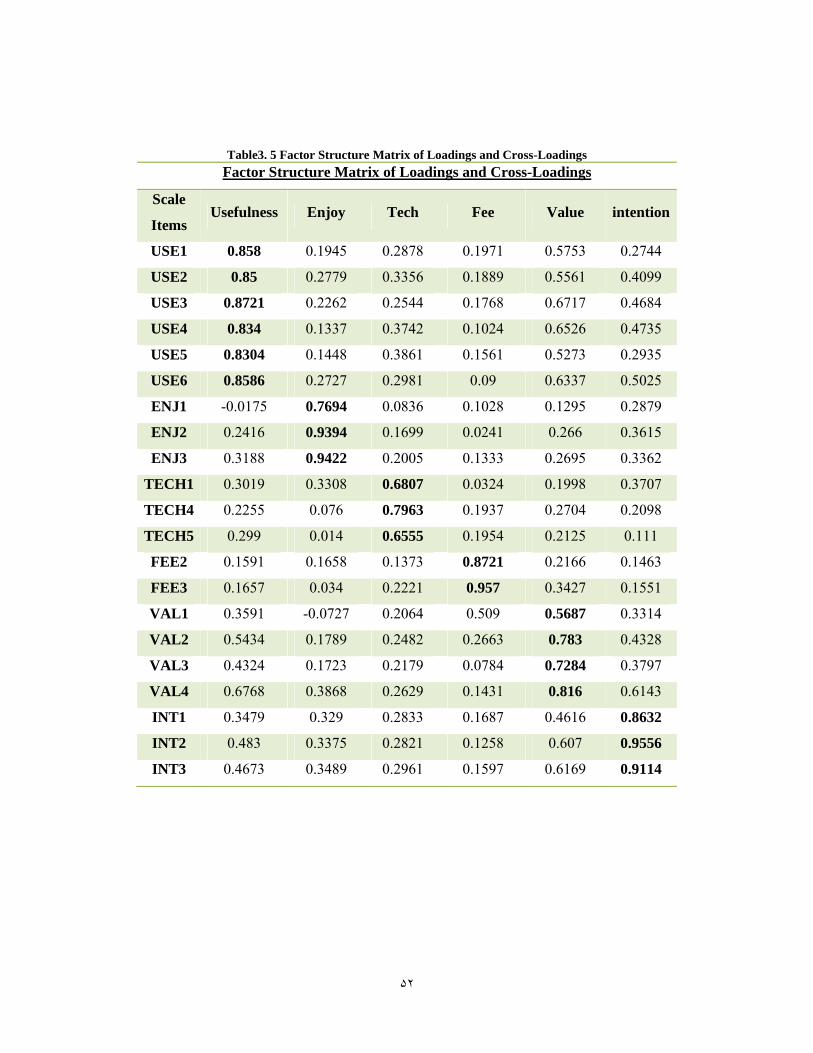
۵٢
Table3. 5 Factor Structure Matrix of Loadings and Cross-Loadings Factor Structure Matrix of Loadings and Cross-Loadings
Scale
Items Usefulness Enjoy Tech Fee Value intention
USE1 0.858 0.1945 0.2878 0.1971 0.5753 0.2744
USE2 0.85 0.2779 0.3356 0.1889 0.5561 0.4099
USE3 0.8721 0.2262 0.2544 0.1768 0.6717 0.4684
USE4 0.834 0.1337 0.3742 0.1024 0.6526 0.4735
USE5 0.8304 0.1448 0.3861 0.1561 0.5273 0.2935
USE6 0.8586 0.2727 0.2981 0.09 0.6337 0.5025
ENJ1 -0.0175 0.7694 0.0836 0.1028 0.1295 0.2879
ENJ2 0.2416 0.9394 0.1699 0.0241 0.266 0.3615
ENJ3 0.3188 0.9422 0.2005 0.1333 0.2695 0.3362
TECH1 0.3019 0.3308 0.6807 0.0324 0.1998 0.3707
TECH4 0.2255 0.076 0.7963 0.1937 0.2704 0.2098
TECH5 0.299 0.014 0.6555 0.1954 0.2125 0.111
FEE2 0.1591 0.1658 0.1373 0.8721 0.2166 0.1463
FEE3 0.1657 0.034 0.2221 0.957 0.3427 0.1551
VAL1 0.3591 -0.0727 0.2064 0.509 0.5687 0.3314
VAL2 0.5434 0.1789 0.2482 0.2663 0.783 0.4328
VAL3 0.4324 0.1723 0.2179 0.0784 0.7284 0.3797
VAL4 0.6768 0.3868 0.2629 0.1431 0.816 0.6143
INT1 0.3479 0.329 0.2833 0.1687 0.4616 0.8632
INT2 0.483 0.3375 0.2821 0.1258 0.607 0.9556
INT3 0.4673 0.3489 0.2961 0.1597 0.6169 0.9114
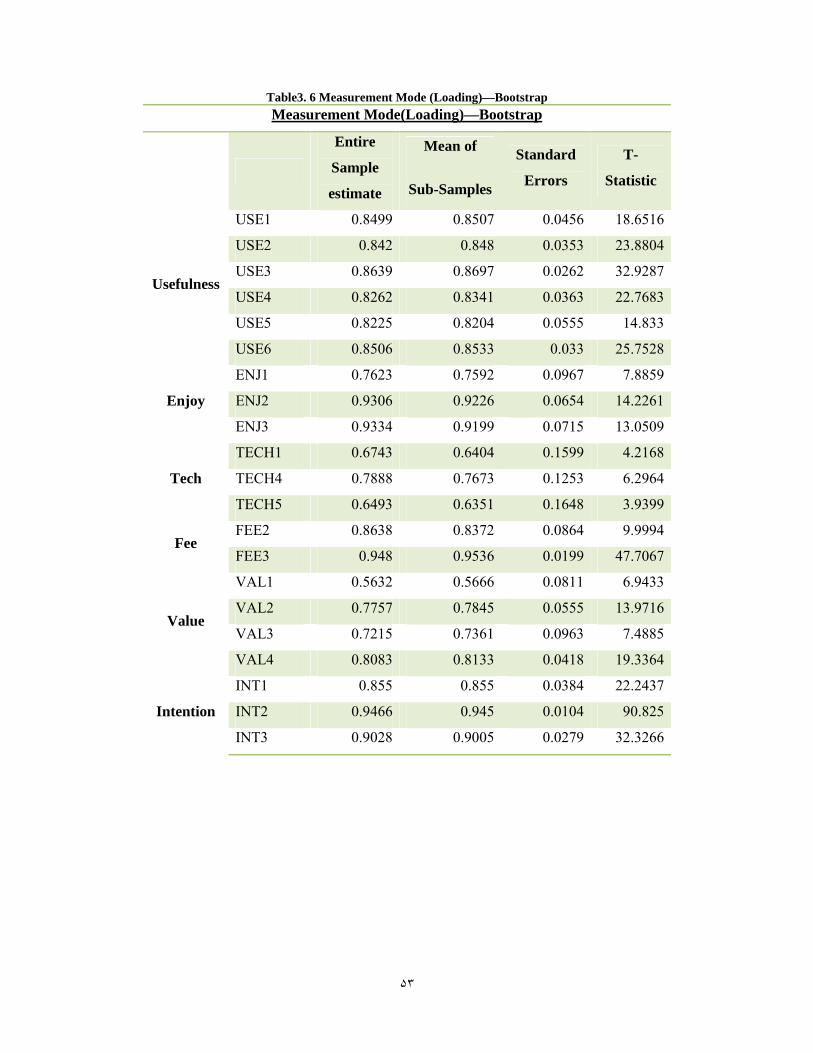
۵٣
Table3. 6 Measurement Mode (Loading)—Bootstrap Measurement Mode(Loading)—Bootstrap
Entire
Sample
estimate
Mean of
Sub-Samples
Standard
Errors
T-
Statistic
Usefulness
USE1 0.8499 0.8507 0.0456 18.6516
USE2 0.842 0.848 0.0353 23.8804
USE3 0.8639 0.8697 0.0262 32.9287
USE4 0.8262 0.8341 0.0363 22.7683
USE5 0.8225 0.8204 0.0555 14.833
USE6 0.8506 0.8533 0.033 25.7528
Enjoy
ENJ1 0.7623 0.7592 0.0967 7.8859
ENJ2 0.9306 0.9226 0.0654 14.2261
ENJ3 0.9334 0.9199 0.0715 13.0509
Tech
TECH1 0.6743 0.6404 0.1599 4.2168
TECH4 0.7888 0.7673 0.1253 6.2964
TECH5 0.6493 0.6351 0.1648 3.9399
Fee FEE2 0.8638 0.8372 0.0864 9.9994
FEE3 0.948 0.9536 0.0199 47.7067
Value
VAL1 0.5632 0.5666 0.0811 6.9433
VAL2 0.7757 0.7845 0.0555 13.9716
VAL3 0.7215 0.7361 0.0963 7.4885
VAL4 0.8083 0.8133 0.0418 19.3364
Intention
INT1 0.855 0.855 0.0384 22.2437
INT2 0.9466 0.945 0.0104 90.825
INT3 0.9028 0.9005 0.0279 32.3266
۵۴
Chapter Four
Analyze
4 Chapter Four: Analyze
In this chapter we would analyzed the results of data which we collected and mentioned
in previous chapter. This includes explanation of descriptive statistics and partial least
square's (PLS) explain and also result of PLS is to come, after that the model's goodness of fit
and finally we would discussed the comparison between technology acceptance model and
value-based model.
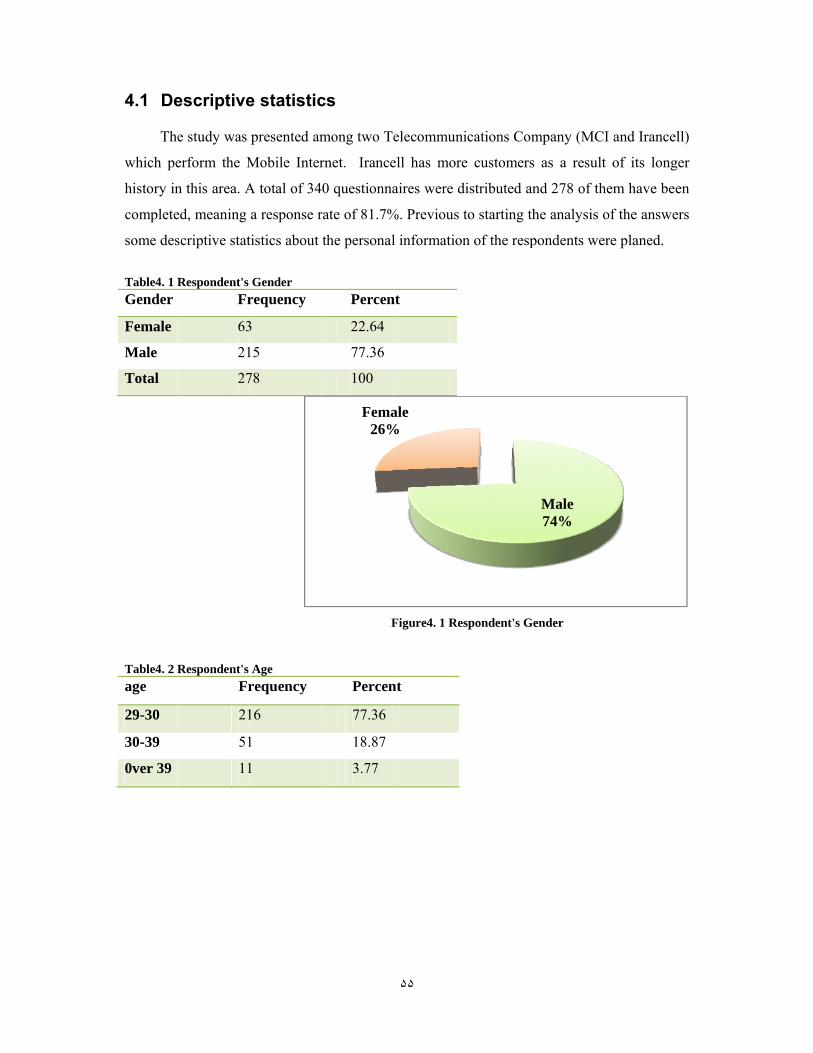
4.1 De
The
which pe
history in
complete
some des
Table4. 1 RGender
Female
Male
Total
Table4. 2 Rage
29-30
30-39
0ver 39
escriptive
e study was
erform the M
n this area. A
ed, meaning
scriptive stat
Respondent's Fr
63
21
27
Respondent's Fr
21
51
11
e statistic
presented am
Mobile Inter
A total of 34
a response r
tistics about
Gender requency
3
15
78
Age requency
16
1
1
cs
mong two T
rnet. Irance
40 questionna
rate of 81.7%
the personal
Percen
22.64
77.36
100
F
Percen
77.36
18.87
3.77
Fema26%
۵۵
Telecommuni
ell has more
aires were d
%. Previous t
l information
nt
Figure4. 1 Res
nt
ale %
ications Com
e customers
distributed an
to starting th
n of the resp
spondent's Ge
mpany (MCI
as a result
nd 278 of the
he analysis o
pondents wer
ender
Male74%
I and Irancel
of its longe
em have bee
of the answe
re planed.
ll)
er
en
rs
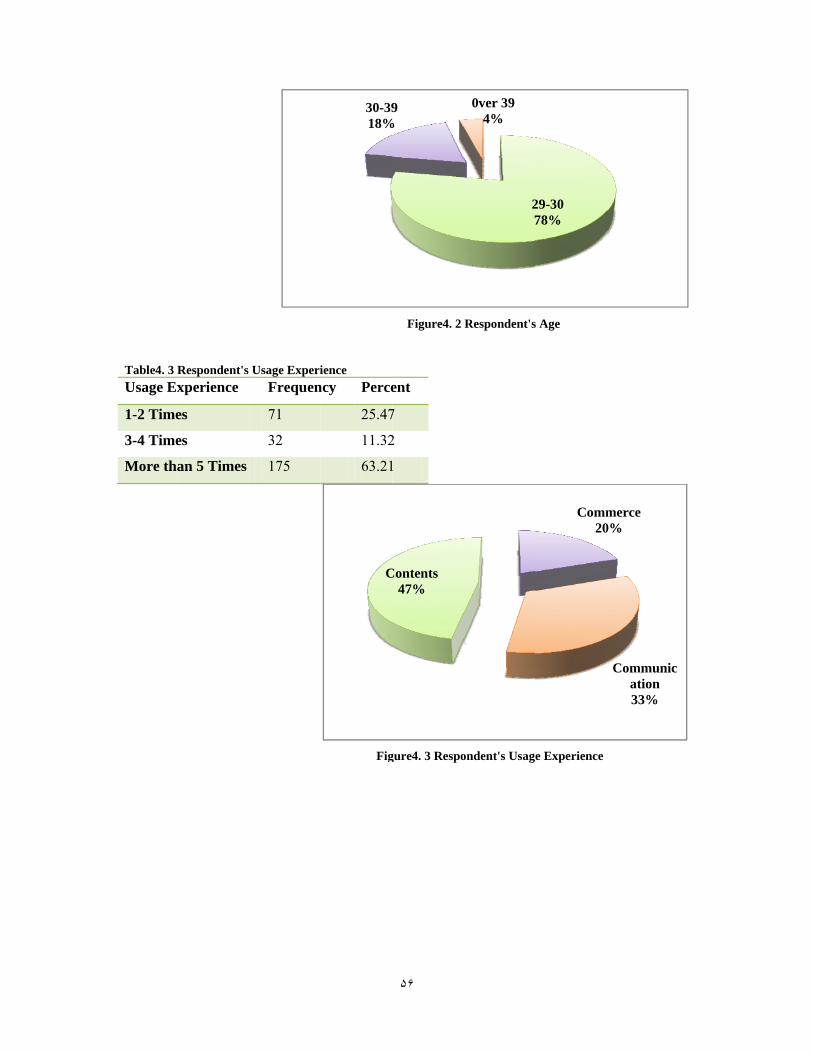
Table4. 3 RUsage Ex
1-2 Time
3-4 Time
More tha
Respondent's xperience
es
es
an 5 Times
Usage ExperiFrequen
71
32
175
ience ncy Perce
25.47
11.32
63.21
Fig
30-3918%
C
۵۶
Figure4. 2
ent
7
2
1
gure4. 3 Respo
9%
Contents 47%
Respondent's
ondent's Usag
27
0ver 394%
s Age
e Experience
29-3078%
Comm20
merce0%
Communication33%
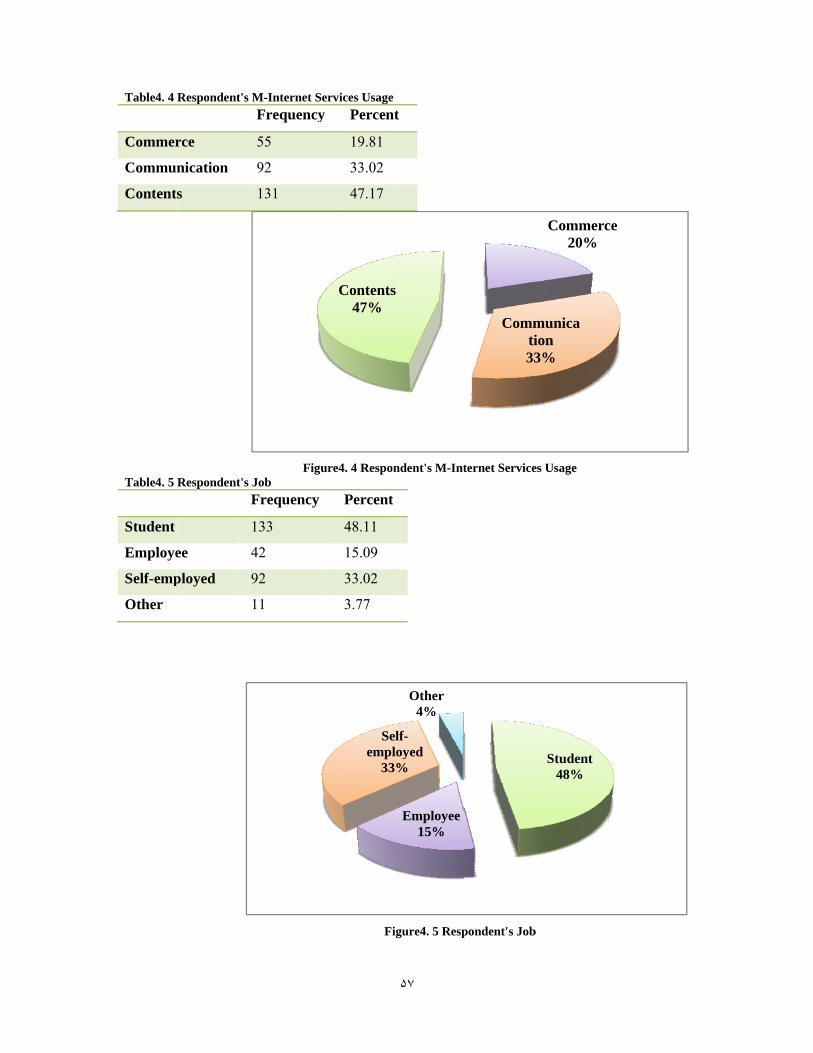
Table4. 4 R
Commer
Commun
Contents
Table4. 5 R
Student
Employe
Self-emp
Other
Respondent's
rce
nication
s
Respondent's
ee
ployed
M-Internet SFrequency
55
92
131
FiguJob Frequency
133
42
92
11
Services Usagey Percen
19.81
33.02
47.17
ure4. 4 Respo
Percent
48.11
15.09
33.02
3.77
Fi
Contents47%
Seempl
33
۵٧
e nt
ondent's M-Int
t
igure4. 5 Resp
s
Employee15%
elf-loyed
3%
Other4%
ternet Service
pondent's Job
Commti33
es Usage
b
Commerc20%
municaion3%
Student48%
ce
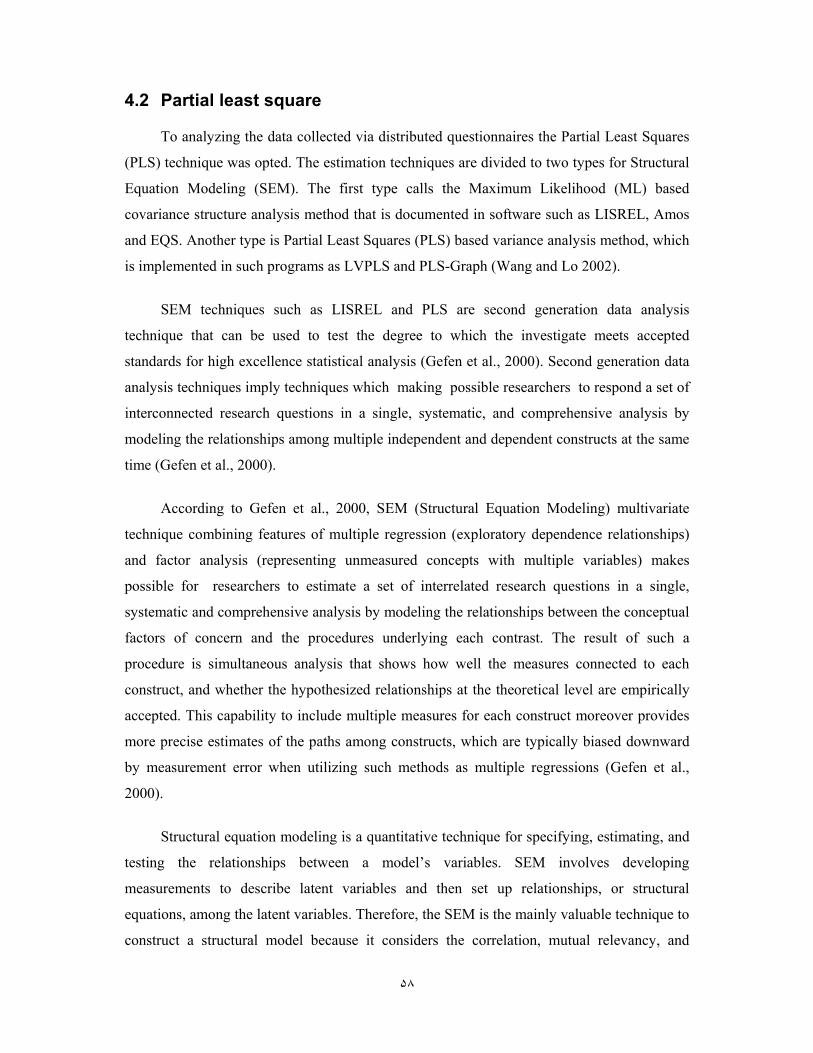
۵٨
4.2 Partial least square
To analyzing the data collected via distributed questionnaires the Partial Least Squares
(PLS) technique was opted. The estimation techniques are divided to two types for Structural
Equation Modeling (SEM). The first type calls the Maximum Likelihood (ML) based
covariance structure analysis method that is documented in software such as LISREL, Amos
and EQS. Another type is Partial Least Squares (PLS) based variance analysis method, which
is implemented in such programs as LVPLS and PLS-Graph (Wang and Lo 2002).
SEM techniques such as LISREL and PLS are second generation data analysis
technique that can be used to test the degree to which the investigate meets accepted
standards for high excellence statistical analysis (Gefen et al., 2000). Second generation data
analysis techniques imply techniques which making possible researchers to respond a set of
interconnected research questions in a single, systematic, and comprehensive analysis by
modeling the relationships among multiple independent and dependent constructs at the same
time (Gefen et al., 2000).
According to Gefen et al., 2000, SEM (Structural Equation Modeling) multivariate
technique combining features of multiple regression (exploratory dependence relationships)
and factor analysis (representing unmeasured concepts with multiple variables) makes
possible for researchers to estimate a set of interrelated research questions in a single,
systematic and comprehensive analysis by modeling the relationships between the conceptual
factors of concern and the procedures underlying each contrast. The result of such a
procedure is simultaneous analysis that shows how well the measures connected to each
construct, and whether the hypothesized relationships at the theoretical level are empirically
accepted. This capability to include multiple measures for each construct moreover provides
more precise estimates of the paths among constructs, which are typically biased downward
by measurement error when utilizing such methods as multiple regressions (Gefen et al.,
2000).
Structural equation modeling is a quantitative technique for specifying, estimating, and
testing the relationships between a model’s variables. SEM involves developing
measurements to describe latent variables and then set up relationships, or structural
equations, among the latent variables. Therefore, the SEM is the mainly valuable technique to
construct a structural model because it considers the correlation, mutual relevancy, and
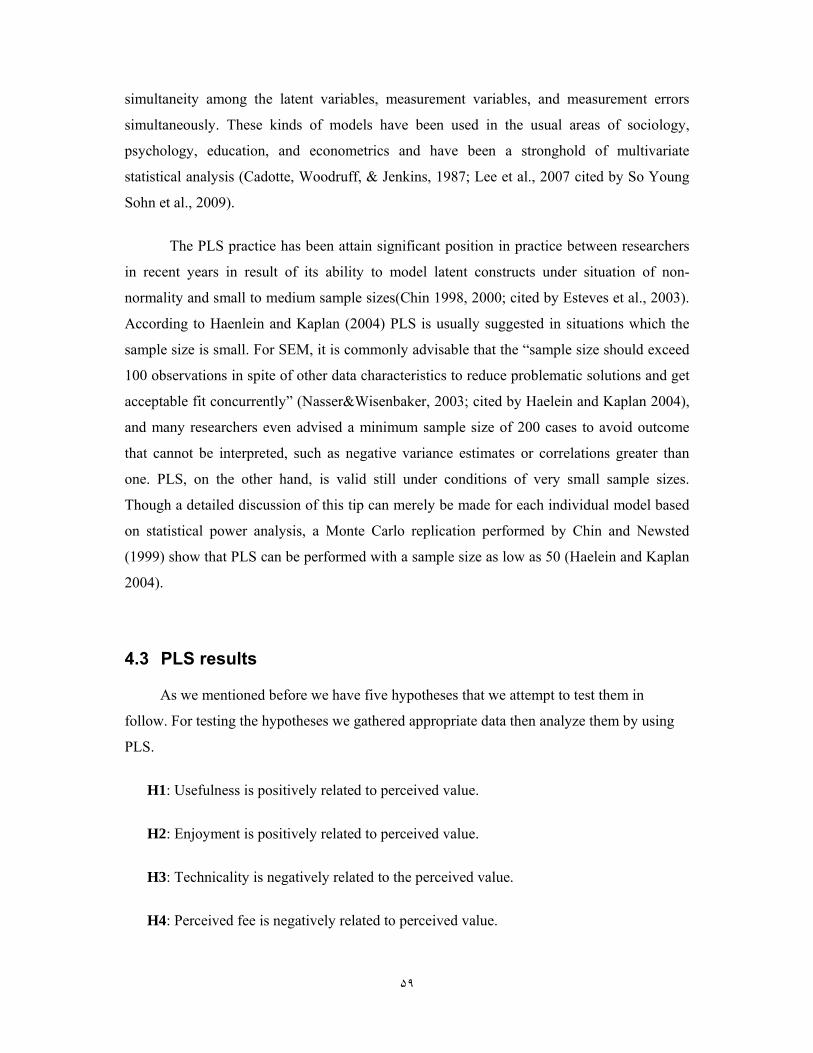
۵٩
simultaneity among the latent variables, measurement variables, and measurement errors
simultaneously. These kinds of models have been used in the usual areas of sociology,
psychology, education, and econometrics and have been a stronghold of multivariate
statistical analysis (Cadotte, Woodruff, & Jenkins, 1987; Lee et al., 2007 cited by So Young
Sohn et al., 2009).
The PLS practice has been attain significant position in practice between researchers
in recent years in result of its ability to model latent constructs under situation of non-
normality and small to medium sample sizes(Chin 1998, 2000; cited by Esteves et al., 2003).
According to Haenlein and Kaplan (2004) PLS is usually suggested in situations which the
sample size is small. For SEM, it is commonly advisable that the “sample size should exceed
100 observations in spite of other data characteristics to reduce problematic solutions and get
acceptable fit concurrently” (Nasser&Wisenbaker, 2003; cited by Haelein and Kaplan 2004),
and many researchers even advised a minimum sample size of 200 cases to avoid outcome
that cannot be interpreted, such as negative variance estimates or correlations greater than
one. PLS, on the other hand, is valid still under conditions of very small sample sizes.
Though a detailed discussion of this tip can merely be made for each individual model based
on statistical power analysis, a Monte Carlo replication performed by Chin and Newsted
(1999) show that PLS can be performed with a sample size as low as 50 (Haelein and Kaplan
2004).
4.3 PLS results
As we mentioned before we have five hypotheses that we attempt to test them in
follow. For testing the hypotheses we gathered appropriate data then analyze them by using
PLS.
H1: Usefulness is positively related to perceived value.
H2: Enjoyment is positively related to perceived value.
H3: Technicality is negatively related to the perceived value.
H4: Perceived fee is negatively related to perceived value.
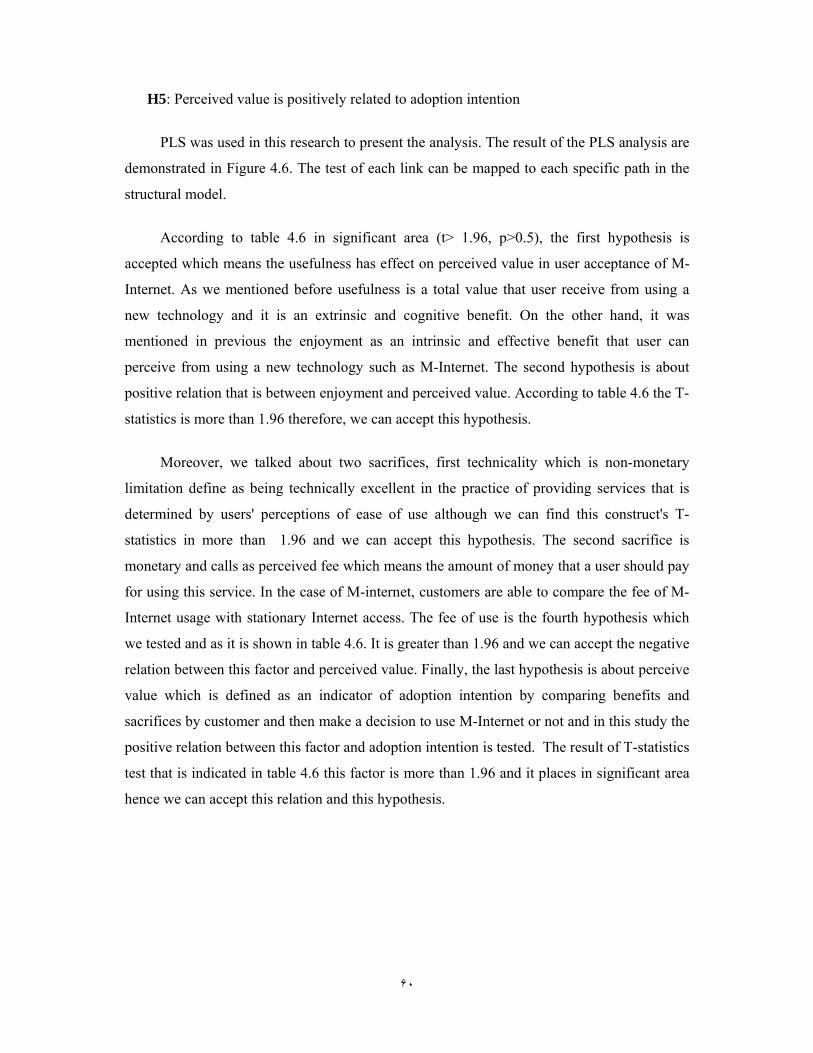
۶٠
H5: Perceived value is positively related to adoption intention
PLS was used in this research to present the analysis. The result of the PLS analysis are
demonstrated in Figure 4.6. The test of each link can be mapped to each specific path in the
structural model.
According to table 4.6 in significant area (t> 1.96, p>0.5), the first hypothesis is
accepted which means the usefulness has effect on perceived value in user acceptance of M-
Internet. As we mentioned before usefulness is a total value that user receive from using a
new technology and it is an extrinsic and cognitive benefit. On the other hand, it was
mentioned in previous the enjoyment as an intrinsic and effective benefit that user can
perceive from using a new technology such as M-Internet. The second hypothesis is about
positive relation that is between enjoyment and perceived value. According to table 4.6 the T-
statistics is more than 1.96 therefore, we can accept this hypothesis.
Moreover, we talked about two sacrifices, first technicality which is non-monetary
limitation define as being technically excellent in the practice of providing services that is
determined by users' perceptions of ease of use although we can find this construct's T-
statistics in more than 1.96 and we can accept this hypothesis. The second sacrifice is
monetary and calls as perceived fee which means the amount of money that a user should pay
for using this service. In the case of M-internet, customers are able to compare the fee of M-
Internet usage with stationary Internet access. The fee of use is the fourth hypothesis which
we tested and as it is shown in table 4.6. It is greater than 1.96 and we can accept the negative
relation between this factor and perceived value. Finally, the last hypothesis is about perceive
value which is defined as an indicator of adoption intention by comparing benefits and
sacrifices by customer and then make a decision to use M-Internet or not and in this study the
positive relation between this factor and adoption intention is tested. The result of T-statistics
test that is indicated in table 4.6 this factor is more than 1.96 and it places in significant area
hence we can accept this relation and this hypothesis.
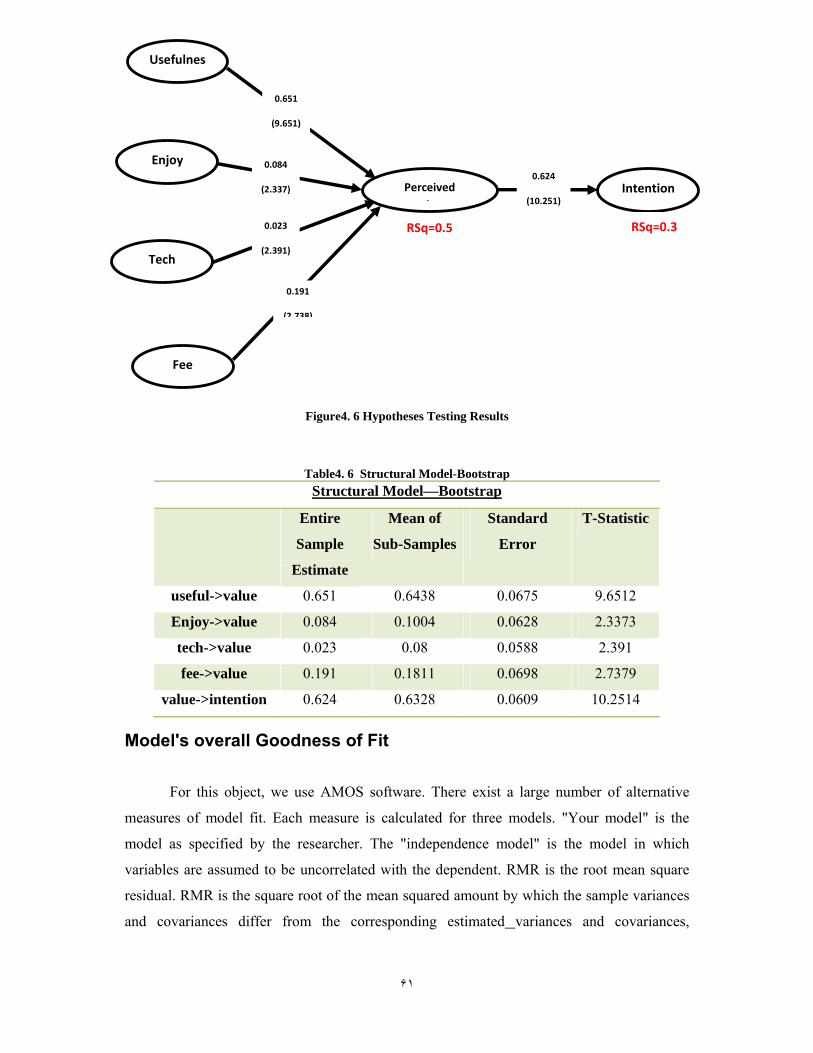
۶١
Figure4. 6 Hypotheses Testing Results
Table4. 6 Structural Model-Bootstrap Structural Model—Bootstrap
Entire
Sample
Estimate
Mean of
Sub-Samples
Standard
Error
T-Statistic
useful->value 0.651 0.6438 0.0675 9.6512
Enjoy->value 0.084 0.1004 0.0628 2.3373
tech->value 0.023 0.08 0.0588 2.391
fee->value 0.191 0.1811 0.0698 2.7379
value->intention 0.624 0.6328 0.0609 10.2514
Model's overall Goodness of Fit
For this object, we use AMOS software. There exist a large number of alternative
measures of model fit. Each measure is calculated for three models. "Your model" is the
model as specified by the researcher. The "independence model" is the model in which
variables are assumed to be uncorrelated with the dependent. RMR is the root mean square
residual. RMR is the square root of the mean squared amount by which the sample variances
and covariances differ from the corresponding estimated variances and covariances,
Intention Perceived l
Usefulnes
Enjoy
Tech
Fee
RSq=0.3
0.624
(10.251)
RSq=0.5
0.191
(2 738)
0.651
(9.651)
0.023
(2.391)
0.084
(2.337)
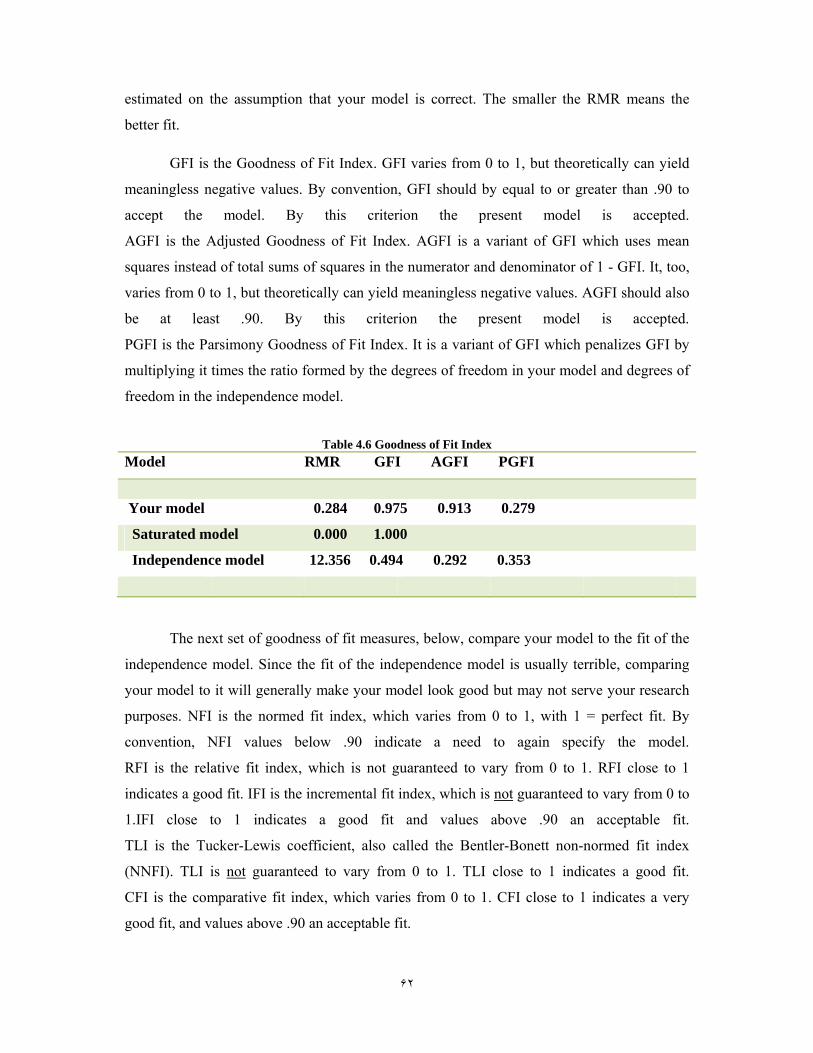
۶٢
estimated on the assumption that your model is correct. The smaller the RMR means the
better fit.
GFI is the Goodness of Fit Index. GFI varies from 0 to 1, but theoretically can yield
meaningless negative values. By convention, GFI should by equal to or greater than .90 to
accept the model. By this criterion the present model is accepted.
AGFI is the Adjusted Goodness of Fit Index. AGFI is a variant of GFI which uses mean
squares instead of total sums of squares in the numerator and denominator of 1 - GFI. It, too,
varies from 0 to 1, but theoretically can yield meaningless negative values. AGFI should also
be at least .90. By this criterion the present model is accepted.
PGFI is the Parsimony Goodness of Fit Index. It is a variant of GFI which penalizes GFI by
multiplying it times the ratio formed by the degrees of freedom in your model and degrees of
freedom in the independence model.
Table 4.6 Goodness of Fit Index
Model RMR GFI AGFI PGFI
Your model 0.284 0.975 0.913 0.279
Saturated model 0.000 1.000
Independence model 12.356 0.494 0.292 0.353
The next set of goodness of fit measures, below, compare your model to the fit of the
independence model. Since the fit of the independence model is usually terrible, comparing
your model to it will generally make your model look good but may not serve your research
purposes. NFI is the normed fit index, which varies from 0 to 1, with 1 = perfect fit. By
convention, NFI values below .90 indicate a need to again specify the model.
RFI is the relative fit index, which is not guaranteed to vary from 0 to 1. RFI close to 1
indicates a good fit. IFI is the incremental fit index, which is not guaranteed to vary from 0 to
1.IFI close to 1 indicates a good fit and values above .90 an acceptable fit.
TLI is the Tucker-Lewis coefficient, also called the Bentler-Bonett non-normed fit index
(NNFI). TLI is not guaranteed to vary from 0 to 1. TLI close to 1 indicates a good fit.
CFI is the comparative fit index, which varies from 0 to 1. CFI close to 1 indicates a very
good fit, and values above .90 an acceptable fit.
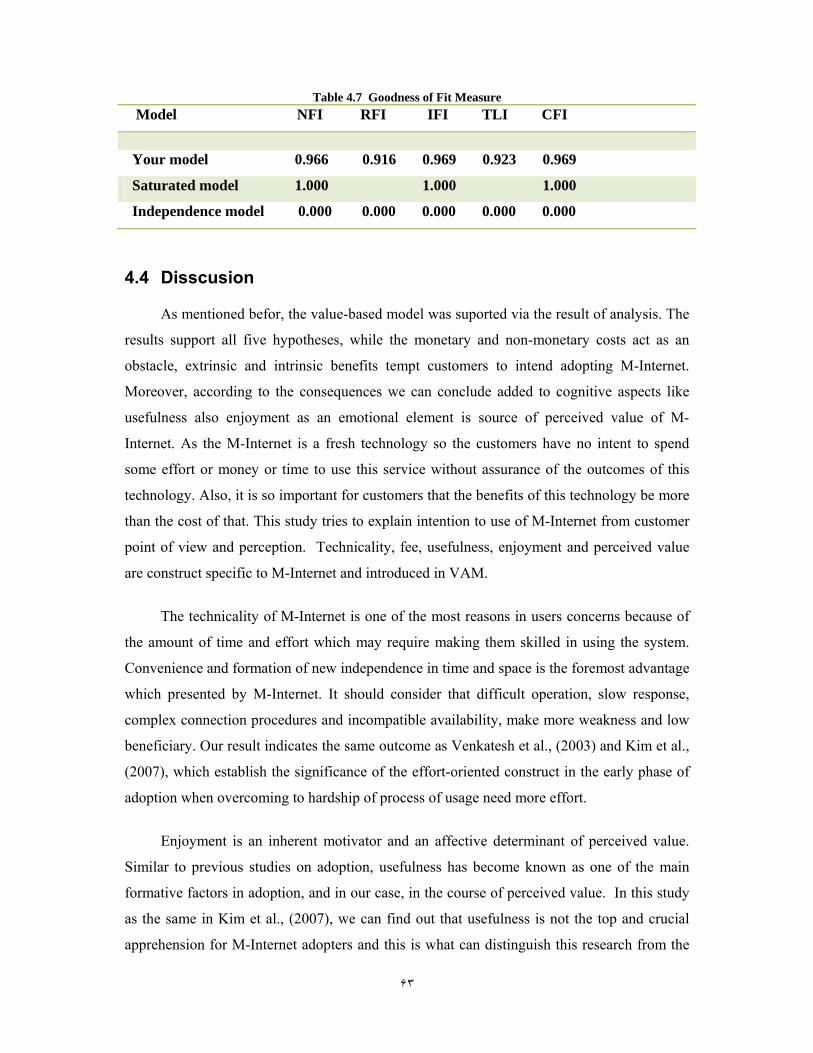
۶٣
Table 4.7 Goodness of Fit Measure Model NFI RFI IFI TLI CFI
Your model 0.966 0.916 0.969 0.923 0.969
Saturated model 1.000 1.000 1.000
Independence model 0.000 0.000 0.000 0.000 0.000
4.4 Disscusion
As mentioned befor, the value-based model was suported via the result of analysis. The
results support all five hypotheses, while the monetary and non-monetary costs act as an
obstacle, extrinsic and intrinsic benefits tempt customers to intend adopting M-Internet.
Moreover, according to the consequences we can conclude added to cognitive aspects like
usefulness also enjoyment as an emotional element is source of perceived value of M-
Internet. As the M-Internet is a fresh technology so the customers have no intent to spend
some effort or money or time to use this service without assurance of the outcomes of this
technology. Also, it is so important for customers that the benefits of this technology be more
than the cost of that. This study tries to explain intention to use of M-Internet from customer
point of view and perception. Technicality, fee, usefulness, enjoyment and perceived value
are construct specific to M-Internet and introduced in VAM.
The technicality of M-Internet is one of the most reasons in users concerns because of
the amount of time and effort which may require making them skilled in using the system.
Convenience and formation of new independence in time and space is the foremost advantage
which presented by M-Internet. It should consider that difficult operation, slow response,
complex connection procedures and incompatible availability, make more weakness and low
beneficiary. Our result indicates the same outcome as Venkatesh et al., (2003) and Kim et al.,
(2007), which establish the significance of the effort-oriented construct in the early phase of
adoption when overcoming to hardship of process of usage need more effort.
Enjoyment is an inherent motivator and an affective determinant of perceived value.
Similar to previous studies on adoption, usefulness has become known as one of the main
formative factors in adoption, and in our case, in the course of perceived value. In this study
as the same in Kim et al., (2007), we can find out that usefulness is not the top and crucial
apprehension for M-Internet adopters and this is what can distinguish this research from the
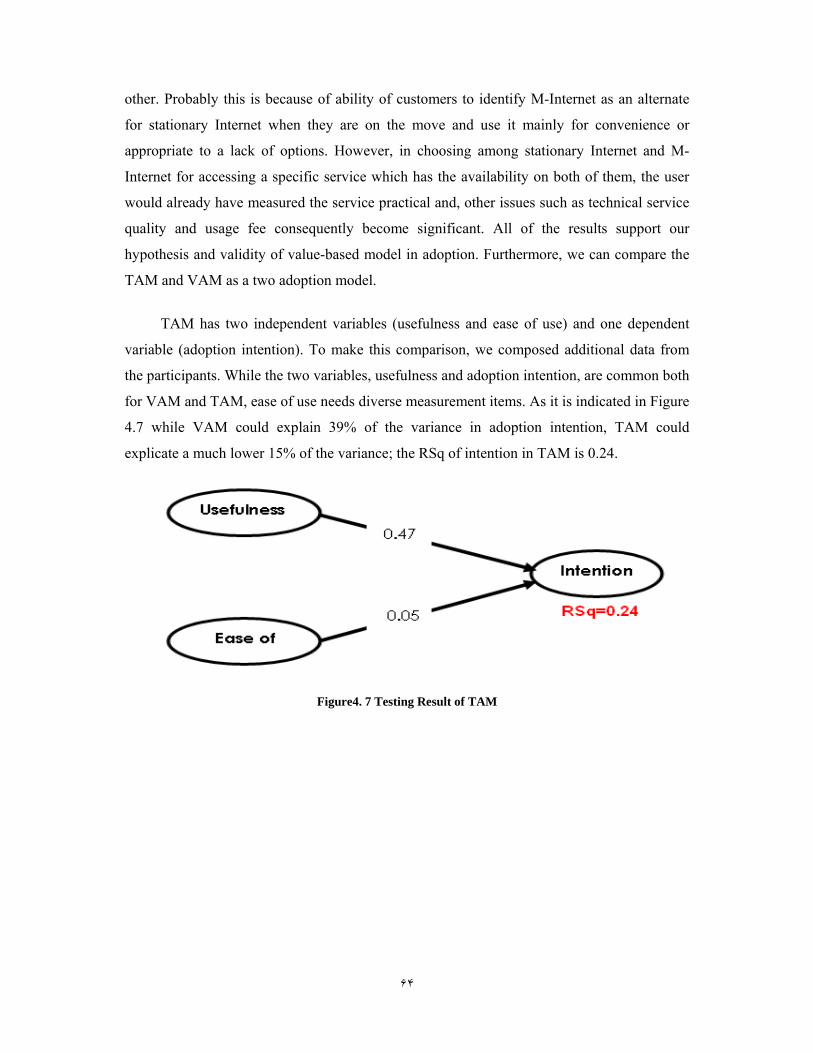
۶۴
other. Probably this is because of ability of customers to identify M-Internet as an alternate
for stationary Internet when they are on the move and use it mainly for convenience or
appropriate to a lack of options. However, in choosing among stationary Internet and M-
Internet for accessing a specific service which has the availability on both of them, the user
would already have measured the service practical and, other issues such as technical service
quality and usage fee consequently become significant. All of the results support our
hypothesis and validity of value-based model in adoption. Furthermore, we can compare the
TAM and VAM as a two adoption model.
TAM has two independent variables (usefulness and ease of use) and one dependent
variable (adoption intention). To make this comparison, we composed additional data from
the participants. While the two variables, usefulness and adoption intention, are common both
for VAM and TAM, ease of use needs diverse measurement items. As it is indicated in Figure
4.7 while VAM could explain 39% of the variance in adoption intention, TAM could
explicate a much lower 15% of the variance; the RSq of intention in TAM is 0.24.
Figure4. 7 Testing Result of TAM
۶۵
Chapter Five
Conclusion and implications
5 Chapter Five: Conclusion and implications
The main conclusions that were obtained are being discussed in the coming section.
After that, the contributions, implications and limitations of this research are talked about,
and finally some suggestions for further research are being forward.
5.1 Conclusion
The mobile Internet is a fresh Information and Communication Technology (ICT) and
here in Iran we have just two companies which provide M-Internet service. The Internet
penetration rate in Iran has a great increasing growth and on the other hand cell phone is
become an essential and daily device in Iranian's life. According of these reasons this
research by the aim of testing adoption factors in using M-Internet commenced.
۶۶
One of the most common and famous model in technology adoption models is
technology acceptance model (TAM). However, TAM as an adoption model in this case is
not appropriate for the reason that the customers decide this technology by in view of its cost
and benefit which are not considered in TAM. In older technology such as Fax, stationary
Internet and etc, in the first stage of adoption almost most of the customers support by their
organization and without spending money and time for learning the operation by himself.
Thus, we need an adoption model by consider the perceived value that user receives.
Perceived value is total value and advantages except costs of use. So, the value-based model
(VAM) is the most suitable model in this study.VAM includes four parameters that are
effective on perceived value which it has direct effect on intention to use. These four
constructs are divided into two parts as benefits and sacrifices. Benefits include usefulness
and enjoyment and sacrifices consist of fee and technicality.
After data collecting by survey and analyzing via PLS software, we found that all of the
hypotheses were supported and value-based model was fitted. In addition, we compared the
RSq of TAM and VAM and the answer is what that we expect. Value-based model explain
the intention to use approximately 15% more than technology acceptance model. This study
concludes that for adapting to M-Internet customers mull over the costs which they should to
pay and the benefits that they gain to make a decision to use or not to use.
5.2 Contribution
If we classify different contributions of a research project into three main categories of
theoretical contribution, empirical contribution and methodological contribution, the
contribution of this research project occur the second contribution. The goal of this study was
to recognize the adoption of M-Internet by applying the existing theory and models (the one
that is used here is value-based model) and regarding the outcomes, results in this study
supported the applied theory. In the first place, in Iran applying the value-based model was
something that didn’t happen before. Further, this study is the first study about the mobile
internet acceptance. Moreover, this study is the one of the earlier in the world that
investigates the value-based adoption of mobile internet.
5.3 Managerial implications
Since M-Internet is novitiate in Iran, consumers will not spend their time, effort and
money in initial steps on it. They tend to assure about its beneficial at first and then, they will
۶٧
use it. Hence, the companies should increase the sense of beneficially more and more among
customers. As mentioned in previous studies (Dodds and Monroe, 1985; Grewal et. al, 1998;
Hee-Woong Kim et al., 2007) perceived fee exerts a robustly significant negative effect on
perceived value. Investing money on a new technology causes high risk for consumers; so,
they are reluctant to adopt the technology. Therefore, it is as clear as crystal that monetary
sacrifice reduces the perceived value of this service. According to results of this research,
Iranian people are sensitive about the fee of M-Internet for making decision to use this
service. This research offers the managers of current telecom company and the upcoming
companies in this market consider the tariff of each kilobit that transfer by users. Technicality
means the amount of time and effort which a consumer requires to learn and utilize the
system. New users concerns about it while the advantage of M-Internet is convenience and
ubiquity. Also, Venkatesh et al. (2003) have emphasized that effort-oriented constructs are
most important in initial stage of adoption when process issues represent barriers to be
remove. On this ground, the service provider must overcome this obstruction by training in
multifarious ways such as SMS, brochure and so on.
5.4 Implication for Further Research
At a first place, data collection was geographically restricted to Iran. Since M-Internet
adoption is a worldwide experience, further research could perhaps be cross-national across
different geographical context. Further research can investigate what additional factors may
have effect on intention to use M-Internet service in Iran also in all around the world. This
study estimates mentioned factors in the starting time of M-Internet usage in Iran and the
evolution and change of some parameters is probable over time. Hence, further research can
recognize the changing in the effective factors in M-Internet acceptance. Further research
could test this model in other contexts to further verify of results.
5.5 Research limitation
In this research, researcher faced some limitations in collecting data. Almost the high
percentage of the participants in this study are who know enough about M-Internet and have
experience about this service. On the other hand, because of short period of lunching this
service in Iran it is very probable that in countries with longer experience in using mobile
internet, results be very different from outcomes of this research. The other limitation that
this study was faced is about 50% of participants were graduate students and approximately

۶٨
70% of respondents were between 20 and 30 years old, this range is the most potential M-
Internet adopters, perhaps this group be more restricted by monetary and cost concerns in
comparison to those who have a stable income and secure job.
۶٩
References
Agarwal, R., & Karahanna, E., (2000) Time flies when you’re having fun: cognitive
absorption and beliefs about Information Technology Usage, MIS Quarterly 24 (4)
Anderson, J.C, Thomson, J.B.L, & Wynstra, F (2000) combining value and price to make
purchase decisions in business markets, Journal of Research in Marketing, 17, 307-329
Bagozzi, R.P. & Phillips, L.W., (1982) Representing and testing organizational theories: a
holistic construal, Administrative Science Quarterly 27 (3)
Barnes, S.J. (2002) the mobile commerce value chain: analysis and future developments,
International Journal of Information Management, 22, 91–108
٧٠
Bouwman, H., Chrisrter, C. B., Molina-Castillo, F. J. & WALDEN, P., (2007) “Barriers and
drivers in the adoption of current and future mobile services in Finland”, Telematics and
Informatics, 24, 145–160
Brief, A.P., Aldag, R.J., Russell, C.J., (1979) An analysis of power in a work setting. Journal
of Social Psychology 109, 289–295
Bruner, G.C & Kumar, A. (2005) Explaining consumer acceptance of handheld Internet
devices, Journal of Business Research, 58, 553– 558
Chang, T.Z. & Wildt, A.R., (1994) Price, product information, and purchase intention: an
empirical study, Journal of the Academy of Marketing Science, 22, (1)
Chao, H.C, (2001) An overview and analysis of mobile internet protocols in cellular
environments, Electronic Networking Applications and policy, 11:5, 435-450
Chen, Z., & Dubinsky, A.J., (2003) A conceptual model of perceived customer value in e-
commerce: a preliminary investigation, Psychology & Marketing, 20, (4)
Cheong, J.H., Park, M.C., (2005) mobile internet acceptance in Korea, Internet Research, 15(2), 125-140
Clarke, I., (2001) Emerging value propositions for m-commerce, Journal of Business
Strategies 18 (2), 133–147
Cooper, D. R. & Schindler, P. S. (2003) Business Research Methods, Mc GRAW-HILL
Chou, Y., Lee, C. & chung, J. (2004) Understanding m-commerce payment systems through
the analytic hierarchy process, Journal of Business Research, 57, 1423– 1430
Davis, F. D (1989) Perceived Usefulness, Perceived Ease of Use, and User Acceptance of
Information Technology. MIS Quarterly, 13:3, 319-340
Davis, F.D. (1993), “User acceptance of information technology: system characteristics, user
perceptions and behavioral impacts”, International Journal of Man-Machine Studies, 38:3,
475 – 487.
٧١
Davis, F.D., Bagozzi R. P. & Warshaw P. R. (1989) User Acceptance of Computer
Technology: A Comparison of Two Theoretical Models, Management Science, 35:8, 983-
1003.
DeLone W.H. & McLean E.R., (1992) Information systems success: the quest for the
dependent variable, Information Systems Research 3 (1)
Deruyter, K., Wetzels, M., & Kleijen, M.(2001) Consumer adoption of E-Service: An
Experimental Study. International Journal of Service Industry Management 12 (2): 184 -207
Desarbo, W.S., Jedidi, K. & Sinha, I., (200s1) Customer value analysis in a heterogeneous
market, Strategic Management Journal 22 (9)
Dickerson, M.D., & Gentry, J.W., (1983), Characteristics of adopters and non-adopters of
home computers, Journal of Consumer Research 10:3, 225-235.
Dodds W.B., Monroe, K.B. (1985) the effect of brand and price information on subjective
product evaluations, Advances in Consumer Research 12 (1)
Esteves, J., Casanovas, J., and Pastor, J., (2003) Modeling with Partial Least Squares Critical
Success Factors Interrelationships in ERP implementations “North Americans Conference on
Information systems” 446-451
Funk, J.l., (2007) Solving the startup problem in Western mobile Internet markets,
Telecommunications Policy, 31, 14–30.
Gefen, D. (2000) Structural equation modeling and regression: Guidelines for research
practice, Communication of the association for Information Systems, 4, 7
Gefen, D., Straub, D., W., and Boudreau, M.C., (2000) Structural Equation Modeling
Techniques and Regression: Guidelines for Research Practice “communications of AIS” 7:7-
1-78
Goda, K. & Hong, H.P. (2007) Application of cumulative prospect theory: Implied seismic
design preference, Structural Safety xxx (2007) xxx–xxx.
٧٢
Grewal, D., Monroe, K.B., & Krishnan, R., (1998), The effects of price comparison
advertising on buyers’ perceptions of acquisition value, transaction value and behavioral
intentions, Journal of Marketing, 62,
Haenlein, M., Kaplan, A.M., (2004) A Beginner’s Guide to Partial Least Squares Analysis,
Lawrence Erlbaum Associates, 3(4). 283-297
He, Y. & Huang, R.-H. (2008) Risk attributes theory: Decision making under risk, European
Journal of Operational Research, 186, 243–260
Hsusa, C.-L., Lub, H.-P., & Hsuc, H.-H. (2007) Adoption of the mobile Internet: An
empirical study of multimedia message service (MMS), Omega, 35, 715 – 726.
Karami, M. (2006), Factors influencing adoption of online ticketing, Master of science thesis,
Lulea University of Technology and Tarbiat Modares University
Kim, H.W, Chan, H.C. & Gupta, S. (2007) Value-based Adoption of Mobile Internet: An
empirical investigation, Decision Support Systems, 43, 111 –126.
King, W.R. & He, J. (2006) A meta-analysis of technology acceptance model, Information
and Management, 43, 740-755
Kotler, ph. (1991) Marketing Management (11th edn) , USA, Canada, Prentice Hall
International Editions, 60-61.
Kuoa, Y., Yub, C., (2006), 3G telecommunication operators’ challenges and roles: A
perspective of mobile commerce value chain, Technovation, 26, 1347–1356.
Lederer, A.L, Maupin b, D.J., Senac, M. p. & Zhuang d , Y. (2000) The technology
acceptance model and the World Wide Web, Decision Support Systems, 29, 269–282.
Legris, P., Ingham, J. & Collerte, P. (2003) Why do people use information technology? A
critical review of technology acceptance model, Information and Management, 40, 191-204
Levy, Y. (2008) an empirical development of critical value factors (CVF) of online learning
activities: An application of activity theory and cognitive value theory, Computers &
Education, 51, 1664–1675
٧٣
Li, S., Rui Zheng, & Li-Bo Li, B.(2007) Do shared features of offered alternatives have an
effect in consumer choice? Journal of Economic Psychology, 28, 658–677
Liker, J.K. & Sindi, A.A. (1997) User acceptance of expert systems: a test of the theory of
reasoned action, Journal of Engineering and Technology Management, 14, 147-173.
Leonard L.N.K., Cornan, T.P. & Kreie, J. (2004) What influences IT ethical behavior
intentions—planned behavior, reasoned action, perceived importance, or individual
characteristics? , Information & Management, 42, 143–158.
Mahatanankoon, P., Wen, J., Lim, B., (2005) Consumer-based m-commerce: exploring
consumer perception of mobile applications: Computer Standards & Interfaces, 27, 347–357
Malhotra, N. K. & Peterson, M. (2006) Basic Marketing Research: A Decision-Making
Approach New Jersey, Pearson Prentice Hall
Moon, J.-W. & Kim, Y.-G. (2001) Extending the TAM for a World-Wide-Web context
Information & Management, 38, 217±230
Ngai a, E.W.T & Gunasekaran b, A. (2007) A review for mobile commerce research and
applications, Decision Support Systems, 43, 3 – 15.
Nysveen, H., Pedersen, H., Thorbjornsen, H., Berthon, P., (2005) Mobilizing the brand.
Journal of Service Research 7 (3), 257–276.
Pagani, M., 2004 Determinants of adoption of third generation mobile multimedia services
Journal of Interactive Marketing 18 (3), 46–59.
Pegani, M & Fine, C.H. (2008) Value network dynamics in 3G–4G wireless communications:
A systems thinking approach to strategic value assessment, Journal of Business Research, 61,
1102–1112
Perkins, C.E. (1998) Mobile networking in the Internet, Mobile Networks and Applications,
3, 319–334
Pura, M., 2005 Linking perceived value and loyalty in location based mobile services.
Managing Service Quality 15 (6), 509–538.
٧۴
Ragowsky, A., Ahituv, N., & Neumann, S. (1996). Identifying the value and importance of
an information system, application Information & Management, 31(2), 89–102
Ragowsky, A., Somers, T. M., & Adams, D. A. (2005) Assessing the value provided by erp
applications through organizational activities Communications of AIS, 16(18), 1–50
Rafaeli, S. & Raban, D.R. (2003) Experimental Investigation of the Subjective Value of
Information in Trading Journal of the Association for Information Systems, 4, 119-139
Shin, D.H, (2007) User acceptance of mobile Internet: Implication for convergence
technologies, interacting with Computers, 19, 472–483.
Saunders, M., Lewise, P. & Thornhill, A. (2000) Research Methods for Business Students,
Prentice Hall
Sohn, S.Y, So, H.K & Moon, T.H (2009) A strategic analysis for successful Brain Korea 21
initiative based on structural equation model, Expert systems with Applications, 36, 5087–
5093
Shu, L., Rui, Z., Li-Bo, L., (2007) Do shared features of offered alternatives have an effect in
consumer choices? Journal of economic psychology 28, 658-677
Sirdeshmukh, D., Singh, J., Sabol, B., (2002) Consumer trust, value, and loyalty in relational
exchanges, Journal of Marketing 66 (1)
Sweeney, J.C. & Soutar, G.N., (2001) Consumer perceived value: the development of a
multiple item scale, Journal of Retailing 77 (2)
Taylor, S. & Todd, P. (1995) Decomposition and crossover effects in the theory of planned
behavior: A study of consumer adoption intentions, Intern. J. of Research in Marketing, 12,
137-155
Thaler, R. (1985) Mental Accounting and Consumer Choice Marketing Science, 4, No.199-
214
٧۵
Tsalgatidou, A., Pitoura, E., (2001) Business models and transaction in mobile electronic
commerce: requirements and properties. Computer Networks 37 (2), 221–236
Van der Kar, E.A.M. (2004) Designing mobile information services Ph.D. Thesis, Delft.
Venkatesh, V., Morris, M.G., Davis, G.B. & Davis, F.D. (2003) User Acceptance of
Information technology: Toward a unified view, MIS Quarterly, 27, 425-478.
Venkatesh, V. & Speiri, C. (1999) Computer technology training in the workplace: a
longitudinal investigation of the effect of mood Organizational Behavior and Human
Decision Processes 70(1), 1-28
Voss, G., Parasuraman, A., Grewal, D., (1998) The role of price and quality perceptions in
pre purchase and post purchase evaluation of services, Journal of Marketing 62 (4)
Wang, Y., Lo, H., (2002) Service quality, customer satisfaction and behavior intentions:
Evidence from china’s telecommunication industry “journal o f Information” 4(6), 50-60
Woodruff, R.B (1997) Customer value: the next source for competitive edge, Journal of the
Academy of Marketing Science, 25,s
www.wikipedia.org : /http://en.wikipedia.org/wiki/Prospect_theory
Zeithaml, V.A (1988) Consumer perceptions of price, quality and value: a means-end model
and synthesis of evidence, Journal of Marketing 52 (3)

٧۶

٧٧
Appendix
A: Questionnaire(Farsi)
به نام خدا
١٠در روزهای آغازين ورود موبايل به ايران، هيچ کس تصور نمي کرد ظرف مدت حدود
اما با گذشت زمان اين . ميليون مشترک برسد ۵٠سال شمار استفاده کنندگان از اين وسيله به حدود
.ميليون رسيده است ۵٠امر تحقق يافت و تعداد مشترکين سه اپراتور در حال حاضر به حدود
امروزه موبايل به جز تماس های تلفنی برای مردم ايران استفاده های ديگری نيز دارد که از
جمله ميتوان به پرداخت قبوض، اطالع رسانی ارگانها و نهادها، گرفتن گزارش از حساب های
ن از اما اخيرا در ايران بر روی موبايل ميتوا. اشاره کرد... های تبليغاتی و SMSبانکی، فرستادن
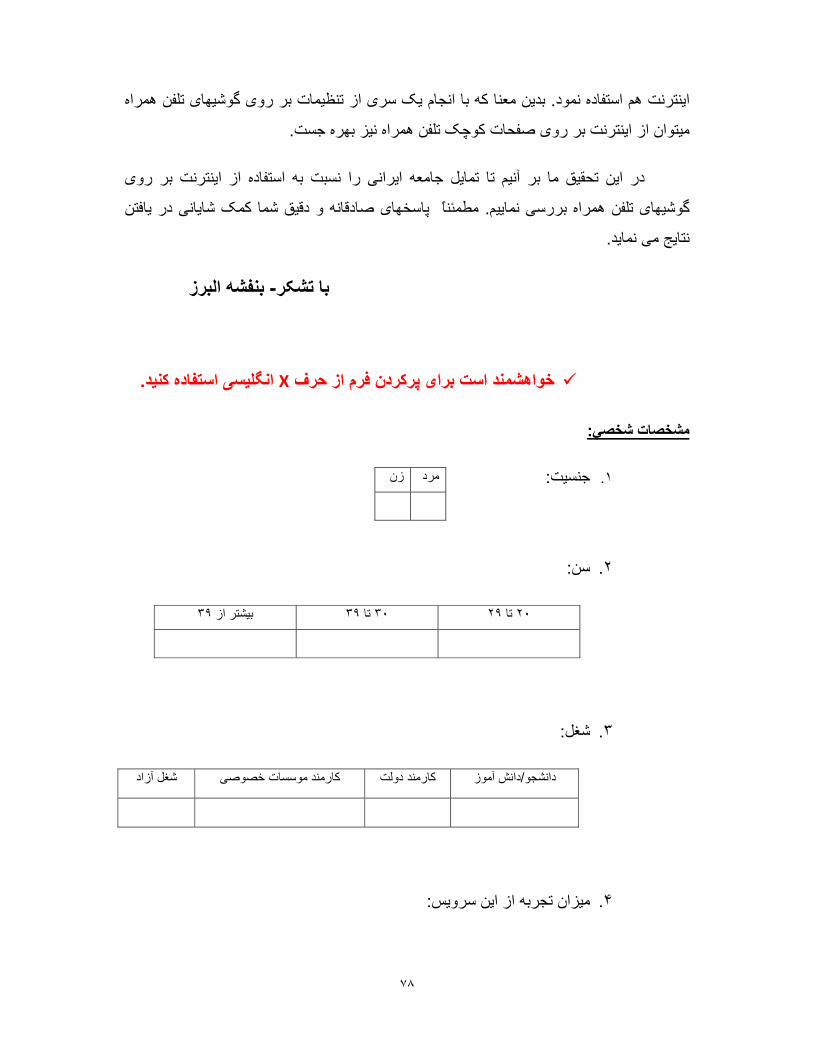
٧٨
بدين معنا که با انجام يک سری از تنظيمات بر روی گوشيهای تلفن همراه . اينترنت هم استفاده نمود
.ميتوان از اينترنت بر روی صفحات کوچک تلفن همراه نيز بهره جست
در اين تحقيق ما بر آنيم تا تمايل جامعه ايرانی را نسبت به استفاده از اينترنت بر روی
مطمئنًا پاسخهای صادقانه و دقيق شما کمک شايانی در يافتن . راه بررسی نماييمگوشيهای تلفن هم
.نتايج می نمايد
بنفشه البرز -با تشکر
.انگليسی استفاده کنيد Xخواهشمند است برای پرکردن فرم از حرف
:مشخصات شخصي
: جنسيت .١
: سن .٢
٣٩بيشتر از ٣٩تا ٢٩٣٠تا ٢٠
:شغل .٣
شغل آزاد کارمند موسسات خصوصیکارمند دولت دانش آموز /انشجود
:ميزان تجربه از اين سرويس .۴
زنمرد
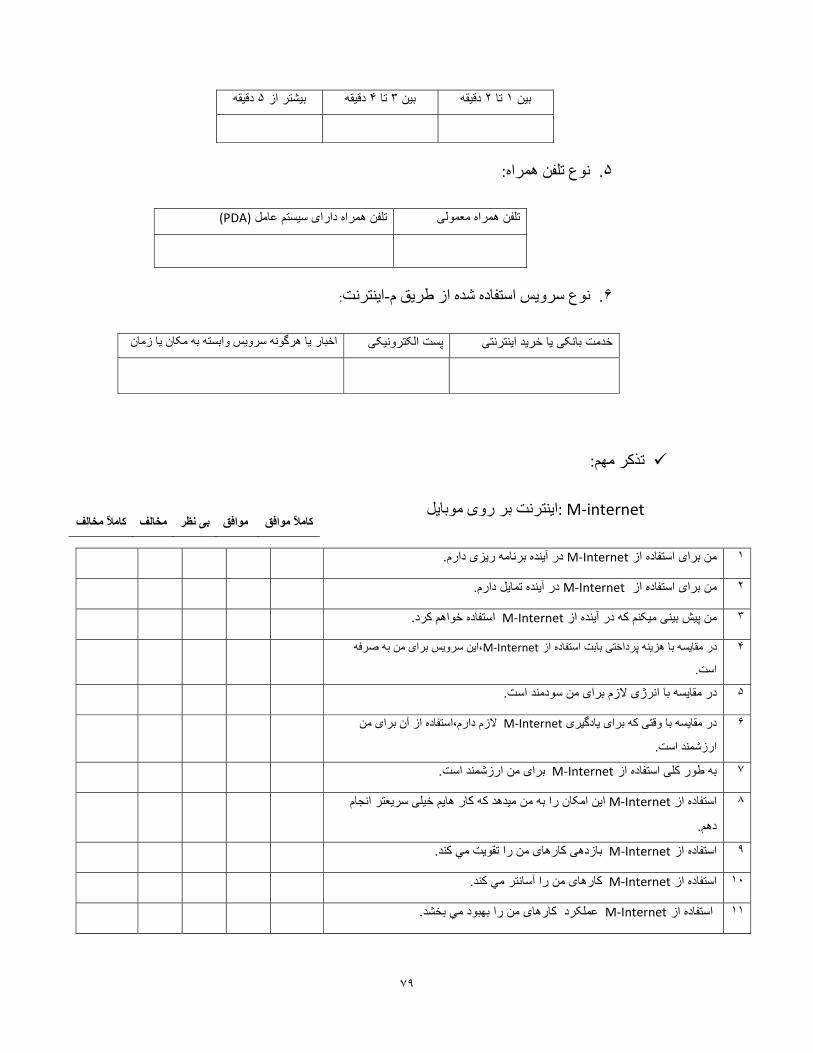
٧٩
دقيقه ۵بيشتر از دقيقه ۴تا ٣بين دقيقه ٢تا ١بين
:نوع تلفن همراه .۵
(PDA)تلفن همراه دارای سيستم عامل تلفن همراه معمولی
:ينترنتا-نوع سرويس استفاده شده از طريق م .۶
اخبار يا هرگونه سرويس وابسته به مکان يا زمانپست الکترونيکیخدمت بانکی يا خريد اينترنتی
: تذکر مهم
: M‐internetاينترنت بر روی موبايل
.در آينده برنامه ريزی دارم M‐Internetمن برای استفاده از ١
.در آينده تمايل دارم M‐Internetمن برای استفاده از ٢
.استفاده خواهم کرد M‐Internetمن پيش بينی ميکنم که در آينده از ٣
،اين سرويس برای من به صرفه M‐Internetدر مقايسه با هزينه پرداختی بابت استفاده از ۴
.است
.ای من سودمند استدر مقايسه با انرژی الزم بر۵
الزم دارم،استفاده از آن برای من M‐Internetدر مقايسه با وقتی که برای يادگيری ۶
.ارزشمند است
.برای من ارزشمند است M‐Internet به طور کلی استفاده از ٧
تر انجام اين امکان را به من ميدهد که کار هايم خيلی سريع M‐Internetاستفاده از ٨
.دهم
.بازدهی کارهای من را تقويت مي کند M‐Internet استفاده از ٩
.کارهای من را آسانتر مي کند M‐Internet استفاده از ١٠
.عملکرد کارهای من را بهبود مي بخشد M‐Internet استفاده از ١١
کامٌال مخالف مخالف بی نظر موافق کامٌال موافق
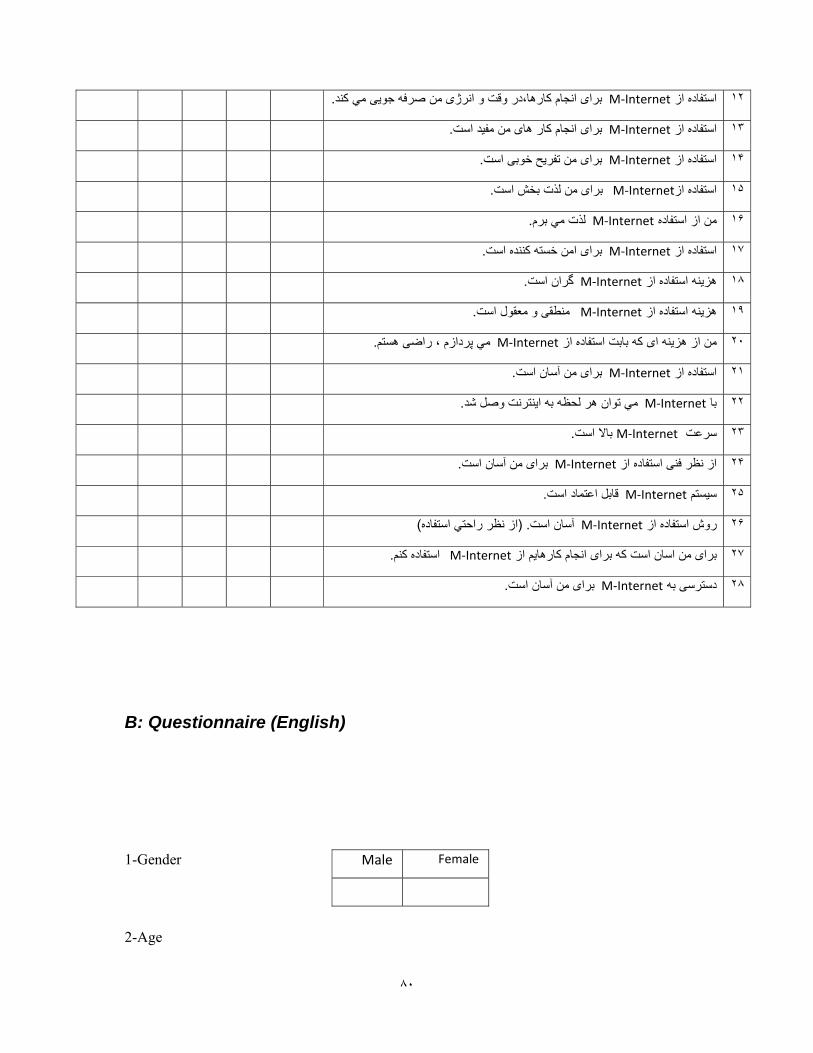
٨٠
.،در وقت و انرژی من صرفه جويی مي کندبرای انجام کارها M‐Internet استفاده از ١٢
.برای انجام کار های من مفيد است M‐Internet استفاده از ١٣
.برای من تفريح خوبی است M‐Internet استفاده از ١۴
.برای من لذت بخش است M‐Internet استفاده از١۵
.لذت مي برم M‐Internet من از استفاده ١۶
.برای امن خسته کننده است M‐Internet استفاده از ١٧
.گران است M‐Internet هزينه استفاده از ١٨
.منطقی و معقول است M‐Internet هزينه استفاده از ١٩
.مي پردازم ، راضی هستم M‐Internet من از هزينه ای که بابت استفاده از ٢٠
.برای من آسان است M‐Internet ده از استفا٢١
.مي توان هر لحظه به اينترنت وصل شد M‐Internet با ٢٢
.باال است M‐Internetسرعت ٢٣
.برای من آسان است M‐Internet از نظر فنی استفاده از ٢۴
.قابل اعتماد است M‐Internet سيستم ٢۵
)از نظر راحتي استفاده. (آسان است M‐Internet از روش استفاده٢۶
.استفاده کنم M‐Internet برای من اسان است که برای انجام کارهايم از ٢٧
.برای من آسان است M‐Internet دسترسی به ٢٨
B: Questionnaire (English)
1-Gender
2-Age
Female Male
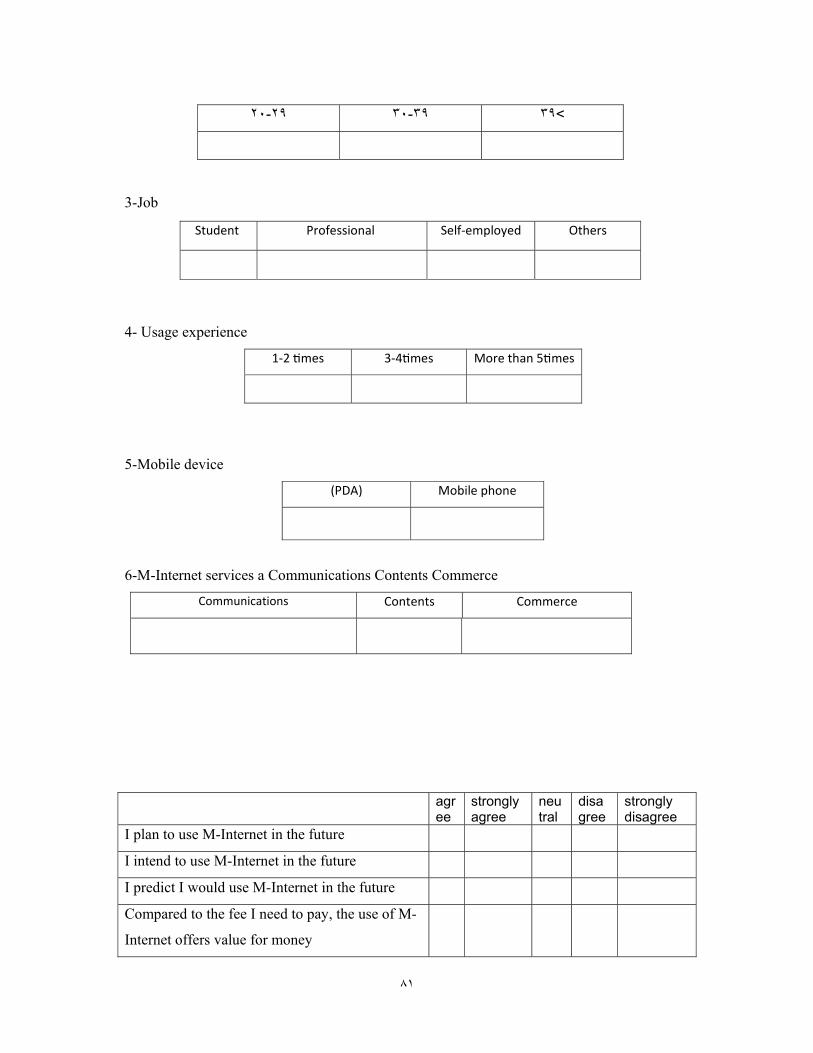
٨١
3-Job
4- Usage experience
More than 5times3‐4times 1‐2 times
5-Mobile device
Mobile phone(PDA)
6-M-Internet services a Communications Contents Commerce
CommerceContentsCommunications
agree
strongly agree
neutral
disagree
strongly disagree
I plan to use M-Internet in the future
I intend to use M-Internet in the future
I predict I would use M-Internet in the future
Compared to the fee I need to pay, the use of M-
Internet offers value for money
<٢٠-٣٠٢٩-٣٩٣٩
Others Self‐employed Professional Student
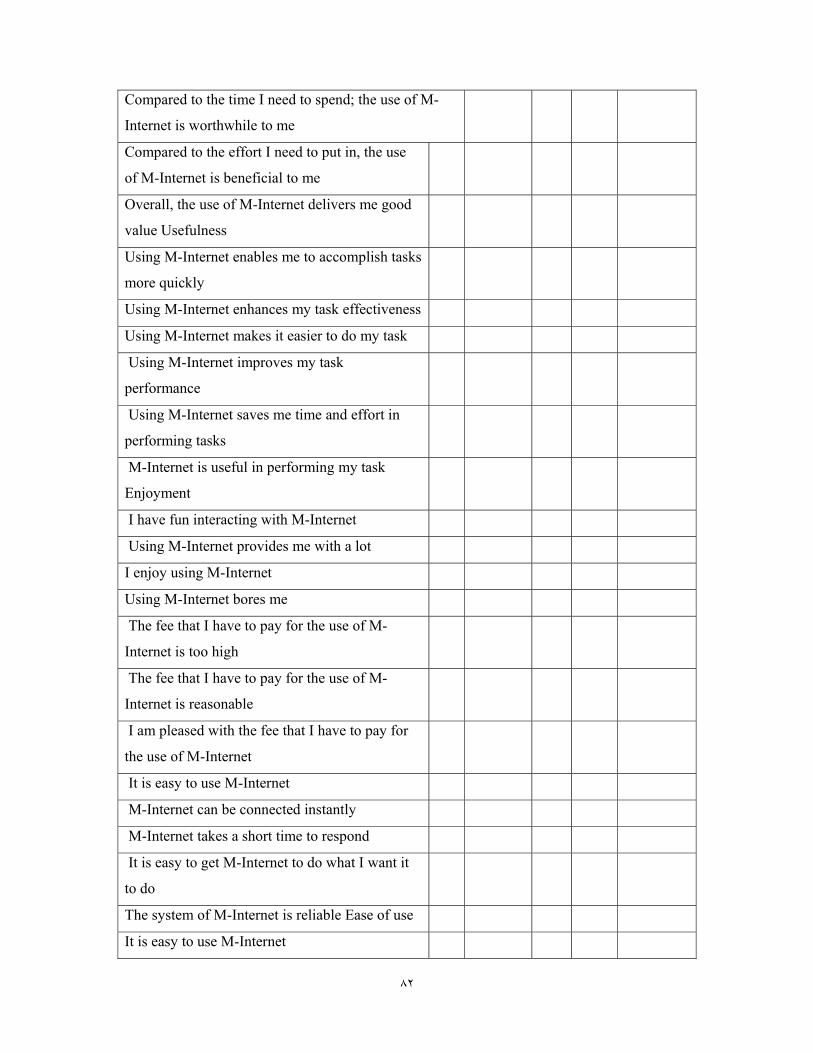
٨٢
Compared to the time I need to spend; the use of M-
Internet is worthwhile to me
Compared to the effort I need to put in, the use
of M-Internet is beneficial to me
Overall, the use of M-Internet delivers me good
value Usefulness
Using M-Internet enables me to accomplish tasks
more quickly
Using M-Internet enhances my task effectiveness
Using M-Internet makes it easier to do my task
Using M-Internet improves my task
performance
Using M-Internet saves me time and effort in
performing tasks
M-Internet is useful in performing my task
Enjoyment
I have fun interacting with M-Internet
Using M-Internet provides me with a lot
I enjoy using M-Internet
Using M-Internet bores me
The fee that I have to pay for the use of M-
Internet is too high
The fee that I have to pay for the use of M-
Internet is reasonable
I am pleased with the fee that I have to pay for
the use of M-Internet
It is easy to use M-Internet
M-Internet can be connected instantly
M-Internet takes a short time to respond
It is easy to get M-Internet to do what I want it
to do
The system of M-Internet is reliable Ease of use
It is easy to use M-Internet

٨٣
It is easy to get M-Internet to do what I want it to
do
It is convenient to access M-Internet