VALUATION OF DSV A/S -A STRATEGIC AND FINANCIAL ...
91
VALUATION OF DSV A/S -A STRATEGIC AND FINANCIAL ANALYSIS- Andri Mar Helgason Handed in 11 th June 2012, Copenhagen Business School M.S in Finance and Strategic Management Supervisor: Jens Borges Institute of Finance Number of characters, excluding front page and appendixes: 121.869 equivalent to 70 pages
-
Upload
khangminh22 -
Category
Documents
-
view
1 -
download
0
Transcript of VALUATION OF DSV A/S -A STRATEGIC AND FINANCIAL ...

VALUATION OF DSV A/S
-A STRATEGIC AND FINANCIAL ANALYSIS-
Andri Mar Helgason
Handed in 11th June 2012, Copenhagen Business School
M.S in Finance and Strategic Management
Supervisor: Jens Borges
Institute of Finance
Number of characters, excluding front page and appendixes: 121.869 equivalent to 70 pages

Master Thesis – MSc in Finance and Strategic Management Valuation of DSV A/S
Executive summary
The main objective of this thesis is to estimate the share value of one DSV A/S share on the 22nd
February 2012.
DSV is originally a Danish based transport and logistics company founded in 1976. However it has
mainly grown with organic growth and acquisitions of other companies and has therefore
transformed into an international transporting company. The recent financial crisis has affected
DSV considerably with decrease in revenue but DSV has been recovering well in the last three
years, the company is sensitive to changes in the overall world economy especially in Europe
because a high portion of their revenue is generated in Europe.
To have a possibility to valuate DSV a strategic analysis was performed with a focus on internal
and external factors. From the strategic analysis it can be assumed that DSV has a flexible business
model with emphasis on the asset light model and their capability to adjust costs very fast.
Regulations from the regulatory bodies in Europe can affect DSV in the near future with new
legislation regarding environmental issues.
Financial analysis followed the strategic analysis. All key financial drivers have been increasing
from 2009 after the impact from the financial crisis. Two large acquisitions were finalized in 2006
and 2008 and the financial drivers in the years after were looked at, it looks like these acquisitions
were successful.
The strategic and financial analysis were used with the reformulated income statement and
balance sheet to forecast the future net operating profit less adjusted tax and free cash flow. The
valuation was done with the discounted cash flow model and then compared with valuation from
selected multiples.
The discounted cash flow model result was a share price of DKK 172.78, compared with the closing
price of February 22nd 2012 the estimated share price is about 41% higher than the actual share
price. This could indicate that the share of DSV is undervalued by investors and they should be
recommended to buy DSV shares as a long-term investment.

Master Thesis – MSc in Finance and Strategic Management Valuation of DSV A/S
Table of Contents
1 INTRODUCTION ....................................................................................................................................................... 1
1.2 PROBLEM STATEMENT ................................................................................................................................................... 2
1.3 THESIS STRUCTURE ........................................................................................................................................................ 2
1.4 METHODS AND MODELS ................................................................................................................................................ 3
1.4.1 Method ............................................................................................................................................................. 3
1.4.2 Models .............................................................................................................................................................. 5
1.5 LIMITATION .................................................................................................................................................................. 6
2. DSV A/S .................................................................................................................................................................. 7
2.1 HISTORY ...................................................................................................................................................................... 7
2.2 OWNERSHIP ................................................................................................................................................................. 8
2.3 MANAGEMENT ............................................................................................................................................................. 8
2.3.1 Board structure................................................................................................................................................. 9
2.3.2 Remuneration ................................................................................................................................................... 9
2.4 STRATEGY AND FINANCIAL TARGETS .................................................................................................................................. 9
2.4.1 Elements of strategy......................................................................................................................................... 9
2.4.2 Financial targets ............................................................................................................................................. 10
2.5 DIVISION OVERVIEW .................................................................................................................................................... 12
2.5.1 DSV Air & Sea ................................................................................................................................................. 12
2.5.2 DSV Road ........................................................................................................................................................ 13
2.5.3 DSV Solutions .................................................................................................................................................. 13
2.5.4 Revenues of DSV ............................................................................................................................................. 14
2.6 SUMMARY ................................................................................................................................................................. 15
3 STRATEGIC ANALYSIS ..............................................................................................................................................16
3.1 EXTERNAL ANALYSIS ..................................................................................................................................................... 16
3.1.1 PESTE framework ........................................................................................................................................... 17
3.1.2 Porter’s Five Forces......................................................................................................................................... 20
3.2 INTERNAL ANALYSIS ..................................................................................................................................................... 27
3.2.1 Porter’s Value Chain ....................................................................................................................................... 27
3.2.2 Resources based view ..................................................................................................................................... 30
3.3 SUMMARY - SWOT ANALYSIS........................................................................................................................................ 32
4 FINANCIAL ANALYSIS ..............................................................................................................................................34
4.1 ACCOUNTING POLICIES ................................................................................................................................................. 34
4.2 EQUITY STATEMENT ..................................................................................................................................................... 35

Master Thesis – MSc in Finance and Strategic Management Valuation of DSV A/S
4.3 BALANCE SHEET .......................................................................................................................................................... 36
4.4 INCOME STATEMENT .................................................................................................................................................... 38
4.5 ROIC BREAKDOWN...................................................................................................................................................... 40
4.5.1 ROIC tree ........................................................................................................................................................ 42
4.6 GOODWILL ANALYSIS .................................................................................................................................................... 43
4.7 PENSION OBLIGATION .................................................................................................................................................. 45
4.8 SUMMARY ................................................................................................................................................................. 45
5 FORECAST ...............................................................................................................................................................47
5.1 INCOME STATEMENT FORECAST ...................................................................................................................................... 47
5.1.1 DSV Air and Sea .............................................................................................................................................. 47
5.1.2 DSV Road ........................................................................................................................................................ 48
5.1.3 DSV Solutions .................................................................................................................................................. 49
5.2 COSTS IN THE INCOME STATEMENT ................................................................................................................................. 49
5.3 CORPORATE TAX RATE .................................................................................................................................................. 50
5.4 BALANCE SHEET FORECASTING ....................................................................................................................................... 50
5.5 SUMMARY ................................................................................................................................................................. 50
6. VALUATION ...........................................................................................................................................................52
6.1 DISCOUNTED CASH FLOW MODEL (DCF) ......................................................................................................................... 52
6.2 MULTIPLES ................................................................................................................................................................ 53
6.3 WEIGHTED AVERAGE COST OF CAPITAL (WACC) ............................................................................................................... 54
6.3.1 DSV capital structure ...................................................................................................................................... 55
6.3.2 Cost of equity .................................................................................................................................................. 55
6.3.3 DSV operating tax........................................................................................................................................... 58
6.3.4 Cost of debt .................................................................................................................................................... 58
6.3.5 WACC estimation............................................................................................................................................ 59
6.4 ESTIMATING THE GROWTH RATE IN THE TERMINAL PERIOD ................................................................................................... 59
6.5 FREE CASH FLOW ......................................................................................................................................................... 59
6.6 VALUATION USING DCF ................................................................................................................................................ 60
6.7 SENSITIVITY ANALYSIS ON DCF VALUATION ....................................................................................................................... 61
6.8 MULTIPLES VALUATION ................................................................................................................................................ 62
6.8.1 Price to earnings value ................................................................................................................................... 62
6.8.2 Price to book value ......................................................................................................................................... 63
6.8.3 EV/EBITDA ratio.............................................................................................................................................. 64
6.8.4 EV/EBIT ratio .................................................................................................................................................. 64
6.9 MULTIPLES COMPARISON WITH COMPETITORS .................................................................................................................. 65

Master Thesis – MSc in Finance and Strategic Management Valuation of DSV A/S
6.9.1 EV/EBITDA, P/E and P/B ................................................................................................................................. 65
6.10 SUMMARY ............................................................................................................................................................... 66
7 CONCLUSION ..........................................................................................................................................................68
8 PERSPECTIVES .........................................................................................................................................................71
9 REFERENCE LIST ......................................................................................................................................................72
10 LIST OF FIGURES ....................................................................................................................................................73
11 LIST OF TABLES ......................................................................................................................................................74
12 LIST OF EQUATIONS ..............................................................................................................................................74
13 LIST OF APPENDIXES .............................................................................................................................................76
14 APPENDIXES ..........................................................................................................................................................76

Master Thesis – MSc in Finance and Strategic Management Valuation of DSV A/S
1
1 Introduction
The transport industry in Europe and all over the world is still recovering from the financial crisis
that started at the end of 2007 with executives getting more optimistic that revenue will continue
to grow for the year 2012, more than in previous years.
A hesitant recovery from recession, sharply rising fuel prices has created unique challenges for the
transport industry for the past few years. DSV A/S (DSV) has been able through their flexible
business model that consists of asset light investment in assets in the forms of trucks and facilities
and not at all in ships and airplanes. This asset light model has proven to have certain benefits,
particularly in a period of recession, as it ensures a flexible cost structure that keeps the fixed costs
of DSV at a minimum level. Also in their model there is comprehensive outsourcing, and the
company aims to generate no more than 5% of the total sales volume itself.
A continuous increase has been in share value since being publicly listed in the Copenhagen stock
exchange in 1987, its share value began to decline for the first time in the beginning of the year
2009. In figure 1 is the development from October 2000 to May 2012.
Figure 1 – DSV share price development
0
10
20
30
40
50
60
70
80
90
100
110
120
130
140
150
16
.10
.20
00
8.3
.20
01
8.8
.20
01
2.1
.20
02
30
.5.2
00
21
8.1
0.2
00
21
4.3
.20
03
12
.8.2
00
36
.1.2
00
42
.6.2
00
42
0.1
0.2
00
41
1.3
.20
05
8.8
.20
05
27
.12
.20
05
22
.5.2
00
61
1.1
0.2
00
65
.3.2
00
71
.8.2
00
71
9.1
2.2
00
72
2.5
.20
08
10
.10
.20
08
6.3
.20
09
5.8
.20
09
23
.12
.20
09
27
.5.2
01
01
4.1
0.2
01
07
.3.2
01
12
8.7
.20
11
15
.12
.20
11
10
.5.2
01
2
Shar
e p
rice
Date
Share price development for DSV
Source: NASDAQOMX and own creation

Master Thesis – MSc in Finance and Strategic Management Valuation of DSV A/S
2
The object of this thesis will be to estimate the fair value of DSV as of 22nd of February 2012 or the
day after the announcement of the 2011 annual report. Strategic and financial analysis will be
used to answer whether DSV stock price reveals the company´s fair value and if the stocks is an
interesting investment choice for investors with medium to long holding period.
1.2 Problem Statement
The main purpose of this thesis will be to analyse and answer the following question:
What is the estimated value per share of DSV when only published data is be used?
The thesis will demonstrate that while using different methods to value the price per share the
estimated price per share will fluctuate between methods. Given that the estimated price per
share will be different from the published stock price could indicate the trading price is not
reflecting its true value or potential value.
In order to estimate the value of DSV the analysing will be split into two parts, a strategic analysis
and a financial analysis. In the strategic analysing the following issues will be looked at, overall
strategy of DSV, SWOT analyses and what is the strategic position and direction of DSV. The
financial analysing will be based on external and published data such as, annual reports from 2007
through 2011 and share prices.
The sub question is:
Is DSV overestimating the goodwill on their balance sheet and how does the goodwill affect the
return on invested capital (ROIC)?
More detailed goodwill analysis is in chapter 4.6.
1.3 Thesis Structure
To make a valuation of DSV it is important to decide wisely which models and valuation methods
to use so that the result will be accountable. The following models and methods were chosen:
Strategic Analysis
Financial Analysis
Forecasting
Valuation

Master Thesis – MSc in Finance and Strategic Management Valuation of DSV A/S
3
The above methods will each have individual chapters within in thesis; the structure of the thesis
is shown below in figure 2
Figure 2 - Structure of the thesis
Source: Own creation
1.4 Methods and Models
The next step is to have a brief description of the chapters and their purpose and what models will
be used. The information will be gathered through secondary sources and DSV annual reports. All
analysis will be performed by the author using the data and information gathered and the relevant
models and methods that are generally accepted by both the business world and the academic
community.
1.4.1 Method
The intent of this thesis is to estimate the value of DSV using only published data available to
everyone. The analysing will probably be more detailed than the average investor would do and
therefore the analysing is more like an informed investor would do when deciding to buy, sell or
hold DSV stock. The analysing will be structured as follow.
Chapter 2: DSV A/S
This chapter will cover a historic overview of the company, including an examination of the
ownership structure, organizational issues, management and finance as well as the markets in
which the company operates. The main purpose of this chapter is to generate a good overview of
the company.

Master Thesis – MSc in Finance and Strategic Management Valuation of DSV A/S
4
Chapter 3: Strategic Analysis
The strategic analysis will be split into two parts, internal and external analysis. Cash flow
estimates and other forecast will be based indirectly on the strategic analysis and therefore the
company’s strategy must be concrete.
Chapter 4: Financial Analysis
Here past performance will be evaluated using annual reports. There will be an equity overview of
changes in the equity, balance sheet and the income statement will be reformulated. Breakdown
of return on invested capital will be done. Also an in-depth analysing of goodwill will be conducted
from the annual report as goodwill accounts for a high percentage of the company’s total assets.
Chapter 5: Forecast
Estimation of future cash flows and future prospects will be generated in this chapter, the
foundation for these forecasts will be content matter already discussed in the preceding chapters.
Chapter 6: Valuation
Here the actual valuation of the company will be done using the information and assumptions
from previous chapters. Two models will be used:
Discounted Cash Flow (DCF) model
Multiple valuation
Before using these models it is vital to determine DSV cost of capital, i.e. the company´s Weighted
Average Cost of Capital (WACC). Also in the valuation chapter there will be usage of sensitivity
analysis to determine how changes in certain variables will affect the estimated share price of
DSV.
Chapter 7: Conclusion
Main conclusions of the thesis will be presented and discussed.
Chapter 8: Perspective
Purpose of the perspective is to expand the project and provide new perspective on the work and
results.

Master Thesis – MSc in Finance and Strategic Management Valuation of DSV A/S
5
1.4.2 Models
The methodology structure is explained above but to fully utilize it, it is important to use a wide
array of models, to summarize the usage of the strategic analysis below is a brief description of
the models that will be used in the strategic analysis and in the valuation.
Strategic analysis:
The purpose of the macro-environment analysis is to determine what opportunities and threats
are for DSV and what external factor might impact the company. The PESTE model will be used to
analyse the macroeconomic factors and influences that can affect the freight transportation
industry.
Industrial analysis will be done to analyse competition in the industry. Porter’s Five Forces model
will be used to analyse the competitive structure of the industry and the model suggest that
competition in an industry is rooted in its underlying economic structure and goes beyond the
behavior of current competitors.
Internal analysis can determine the company´s strength and weaknesses. Porter’s Value Chain
model will serve the purpose of analysing DSV internal matters. With Porter’s Value Chain it is
possible to identify resources and capabilities inside the company, in order to recognize cost
drivers and organizational efficiency. The VRIO framework that is based on Resource Based View
(RBV) will be used but the framework is used to see if companies have sustainable competitive
advantages over their competitors.
Finally the result from the above analyses will be summarized into SWOT and will reflect on the
key conclusion.
Valuation:
Discounted cash flow (DCF) model will be used for discounting free cash flow (FCF) to estimate the
present value of DSV and therefore the estimated share price of DSV shares.
Multiple valuations is sometimes referred to the “quick and dirty” method to value company´s
shares using certain ratios and selected multiples will be compared with DSV competitors.

Master Thesis – MSc in Finance and Strategic Management Valuation of DSV A/S
6
It is necessary to determine the required rate of return on the company’s stock using the capital
asset pricing model (CAPM) it is also essential to calculate the company’s cost of debt given the
capital structure and to do that the weighted average cost of capital (WACC) will be used.
1.5 Limitation
There are some limitations when writing a thesis only based on published information’s due to
irrelevance and limited resources. Relying on information published by DSV and other data
gathered by secondary sources contains some limitation and must therefore be taken at an arm´s
length. Data will be collected from various sources such as annual reports, quarterly reports,
analysis and other financial information from DSV. Data gathered from DSV must be categorized as
subjective because companies have an interest in making their annual reports as positive as
possible.
DSV consist of three divisions Air & Sea, Road and Solutions but in the strategic analysis and
valuation DSV will be analysed from a single brand perspective instead of analysing each division
separately. DSV pursues a general strategy for all three divisions.
From mid year 2007 the world of finance has been a dynamic environment and because this thesis
is written over a time period of several months some relevant information and data might develop
and change during the writing process. Therefore all information released after the announcement
of the 2011 annual report will not be used.
Theory used in this thesis is well recognized academic literature from respected scholars with high
expertise within the field and should therefore be relevant for this thesis.

Master Thesis – MSc in Finance and Strategic Management Valuation of DSV A/S
7
2. DSV A/S
2.1 History
DSV was founded in 1976 by 10 independent Danish haulers, since the establishment of the
company is has achieved rapid expansion and international presence mainly through acquisitions
of competitors and maintained a key position in the global transport industry.
DSV was listed on the Copenhagen Stock Exchange in 1987 and was at the time focusing on the
Danish transport market but that changed in 1989 when their vision to enter the international
transport market was made with the acquisition of two competing export companies Borup
Autotransport A/S and Hammerbro A/S-Bech Trans1. In 1997 and 1999 DSV acquired Samson
Transport Co A/S and Svex Group A/S continuing to broaden their international presence. In 2000
the biggest step in the company´s history was taken by the acquisition of DFDS Dan Transport
Group, which led to a new era and strategy2. It strengthened their global network but they also
entered new market segments such as overseas transport to US and Asia Pacific markets.
In 2005 DSV’s position in the air and sea transport industry was further strengthened with the
acquisitions of the German company J.H. Bachmann, the following year DSV acquired the Dutch
company Frans Maas and advanced its position from being a Scandinavian player to being a true
Pan-European road transport and logistics player. In 2008 DSV acquired the Belgium company ABX
Logistics and gained presence in South America and is now present in all continents. Since 2008
there has been a mergers and acquisitions timeout and capital has been allocated into buy-back of
DSV shares and increase in dividend payout.
DSV is one of Denmark’s most successful international companies; it is listed on the NASDAQOMX
in Copenhagen and is included in the OMXC20 index as one of the 20 most actively traded stocks.
As mentioned above DSV has mainly grown through acquisitions of several companies from 1989
to 2008 but from 2008 their growth has mostly been organic.
In 2001 DSV separated their operations into three divisions, Road, Air & Sea and Solutions, further
discussion in chapter 2.5.
1www.dsv.com
2www.dsv.com

Master Thesis – MSc in Finance and Strategic Management Valuation of DSV A/S
8
2.2 Ownership
Ownership of DSV consists of investors with diverse horizons and different investment strategies.
There is only one class of shares listed for DSV and therefore no shares carry any special rights
over others. Below are geographical and segment overviews that show the ownership structure of
the shares as of 31.12.2011.
Figure 3 - Overview of Ownership
Source: DSV annual report 2011 and own creation
The largest 25 of these shareholders own about 40% of the entire share capital and there is only
one shareholder with ownership of more than 5% of the share and thus required by law to give
public notices of their holding. The largest individual owner as of 31.12.2011 is Lone Pine Capital
LLC with 5.4% ownership of the shares. Lone Pine Capital is a privately owned hedge fund. There
has not been much change in ownership structure from 31.12.2010 both looking at the
geographical distribution and the compositions of shareholders.
According to (Thomson, 2008) there should be a complete interest alignment between large and
small investors in terms of maximizing the firms profit because all parties receive return in
accordance to the amount of invested capital.
2.3 Management
To better understand DSV as company it is vital to establish an overview of the company internal
functions.
34%
53%
2%11%
Geographical distribution of shares
Denmark Foreign countries
Treasury shares Not registered
71%
18%
11%
Ownership of share capital(%)
Financial enterprises, trusts and pension funds
Private individuals and others
Not registered

Master Thesis – MSc in Finance and Strategic Management Valuation of DSV A/S
9
2.3.1 Board structure
Management of most companies in Scandinavia follows the two-tiered board system and DSV is
not an exception of that it consists of a supervisory board and management board (Thomson,
2008). DSV supervisory board is called the board of directors and the management board is called
the executive board. The board of directors is elected by shareholders and the board members are
typically non-executive directors, the board of directors then selects the executives that handles
day to day operations and also sits on the executive’s board. Four out of seven boards of director’s
members are independent3.
In the traditional Scandinavian two-tiered model the board of directors may and can include
members of the staff and are thus elected by the employees of the company (Thomson, 2008).
That is not the case with DSV. In appendix 1 is a figure of the model.
The board of directors supervises the overall vision, strategies and objectives for DSV, whereas the
executive’s board is responsible for the day to day management and implementation of the
strategy.
2.3.2 Remuneration
One of the roles that the board of directors has is to decide the salaries, share options or cash
bonuses for the executives based on the company’s performances4. But it is not stated in the
annual report for 2011 how the boards decides how the incentive program is comprised, how
much is based on financial results and on other measurements. The board of directors is paid a flat
salary and is therefore does not receive any share options or cash bonuses.
2.4 Strategy and financial targets
2.4.1 Elements of strategy
One of the main goals for DSV is to strengthen their position among the world’s leading transport
and logistics companies by providing efficient services to their customers.
All three divisions of DSV are using the same strategy to achieve the goals set for them, below is
the elements of DSV strategy as it was published in the annual report for 2011.
3DSV Annual report 2011
4DSV Notice of Annual General Meeting 2012 No 437, 23 February 2012

Master Thesis – MSc in Finance and Strategic Management Valuation of DSV A/S
10
Figure 4 - Elements of the DSV strategy
Source: DSV annual report 2011
The strategy of DSV is based on the following elements shown in table 1.
Table 1 – Elements of the DSV strategy
Element Overview
Customer Focus
Offer one-stop shopping model within all customer segments that would allow customers to focus on their core business.
Increasing demand for solutions that are tailored to the customer’s business area.
Growth Opportunities to win market share both through acquisitions and organic growth.
Organization Decentralized organizational structure focusing on empowerment and direct communication channels at all levels to facilitate smooth information flow between management and employees.
Asset Light A flexible business model which means that DSV does not invest in fixed assets in the form of trucks, ship or aero planes. This implies comprehensive outsourcing and has certain benefits.
Business Processes
Are optimized on an ongoing basis to increase productivity and enhance the focus on customer profitability and revenue per shipment.
2.4.2 Financial targets
DSV focuses on increasing the return on invested capital (ROIC) and this should be achieved
through increased earnings and a reduction of invested capital. Targets are set for DSV as a whole
and for each division. Table 2 consist DSV long term financial targets.

Master Thesis – MSc in Finance and Strategic Management Valuation of DSV A/S
11
Table 2 – Long term financial targets
Targets DSV Air & Sea Road Solutions
Growth in freight volume* Above market volume
EBITA margin 7% 7-8% 5% 7%
Conversion ratio 30% 35% 25% 25%
ROIC before tax (including goodwill) 25% 25% 25% 20%
Source: DSV annual report 2011
*Growth is defined as growth in freight volume on the markets where DSV operates
EBITA margin is operation profit before impairment of goodwill and special items multiplied by
100 and divided by revenue and the conversion ratio is EBITA multiplied by 100 and divided by
gross profit and finally ROIC before tax is EBITA multiplied by 100 and divided by average invested
capital including goodwill and customer relationship. These three ratios are good indicators
whether DSV is fulfilling their financial targets set by the board of directors.
Target for capital structure for DSV are solid financing structure to increase the return on invested
capital and have sufficient financial flexibility to meet the strategic objectives. The target set for
financial gearing ratio is 2.0 to 2.5, the net interest bearing debt to EBITDA ratio may exceed 2.5 in
extraordinary periods due to major acquisitions5.
Free cash flow is what remains after operating and investment activities and DSV aims to spend
the free cash flow on:
Repayment of net interest bearing debt in periods when the financial gearing ratio is above
the capital structure target
Acquisitions if there are attractive candidates
Distribution to the company’s shareholders by means of share buy-backs and dividends
From March 2010 DSV has been buying-back shares using the Safe Harbor method to hedge the
incentive programs and adjust the capital structure in accordance with the corporate strategy.
For 2012 DSV has allocated non recurring expenses in order to reduce overhead cost. This is done
to make DSV enable to meet future challenges and maintain the positions as best in class in terms
of productivity and profitability in order to achieve the company’s targets.
5DSV Annual report 2011

Master Thesis – MSc in Finance and Strategic Management Valuation of DSV A/S
12
2.5 Division overview
DSV is a global supplier of transport and logistics services and the group has more than 20,000
employees worldwide and subsidiaries in more than 60 countries6. DSV is separated into three
divisions and all divisions are using the same strategy as mentioned before, more specific financial
and strategic detail are in the following subchapters. In table 3 is an overview of few key numbers
from the income statement of DSV from 2007 to 2011.
Table 3 – Overview from the income statement
Disvision 2007 2008 2009 2010 2011
Air & Sea Revenue 8.845 13.307 13.307 18.436 18.145
Gross profit 1.857 2.998 3.424 3.795 4.090
EBITA 691 906 929 1.213 1.355
Conversion ratio* 37,21% 30,22% 27,13% 31,96% 33,13%
Road Revenue 21.943 18.987 17.256 19.726 20.985
Gross profit 4.808 3.993 3.914 4.105 4.280
EBITA 998 874 597 771 834
Conversion ratio* 20,76% 21,89% 15,25% 18,78% 19,49%
Solutions Revenue 4.111 5.141 5.522 4.400 4.580
Gross profit 1.130 1.221 1.561 1.460 1.483
EBITA 222 212 196 268 278
Conversion ratio* 19,65% 17,36% 12,56% 18,36% 18,75%
DSV A/S Revenue 34.899 37.435 36.085 42.562 43.710
Gross profit 7.704 8.175 8.898 9.320 9.819
EBITA 1.882 1.936 1.703 2.202 2.426
Conversion ratio* 24,43% 23,68% 19,14% 23,63% 24,71%
Net profit 1.114 1.233 191 1.194 1.449
Source: DSV annual report 2011 and own creation, *Conversion ratio (EBITA/Gross profit)
2.5.1 DSV Air & Sea
Revenues between 2010 and 2011 decreased about 2.5% because of lower average freight rates in
2011 compared with 2010 however EBITA increased between the years because of an increase in
freight volume as well as higher gross profit because of decrease in directs costs and therefore the
conversion ratio increased between the years.
The Air & Sea division goal is to roll out some of their IT system and only use one IT system as of
2013 that should hopefully enable DSV to facilitate efficient business processes and lower their IT
cost.
6DSV Annual report 2011

Master Thesis – MSc in Finance and Strategic Management Valuation of DSV A/S
13
In the first half of 2011 there was a strong growth both in sea and air freight however the global
economic crisis caused a slowdown in activity in the second half of the year. Therefore the market
development for 2012 is in great uncertainty but DSV expects that sea freight volume will grow by
4-5% in 2012 and air freight measured by volume will be in line with 2011.
2.5.2 DSV Road
Increased revenue generating of the Road division has mostly been through organic growth
between 2010 and 2011. The current market position and strong European network at DSV Road is
the main reason for the organic growth in most countries that the division operates in. Revenues,
gross profit and EBITA have been increasing from 2010 and all of the division revenue comes from
Europe. The customer portfolio of the division comprises of small and medium sized companies as
well as a number of large global customers.
DSV Road operates almost only with one IT system in almost all the European locations and that
platform enables the division to offer the customers more efficient business process and online
booking and track and trace functionalities.
The European markets were characterized by uneven development in 2011 as the severity of the
impact of the economic crisis and uncertainty differed in various countries7. Southern Europe
experienced stagnation and recession whereas Northern and Eastern Europe saw a more positive
development. Because of uncertainty in the European economy market development for 2012 is
subjected to great uncertainties. Still DSV management is fairly optimistic and expects the overall
European road transport market to grow by 1-2%.
2.5.3 DSV Solutions
Organic growth explains about 6.3% of revenue growth between 2010 and 2011. All of the division
revenue is from different parts of Europe. DSV Solutions goal is to grow faster than the market and
expanding its market positions among leading European logistics providers and doing so with
organic growth. To achieve their goal the division works closely with the other two divisions of
DSV in offering integrated services that gives the customers competitive advantages.
7DSV Annual report 2011

Master Thesis – MSc in Finance and Strategic Management Valuation of DSV A/S
14
As the other two divisions of DSV, Solutions is working on implementing one IT system. The main
reason for this implementation is to support the division goal of offering efficient logistics services
which allows customers to monitor the financial and operational efficiency of their orders.
Logistics demand rose in the first part of 2011 however the second half of 2011 the market
development declined because of uncertainty about the European economy. DSV expects that
growth in 2012 will be about 1-2% and hopes to gain market share and improve productivity and
capacity utilization.
2.5.4 Revenues of DSV
In figure 5 is an overview of how revenue of DSV are distribution between country segments.
Figure 5 – Revenue distribution
14%
23%
28%
16%19%
44%
12%
44%
19%
25%
56%
29%
18%
38%
7% 8%
0%
10%
20%
30%
40%
50%
60%
No
rdic
co
un
trie
s
Sou
the
rn E
uro
pe
Oth
er
Euro
pe
No
rth
Am
eri
ca
Asi
a
No
rdic
co
un
trie
s
Sou
the
rn E
uro
pe
Oth
er
Euro
pe
No
rth
Am
eri
ca
Asi
a
No
rdic
co
un
trie
s
Sou
the
rn E
uro
pe
Oth
er
Euro
pe
No
rth
Am
eri
ca
Asi
a
No
rdic
co
un
trie
s
Sou
the
rn E
uro
pe
Oth
er
Euro
pe
No
rth
Am
eri
ca
Asi
a
Air & Sea Road Solutions DSV
% o
f re
ven
ue
Revenue distribution 2011
Source: DSV annual report 2011 and own creation
As shown on the figure above about 85% of DSV revenue is coming from countries in Europe and
because of that the macroeconomic development of Europe is important for DSV as a company.
DSV assumes in their annual report for 2011 that the situation will continue to become more
stable in the markets in which the company operates in.

Master Thesis – MSc in Finance and Strategic Management Valuation of DSV A/S
15
From 2010 revenues and EBITA have been increasing from the decline that occurred in 2009 while
gross profit has been increasing from 2007.
2.6 Summary
DSV has evolved a lot since its foundation in 1976 and has been a successful investment choice in
the NASDAQOMX Copenhagen stock exchange. The company is mostly a product of acquisition of
other companies until the economic crisis started and affected them in 2008. The company is
divided in three divisions, Air & Sea, Road and Solutions and all of them are using the same
strategy.
The government system of DSV is set up by a model that has proved to be very efficient (Thomson,
2008). Compensation to managers is done through an incentive plan which is linked to the
company’s performance. The ownership of the shares is very well distributed between investor
and there is no one with majority voting rights and there is only one class of shares.
DSV has set an overall strategy for their three divisions and financial targets, some they have
reached and some they have not. It seems that the company is regaining the revenues and EBITA
after the decline in 2009 but is still of course very dependent on the macroeconomic development
in Europe.

Master Thesis – MSc in Finance and Strategic Management Valuation of DSV A/S
16
3 Strategic Analysis
The purpose of the strategic analysis it to analyse the non-financial value drivers of DSV. By using
the strategic and financial analysis they will provide information and insight into future earnings
potential. The main objective in this chapter is to identify and analyse internal and external factors
that have an impact on DSV. DSV will be analysed as a single entity since all three divisions of the
company are using the same strategy and a large part of the company´s revenues are generated in
Europe.
In figure 6 is an overview of how this chapter will be constructed, first is the external analysis
which will assess the external environment affecting the freight transportation industry. Second is
the industry analysis which will provide an outside-in perspective on the competitive situation
within the freight transportation industry. Third is the internal analysis which will identify and
analyse the value creating activities within the company and finally a summary using SWOT which
will summarize the company´s strengths and weaknesses and opportunities and threats.
Figure 6 – Overview of strategic analysis models
Own creation
3.1 External analysis
The external or macro environment analysis will be conducted using the PESTE framework and
Porters five forces model will be used to analyse the transporting industry.

Master Thesis – MSc in Finance and Strategic Management Valuation of DSV A/S
17
3.1.1 PESTE framework
In the PESTE framework factors are divided into political, economic, social, technological and
environmental factors. The framework is a useful strategic tool for identifying and understanding
factors that may affect the industry growth or decline, attractiveness and direction. The traditional
PESTE framework consists of the factors below affecting each part of the framework (Johnson,
Scholes & Whittington, 2008).
Political – e.g. Government stability, taxation and foreign trade regulations
Economic – e.g. Business cycles, GDP trends, interest rates and unemployment
Social – e.g. Demographics, lifestyle changes, consumerism
Technological – e.g. New discoveries, speed of technological transfer, rates of
obsolescence
Environmental – e.g. Climate change
Political – The political and regulatory factors will be analysed together because the legislation is
controlled by the policy makers in individual countries and also in the European Union (EU). The
internal European market is a single market where free movement of goods, services, capital and
persons is ensured and in which European citizens are free to live, work, study and do business8.
This has been an advantage for the European businesses to locate and recruit skilled workers from
other European countries without major complications.
In 2008 the EU established a new climate policy that is a major challenge for the transporting
industry, where the main effect from the policy is that CO2 emission should be reduced by 10% in
2020 from the CO2 emission levels in 2005 in transport, housing and agriculture and more
renewable energy should be used9. The aim of the policy is to restructure the EU transportation
system in whole, reduce transportation by road and guide it more towards rail and waterborne
transport. Also there is a risk that the EU will attempt to increase cost in terms of tax or
technological requirements on the road transportation in the near future.
EU legislation about driving and resting times is very strict. The maximum driving time per day is 9
hours and after each 4.5 hours of driving the driver must take an uninterrupted break for 45
8http://europa.eu/legislation_summaries/internal_market/index_en.htm
9http://www.dtl.eu/Nyheder/DTL%20mener/Klima.aspx

Master Thesis – MSc in Finance and Strategic Management Valuation of DSV A/S
18
minutes. The legislation has set to reduce accidents related to transporting in roads. Laws on
competition in the EU implies that large companies must have approval from the EU Commission
before they can merge, that is to prevent large companies that dominate the market to acquire
smaller companies and delete competition. This has not been a problem for DSV because the
companies within the transportation industry do not have large market share. Since DSV is a
Danish company and Denmark is part of the EU the political risk is very low.
DSV is only partly affected by some of the regulations mentioned above because of their asset
light model which transfers most of the cost due to regulation changes on to its subcontractors.
This will of course translate into higher prices for DSV but it will not require direct capital
investment to upgrade the trucks, airplanes and ships. However EU policy towards more rail
transportation could affect DSV significantly due to the fact that DSV has no rail transportation and
the business structure is heavily dependent on road transportation.
Economic – The financial crisis in Europe that started in 2008 and is still continuing after a fairly
good start to 2011 is still affecting the transportation industry in Europe and North America. The
crisis has led to a sharp drop of production for several European and international companies and
this has affected the transportation industry. The overall health of the global and specially the
European economy is vital to DSV.
The real GDP growth for the 27 EU countries for 2008 was 0.3%, -4.3% in 2009, 2% in 2010, 1.5% in
2011 and the forecast for 2012 is 0% stagnation in real GDP growth10.
Oil price fluctuations have a significant impact on the total price of transport service. DSV
concludes customer agreements to separate invoicing of variable fuel surcharges to mitigate this
risk11.
Foreign currency risk could affect DSV but a large proportion of their revenue is in Euros and most
of other currency risk is delimited through currency hedging.
Inflation within the 27 EU countries is generally low or around 2 to 2.5% per year. Interest rates
are also historically very low in Europe for the period.
10
http://epp.eurostat.ec.europa.eu/tgm/refreshTableAction.do?tab=table&plugin=1&pcode=tsieb020&language=en 11
DSV Annual report 2011

Master Thesis – MSc in Finance and Strategic Management Valuation of DSV A/S
19
This shows how demanding the economic environment in Europe is for the moment. DSV is
affected by the general world economic development and declining economic activity impacts
directly on the demand for transport and logistics service. The idea behind the asset light model is
to maintain a flexible cost structure and therefore DSV is faster to adjust their direct cost than
their fixed costs.
As mentioned before the majority of DSV revenue is generated in Europe, Northern and Eastern
Europe have been showing better results than Southern Europe and market outlook is more
positive for the Northern and Eastern part of Europe.
Social – The transportation industry was very affected by the financial crisis that is still ongoing. It
has reflected in reduction of freight volume because of decrease in transportation by consumers
and companies around the world.
More environmental awareness is possible being generated among consumers and companies. In
recent years energy consumption has been increasing in Europe and that could affect consumers
and companies to think more about the environment. Therefore many companies in the
transportation industry have generated a Corporate Social Responsibility (CSR) policy as part of
their strategy. DSV has implemented a CSR policy and it is determined by four areas, human rights,
labor rights, the environment and anti corruption, which is then implemented into contracts with
their subcontractors. It is then vital for DSV to fulfill their CSR policy so that the subcontractors are
willing to use the policy.
Technological – Keeping up with technological advancements is important for the transporting
industry whether it is in IT systems or new technology in trucks, airplanes or ships. Being up to
date could help optimizing processes. DSV is implanting a new IT system in the Road division and
therefore all three divisions are mainly using one IT system and that should help DSV to optimize
business processes and service their customers more efficiently. It is important for company like
DSV to have the best IT system as possible in the fierce competitive environment that the
transportation industry is.
Environment – The transportation industry has wide range of problems regarding the environment
like CO2 emissions and noise problems for example. The environmental impact on DSV is mostly
caused by the transport activities carried out by their subcontractors. A reduction of the

Master Thesis – MSc in Finance and Strategic Management Valuation of DSV A/S
20
environmental impact can be achieved mainly through DSV dialogue with and requirements of its
subcontractors. DSV could use their CSR policy to enlighten their subcontractors about their
environmental strategy.
3.1.2 Porter’s Five Forces
The Porter’s Five Forces framework was developed by Michael Porter in 1979 and is used for
industry analysis and business strategy development. Using the framework can indicate which
factors are influencing DSV, who its main competitors are and how the company can gain
competitive advantage. It also suggests that competition in an industry is rooted in its underlying
economic structure and goes beyond the behavior of current competitors (Porter M. E., 1979).
According to Porter the earning potential in an industry is affected by five forces that are shown
below in table 4 and upon which the definition is based on (Johnson, Scholes & Whittington,
2008). To have as good overview as possible it is necessary to look separately at each division in
this analysis.
Table 4 – Overview of Porter’s Five Forces framework
Forces Definition
Threat of Entry
Profitable businesses that yield high returns will attract new firms. Scale and experience: here can economic of scale me extremely important. Is there a high capital investment required to entry? Access to supply or distribution channels is important. Legislation or government actions can affect possible entry.
Threat of substitution
Often managers focus on their competitors in their own industry and neglect the threat of possible substitutes.
Extra-industry effects are when a substitute comes from outside the incumbents industry and should not be confused with competitor’s threats from within the industry.
Bargaining power of buyers
Customers are essential for the survival of any business. But sometimes customers – here buyers can have such high bargaining power that their suppliers are hard pressed to make any profit at all. Concentrated buyers, where a few large customers account for the majority of sales, buyer power is increased.
Low switching cost is when buyers can easily switch between one supplier or another, they have strong negotiating position and can squeeze suppliers who are desperate for their business.
Bargaining power of suppliers Suppliers are those who supply the organization with what it needs to produce the product or service. Concentrated suppliers are when few producers dominate supply; suppliers have more power over buyers.

Master Thesis – MSc in Finance and Strategic Management Valuation of DSV A/S
21
High switching cost, if it is expensive to move from one supplier to another, then the buyer become relatively dependant and correspondingly weak.
Competitive rivalry
Competitive rivalries are organizations with similar product and service aimed at the same customer group. Competitors are of roughly equal size there is the danger of intense competition as one competitor attempts to gain dominance over others.
Industry growth rate is important, when growth is strong an organization can grow with the market but in situations of low growth or decline any growth is likely to be at the expense of rival. Industries with high fixed cost tend to be highly rivalrous.
Existence of high exit barriers tends to increase rivalry. Low differentiation within the products or service can cause increased rivalry because there is little to stop customers from switching between competitors.
A figure of Porter’s Five Forces can be viewed in appendix 2.
3.1.2.1 Threat of entry
One of the possible threats of entry is good earning potential within the transportation industry,
the global transport industry has evolved significantly over the recent decades. Freight measured
per ton has been increasing from 1970 and markets are getting back in shape after the financial
crisis that started in mid 2007. There has been a great growth increment in the industry over the
past years and has mainly been driven by increased international trade.
There are typically two ways to enter a new market or market segment and that is with
establishing a new transporting company or when an existing company enters new markets. With
the establishment of a new company it usually does not pose a threat due to their small size and
their lack of distribution network. The second possible threat is when an existing company enters
a new market and gains market share from the current operative in the market.
Air & Sea division
Competition in the field of Air & Sea is very high because of many suppliers in the market but DSV
is one of the top ten players12. Looking at both air and sea freight the ten top companies have a
market share of about 43.8% of which DSV has about 2.1% market share. They gained that
position after their acquisitions of ABX Logistics. The world market for air and sea freight consists
of many suppliers therefore there is no one with large market share. Most suppliers provide both
12
DSV, Capital Markets Day 2011

Master Thesis – MSc in Finance and Strategic Management Valuation of DSV A/S
22
kinds of services that are air and sea freight transportation. About 41% of DSV revenue are
generated within the Air & Sea division.
The air and sea freight transportation market is relatively easy to operate in as companies often do
not own the equipment but instead outsource the service to airlines and shipping companies.
There are several things that affect the earning potential within this business, the size of the
companies and their transportation network. These factors can have a positive effect on the
earning potential therefore it can be important for companies to grow larger through acquisitions
or organic growth. There is no heavy capital investment needed to enter this market because of
the similar business model the current suppliers use.
Therefore the barrier to entry is low and not much capital investment is needed or economies of
scale as leasing and outsourcing is possible, the switching cost in the industry is low, looking at all
those factors it is safe to say the market has little barriers to enter.
Road division
The Road divisions can be placed in the same category as the Air & Sea division, there are many
suppliers in the market and severe competition to attract customers. DSV market position is
ranked number three in Europe in regarding to revenue13. About 49% of DSV revenue is generated
within the Road division.
Because most of the suppliers within the road transportation in Europe use a similar model as DSV
there are low entry barriers to enter the market. Therefore heavy capital investment is not needed
and no large fixed costs to undertake. Also because of the internal market within Europe there are
no significant barriers to establish a transporting company with transporting network through
Europe. There is also a low switching cost and low level of differentiation in the industry that
furthers lowers the entry barriers.
Solutions division
The Solutions divisions’ role is to establish long term business relationship with their customers.
This is necessary because many companies today are outsourcing the transporting and logistic part
13
DSV, Capital Markets Day 2011

Master Thesis – MSc in Finance and Strategic Management Valuation of DSV A/S
23
of their supply chain. DSV is a small player and is not among the five biggest players in the logistics
solutions14.
The industry has relatively high barriers to enter because of the need of complete IT logistic
system and capital investment for it. Collaborate with other divisions such as Air & Sea and the
Road division in order to offer the customers a fully integrated transporting solution and the final
point is the necessity for know-how. Therefore the threat of new entrants is low.
3.1.2.2 Threat of substitutes
The threat of substitutes in the transporting industry is relatively low because most of the
companies in the industry are offering air, sea and road transportation. As mentioned before in
the PESTE analysis there is a considerable political focus on moving road transportation to a more
environmental friendly transportations such as rail and maritime transports. In figure 7 is the
development of freight transportation per ton from 2003 to 2010.
Figure 7 – Development of freight transportation in Europe
100
105
110
115
120
125
130
135
140
145
2003 2004 2005 2006 2007 2008 2009 2010
Ind
ex
(20
03
=1
00
)
Year
Freight transportation development
Rail
Road
Sea
Air
Inland water
Source Eurostat15
and own modification
Looking at the figure above it can be assumed that some of the politician’s goals are being reached
as there has been more increase in sea, inland water and rail freight transportation than road. But
air freight transportation has had the most relative increase in freight volume from 2003. It can
therefore be assumed that the pressure that politicians are putting on the transporting industry is
partly working but their goal is to decrease CO2 emission with more environmental transportation.
14
KUEHNE & NAGEL, Capital Market Day 2011 15
http://epp.eurostat.ec.europa.eu/portal/page/portal/transport/data/main_tables

Master Thesis – MSc in Finance and Strategic Management Valuation of DSV A/S
24
Since most companies in the transporting industry have integrated air, sea and road freight
transportation in the business model there is only one substitute for them and that is moving
freight by rail. DSV has no plan to integrate rail network into their business model unlike Kuehne &
Nagel that have over 20 years used rail in their model and have been gaining market share in
previous years16. This could be a weak link for DSV in near future or when CO2 emission code will
be more widely used.
3.1.2.3 Bargaining power of buyers
The customer aspect for DSV is built up off well diversified customers groups that are split into
small and medium sized and they are the key segment for DSV and on the other hand large global
customers. Because of how the customer group is constructed there should not be much
bargaining power for customers within the small and medium sized group because of their size.
But large global customers can have some bargaining power because of their size and volume of
product to move.
However after the downturn of the global economic the consequences for DSV were decrease in
demand and overcapacity in freight volume. Because of that bargaining power of buyers did
increase for some time. But with actions of the freight transportation suppliers to reduce capacity
in the market the bargaining power of buyers was eliminated. But there are more factors than
price that buyers are looking at, things like flexibility, reliability and stability are also important
when choosing a supplier.
Switching cost for buyers also matters for their bargaining power. Low switching cost is when
buyers can easily switch between suppliers or they have strong negotiating position.
Thus the normal condition is that bargaining power for small and medium size customers should
be low but higher for large global customers.
3.1.2.4 Bargaining power of suppliers
Suppliers for DSV are companies providing trucks, airplanes, ships and warehouses where DSV
operates. It is possible to evaluate the bargaining power of suppliers by defining the numbers of
suppliers, the switching cost to change suppliers and their level of differentiation.
16
KUEHNE & NAGEL, Capital Market Day 2011

Master Thesis – MSc in Finance and Strategic Management Valuation of DSV A/S
25
Air & Sea division
The air and sea market is increasingly dominated by fewer and larger suppliers, the suppliers are
shipping and airline companies. The suppliers in the sea freight market are companies Maersk
Line, Hapaq-Lloyd and CMA CGM all with large assets on their balance sheet. Suppliers in the air
freight market are companies like Lufthansa, KLM, SAS and DHL all with large balance sheet like
the sea freight companies.
DSV and the companies mentioned above have all been affected by the financial crisis and the
consequences of the crisis. Overcapacity and low freight rates meant that the companies had to
remove capacity from the market by temporarily removing some of the airplanes and ships from
the market. The air and sea market was on a recovery path in 2010 but changed again in the
second half of 2011. The development impacted the sea freight market in particular, surplus
capacity resulting in falling freight rates, the market also experienced several rate increase
warnings from the shipping companies, most of which never materialized. The air freight market
saw a similar development, although less turbulent.
The level of differentiation and the cost of switching between suppliers for the air and sea markets
is defined as low. But for the suppliers in whole they have a high level of bargaining power based
on small numbers of suppliers and their control of capacity levels.
Road division
Most of DSV suppliers in the road division are European independent carriers. As a result of the
financial crisis many carriers were left with overcapacity problems and need to cut down on their
assets to reduce capacity. In 2010 and 2011 the balance between supply and demand in the
European road transport market improved. With these changes from going from overcapacity to a
scarce hauler capacity in 2010 and 2011 DSV suppliers gained more bargaining power and that
caused an increase in the price to DSV. The switching cost between suppliers in the road division
can be defined as low because of little differentiation between suppliers.
Thus in normal economic conditions the level of bargaining power of suppliers can be defined as
low but when market conditions are tough their bargaining power does increase.

Master Thesis – MSc in Finance and Strategic Management Valuation of DSV A/S
26
Solutions division
The same development has been in the Solutions division as mentioned in the two divisions
before. Recovery in 2010 and first half of 2011 but markets started to decline in the second half of
2011 in step with the growing uncertainty about the European economy. The suppliers for the
Solutions division are owners of warehouses and suppliers of material for DSV logistics operations.
The bargaining power of suppliers here has the same trend as in the sea, air and road freight
market. Their bargaining power was lower in 2008-2010 due overcapacities in their warehouses
but that changed in 2010 and 2011 as demand and supply for warehouses did stabilize and
therefore bargaining power of suppliers can be defined as moderate. The switching cost between
suppliers can be defined as low.
3.1.2.5 Competitive rivalry
There are many companies providing the same service as DSV therefore there is no big market
leader within any of the divisions. Thus the competition within the freight transporting industry is
intense. Growth in the air and sea market in 2011 was about 3% for the sea market segment and
there was DSV growth below the market, the air market segment did not experience any increase
in freight volume but DSV gained about 5% market share. The road freight transporting market in
Europe rose about 2-3% in 2011 while DSV Road division increased their market share about 6%
when measured in total freight volume. Finally the market growth within the solutions market was
about 2-3% when DSV Solutions divisions gained market share about 2% measured by number of
order lines.
The intensity of competition between providers in the transport industry is influenced by several
different factors including competition, size of the companies and the availability of service. As
mentioned before there are not high barriers of entry for the sea, air and road market however
the entry barriers to the solutions markets are high.
The industry is characterized by many factors and low profit margins because of how many
companies are competing. Due to globalization there has also been a huge growth in the industry
over the past several years. There are many small players within the market and it is likely that
there will be mergers and acquisitions in coming years with the effort to gain market share and
increase revenue and profit.

Master Thesis – MSc in Finance and Strategic Management Valuation of DSV A/S
27
3.2 Internal analysis
3.2.1 Porter’s Value Chain
According to (Porter M. E., 1985) competitive advantage cannot be understood by looking at a
firm as a whole therefore Porter’s value chain will be used to examine activities that DSV performs
and how they interact is necessary for analysing the source of competitive advantage. The original
value chain is designed with references to a manufacturing firm. Organizations activities are
divided into two main categories, primary and support activities and together they form the
organizations value chain. The primary activities are split into five main categories whose ultimate
function is to create and deliver a product or service; the categories are (Johnson, Scholes &
Whittington, 2008):
Inbound logistics – receiving, storing and distributing inputs
Operations – transforming inputs into products
Outbound logistics – collecting, storing and distributing products
Marketing and sales – create awareness around the product
Service – enhancing and/or maintaining a product
Next are the supporting activities but their mission is to help the primary activities to improve
their efficiency and effectiveness, the supporting activities are the following:
Procurement – acquiring inputs for the primary activities
Technology development – research and development (R&D), know-how and procedures
Human resource management – recruit, train, rewarding people within the organization
Firm infrastructure – consists of general management, planning, finance, accounting, legal
and government affairs
A figure of Porter’s Value Chain can be viewed in appendix 3.
Because the original value chain was based on a manufacturing firm it is necessary to adjust the
value chain to analyses DSV internal matters, it is important to identify if DSV has some
competitive advantages. Figure 8 shows the adjusted value chain.

Master Thesis – MSc in Finance and Strategic Management Valuation of DSV A/S
28
Figure 8 – Adjusted Value Chain
Source: Porter’s value chain and own modification
As shown on the figure above the primary activities for DSV are three instead of five in the original
value chain, they are incoming orders and sale, execution of the service (production and
distribution) and finally service. These are the factors that mostly affect DSV as a freight
transporting company. In the following analysis three primary activities and one support activity
will be analysed.
3.2.1.1 Incoming orders, sales and service
This part of DSV operations is vital for the company because here is where the organic growth is
created, in order to increase their revenue DSV must constantly be working on getting new
business. In recent years DSV has been very imaginative when it comes to making new business
connection with new customers. For example the “Get Custer” program in Sweden where
employees and the public work as agents for DSV, they can tip DSV of new customers and collect
points for doing so. If the new customer starts ordering from DSV the agent receives points and
when the agent has gathered enough points he will be rewarded with cash17.
The sales and service function is very dependent on superior IT systems therefore is DSV rolling
out some older IT systems to make them fewer and at the same time implementing one global IT
system for most operations within the company. With this implementation of a new IT system
staff of DSV and their customers gain more and better information about their orders and tracking
of their shipments. In mid 2007 DSV introduced a new approach within the company to cut down
17
DSV Moves No.2 2009
Incoming
orders & sale
Execution of
service
(production
&
distribution)
Service
Primary activities
Sup
po
rt
acti
viti
esPurchasing: strategic network & risk
IT
Human resource management
Firm infrastructure

Master Thesis – MSc in Finance and Strategic Management Valuation of DSV A/S
29
cost through Lean approach in many areas such as working hours, postage and vehicles to name
some. One of consequence of this is that all bookings, shipment orders and billing are done
electronically.
Incoming orders, sales and service is an essential part of the DSV value chain, new contacts to
customers are made here and creation of organic growth.
3.2.1.2 Execution of the service
In service companies like DSV the employees are the most important link in the value chain in the
implementation of the service. They manage day to day communication with the customers. DSV
is heavily dependent on key personnel with special professional skills and know how about the
customer. Thus DSV does much to attract and retain qualified and committed staff. DSV is much
aware of the importance of their staff and therefore with constant focus on staff conditions to
create an attractive workplace. Senior staff members are offered incentive pay as part of their
remuneration schemes, by this DSV has managed to maintain a low employee turnover over the
years18.
3.2.1.3 Purchasing: The strategic network and risk
This part is an adaptation to the support activity procurement. The purchase part of the value
chain is the strategic network DSV has with their various suppliers such as financial institutions,
petroleum companies and subcontractors and many other companies which supply goods and
service to DSV. With this strategic network DSV is able to minimize their risk, risk can be defined as
the probability that an event occurs. Events for example like increase in fuel price, striking
employees, change in exchange rate and debtor’s bankruptcy are all risks facing DSV.
DSV customer portfolio is well diversified with a good combination of small and medium size
companies and few large global companies. Their customer’s profession is spread across many
numbers of areas, for example pharmaceutical companies, agriculture companies and many other.
DSV is therefore not dependant on few suppliers or/and customers’ and that helps the company
to minimize their risk in the market.
Risk factors can be divided into two categories, market risk and specific risk. Market risk can be
described as general changes in the market and thus these changes will affect all the companies in
18
DSV Annual report 2011

Master Thesis – MSc in Finance and Strategic Management Valuation of DSV A/S
30
the market, this risk is very hard to handle. While the specific risk can be split into operational and
financial risk, the specific risk only affects the individual company but not necessary their
competitors, companies can to some extent manage this risk. The more a company diversifies
itself the lower the specific risk is, however a company cannot fully diversify all the specific risk
away. If a company wants to achieve higher earnings it must be willing to take more risk, it is up to
the executive board to determine in which direction the company should go concerning the risk it
takes. In the end it will be the shareholders that will pay the price of the risk the company has
taken. Because DSV is using the asset light model they can adapt quickly to changes in the market
and with this model they are quicker to adjust direct costs than adjusting the fixed costs.
3.2.2 Resources based view
The resources based view (RBV) of the firm provides a useful perspective for explaining firm
growth and sustainable competitive advantage ((Penrose, 1959),(Peteraf, 1993)). According to
(Barney, 1991), firm resources includes all assets, capabilities, organizational processes, firm
attributes, information, knowledge, etc. controlled by a firm that enables the firm to conceive of
and implement strategies that improve its efficiency and effectiveness. A competitive advantage
can be attained if the current strategy is value creating and not currently being implemented by
present or possible future competitors.
To gain sustainable competitive advantages it is necessary to add on the previous definition that
other firms are unable to duplicate the benefits of the strategy (Barney, 1991). The RBV is an
approach to study the firm’s internal strength and weaknesses and is based on the two following
assumptions. It is assumed that a firm can be thought of, as bundles of productive resources and
those different firms possess different bundles of these resources, this is the assumption of
resource heterogeneity. Also it is assumed that some of these resources are either very costly to
copy or inelastic in supply, this is the assumption of resource immobility.
To have the ability to have competitive advantages and sustainable competitive advantages it is
required to identify the firm’s potential key resources and evaluate whether these resources fulfill
the VRIO framework presented by (Barney, J., 2002). The VRIO framework acts like a four step
analysis for which resources firms can gain competitive advantages, it can also provide an answer

Master Thesis – MSc in Finance and Strategic Management Valuation of DSV A/S
31
how well firms are managed. There are four questions that are needed to answer in the VRIO
framework.
Value: Do a firm’s resources and capabilities enable firms to respond to environmental
threats and opportunities?
Rarity: Is a resource currently controlled by only a small number of competing firms?
Imitability: Do firms without resources face a cost disadvantage in obtaining or developing
it?
Organization: Are a firm’s other policies and procedures organized to support the
exploitation of its valuable, rare and costly to imitate resources?
A general answers to these questions and DSV position are summarized in table 1 and 2 in
appendix 4 and how the relationship between the VRIO framework and organizational strengths
and weaknesses. The chain is as strong as its weakest link and therefore dependent on the
resource displaying each of the four characteristics to be a possible source of sustainable
competitive advantage (Barney, 1991). In table 5 are answers for the four questions above for
DSV.
Table 5 – DSV answers to the VRIO framework
Question Answer for DSV
Value Here the value involves in the asset light model and DSV flexibility to general changes in the economic environment. They have been able to increase their revenue and decrease their costs. Therefore the answer here is yes.
Rarity Even though the asset light model helps DSV to adjust to changes it is not rare and relatively easy to copy. Therefore the answer here is no.
Imitability Because it is easy to copy the asset light model and easy to establish business connection with trucking, shipment companies and airlines to start up a business. The answer is no.
Organization Even though DSV has through the years established much know-how in the freight transporting business it is easy for current or new companies in the market to imitate their resources. Therefore the answer here is no.
Using the tables in appendix 4 it can be assumed that DSV has competitive parity meaning that
DSV is no better or worse off than its competitors and this option would leave DSV at a normal
economic level.

Master Thesis – MSc in Finance and Strategic Management Valuation of DSV A/S
32
3.3 Summary - SWOT analysis
The SWOT analysis will summarize DSV internal strengths and weaknesses as well as the external
opportunities and threats the company is facing. SWOT summary is in table 6.
Table 6 – SWOT summary
Strengths Weaknesses
Asset light model No rail network
Acquisition expertise No sustainable competitive advantage
Extensive network
Decentralized management
Opportunities Threats
Expansion of Solutions division Intense rivalry and low differentiation
Expansion into railway Regulations decreasing freight transport by road
Environmental impact concerns
Economic stagnation in Europe
Strengths
The asset light model enables DSV to adjust their costs rapidly in response to changes in the
economic environment. DSV strategy allows them to avoid large capital investments when there
are changes in the regulation and technological environment. Even though DSV has been focusing
on organic growth from 2008 due to the state of the financial markets they have much experience
and know-how in the acquisitions process and that knowledge will help them when the financial
market will stabilize. DSVs road network within Europe allows them to service a large geographical
market and because of decentralized management it allows them to response very rapidly in the
localized markets.
Weaknesses
DSV has no rail network and no plan to implement one into their strategy. That could hurt them in
the future because of regulations changes that are trying to shift freight transport from the roads

Master Thesis – MSc in Finance and Strategic Management Valuation of DSV A/S
33
to the rails, sea and waterborne transportation. DSV has no sustainable competitive advantages
that competitors cannot mimic or acquire from other companies.
Opportunities
If DSV manages to expand the Solutions division with emphasis on customer growth that provides
opportunities in the other divisions simultaneously. Given that new customers at the Solutions
division would very likely have the need for the services that the other divisions are offering. Also
if DSV would integrate railway into their business model it could generate sales opportunities that
are not currently available to DSV.
Threats
There is high level of competition and many companies within the freight transportation industry
and that reflects in low levels of differentiation and switching costs puts pressure on profit
margins. While the Road division generates most of DSV revenues any regulation aimed to
decrease freight volume by road could have a negative impact on DSV revenues. Also if DSV and
their subcontractors do not keep up with changes in the CO2 emissions it could have a negative
media and public opinion and could lead to decrease in revenue. DSV services are highly
correlated to the general economical outlook, particularly in Europe. If the current stagnation in
Europe does not change it could hurt DSV in establishing and maintaining their customers
relationship and revenue generation.

Master Thesis – MSc in Finance and Strategic Management Valuation of DSV A/S
34
4 Financial Analysis
The aim of this chapter is to create a clear overview of DSV financial profitability and indentify DSV
core financial drivers, key financial ratios and goodwill analysis. The following analysis is primarily
based on DSV 2011 annual report but in some cases however it is necessary to analyse previous
annual reports.
To have the best possible financial analysis it is important that the reported financial statement
will be reformulated. The reason for this reformulation is to separate operating activities and
financing activities apart as the operating activities are a central part in creating value for the
future, whereas the financing activities show how the operating activities are financed. The
following items from the annual report will be reformulated, equity statement, balance sheet and
the income statement.
By reformulating the balance sheet it will be possible to identify the invested capital (IC) and with
adjusting the income statement it will be possible to interpret the net operating profit less
adjusted tax (NOPLAT) and with these two parameters it is possible to calculate the return on
invested capital (ROIC).
4.1 Accounting policies
To ensure that the financial statements used for the financial analysis are identical for the whole
period that is being analysed it is necessary to look at the accounting policies used in DSV annual
report and see if there have been any changes over the years.
DSV submits their annual reports in accordance with International Financial Reporting Standards
(IFRS) as adopted by the European Union and Danish disclosure requirements for listed
companies, this has been done from 2005.
DSV accounting policies have not changed in the period and the company has announced that
adopting new IFRS standards as required by law has not had significant changes on its financial
statement. Therefore it is not necessary to make adjustments to the reported financial statements
to ensure comparability for the period.
The independent auditor, KPMG has reviewed and approved DSV annual reports for the period
and according to them the reports gives a true and fair view of DSV financial position in

Master Thesis – MSc in Finance and Strategic Management Valuation of DSV A/S
35
accordance with IFRS as adopted by the EU and Danish disclosure requirements for listed
companies.
4.2 Equity statement
The main purpose of reformulating the equity statement is to map all the changes in equity and
include them in the following analysis, if using only the net result from the income statement it is
possible that it does not include value changes incorporated directly in the equity. With this
reformulating it detaches and illustrates how the equity is comprised between the company´s
shareholders and the total income. To fully identify the value changes made on the equity
statement it is important to isolate the so called dirty surplus, dirty surplus is other comprehensive
income, net of tax, an expression of the entries that are entered directly in equity outside profit
and loss under current accounting legislation and guidelines.
The formula below shows the relationship between equity EOY (end of year) and equity BOY
(beginning of year):
Equation 1 – Equity relationship
The equity statement from the 2011 annual report for DSV can be seen below in table 7 as well as
a summary of the reformulated equity statement from 2007-2011 can be seen in table 8. In
appendix 5 is the equity statement for 2007-2010 shown as well as the full reformulated equity
statements.
Table 7 – Equity statement
DKKm
Share
capital
Hedging
reserve
FX
Translation
reserve
Retainted
earnings
Proposed
dividends
Total
share
capital
Non-
controlling
interests
Total
equity
Equity at 1 January 2011 209 -110 66 6.279 105 6.549 36 6.585
Total comprehensive income after tax 4 -8 1.144 105 1.245 9 1.254
Share-based payments 34 34 34
Dividends distributed -105 -105 -5 -110
Purchase and sale of treasury shares, net -2.418 -2.418 -2.418
Capital reduction -19 19
Acquisition/sale of non-controlling interest -16 -16 -10 -26
Dividends on treasury shares 4 4 4
Tax on transactions with owners -14 -14 -14
Total changes -19 0 0 -2.391 -105 -2.515 -15 -2.530
Equity at 31 December 2011 190 -106 58 5.032 105 5.279 30 5.309
Statement of changes in equity 2011
Source: DSV annual report 2011 and own modification

Master Thesis – MSc in Finance and Strategic Management Valuation of DSV A/S
36
Table 8 – Summary of reformulated equity statement
Reformulated Equity statement (DKKm) 2007 2008 2009 2010 2011
Equity BOY 3.844 3.649 3.857 5.530 6.585
Total comprehensive income after tax 1.031 962 234 1.360 1.245
Transactions with owners -1.273 -629 1.428 -349 -2.524
Other 47 -125 11 44 3
Change in equity -195 208 1.673 1.055 -1.276
Equity EOY 3.649 3.857 5.530 6.585 5.309
Source: DSV annual reports 2007-2011 and own modification
Transactions with shareholders in the years 2007 and 2008 were mostly through dividend payout
and buy-back of shares because of the incentive program within DSV. In 2008 DSV bought ABX
Logistics and because DSV debt ratio was high in the beginning of the year 2009 they issued new
shares to fund the acquisition. In 2010 most transactions with shareholders were through dividend
payout and buy-back of shares to fulfill the incentive program. However in 2011, DSV according to
their free cash flow strategy used excess cash to double their dividend payout and bought back
about 11% of outstanding shares in the year 2011.
4.3 Balance sheet
Because traditional balance sheet as published in annual reports are not organized for
assessments of operating performance and value because it mixes together operating assets, non-
operating assets and source of financing. Therefore reformulation of the balance sheet will be
done based on methods from (Koller, Goedhart & Wessels, 2005). The most fundamental rule of
accounting is the equation below:
Equation 2 – Balance sheet
Assets consist primarily of operating assets (OA), such as receivables, inventory, and property,
plant and equipment (PPE). Liabilities consist of operating liabilities (OL), such as accounts payable
and accrued salaries and interest bearing debt (D), such as notes payable and long term debt.
Equity (E) consists of common stock, possibly preferred stock and retained earnings. Using a more
explicit breakdown of assets, liabilities and equity will lead to an expanded version of the balance
sheet relation:
Equation 3 – Expanded balance sheet

Master Thesis – MSc in Finance and Strategic Management Valuation of DSV A/S
37
The traditional balance sheet equation mixes together operating liabilities and source of financing
therefore it is necessary to rearrange the formula to separate them that leads to invested capital:
Equation 4 – Invested capital
The equation reflects more accurately capital used for operations and the financing provided by
investors to fund those operations. Now it is possible to find the drivers behind return on invested
capital (ROIC) and what affects it.
The table below shows the development in invested capital and which factors affect the invested
capital, table 9 below is shown including goodwill but in appendix 6 there is a table excluding
goodwill. Companies according to (Koller, Goedhart & Wessels, 2005) use a little less than two
percent of cash of their gross profit as operating working capital here one percent of cash will be
deducted of gross profit and defined as an operating activity.

Master Thesis – MSc in Finance and Strategic Management Valuation of DSV A/S
38
Table 9 – Reformulated balance sheet
Reformulated balance sheet (including Goodwill)
DKKm 2007 2008 2009 2010 2011
Operating assets
Intangible assets 5.114 8.436 8.721 8.772 8.683
PPE 3.795 5.093 4.975 4.782 4.503
Investment in associates 7 7 9 19 26
Deferred tax assets 328 257 402 449 430
Fixed assets total 9.244 13.793 14.107 14.022 13.642
Trade receivables and other securities 6.438 9.185 7.399 8.405 8.565
Cash (1% of gross profit) 77 82 89 93 98
Operating current assets 6.515 9.267 7.488 8.498 8.663
Total operating assets 15.759 23.060 21.595 22.520 22.305
Operating liabilities
Retirement benefit obligation or similar 405 810 884 871 975
Deferred tax liabilities 300 429 449 576 527
Provision non-current 178 379 562 309 391
Provision current 147 288 373 332 215
Trade payable 5.857 7.802 7.108 7.833 7.938
Corporate tax 183 68 0 228 427
Total operating liabilities 7.070 9.776 9.376 10.149 10.473
Invested capital 8.689 13.284 12.219 12.371 11.832
Net working capital -555 -509 -1.888 -1.651 -1.810
Financial assets
Securities non-current 118 149 96 121 144
Cash (for financial activities) 306 434 278 270 269
Financial assets held for sale 121 82 211 174 16
Financial assets total 545 665 585 565 429
Financial liabilities
Non-current and current financial liabilities 5.504 10.057 7.257 6.235 6.952
Liabilities associated with assets held for sale 81 35 17 116 0
Financial liabilities total 5.585 10.092 7.274 6.351 6.952
Net financial liabilities 5.040 9.427 6.689 5.786 6.523
Equity 3.649 3.857 5.530 6.585 5.309
Invested Capital = Debt + Equity 8.689 13.284 12.219 12.371 11.832
Source: DSV annual reports 2007-2011 and own modification
4.4 Income statement
DSV revenue and expenses as published in the annual reports incurs both through operating and
non-operating activities. It is therefore necessary to reformulate the income statement to find the
net operating profit less adjusted tax (NOPLAT) which is the after tax profit generated from core
operations, excluding any gains from non-operating assets or financing expense such as interest.
NOPLAT is the profit available to both debt holders and equity holders (Koller, Goedhart &

Master Thesis – MSc in Finance and Strategic Management Valuation of DSV A/S
39
Wessels, 2005) whereas net income of the profit is only available to equity holders. There are few
things that are important to keep in mind when calculating the NOPLAT:
Interest is not subtracted from operating profit because interest is considered a payment
to the company’s financial investors, not an operating expenses and by reclassifying
interest as a financing item, NOPLAT becomes independent of the company´s capital
structure.
All non-operating income generated from assets that have been excluded from invested
capital should be excluded when calculating NOPLAT.
Reported taxes are calculated after interest and non-operating income, therefore a
function of non-operating items and capital structure. NOPLAT must focus only on
operation activities and therefore the effects of interest expenses and non-operating
income must be removed from taxes. To calculate operating taxes it is important to start
with the reported taxes add back the tax shield caused by interest expense and remove the
taxes paid on non-operating income. The resulting operating taxes should be equal to the
hypothetical taxes that would be reported by an all-equity, pure operating firm.
The bullets above are based on (Koller, Goedhart & Wessels, 2005). Below in table 10 and 11 are
the reformulated income statement and the calculations of taxes on operating and financial
activities.

Master Thesis – MSc in Finance and Strategic Management Valuation of DSV A/S
40
Table 10 – Reformulated income statement
Reformulated income statement (DKKm) 2007 2008 2009 2010 2011
Revenue 34.899 37.435 36.085 42.562 43.710
Direct cost (Cost of goods sold) 27.195 29.260 27.187 33.242 33.891
Gross profit 7.704 8.175 8.898 9.320 9.819
Other external expenses 1.862 1.843 1.988 1.955 2.092
Special items 28 -78 688 5 0
Staff costs 3.716 3.994 4.671 4.644 4.752
Share of associate's profit, net of tax 7 3 8 -1 -7
Operating profit before special items (EBITDA) 2.091 2.413 1.543 2.717 2.982
Amortization, depreciation and impairment 244 402 536 519 549
Operating profit before interest and tax (EBIT) 1.847 2.011 1.007 2.198 2.433
Taxes (of operating profit) 537 477 406 601 656
Net operating profit less adjusted taxes (NOPLAT) 1.310 1.534 601 1.598 1.778
Financial income 109 121 202 116 119
Financial expenses -370 -522 -749 -654 -557
Net financial items -261 -401 -547 -538 -438
Net financial items after taxes -196 -301 -410 -404 -329
Consolidated profit (Annual report) 1.114 1.233 191 1.194 1.449
Non-controlling interests -47 -6 -6 -10 -9
Net profit 1.067 1.227 185 1.184 1.440
Source: DSV annual reports 2007-2011 and own modification
Table 11 – Calculation of taxes
Calculation of taxes on operating and financial activities 2007 2008 2009 2010 2011
Tax rate 25% 25% 25% 25% 25%
Reported taxes -472 -377 -269 -466 -546
Financial items net -261 -401 -547 -538 -438
Tax of financial items (Tax shield) -65 -100 -137 -135 -110
Operating taxes -537 -477 -406 -601 -656
Net financial items after tax -196 -301 -410 -404 -329
Source: DSV annual reports 2007-2011 and own modification
4.5 ROIC breakdown
To better understand DSV operating performance of their core operations it is necessary to furhter
analyse which factors are influencing the ROIC. Information from the reformulated income
statement and balance sheet will be used. ROIC is independent of the debt structure and other
items which are not targeted for the core operating activities of DSV. This ROIC breakdown will be
based on the ROIC tree from (Koller, Goedhart & Wessels, 2005).
Goodwill will be included in the ROIC breakdown because DSV has through the years grown largely
with acquisitions of other companies and the reason goodwill exists on the DSV balance sheet is

Master Thesis – MSc in Finance and Strategic Management Valuation of DSV A/S
41
because they have paid a premium to book value and used real resources in the acquisition. Thus,
when measuring historical performance for DSV goodwill should be included.
ROIC measures how effectively companies allocates the capital invested in its operations. It is
defined as the return the company earns on each dollar invested in the business (Koller, Goedhart
& Wessels, 2005). ROIC focuses solely on the company’s operations and is therefore a better
analytical tool to understand the company’s performance than return on equity (ROE) and return
on assets (ROA). ROE mixes operating performance with capital structure, making peer group
analysis and trend analysis less meaningful, ROA is inadequate because the ratio double counts
any implicit financing charged by suppliers (Koller, Goedhart & Wessels, 2005).
The equation below shows how ROIC is calculated.
Equation 5 – ROIC calculation
As NOPLAT and invested capital are independent of the financial structure and non-operating
assets, so is ROIC. Using ROIC it is possible to measure how DSV core operating performance has
changed from 2007 to 2011, without the effects of financial structure and other non-operating
items misrepresenting the analysis. Table 12 contains the calculation of ROIC for DSV from 2007 to
2011.
Table 12 – ROIC from 2007-2011
Calculation of ROIC (DKKm) 2006 2007 2008 2009 2010 2011
NOPLAT 874 1.310 1.534 601 1.598 1.778
Invested capital incl goodwill 8.473 8.689 13.284 12.219 12.371 11.832
Average IC 8.581 10.987 12.752 12.295 12.102
ROIC 15,26% 13,96% 4,72% 12,99% 14,69%
Source: Own creation
As seen above the ROIC for 2007 and 2008 is similar but in 2009 there is an immense change in the
ROIC related to the acquisition on ABX Logistics were NOPLAT decreases significantly because of
one off restructuring cost paid in connection with the integration of ABX Logistics. If this one off
expense would be equal to zero the ROIC for 2009 would be around 10 %. Invested capital also
increases noticeably in 2008 because of the acquisition, the largest change was with goodwill

Master Thesis – MSc in Finance and Strategic Management Valuation of DSV A/S
42
which increased about 62 % which is discussed in more detail in chapter 4.6. Therefore looking at
the historical ROIC DSV has been performing relatively well.
4.5.1 ROIC tree
Following analysis of certain ratios and margins will be based on figure 9 on next page. The ROIC
tree is separated into four branches; branches 3 and 4 have revenue as a denominator.
As mentioned earlier ROIC including goodwill has been performing well in previous years
particularly if ROIC for 2009 is adjusted. DSV acquisitions in 2005 and 2008 have been expanding
their balance sheet both in intangible and fixed assets and that has had a negative effect to the
ROIC for these years. Pre-tax ROIC has had the same development as ROIC including goodwill
because of those acquisitions. Next are two meaningful parameters when analysing ROIC, the
operating margin and asset turnover.
Operating margin for DSV from 2005 to 2011 has been stable if 2009 is excluded and indicates that
DSV has been able to create enough revenue to pay for expenses like staff cost and payments on
loans. The operating margin also reveals the profitability of each DKK of sales as a percentage. A
operating margin of 5% shows that the company generates 0.05 ore in profit for every 1 DKK that
is generated, therefore all things equal a high operating margin is what companies want.
Asset turnover for DSV from 2005 to 2011 has been increasing escalating from 2008 after the
acquisition of ABX Logistics, both invested capital and revenue has been increasing. This is
probably related to that DSV and their former acquisitions are making more business synergy.
Asset turnover measures the company’s ability to generate revenue from invested capital. If used
as an inverse, i.e. 1/ATO = IC/Revenue, it shows the amount of invested capital which is used to
generate 1 krone of sales. If the ATO is 2 it means that for every 1 krone invested in the company,
revenue of 2 krone is generated. All things equal it is attractive for companies to have high ATO
(Penman, 2010). In appendix 7 are the formulas behind each graph in figure 9.

Master Thesis – MSc in Finance and Strategic Management Valuation of DSV A/S
43
Figure 9 – ROIC tree
Source: DSV annual reports 2007-2011 and own modification
4.6 Goodwill analysis
Goodwill is located on the balance sheet and is defined as the amount to which the purchase price
exceeds the identifiable assets and liabilities measured to their fair value (Schultze & Weiler,
2010). Goodwill is reviewed annually to determine whether impairment has incurred. Goodwill is
recognized at cost in the balance sheet and subsequently measured at cost less accumulated
impairment losses.
5,29% 5,37%
2,79%
5,16%5,57%
2007 2008 2009 2010 2011
Operating margin
30,87% 29,55%
11,09%
33,69%39,77%
2007 2008 2009 2010 2011
ROIC excl.Goodwill
22,08% 21,84%
24,66%
21,90%22,46%
2007 2008 2009 2010 2011
Gross margin
24,37%21,96%
12,10%
22,10%24,64%
2007 2008 2009 2010 2011
Pre-tax ROIC (incl.Goodwill)
15,98%15,59%
18,45%
15,50% 15,66%
2007 2008 2009 2010 2011
Cost ratio
0,70%
1,07%
1,49%1,22% 1,26%
2007 2008 2009 2010 2011
Depreciation ratio
1,59% 1,36%
5,23%
3,88% 4,14%
2007 2008 2009 2010 2011
Working capital ratio
10,87%
13,60% 13,79%
11,24% 10,30%
2007 2008 2009 2010 2011
PPE ratio
15,26%13,96%
4,72%
12,99%14,69%
2007 2008 2009 2010 2011
ROIC incl.Goodwill
12,68%
19,15%20,76%
17,89% 17,50%
2007 2008 2009 2010 2011
Goodwill ratio
4,02
2,82 2,953,44 3,69
2007 2008 2009 2010 2011
Asset turnover

Master Thesis – MSc in Finance and Strategic Management Valuation of DSV A/S
44
DSV goodwill has been increasing extensively from 2006 with the acquisition of Frans Mass in 2006
and the acquisition of ABX in 2008. The development of goodwill is demonstrated in table 13. It is
obvious how these two acquisitions increased the goodwill, customer relationship and total assets
of DSV. At the same time equity did not change much except in 2009 when DSV raised funds with
capital increase and sale of treasury shares because of ABX acquisition in 2008 and in 2011 it
decreased again because of DSV buy-back of shares.
As mentioned earlier goodwill is reviewed once a year to find out if impairment on goodwill is
necessary. Each division in DSV is responsible for this impairment test and is required to base their
valuation on parameters such as revenue development, gross profit, EBITA margin and growth
expectations in the terminal period. So far DSV has not impaired the goodwill generated in these
two acquisitions which indicates that DSV believes that these acquisitions were successful.
Looking at the ratio between goodwill and total assets it is apparent that goodwill is a high portion
of total assets. The ratio has been increasing from 2006 until 2011 which is normal because DSV
has been expanding with buying other companies. However if DSV had to impair large amount of
their goodwill through retained earnings it would affect the equity therefore DSV is not in a good
position to do that.
Table 13 – Goodwill development
Year (DKKm) 2005 2006 2007 2008 2009 2010 2011
Intangibles 3.109 4.936 5.114 8.436 8.721 8.772 8.683
Goodwill 2.854 4.252 4.424 7.170 7.491 7.615 7.649
Software 99 148 133 270 361 409 435
Customer relathionship 121 503 477 866 768 675 568
Other intangibles 24 0 0 5 2 2 2
Intangibles in progress 11 33 80 125 99 71 29
Equity 3.323 3.844 3.649 3.857 5.530 6.585 5.309
Total assets 10.449 16.062 16.304 23.725 22.180 22.085 22.734
Goodwill/Equity 85,89% 110,61% 121,24% 185,90% 135,46% 115,64% 144,08%
Goodwill/Total assets 27,31% 26,47% 27,13% 30,22% 33,77% 34,48% 33,65%
Changes between years:
Intangibles 58,76% 3,61% 64,96% 3,38% 0,58% -1,01%
Goodwill 48,98% 4,05% 62,07% 4,48% 1,66% 0,45%
Software 49,49% -10,14% 103,01% 33,70% 13,30% 6,36%
Customer relathionship 315,70% -5,17% 81,55% -11,32% -12,11% -15,85%
Other intangibles -100,00% 0,00% 0,00% -60,00% 0,00% 0,00%
Intangibles in progress 200,00% 142,42% 56,25% -20,80% -28,28% -59,15%
Source: DSV annual reports 2007-2011 and own modification

Master Thesis – MSc in Finance and Strategic Management Valuation of DSV A/S
45
It is also essential to look at both ROIC and asset turnover with and without goodwill to identify if
these two large acquisitions were a good finance and strategy decision.
Figure 10 – ROIC and asset turnover with and without goodwill
Source: DSV annual reports 2007-2011 and own modification
It seems by looking at the graphs above that DSV has been performing well and reporting high
ROIC specially when excluding goodwill. Also looking at asset turnover it seems that DSV is
generating high amount of revenue with its invested capital, revenue has been increasing while
invested capital both with and without goodwill has been decreasing which reflects in higher asset
turnover. Therefore is possible to estimate that the integration of Frans Mass and ABX into DSV
business was successful and it geographically diversifies the company operations and enhances
the existing infrastructure of DSV.
4.7 Pension obligation
DSV pension obligations are significant in Great Britain, the Netherlands, Belgium, Germany,
Sweden and Italy. Significant parts of the pension obligations are not funded. In 2011 the
company’s pension obligations stood at DKK 2.228 million as compared to the planned assets of
DKK 1.253 million, resulting into an unfunded status of DKK 975 million. Unfunded pension
obligations will force DSV to make regular cash contributions to bridge the gap between pension
assets and liabilities.
4.8 Summary
The financial analysis of DSV was conducted in order to create a clear overview of DSV financial
profitability and indentify DSV core financial drivers and key financial ratios.
4,02
2,82 2,953,44 3,69
8,18
6,12
7,63
8,95
10,45
2007 2008 2009 2010 2011
Year
Asset turnover
Asset turnover incl. Goodwill
Asset turnover excl. Goodwill
15,26%13,96%
4,72%
12,99%14,69%
30,87%29,55%
11,09%
33,69%
39,77%
2007 2008 2009 2010 2011
Year
ROIC
ROIC incl. Goodwill
ROIC excl. goodwill

Master Thesis – MSc in Finance and Strategic Management Valuation of DSV A/S
46
Reformulating the official financial statement was done to separate operating activities and
financing activities as the operating activities are a central part for creating value for the future,
whereas the financing activities show how the operating activities are financed.
Thereafter an analysis of ROIC development was conducted in order to see how the profitability of
DSV has been developing. ROIC has been positive and relatively stable from 2007 to 2011 when
2009 numbers are adjusted both with and without goodwill therefore DSV has been performing
reasonable.
Goodwill analysis indicates that the two large acquisitions of Frans Mass and ABX were successful
when comparing and analysing the ROIC and asset turnover for DSV for the analysed period.
In the near future pension obligation will have a impact on DSV cash flow because of pension
obligations that are facing the company.

Master Thesis – MSc in Finance and Strategic Management Valuation of DSV A/S
47
5 Forecast
Fundamental part of company valuation is the forecast i.e. to estimate future cash flow in order to
be able to determine the present value of them in the DCF analysis. It is however, not easy to
predict the future therefore estimates are calculated with influence from the strategic and
financial analysis and also from information from DSV. The forecast will be based on the
reformulated balance sheet and income statements.
As mentioned above it is hard to predict the near future therefore the forecast will be split into
two parts: the explicit forecasting period and a terminal period. For the explicit period the forecast
is based on DSV reformulated statements combined with the knowledge gained from the strategic
and financial analysis. While the terminal period assume that DSV has reached a steady state
where the company will grow at a constant rate.
The chosen forecast period will be five years because forecasting a longer period will raise some
difficulty in forecasting individual items in the reformulated income statement and balance sheet.
Therefore the forecast period will be from 2012 to 2016 and 2017 will be the year DSV is assumed
to have reached a steady state.
Acquisitions of other companies are virtually impossible to forecast even though it is in DSV
strategy to grow through acquisitions to increase revenue therefore there will be no forecast for
future acquisitions.
5.1 Income statement forecast
Probably the most important forecast based on the income statement is the revenue forecast.
Most of other items in the income statement will be forecast as a percentage of revenue.
Therefore it is necessary to have the revenue forecast as accurate as possible. Three revenue
forecasts will be conducted or one for each division of DSV and other calculations will be based on
the sum of revenue from the three divisions.
5.1.1 DSV Air and Sea
Revenue generation for this division is as mentioned before mainly from Europe or about 65% of
total revenue therefore the future macroeconomic development in Europe is important. According

Master Thesis – MSc in Finance and Strategic Management Valuation of DSV A/S
48
to the International Monetary Fund (IMF)19 the GDP forecast for 2012 is about 1.4% increase and
for 2013 about 1.9% increase for EU. For North America the forecast from IMF for the G7 countries
will be used therefore the GDP forecast is about 1.6% increase for 2012 and 2.1% increase for
2013. For Asia IMF forecasts about 6.5% increase in 2012 and 7.1% increase for 2013.
Uncertainty is DSV main concern for the current global economic situation however they predict a
growth in the sea freight market and probably a status quo in the air freight market for 2012.
However there are growth opportunities in the Asian market and North America while Europe is
still recovering from the financial crisis. Cautious growth for the Air & Sea division will therefore be
forecasted to be around 3%-4% growth in revenue for the forecasted period.
Table 14 – DSV Air & Sea division
DSV Air & Sea (DKKm) 2006 2007 2008 2009 2010 2011 Average 2012E 2013E 2014E 2015E 2016E 2017E
Revenue 7.582 8.845 13.307 13.307 18.436 18.145 14.408 18.689 19.250 19.924 20.721 21.550 22.412
Change 16,66% 50,45% 0,00% 38,54% -1,58% 20,81% 3,00% 3,00% 3,50% 4,00% 4,00% 4,00%
% of net revenue 25,34% 35,55% 36,88% 43,32% 41,51% 36,52% 41,88% 42,06% 42,23% 42,42% 42,73% 43,14%
Source: DSV annual reports 2006-2011 and own calculations
5.1.2 DSV Road
All of Road division’s revenue is generated in Europe and therefore the revenue is highly
influenced by how the European economy is performing. Different areas of Europe have been
experiencing different economic changes from 2008, stagnation in South-Europe while Northern
and Eastern Europe have been recovering better. As mentioned above the IMF forecast for GDP
for EU has some increase for 2012 and 2013. DSV is fairly optimistic that the European road
transport market will grow by 1%-2% in 2012. Thus, the growth forecast for the Road Division will
be about 1%-3% growth in revenue for the forecasted period.
Table 15 – DSV Road
DSV Road (DKKm) 2006 2007 2008 2009 2010 2011 Average 2012E 2013E 2014E 2015E 2016E 2017E
Revenue 23.401 21.943 18.987 17.256 19.726 20.985 19.779 21.195 21.619 22.159 22.824 23.395 23.862
% change -6,23% -13,47% -9,12% 14,31% 6,38% -1,62% 1,00% 2,00% 2,50% 3,00% 2,50% 2,00%
% of net revenue 62,88% 50,72% 47,82% 46,35% 48,01% 51,15% 47,50% 47,23% 46,97% 46,73% 46,39% 45,93%
Source: DSV annual reports 2006-2011 and own calculations
19
http://www.imf.org/external/pubs/ft/weo/2011/02/weodata/weorept.aspx?sy=2009&ey=2016&scsm=1&ssd=1&sort=country&ds=%2C&br=1&pr1.x=73&pr1.y=6&c=001%2C110%2C163%2C119%2C203%2C123%2C998%2C200%2C904%2C901%2C505%2C511%2C205%2C406%2C603&s=NGDP_RPCH&grp=1&a=1

Master Thesis – MSc in Finance and Strategic Management Valuation of DSV A/S
49
5.1.3 DSV Solutions
The Solutions division differs from the other two divisions as the division offers services within the
warehouse and logistics within DSV and to external buyers. The business is of course highly
correlated to the economic development in Europe because all of the division revenue is
generated in Europe. The limited presence in the European market could provide opportunities for
excellent growth in the market. The growth forecast for the Solutions Division will be about 3.5%-
4.5% growth in revenue for the forecasted period.
Table 16 – DSV Solutions
DSV Solutions (DKKm) 2006 2007 2008 2009 2010 2011 Average 2012E 2013E 2014E 2015E 2016E 2017E
Revenue 989 4.111 5.141 5.522 4.400 4.580 4.751 4.740 4.901 5.098 5.301 5.487 5.679
Change 315,67% 25,05% 7,41% -20,32% 4,09% 66,38% 3,50% 3,40% 4,00% 4,00% 3,50% 3,50%
% of net revenue 11,78% 13,73% 15,30% 10,34% 10,48% 12,33% 10,62% 10,71% 10,80% 10,85% 10,88% 10,93%
Source: DSV annual reports 2006-2011 and own calculations
5.2 Costs in the income statement
There are three main cost drivers and three minor cost drivers affecting the DSV income
statement:
Direct cost: comprises of costs paid to generate the revenue per year. Direct costs include
settlements of accounts with haulage contractors, shipping companies and airlines.
Staff cost: includes wage and salaries, pensions, social security costs and other staff cost.
Other external expenses: includes expenses relating to marketing, IT rent, training and
education, office premises, travelling and communications as well as other selling costs and
administrative expenses.
Special items: include material income and expenses not directly attributable to the
operating activities of DSV, restructuring costs and other significant non-recurring items.
Share of associate‘s profit: proportionate share of the result after tax of associate’s
Net financial items: financial income and expenses include interest, exchange rate gains
and losses on and impairment of securities, payables and foreign currency transactions.
All the expenses above have been about 92% to 94% of revenue between 2007 and 2011. DSV has
implemented an adjustment program to decrease overhead cost as a non-recurrent expense in
2012 with the agenda to lower staff cost. Direct cost is unlikely to get any lower if DSV is to be able
to maintain their organic growth. Thus, direct cost will be estimated as 77% of revenue for the
forecast period and staff cost will be estimated as 10.5% of revenue for the forecast period. DSV

Master Thesis – MSc in Finance and Strategic Management Valuation of DSV A/S
50
has been reviewing the IT system and software and their strategy is to have one IT system for all
their divisions therefore they should be able to lower their IT costs. Estimation for other external
expense will therefore be 5.3% of revenue for the forecast period. The income statement forecast
is in appendix 8.1.
5.3 Corporate tax rate
The current corporate tax rate in Denmark is 25% and it is expected to remain the same in the
forecasting period.
5.4 Balance sheet forecasting
Estimations for the reformulated balance sheet for 2012 to 2017 will be forecasted as function of
expected revenues and equity in the balance sheet will be used as “the plug” to balance the
balance sheet.
Intangible assets
A company records goodwill when the price it paid for an acquisition exceeds the target’s book
value (Koller, Goedhart & Wessels, 2005). DSV strategy is to grow using organic growth and
acquisitions but because it is hard to predict the future, future acquisitions will not be estimated
and therefore goodwill will be kept constant at its current level of 2011 over the entire period.
Intangible assets less goodwill will be forecasted by looking at the ratio of intangible assets less
goodwill against revenue and the development of that ratio from 2007 to 2011 plus the goodwill
of 2011 which will be constant. The forecasting growth for intangible assets less goodwill will be
2.5% of revenue for the forecasted period.
Property, plant and equipment (PPE)
PPE will be estimated as percentage of revenue because over a long period company ratios of PPE
and revenue tend to be quite stable (Koller, Goedhart & Wessels, 2005).
Cash
As mentioned before in the financial analysis, working cash is estimated to be 1% of gross profit
for the forecasting period. The forecasted balance sheet is in appendix 8.2.
5.5 Summary
The above forecast is based on many assumptions and predictions and therefore it is likely that
the actual development for DSV will be different from this forecast.

Master Thesis – MSc in Finance and Strategic Management Valuation of DSV A/S
51
Forecast for the reformulated financial statements can be found in appendix 8. In table 17 below
are the most relevant key numbers from the forecast.
Table 17 – Key numbers from forecast
(DKKm) 2012E 2013E 2014E 2015E 2016E 2017E
Revenue 44.625 45.770 47.181 48.846 50.431 51.953
Operating profit before special items (EBITDA) 3.186 3.268 3.369 3.488 3.601 3.709
Operating profit before interest and tax (EBIT) 2.648 2.724 2.817 2.928 3.033 3.133
Net operating profit less adjusted taxes (NOPLAT) 1.875 1.929 1.995 2.074 2.148 2.220
Consolidated profit 1.540 1.585 1.641 1.707 1.770 1.830
Net profit 1.524 1.569 1.625 1.690 1.752 1.812
Invested capital 12.058 12.171 12.310 12.475 12.632 12.782Source: DSV annual reports 2006-2011 and own calculations

Master Thesis – MSc in Finance and Strategic Management Valuation of DSV A/S
52
6. Valuation
Valuation of DSV will be the topic of the following chapter. First there will be an introduction of
the valuation models used to conduct the valuation of DSV. Internal and external factors which
were analysed in previous chapters will be making the ground for the valuation.
There are of course several methods available to make a valuation of a company, these valuations
can be divided into two main categories:
Relative valuation
Absolute valuation
Valuation models from both methods above will be used and are introduced below.
6.1 Discounted Cash Flow model (DCF)
The chosen valuation method for the absolute valuation will be the discounted cash flow (DCF)
model. This type of valuation method has an advantage because it is a long-term valuation
technique accounting for future development with horizons that are as long as the analyst finds
necessary. The DCF model relies solely on the cash flow in and out of the company, independent
of the accounting policies used. Free cash flow is discounted i.e. the cash flow available to all
investors both equity and debt holders as well as non-equity investors, at the average weighted
cost of capital (Koller, Goedhart & Wessels, 2005).
The two stage DCF model used can be expressed in the following formula:
Equation 6 – Two stage DCF formula
Where:
EV0: enterprise value at time of valuation
FCFt: free cash flow at time t
WACC: weighted average cost of capital
g: growth for the terminal period
n: length of the budget period

Master Thesis – MSc in Finance and Strategic Management Valuation of DSV A/S
53
The explicit forecasting period is represented in the first part of the formula and discounted with
the WACC. The terminal period is the second part of the formula and is based on Gordon’s growth
model where the growth is expected to have reached a steady state and therefore the growth
estimation is kept constant. Valuation using DCF will be done later in chapter 6.6.
6.2 Multiples
The relative valuation model chosen is a more practical multiples-based approach which usually
provides a more broad dispersion of results and is therefore highly debatable. This approach is
commonly used by analysts and can serve as a quick and dirty tool for valuation and to compare its
results with the results from the absolute valuation to evaluate if the absolute models are in a
realistic range. When using a multiples based approach the inputs are often market based which
makes them relative to market performance and can therefore be useful in a second stage of
valuation as it enables comparison of values to comparable firms (Fernandes, 2002).
Calculating and understanding multiples is relatively easy and is therefore an advantage for this
valuation method and it enables comparisons between companies within an industry. There are of
course many multiples available and they are usually divided into three main groups:
Multiples based on capitalization (equity value)
Multiples based on the company value (E+D)
Growth referenced multiples
Four appropriate multiples have been chosen for the relative valuation and are listed below. They
will be used to evaluate the estimated share price from the DCF model for DSV and also compared
with the actual share price as of February 22nd 2012 and the share price from the DCF model.
Price/Earnings – (P/E)
Price/Book Value – (P/BV)
EV/EBITDA
EV/EBIT
Valuation using multiples will be done later in chapter 6.8.

Master Thesis – MSc in Finance and Strategic Management Valuation of DSV A/S
54
6.3 Weighted average cost of capital (WACC)
When valuating a company with DCF it is necessary to discount each year’s forecast of free cash
flow (FCF) for time and risk. The weighted average cost of capital (WACC) will provide the required
rates of return for debt and equity based on their market based valuation. Because free cash flow
is available to all investors the discount factor for free cash flow must represent the risk faced by
all investors which makes the WACC the appropriate discount factor. The WACC represents the
opportunity cost that investors face for investing their funds in one particular investment instead
of others with similar risk. WACC is defined as follows (Koller, Goedhart & Wessels, 2005):
Equation 7 – Weighted average cost of capital (WACC)
Where:
D: market value of the company’s debt
E: market value of the company’s equity
V: total market value of the company
kd: the cost of debt
ke: cost of equity
T: the company’s operating tax rate
Applying the WACC is relatively straightforward however it has some disadvantages. Using the
WACC to discount all future cash flow with a constant cost of capital implies that the company
manages their capital structure to a target rate. To estimate the WACC it is necessary to determine
the target capital structure, the cost of equity and the cost of debt after tax. In order to reduce
uncertainty regarding the calculation of WACC the following assumptions have been made, a
constant capital structure throughout the period, constant cost of equity and cost of debt and a
constant operating tax rate. In the following sub-chapters different parts of the WACC will be
discussed and calculated.

Master Thesis – MSc in Finance and Strategic Management Valuation of DSV A/S
55
6.3.1 DSV capital structure
The ratio between equity and debt can be viewed as the capital structure of the company. In
theory the market value of DSV equity and debt should be used however in practice the book
value of net financial obligations and the market value of equity are most often used (Koller,
Goedhart & Wessels, 2005). When estimating DSV capital structure the book value of net financial
debt and the market value of equity will be used. Table 18 shows the development of the DSV
capital structure from 2007 to 2011.
Table 18 – Capital structure
Market value of DSV equity 2007 2008 2009 2010 2011
Closing rate 111,75 56,5 94 123,3 103
Total shares 188.382 182.872 208.699 206.507 185.644
Market value of DSV equity (DKKm) 21.052 10.332 19.618 25.462 19.121
Net financial obligations (DKKm) 5.040 9.427 6.689 5.786 6.523
Historical capital structure
D/V 19,32% 47,71% 25,43% 18,52% 25,44%
E/V 80,68% 52,29% 74,57% 81,48% 74,56%Source: DSV annual reports 2007-2011, www.nasdaqomxnordic.com and own calculations
The fluctuations in D/V and E/V have been relatively high in the previous five years. The large
increase in D/V ratio in 2008 can be linked to the acquisition of ABX Logistics, decrease in 2009 is
linked to the high debt level of DSV at the end of 2008 and the issue of new shares to fund the
acquisitions of ABX. The increase in D/V ratio in 2011 is because of DSV shares buy-back program.
The average D/V for the period is 27.28% and average E/V is 72.72% and because of the
fluctuation in these two ratios it is necessary to take them into account when estimating the
future capital structure for the WACC. Thus, for the forecasted period the capital structure will be
estimated as the average of previous periods i.e. D/V will be 27% and E/V will be 73%.
6.3.2 Cost of equity
The capital asset pricing model (CAPM) will be used to determine the cost of equity. The CAPM
allows investors to determine the appropriate measure of the risk and return for any asset when
the markets are in equilibrium. Over the years there has been criticism about the CAPM model
because it is based on unrealistic assumptions like the markets are perfectly efficient, all investors
can borrow and lend at risk free rate and there is no transaction cost and all investors are equally

Master Thesis – MSc in Finance and Strategic Management Valuation of DSV A/S
56
rational and have the same expectation of return (Elton, Gruber, Brown & Goetzmann, 2002).
Several models have been made in order to estimate the cost of equity, for example the Fama-
French three factor model and the Arbitrage Pricing Theory model (APT). Even so the CAPM model
is still the most widely used model and is therefore used in this valuation (Koller, Goedhart &
Wessels, 2005).
The cost of equity is expressed as follows:
Equation 8 – Cost of equity
Where:
Ke: cost of equity
rf: risk free interest rate
β: the stock‘s sensitivity to the market (Beta)
E(rm-rf): the expected market risk premium
When using the CAPM the risk free rate and market risk premium are common to all companies it
is only the beta that varies across companies (Koller, Goedhart & Wessels, 2005).
6.3.2.1 Risk free rate
When estimating the risk free rate it is not possible to observe them directly in the market. Ideally
when estimating the risk free rate the cash flow should be discounted using a government bond
with similar maturity as the cash flow. Therefore, the most common proxy is the 10 year
government bond (Koller, Goedhart & Wessels, 2005). Using a bond longer than 10 years is not
acceptable because they are less liquid than the 10 year bond which could cause stale prices and
yield premiums. Therefore, the risk free rate is based on a 10 year Danish government bond. The
effective interest rate as of 22nd February 2012 is 1.91%20
6.3.2.2 Beta
When measuring the company’s stock sensitivity to the market it is helpful to use the Beta
because it measures the company’s market risk (Koller, Goedhart & Wessels, 2005). It reflects the
20
http://www.nasdaqomxnordic.com (Bonds-Denmark-3St.I.21 Ticker: DK0009922676)

Master Thesis – MSc in Finance and Strategic Management Valuation of DSV A/S
57
covariance with the market and since the market portfolio is the portfolio of all stocks, it is
possible to measure how much the return on a specific stock on average changes in relation with
the market portfolio. Therefore Beta can be interpreted in the following way:
β = 0 risk free investment
β < 1 the investment is less risky than the market portfolio
β = 1 the investment has the same risk as the market portfolio
β > 1 the investment is more risky than the market portfolio
To calculate the Beta it is essential to gather the right data for the calculation therefore a weekly
closing price for DSV stocks was gathered and also data for the NASDAQOMX Copenhagen
(OMXC20) index. The approach is as follows:
Chosen period for data is May 8th 2007 to December 31st 2011
Time series for weekly prices are gathered
The above is transformed into returns using:
The volatilities for the market and DSV returns are determined along with the covariance
between DSV and the market
Equation 9 – Beta
Where
σim: the covariance between stock i‘s return and the market
σ2m: the variance of the market return
Originally five years of monthly return was used to estimate the Beta but here the weekly data is
used to estimate the Beta in order to increase the preciseness of the Beta estimation (Koller,
Goedhart & Wessels, 2005).
Using regression with the data gathered the Beta is estimated to be 1,269 with R squared as 0,693.
Outcome and graph from the regression are in appendix 9.

Master Thesis – MSc in Finance and Strategic Management Valuation of DSV A/S
58
6.3.2.3 Market risk premium
The market risk premium is defined as the difference between the market’s expected return and
the risk free rate. Because the expected return on the market is unobservable and there is no
model which has gained acceptance to estimate the market risk premium therefore the market
risk premium is an estimation factor. Koller et al. estimate the market risk premium varies
between 4.5% and 5.5% while historical estimation often report a number around 8%, these
numbers are too high for valuation purposes because they compare the market risk premium
versus short term bonds and use only 75 years of data and are biased by the historical strength of
the U.S. market.
The chosen market risk premium is therefore 5% in the following calculations. With the
information gathered in previous sub-chapters it is possible to calculate DSV cost of equity, the
calculation is shown in table 19:
Table 19 – Cost of equity
Cost of equity calculation Column1
Risk free rate 1,91%
Beta 1,269
Market risk premium 5,00%
Cost of equity 8,26%
Source: own contribution
6.3.3 DSV operating tax
Current corporate tax rate in Denmark is now 25% and will be used in the calculations of WACC
and as mentioned in chapter 5 it is assumed the corporate tax rate will not change in the
forecasted period.
6.3.4 Cost of debt
DSV has not issued bonds in any stock exchange therefore estimating their cost of debt is a bit
hard and also DSV does not have any credit rating from any of the credit rating agencies. By
looking at DSV annual report for 2011 and finding the interest expense related to interest bearing
debt the cost of debt is about 6.8%. When looking at the yield over U.S Treasuries by the bond
rating for Koller et al. companies with credit rating BBB and maturity of their debt about 1-10
years the risk premium is between 2.92% and 3.4%. DSV debt maturity is from the year 2013 to

Master Thesis – MSc in Finance and Strategic Management Valuation of DSV A/S
59
2016 therefore with risk free rate as 1.91% and the risk premium estimated as 4% the cost of debt
before tax is 5.91% and will be used in the WACC calculation.
6.3.5 WACC estimation
Parameters for the WACC formula have been estimated and are the WACC calculations are shown
in table 20 below.
Table 20 – WACC estimation
WACC estimation
Cost of debt 5,91%
Cost of equity 8,26%
Tax 25%
Target D/V 27%
Target E/V 73%
WACC 7,22%
Source: own contribution
6.4 Estimating the growth rate in the terminal period
It is important to estimate the constant growth used to calculate the terminal period in the
valuation when using the discounted cash flow because the terminal value weights heavily in the
final valuation. The terminal period is when a company has reached the steady state and the
forecast assumptions are expected to grow with a constant growth rate in the future. DSV has
potential to grow more in the future assuming the world economy will recover from the recent
financial crisis, DSV has growth potential within the Solutions division and also in North and South
America and Asia.
Based on the above the reasonable growth rate will be set at 2.5%.
6.5 Free cash flow
Free cash flow is the cash flow available to all investors and is independent of leverage. It also is
the cash flow generated by the company’s operations, less any reinvestment back into the
business and provides the basis for the DCF valuation. The free cash flow is calculated for the
explicit period 2012 to 2017 and is calculated as shown in table 21.

Master Thesis – MSc in Finance and Strategic Management Valuation of DSV A/S
60
Table 21 – Free cash flow
Free cash flow calculation
NOPLAT
+Depreciation
=Gross cash flow
Change in working capital
CAPEX
=Gross investment
=Free cash flow
Source: own contribution, based on Koller et al (2005)
Gross cash flow is generated with adding back depreciation to NOPLAT both coming from the
reformulated income statement and balance sheet. The gross cash flow is the cash flow generated
by the company’s operations and is available for investment and investors payout, without having
to sell non-operating assets (Koller, Goedhart & Wessels, 2005).
Gross investment is subtracted from gross cash flow which then shows the free cash flow. CAPEX
includes both changes in PPE and intangible assets. Table 22 shows the calculations for the free
cash flow.
Table 22 – Free cash flow calculations
Free cash flow calculation (DKKm) 2012E 2013E 2014E 2015E 2016E 2017E
NOPLAT 1.875 1.929 1.995 2.074 2.148 2.220
Depreciation 538 544 551 560 568 576
Gross cash flow 2.413 2.473 2.546 2.634 2.717 2.796
Change in working capital -42 -48 -59 -69 -66 -63
CAPEX 802 693 735 776 774 774
Gross investment 760 645 676 707 708 711
Free cash flow 1.652 1.827 1.870 1.926 2.008 2.085
Source: own contribution
6.6 Valuation using DCF
Using the previously stated information calculated above it is possible to calculate the theoretical
value for one DSV share using the DCF model. As mentioned before when using the DCF model the
free cash flow is discounted with the WACC. Table 23 shows the DCF calculations for one DSV
share.

Master Thesis – MSc in Finance and Strategic Management Valuation of DSV A/S
61
Table 23 – DCF valuation
Terminal
DCF Model (DKKm) 2012E 2013E 2014E 2015E 2016E 2017E
Free cash flow 1.652 1.827 1.870 1.926 2.008 2.085
WACC 7,22% 7,22% 7,22% 7,22% 7,22% 7,22%
Discount factor 0,9326 0,8698 0,8112 0,7565 0,7056
Present value (PV) of explicit period 1.541 1.589 1.517 1.457 1.417
Sum of PV of explicit peroid 7.522
Present value of terminal peroid 31.149
Enterprise value 38.670
Interest bearing debt 6.585
Non-controlling interests 9
Equity value 32.076
Outstanding shares 185.644
Price per share (DKK) 172,78
Explicit
Source: own contribution
The estimated price from the DCF model is DKK 172.78 per share at February 22nd 2012. The
closing share price for DSV at Copenhagen NASDAQOMX the same day was DKK 124.2. Thus, it can
be concluded that the share price for DSV is undervalued by investors and it should be
recommended that investors should buy DSV shares as a long term investment.
6.7 Sensitivity analysis on DCF valuation
Valuating a company using the DCF model is done with many assumptions and uncertainty.
Therefore it could be valid to do a sensitivity analysis on some of the central value drivers in the
DCF valuation model. Both growth estimation and the WACC are two of the major factors which
affect the outcome from the DCF model and it is obvious from table 23 that the terminal value is a
large part of the enterprise value and is highly changeable with the two factors mentioned. When
using sensitivity analysis it is possible to focus on how small changes in growth estimation and
WACC will affect the share price while other factors are kept fixed. In table 24 are the results from
the sensitivity analysis when changing the growth estimations and WACC.

Master Thesis – MSc in Finance and Strategic Management Valuation of DSV A/S
62
Table 24 – Sensitivity analysis
6,02% 6,62% 7,22% 7,82% 8,42%
2,00% 214,74 181,97 156,73 136,69 120,40
2,25% 228,55 192,04 164,35 142,62 125,13
2,50% 244,31 203,34 172,78 149,12 130,25
2,75% 262,48 216,10 182,16 156,25 135,83
3,00% 283,66 230,61 192,65 164,12 141,92
Gro
wth
WACC
Source: own contribution
When analysing table 24 it can be observed that small changes in the two factors will have a
relatively large influence on DSV estimated share price. Share price is more sensitive to changes in
the WACC than the growth estimation.
6.8 Multiples valuation
As mentioned before four multiples will be used for the relative valuation. They are shown below,
for each multiples there will be more detailed explanations in each sub-chapter:
Price/Earnings – (P/E)
Price/Book Value – (P/BV)
EV/EBITDA
EV/EBIT
6.8.1 Price to earnings value
The price to earnings ratio uses the current share price of a company and compares it´s to
earnings per share. High P/E ratio could indicate that investors are expecting higher earnings
growth in the future compared with companies with a lower P/E. The P/E ratio shows how many
times an investor is paying for the company’s earnings but the downside of the ratio is it is
affected by the capital structure of the company. This ratio is a classic ratio and widely used
because it is easy to use and provides a base to understand if a stock is priced reasonable. Koller et
al. can exhibit flaws even when comparing companies with identical prospects, since it comingles
operating and non-operating items.

Master Thesis – MSc in Finance and Strategic Management Valuation of DSV A/S
63
Equation 10 – P/E ratio
Where:
Share price (end of year) is DKK 103
Earnings per share (EPS) is the average of EPS of last four years
Therefore is the P/E ratio 19.99. Using the P/E ratio to estimate the share price of DSV it is possible
to use equation 11 below.
Equation 11 – Share price using P/E
Result from the equation above estimates the share price of DSV to be DKK 156.03 which is slightly
lower than the DCF model estimated. Appendix 10 contains the calculated equation 11.
6.8.2 Price to book value
The price to book value ratio is derived from the price per share of the book value, using
outstanding shares and equity and the end of year (31.12.11) price per share as listed in the
NASDAQOMX in Copenhagen.
Equation 12 – P/B ratio
Where:
Book value per share (end of year) is 28.60
Share price (end of year) is DKK 103
Therefore is the P/B ratio 3.60. The P/B ratio can be plugged into equation 13 to estimate the
share price of DSV.
Equation 13 – Share price using P/B ratio

Master Thesis – MSc in Finance and Strategic Management Valuation of DSV A/S
64
The average equity is derived from the reformulated balance sheet and is the average of equity for
the explicit forecasting period. After plugging the data into equation 13 the share price is DKK
109.18 which is considerable lower than the estimated share price from the DCF model. Appendix
10 contains the calculated equation 13.
6.8.3 EV/EBITDA ratio
Using the EV/EBITDA ratio it tells more about the value of company’s because it is not dependent
on the capital structure (Koller, Goedhart & Wessels, 2005). This ratio is often used as an
alternative to P/E ratio to estimate the share price. The EV/EBITDA ratio for DSV is 12.97 and using
equation 14 it is possible to estimate the share price.
Equation 14 – Share price using EV/EBITDA
After plugging the data into the equation the estimated share price for DSV is DKK 204.55 which is
considerable higher than the estimated share price from DCF model. The average EBITDA is the
EBITDA forecasted in the explicit period in the reformulated income statement. Appendix 10
contains the calculated equation 14.
6.8.4 EV/EBIT ratio
The EV/EBIT ratio is almost the same as the EV/EBITDA the only difference is that the EV/EBIT ratio
is taking into account depreciation and amortization therefore the estimated share price should
differ from the EV/EBITDA ratio. For DSV the difference should not be high because they do not
have many assets to depreciate and amortize. The EV/EBIT ratio is 15.89 and using equation 15 it
is possible to estimate the share price.
Equation 15 – Share price using EV/EBIT
The estimated share price is DKK 211.10 after plugging the data into the equation. It is of course
higher than the estimated share price from the EV/EBITDA ratio and also higher than the
estimated share price from the DCF model. The average EBIT is the EBIT forecasted in the explicit
period in the reformulated income statement. Appendix 10 contains the calculated equation 15.

Master Thesis – MSc in Finance and Strategic Management Valuation of DSV A/S
65
6.9 Multiples comparison with competitors
The DFC model is only as accurate as the forecasts it relies on. To confront the valuation from DCF
model a multiples comparison between competitors of DSV will be done. Multiples comparison is
done with similar companies in the transporting industry and they should have similar trends and
exposed to comparable risk factors.
The firm chosen are the Swiss based Kuehne & Nagel, the German Deutsche Post, the Danish DFDS
A/S and finally the Dutch TNT Express NV. All have their headquarters based in Europe and are
competing in the same industry.
Using multiples comparison does have its imperfections, it is important that the companies being
compared do have a similar growth potential and follow the same accounting standards which is
the case with the chosen companies for the comparison.
Valuation is based on expectation on future values and therefore should the multiples comparison
also do that. A further supporting argument for using forward looking multiples is that they are
usually normalized values, reducing any impact from past one time charges (Koller, Goedhart &
Wessels, 2005). The chosen multiples were gathered from Bloomberg. Bloomberg is a well
respected source of information.
6.9.1 EV/EBITDA, P/E and P/B
It is the opinion of Koller et al. (2005) that when using multiples comparisons EV/EBITDA ratio
should always be used because it is not dependant on the capital structure of the company. Table
25 shows the three chosen comparisons multiples.
Table 25 – Multiples comparisons
Company EV/EBITDA P/E P/B
DSV A/S 10,09x 19,13x 4,46x
Kuehne & Nagel 13,18x 24,48x 5,24x
Deutsche Post 4,61x 12,60x 1,51x
DFDS A/S 5,01x 6,51x 0,41x
Tnt Express NV 13,07x NA 1,77x
Average 9,19x 15,68x 2,68x
DSV A/S (thesis estimations) 12,97x 19,99x 3,60x
Source: Bloomberg and own contribution

Master Thesis – MSc in Finance and Strategic Management Valuation of DSV A/S
66
Looking at the EV/EBITDA multiple and comparing it with the other companies, DSV is fairly valued
and is in line with the average for the chosen companies. The P/E multiple for DSV from
Bloomberg is in line with the estimations from the thesis and the P/E multiple for DSV is
positioned above the average level. The P/B multiple for DSV is above the average level but still in
line with Kuehne & Nagel which is probably the most similar company to DSV.
6.10 Summary
The valuation chapter has focused on analysing and calculating the fair value or estimated share
value of DSV as of February 22nd 2012.
Both absolute and relative models where used to valuate the expected share price and the results
have been re-analysed through sensitivity analysis and multiples comparison. The DCF model
valuation which is based on the forecasted and reformulated income statement and balance sheet
with WACC equals to 7.22% and the growth factor in the terminal period of 2.5% estimates the
share price to be DKK 172.78.
The growth estimation and changes in WACC do have a great impact on the share price valuation
with the DCF model. Changes in WACC do influence the share price more than fluctuation with the
growth estimation. Changes in the WACC can be interpreted as changes in the beta as well as
changes in the market risk premium therefore it is crucial for DSV to try manage these factors to
ensure the future success of the company.

Master Thesis – MSc in Finance and Strategic Management Valuation of DSV A/S
67
Figure 11 – Share price differentiation
122,40
172,78
211,10204,55
109,18
156,03
105
120
135
150
165
180
195
210
P/B Actual P/E DCF EV/EBITDA EV/EBIT
Shar
e p
rice
Valuation method
Share price from different valuation methods
Source: own contribution
In figure 11 is a summary of different share price estimations from the absolute and the relative
models used and also the actual share price of DSV as of February 22nd 2012. Both the multiples
based on enterprise value (EV) estimate the share price higher than the actual share price and the
estimated share price from the DCF model. All the valuations in figure 11 except the P/B share
price suggested that the actual share price of DSV is undervalued. This thesis estimates the fair
value for DSV share should be DKK 172.78 from the DCF model.

Master Thesis – MSc in Finance and Strategic Management Valuation of DSV A/S
68
7 Conclusion
The main object of this thesis was to analyse DSV and the transporting industry with the final goal
to determine the fair value of shares on February 22nd 2012. The final valuation was based on the
strategic analysis as well as the financial analysis.
Strategic analysis
With strategic analysis it was possible to indentify the different non-financial drivers, both external
and internal which have an effect on DSV future growth and earnings potential. DSV is one of the
biggest transportation companies in Europe with a large market share in road transporting and air
& sea and have good growth potential within its solutions division.
When analysing DSV is was clear that their main strength is their asset light model which enables
them to keep costs down and avoid large capital investments. After the financial crisis DSV has
been focusing on organic growth but in-house experience regarding acquisitions is still present in
the company which will help them acquiring companies in the near future when the world
economy will regain its former strength. DSV has a large and effective road network in Europe
which does assist them in providing excellent transporting service in Europe and supports other
transportation products which the offer to customers. DSV main problem which could affect them
in the near future is their lack of rail network transportation because regulators are trying to move
freight transportation into a more environmentally sustainable transportation.
At the same time as the none existence of rail network is a weakness of DSV is it also an
opportunity for DSV to add rail network into their strategy. With adding the rail network through
outsourcing like almost all of their other business they can provide a wider range of transporting
service to customers and lower the CO2 emissions. Expanding the solutions divisions is another
opportunity that could help DSV to increase service to customers and increase their revenues.
Integrating the solutions divisions more into their core business will probably do DSV good in the
effort of increasing revenue. The factors that can threaten DSV are mainly political and
economical, the more the regulators try to implement new legislation regarding the decrease of
CO2 emissions the more it does influence DSV possibility to generate revenue. Some factors DSV
cannot influence by itself such as the general economic state of Europe and other countries they

Master Thesis – MSc in Finance and Strategic Management Valuation of DSV A/S
69
operate in. Also there is a high level of competition within the freight transportation industry
which reflects in low level of differentiation and intense rivalry between companies.
Financial analysis
To be able to analyse the financial statement, a reformulation of the income statement was
nesessary to identify the NOPLAT and reformulation of the balance sheet was necessary to identify
the invested capital.
When analysing the ROIC it is clear that it has been increasing until 2009 when it plummeted down
and that is related to the acquisition of ABX Logistics where the NOPLAT decreased significantly
because of an one-time expenses event. Then again in 2010 and 2011 the ROIC has been
increasing and that suggested that DSV has been effectively allocating capital into its operations.
Both operating margin and asset turnover have been increasing after 2009 and that indicates that
DSV has been generating enough revenue to pay their expenses and deliver profit for their
shareholders.
A high proportion of DSV assets is goodwill which is understandable because the company has
through the years mainly grown through acquisitions of other companies. Annually DSV conducts
an impairment test on goodwill and so far it has not been necessary to impair it. Also the
development of the ROIC excluding goodwill indicates that DSV has been performing well and the
acquisitions of Frans Mass and ABX Logistics were right strategic and financial decisions.
Valuation
The valuation chapter is based on findings from the strategic and financial analysis and data from
the forecast chapter is the basis for the estimated share price for DSV. The two valuation models
used are described, the DCF valuation model and the multiples valuation method.
Two of the most fundamental factors influencing the estimated share price are the WACC and the
estimated growth, the WACC was calculated and estimated to be 7.22% and growth was
estimated to be 2.5%. The estimated share price from the DCF model is DKK 172.78 per share
which is about 41% higher than the actual share price on NASDAQOMX Copenhagen stock
exchange on the 22nd February 2012, which was DKK 122.40. The valuation based on the multiples
model gave a range of share price from DKK 109.18 to DKK 211.10.

Master Thesis – MSc in Finance and Strategic Management Valuation of DSV A/S
70
There are many assumptions and uncertainties when estimating the share price using the DCF
model therefore a sensitivity analysis was conducted and the two key factors influencing the share
price were changes, the WACC and the estimated growth. The sensitivity analysis showed that the
estimated share price fluctuated more when changes the WACC then the estimated growth.
With the estimated price per share from the DCF model is about 41% higher than the actual
closing price of 22nd February 2012 and all the multiples valuation except one gave a higher price
than the closing price mentioned before. Therefore the share price is undervalued by market
investors and the recommendation should be to buy the shares in DSV as a long-term investment.

Master Thesis – MSc in Finance and Strategic Management Valuation of DSV A/S
71
8 Perspectives
This master thesis was written over an extended period of time and has therefore been a work-in-
progress paper which is reflected in the final outcome of the estimated share price. The aim of the
thesis was to estimate the share price of DSV from an investor view, DSV share prices as listed on
the NASDAQOMX Copenhagen stock exchange has from the point of when I started to write the
thesis increasing in value and the current stock price is now DKK 123.7 (May 11th 2012). This
closing price is about 1.1% higher than the closing price of February 22nd 2012 but the increase of
the share price from January 1st 2012 (thesis started) the increase has been about 19% when
compared to the closing price of May 11th 2012.
There is still a wide gap between the closing price of February 22nd 2012 and the closing price of
May 11th 2012 when compared to the estimated share price from the DCF model. This gap can
have several reasons, as mentioned before there are many assumptions and uncertainty when
using the DCF model also there is still a great volatility in the world’s stock markets and they are
still recovering from the financial crisis that started in 2007. Europe is of course still trying to
handle their debt crisis and that does influence investors.
There are many issues which is important to analyse, calculate, assume and forecast when
estimating a share price in a publicly traded company. All of the data are from secondary sources
and from annual reports from DSV. I had some difficulties gathering some data because of lack of
access to CBS data resources such as Datastream from the Learning Resource Center. Also does
the NASDAQOMX Copenhagen homepage only provide share information from October 16th 2000
while DSV has been listed on the stock exchange from 1987.
I am confident that the chosen time horizon is appropriate for valuation of DSV and the estimated
share price of DKK 172.78 indicates that the value of DSV is undervalued.

Master Thesis – MSc in Finance and Strategic Management Valuation of DSV A/S
72
9 Reference list
Books:
Barney, J. (2002). Gaining and Sustaining Competitive Advantage. New Jersey: Prentice-Hall.
Elton, E. J., Gruber, M. J., Brown, S. J., & Goetzmann, W. N. (2002). Modern Portfolio Theory and
Investment Analysis (Seventh Edition útg.). John Wiley & Sons.
Fernandes, P. (2002). Valuation Methods and Shareholder Value Creation. London: Academic
Press.
Johnson, G., Scholes, K., & Whittington, R. (2008). Exploring Corporate Strategy. FT Prentice Hall.
Koller, T., Goedhart, M., & Wessels, D. (2005). Valuation - Measuring and Managing the Value of
Companies (4th edition). New Jersey: John Wiley & Sons, Inc.
Penman, S. H. (2010). Financial Statement Analysis and Security Valuation (5th ed.). New York:
McKinsey & Company.
Penrose, E. T. (1959). The Theory of the Growth of the Firm. New York: John Wiley & Sons Inc.
Porter, M. E. (1985). The Value Chain and Competitive Advantage. New York: Free Press.
Thomson, S. (2008). An Indroduction to Corporate Governance. Copenhagen: DJØF Publlishing.
Articles:
Barney, J. (1991). Firm Resources and Sustained Competitive Advantage. Journal of Management,
17(1), 99-120.
Peteraf, M. A. (1993). The cornerstones of competitive advantage: a resources-based view.
Strategic Management Journal, 14(3), 179-191.
Porter, M. E. (1979). How Competitive Forces Shape Strategy. Harvard Business Review, 57(2),
137-145.
Schultze, W., & Weiler, A. (2010). Goodwill accounting and performance measurement.
Managerial, 36(9), 768-784.
Company reports and announcements:
DSV A/S Annual Report 2006

Master Thesis – MSc in Finance and Strategic Management Valuation of DSV A/S
73
DSV A/S Annual Report 2007
DSV A/S Annual Report 2008
DSV A/S Annual Report 2009
DSV A/S Annual Report 2010
DSV A/S Annual Report 2011
DSV Notice of Annual General Meeting 2012 No 437, 23 February 2012
DSV Capital Markets Day 2011
DSV Moves No.2 2009
KUEHNE & NAGEL, Capital Market Day 2011
Websites:
http://epp.eurostat.ec.europa.eu/portal/page/portal/transport/data/main_tables
http://epp.eurostat.ec.europa.eu/tgm/refreshTableAction.do?tab=table&plugin=1&pcode=tsieb020&language=en
http://europa.eu/legislation_summaries/internal_market/index_en.htm
http://www.dtl.eu/Nyheder/DTL%20mener/Klima.aspx
http://www.imf.org/external/pubs/ft/weo/2011/02/weodata/weorept.aspx?sy=2009&ey=2016&scsm=1&ssd=1&sort=country&ds=%2C&br=1&pr1.x=73&pr1.y=6&c=001%2C110%2C163%2C119%2C203%2C123%2C998%2C200%2C904%2C901%2C505%2C511%2C205%2C406%2C603&s=NGDP_RPCH&grp=1&a=1
http://www.nasdaqomxnordic.com (Bonds-Denmark-3St.I.21 Ticker: DK0009922676)
www.dsv.com
www.bloomberg.com
10 List of figures
FIGURE 1 – DSV SHARE PRICE DEVELOPMENT................................................................................................................................ 1
FIGURE 2 - STRUCTURE OF THE THESIS ......................................................................................................................................... 3
FIGURE 3 - OVERVIEW OF OWNERSHIP ........................................................................................................................................ 8
FIGURE 4 - ELEMENTS OF THE DSV STRATEGY ............................................................................................................................. 10
FIGURE 5 – REVENUE DISTRIBUTION .......................................................................................................................................... 14
FIGURE 6 – OVERVIEW OF STRATEGIC ANALYSIS MODELS ............................................................................................................... 16
FIGURE 7 – DEVELOPMENT OF FREIGHT TRANSPORTATION IN EUROPE .............................................................................................. 23
FIGURE 8 – ADJUSTED VALUE CHAIN ......................................................................................................................................... 28
FIGURE 9 – ROIC TREE ........................................................................................................................................................... 43
FIGURE 10 – ROIC AND ASSET TURNOVER WITH AND WITHOUT GOODWILL....................................................................................... 45
FIGURE 11 – SHARE PRICE DIFFERENTIATION ............................................................................................................................... 67

Master Thesis – MSc in Finance and Strategic Management Valuation of DSV A/S
74
11 List of tables
TABLE 1 – ELEMENTS OF THE DSV STRATEGY .............................................................................................................................. 10
TABLE 2 – LONG TERM FINANCIAL TARGETS ................................................................................................................................ 11
TABLE 3 – OVERVIEW FROM THE INCOME STATEMENT .................................................................................................................. 12
TABLE 4 – OVERVIEW OF PORTER’S FIVE FORCES FRAMEWORK ....................................................................................................... 20
TABLE 5 – DSV ANSWERS TO THE VRIO FRAMEWORK .................................................................................................................. 31
TABLE 6 – SWOT SUMMARY ................................................................................................................................................... 32
TABLE 7 – EQUITY STATEMENT ................................................................................................................................................. 35
TABLE 8 – SUMMARY OF REFORMULATED EQUITY STATEMENT ........................................................................................................ 36
TABLE 9 – REFORMULATED BALANCE SHEET ................................................................................................................................ 38
TABLE 10 – REFORMULATED INCOME STATEMENT ....................................................................................................................... 40
TABLE 11 – CALCULATION OF TAXES .......................................................................................................................................... 40
TABLE 12 – ROIC FROM 2007-2011 ....................................................................................................................................... 41
TABLE 13 – GOODWILL DEVELOPMENT ...................................................................................................................................... 44
TABLE 14 – DSV AIR & SEA DIVISION ........................................................................................................................................ 48
TABLE 15 – DSV ROAD .......................................................................................................................................................... 48
TABLE 16 – DSV SOLUTIONS ................................................................................................................................................... 49
TABLE 17 – KEY NUMBERS FROM FORECAST ................................................................................................................................ 51
TABLE 18 – CAPITAL STRUCTURE .............................................................................................................................................. 55
TABLE 19 – COST OF EQUITY .................................................................................................................................................... 58
TABLE 20 – WACC ESTIMATION .............................................................................................................................................. 59
TABLE 21 – FREE CASH FLOW ................................................................................................................................................... 60
TABLE 22 – FREE CASH FLOW CALCULATIONS .............................................................................................................................. 60
TABLE 23 – DCF VALUATION ................................................................................................................................................... 61
TABLE 24 – SENSITIVITY ANALYSIS ............................................................................................................................................. 62
TABLE 25 – MULTIPLES COMPARISONS ...................................................................................................................................... 65
12 List of equations
EQUATION 1 – EQUITY RELATIONSHIP ........................................................................................................................................ 35
EQUATION 2 – BALANCE SHEET ................................................................................................................................................ 36
EQUATION 3 – EXPANDED BALANCE SHEET ................................................................................................................................. 36
EQUATION 4 – INVESTED CAPITAL ............................................................................................................................................. 37
EQUATION 5 – ROIC CALCULATION ........................................................................................................................................... 41
EQUATION 6 – TWO STAGE DCF FORMULA ................................................................................................................................ 52
EQUATION 7 – WEIGHTED AVERAGE COST OF CAPITAL (WACC) ..................................................................................................... 54
EQUATION 8 – COST OF EQUITY ................................................................................................................................................ 56

Master Thesis – MSc in Finance and Strategic Management Valuation of DSV A/S
75
EQUATION 9 – BETA .............................................................................................................................................................. 57
EQUATION 10 – P/E RATIO ..................................................................................................................................................... 63
EQUATION 11 – SHARE PRICE USING P/E ................................................................................................................................... 63
EQUATION 12 – P/B RATIO ..................................................................................................................................................... 63
EQUATION 13 – SHARE PRICE USING P/B RATIO .......................................................................................................................... 63
EQUATION 14 – SHARE PRICE USING EV/EBITDA ....................................................................................................................... 64
EQUATION 15 – SHARE PRICE USING EV/EBIT ............................................................................................................................ 64
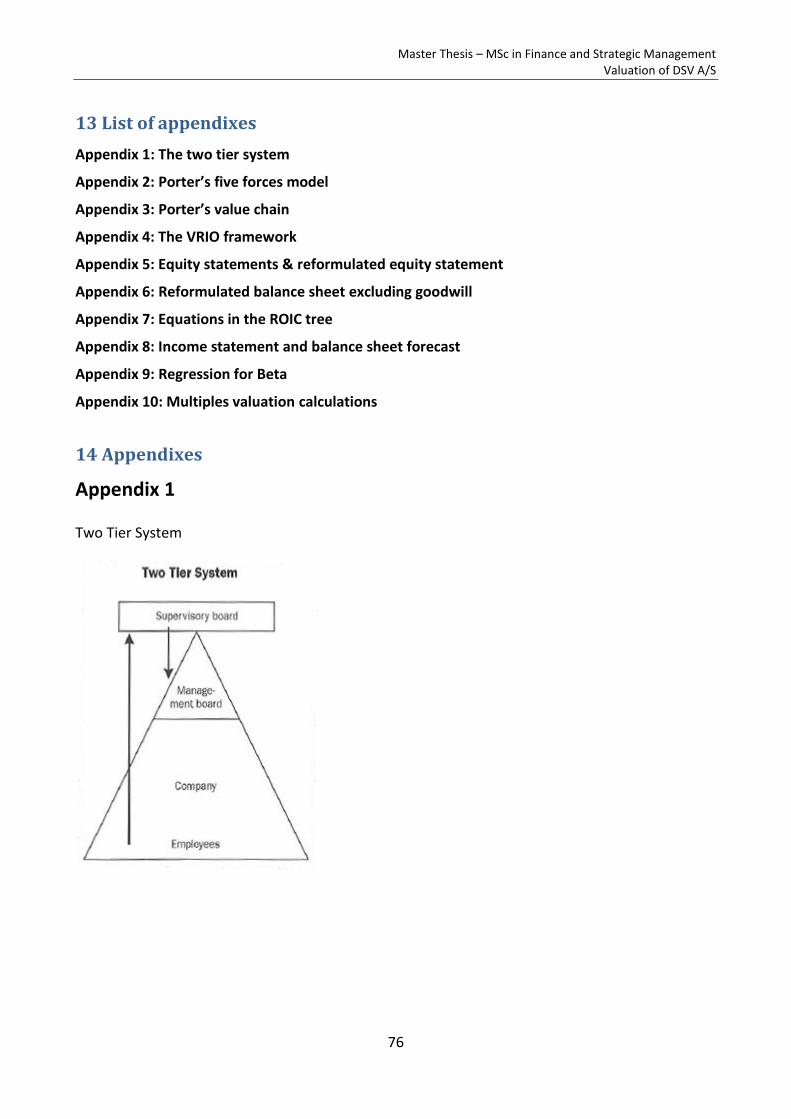
Master Thesis – MSc in Finance and Strategic Management Valuation of DSV A/S
76
13 List of appendixes
Appendix 1: The two tier system
Appendix 2: Porter’s five forces model
Appendix 3: Porter’s value chain
Appendix 4: The VRIO framework
Appendix 5: Equity statements & reformulated equity statement
Appendix 6: Reformulated balance sheet excluding goodwill
Appendix 7: Equations in the ROIC tree
Appendix 8: Income statement and balance sheet forecast
Appendix 9: Regression for Beta
Appendix 10: Multiples valuation calculations
14 Appendixes
Appendix 1
Two Tier System

Master Thesis – MSc in Finance and Strategic Management Valuation of DSV A/S
77
Appendix 2
Figure of Porter’s Five Forces model
Appendix 3
Porters Value Chain

Master Thesis – MSc in Finance and Strategic Management Valuation of DSV A/S
78
Appendix 4
The VRIO framework
Table 1
The relationship between VRIO and organizational strength and weakness
Table 2
DSV position
DSV position

Master Thesis – MSc in Finance and Strategic Management Valuation of DSV A/S
79
Appendix 5
Equity statements
DKKm Share Hedging FX Retainted Proposed Total share Non- Total
Equity at 1 January 2011 209 -110 66 6.279 105 6.549 36 6.585
Total comprehensive income after tax 4 -8 1.144 105 1.245 9 1.254
Share-based payments 34 34 34
Dividends distributed -105 -105 -5 -110
Purchase and sale of treasury shares, net -2.418 -2.418 -2.418
Capital reduction/increase -19 19
Acquisition/sale of non-controlling interest -16 -16 -10 -26
Dvidends on treasury shares 4 4 4
Tax on transactions with owners -14 -14 -14
Total changes -19 0 0 -2.391 -105 -2.515 -15 -2.530
Equity at 31 December 2011 190 -106 58 5.032 105 5.279 30 5.309
DKKm
Share
capital
Hedging
reserve
FX
Translation
reserve
Retainted
earnings
Proposed
dividends
Total share
capital
Non-
controlling
interests
Total
equity
Equity at 1 January 2010 209 -194 -13 5.447 52 5.501 29 5.530
Total comprehensive income after tax 84 79 1.092 105 1.360 10 1.370
Share-based payments 40 40 40
Dividends distributed -52 -52 -52
Purchase and sale of treasury shares, net -297 -297 -297
Capital reduction/increase
Acquisition/sale of non-controlling interest -3 -3 -3 -6
Dvidends on treasury shares
Tax on transactions with owners
Total changes 0 0 0 -260 -52 -312 -3 -315
Equity at 31 December 2010 209 -110 66 6.279 105 6.549 36 6.585
Statement of changes in equity 2011
Statement of changes in equity 2010
DKKm
Share
capital
Hedging
reserve
FX
Translation
reserve
Retainted
earnings
Proposed
dividends
Total share
capital
Non-
controlling
interests
Total
equity
Equity at 1 January 2009 190 -160 -117 3.895 3.808 49 3.857
Total comprehensive income after tax -34 104 113 52 235 5 240
Share-based payments 30 30 30
Dividends distributed
Purchase and sale of treasury shares, net 376 376 376
Capital reduction/increase 19 1.033 1.052 1.052
Acquisition/sale of non-controlling interest -25 -25
Dvidends on treasury shares
Tax on transactions with owners
Total changes 19 -34 104 1.552 52 1.693 -20 1.673
Equity at 31 December 2009 209 -194 -13 5.447 52 5.501 29 5.530
DKKm
Share
capital
Hedging
reserve
FX
Translation
reserve
Retainted
earnings
Proposed
dividends
Total share
capital
Non-
controlling
interests
Total
equity
Equity at 1 January 2008 202 29 -77 3.253 50 3.457 192 3.649
Total comprehensive income after tax -189 -40 1.191 962 2 964
Share-based payments 16 16 16
Dividends distributed -50 -50 -2 -52
Purchase and sale of treasury shares, net -581 -581 -581
Capital reduction/increase -12 12
Acquisition/sale of non-controlling interest -143 -143
Dvidends on treasury shares 4 4 4
Tax on transactions with owners
Total changes -12 -189 -40 642 -50 351 -143 208
Equity at 31 December 2008 190 -160 -117 3.895 0 3.808 49 3.857
Statement of changes in equity 2009
Statement of changes in equity 2008

Master Thesis – MSc in Finance and Strategic Management Valuation of DSV A/S
80
DKKm
Share
capital
Hedging
reserve
FX
Translation
reserve
Retainted
earnings
Proposed
dividends
Total share
capital
Non-
controlling
interests
Total
equity
Equity at 1 January 2007 40 18 -7 3.598 50 3.699 145 3.844
Total comprehensive income after tax 11 -70 1.020 50 1.011 49 1.060
Share-based payments 18 18 18
Dividends distributed -50 -50 -2 -52
Purchase and sale of treasury shares, net -1.222 -1.222 -1.222
Capital reduction/increase 162 -162
Acquisition/sale of non-controlling interest
Dvidends on treasury shares 1 1 1
Tax on transactions with owners
Total changes 162 11 -70 -345 0 -242 47 -195
Equity at 31 December 2007 202 29 -77 3.253 50 3.457 192 3.649
Statement of changes in equity 2007
Reformulated Equity statement (DKKm) 2007 2008 2009 2010 2011
Equity BOY 3.844 3.649 3.857 5.530 6.585
Transactions with shareholders
Capital increase 1.052
Acquisition/disposal of treasury shares -1.222 -581 376 -297 -2.418
Dividends paid to shareholders -51 -48 -52 -106
Exercise of share options
Repurchase of shares
Total -1.273 -629 1.428 -349 -2.524
Total income excluding minority interests
Profit of the year 1.114 1.233 191 1.194 1.449
Dirty surplus (Other comprehensive income) -36 -269 49 176 -195
Minority interests shares of Profit of the year -47 -2 -6 -10 -9
Minority interests included in Equity
Total 1.031 962 234 1.360 1.245
Other
Acquisition of minority interests -143 -25 -6 -26
Acquisition of entities
Disposal of entities
Minority interests shares of Profit of the year 47 2 6 10 9
Minority interests included in Equity
Other 16 30 40 20
Total 47 -125 11 44 3
Changes in Equity -195 208 1.673 1.055 -1.276
Equity EOY 3.649 3.857 5.530 6.585 5.309

Master Thesis – MSc in Finance and Strategic Management Valuation of DSV A/S
81
Appendix 6
Reformulated balance sheet excluding goodwill
Reformulated balance sheet (excluding
Goodwill) DKKm 2007 2008 2009 2010 2011
Operating assets
Intangible assets 690 1.266 1.230 1.157 1.034
PPE 3.795 5.093 4.975 4.782 4.503
Investment in associates 7 7 9 19 26
Deferred tax assets 328 257 402 449 430
Fixed asset total 4.820 6.623 6.616 6.407 5.993
Trade receivables and other securities 6.438 9.185 7.399 8.405 8.565
Cash (1% of gross profit) 77 82 89 93 98
Operating current assets 6.515 9.267 7.488 8.498 8.663
Total operating assets 11.335 15.890 14.104 14.905 14.656
Operating liabilities
Retirement benefit obligation or similar 405 810 884 871 975
Deferred tax liabilities 300 429 449 576 527
Provision non-current 178 379 562 309 391
Provision current 147 288 373 332 215
Trade payable 5.857 7.802 7.108 7.833 7.938
Corporate tax 183 68 0 228 427
Total operating liabilities 7.070 9.776 9.376 10.149 10.473
Invested capital 4.265 6.114 4.728 4.756 4.183
NWC -555 -509 -1.888 -1.651 -1.810
Financial assets
Securities non-current 118 149 96 121 144
Cash (for financial activities) 306 434 278 270 269
Financial assets held for sale 121 82 211 174 16
Accumulated Goodwill 4.424 7.170 7.491 7.615 7.649
Financial assets total 4.969 7.835 8.076 8.180 8.078
Financial liabilities
Non-current and current financial liabilities 5.504 10.057 7.257 6.235 6.952
Liabilities associated with asset held for sale 81 35 17 116 0
Financial liabilities total 5.585 10.092 7.274 6.351 6.952
Net financial liabilities 616 2.257 -802 -1.829 -1.126
Equity 3.649 3.857 5.530 6.585 5.309
Invested Capital = Debt + Equity 4.265 6.114 4.728 4.756 4.183

Master Thesis – MSc in Finance and Strategic Management Valuation of DSV A/S
82
Appendix 7

Master Thesis – MSc in Finance and Strategic Management Valuation of DSV A/S
83
Appendix 8
1. Income statement forecast
Reformulated income statement (DKKm) 2007 2008 2009 2010 2011 2012E 2013E 2014E 2015E 2016E 2017E
Revenue 9,15% 7,27% -3,61% 17,95% 2,70% 2,09% 2,57% 3,08% 3,53% 3,24% 3,02%
Direct costs (% of revenue) 77,92% 78,16% 75,34% 78,10% 77,54% 77,00% 77,00% 77,00% 77,00% 77,00% 77,00%
Other external expenses (% of revenue) 5,34% 4,92% 5,51% 4,59% 4,79% 5,30% 5,30% 5,30% 5,30% 5,30% 5,30%
Staff cost (% of revenue) 10,65% 10,67% 12,94% 10,91% 10,87% 10,50% 10,50% 10,50% 10,50% 10,50% 10,50%
Special items (% of revenue) 0,08% -0,21% 1,91% 0,01% 0,00% 0,05% 0,05% 0,05% 0,05% 0,05% 0,05%
Share of associate's profit, net of tax 0,02% 0,01% 0,02% 0,00% -0,02% 0,01% 0,01% 0,01% 0,01% 0,01% 0,01%
Amortization, depreciation and impairment (% of PPE and intangeble assets) 2,74% 2,97% 3,91% 3,83% 4,16% 4,00% 4,00% 4,00% 4,00% 4,00% 4,00%
Taxes (of operating profit) 25,00% 25,00% 25,00% 25,00% 25,00% 25,00% 25,00% 25,00% 25,00% 25,00% 25,00%
Net financial items (% of revenue) -0,75% -1,07% -1,52% -1,26% -1,00% -1,00% -1,00% -1,00% -1,00% -1,00% -1,00%
Non-controlling interests (% of consolidated profit) -4,22% -0,49% -3,14% -0,84% -0,62% -1,00% -1,00% -1,00% -1,00% -1,00% -1,00%
Reformulated income statement (DKKm) 2007 2008 2009 2010 2011 2012E 2013E 2014E 2015E 2016E 2017E
Revenue 34.899 37.435 36.085 42.562 43.710 44.625 45.770 47.181 48.846 50.431 51.953
Direct cost (Cost of goods sold) 27.195 29.260 27.187 33.242 33.891 34.361 35.243 36.329 37.612 38.832 40.004
Gross profit 7.704 8.175 8.898 9.320 9.819 10.264 10.527 10.852 11.235 11.599 11.949
Other external expenses 1.862 1.843 1.988 1.955 2.092 2.365 2.426 2.501 2.589 2.673 2.754
Special items 28 -78 688 5 0 22 23 24 24 25 26
Staff costs 3.716 3.994 4.671 4.644 4.752 4.686 4.806 4.954 5.129 5.295 5.455
Share of associate's profit, net of tax 7 3 8 -1 -7 4 5 5 5 5 5
Operating profit before special items (EBITDA) 2.091 2.413 1.543 2.717 2.982 3.186 3.268 3.369 3.488 3.601 3.709
Amortization, depreciation and impairment 244 402 536 519 549 538 544 551 560 568 576
Operating profit before interest and tax (EBIT) 1.847 2.011 1.007 2.198 2.433 2.648 2.724 2.817 2.928 3.033 3.133
Taxes (of operating profit) 537 477 406 601 656 774 795 822 854 884 913
Net operating profit less adjusted taxes (NOPLAT) 1.310 1.534 601 1.598 1.778 1.875 1.929 1.995 2.074 2.148 2.220
Financial income 109 121 202 116 119
Financial expenses -370 -522 -749 -654 -557
Net financial items -261 -401 -547 -538 -438 -446 -458 -472 -488 -504 -520
Net financial items after taxes -196 -301 -410 -404 -329 -335 -343 -354 -366 -378 -390
Consolidated profit (Annual report) 1.114 1.233 191 1.194 1.449 1.540 1.585 1.641 1.707 1.770 1.830
Non-controlling interests -47 -6 -6 -10 -9 -15 -16 -16 -17 -18 -18
Net profit 1.067 1.227 185 1.184 1.440 1.524 1.569 1.625 1.690 1.752 1.812
Calculation of taxes on operating and financial activities 2007 2008 2009 2010 2011 2012E 2013E 2014E 2015E 2016E 2017E
Tax rate 25% 25% 25% 25% 25% 25% 25% 25% 25% 25% 25%
Reported taxes -472 -377 -269 -466 -546 -662 -681 -704 -732 -758 -783
Financial items net -261 -401 -547 -538 -438 -446 -458 -472 -488 -504 -520
Tax of financial items (Tax shield) -65 -100 -137 -135 -110 -112 -114 -118 -122 -126 -130
Operating taxes -537 -477 -406 -601 -656 -774 -795 -822 -854 -884 -913
Net financial items after tax -196 -301 -410 -404 -329 -335 -343 -354 -366 -378 -390

Master Thesis – MSc in Finance and Strategic Management Valuation of DSV A/S
84
2. Balance sheet forecast
Reformulated balance sheet (including Goodwill) DKKm 2007 2008 2009 2010 2011 2012E 2013E 2014E 2015E 2016E 2017E
Operating assets
Intangible assets less goodwill (% of revenue) 1,98% 3,38% 3,41% 2,72% 2,37% 2,50% 2,50% 2,50% 2,50% 2,50% 2,50%
PPE (% of revenue) 10,87% 13,60% 13,79% 11,24% 10,30% 10,50% 10,50% 10,50% 10,50% 10,50% 10,50%
Investment in associates (% of revenue) 0,02% 0,02% 0,02% 0,04% 0,06% 0,03% 0,03% 0,03% 0,03% 0,03% 0,03%
Deferred tax assets (% of revenue) 0,94% 0,69% 1,11% 1,05% 0,98% 1,00% 1,00% 1,00% 1,00% 1,00% 1,00%
Trade receivables and other securities (% of revenue) 18,45% 24,54% 20,50% 19,75% 19,60% 19,00% 19,00% 19,00% 19,00% 19,00% 19,00%
Cash (1% of gross profit) 1,00% 1,00% 1,00% 1,00% 1,00% 1,00% 1,00% 1,00% 1,00% 1,00% 1,00%
Operating liabilities
Retirement benefit obligation or similar (% of revenue) 1,16% 2,16% 2,45% 2,05% 2,23% 1,80% 1,80% 1,80% 1,80% 1,80% 1,80%
Deferred tax liabilities (% of revenue) 0,86% 1,15% 1,24% 1,35% 1,21% 1,10% 1,10% 1,10% 1,10% 1,10% 1,10%
Provision non-current (% of revenue) 0,51% 1,01% 1,56% 0,73% 0,89% 0,85% 0,85% 0,85% 0,85% 0,85% 0,85%
Provision current (% of revenue) 0,42% 0,77% 1,03% 0,78% 0,49% 0,65% 0,65% 0,65% 0,65% 0,65% 0,65%
Trade payable (% of revenue) 16,78% 20,84% 19,70% 18,40% 18,16% 18,00% 18,00% 18,00% 18,00% 18,00% 18,00%
Corporate tax (% of revenue) 0,52% 0,18% 0,00% 0,54% 0,98% 0,98% 0,98% 0,98% 0,98% 0,98% 0,98%
Financial assets
Securities non-current (% of revenue) 0,34% 0,40% 0,27% 0,28% 0,33% 0,30% 0,30% 0,30% 0,30% 0,30% 0,30%
Cash (for financial activities) (% of revenue) 0,88% 1,16% 0,77% 0,63% 0,62% 0,50% 0,50% 0,50% 0,50% 0,50% 0,50%
Financial assets held for sale (% of revenue) 0,35% 0,22% 0,58% 0,41% 0,04% 0,15% 0,15% 0,15% 0,15% 0,15% 0,15%
Financial liabilities
Non-current and current financial liabilities (% of revenue) 15,77% 26,87% 20,11% 14,65% 15,90% 15,00% 15,00% 15,00% 15,00% 15,00% 15,00%
Liabilities associated with asset held for sale (% of revenue) 0,23% 0,09% 0,05% 0,27% 0,00% 0,03% 0,03% 0,03% 0,03% 0,03% 0,03%
Reformulated balance sheet (including
Goodwill) DKKm 2007 2008 2009 2010 2011 2012E 2013E 2014E 2015E 2016E 2017E
Operating assets
Intangible assets 5.114 8.436 8.721 8.772 8.683 8.765 8.793 8.829 8.870 8.910 8.948
PPE 3.795 5.093 4.975 4.782 4.503 4.686 4.806 4.954 5.129 5.295 5.455
Investment in associates 7 7 9 19 26 13 14 14 15 15 16
Deferred tax assets 328 257 402 449 430 446 458 472 488 504 520
Fixed asset total 9.244 13.793 14.107 14.022 13.642 13.910 14.071 14.268 14.502 14.724 14.938
Trade receivables and other securities 6.438 9.185 7.399 8.405 8.565 8.479 8.696 8.964 9.281 9.582 9.871
Cash (1% of gross profit) 77 82 89 93 98 103 105 109 112 116 119
Operating current assets 6.515 9.267 7.488 8.498 8.663 8.581 8.802 9.073 9.393 9.698 9.991
Total operating assets 15.759 23.060 21.595 22.520 22.305 22.491 22.872 23.341 23.895 24.422 24.929
Operating liabilities
Retirement benefit obligation or similar 405 810 884 871 975 803 824 849 879 908 935
Deferred tax liabilities 300 429 449 576 527 491 503 519 537 555 571
Provision non-current 178 379 562 309 391 379 389 401 415 429 442
Provision current 147 288 373 332 215 290 298 307 318 328 338
Trade payable 5.857 7.802 7.108 7.833 7.938 8.032 8.239 8.492 8.792 9.078 9.352
Corporate tax 183 68 0 228 427 437 449 462 479 494 509
Total operating liabilities 7.070 9.776 9.376 10.149 10.473 10.433 10.701 11.031 11.420 11.791 12.147
Invested capital 8.689 13.284 12.219 12.371 11.832 12.058 12.171 12.310 12.475 12.632 12.782
NWC -555 -509 -1.888 -1.651 -1.810 -1.852 -1.899 -1.958 -2.027 -2.093 -2.156
Financial assets
Securities non-current 118 149 96 121 144 134 137 142 147 151 156
Cash (for financial activities) 306 434 278 270 269 223 229 236 244 252 260
Financial assets held for sale 121 82 211 174 16 67 69 71 73 76 78
Financial assets total 545 665 585 565 429 424 435 448 464 479 494
Financial liabilities
Non-current and current financial liabilities 5.504 10.057 7.257 6.235 6.952 6.694 6.866 7.077 7.327 7.565 7.793
Liabilities associated with asset held for sale 81 35 17 116 0 13 14 14 15 15 16
Financial liabilities total 5.585 10.092 7.274 6.351 6.952 6.707 6.879 7.091 7.342 7.580 7.809
Net financial liabilities 5.040 9.427 6.689 5.786 6.523 6.283 6.444 6.643 6.878 7.101 7.315
Equity 3.649 3.857 5.530 6.585 5.309 5.775 5.727 5.667 5.597 5.531 5.467
Invested Capital = Debt + Equity 8.689 13.284 12.219 12.371 11.832 12.058 12.171 12.310 12.475 12.632 12.782

Master Thesis – MSc in Finance and Strategic Management Valuation of DSV A/S
85
Appendix 9
Beta for DSV
y = 1,2693x + 0,0007R² = 0,6923
-0,35
-0,25
-0,15
-0,05
0,05
0,15
0,25
0,35
-0,25 -0,15 -0,05 0,05 0,15 0,25
Market
DSV
DSV weekly returns relative to market returns
DSV weekly returns relative to market returns
Linear (DSV weekly returns relative to market returns)
SUMMARY OUTPUT
Regression Statistics
Multiple R 0,832015861
R Square 0,692250393
Adjusted R Square 0,690968103
Standard Error 0,033199777
Observations 242
ANOVA
df SS MS F Significance F
Regression 1 0,595041523 0,595041523 539,8547729 2,36678E-63
Residual 240 0,264534043 0,001102225
Total 241 0,859575565
Coefficients Standard Error t Stat P-value Lower 95% Upper 95% Lower 95,0% Upper 95,0%
Intercept 0,000717548 0,002134887 0,336105744 0,737084789 -0,003487962 0,004923058 -0,003487962 0,004923058
LN OMXC20 1,269261257 0,054627654 23,23477508 2,36678E-63 1,161650373 1,376872141 1,161650373 1,376872141

Master Thesis – MSc in Finance and Strategic Management Valuation of DSV A/S
86
Appendix 10
Calculation of estimated share price using the P/E ratio.
Equation 11
P/E 19,99
Earnings 1.449
Shares 185.644
Share price 156,03
Calculation of estimated share price using the P/B ratio.
Equation 13
Equity (end of year) 5.309
Outstanding shares 185.644
Book value per share 28,60
Price per share 103
P/B 3,60
Average equity 5.627
Book value of equity 20.268
Share price 109,18
Calculation of estimated share price using the EV/EBITDA ratio
Equation 14
EV 38.670
EBITDA 2.982
Ratio 12,97
Average EBITDA 3.437
Ratio*Average EBITDA 44.568
Debt 6.594
EV less debt 37.974
Outstanding shares 185.644
Share price 204,55
Calculation of estimated share price using the EV/EBIT ratio
Equation 15
EV 38.670
EBIT 2.433
Ratio 15,89
Average EBIT 2.881
Ratio*Average EBIT 45.783
Debt 6.594
EV less debt 39.189
Outstanding shares 185.644
Share price 211,10