Validation of extreme snow avalanches and related return periods derived from a...
15
Validation of extreme snow avalanches and related return periods derived from a statistical-dynamical model using tree-ring techniques Romain Schläppy a, ⁎, Nicolas Eckert b , Vincent Jomelli a , Markus Stoffel c,d , Delphine Grancher a , Daniel Brunstein a , Mohamed Naaim b , Michaël Deschatres b a Laboratoire de Géographie Physique, Université Paris 1 Panthéon-Sorbonne, UMR 8591 CNRS, 1 place Aristide Briand, F-92195 Meudon cedex, France b IRSTEA, UR ETGR, 2 rue de la Papeterie, BP 76, F-38402 St-Martin-d’Hères cedex, France c Dendrolab.ch, Institute of Geological Sciences, University of Berne, Baltzerstrasse 1 + 3, CH-3012 Berne, Switzerland d Climatic Change and Climate Impacts, Institute for Environmental Sciences, University of Geneva, 7 Route de Drize, CH-1227 Carouge, Switzerland abstract article info Article history: Received 17 July 2013 Accepted 1 December 2013 Keywords: Dendrogeomorphology Snow avalanche Runout distance Return period Statistical-dynamical model Hazard zoning Specification of expected runout distances and related return periods are the first and most important steps for zoning in snow avalanche prone terrain. In the past, runout distances of extreme events have often been evalu- ated with physically- or statistical-based numerical models. More recently, the statistical-dynamical modeling approach has been put forward, as it has the advantage of providing information on avalanche velocity, pressure, and flow depth at each point along a path quantified in terms of probabilities. Most often, calibration of statistical- dynamical modeling is based on existing data from historical archives so that current events with return periods ≤30 yr can normally be simulated with high confidence, but uncertainty increases as soon as one want to deal with longer return periods, thus calling for validation procedures to corroborate model predictions. In this con- text, we used dendrogeomorphic records of trees impacted by snow avalanches in their runout zone to recon- struct past activity in two avalanche paths of the French Alps. Based on the reconstructed distribution of runout distances of 25 events and mean event frequencies, we successfully derived runout values for events with return periods of ≤300 yr. Comparison of relations between runout distance and return periods between dendrogeomorphic data and predictions of a locally calibrated statistical-dynamical model show good agree- ment. Within the classical intervals used in hazard zoning (i.e. 10–300 yr), mean and mean square errors amounted to ~20 and 30−45 m, respectively. These results suggest that dendrogeomorphic time series of snow avalanches can yield valuable information to anticipate future extreme events and that the employed statistical-dynamical model can be used with reasonable confidence to predict runout distances of avalanches with high return periods, despite some uncertainty inherent to the limits of both approaches. © 2013 Elsevier B.V. All rights reserved. 1. Introduction Snow avalanches are major hazards to human lives in mountain ranges around the world (McClung and Schaerer, 2006). Mitigation against snow avalanches generally includes analysis of runout distances and related return periods (i.e. the average interval of time within which the runout distance is reached or exceeded at a given location) to designate hazard zones and to design defense structures. Runout dis- tances can be identified through a combination of field observations, historical records, meteorological data or the analysis of aerial photos and topographic maps for vegetation and/or geomorphic evidence (Ancey et al., 2004; Mears, 1992; Weir, 2002). As long and continuous historical observations are generally scarce, the extent of avalanches often needs to be estimated using topographic (or statistic) models (Bovis and Mears, 1976; Eckert et al., 2007b; Keylock, 2005; Lied and Bakkehøi, 1980; McClung and Lied, 1987). These models typically consist of simple statistical regressions which explain observed runout distances with various topographic covariates. While they allow an esti- mation of maximum runout distances, they do not, however, provide estimates of avalanche size, speed, force or lateral extent (Delparte et al., 2008). The more physical characteristics of snow avalanches can, in con- trast, be gathered from dynamical models (Voellmy, 1955). Dynamical models require a careful representation of avalanche terrain and inter- nal material properties and can consider interaction between different factors (Mears, 1989). Up-to-date models use the formal framework of continuum mechanics (Savage and Hutter, 1989) to reproduce different types of flows with remarkable accuracy (Bartelt et al., 2012). However, if they are used to simulate single events/scenarios − as generally sug- gested in the avalanche literature (Salm et al., 1990), they do not allow assessment of uncertainties in runout distance predictions in standard statistical terms (McClung, 1990). More recently, propagation models and statistical analyses have been coupled explicitly using Monte Carlo simulations and are commonly summarized as statistical-dynamical modeling approaches (Barbolini Cold Regions Science and Technology 99 (2014) 12–26 ⁎ Corresponding author. Tel.: +33 145075581. E-mail address: [email protected] (R. Schläppy). 0165-232X/$ – see front matter © 2013 Elsevier B.V. All rights reserved. http://dx.doi.org/10.1016/j.coldregions.2013.12.001 Contents lists available at ScienceDirect Cold Regions Science and Technology journal homepage: www.elsevier.com/locate/coldregions
-
Upload
univ-corse -
Category
Documents
-
view
0 -
download
0
Transcript of Validation of extreme snow avalanches and related return periods derived from a...

Cold Regions Science and Technology 99 (2014) 12–26
Contents lists available at ScienceDirect
Cold Regions Science and Technology
j ourna l homepage: www.e lsev ie r .com/ locate /co ld reg ions
Validation of extreme snow avalanches and related return periodsderived from a statistical-dynamical model using tree-ring techniques
Romain Schläppy a,⁎, Nicolas Eckert b, Vincent Jomelli a, Markus Stoffel c,d, Delphine Grancher a,Daniel Brunstein a, Mohamed Naaim b, Michaël Deschatres b
a Laboratoire de Géographie Physique, Université Paris 1 Panthéon-Sorbonne, UMR 8591 CNRS, 1 place Aristide Briand, F-92195 Meudon cedex, Franceb IRSTEA, UR ETGR, 2 rue de la Papeterie, BP 76, F-38402 St-Martin-d’Hères cedex, Francec Dendrolab.ch, Institute of Geological Sciences, University of Berne, Baltzerstrasse 1 + 3, CH-3012 Berne, Switzerlandd Climatic Change and Climate Impacts, Institute for Environmental Sciences, University of Geneva, 7 Route de Drize, CH-1227 Carouge, Switzerland
⁎ Corresponding author. Tel.: +33 145075581.E-mail address: [email protected] (R.
0165-232X/$ – see front matter © 2013 Elsevier B.V. All rhttp://dx.doi.org/10.1016/j.coldregions.2013.12.001
a b s t r a c t
a r t i c l e i n f oArticle history:Received 17 July 2013Accepted 1 December 2013
Keywords:DendrogeomorphologySnow avalancheRunout distanceReturn periodStatistical-dynamical modelHazard zoning
Specification of expected runout distances and related return periods are the first and most important steps forzoning in snow avalanche prone terrain. In the past, runout distances of extreme events have often been evalu-ated with physically- or statistical-based numerical models. More recently, the statistical-dynamical modelingapproach has been put forward, as it has the advantage of providing information on avalanche velocity, pressure,andflowdepth at each point along a path quantified in termsof probabilities.Most often, calibration of statistical-dynamical modeling is based on existing data from historical archives so that current events with return periods≤30 yr can normally be simulated with high confidence, but uncertainty increases as soon as one want to dealwith longer return periods, thus calling for validation procedures to corroborate model predictions. In this con-text, we used dendrogeomorphic records of trees impacted by snow avalanches in their runout zone to recon-struct past activity in two avalanche paths of the French Alps. Based on the reconstructed distribution ofrunout distances of 25 events and mean event frequencies, we successfully derived runout values for eventswith return periods of ≤300 yr. Comparison of relations between runout distance and return periods betweendendrogeomorphic data and predictions of a locally calibrated statistical-dynamical model show good agree-ment. Within the classical intervals used in hazard zoning (i.e. 10–300 yr), mean and mean square errorsamounted to ~20 and 30−45 m, respectively. These results suggest that dendrogeomorphic time series ofsnow avalanches can yield valuable information to anticipate future extreme events and that the employedstatistical-dynamical model can be used with reasonable confidence to predict runout distances of avalancheswith high return periods, despite some uncertainty inherent to the limits of both approaches.
© 2013 Elsevier B.V. All rights reserved.
1. Introduction
Snow avalanches are major hazards to human lives in mountainranges around the world (McClung and Schaerer, 2006). Mitigationagainst snow avalanches generally includes analysis of runout distancesand related return periods (i.e. the average interval of time withinwhich the runout distance is reached or exceeded at a given location)to designate hazard zones and to design defense structures. Runout dis-tances can be identified through a combination of field observations,historical records, meteorological data or the analysis of aerial photosand topographic maps for vegetation and/or geomorphic evidence(Ancey et al., 2004; Mears, 1992; Weir, 2002). As long and continuoushistorical observations are generally scarce, the extent of avalanchesoften needs to be estimated using topographic (or statistic) models(Bovis and Mears, 1976; Eckert et al., 2007b; Keylock, 2005; Lied andBakkehøi, 1980; McClung and Lied, 1987). These models typically
Schläppy).
ights reserved.
consist of simple statistical regressions which explain observed runoutdistances with various topographic covariates.While they allow an esti-mation of maximum runout distances, they do not, however, provideestimates of avalanche size, speed, force or lateral extent (Delparteet al., 2008).
The more physical characteristics of snow avalanches can, in con-trast, be gathered from dynamical models (Voellmy, 1955). Dynamicalmodels require a careful representation of avalanche terrain and inter-nal material properties and can consider interaction between differentfactors (Mears, 1989). Up-to-date models use the formal framework ofcontinuummechanics (Savage andHutter, 1989) to reproduce differenttypes of flowswith remarkable accuracy (Bartelt et al., 2012). However,if they are used to simulate single events/scenarios− as generally sug-gested in the avalanche literature (Salm et al., 1990), they do not allowassessment of uncertainties in runout distance predictions in standardstatistical terms (McClung, 1990).
More recently, propagation models and statistical analyses havebeen coupled explicitly usingMonte Carlo simulations and are commonlysummarized as statistical-dynamical modeling approaches (Barbolini

Fig. 1. Location of the Château Jouan (Montgenèvre) and Avalanche des Pylônes(Chamonix-Mont-Blanc) avalanche paths in the French Alps.
13R. Schläppy et al. / Cold Regions Science and Technology 99 (2014) 12–26
and Keylock, 2002; Bozhinskiy et al., 2001; Eckert et al., 2008b; Keylocket al., 1999; Meunier and Ancey, 2004). Probability distributions are typ-ically chosen for the input variables (e.g., release area and depth, frictioncoefficient, flow height) and runout distances and related return periodsare derived from a large set of model runs. In addition, data on avalanchevelocity, pressure and flow depth can be retrieved at each position alongthe path and quantified in terms of probabilities.
Calibration of statistical-dynamicalmodelswith archival records im-proves the reliability of the approach considerably (Ancey andMeunier,2004), but data available for calibration typically remains quite limited(Straub and Grêt-Regamey, 2006), non-explicit in nature, and difficultto be implemented in the friction law (i.e. friction parameters may betoo numerous for a single solution of the inversion problem; Anceyet al., 2003). Bayesian methods have been used recently to overcomethese difficulties, allowing consistent inference and prediction of highreturn periods with respect to the available information (Ancey, 2005;Eckert et al., 2009; Gauer et al., 2009; Grêt-Regamey and Straub, 2006).
Nevertheless, all models which are currently available are stillhampered considerably by imperfect knowledge of the friction lawrepresenting snow in motion (Rognon et al., 2008) and difficulties toproperly account for transition between different flow types (Issler,1998). Furthermore, statistical-dynamical models are well capable tosimulate contemporary events, corresponding to return period ≤30 yron which they could be calibrated, but uncertainties increase as soonas longer return periods are investigated. A clear need thus exists to val-idate modeling procedures in order to corroborate model predictions.Recent work has used radar measurements on avalanche test sites(Vriend et al., 2013) to evaluate simulated velocity profiles (Fischeret al., 2013). However, such data from experimental sites will likelyyield data on frequent events, but not on extreme runouts correspond-ing to large/rare events.
On forested paths, dendrogeomorphology (Alestalo, 1971; Stoffelet al., 2010) has been demonstrated to represent a powerful tool toreconstruct past activity of avalanches with annual resolution and forperiods covering past decades to centuries (Butler and Sawyer, 2008).The approach is based on the fact that trees form one increment ringper year in temperate climates and that trees affected by mass move-ments record the evidence of geomorphic disturbance in their growth-ring series (Stoffel and Bollschweiler, 2008; Stoffel et al., 2013). Reactionsof trees to snow avalanches are driven by the forces of the avalanche andthe mechanical impact of debris (i.e. rocks and boulder or broken trees)transported by the snow as well as by the size and flexibility of the treeitself (Bebi et al., 2009).
Typical reactions of trees to avalanche include tilting, wounding as aconsequence of trunk, apex and branch breakage (Bartelt and Stöckli,2001; Luckman, 2010). These external disturbances are reflected inthe wood with anomalous anatomical features, which can be detectedand accurately dated in tree-ring series using dendrogeomorphic tech-niques (Butler and Sawyer, 2008; Stoffel and Bollschweiler, 2008;Stoffel et al., 2013). Assessment of yearly patterns of growth anomaliesenables identification of avalanche events based on either quantitative(Butler and Sawyer, 2008; Corona et al., 2012a; Germain et al., 2005;Pederson et al., 2006), qualitative (Stoffel et al., 2006), or semi-quantitative (Schläppy et al., 2013) approaches. Dendrogeomorphicdata has been used repeatedly in the past to deriveminimumavalanchefrequency and magnitude within the path or to estimate avalanchereturn periods based on disturbance frequency of individual trees(Corona et al., 2010; Reardon et al., 2008).
Even if statistical properties of avalanches in forests (McClung, 2003;Teich et al., 2012) and, for instance, relations between forest terrain andavalanche dynamics (Bartelt and Stöckli, 2001; Feistl et al., 2012;Takeuchi et al., 2011) are nowmore and more investigated, little atten-tion has been paid to the potential of dendrogeomorphic avalancherecords for the calibration or validation of avalanche models so far(Germain et al., 2010). Casteller et al. (2008), for instance, used tree-ring records to validate numerical simulations in Argentina, but not
with a focus on runout distance and/or its relation to return periods ina given path.
Hence, this study represents the first cross-validation of high returnperiod avalanche information derived from a statistical-dynamicalmodel and the long-term, higher-return period information gatheredfrom tree-ring records. Using event chronologies from two avalanchepaths located in the French Alps, its aim was to (i) reconstruct past av-alanche activity using a semi-quantitative approach and (ii) evaluaterunout distances, (iii) calculate return periods of specific events usingthe mean frequency and runout distance distribution of snow ava-lanches, and to (iv) compare dendrogeomorphic results with the pre-dictions of extreme avalanches as obtained with a locally calibratedstatistical-dynamical model (Eckert et al., 2010c).
2. Study sites
This study was conducted at two sites in the Rhône-Alpes andProvence-Alpes-Côte d’Azur regions of the French Alps, namely atthe Avalanche des Pylônes path near Chamonix-Mont-Blanc (Haute-Savoie) and the Château Jouan path near Montgenèvre (Hautes-Alpes;Fig. 1). The selection of the sites was driven by the presence of welllocalized starting zones of snow avalanches, a straight avalanche pathas well as by the existence of stopping zones in forests.
2.1. Château Jouan path
The Château Jouan path (44°55′ N, 6°42′ E) is located on a N-facingslope of the Durance Valley, 2 km SW of Montgenèvre (Fig. 2a). At thestudy site, geology is composed of Triassic dolomites and limestones.The nearby meteorological station of Briançon (1324 m asl) recordsmean annual air temperatures (MAAT) of 7.9 °C (1971–2000)with coolest mean values in January (−4.8 °C). Annual precipitationamounts to 770 mm. Between November and March, precipitationfalls primarily as snow, and average annual snowfall reached 258 cmfor the period 1961–2001.

Fig. 2. Localization of sampled trees in the (a) Château Jouan and (b) Avalanche desPylônes paths.
14 R. Schläppy et al. / Cold Regions Science and Technology 99 (2014) 12–26
Snow avalanches are commonly released from a starting zone locat-ed at 2500–2100 m asl (mean slope angle: 36°). Avalanches pass a shorttrack before reaching the runout zone at 2000 m asl (mean slope angle:22°). Vegetation in the upper part of the runout zone is dominatedby shrubs and invasive trees species (e.g., Pinus mugo subsp. mugo),but Larix decidua Mill. starts to dominate at 1800–1700 m asl. At1810 m asl, the path is crossed by a forestry road which is used forcross-country skiing during winter (Fig. 2a).
2.2. Avalanche des Pylônes path
The Avalanche des Pylônes path (45°55′N, 6°51′ E) is located on theS-facing slope of the Arve Valley, immediately next to the first section ofthe Brévent cable car (Chamonix-Planpraz). MAAT at Chamonix-Mont-Blanc (1054 m, asl) was 6.6 °C for the period 1935–1960 and annualprecipitation amounts to 1257 mm. Precipitation falls primarily assnow between November and April (average snow cover period:130 days; Bergue, 2000) and mean annual snowfall was 287 cm(±121 cm) for the period 1960–2007.
Snow avalanches at the site are generally triggered from a startingzone at 1930–1600 m asl (mean slope angle: 47°). Once released, theypass through an incised path before reaching the runout zone (meanslope: 30°) extending from 1450 m to 1100 m asl. A characteristictransverse vegetation pattern (Malanson and Butler, 1984) can be ob-served across the starting zone and track. The inner zone is colonizedexclusively by shrubs, except for a small scree slope located in theeastern part of the starting zone. In the outer zone, forest vegetation ismainly comprised of Picea abies (L.) Karst. with exceptional L. deciduaand Alnus viridis. The runout zone is relatively narrow and trees arevery sparse in the central track above 1200 m asl. However, the outerpart is covered by a relatively dense forest dominated by P. abies with
sparse Pinus sylvestris L., Betula pendula, Abies alba Mill. and someA. alnobetula (Bergue, 2000). The path is crossed by a forestry road at1170 m asl which is used as a skiing track during the winter season.The runout zone ends immediately above the uppermost houses ofdowntown Chamonix-Mont-Blanc (Fig. 2b).
3. Data and methods
3.1. Avalanche historical data
In France, survey of avalanches was initiated by foresters in the1900s (Mougin, 1922). Most avalanche events have been recorded inthe “Enquête Permanente sur les Avalanches” (hereafter referred to asEPA), containing ~80,000 avalanche events in approximately 3900 rec-ognized paths in the French Alps and the Pyrenees. Data on avalanchesare gathered by forest rangers, who also record various quantitative(e.g., runout altitudes, deposit volumes) and qualitative (e.g., flow re-gime, snow quality) data (Jamard et al., 2002). For safety reasons,rangers do not actually measure runout altitudes, but estimate themfrom a distant observation point. As a consequence, recorded altitudesare more uncertain than avalanche counts, and have been missedrepeatedly because of bad visibility.
All observations are stored in a database and complemented withdata onmeteorological conditions during the days preceding avalancheoccurrence. For each surveyed path, EPA data is usually complementedwith a map (Carte de Localisation des Phénomènes Avalancheux or CLPA)localizing the occurrence of avalanches, but these maps usually coveronly a limited time span with frequent omissions of past events.
Locally, the quality of EPA records depends to a large extent on therangers’ careful data recording making certain series poor, at least dur-ing years corresponding to a ranger’s career. In addition, Teich et al.(2012) state that in forested terrain, avalanches are sometimes badlydocumented as they are not of key importance compared to largedestructive avalanches threatening settlements, infrastructure, andhuman lives in open terrain. More generally, the quality of observationsin the different paths is strongly influenced by the potential threat toexisting or projected infrastructure and ease of observation (Jamardet al., 2002). Nevertheless, EPA has repeatedly been found a valuablesource of information for local scale risk evaluation (Eckert et al.,2008a), the design of defense structures (Naaim et al., 2010), and forlarger-scale investigations of avalanche activity and related snow andweather drivers (Eckert et al., 2010a,b; Jomelli et al., 2007).
In this study, we assume that historical records in the Château Jouanand Avalanche des Pylônes paths are sufficient for (i) the calibration ofthe statistical-dynamical model and for (ii) a comparison of predictionswith dendrogeomorphic records. In the Château Jouan path, the firstdocumented event dates back to winter 1926–7. Due to lacking dataon type of avalanche, date of occurrence, or runout elevations, we onlyconsider the period 1950–2011 here. In the Avalanche des Pylônespath, the avalanche survey dates back to winter 1985–6. Due to thepresence of several critical infrastructures (i.e. cable car, road, houses)in the runout zone of the path, the quality of the avalanche survey isassumed to be satisfying for the period 1986–2012 for which historicalarchives exist. Note that for both paths, avalanches recorded in the EPAwere dense flow avalanches.
3.2. A locally calibrated Bayesian statistical-dynamical model
TheBayesian statistical-dynamicalmodel used in this studyhas beenpresented extensively in Eckert et al. (2010c). The main characteristicsof themodel are summarized in Appendix A. It is based on Saint Venantequations solved numerically along a curvilinear profile z = f1 (x),where z is the altitude and x the horizontal distance starting at the topof the path. The classical Voellmy (1955) friction law is used with itswell-known friction coefficients pair, μ and ξ (see Appendix A formore details).

15R. Schläppy et al. / Cold Regions Science and Technology 99 (2014) 12–26
Avalanche frequency a and avalanche magnitude y are modeled astwo independent random processes. Avalanche frequency is a scalardiscrete random variable corresponding to the number of avalanchesrecorded eachwinter andwhose long-rangemean is necessary for com-puting return periods (see Section 3.5). Avalanche magnitude is a ran-dom vector including all the correlated multivariate quantitativecharacteristics that vary from one event to another, namely runout dis-tance, velocity and pressure profiles, or snow volume. The probabilisticmodel is noted p (y,a|θM,θF), indicating that the joint distribution p of therandom variables y and a is indexed by parameters (θM,θF).
Our data sets yi, i ϵ [1, n] and at,t ϵ [1, Tobs] corresponding to the navalanches registered at the study site during Tobs years of observationare assumed to be mutually independent. Bayesian inference (Bayesand Price, 1763) combines observations and a prior distribution π(θM, θF) which encodes prior knowledge about the unknowns, leadingthe joint posterior distribution of all parameters and latent variables,as detailed in Appendix B. For each unknown, a point estimate couldbe derived as well as the related uncertainty quantified by the posteriorstandard deviation and credibility interval (Table 1, see Appendix A fordetails of themeaning of each parameter). From the posterior estimates,the posterior distribution of model variables p(y|θM^ ) and p(a|θF^) couldeasily be obtained (Appendix B).
As discussed in Eckert et al. (2010c), an important point is the needof an informative prior on friction coefficient distributions to grantmodel identifiability. It is all the more true for our case studies wheredata quantity is too low to contain enough information to work withpoorly informative priors. Many tries were carried out with differentprior assumptions resulting from expert knowledge and/or informationtransfer from other paths. Finally, “strongly” informative priors werefound necessary to fit the data in both studied paths (Table 1). Forinstance, the sensitivity to the a priori distribution on σ, the standarddeviation for μ, is very high. In both studied paths, fitting large runoutsby combining data and prior information using Bayes theorem waspossible only with an a priori little dispersed distribution for σ leadingto realistic posterior probabilities for small μ values. Regarding ξ, priorinfluence is much lower so that prior choice is less difficult. Obtainedposterior estimates are, in both paths, relatively close to the priormean(900), i.e. higher than values proposed in other avalanche simulationstudies performed in forested terrain (Bartelt and Stöckli, 2001; Feistlet al., 2012), but lower than those generally used in open grass terrain,in good agreement with the interpretation of ξ in terms of path rough-ness (Appendix A).
3.3. Dendrogeomorphic analysis and avalanche event reconstruction
In this study, the area sampled with dendrogeomorphic techniqueswas restricted to the lower track of the path and its runout zone,
Table 1Parameters of the statistical dynamicalmodel in the (a) Château Jouan and (b)Avalanchedes Pyis provided, as well as the posteriormean, the posterior standard deviation and the lower and u
Prior Posterior
Château Jouan
mean SD 2.5%
a1 a1 ~ U(0,10) 0.69 0.23 0.32a2 a2 ~ U(0,10) 0.9 0.31 0.4b1 b1 ~ N(3,1) 1.08 0.13 0.82b2 b2 ~ N(0,1) 0.15 0.25 −0.36σh σh
2 ∼ Gamma(10,100) 0.32 0.04 0.25c c ~ N(0.5,0.2) 0.49 0.03 0.43d d ~ N(0,0.25) −0.02 0.05 −0.11e e ~ N(0,0.25) −0.01 0.03 −0.07σ σ ~ Gamma(1,0.01) 0.09 0.01 0.07ξ ξ ~ N(900,100) 873 91 697λ λ ~ Gamma(0.01,0.001) 0.31 0.08 0.18
as themain goal was tomaximize the likelihood of identifying themax-imum reach of avalanche events. Sampling was carried out in 2010 and2011. A total of 438 samples (375 increment cores and 63 cross-sections) were taken from 210 trees at Château Jouan and 187 samples(161 increment cores and 26 cross-sections) were selected from 87trees at Avalanche des Pylônes (Fig. 2 and Table 2). Sampling was re-stricted to L. decidua and P. abies. Characteristic growth disturbances(GD) used to calendar-date the occurrence of past snow avalanches in-cluded impact scars (Corona et al., 2013; Stoffel and Perret, 2006;Trappmann and Stoffel, 2013), callus tissue (Schneuwly et al., 2009a;Stoffel et al., 2010) and tangential rows of traumatic resin ducts (TRD;Bollschweiler et al., 2008; Schneuwly et al., 2009b; Stoffel and Hitz,2008), the initiation of compression wood (Butler et al., 2010; Timell,1986) and abrupt growth reductions (Butler and Malanson, 1985;Corona et al., 2012a; Kogelnig-Mayer et al., 2013; Stoffel et al., 2013). Se-lection of trees, sampling design aswell as sample preparation and anal-ysis followed the procedures described in Stoffel and Bollschweiler(2008) and Stoffel et al. (2013).
In a subsequent step, intensities were assigned to GDs in order toemphasize features that are clearly associated with avalanche activityand to discriminate these from disturbances possibly induced by otherfactors (Corona et al., 2012a; Stoffel et al., 2013). GDs were classifiedbased on the visual quality of the evidence of reactionswithin each sam-ple according to the intensity scale presented in Table 3. GD data fromindividual trees were then summarized in a geographic informationsystem with ArcGIS (ESRI, 2013). For each year derived from the tree-ring series, trees that were living (i.e. trees present in a given yearconsidering their age as obtained from sample analysis) were plottedaccording to their geographic coordinates. The determination of snowavalanche years was based on a visual evaluation of the resultingmaps and followed the procedure described by Schläppy et al. (2013).Basically, each map (one per chronology year) was assessed separatelyby analyzing simultaneously the number of disturbed trees present, theproportion of strong intensity GDs compared to intermediate ones aswell as their distribution within the path. Weaker reactions were alsoconsidered in the yearly assessment and could be helpful in caseswhere only few disturbed trees were observed. Note that here an ava-lanche year is related to a winter, with the year 1999 corresponding,for example, to winter 1998–9.
The age structure of the stand was approximated by counting thenumber of tree rings in all sampled trees and visualized after interpola-tion. However, as trees were not sampled at the stem base and as theirpiths as well as the innermost rings were sometimes rotten, the obtain-ed age structure is biased and does neither reflect inception nor germi-nation dates (Corona et al., 2010; Stoffel et al., 2006). Nevertheless, itmay provide valuable data on major disturbance events at the studysite with reasonable precision, as L. decidua has been shown repeatedly
lônes paths. For eachparameter, themarginal priordistribution used for Bayesian inferencepper limits of the 95% credible interval.
Avalanche des Pylônes
97.5% mean SD 2.5% 97.5%
1.19 2.25 0.75 1.02 3.871.62 11.74 4.23 4.82 21.031.34 1.07 0.15 0.79 1.360.64 1.31 0.76 −0.23 2.810.4 0.4 0.04 0.33 0.480.56 0.51 0.02 0.46 0.550.07 −0.01 0.06 −0.12 0.10.05 0.05 0.02 0.02 0.090.12 0.05 0.01 0.04 0.071053 1023 67 898 11440.48 0.63 0.15 0.36 0.97

Table 2Sample size, (a) types, and (b) intensity of growth disturbances in the Château Jouan andAvalanche des Pylônes paths.
Château Jouan Avalanche des Pylônes
Sample analysis Number Percentage Number Percentage
Sampled trees 210 - 87 -Sample type 438 100% 187 100%Cross section 63 14% 26 14%Increment core 375 86% 161 86%Growth disturbances 491 100% 222 100%a Impact scars 35 7% 29 13%TRD⁎ 229 46.5% 106 48%Compression wood 156 32% 36 16%Growth reduction 63 13% 51 23%Callus tissue 8 1.5% 0 0%b Intensity class 5 49 10% 40 18%Intensity class 4 183 36.5% 138 62%Intensity class 3 66 13% 5 2%Intensity class 2 110 22% 19 9%Intensity class 1 83 18.5% 20 9%
⁎ Tangential rows of traumatic resin ducts.
16 R. Schläppy et al. / Cold Regions Science and Technology 99 (2014) 12–26
to recolonize surfaces cleared by snow avalanches and other mass-movement processes in the years following an event (Stoffel et al.,2006; Van der Burght et al., 2012).
3.4. Evaluation of avalanche runout distances from field data
In a first step, we determined runout distances for all historicalevents based on information contained in the EPA database. We usedthe minimum runout elevation reported in the EPA to obtain afirst idea of the reach of individual avalanches. In a second step,runout distances were estimated for all avalanches identified withdendrogeomorphic techniques, and based on the position of im-pacted trees within the path. The reach of avalanches in a givenyear was defined by the location of the lowermost cluster (≥2) oftrees showing strong or moderate reactions as a result of avalanchedisturbance. Reactions in trees scattered below the lowest treecluster were disregarded to avoid overestimation of runout distances.Noteworthy, trees may record several impacts during the same winter,so the maximum reach obtained with tree-ring records will thereforerepresent the largest reach and/or extent of all potential events in agiven winter.
3.5. Evaluation of return periods
A return period Txstop corresponding to the runout distance xstop(i.e. the T year return level) can be evaluated by combining the annualavalanche rate f (the mathematical expectation of the random variable
Table 3Growth disturbance intensity scale emphasizing features that are clearly associated withavalanche activity.
Intensity Growth disturbances characterization
Class 5 Impact scars or dense TRD⁎ which can undoubtly be associated to a scar.Class 4 Obvious TRD⁎ (with some gaps in the rows), presence of callus tissue,
obvious compression wood being formed for more than 3 successivegrowth years or abrupt growth reduction lasting for at least 5 years(associated with stem breakage).
Class 3 Obvious compression wood being formed for 1–3 successive growth yearsfollowing disturbance.
Class 2 Compression wood present but not well defined or growth reductionlasting for less than 5 years.
Class 1 Scattered TRD⁎.
⁎ Tangential rows of traumatic resin ducts.
at t ϵ [1,Tobs]), and F(xstop) = P(Xstop ≤ xstop), the cumulative distribu-tion function (cdf) of runout distances:
Txstop¼ 1
f 1−F xstop� �� � ð1Þ
Hence, for bothmodel outputs andfield data, estimates f and F xstop� �
must be derived. In the Poisson frequencymodel with single parameterθF = λ used in this paper (Appendix A), themean frequency estimate fis simply λ. For field data, rather than considering only the ratio betweenthe total number of avalanche events observed and the related numberof years considered in the chronology (i.e. mean frequency), weretained the median of all possible values. The possible values weredetermined considering the time period for which data quality wasconsidered acceptable and data quantity sufficient to obtain robustestimates of avalanche occurrence rates (see Sections 4.2 and 5 fordetails). This procedure was applied to both the historical and thedendrogeomorphic records.
On the other hand, F xstop� �
, the estimated cumulative distributionfunction (cdf) of runout distances was approximated using a variationof the Hazen formula (Hazen, 1914), common in hydrology:
F xstop� �
¼j xstop� �
þ 0:5
nþ 1ð2Þ
where j (xstop) is the number of events which stopped before the dis-tance xstop, and n the total number of events observed in a path. Thiswas applied to the historical and tree-ring runout distance datasets,but also to a sample of 20,000 simulations of p(xstop|θM^ ), the estimateddistribution of runout distances (see Fig. 3c for Château Jouan).
As a result of the limited number of observations, the estimationof return periods was subject to a considerable level of uncertaintyaffecting both f and F xstop
� �. To evaluate and take into account these
uncertainties, we (i) as said before computed all possible values of fand performed a sensitivity study, and (ii) computed asymptotic non-parametric confidence intervals CIF for F xstop
� �as follows:
CI F ¼ Fxstop �qNαffiffiffin
p �ffiffiffiffiffiffiffiffiffiffiffiffiffiffiffiffiffiffiffiffiffiffiffiffiffiffiffiffiffiffiffiffiffiffiffiffiffiffiffiFxstop � 1− Fxstop
� �rð3Þ
with qNα the quantile of the standard Gaussian distribution related tothe confidence level α (classically 95%). This was done for tree-ringand historical records only, as for model simulations, samples largeenough to lower the width of this interval to zero were considered.
For hazard zoning purposes, the inverse problem has to be solved,i.e. the annual exceedance probability is known, for example 0.01for the centennial event, and the associated runout distance has tobe found. Inverting Eq. (1) shows that the T year return levelxstopT is pro-vided by:
xstopT ¼ F−1xstop
f T−1
f T
!ð4Þ
where F−1xstop
is the inverse cumulative distribution function of the
considered runout sample. For the different samples, F−1xstop
was eval-
uated by kernel smoothing of the empirical inverse step function.This has the advantage to avoid using Hazen (Eq. (2)) or other simi-lar approximations, and provides smoother runout distance–returnperiod relations as compared to the direct use of Eq. (1). Note thatHazen formula was nevertheless used to evaluate the maximum em-pirical return period for each event of the tree-ring and historicalchronicles in the two studied paths, and to obtain bounds for com-puting the confidence interval around the runout distance–returnperiod relationships.

Fig. 3.Multivariate statistical-dynamical avalanchemodel fitted on the Château Jouan EPA data. (a) release abscissa distribution. (b) release depth distribution. (c) runout distance distri-bution. (d) maximal flow depth distribution for avalanches whose runout distance exceeds the 10-yr return period abscissa. (e-f) maximal velocity distribution for avalanches whoserunout distance exceed the (e) 10-yr and (f) 100-yr return period abscissas.
17R. Schläppy et al. / Cold Regions Science and Technology 99 (2014) 12–26
Noteworthy, the joint distribution of the exceedance p y θM ;��� xstopN
xstopT Þ provided by the statistical-dynamical model, summarizes thecharacteristics of all avalanche events at the abscissa xstopT . It can there-fore be considered as the joint distribution of all reference scenarioscorresponding to the return period T (Fig. 3e–f for maximum flowdepths and velocities at the 10-yr return period abscissa and maximumvelocities at the 100-yr return period abscissa in the Château Jouan path,respectively).
3.6. Cross validation of model’s simulations with independentdendrogeomorphic data
As summarized in Fig. 4, the cross validation of model simulationsand dendrogeomorphic chronicles is performed through the calculation
of δ, the mean error, and δ2, the (root) mean square error, betweenreturn levels derived from both methods:
δ ¼ 1T max−T min þ 1ð Þ �
XT max
T¼T min
xstopmodelTð Þ−xstopdendro Tð Þ
� �ð5Þ
δ2 ¼ 1T max−T min þ 1ð Þ �
XT max
T¼T min
xstopmodelTð Þ−xstopdendro Tð Þ
� �224
35
1=2
ð6Þ
where xstopmodelTð Þ and xstopdendro Tð Þ are the runout distances related to re-
turn period T derived from the model and tree-ring reconstruction,

Fig. 4. Flowchart of the principal steps leading to the cross validation of runout distance-return period relationships.
18 R. Schläppy et al. / Cold Regions Science and Technology 99 (2014) 12–26
respectively, and [Tmin, Tmax] the return period range on which thecomparison is made.
The mean error on a given return period range corresponds to themean value of the positive and negative errors on this range withoutconsidering its sign. In our case, a positive mean value implies that
Fig. 5. Age structure of the forest stand growing in the (a) Château Jouan and (b) Avalanche dethenumber of tree rings present in the selected trees and at sampling height. The black arrowcothe EPA data.
simulated runout distances are larger on average than empirical onesfor the [Tmin, Tmax] return period interval, and vice versa. However,independently from the sign, a low mean value can result from thecompensation between overestimations and underestimations fromthemodel. Consequently, a bias tending to zero provides no information
s Pylônes paths as obtained from tree-ring data. Tree ages were approximated by countingrresponds to themaximal reachof very shallow avalancheflows that havebeen recorded in
19R. Schläppy et al. / Cold Regions Science and Technology 99 (2014) 12–26
about the effective dispersion of errors around the mean value. For thisreason, we also calculated the mean square error, which takes intoaccount the average of the squares of the errors. In this case, a lowvalue means that all observed bias were relatively low or tend to zero,indicating that simulations and observations are really similar on the[Tmin, Tmax] range.
4. Results
4.1. Tree-ring analysis and event reconstruction
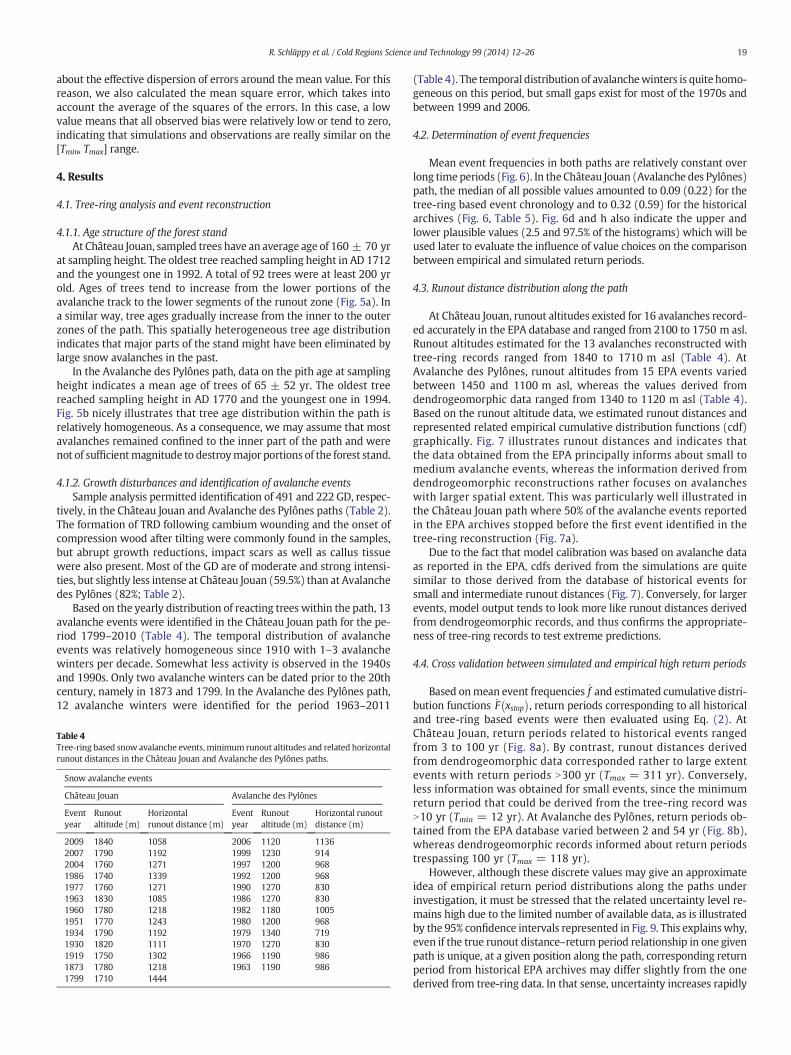
4.1.1. Age structure of the forest standAt Château Jouan, sampled trees have an average age of 160 ± 70 yr
at sampling height. The oldest tree reached sampling height in AD 1712and the youngest one in 1992. A total of 92 trees were at least 200 yrold. Ages of trees tend to increase from the lower portions of theavalanche track to the lower segments of the runout zone (Fig. 5a). Ina similar way, tree ages gradually increase from the inner to the outerzones of the path. This spatially heterogeneous tree age distributionindicates that major parts of the stand might have been eliminated bylarge snow avalanches in the past.
In the Avalanche des Pylônes path, data on the pith age at samplingheight indicates a mean age of trees of 65 ± 52 yr. The oldest treereached sampling height in AD 1770 and the youngest one in 1994.Fig. 5b nicely illustrates that tree age distribution within the path isrelatively homogeneous. As a consequence, we may assume that mostavalanches remained confined to the inner part of the path and werenot of sufficientmagnitude to destroymajor portions of the forest stand.
4.1.2. Growth disturbances and identification of avalanche eventsSample analysis permitted identification of 491 and 222 GD, respec-
tively, in the Château Jouan and Avalanche des Pylônes paths (Table 2).The formation of TRD following cambium wounding and the onset ofcompression wood after tilting were commonly found in the samples,but abrupt growth reductions, impact scars as well as callus tissuewere also present. Most of the GD are of moderate and strong intensi-ties, but slightly less intense at Château Jouan (59.5%) than at Avalanchedes Pylônes (82%; Table 2).
Based on the yearly distribution of reacting trees within the path, 13avalanche events were identified in the Château Jouan path for the pe-riod 1799–2010 (Table 4). The temporal distribution of avalancheevents was relatively homogeneous since 1910 with 1–3 avalanchewinters per decade. Somewhat less activity is observed in the 1940sand 1990s. Only two avalanche winters can be dated prior to the 20thcentury, namely in 1873 and 1799. In the Avalanche des Pylônes path,12 avalanche winters were identified for the period 1963–2011
Table 4Tree-ring based snow avalanche events,minimum runout altitudes and related horizontalrunout distances in the Château Jouan and Avalanche des Pylônes paths.
Snow avalanche events
Château Jouan Avalanche des Pylônes
Eventyear
Runoutaltitude (m)
Horizontalrunout distance (m)
Eventyear
Runoutaltitude (m)
Horizontal runoutdistance (m)
2009 1840 1058 2006 1120 11362007 1790 1192 1999 1230 9142004 1760 1271 1997 1200 9681986 1740 1339 1992 1200 9681977 1760 1271 1990 1270 8301963 1830 1085 1986 1270 8301960 1780 1218 1982 1180 10051951 1770 1243 1980 1200 9681934 1790 1192 1979 1340 7191930 1820 1111 1970 1270 8301919 1750 1302 1966 1190 9861873 1780 1218 1963 1190 9861799 1710 1444
(Table 4). The temporal distribution of avalanchewinters is quite homo-geneous on this period, but small gaps exist for most of the 1970s andbetween 1999 and 2006.
4.2. Determination of event frequencies
Mean event frequencies in both paths are relatively constant overlong time periods (Fig. 6). In the Château Jouan (Avalanche des Pylônes)path, the median of all possible values amounted to 0.09 (0.22) for thetree-ring based event chronology and to 0.32 (0.59) for the historicalarchives (Fig. 6, Table 5). Fig. 6d and h also indicate the upper andlower plausible values (2.5 and 97.5% of the histograms) which will beused later to evaluate the influence of value choices on the comparisonbetween empirical and simulated return periods.
4.3. Runout distance distribution along the path
At Château Jouan, runout altitudes existed for 16 avalanches record-ed accurately in the EPA database and ranged from 2100 to 1750 m asl.Runout altitudes estimated for the 13 avalanches reconstructed withtree-ring records ranged from 1840 to 1710 m asl (Table 4). AtAvalanche des Pylônes, runout altitudes from 15 EPA events variedbetween 1450 and 1100 m asl, whereas the values derived fromdendrogeomorphic data ranged from 1340 to 1120 m asl (Table 4).Based on the runout altitude data, we estimated runout distances andrepresented related empirical cumulative distribution functions (cdf)graphically. Fig. 7 illustrates runout distances and indicates thatthe data obtained from the EPA principally informs about small tomedium avalanche events, whereas the information derived fromdendrogeomorphic reconstructions rather focuses on avalancheswith larger spatial extent. This was particularly well illustrated inthe Château Jouan path where 50% of the avalanche events reportedin the EPA archives stopped before the first event identified in thetree-ring reconstruction (Fig. 7a).
Due to the fact that model calibration was based on avalanche dataas reported in the EPA, cdfs derived from the simulations are quitesimilar to those derived from the database of historical events forsmall and intermediate runout distances (Fig. 7). Conversely, for largerevents, model output tends to look more like runout distances derivedfrom dendrogeomorphic records, and thus confirms the appropriate-ness of tree-ring records to test extreme predictions.
4.4. Cross validation between simulated and empirical high return periods
Based onmean event frequencies f and estimated cumulative distri-bution functions F xstop
� �, return periods corresponding to all historical
and tree-ring based events were then evaluated using Eq. (2). AtChâteau Jouan, return periods related to historical events rangedfrom 3 to 100 yr (Fig. 8a). By contrast, runout distances derivedfrom dendrogeomorphic data corresponded rather to large extentevents with return periods N300 yr (Tmax = 311 yr). Conversely,less information was obtained for small events, since the minimumreturn period that could be derived from the tree-ring record wasN10 yr (Tmin = 12 yr). At Avalanche des Pylônes, return periods ob-tained from the EPA database varied between 2 and 54 yr (Fig. 8b),whereas dendrogeomorphic records informed about return periodstrespassing 100 yr (Tmax = 118 yr).
However, although these discrete values may give an approximateidea of empirical return period distributions along the paths underinvestigation, it must be stressed that the related uncertainty level re-mains high due to the limited number of available data, as is illustratedby the 95% confidence intervals represented in Fig. 9. This explainswhy,even if the true runout distance–return period relationship in one givenpath is unique, at a given position along the path, corresponding returnperiod from historical EPA archives may differ slightly from the onederived from tree-ring data. In that sense, uncertainty increases rapidly

Fig. 6. Evaluation of annual mean frequency in the (a-d) Château Jouan and (e-h) Avalanche des Pylônes paths: (a, e) annual frequency for historical events as a function of the consideredtime window. (b, f) related probability distribution. c, g) annual frequency for dendrogeomorphic events as a function of the considered time window. (d, h) related probability distribu-tion. In this work, for the historical and tree-ring based chronicles, the median of histograms 6b, 6f, 6d, and 6h were primarily considered (Table 5).
20 R. Schläppy et al. / Cold Regions Science and Technology 99 (2014) 12–26
with runout distance for both thehistorical (EPA) anddendrogeomorphicrecords in both paths. At Château Jouan, for example, runout distancesrelated to 30-yr and 100-yr return periods derived from tree-ring dataare between 1200–1352 m and 1271 m and +∞m, respectively.
Noteworthy also, the maximum runout distance related to EPAeventswas reached twice during the period of observation in both stud-ied paths. Consequently, the corresponding return period is somewhatundetermined, leading to a vertical ending of the corresponding runoutdistance–return period relationships and to even higher uncertaintylevels for high return periods evaluated with historical archives.
Because the return periods reported above were evaluated withthe Hazen approximation, introducing an additional source of uncer-tainty for very high return periods, we rather compared runoutdistance–return period relations as derived with themodel simulationsand dendrogeomorphic data using the inverse cumulative distributionfunction (cdf) of the considered runout sample (Eq. (4)). Analysis
Table 5Historical and tree-ring based annual event frequencies. Considered median annual fre-quency and related 2.5%, and 97.5% were derived from Fig. 6.
Path name Chronologytype
Annualfrequency2.5%
Annualfrequencymedian
Annualfrequency97.5%
Chateau Jouan Historical archives 0.26 0.32 0.38Tree-ring data 0.06 0.09 0.14
Avalanche desPylônes
Historical archives 0.54 0.59 0.7Tree-ring data 0.18 0.22 0.26
included the mean and mean square errors for both paths and differentreturn period ranges, according to data availability.
In theChâteau Jouanpath, such a comparisonwas possible for returnperiods ranging roughly from 10 to 300 yr, corresponding to the classi-cal interval used in hazard zoning (Fig. 9, Table 6). Mean and meansquare errors amounted to 19.7 and 28.9 m, respectively, which canbe considered satisfying considering the different uncertainty sourcesthat exist in this kind of analysis regarding data or model and withrespect to the context of avalanche zoning problems. The best fit is ob-served for the range of 100–300 yr, forwhich themean error amountedto only 20.0 m and the mean square error to 23.8 m (Table 6). Largerdiscrepancies were found for the range of 10–30 yr with a negativevalue obtained for the mean error (−36.2 m), reflecting the fact thatrunout distances derived from tree-ring records are larger for thisrange of return period than the one derived from the model. Resultsfor the 10–1000 yr return period range were similar to the range of10–300 yr, given that only nine additional return periodswere availablefor the tree-ring based runout distance–return period relationship(Tmax = 309 yr).
In the Avalanche des Pylônes path, comparison was mostly lim-ited to return periods ranging from 10–100 yr, given the empiricalTmax = 118 yr. However, for the purpose of comparison, we alsocalculated mean and mean square errors over the same intervalsas in the Château Jouan path. As a consequence, mean andmean squareerrors are the same for the 10–300 and 10–1000-yr return period inter-vals, amounting to 23.5 and 45.8 m, respectively (Table 6). In moredetail, for the return period interval 10–30 yr, errors amount to roughly

Fig. 7. Empirical and simulated cumulative distribution functions (cdfs) of runout distances in the (a) Château Jouan and (b) Avalanche des Pylônes paths.
21R. Schläppy et al. / Cold Regions Science and Technology 99 (2014) 12–26
80 m, indicating that the model and tree-ring data are not in goodagreement. Errors start to decrease with increasing ranges of returnperiods: for the interval 30–100 yr, errors are 17.1 and 36.1 m, respec-tively. The best fit was found for the interval 100–300 yr, with meanand mean squared errors equal to −18.0 and 18.1 m, respectively.However, these values should be interpreted cautiously as they only re-flect discrepancies between simulated and tree-ring data for the inter-val 100–118 yr, according to Tmax.
5. Discussion and conclusion
Specification of expected runout distances and related returnperiods in the runout zonehas been defined as thefirst andmost impor-tant step for zoning in snow avalanche prone terrain (McClung, 2000).As a consequence, runout distances of extreme events have often beenevaluated using physically based numerical models in the past. Moreprecisely, the rationales of Salm et al. (1990) were thereby largelyused by practitioners to evaluate “high magnitude” runout distances,
Fig. 8.Return periods (in yr) for each of the historical (grey) and tree-ring based (black) eventsevaluated based onmean event frequencies (Table 5) and the estimated cumulative distributionare not represented to simplify display.
in a rather efficient way but without an explicit statistical framework(Ancey et al., 2004). More recently, statistical-dynamical modelingapproaches have been put forward as an alternative approach, wherecalibration is based on local data reported in historical archives – EPAin the present case – and where probabilistic simulations enable localevaluation of return period at any point along a given path (Eckertet al., 2008b, 2010c).
In this study, a statistical-dynamical approach has been used to ana-lyze runout distances at two avalanche sites in the French Alps, ChâteauJouan and Avalanche des Pylônes. According to historical data availablein the EPA, themodel was capable to simulate current events with rela-tively small return periods (i.e.≤30-yr return interval). As validation ofsimulated data could not be realized for higher return periods with EPAdata, we reconstructed runout distances of larger, and less frequent, av-alanches in both pathswith dendrogeomorphic techniques (e.g., Coronaet al., 2012a; Schläppy et al., 2013; Stoffel and Bollschweiler, 2008). Thedendrogeomorphic record of snow avalanches yielded runout informa-tion for 25 avalanche winters in the paths (Table 4), and thus allowed
in the (a) Château Jouan and (b) Avalanche des Pylônes runout zones. Return periodswerefunction (cdf) of runout distances (Eq. (2)). Note that very small return periods (b5.9 yr)
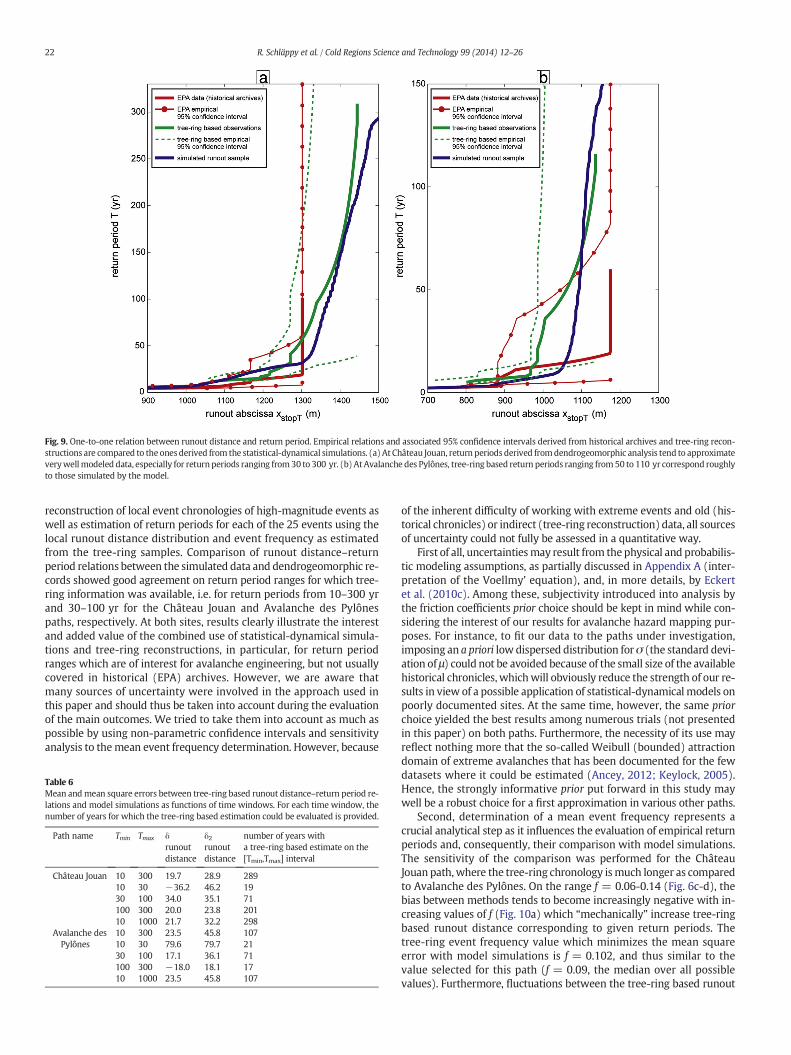
Fig. 9. One-to-one relation between runout distance and return period. Empirical relations and associated 95% confidence intervals derived from historical archives and tree-ring recon-structions are compared to the ones derived from the statistical-dynamical simulations. (a) At Château Jouan, return periods derived fromdendrogeomorphic analysis tend to approximateverywellmodeled data, especially for returnperiods ranging from30 to 300 yr. (b) At Avalanche des Pylônes, tree-ring based return periods ranging from50 to 110 yr correspond roughlyto those simulated by the model.
22 R. Schläppy et al. / Cold Regions Science and Technology 99 (2014) 12–26
reconstruction of local event chronologies of high-magnitude events aswell as estimation of return periods for each of the 25 events using thelocal runout distance distribution and event frequency as estimatedfrom the tree-ring samples. Comparison of runout distance–returnperiod relations between the simulated data and dendrogeomorphic re-cords showed good agreement on return period ranges for which tree-ring information was available, i.e. for return periods from 10–300 yrand 30–100 yr for the Château Jouan and Avalanche des Pylônespaths, respectively. At both sites, results clearly illustrate the interestand added value of the combined use of statistical-dynamical simula-tions and tree-ring reconstructions, in particular, for return periodranges which are of interest for avalanche engineering, but not usuallycovered in historical (EPA) archives. However, we are aware thatmany sources of uncertainty were involved in the approach used inthis paper and should thus be taken into account during the evaluationof the main outcomes. We tried to take them into account as much aspossible by using non-parametric confidence intervals and sensitivityanalysis to themean event frequency determination. However, because
Table 6Mean andmean square errors between tree-ring based runout distance–return period re-lations and model simulations as functions of time windows. For each time window, thenumber of years for which the tree-ring based estimation could be evaluated is provided.
Path name Tmin Tmax δrunoutdistance
δ2runoutdistance
number of years witha tree-ring based estimate on the[Tmin,Tmax] interval
Château Jouan 10 300 19.7 28.9 28910 30 −36.2 46.2 1930 100 34.0 35.1 71100 300 20.0 23.8 20110 1000 21.7 32.2 298
Avalanche desPylônes
10 300 23.5 45.8 10710 30 79.6 79.7 2130 100 17.1 36.1 71100 300 −18.0 18.1 1710 1000 23.5 45.8 107
of the inherent difficulty of working with extreme events and old (his-torical chronicles) or indirect (tree-ring reconstruction) data, all sourcesof uncertainty could not fully be assessed in a quantitative way.
First of all, uncertaintiesmay result from the physical and probabilis-tic modeling assumptions, as partially discussed in Appendix A (inter-pretation of the Voellmy’ equation), and, in more details, by Eckertet al. (2010c). Among these, subjectivity introduced into analysis bythe friction coefficients prior choice should be kept in mind while con-sidering the interest of our results for avalanche hazard mapping pur-poses. For instance, to fit our data to the paths under investigation,imposing an a priori low dispersed distribution forσ (the standard devi-ation of μ) could not be avoided because of the small size of the availablehistorical chronicles, whichwill obviously reduce the strength of our re-sults in view of a possible application of statistical-dynamical models onpoorly documented sites. At the same time, however, the same priorchoice yielded the best results among numerous trials (not presentedin this paper) on both paths. Furthermore, the necessity of its use mayreflect nothing more that the so-called Weibull (bounded) attractiondomain of extreme avalanches that has been documented for the fewdatasets where it could be estimated (Ancey, 2012; Keylock, 2005).Hence, the strongly informative prior put forward in this study maywell be a robust choice for a first approximation in various other paths.
Second, determination of a mean event frequency represents acrucial analytical step as it influences the evaluation of empirical returnperiods and, consequently, their comparison with model simulations.The sensitivity of the comparison was performed for the ChâteauJouan path,where the tree-ring chronology ismuch longer as comparedto Avalanche des Pylônes. On the range f = 0.06-0.14 (Fig. 6c-d), thebias between methods tends to become increasingly negative with in-creasing values of f (Fig. 10a) which “mechanically” increase tree-ringbased runout distance corresponding to given return periods. Thetree-ring event frequency value which minimizes the mean squareerror with model simulations is f = 0.102, and thus similar to thevalue selected for this path (f = 0.09, the median over all possiblevalues). Furthermore, fluctuations between the tree-ring based runout

Fig. 10. Influence of the tree-ring based event frequency on the comparison for the Château Jouan path: (a) mean and mean square errors as functions of the tree-ring event frequency.(b) tree-ring based runout distance–return period relations versus model simulations for the range of possible mean event frequencies from Fig. 6c-d.
23R. Schläppy et al. / Cold Regions Science and Technology 99 (2014) 12–26
distance–return period relations, where f varied between 0.09 and0.102, and modeled data were inferior to 10 m on average (Fig. 10).Consequently, using the median of all possible values as a mean eventfrequency does not only seem relevant but also yields fairly robustresults.
The evaluation of empirical return periods also depends on thecumulative distribution function (cdf) of observed runout distances.Rather than using the classical Hazen formula or other techniquesused for the estimation of empirical exceedance probabilities, we calcu-lated xstopT using the inverse cdf of the considered runout sample(Eq. (4)) so as to minimize the uncertainty level related to the limitednumber of available data.
This study did not, by contrast, quantify the influence of the qualityof the historical and dendrogeomorphic event chronologies. Thesecould have been addressed as well, as recent studies highlighted thattree-ring reconstructions tend to underestimate the number of yearswith natural avalanche activity by up to 60% (Corona et al., 2010,2012a; Schläppy et al., 2013), and that avalanche chronicles, such asthe EPA, may have observational gaps or records of limited quality. Asa matter of fact, both the historical and dendrogeomorphic meanevent frequencies might have been underestimated, which, in turn,may affect the evaluation of empirical return periods. At the sametime, however, and as high return period events tend to cause signifi-cant damage to infrastructure and/or forest, the likelihood that theyhave been missed in historical archives or not been recorded by thetrees is unlikely. As a consequence, and as reported by Corona et al.(2012a), Stoffel and Bollschweiler (2009) and Stoffel et al. (2013), theresulting bias is supposed to influence preferentially small return pe-riods (≤30 yr) which typically correspond to current events. Indeed,the agreement between model and tree-ring data has been shown tobe somewhat limited for this return period range, but much more con-clusive for larger ranges. In consequence, we assume that this source ofuncertaintywill be rather limited for return periods varying between 30and 300 yr, i.e. for the interval which is of much more relevance forlong-term avalanche forecasting.
Another source of uncertainty results from the estimation of runoutdistances based on the position of impacted trees within a path, as
dendrogeomorphic reconstructions have been reported to possibly un-derestimate runout distances in some cases (Corona et al., 2012a). Thisunderestimation is mainly due to changes in path geometry (steepness,curvature) aswell as to the presence of a forest stand in the runout zonethat can induce rapid avalanche deceleration (McClung, 1990;McClungand Schaerer, 1985). As a consequence, snow pressures may be insuffi-cient in these zones to damage trees and thereby cause reactions in thetree-ring record, particularly at the front of the deposit. In addition, thesampling strategy can also influence the accuracy of runout distance es-timation. Given that the sampled trees are generally selected alongtransects across the slope (Fig. 5a), one might underestimate runoutdistances of avalanches stopped between two transects and possibly ex-plains the negative bias observed between runout distances for returnperiods of 30–300 yr (Fig. 9a) derived from tree-ring records andthose obtained with simulations in the Château Jouan path.
We also assumed in this study that an underlying stationary processwould generate high-magnitude snow avalanche events, as, despite of aclear climate control of avalanche occurrences (Castebrunet et al.,2012), long-term changes in avalanche activity could not been foundin most observational records (Laternser and Schneebeli, 2002). Wedid not, therefore, include the findings of Eckert et al. (2013) whoobserved, based on EPA data, a recent and accelerated reduction ofhigh return period avalanches in the French Alps which could possiblybe linked with a decrease of snow cover and changes in preferred ava-lanche types under climate warming (Martin et al., 2001). In addition,climate change since the end of the Little Ice Age as well as changes inland use are likely to have had considerable impacts on both forestcover and avalanche activity on the longer term as well (Jomelli andPech, 2004), but have not been considered in the context of this studyeither. As a consequence, the frequency and magnitude of destructiveforest avalanches may have been larger or smaller in the past, butsigns of such changes are not obvious in the investigated paths wherethe total number of events reconstructed with tree-ring records wasonly large enough to see that the number of recorded events decreaseswith time and at a pace similar to thedecrease of the sample size of treesavailable for dendrogeomorphic analyses (Stoffel et al., 2013). We callfor future work where non-stationary statistical-dynamical simulations

24 R. Schläppy et al. / Cold Regions Science and Technology 99 (2014) 12–26
are implemented and, if possible, confronted with longer and moreabundant tree-ring chronicles to take climate and land-use change ef-fects into account as well (Corona et al., 2012b).
All in all, despite the various sources of uncertainty, we areconvinced that this contribution is of high value as it provides, for thefirst time, a rather conclusive cross-validation of runout distance–returnperiod relations derived from a statistical-dynamical model with dataderived from independent, natural archives. Hence, dendrogeomorphicdata can be seen as an extremely valuable data pool for the assessmentof runout distances and return periods of extremeavalanche events, andin particular for the hazard zoning on forested paths with limited or nohistorical data. At the same time, we illustrate that the statistical-dynamical model presented here can be used with reasonable confi-dence to predetermine high return period avalanches and associatedinformation on avalanche velocity, snow pressure and snow depth. Fur-thermore, it is hoped that the information contained in tree-ring recordscould be used in the future to evaluate the variousmodeling assumptionsrelated to weight and sensitivity for high return periods as well as veloc-ity and/or pressure distributions within the statistical-dynamical set-up,and to propose subsequent model improvements.
Acknowledgements
The authors gratefully acknowledge Louis Manière and MatthieuSchläppy for their assistance in the field. They also want to thank theOffice National des Forêts (ONF) for sampling permissions. This studyhas been realized within the framework of the MOPERA (MOdélisationProbabiliste pour l’Evaluation du Risque d’Avalanche) program fundedby the French National Research Agency (ANR-09-RISK-007-01).R.S. acknowledges support from the Swiss National Science Founda-tion (project P1SKP2_148492). Finally, the authors are grateful toJ. Schweizer, P. Gauer and two anonymous referees whose constructivecomments helped to improve the paper.
Appendix A. Statistical-dynamical model
Following Naaim et al. (2004), dense avalanche flow propagation ismodeled with depth-averaged Saint Venant equations, but, to facilitatethe specification of the input conditions corresponding to each simulationand to reduce computation times, snow incorporation and deposition areignored. Variation in the momentum corresponds to the difference be-tween gravity g and the robust (e.g., able to produce reasonable resultsin most occasions) Voellmy (1955) friction law. The equations of massand momentum conservation in which ν is the flow velocity,h is theflow depth, ϕ is the local slope, and t is time are then:
∂h∂t þ
∂ hvð Þ∂x ¼ 0
∂ hvð Þ∂t þ ∂
∂x αsvhv2 þ ksvg
h2
2
!¼ h g sinϕ−μg cosϕ− g
ξhv2
� g ð7Þ
ksv represents the ratio between the stress normal to the slope and thestress parallel to the slope, and αsv represents the shape of the verticalvelocity profile. These equations are solved numerically using a finitevolume scheme (Naaim, 1998). Classically, αsv and ksv were set to 1 forthe entire study.
Traditionally (Salm et al., 1990), it is assumed that the coefficient μsummarizes snow properties as a function of e.g., altitude or exposure,whereas ξ is assimilated to a morphological parameter representingthe roughness of the path. This interpretation of the Voellmy equationcontinues to be discussed (e.g., Ancey and Meunier, 2004), since it isnot always fulfilled when calibration is undertaken on large datasamples (Naaim et al., 2013). On the other hand, some theoretical justi-fications in its favor have been provided (Salm, 1993). We do not wantto close the debate here, and adopt this simplification for a pragmaticreason: with regard to having two coefficients to estimate for each
event, only n + 1 unknowns have to be estimated from the data.Hence, μi, i ϵ [1, n] aremodeled as latent variables describing the randomeffects from one avalanche to another, and ξ as a parameter in the verystatistical sense of the term.
Regarding probabilistic modeling of avalanche activity, avalanchefrequency is assumed to be a Poisson distributed process (Eckert et al.,2007a), with its single parameter λ quantifying the mean annual ava-lanche number:
a λ∼P λð Þj ð8Þ
Themagnitudemodel embeds the propagationmodel within severalprobabilistic operators describing the variability of the different input–out quantities. First, the release abscissa xstart that corresponds to thebeginning of the release zone is assumed to be purely random, and aBeta-distribution is a flexible choice to model various release zonesbehaviors (Meunier et al., 2001). However, since the Beta distributionis defined on the ]0,1[ interval, a little restrictive normalization is neces-sary. The length of the release zone is used, so that the normalized re-lease position xstartn is:
xstartn��a1; a2 ¼ xstart−xmin
xmax−xmin
��a1; a2∼Beta a1; a2ð Þ ð9Þ
where xmax and xmin are the maximal and minimal abscissas of the re-lease zone that were estimated for the two case studies using simple to-pographical thresholds, and (a1,a2) the two parameters of the Betadistribution corresponding to each data set.
Given the normalized release abscissa xstartn, themean release depthxstartn is assumed to be gamma-distributed, with a parameterizationreflecting the dependency of the snow depth on the release abscissaand a constant dispersion around the mean:
hstart��b1; b2;σh; xstart∼Gamma
1σ2
h
b1 þ b2xstartnð Þ2; 1σ2
h
b1 þ b2xstartnð Þ !
ð10Þ
Thismodel is chosen to represent the skewness of a hydrological var-iable such as snow depth (where values much higher than themean areplausible) as well as the possible variation of snow depth with altitudethrough the parameters (b1,b2,σh) of the Gammamixture correspondingto each data set. For both case studies, release depths and other releasedimensions corresponding to past observations were derived from de-posit volumes of the EPA records as detailed in Eckert et al. (2010c),and/or from snow cover simulations (Durand et al., 2009).
Given the normalized release abscissa and the flow depth, the latentfriction coefficient μ is assumed to benormally distributed,with four pa-rameters (c, d, e, σ) characterizing, for each case study, its dependencyon the release abscissa andmean release depth andwith a constant dis-persion around the mean:
μ��c;d; e;σ ; xstart; hstart∼N cþ dxstartn þ ehstart;σð Þ ð11Þ
Small Gaussian differences between the observed runout distancesxstopdata and the latent computed runout distances xstop are postulated:
xstopdata σnum; xstop∼N xstop;σnum
� ���� ð12Þ
These differences can result from numerical errors due to the imper-fection of the propagation model, and/or from observation errors. Thestandard deviation of these numerical errors σnum is to be specified formodel identifiability.
In summary, the proposed frequency model has only one parameterθF = λ. Conversely, the magnitude model is relatively complex, withten parameters θM = (a1,a2,b1,b2,σh,c,d,e,σ,ξ) and, for each avalanche,the latent friction coefficient μ and the computed runout distance xstop

25R. Schläppy et al. / Cold Regions Science and Technology 99 (2014) 12–26
measured on the horizontal axis starting at the top of the path. The dif-ferent input variables and the latent friction coefficient μ are explicitlymodeled as dependent variables, so as to take possible correlationsinto account that may affect extreme events. The joint probability ofthemagnitude observations given parameters and latent variables is ob-tained by combining the different conditional distributions:
p�xstart ; hstart; xstopdata θM; μ; xstop;σnum
��� �¼ p xstart a1; a2j Þp hstart b1; b2;σh; xstartj Þp xstopdata σnum; xstop
��� ���� ð13Þ
μ appears in the right-hand side term only indirectly, by constrainingthe deterministic propagation and the runout distance xstop.
Appendix B. Bayesian calibration on historical data andposterior sampling
Under the magnitude–frequency independence hypothesis, thefrequency and themagnitudemodels can be inferred separately. As de-tailed in (Eckert et al., 2010c), it is straightforward for the frequencymodel. For the magnitude model, the joint posterior of all unknown is:
p�θM ; μ; xstop data;σnumj Þ∝π θMð Þ � p
�xstart ;hstart ; xstopdata θM ; μ; xstop;σnum
��� �� p μ; xstop θM ; xstart ;hstart ; xstopdata ;σnum
��� ��ð14Þ
where data denotes all observations xstart1 ; hstart 1 ; xstopdata1;…; xstartN ;
�hstart N ; xstopdataN
Þ . π(θM) is the prior distribution detailed in text and
Table 1. p xstart ;hstart ; xstopdata θM ; μ; xstop;σnum
��� �¼
�∏n
i¼1p xstarti ;hstart i ;��
xstopdataiθM; μ; xstop;σnum
��� ��is the likelihood of the independent triplets
xstarti ;hstart i ; xstopdatai
� �; i ∈ 1;n½ �. p μ; xstop θM; xstart ;hstart ; xstopdata ;σnum
��� ��,
the probability of the latent variables given parameters and observations,is given by the model specification (Eq. (11)) combined with the deter-ministic propagation.
Numerical implementation was carried out using Markov ChainMonte Carlo schemes. Specifically, the Metropolis-Hasting algorithm(Metropolis et al., 1953) fully detailed in detailed in Eckert et al.(2010a) was used, and convergence was carefully tested and grantedusing different chains starting at different point of the parameter space.
From the posteriormean θM; λ, the Bayesian estimator of the param-eters of our model under the classic hypothesis of a quadratic loss func-tion, p(y|θM^ ) and p(a|θF^) were obtained for both case studies. Thesedistributions quantify the randomness of the process studied given thedata. For p(y|θM^ ) that includes the marginal distribution of some vari-ables of interest for hazard zoning (runout distance, velocity, flowdepth, see Fig. 3 for the Château Jouan case), a statistical-dynamicalMonte Carlo approach is needed to obtain the distribution of the out-puts of the numerical avalanche propagation model given the distribu-tion of its inputs. The specified conditional distributions have to be usedto integrate over the distribution of the latent friction coefficient μ:
p�y θM��� �
¼Z
p�xstart a1; a2j Þ � p
�hstart b1; b1; σh; xstart
��� �� p xstop xstart;hstart; μ; ξ
��� �� dμ
� ð15Þ
This was easily carried out in the numerical Monte Carlo set-up bypropagating each set of simulated input variables.
References
Alestalo, J., 1971. Dendrochronological interpretation of geomorphic processes. Fennia105, 1–139.
Ancey, C., 2005. Monte Carlo calibration of avalanches described as Coulomb fluid flows.Philos. Trans. R. Soc. 363 (1832), 1529–1550.
Ancey, C., 2012. Are there “dragon-kings” events (i.e. genuine outliers) among extremeavalanches? Eur. Phys. J. Spec. Top. 205, 117–129.
Ancey, C., Meunier, M., 2004. Estimating bulk rheological properties of flowing snowavalanches from field data. J. Geophys. Res. 109.
Ancey, C., Meunier, M., Richard, D., 2003. Inverse problem in avalanche dynamics models.Water Resour. Res. 39.
Ancey, C., Gervasoni, C., Meunier, M., 2004. Computing extreme avalanches. Cold Reg. Sci.Technol. 39, 161–180.
Barbolini, M., Keylock, C.J., 2002. A new method for avalanche hazard mapping using acombination of statistical and deterministic models. Nat. Hazards Earth Syst. Sci. 2,239–245.
Bartelt, P., Stöckli, V., 2001. The influence of tree and branch fracture, overturning and de-bris entrainment on snow avalanche flow. Ann. Glaciol. 32, 209–216.
Bartelt, P., Bühler, Y., Buser, O., Christen, M., Meier, L., 2012. Modeling mass-dependentflow regime transitions to predict the stopping and depositional behavior of snow av-alanches. J. Geophys. Res. 117.
Bayes, M., Price, M., 1763. An essay towards solving a problem in the doctrine of chances.By the late rev. Mr. Bayes, F. R. S. Communicated by Mr. Price, in a letter to John Can-ton, A. M. F. R. S. Philos. Trans. R. Soc. Lond. 53, 370–418.
Bebi, P., Kulakowski, D., Rixen, C., 2009. Snow avalanche disturbances in forest ecosystems—State of research and implications for management. For. Ecol. Manag. 257,1883–1892.
Bergue, M., 2000. P.P.R, Révision partielle du plan de prévention des risques naturelsprévisibles - Commune de Chamonix Mont-Blanc.
Bollschweiler, M., Stoffel, M., Schneuwly, D.M., Bourqui, K., 2008. Traumatic resin ducts inLarix decidua stems impacted by debris flows. Tree Physiol. 28, 255–263.
Bovis, M.J., Mears, A.I., 1976. Statistical prediction of snow avalanche runout from terrainvariables in Colorado. Arct. Alp. Res. 8, 115–120.
Bozhinskiy, A.N., Nazarov, A.N., Chernouss, P.A., 2001. Avalanches: a probabilistic ap-proach to modelling. Ann. Glaciol. 32, 255–258.
Butler, D.R., Malanson, G.P., 1985. A history of high-magnitude snow avalanches, southernGlacier National Park, Montana, USA. Mt. Res. Dev. 5, 175–182.
Butler, D.R., Sawyer, C.F., 2008. Dendrogeomorphology and high-magnitude snow ava-lanches: A review and case study. Nat. Hazards Earth Syst. Sci. 8, 303–309.
Butler, D.R., Sawyer, C.F., Maas, J.A., 2010. Tree-ring dating of snow avalanches in GlacierNational Park,Montana, USA. In: Stoffel,M., Bollschweiler,M., Butler, D.R., Luckman, B.H.(Eds.), Tree Rings and Natural Hazards. Springer Netherlands, Dordrecht, pp. 35–46.
Castebrunet, H., Eckert, N., Giraud, G., 2012. Snow and weather climatic control on snowavalanche occurrence fluctuations over 50 yr in the French Alps. Clim. Past 8,855–875.
Casteller, A., Christen, M., Villalba, R., Martínez, H., Stöckli, V., Leiva, J.C., Bartelt, P., 2008.Validating numerical simulations of snow avalanches using dendrochronology: TheCerro Ventana event in Northern Patagonia, Argentina. Nat. Hazards Earth Syst. Sci.8, 433–443.
Corona, C., Rovéra, G., Lopez Saez, J., Stoffel, M., Perfettini, P., 2010. Spatio-temporal recon-struction of snow avalanche activity using tree rings: Pierres Jean Jeanne avalanchetalus, Massif de l’Oisans, France. Catena 83, 107–118.
Corona, C., Lopez Saez, J., Stoffel, M., Bonnefoy, M., Richard, D., Astrade, L., Berger, F.,2012a. How much of the real avalanche activity can be captured with tree rings?An evaluation of classic dendrogeomorphic approaches and comparison with histor-ical archives. Cold Reg. Sci. Technol. 74–75, 31–42.
Corona, C., Lopez Saez, J., Stoffel, M., Rovera, G., Edouard, J.-L., Berger, F., 2012b. Sevencenturies of avalanche activity at Echalp (Queyras massif, southern French Alps) asinferred from tree rings. The Holocene 23, 292–304.
Corona, C., Trappmann, D., Stoffel, M., 2013. Parameterization of rockfall source areas andmagnitudes with ecological recorders: When disturbances in trees serve the calibra-tion and validation of simulation runs. Geomorphology 202, 33–42.
Delparte, D., Jamieson, B., Waters, N., 2008. Statistical runout modeling of snow ava-lanches using GIS in Glacier National Park, Canada. Cold Reg. Sci. Technol. 54,183–192.
Durand, Y., Laternser, M., Giraud, G., Etchevers, P., Lesaffre, B., Mérindol, L., 2009. Reanal-ysis of 44 yr of climate in the French Alps (1958–2002): methodology, model valida-tion, climatology, and trends for air temperature and precipitation. J. Appl. Meteorol.Climatol. 48, 429–449.
Eckert, N., Parent, E., Bélanger, L., Garcia, S., 2007a. Hierarchical Bayesian modelling forspatial analysis of the number of avalanche occurrences at the scale of the township.Cold Reg. Sci. Technol. 50, 97–112.
Eckert, N., Parent, E., Richard, D., 2007b. Revisiting statistical–topographical methods foravalanche predetermination: Bayesian modelling for runout distance predictive dis-tribution. Cold Reg. Sci. Technol. 49, 88–107.
Eckert, N., Parent, E., Faug, T., Naaim, M., 2008a. Optimal design under uncertainty of apassive defense structure against snow avalanches: from a general Bayesian frame-work to a simple analytical model. Nat. Hazards Earth Syst. Sci. 8, 1067–1081.
Eckert, N., Parent, E., Naaim, M., Richard, D., 2008b. Bayesian stochastic modelling foravalanche predetermination: From a general system framework to return periodcomputations. Stoch. Env. Res. Risk A. 22, 185–206.
Eckert, N., Parent, E., Faug, T., Naaim, M., 2009. Bayesian optimal design of an avalanchedam using a multivariate numerical avalanche model. Stoch. Env. Res. Risk A. 23,1123–1141.
Eckert, N., Baya, H., Deschatres, M., 2010a. Assessing the response of snow avalancherunout altitudes to climate fluctuations using hierarchical modeling: Application to61 winters of data in France. J. Clim. 23, 3157–3180.
Eckert, N., Coleou, C., Castebrunet, H., Deschatres, M., Giraud, G., Gaume, J., 2010b. Cross-comparison ofmeteorological and avalanche data for characterising avalanche cycles:The example of December 2008 in the eastern part of the French Alps. Cold Reg. Sci.Technol. 64, 119–136.

26 R. Schläppy et al. / Cold Regions Science and Technology 99 (2014) 12–26
Eckert, N., Naaim, M., Parent, E., 2010c. Long-term avalanche hazard assessment with aBayesian depth-averaged propagation model. J. Glaciol. 56, 563–586.
Eckert, N., Keylock, C.J., Castebrunet, H., Lavigne, A., Naaim, M., 2013. Temporal trends inavalanche activity in the French Alps and subregions: from occurrences and runoutaltitudes to unsteady return periods. J. Glaciol. 59, 93–114.
ESRI, 2013. ArcGIS. http://www.esri.com/software/arcgis/.Feistl, T., Bebi, P., Bühler, Y., Christen, M., Teich, M., Bartelt, P., 2012. Stopping behavior of
snow avalanches in forests. Proceedings of the International Snow ScienceWorkshopISSW. Anchorage, Alaska, pp. 420–426.
Fischer, J.-T., Fromm, R., Gauer, P., Sovilla, B., 2013. Evaluation of probabilistic snow ava-lanche simulation ensembles with Doppler radar observations. Cold Reg. Sci. Technol.97, 151–158.
Gauer, P., Medina-Cetina, Z., Lied, K., Kristensen, K., 2009. Optimization and probabilisticcalibration of avalanche block models. Cold Reg. Sci. Technol. 59, 251–258.
Germain, D., Filion, L., Hétu, B., 2005. Snow avalanche activity after fire and logging distur-bances, northern Gaspé Peninsula, Quebec, Canada. Can. J. Earth Sci. 42, 2103–2116.
Germain, D., Hétu, B., Filion, L., 2010. Tree-ring based reconstruction of past snow ava-lanche events and risk assessment in Northern Gaspé Peninsula (Québec, Canada).In: Stoffel, M., Bollschweiler, M., Butler, D.R., Luckman, B.H. (Eds.), Tree Rings andNatural Hazards. Springer Netherlands, Dordrecht, pp. 51–73.
Grêt-Regamey, A., Straub, D., 2006. Spatially explicit avalanche risk assessment linkingBayesian networks to a GIS. Nat. Hazards Earth Syst. Sci. 6, 911–926.
Hazen, A., 1914. Storage to be provided in impounding reservoirs for municipal watersupply. Trans. Am. Assoc. Civ. Eng. 77.
Issler, D., 1998. Modelling of snow entrainment and deposition in powder-snow ava-lanches. Ann. Glaciol. 26, 253–258.
Jamard, A.-L., Garcia, S., Bélanger, L., 2002. L’Enquête Permanente sur les Avalanches(EPA) - Statistique descriptive générale des événements et des sites.
Jomelli, V., Pech, P., 2004. Effects of the Little Ice Age on avalanche boulder tongues in theFrench Alps (Massif des Ecrins). Earth Surf. Process. Landf. 29, 553–564.
Jomelli, V., Delval, C., Grancher, D., Escande, S., Brunstein, D., Hetu, B., Filion, L., Pech, P.,2007. Probabilistic analysis of recent snow avalanche activity and weather in theFrench Alps. Cold Reg. Sci. Technol. 47, 180–192.
Keylock, C.J., 2005. An alternative form for the statistical distribution of extreme ava-lanche runout distances. Cold Reg. Sci. Technol. 42, 185–193.
Keylock, C.J., McClung, D.M., Mar Magnússon, M., 1999. Avalanche risk mapping by simu-lation. J. Glaciol. 45, 303–314.
Kogelnig-Mayer, B., Stoffel, M., Schneuwly-Bollschweiler, M., 2013. Four-dimensionalgrowth response of mature Larix decidua to stem burial under natural conditions.Trees 27, 1217–1223.
Laternser, M., Schneebeli, M., 2002. Temporal trend and spatial distribution of avalancheactivity during the last 50 years in Switzerland. Nat. Hazards 27, 201–230.
Lied, K., Bakkehøi, S., 1980. Empirical calculations of snow-avalanche run-out distancebased on topographic parameters. J. Glaciol. 26, 165–177.
Luckman, B.H., 2010. Dendrogeomorphology and snow avalanche research. In: Stoffel, M.,Bollschweiler, M., Butler, D.R., Luckman, B.H. (Eds.), Tree Rings and Natural Hazards.Springer Netherlands, Dordrecht, pp. 27–34.
Malanson, G.P., Butler, D.R., 1984. Transverse pattern of vegetation on avalanche paths inthe northern Rocky Mountains, Montana. Great Basin Nat. 44, 453–458.
Martin, E., Giraud, G., Lejeune, Y., Boudart, G., 2001. Impact of a climate change on ava-lanche hazard. Ann. Glaciol. 32, 163–167.
McClung, D.M., 1990. A model for scaling avalanche speeds. J. Glaciol. 36, 188–198.McClung, D.M., 2000. Extreme avalanche runout in space and time. Can. Geotech. J. 37,
161–170.McClung, D.M., 2003. Magnitude and frequency of avalanches in relation to terrain and
forest cover. Arct. Antarct. Alp. Res. 35, 82–90.McClung, D.M., Lied, K., 1987. Statistical and geometrical definition of snow avalanche
runout. Cold Reg. Sci. Technol. 13, 107–119.McClung, D.M., Schaerer, P.A., 1985. Characteristics of flowing snow and avalanche impact
pressures. Ann. Glaciol. 6, 9–14.McClung, D.M., Schaerer, P.A., 2006. The avalanche handbook, The Mountaineers
Books3rd Revise ed.Mears, A.I., 1989. Avalanche runout distances and dynamics: current methods and limita-
tions. Avalanche Rev. 7.Mears, A.I., 1992. Snow-avalanche hazard analysis for land-use planning and engineering.
Colo. Geol. Surv. 59.Metropolis, N., Rosenbluth, A.W., Rosenbluth, M.N., Teller, A.H., Teller, E., 1953. Equation
of state calculations by fast computing machines. J. Chem. Phys. 21, 1087–1092.Meunier, M., Ancey, C., 2004. Towards a conceptual approach to predetermining long-
return-period avalanche run-out distances. J. Glaciol. 50, 268–278.Meunier, M., Ancey, C., Naaim, M., 2001. Mise au point d’une méthode de prédétermina-
tion statistique des côtes d'arrêt d'avalanches. La Houille Blanche 92–98.
Mougin, P., 1922. Etudes glaciologiques: Les avalanches en Savoie, Etudes glaciologiques.Imprimerie Nationale, Paris.
Naaim, M., 1998. Contribution to snow drift and avalanches flows modelling. (Habilita-tion thesis) Université Joseph Fourier.
Naaim, M., Naaim-Bouvet, F., Faug, T., Bouchet, A., 2004. Dense snow avalanche modeling:Flow, erosion, deposition and obstacle effects. Cold Reg. Sci. Technol. 39, 193–204.
Naaim, M., Faug, T., Naaim-Bouvet, F., Eckert, N., 2010. Return period calculation and pas-sive structure design at the Taconnaz avalanche path (France). Ann. Glaciol. 51,89–97.
Naaim, M., Durand, Y., Eckert, N., Chambon, G., 2013. Dense avalanche friction coeffi-cients: influence of physical properties of snow. J. Glaciol. 59, 771–782.
Pederson, G.T., Reardon, B.A., Caruso, C.J., Fagre, D.B., 2006. High resolution tree-ringbased spatial reconstructions of snow avalanche activity in glacier national park,Montana, USA. Proceedings of the International Snow ScienceWorkshop ISSW. Tellu-ride, CO, pp. 436–443.
Reardon, B.A., Pederson, G.T., Caruso, C.J., Fagre, D.B., 2008. Spatial reconstructions andcomparisons of historic snow avalanche frequency and extent using tree rings inGlacier National Park, Montana, U.S.A. Arct. Antarct. Alp. Res. 40, 148–160.
Rognon, P.G., Chevoir, F., Bellot, H., Ousset, F., Naaim, M., Coussot, P., 2008. Rheology ofdense snow flows: Inferences from steady state chute-flow experiments. J. Rheol.52, 729.
Salm, B., 1993. Flow, flow transition and runout distances of flowing avalanches. Ann.Glaciol. 18, 221–226.
Salm, B.W., Burkhard, A., Gubler, H.U., 1990. Berechnungen von Fliesslawinen: EineAnleitung für Praktiker mit Beispielen.
Savage, S.B., Hutter, K., 1989. The motion of a finite mass of granular material down arough incline. J. Fluid Mech. 199, 177–215.
Schläppy, R., Jomelli, V., Grancher, D., Stoffel, M., Corona, C., Brunstein, D., Eckert, N.,Deschatres, M., 2013. A new tree-ring-based, semi-quantitative approach for thedetermination of snow avalanche events: use of classification trees for validation.Arct. Antarct. Alp. Res. 45, 383–395.
Schneuwly, D.M., Stoffel, M., Bollschweiler, M., 2009a. Formation and spread of callus tis-sue and tangential rows of resin ducts in Larix decidua and Picea abies followingrockfall impacts. Tree Physiol. 29, 281–289.
Schneuwly, D.M., Stoffel, M., Dorren, L., Berger, F., 2009b. Three-dimensional analysis ofthe anatomical growth response of European conifers to mechanical disturbance.Tree Physiol. 29, 1247–1257.
Stoffel, M., Bollschweiler, M., 2008. Tree-ring analysis in natural hazards research – anoverview. Nat. Hazards Earth Syst. Sci. 8, 187–202.
Stoffel, M., Bollschweiler, M., 2009. Tree-ring reconstruction of past debris flows based ona small number of samples—possibilities and limitations. Landslides 6, 225–230.
Stoffel, M., Hitz, O.M., 2008. Rockfall and snow avalanche impacts leave differentanatomical signatures in tree rings of juvenile Larix decidua. Tree Physiol. 28,1713–1720.
Stoffel, M., Perret, S., 2006. Reconstructing past rockfall activity with tree rings: Somemethodological considerations. Dendrochronologia 24, 1–15.
Stoffel, M., Bollschweiler, M., Hassler, G., 2006. Differentiating past events on a cone influ-enced by debris-flow and snow avalanche activity – a dendrogeomorphologicalapproach. Earth Surf. Process. Landf. 31, 1424–1437.
Stoffel, M., Bollschweiler, M., Butler, D.R., Luckman, B.H., 2010. Tree Rings and NaturalHazards. Springer Netherlands, Dordrecht.
Stoffel, M., Butler, D.R., Corona, C., 2013. Mass movements and tree rings: A guide todendrogeomorphic field sampling and dating. Geomorphology 200, 106–120.
Straub, D., Grêt-Regamey, A., 2006. A Bayesian probabilistic framework for avalanchemodelling based on observations. Cold Reg. Sci. Technol. 46, 192–203.
Takeuchi, Y., Torita, H., Nishimura, K., Hirashima, H., 2011. Study of a large-scale dry slabavalanche and the extent of damage to a cedar forest in the Makunosawa valley,Myoko, Japan. Ann. Glaciol. 52, 119–128.
Teich, M., Bartelt, P., Grêt-Regamey, A., Bebi, P., 2012. Snow avalanches in forested terrain:Influence of forest parameters, topography, and avalanche characteristics on runoutdistance. Arct. Antarct. Alp. Res. 44, 509–519.
Timell, T., 1986. Compression wood in Gymnosperms. Springer, Berlin.Trappmann, D., Stoffel, M., 2013. Counting scars on tree stems to assess rockfall hazards: A
low effort approach, but how reliable? Geomorphology 180–181, 180–186.Van der Burght, L., Stoffel, M., Bigler, C., 2012. Analysis and modelling of tree succession
on a recent rockslide deposit. Plant Ecol. 213, 35–46.Voellmy, A., 1955. Über die Zerstörungskraft den Lawinen. Schweiz. Bauzeitung 73,
159–162 (212–217, 246–249 and 280–285).Vriend, N.M., McElwaine, J.N., Sovilla, B., Keylock, C.J., Ash, M., Brennan, P.V., 2013. High-
resolution radar measurements of snow avalanches. Geophys. Res. Lett. 40, 727–731.Weir, P., 2002. Snow avalanche management in forested terrain. Res. Br., B.C. Min. For,
Victoria, B.C.