Vaidya-etal-2007JMTM18,8pdf
22
Is China’s manufacturing sector becoming more high-tech? Evidence on shifts in comparative advantage, 1987-2005 Kirit Vaidya and David Bennett Aston Business School, Birmingham, UK, and Xiaming Liu Birkbeck College, University of London, London, UK Abstract Purpose – The paper assesses the extent to which China’s comparative advantage in manufacturing has shifted towards higher-tech sectors between 1987 and 2005 and proposes possible explanations for the shift. Design/methodology/approach – Revealed comparative advantage (RCA) indices for 27 product groups, representing high-, medium and low-tech sectors have been calculated. Examination of international market attractiveness complements the RCA analysis. Findings for selected sectors are evaluated in the context of other evidence. Findings – While China maintains its competitiveness in low-tech labour intensive products, it has gained RCA in selected medium-tech sectors (e.g. office machines and electric machinery) and the high-tech telecommunications and automatic data processing equipment sectors. Evidence from firm and sector specific studies suggests that improved comparative advantage in medium and high-tech sectors is based on capabilities developing through combining international technology transfer and learning. Research limitations/implications – The quantitative analysis does not explain the shifts in comparative advantage, though the paper suggests possible explanations. Further research at firm and sector levels is required to understand the underlying capability development of Chinese enterprises and the relative competitiveness of Chinese and foreign invested enterprises. Practical implications – Western companies should take account of capability development in China in forming their international manufacturing strategies. The rapid shifts in China’s comparative advantage have lessons for other industrialising countries. Originality/value – While RCA is a well-known methodology, its application at the disaggregated product group level combined with market attractiveness assessment is distinctive. The paper provides a broad assessment of changes in Chinese manufacturing as a basis for further research on capability development at firm and sector levels. Keywords China, Manufacturing industries, Competitive advantage, Competitive strategy, High-tech sectors Paper type Research paper 1. Introduction China has become something of a model for industrial and economic development since the initiation of the “open door” policy in December 1978. The country’s economic growth, to a great extent driven by the manufacturing sector, has been in the 7 to 10 per cent per annum range since the early 1980s leading to an increase of 350 per cent in The current issue and full text archive of this journal is available at www.emeraldinsight.com/1741-038X.htm JMTM 18,8 1000 Received March 2007 Revised June 2007 Accepted June 2007 Journal of Manufacturing Technology Management Vol. 18 No. 8, 2007 pp. 1000-1021 q Emerald Group Publishing Limited 1741-038X DOI 10.1108/17410380710828307
Transcript of Vaidya-etal-2007JMTM18,8pdf

Is China’s manufacturing sectorbecoming more high-tech?Evidence on shifts in comparative
advantage, 1987-2005
Kirit Vaidya and David BennettAston Business School, Birmingham, UK, and
Xiaming LiuBirkbeck College, University of London, London, UK
Abstract
Purpose – The paper assesses the extent to which China’s comparative advantage in manufacturinghas shifted towards higher-tech sectors between 1987 and 2005 and proposes possible explanations forthe shift.
Design/methodology/approach – Revealed comparative advantage (RCA) indices for 27 productgroups, representing high-, medium and low-tech sectors have been calculated. Examination ofinternational market attractiveness complements the RCA analysis. Findings for selected sectors areevaluated in the context of other evidence.
Findings – While China maintains its competitiveness in low-tech labour intensive products, it hasgained RCA in selected medium-tech sectors (e.g. office machines and electric machinery) and thehigh-tech telecommunications and automatic data processing equipment sectors. Evidence from firmand sector specific studies suggests that improved comparative advantage in medium and high-techsectors is based on capabilities developing through combining international technology transfer andlearning.
Research limitations/implications – The quantitative analysis does not explain the shifts incomparative advantage, though the paper suggests possible explanations. Further research at firmand sector levels is required to understand the underlying capability development of Chineseenterprises and the relative competitiveness of Chinese and foreign invested enterprises.
Practical implications – Western companies should take account of capability development inChina in forming their international manufacturing strategies. The rapid shifts in China’s comparativeadvantage have lessons for other industrialising countries.
Originality/value – While RCA is a well-known methodology, its application at the disaggregatedproduct group level combined with market attractiveness assessment is distinctive. The paperprovides a broad assessment of changes in Chinese manufacturing as a basis for further research oncapability development at firm and sector levels.
Keywords China, Manufacturing industries, Competitive advantage, Competitive strategy,High-tech sectors
Paper type Research paper
1. IntroductionChina has become something of a model for industrial and economic development sincethe initiation of the “open door” policy in December 1978. The country’s economicgrowth, to a great extent driven by the manufacturing sector, has been in the 7 to10 per cent per annum range since the early 1980s leading to an increase of 350 per cent in
The current issue and full text archive of this journal is available at
www.emeraldinsight.com/1741-038X.htm
JMTM18,8
1000
Received March 2007Revised June 2007Accepted June 2007
Journal of Manufacturing TechnologyManagementVol. 18 No. 8, 2007pp. 1000-1021q Emerald Group Publishing Limited1741-038XDOI 10.1108/17410380710828307

GDP per capita between 1980 and the end of the twentieth century. Manufacturing valueadded (MVA) grew by annual average real growth rates of 9.2 and 10.4 per cent,respectively, in the five year periods 1995-2000 and 2000-2005. During the same periods,non-manufacturing GDP grew by 8 and 9 per cent, respectively. As a consequence, theshare of MVA in China’s GDP grew from 33.4 per cent in 1995 to 36.0 per cent in 2005(UNIDO, n.d.). Foreign trade has grown in absolute terms and as a proportion of bothGDP and world exports. Whereas in 1980 exports amounted to only 6 per cent of GDP, by2002 the figure was 22 per cent. China’s share of all world exports grew from 0.9 per centin 1980 to 7.4 per cent in 2005. China’s share of world exports of manufactured goodsmore than tripled from 3.4 to 10.7 per cent between 1995 and 2005.
Economic liberalisation in general and the establishment of special economic zonesand other areas in which foreign firms were offered preferential treatment, enabledChina to take advantage of its low-cost labour factor endowment in line with theHeckscher-Ohlin comparative advantage theory (Yeats, 1989, 1992). The result wasfast growth of exports of low-tech labour intensive products (Chan et al., 1999). Theimportance of foreign invested enterprises as exporters also increased as foreign firmstook advantage of favourable cost and policy conditions. Between 1993 and 2000,foreign direct investment (FDI) accounted for almost 14 per cent of total fixedinvestment (Wei and Liu, 2001). The proportion of Chinese exports of manufacturesfrom foreign invested firms grew from 12.5 per cent in 1990 to 31.5 per cent in 1995 and48 per cent in 2000 (Wei and Liu, 2001). Analysis of data reported in the Almanac ofChina’s Foreign Economic Relations and Trade[1] indicates that around 80 per cent ofFDI was in the form of technology. During the period 1987-2005, there has beensignificant growth of FDI into China. In 1987 utilized FDI was just US$2.31 billion(TCD Trade, 2000) while in 2005 it was US$60.33 billion (USCBC, 2007). At the sametime, both China’s industrial output and exports grew at very nearly the same rate asFDI growth.
During the 1980s, Mainland China “captured” export growth in the textile andclothing sectors from Hong Kong, South Korea and Taiwan, as their labour costsincreased and they developed comparative advantage in more technologicallyadvanced industries (Yang and Zhong, 1996). The aim of Chinese industrial policieshas been to speed up the acquisition of technological capabilities and shift rapidly fromlabour intensive, low-tech production and exports to more advanced technologysectors. Increased international technology transfer through FDI, especially in jointventures, and other forms of collaborations between foreign and Chinese firms wasexpected to play an important role in bringing about this shift. FDI was encouraged bytax incentives which were especially favourable for foreign-invested firms operating inChina’s SEZs and other areas designated for special treatment (Sit, 1985; Bennett et al.,1997).
To support industrial capability development, science and technology (henceforthS&T) policy required state-owned scientific research institutions to:
. become more independent;
. generate technologies which could be applied commercially; and
. create better linkages with state enterprises (Simon and Goldman, 1989; Wang,1993).
China’smanufacturing
sector
1001
Later policy initiatives made higher S&T expenditure commitments, put the onus fordeveloping capabilities on firms, recognised the role of foreign enterprises as providersof technology and supported start-ups of high-tech firms (Ministry of Science andTechnology, 1997; State Economic and Trade Commission, 2002; Chen and Shih, 2005).Further, industrial policy was intended to create “national champions” in importantsectors to acquire technological capabilities by collaborating with foreign enterprisesand become internationally competitive (Nolan, 2001; Thun, 2006).
There is an ongoing debate on whether and to what extent China’s industrialcapabilities and competitiveness are improving. According to Nolan (2005) “China isthe ‘workshop for the world’ rather than the ‘workshop of the world’. . . ”. Its moreadvanced industrial output depends heavily on the foreign companies located thereand indigenous Chinese enterprises spend negligible amounts on research anddevelopment. There is not a single Chinese firm in the world’s top 700 firms byresearch and development expenditure and none of the world’s top 100 brands areChinese. An increase in China’s competitiveness will clearly be of interest to foreigncompanies, especially if they are transferring technology to China through licences orjoint ventures, since in this way they could be providing the very technological andknowledge resources that are needed for local companies to become competitors.Foreign companies that have wholly-owned subsidiaries would also be interested inChina’s competitive position since their own operations there might be influenced bythe relative position of other companies in the same or related industrial sectors.
This paper contributes to the debate on China’s manufacturing capability byexamining evidence on the development of comparative advantage in selected high-,medium- and low-tech sectors to draw some conclusions on the technologicaldevelopment of Chinese manufacturing. This evidence combined with company andsector level findings from previous studies has been used to draw conclusions on threequestions:
(1) To what extent has China made a shift away from low-tech, labour intensivemanufacturing to more advanced manufacturing?
(2) In which sectors has China made the most gains and why?
(3) To what extent China’s industrial development and improvements incompetitiveness follow the East Asian model of developing more advancedcapabilities based on first developing competence in low-tech production andenhancing capabilities by combining foreign technology acquisition, learningand R&D?
The next section examines the changing share of MVA by major sectors to look forevidence for a shift towards more advanced technology sectors. Section 3 presents anddiscusses evidence on shifts in revealed comparative advantage (RCAs) for high-,medium- and low-tech sectors. In Section 4, changes in RCAs for the selected productgroups are compared with the growth and size of the relevant world markets. Therobustness of RCA as an indicator of comparative advantage is also tested in thissection by comparing RCAs with trade balances. Section 5 summarises the findingsand limitations and outlines directions for further research.
JMTM18,8
1002
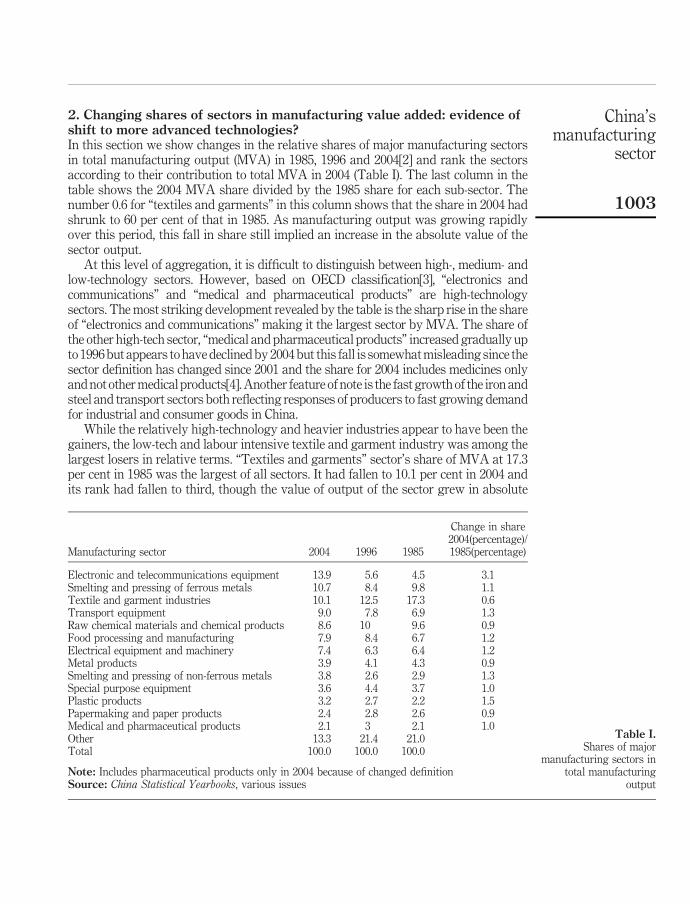
2. Changing shares of sectors in manufacturing value added: evidence ofshift to more advanced technologies?In this section we show changes in the relative shares of major manufacturing sectorsin total manufacturing output (MVA) in 1985, 1996 and 2004[2] and rank the sectorsaccording to their contribution to total MVA in 2004 (Table I). The last column in thetable shows the 2004 MVA share divided by the 1985 share for each sub-sector. Thenumber 0.6 for “textiles and garments” in this column shows that the share in 2004 hadshrunk to 60 per cent of that in 1985. As manufacturing output was growing rapidlyover this period, this fall in share still implied an increase in the absolute value of thesector output.
At this level of aggregation, it is difficult to distinguish between high-, medium- andlow-technology sectors. However, based on OECD classification[3], “electronics andcommunications” and “medical and pharmaceutical products” are high-technologysectors. The most striking development revealed by the table is the sharp rise in the shareof “electronics and communications” making it the largest sector by MVA. The share ofthe other high-tech sector, “medical and pharmaceutical products” increased gradually upto 1996 but appears to have declined by 2004 but this fall is somewhat misleading since thesector definition has changed since 2001 and the share for 2004 includes medicines onlyand not other medical products[4]. Another feature of note is the fast growth of the iron andsteel and transport sectors both reflecting responses of producers to fast growing demandfor industrial and consumer goods in China.
While the relatively high-technology and heavier industries appear to have been thegainers, the low-tech and labour intensive textile and garment industry was among thelargest losers in relative terms. “Textiles and garments” sector’s share of MVA at 17.3per cent in 1985 was the largest of all sectors. It had fallen to 10.1 per cent in 2004 andits rank had fallen to third, though the value of output of the sector grew in absolute
Change in share
Manufacturing sector 2004 1996 19852004(percentage)/1985(percentage)
Electronic and telecommunications equipment 13.9 5.6 4.5 3.1Smelting and pressing of ferrous metals 10.7 8.4 9.8 1.1Textile and garment industries 10.1 12.5 17.3 0.6Transport equipment 9.0 7.8 6.9 1.3Raw chemical materials and chemical products 8.6 10 9.6 0.9Food processing and manufacturing 7.9 8.4 6.7 1.2Electrical equipment and machinery 7.4 6.3 6.4 1.2Metal products 3.9 4.1 4.3 0.9Smelting and pressing of non-ferrous metals 3.8 2.6 2.9 1.3Special purpose equipment 3.6 4.4 3.7 1.0Plastic products 3.2 2.7 2.2 1.5Papermaking and paper products 2.4 2.8 2.6 0.9Medical and pharmaceutical products 2.1 3 2.1 1.0Other 13.3 21.4 21.0Total 100.0 100.0 100.0
Note: Includes pharmaceutical products only in 2004 because of changed definitionSource: China Statistical Yearbooks, various issues
Table I.Shares of major
manufacturing sectors intotal manufacturing
output
China’smanufacturing
sector
1003

terms over this period. Because of the high level of aggregation in Table I, by itself thisevidence on the shift to more advanced technology sectors is not convincing sinceChinese production may be of low-tech products and components within the advancedtechnology sectors. For example, manufacturing of basic calculators, now a relativelylow-technology activity, is part of the “electronics and communications” sector andwhile China is now the world’s largest producer of steel by far, a large proportion ofproduction is low quality basic steels (Brizendine and Oliver, 2001; InterChinaConsulting, 2006).
3. Revealed comparative advantage analysis at a more disaggregated levelThe shortcomings of assessing any shifts in the level of technology from data at theaggregate level have been highlighted at the end of the previous section. Further,changes in shares of production by themselves do not indicate changes in internationalcompetitiveness. Increased production in some sectors may simply be for a protecteddomestic market. Assessment of export performance at a more disaggregated level isneeded to reach more robust conclusions. RCA analysis is one approach for assessingthe relative export performances of sectors.
The RCA index, developed by Balassa (1965), represents a country’s share in worldexports of a given product (or product group) divided by its share in the world exportsof all goods or an appropriate broad category of goods such as manufacturedproducts[5] (Yeats, 1989). For example, if a country has 6 per cent of the world marketin computers, whereas its share of world exports of all products is 2 per cent, the RCAfor computers is 3, i.e. country i’s RCA index for product j is:
RCAij ¼ðXij=XwjÞ
ðXit=XwtÞ
where subscript w denotes world exports and subscript t denotes exports ofall products. The value of the index over 1 indicates that the country has a strongerposition in the world market for computers than its average position for all exportedproducts. The RCA index is also known as the export specialisation index.Conventionally, a country is said to have a RCA in product j if the RCA index has avalue more than one and a revealed comparative disadvantage if the index has a valueless than one. Changes in the RCA index over time indicate improving or decliningcomparative advantage.
The advantages the RCA index offers include:. relative ease of calculation based on limited and readily available data;. ease of interpretation of the evidence; and. examination of trends over time to show changes in comparative advantage.
A disadvantage is that the index does not offer any explanation of changes incomparative advantage. Further, the RCA index may be affected by protectionistmeasures in importing countries or export subsidies, an issue discussed further below.Another limitation of the RCA index is that it is an indicator of comparative advantagebased on exports only, neglecting the import side of trade and the ability of a countryto meet its domestic demand without protection (Lundberg, 1988). This issue has beenaddressed in the next section.
JMTM18,8
1004

Since, the aim of the exercise is to identify shifts in RCA between low-, medium- andhigh-tech sectors, it is necessary to define these categories. The widely acceptedOECD (2005) classification has been used here. R&D intensity defined as directR&D expenditure as a percentage of the value of production of the sector in 12 OECDcountries is used to classify sectors as high-, medium- and low-tech. The latestOECD classification, which uses data for the years 1991-1999, puts five sectors(“aircraft and spacecraft” “pharmaceuticals” “office, accounting and computingmachinery” “radio, TV and communications equipment” and “medical, precision andoptical instruments”) in the high-tech category. R&D intensity of these sectors rangedfrom 13.3 per cent for “aircraft and spacecraft” to 7.7 per cent for “medical, precisionand optical instruments”. There was a clear demarcation between high- andmedium-tech sectors since the R&D intensity of the first medium-tech sector, “electricalmachinery and apparatus” was 3.9 per cent. R&D intensities of the same sectors inChina at present are unlikely to be as high as those in the OECD. Nevertheless, use ofthe OECD classification is justified in the study since higher R&D intensity is areasonable proxy for the pace of technological change as well as the complexity oftechnology which Chinese firms would have to adapt to. Further, it is reasonable toassume that in the long run, Chinese firms would have to match the levels of R&Dintensity in the OECD to attain international competitiveness.
Sources of data for estimating RCAs were various editions of the UN InternationalTrade Statistics Yearbooks. The three-digit level Standard International TradeClassification (SITC) is the most disaggregated level for which comparable data areavailable for a sufficiently broad range of sectors. Since, the SITC classification doesnot precisely match the OECD sector classification, it was necessary to map thethree-digit SITC product groups on to the OECD sectors. Based on the mapping, sixproduct groups at the three-digit level (Table II) were included in the high-techcategory. OECD (2005) classifies radio and television equipment and office machines ashigh-tech. These have been put in the medium-tech category in this study since Chineseproduction in these sectors has been predominantly manufacturing and assemblybased on established technology. A selection of some important medium- and low-techsectors have also been included for comparison. Available data do not allow for a morerefined product classification based on four or five digit levels. Consequently, withinthe high-tech product group, there may be some low-tech products and low-techproduct groups may include some higher-tech products.
Table II lists the product groups separated into high-, medium- and low-techand Table III shows the indices for the product groups for selected years between 1987and 2005. Comparison of the weighted averages of RCAs[6] of the high-, medium- andlow-tech groups highlights two features. The average RCA is the highest for theselected low-tech sectors and the lowest for high-tech sectors indicating that China’sexports are still highly specialised in low-tech sectors. However, the average RCA forthe high-tech sectors is on a rising trend mainly because of increases in RCAs of twoproduct groups. The low-tech sectors’ average RCA is on a falling trend indicating ashift in export specialisation towards high-tech sectors. For medium-tech sectors, theaverage RCA has fluctuated around 2.0 with no apparent trend, possibly because of thevaried performance of product groups in this category. RCAs of selected specificproduct groups, including those in the medium-tech category, are examined in moredetail below.
China’smanufacturing
sector
1005
Two of the high-tech product groups, “automatic data processing” and“telecommunications equipment” show the most striking changes in RCA indicesbetween 1987 and 2005 (Table III). RCA indices for “automatic data processing” roseconsistently from a very low base in 1987 to achieve RCA by 1999 (i.e. RCA indexabove 1) followed by further sharp improvements in later years. This is not necessarilyevidence of improved competitiveness of Chinese companies since a number of foreigncomputer and peripherals manufacturers such as Compaq, IBM, HP and DeltaElectronics (Taiwan) invested in China in the 1990s as a part of global outsourcing ofproducts, components and peripherals and to gain access to the growing Chinesemarket (Asiamoney, 1997). Nevertheless, Chinese enterprises such as Legend andthe Founder Corporation also upgraded their capabilities in the 1990s to manufacturecomputers (principally for the domestic market) and components and peripherals forexport (Business Week, 1997). More recently, Legend (now Lenovo) has transformeditself and established an international brand. In 2004 it strengthened its position in theinternational market for desktop and laptop computers by acquiring IBM’s PCdivision.
High-tech Aircraft and related productsAutomatic data processing equipmentElectro-medical and X-ray equipmentMedicinal and pharmaceutical productsOptical instrumentsTelecommunications equipment, parts andaccessories
Medium-tech Cycles (motorised and non motorised)Electric power machineryElectrical machineryEngines and motorsHousehold type equipmentLorries and other specialised motor vehiclesOffice machinesOther power generating plantsOther road motor vehiclesRadio broadcast receiversRailway vehiclesRotating electric plantsShips and boats, etc.Sound recorders, phonographsTelevision receivers
Low-tech FootwearToys, sporting goods and related productsWomen’s outerwear (not knit)Travel goods and handbagsToolsWatches and clocks
Notes: Within each product group in Table II there may be some products which do not fall within thetechnology levels assigned. For example, tools have been classified as low-tech, but they may includehigh-tech precision tools. Similarly, watches and clocks could include high precision electroniccomponents and products
Table II.Product groups in thestudy
JMTM18,8
1006

“Telecommunications equipment” (SITC 764) also started from comparativedisadvantage in 1987 and is the only other high-tech product group to achieveadvantage during the period. Both exports and imports of SITC 764 consisted mainlyof “telecommunications parts and sound equipment” (SITC 7649) during the 1990s.More recently, exports of “transmission apparatus for radio-telephony” (SITC 7643)have become equally important. In 2005, these two groups accounted for over 77 percent of all of China’s “telecommunications equipment” exports. Although exports ofthis sector were growing, imports were also large in the 1990s leading to persistenttrade deficits possibly because of reliance on imports for more advanced products. Inboth 2003 and 2005, China had significant trade surpluses in this sector.
SITC No. 1987 1991 1995 1999 2003 2005
High-tech product groups541 Medicinal and pharmaceutical products 1.00 0.89 0.73 1.08 0.67 0.46752 Automatic data processing equipment 0.03 0.10 0.62 1.17 2.61 2.64
764Telecommunications equipment, parts andaccessories nes 0.27 0.54 1.15 1.20 1.61 1.65
774 Electro-medical and X-ray equipment 0.02 0.11 0.11 0.09 0.20 0.22792 Aircraft and related products 0.12 0.02 0.07 0.12 0.05 0.05871 Optical instruments 0.20 0.39 1.35 1.75 2.26 2.46
Weighted mean (high-tech) 0.70 0.65 0.91 1.17 2.13 2.16Medium-tech product groups714 Engines and motors nes 0.01 0.02 0.03 0.04 0.04 0.05716 Rotating electric plants 0.46 0.83 1.44 1.46 1.11 0.93718 Other power generating plants 0.07 0.13 0.27 0.20 0.17 0.20751 Office machines 0.64 0.74 1.81 2.41 2.68 2.91761 Television receivers 1.23 1.80 1.18 0.87 1.23 1.37762 Radio broadcast receivers 3.92 5.21 3.80 4.04 2.60 1.92763 Sound recorders, phonographs 0.09 0.35 1.52 2.06 3.27 3.07771 Electric power machinery nes 0.17 0.76 2.35 2.59 1.98 1.75775 Household type equipment nes 0.27 0.98 2.11 2.10 2.11 1.92778 Electrical machinery nes 0.35 0.54 1.05 1.28 1.23 1.06782 Lorries, special motorised vehicles nes 0.02 0.04 0.08 0.03 0.05 0.08783 Road motor vehicles nes 0.01 0.04 0.02 0.04 0.03 0.10785 Cycles (motorised and non-motorised) 0.75 2.10 1.94 2.08 2.23 1.72791 Railway vehicles 0.06 0.09 0.32 0.34 0.19 0.31793 Ships, boats and related products 0.52 0.59 0.81 0.96 0.76 0.63
Weighted mean (medium-tech) 1.98 2.50 1.97 2.02 2.01 1.83Low-tech product groups695 Tools 3.11 1.49 1.60 1.19 1.00 0.94831 Travel goods and handbags 3.81 2.86 6.55 7.73 3.81 2.94842 Women’s outerwear (not knit) 4.04 3.84 6.09 3.93 2.80 2.31851 Footwear 1.55 4.82 5.14 5.51 3.20 2.78885 Watches and clocks n.a. 3.36 2.95 3.00 1.20 0.74894 Toys, sporting goods and related products 3.40 4.99 5.01 6.35 3.69 3.02
Weighted mean (low-tech) 3.28 4.26 5.19 5.40 3.16 2.62
Notes: nes – not elsewhere specified; n.a. – not availableSource: Authors’ calculations from data in various issues of UN International Trade StatisticsYearbooks
Table III.RCA, 1987-2005: selected
product groups
China’smanufacturing
sector
1007
The rising RCA, the large volume of trade in parts and imports indicate integrationof the Chinese telecommunications sector with the world industry and strong domesticdemand for telecommunications equipment. Until recently most of the exports haveconsisted of relatively low-tech products and components such as analog switches andhand-sets with more advanced products being imported (Tan, 2002). However, there isincreasing evidence of upgrading of capabilities in this sector as demonstrated by thegrowth of exports of mobile telephony equipment and the recent trade surpluses.Evidence from European telecommunications companies in an earlier study (Bennettet al., 2001) suggests that participation in joint ventures has enabled a number ofChinese manufacturers to develop the capability to copy advanced technology foreignproducts and cut the technological lead of foreign enterprises. Optical instruments alsoshowed a sharp rise in RCA but imports of such instruments were much larger thanexports throughout the period.
The “medical and pharmaceutical products” group started with the RCA index veryclose to 1, fluctuated until the end of the twentieth century since when the RCA hasfallen. This group includes traditional Chinese medicines as well as Westernpharmaceutical products. The relatively high earlier RCAs were possibly because ofstrength in traditional medicines. The later changes in RCA are explained by poorerexport performance in Western medicines (CIEC, 1998). According to Nolan (2001),Sanjiu has been successful in the domestic pharmaceuticals market and as an exporterby specialising in traditional medicines while the pharmaceutical sector overallremains fragmented and unable to compete globally, though in the late 1990s the sectorbenefited from higher exports of non-patented generic medicines and collaborationswith foreign producers seeking to benefit from lower costs.
RCA indices for “aircraft and related products” were very low throughout theperiod. Much of the activity in this sector was negotiated off-set production thoughsome foreign manufacturers also took advantage of low labour costs to manufactureparts and assemble complete aircraft for domestic and export markets (Mecham, 1993;Smith, 1991; Proctor, 1992). China has made several attempts to develop the civilaircraft manufacturing by restructuring enterprises and seeking collaborations withforeign firms. Given the dominance of the two major players (Boeing and Airbus) in theglobal civil aircraft market and the high R&D and specialist knowledge requirements,the restructuring efforts have not been successful and Chinese enterprises operatemainly as sub-contractors for foreign firms (Nolan, 2001). “Electro-medical and X-rayequipment” also had consistently low RCA indices for the whole sample period thoughthere has been some improvement in later years from a very low base with foreigncompanies such as Siemens and their Chinese partners developing export markets.
In Table III, RCAs for medium-tech groups are mixed. To identify some patterns,Table IV reorganises these groups according to their RCA levels and trends into thefollowing broad categories:
. consistently low RCAs throughout the period;
. change from disadvantage to advantage – moderate rise;
. change from disadvantage to advantage – sharp rise; and
. advantage throughout the period.
JMTM18,8
1008

SIT
CM
ediu
m-t
ech
pro
du
ctg
rou
ps
1987
1991
1995
1999
2003
2005
714
En
gin
esan
dm
otor
sn
es0.
010.
020.
030.
040.
040.
05C
onsi
sten
tly
low
718
Oth
erp
ower
gen
erat
ing
pla
nts
0.07
0.13
0.27
0.20
0.17
0.20
Con
sist
entl
ylo
w78
2L
orri
es,
spec
ial
mot
oris
edv
ehic
les
nes
0.02
0.04
0.08
0.03
0.05
0.08
Con
sist
entl
ylo
w78
3R
oad
mot
orv
ehic
les
nes
0.01
0.04
0.02
0.04
0.03
0.10
Con
sist
entl
ylo
w79
1R
ailw
ayv
ehic
les
0.06
0.09
0.32
0.34
0.19
0.31
Con
sist
entl
ylo
w79
3S
hip
s,b
oats
and
rela
ted
pro
du
cts
0.52
0.59
0.81
0.96
0.76
0.63
Con
sist
entl
ylo
w71
6R
otat
ing
elec
tric
pla
nts
0.46
0.83
1.44
1.46
1.11
0.93
Dis
adv
anta
ge
toad
van
tag
e–
mod
erat
eri
se77
8E
lect
rica
lm
ach
iner
yn
es0.
350.
541.
051.
281.
231.
06D
isad
van
tag
eto
adv
anta
ge
–m
oder
ate
rise
785
Cy
cles
(mot
oris
edan
dn
on-m
otor
ised
)0.
752.
101.
942.
082.
231.
72D
isad
van
tag
eto
adv
anta
ge
–m
oder
ate
rise
751
Offi
cem
ach
ines
0.64
0.74
1.81
2.41
2.68
2.91
Dis
adv
anta
ge
toad
van
tag
e–
shar
pri
se76
3S
oun
dre
cord
ers,
ph
onog
rap
hs
0.09
0.35
1.52
2.06
3.27
3.07
Dis
adv
anta
ge
toad
van
tag
e–
shar
pri
se77
1E
lect
ric
pow
erm
ach
iner
yn
es0.
170.
762.
352.
591.
981.
75D
isad
van
tag
eto
adv
anta
ge
–sh
arp
rise
775
Hou
seh
old
typ
eeq
uip
men
tn
es0.
270.
982.
112.
102.
111.
92D
isad
van
tag
eto
adv
anta
ge
–sh
arp
rise
761
Tel
evis
ion
rece
iver
s1.
231.
801.
180.
871.
231.
37A
dv
anta
ge
thro
ug
hou
t76
2R
adio
bro
adca
stre
ceiv
ers
3.92
5.21
3.80
4.04
2.60
1.92
Ad
van
tag
eth
rou
gh
out
Notes:
nes
–n
otel
sew
her
esp
ecifi
ed;
n.a
.–
not
avai
lab
le
Table IV.Differences in RCA
trends for medium-techproducts, 1987 to 2005
China’smanufacturing
sector
1009
There is some arbitrariness in these broad categories. For example, the “consistentlylow” category includes products with very low RCAs (“engines and motors” “lorriesand special motorised vehicles” “road motor vehicles” and “other power generatingplants”) as well as two product groups (“railway vehicles and ships” “boats and relatedproducts”) with somewhat higher RCAs.
The very low-RCA category includes sectors which typically require high levels ofinvestment for production and product development. The most striking examples arethe road motor vehicles and lorries sectors which are dominated by a few multinationalcompanies which organise their production and suppliers on a global basis to serve themajor markets of North America, Western Europe and East Asia (Dicken, 2007). Inthe 1990s, the Chinese industry was highly fragmented with over a 100 vehiclemanufacturers producing basic vehicles using outmoded product and processtechnologies for the domestic market. For a number of them, the markets were confinedwithin provinces. While the government industrial strategy identified automotive asan industry of strategic importance in the early 1990s and announced plans forrestructuring it with an important role for joint ventures with foreign enterprises(Campbell Haynes, 1995), international vehicle manufacturers saw China as a relativelysmall but fast growing market (Economist Intelligence Unit, 1997). Foreign companies’investments in China were primarily to access a potentially important market(McClellan and Smith, 1997; Harwit, 1995). In the twenty-first century, the automotiveindustry has grown rapidly and there has been consolidation in the sector, partlybecause of government policy to encourage formation of groups and partly because ofmarket forces (Thun, 2006). JVs with foreign companies dominate the list of major carmanufacturers producing cars primarily for the fast growing domestic market withvery limited exports.
The term, “change from disadvantage to advantage – moderate rise” has been usedin Table IV for product groups whose RCAs were below 1 in 1987 and have risen by afactor of 3 or less between 1987 and 2005. Products in the “change from disadvantageto advantage – sharp rise” category typically started with very low RCAs but theincreases over the period ranged between a factor of about 4.6 (office machines) to afactor of 34 (sound recorders and phonographs). RCAs for “television receivers” and“radio broadcast receivers” remained above 1 throughout the period with indices forradios significantly higher than those for televisions[7]. Although China has had acomparative advantage in “cycles” (SITC 785) since the early 1990s, about 70 per centof exports are of non-motorised bicycles, low rather than medium-technology products.
The products with high and improving RCAs in the medium-tech category havesome distinctive features. Some are in the consumer electronic and electrical goodssectors (e.g. “sound recorders and phonographs” “household type equipment” and“television and radio broadcast receivers”) and the remainder in light electricalmachinery (“rotating electric plant” and other electrical machinery). A large number ofstate enterprises acquired technology to manufacture televisions and other consumerelectronics products in the 1980s. By 1987, China had become the world’s largestproducer of television receivers (Dicken, 2007) though much of the production initiallywas for the domestic market. According to Chinese Government figures, the electronicsindustry was growing at 20 per cent per year in the early 1990s and value of annualexports of electronics products grew from about US$6.9 billion in 1992 (O’Kane, 1994)to US$24 billion in 1997. Foreign investment in special economic zones and
JMTM18,8
1010
restructuring and technological upgrading of some state enterprises increased exportsof products and components in these product groups under sub-contractingarrangements or OEM (WTEC, 1997). For other medium-tech sectors such as“household type equipment” and “electrical machinery” also, China offers a low-costproduction base for OEM and sub-contracting arrangements though a number of firmssuch as Haier and Konka have begun to export consumer products under their ownbrand names.
As expected, RCAs for all the low-tech sectors are well above 1 (Table III). “Travelgoods and handbags” “women’s outerwear” “footwear” and “toys and sporting goods”are traditional low-tech, unskilled and semi-skilled labour intensive export products inwhich China has high and rising RCAs throughout the study period. The mainexplanation for this is use of China as a low labour cost export base by foreign firmsthrough sub-contracting, wholly-owned subsidiaries or joint ventures.
As noted above, RCA values may be distorted by government interventions such asexport subsidies and trade barriers in export markets. Assessments of the significanceof export subsidies and other policy interventions in China indicate that they have beendeclining in importance since 1979 and so the RCA indices and other indicators of tradeperformance for manufactured products broadly reflect changes in competitiveness(Foster, 1998; Zhang, 2000). Chinese goods, notably garments and footwear, whichhave a strong price advantage because of cheap labour, have faced trade barriers inexport markets during the period of the study. In spite of these barriers, the evidenceshows that China continues to have strong RCA in low-tech labour-intensive products.Arguably, their RCAs may have been even greater without the trade barriers. Ingeneral, the world economy has remained open to Chinese exports which have grownrapidly and therefore the broad findings on RCA levels and trends in this study areunlikely to have been seriously affected by international trade barriers.
4. RCAs, world market attractiveness and the balance of tradeRCA indices for product groups do not show the level of exports and their importancefor the economy. For example, a high RCA for a product group with low world exportsmay represent lower exports than a lower RCA in a product group with larger worldexports. Further, an increase in RCA may not represent an increase in exports. A fall intotal world exports of a product while the country maintains its level of exports wouldlead to an increase in the RCA index. Therefore, high and/or growing RCA in a productgroup with large and growing world exports represents a stronger performance anda greater contribution to economic growth than a similar RCA in a smaller and slowergrowing market.
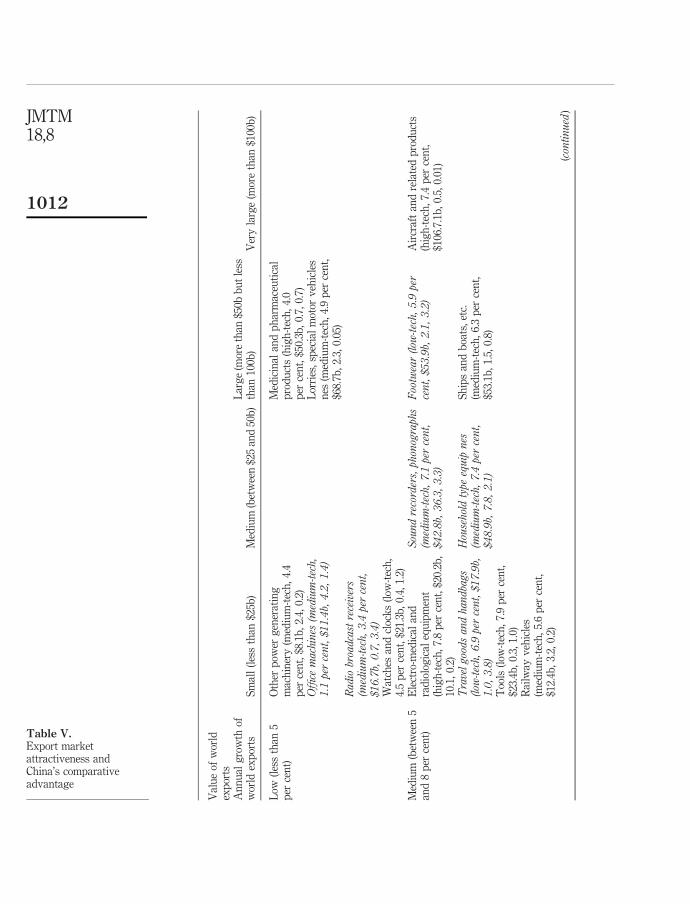
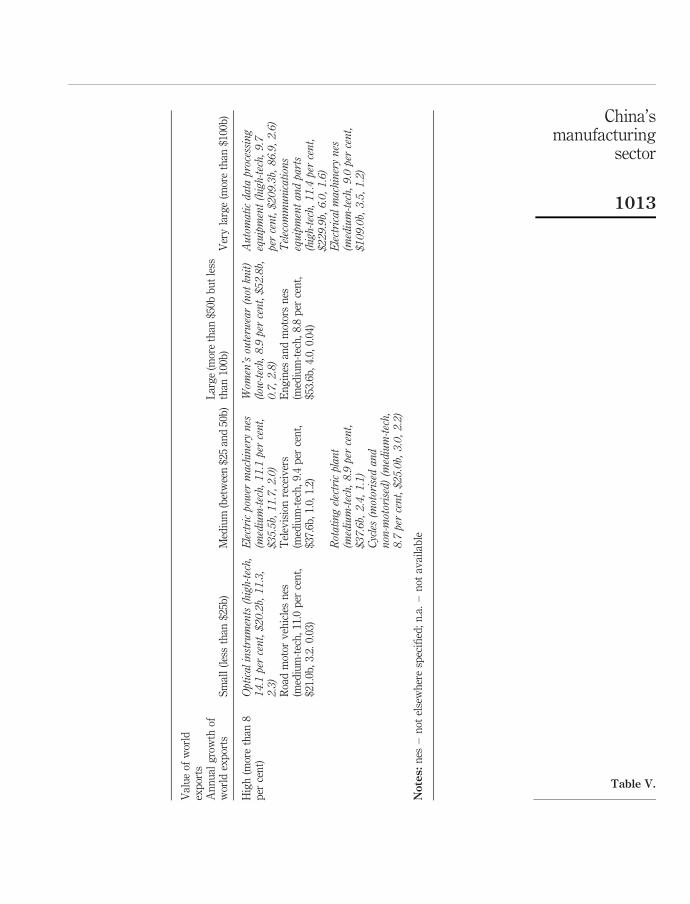
Examining changes in RCAs at the product group level alongside evidence on thesize and growth of world exports for the products over the same period provides abetter understanding of the impact of changes in the manufacturing sector on theeconomy (Table V). For each product group in Table V, the numbers in brackets are,respectively, annual world export growth in per cent between 1987 and 2003[8], the sizeof world exports in billion US$s in 2003 (from UN International Trade StatisticsYearbooks), the 2003 RCA index divided by the 1987 RCA index as an indicator of theshift in China’s RCA over this period, and the RCA index in 2003. The first-two(i.e. growth and size of world exports) are indicators of world market attractiveness,while the last two are indicators of China’s comparative advantage. For example, for
China’smanufacturing
sector
1011
Val
ue
ofw
orld
exp
orts
An
nu
alg
row
thof
wor
ldex
por
tsS
mal
l(l
ess
than
$25b
)M
ediu
m(b
etw
een
$25
and
50b
)L
arg
e(m
ore
than
$50b
bu
tle
ssth
an10
0b)
Ver
yla
rge
(mor
eth
an$1
00b
)
Low
(les
sth
an5
per
cen
t)O
ther
pow
erg
ener
atin
gm
ach
iner
y(m
ediu
m-t
ech
,4.
4p
erce
nt,
$8.1
b,
2.4,
0.2)
Med
icin
alan
dp
har
mac
euti
cal
pro
du
cts
(hig
h-t
ech
,4.
0p
erce
nt,
$50.
3b,
0.7,
0.7)
Office
machines
(medium-tech,
1.1
percent,$11.4b,
4.2,1.4)
Lor
ries
,sp
ecia
lm
otor
veh
icle
sn
es(m
ediu
m-t
ech
,4.
9p
erce
nt,
$68.
7b,
2.3,
0.05
)Radio
broadcastreceivers
(medium-tech,3.4
percent,
$16.7b,
0.7,3.4)
Wat
ches
and
cloc
ks
(low
-tec
h,
4.5
per
cen
t,$2
1.3b
,0.
4,1.
2)M
ediu
m(b
etw
een
5an
d8
per
cen
t)E
lect
ro-m
edic
alan
dra
dio
log
ical
equ
ipm
ent
(hig
h-t
ech
,7.
8p
erce
nt,
$20.
2b,
10.1
,0.
2)
Soundrecorders,phonographs
(medium-tech,7.1
percent,
$42.8b,
36.3,3.3)
Footwear(low
-tech,5.9
per
cent,$53.9b,
2.1,3.2)
Air
craf
tan
dre
late
dp
rod
uct
s(h
igh
-tec
h,
7.4
per
cen
t,$1
06.7
.1b
,0.
5,0.
01)
Travelgoodsandhandbags
(low
-tech,6.9
percent,$17.9b,
1.0,3.8)
Householdtype
equip
nes
(medium-tech,7.4
percent,
$48.9b,
7.8,2.1)
Sh
ips
and
boa
ts,
etc.
(med
ium
-tec
h,
6.3
per
cen
t,$5
3.1b
,1.
5,0.
8)T
ools
(low
-tec
h,
7.9
per
cen
t,$2
3.4b
,0.
3,1.
0)R
ailw
ayv
ehic
les
(med
ium
-tec
h,
5.6
per
cen
t,$1
2.4b
,3.
2,0.
2)
(continued
)
Table V.Export marketattractiveness andChina’s comparativeadvantage
JMTM18,8
1012
Val
ue
ofw
orld
exp
orts
An
nu
alg
row
thof
wor
ldex
por
tsS
mal
l(l
ess
than
$25b
)M
ediu
m(b
etw
een
$25
and
50b
)L
arg
e(m
ore
than
$50b
bu
tle
ssth
an10
0b)
Ver
yla
rge
(mor
eth
an$1
00b
)
Hig
h(m
ore
than
8p
erce
nt)
Opticalinstruments(high-tech,
14.1
percent,$20.2b,
11.3,
2.3)
Electricpower
machinerynes
(medium-tech,11.1
percent,
$35.5b,
11.7,2.0)
Wom
en’souterw
ear(not
knit)
(low
-tech,8.9
percent,$52.8b,
0.7,2.8)
Automaticdata
processing
equipment(high-tech,9.7
percent,$209.3b,
86.9,2.6)
Roa
dm
otor
veh
icle
sn
es(m
ediu
m-t
ech
,11
.0p
erce
nt,
$21.
0b,
3.2.
0.03
)
Tel
evis
ion
rece
iver
s(m
ediu
m-t
ech
,9.
4p
erce
nt,
$37.
6b,
1.0,
1.2)
En
gin
esan
dm
otor
sn
es(m
ediu
m-t
ech
,8.
8p
erce
nt,
$53.
6b,
4.0,
0.04
)
Telecom
munications
equipmentandparts
(high-tech,11.4
percent,
$229.9b,
6.0,1.6)
Rotatingelectricplant
(medium-tech,8.9
percent,
$37.6b,
2.4,1.1)
Electricalmachinerynes
(medium-tech,9.0
percent,
$109.0b,
3.5,1.2)
Cycles(m
otorised
and
non-m
otorised)(m
edium-tech,
8.7
percent,$25.0b,
3.0,2.2)
Notes:
nes
–n
otel
sew
her
esp
ecifi
ed;
n.a
.–
not
avai
lab
le
Table V.
China’smanufacturing
sector
1013
the medium-tech “office machines” product group the annual rate of growth in worldexports was 1.1 per cent, the value of world exports in 2003 was US$11.4 billion, theRCA increased 4.2 fold between 1987 and 2003, and the RCA in 2003 was 1.4. Theproduct groups with either a large improvements in RCA (at least a doubling of RCA)between 1987 and 2003 and RCA . 1 in 2003, or those demonstrating a high RCA(RCA . 2) in 2003, have been shown in italics in Table V.
Among the high-tech product groups, China’s strongest performance is intelecommunications equipment and automatic data processing equipment. These arealso the two product groups with the highest world market attraction indicators,shown by their world export growth and the size of the world export market.Arguably, shift of comparative advantage in favour of these sectors has had ahigher impact on the Chinese economy than if the shift had been in favour of productsin smaller, slower growing markets. Matthews (2001) observes that the earlier EastAsian industrialisers had better opportunities to expand production and catch up oncapabilities in sectors with fast growing markets and rapid technological change. Moredetailed studies are required to investigate whether this could also be an explanationfor China’s strong performance in these two sectors. The table also shows a number oflow and medium-tech product groups in which China has comparative advantagethat fall into medium and high export attractiveness categories (e.g. “officemachines” “sound recorders and phonographs” “household type equipment” “men’souterwear” “toys and sporting goods” “rotating electric plant” “electric powermachinery” “footwear” and “electrical machinery”) indicating that China’s comparativeadvantage is becoming more broadly based.
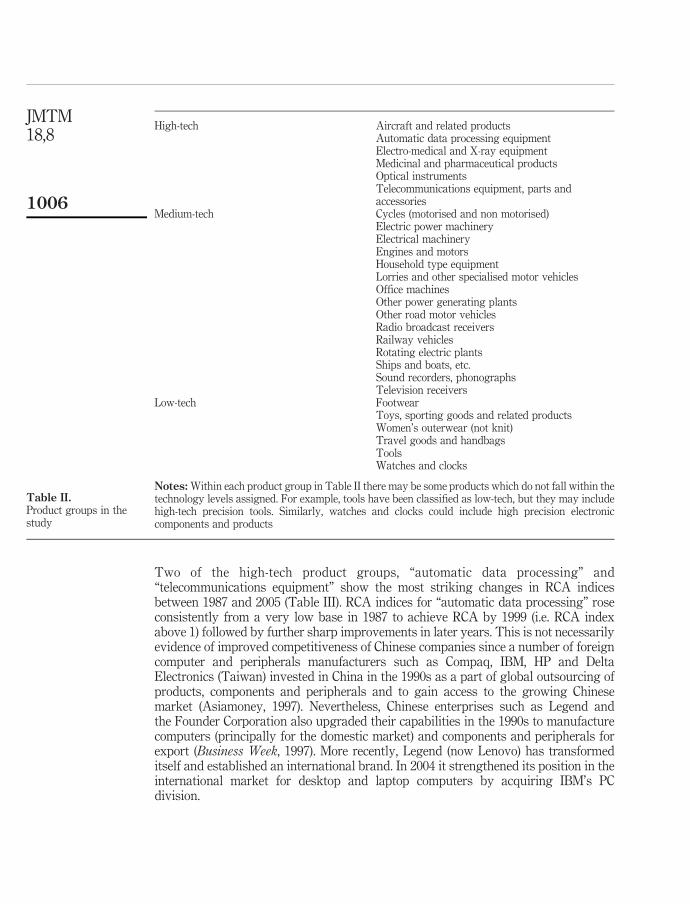
As noted earlier, the RCA index provides an indicator of comparative advantage ina product based on exports specialisation. By itself the index does not give a fullpicture of international competitiveness. A country may be a significant exporter of aproduct but may be an even larger importer. Therefore, trade balances (i.e. exports lessimports) for each product group have been calculated and plotted against RCA indicesfor 2005 to produce a more balanced picture[9]. The scatter diagram in Figure 1 shows apositive correlation (r 2 ¼ 0.48) between RCA indices and trade balances in 2005.“Automatic data processing” and “telecommunications equipment” the two high-techproduct groups with high RCAs also generate the highest trade surpluses. Otherproduct groups contributing large surpluses and RCAs in excess of 1.5 were “toys,sporting goods and related products” “footwear” “sound recorders, phonographs”“women’s clothing” and “household equipment”.
At the other end, a number of product groups (including “aircraft and relatedproducts” “road motor vehicles” and “lorries and specialised motor vehicles”) withRCA indices below 0.5 either have small trade surpluses or deficits. “Opticalinstruments” with a relatively high RCA and a high trade deficit is an exceptionrequiring further investigation. In general, the positive relationship between RCAindices and the trade balance shows that for products for which China has high RCAs,Chinese producers also have a strong position in the domestic market. It is thereforereasonable to conclude that RCAs are robust indicators of internationalcompetitiveness, though the trade balances may overstate competitiveness in thedomestic market because of protection.
JMTM18,8
1014
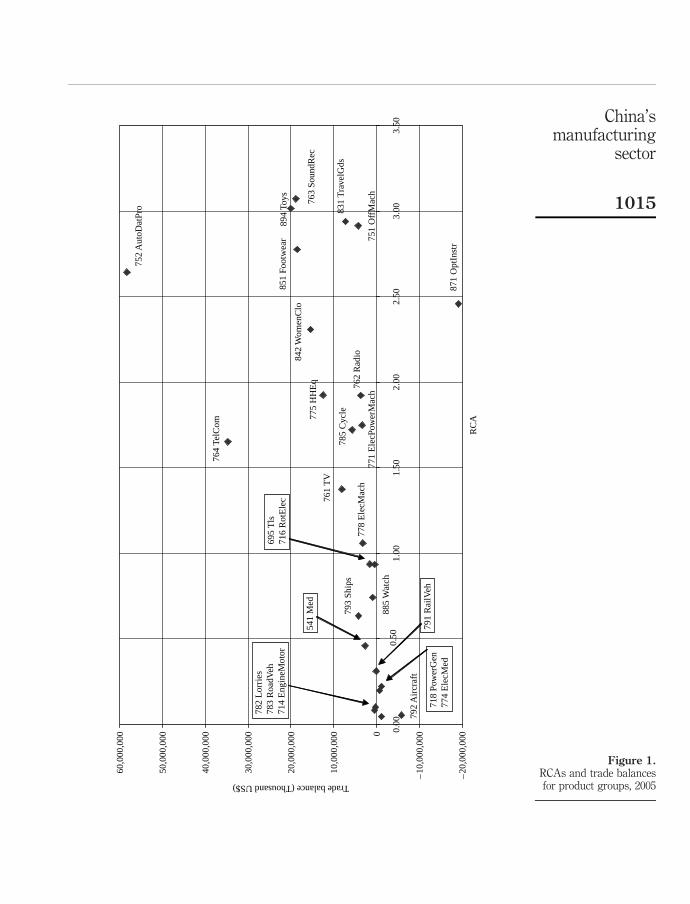
Figure 1.RCAs and trade balancesfor product groups, 2005
–20
,000
,000
–10
,000
,0000
10,0
00,0
00
20,0
00,0
00
30,0
00,0
00
40,0
00,0
00
50,0
00,0
00
60,0
00,0
00
0.00
0.50
1.00
1.50
2.00
2.50
3.00
3.50
RC
A
Trade balance (Thousand US$)
752
Aut
oDat
Pro
764
TelC
om
763
Soun
dRec
894
Toys
851
Foot
wea
r
831
Tra
velG
ds
751
Off
Mac
h
871
Opt
Inst
r
842
Wom
enC
lo
775
HH
Eq 76
2 R
adio
771
Ele
cPow
erM
ach
785
Cyc
le
761
TV
778
Ele
cMac
h
695
Tls
716
Rot
Ele
c
885
Wat
ch
793
Ship
s
541
Med
791
Rai
lVeh
792
Air
craf
t
718
Pow
erG
en77
4 E
lecM
ed
782
Lor
ries
783
Roa
dVeh
714
Eng
ineM
otor
China’smanufacturing
sector
1015

5. RCA indices and other evidence on manufacturing capability in China:conclusionsReturning to the questions posed at the end of the Section 1, this paper has providedquantitative evidence of the outcome of the process of developing manufacturingcapability in the form of RCA shifting in favour of some high-tech and medium-techsectors. The progressive specialisation in electronics and electrical products andtelecommunications is consistent with China following the East Asian latecomer pathin which early industrial development was based on gaining efficient manufacturingcapabilities in:
. consumer product industries with relatively low-technology requirements; and
. low-tech labour intensive production processes in advanced technology sectorseventually leading to more advanced production and competencies.
As noted earlier, the quantitative evidence does not indicate how much of the shift inRCA towards high- and medium-tech sectors can be attributed to foreign firms andhow much to Chinese firms. Nor does it provide insights into the processes by whichChinese forms are developing capabilities and competitiveness. In depth studies at thesector and firm level are required to address these questions. Building on earlierliterature on organisational learning and capability development, a number of authorsincluding Lall (1992), Amsden (2001), Matthews (2001) and Bennett and Vaidya (2005)have identified levels of manufacturing capabilities and approaches to developingthem adopted by East Asian late industrialisers. This body of knowledge is relevantfor studying Chinese capability development.
However, a distinction should be made between two types of sectors when studyingcapability development in Chinese manufacturing. Type one are light consumer andindustrial products for export sectors which started with relatively low-techproduction under sub-contracting or in foreign-Chinese JVs. Development ofcapabilities and comparative advantage in these sectors has been throughsub-contracting or joint venture relationships with foreign firms, which provided therequired technological knowledge, world market access and new capital (Leung et al.,1991; Lan, 1996; Thorburn and Howell, 1995). Essential requirements for the success oftype one sectors have been:
. a favourable policy regime;
. domestic firms and sectors with the basic capabilities to respond to world marketdemand and use the comparative cost advantage offered by the country’s factorendowments; and
. inward FDI flows to take advantage of favourable cost and policy conditions.
Type two sectors produce consumer or industrial products such as cars, machine tools,specialist electronics and steel initially for the domestic market. In such sectors,Chinese firms have used the leverage of the domestic market to acquire foreigntechnology. As Matthews (2001), Kim (1997) and Hobday (1995) show, in both types ofsectors, gaining internationally comparable and competitive capabilities requiresdeepening of firm level know how through learning and R&D. For three of the secondtype of sectors (automotive, machine tools and steel), Bennett et al. (2006) have adaptedthe East Asian learning model to study capability development at the enterprise level.The automotive case study companies have been effective in leveraging mature
JMTM18,8
1016
technology from foreign joint venture partners but their ability to break intoinnovation appears to be limited. Kim (1998) contrasts Hyundai in Korea whichacquired technology from foreign companies and personnel but resolved not to enterinto joint ventures, with Daewoo, which did, and concludes that Hyundai’s approach todeveloping capabilities through internal efforts was more effective in creatinginnovative capacity than that of Daewoo. The Chinese automotive companies appear tobe in a position similar to Daewoo in this respect.
A specialist steel company producing steel tubes for the oil sector has attainedcapability comparable to international competitors through its own R&D efforts,purchase of advanced foreign equipment and use of market leverage on its mainsupplier of equipment to collaborate in innovation. One of the machine tools case studycompanies has acquired its long-term foreign co-production partner and expects tostrengthen its technical and innovative competence based on the acquisition. In allthese cases, direct government support or sector level and internal restructuring withinenterprises have been important.
The process of leveraging acquisition of technology from foreign companiesthrough market access in a high-tech and initially domestic market-oriented sector canbe seen in the telecommunications sector. The initial government approach to twoEuropean companies (Siemens and Alcatel) to set up joint ventures to produce switcheswas a clear case of using the potential market and favourable treatment to attractinvestment and technology transfer (Tan, 2002). Initially, the government restrictedentry of more foreign manufacturers of telecommunications equipment but theserestrictions served to heighten the interest of the excluded firms and when therestrictions were removed, others followed. A number of domestic suppliers such asHuawei and EastCom have also started producing and exporting less advancedtelecommunications equipment.
China has been upgrading and equipping its telecommunications networks withthe most modern systems such as synchronous digital hierarchy equipment for longdistance transmission and global system for mobile telecommunications in recentyears (Tan, 2002). Bennett et al. (2001) showed that for two major Europeantelecommunications equipment companies, China had become the largest singlemarket for a range of products. However, because the market is large with highgrowth potential, they also faced fierce competition from companies from the USA(Motorola) and Japan (Fujitsu) and therefore local production and technologytransfer are parts of the strategy for maintaining a strong position in the market.There are ten foreign-invested plants making cellular mobile telephones, amongwhich one is a wholly-owned foreign subsidiary and eight are majorityforeign-owned joint ventures. Chinese telecommunications manufacturers (jointventure partners and others) have acquired the ability to copy foreign products andadapt them to the local market. One of the European companies estimated that insome areas, the technology of the most capable Chinese enterprises lags about oneyear behind that of Western companies.
The RCA indices and supporting evidence on capability development cited above,albeit piecemeal, suggest that Nolan’s (2005) rather downbeat view on Chinesemanufacturing capability cited in the introduction does not fully reflect the continuingevolution of manufacturing in China. Given the differences between sectors andstrategies of enterprises and evolving government industrial policies, Chinese
China’smanufacturing
sector
1017

manufacturing is likely to encompass a rich range of trajectories on which furthersystematic research at the sector and firm levels is required.
Notes
1. The annual Almanac of China’s Foreign Economic Relations and Trade, published by theformer Ministry of Foreign Trade and Economic Cooperation (MOFTEC) provided data onthe value of technology imported into China. However, the China Commerce Yearbook,published by the Ministry of Commerce (MOFTEC’s successor) does not show thisinformation.
2. The year 2004 is the last for which the data on manufacturing value added by sector areavailable. Chinese statistics on MVA do not conform to the UN standard industrialclassification. The Chinese classification is used here because it provides data on electronicand telecommunication equipment and medical pharmaceutical products while UNIDOstatistics do not include data for these categories at this level of aggregation.
3. The basis on which they are classified as high-tech is indicated in the next section.
4. The share of this sector in total manufacturing value added was 4 per cent in 2001,i.e. showing an increase over 1996.
5. As the concern of this paper is with comparative advantage of manufacturing sub-sectors,the value of exports of all manufactured products has been used as the base in calculatingthe RCA indices. All products would include agricultural and other primary products.
6. The RCAs have been weighted by the value of exports of each product group to obtainweighted averages.
7. The exception to this general statement is the RCA for “television receivers” in 1999 possiblybecause of a revision in the products included in the group.
8. The calculations are not extended to 2005 because export data in the latest available UNInternational Trade Statistics Yearbook for some countries for this year were either subjectto revision or not available.
9. There are more complex indices such as the net trade ratio, which incorporates exports andimports, and the international competitiveness index which incorporates domesticconsumption and production as well as exports and imports (Lundberg, 1988). Both theindices have associated problems, namely distortions if the domestic market is protected andavailability of compatible domestic production and consumption data. The simple balance ofpayments as an indicator is chosen here for a broad comparison while recognising thatimports are subject to distortion because of protection.
References
Amsden, A. (2001), The Rise of “the Rest”: Challenges to the West from Late-IndustrializingEconomies, Oxford University Press, Oxford.
Asiamoney (1997), “Electronics related China plays”, Asiamoney, September, pp. 11-16.
Balassa, B. (1965), “Trade liberalisation and ‘revealed’ comparative advantage”, The ManchesterSchool of Economic and Social Studies, Vol. 33 No. 2, pp. 99-124.
Bennett, D. and Vaidya, K. (2005), “Meeting technology needs of enterprises for nationalcompetitiveness”, International Journal of Technology Management, Vol. 32 Nos 1/2,pp. 112-53.
Bennett, D., Vaidya, K., Wang, X.M. and Zhu, F.D. (1997), “Technology transfer and Chinesegovernment policy: opportunities and implications for business”, TechnologyManagement: Strategies and Applications, Vol. 3 No. 2, pp. 95-107.
JMTM18,8
1018
Bennett, D., Hall, M., He, J.S., Vaidya, K. and Wang, X.M. (2006), “The reality of transferringtechnology to China: what has been learned after 15 years?”, in von Zedtwitz, M. andWang, Y. (Eds), East Meets West, Proceedings of 15th International Conference onManagement of Technology, IAMOT and RCTI Tsinghua University, Miami, FL andBeijing, China.
Bennett, D., Liu, X., Parker, D., Steward, F. and Vaidya, K. (2001), “Technology transfer to China:a study of strategy in 20 major EU industrial companies”, International Journal ofTechnology Management, Vol. 21 Nos 1/2, pp. 151-82.
Brizendine, T. and Oliver, C. (2001), “China’s steel sector in transition”, The China BusinessReview, Vol. 28 No. 1, pp. 22-6.
Business Week (1997), “Going toe to toe with big blue and compaq”, Business Week, No. 3522,pp. 58-9.
Campbell Haynes (1995), A Guide to the Chinese Automotive Industry, Campbell Haynes, London.
Chan, T., Tracy, T.N. and Zhu, W. (1999), China’s Export Miracle: Origin, Results and Prospects,Macmillan, Basingstoke.
Chen, C.H. and Shih, H.T. (2005), High-tech Industries in China, Edward Elgar, Cheltenham.
CIEC (1998), Outlook on China’s Pharmaceutical Industry, China International EconomicConsultants, Beijing.
Dicken, P. (2007), Global Shift: Mapping the Changing Contours of the World Economy, Sage,London.
Economist Intelligence Unit (1997), EIU Motor Business International, 2nd Quarter, EconomistIntelligence Unit, London.
Foster, M.J. (1998), “Foreign trade and investment: policy reforms in China in the mid-1990s”, inStrange, R., Slater, J. and Wang, L. (Eds), Trade and Investment in China: The EuropeanExperience, Routledge, London.
Harwit, E. (1995), China’s Automobile Industry: Policies, Problems and Prospects, M.E. Sharpe,Armonk, NY.
Hobday, M. (1995), Innovation in East Asia: The Challenge to Japan, Edward Elgar, Cheltenham.
InterChina Consulting (2006), China’s Steel Sector, InterChina Cosulting, Beijing, available at:www.interchinaconsulting.com
Kim, L. (1997), “The dynamics of Samsung’s technological learning in semiconductors”,California Management Review, Vol. 39 No. 3, pp. 86-100.
Kim, L. (1998), “Crisis construction and organizational learning: capability building incatching-up at Hyundai Motor”, Organization Science, Vol. 9 No. 4, pp. 506-21.
Lall, S. (1992), “Technological capabilities and industrialisation”, World Development, Vol. 20No. 2, pp. 165-86.
Lan, P. (1996), “Role of IJVs in transferring technology to China”, Journal of Euromarketing, Vol. 4Nos 3/4, pp. 129-53.
Leung, H., Thorburn, J., Chau, E. and Tang, S. (1991), “Contractual relations, foreign directinvestment and technology transfer: the case of China”, Journal of InternationalDevelopment, Vol. 3 No. 3, pp. 277-91.
Lundberg, L. (1988), “Technology, factor proportions and competitiveness”, ScandinavianJournal of Economics, Vol. 90 No. 2, pp. 178-88.
McClellan, B. and Smith, D. (1997), “GM’s China gamble”, Ward’s Auto World, Vol. 33 No. 8,pp. 70-1.
China’smanufacturing
sector
1019
Matthews, J.A. (2001), “National systems of economic learning: the case of technology diffusionmanagement in East Asia”, International Journal of Technology Management, Vol. 22Nos 5/6, pp. 455-79.
Mecham, M. (1993), “With many suitors, China seeks ‘equal partnership’”, Aviation Week &Space Technology, Vol. 139 No. 17, p. 23.
Ministry of Science and Technology (1997), The White Paper on Science and Technology No. 7,Science & Technology Publications, Beijing.
Nolan, P. (2001), China and the Global Business Revolution, Palgrave, Basingstoke.
Nolan, P. (2005), “China at the crossroads”, Journal of Chinese Economics and Business Studies,Vol. 3 No. 1, pp. 1-22.
OECD (2005), Science, Technology and Industry Scoreboard, Organisation for EconomicCooperation and Development, Paris, available at: www.sourceoecd.org/scoreboard
O’Kane, G. (1994), “Japanese giant losing grip”, Asian Business, Vol. 30 No. 1, pp. 42-4.
Proctor, P. (1992), “China’s Xian Aircraft Corp. emphasises Y-7 production, foreignsubcontracts”, Aviation Week & Space Technology, Vol. 136 No. 8, pp. 112-5.
Simon, D. and Goldman, M. (Eds) (1989), Science and Technology in Post-Mao China, HarvardUniversity Press, Cambridge, MA.
Sit, V. (1985), “The special economic zones of China: a new type of export processing zone?”,Developing Economies, Vol. 23, pp. 68-87.
Smith, B. (1991), “Agreements with China a key part of Douglas’ cost-reduction”, Aviation Week& Space Technology, Vol. 134 No. 24, p. 161.
State Economic and Trade Commission (2002), The National Programme for TechnicalInnovation for the Tenth Five-Year Plan, State Economic and Trade Commission, Beijing.
Tan, Z.A. (2002), “Product cycle theory and telecommunications industry – foreign directinvestment, government policy, and indigenous manufacturing in China”,Telecommunications Policy, Vol. 26 Nos 1/2, pp. 17-30.
TCD Trade (2000), Statistics of China’s Utilisation of Foreign Direct Investment, 1979-1999,Hong Kong Trade Development Council, Wanchai, available at: www.tdctrade.com/report/stat/stat_001004.htm
Thorburn, J. and Howell, J. (1995), “Trade and development: the political economy of China’sopen policy”, in Benewick, R. and Wingrove, P. (Eds), China in the 1990s, Macmillan,London.
Thun, E. (2006), Changing lanes in China, Cambridge University Press, Cambridge.
UNIDO (n.d.), China: Statistics, available at: www.unido.org/data/geostat.cfm?cc ¼ cpr
USCBC (2007), FDI in China, The US-China Business Council, Washington, DC, available at:www.uschina.org/statistics/fdi_cumulative.html
Wang, Y.F. (1993), China’s Science and Technology Policy: 1949-1989, Avebury, Aldershot.
Wei, Y. and Liu, X. (2001), Foreign Direct Investment in China: Determinants and Impact,Edward Elgar, Cheltenham.
WTEC (1997) Electronics Manufacturing in the Pacific Rim: Panel Report, Loyola College,Baltimore, MD, available at: www.wtec.org/loyola/em/
Yeats, A. (1989), “Shifting patterns of comparative advantage: manufactured exports ofdeveloping countries”, Policy Planning and Research Working Paper No. 165, World Bank,Washington, DC.
JMTM18,8
1020
Yeats, A. (1992), “China’s foreign trade and comparative advantage: problems, prospects andpolicy implications”, World Bank Discussion Paper No. 141, World Bank, Washington, DC.
Yang, Y. and Zhong, C. (1996), “East Asia: China’s textile and clothing exports in a changingworld economy”, Research School of Pacific and Asian Studies Economic DivisionWorking Paper, Australian National University, Canberra.
Zhang, X. (2000), China’s Trade Patterns and International Comparative Advantage, Macmillan,Basingstoke.
Corresponding authorKirit Vaidya can be contacted at: [email protected]
To purchase reprints of this article please e-mail: [email protected] visit our web site for further details: www.emeraldinsight.com/reprints
China’smanufacturing
sector
1021