2011 Grove Szabo etal
21
The Journal of Physiology J Physiol 589.3 (2011) pp 575–595 575 Fast synaptic transmission in the goldfish CNS mediated by multiple nicotinic receptors Charlotte L. Grove 1 , Theresa M. Szabo 1,2 , J. Michael McIntosh 3 , Samantha C. Do 1 , Robert F. Waldeck 4 and Donald S. Faber 1 1 Dominick P. Purpura Department of Neuroscience, Albert Einstein College of Medicine, Bronx, NY 10461, USA 2 Department of Biological Sciences, Delaware State University, Dover, DE 19901, USA 3 Departments of Biology and Psychiatry, University of Utah, Salt Lake City, UT 84112, USA 4 Neuroscience Program and Department of Biology, University of Scranton, Scranton PA 18510, USA Non-technical summary Usually nicotinic receptors in the central nervous system only influence the strength of a signal between neurons. At a few critical connections, for instance some of those involved in the flight response, nicotinic receptors not only modulate the signal, they actually determine whether a signal is conveyed or not. We show at one of the few such connections accessible for study, up to three different nicotinic receptor subtypes mediate the signal. The subtypes appear to be clustered in separate locations. Depending on the number and combination of the subtypes present the signal can range from short to long duration and from low to high amplitude. This provides a critical connection with a built-in plasticity and may enable it to adapt to a changing environment. Abstract In this study, fast synaptic transmission at vertebrate CNS connections mediated by several different nicotinic ACh receptors (nAChRs) was investigated with paired recordings from pre- and postsynaptic neurons. Analysis of the response kinetics at the axo-axonic connections between the Mauthner (M-) axon and cranial relay neurons (CRN) indicates up to three main components are present and can be characterized by fast, ∼1.5 ms, intermediate, ∼6 ms and slow, ∼15 ms, decay time constants. Further analysis indicates most responses have multiexponential decays and each response falls into one of six classes dependent on the weight and combination of kinetic components. Pharmacological results suggest that up to three nAChRs, α7 ∗ , α3β2 ∗ and α3β4 ∗ , mediate the postsynaptic responses and correspond to the fast, intermediate and slow decay components, respectively. The fast decay component is blocked by ∼35 nM methyllycaconitine (MLA), 100 nM α-bungarotoxin (α-Btx) or 150 nM α-conotoxin (α-Ctx) ArIB. The intermediate decay component is blocked by 2 μM dihydro-beta-erythroidine (DHβE) or 200 nM α-Ctx GIC. The slow decay component is blocked by 10 μM α-Ctx AuIB, but not by 7.25 μM DHβE. Intriguingly, the mEPSPs (minis) at connections with evoked EPSPs best fitted by multiple exponentials, were not composite; rather, there were multiple populations of minis, each with single exponential decay times corresponding to those of the different evoked EPSP components. This indicates that the different receptors are topographically segregated at the connection between the M-axon and CRN axon. These results suggest that, as with glutamate, fast nicotinic synaptic transmission in the CNS can be mediated by multiple receptors in the same postsynaptic neuron. The coexistence of EPSPs of different durations may have implications for network function and plasticity. (Received 27 August 2010; accepted after revision 26 November 2010; first published online 29 November 2010) Corresponding author C. L. Grove: Dominick P. Purpura Department of Neuroscience, 1300 Morris Park Ave, Bronx, NY 10461, USA. Email: [email protected] Abbreviations α-Btx, α-bungarotoxin; α-Ctx, α-conotoxin; BLAST, basic logical alignment search tool; CRN, cranial relay neuron; DHβE, dihydro-beta-erythroidine; M-, Mauthner; MLA, methyllycaconitine; nAChR, nicotinic ACh receptors; m, mini; PSD, post synaptic density; PSD95, postsynaptic density-95; QX-314, N -(2,6-dimethylphenylcarbamoylmethyl)triethylammonium bromide; VAST, vector alignment search tool. C 2011 The Authors. Journal compilation C 2011 The Physiological Society DOI: 10.1113/jphysiol.2010.197608 ) by guest on September 19, 2014 jp.physoc.org Downloaded from J Physiol (
Transcript of 2011 Grove Szabo etal
The
Jou
rnal
of
Phys
iolo
gy
J Physiol 589.3 (2011) pp 575–595 575
Fast synaptic transmission in the goldfish CNS mediatedby multiple nicotinic receptors
Charlotte L. Grove1, Theresa M. Szabo1,2, J. Michael McIntosh3, Samantha C. Do1, Robert F. Waldeck4
and Donald S. Faber1
1Dominick P. Purpura Department of Neuroscience, Albert Einstein College of Medicine, Bronx, NY 10461, USA2Department of Biological Sciences, Delaware State University, Dover, DE 19901, USA3Departments of Biology and Psychiatry, University of Utah, Salt Lake City, UT 84112, USA4Neuroscience Program and Department of Biology, University of Scranton, Scranton PA 18510, USA
Non-technical summary Usually nicotinic receptors in the central nervous system only influencethe strength of a signal between neurons. At a few critical connections, for instance some of thoseinvolved in the flight response, nicotinic receptors not only modulate the signal, they actuallydetermine whether a signal is conveyed or not. We show at one of the few such connectionsaccessible for study, up to three different nicotinic receptor subtypes mediate the signal. Thesubtypes appear to be clustered in separate locations. Depending on the number and combinationof the subtypes present the signal can range from short to long duration and from low to highamplitude. This provides a critical connection with a built-in plasticity and may enable it to adaptto a changing environment.
Abstract In this study, fast synaptic transmission at vertebrate CNS connections mediated byseveral different nicotinic ACh receptors (nAChRs) was investigated with paired recordings frompre- and postsynaptic neurons. Analysis of the response kinetics at the axo-axonic connectionsbetween the Mauthner (M-) axon and cranial relay neurons (CRN) indicates up to three maincomponents are present and can be characterized by fast, ∼1.5 ms, intermediate, ∼6 ms and slow,∼15 ms, decay time constants. Further analysis indicates most responses have multiexponentialdecays and each response falls into one of six classes dependent on the weight and combinationof kinetic components. Pharmacological results suggest that up to three nAChRs, α7∗, α3β2∗ andα3β4∗, mediate the postsynaptic responses and correspond to the fast, intermediate and slow decaycomponents, respectively. The fast decay component is blocked by ∼35 nM methyllycaconitine(MLA), 100 nM α-bungarotoxin (α-Btx) or 150 nM α-conotoxin (α-Ctx) ArIB. The intermediatedecay component is blocked by 2 μM dihydro-beta-erythroidine (DHβE) or 200 nM α-Ctx GIC.The slow decay component is blocked by 10 μM α-Ctx AuIB, but not by 7.25 μM DHβE.Intriguingly, the mEPSPs (minis) at connections with evoked EPSPs best fitted by multipleexponentials, were not composite; rather, there were multiple populations of minis, each withsingle exponential decay times corresponding to those of the different evoked EPSP components.This indicates that the different receptors are topographically segregated at the connection betweenthe M-axon and CRN axon. These results suggest that, as with glutamate, fast nicotinic synaptictransmission in the CNS can be mediated by multiple receptors in the same postsynaptic neuron.The coexistence of EPSPs of different durations may have implications for network function andplasticity.
(Received 27 August 2010; accepted after revision 26 November 2010; first published online 29 November 2010)Corresponding author C. L. Grove: Dominick P. Purpura Department of Neuroscience, 1300 Morris Park Ave, Bronx,NY 10461, USA. Email: [email protected]
Abbreviations α-Btx, α-bungarotoxin; α-Ctx, α-conotoxin; BLAST, basic logical alignment search tool; CRN,cranial relay neuron; DHβE, dihydro-beta-erythroidine; M-, Mauthner; MLA, methyllycaconitine; nAChR,nicotinic ACh receptors; m, mini; PSD, post synaptic density; PSD95, postsynaptic density-95; QX-314,N-(2,6-dimethylphenylcarbamoylmethyl)triethylammonium bromide; VAST, vector alignment search tool.
C© 2011 The Authors. Journal compilation C© 2011 The Physiological Society DOI: 10.1113/jphysiol.2010.197608
) by guest on September 19, 2014jp.physoc.orgDownloaded from J Physiol (
576 C. L. Grove and others J Physiol 589.3
Introduction
Nicotinic transmission is widespread in both the centraland autonomic nervous systems and most studies havefocused on the modulatory role of nicotinic AChreceptors (nAChRs), largely because there are relatively fewexamples of their postsynaptic function (McGehee et al.1995; Jones et al. 1999; Berg & Conroy, 2002; McIntoshet al. 2005; Wonnacott et al. 2006; Dani & Bertrand, 2007).Unfortunately, models of fast nicotinic transmission inthe CNS have not been accessible for paired recordings(Roerig et al. 1997; Frazier et al. 1998; Alkondon et al.1998; Nong et al. 1999; Bradaia & Trouslard, 2002; Hatton& Yang, 2002; Guo et al. 2005; Thinschmidt et al. 2005). Anotable exception is the nicotinic axo-axonic connectionbetween the Mauthner (M-) axon and cranial relay neuron(CRN) of the goldfish, which is readily accessible for pairedrecordings and pharmacological manipulations. As thisis an in vivo model, correlations between behaviour andphysiology are also feasible (Weiss et al. 2006).
Key insights into the physiology of α7 and non-α7nACh receptors have come from paired recordings indissected chick ciliary ganglion of the autonomic system.There, fast synaptic transmission (Zhang et al. 1996; Ullianet al. 1997) is mediated by α7 nAChRs, concentrated onspines and largely excluded from postsynaptic densities(PSDs), and by α3∗ nAChRs, where ∗ indicates the possiblepresence of additional subunits (Lukas et al. 1999), locatedwithin somatic PSDs (Jacob & Berg, 1983; Jacob et al.1984; Loring et al. 1985; Horch & Sargent, 1995; Williamset al. 1998; Shoop et al. 1999). The means by which α7nAChRs are activated is debated. Possible contributions tothe α7 nAChR response include (1) acetylcholine releaseat sites not apposed to PSDs, that is, ectopic release onspines (Shoop et al. 1999, 2001; Coggan et al. 2005;Sargent, 2009), (2) multiquantal release at the relativelyrare spinous active zones and/or (3) diffusion of trans-mitter released somatically to PSDs on spines (Nguyen &Sargent, 2002). These observations raise the question ofthe functional organization of fast nicotinic synapses inthe vertebrate CNS.
To study fast nicotinic transmission we have usedan in vivo CNS model system, the connection in thegoldfish hindbrain between the M-axon and the post-synaptic CRNs. The M-cell is responsible for a stereotypedescape behaviour in the goldfish, the C-start (Zottoli,1977). CRNs relay the command from the M-axonto motorneurons controlling jaw, opercular and ocularmuscles (Diamond, 1971; Hackett & Faber, 1983a; Hackett& Buchheim, 1984) and to interneurons that mediatefeedback inhibition of the M-cells (Hackett & Faber,1983b). Based on morphology, at least two classes ofCRNs have been reported. In one class, the axon projectsmedially from the cell body, crosses over the nearestM-axon and midline before projecting only rostrally to
innervate the trigeminal nucleus (Hackett & Buchheim,1984). In another class, CRN axons bifurcate and courseboth rostrally and caudally after crossing the midline(Titmus & Faber, 1987). By inspection of the CRN homo-logues in the zebrafish (Kimmel et al. 1985), the T-reticularinterneurons, coupled with the morphological evidencein the goldfish, it is likely that different types of CRNsserve different motoneuron targets. The homologue ofthe M-axon–CRN connection in the hatchetfish is thenicotinic connection between the Mauthner and giantfibres, which controls pectoral fins in addition to theaforementioned targets (Auerbach & Bennett, 1969).
We have used the M-axon–CRN connection toinvestigate fast nAChR-mediated transmission in the CNSand the properties imparted by distinct nAChR subtypes.We found that the postsynaptic receptor complementis diverse and can include combinations of α7∗ andnon-α7 nAChRs, which produce different decay kineticsin the EPSPs among CRN types. Furthermore, electro-physiological data indicate these receptor subtypes arelocalized to separate clusters, possibly within one contactor on the separate distinct contacts that comprise aconnection. This insight lays the foundation for studyingthe functional contributions of the different receptor sub-types and pre- and postsynaptic factors influencing thestrength and dynamics of the EPSP.
Methods
Ethical approval
All experiments were performed in accordance with theInstitutional Animal Care and Use Committee (IACUC)protocols approved at Albert Einstein College of Medicine,consistent with the National Institutes of Health’s Guidefor the Care and Use of Laboratory Animals and compliantwith all federal, state and local regulations.
Surgery
One hundred adult male or female goldfish (Carassiusauratis, length 7.5–10 cm, measured without the tail)were obtained from EECHO Systems (North KansasCity, MO, USA), Hunting Creek Fisheries (Thurmond,MD, USA) and Billy Bland Fisheries (Taylor, AR, USA),and were maintained in conditioned water at 17–18◦C(Szabo et al. 2006). Goldfish were anaesthetized using60 mg l−1 3-aminobenzoic acid ethyl ester (MS222) inconditioned water and subsequently mounted in anexperimental chamber in which animals were respiratedthrough the mouth to provide a continuous flow of aeratedconditioned water over the gills. This water contained60 mg l−1 MS222 and was cooled to 6◦C. The spinal cordwas exposed for antidromic stimulation of the M-cell
C© 2011 The Authors. Journal compilation C© 2011 The Physiological Society
) by guest on September 19, 2014jp.physoc.orgDownloaded from J Physiol (
J Physiol 589.3 Fast nicotinic synaptic transmission 577
and goldfish were immobilized with d-tubocurarinechloride (Abbot Laboratories, Chicago, IL, USA) injectedintramuscularly (1 mg (gm body weight)−1) after theanaesthesia took effect. The cranium was opened dorsallyat the location of the fourth ventricle and the cerebellumand the facial lobes were gently retracted rostrally andretained with paper spatulas fashioned from Kimwipes(Mississauga, Ontario, Canada). Subsequently, the vagallobes were retracted laterally and retained to reveal thesection of the brainstem containing the CRN cell bodiesand to enable placement of electrodes in the M-axon andCRN as illustrated in Fig. 1 (Faber & Korn, 1978; Waldecket al. 2000). At the end of the experiment, the goldfish usedfor this project were killed by decapitation in accordancewith IACUC protocols.
Electrophysiology
Paired recordings from the M-axon and CRN axon weremade in current clamp mode using sharp electrodes andan Axoprobe (Axon Instruments, Foster City, CA, USA), atwo-electrode amplifier with cross talk neutralization. Thepresynaptic electrodes were filled with 3 M KCl bufferedwith 10 mM Hepes, pH 7.2 (resistance 8–11 M�).The postsynaptic electrodes were filled with 3 M KCl,75 mM N-(2,6-dimethylphenylcarbamoylmethyl)triethyl-ammonium bromide (QX-314) and 2.5% neuro-biotin (resistance 14–18 M�). QX-314 eliminatedcontamination by regenerative sodium-dependentresponses during collection of EPSPs that were otherwisesuprathreshold at low stimulus frequency. The presynapticM-axon, a myelinated axon 70–100 μm in diametersituated 100–200 μm from the midline and at most100–150 μm below the hindbrain surface, was penetratedafter being located with the aid of a stereomicroscope. TheCRN axons, which run alongside and within 50 μm of theM-axon in the hindbrain, were found by systematicallyprobing the hindbrain while stimulating the M-axonantidromically with an electrode on the exposed caudalspinal column. Once a postsynaptic CRN was penetrated,the M-axon was stimulated with transmembrane currentpulses (15–30 nA, 18 ms duration). The identity of a CRNwas confirmed by the rapid depression of its response torepeated M-axon stimulation, evidence of inputs fromboth M-axons, the EPSP waveform and monosynapticlatency (Hackett & Faber, 1983a; Hackett et al. 1989;Waldeck et al. 2000).
Miniature EPSPs (mEPSPs) were collected continuouslyat a 60 μs per point sampling rate, first withoutdepolarization and subsequently with a 10–20 nAdepolarization of the M-axon. Asynchronous mEPSPsrarely followed the large stimulus-evoked responses.Without depolarization spontaneous mEPSPs frequencywas 1.8 ± 1.3 events s−1 (n = 6).
Perfusion of drugs
The brain was superfused with normal fish saline (in mM:124.0 NaCl, 5.1 KCl, 2.8 NaH2PO4.H2O), 0.9 MgSO4, 1.6CaCl2.2H2O, 5.6 glucose and 20.0 Hepes, pH 7.2), andthe perfusate was drained continuously via a shunt post-erior and lateral to the hindbrain. Two protocols wereemployed for delivery of antagonists to the hindbrain.α-Conotoxins (α-Ctx) GIC, AuIB and ArIB were injectedvia a septum into the fish saline superfusion stream, whichwas maintained at 6◦C and flowed at a rate of 30 μl min−1.A bolus of α-Ctx (20–50 μl) was injected over 1 min. A0.5 ml volume between the injection site and the point atwhich the superfusion was delivered to the brain surfaceenabled adequate mixing of antagonist before the deliverypoint to provide consistent results. This arrangementenabled a reasonably rapid delivery and exchange ofdrugs, with minimum consumption of antagonist andminimum mechanical disruption at the brain surface. Ahigher perfusion flow rate (150–250 μl min−1) protocol,which provided even greater stability and enabled longerrecording times, was used to deliver: α-Btx (Tocris,Ellisville, MO, USA), DHβE and MLA. Unless otherwisespecified, chemicals and reagents were purchased fromSigma (St Louis, MO, USA). α-Ctxs were provided byJ. M. McIntosh and synthesized as previously described:ArIB (Whiteaker et al. 2007), AuIB[V11L;V16D] (Luo et al.1998) and GIC (McIntosh et al. 2002).
Neurobiotin injection and immunohistologicalprotocol
In some experiments, after gathering electrophysiologicaldata the morphology of the M-axon–CRN connection wasmarked by injecting Neurobiotin (Vector Laboratories,Burlingame, CA, USA). The marker was injectediontophoretically into the CRN for at least 30 min using90 nA depolarizing current injections (400 ms at 1 Hz).Subsequently, the fish was perfused intracardially withphosphate buffer and 4% paraformaldehyde in PBS, pH7.4. The dissected brain was refrigerated in fresh 4%paraformaldehyde for 24 h, transferred to cryoprotectant(30% sucrose in 0.1 M phosphate buffer) and stored at4◦C. Using a CM3050S cryostat (Leica Microsystems,Nussloch, Germany), 60 μm horizontal slices were madeand retrieved in a 24-well plate containing 0.1 M phosphatebuffer and refrigerated until further processing. Sliceswere washed in 0.5% Triton in 0.1 M phosphate bufferand treated for 1 h in a blocking solution containing10% normal goat serum (Jackson ImmunoResearch, WestGrove, PA, USA). Brain sections were incubated over-night in primary antibodies to zonula occludins II (rabbitanti-ZO-2) (Molecular Probes, Eugene, OR, USA) at a1:125 dilution in 0.5% Triton and 5% normal goat serumin PBS at 4◦C. ZO-2 antibodies were used because they
C© 2011 The Authors. Journal compilation C© 2011 The Physiological Society
) by guest on September 19, 2014jp.physoc.orgDownloaded from J Physiol (
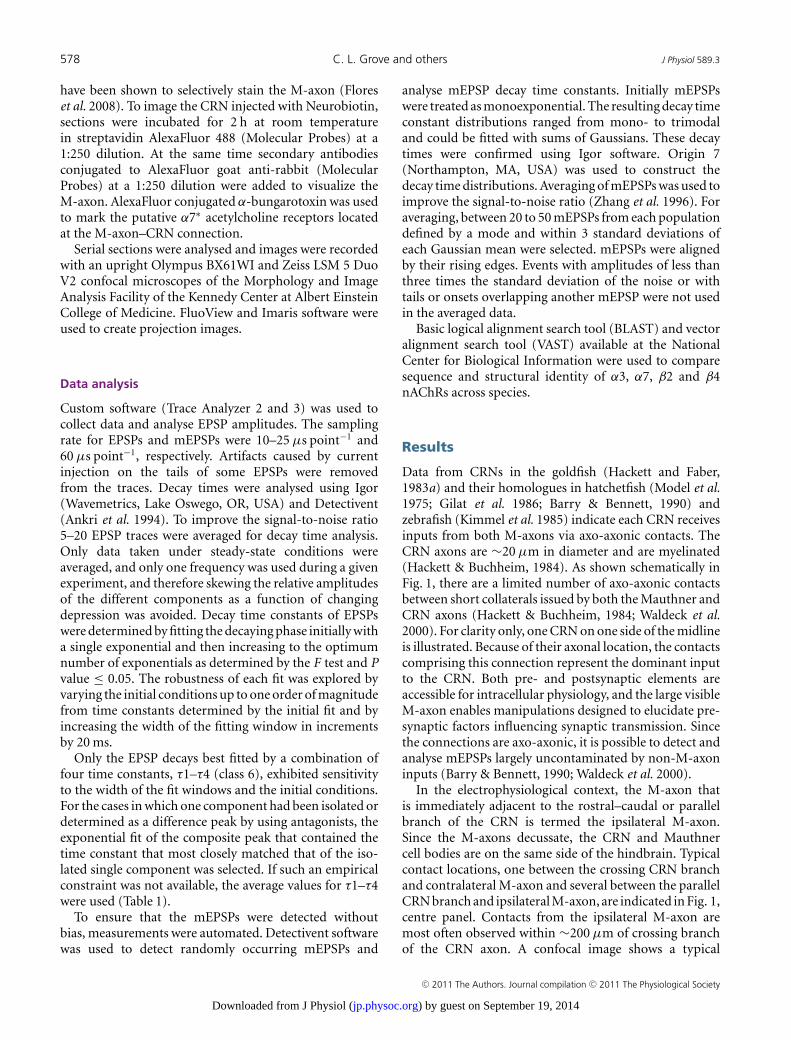
578 C. L. Grove and others J Physiol 589.3
have been shown to selectively stain the M-axon (Floreset al. 2008). To image the CRN injected with Neurobiotin,sections were incubated for 2 h at room temperaturein streptavidin AlexaFluor 488 (Molecular Probes) at a1:250 dilution. At the same time secondary antibodiesconjugated to AlexaFluor goat anti-rabbit (MolecularProbes) at a 1:250 dilution were added to visualize theM-axon. AlexaFluor conjugated α-bungarotoxin was usedto mark the putative α7∗ acetylcholine receptors locatedat the M-axon–CRN connection.
Serial sections were analysed and images were recordedwith an upright Olympus BX61WI and Zeiss LSM 5 DuoV2 confocal microscopes of the Morphology and ImageAnalysis Facility of the Kennedy Center at Albert EinsteinCollege of Medicine. FluoView and Imaris software wereused to create projection images.
Data analysis
Custom software (Trace Analyzer 2 and 3) was used tocollect data and analyse EPSP amplitudes. The samplingrate for EPSPs and mEPSPs were 10–25 μs point−1 and60 μs point−1, respectively. Artifacts caused by currentinjection on the tails of some EPSPs were removedfrom the traces. Decay times were analysed using Igor(Wavemetrics, Lake Oswego, OR, USA) and Detectivent(Ankri et al. 1994). To improve the signal-to-noise ratio5–20 EPSP traces were averaged for decay time analysis.Only data taken under steady-state conditions wereaveraged, and only one frequency was used during a givenexperiment, and therefore skewing the relative amplitudesof the different components as a function of changingdepression was avoided. Decay time constants of EPSPswere determined by fitting the decaying phase initially witha single exponential and then increasing to the optimumnumber of exponentials as determined by the F test and Pvalue ≤ 0.05. The robustness of each fit was explored byvarying the initial conditions up to one order of magnitudefrom time constants determined by the initial fit and byincreasing the width of the fitting window in incrementsby 20 ms.
Only the EPSP decays best fitted by a combination offour time constants, τ1–τ4 (class 6), exhibited sensitivityto the width of the fit windows and the initial conditions.For the cases in which one component had been isolated ordetermined as a difference peak by using antagonists, theexponential fit of the composite peak that contained thetime constant that most closely matched that of the iso-lated single component was selected. If such an empiricalconstraint was not available, the average values for τ1–τ4were used (Table 1).
To ensure that the mEPSPs were detected withoutbias, measurements were automated. Detectivent softwarewas used to detect randomly occurring mEPSPs and
analyse mEPSP decay time constants. Initially mEPSPswere treated as monoexponential. The resulting decay timeconstant distributions ranged from mono- to trimodaland could be fitted with sums of Gaussians. These decaytimes were confirmed using Igor software. Origin 7(Northampton, MA, USA) was used to construct thedecay time distributions. Averaging of mEPSPs was used toimprove the signal-to-noise ratio (Zhang et al. 1996). Foraveraging, between 20 to 50 mEPSPs from each populationdefined by a mode and within 3 standard deviations ofeach Gaussian mean were selected. mEPSPs were alignedby their rising edges. Events with amplitudes of less thanthree times the standard deviation of the noise or withtails or onsets overlapping another mEPSP were not usedin the averaged data.
Basic logical alignment search tool (BLAST) and vectoralignment search tool (VAST) available at the NationalCenter for Biological Information were used to comparesequence and structural identity of α3, α7, β2 and β4nAChRs across species.
Results
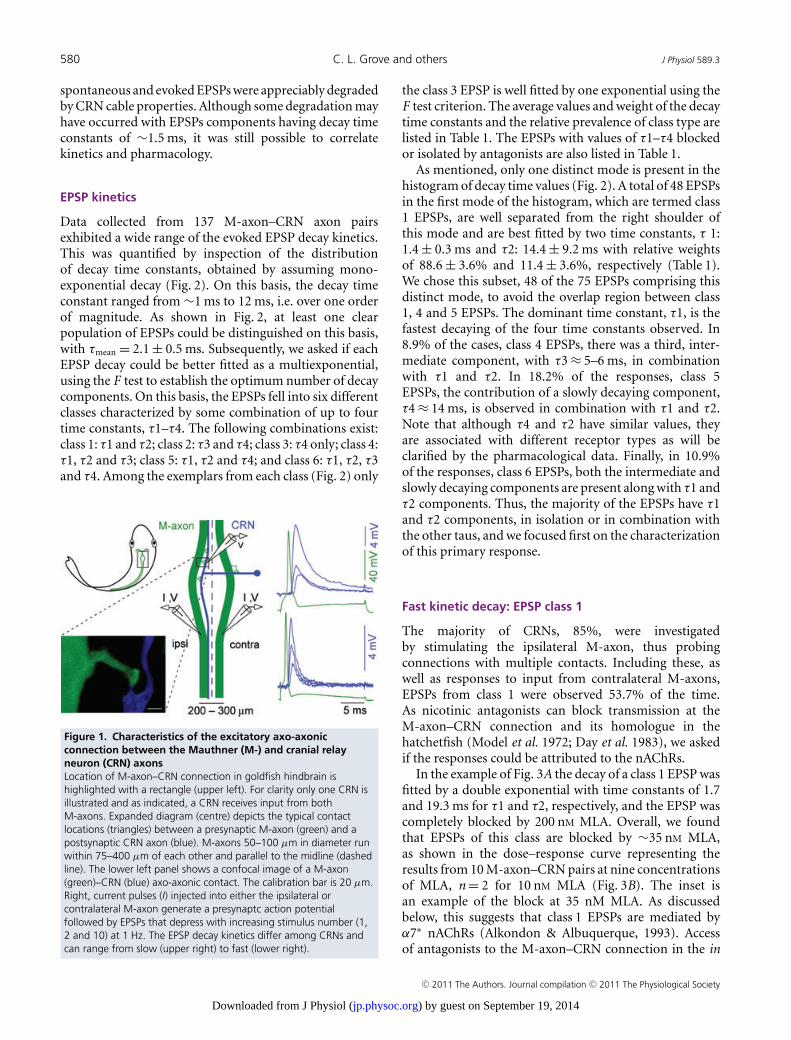
Data from CRNs in the goldfish (Hackett and Faber,1983a) and their homologues in hatchetfish (Model et al.1975; Gilat et al. 1986; Barry & Bennett, 1990) andzebrafish (Kimmel et al. 1985) indicate each CRN receivesinputs from both M-axons via axo-axonic contacts. TheCRN axons are ∼20 μm in diameter and are myelinated(Hackett & Buchheim, 1984). As shown schematically inFig. 1, there are a limited number of axo-axonic contactsbetween short collaterals issued by both the Mauthner andCRN axons (Hackett & Buchheim, 1984; Waldeck et al.2000). For clarity only, one CRN on one side of the midlineis illustrated. Because of their axonal location, the contactscomprising this connection represent the dominant inputto the CRN. Both pre- and postsynaptic elements areaccessible for intracellular physiology, and the large visibleM-axon enables manipulations designed to elucidate pre-synaptic factors influencing synaptic transmission. Sincethe connections are axo-axonic, it is possible to detect andanalyse mEPSPs largely uncontaminated by non-M-axoninputs (Barry & Bennett, 1990; Waldeck et al. 2000).
In the electrophysiological context, the M-axon thatis immediately adjacent to the rostral–caudal or parallelbranch of the CRN is termed the ipsilateral M-axon.Since the M-axons decussate, the CRN and Mauthnercell bodies are on the same side of the hindbrain. Typicalcontact locations, one between the crossing CRN branchand contralateral M-axon and several between the parallelCRN branch and ipsilateral M-axon, are indicated in Fig. 1,centre panel. Contacts from the ipsilateral M-axon aremost often observed within ∼200 μm of crossing branchof the CRN axon. A confocal image shows a typical
C© 2011 The Authors. Journal compilation C© 2011 The Physiological Society
) by guest on September 19, 2014jp.physoc.orgDownloaded from J Physiol (
J Physiol 589.3 Fast nicotinic synaptic transmission 579
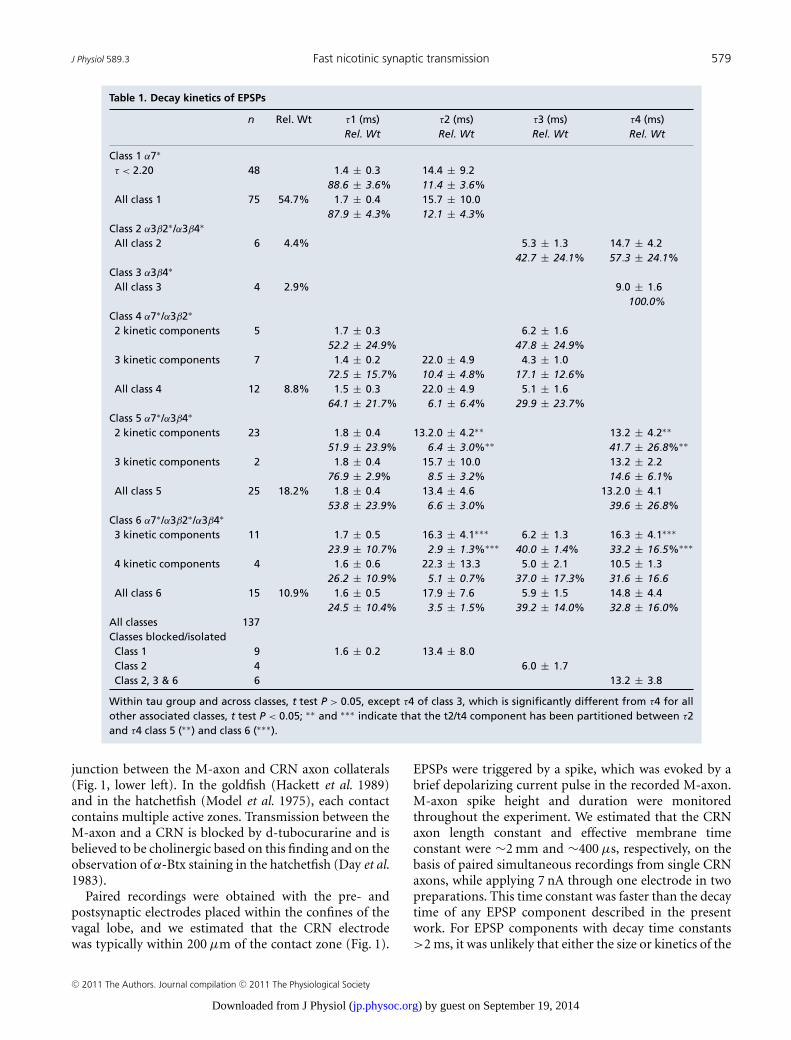
Table 1. Decay kinetics of EPSPs
n Rel. Wt τ1 (ms) τ2 (ms) τ3 (ms) τ4 (ms)Rel. Wt Rel. Wt Rel. Wt Rel. Wt
Class 1 α7∗
τ < 2.20 48 1.4 ± 0.3 14.4 ± 9.288.6 ± 3.6% 11.4 ± 3.6%
All class 1 75 54.7% 1.7 ± 0.4 15.7 ± 10.087.9 ± 4.3% 12.1 ± 4.3%
Class 2 α3β2∗/α3β4∗
All class 2 6 4.4% 5.3 ± 1.3 14.7 ± 4.242.7 ± 24.1% 57.3 ± 24.1%
Class 3 α3β4∗
All class 3 4 2.9% 9.0 ± 1.6100.0%
Class 4 α7∗/α3β2∗
2 kinetic components 5 1.7 ± 0.3 6.2 ± 1.652.2 ± 24.9% 47.8 ± 24.9%
3 kinetic components 7 1.4 ± 0.2 22.0 ± 4.9 4.3 ± 1.072.5 ± 15.7% 10.4 ± 4.8% 17.1 ± 12.6%
All class 4 12 8.8% 1.5 ± 0.3 22.0 ± 4.9 5.1 ± 1.664.1 ± 21.7% 6.1 ± 6.4% 29.9 ± 23.7%
Class 5 α7∗/α3β4∗
2 kinetic components 23 1.8 ± 0.4 13.2.0 ± 4.2∗∗ 13.2 ± 4.2∗∗
51.9 ± 23.9% 6.4 ± 3.0%∗∗ 41.7 ± 26.8%∗∗
3 kinetic components 2 1.8 ± 0.4 15.7 ± 10.0 13.2 ± 2.276.9 ± 2.9% 8.5 ± 3.2% 14.6 ± 6.1%
All class 5 25 18.2% 1.8 ± 0.4 13.4 ± 4.6 13.2.0 ± 4.153.8 ± 23.9% 6.6 ± 3.0% 39.6 ± 26.8%
Class 6 α7∗/α3β2∗/α3β4∗
3 kinetic components 11 1.7 ± 0.5 16.3 ± 4.1∗∗∗ 6.2 ± 1.3 16.3 ± 4.1∗∗∗
23.9 ± 10.7% 2.9 ± 1.3%∗∗∗ 40.0 ± 1.4% 33.2 ± 16.5%∗∗∗
4 kinetic components 4 1.6 ± 0.6 22.3 ± 13.3 5.0 ± 2.1 10.5 ± 1.326.2 ± 10.9% 5.1 ± 0.7% 37.0 ± 17.3% 31.6 ± 16.6
All class 6 15 10.9% 1.6 ± 0.5 17.9 ± 7.6 5.9 ± 1.5 14.8 ± 4.424.5 ± 10.4% 3.5 ± 1.5% 39.2 ± 14.0% 32.8 ± 16.0%
All classes 137Classes blocked/isolatedClass 1 9 1.6 ± 0.2 13.4 ± 8.0Class 2 4 6.0 ± 1.7Class 2, 3 & 6 6 13.2 ± 3.8
Within tau group and across classes, t test P > 0.05, except τ4 of class 3, which is significantly different from τ4 for allother associated classes, t test P < 0.05; ∗∗ and ∗∗∗ indicate that the t2/t4 component has been partitioned between τ2and τ4 class 5 (∗∗) and class 6 (∗∗∗).
junction between the M-axon and CRN axon collaterals(Fig. 1, lower left). In the goldfish (Hackett et al. 1989)and in the hatchetfish (Model et al. 1975), each contactcontains multiple active zones. Transmission between theM-axon and a CRN is blocked by d-tubocurarine and isbelieved to be cholinergic based on this finding and on theobservation of α-Btx staining in the hatchetfish (Day et al.1983).
Paired recordings were obtained with the pre- andpostsynaptic electrodes placed within the confines of thevagal lobe, and we estimated that the CRN electrodewas typically within 200 μm of the contact zone (Fig. 1).
EPSPs were triggered by a spike, which was evoked by abrief depolarizing current pulse in the recorded M-axon.M-axon spike height and duration were monitoredthroughout the experiment. We estimated that the CRNaxon length constant and effective membrane timeconstant were ∼2 mm and ∼400 μs, respectively, on thebasis of paired simultaneous recordings from single CRNaxons, while applying 7 nA through one electrode in twopreparations. This time constant was faster than the decaytime of any EPSP component described in the presentwork. For EPSP components with decay time constants>2 ms, it was unlikely that either the size or kinetics of the
C© 2011 The Authors. Journal compilation C© 2011 The Physiological Society
) by guest on September 19, 2014jp.physoc.orgDownloaded from J Physiol (
580 C. L. Grove and others J Physiol 589.3
spontaneous and evoked EPSPs were appreciably degradedby CRN cable properties. Although some degradation mayhave occurred with EPSPs components having decay timeconstants of ∼1.5 ms, it was still possible to correlatekinetics and pharmacology.
EPSP kinetics
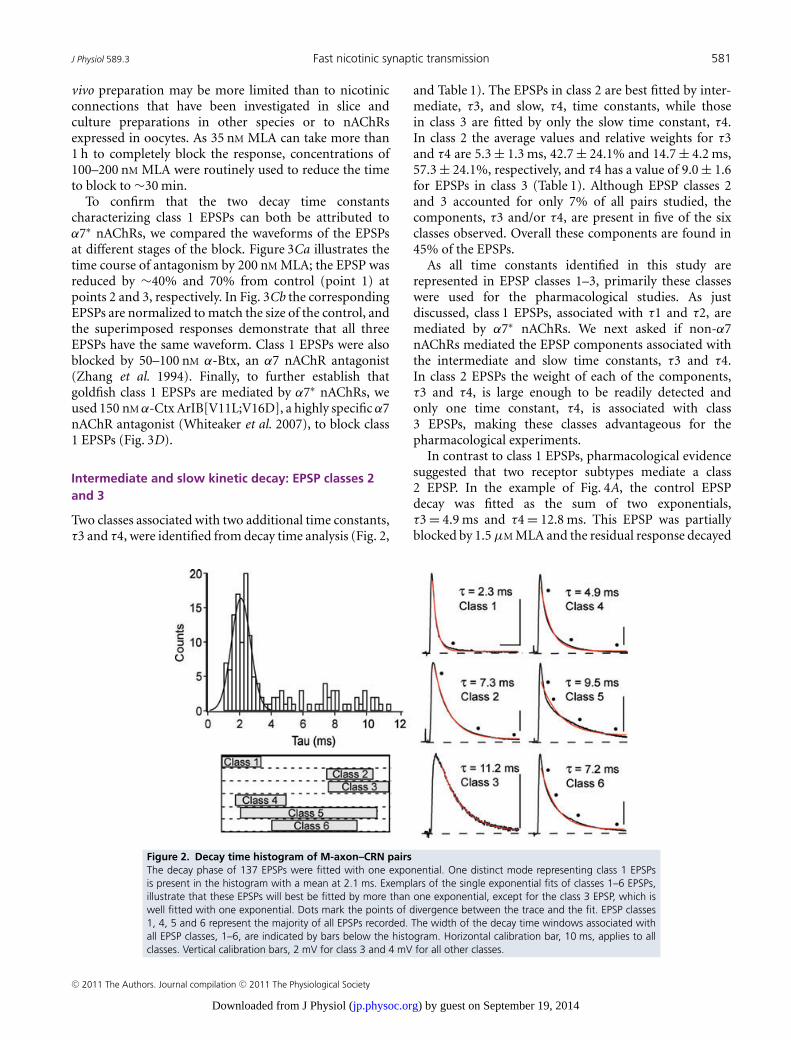
Data collected from 137 M-axon–CRN axon pairsexhibited a wide range of the evoked EPSP decay kinetics.This was quantified by inspection of the distributionof decay time constants, obtained by assuming mono-exponential decay (Fig. 2). On this basis, the decay timeconstant ranged from ∼1 ms to 12 ms, i.e. over one orderof magnitude. As shown in Fig. 2, at least one clearpopulation of EPSPs could be distinguished on this basis,with τmean = 2.1 ± 0.5 ms. Subsequently, we asked if eachEPSP decay could be better fitted as a multiexponential,using the F test to establish the optimum number of decaycomponents. On this basis, the EPSPs fell into six differentclasses characterized by some combination of up to fourtime constants, τ1–τ4. The following combinations exist:class 1: τ1 and τ2; class 2: τ3 and τ4; class 3: τ4 only; class 4:τ1, τ2 and τ3; class 5: τ1, τ2 and τ4; and class 6: τ1, τ2, τ3and τ4. Among the exemplars from each class (Fig. 2) only
Figure 1. Characteristics of the excitatory axo-axonicconnection between the Mauthner (M-) and cranial relayneuron (CRN) axonsLocation of M-axon–CRN connection in goldfish hindbrain ishighlighted with a rectangle (upper left). For clarity only one CRN isillustrated and as indicated, a CRN receives input from bothM-axons. Expanded diagram (centre) depicts the typical contactlocations (triangles) between a presynaptic M-axon (green) and apostsynaptic CRN axon (blue). M-axons 50–100 μm in diameter runwithin 75–400 μm of each other and parallel to the midline (dashedline). The lower left panel shows a confocal image of a M-axon(green)–CRN (blue) axo-axonic contact. The calibration bar is 20 μm.Right, current pulses (I) injected into either the ipsilateral orcontralateral M-axon generate a presynaptc action potentialfollowed by EPSPs that depress with increasing stimulus number (1,2 and 10) at 1 Hz. The EPSP decay kinetics differ among CRNs andcan range from slow (upper right) to fast (lower right).
the class 3 EPSP is well fitted by one exponential using theF test criterion. The average values and weight of the decaytime constants and the relative prevalence of class type arelisted in Table 1. The EPSPs with values of τ1–τ4 blockedor isolated by antagonists are also listed in Table 1.
As mentioned, only one distinct mode is present in thehistogram of decay time values (Fig. 2). A total of 48 EPSPsin the first mode of the histogram, which are termed class1 EPSPs, are well separated from the right shoulder ofthis mode and are best fitted by two time constants, τ 1:1.4 ± 0.3 ms and τ2: 14.4 ± 9.2 ms with relative weightsof 88.6 ± 3.6% and 11.4 ± 3.6%, respectively (Table 1).We chose this subset, 48 of the 75 EPSPs comprising thisdistinct mode, to avoid the overlap region between class1, 4 and 5 EPSPs. The dominant time constant, τ1, is thefastest decaying of the four time constants observed. In8.9% of the cases, class 4 EPSPs, there was a third, inter-mediate component, with τ3 ≈ 5–6 ms, in combinationwith τ1 and τ2. In 18.2% of the responses, class 5EPSPs, the contribution of a slowly decaying component,τ4 ≈ 14 ms, is observed in combination with τ1 and τ2.Note that although τ4 and τ2 have similar values, theyare associated with different receptor types as will beclarified by the pharmacological data. Finally, in 10.9%of the responses, class 6 EPSPs, both the intermediate andslowly decaying components are present along with τ1 andτ2 components. Thus, the majority of the EPSPs have τ1and τ2 components, in isolation or in combination withthe other taus, and we focused first on the characterizationof this primary response.
Fast kinetic decay: EPSP class 1
The majority of CRNs, 85%, were investigatedby stimulating the ipsilateral M-axon, thus probingconnections with multiple contacts. Including these, aswell as responses to input from contralateral M-axons,EPSPs from class 1 were observed 53.7% of the time.As nicotinic antagonists can block transmission at theM-axon–CRN connection and its homologue in thehatchetfish (Model et al. 1972; Day et al. 1983), we askedif the responses could be attributed to the nAChRs.
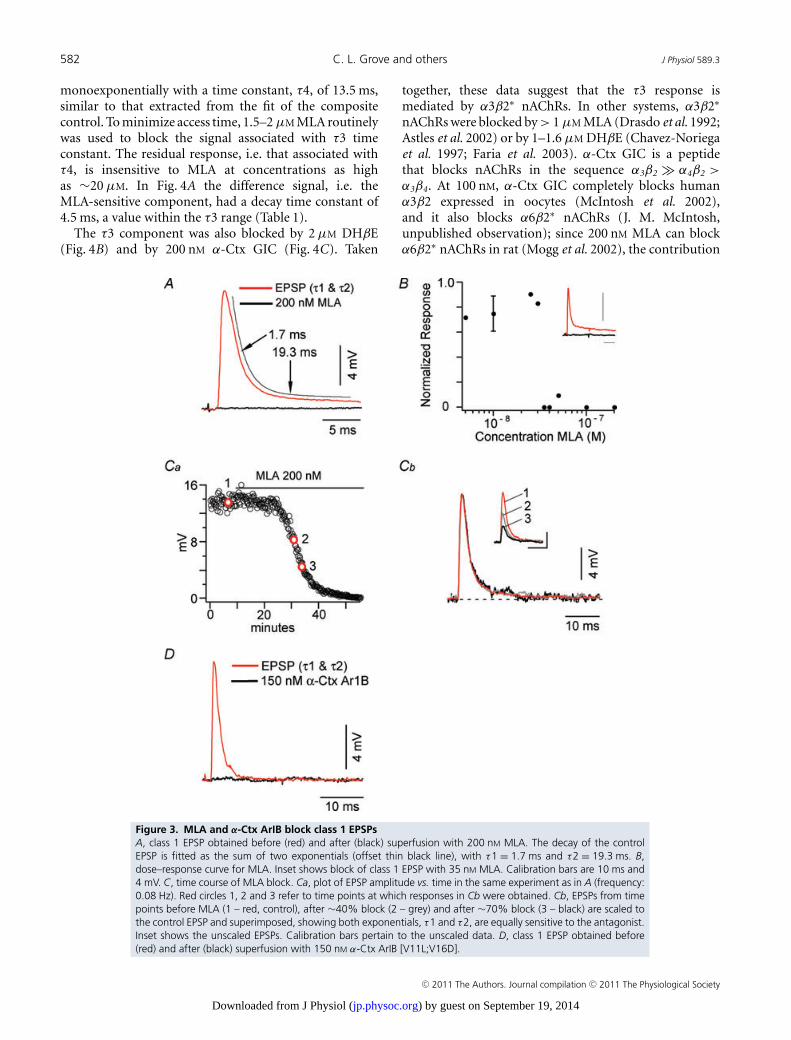
In the example of Fig. 3A the decay of a class 1 EPSP wasfitted by a double exponential with time constants of 1.7and 19.3 ms for τ1 and τ2, respectively, and the EPSP wascompletely blocked by 200 nM MLA. Overall, we foundthat EPSPs of this class are blocked by ∼35 nM MLA,as shown in the dose–response curve representing theresults from 10 M-axon–CRN pairs at nine concentrationsof MLA, n = 2 for 10 nM MLA (Fig. 3B). The inset isan example of the block at 35 nM MLA. As discussedbelow, this suggests that class 1 EPSPs are mediated byα7∗ nAChRs (Alkondon & Albuquerque, 1993). Accessof antagonists to the M-axon–CRN connection in the in
C© 2011 The Authors. Journal compilation C© 2011 The Physiological Society
) by guest on September 19, 2014jp.physoc.orgDownloaded from J Physiol (
J Physiol 589.3 Fast nicotinic synaptic transmission 581
vivo preparation may be more limited than to nicotinicconnections that have been investigated in slice andculture preparations in other species or to nAChRsexpressed in oocytes. As 35 nM MLA can take more than1 h to completely block the response, concentrations of100–200 nM MLA were routinely used to reduce the timeto block to ∼30 min.
To confirm that the two decay time constantscharacterizing class 1 EPSPs can both be attributed toα7∗ nAChRs, we compared the waveforms of the EPSPsat different stages of the block. Figure 3Ca illustrates thetime course of antagonism by 200 nM MLA; the EPSP wasreduced by ∼40% and 70% from control (point 1) atpoints 2 and 3, respectively. In Fig. 3Cb the correspondingEPSPs are normalized to match the size of the control, andthe superimposed responses demonstrate that all threeEPSPs have the same waveform. Class 1 EPSPs were alsoblocked by 50–100 nM α-Btx, an α7 nAChR antagonist(Zhang et al. 1994). Finally, to further establish thatgoldfish class 1 EPSPs are mediated by α7∗ nAChRs, weused 150 nM α-Ctx ArIB[V11L;V16D], a highly specific α7nAChR antagonist (Whiteaker et al. 2007), to block class1 EPSPs (Fig. 3D).
Intermediate and slow kinetic decay: EPSP classes 2and 3
Two classes associated with two additional time constants,τ3 and τ4, were identified from decay time analysis (Fig. 2,
and Table 1). The EPSPs in class 2 are best fitted by inter-mediate, τ3, and slow, τ4, time constants, while thosein class 3 are fitted by only the slow time constant, τ4.In class 2 the average values and relative weights for τ3and τ4 are 5.3 ± 1.3 ms, 42.7 ± 24.1% and 14.7 ± 4.2 ms,57.3 ± 24.1%, respectively, and τ4 has a value of 9.0 ± 1.6for EPSPs in class 3 (Table 1). Although EPSP classes 2and 3 accounted for only 7% of all pairs studied, thecomponents, τ3 and/or τ4, are present in five of the sixclasses observed. Overall these components are found in45% of the EPSPs.
As all time constants identified in this study arerepresented in EPSP classes 1–3, primarily these classeswere used for the pharmacological studies. As justdiscussed, class 1 EPSPs, associated with τ1 and τ2, aremediated by α7∗ nAChRs. We next asked if non-α7nAChRs mediated the EPSP components associated withthe intermediate and slow time constants, τ3 and τ4.In class 2 EPSPs the weight of each of the components,τ3 and τ4, is large enough to be readily detected andonly one time constant, τ4, is associated with class3 EPSPs, making these classes advantageous for thepharmacological experiments.
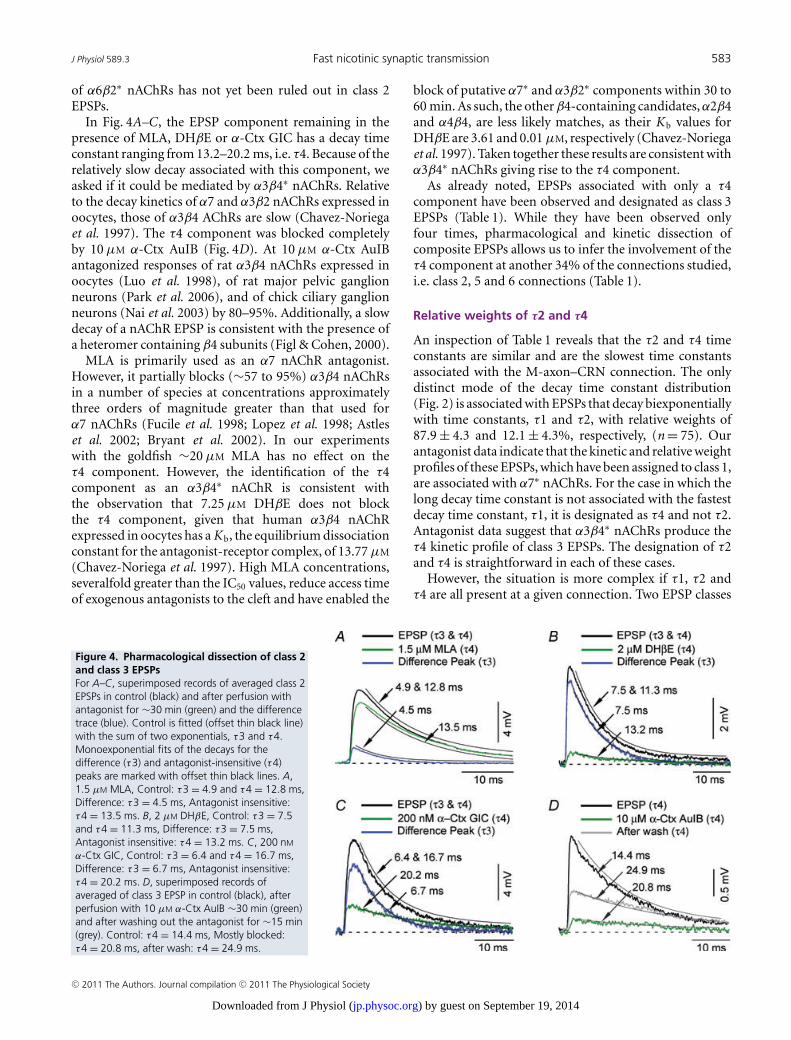
In contrast to class 1 EPSPs, pharmacological evidencesuggested that two receptor subtypes mediate a class2 EPSP. In the example of Fig. 4A, the control EPSPdecay was fitted as the sum of two exponentials,τ3 = 4.9 ms and τ4 = 12.8 ms. This EPSP was partiallyblocked by 1.5 μM MLA and the residual response decayed
Figure 2. Decay time histogram of M-axon–CRN pairsThe decay phase of 137 EPSPs were fitted with one exponential. One distinct mode representing class 1 EPSPsis present in the histogram with a mean at 2.1 ms. Exemplars of the single exponential fits of classes 1–6 EPSPs,illustrate that these EPSPs will best be fitted by more than one exponential, except for the class 3 EPSP, which iswell fitted with one exponential. Dots mark the points of divergence between the trace and the fit. EPSP classes1, 4, 5 and 6 represent the majority of all EPSPs recorded. The width of the decay time windows associated withall EPSP classes, 1–6, are indicated by bars below the histogram. Horizontal calibration bar, 10 ms, applies to allclasses. Vertical calibration bars, 2 mV for class 3 and 4 mV for all other classes.
C© 2011 The Authors. Journal compilation C© 2011 The Physiological Society
) by guest on September 19, 2014jp.physoc.orgDownloaded from J Physiol (
582 C. L. Grove and others J Physiol 589.3
monoexponentially with a time constant, τ4, of 13.5 ms,similar to that extracted from the fit of the compositecontrol. To minimize access time, 1.5–2 μM MLA routinelywas used to block the signal associated with τ3 timeconstant. The residual response, i.e. that associated withτ4, is insensitive to MLA at concentrations as highas ∼20 μM. In Fig. 4A the difference signal, i.e. theMLA-sensitive component, had a decay time constant of4.5 ms, a value within the τ3 range (Table 1).
The τ3 component was also blocked by 2 μM DHβE(Fig. 4B) and by 200 nM α-Ctx GIC (Fig. 4C). Taken
together, these data suggest that the τ3 response ismediated by α3β2∗ nAChRs. In other systems, α3β2∗
nAChRs were blocked by > 1 μM MLA (Drasdo et al. 1992;Astles et al. 2002) or by 1–1.6 μM DHβE (Chavez-Noriegaet al. 1997; Faria et al. 2003). α-Ctx GIC is a peptidethat blocks nAChRs in the sequence α3β2 � α4β2 >α3β4. At 100 nM, α-Ctx GIC completely blocks humanα3β2 expressed in oocytes (McIntosh et al. 2002),and it also blocks α6β2∗ nAChRs (J. M. McIntosh,unpublished observation); since 200 nM MLA can blockα6β2∗ nAChRs in rat (Mogg et al. 2002), the contribution
Figure 3. MLA and α-Ctx ArIB block class 1 EPSPsA, class 1 EPSP obtained before (red) and after (black) superfusion with 200 nM MLA. The decay of the controlEPSP is fitted as the sum of two exponentials (offset thin black line), with τ1 = 1.7 ms and τ2 = 19.3 ms. B,dose–response curve for MLA. Inset shows block of class 1 EPSP with 35 nM MLA. Calibration bars are 10 ms and4 mV. C, time course of MLA block. Ca, plot of EPSP amplitude vs. time in the same experiment as in A (frequency:0.08 Hz). Red circles 1, 2 and 3 refer to time points at which responses in Cb were obtained. Cb, EPSPs from timepoints before MLA (1 – red, control), after ∼40% block (2 – grey) and after ∼70% block (3 – black) are scaled tothe control EPSP and superimposed, showing both exponentials, τ1 and τ2, are equally sensitive to the antagonist.Inset shows the unscaled EPSPs. Calibration bars pertain to the unscaled data. D, class 1 EPSP obtained before(red) and after (black) superfusion with 150 nM α-Ctx ArIB [V11L;V16D].
C© 2011 The Authors. Journal compilation C© 2011 The Physiological Society
) by guest on September 19, 2014jp.physoc.orgDownloaded from J Physiol (
J Physiol 589.3 Fast nicotinic synaptic transmission 583
of α6β2∗ nAChRs has not yet been ruled out in class 2EPSPs.
In Fig. 4A–C, the EPSP component remaining in thepresence of MLA, DHβE or α-Ctx GIC has a decay timeconstant ranging from 13.2–20.2 ms, i.e. τ4. Because of therelatively slow decay associated with this component, weasked if it could be mediated by α3β4∗ nAChRs. Relativeto the decay kinetics of α7 and α3β2 nAChRs expressed inoocytes, those of α3β4 AChRs are slow (Chavez-Noriegaet al. 1997). The τ4 component was blocked completelyby 10 μM α-Ctx AuIB (Fig. 4D). At 10 μM α-Ctx AuIBantagonized responses of rat α3β4 nAChRs expressed inoocytes (Luo et al. 1998), of rat major pelvic ganglionneurons (Park et al. 2006), and of chick ciliary ganglionneurons (Nai et al. 2003) by 80–95%. Additionally, a slowdecay of a nAChR EPSP is consistent with the presence ofa heteromer containing β4 subunits (Figl & Cohen, 2000).
MLA is primarily used as an α7 nAChR antagonist.However, it partially blocks (∼57 to 95%) α3β4 nAChRsin a number of species at concentrations approximatelythree orders of magnitude greater than that used forα7 nAChRs (Fucile et al. 1998; Lopez et al. 1998; Astleset al. 2002; Bryant et al. 2002). In our experimentswith the goldfish ∼20 μM MLA has no effect on theτ4 component. However, the identification of the τ4component as an α3β4∗ nAChR is consistent withthe observation that 7.25 μM DHβE does not blockthe τ4 component, given that human α3β4 nAChRexpressed in oocytes has a K b, the equilibrium dissociationconstant for the antagonist-receptor complex, of 13.77 μM
(Chavez-Noriega et al. 1997). High MLA concentrations,severalfold greater than the IC50 values, reduce access timeof exogenous antagonists to the cleft and have enabled the
block of putative α7∗ and α3β2∗ components within 30 to60 min. As such, the other β4-containing candidates, α2β4and α4β4, are less likely matches, as their K b values forDHβE are 3.61 and 0.01 μM, respectively (Chavez-Noriegaet al. 1997). Taken together these results are consistent withα3β4∗ nAChRs giving rise to the τ4 component.
As already noted, EPSPs associated with only a τ4component have been observed and designated as class 3EPSPs (Table 1). While they have been observed onlyfour times, pharmacological and kinetic dissection ofcomposite EPSPs allows us to infer the involvement of theτ4 component at another 34% of the connections studied,i.e. class 2, 5 and 6 connections (Table 1).
Relative weights of τ2 and τ4
An inspection of Table 1 reveals that the τ2 and τ4 timeconstants are similar and are the slowest time constantsassociated with the M-axon–CRN connection. The onlydistinct mode of the decay time constant distribution(Fig. 2) is associated with EPSPs that decay biexponentiallywith time constants, τ1 and τ2, with relative weights of87.9 ± 4.3 and 12.1 ± 4.3%, respectively, (n = 75). Ourantagonist data indicate that the kinetic and relative weightprofiles of these EPSPs, which have been assigned to class 1,are associated with α7∗ nAChRs. For the case in which thelong decay time constant is not associated with the fastestdecay time constant, τ1, it is designated as τ4 and not τ2.Antagonist data suggest that α3β4∗ nAChRs produce theτ4 kinetic profile of class 3 EPSPs. The designation of τ2and τ4 is straightforward in each of these cases.
However, the situation is more complex if τ1, τ2 andτ4 are all present at a given connection. Two EPSP classes
Figure 4. Pharmacological dissection of class 2and class 3 EPSPsFor A–C, superimposed records of averaged class 2EPSPs in control (black) and after perfusion withantagonist for ∼30 min (green) and the differencetrace (blue). Control is fitted (offset thin black line)with the sum of two exponentials, τ3 and τ4.Monoexponential fits of the decays for thedifference (τ3) and antagonist-insensitive (τ4)peaks are marked with offset thin black lines. A,1.5 μM MLA, Control: τ3 = 4.9 and τ4 = 12.8 ms,Difference: τ3 = 4.5 ms, Antagonist insensitive:τ4 = 13.5 ms. B, 2 μM DHβE, Control: τ3 = 7.5and τ4 = 11.3 ms, Difference: τ3 = 7.5 ms,Antagonist insensitive: τ4 = 13.2 ms. C, 200 nM
α-Ctx GIC, Control: τ3 = 6.4 and τ4 = 16.7 ms,Difference: τ3 = 6.7 ms, Antagonist insensitive:τ4 = 20.2 ms. D, superimposed records ofaveraged of class 3 EPSP in control (black), afterperfusion with 10 μM α-Ctx AuIB ∼30 min (green)and after washing out the antagonist for ∼15 min(grey). Control: τ4 = 14.4 ms, Mostly blocked:τ4 = 20.8 ms, after wash: τ4 = 24.9 ms.
C© 2011 The Authors. Journal compilation C© 2011 The Physiological Society
) by guest on September 19, 2014jp.physoc.orgDownloaded from J Physiol (
584 C. L. Grove and others J Physiol 589.3
contain these decay time constants, class 5 (τ1, τ2 and τ4)and class 6 (τ1, τ2, τ3 and τ4) (Table 1). In some cases,kinetic analysis yields different values for τ2 and τ4, whichare determined to not be redundant by use of the F test. Inthese analyses τ2, associated with the α7∗ nAChRs, and τ4,associated with α3β4∗ nAChRs, are readily assigned. Thelong decay time constant that most closely matches theτ1/τ2 relative weight ratio for class 1 EPSPs as indicatedin Table 1 is given the designation τ2 and the other longdecay time constant is designated as τ4.
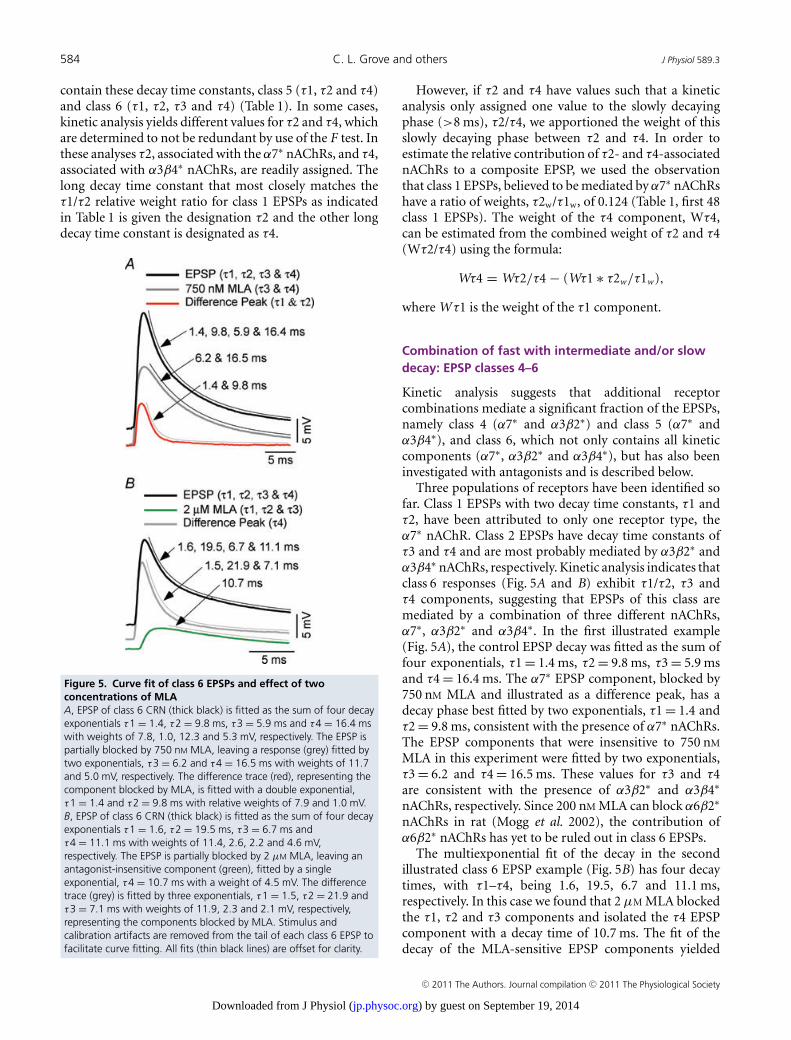
Figure 5. Curve fit of class 6 EPSPs and effect of twoconcentrations of MLAA, EPSP of class 6 CRN (thick black) is fitted as the sum of four decayexponentials τ1 = 1.4, τ2 = 9.8 ms, τ3 = 5.9 ms and τ4 = 16.4 mswith weights of 7.8, 1.0, 12.3 and 5.3 mV, respectively. The EPSP ispartially blocked by 750 nM MLA, leaving a response (grey) fitted bytwo exponentials, τ3 = 6.2 and τ4 = 16.5 ms with weights of 11.7and 5.0 mV, respectively. The difference trace (red), representing thecomponent blocked by MLA, is fitted with a double exponential,τ1 = 1.4 and τ2 = 9.8 ms with relative weights of 7.9 and 1.0 mV.B, EPSP of class 6 CRN (thick black) is fitted as the sum of four decayexponentials τ1 = 1.6, τ2 = 19.5 ms, τ3 = 6.7 ms andτ4 = 11.1 ms with weights of 11.4, 2.6, 2.2 and 4.6 mV,respectively. The EPSP is partially blocked by 2 μM MLA, leaving anantagonist-insensitive component (green), fitted by a singleexponential, τ4 = 10.7 ms with a weight of 4.5 mV. The differencetrace (grey) is fitted by three exponentials, τ1 = 1.5, τ2 = 21.9 andτ3 = 7.1 ms with weights of 11.9, 2.3 and 2.1 mV, respectively,representing the components blocked by MLA. Stimulus andcalibration artifacts are removed from the tail of each class 6 EPSP tofacilitate curve fitting. All fits (thin black lines) are offset for clarity.
However, if τ2 and τ4 have values such that a kineticanalysis only assigned one value to the slowly decayingphase (>8 ms), τ2/τ4, we apportioned the weight of thisslowly decaying phase between τ2 and τ4. In order toestimate the relative contribution of τ2- and τ4-associatednAChRs to a composite EPSP, we used the observationthat class 1 EPSPs, believed to be mediated by α7∗ nAChRshave a ratio of weights, τ2w/τ1w, of 0.124 (Table 1, first 48class 1 EPSPs). The weight of the τ4 component, Wτ4,can be estimated from the combined weight of τ2 and τ4(Wτ2/τ4) using the formula:
Wτ4 = Wτ2/τ4 − (Wτ1 ∗ τ2w/τ1w ),
where Wτ1 is the weight of the τ1 component.
Combination of fast with intermediate and/or slowdecay: EPSP classes 4–6
Kinetic analysis suggests that additional receptorcombinations mediate a significant fraction of the EPSPs,namely class 4 (α7∗ and α3β2∗) and class 5 (α7∗ andα3β4∗), and class 6, which not only contains all kineticcomponents (α7∗, α3β2∗ and α3β4∗), but has also beeninvestigated with antagonists and is described below.
Three populations of receptors have been identified sofar. Class 1 EPSPs with two decay time constants, τ1 andτ2, have been attributed to only one receptor type, theα7∗ nAChR. Class 2 EPSPs have decay time constants ofτ3 and τ4 and are most probably mediated by α3β2∗ andα3β4∗ nAChRs, respectively. Kinetic analysis indicates thatclass 6 responses (Fig. 5A and B) exhibit τ1/τ2, τ3 andτ4 components, suggesting that EPSPs of this class aremediated by a combination of three different nAChRs,α7∗, α3β2∗ and α3β4∗. In the first illustrated example(Fig. 5A), the control EPSP decay was fitted as the sum offour exponentials, τ1 = 1.4 ms, τ2 = 9.8 ms, τ3 = 5.9 msand τ4 = 16.4 ms. The α7∗ EPSP component, blocked by750 nM MLA and illustrated as a difference peak, has adecay phase best fitted by two exponentials, τ1 = 1.4 andτ2 = 9.8 ms, consistent with the presence of α7∗ nAChRs.The EPSP components that were insensitive to 750 nM
MLA in this experiment were fitted by two exponentials,τ3 = 6.2 and τ4 = 16.5 ms. These values for τ3 and τ4are consistent with the presence of α3β2∗ and α3β4∗
nAChRs, respectively. Since 200 nM MLA can block α6β2∗
nAChRs in rat (Mogg et al. 2002), the contribution ofα6β2∗ nAChRs has yet to be ruled out in class 6 EPSPs.
The multiexponential fit of the decay in the secondillustrated class 6 EPSP example (Fig. 5B) has four decaytimes, with τ1–τ4, being 1.6, 19.5, 6.7 and 11.1 ms,respectively. In this case we found that 2 μM MLA blockedthe τ1, τ2 and τ3 components and isolated the τ4 EPSPcomponent with a decay time of 10.7 ms. The fit of thedecay of the MLA-sensitive EPSP components yielded
C© 2011 The Authors. Journal compilation C© 2011 The Physiological Society
) by guest on September 19, 2014jp.physoc.orgDownloaded from J Physiol (
J Physiol 589.3 Fast nicotinic synaptic transmission 585
values of τ1, τ2 and τ3 equal to 1.5, 21.9 and 7.1 ms,respectively. Thus, the values of τ1–τ4 derived from thefit of the decay of the control EPSP correspond quitewell to the estimates obtained separately from analysis ofMLA-sensitive and -insensitive EPSPs components. Basedon these kinetic profiles and the MLA sensitivities ofgoldfish nAChRs established in this study, we suggest thatthese results indicate α7∗ and α3β2∗ nAChRs were blockedby 2 μM MLA and that only an α3β4∗ nAChR-mediatedresponse remained. Table 1 provides the decay timeconstants and weights of the components comprisingthe six classes we have identified. The time constants asblocked or isolated by antagonists are: τ1 = 1.6 ± 0.2,n = 9, τ2 = 13.4 ± 8.0, n = 9, τ3 = 6.0 ± 1.7 ms, n = 4,τ4 = 13.2 ± 3.8 ms, n = 6. Although transmission wasmediated by α7∗ nAChRs alone at the majority of theconnections studied, multiple nAChR types mediatedtransmission at a large fraction of connections.
In both class 6 cases the absolute weight of the residualcomponents, noted in the figure legend (Fig. 5A–B),matches the weight of those components determined byanalysis of the decay kinetics of the unblocked EPSP. Thissuggests that the nAChRs are located only postsynaptically.A presynaptic locus might alter release probability andthe weight of the components between the control andantagonized conditions.
Decay kinetics of mEPSPs
The M-axon–CRN parallel branch connection comprisesa few contacts with multiple active zones (Hackett et al.
1989) and as indicated gives rise to the majority of thesemultiple exponential EPSPs. This raises several questionsabout the structure of the connection. Is the transmitterreleased at a contact detected by only one or by severalreceptor types? If several receptor types mediate the signalat one contact, are distinct receptor types or a mixture ofreceptor types associated with each postsynaptic density(PSD) in apposition to an active zone?
We postulated that aspects of the arrangement of thenAChRs at the M-axon–CRN connection could be inferredfrom the kinetics of the mEPSPs if the sampled mEPSPswere due to asynchronous release from only one M-axon.While there are multiple soma–dendritic inputs to thehatchetfish giant-fibre cell body, a CRN analogue (Barry& Bennett, 1990), the only known axonal inputs are fromthe two M-axons. Thus, we took advantage of this factby injecting a steady subthreshold depolarizing currentdirectly into one M-axon, so that the frequency of mEPSPsattributed to that M-axon could be enhanced.
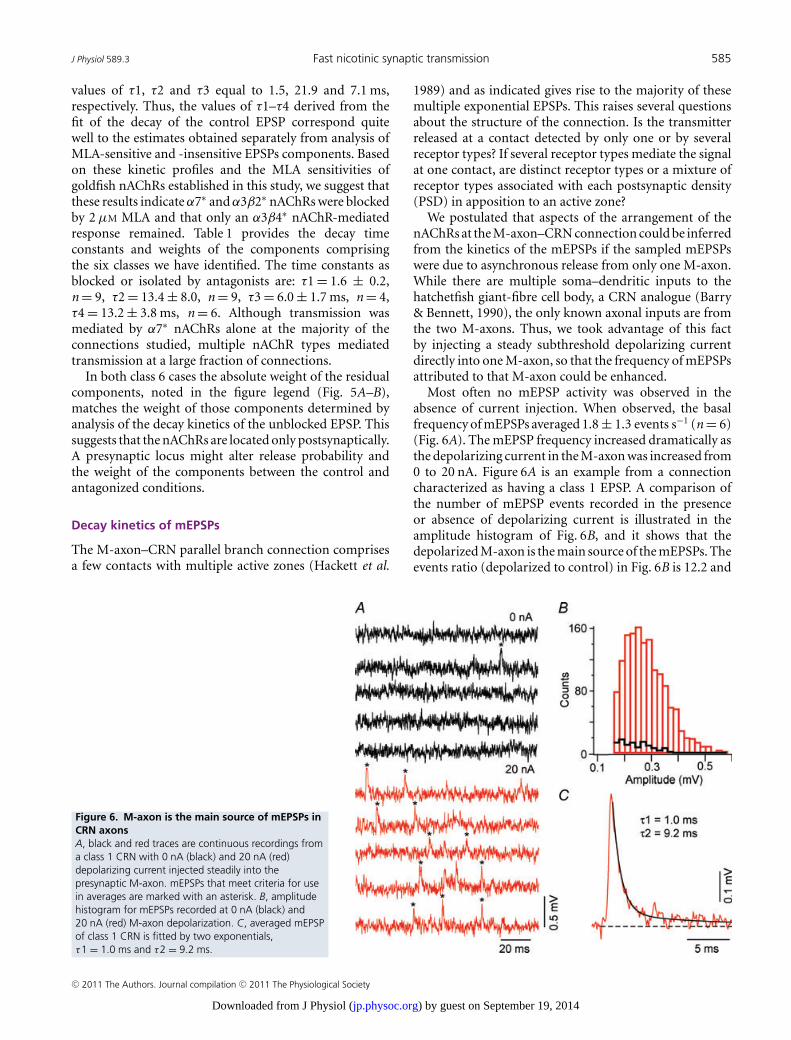
Most often no mEPSP activity was observed in theabsence of current injection. When observed, the basalfrequency of mEPSPs averaged 1.8 ± 1.3 events s−1 (n = 6)(Fig. 6A). The mEPSP frequency increased dramatically asthe depolarizing current in the M-axon was increased from0 to 20 nA. Figure 6A is an example from a connectioncharacterized as having a class 1 EPSP. A comparison ofthe number of mEPSP events recorded in the presenceor absence of depolarizing current is illustrated in theamplitude histogram of Fig. 6B, and it shows that thedepolarized M-axon is the main source of the mEPSPs. Theevents ratio (depolarized to control) in Fig. 6B is 12.2 and
Figure 6. M-axon is the main source of mEPSPs inCRN axonsA, black and red traces are continuous recordings froma class 1 CRN with 0 nA (black) and 20 nA (red)depolarizing current injected steadily into thepresynaptic M-axon. mEPSPs that meet criteria for usein averages are marked with an asterisk. B, amplitudehistogram for mEPSPs recorded at 0 nA (black) and20 nA (red) M-axon depolarization. C, averaged mEPSPof class 1 CRN is fitted by two exponentials,τ1 = 1.0 ms and τ2 = 9.2 ms.
C© 2011 The Authors. Journal compilation C© 2011 The Physiological Society
) by guest on September 19, 2014jp.physoc.orgDownloaded from J Physiol (
586 C. L. Grove and others J Physiol 589.3
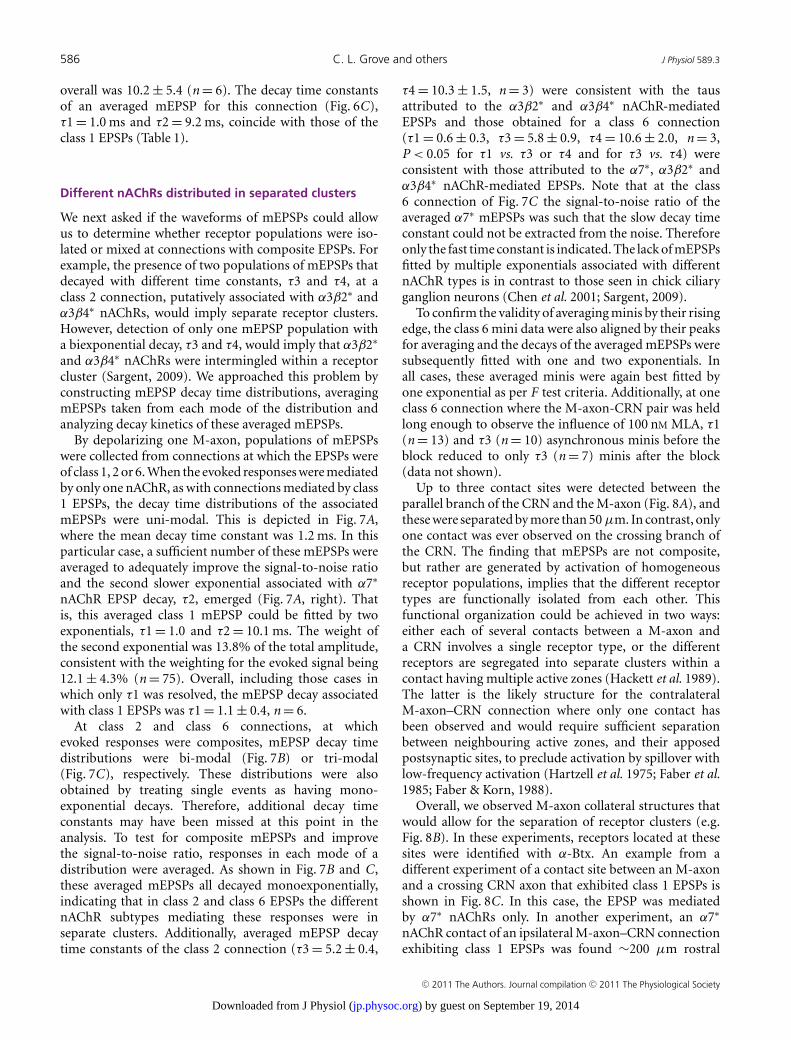
overall was 10.2 ± 5.4 (n = 6). The decay time constantsof an averaged mEPSP for this connection (Fig. 6C),τ1 = 1.0 ms and τ2 = 9.2 ms, coincide with those of theclass 1 EPSPs (Table 1).
Different nAChRs distributed in separated clusters
We next asked if the waveforms of mEPSPs could allowus to determine whether receptor populations were iso-lated or mixed at connections with composite EPSPs. Forexample, the presence of two populations of mEPSPs thatdecayed with different time constants, τ3 and τ4, at aclass 2 connection, putatively associated with α3β2∗ andα3β4∗ nAChRs, would imply separate receptor clusters.However, detection of only one mEPSP population witha biexponential decay, τ3 and τ4, would imply that α3β2∗
and α3β4∗ nAChRs were intermingled within a receptorcluster (Sargent, 2009). We approached this problem byconstructing mEPSP decay time distributions, averagingmEPSPs taken from each mode of the distribution andanalyzing decay kinetics of these averaged mEPSPs.
By depolarizing one M-axon, populations of mEPSPswere collected from connections at which the EPSPs wereof class 1, 2 or 6. When the evoked responses were mediatedby only one nAChR, as with connections mediated by class1 EPSPs, the decay time distributions of the associatedmEPSPs were uni-modal. This is depicted in Fig. 7A,where the mean decay time constant was 1.2 ms. In thisparticular case, a sufficient number of these mEPSPs wereaveraged to adequately improve the signal-to-noise ratioand the second slower exponential associated with α7∗
nAChR EPSP decay, τ2, emerged (Fig. 7A, right). Thatis, this averaged class 1 mEPSP could be fitted by twoexponentials, τ1 = 1.0 and τ2 = 10.1 ms. The weight ofthe second exponential was 13.8% of the total amplitude,consistent with the weighting for the evoked signal being12.1 ± 4.3% (n = 75). Overall, including those cases inwhich only τ1 was resolved, the mEPSP decay associatedwith class 1 EPSPs was τ1 = 1.1 ± 0.4, n = 6.
At class 2 and class 6 connections, at whichevoked responses were composites, mEPSP decay timedistributions were bi-modal (Fig. 7B) or tri-modal(Fig. 7C), respectively. These distributions were alsoobtained by treating single events as having mono-exponential decays. Therefore, additional decay timeconstants may have been missed at this point in theanalysis. To test for composite mEPSPs and improvethe signal-to-noise ratio, responses in each mode of adistribution were averaged. As shown in Fig. 7B and C,these averaged mEPSPs all decayed monoexponentially,indicating that in class 2 and class 6 EPSPs the differentnAChR subtypes mediating these responses were inseparate clusters. Additionally, averaged mEPSP decaytime constants of the class 2 connection (τ3 = 5.2 ± 0.4,
τ4 = 10.3 ± 1.5, n = 3) were consistent with the tausattributed to the α3β2∗ and α3β4∗ nAChR-mediatedEPSPs and those obtained for a class 6 connection(τ1 = 0.6 ± 0.3, τ3 = 5.8 ± 0.9, τ4 = 10.6 ± 2.0, n = 3,P < 0.05 for τ1 vs. τ3 or τ4 and for τ3 vs. τ4) wereconsistent with those attributed to the α7∗, α3β2∗ andα3β4∗ nAChR-mediated EPSPs. Note that at the class6 connection of Fig. 7C the signal-to-noise ratio of theaveraged α7∗ mEPSPs was such that the slow decay timeconstant could not be extracted from the noise. Thereforeonly the fast time constant is indicated. The lack of mEPSPsfitted by multiple exponentials associated with differentnAChR types is in contrast to those seen in chick ciliaryganglion neurons (Chen et al. 2001; Sargent, 2009).
To confirm the validity of averaging minis by their risingedge, the class 6 mini data were also aligned by their peaksfor averaging and the decays of the averaged mEPSPs weresubsequently fitted with one and two exponentials. Inall cases, these averaged minis were again best fitted byone exponential as per F test criteria. Additionally, at oneclass 6 connection where the M-axon-CRN pair was heldlong enough to observe the influence of 100 nM MLA, τ1(n = 13) and τ3 (n = 10) asynchronous minis before theblock reduced to only τ3 (n = 7) minis after the block(data not shown).
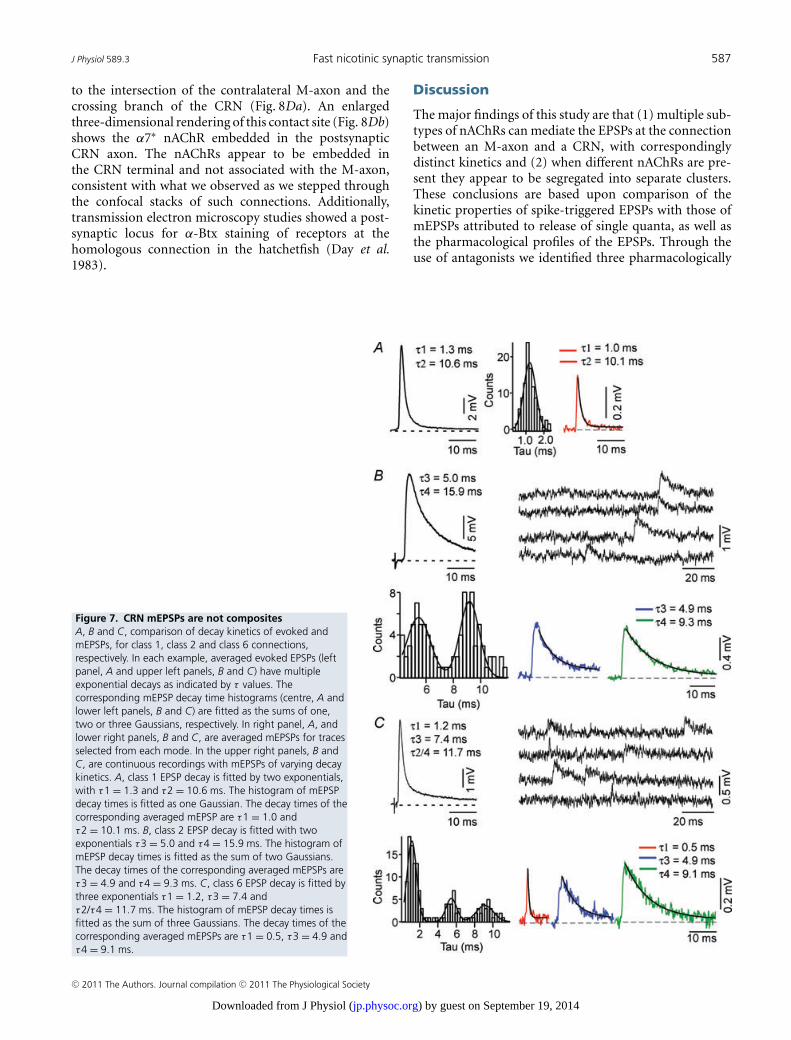
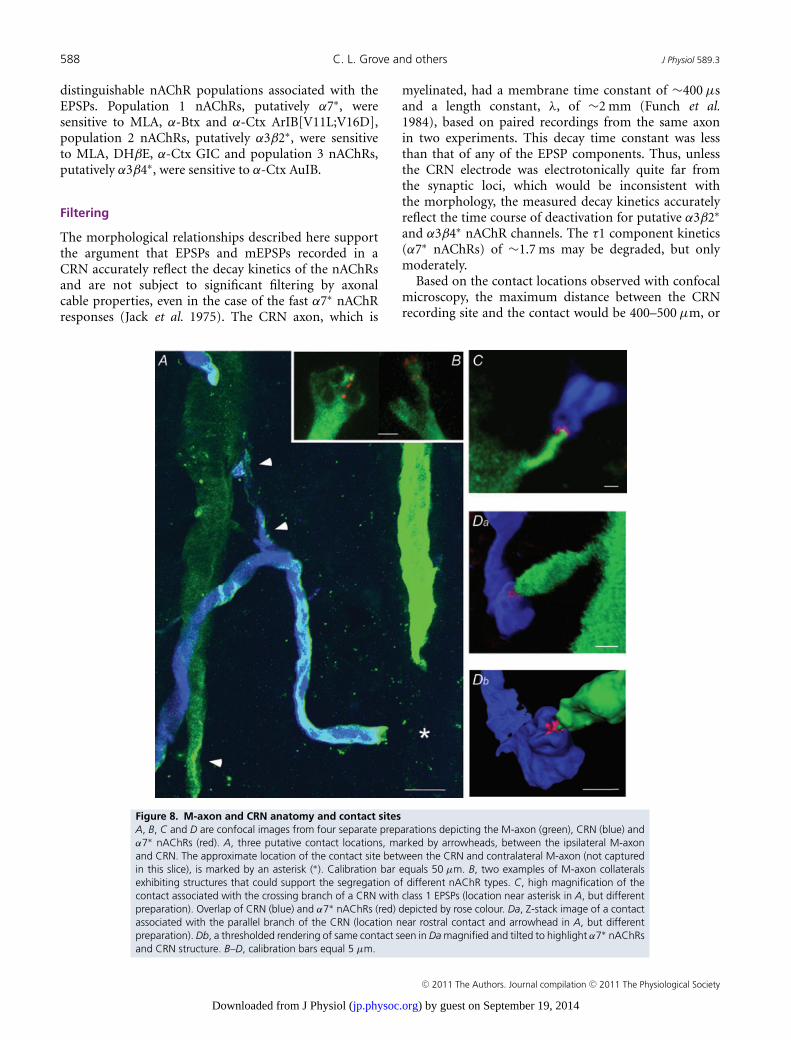
Up to three contact sites were detected between theparallel branch of the CRN and the M-axon (Fig. 8A), andthese were separated by more than 50 μm. In contrast, onlyone contact was ever observed on the crossing branch ofthe CRN. The finding that mEPSPs are not composite,but rather are generated by activation of homogeneousreceptor populations, implies that the different receptortypes are functionally isolated from each other. Thisfunctional organization could be achieved in two ways:either each of several contacts between a M-axon anda CRN involves a single receptor type, or the differentreceptors are segregated into separate clusters within acontact having multiple active zones (Hackett et al. 1989).The latter is the likely structure for the contralateralM-axon–CRN connection where only one contact hasbeen observed and would require sufficient separationbetween neighbouring active zones, and their apposedpostsynaptic sites, to preclude activation by spillover withlow-frequency activation (Hartzell et al. 1975; Faber et al.1985; Faber & Korn, 1988).
Overall, we observed M-axon collateral structures thatwould allow for the separation of receptor clusters (e.g.Fig. 8B). In these experiments, receptors located at thesesites were identified with α-Btx. An example from adifferent experiment of a contact site between an M-axonand a crossing CRN axon that exhibited class 1 EPSPs isshown in Fig. 8C. In this case, the EPSP was mediatedby α7∗ nAChRs only. In another experiment, an α7∗
nAChR contact of an ipsilateral M-axon–CRN connectionexhibiting class 1 EPSPs was found ∼200 μm rostral
C© 2011 The Authors. Journal compilation C© 2011 The Physiological Society
) by guest on September 19, 2014jp.physoc.orgDownloaded from J Physiol (
J Physiol 589.3 Fast nicotinic synaptic transmission 587
to the intersection of the contralateral M-axon and thecrossing branch of the CRN (Fig. 8Da). An enlargedthree-dimensional rendering of this contact site (Fig. 8Db)shows the α7∗ nAChR embedded in the postsynapticCRN axon. The nAChRs appear to be embedded inthe CRN terminal and not associated with the M-axon,consistent with what we observed as we stepped throughthe confocal stacks of such connections. Additionally,transmission electron microscopy studies showed a post-synaptic locus for α-Btx staining of receptors at thehomologous connection in the hatchetfish (Day et al.1983).
Discussion
The major findings of this study are that (1) multiple sub-types of nAChRs can mediate the EPSPs at the connectionbetween an M-axon and a CRN, with correspondinglydistinct kinetics and (2) when different nAChRs are pre-sent they appear to be segregated into separate clusters.These conclusions are based upon comparison of thekinetic properties of spike-triggered EPSPs with those ofmEPSPs attributed to release of single quanta, as well asthe pharmacological profiles of the EPSPs. Through theuse of antagonists we identified three pharmacologically
Figure 7. CRN mEPSPs are not compositesA, B and C, comparison of decay kinetics of evoked andmEPSPs, for class 1, class 2 and class 6 connections,respectively. In each example, averaged evoked EPSPs (leftpanel, A and upper left panels, B and C) have multipleexponential decays as indicated by τ values. Thecorresponding mEPSP decay time histograms (centre, A andlower left panels, B and C) are fitted as the sums of one,two or three Gaussians, respectively. In right panel, A, andlower right panels, B and C, are averaged mEPSPs for tracesselected from each mode. In the upper right panels, B andC, are continuous recordings with mEPSPs of varying decaykinetics. A, class 1 EPSP decay is fitted by two exponentials,with τ1 = 1.3 and τ2 = 10.6 ms. The histogram of mEPSPdecay times is fitted as one Gaussian. The decay times of thecorresponding averaged mEPSP are τ1 = 1.0 andτ2 = 10.1 ms. B, class 2 EPSP decay is fitted with twoexponentials τ3 = 5.0 and τ4 = 15.9 ms. The histogram ofmEPSP decay times is fitted as the sum of two Gaussians.The decay times of the corresponding averaged mEPSPs areτ3 = 4.9 and τ4 = 9.3 ms. C, class 6 EPSP decay is fitted bythree exponentials τ1 = 1.2, τ3 = 7.4 andτ2/τ4 = 11.7 ms. The histogram of mEPSP decay times isfitted as the sum of three Gaussians. The decay times of thecorresponding averaged mEPSPs are τ1 = 0.5, τ3 = 4.9 andτ4 = 9.1 ms.
C© 2011 The Authors. Journal compilation C© 2011 The Physiological Society
) by guest on September 19, 2014jp.physoc.orgDownloaded from J Physiol (
588 C. L. Grove and others J Physiol 589.3
distinguishable nAChR populations associated with theEPSPs. Population 1 nAChRs, putatively α7∗, weresensitive to MLA, α-Btx and α-Ctx ArIB[V11L;V16D],population 2 nAChRs, putatively α3β2∗, were sensitiveto MLA, DHβE, α-Ctx GIC and population 3 nAChRs,putatively α3β4∗, were sensitive to α-Ctx AuIB.
Filtering
The morphological relationships described here supportthe argument that EPSPs and mEPSPs recorded in aCRN accurately reflect the decay kinetics of the nAChRsand are not subject to significant filtering by axonalcable properties, even in the case of the fast α7∗ nAChRresponses (Jack et al. 1975). The CRN axon, which is
myelinated, had a membrane time constant of ∼400 μsand a length constant, λ, of ∼2 mm (Funch et al.1984), based on paired recordings from the same axonin two experiments. This decay time constant was lessthan that of any of the EPSP components. Thus, unlessthe CRN electrode was electrotonically quite far fromthe synaptic loci, which would be inconsistent withthe morphology, the measured decay kinetics accuratelyreflect the time course of deactivation for putative α3β2∗
and α3β4∗ nAChR channels. The τ1 component kinetics(α7∗ nAChRs) of ∼1.7 ms may be degraded, but onlymoderately.
Based on the contact locations observed with confocalmicroscopy, the maximum distance between the CRNrecording site and the contact would be 400–500 μm, or
Figure 8. M-axon and CRN anatomy and contact sitesA, B, C and D are confocal images from four separate preparations depicting the M-axon (green), CRN (blue) andα7∗ nAChRs (red). A, three putative contact locations, marked by arrowheads, between the ipsilateral M-axonand CRN. The approximate location of the contact site between the CRN and contralateral M-axon (not capturedin this slice), is marked by an asterisk (∗). Calibration bar equals 50 μm. B, two examples of M-axon collateralsexhibiting structures that could support the segregation of different nAChR types. C, high magnification of thecontact associated with the crossing branch of a CRN with class 1 EPSPs (location near asterisk in A, but differentpreparation). Overlap of CRN (blue) and α7∗ nAChRs (red) depicted by rose colour. Da, Z-stack image of a contactassociated with the parallel branch of the CRN (location near rostral contact and arrowhead in A, but differentpreparation). Db, a thresholded rendering of same contact seen in Da magnified and tilted to highlight α7∗ nAChRsand CRN structure. B–D, calibration bars equal 5 μm.
C© 2011 The Authors. Journal compilation C© 2011 The Physiological Society
) by guest on September 19, 2014jp.physoc.orgDownloaded from J Physiol (
J Physiol 589.3 Fast nicotinic synaptic transmission 589
∼0.25λ. In confirmation, we measured the decrement andfiltering of two types of responses recorded simultaneouslywith two electrodes that were in the same CRN axon andseparated by 350 to 500 μm: (i) an EPSP evoked by caudalspinal cord stimulation, was reduced in amplitude byabout 20% rostrally, but its kinetics were unchanged, and(ii) the full width half maximum of a passively conductedaction potential evoked by current injected caudallyincreased only slightly, from 1.1 to 1.2 ms. The actionpotential propagated passively because QX-314 diffusingfrom the rostral electrode blocked voltage-dependentsodium current locally. Finally, the frequency of miniswith intermediate, ∼5 ms, and long, ∼10 ms, decay timeconstants did not change after treatment with 200 nM
MLA to block α7∗ nAChR receptors, while those withthe fast decay time constant disappeared. This observationindicates that the minis associated with tau values > 2.5 mswere not filtered α7∗ mEPSPs generated at sites distantfrom the recording electrode.
Specificity of pharmacological dissection
The pharmacological profile for α7, α3β2 and α3β4nAChRs in the goldfish may be different to that for otherspecies. Much of the pharmacology for these receptorshas been studied in oocyte expression systems and inrat, mouse and chick. BLAST and VAST analyses wereused to find the common structural and sequence featuresbetween the teleost (goldfish and/or zebrafish) and thespecies in which the specificity of antagonists had beendemonstrated. Comparison of sequence and structuralhomology across species with each of the α7, α3, β2 and β4nAChR subunit goldfish or zebrafish gene sequences showsa high degree of identity. This holds true particularly inthe case of the sequence fragments and residues of α7, α3and β2 nAChR subunits known to be critical for bindingthe pertinent ligands used in this study.
Due to potential species differences, we cannotdefinitively assign specific receptor subtypes to apopulation type. Nevertheless, the nAChR populationsin the goldfish M-axon–CRN connection are consistentwith α7∗ (population 1), α3β2∗ (population 2) and α3β4∗
(population 3) by analogy to mammalian and chicknAChRs. These three populations contribute to six classesof EPSPs that have different decay time constants asfollows: class 1 (τ1, τ2, population 1 nAChRs), class 2 (τ3,τ4, populations 2 and 3 nAChRs), class 3 (τ4, population 3nAChRs), class 4 (τ1, τ2, τ3, populations 1 and 2 nAChRs),class 5 (τ1, τ2, τ4, populations 1 and 3 nAChRs) andclass 6 (τ1, τ2, τ3, τ4, populations 1, 2 and 3 nAChRs).The pharmacological sensitivities of the different EPSPcomponents and their kinetics are consistent with knownproperties of the different nAChRs in other species.
Class 1 EPSPs are completely blocked by 35–50 nM MLA.For comparison, α7 nAChRs in rat dorsal root ganglionneurons (Genzen et al. 2001), rat dorsal motor vagalneurons (Sahibzada et al. 2002), rat striatal slices (Kaiser& Wonnacott, 2000) and rat superior cervical ganglionneurons (Cuevas et al. 2000) were blocked by 10 nM,10 nM, 50 nM and 200 nM MLA, respectively. Class 1 EPSPswere also blocked by 50–100 nM α-Btx, the concentrationstypically used to block putative α7∗ nAChRs (Day et al.1983; Zhang et al. 1996; Ullian et al. 1997; Chang &Berg, 1999; Sahibzada et al. 2002). At the M-axon–CRNconnection, the α-Btx and MLA blocks were not reversibleafter up to 45 min of washing. A block of putative α7∗
nAChRs with 50 nM α-Btx was similarly found to beirreversible in chick ciliary ganglion (Ullian et al. 1997).
Both α-Btx and MLA block α9∗ nAChRs (Elgoyhen et al.2001; Baker et al. 2004) and α-Btx also blocks α1∗ nAChRs.MLA also blocks α6β2∗ nAChRs (K i 33 nM), (Mogg et al.2002). Therefore, to further establish that goldfish class 1EPSPs are probably mediated by α7∗ nAChRs we utilized150 nM α-Ctx ArIB to block a class 1 EPSP (Fig. 3D). α-CtxArIB is a new α7 nAChR antagonist that does not blockα1∗, α2∗, α3∗, α4∗, α6∗ or α9∗ nAChRs (Whiteaker et al.2007).
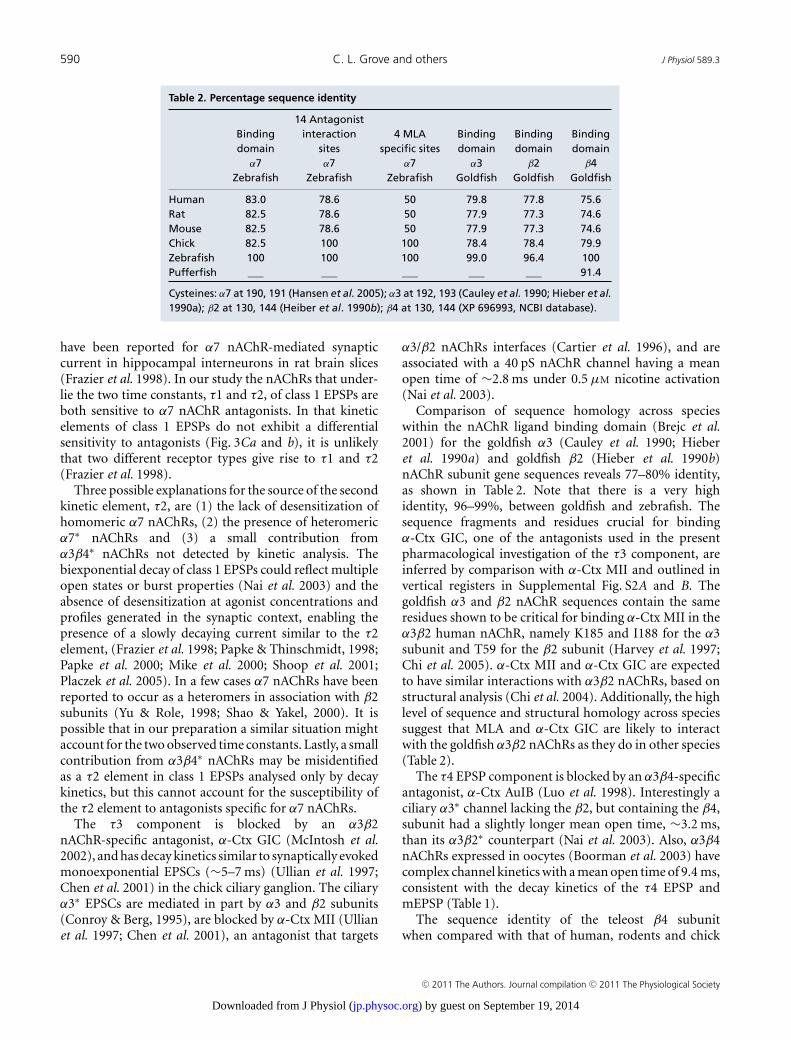
The pharmacological profiles of α7∗ nAChRs in thegoldfish may be different to those in mammalian and avianhomologues and require longer access times, particularlyin an in vivo preparation. However, comparison acrossspecies of sequence and structural homology of the α7nAChR ligand binding domain (Brejc et al. 2001) withthat of the zebrafish, indicates a high level of identity withhuman, rat, mouse and chick (Table 2). The zebrafish andgoldfish are both members of the teleost infraclass and areexpected to have similar antagonist sensitivities. Indeed,they show 100% sequence identity in the nAChR bindingdomain.
MLA binding to the acetylcholine binding protein, asurrogate for the nAChR binding domain, includes inter-actions with 14 residues of the α7 nAChR subunit inter-faces, four of which are specific to MLA (Hansen et al.2005). At these 14 interaction sites, the zebrafish subunitsshare 100% and 78.6% identity with residues of chick andmammalian subunits, respectively (Supplemental Fig. S1).Overall, in the ligand binding domain, the zebrafishshares 82.5–83% gene sequence identity with chick, rat,mouse and human (Table 2). These homologies suggestthat zebrafish and goldfish α7 nAChRs have similar MLAsensitivities to those of human, rat and mouse, butparticularly chick.
Only one decay time constant has been associated withputative α7 nAChR responses to synaptic current in thechick ciliary ganglion preparation, 1.84 ± 0.14 ms (Zhanget al. 1996) and 1.04 ± 0.35 ms (Ullian et al. 1997), and ourobserved τ1 value of class 1 EPSPs is in good agreementwith these reports. However, two decay time constants
C© 2011 The Authors. Journal compilation C© 2011 The Physiological Society
) by guest on September 19, 2014jp.physoc.orgDownloaded from J Physiol (
590 C. L. Grove and others J Physiol 589.3
Table 2. Percentage sequence identity
14 AntagonistBinding interaction 4 MLA Binding Binding Bindingdomain sites specific sites domain domain domain
α7 α7 α7 α3 β2 β4Zebrafish Zebrafish Zebrafish Goldfish Goldfish Goldfish
Human 83.0 78.6 50 79.8 77.8 75.6Rat 82.5 78.6 50 77.9 77.3 74.6Mouse 82.5 78.6 50 77.9 77.3 74.6Chick 82.5 100 100 78.4 78.4 79.9Zebrafish 100 100 100 99.0 96.4 100Pufferfish ___ ___ ___ ___ ___ 91.4
Cysteines: α7 at 190, 191 (Hansen et al. 2005); α3 at 192, 193 (Cauley et al. 1990; Hieber et al.1990a); β2 at 130, 144 (Heiber et al. 1990b); β4 at 130, 144 (XP 696993, NCBI database).
have been reported for α7 nAChR-mediated synapticcurrent in hippocampal interneurons in rat brain slices(Frazier et al. 1998). In our study the nAChRs that under-lie the two time constants, τ1 and τ2, of class 1 EPSPs areboth sensitive to α7 nAChR antagonists. In that kineticelements of class 1 EPSPs do not exhibit a differentialsensitivity to antagonists (Fig. 3Ca and b), it is unlikelythat two different receptor types give rise to τ1 and τ2(Frazier et al. 1998).
Three possible explanations for the source of the secondkinetic element, τ2, are (1) the lack of desensitization ofhomomeric α7 nAChRs, (2) the presence of heteromericα7∗ nAChRs and (3) a small contribution fromα3β4∗ nAChRs not detected by kinetic analysis. Thebiexponential decay of class 1 EPSPs could reflect multipleopen states or burst properties (Nai et al. 2003) and theabsence of desensitization at agonist concentrations andprofiles generated in the synaptic context, enabling thepresence of a slowly decaying current similar to the τ2element, (Frazier et al. 1998; Papke & Thinschmidt, 1998;Papke et al. 2000; Mike et al. 2000; Shoop et al. 2001;Placzek et al. 2005). In a few cases α7 nAChRs have beenreported to occur as a heteromers in association with β2subunits (Yu & Role, 1998; Shao & Yakel, 2000). It ispossible that in our preparation a similar situation mightaccount for the two observed time constants. Lastly, a smallcontribution from α3β4∗ nAChRs may be misidentifiedas a τ2 element in class 1 EPSPs analysed only by decaykinetics, but this cannot account for the susceptibility ofthe τ2 element to antagonists specific for α7 nAChRs.
The τ3 component is blocked by an α3β2nAChR-specific antagonist, α-Ctx GIC (McIntosh et al.2002), and has decay kinetics similar to synaptically evokedmonoexponential EPSCs (∼5–7 ms) (Ullian et al. 1997;Chen et al. 2001) in the chick ciliary ganglion. The ciliaryα3∗ EPSCs are mediated in part by α3 and β2 subunits(Conroy & Berg, 1995), are blocked by α-Ctx MII (Ullianet al. 1997; Chen et al. 2001), an antagonist that targets
α3/β2 nAChRs interfaces (Cartier et al. 1996), and areassociated with a 40 pS nAChR channel having a meanopen time of ∼2.8 ms under 0.5 μM nicotine activation(Nai et al. 2003).
Comparison of sequence homology across specieswithin the nAChR ligand binding domain (Brejc et al.2001) for the goldfish α3 (Cauley et al. 1990; Hieberet al. 1990a) and goldfish β2 (Hieber et al. 1990b)nAChR subunit gene sequences reveals 77–80% identity,as shown in Table 2. Note that there is a very highidentity, 96–99%, between goldfish and zebrafish. Thesequence fragments and residues crucial for bindingα-Ctx GIC, one of the antagonists used in the presentpharmacological investigation of the τ3 component, areinferred by comparison with α-Ctx MII and outlined invertical registers in Supplemental Fig. S2A and B. Thegoldfish α3 and β2 nAChR sequences contain the sameresidues shown to be critical for binding α-Ctx MII in theα3β2 human nAChR, namely K185 and I188 for the α3subunit and T59 for the β2 subunit (Harvey et al. 1997;Chi et al. 2005). α-Ctx MII and α-Ctx GIC are expectedto have similar interactions with α3β2 nAChRs, based onstructural analysis (Chi et al. 2004). Additionally, the highlevel of sequence and structural homology across speciessuggest that MLA and α-Ctx GIC are likely to interactwith the goldfish α3β2 nAChRs as they do in other species(Table 2).
The τ4 EPSP component is blocked by an α3β4-specificantagonist, α-Ctx AuIB (Luo et al. 1998). Interestingly aciliary α3∗ channel lacking the β2, but containing the β4,subunit had a slightly longer mean open time, ∼3.2 ms,than its α3β2∗ counterpart (Nai et al. 2003). Also, α3β4nAChRs expressed in oocytes (Boorman et al. 2003) havecomplex channel kinetics with a mean open time of 9.4 ms,consistent with the decay kinetics of the τ4 EPSP andmEPSP (Table 1).
The sequence identity of the teleost β4 subunitwhen compared with that of human, rodents and chick
C© 2011 The Authors. Journal compilation C© 2011 The Physiological Society
) by guest on September 19, 2014jp.physoc.orgDownloaded from J Physiol (
J Physiol 589.3 Fast nicotinic synaptic transmission 591
(Supplemental Fig. S2C) is ∼74–80% (Table 2). α-CtxAuIB (10 μM) blocks α3β4 nAChRs expressed in oocytesheterologously and in chick and rat endogenously (Luoet al. 1998; Nai et al. 2003; Park et al. 2006). The sites thatconvey this specificity are not yet known. Nevertheless, thezebrafish 54–63 segment in the β4 nAChR subunit that ispart of the complementary face of the antagonist bindingpocket (Brejc et al. 2001; Hansen et al. 2005) is similaracross species, suggesting that this toxin may also havespecificity in the goldfish.
Physiological relevance of multiple nAChR types
The M-axon action potential triggers an escape response,and the classic role for the CRNs or their analogues isto activate supraspinal motorneuron pools that controlthe opercular, ocular, jaw and pectoral fin muscles(Auerbach & Bennett, 1969; Diamond, 1971; Model et al.1972; Hackett & Faber, 1983a; Hackett & Buchheim,1984). During an escape, CRN activation leads to jawclosure, making the fish shape more streamlined (Barryand Bennett, 1990). Why are three different nAChRpopulations present at a connection that has a high safetyfactor and that is associated with a stereotyped behaviour,especially since the escape response is optimized by factorslimiting M-cell activation to a single spike? Indeed it hasbeen assumed that CRNs also do not fire repetitively.Nevertheless, the multiplicity of receptor types may enablea wide variety of important subcellular (Sabatini et al.2001; Berg et al. 2006) and circuit-level adaptive properties(Korn & Faber, 2005). These include (1) increasing thesafety factor of the connection; (2) temporal tuningof the CRN depolarization window to enhance spatialand temporal integration, for example, of delayed inputsto the CRN dendritic arbor from other reticulospinalneurons; (3) differential timing of the excitation ofthe different CRN classes; and (4) differential modula-tion of channel biophysical properties and activationof downstream pathways unique to each receptortype.
Augmenting the EPSP by activating multiple receptorcomponents enables a fast rise time via α7∗ nAChRs andan increased probability that threshold will be attainedwith the added contributions from the α3β2∗ and α3β4∗
receptors that prolong the EPSPs (Zhang et al. 1996). Bothof these attributes would be consistent with the need toquickly and reliably relay the signal from the M-axon,initiating a startle response.
Behavioural observations suggest that in certain casesthe escape may consist of two successive fast body bends.The input underlying the second bend could come fromeither the M-axon or its homologues known to participatein some escapes (Korn & Faber, 2005); in either case, themixed signal CRNs (classes 2, 4, 5 or 6) would be more
likely to integrate these inputs, especially asynchronousexcitation from the homologues.
Second messengers (Tan et al. 1998; Du & Role, 2001;Fischer et al. 2005) interact with the intercellular region ofparticular nAChR subunits and can differentially alter thebiophysical characteristics of the receptor. The presenceof several receptor subtypes enables the cell to regulatemultiple downstream processes simultaneously. Specificmembers of the PSD95 family of PDZ-containing proteinsare associated with particular nAChR subtypes (Conroyet al. 2003; Baer et al. 2007) and mediate such processes(Parker et al. 2004; Berg et al. 2006).
Glutamatergic synapses also are characterized by theco-activation of multiple receptor types that mediatefast synaptic transmission with different kinetics, notablyAMPA and NMDA receptors. Activating NMDA receptors,which have slower kinetics and a higher Ca2+ permeability,has been implicated in activity-dependent plasticities ofsynaptic transmission. While a similar arrangement mightpertain for nAChRs, it is notable that the Ca2+-permeablechannel, α7∗, has the fastest kinetics.
We have demonstrated the presence of six EPSPclasses coupled with at least two CRNs types (Titmus& Faber, 1987; Hackett & Buchheim, 1984), indicatinga significantly greater diversity in CRNs than previouslyappreciated in the goldfish (Kimmel et al. 1985; Barry& Bennett, 1990). This has raised questions as to thephysiological role of this diversity. Instead of the limitedstereotyped role of CRNs in the escape response, CRNsmay be associated with many more behaviours. Indeed,the possibility of varied inputs to the giant fibre cellbody, a CRN homologue in the hatchet fish, suggeststhe involvement of the giant fibre in non-Mauthnerinitiated C-starts (Barry & Bennett, 1990). This systemlends itself to investigating pre- and postsynaptic trans-mission mechanisms, and given that it can be studied invivo, provides a compelling model for exploring cellularcorrelates of a wide variety of behaviours.
References
Alkondon M & Albuquerque EX (1993). Diversity of nicotinicacetylcholine receptors in rat hippocampal neurons. I.Pharmacological and functional evidence for distinctstructural subtypes. J Pharmacol Exp Ther 265, 1455–1473.
Alkondon M, Pereira EFR & Albuquerque EX (1998).α-Bungartotoxin- and methyllycaconitine-sensitive nicotinicreceptors mediate fast synaptic transmission in interneuronsof rat hippocampal slices. Brain Res 810, 257–263.
Ankri N, Legendre P, Faber DS & Korn H (1994). Automaticdetection of spontaneous synaptic responses in centralneurons. J Neurosci Methods 52, 87–100.
Astles PC, Baker SR, Boot JR, Broad LM, Dell CP & Keenan M(2002). Recent progress in the development of subtypeselective nicotinic acetylcholine receptor ligands. Curr DrugTargets CNS Neurol Disord 1, 337–348.
C© 2011 The Authors. Journal compilation C© 2011 The Physiological Society
) by guest on September 19, 2014jp.physoc.orgDownloaded from J Physiol (
592 C. L. Grove and others J Physiol 589.3
Auerbach AA & Bennett MV (1969). Chemically mediatedtransmission at a giant fiber synapse in the central nervoussystem of a vertebrate. J Gen Physiol 53, 183–210.
Baer K, Burli T, Huh KH, Wiesner A, Erb-Vogtli S,Gockeritz-Dujmovic D et al. (2007). PICK1 interacts with α7neuronal nicotinic acetylcholine receptors and controls theirclustering. Mol Cell Neurosci 35, 339–355.
Baker ER, Zwart R, Sher E & Millar NS (2004).Pharmacological properties of α9 α10 nicotinic acetylcholinereceptors revealed by heterologous expression of subunitchimeras. Mol Pharmacol 65, 453–460.
Barry MA & Bennett MV (1990). Projections of giant fibers, aclass of reticular interneurons, in the brain of the silverhatchetfish. Brain Behav Evol 36, 391–400.
Berg DK & Conroy WG (2002). Nicotinic α7 receptors:synaptic options and downstream signaling in neurons. JNeurobiol 53, 512–523.
Berg DK, Conroy WG, Liu Z & Zago WM (2006). Nicotinicsignal transduction machinery. J Mol Neurosci 30, 149–152.
Boorman JP, Beato M, Groot-Kormelink PJ, Broadbent SD &Sivilotti LG (2003). The effects of β3 subunit incorporationon the pharmacology and single channel properties ofoocyte-expressed human α3β4 neuronal nicotinic receptors.J Biol Chem 278, 44033–44040.
Bradaia A & Trouslard J (2002). Fast synaptic transmissionmediated by α-bungarotoxin-sensitive nicotinicacetylcholine receptors in lamina X neurones of neonatal ratspinal cord. J Physiol 544, 727–739.
Brejc K, van Dijk WJ, Klaassen RV, Schuurmans M, Van DerOost J, Smit AB & Sixma TK (2001). Crystal structure of anACh-binding protein reveals the ligand-binding domain ofnicotinic receptors. Nature 411, 269–276.
Bryant DL, Free RB, Thomasy SM, Lapinsky DJ, Ismail KA,McKay SB et al. (2002). Structure-activity studies with ring Eanalogues of methyllycaconitine on bovine adrenal α3β4∗nicotinic receptors. Neurosci Res 42, 57–63.
Cartier GE, Yoshikami D, Gray WR, Luo S, Olivera BM &McIntosh JM (1996). A new α-conotoxin which targets α3β2nicotinic acetylcholine receptors. J Biol Chem 271,7522–7528.
Cauley K, Agranoff BW & Goldman D (1990). Multiplenicotinic acetylcholine receptor genes are expressed ingoldfish retina and tectum. J Neurosci 10, 670–683.
Chang KT & Berg DK (1999). Nicotinic acetylcholine receptorscontaining α7 subunits are required for reliable synaptictransmission in situ. J Neurosci 19, 3701–3710.
Chavez-Noriega LE, Crona JH, Washburn MS, Urrutia A,Elliott KJ & Johnson EC (1997). Pharmacologicalcharacterization of recombinant human neuronal nicotinicacetylcholine receptors h α2β2, h α2β4, h α3β2, h α3β4, hα4β2, h α4β4 and h α7 expressed in Xenopus oocytes. JPharmacol Exp Ther 280, 346–356.
Chen M, Pugh PC & Margiotta JF (2001). Nicotinic synapsesformed between chick ciliary ganglion neurons in cultureresemble those present on the neurons in vivo. J Neurobiol47, 265–279.
Chi SW, Kim DH, Olivera BM, McIntosh JM & Han KH(2004). Solution conformation of α-conotoxin GIC, a novelpotent antagonist of α3β2 nicotinic acetylcholine receptors.Biochem J 380, 347–352.
Chi SW, Lee SH, Kim DH, Kim JS, Olivera BM, McIntosh JM &Han KH (2005). Solution structure of α-conotoxin PIA, anovel antagonist of α6 subunit containing nicotinicacetylcholine receptors. Biochem Biophys Res Commun 338,1990–1997.
Coggan JS, Bartol TM, Esquenazi E, Stiles JR, Lamont S,Martone ME et al. (2005). Evidence for ectopicneurotransmission at a neuronal synapse. Science 309,446–451.
Conroy WG & Berg DK (1995). Neurons can maintain multipleclasses of nicotinic acetylcholine receptors distinguished bydifferent subunit compositions. J Biol Chem 270, 4424–4431.
Conroy WG, Liu Z, Nai Q, Coggan JS & Berg DK (2003).PDZ-containing proteins provide a functional postsynapticscaffold for nicotinic receptors in neurons. Neuron 38,759–771.
Couturier S, Erkman L, Valera S, Rungger D, Bertrand S,Boulter J, Ballivet M & Bertrand D (1990b). α5, α3, andnon-α3. Three clustered avian genes encoding neuronalnicotinic acetylcholine receptor-related subunits. J BiolChem 265, 17560–17567.
Cuevas J, Roth AL & Berg DK (2000). Two distinct classes offunctional 7-containing nicotinic receptor on rat superiorcervical ganglion neurons. J Physiol 525, 735–746.
Dani JA & Bertrand D (2007). Nicotinic acetylcholine receptorsand nicotinic cholinergic mechanisms of the central nervoussystem. Annu Rev Pharmacol Toxicol 47, 699–729.
Day JW, Hall DH, Hall LM & Bennett MV (1983).α-Bungarotoxin labeling and acetylcholinesteraselocalization at the Mauthner fiber giant synapse in thehatchetfish. J Neurosci 3, 272–279.
Diamond J (1971). The Mauthner cell. In Fish Physiology, ed.Hoar WS & Randall DJ, pp. 265–346. Academic Press, NewYork.
Drasdo A, Caulfield M, Bertrand D, Bertrand S & Wonnacott S(1992). Methyl lycaconitine: A novel nicotinic antagonist.Mol Cell Neurosci 3, 237–243.
Du C & Role LW (2001). Differential modulation of nicotinicacetylcholine receptor subtypes and synaptic transmission inchick sympathetic ganglia by PGE2. J Neurophysiol 85,2498–2508.
Elgoyhen AB, Vetter DE, Katz E, Rothlin CV, Heinemann SF &Boulter J (2001). α10: a determinant of nicotinic cholinergicreceptor function in mammalian vestibular and cochlearmechanosensory hair cells. Proc Natl Acad Sci U S A 98,3501–3506.
Faber DS, Funch PG & Korn H (1985). Evidence that receptorsmediating central synaptic potentials extend beyond thepostsynaptic density. Proc Natl Acad Sci U S A 32, 3504–3508.
Faber DS & Korn H (1978). Electrophysiology of the Mauthnercell: basic properties, synaptic mechanisms, and associatednetworks. In Neurobiology of the Mauthner Cell, ed. Faber DS& Korn H, pp. 47–131. Raven, New York.
Faber DS & Korn H (1988) Synergism at central synapses dueto lateral diffusion of transmitter. Proc Natl Acad Sci U S A85, 8708–8712.
Faria M, Oliveira L, Timoteo MA, Lobo MG & Correia-De-Sa P(2003). Blockade of neuronal facilitatory nicotinic receptorscontaining α3β2 subunits contribute to tetanic fade in therat isolated diaphragm. Synapse 49, 77–88.
C© 2011 The Authors. Journal compilation C© 2011 The Physiological Society
) by guest on September 19, 2014jp.physoc.orgDownloaded from J Physiol (
J Physiol 589.3 Fast nicotinic synaptic transmission 593
Figl A & Cohen BN (2000). The subunit dominates therelaxation kinetics of heteromeric neuronal nicotinicreceptors. J Physiol 524, 685–699.
Fischer H, Liu DM, Lee A, Harries JC & Adams DJ (2005).Selective modulation of neuronal nicotinic acetylcholinereceptor channel subunits by Go-protein subunits. J Neurosci25, 3571–3577.
Flores CE, Ene S & Pereda AE (2008). An immunochemicalmarker for goldfish Mauthner cells. J Neurosci Methods 175,64–69.
Frazier CJ, Buhler AV, Weiner JL & Dunwiddie TV (1998).Synaptic potentials mediated via α-bungarotoxin-sensitivenicotinic acetylcholine receptors in rat hippocampalinterneurons. J Neurosci 18, 8228–8235.
Fucile S, Matter JM, Erkman L, Ragozzino D, Barabino B,Grassi F et al. (1998). The neuronal α6 subunit formsfunctional heteromeric acetylcholine receptors in humantransfected cells. Eur J Neurosci 10, 172–178.
Funch PG, Wood MR & Faber DS (1984). Localization of activesites along the myelinated goldfish Mauthner axon:morphological and pharmacological evidence for saltatoryconduction. J Neurosci 4, 2397–2409.
Genzen JR, Van Cleve W & McGehee DS (2001). Dorsal rootganglion neurons express multiple nicotinic acetylcholinereceptor subtypes. J Neurophysiol 86, 1773–1782.
Gilat E, Hall DH & Bennett MV (1986). The giant fiber andpectoral fin adductor motoneuron system in the hatchetfish.Brain Res 365, 96–104.
Guo JZ, Liu Y, Sorenson EM & Chiappinelli VA (2005).Synaptically released and exogenous ACh activates differentnicotinic receptors to enhance evoked glutamatergictransmission in the lateral geniculate nucleus. J Neurophysiol94, 2549–2560.
Hackett JT & Buchheim A (1984). Ultrastructural correlates ofelectrical-chemical synaptic transmission in goldfish cranialmotor nuclei. J Comp Neurol 224, 425–436.
Hackett JT, Cochran SL & Greenfield LJ Jr (1989). Quantaltransmission at Mauthner axon target synapses in thegoldfish brainstem. Neuroscience 32, 49–64.
Hackett JT & Faber DS (1983a). Mauthner axon networksmediating supraspinal components of the startle response inthe goldfish. Neuroscience 8, 317–331.
Hackett JT & Faber DS (1983b). Relay neurons mediatecollateral inhibition of the goldfish Mauthner cell. Brain Res264, 302–306.
Hansen SB, Sulzenbacher G, Huxford T, Marchot P, Taylor P &Bourne Y (2005). Structures of Aplysia AChBP complexeswith nicotinic agonists and antagonists reveal distinctivebinding interfaces and conformations. EMBO J 24,3635–3646.
Hartzell HC, Kuffler SW & Yoshikami D (1975). Post-synapticpotentiation: interaction between quanta of acetylcholine atthe skeletal neuromuscular synapse. J Physiol 251, 427–463.
Harvey SC, McIntosh JM, Cartier GE, Maddox FN & LuetjeCW (1997). Determinants of specificity for α-conotoxin MIIon α3β2 neuronal nicotinic receptors. Mol Pharmacol 51,336–342.
Hatton GI & Yang QZ (2002). Synaptic potentials mediated byα7 nicotinic acetylcholine receptors in supraoptic nucleus.J Neurosci 22, 29–37.
Hieber V, Bouchey J, Agranoff BW & Goldman D (1990a).Nucleotide and deduced amino acid sequence of the goldfishneural nicotinic acetylcholine receptor α-3 subunit. NucleicAcids Res 18, 5293.
Hieber V, Bouchey J, Agranoff BW & Goldman D (1990b).Nucleotide and deduced amino acid sequence of the goldfishneural nicotinic acetylcholine receptor β-2 subunit. NucleicAcids Res 18, 5307.
Horch HL & Sargent PB (1995). Perisynaptic surfacedistribution of multiple classes of nicotinic acetylcholinereceptors on neurons in the chicken ciliary ganglion.J Neurosci 15, 7778–7795.
Jack JB, Noble D & Tsien RW (1975). Electric Current Flow inExcitable Cells. Oxford University Press, London.
Jacob MH & Berg DK (1983). The ultrastructural localizationof α-bungarotoxin binding sites in relation to synapses onchick ciliary ganglion neurons. J Neurosci 3, 260–271.
Jacob MH, Berg DK & Lindstrom JM (1984). Shared antigenicdeterminant between the Electrophorus acetylcholinereceptor and a synaptic component on chicken ciliaryganglion neurons. Proc Natl Acad Sci U S A 81, 3223–3227.
Jones S, Sudweeks S & Yakel JL (1999). Nicotinic receptors inthe brain: correlating physiology with function. TrendsNeurosci 22, 555–561.
Kaiser S & Wonnacott S (2000). α-bungarotoxin-sensitivenicotinic receptors indirectly modulate [3H]dopaminerelease in rat striatal slices via glutamate release. MolPharmacol 58, 312–318.
Kimmel CB, Metcalfe WK & Schabtach E (1985). T reticularinterneurons: a class of serially repeating cells in thezebrafish hindbrain. J Comp Neurol 233, 365–376.
Korn H & Faber DS (2005). The Mauthner cell half a centurylater: a neurobiological model for decision-making? Neuron47, 13–28.
Lopez MG, Montiel C, Herrero CJ, Garcia-Palomero E,Mayorgas I, Hernandez-Guijo JM et al. (1998). Unmaskingthe functions of the chromaffin cell α7 nicotinic receptor byusing short pulses of acetylcholine and selective blockers.Proc Natl Acad Sci U S A 95, 14184–14189.
Loring RH, Dahm LM & Zigmond RE (1985). Localization ofα-bungarotoxin binding sites in the ciliary ganglion of theembryonic chick: an autoradiographic study at the light andelectron microscopic level. Neuroscience 14, 645–660.
Lukas RJ, Changeux JP, Le Novere N, Albuquerque EX, BalfourDJ, Berg DK et al. (1999). International Union ofPharmacology. XX. Current status of the nomenclature fornicotinic acetylcholine receptors and their subunits.Pharmacol Rev 51, 397–401.
Luo S, Kulak JM, Cartier GE, Jacobsen RB, Yoshikami D,Olivera BM & McIntosh JM (1998). α-conotoxin AuIBselectively blocks α3β4 nicotinic acetylcholine receptors andnicotine-evoked norepinephrine release. J Neurosci 18,8571–8579.
McGehee DS, Heath MJ, Gelber S, Devay P & Role LW (1995).Nicotine enhancement of fast excitatory synaptic transmissionin CNS by presynaptic receptors. Science 269, 1692–1696.
McIntosh JM, Dowell C, Watkins M, Garrett JE, Yoshikami D &Olivera BM (2002). α-conotoxin GIC from Conusgeographus, a novel peptide antagonist of nicotinicacetylcholine receptors. J Biol Chem 277, 33610–33615.
C© 2011 The Authors. Journal compilation C© 2011 The Physiological Society
) by guest on September 19, 2014jp.physoc.orgDownloaded from J Physiol (
594 C. L. Grove and others J Physiol 589.3
McIntosh JM, Plazas PV, Watkins M, Gomez-Casati ME,Olivera BM & Elgoyhen AB (2005). A novel α-conotoxin,PeIA, cloned from Conus pergrandis, discriminates betweenrat α9α10 and α7 nicotinic cholinergic receptors. J BiolChem 280, 30107–30112.
Mike A, Castro G & Albuquerque EX (2000). Choline andacetylcholine have similar kinetic properties of activationand desensitization on the α7 nicotinic receptors in rathippocampal neurons. Brain Res 882, 155–168.
Model PG, Highstein SM & Bennett MV (1975). Depletion ofvesicles and fatigue of transmission at a vertebrate centralsynapse. Brain Res 98, 209–228.
Model PG, Spira ME & Bennett MV (1972). Synaptic inputs tothe cell bodies of the giant fibers of the hatchetfish. Brain Res45, 288–295.
Mogg AJ, Whiteaker P, McIntosh JM, Marks M, Collins AC &Wonnacott S (2002). Methyllycaconitine is a potentantagonist of α-conotoxin-MII-sensitive presynapticnicotinic acetylcholine receptors in rat striatum. J PharmacolExp Ther 302, 197–204.
Nai Q, McIntosh JM & Margiotta JF (2003). Relating neuronalnicotinic acetylcholine receptor subtypes defined by subunitcomposition and channel function. Mol Pharmacol 63,311–324.
Nguyen D & Sargent PB (2002). Synaptic vesicle recycling attwo classes of release sites in giant nerve terminals of theembryonic chicken ciliary ganglion. J Comp Neurol 448,128–137.
Nong Y, Sorenson EM & Chiappinelli VA (1999). Fastexcitatory nicotinic transmission in the chick lateralspiriform nucleus. J Neurosci 19, 7804–7811.
Papke RL, Meyer E, Nutter T & Uteshev VV (2000). α7receptor-selective agonists and modes of α7 receptoractivation. Eur J Pharmacol 393, 179–195.
Papke RL & Thinschmidt JS (1998). The correction of α7nicotinic acetylcholine receptor concentration-responserelationships in Xenopus oocytes. Neurosci Lett 256,163–166.
Park KS, Cha SK, Kim MJ, Kim DR, Jeong SW, Lee JW & KongID (2006). An α3β4 subunit combination acts as a majorfunctional nicotinic acetylcholine receptor in male rat pelvicganglion neurons. Pflugers Arch 452, 775–783.
Parker MJ, Zhao S, Bredt DS, Sanes JR & Feng G (2004). PSD93regulates synaptic stability at neuronal cholinergic synapses.J Neurosci 24, 378–388.
Placzek AN, Grassi F, Meyer EM & Papke RL (2005). An α7nicotinic acetylcholine receptor gain-of-function mutantthat retains pharmacological fidelity. Mol Pharmacol 68,1863–1876.
Roerig B, Nelson DA & Katz LC (1997). Fast synapticsignaling by nicotinic acetylcholine and serotonin 5-HT3receptors in developing visual cortex. J Neurosci 17,8353–8362.
Sabatini BL, Maravall M & Svoboda K (2001). Ca2+ signaling indendritic spines. Curr Opin Neurobiol 11, 349–356.
Sahibzada N, Ferreira M Jr, Williams B, Wasserman A, Vicini S& Gillis RA (2002). Nicotinic ACh receptor subtypes ongastrointestinally projecting neurones in the dorsal motorvagal nucleus of the rat. J Physiol 545, 1007–1016.
Sargent P (2009). Nicotinic receptors concentrated in thesubsynaptic membrane so not contribute significantly tosynaptic currents at an embryonic synapse in the chickenciliary ganglion. J Neurosci 29, 3749–3759.
Shao Z & Yakel JL (2000). Single channel properties of neuronalnicotinic ACh receptors in stratum radiatum interneurons ofrat hippocampal slices. J Physiol 527, 507–513.
Shoop RD, Chang KT, Ellisman MH & Berg DK (2001).Synaptically driven calcium transients via nicotinic receptorson somatic spines. J Neurosci 21, 771–781.
Shoop RD, Martone ME, Yamada N, Ellisman MH & Berg DK(1999). Neuronal acetylcholine receptors with α7 subunitsare concentrated on somatic spines for synaptic signaling inembryonic chick ciliary ganglia. J Neurosci 19, 692–704.
Szabo TM, Weiss SA, Faber DS & Preuss T (2006).Representation of auditory signals in the M-cell: role ofelectrical synapses. J Neurophysiol 95, 2617–2629.
Tan W, Du C, Siegelbaum SA & Role LW (1998). Modulationof nicotinic AChR channels by prostaglandin E2 in chicksympathetic ganglion neurons. J Neurophysiol 79, 870–878.
Thinschmidt JS, Frazier CJ, King MA, Meyer EM & Papke RL(2005). Medial septal/diagonal band cells express multiplefunctional nicotinic receptor subtypes that are correlatedwith firing frequency. Neurosci Lett 389, 163–168.
Titmus MJ & Faber DS (1987). Alteration of identified outputsynapses spared by axotomy. In 20th AnniversaryCommemorative Symposium. University of Puerto Rico,Institute of Neurobiology, San Jaun, Puerto Rico.
Ullian EM, McIntosh JM & Sargent PB (1997). Rapid synaptictransmission in the avian ciliary ganglion is mediated by twodistinct classes of nicotinic receptors. J Neurosci 17,7210–7219.
Waldeck RF, Pereda A & Faber DS (2000). Properties andplasticity of paired-pulse depression at a central synapse. JNeurosci 20, 5312–5320.
Weiss SA, Zottoli SJ, Do SC, Faber DS & Preuss T (2006).Correlation of C-start behaviors with neural activityrecorded from the hindbrain in free-swimming goldfish(Carassius auratus). J Exp Biol 209, 4788–4801.
Whiteaker P, Christensen S, Yoshikami D, Dowell C, WatkinsM, Gulyas J et al. (2007). Discovery, synthesis, and structureactivity of a highly selective α7 nicotinic acetylcholinereceptor antagonist. Biochemistry 46, 6628–6638.
Williams BM, Temburni MK, Levey MS, Bertrand S,Bertrand D & Jacob MH (1998). The long internal loopof the α3 subunit targets nAChRs to subdomains withinindividual synapses on neurons in vivo. Nat Neurosci 1,557–562.
Wonnacott S, Barik J, Dickinson J & Jones IW (2006). Nicotinicreceptors modulate transmitter cross talk in the CNS:nicotinic modulation of transmitters. J Mol Neurosci 30,137–140.
Yu CR & Role LW (1998). Functional contribution of the α7subunit to multiple subtypes of nicotinic receptors inembryonic chick sympathetic neurones. J Physiol 509,651–665.
Zhang ZW, Coggan JS & Berg DK (1996). Synaptic currentsgenerated by neuronal acetylcholine receptors sensitive toα-bungarotoxin. Neuron 17, 1231–1240.
C© 2011 The Authors. Journal compilation C© 2011 The Physiological Society
) by guest on September 19, 2014jp.physoc.orgDownloaded from J Physiol (
J Physiol 589.3 Fast nicotinic synaptic transmission 595
Zhang ZW, Vijayaraghavan S & Berg DK (1994). Neuronalacetylcholine receptors that bind α-bungarotoxin with highaffinity function as ligand-gated ion channels. Neuron 12,167–177.
Zottoli SJ (1977). Correlation of the startle reflex andMauthner cell auditory responses in unrestrained goldfish. JExp Biol 66, 243–254.
Author contributions
C.L.G., T.M.S., J.M.M. and D.S.F. designed the research; C.L.G.,T.M.S., S.C.D. and R.F.W. performed the experiments; J.M.M.contributed analytical tools; C.L.G., T.M.S., J.M.M., S.C.D.,R.F.W. and D.S.F analysed and interpreted data, C.L.G. wrotethe paper with critical input from T.M.S., J.M.M. and D.S.F. Allauthors were involved in the design or analysis of experiments
and in the critical reading and revision of the manuscript. Allhave approved the final version of the paper. The experimentswere done at the Department of Neuroscience, Albert EinsteinCollege of Medicine.
Acknowledgements
This work was supported by NIH grants MH53631 andGM48677 to J.M.M., NS21848 to D.S.F. and C.L.G. wassupported by T32DK075-13-17. We thank Drs HeikeNeumeister, Alberto Pereda, Thomas Preuss and Peter Sargentfor critical reading of earlier versions of this manuscript. Wethank Dr Kostantin Dobrenis and Pamela Cabahug of theMorphology Core and Kevin Fisher of the Imaging Core of theKennedy Center and Kathy Grove for their technical expertise.
C© 2011 The Authors. Journal compilation C© 2011 The Physiological Society
) by guest on September 19, 2014jp.physoc.orgDownloaded from J Physiol (