v3-i10(1) - International Journal of Academic Research
170
Sucharitha Publications Dr.T.V.Ramana, (9948440288) Visakhapatnam – 530 017 46-8-10 B/1 Near Aditya School Andhra Pradesh – India Jagannaickpur, Kakinada- 533002 website :www.ijar.org.in Andhra Pradesh-India e-mail: [email protected] SS Xerox, Visakhapatnam
-
Upload
khangminh22 -
Category
Documents
-
view
1 -
download
0
Transcript of v3-i10(1) - International Journal of Academic Research

Sucharitha Publications Dr.T.V.Ramana, (9948440288) Visakhapatnam – 530 017 46-8-10 B/1 Near Aditya School Andhra Pradesh – India Jagannaickpur, Kakinada- 533002 website :www.ijar.org.in Andhra Pradesh-India e-mail: [email protected]
SS Xerox, Visakhapatnam
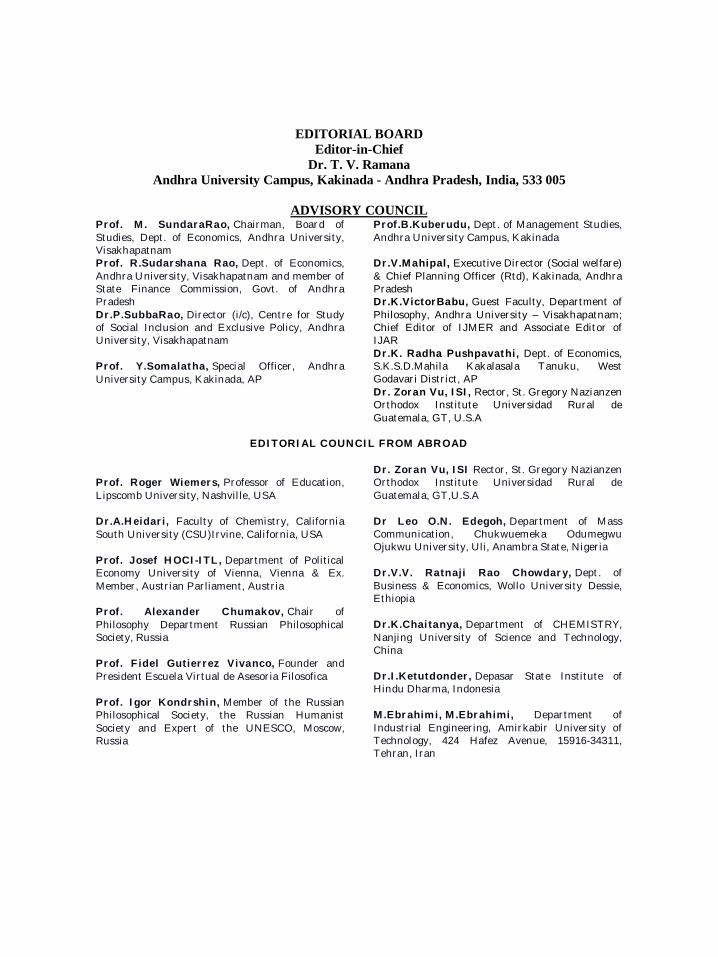
EDITORIAL BOARD Editor-in-Chief
Dr. T. V. Ramana Andhra University Campus, Kakinada - Andhra Pradesh, India, 533 005
ADVISORY COUNCIL
Chairman, Board of Studies, Dept. of Economics, Andhra University, Visakhapatnam Dept. of Economics, Andhra University, Visakhapatnam and member of State Finance Commission, Govt. of Andhra Pradesh Director (i/c), Centre for Study of Social Inclusion and Exclusive Policy, Andhra University, Visakhapatnam Special Officer, Andhra University Campus, Kakinada, AP
Dept. of Management Studies, Andhra University Campus, Kakinada Executive Director (Social welfare) & Chief Planning Officer (Rtd), Kakinada, Andhra PradeshGuest Faculty, Department of Philosophy, Andhra University – Visakhapatnam; Chief Editor of IJMER and Associate Editor of IJAR Dept. of Economics, S.K.S.D.Mahila Kakalasala Tanuku, West Godavari District, APRector, St. Gregory Nazianzen Orthodox Institute Universidad Rural de Guatemala, GT, U.S.A
Professor of Education, Lipscomb University, Nashville, USA Faculty of Chemistry, California South University (CSU)Irvine, California, USA Department of Political Economy University of Vienna, Vienna & Ex. Member, Austrian Parliament, Austria Chair of Philosophy Department Russian Philosophical Society, Russia Founder and President Escuela Virtual de Asesoria Filosofica Member of the Russian Philosophical Society, the Russian Humanist Society and Expert of the UNESCO, Moscow, Russia
Rector, St. Gregory Nazianzen Orthodox Institute Universidad Rural de Guatemala, GT,U.S.A Department of Mass Communication, Chukwuemeka Odumegwu Ojukwu University, Uli, Anambra State, Nigeria Dept. of Business & Economics, Wollo University Dessie, Ethiopia Department of CHEMISTRY, Nanjing University of Science and Technology, ChinaDepasar State Institute of Hindu Dharma, Indonesia Department of Industrial Engineering, Amirkabir University of Technology, 424 Hafez Avenue, 15916-34311, Tehran, Iran
Chairman, Board of Studies, Dept. of Economics, Andhra University, Visakhapatnam Dept. of. Political Science &Public Adnm, Andhra University Campus, Kakinada , Prof.in Physics, University College of Engineering, Jawaharlal Nehru Technological University, Kakinada, Dept. of English, Andhra University Campus, Kakinada, AP BVC Institute of Technology & Science, Amalapuram, AP Centre for Juridical Studies, Dibrugarh University, Dibrugarh, Assam Santanu Kumar Das, Department of Business Administration, Kalam Institute of Technology, Berhampur, Odisha Department of History, Government Arts College, Hassan, Karnataka Department of Mathematics, SVU College of Sciences, Tirupati Department of Journalism & Mass Comm. Central University of Kashmir, Kashmir
Dept. of Commerce, Government City College,(aff) Osmania University, Hyderabad
Rajiv Ganghi Institute of Law College & Dept. of Humanities, JNTUK Dept. of Computer Science and Systems Engineering, Andhra University; India
Dept. of Management Studies, Andhra University Campus, Kakinada
Dept. of political science& public Administration, Andhra University Campus, Kakinada, AP Dept. of political science& public Administration, Andhra University Campus, Kakinada, AP Dept. of political science& public Administration, Andhra University Campus, Kakinada, AP Dept. of Economics, Andhra University Campus, Kakinada, AP Dept. of Economics, S.K.R.B.R College, Narasaraopet, Guntur, district, A.P Department of Education North- Eastern Hill University, Shillong PSG College of Arts & Science Coimbatore S. S. Jalan Girls’ College University of Calcutta-Calcutta Vice- Chancellor, Indira Gandhi Institute of Development Research Mumbai
Department of Telugu, Jnanabharathi Campus, Bangalore University,Bangalore Former Vice Chancellor, Singhania University, Rajasthan
Editor-in-Chief, IJAR – August, vol.3, issue 10(1), October, 2016
Typeset and Printed (Sucharitha publications) in India: IJAR, concentrates on critical and creative research in Multidisciplinary and multiple languages Academic Research. This journal seeks to promote original research and cultivate a fruitful dialogue between old and modern thought. Views expressed in the articles is exclusively of the authors, thus, journal is not responsible of it in any case
visit:www.ijar.org.in
E mail: October, 2016
S. No.
Page No.
1 Study the effect of government debts on Economical inflation:and
1
2 A Synergistic Approach: Spirit of Entrepreneurship among Women Entrepreneurs:and
10
3 Investors investing behavior, preference and perspective Commodity market trading in India:
19
4 Influence of weather parameters on the yield of Rabi Sorghum in Vijayapur district during different climatic modes: and
33
5 Human Resource Development Interventions in Insurance – A Study with Special Reference to the Training & Development in Select Companies :
42
6 International Health Hazards and Issues: 50
7 Micro finance through SHGs towards empowerment of tribal women: A Study of G.L. Puram Mandal in Vizianagaram District:
61
8 Micro Finance System in Andhra Pradesh: 67
9 A Study on the impact of Co-Curricular Activities in Teaching of Biological Sciences at Secondary Level in East Godavari District:
79
10 Blood donation by LGBT people: a distant dream and controversial issue:
85
11 Social empowerment of Dalit women through Self-Help Groups:
91
12 Traduction D’une Histoire « Cut Off » De Chetan Bhagat En Français:
96
13 ‘Savitri’ a submissive woman in R.K. Narayan’s ‘The Dark Room’
103
14 Opinion of Students of Goa (India) towards Advertisements: An Investigational Report-
106
15 A review on Field Extraction and User Session Identification through Web Server Log:
116
16 Decision Making Power in Household and Farm Activities-A Gender Difference Study:
121
17 Janapada Kalarupalu-Streela Patra : and
129
18 Janapada Girijana Nrutyalu : 133
19 :
137
20 : 147
Integrate and harmonize the intellectuals concerning various disciplines is a great task in the dynamic world. Meanwhile, International Journal of Academic Research - A Common Platform of Voice of Intellectuals as Change Agents for better Society’ has been taking care towards the stare with the well acknowledged advisory and editorial committee speaks of strong backbone and its conscious action to deliver the best to the society, state, nation and the world by its unique features covering the areas of Social Science, Humanities and Technology. To add to this thought and idea, with the contributors from various university Professors and institutions of national and international importance, IJAR establish its credibility with the continuous effort to deliver the qualitative aspect of International repute.
IJAR enriches the world by adding the committed dynamic researchers and wish to utmost cooperation from the readers and intellectuals of institutions, universities, colleges etc. in improve the journal. IJAR believes that the present Issue enriches the aim of the journal. IJAR is conveying special thanks and congratulations to the participants with their valuable writings.
This volume is the glimpses of voice of authors that are enthusiastically associated with various issues of the journal. The present issue
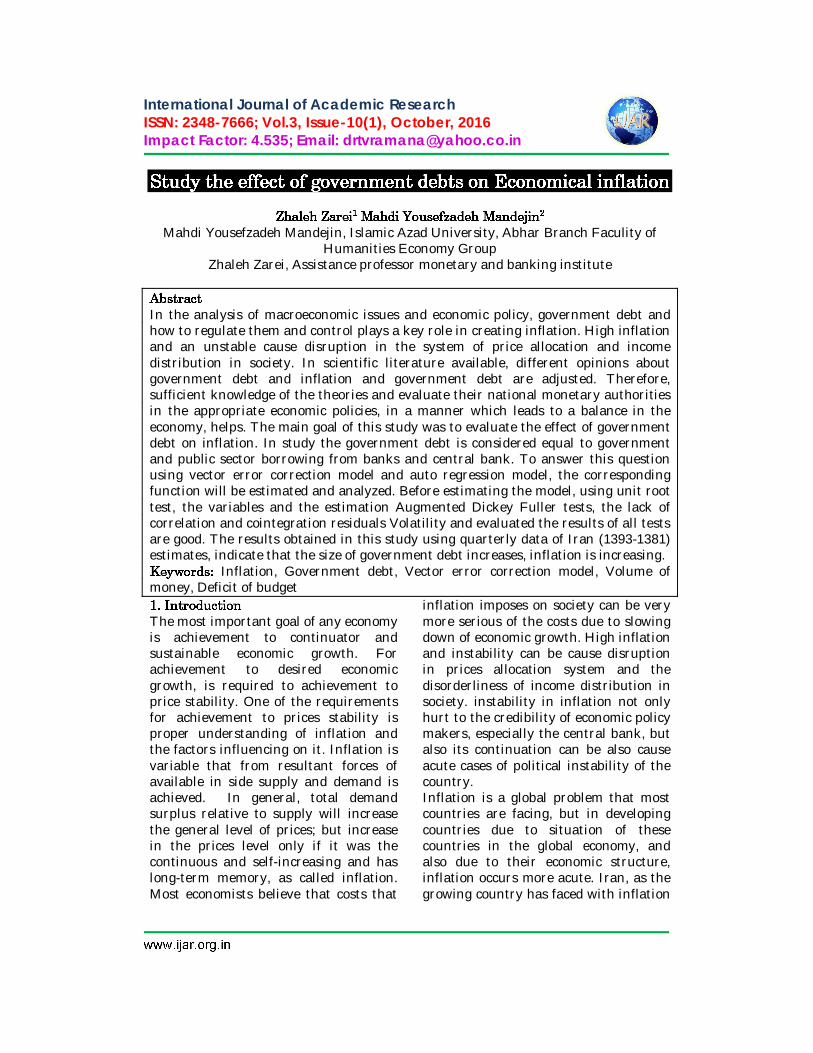
International Journal of Academic Research ISSN: 2348-7666; Vol.3, Issue-10(1), October, 2016 Impact Factor: 4.535; Email: [email protected]
Mahdi Yousefzadeh Mandejin, Islamic Azad University, Abhar Branch Faculity of Humanities Economy Group
Zhaleh Zarei, Assistance professor monetary and banking institute
In the analysis of macroeconomic issues and economic policy, government debt and how to regulate them and control plays a key role in creating inflation. High inflation and an unstable cause disruption in the system of price allocation and income distribution in society. In scientific literature available, different opinions about government debt and inflation and government debt are adjusted. Therefore, sufficient knowledge of the theories and evaluate their national monetary authorities in the appropriate economic policies, in a manner which leads to a balance in the economy, helps. The main goal of this study was to evaluate the effect of government debt on inflation. In study the government debt is considered equal to government and public sector borrowing from banks and central bank. To answer this question using vector error correction model and auto regression model, the corresponding function will be estimated and analyzed. Before estimating the model, using unit root test, the variables and the estimation Augmented Dickey Fuller tests, the lack of correlation and cointegration residuals Volatility and evaluated the results of all tests are good. The results obtained in this study using quarterly data of Iran (1393-1381) estimates, indicate that the size of government debt increases, inflation is increasing.
Inflation, Government debt, Vector error correction model, Volume of money, Deficit of budget
The most important goal of any economy is achievement to continuator and sustainable economic growth. For achievement to desired economic growth, is required to achievement to price stability. One of the requirements for achievement to prices stability is proper understanding of inflation and the factors influencing on it. Inflation is variable that from resultant forces of available in side supply and demand is achieved. In general, total demand surplus relative to supply will increase the general level of prices; but increase in the prices level only if it was the continuous and self-increasing and has long-term memory, as called inflation. Most economists believe that costs that
inflation imposes on society can be very more serious of the costs due to slowing down of economic growth. High inflation and instability can be cause disruption in prices allocation system and the disorderliness of income distribution in society. instability in inflation not only hurt to the credibility of economic policy makers, especially the central bank, but also its continuation can be also cause acute cases of political instability of the country. Inflation is a global problem that most countries are facing, but in developing countries due to situation of these countries in the global economy, and also due to their economic structure, inflation occurs more acute. Iran, as the growing country has faced with inflation
Volume 3, Issue-10(1), October, 2016 International Journal of Academic Research
Published by Office Address Sucharitha Publications Dr.T.V.Ramana, (9948440288) Visakhapatnam – 530 017 46-8-10 B/1 Near Aditya School Andhra Pradesh – India Jagannaickpur, Kakinada- 533002 website :www.ijar.org.in Andhra Pradesh-India e-mail: [email protected]
Design by SS Xerox, Visakhapatnam
EDITORIAL BOARD Editor-in-Chief
Dr. T. V. Ramana Andhra University Campus, Kakinada - Andhra Pradesh, India, 533 005
ADVISORY COUNCIL
Prof. M. SundaraRao, Chairman, Board of Studies, Dept. of Economics, Andhra University, Visakhapatnam Prof. R.Sudarshana Rao, Dept. of Economics, Andhra University, Visakhapatnam and member of State Finance Commission, Govt. of Andhra Pradesh Dr.P.SubbaRao, Director (i/c), Centre for Study of Social Inclusion and Exclusive Policy, Andhra University, Visakhapatnam Prof. Y.Somalatha, Special Officer, Andhra University Campus, Kakinada, AP
Prof.B.Kuberudu, Dept. of Management Studies, Andhra University Campus, Kakinada Dr.V.Mahipal, Executive Director (Social welfare) & Chief Planning Officer (Rtd), Kakinada, Andhra Pradesh Dr.K.VictorBabu, Guest Faculty, Department of Philosophy, Andhra University – Visakhapatnam; Chief Editor of IJMER and Associate Editor of IJAR Dr.K. Radha Pushpavathi, Dept. of Economics, S.K.S.D.Mahila Kakalasala Tanuku, West Godavari District, AP Dr. Zoran Vu, ISI, Rector, St. Gregory Nazianzen Orthodox Institute Universidad Rural de Guatemala, GT, U.S.A
EDITORIAL COUNCIL FROM ABROAD
Prof. Roger Wiemers, Professor of Education, Lipscomb University, Nashville, USA Dr.A.Heidari, Faculty of Chemistry, California South University (CSU)Irvine, California, USA Prof. Josef HOCI-ITL, Department of Political Economy University of Vienna, Vienna & Ex. Member, Austrian Parliament, Austria Prof. Alexander Chumakov, Chair of Philosophy Department Russian Philosophical Society, Russia Prof. Fidel Gutierrez Vivanco, Founder and President Escuela Virtual de Asesoria Filosofica Prof. Igor Kondrshin, Member of the Russian Philosophical Society, the Russian Humanist Society and Expert of the UNESCO, Moscow, Russia
Dr. Zoran Vu, ISI Rector, St. Gregory Nazianzen Orthodox Institute Universidad Rural de Guatemala, GT,U.S.A Dr Leo O.N. Edegoh, Department of Mass Communication, Chukwuemeka Odumegwu Ojukwu University, Uli, Anambra State, Nigeria Dr.V.V. Ratnaji Rao Chowdary, Dept. of Business & Economics, Wollo University Dessie, Ethiopia Dr.K.Chaitanya, Department of CHEMISTRY, Nanjing University of Science and Technology, China Dr.I.Ketutdonder, Depasar State Institute of Hindu Dharma, Indonesia M.Ebrahimi, M.Ebrahimi, Department of Industrial Engineering, Amirkabir University of Technology, 424 Hafez Avenue, 15916-34311, Tehran, Iran
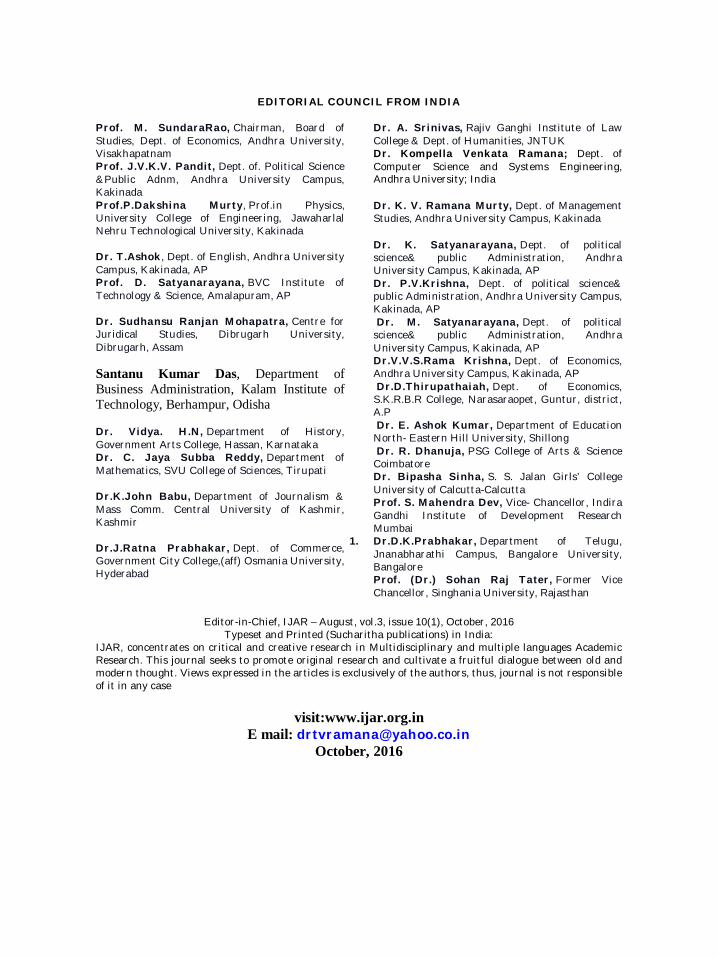
EDITORIAL COUNCIL FROM INDIA Prof. M. SundaraRao, Chairman, Board of Studies, Dept. of Economics, Andhra University, Visakhapatnam Prof. J.V.K.V. Pandit, Dept. of. Political Science &Public Adnm, Andhra University Campus, Kakinada Prof.P.Dakshina Murty, Prof.in Physics, University College of Engineering, Jawaharlal Nehru Technological University, Kakinada Dr. T.Ashok, Dept. of English, Andhra University Campus, Kakinada, AP Prof. D. Satyanarayana, BVC Institute of Technology & Science, Amalapuram, AP Dr. Sudhansu Ranjan Mohapatra, Centre for Juridical Studies, Dibrugarh University, Dibrugarh, Assam Santanu Kumar Das, Department of Business Administration, Kalam Institute of Technology, Berhampur, Odisha Dr. Vidya. H.N, Department of History, Government Arts College, Hassan, Karnataka Dr. C. Jaya Subba Reddy, Department of Mathematics, SVU College of Sciences, Tirupati Dr.K.John Babu, Department of Journalism & Mass Comm. Central University of Kashmir, Kashmir
Dr.J.Ratna Prabhakar, Dept. of Commerce, Government City College,(aff) Osmania University, Hyderabad
Dr. A. Srinivas, Rajiv Ganghi Institute of Law College & Dept. of Humanities, JNTUK Dr. Kompella Venkata Ramana; Dept. of Computer Science and Systems Engineering, Andhra University; India
Dr. K. V. Ramana Murty, Dept. of Management Studies, Andhra University Campus, Kakinada
Dr. K. Satyanarayana, Dept. of political science& public Administration, Andhra University Campus, Kakinada, AP Dr. P.V.Krishna, Dept. of political science& public Administration, Andhra University Campus, Kakinada, AP Dr. M. Satyanarayana, Dept. of political science& public Administration, Andhra University Campus, Kakinada, AP Dr.V.V.S.Rama Krishna, Dept. of Economics, Andhra University Campus, Kakinada, AP Dr.D.Thirupathaiah, Dept. of Economics, S.K.R.B.R College, Narasaraopet, Guntur, district, A.P Dr. E. Ashok Kumar, Department of Education North- Eastern Hill University, Shillong Dr. R. Dhanuja, PSG College of Arts & Science Coimbatore Dr. Bipasha Sinha, S. S. Jalan Girls’ College University of Calcutta-Calcutta Prof. S. Mahendra Dev, Vice- Chancellor, Indira Gandhi Institute of Development Research Mumbai
1. Dr.D.K.Prabhakar, Department of Telugu, Jnanabharathi Campus, Bangalore University, Bangalore Prof. (Dr.) Sohan Raj Tater, Former Vice Chancellor, Singhania University, Rajasthan
Editor-in-Chief, IJAR – August, vol.3, issue 10(1), October, 2016
Typeset and Printed (Sucharitha publications) in India: IJAR, concentrates on critical and creative research in Multidisciplinary and multiple languages Academic Research. This journal seeks to promote original research and cultivate a fruitful dialogue between old and modern thought. Views expressed in the articles is exclusively of the authors, thus, journal is not responsible of it in any case
visit:www.ijar.org.in
E mail: [email protected] October, 2016
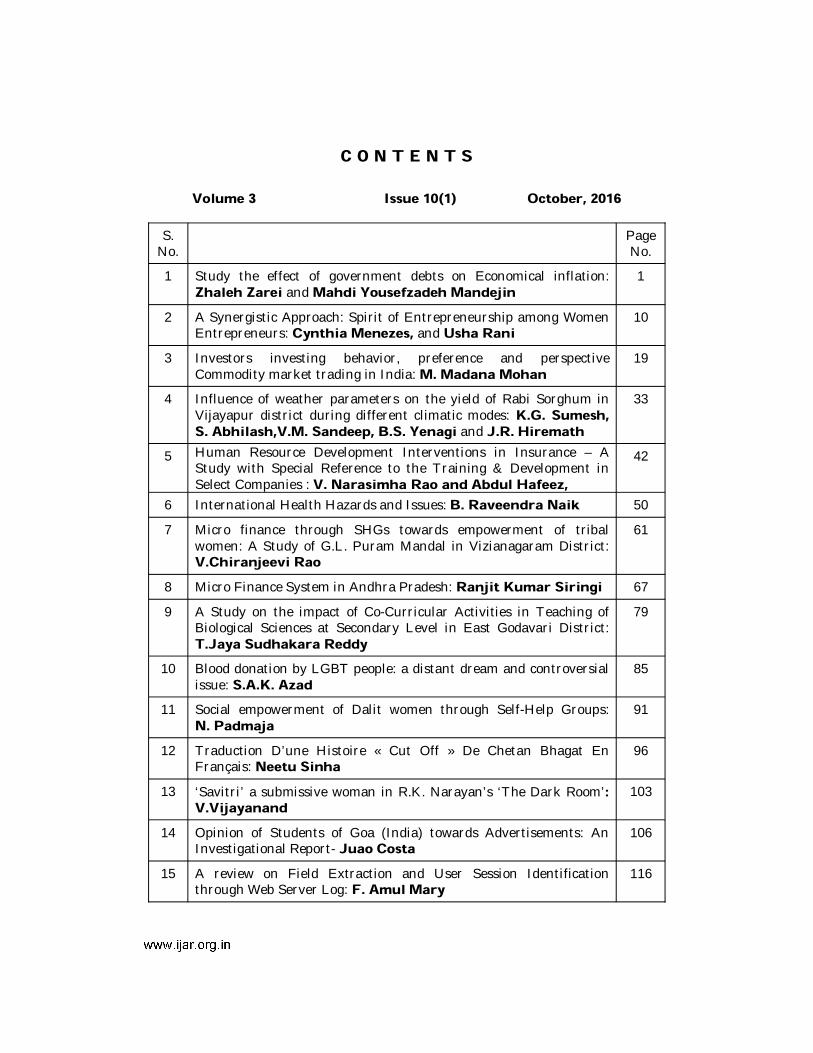
C O N T E N T S
Volume 3 Issue 10(1) October, 2016
S. No.
Page No.
1 Study the effect of government debts on Economical inflation: Zhaleh Zarei and Mahdi Yousefzadeh Mandejin
1
2 A Synergistic Approach: Spirit of Entrepreneurship among Women Entrepreneurs: Cynthia Menezes, and Usha Rani
10
3 Investors investing behavior, preference and perspective Commodity market trading in India: M. Madana Mohan
19
4 Influence of weather parameters on the yield of Rabi Sorghum in Vijayapur district during different climatic modes: K.G. Sumesh, S. Abhilash,V.M. Sandeep, B.S. Yenagi and J.R. Hiremath
33
5 Human Resource Development Interventions in Insurance – A Study with Special Reference to the Training & Development in Select Companies : V. Narasimha Rao and Abdul Hafeez,
42
6 International Health Hazards and Issues: B. Raveendra Naik 50
7 Micro finance through SHGs towards empowerment of tribal women: A Study of G.L. Puram Mandal in Vizianagaram District: V.Chiranjeevi Rao
61
8 Micro Finance System in Andhra Pradesh: Ranjit Kumar Siringi 67
9 A Study on the impact of Co-Curricular Activities in Teaching of Biological Sciences at Secondary Level in East Godavari District: T.Jaya Sudhakara Reddy
79
10 Blood donation by LGBT people: a distant dream and controversial issue: S.A.K. Azad
85
11 Social empowerment of Dalit women through Self-Help Groups: N. Padmaja
91
12 Traduction D’une Histoire « Cut Off » De Chetan Bhagat En Français: Neetu Sinha
96
13 ‘Savitri’ a submissive woman in R.K. Narayan’s ‘The Dark Room’: V.Vijayanand
103
14 Opinion of Students of Goa (India) towards Advertisements: An Investigational Report- Juao Costa
106
15 A review on Field Extraction and User Session Identification through Web Server Log: F. Amul Mary
116
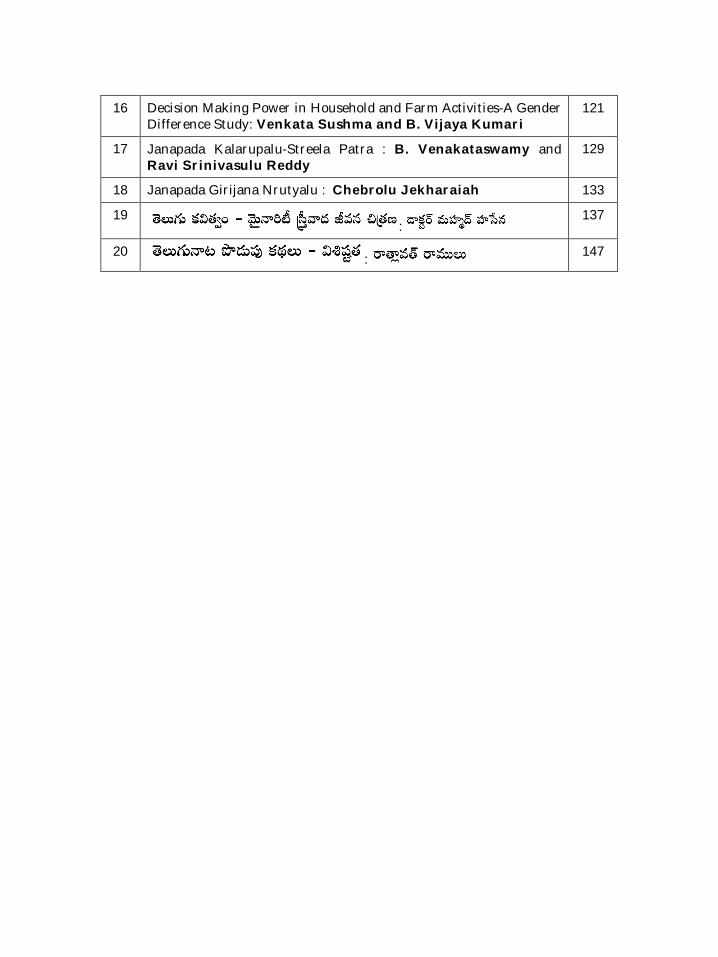
16 Decision Making Power in Household and Farm Activities-A Gender Difference Study: Venkata Sushma and B. Vijaya Kumari
121
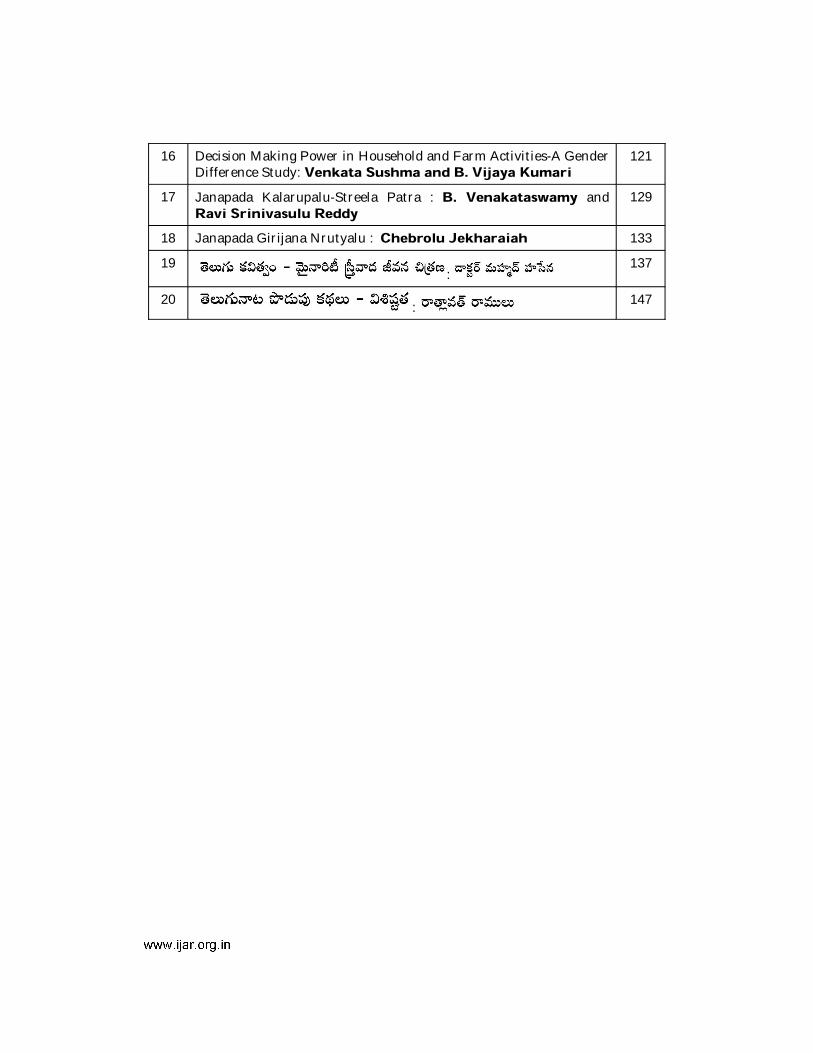
17 Janapada Kalarupalu-Streela Patra : B. Venakataswamy and Ravi Srinivasulu Reddy
129
18 Janapada Girijana Nrutyalu : Chebrolu Jekharaiah 133
19 :
137
20 : 147
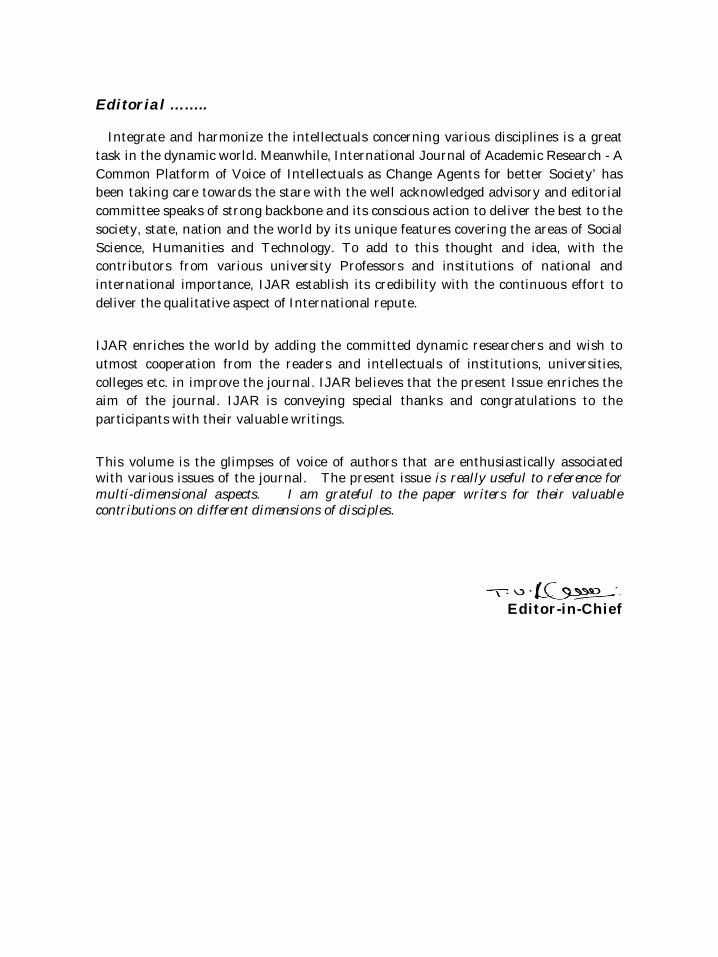
Editorial ……..
Integrate and harmonize the intellectuals concerning various disciplines is a great task in the dynamic world. Meanwhile, International Journal of Academic Research - A Common Platform of Voice of Intellectuals as Change Agents for better Society’ has been taking care towards the stare with the well acknowledged advisory and editorial committee speaks of strong backbone and its conscious action to deliver the best to the society, state, nation and the world by its unique features covering the areas of Social Science, Humanities and Technology. To add to this thought and idea, with the contributors from various university Professors and institutions of national and international importance, IJAR establish its credibility with the continuous effort to deliver the qualitative aspect of International repute.
IJAR enriches the world by adding the committed dynamic researchers and wish to utmost cooperation from the readers and intellectuals of institutions, universities, colleges etc. in improve the journal. IJAR believes that the present Issue enriches the aim of the journal. IJAR is conveying special thanks and congratulations to the participants with their valuable writings.
This volume is the glimpses of voice of authors that are enthusiastically associated with various issues of the journal. The present issue is really useful to reference for multi-dimensional aspects. I am grateful to the paper writers for their valuable contributions on different dimensions of disciples.
Editor-in-Chief
International Journal of Academic Research ISSN: 2348-7666; Vol.3, Issue-10(1), October, 2016 Impact Factor: 4.535; Email: [email protected]
Study the effect of government debts on Economical inflation
Zhaleh Zarei1 Mahdi Yousefzadeh Mandejin2 Mahdi Yousefzadeh Mandejin, Islamic Azad University, Abhar Branch Faculity of
Humanities Economy Group Zhaleh Zarei, Assistance professor monetary and banking institute
Abstract In the analysis of macroeconomic issues and economic policy, government debt and how to regulate them and control plays a key role in creating inflation. High inflation and an unstable cause disruption in the system of price allocation and income distribution in society. In scientific literature available, different opinions about government debt and inflation and government debt are adjusted. Therefore, sufficient knowledge of the theories and evaluate their national monetary authorities in the appropriate economic policies, in a manner which leads to a balance in the economy, helps. The main goal of this study was to evaluate the effect of government debt on inflation. In study the government debt is considered equal to government and public sector borrowing from banks and central bank. To answer this question using vector error correction model and auto regression model, the corresponding function will be estimated and analyzed. Before estimating the model, using unit root test, the variables and the estimation Augmented Dickey Fuller tests, the lack of correlation and cointegration residuals Volatility and evaluated the results of all tests are good. The results obtained in this study using quarterly data of Iran (1393-1381) estimates, indicate that the size of government debt increases, inflation is increasing. Keywords: Inflation, Government debt, Vector error correction model, Volume of money, Deficit of budget 1. IntroductionThe most important goal of any economy is achievement to continuator and sustainable economic growth. For achievement to desired economic growth, is required to achievement to price stability. One of the requirements for achievement to prices stability is proper understanding of inflation and the factors influencing on it. Inflation is variable that from resultant forces of available in side supply and demand is achieved. In general, total demand surplus relative to supply will increase the general level of prices; but increase in the prices level only if it was the continuous and self-increasing and has long-term memory, as called inflation. Most economists believe that costs that
inflation imposes on society can be very more serious of the costs due to slowing down of economic growth. High inflation and instability can be cause disruption in prices allocation system and the disorderliness of income distribution in society. instability in inflation not only hurt to the credibility of economic policy makers, especially the central bank, but also its continuation can be also cause acute cases of political instability of the country. Inflation is a global problem that most countries are facing, but in developing countries due to situation of these countries in the global economy, and also due to their economic structure, inflation occurs more acute. Iran, as the growing country has faced with inflation
www.ijar.org.in 1
International Journal of Academic Research ISSN: 2348-7666; Vol.3, Issue-10(1), October, 2016 Impact Factor: 4.535; Email: [email protected]
for many years. In period after the revolution continued also very rapid price increases and overall inflation had been one of the most important country's economic problems during this period. This issue that has been basically due to performance and organizing of economic over recent decades, in fact, is a fundamental problem and have root in the economic infrastructure of the country. Due to this fact that inflation rate in the country in recent years had increased greatly each year and this has been caused deduction of purchasing power of the people and the community's concern about future of their lives. And implementation of goal oriented plan of subsidies and possible effects on inflation how will depend on its implementation and due to gap and distance between poor and rich areas must adopt necessary measures so that to minimize the pressure on vulnerable groups of society after implementation of the project (Delaware, et al., 1391). 2- Research literature Nowadays in all countries, government is one of economic important institutions that undertake multiple duties in economic domain, for this reason, matter of impacts and consequences of government activities are of the most important topic that consider in the economy science. Economic growth, income distribution, inflation and unemployment are the most important economic and social variables that affected from activities of the government. The budget deficit Budget deficit refers to a situation in which government expenditures are more than its income; or, in other words the government is not able to provide all
its expenses through of its revenues. In developing countries due to economic, social and structural problems, private sector capital is negligible. So duty of the net investment rate enhancement in the economy undertakes the government; the government due to shortage of funds for investment is forced to resort to policy of the budget deficit. The budget deficit is planned enhancement of expenditures relative to incomes (King et al., 1985). Inflation Inflation is continuous and general price enhancement in the prices general. So main characteristic of inflation is continuity and generality prices enhancement. The sudden enhancement in the prices as well as increasing the price of one or more particular item, do not represent inflation (Delaware, et al., 1391). Inflation is variable that obtain from resultant of available forces in total supply and demand side of the economy. In general, total demand surplus relative to supply will increase general level of prices, but if only enhancement of the prices level was self-increasing and have long-term memory, is referred inflation. The important point in inflation is element of time and continuity of the general level enhancement of prices. Loan policy loan policy means government borrowing from other sectors that carry out to four type of foreign borrowing (foreign loans receive from international organizations such as the IMF and World Bank), borrowing from the public (selling bonds to the public and non-bank sectors), borrowing from commercial banks (sale of bonds to commercial banks) and borrowing from the central bank (Rahmani et al., 1391).
Governmental bonds
www.ijar.org.in 2
International Journal of Academic Research ISSN: 2348-7666; Vol.3, Issue-10(1), October, 2016 Impact Factor: 4.535; Email: [email protected]
In fact, bonds are debt documents that are issued by the government and have long maturity. Government failed to meet budget deficits or to supplying required funding for specific civil projects or general, is action to release the Government bonds. Usually interest rate on these bonds is fixe for period whole, as a result, in inflationary conditions, buyers of these bonds, not only do not benefit, but also have loss for them. Government proceed by selling these bonds in order to well-timed secure of revenues deficit and when the exchequer earn various revenues, can depreciate the debt due of mentioned bonds. Therefore, collection and utilization of capitals and small savings through the issuance and sale of bonds, especially short-term bonds is an instrument that can prevent futile stagnation of people and governments savings (Sam Daliry & et al., 1381). Liquidity There are three concepts about liquidity including interest, profit in economy and finance. First is liquidity in the macro economy that runs under monetary policies conditions, and including interest rates, granting loans conditions, and growth results from a combination of monetary and loans. The second is market liquidity how ease of the purchase or sale of a financial asset by a person without a significant change in its price is concerned. The third case is liquidity of balance sheet that with a high degree is concerned to assets of cash equivalents on the balance sheet of a company. For non-financial institutions balance sheet, liquidity is often by short-term cash assets on the balance sheet is measured. For banks that must carefully manage their liquidity, liquidity of balance sheet in detailed items about maturity of assets
and liabilities reflect in short term. The ability of banks for secure to necessary resources often returns to sources secure of cash (Kalantary, 1386). In economic literature, money volume growth (liquidity) is a major cause of inflation. Monetary policy Proceedings series that central banks (monetary capacity) use in order to control of the economic activities of the community. Monetary policies effect on money supply and interest rates and in this way effect on many of economic objectives, such as increasing employment, prices stability, solving problem of depression. In fact, technic of monetary policies adjustment and use of monetary tools have special importance in macroeconomic performance. In fact, the concept of monetary policy is measures adoption to control and volume of money adjustment in circulation. The central bank by using of tools in his hand, Such as open market operations, facilities re-discount and its rate, the direct control of credits, determination of banks liquidity ratio, legal reserve ratio of banks and moral suasion to do this (Jahangard. et al., 1390). Financial policy Financial policy is part of demand management policies that is implemented on behalf of the government. The flow of government payments and receipts that in form of budget revenues and expenditures are unfolded, main variables of financial policy constitute the government (DeLong et al., 2012). The sustainability of financial policy or debt sustainability Term of debt sustainability or financial policy sustainability refers to the level of debt that allows a country funds to its present and future debts without any
www.ijar.org.in 3
International Journal of Academic Research ISSN: 2348-7666; Vol.3, Issue-10(1), October, 2016 Impact Factor: 4.535; Email: [email protected]
renewals or accumulation obligation of government. Sustainable debt is level of debt in which level of debt ratio goes down or remains unchanged and financial deficit is not necessarily zero (Fan, 2007), in general, the sustainability of financial policy means
ability of a government to repay its debts (Moment and colleagues, 1392). Structural inflation Structural inflation often occur and continue because of the unbalanced structures of economic, political, governmental, culture and suchlike (Sultan et al., 1390).
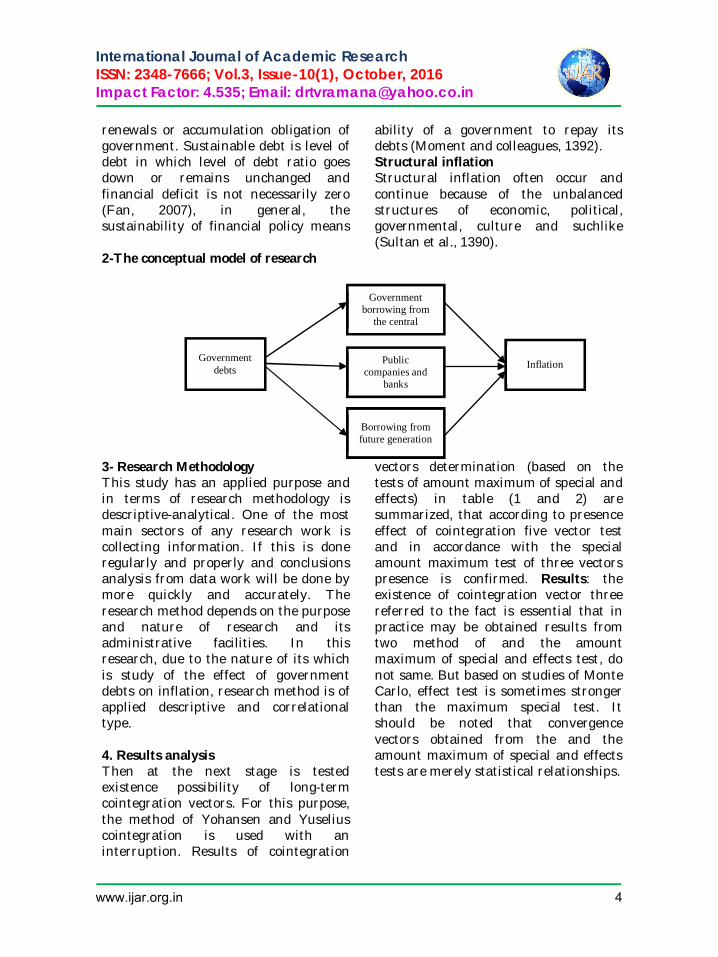
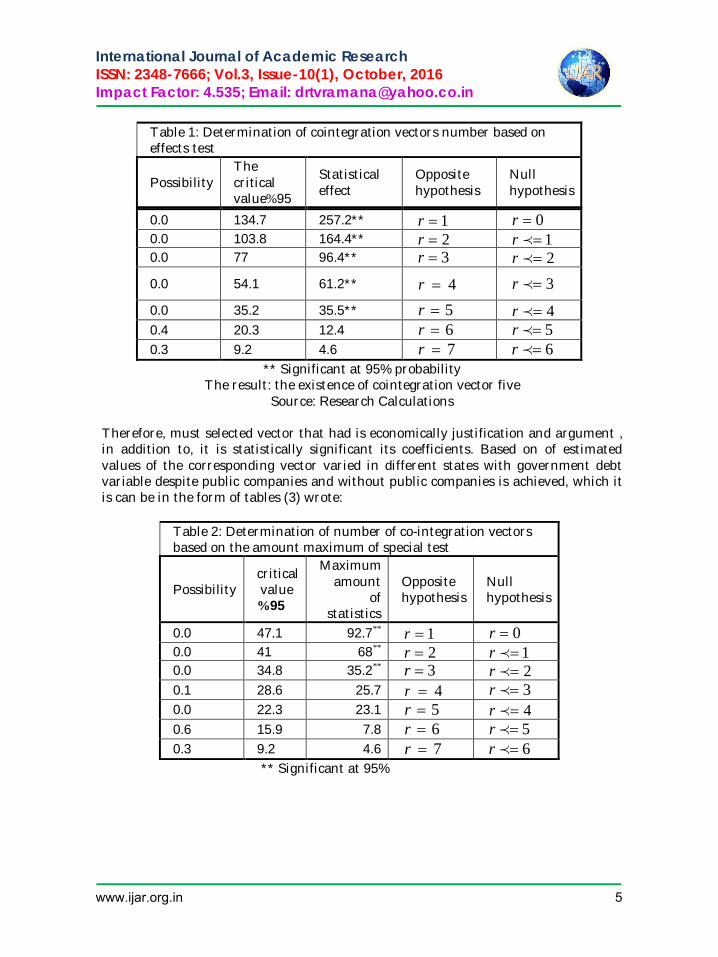
2-The conceptual model of research 3- Research Methodology This study has an applied purpose and in terms of research methodology is descriptive-analytical. One of the most main sectors of any research work is collecting information. If this is done regularly and properly and conclusions analysis from data work will be done by more quickly and accurately. The research method depends on the purpose and nature of research and its administrative facilities. In this research, due to the nature of its which is study of the effect of government debts on inflation, research method is of applied descriptive and correlational type. 4. Results analysis Then at the next stage is tested existence possibility of long-term cointegration vectors. For this purpose, the method of Yohansen and Yuselius cointegration is used with an interruption. Results of cointegration
vectors determination (based on the tests of amount maximum of special and effects) in table (1 and 2) are summarized, that according to presence effect of cointegration five vector test and in accordance with the special amount maximum test of three vectors presence is confirmed. Results: the existence of cointegration vector three referred to the fact is essential that in practice may be obtained results from two method of and the amount maximum of special and effects test, do not same. But based on studies of Monte Carlo, effect test is sometimes stronger than the maximum special test. It should be noted that convergence vectors obtained from the and the amount maximum of special and effects tests are merely statistical relationships.
Government debts
Government borrowing from
the central bank Public
companies and banks
Inflation
Borrowing from future generation
www.ijar.org.in 4
International Journal of Academic Research ISSN: 2348-7666; Vol.3, Issue-10(1), October, 2016 Impact Factor: 4.535; Email: [email protected]
Table 1: Determination of cointegration vectors number based on effects test
Null hypothesis
Opposite hypothesis
Statistical effect
The critical value 95%
Possibility
0r 1r 257.2** 134.7 0.0 1r 2r 164.4** 103.8 0.0 2r 3r 96.4** 77 0.0
3r 4r 61.2** 54.1 0.0
4r 5r 35.5** 35.2 0.0 5r 6r 12.4 20.3 0.4 6r 7r 4.6 9.2 0.3
** Significant at 95% probability The result: the existence of cointegration vector five
Source: Research Calculations
Therefore, must selected vector that had is economically justification and argument , in addition to, it is statistically significant its coefficients. Based on of estimated values of the corresponding vector varied in different states with government debt variable despite public companies and without public companies is achieved, which it is can be in the form of tables (3) wrote:
Table 2: Determination of number of co-integration vectors based on the amount maximum of special test
Null hypothesis
Opposite hypothesis
Maximum amount
of statistics
critical value
95% Possibility
0r 1r **92.7 47.1 0.0 1r 2r **68 41 0.0 2r 3r **35.2 34.8 0.0 3r 4r 25.7 28.6 0.1
4r 5r 23.1 22.3 0.0 5r 6r 7.8 15.9 0.6 6r 7r 4.6 9.2 0.3
** Significant at 95%
www.ijar.org.in 5
International Journal of Academic Research ISSN: 2348-7666; Vol.3, Issue-10(1), October, 2016 Impact Factor: 4.535; Email: [email protected]
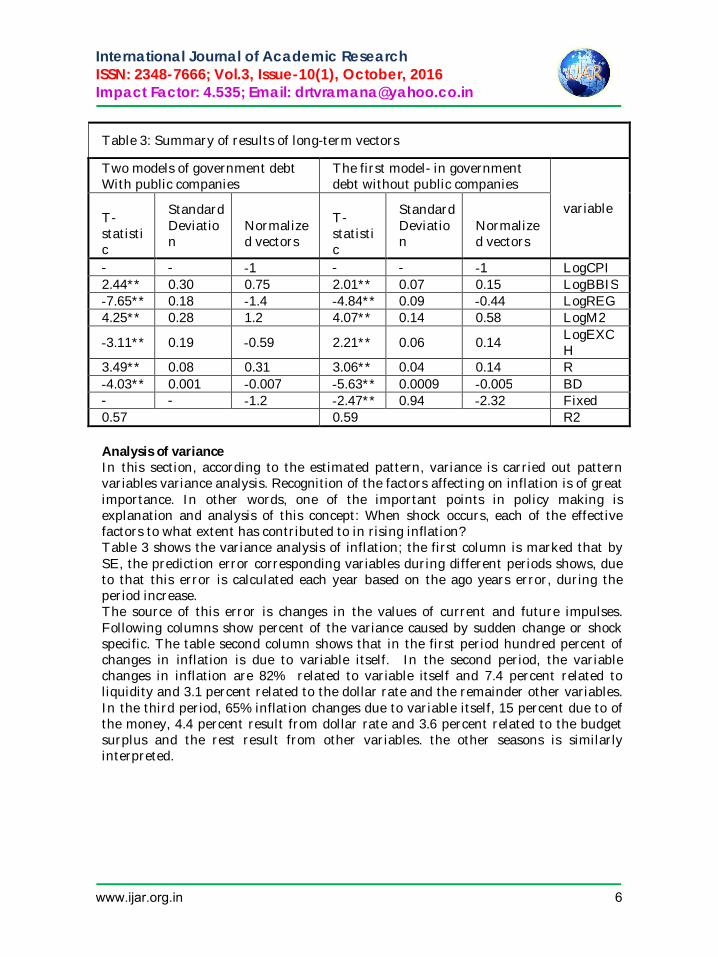
Table 3: Summary of results of long-term vectors
variable
The first model- in government debt without public companies
Two models of government debt With public companies
Normalized vectors
Standard Deviation
T-statistic
Normalized vectors
Standard Deviation
T-statistic
LogCPI 1- - - 1- - - LogBBIS 0.15 0.07 2.01** 0.75 0.30 2.44** LogREG 0.44 - 0.09 4.84- ** 1.4- 0.18 7.65- ** LogM2 0.58 0.14 4.07** 1.2 0.28 4.25** LogEXCH 0.14 0.06 2.21** 0.59 - 0.19 3.11- **
R 0.14 0.04 3.06** 0.31 0.08 3.49** BD 0.005- 0.0009 5.63- ** 0.007- 0.001 4.03- ** Fixed 2.32 - 0.94 2.47- ** 1.2- - - R2 0.59 0.57
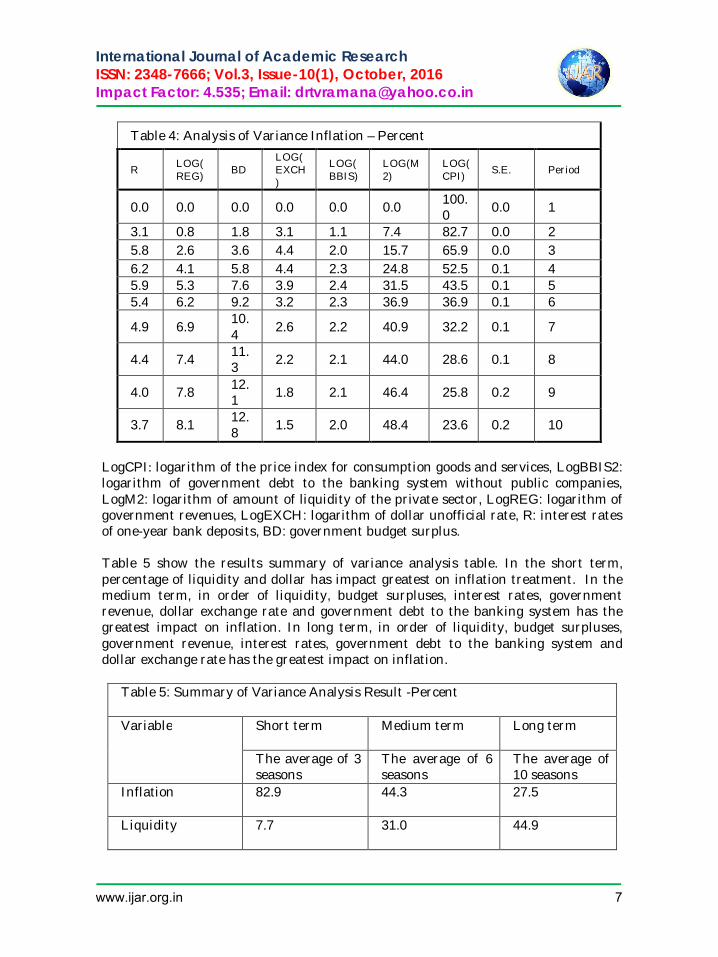
Analysis of variance In this section, according to the estimated pattern, variance is carried out pattern variables variance analysis. Recognition of the factors affecting on inflation is of great importance. In other words, one of the important points in policy making is explanation and analysis of this concept: When shock occurs, each of the effective factors to what extent has contributed to in rising inflation? Table 3 shows the variance analysis of inflation; the first column is marked that by SE, the prediction error corresponding variables during different periods shows, due to that this error is calculated each year based on the ago years error, during the period increase. The source of this error is changes in the values of current and future impulses. Following columns show percent of the variance caused by sudden change or shock specific. The table second column shows that in the first period hundred percent of changes in inflation is due to variable itself. In the second period, the variable changes in inflation are 82% related to variable itself and 7.4 percent related to liquidity and 3.1 percent related to the dollar rate and the remainder other variables. In the third period, 65% inflation changes due to variable itself, 15 percent due to of the money, 4.4 percent result from dollar rate and 3.6 percent related to the budget surplus and the rest result from other variables. the other seasons is similarly interpreted.
www.ijar.org.in 6
International Journal of Academic Research ISSN: 2348-7666; Vol.3, Issue-10(1), October, 2016 Impact Factor: 4.535; Email: [email protected]
Table 4: Analysis of Variance Inflation – Percent
Period S.E. LOG(CPI)
LOG(M2)
LOG(BBIS)
LOG(EXCH)
BD LOG(REG)
R
1 0.0 100.0 0.0 0.0 0.0 0.0 0.0 0.0
2 0.0 82.7 7.4 1.1 3.1 1.8 0.8 3.1 3 0.0 65.9 15.7 2.0 4.4 3.6 2.6 5.8 4 0.1 52.5 24.8 2.3 4.4 5.8 4.1 6.2 5 0.1 43.5 31.5 2.4 3.9 7.6 5.3 5.9 6 0.1 36.9 36.9 2.3 3.2 9.2 6.2 5.4
7 0.1 32.2 40.9 2.2 2.6 10.4 6.9 4.9
8 0.1 28.6 44.0 2.1 2.2 11.3 7.4 4.4
9 0.2 25.8 46.4 2.1 1.8 12.1 7.8 4.0
10 0.2 23.6 48.4 2.0 1.5 12.8 8.1 3.7
LogCPI: logarithm of the price index for consumption goods and services, LogBBIS2: logarithm of government debt to the banking system without public companies, LogM2: logarithm of amount of liquidity of the private sector, LogREG: logarithm of government revenues, LogEXCH: logarithm of dollar unofficial rate, R: interest rates of one-year bank deposits, BD: government budget surplus. Table 5 show the results summary of variance analysis table. In the short term, percentage of liquidity and dollar has impact greatest on inflation treatment. In the medium term, in order of liquidity, budget surpluses, interest rates, government revenue, dollar exchange rate and government debt to the banking system has the greatest impact on inflation. In long term, in order of liquidity, budget surpluses, government revenue, interest rates, government debt to the banking system and dollar exchange rate has the greatest impact on inflation.
Table 5: Summary of Variance Analysis Result -Percent
Long term Medium term Short term Variable
The average of 10 seasons
The average of 6 seasons
The average of 3 seasons
27.5 44.3 82.9 Inflation
44.9 31.0 7.7 Liquidity
www.ijar.org.in 7
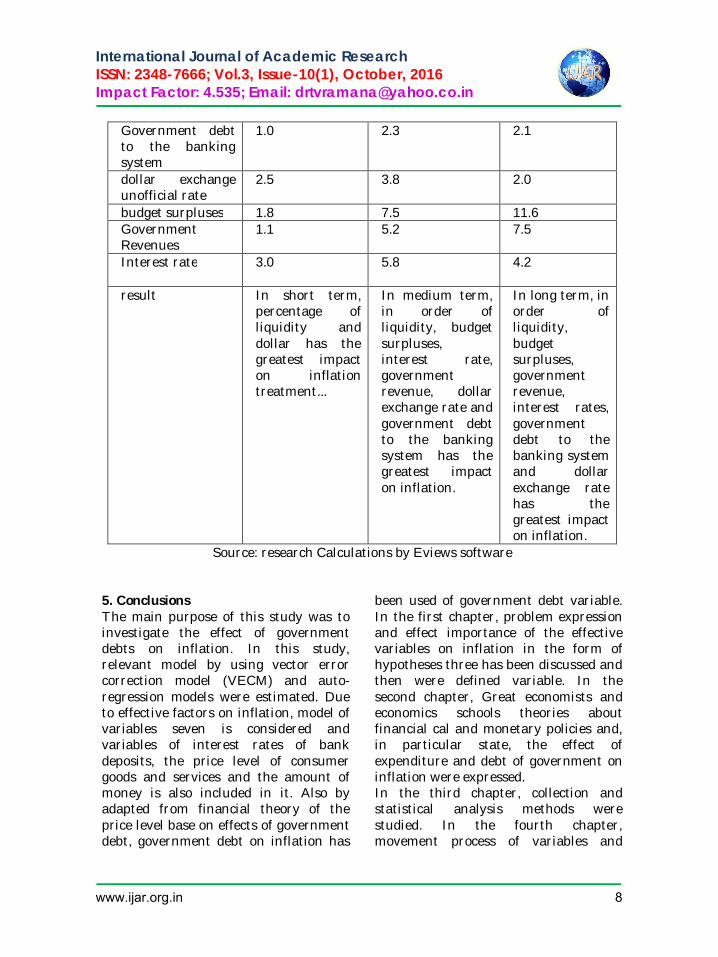
International Journal of Academic Research ISSN: 2348-7666; Vol.3, Issue-10(1), October, 2016 Impact Factor: 4.535; Email: [email protected]
2.1 2.3 1.0 Government debt to the banking system
2.0 3.8 2.5 dollar exchange unofficial rate
11.6 7.5 1.8 budget surpluses 7.5 5.2 1.1 Government
Revenues 4.2 5.8 3.0 Interest rate
In long term, in order of liquidity, budget surpluses, government revenue, interest rates, government debt to the banking system and dollar exchange rate has the greatest impact on inflation.
In medium term, in order of liquidity, budget surpluses, interest rate, government revenue, dollar exchange rate and government debt to the banking system has the greatest impact on inflation.
In short term, percentage of liquidity and dollar has the greatest impact on inflation treatment...
result
Source: research Calculations by Eviews software 5. Conclusions The main purpose of this study was to investigate the effect of government debts on inflation. In this study, relevant model by using vector error correction model (VECM) and auto-regression models were estimated. Due to effective factors on inflation, model of variables seven is considered and variables of interest rates of bank deposits, the price level of consumer goods and services and the amount of money is also included in it. Also by adapted from financial theory of the price level base on effects of government debt, government debt on inflation has
been used of government debt variable. In the first chapter, problem expression and effect importance of the effective variables on inflation in the form of hypotheses three has been discussed and then were defined variable. In the second chapter, Great economists and economics schools theories about financial cal and monetary policies and, in particular state, the effect of expenditure and debt of government on inflation were expressed. In the third chapter, collection and statistical analysis methods were studied. In the fourth chapter, movement process of variables and
www.ijar.org.in 8
International Journal of Academic Research ISSN: 2348-7666; Vol.3, Issue-10(1), October, 2016 Impact Factor: 4.535; Email: [email protected]
output tables of Evews software, analysis and hypotheses of research were tested. The obtained results are as follows: 1) As was stated in the first chapter, public section debt is an important effective factor on inflation that it is consisted of two parts, government debt to central bank and corporates debt and government institutions to the central bank. After examining this factor, results of the research reflects this fact that in the long term, government debt to the banking system had a significant and positive influence on economic inflation in Iran. Amount elasticity of government debts without existence of public companies equivalent of 0.15 with a statistic of t=2.01 and with existence of public enterprises equivalent of 0.75 by statistic of t= 2.44 is obtained that shows the effect of government debts on inflation is high. In other words, any amount of government debts increase is caused by inflation. 2) Public sector debt to the Central Bank is of the major components of the monetary base that have increasing effect on inflation. This part of the monetary base can be regarded as a function of financial policies and its financial position. In set budget as the government's financial program for next year during which all the government monetary requirements for the proper administration of the country was predicted fully and in order to doing so, the country's revenues that must be provider of government expenditures were also expected and also inflexibility of expenditures section in order to reduction, the budget by digital as deficit is equilibrated how to obtaining of the deficit also during the budget bill is presented to the legislature for approval.
References Majid Delaware., Rahele Rafieian., 1391, the study of inflation process in the provinces and the whole country over the period 1387-1369, studies business, Issue 52, pp. 80-100. Mani Motameni., Saeed Karimy-Petanlar., 1392, abiding debts and costs of government in Iran, economic and political information, No. 291, pp. 76 to 85. Mohammad Soltani., Muhammad Lashkari., 1390, being Monetary Test of Inflation and identification of influencing factors on inflation in Iran economy, Journal of Development Strategy, No (28). Teymur Rahmani., Hossein. Abbasinejad., And Abdul Samad Rahmani.1391, analysis of the relationship between inflationary tax and economic growth in Iran, Bulletin Quarterly of Tax , Volume 20, Issue 15, pp. 9-36. Yunus Sam Daliri, Yerafik Nazarian., 1381, bonds and its position in the country's capital market, banks and the economy, Issue 27. Amir Kalantary, 1386, "Liquidity, Liquidity, Liquidity", the bank message, No. 472, pp. 20-21. Esfandiar Jahangard, Sara Ali Asgry., 1390, the study of financial development effect on the effectiveness of monetary policy in developed and developing countries, Quarterly of Economic Modeling Researches (4), pp. 147-169.
www.ijar.org.in 9
International Journal of Academic Research ISSN: 2348-7666; Vol.3, Issue-10(1), October, 2016 Impact Factor: 4.535; Email: [email protected]
A Synergistic Approach: Spirit of Entrepreneurship among Women Entrepreneurs
Dr. Cynthia Menezes, Professor, Bangalore University, Bangalore
Usha Rani M.R, Research Scholar, Faculty: ISBR Business School ,
Bangalore University, Bangalore Abstract: Economic development is dependent on successful entrepreneurship. Spirit of entrepreneurship signifies high level professionalism, risk propensity, creativity, constant updating and strengthening skills and competencies for taking decisive actions which become key source of competitive advantage. For inclusive growth, entrepreneurship development among women should not be neglected. Women entrepreneurs are new generation of business leaders creating indelible mark on the development of the country. Even though it is more challenging to women entrepreneurs, as women emphasis that work and family are both equally important and both are the sources of their satisfaction. In reality, the lives of women entrepreneurs are marked by pressures such as stiff competition, changing technology, volatile market, legal restrictions. Hence, research paper attempts to identify and assess entrepreneurial attitudes, competencies and skills among women entrepreneurship. The findings showed direct relationship between entrepreneurial attitude and competencies which are the related factors, leading to entrepreneurial success and life satisfaction among women in small/micro enterprise. Key Words: Entrepreneurship, Women Entrepreneurs, entrepreneurial attitude, entrepreneurial success. Introduction
“Sprit of Entrepreneurship demands result-oriented attitudes, power of persuasion, constant skill up gradation, dynamic personality with a vision”
In reinvigorating the economy, interest in business and entrepreneurship is flourishing. Specifically, small businesses provide the potential for entrepreneurial activity that is fundamental to economy in developing countries. Management thinker, Peter F. Drucker in “Entrepreneurship and Innovation,” recognized innovation and entrepreneurship are intertwined. In the context of new ventures or existing organizations, Drucker proposed that innovation can be a systematic process; that is, entrepreneurs can directly and positively influence innovation with
resulting improvement in products, processes, and profits, thereby creating value for the organization. It is generally recognized that small business firms have greater opportunities which are not available to larger firms. The market opportunities can provide very profitable niches and competitive advantages to the smaller firm. Also, Neil (1986) examined the benefit of a small business create a distinctive competence in order to remain competitive. Judd and Lee (1981) studied the tactics and financial variables of smaller firms under conditions of recession and inflation. Very few
www.ijar.org.in 10
International Journal of Academic Research ISSN: 2348-7666; Vol.3, Issue-10(1), October, 2016 Impact Factor: 4.535; Email: [email protected]
empirical studies deal directly with strategic behaviours of small business (Sexton and Van Auken, 1982). The Planning Commission as well as the Indian government recognizes the need for women to be part of the mainstream of economic development. All round development and harmonious growth of a nation would be possible only when women are considered as equal partners in progress with men. Women entrepreneurship is seen as an effective strategy to solve the problems of rural and urban poverty In Modern India; more and more women are taking up entrepreneurial activity especially in medium and small scale enterprise/ small business.The small/micro business in a market economy is free to be creative, innovative, explore and try new ideas, and take risks, whereas, big business may be limited by political-legal constraints. To do so, women need to understand different variables which have impact on their business venture. Review of Literature: Oi Lin Cheung, the research article focuses on the reasons for the entrepreneurs to start the small business –whether for necessity or opportunity. Data collected by author, who became new business owners from 2005 to 2010, revealed that unemployment rate had positive impact for the individuals going entrepreneurial. It means that necessity was driving force to be entrepreneurs. Ray M. Valadez, the paper gives insight on the value proposition which have on an economy. The small business serves as the catalyst of economic stimulus and has become fundamental unit or building block of business creation. This paper examines on differences between big and small businesses and points to the value
of small business as not only the big creator of jobs but also an alternative in job displacement. It feed the economy with innovation, talent, and creativity. Martin S. Bressler, the study evaluates on the factors which identifies and develop sustainable competitive advantage as most critical activities for a new business venture. The author have examined various papers on small business strategy and offers a model approach that could enable business owners to better utilize business resources and strengths to increase their likelihood of success. Charles R. B. Stowe & Doug Grider (2014), in this paper, the authors offers strategies for advancing organizational innovation and offers an outcome. Starting with the premise that innovation and creativity can be taught, organizations should develop a balanced approach between innovation in organizational strategies and individual training programs so that individuals will be secure in the organization’s effort to innovate. Innovation training should not be limited to the R&D division but should be fostered throughout an organization. Meenu Goyal et al.(2011), tried to understand transformation brought in the society by Indian women entrepreneurs who have become assertive persuasive and willing to take risks. The paper throws light on reasons & slow progress of women entrepreneurs. It discuss on the schemes for promotion & development of women entrepreneurship in India& case study of women entrepreneur is dealt. Rekha Gupta & Kalpana Kumari (2014), examines women entrepreneurship, in past it was believed that business as male prerogative. The hidden entrepreneurial potential of women has been changing
www.ijar.org.in 11
International Journal of Academic Research ISSN: 2348-7666; Vol.3, Issue-10(1), October, 2016 Impact Factor: 4.535; Email: [email protected]
with growing sensitivity in the roles & focus on skill, knowledge and adaptability in business environment. The paper highlights major constraints and challenges faced by women entrepreneurs, opportunities available to them and recommend suggestions for healthy growth of women entrepreneurs in India.
Statement of the problem: Opportunities for women operating small business enterprise are growing steadily. Today, we can find successful women entrepreneurs possess entrepreneurship attitude and creating own identity. The purpose of this study is to highlight various attributes needed to operate micro business. Objectives of the Study:
To study the perceptions of women entrepreneurs regarding innovative ideas.
To study the tactics and skill sets used by women entrepreneurs on their small business
Research Design: The research paper explores the entrepreneurial attitudes among women entrepreneurs. The research deign adopted for the study is descriptive and empirical in nature. Methodology:
The study is descriptive and analytical. Survey Method: For collection of data a survey method was administrated with the help of structured questionnaire. Sampling Technique: A convenient random sample was selected Sample Size: The sample size is 31
Data Collection: Primary data is collected through the structured questionnaire and informal personal interviews and secondary data through various online journals, websites, books, and articles in newspapers.
Attributes relating Entrepreneurship: Environment: The external environment of a firm demands adaptability and change necessary to survive. Organizations need to become more innovative and entrepreneurial in their activities. The macro environment includes the societal, economic, technological, and political factors that affect an organization. Competitive environment is the more immediate environment which the organization faces on a day-to-day basis. The paper identifies three critical attributes which relates to entrepreneurship. They include dynamism, hostility and differentiation (Miller and Friesen, 1982), Each attributes represents as how well an organization identifies opportunities and matches with its strengths possessed within the organization and become successful in their endeavor. Environmental dynamism is the amount of change required by the small business firms due to actions of competitors, customers’ tastes, advances in technology, and the rate of inflation. Environment hostility is the prevalence of negative factors to the small business firm such as price, product, competitor distribution, regulatory restrictions, and community perception of the small business firm. Differentiation is the uniqueness which helps the organization to gain competitive edge.
www.ijar.org.in 12
International Journal of Academic Research ISSN: 2348-7666; Vol.3, Issue-10(1), October, 2016 Impact Factor: 4.535; Email: [email protected]
Competitive Advantage: According to Winer (2004), competitive advantage focuses on three key components. Winer (2004) states first that competitive advantage must be able to generate customer value. Customer value can be defined by the customer in terms of lower price, speedy delivery, good quality, convenience, or some other characteristic. Second, the enhanced value of the product or service must be perceived by the customer. Finally, effective competitive advantage requires business tactic which would be difficult for business competitors to imitate & produce it. Entrepreneur Attributes: Entrepreneur attributes for a small business are: needs, values, managerial knowledge and skills, and experience. Needs: The driving force which determines the level of entrepreneurial activity is termed the need for achievement, (McClelland, 1961). A successful entrepreneurial venture requires not only a commitment of money, knowledge, and energy, but also requires an emotional commitment. This emotional commitment can be referred to as persistence, passion, and a general belief in the product or service. These drives will influence customers and other stakeholders positively about the business. Values: The basic attribute needed for the entrepreneur to run small business’s culture is the ethical expectations that guide the basic values. These values is manifested in firm’s culture, trust and integrity, thereby image, reputation, market share enhance on small business firm’s product or services. Managerial Knowledge and Skills:
Small business entrepreneurs need business acumen and essential skills to guide the firm and achieve survival. The ability to succeed in small business requires a variety of managerial knowledge and skills. Basic skills include communication, conceptual, interpersonal, administrative, and risk taking in the task. Experience: There are two key dimensions of experience that may affect the entrepreneur’s business success. The dimensions include: background and the number of years and variety of responsibilities taken in the industry. The more experience the entrepreneur has in the industry of the business venture then the greater probability of success in the business. If the industry is very dynamic and requires rapid change due to technology, governmental actions, or competitors’ actions, then the entrepreneur’s experience in the industry is essential for the business’ success. Strategy: Strategy is another causal variable identified for entrepreneur’s success or failure. Strategy has been defined as a pattern in the stream of an organization’s decisions (Mintzberg, 1978). The set of right decisions represents an organization’s objectives for future intentions based on present skills and resources and also assessing the environment opportunities available for them (Miles and Snow, 1978; Rumelt, 1974).Strategy focus on prices, on-time delivery and product quality and uniqueness. These studies and others have demonstrated strong support for a relationship between strategy type and entrepreneurship (Miller, 1983; Miller and Friesen, 1982; Zahra,1986).
www.ijar.org.in 13
International Journal of Academic Research ISSN: 2348-7666; Vol.3, Issue-10(1), October, 2016 Impact Factor: 4.535; Email: [email protected]
Performance Criteria: Performance criteria use a two stage conceptualization by women entrepreneurs on small business performance outcome and Performance output. Performance outcome include: the number of full-time employees, size of selling area, marketing budget, advertising budget, number of inventory
stock outs. These evaluate internal assessment of performance as well as make comparison among key competitors. The second criteria are performance output or organization level. Small business performance is measured by gross profit, net profit, sales and market share
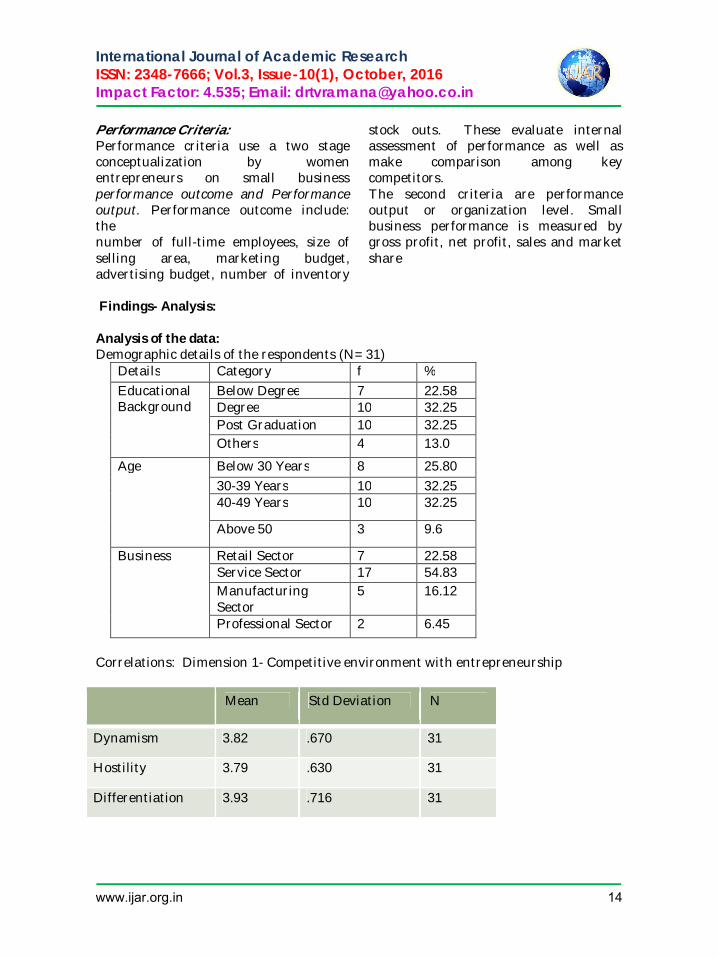
Findings- Analysis: Analysis of the data: Demographic details of the respondents (N=31)
Details Category f % Educational Background
Below Degree 7 22.58 Degree 10 32.25 Post Graduation 10 32.25 Others 4 13.0
Age Below 30 Years 8 25.80 30-39 Years 10 32.25 40-49 Years 10 32.25
Above 50 3 9.6
Business Retail Sector 7 22.58 Service Sector 17 54.83 Manufacturing Sector
5 16.12
Professional Sector 2 6.45
Correlations: Dimension 1- Competitive environment with entrepreneurship
Mean Std Deviation N
Dynamism 3.82 .670 31
Hostility 3.79 .630 31
Differentiation 3.93 .716 31
www.ijar.org.in 14
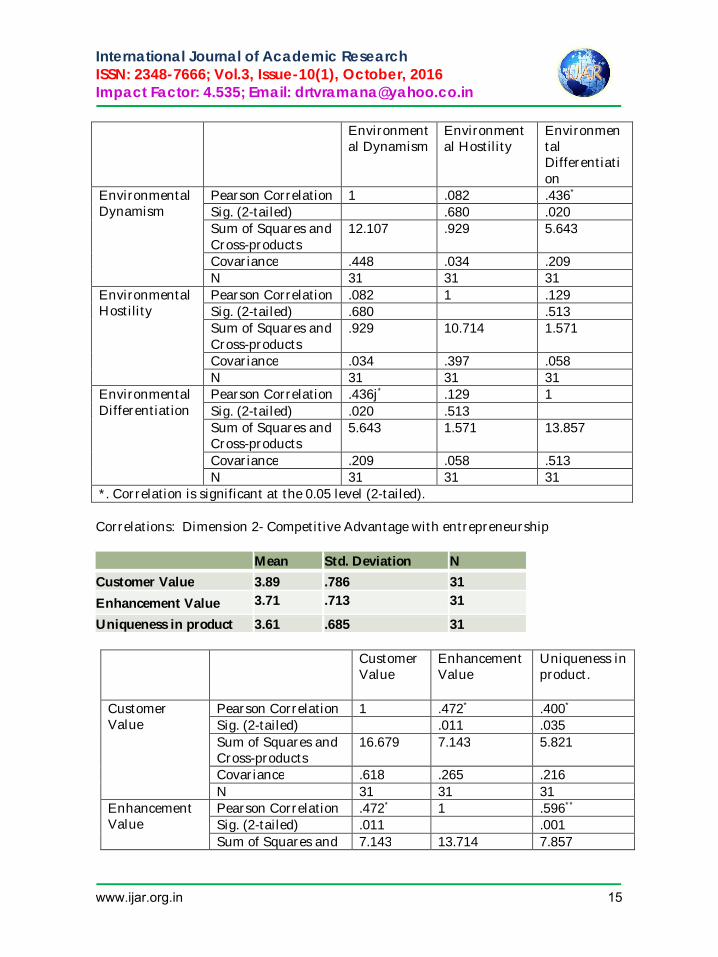
International Journal of Academic Research ISSN: 2348-7666; Vol.3, Issue-10(1), October, 2016 Impact Factor: 4.535; Email: [email protected]
Environmental Dynamism
Environmental Hostility
Environmental Differentiation
Environmental Dynamism
Pearson Correlation 1 .082 .436* Sig. (2-tailed) .680 .020 Sum of Squares and Cross-products
12.107 .929 5.643
Covariance .448 .034 .209 N 31 31 31
Environmental Hostility
Pearson Correlation .082 1 .129 Sig. (2-tailed) .680 .513 Sum of Squares and Cross-products
.929 10.714 1.571
Covariance .034 .397 .058 N 31 31 31
Environmental Differentiation
Pearson Correlation .436j* .129 1 Sig. (2-tailed) .020 .513 Sum of Squares and Cross-products
5.643 1.571 13.857
Covariance .209 .058 .513 N 31 31 31
*. Correlation is significant at the 0.05 level (2-tailed). Correlations: Dimension 2- Competitive Advantage with entrepreneurship Mean Std. Deviation N
Customer Value 3.89 .786 31
Enhancement Value 3.71 .713 31
Uniqueness in product 3.61 .685 31
Customer Value
Enhancement Value
Uniqueness in product.
Customer Value
Pearson Correlation 1 .472* .400* Sig. (2-tailed) .011 .035 Sum of Squares and Cross-products
16.679 7.143 5.821
Covariance .618 .265 .216 N 31 31 31
Enhancement Value
Pearson Correlation .472* 1 .596** Sig. (2-tailed) .011 .001 Sum of Squares and 7.143 13.714 7.857
www.ijar.org.in 15
International Journal of Academic Research ISSN: 2348-7666; Vol.3, Issue-10(1), October, 2016 Impact Factor: 4.535; Email: [email protected]
Cross-products Covariance .265 .508 .291 N 31 31 31
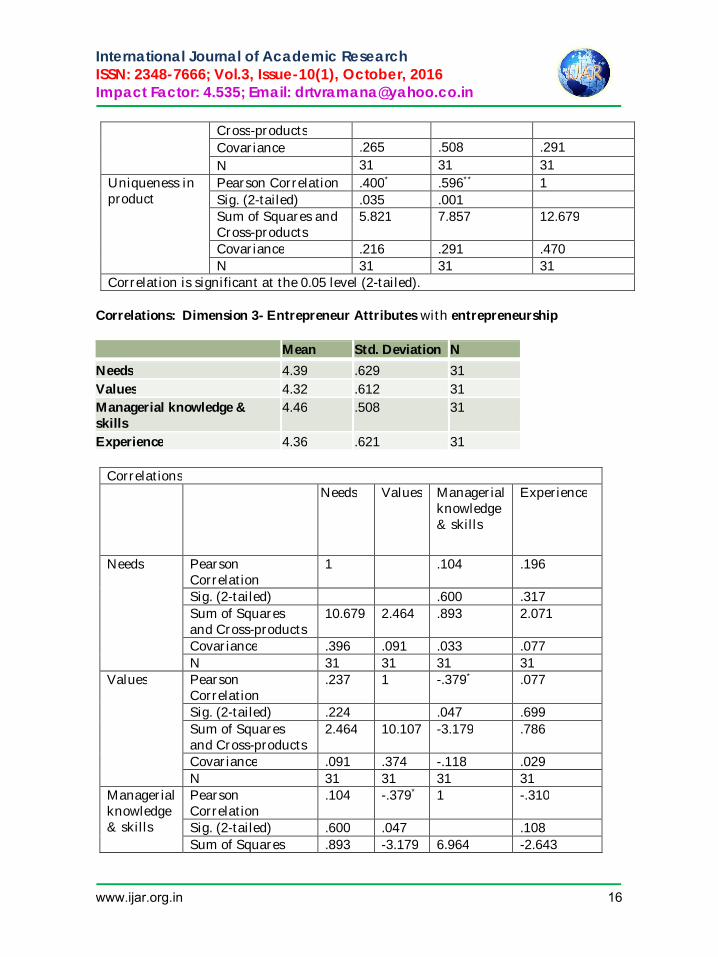
Uniqueness in product
Pearson Correlation .400* .596** 1 Sig. (2-tailed) .035 .001 Sum of Squares and Cross-products
5.821 7.857 12.679
Covariance .216 .291 .470 N 31 31 31
Correlation is significant at the 0.05 level (2-tailed). Correlations: Dimension 3- Entrepreneur Attributes with entrepreneurship Mean Std. Deviation N
Needs 4.39 .629 31 Values 4.32 .612 31 Managerial knowledge & skills
4.46 .508 31
Experience 4.36 .621 31
Correlations Needs Values Managerial
knowledge & skills
Experience
Needs Pearson Correlation
1 .104 .196
Sig. (2-tailed) .600 .317 Sum of Squares and Cross-products
10.679 2.464 .893 2.071
Covariance .396 .091 .033 .077 N 31 31 31 31
Values Pearson Correlation
.237 1 -.379* .077
Sig. (2-tailed) .224 .047 .699 Sum of Squares and Cross-products
2.464 10.107 -3.179 .786
Covariance .091 .374 -.118 .029 N 31 31 31 31
Managerial knowledge & skills
Pearson Correlation
.104 -.379* 1 -.310
Sig. (2-tailed) .600 .047 .108 Sum of Squares .893 -3.179 6.964 -2.643
www.ijar.org.in 16
International Journal of Academic Research ISSN: 2348-7666; Vol.3, Issue-10(1), October, 2016 Impact Factor: 4.535; Email: [email protected]
and Cross-products Covariance .033 -.118 .258 -.098 N 31 31 31 31
Experience Pearson Correlation
.196 .077 -.310 1
Sig. (2-tailed) .317 .699 .108 Sum of Squares and Cross-products
2.071 .786 -2.643 10.429
Covariance .077 .029 -.098 .386 N 31 31 31 31
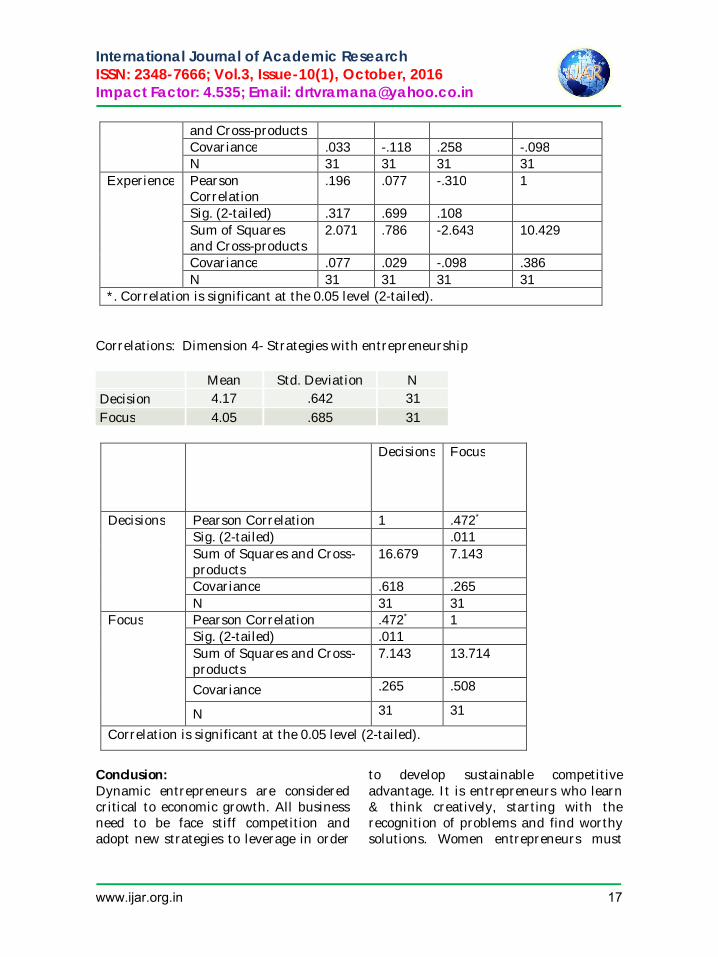
*. Correlation is significant at the 0.05 level (2-tailed). Correlations: Dimension 4- Strategies with entrepreneurship
Mean Std. Deviation N Decision 4.17 .642 31 Focus 4.05 .685 31
Decisions Focus
Decisions Pearson Correlation 1 .472* Sig. (2-tailed) .011 Sum of Squares and Cross-products
16.679 7.143
Covariance .618 .265 N 31 31
Focus Pearson Correlation .472* 1 Sig. (2-tailed) .011 Sum of Squares and Cross-products
7.143 13.714
Covariance .265 .508
N 31 31
Correlation is significant at the 0.05 level (2-tailed).
Conclusion: Dynamic entrepreneurs are considered critical to economic growth. All business need to be face stiff competition and adopt new strategies to leverage in order
to develop sustainable competitive advantage. It is entrepreneurs who learn & think creatively, starting with the recognition of problems and find worthy solutions. Women entrepreneurs must
www.ijar.org.in 17
International Journal of Academic Research ISSN: 2348-7666; Vol.3, Issue-10(1), October, 2016 Impact Factor: 4.535; Email: [email protected]
constantly explore and identify opportunities. Women leaders are assertive, persuasive and willing to take risks. They managed to survive & succeed in this cut-throat competition with their hard work, diligence and perservance. References: Bygrave,, 1993; Carland and and Carland, 2003; Covin and Slevin, 1991; Peterson, 1989). (Drucker, 1985, pp. 30-36). Charles R. B. Stowe & Doug Grider, (April,2014) “ Strategies for advancing organizational innovation” Journal of Management and Marketing Research Volume 15 http://www.aabri.com Jati Nityananda& Ajit Narayan Mohanty “Strategic Entrepreneurship: Key to Success For Competitiveness & Globalization” International Journal of Science and Research (IJSR), India Online ISSN: 2319-7064 Lawton, L., and Parasuraman, A., 1980, “So you want your new product planning to be productive,” Business Horizons, 23(6), pp. 29-34.
Lin Cheung, “Are we seeing ‘necessity’ or ‘opportunity’ entrepreneurship at large?”,Research in business and Economics journal, pp 1-20, http://www.aabri.com/copyright.html. Lindle Hatton,(Oct,2014) “A synergistic approach to small business entrepreneurship” Journal of Management and Marketing Research, Volume 17 http://www.aabri.com Martin S. Bressler, “How small businesses master the art of competition through superior competitive advantage”, 121156 – Journal of Management and Marketing Research Meenu Goyal& Jai Parkash, “ Women Entrepreneurship In India-Problems And Prospects”, International Journal of Multidisciplinary Research Vol.1 Issue 5, September 2011, ISSN 2231 5780 Ray M. Valadez, “The value proposition of small businesses: economic engines for job creation”, Journal of Management and Marketing Research Dr. Rekha Gupta & Kalpana Kumari, “Women Empowerment through Entrepreneurship in India”, AISECT University Journal Vol. III/Issue V March 2014 ISSN: 2278-4187
www.ijar.org.in 18
International Journal of Academic Research ISSN: 2348-7666; Vol.3, Issue-10(1), October, 2016 Impact Factor: 4.535; Email: [email protected]
Investors investing behavior, preference and perspective Commodity market trading in India
Prof. M. Madana Mohan,
M. Com, MBA, MPhil, PhD, BLISc, IRPM, BEd.,PGDCA Professor & Principal, Vishwa Vishwani School of Business, Thumkunta Vil., Near Hakimpet, Hyderabad
Abstract Indian economy is an agriculture economy as around more than half of the population depends upon agriculture sector. Agriculture sector contributes a vast amount to GDP of the economy. The national commodity exchanges, recognized by the Central Government, permits commodities which include precious (gold and silver) and non-ferrous metals, cereals and pulses, ginned and un-ginned cotton, oilseeds, oils and oilcakes, raw jute and jute goods, sugar and gur, potatoes and onions, coffee and tea, rubber and spices. Etc. So the basic aim of this article is to understand the functioning of Commodity Market in India in relation to various exchanges that are available for trading under this market and current scenario of commodity market in India along with rules and regulations under this market. The study also pertains to understand the rationale or behavior of investors towards commodity market which basically aims to understand the perception of retail investors in comparison to other markets through a means of structured questionnaire. Key Words: Indian commodity market, Commodity Trading, Commodity trading decisions Investors investing behaviour and preference Introduction The origin of derivatives can be traced back to the need of farmers to protect themselves against fluctuations in the price of their crop. From the time of sowing to the time of crop harvest, farmers would face price uncertainty. Through the use of simple derivative products, it was possible for the farmer to partially or fully transfer price risks by locking-in asset prices. These were simple contracts developed to meet the needs of farmers and were basically a means of reducing risk. A farmer who sowed his crop in June faced uncertainty Commodity Exchange A commodity exchange is an association or a company or any other body corporate organizing futures trading in commodities for which license has been granted by regulating authority.
Consumer Preferences: - In the short-term, their influence on price volatility is small since it is a slow process permitting manufacturers, dealers and wholesalers to adjust their inventory in advance. Changes in supply: - They are abrupt and unpredictable bringing about wild fluctuations in prices. This can especially have noticed in agricultural commodities where the weather plays a major role in affecting the fortunes of people involved in this industry. The futures market has evolved to neutralize such risks through a mechanism; namely hedging. Literature Review (UNCTAD,5 June 2013) The major findings in this article was laid on the functioning of commodity markets and the flow of information that affect the
www.ijar.org.in 19

International Journal of Academic Research ISSN: 2348-7666; Vol.3, Issue-10(1), October, 2016 Impact Factor: 4.535; Email: [email protected]
trading decisions. The paper also summarizes the recent developments and trends in fundaments on both the demand and supply side. They have urged that due to increase in the number of investors in commodity market who do not base their trading purely on the basis of demand and supply has led to misleading price signals in the market . Another finding in this paper was that investors want to diversify their portfolio which is playing an important role for them to invest in commodity market rather than understanding the fundamentals for investment. (Ke Tang and Wei Xiong, March 2013) The primary objective of this paper was to find out the effect growing investment in commodity futures markets has had on commodity price co-movements. In order to find out the relationship between the two the authors conducted a regression test between the oil and selected commodities from various sectors and the major finding was that with the increase in investment by investors observed since the early 2000s futures prices of non-energy commodities have become increasingly correlated with oil.
(John Baffes and Tassos Haniotis, July 2012) The main objective of this paper was to analyze three potentially key factors behind recent commodity price increases: excess liquidity and speculation, increasing food demand by emerging economies and the use of some food commodities for biofuel production. The major findings in this paper was speculation played a key role during the 2008 price rise whereas the use of some food commodities for biofuel production played a small role and the increase in
food demand by emerging economies played no noticeable role. Methodology Objectives of research: To study the behavior of the individuals, their perspective, investment preference for commodity market trading in India as compared to other financial markets in India. To study the operation and
functioning of commodity market. Research Design: Exploratory design has been selected as data has been collected from the secondary sources in order to understand the functioning of commodity market and data has been collected from primary source in order to satisfy the research objectives. Data Collection Method: Most of the data has collected from secondary sources whereas for conduct of research the primary data has been collected through a structured questionnaire wherein a total of 130 respondents took part out of which only 100 have been taken into consideration as the questionnaire pertains to a specific class of respondents, so in order to reduce the error this has been done. A total of 63 males and 37 females have been included in the research. Sampling: The study mainly deals with the financial behavior of Individual Investors towards Commodity market in India. The required data was collected through a pretested questionnaire administered on a combination of convenience and judgment sample of 100 individual investors. Judgment sample selection is due to the time. Respondents were screened and inclusion was purely on the basis of their Knowledge about
www.ijar.org.in 20
International Journal of Academic Research ISSN: 2348-7666; Vol.3, Issue-10(1), October, 2016 Impact Factor: 4.535; Email: [email protected]
25 17 63 75 10 22 66
0 50 100High income
Retirement…
FREQUENCY
Financial Markets, Commodity market in particular. Instruments used: The primary data was collected through a structured questionnaire by one to one interactions with investors and contact was also made through emails. Analysis and Interpretations: The analysis of the data collected has been performed appropriately and inferences have been drawn. The techniques that are used for analysis of data are Descriptive technique, Crosstabs and Annova which have been performed by the use of SPSS software.
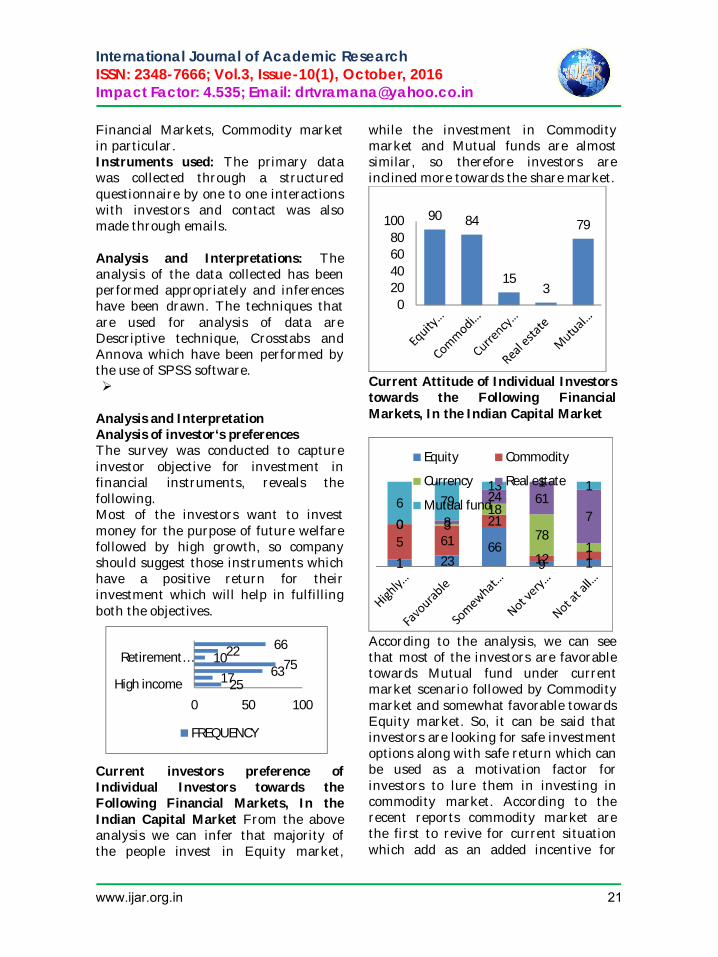
Analysis and Interpretation Analysis of investor‘s preferences The survey was conducted to capture investor objective for investment in financial instruments, reveals the following. Most of the investors want to invest money for the purpose of future welfare followed by high growth, so company should suggest those instruments which have a positive return for their investment which will help in fulfilling both the objectives.
Current investors preference of Individual Investors towards the Following Financial Markets, In the Indian Capital Market From the above analysis we can infer that majority of the people invest in Equity market,
while the investment in Commodity market and Mutual funds are almost similar, so therefore investors are inclined more towards the share market.
Current Attitude of Individual Investors towards the Following Financial Markets, In the Indian Capital Market
According to the analysis, we can see that most of the investors are favorable towards Mutual fund under current market scenario followed by Commodity market and somewhat favorable towards Equity market. So, it can be said that investors are looking for safe investment options along with safe return which can be used as a motivation factor for investors to lure them in investing in commodity market. According to the recent reports commodity market are the first to revive for current situation which add as an added incentive for
90 84
15 3
79
020406080
100
1 23 66
9 1 5 61
21
12 1
0 3 18
78 1
0 8
24 61 7
6 79 13 1 1
Equity Commodity
Currency Real estate
Mutual fund
www.ijar.org.in 21
International Journal of Academic Research ISSN: 2348-7666; Vol.3, Issue-10(1), October, 2016 Impact Factor: 4.535; Email: [email protected]
investors to invest in this market as returns are going to be favorable. 6) Why people resist in investing in Commodity market: According to this analysis we can infer that people who already trade in Commodity market have a perception that perspective investors are not attracted towards Commodity market primarily because of difficulty in understanding as well as lack of Knowledge of Commodity market, so the investing companies can resort to various methods to inform these perspective investors and convert them to real investors.
Ratings of investors for Commodity market on various attributes. In the above chart we can clearly see that investors perceives that tier id high Liquidity, Flexibility and Good returns in the commodity market whereas most of the investors feel that there is lack of Safety in commodity market. Under the category of diversification, it is almost equal so investors think that commodity market plays a role to a certain extent in diversification but not too a great extent. Lastly, investors are not very favorable towards capital appreciation due to investment in commodity market.
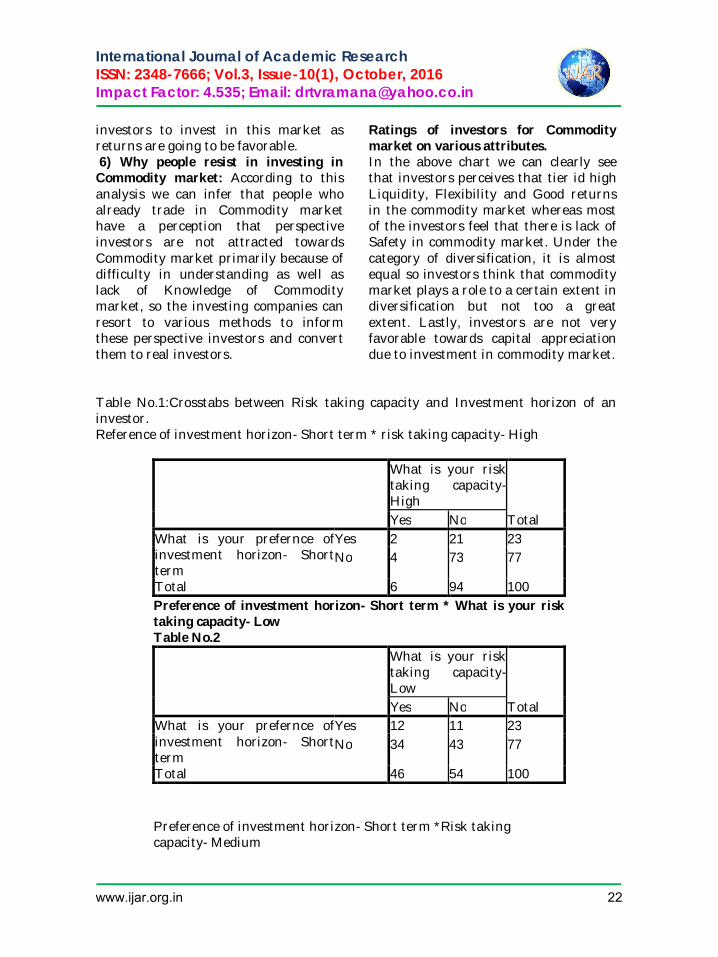
Table No.1:Crosstabs between Risk taking capacity and Investment horizon of an investor. Reference of investment horizon- Short term * risk taking capacity- High
What is your risk taking capacity-High
Total Yes No What is your prefernce of investment horizon- Short term
Yes 2 21 23 No 4 73 77
Total 6 94 100 Preference of investment horizon- Short term * What is your risk taking capacity- Low Table No.2
What is your risk taking capacity-Low
Total Yes No What is your prefernce of investment horizon- Short term
Yes 12 11 23 No 34 43 77
Total 46 54 100 Preference of investment horizon- Short term *Risk taking capacity- Medium
www.ijar.org.in 22
International Journal of Academic Research ISSN: 2348-7666; Vol.3, Issue-10(1), October, 2016 Impact Factor: 4.535; Email: [email protected]
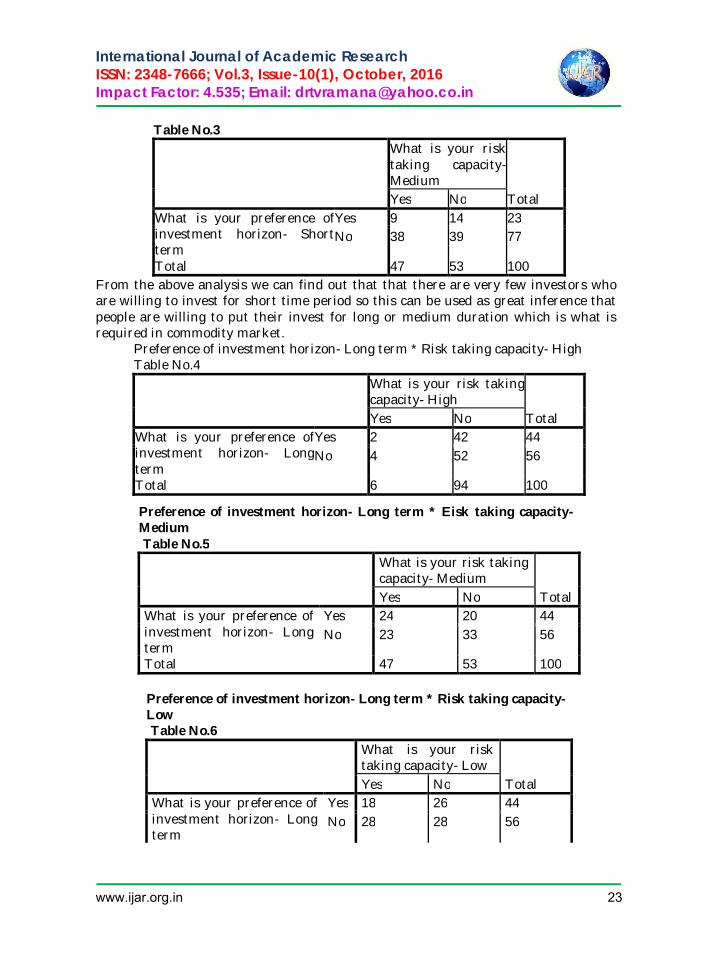
Table No.3
What is your risk taking capacity-Medium
Total Yes No What is your preference of investment horizon- Short term
Yes 9 14 23 No 38 39 77
Total 47 53 100 From the above analysis we can find out that that there are very few investors who are willing to invest for short time period so this can be used as great inference that people are willing to put their invest for long or medium duration which is what is required in commodity market.
Preference of investment horizon- Long term * Risk taking capacity- High Table No.4
What is your risk taking capacity- High
Total Yes No What is your preference of investment horizon- Long term
Yes 2 42 44 No 4 52 56
Total 6 94 100
Preference of investment horizon- Long term * Risk taking capacity- Low Table No.6
What is your risk taking capacity- Low
Total Yes No What is your preference of investment horizon- Long term
Yes 18 26 44 No 28 28 56
Preference of investment horizon- Long term * Eisk taking capacity- Medium Table No.5
What is your risk taking capacity- Medium
Total Yes No What is your preference of investment horizon- Long term
Yes 24 20 44 No 23 33 56
Total 47 53 100
www.ijar.org.in 23
International Journal of Academic Research ISSN: 2348-7666; Vol.3, Issue-10(1), October, 2016 Impact Factor: 4.535; Email: [email protected]
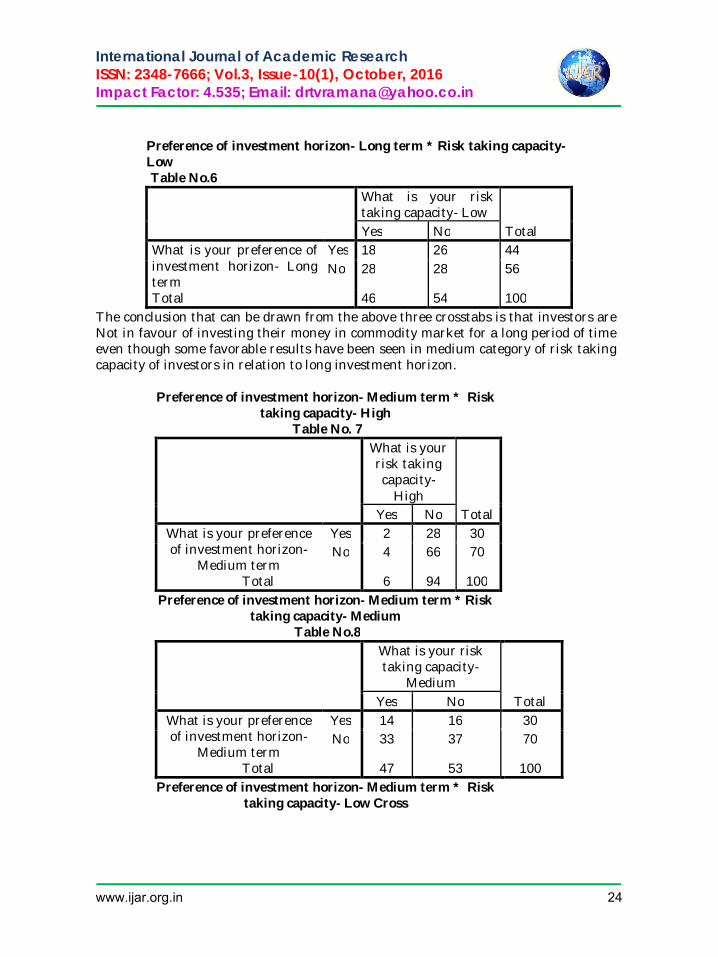
Preference of investment horizon- Long term * Risk taking capacity- Low Table No.6
What is your risk taking capacity- Low
Total Yes No What is your preference of investment horizon- Long term
Yes 18 26 44 No 28 28 56
Total 46 54 100 The conclusion that can be drawn from the above three crosstabs is that investors are Not in favour of investing their money in commodity market for a long period of time even though some favorable results have been seen in medium category of risk taking capacity of investors in relation to long investment horizon.
Preference of investment horizon- Medium term * Risk taking capacity- High
Table No. 7
What is your risk taking capacity-
High Total Yes No
What is your preference of investment horizon-
Medium term
Yes 2 28 30 No 4 66 70
Total 6 94 100 Preference of investment horizon- Medium term * Risk
taking capacity- Medium Table No.8
What is your risk taking capacity-
Medium Total Yes No
What is your preference of investment horizon-
Medium term
Yes 14 16 30 No 33 37 70
Total 47 53 100 Preference of investment horizon- Medium term * Risk
taking capacity- Low Cross
www.ijar.org.in 24
International Journal of Academic Research ISSN: 2348-7666; Vol.3, Issue-10(1), October, 2016 Impact Factor: 4.535; Email: [email protected]
Table No.9
What is your risk
taking capacity- Low Total Yes No
What is your preference of investment horizon-
Medium term
Yes 14 16 30 No 32 38 70
Total 46 54 100 From the above analysis we can infer that there are very few investors who are willing to invest in commodity market. So, we can infer from all the above crosstabs that investors want to invest in commodity market for long duration as compared to the other two horizons and investors have an appetite for medium class of risk. Table No.10Cross tabulation between Annual income and Investment portion of income
Annual income * Investment Portion of your income invested
Investment Portion of your income invested
Total below 10%
10-15 % 15-20% above 20%
below 100000 16 0 0 0 16 100000-200000 6 0 0 0 6 200000-300000 35 5 1 0 41 above 300000 18 14 4 1 37
Total 75 19 5 1 100 In the above analysis we can see that a majority of investors lie between the income group of 200000-300000 and likewise investors are investing only a small portion of their income that is below 10% and the third thing we can infer is that around 35 out of 100 lie in this common region. Crosstabs between n which market the investors invest in relation to How they perceive that market. Current market attitude towards the following financial markets- Equity
Table No.11 In which financial market do you invest- Equity market
What is your current market attitude towards the following financial markets- Equity
Total highly favourable Favourable
somewhat favourable
Not very favourable
Not at all favourable
Yes 1 23 61 5 0 90
No 0 0 5 4 1 10 Total 1 23 66 9 1 100
www.ijar.org.in 25
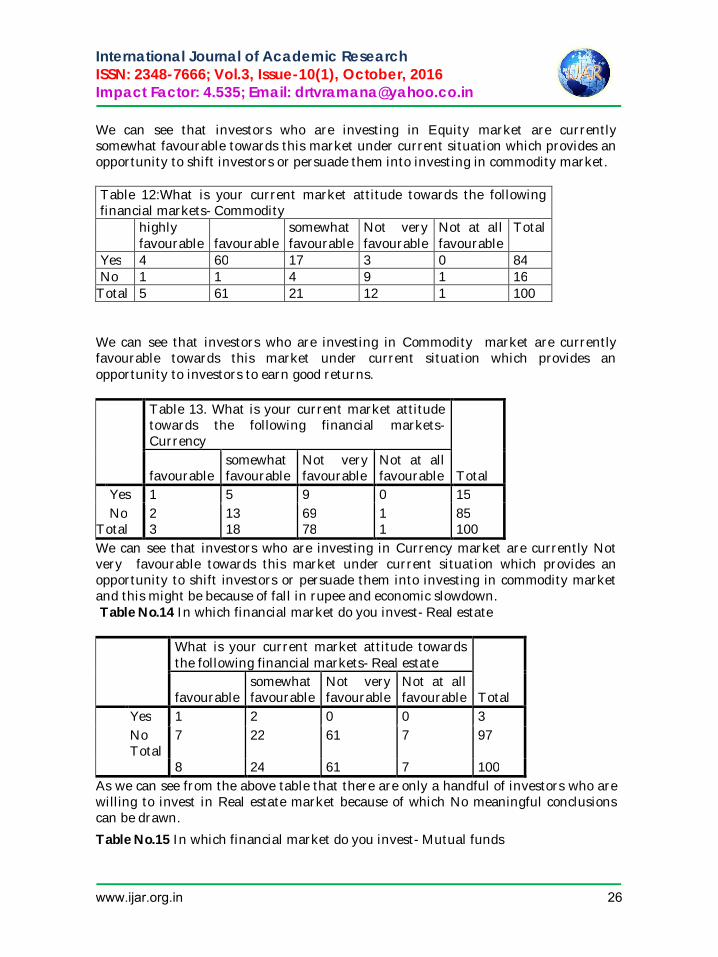
International Journal of Academic Research ISSN: 2348-7666; Vol.3, Issue-10(1), October, 2016 Impact Factor: 4.535; Email: [email protected]
We can see that investors who are investing in Equity market are currently somewhat favourable towards this market under current situation which provides an opportunity to shift investors or persuade them into investing in commodity market. Table 12:What is your current market attitude towards the following financial markets- Commodity highly
favourable favourable somewhat favourable
Not very favourable
Not at all favourable
Total
Yes 4 60 17 3 0 84 No 1 1 4 9 1 16
Total 5 61 21 12 1 100 We can see that investors who are investing in Commodity market are currently favourable towards this market under current situation which provides an opportunity to investors to earn good returns.
Table 13. What is your current market attitude towards the following financial markets- Currency
Total favourable somewhat favourable
Not very favourable
Not at all favourable
Yes 1 5 9 0 15 No 2 13 69 1 85
Total 3 18 78 1 100 We can see that investors who are investing in Currency market are currently Not very favourable towards this market under current situation which provides an opportunity to shift investors or persuade them into investing in commodity market and this might be because of fall in rupee and economic slowdown. Table No.14 In which financial market do you invest- Real estate
What is your current market attitude towards the following financial markets- Real estate
Total favourable somewhat favourable
Not very favourable
Not at all favourable
Yes 1 2 0 0 3 No Total
7 22 61 7 97
8 24 61 7 100 As we can see from the above table that there are only a handful of investors who are willing to invest in Real estate market because of which No meaningful conclusions can be drawn.
Table No.15 In which financial market do you invest- Mutual funds
www.ijar.org.in 26
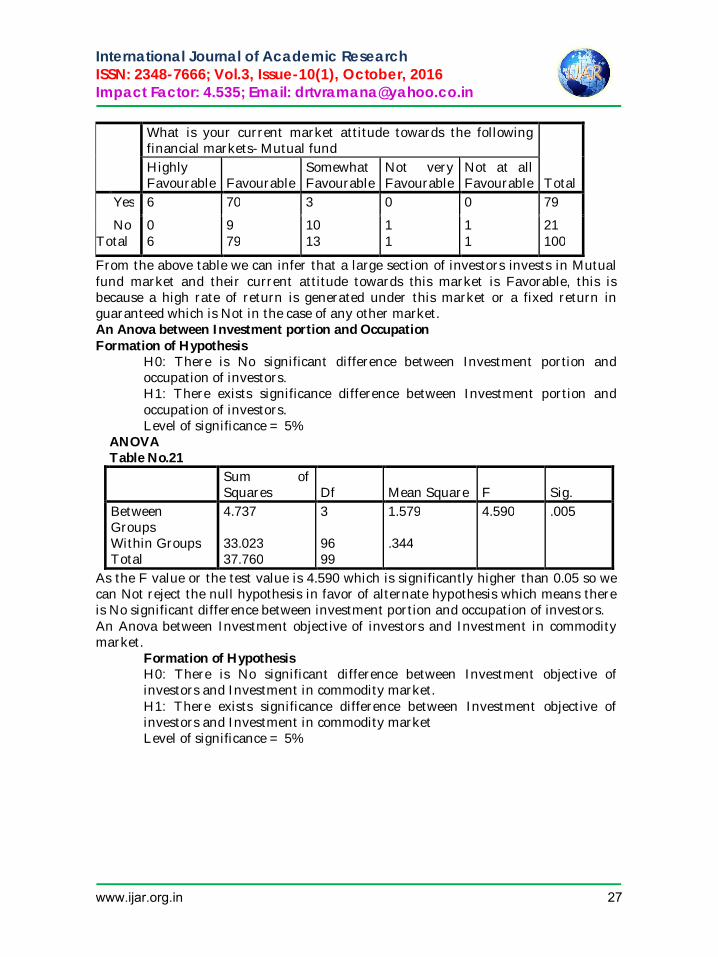
International Journal of Academic Research ISSN: 2348-7666; Vol.3, Issue-10(1), October, 2016 Impact Factor: 4.535; Email: [email protected]
What is your current market attitude towards the following financial markets- Mutual fund
Total Highly Favourable Favourable
Somewhat Favourable
Not very Favourable
Not at all Favourable
Yes 6 70 3 0 0 79
No 0 9 10 1 1 21 Total 6 79 13 1 1 100
From the above table we can infer that a large section of investors invests in Mutual fund market and their current attitude towards this market is Favorable, this is because a high rate of return is generated under this market or a fixed return in guaranteed which is Not in the case of any other market. An Anova between Investment portion and Occupation Formation of Hypothesis
H0: There is No significant difference between Investment portion and occupation of investors. H1: There exists significance difference between Investment portion and occupation of investors. Level of significance = 5%
ANOVA Table No.21
Sum of Squares Df Mean Square F Sig.
Between Groups
4.737 3 1.579 4.590 .005
Within Groups 33.023 96 .344 Total 37.760 99
As the F value or the test value is 4.590 which is significantly higher than 0.05 so we can Not reject the null hypothesis in favor of alternate hypothesis which means there is No significant difference between investment portion and occupation of investors. An Anova between Investment objective of investors and Investment in commodity market.
Formation of Hypothesis H0: There is No significant difference between Investment objective of investors and Investment in commodity market. H1: There exists significance difference between Investment objective of investors and Investment in commodity market Level of significance = 5%
www.ijar.org.in 27
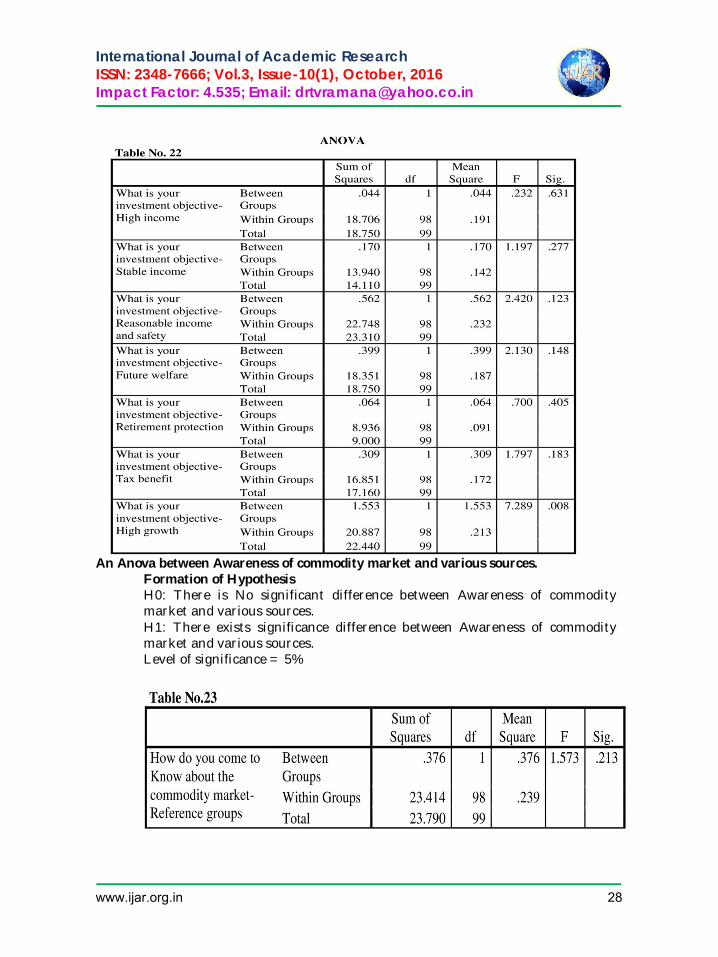
International Journal of Academic Research ISSN: 2348-7666; Vol.3, Issue-10(1), October, 2016 Impact Factor: 4.535; Email: [email protected]
An Anova between Awareness of commodity market and various sources.
Formation of Hypothesis H0: There is No significant difference between Awareness of commodity market and various sources. H1: There exists significance difference between Awareness of commodity market and various sources. Level of significance = 5%
www.ijar.org.in 28
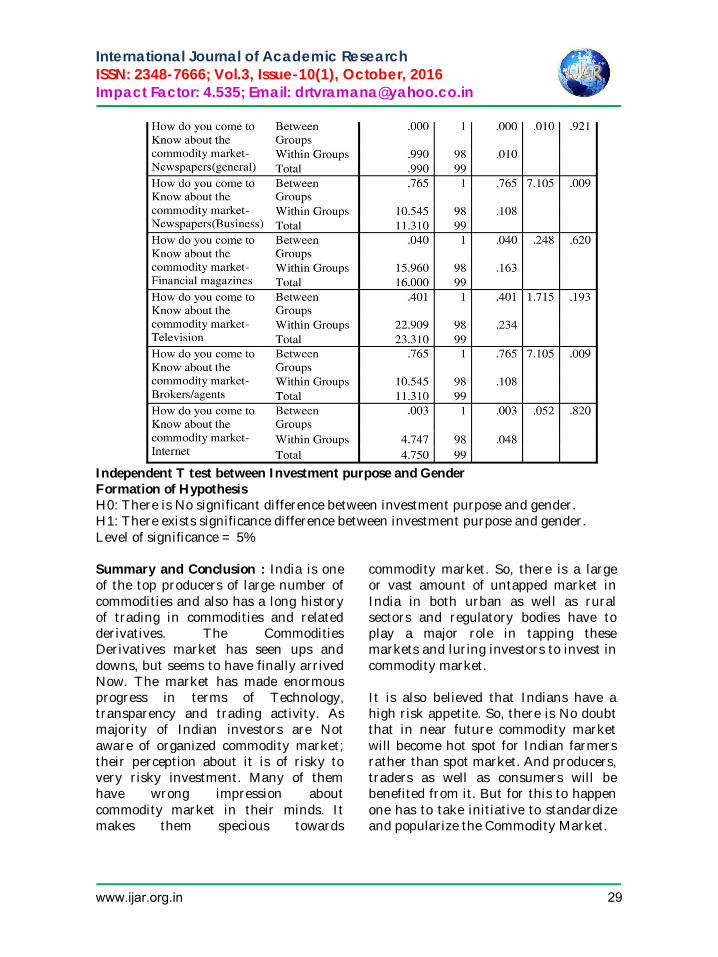
International Journal of Academic Research ISSN: 2348-7666; Vol.3, Issue-10(1), October, 2016 Impact Factor: 4.535; Email: [email protected]
Independent T test between Investment purpose and Gender Formation of Hypothesis H0: There is No significant difference between investment purpose and gender. H1: There exists significance difference between investment purpose and gender. Level of significance = 5% Summary and Conclusion : India is one of the top producers of large number of commodities and also has a long history of trading in commodities and related derivatives. The Commodities Derivatives market has seen ups and downs, but seems to have finally arrived Now. The market has made enormous progress in terms of Technology, transparency and trading activity. As majority of Indian investors are Not aware of organized commodity market; their perception about it is of risky to very risky investment. Many of them have wrong impression about commodity market in their minds. It makes them specious towards
commodity market. So, there is a large or vast amount of untapped market in India in both urban as well as rural sectors and regulatory bodies have to play a major role in tapping these markets and luring investors to invest in commodity market. It is also believed that Indians have a high risk appetite. So, there is No doubt that in near future commodity market will become hot spot for Indian farmers rather than spot market. And producers, traders as well as consumers will be benefited from it. But for this to happen one has to take initiative to standardize and popularize the Commodity Market.
www.ijar.org.in 29
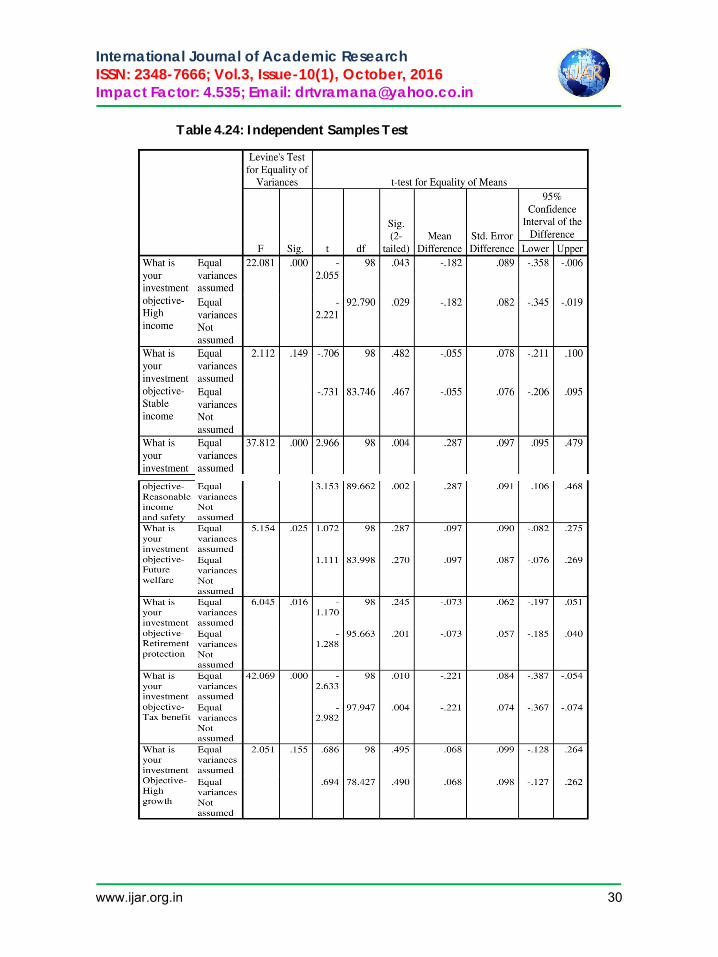
International Journal of Academic Research ISSN: 2348-7666; Vol.3, Issue-10(1), October, 2016 Impact Factor: 4.535; Email: [email protected]
Table 4.24: Independent Samples Test
www.ijar.org.in 30
International Journal of Academic Research ISSN: 2348-7666; Vol.3, Issue-10(1), October, 2016 Impact Factor: 4.535; Email: [email protected]
So, one can conclude on the basis of the analysis that have been carried out that investors in current scenario i.e. with the burden of fall in rupee, increase inflation and high volatility have changed their objectives to Reasonable income along with safety for the purpose of future welfare as future looks uncertain. Now a day's investors are willing to bear very minimum risk and that too for short span of period and most of the investors are inclined to invest their money in mutual funds and commodity market. The attitude of investors towards mutual fund investment is much more favourable than any other market as there is offer of around 12-14% guaranteed return which if brought about in commodity market can lead to tapping of huge untapped market. Investors are willing to invest only in bullions (gold, silver) as their prices tend to rise over a time horizon and due to lack of Knowledge other areas of commodity market as Not favored upon as compared to international market where large amount of money is invested in agriculture based products. In order to increase investment in commodity market the regulators have to take initiative to educate and inform mass people about the working of commodity market and ensure strict rules and regulations for investors safety which is a major concern these days. At last the major findings of this study are that investors are reluctant to invest in commodity market due to lack of Knowledge ad difficulty in understanding the functioning of commodity market and the major area of concern for investors is the safety driven
by the objective of reasonable income for future welfare. Recommendations i) The Commodity market
operational environment is becoming more competitive. Hence, the impact of emerging competition on investor behavior/behavioral changes needs to be studied further.
ii) Developments in Technology influence the behavior of investors. Hence, the impact of Technology on financial behavior is another potential area for close study.
iii) Since the industry is still struggling to win the investors ‘confidence, in-depth analysis into investor ‘s expectations from Commodity market, its performance, management, service and other related areas could be done.
iv) This study reveals that Commodity market investors feel that currently the two major benefits, which Commodity market claim to offer, namely, Diversification and Safety are not satisfactorily delivered. In spite of this, Commodity market industry is growing and we attribute this to investor behavior and other macroeconomic factors. Further research can be done to understand the reasons for growing popularity on one side and the struggle to win investors’ confidence on the other side.
v) As we have seen from this study that Commodity market is on a rise in terms of value, so a study can be conducted further to understand the untapped market.
vi) This study was conducted during
www.ijar.org.in 31

International Journal of Academic Research ISSN: 2348-7666; Vol.3, Issue-10(1), October, 2016 Impact Factor: 4.535; Email: [email protected]
less volatile period of market, a further research can be conducted on commodity market taking into consideration a long period where volatility can also be taken into consideration and more meaningful conclusions can be drawn.
References
articles.economictimes.indiatimes.com/keyword/commodity market (Economic times, 2013)
blog.euromonitor.com/2014/04/monthly-review-of-commodity-markets-april-2014-update.html
businesstoday.intoday.in/story/top-commodities
businesstoday.intodayin/story/indias-commodity-market-to-
register-gains/1/15682.html commodities.about.com/old/man
agingourportfolio/a/commodities-Review-For-2012.htm
Commodity prices and Price volatility: old answers to new questions
Facts and fantasies about commodity futures
Index Investment and Financialization of commodities
Placing the 2006/08 commodity price boom into perspective
Price formation in Financialised commodity market: the role of information
Speculative influences on commodity futures prices 2006-08
www.ijar.org.in 32
International Journal of Academic Research ISSN: 2348-7666; Vol.3, Issue-10(1), October, 2016 Impact Factor: 4.535; Email: [email protected]
Influence of weather parameters on the yield of Rabi Sorghum in Vijayapur district during different climatic modes
K.G. Sumesh1, S. Abhilash2, V.M. Sandeep3, B.S. Yenagi4 and J.R. Hiremath5
1, 4, 5 University of Agricultural Sciences; Dharwad 2 Cochin University of Science and Technology; Cochin
3 Central Research Institute for Dry Land Agriculture; Hyderabad
Abstract:- Sorghum (Sorghum bicolor [L.] Moench) is the world’s fifth major cereal in terms of production and acreage. It is being cultivated largely over the northern Karnataka, mainly during the Rabi season. The recent studies and observations show that there is a decreasing trend for the production and yield for this crop, even though it is suit to be grown under the dry agro-climatic conditions. This study is based on the farm trials conducted in the Vijayapur station. The influences of various weather parameters such as Rainfall, Maximum Temperature, Minimum Temperature, Relative Humidity and Moisture Adequacy Index (MAI) on the yield variations of rabi Sorghum over this station during different climatic modes such as El-Niño and La-Nina have been studied. Result has shown that, these parameters are having significant influence on the yield variations of this crop during these warm and cold seasonal episodes.
Key words: Climatic Water Balance, El-Nino and La-Nina, Moisture Adequacy Index Introduction
Sorghum (Sorghum bicolor [L.] Moench) is a staple food crop for the people living in most of the arid and semi-arid lands. This crop is genetically suited to hot and dry agro-climatic conditions where it is difficult to grow other food grains. It is being cultivated largely over northern Karnataka, mainly during the rabi season. The recent studies and observations show that there is large scale reduction in the production and yield for this particular crop (Parthasarathy Rao et.al 2010). Even though it is suited to be grown under the dry agro-climatic conditions, northern Karnataka is experiencing a reduced production in this crop for the past few decades. In this scenario we are studying the influence of the weather parameters on the yield variations of the rabi Sorghum crop in different climatic modes
such as El-Nino and La-Nina. Studies and observations show that the El-Nino and La-Nina events are having significant impacts on the global climate. A recent study on agriculture show that (James et.al 1998) the El-Nino affects the agriculture over southern US. A study states that the El-Nino events are having significant impact on the Indian monsoon (Torrence et.al 1999); hence it is known that any variation in the monsoon rainfall have got direct impact on Indian agriculture. La-Nina is the counter part of El-Nin o; this condition develops when there is an increase in the magnitude of the trade winds over the Pacific Ocean. If the magnitude of the trade wind is increased, it will push more surface waters from west to east of the Pacific Ocean. The atmospheric temperature will be more over the west Pacific Ocean. The increased atmospheric temperature over the west Pacific Ocean will boot the
www.ijar.org.in 33
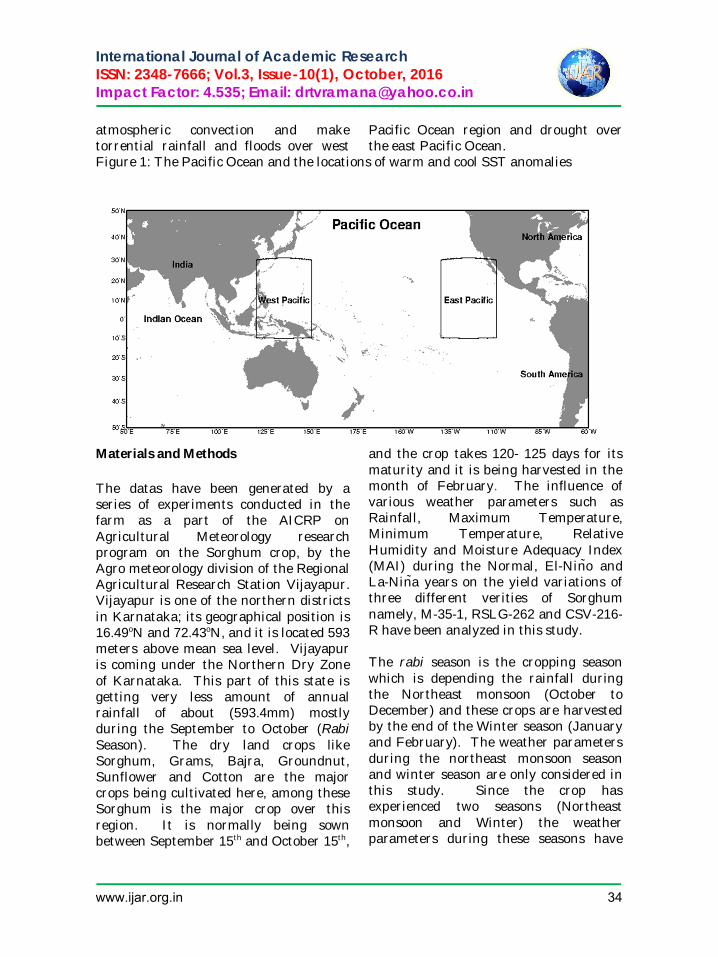
International Journal of Academic Research ISSN: 2348-7666; Vol.3, Issue-10(1), October, 2016 Impact Factor: 4.535; Email: [email protected]
atmospheric convection and make torrential rainfall and floods over west
Pacific Ocean region and drought over the east Pacific Ocean.
Figure 1: The Pacific Ocean and the locations of warm and cool SST anomalies
Materials and Methods
The datas have been generated by a series of experiments conducted in the farm as a part of the AICRP on Agricultural Meteorology research program on the Sorghum crop, by the Agro meteorology division of the Regional Agricultural Research Station Vijayapur. Vijayapur is one of the northern districts in Karnataka; its geographical position is 16.49oN and 72.43oN, and it is located 593 meters above mean sea level. Vijayapur is coming under the Northern Dry Zone of Karnataka. This part of this state is getting very less amount of annual rainfall of about (593.4mm) mostly during the September to October (Rabi Season). The dry land crops like Sorghum, Grams, Bajra, Groundnut, Sunflower and Cotton are the major crops being cultivated here, among these Sorghum is the major crop over this region. It is normally being sown between September 15th and October 15th,
and the crop takes 120- 125 days for its maturity and it is being harvested in the month of February. The influence of various weather parameters such as Rainfall, Maximum Temperature, Minimum Temperature, Relative Humidity and Moisture Adequacy Index (MAI) during the Normal, El-Nino and La-Nina years on the yield variations of three different verities of Sorghum namely, M-35-1, RSLG-262 and CSV-216-R have been analyzed in this study. The rabi season is the cropping season which is depending the rainfall during the Northeast monsoon (October to December) and these crops are harvested by the end of the Winter season (January and February). The weather parameters during the northeast monsoon season and winter season are only considered in this study. Since the crop has experienced two seasons (Northeast monsoon and Winter) the weather parameters during these seasons have
www.ijar.org.in 34
International Journal of Academic Research ISSN: 2348-7666; Vol.3, Issue-10(1), October, 2016 Impact Factor: 4.535; Email: [email protected]
only been considered to analyze the influence of these weather parameters on the Sorghum yield. The El-Nino and La-Nina years have been collected from the National Weather Service website (www.nws.noaa.gov). The warm and cold periods are obtained based on the threshold of +/- 0.5oC for the Oceanic Nino Index (ONI) [3 month running means of ERSST.V4 SST anomalies in the Nino 3.4 region (5oN-5oS, 120o -170oW)], based on centered 30-year base periods updated every 5 years.
The Moisture Adequacy Index
The moisture adequacy index (MAI) is a measure of soil moisture availability, which explains the agricultural droughts. The ratio of Actual Evapotranspiration (AET) to the Potential Evapotranspiration (PET) is known as the moisture adequacy index, and is expressed in percentage (Subrahmanyam et. al 1983). Potential Evapotranspiration or PET is a measure of the ability of the atmosphere to remove water from the surface of the earth through the processes, of evaporation and transpiration assumin
g no control on water supply. Actual Evapotranspiration or AET is the quantity of water that is actually removed from a surface due to the processes of evaporation and transpiration. The softwares namely the PET-calculator and the Weather Cock developed by the scientists at CRIDA Hyderabad to calculate the Moisture adequacy index (MAI) over this region.
Calculation of Potential Evapotraspiration
There are various methods to calculate Potential Evapotranspiration. The PET in the present study has been estimated through Hargreaves method (1985) which is expressed as, PET= 0.0023 RA TD
0.5 (Tm+17.8) Where, RA = extra-terrestrial radiation (mm day-
1) TD = difference between maximum and minimum temperature (°C) Tm = mean temperature (°C)
Where, GSc = solar constant (0.82 MJ m-2 min-1) dr =1 +0.033 cos (2 i / 365) [i = Julian day] (Relative distance of the earth from the sun) d = solar declination in radiance [Solar declination (d) is computed as d = 0.4093 sin (2 (284+ i) /365)] The distance from the earth to sun is calculated as Ws= the sunset hour angle, Ws, in radians is calculated as [Ws = arc cos (-tan (LAT) tan d)]
Results and Discussion We have analyzed the influence of the weather parameters such as rainfall, Maximum Temperature, Minimum Temperature, Relative humidity and the Moisture Availability Index (MAI) on the yield variations of the rabi Sorghum in the Vijayapur station. The phonological stages of the crop are given table 1. This is a dry land crop which needs less
www.ijar.org.in 35
International Journal of Academic Research ISSN: 2348-7666; Vol.3, Issue-10(1), October, 2016 Impact Factor: 4.535; Email: [email protected]
amount of rainfall for its growth. This crop attains its physiological maturity after 88 to 101 days after sowing and it is harvested after 102 to 120 days after sowing. The influence of the weather parameters in each stage of growth and how it will affect the yield of the crop have been analyzed. Normally the crop
is sown between the second fortnight of September and first fortnight of October. The crop needs good amount of rainfall at its early stages. In this series of experiments, the earliest sowing date was on 15th September and the delayed sowing was on 22nd October during these periods.
Table 1: The phonological stages of Sorghum
Stages Days after Sowing
Germination & Emergence 1 to 10
Seedling Stage 11 to 31
Panicle Initiation 32 to 38
Vegetative Stage 39 to 52
Boot leaf Stage 53 to 59
Flowering Stage 60 to 66
Grain Filling & Hardening 67 to 87
Physiological Maturity 88 to 101
Maturity and Harvest 102 to 120 In this study, we are also analyzing the impact of large scale back ground over the regional agricultural practices. As per the Oceanic Nino Index (ONI) analysis by National Weather Service, the climatic modes during the period 2004 to
2010 have been listed in the table 2. From the table it is seen that, there are three El-Nino years, two normal years and one La-Nina year. From the table 2, it is clear that all the years have received good amount of rainfall except 2005-06, which was a dry year.
Table.2: Climatic modes during the period 2004 to 2010.
Years Climatic modes
September (RF mm)
October (RF mm)
November (RF mm)
December (RF mm)
January (RF mm)
February (RF mm)
Total
2004-05 El-Nino 120.0 100.8 9.0 0.0 0.0 0.0 229.8
2005-06 Normal 80.4 112.3 0.0 0.0 0.0 0.0 192.7
2006-07 El-Nino 237.3 81.8 43.2 0.0 0.0 0.0 362.3
2007-08 La-Nina 148.1 36.2 5.9 0.0 0.0 23.0 213.2
2008-09 Normal 155.0 152.6 24.4 4.0 0.0 0.0 336.0
2009-10 El-Nino 338.6 253.0 44.0 19.0 14.0 1.2 669.8
www.ijar.org.in 36
International Journal of Academic Research ISSN: 2348-7666; Vol.3, Issue-10(1), October, 2016 Impact Factor: 4.535; Email: [email protected]
The yields of these crop verities have been given in table 3. The lowest crop yields (below 1000kg /ha) have been given in brackets. It is observed that the crops yielded less during the normal years compared to the El-Nino and La-Nina years. There have been two normal years, during the study period 2005-06 and 2008-09, it is observed that the crop yield for these years was very less compared to the other years. Here the rainfall is influencing the crop in two
different ways. During 2005-06, it is seen that there was no rainfall after October so the crop experienced severe moisture stress during this period. And during 2008-09 there was high amount of rainfall during September and October, and it continued up to December it is the flowering stage of the crop, so it affected the flowering and affected the crop yield. Afterwards no rainfall during January and February during this crop period.
Table 3: Yield variations of the Sorghum verities under different days of sowing in kg/ha
Years
M35-1 RSLG-262 CSV-216-R
D1 D2 D3 D1 D2 D3 D1 D2 D3 2004-05 1508.27 2002.36 1087.47 1739.95 1614.65 1713.94 1427.89 1997.63 1205.67 2005-06 1367.45 1157.40 (510.97) (925.92) 1068.75 (655.04) (566.39) (635.34) (249.21) 2006-07 1246.00 1907.00 1608.00 (918.53) 1206.65 1090.42 1085.90 1974.98 1699.17 2007-08 1312.00 1906.00 1090.0 1395.19 1928.38 856.38 1395.09 1755.12 1227.54 2008-09 (314.22) (721.04) -- (795.31) (962.17) -- (430.85) (872.34) -- 2009-10 1398.73 1226.35 1787.82 1580.96 1955.28 1994.68 1462.76 1861.70 1856.77
Yield variations of the Sorghum Verities during the Normal years From the table 3, it is noticed that the low yields of the Sorghum verities have recorded during the normal years (2005-06 and 2008-09). Figure 2 (A,B) shows the weekly variations of the weather parameters such as rainfall, Maximum Temperature, Minimum Temperature, RH1 (Morning Relative Humidity), RH2 (Afternoon Relative Humidity) and Moisture Adequacy Index (MAI) for the period 2005-06 and 2008-09. These are the periods where the crop yield recorded very low compared to the other periods. From table 3. It is observed that, all the three dates of sowing (DOS1, DOS2 and DOS3) of the verity CSV-216-R have been affected by the weather parameters
during the periods 2005-06. In case of the verity RSLG-262, two date of sowings (DOS1 and DOS3) have been affected by the weather parameters during this period and the verity M35-1, has recorded low yield for the only for DOS3. During the period 2008-09, all the experiment trials for each verity have recorded low yields. So it is understood that some of the weather parameters have adverse effect on the crop. Figure 2(A), shows the weekly variations of the parameters during 2005-06. It is observed that there was no rainfall after the 7th week. The period between 8th and 14th weeks is important to this crop. It is
www.ijar.org.in 37

International Journal of Academic Research ISSN: 2348-7666; Vol.3, Issue-10(1), October, 2016 Impact Factor: 4.535; Email: [email protected]
the period of important stages such as Flowering, Grain filling and Physiological Maturity. So the crop experienced moisture stress during this period. This resulted in low yield for the crop. The other parameters such as are not affecting the crop adversely. Figure 2(B), gives the weekly variations of the parameters during the period 2008-09. It is observed that there was couple of light rainfall events during the weeks between
8th and 14th. This created high humidity in the atmosphere. The afternoon RH (RH2) has increased up to 60%. This condition affected the crop adversely in turn decreased the yield of the crop. The other parameters do not have any adverse effect on the crop. The average yield of these Sorghum verities have listed in the table 4.
Table 4. Average yield of the Sorghum verities during the Normal years Period Verities
M35-1 RSLG-262 CSV-216-R 2005-06 1011.94 883.24 483.64 2008-09 517.63 878.74 651.59 Average 764.785 880.99 567.615
Yield variations of the Sorghum Verities during the El-Nino years There have been three El-Nino years such as 2004-05, 2006-07 and 2009-10. Figure 3(A, B, C) shows the weekly variations of the parameters during the crop season. From figure 3 and 4, it is observed that, there was light rainfall during the period between 8th and 12th weeks after sowing but the afternoon
relative humidity is not high during this period. So that there will not be any adverse effect on the crop yield. From figure 5, it is noticed that there were heavy rainfall from the beginning of the crop season and light right rainfall continued till the end of the crop season. This helped the crop to yield better during this period. The average yields of the Sorghum verities during the El-Nino years are listed in table 5.
Table 5. Average yield of the Sorghum verities during the El-Nino years
Periods
Verities
M35-1 RSLG-262 CSV-216-R
2004-05 1532.7 1689.51 1543.73
2006-07 1587 1071.87 1586.71
2009-10 1470.97 1843.64 1727.08
1530.223 1535.007 1619.173
www.ijar.org.in 38
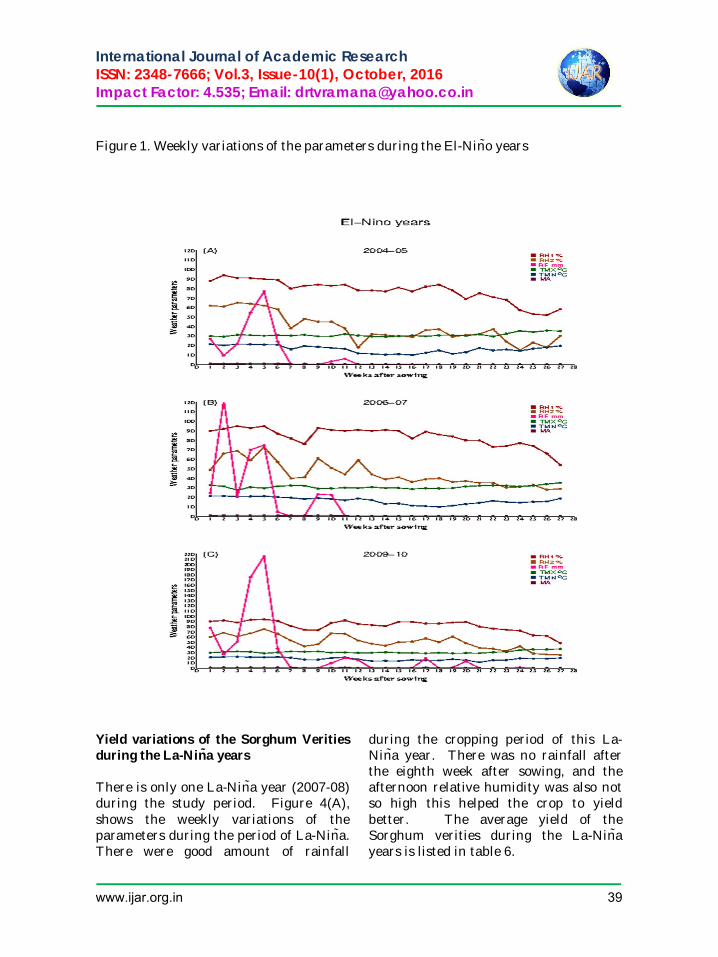
International Journal of Academic Research ISSN: 2348-7666; Vol.3, Issue-10(1), October, 2016 Impact Factor: 4.535; Email: [email protected]
Figure 1. Weekly variations of the parameters during the El-Nino years Yield variations of the Sorghum Verities during the La-Nina years There is only one La-Nina year (2007-08) during the study period. Figure 4(A), shows the weekly variations of the parameters during the period of La-Nina. There were good amount of rainfall
during the cropping period of this La-Nina year. There was no rainfall after the eighth week after sowing, and the afternoon relative humidity was also not so high this helped the crop to yield better. The average yield of the Sorghum verities during the La-Nina years is listed in table 6.
www.ijar.org.in 39
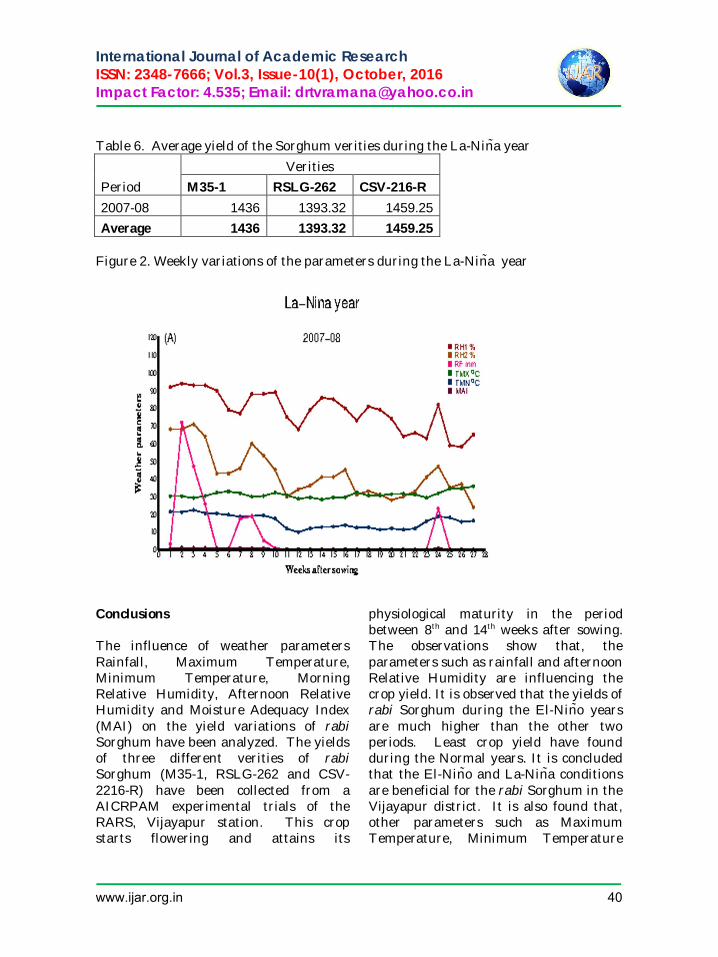
International Journal of Academic Research ISSN: 2348-7666; Vol.3, Issue-10(1), October, 2016 Impact Factor: 4.535; Email: [email protected]
Table 6. Average yield of the Sorghum verities during the La-Nina year
Period
Verities
M35-1 RSLG-262 CSV-216-R
2007-08 1436 1393.32 1459.25
Average 1436 1393.32 1459.25 Figure 2. Weekly variations of the parameters during the La-Nina year
Conclusions The influence of weather parameters Rainfall, Maximum Temperature, Minimum Temperature, Morning Relative Humidity, Afternoon Relative Humidity and Moisture Adequacy Index (MAI) on the yield variations of rabi Sorghum have been analyzed. The yields of three different verities of rabi Sorghum (M35-1, RSLG-262 and CSV-2216-R) have been collected from a AICRPAM experimental trials of the RARS, Vijayapur station. This crop starts flowering and attains its
physiological maturity in the period between 8th and 14th weeks after sowing. The observations show that, the parameters such as rainfall and afternoon Relative Humidity are influencing the crop yield. It is observed that the yields of rabi Sorghum during the El-Nino years are much higher than the other two periods. Least crop yield have found during the Normal years. It is concluded that the El-Nino and La-Nina conditions are beneficial for the rabi Sorghum in the Vijayapur district. It is also found that, other parameters such as Maximum Temperature, Minimum Temperature
www.ijar.org.in 40
International Journal of Academic Research ISSN: 2348-7666; Vol.3, Issue-10(1), October, 2016 Impact Factor: 4.535; Email: [email protected]
and Moisture Adequacy Index (MAI) are having no negative impacts on the crop
yield.
References Philander, S.G.H. (1983), “El-Nino Southern Oscillation phenomena”. Nature, 302: 295-301. Boyin,H., Viva, F.B., Eric Freeman, Jay Lawrimore, Wei, Liu., Thomas, C.P., Thomas, M.S., Peter, W.T., Scott,D.W., and Huai-Min, Zhang., (2015), “Extended Reconstructed Sea Surface Temperature Version 4 (ERSST.v4). Part I: Upgrades and Intercomparisons”. Journal of Climate. Hargreaves, G.L., Hargreaves, G.H., and Riley, J.P., (1985), “Agricultural benefits for Senegal River Basin”. Journal of Irrigation and Drainage Engr, ASCE, 111: 113-124. Parthasarathy, Rao, P., Basavaraj, G., Ahmad, W., and Bhagavatula, S., (2010), “An analysis of availability and utilization of sorghum grain in India”. Journal of SAT Agricultural Research 8. Subrahmanyam, A. R., (1983), “Agro ecological zones of India”. Bioclim, Ser.B.32.Arch, Met, Geophys, 329-333. Thornthwaite, C.W., (1948), “An approach toward a rational classification of climate”. Geor, Review, 38:85-94. James, W, Hansen., Alan, W, Hodges., and James, W, Jones., (1998), “ENSO Influences on Agriculture in the Southeastern United States”. Journal of Climate Vol, 11, pp 404-411. Christopher, Torrence., and Peter, J. Webster., (1999), “Interdecadal Changes in the ENSO–Monsoon System”. American Meteorological Society, Vol.12, August, pp 2679-2690.
www.ijar.org.in 41
International Journal of Academic Research ISSN: 2348-7666; Vol.3, Issue-10(1), October, 2016 Impact Factor: 4.535; Email: [email protected]
Human Resource Development Interventions in Insurance – A Study with Special Reference to the Training &
Development in Select Companies Dr.V. Narasimha Rao,
Professor and Director, P.G. Courses, Akkineni Nageswara Rao College, Gudivada – 521 301. Andhra Pradesh, India,
Abdul Hafeez,
Research Scholar, Dept. of Commerce & Business Administration Acharya Nagarjuna University Nagarjuna Nagar – 522 510.
Guntur District, Andhra Pradesh. India.
Abstract
Human Resource Management regards Training and Development as a function concerned with organizational activity aimed at bettering the job performance of individuals and groups in organizational settings. Training is crucial for organizational development and its success which is indeed fruitful to both employers and employees of an organization. Human Resource Development is a multi-dimensional concept. Human Resource Development assumes great significance in insurance services. Banks and Insurance companies have come to recognize the importance of HRD, and training as one of the components of HRD. Human Resource Development assumes great significance in insurance sector. An attempt is made in this paper to analyze the training and development HRD intervention in select insurance companies.
Key Words: Human Resource Development; Organizational Climate; Training and Development; Insurance.
I. Introduction:
In an organizational context ‘Human Resource Development (HRD)’ is a process by which employees of an organization are helped in a continuous and planned way to acquire capabilities for performing various functions and develop an organizational culture. Competent and motivated employees are essential for organizational survival, growth and excellence. Human Resource Development should be a continuous process in organizations. The success of an organization depends to a large extent depends on the effective utilization of resources. Human Resource Development
is a multi-dimensional concept. Unlike other resources, human resources have rather unlimited potential capabilities. The potential can be used only by creating a climate that can continuously identify, bring to surface, nurture and use the capabilities of people. HRD aims at creating such climate, as is considered as the key to higher productivity, better relations and greater profitability for an organization.
Unlike manufacturing, agricultural and industrial sectors; service industry has some special features. It call for particular emphasis in the design and implementation of HRD
www.ijar.org.in 42
International Journal of Academic Research ISSN: 2348-7666; Vol.3, Issue-10(1), October, 2016 Impact Factor: 4.535; Email: [email protected]
systems. Human Resource Development assumes great significance in insurance services. Banks and Insurance companies have come to recognize the importance of HRD, and training as one of the components of HRD. The other aspects of two HRD systems like performance appraisal, job rotation, career planning and organization development have also, come into practice.
II. Objectives of the Study:
This research paper aims at highlighting the HRD intervention in insurance sector, the training and development. More specifically these are -
An overview of HRD interventions in insurance sector
Analyzing Training & Development in insurance companies.
To offer suggestions based on the observations for more effective training & development in insurance services.
III. Review of literature:
Agarwal Ashok and Udai Pareek (1997) in their study entitled “The Role of HRD in Service Sector” opined that service sector is a large sector with great variations. This study deals with service sector in general and road transport and health sector in particular. In an economy like ours where human resource is available in plenty, HRD in service sector is extremely important. Some unique features of service sector are: services are intangible, they are produced and consumed simultaneously, and they are holistic and integrated. An innovative approach is needed especially in strategic thinking and HRD in service industry.
Kuldeep Singh (2003) in his study "Strategic HR Orientation and Firm
Performance in India" concludes that the strategic alignment of HR planning, selection, performance evaluation, compensation, development, staffing policies results in better organizational performance. The aim of the present study was to find out the relationship between the human resources management practices and firm level performance. The study conducted on 82 Indian firms indicates that there is a significant relationship between the two human resources practices, namely, training and compensation, and perceived organizational and market performance of the firm.
Teseema & Soeters (2006) used eight HR practices in their research paper which are recruitment and selection practices, placement practices, training practices, compensation practices, employee performance evaluation practices, promotion practices, grievance procedure and pension system. According to them these HR practices can affect the employee performance.
Vikas Agarwal (2011) found that Human Resource is the most vital resources for the reason that is the only resource which has got brain. Even the computer brain which has been developed has human brain behind it. Development is a systematic process of learning and growth by which managerial personnel gain and apply knowledge, skills, attitudes and insight to manage the work in their organization effectively and efficiently. The result derived from this survey proved that the hypothesis taken up for conducting the research was true and training and development programmes adopted by LIC help in improving employee’s performance and simultaneously fulfill organizational objectives.
www.ijar.org.in 43
International Journal of Academic Research ISSN: 2348-7666; Vol.3, Issue-10(1), October, 2016 Impact Factor: 4.535; Email: [email protected]
Srimannarayana: 2008 carried out a study to assess the extent of HRD climate prevailing in Indian organizations. A survey has been conducted upon the employees working of 42 organizations. Among those 42, 18 were in manufacturing sector, 13 were in service sector and 11 were in IT sector. A questionnaire was prepared including 38 items grouped into 3 categories of general climate, OCTAPAC culture and HRD mechanisms. It derived the conclusion that a moderate climate prevails in organizations understudy (59.61%) and more favorable HRD climate was in manufacturing sector (62.39%) than in service and IT sectors.
IV. Methodology of the study:
Broadly the study is based on a quantitative approach and to some extent qualitative approach. The three selected organizations for the study include – Life Insurance Corporation of India (LIC), SBI Life Insurance Company, and Reliance Nippon Life Insurance Company as for their operations in Andhra Pradesh.
The study pertains to the life insurance segment of selected organizations. A sample size of 459 respondents is taken for the study & from 176 branches of LIC, 154 branches of SBI Life Insurance, and 143 branches of Reliance Nippon Life Insurance. This paper is compiled mainly relying on primary data; however secondary data sources were also taken into consideration. The perception of respondents is obtained through the execution of a questionnaire. The statistical tools used includes – chi-square test, ANOVA willson two-sample test. V. Hypothesis of the study: H01: There exist no significant difference between the employees of the selected insurance companies regarding the various elements of Training and Development. VI. Results and discussions: Hypothesis Testing H01: There exist no significant difference between the respondents with various educational qualifications with respect to various elements of Training and Development.
Table – 1 ANOVA for the Hypothesis H01 Analysis of Variance for Variable “Training & Development” Qualification N Mean UG 194 3.64 PG & Above 261 3.75 Intermediate 4 4.28
Source DF Sum of Squares Mean Square F Value Pr > F Among 2 2.451957 1.225978 3.0276 0.0494 Within 456 184.649623 0.404933
www.ijar.org.in 44
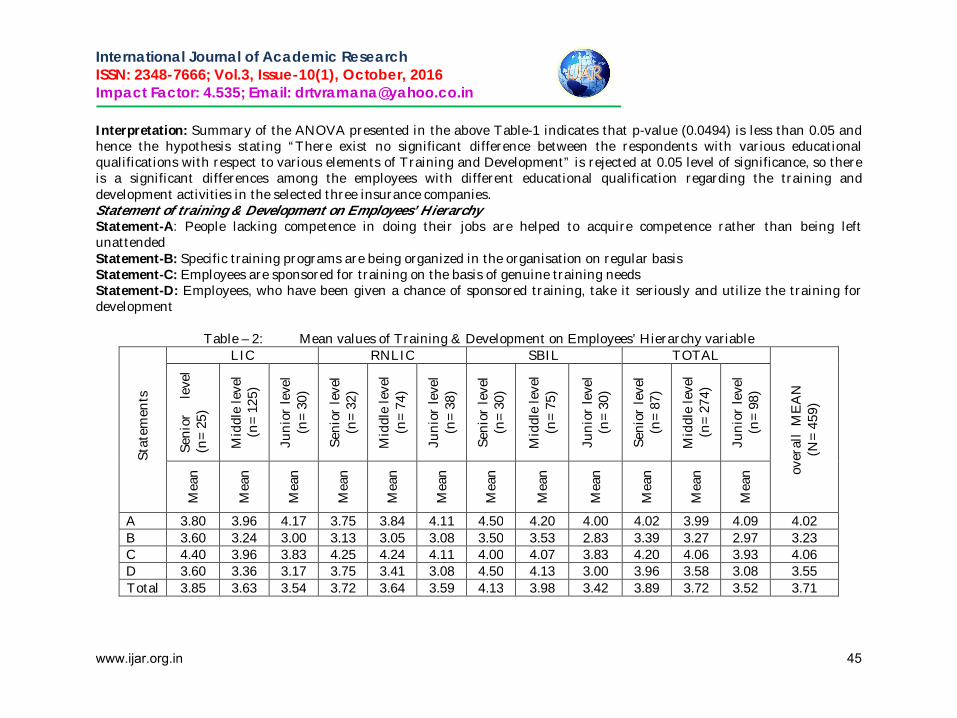
International Journal of Academic Research ISSN: 2348-7666; Vol.3, Issue-10(1), October, 2016 Impact Factor: 4.535; Email: [email protected]
Interpretation: Summary of the ANOVA presented in the above Table-1 indicates that p-value (0.0494) is less than 0.05 and hence the hypothesis stating “There exist no significant difference between the respondents with various educational qualifications with respect to various elements of Training and Development” is rejected at 0.05 level of significance, so there is a significant differences among the employees with different educational qualification regarding the training and development activities in the selected three insurance companies. Statement of training & Development on Employees’ Hierarchy Statement-A: People lacking competence in doing their jobs are helped to acquire competence rather than being left unattended Statement-B: Specific training programs are being organized in the organisation on regular basis Statement-C: Employees are sponsored for training on the basis of genuine training needs Statement-D: Employees, who have been given a chance of sponsored training, take it seriously and utilize the training for development
Table – 2: Mean values of Training & Development on Employees’ Hierarchy variable
Sta
tem
ents
LIC RNLIC SBIL TOTAL
over
all
ME
AN
(N
=45
9)
Seni
or
leve
l (n
=25
)
Mid
dle
leve
l (n
=12
5)
Jun
ior
leve
l (n
=30
)
Seni
or le
vel
(n=
32)
Mid
dle
leve
l (n
=74
)
Jun
ior
leve
l (n
=38
)
Seni
or le
vel
(n=
30)
Mid
dle
leve
l (n
=75
)
Jun
ior
leve
l (n
=30
)
Seni
or le
vel
(n=
87)
Mid
dle
leve
l (n
=27
4)
Jun
ior
leve
l (n
=98
)
Mea
n
Mea
n
Mea
n
Mea
n
Mea
n
Mea
n
Mea
n
Mea
n
Mea
n
Mea
n
Mea
n
Mea
n
A 3.80 3.96 4.17 3.75 3.84 4.11 4.50 4.20 4.00 4.02 3.99 4.09 4.02 B 3.60 3.24 3.00 3.13 3.05 3.08 3.50 3.53 2.83 3.39 3.27 2.97 3.23 C 4.40 3.96 3.83 4.25 4.24 4.11 4.00 4.07 3.83 4.20 4.06 3.93 4.06 D 3.60 3.36 3.17 3.75 3.41 3.08 4.50 4.13 3.00 3.96 3.58 3.08 3.55 Total 3.85 3.63 3.54 3.72 3.64 3.59 4.13 3.98 3.42 3.89 3.72 3.52 3.71
www.ijar.org.in 45
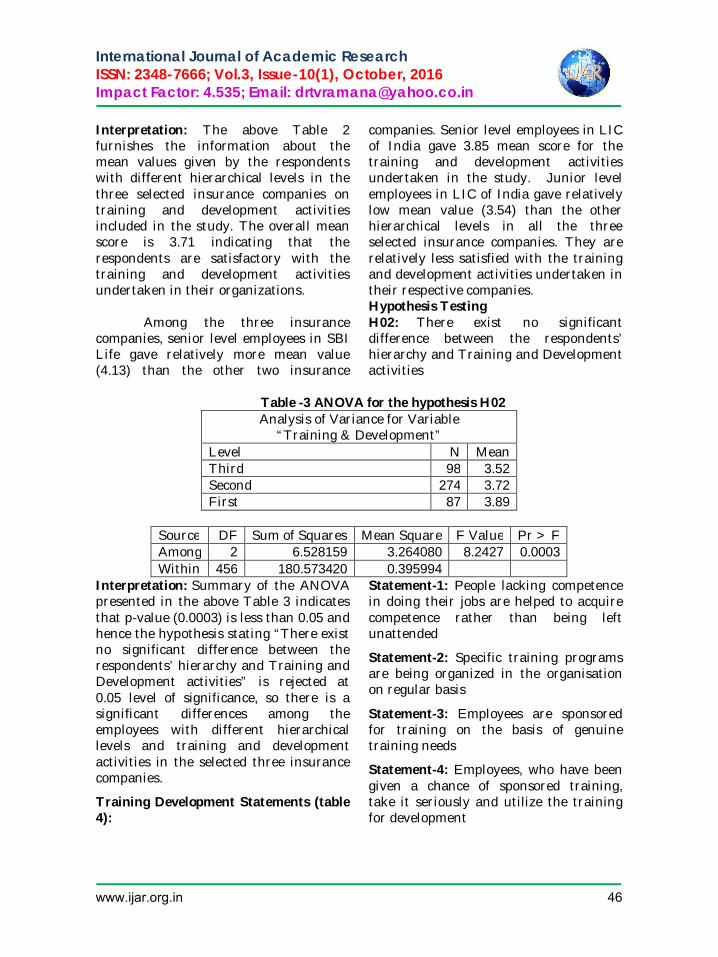
International Journal of Academic Research ISSN: 2348-7666; Vol.3, Issue-10(1), October, 2016 Impact Factor: 4.535; Email: [email protected]
Interpretation: The above Table 2 furnishes the information about the mean values given by the respondents with different hierarchical levels in the three selected insurance companies on training and development activities included in the study. The overall mean score is 3.71 indicating that the respondents are satisfactory with the training and development activities undertaken in their organizations.
Among the three insurance companies, senior level employees in SBI Life gave relatively more mean value (4.13) than the other two insurance
companies. Senior level employees in LIC of India gave 3.85 mean score for the training and development activities undertaken in the study. Junior level employees in LIC of India gave relatively low mean value (3.54) than the other hierarchical levels in all the three selected insurance companies. They are relatively less satisfied with the training and development activities undertaken in their respective companies. Hypothesis Testing H02: There exist no significant difference between the respondents’ hierarchy and Training and Development activities
Table -3 ANOVA for the hypothesis H02
Analysis of Variance for Variable “Training & Development”
Level N Mean Third 98 3.52 Second 274 3.72 First 87 3.89
Source DF Sum of Squares Mean Square F Value Pr > F Among 2 6.528159 3.264080 8.2427 0.0003 Within 456 180.573420 0.395994
Interpretation: Summary of the ANOVA presented in the above Table 3 indicates that p-value (0.0003) is less than 0.05 and hence the hypothesis stating “There exist no significant difference between the respondents’ hierarchy and Training and Development activities” is rejected at 0.05 level of significance, so there is a significant differences among the employees with different hierarchical levels and training and development activities in the selected three insurance companies.
Training Development Statements (table 4):
Statement-1: People lacking competence in doing their jobs are helped to acquire competence rather than being left unattended
Statement-2: Specific training programs are being organized in the organisation on regular basis
Statement-3: Employees are sponsored for training on the basis of genuine training needs
Statement-4: Employees, who have been given a chance of sponsored training, take it seriously and utilize the training for development
www.ijar.org.in 46
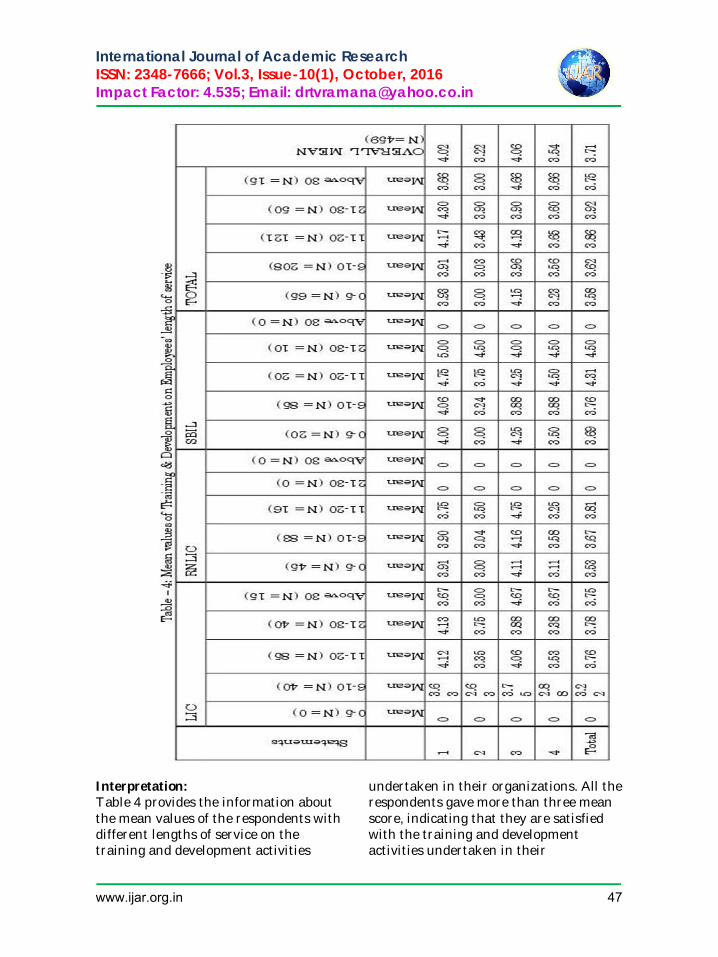
International Journal of Academic Research ISSN: 2348-7666; Vol.3, Issue-10(1), October, 2016 Impact Factor: 4.535; Email: [email protected]
Interpretation: Table 4 provides the information about the mean values of the respondents with different lengths of service on the training and development activities
undertaken in their organizations. All the respondents gave more than three mean score, indicating that they are satisfied with the training and development activities undertaken in their
www.ijar.org.in 47
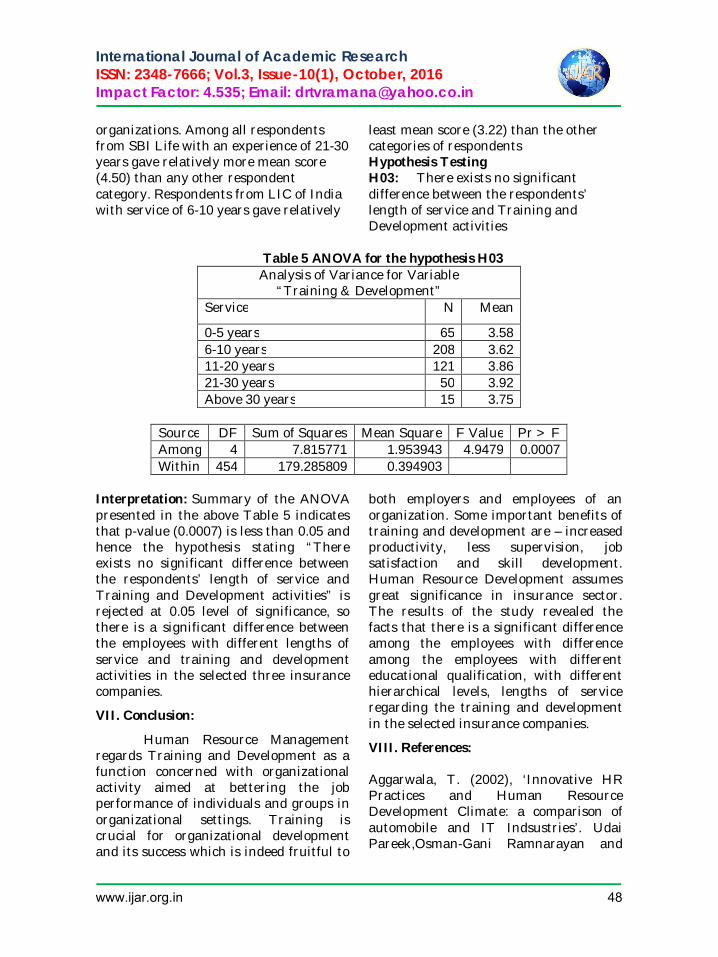
International Journal of Academic Research ISSN: 2348-7666; Vol.3, Issue-10(1), October, 2016 Impact Factor: 4.535; Email: [email protected]
organizations. Among all respondents from SBI Life with an experience of 21-30 years gave relatively more mean score (4.50) than any other respondent category. Respondents from LIC of India with service of 6-10 years gave relatively
least mean score (3.22) than the other categories of respondents Hypothesis Testing H03: There exists no significant difference between the respondents’ length of service and Training and Development activities
Table 5 ANOVA for the hypothesis H03
Analysis of Variance for Variable “Training & Development”
Service N Mean
0-5 years 65 3.58 6-10 years 208 3.62 11-20 years 121 3.86 21-30 years 50 3.92 Above 30 years 15 3.75
Source DF Sum of Squares Mean Square F Value Pr > F Among 4 7.815771 1.953943 4.9479 0.0007 Within 454 179.285809 0.394903
Interpretation: Summary of the ANOVA presented in the above Table 5 indicates that p-value (0.0007) is less than 0.05 and hence the hypothesis stating “There exists no significant difference between the respondents’ length of service and Training and Development activities” is rejected at 0.05 level of significance, so there is a significant difference between the employees with different lengths of service and training and development activities in the selected three insurance companies.
VII. Conclusion:
Human Resource Management regards Training and Development as a function concerned with organizational activity aimed at bettering the job performance of individuals and groups in organizational settings. Training is crucial for organizational development and its success which is indeed fruitful to
both employers and employees of an organization. Some important benefits of training and development are – increased productivity, less supervision, job satisfaction and skill development. Human Resource Development assumes great significance in insurance sector. The results of the study revealed the facts that there is a significant difference among the employees with difference among the employees with different educational qualification, with different hierarchical levels, lengths of service regarding the training and development in the selected insurance companies.
VIII. References:
Aggarwala, T. (2002), ‘Innovative HR Practices and Human Resource Development Climate: a comparison of automobile and IT Indsustries’. Udai Pareek,Osman-Gani Ramnarayan and
www.ijar.org.in 48
International Journal of Academic Research ISSN: 2348-7666; Vol.3, Issue-10(1), October, 2016 Impact Factor: 4.535; Email: [email protected]
T.V. Rao(Ed) HRD in Asia, Oxford &I.B.H,New Delhi,pp.3-10.
Agarwal, V.(2011). ‘Training & development in public organization with reference to LIC of India’, Gurukul Business Review (GBR) Vol. 7, ISSN: 0973-1466.,pp. 87-95
Katou, A.A. (2008), ‘Measuring the impact of HRM on organizational performance’, Journal of Industrial Engineering and Management,1(2), pp.119-142.
Kaur, R., Lehal R. (2010), ‘Human resource management practices in life insurance Corporation of India’, Ph.D. Thesis, P.G. Department of Commerce, Punjabi University Patiala.
Khan, V. A. (2000), ‘Need for Training in Insurance with special reference to Life / Non-life in the Present Liberalized Insurance Market’, Insurance Times, Calcutta, pp.203-211.
Narsaiah, P.V., Reddy, & Sivarami, C. (2002), ‘HRD practices in LIC- An Overview’, The Insurance Times, Vol. XXII, No. 8, August.
Pandit, Princy, Priya, Bharti (1998), Human Resource Development in Life Insurance Corporation of India, Ph.D Thesis, P.G. Department of Commerce, University of Jammu.
Prasannasai, K (1993), ‘The Emerging Role of Human resource Development’ India Journal of Training and Development, April June.Vol XXIII No.2.
Rajesham, Ch., Rajender, K.(2006), Changing Scenario of Indian Insurance Sector, Indian Journal of Marketing, Vol.XXXVI, No. 7, July, pp.9-15.
Rao, T.S. Rama Krishna and Jawaharlal, U. (2004), Training for competence Building in Insurance, Insurance Chronicle, Vol. IV, Issue VI, July, pp. 17-22.
Sheikh, A.M. (2009), ―Human Resource Development and Management S.Chand and Co. ltd, New- Delhi, pp.79-80.
Singh, S.K., (2008), ―HRD Climate: Interventions and Challenges, Human Resource development: HRD-IR Interface Approach, Atlantic Publishers & Distributors, New Delhi-2008.
www.ijar.org.in 49
International Journal of Academic Research ISSN: 2348-7666; Vol.3, Issue-10 (1), October, 2016 Impact Factor: 4.535; Email: [email protected]
International Health Hazards and Issues Dr. B. Raveendra Naik
UGC - Post Doctoral Fellow (R.A), Dept., of Population Studies and Social Work, Sri Venkateswara University, Tirupati 517 502, Andhra Pradesh, India.
E-mail: [email protected] Abstract
It is estimated that by 2020, two-thirds of the global burden of disease will be attributable to chronic non-communicable diseases and most of them strongly associated with diet. The nutrition transition towards refined foods, foods of animal origin, and increased fats plays a pivotal role in the current global epidemics of obesity, diabetes and cardiovascular diseases, among other non-communicable conditions. Sedentary lifestyles and the use of tobacco are also significant risk factors. The epidemics cannot be ended simply by encouraging people to reduce their risk factors and adopt healthier lifestyles, although such encouragement is undoubtedly beneficial if the targeted people can respond. Unfortunately, increasingly obesogenic environments, reinforced by many of the cultural changes associated with globalization, make even the adoption of healthy lifestyles, especially by children and adolescents, more and more difficult. The present paper examines some possible mechanisms for diseases and WHO's role in, the development of a coordinated global strategy on diet, physical activity and health. The situation presents many countries with unmanageable costs. At the same time, there are often continuing problems of undernutrition. A concerted multisectoral approach, involving the use of policy, education and trade mechanisms, is dire necessary to address these matters. Keywords: Obesity, epidemiology, prevention and control, Diet, Physical Fitness, Introduction
The top ten health hazards at international level include Mental health, Cancer, Aids, Family planning, Mobile tech, Global health security and surveillance, War and unrest, Ebola, New sustainable development goals and people centered health systems and are spreading rampantly like wild fire men. World Health Organization (WHO) estimates that, within the next few years, non-communicable diseases will become the principal global causes of morbidity and mortality. The role of diet in the etiology of most non-communicable diseases is well recognised. The shifts towards highly refined foods and towards meat and dairy products containing high levels of saturated fats, i.e. the nutrition
transition, now increasingly evident in middle-income and lower-income countries have, together with reduced energy expenditure, contributed to rises in the incidence of obesity and non-communicable diseases. Because of the global extent of the epidemic, the potential role of international legal mechanisms in promoting healthy diets and preventing over nutrition should be explored. These instruments need not be binding in nature to be effective. Over nutrition, obesity and non-communicable diseases
The 2002 World Health Report lists the leading ten selected risk factors as percentage causes of disease burdens measured in disability-adjusted life years
www.ijar.org.in 50
International Journal of Academic Research ISSN: 2348-7666; Vol.3, Issue-10 (1), October, 2016 Impact Factor: 4.535; Email: [email protected]
(DALYs) for high- and low-mortality developing countries and for developed countries. For developed countries and low-mortality developing countries, overweight was listed as the fifth most serious risk factor. Other risk factors, including tobacco and consumption, hypertension, and underweight, rank higher While the problem of overweight is an essential risk factor for non-communicable diseases, it is not the single or most deadly one. In the USA, 55% of adults are overweight and nearly a quarter are obese. Obesity levels have risen sharply in Australia, Canada and Europe; for example, between 1980 and 1990 in England the prevalence of obesity doubled to 16% and continues to increase. The epidemic of overweight and obesity inflicts significant disadvantages on both the individual and society, i.e. increased risk of disease and death, health care costs and reduced social status, educational attainment, and employment opportunities.
However, the problems of over
nutrition are increasing even in countries where hunger is endemic. Recent reviews have reported significant increases in the prevalence of overweight and obese individuals in developing countries. In Brazil and Mexico, obesity is ceasing to be associated with relatively high socioeconomic status and is becoming a marker of poverty, as in developed countries. The effects of dietary changes are usually exacerbated by a parallel decline in energy expenditure associated with a reduction in daily physical activity. In Europe and North America, fat and sugar account for more than half the caloric intake, and consumption of refined grains has largely replaced that of whole grains (in the USA, 98% of wheat flour is refined). Many people in the
developing world are abandoning traditional diets that are rich in fibre and grain for diets that include increased levels of sugars, oils, and animal fats. For all developing countries combined, the per capita consumption of beef, mutton, goat, pork, poultry, eggs and milk rose by an average 50% per person between 1973 and 1996.
Top 10 Global Health Issues
At the time, the global health community was focused on longstanding challenges such as HIV, family planning, maternal health all of which have been derailed in some way by Ebola this year. All seven billion of us will be affected in some way by at least one of these issues. They’ll shape what Intra Health and other global development organizations do in 2015, and how we do it. Here are our top ten predictions.
1. Mental Health
Maternal mortality, has dominated the global health spotlight for years. Along with depression, post-traumatic stress disorder, dementia, substance abuse and other mental health challenges that affect high and low-income countries alike. “Mental health and wellbeing are fundamental to our collective and individual ability as humans to think, emote, interact with each other, earn a living and enjoy life,”
2. Cancer
Cancer and other communicable diseases will get all the attention and resources because Ebola will likely stunt global progress in addressing. Continue to be a growing challenge for us all, including frontline health workers around the world. 3. AIDS
www.ijar.org.in 51
International Journal of Academic Research ISSN: 2348-7666; Vol.3, Issue-10 (1), October, 2016 Impact Factor: 4.535; Email: [email protected]
In 2014, UNAIDS announced its new fast-track strategy to end the AIDS epidemic by 2030. That’s partly because half of the 35 million people who live with HIV today don’t even know they’re HIV positive, so they don’t know they’re in danger of passing the virus on to others. This year will mark the first full year of a global strategy designed to avert 21 million deaths over the next 15 years.
4. Family planning Family Planning 2020, a global
partnership to make family planning more widely available and it’s already reported some amazing global results, 77 million unintended pregnancies averted, for example, and 125,000 women’s and girls’ lives saved. It also highlights Senegal’s impressive progress, including a new method of contraceptive distribution called the Informed Push Model, which completely eliminated contraceptive stock outs in all public health facilities in Pikine, Senegal, in just six months. Now the government is expanding the model nationwide. Family Planning has yet to take hold in West Africa, but change is coming Family Planning 2020 Progress Report Highlights Intra Health’s Informed Push Model of Contraceptive Distribution. This type of progress is possible everywhere. 5. Mobile Tech
In the hands of trained, connected health workers, mobile technology has the power to transform health care. It can help a lone health worker in even the most remote, isolated village getup-to-date training and provide high-quality care. It can help patients avoid quacks. And it can help connect
health workers to one another and to information that can save lives.
6. Global Health Security And Surveillance
Polio persisted as some 350 cases were reported in eight countries. These are vaccine-preventable illnesses. Their resurgences not to mention the far more dangerous outbreaks of Ebola in West Africa are all threats to our global health security. But it needs international cooperation to create better disease surveillance systems, establish laws and policies that bolster health systems, and prevent violent conflicts that is, to ultimately make a healthier and safer world. 7. War and unrest
War, civil unrest, and acts of terrorism can hinder or even reverse progress in all aspects of global development, including health, education, and gender equality. The international community continues trying to resolve these conflicts and prevent hospitals and health workers from becoming targets of violence. Last year in a landmark resolution, the United Nations stepped up to lead the global effort to protect health workers and hold accountable those who perpetrate violence against them. 8. EBOLA
Ebola killed over 8,000 people in 2014, including hundreds of health workers. In 2015, West Africa and the world will continue struggling to contain the epidemic. People encounter Ebola’s devastating ripple effects: setbacks in HIV and maternal health progress, traumatized communities, and thousands of children orphaned by the disease and abandoned by their remaining family members. Ebola has made clear the
www.ijar.org.in 52
International Journal of Academic Research ISSN: 2348-7666; Vol.3, Issue-10 (1), October, 2016 Impact Factor: 4.535; Email: [email protected]
global need to invest in health systems for the long term and in health workers. 9. New Sustainable Development Goals
This year marks target date for reaching the Millennium Development Goals, which have led to massive worldwide improvements in health and well-being over just 25 years. Now global leaders are finalizing a new set of objectives for global development: the sustainable development goals. These new goals could unite countries on the path toward one of the international community’s most ambitious goals: universal health coverage. To achieve it, we’ll need a greater focus on the global health workforce than the world has ever seen.
10. People-Centered Health Systems
Perhaps more than any crisis in living memory, Ebola has shown a spotlight on the importance of people in health systems. Take away the people as Ebola has done by killing 500 health workers in West Africa and beyond and the system crumbles. Each part of the health system requires people to make health care work and not just clinicians, but statisticians, finance experts, technologists and of course, all of us who seek health care services. Globalization, Food and Diet
Food has been traded since the advent of settled agriculture. Today, however, a qualitative change has occurred in this field because of unprecedented quantitative change. The global value of the food trade grew from US$ 224 billion in 1972 to US$ 438 billion in 1998. Food now accounts for 11% of global trade, a proportion higher than that of fuel. This increase has accompanied the consolidation of
agricultural and food companies into large transnational corporations, which have developed global brand names and marketing strategies with adaptation to local tastes. These corporations are characterized by the global sourcing of supplies, the centralization of strategic assets, resources and decision-making and the maintenance of operations in several countries to serve a more unified global market. An important strategy for these corporations when penetrating into new markets involves the purchase of large, often majority, shareholdings in local food producers, wholesalers or retailers. In China, transnational corporations have invested significantly in local companies in order to produce, distribute, and retail both global and locally adapted products.
Virtually all aspects of the
production and processing of food have been transformed in the last three decades. The overproduction of agricultural produce in developed countries is a perennial problem. For example the food supply in the USA contains 3800 kcal for every adult and child. Moreover, the demand for food is relatively inelastic. These factors have made it necessary to add value to raw agricultural products in the manufacture of food. In the USA, farm value has remained almost unchanged in recent years whereas market value, incorporating added value by the manufacture, retail and food services, has doubled and is now three times higher than farm value.
Along with the changes in the
food supply, the marketing of food has clearly influenced dietary change. As urbanization proceeds, people's preferences are clearly being shaped by
www.ijar.org.in 53
International Journal of Academic Research ISSN: 2348-7666; Vol.3, Issue-10 (1), October, 2016 Impact Factor: 4.535; Email: [email protected]
the introduction of consumers to aggressive marketing techniques and by increased supplies of domestic and imported goods. Global marketing and the systematic moulding of taste by giant corporations is a central feature of the globalization of the food industry. The food industry in the USA spends over US$ 30 billion each year on direct advertising and promotions more than any other industry. Smaller amounts are devoted to food advertising in developing countries, but advertising is increasing as incomes rise in these countries. In South-east Asia, food advertising expenditures increased from US$ 2 billion to US$ 6 billion between 1984 and 1990. Mexicans now drink more Coca Cola than milk. World Health Organization (WHO) Strategy
At the Fifty third World Health Assembly in May 2000, the Director General of WHO presented a global strategy for the prevention and control of non-communicable diseases. It focuses on the following major areas of risk in an integrated way: tobacco use, unhealthy diets and inadequate physical activity. Over nutrition is one piece of this strategy. Two years later, the Fifty fifth World Health Assembly considered a report by the WHO Secretariat which explored a framework for action on diet and physical activity as part of the integrated prevention and control of non-communicable diseases. The report noted that international issues with a major influence on nutrition and physical activity would be identified and addressed, including advertising, mass communication, world trade agreements, food labeling, novel foods, urban planning, and transport. WHO is planning a public consultation process with a view to the creation of a global strategy on diet, physical activity and
health. It is intended that an expert committee will produce a report on diet, nutrition, and the prevention of chronic diseases. There will then be extensive consultation with Member States, UN agencies and private and public organizations, after which a reference group will advise WHO on the development of a global strategy.
WHO's Global Strategy on Diet,
Physical Activity and Health recognizes the need for private as well as public sector involvement to address relevant public health issues. Although WHO is a public international organization with the aims of protecting and promoting public health, it shares certain goals with the private sector and believes that both public and private sectors can agree on certain issues such as adding fruits and vegetables to diets, increasing physical activity, more availability and affordability of health foods, and encouraging the maintenance of healthy body weights. The Global Strategy endorses personal choice, and aims to ensure "that these choices are made by fully informed consumers" and that choices are "made in an environment in which it is easy for people to make healthy decisions about what to eat and how much physical activity they get". The WHO Process for a Global Strategy on Diet, Physical Activity and Health draws distinctions between tobacco and food, noting that unlike tobacco, which kills half its regular users if consumed as intended, "foods are not deadly products. Globalization of public health
Globalization the process of increasing economic, political and social interdependence, which takes place as capital, traded goods, persons, concepts, images, ideas and values diffuse across
www.ijar.org.in 54
International Journal of Academic Research ISSN: 2348-7666; Vol.3, Issue-10 (1), October, 2016 Impact Factor: 4.535; Email: [email protected]
national boundaries occurring at ever increasing rates. The roots of globalization can be traced back to the industrial revolution and the laissez-faire economic policies of the late 19th century. However, the globalization of the late 20th century is assuming a magnitude and taking on patterns unprecedented in world history. Globalization includes many interconnected risks and phenomena that affect the sustainability of health systems and the well-being of populations in rich and poor countries alike. Recently, Yach & Bettcher identified many of the health-related features of global change and observed that the negative health repercussions associated with increasing global interdependence for example, in international trade and communication and financial liberalization cannot be overlooked.
The globalization of modern
information technologies carries the risk of advancing the worldwide trade and consumption of harmful commodities, such as tobacco. At the same time, however, if modern information technologies become accessible and affordable to developing countries, the potential benefits are extensive including telemedicine, interactive health networks, communication services between health workers, and distance learning. As a further example, the globalization of advances in biomedical science raises the possibility of genetics-based discrimination by the public and private sectors in all countries with access to the new technology in genetics. However, advance in genetics can also lead to dramatic progress against diseases in both rich and poor countries, provided that these technologies become available and affordable worldwide.
Emerging and re-emerging infectious diseases
In the early 1970s, it was widely assumed that infectious diseases would continue to decline: sanitation, vaccines and antibiotics were at hand. The subsequent generalized upturn in infectious diseases was unexpected. Worldwide, at least 30 new and re-emerging infectious diseases have been recognized since 1975 (Weiss and McMichael, 2004). HIV/AIDS has become a serious pandemic. Several ‘old’ infectious diseases, including tuberculosis, malaria, cholera and dengue fever, have proven unexpectedly problematic, because of increased antimicrobial resistance, new ecological niches, weak public health services and activation of infectious agents (e.g. tuberculosis) in people whose immune system is weakened by AIDS. Diarrhoeal disease, acute respiratory infections and other infections continue to kill more than seven million infants and children annually (Bryce et al., 2005). Mortality rates among children are increasing in parts of sub-Saharan Africa (Horton, 2004).
The recent upturn in the range,
burden and risk of infectious diseases reflects a general increase in opportunities for entry into the human species, transmission and long-distance spread, including by air travel. Although specific new infectious diseases cannot be predicted, understanding of the conditions favouring disease emergence and spread is improving. Influences include increased population density, increasingly vulnerable population age distributions and persistent poverty (Farmer, 1999). Many environmental, political and social factors contribute.
www.ijar.org.in 55
International Journal of Academic Research ISSN: 2348-7666; Vol.3, Issue-10 (1), October, 2016 Impact Factor: 4.535; Email: [email protected]
These include increasing encroachment upon exotic ecosystems and disturbance of various internal biotic controls among natural ecosystems (Patz et al., 2004). There are amplified opportunities for viral mixing, such as in ‘wet animal markets’. Industrialized livestock farming also facilitates infections (such as avian influenza) emerging and spreading, and perhaps to increase in virulence. Both under- and over-nutrition and impaired immunity (including in people with poorly controlled diabetes and obesity-associated disease now increasing globally) contribute to the persistence and spread of infectious diseases. Large-scale human-induced environmental change, including climate change, is of increasing importance.
Declining regional life expectancy
The upward trajectory in life expectancy forecast in the 1980s has recently been reversed in several regions, especially in Russia and sub-Saharan Africa (McMichael et al., 2004b). These could, in principle, be either temporary aberrations or unconnected to one another. However, identifiable factors appear to link these declines. The fall in life expectancy since 1990 in Russia is unprecedented for a technologically developed country. Multiple drug-resistant tuberculosis is widespread in Russian prisons. Collectively, these factors reflect social disintegration and crisis (Shkolnikov et al., 2004). In sub-Saharan Africa, HIV/AIDS has combined with poverty, malaria, tuberculosis, depleted soils and under nutrition (Sanchez and Swaminathan, 2005), deteriorating infrastructure, gender inequality, sexual exploitation and political taboos to foster epidemics that have reduced life expectancy, in some cases drastically. Adverse health and loss
of human capital, caused by disease and the out-migration of skilled adults, have helped to ‘lock-in’ poverty. More broadly, indebtedness and ill-judged economic development policies, including charges for schooling and health services, have also impaired population health in Africa, following decades of earlier improvement. The intersectoral implications for health promotion are clear. Conflict, most notoriously in Rwanda (André and Platteau, 1998), has also occurred on a sufficient scale to temporarily reduce life expectancy for some populations in sub-Saharan Africa. Age pyramids skewed to young adults have almost certainly played a role in this violence (Mesquida and Wiener, 1996), together with resource scarcity, pre-existing ethnic tensions, poor governance and international inactivity when crises develop. Global Environmental Change
Sustainable population health depends on the viability of the planet's life-support systems (McMichael et al., 2003a). For humans, achieving and maintaining good population health is the true goal of sustainability, dependent, in turn, on achieving sustainable supportive social, economic and environmental conditions. Today, however, human-induced global environmental changes pose risks to health on unprecedented spatial and temporal scales. These environmental changes, evident at worldwide scale, include climate change, biodiversity loss, downturns in productivity of land and oceans, freshwater depletion and disruption of major elemental cycles.
We currently extract ‘goods and
services’ from the world's natural environment about 25% faster than they
www.ijar.org.in 56
International Journal of Academic Research ISSN: 2348-7666; Vol.3, Issue-10 (1), October, 2016 Impact Factor: 4.535; Email: [email protected]
can be replenished (Wackernagel et al., 2002). Our waste products are also spilling over (e.g. carbon dioxide in the atmosphere). Hence, there is now little unused global ‘bio capacity’. We are thus bequeathing an increasingly depleted and disrupted natural world to future generations. Although the resultant adverse health effects are likely to impinge unequally and, often, after time lag, this decline could eventually harm, albeit at varying levels, the entire human population. Global climate change now attracts particular attention. Fossil fuel combustion, in particular, has caused unprecedented concentrations of atmospheric greenhouse gases. The majority expert view is that human-induced climate change is now underway (Oreskes, 2004). The power of storms, long predicted by climate change modelers to increase (Emanuel, 2005), appears (in combination with reduced wetlands and failure to maintain infrastructure) to have contributed to the 2005 New Orleans flood. WHO has estimated that, globally, over 150 000 deaths annually result from recent change in the world's climate relative to the baseline average climate of 1961–1990 (McMichael et al., 2004a). This number will increase for at least the next several decades.
The Faltering Demographic and Epidemiological Transitions
Both the demographic and epidemiological transitions are less orderly than predicted. In some regions, declining fertility rates have overshot the rate needed for an economically and socially optimal age structure. In other countries, population growth has declined substantially because of the reduced life expectancy discussed earlier (McMichael et al., 2004b). Relatedly, the
future health dividend from recent reductions in poverty may be lower than that once hoped because of the emergence of the non-communicable ‘diseases of affluence’, including those due to obesity, dietary imbalances, tobacco use and air pollution. In the 1960s, there was widespread concern over imminent famine, affecting much of the developing world. This problem was largely averted by the ‘Green Revolution’ during the 1970s and 1980s. Meanwhile, the earlier view that unconstrained population growth had little adverse impact upon environmental amenity and other conditions needed for human wellbeing gained strength. However, in the last few years, this position has been re-evaluated (United Nations Department of Economic and Social Affairs Population Division, 2005). Some argue that unsustainable regional population growth is characterized by age pyramids excessively skewed to young age, high levels of under- and unemployment and intense competition for limited resources. These circumstances jeopardize public health. Where there is also significant inequality and/or ethnic tension, catastrophic violence can result (André and Platteau, 1998; Butler, 2004).
The growth of the global
population and its environmental impact means that we may now be less than a generation from exhausting the biosphere's environmental buffer, unless we can rein in our excessive demands on the natural world. If not, then the demographic and epidemiological transitions, already faltering, will be further affected. Population growth may then slow not only because of the usual development-associated fertility decrease but also because of persistently high death rates elsewhere. Meanwhile, the
www.ijar.org.in 57
International Journal of Academic Research ISSN: 2348-7666; Vol.3, Issue-10 (1), October, 2016 Impact Factor: 4.535; Email: [email protected]
growing awareness of these issues, the publicity of the MDGs, the ongoing campaigns against poverty and Third-World debt, calls for public health to address political violence and the renewed vigour of social movements for health (McCoy et al., 2004) affords new potential resources and collaborations to the global health promotion effort. These should be welcomed and acted upon. Emerging Health Issue
In sum, global and regional inequality, narrow and outdated economic theories and an ever-nearing set of global environmental limits endanger population health. On the positive side of the ledger, there have been some gains (e.g. literacy, information sharing and food production, and new medical and public health technologies continue to confer large health benefits). Overall, though, reliance on economic, especially market-based, processes to achieve social goals and to set priorities and on technological fixes for environmental problems is poorly attuned to the long-term improvement of global human well-being and health. For that, a transformation of social institutions and norms and, hence, of public policy priorities is needed (Raskin et al., 2002). Population health can be a powerful lever in that process of social change, if health promotion can rise to this challenge.
Many of these contemporary
risks to population health affect entire systems and social–cultural processes, in contrast to the continuing health risks from personal/family behaviours and localized environmental exposures. These newly recognized risks to health derive from demographic shifts, large-scale environmental changes, an economic
system that emphasizes the material over other elements of well being and the cultural and behavioural changes accompanying development. Together, these emerging health risks present a huge challenge to which the wider community is not yet attuned. The risks fall outside the popular conceptual frame wherein health is viewed in relation to personal behaviours, local environmental pollutants, doctors and hospitals. In countries that promote individual choice and responsibility, there are few economic incentives for the population's health. Health promotion must, of course, continue to deal with the many local and immediate health problems faced by individuals, families and communities. But to do so without also seeking to guide socio-economic development and the forms and policies of regional and international governance is to risk being ‘penny wise but pound foolish’. Tackling these more systemic health issues requires multi-sectoral policy coordination (Yach et al., 2005) at community, national and international levels, via an expanded repertoire of bottom-up, top-down and ‘middle-out’ approaches to health promotion. Conclusions
The prohibitive costs of treating the consequences of over nutrition require that increased attention be given to preventive measures. Parallels exist between these requirements and the initiatives taken to control tobacco consumption, from which important lessons can be learnt, especially with respect to the use of international legal instruments. However, because some of the largest multinational companies are heavily involved in the creation and marketing of unhealthy foods, the control of these activities presents a formidable
www.ijar.org.in 58
International Journal of Academic Research ISSN: 2348-7666; Vol.3, Issue-10 (1), October, 2016 Impact Factor: 4.535; Email: [email protected]
challenge. There is a growing recognition that prevention demands public health actions at both the national and global levels, ranging from more health education to improved food labelling and controls on the marketing of certain foods and soft drinks. This will require innovative and committed collaboration by all concerned.
Although numerous existing international legal measures have direct or indirect implications for public health, international law-making is a largely uncharted area for the public health community. However, the development and negotiation of the WHO Convention will require us to move into this area. In fact, it can well be argued that the scientific evidence base is much firmer for an international legal agreement on tobacco than, for example, in many areas of environmental law-making where ‘‘scientific uncertainty’’ has been a dominant issue. Tobacco control is one of the most rational, evidence-based policies in health care. Moreover, the recent economic data released by the World Bank strengthens immeasurably this bedrock of scientific evidence. On these grounds, the World Bank recommends that ‘‘international organizations such as the United Nations agencies should review their existing programs and policies to ensure that tobacco control is given due prominence and that they should address tobacco control issues that cross borders, including working with the WHO’s proposed Frame-work Convention on Tobacco Control ’’.
Over 40 years ago, activities in
international health were the domain of WHO, governments (based on bilateral agreements), and non-governmental organisations. This has changed. Today,
new players (such as the World Bank and, increasingly, the World Trade Organisation) have an influence on international health. As globalisation of trade and markets takes hold, new coalitions and alliances are forming to examine and deal with the direct and indirect consequences on health. This paper examines the changing context of cooperation in international health, and voices concerns about rising potential inequalities in health, both within and between countries. The question of how such changes will affect the actions of organisations working in international health is also addressed. References
1. World Health Report 1997: conquering suffering, enriching humanity. Geneva: World Health Organization; 1997.
2. Popkin, B.M., Nutrition in transition: the changing global nutrition challenge. Asia Pacific Journal of Clinical Nutrition 2001: 101:S13-8.
3. World Health Report 2002: reducing risks, promoting healthy life. Geneva, World Health Organization; 2002.
4. Flegel, K.M., Carroll, M.D., Kuczmarski, R.J. and Johnson, C.L. Overweight and obesity in the United States 1960–1994.International Journal of Obesity and related Metabolic Disorders 1998;22:39-47.
5. Childhood obesity: an emerging public-health problem. Lancet 2001; 357:1989.
www.ijar.org.in 59
International Journal of Academic Research ISSN: 2348-7666; Vol.3, Issue-10 (1), October, 2016 Impact Factor: 4.535; Email: [email protected]
6. Bennett, N., Todd, T. and Flately,
J., Health survey for England 1993. London: Her Majesty's Stationery Office; 1995.
7. Must, A., Spadano, J., Coakley, E.H., Field, A.E., Colditz, G. and Dietz, W.H., The disease burden associated with overweight and obesity. JAMA 1999;282:1523-9.
8. Allison, D.B., Zannolli, R. and Narayan, K.M.V., The direct health care costs of obesity in the United States. American Journal of Public Health 1999;89:1194-9.
9. Obesity: preventing and managing the global epidemic. Report of a WHO Consultation on Obesity, Geneva, 3-5 June 1997. Geneva; World Health Organization; 1998. WHO document WHO/NUT/NCD/98.
10. Popkin, B.M. and Doak, C.M., The obesity epidemic is a worldwide phenomenon. Nutrition Reviews 1998;56;106-14.
11. Mann, J.I., Diet and risk of coronary heart disease and type 2 diabetes. Lancet 2002; 360:783-9.
12. Grummer-Strawn, L., Hughes, M., Khan, L.K. and Martorell, R., Obesity in women from developing countries. European Journal of Clinical Nutrition 2000;54:247-52.
13. Monteiro, C.A., Benicio, M.H., Mondini, L. and Popkin, B.M., Shifting obesity trends in
Brazil. European Journal of Clinical Nutrition 2000;54:342.
14. Martorell, R., Khan, L.K., Hughes, M. and Grummer-Strawn, L., Obesity in Latin American women and children. Journal of Nutrition 1998;128:1464-73.
15. Pinstrup-Andersen, P. and Pandya-Lorch, R., (Eds.), The unfinished agenda: perspectives on overcoming hunger, poverty, and environmental degradation. Washington (DC): International Food Policy Research Institute; 2001.
www.ijar.org.in 60
International Journal of Academic Research ISSN: 2348-7666; Vol.3, Issue-10(1), October, 2016 Impact Factor: 4.535; Email: [email protected]
Micro finance through SHGs towards empowerment of tribal women: A Study of G.L. Puram Mandal in Vizianagaram
District
V,Chiranjeevi Rao, Department of Economics, Dr. V. S Krishna Govt Degree College, Visakhapatnam.
Abstract: The results of the study ultimately reveal that there are several benefits being bestowed by the different activities under the SHGs scheme. According to the study, the women respondents are receiving both the employment opportunities and the income under the scheme in the study villages. Among the villages , the respondents of Levidi are able to get more employment opportunities and incomes as the resources are available at cheaper rate for their activities when compared to other villages. Regarding activities, the vegetable marketing activity, kirana business activity and dairy activity under this scheme are providing more employment opportunities and incomes to the tribal women in the study area. The findings of this study ultimately indicate that micro finance is playing very vital role in the upbringing of the living conditions of tribal women. The findings of this study ultimately suggests that, In view of fast changing scenario in tribal areas, a vision for self reliance and urge for development has to be inculcated in tribal societies especially in the women folk. These vital changes can be accomplished by establishing thrift and credit societies. Adult literacy centers, SHGs have to be established in al the interior tribal villages. The local organizations have to be empowered and guided properly in functioning and maintenance by women liaison workers and community coordinators. Key words: empowerment, Development, Women and Children Introduction
The Indian Government has been vigorously working for the empowerment of women in general, rural and tribal women in particular by launching various developmental programmes of which Development of Women and Children in Rural Area (DWCRA) is prominent one. Therefore an attempt has been made to look through the impact of the above said scheme on alleviation of poverty of rural women. One such efforts is the DWCRA scheme which was introduced in 1982 as a subcomponent of IRDP to accelerate the integration of women with the rural development programmes. The primary objectives of the DWACRA scheme are to focus attention on the women members of rural families below the poverty line with a view to providing them with
opportunities of self-employment as a sustained goals. The DWACRA programme is designed as Self Help Groups (SHGs) programme in India and initially introduced in 50 selected districts. Later, it was extended to more districts in a phased manner.
The earlier studies on the
functioning of SHGs reveal that an in depth analysis of the programmes very essential to find out whether such a programme is contributing for women enlistment economically and socially. There is also a need to identify the loopholes in the scheme for making them operationally successful. The above analysis shows that SHG is an important programme to rural women and it is a boon to the rural women-folk. The
www.ijar.org.in 61
International Journal of Academic Research ISSN: 2348-7666; Vol.3, Issue-10(1), October, 2016 Impact Factor: 4.535; Email: [email protected]
studies in the context of working patterns of SHGs in the tribal areas of Vizianagaram district are very few. On the other side the earlier studies have more gaps and not covered the determinants of productive activities various independents and appropriate statistical tools to analyze the study.
The need for tribal development
programmes specifically for the development of tribal women is much imperative in the interior region like Vizianagaram District. Hence an attempt is made in this study to evaluate the SHG programme in G.L. Puram tribal Mandal of Vizianagaram District. This study is based on both primary as well as secondary date sources. The G.L. Puram mandal of Vizianagaram district is selected for the study because it is one of the most tribal concentrated areas in the state. The selected mandal has high poverty, lowest female literacy rate, high birth and infant mortality rates, poor health status and concentrated with much extent of tribal population. Thus the G.L. Puram mandal is a typical case for analyzing the social dynamic operating against the emancipation of tribal women through social mobilization and economic support and self-employment programmes. Secondary data on status of SHG program me in the selected mandal have been collected from annual reports of ITDA, Parvatipuram To select the sample Multi Stage Random Sampling technique is applied in sample selection. From the G.L. Puram mandal two villages Levidi and Gumma are selected. From each village 6 SHGs are selected. From each selected SHG ten member house holds are selected. Totally 12 SHGs from G.L. Puram mandal are selected for evaluating the functioning of SHGs at group levels.
For purpose of studying the impact of SHG on socio economic conditions of the SHG members 10 members from each SHG, a total of 120 households are selected by following the Multi stage, Probability Proportionate Sampling (PPS). Data was ascertained from each selected SHG member with the help of a structured questionnaire by Personal Interview method. Functioning of selected SHGs :
The center and state Governments have been implementing the SHGs scheme with a sacred objective of alleviating the poverty among downtrodden sections and women section of the society. In this study an attempt has been made to evaluate the performance of (SHGs). More specifically an attempt has been made to study to what extent the scheme is helpful to increase the awareness of the tribal women in the G.L. Puram mandal of Vizianagaram district.
A. SHGs participation in Developmental Activities:
At the outset to assess the functioning of selected SHGs important aspects like participation of SHG members in various developmental activities, the level of, matching/grant/revolving fund drawn and amount fertilization particulars, amount repaid by the SHG members in the study area have been discussed. Along with thrift, the SHGs has been giving priority to health, family welfare, literacy, and social awareness activities like convergence activities as a basic determinant of the families economic development and welfare. These activities also recognized by SHGs of G.L. Puram mandal in Vizianagaram District and the SHG members are playing very
www.ijar.org.in 62
International Journal of Academic Research ISSN: 2348-7666; Vol.3, Issue-10(1), October, 2016 Impact Factor: 4.535; Email: [email protected]
active role in various developmental activities like participation in Mahila Mandal meetings, craft centers, thrift movement, health & family camp, prohibition literacy complain, and Pallebata etc. in the study area. It is noticed that, a majority of respondents participated in thrift ( 73.33 percent), family welfare and health campaign and Mahila mandal activities (68.69percent), Prajapadam, pallebata (45 percent) and literacy aspects (57.78 percent) respectively. Among the two villages SHGs the proportion is relatively higher in Levidi groups ranging from 65percent in Mahila Mandal and in thrift (100 percent). In the case of Gumma groups the selected SHG members ranging from 23.33 percent in literacy aspects and 73.33 percent in thrift. It is also noticed that , the thrift activities have occupied a good position in all aspects of SHGs. Thrift concepts linked with bank linkage and bank loans. So it may be a reason behind well performance of the SHG members in thrift activities rather than in other activities. As a whole it is observed that, a major number of the respondents has participated in village development activities for the free of cost and they consist of 61.17 percent of the total respondents. B. SHGs Participation in Different Activities: The selected SHG members of all the selected two villages participating in different programmes. It can be noticed that, the selected SHG members are participating in the discussion on various developmental aspects to be organized by them. Among the SHG members, majority of respondents discussed about thrift (73.89 percent), followed by family planning and health (60 percent),
participating in the programmes like pallebata to place their problems before the administration (48.89 percent) ,literacy aspects (43.33 percent) and Mahila Mandal activities (43.33 percent). It is also revealed that the selected SHGs are viable alternatives to achieve the objectives of rural development and to get community participation in all the rural development programmes. C. Financial Assistance received by selected SHGs from different sources:
SHG is a viable organization set up to disburse micro credit to the rural women for the purpose of making them enterprising women and encouraging them to enter into entrepreneurial activities. The women led SHG have successfully demonstrated how to mobilize and mange thrift, apprise credit needs, maintain linkages with the bank and enforce financial self – discipline. The drawn money by the SHGs may be used for productive and non-productive purposes. In tribal areas the families are very poor and they are unable to reach their daily transactions they needed money for, health, marriages, functions, cloth, education, house repairs, unforeseen distress, deliveries and maintenance of old age people child care etc. These people are depending more on moneylenders. SHGs attacking the situation and releasing money to their own needs taking into consideration the needs of respondents pushed them to draw funds from the financial institutions.
It is observed that the selected
SHGs are able to tap Government support. The selected SHGs raised their resources to the tune of Rs. 88.235 as matching grant. But the above grant was kept with the concerned banks in the
www.ijar.org.in 63
International Journal of Academic Research ISSN: 2348-7666; Vol.3, Issue-10(1), October, 2016 Impact Factor: 4.535; Email: [email protected]
form of fixed deposits according to the Government rules. In recent months, by the pressure of SHGs releasing the money basing on the rate of saving and matching grant to income generating activities to eradicate middle men and bogus group formation in field, the authorities made a policy they released matching grant in the name of groups and kept with Banking institutions as the group avail credit linkage with the bank. Total amount of matching grant of SHGs is Rs. 1,20,000 and drawn in 4 times. The drawn amount utilized for productive purposes and little portion of amount is also used to un-productive activities like family maintenance expenditure. The pattern of matching grant drawn during 1st to 4th times is registered as 44.71 per cent, 57.50% 70% and 45.83 percent respectively by unanimous decision of all SHG members. In the case of two villages, the proportion of the amount drawn during the said period, Levidi groups drawn higher compared to the two categories. It is ranging from 75 to 100 percent.. Regarding Gumma groups the percentages indicating a fluctuating trend in the drawn position. The highest amount is drawn in the third time and later it is recorded to 35.50 percent
D. Utilization Patterns:
The concerned Banks have not able to release or accept to draw amount if the saving position of SHGs are not in good position and if they are not able to fulfill the required ratio with matching grant. It is found that Levidi groups are better in saving position in the study area. In addition to the matching grant, SHGs have bank linkage facilities. The concerned branches extended their support to SHGs in the form of credit advance. The three selected villages
SHGs have receive the bank facilities but Levidi village stood in first place in utilizing the amount to income generating productive activities. The utilization pattern of bank finance towards productive and other purposes shows that from the total amount sanctioned to SHGs , only 67.91 per cent of amount is utilized in various income generating productive activities viz; sheep rearing, vegetable cultivation and vegetable vending, jute based products, dairy, petty trade and agarbathi production. The proportion of amount utilized on the above-mentioned productive economic activities is 67.91 percent. Out of which 16.65 percentage of amount utilized on sheep raring, petty trade has occupied 9.56 percent of amount. The remaining amount is utilized for vegetable cultivation and vegetable vending (18.26), Jute based products (16.22%), Agabatti Production (11.28%) and Dairy (4.83%). Among the three village SHG members, large proportion of amount is utilized in Levidi (80.0%) when compared to Gumma.. E. Repayment Position: Amount repaid by SHG members of bank loans including, Bank linkages, bank micro enterprises credit loan shows that the loan repayment performance of the SHG members out of the total amount taken by the groups is quite satisfactory, As a whole the proportion of amount repaid is 88.83 percent and the remaining 11.17 per cent is recorded as outstanding registered with the institutions. Among the selected villages SHG members, the proportion of amount repaid is cent percent in case of Levidi village groups where as the repayment of Gumma groups is recorded as 87.91 percent. Similarly the amount outstanding is recorded as zero in case of
www.ijar.org.in 64
International Journal of Academic Research ISSN: 2348-7666; Vol.3, Issue-10(1), October, 2016 Impact Factor: 4.535; Email: [email protected]
Levidi groups and 12.09 percent in case of Gumma groups. This situation explains that the proportion of amount outstanding is different from village to village. Low level of incomes, returns, high consumption may be attributed as the reasons behind the poor recoveries of loans in the Gumma village. It is observed from this study that the amount drawn by different SHGs in the selected villages shows that, the SHGs in Gumma village drawn finance from the banks on the name of productive activities and the amount are utilized for consumption purposes. The SHGs in Gumma are spending the loan amounts received by them for consumption purposes. Hence this study suggests the need for providing proper guidance and supervision to all the SHGs in the adoption of productive and income generating activities. Conclusion:
There are several benefits being bestowed by the different activities under the Self Help Groups programme. According to the study, the women respondents are receiving both the employment opportunities and the income under the scheme in the study villages. Among the villages , the respondents of Levidi are able to get more employment opportunities and incomes as the resources are available at cheaper rate for their activities when compared to other villages. Regarding activities, the vegetable marketing activity, kirana business activity and dairy activity under this scheme are providing more employment opportunities and incomes to the tribal women in the study area. The findings of this study ultimately indicate that micro finance
is playing very vital role in the upbringing of the living conditions of tribal women. The findings of this study ultimately suggests that, In view of fast changing scenario in tribal areas, a vision for self-reliance and urge for development has to be inculcated in tribal societies especially in the women folk. These vital changes can be accomplished by establishing thrift and credit societies. Adult literacy centers, SHGs have to be established in al the interior tribal villages. The local organizations have to be empowered and guided properly in functioning and maintenance by women liaison workers and community coordinators
References
1. Agarwal. B (1998). Patriarchy and the modernizing state: An introduction; in Bina Agarwal (ed) structures of patriarchy: State Community and house hold in Modernizing Asia, New Delhi, Kalifor women, PP 1-28.
2. Batliwala Srilatha (1997) “ Empowerment women”, Seminor No:449, New Delhi, P-89.
3. GOI (1974), towards equality New Delhi.
4. GOI (1989), National Perspective Plan for women, New Delhi.
5. GOI (1999), 9Th Five Year Plan Document, New Delhi.
6. Government of Andhra Pradesh (2001 ‘Strategy paper on Women’s Empowerment’, Department of Women Development and Child welfare, Hyderabad.
7. Hall C.M. (1992) Women and Empowerment: Strategies for
www.ijar.org.in 65
International Journal of Academic Research ISSN: 2348-7666; Vol.3, Issue-10(1), October, 2016 Impact Factor: 4.535; Email: [email protected]
Increasing Autonomy, Hemisphere Publishing Corporation, Washington.
8. Hasan Zoya (ed) 1994, forging Identities: Gender Communities and the state, New Delhi, Kalifor Women.
9. Jet Buss maker and keep van Kersbergan; “Gender and welfare states: Some Theoretical Reflection” in Gendering welfare states, ed by Diane Sainsbury, London, says Publication, 1994.
10. Kate young (1993) Planning Development with women: Making a world of Difference, Mac Millian, P-157.
11. Kosambi Meera (1997). “Gender Reform and Competing state controls over women: The Rakhmabai lax (1884 – 1988) in Social Reform, Sexuality and the state (ed by) Patricia Uberoi, New Delhi, Sage Publications.
12. Marilee Karl (1995) Women and Empowerment: Participation and Decision Making, London, Zed Books Ltd.
13. Maithreyi Krishna Raj (2000) Public Policy: An Agenda, IAWS, Hyderabad.
14. Patricia Uberoi (1996) (ed), social Reform, Sexuality and the state, New Delhi, Safe Publication, PP-6.
15. Sangari.K and Vaid.S (1999) (Eds) Recasting women: An Introduction is Recasting women: Essays in Colonial hystony New Delhii, Kalifor, Women, PP1-26.
16. Stephen.F. (1997) Women’s Empowerment: A Process of Restricting Power Relations, “ Search Bulletin, XII PP4-13., Quoted by B.V.Jaya Lakshmi (2001) Women’s Empowerment Published by IDPS, Visakhapatnam.
www.ijar.org.in 66
International Journal of Academic Research ISSN: 2348-7666; Vol.3, Issue-10(1), October, 2016 Impact Factor: 4.535; Email: [email protected]
Micro Finance System in Andhra Pradesh Dr. RanjitKumar Siringi
Assistant Professor, Department of Management Studies Andhra University Campus, Kakinada, A.P, India
Abstract: Self -Help is Trust, Belief, and Conviction that the Community, matter how backward, has resources that can be mobilized for meeting individual’s local needs and that of the community for making local improvement and bringing about social change. The poverty alleviation programmes of the Government of Andhra Pradesh (GOAP) can be segregated into five categories namely income enhancement programmes and it includes self-employment programmes like IRDP, DWACRA and TRYSUM, wage employment programmes like JRY and EAS, programmes focusing on providing food and nutritional security like PDS and ICDS, programmes providing basic minimum services like hosing, sanitation, health, education, income maintenance programmes like pension schemes, maternity benefit scheme and survival benefit scheme, and lastly schemes for natural resource management and lively hoods. Most of the poverty alleviation programmes are designed by the central government and implemented by the state on fund sharing basis. A n dhr a P r a de s h a l so promotes some of its own like ‘Adarna’, ‘Girl Child Protection’, and ‘Deepam’, ‘Velugu’.This paper attempts to they can even approach their relatives and friends to borrow some money to purchase their requirements from the market, or even from the cooperative society. Key words: SHGs, Community, DWACRA, Cooperative Society. Introduction “Self -Help is Trust, Belief, and Conviction that the Community, matter how backward, has resources that can be mobilized for meeting individual’s local needs and that of the community for making local improvement and bringing about social change.” The establishment of SHGs can be traced to the existence of one of more common problem areas around which the consciousness of the rural poor is built and the process of group formations initiated. The group thus is usually responsive to perceived needs. Such groups have been formed around specific production activities and often they have promoted savings among their members and used the pooled resources to meet the emergent needs of the members of the group which include consumption needs. Something the internal saving generated is
supplemented by the external resources loaned\donated by NGOs prompting the SHGs. Since the SHGs have formally expected to have any “savings” and also to recycle effectively the pooled resources amongst the members, their activates have attracted attention as a supportive mechanism for meeting the credit needs of the poor (NABARD, 2004) The poverty alleviation programmes of the Government of Andhra Pradesh (GOAP) can be segregated into five categories namely income enhancement programmes and it includes self-employment programmes like IRDP, DWACRA and TRYSUM, wage employment programmes like JRY and EAS, programmes focusing on providing food and nutritional security like PDS and ICDS, programmes providing basic minimum services like hosing, sanitation, health, education,
www.ijar.org.in 67
International Journal of Academic Research ISSN: 2348-7666; Vol.3, Issue-10(1), October, 2016 Impact Factor: 4.535; Email: [email protected]
income maintenance programmes like pension schemes, maternity benefit scheme and survival benefit scheme, and lastly schemes for natural resource management and lively hoods. Most of the poverty alleviation programmes are designed by the central government and implemented by the state on fund sharing basis. Andhra Pradesh also promotes some of its own like ‘Adarna’, ‘Girl Child Protection’, and ‘Deepam’, ‘Velugu’. The evolution of the SHG movement in AP can be traced back to the year 1979, with the implementation of the Integrated Rural Development Programme (IRDP). As a sub component of the IRDP, the Government of India (GOI) started the Development of Women and Children in Rural Areas Programme (DWCRA) in 1982 - 83. Under this programme, women living in neighborhood, with similar socioeconomic background formed into SHGs of 25 members each. They collectively took up economic activities according to their skill and resources. The DWCRA groups were provided with a matching grant of Rs15, 000 to be used as a revolving fund in order to undertake economic activities. Besides this, the groups also received training and their products were exhibited in specially created DWCRA bazaars, thus providing them an opportunity to access diverse markets. This programme picked up momentum and DWCRA groups all over the state were strengthened in the late 1980s and the early 90s. Objectives of SHGs To provide a cost effective credit
delivery system To provide a forum for collective
learning
To provide genuine democratic culture To broaden the pattern of asset
provision
Formation of Self-Help Groups Membership of SHGs A Self-Help Group has a small and manageable membership of not less than 10 persons and not more than 20 belonging to the same village. The members should preferably be from the lower-income group. Members have the freedom to join the group and leave it whenever they like after settling their accounts. No member is forced to join the group. Smooth and efficient functioning of SHGs depends on mutual trust, cooperation and social pressures of members. There can be ‘men only’ and ‘women only’ groups. In some cases, depending upon the interest of individuals there can be ‘mixed groups’. Entry of members, resignations and withdrawals are considered by the entire group. There are three stages in SHG evolution: i) Group formation ii) Capital formation through revolving fund and skill development iii) Income generating activities Group Formation: Group formation is not a spontaneous process. External agencies, individuals working with communities can act as a facilitator in the formation of groups and its development. Self Help Promoting Institutions (SHPI) plays a vital role in the initial stages of group formation. The external facilitators are generally Non-Governmental Organizations, social workers, village level workers, informal associations of local people, community based organizations, government departments, banks, farmer clubs etc.
www.ijar.org.in 68
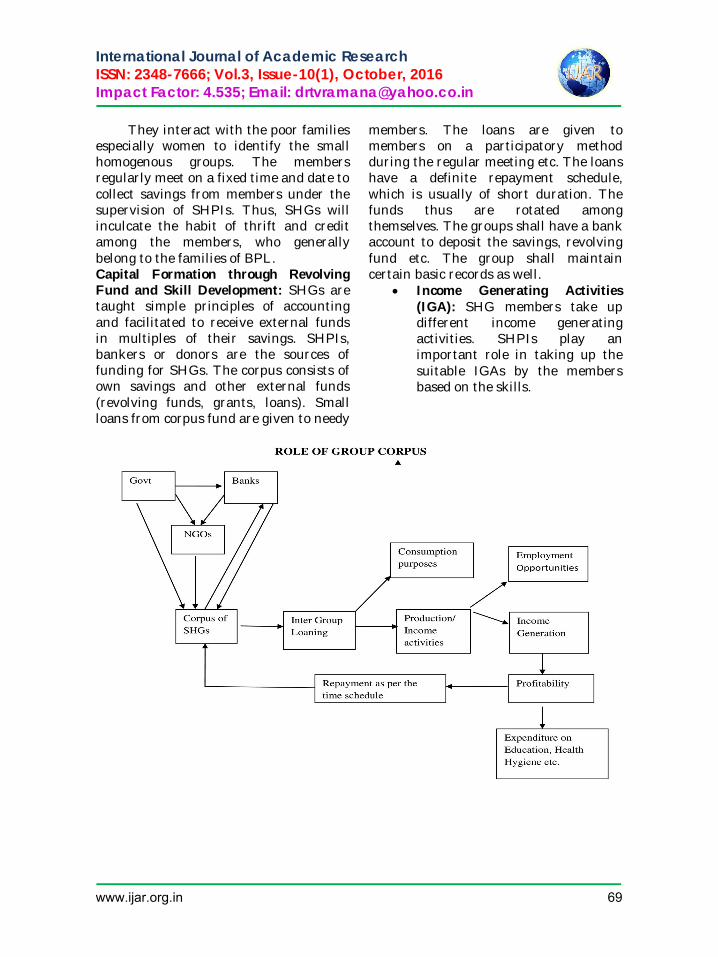
International Journal of Academic Research ISSN: 2348-7666; Vol.3, Issue-10(1), October, 2016 Impact Factor: 4.535; Email: [email protected]
They interact with the poor families especially women to identify the small homogenous groups. The members regularly meet on a fixed time and date to collect savings from members under the supervision of SHPIs. Thus, SHGs will inculcate the habit of thrift and credit among the members, who generally belong to the families of BPL. Capital Formation through Revolving Fund and Skill Development: SHGs are taught simple principles of accounting and facilitated to receive external funds in multiples of their savings. SHPIs, bankers or donors are the sources of funding for SHGs. The corpus consists of own savings and other external funds (revolving funds, grants, loans). Small loans from corpus fund are given to needy
members. The loans are given to members on a participatory method during the regular meeting etc. The loans have a definite repayment schedule, which is usually of short duration. The funds thus are rotated among themselves. The groups shall have a bank account to deposit the savings, revolving fund etc. The group shall maintain certain basic records as well.
Income Generating Activities (IGA): SHG members take up different income generating activities. SHPIs play an important role in taking up the suitable IGAs by the members based on the skills.
www.ijar.org.in 69
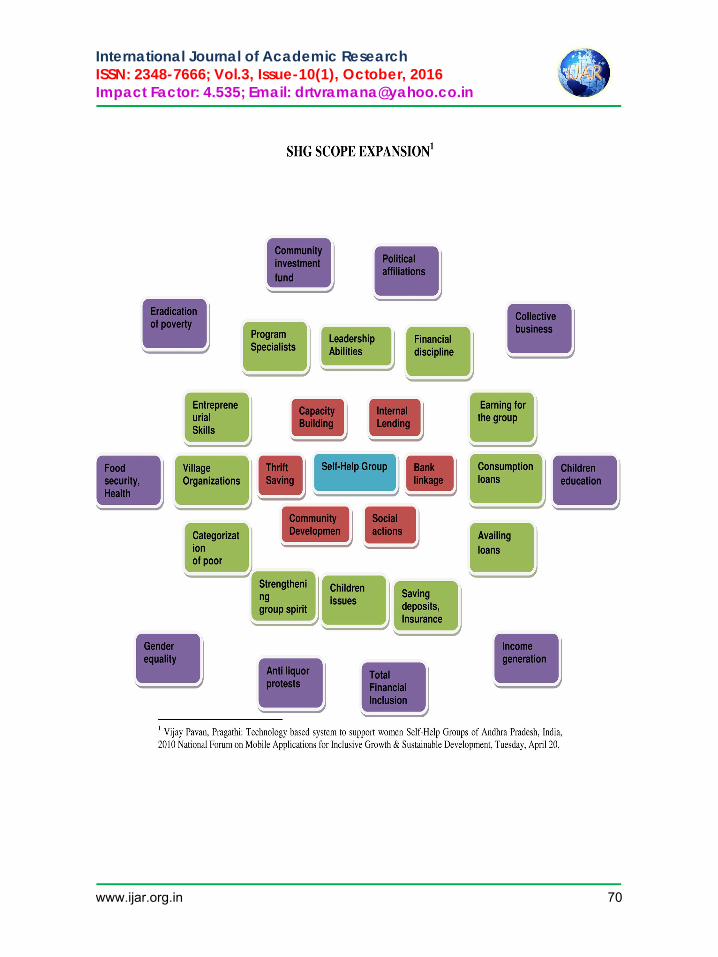
International Journal of Academic Research ISSN: 2348-7666; Vol.3, Issue-10(1), October, 2016 Impact Factor: 4.535; Email: [email protected]
www.ijar.org.in 70
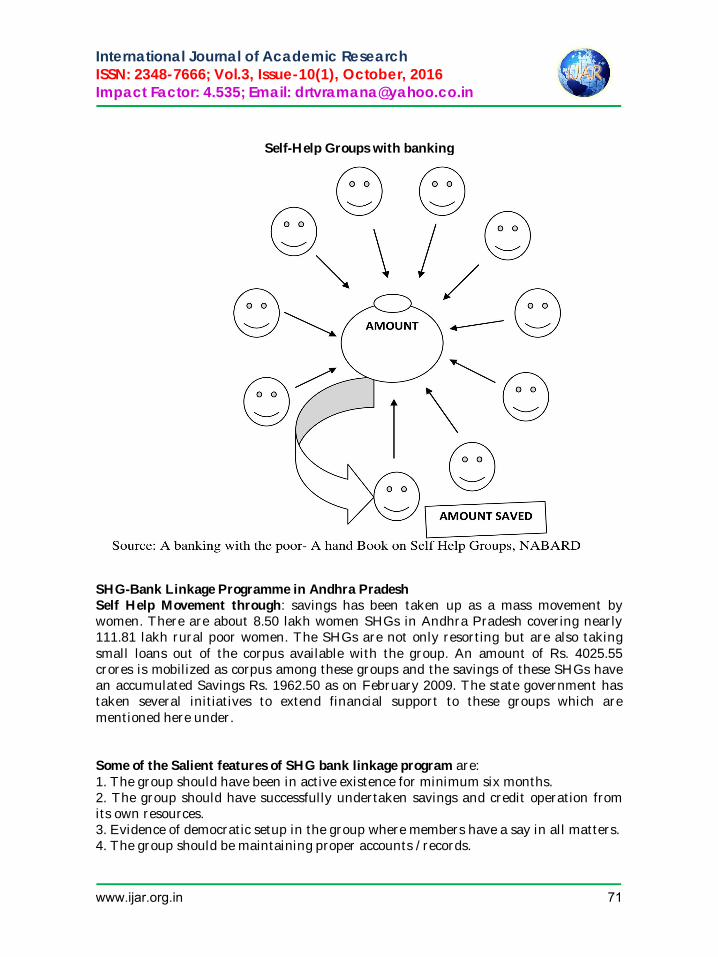
International Journal of Academic Research ISSN: 2348-7666; Vol.3, Issue-10(1), October, 2016 Impact Factor: 4.535; Email: [email protected]
Self-Help Groups with banking
SHG-Bank Linkage Programme in Andhra Pradesh Self Help Movement through: savings has been taken up as a mass movement by women. There are about 8.50 lakh women SHGs in Andhra Pradesh covering nearly 111.81 lakh rural poor women. The SHGs are not only resorting but are also taking small loans out of the corpus available with the group. An amount of Rs. 4025.55 crores is mobilized as corpus among these groups and the savings of these SHGs have an accumulated Savings Rs. 1962.50 as on February 2009. The state government has taken several initiatives to extend financial support to these groups which are mentioned here under. Some of the Salient features of SHG bank linkage program are: 1. The group should have been in active existence for minimum six months. 2. The group should have successfully undertaken savings and credit operation from its own resources. 3. Evidence of democratic setup in the group where members have a say in all matters. 4. The group should be maintaining proper accounts / records.
www.ijar.org.in 71
International Journal of Academic Research ISSN: 2348-7666; Vol.3, Issue-10(1), October, 2016 Impact Factor: 4.535; Email: [email protected]
5. The banker should be convinced that the group has not come into existence only for the sake of participation in the project and availing benefits. There should be a genuine need to help each other and work together among the members. 6. The SHG members should preferably have homogeneous back ground And interest. 7. Any interested NGO or the Self Help Promoting Institutions (SHPI) Concerned should help the SHG by way of training and other support for skill up gradation and proper functioning 8. To generate livelihood for poor women. Linking banks with SHGs : was initiated in Andhra Pradesh in 1992-93 with the linkage of 8 SHGs with SBI, Vysya bank and Sri Anantha Grameena Bank. Due to constant efforts by the government, the program has gathered momentum only sin e 1997. All nationalized banks, RRBs and district Co-operative banks were involved in the program. In Andhra Pradesh, 7 models of delivering credit to rural poor through SHG system exist which are: 1. Financing SHGs directly by banks without any intervention / facilitation of Any SHPI 2. Financing SHGs directly by banks with intervention / facilitation of Non Governmental Organizations. 3. Financing SHGs directly by banks with intervention / facilitation of Governmental Agencies 4. Financing SHGs directly by banks with intervention / facilitation of bank Staff 5. Financing SHGs with financial intervention of nongovernmental organizations 6. Financing SHGs with financial intermediation of NGOs/ SHG cluster associations 7. Financing SHGs with financial intermediation of NGOs/Mutually Aided Cooperative Societies.
8. To generate livelihood for poor women. Loan Amount: Under the program banks / financial institutions are giving minimum loan amount equal to 2 times the savings of the group to the maximum of 6 times to the savings depending on the assessment of the SHG by the bank / financial institutions. Greater the degree of confidence of bank on the SHG, greater could be the proportion of loan. The activities or purposes and size of loans which the group proposes to lend should be left to the common wisdom of the group. Interest Rates: The rate of interest will be decided by the banks / financial institutions which finance SHGs under SHG – Bank Linkage program within the scope of RBI Directives. The Nationalized banks, Regional Rural Banks & Cooperative Banks are coming forward to issue loans to SHGs with lower rate of interest under the program as follows: 1. Andhra Bank - 8% (Irrespective of loan amount) 2. State Bank of Hyderabad - 8% 3. State Bank of India 8.75% up to Rs 2.00 lakhs and 9.5% above - 2.00 lakhs 4. Syndicate Bank -10.5% 5. Indian Bank -10 % 6. Andhra Pragathi Grameena Bank -10 % 7. Deccan Grameena Bank- 10 % 8. Chaitanya Godavari Grameena Bank -10 % 9. Andhra Pradesh Grameena Vikasa Bank, -10 % 10. Saptagiri Grameena Bank, -10 % Repayment period: The repayment period for the loans extended by SHG will be determined by the group. However, the banks could give
www.ijar.org.in 72
International Journal of Academic Research ISSN: 2348-7666; Vol.3, Issue-10(1), October, 2016 Impact Factor: 4.535; Email: [email protected]
a longer repayment period for the loans extended by them to SHGs for allowing rolling over of funds by the groups leading to greater internal capitalization of their fund base. In other words, the SHGs should be able to carry out activities without having any depletion of their resources built up with own funds. In addition, the women SHGs are encouraged to come together as Cooperative Societies at the village level and Mandal level by federating them under Mutually Aided Cooperative Societies Act 1995. Nearly 350 societies have been formed so far. These societies will be accessing credit from financial institutions, donor agencies, DRDAs and Voluntary organizations and help the members of women SHGs in availing bigger loans for economic activities and also help in collective bargaining in marketing of products, purchasing raw material etc., and these societies are popularly known as “Mahila Banks”. These societies have a share capital of Rs. 5.80 crores and total corpus of Rs.17.77 crores. These societies charge interest of 12-18 % per annum for giving loans, with the recovery rate around 98%. Progress in bulk lending programme in Andhra Pradesh: Besides promoting linkage of SHGs with banks, NABARD has also extended bulk lending assistance to six voluntary agencies in Andhra Pradesh for on-lending to SHGs and individuals, in areas where SHGs could not be formed or even where formed, banks are reluctant to finance them. Needless to add the bulk lending is extended only in exceptional cases. Here again, four different routes
for financing rural poor have evolved over the year: 1. Bulk lending by NABARD to
NGOs for on-leading to SHGs. 2. Bulk lending by NABARD to
NGOs for on-lending to SHGs through a Women’s Cooperative Society.
3. Bulk lending by NABARD to NGOs for on-lending to SHGs through mutually Aided Cooperative Society.
4. Bulk lending by NABARD to NGOs for replication of Bangladesh Grameena Bank Experiment.
Progress of SHG-bank linkage in Andhra Pradesh: The salient features of SHG-Bank linkage programmes have been elucidated in NABARD’s circular letter no. NB. DPD. FS>4631/92-A/91-92 dated February 26, 1992. The circular is quite comprehensive in so far as it covers almost every aspect of SHG financing like location of project, assessment of group – its size, composition on, methods of operation, etc; credit assessment and delivery; credit monitoring and supervision; do’s and don’ts etc. The beginning for linking banks with the linkage of 8 self Help Groups promoted by MYRADA with Vysya Bank, State Bank of India and Sri Ananta Grameena Bank. Later, the charitable Organisation (YCO), Elamanchali with Canara Bank and Bank of Baroda. Over the years, an amount of Rs 5.57 crores has been disturbed by 12 Commercial Banks and 12 RRBs to nearly 2145 Self Help Groups in Partnership with 23 NGOs in Andhra Pradesh.
www.ijar.org.in 73
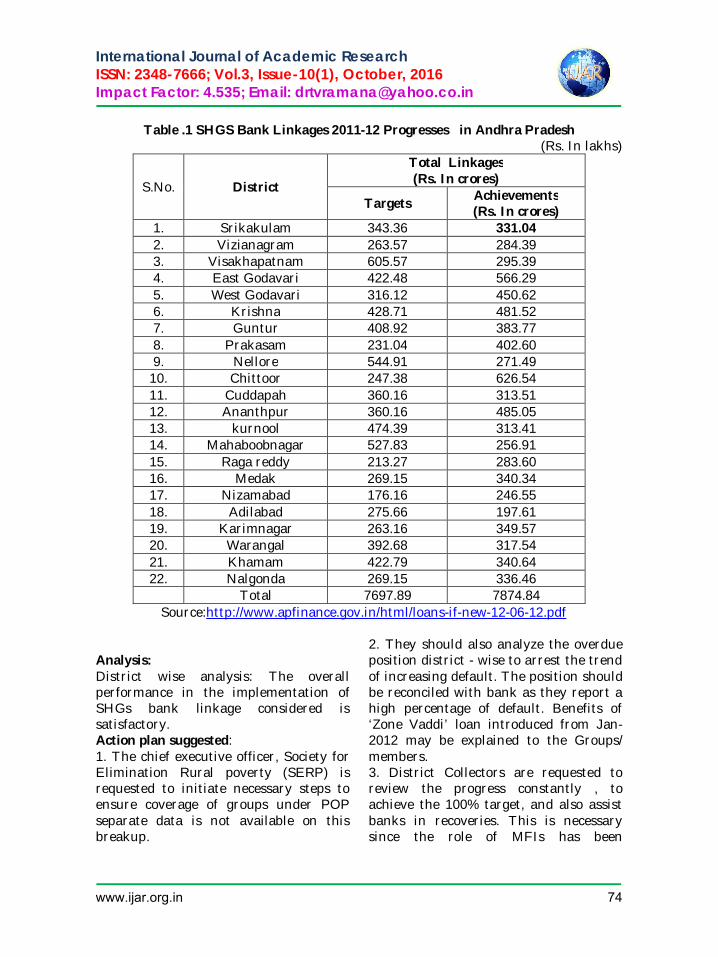
International Journal of Academic Research ISSN: 2348-7666; Vol.3, Issue-10(1), October, 2016 Impact Factor: 4.535; Email: [email protected]
Table .1 SHGS Bank Linkages 2011-12 Progresses in Andhra Pradesh (Rs. In lakhs)
S.No. District
Total Linkages (Rs. In crores)
Targets Achievements (Rs. In crores)
1. Srikakulam 343.36 331.04 2. Vizianagram 263.57 284.39 3. Visakhapatnam 605.57 295.39 4. East Godavari 422.48 566.29 5. West Godavari 316.12 450.62 6. Krishna 428.71 481.52 7. Guntur 408.92 383.77 8. Prakasam 231.04 402.60 9. Nellore 544.91 271.49
10. Chittoor 247.38 626.54 11. Cuddapah 360.16 313.51 12. Ananthpur 360.16 485.05 13. kurnool 474.39 313.41 14. Mahaboobnagar 527.83 256.91 15. Raga reddy 213.27 283.60 16. Medak 269.15 340.34 17. Nizamabad 176.16 246.55 18. Adilabad 275.66 197.61 19. Karimnagar 263.16 349.57 20. Warangal 392.68 317.54 21. Khamam 422.79 340.64 22. Nalgonda 269.15 336.46
Total 7697.89 7874.84 Source:http://www.apfinance.gov.in/html/loans-if-new-12-06-12.pdf Analysis: District wise analysis: The overall performance in the implementation of SHGs bank linkage considered is satisfactory. Action plan suggested: 1. The chief executive officer, Society for Elimination Rural poverty (SERP) is requested to initiate necessary steps to ensure coverage of groups under POP separate data is not available on this breakup.
2. They should also analyze the overdue position district - wise to arrest the trend of increasing default. The position should be reconciled with bank as they report a high percentage of default. Benefits of ‘Zone Vaddi’ loan introduced from Jan-2012 may be explained to the Groups/ members. 3. District Collectors are requested to review the progress constantly , to achieve the 100% target, and also assist banks in recoveries. This is necessary since the role of MFIs has been
www.ijar.org.in 74
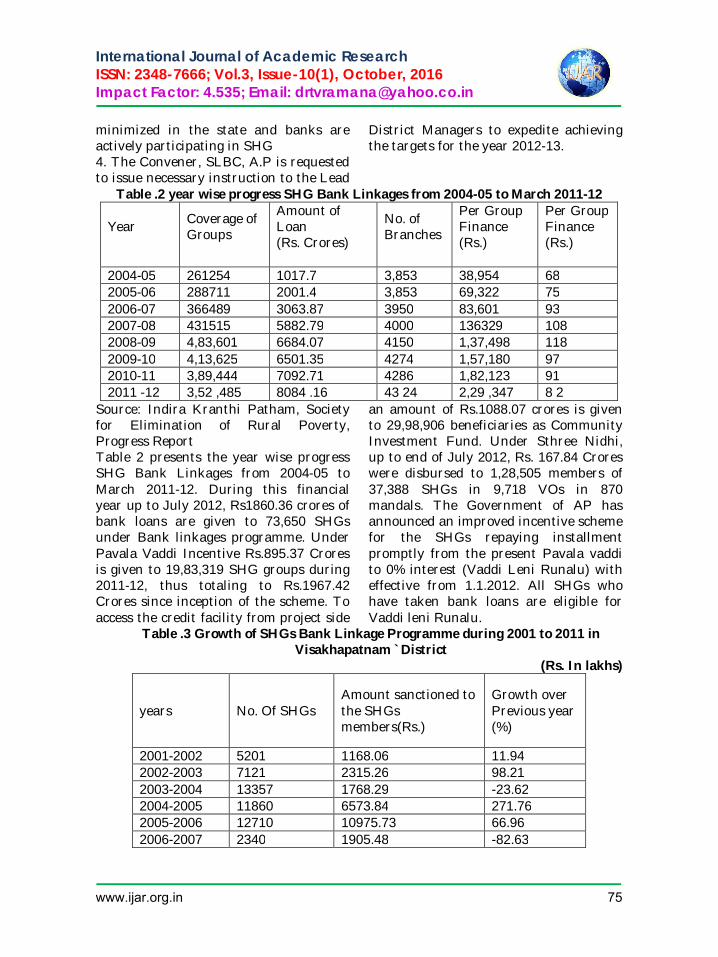
International Journal of Academic Research ISSN: 2348-7666; Vol.3, Issue-10(1), October, 2016 Impact Factor: 4.535; Email: [email protected]
minimized in the state and banks are actively participating in SHG 4. The Convener, SLBC, A.P is requested to issue necessary instruction to the Lead
District Managers to expedite achieving the targets for the year 2012-13.
Table .2 year wise progress SHG Bank Linkages from 2004-05 to March 2011-12
Year
Coverage of Groups
Amount of Loan (Rs. Crores)
No. of Branches
Per Group Finance (Rs.)
Per Group Finance (Rs.)
2004-05 261254 1017.7 3,853 38,954 68 2005-06 288711 2001.4 3,853 69,322 75 2006-07 366489 3063.87 3950 83,601 93 2007-08 431515 5882.79 4000 136329 108 2008-09 4,83,601 6684.07 4150 1,37,498 118 2009-10 4,13,625 6501.35 4274 1,57,180 97 2010-11 3,89,444 7092.71 4286 1,82,123 91 2011 -12 3,52 ,485 8084 .16 43 24 2,29 ,347 8 2
Source: Indira Kranthi Patham, Society for Elimination of Rural Poverty, Progress Report Table 2 presents the year wise progress SHG Bank Linkages from 2004-05 to March 2011-12. During this financial year up to July 2012, Rs1860.36 crores of bank loans are given to 73,650 SHGs under Bank linkages programme. Under Pavala Vaddi Incentive Rs.895.37 Crores is given to 19,83,319 SHG groups during 2011-12, thus totaling to Rs.1967.42 Crores since inception of the scheme. To access the credit facility from project side
an amount of Rs.1088.07 crores is given to 29,98,906 beneficiaries as Community Investment Fund. Under Sthree Nidhi, up to end of July 2012, Rs. 167.84 Crores were disbursed to 1,28,505 members of 37,388 SHGs in 9,718 VOs in 870 mandals. The Government of AP has announced an improved incentive scheme for the SHGs repaying installment promptly from the present Pavala vaddi to 0% interest (Vaddi Leni Runalu) with effective from 1.1.2012. All SHGs who have taken bank loans are eligible for Vaddi leni Runalu.
Table .3 Growth of SHGs Bank Linkage Programme during 2001 to 2011 in Visakhapatnam `District
(Rs. In lakhs)
years No. Of SHGs Amount sanctioned to the SHGs members(Rs.)
Growth over Previous year (%)
2001-2002 5201 1168.06 11.94 2002-2003 7121 2315.26 98.21 2003-2004 13357 1768.29 -23.62 2004-2005 11860 6573.84 271.76 2005-2006 12710 10975.73 66.96 2006-2007 2340 1905.48 -82.63
www.ijar.org.in 75
International Journal of Academic Research ISSN: 2348-7666; Vol.3, Issue-10(1), October, 2016 Impact Factor: 4.535; Email: [email protected]
2007-2008 9260 13131.10 589.12 2008-2009 17385 29168.50 122.13 2009-2010 15476 26364.57 -9.61 2010-2011 5688 9443.50 -64.18 Total 1,00,398 1,02,814.32
Source: Visakhapatnam DRDA The table 3 shows the growth of SHGs Bank Linkage Programme from 2001-2011 in Visakhapatnam `District. In the year 2008-2009 the amount sanctioned as bank loans to 17385 SHGs members was 29168.50 lakhs of the total amount given as bank loans for the period . The bank loans sanctioned to the various SHGs operating in the district was at its lowest in the year 2001-02 where Rs.
1168.06 lakhs were sanctioned to 5201 SHG members
Growth rate of loan amount sanctioned for the period from 2001-2002 to 2010-11 varied from -82.63 to 589.12. The growth rate for the total amount sanctioned was at its highest in the year 2007-08 with 589.12, followed by 271.76 per cent in the year 2004-05. The lowest growth rate was in the year 2006-2007 with -82.63 per cent.
Table 4 Growth of SHGs Bank Linkage Programme from 2001 to 2011, in Paravada Mandal
(Rs. In lakhs)
years No. Of SHGs
Amount sanctioned to
the SHGs members(Rs.)
Growth over Previous year (%)
2001-2002 148 25.70 39.14 2002-2003 274 92.58 260.23 2003-2004 402 66.97 -27.66 2004-2005 475 286.86 328.34 2005-2006 479 498.81 73.88 2006-2007 49 36.50 -92.68 2007-2008 282 403.50 1005.47 2008-2009 395 905.57 124.42 2009-2010 398 762.84 -15.76 2010-2011 135 329.45 -56.81
Total 3037 3408.78 Source: Visakhapatnam DRDA Table 4 presents growth of SHGs Bank Linkage Programme 2001-2011, in Paravada Mandal. In the year 2008-2009 the amount sanctioned as bank loans to 395 SHGs was 905.57 lakhs of the total amount given as bank loans for the period. The bank loans sanctioned to the various SHGs operating in the Mandal was at its lowest in the year 2001-02
where Rs. 25.70 lakhs were sanctioned to 148 SHG members Growth rate of loan amount sanctioned for the period 2001-2002 to 2010-11 varied from -15.76 to 1005.47. The growth rate for the total amount sanctioned was at its highest in the year 2007-08 with 1005.47, followed by 328.34 per cent in the year 2004-05. The lowest
www.ijar.org.in 76
International Journal of Academic Research ISSN: 2348-7666; Vol.3, Issue-10(1), October, 2016 Impact Factor: 4.535; Email: [email protected]
growth rate was in the year 2006-2010 with -15.76 per cent. Pavala Vaddi Scheme (Interest Subsidy)
The Government of Andhra Pradesh introduced Pavalavaddi Scheme (Interest Subsidy) during the year 2004-05 with an objective to provide interest subsidy on the Bank loans taken by the Self Help Groups in Andhra Pradesh to reduce the financial burden on them. The Scheme is applicable to all loans extended by banks on or after 01.07.2004, under SHG Bank Linkage Programme
Process :
1. The DRDA will obtain the details of SHG repayment for the purpose of interest subsidy twice a year through the Mandal Samakhyas.
2. DRDA will calculate the Pavala Vaddi to be given to each SHG basing on the bank statement. The DRDA will give the Pavala Vaddi Cheques to the Mandal Samakhya along with the statement of particulars accruing to each SHG.
3. The Mandal Samakhya in turn will distribute the cheques to the SHGs through the Village Organisations in the Presence of non-officials.
Tab growth of pavala vaddi in Visakhapatnam District from 2004- 2005 to 2009-2010. In the year 2005-2006 the amount sanctioned to 29720 SHGs was 1145.10 lakhs of the total amount given as pavala vaddi for the period. The pavala vaddi loans sanctioned to the various SHGs operating in the district was at its lowest in the year 2004-05 where Rs. 69.13 lakhs were sanctioned to 7380 SHG members Growth rate of loan amount sanctioned for the period 2004- 2005 to 2009-2010 varied from -2.12 to 243.82. The growth rate for the total amount sanctioned was at its highest in the year 2008-09 with 243.82, followed by 199.47 per cent in the year 2005-06. The lowest growth rate was in the year 2009-10 with -2.12 per cent.
Table 5 Growth of pavala vaddi in Paravada Mandal during 2004- 2005 to 2009-2010 (Rs. In lakhs)
Years No. of SHGs Amount sanctioned to
the SHGs members(Rs.)
Growth over Previous year (%)
2004-2005 329 3.09 - 2005-2006 603 10.77 248.54 2006-2007 652 6.29 -41.59 2007-2008 652 22.19 252.78 2008-2009 714 53.68 141.91 2009-2010 568 56.03 4.37
Total 3518 152.05 Source: Visakhapatnam DRDA Table 5 shows growth of pavala vaddi in Paravada Mandal 2004- 2005 to 2009-
2010 .In the year 2009-2010 the amount sanctioned to 568 SHGs was 56.03 lakhs of the total given as pavala vaddi for the
www.ijar.org.in 77
International Journal of Academic Research ISSN: 2348-7666; Vol.3, Issue-10(1), October, 2016 Impact Factor: 4.535; Email: [email protected]
period. The bank loans sanctioned to the various SHGs operating in the mandal was at its lowest in the year 2004-05 where Rs. 3.09 lakhs were sanctioned to 329 SHG members. Growth rate of loan amount sanctioned for the period 2004- 2005 to 2009-2010 varied from -41.59 to 252.78. The growth rate for the total amount sanctioned was at its highest in the year 2007-08 with 252.78, followed by 248.54 per cent in the year 2005-06. The lowest growth rate was in the year 2006-07 with -41.59 per cent. References: 1. Ambiga Devi. P, Gandhimathi. S, Ms. Mirseth Begum, (2012), “social inclusion through financial inclusion – an empirical study on SHGs women in India” excel international journal of multidisciplinary management studies vol.2 issue 4, April 2012, ISSN 2249 8834 pp: 59-68 online available at http://zenithresearch.org.in/. 2. Anuradha Tiwari (2012), “Is Microfinance Working For What It Is Meant To Be? A Comparative Study on Bangladesh and India”, ZENITH International Journal of Multidisciplinary Research, Vol.2 Issue 3, March 2012, ISSN 2231 5780 www.zenithresearch.org.in Pp: 148-164 3. Amarender Reddy. A and Dharm Pal Malik (2011), “A Review of SHG-Bank Linkage Programme in India”, Indian Journal of Industrial Economics and Development, Volume 7 No. 2 (2011): 1-10 4. Arulraj Daniel . J, Selvaraj . V. M. And Raja .E Justus (2011) “Financial Status of Women SHGs: An Analysis” Southern Economist, June 1, 2011, V-50, No.3, Pp.13-16. 5. Anitha H.S. And Ashok D. Revankar (2007), “Micro credit through Self-help-Groups for Rural Development”,
Southern Economist, Volume-46, Number-8, August 15, Pp: 17-19. 6. Atoyebi, G O., Ijaiya, G T. andljaiya, M.A. (2010), “PROBLEMS OF INFORMAL MICROFINANCE IN KWARA SOUTH”: Implications for Rural Finance Policy in Nigeria, INTERNATIONAL ECONOMICS & FINANCE JOURNAL ,Vol. 5, Nos. 1-2, January-December (2010): 159-169. 7. Bandgar P.K. (2012) “Financial Inclusion”, The Management Account, January 2012, Vol.47, No.1, Pp: 22-25. 8. Bidnur V.V. (2012), “Role of self –help group in women’s life with reference to Sangli Miraj and Kupwad Corporation area” , Indian streams Research Journal., Vol - I , ISSUE - XII [ January 2012 ] 9. Badar Alam Iqbal (2012), “Financial Inclusion through Micro-Finance” The Management Account, January 2012, Vol.47, No.1, and Pp: 41-44. 10. Choudari, Appa Rao (2012), “women Micro-Enterprises: A case study”, Southern Economist, March 1, 2012, V-50,No.1, Pp.29-32 11. Coleman, Brett E. (1999), “The Impact of Group Lending in Northeast Thailand”, Journal of Development Economics, Vol. 60, No. 1, pp. 105-41. 12. Chowdhury, M. J. A., Ghosh, D., & Wright, R. E. (2005). “The impact of micro credit on poverty: evidence from Bangladesh”. Progress in Development Studies, 5 (4), Pp:298-309. 13. Dharen Kumar Pandey, Mukesh Kumar.(2011), “Microfinance As A Tool For Financial Inclusion”, EXCEL International Journal of Multidisciplinary Management Studies ,Vol.1 Issue 1, Oct 2011, pp:31-35
www.ijar.org.in 78
International Journal of Academic Research ISSN: 2348-7666; Vol.3, Issue-10(1), October, 2016 Impact Factor: 4.535; Email: [email protected]
A Study on the impact of Co-Curricular Activities in Teaching of Biological Sciences at Secondary Level in
East Godavari District
Dr. T.Jaya Sudhakara Reddy, Principal, Aditya college of Education, Kakinada, AP
Abstract: In order to investigate the impact of co-curricular activities in teaching of biological science at secondary level, it is proposed to study the problem with the title “A study on the impact of co-curricular activities in teaching of biological sciences at secondary level – in East Godavari district” with special reference to have close look of, how far the co-curricular activities in teaching biological science lessons influence on the performances of teachers as well as, students in the secondary level school of the selected district. Most of the teachers said that they are encouraging the students to study the advantages of plants and animals which adjusted in the local area and felt use of slides in teaching biology help the students to understand the concepts of biological sciences. More than eighty percent of the teachers opined that exhibiting the information of biology in bulletin boards help the students to understand and analyse the information. Around eighty five percent of the teachers from the study have expressed that the existing environmental education in biology syllabus helps in using the surrounding environment and that helping the students in preparing herbariums by using different various medicinal leaves. Key Words: empirical observations, formal education, Introduction:
Science education being an important component of the educational system should contribute for the solution of the problems of the country by developing desirable understandings, skills, abilities and attitudes among everyone. The greatest challenge is to humanize science that is to make it relevant to human needs and aspirations. Science is a cumulative and endless series of empirical observations, which result in the formation of concepts and theories, with both concepts and theories being subject to modification in the light of further empirical observations. Science is both a body of knowledge and the process of acquiring it. The progress of science is marked not only an accumulation of fact,
but also by the emergence of scientific method and of the scientific attitude.
Hence, the introduction of science as a discipline at the secondary level is to further strengthen without emphasis on formal education. The concepts, principles and laws of science may appear in the curriculum appropriately but stress should be on comprehension and not on mere formal definitions. The organization of science content around different themes, as being practiced seems appropriate at the secondary stage, but the curricular load needs to be substantially reduced to make room for the additional elements of design and technology, and other co-curricular and extracurricular activities.
www.ijar.org.in 79
International Journal of Academic Research ISSN: 2348-7666; Vol.3, Issue-10(1), October, 2016 Impact Factor: 4.535; Email: [email protected]
A co-curricular activity may be defined in this investigation as an item of work done by the teachers or the pupils out-side the classroom to promote certain skills in biological sciences in the pupils. The activities which are helpful to learn the curricular activities outside the classroom activities are called co-curricular activities.
Need and significance of the study:
Most of the earlier studies have not concentrated on the impact of co-curricular activities in teaching of biological science subject at secondary level. Hence the present study focuses its attention on this area. The present study undertakes with quantitative and qualitative dimensions in appraising the opinion of the secondary school biological science teachers towards the impact of co-curricular activities in teaching on the students. Hence, in order to investigate the impact of co-curricular activities in teaching of biological science at secondary level, it is proposed to study the problem with the title “A study on the impact of co-curricular activities in teaching of biological sciences at secondary level – in East Godavari district” with special reference to have close look of, how far the co-curricular activities in teaching biological science lessons influence on the performances of teachers as well as, students in the secondary level school of the selected district.
Objectives of the study:
1. To create awareness among biological science teachers and Head masters of secondary schools about the importance of
co-curricular activities. 2. To know the existing situation in
biological science teaching regarding the co-curricular activities in the secondary schools.
3. To elicit the opinions of Head master’s and concerned teachers about the measures for providing better and improvised on co-curricular activities.
4. To explore, investigate and analyse data that might reveal secondary school biological science teacher opinion about co-curricular activities.
5. To examine the relationship of participation in co-curricular activities with academic achievement in schools.
6. To find out the co-curricular activities adapted in teaching of biological sciences in accordance with the syllabus.
7. To investigate the attitudes of teachers towards co-curricular activities in biological science teaching at secondary schools.
8. To know how to improve the ability and knowledge of teachers while participating in the co-curricular activities in secondary schools.
9. To evaluate the impact of co-curricular activities in teaching of biological sciences at secondary schools in East Godavari district.
10. To ascertain the factors from teachers regarding the impact of co-curricular activities in teaching of biological sciences at secondary schools in the selected area.
www.ijar.org.in 80
International Journal of Academic Research ISSN: 2348-7666; Vol.3, Issue-10(1), October, 2016 Impact Factor: 4.535; Email: [email protected]
Hypotheses:
1. There is no significant difference between male and female teachers towards the impact of co-curricular activities in teaching biological sciences in all six areas (Science Clubs, Science Exhibitions, Field trips, Radio, Television and Debates) in secondary schools in East Godavari district.
2. There is no significant difference between rural and urban teachers towards the impact of co-curricular activities in teaching biological science in secondary schools in all six areas (Sciences Clubs, Science Exhibitions, Field trips, Radio, Television and Debates) in secondary schools in East Godavari district.
3. There is no significant difference between Graduate and Post-Graduate teachers towards the impact of co-curricular activities in teaching biological sciences in secondary schools in all six areas (Science Clubs, science Exhibitions, Field trips, Radio, Television and Debates) in secondary schools in East Godavari district.
4. There is no significant difference between teachers having B.Ed., and M.Ed., professional qualifications towards the impact of co-curricular activities in teaching biological sciences in secondary schools in all six areas (Sciences Clubs, Science Exhibitions, Field trips, Radio, Television and Dabates) in secondary schools in East Godavari district.
5. There is no significant difference among different management school teachers towards the impact of co-curricular activities in teaching biological sciences in secondary schools in all six areas (Science Clubs, Science Exhibition, Field trips, Radio, Television and Debates) in secondary schools in East Godavari district.
Limitations of the Study:
The present study is aimed to investigate the impact of co-curricular activities in teaching of biological sciences in secondary schools. The study is confined to only biological sciences teachers in East Godavari district of Andhra Pradesh.
Methodology:
The study aimed at knowing the opinions of teachers on the impact of co-curricular activities in biological science teaching at secondary level. The method of investigation is Survey Method. Therefore, the investigator collected the views from teachers who are currently working in secondary schools of the study area, and teaching biological science subject in the selected schools. The nature of the study required personal participation of the researcher for collecting the required information in the selected schools, from different categories of teachers. A survey method of research after careful consideration, is chosen to study the problem. Therefore, the sample was collected from 418 biological science teaching teachers worming in six mandals of East Godavari district. Among these six mandals three are from rural
www.ijar.org.in 81
International Journal of Academic Research ISSN: 2348-7666; Vol.3, Issue-10(1), October, 2016 Impact Factor: 4.535; Email: [email protected]
and three are from urban areas. Enlighten of the above, Head Masters, Secondary Grade Teachers and School Assistant from sample of secondary schools who are related to the current study. The teachers were identified and the required sample was drawn using a stratified random selection.
The analysis of data was carried out using statistical packages and with the help of co-efficient values from the calculations in order to determine inherent facts or meanings. From the table analyses the following findings were derived.
Major findings of the study:
1. Most of the teachers said that they are encouraging the students to study the advantages of plants and animals which adjusted in the local area and felt use of slides in teaching biology help the students to understand the concepts of biological sciences.
2. More than eighty percent of the teachers opined that exhibiting the information of biology in bulletin boards help the students to understand and analyse the information.
3. Around eighty five percent of the teachers from the study have expressed that the existing environmental education in biology syllabus helps in using the surrounding environment and that helping the students in preparing herbariums by using different various medicinal leaves.
4. More than eighty percent of the
teachers agreed that conducting science exhibitions and symposium at school level to help the students to develop their scientific awareness and scientific attitude towards biological sciences.
5. Majority group of respondents agreed that the students are having awareness in identifying the species and genera of various plants and animals surrounded by and most of the teachers felt if students’ visit near by nurseries they will observe the development of new seedlings.
6. More than fifty percent of the respondents opined the social awareness may not be developed in students unless the school management should organize science clubs.
7. A major group of respondents felt that students are allowed to conduct group discussions with the other students of school to explore their talent and the students should visit the pollution control board to know how to control the pollution.
8. Around seventy percent of the respondents agreed that understanding the diseases of plants and animals helping the students to understand the diseases in human beings.
9. A predominant group of teachers felt unless the students are having work experience, they cannot participate in social awareness programmes.
10. More than eighty percent of the respondents agreed that visiting the nurseries by the students will help them to know about the plants grafting at their home.
www.ijar.org.in 82
International Journal of Academic Research ISSN: 2348-7666; Vol.3, Issue-10(1), October, 2016 Impact Factor: 4.535; Email: [email protected]
11. Around sixty percent of the teachers from the study felt that due to lack of environmental awareness the students are not planting various plants at their home.
12. Less than fifty percent of the respondents felt that students are wasting their time in conducting the seminars of biological sciences, whereas, majority of the teachers opined that conducting of biological science clubs at school level will help the students to motivate them towards higher studies.
13. Around seventy percent of the respondents felt that the critical thinking and conversation capacity on the related matter of the students can be developed by conducting the biological science clubs at school level.
14. Most of the teachers opined field trips will encourage the students to know the biological science issues and concepts directly and they will also increase the interest in subject matter. Further, the field trips help the students to develop the friendliness.
15. A significant number of respondents agreed that using the television in biological science teaching help the students to increase the scientific knowledge, develop interest in the related subjects and help to acquire direct experiences.
16. Majority group of the teacher respondents opined that student will try to stop the global warming if the science fairs organized at school level.
17. A dominated group of
respondents agreed that the students not only develop their creative thinking on environment but also enjoy the program if the science fairs organized at school level.
18. Majority of the teachers were agreed that active participation of students in technological fair will be possible with the science fairs organized on educational technology at school level.
19. A predominant group of teachers felt that the students will get awareness on sanitation and HIV/AIDS and its control by conducting the rally programmes at school level.
20. Majority group of respondents in the present study agreed that conducting the rally programmes at school level will help the students in getting the awareness on health, hygiene and regular medical checkup (eye,nose,ear,teeth and skin) etc,.
Conclusion:
Giving a greater place in education to the co-curriculum means that many more clubs and activities will have to be organised for students. This will be very expensive as it will require more staff and more resources to be paid for. This explains why most schools that currently offer a large co-curriculum are well-funded fee-paying institutions. Most ordinary schools, dependent on state-funding, will never be able to match this spending and could not aim to offer an ambitious co-curriculum. If they try, it will be at the expense of more important academic activities.
www.ijar.org.in 83
International Journal of Academic Research ISSN: 2348-7666; Vol.3, Issue-10(1), October, 2016 Impact Factor: 4.535; Email: [email protected]
Many towns today do not have a strong civic society, and in more rural areas there may be no groups at all for young people to join outside school. If schools and colleges do not provide opportunities for youngsters to broaden their experiences, then students will not get them at all. Boosting the place of the co-curriculum in schools is one way of addressing this weakness in modern society, as it will equip young people with the civic spirit, initiative and organising skills to set up their own clubs, teams and activity groups when they leave education. Finally, a successful co-curriculum often depends on building links between the school and the wider community, bringing local enthusiasts in to work with students, and sending students out to work on community projects, help in primary schools, perform for local audiences, etc.
Recommendations of the study:
1. The Government/ management of schools should be established the science museum in every school it will help the students to acquire more knowledge.
2. Every student should be motivated by class teacher to using the library to know the latest information among the related subjects.
3. Provision should be given in secondary schools to conduct the quize and debate programmes for the student’s benefit towards scientific attitudes.
4. There is a lot of need to organize the science clubs and seminars science, and conduct the exhibition at secondary school level to help the students to develop their scientific awareness.
5. Electronic media like Television, Internet should be provided in secondary schools it will help the students to enrich their scientific interests and knowledge in the related subjects.
6. Rally programmes should be conducted at school level once in a year, because of that students will get awareness on use of plastic, plantation of trees and they know how to control the pollution.
References: 1.Barber (1997), ‘Comparing co-curricular provision to a number of non-cited schools’, Newyork, McGraw Hill book Co. 2.Booth(1958), ‘participation of Co-Curricular activity’, New York,Macmillan’. 3.Charter,V.Good (2002) ‘Literature and its importance in future studies’ 4.Edgar, B.Wesley and Stanley, P.Wronski(1901) Teaching social Studies’ 5.John Best,(1976), ‘Research in Education’,Allyn & Bacon, 10 edition (may 27, 2005)
www.ijar.org.in 84
International Journal of Academic Research ISSN: 2348-7666; Vol.3, Issue-10(1), October, 2016 Impact Factor: 4.535; Email: [email protected]
Blood donation by LGBT people: a distant dream and controversial issue
Dr. S.A.K. Azad, Principal University Law College, Bhubaneswar, &
Prafulla Kumar Nayak ,Lecturer, G.M. Law College, Puri At:- Shree Vihar, P.O./Dist – Puri, Odisha, Pin – 752003
Abstract: A society that aspires to respect human rights cannot disrespect people for sexual orientation. Nothing has been as tragic in its impact on sexual minorities as AIDS, homophobia and racism. In a vastly unequal society prejudice against gays, lesbians, bisexual and transgender is still rife. However in less than twenty years society has seen many changes around the world and for sexual minorities across the globe though social revolution has taken place yet bulling and stigma still continues and though equality has become more of a reality but the cause of equality still has many barriers to break because men having sex with men face serious anachronistic obstacles in donating blood with outdated illogical and unequal rules for blood donation. So the rule of blood donation needs to be changed to reflect modern medical science safety for donors and recipients for transfusions. The rules must be respected but fairness and equality need to be considered too in the context of blood wars. The present topic maps the unfolding of blood donation by sexual minorities around the world and controversy surrounding it. Key Words: Gay, Lesbian, Bisexual, Transgender, Homophobia, Racism. Introduction: Donating blood is an act of charity and a philanotrophic act whose impact is immesureable. Indians are by nature charitable but when blood donation is concerned it has yet to catch the fancy of a common man. Health care industry in India is booming in a rapid manner while corporates are making the country the best destination for medical tourism. Government is also promising lot about the role of technology being introduced into healthcare sectors but the simple thing of blood transfusion still lacks proper watch and standards to be established and followed around the country. The world health organization (WHO) has given recommendations for donation policies but in developing countries many of these are not followed. Sexual minorities in India and even
abroad find the task difficult. Historically men having sex with men are excluded on race, religion, ethnicity and sexual orientation and gender identity. They are banned from donating blood because screening includes testing for disease that can be transmitted by blood transfusion in HIV AIDS, viral hepatitis. LGBT individuals as donors have to answer questions about medical history and take a short medical examination to make sure the donation is not hazardous to anybody’s health and this is the area where LGBT individuals are discarded. Importance of bold donation and the controversy of LGBT donating it: Blood donation is one of the significant contribution that a person can make towards a society. It is human duty, the body can repair the loss within few days and it can make sure the return of a
www.ijar.org.in 85
International Journal of Academic Research ISSN: 2348-7666; Vol.3, Issue-10(1), October, 2016 Impact Factor: 4.535; Email: [email protected]
dying man again into light of life. Blood is a liquid of life for each and every life from in planet. Every twenty four hours the human heart pumps 36,000 liters of blood over a distance of 20,000 Km through with each beat. An ailing body needs blood for various reasons. There are four groups of blood, group A, B, AB and O. the required groups must be same while transplanting otherwise the transplantation would go in vain and the person may die. A man with “O” group blood is called universal donor as the people having others can accept it. On the contrary the man with “AB” group of blood is called universal receiver as he can accept all groups of blood. Men who have sex with men blood donor controversy: A classification of men who engage in sex with other men regardless of whether they identify themselves as bisexuals, gay or otherwise are restricted to donate blood. Restrictions on donors are called “deferrals”. Many deferrals are indefinite that means donors who are found ineligible may not be accepted at any point of time in future. The restrictions vary from contrary to country and in many cases men are deferred even though they always have protected sex or have had no sex with men for many years opponents of the deferrals have argued that these policies are not supported by medical science. Many LGBT organizations view the restrictions on donations is based on homophobia and not based on medical concern since donations are rigorously tested to rule out donors that are infected with known virus, such as hepatitis B and hepatitis C. they presume the deferrals are stereotypes. Proponents of lifetime restrictions defend it because of the risk of false negative test results and MSM in developed countries tends to have a
relative high prevalence of HIV/AIDS infections. Blood donation controversy by LGBT persons in India: In India the right of LGBT persons to donate blood is pathetic because the issue is complicated by allegations of discriminatory behavior. In India we have the decentralized system of blood transfusion with different standards of service and quality in every state and periphery. There are four types of blood bank centers 1.Public sector, 2.Redcross society, 3.Non-governmental organizations and 4. Corporate commercial sectors. Even blood banks these days are running short of required blood centers but clubs, colleges, societies and offices etc have also played significant role in these regard but almost all of them have followed the eligibility criteria. Eligibility Criteria
1. The age of the donor should be between 18 to 20 years.
2. Minimum hemoglobin count should be 12.5 gm.
3. The pulse rate should be between 50 & 10 per minute without any irregularities.
4. Blood pressure should be diastolic 50-100 mm mercury and systolic 100-180 mm mercury.
5. The body temperature should be normal and oral temperature should not exceeds 37.50 Celsius.
6. The person should weigh 45 kg or above.
Criteria for Non-eligibility:
www.ijar.org.in 86
International Journal of Academic Research ISSN: 2348-7666; Vol.3, Issue-10(1), October, 2016 Impact Factor: 4.535; Email: [email protected]
1. A person is disqualified to donate blood if he or she is HIV positive.
2. If undergone any dental work or taken asprin within last 72 hours.
3. If one has undergone any immunization within past one month.
4. If one have donated blood or have been treated for malaria within the last 3 months.
5. If a person have undergone any treatment for rabies or receive Hepatitis B immuno globulin within past one year.
So in India gay men, bisexual men and transgender are permanently banned because they run the risk of having sexual transmitted diseases like AIDS. Only lesbians and bisexual women are banned for one year but critics believe these policies are not supported by medical science. LGBT people in India face many legal and social difficulties not experienced by non-LGBT person. Since sexual activity between people of same gender is illegal. In many parts of the world including India blood donations bans apply to gay men but transmen and transwomen also suffer under these kinds of bans with the added stigma of having their gender questioned and ignored. However very recently forty transgender donated blood to Rajib Gandhi Government Hospital blood bank as part of international transgender day celebration. Rambha a 28 year old transgender of Chennai was one of the donors of blood donation camp organized by women and children hospital on an occasion of women’s equality day.
Numerous members from third gender community are willing to become blood donors and break free stereotypes and social stigma associated with them but find the donating process very hard to face. Blood donation controversy by LGBT people in USA: The right of LGBT persons to donate blood in United States is a controvortial and debatable issue because life ban is still in effect which is a stupid prejudice against all laws and bylaws. LGBT donors in US face a indefinite permanent deferral as proponents of life ban perceive that men having sex with men in America have high prevalence of HIV/AIDS, Syphilis and Hepatitis B & C. The federal government in US is considering its lifetime ban and letting gay men donate that blood, but the center for diseases and control (CDC) reported that in 48 out of 50 states men having sex with men represent majority of HIV/AIDS sufferers. The American Association of blood Banks (AABB) and American red cross centers have publicly supported for changing its policy to one year deferral for MSM. Many critics believe that the policy of blood donation is homophobic and not supported by medical guidelines gay men, bisexual men and transgenders are eliminated from blood donor’s pool. Only bisexual women and lesbians have one year deferral since last exposure. The food and drug Administration (FDA) has no bans on lesbian but the procedure for blood donation is complicated. The 33 year policy ban is still in force from 1983 which is in stark contrast to recent advancement in gay rights and could be open to legal challenge given the fact the US Supreme Court has struck down defence of marriage act in 2013.
www.ijar.org.in 87
International Journal of Academic Research ISSN: 2348-7666; Vol.3, Issue-10(1), October, 2016 Impact Factor: 4.535; Email: [email protected]
In US the current guidance from US food and drug administration (FDA) is to defer any male donor who has had sex with another man (MSM) in the past year. This has been since December 2015. Female sexual partners of (MSM) are deferred for one year since last exposure. This is the same policy used for any sexual partner of someone is high risk group. The policy was put in place in 1983 by FDA which regulates blood donation to profit and non-profit organization. In 2006 the AABB, American Red Cross and Americas Blood Centers all supported a change from the current US policy for a lifetime ban deferral of MSM to one year since most recent contract. One model suggested that the change would result in one additional case of HIV transmitted by transfusion every 3 to 8 years. The AABB has suggested making the change since 1977. The FDA did not accept the proposal and had concern about the data used to produce the model citing that additional risk to recipients was to justified. Again on 19th August 2009 the assembly judiciary committee in California passed AJR 13 the US blood donor non-discrimination resolution calling upon FDA to end the MSM blood ban.
Again in April 2010 the New York city council passed a resolution calling on the US food and Drug administration (FDA) to eliminate the ban stating “this ban was based on prejudice a knee-jerk reaction and misunderstanding about HIV/AIDS disease given the constant need for blood it does not make common sense to prohibit donations from entire populations”. On 1st June 2010 Council of District of Columbia passed a resolution calling on FDA to resolve the life time
deferment of blood donation of MSM since 1977 in favour of a policy that protects the safety and integrity of blood supply that is based on up-to-date scientific criteria. In June 2013 the American Medical Association (AMA) issued statement calling on FDA to change its policy stating that “the life time ban on blood donation for MSM is discriminatory and is not based on sound science”. In July 13, 2013 the American osteopathic Association approved a policy calling on FDA to end the indefinite deferment period for MSM and to modify the exclusion criteria for MSM to be consistent with deferrals for those Judged to be at an increased risk of infection. On December 21, 2015 the US FAD changed the policy by replacing the definite deferral with a one year deferral. The change was proposed nevertheless as of May 2016 the American Red Cross reports that the organization is not accepting blood donation from MSM because putting the approved proposal into effect requires training the computer upgrades for which several months are needed. Ultimately on May 27, 2016 the US FDA approved a new blood donor history questionnaire for general use by blood establishment which is compatible with the deferral for 12 months. Before this upgrade the approved questionnaire were compatible only with indefinite deferral of blood donation form MSM. Blood donation controversy by LGBT people in European Union: European Union is a fledging federalist system and most of the countries have anti-discrimination laws yet LGBT people are also restricted for donating their blood. Several countries had permanent life bans. So the
www.ijar.org.in 88
International Journal of Academic Research ISSN: 2348-7666; Vol.3, Issue-10(1), October, 2016 Impact Factor: 4.535; Email: [email protected]
European commission stated that blanket ban on gay blood donation would be contrary EU law and many EU countries cited EU directive 2004/33/EC to justify their bans. An advisory committee on safety of blood tissues and organs recommended a policy change after a study conducted that a total ban may breach equality legislation. So to create standards of safety, directive 2002/98/EC of European parliament and CM/Rec(2010)5 were implemented to combat measures on issues related to sexual orientation and gender identity. The UK lifted its lifetime ban on MSM blood donation on Sept. 2016 and changed the policy to simply restrict MSM with another man within previous 12 months. The advisory committee on safety of blood tissue and organ recommended the policy change after a study conducted that a total ban may breach equality legislation and that the risk of HIV reaching the blood supply would only increase by approximately 2%. A similar policy also exists in rest of the European Union countries and the prevailing interpretation of EU directives 2014/33/EC article 2.1 on door deferrals. The policy however is not very specific and refers to high risk sexual contract. The UK interprets the directive to all forms of homosexual sex as falling within 2.2.2 of Annex III to directive, persons whose behavior or activity places them at risk of acquiring diseases what may be transmitted by blood requiring the deferrals based on window period for disease involved and sets this at 12 months despite the annex suggesting 6 months for risk exposure to Hepatitis B. Bulgaria, Italy, Latvia, Poland and Spain all regard sex between men as not being high risk. In Finland the parliamentary ombudsmen launched an investigation on
the possible unconstitutionally on life time ban in Jan 2006. In June 2008 it was concluded that the ban was unlawful in Finland as it is based on appropriately reasoned epidemiological information and because it is related to sexual behavior rather sexual orientation. In 2013 December Finnish red cross blood service announced that it was lifting the ban and introducing a one year deferral instead. France announced plans in 2015 to lift its ban on blood donation by MSM beginning on 2016 though a 12 month deferral will be put in place. Conclusion To conclude the bigotry behind lesbian, gay, bisexual and transgenders donating blood still exist not only in India but the whole world. The original blood donation rules of men having sex with men is a designation designed to encapsulate sexual activity instead of sexual orientation. The rules are homophobic and nebulous to stigmatize sexual minorities. Discrimination is the core issue in life of LGBT communities it ranges from ridicule to social exclusion to denial of donation of blood. So enacting laws is not enough its implementation in true sense is highly required to make the benefits reach to targeted masses and society at large should also contribute to the full inclusion of LGBT population and LGBT issues must become everybody’s issues to such an extent that the world blood donor day observed on 14th June every year becomes meaningful. References: 1. “Drug Agency reaffirms Ban on gay
men giving Blood, New York Times. 2007-05-24 retrieved 2009-03-26.
www.ijar.org.in 89
International Journal of Academic Research ISSN: 2348-7666; Vol.3, Issue-10(1), October, 2016 Impact Factor: 4.535; Email: [email protected]
2. Blood donation, available at: https://en.wikipedia.org/wiki/blood-donation.
3. Importance of Blood donation by Omma Roy, www.importantindia.com.
4. Blood donation: who are eligible to donate blood? Lawisgreate.com/blood-donation-who-are-eligible-to-donate-blood.
5. Third gender fight social stigma by donating blood, timesof India.indiatimes.com.
6. Transgenders donate blood. The new Indian express 17 April 2015, www.newindianexpress.com.
7. www.bloodbankindia.nt.
8. www.hrc.org.
9. Steve Williams, Trans? You can keep your blood donation then, the LGBT rights cause (May 23, 2014) available at: www.care2.com.
10. www.equaljustice.eu.
www.ijar.org.in 90
International Journal of Academic Research
ISSN: 2348-7666; Vol.3, Issue-10(1), October, 2016
Impact Factor: 4.535; Email: [email protected]
Social empowerment of Dalit women through Self-Help Groups
Dr. N. Padmaja Department of Anthropology, Sri Venkateswara University, Tirupathi, Andhra
Pradesh 517502, India.
Abstract The Government of Andhra Pradesh has taken up many initiatives to alleviate poverty; of this the one of the important concept is women’s empowerment through SHG bank linkage. The states of Andhra Pradesh and Telangana are in forefront in successfully implementing SHG- bank linkage programme. SHGs are recognised as a useful tool to help the poor and as an alternative mechanism to meet urgent credit needs of the poor through thrift. It also enhances the status, in the spheres of economic, political social and cultural life. This paper discusses about Social Empowerment through SHGs, it is measured in various dimensions: Family support, decision-making, on self-confidence of women, Mobility and Gender discrimination. Key words: Empowerment, Self Help Groups, Microfinance Decision making and Mobility.
Introduction Women have been always working side
by side with men in all societies and contributed equally if not more, to the economy, welfare of the family, community life and human development but they have always looked down and given lower position and are dominated by men. The status of women in different times has varied to some extent due to prevailing conditions, but always been subordinate to that of man. Yet, they form the largest disadvantaged group in the country. The rural women have been underestimated and discriminated against all walks of life, in spite of their substantial contribution to the household economy and also contribute to the national economy. Vast sections of the rural poor are deprived of basic amenities, opportunities and oppressed by social customs and practices even now. Several programmes were implemented by various Government and Non-Governmental Organizations to uplift them both economically and socially.
SHG programme is one such attempt but with a difference as it follows group approach it also breaks vicious poverty. 2. Methodology 2.1 Sampling Design: The study covers 3 districts, 16 mandals, 80 villages, 160 SHGs and 480 SHG members including 160 SHG leaders in the Andhra Pradesh and Telangana states.
2.2 Collection of data The data were collected from both primary and secondary sources. a) The primary data were collected through anthropological field work, using an interview schedule, observation and case studies etc b) Secondary data are collected through Internet, Journals, Books, records of the SHGs, Federations and Government Offices . 3 Objectives of the Study 1. To study socio economic profile of
the SHG members 2. To study social empowerment of
the SHG members through self-help groups.
www.ijar.org.in 91
International Journal of Academic Research
ISSN: 2348-7666; Vol.3, Issue-10(1), October, 2016
Impact Factor: 4.535; Email: [email protected]
4 Socio- economic profiles of SHG members The caste, marital status, literacy levels, and family income have significant role to see their socio-economic conditions of the SHG members. 4.1 Literacy Of the sample 480 SHG members 29.37 percent of them are illiterates and remaining 70.6 per cent are literates. 4.2 Marital status Among the sample SHG members 83.33 percent of them are married, and 15.2 percent are widowed and 1.45 percent are divorced/separated. 4.3 Social category The SHG members belong to scheduled caste groups. Majority of them belong to Madiga caste, followed by Mala , Adidravida, Paidi and Holiya Dasari 4.4 Land holdings
More than fifty per cent of the sample SHG members possess less than 2.5 acres of land and 33.95 per cent of the members are landless, the remaining members (1.25%) have land more than 5 acres. 4.5 Occupation The data reveals that 17.5 per cent of the sample SHG members are practicing agriculture and more than half of the sample SHG members are agriculture labourers. The other occupations followed by the members constitute Non-farm labour (6.87%), Livestock (0.20%), Jobs/Services (11.87%), Petty business (6.04%) and other (1.04%).
5. Indicators for social empowerment:
The following indicators taken to measure Social Empowerment of
Scheduled Castes Women through Self Help Groups and they are i) family support, ii) self-confidence, iii) Mobility, iv) Gender Discrimination and vi) Changing of Roles. 5.1 Family support In order to measure, Family support to
SHG activities four factors are taken, they are i)To attend SHG meetings ii) To pay Savings iii) To repay loan instalment iv) SHG work outside the village. These four factors are measured on
three point scale i) Co-operative ii) Indifferent and iii) Put hurdles. Out of 480 sample SHG members, it is
observed that at the time of joining the SHGs nearly fifty percent of the cooperated and other fifty percent raised objections and were not cooperative to them. But later on after seeing the benefits there was gradual change in them. Whereas now, every member in the family extends support to the SHG members to attend SHG meetings, to pay savings, to repay loan instalment and to attend SHG work outside the village. 5.2 Development of Self-Confidence At the time of joining SHGs, only 38.3 percent are literates, 9.2 percent of the members had confidence to approach bank, 9.2 to speak with visitors, 6.7 percent to speak with officials, and nonofficial, 2.5 percent of them had confidence to start SHGs , 4.2 percent had less awareness on rights and procedures. But after joining the groups the members88.6 percent of them became neo literates, 88.3 percent of the SHG members became aware of their rights, development programmes and most of them developed confidence to approach banks, officials and non-officials for getting development benefits. 79.2
www.ijar.org.in 92
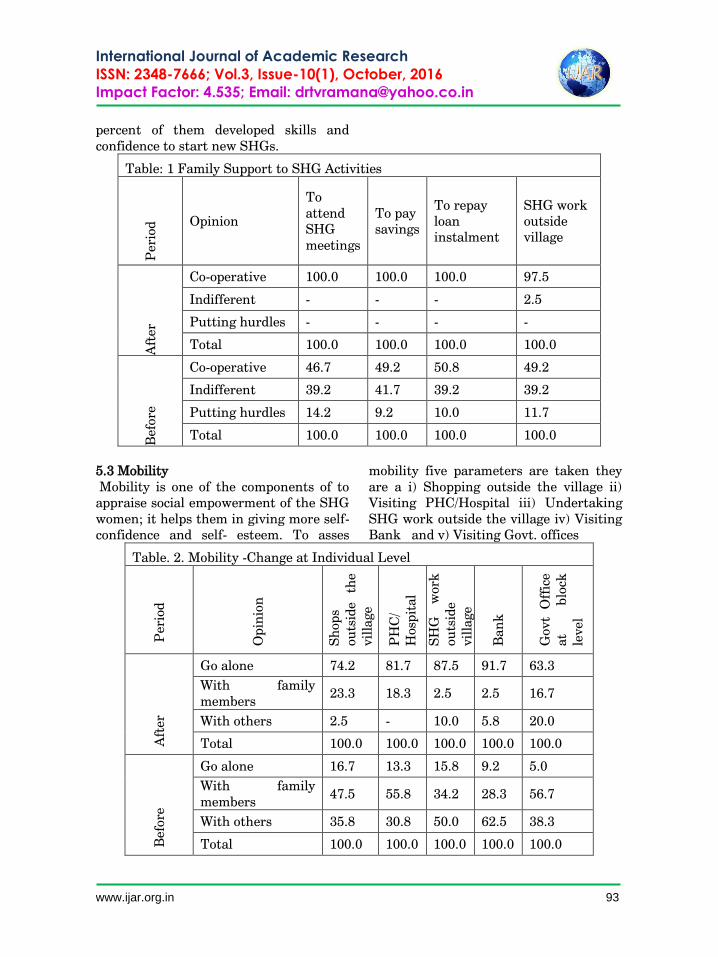
International Journal of Academic Research
ISSN: 2348-7666; Vol.3, Issue-10(1), October, 2016
Impact Factor: 4.535; Email: [email protected]
percent of them developed skills and confidence to start new SHGs.
Table: 1 Family Support to SHG Activities
Per
iod
Opinion
To attend SHG meetings
To pay savings
To repay loan instalment
SHG work outside village
Aft
er
Co-operative 100.0 100.0 100.0 97.5
Indifferent - - - 2.5
Putting hurdles - - - -
Total 100.0 100.0 100.0 100.0
Bef
ore
Co-operative 46.7 49.2 50.8 49.2
Indifferent 39.2 41.7 39.2 39.2
Putting hurdles 14.2 9.2 10.0 11.7
Total 100.0 100.0 100.0 100.0
5.3 Mobility Mobility is one of the components of to appraise social empowerment of the SHG women; it helps them in giving more self-confidence and self- esteem. To asses
mobility five parameters are taken they are a i) Shopping outside the village ii) Visiting PHC/Hospital iii) Undertaking SHG work outside the village iv) Visiting Bank and v) Visiting Govt. offices
Table. 2. Mobility -Change at Individual Level
Per
iod
Op
inio
n
Sh
op
s ou
tsid
e th
e
vil
lage
PH
C/
Hosp
ital
SH
G
work
ou
tsid
e vil
lage
Ban
k
Govt
Off
ice
at
blo
ck
level
Aft
er
Go alone 74.2 81.7 87.5 91.7 63.3
With family members
23.3 18.3 2.5 2.5 16.7
With others 2.5 - 10.0 5.8 20.0
Total 100.0 100.0 100.0 100.0 100.0
Bef
ore
Go alone 16.7 13.3 15.8 9.2 5.0
With family members
47.5 55.8 34.2 28.3 56.7
With others 35.8 30.8 50.0 62.5 38.3
Total 100.0 100.0 100.0 100.0 100.0
www.ijar.org.in 93
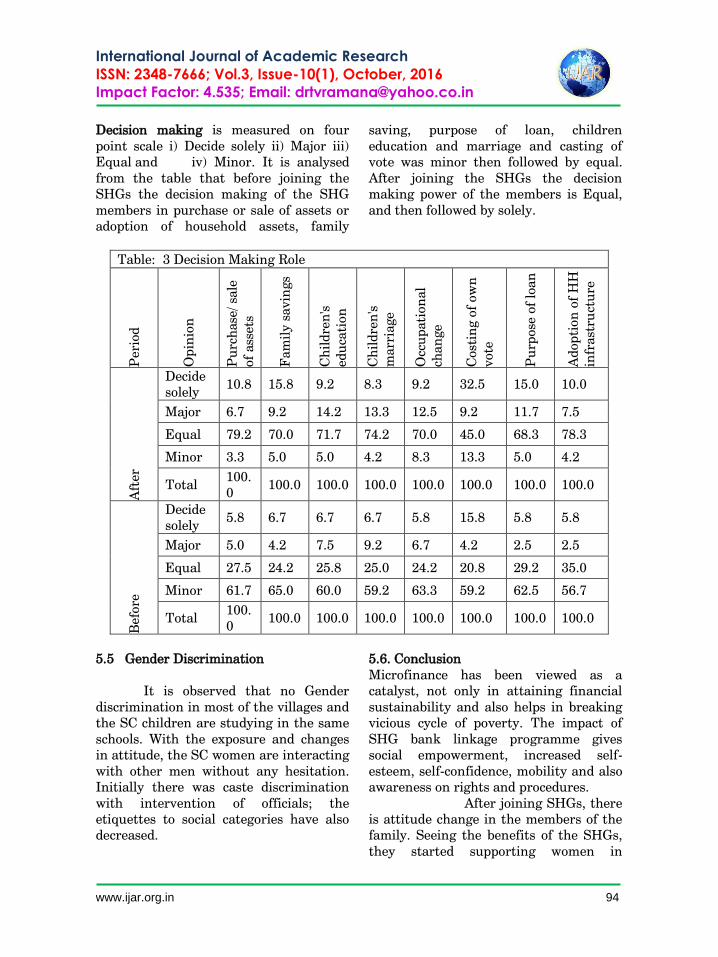
International Journal of Academic Research
ISSN: 2348-7666; Vol.3, Issue-10(1), October, 2016
Impact Factor: 4.535; Email: [email protected]
Decision making is measured on four point scale i) Decide solely ii) Major iii) Equal and iv) Minor. It is analysed from the table that before joining the SHGs the decision making of the SHG members in purchase or sale of assets or adoption of household assets, family
saving, purpose of loan, children education and marriage and casting of vote was minor then followed by equal. After joining the SHGs the decision making power of the members is Equal, and then followed by solely.
Table: 3 Decision Making Role
Per
iod
Op
inio
n
Pu
rch
ase
/ sa
le
of
ass
ets
Fam
ily s
avin
gs
Ch
ild
ren
's
edu
cati
on
Ch
ild
ren
's
marr
iage
Occ
up
ati
on
al
chan
ge
Cost
ing o
f ow
n
vote
Pu
rpose
of
loan
Ad
op
tion
of
HH
in
frast
ruct
ure
Aft
er
Decide solely
10.8 15.8 9.2 8.3 9.2 32.5 15.0 10.0
Major 6.7 9.2 14.2 13.3 12.5 9.2 11.7 7.5
Equal 79.2 70.0 71.7 74.2 70.0 45.0 68.3 78.3
Minor 3.3 5.0 5.0 4.2 8.3 13.3 5.0 4.2
Total 100.0
100.0 100.0 100.0 100.0 100.0 100.0 100.0
Bef
ore
Decide solely
5.8 6.7 6.7 6.7 5.8 15.8 5.8 5.8
Major 5.0 4.2 7.5 9.2 6.7 4.2 2.5 2.5
Equal 27.5 24.2 25.8 25.0 24.2 20.8 29.2 35.0
Minor 61.7 65.0 60.0 59.2 63.3 59.2 62.5 56.7
Total 100.0
100.0 100.0 100.0 100.0 100.0 100.0 100.0
5.5 Gender Discrimination
It is observed that no Gender discrimination in most of the villages and the SC children are studying in the same schools. With the exposure and changes in attitude, the SC women are interacting with other men without any hesitation. Initially there was caste discrimination with intervention of officials; the etiquettes to social categories have also decreased.
5.6. Conclusion Microfinance has been viewed as a catalyst, not only in attaining financial sustainability and also helps in breaking vicious cycle of poverty. The impact of SHG bank linkage programme gives social empowerment, increased self-esteem, self-confidence, mobility and also awareness on rights and procedures. After joining SHGs, there is attitude change in the members of the family. Seeing the benefits of the SHGs, they started supporting women in
www.ijar.org.in 94
International Journal of Academic Research
ISSN: 2348-7666; Vol.3, Issue-10(1), October, 2016
Impact Factor: 4.535; Email: [email protected]
attending in SHG meetings, repaying loan amount and to pay savings. The mobility and self-confidence levels of the SHG members have increased significantly. With inception SHGs of Gender discrimination and social etiquettes have reduced. Thus SHGs thereby, almost addressing goals of gender equality, equity and empowerment. SHG women as members organised or unorganised workers and mothers, they contribute greatly to the economic development and progress of the country. References
Aminur Rahman. 1999. Women and Microcredit in Rural Bangladesh: An Anthropological Study of Grameen Bank
Lending. Boulder, CO; Oxford: West view Press. APMAS. 2009. An Evaluation of Self Help Affinity Groups Promoted by myrada. APMAS, hyderabad. APMAS. 2010. Status of SHG Savings: A study with reference to SHGs in Andhra Pradesh. In-house research study of APMAS, HYDERABAD. EDA and APMAS. 2006. Self Help Groups in India: A study of the lights and shades. Gurgaon: EDA; Hyderabad: APMAS Nanda, B.R. 2006. Indian Women: From Purdah to Modernity. New Delhi: Mittal Publishers. Zainab Rahman. 2007. Empowerment of Rural Indian Women: Study of Uttarakhand. Kalpaz Publication. Delhi.
www.ijar.org.in 95
International Journal of Academic Research ISSN: 2348-7666; Vol.3, Issue-10(1), October, 2016 Impact Factor: 3.656; Email: [email protected] Traduction D’une Histoire « Cut Off » De Chetan Bhagat En
Français Neetu Sinha , Assistant Professor, ASL, Amity University Madhya Pradesh « La limite » est une histoire écrit par Chetan Bhagat, un écrivain indien contemporain. Il nous demande très souvent de lire et de réfléchir sur la situation de notre pays. Il nous encourage aussi à lire en donnant l’envie de le faire grâce à son style simple et systématique. Il a une manière différente et originale de dépeindre l’histoire indienne. Il a publié cette histoire dans son livre « What Young India Wants » dans lequel il parle du problème des jeunesses indiennes et des fautes du système éducatif de l’Inde à présent. Il s’agit d’un étudiant indien qui s’appelle Gautam. Il a obtenu 92 pour cent sur 100 en commerce et a remporté le trophée de son école pour avoir eu les meilleures notes. Mais encore ses meilleures notes ne sont pas suffisantes pour être admis à l’université reconnue. En Inde, il ya beaucoup d’étudiants, qui ont eu le meilleures notes dans leur école mais ils n’ont pas des universités reconnues suffisantes pour l’enseignement supérieur. Dans cette œuvre je vais donner la traduction de l’histoire « Cut Off » Grace à la traduction nous avons une chance de comparer de deux langues : Anglais et Français.
Mots-clés : Traduction, Histoire, supérieur.
La limite
Tout le monde pourrait vous conseillerait comment vivre. Mais personne ne vous donnera de bons conseils sur comment la terminer. Le pire, c’est qu’ils vous suggéraient continuer à vivre, sans aucun respect pour le choix individuel. Oui, Bonjour, je m’appelle Gautam Arora et après passant dix-huit années merveilleuses à Delhi, j’ai décidé de terminer ma vie. Je me suis assis avec mes meilleurs amis Neeraj et sa petite amie Anjali à Costa coffee. DLF centre métropolitain Saket. Le café était trop cher mais étant donné que j’avais un jour à vivre cela ne m’a pas dérangé d’être arnaqué. « La plaisanterie n’est pas autant drôle », a dit Neeraj, en déchirant le deuxième sachet de la cassonade et le mélangeant pour sa petite amie. Si cette fille n’a pas pu mélanger le sucre dans son café je me
suis demandé ce qu’elle sera après le mariage. Est-ce que je fais semblant a plaisanter ? Tu fais tes études en médecine et comme un ami et quelqu’un qui est deux ans plus âgé que moi, je te demande ton avis sur quel est la façon la plus indolore et gracieuse à aller. Et parfaitement il doit être disponible chez le pharmacien voisin qui est amicale, j’ai dit, «J’ai commandé un gâteau caramel à chocolat. Quelles sont les colories supplémentaires au jour précédent ?» Anjali restait calme. Son ipod était bouché à ses oreilles Elle était venue au centre commercial pour faire des courses avec son petit ami plutôt que me rencontrer. Neeraj a dit que c’est lui qui a appelé Anjali comme son père lui avait donné une voiture et un chauffeur qui l’a fait facile à tourner. D’ailleurs elle avait l’air ok. Elle était assez jolie pour inviter le deuxième regard de l’homme bien que ce soit une réussite rare à Delhi, où les
www.ijar.org.in 96
International Journal of Academic Research ISSN: 2348-7666; Vol.3, Issue-10(1), October, 2016 Impact Factor: 3.656; Email: [email protected] principes des hommes sont assez modestes. Type, tu étais au meilleur dans ton école. Combien as –tu déjà eu dans ta classe au lycée ? a demandé Neeraj « 92% » j’ai répondu. «Quatre vingt dix et quoi ? » Neeraj a demandé quand il est en train d’arracher l’écouteur d’Anjali, «Anjali ce type a obtenu 92 sur 100 en commerce ! Est-ce que tu connais quelqu’un a obtenu autant ?» Anjali a fait non de la tète. «Hou la vous auriez dû étudier beaucoup » elle a dit. J’ai fait un signe de tète Je n’avais qu’étudier dans les deux dernières années « pas du temps pour le passetemps » elle a demandé. J’ai fait non de la tète mes seules passetemps sont à manager trois repas et dormir 5 heures par un jour. Le reste du temps a été passé avec mes livres. « Avec 92, tu dois être excellent » Neeraj a fait l’éloge. Pas selon SRCC1, pas selon Stephen’s2 et pas selon Hindu3….oh ha et puis zut J’ai dit quand j’ai ouvert mon sac à dos. Je lui ai donné le supplément de l’admission du journal Je l’avais pris tôt le matin donc maman et papa ne le regarderaient pas. » «Hou la» verifier Lady Sri Ram College. Une licence de commerce est à 95.5 pour cent, Neeraj a dit. C’est un collège pour les jeunes filles » Anjali a dit « Je sais » J’ai répondu « Ne t’en fais pas il ne l’aurait pas fait de toute façon Anjali Pourquoi tu ne vas pas dépenser certains d’argent de ton père » Neeraj a dit et m’a fait un clin d’œil. Anjali et moi les deux avons regardé Neeraj de travers. Neeraj et Anjali se sont embrassés avec affection et a fait un signe a elle de quitter.
Sérieusement, Ne te tue pas, Pour nous tu es encore le meilleur d’école Neeraj a dit après le départ d’Anjali. « Alors Qu’est ce que je fais » j’ai dit à ma vois forte « rester à l’école » Cette marque haut fait les choses pires. Mes parents ont déjà organisé une fête pour nos amis et nos proches comme je l’ai fait une grande fortune de la vie. J’ai coupé un gâteau sur le quel glaçage a dit « Vedette »
« Bon », Neeraj a dit « Pas bon du tout. Tous mes proches ont félicité ma mère .Ils me regardent comme le prochain banquer de succès sur le mur. Le moindre qu’ils attendent de moi à faire est d’être admis dans une bonne école dans DU4 » Il y a encore quelques collèges où tu seras admis » Neeraj a dit quand je lui ai coupé « Mais rien avec la même valeur de la marque. Ainsi tu ne peux pas être admis dans une meilleure maitrise de gestion. Neeraj a poussé ma tasse de café envers moi. Je ne l’avais pas touché. Je l’ai pris et l’ai apporté près de ma bouche mais je n’ai pas pu le boire. « J’ai fait une toute petite erreur du calcul dans l’examen des Mathématiques. » J’ai dit, « j’ai mal lu une conversation bête ». C’est tout. Si seulement….. » Type tu vas aller à l’université de marque ou pas, c’est toujours marrant. « La hélice amusant » j’ai dit « Quels types de gosses prennent –ils de tout façon ? » Neeraj a dit, « tu dois être un rigoriste en matière d’un comptable pour obtenir 97 pour cent. Comme quelqu’un qui ne prend jamais de chance et révise la copie vingt fois » Je ne sais pas, Je l’ai révise cinq fois. Ce calcul stupide…… » Gautam, ne t’inquiète pas. Ce papier est fait. Et le rigoriste ne fait pas bien dans
www.ijar.org.in 97
International Journal of Academic Research ISSN: 2348-7666; Vol.3, Issue-10(1), October, 2016 Impact Factor: 3.656; Email: [email protected] la vie. Les gens d’innovation et d’imagination font. Ce n’est pas ce que DU pense. Tu ne comprends pas, Mon père a déclaré dans son bureau que je vais m’inscrire à SRCC. Je ne peux pas lui aller avec une admission de l’école au deuxième rang. A cause de cela, l’idée de sa vie entière changera. Enfer, moi je ne pourrai pas me débrouiller tout seul. Un SMS d’Anjali sur le portable de Neeraj a interrompu notre conversation. A Kimaya « j’ai essayé la robe du tissu » Neeraj a tapé la réponse. Chérie, c’est super. Achète-la » Neeraj a sourit comme il m’a montré sa réponse. « Je pense que tu dois aller, » j’ai dit. La fille des riches peut piquer une colère jolie, méchante. Neeraj a pris l’argent pour le café. Je l’ai arrêté « Mon plaisir », J’ai dit. Laissez les gens à être heureux sur ton dernier jour, J’ai pensé. Bien sur, Je le prends comme ton plaisir pour avoir cassé les boards5. Neeraj a di et il a sourit. Il a ébouriffé mes cheveux et il a quitté. Je suis sorti du centre commercial et j’ai pris une voiture pour aller chez moi. J’ai rencontré mes parents pendant le dîner. « Bon Quand l’université annoncera les limites ? » Mon père a demandé. « Dans quelques jours, » j’ai dit. J’ai levé les yeux vers le ventilateur à la salle à manger. Non, je ne dois pas me pende. Je ne peux pas supporter l’asphyxie.
Ma mère a coupé les manques
après le dîner. Le couteau m’a fait penser s’ouvrir les veines. Trop pénible, j’ai pensé et j’ai laissé tomber l’idée. Allons, maintenant, les gens de mon bureau me demandent « quand est ce que notre fête aura lieu ? »Mon père a dit quand il a pris une rondelle.
Je vous ai demandé de les inviter à la soirée que nous avons organisée pour les voisins et les proches, ma mère a dit. « Comment cadreront –ils avec vos frères et sœurs ? Mes collègues au bureau sont très sophistiqués » mon père a dit. « Mes frères ne sont pas moins sophistiqués. Ils sont allés à Singapore l’année dernière en vacation. Au moins ils sont meilleurs que votre famille » elle a dit. Mon père s’est moqué de l’expression maussade de ma mère, ses niveaux de bonheur n’étaient pas descendus depuis que j’ai reçu mon résultat. Mes collègues de bureau veulent le verre pas la nourriture. Ne t’en fais pas ! J’aurai l’autre pour eux quand il s’est admis à SRCC ou à Stephen’s Mon père a travaillé dans le service de vente de Tata Tea6. Nous avions fourni tout notre groupe de voisin avec du thé gratuit pour les cinq dernières années Le résultat nous avions plus d’amis que j’aurais aimé. « Même mon chef de mon pays m’a appelé de féliciter pour Gautam. Il a dit « rien comme Stephen’s pour votre brillant fils » mon père a dit. « La tente Gupta est venue de la porte voisine. Elle voulait voir si tu pourrais aider sa fille qui est dans la classe XI » ma mère a dit. Est-elle jolie ? Je voulais demander mais je ne l’ai pas fait. C’était pour rien. Je suis venu à ma chambre après le diner. Je n’étais pas concentré sur la méthode exacte mais j’ai pensé que je dois commencer à travailler à la lettre de suicide de toute façon. Je ne l’ai pas voulu à être un des clichés. Je vous aime tous et c’est le défaut de personne et je suis désolé maman et papa. Ouais juste comme la première impression, les dernières impressions sont aussi
www.ijar.org.in 98
International Journal of Academic Research ISSN: 2348-7666; Vol.3, Issue-10(1), October, 2016 Impact Factor: 3.656; Email: [email protected] importantes. En fait, je n’ai pas voulu de faire aucune lettre de suicide qui est bête. Quand c’est votre dernière vous la feriez importante. J’ai décidé de l’écrire au ministre de l’éducation. J’ai allumé mon ordinateur et je suis allé au site web du ministère de l’éducation. La moitié de liens du site a été cassée. Il y avait un lien appelé « Quoi après la classe XII ? » J’ai cliqué sur la. Cela m’a pris à la page blanche avec un signe de la construction. J’ai soupiré quand j’ai fermé le site. J’ai ouvert Microsoft Word à taper. Cher ministre d’éducation, J’espère que vous allez bien et le grand personnel de votre massif bungalow vous traite bien. Je ne prendrai pas beaucoup de votre temps. J’ai réussi aux examens du douzième et j’ai décidé de terminer ma vie. J’ai eu 92 pour cent dans les boards et j’ai remporté le Trophée d’un pied de mon école pour avoir eu les meilleures notes.
Cependant, il y a beaucoup
d’étudiants avec de telles trophées dans ce pays et mais de places dans les collèges que je ne me suis pas inscrit au collège ce qui me formera pour atteindre à l’échelle prochaine ou pour ouvrir les bonnes opportunités. Je sais que je suis froissé. J’aurais dû travailler plus dur pour avoir encore 3 pour cent. Toutefois, je veux bien vous indiquer certaine chose. Quand mes parents étaient jeunes, certains collèges étaient considérés prestigieux. Maintenant, après 40 ans, les mêmes collèges sont considérés prestigieux. Ce qui est intéressait est qu’aucun nouveau collège a atteint le même marque ni le même niveau de réputation. Aucun collège n’a augmenté le nombre de places
dans les collèges existants de manière afin de recevoir le nombre d’étudiants montant. Je vous donnerai un exemple. En faisant de surfs bêtes, j’ai vu que 3.8 million de candidats ont passé l’examen du douzième de CBSE en 1999, un chiffre qui a augmenté aux 8.9 millions en 2009. C’est juste un board et si vous preniez ICSE et tous les autres boards d’état le numéro total en toute l’Inde n’est plus dix fois que celui de CBSE. Nous avons eu probablement dix billions d’étudiants passant l’examen du douzième cette année. Lorsque tout le monde ne peut pas avoir une place dans un bon collège, je veux juste parler de bons étudiants appelés si. Le 10% en tête de ces dix billions d’étudiants est un billion d’étudiants. Oui, un billion d’étudiants est les meilleures de leur classe. Dans une classe de cinquante, ils auront les cinq rangs meilleurs. On pourrait argumenter que ces brillants élèves méritent une bonne école pour réaliser leur tout potentiel. Réfléchissant sur cela, cela serait bon pour notre pays, aussi, si nous entrainons bien nos brillants élèves à faire partie de l’Inde globalisée. Nouvelle, rayonnante luisante, ou ce que vous voulez appeler. Mais après, il semble comme vous avez cessé de construire des universités. Y-a-t il un billion de places dans les meilleures écoles ? Y en a-t-il au moins un million ? Vous- êtes vous jamais demandé ce qui se passait pour le reste de nous, l’an après l’an ? Est-ce que nous inscrivons nous à une école au deuxième rang ? Une université estimée ? Un enseignement a distance ? Avoir un diplôme dans un pays cher ou raciste ? Votre gouvernement fait beaucoup de choses. Vous dirigez une ligne aérienne qui ne fait jamais de profit. Vous gérez les hôtels. Vous voulez vous
www.ijar.org.in 99
International Journal of Academic Research ISSN: 2348-7666; Vol.3, Issue-10(1), October, 2016 Impact Factor: 3.656; Email: [email protected] engager à faire de substance essentielle comme acier et aluminium qui peuvent être faits facilement par les joueurs les plus efficaces. Toutefois, dans quelque chose, aussi important que former la jeune génération, vous avez fait un pas en arrière… Vous avez arrêté de faire de nouvelles universités. Pourquoi ? Vous avez tout le terrain que vous voulez, les enseignants aiment avoir un emploi gouvernemental. Les fonds d’éducations ne sont jamais interrogés et pourtant (encore) pourquoi ? Pourquoi nous n’avons pas de nouvelles, excellentes universités dans chaque capitale d’Etat, par exemple ? Ohio bien, désolé. Je réagis de manière excessive. Si seulement, je n’avais pas fait cette erreur de calcul dans ma copie de mathématiques. J’irais mieux. En fait, Je suis un des chanceux. Dans quatre ans, le nombre de candidat doublera. Donc, Nous aurons une université qui assure de 99 pour cent de réussite du collège. Mes parents se leurraient un peu de mes talents, et je ressens mal envers eux. Je n’avais pas une petite amie ni beaucoup d’amis, comme les gens qui veulent être inscrit à une bonne université ne sont pas censé d’avoir une vie. Si, seulement j’avais su que travailler très dur pour douze ans ne représente pas grand-chose. À part ça, prenez soin et dites bonjour au premier ministre qui, comme je comprends, enseignait dans une université. Je vous prie d’agréer mes salutations distinguées Gautam (Pauvre étudiant).
J’ai imprimé la lettre et l’ai gardée dans ma poche. J’ai décidé à agir le lendemain matin. Je me suis réveillé comme la domestique a éteint le ventilateur pour donner un bon coup de
balai dans la pièce. Elle est entrée et avait apporté une boîte de sucreries. Une femme de cinquante ans, Elle nous servait pour plus de 10 ans. Qu’est-ce qui s’est passé ? J’ai demandé quand elle m’a donné la boîte. Il y avait du Kaju-barfi7, d’un des magasins les plus chers de la ville. La domestique avait dépensé le salaire d’une semaine distribuant les sucreries aux personnes qu’elle connaît. Mon fils a réussi dans les examens du douzième, elle a dit comme elle commençait son travail. Combien a-t-il eu ? J’ai demandé, encore me frottant les yeux. 42 pour cent. Il a réussi dans l’Anglais aussi ; Elle a dit, son visage rayonnant de fierté. Que va-t-il faire maintenant ? J’ai demandé. Je ne sais pas. Peut-être aurait-il ses propres affaires, Il peut réparer les téléphones portables, elle a dit. Je suis allé à la salle de bains pour une douche. Je me suis rendu compte que les journaux seraient au seuil de la porte. Je suis sorti en courant de la salle de bains. J’ai pris les journaux de l’étage d’entrée. J’ai retiré les pages suppléments d’admission, les ai froissées et les ai jetées dans la poubelle, mise à l’extérieur de la maison. Je suis revenu à l’intérieur de la maison et suis retourné dans la douche. J’ai quitté la maison à midi. J’ai pris le métro à Chandni Chowk et ai demandé mon chemin au marché de l’industrie chimique. Bien que j’aie plus étudié la science après le douzième. Je savais que les certains produits chimiques comme le cuivre du sulfate ou ammonium nitrate pourraient vous tuer. J’ai acheté un paquet des deux produits. Comme j’ai traversé les petits chemins de Chandni Chowk, J’ai passé par un magasin de
www.ijar.org.in 100
International Journal of Academic Research ISSN: 2348-7666; Vol.3, Issue-10(1), October, 2016 Impact Factor: 3.656; Email: [email protected] jalebi8 de cent mètres carrés. Les affaires soulaient bien. J’ai pensé que mon dernier repas devrait être délicieux. Je suis allé au comptoir et ai pris 250 grammes de jalebis.
J’ai pris mon assiette et me suis assis sur un des deux bancs bancal, mis à l’extérieur du magasin. Un couple musulman, avec un garçon de quatre ans, est venu et s’est assis sur le banc à côté. La mère a donné à manger la jalebi au garçon et l’embrassé après chaque bouchée. Il m’a rappelé mon enfance et mes parents, quand ils m’aimaient sans condition et les notes n’avaient pas de rôles. J’ai vu la boîte d’ammonium nitrate et les armes me montaient aux yeux. Je n’ai pas pu manger les Jalebis. Je suis revenu chez moi. Je me suis demandé si je dois me servir de mes produits chimiques avant ou après le dîner. Peut-être c’est meilleur après que tout le monde a dormi, j’ai pensé. Nous étrons à table. Le papa a dit à maman de ne pas cuisiner comme il nous avait acheté le repas chinois à emporter. Maman a apporté la sauce soja, l’huile de chili et le vinaigre avec le vert chilis coupé en petits Katoris9. Nous avons mangé le chop suey américain dans les assiettes d’acier inoxydable. J’ai regardé ma montre, il était 8 heurtes du soir. Encore trois heures, j’ai pensé comme j’ai pensé en laissant un soupir. Une chose, Kalpana, mon père a dit à ma mère, les candidats aux emplois ne sont pas ce qu’ils étaient de nos jours. J’ai fait passer un entretien aux nouveaux stagiaires aujourd’hui, j’ai été déçu. Pourquoi, qu’est-ce qui est passé ? ma mère a dit. Comme ce garçon de Stephen’s, le gosse très intelligent. Mais seulement concernant ses matières.
Vraiment ? ma mère a dit. Ouais, mais je lui ai posé une question différente. J’ai demandé comment irait –t-il pour créer la chaîne de magasins de thé comme les chaînes de magasins de café, et il a eu un blanc, mon père a dit, un pouce des nouilles pendant de sa bouche. Ma mère l’a enlevé de son visage. Et après quelque gosse de Srcc. Il était le meilleur de son école. Mais tu as dû voir son arrogance. Même avant l’entretien a commencé, il dit, « j’espère qu’à la fin de notre entretien, vous pourrez me dire pourquoi je dois entrer dans Tata Tea et pourquoi pas dans une autre entreprise » Peux-tu imaginer ? je suis deux fois plus âgé que lui.’ J’ai pu dire que mon père en était vexé. Si, tu me veux mon avis,’ mon père a continué,’ le meilleur candidat était le garçon de Bhopal. À vrai dire il n’était pas d’un des meilleurs collèges. Mais, il avait obtenu 80 pour cent. Et il a dit, « Je veux apprendre. Et je veux montrer qu’on n’avait pas besoin d’université reconnu pour réussir dans la ville. Les gens de bonne volonté peuvent réussir n’importe où. » Quel gosse ! Merci Dieu, nous l’avions présélectionné comme le meilleur candidat.’ A-t-il trouvé un emploi ? J’ai demandé. Oui, les entreprises ont besoin d’ouvriers qui ne travaillent bien pas les certificats chics. Et nous nous convoquons encore une réunion pour débattre notre critère de liste des candidats sélectionnés. Les meilleurs universités sont très dur à être admettre, seulement les personnes de tunnel de vision se sont sélectionnés. « Puis, pourquoi lui demandez-vous de s’inscrire à Stephen’s ou SRCC ? » ma mère a dit. Mon père s’est tu. Il a repris après une pause et dit, ‘À vrai dire, après aujourd’hui, je dirais, il ne faut pas donner de l’importance juste au renom. Il faut analyser le collège, et arriver à
www.ijar.org.in 101
International Journal of Academic Research ISSN: 2348-7666; Vol.3, Issue-10(1), October, 2016 Impact Factor: 3.656; Email: [email protected] comprendre leurs dévouements et vérifier que ces collèges ne créent pas les pauvres mecs arrogants. Après tout, quoi que soit la marque, tu iras bien. Le monde a besoin de bons gens.’
J’ai regardé mes parents comme, ils continuaient à bavarder. Excusez-moi, mais, j’ai un dessin à exécuter ici. Et maintenant vous faites m’embrouiller, j’ai pensé. Donc, dois-je me renseigner sur d’autres universités et prendre une décision après cela ?’ J’ai dit.
Oui, bien sûr. Pas besoin d’aller par la mentalité du troupeau. Kalpana, tu as dû voir ce garçon de Bhopal.’ Après le dîner, mes parents ont regardé la télé dans le salon en mangeant les fruits. Je suis entré dans ma chambre. Je suis assis sur mon banc pensant à ce qu’il faut faire maintenant. Le téléphone fix a sonné dans la chambre des mes parents. Je y suis entré et l’ai décroché Allo, Gautam ?’ La voix de l’autre côté a dit. C’était le collègue de mon père de travail. Allo, oncle Yash, j’ai dit. ‘Salut.’ Il a dit, ‘félicitations pour ton board.’ ‘Merci, oncle,’ j’ai dit. Papa est dans le salon, en train de finir le dîner, je l’appelle ? Dîner ? Oh ! Ah ! Ne le dérange pas. Dis-lui juste que son portable est avec moi. Il n’est pas perdu. Nous étions dans un voyage d’étude aujourd’hui. Il l’avait oublié dans ma voiture. ‘Un voyage d’étude ? Pour l’entretien ?’ J’ai demandé. ‘Quel entretien ? Non, nous sommes juste allés au bureau de Chandigarh,’ il a dit. Je l’ai souhaité bonne nuit et j’ai raccroché le téléphone. J’ai allumé la lampe à côté dans la chambre de mes parents. Embrouillé, je me suis assis sur
le lit de mon père, en me demandant que faire maintenant. Pour faire de la place, j’ai déplacé son oreiller. Sous l’oreiller se posait une boule de feuille de journal. Je l’ai ramassé. C’était les mêmes pages de suppléments d’admissions celles que j’avais jetées à la poubelle ce matin. Mon père avait entouré la table de limite. J’ai laissé le journal là et suis allé au salon. Mon père disputait avec ma mère sur le choix des chaînes. J’ai regardé mon père. Il m’a souri et m’a offert la pastèque. J’ai refusé. Je suis retourné dans ma chambre. J’ai ramassé les boîtes chimiques et les ai portées aux toilettes. J’ai tiré les chasses et ai vidé les contenus dans les toilettes. Tout était nettoyé à grande eau. ‘Gautam’, ma mère a frappé sur la porte. J’ai oublié à te dire. Tante Gupta est passé encore. Peux-tu enseigner sa fille ? Peut-être, j’ai dit comme je suis sorti des toilettes. Au fait, est-elle jolie ?
Bibliographie
1. Shri Ram College of Commerce. (l’ l’école supérieure de Commerce) 2 Stephen’s: l’école supérieure de Commerce de Delhi. 3. Hindu : l’école supérieure 4. DU : (Delhi University) L’université de Delhi 5. Board : C’est les examens finaux des étudiants de dixième et douzième. 6. TATA TEA : c’est la plus grande entreprise privée indienne.
7. Kaju-barfi: la sucrerie indienne. 8. Jalebis: la sucrerie indienne. 9. Katori : une tasse au nord de l’Inde qui est utilisée à table.
10. Michel, L BEAUD. (2006). L’art de la thèse. Paris : Editions la découverte.
www.ijar.org.in 102
International Journal of Academic Research ISSN: 2348-7666; Vol.3, Issue-10(1), October, 2016 Impact Factor: 3.656; Email: [email protected]
‘Savitri’ a submissive woman in R.K. Narayan’s ‘The Dark Room’
V.Vijayanand,
Lecturer in English & Research Scholar, Sri Y.N.College, Narsapur
Abstract : The most prominent writer R.K.Narayan laid strong foundation to Indian English novel with remarkable style and theme of his writings. “The Dark Room” is one of the rare novels which deals with social consciousness. Narayan generally writes on the lives of the inhabitants of Malgudi, the hopes, and fears, successes and failures. By and large his novels excude optimism and are rare cheerful in nature, however “The Dark Room’ is an exception to this fact. This novel is a tribute survive Indian dutiful and submissive woman ‘Savitri’ who swallows all humiliations, slight to just to keep the marriage a float and keeps pretences in the society. Key Words: typical devoted Indian woman – domineering husband – swallows all humiliations – keep the marriage – submissive woman. One is not born a woman; one becomes one- Simone De Beavoir While talking to Ved Mehata R.K.Narayan said, “To be a good writer any where you must have roots both in religion and in family. I have these things”. This comment of R.K.Narayan is appropriate to all his works either novels or short stories. Like Thomas Hardy he is a true novelist of Indian soil and Indian people. His novels are mostly influenced by our great cultural, philosophical and historical tradition. His novels are neither philosophical nor didactic, but portray realistically the ordinary middle class people’s lives. The representation of woman as the ‘victim’ of violence is quite common and there are many attempts to try and understand the reasons behind the silent suffering of a woman, violence at work place, domestic violence, sexual abuse, and especially isolation are some of the manifestations of violence and exploitation of women.
R.K.Narayan’s woman characters are typical Hindu wives and mothers. They are second to none in doing their best for the well being of their family and for the welfare of their children. Sometimes they excel men in decision making capacity. We see many bold and exemplary woman characters in Narayan’s novels. Savitri is also one of them. (The Dark Room). “The Dark Room” is the third of Narayan’s novels. It was first published in Great Britain in 1938 by Macmillon & Co. Ltd. London. The first Indian edition cameout in 1956. Actually it is the novel where R.K.Narayan thought of a social problem, namely the role of woman in Indian society, and worked it out with reference to the socio-cultural matrix of India of 1930s. Savitri is the central character of R.K.Narayan’s “The Dark Room”. She is a dutiful, obedient, submissive and typical housewife of the India of those times. She appears to be a traditional
www.ijar.org.in 103
International Journal of Academic Research ISSN: 2348-7666; Vol.3, Issue-10(1), October, 2016 Impact Factor: 3.656; Email: [email protected] lady with difference, in some aspects, inspite of her cultural background. She is on the look out for her independent human identity, because she does not wish to remain content with her status as a mere slave to her husband, Ramani. She is an ideal, submissive wife to her cruel husband and endures years of abuse. Even though Ramani beats, insults, criticizes and ignores her, she never raises her voice against him. She is a woman of very sensitive nature. She is always subjected to her husband’s whims and fancies. She is a woman who has been praised and honoured and never been criticized, and who is honoured to be a good Indian wife by this society in the novel. Though her husband’s treatment becomes worse day by day, she ignores every vulgar attempt by Ramani, her husband to save the marriage. She does not receive any pleasure and has not any freedom, love and affection from (Ramani) her husband. Savitri always hungers for Ramani’s love, affection and her love starved children, particularly daughters, Kamala and Sumati. But he ignored every desperate attempt by Savitri to save the wife and husband relationship. Savitri is a true symbol of traditional Indian womenhood. After fifteen years of married life, she has received nothing but rebukes and abuses from her husband. The relationship between a devoted, and submissive wife and a cruel husband is clearly depicted. She as an Indian woman could be flexible to all the likings and disliking of her husband. As a housewife she knows how to manage in the household and marriage. She can understand the changing moods of her husband even the sound of his Chaverolet car horn. When Ramani has an illicit and torrid affair with a newly recruited woman named Santha Bai who looks very
beautiful in his Engladia Insurance company office, even this insult Savitri convinces and console herself to bear quietly when her neighboring friends reveal her this bad news of what happened in the office of her husband. Even when Ramani gives Satvitri’s favourite furniture which he bought some from the office earlier to Santha Bai, for furnishing her office. Savitri never raises her voice to protest in this context.
After conformation of her husbands illegal relationship with Santha Bai, she revolts against her husband’s brutality and throws a challenge to the age old ways of the husband.
“Things! I don’t possess anything in this world what possession can a woman call her own except her body? Everything else that she has is her father’s, her husband’s or her sons, so take, these too ______”. She removed her diamond earrings, the diamond studs on her nose, her necklace, gold bangles and rings, and threw at him (88)
It is apparently due to the reason that any married woman would never think of another man and to marry him also even if she has economic independence. At one stage Savitri bursts out and says:
“The prostitute” changes her man but a married woman does not, that’s all, but both earned their food and shelter in the same manner (93).
When Savitri came to know of her husband’s illict affair with Santha Bai, she cries against her husband like this
www.ijar.org.in 104
International Journal of Academic Research ISSN: 2348-7666; Vol.3, Issue-10(1), October, 2016 Impact Factor: 3.656; Email: [email protected] and moving away from says: “Don’t touch me!” you are dirty, you are impure. Even if I burn my skin, I can’t cleanse myself of the impurity of your touch.” (87)
Thus, Savitri questions her husband about social as well as economic independence. She then decides to provide her daughter’s better education, and make them to stand independently on their own and not depend on their father for anything. As she is aware of the cruel nature of the husband-wife relationship, education would empower them so as not to become dependent on their husbands after getting married. She says:
“Yes, Kamala and Sumati must take their university course and become independent.” (93)
When Ramani’s treatment of Savitri becomes worse, it becomes very difficult for Savitri to bear and thinks the only solution is to die. She runs away from her house in tears throw her self in to the Sarayu river. She drowns herself but floats to the surface of the water and is saved by Mari. A passer by the questions her why she tried to kill herself and narrates her story. (the illicit affair of her husband) Mani and Ponni (wife and husband) appointed Savitri as a temple assistant. The role of temple assist confined to a darkroom is of no comfort to her, because she finds herself molested and eyed by other men and constantly at odds with the sexist driest who hates seeing a woman working in a temple.
At depressed condition, Savitri begin to miss her daughters and wonders if she was selfish and irresponsible to leave them alone. Then Savitri brings together her palms and prays to God.
“Protect Sumati, Babu, and Kamala, Let them all eat well and grow. Please see that they are not unhappy”. (144)
Then she realises that her attempts to run away from house were foolishness and meaningless. And running away will not protect her children or bring her peace. As a woman in the society, she has no place at all except where her family is.
There is a blending of two natures in her character, as we see her at first as a traditional dutiful wife and submissive wife and caring mother, on the one hand a modern, rebellious wife on the other hand. At the suggestive level it may be noted in the Hindu mythology, Savitri is a woman who sacrifices everything including her life to protect her family. For a long time, she was considered the ideal Hindu wife, a suffering martyer like, obedient, virtue, noble, dutiful and submissive woman. References: 1. Narayana R.K. 1956 “The Dark
Room”, Chennai, Indian thought publications.
2. Narayana R.K. 1956 my days Delhi. Orient Paper books.
www.ijar.org.in 105
International Journal of Academic Research ISSN: 2348-7666; Vol.3, Issue-10(1), October, 2016 Impact Factor: 3.656; Email: [email protected] Opinion of Students of Goa (India) towards Advertisements:
An Investigational Report
Dr Juao Costa, Associate Professor,
Rosary College of Commerce and Arts, Navelim , salcete, Goa 406707.
Abstract Television advertisements are powerful tools which influences the public. Most advertisements portray glamorous or larger than life scenario which the teenagers end up watching and comparing with their own lives. These advertisements only generate false values and propagate lifestyles inconsistent with real life. The study was undertaken to find out the opinion of Goan ( India) students towards advertisements. It was observed that there is no significant difference among the students in their opinion towards advertisements. Study was conducted on more than 2000 students from Goa ( South and North) using frequencies, mean score and t test. . It was seen that students in general are not carried away by the exaggerated, deceptive and any other form of advertising. The students have showed a great deal of maturity.
Key words: Advertisements, Opinion, investigation, deceptive, Students
Introduction
The present economy is characterized by the excessive specialization, mass production and competition. This has increased the importance of advertising in the modern business world. Advertising is growing as an industry in the modern national and international market scenario. T.V. advertisements are powerful tools. Most advertisements portray glamorous or larger than life scenario which the teenagers end up watching and comparing with their own lives. These advertisements only generate false values and propagate lifestyles inconsistent with real life. Menon and Gandhi (1997), argue that on finding themselves deprived of things advertised
on T.V., children and latter adults may breed a feeling of frustration or develop an inferiority complex which may develop into social problems. Children and teenagers are easily influenced by the happy, carefree and sumptuous world of T.V. advertisement starting at a very early age. Children learn to desire things they see on the T.V. and eventually become active persuaders in the market place and at home, which has its own implications.
Advertising no doubt improves the economies of developed and developing countries. It stimulates demand for the product, increases production, and generates employment in the economy. However the role of advertising has often
www.ijar.org.in 106
International Journal of Academic Research ISSN: 2348-7666; Vol.3, Issue-10(1), October, 2016 Impact Factor: 3.656; Email: [email protected] been a subject of much debate in the society. Advertising may be useful to the consumers considering that dissemination of information is necessary when a buyer has to make a choice from various products and services. The opposite view is based on the contention that consumers are duped by misleading advertising and hence advertising should be curtailed or at least strictly regulated. In an effort to persuade customers, an advertiser may not be completely truthful or unbiased in the message. Viewers often see advertising as unnecessary, irritating, manipulative, and deceptive (Aaker and Bruzzone, 1985).
The family is the basic and universal social institution of human society. Parents play an important and supportive role in the life of their children. Today the need for positive parental encouragement has been realized. Parental encouragement is must to ensure right type of values and development of personality in children. Unfortunately, in the absence of either one or both parents or the lack of availability of their quality time for teenagers, T.V. turns into a surrogate parent resulting in long hours of viewing. Thus, children watch T.V. in the absence of the parental supervision. This results into the absorption of all the exaggerated ideas, thoughts, violence, sexism etc. into the young immature minds. This type of T.V. contents affects the behavior, attitude, spending pattern, eating habits, value system etc. of the young generation.
T.V. and advertising together present a lethal combination and have become an integral part of our modern society. It is the most convenient route to reach not only the adult consumer but also the adolescents. Adolescents are manipulated by advertisement promises that the product will transform their life.
The impact of T.V. in general and advertisements in particular is vital, because of its enormous potential as an audio – visual communicator. It enables the creative man to communicate by combining motion, sound, words, color, personality and stage setting to express and demonstrate ideas to a large and widely distributed audience in the most effective manner. This helps to grab the attention of the audience or prospective customers.
T.V advertising usually plays a role in either introducing a product, reinforcing the familiarity to the product and also convincing the potential customer to purchase the product. Advertisements are among the most visible marketing strategy and have been the subject of a great deal of attention in the last 10 to 15 years. Advertisements cannot only charge the emotions but also give a subliminal message (Nidhi Kotwal, Gupta, 2008). Advertising today seems to be every where and ever present exerting a far reaching influence on the daily lives of the people. Advertisements develop a self concept in order to induce purchase decisions (Nidhi Kotwal, 2008). T.V. advertisement employs attention grabbing tricks such as catchy and
www.ijar.org.in 107
International Journal of Academic Research ISSN: 2348-7666; Vol.3, Issue-10(1), October, 2016 Impact Factor: 3.656; Email: [email protected] pleasing music, lyrics, jingles, humor and repeated message. The impact of the T.V. advertisements is more than the print media or Radio (Nidhi Kotwal, 2008).
Evidence is mounting that marketing to students is harmful. Nearly every aspect of student’s lives has been adversely affected by recent trends in advertising and marketing. Research links advertising to increased violence, Obesity, and eating disorders in children, as well family stress and negative values. Students are especially vulnerable to persuasive messages.
The role of advertising has often been subject of much debate in society. Advertising may be useful to consumers, considering that dissemination of information is necessary when a buyer has to make a choice from various products and services. The opposite view is based on the contention that consumers are duped by misleading advertising and hence advertising should be curtailed or at least strictly regulated.
It is needless to say that advertising has gained profound recognition and importance all over the globe as an indispensable tool of marketing. This recognition has led to its remarkable growth- both quantitative and qualitatively. One thing is certain about advertising, is that, in spite of growing concern towards some of its social effects, both profit and non-profit organization are increasingly being compelled to use it for extrapolating their objectives.
In his study Ranna, (1995) expressed that among the media; the impact of T.V. advertisements on social behavior including purchasing behavior was the greatest. The reason being that T.V. has charm, instantaneous transmission capability and satellite channels certainly affected the lifestyle of individuals. They tend to buy the product advertised by media, irrespective of its cost. The way of presentation mattered in case of food items whereas in case of clothing, designer label mattered (Mahajan and Sing, 1997).
Hypothesis and Methodology
The study tried to find out the opinion of students of Goa towards Advertisements. For the purpose a hypothesis was formed and tested with various statistical tools such as Mean, Independent sample ‘t’ test, .
Ho: The opinion of students of Goa towards Advertisements is not significant.
The above hypothesis was analyzed and tested based on Region ( South and North Goa) .Further the data collected from the students was grouped into seven important areas to find out the impact of advertising on the following aspects.
1) Watching advertisements by students 2) Advertisements and desire for products 3) Advertising as a source of information 4) Role of models in advertising in influencing students
www.ijar.org.in 108
International Journal of Academic Research ISSN: 2348-7666; Vol.3, Issue-10(1), October, 2016 Impact Factor: 3.656; Email: [email protected] 5) Influence of advertising on drinking and smoking 6) Modeling as career 7) Influence of advertising on purchases To collect the information on the above areas a set of seven statements were designed. The respondent were asked to rank it on a scale of four- One being Not at all; Two Rarely; Three some time; and Four being Often. The statements were:
1. Do you watch Advertisements? 2. Do you desire for the product which is advertised? 3. Do you think advertisement provides with information you needed? 4. Do you believe in your favorite model in an advertisement? 5. If I drink and smoke, it is because of an advertisements and commercials 6. Always I dream to become a model in an advertisement 7. Most of my purchases are influenced by advertisements
In all, 2108 students from all over Goa belonging to Secondary, Higher secondary, Colleges and University were surveyed. Out of these, 964 were Male remaining being Females. The collected data was then grouped into four categories based: Gender (Male and Female), Location (Rural and Urban), Region (South and North Goa), and Education (SSCE, HSSCE, Graduates, P.G.).
Region based analysis and discussion
Goa is divided into two districts for political and administrative purposes. These districts include North and South Goa. Out of 2108 students surveyed, 883 students were from South Goa and 1225 students were from North Goa. The Tables given below give detailed information about the data. Tables 1 gives the frequencies, Table 2 gives the mean Score and Table 3 gives the‘t’ test values.
Watching of Advertisements: The difference between the North and South Goa students watching advertisements is not much. In this case, 61.6% and 61.2% of the North and South Goa students were of the opinion that, they watch advertisements ‘sometimes’ followed by 20.3% and 21.2% who confessed that they watched advertisements ‘often’. However put together the entire result, we see that students from both the districts like to watch advertisements to some extent.
The Mean score of the students from both the district is 2.99 each. This also reveals their liking towards advertisements.
The F ratio for Levene’s test for equality of variance is significant at 5% level (P < 0.05). We take the‘t’ value of equal variance not assumed. Since the‘t’ value is not significant at 5% (p> 0.05), there is no significant difference between North and South Goa students in watching advertisements.
www.ijar.org.in 109
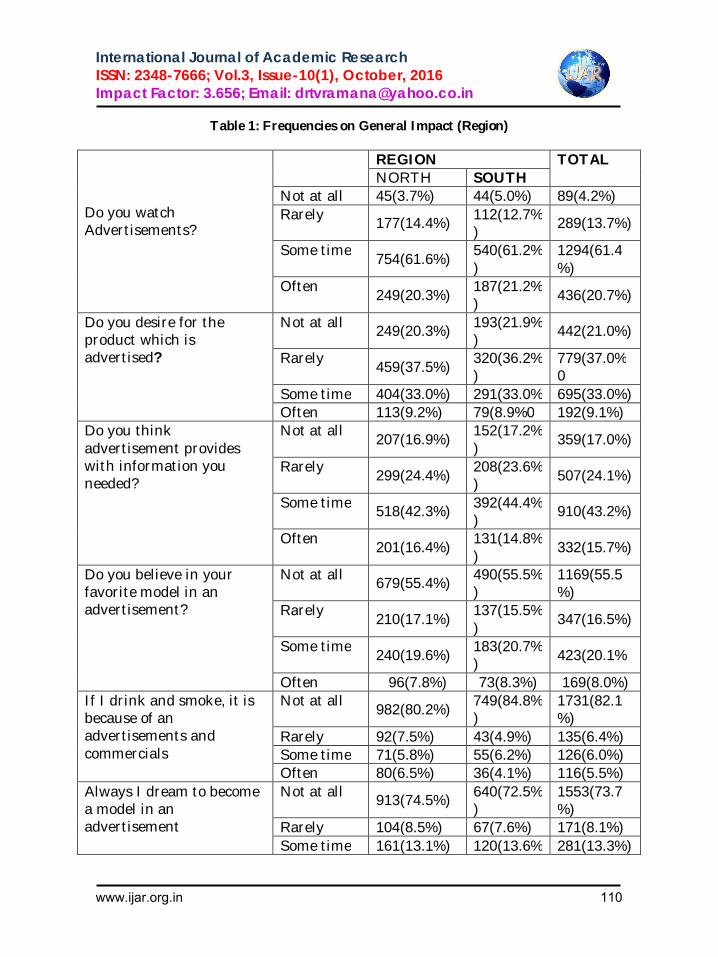
International Journal of Academic Research ISSN: 2348-7666; Vol.3, Issue-10(1), October, 2016 Impact Factor: 3.656; Email: [email protected]
Table 1: Frequencies on General Impact (Region)
Do you watch Advertisements?
REGION TOTAL NORTH SOUTH
Not at all 45(3.7%) 44(5.0%) 89(4.2%) Rarely 177(14.4%) 112(12.7%
) 289(13.7%)
Some time 754(61.6%)
540(61.2%)
1294(61.4%)
Often 249(20.3%)
187(21.2%) 436(20.7%)
Do you desire for the product which is advertised?
Not at all 249(20.3%) 193(21.9%)
442(21.0%)
Rarely 459(37.5%)
320(36.2%)
779(37.0%0
Some time 404(33.0%) 291(33.0% 695(33.0%) Often 113(9.2%) 79(8.9%0 192(9.1%)
Do you think advertisement provides with information you needed?
Not at all 207(16.9%)
152(17.2%)
359(17.0%)
Rarely 299(24.4%)
208(23.6%) 507(24.1%)
Some time 518(42.3%) 392(44.4%)
910(43.2%)
Often 201(16.4%)
131(14.8%)
332(15.7%)
Do you believe in your favorite model in an advertisement?
Not at all 679(55.4%) 490(55.5%)
1169(55.5%)
Rarely 210(17.1%)
137(15.5%)
347(16.5%)
Some time 240(19.6%)
183(20.7%) 423(20.1%
Often 96(7.8%) 73(8.3%) 169(8.0%) If I drink and smoke, it is because of an advertisements and commercials
Not at all 982(80.2%)
749(84.8%)
1731(82.1%)
Rarely 92(7.5%) 43(4.9%) 135(6.4%) Some time 71(5.8%) 55(6.2%) 126(6.0%) Often 80(6.5%) 36(4.1%) 116(5.5%)
Always I dream to become a model in an advertisement
Not at all 913(74.5%) 640(72.5%)
1553(73.7%)
Rarely 104(8.5%) 67(7.6%) 171(8.1%) Some time 161(13.1%) 120(13.6% 281(13.3%)
www.ijar.org.in 110
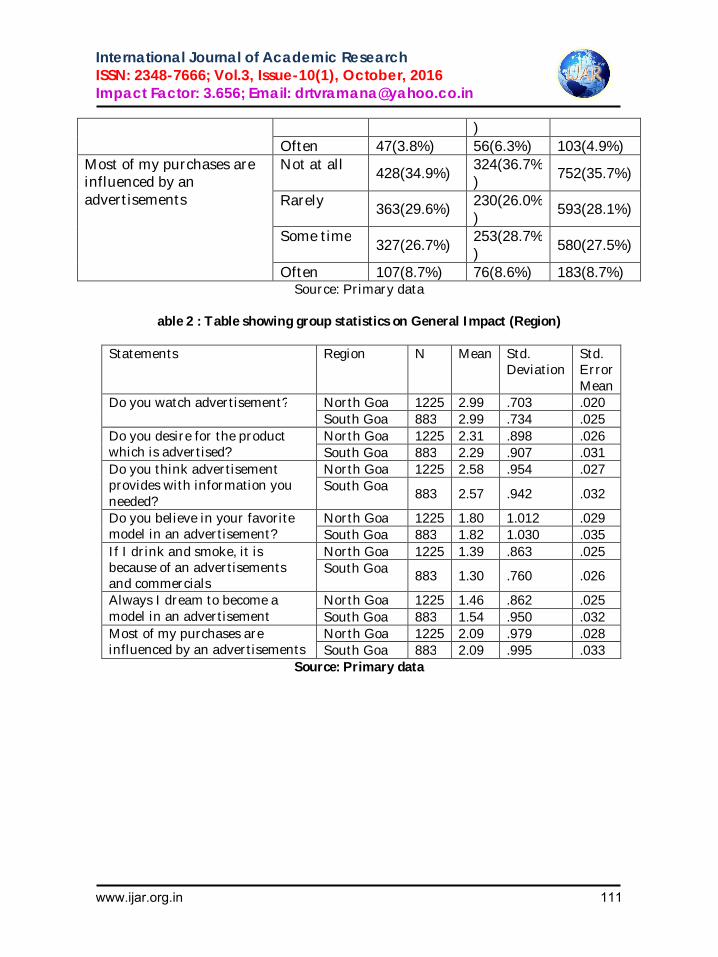
International Journal of Academic Research ISSN: 2348-7666; Vol.3, Issue-10(1), October, 2016 Impact Factor: 3.656; Email: [email protected]
) Often 47(3.8%) 56(6.3%) 103(4.9%)
Most of my purchases are influenced by an advertisements
Not at all 428(34.9%)
324(36.7%) 752(35.7%)
Rarely 363(29.6%) 230(26.0%)
593(28.1%)
Some time 327(26.7%)
253(28.7%) 580(27.5%)
Often 107(8.7%) 76(8.6%) 183(8.7%) Source: Primary data
able 2 : Table showing group statistics on General Impact (Region)
Statements Region N Mean Std. Deviation
Std. Error Mean
Do you watch advertisement? North Goa 1225 2.99 .703 .020 South Goa 883 2.99 .734 .025
Do you desire for the product which is advertised?
North Goa 1225 2.31 .898 .026 South Goa 883 2.29 .907 .031
Do you think advertisement provides with information you needed?
North Goa 1225 2.58 .954 .027 South Goa 883 2.57 .942 .032
Do you believe in your favorite model in an advertisement?
North Goa 1225 1.80 1.012 .029 South Goa 883 1.82 1.030 .035
If I drink and smoke, it is because of an advertisements and commercials
North Goa 1225 1.39 .863 .025 South Goa 883 1.30 .760 .026
Always I dream to become a model in an advertisement
North Goa 1225 1.46 .862 .025 South Goa 883 1.54 .950 .032
Most of my purchases are influenced by an advertisements
North Goa 1225 2.09 .979 .028 South Goa 883 2.09 .995 .033
Source: Primary data
www.ijar.org.in 111
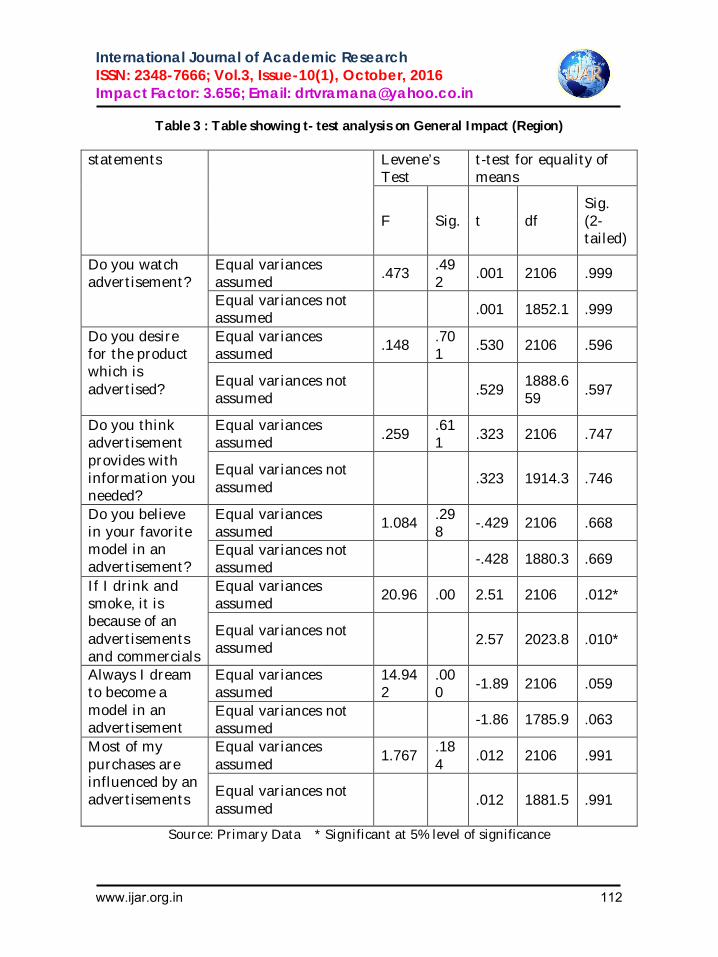
International Journal of Academic Research ISSN: 2348-7666; Vol.3, Issue-10(1), October, 2016 Impact Factor: 3.656; Email: [email protected]
Table 3 : Table showing t- test analysis on General Impact (Region)
statements Levene’s Test
t-test for equality of means
F Sig. t df Sig. (2-tailed)
Do you watch advertisement?
Equal variances assumed
.473 .492
.001 2106 .999
Equal variances not assumed .001 1852.1 .999
Do you desire for the product which is advertised?
Equal variances assumed
.148 .701
.530 2106 .596
Equal variances not assumed .529
1888.659 .597
Do you think advertisement provides with information you needed?
Equal variances assumed .259
.611 .323 2106 .747
Equal variances not assumed
.323 1914.3 .746
Do you believe in your favorite model in an advertisement?
Equal variances assumed
1.084 .298
-.429 2106 .668
Equal variances not assumed -.428 1880.3 .669
If I drink and smoke, it is because of an advertisements and commercials
Equal variances assumed
20.96 .00 2.51 2106 .012*
Equal variances not assumed 2.57 2023.8 .010*
Always I dream to become a model in an advertisement
Equal variances assumed
14.942
.000 -1.89 2106 .059
Equal variances not assumed
-1.86 1785.9 .063
Most of my purchases are influenced by an advertisements
Equal variances assumed
1.767 .184
.012 2106 .991
Equal variances not assumed
.012 1881.5 .991
Source: Primary Data * Significant at 5% level of significance
www.ijar.org.in 112
International Journal of Academic Research ISSN: 2348-7666; Vol.3, Issue-10(1), October, 2016 Impact Factor: 3.656; Email: [email protected] Desire for Products: 37.5% and 36.2% of North and South Goa students desire rarely the advertised product. Whereas 9.2% and 8.9% the students from both the districts desires the product very often. The overall results show that, advertisements do not influence the desire of the students to purchase the products. It means that the students are not influenced by the advertisements.
The Mean score between the North and South Goa students is 2.31 and 2.39, which reveals that students rarely buy the advertised product. Between the North and South Goa students, North Goa student’s purchases are influenced by advertisements.
The F ratio for Levene’s test for equality of variance is not significant at 5% level (P>0.05), therefore we take the‘t’ value of equal variance assumed. In this case the‘t’ value is not significant at 5% i.e. P>0.05. It means that there is no significant difference between North and South Goa students for advertised product desired by them.
A Source of Information: 42.3% students from North Goa and 44.4% students from South Goa agreed to the fact that advertisements do provide information to some extent, whereas 16.4% and 14.8% of North and South Goa student respectively provided a positive attitude towards advertisements. Overall the students from both the districts have agreed that advertisements do provide them with information about the products and services. They believe that
advertisements do provide them with information they needed to make a choice.
The Mean score between North and South Goa student is 2.58 and 2.57 respectively. This score also reveals the positive mind (to some extent) of the student towards advertisement. Though, the score is not very alarming but still talks positive about the advertisements.
The F ratio for Levene’s test for equality of variance is not significant at 5% level. In this case the p value is greater than 0.05. We take the‘t’ value of equal variance assumed. The‘t’ value in this case is not significant (P>0.05,). Thus, we can conclude that there is no significant difference between the North and South Goa students in thinking that advertisements provides them with information that they need.
Role of Model: Between North and South Goa, 55.4% of students from North Goa, and 55.5% from South Goa do not believe at all in their favorite model. A negligible percentage of students from North and South Goa responded favorably towards the influence of models on them. It means that a product endorsed by their favorite model does not induce them to buy the product.
The negligible Mean score i.e. 1.80 and 1.82 also disclosed that students from both the districts are not carried away by the endorsements by their favorite model. Between North and South Goa students, South Goa students are influenced to
www.ijar.org.in 113
International Journal of Academic Research ISSN: 2348-7666; Vol.3, Issue-10(1), October, 2016 Impact Factor: 3.656; Email: [email protected] some extent by these types of advertisements.
In case of‘t’ test analyses, the F ratio for Levene’s test for equality of variance is not significant, (P>0.05). We take the‘t’ value of equal variance assumed. The‘t’ value is not significant at 5%, i.e. P>0.05. Thus, we can say that there is no significant difference between North/South students in believing in their favorite model.
Drinking and Smoking: 80.2 % and 84.8% of North and South Goa students respectively are not at all influenced by the scrupulous tactics of an advertiser. A small percentage of students i.e. 6.5% and 4.1% from North and South Goa respectively are carried away by advertisements in this regards. Thus smoking or drinking if any is not influenced by advertisements.
The Mean (1.39 and 1.30 respectively,) score also reveals that the advertisements do not have any impact upon the minds of students as far as vices are concerned. But between North and South Goa, North Goa students are carried away to some extent in this regards.
Since the F ratio for Levene’s test for equality is significant at 5% level (P<0.05), we take the‘t’ value of equal variance not assumed. In this case‘t’ value is significant (P <0.05). Thus we can say that there is a significant difference between North and South Goa students who smoke and drink because of advertisements.
Modeling as Career: 74.5% of students from North Goa and 72.5% of students from South Goa decline to become a model in an advertisement. A negligible percentage of students showed some interest in modeling.
The Mean score also confirms the above results. It is 1.46 and 1.54 between North and South Goa student respectively which means that they are not at all interested in becoming a model in an advertisement, though South Goa students top the scores.
Further, the‘t’ test analyses shows that, the F ratio for Levene’s test of equality of variance is significant (P<0.05) at 5% level of significance, we take equal variance not assumed. The‘t’ value is not significant (P> 0.05). We can say that there is no significant difference between North and South Goa students and their aspiration to become model in an advertisement.
Influence on purchases: Advertising does not influence the students of North and South Goa. Majority of the students had given their opinion against advertisement. 34.9% of the students from North Goa and 36.7% of the students from South Goa were of the opinion that their purchases are not influenced by advertisements.
The Mean score between the North and South Goa students is 2.09 each. This also reveals a similar kind of situation. The purchases of these students are
www.ijar.org.in 114
International Journal of Academic Research ISSN: 2348-7666; Vol.3, Issue-10(1), October, 2016 Impact Factor: 3.656; Email: [email protected] rarely influenced by the smart tactics of advertising.
The F ratio for Levene’s’ test for equality of variance is significant at 5% level of significance (p< 0.05). We take‘t’ value of equal variance not assumed. Since the‘t’ value is not significant (p > 0.05). There fore, we can say that there exists no significant difference between the North and South Goa students and their purchases being influenced by advertisements.
Conclusion
The world of T.V. advertising seems too good to be true. It has glamour; it offers the best things in life and has quick-fix solutions to almost all problems that consumers may face. Advertising has become such an inextricable part of our lives – thanks to the television –we can really imagine life without it. The products that are advertised most aggressively are the fast moving Consumer Goods. A lot of market research and ground work has been carried out to find out the consumers to be targeted and the most important one is to know the influence of advertising on children. Advertising has become a powerful medium of communication. Advertisements provide information about the product and services. It influences the demand for different type of products by the rich as well as the poor. Most of the studies conducted and reviewed have featured in common – they are conducted on the age group less than 15 years. The age group which is very
weak in judging the situation, taking their own decision etc. One of the important and peculiar traits of this group is that they cannot distinguish between the advertisements and programmes.
References
David A. Aaker & Donald E. Bruzzone (1985), "Causes of Irritation in Television Advertising", Journal of Marketing, Vol. 49, 47-57 Dr Frederic Greene, (1973) “The Impact of Television Advertising on Children from Low Income Families” , Journal of consumer Research, Vol. 4, pp 86-88 Goldstein, J., (1998), “Children and advertising”- The research commercial communication, www.europa.eu.int. Mahajan and Sing,( 1997), Nidhi Kotwal, Neelima Gupta, and Arjee Devi ( 2008), “Impact of TV Advertisements on Buying pattern of Adolescent Girls”, Journal of Social Science, Vol.16(1) pp 51-55. Menon and Gandhi (1997), “Media and communication- New Information order," Vol. 2, New Delhi, Kaniksha Publisher, pp200,205,207 Nidhi Kotwal, Neelima Gupta, and Arjee Devi ( 2008), “Impact of TV Advertisements on Buying pattern of Adolescent Girls”, Journal of Social Science, Vol.16(1) pp 51-55. Shanahan and Morgan, (1990), “VCRs and the Effects of TV: New Diversity or More of the Same?” In J. Dobrow (ed.), “Social and Cultural Aspects of VCR Use”. Hillsdale: Erlbaum, 1990, 107-123.
www.ijar.org.in 115
International Journal of Academic Research ISSN: 2348-7666; Vol.3, Issue-10(1), October, 2016 Impact Factor: 4.535; Email: [email protected]
A review on Field Extraction and User Session Identification through Web Server Log
F. Amul Mary,
Lecturer in Computer Science JMJ College for Women (A)
Andhra Pradesh, Tenali Abstract: In the web servers, log repositories plays a key role as it keeps record of user pattern for different users and it is great source of knowledge. Web Usage Pattern is process of getting the web user browsing patterns by analyzing their navigational behavior. A modern process of identifying a web user session is the average time spent by user on pages. This paper introduces concepts of feature selection for classification and clustering, groups and with different algorithms with a categorizing framework based on search strategies, and provides guidelines in feature selection. This speaks about Stages of Web usage Mining, data cleaning, field extraction, User/IP Address and Session identification, Pattern discovery and analysis and Clustering.With the categorizing framework, we continue our efforts toward building an integrated system for intelligent feature selection. An added advantage of doing so is to help a user employ a suitable algorithm without Knowing details of each algorithm. Some real-world applications are included to demonstrate the use of feature selection in data mining. Keywords: Web usage, Mining, data cleaning, field extraction, Introduction As computer and database technologies advance rapidly, data accumulates in a speed unmatchable by human’s capacity of data processing. Data mining as a multidisciplinary joint effort from databases, machine learning, and statistics, is championing in turning mountains of data into nuggets. Researchers and practitioners realize that in order to use data mining tools effectively, data preprocessing is essential to successful data mining . Feature selection is one of the important and frequently used techniques in data preprocessing for data mining. It reduces the number of features, removes irrelevant, redundant, or noisy data, and brings the immediate effects for applications: speeding up a data mining algorithm, improving mining
performance such as predictive accuracy and result comprehensibility. Feature selection has been a fertile field of research and development since 1970’s in statistical pattern recognition machine Learning and data mining and widely applied to many fields such as text categorization image retrieval customer relationship management intrusion detection and genomic analysis. Feature selection is a process that selects a subset of original features. The optimality of a feature subset is measured by an evaluation criterion. As the dimensionality of a domain expands, the number of features N increases. Finding an optimal feature subset is usually intractable and many problems related to feature selection have been shown to be NP-hard. A typical feature selection process consists of four basic steps. They are
www.ijar.org.in 116
International Journal of Academic Research ISSN: 2348-7666; Vol.3, Issue-10(1), October, 2016 Impact Factor: 4.535; Email: [email protected]
1. Subset generation 2. Subset evaluation 3. Stopping criterion 4. Result validation.
WEB USAGE MINING Web usage mining is the application of data mining techniques on large web log repositories in order to extract useful knowledge about user’s behavioral patterns. The primary data source in case of web usage mining is a web server log (or web access log). A Web server log is a textual file, independent of server platform, in which a Web server enters a record whenever a user requests for a resource. Analyzing the web access logs of different web sites can help understand the user behavior and the web structure, thereby improving the design of this colossal collection of resources. Stages of Web Usage Mining There are four stages of web usage mining 1. Data Collection: During this phase
data is collected from various log files stored in various locations.
2. Preprocessing: This is the most important phase; it takes 80% of the effort of entire web usage mining process. During this phase data is extracted from logs files collected is cleaned and then users are identified and then sessions are made from users identified.
3. Pattern Discovery: This phase discovers various patterns followed by the user.
4. Pattern analysis: After patterns are discovered from web logs analysis is done using various query mechanism such as SQL to perform various OLAP operations.
Preprocessing Stage of Web Usage Mining Whenever loading a particular web page, the browser also requests for all the
objects embedded in the page, such as .gif or .jpg graphics files. These requests for gif and jpeg files are also logged in log files. These requests have to be cleaned before any further analysis of user patterns. Thus click stream data stored in log files requires substantial preprocessing before user behavior can be analyzed. Preprocessing is second phase after data collection and most essential step before discovery and analysis. Input to preprocessing phase is log file. It is large in size and contains number of raw and irrelevant entries and therefore cannot be directly used in Web usage mining process. Preprocessing of log fie is a very complex and painstaking job and it takes 80% of the total time of web usage mining process as whole. A. Log File:
Log file is a plain text file which records information about each user which includes name, IP address, date, time, and bytes transferred, access request. Web server writes information in log file each time a user requests a resource from that particular site. When user submits request to a web server that activity is recorded in web log file. Log file size ranges from 1KB to 100MB. Log files give us information about pages requested in website, bytes sent from server to user and type of error occurred.
B. Location of Log Files: Log files are located in three different locations given below.
1. Server: These log files record usage of data of web server. These log file do not record cached pages visited. Data of these log files contains sensitive and personal information so web server keeps them closed.
2. Proxy server: Web proxy server is intermediary between user and web
www.ijar.org.in 117
International Journal of Academic Research ISSN: 2348-7666; Vol.3, Issue-10(1), October, 2016 Impact Factor: 4.535; Email: [email protected]
server, it takes HTTP requests from user, gives them to web server, then result is passed from web server and returned to user. Client send request to web server via proxy server.
3. Client browser: These log files reside in client’s browser window itself. This information can be recorded only if cookies are enabled. Cookies are pieces of information generated by a web server and stored in user’s computer
C. Log File formats: Data in log files exists in three different formats:
1. W3C Extended log file format
2. NCSA (National Center for Supercomputing Application) common log file format
3. IIS log file format The main motivation behind performing web usage mining is that the information stored in World Wide Web is increasing day by day and so is the user’s demand to get right data. For getting right data user’s navigational patterns have to be studied. For this various mining techniques have to be used which will help us to extract meaningful patterns and relationship from large data. In the field of web usage mining researchers have done considerable research but rapid development of internet makes these studies lag behind. Software has been created to perform Data Cleaning and User Identification using algorithms proposed by for data cleaning, Field extraction and for user identification using Java and data extracted is stored in SQL server. Data cleaning: Data cleaning is second stage after the storage of log file in table. This stage is
performed to remove the unnecessary content which includes requests for images, styles and scripts or other files. This stage is the most simplest of all stages as it consists of only filtration of the data. During this stage all URLS with jpeg, gif and .css extensions are removed using algorithm. Field Extraction: During the stage fields are extracted from log file and is stored in excel file. Records extracted in MS Excel are then stored in SQL server to perform data cleaning and user identification. Fields extracted from excel file are URL name and IP address. It also includes SNO field to find out number of records extracted. User/IP Address identification: During this stage unique users having same IP address are identified using algorithm. Logic used is “If IP address is same but browser version or operating system is different then it represents different user.” Session identification: Web log mining covers a long time periods, therefore users may access the site more than once. Session identification is in order to divide the access records into several accessing sequences, in which the pages are requested at the same time. Traditional session identification algorithm is based on a uniform and fixed timeout. While the interval between two sequential requests exceeds the timeout, new session is determined. A user session can be defined as a set of pages visited by the same user within the duration of one particular visit to a web-site. A user may have a single or multiple sessions during a period. Once a user was identified, the click stream of each user is portioned into logical clusters. The method of portioning into sessions is called as Sessionization.
www.ijar.org.in 118
International Journal of Academic Research ISSN: 2348-7666; Vol.3, Issue-10(1), October, 2016 Impact Factor: 4.535; Email: [email protected]
Pattern Discovery and Analysis: Once user transactions have been identified, a variety of data mining techniques are performed for pattern discovery in web usage mining. These methods represent the approaches that often appear in the data mining literature such as discovery of association rules and sequential patterns and clustering and classification etc., Classification is a supervised learning process, because learning is driven by the assignment of instances to the classes in the training data. Mapping a data item into one of several predefined classes is done. Clustering: Clustering is a technique to group users exhibiting similar browsing patterns. Such knowledge is especially useful for inferring user demographics in order to perform market segmentation in Ecommerce applications or provide personalized web content to pages. Sequential Patterns are used to find inter-session patterns such that the presence of a set of items followed by another item in a time-ordered set of sessions. By using this approach, web marketers can predict future visit patterns which will be helpful in placing advertisements aimed at certain user groups. Pattern Analysis is the last stage of web usage mining. Mined patterns are not suitable for interpretations and judgments. So it is important to filter out uninteresting rules or patterns from the set found in the pattern discovery phase. In this stage tools are provided to facilitate the transformation of information into knowledge. The exact analysis methodology is usually governed by the application for which Web mining is done. Knowledge query mechanism such as SQL is the most common method of pattern analysis. Another method is to load usage data into a data cube in order to perform OLAP operations.
WEB Usage Mining Applications: Users’ behavior is used in different applications such as Personalization, e-commerce, to improve the system and to improve the system design as per their interest etc., Web personalization offers many functions such as simple user salutation to more complicate such as content delivery as per users interests. Content delivery is very important since nonexpert users are overwhelmed by the quantity of information available online. It is possible to anticipate the user behavior by analyzing the current navigation patterns with patterns which were extracted from past web log. Conclusion: Web sites are one of the most important tools for advertisements in international area for universities and other foundation. The quality of a website can be evaluated by analyzing user accesses of the website. To know the quality of a web site user accesses are to be evaluated by web usage mining. The results of mining can be used to improve the website design and increase satisfaction which helps in various applications. Log files are the best source to know user behavior. But the raw log files contains unnecessary details like image access, failed entries etc., which will affect the accuracy of pattern discovery and analysis. So preprocessing stage is an important work in mining to make efficient pattern analysis. To get accurate mining results user’s session details are to be known. The survey was performed on a selection of web usage methodologies in preprocessing. More concentration is done on preprocessing stages like field extraction, User/IP Address identification, and session identification. In future we can create more efficient session reconstructions through graphs
www.ijar.org.in 119
International Journal of Academic Research ISSN: 2348-7666; Vol.3, Issue-10(1), October, 2016 Impact Factor: 4.535; Email: [email protected]
and mining the sessions using graph mining as quality sessions gives more accurate patterns for analysis of users. References: Archana N.Mahanta ,“Web
Mining:Application of Data Mining,”, Proceedings of NCKM , 2008.
Demin Dong, “Exploration on Web Usage Mining and its Application, “, IEEE,2009.
Suresh R.M. and Padmajavalli .R. ,“An Overview of Data Preprocessing in Data and Web usage Mining ,“ IEEE, 2006.
Bamshad Mobasher “Data Mining for Web Personalization,”, LCNS, Springer-Verleg Berlin Heidelberg, 2007.
Chungsheng Zhang and Liyan Zhuang , “New Path Filling Method on Data Preprocessing in Web Mining ,“, Computer and Information Science Journal , August 2008.
Peng Zhu, Ming-sheng Zhao “Session Identification Algorithm for Web Log Mining” ,IEEE,2011
Amithalal Caldera and Yogesh Deshpande,” Evaluation of Session Identification Heuristics in Web Usage Mining” Towards an ICT enabled Society,2011.
www.ijar.org.in 120
International Journal of Academic Research ISSN: 2348-7666; Vol.3, Issue-10(1), October, 2016 Impact Factor: 3.656; Email: [email protected] Decision Making Power in Household and Farm Activities-
A Gender Difference Study G.Venkata Sushma, Teaching associate, Department of Resource Management and consumer Sciences, college of Home Science, Guntur, ANGRAU B. Vijaya Kumari, Teaching associate, Department of Resource Management and consumer Sciences, college of Home Science, Guntur, ANGRAU. Abstract
In recent times, the rural households have come to occupy an important position in development studies. Because it was seen as the social mechanism through which, to at least some degree, all individuals’ welfare and decisions are determined based on assets and resource availability. The social, economic and cultural conditions of the area determine women’s participation in home and farm activities. It also varies from region to region and within a region, their involvement varies among different farming systems, castes, classes and socio- economic status. Results revealed that Household decisions like cooking a particular food, amount spent on food grains, milk, meat were mainly taken by females where as farm related decisions like agricultural produce, use of agricultural produce, buying and selling of land, livestock etc. were taken by males.
Key Words: Decision making, Household, Farm, Gender
Introduction:
According to the 2001 census of India, about 74per cent of women were involved in agriculture and allied activities out of a total female working population (Anonymous, 2005). The data showed that there was a sharp decline of 11per cent of women in the agriculture sector in comparison to the 1991 census. But, agriculture in India is still a family enterprise where the family participates as a unit and the share of women is half of the human resource in farming. The social, economic and cultural conditions of the area determine women’s participation in home and farm activities. It also varies from region to region and within a region, their involvement varies among different farming systems, castes, classes and socio- economic status (Swaminathan, 1985). In most
parts of the country, women of higher caste and socioeconomic status are not allowed to participate in on-farm activities. In poor families, the women are the main performers in the field and income earned by them goes directly into the food basket of the family.The contribution of women in the economic development and social transformation are pivotal. Rural women who are engaged in agriculture form 78 per cent of all women in regular work. Women had an active role and extensive involvement in crop production, livestock production, forest resource management and fishery processing. Lal and Khurana (2011) in their study on “Gender issues: Role of women in agriculture sector” highlighted that rural women were the major contributors in agriculture and its allied fields. Her work ranges from crop production, livestock production to
www.ijar.org.in 121
International Journal of Academic Research ISSN: 2348-7666; Vol.3, Issue-10(1), October, 2016 Impact Factor: 3.656; Email: [email protected] cottage industry, from household and family maintenance activities to transporting water, fuel and fodder.
Methodology
The present study provides the detailed information about the “Decision Making Power in Household and Farm Activities- A Gender Difference Study”. An exploratory research design was adopted to study the information related decision making power in household and farm activities. A total of eighty households (Pamidipadu – 40 households, J.C.Agraharam – 40 households) were selected from the two villages to study Gender decision making power in household and farm related activities in the selected rural households. Eighty men and eighty women were selected from the two villages out of which forty men and forty women were selected from J.C.Agraharam village and forty men and forty women were selected from Pamidipadu village. The key informants for the study were the principal couple – head of the household and spouse within the household.
The household inventory asked about the household related decisions like home management, household budget, and expenditure on education of children, health care of family members, savings and capital transactions. And farm related decisions like agricultural process, labour allocation, livestock related, purchasing farm inputs and disposal of farm produce.
Results and discussion
Table 1 clearly indicated that cooking a particular food is mainly the decision of females (95%) in both the villages,
whereas only five per cent of decisions were taken jointly. Regarding the decisions related to construction of a new house and repairing and renovation of existing house were mostly taken jointly (62.5%). Regarding household budget, decisions like amount spent on consumption for milk, meat, fruits and vegetables were taken by both males and females. About fifty one per cent of decisions were taken jointly for buying food and other household durables followed by individual decisions by 35 per cent of males and 13.75 per cent of females. More than half of the decisions were taken jointly for buying clothes and amount spent on clothing from both the villages. An equal percentage of decisions were taken by male individuals and jointly by both males and females (41.25%) regarding education of children followed by 8.75 per cent by females. While decisions about health care of family members were taken jointly (58.75%). Regarding entrepreneual capital transactions most of the decisions were taken by males (58.75%) followed by joint decisions (38.75%). About 47.5 per cent of decisions were taken jointly for savings and other capital transactions. Nearly 71.25 per cent of decisions related to buying and selling of jewellery and movable property were taken jointly in both the villages. Child related decisions were taken mostly by males when compared to females while for level of education and deciding on age of schooling decisions were taken jointly. Women don’t have decision making power regarding the marriage age of child and amount of expenses to be spent on marriage. It was mainly joint decisions (87.5%)
www.ijar.org.in 122
International Journal of Academic Research ISSN: 2348-7666; Vol.3, Issue-10(1), October, 2016 Impact Factor: 3.656; Email: [email protected] followed by men (12.5%) in both the villages. The results were on par with study conducted by Pandey et al. (2011) on gender involvement in decision making of on farm and off farm activities. The results clearly showed that in food, feed and fodder production male farmers mainly took decisions. In case of animal husbandry and household aspect, most of the decisions were mainly took by both male and female farmers by consulting each other.
From the table 2 it was observed that decisions related to agriculture process were taken mostly by the male respondents followed by joint and individual decisions by females. Regarding labour allocation decisions most of the decisions were taken by female except is arraigning wages to the labour and hiring the labour. Decisions related to livestock were taken by females in both the villages.
Decisions related to capital transactions like buying and selling of land and livestock were taken jointly. About 62.50 per cent of male respondents have decision making power regarding buying farm inputs and implements. Decisions related to disposal of farm produce indicated that 63.75 per cent of male respondents could decide about their selling of food grains. Study on exploring the gender involvement in agricultural decision making in rural areas of Pakistan indicated that women were actively involved in agricultural practices but the degree of involvement of men and women vary according to different activities like crop production, crop protection, marketing, poultry production and livestock management. There were also many cultural, social
and physical obstacles for low participation of female folk in agriculture extension services. (Nosheen et al. 2008)
Conclusion Decision making involves the selection of a course of action from among two or more possible alternatives in order to arrive at a solution for a given problem. The results of this study also proved that there was gender difference with regard to household and farm related decisions. Decisions related to home management like cooking a particular food was taken by females whereas as construction of a new house and repairing and renovation of existing house were mostly taken jointly. Regarding household budget, decisions like amount spent on consumption for milk, meat, fruits, vegetables, buying clothes, amount spent on clothing and health care of family members were taken by both males and females. Decisions related to education of children were taken by males. Regarding entrepreneual capital transactions most of the decisions were taken by males. Decisions related to buying and selling of jewellery and movable property were taken jointly in both the villages. Women don’t have decision making power regarding the marriage age of child and amount of expenses to be spent on marriage. Decisions related to agriculture process and buying farm inputs implements were taken mostly by the male respondents. With regard to labour allocation , most of the decisions were taken by female except in arranging wages to the labour and hiring the labour. Decisions related to livestock were taken by females and decisions related to capital transactions like
www.ijar.org.in 123
International Journal of Academic Research ISSN: 2348-7666; Vol.3, Issue-10(1), October, 2016 Impact Factor: 3.656; Email: [email protected] buying and selling of land and livestock were taken jointly. References Anonymous. 2005. The Hindu Business Line, 30 Dec.
Lal, R. and Khurana, A. 2011. Gender issues: Role of women in agriculture sector. International Journal of Business Economics & Management Research Vol.1, No. 1, Oct, ISSN 2249 8826.
Pandey, S., Meena, B.S., Sharma, P and Dwivedi, R.N. 2011. Gender involvement in decision making of on farm and off farm activities. Journal of Community Mobilization and Sustainable Development. 6(1):042-045.
Nosheen, F., Ali, T., Ahmad, M and Nawaz, H. 2008. Exploring the gender involvement in agricultural decision making a case study of district Chakwal. Department of Home Economics. Journal of agricultural sciences.45 (3):1-6.
Swaminathan, M.S. 1985. Imparting rural women perspective to agriculture research and development. Report of the Project Design Workshop on Women in Farming Systems, held At the International Rice Research Centre, Los Banos, Phillippines.
www.ijar.org.in 124
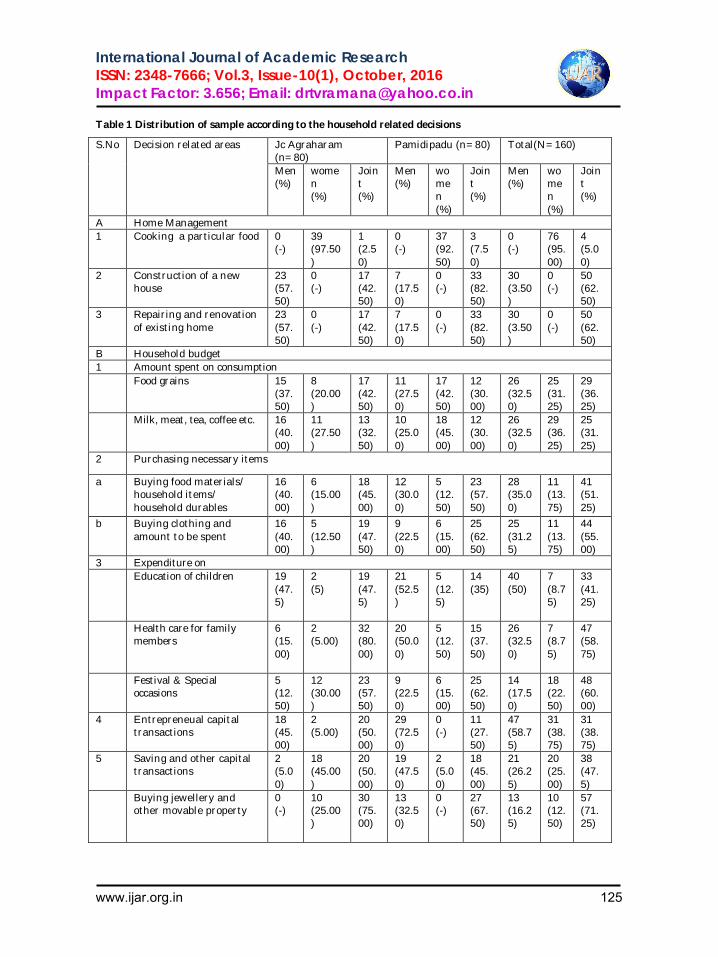
International Journal of Academic Research ISSN: 2348-7666; Vol.3, Issue-10(1), October, 2016 Impact Factor: 3.656; Email: [email protected] Table 1 Distribution of sample according to the household related decisions
S.No Decision related areas Jc Agraharam (n=80)
Pamidipadu (n=80) Total(N=160)
Men (%)
women (%)
Joint (%)
Men (%)
women (%)
Joint (%)
Men (%)
women (%)
Joint (%)
A Home Management 1 Cooking a particular food 0
(-) 39 (97.50)
1 (2.50)
0 (-)
37 (92.50)
3 (7.50)
0 (-)
76 (95.00)
4 (5.00)
2 Construction of a new house
23 (57.50)
0 (-)
17 (42.50)
7 (17.50)
0 (-)
33 (82.50)
30 (3.50)
0 (-)
50 (62.50)
3 Repairing and renovation of existing home
23 (57.50)
0 (-)
17 (42.50)
7 (17.50)
0 (-)
33 (82.50)
30 (3.50)
0 (-)
50 (62.50)
B Household budget 1 Amount spent on consumption Food grains 15
(37.50)
8 (20.00)
17 (42.50)
11 (27.50)
17 (42.50)
12 (30.00)
26 (32.50)
25 (31.25)
29 (36.25)
Milk, meat, tea, coffee etc. 16 (40.00)
11 (27.50)
13 (32.50)
10 (25.00)
18 (45.00)
12 (30.00)
26 (32.50)
29 (36.25)
25 (31.25)
2 Purchasing necessary items
a Buying food materials/ household items/ household durables
16 (40.00)
6 (15.00)
18 (45.00)
12 (30.00)
5 (12.50)
23 (57.50)
28 (35.00)
11 (13.75)
41 (51.25)
b Buying clothing and amount to be spent
16 (40.00)
5 (12.50)
19 (47.50)
9 (22.50)
6 (15.00)
25 (62.50)
25 (31.25)
11 (13.75)
44 (55.00)
3 Expenditure on Education of children 19
(47.5)
2 (5)
19 (47.5)
21 (52.5)
5 (12.5)
14 (35)
40 (50)
7 (8.75)
33 (41.25)
Health care for family members
6 (15.00)
2 (5.00)
32 (80.00)
20 (50.00)
5 (12.50)
15 (37.50)
26 (32.50)
7 (8.75)
47 (58.75)
Festival & Special occasions
5 (12.50)
12 (30.00)
23 (57.50)
9 (22.50)
6 (15.00)
25 (62.50)
14 (17.50)
18 (22.50)
48 (60.00)
4 Entrepreneual capital transactions
18 (45.00)
2 (5.00)
20 (50.00)
29 (72.50)
0 (-)
11 (27.50)
47 (58.75)
31 (38.75)
31 (38.75)
5 Saving and other capital transactions
2 (5.00)
18 (45.00)
20 (50.00)
19 (47.50)
2 (5.00)
18 (45.00)
21 (26.25)
20 (25.00)
38 (47.5)
Buying jewellery and other movable property
0 (-)
10 (25.00)
30 (75.00)
13 (32.50)
0 (-)
27 (67.50)
13 (16.25)
10 (12.50)
57 (71.25)
www.ijar.org.in 125
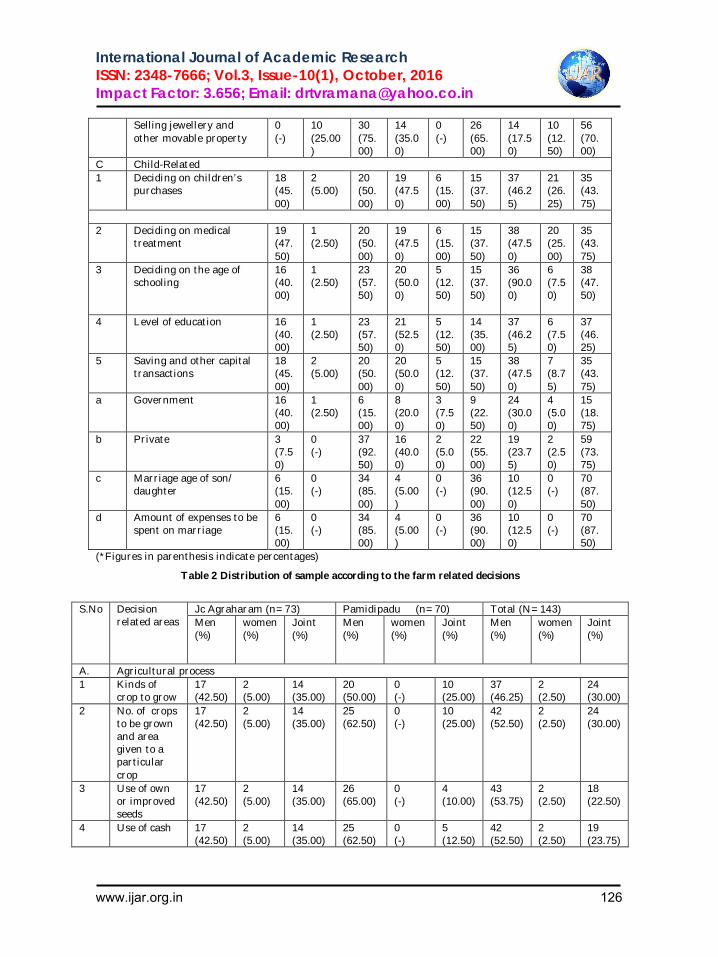
International Journal of Academic Research ISSN: 2348-7666; Vol.3, Issue-10(1), October, 2016 Impact Factor: 3.656; Email: [email protected] Selling jewellery and
other movable property 0 (-)
10 (25.00)
30 (75.00)
14 (35.00)
0 (-)
26 (65.00)
14 (17.50)
10 (12.50)
56 (70.00)
C Child-Related 1 Deciding on children’s
purchases 18 (45.00)
2 (5.00)
20 (50.00)
19 (47.50)
6 (15.00)
15 (37.50)
37 (46.25)
21 (26.25)
35 (43.75)
2 Deciding on medical
treatment 19 (47.50)
1 (2.50)
20 (50.00)
19 (47.50)
6 (15.00)
15 (37.50)
38 (47.50)
20 (25.00)
35 (43.75)
3 Deciding on the age of schooling
16 (40.00)
1 (2.50)
23 (57.50)
20 (50.00)
5 (12.50)
15 (37.50)
36 (90.00)
6 (7.50)
38 (47.50)
4 Level of education 16 (40.00)
1 (2.50)
23 (57.50)
21 (52.50)
5 (12.50)
14 (35.00)
37 (46.25)
6 (7.50)
37 (46.25)
5 Saving and other capital transactions
18 (45.00)
2 (5.00)
20 (50.00)
20 (50.00)
5 (12.50)
15 (37.50)
38 (47.50)
7 (8.75)
35 (43.75)
a Government 16 (40.00)
1 (2.50)
6 (15.00)
8 (20.00)
3 (7.50)
9 (22.50)
24 (30.00)
4 (5.00)
15 (18.75)
b Private 3 (7.50)
0 (-)
37 (92.50)
16 (40.00)
2 (5.00)
22 (55.00)
19 (23.75)
2 (2.50)
59 (73.75)
c Marriage age of son/ daughter
6 (15.00)
0 (-)
34 (85.00)
4 (5.00)
0 (-)
36 (90.00)
10 (12.50)
0 (-)
70 (87.50)
d Amount of expenses to be spent on marriage
6 (15.00)
0 (-)
34 (85.00)
4 (5.00)
0 (-)
36 (90.00)
10 (12.50)
0 (-)
70 (87.50)
(*Figures in parenthesis indicate percentages)
Table 2 Distribution of sample according to the farm related decisions
S.No Decision related areas
Jc Agraharam (n=73) Pamidipadu (n=70) Total (N=143) Men (%)
women (%)
Joint (%)
Men (%)
women (%)
Joint (%)
Men (%)
women (%)
Joint (%)
A. Agricultural process 1 Kinds of
crop to grow 17 (42.50)
2 (5.00)
14 (35.00)
20 (50.00)
0 (-)
10 (25.00)
37 (46.25)
2 (2.50)
24 (30.00)
2 No. of crops to be grown and area given to a particular crop
17 (42.50)
2 (5.00)
14 (35.00)
25 (62.50)
0 (-)
10 (25.00)
42 (52.50)
2 (2.50)
24 (30.00)
3 Use of own or improved seeds
17 (42.50)
2 (5.00)
14 (35.00)
26 (65.00)
0 (-)
4 (10.00)
43 (53.75)
2 (2.50)
18 (22.50)
4 Use of cash 17 (42.50)
2 (5.00)
14 (35.00)
25 (62.50)
0 (-)
5 (12.50)
42 (52.50)
2 (2.50)
19 (23.75)
www.ijar.org.in 126
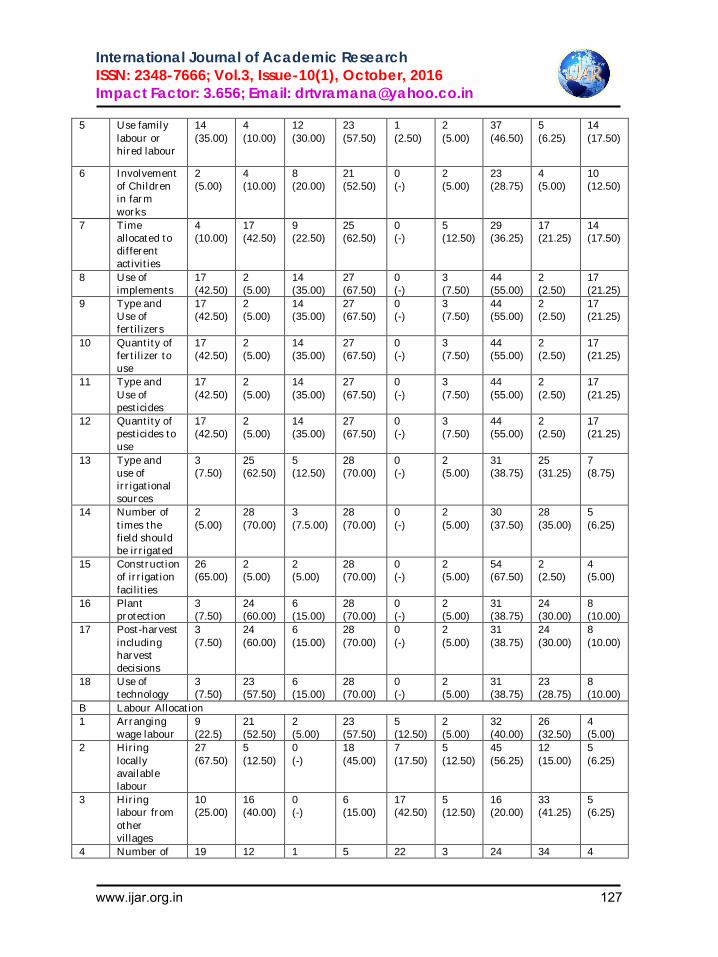
International Journal of Academic Research ISSN: 2348-7666; Vol.3, Issue-10(1), October, 2016 Impact Factor: 3.656; Email: [email protected]
5 Use family labour or hired labour
14 (35.00)
4 (10.00)
12 (30.00)
23 (57.50)
1 (2.50)
2 (5.00)
37 (46.50)
5 (6.25)
14 (17.50)
6 Involvement of Children in farm works
2 (5.00)
4 (10.00)
8 (20.00)
21 (52.50)
0 (-)
2 (5.00)
23 (28.75)
4 (5.00)
10 (12.50)
7 Time allocated to different activities
4 (10.00)
17 (42.50)
9 (22.50)
25 (62.50)
0 (-)
5 (12.50)
29 (36.25)
17 (21.25)
14 (17.50)
8 Use of implements
17 (42.50)
2 (5.00)
14 (35.00)
27 (67.50)
0 (-)
3 (7.50)
44 (55.00)
2 (2.50)
17 (21.25)
9 Type and Use of fertilizers
17 (42.50)
2 (5.00)
14 (35.00)
27 (67.50)
0 (-)
3 (7.50)
44 (55.00)
2 (2.50)
17 (21.25)
10 Quantity of fertilizer to use
17 (42.50)
2 (5.00)
14 (35.00)
27 (67.50)
0 (-)
3 (7.50)
44 (55.00)
2 (2.50)
17 (21.25)
11 Type and Use of pesticides
17 (42.50)
2 (5.00)
14 (35.00)
27 (67.50)
0 (-)
3 (7.50)
44 (55.00)
2 (2.50)
17 (21.25)
12 Quantity of pesticides to use
17 (42.50)
2 (5.00)
14 (35.00)
27 (67.50)
0 (-)
3 (7.50)
44 (55.00)
2 (2.50)
17 (21.25)
13 Type and use of irrigational sources
3 (7.50)
25 (62.50)
5 (12.50)
28 (70.00)
0 (-)
2 (5.00)
31 (38.75)
25 (31.25)
7 (8.75)
14 Number of times the field should be irrigated
2 (5.00)
28 (70.00)
3 (7.5.00)
28 (70.00)
0 (-)
2 (5.00)
30 (37.50)
28 (35.00)
5 (6.25)
15 Construction of irrigation facilities
26 (65.00)
2 (5.00)
2 (5.00)
28 (70.00)
0 (-)
2 (5.00)
54 (67.50)
2 (2.50)
4 (5.00)
16 Plant protection
3 (7.50)
24 (60.00)
6 (15.00)
28 (70.00)
0 (-)
2 (5.00)
31 (38.75)
24 (30.00)
8 (10.00)
17 Post-harvest including harvest decisions
3 (7.50)
24 (60.00)
6 (15.00)
28 (70.00)
0 (-)
2 (5.00)
31 (38.75)
24 (30.00)
8 (10.00)
18 Use of technology
3 (7.50)
23 (57.50)
6 (15.00)
28 (70.00)
0 (-)
2 (5.00)
31 (38.75)
23 (28.75)
8 (10.00)
B Labour Allocation 1 Arranging
wage labour 9 (22.5)
21 (52.50)
2 (5.00)
23 (57.50)
5 (12.50)
2 (5.00)
32 (40.00)
26 (32.50)
4 (5.00)
2 Hiring locally available labour
27 (67.50)
5 (12.50)
0 (-)
18 (45.00)
7 (17.50)
5 (12.50)
45 (56.25)
12 (15.00)
5 (6.25)
3 Hiring labour from other villages
10 (25.00)
16 (40.00)
0 (-)
6 (15.00)
17 (42.50)
5 (12.50)
16 (20.00)
33 (41.25)
5 (6.25)
4 Number of 19 12 1 5 22 3 24 34 4
www.ijar.org.in 127
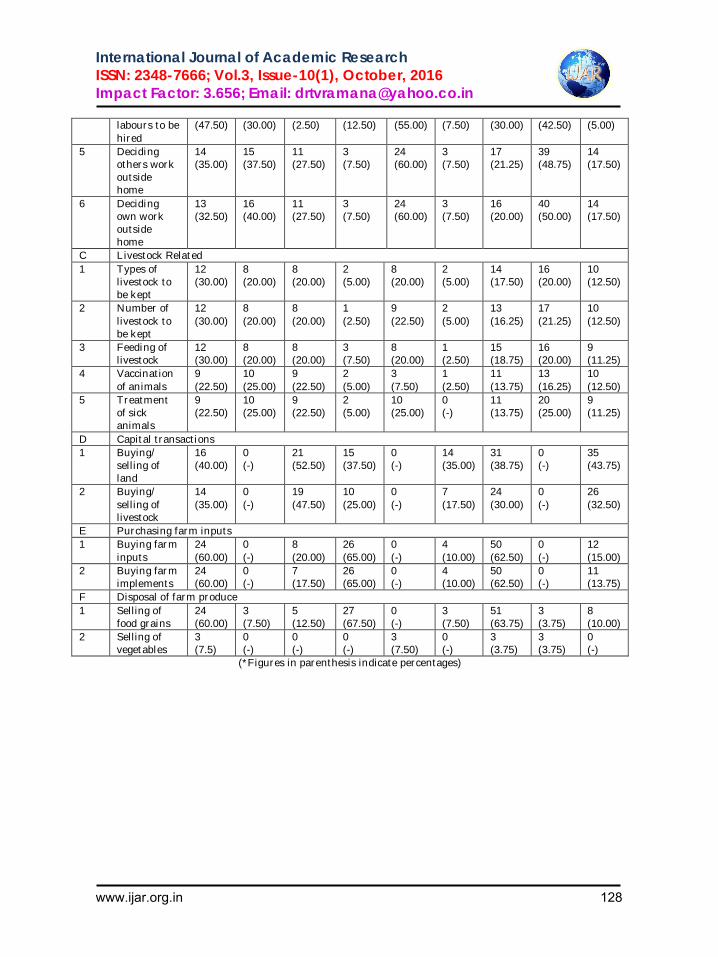
International Journal of Academic Research ISSN: 2348-7666; Vol.3, Issue-10(1), October, 2016 Impact Factor: 3.656; Email: [email protected]
labours to be hired
(47.50) (30.00) (2.50) (12.50) (55.00) (7.50) (30.00) (42.50) (5.00)
5 Deciding others work outside home
14 (35.00)
15 (37.50)
11 (27.50)
3 (7.50)
24 (60.00)
3 (7.50)
17 (21.25)
39 (48.75)
14 (17.50)
6 Deciding own work outside home
13 (32.50)
16 (40.00)
11 (27.50)
3 (7.50)
24 (60.00)
3 (7.50)
16 (20.00)
40 (50.00)
14 (17.50)
C Livestock Related 1 Types of
livestock to be kept
12 (30.00)
8 (20.00)
8 (20.00)
2 (5.00)
8 (20.00)
2 (5.00)
14 (17.50)
16 (20.00)
10 (12.50)
2 Number of livestock to be kept
12 (30.00)
8 (20.00)
8 (20.00)
1 (2.50)
9 (22.50)
2 (5.00)
13 (16.25)
17 (21.25)
10 (12.50)
3 Feeding of livestock
12 (30.00)
8 (20.00)
8 (20.00)
3 (7.50)
8 (20.00)
1 (2.50)
15 (18.75)
16 (20.00)
9 (11.25)
4 Vaccination of animals
9 (22.50)
10 (25.00)
9 (22.50)
2 (5.00)
3 (7.50)
1 (2.50)
11 (13.75)
13 (16.25)
10 (12.50)
5 Treatment of sick animals
9 (22.50)
10 (25.00)
9 (22.50)
2 (5.00)
10 (25.00)
0 (-)
11 (13.75)
20 (25.00)
9 (11.25)
D Capital transactions 1 Buying/
selling of land
16 (40.00)
0 (-)
21 (52.50)
15 (37.50)
0 (-)
14 (35.00)
31 (38.75)
0 (-)
35 (43.75)
2 Buying/ selling of livestock
14 (35.00)
0 (-)
19 (47.50)
10 (25.00)
0 (-)
7 (17.50)
24 (30.00)
0 (-)
26 (32.50)
E Purchasing farm inputs 1 Buying farm
inputs 24 (60.00)
0 (-)
8 (20.00)
26 (65.00)
0 (-)
4 (10.00)
50 (62.50)
0 (-)
12 (15.00)
2 Buying farm implements
24 (60.00)
0 (-)
7 (17.50)
26 (65.00)
0 (-)
4 (10.00)
50 (62.50)
0 (-)
11 (13.75)
F Disposal of farm produce 1 Selling of
food grains 24 (60.00)
3 (7.50)
5 (12.50)
27 (67.50)
0 (-)
3 (7.50)
51 (63.75)
3 (3.75)
8 (10.00)
2 Selling of vegetables
3 (7.5)
0 (-)
0 (-)
0 (-)
3 (7.50)
0 (-)
3 (3.75)
3 (3.75)
0 (-)
(*Figures in parenthesis indicate percentages)
www.ijar.org.in 128
International Journal of Academic Research ISSN: 2348-7666; Vol.3, Issue-10(1), October, 2016 Impact Factor: 4.535; Email: [email protected]
www.ijar.org.in 129
International Journal of Academic Research ISSN: 2348-7666; Vol.3, Issue-10(1), October, 2016 Impact Factor: 4.535; Email: [email protected]
www.ijar.org.in 130
International Journal of Academic Research ISSN: 2348-7666; Vol.3, Issue-10(1), October, 2016 Impact Factor: 4.535; Email: [email protected]
www.ijar.org.in 131
International Journal of Academic Research ISSN: 2348-7666; Vol.3, Issue-10(1), October, 2016 Impact Factor: 4.535; Email: [email protected]
www.ijar.org.in 132
International Journal of Academic Research ISSN: 2348-7666; Vol.3, Issue-10(1), October, 2016 Impact Factor: 4.535; Email: [email protected]
www.ijar.org.in 133
International Journal of Academic Research ISSN: 2348-7666; Vol.3, Issue-10(1), October, 2016 Impact Factor: 4.535; Email: [email protected]
www.ijar.org.in 134

International Journal of Academic Research ISSN: 2348-7666; Vol.3, Issue-10(1), October, 2016 Impact Factor: 4.535; Email: [email protected]
www.ijar.org.in 135
International Journal of Academic Research ISSN: 2348-7666; Vol.3, Issue-10(1), October, 2016 Impact Factor: 4.535; Email: [email protected]
www.ijar.org.in 136
International Journal of Academic Research ISSN: 2348-7666; Vol.3, Issue-10(1), October, 2016 Impact Factor: 4.535; Email: [email protected]
www.ijar.org.in 137
International Journal of Academic Research ISSN: 2348-7666; Vol.3, Issue-10(1), October, 2016 Impact Factor: 4.535; Email: [email protected]
www.ijar.org.in 138
International Journal of Academic Research ISSN: 2348-7666; Vol.3, Issue-10(1), October, 2016 Impact Factor: 4.535; Email: [email protected]
www.ijar.org.in 139

International Journal of Academic Research ISSN: 2348-7666; Vol.3, Issue-10(1), October, 2016 Impact Factor: 4.535; Email: [email protected]
www.ijar.org.in 140
International Journal of Academic Research ISSN: 2348-7666; Vol.3, Issue-10(1), October, 2016 Impact Factor: 4.535; Email: [email protected]
www.ijar.org.in 141
International Journal of Academic Research ISSN: 2348-7666; Vol.3, Issue-10(1), October, 2016 Impact Factor: 4.535; Email: [email protected]
www.ijar.org.in 142
International Journal of Academic Research ISSN: 2348-7666; Vol.3, Issue-10(1), October, 2016 Impact Factor: 4.535; Email: [email protected]
www.ijar.org.in 143
International Journal of Academic Research ISSN: 2348-7666; Vol.3, Issue-10(1), October, 2016 Impact Factor: 4.535; Email: [email protected]
www.ijar.org.in 144
International Journal of Academic Research ISSN: 2348-7666; Vol.3, Issue-10(1), October, 2016 Impact Factor: 4.535; Email: [email protected]
www.ijar.org.in 145
International Journal of Academic Research ISSN: 2348-7666; Vol.3, Issue-10(1), October, 2016 Impact Factor: 4.535; Email: [email protected]
www.ijar.org.in 146
International Journal of Academic Research ISSN: 2348-7666; Vol.3, Issue-10(1), October, 2016 Impact Factor: 4.535; Email: [email protected]
www.ijar.org.in 147
International Journal of Academic Research ISSN: 2348-7666; Vol.3, Issue-10(1), October, 2016 Impact Factor: 4.535; Email: [email protected]
www.ijar.org.in 148
International Journal of Academic Research ISSN: 2348-7666; Vol.3, Issue-10(1), October, 2016 Impact Factor: 4.535; Email: [email protected]
www.ijar.org.in 149
International Journal of Academic Research ISSN: 2348-7666; Vol.3, Issue-10(1), October, 2016 Impact Factor: 4.535; Email: [email protected]
www.ijar.org.in 150
International Journal of Academic Research ISSN: 2348-7666; Vol.3, Issue-10(1), October, 2016 Impact Factor: 4.535; Email: [email protected]
www.ijar.org.in 151
International Journal of Academic Research ISSN: 2348-7666; Vol.3, Issue-10(1), October, 2016 Impact Factor: 4.535; Email: [email protected]
www.ijar.org.in 152
International Journal of Academic Research ISSN: 2348-7666; Vol.3, Issue-10(1), October, 2016 Impact Factor: 4.535; Email: [email protected]
www.ijar.org.in 153
International Journal of Academic Research ISSN: 2348-7666; Vol.3, Issue-10(1), October, 2016 Impact Factor: 4.535; Email: [email protected]
www.ijar.org.in 154
International Journal of Academic Research ISSN: 2348-7666; Vol.3, Issue-10(1), October, 2016 Impact Factor: 4.535; Email: [email protected]
www.ijar.org.in 155
International Journal of Academic Research ISSN: 2348-7666; Vol.3, Issue-10(1), October, 2016 Impact Factor: 4.535; Email: [email protected]
Dear Sir/Madam, Greetings from ijar: IJAR covers all the subjects like: Economics, Rural Development, Entrepreneurship, International Finance & Business, Commerce, Management: Marketing, Finance, HR Retailing, Advertising, Production/Operations Management, Science & Technology, Engineering, Computer Science, Biology, Chemistry, Physics, Technology & Innovation, Library and Information Science, Philosophy, psychology-Meteorology, Marine, Education, Organizational Development, Financial Institutions & Markets Tourism, Hospitality and Leisure, Corporate Finance, Transportation, Geography, Public Administration Political Science, Anthropology, Mathematics, Physical Education, Journalism & Mass Communication, Social Work, Languages- Literature, (Any other discipline)
Mail articles to : [email protected] Dr. T.V. Ramana, M.A., MBA., PGDCA, PGDIM, PGDHRM, (BL), Ph.D Andhra University Campus, Kakinada, 533005, Andhra Pradesh, India, Office : 46-8-10/4 Opp. Aditya School, Jagannaikpur, Kakinada-2, AP, India
International Journal of Academic Research ISSN: 2348-7666; Vol.3, Issue-10(1), October, 2016 Impact Factor: 4.535; Email: [email protected]
Guidelines to the Authors : These give credentials to your paper. Plagiarism is strictly prohibited. Authors are jointly and severely
responsible for any sort of plagiarism
1. Manuscript must be on a standard A4 size paper setting and less than 12 pagesprepared on1.5 spaces and typed in 12 point Times New Roman Font.
2. Author Name(S) & Affiliations: The author (s) full name, designation, affiliation (s),address, mobile/landline numbers, and email/ address should be underneath the title.
3. Abstract: Abstract should be in fully italicized text, not exceeding 300 words. Theabstract must be informative and present overall idea (explain background, aims, methods,results and conclusion) of the paper.
4. Keywords: Abstract must be followed by list of keywords, subject to the maximum of five.These should be arranged in alphabetic order
5. Introduction : A short introduction of the research problem followed by a brief reviewof literature and objectives of the research
6. Objectives and Methodology: Describe the materials used in the experiments andmethods used for data collection, statistical tools used in data collection
7. Results/findings and discussion: This segment should focus on the fulfillment ofstated objectives as given in the introduction. It should be contain the findings presented inthe form of tables, figures and photographs.
8. Conclusion: Analysis conclude with suitable and effective suggestions (if any)
9. Style of Referencing: The list of all references should be alphabetically arranged. It mustbe at the end of the manuscript. The author (s) should mention only the actuallyutilized references in the preparation of manuscript and they are supposed to followHarvard Style of Referencing. The author (s) is supposed to follow the references as perfollowing:
Books: Sundara Rao M., (1996), "Tribal Development." Tata McGraw, Hill, New Delhi, page. 250 Contributions to books: Ramana T.V (2008) ,” Education- A multi-Dimensional weapon for all-round Development:
Edited by D.Pulla Rao, Development of Education-Emerging Dimensions in 21st Century,Chapter 13, pp.190-202. Journal and other articles: Schemenner, R.W., Huber, J.C. and Cook, R.L. (1987), "Geographic Differences and the Location of New Manufacturing Facilities," Journal of Urban Economics, Vol. 21, No. 1, pp. 83-104. Conference papers: Chandel K.S. (2009): "Ethics in Commerce Education." Paper presented at the Annual International Conference for the All India Management Association, New Delhi, India, 19–22 June. Unpublished dissertations and theses: Kumar S. (2006): "Customer Value: A Comparative Study of Rural and Urban Customers," Thesis, Kurukshetra University, Kurukshetra. Online sources: Always indicate the date that the source was accessed, as online resources are frequently updated or removed. Website: Kelkar V. (2009): Towards a New Natural Gas Policy, Economic and Political Weekly,refered on February 17, 2011 http://epw.in/epw/user/viewabstract.jsp
Note: Papers relating to the Languages may be followed as their research (Ph.D/M.Phil) style