
Dynamic and static asymmetric response of a layesred thick disk
Upload
independentCategory
view
2download
0
Behavioral/Systems/Cognitive
V1 Interpatch Projections to V2 Thick Stripes andPale Stripes
Lawrence C. Sincich, Cristina M. Jocson, and Jonathan C. HortonBeckman Vision Center, University of California, San Francisco, San Francisco, California 94143-0730
Cytochrome oxidase (CO) reveals two compartments in V1 (patches and interpatches) and three compartments in V2 (thin, pale, andthick stripes). Previously, it was shown that thin stripes receive input predominantly from patches. Here we examined the projections tothick and pale stripes in macaques, revealed by retrograde tracer injections. After thick stripe injection, cells were distributed in layer 2/3(67%), layer 4A (7%), layer 4B (23%), and layer 5/6 (2%). Except in layer 5/6, cells were concentrated in interpatches, with a stronger biasin layer 2/3 (84%) than in layer 4B (75%). After pale stripe injection, cells were found in layer 2/3 (87%), layer 4A (2%), layer 4B (10%), andlayer 5/6 (2%). As for thick stripes, cells were located preferentially in interpatches in layer 2/3 (84%) and layer 4B (72%) but not in layer5/6. Thick stripes received a higher proportion of their input from layer 4B, compared with pale stripes, consistent with reports that thickstripe neurons exhibit a pronounced layer 4B influence. This difference aside, both stripe types receive similar inputs from V1, at least interms of cortical layer and CO compartment. This finding was bolstered by injecting different tracers into pale and thick stripes; 10 –27%of cells were double labeled, with most located in interpatches. These results suggest that the distinctive receptive field properties ofneurons in thick and pale stripes are generated by local V2 circuits, or by other specific projections, rather than by differing sources oflaminar and compartmental input from V1.
IntroductionIn primates, the second visual area (V2) provides the main linkbetween the primary visual cortex (V1, striate cortex) and highervisual areas. Area V2 contains a regular, repeating pattern of pale-thin-pale-thick stripes, revealed best by staining the tissue for themetabolic enzyme cytochrome oxidase (CO) (Tootell et al., 1983;Horton, 1984). There is considerable evidence to suggest thatneurons in different types of V2 stripes—pale, thin, and thick—differ in their physiological properties (DeYoe and Van Essen,1985; Hubel and Livingstone, 1987; Tootell and Hamilton, 1989;Levitt et al., 1994a; Roe and Ts’o, 1995, 1999; Gegenfurtner et al.,1996; Tamura et al., 1996; Yoshioka and Dow, 1996; Kiper et al.,1997; Peterhans, 1997; Ts’o et al., 2001, 2009; Shipp and Zeki,2002; Xiao et al., 2003; Wang et al., 2007; Chen et al., 2008; Lu andRoe, 2008; Lim et al., 2009; Shipp et al., 2009). To understandhow such specialized properties arise, it is crucial to have anaccurate description of the anatomical projections from V1 to V2.V2 is also of central importance in the dissemination of informationto higher visual areas, because its projections establish several uniquestreams (Felleman and Van Essen, 1991; Ungerleider and Haxby,1994; Van Essen and Gallant, 1994). Thus understanding the divi-sion of visual labor also depends on knowing the organization of thisstriate-to-extrastriate pathway.
CO histology also reveals a distinct pattern in V1 consisting ofa regular array of dark patches (blobs, puffs), embedded in alighter background of cortical enzyme activity referred to as in-terpatches. Previously, it was shown that V2 thin stripes receivetheir V1 input from CO patches (Livingstone and Hubel, 1984;Xiao and Felleman, 2004; Sincich and Horton, 2005). The orga-nization of the V1 projections to thick stripes and pale stripes hasbeen more difficult to establish. Livingstone and Hubel (1984,1987) reported that thick stripes are supplied by a diffuse projec-tion from layer 4B, whereas pale stripes receive input from inter-patches in layer 2/3. This sharp dichotomy would offer astraightforward explanation for why these stripes have differentphysiological properties. However, it was subsequently reportedthat thick and pale stripes derive their input from the same V1layers and compartments (Sincich and Horton, 2002). This latterresult would imply that the distinctive physiological characteris-tics of neurons in thick stripes and pale stripes are not due tosegregated V1 inputs but rather due to other mechanisms orprojections.
Our goal here was to quantify the source of V1 inputs to thickand pale stripes. We compared the relative numerical strength ofinput from patches versus interpatches, and from different cor-tical layers, for these two classes of V2 stripes. In addition, dualtracer injections were made to probe the extent of any commoninput provided by neurons to both stripe types. We found thatinterpatch neurons in layer 2/3 dominated the projections tothick as well as to pale stripes, and that 4B neurons, aligned incolumns beneath the layer 2/3 clusters, also contributed substan-tially to both stripes. The main distinction among these projec-tions was the relatively greater proportion of layer 4B neuronssending axons to thick stripes compared with pale stripes.
Received Nov. 6, 2009; revised March 22, 2010; accepted March 27, 2010.This work was supported by Grants EY10217 (to J.C.H.), EY13676 (to L.C.S.), and EY02162 (to the Beckman Vision
Center) from the National Eye Institute. The California Regional Primate Research Center is supported by NationalInstitutes of Health Base Grant RR00169. Acknowledgement is also made to Research to Prevent Blindness.
Correspondence should be addressed to Dr. Lawrence C. Sincich, Beckman Vision Center, University of California,San Francisco, 10 Koret Way, San Francisco, CA 94143-0730. E-mail: [email protected].
DOI:10.1523/JNEUROSCI.5506-09.2010Copyright © 2010 the authors 0270-6474/10/306963-12$15.00/0
The Journal of Neuroscience, May 19, 2010 • 30(20):6963– 6974 • 6963
Whether this difference suffices to make thick and pale stripesunique physiologically remains to be determined.
Materials and MethodsExperimental procedures. This analysis is based on tissue sections fromexperiments in 17 normal adult macaques of both sexes, performed asdescribed in detail previously (Sincich and Horton, 2002, 2005; Sincich etal., 2007). In brief, five to seven pressure injections of 140 nl of a retro-grade tracer, 0.1% CTB-Au (List Biological) (Llewellyn-Smith et al.,1990), were made approximately every 5 mm along the posterior edge ofthe lunate sulcus in each hemisphere, in which V2 is exposed on thecortical surface. The spacing between injections was sufficient for theretrogradely labeled fields in V1 to be nonoverlapping. Retinotopically,the injections were placed over a range of 1.5° to 10° eccentricity from thefovea. The injections were made at a depth of �1 mm, targeting layers 3and 4, which receive the densest input from V1 (Rockland and Virga,1990). After allowing several days for retrograde transport of CTB-Au theanimals were killed with pentobarbital (150 mg/kg) and perfused withnormal saline followed by 1 L of 1% paraformaldehyde in 0.1 M phos-phate buffer, pH 7.4. The occipital lobes were flatmounted and sectionswere cut tangentially at 50 �m with a freezing microtome. This proce-dure yielded 20 –22 tangential sections in V1, suggesting that fixation andflatmounting resulted in some compression of the cortex, because itsthickness in vivo is �1.0 –1.1 mm. Each section was dried on a slide andreacted for CO (Wong-Riley, 1979; Sincich et al., 2003). The sectionswere then coverslipped temporarily with 0.1 M phosphate buffer andphotographed to document the pattern of CO staining in V1 and V2,before any subsequent histological processing.
At this point, each V2 stripe type was classified as thin, pale, or thick,based upon its physical appearance in CO-stained sections. The stripescould be distinguished most readily in sections passing through the deep-est portion of layer 3, in which their contrast was greatest. It helped tooverlay images of several consecutive sections. Pale stripes were easy toidentify, but differentiating thin and thick stripes often posed a problem.Thin stripes were about half the width of thick stripes, and their COcontent was darker and more punctate. Stripes were classified indepen-dently by each author and accepted only if the designation was clear-cutand unanimous. To avoid errors, stripes were categorized as “unclassifi-able” if doubt existed.
Each injection site was pinpointed by searching near the V1 border fora telltale zone of tracer deposit or tissue damage created by the pipette tip.The injection was assigned to a stripe class before silver intensification ofCTB-Au and therefore without knowledge of the resulting pattern of V1cell labeling. After the injections were located and categorized, the COsections were silver intensified with an IntenSE-M kit (GE Healthcare),dehydrated, and coverslipped for microscopic analysis. If the silver de-posited at the injection site produced substantial contamination of anadjacent stripe, the injection was disqualified at this point. The spatialextent of the injection site before silver intensification was a reliableindicator of the minimum zone of tracer uptake. Although uptake likelyextended beyond this region (for instance, some tracer may have diffusedaway or metabolized after a few days), it is probably less than the sizerevealed after silver reaction, which clearly includes some tracer trans-port. These considerations guided us in determining whether injectionsspilled into neighboring stripes.
In 7 of the 17 animals, we made V2 injections of wheat germ agglutininconjugated to horseradish peroxidase (WGA-HRP) to examine whetherany V1 neurons project to more than one stripe type. A WGA-HRPinjection was targeted 1 mm lateral to each CTB-Au tracer injection, withthe aim of depositing different tracers in different stripe types. In theseanimals, alternate tissue sections were processed for CO and CTB-Au orfor CTB-Au and WGA-HRP. Sections processed for CTB-Au and WGA-HRP were silver intensified while free floating. After exposure for 5 minto 2% sodium thiosulfate, the sections were then reacted for WGA-HRPusing tetramethylbenzidine-ammonium molybdate (LeVay and Voigt,1990). Because this reaction product degrades spontaneously in justmonths, it was stabilized with diaminobenzidine (Rye et al., 1984).
Data analysis. Eight thick stripe injections and eight pale stripe injec-tions, representative of the dataset, were selected for quantitative analy-
sis. Patch/interpatch compartments were defined by analysis of the COsection in layer 2/3 that contained the densest cell labeling. A grayscaledigital photograph of this section was taken with polarizing filters, semi-crossed so that light scattered by the silver grains neutralized the opacityof the silver in transmitted light. Photographed this way, the density ofthe labeled cells had no influence on the CO staining pattern. To verifythis fact, we compared CO fields photographed before silver intensifica-tion and compared them with photographs taken through semicrossedpolarizing filters after silver intensification. CO density contours derivedusing these two methods were virtually indistinguishable. The whiteholes from blood vessels were filled in with pixels of the mean imagegrayscale value using Photoshop CS (Adobe Systems). Next, a low-passFourier-filtered image was subtracted from the original image using Mat-lab (Mathworks) to correct for unevenness in CO staining across theflatmount section, which often occurred because of slight fluctuations incortical depth. The image was blurred with a Gaussian filter (� � 45 �m)and divided into six zones of equal area based on the CO density. Follow-ing the convention that patches occupy approximately one-third of stri-ate cortex (Purves and LaMantia, 1993; Farias et al., 1997), the darkesttwo zones (1 and 2) were defined as patches. The palest four zones (3– 6)were designated as interpatches.
Cells were plotted in the most densely labeled section in layer 2/3 foreach injection and in a single section in layer 4B. Because the tissue wasnot flattened perfectly, it was sometimes necessary to plot cells in several4B sections to cover the area analyzed in the 2/3 section. To identifyindividual CTB-Au-labeled cells, silver-intensified sections were viewedin dark field through crossed polarizing filters at �200 magnification.The location of each CTB-Au-labeled cell was plotted using AutoCAD2002 (Autodesk) via a Wacom Cintiq display tablet placed underneath acamera lucida microscope attachment. For WGA-HRP-labeled cells,bright-field illumination was used. The number of cells was counted ineach of the six zones of CO density. As discussed previously (Sincich andHorton, 2005), this approach eliminates pitfalls inherent in an alternativeway of analyzing the data, namely, one based on the distance of labeledcells from “blob centers.” A two-way � 2 test was used to determinewhether the number of labeled cells in patches versus interpatches dif-fered significantly from a random distribution. In particular, for a pop-ulation of cells to reside preferentially in interpatches, this test measuredthe probability of �67% of the cells lying in zones 3– 6 by chance.
For the dual-tracer experiments, a field of potential overlap was de-fined for the two populations of retrogradely labeled cells. This proce-dure was necessary to determine where there was a reasonable likelihoodof finding double-labeled cells, so that one could calculate their percent-age accurately. We first calculated the median distance between CTB-Aucells, based on Delaunay triangulation. The same calculation was per-formed for WGA-HRP cells. For each tracer type, a scatter plot of the cellswas convolved with a two-dimensional Gaussian filter whose half-width athalf-height equaled the median distance between cells. This operation pro-duced grayscale images that were then thresholded to include 95% of thegray levels. The overlap field was defined as the area of the tissue section inwhich the images delimited for each tracer population were superimposed.
For each V2 injection, a separate analysis was also performed to deter-mine the relative distribution of labeled cells by V1 layer. A region wasselected for analysis in the center of each field of retrogradely labeledcells, in which the density of cells was greatest. This zone was defined bydrawing a polygon with vertices centered on the surrounding patches.Within this zone, the cells were plotted for every single section, from piato white matter, using blood vessels in each section for alignment. Layerswere identified according to the characteristic laminar CO staining pat-terns. Layer 2/3 contained discreet CO patches, layer 4A was recognizedby its “honeycomb” pattern, layer 4B was below the honeycomb and endedwith the onset of the solidly dark layer 4C, and below layer 4C the COstaining intensity lightened markedly in layer 5/6. The number of cells ineach layer was tabulated and compared for each stripe type.
ResultsThe validity of these experiments depended on making an injec-tion of a retrograde tracer within a single V2 stripe of unambig-uous identity. The CO pattern is not visible in vivo, making it
6964 • J. Neurosci., May 19, 2010 • 30(20):6963– 6974 Sincich et al. • V1 Interpatch Projections to V2

impossible to target deliberately an injection into the middle of astripe. Even in histological sections, thick stripes and thin stripescan be hard to differentiate. Hubel and Livingstone (1987) haveobserved that in the macaque “the two types of dark stripes can-not be told apart reliably by differences in thickness,” promptingthem to use the squirrel monkey as an alternative species for theirexperiments. It is true that thick stripes and thin stripes can behard to distinguish in the macaque, although in some animalsthey appear as distinct as in the squirrel monkey [see Sincich et al.(2003), their Fig. 11].
To overcome these challenges, our strategy was to make a largenumber of tracer injections, relying on luck that some would landcleanly within a single identifiable stripe. To facilitate CO stripeidentification, the lunate sulcus was unfolded and flattened be-fore sectioning. This revealed the entire stripe pattern, ratherthan just the sliver of V2 located on the exposed cortical surface.A total of 187 CTB-Au injections were made in 17 animals. Themajority were uninformative, either because they strayed into V1(28 injections), straddled different stripe types (43 injections), fellwithin an unidentifiable stripe (31 injections), or were too small toproduce any retrograde transport (8 injections). Of the 77 satisfac-tory injections, 17 were located in thin stripes, 33 were located in palestripes, and 27 were located in thick stripes. This article describes thefindings from the successful pale stripe and thick stripe injections.
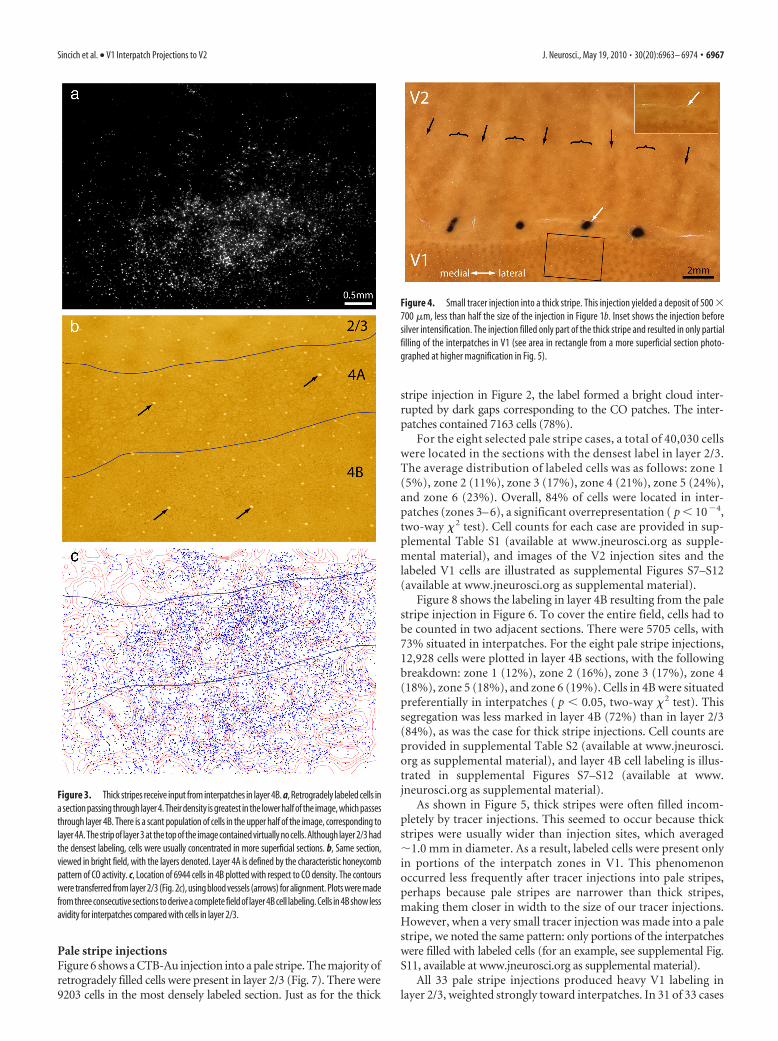
Thick stripe injectionsFigure 1a shows a typical CTB-Au injection before silver intensi-fication. The injection left a characteristic purple tracer deposit,which by chance was located squarely in the middle of a thickstripe, �1 mm from the V1 border. After silver intensification,the injection appeared as a dense cloud, 1.5 mm in diameter, stillconfined to the thick stripe (Fig. 1b).
The retinotopic maps in V1 and V2 form mirror images acrosstheir common border. Consequently, each injection in V2 pro-duced a field of retrogradely labeled cells at a predictable locationin V1. Figure 2a shows the section in V1 which contained thedensest cell labeling, located in layer 2/3. The labeled neuronsappeared as a bright cloud when viewed in dark field throughcrossed polarizing filters. There were a total of 9980 cells labeledby CTB-Au in this field. The nebula of labeled cells was perforatedby holes in which relatively few cells were present. Because thissection was also stained for CO, the distribution of patches couldbe examined simply by switching to bright-field illumination(Fig. 2b). This approach eliminated the problem of aligning ac-curately the pattern of CO staining in one section with the distri-bution of labeled cells in another section.
To define the boundary between patches and interpatches, thedensity of CO staining was divided into six zones of equal area(Fig. 2c), with the darkest two zones corresponding to patches.Figure 2d shows the position of each cell plotted with respect tothe density of CO activity. At a glance, it is apparent that thelabeled cells filled the interpatches confluently, with the overalldensity of labeled cells diminishing toward the edges of the field.The holes seen in dark field, in which cells were sparse, corre-sponded to the CO patches. The concentration of labeled cellsincreased as the density of CO staining decreased. The percentageof cells situated in each zone was as follows: zone 1 (4%), zone 2(9%), zone 3 (14%), zone 4 (18%), zone 5 (24%), and zone 6(31%). Zones 3– 6, defined as the interpatches, contained 8660 ofthe 9980 labeled cells (87%). If the labeled cells were distributedrandomly, only 67% would be expected in interpatches.
For the eight thick stripe injections, the location of eachtracer-filled cell was plotted in the section of layer 2/3 that con-
tained the most labeled cells. A total of 30,441 cells were plotted.The mean distribution of cells was as follows: zone 1 (5%), zone 2(11%), zone 3 (17%), zone 4 (21%), zone 5 (24%), and zone 6(22%). Altogether, 84% of cells were located in interpatches (zones3–6). Cells were significantly more likely to be located in inter-patches than in patches ( p � 10�4 two-way �2 test). Actual layer 2/3cell counts for each case are provided in supplemental Table S1(available at www.jneurosci.org as supplemental material). Imagesof the other thick stripe cases, showing V2 injection sites and theircorresponding labeled V1 cell fields, are illustrated as supplemental Fig-ures S1–S6 (available at www.jneurosci.org as supplemental material).
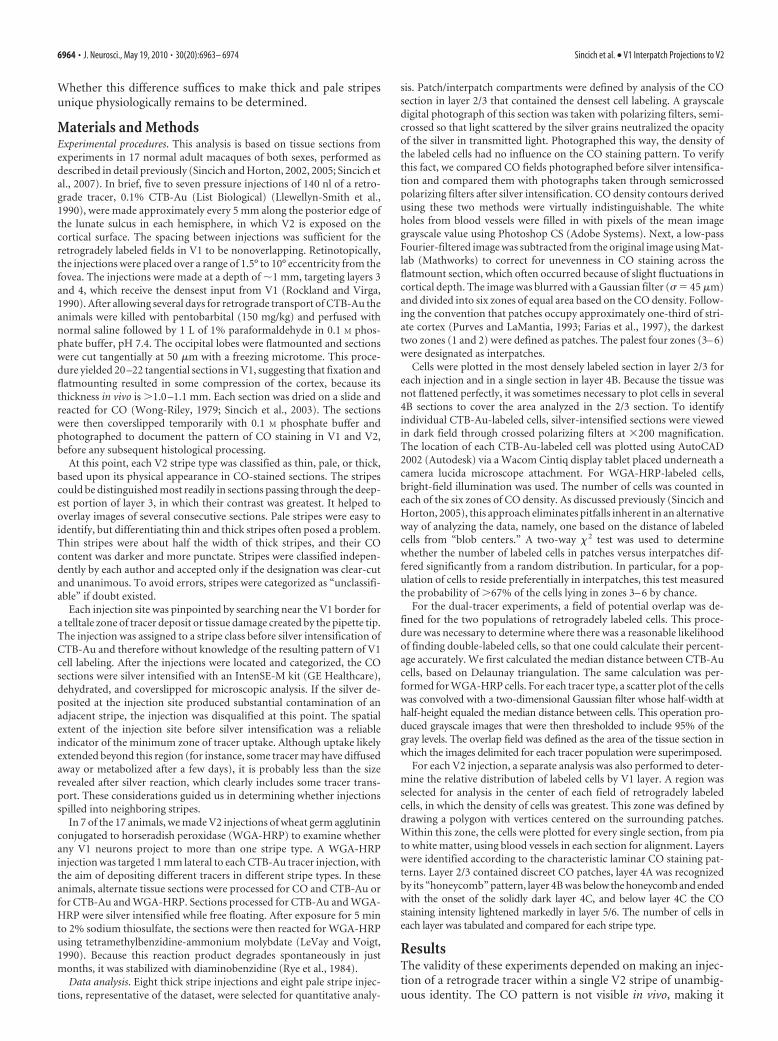
Figure 3 shows a section cut 300 �m deeper that passesthrough layers 4A and 4B, from the same field of labeled cellsillustrated in Figure 2. There was a smattering of cell labeling inlayer 4A. In contrast, the cell labeling was dense in layer 4B.Because the plane of section was slightly oblique, cells had to becounted in three consecutive tissue sections to cover the entirefield in layer 4B. The contrast of CO activity is low in layer 4B.Therefore, the CO density contours derived from the layer 2/3section (Fig. 2c) were used to define patch/interpatch compart-ments in layer 4B, using blood vessels for alignment (Fig. 3b,c).There were 6944 cells in layer 4B, with 72% located in inter-patches, compared with 87% located in interpatches in layer 2/3.
Figure 1. Tracer injection into a thick stripe. a, The white arrow shows a CTB-Au injectionsituated in a thick stripe before silver intensification. The lunate sulcus of the left hemispherehas been opened and flattened to reveal the entire pattern of V2 stripes to aid in stripe identi-fication (arrow, thin; bracket, thick; convention used in all figures). This section passes throughthe center of the injection, which was located at the junction of layer 3 and 4. b, Same sectionrephotographed after silver intensification. The rectangle corresponds to the field analyzed inFigure 2 containing retrogradely filled cells in V1.
Sincich et al. • V1 Interpatch Projections to V2 J. Neurosci., May 19, 2010 • 30(20):6963– 6974 • 6965

The location of cells in layer 4B was examined for each V2tracer injection analyzed in layer 2/3. A total of 19,080 cells wereplotted in eight cases. The mean percentage of cells in each zonewas as follows: zone 1 (9%), zone 2 (16%), zone 3 (18%), zone 4(18%), zone 5 (19%), and zone 6 (20%). Overall, a mean of 75%of 4B cells was located in interpatches. This predilection for in-terpatches was significant ( p � 10�4, two-way � 2 test), but it wasless pronounced than for cells in layer 2/3 (84%). Cell counts areprovided in supplemental Table S2 (available at www.jneurosci.org as supplemental material), along with images of the labeledcells in each 4B field (supplemental Figures S1–S6, available atwww.jneurosci.org as supplemental material).
The injection illustrated in Figure 1 was relatively large andcentered squarely, filling the thick stripe from one edge to theother. Because injections which crossed the boundary from onestripe type to another were excluded from analysis, most injec-tions tended to be smaller. Such cases often produced clusters oflabeled cells that filled the interpatch zones only partially. Figure4 shows a tracer injection at the edge of a thick stripe, whichoccupied less than half the stripe’s width. It resulted in 4920 cellsin the most densely labeled layer 2/3 section, approximately halfthe number in Figure 2. The cells formed clusters, but these clus-ters did not match the CO patches (Fig. 5). Instead, they were
located within discrete subregions of the interpatches. The distri-bution of cells was as follows: zone 1 (2%), zone 2 (11%), zone 3(19%), zone 4 (25%), zone 5 (24%), and zone 6 (19%). Overall,87% of cells were located in interpatches, just as for the case inFigure 2, but portions of the interpatches were nearly devoid ofcells. The same was true in layer 4B, in which 76% of cells werelocated in interpatches, aligned with the clusters in layer 2/3 andthus forming vertical columns of projection neurons (Fig. 5e,f).
All 27 thick stripe injections showed dense retrograde cell la-beling in layer 2/3 and layer 4B. Although cells were plotted indi-vidually in only eight cases, visual inspection confirmed that cellswere located preferentially in interpatches in every case. How-ever, in many cases, the interpatches were only partially occupiedby labeled cells, as illustrated in Figure 5. There was also a smallpopulation of labeled cells in layers 4A, 5, and 6. Cells in layer 4Ashowed an allegiance for interpatches, although this was not as-certained by plotting cells. In contrast, the cells in layers 5 and 6appeared to be distributed randomly. For the case illustrated inFigure 2, the distribution of cells was plotted. There were 512cells, with 69% located in the interpatches ( p � 0.30, two-way � 2
test). The lack of any correlation with V1 CO compartment hasalso been reported for layer 5/6 cells after thin stripe tracer injec-tions (Sincich and Horton, 2005).
Figure 2. Thick stripes receive input from interpatches in layer 2/3. a, Retrogradely labeled cells, appearing bright in dark-field illumination, located in upper layer 3. The field corresponds to therectangle in Figure 1b, but is 300 �m more superficial. b, The same section viewed in bright field, revealing the pattern of CO staining. The white pentagon denotes an interpatch zone in which cellswere plotted in serial vertical sections to determine the relative laminar distribution of labeled cells in the field. Black arrows denote blood vessels used to align CO contours onto deeper sections. c,Contours partitioning the CO activity into six zones of equal area. CO patches were defined as the darkest two zones. d, Plot of 9980 labeled cells in a, showing that they fill the CO interpatches andavoid the CO patches.
6966 • J. Neurosci., May 19, 2010 • 30(20):6963– 6974 Sincich et al. • V1 Interpatch Projections to V2
Pale stripe injectionsFigure 6 shows a CTB-Au injection into a pale stripe. The majority ofretrogradely filled cells were present in layer 2/3 (Fig. 7). There were9203 cells in the most densely labeled section. Just as for the thick
stripe injection in Figure 2, the label formed a bright cloud inter-rupted by dark gaps corresponding to the CO patches. The inter-patches contained 7163 cells (78%).
For the eight selected pale stripe cases, a total of 40,030 cellswere located in the sections with the densest label in layer 2/3.The average distribution of labeled cells was as follows: zone 1(5%), zone 2 (11%), zone 3 (17%), zone 4 (21%), zone 5 (24%),and zone 6 (23%). Overall, 84% of cells were located in inter-patches (zones 3– 6), a significant overrepresentation ( p � 10�4,two-way � 2 test). Cell counts for each case are provided in sup-plemental Table S1 (available at www.jneurosci.org as supple-mental material), and images of the V2 injection sites and thelabeled V1 cells are illustrated as supplemental Figures S7–S12(available at www.jneurosci.org as supplemental material).
Figure 8 shows the labeling in layer 4B resulting from the palestripe injection in Figure 6. To cover the entire field, cells had tobe counted in two adjacent sections. There were 5705 cells, with73% situated in interpatches. For the eight pale stripe injections,12,928 cells were plotted in layer 4B sections, with the followingbreakdown: zone 1 (12%), zone 2 (16%), zone 3 (17%), zone 4(18%), zone 5 (18%), and zone 6 (19%). Cells in 4B were situatedpreferentially in interpatches ( p � 0.05, two-way � 2 test). Thissegregation was less marked in layer 4B (72%) than in layer 2/3(84%), as was the case for thick stripe injections. Cell counts areprovided in supplemental Table S2 (available at www.jneurosci.org as supplemental material), and layer 4B cell labeling is illus-trated in supplemental Figures S7–S12 (available at www.jneurosci.org as supplemental material).
As shown in Figure 5, thick stripes were often filled incom-pletely by tracer injections. This seemed to occur because thickstripes were usually wider than injection sites, which averaged�1.0 mm in diameter. As a result, labeled cells were present onlyin portions of the interpatch zones in V1. This phenomenonoccurred less frequently after tracer injections into pale stripes,perhaps because pale stripes are narrower than thick stripes,making them closer in width to the size of our tracer injections.However, when a very small tracer injection was made into a palestripe, we noted the same pattern: only portions of the interpatcheswere filled with labeled cells (for an example, see supplemental Fig.S11, available at www.jneurosci.org as supplemental material).
All 33 pale stripe injections produced heavy V1 labeling inlayer 2/3, weighted strongly toward interpatches. In 31 of 33 cases
Figure 3. Thick stripes receive input from interpatches in layer 4B. a, Retrogradely labeled cells ina section passing through layer 4. Their density is greatest in the lower half of the image, which passesthrough layer 4B. There is a scant population of cells in the upper half of the image, corresponding tolayer 4A. The strip of layer 3 at the top of the image contained virtually no cells. Although layer 2/3 hadthe densest labeling, cells were usually concentrated in more superficial sections. b, Same section,viewed in bright field, with the layers denoted. Layer 4A is defined by the characteristic honeycombpattern of CO activity. c, Location of 6944 cells in 4B plotted with respect to CO density. The contourswere transferred from layer 2/3 (Fig. 2c), using blood vessels (arrows) for alignment. Plots were madefrom three consecutive sections to derive a complete field of layer 4B cell labeling. Cells in 4B show lessavidity for interpatches compared with cells in layer 2/3.
Figure 4. Small tracer injection into a thick stripe. This injection yielded a deposit of 500 �700 �m, less than half the size of the injection in Figure 1b. Inset shows the injection beforesilver intensification. The injection filled only part of the thick stripe and resulted in only partialfilling of the interpatches in V1 (see area in rectangle from a more superficial section photo-graphed at higher magnification in Fig. 5).
Sincich et al. • V1 Interpatch Projections to V2 J. Neurosci., May 19, 2010 • 30(20):6963– 6974 • 6967

there was also labeling in 4B, but it was sparser than in the super-ficial layers. Just as for thick stripes, layer 4A also showed light celllabeling, weakly biased toward interpatches. In addition, a smallpopulation of cells was present in layer 5/6, distributed randomlywith respect to the CO pattern. For the case illustrated in Figure 6,a plot of a single layer 5/6 section revealed 1569 cells, with 67% ininterpatches ( p � 0.74, two-way � 2 test).
Double labeling of thick and pale stripesFigure 9 illustrates a successful dual-tracer experiment, with aCTB-Au injection in a pale stripe and an HRP-WGA injection in
a thick stripe. The CTB-Au injection resulted in 5925 retro-gradely labeled cells in a single layer 2/3 section, with 79% located ininterpatches (Fig. 10). The WGA-HRP injection produced 1550retrogradely labeled cells in the same section, with 89% in inter-patches. The two fields of retrogradely labeled cells overlappedonly partially, presumably because the injections were made intopale and thick stripes that were not adjacent but rather separatedby a thin stripe and an additional pale stripe, and therefore moreseparated retinotopically. Within the overlap zone, there were981 CTB-Au cells, 731 WGA-HRP cells, and 103 double-labeledcells (Fig. 11). Thus, neurons projecting to both stripe types rep-
Figure 5. Incomplete labeling of interpatches. a, Dark-field view of labeled cells in layer 2/3 resulting from the thick stripe tracer injection in Figure 4. b, The same section in bright field, showingCO staining. c, Contours of CO density. d, Plot of 4920 labeled cells in a, showing that they are located preferentially in interpatches. However, in some regions, the interpatches contain few labeledcells (e.g., green arrow). e, Labeled cells in layer 4B. f, Plot of 1057 labeled cells in layer 4B, showing clusters of cells in interpatches, aligned with the clusters in layer 2/3 above.
6968 • J. Neurosci., May 19, 2010 • 30(20):6963– 6974 Sincich et al. • V1 Interpatch Projections to V2

resented 10% of the CTB-Au population and 12% of the WGA-HRP population.
A second dual-tracer injection was made successfully, thistime in a pale stripe and a thick stripe that were adjacent [depictedin the study by Sincich and Horton (2002), their Fig. 3]. As ex-
pected, the closer proximity of the injections led to a much largerfield of overlap for the two populations of labeled cells. We plot-ted the cells in a subset of the overlap field in which the labelingwas densest for the two tracers. Within that subset area, wecounted 720 CTB-Au cells, 490 WGA-HRP cells, and 179 cellslabeled with both tracers. Consequently, the neurons that pro-jected to both stripes represented 20% of the CTB-Au cells and27% of the WGA-HRP cells. This result contrasts with the negli-gible double-labeled percentage that occurs when adjacent thinand pale stripes are injected (Sincich and Horton, 2005). Eventhough the dual-tracer injections were spaced similarly apart forthe thin/pale and the thick/pale stripe pairs, the fact that manifoldaxons were far more prevalent when targeting pale and thickstripes demonstrates that the wiring is specific rather than anartifact of closely spaced injections in V2.
Laminar distribution of cellsProjections from V1 to V2 arise from layers 2/3, 4A, 4B, 5, and 6(Kennedy and Bullier, 1985; Van Essen et al., 1986; Cusick andKaas, 1988; Rockland, 1992; Levitt et al., 1994b). To quantify therelative contribution of each V1 layer to pale stripes and thickstripes, a representative interpatch zone was identified in eachcase. An example of an interpatch zone is shown in Figure 2. Avertical “core” sample was analyzed by counting the cells in theinterpatch zone in each section from cortical surface to whitematter. On average, after flatmounting and sectioning at 50 �m,striate cortex yielded the following: 8 sections in layer 2/3, less
Figure 6. Tracer injection into a pale stripe. This injection (white arrow) was located very close tothe V1 border. Looking at the injection site before silver intensification (inset), one can ascertain that itwas made in a pale stripe. The rectangle denotes the V1 region shown in Figure 7.
Figure 7. Pale stripes receive input from interpatches in layer 2/3. a, Dark-field view of the most densely labeled section showing field of cells resulting from the pale stripe injection in Figure 6.b, The same section in bright field, showing CO activity. c, Contours of CO density. d, Plot of 9203 labeled cells in a, showing that they are located preferentially in interpatches.
Sincich et al. • V1 Interpatch Projections to V2 J. Neurosci., May 19, 2010 • 30(20):6963– 6974 • 6969

than 1 section in layer 4A, 1.5 sections in layer 4B, 4 sections in4C, and 6 sections in layer 5/6. For the eight thick stripe injectioncases, a total of 14,353 cells were plotted in V1. The relative dis-tribution of cells was as follows: layer 2/3 (67 � 13%), layer 4A(7 � 4%), layer 4B (23 � 10%), and layer 5/6 (2 � 2%). For theeight pale stripe injection cases, 10,780 cells were plotted. Therelative distribution of cells was as follows: layer 2/3 (87 � 8%),layer 4A (2 � 1%), layer 4B (10 � 7%), and layer 5/6 (2 � 2%).Thus, the salient finding was that the projections from layers 4Aand 4B were proportionally more than twice as numerous for
thick stripes compared with pale stripes. After both thick stripeand pale stripe injection, cell labeling peaked in the upper half oflayer 3. Consequently, the section located at the base of layer 3contained fewer labeled cells than the most densely labeled sec-tion in layer 2/3 (compare Figs. 2a and 3a).
In the owl monkey and marmoset it has been reported thatpale stripes fall into two distinct categories based on their loca-tion: lateral or medial to a thick stripe (Xu et al., 2004; Federer etal., 2009). To address this point, we identified the location ofinjected pale stripes in our macaque experiments. Five of theanalyzed pale stripes were located medial to thick stripes, and theremaining three were lateral. There was no difference in the lam-inar proportion of cells (layer 2/3, p � 0.74; layer 4B, p � 0.59;Student’s t test), or in the preference for CO interpatches (layer2/3, p � 0.90; layer 4B, p � 0.89; Student’s t test), when pale stripeinjections were divided into medial and lateral categories. Therewas abundant input from layer 4B to pale stripes located medialto thick stripes (supplemental Table S2, available at www.jneurosci.org as supplemental material), contrary to the projec-tion pattern in the marmoset (Federer et al., 2009). As mentionedpreviously, labeling in layer 4B was absent in only 2 of 33 palestripe injections. In one case, the injection was medial to a thickstripe; in the other case, the injection was lateral to a thick stripe.In both cases, the 4B section appeared not to have been silverintensified long enough.
In the marmoset, it was reported that pale stripe injectionsproduce cell labeling in regions of lowest CO density (zones 5– 6),whereas thick stripe injections result in cell labeling in areas ofintermediate CO density (zones 3– 4) (Federer et al., 2009). Fig-ure 12 shows an analysis of our data in the macaque, comparing
Figure 8. Pale stripes receive input from interpatches in layer 4B. a, Labeled cells in a sectionpassing through layer 4B, from the same region shown in Figure 7. Their density is greatest nearthe injection site at top. b, Same section in bright field, with the layers denoted. c, Location ofcells in 4B plotted with respect to CO density. Cells were plotted in two adjacent 4B sections.
Figure 9. Dual tracer injections into V2. a, CO section showing the pattern of stripes in V2.The pair of white arrows marks a CTB-Au injection into a pale stripe and a WGA-HRP injectioninto a thick stripe. No reaction product is visible at the WGA-HRP injection site because thissection was processed only for CO and CTB-Au. The two tracer injections are separated by a thinstripe and a pale stripe, both uninjected. Inset shows the injection sites before silver enhance-ment. Rectangle below is area analyzed at higher magnification in Figure 10. b, Section 250 �mmore superficial, reacted for CTB-Au and WGA-HRP. In dark-field illumination the WGA-HRPlabel does not show up. There is no overlap between the two injection sites in V2.
6970 • J. Neurosci., May 19, 2010 • 30(20):6963– 6974 Sincich et al. • V1 Interpatch Projections to V2

the proportions of cells in zones 3– 4 versus 5– 6 for thick stripesand pale stripes. There was no significant difference in the relativedistribution of cells after pale stripe and thick stripe injections,for either layer 2/3 or layer 4B. Occasionally, we found more cellsin regions of intermediate CO density (supplemental Table S1,available at www.jneurosci.org as supplemental material) afterinjection into thick stripes (supplemental Fig. S3, available atwww.jneurosci.org as supplemental material), but this also oc-curred after injection into pale stripes (supplemental Fig. S8,
available at www.jneurosci.org as supple-mental material). Thus, in the macaque, thespatial organization of neurons projectingto pale stripes and thick stripes as a functionof CO zone is remarkably similar, unlike inthe marmoset.
DiscussionThe main finding from this study is thatneurons projecting from V1 to thickstripes and pale stripes in V2 are similarlyorganized by layer and CO compartment.For both stripe types, the major projectionarises from layer 2/3. In this layer, �85%of cells projecting to thick stripes and palestripes are located in interpatches. Thereis also a prominent projection from layer4B to thick stripes and pale stripes. In layer4B the projecting neurons are also locatedpreferentially in interpatches (75% forthick stripes, 72% for pale stripes), but thebias is less pronounced than for layer 2/3neurons. There are also sparse projectionsfrom layer 4A and layer 5/6 to thick stripesand pale stripes. The projection from layer4A favors interpatches, but curiously, theprojection from 5/6 is random with re-spect to CO compartment.
Thick stripes and pale stripes derivetheir input not only from the same sourcein V1 but sometimes even from the sameneurons. In one case, a dual tracer injec-tion into adjacent pale and thick stripes,20 –27% of the retrogradely filled cells inlayer 2/3 were double labeled (Sincich andHorton, 2002). For the case shown in Fig-ure 9, dual tracer injections were madein a pale stripe and a thick stripe thatwere separated by several interveningstripes. Not surprisingly, the percentageof double-labeled cells was lower,amounting to only 10 –12% of the cells.Many factors can influence the percent-age of double-labeled cells, includingthe exact location of the tracer injectionsites, the efficiency of each tracer, anduptake by fibers of passage. Nonethe-less, it is clear that a considerable num-ber of layer 2/3 interpatch cells havemanifold projections, sending their ax-ons to both pale stripes and thickstripes, although the majority projectexclusively to a single stripe type.
CO divides V1 into two complemen-tary output streams: interpatches3 pale
and thick stripes and patches 3 to thin stripes. However, thesegregation by CO compartment is not perfect. After pale stripeor thick stripe injection, 16% of cells in layer 2/3 are located inpatches. In other layers, the segregation is even less strict (layers4A, 4B) or absent altogether (layer 5/6). After thin stripe injection,19% of cells are located in interpatches (Sincich and Horton, 2005).Despite this overlap, the V2 projections from patches and inter-patches appear to constitute separate systems, at least for the upper
Figure 10. V1 label after dual tracer injections in V2. a, Bright-field view of the retrograde label from the dual tracer injectionsin Figure 9. The CTB-Au label shows clearly as a gray reaction product, but the brown WGA-HRP label is difficult to discern. Boxedregion is shown at higher magnification in Figure 11 a. b, Adjacent CO section through layer 2/3. c, Density contours superimposedon CO-stained section in b. d, Plot of CTB-Au cells (blue), WGA-HRP cells (green), and double-labeled cells (red). The gray maskdenotes the overlap zone in which double-labeled cells could potentially occur (see Materials and Methods).
Sincich et al. • V1 Interpatch Projections to V2 J. Neurosci., May 19, 2010 • 30(20):6963– 6974 • 6971

layers. The best evidence for this conclusion comes from twocases involving CTB-Au injection in a pale stripe and WGA-HRPinjection in an adjacent thin stripe. Less than 0.5% of cells weredouble labeled [Sincich and Horton (2005), their Fig. 6]. Thisresult suggests that projections from patches and interpatches toV2 are truly separate, although the actual projecting cells maystray across CO compartments (whose exact borders, after all, aredefined arbitrarily).
There is a fundamental difference in the patch versus inter-patch systems regarding the distribution of labeled cells in V1after small tracer injections in V2. After thin stripe injections, nomatter how small, labeled cells are found in every patch, and theirconcentration falls off steadily as a function of CO density(Sincich and Horton, 2005). In contrast, after small tracer injec-tions into pale or thick stripes, labeled cells are often found inclusters within interpatches (Fig. 5; supplemental Fig. S11, avail-able at www.jneurosci.org as supplemental material). The mostlikely explanation is that interpatch labeling is confined to cellsthat share the same orientation tuning as cells at the V2 injectionsite. To test this idea, one could combine optical imaging withretrograde tracer injection. Optical imaging has shown that ori-entation columns are present within pale stripes and thick stripesbut apparently absent in thin stripes (Malach et al., 1994; Xiao etal., 2003; Shmuel et al., 2005; Lu and Roe, 2008). This observationcould explain why interpatches are filled only partially after smallthick or pale stripe injections, whereas patches are filled diffusely(and no patches are skipped) after small thin stripe injections.
Livingstone and Hubel (1988) reported that pale stripes andthick stripes receive entirely different sources of V1 input, withthe former supplied by interpatches in layer 2/3 and the latter bya diffuse projection arising from layer 4B. However, in their firstaccount of the V1-to-V2 projection, Livingstone and Hubel(1984) reported that thick stripes receive confluent labeling fromlayer 2/3. In a later study, Livingstone and Hubel (1987) re-examined the projection to thick stripes in the squirrel monkey.In these experiments, labeling was noted in layer 4B, “without anyclear or consistent correspondence of the filled cells with theoverlying blob pattern” (p. 3375). The authors stated, “we couldeasily have overlooked similar results in previous experiments, sowe went back and re-examined 4 thick-stripe injections from ourearlier experiments, and we did find faint labeling, again in layer4B exclusively” (p. 3375). Thus it appears, combining both their1984 and 1987 studies, that Livingstone and Hubel did identify aprojection from both layers 2/3 and 4B to the thick stripes.
The idea that pale stripes and thick stripes receive completelydifferent V1 input provided a key piece of support for splittingthe visual system into ventral and dorsal streams (Zeki and Shipp,1988; Merigan and Maunsell, 1993; Van Essen and Gallant, 1994;Nassi and Callaway, 2009). It also fit nicely with the discovery thatpale stripes project to area V4 and thick stripes project to area MT(DeYoe and Van Essen, 1985; Shipp and Zeki, 1985). It was hy-
Figure 11. Double-labeled cells projecting to thick and pale stripes. a, CTB-Au cells (upperleft) and WGA-HRP cells (lower right) from Figure 10a. b, Higher-magnification view of theboxed region above, showing double-labeled cells (arrows).
Figure 12. Histogram showing percentage of cells in patches (zones 1–2) versus inter-patches (zones 3– 6) after thick stripe or pale stripe injection. For both stripe classes, the fractionof cells located in interpatches was significantly greater than expected from a random distribu-tion (see Results). In this histogram, we have divided the interpatches into “borders” (zones3– 4) and “centers” (zones 5– 6). None of the comparisons (brackets) between border andcenter categories were significant, except for a greater proportion of cells in centers comparedwith borders in layer 2/3 after pale stripe injection (*p � 0.013, Wilcoxon rank sum test).
6972 • J. Neurosci., May 19, 2010 • 30(20):6963– 6974 Sincich et al. • V1 Interpatch Projections to V2

pothesized that a V1 parvo-dominated upper layer projectionflows via pale stripes to V4, while a magno-dominated projectiongoes from 4B via thick stripes to MT (Livingstone and Hubel,1988). Area MT also receives a direct projection from layer 4B(Shipp and Zeki, 1985; Boyd and Casagrande, 1999; Sincich andHorton, 2003; Nassi and Callaway, 2007). Given our finding thatpale stripes and thick stripes are supplied by both layer 2/3 andlayer 4B, it was important to learn whether their relative contri-butions differ. In fact, 23% of projecting cells to thick stripesoriginate from 4B, whereas for pale stripes, only 10% of project-ing cells come from 4B. Layer 4B is thought to be dominated bythe magnocellular LGN channel, although 4B pyramidal cells re-ceive mixed input from 4C� and 4C� (Yabuta et al., 2001). Thus,our data support the contention that thick stripes receive a morerobust magnocellular signal than do pale stripes.
At the same time, our results show that thick stripes and palestripes have much of their V1 input in common. For both stripeclasses, the most numerous projection comes from the inter-patches in layer 2/3. In some cases, the axons of individual V1neurons ramify widely in V2 (Rockland and Virga, 1990), sup-plying adjacent (or even nonadjacent) thick stripes and palestripes, as shown by our dual tracer injections. Given this exten-sive shared V1 input, it is not clear why cells located within thickstripes and pale stripes have different physiological properties.Recently, for example, columns of disparity-tuned cells have beenidentified in thick stripes (Chen et al., 2008; Kaskan et al., 2009).Why are they absent in pale stripes, if pale stripes also receiveinput from disparity-tuned, oriented V1 cells? It is possible thatmany V1 cells projecting either to thick stripes or to pale stripesdiffer substantially in their functional properties, despite beinglocated in the same cortical column and layer. Another possibilityis that intrinsic local circuits in V2, fed by similar V1 inputs,generate de novo the distinct receptive field properties of cells inthick stripes and pale stripes. Alternatively, cells’ receptive fieldproperties may differ less as a function of stripe type than gener-ally believed. Finally, the major thalamic input to layer 4 of V2from the pulvinar has been inadequately characterized, and thisinput is anatomically distinct for pale and thick stripes (Living-stone and Hubel, 1982; Levitt et al., 1995). Undoubtedly, thereare many anatomical and physiological factors that contribute toreceptive field properties of V2 neurons, and it is necessary towork them out before the unique functions of this major visualcortical area can be fully understood.
ReferencesBoyd JD, Casagrande VA (1999) Relationships between cytochrome oxidase
(CO) blobs in primate primary visual cortex (V1) and the distribution ofneurons projecting to the middle temporal area (MT). J Comp Neurol409:573–591.
Chen G, Lu HD, Roe AW (2008) A map for horizontal disparity in monkeyV2. Neuron 58:442– 450.
Cusick CG, Kaas JH (1988) Cortical connections of area 18 and dorsolateralvisual cortex in squirrel monkeys. Vis Neurosci 1:211–237.
DeYoe EA, Van Essen DC (1985) Segregation of efferent connections andreceptive field properties in visual area V2 of the macaque. Nature317:58 – 61.
Farias MF, Gattass R, Pinon MC, Ungerleider LG (1997) Tangential distri-bution of cytochrome oxidase-rich blobs in the primary visual cortex ofmacaque monkeys. J Comp Neurol 386:217–228.
Federer F, Ichida JM, Jeffs J, Schiessl I, McLoughlin N, Angelucci A (2009)Four projection streams from primate V1 to the cytochrome oxidasestripes of V2. J Neurosci 29:15455–15471.
Felleman DJ, Van Essen DC (1991) Distributed hierarchical processing inthe primate cerebral cortex. Cereb Cortex 1:1– 47.
Gegenfurtner KR, Kiper DC, Fenstemaker SB (1996) Processing of color,form, and motion in macaque area V2. Vis Neurosci 13:161–172.
Horton JC (1984) Cytochrome oxidase patches: a new cytoarchitectonicfeature of monkey visual cortex. Philos Trans R Soc Lond B Biol Sci304:199 –253.
Hubel DH, Livingstone MS (1987) Segregation of form, color, and stereop-sis in primate area 18. J Neurosci 7:3378 –3415.
Kaskan PM, Lu HD, Dillenburger BC, Kaas JH, Roe AW (2009) The orga-nization of orientation-selective, luminance-change and binocular-preference domains in the second (V2) and third (V3) visual areas of NewWorld owl monkeys as revealed by intrinsic signal optical imaging. CerebCortex 19:1394 –1407.
Kennedy H, Bullier J (1985) A double-labeling investigation of the afferentconnectivity to cortical areas V1 and V2 of the macaque monkey. J Neu-rosci 5:2815–2830.
Kiper DC, Fenstemaker SB, Gegenfurtner KR (1997) Chromatic propertiesof neurons in macaque area V2. Vis Neurosci 14:1061–1072.
LeVay S, Voigt T (1990) Retrograde transneuronal transport of wheat-germagglutinin to the retina from visual cortex in the cat. Exp Brain Res82:77– 81.
Levitt JB, Kiper DC, Movshon JA (1994a) Receptive fields and functionalarchitecture of macaque V2. J Neurophysiol 71:2517–2542.
Levitt JB, Yoshioka T, Lund JS (1994b) Intrinsic cortical connections inmacaque visual area V2: evidence for interaction between different func-tional streams. J Comp Neurol 342:551–570.
Levitt JB, Yoshioka T, Lund JS (1995) Connections between the pulvinarcomplex and cytochrome oxidase-defined compartments in visual areaV2 of macaque monkey. Exp Brain Res 104:419 – 430.
Lim H, Wang Y, Xiao Y, Hu M, Felleman DJ (2009) Organization of hueselectivity in macaque V2 thin stripes. J Neurophysiol 102:2603–2615.
Livingstone MS, Hubel DH (1982) Thalamic inputs to cytochrome oxidase-rich regions in monkey visual cortex. Proc Natl Acad Sci U S A79:6098 – 6101.
Livingstone MS, Hubel DH (1984) Anatomy and physiology of a color sys-tem in the primate visual cortex. J Neurosci 4:309 –356.
Livingstone MS, Hubel DH (1987) Connections between layer 4B of area 17and the thick cytochrome oxidase stripes of area 18 in the squirrel mon-key. J Neurosci 7:3371–3377.
Livingstone M, Hubel D (1988) Segregation of form, color, movement, anddepth: anatomy, physiology, and perception. Science 240:740 –749.
Llewellyn-Smith IJ, Minson JB, Wright AP, Hodgson AJ (1990) Choleratoxin B-gold, a retrograde tracer that can be used in light and electronmicroscopic immunocytochemical studies. J Comp Neurol 294:179 –191.
Lu HD, Roe AW (2008) Functional organization of color domains in V1 andV2 of macaque monkey revealed by optical imaging. Cereb Cortex18:516 –533.
Malach R, Tootell RB, Malonek D (1994) Relationship between orientationdomains, cytochrome oxidase stripes, and intrinsic horizontal connec-tions in squirrel monkey area V2. Cereb Cortex 4:151–165.
Merigan WH, Maunsell JH (1993) How parallel are the primate visual path-ways? Annu Rev Neurosci 16:369 – 402.
Nassi JJ, Callaway EM (2007) Specialized circuits from primary visual cortexto V2 and area MT. Neuron 55:799 – 808.
Nassi JJ, Callaway EM (2009) Parallel processing strategies of the primatevisual system. Nat Rev Neurosci 10:360 –372.
Peterhans E (1997) Functional organization of area V2 in the awake mon-key. Cereb Cortex 12:335–357.
Purves D, LaMantia A (1993) Development of blobs in the visual cortex ofmacaques. J Comp Neurol 334:169 –175.
Rockland KS (1992) Laminar distribution of neurons projecting from areaV1 to V2 in macaque and squirrel monkeys. Cereb Cortex 2:38 – 47.
Rockland KS, Virga A (1990) Organization of individual cortical axons pro-jecting from area V1 (area 17) to V2 (area 18) in the macaque monkey. VisNeurosci 4:11–28.
Roe AW, Ts’o DY (1995) Visual topography in primate V2: multiple repre-sentation across functional stripes. J Neurosci 15:3689 –3715.
Roe AW, Ts’o DY (1999) Specificity of color connectivity between primateV1 and V2. J Neurophysiol 82:2719 –2730.
Rye DB, Saper CB, Wainer BH (1984) Stabilization of the tetramethylbensidine(TMB) reaction product: application for retrograde and anterograde tracing,and combination with immunohistochemistry. J Histochem Cytochem32:1145–1153.
Shipp S, Zeki S (1985) Segregation of pathways leading from area V2 to areasV4 and V5 of macaque monkey visual cortex. Nature 315:322–325.
Sincich et al. • V1 Interpatch Projections to V2 J. Neurosci., May 19, 2010 • 30(20):6963– 6974 • 6973

Shipp S, Zeki S (2002) The functional organization of area V2, I: specializa-tion across stripes and layers. Vis Neurosci 19:187–210.
Shipp S, Adams DL, Moutoussis K, Zeki S (2009) Feature binding in thefeedback layers of area V2. Cereb Cortex 19:2230 –2239.
Shmuel A, Korman M, Sterkin A, Harel M, Ullman S, Malach R, Grinvald A(2005) Retinotopic axis specificity and selective clustering of feedbackprojections from V2 to V1 in the owl monkey. J Neurosci 25:2117–2131.
Sincich LC, Horton JC (2002) Divided by cytochrome oxidase: a map of theprojections from V1 to V2 in macaques. Science 295:1734 –1737.
Sincich LC, Horton JC (2003) Independent projection streams from ma-caque striate cortex to the second visual area and middle temporal area.J Neurosci 23:5684 –5692.
Sincich LC, Horton JC (2005) Input to V2 thin stripes arises from V1 cyto-chrome oxidase patches. J Neurosci 25:10087–10093.
Sincich LC, Adams DL, Horton JC (2003) Complete flatmounting of themacaque cerebral cortex. Vis Neurosci 20:663– 686.
Sincich LC, Jocson CM, Horton JC (2007) Neurons in V1 patch columnsproject to V2 thin stripes. Cereb Cortex 17:935–941.
Tamura H, Sato H, Katsuyama N, Hata Y, Tsumoto T (1996) Less segre-gated processing of visual information in V2 than in V1 of the monkeyvisual cortex. Eur J Neurosci 8:300 –309.
Tootell RB, Hamilton SL (1989) Functional anatomy of the second visualarea (V2) in the macaque. J Neurosci 9:2620 –2644.
Tootell RB, Silverman MS, De Valois RL, Jacobs GH (1983) Functional organi-zation of the second cortical visual area in primates. Science 220:737–739.
Ts’o DY, Roe AW, Gilbert CD (2001) A hierarchy of the functional organi-zation for color, form and disparity in primate visual area V2. Vision Res41:1333–1349.
Ts’o DY, Zarella M, Burkitt G (2009) Whither the hypercolumn? J Physiol587:2791–2805.
Ungerleider LG, Haxby JV (1994) ‘What’ and ‘where’ in the human brain.Curr Opin Neurobiol 4:157–165.
Van Essen DC, Gallant JL (1994) Neural mechanisms of form and motionprocessing in the primate visual system. Neuron 13:1–10.
Van Essen DC, Newsome WT, Maunsell JH, Bixby JL (1986) The projec-tions from striate cortex (V1) to areas V2 and V3 in the macaque monkey:asymmetries, areal boundaries, and patchy connections. J Comp Neurol244:451– 480.
Wang Y, Xiao Y, Felleman DJ (2007) V2 thin stripes contain spatially orga-nized representations of achromatic luminance change. Cereb Cortex17:116 –129.
Wong-Riley M (1979) Changes in the visual system of monocularly suturedor enucleated cats demonstrable with cytochrome oxidase histochemis-try. Brain Res 171:11–28.
Xiao Y, Felleman DJ (2004) Projections from primary visual cortex to cyto-chrome oxidase thin stripes and interstripes of macaque visual area 2.Proc Natl Acad Sci U S A 101:7147–7151.
Xiao Y, Wang Y, Felleman DJ (2003) A spatially organized representation ofcolour in macaque cortical area V2. Nature 421:535–539.
Xu X, Bosking W, Sary G, Stefansic J, Shima D, Casagrande V (2004) Func-tional organization of visual cortex in the owl monkey. J Neurosci24:6237– 6247.
Yabuta NH, Sawatari A, Callaway EM (2001) Two functional channels fromprimary visual cortex to dorsal visual cortical areas. Science 292:297–300.
Yoshioka T, Dow BM (1996) Color, orientation and cytochrome oxidasereactivity in areas V1, V2 and V4 of macaque monkey visual cortex. BehavBrain Res 76:71– 88.
Zeki S, Shipp S (1988) The functional logic of cortical connections. Nature335:311–317.
6974 • J. Neurosci., May 19, 2010 • 30(20):6963– 6974 Sincich et al. • V1 Interpatch Projections to V2
Copyright © 2022 FDOKUMEN