Utilizing Online Social Network and Location-Based Data to Recommend Products and Categories in...
20
Utilizing Online Social Network and Location-Based Data to Recommend Products and Categories in Online Marketplaces Emanuel Lacic 1 , Dominik Kowald 1 , Lukas Eberhard 2 , Christoph Trattner 3 , Denis Parra 4 , and Leandro Marinho 5 1 Know-Center, Graz University of Technology, Graz, Austria {elacic,dkowald}@know-center.at 2 IICM, Graz University of Technology, Graz, Austria [email protected] 3 Norwegian University of Science and Technology, Trondheim, Norway [email protected] 4 Pontificia Universidad Catlica de Chile, Santiago, Chile [email protected] 5 UFCG, Campina Grande, Brasil [email protected] Abstract. Recent research has unveiled the importance of online social networks for improving the quality of recommender systems and encour- aged the research community to investigate better ways of exploiting the social information for recommendations. To contribute to this sparse field of research, in this paper we exploit users’ interactions along three data sources (marketplace, social network and location-based) to assess their performance in a barely studied domain: recommending products and domains of interests (i.e., product categories) to people in an online marketplace environment. To that end we defined sets of content- and network-based user similarity features for each data source and studied them isolated using an user-based Collaborative Filtering (CF) approach and in combination via a hybrid recommender algorithm, to assess which one provides the best recommendation performance. Interestingly, in our experiments conducted on a rich dataset collected from SecondLife, a popular online virtual world, we found that recommenders relying on user similarity features obtained from the social network data clearly yielded the best results in terms of accuracy in case of predicting prod- ucts, whereas the features obtained from the marketplace and location- based data sources also obtained very good results in case of predicting categories. This finding indicates that all three types of data sources are important and should be taken into account depending on the level of specialization of the recommendation task. Keywords: recommender systems; online marketplaces; SNA; social data; location- based data; SecondLife; Collaborative Filtering; item recommendations; product recommendations; category prediction
-
Upload
independent -
Category
Documents
-
view
3 -
download
0
Transcript of Utilizing Online Social Network and Location-Based Data to Recommend Products and Categories in...

Utilizing Online Social Network andLocation-Based Data to Recommend Products
and Categories in Online Marketplaces
Emanuel Lacic1, Dominik Kowald1, Lukas Eberhard2, Christoph Trattner3,Denis Parra4, and Leandro Marinho5
1 Know-Center, Graz University of Technology, Graz, Austria{elacic,dkowald}@know-center.at
2 IICM, Graz University of Technology, Graz, [email protected]
3 Norwegian University of Science and Technology, Trondheim, [email protected]
4 Pontificia Universidad Catlica de Chile, Santiago, [email protected]
5 UFCG, Campina Grande, [email protected]
Abstract. Recent research has unveiled the importance of online socialnetworks for improving the quality of recommender systems and encour-aged the research community to investigate better ways of exploitingthe social information for recommendations. To contribute to this sparsefield of research, in this paper we exploit users’ interactions along threedata sources (marketplace, social network and location-based) to assesstheir performance in a barely studied domain: recommending productsand domains of interests (i.e., product categories) to people in an onlinemarketplace environment. To that end we defined sets of content- andnetwork-based user similarity features for each data source and studiedthem isolated using an user-based Collaborative Filtering (CF) approachand in combination via a hybrid recommender algorithm, to assess whichone provides the best recommendation performance. Interestingly, in ourexperiments conducted on a rich dataset collected from SecondLife, apopular online virtual world, we found that recommenders relying onuser similarity features obtained from the social network data clearlyyielded the best results in terms of accuracy in case of predicting prod-ucts, whereas the features obtained from the marketplace and location-based data sources also obtained very good results in case of predictingcategories. This finding indicates that all three types of data sources areimportant and should be taken into account depending on the level ofspecialization of the recommendation task.
Keywords: recommender systems; online marketplaces; SNA; social data; location-based data; SecondLife; Collaborative Filtering; item recommendations; productrecommendations; category prediction

1 Introduction
Research on recommender systems has gained tremendous popularity in recentyears. Especially since the hype of the social Web and the rise of social media andnetworking platforms such as Twitter or Facebook, recommender systems areacknowledged as an essential feature helping users to, for instance, discover newconnections between people or resources. Especially in the field of e-commercesites, i.e., online marketplaces, current research is dealing with the improvementof the prediction task in order to recommend products that are more likely tomatch peoples preferences.
Typically, these online systems calculate personalized recommendations us-ing only one data source, namely marketplace data (e.g., implicit user feedbacksuch as previously viewed or purchased products - see also e.g., [1–3]). Althoughthis approach has been well established and performs reasonably well, nowadays,online marketplaces often also have the opportunity to leverage additional in-formation about the users coming from social and location-based data sources(e.g., via Facebook-connect). Even though previous research has shown that thiskind of data can be useful in the wide field of recommender systems (see Section2), it remains an open problem how to fully exploit these additional data sources(social network and location-based data) to improve the recommendation taskin online marketplaces.
Moreover, it is often not the most important thing in online marketplacesto predict the exactly right products to the users but to suggest domains ofinterests (i.e., product categories) the users could like and could use for furtherbrowsing (e.g, [4, 1]). Thus, it is not only important to investigate to whichextent social and location-based data sources can be used to improve productrecommendations but also to which extent this data can also be used for therecommendation of product categories.
To contribute to this sparse field of research, in this paper we present a firsttake on this problem in form of a research project that aims at understandinghow different sources of interaction data can help in recommending products andcategories to people in an online marketplace. In this respect, we are particularlyinterested in studying the efficiency of different user similarity features derivedfrom various dimensions, not only from the marketplace but also from onlinesocial networks and location-based data to recommend products and categoriesto people via a user-based Collaborative Filtering (CF) approach (we have chosena user-based CF approach since user-based CF is not only a well-establishedrecommender algorithm but also allows us to incorporate various user-basedsimilarity features coming from different data sources, which has been shown toplay an important role in making more accurate predictions [5, 4]). Specifically,we raise the following two research questions:
– RQ1 : To which extent can user similarity features derived from marketplace,social network and location-based data sources be utilized for the recommen-dation of products and categories in online marketplaces?

– RQ2 : Can the different marketplace, social network and location-based usersimilarity features and data sources be combined in order to create a hy-brid recommender that provides more robust recommendations in terms ofprediction accuracy, diversity and user coverage?
In order to address these research questions, we examined content-based andnetwork-based user similarity feature sets for user-based CF over three datasources (marketplace, social and location-based data) as well as their combina-tions using a hybrid recommender algorithm and assessed the results via a morecomprehensive set of recommender evaluation metrics than previous works. Thestudy was conducted using a large-scale dataset crawled from the virtual worldof SecondLife. In this way, we could study the utility of each user similarityfeature separately as well as combine them in the form of hybrid approaches toshow which combinations, per data source and globally, provide the best recom-mendations in terms of recommendation accuracy, diversity and user coverage.Summing this up, the contributions of this work are the following:
– Contrary to previous work in this area [1, 2], we not only employ one sourceof data (marketplace) for the problem of predicting product purchases butshow how data coming from three different sources (marketplace, social andlocation-based data) can be exploited in this context.
– In contrast to related work in the field, we provide also an extensive evalua-tion of various content-based and network-based user similarity features viauser-based Collaborative Filtering as well as their combinations via a hybridrecommender approach.
– Finally, we also provide evidence to what extent top-level and sub-level pur-chase categories can be predicted which is in contrast to previous work (e.g.,[1]) where the authors only focused on the problem recommending top-levelcategories to the users.
To the best of our knowledge, this is the first study that offers such a compre-hensive user similarity feature selection and evaluation for product and categoryrecommendation in online marketplaces.
Overall, the paper is structured as follows: we begin by discussing relatedwork in Section 2. Then we present the datasets (Section 3) and the featuredescription (Section 4) used in our extensive evaluation. After that, we presentour experimental setup in Section 5 and show the results of our experiments inSection 6. Finally, on Section 7 we conclude the paper and discuss the outlook.
2 Related Work
Most of the literature that leverages social data for recommendations is focusedon recommending users, (e.g., [2, 6]), tags (e.g., [7]) or points-of-interest (e.g,[4]), although some works have exploited social information for item or product

recommendation, being the most important ones model-based. Jamali et al. [5]introduced SocialMF, a matrix factorization model that incorporates social re-lations into a rating prediction task, decreasing RMSE with respect to previouswork. Similarly, Ma et al. [4] incorporated social information in two models ofmatrix factorization with social regularization, with improvements in both MAEand RMSE for rating prediction. Among their evaluations, they concluded thatchoosing the right similarity feature between users plays an important role inmaking a more accurate prediction.
On a more general approach, Karatzoglou et al. [8] use implicit feedback andsocial graph data to recommend places and items, evaluating with a ranking taskand reporting significant improvements over past related methods. Compared tothese state-of-the-art approaches, our focus on this paper is at providing a richeranalysis of feature selection (similarity features) with a more comprehensiveevaluation than previous works, and in a rarely investigates domain: productrecommendation in a social online marketplace. For instance, in Guo et al. [2]or Trattner et al. [3] the authors leveraged social interactions between sellersand buyers in order to predict sellers to customers. Other relevant work in thiscontext is the study of Zhang & Pennacchiotti [1] who showed how top-levelcategories can be better predicted in a cold-start setting on eBay by exploitingthe user’s “likes” from Facebook.
3 Datasets
In our study we rely on three datasets6 obtained from the virtual world Sec-ondLife (SL). The main reason for choosing SL over real world sources are man-ifold but mainly due to the fact that currently there are no other datasets avail-able that comprise marketplace, social and location data of users at the sametime. For our study we focused on users who are contained in all three sources ofdata, which are 7,029 users in total. To collect the data (see Table 1) we crawledthe SL platform as described in our previous work [9, 10].
3.1 Marketplace Dataset
Similar to eBay, SecondLife provides an online trading platform where users cantrade virtual goods with each other. Every seller in the SL marketplace7 ownsher own seller’s store and publicly offers all of the store’s products classifiedinto different categories (a hierarchy with up to a maximum of four differentcategories per product). Furthermore, sellers can apply meta-data such as price,title or description to their products. Customers in turn, are able to providereviews to products.
We extracted 29,802 complete store profiles, with corresponding 39,055 trad-ing interactions, and 2,162,466 products, out of which 30,185 were purchased.
6 Note: The datasets could be obtained by contacting the fourth author of this work.7 https://marketplace.secondlife.com/

Marketplace Dataset (Market)
Number of products 30, 185Number of products with categories 24, 276Number of purchases 39, 055Number of purchases with categories 31, 164Mean number of purchases per user 5.56Mean number of purchases per products 1.29Mean number of categories per product 2.86Number of top-level categories 23Number of low-level categories 532Mean number of top-level categories purchase 1, 354.96Mean number of low-level categories purchase 58.58Number of sellers 8, 149Mean number of purchases per seller 3.70
Online Social Network Dataset (Social)
Number of interactions 490, 236Mean number of interactions 69.75Number of groups 39, 180Mean number of groups per user 9, 419Number of interests 5.57Mean number of interests per user 1.34
Location-based Dataset (Location)
Number of different favorite locations 10, 538Mean number of favorite locations per user 5.77Number of different shared locations 5, 736Mean number of shared locations per user 1.94Number of different monitored locations 1, 887Mean number of monitored locations per user 6.52
Table 1. Basic statistics of the SL datasets used in our study.
From the purchased products, 24,276 are described using categories which aredifferentiated in top-level categories and low-level categories (i.e, the assignedproduct categories on the lowest possible level of the category hierarchy). Anexample of a product in the marketplace of SL is shown in the first image ofFigure 1.
3.2 Online Social Network Dataset
The online social network MySecondLife8 is similar to Facebook with regard topostings: users can interact with each other by sharing text messages and com-menting or loving (= liking) these messages. From the extracted 7,029 completeuser profiles, we gathered 39,180 different groups users belong to, 9,419 different
8 https://my.secondlife.com/

(a) SecondLife store (b) SecondLife social stream
Fig. 1. Examples for a store in the marketplace and a social stream of an user in theonline social network of the virtual world SecondLife.
interests users defined for themselves and 490,236 interactions between them.The second image of Figure 1 shows an example of an user profile in the onlinesocial network of SL.
3.3 Location-based Dataset
The world of Second Life is contained within regions, i.e., locations which areindependent from each other. Overall, we extracted three different sources oflocation-based data in our experiments:
a) Favored Locations: Every user of SL can specify up to 10 so-called “Picks”in their profile representing her favorite locations that other users can viewin the user’s MySecondLife profile. We found that the extracted users picked40,558 locations from 10,538 unique locations;
b) Shared Locations: Users in SL can also share information about their cur-rent in-world position through in-world pictures called ”snapshots”, whichalso include in-world GPS information (similar as Foursquare). Overall, weidentified 13,637 snapshots in 5,736 unique locations;
c) Monitored Locations: As in real life, users in SL can create events in thevirtual world and publicly announce them in a public event calendar. Wecollected these events, with an accurate location and start time, and ex-tracted 157,765 user-location-time triples, with 1,887 unique locations.

4 Feature Description
As shown in our previous work (e.g., [10]), similarities between users can bederived in two different ways: either we calculate similarities between users on thecontent (= meta-data) provided directly by the user profiles or on the networkstructure of the user profiles interacting with each other. In the following sectionswe present more details about these ideas.
4.1 Content-based User Similarity Features
We define our set of content-based user similarity features based on differenttypes of entities or meta-data information that are directly associated with theuser profiles in our data sources. In the case of the marketplace dataset theseentities are purchased products, product categories and sellers of the products,in the case of the social network these are groups and interests the users haveassigned, and in the case of the location-based data source these are favoredlocations, shared locations and monitored locations. Formally, we define theentities of a user u as ∆(u) in order to calculate the similarity between twousers, u and v.
The first content-based user similarity feature we induce is based on theentities two users have in common. It is called Common Entities and is givenby:
sim(u, v) = |∆(u) ∩∆(v)| (1)
The second similarity feature, Total Entities, is defined as the union of two users’entities and is calculated by:
sim(u, v) = |∆(u) ∪∆(v)| (2)
These two user similarity features are combined by Jaccard’s Coefficient for En-tities as the number of common entities divided by the total number of entities:
sim(u, v) =|∆(u) ∩∆(v)||∆(u) ∪∆(v)|
(3)
4.2 Network-based User Similarity Features
In our experiments we consider all networks as an undirected graph G〈V,E〉 withV representing the user profiles and e = (u, v) ∈ E if user u performed an actionon v (see also [10]). In the case of the social network, these actions are definedas social interactions, which are a combination of likes, comments and wallposts.In the case of the location-based dataset, actions between users are determinedif they have met each other in the virtual world at the same time in the samelocation9. Furthermore, the weight of an edge waction(u, v) gives the frequency of
9 Note: We derived the networks in our study from the location-based dataset onlyfor the monitored locations, since the exact timestamps are not available for thefavored nor the shared locations in the datasets.

a specific action between two users u and v. Finally, this network structure alsolet us determine the neighbors of users in order to calculate similarities basedon this information. We define the set of neighbors of a node v ∈ G as Γ (v) ={u | (u, v) ∈ E}.
The first network-based user similarity feature we introduce, uses the numberof Directed Interactions between two users and is given by:
sim(u, v) = waction(u, v) (4)
In contrast to Directed Interactions, the following user similarity features arebased on the neighborhood of two users: The first neighborhood similarity featureis called Common Neighbors and represents the number of neighbors two usershave in common:
sim(u, v) = |Γ (u) ∩ Γ (v)| (5)
To also take into account the total number of neighbors of the users, we intro-duced Jaccard’s Coefficient for Common Neighbors. It is defined as:
sim(u, v) =|Γ (u) ∩ Γ (v)||Γ (u) ∪ Γ (v)|
(6)
A refinement of this feature was proposed as Adamic Adar [11], which addsweights to the links since not all neighbors in a network have the same tiestrength:
sim(u, v) =∑
z∈Γ (u)∩Γ (v)
1
log(|Γ (z)|)(7)
Another related similarity feature introduced by Cranshaw et al. [12], calledNeighborhood Overlap, measures the structural overlap of two users. Formally,this is written as:
sim(u, v) =|Γ (u) ∩ Γ (v)||Γ (u)|+ |Γ (v)|
(8)
The Preferential Attachment Score, first mentioned by Barabasi et al. [13], isanother network-based similarity feature with the goal to prefer active users inthe network. This score is the product of the number of neighbors of each userand is calculated by:
sim(u, v) = |Γ (u)| · |Γ (v)| (9)
5 Experimental Setup
In this section we provide a detailed description of our experimental setup. First,we describe the recommender approaches we have chosen in order to evaluate ourthree data sources (marketplace, social network and location-based data) as wellas our derived user similarity features for the task of recommending products andcategories. Afterwards, we describe the evaluation methodology and the metricsused in our study.

5.1 Recommender Approaches
In this subsection we describe the recommender approaches we have used totackle our research questions described in the introductory section of this paper.All mentioned approaches have been implemented into our scalable big datasocial recommender framework SocRec [9, 14], an open-source framework whichcan be obtained from our Github repository10.
Baseline. As baseline for our study, we used a simple MostPopular approachrecommending the most popular products or categories in terms of purchasefrequency to the users.
Recommending Products. The main approach we adopt to evaluate ourdata sources and user similarity features for the task of recommending productsis a User-based Collaborative Filtering (CF) approach. The basic idea of thisapproach is that users who are more similar to each other, e.g., have similartaste, will likely agree or rate on other resources in a similar manner [15]. Outof the different CF approaches, we used the non-probabilistic user-based nearestneighbor algorithm where we first find the k-nearest similar users and afterwardsrecommend the resources of those user as a ranked list of top-N products to thetarget user that are new to her (i.e., she has not purchased those products inthe past). As outlined before, we have chosen this approach since user-basedCF is not only a well-established recommender algorithm but also allows usto incorporate various user-based similarity features coming from different datasources, which has been shown to play an important role in making more accuratepredictions [5, 4].
The similarity values of the user pairs sim(u, v) are calculated based on theuser similarity features proposed in Section 4 (i.e., constructing the neighbor-hood). Based on these similarity values, each item i of the k most similar usersfor the target user u is ranked using the following formula [15]:
pred(u, i) =∑
v∈neighbors(u)
sim(u, v) (10)
Recommending Categories. For the task of recommending categories andin contrast to previous work (e.g., [1]), we are not only focusing here on theprediction of top-level categories but also on the prediction of low-level cate-gories. The prediction of categories was implemented as an extension of productpredictions. Thus, for each product in the list of recommended products (i.e.,the products obtained from the k-nearest neighbors of user u based on a usersimilarity feature), we extracted the assigned category on the highest level in thecase of predicting top-level categories and the assigned category on the lowestlevel in the case of predicting low-level categories. Afterwards, we assigned a
10 https://github.com/learning-layers/SocRec

score to each extracted category ei in the set of all extracted categories Eu forthe target user u based on a similar method as proposed in [1]:
pred(u, ei) =purc(Eu, ei)∑
e∈Eu
purc(Eu, e)(11)
where purc(Eu, ei) gives the number of times the category ei occurs in the setof all extracted categories Eu for user u.
Combining User Similarity Features and Data Sources. To further ex-plore how to combine our data sources and features for recommendation, we in-vestigated different hybridization methods (see also [16]). The hybrid approachchosen in the end is known as Weighted Sum. The score of each recommendeditem in the Weighted Sum algorithm is calculated as the weighted sum of thescores for all recommender approaches. It is given by:
Wreci =∑sj∈S
(Wreci,sj ·Wsj ) (12)
where the combined weighting of the recommended item i, Wreci , is given bythe sum of all single weightings for each recommended item in an approachWreci,sj multiplied by the weightings of the recommender approaches Wsj . Weweighted each recommender approach Wsj based on the nDCG@10 value ob-tained from the individual approaches (calculated based on an additional evalu-ation set where we withheld 20 purchased products - see Section 5.2).
We also experimented with other hybrid approaches, known as Cross-sourceand Mixed Hybrid [16]. However, these approaches have not yielded better resultsthan the Weighted Sum algorithm.
5.2 Evaluation Method and Metrics
To evaluate the performance of each approach in a recommender setting, weperformed a number of off-line experiments. Therefore, we split the SL datasetin two different sets (training and test set) using a method similar to the onedescribed in [9], i.e., for each user we withheld 10 purchased products from thecomplete dataset and added them to the test set to be predicted. Since we didnot use a p-core pruning technique to prevent a biased evaluation, there are alsousers with less than 10 relevant products. We did not include these users intoour evaluation since they did not have enough purchase data available that couldbe used to produce reasonable recommendations based on the marketplace data,although this data is worthwhile for our user-based CF approach to find suitableneighbors. Thus, we used a post-filtering method, where all the recommendationswere still calculated on the whole datasets but accuracy estimates were calculatedonly based on these filtered user profiles (= 959 users).

To finally quantify the performance of each of our recommender approaches,we used a diverse set of well-established metrics in recommender systems [17,18]. These metrics are as follows:
Recall (R@k) is calculated as the number of correctly recommended prod-ucts divided by the number of relevant products, where rku denotes the top krecommended products and Ru the list of relevant products of a user u in theset of all users U . Recall is given by [19]:
R@k =1
|U |∑u∈U
(|rku ∩Ru||Ru|
) (13)
Precision (P@k) is calculated as the number of correctly recommendedproducts divided by the number of recommended products k. Precision is definedas [19]:
P@k =1
|U |∑u∈U
(|rku ∩Ru|
k) (14)
Normalized Discounted Cumulative Gain (nDCG@k) is a ranking-dependent metric that not only measures how many products can be correctlypredicted but also takes the position of the products in the recommended listwith length k into account. The nDCG metric is based on the Discounted Cum-mulative Gain (DCG@k) which is given by [20]:
DCG@k =
|rku|∑k=1
(2B(k) − 1
log2(1 + k)) (15)
where B(k) is a function that returns 1 if the recommended product at positioni in the recommended list is relevant. nDCG@k is calculated as DCG@k dividedby the ideal DCG value iDCG@k which is the highest possible DCG value thatcan be achieved if all the relevant products would be recommended in the correctorder. Taken together, it is given by the following formula [20]:
nDCG@k =1
|U |∑u∈U
(DCG@k
iDCG@k) (16)
Diversity (D@k), as defined in [17], can be calculated as the average dis-similarity of all pairs of resources in the list of recommended products rku. Givena distance function d(i, j) that is the distance, or the dissimilarity between twoproducts i and j, D is given as the average dissimilarity of all pairs of productsin the list of recommended products [17]:
D@k =1
|U |∑u∈U
(1
k · (k − 1)
∑i∈R
∑j∈rku,j 6=i
d(i, j)) (17)

User Coverage (UC) is defined as the number of users for whom at leastone product recommendation could have been calculated (|Ur|) divided by totalnumber of users |U | [21]:
UC =|Ur||U |
(18)
All mentioned performance metrics are calculated and reported based on thetop-10 recommended products.
6 Results
In this section we highlight the results of our experiments for predicting prod-ucts, low-level and top-level categories in terms of algorithmic performance inorder to tackle our two research questions presented in Section 1. Our evaluationhas been conducted in two steps: in the first step we compared the different rec-ommender approaches with the corresponding user similarity features isolated(RQ1 ), see Table 2) and in the second step we combined these approaches in theform of hybrid recommendations (RQ2, see Table 3). All results are presentedby recommender accuracy, given by nDCG@10, P@10 (Precision) and R@10(Recall), D@10 (Diversity) and UC (User Coverage).
6.1 Recommendations based on Single User Similarity Features
The results for the recommendation of products, low-level categories and top-level categories, using content-based and network-based user similarity featuresderived from our three data sources (marketplace, social and location-baseddata), are shown in Table 2 in order to address our first research question (RQ1 ).The results also include the Most Popular (MP) approach as a baseline. Addi-tionally, the performance of the different data sources is also shown in Figure 2in form of Recall/Precision plots.
Recommending Products Regarding the task of predicting product pur-chases (first column in Table 2), the best results in terms of recommender ac-curacy are reached by the network-based features based on interactions (e.g.,loves, comments, wallposts) between the users in the social network. Surpris-ingly these approaches clearly outperform the user-based CF approaches relyingon marketplace data, which implies that social interactions of the users are abetter predictor to recommend products to people than marketplace data.
Another interesting finding is that the neighborhood-based features (Com-mon Neighbors, Jaccard, Neighborhood Overlap and Adamic/Adar) also seem tobe better indicators to determine the similarity between users than the directinteractions between these pairs. Only the Preferential Attachment Score basedrecommender approach does not perform well in this context, although it stillperforms better than the features derived from the marketplace data source.This is to some extent expected and reveals that the individual’s taste is more

Pro
duct
slo
w-l
evel
cate
gori
esto
p-l
evel
cate
gori
es
Use
rSim
.F
eatu
renDCG
@10P
@10
R@
10
nDCG
@10P
@10
R@
10
nDCG
@10P
@10
R@
10
D@
10UC
Most
Popula
r.0
048
.0037
.0047
.0185
.0207
.0157
.2380
.2730
.2221
.6392
100.0
%
Market
Content
Com
mon
Purc
hase
s.0
097
.0073
.0094
.0724
.0641
.0757
.4557
.3884
.4636
.5892
90.5
1%
Com
mon
Sel
lers
.0146
.0102
.0142
.1119
.1005
.1132
.5251
.4610
.5183
.6372
99.0
6%
Jacc
ard
Sel
lers
.0158
.0114
.0154
.1092
.1029
.1047
.5061
.4940
.4927
.6054
99.0
6%
Tota
lSel
lers
.0065
.0052
.0073
.0929
.0743
.0977
.5079
.4094
.5113
.6566
99.0
6%
Com
mon
Cate
gori
es.0
050
.0039
.0054
.1090
.1051
.1041
.5073
.5366
.4674
.6123
99.4
8%
Jacc
ard
Cate
gori
es.0
058
.0039
.0049
.1361
.1301
.1288
.5456*
.5701*.5200*.6
364
99.4
8%
Tota
lC
ate
gori
es.0
007
.0006
.0009
.0225
.0236
.0280
.3317
.3353
.4215
.6575
99.4
8%
Social
Content
Com
mon
Gro
ups
.0022
.0010
.0014
.0402
.0320
.0425
.3233
.2567
.3439
.4307
64.1
3%
Jacc
ard
Gro
ups
.0027
.0016
.0021
.0433
.0339
.0459
.3272
.2557
.3464
.4332
64.1
3%
Tota
lG
roups
.0006
.0005
.0007
.0324
.0272
.0361
.3214
.2323
.3563
.4466
64.1
3%
Com
mon
Inte
rest
s.0
005
.0002
.0002
.0235
.0201
.0267
.2285
.1810
.2474
.3185
46.5
1%
Jacc
ard
Inte
rest
s.0
003
.0002
.0003
.0219
.0201
.0227
.2424
.1857
.2551
.3161
46.5
1%
Tota
lIn
tere
sts
.0004
.0002
.0003
.0285
.0235
.0337
.2639
.1793
.2765
.3319
46.5
1%
Network
Dir
ecte
dIn
tera
ctio
ns
.0345
.0389
.0471
.0582
.0528
.0630
.1743
.1756
.1769
.2169
38.7
9%
Com
mon
Nei
ghb
ors
.1107
.1021
.1104
.1216
.1212
.1243
.2633
.2887
.2584
.3300
62.8
8%
Jacc
ard
Com
mon
Nei
ghb
ors
.1381
.1143
.1378
.1523
.1386
.1618
.3726
.3419
.3814
.4455
71.5
3%
Nei
ghb
orh
ood
Over
lap
.1434*
.1222*.1471*.1620*
.1486*.1719*.3
855
.3471
.3965
.4514
71.5
3%
Adam
ic/A
dar
.1013
.0941
.1067
.1241
.1187
.1272
.3028
.3153
.3042
.3762
69.3
4%
Pre
f.A
ttach
.Sco
re.0
317
.0331
.0380
.0630
.0569
.0650
.3202
.2838
.3332
.4420
70.7
0%
Location
Content
Com
mon
Fav
ore
dL
oca
tions
.0019
.0010
.0015
.0427
.0393
.0481
.4674
.3773
.4946
.6437
96.3
5%
Jacc
ard
Fav
ore
dL
oca
tions
.0028
.0017
.0022
.0472
.0416
.0531
.4636
.3777
.4919
.6490
96.3
5%
Tota
lF
avore
dL
oca
tions
.0031
.0016
.0023
.0459
.0400
.0513
.4794
.3802
.5061
.6635
96.3
5%
Com
mon
Share
dL
oca
tions
.0003
.0003
.0004
.0130
.0103
.0144
.1449
.1180
.1599
.2067
30.4
5%
Jacc
ard
Share
dL
oca
tions
.0005
.0003
.0004
.0134
.0115
.0145
.1420
.1208
.1522
.2042
30.4
5%
Tota
lShare
dL
oca
tions
.0000
.0000
.0000
.0092
.0074
.0106
.1340
.1076
.1520
.2031
30.4
5%
Com
mon
Monit
ore
dL
oca
tions.0
016
.0010
.0014
.0408
.0345
.0449
.4825
.3804
.5139
.6734
98.2
3%
Jacc
ard
Monit
ore
dL
oca
tions
.0017
.0008
.0012
.0473
.0403
.0546
.4987
.3795
.5387
.6760
98.2
3%
Tota
lM
onit
ore
dL
oca
tions
.0011
.0006
.0009
.0366
.0331
.0442
.4770
.3703
.5354
.6757
98.2
3%
Network
Com
mon
Nei
ghb
ors
.0015
.0007
.0010
.0298
.0271
.0345
.3377
.2623
.3632
.4609
67.0
5%
Jacc
ard
Com
mon
Nei
ghb
ors
.0016
.0008
.0011
.0322
.0261
.0367
.3306
.2623
.3545
.4579
67.0
5%
Nei
ghb
orh
ood
Over
lap
.0014
.0007
.0010
.0295
.0267
.0339
.3359
.2614
.3608
.4615
67.0
5%
Adam
ic/A
dar
.0015
.0006
.0009
.0320
.0272
.0353
.3332
.2598
.3530
.4595
67.0
5%
Pre
f.A
ttach
.Sco
re.0
003
.0002
.0002
.0270
.0213
.0335
.3634
.2825
.3458
.4583
70.5
9%
Table
2.
Res
ult
sfo
rth
euse
r-base
dC
Fappro
ach
esbase
don
vari
ous
use
rsi
milari
tyfe
atu
res
show
ing
thei
rp
erfo
rmance
for
the
task
sof
pre
dic
ting
pro
duct
s,lo
w-l
evel
cate
gori
esand
top-l
evel
cate
gori
es,
resp
ecti
vel
y(R
Q1
).Note:
Bold
num
ber
sin
dic
ate
the
hig
hes
tacc
ura
cyva
lues
per
featu
rese
tand
“*”
indic
ate
the
over
all
hig
hes
tacc
ura
cyes
tim
ate
s.

0.000 0.002 0.004 0.006 0.008 0.010 0.012 0.014 0.016Recall
0.000
0.005
0.010
0.015
0.020
0.025
Prec
isio
n
MP(P)MCC(P)
MCCN(S)MCJ(S)
MCT(S)MCCN(C)
MCJ(C) MCT(C)
(a) Products
0.00 0.02 0.04 0.06 0.08 0.10 0.12 0.14Recall
0.00
0.02
0.04
0.06
0.08
0.10
0.12
0.14
0.16
Prec
isio
n(b) low-level categories
0.0 0.1 0.2 0.3 0.4 0.5 0.6Recall
0.0
0.1
0.2
0.3
0.4
0.5
0.6
0.7
Prec
isio
n
(c) top-level categories
0.00 0.02 0.04 0.06 0.08 0.10 0.12 0.14 0.16Recall
0.00
0.02
0.04
0.06
0.08
0.10
0.12
0.14
0.16
Prec
isio
n
SCCN(I)SCJ(I)SCT(I)
SCCN(G)SCJ(G)SCT(G)
SND(I)SNCN(I)
SNJ(I)SNNO(I)
SNAA(I)SNPA(I)
(d) Products
0.00 0.02 0.04 0.06 0.08 0.10 0.12 0.14 0.16 0.18Recall
0.00
0.02
0.04
0.06
0.08
0.10
0.12
0.14
0.16
0.18
Prec
isio
n
(e) low-level categories
0.00 0.05 0.10 0.15 0.20 0.25 0.30 0.35 0.40Recall
0.10
0.15
0.20
0.25
0.30
0.35
0.40
Prec
isio
n
(f) top-level categories
0.0000 0.0005 0.0010 0.0015 0.0020 0.0025Recall
0.000
0.001
0.002
0.003
0.004
0.005
0.006
0.007
0.008
0.009
Prec
isio
n
LCCN(FL)LCJ(FL)LCT(FL)
LCCN(SL)LCJ(SL)LCT(SL)
LCCN(ML)LCJ(ML)LCT(ML)
LNCN(L)LNJ(L)LNNO(L)
LNAA(L)LNPA(L)
(g) Products
0.00 0.01 0.02 0.03 0.04 0.05 0.06Recall
0.00
0.01
0.02
0.03
0.04
0.05
0.06
Prec
isio
n
(h) low-level categories
0.0 0.1 0.2 0.3 0.4 0.5 0.6Recall
0.00
0.05
0.10
0.15
0.20
0.25
0.30
0.35
0.40
0.45
Prec
isio
n
(i) top-level categories
Fig. 2. Recall/Precision plots for the single user similarity features derived from themarketplace (a, b, c), social (d, e, f) and location-based (g, h, i) data sources, showingthe performance of each feature for k = 1 - 10 recommended items, low-level categoriesor top-level categories, respectively (RQ1 ). Note: Each feature name in the legends isderived in the following way: the first two letters describe the data source, the subscriptdenotes the user similarity feature and the value in brackets defines the used data field(e.g., SNNO(I) stands for the Social Network data source, the Neighborhood Overlapsimilarity feature and Interactions data field).
driven by the user’s peers rather than by the popular users in the SecondLifesocial network.
In terms of the marketplace and location-based user similarity features, theresults reveal that they do not provide high estimates of accuracy. This is in-teresting since our previous work [10, 22] showed that these features performextremely well in predicting tie strength or social interactions between users.However, the features derived from the marketplace and the location-based datasources provide the best results with respect to Diversity (D) and User Coverage(UC).
Recommending categories. Regarding the tasks of predicting low-leveland top-level categories, the second and third column of Table 2 report the ac-curacy estimates for the different user similarity features based on the extractedcategories. As expected, all user similarity features end up with a much higheraccuracy than for predicting products, especially in the case of top-level cate-gories, because of the lower level of specialization of these recommendation tasks.In the case of the low-level category predictions, the approaches based on socialinteraction features still perform better than the approaches based on features ofthe marketplace or location-based data sources. Interestingly, the content-baseduser similarity features derived from the social network as well as the location-based features, which performed the worst at product predictions, perform muchbetter for low-level categories, now also outperforming the MP baseline.
In the case of the top-level category recommendations, it can be seen that theuser similarity features of all three data sources provide quite similar results interms of recommender accuracy. The approach based on the Jaccard’s coefficientfor categories performs best in terms of nDCG@10, P@10 and R@10. This resultis very interesting since this feature is based on the marketplace data sourcethat provided quite bad results in the case of product predictions. Summedup, we see that user similarity features derived from all data sources are veryuseful indicators for recommendations, although they depend on the level ofspecialization of the recommendation task (RQ1 ).
6.2 Recommendations Based on Combined Data Sources
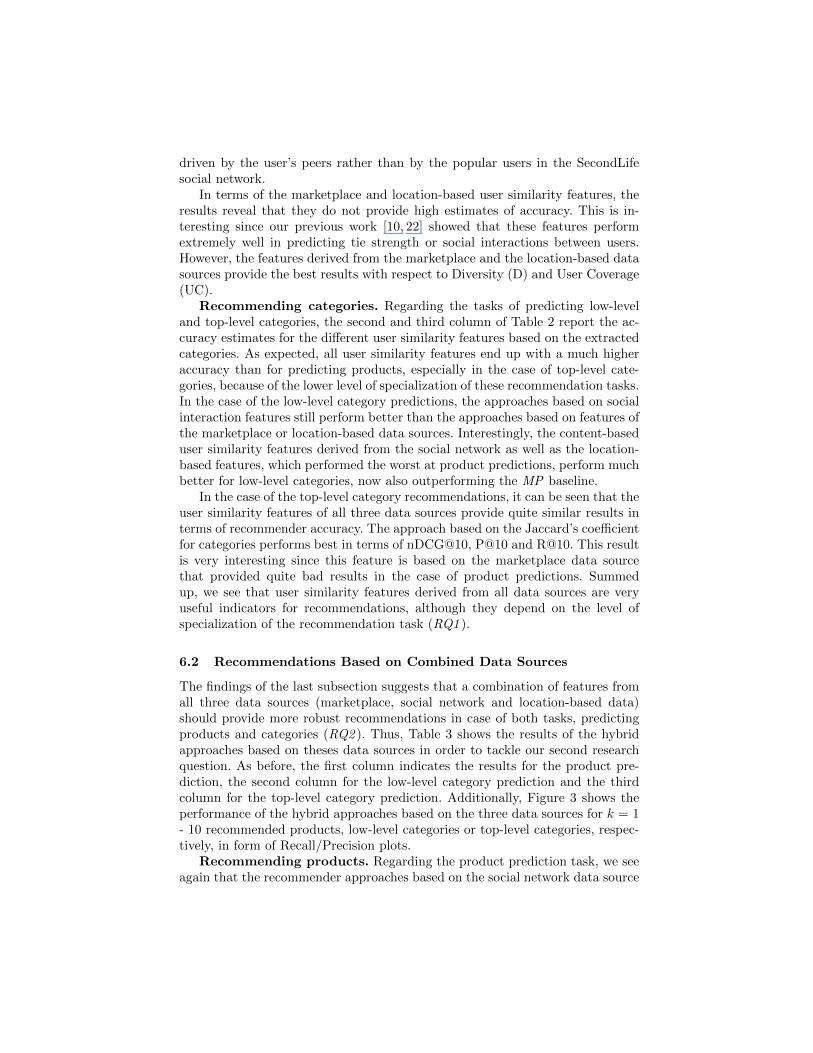
The findings of the last subsection suggests that a combination of features fromall three data sources (marketplace, social network and location-based data)should provide more robust recommendations in case of both tasks, predictingproducts and categories (RQ2 ). Thus, Table 3 shows the results of the hybridapproaches based on theses data sources in order to tackle our second researchquestion. As before, the first column indicates the results for the product pre-diction, the second column for the low-level category prediction and the thirdcolumn for the top-level category prediction. Additionally, Figure 3 shows theperformance of the hybrid approaches based on the three data sources for k = 1- 10 recommended products, low-level categories or top-level categories, respec-tively, in form of Recall/Precision plots.
Recommending products. Regarding the product prediction task, we seeagain that the recommender approaches based on the social network data source

Pro
duct
slo
w-l
evel
cate
gori
esto
p-l
evel
Cate
gori
es
Set
snDCG
@10
P@
10
R@
10
nDCG
@10
P@
10
R@
10
nDCG
@10
P@
10
R@
10
D@
10
UC
Most
Popula
r.0
082
.0021
.0122
.0185
.0207
.0157
.2380
.2730
.2221
.5945
100.0
0%
WeightedSum
Mark
etC
onte
nt
.0151
.0103
.0142
.1051
.0886
.1046
.5232
.4476
.5210
.6421
99.7
9%
Soci
al
Conte
nt
.0030
.0019
.0025
.0702
.0432
.0571
.5555
.3274
.4523
.5603
81.6
5%
Net
work
.1416
.1180
.1450
.2454*
.1416
.1740
.5708
.3385
.4047
.4591
71.5
3%
Com
bin
ed.1418
.1165
.1454
.2104
.1515
.1942
.5901
.4131
.5446
.6245
92.7
0%
Loca
tion
Conte
nt
.0036
.0021
.0030
.0556
.0406
.0556
.5535
.3870
.5535
.6923
100.0
0%
Net
work
.0015
.0007
.0010
.0535
.0284
.0378
.5359
.2672
.3783
.4864
70.5
9%
Com
bin
ed.0
036
.0022
.0031
.0540
.0406
.0540
.5497
.3832
.5497
.6914
100.0
0%
Com
bin
ed.1460*
.1187*
.1493*
.2163
.1708
.2159
.5978*
.4656
.5965*
.6642
100.0
0%
Com
bin
edT
op
3.1
459
.1186
.1475
.2161
.1801*
.2161*
.5829
.4898*
.5829
.6530
100.0
0%
Table
3.
Res
ult
sfo
rth
ehybri
dappro
ach
esbase
don
our
thre
edata
sourc
esfo
rth
eta
sks
of
pre
dic
ting
pro
duct
s,lo
w-l
evel
cate
gori
esand
top-l
evel
cate
gori
es.
The
resu
lts
show
that
all
thre
edata
sourc
es(m
ark
etpla
ce,
soci
al
net
work
and
loca
tion-b
ase
ddata
)are
imp
ort
ant
indic
ato
rsfo
rca
lcula
ting
reco
mm
endati
ons,
since
ahybri
dco
mbin
ati
on
of
all
data
sourc
espro
vid
edth
eb
est
resu
lts
inca
seof
pre
dic
ting
pro
duct
s,lo
w-l
evel
cate
gori
esand
top-l
evel
cate
gori
es(R
Q2
).Note:
Bold
num
ber
sin
dic
ate
the
hig
hes
tacc
ura
cyva
lues
acr
oss
the
data
sourc
esand
“*”
indic
ate
the
over
all
hig
hes
tacc
ura
cyes
tim
ate
s.

0.00 0.02 0.04 0.06 0.08 0.10 0.12 0.14 0.16Recall
0.00
0.02
0.04
0.06
0.08
0.10
0.12
0.14
0.16
Prec
isio
n
MContent
SContentSNetworkSCombined
LContentLNetwork
LCombinedCombined
Top3
(a) Products
0.00 0.05 0.10 0.15 0.20 0.25Recall
0.00
0.05
0.10
0.15
0.20
0.25
Prec
isio
n
(b) low-level categories
0.0 0.1 0.2 0.3 0.4 0.5 0.6Recall
0.20
0.25
0.30
0.35
0.40
0.45
0.50
0.55
Prec
isio
n
(c) top-level categories
Fig. 3. Recall/Precision plots for the hybrid approaches showing the performance ofeach data source for k = 1 - 10 recommended products, low-level categories or top-levelcategories, respectively (RQ2 ).
clearly outperform the ones based on the marketplace and location-based datasources as well as the MP baseline. Furthermore, when combining all three datasources, not only the overall recommendation accuracy is increased with respectto nDCG@10, P@10 and R@10, but also the User Coverage (UC) is increasedto the maximum of 100%.
This means that the hybrid approach combines the strengths of the usersimilarity features of all three data sources in order to be capable of providingaccurate recommendations for all users in the datasets. Another hybrid approachshown in Table 3 combines only the best user similarity features from each datasource (referred to as Top 3 ) and reaches higher accuracy estimates, but lowerDiversity (D).
Recommending categories. In contrast to the results of the product pre-dictions, that showed that the recommender based on the social network datasource clearly outperforms the recommenders based on the marketplace andlocation-based data sources, the results of the category predictions (second andthird column of Table 3) do not show that big differences between the threedata sources. With respect to the low-level category predictions, we again ob-serve that the recommender based on the social network data source still providesthe highest accuracy estimates.
Interestingly, in this case also the recommenders based on the other twodata sources provide reasonable results, which has not been the case of predict-ing products, where the location-based recommender even was outperformed bythe MP baseline. Based on these results we would assume that marketplaceand location-based data sources are suitable of providing accurate predictionsin more general recommendation tasks. The results for the top-level categorypredictions prove this assumption since in this case the recommenders based onmarketplace and location-based data sources even provide better results in termsof recommender accuracy, Diversity and User Coverage than the one based on

social network data in case of the content-based features. As before, the com-bination of all three data sources provide again the best results. Summed up,this results prove our assumption derived from RQ1, that all three data sourcesare important for calculating recommendations, since a combination of all datasources provided the best results in case of predicting products, low-level cate-gories and top-level categories (RQ2 ).
7 Conclusions & Future Work
In this work we presented first results of a recently started project that triesto utilize various user similarity features derived from three data sources (mar-ketplace, social network and location-based data) to recommend products andpoints of interests (i.e., low-level and top-level categories) to people in an onlinemarketplace setting. This section concludes the paper with respect to our tworesearch questions and gives an outlook into the future.
The first research question of this work (RQ1 ) dealt with the question asto which extent user similarity features derived from marketplace, social net-work and location-based data sources can be utilized for the recommendationof products and categories in online marketplaces. To tackle this question weimplemented various user-based Collaborative Filtering (CF) approaches basedon the user similarity features from the data sources and tested them isolated.As the results have shown, the user-based CF approaches that utilize features ofonline social network data to calculate the similarities between users performedbest in case of predicting products, significantly outperforming the other ap-proaches relying on both – marketplace and location-based user data. However,this behavior changed in the case of predicting low-level and top-level categorieswhere the differences between the three data sources got substantially smaller.Surprisingly, with respect to the top-level category predictions, the marketplaceand location-based features even reached the highest results in terms of accuracy,Diversity (D) and User Coverage (UC).
These results showed that user similarity features of all three data sourcesare important indicators for recommendations and suggests that combining themshould result into more robust recommendations, especially in cases of multiplerecommendation tasks on different levels of specialization (topics and categories).Thus, our second research question (RQ2 ) tried to tackle the question if the dif-ferent marketplace, social network and location-based user similarity featuresand data sources can be combined in order to create a hybrid recommender thatprovides more robust recommendations in terms of prediction accuracy, diversityand user coverage. In order to address this question we implemented and evalu-ated hybrid recommenders that combined the features of the data sources. Theresults proved our assumption and showed that hybrid recommender that com-bined user similarity features of all three data sources provided the best resultsacross all accuracy metrics (nDCG@10, P@10, R@10) and all settings (product,low-level category and top-level category recommendations). Moreover, this hy-

brid recommender also provided a User Coverage of 100% and thus, is able toprovide these accurate recommendation to all users in the datasets.
Although the results of this study are based on a dataset obtained from thevirtual world SecondLife, we believe that it bears great potential to create asequence of interesting studies that may have implications for the “real” world(see e.g., [23]). For instance, one of the potential interesting issues we are cur-rently exploring is predicting products and categories to users in a cold-startsetting (i.e., for users that only have purchases a few or even no products inthe past) by a diversity of features. Other important work we plan is the use ofstate-of-the-art model-based approaches in order to assess whether the signalsextracted from similarity features in the current analysis can be replicated (inthe case of social data) or improved (in the case of location data) for differentrecommendation tasks.
We have also shown that using the interaction information between usersimproves not only the task of product recommendation, but also the recom-mendation of low-level and top-level categories. Thus, we are also interested instudying the extent to which recommendations can be improved by utilizingcontent-based similarity features derived from the users’ social streams.
Acknowledgments This work is supported by the Know-Center and the EUfunded project Learning Layers (Grant Agreement 318209). Moreover, parts ofthis work were carried out during the tenure of an ERCIM “Alain Bensoussan”fellowship programme. The Learning Layers project is supported by the Euro-pean Commission within the 7th Framework Program, under the DG Informa-tion society and Media (E3), unit of Cultural heritage and technology-enhancedlearning. The Know-Center is funded within the Austrian COMET Program -Competence Centers for Excellent Technologies - under the auspices of the Aus-trian Ministry of Transport, Innovation and Technology, the Austrian Ministryof Economics and Labor and by the State of Styria. COMET is managed by theAustrian Research Promotion Agency (FFG).
References
1. Zhang, Y., Pennacchiotti, M.: Predicting purchase behaviors from social media.In: Proc. WWW ’13 (2013) 1521–1532
2. Guo, S., Wang, M., Leskovec, J.: The role of social networks in online shopping:Information passing, price of trust, and consumer choice. In: Proc. EC ’11, ACM(2011) 157–166
3. Trattner, C., Parra, D., Eberhard, L., Wen, X.: Who will trade with whom?:Predicting buyer-seller interactions in online trading platforms through social net-works. In: Proc. WWW ’14, ACM (2014) 387–388
4. Ma, H., Zhou, D., Liu, C., Lyu, M.R., King, I.: Recommender systems with socialregularization. In: Proc. WSDM ’11, ACM (2011) 287–296
5. Jamali, M., Ester, M.: A matrix factorization technique with trust propagation forrecommendation in social networks. In: Proc. RecSys ’10, New York, NY, USA,ACM (2010) 135–142

6. Bischoff, K.: We love rock’n’roll: analyzing and predicting friendship links inLast.fm. In: Proc. WebSci ’12, ACM (2012) 47–56
7. Feng, W., Wang, J.: Incorporating heterogeneous information for personalizedtag recommendation in social tagging systems. In: Proc. KDD ’12, ACM (2012)1276–1284
8. Delporte, J., Karatzoglou, A., Matuszczyk, T., Canu, S.: Socially enabled prefer-ence learning from implicit feedback data. In: Machine Learning and KnowledgeDiscovery in Databases. Volume 8189 of LNCS. Springer Berlin Heidelberg (2013)145–160
9. Lacic, E., Kowald, D., Parra, D., Kahr, M., Trattner, C.: Towards a scalable socialrecommender engine for online marketplaces: The case of apache solr. In: Proc.WWW ’14, ACM (2014) 817–822
10. Steurer, M., Trattner, C.: Acquaintance or Partner? Predicting Partnership inOnline and Location-Based Social Networks. In: Proc. ASONAM’13, IEEE/ACM(2013)
11. Adamic, L., Adar, E.: Friends and neighbors on the web. Social networks 25 (2003)211–230
12. Cranshaw, J., Toch, E., Hong, J., Kittur, A., Sadeh, N.: Bridging the gap betweenphysical location and online social networks. In: Proceedings of the 12th ACMinternational conference on Ubiquitous computing, ACM (2010) 119–128
13. Barabasi, A., Albert, R.: Emergence of scaling in random networks. science 286(1999) 509–512
14. Lacic, E., Kowald, D., Trattner, C.: Socrecm: A scalable social recommender enginefor online marketplaces. In: Proc. HT ’14 (2014) 308–310
15. Schafer, J.B., Frankowski, D., Herlocker, J., Sen, S.: Collaborative filtering recom-mender systems. In: The adaptive web. Springer (2007) 291–324
16. Bostandjiev, S., O’Donovan, J., Hollerer, T.: Tasteweights: a visual interactivehybrid recommender system. In: Proc. RecSys ’12, ACM (2012) 35–42
17. Smyth, B., McClave, P.: Similarity vs. diversity. In Aha, D., Watson, I., eds.: Case-Based Reasoning Research and Development. Volume 2080 of LNCS. Springer(2001) 347–361
18. Herlocker, J.L., Konstan, J.A., Terveen, L.G., Riedl, J.T.: Evaluating collaborativefiltering recommender systems. ACM Transactions on Information Systems (TOIS)22 (2004) 5–53
19. Van Rijsbergen, C.J.: Foundation of evaluation. Journal of Documentation 30(1974) 365–373
20. Parra, D., Sahebi, S.: Recommender systems : Sources of knowledge and evalua-tion metrics. In: Advanced Techniques in Web Intelligence-2: Web User BrowsingBehaviour and Preference Analysis. Springer-Verlag (2013) 149–175
21. Ge, M., Delgado-Battenfeld, C., Jannach, D.: Beyond accuracy: evaluating recom-mender systems by coverage and serendipity. In: Proceedings of the fourth ACMconference on Recommender systems, ACM (2010) 257–260
22. Steurer, M., Trattner, C.: Predicting interactions in online social networks: anexperiment in second life. In: Proceedings of the 4th International Workshop onModeling Social Media, ACM (2013) 5
23. Szell, M., Sinatra, R., Petri, G., Thurner, S., Latora, V.: Understanding mobilityin a social petri dish. Scientific reports 2 (2012)