A Preclinical Pipeline for Translational Precision Medicine ...
Upload
washingtonCategory
view
1download
0
Utility of Survival Motor Neuron ELISA for SpinalMuscular Atrophy Clinical and Preclinical AnalysesDione T. Kobayashi1*, Rory J. Olson2, Laurel Sly3, Chad J. Swanson1, Brett Chung1, Nikolai Naryshkin4,
Jana Narasimhan4, Anuradha Bhattacharyya4, Michael Mullenix2, Karen S. Chen1
1 Spinal Muscular Atrophy Foundation, New York, New York, United States of America, 2 Enzo Life Sciences Inc., Ann Arbor, Michigan, United States of America,
3 PharmOptima LLC, Portage, Michigan, United States of America, 4 PTC Therapeutics Inc., South Plainfield, New Jersey, United States of America
Abstract
Objectives: Genetic defects leading to the reduction of the survival motor neuron protein (SMN) are a causal factor forSpinal Muscular Atrophy (SMA). While there are a number of therapies under evaluation as potential treatments for SMA,there is a critical lack of a biomarker method for assessing efficacy of therapeutic interventions, particularly those targetingupregulation of SMN protein levels. Towards this end we have engaged in developing an immunoassay capable ofaccurately measuring SMN protein levels in blood, specifically in peripheral blood mononuclear cells (PBMCs), as a tool forvalidating SMN protein as a biomarker in SMA.
Methods: A sandwich enzyme-linked immunosorbent assay (ELISA) was developed and validated for measuring SMNprotein in human PBMCs and other cell lysates. Protocols for detection and extraction of SMN from transgenic SMA mousetissues were also developed.
Results: The assay sensitivity for human SMN is 50 pg/mL. Initial analysis reveals that PBMCs yield enough SMN to analyzefrom blood volumes of less than 1 mL, and SMA Type I patients’ PBMCs show ,90% reduction of SMN protein compared tonormal adults. The ELISA can reliably quantify SMN protein in human and mouse PBMCs and muscle, as well as brain, andspinal cord from a mouse model of severe SMA.
Conclusions: This SMN ELISA assay enables the reliable, quantitative and rapid measurement of SMN in healthy human andSMA patient PBMCs, muscle and fibroblasts. SMN was also detected in several tissues in a mouse model of SMA, as well as inwildtype mouse tissues. This SMN ELISA has general translational applicability to both preclinical and clinical researchefforts.
Citation: Kobayashi DT, Olson RJ, Sly L, Swanson CJ, Chung B, et al. (2011) Utility of Survival Motor Neuron ELISA for Spinal Muscular Atrophy Clinical andPreclinical Analyses. PLoS ONE 6(8): e24269. doi:10.1371/journal.pone.0024269
Editor: Malu G. Tansey, Emory University, United States of America
Received March 29, 2011; Accepted August 4, 2011; Published August 31, 2011
Copyright: � 2011 Kobayashi et al. This is an open-access article distributed under the terms of the Creative Commons Attribution License, which permitsunrestricted use, distribution, and reproduction in any medium, provided the original author and source are credited.
Funding: The development and testing of the SMN ELISA was funded solely by the SMA Foundation, a non-profit charity focused on accelerating therapies forSMA. DK, BC, KS are employees of the funding organization and are co-authors involved in the study design, data analysis, decision to publish, and preparation ofthe manuscript. RJO and MM are employees and shareholders of Enzo Life Sciences Inc. NN, JN, and AB are employees of PTC Therapeutics Inc. LS is an employeeof PharmOptima. These authors were also involved in the study design, data analysis, decision to publish, and preparation of the manuscript.
Competing Interests: The authors have read the journal’s policy and have the following conflicts: RJO and MM are employees and shareholders of Enzo LifeSciences Inc.; the company manufactures, markets and sells the SMN ELISA described in this manuscript. NN, JN, and AB are employees of PTC Therapeutics Inc.,that develops treatments that may eventually be marketed and whose SMA drug development program is partially funded by the SMA Foundation. LS is anemployee of PharmOptima, a contract research organization that was paid by the SMA Foundation to test human and mouse tissues in the SMN ELISA. There areno other patents, products in development, or marketed products to declare. This does not alter the authors’ adherence to all the PLoS ONE policies on sharingdata and materials.
* E-mail: [email protected]
Introduction
Spinal Muscular Atrophy (SMA) is a progressive neuromuscular
disease typified by severe proximal weakness and degeneration of
alpha motor neurons in the anterior horn of the spinal cord [1,2].
SMA is a relatively common monogenetic disorder among rare
diseases with a carrier rate of 1 in 35 to 1 in 50 and incidence of 1
in 6000 to 1 in 10000 live births, with a majority of cases
presenting in childhood [2–4]. SMA is the foremost cause of
infantile death among genetic disorders, though the natural history
of the disease is evolving due to changes in patient management.
Clinically SMA presents as a spectrum of phenotypes, with the
most severe cases manifesting symptoms by six months of age with
the child never gaining the ability to sit independently and often
resulting in death (Type I). SMA patients with milder disease have
later onset that presents in between six months of age to the third
or fourth decade of life and achieve higher levels of motor
function, gaining the ability to sit (Type II) or stand (Type III)
though over time patients may progressively lose function and may
display characteristics of more severe SMA. The variability in
clinical manifestation of SMA is driven by the unique genetics that
give rise to the disease. SMA is caused by deletion or mutational
inactivation of the Survival of Motor Neuron 1 (SMN1) gene.
Humans also carry a second nearly identical copy of the SMN
gene called SMN2 [5]. Both the SMN1 and SMN2 genes express
SMN protein, however, the amount of functional full-length
PLoS ONE | www.plosone.org 1 August 2011 | Volume 6 | Issue 8 | e24269
protein produced by SMN2 is much less (by 70–90%) than that
produced by SMN1 [5–7]. The SMN2 gene features a C-T
replacement in exon 7 that preferentially promotes an alternative
splicing pattern that excludes exon 7, resulting in production of an
unstable, partially functional truncated SMND7 protein [8].
Although SMN2 cannot completely compensate for the loss of
the SMN1 gene, patients with milder forms of SMA generally have
higher SMN2 copy numbers, and this phenomenon has been
recapitulated in several transgenic mouse models of SMA [9,10].
This inverse relationship between SMA severity and SMN2
expression provides a strong biological rationale for developing
SMA therapeutics that upregulate SMN expression.
Currently SMN upregulation is being aggressively pursued as an
SMA therapeutic approach by several investigators. These
approaches span the gamut from histone deacetylase (HDAC)
inhibitors (e.g. valproic acid, phenylbutyrate, LBH589, SAHA and
trichostatin A) that act via multiple mechanisms to increase SMN
levels [11–17], small molecules that promote the inclusion of
SMN2 exon 7, read-through of the aberrant stop codon in the
SMND7 mRNA or promote SMN transcription (e.g. aminogly-
cosides, hydroxyurea, salbutamol, SMN2 antisense oligonucleo-
tides, tetracycline derivatives) [18–21], gene replacement of SMN1
[22–24], proteasome inhibitors (e.g. MG132, bortezomib ) [25] or
other mechanisms (e.g. D157495, hydroxyurea, indoprofen
analogues) [26–31]. While proof of concept for SMN protein
increases have been achieved experimentally in fibroblast and
other cell lines derived from SMA patients and even in transgenic
SMA mouse models for several of these studies, in the majority of
cases SMN levels are being quantified using western blot analysis.
Western blot analysis is both time consuming and not fully
quantitative, making it a less than ideal tool for assessing SMN
levels.
As some of these SMN-targeting approaches evolve into
preclinical drug candidates and ultimately enter clinical trials a
critical need for a SMN protein measurement tool that is rapid,
quantitative, permits a greater throughput for sample testing and is
manufactured using standardized processes to maximize repro-
ducibility of measurements has emerged. A number of useful SMN
immunoassays have been reported and shown to detect differences
in SMN levels in blood and/or fibroblast cells from SMA patients,
and to detect therapeutic-induced changes in SMN levels in
similar tissues [32–34]. While they are of great potential value for
drug development, the previously reported assays have not been
scaled up for production or validated for use in SMA animal
models, and represent a gap in the translation of efficacy results in
preclinical testing to measurements in human tissues.
Here we describe the development and application of an SMN
enzyme-linked immunosorbent assay (ELISA) that uses a recom-
binant human SMN protein standard and a capture antibody
commonly used in SMA research. The sensitivity of the assay is
50 pg/mL for human SMN. It has been validated for detection of
SMN in human peripheral blood mononuclear cells (PBMCs) and
has been used to measure SMN protein in brain, spinal cord, liver
heart, skin and muscle tissues in a widely used transgenic mouse
model of severe SMA. Furthermore, SMN protein was measured
in mouse PBMCs, providing a template for analysis and
comparison of SMN levels that could bridge drug-induced SMN
increases in peripherally available tissue to inaccessible human
tissues in clinical studies. Lastly we demonstrate the ability of the
assay to measure SMN reliably in human tissue homogenates, as
well as in treated cultures from SMA patients, broadening the
potential utility of the assay for use in clinical trials and
examinations of the natural history of SMA. While the precise
relationship between SMA severity and SMN protein levels
remains to be defined in these tissues, the SMN ELISA offers the
opportunity to address this and other questions of fundamental
biology and drug-specific pharmacodynamics of SMN expression.
Results
Human SMN protein standardRecombinant human SMN was generated from full-length
cDNA expressed in E. coli containing the pET28a/hSMN-His/
TEV vector and purified for use as a standard in the ELISA. After
inducing hSMN expression with ITPG, cells were harvested and
lysed, with further treatment to extract hSMN from inclusion
bodies within cell pellets. The resulting suspension was purified
and concentrated over a HiTrap chelating column charged with
NiCl2. The recombinant protein was greater than 95% pure as
determined by SDS-PAGE and densitometry measurements (data
not shown), and was used as a reagent in subsequent ELISA
experiments.
Optimization of assay conditions and reagentsSeveral conditions for optimized SMN signal detection were
explored. These parameters included plate coating buffer pH,
antibody coating concentrations, and incubation times. The basic
reagents used in early optimization experiments were the Sigma
2B1 antibody for the capture antibody, the SC-15320 antibody for
the detection antibody and a recombinant SMN protein as the
ELISA standard. Conditions that produced the greatest SMN
signals in each experiment were selected and incorporated into the
protocol for each optimization analysis that followed.
The coating titration analysis indicated maximal efficiency using
3.5 mg/mL of 2B1 with the using the 10 mM PO4 15 mM NaCl
pH 7.2 coating solution (Figure S1, S2). The detection antibody
was titred to determine the best signal-to-noise ratio for the
standard. A detection antibody concentration of 1.5 mg/mL was
selected for further testing (Figure S3). Subsequently, both antigen
and detection antibodies were tested for 1 and 2 hour incubations,
with 30 minute incubations in peroxidase-conjugated goat anti-
rabbit secondary antibody and TMB substrate. As no benefits
were seen from longer incubations, antigens and detection
antibodies were used with 1 hour incubations in all subsequent
tests (data not shown). Several reagents were assessed for the ability
to interfere with the assay and SDS and sodium deoxycholate were
found to strongly interfere with the SMN measurements in the
assay. The interference results are summarized in Table S1.
Detection antibodies from Santa Cruz Biotechnology, Novus
Biologicals, ProteinTech, and Aviva Systems Biology were tested.
Other commonly used SMN antibodies were not tested due to
similarities in their SMN N-terminal epitope to 2B1 antibody or to
the 2B1 mouse antibody isotype (IgG1). The reactivity to the
recombinant human SMN protein was similar between the Aviva
and the SC-15320 antibodies while the Novus antibody did not
react to the antigen; however, the ProteinTech antibody had 4-
fold greater reactance to the protein standard (Table S2). As all of
the antibodies reacted to HeLa lysates with the same affinity, the
ProteinTech antibody that was most sensitive to the SMN protein
standard was chosen for further experiments.
Three extraction buffers were tested with frozen PBMCs that
were pelleted and resuspended at 1 mL of buffer per 108 cells.
PBMC lysates were tested against the human SMN standard
protein at 0.063 to 4 ng/mL for the ProteinTech antibody 11708-
1-AP and at 0.25–16 ng/mL for the SC-15320 antibody. The
greatest SMN signal with the lowest variability and broadest
dynamic range was seen with the combination of ER4 and the
ProteinTech antibody (Table S3).
Translational ELISA Detection of SMN
PLoS ONE | www.plosone.org 2 August 2011 | Volume 6 | Issue 8 | e24269

SMN ELISA reagents and PBMC lysisThe SMN ELISA utilizes a mouse monoclonal antibody raised
from immunization with full length SMN protein (2B1), an
affinity-purified rabbit polyclonal antibody raised against a GST-
tagged SMND7 protein (11708-AP-1), and a recombinant human
SMN protein standard. The 2B1 antibody is immobilized on the
plate surface and binds with high affinity to the N-terminus within
the first 27 amino acids of the SMN protein [35]. The 11708-1-AP
antibody binds to the captured SMN and is subsequently detected
using a horseradish peroxidase-conjugated goat anti-rabbit
polyclonal antibody. Prior to the assay, PBMCs are lysed in a
detergent containing buffer and diluted into an assay diluent. A
summary of ELISA characteristics is given in Table 1.
SMN detection, assay linearity and recovery in donorPBMCs
The SMN ELISA was run under optimized conditions with the
SMN protein standard to determine interassay variability and
assay sensitivity. SMN levels were calculated using 3 separate
experiments (N = 6) with the recombinant hSMN standard titrated
from 0 to 3200 pg/mL (Figure 1A, Table 1). The results from the
assays indicate that the lower detection limit or sensitivity of the
assay is 50 pg/mL, as this is the concentration two standard
deviations above background (Table 1). In addition the interassay
variability was low, with coefficients of variance (CVs) between 4.3
and 10.6% (Table 1). HeLa lysates were serially diluted 1:4 to
1:512 in assay buffer from a starting undiluted concentration of
16106 HeLa cells/mL and compared to the same dilutions using
the hSMN standard. SMN protein levels were detected in all
samples and dilutions with the signal being linear in the 1:4 to 1:32
range. Parallelism between HeLa lysate dilutions from 1:4 to 1:32
and dilutions of the recombinant hSMN standard was observed,
indicating that the antibody binding characteristics of lysates and
the standard are similar and the assay SMN protein concentration
calculation in the assay is accurate (Figure 1B). Six separate lots of
healthy donor PBMCs were acquired (AllCells lots A1681, 1691,
A1761, A1776, A1788, A1802) and counted, and cell titrations
from these lots were analyzed for SMN protein using the ELISA
(Figure 1C). SMN protein levels varied by nearly 3-fold between
individuals and the average value for the samples were 70.2 pg/
106 cells.
Validity and comparability of SMN signal detectionTo confirm the specificity of SMN signal detection by the
ELISA, SMN protein was quantified in GM03813 cells in both the
ELISA and western blots after siRNA knockdown. SMN levels
were comparable between Western blot and SMN ELISA
(Figure 2), confirming the specificity of the SMN signal detected
by ELISA in these cells. When quantified as percentage of protein
versus mock transfection or as a ratio of SMN to GAPDH signal in
Western blot, the SMN levels were reduced by 80–85%; ELISA
SMN levels were reduced by 86% of the mock transfection levels
(Figure 2A). While no obvious dose-effect was seen from 10 and
50 nM siRNA knockdown, error bars were observed to be smaller
with the ELISA analysis.
Table 1. Summary of SMN ELISA Characteristics.
hSMN Standard Curve Dynamic range 3200-50 pg/mL
Reproducibility ,11% CV
Sensitivity limit 50 pg/mL
Freeze Thaw Thaw 1 recovery 102%
Thaw 2 recovery 112%
Thaw 3 recovery 79%
PBMC Dilution Linearity 1:4 88–106% (98%)
1:8 93–109% (102%)
1:16 95–112% (105%)
1:32 100%
PBMC SMN Spike Recovery 267 pg/mL spike 88–116% (100%)
(1:4 PBMC dilution) 667 pg/mL spike 95–137% (105%)
1667 pg/mL spike 79–131% (99%)
Minimum Sample Dilutions Human PBMCs 1:4
Human Muscle 1:5
Mouse, Non-Human Primate PBMCs 1:4
Mouse Brain, Fat, Heart, Liver, Muscle, Skin, Spinal Cord 1:5–1:20
Mouse Brain Subregions and Sciatic Nerve 1:4–1:20
The hSMN Standard Curve: Dynamic range was generated using N = 6 curves from N = 3 experiments. Reproducibility ranged from 4.3–10.6% CVs. The sensitivity limitwas derived from the extrapolated value of SMN signal taken at 2 standard deviations above the background level of the assay. Freeze Thaw: The freeze thawexperiment was conducted using a single normal human PBMC sample with a 1:4 lysate dilution. No reduction in SMN signal was seen with up to two freeze thawcycles. Recovery was calculated as the mean percentage of SMN signal from a series of up to three sequential freeze thaw cycles compared to the signal from thesample analyzed at the time of cell lysis. PBMC Dilutional Linearity: PBMCs were lysed and diluted from 1:4 to 1:32 to assess linearity of sample signal upon dilution.Dilution values were 65–12% for all analyses with means ranging from 98 to 105%. PBMC SMN Spike Recovery: Using a 1:4 lysis dilution PBMC samples were spiked with0, 267, 667 or 1667 pg/mL of the recombinant human SMN used as a standard in the ELISA. The SMN spike signal recovery was calculated based on the expected valuefrom adding the additional SMN to the value produced by the non-spiked samples. Values ranged by +5–37% over the non-spiked signal with mean values rangingfrom 99–105%, suggesting that accurate analysis of SMN in samples with increased SMN levels is possible, and may benefit from greater sample dilutions. The SMNspike was added into the PBMC mixture at the time of lysis. Minimum Sample Dilutions: Given the differences in sample masses and protein concentrations, differenttissue dilutions of mL lysis buffer/mg tissue were used for the SMN protein analysis ranging from 1:2 to 1:20.doi:10.1371/journal.pone.0024269.t001
Translational ELISA Detection of SMN
PLoS ONE | www.plosone.org 3 August 2011 | Volume 6 | Issue 8 | e24269

Figure 1. ELISA Performance, parallelism and detection of SMN in human PBMCs. A: The recombinant hSMN standard curve datadeveloped from N = 6 curves were highly reproducible with standard deviations of about 60.23 OD unit variations. The dotted lines surrounding thedose-response curve represent 2 standard deviations. B: Comparison of SMN signal detection between recombinant human SMN (dilutions from 1:4to 1:256) and SMN extracted from HeLa cell lysates (1:4–1:32) revealed a high degree of parallelism between reagents, allowing for accurateevaluation of native SMN protein using the recombinant SMN ELISA standard. C: The SMN ELISA detected protein in adult donor PBMCs; valuesranged from 86 to 229 pg SMN per well at a dilution of 1:4 and an average of 70.2 pg SMN protein per 106 cells. 107 PBMCs diluted 1:4 through 1:32produced linear SMN protein levels. Even with only N = 6 normal samples, SMN levels in PBMCs varied by nearly 3-fold. Error bars represent standarddeviations.doi:10.1371/journal.pone.0024269.g001
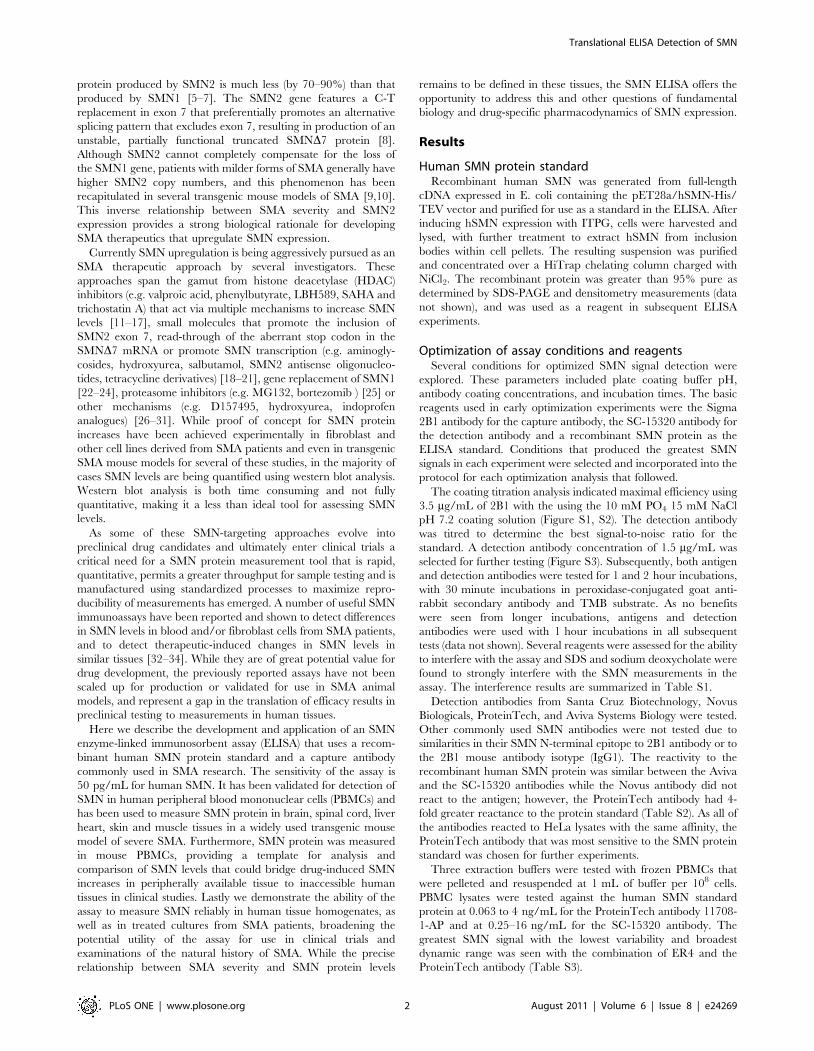
Figure 2. Specificity of SMN ELISA signal detection. To confirm that ELISA signals are specific to SMN protein, SMA Type I fibroblasts weretreated with siRNA to knock down the expression of SMN protein. Treated cells were lysed and read in the ELISA and an SMN Western blot. A:GM03813 SMN protein levels are reduced by 80–86% compared to mock transfected cells in both Western blot and ELISA analysis. B: The image ofthe SMN Western blot visually corroborates the reduction in SMN levels induced by siRNA knockdown.doi:10.1371/journal.pone.0024269.g002
Translational ELISA Detection of SMN
PLoS ONE | www.plosone.org 4 August 2011 | Volume 6 | Issue 8 | e24269

Lysates from PBMC donor lots were used to measure recovery
of spiked recombinant SMN, to evaluate native SMN resistance to
freeze and thaw conditions, and to determine levels of native SMN
in monocyte and lymphocyte subpopulations. In the spike and
recovery experiment, recombinant hSMN antigen at concentra-
tions of 267, 667 and 1667 pg/mL were added to PBMC lysate
samples diluted 1:2 and 1:4 in assay buffer and run in the assay.
The recoveries were not reproducible in 1:2 diluted cell lysates
(data not shown). The mean recovery was 101% using a 1:4
diluted cell lysate (Table 1). PBMC lysates were also tested for
stability after multiple freeze-thaw cycles. PBMC lysate from
donor A1761 was assessed for SMN protein stability after 0, 1, 2,
and 3 freeze thaws (Table 1). After 3 freeze thaw cycles a 21%
decrease in protein detection was observed, suggesting that PBMC
lysates can withstand up to 2 freeze-thaws without an impact on
SMN detection. To determine if PBMC subpopulations express
different levels of SMN, PBMCs were separated into lymphocyte
and monocyte populations using Miltenyi magnetic beads prior to
analysis. The average SMN levels for lymphocytes and monocytes
were 9.1 and 12.2 pg SMN per 106 cells respectively (Figure 3).
The data were not statistically different suggesting no discernable
difference in SMN levels in lymphocytes and monocytes.
Given the results from the cell titration and recombinant hSMN
spiking experiments, 1:4 was chosen as the minimum PBMC lysate
dilution out of extraction buffer for subsequent experiments.
SMN protein in Type I SMA patient PBMCsThe results from the analysis of 6 lots of healthy adult donor
PBMCs and subsequent assay validation studies indicated that
SMN ELISA could detect SMN protein in lysates from as few as
312,000 cells in healthy donor cells, and that the assay could detect
down to 3.6 pg of hSMN per well. Based upon the assay limits of
detection, the ELISA would likely reliably detect SMN levels that
were as low as ,10% of the amount found in the average healthy
PBMC donor. Therefore the assay was predicted to be capable of
measuring SMN in at least some samples from the SMA Type I
patients who are expected to have the lowest levels of SMN.
To confirm the ability of the assay to detect the low levels of
SMN expected in SMA, 0.5 mL aliquots of PBMC samples in
freezing medium were obtained from University of Utah (kindly
provided by Dr. Kathryn Swoboda). The samples represented a
spectrum of severe disease in Type I SMA and were collected from
children who ranged in age from one day through nine months of
age (Sample #182, 206, 211,255). Cell counts from the samples
ranged from 4.056106 to 7.66107 cells. All samples were lysed
with 1 mL of lysis buffer with the exception of sample #211 which
had a low count and was lysed in 0.5 mL of lysis buffer. As shown
in Figure 4, the average SMN level in the 6 healthy adult donors
was 70.2 pg SMN/106 cells. In contrast the average SMN protein
level from SMA Type 1 PBMCs was 8.3 pg/ 106 cells (Figure 4),
only 12% of levels in healthy adult PBMCs.
Detection of SMN in human buccal cells, saliva, and urineSeveral other human fluids and tissues were acquired and tested
to determine if the ELISA could detect SMN signals in other
peripherally accessible matrices. Evaluation of plasma, saliva and
urine for SMN protein did not produce detectable signals at any
dilution, while the PBMCs from the same donors yielded signals in
the expected range for that matrix (3.4–10.4 ng/mg).
Measurement of SMN in human muscleFour skeletal muscle samples from 3 individuals were homog-
enized in ER4. One sample was from a 37 year old male
(#6181A1, unknown muscle type), 2 samples from a 69 year old
female (#9834B1 tibialis anterior and #9846A1, unknown muscle
type) and 1 sample from a 97 year old female (#7103A1,
diaphragm) were prepared at 1:5 dilutions. In samples #6181A1
and #7103A1, fatty material was visible in the muscle before and
after homogenization. Protein concentrations ranged from 1.36 to
6.92 mg/mL and the two samples with greater fat content had the
two lowest yields of total protein (Table 2). SMN protein was
detectable in all homogenates, with concentration ranging from
454 to 2230 pg/mL (Table 2). The concentration of desmin, a
muscle-specific protein, was also quantified using an ELISA for
human desmin and the concentration ranged from 1.39 to
18.5 ng/mL. SMN levels were normalized to either total soluble
protein or desmin and both normalized data agreed with each
other, suggesting that neither measurement presents an obvious
advantage for normalizing SMN levels.
Figure 3. Quantitation of SMN by PBMC subtype. There was nosignificant difference in SMN protein levels between human lympho-cytes and monocytes fractions separated from PBMCs. SMN protein wasdetectable in the majority of samples for both cell types, ranging from6.8–25.8 pg/106 cells for lymphocytes and 8–17.5 pg/106 cells formonocytes. Error bars represent standard deviations.doi:10.1371/journal.pone.0024269.g003
Figure 4. Detection of SMN Protein in SMNA Type 1 PBMCs.SMA Type I patient samples (N = 4) were tested in the SMN ELISA atdilutions of 1:4 with 1.256106 and 2.56106 PBMCs. SMN protein signalwas detected in all samples, with an average of 8.32 pg SMN proteinper 106 cells. Based on the average of 70.2 pg SMN protein per 106 cellscalculated for adult normal donor PBMCs, the amount of SMN protein inPBMCs of Type I SMA patients in this patient cohort is 88% less thannormal. Error bars represent standard deviations.doi:10.1371/journal.pone.0024269.g004
Translational ELISA Detection of SMN
PLoS ONE | www.plosone.org 5 August 2011 | Volume 6 | Issue 8 | e24269

Detection of SMN changes in an SMA patient fibroblast lineSMN upregulation was detected in Type I SMA fibroblasts
(GM03813) treated with proteasome inhibitors MG132 and
bortezomib (Figure 5). Serially diluted compounds were added into
the cell culture medium and incubated for 24 h in the presence of
0.001 to 1 mM MG132 or 0.1 to 100 nM bortezomib in 0.5%
DMSO. SMN protein was measured using the SMN ELISA. A 1.27
fold increase in SMN protein over signal from DMSO-treated cells
was observed in fibroblasts treated with 0.3 mM MG132 whereas
3 nM of bortezomib produced a 1.67 fold SMN protein increase
(Figure 5A). Both MG132 and bortezomib were found to be
cytotoxic to GM03813 fibroblasts, a (Figure 5B).
Reactivity of human SMN is greater than that of mouseSmn in the ELISA
Quantification of recombinant mouse and human SMN
proteins using the ELISA in the 390 to 50000 pg/mL and 50 to
3200 pg/mL range respectively showed a marked difference
in reactivity to the SMN protein between the two species.
Recombinant mouse Smn was only detected at ,10% the levels of
recombinant human SMN on a concentration basis. However,
despite the lower reactivity, the mouse SMN signal is still linear in
the dynamic range of the assay (Figure 6).
SMN signal across speciesSMN protein signal from human, wild-type mouse, and non-
human primate (NHP) PBMCs (N = 1–2) was assessed in the
ELISA at dilutions of 1:4 to 1:32. Due to the high numbers of
PBMCs in the human and NHP samples, cells were diluted at a
ratio of 1 mL/107 PBMCs in the ER4 buffer. Cell viability upon
thawing was between 70–95%. Human, NHP, and mouse signals
were detected across all dilutions and yielded 646, 121 and
190 pg/106 PBMCs respectively (Figure 7). The SMN levels seen
in this experiment were about 10-fold higher than the ones seen
from PBMCs lysed at 1 mL/108 cells (Figure 1C, Figure 6).
SMN protein quantification and timecourse in a severemodel of SMA
The SMN ELISA enabled quantitative measurement of SMN
levels across ages in a severe model of SMA. The D7 model is a
commonly-used model of severe SMA disease with a deletion of
the mouse Smn gene, a complete human SMN2 transgene that
predominantly generates an SMN2D7 transcript lacking exon 7,
and multiple copies of the SMN2D7 cDNA, which results in a
short-lived protein [36]. Brain, spinal cord and muscle were
harvested from postnatal day P3, 9 and P14 from D7 wild-type
(WT), heterozygous (HET) and knockout (KO) mice, (all carrying
the human SMN2 and SMN2 D7 cDNA genes and, respectively,
2, 1, 0 copies of the mouse Smn gene. Standard deviations were
generally low, with the exception of muscle tissue in the KO
animals, as the SMN protein levels in these tissues was closest to
the limit of detection for the ELISA at P3 and P9 and was not
detectable at P14 (Figure 8). Generally SMN levels in KO mouse
tissues were less than 10% the levels of SMN protein in WT mouse
tissues (Figure 8, Table 3). SMN protein levels decreased in the
Table 2. SMN protein in human muscle.
SampleHigh fatcontent?
Total protein(mg/mL) SMN (pg/mL) Desmin (ng/mL)
SMN pg/mg totalprotein SMN pg/ng Desmin
6181A1 Yes 4.53 454 18.5 501 24,500
7103A1 Yes 1.36 810 1.39 2980 583,000
9834B1 No 6.92 2230 8.48 1620 263,000
9846A1 No 5.94 693 9.24 582 75,000
doi:10.1371/journal.pone.0024269.t002
Figure 5. Detection of SMN protein dose-response in SMA fibroblasts. SMA Type I fibroblasts (line GM03813) were treated for 24 h with theproteasome inhibitors MG132 or bortezomib (N = 2 each). A: A peak SMN protein upregulation of 27% was observed with 0.3 mM of MG132(EC50 = 0.68 uM) and a 67% increase was seen with 3 nM bortezomib (EC50 = 10 nM). B: Cell viability as measured by ATP levels (CellTiter-Glo,Promega) decreased to 50–75% at doses near and above doses that increased SMN protein levels. Error bars represent standard deviations.doi:10.1371/journal.pone.0024269.g005
Translational ELISA Detection of SMN
PLoS ONE | www.plosone.org 6 August 2011 | Volume 6 | Issue 8 | e24269

following order brain.spinal cord.muscle (gastrocnemius) for
each genotype at any given age (Figure 8, Table 3). The fold
difference in SMN levels between brain and spinal cord was
similar in both WT and HET mice (2.3 and 3.8-fold). The SMN
expression difference between the brain and muscle was greatest in
KO mice (8.5-fold less) than WT and HET (2.3 and 3.8-fold less,
respectively) (Figure 8A, 8C). Additionally, the SMN protein levels
in KO mice ranged from ,3 to 10-fold less than those in WT
animals at any given age or in any given tissue. Between P3 and
P14, the levels of SMN were decreased in all genotypes, suggesting
a natural developmental expression change. However, the slopes
of the decline in SMN expression over time across genotypes and
tissues were not the same, with brain declining the most rapidly of
the three tissues. SMN expression levels in the brain decreased by
85% in KO mice from P3 to P14. Spinal cord SMN signal
diminished by 43% in the same timeframe (Figure 8B, Table 3).
Furthermore, in muscle tissue the SMN protein decline was linear
between P3 to P14, while the decline of SMN protein in brain was
more precipitous between P3 to P9 than P9 to P14. The variable
pattern of decline across tissues and genotypes suggests differential
regulation of SMN in the D7 model or alternatively different
pathological disease processes that may affect SMN expression.
Expression pattern of Smn protein in PBMCs, CNS andother WT mouse tissues
To establish a template for analysis in target and easily
accessible tissues, Smn was measured in several tissues in wild-
type FVBn mice (N = 7 at 14 weeks of age). Analyzed tissues
included brain, muscle, spinal cord as well as liver, heart,
abdominal adipose tissue and ear pinnae and PBMCs. Whole
blood was extracted from the same mice in a terminal collection. A
Ficoll gradient was used to isolate PBMCs. The volume of whole
blood collected from the mice ranged from 0.350 to 0.700 mL,
and total viable cell counts ranged from 3 to 14.86106 cells/mL of
lysate (0.8 to 2.56106 cells/mL whole blood). Viability of cells
ranged from 95 to 99%. Concentrations of Smn in tissue samples
were determined based on a standard curve derived from
recombinant human SMN.
Mouse Smn was detectable in all tissues and PBMC samples
(Figure 9A). The average Smn levels in mouse PBMCs were
calculated using either per mg of total soluble protein (3.5 ng/mg
total protein) or per 106 cells (67.2 pg/106 cells). Despite
differential reactivity to the recombinant human and mouse
SMN protein (Figure 6), the amount of Smn detected in wild-type
mouse PBMCs was similar to that found in healthy humans at 70.2
and 67.2 pg/106 cells (Figure 1C, 9A). Surprisingly, the levels of
mouse Smn detected across the panel of tissues ranged 60-fold
from the lowest expressing tissue (muscle) to the highest (ear
pinnae skin) (Figure 9A). Generally there appeared to be three
strata of Smn levels by tissue, with the lowest levels in the muscle
(66 pg/mg), heart (251 pg/mg), spinal cord (329 pg/mg), and
adipose tissues (389 pg/mg). SMN levels in liver and brain were
intermediate at 933 and 1110 pg/mg respectively, and the highest
levels were observed in PBMCs and the ear skin (3980 pg/mg).
Smn signal was detected in mouse hemibrain, spinal cord,
quadriceps and sciatic nerve processed via Precellys homogeniza-
tion (Figure 9B). Muscle and nerve had the lowest levels of this
tissue set, at 119 pg/mg and 425 pg/mg respectively. Smn varied
by over 2-fold across regions of the brain, from 1192 pg/mg in the
striatum to 1536 to 1587 pg/g in the olfactory bulb and cortex, to
their highest levels in the hippocampus measured at 2520 pg/mg
on average (Figure 9B).
Comparability of SMN protein measurements in mousetissue
To confirm the relationship between SMN protein as detected
by the ELISA and another quantitation method, HET and KO
Delta7 mice were tested in the ELISA and Western blot. Results
between the two methods were similar as the ratio of SMN signal
and total protein between HETs and KOs was 2.2-fold in the
ELISA and 2.3-fold in the Western blot (Supplementary Figure
S4).
Discussion
This report describes the development of a sensitive and reliable
SMN ELISA tool that has utility in preclinical studies and
Figure 7. ELISA SMN signal detection across species. SMNprotein was detected in human, primate and mouse in the ELISA. Allsamples had viabilities of 80–95%. Error bars represent standarddeviations.doi:10.1371/journal.pone.0024269.g007
Figure 6. SMN species parallelism. Full-length recombinant mouseand human SMN proteins were tested in the ELISA at a range ofconcentrations (390–50000 pg/mL and 50–3200 pg/mL respectively).The human SMN was detected with 10-fold greater signal at all pointsthan the mouse SMN. The relationship between the mouse to humandose-response curve was linear and values were comparable acrossequivalent points in the dilution curves (p = 0.86). Error bars representstandard deviations.doi:10.1371/journal.pone.0024269.g006
Translational ELISA Detection of SMN
PLoS ONE | www.plosone.org 7 August 2011 | Volume 6 | Issue 8 | e24269

imminent new clinical trials in SMA. The 50 pg/ml detection
limit of the assay permits analysis of SMN levels in human and
mouse PBMCs and muscle, human fibroblasts and several other
tissues in WT and SMA model mice. Other efforts have also
produced useful SMN ELISAs [32,33,37]. The assay described
here is distinct in that it has undergone optimization and quality
assurance tests for scale-up and manufacturing and can be used as
a kit by clinical laboratories as well as basic researchers. Our
findings have implications for the design of both preclinical and
clinical studies in SMA with respect to timing, mass and volume of
sample collections that may be executed in trials of SMN-
upregulating therapeutics. This ELISA also provides a tool for
developing preclinical pharmacodynamic information on respons-
es to SMN-upregulating therapeutics that can be translated to
human studies by virtue of being done in the same peripherally
accessible tissue (PBMCs) between the bench and the clinic.
PBMCs from mice and healthy human donors and SMA
patients were assessed for SMN levels successfully using the
ELISA. SMN levels were similar in samples from normal human
donors and mice at 6.32 ng/mg versus 3.53 ng/mg respectively
when prepared in 1 mL/106 cells for lysis (Figures 1C, 9A), but the
direct quantitative comparison across species is not possible given
the difference in SMN signal in the ELISA between species.
PBMCs from very young Type I SMA children had 88% less
SMN relative to normal adult donors. These data were derived
from a small number of samples but they agree with the data
generated using western blots and other SMN immunoassays
incorporating different antibodies and measuring SMN in different
cell types [9,27,32,37,38]. In dilution experiments using healthy
human PBMCs, SMN was measurable at levels ,5-fold over the
limit of quantitation using 36105 cells, suggesting that analysis
would be possible with far fewer cells or in a smaller blood volume.
Given that use of different ratios of lysis buffer to PBMCs yields as
much as a 10-fold increase in SMN protein signal (Figure 1C, 7), it
is important to explore the lower limits of blood sample volumes as
part of the effort to evaluate conditions for PBMC collection and
storage processes to maximize detection of SMN for multisite
SMA clinical studies.
SMN was readily detectable in human muscle tissue samples
and SMA patient fibroblasts (Table 2, Figures 2, 5). Knockdown of
SMN in Type I SMA GM03813 fibroblasts with siRNA resulted in
80–86% reductions in protein levels as measured Western blot and
ELISA analyses, confirming the validity of the ELISA’s signal
detection (Figure 5). SMA fibroblasts treated with proteasome
inhibitors produced a quantifiable 27–67% increase in SMN
protein; the data also underscore the need to normalize SMN
levels to cell counts or total protein as the levels were increased at
concentrations that also showed cytotoxicity (Figure 5). Analysis of
the data suggests that the ELISA can be effectively used to detect a
20% change in fibroblast SMN levels with only a few samples and
Figure 8. SMN protein in WT, HET and KO Delta7 mice was detected by the ELISA. While tissue levels in brain homogenates were higherthan both spinal cord and muscle across all genotypes, the ratio of brain to spinal cord, and brain to muscle in the homozygous KO mice was 1.4-foldand 12.2-fold, respectively. The decline of SMN levels over time between muscle and spinal cord tissues was relatively similar across genotypes;however, the reduction seen for brain SMN was more precipitous dropping ,40% between P3 and P9. Variability was greatest in the spinal cordtissues, and SMN levels in KO muscle tissue approached the limit of detection by P9. Statistical analyses are presented in Table 2. Error bars representstandard deviations.doi:10.1371/journal.pone.0024269.g008
Translational ELISA Detection of SMN
PLoS ONE | www.plosone.org 8 August 2011 | Volume 6 | Issue 8 | e24269

it may be useful for secondary drug discovery compound screening
in a 96-well plate format (Figure 5). The human muscle SMN
signal varied widely across samples and further exploration with a
more limited set of muscle types and donor ages is warranted.
While muscle is important as a possible SMA disease target tissue,
the contribution of excess intramuscular fat in SMA muscle
samples should be carefully considered for interpreting a muscle-
specific SMN signal [39]. While normalization to the muscle
marker desmin agreed with SMN normalized to total protein
content, normalization against adipose-specific markers may also
be useful to explore. Thus, justification for SMA muscle collections
in trials for SMN measurement with this ELISA requires further
study with more annotated muscle samples.
While these data demonstrate that SMN can be reliably
measured in PBMCs, it is important to note the challenges of
working with PBMCs and limitations on sample collections
inherent to analysis in fragile pediatric SMA patients. PBMCs
require complex processing and are sensitive to diverse factors
including acute and chronic inflammation. SMA clinical studies
utilizing PBMCs will need an optimized protocol for collection,
processing and storage and these studies are underway. The
allowable volume of whole blood that may be drawn from a child
or infant for study is also limited, and because there are likely to be
several other blood analyses performed in drug trials, analysis of
PBMCs for SMN protein needs to be balanced against other
sample uses. Generally, 16106 PBMCs can be isolated per
milliliter of whole blood. The SMN ELISA described here should
allow 2 or more analyses per mL of whole blood drawn. Children
have been reported to have higher PBMC counts than adults in
healthy populations. Higher PBMC counts have not been
established in children from SMA population, if confirmed then
it becomes possible to test SMN levels with smaller volumes of
blood [40].
One important perspective on the analysis of SMN in PBMCs
in SMA for the purposes of assessing the efficacy of an SMN-
upregulating drug is that the levels of SMN in blood cells may or
may not be reflective of SMN levels in disease target tissues in the
spinal cord or muscle. In addition to determining the relationship
between baseline PBMC and SMA target tissue SMN levels, it is
important to determine whether PBMCs will be effective cells for
assessing SMN response to therapeutics, and relate the relation-
ship of changes in PBMCs to changes in spinal cord and muscle.
As one way of assessing this, we developed a template for analysis
in the mouse to determine relationships between SMN levels in
peripheral and disease-target tissues in mouse and human which
will enable decision making for clinical trial designs.
The ELISA is able to detect the Smn protein in mice, despite
differences in reactivity between human and mouse recombinant
proteins in the assay, and is able to detect Smn in PBMCs from the
Macaca genus (Figure 6, 7). It is unclear the extent to which the
different reactivity observed between human and mouse is due to
differences in the epitopes recognized by the two assay antibodies,
or to differences in the expression and purification of the two
recombinant proteins. Based on peptide mapping experiments, the
epitope for the ELISA’s capture and detection antibody are
proposed to be between amino acids 14–20 and 197–204 in the
human SMN protein, and between amino acids 11–17 and 192–
197 in the mouse Smn protein (personal communication, Andreas
Weiss, Novartis). The shorter epitope for the mouse protein
towards the C-terminus may be playing a role in the differential
detection between the two species. As SMN measurements from a
macaque species were previously reported by Battaglia et al., these
data may motivate researchers interested in measuring Smn from
these animals to consider similar polyclonal SMN antibody
strategies for measuring Smn in macaques [41]. Furthermore,
while commercial sources with validated protocols for collection
and processing of porcine PBMCs were not available, it is
expected that the ELISA will perform like Western blots with the
BD antibody in detecting native Smn in porcine models for large-
animal analysis for SMA therapeutics that are in development
[42,43].
The results from the wild-type and SMA model mouse tissues
showed striking differences in SMN levels among tissues and
generally were comparable to signals detected in Western blots
(Supplemental Figure S4). Consistent with other publications,
SMN levels were higher in brain than in spinal cord and higher in
spinal cord than in muscle. The comparative analysis across tissues
Table 3. SMN protein timecourse across Delta7 mousegenotypes with statistical significance.
Genotype Tissue AgeSMN pg/mgtotal protein SD
WT Brain P3 7660 716
P9 4550*** 143
P14 4400 194
Muscle P3 2900+++ 379
P9 2010*+++ 164
P14 1250**+++ 441
Spinal Cord P3 4540+++ 1820
P9 3640 1360
P14 2670***+++ 247
HET Brain P3 6440 605
P9 3940*** 588
P14 3580 188
Muscle P3 1770+++ 403
P9 1530+ 303
P14 934 **+++ 250
Spinal Cord P3 2960+++ 444
P9 2340*+++ 259
P14 2280+++ 375
KO Brain P3 2820 694
P9 972*** 329
P14 402 151
Muscle P3 333++ 83
P9 122*+ 30
P14 ,LOD N/A
Spinal Cord P3 1130++ 259
P9 789 332
P14 644 378
SMN protein values generally decline from P3 to P9 and P14 across allgenotypes, though the rate of decline is distinct between genotypes. In generalSMN protein levels in brain were higher than levels in spinal cord and muscleacross all ages and genotypes. An ANOVA with Tukey’s post-test performed forall analyses with the exception of the WT and HET comparisons at P14 that weredone with an unpaired t-test as at P14 KO muscle signal was below the assayLOD.*Denotes SMN protein values are significantly less statistically than the value ofthe same tissue at the previous age.+Denotes SMN protein values are significantly less statistically than the value ofthe brain tissue of the same genotype and age. P-values are indicated byasterisks or plus signs in the following manner: p,0.001 by ***, p,0.01 by** and p,0.05 by *. LOD = limit of detection.
doi:10.1371/journal.pone.0024269.t003
Translational ELISA Detection of SMN
PLoS ONE | www.plosone.org 9 August 2011 | Volume 6 | Issue 8 | e24269

provided the novel measurement of up to a 60 fold increase in
SMN levels within tissues of the same genotype. SMN levels in
mouse PBMCs are intermediate between liver and skin tissues
when normalized to total protein levels [24,36]. It is possible to
broadly classify the liver, skin and PBMCs into a group of tissues
with high SMN levels that contain a large number of cells capable
of rapidly dividing whereas brain, spinal cord, muscle and heart
(with the possible exception of the hippocampus and olfactory
bulb) are largely post-mitotic organs with smaller populations of
dividing cells [44]. Regional differences in brain structures are
observable using the ELISA and generally replicate prior reports
(Figure 9B) [41,44]. Analysis of tissues in the complete motor
circuit of brain, spinal cord, muscle and nerve produced results
similar to that done with a different homogenization method, and
it was striking to note that muscle, nerve and spinal cord, the
primary tissues associated with SMA, generally had the lowest
levels of Smn measured in tissues.
Whether SMA target tissues will respond to drugs designed to
increase SMN in the same manner as in other tissues must be
determined on a case-by-case basis for each drug, as drug exposure
and metabolism across tissues will figure heavily into this answer.
The differences in expression levels across tissues motivate
speculation that each tissue may tolerate and respond to SMN
depletion in different ways. This data also provides a glimpse at the
scope of regulatory processing that impacts SMN protein
expression. It is of interest to note that the ear skin tissue in WT
mouse with highly abundant SMN protein is a tissue that together
with the tail and hindpaws becomes progressively necrotic in SMA
mice that are rescued from SMN depletion by genetic reintro-
duction of SMN or therapeutic upregulation of SMN
[23,24,45,46]. While the necrosis is very rarely seen in SMA
patients [47,48], and the phenomenon has been hypothesized to
be a possible result of impairments to autonomic and/or vascular
systems, it is also possible that SMN depletion contributes to this
phenotype in tissues with exceedingly high normal expression.
These findings do support the emerging thesis in the SMA field
that SMN depletion causes an organism-wide disorder that may
produce dysfunction in tissues and systems not normally associated
with SMA and in turn these tissues may influence the more
primarily SMA-like phenotypes of the CNS and musculature
[44,49].
The postnatal decrease in SMN expression seen in WT, HET
and KO D7 mice is also consistent with other reports and the
similarity between SMN ELISA and Western blot results suggest
that the ELISA is capable of detecting the highly expressed but
short-lived D7 protein species [8,50,51]. It is clear that the rate of
SMN decline is different between brain, spinal cord and muscle.
Given the 14-day lifespan of the D7 KO mouse, and the severity of
the muscle weakness phenotype, it is important to carefully select
the time of intervention for SMN-upregulating drug studies and to
place the data in the correct context of the developmental SMN
protein decline, which differs between tissues.
These SMN ELISA data provide frameworks from which
investigators may explore a central question in SMA therapy –
how much SMN is needed to rescue function? Given that
hindlimb muscle weakness is reported and motor neuron loss in
the L3–L6 region is not observed at P4 but is present at P9 in D7
mice it is notable that in spinal cord and hindlimb muscle SMN
levels decrease by only 20–25% (Figure 8B, 8C, Table 3) [36,52].
Whether this decrement is evidence that tissues with relatively
modest SMN levels are unable to tolerate loss of SMN compared
to the brain which loses 50% of its SMN signal in this timeframe,
or whether this is cause for optimism in thinking that only modest
increases in SMN may be needed to produce benefits in mouse
models or human patients is debatable and requires much more
investigation.
In summary, SMN protein analysis via a sensitive and reliable
ELISA offers a unique opportunity to generate information that is
of directly translatable preclinical and clinical value. Fully
quantitative analysis of human PBMCs and fibroblasts will allow
for determination of SMN responses to drugs both in basic
research and drug screening as well as in a clinical trial setting.
The SMN protein analysis of human and mouse tissues in the
CNS, internal organs, and blood and skin tissues provide a
Figure 9. Smn protein levels by tissue in WT mice. Smn protein levels are distinct across the an array of tissues and regions of the brain. A: Smnlevels varied by as much as 10-fold across tissue types in adult FVB mice (14 weeks old). SMN levels by tissue were distributed on a basis looselyordered by having lesser to greater dividing cell populations. Smn levels for tissues are represented as Smn pg/mg total protein. PBMCs arerepresented as Smn pg/mg total protein in the lysis buffer extract. On a per cell basis the average Smn level was 67.2 pg/106 PBMCs. B: Smn proteinin the brain, spinal cord, sciatic nerve and quadriceps muscle of wildtype mice shows marked variations, with spinal cord having 6-fold greater levelsthan muscle and nerve. In the brain, Smn protein signal in the thalamus was nearly 2.5-fold less than hippocampal levels. Error bars representstandard deviations.doi:10.1371/journal.pone.0024269.g009
Translational ELISA Detection of SMN
PLoS ONE | www.plosone.org 10 August 2011 | Volume 6 | Issue 8 | e24269

framework for developing drug-response relationships between
peripherally accessible tissues and target SMA tissues in animal
models that can then be extrapolated to the patient on a drug-by-
drug basis. Interestingly, the details of the broadly variable SMN
protein expression pattern also suggest a high degree of regulation
across tissues, and this may influence both primary and secondary
disease mechanisms. While these data are collectively of some
interest, their greater value may lie in motivating further
exploration of SMN regulation, investigation of SMN dependence
across tissues, more quantitative testing of SMN-upregulating drug
responses as well as optimization of tissue analysis for SMA clinical
trials.
Materials and Methods
Ethics StatementSMA patient samples from the University of Utah were
collected in accordance with study protocols approved by the
University of Utah Institutional Review Board (IRB) (clinical-
trials.gov registry # NCT00756821), with written and verbal
consent obtained. Human samples from Asterand (Detroit, MI)
were harvested via autopsies from a network of hospitals and are
exempt from IRB approval; next of kin provided written approval
for tissue harvest. Samples from Analytical Biological Services
(Wilmington, DE) were collected with written informed consent
provided by donors or their guardians. Samples from AllCells
(Emeryville, CA) were collected from donors who gave written
consent in accordance with protocols approved by their governing
IRB (Biomed). Primate blood samples from BioQuant (San Diego,
CA) were collected in accordance with practices recommended
by the Weatherall Report. All animals were maintained and
harvested according to protocols approved by each facility’s
Institutional Animal Care and Use Committee (IACUC). At
PharmOptima the animal tissues were harvested under protocol
10-08-02 approved by the Western Michigan University IACUC.
Mouse tissues collected at PsychoGenics were harvested under
protocol 86-2-0310 approved by the PsychoGenics IACUC.
PBMC sources and processingSample collection was done according to the guidelines of the
IRB at the University of Utah. Donor adult PBMCs were
purchased from AllCells (Emeryville, CA) and SMA Type I patient
PBMCs were generously provided by Dr. Kathy Swoboda of the
University of Utah. Samples were collected perinatally to 4 months
of age. Whole blood samples at the University of Utah were
collected in BD CPT tubes (#362761) and centrifuged at
1600RCF for 30 minutes at 20uC. After removal of plasma, the
buffy coat containing PBMCs was placed in a 15 mL tube and
filled to 15 mL with PBS and centrifuged at 300 RCF for
15 minutes at 20uC. Supernatant was removed and the pellets
were resuspended in 10 mL PBS and centrifuged for 15 minutes at
20uC. After final removal of supernatant, PBMCs were resus-
pended in freeze media (20% Fetal Bovine Serum, 10%
Dimethylsulfoxide in RPMI media), transferred to cryovials and
frozen at 2140uC until lysis. Sample collection was done
according to the guidelines of the Institutional Review Board at
the University of Utah.
PBMC fractionation analysisThe PBMC cell pellet was resuspended in 80 mL assay buffer
per 107 total cells, followed by addition of 20 mL of CD14
MicroBeads (Miltenyi #130-050-201, Auburn, CA), per 107 total
cells for positive monocyte selection. Cell suspension was mixed
and incubated for 15 minutes at 4uC. Cells were washed by adding
approximately 2 mL buffer per 107 total cells, followed by
centrifugation. Supernatant was decanted and cell pellet was
resuspended in 500 mL buffer. The columns were placed in the
magnetic field of the OctoMACSTM (Miltenyi Biotec #130-
042108) separator. The column was washed with 500 mL buffer.
The cell suspension was applied to the column. Unlabeled cells
(lymphocyte fraction) that passed through the column were
collected. The column was washed three times with 500 mL buffer
and collected in the same tube (,2 mL total effluent per sample).
One milliliter of buffer was added to the column, and the
magnetically labeled cells were flushed out by plunger.
Recombinant SMN protein expression and purificationExpression of SMN1 was performed in E. coli BL21DE3 cells
containing the recombinant plasmid pET28a/hSMN-His/TEV
expression vector. The recombinant protein was expressed by
adding isopropyl B–D-thiogalactopyranaside (IPTG) at a final
concentration of 1 mM. The induced cells were harvested,
resuspended in 20 mM sodium phosphate pH 7.4, 500 mM
NaCl, 10 mM imidazole, and protease inhibitors and disrupted
by sonication. The sonicate was centrifuged and the supernatant
discarded. The pellet was resuspended in 6 M urea to denature
proteins expressed in inclusion bodies. The suspension was
centrifuged and the supernatant collected and loaded onto a
HiTrap Chelating HP column charged with NiCl2. The column
was washed with 20 mM sodium phosphate pH 7.4, 500 mM
NaCl, 10 mM imidazole, and 6 M urea and the protein was eluted
with 20 mM sodium phosphate pH 7.4, 500 mM NaCl, 250 mM
imidazole, and 6 M urea. Fractions containing the protein were
pooled and concentrated by running the protein solution back
over the column charged with NiCl2. Using the same process
previously described, the protein was eluted from the column and
re-folded by dialysis.
ELISA reagent and assay conditions optimizationUsing the Sigma 2B1 antibody (#S2944, St. Louis, MO) for the
capture antibody, the SC-15320 antibody (Santa Cruz Biotech-
nology, Santa Cruz, CA) for the detection antibody and the
recombinant SMN protein standard, several conditions for
optimized SMN signal detection were explored. The following
coating buffers and pHs were tested: 10 mM PO4 15 mM NaCl
pH 7.2, 10 mM PO4 pH 8.0, and 200 mM Carbonate-Bicarbon-
ate pH 9.4 using 16 mg/mL of the 2B1 antibody. Subsequently,
the 2B1 antibody was plated at 2, 4, 6, and 8 mg/mL using the
10 mM PO4 15 mM NaCl pH 7.2 coating condition. The SC-
15320 detection antibody was titrated to determine the concen-
tration that would produce the best signal-to-noise ratio. The
human SMN recombinant standard was tested at 0, 0.5 and
16 mg/mL against 62.5–2500 ng/mL of detection antibody, and
1.5 mg/mL was selected for further testing. Antigen and detection
antibodies were tested for 1 and 2 hour incubations, with
30 minute incubations in peroxidase-conjugated goat anti-rabbit
secondary antibody and TMB substrate. The 1 hr incubation time
was used in further analysis.
Several reagents were assessed for the ability to interfere with
the SMN protein signal. All interference reagents were tested in
assay buffer for signal detection with 16 ng/mL of the recombi-
nant human SMN standard protein and compared to an assay
buffer control (100 mM PO4, 150 mM NaCl, 1% Bovine Serum
Albumin [BSA], 0.1% Tween-20). Ethylenediaminetetraacetic
acid (EDTA), ethylene glycol tetraacetic acid (EGTA) and
phenylmethanesulfonylfluoride (PMSF) were tested at 1, 2, 4,
8 mM. NP-40 was tested at 2, 4, 8, 16%. PIC8340 was tested at
0.5, 1, 2, 4 mL/mL. Sodium dodecyl sulfate (SDS) was tested at
Translational ELISA Detection of SMN
PLoS ONE | www.plosone.org 11 August 2011 | Volume 6 | Issue 8 | e24269

0.1, 0.2, 0.4, 0.8%, Sodium deoxycholate was tested at 0.06, 0.13,
0.25, 0.50%. Triton X-100 was tested at 0.25, 0.5, 1, and 2%.
Zwittergent 3–14 was tested at 0.006, 0.013, 0.025 and 0.05%.
SMN antibody and extraction buffer screeningThe 2B1 antibody from Sigma was chosen as the capture
antibody and further optimization was done for SMN protein
extraction buffers and SMN detection antibodies. Detection
antibodies from Santa Cruz Biotechnology (#SC-15320, Santa
Cruz, CA), Novus Biologicals (#NB100-57859, Littleton, CO),
ProteinTech Group (#11708-1-AP, Chicago, IL), and Aviva
Systems Biology (#ARP40209-P050, San Diego, CA) were tested.
Frozen PBMCs were thawed and split equally into 3 conical
15 mL tubes for selection of an optimized SMN extraction buffer.
Three extraction buffers were tested:100 mM Tris, pH 7.5, 2.5%
NP-40; 100 mM Tris, pH 7.5, 2.5% NP-40, 300 mM NaCl, 0.5%
SDS, 25 mM NaF, 3 mM EDTA, 1 mM MgCl2, 20 mM b-
Glycerophosphate; and 50 mM Tris, pH 7.5, 300 mM NaCl,
10% (w/v) glycerol, 3 mM EDTA, 1 mM MgCl2, 20 mM b-
glycerophosphate, 25 mM NaF, 1% Triton X-100 (ER4). Cells
were pelleted and resuspended at 1 mL of buffer per 108 cells and
tested against the human SMN standard protein at 0.063 to 4 ng/
mL for the ProteinTech antibody 11708-1-AP and at 0.25–16 ng/
mL for the SC-15320 antibody (Table S2).
Validity of SMN ELISA signal detectionLysates from GM03813c ells treated with siRNA against SMN
transcript were assessed in the ELISA to confirm that the signals
being detected in the ELISA are specific to SMN protein.
GM03813 cells were cultured, lysed and processed as described in
the ELISA proteosome inhibitor experiment with the exception
that the cells were treated for 48 h with SMN siRNA at 10 mM
and 50 mM (#L-011108-00-0005 from Dharmacon, Lafayette,
CO), negative control (AM4635, Ambon, Austin, TX) or
transfection reagent alone (Mock). The siRNA transfection mix
was generated performed according to manufacturer instructions
and allowed to form in serum-free media with interferrin for
10 minutes at room temperature. The siRNA/interferin complex-
es were added to 96-well plates (20 ml) and 7500 GM03813 cells
were subsequently added to each well (180 ml). After 48 h
incubating at 37uC, cells were harvested and lysed in preparation
for analysis by ELISA and by Western blot. For the Western blots,
cells from each well were lysed in 5 uL of Laemmli buffer, with
20 uL loaded into the gel. The blot SMN was detected using a
mouse monoclonal BD antibody was used at 1:1000 (#610646,
San Diego, CA) with an Alexa Fluor680 goat anti-mouse IgG
antibody (#A-21057, Invitrogen) as the secondary antibody. For
the loading control a rabbit polyclonal GAPDH Santa Cruz
Biotechnology antibody (#SC-25778) was used at 1:1000, with a
IRdye800 conjugated goat-anti-rabbit IgG at 1:10000 as a
secondary antibody (#611-132-122, Rockland Immunochemicals,
Gilbertsville, PA) as a control. Blots were read on an Odyssey LI-
COR system (Lincoln, Nebraska) in the 700 nm and 800 nm
wavelength channels.
ELISA protocolRecombinant human SMN1 was generated from full-length
cDNA expressed in bacterial expression vectors and purified for
use as a standard in the ELISA. The mouse monoclonal capture
antibody Sigma anti-SMN clone 2B1 (#S2944, St. Louis, MO)
was coated using 100 uL onto Costar Stripwell (#92592, Lowell,
MA) at 3.5 mg/mL. After overnight incubation at room temper-
ature, the plate was blocked for 5 hours with 1% BSA in PBS. Cell
lysate samples and recombinant hSMN or HeLa cell lysates
(generated from lysis in ER4 buffer) standards were loaded at
100 mL per well. Standards were diluted in 2-fold dilutions or from
50–3200 pg/mL. Samples were incubated for one hour at room
temperature, washed and then incubated with a rabbit polyclonal
detection antibody raised against the product of a recombinant
SMN2 gene from Proteintech Group (#11708-AP-1, Chicago, IL)
at 2 mg/mL for one hour at room temperature. After washing, a
peroxidase conjugated goat anti-rabbit IgG from Jackson Im-
munoresearch (#111-035-144, West Grove, PA) was applied at
50 ng/mL to the plate and incubated for 30 minutes at room
temperature. After washing, plates were developed with TMB
substrate for 30 minutes incubation at room temperature and the
reaction stopped with 1 N HCl. Plates were then read on a
spectrophotometer at 450 nm. Plates were sealed and gently
shaken during all incubations, dilutions of sample and standard
were made using assay buffer (1% BSA, 0.1% Tween-20 in PBS).
The ELISA is available as a kit from Enzo Life Sciences (#ADI-
900-209 Farmingdale, NY) and sold for research use only under
license from INSERM (Paris, France).
Cell lysisA cell count with a hemocytometer was always performed
immediately prior to lysis for accurate count of viable cells, which
was used for determining volume of cell lysis buffer. Lysis buffer
ER4 containing 300 mM NaCl, 10% glycerol, 3 mM EDTA,
1 mM MgCl2, 20 mM b-glycerophosphate, 25 mM NaF and 1%
Triton X-100 and 0.1% Kathon was used along with protease
inhibitors PIC8340 (Sigma #P8340) and phenylmethylsulphonyl
fluoride (Sigma #P7626). PBMCs were thawed in a 37uC water
bath and resuspended in ER4 with inhibitors at 108 cells per
milliliter. The cell suspension was gently vortexed and placed on
ice for 30 minutes. The cell lysate was transferred to a 1.5 mL
centrifuge tube and was clarified by centrifugation for 10 minutes
at 14000RCF, 4uC. The supernatant was transferred to a clean
vial and either assayed immediately or stored at 270uC until use.
HeLa lysates are prepared in a similar manner with the exception
that cells were lysed at a ratio of 1 mL per 106 cells.
ELISA and PBMC validation experimentsFor the dilutional linearity experiment, six lots of control
PBMCs were purchased from AllCells for further assay testing.
After thawing and lysis, PBMCs were serially diluted 4-fold and
compared to hSMN standard curve for linearity from 1:4 to 1:32
dilutions. To test spike recovery, PBMC lysates were diluted 1:2
and 1:4, with hSMN spikes of 267, 667, 1667 pg/mL and assessed
by ELISA. The recovery value was calculated by subtracting the
background hSMN concentration of the unspiked matrix from the
concentration value, and dividing by the spiked concentration and
multiplying it by 100. To determine reproducibility, hSMN
standard was analyzed in N = 4 experiments. Sensitivity was
interpolated by two standard deviations above mean signal at
background. For parallelism analysis of native versus recombinant
SMN, dose-response curves were made with HeLa cell lysates and
hSMN standards and assessed by ELISA at dilutions from 1:4 to
1:512. For freeze-thaw experiments tubes of cell lysates thawed 0,
1, 2, or 3 times were assessed in the ELISA.
Human biofluid and tissue analysisVarious human fluids and tissues were acquired to determine
whether the SMN ELISA could detect signals in other matrices.
Panels of plasma, saliva, urine, buccal swabs and PBMCs from 6
normal donors were acquired for SMN protein analysis from
Analytical Biological Services (Wilmington, DE). Plasma, saliva
and urine samples were thawed, gently mixed and transferred to
Translational ELISA Detection of SMN
PLoS ONE | www.plosone.org 12 August 2011 | Volume 6 | Issue 8 | e24269

1.5 mL tubes for centrifugation at 1200 rpm for 10 minutes at
4uC. Plasma saliva and urine samples were serially diluted from
1:2 to 1:128. Buccal swab and PBMC samples were incubated
with 200 to 400 mL of ER4 on ice for 30 minutes. Samples were
vortexed twice during the incubation and then transferred to
1.5 mL tubes for processing as above. Buccal cells and PBMCs
were serially diluted at 1:2 to 1:256 and 1:4 to 1:512 respectively,
with SMN pg/mL results normalized to the mg/mL of total
cellular protein levels as measured by protein quantitation assay.
Human muscle samples (N = 4) were acquired from Asterand
(Detroit, MI) and analyzed in the SMN ELISA and also in a
desmin ELISA as a muscle-specific control from USCN Life
Science (#E90373Hu, Burlington, NC). There were 4 muscle
samples collected post-mortem from donors aged 37–97 years that
died of coronary heart disease or accidental head trauma. Samples
were homogenized using a polytron at medium speed for 2 to 3
pulses of 5 seconds each on ice in a 1:5 ER4 dilution. The
resulting lysates were tested in the SMN ELISA as described above
while the desmin ELISA was tested as per manufacturer
instructions.
SMN measurement in a drug-treated SMA fibroblast cellline
Type I SMA fibroblast samples were acquired from Coriell (line
#GM03813, Camden, NJ) and were thawed and incubated in in
DMEM-10% FBS for 3 days. Cells were trypsinized, counted and
resuspend to 25000 cells/ml in DMEM-10%FBS. Cell suspensions
were plated at 5000 cells per well in a 96 well microtiter plate and
incubated for 3 to 5 h. Proteosome inhibitors MG132 (0.001 to
1 mM) and bortezomib (0.001 to 100 nM) were prepared in 7-
point dilution curve in DMSO. For each drug 1 mL of compound
solution was added to each well and incubated for 24 h in a cell
culture incubator (37uC, 5% CO2, 100% relative humidity). At the
time of SMN analysis, supernatant was removed from the cells and
100 mL of the ER4 extraction buffer added per well. After shaking
for 1 h at room temperature, 100 mL of cell lysate was transferred
to appropriate wells in the SMN ELISA plate and processed as per
described above. SMN signal was calculated as a fold over the
signal detected in DMSO-treated negative control cells. Viability
for cells in parallel treatment wells was assessed using a CellTitre-
Glo assay from Promega (#7571, Madison, WI) according to
manufacturer instructions.
Comparison of human and mouse SMN reactivity inELISA
Recombinant human SMN and mouse Smn standards were
compared side-by-side for reactance at ranges of 50 to 3200 pg/
mL and 390 to 50000 pg/mL respectively and developed as
described above. General reactivity of mouse Smn was estimated
as a percentage of the human SMN OD value curve.
SMN protein detection in PBMCs across speciesWhole blood from a non-human primate (Cynomologous
macaque) was acquired for SMN ELISA analysis from BioQuant
(San Diego, CA). Briefly, the monkey blood sample was diluted 1:2
with room temperature PBS. Six milliliters of diluted sample was
then layered onto 3 ml of Lymphoprep solution (#1114544, Axis-
Shield, Oslo, Norway) in separate 15 ml centrifuge tubes. The
samples were then centrifuged at 2500 rpm for 20 minutes at
room temperature. The resultant upper layer was then harvested
and cells pelleted by centrifugation at 1500 rpm for 10 minutes.
The cell pellet was then suspended in 2 ml of erythrocyte lysis (EL)
buffer (#00-4333-57, eBioscience, San Diego, CA) and incubated
for 5 minutes at room temperature prior to centrifugation. Cells
were washed with PBS to remove the EL buffer and resuspended
in PBS and enumerated as previously described. Finally PBMC’s
were pelleted and resuspended in 200 ml of ER4 lysis buffer. Non-
human primate PBMC lysates were run alongside lysates from
normal human PBMCs (from AllCells) and mouse PBMCs
harvested from 8 week old FVBn animals at PharmOptima.
Samples were thawed and lysed at dilutions ranging from 1:4 to
1:32 in ER4 buffer at a ratio of 1 mL/107 cells.
Mouse tissue analysisSMA ‘D7’ model mice (Smn2/2; hSMN2+/+; hSMN2D7+/+,
Jackson Laboratory strain #005025) of homozygous, heterozygous
and wild-type genotypes (N = 6 per genotype) were sacrificed at
P3, P9, and P14 for tissue collection at PsychoGenics (Tarrytown,
NY). Wild-type FVB mice were provided by Charles River
Laboratories (Wilmington, MA) and sacrificed for collection at
PharmOptima (Portage, MI). All animals had ad libitum access to
food and water, were maintained in a 12:12 hour light-dark cycle
and were managed under protocols to promote ethical use by each
facility’s Institutional Animal Care and Use Committee (IACUC).
SMA D7 mice were anesthetized with an intraperitoneal dose of
50–90 mg/kg pentobarbital. Blood was collected via cardiac
puncture and stored at 4uC in EDTA tubes until centrifugation at
2000G for 15 minutes. Plasma and blood pellets were then stored
at 280uC. Hemisected brains, whole spinal cord, and left and
right gastrocnemius and soleus muscles were also collected and
stored at 280uC. Following overnight shipment on dry ice, the
mouse tissues were returned to 280uC storage at PharmOptima.
Adult wildtype FVB mice (N = 3/gender, 14 weeks old) were
anesthetized in similar fashion, with blood kept on wet ice until
processing to isolate peripheral blood mononuclear cells (PBMC).
Tissues collected included hemisected brain, whole spinal cord,
gastrocnemius muscle, liver, heart, abdominal adipose tissue, ear
pinnae, and 2 mm punches from the ear pinnae. Following tissue
collection, whole blood was diluted 1:1 with 0.1 M PBS. Each
diluted sample was layered onto 3 mL Lymphoprep solution.
Samples were centrifuged at 800G for 30 minutes at room
temperature (brake off). The white band at the interface with the
gradient solution was transferred to a clean 15 mL tube. The cells
were washed by adding approximately 13 mL PBS and centrifu-
gation at 230G for 10 minutes at room temperature. The
supernatant was discarded and the red blood cells lysed with
1 mL RBC lysis buffer (#00-4333-57, eBioscience, San Diego,
CA). Approximately 13 mL of PBS was added to dilute the lysis
buffer and then tubes were centrifuged at 230G for 10 minutes at
room temperature. The supernatant was discarded and pellets
resuspended by addition of 1 mL PBS. The total number of cells
in all 4 hemocytometer squares was counted by trypan blue
exclusion. Using a 1:2 dilution, the number of viable cells that
excluded the dye and the number of dead cells that did not
exclude the dye was recorded.
Tissues were homogenized on ice in 4 to 30 mL ER4 per mg of
wet weight with a minimum volume of 200 mL using either a
Precellys tissue homogenizer or a polytron. Precellys homogeni-
zation was done at 5500 rpm for three 30 s cycles. Polytron
homogenization used 3 separate 5 second pulses on ice at a
medium speed. Samples were cleared via centrifugation at 14000G
for 10 minutes at 4uC and supernatant transferred to a clean tube
for protein quantitation using a BioRad DC protein assay (#500-
0112, Hercules, CA), or a Thermoscientific BCA assay (#23225,
Hudson, NH). Homogenates were by diluted to 200 mg/mL total
protein concentration in assay buffer with subsequent dilutions
specific to each tissue and genotype. Tests for spike-recovery of
Translational ELISA Detection of SMN
PLoS ONE | www.plosone.org 13 August 2011 | Volume 6 | Issue 8 | e24269

hSMN protein and tissue levels of SMN across were conducted
with wild-type brain, muscle and spinal cord, while the ER4 lysis
buffer was chosen for subsequent analysis of mouse tissues.
CNS and motor circuit analysis of SMN proteinSMN was measured in wild-type mouse hemibrain, quadriceps
muscle, spinal cord, and sciatic nerve. In the other mouse
hemibrain, the cerebellum, cortex, hippocampus, olfactory bulb,
striatum and thalamus was also dissected and processed for
analysis. Due to the small mass of some tissues, they were
homogenized by the Precellys system (Gaithersberg, MD). Tissues
were weighed and 4 uL of ER4 lysis buffer was added for each mg
of tissue. Samples were homogenized at 4uC at 5500 rpm at three
cycles of 30 s per cycle and protein concentrations were assessed.
ELISA analysis was done at dilutions ranging from 1:5 to 1:25.
Comparison of SMN protein signal detection in mousetissues
Delta7 mouse brains were analyzed in Western blot and the
SMN ELISA. Tissues were harvested from N = 3 Delta7 KO and
HET mice and homogenized in Laemmli buffer for Western
blotting and the SMN ELISA as described in previous sections.
Total protein for each sample was measured by the BCA assay and
used to normalize the SMN signals and generate information for
loading gels. Gels were loaded with 30 mg protein for the KO
samples and 25 mg of protein for HET samples. ELISA results
were expressed as SMN pg/mg total proteins and Western blot
results were expressed as ratio of SMN to total protein.
Statistical MethodsAnalysis of statistical significance between SMN levels in mouse
tissues was done by one-way ANOVA with Tukey’s test or an
unpaired t-test using Prism software by GraphPad (La Jolla, CA).
P-values are indicated by asterisks or plus signs in the following
manner: p,0.001 by ***, p,0.01 by ** and p,0.05 by *. In
figures error bars depicted are standard deviations except where
specified otherwise.
Supporting Information
Figure S1 Evaluation of coating buffers for SMN signaloptimization. Three coating buffers were tested against 2–8 mg/
mL of human SMN recombinant protein for best signal. Coating
buffers included 10 mM PO4 15 mM NaCl pH 7.2, 10 mM PO4
pH 8.0, and 200 mM Carbonate-Bicarbonate pH 9.4. Error bars
represent standard deviations.
(TIF)
Figure S2 Titration of capture antibody in the SMNELISA. A titration experiment with capture antibody 2B1 was
performed at 0, 0.5, and 16 mg/mL using 10 mM PO4 15 mM
NaCl pH 7.2 for the coating buffer. 3.5 mg/mL was selected as the
coating concentration following 4-parameter analysis. Error bars
represent standard deviations.
(TIF)
Figure S3 Titration of detection antibody in the SMNELISA. Recombinant SMN protein was tested at 0, 0.5, and
16 ng/mLwith 62.5 to 2500 mg/mL of the Santa Cruz SMN
detection antibody to evaluate the antibody concentration signal to
noise values. Following this analysis 1.5 mg/mL was used for the
detection antibody concentration.
(TIF)
Figure S4 Comparability of SMN protein signal inmouse tissues with ELISA and Western blots. Brain tissue
from postnatal day 9 KO and postnatal day 50 HET Delta7 mice
were homogenized and analyzed side-by-side in A: the SMN
ELISA and B: Western blot. C: The image of the Western blot
visually corroborates the results with the ELISA. Error bars
represent standard deviations. P-values are indicated by asterisks
or plus signs in the following manner: p,0.01 by ** and p,0.05
by *.
(TIF)
Table S1 Summary of reagents tested for SMN ELISA signal
interference. Reagents were tested at a range of four concentra-
tions in assay buffer (100 mM PO4, 150 mM NaCl, 1%BSA
0.1%Tween-20) and assay buffer with 16 ng/mL human SMN
recombinant protein standard. Significant interference was
observed with SDS and Sodium deoxycholate, as all concentra-
tions tested caused 50% or greater reduction in SMN protein
signal detection.
(DOCX)
Table S2 Comparison of detection antibody reactivity to SMN
protein. Detection antibodies were tested with capture antibody
2B1 coated at 3.5 ug/mL. Recombinant hSMN was prepared in a
dilution series 0.0625–8 ng/mL, HeLa lysate was prepared in
100 mM Tris, pH 7.5, 2.5% NP-40 extraction buffer and tested in
a 1:100 to 1:625 dilution series.
(DOCX)
Table S3 Comparison of SMN extraction buffers. Extraction
buffers were evaluated with human PBMCs using capture
antibody 2B1 coated at 3.5 ug/mL. ER2 consisted of 100 mM
Tris, pH 7.5, 2.5% NP-40, ER2+ contained 100 mM Tris,
pH 7.5, 2.5% NP-40, 300 mM NaCl, 0.5% SDS, 25 mM NaF,
3 mM EDTA, 1 mM MgCl2, 20 mM b-Glycerophosphate, and
ER4 contained 50 mM Tris, pH 7.5, 300 mM NaCl, 10% (w/v)
glycerol, 3 mM EDTA, 1 mM MgCl2, 20 mM b-glycerophos-
phate, 25 mM NaF, 1% Triton X-100. CV = coefficient of
variance. OD = optical density.
(DOCX)
Acknowledgments
We would like to express our gratitude to the following people and
organizations for their contributions to this work: Suzanne Forrest, Cynthia
Joyce, Kathleen McCarthy and Sergey Paushkin of the SMA Foundation
for review of this paper and sample management; Dr. Kathy Swoboda,
Benjamin Chisum, and Kelly Murphy and from the University of Utah
Department of Neurology for their kindly provided SMA Type I PBMC
samples; Dr. Wendy Chung, Jiancheng Guo, and Patricia Lanzano of
Columbia University Medical Center for collecting tissues early in the
development of the working ELISA; Douglas Decker and Jeffery Burr from
PharmOptima performed tissue harvests and Smn analyses at PharmOp-
tima; Sylvie Ramboz, Kim Cirillo, Bassem El-Khodor, Monica Patry and
Judy Johnson Watson from PsychoGenics provided the SMA model mouse
tissues; Lexicon Pharmaceuticals, Inc. provided helpful technical input into
the assay design; Andreas Weiss of Novartis provided information on the
epitopes for SMN antibodies; Sebastien Burel and C. Frank Bennett of Isis
Pharmaceuticals generously made non-human primate blood available for
analysis; Charlotte Sumner, Tara Martinez, and James Van Meerbeke of
Johns Hopkins University, Rajeev Sivasankaran and Cheng Song of
Novartis, and Heather Plasterer and Sean Jennings of Repligen, were
instrumental beta testers of the SMN ELISA.
Author Contributions
Conceived and designed the experiments: DTK RJO CJS NN MM KSC.
Performed the experiments: RJO LS JN AB. Analyzed the data: DTK
RJO CJS LS NN JN AB BC. Wrote the paper: DTK RJO LS.
Translational ELISA Detection of SMN
PLoS ONE | www.plosone.org 14 August 2011 | Volume 6 | Issue 8 | e24269

References
1. Pearn J (1980) Classification of spinal muscular atrophies. Lancet 1: 919–922.
2. Crawford TO, Pardo CA (1996) The neurobiology of childhood spinal muscular
atrophy. Neurobiol Dis 3: 97–110.
3. Pearn J (1978) Incidence, prevalence, and gene frequency studies of chronicchildhood spinal muscular atrophy. J Med Genet 15: 409–413.
4. Hendrickson BC, Donohoe C, Akmaev VR, Sugarman EA, Labrousse P, et al.
(2009) Differences in SMN1 allele frequencies among ethnic groups withinNorth America. J Med Genet 46: 641–644.
5. Lefebvre S, Burglen L, Reboullet S, Clermont O, Burlet P, et al. (1995)
Identification and characterization of a spinal muscular atrophy-determininggene. Cell 80: 155–165.
6. Lorson CL, Hahnen E, Androphy EJ, Wirth B (1999) A single nucleotide in the
SMN gene regulates splicing and is responsible for spinal muscular atrophy. ProcNatl Acad Sci U S A 96: 6307–6311.
7. Monani UR, Lorson CL, Parsons DW, Prior TW, Androphy EJ, et al. (1999) A
single nucleotide difference that alters splicing patterns distinguishes the SMAgene SMN1 from the copy gene SMN2. Hum Mol Genet 8: 1177–1183.
8. Cho S, Dreyfuss G (2010) A degron created by SMN2 exon 7 skipping is a
principal contributor to spinal muscular atrophy severity. Genes Dev 24:438–442.
9. Lefebvre S, Burlet P, Liu Q, Bertrandy S, Clermont O, et al. (1997) Correlation
between severity and SMN protein level in spinal muscular atrophy. Nat Genet16: 265–269.
10. Park GH, Kariya S, Monani UR (2010) Spinal muscular atrophy: new and
emerging insights from model mice. Curr Neurol Neurosci Rep 10: 108–117.
11. Andreassi C, Angelozzi C, Tiziano FD, Vitali T, De Vincenzi E, et al. (2004)Phenylbutyrate increases SMN expression in vitro: relevance for treatment of
spinal muscular atrophy. Eur J Hum Genet 12: 59–65.
12. Brichta L, Hofmann Y, Hahnen E, Siebzehnrubl FA, Raschke H, et al. (2003)Valproic acid increases the SMN2 protein level: a well-known drug as a potential
therapy for spinal muscular atrophy. Hum Mol Genet 12: 2481–2489.
13. Chang JG, Hsieh-Li HM, Jong YJ, Wang NM, Tsai CH, et al. (2001) Treatment
of spinal muscular atrophy by sodium butyrate. Proc Natl Acad Sci U S A 98:9808–9813.
14. Garbes L, Riessland M, Holker I, Heller R, Hauke J, et al. (2009) LBH589
induces up to 10-fold SMN protein levels by several independent mechanismsand is effective even in cells from SMA patients non-responsive to valproate.
Hum Mol Genet 18: 3645–3658.
15. Sumner CJ, Huynh TN, Markowitz JA, Perhac JS, Hill B, et al. (2003) Valproicacid increases SMN levels in spinal muscular atrophy patient cells. Ann Neurol
54: 647–654.
16. Riessland M, Ackermann B, Forster A, Jakubik M, Hauke J, et al. (2010) SAHAameliorates the SMA phenotype in two mouse models for spinal muscular
atrophy. Hum Mol Genet 19: 1492–1506.
17. Hahnen E, Eyupoglu IY, Brichta L, Haastert K, Trankle C, et al. (2006) In vitroand ex vivo evaluation of second-generation histone deacetylase inhibitors for
the treatment of spinal muscular atrophy. J Neurochem 98: 193–202.
18. Hastings ML, Berniac J, Liu YH, Abato P, Jodelka FM, et al. (2009)Tetracyclines that promote SMN2 exon 7 splicing as therapeutics for spinal
muscular atrophy. Sci Transl Med 1: 5ra12.
19. Hua Y, Vickers TA, Baker BF, Bennett CF, Krainer AR (2007) Enhancement ofSMN2 exon 7 inclusion by antisense oligonucleotides targeting the exon. PLoS
Biol 5: e73.
20. Mattis VB, Rai R, Wang J, Chang CW, Coady T, et al. (2006) Novel
aminoglycosides increase SMN levels in spinal muscular atrophy fibroblasts.Hum Genet 120: 589–601.
21. Singh NK, Singh NN, Androphy EJ, Singh RN (2006) Splicing of a critical exon
of human Survival Motor Neuron is regulated by a unique silencer elementlocated in the last intron. Mol Cell Biol 26: 1333–1346.
22. Azzouz M, Le T, Ralph GS, Walmsley L, Monani UR, et al. (2004) Lentivector-
mediated SMN replacement in a mouse model of spinal muscular atrophy. J ClinInvest 114: 1726–1731.
23. Foust KD, Wang X, McGovern VL, Braun L, Bevan AK, et al. (2010) Rescue of
the spinal muscular atrophy phenotype in a mouse model by early postnataldelivery of SMN. Nat Biotechnol 28: 271–274.
24. Passini MA, Bu J, Roskelley EM, Richards AM, Sardi SP, et al. (2010) CNS-
targeted gene therapy improves survival and motor function in a mouse model ofspinal muscular atrophy. J Clin Invest 120: 1253–1264.
25. Chang HC, Hung WC, Chuang YJ, Jong YJ (2004) Degradation of survival
motor neuron (SMN) protein is mediated via the ubiquitin/proteasomepathway. Neurochem Int 45: 1107–1112.
26. Andreassi C, Jarecki J, Zhou J, Coovert DD, Monani UR, et al. (2001)
Aclarubicin treatment restores SMN levels to cells derived from type I spinalmuscular atrophy patients. Hum Mol Genet 10: 2841–2849.
27. Angelozzi C, Borgo F, Tiziano FD, Martella A, Neri G, et al. (2008) Salbutamol
increases SMN mRNA and protein levels in spinal muscular atrophy cells. J MedGenet 45: 29–31.
28. Butchbach ME, Singh J, Thorsteinsdottir M, Saieva L, Slominski E, et al. (2010)Effects of 2,4-diaminoquinazoline derivatives on SMN expression and
phenotype in a mouse model for spinal muscular atrophy. Hum Mol Genet19: 454–467.
29. Grzeschik SM, Ganta M, Prior TW, Heavlin WD, Wang CH (2005)Hydroxyurea enhances SMN2 gene expression in spinal muscular atrophy
cells. Ann Neurol 58: 194–202.
30. Jarecki J, Chen X, Bernardino A, Coovert DD, Whitney M, et al. (2005) Diversesmall-molecule modulators of SMN expression found by high-throughput
compound screening: early leads towards a therapeutic for spinal muscularatrophy. Hum Mol Genet 14: 2003–2018.
31. Singh J, Salcius M, Liu SW, Staker BL, Mishra R, et al. (2008) DcpS as a
therapeutic target for spinal muscular atrophy. ACS Chem Biol 3: 711–722.32. Kolb SJ, Gubitz AK, Olszewski RF, Jr., Ottinger E, Sumner CJ, et al. (2006) A
novel cell immunoassay to measure survival of motor neurons protein in bloodcells. BMC Neurol 6: 6.
33. Piepers S, Cobben JM, Sodaar P, Jansen MD, Wadman RI, et al. (2011)
Quantification of SMN protein in leucocytes from spinal muscular atrophypatients: effects of treatment with valproic acid. J Neurol Neurosurg Psychiatry
82(8): 850–852.34. Sumner CJ, Kolb SJ, Harmison GG, Jeffries NO, Schadt K, et al. (2006) SMN
mRNA and protein levels in peripheral blood: biomarkers for SMA clinicaltrials. Neurology 66: 1067–1073.
35. Pellizzoni L, Kataoka N, Charroux B, Dreyfuss G (1998) A novel function for
SMN, the spinal muscular atrophy disease gene product, in pre-mRNA splicing.Cell 95: 615–624.
36. Le TT, Pham LT, Butchbach ME, Zhang HL, Monani UR, et al. (2005)SMNDelta7, the major product of the centromeric survival motor neuron
(SMN2) gene, extends survival in mice with spinal muscular atrophy and
associates with full-length SMN. Hum Mol Genet 14: 845–857.37. Nguyen thi M, Humphrey E, Lam LT, Fuller HR, Lynch TA, et al. (2008) A
two-site ELISA can quantify upregulation of SMN protein by drugs for spinalmuscular atrophy. Neurology 71: 1757–1763.
38. Patrizi AL, Tiziano F, Zappata S, Donati MA, Neri G, et al. (1999) SMN proteinanalysis in fibroblast, amniocyte and CVS cultures from spinal muscular atrophy
patients and its relevance for diagnosis. Eur J Hum Genet 7: 301–309.
39. Sproule DM, Punyanitya M, Shen W, Dashnaw S, Martens B, et al. (2011)Muscle volume estimation by magnetic resonance imaging in spinal muscular
atrophy. J Child Neurol 26: 309–317.40. Elsasser-Beile U, Dursunoglu B, Gallati H, Monting JS, von Kleist S (1995)
Comparison of cytokine production in blood cell cultures of healthy children and
adults. Pediatr Allergy Immunol 6: 170–174.41. Battaglia G, Princivalle A, Forti F, Lizier C, Zeviani M (1997) Expression of the
SMN gene, the spinal muscular atrophy determining gene, in the mammaliancentral nervous system. Hum Mol Genet 6: 1961–1971.
42. Lorson MA, Spate LD, Prather RS, Lorson CL (2008) Identification andcharacterization of the porcine (Sus scrofa) survival motor neuron (SMN1) gene:
an animal model for therapeutic studies. Dev Dyn 237: 2268–2278.
43. Lorson MA, Spate LD, Samuel MS, Murphy CN, Lorson CL, et al. (2011)Disruption of the Survival Motor Neuron (SMN) gene in pigs using ssDNA.
Transgenic Res [Epub ahead of print]. doi:10.1007/s11248-011-9496-8.44. Wishart TM, Huang JP, Murray LM, Lamont DJ, Mutsaers CA, et al. (2010)
SMN deficiency disrupts brain development in a mouse model of severe spinal
muscular atrophy. Hum Mol Genet 19: 4216–4228.45. Avila AM, Burnett BG, Taye AA, Gabanella F, Knight MA, et al. (2007)
Trichostatin A increases SMN expression and survival in a mouse model ofspinal muscular atrophy. J Clin Invest 117: 659–671.
46. Williams JH, Schray RC, Patterson CA, Ayitey SO, Tallent MK, et al. (2009)Oligonucleotide-mediated survival of motor neuron protein expression in CNS
improves phenotype in a mouse model of spinal muscular atrophy. J Neurosci
29: 7633–7638.47. Rudnik-Schoneborn S, Vogelgesang S, Armbrust S, Graul-Neumann L,
Fusch C, et al. (2010) Digital necroses and vascular thrombosis in severe spinalmuscular atrophy. Muscle Nerve 42: 144–147.
48. Araujo Ade Q, Araujo M, Swoboda KJ (2009) Vascular perfusion abnormalities
in infants with spinal muscular atrophy. J Pediatr 155: 292–294.49. Park GH, Maeno-Hikichi Y, Awano T, Landmesser LT, Monani UR (2010)
Reduced survival of motor neuron (SMN) protein in motor neuronal progenitorsfunctions cell autonomously to cause spinal muscular atrophy in model mice
expressing the human centromeric (SMN2) gene. J Neurosci 30: 12005–12019.
50. Frugier T, Nicole S, Cifuentes-Diaz C, Melki J (2002) The molecular bases ofspinal muscular atrophy. Curr Opin Genet Dev 12: 294–298.
51. Gabanella F, Carissimi C, Usiello A, Pellizzoni L (2005) The activity of thespinal muscular atrophy protein is regulated during development and cellular
differentiation. Hum Mol Genet 14: 3629–3642.52. El-Khodor BF, Edgar N, Chen A, Winberg ML, Joyce C, et al. (2008)
Identification of a battery of tests for drug candidate evaluation in the
SMNDelta7 neonate model of spinal muscular atrophy. Exp Neurol 212: 29–43.
Translational ELISA Detection of SMN
PLoS ONE | www.plosone.org 15 August 2011 | Volume 6 | Issue 8 | e24269
Copyright © 2022 FDOKUMEN


![[Posterior cortical atrophy]](https://static.fdokumen.com/doc/165x107/6331b9d14e01430403005392/posterior-cortical-atrophy.jpg)