Using spatial analysis to explore synergies between the Aichi Biodiversity Targets and REDD+ in the...
36
Using spaial analysis to explore synergies between the Aichi Biodiversity Targets and REDD+ in the Philippines A preliminary analysis
-
Upload
independent -
Category
Documents
-
view
3 -
download
0
Transcript of Using spatial analysis to explore synergies between the Aichi Biodiversity Targets and REDD+ in the...
Using spaial analysis to explore synergies between the Aichi Biodiversity Targets and REDD+ in the PhilippinesA preliminary analysis

The United Naions Environment Programme World Conservaion Monitoring Centre (UNEP-WCMC) is the specialist biodiversity assessment centre of the United Naions Environment Programme (UNEP), the world’s foremost intergovernmental environmental organisaion. The Centre has been in operaion for over 30 years, combining scieniic research with pracical policy advice.
This publicaion may be reproduced for educaional or non-proit purposes without special permission, provided acknowledgement to the source is made. Reuse of any igures is subject to permission from the original rights holders. No use of this publicaion may be made for resale or any other commercial purpose without permission in wriing from UNEP. Applicaions for permission, with a statement of purpose and extent of reproducion, should be sent to the Director, UNEP-WCMC, 219 Huningdon Road, Cambridge, CB3 0DL, UK.
ACKNOWLEDGEMENTSThis brochure was produced by UNEP World Conservaion Monitoring Centre, as part of the REDD-PAC project under the Internaional Climate Iniiaive (IKI). The Federal Ministry for the Environment, Nature Conservaion, Building and Nuclear Safety supports this iniiaive on the basis of a decision adopted by the German Bundestag (parliament).
The working session that developed the work within this report was also supported by GIZ under the project Naional REDD+ System Philippines, implemented by the Department for Environment and Natural Resources (DENR) and the Deutsche Gesellschat für Internaionale Zusammenarbeit (GIZ) GmbH with funding by the German Federal Ministry for the Environment, Nature Conservaion, Building and Nuclear Safety (BMUB) under its Internaional Climate Iniiaive.
We would like to thank all the paricipants of the working session held in Manila, October 2013, for their technical insight and contribuions. Special thanks go to Engr. Mari Trix Estomata (GIZ), the Forestry Management Bureau (FMB) (DENR) and all the staf at the Remote Sensing and GIS Laboratory, Department of Geodeic Engineering, University of the Philippines for organising and hosing the working session. We would also like to thank Conservaion Internaional-PH (CI-PH), Fauna and Flora Internaional-PH (FFI), The Biodiversity Management Bureau (BMB), Naional Commission on Indigenous Peoples (NCIP), and the River Basin Control Oice (RBCO).
DISCLAIMER
The contents of this report do not necessarily relect the views or policies of UNEP, contributory organisaions or editors. The designaions employed and the presentaions of material in this report do not imply the expression of any opinion whatsoever on the part of UNEP or contributory organisaions, editors or publishers concerning the legal status of any country, territory, city area or its authoriies, or concerning the delimitaion of its froniers or boundaries or the designaion of its name, froniers or boundaries. The menion of a commercial enity or product in this publicaion does not imply endorsement by UNEP.
CONTRIBUTORSMatea Osi, Julia Thorley, Elina Väänänen, Lucy Goodman, Stephen Woroniecki, Oliver G. Coroza, Jose Don T. De Alban, Edmund Leo B. Rico, Angelica Krisina V. Monzon, Bernd-Markus Liss, Mari Trix Estomata, Andre Jon Uychiaoco, Engr. Eugenio O Diaz, Jr and Rebecca Mant.
CITATION Osi, M., Thorley, J., Väänänen, E., Goodman, L., Woroniecki, S., Coroza, O. G., De Alban, J. D. T., Rico, E. L. B., Monzon A. K. V., Liss, B.-M., Estomata, M. T., Uychiaoco, A. J., Diaz, E. O. and Mant, R. (2014) Using spaial analysis to explore synergies between the Aichi Biodiversity Targets and REDD+ in the Philippines. A preliminary analysis. Prepared by UNEP-WCMC, Cambridge, UK.
Available online at: wcmc.io/aichi-targets-REDD-Philippines
© 2014 United Naions Environment Programme
UNEP World Conservaion Monitoring Centre219 Huningdon RoadCambridge, CB3 0DLUnited KingdomTel: +44 (0) 1223 277314Fax: +44 (0) 1223 277136Email: [email protected]: www.unep-wcmc.org
UNEP promotes environmentallysound pracices globally and in its own aciviies.
Our prining and distribuion policy aims to reduce UNEP’s carbon footprint. This publicaion is printed on Carbon
Balanced, FSC-ceriied paper, and is made from 10% recovered ibre. It is manufactured under the internaional ISO 14001
standard, EMAS (Eco-Management & Audit Scheme) and the IPPC (Integrated Polluion Prevenion and Control) regulaion.
Using spaial analysis to explore synergies between the Aichi Biodiversity Targets and REDD+ in the PhilippinesA preliminary analysis
COVER IMAGE CREDITSFront: Let: Frog, Daet, Bicol Region, Philippines © Toto Ong (CC BY-NC-SA 2.0) htps:s//lic.kr/p/akmPCMCentre: Southern Cebu’s Wildlowers, Cebu, Central Visayas, Philippines © Storm Crypt (CC BY-NC-ND 2.0) htps://lic.kr/p/68or5NRight: Banaue, Philippines © Just one way icket (CC BY-NC-ND 2.0) htps://lic.kr/p/eiBWGC
Licences for images throughout with CC BY 2.0htp://creaivecommons.org/licenses/by/2.0/legalcode
Licences for images throughout with CC BY-NC-ND 2.0htps://creaivecommons.org/licenses/by-nc-nd/2.0/
Licences for images throughout with CC BY-NC-SA 2.0htps://creaivecommons.org/licenses/by-nc-sa/2.0/
Licences for images throughout with CC BY 3.0htps://creaivecommons.org/licenses/by/3.0/
Back: Abra river downstream © Engr. Eugenio O. Diaz, Jr, DENR River Basin Control Oice
Middle: Pine tree, reaching for the sky © Jun’s World (CC BY 2.0)htps://lic.kr/p/9XxREtLower: Mangrove Swamp Forest Reserve © Roberto Verzo (CC BY 2.0) htps://lic.kr/p/2j4nZo
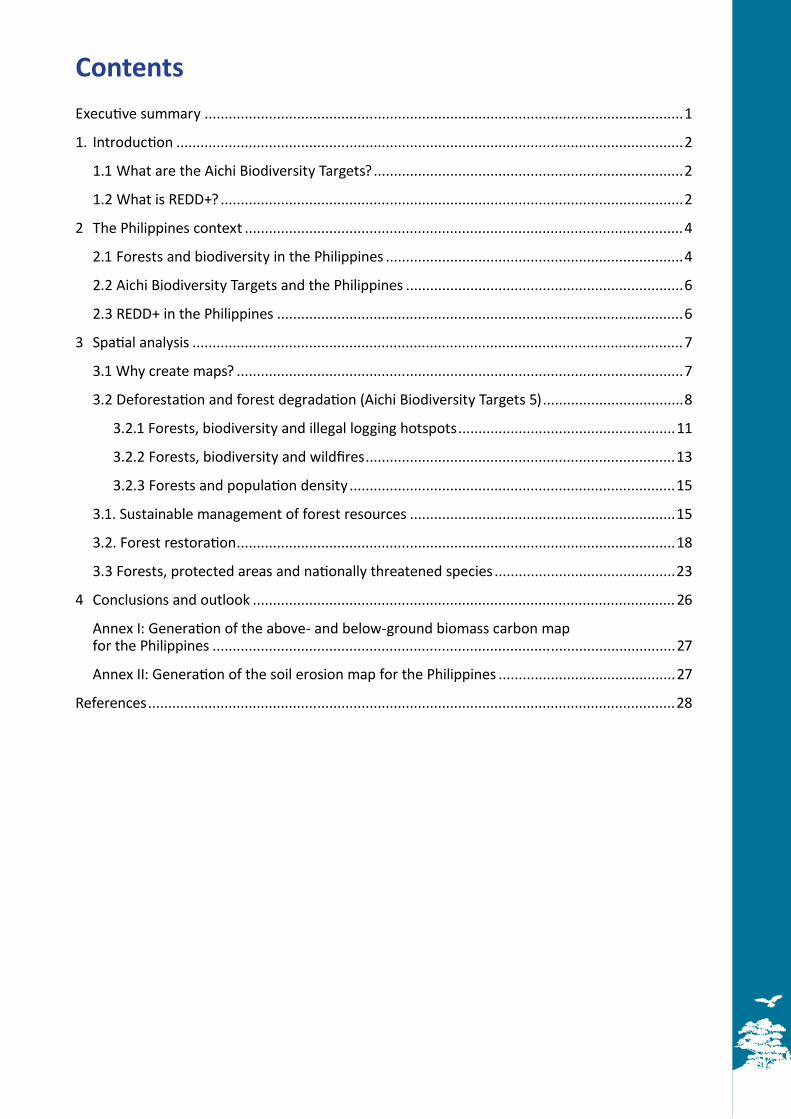
ContentsExecuive summary .......................................................................................................................1
1. Introducion ..............................................................................................................................2
1.1 What are the Aichi Biodiversity Targets? .............................................................................2
1.2 What is REDD+? ...................................................................................................................2
2 The Philippines context .............................................................................................................4
2.1 Forests and biodiversity in the Philippines ..........................................................................4
2.2 Aichi Biodiversity Targets and the Philippines .....................................................................6
2.3 REDD+ in the Philippines .....................................................................................................6
3 Spaial analysis ..........................................................................................................................7
3.1 Why create maps? ...............................................................................................................7
3.2 Deforestaion and forest degradaion (Aichi Biodiversity Targets 5) ...................................8
3.2.1 Forests, biodiversity and illegal logging hotspots ......................................................11
3.2.2 Forests, biodiversity and wildires .............................................................................13
3.2.3 Forests and populaion density .................................................................................15
3.1. Sustainable management of forest resources ..................................................................15
3.2. Forest restoraion .............................................................................................................18
3.3 Forests, protected areas and naionally threatened species .............................................23
4 Conclusions and outlook .........................................................................................................26
Annex I: Generaion of the above- and below-ground biomass carbon map for the Philippines ...................................................................................................................27
Annex II: Generaion of the soil erosion map for the Philippines ............................................27
References ...................................................................................................................................28
Using spaial analysis to explore synergies between the Aichi Biodiversity Targets 1
Execuive summary• Acion for REDD+ under the United Naions
Framework Convenion on Climate Change (UNFCCC) can contribute towards achieving the Aichi Biodiversity Targets, and vice versa. However, how Naional Biodiversity Strategy and Acion Plans (NBSAPs) and REDD+ aciviies are ulimately planned and implemented is key to determining the extent of synergies and complementariies.
• The Philippines is presently in the process of revising its NBSAP under the Convenion on Biological Diversity’s (CBD), and has had a REDD+ Strategy in place since 2010. Spaial overlay maps, such as those presented in this report, can help idenify locaions where synergies can be achieved between acions which contribute to the Aichi Biodiversity Targets and REDD+.
• Informaion on past trends in forest cover, alongside an understanding of the drivers of deforestaion and forest degradaion, can support both NBSAP and REDD+ planning. Addiionally, REDD+ requires informaion on exising carbon stocks in forests.
• Muliple drivers of deforestaion exist and informaion on a range of factors that relate to these drivers can be useful in the context of addressing pressures on biodiversity and forests in the Philippines. These include those examined in this report: illegal logging hotspot areas, wildires, and populaion density.
• Considering priority areas of biodiversity within REDD+ planning can potenially secure muliple beneits from REDD+ and help contribute to achieving the Aichi Biodiversity Targets. For example, this report explores how prioriising areas of importance for biodiversity under REDD+ could contribute to Aichi Biodiversity Target 5 (halving the rate of loss of all natural habitats, including forests and signiicantly reducing degradaion and fragmentaion) and Aichi Biodiversity Target 12 (prevening the exincion of known threatened species, and improving and sustaining their conservaion status).
• Spaial analysis can support planning for ecosystem services such as soil erosion control. It allows exploring where exising forests play an important role in prevening soil erosion, and where forest restoraion could potenially reduce soil erosion. The later could potenially inform site selecion under the Naional Greening Programme.
• The most useful analysis for supporing planning varies depending on which aciviies are being considered. Several examples are highlighted in this report, including analysis to support planning for the sustainable management of forests under REDD+ in line with the Aichi Biodiversity Target 7 (sustainably managing areas under agriculture, aquaculture and forestry, ensuring conservaion of biodiversity), and analysis to support planning for reducing deforestaion and forest degradaion.
• Overall, joint planning for achieving the Aichi Biodiversity Targets and REDD+ that takes into account relevant spaial informaion, could help the Philippines develop complementary approaches, coordinate eforts between ministries, and build coherent biodiversity conservaion, climate change miigaion, and land use policies.
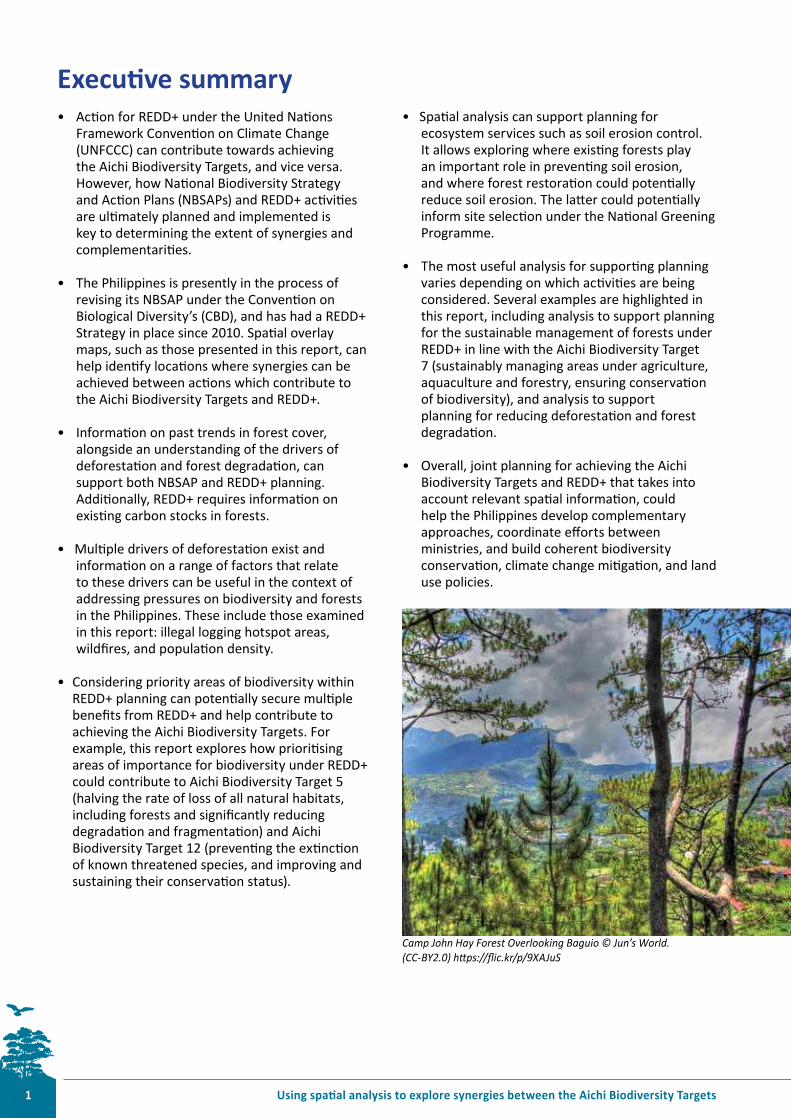
Camp John Hay Forest Overlooking Baguio © Jun’s World. (CC-BY2.0) htps://lic.kr/p/9XAJuS
2and REDD+ in the Philippines
1. Introducion1.1 What are the
Aichi Biodiversity Targets?
In October 2010, the Paries to the Convenion on Biological Diversity (CBD) adopted a ime-bound framework for acion on biodiversity in the form of the Strategic Plan for Biodiversity for the period 2011-2020, and its 20 Aichi Biodiversity Targets. These targets include objecives that range from conservaion of marine and terrestrial ecosystems, to access to geneic resources and beneits arising from their use, including ambiious targets for the conservaion, sustainable use and restoraion of forests. The targets are global, but acions to achieve them are primarily implemented at the naional, sub-naional and local level. The Strategic Plan is translated into naional circumstances and implemented by countries through Naional Biodiversity Strategies and Acion Plans (NBSAPs). Countries are supposed to ensure that their NBSAPs are mainstreamed into all sectors which have an impact (be it posiive or negaive) on biodiversity. At present, most countries, including the Philippines are in the process of submiing updated NBSAPs following the launch of the Strategic Plan.
1.2 What is REDD+?
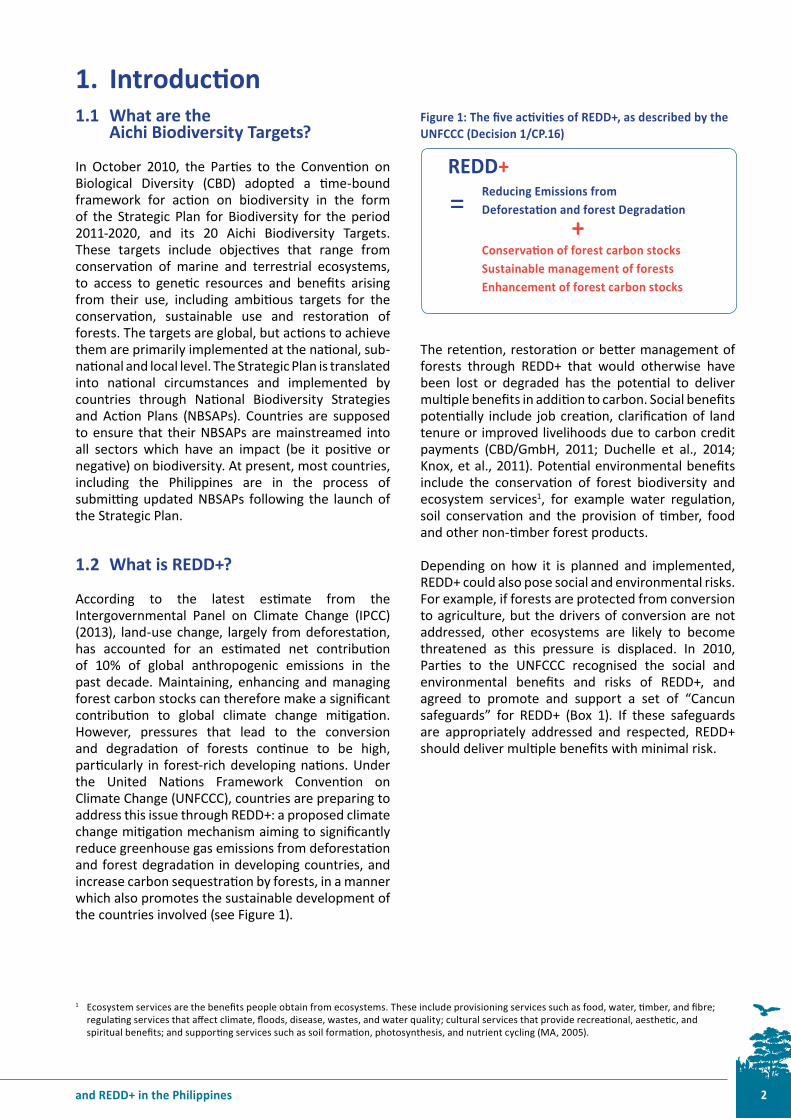
According to the latest esimate from the Intergovernmental Panel on Climate Change (IPCC) (2013), land-use change, largely from deforestaion, has accounted for an esimated net contribuion of 10% of global anthropogenic emissions in the past decade. Maintaining, enhancing and managing forest carbon stocks can therefore make a signiicant contribuion to global climate change miigaion. However, pressures that lead to the conversion and degradaion of forests coninue to be high, paricularly in forest-rich developing naions. Under the United Naions Framework Convenion on Climate Change (UNFCCC), countries are preparing to address this issue through REDD+: a proposed climate change miigaion mechanism aiming to signiicantly reduce greenhouse gas emissions from deforestaion and forest degradaion in developing countries, and increase carbon sequestraion by forests, in a manner which also promotes the sustainable development of the countries involved (see Figure 1).
Figure 1: The ive aciviies of REDD+, as described by the UNFCCC (Decision 1/CP.16)
The retenion, restoraion or beter management of forests through REDD+ that would otherwise have been lost or degraded has the potenial to deliver muliple beneits in addiion to carbon. Social beneits potenially include job creaion, clariicaion of land tenure or improved livelihoods due to carbon credit payments (CBD/GmbH, 2011; Duchelle et al., 2014; Knox, et al., 2011). Potenial environmental beneits include the conservaion of forest biodiversity and ecosystem services1, for example water regulaion, soil conservaion and the provision of imber, food and other non-imber forest products.
Depending on how it is planned and implemented, REDD+ could also pose social and environmental risks. For example, if forests are protected from conversion to agriculture, but the drivers of conversion are not addressed, other ecosystems are likely to become threatened as this pressure is displaced. In 2010, Paries to the UNFCCC recognised the social and environmental beneits and risks of REDD+, and agreed to promote and support a set of “Cancun safeguards” for REDD+ (Box 1). If these safeguards are appropriately addressed and respected, REDD+ should deliver muliple beneits with minimal risk.
REDD+Reducing Emissions from Deforestaion and forest Degradaion
+Conservaion of forest carbon stocksSustainable management of forestsEnhancement of forest carbon stocks
=
1 Ecosystem services are the beneits people obtain from ecosystems. These include provisioning services such as food, water, imber, and ibre; regulaing services that afect climate, loods, disease, wastes, and water quality; cultural services that provide recreaional, aestheic, and spiritual beneits; and supporing services such as soil formaion, photosynthesis, and nutrient cycling (MA, 2005).

Using spaial analysis to explore synergies between the Aichi Biodiversity Targets 3
1.2 Why explore synergies between the two?
As countries prepare to implement aciviies aimed at achieving the Aichi Biodiversity Targets, it may be helpful to consider how these aciviies relate to and complement acions which support REDD+ planning and implementaion, and consequently, to promote synergies between them. If the REDD+ Cancun safeguards are respected and addressed, this will increase the ability of REDD+ to contribute towards achieving the Aichi Biodiversity Targets. The Cancun safeguards promote REDD+ acions consistent with the conservaion of natural forests and biological diversity, and that efecively involve indigenous people and local communiies.
While REDD+ holds promise for biodiversity conservaion, it should be noted that REDD+ cannot contribute to the achievement of all the Aichi Biodiversity Targets, since these are broader than forest and its role in climate change miigaion. The achievement of the Aichi Biodiversity Targets could also someimes be hindered under REDD+ if pressure on forest land were displaced across naional boundaries or into other ecosystems. Sill, joint planning for achievement of the Aichi Biodiversity Targets and REDD+ implementaion could help countries to develop cost-efecive and complementary approaches to biodiversity conservaion and climate change miigaion.
Since responsibiliies for CBD and REDD+ implementaion are oten held by diferent ministries (or departments within ministries), coordinaion of their eforts could help to enhance likely synergies, and minimise any conlicts. This is also applicable to wider cross-sectoral coordinaion with ministries responsible for agriculture, energy, infrastructure and extracive resources. Coordinaion may be paricularly important during the policy development, informaion-sharing, and stake-holder consultaion processes. Eforts to collect informaion, manage and share datasets on forests, biodiversity and other naional priority areas could ensure coherent land use policies.
Joint planning for implementaion of the Aichi Biodiversity Targets and REDD+ holds great relevance for a country such as the Philippines. Having raiied both the Convenion on Biological Diversity (CBD) and the Kyoto Protocol under the UNFCCC, the Philippines is currently in the process of revising its NBSAP under the CBD, and has had a REDD+ Strategy in place since 2010. This report presents the outcomes of a naional workshop conducted by United Naions Environment Programme World Conservaion Monitoring Centre (UNEP-WCMC) in October 2013 with the Department for Environment and Natural Resources as part of the German government funded REDD-PAC project. The workshop aimed to demonstrate how spaial data can be used by naional decision makers to inform where REDD+ could also help to meet a country’s biodiversity conservaion targets under the CBD.
Box 1: REDD+ safeguards ideniied in Appendix I of Decision 1/CP.16
When undertaking the aciviies referred to in paragraph 70 of this decision, the following safeguards should be promoted and supported:
a) That acions complement or are consistent with the objecives of naional forest programmes and relevant internaional convenions and agreements;
b) Transparent and efecive naional forest governance structures, taking into account naional legislaion and sovereignty;
c) Respect for the knowledge and rights of indigenous peoples and members of local communiies, by taking into account relevant internaional obligaions, naional circumstances and laws, and noing that the United Naions General Assembly has adopted the United Naions Declaraion on the Rights of Indigenous Peoples;
d) The full and efecive paricipaion of relevant stakeholders, in paricular indigenous peoples and local communiies, in the acions referred to in paragraphs 70 and 72 of this decision;
e) That acions are consistent with the conservaion of natural forests and biological diversity, ensuring that the acions referred to in paragraph 70 of this decision are not used for the conversion of natural forests, but are instead used to incenivize the protecion and conservaion of natural forests and their ecosystem services, and to enhance other social and environmental beneits;
f) Acions to address the risks of reversals;
g) Acions to reduce displacement of emissions.
4and REDD+ in the Philippines
2 The Philippines context 2.1 Forests and biodiversity
in the Philippines
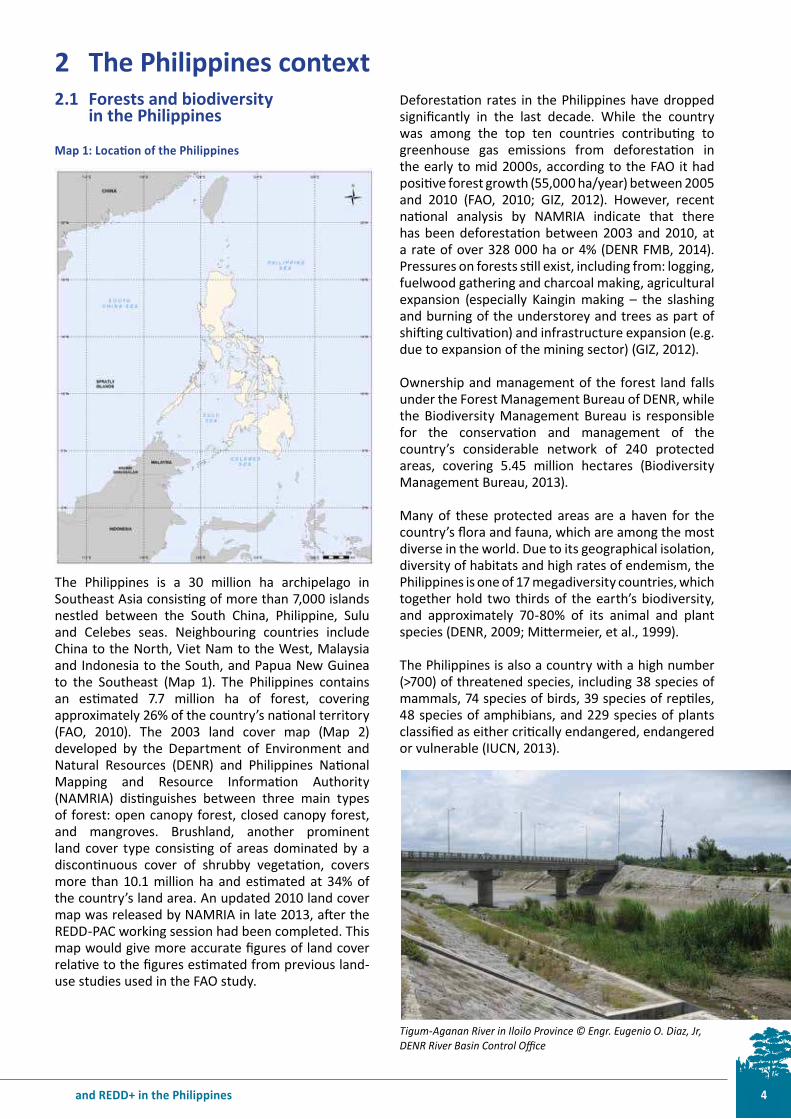
Map 1: Locaion of the Philippines
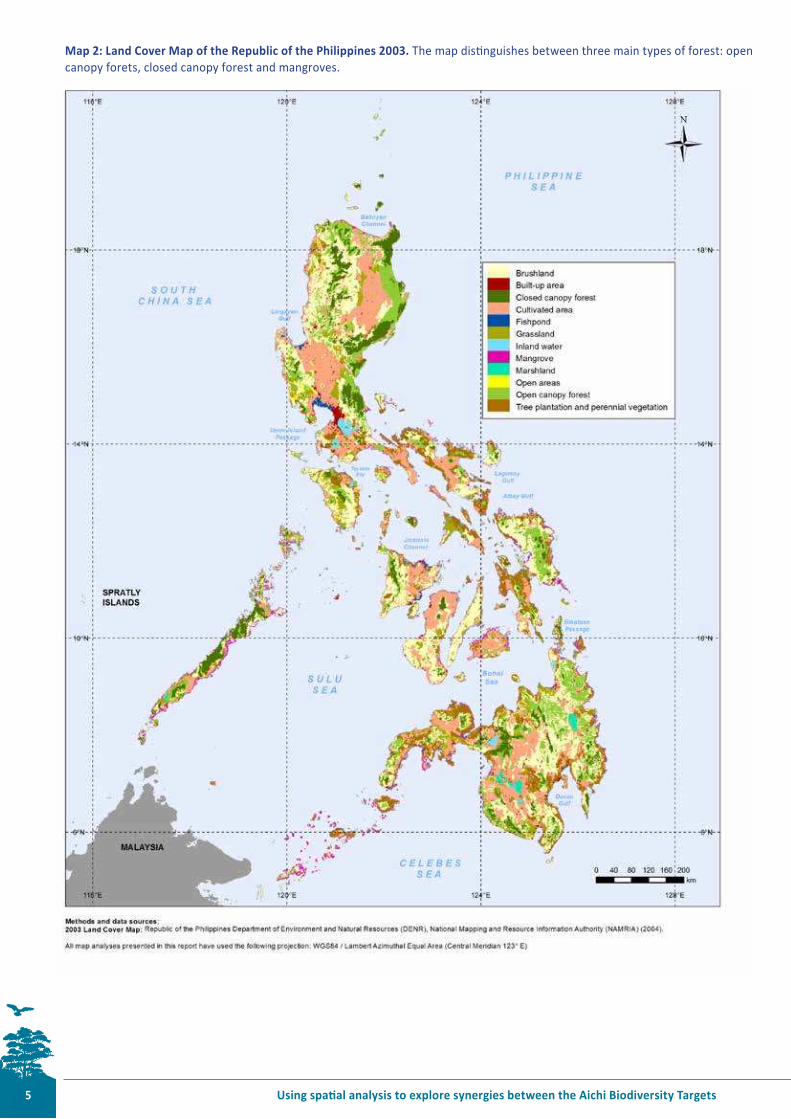
The Philippines is a 30 million ha archipelago in Southeast Asia consising of more than 7,000 islands nestled between the South China, Philippine, Sulu and Celebes seas. Neighbouring countries include China to the North, Viet Nam to the West, Malaysia and Indonesia to the South, and Papua New Guinea to the Southeast (Map 1). The Philippines contains an esimated 7.7 million ha of forest, covering approximately 26% of the country’s naional territory (FAO, 2010). The 2003 land cover map (Map 2) developed by the Department of Environment and Natural Resources (DENR) and Philippines Naional Mapping and Resource Informaion Authority (NAMRIA) disinguishes between three main types of forest: open canopy forest, closed canopy forest, and mangroves. Brushland, another prominent land cover type consising of areas dominated by a disconinuous cover of shrubby vegetaion, covers more than 10.1 million ha and esimated at 34% of the country’s land area. An updated 2010 land cover map was released by NAMRIA in late 2013, ater the REDD-PAC working session had been completed. This map would give more accurate igures of land cover relaive to the igures esimated from previous land-use studies used in the FAO study.
Deforestaion rates in the Philippines have dropped signiicantly in the last decade. While the country was among the top ten countries contribuing to greenhouse gas emissions from deforestaion in the early to mid 2000s, according to the FAO it had posiive forest growth (55,000 ha/year) between 2005 and 2010 (FAO, 2010; GIZ, 2012). However, recent naional analysis by NAMRIA indicate that there has been deforestaion between 2003 and 2010, at a rate of over 328 000 ha or 4% (DENR FMB, 2014). Pressures on forests sill exist, including from: logging, fuelwood gathering and charcoal making, agricultural expansion (especially Kaingin making – the slashing and burning of the understorey and trees as part of shiting culivaion) and infrastructure expansion (e.g. due to expansion of the mining sector) (GIZ, 2012).
Ownership and management of the forest land falls under the Forest Management Bureau of DENR, while the Biodiversity Management Bureau is responsible for the conservaion and management of the country’s considerable network of 240 protected areas, covering 5.45 million hectares (Biodiversity Management Bureau, 2013).
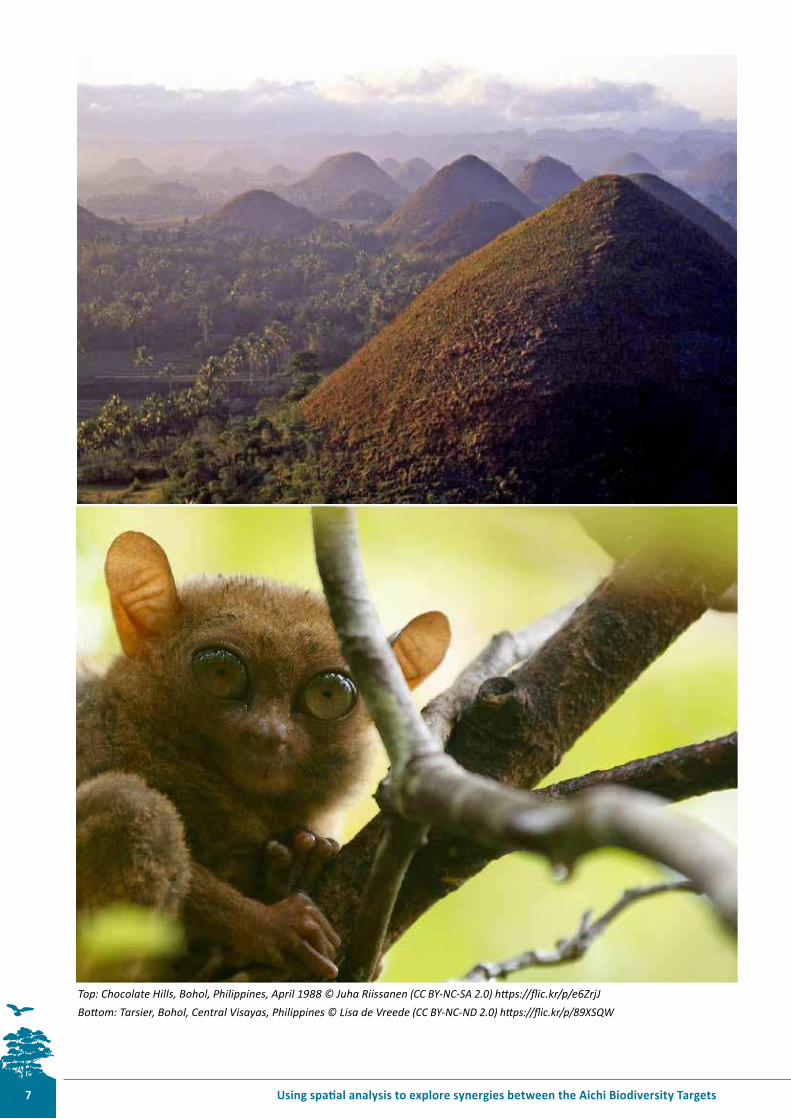
Many of these protected areas are a haven for the country’s lora and fauna, which are among the most diverse in the world. Due to its geographical isolaion, diversity of habitats and high rates of endemism, the Philippines is one of 17 megadiversity countries, which together hold two thirds of the earth’s biodiversity, and approximately 70-80% of its animal and plant species (DENR, 2009; Mitermeier, et al., 1999).
The Philippines is also a country with a high number (>700) of threatened species, including 38 species of mammals, 74 species of birds, 39 species of repiles, 48 species of amphibians, and 229 species of plants classiied as either criically endangered, endangered or vulnerable (IUCN, 2013).
4
Tigum-Aganan River in Iloilo Province © Engr. Eugenio O. Diaz, Jr, DENR River Basin Control Oice
Using spaial analysis to explore synergies between the Aichi Biodiversity Targets 5
Map 2: Land Cover Map of the Republic of the Philippines 2003. The map disinguishes between three main types of forest: open canopy forets, closed canopy forest and mangroves.

6and REDD+ in the Philippines
2.2 Aichi Biodiversity Targets and the Philippines
The Philippines raiied the Convenion on Biological Diversity (CBD) in 1993. Its NBSAP, the primary instrument for implemening the Convenion at the naional level, was irst completed in 1997. Following the 10th Conference of the Paries to the CBD in 2010, which established the Strategic Plan for Biodiversity and its 20 Aichi Biodiversity Targets, the Philippines has been updaing its NBSAP on an on-going basis to relect the goals of the Strategic Plan and Aichi Biodiversity Targets.
Although the details of the NBSAP are currently under development, it is expected that strengthening of the Protected Areas System, insituionalizing biodiversity conservaion approaches (e.g. biodiversity corridors), and insituionalizing monitoring and evaluaion systems will be prioriies for the government in the updated iteraion.
2.3 REDD+ in the Philippines
In 2010, the REDD-plus Strategy Team of the Philippine Government developed the Philippine Naional REDD-Plus Strategy (PNRPS), with the paricipaion of civil society and non-governmental organizaions. The strategy encompasses a 10 year imeframe (2010-2020), consising of a Readiness Phase of three to ive years, followed by a gradual scaling up to a ive year Engagement Phase.
The PNRPS links to the country’s Naional Climate Change Acion Plan (2011-2028), as well as the Philippines Development Plan (2011-2016), and aims to build the adapive capacity of communiies and increase the resilience of natural ecosystems to climate change, thus opimising miigaion opportuniies towards sustainable development.
The PNRPS has adopted an inter-sectoral approach to REDD+ development, aiming to increase communicaion and coordinaion between key agencies and sectors which have links to deforestaion and forest degradaion. Environmental muliple-beneits consideraions feature prominently throughout the Strategy, which “assumes watershed, natural ecosystem and landscape-level approaches to REDD-plus development in order to ensure muliple beneits”, with the aim of targeing “projects on sites where emissions reducions can be achieved at a reasonable scale and cost, while also seeking to maximise co-beneits” (DENR & CoDe REDD-plus Philippines, 2010). The Strategy also targets areas of biodiversity conservaion priority, staing that these are “oten the last remaining forest blocks in the country” (DENR & CoDe REDD-plus Philippines, 2010).
In 2011, the Philippines undertook a mulilateral process to prepare for REDD+ through the development of an Iniial Naional Programme with the UN-REDD Programme. This focussed on strengthening REDD+ readiness in the country through efecive, inclusive and paricipatory management processes, developing an approach to social and environmental safeguards, and building capacity to establish reference baselines (UN-REDD, 2010). The Iniial Naional Programme also aimed to address naional prioriies of poverty alleviaion, environmental protecion and management, and adaping to climate change impacts while reducing greenhouse gas emissions globally.
Through the development of its various strategies and policies, the Philippines has made a clear efort to integrate its sectoral policies in recogniion of the linkages between acions to conserve biodiversity, miigate against climate change, and adapt to its impacts. A comprehensive framework for climate change acion and sustainable development is important in a country such as the Philippines, which was ranked seventh most afected by extreme weather events between 1993 and 2012, and second most afected in 2012 alone, according to Germanwatch’s Global Climate Risk Index (Kret & Eckstein, 2013). Recent events, such as Typhoon Haiyan2, which struck the Philippines in November 2013, causing unprecedented destrucion to human lives and cosing the Philippine economy billions of dollars’ worth of damage, demonstrate the perinence of climate change miigaion and adaptaion for the country. Such events are predicted with medium conidence to become more intense in the future (IPCC, 2013).
© Paulo Alcazaren LIPAD Aerial Photography
2 Although trends rather than events can be atributed to climate change, there is evidence that the intensity of typhoons such as Haiyan may have been exacerbated by climate change (IPCC, 2013).
Map 2: Land Cover Map of the Republic of the Philippines 2003. he map disinguishes between three main types of forest: open canopy forets, closed canopy forest and mangroves.
Using spaial analysis to explore synergies between the Aichi Biodiversity Targets 7
Top: Chocolate Hills, Bohol, Philippines, April 1988 © Juha Riissanen (CC BY-NC-SA 2.0) htps://lic.kr/p/e6ZrjJBotom: Tarsier, Bohol, Central Visayas, Philippines © Lisa de Vreede (CC BY-NC-ND 2.0) htps://lic.kr/p/89XSQW
8and REDD+ in the Philippines
3 Spaial analysis3.1 Why create maps?
Maps can serve as useful tools in the decision-making process, as they can support spaial planning, are oten rapidly produced, customizable and easily communicated.
Spaial analysis exercises can serve as a useful tool for exploring where acions for REDD+ may also complement or further promote a country’s commitments under the CBD and help it realise its Aichi Biodiversity Targets. For example, Aichi Biodiversity Target 12 has the ambiion to prevent the exincion of known threatened species, and improve and sustain their conservaion status by 2020. If spaial informaion on threatened species is available, a spaial analysis exercise for REDD+ could look at where areas of importance for REDD+ acions are in relaion to areas which contain high concentraions of threatened species, to see the extent of overlaps.
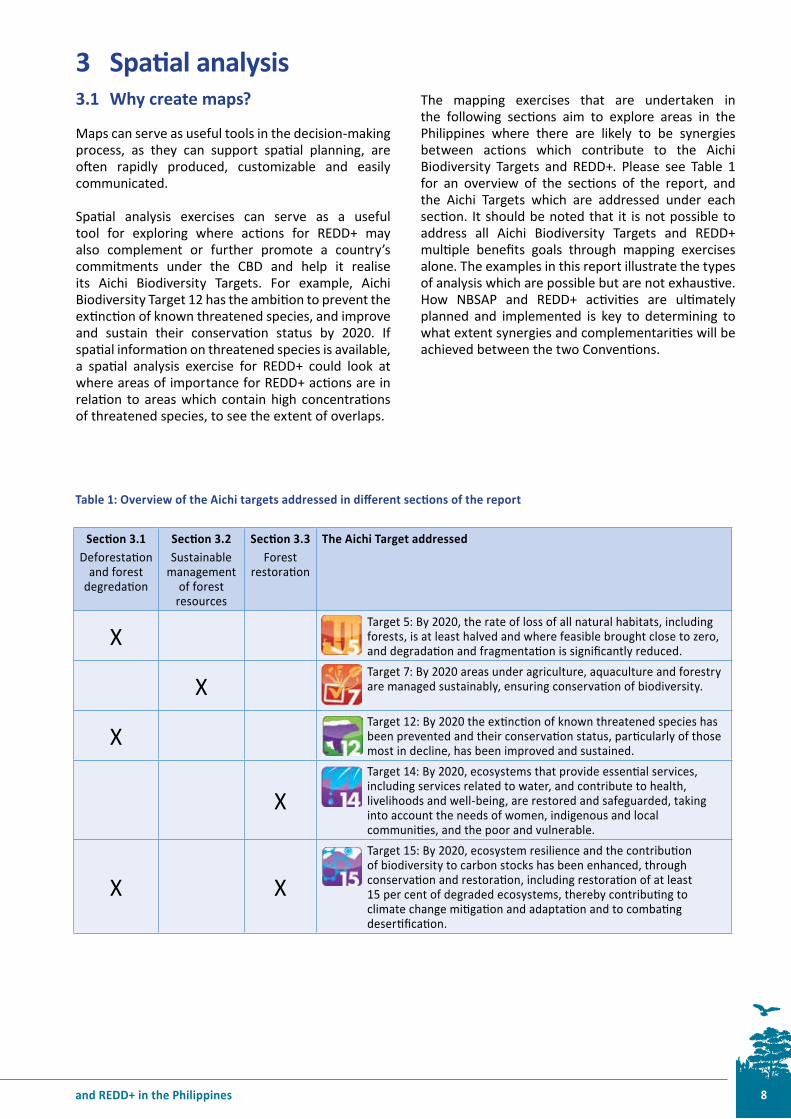
The mapping exercises that are undertaken in the following secions aim to explore areas in the Philippines where there are likely to be synergies between acions which contribute to the Aichi Biodiversity Targets and REDD+. Please see Table 1 for an overview of the secions of the report, and the Aichi Targets which are addressed under each secion. It should be noted that it is not possible to address all Aichi Biodiversity Targets and REDD+ muliple beneits goals through mapping exercises alone. The examples in this report illustrate the types of analysis which are possible but are not exhausive. How NBSAP and REDD+ aciviies are ulimately planned and implemented is key to determining to what extent synergies and complementariies will be achieved between the two Convenions.
Secion 3.1Deforestaion
and forest degredaion
Secion 3.2Sustainable
management of forest
resources
Secion 3.3Forest
restoraion
The Aichi Target addressed
XTarget 5: By 2020, the rate of loss of all natural habitats, including forests, is at least halved and where feasible brought close to zero, and degradaion and fragmentaion is signiicantly reduced.
XTarget 7: By 2020 areas under agriculture, aquaculture and forestry are managed sustainably, ensuring conservaion of biodiversity.
XTarget 12: By 2020 the exincion of known threatened species has been prevented and their conservaion status, paricularly of those most in decline, has been improved and sustained.
X
Target 14: By 2020, ecosystems that provide essenial services, including services related to water, and contribute to health, livelihoods and well-being, are restored and safeguarded, taking into account the needs of women, indigenous and local communiies, and the poor and vulnerable.
X X
Target 15: By 2020, ecosystem resilience and the contribuion of biodiversity to carbon stocks has been enhanced, through conservaion and restoraion, including restoraion of at least 15 per cent of degraded ecosystems, thereby contribuing to climate change miigaion and adaptaion and to combaing deseriicaion.
Table 1: Overview of the Aichi targets addressed in diferent secions of the report
Using spaial analysis to explore synergies between the Aichi Biodiversity Targets 9
3.2 Deforestaion and forest degradaion (Aichi Biodiversity Target 5)
Both the Aichi Biodiversity Targets and REDD+ include the aim to reduce deforestaion and forest degradaion. Aichi Biodiversity Target 5, states that by “2020, the rate of loss of all natural habitats, including forests, is at least halved and where feasible brought close to zero, and degradaion and fragmentaion is signiicantly reduced” and the two irst REDD+ aciviies are reducing emissions from deforestaion and forest degradaion.
In order to plan for reducing deforestaion and degradaion it is important to understand where deforestaion and degradaion are currently occurring and may occur in the future. Informaion on past trends in forest extent can support ideniicaion of drivers of deforestaion and so the ideniicaion of potenial areas of future deforestaion. Informaion on paricular drivers such as ires and illegal logging can also support more speciic planning (see secions 3.2.1 and 3.2.2).
The primary aim of REDD+ is overall emissions reducions through management and enhancement of carbon stocks. Therefore, planning for REDD+ also needs to take into account carbon stocks and their rate of loss, to inform decisions on which stocks will be maintained or enhanced in REDD+ implementaion. In paricular, emissions from forests depend on levels of deforestaion and degradaion, and the density of carbon in deforested and degraded areas.
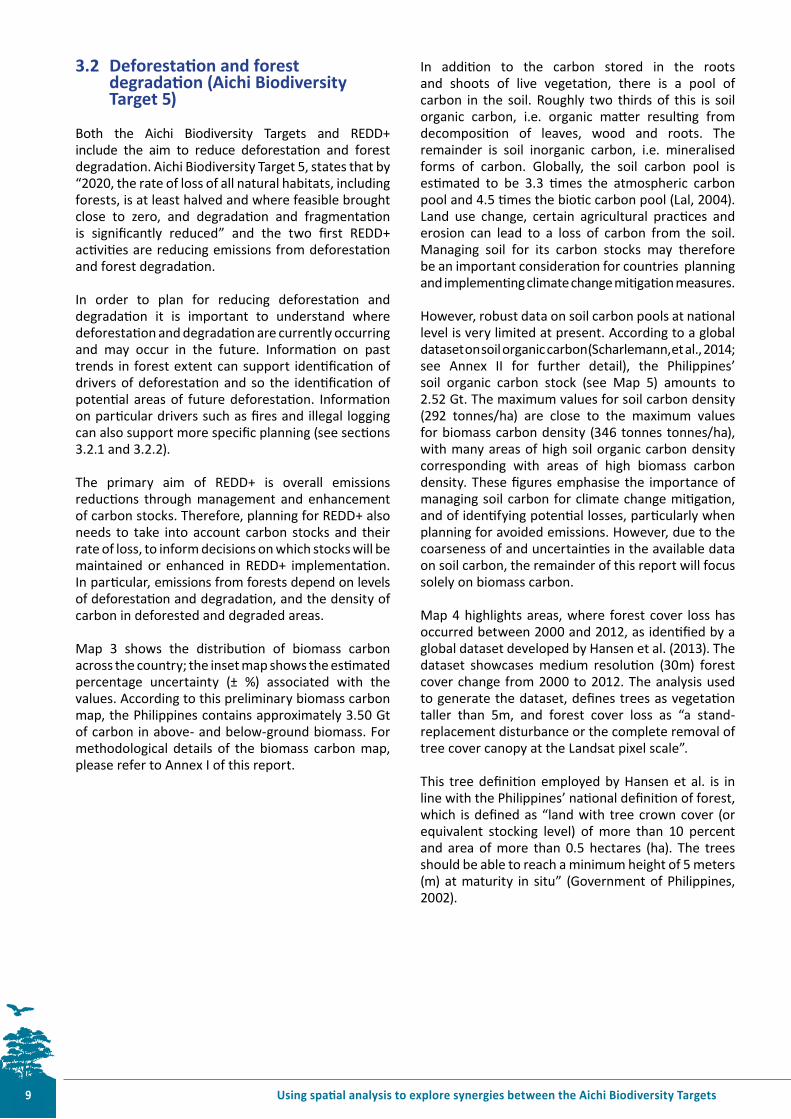
Map 3 shows the distribuion of biomass carbon across the country; the inset map shows the esimated percentage uncertainty (± %) associated with the values. According to this preliminary biomass carbon map, the Philippines contains approximately 3.50 Gt of carbon in above- and below-ground biomass. For methodological details of the biomass carbon map, please refer to Annex I of this report.
In addiion to the carbon stored in the roots and shoots of live vegetaion, there is a pool of carbon in the soil. Roughly two thirds of this is soil organic carbon, i.e. organic mater resuling from decomposiion of leaves, wood and roots. The remainder is soil inorganic carbon, i.e. mineralised forms of carbon. Globally, the soil carbon pool is esimated to be 3.3 imes the atmospheric carbon pool and 4.5 imes the bioic carbon pool (Lal, 2004). Land use change, certain agricultural pracices and erosion can lead to a loss of carbon from the soil. Managing soil for its carbon stocks may therefore be an important consideraion for countries planning and implemening climate change miigaion measures.
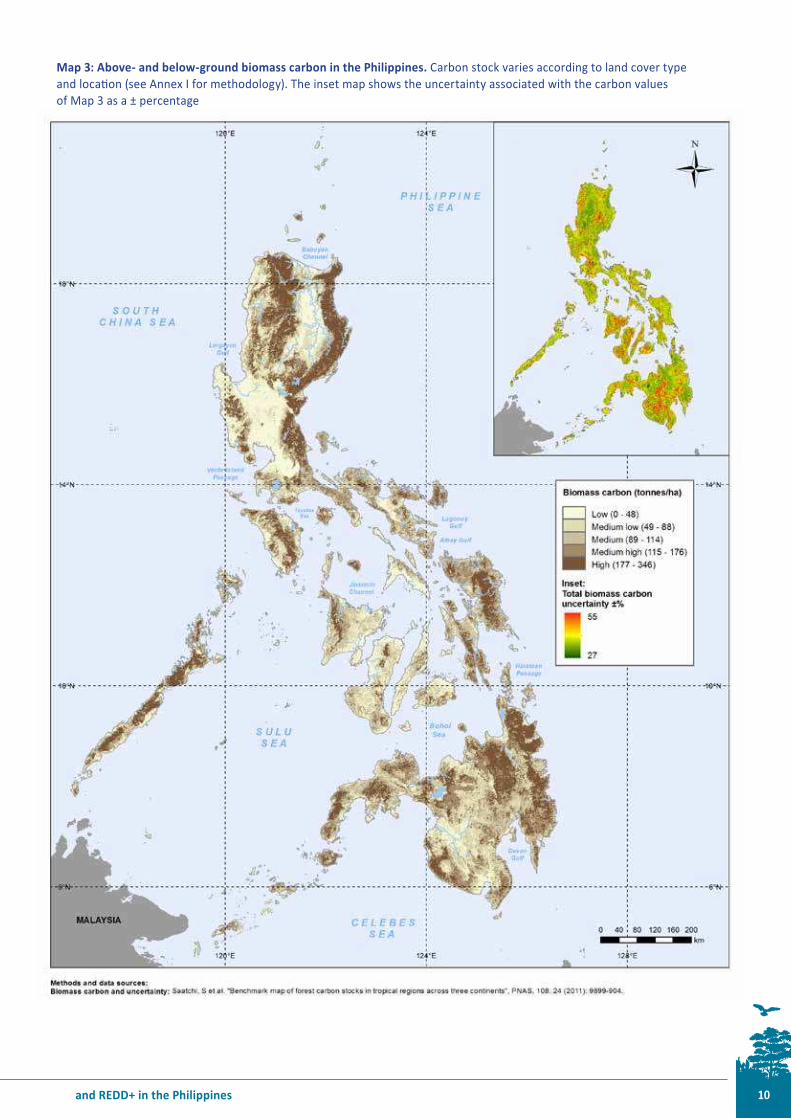
However, robust data on soil carbon pools at naional level is very limited at present. According to a global dataset on soil organic carbon (Scharlemann, et al., 2014; see Annex II for further detail), the Philippines’ soil organic carbon stock (see Map 5) amounts to 2.52 Gt. The maximum values for soil carbon density (292 tonnes/ha) are close to the maximum values for biomass carbon density (346 tonnes tonnes/ha), with many areas of high soil organic carbon density corresponding with areas of high biomass carbon density. These igures emphasise the importance of managing soil carbon for climate change miigaion, and of idenifying potenial losses, paricularly when planning for avoided emissions. However, due to the coarseness of and uncertainies in the available data on soil carbon, the remainder of this report will focus solely on biomass carbon.
Map 4 highlights areas, where forest cover loss has occurred between 2000 and 2012, as ideniied by a global dataset developed by Hansen et al. (2013). The dataset showcases medium resoluion (30m) forest cover change from 2000 to 2012. The analysis used to generate the dataset, deines trees as vegetaion taller than 5m, and forest cover loss as “a stand-replacement disturbance or the complete removal of tree cover canopy at the Landsat pixel scale”.
This tree deiniion employed by Hansen et al. is in line with the Philippines’ naional deiniion of forest, which is deined as “land with tree crown cover (or equivalent stocking level) of more than 10 percent and area of more than 0.5 hectares (ha). The trees should be able to reach a minimum height of 5 meters (m) at maturity in situ” (Government of Philippines, 2002).
10and REDD+ in the Philippines
Map 3: Above- and below-ground biomass carbon in the Philippines. Carbon stock varies according to land cover type and locaion (see Annex I for methodology). The inset map shows the uncertainty associated with the carbon values of Map 3 as a ± percentage

Using spaial analysis to explore synergies between the Aichi Biodiversity Targets 11
Map 4: Forest cover loss in the Philippines (2000-2012). Understanding the locaions of past loss can help develop policies to reduce future loss.
12and REDD+ in the Philippines
Map 5: Soil organic carbon to 1m depth in the Philippines
Forest degradaion is harder to detect and map, despite also being an important driver of emissions and biodiversity loss. Nevertheless, mapping of past deforestaion, degradaion and carbon stocks are important for planning and implemening the Aichi Biodiversity Targets and REDD+. Neither the Aichi Biodiversity Targets which aim to reduce the rate of loss of habitats, nor REDD+, can be planned and implemented successfully without a proper understanding of the drivers of deforestaion and forest degradaion, along with a strategy to address and minimise these.
In the context of the Philippines, major drivers of deforestaion include: logging (legal and illegal), fuelwood gathering and charcoal making, agricultural expansion (especially Kaingin making), infrastructure expansion (e.g. expansion of the mining sector), and biophysical factors such as climate change, typhoons, loods and landslides (GIZ, 2012). The following secions of the report examine the usefulness of maps of illegal logging hotspot areas, wildires, and populaion density in the context of pressures on biodiversity and forests in the Philippines.
3.2.1 Forests, biodiversity and illegal logging hotspots
The Philippines was formerly one of the Southeast Asian countries most afected by illegal logging acivity (Wertz-Kanounnikof & Kongphan-Apirak, 2008). Despite a moratorium on logging in 2011, logging has been ranked as the principal driver of forest degradaion throughout the Philippines (GIZ, 2012). In 2012, 41% of Filipino key informants ideniied logging as the criical driver of forest deforestaion and degradaion. Timber poaching (cuing of imber on a per tree basis) was ranked the third most important driver of deforestaion in three of four regions. Logging and poaching aciviies have wider efects as they open up forests for other types of degradaion aciviies (e.g. Kaingin making).
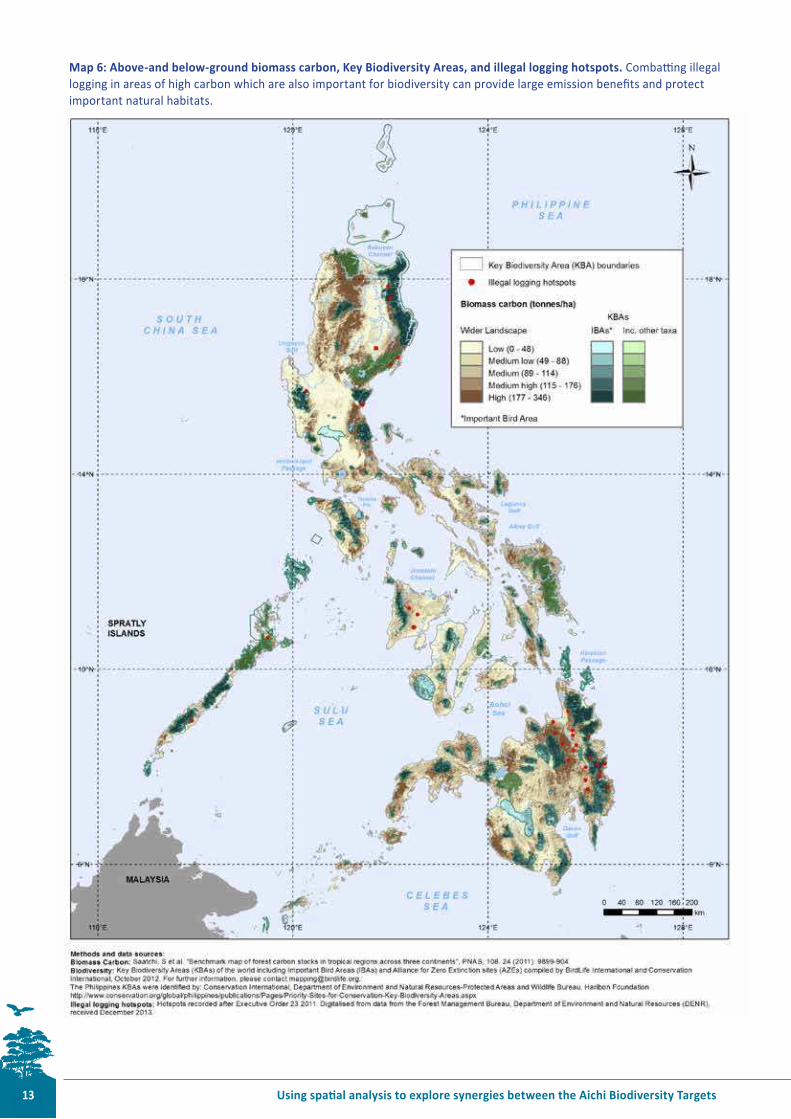
Understanding the locaions of illegal logging in relaion to carbon (Map 6) can therefore support planning for REDD+ and Aichi Biodiversity Target 5. Aichi Biodiversity Target 5 is speciically about natural habitats. The illegal logging hotspots indicate where there is pressure from forest degradaion (FMB DENR, 2013). Map 6 also shows relaion of biomass carbon and illegal logging hotspots to areas of importance for biodiversity which may therefore be paricularly important natural habitat. Key Biodiversity Areas (KBAs) data include Important Bird Areas (IBAs) and areas important for other taxa, which are ideniied at a country level according to naionally agreed criteria. As can be seen, most illegal logging hotspots are located in the Southern Mindanao and Caraga regions of the Philippines, and either overlap with or are located in the vicinity of several KBAs.
Conserving forests against illegal logging is not just relevant to Aichi Biodiversity Target 5 but also Aichi Biodiversity Target 15 which states that “by 2020, ecosystem resilience and the contribuion of biodiversity to carbon stocks has been enhanced, through conservaion and restoraion, including restoraion of at least 15 per cent of degraded ecosystems, thereby contribuing to climate change miigaion and adaptaion and to combaing deseriicaion”. Conserving forests can help in protecing carbon stocks and so climate change miigaion. Addiionally, there is evidence that biodiversity can play a role in maintaining the resilience of carbon and ecosystems (including three literature reviews: Elmqvist et al., 2003; Miles, et al., 2010; and Thompson et al., 2012)). Therefore, prioriising areas for REDD+ which are of importance for biodiversity and are located in areas where there is exposure to degradaion, may contribute towards meeing Aichi Biodiversity Target 15 and decrease the risk of reversal of carbon savings achieved by REDD+.
Methods and data sourcesSoil organic carbon: This map shows soil organic carbon to a depth of 1 metre at a 30 arc-second resoluion. Scharlemann, J.P.W., Hiederer, R., Tanner, E., Kapos, V. (2014) Global soil carbon: understanding and managing the largest terrestrial carbon pool. Carbon Management, February 2014, Vol. 5, No. 1, Pages 81-91
Using spaial analysis to explore synergies between the Aichi Biodiversity Targets 13
Map 6: Above-and below-ground biomass carbon, Key Biodiversity Areas, and illegal logging hotspots. Combaing illegal logging in areas of high carbon which are also important for biodiversity can provide large emission beneits and protect important natural habitats.
14and REDD+ in the Philippines
3.2.2 Forests, biodiversity and wildires
Wildires pose a hazard in the Philippines, paricularly in the summer. They originate from land being cleared for agriculture (for example, through kaingin making), accidental ires that spread through the forests, and human setlement next to forests which have increased (DENR, 2009; GIZ, 2012). The frequency and intensity of wildires in the Philippines has also been linked to global warming and the El Niño phenomenon (DENR, 2009). Between 2000 and 2010, a total of 34,921 ha of land was damaged by forest ires, including 19,607 ha of natural forest land, and 15,314 ha of plantaion areas.
Carbon losses from ires depend on the intensity of the ire, the vegetaion type and speed of regeneraion. In the Philippines, ire damaged forests can recover through ime owing to the rainy season aiding vegetaion growth; however, widespread forest ires coninue to be a hazard as long as people are able to access forests without proper control (GIZ, 2012).
Reducing forest degradaion, including through managing ires, can not only contribute to Aichi Biodiversity Target 5 and REDD+ but also to reducing the exincion of known threatened species exposed to pressures from forest degradaion. Aichi Biodiversity Target 12, calls for the exincion of known threatened species to be prevented and their conservaion status to be improved and sustained by 2020.
The government has made concerted eforts to address the issue, through invesing in training programmes for its forestry workers and local communiies to learn how to prevent and combat forest ires efecively (DENR, 2013). Priority areas for ire control and prevenion have also been set in places where tree planing is occurring under the Naional Greening Programme, as well as protected areas where monitoring is taking place, in recogniion of the role of these areas in providing valuable habitat for endangered species and ensuring water supplies for nearby communiies (DENR, 2013).
Map 7 shows the distribuion of areas of high threatened species richness in relaion to ire occurrence between January and June 2013, which falls mostly in the dry season in the Philippines. The species richness layer is based on species ranges3 of threatened mammals, amphibians and repiles. The map also shows the boundaries of the Ancestral Domains (Philippines Consituion Aricle XII), recognising the role of Indigenous Peoples in the conservaion of threatened biodiversity.
The map shows that ire occurrence between January and June 2013 was most acute in the Cordillera Administraive Region (CAR) and the Central Luzon region in the north of the country. This coincides with the DENR Forest Management Bureau’s list of forest ire hotspots, which lists Cordillera Administraive Region (CAR) as the top hotspot, followed by Central Luzon (DENR, 2013).
Forest ires are an important consideraion under any future naional REDD+ mechanism. Strategies which aim to prevent forest ire under REDD+ will help guarantee the permanence of carbon stocks, reduce risks associated with forest regeneraion and sustainable management of forest projects (Kapos et al., 2012), as well as help protect biodiversity and the livelihoods of forest-dependent people (Barlow et al., 2012).
3 The species distribuion maps, someimes referred to as ‘limits of distribuion’ or ‘ield guide’ maps, aim to provide the current known distribuion of the species within its naive range. The limits of distribuion can be determined by using known occurrences of the species, along with the knowledge of habitat preferences, remaining suitable habitat, elevaion limits, and other expert knowledge of the species and its ranges (IUCN, 2013).
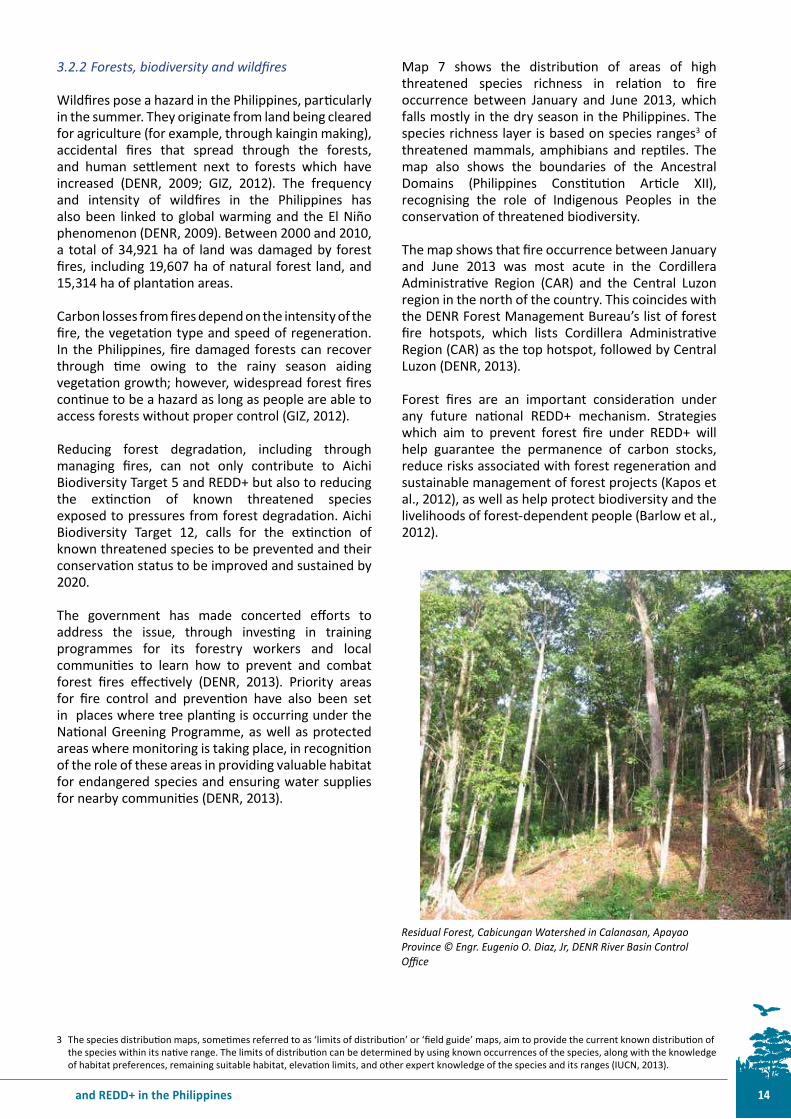
Residual Forest, Cabicungan Watershed in Calanasan, Apayao Province © Engr. Eugenio O. Diaz, Jr, DENR River Basin Control Oice

Using spaial analysis to explore synergies between the Aichi Biodiversity Targets 15
Map 7: Distribuion of areas of high threatened species richness based on species ranges (mammals, amphibians and repiles) and Ancestral Domains in relaion ire occurrence (January to June 2013). Managing ires in areas with many theatened species can support REDD+ and Aichi Biodiversity Target 12.
16and REDD+ in the Philippines
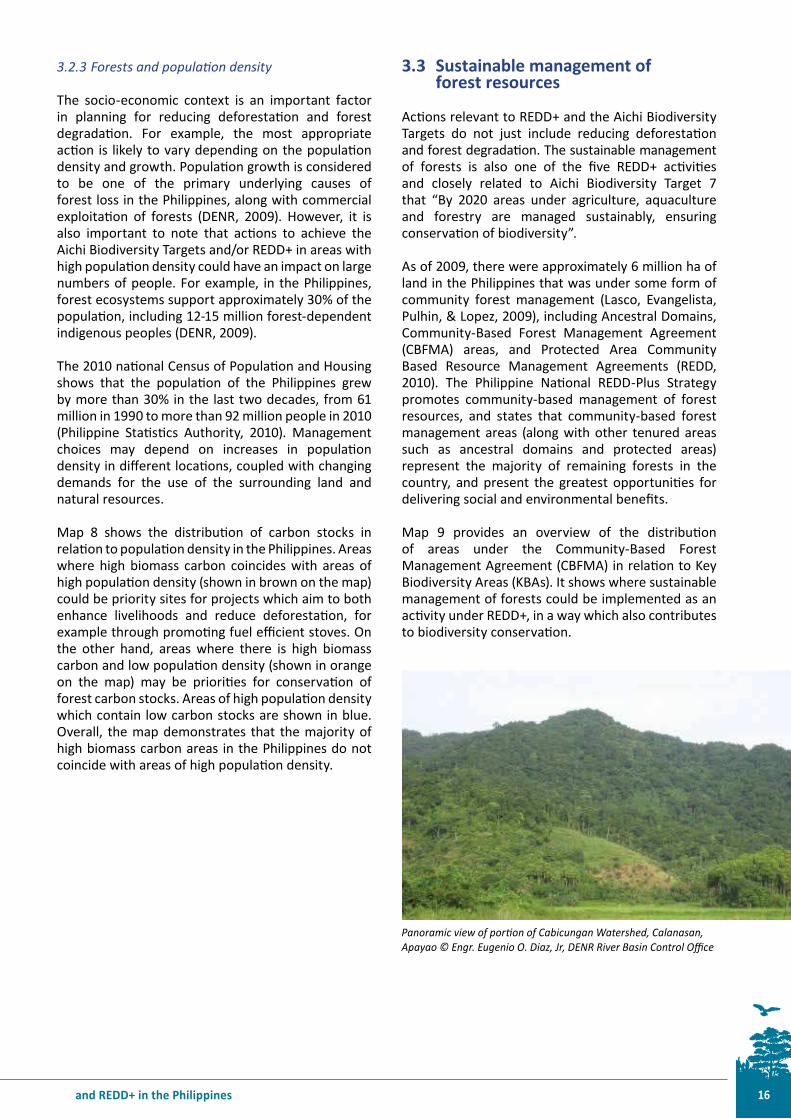
Panoramic view of porion of Cabicungan Watershed, Calanasan, Apayao © Engr. Eugenio O. Diaz, Jr, DENR River Basin Control Oice
3.2.3 Forests and populaion density
The socio-economic context is an important factor in planning for reducing deforestaion and forest degradaion. For example, the most appropriate acion is likely to vary depending on the populaion density and growth. Populaion growth is considered to be one of the primary underlying causes of forest loss in the Philippines, along with commercial exploitaion of forests (DENR, 2009). However, it is also important to note that acions to achieve the Aichi Biodiversity Targets and/or REDD+ in areas with high populaion density could have an impact on large numbers of people. For example, in the Philippines, forest ecosystems support approximately 30% of the populaion, including 12-15 million forest-dependent indigenous peoples (DENR, 2009).
The 2010 naional Census of Populaion and Housing shows that the populaion of the Philippines grew by more than 30% in the last two decades, from 61 million in 1990 to more than 92 million people in 2010 (Philippine Staisics Authority, 2010). Management choices may depend on increases in populaion density in diferent locaions, coupled with changing demands for the use of the surrounding land and natural resources.
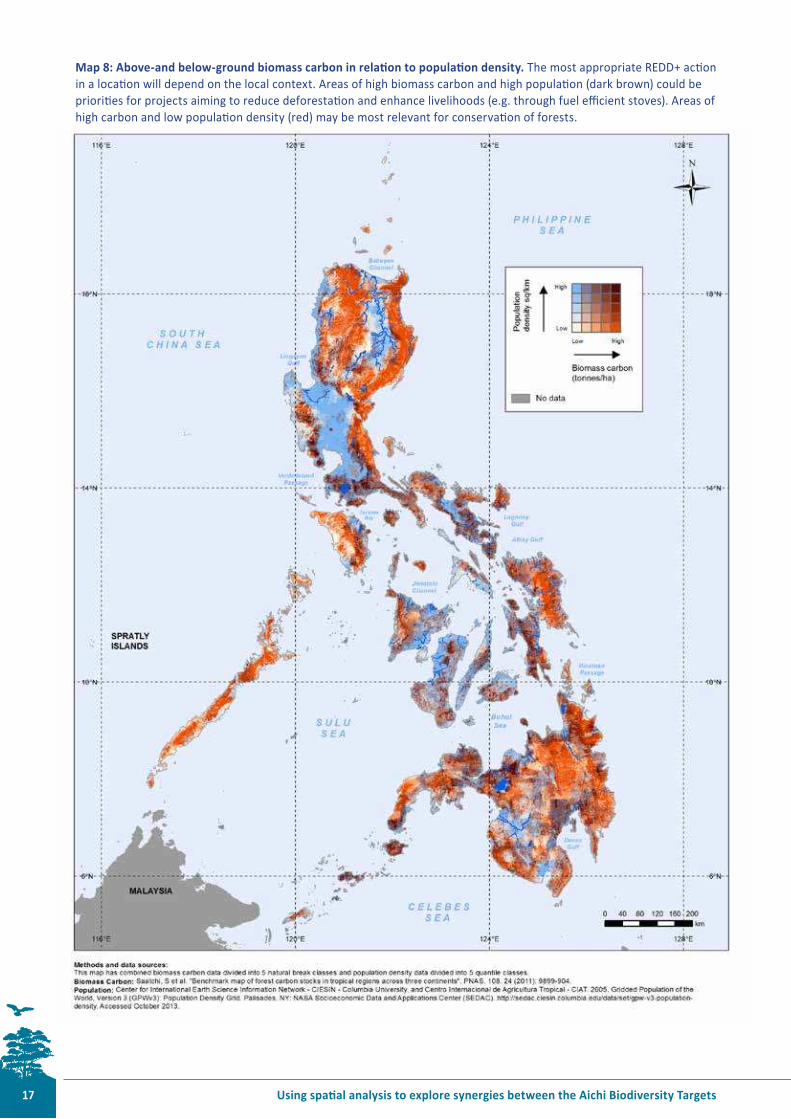
Map 8 shows the distribuion of carbon stocks in relaion to populaion density in the Philippines. Areas where high biomass carbon coincides with areas of high populaion density (shown in brown on the map) could be priority sites for projects which aim to both enhance livelihoods and reduce deforestaion, for example through promoing fuel eicient stoves. On the other hand, areas where there is high biomass carbon and low populaion density (shown in orange on the map) may be prioriies for conservaion of forest carbon stocks. Areas of high populaion density which contain low carbon stocks are shown in blue. Overall, the map demonstrates that the majority of high biomass carbon areas in the Philippines do not coincide with areas of high populaion density.
3.3 Sustainable management of forest resources
Acions relevant to REDD+ and the Aichi Biodiversity Targets do not just include reducing deforestaion and forest degradaion. The sustainable management of forests is also one of the ive REDD+ aciviies and closely related to Aichi Biodiversity Target 7 that “By 2020 areas under agriculture, aquaculture and forestry are managed sustainably, ensuring conservaion of biodiversity”.
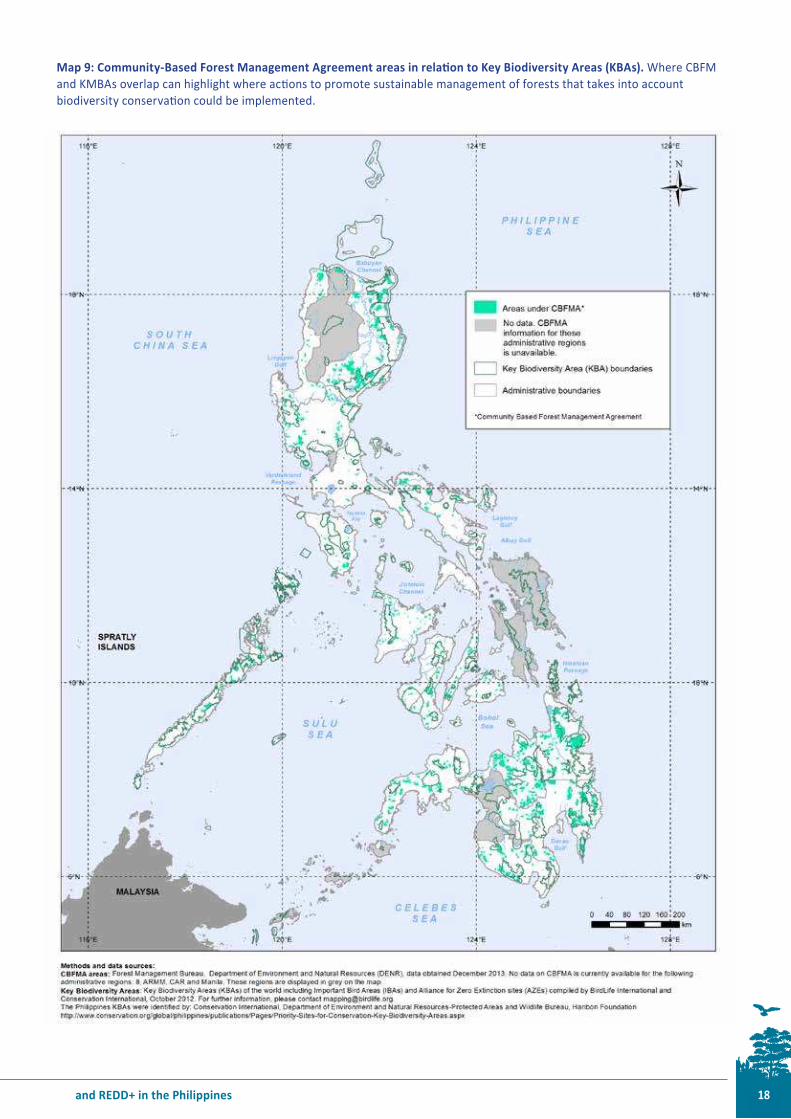
As of 2009, there were approximately 6 million ha of land in the Philippines that was under some form of community forest management (Lasco, Evangelista, Pulhin, & Lopez, 2009), including Ancestral Domains, Community-Based Forest Management Agreement (CBFMA) areas, and Protected Area Community Based Resource Management Agreements (REDD, 2010). The Philippine Naional REDD-Plus Strategy promotes community-based management of forest resources, and states that community-based forest management areas (along with other tenured areas such as ancestral domains and protected areas) represent the majority of remaining forests in the country, and present the greatest opportuniies for delivering social and environmental beneits.
Map 9 provides an overview of the distribuion of areas under the Community-Based Forest Management Agreement (CBFMA) in relaion to Key Biodiversity Areas (KBAs). It shows where sustainable management of forests could be implemented as an acivity under REDD+, in a way which also contributes to biodiversity conservaion.
Using spaial analysis to explore synergies between the Aichi Biodiversity Targets 17
Map 8: Above-and below-ground biomass carbon in relaion to populaion density. The most appropriate REDD+ acion in a locaion will depend on the local context. Areas of high biomass carbon and high populaion (dark brown) could be prioriies for projects aiming to reduce deforestaion and enhance livelihoods (e.g. through fuel eicient stoves). Areas of high carbon and low populaion density (red) may be most relevant for conservaion of forests.
18and REDD+ in the Philippines
Map 9: Community-Based Forest Management Agreement areas in relaion to Key Biodiversity Areas (KBAs). Where CBFM and KMBAs overlap can highlight where acions to promote sustainable management of forests that takes into account biodiversity conservaion could be implemented.
Using spaial analysis to explore synergies between the Aichi Biodiversity Targets 19
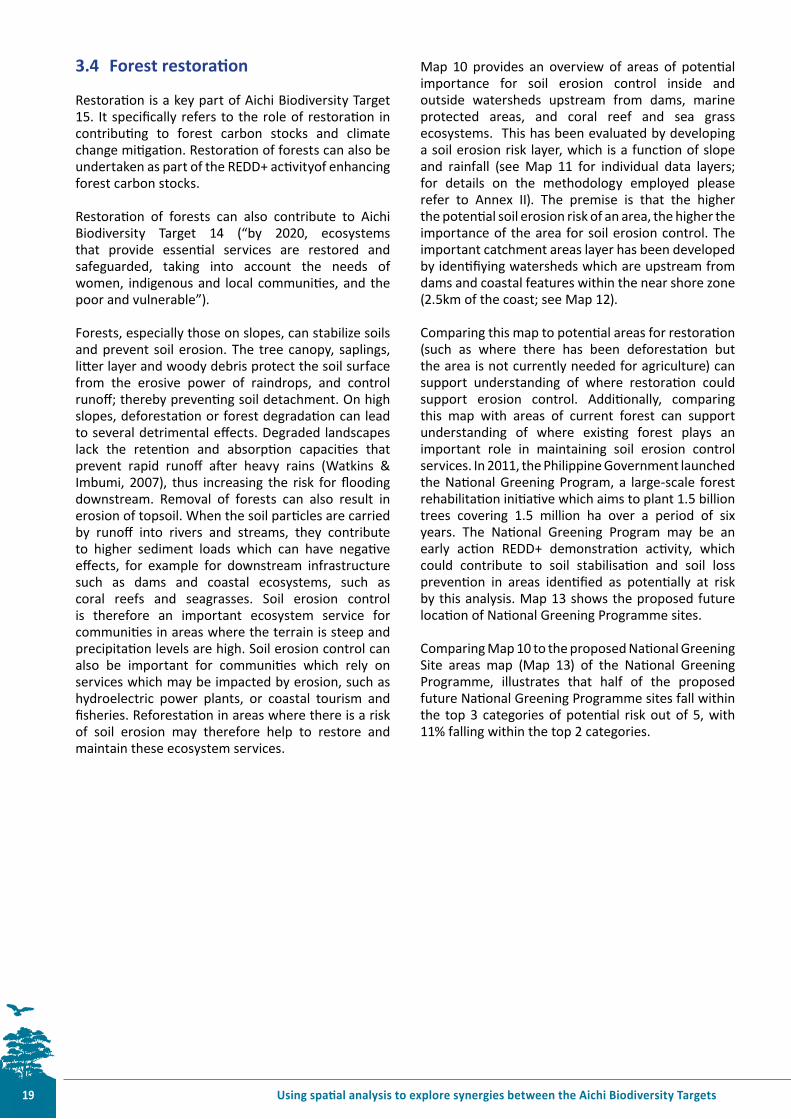
3.4 Forest restoraion
Restoraion is a key part of Aichi Biodiversity Target 15. It speciically refers to the role of restoraion in contribuing to forest carbon stocks and climate change miigaion. Restoraion of forests can also be undertaken as part of the REDD+ acivityof enhancing forest carbon stocks.
Restoraion of forests can also contribute to Aichi Biodiversity Target 14 (“by 2020, ecosystems that provide essenial services are restored and safeguarded, taking into account the needs of women, indigenous and local communiies, and the poor and vulnerable”).
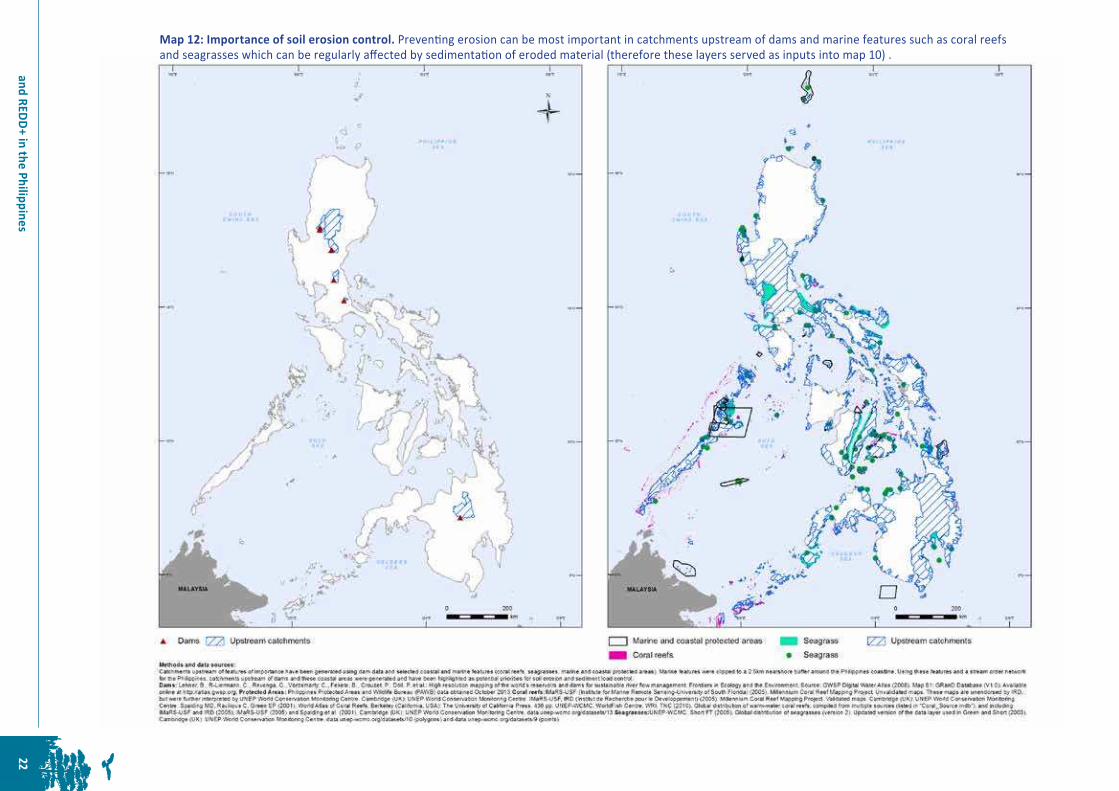
Forests, especially those on slopes, can stabilize soils and prevent soil erosion. The tree canopy, saplings, liter layer and woody debris protect the soil surface from the erosive power of raindrops, and control runof; thereby prevening soil detachment. On high slopes, deforestaion or forest degradaion can lead to several detrimental efects. Degraded landscapes lack the retenion and absorpion capaciies that prevent rapid runof ater heavy rains (Watkins & Imbumi, 2007), thus increasing the risk for looding downstream. Removal of forests can also result in erosion of topsoil. When the soil paricles are carried by runof into rivers and streams, they contribute to higher sediment loads which can have negaive efects, for example for downstream infrastructure such as dams and coastal ecosystems, such as coral reefs and seagrasses. Soil erosion control is therefore an important ecosystem service for communiies in areas where the terrain is steep and precipitaion levels are high. Soil erosion control can also be important for communiies which rely on services which may be impacted by erosion, such as hydroelectric power plants, or coastal tourism and isheries. Reforestaion in areas where there is a risk of soil erosion may therefore help to restore and maintain these ecosystem services.
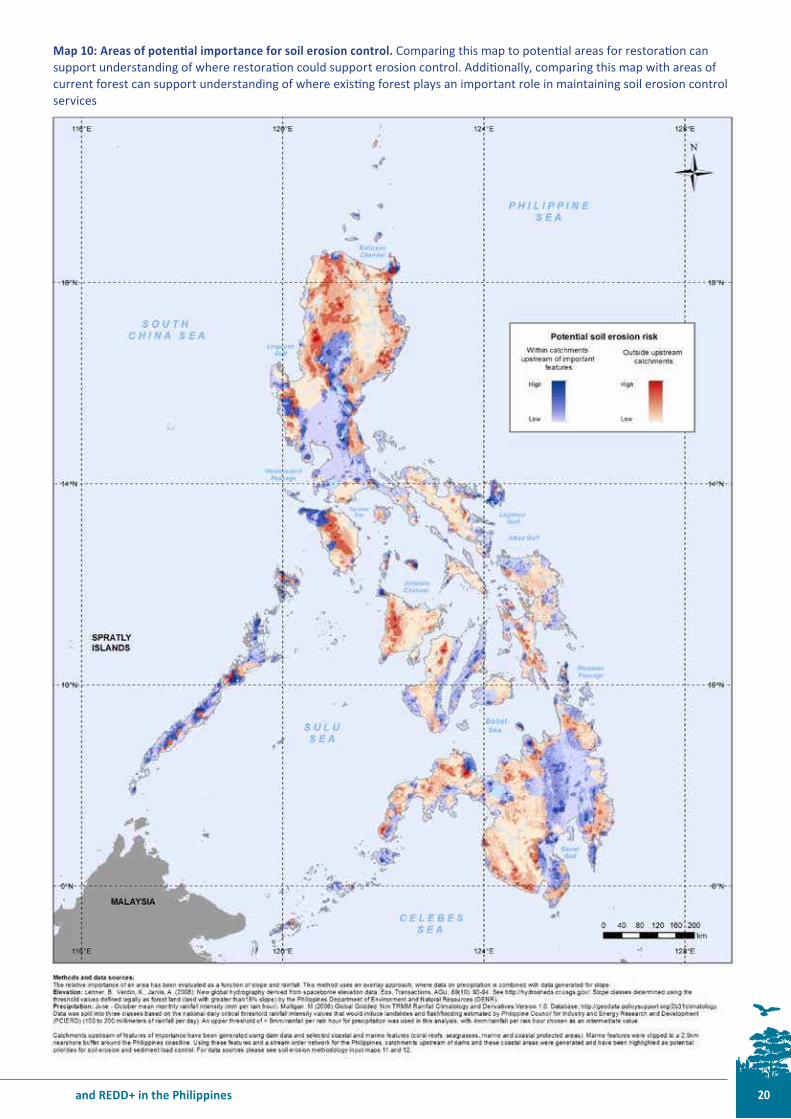
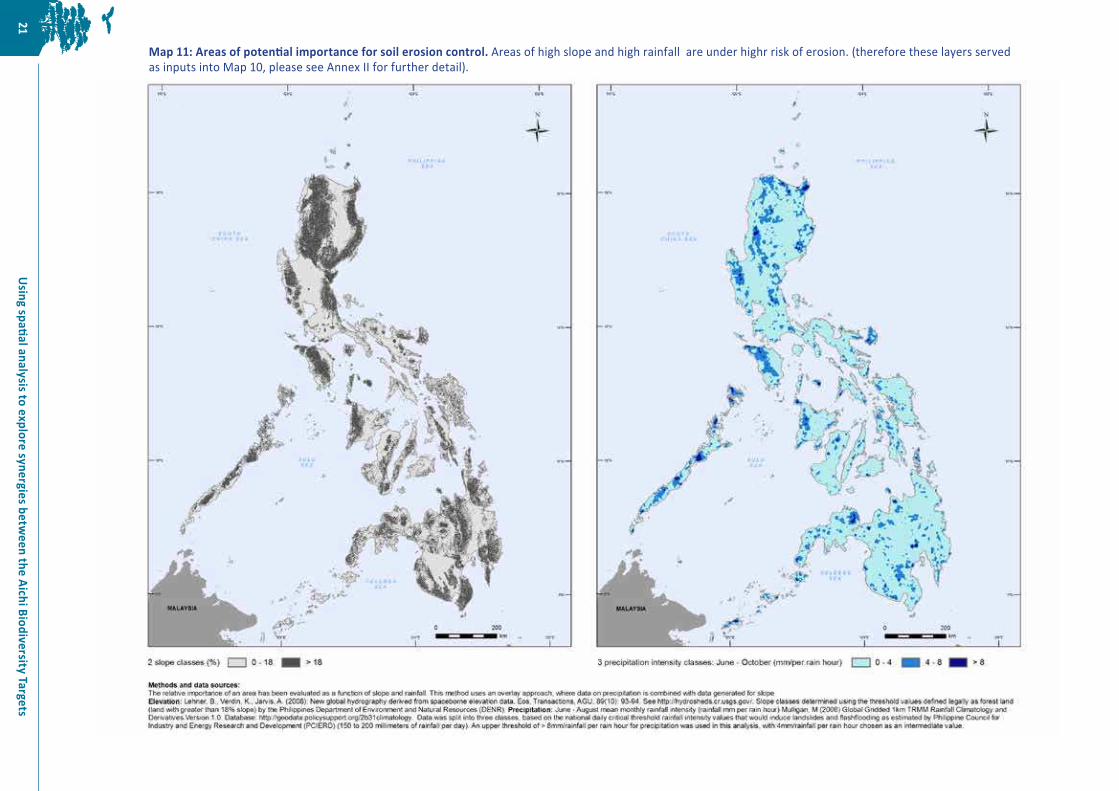
Map 10 provides an overview of areas of potenial importance for soil erosion control inside and outside watersheds upstream from dams, marine protected areas, and coral reef and sea grass ecosystems. This has been evaluated by developing a soil erosion risk layer, which is a funcion of slope and rainfall (see Map 11 for individual data layers; for details on the methodology employed please refer to Annex II). The premise is that the higher the potenial soil erosion risk of an area, the higher the importance of the area for soil erosion control. The important catchment areas layer has been developed by ideniiying watersheds which are upstream from dams and coastal features within the near shore zone (2.5km of the coast; see Map 12).
Comparing this map to potenial areas for restoraion (such as where there has been deforestaion but the area is not currently needed for agriculture) can support understanding of where restoraion could support erosion control. Addiionally, comparing this map with areas of current forest can support understanding of where exising forest plays an important role in maintaining soil erosion control services. In 2011, the Philippine Government launched the Naional Greening Program, a large-scale forest rehabilitaion iniiaive which aims to plant 1.5 billion trees covering 1.5 million ha over a period of six years. The Naional Greening Program may be an early acion REDD+ demonstraion acivity, which could contribute to soil stabilisaion and soil loss prevenion in areas ideniied as potenially at risk by this analysis. Map 13 shows the proposed future locaion of Naional Greening Programme sites.
Comparing Map 10 to the proposed Naional Greening Site areas map (Map 13) of the Naional Greening Programme, illustrates that half of the proposed future Naional Greening Programme sites fall within the top 3 categories of potenial risk out of 5, with 11% falling within the top 2 categories.
20and REDD+ in the Philippines
Map 10: Areas of potenial importance for soil erosion control. Comparing this map to potenial areas for restoraion can support understanding of where restoraion could support erosion control. Addiionally, comparing this map with areas of current forest can support understanding of where exising forest plays an important role in maintaining soil erosion control services
Using spaial analysis to explore synergies between the Aichi Biodiversity Targets
21
Map 11: Areas of potenial importance for soil erosion control. Areas of high slope and high rainfall are under highr risk of erosion. (therefore these layers served as inputs into Map 10, please see Annex II for further detail).
22
an
d R
ED
D+
in th
e P
hilip
pin
es
Map 12: Importance of soil erosion control. Prevening erosion can be most important in catchments upstream of dams and marine features such as coral reefs and seagrasses which can be regularly afected by sedimentaion of eroded material (therefore these layers served as inputs into map 10) .

Using spaial analysis to explore synergies between the Aichi Biodiversity Targets 23
Map 13: Potenial sites for the Naional Greening Programme (NGP) 2014-2016 in the Philippines
24and REDD+ in the Philippines
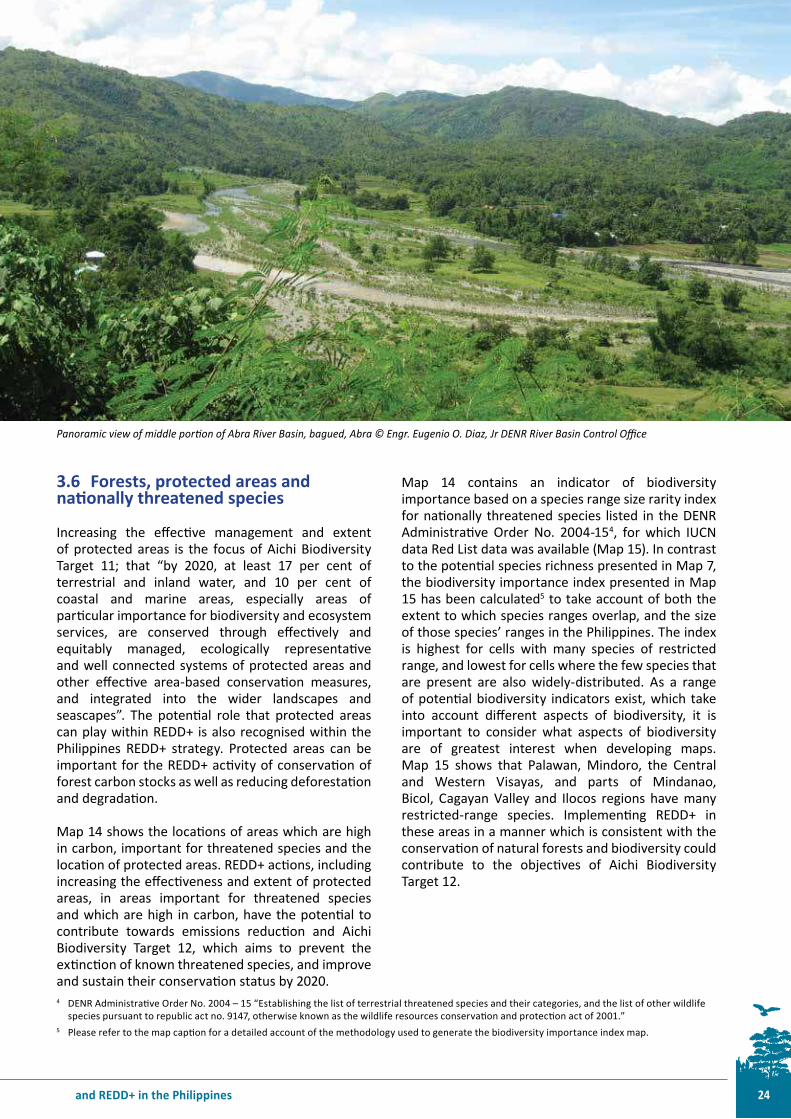
Panoramic view of middle porion of Abra River Basin, bagued, Abra © Engr. Eugenio O. Diaz, Jr DENR River Basin Control Oice
4 DENR Administraive Order No. 2004 – 15 “Establishing the list of terrestrial threatened species and their categories, and the list of other wildlife species pursuant to republic act no. 9147, otherwise known as the wildlife resources conservaion and protecion act of 2001.”
5 Please refer to the map capion for a detailed account of the methodology used to generate the biodiversity importance index map.
3.6 Forests, protected areas and naionally threatened species
Increasing the efecive management and extent of protected areas is the focus of Aichi Biodiversity Target 11; that “by 2020, at least 17 per cent of terrestrial and inland water, and 10 per cent of coastal and marine areas, especially areas of paricular importance for biodiversity and ecosystem services, are conserved through efecively and equitably managed, ecologically representaive and well connected systems of protected areas and other efecive area-based conservaion measures, and integrated into the wider landscapes and seascapes”. The potenial role that protected areas can play within REDD+ is also recognised within the Philippines REDD+ strategy. Protected areas can be important for the REDD+ acivity of conservaion of forest carbon stocks as well as reducing deforestaion and degradaion.
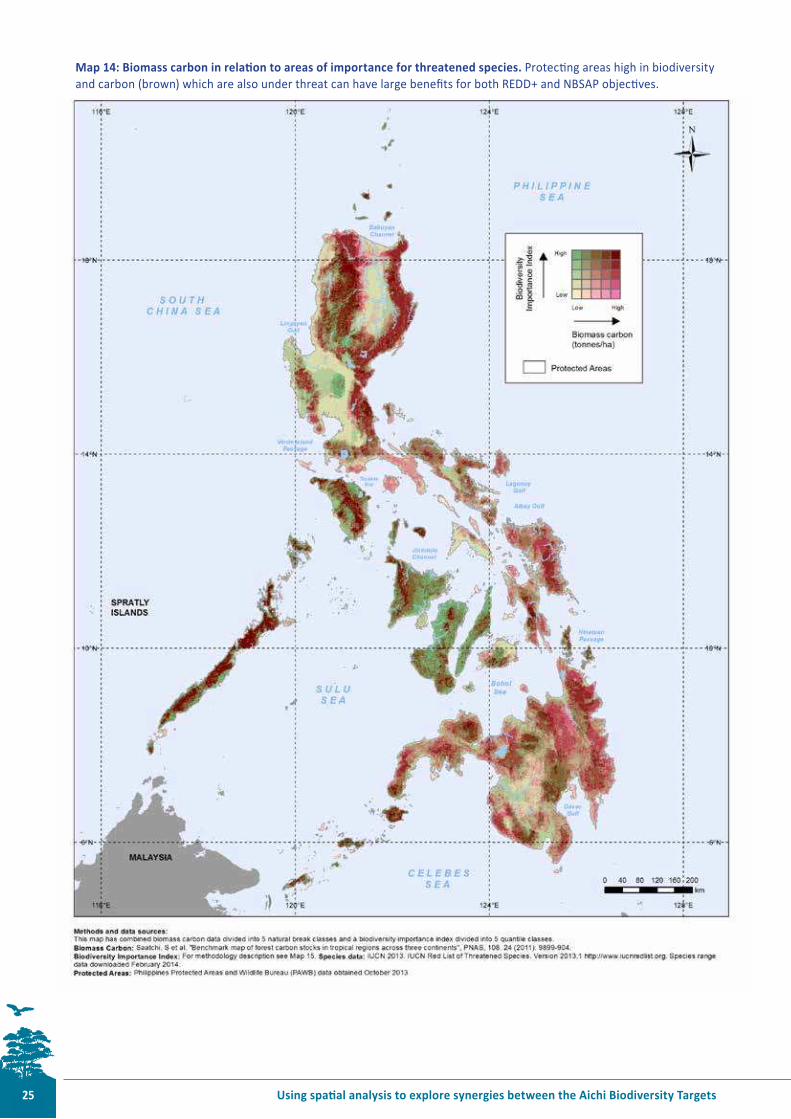
Map 14 shows the locaions of areas which are high in carbon, important for threatened species and the locaion of protected areas. REDD+ acions, including increasing the efeciveness and extent of protected areas, in areas important for threatened species and which are high in carbon, have the potenial to contribute towards emissions reducion and Aichi Biodiversity Target 12, which aims to prevent the exincion of known threatened species, and improve and sustain their conservaion status by 2020.
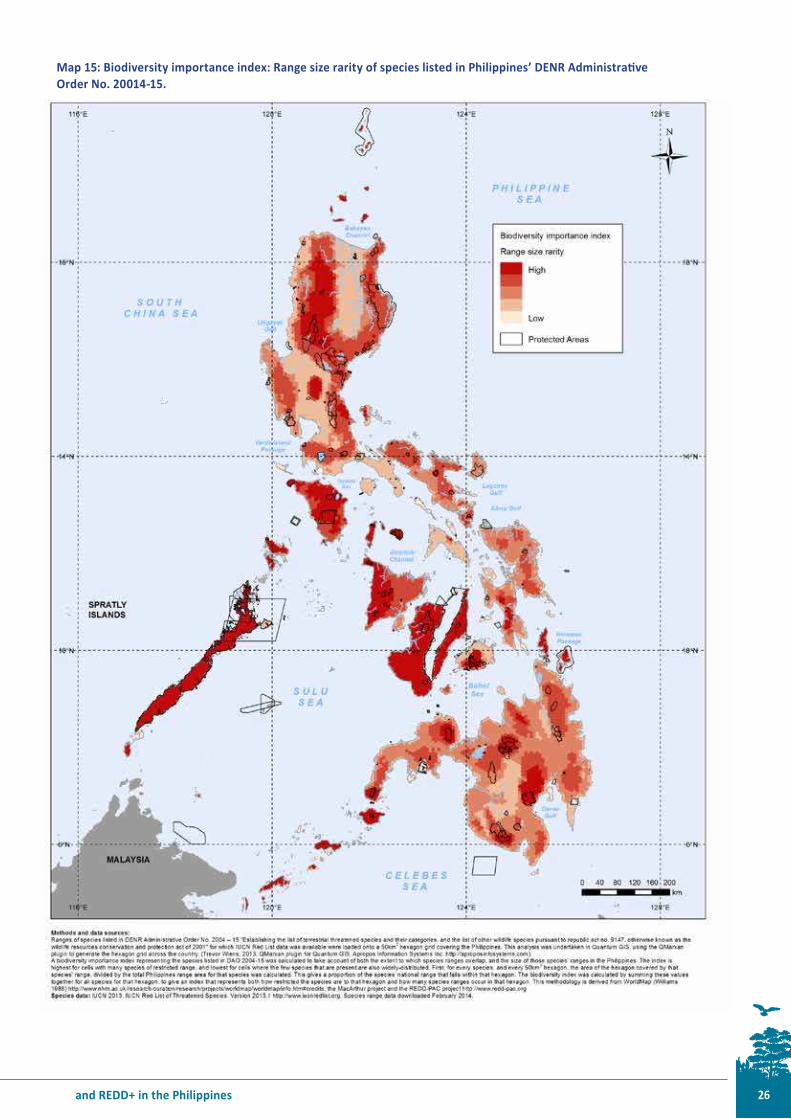
Map 14 contains an indicator of biodiversity importance based on a species range size rarity index for naionally threatened species listed in the DENR Administraive Order No. 2004-154, for which IUCN data Red List data was available (Map 15). In contrast to the potenial species richness presented in Map 7, the biodiversity importance index presented in Map 15 has been calculated5 to take account of both the extent to which species ranges overlap, and the size of those species’ ranges in the Philippines. The index is highest for cells with many species of restricted range, and lowest for cells where the few species that are present are also widely-distributed. As a range of potenial biodiversity indicators exist, which take into account diferent aspects of biodiversity, it is important to consider what aspects of biodiversity are of greatest interest when developing maps. Map 15 shows that Palawan, Mindoro, the Central and Western Visayas, and parts of Mindanao, Bicol, Cagayan Valley and Ilocos regions have many restricted-range species. Implemening REDD+ in these areas in a manner which is consistent with the conservaion of natural forests and biodiversity could contribute to the objecives of Aichi Biodiversity Target 12.
Using spaial analysis to explore synergies between the Aichi Biodiversity Targets 25
Map 14: Biomass carbon in relaion to areas of importance for threatened species. Protecing areas high in biodiversity and carbon (brown) which are also under threat can have large beneits for both REDD+ and NBSAP objecives.
26and REDD+ in the Philippines
Map 15: Biodiversity importance index: Range size rarity of species listed in Philippines’ DENR Administraive Order No. 20014-15.
Using spaial analysis to explore synergies between the Aichi Biodiversity Targets 27
4 Conclusions and outlookThe maps presented in this report demonstrate that there are concrete opportuniies in the Philippines for linking acions to support REDD+ and those which aim to achieve the Aichi Biodiversity Targets. However, it should also be noted that REDD+ cannot contribute to the achievement of all the Aichi Biodiversity Targets, since these are broader than forests and its role in climate change miigaion.
Joint planning for achieving the CBD Aichi Biodiversity Targets and REDD+ could help the Philippines develop complementary approaches, coordinate eforts between ministries, and build coherent biodiversity conservaion, climate change miigaion and land use policies. Spaial analysis as presented in this report can support such planning. For example, both NBSAP and REDD+ planning require informaion on past trends in forest cover and the drivers of forest loss (such as illegal logging hotspot areas, wildires).
Using spaial analysis for prioriising areas under REDD+ to secure muliple beneits could help contribute to more than one Aichi Biodiversity Target. For example, as this report illustrates, prioriising areas of importance for biodiversity under REDD+ could contribute to Target 5 on reducing the rate of loss of all natural habitats and Target 12 on prevening the exincion of known threatened species.
The speciic analysis needed for supporing planning varies between the diferent REDD+ aciviies. For example, this report illustrates how maps can support both planning for reducing deforestaion and planning for the sustainable management of forests under REDD+ and Aichi Biodiversity Target 7 (sustainably managing areas under agriculture, aquaculture and forestry, ensuring conservaion of biodiversity).
Spaial analysis can also support planning for the conservaion or enhancement of ecosystem services such as soil erosion. It allows exploraion of where exising forest play an important role in prevening soil erosion, and where forest restoraion could potenially reduce soil erosion. This could potenially inform the selecion of sites under the Naional Greening Programme.
As planning for REDD+ and the Aichi Biodiversity Targets moves forward, the implementaion of NBSAP and REDD+ aciviies will ulimately determine the extent to which synergies are achieved.
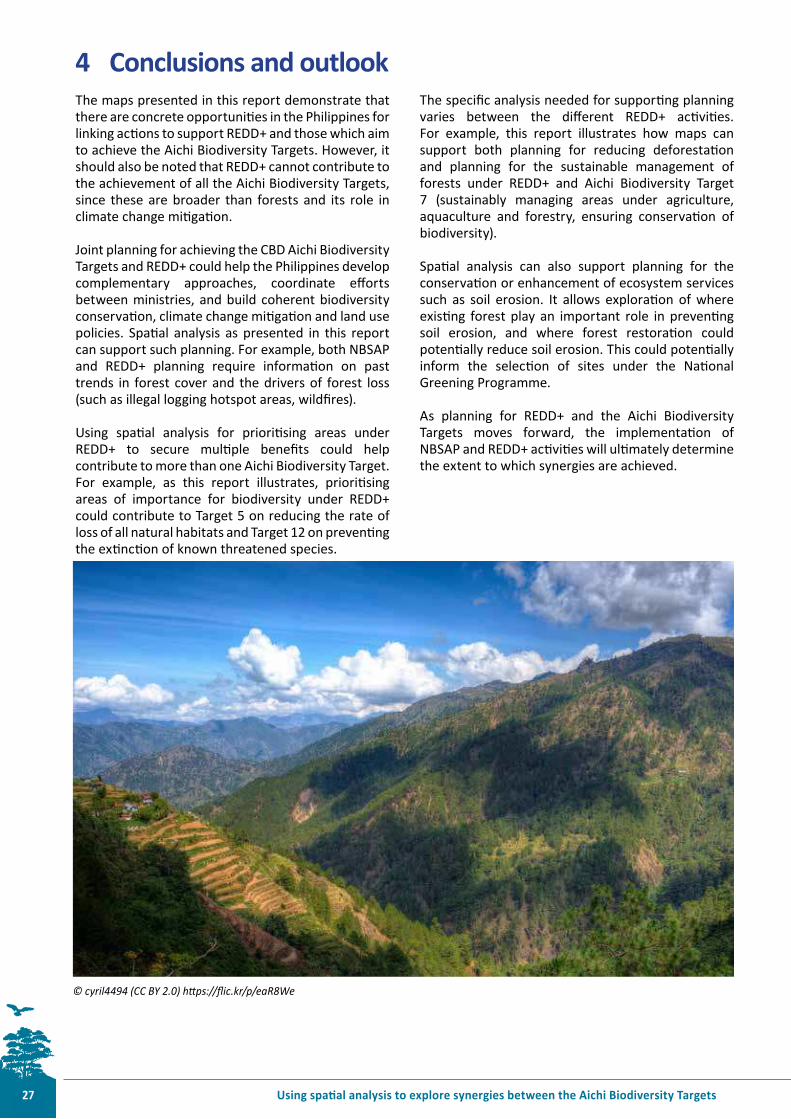
© cyril4494 (CC BY 2.0) htps://lic.kr/p/eaR8We

28and REDD+ in the Philippines
Annex I: Generaion of the above- and below-ground biomass carbon map for the Philippines
An esimate of the above-ground biomass carbon contained within the Philippines was developed using a 1 km resoluion pan-tropical map of biomass carbon produced by Saatchi et al. (2011). According to this data, approximately 2.06 - 4.45 Gigatonnes (GtC) of above- and below-ground biomass carbon is stored in the Philippines, with a mean value of 3.50 GtC. Map 2 shows the distribuion of biomass carbon across the Philippines, with the inset map showing the esimated percentage uncertainty (±%) associated with the values.
The biomass carbon map was produced in several stages by the NASA Jet Propulsion Laboratory, California Insitute of Technology research group. Forest plots were sampled and a relaionship was derived between these forest measurements and GLAS Lidar derived Lorey’s height to give above ground and below ground biomass values for several hundred Lidar footprints. These Lidar footprints were then used as calibraion plots for a MaxEnt spaial model to predict carbon values, where the 14 variables for the model were derived from remote sensing quick scaterometer (QSCAT) data, moderate resoluion imaging spectroradiometer (MODIS) and the SRTM digital elevaion data, 5 NDVI (Normalized Diference Vegetaion Index), 3 LAI (Leaf Area Index), 4 QSCAT (Quick Scaterometer), and 2 SRTM (Shutle Radar Topography Mission) metrics. Finally, a spaially explicit uncertainty esimate was produced from the model, which can be used to evaluate the uncertainty of the map at a naional scale.
Annex II: Generaion of the potenial soil erosion risk map for the Philippines
To evaluate the potenial importance of an area for soil erosion control, the analysis presented here uses a simple quanitaive approach. Relaive importance has been evaluated as a funcion of slope and rainfall. Precipitaion intensity data for June – October for the Philippines (mean monthly rainfall intensity, mm per rain hour) (Mulligan, 2006) was combined and split into three classes, based on the naional daily criical threshold rainfall intensity values that would induce landslides and lash looding as esimated by Philippine Council for Industry and Energy Research and Development (PCIERD) (150 to 200 millimeters of rainfall per day). An upper threshold of >8mm/rainfall per rain hour for precipitaion was used in this analysis, with 4mm/rainfall per rain hour chosen as an intermediate value.
Digital Elevaion Model (DEM) data (Lehner et al., 2008a) was used to generate slope, which was then reclassed into two classes, in accordance with the threshold used by the Department of Environment and Natural Resources of the Philippines (DENR). Upland areas, deined as those with >18% slope.
These two elements were then combined addiively. Since there are 2 classes for slope (1-2) and 3 classes for mean precipitaion (1-3) the resuling output has a maximum value of 5, and a minimum value of 2, and therefore 4 classes. These classes represent a low to high potenial importance of an area for soil erosion control. Highest values represent higher erosion risk. No weighing is used in this approach; the relaive importance of high precipitaion is the same as that for steep slopes.
Catchments upstream of features of importance were generated using dam data and selected coastal and marine features (coral reefs, seagrasses, marine and coastal protected areas). Marine features were clipped to a 2.5km nearshore bufer around the Philippines coastline (Davidson-Arnot & Greenwood, 2009). Using these features and a stream order network for the Philippines, catchments upstream of dams and coastal areas were generated and have been highlighted as potenial prioriies for soil erosion and sediment load control. Proposed future locaions of Naional Greening Programme sites in areas ideniied as potenially at risk could also efecively contribute to soil stabilisaion and the reducion of erosion.
Using spaial analysis to explore synergies between the Aichi Biodiversity Targets 29
ReferencesMillenium Ecosystem Assessment (2005) Ecosystems and Human Well-being: Synthesis. Washington, D.C., Island Press.
Barlow, J., Parry, L., Gardner, T. A., Ferreira, J., Aragão, L. E. O. C., Carmenta, R., Berenguer, E., Vieira, I. C.G. G., Souza, C. & Cochrane, M. A. (2012) The criical importance of considering ire in REDD+ programs. Biological Conservaion, 154, 1–8.
Biodiversity Management Bureau (2013) Establishing and Managing Protected Areas. Accessed 29/09/14 Available at: htp://bmb.gov.ph/index.php?opion=com_content&view=aricle&id=120:establishing-and-managing-protected-areas&caid=58:protected-area-management.
Davidson-Arnot, R.G.D., & Greenwood, B. (2009) Nearshore Processes. In Isla, F.I. (Ed.) Coastal Zone and Estuaries - Volume 1 in Encyclopedia of Life Support Systems (EOLSS), Developed under the Paris, France, UNESCO.
Department of Environment and Natural Resources (DENR) (2009) Assessing progress towards the 2010 Biodiversity Target: The 4th Naional Report to the Convenion on Biological Diversity (p. 108). Quezon City, Philippines.
DENR (2013) Press release: DENR readies for forest ires. Quezon City, Philippines. Published 25 March 2013. Department of Environment and Natural Resources (DENR).
DENR, & CoDe REDD-plus Philippines (2010) The Philippine Naional REDD-plus Strategy. Quezon City, Philippines.
Duchelle, A. E., Cromberg, M., Gebara, M. F., Guerra, R., Melo, T., Larson, A.,Cronkleton, P., Börner, J., Sills, E., Wunder, S., Bauch, S., May, P., Selaya, G. & Sunderlin, W. D. (2014) Linking Forest Tenure Reform, Environmental Compliance, and Incenives: Lessons from REDD+ Iniiaives in the Brazilian Amazon. World Development, 55, 53–67.
Elmqvist, T., Folke, C., Nyström, M., Peterson, G., Bengtsson, J., Walker, B., & Norberg, J. (2003) Response diversity, ecosystem change, and resilience. Froniers in Ecology and the Environment. 1(9), 488-494.
Elmqvist, T., Wall, M., Berggren, A. L., Blix, L., Friiof, A., & Rinman, U. (2001) Tropical forest reorganizaion ater cyclone and ire disturbance in Samoa: remnant trees as biological legacies. Ecology and Society, 5(2), 10.
FAO (2010) Global Forest Resources Assessment 2010: Country Report - Philippines. Rome, Italy, FAO. Accessed 29.09.2014. Available at: htp://www.fao.org/docrep/013/al599E/al599E.pdf
GIZ (2012) Analysis of Key Drivers of Deforestaion and Forest Degradaion in the Philippines. Manila, Philippines.
Government of Philippines (2002) Philippines Naional Forest Inventory - Field Manual. Manila, Philippines.
Hansen, M. C., Potapov, P. V., Moore, R., Hancher, M., Turubanova, S. a., Tyukavina, a., Thau, D., Stehman, S. V., Goetz, S. J., Loveland, T. R., Kommareddy, A., Egorov, A., Chini, L., Jusice, C. O. & Townshend, J. R. G. (2013) High-Resoluion Global Maps of 21st-Century Forest Cover Change. Science, 342(6160), 850–853.
IPCC Working Group 1 (2013) Climate Change 2013: The Physical Science Basis. Full Report. Cambridge: Cambridge University Press.
IUCN (2013) IUCN Red List of Threatened Species. Version 2013.2. Gland, Switzerland. Accessed 6.2.2014. Available at: www.iucnredlist.org
Kapos, V., Herkenrath, P., & Miles, L. (2007) Reducing Emissions from Deforestaion: A Key Opportunity for Ataining Muliple Beneits Cambridge, UK. UNEP World Conservaion Monitoring Centre.
Kapos, V., Kurz, W. A., Gardner, T., Mansourian, S., Parrota, J. A., Sasaki, N., & Schmit, C. B. (2012) Impacts of forest and land management on biodiversity and carbon. In S. Parrota, J.A., Wildburger, C., Mansourian (Ed.), Understanding Relaionships between Biodiversity, Carbon, Forests and People: The Key to Achieving REDD+ Objecives. A Global Assessment Report. Prepared by the Global Forest Expert Panel on Biodiversity, Forest Management, and REDD+ Vienna, Austria. IUFRO World Series Volume 31.
Knox, A., Caron, C., Miner, J., Goldstein, A., & Fonciers, R. (2011) Land tenure and payment
30and REDD+ in the Philippines
for environmental services. Challenges and opportuniies for REDD+. Land Tenure Journal, 2.
Kret, S., & Eckstein, D. (2013) Global Climate Risk Index 2014: Who Sufers Most from Extreme Weather Events? Weather-Related Loss Events in 2012 and 1993 to 2012. Bonn, Germany. German Watch.
Lal, R. (2004) Soil Carbon Sequestraion Impacts on Global Climate Change and Food Security. Science, 304, 1623–1627.
Lasco, R. D., Evangelista, R. S., Pulhin, F. B., & Lopez. (2009) Community-Based Forest Management (CBFM) and Climate Change Miigaion in the Philippines. Subic, Philippines.
Miles, L., Dunning, E., Doswald, N., & Osi, M. (2010) A safer bet for REDD+: Review of the evidence on the relaionship between biodiversity and the resilience of forest carbon stocks. Cambridge, UK. UNEP World Conservaion Monitoring Centre.
Mitermeier, R. A., Robles Gil, P., & Mitermeier, C. G. (1999) Megadiversity: Earth’s Biologically Wealthiest Naions. Monterrey, Mexico. Cemex, Conservaion Internaional.
Philippine Staisics Authority (2010) Populaion and Annual Growth Rates for The Philippines and Its Regions, Provinces, and Highly Urbanized Ciies Based on 1990, 2000, and 2010 Censuses. Philippine Staisics Authority.
Saatchi, S. S., Harris, N. L., Brown, S., Lefsky, M., Mitchard, E. T. A., Salas, W., Zuta, B. R., Buermann, W., Lewis, S. L., Hagen, S., Petrova, S., White, L., Silman, M. & Morel, A. (2011) Benchmark map of forest carbon stocks in tropical regions across three coninents. Proceedings of the Naional Academy of Sciences of the United States of America, 108(24), 9899–9904.
Scharlemann, J. P., Tanner, E. V., Hiederer, R., & Kapos, V. (2014) Global soil carbon: understanding and managing the largest terrestrial carbon pool. Carbon Management, 5(1), 81–91.
Secretariat of the Convenion on Biological Diversity & GmbH, D. G. für I. Z. (giz) (2011) Biodiversity and Livelihoods; REDD-plus Beneits. Montreal and Eschborn: Secretariat of the Convenion on Biological Diversity and GmbH, Deutsche Gesellschaſt für Internaionale Zusammenarbeit (giz).
Thompson, I. D., Ferreira, J., Gardner, G., Guariguata,
M., Koh, L, P., Okabe, K., Pan, Y., Schmit, C. B. & Tylianakis, J. (2012) Forest biodiversity, carbon and other ecosystem services: relaionships and impacts of deforestaion and forest degradaion. In J. A. Parrota, C. Wildburger, & S. Mansourian (Eds.), Understanding Relaionships between Biodiversity, Carbon, Forests and People: The Key to Achieving REDD+ Objecives. A Global Assessment Report. Prepared by the Global Forest Expert Panel on Biodiversity, Forest Management, and REDD+. Vienna, IUFRO World Series Volume 31.
UNFCCC (2010) Decision 1/CP.16. The Cancun Agreements: Outcome of the work of the Ad Hoc Working Group on Long-term Cooperaive Acion under the Convenion. FCCC/CP/2010/7/Add.1. Accessed 29.09.2014. Available at: htp://unfccc.int/resource/docs/2010/cop16/eng/07a01.pdf#page=2
The UN-REDD Programme (UN-REDD) (2010) Naional Programme Document –The Philippines. Geneva, Switzerland, The UN-RED Programme Secretariat.
Van der Werf, G. R., Morton, D. C., DeFries, R. S., Olivier, J. G. J., Kasibhatla, P. S., Jackson, R. B., Collatz, G. J. & Randerson, J. T. (2009) CO2 emissions from forest loss. Nature Geoscience, 2(11), 737–738.
Van Ruijven, J., & Berendse, F. (2010) Diversity enhances community recovery, but not resistance, ater drought. Journal of Ecology 98(1), 81-86
Watkins, T. Y., & Imbumi, M. (2007) Forests of mount Kulal, Kenya: Source of water and support to local livelihoods. Unasylva, 58(229), 33–37.
Wertz-Kanounnikof, S., & Kongphan-Apirak, M. (2008) Reducing forest emissions in Southeast Asia: A review of land-use change and how payments for environmental services (PES) schemes can afect them. Bogor, Indonesia, Centre for Internaional Forestry research.
REDD+ aims to incenivise Reducing Emissions from Deforestaion and forest Degradaion, as well as the conservaion of forest carbon stocks, sustainable management of forests and the enhancement of forest carbon stocks. Acion for REDD+ under the United Naions Framework Convenion on Climate Change (UNFCCC) can contribute towards achieving the Aichi Biodiversity Targets, and vice versa. Having raiied both the Convenion on Biological Diversity (CBD) and the UNFCCC, joint planning for implementaion of the Aichi Biodiversity Targets and REDD+ holds great relevance for a country such as the Philippines.
Spaial analysis exercises can serve as a useful tool for exploring where acions for REDD+ may also complement or further promote a country’s commitments under the CBD and help it realise its Aichi Biodiversity Targets. This report presents selected results of spaial analysis to explore how spaial data can be used to inform where REDD+ could also help to meet the Philippines’ biodiversity conservaion targets under the CBD.
Contact:UNEP World Conservaion Monitoring Centre219 Huningdon RoadCambridge, CB3 0DL, United KingdomTel: +44 1223 814636Fax: +44 1223 277136E-mail: [email protected]