Using integrated census microdata for evidence-based policy making: the IPUMS-International global...
15
1 Using integrated census microdata for evidence-based policy making: the IPUMS-International global initiative 1 Robert McCaa 2 , Albert Esteve 3 , Steven Ruggles 4 , and Matt Sobek 5 Key words: integrated census microdata, IPUMS-International, Millennium Development Goals, orphanhood, South Africa, literacy, education, Kenya Integrated census microdata constitute a new resource for social science research and policy making. The IPUMS-International project (www.ipums.org/international ) is a global initiative in cooperation with national statistical authorities world-wide to anonymize, integrate and disseminate samples of census microdata. Extracts adapted to the specific research needs of each user are distributed as ASCII text-files along with the corresponding metadata without charge via the Internet. Researchers analyze the data using their own software and hardware. This paper offers a brief over-view of the project and invites official statistical agencies in Africa to obtain additional information about participating in the IPUMS initiative by emailing the principal author of this paper. To illustrate one possible application for evidence-based policy making with respect to the Millennium Development Goals, microdata from the 1999 census of Kenya are used to measure progress toward the attainment of universal primary education and the elimination of gender inequities in access to primary education. 1 A version of the paper was presented at the Uganda Statistical Society Forum, Kampala, November 19, 2005. 2 Professor of History, University of Minnesota, Minneapolis, MN 55455 USA. [email protected] 3 Research Scientist, Center of Demographic Studies, Autonomous University of Barcelona, [email protected] 4 Director, University of Minnesota Population Center, and Professor of History. [email protected] 5 Research Scientist, University of Minnesota Population Center. [email protected]
Transcript of Using integrated census microdata for evidence-based policy making: the IPUMS-International global...
1
Using integrated census microdata for evidence-based policy making: the IPUMS-International global initiative1
Robert McCaa2, Albert Esteve3, Steven Ruggles4, and Matt Sobek5
Key words: integrated census microdata, IPUMS-International, Millennium Development Goals, orphanhood, South Africa, literacy, education, Kenya Integrated census microdata constitute a new resource for social science research and policy making. The IPUMS-International project (www.ipums.org/international) is a global initiative in cooperation with national statistical authorities world-wide to anonymize, integrate and disseminate samples of census microdata. Extracts adapted to the specific research needs of each user are distributed as ASCII text-files along with the corresponding metadata without charge via the Internet. Researchers analyze the data using their own software and hardware. This paper offers a brief over-view of the project and invites official statistical agencies in Africa to obtain additional information about participating in the IPUMS initiative by emailing the principal author of this paper. To illustrate one possible application for evidence-based policy making with respect to the Millennium Development Goals, microdata from the 1999 census of Kenya are used to measure progress toward the attainment of universal primary education and the elimination of gender inequities in access to primary education.
1 A version of the paper was presented at the Uganda Statistical Society Forum, Kampala, November 19, 2005. 2 Professor of History, University of Minnesota, Minneapolis, MN 55455 USA. [email protected] 3 Research Scientist, Center of Demographic Studies, Autonomous University of Barcelona, [email protected] 4 Director, University of Minnesota Population Center, and Professor of History. [email protected] 5 Research Scientist, University of Minnesota Population Center. [email protected]
2
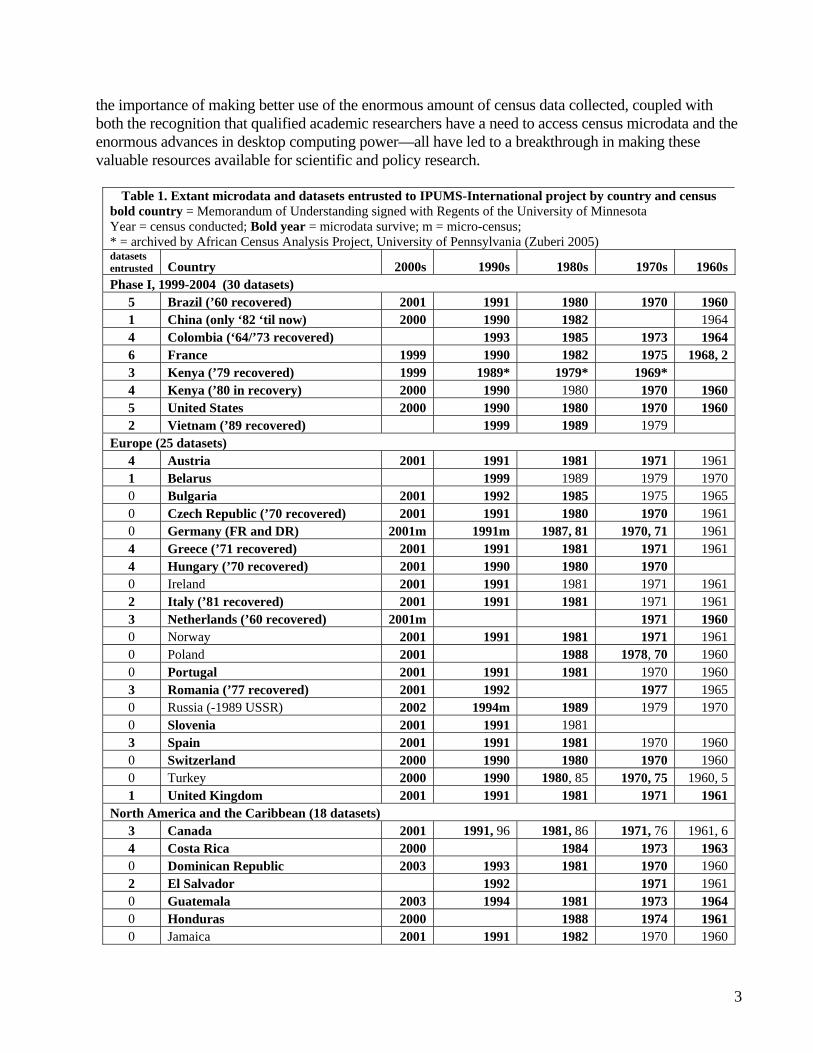
1. Census microdata and the IPUMS-International integration initiative. Census microdata are the individual responses to census questionnaires recorded in computerized form as numeric or alphabetic codes. The data include such mundane characteristics as age, sex, marital condition, relationship to head, migration, education, occupation, etc. Often the datasets include records for families, households and dwellings as well as for individuals. Over the past half century most of the major statistical agencies have prepared census microdata files for analysis by staff and, in many cases, by external researchers. Before the microcomputer revolution of recent years, the computational resources to analyze census microdata were the exclusive preserve of only the official statistical authorities, large universities or well endowed research institutes. Now, with the ever-expanding power of microcomputers, analysis of large census microdata files is readily performed by ordinary researchers and, increasingly, even by their students. Today, census microdata are widely used by researchers and policy makers in the developed countries, but are relatively little used elsewhere. This gap is about to shrink, thanks, on the one hand, to the IPUMS-International global initiative (https://www.ipums.org/international) led by the University of Minnesota Population Center and, on the other, to a policy revolution by statistical authorities in the developing world, which are increasingly recognizing census microdata as statistical products to be disseminated along with conventional publications. A good example of this revolution is the dissemination policy of the Central Statistical Agency of the Federal Democratic Republic of Ethiopia, which in 2005 began to distribute a wide variety of microdata products on CD and from its website (http://www.csa.gov.et ). In the case of Africa, beginning in the 1990s, the African Census Analysis Project (www.acap.upenn.edu) blazed a path, methodically assembling a collection of microdata from some 25 countries for a total of more than 45 censuses (Zuberi 2005). The ACAP repository offers a trove of census data, much of it recovered from old computer tapes. A growing number of researchers and graduate students in residence at the University of Pennsylvania are exploiting these materials, primarily for academic research. A good example of the fruits of the initiative is the recently published book entitled “The Demography of South Africa” in collaboration with Statistics South Africa and based on a ten percent sample of the 1996 census (Zuberi, Sibanda and Udjo 2005). Meanwhile, as of March 2006, IPUMS has become the largest repository of census microdata in the world with the official statistical authorities of more than 40 countries, encompassing over half of the world’s population, entrusting a total of 138 censuses to the Minnesota Population Center (Table 1). The successes of ACAP and IPUMS is due in part to the increasing recognition among official statisticians that anonymized census microdata constitute statistical data products. As such, they do not violate even the most stringent laws on statistical confidentiality, or privacy. In country-after-country, close study of the legislation on statistical privacy reveals that the dissemination of anonymized microdata, with names and detailed geographical identifiers suppressed, is not prohibited by law. In the rare instance where laws are interpreted to the contrary, this is often based on a misreading of the statutes and a misunderstanding of the statistical nature of anonymized census microdata. The General Data Dissemination System (GDDS) of the International Monetary Fund is widely recognized as the gold standard with respect to issues of privacy and statistical confidentiality. Our analysis completed in 2001 revealed that census microdata samples were disseminated by 37 of the 52 member states of the GDDS (McCaa and Ruggles 2002). This change in legal interpretation as well as the understanding of
3
the importance of making better use of the enormous amount of census data collected, coupled with both the recognition that qualified academic researchers have a need to access census microdata and the enormous advances in desktop computing power—all have led to a breakthrough in making these valuable resources available for scientific and policy research.
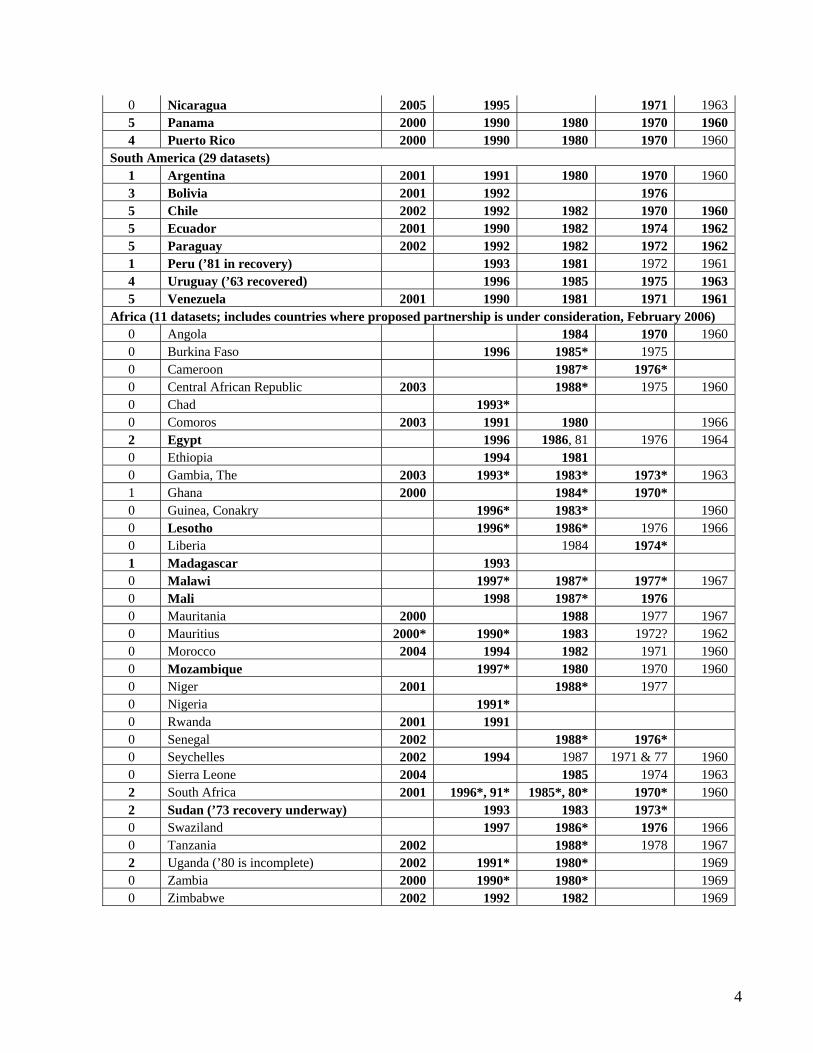
Table 1. Extant microdata and datasets entrusted to IPUMS-International project by country and census bold country = Memorandum of Understanding signed with Regents of the University of Minnesota Year = census conducted; Bold year = microdata survive; m = micro-census; * = archived by African Census Analysis Project, University of Pennsylvania (Zuberi 2005) datasets entrusted Country 2000s 1990s 1980s 1970s 1960s Phase I, 1999-2004 (30 datasets)
5 Brazil (’60 recovered) 2001 1991 1980 1970 1960 1 China (only ‘82 ‘til now) 2000 1990 1982 1964 4 Colombia (‘64/’73 recovered) 1993 1985 1973 1964 6 France 1999 1990 1982 1975 1968, 2 3 Kenya (’79 recovered) 1999 1989* 1979* 1969* 4 Kenya (’80 in recovery) 2000 1990 1980 1970 1960 5 United States 2000 1990 1980 1970 1960 2 Vietnam (’89 recovered) 1999 1989 1979
Europe (25 datasets) 4 Austria 2001 1991 1981 1971 1961 1 Belarus 1999 1989 1979 1970 0 Bulgaria 2001 1992 1985 1975 1965 0 Czech Republic (’70 recovered) 2001 1991 1980 1970 1961 0 Germany (FR and DR) 2001m 1991m 1987, 81 1970, 71 1961 4 Greece (’71 recovered) 2001 1991 1981 1971 1961 4 Hungary (’70 recovered) 2001 1990 1980 1970 0 Ireland 2001 1991 1981 1971 1961 2 Italy (’81 recovered) 2001 1991 1981 1971 1961 3 Netherlands (’60 recovered) 2001m 1971 1960 0 Norway 2001 1991 1981 1971 1961 0 Poland 2001 1988 1978, 70 1960 0 Portugal 2001 1991 1981 1970 1960 3 Romania (’77 recovered) 2001 1992 1977 1965 0 Russia (-1989 USSR) 2002 1994m 1989 1979 1970 0 Slovenia 2001 1991 1981 3 Spain 2001 1991 1981 1970 1960 0 Switzerland 2000 1990 1980 1970 1960 0 Turkey 2000 1990 1980, 85 1970, 75 1960, 5 1 United Kingdom 2001 1991 1981 1971 1961
North America and the Caribbean (18 datasets) 3 Canada 2001 1991, 96 1981, 86 1971, 76 1961, 6 4 Costa Rica 2000 1984 1973 1963 0 Dominican Republic 2003 1993 1981 1970 1960 2 El Salvador 1992 1971 1961 0 Guatemala 2003 1994 1981 1973 1964 0 Honduras 2000 1988 1974 1961 0 Jamaica 2001 1991 1982 1970 1960
4
0 Nicaragua 2005 1995 1971 1963 5 Panama 2000 1990 1980 1970 1960 4 Puerto Rico 2000 1990 1980 1970 1960
South America (29 datasets) 1 Argentina 2001 1991 1980 1970 1960 3 Bolivia 2001 1992 1976 5 Chile 2002 1992 1982 1970 1960 5 Ecuador 2001 1990 1982 1974 1962 5 Paraguay 2002 1992 1982 1972 1962 1 Peru (’81 in recovery) 1993 1981 1972 1961 4 Uruguay (’63 recovered) 1996 1985 1975 1963 5 Venezuela 2001 1990 1981 1971 1961
Africa (11 datasets; includes countries where proposed partnership is under consideration, February 2006) 0 Angola 1984 1970 1960 0 Burkina Faso 1996 1985* 1975 0 Cameroon 1987* 1976* 0 Central African Republic 2003 1988* 1975 1960 0 Chad 1993* 0 Comoros 2003 1991 1980 1966 2 Egypt 1996 1986, 81 1976 1964 0 Ethiopia 1994 1981 0 Gambia, The 2003 1993* 1983* 1973* 1963 1 Ghana 2000 1984* 1970* 0 Guinea, Conakry 1996* 1983* 1960 0 Lesotho 1996* 1986* 1976 1966 0 Liberia 1984 1974* 1 Madagascar 1993 0 Malawi 1997* 1987* 1977* 1967 0 Mali 1998 1987* 1976 0 Mauritania 2000 1988 1977 1967 0 Mauritius 2000* 1990* 1983 1972? 1962 0 Morocco 2004 1994 1982 1971 1960 0 Mozambique 1997* 1980 1970 1960 0 Niger 2001 1988* 1977 0 Nigeria 1991* 0 Rwanda 2001 1991 0 Senegal 2002 1988* 1976* 0 Seychelles 2002 1994 1987 1971 & 77 1960 0 Sierra Leone 2004 1985 1974 1963 2 South Africa 2001 1996*, 91* 1985*, 80* 1970* 1960 2 Sudan (’73 recovery underway) 1993 1983 1973* 0 Swaziland 1997 1986* 1976 1966 0 Tanzania 2002 1988* 1978 1967 2 Uganda (’80 is incomplete) 2002 1991* 1980* 1969 0 Zambia 2000 1990* 1980* 1969 0 Zimbabwe 2002 1992 1982 1969
5
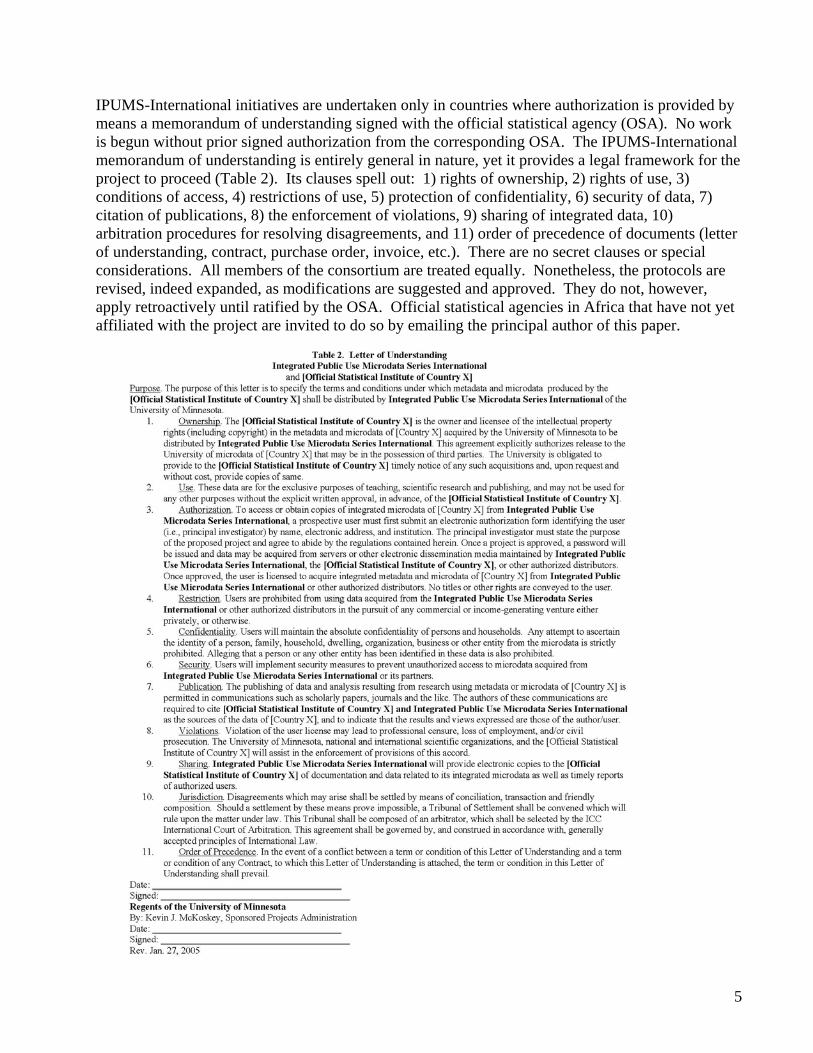
IPUMS-International initiatives are undertaken only in countries where authorization is provided by means a memorandum of understanding signed with the official statistical agency (OSA). No work is begun without prior signed authorization from the corresponding OSA. The IPUMS-International memorandum of understanding is entirely general in nature, yet it provides a legal framework for the project to proceed (Table 2). Its clauses spell out: 1) rights of ownership, 2) rights of use, 3) conditions of access, 4) restrictions of use, 5) protection of confidentiality, 6) security of data, 7) citation of publications, 8) the enforcement of violations, 9) sharing of integrated data, 10) arbitration procedures for resolving disagreements, and 11) order of precedence of documents (letter of understanding, contract, purchase order, invoice, etc.). There are no secret clauses or special considerations. All members of the consortium are treated equally. Nonetheless, the protocols are revised, indeed expanded, as modifications are suggested and approved. They do not, however, apply retroactively until ratified by the OSA. Official statistical agencies in Africa that have not yet affiliated with the project are invited to do so by emailing the principal author of this paper.
6
Many statistical agencies cooperate in the project because little commitment of human resources is required and the project pays a standard fee to compensate for the marginal costs of preparing the microdata and documentation. Upon receipt of official invoice, the National Science Foundation of the United States authorizes the Minnesota Population Center (MPC) to pay US$1,000 per census for microdata, documentation and non-exclusive rights to dissemination. For datasets with more than one million person records, the fee is increased to US$5,000. The IPUMS has two goals: first, to preserve census microdata and, second, to make anonymized, integrated sample extracts available to researchers and policy analysts free of charge. Data recovery is required for all but the most recent datasets. The recovery of data from old tapes is a challenging undertaking for even the most technically skilled cyber sleuths. The MPC does not recover data. Instead the project pays costs of data recovery, relying on the technical skills and widely recognized talents of the United Nations Demographic Center for Latin America and the Caribbean (CELADE) or, where more convenient, a specialized data recovery firm. Most of the datasets for censuses from the 1960s or 1970s were recovered in this way. For example, in the case of the 1979 census microdata of Kenya, in addition to the five percent national sample held by ACAP, approximately two-thirds of the person records (9,781,690) were recovered by a commercial firm at a cost of less than $1,000. The project’s most recent success was the 1977 census of Romania, where 97.2% of the person records were recovered by the same firm. To make census microdata useful for research they must be thoroughly documented and integrated. Integrating census data is not a new idea. First proposed in 1872 at the International Statistics Congress held in St. Petersburg, little progress was made until the last half of the twentieth century. One of the signal achievements of the United Nations Statistics Division has been in the international harmonization of census concepts from the enumeration form to the publication of final tables. While incomplete, the effort has enjoyed widespread support by statistical agencies around the globe. Beginning in 1991, the IPUMS-USA project has worked to harmonize census data for the United States for the period since 1850 (Ruggles and Sobek 1997), and IPUMS-International has capitalized on this experience (Esteve and Sobek 2003). The IPUMS-International project adopts uniform coding schemes, nomenclatures and classifications, based where possible on the United Nations Statistics Division’s Principles and Recommendations for Population and Housing Censuses (1998) and other international standards such as:
• UNESCO (1997) The International Standard Classification of Education (ISCED 1997). • International Labor Office (1990) International Standard Classification of Occupations
(ISCO-88). • United Nations Statistics Division (1990) International Standard Industrial Classification of
All Economic Activities (ISIC-88). • United Nations Economic Commission for Europe (1999). Recommendations for the 2000
Censuses of Population and Housing in the ECE Region (Statistical Standards and Studies No. 49)
International census samples employ differing numeric classification systems and reconciliation of these codes is a major effort. Variables must be easy to use for comparisons across time and space. This requires that we provide the lowest common denominator of detail that is fully comparable. On
7
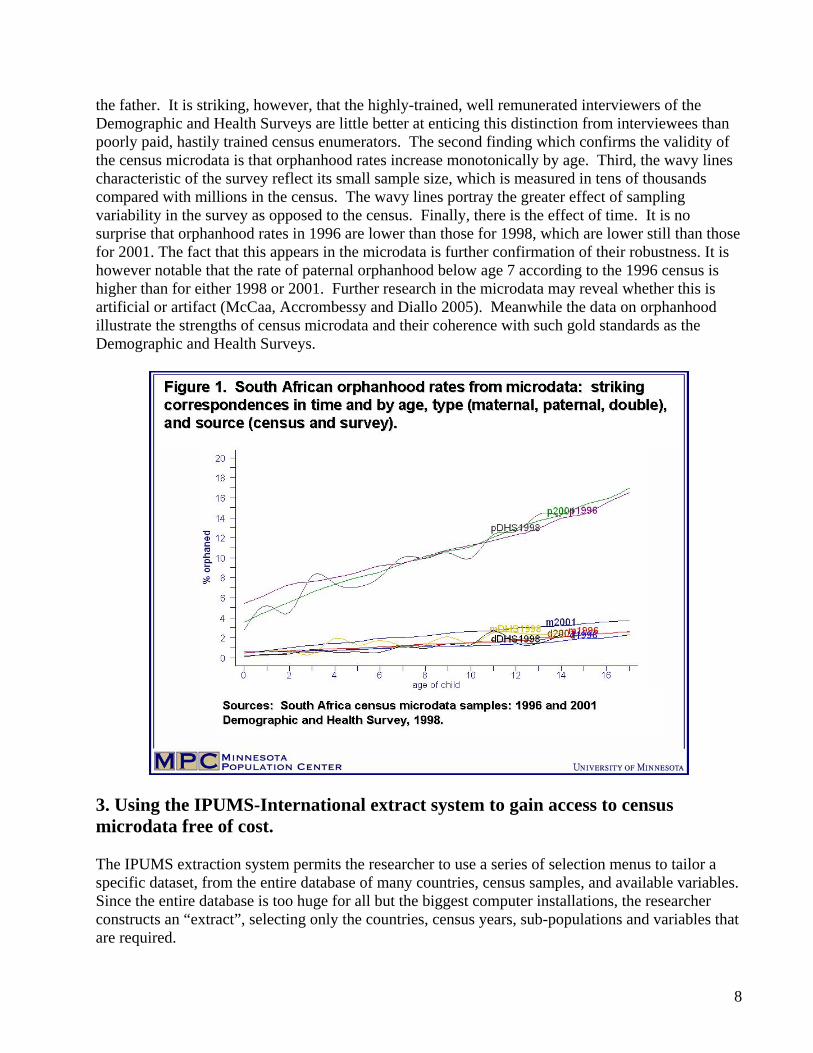
the other hand, we must retain all meaningful detail in each sample, even when it is unique to a single dataset (Ruggles et. Al. 2003). For most variables, it is impossible to construct a single uniform classification without losing information. Some samples provide far more detail than others, so the lowest common denominator of all samples inevitably loses important information. Composite coding schemes offer a solution. Similar to those used by the International Labor Organization for occupations and industries, we apply composite coding to each variable to retain all original detail, and at the same time provide comparable codes across countries and censuses. The first one or two digits of each code provides information available across all samples. The next one or two digits provide additional information available in a broad subset of samples. Finally, trailing digits provide detail only rarely available. Where a concept is not present, a zero place-holder is assigned to that digit. Consider marital status, for example. In the IPUMS-International system, the first digit of this variable with four categories is comparable across all samples: single, married, widowed, and separated/divorced. The second digit delineates consensual unions from other forms of marriage (where possible) and distinguishes among the categories separated, divorced, and married with spouse absent. The final digit provides additional detail with the married and married-spouse-absent categories, such as polygamous marriages in Kenya (Esteve and Sobek 2003). The basic goal of our harmonization efforts is to simplify use of the data while losing no meaningful information. The IPUMS harmonization strategy has proven flexible enough to accommodate the integration of data across broad spans of time (the United States for 1850-2000) and space (Brazil, China, Colombia, France, Kenya, Kenya, the United States, and Vietnam; Sobek et. al. 2002). 2. Orphanhood in Africa: an example of using evidenced-based census microdata Before describing how to use the IPUMS, consider a practical case for disseminating microdata by examining the evidence on orphanhood. Orphans are generally defined in censuses and surveys, as individuals who, due to death, have lost one or more of their biological parents. This is operationalized in most questionnaires by requesting whether each biological parent is alive, dead, or unknown, with a distinct datum for mother and father. Answers to this question may be used not only to estimate the frequency of orphans by age, sex and a variety of other characteristics, as well as to estimate adult mortality. Unfortunately, most census publications offer only rudimentary tables in this regard, and many CD products often do not offer greater detail. With the availability of microdata ordered by households, it is possible to study the rate of orphanhood by age, sex and type (paternal, maternal or double) as well as the social and economic conditions of the households or institutions in which orphans live. Do the census data on orphanhood make sense? It is striking that in the case of South Africa, orphanhood rates by type and age for the censuses of 1996 and 2001 compare favorably with rates from the Demographic and Health Survey of 1998 (Figure 1). The overlapping lines in Figure 1 leave little doubt that the sources are telling a similar story. Four features stand out. First, orphanhood rates at any age differ dramatically by type, with maternal orphans typically twice as frequent as double, and paternal orphans four to five times more frequent than maternal. Clearly a goodly proportion of so-called paternal orphans is due to “social” factors and not due to the death of
8
the father. It is striking, however, that the highly-trained, well remunerated interviewers of the Demographic and Health Surveys are little better at enticing this distinction from interviewees than poorly paid, hastily trained census enumerators. The second finding which confirms the validity of the census microdata is that orphanhood rates increase monotonically by age. Third, the wavy lines characteristic of the survey reflect its small sample size, which is measured in tens of thousands compared with millions in the census. The wavy lines portray the greater effect of sampling variability in the survey as opposed to the census. Finally, there is the effect of time. It is no surprise that orphanhood rates in 1996 are lower than those for 1998, which are lower still than those for 2001. The fact that this appears in the microdata is further confirmation of their robustness. It is however notable that the rate of paternal orphanhood below age 7 according to the 1996 census is higher than for either 1998 or 2001. Further research in the microdata may reveal whether this is artificial or artifact (McCaa, Accrombessy and Diallo 2005). Meanwhile the data on orphanhood illustrate the strengths of census microdata and their coherence with such gold standards as the Demographic and Health Surveys.
3. Using the IPUMS-International extract system to gain access to census microdata free of cost. The IPUMS extraction system permits the researcher to use a series of selection menus to tailor a specific dataset, from the entire database of many countries, census samples, and available variables. Since the entire database is too huge for all but the biggest computer installations, the researcher constructs an “extract”, selecting only the countries, census years, sub-populations and variables that are required.
9
First, though, the researcher must be approved to gain access to the data. Access to the IPUMS-International database is restricted to researchers and policy makers who are qualified to use the data, have a specific research need for accessing the data, and who agree to abide by the conditions of use. Access is restricted so that the highest quality data may be made available with a minimum of confidentiality protections imposed on the data. Application is made electronically by clicking the “Apply for Access” button, and completing the application form. The user must agree to the following conditions: that the data will:
1. not be re-distributed to others, 2. only be used for scholarly purposes, 3. not be used for commercial purposes (commercial users must contact the national statistical
authorities for permission), 4. not be used to identify individuals, households or other entities (ie., that confidentiality will
be respected 5. be safely secured (such as password or encrypted); 6. and be appropriately cited if publication results from the use of the data
Finally, the user and the user’s institution must agree to be bound by these restrictions and may be punished if a violation occurs either deliberately or through carelessness. The application is submitted electronically and a decision on access is usually granted within a week or less. About one-third of applicants are denied access, usually because the description of the research project does not indicate that access to the microdata is needed. If approved, the researcher uses a password to gain access to the extraction system, by clicking the “Create an Extract” button. If the project involves a group, each individual researcher must apply for access and agree to the conditions of use. If a class is involved, each student must apply for access. Unlike the access system used by the Australian Bureau of Statistics and that of the SARs system in the United Kingdom, approval is not granted to institutions. Instead, the IPUMS-International method is to entrust each individual with the responsibility for the proper use of the data. At the same time each individual’s institution may be held responsible if misuse occurs. Once approved, a data extract is designed by clicking “create an extract” from the IPUMS-International home page, entering the user name and password, and completing the extract selections on a series of screen. As a guest, it is possible to explore the entire site, but no extract will be constructed, even if the user completes all the necessary screens. Only registered users may obtain data, and the necessary password must be entered to do so. Currently four selection screens encompass the construction of an extract:
1. sample selection (including countries and census years); 2. variable selection; 3. case selection (subpopulations, such as females aged 15-19 years in the workforce who are
also heads of households); and 4. request summary.
10
Sample selection. The first selection screen is used to specify record structure type (flat or hierarchical) and the format of the metadata required for the statistical package to be used to analyze the data (SPSS, SAS, or Stata or any package that will read ASCII text files, such as CSPro, ReDATAM, etc.). Note that the researcher uses his or her own software to analyze the microdata. The project does not distribute software nor does it provide statistical tools for analysis. Researchers do not need to learn any specific statistical package to analyze the integrated microdata. Variable selection. The second screen is used to select the variables that are the object of study. The screen lists only those variables that are available for the countries and census years chosen on the sample selection screen. Variables that are present in a specific census are signified by an “X”. From this screen (or from the “Variable Availability” bar on the home page, the researcher may examine the metadata for a specific variable. By clicking the variable name a window appears describing the variable and discussing comparability issues between censuses and countries. Clicking “Codes” displays a screen with metadata for the integrated codes and the corresponding labels available in specific censuses. Source documentation, including the original census questionnaires and enumerator instructions are readily available in English and the official language so that researchers may examine the exact wording and definitions. Users are urged to study the documentation carefully to make the best possible use of the data. Case selection (optional). The IPUMS data extract system already contains over 100 million person records. Therefore a means of selecting specific cases or subpopulations is very handy to avoid transferring data that the user has no interest in analyzing. The case selection feature makes it possible to select only cases that satisfy very specific criteria, such as male heads of households aged 20-35 years, who are not in the workforce. The case selection screen makes it possible to select specific individuals or all individuals co-residing with an individual with selected characteristics. One of the most valuable enhancements of the database is the “SUBSAMPLE” feature. With SUBSAMPLE, the research may request any of 100 sub-samples each of which is nationally representative and preserves any stratification of the larger sample from which it was drawn. This tool may be used to test procedures, economize resources, where the research does not require large samples, or estimate variances through the replicate method. Request summary. The last screen permits the user to confirm that the selections are correct. If not, the researcher may return to any one of the previous screens to make any desired corrections or adjustments. Once the selection criteria are correct, the request is submitted. At this point the session is over and the researcher is free to engage in other activities. Download or Revise an extract. Meanwhile, behind the scene, the extract engine queues in the request, and then proceeds to fulfill the order. Usually in a matter of minutes, an email is sent to researcher notifying that the request is complete and that the extract is available. A link is provided to a password-protected page for downloading the specific extract using SSL (Secure Sockets Layer) protocol. The data are encrypted during transmission using a 128-bit encryption standard, matching the level used today by the banking and other industries where security and confidentiality is essential. The researcher may then securely download the file, decompress it and proceed with the analysis using the supplied integrated metadata consisting of variable names and labels. The metadata are in ASCII format so that a researcher may readily adapt them for use by any statistical software.

11
The user may also revise a prior extract, retrieving the selections, making some adjustments and re-submitting the request. For example, a researcher might prepare a test dataset extracting, by means of the SUBSAMPLE case selection feature, a 1% sample from the database with selected specifications. Then once the researcher has tested and confirmed various trials, the extract specifications may be retrieved, the SUBSAMPLE case selection feature clicked off, the specifications re-submitted and be rewarded with a complete dataset with all other specifications intact. 4. Who uses IPUMS-International microdata and what do they use the data for? The succinct answer is university professors, policy researchers and students use the data to investigate economic, demographic and social issues in comparative perspective. In a very brief period, IPUMS-International has become an indispensable component of social science infrastructure. Hundreds of projects by scholars in more than thirty-four countries are already underway. The United States accounts for the largest number of applicants (72%), followed by Canada (4%). Switzerland, thanks to the presence of a large number of international organizations, ranks third (3%). Every continent is represented. Over 5% or researchers are working in Europe. African users, at less than 3% of the total, are under-represented at present, but this is because only 2 samples are from the region (Kenya 1989 and 1999), constituting less than 3% of the total person records in the database. With the inclusion in 2006 of two integrated census samples for South Africa followed by two for Uganda in 2007, a sharp increase in usage by African experts is to be expected. The application does not inquire as to country of origin, citizenship or identity. Nevertheless, it is apparent from names and project descriptions, that a considerable fraction of researchers at US and Canadian universities are nationals using the IPUMS-International database to study their country of origin, including not only Brazil, Kenya, China, Colombia, Kenya and Vietnam but also France.
Table 3. 446 Research topics classified in 26 categories ordered by frequency
Migration 64 Marriage 12Schooling 57 Aging 12Gender 30 Equality/inequality 12Data management/development 26 Mortality 12Teaching 37 Development 10Health 21 Statistics 9Fertility 21 Sampling 9Methods 17 Demography 7Wages 17 Brain drain/gain 6Urbanization 15 Religion 4Family 15 Population projection 3Children 13 Disability 3Poverty 12 Vital statistics evaluation 2
12
Research topics. Applicants are required to submit a succinct description of the proposed research to justify access to the database. I have classified the first 446 successful applications, somewhat arbitrarily, into 26 categories (Table 3). They demonstrate the wide range of research uses for which census microdata may be used. Research topics include the living arrangements of the aged, female labor-force participation and educational attainment, regional inequality differentials, patterns of age hypergamy, international migration, relationship between divorce and family composition, between disease factors and education, and between marriage and socio-economic conditions. Most of these studies incorporate both cross-national and cross-temporal comparisons. For example, a National Academy of Sciences panel on “Transitions to Adulthood in Developing Countries” is using the data from Colombia, Kenya, Kenya, and Vietnam to analyze changing outcomes such as schooling, work, fertility, and marriage as a function of age, gender, and household characteristics. A scattering of studies propose to analyze various needs at the level of minor administrative districts for various institutions or professions, such as schools, teachers, clinics, health professionals, etc. While one might expect that these studies would be better served by access to 100% microdata, the high-density harmonized samples available from the IPUMS website make the results of such studies suggestive if not conclusive. The following abridged and edited project description is a detailed example of a policy study which couples economic data from an official source with census microdata over four decades:
[This project proposes to] analyze the impact of public investment in [Country N] on a number of social and economic indicators over the last 40 years at the [major administrative district, MADs] level. There is evidence that despite high periods of overall growth in [Country N] very little economic convergence across [MADs] has occurred. This phenomenon has raised questions about the lack of ability (or willingness) of the central government to reduce disparities using national resources. This study tries to estimate the impact of different kinds of national investment and the role they have played over four decades of development in [Country N].
5. How census microdata may be used for local planning to attain Millennium Development Goals: schooling and literacy in Kenya. The United Nations has an ambitious campaign, The Millennium Development Goals, which lays out a total of 8 development objectives to attain by the year 2015. The 191 member countries of the United Nations have endorsed objectives to eradicate extreme poverty and hunger, achieve universal primary education, promote gender equality and female autonomy, reduce infant mortality, improve maternal health, combat HIV/AIDS, malaria and other diseases, guarantee the sustainability of the environment, and foment a world association for development. For each objective, the United Nations has developed a battery of indicators to evaluate the situation and to measure improvements in each region and country of the world. Nevertheless, region or nation is not always the most appropriate scale for this type of analysis, because, often, statistics for an entire country are not representative of the situation in small areas or localities, above all in those countries where great inequalities are observed at the local level. For this reason, analysis at the local level can identify the most disadvantaged areas to organize a better distribution of assistance and resources devoted to solving the problems.
13
Confronted with this challenge, local statistics are called upon to play a more important role in measuring results. Population censuses, and by extension the corresponding microdata, are also a most important source for this type of analysis because they guarantee a more or less homogeneous treatment and complete territorial coverage. To illustrate the use of census microdata, we analyze a 5% sample from the Population Census of Kenya for year 1999 obtained from the IPUMS-International web-site and address the second and third objectives of the Millennium Development Goals (MDGs): to achieve universal primary education and promote gender equity. The analysis focuses on districts, of which there are 69 identified in the data. For each district the index proposed by the United Nations is computed. The results are show that the principal deficiences are confined to a few districts with the worst conditions. Is primary education universal in Kenya? To respond to this question we much use three distinct indicators, following UN recommendations. First is the net rate of primary schooling. Calculation of this indicator required three variables: age, school attendance, and level of education attained. All these variables are available in the microdata for the 1999 census of Kenya. For purposes of international comparison, we use the UNICEF definition of primary school (6 years) instead of the Kenyan standard of eight (for an explanation, see www.ipums.org/international “Variables”, “EDATTAIN”; note that the IPUMS variable “YRSCHOOL” facilitates comparing any definition compatible with the coding of the original source data). The rate is the result of obtaining the percentage of persons attending primary school divided by the total children of primary school age. To compute this indicator, we have taken into account children aged 6-11 years old (4.8 million in 1999). We find that 79.3% of boys and girls of primary school age are declared as attending school. Moreover, school enrollment rates of 90% or more are found in 16 districts (Homa Bay, Keiyo, Kiambu, Kirinyaga, Kisumu, Maragua, Marakwet, Migori, Muranga, Nyandaura, Nyando, Nyeri, Rachuonyo, South Kissi, Suba, and Thika), totaling 1.1 million children. Unfortunately, one million primary aged children were not attending school. Enrollment rates of less than 66% are found in 16 of the lowest enrolling district (844,000 children), and the rate is less than 25% in four districts (Wajir, Turkana, Mandera, and Garissa). Here, at a minimum, one-fifth of the total shortfall for Kenya to achieve the MDG of universal primary education is concentrated in these four districts. The dozen other districts with low attendance rates—Baringo, Isiolo, Kajiado, Kilifi, Kwale, Malindi, Marsabit, Moyale, Narok, Samburu, Tana River, and West-Pokot—account for an additional 30% of the shortfall. According to the UNICEF standard, six years of schooling is defined as completing primary education. Since longitudinal data, which would permit tracing the evolution of educational attainment of each cohort of students, are not available, we have opted to compute, as an approximation, the percentage of children between age 13 and 15, which had completed their primary studies. Age and level of educational attainment are required to compute this indicator. The national average from the 1999 census microdata indicates that 33.5% of Kenyan children between the ages of 13 and 15 years have completed their primary schooling. This figure is significantly distant from the 100% objective. Nevertheless, this figure is a lagging indicator, since it reflects educational accomplishments (or lack thereof) of some 5-10 years before. Districts that
14
score poorly on this goal are precisely those where large fractions of children are not attending school at all, and vice-versa. The list of poorly performing districts is almost identical to that for primary school attendance. The Kenyan census form of 1999 did not contain a question on literacy, but years of schooling completed may be used as a proxy. We choose two years and computed the rate for nine year olds and above. The literacy rate for the Kenyan population as a whole aged nine years or more is 81.8%. Of the six indicators this one comes closest to the Millennium Goal target. For this reason a 75% threshold is selected. Some 18 districts fall below the threshold, including all the 16 districts with the lowest rates of primary school attendance, plus Lamu and Trans Mara. Combined they amount to only 16% of the population aged 9+ years, but they account for almost half of the illiterates in that group. Gender equity is considered here only partially, since we treat only those aspects related to educational attendance, attainment and literacy, taking as our point of departure the statistics calculated above. In recent decades Kenya has made substantial progress in providing gender equity in schooling. Female rates of primary school attendance slightly exceed male rates in 37 of 69 districts. Discrimination against females in basic access to education is substantial in only five districts (Garissa, Kilifi, Malindi, Marsabit, and Moyale) where male attendance rates exceed those of females by nine or more percentage points. Differences in the lagging indicators of primary school completion and literacy are more noticeable. The 2009 census will reveal the degree to which these gender inequities persist. Meanwhile the more serious problem seems to be general access to education rather than gender equity. 6. Conclusions. Census microdata are exceedingly useful for analyzing populations. Because they are microdata they register the characteristics of individuals and thus can be studied by taking into account any or all of the characteristics present in the record. Because they come from a census, this is a source without paragon for demographic and social analysis due to its high density, complete national coverage, and near simultaneous execution. Moreover, if the microdata are integrated with censuses from several decades and different countries, comparative analysis in time and space opens additional avenues for research. In sum, integrated census microdata are destined to play an important role in social science research and policy making, as has been demonstrated here with the example of the Millennium Development Goals. Without doubt, the use of census microdata will have a significant, positive impact on the understanding of the social and demographic dynamics of individuals, families, and nations. The IPUMS-International initiative is conscious of this potential, and it is for this reason that the National Science Foundation is providing sustained funding to develop a global collaboratory with national statistical authorities, universities, and research institutes. Institutions and researchers interested in working on this initiative to add more samples for more countries are invited to contact the authors of this paper. Researchers interested in using the microdata are invited to apply for access and use the microdata as research needs require. References.
15
Esteve, A. and Sobek, M.. (2003). Challenges and Methods of International Census Harmonization. Historical Methods 36: 66-79. Ethiopia, Democratic Federal Republic. Central Statistical Agency. (2004).“Directive No. 1/2004. Directive issues to establish procedures for accessing raw data to users,”. http://www.csa.gov.et/text_files/directives.htm Kenya. Central Bureau of Statistics (2001). 1999 Census of Population and Housing Microdata File. McCaa, R., Accrombessy, F. D. E, and Diallo, K. (2005). “Calibrating orphanhood: results from census microdata and surveys compared with UNAIDS estimates for 3 African countries,” Global Health Forum IX, Mumbai, India: Sept. 14. McCaa, R. and Ruggles, S. (2002). The Census in Global Perspective and the Coming Microdata Revolution. In Vol. 13, Nordic Demography: Trends and Differentials, Scandinavian Population Studies, edited by J. Carling. Oslo: Unipub/Nordic Demographic Society, pp. 7-30. Ruggles, S., Sobek, M., McCaa, R., King, M. and Levison, D. (2003). IPUMS-International. Historical Methods 36: 60-65. Ruggles, S, and Sobek, M., et. al. (1997). Integrated Public Use Microdata Series: Version 2.0. Minneapolis: Historical Census Projects, University of Minnesota. Sobek, M., Ruggles, S. and McCaa, R., et al. (2002). Integrated Public Use Microdata Series-International: Preliminary Version 1.0. Minneapolis: Minnesota Population Center, University of Minnesota. Statistics South Africa (1998). 1996 Census of Population and Housing: 10% Sample of unit records. Statistics South Africa (2003). 2001 Census of Population and Housing: 10% Sample of unit records (Version 1). Zuberi, T., Sibanda, A. and Udjo, E., eds. (2005). The Demography of South Africa. Armonk, NY: M.E. Sharpe. Zuberi, T. (2005). “Building regional data archives: the African Census Analysis Project (ACAP),” IUSSP XXV International Population Conference, Tours France, July 18.