Using in vitro/in silico data for consumer safety assessment of feed flavoring additives - A...
12
Using in vitro/in silico data for consumer safety assessment of feed flavoring additives e A feasibility study using piperine A. Thiel a, * , S. Etheve a , E. Fabian b , W.R. Leeman c , J.R. Plautz a a DSM Nutritional Products AG, Wurmisweg 576, 4303 Kaiseraugst, Switzerland b BASF SE, Experimental Toxicology and Ecology, 67056 Ludwigshafen, Germany c TNO, Utrechtseweg 48, 3704 HE Zeist, The Netherlands article info Article history: Received 8 December 2014 Received in revised form 8 June 2015 Accepted 9 June 2015 Available online 21 June 2015 Keywords: Residue estimation Transfer database Piperine Metabolism Risk assessment abstract Consumer health risk assessment for feed additives is based on the estimated human exposure to the additive that may occur in livestock edible tissues compared to its hazard. We present an approach using alternative methods for consumer health risk assessment. The aim was to use the fewest possible number of animals to estimate its hazard and human exposure without jeopardizing the safety upon use. As an example we selected the feed flavoring substance piperine and applied in silico modeling for residue estimation, results from literature surveys, and Read-Across to assess metabolism in different species. Results were compared to experimental in vitro metabolism data in rat and chicken, and to quantitative analysis of residues' levels from the in vivo situation in livestock. In silico residue modeling showed to be a worst case: the modeled residual levels were considerably higher than the measured residual levels. The in vitro evaluation of livestock versus rodent metabolism revealed no major differ- ences in metabolism between the species. We successfully performed a consumer health risk assessment without performing additional animal experiments. As shown, the use and combination of different alternative methods supports animal welfare consideration and provides future perspective to reducing the number of animals. © 2015 The Authors. Published by Elsevier Inc. This is an open access article under the CC BY-NC-ND license (http://creativecommons.org/licenses/by-nc-nd/4.0/). 1. Introduction Feed additives, including feed flavorings, require a thorough evaluation of consumer safety (Fig. 1). As presented by the Euro- pean Food Safety Authority (EFSA, 2012a), such an evaluation can be seen as a four step process from hazard characterization in laboratory animals or available literature through to determination of additive residues in the consumable target species. Step 1 is a hazard characterization usually done in rats, which will also include the kinetic and metabolic profiling of the additive. Step 2 is the comparison of these rat data with the kinetics and metabolism of the feed additive in the target livestock species to determine the identity and amount of the major metabolites. In case the target animal would form species-specific metabolites that were not present in the laboratory rat, gathering additional toxicological information about this metabolite would be warranted. Step 3 consists of determination of relevant residue levels in the edible tissues of livestock. In Step 4, the risk characterization for the feed additive is derived based on the exposure of the consumer to the substance and its metabolites' via edible tissues that is then compared to the Health Based Guidance Values such as the Acceptable Daily Intake (ADI) derived from toxicological studies. Briefly, step 1 requires gathering the relevant toxicological (hazard) information either from literature (original literature and/ or reviews from competent bodies such as EFSA or the Joint FAO/ WHO Expert Committee on Food Additives (JECFA)) or from spe- cifically designed toxicological studies, step 2 requires metabolism studies in laboratory rat and target species using radiolabelled material. Step 3 requires the feeding of livestock animals followed by collection of their edible tissues for analytical determination of the residues' concentrations. Following the EFSA guidance docu- ment (EFSA, 2012a) such an evaluation will require a rather extensive use of both laboratory animals and livestock animals for meeting the experimental objectives. Under normal farming con- ditions, the target species animals would be marketed; however, because of the nature of the experimental conditions, the remains of the animals must be discarded. With the current increased emphasis on reducing the use of * Corresponding author. E-mail address: [email protected] (A. Thiel). Contents lists available at ScienceDirect Regulatory Toxicology and Pharmacology journal homepage: www.elsevier.com/locate/yrtph http://dx.doi.org/10.1016/j.yrtph.2015.06.006 0273-2300/© 2015 The Authors. Published by Elsevier Inc. This is an open access article under the CC BY-NC-ND license (http://creativecommons.org/licenses/by-nc-nd/4.0/). Regulatory Toxicology and Pharmacology 73 (2015) 73e84
Transcript of Using in vitro/in silico data for consumer safety assessment of feed flavoring additives - A...
lable at ScienceDirect
Regulatory Toxicology and Pharmacology 73 (2015) 73e84
Contents lists avai
Regulatory Toxicology and Pharmacology
journal homepage: www.elsevier .com/locate/yrtph
Using in vitro/in silico data for consumer safety assessment of feedflavoring additives e A feasibility study using piperine
A. Thiel a, *, S. Etheve a, E. Fabian b, W.R. Leeman c, J.R. Plautz a
a DSM Nutritional Products AG, Wurmisweg 576, 4303 Kaiseraugst, Switzerlandb BASF SE, Experimental Toxicology and Ecology, 67056 Ludwigshafen, Germanyc TNO, Utrechtseweg 48, 3704 HE Zeist, The Netherlands
a r t i c l e i n f o
Article history:Received 8 December 2014Received in revised form8 June 2015Accepted 9 June 2015Available online 21 June 2015
Keywords:Residue estimationTransfer databasePiperineMetabolismRisk assessment
* Corresponding author.E-mail address: [email protected] (A. Thiel).
http://dx.doi.org/10.1016/j.yrtph.2015.06.0060273-2300/© 2015 The Authors. Published by Elsevier
a b s t r a c t
Consumer health risk assessment for feed additives is based on the estimated human exposure to theadditive that may occur in livestock edible tissues compared to its hazard. We present an approach usingalternative methods for consumer health risk assessment. The aim was to use the fewest possiblenumber of animals to estimate its hazard and human exposure without jeopardizing the safety upon use.As an example we selected the feed flavoring substance piperine and applied in silico modeling forresidue estimation, results from literature surveys, and Read-Across to assess metabolism in differentspecies. Results were compared to experimental in vitro metabolism data in rat and chicken, and toquantitative analysis of residues' levels from the in vivo situation in livestock. In silico residue modelingshowed to be a worst case: the modeled residual levels were considerably higher than the measuredresidual levels. The in vitro evaluation of livestock versus rodent metabolism revealed no major differ-ences in metabolism between the species. We successfully performed a consumer health risk assessmentwithout performing additional animal experiments. As shown, the use and combination of differentalternative methods supports animal welfare consideration and provides future perspective to reducingthe number of animals.© 2015 The Authors. Published by Elsevier Inc. This is an open access article under the CC BY-NC-ND
license (http://creativecommons.org/licenses/by-nc-nd/4.0/).
1. Introduction
Feed additives, including feed flavorings, require a thoroughevaluation of consumer safety (Fig. 1). As presented by the Euro-pean Food Safety Authority (EFSA, 2012a), such an evaluation canbe seen as a four step process from hazard characterization inlaboratory animals or available literature through to determinationof additive residues in the consumable target species. Step 1 is ahazard characterization usually done in rats, which will alsoinclude the kinetic and metabolic profiling of the additive. Step 2 isthe comparison of these rat data with the kinetics and metabolismof the feed additive in the target livestock species to determine theidentity and amount of the major metabolites. In case the targetanimal would form species-specific metabolites that were notpresent in the laboratory rat, gathering additional toxicologicalinformation about this metabolite would be warranted. Step 3consists of determination of relevant residue levels in the edible
Inc. This is an open access article u
tissues of livestock. In Step 4, the risk characterization for the feedadditive is derived based on the exposure of the consumer to thesubstance and its metabolites' via edible tissues that is thencompared to the Health Based Guidance Values such as theAcceptable Daily Intake (ADI) derived from toxicological studies.
Briefly, step 1 requires gathering the relevant toxicological(hazard) information either from literature (original literature and/or reviews from competent bodies such as EFSA or the Joint FAO/WHO Expert Committee on Food Additives (JECFA)) or from spe-cifically designed toxicological studies, step 2 requires metabolismstudies in laboratory rat and target species using radiolabelledmaterial. Step 3 requires the feeding of livestock animals followedby collection of their edible tissues for analytical determination ofthe residues' concentrations. Following the EFSA guidance docu-ment (EFSA, 2012a) such an evaluation will require a ratherextensive use of both laboratory animals and livestock animals formeeting the experimental objectives. Under normal farming con-ditions, the target species animals would be marketed; however,because of the nature of the experimental conditions, the remainsof the animals must be discarded.
With the current increased emphasis on reducing the use of
nder the CC BY-NC-ND license (http://creativecommons.org/licenses/by-nc-nd/4.0/).
Abbreviations
ADI acceptable daily intakeAI active incubationsAROD alkoxyresurofin-O-dealkylaseBROD benzyloxyresurofin-O-debenzylaseEROD ethoxyresurofin-O-deethylaseECHA European Chemicals AgencyEFSA European Food Safety AuthorityEMA European Medicines AgencyEPA Environmental Protection Agency (USA)HPV High Production Volume Chemicals ProgramHDC heat deactivated controlHPLC high performance liquid chromatographyIPCS International Program on Chemical SafetyJECFA Joint FAO/WHO Expert Committee Report on Food
Additives
LC-MS liquid chromatography-mass spectrometryL(O)AEL lowest (observed) adverse effect levelLOQ limit of quantificationMoE margin of exposure: N(L)OAEL/exposureMRTD maximum recommended therapeutic doseNTP National Toxicology ProgramN(O)AEL no (observed) adverse effect leveln.a. not applicablePROD pentoxyresorufin-O-depentylasePBPK physiologically based pharmacokinetic(Q)SAR (quantitative) structure activity relationshipRP reverse phaseTTC threshold of toxicological concernTdB transfer databaseUV ultraviolet
A. Thiel et al. / Regulatory Toxicology and Pharmacology 73 (2015) 73e8474
animals for experimental purposes, we find it timely to present ourcase study of a modified approach to the safety assessment of feedadditives thereby using and combining alternative methods. Whilethe overall focus must remain on safety to the consumer, byproviding alternative approaches for each step in the hazard char-acterization process, the current evaluation demonstrated that it ispossible to reduce or avoid animal studies.
Information for hazard characterization can be obtained fromliterature from entries in databases such as that available from theEuropean Chemicals Agency (ECHA). However, it may be that the
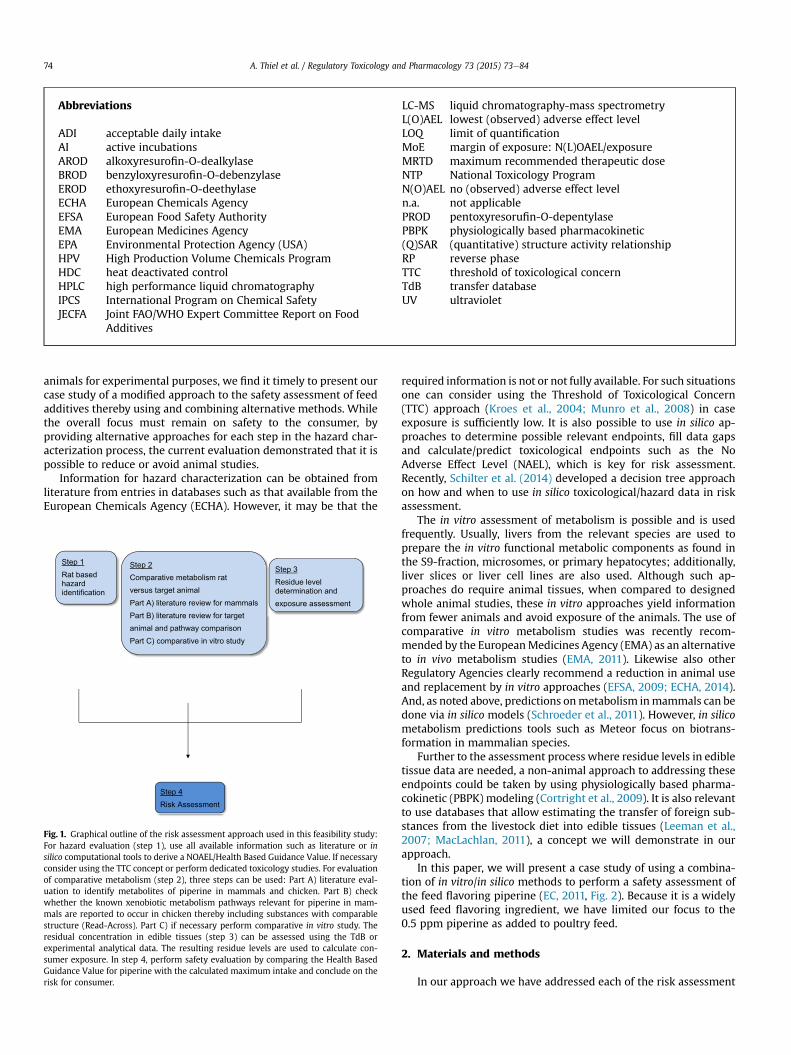
Fig. 1. Graphical outline of the risk assessment approach used in this feasibility study:For hazard evaluation (step 1), use all available information such as literature or insilico computational tools to derive a NOAEL/Health Based Guidance Value. If necessaryconsider using the TTC concept or perform dedicated toxicology studies. For evaluationof comparative metabolism (step 2), three steps can be used: Part A) literature eval-uation to identify metabolites of piperine in mammals and chicken. Part B) checkwhether the known xenobiotic metabolism pathways relevant for piperine in mam-mals are reported to occur in chicken thereby including substances with comparablestructure (Read-Across). Part C) if necessary perform comparative in vitro study. Theresidual concentration in edible tissues (step 3) can be assessed using the TdB orexperimental analytical data. The resulting residue levels are used to calculate con-sumer exposure. In step 4, perform safety evaluation by comparing the Health BasedGuidance Value for piperine with the calculated maximum intake and conclude on therisk for consumer.
required information is not or not fully available. For such situationsone can consider using the Threshold of Toxicological Concern(TTC) approach (Kroes et al., 2004; Munro et al., 2008) in caseexposure is sufficiently low. It is also possible to use in silico ap-proaches to determine possible relevant endpoints, fill data gapsand calculate/predict toxicological endpoints such as the NoAdverse Effect Level (NAEL), which is key for risk assessment.Recently, Schilter et al. (2014) developed a decision tree approachon how and when to use in silico toxicological/hazard data in riskassessment.
The in vitro assessment of metabolism is possible and is usedfrequently. Usually, livers from the relevant species are used toprepare the in vitro functional metabolic components as found inthe S9-fraction, microsomes, or primary hepatocytes; additionally,liver slices or liver cell lines are also used. Although such ap-proaches do require animal tissues, when compared to designedwhole animal studies, these in vitro approaches yield informationfrom fewer animals and avoid exposure of the animals. The use ofcomparative in vitro metabolism studies was recently recom-mended by the EuropeanMedicines Agency (EMA) as an alternativeto in vivo metabolism studies (EMA, 2011). Likewise also otherRegulatory Agencies clearly recommend a reduction in animal useand replacement by in vitro approaches (EFSA, 2009; ECHA, 2014).And, as noted above, predictions onmetabolism inmammals can bedone via in silico models (Schroeder et al., 2011). However, in silicometabolism predictions tools such as Meteor focus on biotrans-formation in mammalian species.
Further to the assessment process where residue levels in edibletissue data are needed, a non-animal approach to addressing theseendpoints could be taken by using physiologically based pharma-cokinetic (PBPK) modeling (Cortright et al., 2009). It is also relevantto use databases that allow estimating the transfer of foreign sub-stances from the livestock diet into edible tissues (Leeman et al.,2007; MacLachlan, 2011), a concept we will demonstrate in ourapproach.
In this paper, we will present a case study of using a combina-tion of in vitro/in silico methods to perform a safety assessment ofthe feed flavoring piperine (EC, 2011, Fig. 2). Because it is a widelyused feed flavoring ingredient, we have limited our focus to the0.5 ppm piperine as added to poultry feed.
2. Materials and methods
In our approach we have addressed each of the risk assessment
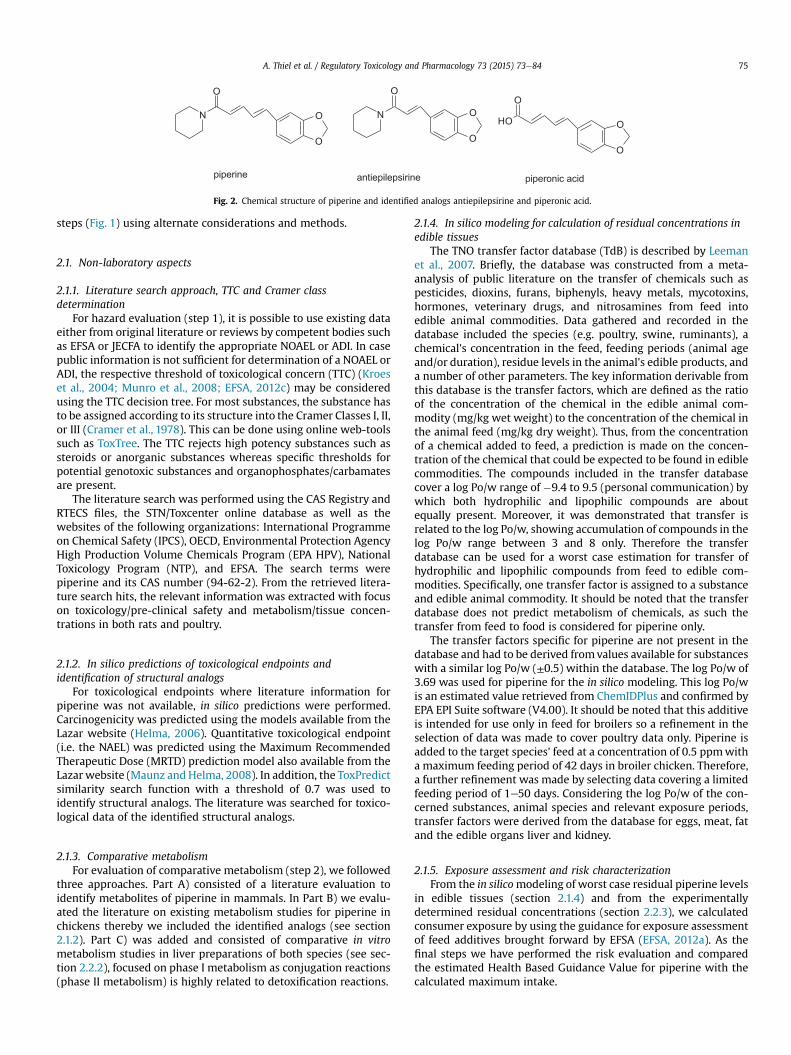
Fig. 2. Chemical structure of piperine and identified analogs antiepilepsirine and piperonic acid.
A. Thiel et al. / Regulatory Toxicology and Pharmacology 73 (2015) 73e84 75
steps (Fig. 1) using alternate considerations and methods.
2.1. Non-laboratory aspects
2.1.1. Literature search approach, TTC and Cramer classdetermination
For hazard evaluation (step 1), it is possible to use existing dataeither from original literature or reviews by competent bodies suchas EFSA or JECFA to identify the appropriate NOAEL or ADI. In casepublic information is not sufficient for determination of a NOAEL orADI, the respective threshold of toxicological concern (TTC) (Kroeset al., 2004; Munro et al., 2008; EFSA, 2012c) may be consideredusing the TTC decision tree. For most substances, the substance hasto be assigned according to its structure into the Cramer Classes I, II,or III (Cramer et al., 1978). This can be done using online web-toolssuch as ToxTree. The TTC rejects high potency substances such assteroids or anorganic substances whereas specific thresholds forpotential genotoxic substances and organophosphates/carbamatesare present.
The literature search was performed using the CAS Registry andRTECS files, the STN/Toxcenter online database as well as thewebsites of the following organizations: International Programmeon Chemical Safety (IPCS), OECD, Environmental Protection AgencyHigh Production Volume Chemicals Program (EPA HPV), NationalToxicology Program (NTP), and EFSA. The search terms werepiperine and its CAS number (94-62-2). From the retrieved litera-ture search hits, the relevant information was extracted with focuson toxicology/pre-clinical safety and metabolism/tissue concen-trations in both rats and poultry.
2.1.2. In silico predictions of toxicological endpoints andidentification of structural analogs
For toxicological endpoints where literature information forpiperine was not available, in silico predictions were performed.Carcinogenicity was predicted using the models available from theLazar website (Helma, 2006). Quantitative toxicological endpoint(i.e. the NAEL) was predicted using the Maximum RecommendedTherapeutic Dose (MRTD) prediction model also available from theLazar website (Maunz and Helma, 2008). In addition, the ToxPredictsimilarity search function with a threshold of 0.7 was used toidentify structural analogs. The literature was searched for toxico-logical data of the identified structural analogs.
2.1.3. Comparative metabolismFor evaluation of comparative metabolism (step 2), we followed
three approaches. Part A) consisted of a literature evaluation toidentify metabolites of piperine in mammals. In Part B) we evalu-ated the literature on existing metabolism studies for piperine inchickens thereby we included the identified analogs (see section2.1.2). Part C) was added and consisted of comparative in vitrometabolism studies in liver preparations of both species (see sec-tion 2.2.2), focused on phase I metabolism as conjugation reactions(phase II metabolism) is highly related to detoxification reactions.
2.1.4. In silico modeling for calculation of residual concentrations inedible tissues
The TNO transfer factor database (TdB) is described by Leemanet al., 2007. Briefly, the database was constructed from a meta-analysis of public literature on the transfer of chemicals such aspesticides, dioxins, furans, biphenyls, heavy metals, mycotoxins,hormones, veterinary drugs, and nitrosamines from feed intoedible animal commodities. Data gathered and recorded in thedatabase included the species (e.g. poultry, swine, ruminants), achemical's concentration in the feed, feeding periods (animal ageand/or duration), residue levels in the animal's edible products, anda number of other parameters. The key information derivable fromthis database is the transfer factors, which are defined as the ratioof the concentration of the chemical in the edible animal com-modity (mg/kg wet weight) to the concentration of the chemical inthe animal feed (mg/kg dry weight). Thus, from the concentrationof a chemical added to feed, a prediction is made on the concen-tration of the chemical that could be expected to be found in ediblecommodities. The compounds included in the transfer databasecover a log Po/w range of �9.4 to 9.5 (personal communication) bywhich both hydrophilic and lipophilic compounds are aboutequally present. Moreover, it was demonstrated that transfer isrelated to the log Po/w, showing accumulation of compounds in thelog Po/w range between 3 and 8 only. Therefore the transferdatabase can be used for a worst case estimation for transfer ofhydrophilic and lipophilic compounds from feed to edible com-modities. Specifically, one transfer factor is assigned to a substanceand edible animal commodity. It should be noted that the transferdatabase does not predict metabolism of chemicals, as such thetransfer from feed to food is considered for piperine only.
The transfer factors specific for piperine are not present in thedatabase and had to be derived fromvalues available for substanceswith a similar log Po/w (±0.5) within the database. The log Po/w of3.69 was used for piperine for the in silico modeling. This log Po/wis an estimated value retrieved from ChemIDPlus and confirmed byEPA EPI Suite software (V4.00). It should be noted that this additiveis intended for use only in feed for broilers so a refinement in theselection of data was made to cover poultry data only. Piperine isadded to the target species' feed at a concentration of 0.5 ppmwitha maximum feeding period of 42 days in broiler chicken. Therefore,a further refinement was made by selecting data covering a limitedfeeding period of 1e50 days. Considering the log Po/w of the con-cerned substances, animal species and relevant exposure periods,transfer factors were derived from the database for eggs, meat, fatand the edible organs liver and kidney.
2.1.5. Exposure assessment and risk characterizationFrom the in silicomodeling of worst case residual piperine levels
in edible tissues (section 2.1.4) and from the experimentallydetermined residual concentrations (section 2.2.3), we calculatedconsumer exposure by using the guidance for exposure assessmentof feed additives brought forward by EFSA (EFSA, 2012a). As thefinal steps we have performed the risk evaluation and comparedthe estimated Health Based Guidance Value for piperine with thecalculated maximum intake.
A. Thiel et al. / Regulatory Toxicology and Pharmacology 73 (2015) 73e8476
2.2. Laboratory experiments
2.2.1. ChemicalsPiperine (CAS 94-62-2) was obtained from Acros Organics (pu-
rity: 98.7%). Capsaicin was obtained from Sigma (product number360,376); testosterone (purity: >99.9%) was from SigmaeAldrich.For the poultry feeding studies (see section 2.2.3), CRINA® PoultryPlus, containing 0.1% piperine, was added in amounts up to4500 ppm in the feed.
2.2.2. In vitro experiments2.2.2.1. Animals used for preparation of liver fractions. For thein vitro experiments livers from male Crl:WI (Han) Wistar rats(Charles River, Sulzfeld, Germany) and female Leghorn Braunchickens (obtained from a local farmer) were used. The animalswere not pre-treated with enzyme inducers before sacrifice.
2.2.2.2. Preparation of liver S9-fraction and liver microsomes forin vitro metabolism experiments. Liver samples fromhen or ratwerecut into small pieces, mixed with homogenization buffer (saccha-rose (250 mM), EDTA-Na2 (1 mM)), and homogenized with a PotterElvehjem homogenizer. Raw cell compartments were separated bycentrifugation at 9,000 g (15 min/4 �C), which yielded the S9-fraction in the supernatant. The microsomes were collected viasedimentation from the S9-faction by centrifugation at 100,000 g(60 min/0e4 �C), washed with washing solution (KCl, 150 mM) andre-centrifuged at 100,000 g (60 min/0e4 �C). Re-suspension buffer(glutathion 1 mM; EDTA, 1 mM; MgCl2 � 6H2O, 4 mM; KH2PO4,0.1 M; glycerol, 20% (v/v), adjusted to pH 7.5) was added to thepellet, which was then re-homogenized.
The rat or hen liver preparations were characterized using thefollowing parameters: protein content according to Bradford, to-tal cytochrome P450 content according to Omura and Sato(1964a,b), and AROD-activities according to Lubet et al. (1990).Since liver microsomes are integral constituents of the S9-fractionand contribute essentially to their metabolic activities, the char-acterization of a liver S9-fraction is simultaneously addressed bythe characterization of the associated microsomes prepared fromthat S9-fraction. This characterization was done to guaranteevalid microsome preparations compared to internal, historicalcontrols.
The rat liver microsomes were characterized as follows: totalprotein content 18.4 mg/mL; cytochrome b5-content 0.5 nmol/mgprotein; total cytochrome P450 content 0.6 nmol/mg protein; andEROD, PROD, and BROD-activities were 29.1, 22.4, 63.3 pmol/min/mg protein, respectively. The hen liver microsomes were charac-terized as follows: total protein content 18.4 mg/mL; cytochromeb5-content 0.2 nmol/mg protein; total cytochrome P450 content<0.01 nmol/mg protein; the EROD and PROD-activities were 0.4and 0.3 pmol/min/mg protein, respectively. BROD activities werenot detectable.
2.2.2.3. Incubation of S9-fraction and microsomes with piperine.Piperine at a nominal concentration of 100 mM and 10 mM wereeach incubated with the liver microsomes and the S9-fractionsobtained from rat or hen. Incubations with microsomes were car-ried out with 0.5 mg microsomal protein/mL incubate. For in-cubations with S9-fraction, 250 mL/mL incubatewere used. Piperinein DMSOwas added at a final DMSO concentration of 2.5% (v/v). Theincubations were performed at 37 �C for 2 h including 30 mL/mLincubate of a NADPH-regeneration system. The NADPH-regeneration system contained glucose-6-phosphate mono-sodium salt 131 mg/mL, NADPH 33.3 mg/mL, MgCl2 1 M (143 mL/mL), and glucose-6-phosphate-dehydrogenase 200 mL/mL (¼ 140units).
In addition, appropriate controls were processed under identicalincubation conditions: (i) testosterone as positive control at200 mM without addition of piperine, (ii) heat-deactivated (100 �C,about 10 min) controls with piperine, and (iii) buffer controls withpiperine but without microsomes or S9-mix. Further, an extractionefficiency control was used that was not incubated but immediatelystopped using acetone. After incubation, the proteins wereprecipitated by adding 1 volume of acetone and centrifuged. Fromthe resulting supernatant, an aliquot was taken for HPLC-UV-analysis. All incubations were carried out in two replicates.Testosterone was incubated in parallel and used as a positive con-trol to show the validity of the test system.
2.2.2.4. Analysis of metabolites in incubates of liver S9-fraction ormicrosomes. Piperine and its metabolites were separated by HPLC(HP 1200) with UV detection (240 nm) using a Gemini 5m C18,150� 3mm column. Gradient elutionwas a mixture of acetonitrile/0.1% HCOOH: v/v (A) and deionizedwater/0.1% HCOOH: v/v (B) witha constant flow rate in all steps of 0.6 mL/min. The gradient was asfollows: 0e1 min: kept at 95% B; 1e35 min: gradient change to 10%B; 35e40min: kept at 10% B; 40e45min: gradient change to 95% B;45e55 min: kept at 95% B.
The positive control testosterone and its metabolites wereseparated by HPLC (Waters Aliance) with Purospher RP18,150 � 4 mm column and UV-detection (240 nm). Gradient elutionwas a mixture of deionized water/25% methanol/0.1% HCOOH: v/v/v (A) and deionized water/63.5% methanol/1.5% acetonitrile/0.1%HCOOH: v/v/v (B) with a constant flow rate of 0.7 mL/min in allsteps. The gradient was as follows: 0e10 min: kept at 25% B;10e35min: gradient change to 100% B; 35e50 min: kept at 100% B;50e60 min: gradient change to 25% B; 60e70 min: kept at 25% B.
2.2.3. Residue measurements in in vivo target animal safety studiesLivers were obtained fromRoss 308 broiler chicken of both sexes
that from hatch until 35 days of age were treated with CRINA®
Poultry Plus at dietary concentrations of 0, 450 and 4500 ppm in atarget animal safety/tolerance study. CRINA® Poultry Plus is apreparation of flavoring substances used for animal feed and con-tains amongst others piperine (0.1%). Thus, the piperine concen-trations fed to the animals were 0, 0.45, and 4.5 ppm. The birdswere housed separated by sex and had unrestricted access to apelletized broiler diet and drinking water. Each dose group con-sisted of 8 replicate pens (4 pens per sex) with each replicate pencontaining 20 birds. On day 0, five birds per pen were randomlypre-selected. On day 35, the pre-selected birds were sacrificed.Their livers were collected, put on ice and subsequently storedat �20 �C until analysis of piperine content. In total 20 liver per sexwere analyzed in the control and 40 animals in the low dose groupfor the presence of piperine. In the high dose group in total 13 birdswere analyzed with a minimum of 1 bird per pen. It was notconsidered necessary to analyze the remaining livers because allsamples were below the LOQ.
Before analysis, the liver samples were thawed at room tem-perature in the dark. An amount of 50 mL of internal standard so-lution (capsaicin) was added to about 200 mg of liver tissue,followed by 1.5 mL of ethyl acetate. The mixture was homogenizedusing Precellys system and centrifuged. Afterwards 1 mL of thesupernatant was evaporated to dryness and then dissolved with150 mL of acetonitrile. An amount of 10 mL of the mixture wasinjected into the LC-MS/MS system.
LC analysis was performed using HPLC system (Agilent, USA)with a Sunfire C18 (50 � 4.6 mm, dp ¼ 2.5 mm, Waters) column.Gradient elution was a mixture of 20 mM ammonium acetate (A)and acetonitrile (B) with a constant flow rate of 0.8 mL/min in allsteps. The gradient was as follows: 0.00e0.50 min: kept at 20% B;
A. Thiel et al. / Regulatory Toxicology and Pharmacology 73 (2015) 73e84 77
0.50e20.00: gradient change to 90% B; 20.0e25.0: kept at 90% B;25.0e30.0: gradient change to 20% B and 30.0e35.0: kept at 20% B.A triple quadrupole API 4000 mass spectrometer (AB Sciex, Tor-onto, Canada) equipped with a Turbo Ionspray (ESI) in positive ionmode was used. Quantification was done by applying externalcalibration using internal standard. The criteria for identificationand quantificationwere the retention time andMRM transitionm/z286/201 for piperine and m/z 306/137 for the internal standard(capsaicin).
3. Results
3.1. Hazard evaluation (step 1)
Using the ToxTree tool, piperine e a non-mutagenic substancewas determined to be a Cramer Class III compound.
Literature findings: Piperine was reported to be not mutagenicin the Ames Test (EFSA, 2011), negative in two in vitromicronucleus(MNT) assays (Singh et al., 1994; Thiel et al., 2014), negative inseveral in vivo MNT studies (EFSA, 2011) and in a recently con-ducted in vivoMNT (Thiel et al., 2014). Kinetic and metabolism datawere identified for mammalian species including laboratory rat(Bajad et al., 2002, 2003a; Suresh and Srinivasan, 2010) and human(Sethi et al., 2009; Hoelzel and Spiteller, 1984; Kakarala et al., 2010).However, metabolism data in target species were not available.Piperine was tested in rats for 8 weeks as dietary mixture at con-centrations approximately equivalent to doses of 10e20 mg/kg bw/d (Bhat and Chandrasekhara, 1986). In this study, no adverse effectson hematological and clinical chemistry parameters were seen. Inother experiments focusing on the male reproductive tract, dosesranging from 1 to 100 mg/kg bw/d given by gavage to male rats for30 days (Malini et al., 1999; D'Cruz et al., 2005, 2008). The lowestdose administered, 1 mg/kg bw/d, produced no adverse effects onsexual organs and sperm. Doses equivalent to 5 mg/kg bw/d orhigher produced reduced weights of male sexual organs includingtestis, cauda epididymides, vas deferens, seminal vesicle andventral prostate. Sperm counts, motility and viability were reduced.Histopathologically, desquamation of spermatocytes, round andelongated spermatids and their accumulation in the lumen ofseminiferous tubules was seen. In a further experiment with astudy design focusing on liver (Gagini et al., 2010), a dose level of1.12 mg/kg bw/d was given orally for 23 days to rats. The livers ofthe animals were examined histopathologically without significantfindings. Recently, EFSA summarized the results of a 90-day studywith piperine. EFSA concluded that the NOAEL of this study was5 mg/kg bw/d based on a dose-dependent increase in plasmacholesterol levels in males at the next higher doses (EFSA, 2015).
Standard experimental carcinogenicity studies are not availablefor piperine and therefore in silico predictions were performedusing the in silico models available from the Lazar website (Helma,2006). Piperine was predicted to be a non-carcinogen by those insilico models. The confidence for the predictions was above 0.025for 4 out of the 6 models: The DSSTox Carcinogenicity Potency DBSMulitCellCall and the DSSTox Carcinogenic Potency DBS Mousemodel showed confidence values below 0.025.
Interestingly, several published studies suggest an onco-preventative activity rather than a carcinogenic activity e a resultwhich supports the predictions of the absence of carcinogenicity(Wbra et al., 1992; Selvendiran et al., 2003, 2004, 2005a, 2005b,2006; Manoharan et al., 2009; Krishnakumar et al., 2009;Vellaichamy et al., 2009). In these experimental studies, piperinewas administered subcutaneously or orally together with knowncarcinogenic substances using intermittent or continuous piperineexposures at dose levels up to 100 mg/kg bw/d. In none of thestudies did the co-administration of piperine at the doses used
increase the incidence in benign or malignant tumors in theinvestigated organs. In contrast, piperine co-administrationreduced the incidence of tumors, reduced the tumor volumes,and the tumor burden in animals in most of the studies. Wisemanet al. (1987), reported an absence of carcinogenic activity in pre-weanling mice that received 4 intraperitoneal injections and werethen observed for 18 months. The overall weight of evidencetherefore suggests that piperine does not have a carcinogenicpotential.
Conflicting results are available in terms of immunomodulation:The administration of piperine at dose levels of 0, 1.12, 2.25, or4.5 mg/kg bw for 5 consecutive days to 6-week old male Swiss miceresulted in a toxicological profile for immunotoxicity as indicatedby reduced relative weights of spleen, thymus, and mesentericlymph node, as well as the lower number of white blood cells in thehigh dose group. Several functional tests for humoral and cellularimmunity were also performed and indicated changes in immunefunction. The authors concluded that the high dose had a consistentimmunosuppressive effect and that the NOAEL from this study was1.12 mg/kg bw/d (Dogra et al., 2004). In contrast, in mice a pro-tective effect of piperine on cadmium-induced toxicity to the im-mune system at comparable dose levels was reported by Pathakand Khandelwal (2009).
Further information related to pharmacological effects bothin vitro and in vivo are available in the public domain (as reviewede.g. by Perez Gutierrez et al., 2013 or Meghwal and Goswami(2013)). However, with this information a NOAEL for risk assess-ment cannot be deduced.
Judicious choice of the in vitro dose concentrations relative tothe in vitro biological component's size, collection of culture me-dium for quantification of parent and metabolite free concentra-tions at different time points during the assays, and theirassociation to the assay's endpoint, would be relevant for the use ofin vitro information in (quantitative) risk assessment (Schroederet al., 2011; Leist et al. 2012, Blaauboer et al., 2012; Bessems et al.,2014), however, such details were not available.
In conclusion, the most comprehensive study (90-day study inrats summarized by EFSA (2015)) results in a NOAEL of 5 mg/kg bw/d whereas adverse effects on male sexual organs were reported atthe same dose by other authors. A dose of 1 mg/kg bw/d was notassociated with toxicity to male sexual organs (Malini et al., 1999;D'Cruz et al., 2005, 2008). It is not explicitly mentioned in theEFSA (2015) report whether male reproductive organs wereexamined, however, the reported study is a regulatory toxicologicalstudy and therefore the male reproductive organs were most likelyexamined. Nevertheless, the available literature data make thededuction of an overall NOAEL from experimental data difficultmainly due to conflicting and missing information (especially onthe toxicological endpoint reprotoxicity). For the purpose of thismanuscript, we used 1 mg/kg bw/d as a NOAEL. Applying the EFSAsstandard uncertainty factors of 10 � 10 � 2 for inter-and intra-species variations and for extrapolation from subchronic to chronicexposure (EFSA, 2012b), a Health Based Guidance Value of 5 mg/kgbw/d can be calculated.
Considering the uncertainty in terms of the NOAEL describedabove and because piperine is not genotoxic, we decided toconsider as well the TTC value for Cramer Class III compounds. Theoriginal Cramer Class III TTC threshold was found to be 90 mg/d or1.5 mg/kg bw/d (EFSA, 2012; Kroes et al., 2004). Recently, the orig-inal dataset was re-evaluated with focus on organophosphatesincluding carbamates, organohalogens and remaining Cramer ClassIII compounds. This allowed the definition of a refined Cramer ClassIII threshold being 4 mg/kg bw/d (Leeman et al., 2014).
A further possibility is to predict quantitative toxicologicalendpoints by using the MRTD model which is available from the
A. Thiel et al. / Regulatory Toxicology and Pharmacology 73 (2015) 73e8478
Lazar website (Maunz and Helma, 2008): The predicted MRTD was0.014 mmol/d which is considered a human LAEL (Schilter et al.,2014). The predicted MRTD is equivalent to 60 mg/kg bw/d thereby considering piperines' molecular weight of 285.34 g/moland a 70 kg adult person (EFSA, 2012b). Applying a conservativeuncertainty factor of 3 to convert the LAEL into a human NAEL(ECHA, 2012), this results in 20 mg/kg bw/d which is at the sameorder of magnitude as the derived Health Based Guidance Valueand the TTC thresholds for a Cramer Class III compound as dis-cussed above.
The similarity search using ToxPredict software and a similaritysearch threshold of 0.7 revealed two structural related substances:antiepilepsirine (CAS 23434-86-8) and piperonic acid (CAS 5285-18-7). Piperonic acid lacks the piperidine group of piperine (Fig. 2).For both substances comprehensive toxicological data were notidentified in peer reviewed scientific literature. Antiepilepsirine hasanticonvulsant properties and has been used for decades in thetreatment of epilepsy in China with therapeutic doses of 10 mg/kgbw/d. At doses above 200 mg/kg bw/d clinical side effects con-sisting of mild vertigo, drowsiness, anorexia and/or nausea canoccur (Pei 1999).
3.2. Comparative metabolism from literature (step 2)
3.2.1. Piperine metabolism in rat (Fig. 1, step 2, part A)In rat urine, the metabolites piperonylic acid, piperonal,
vanillic acid, and piperonyl alcohol were found; in the bile, pipericacid was found, suggesting that the amide eCO-N-bond wascleaved (Bhat and Chandrasekhara, 1987). However, the presenceof piperic acid in bile was not confirmed (Bajad et al., 2002) andthe urinary metabolites previously described could not beconfirmed (Bajad et al., 2003b). Instead, in rat plasma and urine amajor metabolite was characterized by MS and 1H NMR: 5-(2,4-methylenedioxy phenyl)-2E,4E-pentadienoic acid-N-(3-yl propi-onic acid)-amide resulting from oxidation of the piperidine ring inthe 4-position followed by loss of an ethylene group (see Fig. 5).In addition, a minor metabolite was proposed to be E,E-1-[5-(3-methoxy-4-hydroxyphenyl)-1-oxo-2,4-pentadienyl]piperidine(Bajad et al., 2003a).
In human urine four metabolites were identified: 5-(3,4-dihydroxyphenyl)valeric acid piperidide, its 4-hydroxylated deriv-ative, and 5-(3,4-dihydroxyphenyl)-2,4-pentaidenoic acid piper-idide as well as its 4-hydroxylated derivative (Hoelzel and Spiteller,1984). The apparent differences between the metabolites observedin rats vs. humans may be explained by the stringent conditions(pH2 adjusted with 4 N HCl) used during metabolite isolation re-ported by Bhat and Chandrasekhara (1987). This suggests that thecleavage of the amide bond may have been produced artificially.
Overall, metabolites observed in rats and humans are consid-ered to be derived from identical metabolism pathways. The stepsfor mammalian metabolism of piperine are: cleavage of an amide-group (A), hydroxylation of the piperidine ring in position 4 (D),opening of the benzodioxole group, and reduction of the double-bonds (Table 1 and Fig. 5).
Metabolism of the structural related antiepilepsirine, studied inisolated perfused rat liver, resulted in two metabolites: 3,4-methylene dioxycinnamyl hydroxypiperidine and 4-hydroxy-3-methoxycinnamyl piperidine (Dong et al., 1989). Information onthemetabolism of piperonic acid was not found; however, it is mostlikely the initial metabolite of piperine once the amide-function iscleaved (Fig. 5, reaction A).
3.2.2. Piperine metabolism in chicken (part B)Relevant information on chicken metabolism was not available
in the published literature. From the existing primary literature or
from literature reviews (Pan and Fouts, 1978a and b) on existingxenobiotic metabolism pathways in poultry, it remained unclearwhether the identified steps on mammalian piperine metabolismexist in chicken (Table 1). Metabolism information in target animalspecies for the two structurally related substances was not found.Therefore no prediction of metabolism of piperine in chicken couldbe made and subsequently a comparative in vitrometabolism studywas performed.
3.2.3. Comparative in vitro metabolism study using piperine (partC)
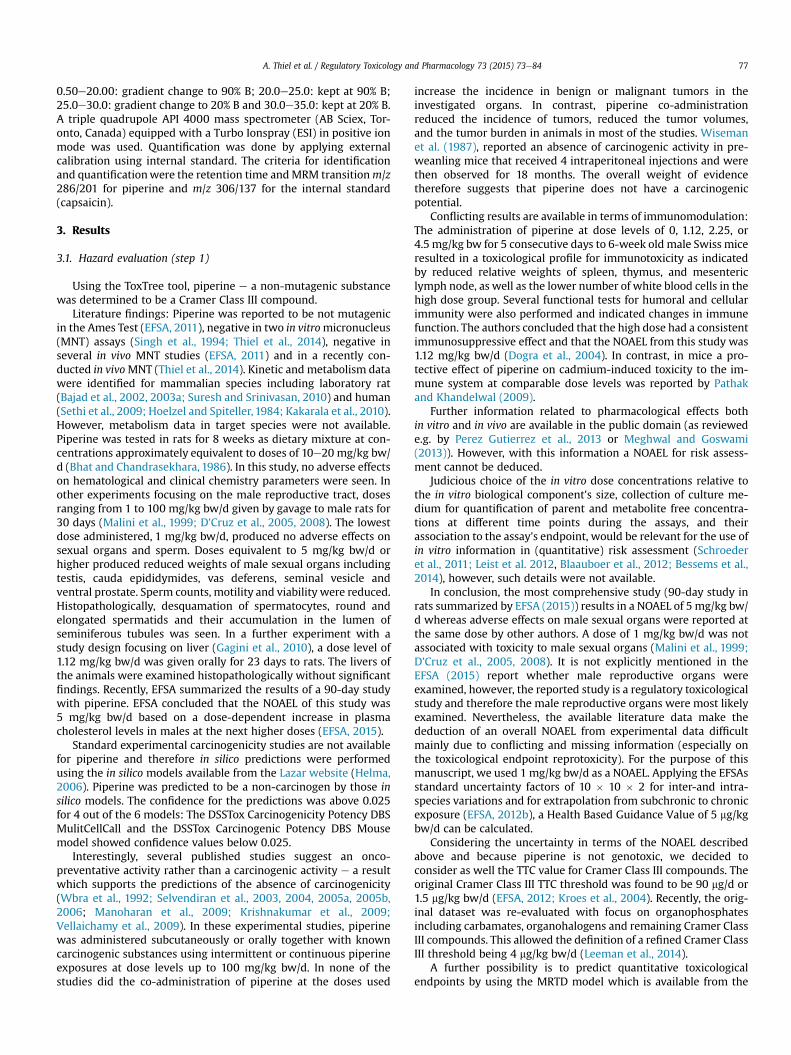
A comparative in vitrometabolism study using male rat liver S9-fraction and microsomes and female Brown Leghorn hen liver S9-fraction and microsomes was conducted. Piperine was metabo-lized using liver microsomes and liver S9-fraction of rats and hensunder the chosen incubation conditions of the study (Figs. 3 and 4).In each microsomal and S9-fraction incubate of rats and hens,10e13 metabolites could be separated by HPLC. All metabolites hadshorter retention times in the RP-chromatogram than the parentcompound (retention time for piperine, isomer 1 about 22.6 minand isomer 2 about 23.0 min) and are therewith more polar thanpiperine. The E/Z-isomerization of piperine is a typical behaviorand is also known from other matrices (Ternes and Krause, 2002).The most polar metabolites have retention times of about9e11 min. Characteristic patterns of metabolites that occur in bothin vitro metabolism systems of both species elute at about 16e17,17e18, and 19e20min (Figs. 3 and 4). Ametabolite with a retentiontime of 14.9 min was detected in liver microsomes of hens and inliver S9-fraction of hens and rats. A minor metabolite with aretention time of 14.3 minwas detected in S9-fraction of hens only.However, taken together, it can be concluded from the comparisonof the performed in vitro experiments that the observed metabolicprofiles of piperine in liver systems of rats and hens are similar.
3.3. Residue levels (step 3)
3.3.1. Residue estimation using the TNO transfer factor databasePiperine was evaluated for its transfer from feed to edible
commodities using the transfer database. No data for piperine werepresent in the database. For the case under consideration, thetransfer factor was derived based on the physical chemical prop-erties of piperine, more specifically on the log of the octanol:waterpartition coefficient (log Po/w). For the log Po/w, a very good cor-relation with the respective transfer factors is known (Leemanet al., 2007).
The transfer factors of piperine from feed to edible commoditieswere based on 1) the concentration of piperine in the feed, 2) thetransfer derived using the 95th percentile of substances with a logPo/w in the same range as piperine (range used of ± 0.5), 3) therelevant animal species, and 4) the relevant exposure duration.Although the initial approach was for meat, fat, liver and kidney ofbroilers only, transfer factors were also calculated for eggs and areprovided as additional information. The results are presented inTable 2. Based on these transfer factors the piperine concentrationswere calculated for each of the various edible commodities (seeTable 3).
The transfer factors derived from the TdB are all based on 10 ormore data points and are therefore considered of relevance forpiperine. Because the selected dataset of transfer factors are basedon the 95th percentile of the distribution, the calculated residualpiperine concentrations are considered to represent a reasonableworst case for subsequent consumer risk assessment.
3.3.2. Residue determination by analytical meansThe piperine residue concentrations in the edible tissues, as

Fig. 3. Metabolite patterns (HPLC-UV chromatogram) of piperine; 100 mM in liver microsomes from male Wistar-Han Rats and female Leghorn Braun hens: from top to bottom:Heat deactivated controls (HDC) from rat and hen, Active incubations (AI) from rat and hen, piperine isomers elute after 22.5 and 23 min.
A. Thiel et al. / Regulatory Toxicology and Pharmacology 73 (2015) 73e84 79
estimated with the TdB, predicted that the liver would have thehighest amount. However, these amounts were only in the upperppb range, which was used to guide the sensitivity of an analyticalmethod.
The analytical method developed for residue level measure-ments in liver had a limit of quantification (LOQ) of 0.1 mg/kg(0.1 ppb). 73 samples from the control (0 ppm), 450 ppm and4500 ppm CRINA® Poultry Plus groups, corresponding to 0, 0.45and 4.5 ppm piperine, respectively, were analyzed for piperine. Ineach of the analyzed liver samples, the determined concentrationswere below the LOQ.
3.4. Risk assessment (step 4)
A consumer exposure estimate for piperinewas performed usingthe calculated worst case residual piperine levels and the actualmeasured piperine residual levels based on the in-life exposuresituation. The first exposure estimation was designed in a
conservative way and therefore we used only the high consumingpersons acute consumptionfigures for adult and toddlers as given inthe respective EFSA guidance (EFSA, 2012a) (Table 2). Acute intakeestimates usually result in higher exposure andwere therefore usedalso to assess chronic exposures. The acute intake levels for piperinewere calculated to be 1.3 mg/kg bw/d for adults (78 mg/d) and 1.1 mg/kg bw/d for toddlers (13.2 mg/d) based on the transfer databaseestimation, and 0.002 mg/kg bw/d for adults and 0.001 mg/kg bw/d for toddlers based on the measured concentrations in the broilerliver (see Table 4). Comparison with available intake data comingfrom use of piperine in food, reveals that intakes of piperine by theconsumer is about 0.3 mg/kg bw/d (20 mg/person/d) (EFSA, 2011)which is in a comparable range andbelow the deducedHealth BasedGuidance Value of 5 mg/kg bw/d, below the original and refined TTCthreshold level of 1.5 mg/kg bw/d and 4 mg/kg bw/d for Cramer ClassIII compounds, respectively (Kroes et al., 2004; Leeman et al., 2014).The intake is also below the predicted human NAEL of 20 mg/kg bw/d. The highest calculated acute exposure is 1.3 mg/kg bw/d, which
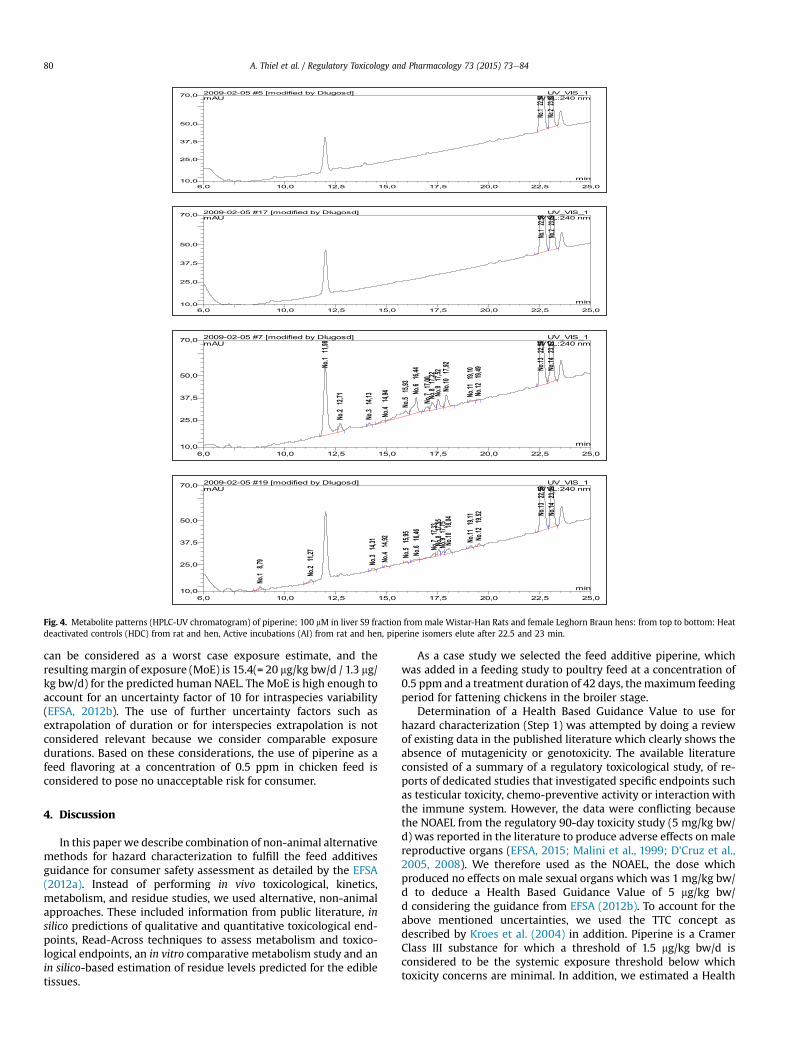
Fig. 4. Metabolite patterns (HPLC-UV chromatogram) of piperine; 100 mM in liver S9 fraction from male Wistar-Han Rats and female Leghorn Braun hens: from top to bottom: Heatdeactivated controls (HDC) from rat and hen, Active incubations (AI) from rat and hen, piperine isomers elute after 22.5 and 23 min.
A. Thiel et al. / Regulatory Toxicology and Pharmacology 73 (2015) 73e8480
can be considered as a worst case exposure estimate, and theresulting margin of exposure (MoE) is 15.4(= 20 mg/kg bw/d / 1.3 mg/kg bw/d) for the predicted human NAEL. The MoE is high enough toaccount for an uncertainty factor of 10 for intraspecies variability(EFSA, 2012b). The use of further uncertainty factors such asextrapolation of duration or for interspecies extrapolation is notconsidered relevant because we consider comparable exposuredurations. Based on these considerations, the use of piperine as afeed flavoring at a concentration of 0.5 ppm in chicken feed isconsidered to pose no unacceptable risk for consumer.
4. Discussion
In this paper we describe combination of non-animal alternativemethods for hazard characterization to fulfill the feed additivesguidance for consumer safety assessment as detailed by the EFSA(2012a). Instead of performing in vivo toxicological, kinetics,metabolism, and residue studies, we used alternative, non-animalapproaches. These included information from public literature, insilico predictions of qualitative and quantitative toxicological end-points, Read-Across techniques to assess metabolism and toxico-logical endpoints, an in vitro comparative metabolism study and anin silico-based estimation of residue levels predicted for the edibletissues.
As a case study we selected the feed additive piperine, whichwas added in a feeding study to poultry feed at a concentration of0.5 ppm and a treatment duration of 42 days, themaximum feedingperiod for fattening chickens in the broiler stage.
Determination of a Health Based Guidance Value to use forhazard characterization (Step 1) was attempted by doing a reviewof existing data in the published literature which clearly shows theabsence of mutagenicity or genotoxicity. The available literatureconsisted of a summary of a regulatory toxicological study, of re-ports of dedicated studies that investigated specific endpoints suchas testicular toxicity, chemo-preventive activity or interaction withthe immune system. However, the data were conflicting becausethe NOAEL from the regulatory 90-day toxicity study (5 mg/kg bw/d) was reported in the literature to produce adverse effects on malereproductive organs (EFSA, 2015; Malini et al., 1999; D'Cruz et al.,2005, 2008). We therefore used as the NOAEL, the dose whichproduced no effects on male sexual organs which was 1 mg/kg bw/d to deduce a Health Based Guidance Value of 5 mg/kg bw/d considering the guidance from EFSA (2012b). To account for theabove mentioned uncertainties, we used the TTC concept asdescribed by Kroes et al. (2004) in addition. Piperine is a CramerClass III substance for which a threshold of 1.5 mg/kg bw/d isconsidered to be the systemic exposure threshold below whichtoxicity concerns are minimal. In addition, we estimated a Health

Fig. 5. Metabolites of piperine described for mammals.
Table 1Comparison of principal metabolic pathways of piperine.
Major metabolism step in mammals Occurrence in chicken for the following substances
A: Cleavage of amide-group No dataB: Opening of the1,3-benzodioxole group No dataC: Reduction of double-bonds No dataD: Hydroxylation of piperidine ring in position 4 with/without loss of ethylene group No data
Table 2Calculated transfer factors for chicken products using the TNO transfer factordatabase.
Animal product GM GSD Median P90 P95 P99 N Max
Eggs 0.03 0.04 0.01 0.11 0.14 0.16 29 0.16Meat 0.02 0.04 0.00 0.03 0.19 0.19 17 0.19Fat 0.01 0.01 0.01 0.03 0.04 0.04 14 0.04Edible offals 0.09 0.20 0.02 0.18 0.29 0.99 25 0.99
GM: geometric mean.GSD: geometric standard deviation.Pxx: xxth percentile.N: amount of data underlying the statistical data.Max: maximum transfer factor found for the selected dataset.
A. Thiel et al. / Regulatory Toxicology and Pharmacology 73 (2015) 73e84 81
Based Guidance Value from the available in silico tools and pre-dicted theMRTD that was converted into a human NAEL of 20 mg/kgbw/d.
For step 2, which is the comparison of metabolites formed inrats versus those seen in poultry, based only on available literaturewe could not reach what we considered to be a reliable conclusion.From the review of Pan and Fouts (1978a and b) it is evident thatmany of themetabolism steps occurring in rats, such as conjugationof phenolic compounds with sulfate or glucuronic acid, conjugationof carboxylic acids, or ester hydrolysis, are also well documented inpoultry. However, from the literature we could not confirm thatpoultry would use the major steps for piperine metabolism foundin mammals, including amide-bond cleavage, hydroxylation of apiperidine-ring or opening of a benzodioxole group (see Table 1 andFig. 4). Likewise, no metabolism data of structural analogs in
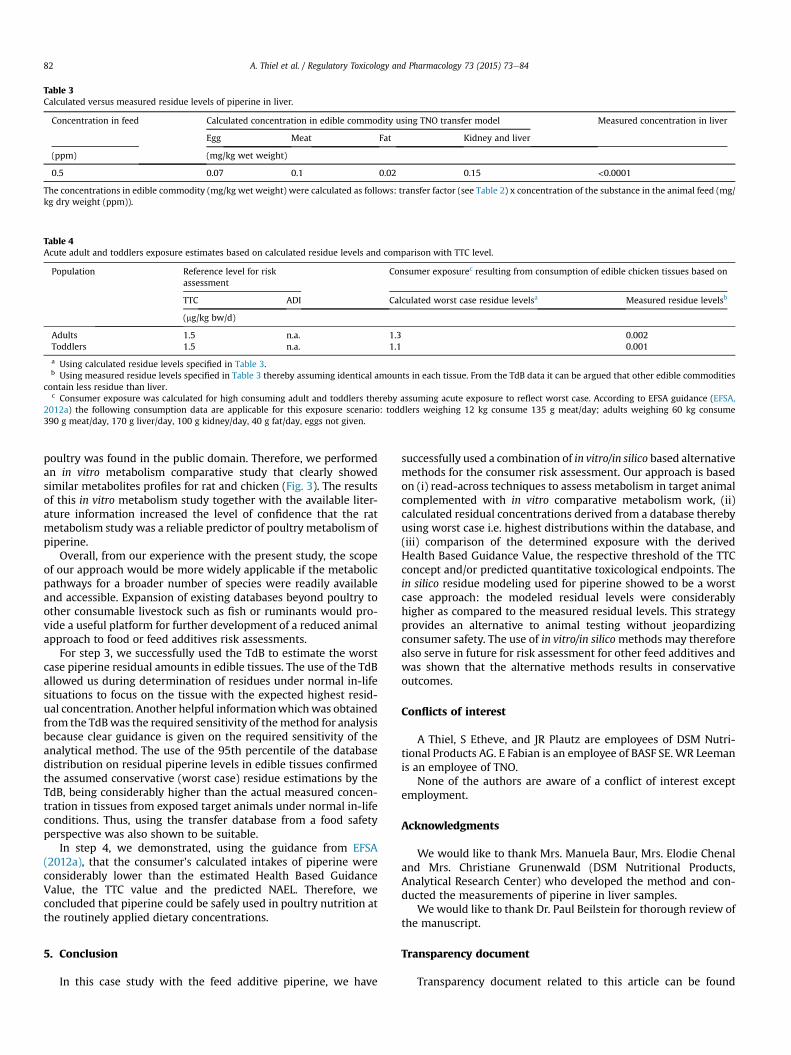
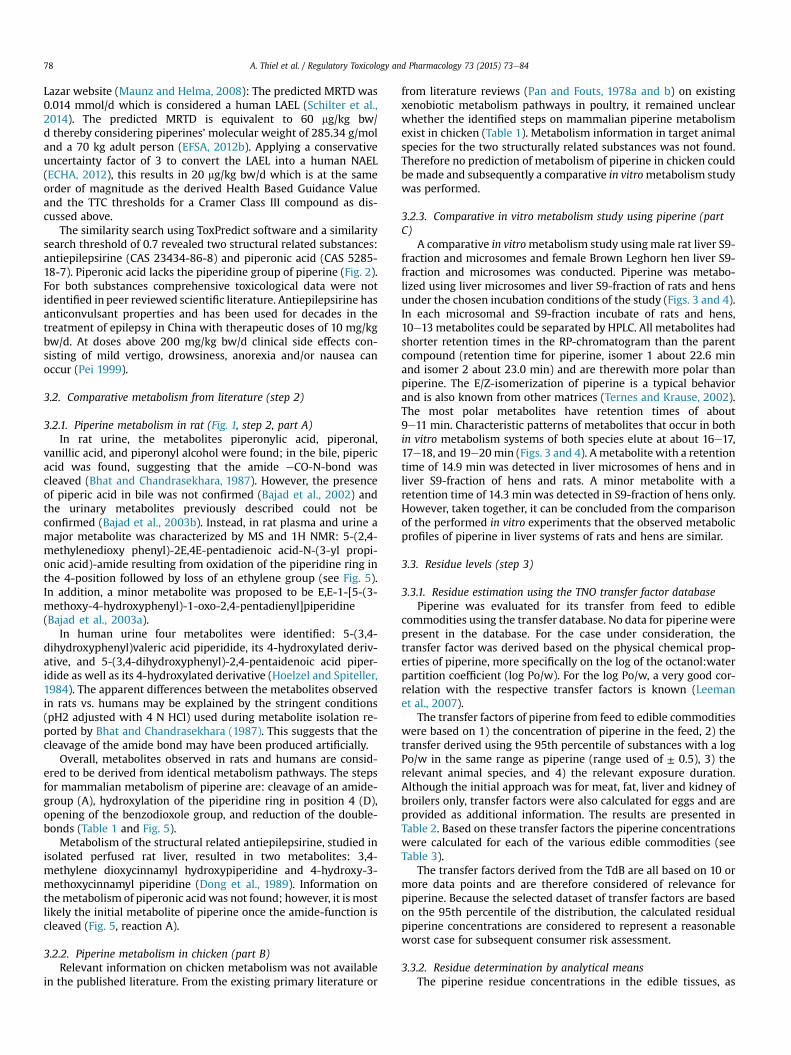
Table 3Calculated versus measured residue levels of piperine in liver.
Concentration in feed Calculated concentration in edible commodity using TNO transfer model Measured concentration in liver
Egg Meat Fat Kidney and liver
(ppm) (mg/kg wet weight)
0.5 0.07 0.1 0.02 0.15 <0.0001
The concentrations in edible commodity (mg/kg wet weight) were calculated as follows: transfer factor (see Table 2) x concentration of the substance in the animal feed (mg/kg dry weight (ppm)).
Table 4Acute adult and toddlers exposure estimates based on calculated residue levels and comparison with TTC level.
Population Reference level for riskassessment
Consumer exposurec resulting from consumption of edible chicken tissues based on
TTC ADI Calculated worst case residue levelsa Measured residue levelsb
(mg/kg bw/d)
Adults 1.5 n.a. 1.3 0.002Toddlers 1.5 n.a. 1.1 0.001
a Using calculated residue levels specified in Table 3.b Using measured residue levels specified in Table 3 thereby assuming identical amounts in each tissue. From the TdB data it can be argued that other edible commodities
contain less residue than liver.c Consumer exposure was calculated for high consuming adult and toddlers thereby assuming acute exposure to reflect worst case. According to EFSA guidance (EFSA,
2012a) the following consumption data are applicable for this exposure scenario: toddlers weighing 12 kg consume 135 g meat/day; adults weighing 60 kg consume390 g meat/day, 170 g liver/day, 100 g kidney/day, 40 g fat/day, eggs not given.
A. Thiel et al. / Regulatory Toxicology and Pharmacology 73 (2015) 73e8482
poultry was found in the public domain. Therefore, we performedan in vitro metabolism comparative study that clearly showedsimilar metabolites profiles for rat and chicken (Fig. 3). The resultsof this in vitro metabolism study together with the available liter-ature information increased the level of confidence that the ratmetabolism study was a reliable predictor of poultry metabolism ofpiperine.
Overall, from our experience with the present study, the scopeof our approach would be more widely applicable if the metabolicpathways for a broader number of species were readily availableand accessible. Expansion of existing databases beyond poultry toother consumable livestock such as fish or ruminants would pro-vide a useful platform for further development of a reduced animalapproach to food or feed additives risk assessments.
For step 3, we successfully used the TdB to estimate the worstcase piperine residual amounts in edible tissues. The use of the TdBallowed us during determination of residues under normal in-lifesituations to focus on the tissue with the expected highest resid-ual concentration. Another helpful informationwhichwas obtainedfrom the TdBwas the required sensitivity of themethod for analysisbecause clear guidance is given on the required sensitivity of theanalytical method. The use of the 95th percentile of the databasedistribution on residual piperine levels in edible tissues confirmedthe assumed conservative (worst case) residue estimations by theTdB, being considerably higher than the actual measured concen-tration in tissues from exposed target animals under normal in-lifeconditions. Thus, using the transfer database from a food safetyperspective was also shown to be suitable.
In step 4, we demonstrated, using the guidance from EFSA(2012a), that the consumer's calculated intakes of piperine wereconsiderably lower than the estimated Health Based GuidanceValue, the TTC value and the predicted NAEL. Therefore, weconcluded that piperine could be safely used in poultry nutrition atthe routinely applied dietary concentrations.
5. Conclusion
In this case study with the feed additive piperine, we have
successfully used a combination of in vitro/in silico based alternativemethods for the consumer risk assessment. Our approach is basedon (i) read-across techniques to assess metabolism in target animalcomplemented with in vitro comparative metabolism work, (ii)calculated residual concentrations derived from a database therebyusing worst case i.e. highest distributions within the database, and(iii) comparison of the determined exposure with the derivedHealth Based Guidance Value, the respective threshold of the TTCconcept and/or predicted quantitative toxicological endpoints. Thein silico residue modeling used for piperine showed to be a worstcase approach: the modeled residual levels were considerablyhigher as compared to the measured residual levels. This strategyprovides an alternative to animal testing without jeopardizingconsumer safety. The use of in vitro/in silicomethods may thereforealso serve in future for risk assessment for other feed additives andwas shown that the alternative methods results in conservativeoutcomes.
Conflicts of interest
A Thiel, S Etheve, and JR Plautz are employees of DSM Nutri-tional Products AG. E Fabian is an employee of BASF SE. WR Leemanis an employee of TNO.
None of the authors are aware of a conflict of interest exceptemployment.
Acknowledgments
We would like to thank Mrs. Manuela Baur, Mrs. Elodie Chenaland Mrs. Christiane Grunenwald (DSM Nutritional Products,Analytical Research Center) who developed the method and con-ducted the measurements of piperine in liver samples.
We would like to thank Dr. Paul Beilstein for thorough review ofthe manuscript.
Transparency document
Transparency document related to this article can be found

A. Thiel et al. / Regulatory Toxicology and Pharmacology 73 (2015) 73e84 83
online at http://dx.doi.org/10.1016/j.yrtph.2015.06.006.
References
Bajad, S., Singla, A.K., Bedi, K.L., 2002. Liquid chromatographic method for deter-mination of piperine in rat plasma: application of pharmacokinetics.J. Chromatogr. B 776, 245e249.
Bajad, S., Khajuria, R.K., Suri, O.P., Bedi, K.L., 2003a. Characterisation of a new minorurinary metabolite of piperine, an omnipresent food component, by LC-MS/MS.J. Sep. Sci. 26, 943e946.
Bajad, S., Coumar, M., Khajuria, R., Suri, O.P., Bedi, K.L., 2003b. Characterisation of anew rat urinary metabolite by LC/NMR/MS studies. Eur. J. Pharm. Sci. 19,413e421.
Bessems, J.G., Loizou, G., Krishnan, K., Clewell, H.J., Bernasconi, C., Bois, F., Coecke, S.,Collnot, E.-M., Diembeck, W., Farcal, L.R., Geraets, L., Gundert-Remy, U.,Kramer, N., Küsters, G., Leite, S.B., Pelkonen, O.R., Schr€oder, K., Testai, E., Wilk-Zasadna, I., Zaldívar-Comenges, J.-M., 2014. PBTK modelling platforms andparameter estimation tools to enable animal-free risk assessment recommen-dations from a joint EPAA e EURL ECVAM ADME workshop. Regul. Toxicol.Pharmacol. 68, 119e139.
Bhat, B.G., Chandrasekhara, N., 1986. Lack of adverse influence of black pepper, itsoleoresin and piperine in the weanling rat. J. Food Saf. 7, 215e233.
Bhat, B.G., Chandrasekhara, N., 1987. Metabolic disposition of piperine in the rat.Toxicology 44, 99e106.
Blaauboer, B.J., Boekelheide, K., Clewell, H.J., Daneshian, M., Dingemans, M.M.L.,Goldberg, A.M., Heneweer, M., Jaworska, J., Kramer, N.I., Leist, M., Seibert, H.,Testai, E., Vandebriel, R.J., Yager, J.D., Zurlo, J., 2012. The use of biomarkers oftoxicity for integrating in vitro hazard estimates into risk assessment forhumans. ALTEX 29 (4), 411e425.
Chem IDPlus, Available at: http://chem.sis.nlm.nih.gov/chemidplus/ (accessed28.02.14).
Cramer, G.M., Ford, R.A., Hall, R.L., 1978. Estimation of toxic hazard e a decision treeapproach. Food Cosmet. Toxicol. 16, 255e276.
Cortright, K.A., Wetzlich, S.E., Craigmill, A.L., 2009. A PBPK model for midazolam infour avian species. J. Veterinary Pharmacol. Ther. 32 (6), 552e565.
D'Cruz, S.C., Mathus, P.P., 2005. Effect of piperine on the epididymides of adult rats.Asian J. Androl. 7 (4), 363e368.
D'Cruz, S.C., Vaithinathan, S., Saradha, B., Mathur, P.P., 2008. Piperine activatestesticular apoptosis in adult rats. J. Biochem. Mol. Toxicol. 22 (6), 382e388.
Dogra, R.K.S., Khanna, S., Shanker, R., 2004. Immunotoxicological effects of piperinein mice. Toxicology 196, 229e236.
Dong, S.N., Bai, F., Yang, H.J., Lou, Y.Q., Liang, W.S., 1989. Studies on the metabolismof antiepilepserine in isolated perfused rat liver. Acta Pharm. Sin. 24 (4),241e245.
EC, 2011. European Union Register of Feed Additives Pursuant to Regulation (EC) No1831/2003. Appendixes 3b & 4, Annex : List of additives (Status: Released 28February 2011), Available at: http://www.platform-fefana.org/Website/DOCS/comm_register_feed_additives_1831-03.pdf. accessed on 28-February-2014.
ECHA, 2012. Guidance on Information Requirements and Chemical Safety Assess-ment Chapter R.8: Characterisation of Dose (Concentration)-response for Hu-man Health, Version 2.1. November 2012, Available at: http://echa.europa.eu/documents/10162/13632/information_requirements_r8_en.pdf (accessed05.11.14).
ECHA, 2014. The Use of Alternatives to Testing on Animals for REACH. ECHA-14-A-08-EN, Available at: http://echa.europa.eu/documents/10162/13639/alternatives_test_animals_2014_summary_en.pdf (accessed 21.11.14).
EFSA, 2009. Opinion of the Scientific Committee on a request from EFSA on existingapproaches incorporating replacement, reduction and refinement of animaltesting: applicability in food and feed risk assessment. EFSA J. (2009) 1052, 1-77,Available at: http://www.efsa.europa.eu/en/efsajournal/doc/1052.pdf (accessed21.11.14).
EFSA, 2011. Scientific opinion on flavouring group evaluation 86, revision 1(FGE.86Rev1): consideration of aliphatic and aromatic amines and amidesevaluated by JECFA (65th meeting), EFSA panel on food contact materials, en-zymes, flavourings and processing aids (CEF). EFSA J. 9 (4), 1926. http://dx.doi.org/10.2903/j.efsa.2011.1926.
EFSA, 2012a. EFSA Panel on additives and products or substances used in animalfeed (FEEDAP): guidance for establishing the safety of additives for consumer.EFSA J. 10 (1), 2537. http://dx.doi.org/10.2903/j.efsa.2012.2537.
EFSA, 2012b. EFSA Scientific Committee; guidance on selected default values to beused by the EFSA Scientific Committee, Scientific Panels and Units in theabsence of actual measured data. EFSA J. 10 (3), 2579. http://dx.doi.org/10.2903/j.efsa.2012.2579.
EFSA, 2012c. Scientific opinion on exploring options for providing advice aboutpossible human health risks based on the concept of threshold of toxicologicalconcern (TTC). EFSA J. 10 (7), 2750. http://dx.doi.org/10.2903/j.efsa.2012.2750.
EFSA, 2015. EFSA CEF Panel (EFSA panel on food contact materials, enzymes, fla-vourings and processing aids), 2015. Scientific opinion on flavouring groupevaluation 86, revision 2 (FGE.86Rev2): consideration of aliphatic and arylalkylamines and amides evaluated by JECFA (65th meeting). EFSA J. 13 (1) http://dx.doi.org/10.2903/j.efsa.2015.3998, 3998, 49.
EMA, 2011. European Medicines Agency, Committee for Medicinal Products forVeterinary Use (CVMP) VICH GL47: Studies to Evaluate the Metabolism andResidue Kinetics of Veterinary Drugs in Food-producing Animals: Laboratory
Animal Comparative Metabolism Studies. 14-March-2011 EMA/CVMP/VICH/463104/2009.
Gagini, T.B., Silva, R.E., Castro, I.S., Soares, B.A., Lima, M.E.F., Brito, M.F., Mazur, C.,Direito, G.M., Danelli, M., 2010. Oral administration of piperine for the control ofaflatoxin intoxication in rats. Braz. J. Microbiol. 41, 345e348.
Helma, C., 2006. Lazy structure-activity relationships (lazar) for the prediction ofrodent carcinogenicity and Salmonella mutagenicity. Mol. Divers. 10, 147e158.
Hoelzel, C., Spiteller, G., 1984. Piperine e an example of individually different(polymorph) metabolism of an omnipresent nutrition component. Liebigs Ann.Chem. 1319e1331.
Kakarala, M., Dubey, S.K., Tarnowski, M., Cheng, C., Liyanage, S., Strawder, T., Tazi, K.,Sen, A., Djuric, Z., Brenner, D.E., 2010. Ultra-low flow liquid chromatographyassay with ultraviolet (UV) detection for piperine quantitiation in humanplasma. J. Agric. Food Chem. 58, 2594e6599.
Krishnakumar, N., Manoharan, S., Palaniappan, L.R.M., Venkatachalam, P.,Manohar, M.G.A., 2009. Chemopreventive efficacy of piperine in 7,12-dimehtlybenz (a) anthracene (DMBA)-induced hamster buccal pouch carcinogenesis: anFT-IR study. Food Chem. Tox. 47, 2813e2820.
Kroes, R., Renwick, A.G., Cheeseman, M., Kleiner, J., Mangelsdorf, I., Piersma, A.,Schilter, B., Schlatter, J., van Schothorst, F., Vos, J.G., Würtzen, G., 2004. Struc-ture-based thresholds of toxicological concern (TTC): guidance for applicationto substances present at low levels in the diet. Food Chem. Toxicol. 42, 65e83.
Lazar website: http://lazar.in-silico.ch/predict.Leeman, W.R., van den Berg, K.J., Houben, G.F., 2007. Transfer of chemicals from feed
to animal products: the use of transfer factors in risk assessment. Food Addit.Contam. 24 (1), 1e13.
Leeman, W.R., Krul, L., Houben, G.F., 2014. Reevaluation of the munro dataset toderive more specific TTC thresholds. Regul. Toxicol. Pharmacol. 69, 273e278.
Leist, M., Lidbury, B.A., Yang, C., Hayden, P.J., Kelm, J.M., Ringeissen, S., Detroyer, A.,Meunier, J.R., Rathman, J.F., Jackson Jr., G.R., Stolper, G., Hasiwa, N., 2012. Noveltechnologies and an overall strategy to allow hazard assessment and risk pre-diction of chemicals, cosmetics, and drugs with animal-free methods. Altex 29,373e388.
Lubet, R.A., Syi, J.L., Nelson, J.O., Nims, R.W., 1990. Induction of hepatic cytochromeP-450 mediated alkoxyresorufin O-dealkylase activities in different species byprototype P-450 inducers. Chem. Biol. Interact. 75, 325e339.
MacLachlan, D.J., 2011. Estimating the transfer of contaminants in animal feedstuffsto livestock tissues, milk and eggs: a review. Anim. Prod. Sci. 51, 1067e1078.
Malini, I., Manimaran, R.R., Arunakaran, J., Aruldhas, M.M., Govindarajulu, P., 1999.Effects of piperine on testis of albino rats. J. Ethnopharmacol. 64, 219e225.
Manoharan, S., Balakrishnan, S., Menon, V.P., Alias, L.M., Reena, A.R., 2009. Che-mopreventive efficacy of curcumin and piperine during 7,12-dimethylbenz[a]anthracene-induced hamster buccal pouch carcinogenesis. Singap. Med. J. 50(2), 139e146.
Maunz, A., Helma, C., 2008. Prediction of chemical toxicity with local support vectorregression and activity-specific kernels. SAR QSAR Environ. Res. 19 (5e6),413e431.
Meghwal, M., Goswami, T.K., 2013. Piper nigrum and piperine: an update. Phy-thotherapy Res. 27, 1121e1130. http://dx.doi.org/10.1002/ptr.4972.
Munro, I.C., Renwick, A.G., Danielewska-Nikiel, B., 2008. The threshold of toxico-logical concern (TTC) in risk assessment. Toxicol. Lett. 180, 151e156.
Omura, T., Sato, R., 1964a. The carbon monoxide-binding pigment of liver micro-somes. I. evidence for its hemoprotein nature. J. Biol. Chem. 239, 2370e2378.
Omura, T., Sato, R., 1964b. The carbon monoxide-binding pigment of liver micro-somes: II. Solubilization, purification, and properties. J. Biol. Chem. 239,2379e2385.
Pan, H.P., Fouts, J.R., 1978a. Drug metabolism in birds: part 1. Drug Metab. Rev. 7,1e140.
Pan, H.P., Fouts, J.R., 1978b. Drug metabolism in birds: part 2. Drug Metab. Rev. 7,141e253.
Pathak, N., Khandelwal, S., 2009. Immunomodulatory role of piperine in cadmiuminduced thymic atrophy and splenomegaly in mice. Environ. Toxicol. Pharma-col. 28, 52e60.
Pei, Y.Q., 1999. A review of pharmacological and clinical use of antiepilepsirine andits derivatives. Res. Commun. Pharmacol. Toxicol. 4 (3e4), II13eII23.
Perez Gutierrez, R.M., Neira Gonzalez, A.M., Hoyo-Vadillo, C., 2013. Alkaloids frompiper: a review of its phytochemistry and pharmacology. Mini Rev Med. Chem.13, 163e193.
Schilter, B., Benigini, R., Boobis, A., Chiodini, A., Cockburn, A., Cronin, M.T.D., LoPiparo, E., Modi, S., Thiel, A., Worth, A., 2014. Estabilishing the level of safetyconcern for chemicals in food without the need for toxicity testing. Regul.Toxicol. Pharmacol. 68 (2), 275e296. http://dx.doi.org/10.1016/j.yrtph.2013.08.018.
Schroeder, K., Bremm, K.D., Alepee, N., Bessems, J.G.M., Blaauboer, B., Boehn, S.N.,Burek, C., Coecke, S., Gobmau, L., Heweitt, N.J., Heylings, J., Huqyler, J., Jaeger, M.,Jagelavicius, M., Jarrett, N., Ketelslegers, H., Kocina, I., Koester, J., Kreysa, J.,Note, R., Poth, A., Radtke, M., Rogiers, V., Scheel, J., Schulz, T., Steinkellner, H.,Toeroek, M., Whelan, M., Winkler, P., Diembeck, W., 2011. Report from the EPAAworkshop: In vitro ADME in safety testing used by EPAA industry sectors.Toxicol. In Vitro 25 (3), 589e604. http://dx.doi.org/10.1016/j.tiv.2010.12.005.
Selvendiran, K., Banu, S.M., Sakthisekaran, D., 2004. Protective effect of piperine onbenzo(a)pyrene-induced lung carcinogenesis in Swiss albino mice. Clin. Chim.Acta 350, 73e78.
Selvendiran, K., Banu, S.M., Sakthisekaran, D., 2005a. Oral supplementation ofpiperine leads to altered phase II enzymes and reduced DNA damage and DNA-
A. Thiel et al. / Regulatory Toxicology and Pharmacology 73 (2015) 73e8484
protein cross links in Benzo(a)pyrene induced experimental lung carcinogen-esis. Mol. Cell. Biochem. 268, 141e147.
Selvendiran, K., Singh, J.P.V., Krishnan, K.B., Sakthisekaran, D., 2003. Cytoprotectiveeffect of piperine against benzo(a)pyrene induced lung cancer with reference tolipid peroxidation and antioxidant system in Swiss albino mice. Fitoterapia 74,109e115.
Selvendiran, K., Thirunavakkarasu, C., Singh, J.P.V., Padmavathi, R., Sakthisekaran, D.,2005b. Chemopreventive effect of piperine on mitochondrial TCA cycle andphase-I and glutathione-metabolizing enzymes in benzo(a)pyrene inducedlung carcinogenesis in Swiss albino mice. Mol. Cell. Biochem. 271, 101e106.
Selvendiran, K., Prince Vijeya Singh, J., Sakthisekaran, D., 2006. In vivo effect ofpiperine on serum and tissue glycoprotein levels in benzo(a)pyrene inducedlung carcinogenesis in Swiss albino mice. Pulm. Pharmacol. Ther. 19, 107e111.
Sethi, P., Dua, V.K., Mohanty, S., Mishra, S.K., Jain, R., Edwards, G., 2009. Develop-ment and validation of a reversed phase HPLC method for simultaneousdetermination of curcumin and piperine in human plasma for application inclinical pharmacological studies. J. Liq. Chromatogr. Relat. Technol. 32,2961e2974.
Singh, J., Reen, R., Wiebel, F.J., 1994. Piperine, a major ingredient of black and longpeppers, protects against AFB1- induced cytotoxicity and micronuclei formationin H4IIEC3 rat hepatoma cells. Cancer Lett. 86, 195e200.
Suresh, D., Srinivasan, K., 2010. Tissue distribution & elimination of capsaicin,piperine, and curcumin following oral intake in rats. Indian J. Med. Res. 131,682e691.
Ternes, W., Krause, E.L., 2002. Characterization and determination of piperine andpiperine isomers in eggs. Anal. Bioanal. Chem. 374, 155e160.
Thiel, A., Buskens, C., Woehrle, T., Etheve, S., Schoenmakers, A., Fehr, M., Beilstein, P.,2014. Black pepper constituent piperine: genotoxicity studies in vitro andin vivo. Food Chem. Toxicol. 66, 350e357.
ToxPredict, Available at: http://apps.ideaconsult.net:8080/ToxPredict/.ToxTree, Available at: http://toxtree.sourceforge.net/.Vellaichamy, L., Balakrishnan, S., Panjamurthy, K., Manoharan, S., Alias, L.M., 2009.
Chemopreventive potential of piperine in 7,12-dimethylbenz[a]anthraceneinduced skin carcinogenesis in Swiss albino mice. Environ. Toxicol. Pharmacol.28, 11e18.
Wbra, H., El-Mofty, M.M., Schwaireb, M.H., Dutter, A., 1992. Carcinogenicity testingof some constituents of black pepper (piper nigrum). Exp. Toxic. Pathol. 44,61e65.
Wiseman, R.W., Miller, E.C., Miller, J.A., Liem, A., 1987. Structure-activity studies onthe hepatocarcinogenicities of alenylbenzene derivatives related to estragoleand safrole on administration to preweanling male C57BL/6J x C3H/heJ F1 mice.Cancer Res. 47, 2275e2283.