Safety evaluation of certain food additives and contaminants
350
-
Upload
khangminh22 -
Category
Documents
-
view
1 -
download
0
Transcript of Safety evaluation of certain food additives and contaminants


Safety evaluation ofcertain food additives andcontaminants
Prepared by theSixty-seventh meeting of the Joint FAO/WHOExpert Committee on Food Additives (JECFA)
WHO FOODADDITIVESSERIES: 58
World Health Organization, Geneva, 2007
IPCS — International Programme on Chemical Safety
WHO Library Cataloguing-in-Publication Data
Safety evaluation of certain food additives / prepared by the sixty-seventh meeting of theJoint FAO/WHO Expert Committee on Food Additives (JEFCA).
(WHO food additives series ; 58)
1.Food additives - toxicity. 2.Food contamination. 3.Risk assessment. 4.Carotenoids.5.Parabens. 6.Aluminum - toxicity. 7.alpha-Chlorohydrin - toxicity. 8.Methylmercurycompounds - toxicity. I.Joint FAO/WHO Expert Committee on Food Additives. Meeting(67th : 2006 : Geneva, Switzerland) II.International Programme on Chemical Safety.III.Series.
ISBN 978 92 4 166058 7 (NLM classification: WA 712) ISSN 0300-0923
© World Health Organization 2007
All rights reserved. Publications of the World Health Organization can be obtained fromWHO Press, World Health Organization, 20 Avenue Appia, 1211 Geneva 27, Switzerland(tel.: +41 22 791 3264; fax: +41 22 791 4857; e-mail: [email protected]). Requestsfor permission to reproduce or translate WHO publications – whether for sale or fornoncommercial distribution – should be addressed to WHO Press, at the above address(fax: +41 22 791 4806; e-mail: [email protected]).
The designations employed and the presentation of the material in this publication donot imply the expression of any opinion whatsoever on the part of the World HealthOrganization concerning the legal status of any country, territory, city or area or of itsauthorities, or concerning the delimitation of its frontiers or boundaries. Dotted lines onmaps represent approximate border lines for which there may not yet be full agreement.
The mention of specific companies or of certain manufacturers’ products does not implythat they are endorsed or recommended by the World Health Organization in preferenceto others of a similar nature that are not mentioned. Errors and omissions excepted, thenames of proprietary products are distinguished by initial capital letters.
All reasonable precautions have been taken by the World Health Organization to verifythe information contained in this publication. However, the published material is beingdistributed without warranty of any kind, either expressed or implied. The responsibilityfor the interpretation and use of the material lies with the reader. In no event shall theWorld Health Organization be liable for damages arising from its use.
This publication contains the collective views of an international group of experts anddoes not necessarily represent the decisions or the stated policy of the World HealthOrganization.
Typeset in IndiaPrinted in Spain

CONTENTS
Preface
Food additives
Lycopene, synthetic..........................................................................................Lycopene from Blakeslea trispora....................................................................Propyl paraben.................................................................................................
Food contaminantsAluminium from all sources, including food additives.......................................1,3-Dichloro-2-propanol....................................................................................3-Chloro-1,2-propanediol..................................................................................Methylmercury..................................................................................................
AnnexesAnnex 1 Reports and other documents resulting from previous meetings of
the Joint FAO/WHO Expert Committee on Food Additives.............Annex 2 Abbreviations used in the monographs...........................................Annex 3 Participants in the Sixty-seventh meeting of the Joint FAO/WHO
Expert Committee on Food Additives..............................................Annex 4 Recommendations on compounds on the agenda and further
toxicological studies and information required.................................
v
13
1571
103
117119209239269
317
319329
333
337
Annatto extracts................................................................................................

This publication is a contribution to the International Programme on ChemicalSafety (IPCS).
The IPCS, established in 1980, is a joint venture of the United Nations EnvironmentProgramme (UNEP), the International Labour Organization (ILO) and the WorldHealth Organization (WHO). The overall objectives of the IPCS are to establish thescientific basis for assessing the risk to human health and the environment toexposure from chemicals, through international peer-review processes, as aprerequisite for the promotion of chemical safety, and to provide technicalassistance in strengthening national capacities for the sound management ofchemicals.

PREFACE
The monographs contained in this volume were prepared at the sixty-seventhmeeting of the Joint FAO/WHO Expert Committee on Food Additives (JECFA),which met at FAO Headquarters in Rome, Italy, 20–29 June 2006. Thesemonographs summarize the safety data on selected food additives and foodcontaminants reviewed by the Committee.
The sixty-seventh report of JECFA has been published by the World HealthOrganization as WHO Technical Report No. 940. Reports and other documentsresulting from previous meetings of JECFA are listed in Annex 1. The participantsin the meeting are listed in Annex 3 of the present publication; a summary of theconclusions of the Committee is given in Annex 4. Some of the substances listed inAnnex 4 were evaluated at the meeting only for specifications.
Specifications that were developed at the sixty-seventh meeting of JECFA havebeen issued separately by FAO as Compendium of food additive specifications,FAO JECFA Monographs 3, 2006 (ISBN 92-5-105559-9). The monographs in thepresent publication should be read in conjunction with the specifications and thereport.
JECFA serves as a scientific advisory body to FAO, WHO, their Member States,and the Codex Alimentarius Commission, primarily through the Codex Committeeon Food Additives, the Codex Committee on Contaminants in Food, and the CodexCommittee on Residues of Veterinary Drugs in Foods, regarding the safety of foodadditives, residues of veterinary drugs, naturally occurring toxicants andcontaminants in food. Committees accomplish this task by preparing reports of theirmeetings and publishing specifications or residue monographs and toxicologicalmonographs, such as those contained in this volume, on substances that they haveconsidered.
The toxicological monographs contained in the volume are based on workingpapers that were prepared by Temporary Advisers. A special acknowledgement isgiven at the beginning of each monograph to those who prepared these workingpapers.
Many proprietary unpublished reports are unreferenced. These were voluntarilysubmitted to the Committee by various producers of the food additives under review,and in many cases represent the only data available on those substances. TheTemporary Advisers based the working papers they developed on all the data thatwere submitted, and all of these reports were available to the Committee when itmade its evaluation. The monographs were edited by H. Mattock, Tignieu-Jameyzieu, France.
The preparation and editing of the monographs included in this volume weremade possible through the technical and financial contributions of the ParticipatingOrganizations of the International Programme on Chemical Safety (IPCS), whichsupports the activities of JECFA.
The designations employed and the presentation of the material in thispublication do not imply the expression of any opinion whatsoever on the part of theorganizations participating in the IPCS concerning the legal status of any country,territory, city, or area or its authorities, or concerning the delimitation of its frontiers
- v -

or boundaries. The mention of specific companies or of certain manufacturers’products does not imply that they are endorsed or recommended by theorganizations in preference to others of a similar nature that are not mentioned.
Any comments or new information on the biological or toxicological propertiesof the compounds evaluated in this publication should be addressed to: Joint WHOSecretary of the Joint FAO/WHO Expert Committee on Food Additives, InternationalProgramme on Chemical Safety, World Health Organization, Avenue Appia, 1211Geneva 27, Switzerland.
vi

FOOD ADDITIVES


ANNATTO EXTRACTS (addendum)
First draft prepared by
R. Kroes,1 I.C. Munro 2 & R. Walker 3
1 Institute for Risk Assessment Sciences, Utrecht University, Soest,Netherlands;
2 CanTox Health Sciences International, Mississauga, Ontario, Canada; and
3Ash, Aldershot, Hampshire, England
Explanation.................................................................................Biological data............................................................................
Chemical composition..........................................................Toxicological studies............................................................
Short-term studies on toxicity........................................Reproductive toxicity......................................................Special studies...............................................................
Dietary intake.............................................................................Comments..................................................................................Evaluation...................................................................................References.................................................................................
1. EXPLANATION
Annatto extracts are obtained from the outer layer of the seeds of the tropicaltree Bixa orellana. The principal pigment in annatto extract is cis-bixin, which iscontained in the resinous coating of the seed itself. Processing primarily entails theremoval of the pigment by abrasion of the seeds in an appropriate suspendingagent. Traditionally, water or vegetable oil is used for this purpose, although solventextraction is also employed to produce annatto extracts with a higher content ofpigment. Microcrystalline bixin products of 80–97% purity have been developed inresponse to the need for more concentrated annatto extracts.
Annatto extracts were evaluated by the Committee at its thirteenth,eighteenth, twenty-sixth, forty-sixth, fifty-third and sixty-first meetings (Annex 1,references 19, 35, 59–61, 122, 143 and 166).
At its eighteenth meeting, the Committee considered the results of long-termand short-term tests in experimental animals fed an annatto extract containing0.2–2.6% pigment expressed as bixin. A long-term study in rats provided the basisfor evaluation; the no-observed-effect level (NOEL) in this study was 0.5% in thediet, the highest dose tested, equivalent to 250 mg/kg bw. A temporary acceptabledaily intake (ADI) for this annatto extract was established at 0–1.25 mg/kg bw.
34
557
10101112
- 3 -
5
8

The Committee re-evaluated annatto extracts at its twenty-sixth meeting,when the results of the requested studies of metabolism became available. Studiesof mutagenicity, additional long-term (1-year) studies in rats, and observations ofthe effects of annatto extract in humans were also considered. The metabolismstudies were conducted on three different extracts—a vegetable oil solution, avegetable oil suspension (containing mainly bixin pigment) and a water-solubleextract (mainly norbixin)—alone and in admixture. No evidence was found for theaccumulation of annatto pigments in the tissues of rats fed with at low dietaryconcentrations (20–220 mg/kg bw per day) with annatto extracts containing up to2.3% bixin/norbixin mixture for 1 year, and clearance from the plasma was rapid.
The NOEL in the original long-term study in rats was identified as 0.5% inthe diet, equivalent to 250 mg/kg bw, and the ADI for these annatto extracts wasset at 0–0.065 mg/kg bw expressed as bixin. At that time, the Committee consideredthe highest concentration of bixin in the material tested (i.e. 2.6%) and establishedan ADI on the basis of the content of bixin.
At its forty-sixth meeting, the Committee revised the specifications for annattoextracts and redesignated them according to their methods of manufacture into twogeneral types: oil- or alkali-extracted products, and solvent-extracted products. TheADI was not changed at that meeting. At its fifty-third meeting, the Committeeassessed intake of annatto extracts and concluded that the intake of annattoextracts would exceed the ADI for bixin if all foods contained annatto extracts at themaximum levels proposed in the Codex Alimentarius Commission draft GeneralStandard for Food Additives (GSFA) (Codex Alimentarius Commission (2006).Intake assessments based on national permitted levels led to the conclusion thatthe ADI for bixin was unlikely to be exceeded as a result of the use of annattoextracts.
Table 1 describes the designation of the extracts.
At its sixty-first meeting, the Committee established temporary ADIs forannatto extracts B, C, E and F. As insufficient data on the potential toxicity ofannatto D or annatto G were available, no ADIs could be established for thoseextracts.
At that meeting, additional information was requested to clarify the rolethat the non-pigment components of the extract play in the expression of thequalitative and quantitative differences in toxicity between the various extracts. Inaddition, the Committee requested data on the reproductive toxicity of an extract,such as annatto F, that contains norbixin.
At the present meeting, most of those data were available and wereevaluated, and a re-evaluation of the overall database was performed.
2. BIOLOGICAL DATA
Newly published and unpublished data regarding chemical composition,short term toxicity, genotoxicity and anti-genotoxicity, reproductive toxicity andcancer promotion became available.
4 ANNATTO EXTRACTS

2.1 Chemical composition
Mass balance studies (Reading Scientific Service Ltd, 2005a, 2005b) havecharacterized the components of four annatto extracts listed in Table 1. These dataindicate that the non-pigment material in these extracts consists of several wellknown plant constituents, none of which would be expected to raise any safetyconcerns under the intended conditions of use of the extracts.
2.2 Toxicological studies
2.2.1 Short-term studies of toxicity
In its sixty-first report, the Committee described an unpublished 13-weekstudy in Sprague-Dawley rats given annatto C, a purified annatto extract containing
Table 1. Designation of annatto extracts
Annatto extractdescriptiona
Alternativedesignationb
Pigment content (%)c Specified pigmentcontentd (%)
Bixin Norbixin
Solvent-extracted bixin Annatto B 89.2 1.6 85% pigment (asbixin)
(92) (1.7) 2% norbixin
Solvent-extractednorbixin
Annatto C NR (91.6) 85% pigment (asnorbixin) (includesNa+ and K+ salts)
Oil-processed bixin Annatto D 10.2 0.18 10% pigment (asbixin)
Aqueous processedbixin
Annatto E 25.4 1.1 25% pigment (asbixin)
(26) (4.2) 7% norbixin
Alkali-processednorbixin (acidprecipitated)
Annatto F NA 41.5 35% norbixin
NA (38.4)
Alkali-processednorbixin (not acidprecipitated)
Annatto G NA 17.1 15% norbixin
NA: not applicable; NR: not reported.a Description used by the Committee at its present meeting.b Designation used by the Committee at its sixty-first meeting.c Analytical data on the bixin/norbixin content of various extracts. Values in parentheses are
for extracts tested in 90-day studies.d Specified by the Committee at its present meeting
ANNATTO EXTRACTS 5

Table 2. Mass balances for various annatto preparations
Fraction /component
Annatto extract
Solvent-extractedbixin (B)
Aqueous-processedbixin (E)
Alkali-processednorbixin (F)
Alkali-processed norbixin,not acid precipitated (G)
% w/w % w/w % w/w % w/w Calculated% w/dry wa
Hexane solubles 2.4 26.8 12.6 0.75 NC
Geranyl geraniol ND 8.4 10.0 0.75 7.7
Aliphatichydrocarbons(wax)
NQ 1.6 Present NQ —
Tocotrienols < 0.01 3.4 0.02 < 0.01 < 0.1
Other terpenoidsby difference,including geranylgeranene
ND 13.4 ND NQ —
Aromaticcomponent
NQ Trace Present NQ —
Acetone solubles NC NC NC NC NC
Bixin 87 29.2 ND ND —
Bixin isomersb 4.0 — ND ND —
Unknown bixinsc — 1.1 ND ND —
Norbixin — 0.9 39.0 (9-cis) 1.8 (9-cis) 18
Norbixinsd 2.0 —e 8.0 (others) 0.5(others)
5
Fatty acid esters < 0.01 4.1 1.9 < 0.01 < 0.1
Polyphenols ND 4.0 ND ND —
Moisture 0.1 9.4 4.1 90.6 0
Acetone insolublesf < 1 20.4 34.5 7.4 NC
Protein 0.9 5.6 6.2 0.5 5
Ash 0.1 4.9 12.1 3.2 33
Carbohydrate 0.1 0.3 0.7 1.5 15
Lignocellulose < 0.1 9.6 15.5 1.5 15
Total 95 95.9 > 95 > 99 > 99
NC: not calculated. ND: not detected; NQ: not quantifiable.a Calculated from the preceding column, based on moisture content.b ‘Bixin isomers’ refers to all isomers including bixin itself.c ‘Unknown bixins’ refers to all isomers other than bixin itself, indicating that all other isomers
were not separated and therefore not reported as ‘Bixin isomers’.d ‘Norbixins’ refers to all isomers including norbixin itself.e This material contains only small amounts of norbixin and non-quantifiable amounts of other
isomers of norbixin.
6 ANNATTO EXTRACTS

91.6% norbixin. This study has now been published (Hagiwara et al., 2003a), withno different information being available than was previously submitted to theCommittee.
In a new short-term study of toxicity published by Bautista et al. (2004),groups of 15 male and 15 female Wistar rats were given annatto powder (bixin, 27%)suspended in corn oil and administered by gavage as a single dose at 2000 mg/kgbw per day for 4 weeks (no adverse effects having been noted in a preliminaryexperiment with annatto at a dose of 1000 mg/kg bw per day). Haematological andbiochemical examination and necropsy were performed on 10 rats of each sex onday 29 and on the remaining 5 rats of each sex after recovery at day 43. Decreasederythrocyte counts and haemoglobin concentrations were observed in males anddecreased leukocyte counts in males and females on day 29, but not in the recoverygroups. At necropsy, no lesions were observed, but focal renal cell apoptosisoccurred in 2 out of 10 treated female rats without proliferation or tubular damage.
2.2.2 Reproductive toxicity
A study of prenatal developmental toxicity with annatto F was performedaccording to OECD guidelines and in compliance with good laboratory practice(GLP) (Huntingdon Life Sciences Laboratory, UK, 2005). Groups of 22 Sprague-Dawley rats were given alkali-processed norbixin (acid precipitated) (annatto F) witha norbixin content of 42.5% at a dose of 0, 20, 40, 80 or 160 mg/kg bw per day(equivalent to an intake of norbixin of 8.5, 17, 34 and 68 mg/kg bw per day) by oralgavage on days 6–19 of gestation. Controls were dosed with vehicle only (0.5%aqueous sodium carboxymethycellulose). Animals were killed on day 20, aftermating for reproductive assessment and fetal examination. Adult females wereexamined macroscopically at necropsy on day 20 after mating, the uterus andcontents were weighed, corpora lutea counted, and living and dead fetuses andresorptions were recorded. Fetuses were weighed and examined for externallyvisible abnormalities, and all fetuses were examined macroscopically at necropsy.Subsequently, detailed internal visceral examination followed by skeletal examina-tion were performed for half the fetuses, and the other half were fixed and seriallysectioned for examination for visceral abnormalities.
There were no deaths among the dams, and no clinical findings that wereconsidered to be related to treatment, and there were no adverse effects oftreatment on body-weight gain or food consumption. There was no increase inembryolethality and no reduction in fetal or placental weight. The annatto extractdid not induce any increase in the incidence of externally visible, visceral, or skeletalabnormalities in the exposed offspring treated with does of up to 160 mg/kg bw perday. The amniotic sacs of the majority of litters in the groups at 80 and 160 mg/kgbw per day were stained yellow/orange, showing that the norbixin had been wellabsorbed. The no-observed-effect level (NOEL) for annatto F (alkali-processednorbixin, acid precipitated) in this study was 160 mg/kg bw per day, the highest dosetested.
ANNATTO EXTRACTS 7

2.2.3 Special studies
(a) Cancer promotion
In the report of its sixty-first meeting, the Committee described unpublishedstudies in which the effect of annatto extract (norbixin) containing 87% norbixin wasexamined in a medium-term assay for carcinogenesis. These studies have nowbeen published (Hagiwara et al., 2003b).
A similar study has been published by a different group of workers studyingthe effects of an annatto extract containing bixin in the same medium-termassay for carcinogenesis. Agner et al. (2004) investigated the carcinogenic andanticarcinogenic effects of dietary annatto in male Wistar rat liver, using thepreneoplastic glutathione S-transferase (GST-P) foci and DNA damage biomarkers.Groups of 14 male Wistar rats were given diets containing oil extract of annatto,containing 5% bixin, at a concentration of 20, 200, or 1000 ppm (annatto: 1.5, 16.45and 84.8 mg/kg bw per day; bixin: 0.07; 0.80 and 4.23 mg/kg bw per day,respectively), continuously during 2 weeks before (pre-initiation protocol), or 8 weeksafter treatment with diethylnitrosamine (DEN) at a dose of 200 mg/kg bw, givenintraperitoneally (post-initiation protocol), with corresponding control groups. Thecomet assay was used to investigate the modifying potential of annatto on DEN-induced DNA damage. Groups of 10 male Wistar rats were dosed with annatto for2 weeks before treatment with DEN injection (20 mg/kg bw, given by intraperitonealinfection) and sacrificed 4 h later with rats in the corresponding control groups. Theresults showed that annatto at up to the highest concentration tested (1000 ppm)neither potentiated nor ameliorated the effects of DEN in either GST-P foci develop-ment or in comet assays.
The same group of researchers also studied annatto in another anti-carcinogenicity model system (Agner et al., 2005). Based on evidence that hasindicated carotenoids as possible agents that decrease the risk of colorectal cancer,the authors evaluated the activity of annatto on the formation of aberrant crypt fociinduced by dimethylhydrazine (DMH) in the rat colon. They also investigated theeffect of annatto on DMH-induced DNA damage, by the comet assay. Groups of12 male Wistar rats were given subcutaneous injections of DMH at 40 mg/kg bwtwice per week for 2 weeks to induce aberrant crypt foci. They also receivedexperimental diets with annatto containing 5% bixin at 20, 200 or 1000 ppm(annatto: 1.22, 12.26 or 56.38 mg/kg bw per day; bixin: 0.06, 0.61 or 2.82 mg/kg bwper day) for 5 weeks before, or 10 weeks after treatment with DMH. In both protocolsthe rats were sacrificed in week 15. For the comet assay, the animals were fed withthe same experimental diets for 2 weeks. Four hours before sacrifice, the animalsreceived a subcutaneous injection of DMH at 40 mg/kg bw. Under such conditions,dietary administration of annatto at up to 1000 ppm did not induce DNA damage inblood and colon cells or in aberrant crypt foci in the rat distal colon. Conversely,annatto, mainly when administered after treatment with DMH, inhibited the numberof crypts per colon (animal), but not the incidence of DMH-induced aberrant cryptfoci. No antigenotoxic effect was observed in colon cells. These findings suggestpossible chemopreventive effects of annatto through modulation of the cryptal
8 ANNATTO EXTRACTS

cell proliferation (anti-promotion effect) but not at the initiation stage of coloncarcinogenesis.
(b) Genotoxicity
At its sixty-first meeting, the Committee reported on the large number ofstudies of genotoxicity with annatto extracts and with pure bixin or norbixin. Studiesof genotoxicity in vitro revealed equivocal and inconsistent positive results only atconcentrations that exceeded solubility or at concentrations that were cytotoxic.Since the results of tests on analytical-grade bixin and norbixin were negative, someweak positive results obtained with the concentrated annatto extracts in bacterialtests in the absence of an endogenous metabolic activation system were consideredto be caused by other components in the annatto preparations. Results of testsfor mutagenicity in mammalian cells and for chromosomal aberration wereinconsistent. Weak positive results at toxic concentrations were noted for somepreparations in tests for mutagenicity in mammalian cells in the absence of anendogenous metabolic activation system. Weak positive results were noticed onlyin the presence of an endogenous metabolic activation system in tests forchromosomal aberration. Annatto preparations B, E and F did not demonstrate anypotential to cause genetic damage in the assay for micronucleus formation in micein vivo.
(c) Anti-genotoxic activity
At its sixty-first meeting, the Committee reported a number of studies regard-ing anti-mutagenic and anti-carcinogenic activities with annatto preparations.
Recently, the antigenotoxic and antimutagenic potential of annatto extract(norbixin) against oxidative stress in vitro was reported by Junior et al. (2005).The authors evaluated the effect of norbixin at 2 mmol/l on the response ofEscherichia coli cells to DNA damage induced by UV radiation, hydrogen peroxide(H2O2) and superoxide anions (O2*-) and found that norbixin protects the cellsagainst these agents. Norbixin enhanced survival by at least 10 times. Norbixin at2 mmol/l also inhibited the induction of genotoxicity by UVC in the SOS chromotestassay. Norbixin was also shown to have antimutagenic properties, with a maximuminhibition of H2O2-induced mutagenic activity of 87%, in a test for mutatgenicity inSalmonella typhimurium strain TA102.
Similar studies on the anticlastogenic effect of bixin on chromosomaldamage induced by the clastogen cisplatin (cDDP) in human lymphocyte cultureshave also been reported (Antunes et al. 2005). Blood samples were obtained fromsix healthy, non-smoking volunteers—two females and four males aged 18–35years. The concentrations of bixin (1.0, 2.5, 5.0 or 10 g/ml) tested in combinationwith cDDP were established on the basis of mitotic index measurements. While bixinalone was not cytotoxic or clastogenic, it reduced the inhibitory effect of cDDP onthe lymphocyte mitotic index in a concentration-dependent manner. Culturessimultaneously treated with bixin and cDDP showed a statistically significantreduction in total chromosomal aberrations and aberrant metaphases.
ANNATTO EXTRACTS 9

In its previous evaluations, the Committee had concluded that annattoextracts are not carcinogenic. This conclusion was based on the results of test withannatto preparations containing bixin at low concentrations. In a study of theinitiation and promotion of liver carcinogenesis, solvent-extracted norbixin did notincrease the incidence of preneoplastic lesions. A recent study showed that annattoextract (5% bixin) at dietary concentrations of up to 1000 mg/kg neither potentiatednor ameliorated the effects of DEN in the livers of male rats as measured bydevelopment of preneoplastic GST-P foci or DNA fragmentation using the cometassay. Together with the results of the tests for genotoxicity and the absence ofproliferative lesions in the short-term tests for toxicity, these data support the earlierconclusions by the Committee that annatto extracts are not carcinogenic.
3. DIETARY INTAKE
During its sixty-first meeting, the Committee performed an assessment ofdietary exposure based on typical use levels of annatto extracts expressed asbixin and norbixin, provided by industry. Combining those levels with variousaverage food consumption levels resulted in a dietary exposure ranging from0.03 to 0.4 mg/day. Combining the use levels reported by industry with 97.5thpercentiles of consumption by consumers in the United Kingdom of foods potentiallycontaining annatto resulted in a dietary exposure to total bixin plus norbixin at1.5 mg/day.
No additional data were provided for this meeting, therefore exposurescenarios were performed on the basis of the previous dietary exposure to pigmentsassuming a body weight of 60 kg.
4. COMMENTS
Mass balance studies have characterized the components of the annattoextracts to the extent of greater than 95%, including non-pigment material, exceptfor oil-processed bixin for which no new analytical data were provided.
A study of developmental toxicity in rats fed with an annatto extract with anorbixin content of 41.5% at doses of up to 160 mg/kg bw per day (equal to 68 mg/kgbw per day expressed as norbixin) confirmed the absence of developmental toxicityat this, the highest dose tested.
In its previous evaluations, the Committee had concluded that annattoextracts are not carcinogenic. This conclusion was based on the results of tests withannatto preparations containing low concentrations of bixin. In a study of theinitiation and promotion of liver carcinogenesis, solvent-extracted norbixin did notincrease the incidence of preneoplastic lesions. A recent study showed that annattoextract (5% bixin) at dietary concentrations of up to 1000 mg/kg had no influenceon the development of preneoplastic GST-P-positive foci in livers of male ratstreated with DEN, nor on DNA fragmentation in the livers using the comet assay.Together with the results of the tests for genotoxicity and the absence of proliferative
10 ANNATTO EXTRACTS

lesions in the short-term tests for toxicity, those data support the earlier conclusionmade by the Committee, that annatto extracts are not carcinogenic.
During its sixty-first meeting, the Committee performed an assessment ofdietary exposure based on typical use levels (provided by industry) of extractsexpressed as bixin and norbixin. Combining those levels with various average levelsof food consumption resulted in dietary exposures ranging from 0.03 to 0.4 mg/day.Combining the use levels reported by industry with 97.5th percentiles ofconsumption by United Kingdom (UK) consumers of foods potentially containingannatto resulted in a dietary exposure of 1.5 mg/day of total bixin plus norbixin.
No additional data were provided for this meeting, therefore exposurescenarios were performed on the basis of the previous dietary exposure topigments, assuming a body weight of 60 kg.
5. EVALUATION
At its present meeting, the Committee re-evaluated the 90-day studies oftoxicity available for four of the extracts for which compositional data were provided.The results of those studies are summarized in Table 3.
In re-evaluating the studies of toxicity with solvent-extracted bixin (92% bixin)and solvent-extracted norbixin (91.6% norbixin) in the light of the additionalcompositional data, the Committee considered that ADIs could be allocated to thosepigments on the basis of the studies conducted on the extracts summarized inTable 3.
The Committee established an ADI for bixin of 0–12 mg/kg bw on the basisof the NOEL of 1311 mg/kg bw per day from a 90-day study in male rats fed anextract containing 92% bixin, corrected for pigment content and applying a safetyfactor of 100.
The Committee established a group ADI for norbixin and its sodium andpotassium salts of 0–0.6 mg/kg bw (expressed as norbixin) on the basis of the NOELof 69 mg/kg bw per day from a 90-day study in male rats fed an extract containing91.6% norbixin, corrected for pigment content and applying a safety factor of 100.
The Committee further evaluated compositional data on aqueous processedbixin and alkali-processed norbixin (acid-precipitated), together with toxicologicaldata on annatto extracts for which NOELs had been identified in 90-day studies oftoxicity. It concluded that the use of these annatto extracts as sources of bixin ornorbixin would not raise safety concerns, provided that they complied with therelevant specifications. Accordingly, the ADIs given above could be applied to bixinand norbixin derived from those annatto extracts. The Committee noted that thepigment in alkali-processed norbixin (not acid-precipitated) consists of sodium orpotassium salts of norbixin and that compositional data on this extract, complyingwith the specifications, did not raise safety concerns. Consequently, the Committeeconcluded that the group ADI for norbixin and its sodium and potassium salts couldbe applied to norbixin salts from this source.
ANNATTO EXTRACTS 11

As no NOEL could be identified for oil-processed bixin and no compositionaldata were available, the Committee decided that the above evaluation could not beapplied to this extract.
If all the pigment ingested were bixin, the estimated dietary exposure of1.5 mg/day would result in an intake of bixin of 26 μg/kg bw per day, correspondingto approximately 0.2% of the ADI (0–12 mg/kg bw). Similarly, if all the pigment werenorbixin, the estimated dietary exposure of 1.5 mg/day would result in an intake ofnorbixin of 26 μg/kg bw per day, corresponding to approximately 4% of the ADI(0–0.6 mg/kg bw).
All previously established ADIs and temporary ADIs for bixin and annattoextracts were withdrawn.
The tentative specifications for all annatto extracts were revised and thetentative designations removed, with the exception of the specification for annattoextract (oil-processed bixin), which was maintained as tentative because therequested information on chemical characterization of the non-colouring-mattercomponents of commercial products was not provided. The tentative specificationfor annatto extract (oil-processed bixin) would be withdrawn if the requestedinformation is not received by the Committee before the end of 2008.
The Chemical and Technical Assessment prepared by the Committee at itssixty-first meeting was updated.
6. REFERENCES
Agner, A.R., Barbisan, L.F., Scolastici, C., & Salvadori, D.M. (2004) Absence of carcinogenicand anticarcinogenic effects of annatto in the rat liver medium-term assay. Food Chem.Toxicol., 42, 1687–1693.
Agner, A.R., Bazo, A.P., Ribeiro, L.R., Salvadori, D.M. (2005) DNA damage and aberrant cryptfoci as putative biomarkers to evaluate the chemopreventive effect of annatto (Bixaorellana L.) in rat colon carcinogenesis. Mutat Res., 582, 146–154.
Table 3. Results of 90-day studies of toxicity with annatto extracts
Annatto extract Pigment in extract tested (%) Extract NOELa (mg/kg bw)
Bixin Norbixin Male Female
Solvent-extracted bixin 92 1.7 1311 1446
Solvent-extracted norbixin NR 91.6 69 76
Aqueous processed bixin 26 4.2 734 801
Alkali-processed norbixin (acidprecipitated)
NA 38.4 79 86
NA: not applicable; NR: not reported.aAs determined by the Committee at its sixty-first meeting.
12 ANNATTO EXTRACTS

Antunes, L.M., Pascoal, L.M., Bianchi, Mde. L., & Dias, F.L. (2005) Evaluation of theclastogenicity and anticlastogenicity of the carotenoid bixin in human lymphocyte cultures.Mutat Res., 585, 113–119.
Codex Alimentarius Commission (2006) Codex General Standard for Food Additives(GSFA). Currently adopted Standards (http://www.codexalimentarius.net/gsfaonline/-index.html?lang=en) and Draft Standards Tables 1–3. Additives permitted for use underspecified conditions in certain food categories or individual food items (ftp://ftp.fao.org/codex/ccfac38/fa3808ae.pdf, ftp://ftp.fao.org/codex/ccfac38/fa3808be.pdf, ftp://ftp.fao.org/codex/ccfac38/fa3808ce.pdf).
Bautista, A.R., Moreira, E.L., Batista, M.S., Miranda, M.S., & Gomes, I.C. (2004) Subacutetoxicity assessment of annatto in rat. Food Chem. Toxicol., 42, 625–629.
Hagiwara, A., Imai, N., Ichihara, T., Sano, M., Tamano, S., Aoki, H., Yasuhara, K., Koda, T.,Nakamura, M., & Shirai, T. (2003a) A thirteen-week oral toxicity study of annatto extract(norbixin), a natural food color extracted from the seed coat of annatto (Bixa orellana L.),in Sprague-Dawley rats. Food Chem. Toxicol., 41, 1157–1164.
Hagiwara, A., Imai, N., Doi, Y., Nabae, K., Hirota, T., Yoshino, H., Kawabe, M., Tsushima, Y.,Aoki, H., Yasuhara, K., Koda, T., Nakamura, M., & Shirai, T. (2003b) Absence of liver tumorpromoting effects of annatto extract (norbixin), a natural carotenoid food color, in a medium-term liver carcinogenesis bioassay using male F344 rats. Cancer Lett., 199, 9–17.
Huntingdon Life Sciences Ltd (2005) Annatto F (annatto extract norbixin): prenataldevelopmental toxicity study in the CD rat by oral gavage administration. Unpublishedreport No. ATE 020/052839 from Huntingdon Life Sciences Ltd, Huntingdon, England.Submitted to WHO by Annatto Interest Group (AIG), Cork, Ireland.
Junior, A.C., Asad, L.M., Oliveira, E.B., Kovary, K., Asad, N.R., & Felzenszwalb, I. (2005)Antigenotoxic and antimutagenic potential of an annatto pigment (norbixin) againstoxidative stress. Genet. Mol. Res., 4, 94–99.
Reading Scientific Services Ltd (2005a) Studies on the mass balance of annatto extracts -annatto types B, F and G. Unpublished report No. P4-09486R from Reading ScientificServices Ltd, Reading UK. Submitted to WHO by Annatto Interest Group (AIG), Cork,Ireland.
Reading Scientific Services Ltd (2005b) Studies on the mass balance of annatto extracts -annatto E. Unpublished report No. P3-05105R2 from Reading Scientific Services Ltd,Reading UK. Submitted to WHO by Annatto Interest Group (AIG), Cork, Ireland.
ANNATTO EXTRACTS 13


LYCOPENE (SYNTHETIC)
First draft prepared by
M.E.J. Pronk 1, S.M.G.J. Pelgrom 1, A.G.A.C. Knaap 1, M. DiNovi 2 &Z. Olempska-Beer 2
1Centre for Substances and Integrated Risk Assessment, National Institutefor Public Health and the Environment, Bilthoven, Netherlands; and
2Center for Food Safety and Applied Nutrition, Food and Drug Administration,College Park, Maryland, USA
Explanation ................................................................................Biological data ...........................................................................
Biochemical aspects ...........................................................Stereochemical isomerism ............................................Specifications ................................................................Absorption, distribution, and excretion ..........................Metabolism ...................................................................Special studies on the accumulation of lycopene in rat liver ......................................................................Effects on enzymes and other biochemical parameters ....................................................................
Toxicological studies ...........................................................Acute toxicity .................................................................Short-term studies of toxicity ........................................Long-term studies of toxicity and carcinogenicity .........Genotoxicity ..................................................................Reproductive toxicity .....................................................Additional toxicological data on impurities/reaction by-products ...................................................................
Observations in humans .....................................................Dietary intake ............................................................................
Introduction .........................................................................Background exposure to lycopene from food .....................Exposure to added lycopene from proposed food uses ......
Comments .................................................................................Evaluation ..................................................................................References ................................................................................
1. EXPLANATION
At the request of the Codex Committee on Food Additives and Contaminants(CCFAC) at its Thirty-seventh Session (Codex Alimentarius Commission, 2005),the JECFA Committee at its present meeting evaluated lycopene to be used as afood additive. Lycopene is a naturally-occurring pigment found in vegetables(especially tomatoes), fruits, algae and fungi. It can also be synthesized chemically.
15161616171826
27
30313131354040
515252525354586162
- 15 -

The Committee had previously evaluated lycopene (both natural and synthetic)to be used as a food colour at its eighth, eighteenth, and twenty-first meetings(Annex 1, references 8, 35 and 44). The lack of adequate information available atthose meetings precluded the Committee from developing specifications andestablishing an acceptable daily intake (ADI) for lycopene to be used as a foodcolour. Under consideration at the present meeting were synthetic lycopene (thesubject of this item) and lycopene from the fungus Blakeslea trispora (seemonograph ‘Lycopene from Blakeslea trispora’, in this volume).
Synthetic lycopene is produced by the Wittig condensation of intermediates.The raw materials of this reaction are commonly used in the production of othercarotenoids used in food.
2. BIOLOGICAL DATA
2.1 Biochemical aspects
Lycopene belongs to the family of carotenoids and is a biochemical precursorof higher carotenoids, e.g. -carotene. However, unlike -carotene, lycopene lacks
-ionone ring structure and is therefore devoid of provitamin A activity.
In analogy with naturally occurring lycopene, the predominant isomer insynthetic lycopene is all-trans-lycopene (CAS No. 502-65-8). The chemical namefor lycopene is 2,6,10,14,19,23,27,31-octamethyl-2,6,8,10,12,14,16,18,20,22,24,-26,30-dotriacontatridecaene, and synonyms are , -carotene, all-trans-lycopene,and (all-E)-lycopene. Lycopene is an unsaturated acyclic hydrocarbon with thechemical structure shown in Figure 1.
2.1.1 Stereochemical isomerism
All carotenoids contain an extended conjugated polyene backbone.Although theoretically each of these carbon–carbon double bonds can exist in eithertrans or cis configurations (also referred to as E- or Z-configurations, respectively),the vast majority of carotenoids, including lycopene, exhibit predominantly the all-trans configuration. Lycopene, however, can undergo a conversion of one or more
Figure 1. Chemical structure of lycopene
CH3 CH3 CH3
CH3
CH3H3C
H3C
CH3 CH3
CH3
all trans-lycopene
16 LYCOPENE (SYNTHETIC)
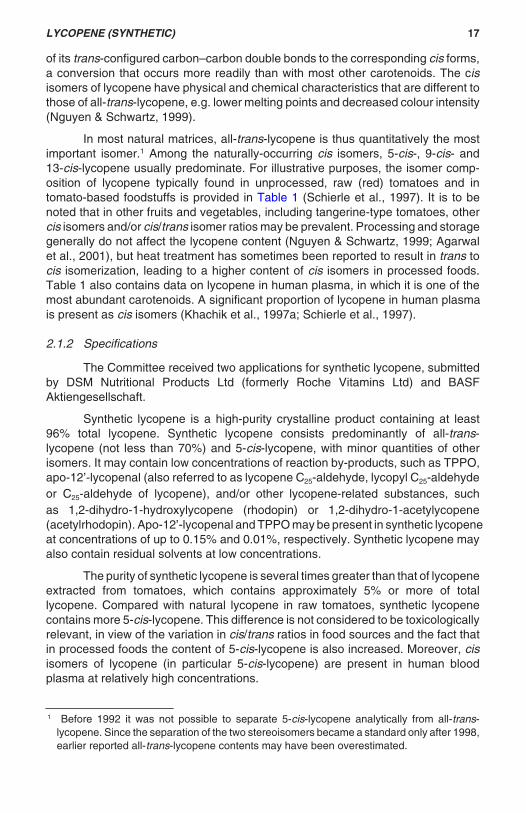
of its trans-configured carbon–carbon double bonds to the corresponding cis forms,a conversion that occurs more readily than with most other carotenoids. The cisisomers of lycopene have physical and chemical characteristics that are different tothose of all-trans-lycopene, e.g. lower melting points and decreased colour intensity(Nguyen & Schwartz, 1999).
In most natural matrices, all-trans-lycopene is thus quantitatively the mostimportant isomer.1 Among the naturally-occurring cis isomers, 5-cis-, 9-cis- and13-cis-lycopene usually predominate. For illustrative purposes, the isomer comp-osition of lycopene typically found in unprocessed, raw (red) tomatoes and intomato-based foodstuffs is provided in Table 1 (Schierle et al., 1997). It is to benoted that in other fruits and vegetables, including tangerine-type tomatoes, othercis isomers and/or cis/trans isomer ratios may be prevalent. Processing and storagegenerally do not affect the lycopene content (Nguyen & Schwartz, 1999; Agarwalet al., 2001), but heat treatment has sometimes been reported to result in trans tocis isomerization, leading to a higher content of cis isomers in processed foods.Table 1 also contains data on lycopene in human plasma, in which it is one of themost abundant carotenoids. A significant proportion of lycopene in human plasmais present as cis isomers (Khachik et al., 1997a; Schierle et al., 1997).
2.1.2 Specifications
The Committee received two applications for synthetic lycopene, submittedby DSM Nutritional Products Ltd (formerly Roche Vitamins Ltd) and BASFAktiengesellschaft.
Synthetic lycopene is a high-purity crystalline product containing at least96% total lycopene. Synthetic lycopene consists predominantly of all-trans-lycopene (not less than 70%) and 5-cis-lycopene, with minor quantities of otherisomers. It may contain low concentrations of reaction by-products, such as TPPO,apo-12’-lycopenal (also referred to as lycopene C25-aldehyde, lycopyl C25-aldehydeor C25-aldehyde of lycopene), and/or other lycopene-related substances, suchas 1,2-dihydro-1-hydroxylycopene (rhodopin) or 1,2-dihydro-1-acetylycopene(acetylrhodopin). Apo-12’-lycopenal and TPPO may be present in synthetic lycopeneat concentrations of up to 0.15% and 0.01%, respectively. Synthetic lycopene mayalso contain residual solvents at low concentrations.
The purity of synthetic lycopene is several times greater than that of lycopeneextracted from tomatoes, which contains approximately 5% or more of totallycopene. Compared with natural lycopene in raw tomatoes, synthetic lycopenecontains more 5-cis-lycopene. This difference is not considered to be toxicologicallyrelevant, in view of the variation in cis/trans ratios in food sources and the fact thatin processed foods the content of 5-cis-lycopene is also increased. Moreover, cisisomers of lycopene (in particular 5-cis-lycopene) are present in human bloodplasma at relatively high concentrations.
1 Before 1992 it was not possible to separate 5-cis-lycopene analytically from all-trans-lycopene. Since the separation of the two stereoisomers became a standard only after 1998,earlier reported all-trans-lycopene contents may have been overestimated.
LYCOPENE (SYNTHETIC) 17

Synthetic lycopene is a red crystalline powder. It is freely soluble inchloroform and tetrahydrofuran, sparingly soluble in vegetable oils, ether andhexane, and is insoluble in water. Lycopene is sensitive to light, heat and oxygen,but is stable when stored under inert gas in light-proof containers in a cool place.Since it is not possible to get crystalline lycopene into an aqueous solution, andbecause of its susceptibility to oxidative degradation in the presence of light andoxygen, lycopene crystals are not suitable for commercial use. Only formulatedmaterial is marketed for use in food. Lycopene crystals are formulated assuspensions in edible oils or as water dispersible powders, and are stabilized withantioxidants. The other substances present in the marketed formulations (such assucrose, corn starch, gelatin, corn oil, ascorbyl palmitate and -tocopherol) arecommon food ingredients and do not raise safety concerns.
The Committee noted that most of the available toxicological studieshad been performed with synthetic-lycopene formulations complying with thespecifications.
2.1.3 Absorption, distribution, and excretion
Rats
Absorption, distribution and excretion of lycopene were determined in maleand female Wistar rats given a 10% beadlet formulation of 6,7,6’,7’-[14C]-labelledlycopene (specific activity, 97.6 μCi/mg, equivalent to 3.61 MBq/mg; radiochemicalpurity, 98%) as a single dose by gavage. Except for the radiolabel, the beadletformulation was comparable to the commercial formulation, Lycopene 10% CWS,used in the pre-treatment experiment. A series of experiments was performed:
• A balance and blood level study in groups of five male and five female rats thatwere given a lowest dose of 0.2 mg/kg bw or highest dose of 2.0 mg/kg bw, andwere sacrificed at 96 h after dosing;
Table 1. Isomer composition of lycopene in different samples
Sample Isomer (as a percentage of total lycopene)
All-trans-lycopene
5-cis-lycopene
9-cis-lycopene
13-cis- + 15-cis-lycopene
Other cisisomers oflycopene
Raw tomatoes 94–96 3–5 0–1 1 < 1
Cookedtomato-basedfoodstuffs
35–96 4–27 < 1–14 < 1–7 < 1–22
Human bloodplasma
32–46 20–31 1–4 8–19 11–28
From Schierle et al. (1997)
18 LYCOPENE (SYNTHETIC)

• A bioretention study in 16 male and 16 female rats given a dose of 2.0 mg/kg bw,and sacrificed at 2, 4, 8, or 12 h after dosing;
• A balance study in five male and five female rats that were given a dose of2.0 mg/kg bw and that were pre-treated for 14 days by feed admix withnon-radiolabelled test article at a concentration of 25 mg of lycopene/kg feed.Sacrifice was at 96 h after the last (radioactive) dosing;
• A balance study in four male and four female bile-duct cannulated rats given adose of 2.0 mg/kg bw, and sacrificed at 48 h after dosing.
Depending on the study, radioactivity was analysed using liquid scintillationcounting (LSC) in samples of expired air, urine, faeces, blood, plasma, and/or bilecollected at several time-points during the study, and in organs/tissues sampled atsacrifice. The study was certified for compliance with good laboratory practice (GLP)and quality assurance (QA).
Overall recovery of radiolabel in the studies was more than 92.5%. Bloodand plasma concentrations peaked at 2 h after administration of both the lowest andthe highest dose, with maximum blood concentrations being approximately 60% ofmaximum plasma concentrations. Average half-lives in blood and plasma were 5.2and 3.9 h, respectively. Plasma concentrations were not linear with dose, given thatthe area-under-the-curve (AUC) values only differed by a factor of approximately 5instead of 10. During the 96 h after administration, radioactivity (as a percentage ofadministered dose) was mainly excreted via the faeces (88–97%). Only smallamounts of radioactivity were recovered from the urine (3.1– 4%), expired air (1.1%)and organs/tissues (1.6–2.8%). In the study with bile-duct cannulated rats, ofwhich only two males completed the experimental period of 48 h, radioactivityexcreted in the bile in 48 h amounted to 1.3–2% of the administered dose. This lowrate of biliary excretion indicates that the large amount of radioactivity found in thefaeces represents mainly non-absorbed material. On average, only 8.7% of theadministered dose was absorbed, of which 44% was excreted in urine, 20% inbile, 13% in expired air, and 24% remained in organs and tissues at 96 h afteradministration. Owing to poor absorption, low absolute amounts of radioactivity(<1 μg lycopene equivalents/g) were measured in organs/tissues, blood and plasmaat any time. The highest levels of radioactivity in organs/tissues were found in theliver (with maximum reached at 8 h after administration, and somewhat higher levelsin females than in males), followed by spleen, ovaries/uterus, fat, adrenals andintestinal tract, and levels were generally linear with dose. Pre-treatment for 14 daysdid not affect the excretion pattern, but reduced the amount of residual tissueradioactivity: only 0.9–1% of the administered dose was recovered from organs/tissues at 96 h after administration. No obvious sex differences were observed(Wendt & Bausch, 1995).
Analysis of plasma samples demonstrated systemic absorption of lycopenein toxicological studies in rats receiving Lycopene 10% CWS for 4 weeks at alycopene dose of 1000 mg/kg bw per day or for 14 weeks at a dose of 50, 150, or500 mg/kg bw per day (Niederhauser et al., 1996; Buser & Urwyler, 1996; seesection 2.2.2).
LYCOPENE (SYNTHETIC) 19

Systemic absorption was also demonstrated in toxicological studies in whichlycopene was administered at lower doses than described above but over a longerduration. When rats were given lycopene (as Lycopene 10% WS beadlets) at a doseof 10, 50, or 250 mg/kg bw per day for 52 weeks, followed by a 13-week treatment-free period, lycopene was found in plasma and liver samples of all groups. Meanplasma concentrations of lycopene at weeks 13, 26, and 52 showed an approximatedose-related (but not dose-proportional) increase with the highest values occurringat 250 mg/kg bw per day. They tended to be higher for females than for thecorresponding males at 50 and 250 mg/kg bw per day, and did not seem to increaseafter week 26. At week 6 of the recovery period, lycopene was only detectable(at a very low level) in plasma of 1 out of 10 animals at the highest dose. Liversamples of male rats showed a dose-related (but not dose-proportional) increasein lycopene concentration at week 52, while in liver samples of females the lycopeneconcentration reached a maximum at 50 mg/kg bw per day. The concentrationsin liver were 3–4 times higher in females than in males (47, 176, and 200 mg/kgand 172, 709, and 657 mg/kg in males and females dosed with 10, 50, and250 mg/kg bw per day, respectively). At the end of the recovery period, lycopeneconcentrations in the liver of animals at the highest dose had fallen to approximately10% of the week 52 values (Smith et al., 2005).
When rats were given lycopene (as Lycopene 10% WS beadlets) at a doseof 2, 10, or 50 mg/kg bw per day for 104 weeks, mean lycopene plasma conc-entrations at weeks 52 and 104 showed a dose-related (but not dose-proportional)increase with higher values occurring at week 104 than week 52, and tended to bea little higher for males than for the corresponding females. Liver samples showeda dose-related (but not dose-proportional) increase in lycopene concentration atweek 104, with concentrations in females being approximately two times higher thanin males (33, 80, and 193 mg/kg and 54, 154, and 442 mg/kg in males and femalesgiven lycopene at a dose of 2, 10, and 50 mg/kg bw per day, respectively) (Edwardset al., 2006).
Zaripheh et al. (2003) examined the distribution of 6,7,6’,7’-[14C]-labelledlycopene (specific radioactivity, 1.83 μCi/mg, equivalent to 0.07 MBq/mg) in maleF344 rats pre-fed a lycopene-enriched diet for 30 days and subsequently given22 μCi (equivalent to 0.81 MBq) of [14C]lycopene (in 0.5 ml cottonseed oil) viagavage. Lycopene was added to the diet in the form of water-dispersible beadletscontaining 10% lycopene, at a target concentration of 0.25 g/kg. The dose oflycopene administered via gavage (0.246 mg) was approximately 5% of the dailydose of lycopene received via the diet, and contained 98% all-trans-lycopene. Aftergavage, each rat was placed in a metabolic cage and faeces and urine werecollected every 24 h until sacrifice. At 0, 3, 6, 24, 72, and 168 h, eight rats per time-point were sacrificed, and blood, tissues and organs were collected. Radioactivityin excreta, serum and tissues was analysed using LSC. Over 168 h, 68% of theadministered radioactivity was excreted via the faeces, the majority of this withinthe first 48 h. The amount of radioactivity retained in the body (tissues and serum)at 168 h was 3%. Total recovery at 168 h (including also urine and gastrointestinalcontents) was 74%. Serum concentrations of radioactivity were highest between 3and 24 h, and declined thereafter. In liver, peak concentrations were reached at
20 LYCOPENE (SYNTHETIC)

24 h. At all time-points, approximately 72% of tissue radioactivity was found in theliver. Hepatic radioactivity was made up of approximately 80% all-trans-lycopeneand major cis isomers of lycopene (including 5-cis-lycopene) and approximately20% polar metabolites. In extra-hepatic tissue, radioactivity was greatest in adiposetissue, spleen and adrenals.
In a follow-up study, 48 male F344 rats were divided into four groups pre-fedeither a control or a lycopene-enriched diet for 30 days and killed at 5 or 24 h afterreceiving a single dose of 421.8 kBq of 6,7,6’,7’-[14C]-labelled lycopene (specificradioactivity 6771 kBq/mg) by gavage in 0.5 ml cottonseed oil. Lycopene was addedto the diet in the form of 5% water-dispersible lycopene beadlets, at a targetconcentration of 0.25 g of lycopene/kg. The lycopene dose via gavage (0.152 mg)was approximately 2% of the daily lycopene dose via the diet. Radioactivity inexcreta collected at 3, 6, and 24 h and in serum and tissues collected at sacrificewas analysed using LSC. Non-radioactive lycopene was detectable in serum andliver at both time-points. Irrespective of time, non-radioactive lycopene concentr-ations in serum and liver were higher in rats pre-fed with lycopene than in rats fedthe control diet. Absorption of radioactivity at 24 h was less for rats pre-fed rats withlycopene (5.5%) than for control rats (6.9%). Irrespective of pre-treatment diet,elimination of radioactivity was primarily via faeces (10–12% in 24 h), with only minorelimination via urine (0.088–0.091% in 24 h). Total recovery at 24 h from all tissues,gastrointestinal contents, and excreta was 75 and 57% for rats pre-fed with lycopeneand control rats, respectively. In tissues/organs, most radioactivity was found in thecontents and tissues of the gastrointestinal tract, followed by liver and spleen. Otherextrahepatic tissues contained only small amounts of radioactivity. In liver andspleen, radioactivity increased with time and was affected by the diet, such that ratspre-fed with the control diet had higher concentrations of radioactivity than the ratspre-fed with lycopene, particularly at 24 h. Hepatic radioactivity was made up of71–76% all-trans-lycopene and major cis isomers of lycopene (including 5-cis-lycopene) and 24–29% polar metabolites, irrespective of pre-treatment diet and time(Zaripheh & Erdman, 2005).
Crystalline 6,7,6’,7’-[14C]-lycopene (specific activity, 101 μCi/mg, equivalentto 3.74 MBq/mg) was administered by gavage to three male and three femaleSprague Dawley rats at a single dose of 20 μCi, equivalent to 0.74 MBq (in 1 mlolive oil containing -tocopherol at 1 mg/ml). Blood was drawn before and at 4, 8,24, 48, and 72 h after dosing, after which the rats were killed and organs wereremoved for radioactivity analysis. Maximal absorption into the blood of radioactivelycopene occurred between 4 and 8 h after administration. All organs examinedcontained radioactivity, but only trace or small amounts when compared with liver,which contained by far the highest amount (Mathews-Roth et al., 1990).
Special studies on the accumulation of lycopene in rat liver are described insection 2.1.5.
Rabbits
In order to establish absorption and tolerance for rabbits, four non-pregnantfemale New Zealand White rabbits were given Lycopene 10% WS beadlets (batch
LYCOPENE (SYNTHETIC) 21

No. UT00120002; 10.5% synthetic lycopene, of which 74% was all-trans- lycopene)at a maximum practical daily dose of lycopene of 131 mg/kg bw by gavage for21 days. After a washout period of 20 days, this was followed by a single gavagedose of a 10% beadlet formulation of 6,7,6’,7’-[14C]-lycopene (specific radioactivity,2.88 μCi/mg, equivalent to 0.11 MBq/mg; radiochemical purity, 98%) at a dose of6 mg/kg bw. Blood samples were taken up to 24 h after dosing on days 1, 6, and21 and up to 72 h after dosing the radiolabel.
One rabbit died after the first dose owing to a dosing error. The remainingthree animals tolerated administration well, with no signs of ill health or effects onbody weight. After the first dose, lycopene appeared in plasma after 1 h and amaximum concentration was reached after 2 h (56 μg/l). Plasma lycopene concen-trations remained at this level thereafter, with the proportion of the all-trans isomerincreasing from 19% at 1 h to 43% at 24 h. Plasma lycopene concentrations after6 and 21 doses showed mean plasma lycopene concentrations of between 96 and163 μg/l at all time-points (27–29% all-trans-lycopene) with a slight rise occurringat the 2 h time-point. Steady state was reached by day 6. After the radiolabelleddose, lycopene appeared in plasma after 1–2 h and a maximum concentration wasreached after 10 h (18 μg/l), with the proportion of the all-trans isomer increasingfrom 36% after 2 h to 93% after 48 h. Radioactivity, however, appeared in plasmaafter 0.5 h, with maximum concentrations (approximately 50 μg equivalents/l)reached between 2 and 6 h. Lycopene as a percentage of radio-activity increasedfrom 0% at 0.5 h to 36% at 10 h, and then declined to 33 and 5% at 24 and 72 h,respectively (Edwards et al., 2002).
In a further study, three female New Zealand White rabbits receivedlycopene at a higher dose of 400 mg/kg bw per day, achieved by dosing twice ratherthan once daily. Lycopene was administered as Lycopene 10% WS beadlets (batchNo. UT02070001; 13.2% synthetic lycopene, with 74% being all-trans-lycopene) for21 consecutive days. One animal died after the first dose owing to a dosing error.The remaining two animals showed good tolerance for treatment with lycopene,but displayed dark red discoloured faeces, stomach and intestinal contents.Lycopene was observed in the plasma 2 to 4 h after the first dose, with a maximumof 69 μg/l reached at 8 h. On days 6 and 21 of dosing, maximum plasma lycopeneconcentrations were 171 (at 4 and 8 h) and 339 μg/l (at 4 h), respectively. Samplesof liver taken at termination showed lycopene concentrations of 1 and 2.3 mg/kg(Edwards et al., 2004a).
Dogs
The pharmacokinetics and tissue distribution of lycopene was studied inmale beagle dogs. The dogs were fed a lycopene-free dog food with a high fatcontent to aid lycopene absorption. The test material (a 5% lycopene-containinggranular reddish powder) was administered in gelatin capsules 2 h after initiationof feeding, as single doses containing lycopene at 10, 30, or 50 mg/kg bw to twodogs per dose or at a dose of 30 mg/kg bw per day for 28 days to six dogs. In thesingle- and repeated-dose studies blood was collected for plasma lycopene analysisat several time-points. In the repeated-dose study, three dogs per time-pointwere killed at 1 and 5 days after the last dose, and tissues/organs were collected
22 LYCOPENE (SYNTHETIC)

for lycopene analysis. Peak plasma concentrations (56–129, 112–507, and 364–452 nmol/l from lowest to highest dose, respectively) were observed between 11and 21 h in the single-dose studies, where half-lives ranged from 23 to 59 h. In therepeated-dose study, the plasma half-life of lycopene was approximately 30 h anda steady-state plasma concentration of approximately 800 nmol/l was reachedapproximately 4 days after the first dose. In tissues/organs, lycopene concentrationswere highest in the liver, followed by adrenals, spleen, lymph nodes, and intestinaltissues. Tissue concentrations were generally higher at 5 days than at 1 day afterthe last dose. Although the test material contained 70% all-trans-lycopene, most ofthe lycopene identified in plasma and tissues was cis-lycopene, with only 23–41%all-trans-lycopene. Moreover, the percentage of all-trans-lycopene in many tissues,including liver, was significantly lower than that in plasma (Korytko et al., 2003).
Monkeys
Five female rhesus monkeys were given crystalline 6,7,6’,7’-[14C]-lycopene(specific activity, 101 μCi/mg, equivalent to 3.74 MBq/mg) by gavage as a singledose at 50 μCi, equivalent to 1.85 MBq (in 2.5 ml olive oil containing -tocopherolat 1 mg/ml). Blood was drawn before and at 2, 4, 8, 24, and 48 h after dosing,after which the monkeys were killed and organs were removed for radioactivityanalysis. The monkeys absorbed lycopene with considerable individual variation,both in blood, where peak concentrations were reached between 8 h and 48 h,and in organs. Liver contained the largest amount of radioactivity, but considerableamounts were also found in the spleen and organs of the digestive tract(Mathews-Roth et al., 1990).
Humans
In a randomized, parallel-group study design involving six male volunteersper group, the relative plasma response to lycopene intake from different sourceswas investigated, with restriction of intake of lycopene-rich food products during thestudy. After a 2-week lycopene-depletion phase, the subjects were given 20 mg oflycopene daily for 8 days as tomato juice, soup prepared from tomato paste, orlycopene tablets (lycopene 5% TG; batch No. UT990059720, containing a nominalcontent of 5 mg of synthetic lycopene per tablet) with dinner. For reasons ofcomparability, subjects received dinners with similar fat contents. Plasmaconcentrations of lycopene were monitored throughout the depletion and dosingphases and for 22 days after dosing, and kinetics were evaluated.
The three preparations of lycopene differed with respect to their isomercomposition, although for all preparations the all-trans isomer was the predominantform (92%, 86%, and 73% for tomato juice, tomato soup, and tablets, respectively),and the 5-cis isomer was the predominant cis isomer (4%, 6%, and 19%,respectively). The plasma response was qualitatively the same for the threepreparations, with a decline in lycopene concentrations during the depletion phase,a rise during treatment and peak concentrations reached after 8–9 days, and adecline in the after-dosing phase. Quantitatively, the plasma response of total andall-trans-lycopene was comparable for tablets and tomato soup, but was much lowerfor tomato juice. The plasma response of 5-cis-lycopene was relatively high for
LYCOPENE (SYNTHETIC) 23

tablets when compared with tomato soup and tomato juice, but this differencedisappeared upon normalization to cholesterol concentrations. The latter was doneto reduce the considerable interindividual variation observed in plasmaconcentrations of lycopene. The estimated half-lives were approximately 5 days and9 days for all-trans- and 5-cis-lycopene, respectively, and did not differ betweengroups. The systemic availability of synthetic lycopene from a tablet formulation wascomparable to that observed from processed tomatoes (soup from tomato paste)and superior to that from tomato juice (Cohn et al., 2000, 2004).
No other specific studies with synthetic lycopene in humans were available,but a number of publications were provided on the kinetics of lycopene in general.These have been summarized below.
Lycopene, like all carotenoids, is fat-soluble and follows the same digestionand intestinal absorption pathways as dietary fat (Rao & Agarwal, 1999). Absorptionof dietary carotenoids begins with their release from the food matrix and dissolutionin the lipid phase, followed by incorporation into lipid micelles in the small intestine,which is required for mucosal uptake, and finally, transport to the lymphatic and/orportal circulation (Erdman et al., 1993; Parker, 1996; Holloway et al., 2000).Movement of carotenoids from the mixed lipid micelle into the mucosal cells of theduodenum appears to occur via passive diffusion, and subsequent transport fromthe enterocytes to the blood stream involves incorporation into chylomicrons (withlycopene in the hydrophobic core), and secretion into the lymphatics. There is noevidence for significant portal absorption of carotenoids in humans (Parker, 1996).Carotenoids are transported in plasma exclusively by lipoprotein, with lycopenebeing transported primarily by low density lipoprotein (LDL) (Erdman et al., 1993;Parker, 1996; Holloway et al., 2000). Lycopene accumulates in tissues rich in LDLreceptors, such as liver, adrenals and testes (Holloway et al., 2000). Other humantissues containing detectable concentrations of lycopene include blood plasma,adipose tissue, prostate, and lung (Schmitz et al., 1991; Redlich et al., 1996; Rao& Agarwal, 1999). Reported tissue concentrations of lycopene vary betweenindividuals by about 100-fold (Rao & Agarwal, 1999).
Lycopene is the most predominant carotenoid in human plasma. Lycopenereaches its maximum concentration in the plasma 24–48 h after dosing (Stahl &Sies, 1992) but with repeated dosing the blood concentration continues to rise untila steady state is reached. Rao & Agarwal (1999) reported a half-life of lycopene inplasma in the order of 2–3 days, while Cohn et al. (2004) reported estimated half-lives of 5 days and 9 days for all-trans- and 5-cis-lycopene, respectively. Whensubjects were given a diet low in or without lycopene, their plasma lycopeneconcentrations were significantly lower after 1 to 2 weeks (Böhm & Bitsch, 1999;Porrini & Riso, 2000; Cohn et al., 2004); half-lives were then estimated to bebetween 12 and 33 days (Rock et al., 1992; Burri et al., 2001). Besides the effectof dietary fat (and dietary fibre content) on lycopene bioavailability, a number ofconditions have been suggested to affect the absorption, metabolism or clearanceof carotenoids, e.g. smoking and alcohol consumption (Bowen et al., 1993; Gärtneret al., 1997). Smokers have been reported to have lower plasma concentrations ofmost carotenoids than have non-smokers. This was also demonstrated for lycopeneby Pamuk et al. (1994). However, other studies in smokers (Peng et al., 1995; Brady
24 LYCOPENE (SYNTHETIC)

et al., 1996; Driskell et al., 1996; Mayne et al., 1999) showed no effect of smokingon plasma lycopene concentrations. Chronic alcohol consumption has beenreported to decrease dietary absorption of carotenoids (Leo & Lieber, 1999).However, Brady et al., (1996) found no interaction between alcohol and plasmalycopene.
Plasma lycopene concentrations reported for controls in several studiesranged from 0.2 to 1.9 μmol/l (Schierle et al., 1997; Paetau et al., 1998; Mayne etal., 1999; Porrini & Riso, 2000; Hoppe et al. 2003; Cohn et al., 2004). Themost abundant geometrical isomers in human plasma are all-trans-lycopene and5-cis-lycopene, with all the cis isomers contributing to more than 50% of totallycopene (see also Table 1; Schierle et al., 1997; Rao & Agarwal, 1999). The mostprominent geometric isomer that occurs in plant sources is all-trans-lycopene. Whileheat treatment and processing may result in trans- to cis-isomerization, leading toincreases (< 10%) in the cis-lycopene content of foods (Schierle et al., 1997; Boileauet al., 2002), this cannot fully explain the higher concentrations of cis isomers foundin human blood (and tissues) when compared with those in the foods consumed.Hence, biological conversions may take place in humans after consumption(Holloway et al., 2000). Indeed, exposure to low pH in the stomach has been shownto result in a small increase in cis isomers of lycopene (Boileau et al., 2002). It isnot known whether the proportion of cis isomers is increased in plasma because oftheir greater intrinsic bioavailability or because of a faster catabolism of the all-trans isomer in the body or both. It was speculated that probably owing to the shorterlength of the molecule, their greater solubility in mixed micelles and lower tendencyto aggregate, cis isomers are more readily bioavailable (Boileau et al., 1999, 2002).
The bioavailability of carotenoids is affected by food preparation in thepresence of lipids, and the functional status of the intestine. In humans, dependingon the presence of fat in the meal, appreciable quantities of carotenoids areabsorbed and can be found in circulating plasma and later in adipose tissue (Su etal., 1998). Studies have demonstrated that the absorption of lycopene is increasedwhen it is ingested with a high-fat diet. The addition of oil to tomato juice beforeheating also improves the bioavailability of lycopene (Stahl & Sies, 1992; Fieldinget al., 2005). Heat treatment in the processing of raw tomatoes results in therelease of lycopene from the cellular matrix, making it more bioavailable (Gärtneret al., 1997).
Studies on the bioavailability of synthetic lycopene and lycopene from naturalsources have reported conflicting results. Some studies did not find a difference inbioavailability between supplements containing natural lycopene extracts andlycopene from tomato products (Paetau et al., 1998; Rao & Agarwal, 1998), whileothers reported that lycopene from tomato juice or lycopene in the form of a tomatooleoresin was clearly better absorbed than lycopene from fresh tomatoes (Böhm &Bitsch, 1999). Tang et al. (2005) reported that lycopene from cooked tomatoes wasabout three times less bioavailable than synthetic lycopene dissolved in corn oil.However, no oil was added to the lycopene extracted from tomatoes, which mighthave had a certain effect on the bioavailability, as was reported by Stahl & Sies(1992) and Fielding et al. (2005). Other studies reported that the bioavailability ofsynthetic lycopene was comparable to that of lycopene extracted from tomatoes in
LYCOPENE (SYNTHETIC) 25

the form of an oleoresin (Hoppe et al., 2003) or from tomato juice (Paetau et al.,1998). While the absorption of lycopene can be affected by other carotenoids(Wahlqvist et al., 1994; Gaziano et al., 1995), lycopene did not affect the absorptionof other carotenoids like -carotene, -carotene, -cryptoxanthin, zeaxanthin, andlutein (Hoppe et al., 2003).
Diwadkar-Navsariwala et al. (2003) presented a physiological pharmacoki-netic model, validated by a phase I study in groups of five healthy male subjects,describing the disposition of lycopene delivered as a tomato beverage formulation(i.e. tomato paste mixed with olive oil and distilled water) as single lycopene dosesof 10, 30, 60, 90, or 120 mg. While the percentage absorption decreased withincreasing dose, the absolute amount of lycopene absorbed was not statisticallydifferent between the doses and amounted to a mean value of 4.7 mg. Independentof the dose, 80% of the subjects absorbed less than 6 mg of lycopene, suggestingthat lycopene bioavailability is saturated at doses of above 10 mg per person.The model comprised seven compartments: gastrointestinal tract, enterocytes,chylomicrons, plasma lipoproteins, fast-turnover liver, slow-turnover tissues, and adelay compartment before the enterocytes, with the slow-turnover tissues servingas a slow-depleting reservoir for lycopene.
2.1.4 Metabolism
A post-mitochondrial preparation of rat intestinal mucosa with or withoutadded soya bean lipoxygenase was used to investigate the metabolism of deu-terated all-trans-lycopene (12,12’,14,14’,19,19,19,19’,19’,19’-2H10-lycopene or 2H10-lycopene). Metabolites were identified by atmospheric pressure chemical ionizationmass spectrometry (MS). The addition of lipoxygenase significantly increased theproduction of lycopene metabolites. All metabolites were formed after 15 min ofincubation, and the amount was not significantly changed after 60–90 min ofincubation. Both central and excentric cleavage of lycopene occurred, and cleavageproducts as well as oxidation products of the original all-trans-lycopene wereobserved, including cis isomers (Ferreira et al., 2004).
Rats
Three male bile-duct cannulated Wistar rats received 6,7,6’,7’-[14C]-lycopene(specific activity, 115 μCi/mg, equivalent to 4.26 MBq/mg; radiochemical purity,98%) as a single dose at 2 mg/kg bw administered by gavage. The [14C]lycopenewas formulated as simulated beadlets with fish gelatin, similar to commerciallycopene formulations (radiochemical purity in formulation, 75%). Urine and bilewere collected at 0–6, 6–12, and 12–24 h after dosing. The rats were sacrificed 24 hafter dosing and radioactivity in blood plasma, urine, bile and liver was determinedby LSC. The metabolite profile was determined in urine and bile extracts byreversed-phase radio high-performance liquid chromatography (HPLC). Twenty-four h after dosing, on average 1.4% of the administered dose was excreted viaurine, and 0.84% and 0.78% was found in bile and liver, respectively. Thechromatograms of urine and bile were comparable, and both showed three broadpeak regions, all showing more polarity than lycopene. The isolation and
26 LYCOPENE (SYNTHETIC)
characterization of individual metabolites was not achieved. Lycopene itself was notdetected in urine and bile samples (Mair et al., 2005).
Humans
The metabolic pathway of lycopene has not been fully described. A numberof oxidative metabolites of lycopene have been identified in tomato paste, tomatojuice and in human serum (Khachik et al., 1998a). The major metabolites wereidentified as lycopene 1,2-epoxide and lycopene 5,6-epoxide. Other minormetabolites were also identified, including 2,6-cyclolycopene-1,5-diol I and 2,6-cyclolycopene-1,5-diol II. A few of the metabolites are naturally found in tomatoproducts at low concentrations. In human serum and human milk only 2,6-cyclolycopene-1,5-diol I and 2,6-cyclolycopene-1,5-diol II were found (Khachiket al., 1997a, 1998a). These two epimeric isomers are dihydroxylycopenes with afive-member ring end-group. Apparently, lycopene undergoes oxidation to yieldlycopene 5,6-oxide followed by cyclization and enzymatic reduction to form thetwo epimeric isomers of 2,6-cyclolycopene-1,5-diol (Khachik et al., 1997b, 1998b).None of the products formed by cleavage in the respective 11 conjugated doublebonds of lycopene (as described by Kim et al., 2001) were detected in the bloodof humans.
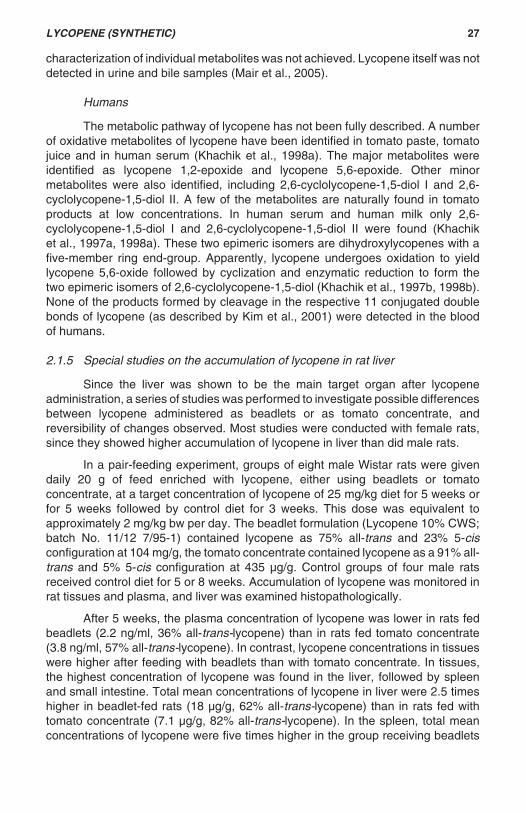
2.1.5 Special studies on the accumulation of lycopene in rat liver
Since the liver was shown to be the main target organ after lycopeneadministration, a series of studies was performed to investigate possible differencesbetween lycopene administered as beadlets or as tomato concentrate, andreversibility of changes observed. Most studies were conducted with female rats,since they showed higher accumulation of lycopene in liver than did male rats.
In a pair-feeding experiment, groups of eight male Wistar rats were givendaily 20 g of feed enriched with lycopene, either using beadlets or tomatoconcentrate, at a target concentration of lycopene of 25 mg/kg diet for 5 weeks orfor 5 weeks followed by control diet for 3 weeks. This dose was equivalent toapproximately 2 mg/kg bw per day. The beadlet formulation (Lycopene 10% CWS;batch No. 11/12 7/95-1) contained lycopene as 75% all-trans and 23% 5-cisconfiguration at 104 mg/g, the tomato concentrate contained lycopene as a 91% all-trans and 5% 5-cis configuration at 435 μg/g. Control groups of four male ratsreceived control diet for 5 or 8 weeks. Accumulation of lycopene was monitored inrat tissues and plasma, and liver was examined histopathologically.
After 5 weeks, the plasma concentration of lycopene was lower in rats fedbeadlets (2.2 ng/ml, 36% all-trans-lycopene) than in rats fed tomato concentrate(3.8 ng/ml, 57% all-trans-lycopene). In contrast, lycopene concentrations in tissueswere higher after feeding with beadlets than with tomato concentrate. In tissues,the highest concentration of lycopene was found in the liver, followed by spleenand small intestine. Total mean concentrations of lycopene in liver were 2.5 timeshigher in beadlet-fed rats (18 μg/g, 62% all-trans-lycopene) than in rats fed withtomato concentrate (7.1 μg/g, 82% all-trans-lycopene). In the spleen, total meanconcentrations of lycopene were five times higher in the group receiving beadlets
LYCOPENE (SYNTHETIC) 27

(6.3 μg/g, 78% all-trans-lycopene) than in the group receiving tomato concentrate(1.2 μg/g, 80% all-trans-lycopene). In the small intestine, total mean concentrationsof lycopene were almost three times higher in the group receiving beadlets(2.8 μg/g, 61% all-trans-lycopene) than in the group receiving tomato concentrate(1.0 μg/g, 68% all-trans-lycopene). For all other tissues investigated (adrenal, heart,lung, kidney, brain, fat, eye, muscle, skin, testes, thyroid gland), the concentrationsof lycopene found were less than 1 μg/g or not detectable. Compared with the feedgiven, supplementation resulted in lower relative amounts of the all-trans isomer inall tissues with detectable lycopene, except for spleen where feeding with beadletsresulted in a somewhat higher proportion of the all-trans isomer. Depletion for3 weeks led to significantly lower concentrations of lycopene in tissues in bothgroups receiving beadlets or tomato concentrate, with a significant increase in therelative amount of the all-trans isomer in liver, spleen, and small intestine.Histological examination of the liver did not reveal carotenoid inclusions in thetreated or control animals (Glatzle et al., 1997).
The time-course of lycopene levels in liver, spleen, and plasma wasinvestigated in a pair-feeding experiment in which female Wistar rats were given 20g/day of feed enriched with lycopene beadlets (lycopin 10% CWS; batch No.511821, containing 113 mg/g lycopene of a 72% all-trans and 22% 5-cisconfiguration) at a target concentration of lycopene of 110–120 mg/kg diet for up to64 weeks (equivalent to approximately 10 mg/kg bw per day). The concentration oflycopene was monitored in liver, spleen, and plasma of rats sacrificed after 2, 4, 6,8, 10, 12, 14, 18, 22, 26, and 64 weeks of treatment (3–10 rats per time-point).Control animals (three to –six per time-point) were sacrificed at the start of the study,and after 20, 26, and 64 weeks. Histopathological and morphological examinationof liver and spleen was also performed.
Lycopene was found in the liver and spleen of all animals receivingsupplementation and in the plasma in most animals. Liver showed the highestconcentration of lycopene, mean concentrations increasing from 80 μg/g after2 weeks of treatment to 248 μg/g after 64 weeks; no steady state was reached. Thespleen showed mean concentrations of lycopene of 33 μg/g after 2 weeks, 87 μg/gafter 14 weeks, 104 μg/g after 22 weeks, and 78 μg/g after 64 weeks; a steady statewas found after approximately 14 weeks of treatment. There was a large variabilityin plasma concentrations, with mean concentrations of lycopene of 29–54 ng/ml inweeks 2 to 10 and 57–120 ng/ml in weeks 12 to 64. Compared with the feed given,5-cis-lycopene was significantly increased in tissues and plasma. The proportion ofall-trans-lycopene was 52–62% in the liver, 61–71% in spleen, and 40–47% inplasma. At necropsy, brown-orange staining of the abdominal adipose tissue andred-orange to dark red discoloration of the liver were increasingly noted after 26 and6 weeks of treatment, respectively. Upon histopathology, deposits were found in theliver and, to a lesser extent, spleen of all treated animals. To further investigatethese deposits, morphological examinations were performed by semi-quantitativelight microscopy and electron microscopy. Light microscopy revealed a time-relatedincrease in pigment deposition in hepatocytes between week 2 (average grading1.2) and week 18 (average grading 3.8), but no apparent further increase there-after (average grading 3.8–4 between weeks 18 and 64). Pigments appeared as
28 LYCOPENE (SYNTHETIC)

brown-orange gritty deposits in the cytoplasm in normal light and as birefringentmaterial in polarized light. There was a significant correlation between total liverlycopene concentration and birefringent deposits. Despite significant accumulationof pigment in liver cells, there was no evidence of lycopene-related liver damageafter 64 weeks of continuous exposure. The deposits in the spleen were alsobirefringent pigments (average grading, 1–1.3). Upon ultrastructural localization oflycopene, the intracellular inclusions, varying in size from submicron sizes up toseveral micrometres, were found to be present in a compartment with a clearlydiscernable membrane bilayer, indicating a pathway that involves the endocytoticsystem of the hepatocytes (Glatzle et al., 1998a; Urwyler & Bohrmann, 1998).
In another pair-feeding experiment, female Wistar rats were given 20 g/dayof feed enriched with lycopene beadlets (lycopin 10% CWS; batch No. 511821,containing 11% lycopene of a 72% all-trans and 22% 5-cis configuration) at targetconcentrations of lycopene of 50 or 100 mg/kg diet for 4 weeks (equivalent toapproximately 5 or 10 mg/kg bw per day), followed by a depletion period of up to21 weeks. Accumulation and depletion of lycopene was monitored in liver, spleen,and plasma of six rats of each group per time-point after 2 weeks and 4 weeks ofsupplementation and after 1, 2, 3, 5, 7, 10, 13, 17, and 21 weeks of depletion. Controlanimals received control diet and were examined after 4, 6, 11, 17, and 25 weeks(three rats per time-point). The liver was also examined histopathologically.
After 4 weeks of treatment, rats in both treated groups had accumulatedlycopene in liver (72 μg/g, 61% all-trans-lycopene and 105 μg/g, 53% all-trans-lycopene at 5 and 10 mg/kg bw per day, respectively) and spleen (38 μg/g, 72% all-trans-lycopene and 35 μg/g, 64% all-trans-lycopene at 5 and 10 mg/kg bw per day,respectively). Plasma concentrations were approximately 30 ng/ml at both doses,with approximately 50% and 41% all-trans-lycopene at 5 and 10 mg/kg bw per day,respectively. After 1 week of depletion, lycopene was no longer detectable in theplasma. During the depletion period, a steady decrease of total lycopene in liver andspleen was observed, while the proportion of the all-trans isomer steadily increasedin both tissues. Histological examination showed intracellular brown-orange grittypigments in livers of treated animals (average grading 1), up to 7 weeks (5 mg/kgbw per day) or 10 weeks (10 mg/kg bw per day) of depletion. Thereafter, depositswere no longer observed. In polarized light, the pigments occurred as birefringentdeposits. There was no indication of treatment-related morphological changes inthe liver (Glatzle et al., 1998b).
The occurrence of liver deposits after administration of tomato concentrateor beadlets was investigated in a pair-feeding experiment in which female Wistarrats were fed lycopene at doses of approximately 20 mg/kg bw per day as tomatoconcentrate mixed with feed for 4, 8, or 13 weeks, followed by a depletion period of4, 8, or 12 weeks for those rats that were treated for 13 weeks. Other rats were fedlycopene at a dose of approximately 4 mg/kg bw per day (intended dose 5 mg/kgbw per day) as beadlets (lycopin 10% CWS; batch No. 511821, containing lycopeneat 113 mg/g of a 72% all-trans and 22% 5-cis configuration) mixed with feed for4 weeks or 8 weeks. Accumulation and depletion of lycopene were monitored in ratliver (six rats per time-point), and liver was examined histopathologically.
LYCOPENE (SYNTHETIC) 29

Liver concentrations of lycopene were comparable in the groups fed withtomato concentrate (39, 45, and 43 μg/g after 4, 8, and 13 weeks) and in the groupsfed with beadlets (42 and 49 μg/g after 4 and 8 weeks), just like the presence ofbirefringent deposits (in all but one animals of the groups receiving tomatoconcentrate and in all animals of the groups receiving beadlets, with averagegradings of 1.3 and 1.6, respectively). However, the proportion of all-trans-lycopenein the groups receiving tomato concentrate was higher (68–72%, with 25% 5-cis-lycopene) than in the groups receiving beadlets (55–59%, with 38% 5-cis-lycopene).During the depletion period for the group receiving tomato concentrate, theconcentration of lycopene in the liver steadily decreased, with an increase in theproportion of all-trans-lycopene (up to 82%). The birefringent deposits, however, didnot reduce appreciably (Glatzle et al., 1998c).
Ten female rats from the 64-week experiment by Glatzle et al. (1998a)were transferred into a new study protocol to investigate the long-term effects ofcontinuous feeding with lycopene at 10 mg/kg bw per day over a total of 2 years(Urwyler & Riss, 1999; see also section 2.2.3). Compared with the liver lycopenecontent of 248 μg/g (55% all-trans-lycopene) observed after 64 weeks, a decreasein liver lycopene content was observed from week 64 to week 104 of treatment(78–215 μg/g), while no change in the proportion of all-trans-lycopene was noted(50–57%). The authors attributed this decrease to the relationship between age,general health status and feed consumption. Comparing this decrease with theobservations on liver lycopene content in the long-term studies of toxicity by Smithet al. (2005) and Edwards et al. (2006) (see section 2.1.3), a similar reductionbetween 1 year and 2 years of treatment was found in female rats; however, onlyat a dose of 50 mg/kg bw per day (from 709 μg/g after 1 year to 442 μg/g after2 years), not at 10 mg/kg bw per day (from 172 to 154 μg/g). In male rats no reductionwas observed, neither at 10 mg/kg bw per day (from 47 to 80 μg/g) nor at 50 mg/kgbw per day (from 176 to 193 μg/g). Pigment deposition was observed in thehepatocytes of all rats, with an average grading of 5 in five prematurely sacrificedrats and 3 in the remaining five rats. Pigments appeared as brown-orange grittydeposits in the cytoplasm with normal light, and as birefringent crystals withpolarized light. Despite the high pigment load and the long duration of exposure,there was no indication of associated microscopic changes in the liver.
2.1.6 Effects on enzymes and other biochemical parameters
Three publications were provided in which the effect of lycopene (mostly fromnatural sources) on the activities of drug-metabolizing and/or antioxidant enzymeswas investigated (Gradelet et al., 1996, Jewell & O’Brien, 1999; Breinholt et al.,2000). These studies have been summarized in section 2.1.5 of the monograph‘Lycopene from Blakeslea trispora’, in this volume. The studies showed thatlycopene has only minor modifying effects, if any, on phase I and phase IIxenobiotic-metabolizing enzymes and on antioxidant enzymes.
30 LYCOPENE (SYNTHETIC)

2.2 Toxicological studies
2.2.1 Acute toxicity
One study of acute toxicity has been performed with synthetic lycopene. Inthis study, three male and three female Wistar rats received Lycopene 10 CWD(batch No. OD-12-04 6.Spr.A; 9.81% synthetic lycopene) as a single oral dose at5000 mg/kg bw by gavage. This study followed OECD test guideline 423 (acutetoxic class method; 1996), and was certified for compliance with GLP and QA. Noanimals died and the median lethal dose (LD50) was > 5000 mg/kg bw (BASF,2001a).
Studies of acute toxicity have also been provided for lycopene extracted fromtomatoes, administered via oral, subcutaneous or intraperitoneal route to mice(Milani et al., 1970). These studies have been summarized in Table 2 of themonograph ‘Lycopene from Blakeslea trispora’, in this volume. Lycopene extractedfrom tomatoes was not acutely toxic (LD50 > 3000 mg/kg bw).
2.2.2 Short-term studies of toxicity
Rats
Groups of six male and six female Wistar rats were given diets mixed withLycopene 10% CWS (batch No. 20/93-2; 9.9% synthetic lycopene, < 0.001% apo-12’-lycopenal) at concentrations intended to provide lycopene at 1000 mg/kg bw perday for 4 weeks. A control group of six males and six females received a diet mixedwith the beadlet formulation without lycopene (batch No. 19/93-3; placebo group)and another control group of six males and six females received the pure dietfor rodents (standard control group). To compare the toxicity of this Lycopene10% CWS formulation containing < 0.001% of the impurity apo-12’-lycopenal (i.e.< 0.01% relative to lycopene) with that of a Lycopene 10% CWS beadlet formulationcontaining 0.2% of this impurity (i.e. 2% relative to lycopene), an additional groupof six males and six females received a diet providing an intended dose of 1000 mgof lycopene + 20 mg of apo-12’-lycopenal/kg bw per day for 4 weeks. The latterformulation was obtained by mixing a Lycopene 10% CWS formulation (batch No.7/95-1; 11.5% synthetic lycopene, 0.025% apo-12’- lycopenal) with a lycopene-C25-aldehyde 2% CWS formulation (batch No. RS2/95-69; 0.305% syntheticlycopene, 2.16% apo-12’-lycopenal). Owing to a mistake in feed preparation, thisgroup received only 0.3% instead of the intended 2% apo-12’-lycopenal, so twoadditional groups of of six males and six females were introduced, receiving eithera diet providing 1000 mg of lycopene + 20 mg of apo-12’-lycopenal/kg bw perday or a placebo diet. Observations included clinical signs, body weight, foodconsumption, ophthalmoscopy, haematology, clinical chemistry, urine analysis,organ weights, macro- and microscopy, and plasma concentrations of lycopene,apo-12’-lycopenal, vitamin A and E. The study was certified to comply with GLPand QA.
The only treatment-related changes observed were a red discoloration of thefaeces and a brown-orange discoloration of the liver in most animals receiving either
LYCOPENE (SYNTHETIC) 31

lycopene only or lycopene supplemented with apo-12’-lycopenal. Histologically, thediscoloration of the liver correlated with deposits of brown-yellow fine granulatedpigment in hepatocytes with no other associated histopathological alterations. Thequantity of pigment was significantly higher in females than in males; the averagegrading being moderate in females and slight in males. No consistent andtoxicologically relevant changes were observed in haematology, clinical chemistry,and urine analysis parameters. Except for a statistically significantly increasedrelative liver (15%) and kidney (12%) weight in males of the group receiving1000 mg of lycopene + 20 mg of apo-12’- lycopenal/kg bw, organ weights were notaffected. In the absence of any histopathological changes, these weight changeswere not considered to be toxicologically relevant. The analysis of plasma samplescollected on the day of necropsy from non-fasted rats showed group meanconcentrations of lycopene of 120–250 μg/l in males and 140–190 μg/l in femalesin the groups treated with lycopene, with concentrations being significantly higherwith increasing supplementation with apo-12’-lycopenal. This effect was morepronounced in males than in females. Apo-12’-lycopenal was only detectable inplasma of rats receiving 1000 mg of lycopene + 20 mg of apo-12’-lycopenal/kg bw,with group mean concentrations of 10 and 8 μg/l in males and females, respectively(or approximately 4% of the lycopene content). Vitamin A concentrations in plasmawere not consistently affected, while vitamin E concentrations were consistentlyhigher in all groups receiving feed together with formulation (approximately 2.3-foldin males and 3-fold in females). This effect was most probably due to the highconcentration of vitamin E in the basic formulation. It was concluded that thelycopene beadlet formulation was well tolerated and that in the absence ofhistopathological liver damage, the treatment-related pigment deposition was notconsidered to be toxicologically relevant. The no-observed-effect level (NOEL) was1000 mg of lycopene/kg bw per day, the only dose tested. The presence of apo-12’-lycopenal impurity at a concentration of 2% in the formulation (relative to lycopene)did not result in additional findings (Niederhauser et al., 1996; McClain & Bausch,2003) .
In a 14-week study of toxicity, Wistar rats were treated with Lycopene 10%CWS (batch No. 20/93-2; 9.9% synthetic lycopene) as a dietary admixture atconcentrations intended to provide lycopene at 50, 150, and 500 mg/kg bw perday. A control group received a diet mixed with the beadlet formulation withoutlycopene (batch No. 19/93-3; placebo group) and another control group receivedthe pure diet for rodents (standard control group). There were 26 males and 26females per group, with 6 males and 6 females assigned to recovery groups for a5-week treatment-free period. The study was certified for compliance with GLP andQA. Observations included clinical symptoms and mortality (daily), body-weightdevelopment and food consumption (weekly), ophthalmoscopy (before dosing onall animals, and in week 9 on animals in the control groups and the group receivingthe highest dose), haematology and clinical chemistry (in blood taken from 10animals per group before dosing and in weeks 7 and 14), and urine analysis (in urinesampled from 10 animals per group in weeks 6 and 13). In addition, blood was takenfrom all animals in the recovery groups just before the start and at the end of therecovery period for clinical chemistry determinations, and from six males andsix females of each group in weeks 2, 8, 12, and 17 for plasma concentration
32 LYCOPENE (SYNTHETIC)

determinations. At necropsy, a macroscopic examination was performed on allanimals, and absolute and relative weights of adrenals, brain, heart, kidneys, liver,ovaries, spleen, testes, and thyroid were determined. Microscopy was carried outon a number of organs and tissues from 20 males and 20 females in the controlgroups and in the group receiving the highest dose, on the liver from 20 males and20 females in the groups receiving the lowest and intermediate dose, and on allgross lesions.
There were no treatment-related deaths or adverse effects on general healthand behaviour, eyes, or urine analysis parameters. The only sign associated withthe intake of lycopene was a reddish discoloration of the faeces of all animals fromthe group receiving the highest dose and to a lesser extent from the groups at theintermediate and lowest dose. Food consumption was comparable in all groups.Body-weight gain was slightly increased (7–10%) in females treated with lycopenewhen compared with standard controls, but not when compared with femalestreated with placebo. In the recovery period, females at the intermediate and highestdose also had an increased body-weight gain, compared with the standard controls(6–18% difference) and the females treated with placebo (12–25% difference).Statistically significant increases in aspartate aminotransferase (ASAT) and alanineaminotransferase (ALAT) were observed in male, but not female rats in the groupsat 50, 150, and 500 mg/kg bw per day after 93 days of treatment (ASAT, twofoldat the lowest dose and threefold at the intermediate and highest dose; ALAT, nochange at the lowest dose and twofold at the intermediate and highest dose).A trend for elevated ASAT and ALAT activities was still seen in male rats after5 weeks of recovery, although this was not statistically significant. Also, statisticallysignificant changes were observed in some other biochemical parameters as wellas in some haematological parameters after 93 days of treatment. However, asthese changes were either small, not dose-related and/or found in one sex only,they were considered not to be related to treatment. In all groups the plasmaconcentration of lycopene was continuously high, with higher mean concentrationsin females (133–344 μg/l) than in males (102–197 μg/l). In male rats, plasmaconcentrations were comparable between the three dose groups, while in femalerats plasma concentrations increased non-proportionally with dose. After 2 weeksof recovery, complete elimination of lycopene in plasma was shown in all animals.Statistically significant changes in organ weights were only observed in animalsreceiving the highest dose, where females showed a decrease of 15% in relativethyroid weight, and males a 2% increase in relative brain weight. These changeswere not associated with morphological changes and did not persist beyond therecovery period. Necropsy revealed an orange-red discoloration of the liver (inmales at 500 mg/kg bw per day and in females at 50, 150, and 500 mg/kg bw perday) and the adipose tissue (in males and females at 150 and 500 mg/kg bw perday). There were no microscopic findings that were considered to be related totreatment, except for the deposition of orange-brown, birefringent pigment in thehepatocytes of animals of all lycopene-treated groups, with females more severelyaffected than males (average grading, severe and slight to moderate, respectively).There was, however, no histopathological evidence of any hepatocellular damage.The pigment deposits were still present after 5 weeks of recovery. In the absenceof histopathological liver damage, the relatively small increase in ASAT and ALAT
LYCOPENE (SYNTHETIC) 33

activities and the pigment deposition were not considered to be toxicologicallyrelevant. The NOEL was 500 mg of lycopene/kg bw per day, the highest dose tested(Buser & Urwyler, 1996; McClain & Bausch, 2003).
In a 3-month study of toxicity, groups of 10 male and 10 female Wistar ratswere dosed daily by gavage with one of the following: water, Lycopene 10 CWD(500, 1500, or 3000 mg/kg bw per day), Lycopene 10 CWD formulation matrix(3000 mg/kg bw per day), LycoVit 10% (3000 mg/kg bw per day), or LycoVit 10%formulation matrix (3000 mg/kg bw per day). These doses correspond toapproximate doses of lycopene of 50, 150, and 300 mg/kg bw per day fromLycopene 10 CWD (batch No. OD-12-04 6.Spr.A, containing 9.81% syntheticlycopene) and 300 mg/kg bw per day from LycoVit 10% (batch No. 20014372,containing 10.8% synthetic lycopene). Additional satellite groups of five males andfive females received water or 3000 mg/kg bw per day of either Lycopene 10 CWDor LycoVit 10% for an interim evaluation at 4 weeks. The study followed OECDguideline 408 (1998), and was certified to comply with GLP and QA. Plasmaconcentrations of lycopene were not determined in this study.
There were no significant differences in body weight, food consumption,organ weights, or haematological evaluations between treatment groups, andthere were no treatment-related deaths or effects seen in ophthalmoscopicevaluations. Similarly, a battery of behavioural and reflex tests, motor activityassessments, clinical chemistry evaluations, and urine analysis did not reveal anybiologically relevant findings. Treatment-related clinical findings were limited toa red discoloration of the faeces of animals in the Lycopene 10 CWD and LycoVit10% treatment groups. Consistent with this finding was a red discoloration in thegastrointestinal tract (jejunum, caecum, and at highest dose stomach) of theseanimals, which was not associated with changes in gross pathology orhistopathology. No other remarkable or substance-related abnormalities wereobserved in any of the other tissues examined, nor were there any significanthistopathological findings. Given the absence of relevant toxicological findings withboth lycopene formulations, the NOEL was approximately 300 mg of lycopene/kgbw per day, the highest dose tested (BASF, 2001b; Mellert et al., 2002).
In a study evaluating the biodistribution of a single dose of [14C]lycopene,groups of 24 male F344 rats (mean body weight, 113 g) were pre-fed either alycopene-enriched or a control diet for 30 days. The test diet contained syntheticlycopene (as 5% water-dispersible lycopene beadlets) at a concentration of 0.25 g/kg, and it was calculated that rats consumed approximately 8 mg of lycopene perday from the diet. Food intake and weight gain were not affected by treatment, andno effects were apparent other than a red discoloration of the liver and faeces(Zaripheh & Erdman, 2005).
A 100-day feeding study was conducted in which 10 male and 10 femaleWistar rats were given synthetic lycopene (purity, 97–98.5%) at a dose of 1000 mg/kg bw per day, mixed with a small amount of food. A control group of 20 animalswas also included. No adverse clinical signs were observed, and treatment didnot affect weight gain or haematology parameters (haemoglobin, erythrocyte and
34 LYCOPENE (SYNTHETIC)

leukocyte counts, and differential blood counts). Liver, kidneys, adrenals, spleen,pancreas, testes, ovaries, skin, bone, and bone marrow were histologically normal.Signs of tissue storage of lycopene were not detected by microscopic examination(Zbinden & Studer, 1958).
A 90-day feeding study in rats given lycopene derived from B. trispora(Jonker et al., 2003) was also available. Studies of 14–16 days or 10 weeks durationin rats given lycopene oleoresin from tomato were also available, but were notdesigned to examine adverse health effects (Zhao et al., 1998; Gradelet et al., 1996;Jewell & O’Brien, 1999; Breinholt et al., 2000). All these studies have beensummarized in section 2.2.2 of the monograph ‘Lycopene from Blakeslea trispora’,in this volume. Lycopene from natural sources was well tolerated, without relevantadverse effects. The only treatment-related finding in the full study of toxicitywith lycopene from B. trispora was a red discoloration of the contents of thegastrointestinal tract, caused by ingestion of the red-staining test substance. TheNOEL was approximately 600 mg of lycopene/kg bw per day, corresponding tothe highest dose tested in that study.
Dogs
In a study evaluating the pharmacokinetics and tissue distribution oflycopene, six male beagle dogs were given a 5% lycopene-containing granularreddish powder in gelatin capsules providing lycopene at a dose of 30 mg/kg bwper day for 28 days. Food consumption and body weight were not affected bytreatment, and, other than red material in faeces, no clinical signs were observed(Koryotko et al., 2003).
One female mongrel dog was treated orally with gelatin capsules containingsynthetic lycopene (purity, 97–98.5%) at a dose of 100 mg/kg bw, once daily for192 days. In total, the animal received 272 g of lycopene without displaying signsof intolerance. Body weight increased from 13 to 15 kg, and haematology, clinicalchemistry and urine analysis parameters investigated were normal. Macroscopy didnot reveal treatment-related changes. Chemical analysis showed the presence oflycopene in the liver and, to a much lesser extent, kidneys. The pigment was alsodetectable histologically in liver cells. Otherwise, the liver was histologically normal,as were other tissues and organs (Zbinden & Studer, 1958).
2.2.3 Long-term studies of toxicity and carcinogenicity
Rats
Zbinden & Studer (1958) investigated the toxicity of lycopene as part of atwo-generation study of reproductive toxicity. Groups of 15 male and 15 femaleWistar rats were found to develp normally when given a diet containing 0 or 0.1%synthetic lycopene (purity, 97–98.5%) for 200 days. There were no mortalities orgreat differences in food consumption and body-weight gain, and there were noremarkable haematological findings. Histopathological examinations in tissues andorgans of two rats of each sex per group did not reveal abnormalities, with theexception of pigment deposition (in females marked and in males slight) in the liver
LYCOPENE (SYNTHETIC) 35

of animals treated with lycopene. Continuation of treatment of the remaining 13 ratsof each sex per group for a further 200 days was reported not to result in anysign of toxicity or spontaneous tumours (Zbinden & Studer, 1958).
In a 52-week study of toxicity, groups of 20 male and 20 female Wistar ratswere treated with Lycopene 10% WS beadlets (batch No. UT02070001; 13.2%synthetic lycopene) mixed in the diet at target doses of lycopene of 10, 50, and250 mg/kg bw per day. A control group received a diet mixed with placebo beadlets(batch No. UT02111005; placebo group) and another control group received thepure diet for rodents (standard control group). Five rats of each sex in the standardcontrol group and the group at the highest dose were assigned to recovery groupsfor a 13-week treatment-free period. The study followed OECD guideline 452(1981), and was certified to comply with GLP and QA. In addition to the standardobservations, a functional observational battery and motor activity assessment wereincluded, plasma and liver samples were analysed for total lycopene content (i.e.sum of all determined isomers), and liver from all animals in the study was examinedmicroscopically.
Analysis of plasma and liver samples demonstrated systemic absorption oflycopene in all groups receiving Lycopene 10% WS beadlets (see section 2.1.3).Discoloured faeces or red staining was noted in both sexes in all groups givenlycopene. There were no treatment-related deaths, ophthalmic changes, orneurological changes. Body-weight gain, food consumption, and food conversionefficiency were unaffected by treatment after 52 weeks. Haematology parameterswere not consistently affected by treatment, nor were clinical chemistry parametersother than ASAT and ALAT activities. At week 13, slight increases in the groupmean activities of ASAT and ALAT were recorded at the highest dose only. At weeks26 and 52, group mean activities of these enzymes were increased in a dose-dependent manner in males (up to 1.7- and 2.6-fold, respectively) and females (upto 1.4- and 2-fold, respectively) at the lowest, intermediate and highest dose,although not always statistically significantly and generally without real progressionbetween week 26 and week 52. At the end of the treatment-free period, ASAT andALAT activities had declined, but still tended to be higher in the group at the highestdose than in the standard control group. At week 51 there was an increase in urinaryvolume and decrease in urinary specific gravity in both sexes at 250 mg/kg bw perday. These findings were not accompanied by related changes in the kidney orincreased water consumption. The weights of the adrenals, kidneys, liver, brain,testes and epididymides, and ovaries were unaffected by treatment. Macroscopyrevealed abnormal contents (often a thick, red substance) in the stomach andcaecum, and yellow connective tissue in the abdominal cavity of animals receivingthe intermediate or highest dose at terminal kill, but not at the end of the treatment-free period. These findings did not correlate with any microscopic observation andwere probably associated with the colour of the test article. The macroscopic findingof mottled liver in both control and treated animals, especially males, correlated withagonal congestion/haemorrhage seen microscopically. Treatment-related findingsupon microscopy were confined to the liver, particularly of females.
In females at terminal kill, there were increases in the incidences andseverity of hepatocyte pigment (in treated and placebo-fed groups, without a
36 LYCOPENE (SYNTHETIC)

obvious dose–response relationship) and pigmented histiocytes (in a dose-relatedmanner in all groups treated with lycopene) compared with those in of standardcontrols. In females at the intermediate and highest dose there was also a greaterincidence and severity of basophilic foci. After the treatment-free period, thesefindings were still observed, although the incidences of hepatocyte pigment andbasophilic foci were slightly lower and similar, respectively, in females at the highestdose than in standard controls. In males, hepatocyte pigment was rarely seen, andthe incidences of pigmented histiocytes and basophilic foci were only marginallyincreased in groups treated with lycopene. The pigment in hepatocytes andhistiocytes was seen as fine golden brown granular deposits, which stained variablypositive for both haemosiderin and lipofuscins. It was concluded that treatmentwith lycopene for 52 weeks resulted in liver pigmentation with associatedhistopathological alterations of basophilic foci (in females at the intermediate andhighest dose), while in the short-term studies of toxicity the latter were not observed.
The significance of these treatment-related alterations for humans is unclear,given that there was no apparent sign of liver dysfunction and that, in contrast tohumans, basophilic foci are commonly found at high incidences in the ageing rat.The latter is, for example, reported for F344 rats by Eustis et al. (1990), and is alsoobserved in the present study in female control animals (standard and placebo).Basophilic foci were also observed in control animals (especially females) of other(26-week and 104-week) studies by the same laboratory using the same strain ofrats (see also 104-week study below). However, the Committee also noted that thealterations were observed in a single, non-standardized liver section investigated,which would not necessarily be representative of other sections of the liver (Smithet al., 2005).
In a study of carcinogenicity, groups of 50 male and 50 female Wistar ratswere treated with Lycopene 10% WS beadlets (batch No. UT02070001; 13.2%synthetic lycopene) mixed in the diet at target doses of lycopene of 2, 10, and50 mg/kg bw per day for 104 weeks. Two control groups of 50 males and 50 femalesreceived either a diet mixed with placebo beadlets (batch No. UT02111005; placebogroup) or the pure diet (standard control group). The study followed OECD guideline451 (1981), and was certified for compliance with GLP and QA. In addition to thestandard observations, plasma and liver samples were analysed for total lycopenecontent (i.e. sum of all determined isomers), and liver, mesenteric and mandibularlymph nodes from all animals in the study were examined microscopically, as wellas kidney from all female rats.
Analysis of plasma and liver samples demonstrated systemic absorption oflycopene in all groups receiving Lycopene 10% WS beadlets (see section 2.1.3).Survival was acceptable, being 86, 80, 74, 66, and 82% and 78, 80, 78, 84, and74% for males and females, respectively, from the standard control group to thegroup at the highest dose, respectively. There was no influence of treatment onincidences and causes of morbidity and mortality, or on incidences of clinical signscommonly seen in laboratory rats. Red discoloured faeces were noted in both sexesat 50 and 10 mg/kg bw per day, from the onset and week 67 of treatment,respectively. Food consumption, overall body-weight gain and food conversionefficiency of males and females given lycopene in the diet were similar to that of the
LYCOPENE (SYNTHETIC) 37

standard control and placebo groups. Erythrocyte and leukocyte counts were notconsistently affected by treatment.
Macroscopically, several findings in the gastrointestinal tract (e.g. abnormalor dark contents in the stomach and caecum, red discoloration of jejunum) andyellow connective tissue, especially in males and females at the highest dose, wereprobably associated with the colour of the test article. Likewise, treatment withlycopene resulted in dark/red discoloration in the kidney (especially in females atthe highest dose) and lymph nodes, and variable discolorations in the liver,corresponding with non-neoplastic findings observed microscopically. In the kidneyof females at the highest dose, the incidence and severity of tubular pigment wereincreased compared with values for controls and other treatment groups. In males,renal tubular pigmentation was significantly less than in females and there was nodifference between control and treated groups. In the mesenteric lymph node, allanimals, including controls, displayed pigment or pigmented histiocytes, but theseverity of pigmentation was increased in the placebo group (females only) and inlycopene-treated animals. In the mandibular lymph node, the incidence of pigment/pigmented histiocytes was increased in the placebo and treated groups, with theseverity also being increased in females. The increases in lymph node pigmentationwere not consistently dose-dependent. Pigmentation, seen as fine granular orglobular golden-brown deposits, was also observed in the liver, especially infemales. In females treated with placebo or lycopene, there were increases in theincidences and severity of hepatocyte pigment (without an obvious dose–responserelationship) and pigmented histiocytes (severity only increased in the group at thehighest dose) above that in standard controls. In males, hepatocyte pigment wasrarely seen, but the incidence of pigmented histiocytes was also increased inthe groups receiving placebo or lycopene above that in standard controls. Othernon-neoplastic findings in the liver included a greater incidence and severity ofmultinucleate cells (dose- related, in all treated males, albeit marginally at the lowestdose), and of histologically altered cell foci. Altered cell foci of the eosinophilic typewere of greater severity but their incidence was without an obvious dose–responserelationship in groups of males given placebo or lycopene. The incidence andseverity of basophilic, normochromic and clear cell foci was greater in females atthe intermediate and/or highest dose (albeit that for basophilic foci the incidenceswere only slightly above the high background incidence of spontaneous). In placebocontrols and in treated animals at all doses, the incidence of vacuolated foci wasgreater than that in controls receiving pure diet only, but was without an obviousdose–response relationship. For eosinophilic and basophilic foci it was stated bythe authors that there was no evidence of an increase in cellular pleomorphism,distorted architecture or increased mitotic activity, but no data were provided tosupport this statement.
No liver carcinomas were observed in this study, and there was no treatment-related increase in liver adenomas. In fact, the types and incidences of tumoursobserved were generally similar in control and treated groups. The highest inci-dences were found for pituitary adenomas, mesenteric lymph node haemangiomas,uterus adenocarcinomas and stromal polyps, and mammary gland fibroadenomas(of which the incidence seemed to be slightly increased in females treated with
38 LYCOPENE (SYNTHETIC)

lycopene). It was concluded that there were no indications to suggest an associationbetwwen carcinogenicity and administration of lycopene.
As to the non-neoplastic findings, it was concluded that treatment withlycopene for 104 weeks, as with treatment for 52 weeks, resulted in liverpigmentation with associated histopathological alterations of hepatocellular foci, inparticular eosinophilic, normochromic and basophilic foci, and mainly at theintermediate and highest dose. Again, the significance of these treatment-relatedalterations for humans is unclear, given that there was no apparent sign of liverdysfunction, they were without a consistent dose–response relationship, andplacebo controls were in some cases also affected. Moreover, in contrast tohumans, hepatocellular foci are commonly found in the ageing rat at highincidences, and while experimental models suggest that some foci may beprecursors of hepatocellular neoplasia, it is also known that only a very smallproportion of foci progress to neoplasia even after continued administration. Indeed,treatment with lycopene did not result in an increase in liver tumours. However,the Committee also noted that the alterations were observed in a single, non-standardized liver section investigated, which would not necessarily berepresentative for other sections of the liver (Edwards et al., 2006).
Ten female Wistar rats from a 64-week exploratory study investigating thetime-course of lycopene concentrations in liver, spleen, and plasma under steady-state conditions (see study by Glatze et al., 1998a, section 2.1.5) were transferredto a study investigating the long-term effects of continuous feeding with lycopeneover a total of 2 years. The rats were pair-fed a diet enriched with lycopene (aslycopin 10% CWS beadlets (batch No. 511821; 113 mg of synthetic lycopene/g) ata concentration of 113 mg/kg. The amount of feed served was adapted weekly tothe body weights measured, so as to provide lycopene at a dose of approximately10 mg/kg bw per day throughout the study. Animals were observed daily for clinicalsigns and weekly for body-weight development. At 18 and 21 months, blood wascollected from non-fasted rats and analysed for ASAT, ALAT, alkaline phosphatase,triglycerides, phospholipids, and total cholesterol. At necropsy, the liver and alltissues with macroscopic changes were removed and examined microscopically.
Except for the pathology data, the results for the observations performedwere described with little detail or not at all, as was the case for body-weightdevelopment. It was stated that no clinical signs were recorded throughout thestudy, and that five rats were sacrificed prematurely owing to deterioration of theirgeneral condition. In absence of a concurrent control group, clinical chemistryvalues for the non-fasted rats were compared with historical control values for fastedfemale Wistar rats. Clinical chemistry parameters were elevated, which was mostlikely to be caused by the non-fasting state of the animals. Upon macroscopy,staining of the mammary gland and abdominal fat tissue (yellow) and liver (orange)was noted in some animals, as well as enlarged pituitary glands (in four out of fiveprematurely sacrificed rats and in two out of five rats surviving to the end).Histopathology showed brown-orange gritty deposits in hepatocytes of all rats, withthe amount of pigment deposited higher in prematurely sacrificed animals thanin animals at terminal kill. No microscopic changes associated with the liverpigmentation were observed, nor with the discoloration of other tissues. Pituitary
LYCOPENE (SYNTHETIC) 39

adenomas were found in all animals with enlarged pituitary glands, and werethe cause of the moribund condition of prematurely sacrificed animals (Urwyler &Riss, 1999).
2.2.4 Genotoxicity
The results of studies of genotoxicity with synthetic lycopene aresummarized in Table 2. The studies followed OECD test guidelines 471 (1983 +update/1997), 473 (1983 + update/1997), 474 (1987 + update/97), 476 (1984 +update), or (proposal for) 486 (1997), and were certified to comply with GLP andQA.
The results of some studies of genotoxicity in vitro and in vivo with lycopenefrom natural sources have also been provided (He & Campbell, 1990; Pool-Zobelet al., 1997; Riso et al., 1999; Aizawa et al., 2000; Guttenplan et al., 2001; McClain& Bausch, 2003). The studies in vitro concerned tests for gene mutation in bacteria(Salmonella typhimurium, Escherichia coli), the studies in vivo included a test formicronucleus formation in mouse peripheral blood, tests for DNA damage in humanlymphocytes and a test for spontaneous mutation in LacZ mouse DNA. Thesestudies have been summarized in Table 3 of the monograph ‘Lycopene fromBlakeslea trispora’, in this volume. Lycopene from natural sources gave negativeresults in all studies.
2.2.5 Reproductive toxicity
(a) Multigeneration study
Rats
In a two-generation study of reproductive toxicity, groups of 15 male and15 female Wistar rats received a diet containing 0 or 0.1% synthetic lycopene(purity, 97–98.5%) for 14–16 weeks before mating and subsequently throughoutpregnancy and beyond, for a total of 238 treatment days. After weaning, pups of thefirst generation were fed either the same diet containing lycopene (13 male and18 female rats) or the control diet (38 animals) for 50–80 days. One of the damstreated with lycopene aborted; the number of offspring was slightly but notsignificantly lower than in the control group, in which two animals aborted. Theduration of gestation was normal, and no malformations were seen. Pup weight atbirth was slightly but not significantly higher in the treated group than in the controlgroup. Continuation of treatment of the first generation for a further 200 days, whileproducing a second generation, was reported to have resulted in a normalreproduction (Zbinden & Studer, 1958).
Sprague-Dawley rats were treated with diets mixed with Lycopene 10% WSbeadlets (batch No. UT02070001; 13.2% synthetic lycopene) to provide lycopeneat target doses of 50, 150, or 500 mg/kg bw per day for two consecutive generations(F0 and F1). F0 animals (30 of each sex per dose) received the test diet 10 weeksbefore pairing, throughout mating and gestation, and throughout to necropsy afterweaning. F1 animals (25 of each sex per dose) were mated after 10 weeks of
40 LYCOPENE (SYNTHETIC)

exposure and females were allowed to rear their young to weaning. Two controlgroups were included: one (standard) control group received the basic powdereddiet, the other (placebo) control group received a diet mixed with placebo beadlets(batch No. UT02111005). The study followed OECD guideline 416 (2001).Additionally, blood and liver samples from selected F0 and F1 adults (five of eachsex per group) and their weanlings (two of each sex per litter) were taken shortlybefore sacrifice for determination of lycopene content. The study was certified tocomply with GLP and QA.
The achieved intakes during pre-mating, gestation and lactation were consi-stent with the target doses. Data on exposure showed detectable concentrations oflycopene in the plasma of rats in all groups treated with Lycopene 10% WS beadlets,with higher values in adult females than in adult males in each generation. Therewas no dose-dependency for adult males in either generation, while for adultfemales concentrations increased with dose but proportionally to a lesser degreethan the dose. Plasma concentrations in the weaning pups were greater than thosein the adults for both generations, were consistent between the sexes and increasedwith dose but proportionally to a lesser degree than the dose. All treated groups ofadult males and females from each generation had detectable concentrations oflycopene in the liver. As noted for plasma, levels in females were much higher thanin males, with no dose- dependency for males and an increase with dose for femalesbut proportionally to a lesser degree than the dose. Liver concentrations for theweaning pups were again consistent between the sexes for both generations. Valuesfor the group at the lowest dose were comparable with those noted for the adultmales and then increased slightly with dose but proportionally to a lesser degree.
Observations not related to reproduction in adults included red-colouredfaeces in all groups receiving lycopene throughout the study, and orange-stainedfur/skin for F0 and F1 animals at 500 mg/kg bw per day and for F0 males at 150 mg/kg bw per day. In the F0 generation, treatment with lycopene generally had no effecton mean body-weight change and food consumption. In the F1 generation, malesand females at 500 mg/kg bw per day occasionally had a marginally lower foodconsumption during pre-mating, resulting in a marginally lower body weight duringthe first 7 or 2 weeks, respectively, but overall there was little or no effect on bodyweight and body-weight gain. F1 females at 500 and 150 mg/kg bw per day also hadslightly reduced food consumption during days 7– 20 of gestation and days 1–7 oflactation. Compared with standard controls, mean body-weight gain was reducedin all groups given beadlets, including placebo, during the last week of gestationand the first week of lactation but recovered thereafter, resulting in only slightly lowerbody weights (< 5%) at day 21 of lactation. In the groups receiving lycopene,macroscopic examination showed dark adipose tissue in some animals of the F0
generation, and yellow discoloration of fat and organs of the abdominal cavity andliver streaks in some animals of the F1 generation. Treatment-related histologicalchanges were, however, not observed.
Some occasional small changes (generally less than 10% change) inabsolute and/or relative organ weights were observed (e.g. for coagulating glands/seminal vesicles and uterus), without histopathological correlate.
LYCOPENE (SYNTHETIC) 41

With respect to reproductive findings, no treatment-related effects on matingperformance and fertility were observed. Gonadal function, as assessed by determi-nation of estrus cycle, detailed sperm analysis (motility, counts, morphology), andmicroscopic examination of ovaries, testes and epididymes, was also unaffected.
The survival and growth of F0 offspring was not affected by treatment, whilethe number of F1 offspring dying during days 1–4 was increased (13, 21, and 14 ingroups treated with lycopene versus 5 in control groups). Live litter sizes, however,were unaffected and comparable with those for controls throughout lactation. F2 pupbody weights were not affected by treatment, except for a slightly decreased weightfor female pups at the highest dose at day 1. Although some changes in physicaldevelopment of F1 and F2 pups (measured as mean day of attainment of pinnaunfolding, incisor eruption and eye opening) reached statistical significance, theywere only of a minor nature. During lactation, an increased number of F2 pups atthe highest dose showed clinical signs (thin, lacrimation, hair-loss, pale), but onlyone or two litters were affected.
Aside from red-coloured faeces and yellow-orange stained fur/skin/fat/abdominal organs owing to the colour of lycopene, it can be concluded that in theparental generation treatment with lycopene was only associated with marginaleffects on body weight and food consumption (F1 only), with no influence on matingperformance and fertility. Hence, the NOEL for parental and reproductive toxicitywas 500 mg of lycopene/kg bw per day, the highest dose tested. The NOEL foreffects on growth and development of the offspring was also 500 mg of lycopene/kg bw per day, as the clinical findings in F2 pups at the highest dose can beconsidered to be incidental (Edwards et al., 2005).
Developmental toxicity
Rats
In order to establish the influence of the impurity apo-12’-lycopenal on thepotential developmental toxicity of lycopene, groups of up to 14 pregnant femaleWistar rats were treated with Lycopene 10% CWS containing a low concentrationof apo-12’-lycopenal (batch No. 20/93-2) or Lycopene 10% CWS with anapproximate 10-fold excess of apo-12’-lycopenal (mixture of batch Nos 7/95-1 andRS2/95-70). The formulations were given as a dietary admixture at concentrationscalculated to provide lycopene at a dose of 1000 mg/kg bw per day or 1000 mg oflycopene + 20 mg of apo-12’-lycopenal/kg bw per day, respectively, from days 6 to18 of gestation, followed by caesarian section on day 21 of gestation. A controlgroup receiving a placebo beadlet formulation (batch No. 19/93-3) was alsoincluded, following the same protocol. Observations included clinical signs andmeasurement of body weight and food consumption. At necropsy, uterus andovaries were examined for reproductive parameters and internal organs wereexamined macroscopically. Fetuses were examined for external, visceral andskeletal deviations. The study followed OECD guideline 414 (1981), however withless than the recommended number of pregnant animals, and was certified tocomply with GLP and QA.
42 LYCOPENE (SYNTHETIC)

Tab
le 2
. Stu
die
s o
f g
eno
toxi
city
wit
h ly
cop
ene
(syn
thet
ic)
End
-poi
ntT
est s
yste
mT
est s
ubst
ance
Con
cent
ratio
nR
esul
tR
efer
ence
In v
itro
Rev
erse
mut
atio
nS
. typ
him
uriu
m T
A98
,T
A10
0, T
A15
35, T
A15
37E
. col
i WP
2 uv
rA
Lyco
pene
10
CW
Da
(in w
ater
)20
–5 0
00 μ
g/pl
ate,
± S
9N
egat
iveb
BA
SF
(20
00)
Rev
erse
mut
atio
nS
. typ
him
uriu
m T
A97
, TA
98,
TA
100,
TA
102,
TA
1535
,T
A15
37 E
. col
i WP
2 uv
rA
Lyco
pene
c (in
DM
SO
)1.
6–1
000
g/pl
ate,
± S
9N
egat
ived
Goc
ke (
1996
); M
cCla
in &
Bau
sch
(200
3)
Rev
erse
mut
atio
nS
. typ
him
uriu
m T
A97
, TA
100
Lyco
pene
, deg
rade
de
(in D
MS
O)
250–
1 00
0 g/
plat
e, ±
S9
Pos
itive
fG
ocke
(19
96);
McC
lain
&B
ausc
h (2
003)
Rev
erse
mut
atio
nS
. typ
him
uriu
m T
A97
, TA
98,
TA
100,
TA
102,
TA
1535
,T
A15
37 E
. col
i WP
2 uv
rA
Lyco
pene
10%
CW
Sg
(in w
ater
)10
0–10
000
g/
plat
e, ±
S9
Neg
ativ
ehG
ocke
(19
96);
McC
lain
&B
ausc
h (2
003)
Rev
erse
mut
atio
nS
. typ
him
uriu
m T
A97
, TA
100
Lyco
pene
10%
CW
S,
aged
i (in
wat
er)
100–
10 0
00
g/pl
ate,
± S
9N
egat
iveh
Goc
ke (
1996
); M
cCla
in &
Bau
sch
(200
3)
Rev
erse
mut
atio
nS
. typ
him
uriu
m T
A97
, TA
98,
TA
100,
TA
102,
TA
1535
Lyco
pene
10%
WS
j (in
wat
er)
100–
10 0
00
g/pl
ate,
± S
9N
egat
ivek
Goc
ke (
1999
); M
cCla
in &
Bau
sch
(200
3)
Rev
erse
mut
atio
nS
. typ
him
uriu
m T
A97
, TA
98,
TA
100,
TA
102,
TA
1535
Lyco
pene
10%
FS
l (in
acet
one)
100–
10 0
00
g/pl
ate,
± S
9N
egat
ivem
Goc
ke (
2000
); M
cCla
in &
Bau
sch
(200
3)
Gen
e m
utat
ion
Mou
se ly
mph
oma
L157
8YT
k+/- c
ells
Lyco
pene
10%
CW
S (
intr
eatm
ent m
ediu
m)
6.25
–400
μg/
ml,
– S
9;12
.5–8
00 μ
g/m
l, +
S9
Neg
ativ
enM
uste
r (1
996a
); M
cCla
in &
Bau
sch
(200
3)
LYCOPENE (SYNTHETIC) 43

Tab
le 2
(co
ntd)
End
-poi
ntT
est s
yste
mT
est s
ubst
ance
Con
cent
ratio
nR
esul
tR
efer
ence
Chr
omos
omal
abe
rrat
ion
Chi
nese
ham
ster
V79
cells
Lyco
pene
10
CW
D (
inw
ater
)F
irst e
xper
imen
t: 15
6.25
,31
2.5,
or
625
μg/m
l, –S
9;62
5, 1
250,
or
2500
μg/
ml,
+S
9S
econ
d ex
perim
ent:
300,
600,
or
1200
μg/
ml,
–S9;
p
1200
μg/
ml,
–S9;
q 60
0,12
00, o
r 24
00 μ
g/m
l, +
S9q
Thi
rd e
xper
imen
t: 10
00,
1200
, or
1400
μg/
ml,
–S9
Neg
ativ
eo
Wea
k po
sitiv
er
Pos
itive
s
BA
SF
(20
01c)
Chr
omos
omal
abe
rrat
ion
Hum
an ly
mph
ocyt
esLy
cope
ne 1
0% C
WS
(in
cultu
re m
ediu
m)
250–
1000
g/
ml,
–S9;
250
–25
00
g/m
l, +
S9
Neg
ativ
etM
iller
(19
96a)
; McC
lain
& B
ausc
h (2
003)
In v
ivo
Mic
ronu
cleu
s fo
rmat
ion
Mou
se b
one
mar
row
Lyco
pene
10
CW
D (
inw
ater
)50
0, 1
000,
or
2000
mg/
kgbw
, 2 x
intr
aper
itone
al d
ose
with
an
inte
rval
of 2
4 h
Neg
ativ
euB
AS
F (
2001
d)
Mic
ronu
cleu
s fo
rmat
ion
Mou
se b
one
mar
row
Lyco
pene
10%
CW
S (i
nw
ater
)10
70, 2
140,
or
4280
mg/
kgbw
, 2 x
ora
l dos
e w
ith a
nin
terv
al o
f 24
h
Neg
ativ
evM
iller
(19
96b)
; McC
lain
& B
ausc
h (2
003)
Mic
ronu
cleu
s fo
rmat
ion
Mou
se b
one
mar
row
Lyco
pene
10%
CW
S,
aged
w (
in w
ater
)21
40 o
r 42
80 m
g/kg
bw
, 2 x
oral
dos
e w
ith a
n in
terv
al o
f24
h
Neg
ativ
evM
iller
(19
96b)
; McC
lain
& B
ausc
h (2
003)
44 LYCOPENE (SYNTHETIC)

Tab
le 2
(co
ntd)
End
-poi
ntT
est s
yste
mT
est s
ubst
ance
Con
cent
ratio
nR
esul
tR
efer
ence
Mic
ronu
cleu
s fo
rmat
ion
Mou
se p
erip
hera
l blo
odLy
cope
ne 1
0% C
WS
in s
oft d
rink
50 m
g of
lyco
pene
/l, a
dlib
itum
for
14 d
aysx
Neg
ativ
eM
uste
r (1
999)
;M
cCla
in &
Bau
sch
(200
3)
Mic
ronu
cleu
s fo
rmat
ion
Mou
se p
erip
hera
l blo
odLy
cope
ne 1
0% C
WS
in s
oft d
rink,
age
dy
25 o
r 50
mg
of ly
cope
ne/l,
ad li
bitu
m fo
r 14
day
sz
Neg
ativ
eM
uste
r (1
999)
;M
cCla
in &
Bau
sch
(200
3)
Uns
ched
uled
DN
Asy
nthe
sis
Rat
hep
atoc
ytes
Lyco
pene
10
CW
D (
inw
ater
)10
00 o
r 20
00 m
g/kg
bw
,si
ngle
ora
l dos
eN
egat
iveaa
BA
SF
(20
01e)
Uns
ched
uled
DN
Asy
nthe
sis
Rat
hep
atoc
ytes
Lyco
pene
10%
CW
S(in
wat
er)
6000
mg/
kg b
w, s
ingl
eor
al d
ose
Neg
ativ
eabM
uste
r (1
996b
);M
cCla
in &
Bau
sch
(200
3)
Uns
ched
uled
DN
Asy
nthe
sis
Rat
hep
atoc
ytes
Lyco
pene
10%
CW
S,
aged
w (
in w
ater
)60
00 m
g/kg
bw
, sin
gle
oral
dos
eN
egat
iveab
Mus
ter
(199
6b);
McC
lain
& B
ausc
h(2
003)
DM
SO
, dim
ethy
l sul
foxi
de; S
9, 9
000
× g
sup
erna
tant
from
rat
live
ra
Bat
ch N
o. O
D-1
2-04
6.S
pr.A
, con
tain
ing
9.81
% ly
cope
ne, e
xcep
t for
the
assa
y fo
r un
sche
dule
d D
NA
syn
thes
is in
viv
o, w
here
the
sam
e ba
tch
was
repo
rted
to c
onta
in 9
.3%
lyco
pene
.b W
ith a
nd w
ithou
t met
abol
ic a
ctiv
atio
n fr
om S
9, u
sing
bot
h th
e pl
ate
inco
rpor
atio
n m
etho
d an
d th
e pr
einc
ubat
ion
met
hod.
No
cyto
toxi
city
or p
reci
pita
tion
was
obs
erve
d.c B
atch
No.
DV
-111
255;
pur
ity, 9
9.74
%.
d With
and
with
out m
etab
olic
act
ivat
ion
from
S9,
usi
ng b
oth
the
plat
e in
corp
orat
ion
met
hod
and
the
prei
ncub
atio
n m
etho
d. N
o cy
toto
xici
ty w
as o
bser
ved.
Pre
cipi
tatio
n w
as o
bser
ved
at 2
00 a
nd 1
000
μg/p
late
. Pre
viou
s ex
perim
ents
with
a le
ss p
ure
batc
h of
cry
stal
line
lyco
pene
(pu
rity,
96%
) sh
owed
posi
tive
effe
cts,
esp
ecia
lly w
ith s
trai
ns T
A10
0 an
d T
A97
. Thi
s w
as o
win
g to
a m
utag
enic
impu
rity,
as
dem
onst
rate
d by
the
nega
tive
resu
lts fo
r pu
recr
ysta
lline
lyco
pene
.
LYCOPENE (SYNTHETIC) 45

Tab
le 2
(co
ntd)
e B
atch
No.
DV
-111
255;
pur
ity, 9
9.74
%, d
egra
ded
by e
xpos
ure
to a
ir or
a c
ombi
natio
n of
air,
ligh
t and
roo
m te
mpe
ratu
re.
f Onl
y w
ithou
t met
abol
ic a
ctiv
atio
n fr
om S
9, a
nd m
ore
pron
ounc
ed in
TA
100
than
in T
A97
. Pre
incu
batio
n m
etho
d w
as u
sed,
with
pre
cipi
tatio
n ob
serv
edat
all
conc
entr
atio
ns, b
ut n
o cy
toto
xici
ty. A
dditi
onal
exp
erim
ents
sho
wed
that
the
form
atio
n of
mut
agen
ic d
egra
datio
n pr
oduc
tsby
oxi
dativ
e pr
oces
ses
can
be r
educ
ed b
y ad
ding
ant
ioxi
dant
s lik
e D
L--t
ocop
hero
l.g
Bat
ch N
o. 7
/95-
1, c
onta
inin
g 11
.5%
/10.
9% ly
cope
ne (
by U
V/H
PLC
, res
pect
ivel
y).
h W
ith a
nd w
ithou
t met
abol
ic a
ctiv
atio
n fr
om S
9, u
sing
the
prei
ncub
atio
n m
etho
d. N
o cy
toto
xici
ty w
as o
bser
ved.
Red
par
ticle
s ob
serv
ed a
t 10
000
μg/
plat
e di
d no
t allo
w e
valu
atio
n of
bac
kgro
und
grow
th.
i Bat
ch N
o. 7
/95-
1, c
onta
inin
g 11
.5%
/10.
9% ly
cope
ne (
by U
V/H
PLC
, res
pect
ivel
y), a
fter
stre
ss s
tora
ge (
unde
r ai
r in
dar
k bo
ttle
at 4
5 C
for
1, 2
, 4, o
r8
wee
ks).
j Bat
ch N
o. R
S2/
99-1
05, c
onta
inin
g 10
.4%
lyco
pene
and
0.1
9% C
25-ly
copy
l-ald
ehyd
e (b
y H
PLC
).k W
ith a
nd w
ithou
t met
abol
ic a
ctiv
atio
n fr
om S
9, u
sing
the
prei
ncub
atio
n m
etho
d. R
eddi
sh p
reci
pita
tion
was
obs
erve
d at
10
000
μg/p
late
, not
allo
win
gev
alua
tion
of b
ackg
roun
d gr
owth
and
nec
essi
tatin
g m
anua
l cou
ntin
g. C
ytot
oxic
ity w
as o
nly
obse
rved
at 3
160
μg/p
late
for
TA
102
with
out S
9.l B
atch
No.
UE
0000
2004
, con
tain
ing
10.5
% ly
cope
ne (
by U
V).
m W
ith a
nd w
ithou
t met
abol
ic a
ctiv
atio
n fr
om S
9, u
sing
bot
h th
e pl
ate
inco
rpor
atio
n m
etho
d an
d th
e pr
einc
ubat
ion
met
hod.
Red
dish
pre
cipi
tatio
n w
asob
serv
ed a
t 316
μg/
plat
e an
d gr
eate
r. C
ytot
oxic
ity w
as n
ot o
bser
ved.
n W
ith a
nd w
ithou
t met
abol
ic a
ctiv
atio
n fr
om S
9. C
ytot
oxic
ity w
as o
bser
ved
at 4
00 (
with
out S
9) a
nd 8
00 μ
g/m
l (w
ith S
9).
o W
ith a
nd w
ithou
t met
abol
ic a
ctiv
atio
n fr
om S
9. T
he c
ell c
ultu
res
wer
e tr
eate
d fo
r 4
h w
ithou
t and
with
S9
and
wer
e ha
rves
ted
14 h
late
r. E
ffect
s on
mito
tic in
dex
wer
e on
ly o
bser
ved
with
out S
9, a
t 625
μg/
ml.
p T
he c
ells
wer
e ex
pose
d co
ntin
uous
ly fo
r 18
h a
nd w
ere
then
har
vest
ed. E
ffect
s on
mito
tic in
dex
wer
e ob
serv
ed a
t 600
and
120
0 μg
/ml.
q T
he c
ells
wer
e ex
pose
d co
ntin
uous
ly fo
r 18
h (
with
out S
9) o
r 4
h (w
ith S
9), a
nd w
ere
harv
este
d at
28
h. N
o ef
fect
s on
mito
tic in
dex
wer
e ob
serv
ed.
r Onl
y w
ithou
t met
abol
ic a
ctiv
atio
n fr
om S
9, a
t a h
arve
st ti
me
of 2
8 h.
A s
light
, not
sta
tistic
ally
sig
nific
ant i
ncre
ase
in s
truc
tura
l abe
rrat
ions
was
obs
erve
d.s T
he c
ell c
ultu
res
wer
e tr
eate
d fo
r 18
h a
nd w
ere
harv
este
d 10
h la
ter.
A d
ose-
depe
nden
t, st
atis
tical
ly s
igni
fican
t inc
reas
e in
str
uctu
ral (
but n
otnu
mer
ical
) ab
erra
tions
was
obs
erve
d at
whi
ch th
e te
st s
ubst
ance
was
inso
lubl
e an
d di
stin
ct p
reci
pita
tion
occu
rred
. Effe
cts
on m
itotic
inde
x w
ere
obse
rved
at 1
400
μg/m
l.t W
ith a
nd w
ithou
t met
abol
ic a
ctiv
atio
n fr
om S
9. In
the
first
exp
erim
ent,
cells
wer
e tr
eate
d co
ntin
uous
ly fo
r 22
h w
ithou
t S9
and
then
har
vest
ed o
r wer
etr
eate
d fo
r 3
h w
ith S
9 an
d ha
rves
ted
19 h
late
r. In
the
seco
nd e
xper
imen
t, th
e ce
ll cu
lture
s w
ere
trea
ted
for
3 h
with
out a
nd w
ith S
9 an
d w
ere
harv
este
d 19
h la
ter.
Cyt
otox
icity
was
obv
ious
at t
he h
ighe
st c
once
ntra
tions
test
ed, a
s in
dica
ted
by a
red
uctio
n of
the
mito
tic in
dex
and
the
num
ber
of c
ells
that
cou
ld b
e ev
alua
ted.
u N
o to
xic
sign
s or
sym
ptom
s w
ere
obse
rved
, and
no
effe
cts
on th
e ra
tio o
f pol
ychr
omat
ic v
ersu
s no
rmoc
hrom
atic
ery
thro
cyte
s.
46 LYCOPENE (SYNTHETIC)

Tab
le 2
(co
ntd)
v No
toxi
c si
gns
or s
ympt
oms
wer
e ob
serv
ed, b
ut th
e ra
tio o
f pol
ychr
omat
ic v
s no
rmoc
hrom
atic
ery
thro
cyte
s w
as s
light
ly r
educ
ed.
w B
atch
No.
7/9
5-1,
con
tain
ing
11.5
%/1
0.9%
lyco
pene
(by
UV
/HP
LC, r
espe
ctiv
ely)
, afte
r st
ress
sto
rage
(un
der
air
in d
ark
bottl
e at
45
˚C fo
r 8
wee
ks).
x Equ
ival
ent t
o a
dose
of l
ycop
ene
of 3
.5-1
1.5
mg/
kg b
w p
er d
ay, e
stim
ated
bas
ed o
n an
ave
rage
(w
ater
) in
take
of 3
-10
ml/d
ay fo
r gr
owin
g m
ice
and
an a
vera
ge b
ody
wei
ght o
f 43.
5 g.
No
toxi
c ef
fect
s w
ere
obse
rved
and
the
ratio
of p
olyc
hrom
atic
vs
norm
ochr
omat
ic e
ryth
rocy
tes
was
not
affe
cted
.y A
fter
stor
age
at 4
5 ˚C
for
4 w
eeks
in th
e da
rk.
z Equ
ival
ent t
o a
dose
of l
ycop
ene
of 1
.7-5
.8 o
r 3.
5-11
.5 m
g/kg
bw
per
day
, est
imat
ed b
ased
on
an a
vera
ge (
wat
er)
inta
ke o
f 3-1
0 m
l/day
for
grow
ing
mic
e an
d an
ave
rage
bod
y w
eigh
t of 4
3.5
g. N
o to
xic
effe
cts
wer
e ob
serv
ed a
nd th
e ra
tio o
f pol
ychr
omat
ic v
s no
rmoc
hrom
atic
ery
thro
cyte
s w
as n
otaf
fect
ed.
aa N
o to
xic
sign
s or
sym
ptom
s w
ere
obse
rved
.ab
No
sign
s of
toxi
city
or
cyto
toxi
city
wer
e ob
serv
ed.
LYCOPENE (SYNTHETIC) 47

No effects were observed on body weight and food consumption. In 13 outof 14 females of the group receiving lycopene + apo-12’-lycopenal, yellowish fat inthe abdominal cavity was noted. Reproductive parameters evaluated (numbers ofcorpora lutea, implantations, resorptions and live/dead fetuses, fetal body weightand sex ratio) were not affected. Fetal examination showed an increased incidenceof extra-thoracic (14th) ribs in the lycopene group compared with the group receivinglycopene + apo-12’-lycopenal and the control group (26.1, 16.8, and 14.7%,respectively). Co-administration of apo-12’-lycopenal at a concentration of 2% inthe formulation (relative to lycopene) did thus not result in substance-related effects(Eckhardt, 1996; McClain & Bausch, 2003).
In a study to examine the effects of lycopene on embryonic and fetaldevelopment, groups of mated female Wistar rats were given diets admixed withLycopene 10% WS beadlets (batch No. UT02070001; 13.2% synthetic lycopene)from day 5 (implantation) through to day 21 post coitum (the day of scheduledcaesarean section), at target doses of lycopene of 50, 150, and 500 mg/kg bw perday. There were two control groups, one receiving standard diet, and the otherreceiving placebo-control beadlets (batch No. UT02111005). Each group consistedof 22 mated female rats, with an additional three mated female rats per group in thethree groups receiving lycopene for exposure monitoring. From the latter animals,blood was taken on days 6 and 21 post coitum. The study followed OECD guideline414 (2001), and was certified to comply with GLP and QA.
Analysis of plasma samples showed systemic absorption of Lycopene 10%WS beadlets in all three treated groups, without clear dose-dependency. For allgroups, higher mean values were observed in the plasma on day 20 than on day 6.No mortalities occurred and no clinical signs were observed, except for discolouredfaeces in all animals treated with lycopene. No treatment-related effects on bodyweight and food consumption were observed. In beadlet controls and females atthe highest dose, postimplantation loss (which was caused by embryonic rather thanfetal resorptions) was slightly increased above control and historical control values.Although examination of fetuses showed some differences in individual visceral andskeletal findings between treated groups and (historical) controls (among which left-sided umbilical artery, abnormally shaped sternebrae and vertebral bodies, andnon-ossified cervical vertebral bodies), treatment with lycopene did not increase theoverall number of external, visceral and skeletal abnormalities and variations. Mostfindings were common variations or abnormalities for the rat strain used. The NOELfor maternal and developmental toxicity was 500 mg/kg bw per day, the highestdose tested (Edwards et al., 2004b).
In a study of developmental toxicity, groups of 25 pregnant Sprague-Dawleyrats were given water, or Lycopene 10 CWD (500, 1500, or 3000 mg/kg bw per day),Lycopene 10 CWD formulation matrix (3000 mg/kg bw per day), LycoVit 10% (3000mg/kg bw per day), or LycoVit 10% formulation matrix (3000 mg/kg bw per day) bygavage on day 6 to day 19 post-coitum. These doses correspond to approximatelycopene dosages of 50, 150, and 300 mg/kg bw per day for Lycopene 10 CWD(batch No. OD-12-04 6.Spr.A, containing 9.81% synthetic lycopene) and 300 mg/kg bw per day for LycoVit 10% (batch No. 20014372, containing 10.8% synthetic
48 LYCOPENE (SYNTHETIC)

lycopene). The animals were sacrificed on day 20 post coitum. The study followedOECD guideline 414 (draft of 1999), and was certified for compliance with GLP and QA.
Red-coloured faeces were observed from day 7 or 8 post-coitum at allfemales receiving Lycopene 10 CWD or LycoVit. Some other clinical observations(e.g. regurgitation) reflected systemic responses to the high viscosity and largevolumes of the test and control substances administered. At necropsy, the animalstreated with lycopene animals showed thick reddish contents in the intestines (witha dose-dependent increase) or stomach. Maternal food consumption, body-weightgain and gravid uterus weight were not affected by treatment. At caesarian section,some small, not statistically significant changes were observed in the numbers ofimplantation sites and fetuses per dam (slight decrease) and in early resorptionsand postimplantation loss (slight increase) in females receiving Lycopene 10 CWD(no dose–response relationship) and LycoVit when compared with placebo andvehicle controls. Fetal body weights were not affected by treatment. No treatment-related effects on external and soft tissue malformations and variations wereobserved. Treatment with lycopene also did not affect skeletal malformations. Therewas a large number of skeletal variations and cartilage in fetuses from all groups,mostly related to incomplete or absent ossification. Generally, fetal and litterincidences were similar in treated and control groups, and were consistent withhistorical control data. Despite some differences in individual findings (includingincomplete ossification and absence of cartilage of the supraoccipital, parietal andhyoid bones), the overall rate of skeletal variations and cartilage did not differbetween groups. Given the absence of relevant toxicological findings with bothlycopene formulations, the NOEL for both maternal and developmental toxicity wasapproximately 300 mg of lycopene/kg bw per day, the highest dose tested (BASF,2001f; Christian et al., 2003).
Rabbits
In order to find appropriate doses for the main study, a preliminary study ofprenatal developmental toxicity was conducted in groups of five mated Himalayanrabbits receiving either placebo beadlets (batch No. UT02111005) or Lycopene10% WS beadlets (batch No. UT02070002; 13.2% synthetic lycopene) at a dailydose of lycopene of 0 or 400 mg/kg bw (divided between two doses), respectively,by gavage from day 6 until day 27 of gestation. Since analysis of plasma samplesand liver samples at termination demonstrated the presence of systemic absorption,it was concluded that the maximum practical dose caused no apparent maternaland embryo-fetal toxicity and was an appropriate highest dose for the main study(Edwards et al., 2004c).
In the main study, groups of 20 mated female Himalayan rabbits were givenLycopene 10% WS beadlets (batch No. UT02070001; 13.2% synthetic lycopene)at a dose of lycopene of 0 (beadlet control), 50, 150, or 400 mg/kg bw per day bygavage (twice daily) from day 6 until to day 27 post coitum, with caesarean sectioncarried out on day 28 post coitum. Exposure was monitored by blood sampling fromfour animals per group on days 6 and 27 post coitum. The study followed OECDguideline 414 (2001), and was certified to comply with GLP and QA
LYCOPENE (SYNTHETIC) 49

Systemic absorption of lycopene was demonstrated in all groups receivingLycopene 10% WS beadlets, both on day 6 and day 27 post coitum, without cleardose-dependency. For all groups, the mean plasma concentrations of lycopenewere slightly higher on day 6 than on day 27 post coitum. At 50, 150, and 400 mg/kg bw per day, red faeces were noted from day 6 post coitum until termination.During necropsy, reddish stomach content was noted for one female at 50 mg/kgbw per day and for most females at 150 and 400 mg/kg bw per day. At 50 and at400 mg/kg bw per day, a single female was found dead in each group; these deathswere assumed to be caused by oesophageal reflux and aspiration of the veryviscous suspension of the test item. Treatment with lycopene had no apparent effecton food consumption and body-weight gain. One female at the highest dosedelivered pre-term on day 28 post coitum. One female in the beadlet control groupand one female at the highest dose had total postimplantation loss. Excluding thesetwo females, postimplantation loss (which concerned embryonic rather than fetalresorptions) was slightly increased in females at the lowest and intermediate dosewhen compared with the control group and with historical controls, but not in femalesat the highest dose. The number of fetuses per dam and fetal weights were notaffected by treatment. Identical to the preliminary study, examination of the fetusesdid not reveal any differences in total numbers of litters and fetuses with externaland fresh visceral findings, although some individual findings differed betweengroups (including sutural bone between frontals, absence of accessory lung lobe,and additional ossification of forelimb and hindlimb). Given the absence of relevanttoxicological findings, the NOEL for maternal and developmental toxicity was 400 mgof lycopene/kg bw per day, the highest dose tested (Edwards et al., 2004d).
In a study of the potential developmental toxicity of two synthetic lycopeneformulations (Lycopene 10 CWD and LycoVit 10%), groups of 25–34 pregnant NewZealand White rabbits were given water, Lycopene 10 CWD (500, 1500, or 2000mg/kg bw per day), Lycopene 10 CWD formulation matrix (2000 mg/kg bw per day),LycoVit 10% (2000 mg/kg bw per day), or LycoVit 10% formulation matrix (2000 mg/kg bw per day) by gavage from day 6 until day 28 post-coitum. These correspondto approximate lycopene dosages of 50, 150, and 200 mg/kg bw per day fromLycopene 10 CWD (batch No. OD-13-10 Fass 1, containing 10% synthetic lyco-pene) and 200 mg/kg bw per day from LycoVit 10% (batch No. 80000007, containing10% synthetic lycopene). The animals were sacrificed on day 29 post coitum. Thestudy followed OECD guideline 414 (draft of 2000), and was certified to comply withGLP and QA.
Red-coloured faeces were observed for all females receiving Lycopene10 CWD or LycoVit. There was a high rate of mortality in the groups given Lycopene10 CWD, which was, in part, related to regurgitation after gavage and accidentalaspiration of stomach contents into the lungs, owing to the high viscosity, largevolume and possibly bad taste/odour of the test substance. Other observations inthe animals treated with lycopene included breathing problems and alteredgastointestinal motility and, at necropsy, red material in stomach, intestines and, insome decedent animals, lungs. Compared with vehicle controls, food consumptionwas reduced in the group receiving Lycopene 10 CWD at the highest dose duringdays 6 to 25 of gestation, accompanied by a slightly reduced body-weight gain
50 LYCOPENE (SYNTHETIC)

( 9%) over the whole treatment period in this group. The reduced food consumptionwas most probably associated with the high viscosity of the preparation at thehighest dose. Food consumption was also slightly reduced in both matrix controlgroups during days 6 to 29, resulting in a slight decrease in body-weight gain ( 10%)only for the LycoVit matrix group. No treatment-related effects on external and softtissue malformations and variations were observed. There were a large number ofskeletal variations and cartilage in fetuses from all groups, including controls, mostlyrelated to incomplete or absent ossification. For most findings there was norelationship with lycopene treatment. For some individual findings (e.g. unossifiedor incomplete ossification of the 5th and 6th sternebrae) the incidences were slightlyincreased in the group receiving LycoVit, while for the overall rate of skeletalvariations and cartilage this was not the case. Given the inherent variability inossification in term fetuses, the skeletal findings are not considered to be relatedto treatment. It can be concluded that in rabbits, more than in rats, gavageadministration of the viscous, gelatinous suspensions of Lycopene 10 CWD orLycoVit 10% at maximum dosage volumes affected the animals’ ability to retain theintubated test material and altered the animals’ gastrointestinal motility, contributingto maternal stress and in some cases maternal deaths. Despite these difficulties,no direct toxic effect of lycopene on maternal animals or fetuses was observed.Noting also that the amount and mode of administration is not representativefor human exposure to lycopene from food or dietary supplements, for bothformulations the NOEL for both maternal and developmental toxicity wasapproximately 200 mg of lycopene/kg bw per day, the highest dose tested (BASF,2001g; Christian et al., 2003).
2.2.6 Additional toxicological data on impurities/reaction by-products
Since most of the available toxicological studies were performed withformulations of synthetic lycopene complying with the specifications, the safety ofany impurities/reaction by-products present (if any) has been implicitly tested at theirmaximum permissible levels. Additional data were, however, available for apo-12’-lycopenal and TPPO.
Three studies were available that were conducted with 10% syntheticlycopene formulations containing an enhanced content of apo-12’-lycopenal (up to2% relative to lycopene). These studies, i.e. a 4-week study of toxicity in rats(Niederhauser et al., 1996), a study of developmental toxicity in rats (Eckhardt,1996), and a test for gene mutations in vitro in Salmonella typhimurium (Gocke,1999), have been summarized in sections 2.2.2, 2.2.4 and 2.2.5(b) of thismonograph, respectively. In these studies, apo-12’-lycopenal did not inducesubstance-related effects.
TPPO gave negative results in a test for gene mutations in vitro in S.typhimurium strains TA97, TA98, TA100, TA102, and TA1535, at concentrations of31.6–3160 μg/plate with and without metabolic activation, and using both the plateincorporation method and the preincubation method (Gocke, 1998). Additionally,limited information on the toxicity of TPPO was available from a public database(EC-ECB, 2000). The original studies were, however, not available to theCommittee. In a 3-month feeding study in Sprague-Dawley rats given TPPO at a
LYCOPENE (SYNTHETIC) 51

dose of 20, 100, 500 or 2500 mg/kg feed, followed by a 7-week recovery period,TPPO was reported to have resulted in clinical signs, reduced feed consumptionand body-weight gain, haematological and biochemical alterations, increased organweights, hepatic degeneration, and death. The NOEL was 20 mg/kg feed,equivalent to 1 mg/kg bw per day. When administered to beagle dogs at doses of20, 200, 2000, or 10 000 mg/kg feed for 3 months, no effects were observed at 20and 200 mg/kg feed, while clinical signs, haematological and biochemicalalterations, emaciation, liver damage, atrophy of the skeletal musculature, anddeath were observed at 2000 and 10 000 mg/kg feed. The NOEL was 200 mg/kgfeed, equivalent to 5 mg/kg bw per day. TPPO gave negative results in a test forgene mutations in vitro in S. typhimurium strains TA98, TA100 and TA1537, atconcentrations of 4–2500 μg/plate with and without metabolic activation.
2.3 Observations in humans
A number of epidemiological studies were provided on the purported healthbenefits of lycopene. A review of these studies is however beyond the scope of thismonograph dealing with the safety aspects of lycopene.
Most studies in humans reported in literature (see summaries in section 2.3of the monograph ‘Lycopene from Blakeslea trispora’, in this volume), althoughnot specifically designed to assess the safety of lycopene, revealed no adverseeffects after administration of dietary lycopene. There are, however, case reportsof yellow-orange skin discoloration and/or gastrointestinal discomfort afterprolonged high intakes of lycopene-rich food and supplements. This so-calledlycopenodermia is reversible upon cessation of lycopene ingestion.
3. DIETARY INTAKE
3.1 Introduction
Lycopene is a naturally-occurring pigment found in a number of fruits andvegetables, notably tomato, watermelon, guava, pink grapefruit, and apricot. It isalso produced by a number of algae and fungi. These foods are common to mostcultures; therefore, lycopene is already part of the diet. Because of evidence thatthe consumption of lycopene is associated with some potential health benefits, foodprocessors are seeking to add lycopene to processed foods. Such foods include:flavoured dairy beverages, yogurts, candies, cereals, soups, salad dressings,sauces, fruit and vegetable juices, sports drinks, carbonated beverages, and cerealand energy bars. Additionally, lycopene is available directly as a dietary supplement.The Committee considered the additional exposure to lycopene from its proposedfood uses in context with the naturally-occurring background intake from food.
The Committee received dossiers concerning lycopene exposure from threefood-ingredient processors and obtained additional information from the publishedliterature and national government sources (BASF, 2006; DSM, 2006; Vitatene,2006). Lycopene can be obtained from a number of sources: extracted from fruits,such as tomatoes or watermelons, extracted from fungi, such as B. trispora, or
52 LYCOPENE (SYNTHETIC)

chemically synthesized from smaller organic starting materials. Although theCommittee was asked to evaluate both synthetic lycopene and lycopene derivedfrom B. trispora, the proposed food uses/use levels for lycopene from B. trisporaencompass those of synthetic lycopene (with the single exception of cereal bars),therefore the estimated exposure was considered together. Although purifiedlycopene is unstable in the presence of light and temperatures above roomtemperature, it is known to be stable in a food matrix (processed tomato products)(Agarwal et al., 2001).
3.2 Background exposure to lycopene from food
Concentrations of lycopene in fruit and vegetables typically vary fromapproximately 1 mg/100 g of fresh fruit to 20 mg/100 g, with some specially-bredtomatoes having concentrations reaching 40 mg/100 g. In processed tomatoproducts, such as ketchup, juice, and pastes, the lycopene can be concentrated toup to 100 mg/100 g of food (Lugasi et al., 2003). National dietary exposures tolycopene have been estimated and reported in the literature. Table 3 summarizessome of these estimates. The estimates consistently range from approximately 1 to10 mg/person per day, with the sole exception of a Canadian study that showedbackground intakes of approximately 25 mg/day. The Committee noted that theconcentrations of lycopene measured in foods and used in this exposure study wereconsistently three to five times higher than those used in the other studies. Noexplanation of these high levels was reported. An international estimate of lycopeneintake from food was prepared using the Global Environment Monitoring System—Food Contamination Monitoring and Assessment Programme (GEMS/Food) re-gional diets. Based primarily on intake of tomatoes, the estimates ranged from 1 to7 mg/person per day in the five regional diets (DSM, 2006).
Table 3. National estimates of lycopene intake from natural dietary sources
Country Intake(s) (mg/person per day) Reference
Canada 6.3, 25 Johnson-Down et al. (2002);Agarwal et al. (2001)
Finland 0.8 Järvinen (1995)
France 2.0 DSM (2006)
Germany 1.3 Pelz et al. (1998)
Hungary 4.4 Lugasi et al. (2003)
Netherlands 1.3 Goldbohm et al. (1998)
United Kingdom 1.0, 5.0 Scott et al. (1996); DSM (2006)
United States of America 0.6, 1.6 Vanden Langenberg et al. (1996)
3.7, 3.1, 11 Forman et al. (1993); Yong et al.(1994); McClain & Bausch (2003)
LYCOPENE (SYNTHETIC) 53

In a submission to the US Food and Drug Administration’s GenerallyRecognized As Safe (GRAS) notification programme, a food-ingredient processorestimated that mean background intake of lycopene from food in the USA was8.2 mg/day (GRN 156; US Food and Drug Administration, 2002b). According to aintake (GRN 119; US Food and Drug Administration, 2002a, 2002b). Theseestimates are consistent with the reported national estimates and the GEMS/Foodinternational estimates.
3.3 Exposure to added lycopene from proposed food uses
The Committee considered the proposed uses for lycopene in numerousfood categories, including flavoured dairy beverages, yogurts, candies, cereals,soups, salad dressings, sauces, fruit and vegetable juices, sports drinks,carbonated beverages, and cereal and energy bars. Table 4 contains proposed foodcategories and associated use levels for the lycopene from B. trispora. The foodcategory system (Annex B) of the General Standard for Food Additives (GSFA) ofthe Codex Alimentarius Commission [CODEX STAN 192-1995 (Rev. 6-2005)] wasused to classify the uses. The highest use level proposed (either for the USA or theEU) appears in the table. These food category/use level combinations were usedwith food intake information from the US Continuing Survey of Food Intake byIndividuals (1994–6, 1998 supplement) and the UK National Diet and NutritionSurvey (NDNS; 1992–1993, 1997) to derive estimates of added lycopene intake forthe USA and European populations (Table 5 and Table 6, respectively). Foodintakes from a Dutch Survey (DNFCS-3, 1997–8) were combined with foodcategory/use level combinations (Table 7) from the synthetic-lycopene dossier toestimate intake from that source (Table 8). Additional analyses using food intakedata from France and the UK were provided; estimated intakes were less than thosepresented in Table 8 and are not presented in this monograph (DSM, 2006).
Table 4. Proposed food uses for lycopene from Blakeslea trispora
Food category Use level (mg/kg)
01.0 Dairy products and analogues
01.1.2 Cultured dairy drinks 20
01.1.2 Dairy-based fruit drinks 20
01.7 Gelatin desserts, puddings, and custards 25
02.0 Fats, oils, and fat emulsions
0.2.2.2 Table fat spreads 5
05.0 Confectionery
05.2.1 Hard candy 25
05.2.2 Jelly products 25
05.4 Decorations, fillings, and icings 25
06.0 Cereals and cereal products
06.3 Ready-to-eat cereals 50
54 LYCOPENE (SYNTHETIC)

Food category Use level (mg/kg)
07.0 Bakery wares
07.1.2 Crackers 30
12.0 Salts, spices, soups, salads, protein products, and fermentedsoybean products
12.5.1 Prepared and condensed soups 7
12.5.2 Dry soup mixes 575
12.6.1 Low-fat salad dressings 20
12.6.2 Tomato-based gravies and specialty sauces 50
12.6.2 Non-emulsified sauces, seasonings, relishes, and pickles 50
12.9 Meat substitutes 50
13.0 Foodstuffs intended for particular nutritional uses
13.4 Dairy- and non-dairy-based meal replacement beverages 25
14.0 Non-dairy beverages
14.1.2.1 Fruit juices 25
14.1.3.1 Fruit nectars 25
14.1.4 Energy, sport, and isotonic drinks 25
14.1.4.2 Fruit-flavoured drinks 25
15.0 Ready-to-eat savouries
15.1 Nutrient bars 50
15.1 Salty snacks 30
From General Standard for Food Additives of the Codex Alimentarius Commission (CODEXSTAN 192-1995, Rev. 6, 2005).
Table 5. Summary of the estimated daily intake of lycopene from Blakesleatrispora in the USA, 1994–1996, 1998 USDA CSFII data
Populationgroup
Agegroup(years)
Percentage ofusers
ActualNo. oftotalusers
Intake (mg/person per day)
All-person All-user
Mean 90thpercentile
Mean 90thpercentile
Infants 0–2 78.7 2591 6.7 15.4 8.5 17.0
Children 3–11 99.6 6132 10.7 19.5 10.8 19.5
Femaleteenagers
12–19 98.8 707 10.6 21.3 10.7 21.6
Maleteenagers
12–19 98.1 714 13.1 27.1 13.3 27.1
LYCOPENE (SYNTHETIC) 55

Populationgroup
Agegroup(years)
Percentage ofusers
ActualNo. oftotalusers
Intake (mg/person per day)
All-person All-user
Mean 90thpercentile
Mean 90thpercentile
Femaleadults
20 andolder
97.2 4534 7.1 15.2 7.3 15.3
Male adults 20 andolder
96.5 4834 9.6 20.4 10.0 20.9
From 1994–1996, 1998 USDA CSFII data
Table 6. Summary of the estimated daily intake of lycopene from Blakesleatrispora in the UK, 1992–1993 and 1997
Populationgroup
Agegroup(years)
Percentageof users
No. oftotalusers
Intake (mg/person per day)
All-personconsumption
All-userconsumption
Mean 90th%ile
95th%ile
Mean 90th%ile
95th%ile
Children 1.5–4.5 95.5 1574 7.6 14.6 18.7 7.9 14.7 19.0
Young people 4–10 97.5 816 8.3 15.8 18.3 8.5 15.9 18.6
Femaleteenagers
11–18 93.5 417 6.4 13.6 15.9 6.7 14.1 16.5
Maleteenagers
11–18 92.3 384 7.6 16.6 20.8 8.3 17.0 21.5
Female adults 16–64 72.4 694 3.1 7.7 10.6 4.0 8.6 12.0
Male adults 16–64 71.5 548 3.5 9.0 11.5 4.5 10.0 13.2
%tile: percentileFrom UK National Diet and Nutrition Survey data, 1992–1993 and 1997
Table 7. Proposed food uses for synthetic lycopene
Food category Use level (mg/kg)
Fruit and vegetable juice 25
Fruit juice drinks 25
Soft drinks 25
Squash 25
56 LYCOPENE (SYNTHETIC)

Food category Use level (mg/kg)
Sports and energy drinks 25
Dairy fruit drinks 25
Yogurt, yogurt drinks 50
Cereals 80
Cereal bars 80
Crackers 100
Margarine, low-fat spreads 40
Hard candy 70
Table 8. Estimated daily intake of synthetic lycopene, Netherlands 1997– 1998
Intake (mg/person per day)
All-person All-user
Population group(years)
N Mean 50th % ile 95th % ile N Mean 50th % ile 95th % ile
Child aged 1–3 254 13.2 11.8 29.2 253 13.2 11.8 29.2
Boys aged 4–9 242 15.9 15.0 29.6 241 16.0 15.0 29.6
Girls aged 4–9 272 15.0 14.1 28.4 272 15.0 14.1 28.4
Males aged 10–18 391 18.9 17.7 36.8 390 18.9 17.7 36.8
Females aged 10–18 380 16.5 14.9 32.7 380 16.5 14.9 32.7
Males aged 19 andolder
2117 8.8 6.5 24.9 2042 9.1 6.7 25.2
Females aged 19and older
2544 8.3 6.2 22.7 2431 8.7 6.6 22.9
%ile: percentileFrom Dutch DNFCS-3, 1997–98 data
Each of the analyses suggests that an intake of approximately 30 mg/daycould be expected for a consumer at or above the 95th percentile of the intakedistribution. This high-percentile intake is approximately 10 times greater than meanbackground intakes of lycopene (it would be expected that high-percentilebackground intake might be two or more times greater than the mean). Theconservatisms in each analysis have been noted: all foods that might contain addedlycopene would do so, and at the proposed maximum use level. Because theconcentrations for food additive use are approximately four times higher than theconcentrations needed to colour food, the estimated intake of 30 mg/person per daycovers uses of lycopene as a food colour.
LYCOPENE (SYNTHETIC) 57

4. COMMENTS
Toxicological data
The Committee considered the results of a large number of studies ofpharmacokinetics and metabolism, acute toxicity, short- and long-term studies oftoxicity, and studies of carcinogenicity, genotoxicity and reproductive toxicity withlycopene. Most of these studies had been performed with formulations of syntheticlycopene complying with the specifications as prepared at the present meeting, andmet appropriate standards for study protocol and conduct.
In rats given a single oral dose of a formulation containing 10% radiolabelledsynthetic lycopene, lycopene was rapidly but poorly absorbed. Owing to the poorabsorption (less than 10% of the administered dose), concentrations of radioactivityin organs and tissues were low, with highest concentrations being found in the liver,and lower concentrations in the spleen, adipose tissue and adrenals. In rats,repeated oral doses of formulations containing 10% synthetic lycopene and oflycopene from tomato concentrate also resulted in the accumulation of lycopene inthe liver (with higher concentrations in females than in males), and to a lesser extentin spleen and adipose tissue. This accumulation in the liver was associated withpigment deposits in hepatocytes, both with synthetic lycopene and with lycopenefrom tomato concentrate, although higher doses of the latter were necessary toinduce the same level of effect. In the rat body, the isomeric ratio changed to favourcis isomers, the percentage of cis isomers of lycopene being higher in plasma andmost tissues, including liver, than in the test material. Trans to cis isomerization wasalso observed in dogs. Studies in dogs and monkeys confirmed that the highestconcentrations of lycopene accumulate in the liver.
In humans, absorption of formulated synthetic lycopene was comparable toabsorption of lycopene contained in tomato-based products. As in laboratoryspecies, the systemic availability of lycopene in humans is generally low, but canbe increased in the presence of dietary fat. The most abundant isomers in humanplasma are all-trans-lycopene and 5-cis-lycopene, with all the cis isomerscontributing to more than 50% of total lycopene. This isomer ratio differs from thatof synthetic lycopene and lycopene in food, indicating that conversions take placeafter ingestion, as was also shown in laboratory species.
Little is known about the metabolism or degradation of lycopene in mammals.It is not converted to vitamin A. In rats, non-characterized polar metabolites arepresent in tissues and excreta. In humans, the proposed metabolic pathwayinvolves oxidation of lycopene to lycopene 5,6-oxide, which subsequentlyundergoes cyclization and enzymatic reduction to form an epimeric mixture of 2,6-cyclolycopene-1,2-diol.
When administered orally as a formulation containing 10% syntheticlycopene, the LD50 for lycopene was more than 500 mg/kg bw in rats.
The toxicity of synthetic lycopene was evaluated using the results of short-term studies in which rats were given one of several 10% formulations, either in thediet for 4 or 14 weeks, or by gavage for 3 months. Synthetic lycopene was well
58 LYCOPENE (SYNTHETIC)

tolerated in those studies. A reddish discoloration of the faeces was observed in thefeeding and the gavage studies, owing to excretion of the red-staining testsubstance. The gavage study also showed a red discoloration of contents of thegastrointestinal tract, and the feeding studies showed an orange-reddishdiscoloration of the liver and adipose tissue. The observed discoloration in the liverwas associated with orange-brown pigment deposits in the hepatocytes, with femalerats being more affected than males. There was, however, no histopathologicalevidence of liver damage. The Committee considered that the changes observedin the short-term studies of toxicity did not represent adverse effects. The NOELsfor lycopene were 1000, 500 and 300 mg/kg bw per day for the 4-week, 14-weekand 3-month study, respectively, corresponding to the highest doses tested in thosestudies.
Observations made in short-term studies of toxicity in dogs were consistentwith the findings in rats. When administered in capsules at a dose of 30 mg/kg bwper day for 28 days or 100 mg/kg bw per day for 192 days, synthetic lycopenecaused only a red discoloration of the faeces and liver, respectively, with pigmentbeing detectable in the latter, without associated hepatocellular alterations.
In a long-term study of toxicity, rats received diet mixed with a beadletformulation containing 10% synthetic lycopene at target doses of 0 (untreatedcontrol), 0 (beadlet control), 10, 50, or 250 mg/kg bw per day for 52 weeks, followedby a recovery period of 13 weeks for some of the animals. Treatment-relatedfindings were confined to discoloured faeces/red staining at the lowest, intermediateand highest dose, red contents in the stomach and caecum and yellow connectivetissue in the abdominal cavity at the intermediate and highest dose, and (particularlyin female rats at all doses) golden brown pigment deposits in the liver. The pigmentdeposits were still observed after recovery, albeit to a lesser degree. There was noapparent sign of liver dysfunction but, in contrast to the findings in the short-termstudies of toxicity, the liver pigmentation in hepatocytes and histiocytes wasassociated with a greater incidence and severity of basophilic foci in females at theintermediate and highest dose than in females at the lowest dose or in the controlgroups. The histopathological alterations were considered to be treatment-related.
In a study of carcinogenicity in which diets were mixed with the same beadletformulation containing 10% synthetic lycopene, rats received synthetic lycopene attarget doses of 0 (untreated control), 0 (beadlet control), 2, 10, or 50 mg/kg bw perday for 104 weeks. Again, treatment resulted in a red discoloration of the faeces,red contents in the gastrointestinal tract, and yellow connective tissue at theintermediate and/or highest dose, golden brown pigment deposits in the liver (at alldoses), as well as pigmentation in kidneys (females at the highest dose) andmesenteric and mandibular lymph nodes (at all doses). Liver pigmentation wasobserved in females (in hepatocytes and histiocytes) and, to a lesser degree, inmales (in histiocytes). Histopathologically, the liver pigmentation was associatedwith a greater incidence and severity of eosinophilic foci in males and ofnormochromic and basophilic foci in females, especially at the intermediate andhighest dose, albeit without a consistent dose–response relationship. There was noapparent sign of liver dysfunction. Also, no increase in the incidence of liver tumourswas observed, nor was treatment with lycopene associated with an increase in the
LYCOPENE (SYNTHETIC) 59

incidence of tumours in any other tissue or organ. The histopathological alterationsof liver foci mainly observed at the intermediate and highest dose were consideredto be treatment-related.
Synthetic lycopene has been tested in vitro for its capacity to induce reversemutations in S. typhimurium and E. coli, gene mutations in mouse lymphomaL1578Y Tk+/- cells, and chromosomal aberrations in Chinese hamster V79 cells andhuman lymphocytes. It has also been tested in vivo for its ability to inducemicronucleus formation in bone marrow and peripheral blood cells of mice andunscheduled DNA synthesis in rat hepatocytes. In those studies, severalformulations containing 10% synthetic lycopene were tested, and the outcomeswere predominantly negative. In contrast, when oxidatively degraded, unformulatedsynthetic lycopene was tested for capacity to induce gene mutations in S.typhimurium, the outcome was positive. On the basis of those data and the resultsof the study of carcinogenicity in rats, the Committee concluded that syntheticlycopene, when formulated and, as such protected against oxidative processes, hasno genotoxic or carcinogenic potential.
In a two-generation study of reproductive toxicity, rats received a diet mixedwith a formulation containing 10% synthetic lycopene at target doses of 0, 50, 150,or 500 mg/kg bw per day. In the parental generation, apart from red-coloured faecesand yellow-orange staining of fur/skin/fat/abdominal organs attributable to thecolour of lycopene, treatment with lycopene was only associated with marginaleffects on body weight and food consumption (F1 generation only). Matingperformance and fertility, and survival and growth of the pups were not affected bytreatment with lycopene. The NOELs for parental, reproductive and offspring toxicitywere all 500 mg/kg bw per day, the highest dose tested.
The developmental toxicity of synthetic lycopene was evaluated via studiesin which one of several 10% formulations was administered orally to rats (via dietand via gavage) and rabbits (via gavage) at up to maximum practical doses.Administration via the diet was better tolerated than was administration of largevolumes of the highly viscous test substance via gavage. In all studies, damsshowed red discoloured faeces, and in the gavage studies the contents of thegastrointestinal tract were red. Synthetic lycopene did not affect reproductive or fetalparameters in the studies in rats and rabbits, nor did it increase the overall numberof external, visceral and skeletal abnormalities and variations. Given the absenceof significant toxicological findings, the NOELs for maternal and developmentaltoxicity were 500 and 300 mg/kg bw per day in the feeding and gavage studies inrats, respectively, and 400 and 200 mg/kg bw per day in the gavage studies inrabbits, corresponding to the highest doses tested in those studies.
In reports in the literature, most studies in humans, although not specificallydesigned to assess the safety of lycopene, revealed no adverse effects afteradministration of dietary lycopene. There are, however, case reports of yellow-orange skin discoloration and/or gastrointestinal discomfort after prolonged highintakes of lycopene-rich food and supplements, those effects being reversible uponcessation of lycopene ingestion.
60 LYCOPENE (SYNTHETIC)

Since most of the available toxicological studies were performed withformulations of synthetic lycopene complying with the specifications, the safety ofany impurities/reaction by-products present (if any) has been implicitly tested at theirmaximum permissible levels. Additional toxicological data available on apo- 12’-lycopenal and TPPO did not raise safety concerns.
Dietary exposure assessment
Lycopene is a normal constituent of the human diet owing to its presencein a number of vegetables and fruits. Dietary intakes of lycopene range from 1 to10 mg/person per day, based on published estimates from eight countries.Additional exposure to lycopene would result from its proposed uses in a variety offood types, including flavoured dairy beverages, yogurts, candies, cereals, soups,salad dressings, sauces, fruit and vegetable juices, sports drinks, carbonatedbeverages, and cereal and energy bars. An estimate of high exposure (greater than95th percentile), which includes intake from fruits and vegetables, is 30 mg/personper day. This estimate is based on food intake data from a number of nationalsurveys, combined with proposed maximum levels for use of lycopene in food. Thisestimate is conservatively high in that it is assumed that lycopene would be presentin all foods within a food type, at the maximum use level.
5. EVALUATION
After ingestion, synthetic lycopene is considered to be equivalent tonaturally-occurring dietary lycopene. Being a normal constituent of the human diet,background intake ranging from 1 to 10 mg/person per day, lycopene has a longhistory of consumption. Available data indicate that dietary lycopene is generallywell tolerated in humans. After prolonged high intakes of lycopene-rich food andsupplements, effects limited to yellow-orange skin discoloration and/orgastrointestinal discomfort have been reported. In the available toxicologicalstudies, histopathological alterations of liver foci were observed in rats with syntheticlycopene at doses of greater than or equal to 50 mg/kg bw per day for 1 year and10 mg/kg bw per day for 2 years. The significance of these treatment-relatedalterations for humans is not clear, given that there was no apparent sign of liverdysfunction and that they were without a consistent dose–response relationship.Moreover, although hepatocellular foci are commonly found at a high incidence inthe ageing rat, they are extremely rare in humans. Only in parts of the world where,for example, hepatitis is endemic, low incidences of hepatocellular foci are found.Although foci can be precursors of liver neoplasia in rats, the Committee noted thattreatment with synthetic lycopene did not cause progression of the foci to neoplasiain the 2-year study of carcinogenicity. The Committee also noted that manysubstances that are known to induce liver foci in rodents do not have a similar effectin humans. Taking all this into account, the Committee concluded that the observedhistopathological alterations of liver foci in rats do not raise a safety concern forhumans.
The Committee established an ADI of 0–0.5 mg/kg bw for synthetic lycopenebased on the highest dose of 50 mg/kg bw per day tested in the 104-week study in
LYCOPENE (SYNTHETIC) 61

rats (at which no adverse effects relevant to humans were induced), and a safetyfactor of 100. This ADI was made into a group ADI to include lycopene from B.trispora, which was also under consideration at the present meeting and which wasconsidered to be toxicologically equivalent to chemically synthesized lycopene. Theestimate of high exposure (greater than 95th percentile) of 30 mg/person per day,equivalent to 0.5 mg/kg bw per day, and which includes background exposure, iscompatible with the ADI.
6. REFERENCES
Agarwal, A., Shen, H., Agarwal, S. & Rao, A.V. (2001) Lycopene content of tomato products:its stability, bioavailability and in vivo antioxidant properties. J. Med. Food, 4, 9–15.
Aizawa, K., Inakuma, T. & Oshima, S. (2000) Assessment of the mutagenicity of lycopene bythe Ames test. Nippon Nogeikagaku Kaishi, 74, 679–681 (in Japanese).
BASF (2000) Salmonella typhimurium/Escherichia coli reverse mutation assay (standardplate test and preincubation test) with Lycopene 10 CWD. Unpublished report No.40M0116/004038 from BASF Aktiengesellschaft, Ludwigshafen, Germany.
BASF (2001a) Lycopene 10 CWD – acute oral toxicity study in Wistar rats. Unpublished reportNo. 10A0116/001036 from BASF Aktiengesellschaft, Ludwigshafen, Germany.
BASF (2001b) Lycopene 10 CWD and LycoVit 10% – subchronic toxicity study in Wistar rats;administration by gavage for 3 months. Unpublished report No. 51C0116/00052 fromBASF Aktiengesellschaft, Ludwigshafen, Germany.
BASF (2001c) In vitro chromosome aberration assay with Lycopene 10 CWD in V79 cells.Unpublished report No. 32M0116/004044 from BASF Aktiengesellschaft, Ludwigshafen,Germany.
BASF (2001d) Cytogenetic study in vivo with Lycopene 10 CWD in the mouse micronucleustest after two intraperitoneal administrations. Unpublished report No. 26M0116/004045from BASF Aktiengesellschaft, Ludwigshafen, Germany.
BASF (2001e) In vivo unscheduled DNA synthesis (UDS) assay with Lycopene 10 CWD in rathepatocytes single oral administration. Unpublished report No. 80M0116/004146 fromBASF Aktiengesellschaft, Ludwigshafen, Germany.
BASF (2001f) Lycopene 10 CWD and LycoVit 10% – prenatal developmental toxicity study inSprague-Dawley rats; oral administration (gavage). Unpublished report No. 20267 RSR(30R0116/009011) from Centre International de Toxicologie, Evreux, France. Submittedto WHO by BASF Aktiengesellschaft, Ludwigshafen, Germany.
BASF (2001g) Lycopene 10 CWD and LycoVit 10% – prenatal developmental toxicity studyin New Zealand White rabbits; oral administration (gavage). Unpublished report No. 20459RSR (40R0116/009017) from Centre International de Toxicologie, Evreux, France.Submitted to WHO by BASF Aktiengesellschaft, Ludwigshafen, Germany.
BASF (2006) Dossier on exposure to lycopene. Submitted to WH0 by BASF.Böhm, V. & Bitsch, R. (1999) Intestinal absorption of lycopene from different matrices and
interactions to other carotenoids, the lipid status, and the antioxidant capacity of humanplasma. Eur. J. Nutr., 38, 118–125.
Boileau, A.C., Merchen, N.R., Wasson, K., Atkinson, C.A. & Erdman, J.W. Jr (1999) Cis-lycopene is more bioavailable than trans-lycopene in vitro and in vivo in lymph- cannulatedferrets. J. Nutr., 129, 1176–1181.
Boileau, T.W.-M., Boileau, A.C. & Erdman, J.W. Jr (2002) Bioavailability of all-trans and cis-isomers of lycopene. Exp. Biol. Med., 227, 914–919.
Bowen, P.E., Mobarhan, S. & Smith, J.C. Jr (1993) Carotenoid absorption in humans. MethodsEnzymol., 214, 3–17.
62 LYCOPENE (SYNTHETIC)

Brady, W.E., Mares-Perlman, J.A., Bowen, P. & Stacewicz-Sapuntzakis, M. (1996) Humanserum carotenoid concentrations are related to physiologic and lifestyle factors. J. Nutr.,126, 129–137.
Breinholt, V., Lauridsen, S.T., Daneshvar, B. & Jakobsen, J. (2000) Dose-response effects oflycopene on selected drug-metabolizing and antioxidant enzymes in the rat. Cancer Lett.,154, 201–210.
Burri, B.J., Neidlinger, T.R. & Clifford, A.J. (2001) Serum carotenoid depletion follows first-order kinetics in healthy adult women fed naturally low carotenoid diets. J. Nutr., 131,2096–2100.
Buser, S.M. & Urwyler, H. (1996) Ro 01-9251/008 (lycopene): 14-week oral toxicity study inthe rat (feed admix); (Protocol No. 157V94). Unpublished report No. B-161’162 from F.Hoffmann-La Roche Ltd, Basel, Switzerland. Submitted to WHO by DSM NutritionalProducts Ltd, Basel, Switzerland.
Christian, M.S., Schulte, S. & Hellwig, J. (2003) Developmental (embryo-fetal toxicity/teratogenicity) toxicity studies of synthetic crystalline lycopene in rats and rabbits. FoodChem. Toxicol., 41, 773–783.
Codex Alimentarius Commission (2005) Report of the Thirty-seventh Session of the CodexCommittee on Food Additives and Contaminants, The Hague, The Netherlands, 25–29April 2005. Rome, Food and Agriculture Organization of the United Nations, 2005(ALINORM 05/28/12; http://www.codexalimentarius.net/download/report/639/al28_12e.pdf).
Cohn, W., Schalch, W., Aebischer, C. & Schierle, J. (2000) Comparison of lycopeneconcentrations in plasma during and after regular consumption of tablets containingsynthetic lycopene or lycopene from natural sources in the form of tomato juice or tomatosoup (pilot trial). Unpublished report No. B-106’894 from F. Hoffmann-La Roche Ltd, Basel,Switzerland. Submitted to WHO by DSM Nutritional Products Ltd, Basel, Switzerland.
Cohn, W., Thürmann, P., Tenter, U., Aebischer, C., Schierle, J. & Schalch, W. (2004)Comparative multiple dose plasma kinetics of lycopene administered in tomato juice,tomato soup or lycopene tablets. Eur. J. Nutr., 43, 304–312.
Diwadkar-Navsariwala, V., Novotny, J.A., Gustin, D.M., Sosman, J.A., Rodvold, K.A., Crowell,J.A., Stacewicz-Sapuntzakis, M. & Bowen, P.E. (2003) A physiological pharmacokineticmodel describing the disposition of lycopene in healthy men. J. Lipid Res., 44, 1927–1939.
Driskell, J.A., Giraud, D.W., Sun, J. & Martin, H.D. (1996) Plasma concentrations ofcarotenoids and tocopherols in male long-term tobacco chewers, smokers and nonusers.Internat. J. Vit. Nutr. Res., 66, 203–209.
DSM (2006) Dossier on exposure to lycopene. Submitted to WH0 by DSM.EC-ECB (2000) IUCLID Dataset on triphenylphosphine oxide, ID 0789. European Chemicals
Bureau, European Commission.Eckhardt, K. (1996) Ro 01-9251 (lycopene) or Ro 01-9251 (lycopene) plus Ro 40-6113
(lycopene-C25-aldehyde): embryotoxicity and teratogenicity study in rats (feed admixture;Study-No. 175R95). Unpublished report No. B-163’302 from F. Hoffmann-La Roche Ltd,Basel, Switzerland. Submitted to WHO by DSM Nutritional Products Ltd, Basel,Switzerland.
Edwards, J.A., Elste, V., Goelzer, P., Spitzer, V. & Schierle, J. (2002) Lycopene (Ro 01-9251/000): sighting investigation of absorption and tolerance following gavageadministration to the rabbit. Unpublished report No. VFHS 04-2002 (DSM No. 1008910)from Roche Vitamins AG, Basel, Switzerland. Submitted to WHO by DSM NutritionalProducts Ltd, Basel, Switzerland.
Edwards, J.A., Elste, V., Spitzer, V. & Schierle, J. (2004a) Lycopene (Ro 01-9251/000):sighting investigation of absorption and tolerance following gavage (twice daily)administration to the rabbit. Unpublished report No. VFHS 01-2003 (DSM No. 1011619)from DSM Nutritional Products Ltd, Basel, Switzerland.
LYCOPENE (SYNTHETIC) 63

Edwards, J.A., Marburger, A., Schierle, J. & Spitzer, V. (2004b) Lycopene 10% WS beadlets(Ro 01-9251) – prenatal developmental toxicity study in the Han Wistar rat. Unpublishedreport No. 848973 (DSM No. 1016176) from RCC Ltd, Füllinsdorf, Switzerland. Submittedto WHO by DSM Nutritional Products Ltd, Basel, Switzerland.
Edwards, J.A., Marburger, A., Schierle, J. & Spitzer, V. (2004c) Lycopene 10% WS beadlets(Ro 01-9251) – preliminary prenatal developmental toxicity study in the Himalayan rabbit.Unpublished report No. 848971 (DSM No. 1014357) from RCC Ltd, Füllinsdorf,Switzerland. Submitted to WHO by DSM Nutritional Products Ltd, Basel, Switzerland.
Edwards, J.A., Marburger, A., Schierle, J. & Spitzer, V. (2004d) Lycopene 10% WS beadlets(Ro 01-9251) – prenatal developmental toxicity study in the Himalayan rabbit. Unpublishedreport No. 848972 (DSM No. 1014560) from RCC Ltd, Füllinsdorf, Switzerland. Submittedto WHO by DSM Nutritional Products Ltd, Basel, Switzerland.
Edwards, J.A., Marsden, E., Schierle, J. & Spitzer, V. (2005) Lycopene 10% WS beadlets (Ro01-9251) – two generation reproduction study in rats by the oral route (dietary admixture).Unpublished report No. 161/582 (DSM No. 2500018) from MDS Pharma Services, SaintGermain sur L’Arbresle, France. Submitted to WHO by DSM Nutritional Products Ltd,Basel, Switzerland.
Edwards, J.A., Smith, T., Schierle, J. & Decker-Ramanzina, N. (2006) Lycopene 10% WSbeadlets (Ro 01-9251): 104 week oral (dietary) administration carcinogenicity study in therat. Unpublished report No. 2285/001 (DSM No. 2500022) from Covance Laboratories Ltd,Harrogate, United Kingdom. Submitted to WHO by DSM Nutritional Products Ltd, Basel,Switzerland.
Erdman, J.W. Jr, Bierer, T.L. & Gugger, E.T. (1993) Absorption and transport of carotenoids.Ann. NY Acad. Sci., 691, 76–85.
Eustis, S.L., Boorman, G.A., Harada, T. & Popp, J.A. (1990) Liver. In: Boorman, G.A., Eustis,S.L., Elwell, M.R, Montgomery, C.A. Jr & MacKenzie, W.F., eds, Pathology of the Fischerrat – reference and atlas, San Diego: Academic Press Inc., pp. 78–81.
Ferreira, A.L.A., Yeum, K-.J., Russell, R.M., Krinsky, N.I. & Tang, G. (2004) Enzymatic andoxidative metabolites of lycopene. J. Nutr. Biochem., 15, 493–502.
Fielding, J.M., Rowley, K.G., Cooper, P. & O’Dea, K. (2005) Increases in plasma lycopeneconcentration after consumption of tomatoes cooked with olive oil. Asia Pac. J. Clin.Nutr., 14, 131–136.
Forman, M.R., Lanza, E., Yong, L.C., Holden, J.M., Graubard, B.I., Beecher, G.R., Meltiz, M.,Brown, E.D. & Smith, J.C. (1993) The correlation between two dietary assessments ofcarotenoid intake and plasma carotenoid concentrations: application of a carotenoid food-composition database. Am. J. Clin. Nutr., 58, 519–524.
Gärtner, C., Stahl, W. & Sies, H. (1997) Lycopene is more bioavailable from tomato paste thanfrom fresh tomatoes. Am. J. Clin. Nutr., 66, 116–122.
Gaziano, J.M., Johnson, E.J., Russel, R.M., Manson, J.E., Stampfer, M.J., Ridker, P.M., Frei,B., Hennekens, C.H. & Krinski, N.I. (1995) Discrimination in absorption or transport of
-carotene isomers after oral supplementation with either all-trans- or 9-cis- - carotene.Am. J. Clin. Nutr., 61, 1248–1252.
Glatzle, D., Moalli, S., Riss, G., Liechti, H., Matter, U., Goralczyk, R., Jordan, P. & Bausch, J.(1997) Comparative study of rat tissue lycopene levels after administration of Lycopene10% CWS or tomato concentrate as feed admix to male rats for 5 weeks (2 mg lycopene/kg body weight/day) and after subsequent depletion for 3 weeks – exploratory trial Lycopin01-95. Unpublished report No. B-106’836 from F. Hoffmann-La Roche Ltd, Basel,Switzerland. Submitted to WHO by DSM Nutritional Products Ltd, Basel, Switzerland.
Glatzle, D., Moalli, S., Riss, G., Liechti, H., Matter, U., Urwyler, H., Jordan, P., Cohn, W. &Bausch, J. (1998a) Lycopene levels in rat liver and the occurrence of liver deposits afteradministration of Lycopin 10% CWS as feed admix to female rats for up to 64 weeks(10 mg lycopene/kg body weight/day) – exploratory trial Lycopin 01-96. Unpublished report
64 LYCOPENE (SYNTHETIC)

No. B-106’848 from F. Hoffmann-La Roche Ltd, Basel, Switzerland. Submitted to WHO byDSM Nutritional Products Ltd, Basel, Switzerland.
Glatzle, D., Moalli, S., Riss, G., Liechti, H., Urwyler, H., Jordan, P., Cohn, W. & Bausch, J.(1998b) Lycopene depletion in rat liver and the disappearance of liver deposits after feedinga lycopene-free diet subsequent to the administration of Lycopin 10% CWS as feed admixto female rats (5 and 10 mg lycopene/kg body weight/day) – exploratory trial Lycopin 01-97.Unpublished report No. B-106’849 from F. Hoffmann-La Roche Ltd, Basel, Switzerland.Submitted to WHO by DSM Nutritional Products Ltd, Basel, Switzerland.
Glatzle, D., Riss, G., Moalli, S., Urwyler, H., Jordan, P. & Bausch, J. (1998c) Lycopene levelsin rat liver and the occurrence of liver deposits after administration of tomato concentrateor Lycopin 10% CWS as feed admix to female rats for up to 13 weeks (20 mg lycopene/kg body weight/day in the case of tomato concentrate or 5 mg lycopene/kg body weight/day in the case of beadlets) and after depletion up to 12 weeks in the case of tomatoconcentrate – exploratory trial Lycopin 01-98. Unpublished report No. B-106’875 fromF. Hoffmann-La Roche Ltd, Basel, Switzerland. Submitted to WHO by DSM NutritionalProducts Ltd, Basel, Switzerland.
Gocke, E. (1996) Mutagenicity evaluation of various preparations of lycopene (Ro 01-9251)in the Ames test (study Nos 54M94; 22M95; 182M95). Corrected version of the originalreport dated 08.12.1995. Unpublished report No. B-163’291 from F. Hoffmann-La RocheLtd, Basel, Switzerland. Submitted to WHO by DSM Nutritional Products Ltd, Basel,Switzerland.
Gocke, E. (1998) Mutagenicity evaluation of triphenylphosphine oxide, Ro 08-0896/000, in theAmes test (Study No. 154M98). Unpublished report No. B-167’824 from F. Hoffmann-LaRoche Ltd, Basel, Switzerland. Submitted to WHO by DSM Nutritional Products Ltd, Basel,Switzerland.
Gocke, E. (1999) Investigation of a preparation of Lycopene 10% WS containing a specifiedamount of C25-lycopyl-aldehyde for mutagenic activity in the Ames test (Study No.460M99). Unpublished report No. B-170’385 from F. Hoffmann-La Roche Ltd, Basel,Switzerland. Submitted to WHO by DSM Nutritional Products Ltd, Basel, Switzerland.
Gocke, E. (2000) Mutagenicity evaluation of Lycopene 10% FS, a suspension ofmicrocrystalline lycopene (Ro 01-9251/000) in vegetable oil, in the Ames test (Study No.144M00). Unpublished report No. B-171’512 from F. Hoffmann-La Roche Ltd, Basel,Switzerland. Submitted to WHO by DSM Nutritional Products Ltd, Basel, Switzerland.
Goldbohm, R.A., Brants, H.A., Hulshof, K.F. & van den Brandt, P.A. (1998) The contributionof various foods to vitamin A and carotenoids in The Netherlands. Int. J. Vitam. Nutr.Res., 68, 378–383.
Gradelet, S., Astorg, P., Leclerc, J., Chevalier, J., Vernevaut, M.-F. & Siess, M.-H. (1996)Effects of canthaxanthin, astaxanthin, lycopene and lutein on liver xenobiotic-metabolizingenzymes in the rat. Xenobiotica, 26, 49–63.
US Food and Drug Administration (2002a) GRN 119. Submission to the US Food and DrugAdministration (http://www.cfsan.fda.gov/~rdb/opa-gras.html).
US Food and Drug Administration (2002b) GRN 156. Submission to the US Food and DrugAdministration (http://www.cfsan.fda.gov/~rdb/opa-gras.html).
Guttenplan, J.B., Chen, M., Kosinska, W., Thompson, S., Zhao, Z. & Cohen, L.A. (2001)Effects of a lycopene-rich diet on spontaneous and benzo[a]pyrene-induced mutagenesisin prostate, colon and lungs of the lacZ mouse. Cancer Lett., 164, 1–6.
He, Y. & Campbell, T.C. (1990) Effects of carotenoids on aflatoxin B1-induced mutagenesis inS. typhimurium TA 100 and TA 98. Nutr. Cancer, 13, 243–253.
Holloway, D.E., Yang, M., Paganga, G., Rice-Evans, C.A. & Bramley, P.M. (2000)Isomerization of dietary lycopene during assimilation and transport in plasma. Free Rad.Res., 32, 93–102.
LYCOPENE (SYNTHETIC) 65

Hoppe, P.P., Krämer, K., van den Berg, H., Steenge, G. & van Vliet, T. (2003) Synthetic andtomato-based lycopene have identical bioavailability in humans. Eur. J. Nutr., 42,272–278.
Järvinen, R. (1995) Carotenoids, retinoids, tocopherols and tocotrienols in the diet: the FinnishMobile Clinic Health Examination survey. Int. J. Vitam. Nutr. Res., 65, 24–30.
Jewell, C. & O’Brien, N.M. (1999) Effect of dietary supplementation with carotenoids onxenobiotic metabolizing enzymes in the liver, lung, kidney and small intestine of the rat.Br. J. Nutr., 81, 235–242.
Johnson-Down, L., Saudny-Unterberger, H. & Gray-Donald, K. (2002) Food habits ofCanadians: lutein and lycopene intake in the Canadian population. J. Am. Diet. Assoc.,102, 988–991.
Jonker, D., Kuper, C.F., Fraile, N., Estrella, A. & Rodríguez Otero, C. (2003) Ninety-day oraltoxicity study of lycopene from Blakesla trispora in rats. Regul. Toxicol. Pharmacol., 37,396–406.
Khachik, F., Spangler, C.J., Smith, J.C. Jr, Canfield, L.M., Steck, A. & Pfander, H. (1997a)Identification, quantification, and relative concentrations of carotenoids and theirmetabolites in human milk and serum. Anal. Chem., 69, 1873–1881.
Khachik, F., Steck, A. & Pfander, H. (1997b) Bioavailability, metabolism, and possiblemechanism of chemoprevention by lutein and lycopene in humans. In: Ohigashi, H.,Osawa, T., Terao, J., Watanabe, S. & Yoshikawa, T., eds. Food factors for cancerprevention. Tokyo: Springer-Verlag, pp.542–547.
Khachik, F., Steck, A., Niggli, U.A. & Pfander, H. (1998a) Partial synthesis and structuralelucidation of the oxidative metabolites of lycopene identified in tomato paste, tomato juice,and human serum. J. Agric. Food Chem., 46, 4874–4884.
Khachik, F., Pfander, H. & Traber, B. (1998b) Proposed mechanisms for the formation ofsynthetic and naturally occurring metabolites of lycopene in tomato products and humanserum. J. Agric. Food Chem., 46, 4885–4890.
Kim, S.-J., Nara, E., Kobayashi, H., Terao, J. & Nagao, A. (2001) Formation of cleavageproducts by autooxidation of lycopene. Lipids, 36, 191–199.
Korytko, P.J., Rodvold, K.A., Crowell, J.A., Stacewicz-Sapuntzakis, M., Diwadkar-Navsariwala, V., Bowen, P.E., Schalch, W. & Levine, B.S. (2003) Pharmacokinetics andtissue distribution of orally administered lycopene in male dogs. J. Nutr., 133, 2788–2792.
Leo, M.A. & Lieber, C.S. (1999) Alcohol, vitamin A, and -carotene: adverse interactions,including hepatotoxicity and carcinogenicity. Am. J. Clin. Nutr., 69, 1071–1085.
Lugasi, A., Bíró, L., Hóvárie, J., Sági, K.V., Brandt, S. & Barna, E. (2003) Lycopene contentof foods and lycopene intake in two groups of the Hungarian population. Nutr. Res., 23,1035–1044.
Mair, P., Fröscheis, O., Elste, V., Moser, P. & Liechti, H. (2005) Determination of biliaryand urinary metabolites of 14C-lycopene (RO0019251-002-003) following single oraladministration to the rat. Unpublished report No. 2500141 from DSM Nutritional ProductsLtd, Basel, Switzerland.
Mathews-Roth, M.M., Welankiwar, S., Sehgal, P.K., Lausen, N.C.G., Russett, M. & Krinsky,N.I. (1990) Distribution of [14C]canthaxanthin and [14C]lycopene in rats and monkeys.J. Nutr., 120, 1205–1213.
Mayne, S.T., Cartmel, B., Silva, F., Kim, C.S., Fallon, B.G., Briskin, K., Zheng, T., Baum, M.,Shor-Posner, G. & Goodwin, W.J. Jr (1999) Plasma lycopene concentrations in humansare determined by lycopene intake, plasma cholesterol concentrations and selecteddemographic factors. J. Nutr., 129, 849–854.
McClain, R.M. & Bausch, J. (2003) Summary of safety studies conducted with syntheticlycopene. Regul. Toxicol. Pharmacol., 37, 274–285.
66 LYCOPENE (SYNTHETIC)

Mellert, W., Deckardt, K., Gembardt, C., Schulte, S., Van Ravenzwaay, B. & Slesinski, R.S.(2002) Thirteen-week oral toxicity study of synthetic lycopene products in rats. Food Chem.Toxicol., 40, 1581–1588.
Milani, C., Maccari, M. & Mosconi, P. (1970) Action of lycopene in the experimental gastriculcer. Pharmacology, 4, 334–340.
Miller, B. (1996a) Chromosome analysis in human peripheral blood lymphocytes treated invitro with Ro 01-9251 (Lycopene 10% CWS) in the presence and in the absence of ametabolic activation system (study No. 080M95). Unpublished report No. B-164’910 fromF. Hoffmann-La Roche Ltd, Basel, Switzerland. Submitted to WHO by DSM NutritionalProducts Ltd, Basel, Switzerland.
Miller, B. (1996b) Micronucleus test in mouse bone marrow after oral administration of Ro01-9251 (Lycopene 10% CWS) (study No. 200M95). Unpublished report No. B-164’911from F. Hoffmann-La Roche Ltd, Basel, Switzerland. Submitted to WHO by DSM NutritionalProducts Ltd, Basel, Switzerland.
Muster, W. (1996a) Mutagenicity evaluation of Ro 01-9251 (Lycopene 10% CWS) in themouse lymphoma L5178Y Tk+/- cell mutation test (ML/TK) using a fluctuation protocol(study No. 169M95). Unpublished report No. B-163’212 from F. Hoffmann-La Roche Ltd,Basel, Switzerland. Submitted to WHO by DSM Nutritional Products Ltd, Basel,Switzerland.
Muster, W. (1996b) In vivo/in vitro rat hepatocyte DNA repair test with Lycopene 10% CWS(Ro 01-9251), unscheduled DNA synthesis (UDS) test in vivo (study No. 196M95).Unpublished report No. B-163’211 from F. Hoffmann-La Roche Ltd, Basel, Switzerland.Submitted to WHO by DSM Nutritional Products Ltd, Basel, Switzerland.
Muster, W. (1999) Lycopene (Ro 01-9251)-containing soft drinks: micronucleus test (MNT) inperipheral blood of mice. Oral administration (drinking water) (study No. 214M96).Unpublished report No. B-165’536 from F. Hoffmann-La Roche Ltd, Basel, Switzerland.Submitted to WHO by DSM Nutritional Products Ltd, Basel, Switzerland.
Nguyen, M.L. & Schwartz, S.J. (1999) Lycopene: chemical and biological properties. FoodTechnol., 53, 38–45.
Niederhauser, U.B., Urwyler, H. & Schierle, J. (1996) Ro 01-9251/008 (Lycopene 10% CWS):4-week oral toxicity study in rats; a comparison of batches containing low (<0.01%) andhigh (2%) concentrations of the impurity Ro 40-6113 (lycopene C25- aldehyde) (study No.193V95). Unpublished report No. B-164’981 from F. Hoffmann-La Roche Ltd, Basel,Switzerland. Submitted to WHO by DSM Nutritional Products Ltd, Basel, Switzerland.
Paetau, I., Khachik, F., Brown, E.D., Beecher, G.R., Kramer, T.R., Chittams, J. & Clevidence,B.A. (1998) Chronic ingestion of lycopene-rich tomato juice or lycopene supplementssignificantly increases plasma concentrations of lycopene and related tomato carotenoidsin humans. Am. J. Clin. Nutr., 68, 1187–1195.
Pamuk, E.R., Byers, T., Coates, R.J., Vann, J.W., Sowell, A.L., Gunter, E.W. & Glass, D.(1994) Effect of smoking on serum nutrient concentrations in African-American women.Am. J. Clin. Nutr., 59, 891–895.
Parker, R.S. (1996) Absorption, metabolism, and transport of carotenoids. FASEB J., 10,542–551.
Pelz, R., Schmidt-Faber, B. & Heseker, H. (1998) Carotenoid intake in the German NationalFood Consumption Survey. Z. Ernahrungswiss., 37, 319–327.
Peng, Y.-M., Peng, Y.-S., Lin, Y., Moon, T., Roe, D.J. & Ritenbaugh, C. (1995) Concentrationsand plasma-tissue-diet relationships of carotenoids, retinoids, and tocopherols in humans.Nutr. Cancer, 23, 233–246.
Pool-Zobel, B.L., Bub, A., Müller, H., Wollowski, I. & Rechkemmer, G. (1997) Consumption ofvegetables reduces genetic damage in humans: first results of a human intervention trialwith carotenoid-rich foods. Carcinogenesis, 18, 1847–1850.
LYCOPENE (SYNTHETIC) 67

Porrini, M. & Riso, P. (2000) Lymphocyte lycopene concentration and DNA protection fromoxidative damage is increased in women after a short period of tomato consumption. J.Nutr., 130, 189–192.
Rao, A.V. & Agarwal, S. (1998) Bioavailability and in vivo antioxidant properties of lycopenefrom tomato products and their possible role in the prevention of cancer. Nutr. Cancer,31, 199–203.
Rao, A.V. & Agarwal, S. (1999) Role of lycopene as antioxidant carotenoid in the preventionof chronic diseases: a review. Nutr. Res., 19, 305–323.
Redlich, C.A., Grauer, J.N., van Bennekum A.M., Clever, S.L., Ponn, R.B. & Blaner, W.S.(1996) Characterization of carotenoid, vitamin A, and -tocopheral levels in human lungtissue and pulmonary macrophages. Am. J. Respir. Crit. Care Med., 154, 1436–1443.
Riso, P., Pinder, A., Santangelo, A. & Porrini, M. (1999) Does tomato consumption effectivelyincrease the resistance of lymphocyte DNA to oxidative damage? Am. J. Clin. Nutr., 69,712–718.
Rock, C.L., Swendseid, M.E., Jacob, R.A. & McKee, R.W. (1992) Plasma carotenoid levels inhuman subjects fed a low carotenoid diet. J. Nutr., 122, 96–100.
Schierle, J., Bretzel, W., Bühler, I., Faccin, N., Hess, D., Steiner, K. & Schüep, W. (1997)Content and isomeric ratio of lycopene in food and human blood plasma. Food Chem.,59, 459–465.
Schmitz, H.H., Poor, C.L., Wellman, R.B. & Erdman, J.W. Jr (1991) Concentrations of selectedcarotenoids and vitamin A in human liver, kidney and lung tissue. J. Nutr., 121, 1613–1621.
Scott, K.J., Thurnham, D.I., Hart, D.J., Bingham, S.A. & Day, K. (1996) The correlationbetween the intake of lutein, lycopene and -carotene from vegetables and fruits, and bloodplasma concentrations in a group of women aged 50-65 years in the UK. Br. J. Nutr., 75,409–418.
Smith, T., Schierle, J., Spitzer, V. & Edwards, J.A. (2005) Lycopene 10% WS Beadlets (Ro01-9251), 52-week oral (dietary) administration toxicity study in the rat. Unpublished reportNo. 2285/002 (DSM No. 25000020) from Covance Laboratories Ltd, Harrogate, UnitedKingdom. Submitted to WHO by DSM Nutritional Products Ltd, Basel, Switzerland.
Stahl, W. & Sies, H. (1992) Uptake of lycopene and its geometrical isomers is greater fromheat-processed than from unprocessed tomato juice in humans. J. Nutr., 122, 2161–2166.
Su, L.-C. J., Bui, M., Kardinaal, A., Gomez-Aracena, J., Martin-Moreno, J., Martin, B., Thamm,M., Simonsen, N., van’t Veer, P., Kok, F., Strain, S. & Kohlmeier, L. (1998) Differencesbetween plasma and adipose tissue biomarkers of carotenoids and tocopherols. CancerEpidemiol. Biomarkers Prev., 7, 1043–1048.
Tang, G., Ferreira, A.L.A., Grusak, M.A., Qin, J., Dolnikowski, G.G., Russell, R.M. & Krinsky,N.I. (2005) Bioavailability of synthetic and biosynthetic deuterated lycopene in humans. J.Nutr. Biochem., 16, 229–235.
Urwyler, H. & Bohrmann, B. (1998) Morphological examinations in a kinetic study with Ro01-9251 (Lycopin) in female rats (Protocol 01-96). Unpublished report No. B-165’430 fromF. Hoffmann-La Roche Ltd, Basel, Switzerland. Submitted to WHO by DSM NutritionalProducts Ltd, Basel, Switzerland.
Urwyler, H. & Riss, G. (1999) Long-term feeding study of Lycopene (Ro 01-9251) in rats(Protocol R31/97). Unpublished report No. B-165’432 from F. Hoffmann-La Roche Ltd,Basel, Switzerland. Submitted to WHO by DSM Nutritional Products Ltd, Basel,Switzerland.
Vanden Langenberg, G.M., Brady, W.E., Nebeling, L.C., Block, G., Forman, M., Bowen, P.E.,Stacewicz-Sapuntzakis, M. & Mares-Perlman, J.A. (1996) Influence of using differentsources of carotenoid data in epidemiologic studies. J. Am. Diet. Assoc., 96, 1271–1275.
Vitatene (2006) Dossier on exposure to lycopene. Submitted to WH0 by Vitatene.Wahlqvist, M.L., Wattanapenpaiboon, N., Macrae, F.A., Lambert, J.R., MacLennan, R., Hsu-
Hage, B.H.-H. & Australian Polyp Prevention Project Investigators. (1994) Changes in
68 LYCOPENE (SYNTHETIC)

serum carotenoids in subjects with colorectal adenomas after 24 mo of -carotenesupplementation. Am. J. Clin. Nutr., 60, 936–943.
Wendt, G. & Bausch, J. (1995) 14C-Lycopene: absorption, distribution and excretion aftersingle oral administration to untreated and pretreated rats and to bile-duct cannulated rats.Unpublished report No. 364274 (Roche No. B-106’828) from RCC Umweltchemie AG,Itingen, Switzerland. Submitted to WHO by DSM Nutritional Products Ltd, Basel,Switzerland.
Yong, L.C., Forman, M.R., Beecher, G.R., Graubard, B.I., Campbell, W.S., Reichman, M.E.,Taylor, P.R., Lanza, E., Holden, J.M. & Judd, J.T. (1994) Relationship between dietaryintake and plasma concentrations of carotenoids in premenopausal women: application ofthe USDA-NCI carotenoid food-composition database. Am. J. Clin. Nutr., 60, 223–230.
Zaripheh, S. & Erdman, J.W. Jr (2005) The biodistribution of a single oral dose of [14C]-lycopene in rats prefed either a control or lycopene-enriched diet. J. Nutr., 135, 2212–2218.
Zaripheh, S., Boileau, T.W.-M., Lila, M.A. & Erdman, J.W. Jr (2003) [14C]-Lycopene and [14C]-labeled polar products are differentially distributed in tissues of F344 rats prefed lycopene.J. Nutr., 133, 4189–4195.
Zbinden, G. & Studer, A. (1958) Tierexperimentelle Untersuchungen über die chronischeVerträglichkeit von -Carotin, Lycopin, 7,7’-Dihydro- -carotin und Bixin. Z. Lebensmitt.-Unters., 108, 113–134 (in German).
Zhao, Z., Khachik, F., Richie, J.P. Jr & Cohen, L.A. (1998) Lycopene uptake and tissuedisposition in male and female rats. Proc. Soc. Exp. Biol. Med., 218, 109–114.
LYCOPENE (SYNTHETIC) 69


LYCOPENE FROM BLAKESLEA TRISPORA
First draft prepared by
M.E.J. Pronk,1 S.M.G.J. Pelgrom,1 A.G.A.C. Knaap,1 M. DiNovi2 &Z. Olempska-Beer2
1Centre for Substances and Integrated Risk Assessment, National Institutefor Public Health and the Environment, Bilthoven, Netherlands; and
2Center for Food Safety and Applied Nutrition, Food and Drug Administration,College Park, Maryland, USA
Explanation ................................................................................Biological data ...........................................................................
Biochemical aspects ...........................................................Stereochemical isomerism ............................................Specifications ................................................................Absorption, distribution and excretion ...........................Metabolism ...................................................................Effects on enzymes and other biochemical parameters ....................................................................
Toxicological studies ...........................................................Acute toxicity .................................................................Short-term studies of toxicity ........................................Long-term studies of toxicity and carcinogenicity .........Genotoxicity ..................................................................Reproductive toxicity .....................................................
Observations in humans .....................................................Case studies .................................................................Clinical trials ..................................................................
Dietary intake ............................................................................Introduction .........................................................................Background exposure to lycopene from food .....................Exposure to added lycopene from proposed food uses ......
Comments .................................................................................Evaluation ..................................................................................References ................................................................................
1. EXPLANATION
At the request of the Codex Committee on Food Additives and Contaminants(CCFAC) at its Thirty-seventh Session (Codex Alimentarius Commission, 2005),the JECFA Committee at its present meeting evaluated lycopene to be used as afood additive.
Lycopene is a naturally-occurring pigment found in vegetables (especiallytomatoes), fruits, algae and fungi. It can also be synthesized chemically. TheCommittee had previously evaluated lycopene (both natural and synthetic) to be
71727273737478
7879798083838484848788888990949595
- 71 -

used as a food colour at its eighth, eighteenth, and twenty-first meetings (Annex 1,references 8, 35 and 44). The lack of adequate information at those meetingsprecluded the Committee from developing specifications and establishing anacceptable daily intake (ADI) for lycopene to be used as a food colour. Underconsideration at the present meeting were lycopene from the fungus Blakesleatrispora (the subject of this item) and synthetic lycopene (see monograph ‘Lycopene(synthetic)’, in this volume).
Lycopene from B. trispora is obtained by cofermentation of the (+) and (-)sexual mating types of the fungus. It is an intermediate in the biosynthesis of -carotene from B. trispora, the safety of which was evaluated by the Committee atits fifty-seventh meeting (Annex 1, reference 154). The Committee concluded at thatmeeting that the source organism B. trispora is neither pathogenic nor toxigenic,and that the production process and composition of -carotene from B. trispora donot raise safety concerns.
Lycopene is extracted from the biomass of B. trispora and purified bycrystallization and filtration, using the solvents isobutyl acetate and isopropanol. Theprocess by which lycopene is produced from B. trispora is nearly identical to thatused to manufacture -carotene from B. trispora, the only difference being theaddition of imidazole to the fermentation broth to inhibit the formation of - and -carotene from lycopene.
2. BIOLOGICAL DATA
2.1 Biochemical aspects
Lycopene belongs to the family of carotenoids and is a biochemical precursorof higher carotenoids, e.g. -carotene. However, unlike -carotene, lycopene lacks
-ionone ring structure and is therefore devoid of provitamin A activity.
Lycopene from B. trispora is biosynthesized via the same pathway aslycopene produced in the tomato, with the predominant lycopene isomer in thefermentation material being all-trans-lycopene (CAS No. 502-65-8).
The chemical name for lycopene is 2,6,10,14,19,23,27,31-octamethyl-2,6,8,10,12,14,16,18,20,22,24,26,30-dotriacontatridecaene, and synonyms are
, -carotene, all-trans-lycopene, and (all-E)-lycopene. Lycopene is an unsaturatedacyclic hydrocarbon with the chemical structure shown in Figure 1.
Figure 1. Chemical structure of lycopene
CH3 CH3 CH3
CH3
CH3H3C
H3C
CH3 CH3
CH3
all trans-lycopene
72 LYCOPENE FROM BLAKESLEA TRISPORA

2.1.1 Stereochemical isomerism
All carotenoids contain an extended conjugated polyene backbone.Although theoretically each of these carbon–carbon double bonds can exist in eithertrans or cis configurations (also referred to as E- or Z-configurations, respectively),the vast majority of carotenoids, including lycopene, exhibit predominantly the all-trans configuration. Lycopene, however, can undergo conversion of one or more ofits trans-configured carbon–carbon double bonds to the corresponding cis forms, aconversion that occurs more readily than with most other carotenoids. The cisisomers of lycopene have physical and chemical characteristics that are different tothose of all-trans-lycopene, e.g. lower melting points and decreased colour intensity(Nguyen & Schwartz, 1999).
In most natural matriceos, all-trans-lycopene is thus quantitatively the mostimportant isomer.1 Among the naturally-occurring cis isomers, 5-cis-, 9-cis- and 13-cis-lycopene usually predominate. For illustrative purposes, the isomer compositionof lycopene typically found in unprocessed, raw (red) tomatoes and in tomato-basedfoodstuffs is provided in Table 1 (Schierle et al., 1997). It is to be noted that in otherfruits and vegetables, including tangerine-type tomatoes, other cis isomers and/orcis/trans isomer ratios may be prevalent. Processing and storage do not generallyaffect the lycopene content (Nguyen & Schwartz, 1999; Agarwal et al., 2001), butheat treatment has sometimes been reported to result in trans to cis isomerization,leading to a higher content of cis isomers in processed foods. Table 1 also containsdata on lycopene in human plasma, in which lycopene is one of the most abundantcarotenoids. A significant proportion of lycopene in human plasma is present ascis isomers (Khachik et al., 1997a; Schierle et al., 1997).
2.1.2 Specifications
The Committee received one application for lycopene from B. trispora fromVitatene SA.
Lycopene crystals from B. trispora contain at least 95% total lycopene (ofwhich at least 90% is all-trans-lycopene) and up to 5% other carotenoids ( - and- carotene). The extraction solvents isopropanol and isobutyl acetate may be
present in the final product at concentrations of less than 0.1% and 1%, respectively.Imidazole used during fermentation may be found in lycopene at a concentration ofless than 0.0001%.
The purity of lycopene from B. trispora is several times greater than that oflycopene extracted from tomatoes, which contains approximately 5% or more oftotal lycopene, while the cis/trans isomer ratio is comparable in lycopene from bothsources.
Lycopene from B. trispora is a red crystalline powder. It is freely soluble inchloroform and tetrahydrofuran, sparingly soluble in vegetable oils, ether andhexane, and is insoluble in water. Lycopene is sensitive to light, heat and oxygen,but is stable when stored under inert gas in light-proof containers in a cool place.
1 Before 1992 it was not possible to separate 5-cis-lycopene analytically from all-trans-lycopene. Since the separation of the two stereoisomers became a standard only after 1998,earlier reported all-trans-lycopene contents may have been overestimated.
LYCOPENE FROM BLAKESLEA TRISPORA 73

Since it is not possible to get crystalline lycopene into an aqueous solution, andbecause of its susceptibility to oxidative degradation in the presence of light andoxygen, lycopene crystals are not suitable for commercial use. Only formulatedmaterial is marketed for use in food. Lycopene crystals from B. trispora areformulated as suspensions in edible oils or as water dispersible powders, and arestabilized with antioxidants. The other substances present in the marketedformulations (such as sunflower-seed oil and -tocopherol) are common foodingredients and do not raise safety concerns.
2.1.3 Absorption, distribution and excretion
Rats
Using mesenteric lymph-duct cannulated male albino rats as an animalmodel, Clark et al. (1998) investigated the absorption of purified lycopene (fromtomato paste) after continuous infusion with a lipid emulsion (olive oil) containing20 μmol/l of lycopene (2.5 ml/h) via a feeding tube placed into the duodenum. Lymphsamples were collected for analysis at 2-h intervals up to 12 h after the start ofinfusion from three animals. In a second experiment, emulsions with four differentconcentrations of lycopene (5, 10, 15, 20 μmol/l) were intraduodenally infused intothree rats per treatment, and samples of lymph collected at between 6 to 12 h ofinfusion were analysed (representing absorption under steady-state conditions). Ina third experiment the possible interactions of lycopene (20 μmol/l) withcanthaxanthin (20 μmol/l) were studied in four animals per treatment groupAbsorption, calculated by dividing the concentration of lycopene recovered in thelymph per hour by the concentration of lycopene infused into the duodenum perhour, ranged from 2 to 8%, with an average recovery of 6%. Lycopene wasabsorbed intact in a dose-dependent manner, with a steady-state reached in thelymph after 6 h of continuous intraduodenal infusion. Lycopene and canthaxanthindid not significantly affect each other’s absorption (Clark et al., 1998). In an
Table 1. Isomer composition of lycopene in different samples
Sample Isomer (as a percentage of total lycopene)
All-trans-lycopene
5-cis-lycopene
9-cis-lycopene
13-cis- + 15-cis-lycopene
Other cisisomers oflycopene
Raw tomatoes 94–96 3–5 0–1 1 < 1
Cookedtomato-basedfoodstuffs
35–96 4–27 < 1–14 < 1–7 < 1–22
Human bloodplasma
32–46 20–31 1–4 8–19 11–28
From Schierle et al. (1997)
74 LYCOPENE FROM BLAKESLEA TRISPORA

additional study, similar to the second experiment, the effect of different oils (oliveoil and corn oil) on the absorption of lycopene was investigated. Lycopene was lessefficiently absorbed from corn oil emulsions (average recovery, 2.5%) than fromolive oil emulsions (average recovery, 6%) (Clark et al., 2000).
The colonic absorption and distribution of lycopene was investigated infemale Sprague-Dawley rats. Groups of six rats, with or without a single-barreledcolostomy at the mid colon) received a single intragastric or intracolonic dose of12 mg of lycopene (56 mg/kg bw; source not specified) in corn oil or plain corn oil(controls), and were euthanized 24 h after exposure for determination of lycopenecontent in the faeces and tissues (jejunum, colon, liver). Lycopene was detectedin the blood in trace amounts within 4 to 8 h after the single dose, and wassubsequently deposited in the liver, suggesting that lycopene is absorbed from thecolon as well as the small intestine of rats. A large amount of lycopene wasrecovered in the faeces. After intragastric lycopene treatment, lycopene wasdetected in the mucosae of the proximal and distal colon of the colostomized rats(Oshima et al., 1999).
Groups of F344 rats received diets containing lycopene at a concentrationof 0, 0.005, 0.012, 0.024, 0.05, or 0.124% for 10 weeks (equivalent to 0, 2.5, 6, 12,25, or 60 mg of lycopene/kg bw per day, respectively) in a study investigatingthe uptake and tissue disposition of lycopene. There were 10 and 20 animals ofeach sex in the treated and control groups, respectively, and lycopene wasadministered as a tomato oleoresin (Betatene) containing 5.7% carotenoids (3.7%lycopene, 0.04% 2,6-cyclolycopene-1,5-diol and almost 2% others) in medium-chain triglyceride. Approximately 55% of the administered lycopene was recoveredin the faeces. In males and in females, concentrations of lycopene were highest inthe liver (42–120 μg/g of tissue), followed by mammary gland (174–309 ng/g oftissue), serum (145–313 ng/g of tissue), lung (134–227 ng/g of tissue), and prostate(47–97 ng/g of tissue). Tissue concentrations were not related to the doseadministered (Zhao et al., 1998).
Other publications on the kinetics of lycopene in rats have also been provided(Mathews-Roth et al., 1990; Zaripheh et al., 2003; Zaripheh & Erdman, 2005), aswell as publications on the kinetics of lycopene in dogs (Koryotko et al., 2003) andmonkeys (Mathews-Roth et al., 1990). These studies have been summarized insection 2.1.3 of the monograph ‘Lycopene (synthetic)’, in this volume.
Calves
In a 2-week feeding study in preruminant calves, an evaluation was made ofdifferences in lycopene absorption from a synthetic lycopene preparation (LycoVit10%; 10% lycopene) versus lycopene from a natural tomato resin (Lyc-O-MatoBeads 5%; 5% lycopene). Groups of eight calves received lycopene as daily dosesat 15 mg for 14 days in milk-replacer. Plasma was analysed for carotenoids before,directly after and at several time-points during a 10-day post-treatment period. Inplasma, all-trans- and 5-cis-lycopene were present, as well as three lycopenemetabolites not previously found. These metabolites (probably hydrogenationproducts of all-trans- and 5-cis-lycopene) contributed 52% to the total lycopenecontent measured at the end of the intervention period. On days 14 to 21, theconcentration of total lycopene in the plasma in calves receiving lycopene from the
LYCOPENE FROM BLAKESLEA TRISPORA 75

synthetic preparation (216–286 nmol/l) was more than three-fold that in calves fedlycopene from the tomato resin (46–72 nmol/l); however, no differences wereobserved in the distribution of the isomers and metabolites of lycopene (Siciliaet al., 2005).
Humans
No specific studies with lycopene from B. trispora in humans were available,but a number of publications were provided on the kinetics of lycopene in general.These have been summarized below.
Lycopene, like all carotenoids, is fat-soluble and follows the same digestionand intestinal absorption pathways as dietary fat (Rao & Agarwal, 1999). Absorptionof dietary carotenoids begins with their release from the food matrix and dissolutionin the lipid phase, followed by incorporation into lipid micelles in the small intestine,which is required for mucosal uptake, and finally, transport to the lymphatic and/orportal circulation (Erdman et al., 1993; Parker, 1996; Holloway et al., 2000).Movement of carotenoids from the mixed lipid micelle into the mucosal cells of theduodenum appears to occur via passive diffusion, and subsequent transport fromthe enterocytes to the blood stream involves incorporation into chylomicrons (withlycopene in the hydrophobic core), and secretion into the lymphatics. There is noevidence for significant portal absorption of carotenoids in humans (Parker, 1996).Carotenoids are transported in plasma exclusively by lipoprotein, with lycopenebeing transported primarily by low density lipoprotein (LDL) (Erdman et al., 1993;Parker, 1996; Holloway et al., 2000). Lycopene accumulates in tissues rich in LDLreceptors such as liver, adrenals and testes (Holloway et al., 2000). Other humantissues containing detectable concentrations of lycopene include blood plasma,adipose tissue, prostate, and lung (Schmitz et al., 1991; Redlich et al., 1996; Rao& Agarwal, 1999). Reported tissue concentrations of lycopene vary betweenindividuals by about 100-fold (Rao & Agarwal, 1999).
Lycopene is the most predominant carotenoid in human plasma. Lycopenereaches its maximum concentration in the plasma 24–48 h after dosing (Stahl &Sies, 1992) but with repeated dosing the blood concentration continues to rise untila steady state is reached. Rao & Agarwal (1999) reported a half-life of lycopene inplasma in the order of 2–3 days, while Cohn et al. (2004) reported estimated half-lives of 5 and 9 days for all-trans- and 5-cis-lycopene, respectively. When subjectswere given a diet low in or without lycopene, their plasma lycopene concentrationswere significantly lower after 1–2 weeks (Böhm & Bitsch, 1999; Porrini & Riso, 2000;Cohn et al., 2004); half-lives were then estimated to be between 12 and 33 days(Rock et al., 1992; Burri et al., 2001). Besides the effect of dietary fat (and dietaryfibre content) on lycopene bioavailability, a number of conditions have beensuggested to affect the absorption, metabolism or clearance of carotenoids, e.g.smoking and alcohol consumption (Bowen et al., 1993; Gärtner et al., 1997).Smokers have been reported to have lower plasma concentrations of mostcarotenoids than non-smokers. This was also demonstrated for lycopene by Pamuket al. (1994). However, other studies in smokers (Peng et al., 1995; Brady et al.,1996; Driskell et al., 1996; Mayne et al., 1999) showed no effect of smoking onplasma lycopene concentrations. Chronic alcohol consumption has been reported
76 LYCOPENE FROM BLAKESLEA TRISPORA

to decrease dietary absorption of carotenoids (Leo & Lieber, 1999). However, Bradyet al., (1996) found no interaction between alcohol and plasma lycopene.
Plasma lycopene concentrations reported for controls in several studiesranged from 0.2 to 1.9 μmol/l (Schierle et al., 1997; Paetau et al., 1998; Mayneet al., 1999; Porrini & Riso, 2000; Hoppe et al., 2003; Cohn et al., 2004). The mostabundant geometrical isomers in human plasma are all-trans-lycopene and 5-cis-lycopene, with all the cis isomers contributing to more than 50% of total lycopene(see also Table 1; Schierle et al., 1997; Rao & Agarwal, 1999). The most prominentgeometric isomer that occurs in plant sources is all-trans-lycopene. While heattreatment and processing may result in trans- to cis-isomerization, leading toincreases (< 10%) in the cis-lycopene content of foods (Schierle et al., 1997; Boileauet al., 2002), this cannot fully explain the higher concentrations of cis isomers foundin human blood (and tissues) when compared with those in the foods consumed.Hence, biological conversions may take place in humans after consumption(Holloway et al., 2000). Indeed, exposure to low pH in the stomach has been shownto result in a small increase in cis isomers of lycopene (Boileau et al., 2002). It isnot known whether the proportion of cis isomers is increased in plasma because oftheir greater intrinsic bioavailability or because of a faster catabolism of the all-trans isomer in the body, or both. It was speculated that, probably owing to theshorter length of the molecule, their greater solubility in mixed micelles and lowertendency to aggregate, cis isomers are more readily bioavailable (Boileau et al.,1999, 2002).
The bioavailability of carotenoids is affected by food preparation in thepresence of lipids, and the functional status of the intestine. In humans, dependingon the presence of fat in the meal, appreciable quantities of carotenoids areabsorbed and can be found in circulating plasma and later in adipose tissue (Su etal., 1998). Studies have demonstrated that the absorption of lycopene is increasedwhen it is ingested with a high-fat diet. The addition of oil to tomato juice beforeheating also improves lycopene bioavailability (Stahl & Sies, 1992; Fielding et al.,2005). Heat treatment in the processing of raw tomatoes results in the release oflycopene from the cellular matrix, making it more bioavailable (Gärtner et al., 1997).
Studies on the bioavailability of synthetic lycopene and lycopene from naturalsources have reported conflicting results. Some studies did not find a difference inbioavailability between supplements containing natural lycopene extracts andlycopene from tomato products (Paetau et al., 1998; Rao & Agarwal, 1998), whileothers reported that lycopene from tomato juice or lycopene in the form of a tomatooleoresin was clearly better absorbed than lycopene from fresh tomatoes (Böhm &Bitsch, 1999). Tang et al. (2005) reported that lycopene from cooked tomatoes wasabout three times less bioavailable than synthetic lycopene dissolved in corn oil.However, no oil was added to the lycopene extracted from tomatoes, which mighthave had a certain effect on the bioavailability, as was reported by Stahl & Sies(1992) and Fielding et al. (2005). Other studies reported that the bioavailability ofsynthetic lycopene was comparable to that of lycopene extracted from tomatoes inthe form of an oleoresin (Hoppe et al., 2003) or from tomato juice (Paetau et al.,1998). While the absorption of lycopene can be affected by other carotenoids(Wahlqvist et al., 1994; Gaziano et al., 1995), lycopene did not affect the absorption
LYCOPENE FROM BLAKESLEA TRISPORA 77

of other carotenoids like -carotene, -carotene, -cryptoxanthin, zeaxanthin, andlutein (Hoppe et al., 2003).
2.1.4 Metabolism
The metabolic pathway of lycopene has not been fully described. A numberof oxidative metabolites of lycopene have been identified in tomato paste, tomatojuice and in human serum (Khachik et al., 1998a). The major metabolites wereidentified as lycopene 1,2-epoxide and lycopene 5,6-epoxide. Other minormetabolites were also identified, including 2,6-cyclolycopene-1,5-diol I and 2,6-cyclolycopene-1,5-diol II. A few of the metabolites are naturally found in tomatoproducts at low concentrations. In human serum and human milk only 2,6-cyclolycopene-1,5-diol I and 2,6-cyclolycopene-1,5-diol II were found (Khachik etal., 1997a, 1998a). These two epimeric isomers are dihydroxylycopenes with a five-member ring end-group. Apparently, lycopene undergoes oxidation to yieldlycopene 5,6-oxide followed by cyclization and enzymatic reduction to form the twoepimeric isomers of 2,6-cyclolycopene-1,5-diol (Khachik et al., 1997b, 1998b).None of the products formed by cleavage in the respective 11 conjugated doublebonds of lycopene (as described by Kim et al., 2001) were detected in the blood ofhumans.
2.1.5 Effects on enzymes and other biochemical parameters
The effect of the administration of lycopene (purity, 98.7%) in corn oil ondrug-metabolizing enzyme capacity (PROD, EROD, BROD, MROD, QR, UDPGT,and GST)2, antioxidant enzyme activities and the ability to modulate PhIP3-inducedDNA adducts in liver and colon and oxidative stress in blood was investigated inrats. Groups of four female Wistar rats received lycopene at a dose of 0 (corn oilonly), 0.001, 0.005, 0.05 or 0.1 g/kg bw per day for 14 days. Blood was collectedon day 14 before administration of the last dose in order to determine plasmalycopene concentration. The last dose was given in conjunction with tritium-labelledPhIP, and 24 h later, blood was taken, animals were killed and liver was removedfor preparation of subcellular fractions. Plasma lycopene concentrations in thelycopene-supplemented groups were low (16–71 nmol/l), indicating poorabsorption. BROD activity in the liver was induced in a dose-dependent fashion (upto and including 0.05 g/kg bw per day) at all doses investigated. EROD activity wasinduced only at the two highest concentrations tested. The extent of induction,however, was relatively minor for both enzymes (two-fold or less). Neither PRODnor MROD were affected at any dose. An investigation of selected phase IIdetoxification enzymes showed that lycopene is capable of inducing hepatic QR,approximately two-fold, at doses between 0.001 and 0.05 g/kg bw per day, while atthe highest dose of 0.1 g/kg bw per day the activity was comparable to the controllevel. UDPGT and GST activity were only slightly increased (less than two-fold) at
2 EROD: ethoxyresorufin O-deethylase; MROD: methoxyresorufin O-demethylase; PROD:pentoxyresorufin O-dealkylase; BROD: benzyloxyresorufin O-dealkylase; QR: quinonereductase; UDPGT: uridine 5’-diphosphate glucuronosyltransferase; GST: glutathionetransferase.
3 PhIP: 2-amino-1-methyl-6-phenylimidazo [4,5-b]pyridine
78 LYCOPENE FROM BLAKESLEA TRISPORA

0.005 and 0.1 g/kg bw per day, respectively. Investigation of antioxidant enzymesshowed slight induction of superoxide dismutase (SOD), glutathione reductase(GR), glutathione peroxidase (GPx) and catalase (CAT) at the lower doses, whileat the higher doses the (still slightly increased) activities returned to control levels.PhIP-induced oxidative stress in plasma was not affected by lycopene at any dose,nor was the level of PhIP-DNA adducts in liver or colon (Breinholt et al., 2000).
The minor inducing effects of lycopene on drug-metabolizing enzymes asobserved in the above study were not observed in other studies. Gradelet et al.(1996) investigated phase I (PROD, EROD, BROD, MROD, NDMAD, ERDM)4 andphase II xenobiotic-metabolizing enzyme activities (QR, GST, 4NP-UGT, 4-HBP-UGT, ALDH1, ALDH3)5 in liver microsomes and cytosol of five male Wistar ratsgiven diets containing lycopene at 300 mg/kg (as 5% lycopene oleoresin fromtomato, mixed with corn oil) for 15 days. In this study, lycopene only affected theactivity of NDMAD, which was reduced to 60% of the control value. In another study,eight male Wistar rats given 15 g per day of a diet containing 300 mg/kg lycopene(as 3.6% lycopene oleoresin from tomato, mixed with maize oil) for 16 days, afterwhich the effect on xenobiotic metabolizing enzyme activities in the liver, lung,kidney and small intestine was investigated. BROD activity in the lung was reducedto 41% of control value, while other activities (EROD, PROD, MROD, GST) werenot affected by lycopene treatment (Jewell & O’Brien, 1999). With the exception ofhepatic QR, Zaripheh et al. (2005) did not observe changes in the activity of phaseI (EROD, BROD, MROD) and phase II enzymes (QR, GST) in liver and selectedextra-hepatic tissues of F344 rats fed lycopene at a concentration of 0.25 g/kg dietfor periods of 0, 3, 7, 30, or 37 days, or for 30 days followed by a basal diet periodfor 7 days. Hepatic QR was increased in rats receiving the lycopene-supplementeddiet for 3 and 7 days, but not in rats treated for 0, 30, or 37 days. Withdrawal oflycopene from the diet significantly reduced hepatic QR activity compared to theenzyme activity observed at 30 days of treatment.
2.2 Toxicological studies
2.2.1 Acute toxicity
No studies of acute toxicity were available with lycopene from B. trispora.Data were provided on the acute toxicity of lycopene from other natural sources.The acute toxicity of lycopene from a natural tomato oleoresin extract was tested intwo studies stated to be certified in compliance with good laboratory practice (GLP),and which resembled OECD test guidelines 401 (limit test; 1987) and 402 (limit test;1987). Three other studies of acute toxicity have been performed with lycopeneextracted from tomatoes. Details on the conduct of these studies, however, werenot available. The results are summarized in Table 2.
4 NDMAD: N-nitrosodimethylamine N-demethylase; ERDM: erythromycin N-demethylase.5 4NP-UGT: p-nitrophenol UDP glucuronosyltransferase; 4-HBP-UGT: 4-hydroxybiphenyl
UDP glucuronosyl-transferase; ALDH: aldehyde dehydrogenase.
LYCOPENE FROM BLAKESLEA TRISPORA 79

2.2.2 Short-term studies of toxicity
Rats
The possible toxicity of lycopene biomass (biomass of B. trispora; batchNo. LC-411; 4.4% lycopene), extracted from the fermentation manufacturingprocess of lycopene, was examined in a short-term study in male and female Wistarrats. Based on the results of a 21-day range-finding study, groups of 20 rats ofeach sex were given diets containing the dried lycopene biomass at 0, 0.1, 0.3,or 1.0% (w/w) for 28 days, corresponding to mean daily intakes of 0, 90, 272, and906 mg/kg bw in males, and 0, 87, 260, and 868 mg/kg bw in females. The studyfollowed OECD guideline 407 (1995), and was certified for compliance with GLPand quality assurance (QA). Observations included clinical signs, neurobehav-ioural observations and motor activity assessment, growth, food consumption,food conversion efficiency, haematology, clinical chemistry, organ weights, grossnecropsy, and histopathology.
Haematological measurements revealed statistically significant decreasesin mean corpuscular volume and prothrombin time in male rats of the group at 1.0%.The decreases were, however, very small (3% and 6%, respectively), and othererythrocyte or coagulation variables were not significantly affected. Therefore, thesefindings were considered to be of no toxicological relevance. The only finding uponhistopathology was a statistically significantly decreased incidence of ‘increasedhyaline droplet nephropathy’ in males of the group at 1.0% (0 out of 20 versus 5 outof 20 in the control group), which is of no toxicological relevance. All otherobservations did not reveal treatment-related changes (Jonker, 2000).
Groups of 20 male and 20 female Wistar rats were given diets containinglycopene, as a suspension in sunflower-seed oil (20% w/w), at concentrations of 0,0.25, 0.50, and 1.0% for 90 days. The lycopene examined in this study was derivedfrom B. trispora. The sunflower-seed oil was used to balance the level of added fatin the experimental diets, i.e. about 4–5%. The corresponding mean intake oflycopene was calculated to be 0, 145, 291, and 586 mg/kg bw per day for malesand 0, 156, 312, and 616 mg/kg bw per day for females. The study followed OECDguideline 408 (1998), and was stated to be certified for compliance with GLP.Plasma concentrations of lycopene were not determined in this study.
Clinical signs related to treatment with lycopene were limited to pinkdiscoloration of the fur of all animals at the highest dose and many at theintermediate dose, resulting from direct contact with the red-staining lycopenepresent in the dietary admixture. Neurobehavioural testing, including functionalobservational battery and motor activity assessment, and ophthalmologicalexaminations revealed no treatment-related effects.
There were no statistically significant or consistent differences in bodyweights, food or water consumption, organ weights, or in parameters ofhaematology, clinical chemistry or urine analysis between the treated and controlgroups.
The only treatment-related finding upon gross necropsy was a reddishdiscoloration of the contents of the gastrointestinal tract of all treated rats. Thisdiscoloration did not extend to any tissue. Histopathological examination did
80 LYCOPENE FROM BLAKESLEA TRISPORA

not reveal lycopene-related lesions. In the absence of toxicologically relevantfindings, the no-observed-effect level (NOEL) was a dietary concentration of 1.0%lycopene, the highest dose tested, equal to 586 and 616 mg/kg bw per day for malesand females, respectively (Jonker et al., 2003).
The short-term toxicity of a natural tomato oleoresin extract (NTOE) derivedfrom processing tomatoes was investigated in a 13-week study of toxicity in CDrats. Groups of 20 male and 20 female rats were given the NTOE (Lyc-o-mato6%, containing 6% lycopene) at dose of 0, 45, 450, or 4500 mg/kg bw per day dilutedin peroxide-free corn oil and administered by gavage. These doses correspond tointakes of lycopene of 0, 2.7, 27, and 270 mg /kg bw per day, respectively. Bodyweight, food consumption, and clinical signs were observed throughout the study.Analyses of haematology, clinical chemistry, ophthalmoscopy, and urine analysiswere conducted at various time-points through the study. At the end of thestudy, plasma concentration determination, organ weight measurements, andmacroscopic and microscopic evaluation of a number of tissues were conducted.The study was stated to be certified for compliance with GLP.
Absorption was demonstrated by the presence of lycopene in plasma, withsimilar levels for the groups receiving the intermediate or highest dose and a lowerlevel for the group at the lowest dose. Treatment-related signs were restricted tostaining of the faeces (orange-coloured at the lowest dose (males only) andintermediate dose, red-coloured at the highest dose). Body-weight gain, food intake,and food conversion efficiency of treated animals were similar to the controls. Therewere neither ocular lesions nor significant treatment-related differences betweengroups in urine analysis parameters, organ weights, macroscopic and microscopicfindings. Plasma alkaline phosphatase activities of treated animals were lower (not
Table 2. Studies of acute toxicity with natural lycopene
Lycopenepreparation
Species Sex Route LD50 (mg/kg bw) Reference
Lyc-o-mato 6%a
(natural tomatooleoresin extract)
Rat M, F Oral > 5000 Matulka et al.(2004)
Lyc-o-mato 6%(natural tomatooleoresin extract)
Rat M, F Dermal > 2000 Matulka et al.(2004)
Lycopene fromtomatoes
Mouse M Oral > 3000 Milani et al. (1970)
Lycopene fromtomatoes
Mouse M Subcutaneous > 3000 Milani et al. (1970)
Lycopene fromtomatoes
Mouse M Intraperitoneal > 3000 Milani et al. (1970)
M: male; F: femalea A 6% lycopene solution in tomato oleoresins, derived from food-processing tomatoes.
LYCOPENE FROM BLAKESLEA TRISPORA 81

statistically significantly) than those of the controls, which was thought to have beenthe consequence of the smaller volume of corn oil used in the treatment groups.Slightly higher blood urea concentration and leukocyte count and lower bilirubinconcentration in females at the highest dose, and slightly increased platelet valuesin all treated females (no dose–response relationship) were not considered to betoxicologically relevant. The highest dose tested, 4500 mg/kg bw per day, equivalentto 270 mg of lycopene/kg bw per day, was reported to be the NOEL for NTOE(Matulka et al., 2004).
F344 rats received diets containing lycopene at a concentration of 0, 0.005,0.012, 0.024, 0.05, or 0.124% (equivalent to lycopene at 0, 2.5, 6, 12, 25, or60 mg/kg bw per day, respectively) for 10 weeks in a study investigating the uptakeand tissue disposition of lycopene. There were 10 and 20 animals of each sex inthe treated and control groups, respectively, and lycopene was administered as atomato oleoresin (Betatene) containing 5.7% carotenoids (3.7% lycopene and 2%others) in medium-chain triglyceride. No adverse effects of lycopene treatment werenoted on weight gain, behaviour, or coat appearance, with the exception of abrownish discoloration of the tail in a few experimental animals (Zhao et al., 1998).
In studies evaluating the potential effect of lycopene on liver and other tissueenzyme activity, no significant variations in comparison to controls were observedin food intake, body weight, or liver weight in a group of five male Wistar rats givendiets containing lycopene at a concentration of 300 mg/kg (as 5% lycopeneoleoresin from tomato, mixed with corn oil) for 15 days (Gradelet et al., 1996) orgroups of four female Wistar rats receiving gavage administrations of lycopene(purity, 98.7%) in corn oil at doses ranging from 1 to 100 mg/kg bw per day for14 days (Breinholt et al., 2000). Likewise, Jewell & O’Brien (1999) did not observeany differences in food intake, body weight, or organ weights (liver, lung, kidney,small intestine) of eight male Wistar rats receiving 15 g per day of a diet containinglycopene at 300 mg/kg (as 3.6% lycopene oleoresin from tomato, mixed with maizeoil) for 16 days.
Publications on short-term studies of toxicity performed with syntheticlycopene have also been provided. McClain & Bausch (2003) described a 4- and a14-week feeding study in rats, and Mellert et al. (2002) a 3-month study in ratstreated by gavage. Other studies with synthetic lycopene not of classical toxicitydesign included a 30-day and 100-day feeding study in rats (Zaripheh & Erdman,2005; Zbinden & Studer, 1958), and a 28-day and 192-day study in dogs givencapsules (Koryotko et al., 2003; Zbinden & Studer, 1958). All these studies havebeen summarized in section 2.2.2 of the monograph ‘Lycopene (synthetic)’, in thisvolume. Synthetic lycopene was well tolerated in these studies. The only treatment-related findings were a red discoloration of the faeces and, in one study, also ofcontents of the gastrointestinal tract, owing to ingestion and excretion of the red-staining test substance. The liver appeared to be the target organ in the feedingstudies, the discoloration observed being associated with orange-brown pigmentdeposits but not with histopathological liver damage. The Committee consideredthat the observations in the short-term studies of toxicity did not represent adverseeffects. The NOELs for lycopene in the full studies of toxicity were 1000, 500 and
82 LYCOPENE FROM BLAKESLEA TRISPORA

300 mg/kg bw per day for the 4-week, 14-week and 3-month study, respectively,corresponding to the highest doses tested in these studies.
2.2.3 Long-term studies of toxicity and carcinogenicity
No long-term studies of toxicity or carcinogenicity have been conducted withlycopene from B. trispora. Several studies were provided that examined thepotential chemopreventive effects of lycopene on experimentally-induced orspontaneous (one study) tumorigenesis. In these studies, mice were given drinking-water containing lycopene at a concentration of up to 50 mg/l for up to 21 weeks(Kim et al., 1997; Kim et al., 1998), or a diet containing lycopene at a concentrationof 0.5 or 700 mg/kg for 8–13 months or 28 weeks, respectively (Nagasawa et al.,1995; Black, 1998). Rats received lycopene at doses of up to 6 mg per animal twicein one week by gavage (Narisawa et al., 1996), in drinking-water at up to 25 mg/lfor up to 35 weeks (Narisawa et al., 1998; Okajima et al., 1997), in the diet at up to500 mg/kg for up to 19 weeks (Cohen et al., 1999; Jain et al., 1999; Wargovichet al., 2000), or up to 10 mg/kg bw via intraperitoneal injection, for 5 days (Wanget al., 1989) or twice per week for 18 weeks (Sharoni et al., 1997). These studieswere however not designed to examine adverse health effects, so mostly only bodyweights, intakes (food and/or water) and sometimes some organs (weights orhistopathology) were monitored. In general, these parameters did not showintergroup differences, but it must be noted that in almost all studies no appropriatenegative control group (i.e. no carcinogen, and no lycopene) was included. Besides,the duration of treatment in the studies was short-term rather than long-term.
2.2.4 Genotoxicity
The results of two studies of genotoxicity in vitro with lycopene from B.trispora6 are summarized in Table 3 (CTBR, 2003a, 2003b). The studies followedOECD test guidelines 471 (1997) and 473 (1997), and were certified for compliancewith GLP and QA. The results of some studies of genotoxicity with lycopene fromother natural sources, as reported in literature, have also been summarized inTable 3.
A review on studies performed with synthetic lycopene has also beenprovided, in which several studies on genotoxicity in vitro and in vivo have beendescribed (McClain & Bausch, 2003). The studies in vitro concerned gene mutationtests in bacteria (Salmonella typhimurium, Escherichia coli) and mammalian cells(mouse lymphoma L1578Y Tk+/- cells) and a chromosomal aberration test in humanlymphocytes. The studies in vivo included tests for micronucleus formation in mice(bone marrow and peripheral blood) and a test for unscheduled DNA synthesis inrats (liver). All these studies are summarized in Table 2 of the monograph ‘Lycopene(synthetic)’, in this volume. Unformulated synthetic lycopene is sensitive to air andlight, thereby forming mutagenic degradation products. When formulated and assuch protected against oxidative processes, synthetic lycopene gave predominantlynegative results in the studies on genotoxicity.
6 According to the applicant the lycopene tested in the CTBR studies was from Blakesleatrispora. The CTBR reports do not specifically mention the source of lycopene.
LYCOPENE FROM BLAKESLEA TRISPORA 83

2.2.5 Reproductive toxicity
No studies of reproductive or developmental toxicity have been conductedwith lycopene from B. trispora. Three publications were provided, describing atwo-generation study of toxicity in rats (Zbinden & Studer, 1958) and studies ofdevelopmental toxicity in rats and rabbits (Christian et al., 2003; McClain &Bausch, 2003) given synthetic lycopene. These studies have been summarized insection 2.2.5 of the monograph ‘Lycopene (synthetic)’, in this volume. Syntheticlycopene was reported to have not affected normal reproduction. In the studies ofdevelopmental toxicity, synthetic lycopene was generally tolerated well, withoutadverse effects on reproductive parameters or on the growth, survival anddevelopment of offspring. Synthetic lycopene was not teratogenic. As observed inshort-term studies of toxicity, the only treatment-related finding was a reddiscoloration of the faeces and of the contents of the gastrointestinal tract. TheNOEL for maternal and developmental toxicity was approximately 300 mg/kg bwper day for rats and approximately 200 mg/kg bw per day for rabbits, correspondingto the highest doses tested in the studies.
2.3 Observations in humans
2.3.1 Case studies
Reich et al. (1960) reported a case of lycopenodermia occurring in a femaleaged 61 years who consumed 2 l of tomato juice per day for several years (exactduration not specified). The subject suffered from recurrent bouts of abdominal pain,associated with nausea, vomiting and diarrhoea, and presented with orange-yellowdiscoloration of the skin on the hands, forearms, face, and soles of feet. Clinical andchemical investigation revealed unusually high serum lycopene concentrations andhepatic storage of lycopene pigments, as evidenced by large, round vacuolatedparenchymal cells, and the presence of fatty cysts and fine yellow masses. Theauthors concluded that the subject suffered from lycopenodermia, caused by highintakes of lycopene from tomato juice (Reich et al., 1960).
Similar symptoms were reported for a female aged 19 years who consumedfour to five large tomatoes plus pasta with tomato sauce daily for 3 years. A yellow-orange pigmentation was observed on the forehead, nasolabial folds, palms of thehands, and soles of the feet, and recurrent abdominal pain was reported. Hepaticechographia revealed liver alterations caused by deposits of lycopene, and whendietary intake of tomatoes was restricted, there was a complete regression ofpigmentation and the abdominal pain disappeared. Based on clinical features anddietary history, the authors diagnosed the subject with lycopenodermia (La Placaet al., 2000).
Additional case studies documenting incidences of orange-yellow skindiscoloration (e.g. carotenodermia) in individuals consuming diets rich in tomatoesor tomato products (e.g. tomato soup) have been reported (Bonnetblanc et al., 1987;Gandhi et al., 1988), and both have identified the lycopene content of the tomatoes/tomato products as the probable cause of the discoloration.
84 LYCOPENE FROM BLAKESLEA TRISPORA

Tab
le 3
. Stu
die
s o
f g
eno
toxi
city
wit
h ly
cop
ene
fro
m B
lake
slea
tri
spo
ra a
nd
fro
m o
ther
nat
ura
l so
urc
es
End
-poi
ntT
est s
yste
mT
est s
ubst
ance
Con
cent
ratio
nR
esul
tR
efer
ence
In v
itro
Rev
erse
mut
atio
nS
. typ
him
uriu
m T
A98
,T
A10
0Ly
cope
ne fr
om to
mat
opa
ste
(in D
MS
O)
100
μg/p
late
, ± S
9N
egat
ivea
He
& C
ampb
ell (
1990
)
Rev
erse
mut
atio
nS
. typ
him
uriu
m T
A98
,T
A10
0, T
A15
35, T
A15
37E
. col
i WP
2 uv
rA
Lyco
pene
from
tom
ato
past
e (in
DM
SO
)0.
05–5
000
μg/p
late
, ± S
9N
egat
ivea
Aiz
awa
at a
l. (2
000)
Rev
erse
mut
atio
nS
. typ
him
uriu
m T
A98
,T
A10
0, T
A15
35, T
A15
37,
TA
1538
E. c
oli W
P2
uvrA
Lyc-
o-m
ato
6%b
(nat
ural
tom
ato
oleo
resi
nex
trac
t; in
wat
er)
312.
5–50
00 μ
g/pl
ate,
± S
9N
egat
ivec
Mat
ulka
et a
l. (2
004)
Rev
erse
mut
atio
nS
. typ
him
uriu
m T
A98
,T
A10
0, T
A15
35, T
A15
37E
. col
i WP
2 uv
rA
Lyco
pene
20%
CW
Dd
(in w
ater
)U
p to
500
0 μg
/pla
te, ±
S9
Neg
ativ
eeC
TB
R (
2003
a)
Chr
omos
omal
abe
rrat
ion
Hum
an ly
mph
ocyt
esLy
cope
ne 2
0% C
WD
(in w
ater
)12
80, 2
560,
or
5000
μg/
ml,
± S
9N
egat
ivef
CT
BR
(20
03b)
In v
ivo
Mic
ronu
cleu
s fo
rmat
ion
Mou
se p
erip
hera
l blo
odLy
cope
ne in
tom
ato
juic
e (1
:1 d
ilute
d w
ithw
ater
)
54 m
g ly
cope
ne/l,
ad
libitu
mfo
r 14
day
sg
Neg
ativ
eM
cCla
in &
Bau
sch
(200
3)
DN
A d
amag
e (C
omet
assa
y)H
uman
lym
phoc
ytes
Lyco
pene
in to
mat
oju
ice
40 m
g ly
cope
ne/d
ay, f
or2
wee
ksN
egat
iveh
Poo
l-Zob
el e
t al.
(199
7)
DN
A d
amag
e (C
omet
assa
y)H
uman
lym
phoc
ytes
Lyco
pene
in to
mat
opu
rée
16.5
mg
lyco
pene
/day
, for
21 d
ays
Neg
ativ
eiR
iso
et a
l. (1
999)
LYCOPENE FROM BLAKESLEA TRISPORA 85

Tab
le 1
. (co
ntd.
)
Spo
ntan
eous
mut
atio
nLa
cZ m
ouse
DN
Afr
om lu
ng, c
olon
and
pros
tate
Lyco
pene
-ric
h to
mat
ool
eore
sinj
7 or
14
g/kg
die
t, fo
r9
mon
ths
Neg
ativ
eG
utte
npla
n et
al.
(200
1)
DM
SO
, dim
ethy
l sul
foxi
de; S
9, 9
000
× g
supe
rnat
ant f
rom
rat
live
ra
With
and
with
out m
etab
olic
act
ivat
ion
from
S9.
No
furt
her
deta
ils a
vaila
ble.
bA
6%
lyco
pene
sol
utio
n in
tom
ato
oleo
resi
ns, d
eriv
ed fr
om fo
od-p
roce
ssin
g to
mat
oes.
c W
ith a
nd w
ithou
t met
abol
ic a
ctiv
atio
n fr
om S
9, u
sing
the
plat
e in
corp
orat
ion
met
hod.
No
cyto
toxi
city
was
obs
erve
d. P
reci
pita
tion
was
see
n at
500
0μg
/pla
te.
dB
atch
no.
154
LC1,
con
tain
ing
21.2
% ly
cope
ne in
an
octe
nyl s
ucci
nic
anhy
drid
e st
arch
mat
rix w
ith
-toc
ophe
rol.
e With
and
with
out m
etab
olic
act
ivat
ion
from
S9,
usi
ng b
oth
the
plat
e in
corp
orat
ion
met
hod
and
the
prei
ncub
atio
n m
etho
d. N
o cy
toto
xici
ty w
as o
bser
ved.
Red
pre
cipi
tate
was
pre
sent
at a
ll do
ses
but d
id n
ot in
terf
ere
with
sco
ring.
f With
and
with
out m
etab
olic
act
ivat
ion
from
S9.
The
cel
ls w
ere
expo
sed
for
4 h
with
out a
nd w
ith S
9 an
d w
ere
harv
este
d 17
h la
ter,
or
for
21 h
with
out
S9
and
harv
este
d im
med
iate
ly th
erea
fter.
No
effe
cts
on r
elat
ive
mito
tic in
dex
wer
e ob
serv
ed.
gE
quiv
alen
t to
3.7–
12.4
mg
of ly
cope
ne/k
g bw
per
day
, est
imat
ed b
ased
on
an a
vera
ge (w
ater
) int
ake
of 3
-10
ml/d
ay fo
r gro
win
g m
ice
and
an a
vera
gebo
dy w
eigh
t of 4
3.5
g. N
o to
xic
effe
cts
wer
e ob
serv
ed.
h Ly
cope
ne s
uppr
esse
d th
e le
vel o
f DN
A s
tran
d br
eaks
, but
not
the
leve
l of o
xidi
zed
pyrim
idin
e ba
ses.
i Lyc
open
e re
duce
d ly
mph
ocyt
e D
NA
dam
age
as in
duce
d by
hyd
roge
n pe
roxi
de.
j Bet
aten
e, a
5.7
% c
arot
enoi
d su
spen
sion
(3.
7% ly
cope
ne a
nd 2
% o
ther
s) in
med
ium
-cha
in tr
igly
cerid
es.
86 LYCOPENE FROM BLAKESLEA TRISPORA

Hence, prolonged high intakes of lycopene-containing food accompanied byhigh serum concentrations of lycopene can result in a cutaneous disease referredto as lycopenodermia. Lycopenodermia can be accompanied by the presence oflycopene deposits in focal areas of the liver, often resulting in the formation of fattycysts, and by abdominal pain. It is reversible upon cessation of lycopene ingestion.
2.3.2 Clinical trials
A number of clinical trials were provided, mostly with a focus on investigatingthe antioxidant properties of lycopene supplementation. Safety-related end-pointswere only addressed in few of these studies (see short summaries below), but werelimited to reporting of adverse symptoms and/or measurement of somehaematology and clinical chemistry parameters.
In a dietary intervention study in 23 healthy male volunteers, administrationof 40 mg of lycopene (as tomato juice) for 2 weeks was tolerated well and did notsignificantly affect blood haemoglobin, leukocyte count, serum electrolytes, orserum cholesterol (Müller et al., 1999).
In a cross-over dietary intervention study, 19 healthy subjects (10 males and9 females) received daily 39.2 mg of lycopene from spaghetti sauce, 50.4 mg oflycopene from tomato juice, 75 mg of lycopene from tomato oleoresin capsules,and a placebo. All four treatments lasted 1 week, followed by a 1-week washoutphase. Treatment with lycopene had no effect on plasma lipid (total, HDL- andLDL-cholesterol, and triglyceride) concentrations, and no adverse symptoms werereported throughout the duration of the study (Agarwal & Rao, 1998).
No adverse effects were reported in groups of 12 men and 12 womenconsuming daily 15 mg of encapsulated synthetic (LycoVit 10%) or tomato-derivedlycopene (Lyc-O-Mato Beads 5%) in a 28-day study (Hoppe et al., 2003).
After placing 34 healthy female volunteers on a lycopene-rich diet for 1 week(providing approximately 40 mg of lycopene per day), no changes were observedin leukocyte count, lipid profile, liver function tests, and serum creatine kinaseactivity (Chopra et al., 2000).
No effects were found on concentrations of total and HDL-cholesterol, andtriglycerides in groups of female volunteers (six to eight per group) treated for6 weeks with a daily dose of 5 mg of lycopene obtained from three different sources(i.e. tomato oleoresin soft gel capsules, tomato juice, or raw tomatoes) (Böhm &Bitsch, 1999).
In a multi-cohort study in healthy French (38 males and 37 females), Irish(72 males and 66 females), Dutch (33 males and 39 females), and Spanishvolunteers (32 males and 32 females), serum responses to carotenoids andtocopherols were measured upon supplementation with capsules containing 15 mgof carotenoids (carotene-rich palm oil, lutein, or lycopene) in corn oil or corn oilonly (placebo), with or without 100 mg of -tocopherol. The volunteers, dividedinto four groups of each sex per cohort, received supplements over 20 weeks. Inthe first 4 weeks, they received -tocopherol only, in the next 12 weeks eithercarotene-rich palm oil, lutein, lycopene, or placebo, and in the final 4 weeks the
LYCOPENE FROM BLAKESLEA TRISPORA 87

carotenoids/placebo with -tocopherol. Only in the Spanish cohort was monitoringcarried out for biochemical and haematological indices, plasma total, HDL- and LDL-cholesterol concentrations, and any incidences of adverse events. Results ofhaematological analysis and clinical chemistry in this cohort were unremarkableand no significant changes were observed in plasma lipid concentrations.Carotenodermia was reported in 25% of the subjects in the Spanish cohortsupplemented with lycopene, compared with 95% of those supplemented withcarotene and 40% of those supplemented with lutein (Olmedilla et al., 2002).
In a double-blind study conducted by Postaire et al. (1997), healthy subjects(10 per group) received either 26 mg of -carotene plus 4 mg of lycopene per dayor 6 mg of -carotene plus 6 mg of lycopene in capsules for 8 weeks. A slight changein the yellow, but not red, pigmentation of the skin (i.e. carotenodermia) wasobserved in the group receiving -carotene at a high dose. A significant increase inskin melanin concentration was found in both treatment groups.
Prostate cancer patients (n = 32) received approximately 30 mg of lycopeneper day from tomato sauce-based pasta dishes during a 3-week interventionsegment of a clinical trial. Patients were asked to record any gastrointestinaladverse effects (i.e. constipation, burping, gas and/or flatulence, nausea, bloating,diarrhoea, cramping, and heartburn). With the exception of three patients whoreported minor gastrointestinal disturbances, which resolved within a few days, thedietary intervention was well accepted (Chen et al., 2001).
In a randomized clinical trial in 15 patients with prostate cancer, subjectswere treated with 15 mg of lycopene (as Lyc-O-Mato capsules) twice per day for3 weeks, during which time subjects were asked to report any adverse events, andwere subjected to full physical examinations and a complete blood count andchemistry profile assessment. Another group of 11 patients that did not receivelycopene was also monitored. None of the subjects reported any adverse eventsand no abnormalities were observed in blood counts or clinical chemistry (Kucuket al., 2001).
Taken together, these studies show that administration of dietary lycopeneis generally well tolerated, with adverse effects limited to minor gastrointestinaldisturbances in prostate cancer patients and dermal discoloration in healthy peopletreated with lycopene for several weeks.
3. DIETARY INTAKE
3.1 Introduction
Lycopene is a naturally-occurring pigment found in a number of fruits andvegetables, notably tomato, watermelon, guava, pink grapefruit, and apricot. It isalso produced by a number of algae and fungi. These foods are common to mostcultures; therefore, lycopene is already part of the diet. Because of evidence thatthe consumption of lycopene is associated with some potential health benefits, foodprocessors are seeking to add lycopene to processed foods. Such foods include:flavoured dairy beverages, yogurts, candies, cereals, soups, salad dressings,
88 LYCOPENE FROM BLAKESLEA TRISPORA

sauces, fruit and vegetable juices, sports drinks, carbonated beverages, and cerealand energy bars. Additionally, lycopene is available directly as a dietary supplement.The Committee considered the additional exposure to lycopene from its proposedfood uses in context with the naturally-occurring background intake from food.
The Committee received dossiers concerning lycopene exposure from threefood-ingredient processors and obtained additional information from the publishedliterature and national government sources (BASF, 2006; DSM, 2006; Vitatene,2006). Lycopene can be obtained from a number of sources: extracted from fruits,such as tomatoes or watermelons, extracted from fungi, such as Blakesleatrispora, or chemically synthesized from smaller organic starting materials. Althoughthe Committee was asked to evaluate both synthetic lycopene and lycopene derivedfrom B. trispora, the proposed food uses/use levels for lycopene from B. trisporaencompass those of synthetic lycopene (with the single exception of cereal bars),therefore, the estimated exposure was considered together. Although purifiedlycopene is unstable when exposed to light and temperatures above roomtemperature, it is known to be stable in a food matrix (processed tomato products)(Agarwal et al., 2001).
3.2 Background exposure to lycopene from food
Concentrations of lycopene in fruit and vegetables typically vary fromapproximately 1 mg/100 g of fresh fruit to 20 mg/100 g, with some specially-bredtomatoes having concentrations reaching 40 mg/100 g. In processed tomatoproducts, such as ketchup, juice, and pastes, the lycopene can be concentratedto up to 100 mg/100 g food (Lugasi et al., 2003). National dietary exposures tolycopene have been estimated and reported in the literature. Table 4 summarizessome of these estimates. The estimates consistently range from approximately 1 to10 mg/person per day, with the sole exception of a Canadian study that showedbackground intakes of approximately 25 mg/day. The Committee noted that theconcentrations of lycopene measured in foods and used in this exposure study wereconsistently three to five times higher than those used in the other studies. Noexplanation of these high levels was reported. An international estimate of lycopeneintake from food was prepared using the Global Environment Monitoring System—Food Contamination Monitoring and Assessment Programme (GEMS/Food)regional diets. Based primarily on tomato intake, the estimates ranged from 1 to7 mg/person per day in the five regional diets (DSM, 2006).
In a submission to the Food and Drug Administration’s GenerallyRecognized As Safe (GRAS) notification programme, a food-ingredient processorestimated that the mean background intake of lycopene from food in the USA was8.2 mg/day (GRN 156; US Food and Drug Administration, 2002b). According to asecond submission, it was stated that an intake of 5 mg/day was comparable tobackground intake (GRN 119; US Food and Drug Administration, 2002a). Theseestimates are consistent with the reported national estimates and the GEMS/Foodinternational estimates.
LYCOPENE FROM BLAKESLEA TRISPORA 89

3.3 Exposure to added lycopene from proposed food uses
The Committee considered the proposed uses for lycopene in numerousfood categories, including flavoured dairy beverages, yogurts, candies, cereals,soups, salad dressings, sauces, fruit and vegetable juices, sports drinks,carbonated beverages, and cereal and energy bars. Table 5 contains foodcategories and associated proposed use levels for lycopene from B. trispora. Thefood category system (Annex B) of the General Standard for Food Additives (GSFA)of the Codex Alimentarius Commission [CODEX STAN 192-1995 (Rev. 6-2005)]was used to classify the uses. The highest use level proposed (either for the USAor the EU) appears in the table. These food category/use level combinations wereused with food intake information from the US Continuing Survey of Food Intake byIndividuals (1994–6, 1998 supplement) and the UK National Diet and NutritionSurvey (1992–3, 1997) to derive estimates of added lycopene intake for the USAand European populations (Table 6 and Table 7, respectively). Food intakes froma Dutch Survey (DNFCS-3, 1997–8) were combined with food category/use levelcombinations (Table 8) from the dossier concerning synthetic lycopene to estimateintake from that source (Table 9). Additional analyses using French and UK foodintake data were provided; estimated intakes were less than those presented inTable 9, and are not presented in this monograph (DSM, 2006).
Each of the analyses suggests that an intake of approximately 30 mg/daycould be expected for a consumer at or above the 95th percentile of the intakedistribution. This high-percentile intake is approximately 10 times greater thanmean background intakes of lycopene (it would be expected that high-percentilebackground intake might be two or more times greater than the mean). Theconservatisms in each analysis have been noted: all foods that might contain addedlycopene would do so, and at the proposed maximum use level. Because theconcentrations for food additive use are approximately four times higher than thoseneeded to colour food, the estimated intake of 30 mg/person per day covers usesof lycopene as a food colour.
Table 4. National estimates of intake of lycopene from natural dietary sources
Country Intake(s) (mg/person per day) Reference
Canada 6.3, 25 Johnson-Down et al. (2002);Agarwal et al. (2001)
Finland 0.8 Järvinen (1995)
France 2.0 DSM (2006)
Germany 1.3 Pelz et al. (1998)
Hungary 4.4 Lugasi et al. (2003)
Netherlands 1.3 Goldbohm et al. (1998)
United Kingdom 1.0, 5.0 Scott et al. (1996); DSM (2006)
United States of America 0.6, 1.6 Vanden Langenberg et al. (1996)
3.7, 3.1, 11 Forman et al. (1993); Yong et al.(1994); McClain & Bausch (2003)
90 LYCOPENE FROM BLAKESLEA TRISPORA

Table 5. Proposed food uses for lycopene from Blakeslea trispora
Food category Use level (mg/kg)
01.0 Dairy products and analogues
01.1.2 Cultured dairy drinks 20
01.1.2 Dairy-based fruit drinks 20
01.7 Gelatin desserts, puddings, and custards 25
02.0 Fats, oils, and fat emulsions
0.2.2.2 Table fat spreads 5
05.0 Confectionery
05.2.1 Hard candy 25
05.2.2 Jelly products 25
05.4 Decorations, fillings, and icings 25
06.0 Cereals and cereal products
06.3 Ready-to-eat cereals 50
07.0 Bakery wares
07.1.2 Crackers 30
12.0 Salts, spices, soups, salads, protein products, and fermentedsoybean products
12.5.1 Prepared and condensed soups 7
12.5.2 Dry soup mixes 575
12.6.1 Low-fat salad dressings 20
12.6.2 Tomato-based gravies and specialty sauces 50
12.6.2 Non-emulsified sauces, seasonings, relishes, and pickles 50
12.9 Meat substitutes 50
13.0 Foodstuffs intended for particular nutritional uses
13.4 Dairy- and non-dairy-based meal replacement beverages 25
14.0 Non-dairy beverages
14.1.2.1 Fruit juices 25
14.1.3.1 Fruit nectars 25
14.1.4 Energy, sport, and isotonic Drinks 25
14.1.4.2 Fruit-flavoured drinks 25
15.0 Ready-to-eat savouries
15.1 Nutrient bars 50
15.1 Salty snacks 30
From General Standard for Food Additives of the Codex Alimentarius Commission(CODEX STAN 192-1995, Rev. 6, 2005).
LYCOPENE FROM BLAKESLEA TRISPORA 91

Table 6. Summary of the estimated daily intake of lycopene from Blakesleatrispora, USA 1994–1996
Populationgroup
Age group(years)
% Users Actualno. oftotalusers
Consumption (mg/person per day)
All-person All-user
Mean 90thpercentile
Mean 90thpercentile
Infants 0 to 2 78.7 2,591 6.7 15.4 8.5 17.0
Children 3 to 11 99.6 6,132 10.7 19.5 10.8 19.5
Femaleteenagers
12 to 19 98.8 707 10.6 21.3 10.7 21.6
Maleteenagers
12 to 19 98.1 714 13.1 27.1 13.3 27.1
Female adults 20 and up 97.2 4,534 7.1 15.2 7.3 15.3
Male adults 20 and up 96.5 4,834 9.6 20.4 10.0 20.9
From 1998 USDA CSFII Data
Table 7. Summary of the estimated daily intake of lycopene from Blakesleatrispora, UK, 1992–1993, 1997
Populationgroup
Agegroup(years)
% Users No. oftotalusers
Consumption (mg/person per day)
All-person All-user
Mean 90th%ile
95th%ile
Mean 90th%ile
95th%ile
Children 1.5–4.5 95.5 1574 7.6 14.6 18.7 7.9 14.7 19.0
Youngpeople
4–10 97.5 816 8.3 15.8 18.3 8.5 15.9 18.6
Femaleteenagers
11–18 93.5 417 6.4 13.6 15.9 6.7 14.1 16.5
Maleteenagers
11–18 92.3 384 7.6 16.6 20.8 8.3 17.0 21.5
Femaleadults
16–64 72.4 694 3.1 7.7 10.6 4.0 8.6 12.0
Male adults 16–64 71.5 548 3.5 9.0 11.5 4.5 10.0 13.2
%ile: percentile; From UK National Diet and Nutrition Survey data, 1992–1993, 1997.
92 LYCOPENE FROM BLAKESLEA TRISPORA

Table 8. Proposed food uses for synthetic lycopene
Food category Use level (mg/kg)
Fruit and vegetable juice 25
Fruit juice drinks 25
Soft drinks 25
Squash 25
Sports and energy drinks 25
Dairy fruit drinks 25
Yogurt, yogurt drinks 50
Cereals 80
Cereal bars 80
Crackers 100
Margarine, low-fat spreads 40
Hard candy 70
Table 9. Estimated daily intake of synthetic lycopene, Netherlands, 1997–1998
Population group(years)
Intake (mg/person per day)
All-person All-user
N Mean 50th %tile 95th %tile N Mean 50th %tile 95th %tile
Child aged 1–3 254 13.2 11.8 29.2 253 13.2 11.8 29.2
Boys aged 4–9 242 15.9 15.0 29.6 241 16.0 15.0 29.6
Girls aged 4–9 272 15.0 14.1 28.4 272 15.0 14.1 28.4
Males aged 10–18 391 18.9 17.7 36.8 390 18.9 17.7 36.8
Females aged 10–18
380 16.5 14.9 32.7 380 16.5 14.9 32.7
Males aged 19and older
2117 8.8 6.5 24.9 2042 9.1 6.7 25.2
Females aged 19and older
2544 8.3 6.2 22.7 2431 8.7 6.6 22.9
%tile: percentileFrom Dutch DNFCS-3, 1997–1998 data
LYCOPENE FROM BLAKESLEA TRISPORA 93

4. COMMENTS
Toxicological data
The Committee considered the results of short-term studies of toxicity andstudies of genotoxicity that had been performed with formulations of lycopene fromB. trispora complying with the specifications as prepared at the present meeting,and that met appropriate standards for study protocol and conduct.
In a short-term study of toxicity, rats received diets mixed with a suspensionof 20% (w/w) lycopene in sunflower-seed oil, resulting in dietary concentrationsof lycopene of 0, 0.25, 0.50, or 1.0%, equal to approximately 0, 150, 300, and600 mg/kg bw per day respectively, for 90 days. Lycopene from B. trispora was welltolerated, and there were no adverse effects. The only treatment-related finding wasa red discoloration of the contents of the gastrointestinal tract, caused by ingestionof the red-staining test substance. The NOEL for lycopene was approximately600 mg/kg bw per day, the highest dose tested.
Lycopene from B. trispora has been tested in vitro for its capacity to inducereverse mutations in S. typhimurium and E. coli and chromosomal aberrations inhuman lymphocytes. In those studies, lycopene was formulated as 20% cold water-dispersible product. Lycopene gave negative results in both studies.
No studies of acute toxicity, long-term studies of toxicity or studies ofreproductive and developmental toxicity have been conducted with lycopene fromB. trispora. No data were available on the bioavailability of formulated lycopene fromB. trispora, but it is expected that after ingestion lycopene from B. trispora isequivalent to natural dietary lycopene, because the other components in the finalformulations are also present in food.
The Committee also considered a number of published studies ofpharmacokinetics and metabolism, tolerance, acute toxicity, genotoxicity, and short-term studies of toxicity with lycopene derived from other natural sources. Thematerials tested in those studies (e.g. tomato-derived [oleoresin] extracts, tomatopaste, tomato juice) did not comply with the food-additive specifications for lycopenefrom B. trispora, and several studies were not aimed at examining adverse healtheffects. Nonetheless, the Committee was able to conclude that there is evidencefor a similar kinetic profile indicating low absorption of orally administered lycopenein laboratory species and humans, that little is known about the metabolism oflycopene and that, taken as a whole, the results are consistent with low toxicity,show no evidence for genotoxicity, and generally reveal no adverse effects inhumans after administration of dietary lycopene. There is also evidence for acommon feature in the alteration of the isomeric ratio to favour cis isomers afterconsumption of lycopene, given that all-trans-lycopene is less abundant in plasmaof humans and animals than it is in lycopene in foods. This is also likely to be thecase for lycopene from B. trispora.
On the basis of the observed phenomenon of trans- to cis-isomerization afteringestion, the Committee concluded that differences in trans and cis isomer ratio oflycopene from B. trispora and other lycopenes (whether from other natural sources
94 LYCOPENE FROM BLAKESLEA TRISPORA
or chemically synthesized) are not toxicologically relevant. The Committee thusconsidered lycopene from B. trispora to be toxicologically equivalent to chemicallysynthesized lycopene.
Dietary exposure assessment
Lycopene is a normal constituent of the human diet owing to its presence ina number of vegetables and fruits. Dietary intakes of lycopene range from 1 to10 mg/person per day, based on published estimates from eight countries.Additional exposure to lycopene would result from its proposed uses in a variety offood types, including flavoured dairy beverages, yogurts, candies, cereals, soups,salad dressings, sauces, fruit and vegetable juices, sports drinks, carbonatedbeverages, and cereal and energy bars. An estimate of high exposure (greater than95th percentile), which includes intake from fruits and vegetables, is 30 mg/personper day. This estimate is based on food intake data from a number of nationalsurveys, combined with proposed maximum levels for use of lycopene in food. Thisestimate is conservatively high in that it is assumed that lycopene would be presentin all foods within a food type, at the maximum use level.
5. EVALUATION
Lycopene from B. trispora is considered to be toxicologically equivalent tochemically synthesized lycopene, for which an ADI of 0–0.5 mg/kg bw wasestablished by the Committee at its present meeting. This was given furthercredence by the negative results obtained for lycopene from B. trispora in two testsfor genotoxicity, and the absence of adverse effects in a short-term study of toxicityconsidered at the present meeting. The ADI for synthetic lycopene was thereforemade into a group ADI of 0–0.5 mg/kg bw to include lycopene from B. trispora.
6. REFERENCES
Agarwal, S. & Rao, A.V. (1998) Tomato lycopene and low density lipoprotein oxidation: ahuman dietary intervention study. Lipids, 33, 981–984.
Agarwal, A., Shen, H., Agarwal, S. & Rao, A.V. (2001) Lycopene content of tomato products:its stability, bioavailability and in vivo antioxidant properties. J. Med. Food, 4, 9–15.
Aizawa, K., Inakuma, T. & Oshima, S. (2000) Assessment of the mutagenicity of lycopene bythe Ames test. Nippon Nogeikagaku Kaishi, 74, 679–681 (in Japanese).
BASF (2006) Dossier concerning exposure to lycopene. Submitted to WHO by BASF.Black, H.S. (1998) Radical interception by carotenoids and effects on UV carcinogenesis.
Nutr. Cancer, 31, 212–217.Böhm, V. & Bitsch, R. (1999) Intestinal absorption of lycopene from different matrices and
interactions to other carotenoids, the lipid status, and the antioxidant capacity of humanplasma. Eur. J. Nutr., 38, 118–125.
Boileau, A.C., Merchen, N.R., Wasson, K., Atkinson, C.A. & Erdman, J.W. Jr (1999) Cis-lycopene is more bioavailable than trans-lycopene in vitro and in vivo in lymph-cannulatedferrets. J. Nutr., 129, 1176–1181.
Boileau, T.W.-M., Boileau, A.C. & Erdman, J.W. Jr (2002) Bioavailability of all-trans and cis-isomers of lycopene. Exp. Biol. Med., 227, 914–919.
LYCOPENE FROM BLAKESLEA TRISPORA 95

Bonnetblanc, J.-M., Bonafé, J.-L. & Vidal, E. (1987) Caroténodermies diététiques. [Dieteticcarotenodermia]. Ann. Dermatol. Venereol., 114, 1093–1096 (in French).
Bowen, P.E., Mobarhan, S. & Smith, J.C. Jr (1993) Carotenoid absorption in humans. MethodsEnzymol., 214, 3–17.
Brady, W.E., Mares-Perlman, J.A., Bowen, P. & Stacewicz-Sapuntzakis, M. (1996) Humanserum carotenoid concentrations are related to physiologic and lifestyle factors. J. Nutr.,126, 129–137.
Breinholt, V., Lauridsen, S.T., Daneshvar, B. & Jakobsen, J. (2000) Dose-response effects oflycopene on selected drug-metabolizing and antioxidant enzymes in the rat. Cancer Lett.,154, 201–210.
Burri, B.J., Neidlinger, T.R. & Clifford, A.J. (2001) Serum carotenoid depletion follows first-order kinetics in healthy adult women fed naturally low carotenoid diets. J. Nutr., 131, 2096–2100.
Chen, L., Stacewicz-Sapuntzakis, M., Duncan, C., Sharifi, R., Ghosh, L., van Breemen, R.,Ashton, D. & Bowen, P.E. (2001) Oxidative DNA damage in prostate cancer patientsconsuming tomato sauce-based entrees as whole-food intervention. J. Natl. Cancer Inst.,93, 1872–1879.
Chopra, M., O'Neill, M.E., Keogh, N., Wortley, G., Southon, S. & Thurnham, D.I. (2000)Influence of increased fruit and vegetable intake on plasma and lipoprotein carotenoidsand LDL oxidation in smokers and nonsmokers. Clin. Chem., 46, 1818–1829.
Christian, M.S., Schulte, S. & Hellwig, J. (2003) Developmental (embryo-fetal toxicity/teratogenicity) toxicity studies of synthetic crystalline lycopene in rats and rabbits. FoodChem. Toxicol., 41, 773–783.
Clark, R.M., Yao, L., She, L. & Furr, H.C. (1998) A comparison of lycopene and canthaxanthinabsorption: using the rat to study the absorption of non-provitamin A carotenoids. Lipids,33, 159–163.
Clark, R.M., Yao, L., She, L. & Furr, H.C. (2000) A comparison of lycopene and astaxanthinabsorption from corn oil and olive oil emulsions. Lipids, 35, 803–806.
Codex Alimentarius Commission (2005) Report of the Thirty-seventh Session of theCodex Committee on Food Additives and Contaminants, The Hague, The Netherlands,25–29 April 2005. Rome, Food and Agriculture Organization of the United Nations,2005 (ALINORM 05/28/12; http://www.codexalimentarius.net/download/report/639/al28_12e.pdf).
Cohen, L.A., Zhao, Z., Pittman, B. & Khachik, F. (1999) Effect of dietary lycopene on N-methylnitrosourea-induced mammary tumorigenesis. Nutr. Cancer, 34, 153–159.
Cohn, W., Thürmann, P., Tenter, U., Aebischer, C., Schierle, J. & Schalch, W. (2004)Comparative multiple dose plasma kinetics of lycopene administered in tomato juice,tomato soup or lycopene tablets. Eur. J. Nutr., 43, 304–312.
CTBR (2003a) Lycopene 20% CWD bacterial mutation test. Unpublished report No. 960171from CTBR Bio-Research Inc., Senneville, Canada. Submitted to WHO by Vitatene S.A.,León, Spain.
CTBR (2003b) Lycopene 20% CWD chromosome aberration test. Unpublished report No.960172 from CTBR Bio-Research Inc., Senneville, Canada. Submitted to WHO by VitateneS.A., León, Spain.
Driskell, J.A., Giraud, D.W., Sun, J. & Martin, H.D. (1996) Plasma concentrations ofcarotenoids and tocopherols in male long-term tobacco chewers, smokers and nonusers.Internat. J. Vit. Nutr. Res., 66, 203–209.
DSM (2006) Dossier on exposure to lycopene. Submitted to WH0 by DSM.Erdman, J.W. Jr, Bierer, T.L. & Gugger, E.T. (1993) Absorption and transport of carotenoids.
Ann. NY Acad. Sci., 691, 76–85.
96 LYCOPENE FROM BLAKESLEA TRISPORA

Fielding, J.M., Rowley, K.G., Cooper, P. & O’Dea, K. (2005) Increases in plasma lycopeneconcentration after consumption of tomatoes cooked with olive oil. Asia Pac. J. Clin.Nutr., 14, 131–136.
Forman, M.R., Lanza, E., Yong, L.C., Holden, J.M., Graubard, B.I., Beecher, G.R., Meltiz, M.,Brown, E.D. & Smith, J.C. (1993) The correlation between two dietary assessments ofcarotenoid intake and plasma carotenoid concentrations: application of a carotenoid food-composition database. Am. J. Clin. Nutr., 58, 519–524.
Gandhi, M., Walton, S. & Wyatt, E.H. (1988) Hypercarotenaemia in a tomato soup faddist.BMJ, 297, 1635.
Gärtner, C., Stahl, W. & Sies, H. (1997) Lycopene is more bioavailable from tomato paste thanfrom fresh tomatoes. Am. J. Clin. Nutr., 66, 116–122.
Gaziano, J.M., Johnson, E.J., Russel, R.M., Manson, J.E., Stampfer, M.J., Ridker, P.M., Frei,B., Hennekens, C.H. & Krinski, N.I. (1995) Discrimination in absorption or transport of
-carotene isomers after oral supplementation with either all-trans- or 9-cis- - carotene.Am. J. Clin. Nutr., 61, 1248–1252.
Goldbohm, R.A., Brants, H.A., Hulshof, K.F. & van den Brandt, P.A. (1998) The contributionof various foods to vitamin A and carotenoids in The Netherlands. Int. J. Vitam. Nutr.Res., 68, 378–383.
Gradelet, S., Astorg, P., Leclerc, J., Chevalier, J., Vernevaut, M.-F. & Siess, M.-H. (1996)Effects of canthaxanthin, astaxanthin, lycopene and lutein on liver xenobiotic- metabolizingenzymes in the rat. Xenobiotica, 26, 49–63.
Guttenplan, J.B., Chen, M., Kosinska, W., Thompson, S., Zhao, Z. & Cohen, L.A. (2001)Effects of a lycopene-rich diet on spontaneous and benzo[a]pyrene-induced mutagenesisin prostate, colon and lungs of the lacZ mouse. Cancer Lett., 164, 1–6.
He, Y. & Campbell, T.C. (1990) Effects of carotenoids on aflatoxin B1-induced mutagenesis inS. typhimurium TA 100 and TA 98. Nutr. Cancer, 13, 243–253.
Holloway, D.E., Yang, M., Paganga, G., Rice-Evans, C.A. & Bramley, P.M. (2000)Isomerization of dietary lycopene during assimilation and transport in plasma. Free Rad.Res., 32, 93–102.
Hoppe, P.P., Krämer, K., van den Berg, H., Steenge, G. & van Vliet, T. (2003) Synthetic andtomato-based lycopene have identical bioavailability in humans. Eur. J. Nutr., 42,272–278.
Jain, C.K., Agarwal, S. & Rao, A.V. (1999) The effect of dietary lycopene on bioavailability,tissue distribution, in vivo antioxidant properties and colonic preneoplasia in rats. Nutr.Res., 19, 1383–1391.
Järvinen, R. (1995) Carotenoids, retinoids, tocopherols and tocotrienols in the diet: the FinnishMobile Clinic Health Examination survey. Int. J. Vitam. Nutr. Res., 65, 24–30.
Jewell, C. & O'Brien, N.M. (1999) Effect of dietary supplementation with carotenoids onxenobiotic metabolizing enzymes in the liver, lung, kidney and small intestine of the rat.Br. J. Nutr., 81, 235–242.
Johnson-Down, L., Saudny-Unterberger, H. & Gray-Donald, K. (2002) Food habits ofCanadians: lutein and lycopene intake in the Canadian population. J. Am. Diet. Assoc.,102, 988–991.
Jonker, D. (2000) Repeated dose (28-day) oral toxicity study with carotene biomass andlycopene biomass in rats. Unpublished report No. V99.1154 from TNO Nutrition and FoodResearch Institute, Zeist, Netherlands. Submitted to WHO by Vitatene S.A., León, Spain.
Jonker, D., Kuper, C.F., Fraile, N., Estrella, A. & Rodríguez Otero, C. (2003) Ninety-day oraltoxicity study of lycopene from Blakeslea trispora in rats. Regul. Toxicol. Pharmacol., 37,396–406.
Khachik, F., Spangler, C.J., Smith, J.C. Jr, Canfield, L.M., Steck, A. & Pfander, H. (1997a)Identification, quantification, and relative concentrations of carotenoids and theirmetabolites in human milk and serum. Anal. Chem., 69, 1873–1881.
LYCOPENE FROM BLAKESLEA TRISPORA 97

Khachik, F., Steck, A. & Pfander, H. (1997b) Bioavailability, metabolism, and possiblemechanism of chemoprevention by lutein and lycopene in humans. In: Ohigashi, H.,Osawa, T., Terao, J., Watanabe, S. & Yoshikawa, T., eds, Food factors for cancerprevention, Tokyo: Springer-Verlag, pp. 542–547.
Khachik, F., Steck, A., Niggli, U.A. & Pfander, H. (1998a) Partial synthesis and structuralelucidation of the oxidative metabolites of lycopene identified in tomato paste, tomato juice,and human serum. J. Agric. Food Chem., 46, 4874–4884.
Khachik, F., Pfander, H. & Traber, B. (1998b) Proposed mechanisms for the formation ofsynthetic and naturally occurring metabolites of lycopene in tomato products and humanserum. J. Agric. Food Chem., 46, 4885–4890.
Kim, D.J., Takasuka, N., Kim, J.M., Sekine, K., Ota, T., Asamoto, M., Murakoshi, M., Nishino,H., Nir, Z. & Tsuda, H. (1997) Chemoprevention by lycopene of mouse lung neoplasia aftercombined initiation treatment with DEN, MNU and DMH. Cancer Lett., 120, 15–22.
Kim, J.M., Araki, S., Kim, D.J., Park, C.B., Takasuka, N., Baba-Toriyama, H., Ota, T., Nir, Z.,Khachick, F., Shimidzu, N., Tanaka, Y., Osawa, T., Uraji, T., Murakoshi, M., Nishino, H. &Tsuda, H. (1998) Chemopreventive effects of carotenoids and curcumins on mouse coloncarcinogenesis after 1,2-dimethylhydrazine initiation. Carcinogenesis, 19, 81–85.
Kim, S.-J., Nara, E., Kobayashi, H., Terao, J. & Nagao, A. (2001) Formation of cleavageproducts by autooxidation of lycopene. Lipids, 36, 191–199.
Korytko, P.J., Rodvold, K.A., Crowell, J.A., Stacewicz-Sapuntzakis, M., Diwadkar-Navsariwala, V., Bowen, P.E., Schalch, W. & Levine, B.S. (2003) Pharmacokinetics andtissue distribution of orally administered lycopene in male dogs. J. Nutr., 133, 2788–2792.
Kucuk, O., Sarkar, F.H., Sakr, W., Djuric, Z., Pollak, M.N., Khachik, F., Li, Y.-W., Banerjee,M., Grignon, D., Bertram, J.S., Crissman, J.D., Pontes, E.J. & Wood, D.P. Jr (2001) PhaseII randomized clinical trial of lycopene supplementation before radical prostatectomy.Cancer Epidemiol. Biomarkers Prev., 10, 861–868.
La Placa, M., Pazzaglia, M. & Tosti, A. (2000) Lycopenaemia. J. Eur. Acad. Dermatol.Venereol., 14, 311–312.
Leo, M.A. & Lieber, C.S. (1999) Alcohol, vitamin A, and -carotene: adverse interactions,including hepatotoxicity and carcinogenicity. Am. J. Clin. Nutr., 69, 1071–1085.
Lugasi, A., Bíró, L., Hóvárie, J., Sági, K.V., Brandt, S. & Barna, E. (2003) Lycopene contentof foods and lycopene intake in two groups of the Hungarian population. Nutr. Res., 23,1035–1044.
Mathews-Roth, M.M., Welankiwar, S., Sehgal, P.K., Lausen, N.C.G., Russett, M. & Krinsky,N.I. (1990) Distribution of [14C]canthaxanthin and [14C]lycopene in rats and monkeys. J.Nutr., 120, 1205–1213.
Matulka, R.A., Hood, A.M. & Griffiths, J.C. (2004) Safety evaluation of a natural tomatooleoresin extract derived from food-processing tomatoes. Regul. Toxicol. Pharmacol.,39, 390–402.
Mayne, S.T., Cartmel, B., Silva, F., Kim, C.S., Fallon, B.G., Briskin, K., Zheng, T., Baum, M.,Shor-Posner, G. & Goodwin, W.J. Jr (1999) Plasma lycopene concentrations in humansare determined by lycopene intake, plasma cholesterol concentrations and selecteddemographic factors. J. Nutr., 129, 849–854.
McClain, R.M. & Bausch, J. (2003) Summary of safety studies conducted with syntheticlycopene. Regul. Toxicol. Pharmacol., 37, 274–285.
Mellert, W., Deckardt, K., Gembardt, C., Schulte, S., Van Ravenzwaay, B. & Slesinski, R.S.(2002) Thirteen-week oral toxicity study of synthetic lycopene products in rats. Food Chem.Toxicol., 40, 1581–1588.
Milani, C., Maccari, M. & Mosconi, P. (1970) Action of lycopene in the experimental gastriculcer. Pharmacology, 4, 334–340.
Müller, H., Bub, A., Watzl, B. & Rechkemmer, G. (1999) Plasma concentrations of carotenoidsin healthy volunteers after intervention with carotenoid-rich foods. Eur. J. Nutr., 38, 35–44.
98 LYCOPENE FROM BLAKESLEA TRISPORA

Nagasawa, H., Mitamura, T., Sakamoto, S. & Yamamoto, K. (1995) Effects of lycopene onspontaneous mammary tumour development in SHN virgin mice. Anticancer Res., 15,1173–1178.
Narisawa, T., Fukaura, Y., Hasebe, M., Ito, M., Aizawa, R., Murakoshi, M., Uemura, S.,Khachik, F. & Nishino, H. (1996) Inhibitory effects of natural carotenoids, -carotene, -carotene, lycopene and lutein, on colonic aberrant crypt foci formation in rats. CancerLett., 107, 137–142.
Narisawa, T., Fukaura, Y., Hasebe, M., Nomura, S., Oshima, S., Sakamoto, H., Inakuma, T.,Ishiguro, Y., Takayasu, J. & Nishino, H. (1998) Prevention of N-methylnitrosourea- inducedcolon carcinogenesis in F344 rats by lycopene and tomato juice rich in lycopene. Jpn. J.Cancer Res., 89, 1003–1008.
Nguyen, M.L. & Schwartz, S.J. (1999) Lycopene: chemical and biological properties. FoodTechnol., 53, 38–45.
Okajima, E., Ozono, S., Endo, T., Majima, T., Tsutsumi, M., Fukuda, T., Akai, H., Denda, A.,Hirao, Y., Okajima, E., Nishino, H., Nir, Z. & Konishi, Y. (1997) Chemopreventive efficacyof piroxicam administered alone or in combination with lycopene and - carotene on thedevelopment of rat urinary bladder carcinoma after N-butyl-N-(4- hydroxybutyl)nitrosaminetreatment. Jpn. J. Cancer Res., 88, 543–552.
Olmedilla, B., Granado, F., Southon, S., Wright, A.J.A., Blanco, I., Gil-Martinez, E., van denBerg, H., Thurnham, D., Corridan, B., Chopra, M. & Hininger, I. (2002) A Europeanmulticentre, placebo-controlled supplementation study with -tocopherol, carotene-richpalm oil, lutein or lycopene: analysis of serum responses. Clin. Sci., 102, 447–456.
Oshima, S., Inakuma, T. & Narisawa, T. (1999) Absorption and distribution of lycopene in ratcolon. J. Nutr. Sci. Vitaminol., 45, 129–134.
Paetau, I., Khachik, F., Brown, E.D., Beecher, G.R., Kramer, T.R., Chittams, J. & Clevidence,B.A. (1998) Chronic ingestion of lycopene-rich tomato juice or lycopene supplementssignificantly increases plasma concentrations of lycopene and related tomato carotenoidsin humans. Am. J. Clin. Nutr., 68, 1187–1195.
Pamuk, E.R., Byers, T., Coates, R.J., Vann, J.W., Sowell, A.L., Gunter, E.W. & Glass, D.(1994) Effect of smoking on serum nutrient concentrations in African-American women.Am. J. Clin. Nutr., 59, 891–895.
Parker, R.S. (1996) Absorption, metabolism, and transport of carotenoids. FASEB J., 10,542–551.
Pelz, R., Schmidt-Faber, B. & Heseker, H. (1998) Carotenoid intake in the German NationalFood Consumption Survey. Z. Ernahrungswiss., 37, 319–327.
Peng, Y.-M., Peng, Y.-S., Lin, Y., Moon, T., Roe, D.J. & Ritenbaugh, C. (1995) Concentrationsand plasma-tissue-diet relationships of carotenoids, retinoids, and tocopherols in humans.Nutr. Cancer, 23, 233–246.
Pool-Zobel, B.L., Bub, A., Müller, H., Wollowski, I. & Rechkemmer, G. (1997) Consumption ofvegetables reduces genetic damage in humans: first results of a human intervention trialwith carotenoid-rich foods. Carcinogenesis, 18, 1847–1850.
Porrini, M. & Riso, P. (2000) Lymphocyte lycopene concentration and DNA protection fromoxidative damage is increased in women after a short period of tomato consumption. J.Nutr., 130, 189–192.
Postaire, E., Jungmann, H., Bejot, M., Heinrich, U. & Tronnier, H. (1997) Evidence forantioxidant nutrients-induced pigmentation in skin: results of a clinical trial. Biochem. Mol.Biol. Int., 42, 1023–1033.
Rao, A.V. & Agarwal, S. (1998) Bioavailability and in vivo antioxidant properties of lycopenefrom tomato products and their possible role in the prevention of cancer. Nutr. Cancer,31, 199–203.
Rao, A.V. & Agarwal, S. (1999) Role of lycopene as antioxidant carotenoid in the preventionof chronic diseases: a review. Nutr. Res., 19, 305–323.
LYCOPENE FROM BLAKESLEA TRISPORA 99

Redlich, C.A., Grauer, J.N., van Bennekum A.M., Clever, S.L., Ponn, R.B. & Blaner, W.S.(1996) Characterization of carotenoid, vitamin A, and -tocopherol levels in human lungtissue and pulmonary macrophages. Am. J. Respir. Crit. Care Med., 154, 1436–1443.
Reich, P., Shwachman, H. & Craig, J.M. (1960) Lycopenemia. A variant of carotenemia.New Engl. J. Med., 262, 263–269.
Riso, P., Pinder, A., Santangelo, A. & Porrini, M. (1999) Does tomato consumption effectivelyincrease the resistance of lymphocyte DNA to oxidative damage? Am. J. Clin. Nutr., 69,712–718.
Rock, C.L., Swendseid, M.E., Jacob, R.A. & McKee, R.W. (1992) Plasma carotenoid levels inhuman subjects fed a low carotenoid diet. J. Nutr., 122, 96–100.
Schierle, J., Bretzel, W., Bühler, I., Faccin, N., Hess, D., Steiner, K. & Schüep, W. (1997)Content and isomeric ratio of lycopene in food and human blood plasma. Food Chem.,59, 459–465.
Schmitz, H.H., Poor, C.L., Wellman, R.B. & Erdman, J.W. Jr (1991) Concentrations of selectedcarotenoids and vitamin A in human liver, kidney and lung tissue. J. Nutr., 121, 1613–1621.
Scott, K.J., Thurnham, D.I., Hart, D.J., Bingham, S.A. & Day, K. (1996) The correlationbetween the intake of lutein, lycopene and -carotene from vegetables and fruits, andblood plasma concentrations in a group of women aged 50–65 years in the UK. Br. J.Nutr., 75, 409–418.
Sharoni, Y., Giron, E., Rise, M. & Levy, J. (1997) Effect of lycopene-enriched tomato oleoresinon 7,12-dimethyl-benz[a]anthracene-induced rat mammary tumors. Cancer Detect.Prev., 21, 118–123.
Sicilia, T., Bub, A., Rechkemmer, G., Kraemer, K., Hoppe, P.P. & Kulling, S.E. (2005) Novellycopene metabolites are detectable in plasma of preruminant calves after lycopenesupplementation. J. Nutr., 135, 2616–2621.
Stahl, W. & Sies, H. (1992) Uptake of lycopene and its geometrical isomers is greater fromheat-processed than from unprocessed tomato juice in humans. J. Nutr., 122, 2161– 2166.
Su, L.-C. J., Bui, M., Kardinaal, A., Gomez-Aracena, J., Martin-Moreno, J., Martin, B., Thamm,M., Simonsen, N., van’t Veer, P., Kok, F., Strain, S. & Kohlmeier, L. (1998) Differencesbetween plasma and adipose tissue biomarkers of carotenoids and tocopherols. CancerEpidemiol. Biomarkers Prev., 7, 1043–1048.
Tang, G., Ferreira, A.L.A., Grusak, M.A., Qin, J., Dolnikowski, G.G., Russell, R.M. & Krinsky,N.I. (2005) Bioavailability of synthetic and biosynthetic deuterated lycopene in humans. J.Nutr. Biochem., 16, 229–235.
US Food and Drug Administration (2002a) GRN 119. Submission to the US Food and DrugAdministration (http://www.cfsan.fda.gov/~rdb/opa-gras.html).
US Food and Drug Administration (2002b) GRN 156. Submission to the US Food and DrugAdministration (http://www.cfsan.fda.gov/~rdb/opa-gras.html).
Vanden Langenberg, G.M., Brady, W.E., Nebeling, L.C., Block, G., Forman, M, Bowen, P.E.,Stacewicz-Sapuntzakis, M. & Mares-Perlman, J.A. (1996) Influence of using differentsources of carotenoid data in epidemiologic studies. J. Am. Diet. Assoc., 96, 1271–1275.
Vitatene (2006) Dossier on exposure to lycopene. Submitted to WHO by Vitatene.Wahlqvist, M.L., Wattanapenpaiboon, N., Macrae, F.A., Lambert, J.R., MacLennan, R., Hsu-
Hage, B.H.-H. & Australian Polyp Prevention Project Investigators (1994) Changes inserum carotenoids in subjects with colorectal adenomas after 24 mo of -carotenesupplementation. Am. J. Clin. Nutr., 60, 936–943.
Wang, C.-J., Chou, M.-Y. & Lin, J.-K. (1989) Inhibition of growth and development of thetransplantable C-6 glioma cells inoculated in rats by retinoids and carotenoids. CancerLett., 48, 135–142.
Wargovich, M.J., Jimenez, A., McKee, K., Steele, V.E., Velasco, M., Woods, J., Price, R.,Gray, K. & Kelloff, G.J. (2000) Efficacy of potential chemopreventive agents on rat colonaberrant crypt formation and progression. Carcinogenesis, 21, 1149–1155.
100 LYCOPENE FROM BLAKESLEA TRISPORA

Yong, L.C., Forman, M.R., Beecher, G.R., Graubard, B.I., Campbell, W.S., Reichman, M.E.,Taylor, P.R., Lanza, E., Holden, J.M. & Judd, J.T. (1994) Relationship between dietaryintake and plasma concentrations of carotenoids in premenopausal women: application ofthe USDA-NCI carotenoid food-composition database. Am. J. Clin. Nutr., 60, 223–230.
Zaripheh, S. & Erdman, J.W. Jr (2005) The biodistribution of a single oral dose of [14C]-lycopene in rats prefed either a control or lycopene-enriched diet. J. Nutr., 135, 2212–2218.
Zaripheh, S., Boileau, T.W.-M., Lila, M.A. & Erdman, J.W. Jr (2003) [14C]-Lycopene and [14C]-labeled polar products are differentially distributed in tissues of F344 rats prefed lycopene.J. Nutr., 133, 4189–4195.
Zaripheh, S., Miksanek, J., Keck, A.S., Jeffery, E.H. & Erdman, J.W. (2005) Does feedinglycopene for different lengths of time result in the activation of phase I and phase IIdetoxification enzymes in tissues of F344 rats? FASEB J., 19, A291.5.
Zbinden, G. & Studer, A. (1958) Tierexperimentelle Untersuchungen über die chronischeVerträglichkeit von -Carotin, Lycopin, 7,7’-Dihydro- -carotin und Bixin. Z. Lebensmitt.-Unters., 108, 113–134 (in German).
Zhao, Z., Khachik, F., Richie, J.P. Jr & Cohen, L.A. (1998) Lycopene uptake and tissuedisposition in male and female rats. Proc. Soc. Exp. Biol. Med., 218, 109–114.
LYCOPENE FROM BLAKESLEA TRISPORA 101


PROPYL PARABEN (addendum)
First draft prepared by
S. Barlow,1 A. Mattia2 & J-C. Leblanc3
1Brighton, England;
2United States Food and Drug Administration, College Park, Maryland,USA; and
3Agence Francaise de Sécurité Sanitaire des Aliments, Maisons Alfort, France
Explanation ................................................................................Biological data ...........................................................................
Biochemical aspects ...........................................................Absorption, distribution, metabolism and excretion ......
Toxicological studies ...........................................................Reproductive toxicity .....................................................
Observations in humans .....................................................Dietary intake ............................................................................Comments .................................................................................Evaluation ..................................................................................References ................................................................................
1. EXPLANATION
The parabens (methyl, ethyl, and propyl p-hydroxybenzoate) having afunctional use as preservatives in food were evaluated by the Committee at its sixth,ninth, tenth and seventeenth meetings (Annex 1, references 6, 11, 13 and 32). Atits seventeenth meeting, the Committee established a group acceptable daily intake(ADI) of 0–10 mg/kg bw (expressed as the sum of methyl, ethyl, and propyl estersof p-hydroxybenzoic acid). Additional information subsequently became availableconcerning the estrogenic and reproductive effects of the parabens, which led theEuropean Food Safety Authority (European Food Safety Authority, 2004) to excludepropyl paraben from the group ADI for the parabens. At its Thirty-seventh Session(Codex Alimentarius Commission, 2005), the Codex Committee on Food Additivesand Contaminants, placed propyl paraben on the priority list for toxicological re-evaluation by JECFA.
103104104104104104110110112114114
- 103 -

2. BIOLOGICAL DATA
2.1 Biochemical aspects
2.1.1 Absorption, distribution, metabolism and excretion
The absorption, distribution, metabolism and excretion of the parabens werestudied in rats, rabbits and dogs some years ago and have been described earlierby this Committee (Annex 1, reference 33). In summary, the methyl, ethyl, andpropyl esters of p-hydroxybenzoic acid are well absorbed and the ester linkage isreadily hydrolysed by liver esterases, as indicated by rapid excretion and highurinary levels of p-hydroxybenzoic acid and conjugated products of hydrolysis.
2.2 Toxicological studies
2.2.1 Reproductive toxicity
Several of the parabens have been tested for effects on reproductive functionand for estrogenic activity, in vitro and in vivo. In order to compare the results forpropyl paraben with those for other parabens, relevant studies on all the parabensare described below.
(a) Effects on juvenile and adult males
Groups of eight male Wistar rats aged 3 weeks were given diets containingmethyl or ethyl p-hydroxybenzoate at a dose of 0.00%, 0.1%, or 1.0% for 8 weeks,corresponding to average intakes of methyl p-hydroxybenzoate of 103 and 1030mg/kg bw per day and ethyl p-hydroxybenzoate of 103 and 1043 mg /kg bw perday, respectively. After 8 weeks, the rats were killed, blood was taken for hormoneassays, testes, epididymides, prostate, seminal vesicles and preputial glands wereweighed, sperm counts in testes and epididymides were determined and the testeswere examined morphologically. Neither compound had an effect on weightsof the reproductive organs, on sperm counts in the testes and epididymides, oron the morphological examinations of spermatogonia, spermatocytes, roundspermatids and elongated spermatids. Serum concentrations of testosterone,luteinizing hormone (LH) and follicle-stimulating hormone (FSH) were not affected(Oishi, 2004).
Groups of eight male Wistar rats aged 3 weeks were given diets containingpropyl p-hydroxybenzoate at a dose of 0.00%, 0.01%, 0.10% or 1.00% for 4 weeks,corresponding to approximate intakes of propyl-p-hydroxybenzoate of 10, 100 and1000 mg/kg bw per day, respectively. The basal diet used was a modified AIN93Gdiet devoid of soya-based phytoestrogens. After 4 weeks, the rats were killed, bloodwas taken for hormone assays, testes, epididymides, prostate, seminal vesicles andpreputial glands were weighed and sperm counts in testes and epididymides weredetermined. There were no effects on the weights of the reproductive organs. Thecauda epididymal sperm reserves and concentrations were significantly decreasedin rats in the groups receiving the intermediate and highest doses. Sperm re-serves were 43.6, 31.1, 25.7 and 22.5 x 10⁷/cauda in control group and in the
104 PROPYL PARABEN

groups receiving the lowest, intermediate and highest dose, respectively. Spermconcentrations were 108, 70.8, 63.1 and 48.8 x 10⁷/g, respectively. The daily spermproduction (DSP) and its efficiency (DSP/g) in the testes were also significantlylower in all treated groups compared with controls. DSP in treated groups was about70% of the control value; however, no dose–response relationship was observed(37.5, 26.2, 27.0 and 25.9 x 10⁶ in the control, group and in the groups receiving thelowest, intermediate or highest dose, respectively). Serum testosterone wassignificantly decreased in a dose-dependent manner, the reduction being significantat the highest dose (9.08, 8.20, 7.17 and 5.86 ng/ml in the control group, and in thegroups receiving the lowest, intermediate and highest dose, respectively) (Oishi,2002a).
Groups of eight male Crj:CD-1 mice aged 4 weeks were given dietscontaining butyl p-hydroxybenzoate at a dose of 0.00%, 0.01%, 0.10% or 1.00% for10 weeks, corresponding to average intakes of butyl p-hydroxybenzoate (calculatedfrom food consumption) of 14.4, 146 and 1504 mg/kg bw per day, respectively. After10 weeks, the mice were killed, blood was taken for testosterone assay, testes,epididymides, ventral prostate, seminal vesicles and preputial glands wereweighed, sperm counts in testes and epididymides were determined and the testeswere examined morphologically. Dose-dependent reductions were observed inspermatid counts in the seminiferous tubules; the reduction in round spermatids wasstatistically significant at the highest dose and the reductions in elongatedspermatids were statistically significant at all three doses. Serum testosterone wassignificantly decreased by about 45% at the highest dose (Oishi, 2002b).
Groups of eight Wistar rats aged 3 weeks were given diets containing butylp-hydroxybenzoate at a dose of 0.00%, 0.01%, 0.10% and 1.00% for 8 weeks,corresponding to average butyl p-hydroxybenzoate intakes of 10, 100 and 1000 mg/kg bw per day, respectively. At the end of 8 weeks, the rats were killed, blood wastaken for testosterone assay, testes, epididymides, ventral prostate, seminalvesicles and preputial glands were weighed, and sperm counts in testes andepididymides were determined. The absolute weight of the seminal vesicles wassignificantly reduced at the highest dose and there was a dose-related reduction inabsolute weights of the epididymides, reaching statistical significance at the highestdose. The cauda epididymal sperm reserve of all treated groups was significantlydecreased. The sperm count of the highest dose group was 58% of the controlvalue. The DSP and efficiency in the testis was also significantly lower in all treatedgroups, in a dose-related manner. Serum testosterone concentrations also showeddose-related reductions that were significant at the intermediate and highest doses(Oishi, 2001).
Butyl p-hydroxybenzoate has been reported to show potent spermaticidalactivity in human spermatozoa in vitro as a result of impairment of the spermmembrane function. In this respect, butyl p-hydroxybenzoate was three and eighttimes more potent than propyl or methyl p-hydroxybenzoate, respectively (Song etal., 1989, 1992). In human sperm in vitro, propyl-p-hydroxybenzoate was aneffective spermicide at a concentration of 3 mg/ml (Bao-Liang et al., 1989).
PROPYL PARABEN 105
(b) Effects on offspring
Neonatal Wistar rats were given butyl p-hydroxybenzoate subcutaneouslyat a dose of 2 mg/kg bw per day on postnatal days 2–18. Diethylstilbestrol andethinylestradiol were used as positive controls. Testes were weighed at age 18, 25,35 and 75 days. Both positive-control substances caused significant reductions intestes weight at each time-point, but butyl p-hydroxybenzoate had no effect on testisweight or other aspects of testis development (distension of the rete testis andefferent ducts, epithelial cell height in the efferent ducts, immunoexpression of thewater channel aquaporin-1) (Fisher et al.,1999).
Pregnant Sprague-Dawley rats were injected subcutaneously with butyl-p-hydroxybenzoate at a daily dose of 100 or 200 mg/kg bw from day 6 of gestationto postnatal day 20 and the offspring were examined at postnatal day 21, 49, 70and 90. In the group exposed to 200 mg/kg bw per day, the proportion of pups bornalive and of pups surviving to weaning were significantly decreased. In bothtreatment groups, the body weights of female offspring were significantly decreasedat postnatal day 49, 70 and 90. The weights of testes, seminal vesicles and prostateglands and the days to vaginal opening were significantly decreased in male andfemale offspring, respectively on postnatal day 49, but not on postnatal day 70 or90, in rats exposed to 100 mg/kg bw per day. No such effects were observed after200 mg/kg bw per day. The weights of female reproductive organs were not affected.The sperm count and the sperm motile activity in the epididymis were decreased atpostnatal day 90 after 100 and 200 mg/kg bw per day. Testicular expression ofestrogen receptor mRNAs was increased in the 200 mg/kg bw per day group atpostnatal day 90 (Kang et al., 2002).
(c) Studies on estrogenic effects
In vitro
Methyl, ethyl, propyl and butyl p-hydroxybenzoate, 4-n-dodecyl-p-hydroxybenzoate acid and p-hydroxybenzoic acid were tested in the in-vitrorecombinant yeast estrogen screen (YES), in which yeast cells are transfected withthe human estrogen receptor alpha (ER ) gene. Weak positive reactions wereobserved with the butyl, propyl, ethyl, and methyl esters (butyl > propyl > ethyl >methyl), while 4-n-dodecyl-p-hydroxybenzoate and p-hydroxybenzoic acid werewithout activity. The relative potency of 17 -estradiol (E2) was approximately2 500 000 times greater than that of methyl p-hydroxybenzoate. The magnitudeof the estrogenic response increased with alkyl group size, with 17 -estradiolhaving a relative potency of 150 000, 30 000 and 10 000 times greater than theethyl, propyl and butyl esters, respectively. The effect of propyl p-hydroxybenzoateand butyl p-hydroxybenzoate was inhibited by addition of the anti-estrogen,4-hydroxy-tamoxifen, demonstrating that these compounds had to interact with theestrogen receptor in order to show estrogenic activity. In a competitive binding assayit was also found that non-metabolized butyl p-hydroxybenzoate was able tocompete with 3H-17 -estradiol for binding to the rat estrogen receptor with an affinityapproximately five orders of magnitude lower than diethylstilbestrol and betweenone and two orders of magnitude less than 4-nonylphenol (Routledge et al., 1998).
106 PROPYL PARABEN

Methyl, ethyl, propyl, butyl, benzyl and dodecyl p-hydroxybenzoate weretested in the YES assay in another study. Relative to 17 -estradiol, estrogenicactivity was detected for the propyl (1/30 000), butyl (1/8 000) and benzyl p-hydroxybenzoates (1/4 000). The relative potencies of the methyl and ethyl esterswere insignificant at 1/3 000 000 and 1/200 000, respectively and no activity wasdetected for the dodecyl ester. A total of 73 phenolic compounds were assayed inthis study and the authors concluded that the presence of an unhindered -OH groupin the para position and a relative molecular mass in the range of 140 to 250 werenecessary for activity (Miller et al., 2001).
Using a standardized estrogen receptor competitive-binding assay, sevenparabens were tested for their ability to displace 3H-17 -estradiol from the estrogenreceptor (obtained from uteri from ovariectomized Sprague-Dawley rats) and theirrelative binding affinity (RBA) was calculated. 2-Ethylhexyl p-hydroxybenzoate(RBA = 0.018%) was the most potent paraben tested, followed by heptyl (0.008%),benzyl (0.003%), butyl (0.0009%), propyl (0.0006%), ethyl (0.0006%), and methylp-hydroxybenzoate (0.0004%). For comparison, RBAs for 4-nonylphenol andbisphenol A in this assay were 0.035% and 0.008%, respectively (Blair et al., 2000).
The estrogenic activity of parabens in vitro was found to increase in the ordermethyl, ethyl, propyl, butyl, isopropyl and isobutyl p-hydroxybenzoate by assayingestrogen receptor-dependent proliferation of human MCF7 breast cancer cells.Their potencies were 105 to 107 times lower than that of 17 -estradiol. Using acompetitive binding assay it was also shown that the parabens had similar relative(to diethylstilboestrol) binding affinities (RBA) to the human estrogen receptors
(ER ) and (ER ). The RBA values for the parabens ranged from 0.01% to 0.1%of that of diethylstilbestrol (Okubo et al., 2001).
Another study on the estrogenic effects of methyl, ethyl, propyl and butylp-hydroxybenzoate in estrogen-sensitive human MCF7 breast cancer cells hadalso been reported. Competitive inhibition of 3H-17 -estradiol binding to MCF7cell estrogen receptors could be detected at 106-fold molar excess of butyl(86% inhibition), propyl (77%), ethyl (54%) and methyl p-hydroxybenzoate (21%inhibition). At concentrations of 10-6 mol/l the parabens also increased theexpression of estrogen-regulated genes in the MCF7 cells and increased theproliferation of the cells in monolayer culture. Molecular modelling showed thatthe parabens bind to the ligand-binding domain of the ER -receptor (Byford etal., 2002).
Using similar experimental methods, isobutyl and benzyl p-hydroxybenzoatewere also shown to be estrogenic in MCF7 cells and in another estrogen-sensitivehuman breast-cancer cell line, ZR-75-1, but to have no effect on the estrogen-insensitive MDA-MB-231 human breast-cancer cell line. Competitive inhibitionof 3H-17 -estradiol binding was detected at 100 000-fold molar excess of isobutyl(81% inhibition) and benzyl p-hydroxybenzoate (57% inhibition). At concentrationsof 10-5 mol/l, these parabens maximally increased the expression of estrogen-regulated genes in the MCF7 cells and increased the proliferation of the MCF7and ZR-75-1 cells in monolayer culture. The proliferation induced in MCF7 cells byboth parabens could be inhibited by the anti-estrogen, ICI 182 780 (Darbre et al.,2002, 2003).
PROPYL PARABEN 107

The expression profiling of 120 estrogen-responsive genes in MCF7 cellstreated with methyl, ethyl, propyl or butyl p-hydroxybenzoate has been investigated.Significant correlations were obtained for the propyl (R = 0.74) and butyl (R = 0.60)esters, but not for the methyl (R = -0.21) and ethyl (R = 0.19) esters (Terasaka etal., 2006).
In MCF7 cells, the common metabolite of the parabens, p-hydroxybenzoicacid, is reported to have weak estrogenic activity, It displaced 17 -estradiol fromthe estrogen receptor by 54% at 5 × 10⁶-fold molar excess and by 99% at 107-foldmolar excess. It also increased the expression of a stably transfected estrogen-responsive chloramphenicol acetyltransferase reporter gene (ERE-CAT) at5 × 10-4 mol/l in MCF7 cells after 24 h and 7 days and this could be inhibited by theanti-estrogen, ICI 182 780. Proliferation of MCF7 and ZR-75-1 cells was alsoincreased by p-hydroxybenzoic acid at 10-5 mol/l. Methyl p-hydroxybenzoate wasreported to have a relative binding activity similar to that of p-hydroxybenzoic acid,but to have a greater activity on gene expression and cell proliferation in these testsystems (Pugazhendhi et al., 2005).
The estrogenic activity of methyl, ethyl, propyl and butyl p-hydroxybenzoateand p-hydroxybenzoic acid itself was investigated using three reporter cell linesderived from the human cervical epithelioid carcinoma HeLa cell line, transfectedwith either the human ER or the human ER gene. Neither p-hydroxybenzoicacid nor the methyl ester was active in either cell line at a concentration of up to10-5 mol/l. Estrogenic activity increased with increasing alky chain length, with theethyl, propyl and butyl esters showing activity in both cell lines at concentrations of10-6 mol/l (propyl and butyl esters) or > 10-6 mol/l (ethyl ester) (Gomez et al., 2005).
Combinations of xenoestrogens, which included benzyl p-hydroxybenzoate,have been shown to produce an estrogenic effect in vitro in the YES assay, althoughthe concentrations of each chemical were below their individual thresholds for effectin the assay (Rajapakse et al., 2002).
In vivo
Methyl and butyl p-hydroxybenzoate have been tested in uterotrophicassays using both immature and ovariectomized (OVX) rats treated by oral gavageand/or subcutaneous administration. OVX rats were only dosed subcutaneously.Methyl p-hydroxybenzoate at oral or subcutaneous doses up to 800 mg/kg bw perday for 3 days did not increase the uterus weight in immature rats and failed toincrease uterus weight or vaginal cornification in OVX rats. Butyl p-hydroxybenzoatedid not produce a statistically significant increase in uterus weight in immature ratstreated by oral administration at a dose of up to 1200 mg/kg bw per day for 3 days.However, subcutaneous administration of butyl p-hydroxybenzoate at doses of400–800 mg/kg bw per day significantly increased wet weights of the uterus inimmature rats. The relative potency of the butyl ester was at least 10 000-foldless than that of subcutaneously administered 17 -estradiol. In the OVX rats,subcutaneous doses of 1000–1200 mg/kg bw per day were needed to producestatistically significant uterotrophic effects (Routledge et al., 1998).
108 PROPYL PARABEN

Methyl, ethyl, propyl and butyl p-hydroxybenzoate have been tested inan uterotrophic assay in mature OVX CD1 mice treated by subcutaneousadministration. The parabens were given for 3 days at two different equimolar dosesof 362 and 1086 μmol/kg bw per day, corresponding to 55 and 165, 60 and 180, 65and 195 and 70 and 210 mg/kg bw per day, for the methyl, ethyl, propyl and butylp-hydroxybenzoate, respectively. Both doses of all the parabens tested caused asignificant increase in uterine wet weight compared with controls, accompanied byhypertrophy of the uterine luminal and glandular epithelium and myometrium.Relative potencies, compared with 10 μg of 17 -estradiol (100), were in a similarrange (0.02–0.009) for all four parabens, i.e. 5 000 to 25 000 times less potent thanestradiol. The luminal epithelial hyperplasia response suggested that the estrogenicactivity increased with increasing alkyl chain length (Lemini et al., 2004).
In mice, subcutaneous administration of isobutyl p-hydroxybenzoate at adose of 12 mg/day (approximately 720 mg/kg bw per day) for 3 days and topicaladministration of three daily doses of benzyl p-hydroxybenzoate at 33 mg/animal(approximately 2000 mg/kg bw per day) applied to the dorsal skin, increased theuterine weight in immature female CD1 mice. Relative potencies, compared with17 -estradiol, were 2 400 000 and 330 000 times lower for the isobutyl and butylparabens, respectively. Topical administration of benzyl p-hydroxybenzoate asthree daily doses at 10 mg/animal (approximately 750 mg/kg bw per day) to thedorsal skin of immature mice did not significantly increase uterine weight (Darbreet al., 2002, 2003).
The estrogenic activity of p-hydroxybenzoic acid (the main metabolite of thep-hydroxybenzoic acid esters in mammals) was investigated in CD1 mice. A dose-dependent response on vaginal cornification and uterotrophic activities in bothimmature and adult OVX mice was seen after subcutaneous administration of p-hydroxybenzoic acid at 5 mg/kg bw per day for 3 consecutive days. The potencywas calculated to be approximately 1000 times less than that of 17 -estradiol(Lemini et al., 1997).
The estrogenic activity of methyl, ethyl, propyl and butyl p-hydroxybenzoateand their shared main metabolite, p-hydroxybenzoic acid, was investigated inmouse and rat uterotrophic assays. Immature B6D2F1 mice were treated by oralgavage or subcutaneously with the test compounds at a dose of 1, 10 or 100 mg/kgbw per day for 3 consecutive days; none of the compounds tested producedany estrogenic responses and, for ethyl p-hydroxybenzoate, there was no responseeven at an oral dose of 1000 mg/kg bw per day. In immature Wistar rats, p-hydroxybenzoic acid was inactive when administered subcutaneously at a dose of5 mg/kg bw per day. Butyl p-hydroxybenzoate produced no response at a dose of200 or 400 mg/kg bw per day, and only a weak estrogenic response at 600 mg/kgbw per day; the paraben was at least 6000 times less potent than the positivecontrol, estradiol benzoate at 0.1 mg/kg bw per day (Hossaini et al., 2000). Thusthe estrogenic effect of p-hydroxybenzoic acid given subcutaneously at 5 mg/kg bwper day, as reported by Lemini et al. (1997), was not confirmed in this study, evenat a subcutaneous dose of up to 100 mg/kg bw per day.
PROPYL PARABEN 109

(d) Studies on androgenic and anti-androgenic effects
In vitro
Isobutyl, butyl, isopropyl, propyl, ethyl and methyl p-hydroxybenzoate havebeen studied for androgenic and anti-androgenic activity in two different types ofstably transfected CHO-K1 cell lines. None of the compounds had androgenicactivity. Isobutyl, butyl, isopropyl, propyl p-hydroxybenzoate all showed anti-androgenic activity. They showed weak inhibitory effects on dihydrotestosterone(DHT)-induced luciferase activity, with IC50 values ranging from 4.2 to 8.6 × 10⁻⁵,compared with IC50 values of 3.0 × 10⁻⁷ and 7.0 × 10⁻⁷ for the known anti-androgens,cyproterone acetate and flutamide, respectively. The ethyl and methyl p-hydroxybenzoate did not show any significant activity, with IC50 values of > 1.0 × 10⁻⁴
(Satoh et al., 2005).
2.3 Observations in humans
The presence of small amounts of parabens in tissue samples from humanbreast tumours has been reported. Samples of breast tumours were obtainedfrom 20 patients and analysed by high-performance liquid chromatography(HPLC) and tandem mass spectrometry for methyl, ethyl, propyl, butyl, isobutyl, andbenzyl p-hydroxybenzoate. The reported mean total concentration of parabens was20.6 ng/g tissue (blank value of 33.8 ng/g subtracted). Methyl p-hydroxybenzoatewas the paraben present in the greatest amount (12.8 ng/g) followed by propylp-hydroxybenzoate (2.6 ng/g). Benzyl p-hydroxybenzoate could not be detected.The authors calculated a corrected (for 50% recovery) average total paraben con-centration of 100 ng/g, and compared this with the concentration of approximately150 ng/ml (10-6 mol/l) of propyl, butyl, and isopropyl p-hydroxybenzoate known tostimulate estrogen-dependent growth in MCF7 human breast cancer cells (Darbreet al., 2004).
3. DIETARY INTAKE
No exposure data were provided to the Committee for this assessment andno specific information on the intake of propyl paraben was available. No informationon the food categories in which the parabens can be used or on maximum permitteduse levels were available in the GSFA online Food Additives Group details formethyl, ethyl, propyl parabens and their sodium salts.1
In the European Union (EU), methyl, ethyl-, and propyl p-hydroxybenzoatesand their salts have been permitted as food additives in six categories of processedfoods, as shown in Table 1.
In the United States of America (USA), the parabens are used as aningredient in food at levels that should not exceed those consistent with goodmanufacturing practices (GMP). Current GMP allows for a maximum level of 0.1%
1 See United States Code of Federal Regulations, Title 21: Food and Drugs at http://www.accessdata.fda.gov/scripts/cdrh/cfdocs/cfcfr/cfrsearch.cfm.
110 PROPYL PARABEN

in food (Title 21 of the US Code of Federal Regulations, Sections 172.145, 184.1490and 184.1670, see also section 172.1
An exposure assessment was performed for parabens in a report from theEuropean Commission on dietary food additive intake in the EU according to theguidelines on first conservative estimates (Tier 1). Intakes were below the EUtemporary group ADI for the parabens of 10 mg/kg bw per day (EuropeanCommission, 2001).
An estimate of intake was made for this meeting of the Committee based onmaximum permitted use levels and from food consumption data available from anEU report (European Commission, 2004). Results, as shown in Table 2, indicatethat, even if it was assumed that all four food categories consumed by highconsumers contain parabens at the EU maximum permitted level, the sum of theseexposures together would not exceed the group ADI of 10 mg/kg in any subgroupof the population, including young children.
Table 1. Permitted use levels of parabens in the European Union
EU food category Maximum permitted level(mg/kg)a
Codex GSFA food category
Snacks – potato, cereal, flour orstarch-basedandprocessed nuts, including coatednuts and nut mixtures
300 15.115.2
Confectionery (excludingchocolate)
300 5.2
Liquid dietary food supplements 2000 13.6
Jelly coatings of meat products(cooked, cured or dried)
1000 8.2 and 8.3
Surface treatment of dried meatproducts
Quantum satisb 8.2.1.2
EU, European Union; GSFA, General Standard for Food Additivesa Maximum permitted level in the EU, singly or in combination for the groupb ‘Sufficient’ quantity
Heptylparaben—Part 172 Food additives permitted for direct addition to food for humanconsumption, Subpart B – Food Preservatives, Section 172.145; Methylparaben-—Part 184Direct food substances affirmed as generally recognized as safe, Subpart B – Listing ofSpecific Substances Affirmed as GRAS, Section 184.1490;
Propylparaben-—Part 184 Direct food substances affirmed as generally recognized as safe,Subpart B – Listing of Specific Substances Affirmed as GRAS, Section 184.1670; and Part172 Food additives permitted for direct addition to food for human consumption, SubpartF – Flavoring Agents and Related Substances - Section 172.510 - Natural flavoringsubstances and natural substances used in conjunction with flavours.
PROPYL PARABEN 111

A publication from Soni et al. (2002) has assessed exposure to parabens infood in the USA in the population aged between 2 and 65 years. Based on similarconservative assumptions to those used for the EU estimates, dietary intake asshown in Table 2 varied from an average of 222 mg/day to 466 mg/kg for consumersat the 90th percentile, equivalent to about 4–8 mg/kg bw per day for an adult,assuming, a body weight of 60 kg.
4. COMMENTS
Toxicological data
Data on endocrine and reproductive effects are available from studies in vitroand in vivo with various parabens, including the three parabens used in food, andon their common metabolite, p-hydroxybenzoic acid. They show that the likelihoodof such effects is related to the length of the alkyl chain, with occurrence and potencyincreasing with increasing chain length. The three parabens used as food additives(methyl, ethyl and propyl p-hydroxybenzoate) are those with the shortest chainlength.
The parabens have been shown to exhibit weak estrogenic activity in anumber of test systems in vitro. They are able to bind to the estrogen receptorsER and ER and to stimulate proliferation in estrogen-dependent mammalian celllines. In these test systems, estrogenic potency increases with increasing lengthand branching of the alkyl chain in the following order: methyl < ethyl < propyl< butyl < isopropyl < isobutyl < benzyl < heptyl < 2-ethylhexyl p-hydroxybenzoate.For example, in assays screening for estrogenic activity in recombinant yeast (usingyeast cells transfected with the human ER gene), the relative potency of 17 -estradiol was around 3 million-fold that of methyl p-hydroxybenzoate; and that of17 -estradiol was 150 000–200 000-fold that of ethyl p-hydroxybenzoate. Therelative potency of 17 -estradiol was 30 000-fold and 10 000-fold that of the propyland butyl esters, respectively. One study has reported that the common metaboliteof the parabens, p-hydroxybenzoic acid, shows estrogenic activity by several
Table 2. Estimates of total intakes of parabens used in food
Geographical area, date Estimated intakes (mg/day) Estimated intakes in average to highquantiles (mg/kg bw per day)
USA, 2002 222 to 466 a 3.7 to 7.8 c
EU, 2004 72 to 318 b
60 to 140 b
1.2 to 5.3 c
2 to 9.3 d
a Sum of the average and 90th percentiles of potential intake based reported for six foodcategories
b Sum of the average and 95th percentiles of potential intake reported for four food categoriesc Assuming an average body weight of 60 kg for adultsd Assuming an average body weight of 30 kg for children and 15 kg for small children
112 PROPYL PARABEN

measures in estrogen-dependent mammalian cell lines, with relative binding affinityto the estrogen receptor being 500 000 times lower than that of 17 -estradiol. Twoother studies on p-hydroxybenzoic acid have reported that it is inactive in vitro. TheCommittee considered that the relevance for human health, if any, of very weakestrogenic activity in vitro is unclear at present.
The estrogenic activity of the parabens and their common metabolite, p-hydroxybenzoic acid, has been tested in vivo in uterotrophic assays in immature orovariectomized mice or rats treated by oral, subcutaneous or topical dermaladministration. While methyl, ethyl and propyl parabens showed uterotrophicactivity after dosing by the subcutaneous route, none of those were active in theuterotrophic assay when given orally by gavage at doses of up to 800 mg/kg bw perday for the methyl paraben, up to 1000 mg/kg bw per day for the ethyl paraben andup to 100 mg/kg bw per day for the propyl paraben. For p-hydroxybenzoic acid, onestudy reported an uterotrophic effect in mice after subcutaneous administration, butthis was not confirmed in a subsequent study in which it was given orally orsubcutaneously at higher doses than in the first study.
Several studies have investigated the effects of parabens on malereproductive parameters in rodents. Juvenile rats given diets containing propylparaben at doses equivalent to about 10, 100 or 1000 mg/kg bw per day for 4 weeksshowed dose-related reductions in epididymal sperm reserves and spermconcentrations at the intermediate and highest doses, reductions in daily spermproduction in the testis and reductions in serum concentrations of testosterone inall treated groups. In a similar study, in which diets containing butyl paraben at thesame doses were given for 8 weeks, similar effects were observed but they weremore marked than those with propyl paraben and, in addition, epididymal andseminal vesicle weights were reduced. Similar effects on sperm counts and serumconcentrations of testosterone were observed in juvenile mice given butyl parabenat dietary doses of 15–1500 mg/kg bw per day for 10 weeks. In contrast to butyl andpropyl parabens, neither methyl paraben nor ethyl paraben showed any effects onmale reproductive organs, sperm parameters or sex hormones in juvenile rats givendietary doses of up to 1000 mg/kg bw per day for 8 weeks. There are insufficientdata to conclude whether the effects observed with parabens of higher alkyl chainlength in males are mediated via an estrogenic, anti-androgenic or some othermechanism.
Dietary exposure assessment
No specific information on the intake of propyl paraben was available to theCommittee. Estimates of total dietary intake of parabens by consumers have beencalculated, using the respective use levels from the USA and the EU and assumingan average adult body weight of 60 kg. In the USA, average to 90th-percentileintakes range from 3.7 to 7.8 mg/kg bw per day. In the EU, average to 95th-percentile intakes range from 1.2 to 5.3 mg/kg bw per day. The estimates are highlyconservative, being based on the assumption that parabens are used in all possiblefoods at the highest maximum permitted levels.
PROPYL PARABEN 113

5. EVALUATION
The Committee concluded that, in view of the adverse effects in male rats,propyl paraben (propyl p-hydroxybenzoate) should be excluded from the group ADIfor the parabens used in food. This conclusion was reached on the grounds that thegroup ADI was originally set on a no-observed-effect level (NOEL) of 1000 mg/kgbw per day for a different toxicological end-point—growth depression—taken fromthe range of studies then available for the methyl, ethyl and propyl parabens. Propylparaben has shown adverse effects in tissues of reproductive organs in male ratsat dietary doses of down to 10 mg/kg bw per day, which is within the range of thegroup ADI (0–10 mg/kg bw), with no NOEL yet identified.
The Committee maintained the group ADI of 0–10 mg/kg bw for the sum ofmethyl and ethyl esters of p-hydroxybenzoic acid.
6. REFERENCES
Bao-Liang, S., Hai-Ying, L. & Dun-Ren, P. (1989) In-vitro spermicidal activity of parabensagainst human spermatozoa. Contraception, 39, 331–336.
Blair, R.M., Fang, H., Branham, W.S., Hass, B.S., Dial, S.L., Moland, C.L., Tong, W., Shi, L.,Perkins, R. & Sheehan, D.M. (2000) The estrogen receptor relative binding of 188 naturaland xenochemicals: Structural diversity of ligands. Toxicol. Sci., 54, 138–153.
Byford, J.R., Shaw, L.E., Drew, M.G.B., Pope, G.S., Sauer, M.J. & Darbrre, P.D. (2002)Oestrogenic activity of parabens in MCF7 human breast cancer cells. J. Steroid Biochem.Mol. Biol., 80, 49–60.
Codex Alimentarius Commission. Report of the Thirty-seventh Session of the CodexCommittee on Food Additives and Contaminants, The Hague, The Netherlands, 25–29April 2005. Rome, Food and Agriculture Organization of the United Nations, 2005(ALINORM 05/28/12; http://www.codexalimentarius.net/download/report/639/al28_12e.pdf)
Darbre, P.D., Byford, J.R., Shaw, L.E., Horton, R.A., Pope, G.S. & Sauer, M.J. (2002)Oestrogenic activity of isobutylparaben in vitro and in vivo. J. Appl. Toxicol., 22, 219–226.
Darbre, P.D., Byford, J.R., Shaw, L.E., Hall, S., Goldham, N.G., Pope, G.S. & Sauer, M.J.(2003) Oestrogenic activity of benzylparaben. J. Appl. Toxicol., 23, 43–51.
Darbre, P.D., Aljarrah, A., Miller, R., Goldham, N.G., Sauer, M.J. & Pope, G.S. (2004)Concentrations of parabens in human breast tumours. J. Appl. Toxicol., 24, 5–13.
EFSA (2004) Opinion of the Scientific Panel on Food Additives, Flavourings, Processing Aidsand Materials in Contact with Food on a request from the Commission related to parahydroxybenzoates (E214–219). Question number EFSA-Q-2004-063. Adopted on 13 July2004. Available at (accessed on 18 May 2006): http:www.efsa.eu.int/science/afc/afc_opinions/630en.html.
European Commission (2001) Report from the European Commission on dietary food intakein the EU, October 2001. (www.europa.eu.int/comm./food).
European Commission (2004) Reports on tasks for scientific cooperation 3.2.9: Occurrenceand intake of chloropropanols in food, Directorate-General health and consumerprotection, June 2004.
Fisher, J.S., Turner, K.J., Brown, D. & Sharpe, R.M. (1999). Effect of neonatal exposure toestrogenic compounds on development of the excurrent dusts of the rat testis throughpuberty to adulthood. Environ. Health Perspect., 107, 397–405.
Gomez, E., Pillon, A., Fenet, H., Rosain, D., Duchesne, M.J., Nicolas, J.C., Balaguer, P. &Casellas, C. (2005) Estrogenic activity of cosmetic components in reporter cell lines:parabens, UV screens, and musks. J. Toxicol. Environ. Health Part A, 68, 239–251.
114 PROPYL PARABEN

Hossaini, R.A., Larsen, J.-J. & Larsen, J.C. (2000) Lack of estrogenic effects of foodpreservatives (parabens) in uterotrophic assays. Food Chem. Toxicol., 38, 319–323.
Kang, K.-S., Che, J.-H., Ryu, D.-Y., Kim, T.-W., Li, G.-X. & Lee, Y-S. (2002) Decreased spermnumber and motile activity on the F1 offspring maternally exposed to butyl p-hydroxybenzoic acid (butyl paraben). J. Vet. Med. Sci., 64, 227–235.
Lemini C., Silva G., Timossi C., Luque D., Valverde A., Gonzalez-Martinez M., Hernandez A.,Rubio-póo C., Chavez Lara B. & Valenzuela F. (1997) Estrogenic effects of p-hydroxybenzoic acid in CD1 mice. Environ. Res., 75, 130–134.
Lemini C., Hernandez A., Jaimez, R., Franco, Y., Avila, M.E. & Castell, A. (2004) Morphometricanalysis of mice uteri treated with the preservatives methyl, ethyl, propyl, and butylparaben.Toxicol. Ind. Health., 20, 123–132.
Miller, D., Wheals, B.B., Beresford, N. & Sumpter, J. (2001) Estrogenic activity of phenolicadditives determined by an in vitro yeast bioassay. Environ. Health Perspect., 109,133–138.
Oishi, S. (2001) Effects of butylparaben on the male reproductive system in rats. Toxicol.Indust. Health, 17, 31–39.
Oishi, S. (2002a) Effects of propyl paraben on the male reproductive system. Food Chem.Toxicol., 40, 1807–1813.
Oishi, S. (2002b) Effects of butylparaben on the male reproductive system in mice. Arch.Toxicol., 76, 423–429.
Oishi, S. (2004) Lack of spermatotoxic effects of methyl and ethyl esters of p-hydroxybenzoicacid in rats. Food Chem. Toxicol., 42, 1845–1849.
Okubo, T., Yokoyama, Y., Kano, K. & Kano, I. (2001) ER-dependent estrogenic activity ofparabens assessed by proliferation of human breast cancer MCF-7 cells and expressionof ER and PR. Food Chem. Toxicol., 39, 1225–1232.
Pugazhendhi, D., Pope, G.S., & Dabre, P.D. (2005) Oestrogenic activity of p-hydroxybenzoicacid (common metabolite of the parabens) and methylparaben in human breast cancer celllines. J. Appl. Toxicol., 25, 301–309.
Rajapakse, N., Silva, E. & Kortenkamp, A. (2002) Combining xenoestrogens at levels belowindividual no-observed-effect-concentrations dramatically enhances steroid hormoneaction. Environ. Health Perspect., 110, 917–921.
Routledge, E.J., Parker, J., Odum, J., Ashby, J. & Sumpter, J.P. (1998) Some alkyl hydroxylbenzoate preservatives (parabens) are estrogenic. Toxicol. Appl. Pharmacol., 153, 12–19.
Satoh, K., Nonaka, R., Ohyama, K-I. & Nagai, F. (2005) Androgenic and antiandrogenciceffects of alkylphenols and parabens assessed using the reporter gene assay with stablytransfected CHO-K1 cells (AR-EcoScreen system). J. Health Sci., 51, 557–568.
Song, B.L., Li, H.Y. & Peng, D.R. (1989) In vitro spermicidal activity of parabens against humanspermatozoa. Contraception, 39, 331–335.
Song, B.L., Peng, D.R., Li, H.Y., Zhang, G.H., Zhang, J., Li, K.L. & Zhao, Y.O. (1992)Evaluation of the effect of butyl p-hydroxybenzoate on the proteolytic activity andmembrane function of human spermatozoa. J. Reprod. Fertil., 91, 435–440.
Soni, M.G., Taylor, S.L., Greenberg, N.A. and Burdock, G.A. (2002) Evaluation of the healthaspects of methyl paraben: a review of the published literature. Food Chem. Toxicol., 40,1335–1373.
Terasaka, S., Inoue, A., Tanji, M. & Kiyama, R. (2006) Expression profiling of estrogen-responsive genes in breast cancer cells treated with alkylphenols, chlorinated phenols,parabens or bis- and benzoylphenols for evaluation of estrogenic activity. Toxicol. Lett.,163, 130–141.
PROPYL PARABEN 115

FOOD CONTAMINANTS


ALUMINIUM FROM ALL SOURCES, INCLUDING FOOD ADDITIVES(addendum)
First draft prepared by
D.J. Benford,1 N. Thatcher,1 D. Mason,1 D. Street,2 C. Leclercq,3 M. DiNovi,2
J. Bend4 & B. Whitehouse5
1 Food Standards Agency, London, England;
2 Center for Food Safety and Applied Nutrition, United States Food and DrugAdministration, College Park, MD, USA;
3 Food Safety Exposure Analysis, Istituto Nazionale di Ricerca per gli Alimentie la Nutrizione (INRAN), Rome, Italy;
4 Department of Pathology, Schulich School of Medicine and Dentistry,University of Western Ontario, London, Ontario, Canada; and
5Bowdon, Cheshire, England
Explanation ................................................................................Introduction .........................................................................
General considerations on exposure ............................Biological data ...........................................................................
Biochemical aspects ...........................................................Absorption, distribution and excretion ...........................Effects on enzymes and other parameters ...................
Toxicological studies ...........................................................Acute toxicity .................................................................Short-term studies of toxicity ........................................Long-term studies of toxicity and carcinogenicity .........Genotoxicity ..................................................................Reproductive toxicity .....................................................Special studies ..............................................................
Observations in humans ............................................................Biomarkers of exposure ......................................................
Biomarkers of effects ....................................................Clinical observations .....................................................Epidemiological studies ................................................
Analytical methods ....................................................................Food additives .....................................................................Food samples .....................................................................
Sampling protocols ....................................................................Exposure to aluminium in the diet and other sources ...............
Dietary exposure (including drinking-water) ........................Drinking-water ...............................................................Aluminium from natural dietary sources .......................
120120121121121121130132132132135135136142149149149149152174174174175175175176177
- 119 -

Aluminium migrating from food-contact material (foodcontainers, cookware, utensils and packaging) ............Aluminium present in food additives .............................Assessment of total dietary exposure ...........................
Other sources of exposure ..................................................Inhalation ......................................................................Dermal exposure to consumer products containingaluminium .....................................................................Consumption of medicines containing aluminium .........
Effects of processing .................................................................Dose–response analysis and estimation of risk ofcarcinogenicity/toxicity ...............................................................
Contribution of data to assessment of risk ..........................Pivotal data from biochemical and toxicological studies ..........................................................................Pivotal data from human clinical/epidemiological studies ..........................................................................
Comments .................................................................................Evaluation ..................................................................................References ................................................................................
1. EXPLANATION
1.1 Introduction
Various aluminium compounds were evaluated by the Committee at itsthirteenth, twenty-first, twenty-sixth, twenty-ninth, thirtieth and thirty-third meetings(Annex 1, references 20, 44, 59, 70, 73 and 83). At its thirteenth meeting, anacceptable daily intake (ADI) ‘not specified’ was established for sodium alumino-silicate and aluminium calcium silicate (Annex 1, reference 20). At its thirtiethmeeting, the Committee noted concerns about a lack of precise information on thealuminium content of the diet and a need for additional safety data. The Committeeset a temporary ADI of 0–0.6 mg/kg bw expressed as aluminium for all aluminiumsalts added to food, and recommended that aluminium in all its forms should bereviewed at a future meeting.
In the evaluation made by the Committee at its thirty-third meeting (Annex 1,references 83, 84), emphasis was placed on estimates of consumer exposure,absorption and distribution of dietary aluminium and possible neurotoxicity, partic-ularly the relationship between exposure to aluminium and Alzheimer disease. TheCommittee set a provisional tolerable weekly intake (PTWI) of 0–7.0 mg/kg bw foraluminium, including food additive uses. This was based upon a study in whichno treatment-related effects were seen in beagle dogs given diets containingsodium aluminium phosphate (SALP) acidic at a concentration of 3% for 189 days,equivalent to approximately 110 mg/kg bw aluminium. A consolidated monographwas produced (Annex 1, reference 84).
Aluminium was re-evaluated by the Committee at its present meeting, asrequested by the Codex Commission on Food Additives and Contaminants(CCFAC) at its Thirty-seventh Session (Codex Alimentarius Commission, 2005).
177178182186186
186186187
187187
187
190190196198
120 ALUMINIUM FROM ALL SOURCES, INCLUDING FOOD ADDITIVES
The Committee was asked to consider all data relevant to the evaluation of thetoxicity and intake (including bioavailability) of aluminium used in food additives andfrom other sources, including SALP. CCFAC asked that the exposure assessmentcover all compounds included in the Codex General Standard for Food Additives(GSFA).
Two documents were particularly important in the evaluation made by theCommittee at its present meeting: the International Programme on Chemical Safety(IPCS) Environmental Health Criteria document on aluminium (WHO, 1997) and areport by the United Kingdom (UK) Committee on Toxicity of Chemicals in Food,Consumer Products and the Environment (COT) on a water pollution incident thatoccurred in Cornwall, England in 1988 (COT, 2005). The Committee used thoseassessments as the starting point for its evaluation and also evaluated other datain the scientific literature relating to aluminium compounds. No original toxicologicaldata on aluminium-containing food additives were submitted.
1.1.1 General considerations on exposure
Aluminium is the third most abundant element and a major constituent of theearth’s crust, where it is present as Al3+ in combination with oxygen, fluorine, siliconand other constituents, and not in the metallic elemental state. It is released to theenvironment both by natural processes and from anthropogenic sources. It isnaturally present in varying amounts in most foodstuffs, and concentrations in foodcrops are influenced by geographical region. Use of aluminium and aluminiumcompounds in processing, packaging and storage of food products, and asflocculants in the treatment of drinking-water may contribute to its presence indrinking-water and foods. A number of aluminium salts are used as food additives(see section 6.1.4). In general, the foods that contain the highest concentration ofaluminium are those that contain aluminium additives (WHO, 1997).
2. BIOLOGICAL DATA
2.1 Biochemical aspects
2.1.1 Absorption, distribution and excretion
(a) Absorption
The mechanism of gastrointestinal absorption of aluminium is complex andhas not yet been fully elucidated (WHO, 1997). The extent to which aluminium isabsorbed depends upon the amount of the chemical species present in the gutlumen, in the blood and in the interstitial fluid. Aluminium species may be modifiedin the gut before absorption. Absorption will also be influenced by complexingligands (e.g. citrate, lactate) and competing ions (e.g. iron, silicon). Some authorshave suggested that acid digestion in the stomach would solubilize the majority ofingested aluminium to the monomolecular species. This would then be convertedto the aluminium hydroxide as pH is neutralized in the duodenum. The solubility ofAl3+ is lowest at neutral pH. Most of the substance is expected to precipitate in the
ALUMINIUM FROM ALL SOURCES, INCLUDING FOOD ADDITIVES 121

intestine, making it unavailable for uptake, with subsequent faecal excretion.Aluminium complexes, particularly in the presence of carboxylic acids such ascitrate, are thought to improve solubility in the intestine and hence increasealuminium available for intestinal uptake (Reiber et al., 1995; Yokel & McNamara,2001).
There are indications that the toxicokinetics of aluminium are dose-dependent and since high doses have been administered in many studies, theresults of these studies, with respect to their relevance to humans, should beinterpreted with caution. It should also be considered that accurate quantification ofaluminium absorption has proved difficult. One reviewer highlighted the fact that, inthe past, the absence of an appropriate radioisotope compromised the reliability ofstudies. Measurement of blood concentrations appears to be a poor indicator ofaluminium absorption and, while urinary excretion appears to provide a betterestimation of aluminium absorption, it offers no information about retention in tissuessuch as bone. It has been suggested that measurement of the 26Al radioisotope byhigh-energy accelerator mass spectrometry (AMS) offers a more accuratemeasurement of aluminium levels, since the lower limit of detection (10-18 g) allowsphysiological concentrations of aluminium to be quantified (Drueke, 2002).
A study investigated the influence of the chemical species of aluminium onuptake using the Caco-2 model of gastrointestinal absorption in vitro. Flux acrossand uptake into Caco-2 cells was investigated for the aluminium ion, and foraluminium citrate, maltolate, hydroxide and fluoride, at a concentration of 8 mmol/l.The flux of aluminium fluoride was dramatically increased at 2 h compared with thatof the other aluminium species. This was associated with a reduced transepithelialelectrical resistance (TEER) which indicates opening of tight junctions between cellsresulting in increased paracellular flux, possibly as a result of toxicity caused byfluoride and/or aluminium. The permeability of all aluminium species highlycorrelated with a marker of paracellular diffusion, with the exception of aluminiumhydroxide (possibly owing to its poor solubility). Calcium (1.25 mmol/l) is requiredin the culture medium to maintain tight junction integrity and its absence greatlyincreased aluminium flux across the monolayer. Kinetic studies indicated thatuptake of aluminium species into cells was probably the result of passive diffusion.The use of the 26Al radioisotope at 2 μmol/l, a concentration more relevant todrinking-water, showed that uptake and flux of aluminium were not significantlydifferent among the aluminium species. Approximately 0.015% of the aluminium inthe uptake medium fluxed across the monolayer, while about 0.75% remainedassociated with the cells, corresponding to an intracellular aluminium concentrationof 5 μmol/l (Zhou & Yokel, 2005).
Rat small intestine was perfused with a buffered (pH 7) solution of aluminiumsulfate (93 μmol/l). Of the total aluminium perfused, only 62.2 ± 6.1 (standarddeviation, SD) % was recovered from the effluent and 35.1 ± 5.8 (SD) % wasrecovered from the mucus and mucosa, predominantly in the distal third. Sinceultrafiltration experiments had indicated that only 14.3 ± 1.3 (SD)% of a freshlyprepared perfusate was able to pass through an ultrafilter, the authors suggestedthat a proportion of the mucosal aluminium is likely to be colloidal/particulate (Powellet al., 1994).
122 ALUMINIUM FROM ALL SOURCES, INCLUDING FOOD ADDITIVES

In studies of rat intestinal perfusion, it was found that aluminium uptake wasreduced by various paracellular pathway blockers and a sodium transport blocker.Aluminium uptake from calcium-supplemented medium was increased and theauthors suggested this might be owing to decreased resistance to paracellular fluxin the absence of calcium (Provan & Yokel, 1988a). Follow-up work suggestedaluminium might interact with the calcium uptake pathway since various calcium-channel blockers reduced aluminium uptake. Conversely calcium-channelactivators increased aluminium uptake (Provan & Yokel, 1988b).
Studies of rat intestinal perfusion with aluminium chloride (20 mmol/l)found that increasing concentrations of sodium chloride (0–120 mmol/l) did notaffect aluminium uptake. However, increasing concentrations of calcium chloride(0–10 mmol/l) were associated with a reduction in aluminium absorption (van derVoet & de Wolff, 1998). The effect of aluminium on radiolabelled calcium (45Ca)uptake was investigated in cultured chicken enterocytes. Increasing concentrationsof aluminium lactate (0–150 μmol/l) resulted in approximately 50% reductionin 45Ca uptake, although the effect of aluminium does not appear to be sensitive tocalcium-channel activators. Similarly, an isolated intestinal loop experiment in ratsshowed that the presence of aluminium chloride at 50 mg Al/kg bw1 resulted in asignificant reduction in calcium uptake (Orihuela et al., 2005a).
Aluminium was detected in samples of whole blood, urine and tissue fromrats treated with aluminium lactate at 12 mg/kg bw, but not 1 mg/kg bw, by oralgavage (Wilhelm et al., 1992).
Groups of 10 male Wistar rats received either deionized water or drinking-water supplemented with aluminium chloride (5 or 20 mgAl/kg bw per day) for 6months. The animals were placed in metabolic cages for 6 days before, during (thirdmonth) and at the end of the study, for measurement of water consumption anddiuresis (balance study). Absorption was reported to be 6.1 and 5.8 μg/kg bw perday, in the groups receiving doses of 5 and 20 mg Al/kg bw per dayrespectively (Somova & Khan, 1996).
In studies reported by the World Health Organization (WHO, 1997), therelationship between solubility of various aluminium compounds and absorptionwas examined in Sprague-Dawley rats given aluminium compounds orally at a doseof 1.2 mmol (35 mg Al) per kg bw. Aluminium absorption, measured by urinaryexcretion, largely mirrored solubility. Urinary excretion of 0.015% of theadministered dose was detected with aluminium hydroxide, with excretion beingtwice that for aluminium chloride and aluminium lactate. Inclusion of citrate resultedin an increase in excretion of 50–100 times. The validity of using urinary excretionas a marker of absorption was assessed in isolated intestinal loop experiments,which supported the excretion data (Froment et al., 1989a). Further work indicatedthat absorption was likely to occur in the proximal small intestine. A mechanism wasproposed whereby potent calcium chelation by aluminium citrate compromises tight
1 The abbreviation ‘Al’ is used in expressing dietary concentrations or doses as aluminiumrather than as the administered aluminium compound, and for total aluminium content infood, or its associated dietary exposure when the nature of the aluminium compoundspresent is unknown.
ALUMINIUM FROM ALL SOURCES, INCLUDING FOOD ADDITIVES 123

junction integrity, leading to enhanced paracellular absorption (Froment et al.,1989b).
The 26Al radioisotope was used to assess gastrointestinal absorption, tissueretention and urinary excretion of dietary aluminium in the presence and absenceof citrate in rats. Groups of 20 rats were given 3.8 ng of 26Al and 63 ng of 27Al by oralgavage in 400 μl of deionized water, with either 20 mg of citric acid or weakhydrochloric acid of similar pH. Urine was collected throughout the study and twoanimals per dose group were killed at 0.5, 1, 1.5, 2, 4, 6, 8, 120, 360 and 720 h aftergavage. 26Al present in plasma reached a peak of 0.01% of the administered dose1 h after gavage, with a modest but statistically significant increase in aluminiumabsorption in the presence of citrate (Jouhanneau et al., 1997).
A contemporary study also using the 26Al radioisotope, given to fasted ratsas either aluminium hydroxide or citrate, found fractional absorption to be 0.1% and5% respectively (Schonholzer et al., 1997).
Groups of at least four guinea pigs were fed one of six diets twice per weekfor 3 weeks: sponge cake and orange juice (1 : 1); sponge cake and water (1 : 1);bread and jam and tea (2 : 1 : 1); bread and jam and water (2 : 1 : 1); orange juice;or tea (available instead of drinking-water and in the absence of diet for 2 h per day).The total amount of aluminium ingested from these test diets was 44 000, 37 000,300, 230, 5, and 240 μg respectively. Each 24 h test-diet period was preceded andfollowed by an 8 h fast, with guinea-pig chow being consumed ad libitum at all othertimes. Control animals ate guinea-pig chow only, consuming approximately 2800 μgof aluminium. The sponge cake contained SALP acidic, and the test diets withsponge cake contained substantially more aluminium than the other test diets.
Aluminium concentrations were measured in brain, kidney and bone (femur)by inductively coupled plasma-mass spectrometry (ICP-MS), and in upper intestinalcontents by size exclusion chromatography (SEC) coupled to ICP-MS. Aluminiumconcentrations in the femurs of animals fed sponge cake, with or without orangejuice, were significantly higher than in animals fed any other diet. Femurconcentrations of aluminium were higher in the animals fed orange juice and spongecake than in those fed cake without orange juice, although the amount of aluminiumingested was similar in the two groups. In the kidney, concentrations of aluminiumwere below the detection limit in animals fed guinea-pig chow, bread, tea and jam,but aluminium was detectable in animals fed the diets containing sponge cake.Concentrations were significantly higher in the animals fed sponge cake and orangejuice compared with controls, but not in animals fed sponge cake and water. Noneof the diets produced elevated concentrations of aluminium in the brain. Less than1% of aluminium in the upper intestinal contents was found in the soluble fraction,and characterization by SEC-ICP-MS indicated that this aluminium was not presentas citrate (Owen et al., 1994).
An 8-week feeding study in rats examined the absorption of aluminium(1.5– 2 g/kg diet) either as hydroxide or complexed with organic anions—citrate,malate, lactate or tartrate. All the organic anions significantly increased plasmaaluminium concentrations compared with those in the group treated with aluminium
124 ALUMINIUM FROM ALL SOURCES, INCLUDING FOOD ADDITIVES
hydroxide. There was no significant difference in plasma aluminium concentrationsbetween the organic anion treated groups (Testolin et al., 1996).
Rats were given 26Al (3.8 ng in 27Al, 63 ng) by oral gavage (300 μl), in waterwith a low, medium or high concentration of silicon (< 0.1, 6 or 14 mg Si/lrespectively) in the presence or absence of citrate (26 g/l). While citrate significantlyincreased fractional intestinal absorption of 26Al by a factor of 6–7, silicon had nosignificant effect, either in the presence or absence of citrate. The same study alsofound a significant 15-fold increase in 26Al absorption in animals subjected to a 24 hfast compared with non-fasted animals (Drueke et al., 1997).
A small study examining aluminium concentrations in the blood 60 min afteradministration of a drink containing aluminium citrate (Al, 0.3 g; citrate, 4.8 g) foundlarger increases in blood concentrations in elderly people (aged > 77 years)compared with people aged 20–70 years. This study also found that increases inblood aluminium concentrations in younger patients with Alzheimer disease weresimilar to those in elderly sufferers and in controls. The authors suggested thataluminium exposure in these groups may be increased twofold (Taylor et al., 1992).
In a two-part study, the authors initially assessed the speciation of aluminiumin vitro in infusions of black tea. Tea samples were incubated alone (pH 4.5) or withan equal volume of human gastric juice (pH 2.2) for 1 h at 37 °C, then centrifugedthrough micro-concentrators with relative molecular mass cut-offs of 3, 10 and30 kDa. Further acid-digested samples were adjusted to pH 6.5 and then centrifugedthrough 3000 Da filters. Of the aluminium in the tea, 78% passed through the 3 kDafilter, and this percentage rose to over 90% with the addition of gastric juice.However, when the gastric juice-digested infusion was adjusted to pH 6.5, just 5%of the aluminium passed through the 3 kDa ultrafilter. These findings suggested thatwhen digested tea passes from the stomach into the duodenum, the pH changewould be expected to cause a rapid re-association of aluminium with species witha high relative molecular mass, such as polyphenols.
In the second part of the study, one healthy volunteer drank 2 l of tea over 4 hwhile commencing a 24 h urine collection. Urine collection continued for a further24 h in which no tea was consumed, but deionized water was allowed ad libitum.There was little difference in the concentration of aluminium in urine during the two24 h collection periods. However, urinary volume and total aluminium excretion weregreater after drinking tea than during the second 24 h collection period. The authorssuggested that only a small proportion of the aluminium in tea is potentially availablefor absorption throughout the small bowel (Powell et al., 1993).
Aluminium uptake was determined in a single human volunteer given a singleoral dose of 26Al (1.1 μg) in sodium citrate. Plasma concentrations of the isotopewere measured 6 h after administration and uptake was determined byextrapolation. Uptake was estimated to be 1% of the administered dose (Priest etal., 1995; Priest, 2004).
In a later study, patients with Down syndrome and controls were givenorange juice containing 26Al and the effect of added silicate was assessed.Gastrointestinal absorption factors were calculated (aluminium absorbed :
ALUMINIUM FROM ALL SOURCES, INCLUDING FOOD ADDITIVES 125

aluminium administered). Control values ranged from 0.04 to 1.5 × 10⁻⁴. The additionof silicate reduced absorption by a factor of approximately 7, while uptake was fivetimes higher in patients with Down syndrome (Priest, 2004).
The uptake of various forms of aluminium was assessed in human volunteersdosed with 100 mg of aluminium via a paediatric feeding tube. Absorption fractionswere calculated for aluminium citrate, aluminium hydroxide and aluminiumhydroxide with sodium citrate (5 × 10⁻³, 1.04 × 10⁻⁴ and 1.36 × 10⁻³ respectively).These results demonstrated the greater bioavailability of the citrate complex andthe ability of citrate to enhance the bioavailability of aluminium in another chemicalform. This study also noted that variability between the two subjects appeared to becaused by longer retention of the 26Al in the intestine, before defaecation. The 26Alremained in the intestine for approximately 1 day longer in one subject and this wasassociated with higher blood concentrations and protracted excretion (Priest et al.,1998).
In another study, a fruit drink containing 26Al (27 ng) was given to 13 patientswith Alzheimer disease (aged 63–76 years) and 13 age-matched controls after anovernight fast. This study found that gut absorption ranged from 0.06–0.1% of theadministered dose with a 1.6-fold increase in absorption by Alzheimer patients(Moore et al., 2000).
A fractional aluminium absorption of 0.22% was determined bycomparing 26Al urinary concentrations in human male volunteers given 26Al eitherby intravenous injection or in drinking-water (Priest et al., 1995b; Priest et al., 1998acited in COT, 2005).
Three human male volunteers were given aluminium (280 mg, 104 mmol)as aluminium hydroxide with citrate (3.2 g, 1.67 mmol) in 100 ml of fruit juice, afteran overnight fast. The authors suggested that it is unlikely that the aluminium wasabsorbed as aluminium citrate, since the blood citrate peak preceded the aluminiumpeak by 45–60 min. Therefore, they favoured the hypothesis proposed by Fromentet al. (1989b) whereby citrate facilitates aluminium absorption by opening tightjunctions in the gut epithelium (Taylor, 1998).
(b) Distribution
Groups of 10 male Wistar rats received either deionized water or aluminiumchloride (5 or 20 mg Al/kg bw per day) for 6 months. Aluminium was measured inplasma, brain, liver, bone and kidney and showed dose-related significant increasesin concentration when compared with the control animals (Somova & Khan, 1996).
Groups of 20 male Wistar rats were given aluminium chloride at a dose of5 mg Al/kg bw per day by intravenous injection for 3 consecutive days. Half of theanimals were sacrificed on day 4 and the other half on day 22. Haematologicalparameters and aluminium and iron concentrations in brain, liver, kidney and bonewere studied. It was noted that aluminium had accumulated in the brain, bone andkidney of the animals sacrificed after 4 days. These levels had returned to normalafter 22 days, when increased concentrations of aluminium in the liver were noted(Somova et al., 1995).
126 ALUMINIUM FROM ALL SOURCES, INCLUDING FOOD ADDITIVES
Groups of six rats were given aluminium hydroxide (Al(OH)3) or aluminiumchloride at a dose of 0.1, 2.0 or 100 mg Al/l (equivalent to 0, 0.01, 0.2 and 5.5 mgAl/kg bw per day) with either water, citrate or acetate for 10 weeks. Aluminiumconcentrations were determined in tibia, brain, liver, intestine, blood and kidney byflameless atomic absorption. These did not differ between the treatment groups,with the exception of the intestine, where intestinal cell aluminium concentrationsincreased in a dose-dependent manner in the presence of citrate (Fulton, 1989).
Rats were given a single oral dose of aluminium at 0, 0.2, 0.4, or 0.8 mmolas aluminium lactate by gavage in 1 ml of 16% citrate (equivalent to 0, 0.04, 0.08and 0.16 mg Al/kg bw per day). The diet used in this study contained 7.79 mg Al/kg.Tissue aluminium concentrations were determined after 7 h by atomic absorptionspectrophotometry. Significant increases above values for controls were observedin all tibia samples. Serum and kidney concentrations of aluminium in the groups at0.2 and 0.4 mmol were significantly increased above those of the controls, with asignificantly greater increase at 0.8 mmol. Significant increases in the liver andspleen were only observed at 0.8 mmol. Rats at 0.8 mmol retained significantlygreater amounts of aluminium in soft tissues than those at 0.2 or 0.4 mmol. Theauthors suggested this might indicate that physiological mechanisms were unableto prevent the tissue accumulation of aluminium in the rats given the highest dose(Sutherland et al., 1996).
In rats dosed orally with 26Al (3.8 ng with 63 ng 27Al) uptake of aluminium intobone was found to be rapid (approximately 1 h) and it remained in the skeleton forthe duration of a 30 day study. These authors suggested a minimum residence timeof approximately 500 days (Jouhanneau et al., 1997).
Groups of growing (age 2 months), mature (age 8 months) and ageing (age19 months) male Sprague-Dawley rats were given aluminium lactate at aconcentration of 0.8 mmol by oral gavage. Rats were sacrificed on days 1, 9, 15,21, 27, 36 and 44 (minimum of seven per age group). One day after dosing, growingrats had higher concentrations of aluminium in bone (tibia) than did mature andageing rats, which had similar concentrations. Ageing rats had higher concen-trations in the kidneys on day 1, and lower concentrations on day 9 than growingand mature rats. The half-life (time taken for tissue concentration to halve) ofaluminium in the kidneys and tibias increased with age. Multiple stepwise regressionanalysis indicated that several factors that change with age (including animal size,kidney function, bone turnover and metabolism of other minerals), but not ageitself, were predictive of tibia aluminium concentration. Age was also a predictor ofliver and spleen aluminium concentrations. However, the measured changes ingut, kidney, bone and mineral metabolism were less predictive of soft tissuealuminium concentration than of bone aluminium concentration (Greger &Radzanowski, 1995).
Microdialysis was used to measure aluminium in extracellular fluid of frontalcortex, lateral ventricle and blood in rats (species not reported). The concentrationof aluminium in the dialysate from the frontal cortex reached a maximal steadyvalue within 5 min after the administration of aluminium citrate (0.5 mmol/kg bw) asan intravenous bolus. Also, there was a higher concentration of aluminium, and
ALUMINIUM FROM ALL SOURCES, INCLUDING FOOD ADDITIVES 127

higher brain : blood ratio, in the frontal cortex than in cerebrospinal fluid. The authorsstated that this supports the suggestion that aluminium enters the brain from blood,through the blood–brain barrier, rather than through the choroid plexus. Theconcentration ratio of aluminium in extracellular fluid in the brain : blood was 0.15at constant blood and brain extracellular-fluid aluminium concentrations, suggestingthat the transfer of aluminium citrate across the blood–brain barrier is mediated bycarriers, rather than by diffusion. Various substrates were included in the dialysateof the microdialysis probe implanted in the frontal cortex of rats. Addition of CN- or2,4-dinitrophenol as metabolic inhibitors, pyruvate as a substrate for the carriermonocarboxylate transporter (MCT), or other factors to reduce proton availabilityand proton gradients significantly increased the brain : blood ratio to approximately1. These results are consistent with the hypothesis for MCT-mediated transportacross the blood–brain barrier. However, lack of aluminium citrate uptake in raterythrocytes expressing MCT1 and the band 3 anion exchange transportersuggests it is not an effective substrate for either of these transporters. Uptake ofaluminium citrate into murine-derived endothelial cells appeared to be independentof sodium and pH, and dependent on energy. Uptake was inhibited by substratesand/or inhibitors of the MCT and organic anion transporter families. Determinationof 26Al concentrations in rat brain indicated a prolonged brain half-life (approximately150 days). The authors noted that this is difficult to extrapolate to humans owing toinsufficient insight into allometric scaling for metals between rats and humans(Yokel, 2005).
Rats aged 2 months received intraperitoneal injections of aluminiumgluconate (0.667 mg Al/250 μl) three times per week for 2 months. Theconcentration of aluminium was estimated in brain regions and liver. Liverconcentration was reported to be 44-times higher in treated rats than in controls,while a 3.5-fold increase was observed in the brain, with some regions appearingto be more vulnerable to aluminium accumulation. The highest concentrations werereported in the temporal cortex, hippocampus and anterior olfactory nuclei. Theimpact of aluminium exposure on distribution of glutamate, aspartate and glutaminewas also studied. Of the three amino acids assayed, the distribution pattern ofglutamine in the brain was distinctly different to that in controls (Struys-Ponsar etal., 1997).
Lactating rats with a litter size of 11 were injected subcutaneously with asolution containing 20 dpm 26Al ( 26AlCl3) and 0.009 mg 27Al ( 27AlCl3) daily frompostnatal days 1 to 20. Incorporation of 26Al into the brain, liver, kidneys and boneof suckling rats was measured by mass spectrometry and shown to increasesignificantly from days 5 to 20. After weaning, the amount of aluminium in the liverand kidneys decreased remarkably. However, in the brain the amount of 26Al hadonly diminished slightly up to 140 days after weaning (Yumoto et al., 2003).
In a review of published studies, papers were identified in which aluminiumwas administered to pregnant rats, mice or rabbits and accumulation of aluminiumwas measured in dams, fetus or offspring. Seven studies were identified in whichaluminium was administered during gestation and fetal accumulation wasdetermined. In another seven studies, aluminium was administered at least untilbirth and evaluated the accumulation in the dams and/or pups. These fourteen
128 ALUMINIUM FROM ALL SOURCES, INCLUDING FOOD ADDITIVES

studies included four different aluminium compounds (hydroxide, chloride, lactateand citrate) administered by four routes (gavage, feed, intraperitoneal injection andsubcutaneous injection) with total doses ranging from 14 to 8400 mg/kg bw. Fetalaluminium concentrations were not increased in six of the seven studies and pupaluminium concentrations were not increased in four of the five studies in which theywere measured. Maternal aluminium concentrations were increased in somestudies, but there was no consistent pattern of organ-specific accumulation and itwas reported that the positive results of several of the studies were contradicted bysubsequent reports from the same laboratory. Placental concentrations wereincreased in six out of nine studies and were greater than corresponding fetalconcentrations (Borak & Pierce, 1998).
In a human volunteer, blood samples were taken at 6, 12 and 24 h afteringestion of 26Al (100 ng, 70 Bq) with 27Al (1 μg) in sodium citrate. The highestplasma 26Al concentration (0.3 ng/l) was found in the sample collected at 6 h.Assuming a plasma volume of 3 l, 1% of the administered dose (1 ng) would havebeen in the circulation. Of this, 5% appeared in a fraction with low relative molecularmass. The remainder was associated with the fraction with high relative molecularmass, specifically, 80% with transferrin, 10% with albumin and 5% in other specieswith high relative molecular mass (Day et al., 1991). Consistent with this, studies ofaluminium binding indicate that that 90% of the aluminium in blood is associatedwith transferrin, with the remaining 10% existing as aluminium citrate (Ohman &Martin, 1994). While binding studies have shown that transferrin is the strongestaluminium-binding protein in blood, a difference of nearly 10 log units in transferrinbinding between aluminium and iron (Martin et al., 1987), indicates that aluminiumis unlikely to compete with iron for transferrin binding.
(c) Excretion
Rats dosed orally with 26Al (3.8 ng with 63 ng 27Al) were found to haveexcreted approximately 90% of the aluminium in the urine within 48 h after dosing(Jouhanneau et al., 1997).
The importance of bile as an excretory route for ingested aluminium has beenexplored. Bile ducts of 30 male Sprague-Dawley rats were cannulated to allow bothbile collection and re-infusion of bile acids. Five days after surgery, rats (averagebody weight, 191 ± 4 g) were given a single oral dose of aluminium (0, 0.2, 0.4, or0.8 mmol, equivalent to 0, 0.04, 0.08 and 0.16 mg Al/kg bw per day) as aluminiumlactate given by gavage in 1 ml of 16% citrate. Bile was collected fromunanaesthetized rats 1–7 h after dosing. Biliary aluminium secretion was highestduring the first hour of bile collection. All rats dosed with aluminium secretedsignificantly greater amounts of aluminium in bile than did rats in the control group.However, biliary aluminium secretion did not vary among animals given aluminiumat different doses, suggesting that biliary secretion of aluminium was saturated atthese doses (Sutherland et al., 1996).
A human male volunteer was given a solution of 26Al (0.7 μg, 574 Bq) intrisodium citrate (35 mg) intravenously. Urinary and faecal excretion were 83% and1.8%, respectively, of the initial dose over 13 days after administration. Whole body
ALUMINIUM FROM ALL SOURCES, INCLUDING FOOD ADDITIVES 129

retention of 26Al was 15% 13 days after administration, declining to 4% at 1178 days,corresponding to a biological half-life of 7 years (Priest et al., 1995). In a secondstudy, six human male volunteers were each given a solution of 26Al (84 ng, 60 Bq)with citrate (25 mg) intravenously. On average, 59 ± 10 (SD) % was excreted in thefirst 24 h and by 5 days 72 ± 7 (SD) % had been excreted in the urine. The urinaryexcretion of 26Al did not correlate with either the mass of voided urine, or excretionof sodium, potassium, calcium, magnesium or phosphorus. Faecal excretion was1.2% ± 0.3 (SD) over the 5 days after administration. On the fifth day, whole-bodyretention ranged from 16% to 36%, with a mean of 27 ± 7 (SD) %. The authorssuggested that the substantial interindividual variation probably reflected genuinedifferences in the clearance patterns, which may have implications for whole-bodyconcentrations in the long term (Talbot et al., 1995).
2.1.2 Effects on enzymes and other parameters
Aluminium has been reported to modify the absorption of essential minerals(WHO, 1997).
In a study conducted in vitro, isolated chick duodenum enterocytes wereincubated for 1 h with aluminium lactate at 100 μmol/l. In the presence of aluminium,the maximum uptake of calcium and the affinity constant (km) were significantlydecreased. This reduction was not reversed in cells in which the aluminium-containing media was replaced by aluminium-free media before the measurementof uptake of aluminium. The effect of aluminium on calcium uptake wasconcentration-dependent (measured range of concentrations of aluminium: 10, 20,50, 100, 125 or 150 μmol/l) exhibiting an inhibitory saturation-type phenomenon.Calcium uptake was lower at pH 6.5 than at pH 7.4, differences being statisticallysignificant in the range of 20 to 50 μmol/l. Calcium channel activators A23187 andcapsaicin did not modify the effects of aluminium (Orihuela et al., 2005a).
The influence of intestinal glutathione (GSH) concentrations on the effectsof aluminium on calbindin-D9k-related calcium transport was assessed in adult maleWistar rats given aluminium chloride by oral gavage daily for 7 days (50 mg Al/kgbw). This treatment significantly increased the tissue aluminium content in the smallintestine (as measured at the end of the experimental period) compared with controlanimals. At 24 h, intestinal calcium absorption was significantly decreased in ratsgiven aluminium, or aluminium plus GSH (5 and 10 mmol/kg bw). After 7 days, theinhibitory effect of aluminium on calcium absorption was prevented by simultaneousadministration of aluminium with GSH (10 mmol/kg bw). Depletion of GSH byintraperitoneal injection of buthionine sulfoximine (2 mmol/kg bw,) decreasedcalcium absorption in control animals, and further enhanced the inhibition of calciumabsorption by aluminium. Aluminium decreased the duodenal expression ofcalbindin-D9k, this was prevented by co-administration of GSH at 7 days, but notat 24 h (Orihuela et al., 2005a).
The same authors carried out further studies on the effect of aluminium onGSH metabolism in the small intestine. Adult male Wistar rats were given aluminiumchloride at a dose of 30, 60, 120 and 200 mg/kg bw per day by oral gavage for7 days. The authors commented that exposure to aluminium from the diet and
130 ALUMINIUM FROM ALL SOURCES, INCLUDING FOOD ADDITIVES

drinking-water was negligible, although data were not provided. It is unclear whetherthe doses were expressed as aluminium or as aluminium chloride. There was adose-related decrease of GSH in the small intestine that was statistically significantat doses of 60 mg/kg bw and above. A 71% increase in the GSH concentration wasmeasured at the highest aluminium dose assayed. The ratio of oxidized : reducedglutathione (GSSG : GSH) increased as the aluminium dose increased becomingstatistically significant at 200 mg/kg bw. Specific activities of glutathione-synthase(from 60 mg /kg bw per day) and glutathione-reductase (from 120 mg /kg bw perday) were significantly reduced (26 and 31% respectively) compared with thecontrols, while glutathione S-transferase activity was shown to only be slightlymodified by treatment with aluminium. A positive linear correlation between theintestine GSH depletion and a reduction of in-situ calcium absorption, both producedby aluminium, was reported. The authors commented that the results taken as awhole indicate that aluminium alters GSH metabolism in the small intestine bydecreasing its turnover, leading to an unbalanced redox state in the epithelial cells,thus contributing to deterioration in GSH-dependent absorptive functions (Orihuelaet al., 2005b).
Intragastric administration of aluminium lactate at 0 or 10 mg Al/kg bw perday to six male Wistar rats for 12 weeks resulted in significant increases inintrasynaptosomal calcium concentrations, decreased Ca2+ ATPase, increasedcalcium uptake and increased calpain activity in the brain, indicating alterations incalcium homeostasis. No information on the aluminium content of the diet wasprovided (Kaur & Gill, 2005).
Aluminium chloride has been investigated for effects on enzymes and otherparameters associated with oxidative damage. Groups of seven male Sprague-Dawley rats were treated orally at a dose of 34 mg/kg bw every other day for 30days, equivalent to 17 mg/kg bw per day. This dose was stated to be 1/25 of the ratoral median lethal dose (LD50) for aluminium and the comparison indicates that thedose is expressed as aluminium rather than aluminium chloride, although this is notclear from the paper. No other details on dosing and no information on aluminiumcontent of the diet are provided. Treatment with aluminium chloride resulted inchanges in a large number of parameters, including significantly increasedthiobarbituric acid reactive substances and decreased glutathione S-transferaseactivity and levels of sulfydryl groups in plasma, liver, brain, testes and kidney. Arange of aminotransferase and similar enzymes were decreased in liver and testesand increased in plasma, acetylcholinesterase decreased in brain and plasma.Concomitant administration of vitamin E (100 mg/kg bw) or selenium (200 μg/kg bw)partially or totally alleviated the effects of aluminium chloride on these parameters(El-Demerdash, 2004).
A similar study was conducted in rabbits at the same laboratory. Groups ofsix male New Zealand White rabbits were treated orally with aluminium chloride ata dose of 34 mg/kg bw every other day for 16 weeks, equivalent to 17 mg/kg bw perday. This dose was stated to be 1/25 of the rabbit oral LD50 for aluminium and thecomparison indicates that the dose is expressed as aluminium rather thanaluminium chloride, although this is not clear from the paper. No other details ondosing and no information on aluminium content of the diet were provided. The
ALUMINIUM FROM ALL SOURCES, INCLUDING FOOD ADDITIVES 131

effects of aluminium chloride were similar to those in the study of El-Demerdash(2004). Vitamin E and selenium were not investigated but amelioration by ascorbicacid (40 mg/kg bw) was reported (Yousef, 2004).
In a study to investigate the possible effects of aluminium exposure onvarious aspects of calcium homeostasis, three male rhesus monkeys (body weight,3–4 kg) received aluminium lactate at at dose of 25 mg Al/kg bw by gastric intubationon alternate days for 52 weeks, equivalent to 13 mg Al/kg bw per day. There wasno information on the aluminium content of the diet. Aluminium exposure caused adecline in the activity of Ca2+ ATPase in the brain. The total calcium content wasalso significantly raised. Concomitant to this, the levels of lipid peroxidation wereincreased in the treated animals, suggesting aluminium-induced neuronal change.The authors suggest that the results indicate that the toxic effects of aluminium couldbe mediated through modifications in the intracellular calcium homeostasis withresultant altered neuronal function (Sarin et al., 1997a).
Three male rhesus monkeys (body weight, 3–4 kg) received aluminiumlactate at a dose of 25 mg Al/kg bw on alternate days for 52 weeks, equivalent to13 mg Al/kg bw per day. There was no information on the aluminium content of thediet. Aluminium administration caused a significant decrease in the total lipid,glycolipid and phospholipid in the brains of these primates. Phospholipid tocholesterol ratios were markedly increased, indicating a loss of membrane integrity,supported by the observation that aluminium had a significant effect on the variousmembrane-bound enzymes in terms of decreased activities of Na+K+ ATPase andacetylcholinesterase, along with a decrease in the myelin-specific enzyme, 2’3’-cyclic nucleotide phosphohydrolase. The authors considered the latter decreasewas suggestive of possible demyelination, which in turn can be attributed toaluminium-induced lipid peroxidation and resultant loss of lipids (Sarin et al., 1997b).
2.2 Toxicological studies
2.2.1 Acute toxicity
The oral LD50 of aluminium chloride was 3630 ± 400 mg/kg bw, equal to737 ± 81 mg Al/kg bw in male Wistar rats. Effects observed in rats after dosing atand above 520 mg Al/kg bw included lethargy, reduced spontaneous movement,lacrimation and breathing difficulties. No effects were observed in the animalsreceiving the lowest dose (325 mg Al/kg bw) (Kumar, 2001).
2.2.2 Short-term studies of toxicity
(a) Rats
Groups of 15 male albino rats (strain not reported) were given aluminiumsulfate at 0, 17, 22, 29, 43, 86 or 170 mg Al/kg bw or potassium aluminium sulfateat 29 or 43 mg Al/kg bw by oral gavage for 21 days. No information was providedon the aluminium content of the diet. The effects of both compounds were similarat comparable doses of aluminium. The end-points were histopathologicalexamination of heart, liver, kidney, brain, testes, stomach and femur. Mild
132 ALUMINIUM FROM ALL SOURCES, INCLUDING FOOD ADDITIVES

histopathological effects were reported in the kidney and liver at the lowest dose17 mg Al/kg bw per day (as aluminium sulfate). Severity of effects increased withdose and effects on nerve cells, testes, bone and stomach were also reported athigher doses. WHO (1997) stated that the data presented were inadequate to verifythe reported effects (Roy et al., 1991; WHO, 1997).
Groups of 10 male Wistar rats received aluminium chloride in deionizedwater as drinking-water for 6 months at doses stated to be 5 and 20 mg Al/kg bw,although it is unclear how these doses were achieved. Control animals consumeddeionized water. All animals consumed ‘standard pellet food’ ad libitum. Noinformation was provided on the aluminium content of the diet and therefore thetotal dose of aluminium is uncertain. After 6 months, the body weights of animalsat the lowest dose (5 mg Al/kg bw per day) and at the highest dose (20 mg Al/kgbw per day) were 80% and 84% of control, respectively. Interim body weightswere not reported. Erythrocyte count in the groups at the lowest and highestdose was reduced by 31% and 23% respectively; haemoglobin by 27% and28% respectively; erythrocyte glucose-6-phosphate dehydrogenase by 14 %and 11% respectively; erythrocyte acetylcholinesterase was reduced by 29% and20% respectively; erythrocyte volume fraction was reduced by 10% in both groups.No significant changes in leukocyte count were found in either group (Somova &Khan, 1996).
Results of histopathological observations in the above study were reportedseparately. At 20 mg Al/kg bw, there were spongiform changes and neurofibrillarydegeneration in the hippocampus of the brain and atrophy and fibrosis in the kidney(Somova et al., 1997).
Groups of 16 male Sprague-Dawley rats were fed diets containing aluminiumhydroxide for 29 days. Groups received 1079 mg Al/kg diet, 1012 mg Al/kg diet plus4% citrate, or 2688 mg Al/kg diet plus 4% citrate, equivalent to approximately 100,100 and 270 mg Al/kg bw per day respectively. Concentrations of aluminium in tibia,liver and serum and urinary excretion of aluminium were highly correlated with oralexposure. Ingestion of citrate had small but significant effects on aluminiumretention. Erythrocyte volume fractions were inversely correlated with tissueconcentrations of aluminium (Greger & Powers, 1992; cited in WHO, 1997).
Aluminium tissue concentrations and body and organ weight changes weremeasured in a 2 × 2 × 2 × 2 factorial design study exposing groups of rats to dietscontaining 13 or 1100 mg Al/kg as hydroxide or citrate and calcium (2.7 or 10 g/kgdiet) for 30 days. Further groups of six animals in a 4 × 2 factorial design experimentwere exposed to 14 or 900 mg Al/kg diet per day and one of four levels of citrate for28 days. Ingestion of citrate was reported to increase the retention of aluminium inbone of rats fed the highest dose (100 mg Al/kg diet per day) and on the high-calciumdiet, aluminium concentrations were reported to decrease without a change ingrowth of the animals. In a third experiment, of 2 × 2 × 2 factorial design, groups ofseven rats were exposed to 9 or 1000 mg Al/kg diet per day and citrate. ‘Sham’operations were carried out on these animals, or they had one kidney removed.Reduction in kidney function was insufficient to alter growth, but aluminium retentionwas increased in bone by 13% (Ecelbarger & Greger, 1991; cited in WHO, 1997).
ALUMINIUM FROM ALL SOURCES, INCLUDING FOOD ADDITIVES 133

Dogs
Groups of four male and four female beagle dogs were fed SALP basic atdietary concentrations of 0, 3000, 10 000 or 30 000 mg/kg for 26 weeks. Themeasured aluminium concentrations averaged 94, 284, 702 and 1922 mg Al/kg diet,providing average doses equal to 4, 10, 27 or 75 and 3, 10, 22 or 80 mg Al/kg bwper day for male and female dogs, respectively. Toxicity was reported to be limitedto a sharp transient decrease in food consumption and a concomitant decrease inbody weight in males at the highest dose, but these data are not shown in thepublication. No treatment-related effects on serum chemistry, haematology or urineanalysis were observed. A decrease in testes weight was seen in males at thehighest dose and two animals had moderate seminiferous tubule germinationepithelial cell degeneration and atrophy. Mild to moderate hepatocyte vacuolationaccompanied by hypertrophy and mild bile stasis was also seen in the animals atthis dose. The authors considered that the effects on the testes and liver were likelyto be caused by the decreased food consumption. Very mild to mild tubular-glomerular nephritis was also reported in the males at the highest dose. There wereno significant changes in bone aluminium content. A 60% increase in concentrationof aluminium in the brain was recorded in the female, but not male, dogs at thehighest dose (Pettersen et al., 1990). WHO (1997) concluded that the lowest-observed effect level (LOEL) from this study was 75–80 mg Al/kg bw per day.
A similar study with SALP acidic, as described in an unpublished report, wasused by the Committee at its thirty-third meeting in deriving the PTWI of 7.0 mg /kgbw for aluminium (Annex 1, references 83, 84). The published paper describing thisstudy was not cited in the monograph, but is available and is described here forcomparison. Groups of six male and six female dogs were fed diets containing SALPacidic at concentrations at 0, 0.3, 1.0 or 3.0% for 6 months. The authors stated thatthe basal diet was reanalysed for contaminants and the concentration andhomogeneity of SALP in the blended diets was verified analytically; however, datawere not provided on aluminium content of the control diet. Groups of males andfemales given test diet consumed less food most weeks than controls; intake wasnoted sporadically to be significantly decreased in all the treated groups of females.The authors noted that the differences in food consumption were not considered tobe toxicologically significant, in the absence of any correlating loss in body weight.The average daily food intake of SALP was calculated on the basis of foodconsumption data and body weight. For males given 0.3, 1.0 or 3.0%, the meanintakes were reported to be 120, 320 and 1030 mg/kg bw per day, and for femalesthey were 110, 360 and 1090 mg/kg bw per day, respectively, corresponding to 10,27 and 88 mg Al/kg bw per day and 9, 31 and 93 mg Al/kg bw per day. TheCommittee at its thirty-third meeting (Annex 1, reference 84) concluded that 3% inthe diet was equivalent to a dose of SALP of 1250 mg/kg bw, which was equivalentto approximately 110 mg Al/kg bw.
The nature and frequency of the adverse signs observed were such thatnone were considered to be related to treatment. No effect on haematological orclinical chemistry parameters was observed in treated dogs. All the measuredparameters were considered to be within the normal range for dogs of this age andstrain. Ophthalmological examinations, conducted before the start of the test and
134 ALUMINIUM FROM ALL SOURCES, INCLUDING FOOD ADDITIVES

at terminations, revealed no adverse ocular changes. No treatment-related changeswere evident in the results of urine analysis or faecal occult blood tests. None of theorgan weights (absolute or relative values) of treated animals differed significantlyfrom those of control animals. At autopsy and upon histopathological examinationthe variations observed were within the normal range for dogs of this age and strain(Katz et al., 1984).
Comparison of the above two studies indicates that the basic form of SALPmay be more toxic than the acidic form. The FAO specification monograph for SALPacidic (Annex 1, reference 178) specifies not less than 95% of NaAl3H14
(PO4)8.4H2O, and 'insoluble in water', while SALP basic is a mixture of 70% of acomplex of SALP (sparingly soluble) and 30% of disodium phosphate (very soluble).Both are cited as soluble in hydrochloric acid, but it is possible that differences inbioavailability resulting from differing solubilities could offer an explanation for theseresults.
2.2.3 Long-term studies of toxicity and carcinogenicity
No new long-term studies of toxicity or carcinogenicity were identified.
2.2.4 Genotoxicity
No new studies of genotoxicity conducted according to standard protocolswere identified. Studies reported in WHO (1997) suggest that aluminium is able toform complexes with DNA and can cross-link chromosomal proteins and DNA. Anumber of mechanistic studies have investigated DNA damage and cell cycling.
Human peripheral blood lymphocytes were treated with aluminium chlorideat 1, 2, 5, 10 and 25 μg/ml at different stages of the cell cycle, and micronucleusformation and apoptosis were assessed. The frequency of micronucleus formationincreased initially, but decreased at high concentrations (10 and/or 25 μg/ml),correlating with an increase in apoptosis. The G0/G1 phase of cell cycle was foundto be more sensitive than the S/G2 phases. The authors concluded that thisindicates oxidative stress or liberation of DNase as a major source of DNA damageinduced by aluminium (Banasik et al., 2005).
Human peripheral blood lymphocytes were treated with aluminium chlorideat concentrations of 1, 2, 5, 10 and 25 μg/ml (corresponding to 4, 8, 21, 40 and104 μmol/l) for 72 h. The level of DNA damage and apoptosis was assessed bycomet assay, and apoptosis was confirmed by flow cytometry. Aluminium inducedDNA damage in a concentration-dependent manner at concentrations of up to 10μg/ml. At 25 μg/ml, DNA damage declined, accompanied by a high level ofapoptosis, indicating selective elimination of damaged cells. In addition, cellswere pre-treated with aluminium chloride (10 μg/ml for 72 h) and then irradiatedwith 2 Gy to examine effect of aluminium on DNA repair. Cells pre-treated withaluminium chloride showed a decreased DNA repair capacity (Lankoff et al., 2006).
Lymphocytes or skin fibroblasts of patients with sporadic (n = 14) or familial(n = 8) Alzheimer disease were assessed. The frequency of spontaneousmicronucleus formation in cells from patients with sporadic or familial Alzheimer
ALUMINIUM FROM ALL SOURCES, INCLUDING FOOD ADDITIVES 135

disease was significantly higher than in controls. Treatment with aluminium sulfate[Al2(SO4)3] did not increase the frequency of micronucleus formation in lymphocytesor fibroblasts of Alzheimer patients, but did induce micronucleus formation at aconcentration of 1 mmol/l in cells from control subjects (Trippi et al., 2001).
The effect of aluminium ions on DNA synthesis, assessed by 3H thymidineincorporation, was studied in normal human dermal fibroblasts in vitro usingconcentrations of 1.85–74 μmol Al/l (aluminium nitrate) and incubation periods of 1,2, 3, 4 and 5 days. At 1.85 μmol/l, aluminium salts exerted a slight positive, but notsignificant, effect on DNA synthesis after day 3 or 5 of incubation. This effect wasseen to be statistically significant at concentrations of 3.7 μmol/l and 2 daysexposure onward. At 74 μmol/l and 5 days exposure, synthesis increased by 322%over control. Human dermal fibroblast proliferation was also studied. Aluminiumsalts moderately increased fibroblast division in a continuous manner from 7.4–74μmol/l after 3 days incubation (Dominguez et al., 2002).
2.2.5 Reproductive toxicity
(a) Multigeneration studies
Groups of 40 Swiss Webster mice were fed diets containing 7 (control),500 or 1000 mg Al/kg diet as aluminium lactate either from conception until weaningor from conception to age 150–170 days. According to later studies by theseauthors, these dietary concentrations were expected to be equivalent to < 1, 50 or100 mg Al/kg bw per day in adult mice. A battery of six neurobehavioural tests wasapplied at 150–170 days. There were no treatment-related effects on the bodyweight of the dams of offspring or on litter size. A higher incidence of cagemateaggression was reported in the offspring at the highest dose as adults. At theconclusion of the study, grip strength was reduced in mice of both treatment groups,but this was not dose-dependent or increased by post-weaning exposure. Brain,spinal cord and liver aluminium concentrations were elevated in adults withcontinuous exposure after weaning, again with no clear dose–response relationship(Golub et al., 1995).
Swiss Webster mice received diets containing 7 (control), 100, 500 or1000 mg Al/kg diet as aluminium lactate throughout development (conception toage 35 days). The authors stated that these dietary concentrations provided dosesof < 1, 10, 50 or 100 mg Al/kg bw per day in adult mice. The basal diet used in thisstudy was ‘sub-optimal’, intended to mimic the daily intake of nutrients by youngwomen, which while not necessarily deficient, represents a normal deviation fromrecommended intakes. Data were drawn from a pool of 30 to 40 pregnancies pertreatment group. There were no differences in number of dams completingpregnancy, duration of gestation, pregnancy body-weight gain, litter size at birth orbirth weight. By weaning, both males and females in the groups at 500 or 1000 mgAl/kg (50 and 100 mg/kg bw per day) weighed significantly less than did the controls(Golub & Germann, 2001).
Male CD-1 mice aged 8–9 weeks were given aluminium chloride bysubcutaneous injection at doses of 0, 7 or 13 mg Al/kg bw per day for 14 days before
136 ALUMINIUM FROM ALL SOURCES, INCLUDING FOOD ADDITIVES

mating. Females were not dosed at any time during this study. The dosesdetermined for use in this study were designed to reach serum concentrationscomparable to those reported in haemodialysis patients. Male mice were mated withthree randomly assigned female mice daily for 9 weeks. Mean mating frequenciesfor the aluminium-treated groups reduced significantly from weeks 4 to 6 and amarked reduction in male fertility was also observed. Mating was reported to havereturned to near normal control levels as the experiment terminated. Significantlyhigher numbers of postimplantion losses, fetal mortality and induced petechialhaemorrhage, but no significant fetal abnormalities were observed in the groupstreated with aluminium. The dominant lethal assay showed no difference in thenumber of implantations between aluminium-treated males and controls. Similarimplantation losses were observed in all the groups except the group at the highestdose of aluminium at weeks 3 and 5. Further groups of 25 male mice were treatedas before, at weeks 3, 5 and 11, and 8 animals of each group were examined forserum and testicular aluminium. The weights of the reproductive organs of thealuminium-treated animals decreased significantly as aluminium accumulated in thetestes. Spermatogenic impairment in the testes within the seminiferous tubules wasalso apparent, but these disturbances disappeared at the end of the experiment.The authors concluded that aluminium exerted substantial negative effects on malereproductive function and produced genetic toxicity. However, these effects werefound to be reversible (Guo et al., 2005).
Female Sprague-Dawley rats were given drinking-water containingaluminium (as aluminium nitrate nonahydrate) at doses of 0, 50 and 100 mg Al/kgbw per day for 15 days before mating and then throughout gestation, lactation andpost-weaning. The aluminium content of the feed was 42 mg/kg. In order to enhancethe gastrointestinal absorption, doses of 355 and 710 mg/kg per day of citric acidwere added to the drinking-water of the groups exposed to 50 and 100 mg Al/kg bwper day, respectively. Controls received water supplemented with 710 mg/kg perday of citric acid. It is noted that doses were adjusted to maintain a constant uptakeof aluminium. Body weight was decreased relative to controls on postnatal days12–21 in pups treated with 100 mg Al/kg bw per day. Sexual maturation was delayedin all aluminium-treated females and in aluminium-treated males at 100 mg/kg bwper day. Forelimb grip strength was reduced in males at 100 mg Al/kg bw per day(Colomina et al., 2005).
(b) Developmental toxicity
Oral administration of aluminium has been reported to result in developmen-tal effects, including growth retardation and skeletal anomalies, with the severity ofeffects being highly dependent on the form of aluminium and the presence oforganic chelators that influence bioavailability (WHO, 1997). These data aresummarized in Table 1, and indicate that the lowest-observed-adverse-effect level(LOAEL) for developmental effects was 13 mg Al/kg bw per day after treatment withaluminium nitrate, a soluble form of aluminium, administered by gavage (derivedfrom the study of Paternain et al., 1988). Dose-related maternal toxicity (reducedbody-weight gain) was also reported.
ALUMINIUM FROM ALL SOURCES, INCLUDING FOOD ADDITIVES 137

Groups of 10 pregnant Sprague-Dawley rats were given aluminium nitrateas a daily dose at 180, 360 or 720 mg/kg by oral gavage on days 6 to 14 of gestation,equivalent to 13, 26 or 52 mg Al/kg bw per day. No information was provided on thealuminium content of the diet and therefore the total dose of aluminium is uncertain.Number of corpus lutea, total implantions, number of dead and live fetuses andnumber of resorptions were recorded and there were no significant adverse effectson these parameters. However, there was a dose-dependent increase in thenumber of stunted fetuses and the number of litters with runt fetuses in the groupstreated with aluminium. Dams given aluminium gained significantly less body weightthroughout gestation (non-dose-related) and their placentas weighed significantlyless. Fetal weight, body length and tail length from the treated groups showedsignificant decreases, with fetal body weights being significantly lower in all treatedgroups in a dose-related manner. Treatment with aluminium resulted in asignificantly increased incidence in skeletal variations in all the treated groups (riband sternebral variations and reduced ossification and a significant increase inhaematomas at the highest dose) (Paternain et al., 1988).
Groups of 10 pregnant Sprague-Dawley rats were given aluminium nitrateat a dose of 180, 360 or 720 mg/kg, equivalent to 13, 26 or 52 mg Al/kg bw per day.by oral gavage from day 14 of gestation until day 21 of lactation The diet wasreported to contain 60 mg Al/kg, which would have provided a dose equivalent to6 mg Al/kg bw per day. No mention was made of maternal toxicity. The dosingregime did not produce overt fetotoxic effects, other than a decrease in birth weightat the highest dose. However, the number of litters was significantly lower in thetreated groups than in the controls. The growth of the offspring was significantly lessfrom birth and throughout lactation for the group at the highest dose (52 mg Al/kgbw per day). The animals in all the aluminium-treated groups weighed significantlyless than controls at day 21. Relative organ weights (heart, lungs, spleen, liver,kidneys, brain) were reported and in many cases were significantly increased intreated animals relative to controls. The effects were not dose-dependent and insome cases (especially for the brains) would simply be caused by the growthretardation of the animals. The authors concluded that very few toxic effects wereobserved in the group at the lowest dose (Domingo et al., 1987).
A total of 31 time-mated Charles River CD dams were fed a solution ofaluminium lactate at a dose of 0, 5, 25, 50, 250, 500 or 1000 mg Al/kg bw per dayby daily gastric gavage from days 5 to 15 of gestation. No information was providedon the aluminium content of the diet and therefore the total dose of aluminium isuncertain. The 390 offspring were evaluated for morphological and physio-logical parameters of reproductive functioning, including birth weight, anogenitaldistance, timing of vaginal opening, regularity of estrous cycles, duration ofpseudopregnancy, number of superovulated oocytes and gonadal weight. Noconsistent or reproducible findings were reported in these parameters, with theexception of the regularity of estrous cycles. A temporary increase in the proportionof aberrant estrous cycles was detected in the first four cycles after vaginal openingin the group at 250 mg/kg bw per day, with none by the fifth consecutive cycle. Theauthors suggested that aluminium does not have a developmental reproductivetoxic effect (Agarwal et al., 1996).
138 ALUMINIUM FROM ALL SOURCES, INCLUDING FOOD ADDITIVES

Tab
le 1
. Stu
die
s o
f d
evel
op
men
tal t
oxi
city
wit
h a
lum
iniu
m s
alts
ad
min
iste
red
ora
lly, p
ub
lish
ed s
ince
th
e p
revi
ou
sev
alu
atio
np
erfo
rmed
by
the
Co
mm
itte
e
Spe
cies
Rou
teC
ompo
und
Dos
eD
urat
ion
(day
s of
gest
atio
n)N
OA
EL/
LOA
EL
Ref
eren
ce
Mou
se (
Sw
iss,
20 p
er g
roup
)G
avag
eA
l(OH
) 366
.5, 1
33, 2
66 m
g/kg
bw p
er d
ay a,
b
Day
s 6–
15N
o ev
iden
ce o
f mat
erna
lto
xici
ty, e
mbr
yo/fe
tal
toxi
city
or
tera
toge
nici
tyre
port
ed
Dom
ingo
et a
l. (1
989)
Mou
se (
Sw
iss
Web
ster
)D
iet
Alu
min
ium
lact
ate
25 a
nd 1
000
mg
Al/
kg d
iet,
equi
vale
nt to
4 an
d 10
0 m
g A
l/kg
bw p
er d
ay
Day
0 to
wea
ning
LOA
EL:
100
mg/
kg b
wpe
r da
y (g
esta
tion
and
lact
atio
n ex
posu
re:
grow
th r
etar
datio
n in
offs
prin
g be
ginn
ing
onpo
stna
tal d
ay 1
0)
Gol
ub e
t al.
(199
2)
Mou
se (
Sw
iss
CD
1,10
–13
per
grou
p)G
avag
eA
l(OH
) 3A
lum
iniu
m la
ctat
eA
l(OH
) 3 +
lact
ic a
cid
57.5
mg/
kg b
w p
erda
ya,
b
166
mg/
kg b
w p
erda
ya,
b
627
mg/
kg b
w p
erda
ya,
b
Day
s 6–
15A
l(OH
) 3: N
o to
xici
ty
repo
rted
Alu
min
ium
lact
ate:
LOA
EL:
166
mg/
kg b
wpe
r da
y (p
oor
ossi
ficat
ion,
ske
leta
lva
riatio
ns, c
left
pala
te)
Al(O
H) 3
+ la
ctic
aci
d: n
o
toxi
city
rep
orte
d
Col
omin
a et
al.
(199
2)
Mou
se (
CB
A)
Wat
erA
l 2(S
O4)
375
0 m
g/l a,
bD
ays
10–1
7N
o to
xici
ty r
epor
ted
Cla
yton
et a
l. (1
992)
,ci
ted
in W
HO
(19
97)
ALUMINIUM FROM ALL SOURCES, INCLUDING FOOD ADDITIVES 139

Tab
le 1
. (co
ntd)
Spe
cies
Rou
teC
ompo
und
Dos
eD
urat
ion
(day
sof
ges
tatio
n)N
OA
EL/
LOA
EL
Ref
eren
ce
Rat
(S
prag
ue-D
awle
y)G
avag
eA
l(NO
3)3
13, 2
6 or
52
mg
Al/k
g bw
per
day
(+ e
quiv
alen
t of 6
mg/
kg b
w p
erda
y fr
om d
iet)
Day
s 14
–21
LOA
EL:
13
mg
Al/k
gbw
per
day
(dec
reas
ed s
urvi
val
ratio
s)
Dom
ingo
et a
l.(1
987)
Rat
(S
prag
ue-D
awle
y,10
per
gro
up)
Gav
age
Al(N
O3)
313
, 26
or 5
2 m
g A
l/kg
bw p
erda
ya
Day
s 6–
14LO
AE
L: 1
3 m
g A
l/kg
bw p
er d
ay(f
etal
mal
form
atio
nsan
d va
riatio
ns)
Pat
erna
in e
t al.
(198
8)
Rat
(S
prag
ue-D
awle
y)D
iet
AlC
l 3 w
ith
acco
mpa
nyin
gpa
rath
yroi
d ho
rmon
ein
ject
ion
50 m
g/kg
bw
per
day
a,b
Day
s 6–
19LO
AE
L: 5
0 m
g/kg
bw p
er d
ay (r
educ
edsk
elet
al o
ssifi
catio
nan
d in
crea
sed
inci
denc
e of
ske
leta
lva
ritio
ns)
McC
orm
ack
et a
l.(1
979)
, cite
d in
WH
O (
1997
)
Wis
tar
rats
(13
–14
per
grou
p)D
iet
AlC
l 316
0 or
200
mg
Al/k
g bw
per
day
a
Day
8 to
part
uriti
onLO
AE
L: 1
60 m
g/kg
/pe
r da
y (p
re-
wea
ning
mor
talit
y)
Ber
nuzz
i et a
l.(1
986)
Rat
(S
prag
ue-D
awle
y,15
–19
per
grou
p)G
avag
eA
l(OH
) 3A
lum
iniu
m c
itrat
eA
l(OH
) 3 +
citr
ic a
cid
384
mg/
kg b
w p
er d
ay a,
b
1064
mg/
kg b
w p
er d
ay a,
b
384
mg/
kg b
w p
er d
ay +
62
mg
citr
ic a
cid/
kg b
w p
er d
ay a,
b
Day
s 6–
15LO
AE
Ls(r
educ
ed fe
tal b
ody
wei
ght;
incr
ease
dsk
elet
al v
aria
tions
)
Góm
ez e
t al.
(199
1), c
ited
inW
HO
(19
97)
140 ALUMINIUM FROM ALL SOURCES, INCLUDING FOOD ADDITIVES

Tab
le 1
. (co
ntd)
Spe
cies
Rou
teC
ompo
und
Dos
eD
urat
ion
(day
s of
gest
atio
n)N
OA
EL/
LOA
EL
Ref
eren
ce
Rat
(W
ista
r, 1
8–19
per
grou
p)G
avag
eA
l(OH
) 319
2, 3
84, 7
68m
g/kg
bw
per
day
a,b
Day
s 6–
15N
OE
L: 7
68 m
g/kg
bw
per
day
Góm
ez e
t al.
(199
0),
cite
d in
WH
O (
1997
)
Rat
(C
D, a
ppro
x.th
ree
per
grou
p)G
avag
eA
lum
iniu
m la
ctat
e0,
5, 2
5, 5
0, 2
50,
500
or 1
000
mg
Al/k
g bw
per
day
a
Day
s 5–
15N
o co
nsis
tent
neur
oend
ocrin
e or
repr
oduc
tive
effe
cts
Aga
rwal
et a
l. (1
996)
Ada
pted
from
WH
O (
1997
)A
lCl 3
: alu
min
ium
chl
orid
e; A
l(OH
) 3: a
lum
iniu
m h
ydro
xide
; Al(N
O3)
3: a
lum
iniu
m n
itrat
e; A
l 2(S
O4)
3: a
lum
iniu
m s
ulfa
te; L
OA
EL:
low
est-
obse
rved
-adv
erse
-ef
fect
leve
l; N
OA
EL:
no-
obse
rved
-adv
erse
-effe
ct le
vel.
a N
o in
form
atio
n on
alu
min
ium
con
tent
of d
iet;
b U
ncle
ar if
dos
e is
exp
ress
ed a
s al
umin
ium
or
as a
dmin
iste
red
subs
tanc
e.
ALUMINIUM FROM ALL SOURCES, INCLUDING FOOD ADDITIVES 141

Groups of 20 pregnant mice were given Al(OH)3 at a daily dose of 0, 66.5,133 or 266 mg/kg by oral gavage on days 6 to 15 of gestation and killed on day 18of gestation. Females were evaluated for body-weight gain, food consumption,appearance and behaviour, survival rates and reproduction data. No significanteffects attributable to treatment were seen in any of these parameters. Notreatment-related changes were recorded in the number of total implants,resorptions, number of live and dead fetuses, fetal size parameters and fetal sexdistribution. Examination of the fetuses did not reveal any external, skeletal or softtissue differences in comparison with the controls. Thus, the authors concluded thatno maternal, embryo/fetal or teratogenicity was observed with the doses ofaluminium administered to mice in this study (Domingo et al., 1989).
2.2.6 Special studies
(a) Studies of neurotoxicity and neurobehaviour
There is considerable evidence that aluminium is neurotoxic in experimentalanimals, but species variation exists. In susceptible species (rabbit, cat, guinea-pig,ferret), the toxicity is characterized by progressive encephalopathy resulting indeath associated with status epilepticus. The progressive neurological impairmentis associated with neurofibrillary pathology in large and medium size neuronspredominantly in the spinal cord, brain stem and selected areas of the cortex. Thesefibrils are morphologically and biochemically different from those that occur inAlzheimer disease. In addition, aluminium has been found to induce epilepticseizures in all species studied (e.g. primates, rodents and fish). These effects havebeen observed after parenteral injection (e.g. intrathecal, intracerebral andsubcutaneous) and there have been no reports of progressive encephalopathy orepilepsy when aluminium compounds were given orally (WHO, 1997).
Behavioural impairment has been observed in the absence of overtencephalopathy or neurohistopathology in rats and mice given diets or drinking-water containing soluble aluminium salts (e.g. lactate, chloride) generally at dosesof 200 mg Al/kg bw per day or more, as summarized in Table 2. Effects involvedimpairment of performance on passive and conditioned avoidance responses (COT,2005). Because these studies were designed specifically to investigate behaviouraleffects and other potential end-points were incompletely evaluated, a possible roleof organ damage (kidney, liver, immunological) cannot be discounted (WHO, 1997).
The effects of oral exposure to aluminium on brain development have beenstudied in mice. Effects recorded in more than one study in immature animalsincluded impaired performance of reflexes and simple behaviours. Postnatalmortality and growth were also affected at the higher doses in some of these studies.Adult rats and mice have also been assessed for brain function after developmentexposures. Reduced grip strength and startle responsiveness were found to persistup to age 150 days. There was no effect on reactions to the light avoidance task inrats after gestational or postnatal exposure (WHO, 1997).
Swiss Webster mice were fed diets containing aluminium at 25 (control), 500or 1000 mg Al/kg (as aluminium lactate) from conception through weaning. Maternalintakes were reported to be 5, 100 and 200 mg Al/kg bw, respectively at the
142 ALUMINIUM FROM ALL SOURCES, INCLUDING FOOD ADDITIVES
beginning of pregnancy and 10, 210 and 420 mg Al/kg bw, respectively near theend of lactation. Weights, food intake and toxic signs were recorded at regularintervals and pregnancy outcome evaluated. Pups were assessed for growth,neurobehavioural development and toxic signs before weaning. They were thenassessed immediately after weaning and 2 weeks after weaning during which timethey were maintained on control (25 mg Al/kg) diet. No maternal or reproductivetoxicity was detected and there were no group differences in pup mortality, growth,toxic signs or neurobehavioural development before weaning. In general, dietaryaluminium was associated with dose-related greater foot splay, decreasedsensitivity to heat and greater forelimb and hindlimb grip strength shortly afterweaning and, to some extent, after a 2-week recovery period on control diet (Donaldet al., 1989).
Male Swiss Webster mice were fed diets containing 7 (control, with andwithout citrate), 100, 500, 750 or 1000 mg Al/kg diet as aluminium lactate (with 3.2%citrate to promote aluminium absorption) from the beginning of puberty (45 days ofage) for either 4 or 8 weeks. There was no effect of aluminium content on food intakein any of the treatment groups, or on liver, spleen and tibia weights. A decrease inbrain weight was recorded in the animals that received 1000 mg Al/kg diet (whichthe authors considered provided 100 mg Al/kg bw per day), for 4 weeks but not inthe same group treated for the longer duration. A dose-related effect of aluminiumon forelimb grip strength was recorded in the groups exposed for 4 weeks (i.e. inpubertal mice) but this effect disappeared in young adulthood, despite continuedadministration of aluminium (Golub & Keen, 1999).
Groups of 18 male and female Swiss Webster mice were fed diets containingaluminium at a dose of 1000 mg Al/kg diet in the form of aluminium lactate, fromconception and throughout their lifespan. The authors considered this diet to providea dose to adult mice of 100 mg Al/kg bw per day, control diet provided less than1 mg Al/kg bw per day. Animals in the control and treated groups had a similarmortality rate and no evidence of gross neurodegeneration was seen. There wereno consistent differences in neurobehavioural tests based on grip strength,temperature sensitivity or negotiating a maze. The only toxic signs reported werered eyes, fur loss and circling (motor stereotypy) all with a low incidence (no groupincidences reported) (Golub et al., 2000).
In the study described in section 2.2.5.1, Swiss Webster mice received dietscontaining 7 (control), 100, 500 or 1000 mg Al/kg diet as aluminium lactate,throughout development (conception to age 35 days) and were subjected tobehavioural tests as adults (aged more than 90 days). The authors considered thesedietary doses to be equivalent to less than 1, 10, 50 and 100 mg Al/kg bw per dayin adult mice. By weaning, both males and females in the groups at 500 or 1000 mgAl/kg weighed significantly less than controls. One offspring from each litter wasused for behavioural testing. Subtle deficits in several neuroparameters, includingimpaired learning in a maze, were observed in the animals that received dietcontaining 1000 mg Al/kg, but not at the lower doses. A reduction in hindgripstrength was reported in approximately 15% of animals receiving the highestdose, this was no longer significant after adjustment for body weight (Golub &Germann 2001).
ALUMINIUM FROM ALL SOURCES, INCLUDING FOOD ADDITIVES 143
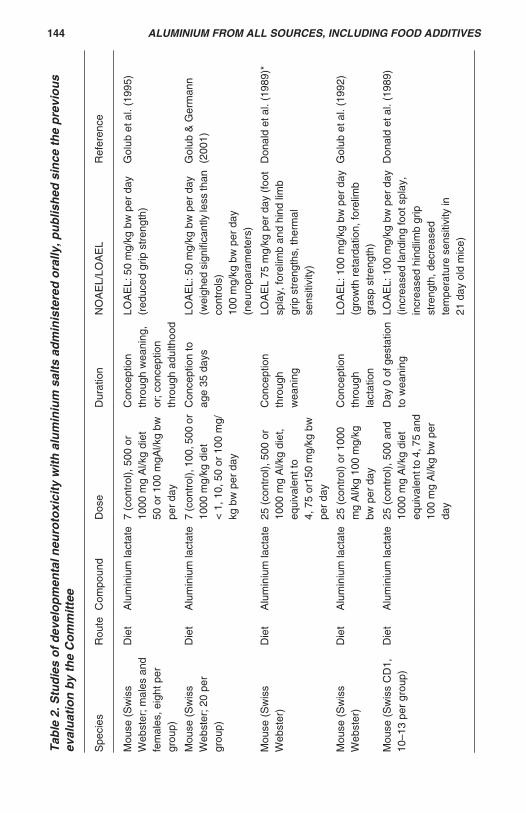
Tab
le 2
. Stu
die
so
fd
evel
op
men
tal n
euro
toxi
city
wit
hal
um
iniu
m s
alts
ad
min
iste
red
ora
lly, p
ub
lish
ed s
ince
th
e p
revi
ou
sev
alu
atio
n b
y th
e C
om
mit
tee
Spe
cies
Rou
teC
ompo
und
Dos
eD
urat
ion
NO
AE
L/LO
AE
LR
efer
ence
Mou
se (
Sw
iss
Web
ster
; mal
es a
ndfe
mal
es, e
ight
per
grou
p)
Die
tA
lum
iniu
m la
ctat
e7
(con
trol
), 5
00 o
r10
00 m
g A
l/kg
diet
50 o
r 10
0 m
gAl/k
g bw
per
day
Con
cept
ion
thro
ugh
wea
ning
,or
; con
cept
ion
thro
ugh
adul
thoo
d
LOA
EL:
50
mg/
kg b
w p
er d
ay(r
educ
ed g
rip s
tren
gth)
Gol
ub e
t al.
(199
5)
Mou
se (
Sw
iss
Web
ster
; 20
per
grou
p)
Die
tA
lum
iniu
m la
ctat
e7
(con
trol
), 1
00, 5
00 o
r10
00 m
g/kg
die
t<
1, 1
0, 5
0 or
100
mg/
kg b
w p
er d
ay
Con
cept
ion
toag
e 35
day
sLO
AE
L: 5
0 m
g/kg
bw
per
day
(wei
ghed
sig
nific
antly
less
than
cont
rols
)10
0 m
g/kg
bw
per
day
(neu
ropa
ram
eter
s)
Gol
ub &
Ger
man
n(2
001)
Mou
se (
Sw
iss
Web
ster
)D
iet
Alu
min
ium
lact
ate
25 (
cont
rol),
500
or
1000
mg
Al/k
g di
et,
equi
vale
nt to
4, 7
5 or
150
mg/
kg b
wpe
r da
y
Con
cept
ion
thro
ugh
wea
ning
LOA
EL
75 m
g/kg
per
day
(fo
otsp
lay,
fore
limb
and
hind
lim
bgr
ip s
tren
gths
, the
rmal
sens
itivi
ty)
Don
ald
et a
l. (1
989)
*
Mou
se (
Sw
iss
Web
ster
)D
iet
Alu
min
ium
lact
ate
25 (
cont
rol)
or 1
000
mg
Al/k
g 10
0 m
g/kg
bw p
er d
ay
Con
cept
ion
thro
ugh
lact
atio
n
LOA
EL:
100
mg/
kg b
w p
er d
ay(g
row
th r
etar
datio
n, fo
relim
bgr
asp
stre
ngth
)
Gol
ub e
t al.
(199
2)
Mou
se (
Sw
iss
CD
1,10
–13
per
grou
p)D
iet
Alu
min
ium
lact
ate
25 (
cont
rol),
500
and
1000
mg
Al/k
g di
eteq
uiva
lent
to 4
, 75
and
100
mg
Al/k
g bw
per
day
Day
0 o
f ges
tatio
nto
wea
ning
LOA
EL:
100
mg/
kg b
w p
er d
ay(in
crea
sed
land
ing
foot
spl
ay,
incr
ease
d hi
ndlim
b gr
ipst
reng
th, d
ecre
ased
tem
pera
ture
sen
sitiv
ity in
21 d
ay o
ld m
ice)
Don
ald
et a
l. (1
989)
144 ALUMINIUM FROM ALL SOURCES, INCLUDING FOOD ADDITIVES

Tab
le 2
. (co
ntd)
Spe
cies
Rou
teC
ompo
und
Dos
eD
urat
ion
NO
AE
L/LO
AE
LR
efer
ence
Mou
se (
Sw
iss
Web
ster
)D
iet
Alu
min
ium
lact
ate
with
and
with
out
citr
ate
7 (c
ontr
ol),
100,
500
, 750
or
1000
mg/
kg d
iet
<1,
10,
50,
75
or 1
00 m
g/kg
bw
per
day
4 or
8 w
eeks
from
beg
inni
ng o
fpu
bert
y (4
5 da
ys)
NO
AE
L: 1
00 m
g/kg
bw
per
day
(no
cons
iste
nt to
xic
effe
cts
reco
rded
)
Gol
ub &
Kee
n(1
999)
Mou
se (
Sw
iss
Web
ster
;18
per
gro
up)
Die
tA
lum
iniu
m la
ctat
e7
(con
trol
) an
d 10
00 m
g A
l/kg
diet
< 1
and
100
mg/
kg b
w p
er d
ayin
adu
lts
Con
cept
ion
thro
ugh
lifes
pan
LOA
EL:
100
mg/
kg (r
edey
es, f
ur lo
ss, c
irclin
g)G
olub
et a
l. (2
000)
Mou
se (
Sw
iss
Web
ster
)D
iet
Alu
min
ium
lact
ate
7 (c
ontr
ol)
or 1
000
mg
Al/k
gdi
et20
0 m
g A
l/kg
bw p
er d
ay in
preg
nant
mic
e42
0 m
g A
l/kg
bw p
er d
ay in
lact
atin
g m
ice
130
mg
Al/k
g bw
per
day
inad
ult o
ffspr
ing
Con
cept
ion
tow
eani
ng o
r;co
ncep
tion
toag
e 52
day
s
LOA
EL:
100
0 m
g A
l/kg
diet
(lo
wer
res
pons
eam
plitu
des,
red
uced
audi
tory
sta
rtle
)
Gol
ub e
t al.
(199
4)
Rat
(W
ista
r; (
13–
14 p
er g
roup
)D
iet
AlC
l 316
0 or
200
mg
Al/k
g bw
per
day
a
GD
8 to
par
turit
ion
LOA
EL:
160
mg/
kg p
erda
y (p
re-w
eani
ngm
orta
lity,
del
ay in
neur
omot
orde
velo
pmen
t)
Ber
nuzz
i et a
l.(1
986)
ALUMINIUM FROM ALL SOURCES, INCLUDING FOOD ADDITIVES 145

Tab
le 2
. (co
ntd)
Spe
cies
Rou
teC
ompo
und
Dos
eD
urat
ion
NO
AE
L/LO
AE
LR
efer
ence
Rat
(W
ista
r; 6
–12
per
grou
p)D
iet
Alu
min
ium
lact
ate
orA
lCl 3
100,
200
or
300
mg
Al/k
g bw
per
day
(AlC
l 3)a
100,
200
or
400
mg
Al/k
g bw
per
day
(Alla
ctat
e) a
Day
s 1–
21 o
fge
stat
ion
LOA
EL:
200
mg
Al/k
g bw
per
day
as A
lCl 3
(grip
stre
ngth
)10
0 m
g A
l/kg
bw p
er d
ay a
sA
llact
ate
(grip
str
engt
h)x
Ber
nuzz
i et a
l.(1
989a
)
Rat
(W
ista
r;25
–38
per
grou
p)O
ral g
avag
eA
lum
iniu
m la
ctat
e10
0, 2
00 o
r 30
0 m
gA
l/kg
bw p
er d
ay a
Pos
tnat
al d
ays
5–14
LOA
EL:
100
mg
Al/k
g bw
per
day
(neg
ativ
e ge
otax
iste
st)
Ber
nuzz
i et a
l.(1
989b
)
Rat
(W
ista
r; fo
urpe
r gr
oup;
mul
tiple
gro
ups
per
dose
)
Ora
l gav
age
Alu
min
ium
lact
ate
100
or 2
00 m
g A
l/kg
bw p
er d
ay a
Pos
tnat
al d
ays
5–14
LOA
EL:
200
mg/
kg b
w p
erda
y (in
crea
sed
brai
n A
l,de
crea
sed
chol
ine
acet
yltr
ansf
eras
e &
gene
ral a
ctiv
ity)
Che
rror
et e
t al.
(199
2)
Rat
(W
ista
r; 6
–9pe
r gr
oup)
Die
tA
lum
iniu
m la
ctat
e40
0 m
g A
l/kg
bw p
erda
ya
Day
s 1–
7 of
gest
atio
n; o
r da
ys1–
14 o
f ges
tatio
n; o
rco
ncep
tion
topa
rtur
ition
LOA
EL:
400
mg
Al/k
g bw
per
day
(loco
mot
or c
o-or
dina
tion)
Mul
ler
et a
l.(19
90)
AlC
l 3: a
lum
iniu
m c
hlor
ide;
LO
AE
L: lo
wes
t-ob
serv
ed-a
dver
se-e
ffect
leve
l; N
OA
EL:
no-
obse
rved
-adv
erse
-effe
ct le
vel.
a N
o in
form
atio
n on
alu
min
ium
con
tent
of d
iet
146 ALUMINIUM FROM ALL SOURCES, INCLUDING FOOD ADDITIVES

Soluble (aluminium chloride, 30 and 100 mg/kg bw) and insoluble (aluminiumhydroxide, 100 and 300 mg/kg bw) aluminium were administered orally once perday for 90 days to Long-Evans rats (groups of 10 males and 10 females). It is unclearif these doses related to the content of aluminium or of the substance tested. Noinformation was provided on aluminium content of the chow. No relevant differencesin body weight or general condition were observed between treatment groups.Performance in learning to negotiate a maze was significantly impaired in all of thealuminium-treated groups, with the performance of those receiving the highest doseof aluminium chloride being worst. The aluminium content of the brains wassignificantly elevated in each treatment group. The elevation was highest inthose animals treated at 100 mg/kg bw (336% of control values). Brainacetylcholinesterase activity was significantly elevated by 65–83% in the twogroups receiving the highest dose. Brain choline acetyltransferase activity wassignificantly lowered to 58% of control in the group treated with aluminium chlorideat 100 mg/kg bw . (Bilkei-Gorzo, 1993).
Male Wistar rats (age 2 months, n = 19 test, n = 10 control) were givenaluminium gluconate daily by intraperitoneal injection three times per week for2 months or 3 months, or 2 months with 1 months rest. The test animals received0.667 mg Al/250 μl and controls received an equal volume of sodium gluconateby intraperitoneal injection. Treatment began 2 months before behavioural testingand was maintained throughout the maze learning to avoid any decrease intissue aluminium concentrations. No significant difference in body weight wasobserved at the end of the 2 months of treatment. Before the maze experiment thebody weight of the rats was reduced by food deprivation and maintained at 80% oftheir free-feeding value. Rats were submitted to a radial maze test to determine theinfluence of aluminium on cognitive and non-cognitive behavioural processes. Bothlearning abilities (working memory and reference memory) and rapidity (time spentto respond to and master a trial) were recorded. Aluminium concentration wasevaluated in the brain, serum and liver, significant increases were recorded in alltissue measurements. In the brain, aluminium accumulation was area-specific; thehighest levels being observed in the temporal cortex, anterior olfactory nucleus andhippocampus. Despite the accumulation in the brain, no decrease in learning abilitywas observed, the only behavioural difference observed was a decrease in rapidity(Struys-Ponsar et al., 1997).
Pregnant rats received diets containing aluminium lactate at 400 mg Al/kgbw per day for either the first week (days 1–7 of gestation); first and second (days1–14 of gestation); or from day 1 of gestation to parturition. Maternal body weightwas significantly decreased on days 16 and 19 of gestation by 26% and 35%,respectively, for the group treated from day 1 of gestation to parturition, but not atthe other doses. No effect of treatment on litter size, mortality rate or body-weightgain of pups was noted. Performance of the pups was impaired in a negativegeotaxis test for those receiving the second two dosing regimes, and in locomotorco-ordination and operant conditioning tests for all three treatment groups. Nodifferences were apparent in grasping and righting reflexes (Muller et al., 1990)
Pregnant Wistar rats received diets containing either aluminium chloride(100, 300 or 400 mg Al/kg bw per day) or aluminium lactate (100, 200 or 400 mg
ALUMINIUM FROM ALL SOURCES, INCLUDING FOOD ADDITIVES 147

Al/kg bw per day) from day 1 of gestation to parturition. Maternal food and waterconsumption was not affected by treatment. A 5–10% deficit in maternal body weightwas reported at day 18 of gestation in the groups receiving the intermediate andhighest dose of aluminium chloride and the highest dose of aluminium lactate, butnot at earlier times. No effect of treatment on litter size was detected, but increasedmortality was reported during the first week. This effect was significant in the groupsreceiving 300 mg Al/kg bw per day as aluminium chloride or 400 mg Al/kg bw perday as aluminium lactate. The neuromotor maturation of surviving pups treated withaluminium showed impairment during the first 2 weeks of life, with grasping reflexbeing significantly affected in all three groups receiving aluminium lactate and in alltreated groups except that receiving the lowest dose of aluminium chloride(Bernuzzi et al., 1989a).
Astrocytes were prepared from cerebral cortex of rats aged 1–3 days. A3-(4,5-dimethylthiazole-2-yl)-2,5-diphenyl tetrazolium bromide (MTT) test gave anIC50 of approximately 343 μmol Al/l. In subsequent experiments, cultures wereexposed to aluminium chloride at concentrations of 200, 400 or 800 μmol/l. Lactatedehyrogenase release showed a significant increase at 800 μmol/l. Cellular toxicitymeasured by vacuolation of cytoplasmic compartment and swollen appearancewas measured in all but the control cultures. Exposure of cultures to 200, 400 or800 μmol/l specifically increased glutamine synthetase at all three doses. In parallelwith this increase, a higher rate of disappearance of glutamate from culture mediawas observed, as well as an accumulation of glutamine in the cellular extract. Theauthors suggest that these results indicate that the astrocyte population is apotential target for toxic action of aluminium that could mediate the pathogenesis ofthis metal (Struys-Ponsar et al., 2000).
(b) Hormonal activity/effects
Groups of six ICR mice (CD-1 derived) were given aluminium chloride at adose of 35 mg Al/kg bw per day by intraperitoneal injection for 12 days to studyeffect on nitric oxide production in serum and testis. Serum and testicular aluminiumconcentrations increased significantly compared with controls. Aluminium admin-istration significantly increased the production of nitric oxide and decreasedtesticular adenosine 3’,5’-cyclic monophosphate (cAMP). As a consequence ofthe decreased cAMP activity, the observed transport of cholesterol into themitochondria of Leydig cells, and thus the secretion of testosterone, was reduced(Guo et al., 2005).
(c) Effects on bone
Excessive deposits of aluminium in the skeleton may result in a syndromereferred to as ‘aluminium-induced bone disease’, and a number of animal modelsof osteomalacia involve intraperitoneal or intravenous injection of aluminium.Osteomalacia occurs when aluminium concentrations in bone reach 100 μg/g boneash, which is more than 10 times the normal human bone aluminium concentration.No studies of oral administration were identified (WHO, 1997).
148 ALUMINIUM FROM ALL SOURCES, INCLUDING FOOD ADDITIVES

3. OBSERVATIONS IN HUMANS
3.1 Biomarkers of exposure
Concentrations of aluminium in blood, urine and faeces can be measured inhumans, but these measurements are not directly related to oral exposure toaluminium (ATSDR, 1999). One reason is that the gastrointestinal tract is a barrierto aluminium uptake (Priest, 2004), and a second reason is that the compositionand acidity of the diet affect how much aluminium will be absorbed (Becaria et al.,2002). ATSDR (1999) pointed out that high levels of exposure to aluminium can bereflected by aluminium concentrations in urine, but noted that the rapid excretion ofaluminium in urine affects the validity of this parameter as a measurement ofbioavailability.
Priest (2004; p. 375) estimated that “…most aluminium that enters the bloodis excreted in urine within a few days or weeks.” Aluminium concentrations in faecescan also be measured and used to estimate a part of the oral exposure to aluminium,but not the portion that is absorbed by the body (ATSDR, 1999).
3.1.1 Biomarkers of effects
At the current time, no simple non-invasive test was available to measurethe effects of oral exposure to aluminium in humans (ATSDR, 1999).
3.1.2 Clinical observations
(a) Dialysis encephalopathy and other disorders in patients withchronic renal failure
In the early to mid 1970s, reports were published describing a cluster ofsymptoms observed in patients from different dialysis units (Alfrey et al., 1972;Mahurkar et al., 1973; Barratt & Lawrence, 1975; Rosenbek et al., 1975). Accordingto Alfrey et al. (1976), the majority of patients described in the reports had been onintermittent haemodialysis for several years, and the clinical findings includedspeech difficulty, asterixis, myoclonus, dementia, focal seizures and an abnormalelectroencephalogram. The symptoms often progressed to coma and death. Thiscluster of symptoms became defined as dialysis encephalopathy syndrome (DES)and the cause of the syndrome was investigated. Initially, clinicians suggested anumber of possible causes: viral infections, vitamins, amino acid or dopa deficiency,hypertension, drug intoxication, toxic metal deposition or aluminium accumulation(Starkey, 1987). Over the past 30 years, a substantial amount of evidence on thisdisorder has been collected and aluminium is now widely considered to be a primarycause of DES (Kerr et al., 1992; WHO, 1997; Flaten, 2001; Goyer & Clarkson, 2001).This evidence included findings of elevated concentrations of aluminium in blood,bone, muscle, and brain tissue in patients with DES (Starkey, 1987; Goyer &Clarkson, 2001). Kerr et al. (1992) discussed four factors involved in aluminiumintoxication of patients with chronic renal failure: “1) exposure to large volumes ofcontaminated fluid during haemodialysis, peritoneal dialysis, haemofiltration andoccasionally, intravenous therapy; 2) ingestion of grams of aluminium daily as a
ALUMINIUM FROM ALL SOURCES, INCLUDING FOOD ADDITIVES 149

phosphate binder; 3) loss of the renal excretory pathway for aluminium; and 4)increased aluminium absorption from the gut in uraemia” [p. 123]. In addition to DES,other disorders associated with aluminium have been observed in patients withchronic renal failure on dialysis, including osteomalacia, extraskeletal calcification,microcytic anaemia and cardiac arrest (Starkey, 1987; Drüeke, 2002).
Among the early studies on DES and concentrations of aluminium in waterused to make dialysis fluids, one study found that DES rarely affected patients inthose centres in the UK that used water with aluminium concentrations of less than50 μg/l (Parkinson et al., 1979, 1981). Another study in the Trent region in Englandfound that the average water concentration for patients on dialysis that developedencephalopathy was 328 μg/l (average aluminium concentration in water forpatients experiencing multiple bone fractures was 160 μg/l, for patients on dialysiswithout either disorder, 80μg/l) (Platts et al.,1977). When Parkinson et al. (1981)summarized the early clinical studies or outbreaks of DES that included measuresof the concentration of aluminium in water used to make dialysis fluid, they foundthat the concentrations of aluminium in water associated with DES were usuallyreported to be greater than 200 μg/l. Treating water used for dialysis with variousmethods such as filtration, carbon adsorption, reverse osmosis and de-ionization,depending on the water supply, has been found to reduce the incidence of DES(Parkinson et al., 1981; Kerr et al., 1992).
(b) Osteomalacia
In addition to bone changes observed in patients on dialysis, osteomalaciahas also been observed in several patients on long-term parenteral nutrition (TPN)who had a variety of gastrointestinal illnesses with malabsorption but who had notbeen taking large amounts of antacids (Klein et al., 1982; Ott, 1985). Klein et al.(1982) found a substantial quantity of aluminium delivered intravenously in the TPNwhen casein hydrolysate was used as the protein source. They found that thepatients had elevation of serum aluminium content, increased urinary excretion ofaluminium and a high content of aluminium in trabecular bone. While suspicious,the researchers state that the “…data do not prove a pathogenic relationshipbetween Al and bone disease” (Klein et al., 1982; p. 1425).
There have also been a few case reports of adults, infants and a child withnormal renal function who experienced skeletal changes from frequent use ofaluminium-containing antacids for the treatment of gastrointestinal illness(Neumann & Jensen, 1989; Foldes et al., 1991; Pivnick et al., 1995; Shetty et al.,1998; Woodson, 1998; ATSDR, 1999). The antacids in these cases wereconsidered to induce phosphate depletion that resulted in alteration of bone. Oneexample of such a case was described by Woodson (1998). A woman aged39 years, taking large doses of an antacid containing a high concentration ofaluminium and magnesium hydroxide for peptic ulcer and gastritis, reported pain inthe right foot. X-ray examination of the foot revealed a callous around a stressfracture of the calcaneous. Bone biopsy found that 27.6% of the bone surface hadaluminium deposits. The amount of intake of elemental aluminium in the antacidwas estimated to be 6.3 g/day and 18 kg over 8 years. Woodson suggested that theantacid had bound phosphate in the gut causing its malabsorption and that profound
150 ALUMINIUM FROM ALL SOURCES, INCLUDING FOOD ADDITIVES

phosphate depletion had occurred that resulted in osteomalacia. When the patientstopped intake of the antacid, she had improvement in symptoms and objectivefindings.
(c) A case of severe cerebral congophilic angiopathy, an Alzheimer-related disease
In July 1988, a water authority inadvertently discharged 20 tonnes ofaluminium sulfate into the drinking-water supplied to Camelford, UK and its vicinity.The drinking-water was considered to be heavily polluted for 3 days, not only withthe increased concentration of aluminium but also with copper, lead and zinc thathad leached from pipes, owing to the increased acidity of the water (Coggon, 1991;Owen et al., 2002). The highest aluminium concentration measured in water for thisaccident was 620 mg/l (Owen et al., 2002). The highest concentration consideredpalatable for drinking was 100 mg/l (WHO, 1997 cites Clayton, 1989). Initial acuteeffects reported in this population were gastrointestinal problems and oralulceration (Coggon, 1991). Since January 1989, an advisory group of independentexperts has met on several occasions to evaluate possible long-term health effectsfrom the accident. Other epidemiology studies from this setting are discussed insection 3.1.3, but a recently published case study (Exley & Esiri, 2006) will beconsidered here.
Exley & Esiri (2006) report postmortem findings on brain tissues from aresident of Camelford who was referred for a neurological examination in 2003 atage 58 years and died in 2004 of an unspecified neurological condition. Examinationof brain tissue revealed “a rare form of sporadic early-onset ß amyloid angiopathyin cerebral cortical and leptomeningeal vessels, and in leptomeningeal vessels overthe cerebellum” (Exley & Esiri, 2006, p.1). DNA testing of brain tissue detectedAPOE genotype 4/4. During the analysis of brain tissue for concentration ofaluminium, the examiner was masked to whose tissue sample was under study andconducted analysis on tissue from this patient along with three other patients. Arange of aluminium concentrations in tissues were found for the present case, froma low in the range of 3–7 μg/g dry weight (exact measurement not presented inpaper) to a high of 23.0 μg/g dry weight. The authors report these concentrationsas coincident with the severely affected areas of the cortex and find them to be highin comparison to what they consider to be usual aluminium concentration in braintissue, 0–2 μg/g dry weight. One of the three other individuals had neuropathologysimilar to the case but was 22 years older; and the highest aluminium concentrationin the tissue of this person was 25.16 μg/g. The paper does not state that this personwas exposed in the Lowermoor incident so presumably he/she was not exposed.The researchers also discuss findings from other studies regarding APOE genotype4/4 as a risk factor for early age onset of Alzheimer disease and for deposition of
ß-amyloid angiopathy in walls of cortical and leptomeningeal blood vessels. Theywere not aware of examination of brain tissue for aluminium concentrations in otherstudies of similar cases. They conclude by indicating that it is not yet understoodwhat role aluminium has, if any, in the initiation and progression of this rare disease.
ALUMINIUM FROM ALL SOURCES, INCLUDING FOOD ADDITIVES 151

3.1.3 Epidemiological studies
(a) Alzheimer disease, dementia or cognitive impairment
(i) Exposure to aluminium in drinking-water
There have been several reviews of the epidemiology studies of aluminiumin water in relation to Alzheimer disease, dementia or cognitive impairment (e.g.Doll, 1993; WHO, 1997; Flaten, 2001; Jansson, 2001 & COT, 2005). A tablesummarizing the epidemiology studies reviewed in the WHO report (1997) updatedby COT (2005) is shown at the end of this section (Table 3). Studies reviewed inthis document include additional studies not listed in the original table and, for thepurpose of the discussion below, have been inserted in the table (indicated byasterisks). The studies are listed by publishing year in the table, but they aregrouped according to study design in the text for the purpose of comparison.
An epidemiology study was included in this review only if information onexposure assessment and disease definition were provided and if the study wasadjusted for one or more of the possible risk factors for Alzheimer disease. The oneexception to this definition was the inclusion of a brain autopsy case–control study(McLachlan et al., 1996). Potential confounders of the relationship betweenaluminium and Alzheimer disease were not collected in the study, but classificationof cases was meticulous at the tissue level and information on exposure toaluminium in water 10 years before death was ascertained, warranting its inclusionin this review.
One comment by investigators that recurs throughout these studies is theissue regarding bioavailability of aluminium. They recognize that the concentrationof aluminium is much higher in food than in water and that only a small portion ofthe daily intake of aluminium is from water. One investigator postulated that“aluminium in drinking-water is either dissolved or readily brought into solution andits bioavailability may therefore be much higher than aluminium from othersources” (Martyn, 1989; p. 59); however, the bioavailability of aluminium from waterversus foods is not yet fully understood and the relation of different species ofaluminium in human absorption requires further study. Only one of the epidemiologystudies below examined any form of aluminium other than total aluminiumconcentrations in water.
Ecological study
Flaten (1990) conducted an exploratory ecological study to determine theassociation of age-adjusted death rates from dementia, Parkinson disease andamyotrophic lateral sclerosis (ALS) for 193 municipality aggregates in Norway withthe weighted mean aluminium values in drinking-water for each of these aggregates(weighted by the number of persons served by the individual water works). Deathcertificates containing ICD-8 codes for dementia, Parkinson disease and ALS asthe underlying or contributory cause of death were used to ascertain disease. Deathrates were calculated for 10 year and for 5 year intervals for the years, 1969–1983.Aluminium content in finished water was obtained across four seasons in1982–1983 from each of the Norwegian waterworks and ranged from: not
152 ALUMINIUM FROM ALL SOURCES, INCLUDING FOOD ADDITIVES

detectable (< 0.008 mg/l) to 4.10 mg/l (the value at the 90th percentile was 0.238mg/l). For dementia, the death rates for the period 1974–1983 increased for bothmen and women across low, medium and high categories of aluminiumconcentration in water, with no overlap in the 95% confidence intervals. ForParkinson disease, there were somewhat higher death rates at higher aluminiumconcentration in water but the 95% confidence intervals overlapped. No significantassociation between ALS death rates and aluminium concentrations in waterwas observed.
Flaten (1990) emphasized the exploratory nature of his ecological study andnoted that increased dementia rates might be explained by other factors, such associoeconomic variables. He found, for example, that dementia rates alsocorrelated strongly with population density although “Al concentration and thepercentage living in densely populated areas were not strongly inter-correlated” [p. 165]. Furthermore, while a patient may have dementia, the diseasemay not be considered by a physician as an underlying or contributory cause ofdeath and reporting of this disorder on a death certificate may vary widely; however,unless under-reporting varied systematically by area of aluminium concentration, itis difficult to perceive how this would strongly influence the findings.
Flaten (1990) mentioned that aluminium levels in Norway may be changingin water over time owing to increased acidification of rain which helps mobilizealuminium from the soil. This change should be distributed throughout the countryand not in a specific region. Because death rates were ascertained over a 10-yearperiod and aluminium concentrations in water were ascertained over four seasonsin a single year, exposure levels of aluminium before onset of disease are not knownon an ecological or individual level.
Prevalence (cross-sectional) studies
Martyn et al. (1989) studied prevalence of dementia and epilepsy in 88county districts in England for the age group 40–69 years. Dementia and epilepsywere defined by results on a computer tomography (CT) scan and by clinicalinformation supplied on a request form for the CT scan. Dementia was detected in1203 persons and categorized as probable Alzheimer disease, possible Alzheimerdisease, cerebrovascular dementia or other causes of dementia. Age-adjustedrates of disease for each county district were calculated and adjusted for differencesfrom nearest CT scan as well as size of the population served by the CT scan units.
Exposure to aluminium was based on the residual concentration ofaluminium for each water source across the 88 county districts over a 10 year periodbefore diagnosis of patients. A mean concentration of aluminium in the water wasdetermined for each county district. Five categories of water exposure were created:0–0.01 mg/l, 0.02–0.04 mg/l, 0.05–0.07 mg/l, 0.08–0.11 mg/l, and > 0.11 mg/l. Riskof Alzheimer disease and epilepsy in patients in county districts with higher meanaluminium concentration were calculated relative to the lowest category ofaluminium concentration (0 to 0.01 mg/l). Significant relative risks were found forthe ‘probable Alzheimer disease’ category, but not for other dementia diseasecategories or epilepsy. Table 3 indicates this finding, but a clear dose–response
ALUMINIUM FROM ALL SOURCES, INCLUDING FOOD ADDITIVES 153

trend of increasing risk of probable Alzheimer disease with increasing aluminiumconcentration in water was not observed.
Michel et al. (1991) studied a sample of persons residing in France (theyused a three-stage approach to sampling: they randomly sampled cantons (districts)in the department of Gironde, then communes (parishes) from the cantons andfinally, study participants from the parishes); 4050 subjects were obtained throughsampling, but 1258 (31%) persons declined to participate in the study. The finalsample size was 2792 persons.
Alzheimer disease was determined in a two-stage process. For the firststage, a screening was done by psychologists (Diagnostic Statistical Manual(DSM)-III criteria for dementia and psychometric tests). Patients who tested positiveby the criteria in the first stage went to a second stage. In the second stage, seniorneurologists interviewed patients and performed a clinical examination (using thecriteria for Alzheimer disease specified by the Joint Working Group of the USNational Institute of Neurological and Communicable Disorders and Stroke andAlzheimer Disease and Related Disorders (NINCDS-ARDA)) (McKhann et al.,1984). Exposure to aluminium was based on the concentration of aluminium in thewell water for a parish. Aluminium concentration in well water ranged from 0.01 to0.16 mg/l. The researchers evaluated whether increasing levels (across fourcategories) of aluminium in well water across parishes correlated with increasingprevalence of Alzheimer disease across parishes. They found a statisticallysignificant association between prevalence of probable Alzheimer disease andcategory of aluminium concentration. This association continued to be observedafter adjusting for age, education, and urban/rural. They found a relative risk of 1.16for an increase of 0.01 mg/l and relative risk of 4.53 for an increase in 0.1 mg/l (95%confidence interval (CI), 3.36–6.10).
Wettstein et al. (1991) conducted a prevalence study in Switzerland to testthe mnestic and naming performance of 800 persons aged 81 to 84 years, whohad lived for more than 15 years in either of two districts: in one of these districtsthe water supply contained a high concentration of aluminium and in the other theconcentration of aluminium in the water supply was low (98 μg/l versus 4 μg/l). Theresearchers also examined the serum and urinary aluminium concentration of 40nursing-home patients living in either of the two districts to examine differences inintake of metal from water; 20 of the nursing home patients (10 patients in eachdistrict) were diagnosed as having senile dementia.
The two city-districts selected for the study had socioeconomically similarpopulations. Four hundred study participants from the low-aluminium district and405 study participants from the high-aluminium district were enrolled in the study,using the same method for selecting individuals for contact in each district. Theparticipants were interviewed and given the mnestic and naming subtest of the MiniMental Status test.
No significant differences in test scores for the participants in the two districtswere found. Age and education affected these scores but these factors were equallydistributed in the two districts and did not appear to confound the findings. Serumaluminium concentrations in the nursing-home patients with Alzheimer disease
154 ALUMINIUM FROM ALL SOURCES, INCLUDING FOOD ADDITIVES

were somewhat higher in the low-aluminium district than the high-aluminium district,the opposite of postulated results. For the 10 control patients in each district therewas no significant difference in mean serum aluminium concentrations. Urinaryexcretion of aluminium was similar in the two groups of nursing-home patients withAlzheimer disease; however, the urinary aluminium : creatinine ratio wassignificantly higher in control patients from the low-aluminium district than from thehigh-aluminium district. Researchers concluded that they could not demonstrate aconsistent effect of residence in nursing homes with high or low aluminium indrinking-water (Wettstein et al., 1991, p.100). This study is interesting because itattempted to evaluate biomarkers for exposure to aluminium while determiningwhether poorer mnestic and naming performance are associated with higherconcentrations of aluminium in water.
Forbes et al. (1992; 1994a; 1994b; 1995a; 1997) studied participants from acohort of men enrolled in the Ontario Longitudinal Study of Aging; this cohort initiallyenrolled 2000men at age 45 years and has been followed for more than 30 years.Forbes et al. evaluated the association between impaired mental function andvarious chemicals in drinking-water. In 1990–1991, the researchers administered aquestionnaire by telephone to the remaining participants. Participants respondeddirectly to the questionnaire (n = 513) or the questionnaire was administered toproxy persons if participants were deceased (usually to a relative of a deceasedcohort member, n = 224) or unable to respond for other reasons (n = 45). A total of782 interviews were conducted (Forbes et al., 1992; 1994b). In later papers, thenumber of interviews increased to 870 (545 participants, 276 relatives, and 49proxies) (Forbes et al., 1994a; 1997). The questionnaire contained about 100questions, including a modified mental status test and nine questions which testedshort-term memory. When all 100 questions were answered correctly, the studyparticipant was characterized as having no impairment of mental function;otherwise, a study participant was considered to have some impairment of mentalfunction (Forbes et al., 1992; 1994b).
Information on the residence of these men over the past 30 years was known.The researchers estimated exposure to aluminium for each individual based on theconcentration of aluminium currently in the water supply of the city in which theindividual had lived the longest. For the analysis, there was information availableon both the questionnaire results and water exposure information for 485 men fromthe cohort (Forbes et al., 1992); in later papers, information for a somewhat highernumber of men was available. The odds ratio for the association of some impairmentof mental function with high concentrations of aluminium ( 0.085 mg/l) in drinking-water compared with lower concentrations was 1.14, which was not statisticallysignificant (p > 0.05) (Forbes et al., 1992). When only the data from the studyparticipants who were directly interviewed were analysed, the odds ratio increasedto 1.53, but was not statistically significant (95% CI, 0.94–2.51) (Forbes et al.,1994b).
Forbes et al. (1992; 1994a; 1994b; 1995a; 1997) also evaluated a numberof other water constituents or characteristics, including fluoride, pH, organic matter(DOC), turbidity, silica, and iron, and found the association between aluminium andimpairment of mental function to be somewhat more complicated (data from all study
ALUMINIUM FROM ALL SOURCES, INCLUDING FOOD ADDITIVES 155
participants used). For example, a significant association of aluminium and fluorideconcentrations with impairment of mental function was found when personsconsuming water with high aluminium concentrations ( 0.085 mg/l) and low fluoridelevels (< 0.13 mg/l) were compared with persons consuming water with lowaluminium concentrations and high fluoride concentrations (OR = 2.72, p = .01)(Forbes et al., 1992). Low or high iron concentrations in the water did not appear toaffect this association (Forbes et al., 1997). As another example, at a pH of greaterthan 8.05, the association between high aluminium concentrations and impairmentof mental function was in a positive direction (OR = 1.30 (95% CI, 0.85–2.04), whileat medium and low pH, the association was in the opposite direction (at pH range7.85–8.05, OR = 0.68 (95% CI, 0.21–2.19); at pH < 7.85, OR = 0.76 (95% CI,0.28–2.06), although none of the findings were statistically significant. A logisticregression model that accounted for various water constituents or characteristicsand other factors (that is, fluoride, pH, turbidity, silica, iron, source of water, level ofeducation, health at age 62 years, income at age 45 years, total number of moves,and age) found a significant association between high aluminium concentrationsand impairment of mental function (OR = 2.35, 95% CI, 1.32–4.18) (Forbes et al.1995a). In regard to their findings, Forbes et al. (1994a, 1994b) comment that theresults must be considered in light of the problem of substantial drop-out ofparticipants from Ontario Longitudinal Study of Aging over 30 years, whichpotentially affects whether the results from the remaining participants are rep-resentative of the study population. They also comment that the presence of anyimpairment of mental function on screening tests is not the same as dementia, andcomment that they may not have considered other possible important confoundingfactors.
Jacqmin et al. (1994) studied 3777 French men and women aged 65 yearsand older enrolled at baseline for a population-based cohort study (the Paquidstudy). These participants were randomly selected from electoral rolls from one of75 randomly selected rural or urban parishes in the administrative areas of Girondeor Dordogne in south-western France (more sampling detail described above,Michel et al., 1991, Gironde only). A study participant who scored less than 24 onthe Mini-Mental State Examination (MMSE) was considered to have cognitiveimpairment.
Exposure to aluminium was based on information collected in two surveysin 1991 of 75 drinking-water areas that supplied the cohort participants. In additionto aluminium, these surveys measured pH and various chemicals in the water(aluminium, calcium, and fluorine). The researchers also collected historicalinformation on chemical concentrations in water for the period 1981–1991. For eachparish, the researchers calculated a weighted mean of all measures for eachchemical.
The researchers analysed prevalence rates for cognitive impairment acrossincreasing concentrations of aluminium, calcium, fluorine and increasing pH. Themain finding of the study was a significant protective effect of high calciumconcentrations for cognitive impairment before and after adjusting for the effects ofage, sex, level of educationa and occupation of the study subjects. No significantassociation of aluminium concentrations with cognitive impairment was observed
156 ALUMINIUM FROM ALL SOURCES, INCLUDING FOOD ADDITIVES

(highest category of aluminium in this study was greater than or equal to 18 μg/l),except when the logistic regression model incorporated an interactive term foraluminium and pH. The researchers further evaluated this relationship. A stratifiedanalysis of pH and aluminium demonstrated that the odds ratio for the associationof aluminium with cognitive impairment mildly increased in magnitude withincreasing doses of aluminium when the pH was 7.0 but decreased in magnitudewith increasing doses of aluminium when the pH was 8.0. It was not clear to theresearchers how to interpret this finding. The study did not demonstrate an effectof calcium on the aluminium-cognitive impairment relationship. Researchers alsoanalysed exposure to aluminium cooking vessels, but did not find an association ofthis exposure with cognitive impairment.
The results of this study conflict with those of the study conducted by Michelet al. (1991), athough the participants in the Michel study are a sub-sample (fromGironde) of the participants in this study. Jacqmin et al. (1994; p. 49) consider thatthe difference in the two studies is related to problems with the historical assessmentof aluminium in drinking-water: “A previous report on the Paquid study supportedthe hypothesis of an association between the risk of Alzheimer’s disease and highlevels of aluminium in the drinking water. However, this was based on retrospectivemeasures of the concentrations of aluminium that were not reliable: in particular,some of these measures were old and sampling and dosage techniques havechanged in recent years” There were other differences between the two studies,including a difference in the health end-point (probable Alzheimer disease versuscognitive impairment).
Forbes et al. (1995b) used Ontario death certificate data from StatisticsCanada for a cross-sectional mortality study. Researchers searched for ICD-9codes for Alzheimer disease (ICD-9 code 331.0), presenile dementia (ICD-9 code290.1) or bronchopneumonia (ICD-9 code 485) when they examined records. A totalof 3161 persons who died with Alzheimer disease or presenile dementia as theunderlying cause of death were enrolled in the study. It is difficult to determine fromthe paper how the researchers calculated death rates for Alzheimer disease orpresenile dementia, but presumably all other deaths in the same age category asthose from Alzheimer disease were used as the denominator for the rates.Bronchopneumonia deaths were considered only briefly in the paper in relation towater concentrations of chemicals because bronchopneumonia may be the actualcause of death in many patients with Alzheimer disease.
Presumably, the researchers estimated exposure to aluminium in water foreach individual based on the concentration of aluminium currently in the watersupply for the residence where the individual lived at the time of death. They hadused residence water-supply information for living individuals when evaluatingexposure in their earlier studies (Forbes et al., 1992, 1994a, 1994b), but the methodof assigning exposure for persons who died was not explicitly stated.
Researchers categorized aluminium concentrations in water according tothree categories: 0.067 mg/l, 0.068–0.20 mg/l and 0.336 mg/l. There were novalues between 0.21 and 0.335 mg/l. More than 75% of the individuals withAlzheimer disease were exposed at the intermediate level, 0.068–0.20 mg/l, while
ALUMINIUM FROM ALL SOURCES, INCLUDING FOOD ADDITIVES 157

less than 1% (n = 14) of individuals were exposed at the highest level, > 0.336 mg/l. It is not clear from the methods why the researchers selected these particularranges of aluminium concentration for each category. Results of the analysisshowed a significantly greater than 1.0 rate ratio for the association of death fromAlzheimer disease with the highest category compared with the lowest (all ages ofAlzheimer disease: rate ratio = 2.42 (95% CI, 1.42–4.11); this rate ratio increasedwhen higher ages were used to identify deaths from Alzheimer disease (i.e. at 75years and older, at 85 years and older). However, there was a less than 1.0 rateratio for the association of death from Alzheimer disease with the intermediatecategory of values compared with the lowest (all ages of Alzheimer disease: rateratio, 0.92, 95% CI, 0.84–1.01). From these findings, the researchers proposed thatthere may be a J-shaped rather than linear dose–response relationship whenaluminium concentrations in water reach the levels found in this study. When onlytwo categories were used in analysing the data, above or below 0.075 mg/l (or 0.068or 0.085 mg/l), the rate ratios for the association of Alzheimer disease death withthe higher category compared with the lower category were all below 1.0 (Forbeset al., 1995b; p. 646).
The researchers also modeled the effects of fluoride, pH and silica (SiO2) onthe aluminium–Alzheimer disease association, finding possible interactive effectsof some of these chemicals. For example, when high concentrations of fluoride(> 0.5 mg/l) and pH ( 7.96) are present, the risk ratio for high concentrations ofaluminium associated with Alzheimer disease is reduced. In a later paper, Forbeset al. (1997) added iron concentrations in water to the multivariate analysis (poissonregression model) and continued to observe the J-shaped association betweenaluminium concentrations and death from Alzheimer disease for persons aged85 years or older.
Gillette-Guyonnet et al. (2005) analysed baseline data from an ongoingcohort study, the Epidemiology of Osteoporosis (EPIDOS) study, that followswomen aged more than 75 years residing in five cities in France (n = 7598 women)to determine risk factors for fracture of the femoral neck. Gillette-Guyonnet et al.(2005), however, used data from this study to compare exposures to concentrationsof chemicals in water in women with cognitive impairment at baseline of the studyto exposures in women without cognitive impairment at baseline.
Cognitive impairment at baseline was assessed by the Short Portable MentalStatus Questionnaire (SPMSQ) and women with a Pfeiffer score of < 8 wereconsidered to have cognitive impairment. Exposure to chemicals in water wasassessed from questioning women about water intake, from the tap or from bottledmineral water, and from obtaining data about the concentrations of aluminium, silicaand calcium concentrations in brands of bottled water or the city water supply.Aluminium in water varied from undetectable to 0.032 mg/l in bottled water and from0.01 to 0.063 mg/l in the five cities in the study.
The researchers did not find an association between cognitive impairmentand aluminium in the baseline study. They were able to adjust for a number ofpotential confounders in their analyses, including age, education and income. They
158 ALUMINIUM FROM ALL SOURCES, INCLUDING FOOD ADDITIVES

did find that cognitive impairment was associated with lower silica concentrationsin drinking-water. No effect of calcium in water was observed.
Only one of the seven prevalence studies presented here examined dailyingestion of water at the individual level; most used average concentration ofaluminium in the water supply to residences as an estimate of aluminium exposure.For three of the seven studies, an association of Alzheimer disease with aluminiumwas found, although the measurement of historical aluminium concentrations wascalled into question for one of these studies. Of the other four studies, all of whichexamined cognitive impairment, only one found an association between cognitiveimpairment and aluminium. The issue of the possible effect of other chemicals indrinking-water on the relationship between Alzheimer disease and aluminium wasevaluated in two studies, but little information on potential confounding factors wasavailable overall. A difficulty for several of these studies is determining an estimateof exposure before development of disease.
Case–control studies
Neri & Hewitt (1991) conducted a cross-sectional case–control study inOntario, Canada in 1986. Cases were 2344 individuals aged 55 years or older whohad a diagnosis of Alzheimer disease or presenile dementia by ICD-9 code (331.0or 290.0) on their hospital summary record. Controls were 2232 individuals matchedby age and sex to cases that had non-psychiatric diagnoses on their hospital record.Aluminium concentration of finished water in the municipal water supply for the areaof the patient’s current residence was obtained (if water information was notavailable for the patient’s locality, the individual was not enrolled in the study). Theunmatched analysis indicated that the estimated relative risk for Alzheimer diseaseincreased with increasing concentrations of aluminium in the water supply (from0.01 mg/l to above 0.20 mg/l), although the statistical significance of this finding wasnot shown.
Forster et al. (1995) conducted a case–control study of presenile dementiaof the Alzheimer type (PDAT) in northern England to determine risk factors for thisdisease. Cases (n = 109) were ascertained through hospital admission and othermedical records; they were individuals who were aged less than 65 years when theywere diagnosed as having dementia by clinical algorithm criteria for Alzheimerdisease in the period 1981–1989 and confirmed at the study interview. Controls(n = 109) were randomly selected from the same northern regional health authority(although not the same general practice) as the cases and pair-matched to caseson age and sex. Close relatives were used as informants for both cases and controlsto respond to questions about exposure to risk factors in the period before the onsetof PDAT in the cases. Historical data on aluminium concentration in drinking-waterwas obtained from the local water authority in the mid to late 1980s where eachcase lived the longest in the 10 years before onset of PDAT (the same time periodand residence criteria was used for the matched control). Aluminium concentrationin water was analysed and no significant association of Alzheimer disease with thisexposure was seen across four categories of increasing concentration of aluminium(< 50 μg/l, > 50 μg/l, > 99 μg/l, > 149 μg/l). Taylor et al. (1995) used the same studyparticipants and used exposure to current water supply levels of aluminium and
ALUMINIUM FROM ALL SOURCES, INCLUDING FOOD ADDITIVES 159

silicon to examine if dissolved silicon in drinking-water was related to PDAT. Thereason for studying this relationship was based on the possibility that silicon mightaffect the bioavailability of aluminium. They found that soluble silicon concentrationsfor the cases did not differ significantly from those for the controls, but did find asignificant inverse relationship between silicon and aluminium concentrations(Spearman’s rank order correlation coefficient 0.43, p < 0.001).
McLachlan et al. (1996) conducted a case–control study in Canada.Definition of cases and controls was based on postmortem histopathologicalexamination of brains of individuals who were residents of Ontario at time of death.Cases were categorized as having definitive pathological diagnosis of Alzheimerdisease (n = 296) with an absence of any other degenerative process, or Alzheimerdisease pathology with other neuropathologic changes and clinical dementia(n = 89). Controls were categorized as having either no histopathology onpostmortem (n = 125) or having histopathological changes for several otherdiseases, none for which an association with aluminium has been found (n = 340).
Exposure to aluminium in water was based on water source for residence attime of death and also on a 10-year residential history obtained for a subset of thecases (n = 119) and controls (n = 51) from a telephone interview of next of kin ofthese individuals. The 10-year exposure was calculated using water supply data foreach residence of an individual weighted by duration of residence in that location.In the analysis, the cases from the first category were compared with controls andthen all cases were combined and compared with controls (all controls and a subsetof controls). A significant association was found between Alzheimer disease andaluminium concentrations in water > 100 μg/l for residence at time of deathor 10-year exposure history (all cases and controls, current: OR = 1.7 (95% CI,1.2–2.5); 0-year: OR = 2.6; 95% CI, 1.2–5.3). Similar results were found for otherconfigurations of case–control comparisons. Other potential confounders of therelationship between Alzheimer disease and aluminium were not available in thisstudy, including age. The 10-year residential history may not be sufficient to detectexposures that cause disease.
Martyn et al. (1997) conducted a case–control study that involved men fromeight regions of England and Wales who were aged between 42 and 75 years. Studyparticipants were identified from the CT records of eight neuroradiology centres.Men with a possible diagnosis of dementia on the CT record, a normal CT scan ora CT scan which showed only cerebral atrophy without evidence of infarction, andhospital notes indicating a clinical diagnosis of Alzheimer disease were enrolled ascases (n = 106). Men were enrolled into one of three control groups when: (a) theCT scan indicated a diagnosis of dementia without other evidence indicatingAlzheimer disease (‘other dementia’ control group, n = 99); (b) the CT scan indicateda diagnosis of primary brain cancer (‘brain cancer’ control group, n = 226); or (c) theCT scan indicated another diagnosis other than dementia, such as malignant braintumour, epilepsy or chronic disabling disease (‘other’ control group, n = 441).
Exposure to aluminium in drinking-water was ascertained through ques-tionnaire information given to the study participant or the next of kin (if participanthad died or was unable to fill out questionnaire). The questionnaire elicited the
160 ALUMINIUM FROM ALL SOURCES, INCLUDING FOOD ADDITIVES

addresses of all places of residence of 3 years or more since the study participantwas aged 25 years. The investigators collected information on concentrations ofaluminium and molybdate-reactive silica in drinking-water for these addresses andestimated an average concentration of the chemicals in drinking-water over time foreach individual. The exposure for aluminium in water ranged from less than0.015 mg/l to greater than 0.109 mg/l. In a comparison of the cases with each controlgroup, no increased risk of Alzheimer disease with aluminium in drinking-water wasobserved, nor was a protective effect of silicon in drinking-water found ashypothesized. The use of three control groups aided in providing evidence that thelack of association was consistently found and less likely to be a result of study biasfrom control selection or control response to questionnaire.
Gauthier et al. (2000) conducted a case–control study in Quebec, Canada,enrolling 68 cases of Alzheimer disease and 68 controls matched pair-wise to caseson age and sex. These study participants were a subset of a larger random sampleof persons aged 70 years or older selected from the Quebec health plan files.Alzheimer disease diagnosis occurred after a three-phase assessment of sampledindividuals. A screening test, the Modified Mini-Mental State Examination (3MS),determined if sampled subjects were considered cognitively impaired or not. If theywere considered cognitively impaired, they underwent a second phase of as-sessment for dementia (standardized clinical interview with proxy respondent anda series of neuropsychological tests with subject), and if considered to havedementia, underwent a standardized medical examination with a neurologist. Thecases were selected from those persons diagnosed as possible or probableAlzheimer disease without other co-morbid anomalies by the neurologist, andcontrols were selected from among persons without dementia. Individual exposureof the cases and controls to aluminium in water was determined in two ways usingdata from a water sampling campaign in 1995–1996: (a) concentrations in the watersupply to the participant’s current residence; and (b) estimated long-term exposureto aluminium since 1945 based on the study participant’s residential history(constructed with current water data from municipalities). During the laboratoryanalysis of water a total of 19 physicochemical variables were assessed. Speciationof aluminium was also performed, including concentrations of total aluminum, totaldissolved aluminium, total monomeric aluminium, organic monomeric aluminium,and inorganic monomeric aluminium. Other information collected about the casesand controls included occupational history, highest level of education, family history,medical history and presence or absence of ApoE 4 allele (from the participants’blood samples).
The results of the study showed no significant association between long-termexposure to forms of aluminium found in drinking-water and Alzheimer disease.However, for current exposure, a significant association was found between organicmonomeric aluminium and Alzheimer disease (OR = 2.67, 95% CI, 1.04–6.90),adjusted for education, presence of family cases of Alzheimer disease, andpresence of at least one ApoE 4 allele. The authors suggest that there is biologicalplausibility for this finding, citing research about how this form of aluminiumcomplexes with organic acids of low relative molecular mass and how complexesare absorbed into the gastrointestinal tract, circulate in blood and cross the
ALUMINIUM FROM ALL SOURCES, INCLUDING FOOD ADDITIVES 161

blood–brain barrier (p. 239). They suggest that the reason for not observing thisassociation for long-term exposure may be related to the imprecision of the long-term exposure estimates.
Gillette-Guyonnet et al. (2005) studied women in a single city (Toulouse) ofa five-city cohort study who agreed 7 years after enrolling in the Epidemiology ofOsteoporosis (EPIDOS) study to be enrolled in another prospective study; this otherprospective study aims to determine risk factors for Alzheimer disease. Theresearchers compared women who enrolled in this additional study and werediagnosed with Alzheimer disease (cases, n = 60) to women enrolled in the studyof Alzheimer disease who had normal cognitive function (controls, n = 323). Theydescribed the design of this study a nested case–control study (nested within thelarger cohort). They retrospectively used the information on exposure to chemicalsin water collected 7 years earlier at baseline of EPIDOS (1992–1994) and again in1999–2000. Exposure to chemicals in water was determined by questioning womenabout water intake, from the tap or from bottled mineral water, and obtaining dataabout the concentrations of aluminium, silica and calcium concentrations inbrands of bottled water or the city water supply. Aluminium concentration in thewater supply of Toulouse was measured as 0.063 in 1992–1994 and 0.060 mg/l in1999–2000.
To determine the status of the women with respect to Alzheimer disease,researchers began by employing the SPMSQ, the MMSE and the Grober andBuschke test to assess cognitive function. These tests, an assessment in the homeof the study participant’s independence in instrumental activities of daily living andcomputed tomography reports or scans were evaluated by a geriatrician andneurologist to determine if the woman had normal cognitive function, mild cognitiveimpairment, Alzheimer disease or other types of dementia. The clinicians usedNINCDS-ADRDA criteria in the diagnosis of Alzheimer disease.
The researchers did not find an association between Alzheimer disease andaluminium in the study. They were able to adjust for a number of potential con-founders in their analyses, including age, education and income. They did, however,find that Alzheimer disease was associated with lower silica concentrations indrinking-water. No effect of calcium in water was observed.
An additional case–control study conducted by Altmann et al. (1999) thatexamined association of aluminium in water from the Camelford water pollutionincident with disease differs from the above case–control studies in that it aimed tomeasure disturbance of cerebral function, rather than Alzheimer disease, usingpsychological tests and visual evoked potentials (VEP). A difficulty with this studyis that selection of cases (n = 55) was not investigator-initiated but was initiated bylawyers on behalf of persons who were considering litigation on account of allegedeffects from the water pollution incident. The cases complained about short-termmemory loss and impaired concentration. Therefore, the cases had an idea aboutboth the exposure and possible health effects before the study was begun. Theinvestigators selected as controls 15 siblings of the cases (nearest in age to thecases of his or her siblings) who had not lived in the area of water contaminationsince before the incident. Because of the likelihood that controls were aware that
162 ALUMINIUM FROM ALL SOURCES, INCLUDING FOOD ADDITIVES

cases were considering litigation, it is possible that this awareness had some affecton the control’s performance on tests. The least subjective test in the battery of testsused in the study was VEP. A significant difference between the 15 pairs of casesand their siblings was detected on VEP, with the siblings having a better flashpattern. Potential confounders of this finding, if any, are not discussed in the paper.Due to issues with the study design and differences in end-points, this study will notbe included in the comparison with the other case–control studies.
In summary, two of the six case–control studies presented here showed astatistically significant association of Alzheimer disease with aluminium. Exposureassessment varied in the six studies, from ascertaining aluminium concentration inthe current residential water supply in a cross-sectional case–control study (Neri &Hewitt, 1991) to questioning individuals directly about their ingestion of tap or bottledmineral water in a nested case–control study (Gillette-Guyonnet et al., 2005). Threeof the studies depended on informants to recall the past residential history for casesor controls, which was used to construct historical exposure to water. The use ofinformants, rather than direct questioning of study participants, are often requiredin retrospective studies of patients with a disease involving memory loss but mayresult in inaccurate exposure assessment.
Another issue to consider when examining the results of these studies isdisease definition. Disease definition varied from identification of cognitive impair-ment in women (Gillette-Guyonnet et al., 2005) to Alzheimer disease identificationusing postmortem histopathological examination of brain tissue (McLachlan et al.,1996). If aluminium has a role only in the pathogenesis of Alzheimer disease andnot cognitive impairment or other forms of dementia then careful attention to criteriafor evaluating the form of the disease is warranted.
Of the two studies showing an association of Alzheimer disease withaluminium, the study by Gauthier et al. (2000) evaluated the speciation of aluminiumin water and the association of Alzheimer disease was found for only one of thesespecies, organic monomeric aluminium. This finding leads to questions aboutbioavailability of different species of aluminium and the effect, if any, on path-ogenesis of Alzheimer disease.
Prospective cohort study
Rondeau et al. (2000) analysed data from a prospective cohort study (thePaquid cohort) of 3777 persons who were aged 65 years or older and lived at homeat the onset of the study. These participants were randomly selected from electoralrolls from one of 75 randomly selected rural or urban parishes in the administrativeareas of Gironde or Dordogne in south-western France (more sampling detaildescribed above (Michel et al., (1991), Gironde only). Alzheimer disease wasdetermined in a two-stage process. For the first stage, a screening was done bypsychologists (DSM-III criteria for dementia and psychometric tests). Patients whotested positive by the criteria in the first stage went to a second stage. In the secondstage, senior neurologists interviewed patients and performed a clinical exam-ination (NINCDS-ADRDA criteria for Alzheimer disease and Hachinski score forvascular dementia). Study participants were re-examined at specific intervals after
ALUMINIUM FROM ALL SOURCES, INCLUDING FOOD ADDITIVES 163

the start of the study with the same criteria as above to detect new cases ofdementia. An additional test for dementia, the MMSE, was added after the base-line exams.
Exposure to aluminium was based on information collected in two surveysin 1991 of 77 drinking-water areas that supplied the cohort participants. Thesesurveys measured pH and various chemicals in the water (aluminium, calcium, andfluorine). Information on chemical analyses of drinking-water (aluminium andsilicon) conducted by the sanitary administration between 1991 and 1994 was alsoused. The researchers additionally collected historical information on chemicalconcentrations in water for the period 1981–1991. For each parish, the researcherscalculated a weighted mean of all measures for each chemical (for the 70 of 77drinking-water areas that had all available information). For the analysis, aluminiumwas characterized in three ways: (1) 0.1 vs < 0.1; (2) as a continuous variable;and (3) grouped into four categories (< 0.0038 mg/l, 0.0038 to < 0.0110 mg/l, 0.0110 to < 0.1000 mg/l, 0.1000). Aluminium concentrations in water ranged from0.001 to 0.459 mg/l, with a median value of 0.009 mg/l.
For analysis of the data, the researchers evaluated 2698 participants of theoriginal cohort. The reason for the drop in sample size from the baseline numberwas because of the following reasons: the exclusion of persons who were dementedat baseline (n = 102) in order to ascertain incident cases during 8 years of follow-up, the lack of participation of study subjects in follow-up visits (due to death orrefusal (n = 703)), and the lack of water measurement and adjustment co-variatesfor some participants (n = 274).
Results of the analysis showed that the risk associated with dementia(incident cases, n = 253) or the risk associated with Alzheimer disease (incidentcases, n = 182) was significantly elevated at aluminium concentrations in drinking-water of 0.1 mg/l compared with the lowest aluminium concentrations (respectively,relative risk, RR = 1.99, 95% CI, 1.20–3.28; RR = 2.14, 95% CI, 1.21–3.80, adjustedfor age, gender, level of education, place of residence, and wine consumption).There was no linear dose–response observed across the four aluminium categorieswith dementia or Alzheimer disease, and the researchers suggest the possibilityof a threshold effect at the highest category of aluminium concentration. Con-centrations of silicon in the water of > 11.25 mg/l were associated with a reducedrisk for developing dementia or Alzheimer disease, but there did not appear to bean interaction between aluminium and silicon associated with outcome of disease.No effect of pH was observed.
This study found an association of Alzheimer disease and dementia withaluminium concentrations 0.1 mg/l in water, although no dose–response wasobserved. The study had several strengths. Exposure was assessed before onsetof disease and information about potential confounders of the relationship betweenAlzheimer disease and aluminium was obtained directly from study participantsrather than informants; disease was diagnosed carefully with standard tests andclinical evaluation; and researchers examined whether loss to follow-up of cohortparticipants explained findings. The researchers also analysed water for otherchemicals and could examine the effect of these chemicals on the relationship
164 ALUMINIUM FROM ALL SOURCES, INCLUDING FOOD ADDITIVES

between Alzheimer disease and aluminium. Findings from the study conflicted withfindings from another study using the full cohort and the same exposure assessment(Jacqmin et al., 1994), but the latter study evaluated study participants at baselinein the cohort and used a different health end-point, cognitive impairment (scoringbelow 24 on the MMSE).
Conclusions about studies of exposure to aluminium in drinking-water
Some of the epidemiology studies suggest the possibility of an associationof Alzheimer disease with aluminium in water, but other studies do not confirm thisassociation. Many of the methodological issues concerning the studies arediscussed above. All studies lack information on ingestion of aluminium from foodand how concentrations of aluminium in food affect the association betweenaluminium in water and Alzheimer disease. Some of the studies have examined theeffect of other chemicals in water but more information is needed in this area.
(ii) Exposure to aluminium in food
There are very few studies that incorporate information about dietary intakein epidemiological studies of Alzheimer disease, and all studies used a case–control design.
Rogers & Simon (1999) conducted a pilot case–control study to determinewhether intake of food containing aluminium additives differs in individuals with andwithout newly diagnosed Alzheimer disease. The cases and the matched controlswere selected from a nursing home in New York, USA from March to November1993. The cases were defined as persons with newly-diagnosed Alzheimer diseasefrom 1990 to 1993. The diagnosis of Alzheimer disease was ascertained usingcriteria specified by NINCDS-ADRDA. A total of 46 participants composing 23matched pairs were enrolled in the study. Next-of-kin or spouse responded toquestions on the participants’ medical history, lifestyle behaviour and dietary intakebefore admission to the Centre.
The crude ORs for the association between categories of aluminium-containing foods and Alzheimer disease were generally low and non-significant. Astatistically significant association between food intake and disease was only foundfor one category “pancakes, waffles, biscuits, muffins, cornbread, corn tortillas”based on five discordant matched case–control pairs (OR = undefined; p = 0.025).
Several of the ORs markedly increased when adjusted for other possiblefactors that may affect the food-disease relationship, thus indicating the instabilityof several of these estimates. The large difference between the crude and adjustedORs after adjusting for up to six covariates in the conditional logistic regressionmodel also indicates the difficulty of using complex models to analyse a smallnumber of matched case–control pairs. The authors did not discuss or show theconfidence interval around each OR, and therefore, the reader could not examinethe extent of variability of the estimates. Other difficulties with the study included:(1) the long time to recall of dietary intake information—surrogates had to recall dietin a time period up to 8 years before the interview; (3) the potential for differentialrecall between case versus control surrogates owing to the likely differences in
ALUMINIUM FROM ALL SOURCES, INCLUDING FOOD ADDITIVES 165

intensity of care of study participants and the influence that intensity of care mayhave on knowledge of diet; (4) the potential for a control to change usual dietarypatterns when diagnosed with heart disease or high blood pressure, especially if heor she reduces intake of fatty foods such as biscuits containing aluminium; (5)the lack of validation of dietary intake questions developed for this study; and(6) the problems with incomplete information about the amount of aluminium indifferent brands of foods. Although the findings in this pilot study should beinterpreted cautiously and considered exploratory, they are intriguing enough tosuggest that future epidemiological studies of intake of food containing aluminiumand Alzheimer disease are warranted.
A few epidemiology studies have also examined the relation between teadrinking and Alzheimer disease. Pennington (1987) summarized the literature onaluminium content in individual foods and found that the concentration of aluminiumin tea leaves and powder ranged from 67.0 to 14.0 mg/100 g, but that aluminiumconcentration in a cup of brewed tea (8 fl oz) ranged from 0.05 to 1.07 mg/100 g.Findings from the epidemiology studies on tea are presented below.
Broe et al. (1990) conducted a case–control study in Australia in 1986–1988that enrolled 170 newly diagnosed cases of Alzheimer disease and 170 controlsmatched to cases on age, sex and, when possible, attendance of the same generalpractice clinic as the case. Cases were evaluated by neurologists and underwent astandardized battery of tests and examinations for Alzheimer disease and wereclassified as probable or possible Alzheimer disease by NINCDS-ADRDA criteria.Trained interviewers questioned individuals, usually in their homes, about healthhistory, family history, lifestyle and occupational or domestic exposures. Inter-viewers asked about tea drinking history. No significant association between teadrinking and Alzheimer disease was detected on analysis of matched pairs, evenat levels of “>4 cups of tea daily sometime in life” (odds ratio = 1.42, 95% CI,0.93–2.17).
In another case–control study in northern England (Forster et al., 1995, seedescription of study above), the measure “>4 cups of tea daily” was also used, butno significant association between tea drinking and PDAT was detected although,as in the Australian study, the odds ratio was above 1.0 (OR = 1.4; 95% CI, 0.81–2.63).
166 ALUMINIUM FROM ALL SOURCES, INCLUDING FOOD ADDITIVES

Tab
le 3
. Ep
idem
iolo
gic
al s
tud
ies
of
alu
min
ium
in d
rin
kin
g-w
ater
an
d d
emen
tia
or
Alz
hei
mer
dis
ease
Typ
e of
stu
dyM
easu
re o
f exp
osur
e to
alum
iniu
m in
wat
erO
utco
me
mea
sure
/dat
aso
urce
Res
ults
Ref
eren
ce
Eco
logi
cal
Alu
min
ium
in d
rinki
ng-w
ater
(con
curr
ent)
Fou
r se
ason
al s
ampl
es
Men
tion
of d
emen
tia IC
D9
290,
290
.1 (
dem
entia
),34
2.0
(Par
kins
on),
348
.0(A
LS);
sex
-adj
uste
d de
ath
cert
ifica
te
AD
onl
y:
RR
Al (
mg/
l)
Mal
es
F
emal
es<
0.0
5
1.00
1
.00
0.05
-0.2
1.1
5
1.1
9>
0.2
1.32
1
.42
PD
and
ALS
—no
gra
dien
t
Fla
ten
(199
0)
Mor
bidi
ty p
reva
lenc
eA
lum
iniu
m in
fini
shed
drin
king
-wat
er; h
isto
rical
Dem
entia
by
diag
nost
icca
tego
ry (
not s
tand
ard)
CT
sca
n ce
ntre
reco
rds
age-
sex-
adju
sted
All
mal
es a
nd fe
mal
es R
R =
1.3
–1.5
, no
dose
-res
pons
ere
latio
nshi
pM
ales
and
fem
ales
age
d <
65
year
s R
R =
1.4
–1.7
, dos
e re
spon
se
Mar
tyn
et a
l. (1
989)
Mor
bidi
ty p
reva
lenc
eca
se–c
ontr
olF
inis
hed
drin
king
-wat
eral
umin
ium
; his
toric
al‘C
ases
’ wer
e ho
spita
ldi
scha
rges
of A
D (
ICD
933
1.0)
,P
rese
nile
dem
entia
(IC
D 9
290)
Age
/sex
/res
iden
ce-m
atch
edco
ntro
ls w
ith o
ther
diag
nose
s
Hos
pita
l Med
ical
Rec
ords
Inst
itute
dat
abas
e-O
ntar
io
RR
from
OR
, gra
dien
t for
AD
Al (
mg/
l)
RR
from
OR
< 0
.01
1.0
00.
01–0
.099
1.1
30.
010–
0.19
9
1.2
6>
0.2
1
.46
Ner
i & H
ewitt
(19
91)
ALUMINIUM FROM ALL SOURCES, INCLUDING FOOD ADDITIVES 167
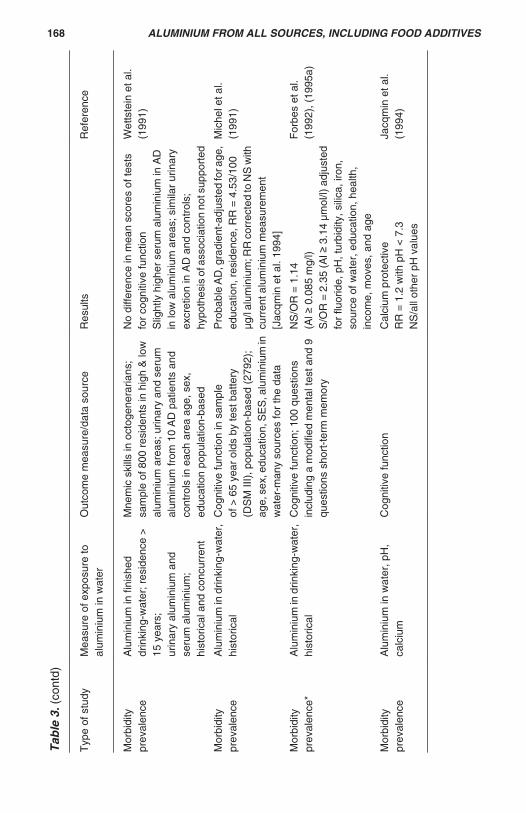
Tab
le 3
. (co
ntd)
Typ
e of
stu
dyM
easu
re o
f exp
osur
e to
alum
iniu
m in
wat
erO
utco
me
mea
sure
/dat
a so
urce
Res
ults
Ref
eren
ce
Mor
bidi
typr
eval
ence
Alu
min
ium
in fi
nish
eddr
inki
ng-w
ater
; res
iden
ce >
15 y
ears
;ur
inar
y al
umin
ium
and
seru
m a
lum
iniu
m;
hist
oric
al a
nd c
oncu
rren
t
Mne
mic
ski
lls in
oct
ogen
erar
ians
;sa
mpl
e of
800
res
iden
ts in
hig
h &
low
alum
iniu
m a
reas
; urin
ary
and
seru
mal
umin
ium
from
10
AD
pat
ient
s an
dco
ntro
ls in
eac
h ar
ea a
ge, s
ex,
educ
atio
n po
pula
tion-
base
d
No
diffe
renc
e in
mea
n sc
ores
of t
ests
for
cogn
itive
func
tion
Slig
htly
hig
her
seru
m a
lum
iniu
m in
AD
in lo
w a
lum
iniu
m a
reas
; sim
ilar
urin
ary
excr
etio
n in
AD
and
con
trol
s;hy
poth
esis
of a
ssoc
iatio
n no
t sup
port
ed
Wet
tste
in e
t al.
(199
1)
Mor
bidi
typr
eval
ence
Alu
min
ium
in d
rinki
ng-w
ater
,hi
stor
ical
Cog
nitiv
e fu
nctio
n in
sam
ple
of >
65
year
old
s by
test
bat
tery
(DS
M II
I), p
opul
atio
n-ba
sed
(279
2);
age,
sex
, edu
catio
n, S
ES
, alu
min
ium
inw
ater
-man
y so
urce
s fo
r th
e da
ta
Pro
babl
e A
D, g
radi
ent-
adju
sted
for a
ge,
educ
atio
n, r
esid
ence
, RR
= 4
.53/
100
μg/l
alum
iniu
m; R
R c
orre
cted
to N
S w
ithcu
rren
t alu
min
ium
mea
sure
men
t[J
acqm
in e
t al.
1994
]
Mic
hel e
t al.
(199
1)
Mor
bidi
typr
eval
ence
*A
lum
iniu
m in
drin
king
-wat
er,
hist
oric
alC
ogni
tive
func
tion;
100
que
stio
nsin
clud
ing
a m
odifi
ed m
enta
l tes
t and
9qu
estio
ns s
hort
-ter
m m
emor
y
NS
/OR
= 1
.14
(Al
0.0
85 m
g/l)
S/O
R =
2.3
5 (A
l 3
.14
μmol
/l) a
djus
ted
for
fluor
ide,
pH
, tur
bidi
ty, s
ilica
, iro
n,so
urce
of w
ater
, edu
catio
n, h
ealth
,in
com
e, m
oves
, and
age
For
bes
et a
l.(1
992)
, (19
95a)
Mor
bidi
typr
eval
ence
Alu
min
ium
in w
ater
, pH
,ca
lciu
mC
ogni
tive
func
tion
Cal
cium
pro
tect
ive
RR
= 1
.2 w
ith p
H <
7.3
NS
/all
othe
r pH
val
ues
Jacq
min
et a
l.(1
994)
168 ALUMINIUM FROM ALL SOURCES, INCLUDING FOOD ADDITIVES

Tab
le 3
. (co
ntd)
Typ
e of
stu
dyM
easu
re o
f exp
osur
e to
alum
iniu
m in
wat
erO
utco
me
mea
sure
/dat
a so
urce
Res
ults
Ref
eren
ce
Cas
e-co
ntro
l*A
lum
iniu
m in
drin
king
-w
ater
, his
toric
alP
DA
TP
erso
ns a
ged
< 6
5 ye
ars;
109
case
s, 1
09 c
ontr
ols
(mat
ched
toca
ses,
age
, sex
)
OR
/NS
for a
lum
iniu
m m
easu
res
atal
l lev
els
(hig
hest
> 1
49 μ
g/l)
For
ster
et a
l. (1
995)
Mor
bidi
ty p
reva
lenc
eA
lum
iniu
m in
drin
king
-w
ater
Mal
es, m
entio
n of
AD
or
pres
enile
dem
entia
(IC
D-9
), d
eath
cer
tific
ate
No
age-
educ
atio
n ad
just
men
ts.
Con
trol
led
for
pH, S
iO2,
F in
wat
er
RR
of A
D a
t all
ages
= 2
.42
for
alum
iniu
m >
336
μg/l
RR
of A
D a
t age
75
+ =
3.1
5 fo
ral
umin
ium
> 3
36 μ
g/l
*sam
ple
size
= 1
4 at
alu
min
ium
>33
6 μg
/lN
o lin
ear
dose
-res
pons
e(J
-sha
ped
resp
onse
cur
ve)
For
bes
et a
l. (1
995b
)
Cas
e-co
ntro
lA
lum
iniu
m in
drin
king
-w
ater
; res
iden
ce-w
eigh
ted;
hist
oric
al
Pat
holo
gica
l con
firm
atio
n of
diag
nosi
s in
all
case
s an
d co
ntro
ls;
no a
ge-s
ex-e
duca
tion
adju
stm
ent
RR
= 1
.7 fo
r al
umin
ium
> 1
00 μ
g/l
RR
= 2
.5 fo
r al
umin
ium
> 1
00 μ
g/l
whe
n ba
sed
adju
stm
ent f
or10
-yea
r wei
ghte
d ex
posu
re h
isto
ry
McL
achl
an e
t al.
(199
6)
Mor
bidi
ty in
cide
nce
(Cas
e-co
ntro
l)A
lum
iniu
m in
drin
king
-w
ater
, exp
osur
e as
yea
rsbe
fore
dia
gnos
is
106
mal
es c
linic
al d
iagn
osis
AD
,C
ontr
ols
= o
ther
dem
entia
, bra
inca
ncer
, oth
er n
euro
dege
nera
tion,
*no
dise
ase,
all
aged
45–
75.
Adj
uste
d fo
r ag
e, S
iO2
No
incr
ease
d ris
k, h
ighe
stal
umin
ium
> 1
09 μ
g/l v
s lo
wes
tal
umin
ium
< 1
6 μg
/l
Mar
tyn
et a
l. (1
997)
ALUMINIUM FROM ALL SOURCES, INCLUDING FOOD ADDITIVES 169

Tab
le 3
. (co
ntd)
Typ
e of
stu
dyM
easu
re o
f exp
osur
e to
alum
iniu
m in
wat
erO
utco
me
mea
sure
/dat
a so
urce
Res
ults
Ref
eren
ce
Cas
e-co
ntro
lA
lum
iniu
m in
drin
king
-wat
er,
estim
ates
(hi
stor
ical
) of
long
term
exp
osur
e, v
arie
ty o
fal
umin
ium
spe
cies
68 e
lder
ly c
linic
ally
dia
gnos
edag
e an
d se
x-m
atch
ed c
ontr
ols
adju
sted
for e
duca
tion,
Apo
E
4al
lele
, AD
or
dem
entia
fam
ilyhi
stor
y
NS
for
all a
lum
iniu
mm
easu
res
exce
pt m
onom
eric
orga
nic
alum
iniu
m a
t tim
e of
diag
nosi
s, O
R =
2.6
7
Gau
thie
r et
al.
(200
0)
Pro
spec
tive
coho
rtA
lum
iniu
m in
drin
king
-wat
er,
time-
wei
ghte
d hi
stor
ical
2698
mal
es a
nd fe
mal
es a
ged
>65
at b
asel
ine,
8 y
ear
follo
w-u
pde
men
tia (
DS
M-I
IIR, M
MS
E),
AD
(N
INC
DS
-AR
DR
A)
popu
latio
n-ba
sed
(340
1),
adju
sted
for
age,
sex
,ed
ucat
ion,
pla
ce o
f res
iden
ce,
win
e co
nsum
ptio
n
RR
of d
emen
tia =
1.9
9 fo
ral
umin
ium
> 0
.1 m
g/l
RR
of A
D =
2.2
0 fo
ral
umin
ium
> 0
.1 m
g/l
Hig
h si
lica
leve
ls m
ay b
epr
otec
tive
Ron
deau
et a
l. (2
000)
Mor
bidi
ty p
reva
lenc
e*A
lum
iniu
m in
drin
king
-wat
eran
d qu
estio
nnai
re r
espo
nse
abou
t bot
tled
and
tap
wat
er
5691
wom
en a
ged
> 7
5 ye
ars
atba
selin
e, 5
citi
es, E
pide
mio
logy
of O
steo
poro
sis
stud
y, c
ogni
tive
impa
irmen
t, P
feiff
er s
core
< 8
NS
for
alum
iniu
mT
ap w
ater
ran
ge: 0
.01-
0.06
3m
g/l,
five
citie
sB
ottle
d m
iner
al w
ater
ran
ge:
non-
dete
ctab
le to
0.0
32 m
g/l
Gile
tte-G
uyon
net e
t al.
(200
5)
170 ALUMINIUM FROM ALL SOURCES, INCLUDING FOOD ADDITIVES
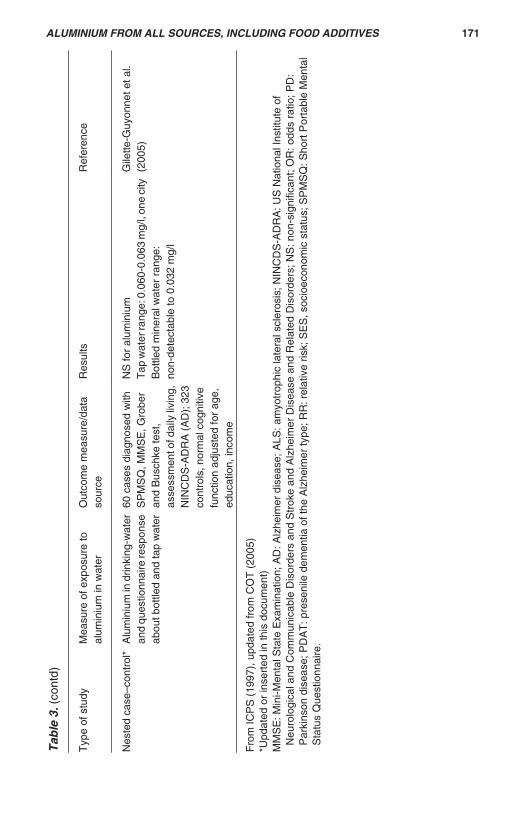
Tab
le 3
. (co
ntd)
Typ
e of
stu
dyM
easu
re o
f exp
osur
e to
alum
iniu
m in
wat
erO
utco
me
mea
sure
/dat
aso
urce
Res
ults
Ref
eren
ce
Nes
ted
case
–con
trol
*A
lum
iniu
m in
drin
king
-wat
eran
d qu
estio
nnai
re re
spon
seab
out b
ottle
d an
d ta
p w
ater
60 c
ases
dia
gnos
ed w
ithS
PM
SQ
, MM
SE
, Gro
ber
and
Bus
chke
test
,as
sess
men
t of d
aily
livi
ng,
NIN
CD
S-A
DR
A (
AD
); 3
23co
ntro
ls, n
orm
al c
ogni
tive
func
tion
adju
sted
for
age,
educ
atio
n, in
com
e
NS
for
alum
iniu
mT
ap w
ater
rang
e: 0
.060
-0.0
63 m
g/l,
one
city
Bot
tled
min
eral
wat
er r
ange
:no
n-de
tect
able
to 0
.032
mg/
l
Gile
tte-G
uyon
net e
t al.
(200
5)
Fro
m IC
PS
(19
97),
upd
ated
from
CO
T (
2005
)*U
pdat
ed o
r in
sert
ed in
this
doc
umen
t)M
MS
E: M
ini-M
enta
l Sta
te E
xam
inat
ion;
AD
: Alz
heim
er d
isea
se; A
LS: a
myo
trop
hic
late
ral s
cler
osis
; NIN
CD
S-A
DR
A: U
S N
atio
nal I
nstit
ute
ofN
euro
logi
cal a
nd C
omm
unic
able
Dis
orde
rs a
nd S
trok
e an
d A
lzhe
imer
Dis
ease
and
Rel
ated
Dis
orde
rs; N
S: n
on-s
igni
fican
t; O
R: o
dds
ratio
; PD
:P
arki
nson
dis
ease
; PD
AT
: pre
seni
le d
emen
tia o
f the
Alz
heim
er ty
pe; R
R: r
elat
ive
risk;
SE
S, s
ocio
econ
omic
sta
tus;
SP
MS
Q: S
hort
Por
tabl
e M
enta
lS
tatu
s Q
uest
ionn
aire
.
ALUMINIUM FROM ALL SOURCES, INCLUDING FOOD ADDITIVES 171

A third case–control was conducted in Canada (The Canadian Study ofHealth and Aging, 1994). This study enrolled study participants aged 65 years orolder from communities and institutions across Canada (except Ontario), usinghealth insurance plan information. Sampled individuals from the community werescreened for cognitive impairment with the 3MS. If the 3MS suggested impairment,individuals underwent clinical examination. Diagnosis of dementia was based onDSM-III-R, while possible or probable Alzheimer disease was based on the findingsof dementia plus NINCDS-ADRDA criteria. Persons in institutions were examinedclinically without first undergoing screening. Cases were selected from the possibleand probable Alzheimer disease groups of patients (n = 258) and controls (n = 535)were selected from individuals assessed to be cognitively normal. Controls werefrequency-matched to cases on age group, study centre, and residence in acommunity or institution. Proxy respondents for cases and controls answered a risk-factor questionnaire that included a limited dietary history, including a questionabout tea intake. The researchers did not find an association between Alzheimerdisease and tea (OR = 1.40; 95% CI, 0.86–2.28, adjusting for age, sex, educationand residence.
A fourth pilot case–control study conducted by Rogers & Simon (1999) in theUSA and described immediately above also found no association betweenAlzheimer disease and tea (OR = O.6, p = 0.69). The OR was calculated from avery small number of discordant pairs (n = 11 pairs).
(iii) Exposure to aluminium in antacids
Aluminium concentrations in antacids, when present, are at a much higherconcentration than are found in water. Daily intake of aluminium in antacids hasbeen estimated as 1 g or more by Anke et al. (2001) and up to 5 g by Lione (1985).Case-reports of the effects of aluminium-containing antacids related to skeletalchanges are described earlier in this document. Flaten (2001) reviewed 13epidemiological studies that were germane to evaluating antacid use and Alzheimerdisease, including three studies that indirectly evaluated this relationship bystudying groups of patients with peptic ulcer or who were regular users of the H2
blocker cimetidine. The 13 studies were published from 1984 to 1999, and themajority of the studies had a case–control design (9 of the 13). There was noprospective study design among these studies that could have allowed forascertainment of antacid use directly from the patient before onset of disease. Noneof the estimates of risk (OR, RR or standardized mortality ratio, SMR) achievedstatistical significance, and in 11 of the 13 studies, the risk estimate was below 1.0,tending in the direction of a protective association of the use of antacids withAlzheimer disease. However, sample size in most of these studies is very small,dose and frequency of use information for the antacid was not obtained, andinformation about whether antacids contain aluminium is sometimes not presented.
Case-reports of frequent use of antacids and its effect on bone are discussedabove in the section on osteomalacia.
172 ALUMINIUM FROM ALL SOURCES, INCLUDING FOOD ADDITIVES

(b) Other neurological conditions: ALS, parkinsonism–dementia
Studies of patients and sampling of drinking-water and garden soil have beenconducted in three areas of the western Pacific with high incidence rates ofamyotrophic lateral sclerosis (ALS) and parkinsonism–dementia (Gajdusek &Salazar, 1982; Perl et al., 1982). These three areas include Guam, the Kii Peninsulaof Japan and southern West New Guinea. Unusually low concentrations of calciumand magnesium were found in the drinking-water and soil from these areas, whilerelatively high concentrations of other elements were found, including aluminium.Gajdusek & Salazar (1982) observed that villages with a high incidence of ALS orparkinsonism–dementia had different geographical terrain compared with othervillages in the same general regions with low incidence of disease; however,investigators only obtained samples of water and soil from the high but not the lowincidence villages. Perl et al. (1982) examined accumulation of aluminium withinthe brain tissue of eight Guamanian persons, three of whom had died of ALS orparkinsonism–dementia and five of whom (the controls) had died of non-neurological disorders and did not show signs of neurological disease before death.The brain tissue of all eight persons contained aluminium, but concentrations werehigher in the patients with ALS and parkinsonism–dementia and in one controlcompared with the remaining four controls. Perl et al. (1982) found the presence ofneurofibrillary tangle-bearing hippopcampal neurons in the persons with the higherconcentrations of aluminium, but did not detect neurofibrillary tangle-bearingneurons in the four remaining controls. The role of aluminium, if any, in the initiationand development of the disease is not elucidated in these studies since the effectof the other factors potentially associated with the disease or their interactions arenot yet fully understood.
In Italy, Bergomi et al. (2002) conducted a population-based case–controlstudy to evaluate the association between exposure to trace elements, includingaluminium, and sporadic ALS. They enrolled patients from five provinces of Italywhose first diagnosis of ALS occurred in 1998–1999. A neurologist diagnosed ALSand determined if the disease was possible, probable or definite, based on the ElEscorial criteria (Brooks, 1994). A patient with possible or probable ALS wasfollowed until a conclusive diagnosis was made and then defined as a case in thestudy. Controls were selected from the same population as the cases, employingrandom sampling from the National Health Service directory (all citizens in Italy areincluded in the National Health Service) and matching by same birth year andgender as the cases. The sample size for the study was 62 persons, 22 cases (10women and 12 men) and 40 controls (18 women and 22 men). Investigatorsadministered a questionnaire on clinical, life-style and dietary factors and sampledtoenail specimens and blood. Toenails were analysed for a number of traceelements, including cadmium, lead, copper, manganese, selenium, chromium,cobalt, iron and aluminium. No association between ALS and aluminium was found.The meaning of this result is difficult to determine since toenail concentration ofaluminium as a biomarker for chronic environmental exposure to aluminium has yetto be validated.
ALUMINIUM FROM ALL SOURCES, INCLUDING FOOD ADDITIVES 173

(c) All-cause mortality
As a follow-up to the water pollution incident in Camelford, UK and its vicinity(see section 3.1.2, case of severe cerebral congophilic angiopathy, for a fullerdescription of this incident), Owen et al. (2002) compared mortality in the area withwater pollution (n = 11 114 residents) to mortality in an adjacent area free of pollution(n = 5359 residents). They collected information on deaths from July 1988 toDecember 1997 and corrected death rates for differences in age distribution andsex between the two populations. They calculated an SMR for the exposedpopulation and a SMR for the unexposed population, standardized to England andWales or standardized to Cornwall and the Isles of Scilly. The ratio of the SMRfor the exposed population to the SMR for the unexposed population was 1.08(95% CI, 0.97–1.21), standardized to England and Wales. The ratio of SMRs,standardized to Cornwall and the Isles of Scilly was closely similar. These resultssuggest a very small but not statistically significant excess of mortality in theexposed group. No other factors were considered in this study. The authors notedthat not all deaths were accounted for if individuals moved out of either area beforethe recommendation in 1991 to ascertain deaths. It is not clear how much influenceunder-reporting of deaths had on the estimates.
(d) Other disorders
At the present time, oral exposure to aluminium in humans has not beenassociated with cancer, genotoxicity or reproductive toxicity.
4. ANALYTICAL METHODS
4.1 Food additives
Each specification monograph for food additives containing aluminium hasmethods of analysis for identity and purity (qualitative methods for identification, andquantitative methods for assessing the purity of the additive). The methods areeither included in the monographs or refer to methods in common for two or moresubstances in Volume 4 of the Combined Compendium of Food Additive Spec-ifications (Annex 1, reference 180).
4.2 Food samples.
Food samples would normally be rendered into soluble samples, e.g. bymicrowave-assisted acid digestion, before instrumental measurement of aluminium.Graphite-furnace atomic absorption spectrometry, inductively coupled plasma-optical/atomic emission spectrometry (ICP-OES/AES) and inductively coupledplasma mass spectrometry (ICP-MS) are commonly used methods for measuringaluminium in foods. All offer low detection limits, which are typically 0.1 mg/kgsample or lower, depending on the sample type.
Graphite-furnace atomic absorption spectrometry can be affected by high-chloride matrices and this can be a problem especially for biological samples. ICP-AES and ICP-MS are relatively free from interference, although Ti and Ca can give
174 ALUMINIUM FROM ALL SOURCES, INCLUDING FOOD ADDITIVES

high background signals in ICP-AES and ICP-MS can suffer interference fromberyllium oxide, boron oxide and cyanide.
In proficiency testing schemes, errant results that deviate from the modecannot be ascribed to any particular analytical method. All the methods describedabove are capable of returning reliable results for aluminium in food.
Aluminium is an abundant element in the environment so background levelsin laboratory analysis can be a problem, particularly when measuring biologicalsamples (blood, plasma etc) where concentrations are low (low parts per billion, μg/kg). Concentrations in food are generally higher (low parts per million, mg/kg) andso analytical background contamination is not such a problem but it always needsto be guarded against.
A large proportion of errant results in proficiency testing schemes aresubmitted by laboratories using non-accredited procedures. These errant resultstend to be too high compared with the norm, and this may be owing to insufficientcare taken to exclude high background levels of aluminium in reagents and glass/plastic ware or other contamination issues.
5. SAMPLING PROTOCOLS
There is no specific Codex method of sampling of food to be analysed foraluminium, but there are Codex Alimentarius Committee Guidelines CAC/GL 50(2004) ‘General guidelines in sampling’ which are helpful.
6. EXPOSURE TO ALUMINIUM IN THE DIET AND OTHER SOURCES
Only consumer exposure to aluminium in the diet and other routes orcommodities was considered by the Committee, without consideration foroccupational exposure. Previous reviews by the Committee (WHO, 1989a; WHO,1989b) IPCS (WHO, 1997) & COT (COT, 2005) and recent literature data wereconsidered.
Dietary sources of exposure include natural dietary sources, drinking-water,migration from food contact material and food additives. When dietary exposure wasexpressed on a kg body weight basis, a standard 60 kg adult was considered, unlessotherwise specified.
6.1 Dietary exposure (including drinking-water)
In the last evaluation made by the Committee, dietary exposure, particularlythrough foods containing aluminium compounds used as food additives, was foundto represent the major route of aluminium exposure by the general public excludingpersons who regularly ingest aluminium-containing drugs (WHO, 1989a; 1989b).The review by IPCS in 1997 confirmed that non-occupational human exposure toaluminium in the environment is primarily through ingestion of food and water (WHO,1997). Of these, food appeared as the principal contributor.
ALUMINIUM FROM ALL SOURCES, INCLUDING FOOD ADDITIVES 175

The three dietary sources of aluminium are natural sources (foods andbeverages, drinking-water), packaging and utensils used during food preparationand storage and food additives.
The geological origins of the soil and its conditions, especially its pH, havea significant influence on the aluminium content of the food chain. The solubility ofaluminium compounds may increase when acid rain decreases the pH of the soil,as a consequence aluminium content increases in surface water, plants and animals(Anke, 2001).
6.1.1 Drinking-water
In the last evaluation by the Committee (Annex 1, reference 84), althoughwater was not found to contribute significantly to the total aluminium exposure fromall sources for most individuals, elevated aluminium concentrations were reportedin water from certain areas and resultant aluminium exposure could be as high asthe dietary contribution.
Aluminium in natural waters is mainly derived from weathering of rocks andminerals. Analytical data from drinking-water in the USA suggest that the aluminiumcontent of raw surface water is higher than that of raw ground water. Thus 55% ofthe raw surface waters had a concentration of greater than 50 μg/l vs only 4%of the raw ground waters (Miller, 1984).
Concentration of dissolved aluminium in raw water near pH 7 is typicallybetween 1 and 50 μg/l, but can increase to 500–1000 μg/l in acidified water (Yokel,2004, cited in Schafer). Based on the consumption of 2 l of water per day, exposurethrough this source is therefore up to 2 mg/day, corresponding to 0.03 mg Al/kg bwper day
Aluminium may also be present in drinking-water owing to the use of saltsof aluminium as a chemical coagulation-based treatment of surface waters, whichis the most common approach for treatment of surface waters (WHO, 2004).Chemical coagulants are usually salts of aluminium or iron. Typical coagulant dosesare 2–5 mg Al/l. Coagulation is used for removal of microorganisms, turbidity andcolour and can also remove certain heavy metals and low-solubility organicchemicals, such as certain organochlorine pesticides. No health-based guidelinevalue for aluminium in drinking-water has been established by WHO. However,practical levels were derived which minimize concentrations of aluminium in finishedwater: 0.1 mg/l or less in large water treatment facilities, and 0.2 mg/l or less in smallfacilities (WHO, 2004). These recommendations provide a compromise betweenthe beneficial effects of the use of aluminium salts as coagulants in water treatmenton the one hand, and discoloration and health concerns about aluminium as apotential neurotoxicant, on the other hand. The presence of aluminium at con-centrations in excess of 0.1–0.2 mg/l is unlikely since it often leads to consumercomplaints as a result of deposition of aluminium hydroxide floc in distributionsystems and the exacerbation of discoloration of water by iron.
176 ALUMINIUM FROM ALL SOURCES, INCLUDING FOOD ADDITIVES

Based on a daily consumption of 2 l per day, dietary exposure to aluminiumfrom treated drinking-water may be up to 0.4 mg/day, corresponding to 0.007 mg/kg bw per day.
6.1.2 Aluminium from natural dietary sources
The aluminium content of the flora also depends on the variety, part and ageof the plant. The concentration of aluminium is high in leaves, medium in blossoms,ears, fruits and seeds, and low in stalks (Anke et al., 2001).
Müller et al. (1998) reported analytical data on 128 foods and drinks inGermany in 1988 and 1992, including non-processed foods. The highestconcentrations of aluminium (mg/kg fresh matter) were found in spices (mean, 145mg/kg fresh matter; range, 6.5–695), cocoa and cocoa products (mean, 33 mg/kg;range, 9–103) and herbs (mean, 19 mg/kg; range, 8–26). Intermediate concentra-tions were found in vegetables (mean, 5.7 mg/kg; range, 0.7–33) and in meat,sausage, offal (mean, 5.4 mg/kg; range, 2.5–10). Lowest concentrations were foundin fruit (mean, 1.5 mg/kg; range, 0.4–2.6). Generally, a relatively large variationin concentration was found within all categories of foodstuffs. Most foodstuffscontained less than 5 mg/kg.
Tea leaves contain high concentrations of aluminium, but only a smallproportion of it remains in the tea decoction, providing around 0.4 mg Al/cup(Neelam, 2000).
According to Greger (1992), most unprocessed foods in the USA containaluminium at less than 5 mg/kg and most individuals consume aluminium at 1 to10 mg/day from natural dietary sources. The average Swedish daily diet fromunprocessed foods was calculated to contain about 0.6 mg aluminium with threefood items providing 80%: coffee, wheat flour and tea (Jorhem & Haegglund, 1992).
6.1.3 Aluminium migrating from food-contact material (food containers, cookware,utensils and packaging)
Because of its lightness, malleability, tensile strength and corrosionresistance, aluminium is used extensively in structural materials in the packagingof foodstuffs and beverages (cans, cartons, laminated paperboard packages, tubs,foil), in kitchen utensils (knives and forks, pots and pans, baking trays, mocha-typecoffee pot). The use of aluminium has increased in recent years owing to thewidespread use of precooked or frozen foods sold in disposable trays or wrappedin aluminium foil. Aluminium dissolves in non-oxidizing acids and can therefore bereleased from aluminium-containing packaging into the foodstuff in presence of anacidic medium. A number of studies have been conducted to estimate potentialexposure from this source.
In Sweden, the aluminium content of beverages packed in glass bottles wasnot found to be different from that of aluminiumcans, indicating that the release ofaluminium from the cans to the contents is small (Jorhem & Haegglund, 1992). Anumber of studies show that migration of aluminium from aluminium-containingcookware and utensils into food was found to be high if acidic foods (tomato sauces,
ALUMINIUM FROM ALL SOURCES, INCLUDING FOOD ADDITIVES 177

sauerkraut) are cooked in uncoated aluminium containers. The highest rate ofmigration is found when aluminium utensils are used for acid foods (AFSA/AFSSPS/AVS, 2003; Scancar, 2003).
In the Netherlands, aluminium in duplicate diets of 18 subjects cooking inaluminium pans was found to be similar to that of the other subjects (Ellen et al.,1990). A study performed in Italy showed that aluminium does migrate fromcontainers to foods and beverages in conditions representative of actual use, withthe highest release into acidic and salty foods (pickles and tomatoes); the overallincrease in dietary exposure through this source could reach 6 mg/day undertheoretical worst-case assumptions (Gramiccioni et al., 1996). On the other hand,aluminium in duplicate diets of Swedish women using regularly aluminium utensilsand foils was found to be 2 mg/day higher than that of women who did not use them(Jorhem & Haegglund, 1992).
A higher contribution from aluminium migration was reported in a studyconducted in India (Neelam, 2000). Food was prepared according to traditionalrecipes in stainless steel, old aluminium vessels (age 10 years) and new aluminiumvessels (age 1 to 15 days) and analysed for aluminium. Based on food consumptiondata, exposure in the urban population was estimated to be 9.6 (range, 5.6–16.2),14.2 (range, 8.3–23.2) and 18.2 (range, 10.5–32) mg/day, respectively. These datasuggest that daily use of an aluminium vessel may lead to an increased exposureof around 7 mg/day.
6.1.4 Aluminium present in food additives
Table 4 presents the provisions made for aluminium compounds in the
of Table 1 and 2 of the Codex GSFA and for these additives reference is made tothe PTWI for aluminium established in 1988 by the JECFA Committee. This is thecase for aluminium ammonium sulfate and SALP, acidic and basic. Thesealuminium compounds may be used according to good manufacturing practices(GMP) in a large number of products and at maximum levels in other products. TheCommittee noted that maximum levels are generally expressed as aluminium (e.g.35 000 mg/kg expressed as Al for SALP used in processed cheese) but that in somecases the reporting basis is not specified (aluminium ammonium sulfate, up to10 000 mg/kg in bakery products).
Some additives containing aluminium are listed in Tables 1, 2 and 3 of thecurrent draft Codex GSFA. In Table 3, reference is made to an ADI ‘not specified’for aluminium, and sodium aluminium silicate, calcium aluminium silicate andaluminium silicate are allowed at GMP in food in general. Specifications areavailable in the Combined Compendium of Food Additive Specifications (Annex 1,reference 180) for other aluminium compounds, but no provision has yet been madefor them in the Codex GSFA. This is the case for aluminium lakes of dyes andcolours, aluminium sulfate and potassium aluminium sulfate. Other aluminiumcompounds are used in a number of countries but are not reported in the Codex
178 ALUMINIUM FROM ALL SOURCES, INCLUDING FOOD ADDITIVES
current draft Codex GSFA.
Some aluminium-containing additives are listed in the current draft versions

GSFA or in the Combined Compendium. This is the case for aluminium powder,aluminium oxide, potassium aluminium silicate and SALP.
The Committee was provided with an assessment of exposure to SALP inEurope (EFPA, 2005). In this assessment, the total annual sales of SALP in thecountries of the European Union (EU) in 2004 (852 tonnes) was divided by 380million (the estimated number of residents) to calculate the average exposure percapita: 2.24 g of SALP per year. Based on a standard body weight of 60 kg, theaverage exposure was estimated to be about 0.1 mg/kg bw per day, expressed asSALP. This exposure corresponds to an intake of less than 0.01 mg Al/kg bw perday, based on the 8.5% aluminium content of the tetra hydrate SALP acidic.
The Committee was also provided with disappearance data for the USA,collected by the International Food Additives Council, for a number of aluminiumcompounds used as food additives (O’Brien Nabors, 2006). Overall, alumin-ium present in SALP, basic and acidic; aluminium sodium sulfate; sodium aluminiumsilicate and aluminium lakes intended for human consumption, sold in the USA in2003 and 2004 amounted to respectively 5921 pounds (x 0.45 = 2664 kg) and 5961pounds (x 0.45 = 2682 kg), equivalent to 9 mg Al/capita per year (based onpopulations of 290 850 005 and 293 656 842 in 2003 and 2004 respectively).
These data may provide an estimate of average exposure to aluminiumthrough additives in two very large populations (the EU and USA). However, theconsumption is not homogeneously distributed among EU countries with the UKbeing the largest consumer of SALP) and may not be homogeneously distributedamong consumers. Thus, from the use of approximately four million pounds inweight of aluminium in food additives in the USA in 1982, it has been estimated thatthe average citizen of the USA theoretically consumes 21.5 mg Al/day from foodadditives. However, further information allows it to be estimated that about 5% ofadults in the USA were exposed to more than 95 mg Al/day from additives while50% of them were exposed to 24 mg or less. These data indicate that individual useof aluminium-containing food additives varies greatly among consumers (Greger,1992).
Further data are available to estimate exposure in the population of interesti.e. regular consumers of products containing aluminium compounds.
According to Greger (1992), the most commonly used aluminium-containingfood additives in the USA are acidic SALP (leavening agent in baked goods); thebasic form of SALP (emulsifying agent in processed cheese); aluminiumphosphates (acidifying agents); bentonite (materials-handlings aid), aluminiumlakes of various food dyes and colours, aluminium silicates (anti-caking agents).Although aluminium-containing additives were found to be present in only a limitednumber of foods, some processed foods have very high contents. Greger (1992)reports concentrations of 297 mg/kg in processed cheese, 400 mg/kg in home madecorn bread, 128 mg/kg in muffins, 2300 mg/kg in baking powder and 164 mg/kgin salt.
ALUMINIUM FROM ALL SOURCES, INCLUDING FOOD ADDITIVES 179

Tab
le 4
.Alu
min
ium
co
mp
ou
nd
s u
sed
as
foo
d a
dd
itiv
es p
rese
nt
in t
he
curr
ent
dra
ft G
SF
A
Nam
eF
unct
ion
App
licat
ions
Leve
ls o
f use
(ex
pres
sed
as a
lum
iniu
m)
INS
No.
JEC
FA
eva
luat
iona
SA
LP, a
cidi
c &
bas
icA
cidi
ty r
egul
ator
,em
ulsi
fier
in p
roce
ssed
chee
ses,
rai
sing
age
ntin
bak
ery
prod
ucts
,st
abili
zer,
thic
kene
r
Bak
ing
pow
der,
flou
rs,
bake
ry p
rodu
cts,
che
ese,
coco
a po
wde
rs, d
esse
rts,
bake
ry w
ares
,co
nfec
tione
ry, m
ixes
for
soup
s an
d sa
uces
,co
ncen
trat
es fo
r w
ater
-ba
sed
flavo
ured
drin
ks
Up
to 3
5 00
0 m
g/kg
inpr
oces
sed
chee
se a
nd45
000
mg/
kg in
flou
rs
541(
i), 5
41(ii
)P
TW
I for
alu
min
ium
pow
der
(GS
FA
Tab
les
1an
d 2)
Alu
min
ium
am
mon
ium
sulfa
teF
irmin
g ag
ent,
rais
ing
agen
t, st
abili
zer
Bak
ery
prod
ucts
(in
clud
ing
ordi
nary
bak
ery
prod
ucts
),eg
g pr
oduc
ts, h
erbs
and
spic
es, s
oya-
bean
pro
duct
s,sn
acks
, pro
cess
ed fi
sh,
proc
esse
d ve
geta
bles
,ca
ndie
d fr
uit
Up
to 1
0 00
0 m
g/kg
inba
kery
pro
duct
sG
MP
in s
tarc
h an
d so
ya-
bean
pro
duct
s
523
PT
WI f
or a
lum
iniu
mpo
wde
r (G
SF
A T
able
s 1
and
2)
Sod
ium
alu
min
ium
silic
ate
Ant
i-cak
ing
agen
tS
alt a
nd s
alt s
ubst
itute
s,su
gar,
gra
inP
erm
itted
for
use
in fo
od in
gene
ral
Up
to 2
0 00
0 m
g/kg
in s
alt
GM
P in
gra
in a
nd fo
od in
gene
ral
554
AD
I ‘no
t spe
cifie
d’
180 ALUMINIUM FROM ALL SOURCES, INCLUDING FOOD ADDITIVES

Tab
le 4
(co
ntd)
Nam
eF
unct
ion
App
licat
ions
Leve
ls o
f use
(exp
ress
ed a
sal
umin
ium
)IN
S N
o.JE
CF
A e
valu
atio
na
Cal
cium
alu
min
ium
sili
cate
Ant
i-cak
ing
agen
tS
alt a
nd s
alt s
ubst
itute
s,su
gar,
Gra
pe w
ines
, gra
inP
erm
itted
for
use
in fo
od in
gene
ral
Up
to 2
0 00
0 m
g/kg
in s
alt
GM
P in
gra
in, g
rape
win
ean
d fo
od in
gen
eral
556
AD
I ‘no
t spe
cifie
d’ (
GS
FA
Tab
les
1, 2
and
3)
Alu
min
ium
sili
cate
Ant
i-cak
ing
agen
tS
alt a
nd s
alt s
ubst
itute
sG
rain
, her
bs a
nd s
pice
sP
erm
itted
for
use
in fo
od in
gene
ral
Up
to 1
0 00
0 m
g/kg
in s
alt
GM
P in
gra
in, h
erbs
and
spic
es a
nd in
food
inge
nera
l
559
AD
I ‘no
t spe
cifie
d’ (
GS
FA
Tab
les
1, 2
and
3)
AD
I: ac
cept
able
dai
ly in
take
; GM
P: g
ood
man
ufac
turin
g pr
actic
e; G
SF
A: G
ener
al S
tand
ard
for
Foo
d A
dditi
ves;
SA
LP: s
odiu
m a
lum
iniu
m p
hosp
hate
a As
repo
rted
in c
urre
nt d
raft
Cod
ex G
SF
A.
ALUMINIUM FROM ALL SOURCES, INCLUDING FOOD ADDITIVES 181

Also, the Swedish study of Jorhem & Haegglund (1992) clearly dem-onstrated that aluminium compounds used as food additives increase the dailyintake of aluminium by one order of magnitude in consumers of the foods whichcontain such compounds. The major contributor of aluminium to the Swedishduplicate diets was found to be a chocolate/mint cake. The high concentration ofaluminium in this cake may derive from its known ingredients cocoa, mint and/orbaking soda. The six diets including this cake contained on average 72 mg Al/daywhile the mean content of the remaining 99 diets was 9.7 mg Al/day.
In Germany, the highest aluminium content in processed foods was found inbiscuits (22 mg/kg) and in soft cheese (8 to 16 mg/kg) Müller et al., 1998).
In the 2000 UK TDS, the miscellaneous cereals group was reported with thehighest mean concentration of aluminium (19 mg/kg fresh weight) (FSA, 2004).
In the second Chinese Total Diet Study (Junquan Gao, 2006) the highestcontent was found in cereal products (50 mg/kg), owing to the use of leaveningagents containing aluminium. The maximum concentration of aluminium given inChinese standards was 100 mg/kg in cereals and cereal products.
The potential high aluminium content of cereal products and in particular ofordinary baked goods may be of special importance in a number of countries sincethey constitute staple food and may therefore be consumed regularly in largequantity.
6.1.5 Assessment of total dietary exposure
Duplicate diet studies have been performed in a number of countries(Table 5). Mean values varied between 3 and 13 mg/day. The highest singlereported value was 100 mg/day in a sample from Sweden. Data reported inGermany suggest that aluminium progressively decreased in the diet by about halffrom 1988 to 1996, probably owing to efforts to reduce the acidity of rain (Ankeet al., 2001).
Moreover, duplicate diet studies were collected and analysed in ninedeveloped and developing countries involved in a multicentre study published in1991 (Parr et al., (1991). The 75th percentile of exposure to aluminium wasestimated after normalizing for a 10 MJ daily energy intake. The lowest values wereobserved in Japan and Norway (2 mg/day). Increasing values were observed inItaly, Spain, Thailand, Brazil, China, Iran and Turkey reaching 18 mg in Sudan.
A number of market-basket studies have been performed, allowingestimation of exposure in different population groups by calculation (Table 6). Theseresults are based on mean content of aluminium in food groups and meanconsumption.
In the adult population, mean exposure to aluminium estimated by modeldiet or market basket varied from approximately 2 mg in the French survey to morethan 40 mg/day in China.
182 ALUMINIUM FROM ALL SOURCES, INCLUDING FOOD ADDITIVES

Exposure to aluminium was found to be lower in the 1993 US Food and DrugAdministration (FDA) Total Diet Study (TDS) when compared with that conductedin 1984 (Pennington & Schoen, 1995). The highest mean exposure per kg bw wasfound in small children: 6 mg/day for children aged 2 years, which corresponds toapproximately 0.5 mg/kg bw per day based on a standard 12 kg bw.
Table 5. Intake of aluminium determined by the duplicate portion techniquein several countries
Country Year ofinvestigation
Mean (range) inmg/day
Reference Remarks
Netherlands 1978 4.6 (1.4–33.3) Ellen et al.(1990)
101 adults (26 femalesand 75 males), one 24 hsample each
Netherlands 1984–1985 3.1 (0.6–12.9) Ellen et al.(1990)
110 adults (53 femalesand 57 males) 1 weeksample each
Hungary 1989–1990 3.3 (0.3–19.4) Gergely et al.(1991)
84 samples
Japan 1981 4.0 (1.3–10.3) Shiraishi et al.(1989)
31 males, 62 24 hsamples
Germany 19881991/21996
5.4/6.54.6/4.93.1/3.2
Anke et al.(2001)
Females/males mixeddiet
Germany 1996 4.1/4.1 Anke et al.(2001)
Females/males; ovo-lacto-vegetarian diet
Italy Not reported 2.5/3.1/4.3/6.3 Gramiccioniet al. (1996)
Four different regions(overall 19 24 h samples)
India 2000–2001 6.4 (1.9–12.1) Tripathi et al.(2002)
45 24 h samples
Taiwan(China)
1989, 1990 5.2/4.9 Liu & Chung(1992)
15 subjects, three 24 hsamples, females/males
Sweden Not reported 13.0 (1.2–100) Jorhem &Haegglund(1992)
105 duplicate diets in 15non-smoking females
ALUMINIUM FROM ALL SOURCES, INCLUDING FOOD ADDITIVES 183

Table 7. Intake of aluminium (mg/day) calculated with the market basketmethod or a model diet in several countries
Country Year of investigation Mean or range, inmg/day; Males/females
Remarks Reference
China 1992–1993 17.831.543.4/41.5
Young children(2–7 years)Older children(8–12 years)Adults (20–50years)
Junquan Gao(2006)
Japan 1986 3.8/3.54.1/3.02.3/2.3
Children (3 years)Teenagers (16years)Adult (40 years)males
Shiraishi et al.(1988)
UK 19972000
3.44.7
MAFF (1999)MAFF (2004)
Finland 1975–1978 6.7 Varo & Koivistoinen(1980)
USA 1993 0.711.578–9
6—11 months14–16 years,malesAdult femalesAdult males
Pennington &Schoen (1995)
USA 1984 1.86.38.612.78.713.78.911.8
6–11 months2 years14–16 yearsfemales14–16 years males25–30 yearsfemales25–30 years males60–65 yearsfemales60–65 years males
Pennington & Jones(1989)
USA 1985 14.3 25–30 years males Iyengar et al. (1987)
France 2000 1.31.6
3–15 years15 years andabove
Leblanc et al. (2005)
MAFF: Ministry of Agriculture, Fisheries and Food
184 ALUMINIUM FROM ALL SOURCES, INCLUDING FOOD ADDITIVES

In contrast, the 2000 UK TDS revealed that dietary exposure to aluminiumhas increased by about one third, reaching 4.7 mg/day (FSA, 2004) versus3.4 mg/day in the previous UK TDS conducted in 1997 (MAFF, 1999). In the morerecent study, miscellaneous cereals, which contained aluminium at a meanconcentration of 19 mg /kg, were the most significant (45%) contributor to the dietaryexposure of the population, probably owing to the use of aluminium-containingfood additives. On the other hand, bread contained aluminium at an averageconcentration of 3 mg/kg and contributed only 7% of the overall exposure. Exposureexpressed per kg bw varied from 0.06 mg/kg bw per day in the elderly to 0.16 mg/kg bw per day in toddlers (1.5–4.5 years), based on measured body weight. Highlevels of exposure, estimated on the basis of high level of consumption, wasestimated to vary from 0.13 mg/kg bw per day in the elderly to 0.33 mg/kg bw perday in toddlers.
In the second Chinese Total Diet Study conducted in 1992–93, highexposure to aluminium was estimated owing to the high mean aluminium contentof cereal products. In children, mean estimated dietary exposure was around 1 mg/kgbw per day in both age class 2–7 years and 8–12 years: considering as standardbody weight 16.5 kg and 29.4 kg respectively. Exposure in high consumers of theseproducts or in regular consumers of products would be higher.
Infants
Since the 1990s, there has been some concern about the aluminium contentof infant formulae (Greger, 1992). The aluminium content of human milk andcows’ milk was found to be negligible (< 0.05 mg/l) (Koo et al., 1989, cited byGreger, 1992) while high levels of aluminium were found in milk-based formulaeand soya-based formulae leading to the presence of aluminium at of 0.01–0.36 and0.4–6.4 mg/l respectively in the products ready for consumption (Greger, 1992). Ahigh concentration of aluminium was also found in soya-based powder infantformula present on the Swedish market (Jorhem & Haegglund, 1992): 14 mg/kgwhich, based on a typical dilution factor of 1 : 7, corresponds to 2 mg/l in thereconstituted milk.
Based on the German DONALD study (Kersting, 1998), in a 3 month infantweighing on average 6.1 kg, average and 95th percentile consumption of dry infantformula are respectively 105 and 144 g/day, which, based on a 1:7 dilution factorcorrespond to respectively 0.7 and 1 l/day of reconstituted formulae.
Thus, infants aged 3 months consuming a soya-based formula containingaluminium at a concentration of 6 mg/l (the highest concentration reported) oncereconstituted could be exposed to approximately 4 mg/day on average and 6 mg/day for high percentile consumption. In the case of milk-based formulae containingaluminium at 0.4 mg/l (highest concentration reported), once reconstituted, potentialexposure to aluminium would be up to 0.3 mg/day for average consumption and 0.4mg/day for high consumption. Infants fed the same quantities of human or cows’milk would be exposed only to less than 0.03 mg/day for average consumption andless than 0.05 mg/day for high consumption.
ALUMINIUM FROM ALL SOURCES, INCLUDING FOOD ADDITIVES 185

Expressed on a kg body weight basis these values correspond to 1 mg/kgbw and 0.06 mg/kg bw for high consumption in infants fed soya-based formulae andmilk-based formulae, respectively. In the case of infants fed human or cows’ milk,high consumption would lead to an aluminium exposure of less than 0.01 mg/kg bw.
6.2 Other sources of exposure
6.2.1 Inhalation
When aluminium was reviewed by the Committee in 1988, exposure toaluminium from air, even in industrial areas, was found to be minor relative to thatfrom food (Annex 1, reference 84).
Atmospheric concentrations of aluminium in non-industrial rural and urbanareas range from 0.05 to 0.5 and 0.1 to 5 μg/m3 and are typically 0.2 and 1 μg/m3,respectively. In industrial areas, the concentration of aluminium may rise to 25–2500μg/m3. The main source in remote locations is weathering of aluminosilicate rocksand soils. Anthropogenic sources are coal combustion, iron, pumice stone, cement,kaolin and chalk works as well as waste incineration. Atmospheric particulatealuminium consists of silicates, oxides and hydroxides (Yokel & McNamara, 2001;Yokel, 2004, cited in Schafer, 2005).
Consumer exposure through air is a minor source of exposure. Accordingto Environmental Health Criteria 194, pulmonary exposure may contribute up to0.04 mg/day (WHO, 1997).
6.2.2 Dermal exposure to consumer products containing aluminium
Aluminium chlorohydrate in antiperspirants produces insoluble aluminiumhydroxide on the skin to form an obstructive plug in the sweat gland duct. Manydeodorant stones contain aluminium sulfate. In dental rinses and toothpastes,aluminium is used to reduce dentinal hypersensitivity. Aluminium is found in someacne cleaning preparations as an abrasive (Yokel, 2004, cited in Schafer, 2005).Results of a preliminary study on dermal absorption of aluminium chlorohydrateused as active ingredient of antiperspirant suggest that about 4 μg of aluminium isabsorbed from a single use on both underarms (Flarend, 2001).
6.2.3 Consumption of medicines containing aluminium
Aluminium hydroxides administered orally are used as antacids and inphosphate binders. Aluminium is also an auxiliary in diarrhoeal remedy preparationsand buffered analgesics, in anorectic preparations (as a keratolytic) and vaginaldouches, in products for dermatitis (as an astringent), in first-aid antibiotics, andantiseptics. Furthermore, aluminium salts are added as adjuvant to vaccines andallergy immunotherapeutics in order to increase their antigenic properties (Yokel,2004, cited in Schafer, 2005; Anke et al., 2001). According to Anke et al. (2001),daily intake of aluminium in e.g. antacids may be 1 g and more. According to Lione(2005), if taken as directed, the daily intake of aluminium from antacids can be asmuch as 5 g, while aluminium-buffered aspirin used for rheumatoid arthritis cancontribute 0.7 g/day.
186 ALUMINIUM FROM ALL SOURCES, INCLUDING FOOD ADDITIVES

Bioavailability of aluminium
Available data are not sufficient to correct the exposure assessment on thebasis of bioavailability. Aluminium contained in some additives such as silicates mayhave a low bioavailability, but the main sources of exposure are sulfates andphosphates used in cereal products. Experimental data suggest that absorption ofaluminium increases in presence of citric acid through chelation (Fulton & Jeffery,1990). Very few data are available on the content of citric acid in the diet. Citric acidis one of the main organic acids present in fruit, with amounts varying from 0.05 to3.2 g/l in juices (Chinnici et al., 2005). Citric acid in cheese was shown to vary from0.07 g/kg in brie to 1.5 g/kg in cheddar cheese (Mullin & Emmons, 1997). Citric acidmay also be added to fruit based products (fruit juices, jam, cocoa products) and tocheese as an additive. A diet high in fruit and fruit based products could eventuallylead to a higher bioavailability of aluminium.
7. EFFECTS OF PROCESSING
The Committee found no information on reduction of the aluminium contentof foodstuffs by processing.
8. DOSE–RESPONSE ANALYSIS AND ESTIMATION OF RISK OFCARCINOGENICITY/TOXICITY
8.1 Contribution of data to assessment of risk
8.1.1 Pivotal data from biochemical and toxicological studies
Assessment of the bioavailability of aluminium compounds is confounded bylimitations in the analytical methodology, particularly for older studies, by concurrentexposure to modifying factors and by dose-dependency. Speciation appears to bean important factor in absorption and it is widely assumed that soluble aluminiumcompounds, such as the chloride and lactate salts, are more bioavailable thaninsoluble compounds, such as aluminium hydroxide or silicates. Studies inlaboratory animals and in human volunteers generally show that absorption ofaluminium is less than 1%. However, because of the differences in methodology, itis not possible to draw precise conclusions on the rate and extent of absorption ofdifferent aluminium compounds. Concurrent intake of organic anions (particularlycitrate) increases the absorption of aluminium, while other food components, suchas silicates and phosphate, may reduce the absorption of aluminium.
Studies reviewed by the Committee at its thirty-third meeting (Annex 1,references 83, 84) showed no detectable aluminium in the urine of normalsubjects given aluminium hydroxide gel (2.5 g Al/day, equivalent to 42 mg/kg bwper day assuming body weights of 60 kg) for 28 days. In contrast, faecal excretionof aluminium in patients with chronic renal disease given aluminium hydroxide(1.5–3.5 g Al/day, equivalent to 25–57 mg/kg bw per day, assuming body weightsof 60 kg) for 20–32 days indicated a daily absorption of 100–568 mg of aluminium.
ALUMINIUM FROM ALL SOURCES, INCLUDING FOOD ADDITIVES 187
Slight increases in concentrations of aluminium in plasma were reported over thestudy period.
Oral dosing of rats with aluminium compounds has been shown to result inincreased concentrations of aluminium in blood, bone, brain, liver and kidney.Studies with 26Al administered intravenously to a small number of human volunteersindicate a biological half-life of about 7 years (in one individual) and interindividualvariation in clearance patterns.
Aluminium compounds have been reported to interfere with the absorptionof essential minerals such as calcium and phosphate, although the extent to whichthis occurs at dietary exposure levels is unclear.
The available toxicological studies were from the published literature andwere not designed to assess the safety of food additives. Most were conducted toinvestigate specific effects or mechanisms of action, and many do not provideinformation on the dose–response relationship. Some do not make clear whetherthe stated dose relates to aluminium or to the aluminium compound tested. A furthercomplication is that many studies do not appear to have taken into account the basalaluminium content of the animal feed before addition of the test material. Somestudies refer to a basal aluminium content of about 7 mg/kg, which would not addsignificantly to the doses of aluminium under investigation. However, ATSDR (1999)reported that there are diverse concentrations ranging from 60 to 8300 mg/kg feedand that substantial variation between brands and between lots occurs. For chowcontaining aluminium at a concentration of 200 mg/kg, applying the default JECFAconversion factors indicates doses equivalent to 30 mg Al/kg bw for mice and20 mg Al/kg bw for rats. The toxicological data are influenced by the solubility, andhence the bioavailability, of the tested aluminium compounds, and the dose–response relationship will be influenced by the aluminium content of the basalanimal feed.
Recent studies have identified effects of aluminium compounds at doseslower than those reviewed previously by the Committee. Studies in rats, rabbits andmonkeys have indicated effects on enzyme activity and other parametersassociated with oxidative damage and calcium homeostasis in short-term studieswith aluminium compounds administered at oral doses of 10–17 mg Al/kg bw perday. These studies involved administration at a single dose and did not take intoaccount the aluminium content of the diet. The functional relevance of theobservations is unclear and since the total exposure is unknown, they are notsuitable for the dose–response analysis.
Mild histopathological changes were identified in the kidney and liver of ratsgiven aluminium sulfate by gavage at a dose of 17 mg Al/kg bw per day for 21 days.Rats given drinking-water containing aluminium chloride at a dose of 5 and 20 mgAl/kg bw per day for 6 months showed non-dose-dependent decreases in bodyweight and changes in haematological parameters and acetylcholine-associatedenzymes in the brain. Histopathological changes were observed in the kidney andbrain at doses of 20 mg Al/kg bw per day in the latter study. These effects have notbeen observed in other studies and total exposure is unknown since aluminiumcontent of the diet was not taken into account.
188 ALUMINIUM FROM ALL SOURCES, INCLUDING FOOD ADDITIVES

Beagle dogs given diets containing SALP (basic) for 6 months showeddecreased food intake and body weight and histopathological changes in the testes,liver and kidneys in the males at the highest concentration tested, 1922 mg Al/kg ofdiet, equal to 75 mg Al/kg bw per day. No effects were seen in female dogs at thisdietary concentration, equal to 80 mg Al/kg bw per day. The no-observed-effect level(NOEL) in this study was a dietary concentration of 702 mg Al/kg, equal to27 mg Al/kg bw per day. This study is similar to that providing the basis for thepreviously established PTWI, which used SALP acidic. The Committee noted thatthere was no explanation for the observed sex difference, and limitations in thereporting made interpretation of this study difficult.
Special studies have highlighted a potential for effects on reproduction, onthe nervous system and on bone. Few of these studies are adequate to serve as abasis for the determination of no-effect levels, as they were designed to addressspecific aspects and only a very limited range of toxicological end-points wereexamined.
Soluble aluminium compounds have demonstrated reproductive toxicity,with LOELs in the region of 13–200 mg Al/kg bw per day for reproductive anddevelopmental effects with aluminium nitrate. None of these studies identifiedNOELs. The lowest LOELs were obtained in studies in which aluminium compoundswere administered by gavage; taking into account the aluminium content of the diet,the total dose may have been in the region of 20 mg Al/kg bw per day or more.
Neurotoxicity potential has received particular attention because of aspeculated association of aluminium with Alzheimer disease. Many of the studiesin laboratory animals have been conducted using parenteral administration and areof uncertain relevance for dietary exposure because of the limited bioavailability ofaluminium compounds likely to be present in food. In contrast to studies with otherroutes of administration, the available data from studies using oral administrationdo not demonstrate definite neuropathological effects. Some studies indicate thatcertain aluminium compounds, especially the more soluble forms, have the potentialto cause neurobehavioural effects, at doses in the region of 50 to 200 mg Al/kg bwper day administered in the diet. The studies indicating the lowest LOELs tookaccount of the basal diet content of aluminium and one of these studies alsoindicated a NOEL of 10 mg Al/kg bw per day.
The previously established PTWI of 0–7.0 mg/kg bw for aluminium wasbased upon a study in which no treatment-related effects were seen in beagle dogsgiven diets containing SALP acidic at a dietary concentration of 3% for 189 days,equivalent to approximately 110 mg Al/kg bw.
The new data reviewed at the present meeting indicated that soluble formsof aluminium may cause reproductive and developmental effects at doses lowerthan that used to establish the previous PTWI. Although insoluble aluminiumcompounds may be less bioavailable, the evidence that other dietary components,such as citrate, can increase uptake of insoluble aluminium suggests that data fromstudies with soluble forms of aluminium can be used as a basis for deriving thePTWI.
ALUMINIUM FROM ALL SOURCES, INCLUDING FOOD ADDITIVES 189

8.1.2 Pivotal data from human clinical/epidemiological studies
The previous evaluation of aluminium made by the Committee at its thirty-third meeting (Annex 1, references 83, 84) did not include epidemiology studies.Since then, a number of epidemiology studies have been conducted, with mostfocusing on the potential association of oral exposure to aluminium in water, foodor antacids with Alzheimer disease and cognitive impairment. Some epidemiologystudies suggest an association of consumption of aluminium in water with Alzheimerdisease, but this was not confirmed in others. None of the studies accounted foringestion of aluminium in food, a potentially important confounding factor. Thestudies relied on concentrations of aluminium in the residential water supply as ameasure of exposure, with the one exception of a study that also assessed ingestionof bottled water.
There is minimal information from the epidemiology literature about theassociation between intake of aluminium in food and neurological conditions, andthe current information from a pilot case–control study evaluating Alzheimer diseaseis considered to be preliminary. Epidemiology studies of the use of antacids did notcapture dose information and did not demonstrate an association with neurologicalconditions. In the literature there have been a few case reports of adults, infants anda child with normal kidney function who experienced skeletal changes attributableto frequent use of aluminium-containing antacids considered to induce phosphatedepletion.
In summary, no pivotal epidemiology studies were available for the riskassessment.
9. COMMENTS
Absorption, distribution, metabolism and excretion
Assessment of the bioavailability of aluminium compounds is confounded bylimitations in the analytical methodology, particularly for older studies, by concurrentexposure to modifying factors and by dose-dependency. Speciation appears to bean important factor in absorption and it is widely assumed that soluble aluminiumcompounds, such as the chloride and lactate salts, are more bioavailable thaninsoluble compounds, such as aluminium hydroxide or silicates. Studies inlaboratory animals and in human volunteers generally show that absorption ofaluminium is less than 1%. However, because of the differences in methodology, itis not possible to draw precise conclusions on the rate and extent of absorption ofdifferent aluminium compounds. Concurrent intake of organic anions (particularlycitrate) increases the absorption of aluminium, while other food components, suchas silicates and phosphate, may reduce the absorption of aluminium.
Studies reviewed by the Committee at its thirty-third meeting (Annex 1,references 83, 84) showed no detectable aluminium in the urine of normalsubjects given aluminium hydroxide gel (2.5 g Al/day, equivalent to 42 mg Al/kg bwper day assuming body weights of 60 kg) for 28 days. In contrast, faecal excretionof aluminium in patients with chronic renal disease given aluminium hydroxide
190 ALUMINIUM FROM ALL SOURCES, INCLUDING FOOD ADDITIVES

(1.5–3.5 g Al/day, equivalent to 25–57 mg Al/kg bw per day, assuming body weightsof 60 kg) for 20–32 days indicated a daily absorption of 100–568 mg of aluminium.Slight increases in concentrations of aluminium in plasma were reported over thestudy period.
Oral dosing of rats with aluminium compounds has been shown to result inincreased concentrations of aluminium in blood, bone, brain, liver and kidney.Studies with 26Al administered intravenously to a small number of human volunteersindicate a biological half-life of about 7 years (in one individual) and interindividualvariation in clearance patterns.
Aluminium compounds have been reported to interfere with the absorptionof essential minerals such as calcium and phosphate, although the extent to whichthis occurs at dietary exposure levels is unclear.
Toxicological data
The available studies were from the published literature and were notdesigned to assess the safety of food additives. Most were conducted to investigatespecific effects or mechanisms of action, and many do not provide information onthe dose–response relationship. Some do not make clear whether the stated doserelates to elemental aluminium or to the aluminium compound tested. A furthercomplication is that many studies do not appear to have taken into account the basalaluminium content of the animal feed before addition of the test material. Somestudies refer to basal aluminium content in the region of 7 mg/kg, which would notadd significantly to the doses of aluminium under investigation. However, it has beenreported that there are diverse concentrations ranging from 60 to 8300 mg/kg feedand that substantial brand-to-brand and lot-to-lot variation occurs. For chowcontaining aluminium at a concentration of 200 mg/kg, applying the default JECFAconversion factors indicates doses equivalent to 30 mg Al/kg bw for mice and20 mg Al/kg bw for rats.
The toxicological data are influenced by the solubility, and hence thebioavailability, of the tested aluminium compounds, and the dose–responserelationship will be influenced by the aluminium content of the basal animal feed.
Recent studies have identified effects of aluminium compounds at doseslower than those reviewed previously by the Committee. Studies in rats, rabbits andmonkeys have indicated effects on enzyme activity and other parametersassociated with oxidative damage and calcium homeostasis in short-term studieswith aluminium at oral doses in the region of 10–17 mg/kg bw per day. Those studiesinvolved administration at a single dose and did not take into account the aluminiumcontent of the diet. The functional relevance of the observations is unclear and sincethe total exposure is unknown, they are not suitable for the dose–response analysis.
Mild histopathological changes were identified in the kidney and liver of ratsgiven aluminium sulfate by gavage at a dose of 17 mg Al/kg bw per day, for 21 days.Rats given drinking-water containing aluminium chloride at a dose of 5 or 20 mg Al/kg bw per day, for 6 months showed non-dose-dependent decreases in body weightand changes in haematological parameters and acetylcholine-associated enzymes
ALUMINIUM FROM ALL SOURCES, INCLUDING FOOD ADDITIVES 191

in the brain. Histopathological changes were observed in the kidney and brain atdoses of 20 mg Al/kg bw per day, in the latter study. Such effects had not beenobserved in other studies and total exposure was unknown since the aluminiumcontent of the diet was not taken into account.
Beagle dogs given diets containing SALP basic for 6 months showeddecreased food intake and body weight and histopathological changes in the testes,liver and kidneys in the males at the highest tested concentration of aluminium,1922 mg/kg of diet, equal to 75 mg/kg bw per day. No effects were seen in femaledogs at this dietary concentration, equal to 80 mg Al/kg bw per day. The NOEL inthis study was a dietary concentration of 702 mg/kg, equal to 27 mg Al/kg bw perday. This study is similar to that providing the basis for the previously establishedPTWI, which used SALP acidic. The Committee noted that there was no explanationfor the observed sex difference, and limitations in the reporting made interpretationof this study difficult.
Special studies have highlighted a potential for effects on reproduction, onthe nervous system and on bone. Few of those studies are adequate to serve as abasis for the determination of no-effect levels, as they were designed to addressspecific aspects and only a very limited range of toxicological end-points wereexamined.
Soluble aluminium compounds have demonstrated reproductive toxicity,with LOELs in the region of 13–200 mg Al/kg bw per day, for reproductive anddevelopmental effects with aluminium nitrate. None of those studies identifiedNOELs. The lowest LOELs were obtained in studies in which aluminium compoundswere administered by gavage; taking into account the aluminium content of the diet,the total dose may have been in the region of 20 mg Al/kg bw per day or more.
Neurotoxicity potential has received particular attention because of aspeculated association of aluminium with Alzheimer disease. Many of the studiesin laboratory animals have been conducted using parenteral administration and areof uncertain relevance for dietary exposure because of the limited bioavailability ofaluminium compounds likely to be present in food. In contrast to studies with otherroutes of administration, the available data from studies using oral administrationdo not demonstrate definite neuropathological effects. Some studies indicate thatcertain aluminium compounds, especially the more soluble forms, have the potentialto cause neurobehavioural effects at doses in the region of 50 to 200 mg Al/kg bwper day, administered in the diet. The studies indicating the lowest LOELs tookaccount of the basal diet content of aluminium and one of those studies alsoindicated a NOEL of 10 mg Al/kg bw per day.
The previously established PTWI of 0–7.0 mg/kg bw for aluminium wasbased upon a study in which no treatment-related effects were seen in beagle dogsgiven diets containing SALP acidic at a dietary concentration of 3% for 189 days,equivalent to approximately 110 mg Al/kg bw.
The new data reviewed at the present meeting indicated that soluble formsof aluminium may cause reproductive and developmental effects at a dose lowerthan that used to establish the previous PTWI. Although insoluble aluminium
192 ALUMINIUM FROM ALL SOURCES, INCLUDING FOOD ADDITIVES

compounds may be less bioavailable, the evidence that other dietary components,such as citrate, can increase uptake of insoluble aluminium suggests that datafrom studies with soluble forms of aluminium can be used as a basis for derivingthe PTWI.
Observations in humans
The previous evaluation of aluminium made by the Committee at its thirty-third meeting did not include epidemiology studies. Since then a number ofepidemiology studies had been conducted, with most focusing on the potentialassociation of oral exposure to aluminium in water, food or antacids with Alzheimerdisease and cognitive impairment. Some epidemiology studies of aluminium inwater suggested an association of consumption of aluminium in water withAlzheimer disease, but such an association was not confirmed in others. None ofthe studies accounted for ingestion of aluminium in foods, a potentially importantconfounding factor. The studies relied on concentrations of aluminium in theresidential water supply as a measure of exposure, with the one exception of a studythat also assessed ingestion of bottled water.
There was minimal information from the epidemiology literature about theassociation between intake of aluminium in food and neurological conditions, andthe current information from a pilot case–control study evaluating Alzheimer diseasewas considered to be preliminary. The epidemiology studies of the use of antacidsdid not capture dose information and did not demonstrate an association withneurological conditions. In the literature there have been a few case reports ofadults, infants and a child with normal kidney function who experienced skeletalchanges attributable to frequent use of aluminium-containing antacids consideredto induce phosphate depletion.
In summary, no pivotal epidemiology studies were available for the riskassessment.
Exposure to aluminium from the diet and other sources
Only consumer exposure to aluminium in the diet and via other routes orcommodities were considered by the Committee; occupational exposure was nottaken into account. Dietary sources of exposure include natural dietary sources,drinking-water, migration from food-contact material and food additives. Whendietary exposure was expressed on a kg body weight basis, a standard body weightof 60 kg for an adult was considered by the Committee, unless otherwise specified.
Soil composition has a significant influence on the aluminium content of thefood chain. The solubility of aluminium compounds may increase when acid raindecreases the pH of the soil; as a consequence, aluminium content increases insurface water, plants and animals. Most foods contain aluminium at concentrationsof less than 5 mg/kg. It is estimated that quantities of about 1–10 mg/day per persongenerally derive from natural dietary sources of aluminium, corresponding to up to0.16 mg Al/kg bw per day. The concentration of dissolved aluminium in untreatedwater at near pH 7 is typically 1–50 μg/l, but this can increase to 1000 μg/l in acidicwater. Exposure through this source is therefore up to 2 mg/day, corresponding to
ALUMINIUM FROM ALL SOURCES, INCLUDING FOOD ADDITIVES 193

0.03 mg/kg bw per day based on the consumption of 2 l of water per day. Aluminiummay also be present in drinking-water owing to the use of aluminium salts asflocculants in the treatment of surface waters. The concentration of aluminium infinished water is usually less than 0.2 mg/l. Based on a daily consumption of 2 l perday, dietary exposure to aluminium from treated drinking-water may be up to0.4 mg/day, corresponding to 0.007 mg/kg bw per day.
Aluminium is used extensively in structural materials used in food-contactmaterials, including kitchen utensils. Aluminium can be released into the foodstuffin the presence of an acidic medium. Conservative assessments suggest that meanpotential dietary exposure through this source may be up to 7 mg Al/day. Suchdietary exposure corresponds to 0.1 mg Al/kg bw per day.
The current draft provisions made for aluminium compounds in the CodexGSFA are reported in Table 4. Some aluminium-containing additives are listed onlyin the current versions of Table 1 and 2 of the Codex GSFA, and for those additivesreference is made to the PTWI for aluminium established in 1988 by JECFA. It isthe case for aluminium ammonium sulfate and SALP, acidic and basic. Thosealuminium compounds may be used according to GMP in a large number ofproducts and at maximum levels in other products. The Committee noted thatmaximum levels are generally expressed as aluminium (e.g. 35 000 mg Al/kg, forSALP used in processed cheese) but that in some cases the reporting basis is notspecified (up to 10 000 mg/kg in bakery products containing aluminium ammoniumsulfate).
The Committee also noted that some food additives containing aluminiumare listed in Tables 1, 2 and 3 of the current draft Codex GSFA. In Table 3, referenceis made to an ADI ‘not specified’, and sodium aluminium silicate, calcium aluminiumsilicate and aluminium silicate are allowed at concentrations consistent with GMPin food in general. Specifications for other aluminium compounds are available inthe Combined Compendium of Food Additive Specifications (Annex 1, reference180), but no provision had yet been made for them in Codex GSFA. This is the casefor aluminium lakes of colouring matters, aluminium sulfate, aluminium powder andpotassium aluminium sulfate. Other aluminium compounds are used in a numberof countries but are not reported in the Codex GSFA or in the CombinedCompendium of Food Additive Specifications. This was the case for aluminiumoxide and potassium aluminium silicate.
The Committee was provided with an exposure assessment based onannual sales of SALP in Europe suggesting that the average exposure in the generalpopulation is about 0.1 mg/kg bw per day, corresponding to less than 0.01 mg Al/kg bw per day, based on the fact that tetrahydrate SALP acidic has an aluminiumcontent of 8.5%. The Committee was also provided with disappearance data fromthe USA for a number of aluminium compounds used as food additives. Overall,aluminium present in SALP, basic and acidic; aluminium sodium sulfate; sodiumaluminium silicate and aluminium lakes intended for human consumption sold in theUSA in 2003 and 2004 would provide 9 mg of aluminium per capita per year,corresponding to 0.0004 mg/kg bw per day. Other data provided to the Committeesuggest that there is a large range of exposure among consumers. A survey
194 ALUMINIUM FROM ALL SOURCES, INCLUDING FOOD ADDITIVES

conducted in 1979 suggests that 5% of adults in the USA were exposed to morethan 1.5 mg Al/kg bw per day, from food additives.
Additional data were available to estimate exposure in the population ofinterest i.e. regular consumers of products containing food additives containingaluminium. In the USA, although aluminium-containing additives were found tobe present in only a limited number of foods, some processed foods have a veryhigh aluminium content: processed cheese, 300 mg/kg; home-made corn bread,400 mg/kg (owing to the use of aluminium-containing leavening agents); muffins,130 mg/kg; baking powder, 2300 mg/kg; and table salt, 164 mg/kg. In Germany,the processed foods found to have the highest aluminium content were biscuits(22 mg/kg) and soft cheese (8–16 mg/kg). In the 2000 UK Total Diet Study, themiscellaneous cereals group was reported to have the highest mean concentrationof aluminium (19 mg/kg). In the 1992–1993 Chinese Total Diet Study, cerealproducts were also found to have the highest aluminium content (50 mg/kg) owingto the use of leavening agents containing aluminium. The potentially high aluminiumcontent of cereal products and, in particular, of ordinary baked goods may be ofspecial importance in a number of countries where they constitute staple food andmay therefore be consumed regularly in large quantities by a significant proportionof the population.
Total dietary exposure to aluminium from all sources has been estimatedthrough duplicate diet studies performed in adults in a number of countries. Meanvalues varied between 3 and 13 mg/day. The highest single reported value was100 mg/day. In a multicentre study, exposure at the 75th percentile ranged from3 to 26 mg/day, according to country. Data reported in Germany suggest that theamount of aluminium in the diet decreased by about half between 1988 and 1996.
A number of market-basket studies have also been performed, allowingestimation of exposure in different population groups based on mean content ofaluminium in food groups, and on mean consumption. Exposure for consumers witha high consumption of cereal products or in regular consumers of products thatcontain higher-than-mean concentrations of aluminium will therefore be higher thanestimated in those studies. In the adult population, mean exposure to aluminiumestimated by model diet or market basket varied from 2 mg/day in the most recentFrench survey to more than 40 mg/day in China.
The highest mean exposure to aluminium per kg bw was found in youngchildren: 0.16 mg/kg bw per day in the 1.5–4.5 years age group in the UK, basedon measured body weight; approximately 0.5 mg/kg bw per day in the USA inchildren aged 2 years, considering a standard body weight of 12 kg; approximately1 mg/kg bw per day in China in age groups 2–7 years and 8–12 years, consideringas standard body weight 16.5 kg and 29.4 kg, respectively.
Values for high levels of exposure, estimated on the basis of high levels ofconsumption, were available for UK children aged 1.5–4.5 years (0.33 mg/kg bwper day).
The issue of bioavailability was considered by the Committee, but availabledata were not sufficient to correct the exposure assessment on the basis of
ALUMINIUM FROM ALL SOURCES, INCLUDING FOOD ADDITIVES 195

bioavailability. Aluminium contained in some food additives such as silicates mayhave a low bioavailability, but the main sources of exposure are sulfates andphosphates used in cereal products. A diet high in fruit and fruit-based productscould lead to higher bioavailability owing to the increased absorption of aluminiumin the presence of citric acid. Citric acid is one of the main organic acids present infruit and may also be added to fruit-based products and to cheese.
The aluminium content of milk and formulae was considered whenestimating exposure for infants. The aluminium content of human and cows’ milkwas found to be negligible (less than 0.05 mg/l), while cows’ milk-based and soya-based formulae were found to contain high levels of aluminium, leading toconcentrations of 0.01–0.4 and 0.4–6 mg/l, respectively, in the ready-to-drinkproduct. The Committee estimated dietary exposure to aluminium based on thehighest of those values in an infant aged 3 months weighing an average of 6 kg,considering 1 l of reconstituted formula per day as consumption at the 95thpercentile. Expressed on a kg body weight basis, dietary exposure to aluminiumwas estimated to be up to 1 mg/kg bw per day and 0.06 mg/kg bw per day in infantsfed soya-based formulae and milk-based formulae respectively. In the case ofinfants fed human or cows’ milk, high consumption would lead to aluminiumexposures of less than 0.01 mg/kg bw per day.
Sources of exposure to aluminium other than in the diet that were consideredby the Committee were air, cosmetic and toiletry products and medicines. aluminiumfrom air, in industrial areas, contributes up to 0.04 mg/day and therefore constitutesa minor source of exposure. Estimates of dermal absorption of aluminiumchlorohydrate used as an active ingredient of antiperspirant suggest that only about4 μg of aluminium is absorbed from a single use on both underarms. Some medicalapplications of aluminium may lead to long-term exposure: aluminium hydroxidesin antacids, phosphate-binders and buffered analgesics. If taken as directed, thedaily intake of aluminium from antacids could be as much as 5 g, while aluminium-buffered aspirin used for rheumatoid arthritis could contribute 0.7 g of aluminiumper day.
In conclusion, the present assessment confirms previous evaluations madeby the Committee in which dietary exposure, particularly through foods containingaluminium compounds used as food additives, was found to represent the majorroute of aluminium exposure for the general population, excluding persons whoregularly ingest aluminium-containing drugs.
10. EVALUATION
The Committee concluded that aluminium compounds have the potential toaffect the reproductive system and developing nervous system at doses lower thanthose used in establishing the previous PTWI and therefore the PTWI should berevised. However, the available studies have many limitations and are not adequatefor defining the dose–response relationships. The Committee therefore based itsevaluation on the combined evidence from several studies. The relevance of studiesinvolving administration of aluminium compounds by gavage was unclear becausethe toxicokinetics after gavage were expected to differ from toxicokinetics after
196 ALUMINIUM FROM ALL SOURCES, INCLUDING FOOD ADDITIVES

dietary administration, and the gavage studies generally did not report totalaluminium exposure including basal levels in the feed. The studies conducted withdietary administration of aluminium compounds were considered most appropriatefor the evaluation. The lowest LOELs for aluminium in a range of different dietarystudies in mice, rats and dogs were in the region of 50–75 mg Al/kg bw per day.
The Committee applied an uncertainty factor of 100 to the lower end of thisrange of LOELs (50 mg Al/kg bw per day) to allow for inter- and intraspeciesdifferences. There are deficiencies in the database, notably the absence of NOELsin the majority of the studies evaluated and the absence of long-term studies on therelevant toxicological end-points. The deficiencies are counterbalanced by theprobable lower bioavailability of the less soluble aluminium species present in food.Overall, an additional uncertainty factor of three was considered to be appropriate.The Committee confirmed that the resulting health-based guidance value should beexpressed as a PTWI, because of the potential for bioaccumulation. The Committeeestablished a PTWI of 1 mg Al/kg bw, which applies to all aluminium compounds infood, including additives. The previously established ADIs and PTWI for aluminiumcompounds were withdrawn.
The potential range of exposure from dietary sources is summarized inTable 8.
The Committee noted that the PTWI is likely to be exceeded to a large extentby some population groups, particularly children, who regularly consume foods thatinclude aluminium-containing additives. The Committee also noted that dietary
Table 8. Estimated ranges of mean exposure of the adult population toaluminium from different dietary sources
Mean exposure Natural dietarysources
Water (assuming aconsumption of2 l/day)
Food-contactmaterials
Overall diet,includingadditives
Expressed as mgAl/week
7–70 < 0.7 (typicaluntreated water)1.4–2.8 (watertreated withaluminium salts)14 (acidic untreatedwater)
0–49a 14–280
Expressed aspercentage ofPTWI(assuming a bodyweight of 60 kg)
2–120 1–20 < 80a 20–500
Al: total aluminiumaTheoretical exposure using conservative assumptionsPTWI: provisional tolerable weekly intake
ALUMINIUM FROM ALL SOURCES, INCLUDING FOOD ADDITIVES 197

exposure to aluminium is expected to be very high for infants fed on soya-basedformula.
Further data on the bioavailability of different aluminium-containing foodadditives are required.
There is a need for an appropriate study of developmental toxicity and amultigeneration study incorporating neurobehavioural end-points, to be conductedon a relevant aluminium compound(s).
Studies to identify the forms of aluminium present in soya formulae, and theirbioavailability, are needed before an evaluation of the potential risk for infants fedon soya formulae can be considered.
Recommendations to Codex
The Committee recommended that provisions for aluminium-containingadditives included in the Codex GSFA should be compatible with the newlyestablished PTWI for aluminium compounds of 1 mg Al/kg bw The Committee notedin particular that provisions for such additives used at levels consistent with GMPin staple foods may lead to high exposure in the general population and in partic-ular in children.
11. REFERENCES
AFSA/AFSSPS/AVS (2003) Evaluation des risques sanitaires liés à l’exposition de lapopulation française à l’aluminium. Eaux, aliments, produits de santé. Agence Françaisede Securité Sanitaire des Aliments, Agence Francaise de Securité Sanitaire des Produitsde Santé et Institut de Veille Sanitaire.
Agarwal, S.K., Ayyash, L., Gourley, C.S., Levy, J., Faber, K. & Hughes, C.L. Jr (1996)Evaluation of the developmental, neuroendocrine and reproductive toxicology of aluminium1. Food. Chem. Toxicol., 34, 49–53.
Alfrey, A.C., LeGendre, G.R. & Kaehny, W.D. (1976) The dialysis encephalopathy syndrome:possible aluminium intoxication. N. Engl. J. Med., 294, 184–188.
Alfrey, A.C., Mishel, l.J.M., Burks, J., Contiguglia, S.R., Rudolph, H., Lewin, E. & Holmes, J.H.(1972) Syndrome of dyspraxia and multifocal seizures associated with chronichemodialysis. Trans. Am. Soc. Artif. Intern. Organs., 18, 257–261.
Altmann, P., Cunningham, J., Dhanesha, U., Ballard, M., Thompson, J. & Marsh, F. (1999)Disturbance of cerebral function in people exposed to drinking.water contaminated withaluminium sulphate: retrospective study of the Camelford water incident. BMJ, 319,807–811.
Anke, M., Müller, M., Müller, R. & Schäfer, U. (2001) The biological and toxicologicalimportance of aluminium in the environment and food chain of animals and humans. In:Romancik, V. & Koprda, V, eds. Proceedings of the 21st International Symposium ofIndustrial Toxicology 2001, May 30–June 1, Bratislava, Slovakia. pp 242–257.
ATSDR (1999) Toxicological profile for aluminium. Atlanta, GA: Agency for Toxic Substancesand Disease Registry (http://www.atsdr.cdc.gov/toxprofiles/tp22.html).
Barratt, L.J. & Lawrence, J.R. (1975) Dialysis-associated dementia. Aust. NZ. J. Med., 5,62–65.
Becaria, A., Campbell, A. & Bondy, S.C. (2002). Aluminum as a toxicant. Toxicol. Ind.Health, 18, 309–320.
198 ALUMINIUM FROM ALL SOURCES, INCLUDING FOOD ADDITIVES

Bergomi, M., Vinceti, M., Nacci, G., Pietrini, V., Brätter, P., Alber, D., Ferrari, A., Vescovi, L.,Guidetti, D., Sola, P., Malagù, Aramini C, & Vivoli, G. (2002) Environmental exposure totrace elements and risk of amyotrophic lateral sclerosis: a population-based case-controlstudy. Environ. Res., 89, 116–123.
Bernuzzi, V., Desor, D. & Lehr, P.R. (1986) Effects of prenatal aluminum exposure onneuromotor maturation in the rat. Neurobehav. Toxicol. Teratol., 8, 115–119
Bernuzzi, V., Desor, D. & Lehr, P.R. (1989a). Developmental alternations in offspring of femalerats orally intoxicated by aluminum chloride or lactate during gestation. Teratology, 40,21-27
Bernuzzi, V., Desor, D. & Lehr, P.R. (1989b) Effects of postnatal aluminum lactate exposureon neuromotor maturation in the rat. Bull. Environ. Contam. Toxicol., 42, 451–455.
Bilkei-Gorzo, A. (1993) Neurotoxic effect of enteral aluminium 1. Food. Chem. Toxicol., 31,357–361.
Broe, G.A., Henderson, A.S., Creasey, H., McCusker, E., Korten, A.E., Jorm, A.F., Longley,W. & Anthony, J.C. (1990) A case-control study of Alzheimer’s disease in Australia.Neurology, 40, 1698–1699.
Brooks, B.R. (1994) El Escorial World Federation of Neurology criteria for the diagnosis ofamyotrophic lateral sclerosis. Subcommittee on Motor Neuron Diseases/ AmyotrophicLateral Sclerosis of the World Federation of Neurology Research Group on NeuromuscularDiseases and the El Escorial “Clinical limits of amyotrophic lateral sclerosis” workshopcontributors. J. Neurol. Sci., 124 (Suppl.), 96–107.
Canadian Study of Health and Aging. (1994) The Canadian Study of Health and Aging: Riskfactors for Alzheimer’s disease in Canada. Neurology, 44, 2073–2080.
Chinnici, F., Spinabelli, U., Riponi, C. & Amato, A. (2005) Optimization of the determination oforganic acids and sugars in fruit juices by ion-exclusion liquid chromatography. J. Food.Compost. Anal., 18, 121–130
Clayton, D.B. (1989) Water pollution at Lowermoor North Cornwall: report of the Lowermoorincident health advisory committee. Truro, United Kingdom:Cornwall District HealthAuthority.
Codex Alimentarius Commission. Codex General Standard for Food Additives (GSFA).Currently adopted Standards (http://www.codexalimentarius.net/gsfaonline/index.html?lang=en) and Draft Standards Tables 1–3. Additives permitted for use under specifiedconditions in certain food categories or individual food items (ftp://ftp.fao.org/codex/ccfac38/fa3808ae.pdf, ftp://ftp.fao.org/codex/ccfac38/fa3808be.pdf, ftp://ftp.fao.org/codex/ccfac38/fa3808ce.pdf,)
Codex Alimentarius Commission (2005) Report of the Thirty-seventh Session of the CodexCommittee on Food Additives and Contaminants, The Hague, The Netherlands, 25–29April 2005. Rome, Food and Agriculture Organization of the United Nations, 2005(ALINORM 05/28/12; http://www.codexalimentarius.net/download/report/639/al28_12e.pdf).
Coggon, D. (1991) Camelford revisited. BMJ, 303, 1280–1281.Colomina, M.T., Roig, J.L., Torrente, M., Vicens, P. & Domingo, J.L. (2005) Concurrent
exposure to aluminum and stress during pregnancy in rats: effects on postnataldevelopment and behavior of the offspring. Neurotoxicol. Teratol., 27, 565–574.
COT. (2005) Appendix 16: Review paper on aluminium prepared for the Lowermoor Subgroupby the Department of Health Toxicology Unit, Imperial College, London. In: Subgroupreport on the Lowermoor water pollution incident. UK Committee on Toxicity of Chemicalsin Food, Consumer Products and the Environment, Food Standards Agency (http://www.advisorybodies.doh.gov.uk/cotnonfood/lsgreportjan05.pdf).
Day, J.P., Barker, J., Evans, L.J., Perks, J., Seabright, P.J., Ackrill, P., Lilley, J.S., Drumm,P.V. & Newton, G.W. (1991) Aluminum absorption studied by 26Al tracer. Lancet, 337, 1345.
Doll, R. (1993) Review: Alzheimer’s disease and environmental aluminium. Age Ageing, 22,138–153.
ALUMINIUM FROM ALL SOURCES, INCLUDING FOOD ADDITIVES 199

Dominguez, C., Moreno, A. & Llovera, M. (2002) Aluminum ions induce DNA synthesis butnot cell proliferation in human fibroblasts in vitro. Biol. Trace Elem. Res., 86, 1–10.
Domingo, J.L., Paternain, J.L., Llobet, J.M. & Corbella, J. (1987) Effects of oral aluminumadministration on perinatal and postnatal development in rats. Res. Commun. Chem.Pathol. Pharmacol., 57 129–132.
Domingo, J.L., Gomez, M., Bosque, M.A. & Corbella, J. (1989) Lack of teratogenicity ofaluminum hydroxide in mice. Life Sci., 45, 243–247.
Donald, J.M., Golub, M.S., Gershwin, M.E. & Keen, C.L. (1989) Neurobehavioral effects inoffspring of mice given excess aluminum in diet during gestation and lactation.Neurotoxicol. Teratol., 11, 345–351.
Drüeke, TB. (2002) Intestinal absorption of aluminium in renal failure. Nephrol. Dial.Transplant., 17(Suppl. 2), 13–16.
Drueke, T.B., Jouhanneau, P., Banide, H., Lacour, B., Yiou, F. & Raisbeck, G. (1997) Effectsof silicon, citrate and the fasting state on the intestinal absorption of aluminium in rats. ClinSci (Lond.,) 92, 63–67.
EFPA (2005) Chemical and technical assessment on the use of SALP as a food additive.Submitted to the Committee by CEFIC (European Chemical Industry Council) on 8December 2005.
El Demerdash, F.M. (2004) Antioxidant effect of vitamin E and selenium on lipid peroxidation,enzyme activities and biochemical parameters in rats exposed to aluminium. J. TraceElem. Med. Biol., 18, 113–121.
Ellen, G., Egmond, E., Van Loon, J.W., Sahertian, E.T. & Tolsma, K. (1990) Dietary intakesof some essential and non-essential trace elements, nitrate, nitrite and N-nitrosamines, byDutch adults: estimated via a 24-hour duplicate portion study. Food Addit. Contam., 7,207–221.
Exley, C. & Esiri, M.M. (2006) Severe cerebral congophilic angiopathy coincident withincreased brain aluminium in a resident of Camelford, Cornwall, UK. J. Neurol. Neurosurg.Psychiatr., 77, 877–879.
Flarend, R., Bin, T., Elmore, D. & Hem, S.L. (2001) A preliminary study of the dermalabsorption of aluminium from antiperspirants using aluminium-26. Food Chem. Toxicol.,39, 163–168.
Flaten, T.P. (1990) Geographical associations between aluminium in drinking water and deathrates with dementia (including Alzheimer’s disease), Parkinson’s disease and amyotrophiclateral sclerosis in Norway. Environ. Geochem. Health., 12, 152–167.
Flaten, T.P. (2001) Aluminium as a risk factor in Alzheimer’s disease, with emphasis ondrinking water. Brain Res. Bull., 55, 187–196.
Foldes, J., Balena, R., Ho, A., Parfitt, A.M. & Kleerekoper, M. (1991) Hypophosphatemicrickets with hypocalciuria following long-term treatment with aluminium-containing antacid.Bone, 12, 67–71.
Forbes, W.F., Hayward, L.M, & Agwani, N. (1992) Geochemical risk factors for mentalfunctioning, based on the Ontario Longitudinal Study of Aging (LSA). I. Results from apreliminary investigation. Can. J. Aging., 2, 269–280.
Forbes, W.F. & Agwani, N. (1994a) Geochemical risk factors for mental functioning, based onthe Ontario Longitudinal Study of Aging (LSA). III. The effects of different aluminum-containing compounds. Can. J. Aging., 13, 488–498.
Forbes, W.F., McAiney, C.A., Hayward, L.M. & Agwani, N. (1994b) Geochemical risk factorsfor mental functioning, based on the Ontario Longitudinal Study of Aging (LSA). II. The roleof pH. Can. J. Aging., 13, 249–267.
Forbes, W.F., Agwani, N. & Lachmaniuk, P. (1995a) Geochemical risk factors for mentalfunctioning, based on the Ontario Longitudinal Study of Aging (LSA). IV. The role of silicon-containing compounds. Can. J. Aging., 14, 630–641.
200 ALUMINIUM FROM ALL SOURCES, INCLUDING FOOD ADDITIVES

Forbes, W.F., Lessard, S. & Gentleman, J.F. (1995b) Geochemical risk factors for mentalfunctioning, based on the Ontario Longitudinal Study of Aging (LSA). V. Comparisons ofresults, relevant to aluminum water concentrations, obtained from the LSA and from deathcertificates mentioning dementia. Can. J. Aging., 14, 642–656.
Forbes, W.F., Gentleman, J.F., Agwani, N., Lessard, S. & McAiney, C.A. (1997) Geochemicalrisk factors for mental functioning, based on the Ontario Longitudinal Study of Aging (LSA).VI. The effects of iron on the associations of aluminum and fluoride water concentrationsand of pH with mental functioning, based on results obtained from the LSA and from deathcertificates mentioning dementia. Can. J. Aging., 16, 142–159.
Forster, D.P., Newens, A.J., Kay, D.W.K. & Edwardson, J.A. (1995) Risk factors in clinicallydiagnosed presenile dementia of the Alzheimer type: a case-control study in northernEngland. J. Epidemiol. Community Health, 49, 253–258.
Froment, D.H., Buddington, B., Miller, N.L. & Alfrey, A.C. (1989a) Effect of solubility on thegastrointestinal absorption of aluminum from various aluminum compounds in the rat. J.Lab. Clin. Med., 114, 237–242.
Froment, D.P., Molitoris, B.A., Buddington, B., Miller, N. & Alfrey, A.C. (1989b) Site andmechanism of enhanced gastrointestinal absorption of aluminum by citrate. Kidney Int.,36, 978–984.
FSA (2004) 2000 Total Diet Study of 12 elements – aluminium, arsenic, cadmium, chromium,copper, lead, manganese, mercury, nickel, selenium, tin and zinc. (Food SurveyInformation Sheet FSIS 48/04). London: The Stationery Office, Food Standards Agency.
Fulton, B. & Jeffery, E.H. (1990) Absorption and retention of aluminium from drinking water.1. Effect of citric acid and ascorbic acids on aluminium tissue levels in rabbits. Fundam.Appl. Toxicol., 14, 788–796.
Fulton, B., Jaw, S. & Jeffery, E.H. (1989) Bioavailability of aluminum from drinking water.Fundam. Appl. Toxicol., 12, 144–150.
Gajdusek, D.C. & Salazar, A.M. (1982) Amyotrophic lateral sclerosis and parkinsoniansyndromes in high incidence among the Auyu and Jakai people of West New Guinea.Neurology, 32, 107–126.
Gauthier, E., Fortier, I., Courchesne, F., Pepin, P., Mortimer, J. & Gauvreau, D. (2000)Aluminum forms in drinking water and risk of Alzheimer’s disease. Environ. Res., 84,234–246.
Gillette-Guyonnet, S., Andrieu, S., Nourhashemi, F., La Guéronnière, V., Grandjean, H. &Vellas, B. (2005) Cognitive impairment and composition of drinking water in women:findings of the EPIDOS Study. Am. J. Clin. Nutr., 81, 897–902.
Gergely, A., Tekes, M., Milotay, K. & Bíró, G. (1991) Selenium and aluminium in Hungariannutrition. In: Momcilovic B, ed. Trace elements in man and animals 7 (TEMA 7). Zagreb,pp 22-6, 22-7,
Golub, M.S & Germann, S.L. (2001) Long-term consequences of developmental exposureto aluminum in a suboptimal diet for growth and behavior of Swiss Webster mice.Neurotoxicol. Teratol., 23, 365–72.
Golub, M.S., Germann, S.L., Han, B. & Keen, C.L. (2000) Lifelong feeding of a high aluminumdiet to mice. Toxicology, 150, 107–117.
Golub, M.S. & Keen, C.L. (1999) Effects of dietary aluminum on pubertal mice. Neurotoxicol.Teratol., 21, 595–602.
Goyer, R.A. & Clarkson, J.W. (2001) Toxic effects of metals. In: Klassen, C.D., ed, Cassarett& Doull’s toxicology: the basic science of poisons, sixth ed., New York: McGraw-HillPublishing Company, pp. 811–867.
Gramiccioni, L., Ingrao, G., Milana, M.R., Santaroni, P. & Tomassi, G. (1996) Aluminum levelsin Italian diets and in selected foods from aluminum utensils. Food Addit. Contam., 13,767–774.
ALUMINIUM FROM ALL SOURCES, INCLUDING FOOD ADDITIVES 201

Greger, J.L. (1992) Dietary and other sources of aluminium intake. In: Chadwick DJ & WhelanJ, eds. Aluminium in biology and medicine (Ciba Foundation Symposium 169). Chichester,England: John Wiley & Sons, pp. 26–49.
Greger, J.L. & Powers, C.F. (1992) Assessment of exposure to parenteral and oral aluminumwith and without citrate using a desferrioxamine test in rats. Toxicology, 76, 119–132.
Greger, J.L. & Radzanowski, G.M. (1995) Tissue aluminium distribution in growing, matureand ageing rats: relationship to changes in gut, kidney and bone metabolism. Food Chem.Toxicol., 33, 867–875.
Guo, C-H., Lu, Y-F. & Hsu, G-S. W. (2005) The influence of aluminium exposure on malereproduction and offspring in mice. Environ. Toxicol. Pathol., 20, 135–141.
Iyengar, G.V., Tanner, J.T., Wolf, W.R., & Zeisler, R. (1987) Preparation of a mixed humandiet material for the determination of nutrient elements, selected toxic elements and organicnutrients: a preliminary report. Sci. Total Environ., 61, 235–252.
Jacqmin, H., Commenges, D., Letenneur, L., Barberger-Gateau, P. & Dartigues, J-F. (1994)Components of drinking water and risk of cognitive impairment in the elderly. Am. J.Epidemiol., 139, 48–57.
Jansson, E.T. (2001) Aluminum exposure and Alzheimer’s disease. J. Alzheimers Dis., 3,541–549.
Jorhem, L. & Haegglund, G. (1992) Aluminium in foodstuffs and diets in Sweden. Z. Lebensm.Unters. Forsch., 194, 38–42.
Jouhanneau, P., Raisbeck, G.M., Yiou, F., Lacour, B., Banide, H. & Drueke, T.B. (1997)Gastrointestinal absorption, tissue retention, and urinary excretion of dietary aluminum inrats determined by using 26Al. Clin. Chem., 43, 1023–1028.
Junquan, Gao (2006) Chinese dietary intakes of aluminum. Unpublished data submitted to theCommittee. Data extracted from Chen, Junshi & Gao Junquan (1997). The Chinese TotalDiet Study in 1992 - chemical contaminants (I) Comparison between different areas. JHygiene Res., 26, 199–203 (in Chinese).
Katz, A.C., Frank, D.W., Sauerhoff, M.W., Zwicker, G.M. & Freudenthal, R.I. (1984) A 6-monthdietary toxicity study of acidic sodium aluminium phosphate in beagle dogs. Food Chem.Toxicol., 22, 7–9.
Kaur, A. & Gill, K.D. (2005) Disruption of neuronal calcium homeostasis after chronicaluminium toxicity in rats. Basic Clin. Pharmacol. Toxicol., 96, 118–122.
Kerr, D.N.S., Ward, M.K., Ellis, H.A., Simpson, W. & Parkinson, I.S. (1992) Aluminiumintoxication in renal disease. In: Chadwick DJ & Whelan J, eds. Aluminium in biology andmedicine (Ciba Foundation Symposium). Wiley, Chichester, 169, 123–141.
Kersting, M., Alexy, U., Sichert-Hellert, W., Manz, F. & Schöch, G. (1998) Measuredconsumption of commercial infant food products in German infants: Results from theDONALD study. J. Pediatr. Gastroenterol. Nutr., 27, 547–552.
Klein, G,L., Alfrey, A.C., Miller, N.L., Sherrard, D.J., Hazlet, T.K., Ament, M.E. & Coburn,J.W. (1982) Aluminum loading during total parenteral nutrition. Am. J. Clin. Nutr., 35,1425–1429.
Koo, W.W.K., Kaplan, L.A., Krug-Wispe, S.K., Succop, P., Bendon, R. (1989) Response ofpreterm infants to aluminium in parenteral nutrition. J. Parenter. Enteral Nutr., 13,516–519.
Kumar, S. (2001) Acute toxicity of aluminium chloride, acephate, and their coexposure in maleWistar rat. Int. J. Toxicol., 20, 219–223.
Lankoff, A., Banasik, A., Duma, A., Ochniak, E., Lisowska, H., Kuszewski, T., Gozdz, S. &Wojcik, A. (2006) A comet assay study reveals that aluminium induces DNA damage andinhibits the repair of radiation-induced lesions in human peripheral blood lymphocytes.Toxicol. Lett., 161, 27–36.
202 ALUMINIUM FROM ALL SOURCES, INCLUDING FOOD ADDITIVES

Leblanc, J-C., Guérin, T., Noel, L., Calamassitran, G., Volatier, J-L. & Verger, P. (2005) Dietaryexposure estimates of 18 elements from the 1st French Total Diet Study. Food Addit.Contam., 22, 624–641.
Lione, A. (1985) Aluminum intake from non-prescription drugs and sucralfate. Gen.Pharmacol., 16, 223–228.
Liu, S-M. & Chung, C. (1992) Trace elements in Taiwanese diet in different seasons. J.Radioanal. Nucl. Chem., 161, 27–38.
MAFF (1999) 1997 Total Diet Study – aluminium, arsenic, cadmium, chromium, copper, lead,mercury, nickel, selenium, tin and zinc (Food Surveillance Information Sheet No. 191).London: Ministry of Agriculture, Fisheries and Food, The Stationery Office.
Ministry of Agriculture, Fisheries and Food (2004) 2000 Total Diet Study of 12 elements –aluminium, arsenic, cadmium, chromium, copper, lead, manganese, mercury, nickel,selenium, tin and zinc (Food Survey Information Sheet FSIS 48/04). London: Ministry ofAgriculture, Fisheries and Food, The Stationery Office.
Mahurkar, S.D., Dhar, S.K., Salta, R., Meyers, L., Smith, E.C. & Dunea, G. (1973) Dialysisdementia. Lancet, 1, 1412–1415.
Martin, R.B., Savory, J., Brown, S., Bertholf, R.L. & Wills, M.R. (1987) Transferrin binding ofAl3+ and Fe3+. Clin. Chem., 33, 405–407.
Martyn, C.N., Barker, D.J.P., Osmond, C., Harris, E.C., Edwardson, J.A. & Lacey, R.F. (1989)Geographical relation between Alzheimer’s disease and aluminium in drinking water.Lancet, 1, 59–62.
Martyn, C.N., Coggon, D.N., Inskip, H., Lacey, R.F. & Young, W.F. (1997) Aluminumconcentrations in drinking water and risk of Alzheimer’s disease. Epidemiology, 8,281–286.
McKhann, G., Drachman, D., Flostein, M., Katzman, R., Price, D. & Stadlan, E.M. (1984)Clinical diagnosis of Alzheimer’s disease: report of the NINCDS-ADRDA Work Groupunder the auspices of the Department of Health and Human Services Task Force onAlzheimer’s disease. Neurology, 34, 939–944.
McLachlan, D.R.C., Bergeron, C., Smith, J.E., Boomer, D. & Rifat, S.L. (1996) Risk forneuropathologically confirmed Alzheimer’s disease and residual aluminium in municipaldrinking water employing weighted residential histories. Neurology, 46, 401–405.
Michel, P., Commenges, D., Dartigues, J F., Gagnon, M., Barberger-Gateau, P., Letenneur,L. & The Paquid Research Group. (1991) Study of the relationship between aluminiumconcentration in drinking water and risk of Alzheimer’s disease. In: Iqbal, K., McLachlan,D.R.C., Winblad, B. & Wisniewski, H.M., eds, Alzheimer’s disease: basic mechanisms,diagnosis and therapeutic strategies. Chichester: John Wiley & Sons Ltd, pp. 387–391.
Miller, R.G., Kopfler, F.C., Kelty, K.C., Stober, J.A. & Ulmer, N.S. (1984) The occurrence ofaluminum in drinking water. J. Am. Water Works Assoc., 76, 84–91.
Moore, P.B., Day, J P., Taylor, G.A., Ferrier, I.N., Fifield, L.K. & Edwardson, J.A. (2000)Absorption of aluminium-26 in Alzheimer’s disease, measured using accelerator massspectrometry. Dement. Geriatr. Cogn. Disord., 11, 66–69.
Müller, M., Anke, M. & Illing-Günther, H. (1998) Aluminium in foodstuffs. Food Chem., 61,419–428.
Muller. G., Bernuzzi, V., Desor, D., Hutin, M.F., Burnel, D. & Lehr, P.R. (1990) Developmentalalterations in offspring of female rats orally intoxicated by aluminum lactate at differentgestation periods. Teratology, 42, 253–261
Mullin, W.J. & Emmons, D.B. (1997) Determination of organic acids and sugars in cheese,milk and whey by high performance liquid chromatography. Food Res. Intern., 30,147–151.
Neelam, Bamji M.S. & Kaladhar, M. (2000) Risk of increased aluminium burden in the Indianpopulation: contribution from aluminium cookware. Food Chem., 70, 57–61.
ALUMINIUM FROM ALL SOURCES, INCLUDING FOOD ADDITIVES 203

Neri, L.C. & Hewitt, D. (1991) Aluminium, Alzheimer’s disease, and drinking water. Lancet,338, 390.
Neumann, L. & Jensen, B.G. (1989) Osteomalacia from Al and Mg antacids. Report of a caseof bilateral hip fracture. Acta Orthop. Scand., 60, 361–362.
O’Brien Nabors, L. (2006) Letter to JECFA International Food Additive Council, dated 17March 2006.
Ohman, L.O. & Martin, R.B. (1994) Citrate as the main small molecule binding Al3+ in serum.Clin. Chem., 40, 598–601.
Orihuela, D., Meichtry, V. & Pizarro, M. (2005a) Aluminium-induced impairment of transcellularcalcium absorption in the small intestine: calcium uptake and glutathione influence. J.Inorg. Biochem., 99, 1879–1886.
Orihuela, D., Meichtry, V., Pregi, N. & Pizarro, M. (2005b) Short-term oral exposure toaluminium decreases glutathione intestinal levels and changes enzyme activities involvedin its metabolism. J. Inorg. Biochem., 99, 1871–1878.
Ott, S.M. (1985) Aluminum accumulation in individuals with normal renal function. Am.J.Kidney Dis., 6, 297–300.
Owen, L.M., Crews, H.M., Bishop, N.J. & Massey, R.C. (1994) Aluminium uptake from somefoods by guinea pigs and the characterization of aluminium in in vivo intestinal digesta bySEC-ICP-MS 2. Food Chem. Toxicol., 32, 697–705.
Owen, P.J., Miles, D.P.B., Draper, G.J. & Vincent, T.J. (2002) Retrospective study of mortalityafter water pollution incident at Lowermoor in north Cornwall. BMJ, 324, 1189.
Parkinson, I.S., Ward, M.K., Feest, T.G., Fawcett, R.W.P. & Kerr, D.N.S (1979) Fracturingdialysis osteodystrophy and dialysis encephalopathy: an epidemiological survey. Lancet,1, 406–409.
Parkinson, I.S., Ward, M.K. & Kerr, D.N.S. (1981) Dialysis encephalopathy, bone disease andanaemia: the aluminium intoxication syndrome during regular haemodialysis. J. Clin.Pathol., 34, 1285–1294.
Parr, R.M., Abdulla, M., Aras, N.K., Byrne, A.R., Camara-Rica, C., Finnie, S., Gharib, A.G.,Ingrao, G., Iyengar, G.V., Khangi, F.A., Krishnan, S.S., Kumpulainen, J., Liu, S., Schelenz,R., Srianujata, S., Tanner, J.T. & Wolf, W. (1991) Dietary intakes of trace elements andrelated nutrients in eleven countries: preliminary results from an International AtomicEnergy Agency (IAEA) co-ordinated research programme. In: Momcilovic, B., ed. Traceelements in man and animals 7 (TEMA 7), Zagreb, pp 13–3, 13–4, 13–5.
Paternain, J.L., Domingo, J.L., Llobet, J.M. & Corbella, J. (1988) Embryotoxic and teratogeniceffects of aluminum nitrate in rats upon oral administration. Teratology, 38, 253–257.
Pennington, J.A.T. (1987) Aluminium content of foods and diets. Food Addit. Contam., 5,161–232.
Pennington, J.A.T., & Jones, J.W. (1989) Dietary intake of aluminum. In: Gitelman HJ, ed.Aluminum and health. A critical review. New York, Basel, Marcel Dekker, Inc., pp. 67–100.
Pennington, J.A., & Schoen, S.A. (1995) Estimates of dietary exposure to aluminium. FoodAddit. Contam., 12, 119–128.
Perl, D.P., Gajdusek, D.C., Garruto, R.M., Yanagihara, R.T. & Gibbs, C.J. (1982) Intraneuronalaluminium accumulation in amyotrophic lateral sclerosis and parkinsonism-dementia ofGuam. Science, 217, 1053–1055.
Petterson, J.C., Hackett, D.S., Zwicker, G.M. & Sprague, G.L. (1990) Twenty-six week toxicitystudy with KASAL (basic sodium aluminium phosphate) in beagle dogs. Environ.Geochem. Health, 12, 121–123.
Pivnick, E.K., Kerr, N.C., Kaufman, R.A., Jones, D.P. & Chesney, R.W. (1995) Ricketssecondary to phosphate depletion. Clin. Pediatr., 34, 73–78.
Platts, M.M., Goode, G.C. & Hislop, J.S. (1977) Composition of the domestic water supply andthe incidence of fractures and encephalopathy in patients on home dialysis. BMJ, 2,657–660.
204 ALUMINIUM FROM ALL SOURCES, INCLUDING FOOD ADDITIVES

Powell, J.J., Ainley, C.C., Evans, R. & Thompson, R.P. (1994) Intestinal perfusion of dietarylevels of aluminium: association with the mucosa. Gut, 35, 1053–1057.
Powell, J.J., Greenfield, S.M., Parkes, H.G., Nicholson, J.K. & Thompson, R.P. (1993) Gastro-intestinal availability of aluminium from tea. Food Chem. Toxicol., 31, 449–454.
Priest, N.D. (2004) The biological behaviour and bioavailability of aluminium in man, withspecial reference to studies employing aluminium-26 as a tracer: review and study update.J. Environ. Monit., 6, 375–403.
Priest, N.D., Newton, D., Day, J.P., Talbot, R.J. & Warner, A.J. (1995) Human metabolism ofaluminium-26 and gallium-67 injected as citrates. Hum. Exp. Toxicol.,14, 287–293.
Priest, N.D., Newton, D., Talbot, R.J., McAughey, J., Day, J.P. & Fifield, L.K. (1998) Industrysponsored studies on the biokinetics and bioavailability of aluminium in man. In: Priest,N.D. & O'Donnell, T.V., eds. Health in the aluminium industry, London: MiddlesexUniversity Press, pp. 105–129.
Provan, S.D. & Yokel, R.A. (1988a) Aluminum uptake by the in situ rat gut preparation. J.Pharmacol. Exp. Ther., 245, 928–931.
Provan, S.D. & Yokel, R.A. (1988b) Influence of calcium on aluminum accumulation by the ratjejunal slice. Res. Commun. Chem. Pathol. Pharmacol., 59, 79–92.
Reiber, S., Kukull, W. & Standish-Lee, P. (1995) Drinking water aluminium and bioavailability.J. Am. Water Works Assoc., 87, 86–100.
Rogers, M.A.M. & Simon, D.G. (1999) A preliminary study of dietary aluminium intake and riskof Alzheimer’s disease. Age Ageing, 28, 205–209.
Rondeau, V., Commenges, D., Jacqmin-Gadda, H. & Dartigues, J-F. (2000) Relation betweenaluminium concentrations in drinking water and Alzheimer’s disease: an 8-year follow-upstudy. Am. J. Epidemiol., 152, 59–66.
Rosenbek, J.C., McNeil, M.R., Lemme, M.L., Prescott, T.E. & Alfrey, A.C. (1975) Speech andlanguage findings in a chronic hemodialysis patient: a case report. J. Speech Hear.Disord., 40, 245–252.
Roy, A.K., Talukder, G. & Sharma, A. (1991) Similar effects in vivo of two aluminum salts onthe liver, kidney, bone, and brain of Rattus norvegicus. Bull. Environ. Contam. Toxicol.,47, 288–295.
Scancar, J., Stibilj, V. & Milacic, R. (2003) Determination of aluminium in Slovenian foodstuffsand its leachability from aluminium-cookware. Food Chem., 85, 151–157.
Sarin, S., Julka, D. & Gill, K.D. (1997a) Regional alterations in calcium homeostasis in theprimate brain following chronic aluminium exposure. Mol. Cell. Biochem., 168, 95–100.
Sarin, S., Gupta, V. & Gill, K.D. (1997b) Alterations in lipid composition and neuronal injury inprimates following chronic aluminium exposure. Biol. Trace Elem Res., 59, 133–143
Schafer (2005) Aluminium in the food chain with special respect to the safety of acid sodiumaluminium phosphate (SALP) E 541 as additive in bakery products. Study sponsored byEFPA (European Food Phosphates Association) to Jena University. Submitted to theCommittee by CEFIC (European Chemical Industry Council) on 8 December 2005.
Schonholzer, K.W., Sutton, R.A., Walker, V.R., Sossi, V., Schulzer, M., Orvig, C., Venczel, E.,Johnson, R.R., Vetterli, D., Dittrich-Hannen, B., Kubik, P. & Suter, M. (1997) Intestinalabsorption of trace amounts of aluminium in rats studied with 26-aluminium and acceleratormass spectrometry. Clin. Sci (Lond.), 92, 379–383.
Shetty, A.K, Thomas, T., Rao, J. & Vargas, A. (1998) Rickets and secondary craniosynostosisassociated with long-term antacid use in an infant. Arch. Pediatr. Adolesc. Med., 152,1243–1245.
Shiraishi, K., Yoshimizu, K., Tanaka, G. & Kawamura, H. (1989) Daily intake of 11 elementsin relation to reference Japanese man. Health Phys., 57, 551–557.
Shiraishi, K., Yamagami, Y., Kameoka, K. & Kawamura, H. (1988) Mineral contents in modeldiet samples for different age groups. J. Nutr. Sci. Vitaminol., 34, 55–65
ALUMINIUM FROM ALL SOURCES, INCLUDING FOOD ADDITIVES 205

Somova, L.I. & Khan, M.S. (1996) Aluminium intoxication in rats. II. Chronic toxicity: effectson aluminium balance, aluminium plasma and tissue levels and haematology. SouthAfrican Journal of Food Science and Nutrition, 8, 102–105.
Somova, L., Gregory, M.A., Khan, M.S., Surajpal, S., Mabika, M., Channa, M.L. & Nadar, A.(1995) Aluminium intoxication in rats. South African Journal of Food Science andNutrition, 7, 151–155.
Somova, L.I., Missankov, A. & Khan, M.S. (1997) Chronic aluminum intoxication in rats: dose-dependent morphological changes. Methods Find. Exp. Clin. Pharmacol., 19, 599–604.
Starkey, B.J. (1987) Aluminium in renal disease: current knowledge and future developments.Ann. Clin. Biochem., 24, 337–344.
Struys-Ponsar, C., Kerkhofs, A., Gauthier, A., Soffie, M. & van den Bosch de Aguilar.(1997).Effects of aluminum exposure on behavioral parameters in the rat. Pharmacol.Biochem. Behav., 56, 643-648.
Sutherland, J.E., Radzanowski, G.M. & Greger, J.L. (1996) Bile is an important route ofelimination of ingested aluminum by conscious male Sprague-Dawley rats. Toxicology,109, 101–109.
Talbot, R.J., Newton, D., Priest, N.D., Austin, J.G. & Day, J.P. (1995) Inter-subject variabilityin the metabolism of aluminium following intravenous injection as citrate. Hum. Exp.Toxicol., 14, 595–599.
Taylor, G.A., Ferrier, I.N., McLoughlin, I.J., Fairbairn, A.F., McKeith, I.G., Lett, D. & Edwardson,J.A. (1992) Gastrointestinal absorption of aluminium in Alzheimer's disease: response toaluminium citrate. Age Ageing, 21, 81–90.
Taylor, G.A., Moore, P.B., Ferrier, I.N., Tyrer, S.P. & Edwardson, J.A. (1998) Gastrointestinalabsorption of aluminium and citrate in man. J. Inorg. Biochem., 69, 165–169.
Taylor, G.A., Newens, A.J., Edwardson, J.A., Kay, D.W.K. & Forster, D.P. (1995) Alzheimer’sdisease and the relationship between silicon and aluminium in water supplies in northernEngland. J. Epidemiol. Community Health, 49, 323–328.
Testolin, G., Erba, D., Ciappellano, S. & Bermano, G. (1996) Influence of organic acids onaluminium absorption and storage in rat tissues. Food Addit. Contam., 13, 21–27.
Tripathi, R.M., Mahapatra, S., Raghunath, R., Kumar, A.V. & Sadasivan, S. (2002) Daily intakeof aluminium by adult population of Mumbai, India. Sci. Total Environ., 299, 73–77.
Trippi, F., Botto, N., Scarpato, R., Petrozzi, L., Bonuccelli, U., Latorraca, S., Sorbi, S. &Migliore, L. (2001) Spontaneous and induced chromosome damage in somatic cells ofsporadic and familial Alzheimer's disease patients. Mutagenesis, 16, 323–327.
van der Voet, G.B. & de Wolff, F.A. (1998) Intestinal absorption of aluminum: effect of sodiumand calcium. Arch. Toxicol., 72, 110–114.
Varo, P. & Koivistoinen, P. (1980) Mineral element composition of Finnish foods. XII. Generaldiscussion and nutritional evaluation. Acta Agric Scand Suppl., 22, 165–171.
Wettstein, A., Aeppli, J., Gautshi, K. & Peters, M. (1991) Failure to find a relationship betweenmnestic skills of octogenarians and aluminum in drinking water. Int. Arch. Occup. Environ.Health, 63, 97–103.
WHO (1997) Aluminium (Environmental Health Criteria 194). Geneva: InternationalProgramme on Chemical Safety (IPCS) (http://www.inchem.org/documents/ehc/ehc/ehc194.htm).
WHO (2004) WHO guidelines for drinking-water quality, third edition. Vol. 1 Recom-mendations. Geneva, World Health Organization (http://www.who.int/water_sanitation_health/dwq/gdwq3/en/index.html).
Wilhelm M, Zhang XJ, Hafner D, Ohnesorge FK. (1992) Single-dose toxicokinetics ofaluminium in the rat. Arch Toxicol, 66, 700-705
Woodson, G.C. (1998) An interesting case of osteomalacia due to antacid use associated withstainable bone aluminum in a patient with normal renal function. Bone, 22, 695–698.
206 ALUMINIUM FROM ALL SOURCES, INCLUDING FOOD ADDITIVES

Yokel, R.A. (2004) Aluminum. In: Merian, E., Anke, M., Ihnat, M. & Stoeppler, M., eds,Elements and their compounds in the environment, 2nd ed. Weinheim: Wiley-VCH Verlag,Vol. 2, pp. 635–658.
Yousef, M.I. (2004) Aluminium-induced changes in hemato-biochemical parameters, lipidperoxidation and enzyme activities of male rabbits: protective role of ascorbic acid.Toxicology, 199, 47–57.
Yumoto, S., Nagai, H., Kobayashi, K., Tamate, A., Kakimi, S. & Matsuzaki, H. (2003) 26Alincorporation into the brain of suckling rats through maternal milk. J. Inorg. Biochem., 97,155–160.
Zhou, Y. & Yokel, R.A. (2005) The chemical species of aluminum influences its paracellularflux across and uptake into Caco-2 cells, a model of gastrointestinal absorption. Toxicol.Sci., 87, 15–26.
ALUMINIUM FROM ALL SOURCES, INCLUDING FOOD ADDITIVES 207


1,3-DICHLORO-2-PROPANOL (addendum)
First draft prepared by
G. Williams,1 K. Schneider,2 J-C. Leblanc3 & J.C. Larsen4
1 Department of Pathology, New York Medical College, Valhalla, USA;
2 Forschungs- und Beratungsinstitut Gefahrstoffe GmbH (FoBiG), Freiburg,Germany;
3Agence Française de Sécurité Sanitaire des Aliments, Maisons Alfort,France; and
4 Division of Toxicology and Risk Assessment, Danish Institute of Food andVeterinary Research, Søborg, Denmark
Explanation.................................................................................Biological data............................................................................
Biochemical aspects............................................................Toxicological studies............................................................
Short-term studies of toxicity.........................................Long-term studies of toxicity and carcinogenicity..........Genotoxicity...................................................................Reproductive toxicity......................................................
Observation in humans........................................................Analytical methods.....................................................................
Chemistry.............................................................................Description of analytical methods........................................
Levels and patterns of contamination of food commodities.......Surveillance data...........................................................National occurrence of 1,3-dichloro-2-propanol.............Soy sauce and soy sauce-based products....................Food ingredients............................................................Other food products.......................................................Co-occurrence of 3-chloro-1,2-propanediol and 1, 3-dichloro-2-propanol.....................................................
Estimated dietary intake.............................................................National assessments of intake from diet............................International estimates of intake from GEMS/Food Consumption Cluster Diets..................................................
Comments..................................................................................Evaluation...................................................................................References.................................................................................
210211211211211211216217217217217217218218218219221221
222227227
231234236237
- 209 -

1. EXPLANATION
1,3-Dichloro-2-propanol is formed when chloride ions react with lipid com-ponents in foods under a variety of conditions, including food processing, cooking,and storage. The compound has been found as a contaminant in various foodsand food ingredients, most notably in acid-hydrolysed vegetable protein (acid-HVP)and soy sauces.1 This compound was first evaluated by the Committee at its forty-first meeting (Annex 1, reference 107), when it concluded that it is an undesirablecontaminant in food and expressed the opinion that its concentration in acid-HVPshould be reduced as far as technically achievable.
1,3-Dichloro-2-propanol was re-evaluated by the Committee at its fifty-seventh meeting (Annex 1, reference 154). Although only a few studies of kineticsand metabolism and few short- and long-term studies of toxicity and of reproductivetoxicity were available for evaluation, they clearly indicated that 1,3-dichloro-2-propanol was hepatotoxic and nephrotoxic, induced a variety of tumours in variousorgans in rats, and was genotoxic in vitro. The Committee therefore concluded thatit would be inappropriate to estimate a tolerable intake of 1,3-dichloro-2-propanol.The Committee noted that the dose that caused tumours in rats (19 mg/kg bw perday) was about 20 000 times greater than the highest estimated intake of 1,3-dichloro-2-propanol by consumers of soy sauce (1 μg/kg bw per day), and that theavailable evidence suggested that in soy sauces 1,3-dichloro-2-propanol wasassociated with high concentrations of 3-chloro-1,2-propanediol, concentrations ofthe latter being approximately 50 times higher than those of 1,3-dichloro-2-propanol.Therefore, in the opinion of the Committee, regulatory control of the latter wouldobviate the need for specific controls on 1,3-dichloro-2-propanol.
The present re-evaluation was conducted in response to a request from theCodex Committee on Food Additives and Contaminants (CCFAC) at its Thirty-seventh Session (Codex Alimentarius Commission, 2005) that JECFA review andsummarize all new data on the toxicology (including new studies of genotoxicity invivo) and occurrence of 1,3-dichloro-2-propanol. In particular, the Committee wasasked to carry out an exposure assessment to readdress 1,3-dichloro-2-propanolas a separate issue from 3-chloro-1,2-propanediol.
Since the last evaluation of 1,3-dichloro-2-propanol by the Committee(Annex 1, references 154, 155) evaluations have been produced by other authorities(Committee on Mutagenicity, 2003; FSANZ, 2003; Committee on Carcinogenicity,2004; National Toxicology Program, 2005).
1 The term ‘soy sauce’ is used to encompass liquid seasonings made from soya beans by arange of methods including acid-hydrolysis and traditional fermentation, possibly with theaddition of acid-HVP. In some countries, the term ‘soy sauce’ is reserved solely forfermented products.
210 1,3-DICHLORO-2-PROPANOL

2. BIOLOGICAL DATA
2.1 Biochemical aspects
No new data were available.
2.2 Toxicological studies
2.2.1 Short-term studies of toxicity
No new data were available.
2.2.2 Long-term studies of toxicity and carcinogenicity
No new studies were available.
(a) Dose-response modelling
Cancer dose–response data were analysed by dose–response modelling, inaccordance with the International Programme on Chemical Safety (IPCS) documentPrinciples for modelling dose–response for the risk assessment of chemicals (IPCS,2004). Modelling was performed of data for neoplastic changes reported in the studyby Research & Consulting Co. (1986). In this long-term study of carcinogenicity,male and female rats were given drinking-water containing 1,3-dichloro-2-propanolfor up to 2 years. Treatment-related increases in the incidence of tumours wereobserved in the kidney of male rats (Table 1) and in the liver, thyroid gland and thetongue of both sexes (Tables 1 and 2).
Incidence data for individual tumour sites and for animals with treatment-related tumours were compiled for both sexes and used for dose–responsemodelling. For this purpose, only data for the groups exposed for 2 years were used;interim sacrifice groups were not considered.
Modelling
Eight models were fitted to the dose–response data. The benchmark dosewas set at a 10% increase in the incidence of tumours above background (BMD10)(background adjustment: extra risk). The lower confidence limit for the benchmarkdose (BMDL10) was 95%. Datasets for the two sexes were modelled independently.All datasets were found to be suitable for modelling, when models were appliedusing standard options as provided in the software package, without the necessityto implement additional restrictions and/or modifications of the models.
Table 3 shows the results for all treatment-related tumours in male rats.Reasonable fits, judged on the basis of visual examination of curve fits and onstatistical evaluation (p values of suitable models were > 0.2), and consistent valuesfor BMD10 and BMDL10 were obtained for the eight models.
Akaike’s information criterion (AIC) values were similar for all models. Thelogistic, quantal-quadratic and the probit model gave somewhat worse fits, as canbe seen from residual values and chi-squared values. The BMDL10s from these
1,3-DICHLORO-2-PROPANOL 211

models were somewhat higher than from other models, but were still in a reasonablerange.
BMD10s and BMDL10s varied within the range of 5.4 to 7.5 and 3.3 to 6.1 mg/kgbw per day, respectively. This proves the required independency of results from thechosen model. Modelling for malignant tumours only gave similar results (notshown) with BMD10 and BMDL10 ranges of 8.3 to 10.1 mg/kg bw per day and 5.6 to
Table 1. Number of male rats bearing tumours after receiving drinking-watercontaining 1,3-dichloro-2-propanol for 2 years
Tumour site Concentration (mg/kg)
0 2.1 6.3 19
Kidney
Tubular adenoma 0/50 0/50 3/50 9/50
Tubular carcinoma 0/50 0/50 0/50 1/50
Combined 0/50 0/50 3/50 9/50 a
Liver
Hepatocellularadenoma
1/50 0/50 0/50 0/50
Hepatocellularcarcinoma
0/50 0/50 2/50 8/50
Combined 1/50 0/50 2/50 8/50
Thyroid gland
Follicular adenoma 0/50 0/50 2/50 3/48
Follicular carcinoma 0/50 0/50 2/50 1/48
Combined 0/50 0/50 4/50 4/48
Tongue
Papilloma 0/50 1/50 0/49 6/50
Carcinoma 0/50 0/50 0/49 6/50
Combined 0/50 1/50 0/49 12/50
All treatment-affected sites: kidney tubular adenoma and carcinoma, hepatocellularadenoma and carcinoma, follicular adenoma and carcinoma of the thyroid, papilloma andcarcinoma of the tongue
Benign tumours 1/50 1/50 5/50 17/50
Malign tumours 0/50 0/50 4/50 14/50
Combined 1/50 1/50 8/50 b 29/50 c
From Research & Consulting Co. (1986)a Male No. 274 had an adenoma and a carcinoma and was counted only onceb Male No. 201 had a benign and a malign tumour and was counted only oncec Males Nos 269 and 274 each had a benign and a malign tumour; both animals were counted
only once
212 1,3-DICHLORO-2-PROPANOL

8.4 mg/kg per day, respectively. Figure 1 shows the dose–response data and thecurve fit for the gamma model, as an example.
Modelling results for female rats (animals with treatment-related tumours)are shown in Table 4. As for male rats, several models gave reasonable fits andBMD10s and BMDL10s varied only within a narrow range: the ranges obtained were7.6 to 10.3 mg/kg bw per day for BMD10 and 6.6 to 7.7 mg/kg bw per day forBMDL10. Figure 2 shows the dose–response data for female animals and the curvefit for the Weibull model as an example.
Table 5 gives a summary of the modelling of data for individual tumour sites.Modelling was performed on incidence data for tumour-bearing animals for benignand malign kidney tumours (males only), hepatocellular tumours (males andfemales) as well as tumours of the tongue (males and females) (see Table 1 and 2 forincidence data for males and females, respectively). Incidence data for thyroid
Table 2. Number of female rats bearing tumours after receiving drinking-watercontaining 1,3-dichloro-2-propanol for 2 years
Tumour site Concentration (mg/kg)
0 3.4 9.6 30
Liver
Hepatocellularadenoma
1/50 1/50 1/50 5/50
Hepatocellularcarcinoma
0/50 0/50 1/50 36/50
Combined 1/50 1/50 2/50 41/50
Thyroid gland
Follicular adenoma 1/50 0/50 3/50 3/49
Follicular carcinoma 0/50 0/50 0/50 2/49
Combined 1/50 0/50 3/50 5/49
Tongue
Papilloma 0/50 0/50 0/50 7/49
Carcinoma 0/50 1/50 1/50 4/49
Combined 0/50 1/50 1/50 11/49
All treatment-affected sites: hepatocellular adenoma and carcinoma, follicular adenoma andcarcinoma of the thyroid, papilloma and carcinoma of the tongue
Benign tumours 2/50 1/50 4/50 12/50
Malign tumours 0/50 1/50 2/50 37/50
Combined 2/50 2/50 6/50 42/50 a
From Research & Consulting Co. (1986)a Several animals had both benign and malign tumours and were counted only once.
1,3-DICHLORO-2-PROPANOL 213
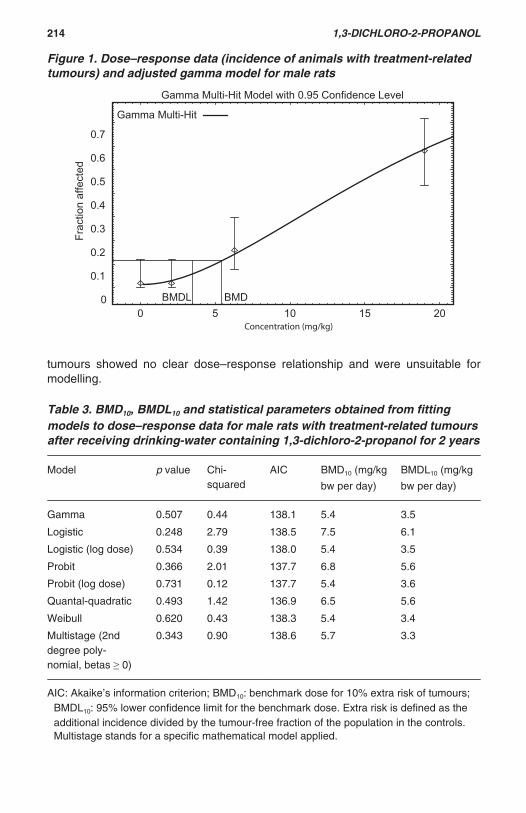
tumours showed no clear dose–response relationship and were unsuitable formodelling.
Table 3. BMD10, BMDL10 and statistical parameters obtained from fittingmodels to dose–response data for male rats with treatment-related tumoursafter receiving drinking-water containing 1,3-dichloro-2-propanol for 2 years
Model p value Chi-squared
AIC BMD10 (mg/kg
bw per day)
BMDL10 (mg/kg
bw per day)
Gamma 0.507 0.44 138.1 5.4 3.5
Logistic 0.248 2.79 138.5 7.5 6.1
Logistic (log dose) 0.534 0.39 138.0 5.4 3.5
Probit 0.366 2.01 137.7 6.8 5.6
Probit (log dose) 0.731 0.12 137.7 5.4 3.6
Quantal-quadratic 0.493 1.42 136.9 6.5 5.6
Weibull 0.620 0.43 138.3 5.4 3.4
Multistage (2nddegree poly-nomial, betas 0)
0.343 0.90 138.6 5.7 3.3
AIC: Akaike’s information criterion; BMD10: benchmark dose for 10% extra risk of tumours;BMDL10: 95% lower confidence limit for the benchmark dose. Extra risk is defined as theadditional incidence divided by the tumour-free fraction of the population in the controls.Multistage stands for a specific mathematical model applied.
Figure 1. Dose–response data (incidence of animals with treatment-relatedtumours) and adjusted gamma model for male rats
0
0.1
0.2
0.3
0.4
0.5
0.6
0.7
0 5 10 15 20
Frac
tion
affe
cted
Concentration (mg/kg)
Gamma Multi-Hit Model with 0.95 Confidence Level
BMDL BMD
Gamma Multi-Hit
214 1,3-DICHLORO-2-PROPANOL
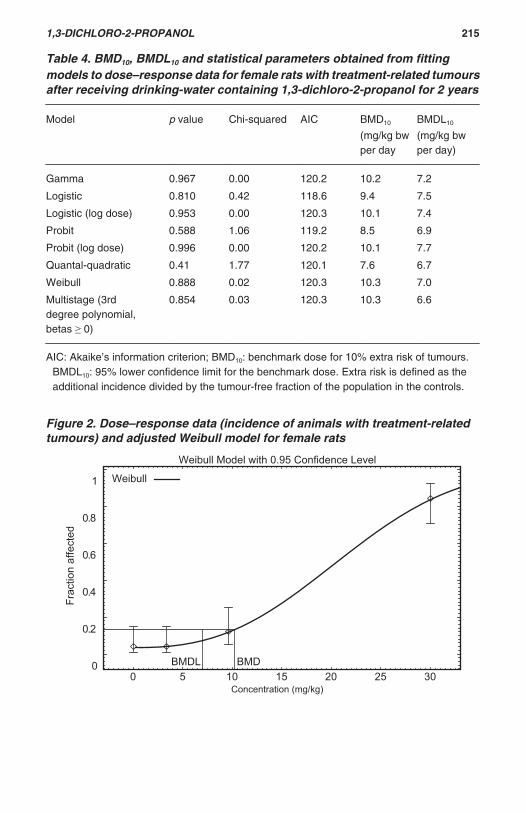
Figure 2. Dose–response data (incidence of animals with treatment-relatedtumours) and adjusted Weibull model for female rats
0
0.2
0.4
0.6
0.8
1
0 5 10 15 20 25 30
Frac
tion
affe
cted
Concentration (mg/kg)
Weibull Model with 0.95 Confidence Level
BMDL BMD
Weibull
Table 4. BMD10, BMDL10 and statistical parameters obtained from fittingmodels to dose–response data for female rats with treatment-related tumoursafter receiving drinking-water containing 1,3-dichloro-2-propanol for 2 years
Model p value Chi-squared AIC BMD10
(mg/kg bwper day
BMDL10
(mg/kg bwper day)
Gamma 0.967 0.00 120.2 10.2 7.2
Logistic 0.810 0.42 118.6 9.4 7.5
Logistic (log dose) 0.953 0.00 120.3 10.1 7.4
Probit 0.588 1.06 119.2 8.5 6.9
Probit (log dose) 0.996 0.00 120.2 10.1 7.7
Quantal-quadratic 0.41 1.77 120.1 7.6 6.7
Weibull 0.888 0.02 120.3 10.3 7.0
Multistage (3rddegree polynomial,betas 0)
0.854 0.03 120.3 10.3 6.6
AIC: Akaike’s information criterion; BMD10: benchmark dose for 10% extra risk of tumours.BMDL10: 95% lower confidence limit for the benchmark dose. Extra risk is defined as theadditional incidence divided by the tumour-free fraction of the population in the controls.
1,3-DICHLORO-2-PROPANOL 215

Software
Modelling was carried out using the US EPA BMDS (benchmark dosesoftware), version 1.3.2.2
2.2.3 Genotoxicity
In a test for micronucleus formation in bone marrow of rats in vivo, which wasconducted according to OECD guideline No. 474, groups of six male Han Wistarrats were given 1,3-dichloro-2-propanol orally at a dose of 0, 25, 50, or 100 mg/kg
Table 5. Result of dose–response modelling (BMD10, BMDL10) for varioustreatment-affected tumour sites for male and female rats receiving drinking-water containing 1,3-dichloro-2-propanol for 2 years
Tumour site and type Models withacceptable fits
Range of BMD10s
(mg/kg bw perday)
Range of BMDL10s
(mg/kg bw perday)
Males
Renal adenoma andcarcinoma
Gamma, log logistic,log probit, Weibull,multistage
11.1–12.2 7.2–7.7
Hepatocellular adenomaand carcinoma
Logistic, probit, logprobit, quantal-quadr.,multistage
14.4–16.0 10.3–12.3
Tongue papilloma andcarcinoma
Gamma, logistic, loglogistic, probit, logprobit, quantal-quadratic, Weibull,multistage
12.4–17.9 8.7–11.6
Females
Hepatocellular adenomaand carcinoma
Gamma, logistic, loglogistic, probit, logprobit, Weibull,multistage
11.2–14.6 9.1–10.1
Tongue papilloma andcarcinoma
Gamma, logistic, loglogistic, probit, logprobit, quantal-quadratic, Weibull,multistage
17.1–22.8 11.5–19.1
BMD10: benchmark dose for 10% extra risk of tumours. BMDL10: 95% lower confidence limitfor the benchmark dose. Extra risk is defined as the additional incidence divided by thetumour-free fraction of the population in the controls.
2 The BMDS is freely available at <http://cfpub.epa.gov/ncea/>.
216 1,3-DICHLORO-2-PROPANOL

bw per day for two consecutive days. The high dose produced piloerection, weightloss and lethargy. Bone marrow was harvested 24 h after the final dose. The ratiosof polychromatic to normochromatic erythrocytes (PCE/NCE) varied amongstindividual animals of the control group, but the mean value was within the range ofdata from historical control groups. Rats treated with 1,3-dichloro-2-propanol at anydose had group mean PCE/NCE ratios that were comparable to those of the controlgroup and that were within the normal range. Thus toxicity to the bone marrow wasnot demonstrated. There was no statistically significant increase in the frequencyof micronucleus formation with 1,3-dichloro-2-propanol at any dose, while thepositive-control agent, cyclophosphamide, was clearly active (Howe, 2002).
In a study of unscheduled DNA synthesis in rat hepatocytes in vivo, whichwas conducted according to OECD guideline No. 486, groups of three Han Wistarmale rats were given a single oral dose of 1,3-dichloro-2-propanol at 0, 40, or 100 mg/kg bw. In the 2–4 h experiment, piloerection and lethargy were observed. Hepato-cytes were isolated at 2–4 h and 12–24 h after dosing and cultured in the presenceof [3H]thymidine; the incorporation of [3H]thymidine during unscheduled DNAsynthesis was measured autoradiographically. No information on liver toxicity wasprovided. 1,3-Dichloro-2-propanol did not elicit unscheduled DNA synthesis, whilethe positive-control compounds, 2-acetylaminofluorene and dimethylnitrosamine,were clearly active (Beevers, 2003).
2.2.4 Reproductive toxicity
No new data were available.
2.3 Observation in humans
No new data were available.
3. ANALYTICAL METHODS
3.1 Chemistry
Chloropropanols are chemicals formed when glycerol reacts with chlorineunder acidic conditions. 1,3-Dichloro-2-propanol (CAS Registry No. 96-23-1) boilsat 175 °C at normal pressure and its solubility in water at 20 °C is 15.2 g per 100 g.
3.2 Description of analytical methods
1,3-Dichloro-2-propanol can be measured by using gas chromatographicseparation and mass spectrometric detection (GC/MS) with an automatedheadspace procedure (HS GC/MS). The in-house validation methods developed bythe Central Science Laboratory (CSL) of the United Kingdom GovernmentDepartment for Environment Food and Rural Affairs (Crews et al., 2002) and alsoby the Center for Food Safety and Applied Nutrition (CFSAN) of the United StatesFood and Drug Administration (FDA) are available and published. The results fromthe two-method comparison showed that, in spite of a limit of detection (LOD) thatwas higher for the United Kingdom (UK) method than the FDA method (3.000 versus
1,3-DICHLORO-2-PROPANOL 217

0.055 ng/g), the recoveries for the spike-test portions, as well as the amountsof 1,3-dichloro-2-propanol found in the retail products, were comparable for1,3-dichloro-2-propanol at concentrations of of 10 ng/g in soy and related sauces.
The CSL method has the advantage of being faster and simpler than theFDA modified method, which is more labour-intensive, but the FDA method hasthe advantage that it allows extraction and analysis of 1,3-dichloro-2-propanol and3-chloro-1,2-propanediol in the same GC/MS run.
In a paper published in 2006, the Chinese authors also proposed amethodology that allows the simultaneous separation and determination ofchloropropanols (1,3-dichloro-2-propanol, 2,3-dichloro-2-propanol, 3-monochloro-propane-1,2-diol and 2-monochloro-1,3-propanediol) in soy sauce and otherflavouring, using GC/MS in negative chemical and electron-impact ionizationmodes, at low concentrations of around 0.6 μg/kg (Xiamin Xu et al., 2006).
4. LEVELS AND PATTERNS OF CONTAMINATION OF FOODCOMMODITIES
4.1.1 Surveillance data
Chloropropanols are a group of chemical contaminants formed under certainprocessing and storage conditions; 3-chloro-1,2-propanediol and 1,3-dichloro-2-propanol are primary members of this group. 1,3-Dichloro-2-propanol is formedduring the production of acid-HVPs such as soya beans from the reaction ofhydrochloric acid and residual vegetable fat from the raw materials used. As a resultof the use of acid-HVP, 1,3-dichloro-2-propanol has now been found as acontaminant in various foods and food ingredients, most notably in acid-HVPs andsoy sauces3 (Codex Commission on Food Additives and Contaminants, 2006).
4.1.2 National occurrence of 1,3-dichloro-2-propanol
Data on the occurrence of 1,3-dichloro-2-propanol were submitted bymember states of the European Union (European Union, 2004), Australia (FSANZ,2003), Hong Kong Special Administrative Region of China (SAR) (FEHD, 2005),and Japan (MAFF, 2005 and 2006). Data on soy sauces and related products werealso available for the United States of America (USA) from the literature (Nyman etal., 2003b).
Table 6 describes the summary of the distribution-weighted concentration of1,3-dichloro-2-propanol in soy sauce and soy-sauce based products, in other foodsproducts and in food ingredients from those countries, from 2001 to 2006.
3 The term ‘soy sauce’ is used to encompass liquid seasonings made from soya beans by arange of methods including acid hydrolysis and traditional fermentation, possibly with theaddition of acid-HVP. In some countries the term ‘soy sauce’ is reserved solely for fermentedproducts.
218 1,3-DICHLORO-2-PROPANOL

4.1.3 Soy sauce and soy sauce-based products
(a) Australia
Australia submitted occurrence data for 39 individual samples of differentsoy and oyster sauces, based on food surveys conducted in 2001 and 2002(FSANZ, 2003). Sampling was undertaken of selected soy and oyster sauces anda range of other foods available at Australian retail outlets. The method used forquantitative analysis of 1,3-dichloro-2-propanol was based on the Association ofOfficial Analytical Chemists (AOAC) Method No. 2000.01. The limit of quantification(LOQ) was 0.01 mg/kg. The majority of soy and oyster sauces did not containdetectable levels of 1,3-dichloro-2-propanol. 1,3-Dichloro-2-propanol was detectedonly at less than 1 mg/kg in those sauces that also contained 3-chloro-1,2-propanediol, that is, mainly soy seasoning sauce.
• The highest contamination level was reported for the seasoning soy sauceproduct, with a maximum of about 0.6 mg/kg.
• The average was calculated by assigning a value of half the reporting limits tothe 26% of samples for which the reported value was less than the limit.
• The average concentration of 1,3-dichloro-2-propanol in the soy sauce and soysauce based products was reported to be 0.07 mg/kg.
(b) Hong Kong SAR
Hong Kong SAR submitted the results of occurrence data in aggregatesamples of different soy sauce and sauce-based products using the GlobalEnvironment Monitoring System—Food Contamination Monitoring and AssessmentProgramme (GEMS/Food) reporting format. Sampling was performed in 2003 andincluded the results of the analysis of 84 samples. Based on the very low limits ofdetection and quantification, 0.5 and 1.5 μg/kg respectively for 1,3-dichloro-2-propanol, analyses were performed using GC/MS. No indicator of analytical qualityassurance was described in the submission data (FEHD, 2005).
• The average was calculated by assigning a value of half the reporting limits tothe 84% of samples for which the reported value was less than the limit.
• The average concentration of 1,3-dichloro-2-propanol reported to be present insoy sauce and sauce-based products was less than 1.0 μg/kg.
• Of the 84 samples, two samples were reported to have tested positive for 1,3-dichloro-2-propanol: these were concentrated soup (2.7 μg/kg) and soy-sauceproduct (2.4 μg/kg).
(c) European Union
Individual occurrence data for 1,3-dichloro-2-propanol were available fromfour member states of the European Union (Austria, Finland, Germany and the UK)from the reports on tasks for Scientific Cooperation on levels of 3-chloro-1,2-propanediol and related substances in foodstuffs (European Union, 2004). The JointResearch Centre of the European Commission assisted in the task by providingadvice on analytical methodology. Participants agreed that only occurrence data
1,3-DICHLORO-2-PROPANOL 219

obtained after 1997 until the year before the publication report in 2004 should besubmitted as there was concern about the robustness of data acquired before thatdate. Some occurrence data provided by participants were from targeted samplingof products suspected of containing high levels of chloropropanols.
Of the 2035 soy sauce and related samples available, 282 were analysed for1,3-dichloro-2-propanol. These were of the following origins: Austria (n = 10), Finland(n = 35), Germany (n = 114), and UK (n = 123). The limit of quantification for soysauce and soy-sauce based products was between 0.005 mg/kg and 0.15 mg/kg.
• The average was calculated by assigning a value of half the reporting limits tothe 80% of samples for which the reported value was less than the limit.
• The weighted average concentration of 1,3-dichloro-2-propanol in soy sauce andsauce-based products was reported to be 0.092 mg/kg. For the different types ofsoy sauce, the average concentrations of 1,3-dichloro-2-propanol were reportedas follows: mushroom soy sauce, 0.43 mg/kg; soy sauce and seasoning sauce,0.08 mg/kg; dark soy sauce, 0.036 mg/kg; and light soy sauce, 0.027 mg/kg.Other average concentrations of 1,3-dichloro-2-propanol reported for sauce-based products were less than 0.01 mg/kg.
(d) Japan
Using the GEMS/Food reporting format, Japan submitted the results ofoccurrence data on levels of 1,3-dichloro-2-propanol in aggregate and individualsamples of soy sauce containing acid-HVP. Sampling was performed in 2005–2006and included results of the analysis of 40 samples of soy sauce made with acid-HVPs. The method used for analysis of 1,3-dichloro-2-propanol was validated in-house using GC/MS, and was published in a paper cited in MAFF (2005 and2006). 4The LOD and LOQ were 0.002 mg/kg and 0.004 mg/kg, respectively.
• The results of 83% of analyses of samples of soy sauces made with acid-HVPindicated that concentrations of 1,3-dichloro-2-propanol were below the LOQ.Samples containing quantified levels of 1,3-dichloro-2-propanol also contained3-chloro-1,2-propanediol (at or above 3.4 mg/kg). The highest level reported was0.022 mg/kg and the average was 0.005 mg/kg.
(e) USA
Results of occurrence data for individual samples of 39 different soy sauceand sauce-based products purchased from retail outlets in metropolitan areas in2002 were published by the FDA (Nyman et al., 2003a). The method used forquantitative analysis of 1,3-dichloro-2-propanol was based on a modified version ofAOAC Method No. 2000.01. Based on this modified method, validated in-house, anLOQ of 0.025 mg/kg was established for 1,3-dichloro-2-propanol. The authorsconcluded that all samples that contained 1,3-dichloro-2-propanol at a concen-tration of greater than 0.05 mg/kg were from products manufactured in Asia,indicating that at the time of their study some Asian manufacturers had not made
4 Journal of Food Hygienic Society of Japan 1995, 36(3):360–364.
220 1,3-DICHLORO-2-PROPANOL

the necessary processing changes to control the formation of chloropropanols inacid-HVP.
1,3-dichloro-2-propanol was detected in 36% of those sauces that alsocontained 3-chloro-1,2-propanediol, mainly in samples of soy sauce. The highestconcentration reported was 9.84 mg/kg, for a soy sauce.
• The average was calculated by assigning a value of half the reporting limits tothe 64% of samples for which the reported value was less than the limit.
• The average concentration of 1,3-dichloro-2-propanol was reported to be 0.62mg/kg.
4.1.4 Food ingredients
(a) European Union
Results of the analysis of 1,3-dichloro-2-propanol in over 24 samples of foodingredients were available from the reports on Tasks for Scientific Cooperation onlevels of 3-chloro-1,2-propanediol and related substances in foodstuffs, but it wasnot possible to precisely identify from which member states the data were derived(European Union, 2004). 1,3-Dichloro-2-propanol was investigated in malt productsonly. Of these samples, 13% were found to contain 1,3-dichloro-2-propanol at aconcentration that was greater than the LOQ, set at 0.010 mg/kg. The weightedaverage concentration of 1,3-dichloro-2-propanol for this food category wasreported to be 0.009 mg/kg in quantified samples.
(b) Japan
Using the GEMS/Food reporting format, Japan submitted to the JECFAsecretariat the results of occurrence data on the levels of 1,3-dichloro-2-propanolin acid-HVPs from aggregate and individual samples. Sampling was performed in2005–2006 and included results of the analysis of 40 samples of acid-HVPs. Themethod used for analysis was validated in-house using GC/MS. The analyticalmethod has been published in a paper cited in MAFF (2005 and 2006).4The LODand LOQ were 0.002 mg/kg and 0.004 mg/kg, respectively.
• Results of the analysis of 1,3-dichloro-2-propanol in more than 30 out of 40samples of acid-HVPs from other production processes showed thatconcentrations of 1,3-dichloro-2-propanol were below the LOQ. The averageconcentration was reported to be 0.008 mg/kg in acid-HVPs.
4.1.5 Other food products
Only Australia and the European Union submitted occurrence data for foodsand food groups likely to contain 1,3-dichloro-2-propanol as a result of processingor storage conditions. Analysis of several products included in the diet, e.g. cereals,meat and meat products, dairy products, fish and seafood products, was reported.
1,3-DICHLORO-2-PROPANOL 221

(a) Australia
Australia submitted occurrence data for 204 individual samples of otherfoods based on food surveys conducted in 2001 and 2002 (FSANZ, 2003). Samplingwas performed in selected other foods and a range of other foods available atAustralian retail outlets. The method used for quantitative analysis of 1,3-dichloro-2-propanol was similar that used to analyse this compound in soy and oyster saucesand was based on AOAC Method No. 2000.01. The LOD and LOQ were 0.003 mg/kg and 0.005 mg/kg, respectively. Analyses were performed for the following foodcategories: meat and meat products (99 samples), fish and fish products (29samples), chicken eggs (8 samples), cereals (37 samples), infant food (3 samples),infant formulas (3 samples), cheese, cheddar and processed (12 samples), starchyvegetables (3 samples), roasted coffee and cocoa paste (6 samples), vegetable oilsand fat (4 samples). Of these samples, 25% were reported to contain 1,3-dichloro-2-propanol at concentrations greater than the LOQ.
• Fish and fish products. 1,3-Dichloro-2-propanol was quantified in three samples:two samples of fish fillets, battered and fried, 0.024 mg/kg; and in one sample ofbattered fish fillet, fried, at a concentration that was slightly greater than the LOQof 0.006 mg/kg. The weighted average concentration of 1,3-dichloro-2-propanolfor this food category was reported to be 0.0025 mg/kg.
• Meat and meat products, including poultry and game. 1,3-Dichloro-2-propanolwas quantified in 48 out of 99 samples: 25 out of 44 samples of beef, mincedproducts, fried, raw or cooked, from 0.011 to 0.11 mg/kg; in 22 out of 43 samplesof sausages, meat products, fried, raw or cooked and leg ham, from 0.015 to0.069 (sausages, meat products, fried, raw or cooked ) and from 0.014 to 0.021(leg ham) mg/kg, respectively; and in one sample of chops, lamb raw product,0.091 mg/kg. The weighted average concentration of 1,3-dichloro-2-propanol forthis food category was reported to be 0.019 mg/kg.
(b) European Union
Results of the analysis of more than 42 samples of products other than soysauce and soy sauce-based products were available from the European Unionreport (European Union, 2004). 1,3-Dichloro-2-propanol was investigated in thefollowing food categories: cereals and cereal products, excluding bakery (twosamples), meat and meat products (16 samples), fish and fish products (14samples) and in salts, spices, soups, sauces, salads and protein (10 samples). Only2 out of 42 samples were found to contain 1,3-dichloro-2-propanol at a concentrationgreater than the LOQ, set at 0.010 mg/kg; these were two samples of ediblesausage casing found to contain 1,3-dichloro-2-propanol at 0.5 and 1.5 mg/kg.
4.1.6 Co-occurrence of 3-chloro-1,2-propanediol and 1,3-dichloro-2-propanol
Few studies have analysed 3-chloro-1,2-propanediol and 1,3-dichloro-2-propanol in the same food samples. The USA reported a study in 55samples in 2003. Hong Kong SAR reported 84 samples in 2003, the UK reported51 samples in 2000/2002, European Union member states reported 232 samples
222 1,3-DICHLORO-2-PROPANOL

in 2004, Australia reported 39 samples in 2000 to 2002 and Japan reported 80samples in 2005–2006.
Analysis of the study of co-occurrence described below includes caseswhere quantifiable amounts of both 3-chloro-1,2-propanediol and 1,3-dichloro-2-propanol were measured in the same sample of soy sauce and soy sauce-basedproducts and in food ingredients such as acid-HVPs. Figure 3 shows a plot of thepercentage of 1,3-dichloro-2-propanol/3-chloro-1,2-propanediol contained in samplesof different types of soy sauce (53 samples of soy sauce, 11 samples of seasoningsoy sauce, 3 samples of oyster sauce, 11 samples of other sauces and 19 samplesof mushroom sauce) and 10 samples of acid-HVPs found to contain bothsubstances at quantifiable concentrations greater than 0.4 mg/kg of 3-chloro-1,2-propanediol.
Based on a limited number of data, some trends were apparent:
• Food ingredients such as acid-HVPs contain less 1,3-dichloro-2-propanol/3-chloro-1,2-propanediol than do mushroom soy sauce or seasoning soy sauce—0.1% versus 1.3–1.4%, respectively.
• Other soy sauces and oyster soy sauce contain more 1,3-dichloro-2-propanol/3-chloro-1,2-propanediol the highest percentage compared to than do othertypes of soy sauce, at 2.4% and 8.3% respectively.
(a) Soy sauce and soy sauce-based products
Co-occurrence of 3-chloro-1,2-propanediol and 1,3-dichloro-2-propanol inthe same food samples was reported in 102 samples of soy sauce and soy sauce-based products, including 14 samples from the USA, 2 samples from Hong KongSAR, 7 samples from Japan, 12 from the UK, 58 from the European Union and 9from Australia.
1,3-Dichloro-2-propanol was detected only in those soy sauces thatcontained 3-chloro-1,2-propanediol, which suggests that, in this product, 1,3-dichloro-2-propanol is derived from 3-chloro-1,2-propanediol. Co-occurrence wasfound when samples contained 3-chloro-1,2-propanediol at a concentration greaterthan 0.4 mg/kg (82% of samples). When 3-chloro-1,2-propanediol is present at aconcentration of less than 0.4 mg/kg, 1,3-dichloro-2-propanol is generally rarelydetected, but this is reliant on the performance of the analytical method (LOD andLOQ) for analysis of 1,3-dichloro-2-propanol.
The statistical analysis of co-occurrence and the relationship between thetwo substances includes the analysis of 102 results for which quantifiable amountsof 3-chloro-1,2-propanediol and 1,3-dichloro-2-propanol were measured in thesame sample. As shown by the regression linear depicted in Figure 4, therelationship between 3-chloro-1,2-propanediol and 1,3-dichloro-2-propanol is highlysignificant with a very good Pearson correlation (r = 0.9209). The formula givenbelow describes the linear relationship for predicting the concentration of 1,3-dichloro-2-propanol from a quantified level of 3-chloro-1,2-propanediol of greaterthan 0.4 mg/kg in soy sauce and sauce-based products:
[1,3-dichloro-2-propanol]= 0.00949866 [3-chloro-1,2-propanediol]
1,3-DICHLORO-2-PROPANOL 223

Tab
le 6
. Su
mm
ary
of
the
dis
trib
uti
on
-wei
gh
ted
co
nce
ntr
atio
no
f1,
3-d
ich
loro
-2-p
rop
ano
l in
so
y sa
uce
an
dso
y sa
uce
-bas
edp
rod
uct
s, in
oth
er f
oo
ds
and
in f
oo
d in
gre
die
nts
fro
mva
rio
us
cou
ntr
ies,
200
1 to
200
6
Pro
duct
sC
ount
ry a
nd d
ate
LOQ
(m
g/kg
)N
o. o
fsa
mpl
esN
o. o
f sam
ples
with
conc
entr
atio
n <
LO
QM
eana
(mg/
kg)
CV
b (%
)M
axim
um(m
g/kg
)
Soy
sau
ce a
nd s
oy s
auce
-ba
sed
prod
ucts
Eur
ope
(EC
Sco
op T
ask
3.2.
9), 2
004
0.00
5-0.
1528
222
20.
092
286
1.37
Hon
g K
ong
SA
R, 2
003
0.00
1584
820.
001
NA
0.00
3
US
A, 2
000-
2002
0.02
539
170.
621
309
9.84
Aus
tral
ia, 2
001-
2002
0.01
039
170.
070
216
0.60
Japa
n, 2
005-
2006
0.00
440
330.
005
640.
02
All
484
371
0.11
033
29.
84
Mea
t and
mea
t pro
duct
sA
ustr
alia
, 200
1-20
020.
005
9951
0.01
912
50.
11
Fis
h an
d se
a fo
odA
ustr
alia
, 200
1-20
020.
005
2926
0.00
2511
10.
024
Foo
din
gred
ient
s:A
cid
HV
Ps
Japa
n, 2
005-
2006
0.00
240
300.
008
148
0.07
0
Mal
tex
trac
tE
urop
e (E
C S
coop
task
3.2.
9), 2
004
0.01
024
210.
008
104
0.02
5
All
5613
0.00
813
40.
070
CV
: coe
ffici
ent o
f var
iatio
n; a
cid-
HV
P: a
cid-
hydr
olys
ed v
eget
able
pro
tein
; LO
Q: l
imit
of q
uant
ifica
tion;
NA
: not
ava
ilabl
e; S
AR
: Spe
cial
Adm
inis
trat
ive
Reg
ion
of C
hina
.a C
once
ntra
tions
of l
ess
than
the
LOD
or L
OQ
wer
e as
sum
ed to
be
half
of th
ose
limits
and
the
mea
n w
as w
eigh
ted
acco
rdin
g to
the
num
ber o
f sam
ples
from
cou
ntrie
s.b
Coe
ffici
ent o
f var
iatio
n (s
tand
ard
devi
atio
n di
vide
d by
mea
n, %
)
224 1,3-DICHLORO-2-PROPANOL

Although to be validated this model needs to be tested with other data sets,it represents at this time the best first approach to considering the relationshipbetween the levels of 3-chloro-1,2-propanediol and 1,3-dichloro-2-propanol in thesame kinds of product: soy sauce and related sauce-based products.
Moreover, it could be deduced from data on samples containing 3-chloro-1,2-propanediol at concentrations between greater than 0.4 mg/kg and 1000mg/kg that such samples would contain 1,3-dichloro-2-propanol at a concentrationof about 1%. The data also seem to show that samples containing 3-chloro-1,2-propanediol at between less than 0.4 mg/kg and the LOQ would contain a higherproportion of 1,3-dichloro-2-propanol, at around 34% on average (only foursamples, not shown in Figure 2), but this is could also be caused by an analyticalartefact whereby the measurement of quantifiable levels of a substance atconcentrations close to the LOD and LOQ is subject to some uncertainty.
(b) Food ingredients
The co-occurrence of 3-chloro-1,2-propanediol and 1,3-dichloro-2-propanolin the same food samples was reported in 10 samples of acid-HVP productsprovided by Japan. In spite of the few data available, the analyses showed a very
Figure 3. Percentage of 1,3-dichloro-2-propanol/3-chloro-1,2-propanediol indifferent soy sauce and soy sauce-based products and acid-HVP
0 10 20 30 40 50 60
0
2
4
6
8
10
12
14
Number of individual samples per group
Soy, R = 1.3Seasoning, R = 1.4Oyster, R = 8.3Other, R = 2.4Mushroom, R = 1.4 Acid-HVPs, R = 0.1
Acid HVP: acid-hydrolysed vegetable protein.
Per
cent
age
of 1
,3-d
ichl
oro-
2-pr
opan
ol /3
-chl
oro-
1,2-
prop
aned
iol
1,3-DICHLORO-2-PROPANOL 225

good Pearson correlation (r = 0.8736). As shown by the linear regression obtainedfrom these data, the relationship between 3-chloro-1,2-propanediol and 1,3-dichloro-2-propanol is highly statistically significant and a model of linearity couldbe proposed. The formula given below describes a linear relationship to predict theconcentration of 1,3-dichloro-2-propanol from a quantified level of 3-chloro-1,2-propanediol in acid-HVPs as food ingredients:
[1,3-dichloro-2-propanol] = 0.0017738 [3-chloro-1,2-propanediol]
(c) Other food products
Only data from the European Union report and Australia give information onthe co-occurrence of 3-chloro-1,2-propanediol and 1,3-dichloro-2-propanol in otherfoods. The levels of 1,3-dichloro-2-propanol in various foods were highly variableand, in main foods, 1,3-dichloro-2-propanol was detected in the absence of detectedlevels of 3-chloro-1,2-propanediol. 1,3-Dichloro-2-propanol is mainly found atquantifiable level in samples of meat and meat products (50 out of 115 samples) atconcentrations that ranged from 0.006 to 0.11 mg/kg. In these products, theconcentration of 1,3-dichloro-2-propanol was generally found to be higher than thatof 3-chloro-1,2-propanediol. Two samples of fish fillet from the Australia marketwere found to contain 1,3-dichloro-2-propanol at a concentration of 0.006 and0.024 mg/kg. 3-Chloro-1,2-propanediol was quantified in 33% of these 50 samples.
Figure 4. Co-occurrence of 1,3-dichloro-2-propanol and 3-chloro-1,2-propanediol at quantifiable concentrations in soy sauce and soy sauce-basedproducts
0 200 400 600 800
0
2
4
6
8
10
3-chloro-1,2-propanediol (mg/kg)
1,3-
dich
loro
-2-p
ropa
nol (
mg/
kg)
[1,3-dichloro-2-propanol] = 0.00949866 [3-chloro-1,2-propanediol]
r = 0.92091976
226 1,3-DICHLORO-2-PROPANOL

Co-occurrence was reported in 16 samples of thick meat sausage (dry-fried),sausage meat (raw or cooked), leg ham and beef (minced cooked), with the averageconcentration of 1,3-dichloro-2-propanol being 0.034 mg/kg and of 3-chloro-1,2-propanediol being 0.014 mg/kg.
Summary of national occurrence data and co-occurrence of 3-chloro-1,2-propanediol and 1,3-dichloro-2-propanol
Data on 1,3-dichloro-2-propanol analysed in food were obtained fromseveral countries. 1,3-Dichloro-2-propanol was only found at quantified levels insamples of soy sauce, of ingredients such as acid-HVPs and malt products, ofminced beef (dry-fried, raw or cooked), pork ham, sausage meat (raw or cooked)and in samples of fish fillet (battered and fried). Average levels in samples of soysauce-based products ranged from 0.09 mg/kg for soy oyster sauce to 0.6 mg/kgfor soy mushroom sauce. Average levels were 0.024 mg/kg in samples of fishproduct, 0.034 mg/kg in samples of meat products and 0.022 mg/kg in samples ofmalt products.
1,3-Dichloro-2-propanol was detected only in samples that also contained3-chloro-1,2-propanediol, except in samples of meat and meat products where 1,3-dichloro-2-propanol was detected in the presence (18 samples) and in the absence(32 samples) of detected levels of 3-chloro-1,2-propanediol. In meat products, theconcentrations of 1,3-dichloro-2-propanol were generally higher than those of3-chloro-1,2-propanediol.
The Committee noted that 1,3-dichloro-2-propanol is found in samples ofsoy sauce and soy sauce-based products when the concentrations of 3-chloro-1,2-propanediol exceed 0.4 mg/kg. Based on limited data, there appears to be alinear relationship between the concentrations of 1,3-dichloro-2-propanol and3-chloro-1,2-propanediol, but there was considerable scatter in the data at lowconcentrations and there was some variation between different types of products.Additional occurrence data would be needed to confirm these relationships, beforethey could be used to predict the concentrations of 1,3-dichloro-2-propanol basedon the concentrations of 3-chloro-1,2-propanediol.
5. ESTIMATED DIETARY INTAKE
5.1 National assessments of intake from diet
Dietary intakes of 1,3-dichloro-2-propanol have been reported for 10 count-ries (Australia, Denmark, Finland, France, Germany, Ireland, the Netherlands,Sweden, Thailand and the UK). No dietary intakes were available for Latin Americaand Africa. Mainly, countries have calculated national intake using deterministicmodelling by crossing national individual consumption data with national meanoccurrence data obtained from surveys conducted in their country.
Consistent with their national food consumption data, all countries exceptGermany calculated estimates for the adult population and children. Meanoccurrence data used in the calculation are those reported in the preceding section
1,3-DICHLORO-2-PROPANOL 227

on country occurrence data, where all values classified as being less than the LOQwere assumed to have 1,3-dichloro-2-propanol at a concentration of half the LOQ,except for Thailand where no information was available concerning the treatmentof data below the quantification limit. Intake estimates were calculated on a per-kilogram of body weight basis. Estimates reported by each country are describedaccording to the two following variables of intake distribution (mean and high-percentile dietary exposures):
• Average estimates: combination of the average food consumption and meanoccurrence data for food consumed
• P95: 95th percentile of the intake distribution
Table 7 summarizes national estimated dietary intakes of 1,3-dichloro-2-propanol from various food sources, including soy sauce and soy sauce-basedproducts.
Table 8 summarizes national estimated consumption of soy sauce and soysauce-based products by consumers only from various countries, and thecorresponding estimated dietary intakes of 1,3-dichloro-2-propanol.
(a) Australia
Australia submitted the results of dietary exposure assessment forchloropropanols (FSANZ, 2003). Intake calculations were obtained in adeterministic way using a dietary modelling computer program (Dietary Modellingof Nutritional Data, DIAMOND) crossing mean concentration of 1,3-dichloro-2-propanol in a wide range of foods, including soy sauce and soy sauce-basedproducts consumed by each individual reported in the 1995 National NutritionSurvey based on 24 h-recall methodology. To provide a more refined estimate ofdietary exposure, values for concentrations that were below the limit of reporting(LOR = 78%) were assigned a concentration equal to the LOR.
Dietary exposure was conducted using food groupings based on the CodexGSFA classification system for food additives. Foods are classified according tomajor food types, as raw and processed foods, to which reported analyticalconcentrations are assigned. Calculations are made in assigning concentrations of1,3-dichloro-2-propanol to food groups for food eaten “as is”, as well as for foodused as ingredients in mixed foods. Where a single food from a food group wasanalysed, the concentration of 1,3-dichloro-2-propanol was assigned to the wholegroup, assuming that like foods would contain 1,3-dichloro-2-propanol at a similarconcentration. This is likely to result in an overestimation of dietary, but assumes aworst-case scenario.
Table 7 shows that the intake estimates for whole population aged more than2 years ranged from 0.041 μg/kg bw per day on average to 0.105 μg/kg bw per dayfor consumers at the 95th percentile. Children aged between 2 and 12 years hadexposures that ranged from 0.051 μg/kg bw per day on average to 0.136 μg/kg bwper day for consumers at the 95th percentile. Children aged between 13 and19 years had exposures that ranged from 0.035 μg/kg bw per day on average to0.094 μg/kg bw per day for consumers at the 95th percentile. Adults aged 20 years
228 1,3-DICHLORO-2-PROPANOL

and older had exposures that ranged from 0.039 μg/kg bw per day on average to0.101 μg/kg bw per day for consumers at the 95th percentile.
Major contributors to estimated dietary exposures to 1,3-dichloro-2-propanolfor all groups were minced meat (45%), sausages (25%), bread (10%) soy andoyster sauce (7%), and ham and bacon (6%).
(b) European Union
No national estimates of dietary intake of 1,3-dichloro-2-propanol wereavailable from the European Commission report (European Union, 2004).
As a first approach to estimating exposure to 1,3-dichloro-2-propanol amongthe European Member States involved in the Scientific Cooperation on levels of 3-chloro-1,2-propanediol and related substances in foodstuffs (European Union,2004), an assessment of estimated intake was made by the Committee at its presentmeeting. This assessment was based on data on occurrence and food consumptionavailable for food sources found to contain 1,3-dichloro-2-propanol, which werepublished in the European Commission report and the Australian report.
This assessment took into account the weighted average concentration of1,3-dichloro-2-propanol reported in Table 6 for the following food sources: soy sauceproducts (0.092 mg/kg), meat and meat products (0.019 mg/kg, corresponding tothe weighted mean from Australia) and fish products (0.0025 mg/kg, correspondingto the weighted mean from Australia). Average food consumption and consump-tion at the 95th percentile for these products reported by member states in the ECreport was used. Estimated dietary intakes were assessed for eight members ofthe European community (Denmark, Finland, France, Germany, Ireland, theNetherlands, Sweden and UK) according a mean body weight of 65 kg for adults,30 kg for children and 15 kg for young children. Owing to differences in theconsumption data reported by countries (whole-population, consumers only) andthe mode of calculation of intake, estimates of dietary exposure to 1,3-dichloro-2-propanol made by the Committee at its present meeting are likely to beoverestimated, as high-percentile (95th) intakes of different products have beensummed and it is improbable that a consumer will have a high consumption of allproducts. Table 6 summarizes estimated intakes for mean and high-percentileconsumption from various food sources.
• Estmates of average intake from all sources ranged from 0.008 to 0.048 μg/kgbw per day for the adult population and from 0.011 to 0.035 μg/kg bw per day forchildren. For consumers at a high percentile (95th), including young children,estimated intakes ranged from 0.025 to 0.133 μg/kg bw per day.
• Estimated intakes from meat and meat products ranged from 0.007 μg/kg bw perday on average to 0.069 μg/kg bw per day for adults at the 95th percentile ofconsumption. Children have exposures that ranged from 0.009 μg/kg bw per dayon average to 0.075 μg/kg bw per day at the 95th percentile of consumption.
• Estimated intakes from soy sauce and related products ranged from 0.001 μg/kgbw per day on average to 0.023 μg/kg bw per day at the 95th percentile for adults.Exposures for children ranged from 0.002 μg/kg bw per day on average to 0.055μg/kg bw per day at the 95th percentile (Table 8).
1,3-DICHLORO-2-PROPANOL 229

Meat and meat products made the greatest contribution to total exposure to1,3-dichloro-2-propanol in all groups and countries when compared with soy sauceand soy sauce-based products, from 72% to 99% versus <1% to 28%, respectively.
Consumption of soy sauce and soy sauce-based products by consumersonly from various countries and estimated dietary exposure to 1,3-dichloro-2-propanol
Table 8 summarizes consumption and estimated dietary intakes of 1,3-dichloro-2-propanol from soy sauce and soy sauce-based products in consumersonly from various countries. The percentage of consumers of soy sauce and soysauce-based products was reported to range from 1.4% to 8% in the adultpopulation and from 1% to 8.7% in children. Consumption ranged from 1 to 30 g/day, for various countries, in adults and from 0.6 to 16 g/day in children. An estimateof dietary intakes of 1,3-dichloro-2-propanol was obtained using consumption of soysauce by consumers only in each country and a fixed weighted concentration of 1,3-dichloro-2-propanol in soy sauce as described in reports by countries (Australia,0.069 mg/kg; and European countries, 0.092 mg/kg). A standard average bodyweight of 65 kg for adults, 30 kg for children and 15 kg for young children was used.
For adults, average intakes ranged from 0.001 to 0.011 μg/kg bw per dayand intakes at the 95th percentile ranged from 0.006 to 0.032 μg/kg bw per day. Inchildren, average intakes ranged from 0.002 to 0.012 μg/kg bw per day, and intakesat the 95th percentile ranged from 0.007 to 0.055 μg/kg bw per day.
Summary of national intake estimates
National estimates of dietary intake of 1,3-dichloro-2-propanol provided byAustralia and estimates for European Union member states were assessed by theCommittee based on available occurrence data provided both by member statesand Australia. Intakes were calculated by linking individual consumption data withmean occurrence data, using the actual body weight of the consumer as reportedin consumption surveys.
At the national level, intake estimates from various food sources includingsoy sauce and soy-sauce products ranged from 0.008 to 0.051 μg/kg bw per dayfor the average in the general population. For consumers at a high percentile (95th),including young children, intake estimates ranged from 0.025 to 0.136 μg/kg bwper day.
Meat products are the main contributor to intake in all national estimates,ranging from 45% to 99% depending on the country diet. Soy sauce and soy sauce-based products contributed up to 30% in all national estimates. Other food groupscontributed up to 10% of the total intake.
The Committee concluded that based on national estimates, an intake of0.051 μg/kg bw per day of 1,3-dichloro-2-propanol could be taken to represent theaverage for the general population and that an intake of 1,3-dichloro-2-propanol of0.136 μg/kg bw per day could be taken to represent consumers with a high intake.In these intake estimates for average to high intake, young children are alsoincluded.
230 1,3-DICHLORO-2-PROPANOL

Table 7. Estimated dietary intake of 1,3-dichloro-2-propanol from various foodsources including soy sauce and soy sauce-based products
Country Population group Intake of 1,3-dichloro-2-propanol(μg/kg bw per day)a
Mean 95th Percentileb
Australia All ( 2 years) 0.041 0.105
2–12 years 0.051 0.136
13–19 years 0.035 0.094
20 years 0.039 0.101
Denmark Adult 0.040 —
Finland Adult 0.010 —
France 18 years 0.018 0.038
3–14 years 0.031 0.064
Germanyc Adult 0.008 0.026
14 years 0.011 0.036
Ireland Adult 0.048 0.077
Netherlands Adult 0.021 0.053
Children 0.036 0.099
Sweden Adult 0.011 0.025
United Kingdomc 18 years 0.016 0.041
1.5–4.5 years 0.035 0.133
a Only 5% of consumers had exposures above this level.b Estimated dietary intakes of 1,3-dichloro-2-propanol for European countries were
assessed by the Committee based on available food consumption data and a fixedweighted concentration of 1,3-dichloro-2-propanol for food categories found to contain 1,3-dichloro-2-propanol in the European Union report (European Union, 2004) (soy sauce andsoy sauce-based products) and in the Australian report for the other foods group (meatand fish products). Standard average body weights of 65 kg for adults, 30 kg for childrenand 15 kg for young children were used.
c Consumers only
5.2 International estimates of intake from GEMS/Food ConsumptionCluster Diets
The new descriptions of the GEMS/Food Consumption Cluster Diets allowa better refinement of intake assessments for chloropropanolsl, e.g. information isprovided on soy sauce consumed as is and oil of soya bean for other uses, cheeseprocessed, which makes the diets more relevant than those used for the previousevaluation by the Committee.
1,3-DICHLORO-2-PROPANOL 231

Data on distribution contamination from aggregate food items taking intoaccount the weighting of samples from submitted and published results have beendescribed according to the GEMS/Food categorization of 13 cluster diets (WHO,2006). Table 6 shows the summary of the distribution-weighted concentration of1,3-dichloro-2-propanol in soya sauce and soy sauce-based products, in otherfoods and in food ingredients from various countries from 2001 to 2006 reported asthe best available occurrence data.
In general, the food items analysed were well characterized and it waspossible to match sources, contamination and consumption to the new GEMS/Foodcluster diets. Occurrence data were multiplied by the total mean consumption of thecorresponding food category or subcategory reported, to derive mean total intakes
Table 8. Consumption of soy sauce and soy sauce-based products byconsumers only from various countries and estimated dietary exposure to1,3-dichloro-2-propanol
Country Populationgroup
No ofconsumers(%)
Consumption(g/day)
Intake of 1,3-dichloro-2-propanol(μg/kg bw per day) a
Mean P95b Mean P95
Australia All ( 2 years) 13 858 (7.6) 9.3 27.9 — —
2–12 years 2 079 (4.9) 4.8 16.2 0.011 0.037
13–19 years 1 063 (8.7) 9.3 25.4 — —
20 years 10 716 (8.1) 10.1 30.3 0.011 0.032
France 18 years 1 474 (2.4) 3.6 5.8 0.005 0.008
3–14 years 1 014 (1) 3.4 5.6 0.010 0.017
Germany Adult 25 000 (5.5) 0.9 4.3 0.001 0.006
4–14 years 2 614 (6.6) 0.6 2.2 0.002 0.007
Ireland Adult 958 (1.9) 1.9 4.1 0.003 0.006
Netherlands Adult 4 711 (3.7) 6.1 16.0 0.009 0.023
Children 1 383 (7.5) 4.0 14.5 0.012 0.044
Sweden Adult 1 212 (1.4) 2.3 4.8 0.003 0.007
UnitedKingdom
Adult 2 197 (8.7) 4.0 9.0 0.006 0.013
1–4 years 1 675 (2.4) 4 9.0 0.006 0.055
a Estimated dietary intakes of 1,3-dichloro-2-propanol were obtained using consumption ofsoy sauce by consumers only in each country and a fixed weighted concentration of 1,3-dichloro-2-propanol in soy sauce as described in reports (Australia, 0.069 mg/kg; andEuropean countries, 0.092 mg/kg). Standard average body weights of 65 kg for adults,30 kg for children and 15 kg for young children were used.
b 95th percentile: only 5% of consumers had exposures above this level.
232 1,3-DICHLORO-2-PROPANOL

per cluster diet of 1,3-dichloro-2-propanol from all food sources. A summary of theinternational dietary intake estimates expressed in μg/kg bw per day is presentedin Table 9.
International mean intakes from all sources were estimated to range from0.008 to 0.090 μg/kg bw per day for the 13 GEMS/Food cluster diets, assuming abody weight of 60 kg.
Meat and meat products made the greatest contribution to total exposure inall cluster diets except for clusters C, G, K and L and ranged from 54% to 72%. Soyasauce and oil of soya beans contributed more than 10% of the total exposure in allcluster diets (range, 24–68%; Table 9). Fish products contributed less than 5% ofthe total exposure in all cluster diets, except clusters A and J.
Table 9 Summary of estimates of international dietary intake of 1,3-dichloro-2-propanol from all food sources (in μg/kg bw per day) for the 13GEMS/Food Consumption Cluster Diets
Diet Food category Total
Soya a Meatb Fishc
Intaked % Totalintake
Intakea % Totalintake
Intakea % Totalintake
Intake
A 0.003 31 0.006 63 0.001 6 0.009
B 0.012 26 0.034 72 0.001 2 0.047
C 0.011 57 0.008 40 0.001 3 0.019
D 0.007 30 0.016 66 0.001 4 0.024
E 0.012 30 0.026 67 0.001 2 0.039
F 0.013 24 0.040 72 0.002 3 0.055
G 0.020 55 0.015 42 0.001 3 0.036
H 0.019 41 0.027 58 0.001 1 0.047
I 0.004 31 0.008 65 0.000 4 0.012
J 0.003 30 0.005 62 0.001 8 0.008
K 0.036 58 0.025 41 0.000 1 0.062
L 0.042 68 0.017 28 0.002 4 0.062
M 0.041 46 0.048 54 0.001 1 0.090
GEMS/Food: Global Environment Monitoring System—Food Contamination Monitoring andAssessment Programme
a Soya sauce and oil of soya beans.b Meat from cattle, pigs and sheepc Fish, marine and freshwater.d Weighted average concentration as reported in Table 8 for the food category or subcategory
considered and food consumption in new 13 GEMS/Food Consumption Cluster Diets.
1,3-DICHLORO-2-PROPANOL 233
6. COMMENTS
Toxicological data
At its present meeting, the Committee reviewed two new studies ofgenotoxicity, a test for micronucleus formation in rat bone marrow in vivo and anassay for unscheduled DNA synthesis in rat hepatocytes in vivo/in vitro, which metappropriate standards for study protocol and conduct. In those assays, 1,3-dichloro-2-propanol yielded negative results in the tissues assessed. However,toxicity was not demonstrated in the tissues and hence the level of exposure isunclear. No other new data were available.
In the light of the limitations of the negative results for genotoxicity in vivo,the Committee reconsidered the results from the long-term study of carcinogenicitypreviously evaluated at its fifty-seventh meeting (Annex 1, reference 154). In thatstudy, rats were given drinking-water containing 1,3-dichloro-2-propanol at a doseof 0, 2.1, 6.3, or 19 mg/kg bw per day in males and 0, 3.4, 9.6, or 30 mg/kg bw perday in females for 104 weeks. Increased incidences of tumours were demonstratedin both sexes at the two higher doses tested. No increase in tumour incidence wasseen at the lowest doses tested, 2.1 and 3.4 mg/kg bw per day for male and femalerats, respectively. Treatment-related increases in tumour incidence (adenomasand carcinomas) occurred in liver, kidney (males only), the tongue, and thyroidgland. Certain of the tumours (i.e. liver and kidney) might have arisen by non-genotoxic processes, but no clear mode of action was established. Moreover nomode of action was evident for the increased incidence of tongue papillomas andcarcinomas in both sexes of rats at the highest dose. In spite of the negative resultsfor genotoxicity in vivo in the tissues assessed (i.e. bone marrow and liver), theCommittee could not exclude a genotoxic basis for the neoplastic findings, becauseof the absence of persuasive negative genotoxicity data in the target organs forcarcinogenicity, and the findings that 1,3-dichloro-2-propanol caused pointmutations in bacteria and mammalian cells in culture and caused multi-organcarcinogenicity in both sexes. The Committee therefore confirmed that 1,3-dichloro-2-propanol should be regarded as a genotoxic and carcinogenic compound andperformed dose–response modelling of the carcinogenicity data from the long-termstudy in rats to calculate the margin of exposure, according to the recommendationsof the Committee at its sixty-first meeting (Annex 1, reference 166).
The Committee calculated benchmark doses for 10% extra risk of tumoursand 95% lower confidence limit for the benchmark dose (BMDL10) values for theincidences of treatment-related tumours at each site for each sex. Extra risk isdefined as the additional incidence divided by the tumour-free fraction of thepopulation in the controls. Also, because of the presumed common genotoxic modeof action, the incidences of animals with treatment-related tumours were modelledfor each sex. Consistent results were obtained from use of several models for alldatasets modelled. The BMDL10 values for the individual treatment-related tumoursranged from 7.2 to 19.1 mg/kg bw per day and for the incidence data for tumour-bearing animals from 3.3 to 7.7 mg/kg bw per day, as shown in Table 10.
234 1,3-DICHLORO-2-PROPANOL

Occurrence
Data on 1,3-dichloro-2-propanol analysed in food were obtained fromseveral countries. 1,3-Dichloro-2-propanol was only found at quantifiable levels insamples of soy sauce, in samples of ingredients such as acid-HVPs and maltproducts, in samples of minced beef (dry-fried, raw or cooked), pork ham, sausagemeat (raw or cooked) and in samples of fish fillet (battered and fried).
Average concentrations in samples of soy sauce-based products rangedfrom 0.09 mg/kg in soy oyster sauce to 0.6 mg/kg in soy mushroom sauce. Averageconcentrations were 0.024 mg/kg in samples of fish product, 0.034 mg/kg insamples of meat products and 0.022 mg/kg in samples of malt products.
1,3-Dichloro-2-propanol was detected only in samples that also contained 3-chloro-1,2-propanediol, except in samples of meat and meat products where 1,3-dichloro-2-propanol was detected in the presence (18 samples) and in the absence(32 samples) of detected levels of 3-chloro-1,2-propanediol. In meat products,the concentrations of 1,3-dichloro-2-propanol were generally higher than those of3-chloro-1,2-propanediol.
The Committee noted that 1,3-dichloro-2-propanol is found in samples of soysauce and soy sauce-based products when the concentrations of 3-chloro-1,2-propanediol exceed 0.4 mg/kg.
Based on limited data, there appears to be a linear relationship between theconcentrations of 1,3-dichloro-2-propanol and 3-chloro-1,2-propanediol, but therewas considerable scatter in the data at low concentrations and there was somevariation between different types of products. Additional occurrence data wouldbe needed to confirm the relationships before they could be used to predict theconcentrations of 1,3-dichloro-2-propanol based on the concentrations of 3-chloro-1,2-propanediol.
Dietary exposure assessment
National estimates of dietary intake of 1,3-dichloro-2-propanol were providedby Australia, and estimates for European Union member states were assessed bythe Committee based on available occurrence data provided both by EuropeanUnion member states and Australia. Intakes were calculated by linking individualconsumption data with mean occurrence data, using the actual body weight of theconsumer as reported in consumption surveys.
Intake estimates from various food sources including soy sauce and soy-sauce products at the national level ranged from 0.008 to 0.051 μg/kg bw per dayfor the average in the general population. For consumers at a high percentile(95th), including young children, intake estimates ranged from 0.025 to 0.136 μg/kgbw per day.
Meat products were the main contributor to intake in all national estimates,ranging from 45% to 99% depending on the country diet. Soy sauce and soy sauce-based products contributed up to 30% in all national estimates. Other food groupscontributed up to 10% of the total intake.
1,3-DICHLORO-2-PROPANOL 235

The Committee concluded that based on national estimates, an intake of0.051 μg/kg bw per day of 1,3-dichloro-2-propanol could be taken to represent theaverage for the general population and that an intake of 1,3-dichloro-2-propanol of0.136 μg/kg bw per day could be taken to represent high consumers. In the intakeestimates for average to high intake, young children are also included.
7. EVALUATION
The available evidence suggests that 1,3-dichloro-2-propanol occurs atlower concentrations than 3-chloro-1,2-propanediol in soy sauce and relatedproducts, and also in food ingredients containing acid-HVP. However, in meatproducts the concentrations of 1,3-dichloro-2-propanol are generally higher thanthose of 3-chloro-1,2-propanediol.
The Committee concluded that the critical effect of 1,3-dichloro-2-propanolis carcinogenicity. The substance yielded negative results in two new studies ofgenotoxicity, a test for micronucleus formation in bone marrow in vivo and an assayfor unscheduled DNA synthesis in vivo/in vitro in rat hepatocytes, but limitations inthose studies and positive findings in tests for genotoxicity in vitro as well as lack of
Table 10. BMD10a and BMDL10
b values obtained from fitting models toincidence data for all treatment-related tumours and for individual tumourlocations in male and female rats given drinking water containing 1,3-dichloro-2-propanol for 2 years
Treatment-affected sites andtumour types
Range of BMD10 values
(mg/kg bw per day)
Range of BMDL10 values
(mg/kg bw per day)
Males
Tumour-bearing animals/alltreatment-associated sites
5.4–7.5 3.3–6.1
Renal adenoma and carcinoma 11.1–12.2 7.2–7.7
Hepatocellular adenoma andcarcinoma
14.4–16.0 10.3–12.3
Tongue papilloma and carcinoma 12.4–17.9 8.7–11.6
Females
Tumour-bearing animals/alltreatment-associated sites
8.5–10.3 6.6–7.7
Hepatocellular adenoma andcarcinoma
11.2–14.6 9.1–10.1
Tongue papilloma and carcinoma 17.1–22.8 11.5–19.1
aBMD10: benchmark dose for 10% extra risk of tumours.bBMDL10: 95% lower confidence limit for the benchmark dose. Extra risk is defined as the
additional incidence divided by the tumour-free fraction of the population in the controls.
236 1,3-DICHLORO-2-PROPANOL

knowledge on the modes of action operative at the various tumour locations led theCommittee to the conclusion that a genotoxic mode of action could not be excluded.Accordingly, the cancer dose–response data were analysed by dose–responsemodelling, and the Committee used eight different models to calculate BMD10
and BMDL10 values. BMDL10 values for the individual tumours ranged from 7.2 to19.1 mg/kg bw per day and for incidence data on tumour-bearing animals for alltreatment-affected locations from 3.3 to 7.7 mg/kg bw per day.
The Committee concluded that a representative mean intake for the generalpopulation of 1,3-dichloro-2-propanol of 0.051 μg/kg bw per day and an estimatedhigh-level intake (young children included) of 0.136 μg/kg bw per day could be usedin the evaluation. Comparison of the mean and high-levels intakes with the lowestBMDL10 of 3.3 mg/kg bw per day, which was the BMDL10 for incidence data ontumour-bearing animals for all treatment-affected locations, indicates margins ofexposure of approximately 65 000 and 24 000, respectively. Based on thosemargins of exposure, the Committee concluded that the estimated intakes of 1,3-dichloro-2-propanol were of low concern for human health.
8. REFERENCES
Beevers, C. (2003) 1,3-Dichloropropan-2-ol (1,3-dichloro-2-propanol): Induction of un-scheduled DNA synthesis in rat liver using an in vivo/in vitro procedure. Report no 2150/1-D6173 from Covance Laboratories Ltd, England. Available from UK Food StandardsAgency as FSA final report no. T01024.
Codex Alimentarius Commission. Report of the Thirty-seventh Session of the CodexCommittee on Food Additives and Contaminants, The Hague, The Netherlands, 25–29April 2005. Rome, Food and Agriculture Organization of the United Nations, 2005(ALINORM 05/28/12; http://www.codexalimentarius.net/download/report/639/al28_12e.pdf).
Codex Commission on Food Additives and Contaminants (2006) Discussion paper on acid-HVP-containing products and other products containing chloropropanols. Provided tomembers of CCFAC for discussion during its Thirty-eighth Session, The Hague, TheNetherlands, 24–28 April 2006.
Committee on Mutagenicity (2003) Statement on the mutagenicity of 1,3-dichloropropan-2-ol;COM/03/S4—October 2003. Updated 24 July 2004. Department of Health, UnitedKingdom (http://www.advisorybodies.doh.gov.uk/com/1,3-dcp.htm).
Committee on Carcinogenicity (2004) Carcinogenicity of 1,3-dichloropropan-2-ol (1,3-dichloro-2-propanol) and 2,3-dichloropropan-1-ol (2,3-DCP). COC/04/S2 –June 2004(http://www.advisorybodies.doh.gov.uk/coc/1,3-2,3dcp04.htm).
Crews, C., Lebrun, G. & Brereton, P.A. (2002) Determination of 1,3-dichloropropanol on soysauces by automated headspace gas chromatography-mass spectrometry. Food Add.Contam., 19, 343–349.
European Union (2004) Reports on tasks for scientific cooperation. Report of expertsparticipating in Task 3.2.9: Occurrence and intake of chloropropanols in food. Directorate-General Health and Consumer Protection. Available from: http://ec.europa.eu/food/food/chemicalsafety/contaminants/mcpd_en.htm.
FEHD (2005) Data from an Excel file of the occurrence data for chloropropanols in soy saucesand related products. Submitted to the JECFA secretariat by Food and EnvironmentalHygiene Department, Hong Kong Special Administrative Region of China.
FSANZ (2003) Chloropropanols in food. An analysis of the public health risk. Food StandardsAustralia New Zealand, 2003 (Technical report series No. 15).
1,3-DICHLORO-2-PROPANOL 237

Howe, J. (2002) 1,3-Dichloropropan-2-ol (1,3-dichloro-2-propanol): Induction of micronuclei inthe bone marrow of treated rats. Unpublished report No 2150/1-D6172 from CovanceLaboratories Ltd, England. Available from UK Food Standards Agency as FSA final reportNo. T01024.
IPCS (2004) Principles for modelling dose–response for the risk assessment of chemicals.Geneva: World Health Organization, International Programme on Chemical Safety.
MAFF (2005 and 2006) Surveillance data on chloropropanols. Submitted to the JECFAsecretariat by the Ministry of Agriculture, Forestry and Fisheries of Japan, December 2005and May 2006.
National Toxicology Program (2005) 1,3-Dichloro-2-propanol [CAS No. 96-23-1]. Review oftoxicological literature. National Institute of Environmental Health Sciences (NIEHS),National Institutes of Health, US Department of Health and Human Services.
Nyman, P.J., Diachenko, G.W. & Perfetti, G.A. (2003a) Survey of chloroproanols in soy saucesand related products, Food Add. Contam., 20, 909–915.
Nyman, P.J., Diachenko, G.W. & Perfetti, GA. (2003b) Determination of 1,3-dichloropropanolin soy and related sauces by using gas chromatography/mass spectrometry. Food Addit.Contam., 20, 903–908.
Research & Consulting Co. (1986) 104-week chronic toxicity and oncogenicity study with 1,3-dichlor-propan-2-ol in the rat. Unpublished report No. 017820 from Research & ConsultingCo. AG, Itingen, Switzerland.
WHO (2006) GEMS/Food consumption clusters diets. Department of Food Safety, Zoonosesand Foodborne Diseases, Geneva, World Health Organization.
Xiamin Xu, Yiping Ren, Pinggu wu, Jianlong Han & Xianghong Shen (2006) The simultaneousseparation and determination of chloropropanols in soy sauce and other flavoring with gaschromatography-mass spectrometry in negative chemical and electron impact ionisationmodes. Food Addit. Contam., 23, 110–119.
238 1,3-DICHLORO-2-PROPANOL

3-CHLORO-1,2-PROPANEDIOL (addendum)
First draft prepared by
G. Williams,1 K. Schneider,2 J-C Leblanc3 & J.C. Larsen4
1 Department of Pathology, New York Medical College, Valhalla, USA;
2 Forschungs- und Beratungsinstitut Gefahrstoffe GmbH (FoBiG), Freiburg,Germany;
3Agence Française de Sécurité Sanitaire des Aliments, Maisons Alfort,France; and
4 Division of Toxicology and Risk Assessment, Danish Institute of Food andVeterinary Research, Søborg, Denmark
Explanation ................................................................................Biological data ...........................................................................
Biochemical aspects ...........................................................Toxicological data ...............................................................
Short-term studies of toxicity ........................................Long-term studies of toxicity and carcinogenicity .........Genotoxicity ..................................................................Reproductive toxicity .....................................................
Observations in humans .....................................................Analytical methods ....................................................................
Chemistry ............................................................................Description of analytical methods .......................................
Levels and patterns of contamination of food commodities ......Surveillance data ................................................................National occurrence of 3-chloro-1,2-propanediol ................
Soy sauce and soy sauce-based products ...................Food ingredients ...........................................................Other products ..............................................................
Estimated dietary intake ............................................................National assessments of intake from diet ...........................International estimates of intake for GEMS/Food Consump-tion Cluster Diets .................................................................
Comments .................................................................................Evaluation ..................................................................................References ................................................................................
1. EXPLANATION
3-Chloro-1,2-propanediol is formed when chloride ions react with lipidcomponents in foods under a variety of conditions, including food processing,cooking, and storage. The compound has been found as a contaminant in various
239241241241241241241242243243243243244244244245248249252252
261264265266
- 239 -

foods and food ingredients, most notably in acid-hydrolysed vegetable protein (acid-HVP) and soy sauces.1 3-Chloro-1,2-propanediol was first evaluated by theCommittee at its forty-first meeting (Annex 1, reference 107). The Committeeconcluded that it is an undesirable contaminant in food and expressed the opinionthat its concentration in acid-HVP should be reduced as far as technicallyachievable.
3-Chloro-1,2-propanediol was re-evaluated by the Committee at its fifty-seventh meeting (Annex 1, reference 154). Short- and long-term studies in rodentsshowed that 3-chloro-1,2-propanediol is nephrotoxic in both sexes and also affectsthe male reproductive tract and male fertility. At that meeting, the Committeeconsidered that the kidney was the main target organ and tubule hyperplasia in thekidney the most sensitive end-point for deriving a tolerable intake. This effect wasseen in a long-term study of toxicity and carcinogenicity in male and female Fischer344 rats given drinking-water containing 3-chloro-1,2-propanediol. The Committeeconcluded that 1.1 mg/kg bw per day, the lowest dose, was a lowest-observed-effectlevel (LOEL) and that this was close to a no-observed-effect level (NOEL). TheCommittee established a provisional maximum tolerable daily intake (PMTDI) of 2μg/kg bw for 3-chloro-1,2-propanediol on the basis of this LOEL, using a safetyfactor of 500. This factor was considered adequate to allow for the absence of aclear NOEL and to account for the effects on male fertility and for inadequacies inthe studies of reproductive toxicity. Data available to the Committee at that timeindicated that the estimated mean intake of 3-chloro-1,2-propanediol for consumersof soy sauce would be at or above this PMTDI.
The present re-evaluation was conducted in response to a request from theCodex Committee on Food Additives and Contaminants (CCFAC) at its Thirty-seventh Session (Codex Alimentarius Commission, 2005a) for the JECFACommittee to review and summarize all new data on the toxicology and occurrenceof 3-chloro-1,2-propanediol. In particular, the Committee was asked to carry out anexposure assessment for 3-chloro-1,2-propanediol based on the contributions fromall food groups in the diet (not only soy sauce), with particular consideration topopulation groups that might have higher levels of exposure.
Since the Committee’s last evaluation of 3-chloro-1,2-propanediol (Annex 1,references 154, 155) this substance has also been evaluated by the Food StandardsAustralia New Zealand (FSANZ, 2003).
1 The term ‘soy sauce’ is used to encompass liquid seasonings made from soya beans by arange of methods including acid-hydrolysis and traditional fermentation, possibly with theaddition of acid-HVP. In some countries, the term ‘soy sauce’ is reserved solely forfermented products.
240 3-CHLORO-1,2-PROPANEDIOL

2. BIOLOGICAL DATA
2.1 Biochemical aspects
No new information was available.
2.2 Toxicological data
2.2.1 Short-term studies of toxicity
Rats
In a study to investigate effects on neurobehaviour, groups of 10 male and10 female Sprague-Dawley rats were given 3-chloro-1,2-propanediol as oral dosesat 0, 10, 20, or 30 mg/kg bw per day for 11 weeks. Although body-weight gain wassignificantly decreased in the males at the highest dose, no significant effects onthe results of tests for motor activity, landing foot splay, or forelimb grip strengthwere found in treated rats at weeks 1, 3, 5, 7, 9, or 11 when compared with controlrats that received saline. These results suggest that 3-chloro-1,2-propanediol, atthe doses used, does not produce neuromotor deficits (Kim et al., 2004).
2.2.2 Long-term studies of toxicity and carcinogenicity
No new studies were available.
2.2.3 Genotoxicity
The previously reviewed reports from Fellows (2000) and Marshall (2000)have now been published (Robjohns et al., 2003).
The formation of micronuclei in bone marrow erythrocytes was studied ingroups of six male Crl:Han Wist(Glx:BRL)BR rats given 3-chloro-1,2-propanediolas oral doses at 0, 15, 30 or 60 mg/kg bw per day for two consecutive days, basedon a preliminary dose range-finding experiment in which a dose of 60 mg/kg bw perday was close to the maximum tolerated dose. Administration of 3-chloro-1,2-propanediol at the highest dose produced signs of toxicity (piloerection) and areduction in the ratio of polychromatic to normochromatic erythrocytes, indicatingtoxicity to erythropoietic cells. No increase in micronucleated polychromaticerythrocytes was produced by 3-chloro-1,2-propanediol, while the positive control,cyclophosphamide, was clearly active.
Unscheduled DNA synthesis in hepatocytes was studied in groups of fourmale Crl:Han Wist(Glx:BRL)BR rats given 3-chloro-1,2-propanediol as single oraldoses at 0, 40 or 100 mg/kg bw, based on a preliminary dose range-findingexperiment in which 100 mg/kg bw per day was close to the maximum tolerateddosage. In one part of the experiment, hepatocytes were isolated at 2–4 h afterdosing and in the second, at 12–14 h after dosing. Hepatocytes were culturedwith [3H]thymidine, incorporated during unscheduled DNA synthesis, which wasmeasured autoradiographically. The administration of 3-chloro-1,2-propanedioldid not elicit any increase in the net number of nuclear grains indicative of
3-CHLORO-1,2-PROPANEDIOL 241

unscheduled DNA synthesis, while the positive controls, 2-acetylaminofluorene anddimethylnitrosamine, were clearly active (Robjohns et al., 2003).
2.2.4 Reproductive toxicity
Rats
To study mechanisms of antifertility in male rats, groups of 15 male Sprague-Dawley rats aged 8 weeks were given 3-chloro-1,2-propanediol daily by intragastricinstillation at a dose of 0, 0.01, 0.05, 0.25, 1 or 5 mg/kg bw per day for 28 days. Atthe end of the treatment period, male rats were mated overnight with untreatedfemales. Males successfully inducing pregnancy were sacrificed to assess spermparameters, histopathology of reproductive organs, and spermatogenesis. Thepregnant females were sacrificed on day 20 of gestation to evaluate pregnancyoutcome. The paternal administration of 3-chloro-1,2-propanediol did not affectbody or reproductive-organ weights. The highest dose produced adverse effects onmale fertility and pregnancy outcome without inducing histopathological changes inthe testes and epididymides of animals that successfully impregnated females. Atdoses of 0.25 mg/kg bw per day and greater, sperm counts were decreased. Theauthors applied statistical analysis to the numbers of motile sperm and reportedstatistically significantly reduced sperm motility at doses of 0.25 mg/kg bw andgreater. However, no statistical analysis was performed on the appropriatemeasure, i.e. motile sperm as percentage of total sperm. There were also errors inthe reported percentages of motile sperm; recalculation of percentages yielded thefollowing values: 83%, 80%, 85%, 73%, 73%, and 72% for the control group, andthe groups at 0.05, 0.25, 1, and 5 mg/kg bw per day, respectively. There was noapparent effect on the percentage of motile sperm at any dose. The copulation indexwas unaffected by treatment, while the fertility index was markedly reduced at thehighest dose, 14.3% vs 100% in controls. At the highest dose, reductions occurredin the numbers of corpora lutea (10.5 vs 19.8 in controls), total implants (10.5 vs15.9 in controls) and total live fetuses (1.0 vs 14.5 in controls). 3-Chloro-1,2-propanediol did not affect concentrations of testosterone or luteinizing hormone inthe blood of male rats. The NOEL for effects on male fertility and on pregnancyoutcome was 1 mg/kg bw per day (Kwack et al., 2004).
Groups of six rats aged 8 weeks were given intraperitoneal doses of 3-chloro-1,2-propanediol at 10 or 100 mg/kg bw, and testes and epididymides were examined3, 6, 12, and 24 h later. In the testes of animals treated with 3-chloro-1,2-propanediolat a dose of 100 mg/kg bw, apoptosis was not detected by DNA laddering,deoxynucleotidyl transferase-mediated dUTP-biotin nick end-labelling (TUNEL)staining, or caspase-7 protein expression. The level of H+-ATPase as assessedimmunohistochemically in the cauda epididymis was reduced. These results indicatethat 3-chloro-1,2-propanediol had a spermatotoxic effect, which was mediated byreduced H+-ATPase expression in the cauda epididymis. Reduced H+-ATPaseactivity is predicted to produce an altered pH in the cauda epididymis, which mightlead to a disruption of sperm maturation and motility (Kwack et al., 2004).
To study testicular organogenesis, groups of pregnant rats were given3-chloro-1,2-propanediol as intragastric doses at 0, 5, 10 or 25 mg/kg bw per dayfrom days 11 to 18 of gestation. On day 19 of gestation, the testes were removed
242 3-CHLORO-1,2-PROPANEDIOL

from fetuses for histological examination, measurement of testosterone productionand expression of eight testicular genes was assessed by reverse transcription-polymerase chain reaction (RT-PCR). 3-Chloro-1,2-propanediol and its mainmetabolite, -chlorolactic acid, were detected in maternal plasma and in fetaltissues at 0.5–3.0 h after dosing. The mean body-weight gains of pregnant ratstreated with 3-chloro-1,2-propanediol at 10 and 25 mg/kg bw were decreased.Testes of exposed fetuses exhibited normal histology and produced testosteroneat levels that were similar to controls. In addition, 3-chloro-1,2-propanediol did notalter gene expression in the fetal testes. Thus, 3-chloro-1,2-propanediol had aminimal effect on rat testicular organogenesis (El Ramy et al., 2006).
2.3 Observations in humans
No new information was available.
3. ANALYTICAL METHODS
3.1 Chemistry
3-chloro-1,2-propanediol (CAS Registry No. 96-24-2) is a colourless, slightlyoily liquid with a faint and pleasant odour. 3-Chloro-1,2-propanediol boils at 213 °Cat atmospheric pressure, does not distill with water vapour, has a density of 1.3204g/cm3 (20 °C), and is readily soluble in water and ethanol. 3-Chloro-1,2-propanediolis relatively unstable in aqueous alkaline media and are decomposed to glycerol viathe intermediate epoxyde glycidiol according to a reaction commonly used to reducethe levels of 3-chloro-1,2-propanediol in commercial hydrolysed vegetable protein(HVP) (Hamlet et al., 2002).
3.2 Description of analytical methods
The application of mass spectrometric detection in recent years has in-creased sensitivity of analysis. A validated gas chromatography-mass spectrometry(GC/MS) method capable of measuring 3-chloro-1,2-propanediol in food andfood ingredients at concentrations as low as 0.010 mg/kg is available and has beenaccepted as a first action status method by the Association of Official AnalyticalChemists (AOAC) (Method No. 2000.01) (Brereton et al., 2001). Results shownthat the method is satisfactory when used by analysts not specialized in thedetermination of 3-chloro-1,2-propanediol and that the method can also be appliedto a wide range of foods and ingredients.
The Central Science Laboratory (CSL) of the UK Government Departmentfor Environment Food and Rural Affairs (Crews et al., 2002) and the United StatesFood and Drug Administration (FDA) (Nyman et al., 2003a) have developed a fullyin-house validation method to allow both extraction and analysis of 3-chloro-1,2-propanediol and 1,3-dichloropropanol in the same GC/MS run.
In a paper published in 2006, the Chinese authors also proposed amethodology that allows the simultaneous separation and determination ofchloropropanols (1,3-dichloropropanol, 2,3-dichloropropanol, 3-monochloro-
3-CHLORO-1,2-PROPANEDIOL 243

propane-1,2-diol and 2-monochloro-1,2-propanediol) in soy sauce and otherflavouring, using GC/MS in negative chemical and electron-impact ionizationmodes, at concentrations of around 0.6 μg/kg (Xiamin Xu et al., 2006).
4. LEVELS AND PATTERNS OF CONTAMINATION OF FOODCOMMODITIES
4.1 Surveillance data
Acid-HVPs are widely used in seasonings and as ingredients in processedsavoury food products. They are used to flavour a variety of foods, including manyprocessed and prepared foods such as sauces, soups, snacks, gravy mixes,bouillon cubes, etc. As a result of these uses, 3-chloro-1,2-propanediol has beenidentified in many foods and food ingredients, most notably in acid-HVP and soysauces (Codex Commission on Food Additives and Contaminants, 2006)
Recent studies have demonstrated that 3-chloro-1,2-propanediol may alsobe formed in other processed foods, particularly in meat products (salami and beefburgers), dairy products (processed cheese and cheese alternatives), a range ofcereal products subjected to heat treatments such as baking, roasting or toasting(toasted biscuits, doughnuts, malt and malt extract) and some other foods. It seemsevident that chloropropanediols and possibly also dichloropropanols in these foodsare formed from chlorides and naturally and/or intentionally added lipids (FoodStandards Agency, 2005a).
Fatty acid esters of monochloropropanols have recently been identified in arange of processed and unprocessed foods (Svejkovska et al., 2004). To date, onlya limited number of analyses have been reported, but the amount of esterified3-chloro-1,2-propanediol in many of the samples is higher than the amount of free(non-esterified) monochloropropanol in the same samples. The significance of thepresence of esterified 3-chloro-1,2-propanediol in food has yet to be determined.
4.2 National occurrence of 3-chloro-1,2-propanediol
Data on the occurrence of 3-chloro-1,2-propanediol in food were providedby 14 countries: member states of the European Union (European Union, 2004)(Austria, Denmark, Finland, France, Germany, Ireland, the Netherlands, Norway,Sweden, the United Kingdom (UK) (Food Standards Agency, 2005b), Australia(FSANZ, 2003), Hong Kong Special Administrative Region of China (SAR) (Foodand Environmental Hygiene Department, 2005), Japan (Ministry of Agriculture,Forestry and Fisheries of Japan , 2005 and 2006), Thailand (Ministry of Agricultureand Cooperatives of Thailand, 2006) and by the International Hydrolyzed ProteinCouncil (IPHC; International Hydrolyzed Protein Council, 2005). Data on soy saucesand related products were also available for the United States of America (USA)from the literature (Nyman et al., 2003b).
Since the fifty-seventh meeting of the Committee in 2002 (Annex 1, reference154) at which only soy sauces and related products were evaluated, moreoccurrence data have been collected on 3-chloro-1,2-propanediol in heat processedfoods like bread and bakery waves, malt, batter, meat and fish products.
244 3-CHLORO-1,2-PROPANEDIOL

Table 1 summarizes the distribution-weighted concentration of 3-chloro-1,2-propanediol in soy sauce and soy sauce-based products, in other foods and in foodingredients from various countries, between 2001 to 2006.
4.2.1 Soy sauce and soy sauce-based products
(a) Australia
Australia submitted occurrence data for 39 individual samples of differentsoy and oyster sauces based on food surveys conducted in 2001 and 2002 (FSANZ,2003). Selected soy and oyster sauces and a range of other foods available atAustralian retail outlets were sampled. The method used for the quantitativeanalysis of 3-chloro-1,2-propanediol was based on AOAC Method No. 2000.01. Thelimit of quantification (LOQ) for 3-chloro-1,2-propanediol was 0.01 mg/kg. Themajority of soy and oyster sauces did not contain 3-chloro-1,2-propanediol atdetectable concentrations. A small number of samples contained high concentra-tions of 3-chloro-1,2-propanediol.
• The average was calculated by assigning a value of half the reporting limits tothe 44% of samples for which the reported value was less than the limit.
• The highest average concentration was reported for soy seasoning sauceproduct, with a maximum at 74.3 mg/kg. For the other sauces, the reportedaverage concentration is 0.16 mg/kg.
(b) Hong Kong SAR
Hong Kong submitted occurrence data for 3-chloro-1,2-propanediol inaggregate samples of different soy sauce and sauce-based products, using theGlobal Environment Monitoring System—Food Contamination Monitoring andAssessment Programme (GEMS/Food) reporting format. Sampling was performedin 2003 and included the analytical results for 84 samples. Based on the very lowlevel of the limit of detection (LOD) and LOQ, respectively 2.5 and 7.5 μg/kg,analysis was carried out using GC/MS. No indicator of analytical quality assur-ance was described in the submitted data (Food and Environmental HygieneDepartment, 2005).
• The average was calculated by assigning a value of half the reporting limit to the84% of samples for which the reported value was less than the limit
• A higher average concentration of 3-chloro-1,2-propanediol is reported forconcentrated sauce (105 μg/kg) and concentrated soup (14.6 μg/kg). Otheraverages reported for sauce-based products are between about 2.5 and5.0 μg/kg.
(c) European Union
Individual data on 3-chloro-1,2-propanediol were submitted for 10 countriesof the European community—Austria, Denmark, Finland, France, Germany, Ireland,the Netherlands, Norway, Sweden and the UK—from the reports on Tasks forScientific Cooperation on levels of 3-chloro-1,2-propanediol and related substancesin foodstuffs (European Union, 2004). The Joint Research Centre of the European
3-CHLORO-1,2-PROPANEDIOL 245

Commission assisted in the task by providing advice on analytical methodology.Participants agreed that only occurrence data obtained after 1997 until the yearbefore the publication of the report in 2004 should be submitted as there wasconcern about the robustness of data acquired prior to that date. Some occurrencedata provided by participants were from targeted sampling of products suspectedto contain chloropropanols at high concentrations.
Results of analysis of 3-chloro-1,2-propanediol in over 2035 samples of soysauce and soy sauce-based products were provided by all 10 member states of theEuropean Union : Austria (n = 316), Denmark (n = 43), Finland (n = 163), France(n = 73), Germany (n = 692), Ireland (n = 178), the Netherlands (n = 273), Norway(n = 51), Sweden (n = 76) and UK (n = 170). The LOQ for soy sauce and soy sauce-based products was mainly between 0.006 mg/kg and 1 mg/kg (98%). A few results(less than 2%) were provided with a LOQ of 2.5 or 5 mg/kg.
• The average was calculated by assigning a value of half the reporting limit to the65% of samples for which the reported value was less than the limit.
• The weighted average for the group was reported to be 9.16 mg/kg. The highestaverage concentration of 3-chloro-1,2-propanediol was reported for seasoningsauce (40.9 mg/kg), mushroom soy sauce and light soy sauce (15.5 mg/kg), soysauce (7.8 mg/kg), dark soy sauce (5.3 mg/kg) and teriyaki sauce (3.4 mg/kg).Others averages reported for sauce-based products were less than 1 mg/kg. Thedistribution of contamination in products differs according to the country of origin.Products from China (not including Hong Kong), Thailand and Viet Nam had thehighest mean concentrations of 3-chloro-1,2-propanediol, with respectively 51%,61% and 95% of samples with quantifiable levels containing 3-chloro-1,2-propanediol at greater than 10 mg/kg.
(d) Japan
Japan submitted occurrence data on the levels of 3-chloro-1,2-propanediolin aggregate and individual samples of acid-HVP containing soy sauce, using theGEMS/Food reporting format. Sampling was performed in 2005–2006 and includedanalysis results for 3-chloro-1,2-propanediol in 200 samples of soy sauce madewith acid-HVP and in 104 samples of soy sauce made by traditional fermentation.The method used for analysis of 3-chloro-1,2-propanediol had been validated in-house using GC/MS. The analytical method has been published published in apaper cited in MAFF (2005 and 2006).2 The LOD and LOQ were 0.002 mg/kg and0.004 mg/kg, respectively.
Eighty-nine percent of analytical results from samples of soy sauce made bytraditional fermentation are below the LOQ versus (vs) 0.6% of results for samples ofsoy sauces made with acid-HVP. The highest concentration reported was 33 mg/kgfor soy sauces made with acid-HVP and 0.008 mg/kg for soy sauce made bytraditional fermentation. The average concentration of 3-chloro-1,2-propanediolwas 1.8 mg/kg for soy sauces made with acid-HVP and 0.003 mg/kg for soy saucemade by traditional fermentation.
2 Journal of Food Hygienic Society of Japan 1995, 36(3):360–364.
246 3-CHLORO-1,2-PROPANEDIOL

(e) International Hydrolyzed Protein Council (IHPC)
Data based on the annual surveys in 2004 were submitted by IHPC forconsideration by the Committee at its present meeting. In all, 26 commercialsamples of soy sauce made with acid-HVP were analysed for 3-chloro-1,2-propanediol content by at least two different laboratories. No information on thesampling protocol or analytical methods used was provided, nor were indicators ofanalytical quality assurance described in the report submitted to JECFA.Differences in the analytical sensitivites between laboratories were between 0.01and 0.065 mg/kg.
Eighty-nine percent of analytical results from soy sauce were below the LOQ.The highest concentration reported was 4 mg/kg. The average concentration of3-chloro-1,2-propanediol was 0.18 mg/kg.
(f) Thailand
• Thailand submitted occurrence data on the concentrations of 3-chloro-1,2-propanediol in seasoning soy sauces from aggregate samples (212 samples, ofwhich 190 were collected from household surveys and 23 from market surveys)and other foods (56 samples, of which 24 were collected from household surveysand 32 from market surveys) (Ministry of Agriculture and Cooperatives ofThailand, 2006). The method used for quantitative analysis of 3-chloro-1,2-propanediol was based on AOAC Method No. 2000.01. The LOD and LOQ for3-chloro-1,2-propanediol were 0.001 mg/kg and 0.010 mg/kg respectively. Noinformation was available on the number of samples in which 3-chloro-1,2-propanediol was present at less than the LOQ, nor on how censored data hadbeen treated in the calculation of the average content of 3-chloro-1,2-propanediolin different seasoning products.
• 3-chloro-1,2-propanediol was quantified only in seasoning products from house-hold surveys. The average concentration of 3-chloro-1,2-propanediol in sea-soning sauce (acid-HVP) (30 samples) was reported to be 0.454 mg/kg and thehighest concentration was 5.12 mg/kg. The average concentration of 3-chloro-1,2-propanediol in fermented soya bean (35 samples) was reported to be 0.087mg/kg and the highest concentration was 2.64 mg/kg. The average content of3-chloro-1,2-propanediol in soup powder (seven samples) was reported to be0.032 mg/kg and the highest concentration was 0.085 mg/kg. The averagecontent of 3-chloro-1,2-propanediol in local dark sauce (38 samples) wasreported to be 0.010 mg/kg and the highest concentration was 0.043 mg/kg.
• Average concentrations reported for other seasoning products and other foodswere less than 0.01 mg/kg.
• The weighted average for the soy sauce group has been calculated to be0.09 mg/kg.
(g) USA
Occurrence data for individual samples of 55 different soy sauce and sauce-based products purchased from retail outlets in metropolitan areas in 2002 had beenpublished by the FDA (Nyman et al., 2003a). The method used for quantitativeanalysis of 3-chloro-1,2-propanediol was based on AOAC Method No. 2000.01. An
3-CHLORO-1,2-PROPANEDIOL 247

LOQ of 0.025 mg/kg was established for 3-chloro-1,2-propanediol. Tha authorsconcluded that all samples that contained 3-chloro-1,2-propanediol at > 1 ppm(I mg/kg) were manufactured in Asia, indicating that at the date of the publicationsome Asian manufacturers had not made the necessary processing changes tocontrol the formation of chloropropanols in acid-HVPs.
A small number of samples contained 3-chloro-1,2-propanediol at highconcentrations (> 6 mg/kg). The highest concentration was reported for a soy sauce,with a maximum concentration of 3-chloro-1,2-propanediol of about 876 mg/kg.
• The average was calculated by assigning a value of half the reporting limit to the40% of samples for which the reported value was less than the limit
• The average concentration reported for soy sauce and sauce-based productswas 44.1 mg/kg.
4.2.2 Food ingredients
(a) European Union
Results of the analysis of 3-chloro-1,2-propanediol in more than 295 samplesof ingredients were available in the European Union report (European Union,2004). 3-Chloro-1,2-propanediol has been investigated in the following food ingre-dients: breadcrumbs (6 samples), caramel (5 samples), gelatin (12 samples), HVPs(146 samples), meat extract (16 samples), malts (63 samples), modified starches(9 samples), yeast extract (12 samples) and seasonings (15 samples). Of thesesamples, 34% contained 3-chloro-1,2-propanediol at a concentration greater thanthe LOQ set at 0.010–0.020 mg/kg in the following ingredients:
• HVPs: results for 146 samples were provided. 3-Chloro-1,2-propanediol wasquantified in 39% of samples. The weighted average for this food category wasreported to be 0.171 mg/kg.
• Meat extract: results for 16 samples were provided. 3-Chloro-1,2-propanediolwas quantified in 31% of samples. The weighted average for this food categorywas reported to be 0.064 mg/kg.
• Malts: results for 63 samples were provided. 3-Chloro-1,2-propanediol wasquantified in 49% of samples. The weighted average for this food category wasreported to be 0.096 mg/kg.
• Modified starches: results for nine samples were provided. 3-Chloro-1,2-propanediol was quantified in 22% of samples. The weighted average for thisfood category was reported to be 0.059 mg/kg.
• Seasonings: results for 15 samples were provided. 3-Chloro-1,2-propanediolwas quantified in 27% of samples. The weighted average for this food categorywas reported to be 0.016 mg/kg.
(b) Japan
Japan submitted the results of occurrence data in aggregate and individualsamples on the concentrations of 3-chloro-1,2-propanediol in acid-HVPs, using theWHO GEMS/Food reporting format. Sampling was performed in 2005–2006 andincluded results for 3-chloro-1,2-propanediol in acid-HVPs in 148 samples from
248 3-CHLORO-1,2-PROPANEDIOL

well-controlled production processes and 49 from other production processes Thepublished method used for the analysis of 3-chloro-1,2-propanediol had beenvalidated in-house using GC/MS (cited in MAFF, 2005, 2006).3 The LOD and LOQwere 0.002 mg/kg and 0.004 mg/kg, respectively.
• All the results for 3-chloro-1,2-propanediol in acid-HVPs from well-controlledproduction processes or from other production processes were less than theLOQ. The highest concentration reported was 44 mg/kg for acid-HVPs from otherproduction processes vs 0.14 mg/kg for acid-HVPs from well-controlled pro-duction processes. The average concentration of 3-chloro-1,2-propanediol was6.5 mg/kg for acid-HVP from other production processes vs 0.047 mg/kg for acid-HVPs from well-controlled production processes.
(c) IHPC
Data from the last three annual surveys 2000–2002 were submitted by IHPCfor consideration by the Committee at its present meeting. In all, 86 commercialsamples of acid-HVP had been analysed for 3-chloro-1,2-propanediol content by atleast two different laboratories (21 commercial samples in 2000, 38 in 2001 and 22in 2002). No information on the preparation of the samples or analytical methodsused by the laboratories was presented, and there was no indication that analyticalquality assurance had been performed, according to the report submitted to theCommittee. Differences in analytical sensitivities observed between laboratorieswere expressed on a dry-substance basis (in 2000 the LOD ranged from 0.01 to0.2 mg/kg; in 2001, from 0.007 to 0.025 mg/kg; in 2002, from 0.003 to 0.1 mg/kg).
• 9% of analytical results were less than the LOQ. The highest concentrationreported was 2.54 mg/kg. The average concentration of 3-chloro-1,2-propanediol was calculated to be 0.103 mg/kg.
4.2.3 Other products
Few countries have reported data on 3-chloro-1,2-propanediol for productsother than soy sauce and sauce-based products. Australia and the European Unionsubmitted occurrence data on foods and food groups likely to contain 3-chloro-1,2-propanediol as a result of processing or storage conditions. Analysis of severalproducts included in the diet, such as cereals, meat and meat products, dairyproducts, fish and seafood products, was reported.
(a) Australia
Australia submitted occurrence data for 204 individual samples of differentfoods based on food surveys conducted in 2001 and 2002 (FSANZ, 2003). Selectedfoods and a range of foods available at Australian retail outlets were sampled. Themethod used for quantitative analysis of 3-chloro-1,2-propanediol was similar to thatused for soy and oyster sauces and was based on AOAC Method No. 2000.01. TheLOD was 0.005 mg/kg and the LOQ was 0.01 mg/kg. Analyses have been done onthe following food categories: meat and meat products (99 samples), fish and fishproducts (29 samples), chicken eggs (8 samples), cereals (37 samples), infant
3-CHLORO-1,2-PROPANEDIOL 249

food (3 samples), infant formulas (3 samples), cheese, cheddar and processed(12 samples), starchy vegetables (3 samples), roasted coffee and cocoa paste(6 samples), vegetable oils and fat (4 samples).
Only 9% of the samples were found to contain 3-chloro-1,2-propanediol inquantities greater than the LOQ.
• Cereals: none of the 37 samples were found to contain 3-chloro-1,2-propanediolat a quantifiable level. The weighted average concentration for this food categorywas reported to be 0.003 mg/kg.
• Fish and fish products: 3-chloro-1,2-propanediol was quantified in 17% ofsamples, and only in fish portion crumbed-over baked (0.037 mg/kg). Theweighted average concentration for this food category was reported to be0.009mg/kg.
• Meat and meat products, including poultry and game: 3-chloro-1,2-propanediolwas quantified in 26% of samples (mainly in bacon dried, sausage fried, rawor cooked and leg ham) at concentrations between 0.006 and 0.069 mg/kg.The weighted average concentration for this food category was reported to be0.007 mg/kg.
(b) European Union
Results of the analysis of 3-chloro-1,2-propanediol in more than 1637samples of products other than soy sauce were available in the European Unionreport (European Union, 2004): Denmark (n = 19), Finland (n = 345), France(n = 146), Germany (n = 71), Ireland (n = 25), Norway (n = 54), Sweden (n = 151)and UK (n = 547). Of the samples, 35% contained 3-chloro-1,2-propanediol at aconcentration greater than the LOQ, mainly set at 0.010 mg/kg. The overallweighted average concentration of 3-chloro-1,2-propanediol in all ‘others’ productsanalysed by member states was reported to be 0.013 mg/kg.
• Dairy: results were submitted for 137 samples, mainly from the UK. 3-Chloro-1,2-propanediol was quantified in 86% of samples, only in cheese, processedcheese and cheese analogue (68 out of 79 samples), at an averageconcentration of about 0.008–0.012 mg/kg. The weighted average concentrationfor this food category was reported to be 0.007 mg/kg.
• Fat and oils, and fat emulsions: results were provided for 34 samples. 3-Chloro-1,2-propanediol was quantified in 41% of samples, mainly in mixed and/or flavoured products based on fat emulsion product (14 out of 34 samples) at0.184 mg/kg. The weighted average concentration for this food category wasreported to be 0.09 mg/kg.
• Fruit and vegetables: results were provided for 37 samples. 3-Chloro-1,2-propanediol was quantified in 62% of samples, mainly in processed vegetables,products made from nuts and seeds (23 out of 37 samples) at 0.068 mg/kg.The weighted average concentration for this food category was reported to be0.061 mg/kg.
• Confectionery: results were provided for 39 samples. 3-Chloro-1,2- propanediolwas quantified in 8% of samples, in confectionery products and in sugar-basedconfectionery (3 out of 39 samples) at 0.007 mg/kg. The weighted averageconcentration for this food category was reported to be 0.006 mg/kg.
250 3-CHLORO-1,2-PROPANEDIOL

• Cereals and cereals products: results were provided for 203 samples.3-Chloro-1,2-propanediol was quantified in 26% of samples, mainly in productscontaining flour and starch at 0.010 mg/kg (7 out of 11 samples) and pasta andnoodles (94 out of 143 samples) at 0.032 mg/kg. The weighted averageconcentration for this food category was reported to be 0.024 mg/kg.
• Bakery wares: results were provided for 337 samples. 3-Chloro-1,2- propanediolwas quantified in more than half of the samples (51%), mainly in crackers(0.030 mg/kg), cake and cookies (0.029 mg/kg), other ordinary bakery products(0.027 mg/kg), bread and rolls and other fine bakery products (0.016 mg/kg), andbiscuits (0.013 mg/kg). The weighted average concentration for this foodcategory was reported to be 0.020 mg/kg.
• Meat and meat products, including poultry and game: results were provided for153 samples. 3-Chloro-1,2-propanediol was quantified in 36% of samples, mainlyin sausage casings (13.9 mg/kg), processed comminuted meat, poultry andgame products non-heat-treated (0.062 mg/kg), processed meat, poultry andgame products comminuted or in whole pieces heat-treated or non-heat- treatedor frozen (0.012 mg/kg). The weighted average concentration for this foodcategory was reported to be 1.47 mg/kg.
• Fish and fish products including molluscs, crustaceans and echinoderms(MCE): results were provided for 60 samples. 3-Chloro-1,2-propanediol wasquantified in 25% of samples, mainly in fully preserved fish and fish products,including MCE hot smoked (0.041 mg/kg) and canned (0.017 mg/kg), and inprocessed fish and fish products, including MCE cooked/or fried (0.010 mg/kg).The weighted average concentration for this food category was reported to be0.013 mg/kg.
• Salts, spices, soup sauces, salads, protein products: results were provided for454 samples. 3-Chloro-1,2-propanediol was quantified in 45% of samples, mainlyin non-emulsified sauce (e.g ketchup, cheese sauce, cream sauce, brown gravywhere 2 out of 59 samples were highly contaminated, containing 3-chloro-1,2-propanediol at a concentration of 2.82 mg/kg), in herbs, spices, seasoning andcondiments where 75% of samples contained 3-chloro-1,2-propanediol atquantified levels (166 out of 221 samples, 0.259 mg/kg), in protein products(1 out of 7 samples, 0.210 mg/kg), in sauces and like products (0.048 mg/kg), inmixes for sauces and gravies (0.033 mg/kg) and in mixes for soups and broths(0.011 mg/kg). The weighted average concentration for this food category wasreported to be 0.286 mg/kg.
• Foodstuffs intended for particular nutritional uses: very few samples wereanalysed but all of them four were quantified. The weighted average con-centration for this food category was reported to be 0.030 mg/kg.
• Beverages excluding dairy products: results were provided for 131 samples.3-Chloro-1,2-propanediol was quantified in 7% of samples (9 out of 131), mainlybeer and malt beverages, being found at a low concentration (0.006 mg/kg).The weighted average concentration for this food category was reported to be0.007 mg/kg.
3-CHLORO-1,2-PROPANEDIOL 251

• Ready-to-eat savouries: results were provided for 23 samples. 3-Chloro-1,2-propanediol was quantified in 34% of samples, mainly in snacks—potato, cereal,flour or starch-based foods (0.013 mg/kg). The weighted average concentrationfor this food category was reported to be 0.010 mg/kg.
• Composite foods: results were provided for 24 samples. 3-Chloro-1,2-propanediol was quantified in 21% of samples. The weighted averageconcentration for this food category was reported to be 0.013 mg/kg.
(c) Thailand
Occurrence data on the concentrations of 3-chloro-1,2-propanediol found inaggregate samples of other foods (56 samples: 24 collected by household surveyand 32 by market survey) (Ministry of Agriculture and Cooperatives of Thailand,2006) were available. 3-Chloro-1,2-propanediol has only been found at quantifiedlevels in snack food products (5 samples) from household-survey sampling; theaverage concentration 3-chloro-1,2-propanediol was < 0.010 mg/kg and the highestvalue was 0.028 mg/kg.
Summary of occurrence data for 3-chloro-1,2-propanediol
Data on the occurrence of 3-chloro-1,2-propanediol in food were providedby 14 countries and by IHPC. Data on 3-chloro-1,2-propanediol in soy sauces andrelated products for an additional country were available from the literature.
The average concentration of 3-chloro-1,2-propanediol present in soysauce and soy sauce-related products was much higher (8 mg/kg; range, 0.01 to44.1 mg/kg) than in any other food or food ingredient (< 0.3 mg/kg). Data from Japanshow that soy sauce produced by traditional fermentation contains insignificantaverage amounts of 3-chloro-1,2-propanediol (0.003 mg/kg) compared with soysauce made with acid-HVP (1.8 mg/kg).
5. ESTIMATED DIETARY INTAKE
5.1 National assessments of intake from diet
National dietary intake data for 3-chloro-1,2-propanediol were provided for10 countries (Denmark, Finland, France, Germany, Ireland, the Netherlands,Norway, Sweden, UK, Thailand). These national intakes were calculated by linkingdata on individual consumption and body weight from national food consumptionsurveys with mean occurrence data obtained from food contamination surveys.
Consistent with their national food consumption data, all countries exceptGermany calculated estimates for the adult population and children. Meanoccurrence data used in the calculation are those reported in section 4 of thismonograph, in which all values classified as being less than the LOQ were assumedto contain 3-chloro-1,2-propanediol at a concentration equal to LOQ/2, except forThailand where no information was available concerning the treatment of valuesless than the LOQ. Intake estimates were calculated on a per kilogram of bodyweight basis. Estimates reported by each country were described according to the
252 3-CHLORO-1,2-PROPANEDIOL

following two variables of intake distribution for mean and high-percentile dietaryexposures: average estimates (average food consumption combined with meanoccurrence data for food consumed); and the 95th percentile of the intakedistribution (P95).
Table 2 summarizes estimates of national dietary intakes of 3-chloro-1,2-propanediol from various food sources, including soy sauce and soy sauce-basedproducts.
(a) Australia
Australia submitted the results of an assessment of dietary exposure tochloropropanols (FSANZ, 2003). Intake calculations were made in a deterministicway using the dietary modelling computer program (DIAMOND), multiply meanconcentration of chloropropanols in a wide range of foods, including soy and soysauces, consumed by each individual reported in the 1995 National Nutrition Surveybased on a 24 h-recall methodology. To provide a more refined estimate of dietaryexposure, concentrations reported to be less than the reporting limits (LOR = 78%)were assigned by a concentration equal to the LOR.
Dietary exposure assessment was conducted using food groupings basedon the Codex system of classification for food additives. Foods are classifiedaccording to major food types as raw and processed foods, and analyticalconcentrations fit easily to these to these food groupings. Calculations are made byassigning values for 3-chloro-1,2-propanediol concentrations to food groups forfood eaten “as is”, as well as as used as ingredients in mixed foods. Where a singlefood from a food group was analysed, the concentration of 3-chloro-1,2- propanediolreported was assigned to the whole group, assuming that like foods would contain3-chloro-1,2-propanediol at similar concentrations. This is likely to result in an over-estimation of dietary exposures, but assumes a worst-case scenario.
The intake estimates for the whole population aged more than 2 yearsranged from an average of 0.20 μg/kg bw per day to 0.65 μg/kg bw per day forconsumer sat the 95th percentile. Children aged from 2 to 12 years had exposuresranging from an average of 0.17 μg/kg bw per day to 0.18 μg/kg bw per day forconsumers at the 95th percentile. Children aged from 13 to 19 years had exposuresranging from an average of 0.19 μg/kg bw per day to 0.65 μg/kg bw per day for theconsumer at the 95th percentile. Adults aged 20 years and greater had exposuresranging from an average of 0.21 μg/kg bw per day to 0.75 μg/kg bw per day forconsumers at the 95th percentile.
Major contributors to total exposure were soy and oyster sauce, ranging from86% for children to 94% for adults
Where estimated exposure was expressed as a percentage of the PMTDIset by the Committee in 2001 (2 μg/kg/bw per day), the estimated dietary exposureto 3-chloro-1,2-propanediol from a wide range of foods, including soy sauce andrelated products, was far less than the PMTDI for all groups reported, both for meanconsumption (< 10%) and for consumers at the 95th percentile (< 40%). Intakesranged from 8.5% to 9% for children aged 2–12 years, from 9.5% to 33%, forchildren aged 13–19 years, and from 10% to 38% for adults aged 20 years andgreater.
3-CHLORO-1,2-PROPANEDIOL 253

Tab
le 1
. Su
mm
ary
of
the
dis
trib
uti
on
-wei
gh
ted
co
nce
ntr
atio
no
f 3-
chlo
ro-1
,2-p
rop
aned
iol i
n s
oy
sau
ce a
nd
so
y sa
uce
-bas
edp
rod
uct
s, in
oth
er f
oo
ds
and
in f
oo
d in
gre
die
nts
fro
m v
ario
us
cou
ntr
ies,
200
1 to
200
6
Pro
duct
Cou
ntry
and
dat
eLO
Q (
mg/
kg)
NN
< L
OQ
Mea
na (m
g/kg
)M
axim
um (
mg/
kg)
Soy
sau
ce a
nd s
oy s
auce
-bas
ed p
rodu
cts
EC
(S
coop
task
3.2
.9, 2
004)
0.00
6–5.
000
2035
1321
9.16
1779
Hon
g K
ong
SA
R, 2
003
0.00
7584
710.
010.
2
US
A, 2
003
0.01
255
844
.187
6
Aus
tral
ia, 2
001–
2002
0.01
3917
15.4
148
Japa
n, 2
005–
2006
0.00
220
01
1.8
33
Tha
iland
, 200
4–20
050.
0119
0N
A0.
095
IHP
C, 2
004
0.01
–0.1
2615
0.18
4
All
data
0.00
6–5.
000
2629
1433
8.39
1779
Dai
ry p
rodu
cts
(che
eses
)
EU
, 199
7–20
020.
01–0
.02
137
126
0.00
70.
095
Aus
tral
ia, 2
001–
2002
0.00
512
120.
0025
0.00
25
All
0.00
5–0.
010
149
138
0.00
70.
095
Fat
and
oils
, and
fat e
mul
sion
s
EU
, 199
7–20
020.
0134
200.
091.
5
Aus
tral
ia, 2
001–
2002
0.00
54
40.
0025
0.00
25
All
0.00
5–0.
010
3824
0.08
11.
5
Nut
s an
d se
eds,
pro
cess
ed v
eget
able
sE
U, 1
997–
2002
0.01
3714
0.06
10.
69
254 3-CHLORO-1,2-PROPANEDIOL

Tab
le 1
. (co
ntd)
Pro
duct
Cou
ntry
and
dat
eLO
Q (
mg/
kg)
NN
< L
OQ
Mea
na (m
g/kg
)M
axim
um (
mg/
kg)
Cer
eals
and
cer
eal p
rodu
cts
(flo
urs
and
star
ch, p
asta
and
noo
dles
and
bake
ry w
ares
)
EU
, 199
7–20
020.
01–0
.02
540
314
0.02
40.
945
Aus
tral
ia, 2
001–
2002
0.00
537
340.
0028
0.00
7
All
0.00
5–0.
020
577
348
0.02
30.
945
Mea
t and
mea
t pro
duct
s
EU
, 199
7–20
030.
0115
297
0.04
10.
41
Aus
tral
ia, 2
001–
2002
0.00
599
730.
006
0.06
9
All
0.00
5–0.
010
251
170
0.02
70.
41
Fis
h pr
oduc
ts
EU
, 199
7–20
020.
0160
450.
013
0.19
1
Aus
tral
ia, 2
001–
2002
0.00
529
230.
010.
083
All
0.00
5–0.
010
8968
0.01
20.
191
Sal
ts, s
pice
s, s
oup
sauc
es, s
alad
s, p
rote
in p
rodu
cts
E
U, 1
997–
2002
0.01
–2.5
454
248
0.28
650
.7
Foo
dstu
ffs in
tend
ed fo
r pa
rtic
ular
nut
ritio
nal u
ses
E
U, 1
997–
2002
0.01
–0.0
813
112
20.
007
0.02
Aus
tral
ia, 2
001–
2002
0.00
56
60.
0025
0.00
25
All
0.00
5–0.
080
137
128
0.00
70.
02
Rea
dy-t
o-ea
t sav
ourie
s
EU
, 199
7–20
020.
006–
0.02
023
150.
010.
041
Com
posi
te fo
odE
U, 1
997–
2002
0.01
2419
0.01
30.
113
3-CHLORO-1,2-PROPANEDIOL 255

Tab
le 1
. (co
ntd)
Pro
duct
Cou
ntry
and
dat
eLO
Q (
mg/
kg)
NN
< L
OQ
Mea
na (m
g/kg
)M
axim
um (
mg/
kg)
Egg
sA
ustr
alia
, 200
1–20
020.
005
88
0.00
250.
0025
Roo
t and
tube
rs (
pota
to c
risps
)
Aus
tral
ia, 2
001–
2002
0.00
53
30.
0025
0.00
25
Bev
erag
es:
Cof
fee
roas
ted
EU
, 199
7–20
020.
0120
200.
005
0.00
5
Aus
tral
ia, 2
001–
2002
0.00
53
30.
0025
0.00
25
All
0.00
5–0.
010
2323
0.00
50.
005
Coc
oa p
aste
and
choc
olat
e pr
oduc
tsA
ustr
alia
, 200
1–20
030.
005
31
0.01
40.
03
EU
, 199
7–20
020.
0112
120.
005
0.00
5
All
0.00
5–0.
080
1513
0.00
70.
005
Bee
r an
d m
alts
beve
rage
sE
U, 1
997–
2002
0.01
–0.0
810
092
0.00
80.
017
All
0.00
5–0.
080
138
128
0.00
80.
03
Con
fect
ione
ry, s
ugar
-bas
ed(c
hew
ing
gum
, can
dy, n
ouga
ts…
)
EU
, 199
7–20
020.
0127
240.
007
0.02
3
Foo
d in
gred
ient
sA
cid
HV
Ps
IHP
C, 2
000–
2002
0.01
–0.1
817
0.10
32.
5
EU
, 199
7–20
020.
01–1
.15
146
890.
171
1.84
Japa
n, 2
005–
2006
0.00
414
80
0.04
70.
14
All
0.01
–1.1
537
596
0.10
72.
5
Mea
t ext
ract
sE
U, 1
997–
2002
0.01
–0.0
216
110.
064
0.55
256 3-CHLORO-1,2-PROPANEDIOL

Tab
le 1
. (co
ntd)
Pro
duct
Cou
ntry
and
dat
eLO
Q (
mg/
kg)
NN
< L
OQ
Mea
na (m
g/kg
)M
axim
um (
mg/
kg)
Mal
tsE
U, 1
997–
2002
0.01
6332
0.09
60.
85
Mod
ified
sta
rche
sE
U, 1
997–
2002
0.01
97
0.05
90.
49
Sea
soni
ngs
EU
, 199
7–20
020.
0215
110.
016
0.06
Oth
ers
EU
, 199
7–20
020.
0111
90.
008
0.02
5
All
0.01
–1.1
548
926
20.
099
2.5
EU
: Eur
opea
n U
nion
; IH
PC
: Int
erna
tiona
l Hyd
roly
zed
Pro
tein
Cou
ncil;
LO
Q: l
imit
of q
uant
ifica
tion;
NA
: not
ava
ilabl
e; S
AR
: Spe
cial
Adm
inis
trat
ive
Reg
ion
of C
hina
.a
Dat
a be
low
the
LOD
or
LOQ
hav
e be
en a
ssum
ed to
be
half
of th
ose
limits
(ex
cept
for
Tha
iland
in s
oy s
auce
, whe
re n
o in
form
atio
n w
as a
vai-
labl
e) a
nd th
e m
ean
is w
eigh
ted
acco
rdin
g to
the
num
ber
of s
ampl
es p
er c
ount
ry
3-CHLORO-1,2-PROPANEDIOL 257

(b) European Union
Member States provided their own national estimates of dietary intake of3- chloro-1,2-propanediol in reports on Tasks for Scientific Cooperation on levels of3-chloro-1,2-propanediol and related substances in foodstuffs (European Union,2004). As adequate national data were available, participants used their own datato calculate exposure to 3-chloro-1,2-propanediol from soy sauce. However, asadequate national data for other foods were not available, participants used pooledoccurrence data to calculate dietary exposure to 3-chloro-1,2-propanediol from allother foods. Eight participants from the European community provided intake data:Denmark, Finland, France, Germany, Ireland, the Netherlands, Sweden and UK.Estimated intakes were described only for 3-chloro-1,2-propanediol in theScoop task.
The intake estimates for the adult population aged greater than 18 yearsranged from an average of 0.16 μg/kg bw per day to 1.38 μg/kg bw per day forconsumers at the 95th percentile. Depending on country, children aged 2–14 yearshad exposures ranging from an average of 0.15 μg/kg bw per day to 2.3 μg/kg bwper day for consumers at the 95th percentile.
Where estimated exposure was expressed as a percentage of the PMTDI,results ranged from 8% to 69% for the adult population, and from 7.5% to 115% forchildren.
The highest contribution for high-level consumers was from soy sauces andsoy sauce-based products, ranging from 5% to 86% of the PMTDI for children andfrom 1% to 54% of the PMTDI for adults.
(c) Thailand
Thailand submitted the results of dietary intake assessments carried out in2004–2005 (Ministry of Agriculture and Cooperatives of Thailand, 2006). Intakecalculations were obtained in a deterministic way by combining meanconcentrations of 3-chloro-1,2-propanediol in a wide range of foods, includingseasonings, by consumption data collected from different regions of Thailand usinga household-seasoning-product disappearance method and a food-frequencymethod for the consumption of other foods. 1945 individuals in 512 households weresurveyed. Per-capita intake per day was derived from the quantity of food availableor consumed by the householder, divided by the number of family members. Dailydietary intake was converted to μg/kg bw per day using Thai reference body weightsof 57 kg for adults.
The intake estimates for adults aged more than 16 years ranged from anaverage of 0.02 μg/kg bw per day to 0.06 μg/kg bw per day for consumers at the95th percentile.
Where estimated exposure was expressed as a percentage of the PMTDI,results for the adult population were less than 5% of the PMTDI set by theCommittee in 2001 (2 μg/kg bw per day).
The major contributor to total exposure was seasonings, sauce (acid-HVP)at 74%.
258 3-CHLORO-1,2-PROPANEDIOL

(d) UK
The UK submitted dietary intake assessments carried out in 2005 (FoodStandards Agency, 2005b). Intake calculations were obtained using meanconcentrations of 3-chloro-1,2-propanediol found in a wide range of foods, includingcompilation of occurrence data from the European Union task report and additionaldata obtained from Germany, Spain and Finland from activities to monitor3-chloro-1,2-propanediol. Occurrence data for the products in which HVP may befound and previously not reported in the European Union report as potential sourcesof exposure, such as casseroles, pizzas and snacks, were therefore identified andincorporated using a recipe database. Consumption data for all foods including thepercentage of ingredients in compound foods were derived from the UK NationalDiet and Nutrition Surveys (NDNS) realized in 1992–1993 for children and from theUK NDNS realized in 2000–2001 for adults aged 19–64 years. Exposure wasestimated for consumers only using the UK FSA intake computer program. It wasclear in the report that many of these estimations were done with occurrence datathat preceded the introduction of European limits for 3-chloro-1,2-propanediol inliquid condiments.
The intake estimates for adults ranged from 0.40 μg/kg bw per day in averageto 1.30 μg/kg bw per day for consumers at the 95th percentile. Children aged from1.5 to 4.5 years had exposures ranging from an average of 0.70 μg/kg bw per dayto 2.30 μg/kg bw per day for consumers at the 95th percentile.
Where estimated exposure was expressed as a percentage of the PMTDI,results for adults ranged from 20% to 65% and from 35% to 115% for young children.
The greatest contribution for consumers with a high intake was made byinstant noodles for adult s and dark soy sauce for young children.
Consumption of soy sauce and soy sauce-based products by consumersonly from various countries and estimated dietary exposure to 3-chloro-1,2-propanediol
The percentage of consumers of soy sauce and soy sauce-based productswas reported to range from 1.4% to 8% in the adult population and from 1% to 8.7%in children population. Consumption, according to country, ranged from 1 to30 g/day for the adult population and from 0.6 to 16 g/day in children.
Combining the average levels of contamination for soy sauce produced bytraditional fermentation or using acid-HVP (from the Japanese submission) with afigure for daily consumption of soy sauce of 30 g (per-capita consumption for Japanand 95th percentile of consumption from Australia) resulted in dietary exposures of0.0015 and 0.90 μg/kg bw per day, respectively, assuming a body weight of 60 kg.
Summary of national intake estimates
National dietary intake data for 3-chloro-1,2-propanediol were provided for10 countries (Denmark, Finland, France, Germany, Ireland, the Netherlands,Norway, Sweden, Thailand, UK). These national intakes were calculated by linkingdata on individual consumption and body weight from national food consumptionsurveys with mean occurrence data obtained from food contamination surveys.
3-CHLORO-1,2-PROPANEDIOL 259

The Committee concluded that, based on national estimates from a widerange of foods including soy sauce and soy-sauce related products, an intake of3-chloro-1,2-propanediol of 0.7 μg/kg bw per day could be taken to represent theaverage for the general population, and an intake of 2.3 μg/kg bw per day could betaken to represent consumers with a high intake. In these estimates for average tohigh intake, young children are included.
When the estimated exposures are expressed as a percentage of the currentPMTDI, the results at the national level ranged from 1% to 35% for averageexposure in the general population. For the consumers at the high percentile (95th),the estimated intakes ranged from 3% to 85% and up to 115% in young children.These estimates are based on concentrations of 3-chloro-1,2- propanediol derivedbefore any intervention to reduce occurrence had been undertaken by governmentor industry.
Table 2. Estimated dietary intake of 3-chloro-1,2-propanediol from variousfood sources, including soy sauce and soy sauce-based products
Country Population group Intake (μg/kg bw per day)
Mean P95b
Australia All ( 2 years) 0.20 0.65
2–12 years 0.17 0.18
13–19 years 0.19 0.65
20 years 0.21 0.75
Denmark Adult 0.21 -
Finland Adult 0.23 -
France 18 years 0.22 -
3–14 years 0.30 -
Germanya Adult 0.17 0.72
4 years 0.48 1.70
14 years 0.15 0.53
Ireland Adult 0.36 0.68
Netherlands Adult 0.30 1.38
Children 0.34 1.69
Sweden Adult 0.16 0.48
Thailand Whole population 0.02 0.06
United Kingdoma 18 years 0.40 1.3
1.5–4.5 years 0.70 2.3
a Consumers only; b95th percentile: only 5% of consumers had exposures above this level.
260 3-CHLORO-1,2-PROPANEDIOL
5.2 International estimates of intake for GEMS/Food Consumption ClusterDiets
The new descriptions of the GEMS/Food Consumption Cluster Diets allowa better refinement of intake assessments for 3-chloro-1,2-propanediol, e.g.information is provided on soy sauce consumed as is and oil of soya bean for otheruses, cheese processed, which makes the diets more relevant than those used forthe previous evaluation by the Committee.
Data on distribution of contamination from aggregate data on food itemstaking into account the weighting of samples from submitted and published resultshave been described according to the 13 GEMS/Food Consumption Cluster Diets(WHO, 2006). Table 1 summarizes the distribution-weighted concentration of3-chloro-1,2-propanediol in soy sauce and soy sauce-based products, in otherfoods and in food ingredients from various countries from 2001 to 2006 reported asthe best available occurrence data to 3-chloro-1,2-propanediol.
In general, the food items analysed were well characterized and it waspossible to match sources, contamination and consumption for the 13 revisedGEMS/Food Consumption Cluster Diets. Each weighted mean concentration of3-chloro-1,2-propanediol was taken into account when quantified values for3-chloro-1,2-propanediol and 1,3-dichloropropanol were reported for a foodcategory or subcategory (e.g cheeses, soy sauce). These concentrations weremultiplied by the total mean consumption of food in the corresponding category orsubcategory to derive mean total intakes of 3-chloro-1,2-propanediol from all foodsources for each cluster diet. Table 3 summarizes estimates of international dietaryintake of 3-chloro-1,2-propanediol from all food sources (in μg/kg bw per day).
The range for international mean intakes of 3-chloro-1,2-propanediol fromall sources was estimated to be between 0.28 μg/kg bw per day and 3.41 μg/kg bwper day for the 13 GEMS/Food Consumption Cluster Diets, assuming a body weightof 60 kg.
Where estimated exposure was expressed as a percentage of the PMTDIas proposed by the rules of the CCFAC (Codex Alimentarius Commission, 2005b),results ranged from 14% to 170% for the average in the general population. Forthree diets—clusters K, L and M—exposure to 3-chloro-1,2-propanediol wasgreater than the PTMDI.
Soy sauce and oil of soya beans are the main contributors to intake of3-chloro-1,2-propanediol for each diet, representing between 10% and 161% ofthe PMTDI. Intakes were estimated to be between 0.20 μg/kg bw per day and3.22 μg/kg bw per day. Wheat-based products contribute more than 5% of thePMTDI in three diets (B, C and D). Others foods mainly contribute less than 5% ofthe PTMDI in all of the cluster diets.
3-CHLORO-1,2-PROPANEDIOL 261

Tab
le 3
. Su
mm
ary
of
esti
mat
es o
f in
tern
atio
nal
die
tary
inta
ke o
f 3-
chlo
ro-1
,2-p
rop
aned
iol f
rom
all
foo
d s
ou
rces
(in
μg
/kg
bw
day
) fo
r th
e 13
GE
MS
/Fo
od
Co
nsu
mp
tio
n C
lust
er D
iets
Clu
ster
Die
tF
ood
cate
gory
Tot
al fr
om a
llfo
od s
ourc
es
Whe
atS
oya
bN
uts
and
oils
eeds
Mea
tcA
nim
al o
ils a
ndfa
tsB
eer
dO
ther
food
se
Inta
kea
% PT
MD
IIn
take
a% P
TM
DI
Inta
kea
% PT
MD
IIn
take
a% P
TM
DI
Inta
kea
% PT
MD
IIn
take
a% P
TM
DI
Inta
kea
% PT
MD
IIn
take
% PT
MD
I
A0.
033
1.7
0.22
011
0.03
21.
60.
009
0.4
0.00
10.
10.
018
0.9
0.01
0.8
0.33
16
B0.
150
7.5
0.91
346
0.07
03.
50.
049
2.4
0.01
50.
80.
011
0.6
0.01
0.4
1.22
61
C0.
161
8.0
0.84
942
0.04
12.
10.
011
0.6
0.00
10.
10.
001
0.0
0.01
0.6
1.08
54
D0.
147
7.4
0.55
928
0.03
51.
80.
023
1.1
0.00
90.
50.
009
0.4
0.01
0.5
0.79
39
E0.
089
4.5
0.91
146
0.06
93.
40.
038
1.9
0.02
11.
10.
032
1.6
0.02
0.7
1.18
59
F0.
082
4.1
1.03
052
0.03
81.
90.
058
2.9
0.01
10.
60.
022
1.1
0.01
0.5
1.25
63
G0.
065
3.3
1.52
576
0.04
32.
20.
022
1.1
0.00
30.
20.
003
0.1
0.01
0.7
1.68
84
H0.
030
1.5
1.48
774
0.03
41.
70.
039
2.0
0.03
71.
90.
014
0.7
0.01
0.5
1.65
83
I0.
026
1.3
0.27
714
0.03
31.
60.
011
0.5
0.00
10.
10.
015
0.7
0.01
0.4
0.37
19
J0.
016
0.8
0.19
610
0.04
02.
00.
008
0.4
0.00
10.
10.
007
0.4
0.01
0.4
0.28
14
K0.
043
2.2
2.73
013
70.
028
1.4
0.03
71.
80.
008
0.4
0.01
30.
70.
000.
22.
8614
3
262 3-CHLORO-1,2-PROPANEDIOL

Tab
le 3
.Con
td
Clu
ster
Die
tF
ood
cate
gory
Tot
al fr
om a
llfo
od s
ourc
es
Whe
atS
oya
bN
uts
and
oils
eeds
Mea
tcA
nim
al o
ils a
ndfa
tsB
eer
dO
ther
food
se
Inta
kea
% PT
MD
IIn
take
a% P
TM
DI
Inta
kea
% PT
MD
IIn
take
a% P
TM
DI
Inta
kea
% PT
MD
IIn
take
a% P
TM
DI
Inta
kea
% PT
MD
IIn
take
% PT
MD
I
L0.
039
2.0
3.22
416
10.
100
5.0
0.02
51.
30.
006
0.3
0.01
10.
60.
010.
53.
4117
1
M0.
088
4.4
3.12
615
60.
037
1.8
0.07
03.
50.
033
1.6
0.03
51.
80.
010.
53.
4017
0
GE
MS
/Foo
d: G
loba
l Env
ironm
ent M
onito
ring
Sys
tem
-Foo
d C
onta
min
atio
n M
onito
ring
and
Ass
essm
ent P
rogr
amm
e; P
TM
DI:
prov
isio
nal m
axim
umto
lera
ble
daily
inta
ke.
a Wei
ghte
d av
erag
e co
ncen
trat
ion
as re
port
ed in
Tab
le 2
for t
he fo
od c
ateg
ory
or s
ubca
tego
ry c
onsi
dere
d an
d fo
od c
onsu
mpt
ion
in th
e ne
w 1
3 G
EM
S/
Foo
d C
onsu
mpt
ion
Clu
ster
Die
ts.
b S
oy s
auce
and
oil
of s
oya
bean
s.c M
eat f
rom
cat
tle, p
igs
and
shee
p.d
Fro
m b
arle
y, m
aize
, mill
et a
nd s
orgh
um.
e Oth
ers
food
s fr
om a
ll th
e fo
llow
ing
food
cat
egor
y or
sub
cate
gory
(sug
ar c
onfe
ctio
nery
, coc
oa b
eans
, spi
ces,
fish
mar
ine
and
fres
hwat
er, a
nd c
hees
esfr
om r
aw m
ilk a
nd p
roce
ssed
) co
ntrib
uted
less
than
1%
of t
he P
TM
DI o
f 2 μ
g/kg
bw
per
day
.
3-CHLORO-1,2-PROPANEDIOL 263

6. COMMENTS
Toxicological data
At its present meeting, the Committee evaluated two new short-term studieson the reproductive effects of 3-chloro-1,2-propanediol in rats.
In the first study, effects on fertility and sperm parameters were examined inmale rats given 3-chloro-1,2-propanediol by oral gavage at doses ranging from0.01 to 5 mg/kg bw per day for 28 days. The NOEL for effects on fertility was1 mg/kg bw per day, in accordance with the results of earlier studies. With respectto the findings on sperm count, the nature of the dose–response relationship wasunusual and was not in conformity, quantitatively, with results from earlier studies.The Committee considered that the data on sperm motility did not show any effectof treatment; the proportion of motile sperm in all treated groups was within 10% ofthe control value. On the basis of these considerations, the Committee concludedthat this study should not be used as the pivotal study for risk assessment.
In the second new study it was shown that administration of 3-chloro-1,2-propanediol at doses of up to 25 mg/kg bw per day by gavage to pregnant ratson days 11 to 18 of gestation did not affect testicular organogenesis in the fetuses.
In a new study of neurotoxicity, rats given repeated oral doses of 3-chloro-1,2- propanediol at doses of up to 30 mg/kg bw per day for 11 weeks did not showneuromotor deficits. Previous studies in rats and mice had indicated that high dailydoses (mice, 25–100 mg/kg bw; rats, 50–100 mg/kg bw) given intraperitoneally wereassociated with dose-related lesions of the central nervous system.
Occurrence
Acid-HVPs are widely used in seasonings and as ingredients in processedsavoury food products. They are used to flavour a variety of foods, including manyprocessed and prepared foods, such as sauces, soups, snacks, gravy mixes,bouillon cubes. As a result of those uses, 3-chloro-1,2-propanediol had beenidentified in many foods and food ingredients, most notably in acid-HVP and soysauces.
Recent studies have demonstrated that 3-chloro-1,2-propanediol may alsobe formed in other processed foods, particularly in meat products (salami and beefburgers), dairy products (processed cheese and cheese alternatives), a range ofcereal products subjected to heat treatments such as baking, roasting or toasting(toasted biscuits, doughnuts, malt and malt extract), and some other foods.
Data on the occurrence of 3-chloro-1,2-propanediol in food were providedby 14 countries and by the International Hydrolyzed Protein Council. Data on3-chloro-1,2-propanediol in soy sauces and related products for an additionalcountry were available from the published literature.
The average concentration of 3-chloro-1,2-propanediol present in soy sauceand soy sauce-related products was much higher (8 mg/kg, with a range of 0.01 to44.1 mg/kg) than that present in any other food or food ingredient (less than
264 3-CHLORO-1,2-PROPANEDIOL
0.3 mg/kg). Data from Japan showed that soy sauce produced by traditionalfermentation contains insignificant average amounts of 3-chloro-1,2-propanediol(0.003 mg/kg) compared with soy sauce made with acid-HVP (1.8 mg/kg).
Fatty acid esters of monochloropropanols have recently been identified in arange of processed and unprocessed foods. To date, only a limited number ofanalyses have been reported, but the amount of esterified 3-chloro-1,2- propanediolin many of the samples is higher than the amount of free (non- esterified)monochloropropanol in the same samples. The significance of the presence ofesterified 3-chloro-1,2-propanediol in food has yet to be determined.
Dietary exposure assessment
National dietary intake data for 3-chloro-1,2-propanediol were provided for10 countries (Denmark, Finland, France, Germany, Ireland, the Netherlands,Norway, Sweden, Thailand, UK). The national intakes were calculated by linkingdata on individual consumption and body weight from national food consumptionsurveys with mean occurrence data obtained from food contamination surveys. Theestimated average intakes from a wide range of foods, including soy sauce and soysauce-related products, ranged from 0.02 to 0.7 μg/kg bw per day in the generalpopulation. For consumers at a high percentile (95th), including young children, theestimated intakes ranged from 0.06 to 2.3 μg/kg bw per day.
Combining the average contamination levels for soy sauce produced bytraditional fermentation or with acid-HVP (from the Japanese submission) with adaily consumption figure of soy sauce of 30 g (per-capita consumption for Japanand 95th percentile of consumption from Australia) resulted in values for dietaryexposures of 0.0015 and 0.90 μg/kg bw per day, respectively, assuming a bodyweight of 60 kg.
7. EVALUATION
As no new pivotal toxicological studies had become available, theCommittee retained the previously established PMTDI of 2 μg/kg bw for3-chloro-1,2- propanediol.
The Committee concluded that, based on national estimates from a widerange of foods, including soy sauce and soy sauce-related products, an intake of3-chloro-1,2-propanediol of 0.7 μg/kg bw per day could be taken to represent theaverage for the general population, and that an intake of 2.3 μg/kg bw per day couldbe taken to represent high consumers. In the intake estimates for average to highintake, young children are also included.
When the estimated exposures are expressed as a percentage of the currentPMTDI, the results at the national level ranged from 1% to 35% for averageexposure in the general population. For consumers at the high percentile (95th), theestimated intakes ranged from 3% to 85% and up to 115% in young children. Theestimates are based on concentrations of 3-chloro-1,2-propanediol derived beforeany remedial action had been taken by government or industry.
3-CHLORO-1,2-PROPANEDIOL 265

Because the distribution of 3-chloro-1,2-propanediol concentrations in soysauce contains a number of highly contaminated samples, regular consumption ofa certain brand or specific type of product could result in intakes greater than thePMTDI by such consumers. The Committee noted that reduction in theconcentration of 3-chloro-1,2-propanediol in soy sauce made with acid-HVP couldsubstantially reduce the intake of this contaminant by certain consumers of thiscondiment.
Recommendation
The Committee noted that it has been reported that fatty acid esters of3-chloro-1,2-propanediol are present in foods, but there were insufficient data toenable either their intake or toxicological significance to be evaluated. TheCommittee recommended that studies be undertaken to address this question.
8. REFERENCES
Brereton, P., Kelly, J., Crews, C., Honour, S., Wood, R., Davies, A. (2001) Determination of3-chloro-1,2-propanediol in foods and food ingredients by gas chromatography with massspectrometric detection: collaborative study. J AOAC Int., 84, 455–465.
Codex Alimentarius Commission (2005a) Report of the Thirty-seventh Session of theCodex Committee on Food Additives and Contaminants, The Hague, The Netherlands,25–29 April 2005. Rome, Food and Agriculture Organization of the United Nations,2005 (ALINORM 05/28/12; http://www.codexalimentarius.net/download/report/639/al28_12e.pdf).
Codex Alimentarius Commission (2005b) CCFAC policy for exposure assessment ofcontaminants and toxins in foods or food groups. Procedure manual, Fifteenth edition.Joint FAO/WHO Food Standards Programme. pp. 114–117.
Codex Commission on Food Additives and Contaminants (2006) Discussion paper on acid-HVP-containing products and other products containing chloropropanols. Provided tomembers of CCFAC for discussion during its Thirty-eighth Session, The Hague, TheNetherlands, 24–28 April 2006.
Crews, C., Lebrun, G., Brereton, P.A. (2002) Determination of 1,3-dichloropropanol in soysauces by automated headspace gas chromatography-mass spectrometry. Food Addit.Contam., 19, 343–349.
El Ramy, R., Elhkim, M.O., Poul, M., Forest, M.G., Leduque, P. & Le Magueresse-Battistoni,B. (2006) Lack of effect on rat testicular organogenesis after in utero exposure to3- monochloropropane-1,2-diol (3-chloro-1,2-propanediol). Reprod. Toxicol., 22, 485–492.
European Union (2004) Reports on tasks for scientific cooperation. Report of expertsparticipating in Task 3.2.9: Occurrence and intake of chloropropanols in food. Directorate-General Health and Consumer Protection. Available from: http://ec.europa.eu/food/food/chemicalsafety/contaminants/mcpd_en.htm.
Fellows, M. (2000) 3-chloro-1,2-propanediol: measurement of unscheduled DNA synthesis inrat liver using an in-vitro/in-vivo procedure. Unpublished report No. 1863/1-D5140 fromCovance Laboratories Ltd, England.
Food and Environmental Hygiene Department (2005) Occurrence data for chloropropanols insoy sauces and related products. Submission to the JECFA secretariat, December 2005.
Food Standards Agency (2005a) Report of the final FSA funded research projects onoccurrence and formation of chloropropanols and their derivatives in foods. Submitted toJECFA, December 2005.
266 3-CHLORO-1,2-PROPANEDIOL

Food Standards Agency (2005b) UK assessment of dietary intakes of 3-chloro-1,2- propanediol in the European diet. Submitted to JECFA, December 2005.
FSANZ (2003) Chloropropanols in food. An analysis of the public health risk. Food StandardsAustralia New Zealand. Technical report series No. 15.
Hamlet, C.G., Sadd, P.A., Crews, C., Velisek, J. and Baxter, D.E. (2002) Occurrence of3- chloro-propane-1,2-diol (3-chloro-1,2-propanediol and related compounds in foods: areview. Food Addit. Contam., 19, 619–631.
International Hydrolyzed Protein Council (2005) Data and comments on 3-chloro-1,2- propanediol levels in acid-HVP products and soy sauces. Submission to the JECFAsecretariat, December 2005.
Kim, K., Song, C., Park, Y., Koh, S., Kim, J., Kim, S., Kim, Y., Kim, S.U. & Jung, H. (2004)3- Monochloropropane-1,2-diol does not cause neurotoxicity in vitro or neurobehavioraldeficits in rats. Neurotoxicology, 25, 377–385.
Kwack, S.J., Kim, S.S., Choi, Y.W., Rhee, G.S., DaLee, R., Seok, J.H., Chae, S.Y., Won Y.H.,Lim, K.J., Choi, K.S., Park, K.L. & Lee, B.M. (2004) Mechanism of antifertility in male ratstreated with 3-monochloro-1,2-propanediol (3-chloro-1,2-propanediol). J. Toxicol. Environ.Health, 67, 2001–2011.
Marshall, R.M. (2000) 3-chloro-1,2-propanediol : Induction of micronuclei in the bone-marrowof treated rats. Unpublished report No. 1863/2-D5140 from Covance Laboratories Ltd,England.
Ministry of Agriculture and Cooperatives of Thailand (2006) Summary report on riskassessment of 3-chloro-1,2-propanediol to Thaïs. Submission to the JECFA secretariat,May 2006.
Ministry of Agriculture, Forestry and Fisheries of Japan (2005 and 2006) Surveillance data onchloropropanols. Submission to the JECFA secretariat, December 2005 and May 2006.
Nyman, PJ., Diachenko, GW., and Perfetti, GA. (2003a) Survey of chloroproanols in soysauces and related products. Food Addit. Contam., 20, 909–915.
Nyman, PJ., Diachenko, GW., and Perfetti, GA. (2003b) Determination of 1,3-dichloropropanol in soy and related sauces by using gas chromatography / massspectrometry. Food Addit. Contamin., 20, 903–908.
Robjohns, S., Marshall, R., Fellows, M. & Kowalczyk, G. (2003) In vivo genotoxicity studieswith 3-monochloropropan-1,2-diol. Mutagenesis, 18, 401–404.
Svejkovska, B., Novotny, O., Divinova, V., Reblova, Z., Dolezal, M., Velisek, J. (2004): Estersof 3-chloropropane-1,2-diol in foodstuffs. Czech J. Food Sci., 22, 190–196.
WHO (2006) GEMS/Food Consumption Cluster Diets. Department of Food Safety, Zoonosesand Foodborne Diseases, Revision June.
Xiamin Xu, Yiping Ren, Pinggu Wu, Jianlong Han, Xianghong Shen (2006). The simultaneousseparation and determination of chloropropanols in soy sauce and other flavoring with gaschromatography-mass spectrometry in negative chemical and electron impact ionisationmodes. Food Addit. Contam., 23, 110–119.
3-CHLORO-1,2-PROPANEDIOL 267


METHYLMERCURY (addendum)
First draft prepared by
S. Barlow,1 M. Bolger,2 M. DiNovi,2 A. Renwick,3 D. Street2 & J. Schlatter4
1 Brighton, England;
2 United States Food and Drug Administration, College Park, Maryland, USA;
3 University of Southampton, Southampton, England; and
4 Swiss Federal Office of Public Health, Zurich, Switzerland
- 269 -
Explanation ................................................................................Biological data ...........................................................................
Biochemical aspects ...........................................................Absorption, distribution and excretion ...........................
Toxicological studies ...........................................................Reproductive and developmental toxicity .....................Relevance of studies of developmental toxicity inrodents to risk assessment in humans .........................
Observations in humans .....................................................Prenatal exposure and neurodevelopment ...................Neurodevelopment and postnatal exposure tomethylmercury in human milk during infancy ................Neurodevelopment and exposure to methylmercuryduring childhood ...........................................................Methylmercury exposure and cardiovascular function inthe young ......................................................................Methylmercury exposure and neurological effects inadults ............................................................................Methylmercury exposure and cardiovascular effects inadults ............................................................................Dose–response assessments .......................................Risk–benefit analyses ...................................................
Dietary intake ............................................................................Biomarkers of exposure ......................................................
Relationships between various biomarkers of exposure .......................................................................Cord tissue as a biomarker of exposure .......................Blood methylmercury concentrations in childhood .......Blood mercury concentrations in women of childbearingage ................................................................................Biomarkers of co-exposure to other environmentalcontaminants ................................................................Consumption of fish and whale and exposure tomethylmercury ..............................................................Consumption of other foods and exposure tomethymercury ...............................................................
270271271271272272
273274274
278
279
281
282
284286287291291
291291295
296
296
297
299

1. EXPLANATION
Methylmercury was evaluated by the Committee at its sixteenth, twenty-second, thirty-third, fifty-third and sixty-first meetings (Annex 1, references 30, 47,83, 143 and 166). At its sixty-first meeting, the Committee established a newprovisional tolerable weekly intake (PTWI) of 1.6 μg/kg bw, after consideringinformation that had become available since its fifty-third meeting. This informationincluded the results of studies performed in laboratory animals and humans,and epidemiological studies of the possible effects of prenatal exposure tomethylmercury on child neurodevelopment. Neurodevelopment was considered tobe the most sensitive health outcome and development in utero the most sensitiveperiod of exposure. Calculation of the PTWI was based on an average benchmark-dose level or no-observed-effect level (BMDL or NOEL) of 14 mg/kg (14 μg/g) formercury in maternal hair in the studies of neurodevelopmental effects in cohorts ofchildren from the Faroe Islands and the Seychelles. The concentration of mercuryin maternal hair was calculated to be equivalent to a maternal blood methylmercuryconcentration of 0.056 mg/l (56 μg/l), which was calculated to arise from a dailyintake of methylmercury of 1.5 μg/kg bw. The PTWI was derived by dividing thisintake by a total uncertainty factor of 6.4 to give a value of 1.6 μg/kg bw. The PTWIestablished in 2003 was considered to be sufficient to protect the developing embryoand fetus, the most sensitive subgroup of the population. The new value of 1.6 μg/kgbw was a revision of the previous PTWI of 3.3 μg/kg bw, and the latter value shouldbe considered as withdrawn.
After the establishment of this new PTWI, based on maternal–fetal exposure,Codex Commission on Food Additives and Contaminants (CCFAC) at its Thirty-seventh Session in 2005 (Codex Alimentarius Commission, 2005) considered adiscussion paper on guideline levels (GLs) for methylmercury in fish. CCFAC notedthat the Joint Expert Committee on Food Additives (JECFA) usually sets a singlehealth-based guidance value for the whole population, which is protective for themost sensitive part of the population; however, in the case of guidance values basedon developmental end-points, this may be overly conservative for some parts of thepopulation. CCFAC further commented that in specific cases JECFA might considersetting separate values for subgroups of the population. This request to clarify the
270 METHYLMERCURY
The effect of GLs for methylmercury on exposure and risk ...............................................................................
The nature of GLs .........................................................Data submitted to the Committee .................................The impact of risk management options on exposure .......................................................................
Comments .................................................................................Vulnerability of the embryo and fetus ..................................Vulnerability of the infant and child .....................................Vulnerability of adults ..........................................................Impact of current GLs for methylmercury in fish on exposureand risk ...............................................................................
Evaluation ..................................................................................References ................................................................................
299300300
305307307307308
308309310
PTWI for methylmercury in this context was considered by the Committee at itspresent meeting, taking into account relevant earlier and recent studies. Thefollowing issues were addressed:
• Clarification of the relevance of the PTWI of 1.6 μg/kg bw for different subgroupsof the population;
• Assessment of the scientific evidence on the relevance of direct exposure tomethylmercury to neurodevelopment in infants and young children;
• The impact of current GLs for methylmercury in fish on exposure and risk.
Descriptions of additional papers relevant to prenatal risks, published sincethe last review in 2004, are included for completeness.
2. BIOLOGICAL DATA
2.1 Biochemical aspects
2.1.1 Absorption, distribution and excretion
Details regarding the absorption and distribution of methylmercury in variousspecies of experimental animals have been previously provided (Annex 1, reference144). Briefly, methylmercury is effectively absorbed from the gastrointestinal tractand readily crosses the placenta and blood–brain barrier. Concentrations in thefetal blood and brain are generally greater than the corresponding maternalconcentrations at parturition.
Recent analyses/assessments have further indicated that methylmercurytends to concentrate in the fetus. The relationship between mercury in erythrocytesand plasma fatty acid composition in 63 pairs of Japanese mothers and fetuses(umbilical cord blood) at delivery was recently reported. The geometric meanconcentration of mercury in fetal erythrocytes was 13.4 ng/g, which was significantlyhigher than that in maternal erythrocytes (8.41 ng/g). The average ratio of mercuryin fetal/maternal erythrocytes was 1.6 (range, 1.1 to 2.2). This suggests individualdifferences in methylmercury concentration ratios between maternal and fetalcirculations at delivery. A significant correlation was observed between maternaland fetal concentrations of n-3 polyunsaturated fatty acids (PUFA) (r = 0.37,p < 0.01) and between concentrations of mercury in fetal erythrocytes and PUFA infetal plasma (r = 0.35, p < 0.01). These results confirm that methylmercury andPUFA, which originated from fish consumption, transferred from maternal to fetalcirculation (Sakamoto et al., 2004a).
The transport of methylmercury from maternal blood into human milk is lessefficient than the transport across the blood–brain and blood–placenta barriers, andmethylmercury concentrations in human milk are known to be very low (Skerfving,1988; Oskarsson et al., 1995, 1996). Exposure of rodent offspring to methylmercuryvia lactation is lower than exposure in utero, with milk : blood ratios of the order of0.03–0.2 (Annex 1, reference 144). Observations of decreasing concentrations ofinorganic mercury in maternal blood during breastfeeding suggest that mercury maybe excreted in human milk (Vahter et al., 2000); however the relevance of this
METHYLMERCURY 271

observation to methylmercury excretion via human milk is uncertain because of thekinetic differences between the two forms of mercury.
2.2 Toxicological studies
2.2.1 Reproductive and developmental toxicity
Since polychlorinated biphenyls (PCBs) and methylmercury both occur ascontaminants in some marine species and because co-exposure to PCBs was anissue in the studies in humans in the Faroe Islands, further studies were carried outto investigate the interactions of PCBs and methylmercury in development (Roeggeet al., 2003; Widholm et al., 2004).
In the first study, the effect of pre- and postnatal exposure to PCBs and/ormethylmercury on motor function was examined. Groups of at least 15 female Long-Evans rats (aged 60 days) were assigned to each of four exposure groups: (1) PCBsonly, dissolved in corn oil and fed on a wafer cookie at 6 mg/kg bw per day; (2)methylmercury only, given at 0.5 μg/ml in the drinking-water (giving an averageexposure of 41.90 μg/kg bw per day before mating and 58.90 μg/kg bw per dayduring gestation); (3) PCBs + methylmercury at the same doses; and (4) a controlgroup given wafer cookies containing corn oil and pure drinking-water). It should benoted that the study was conducted in three cohorts spaced 6 months apart, withanimals being assigned to the treatment groups evenly across each cohort. Matingcommenced 28 days after the start of dosing and treatment continued for 66 daysduring mating, pregnancy and lactation until the offspring were aged 16 days. Theoffspring were weaned at age 21 days. The dams showed no overt signs of toxicityand there was no effect of treatment on length of gestation, dam body or liver weight,litter size or percentage of live births. The offspring of the groups exposed to PCBsor PCBs + methylmercury showed signs of toxicity, including significantly lower bodyweights, increased liver- and brain : body weight ratios and lower thymus : bodyweight ratio at age 21 days. After weaning and up to age 63 days, body weightswere significantly reduced by 5–11% in the group exposed to PCBs and by 11–15%in the group exposed to PCB + methylmercury. Body weight was unaffected in thegroup exposed to methylmercury at up to age 63 days, but after this time, averagebody weight in this group was 7% lower than that of the controls, while average bodyweight in groups exposed to PCBs or PCBs + methylmercury was reduced by 8%and 11% respectively. Starting at age 60 days, one male and one female from eachlitter were tested over the next 4 weeks on three motor tasks that involved cerebellarfunction. Function measure by ability to traverse a rotating rod showed significantimpairment in offspring exposed to PCBs + methylmercury, while offspring exposedto PCBs only were also impaired but not significantly. In the vertical-rope climb task,females exposed to methylmercury only were slightly impaired compared withcontrols, the difference being statistically significant on the third day of the 3 daysof testing. In the parallel-bars test, males exposed to methylmercury only madesignificantly fewer hindlimb slips than did controls. There were no other significanteffects of treatment in these two tests (Roegge et al., 2003).
In a further publication, describing the same experiment, one male and onefemale from each litter in the four treatment groups were tested on a spatial
272 METHYLMERCURY

alternation task at age 110 days. This test was chosen because it assesses bothmemory and learning and has previously been shown to be sensitive to disruptionby PCBs. Methylmercury alone caused no overt toxicity. On the spatial alternationtask, animals exposed to PCBs and/or methylmercury showed impaired functionrelative to controls. Specifically, there were significant reductions in non-cuedalternation training in the groups treated with methylmercury only or PCBs +methylmercury, and reductions in delayed spatial alternation in the groups treatedwith PCBs only or methylmercury only. The group treated with PCBs +methylmercury showed a reduction of similar magnitude in delayed spatialalternation but the difference was not statistically significant because of variabilitywithin the group. Exposure to PCBs did not potentiate the effects of exposure tomethylmercury. The authors concluded that the delays were indicative of either anassociative or attentional impairment, rather than an effect on memory (Widholmet al., 2004).
Following up on earlier studies in which deficits in vision, hearing and finemotor control were observed during middle age in monkeys exposed tomethylmercury at 50 μg/kg bw per day from birth to age 7 years or exposed at 10,25 or 50 μg/kg bw per day in utero and after birth for 4–4.5 years (Rice & Gilbert,1982, 1990; Rice & Hayward, 1999; Rice, 1999), a further study was conducted bythe same group to examine the effects of methylmercury when exposure was limitedto the prenatal period. To prevent postnatal exposure, the offspring were separatedfrom their mothers at birth and reared separately. The mothers showed no overtsigns of toxicity during gestation. Offspring of monkeys exposed orally tomethylmercury at doses of 0, 50, 70 or 90 μg/kg bw per day before and throughoutpregnancy were tested at 11–14.5 years of age on a visual contrast sensitivity task.There were 9, 8, 2 and 2 offspring in the 0, 50, 70 and 90 μg/kg bw per day groups,respectively. Monkeys exposed prenatally to methylmercury showed a significantloss of contrast sensitivity, particularly for higher frequency visual images. Thedegree of impairment was not related to maternal or newborn methylmercury bodyburden or clearance and in almost half the exposed animals function wasunimpaired (Burbacher et al., 2005).
2.2.2 Relevance of studies of developmental toxicity in rodents to risk assessmentin humans
Although there are a number of studies in rodents that have addressed theissue of prenatal vs postnatal exposure, the utility of these studies to address thequestion of vulnerability of humans at different life stages is limited. The periodduring which brain growth is most rapid (brain growth spurt) during developmentoccurs postnatally during the first 3 weeks of life in rats, while it occurs prenatallyduring the third trimester of gestation in humans (Dobbing & Sands, 1979; Rice &Barone, 2000). It has therefore been suggested that rats exposed to methylmercurypostnatally during lactation could be used as models—at least with respect to thebrain growth spurt—for human prenatal exposure during the last trimester. Forexample, administration of methylmercury during the postnatal phase only in rats(Wakabayashi et al., 1995) has resulted in central nervous system lesions that aresimilar to those of human fetal Minamata disease (Takeuchi, 1982), while prenataladministration of methylmercury to rats does not produce the same spectrum of
METHYLMERCURY 273

damage to the central nervous system as in humans exposed prenatally (Kakita etal., 2000a; 2000b; 2001).
However, there are known toxicokinetic differences between rodents andhumans with regard to methylmercury (Annex 1, reference 144) that preclude simpleextrapolation. In addition, a more recent study indicated that the postnatal ratreceiving methylmercury via maternal milk may not be a suitable model for exposureof humans in the third trimester of gestation because blood and brain concentrationsof methylmercury decline rapidly during the suckling period (Sakamoto et al.,2002a). The same group has shown that if methylmercury is administered directlyto suckling rats via a micropipette, rather than via maternal milk, then the postnatalrat may serve as a useful model for exposure in humans during the third trimester(Sakamoto et al., 2004b).
2.3 Observations in humans
2.3.1 Prenatal exposure and neurodevelopment
Cognitive development was investigated at age 1 year in a prospectivecohort study of 233 infants born to mothers with generally low levels of exposure tomercury during pregnancy, in Krakow between 2001 and 2003. Samples of maternaland umbilical cord blood were taken at delivery. Cognitive function in the infantswas assessed by Bayley Scales of Infant Development (BSID-II), mental and motorscales. Fish consumption in grams per week, assessed by questionnaire duringpregnancy, was related to both maternal blood and cord blood mercuryconcentrations. The method of preparation of the fish (smoked, fried, roasted orgrilled) had no effect on maternal blood levels of mercury. The geometric mean formaternal whole blood total mercury concentrations at delivery was 0.55 μg/l (range,0.10–3.40) and for cord blood was 0.88 μg/l (range, 0.10–5.00), with a significantcorrelation between maternal and cord blood values. These values are consistentwith published values from other countries. One hundred and ninety-seven infantsshowed normal development on the Bayley mental and motor scales and 36 showeddelayed motor or psychomotor performance, with a significant difference betweenthe mean psychomotor development Index for the two groups. There were nosignificant differences between the two groups in the proportions of mothersbreastfeeding for given time intervals (< 25, 26–38, 39–51 and > 52 weeks). For thegroup of infants with normal developmental scores, the geometric mean for maternalblood mercury was significantly lower than that of the group with delayeddevelopment (0.52 μg/l; 95% confidence interval [CI] 0.46–0.58; and 0.75 μg/l; 95%CI, 0.59–0.94, in normal and delayed groups respectively). Cord blood mercuryconcentrations were also lower in the normal group (0.85 μg/l; 95% CI, 0.78–0.93and 1.05 μg/l; 95% CI, 0.87–1.27, in normal and delayed groups respectively), butthe significance was borderline (p = 0.070). The relative risk (RR) for delayedperformance increased more than three-fold (RR = 3.58; 95% CI, 1.40–9.14) if thecord blood mercury concentration was greater than the median value of 0.80 μg/l.Similar analysis for mercury concentrations in maternal blood showed a significantlyincreased risk for delayed performance (RR = 2.82; 95% CI, 1.17– 6.79) if maternalblood mercury concentration was greater than the median value of 0.50 μg/l(Jedrychowski et al., 2005).
274 METHYLMERCURY

The association between maternal fish consumption during pregnancy,umbilical cord mercury concentrations, child fish consumption and developmentwere assessed in 7421 British children born in Bristol in 1991–1992 (part of the AvonLongitudinal Study of Parents and Children (ALSPAC) study. At age 15 months, aparent-completed assessment, based on the MacArthur Communicative Develop-ment Inventory (MCDI), assessed the children’s vocabulary, comprehension andsocial activity. When the child was aged 18 months, the parents administered anadaptation of the Denver Developmental Screening Test (DDST) which screens fordevelopmental differences in language, social skills, fine and gross motor skills.Eighty-eight percent of the mothers ate fish during pregnancy, and of these, 80%ate fish at least once a week. Higher mean developmental assessment scores wereassociated with a modest but consistent increase in maternal fish intake duringpregnancy, particularly for the MCDI comprehension score. Tests for trend weresignificant for all measures except social skills in the DDST. These associationswere not altered by the child’s fish intake, but the child’s intake at age 6 and12 months was independently associated with an increase in all of theneurodevelopment scores except the language score in the DDST. Breastfeedingdid not confound these relationships. Other potentially confounding factors (firstborn, female sex, higher home-observation-for-measurement of the environment(HOME) scores, higher maternal education, mother abstaining from alcohol duringpregnancy) did not modify the relationship between maternal fish intake andneurodevelopment. Maternal fish intake was associated with wet weight umbilicalcord mercury concentrations, but overall, umbilical cord concentrations were low inthis population (median 0.01 μg/g, with only 33 cord concentrations being 0.1 μg/g)and when umbilical cord mercury concentrations were divided into quartiles, therewas no association between the quartiles and the developmental scores. Theseconcentrations are considerably lower that that reported to be the median forumbilical cords in the Faroe Islands cohort (Dalgard et al., 1994), which was 0.3 μg/gdry weight, equivalent to around 0.04 μg/g when adjusted to a wet weight value,based on a water content of 85–90%. These results indicate that these low levelsof prenatal exposure are not associated with developmental effects and that, whenfish is not significantly contaminated with mercury, fish intakes during pregnancyand lactation may be beneficial for development (Daniels et al., 2004).
A further statistical analysis has been undertaken of previously reportedneurodevelopmental test data obtained at age 5.5 years in the Seychelles ChildDevelopment Study (SCDS) (Davidson et al., 1998). Linear measurement errormodels were used to correct bias resulting from unknown errors of measurement indata in order to obtain unbiased slope estimates that better approximate the truerelationship between exposure and outcome. Reanalysis using the measurement-error-model approach indicated that adjustment for measurement errors in prenatalexposure and other explanatory variables had no appreciable effect on the originalresults (Huang et al., 2003).
Another further statistical analysis of the data from the SCDS at age 9 yearshas also been published. In the original analysis of the data at age 9 years (Myerset al., 2003), which has been reviewed previously by this Committee (Annex 1,reference 167), conventional linear regression models were used to analyse thedata concerning prenatal exposure to methylmercury via maternal fish consumption
METHYLMERCURY 275

and neurodevelopmental test scores. Such models assume a linear relationshipbetween exposure and outcome. However, if the true relationship betweenexposure and outcome were nonlinear, other statistical models would be moreappropriate. Accordingly, the data from the SCDS gathered at age 9 years has beenre-analysed using semi-parametric additive modelling with different degrees ofsmoothing to explore whether nonlinear effects of prenatal exposure were present.From the original 21 end-points yielded by the neurodevelopmental tests on 643children, they selected the six end-points with a two-tailed p value of less than 0.2.A nonlinear effect was identified with the smoother model on adjusted results foronly one end-point, the grooved pegboard dominant hand. It suggested no effect ofexposure up to a maternal hair total mercury concentration of 12 μg/g, but a slighteffect above 12 μg/g. However, the authors noted that there were fewer data pointsabove a maternal hair concentration of 12 μg/g and the curves were estimated withless precision. In the new analysis, the overall effect for prenatal exposure to totalmercury was also significant (p = 0.04), while the overall effect in the previous linearanalysis (Myers et al., 2003) was not (p = 0.08). The significant associations foundin the previous linear analysis (adverse effect on grooved pegboard non-dominanthand in males and a beneficial effect on the Connors Teacher Rating Scale)remained significant in this new analysis. The authors concluded that this reanalysisconfirms the findings of their previous linear regression analysis, with little evidencefor adverse effects from prenatal methylmercury exposure in the Seychelles cohort,but that it does reveal a possible adverse effect in the uppermost exposure rangeat greater than 12 μg/g for maternal hair mercury (Huang et al., 2005). The authorsfurther note that this possibility is consistent with the World Health Organization(WHO) analysis of the data from the Iraq poisoning incident, which also suggesteda threshold for adverse effects on the offspring in the range of 10–20 μg/g formaternal hair mercury as a biomarker for prenatal exposure (WHO, 1990).
In the SCDS main study, at age 19 months, enhanced Motor DevelopmentalIndex scores were associated with increasing exposure to methylmercury in groupsof caregivers with higher intelligence quotient (IQ) at several levels of family income.A similar analysis of the evaluations at 66 months to determine whether themodifying influences of social and environmental factors were consistent with thosepreviously observed was performed. Children in the cohort (n = 711) were evaluatedfor cognitive ability (McCarthy Scales of Children’s Abilities), language development(Preschool Language Scale), drawing and copying (Bender Gestalt Test),scholastic achievement (the Woodcock-Johnson Test of Achievement), andbehaviour (the Child Behavior Checklist). Interactions between prenatal exposureto methylmercury and caregiver intelligence, socioeconomic status, homeenvironment, and sex were examined by multiple regression analysis. The medianprenatal exposure to methylmercury as measured by concentrations in maternalhair was 5.9 μg/g, with a range of 0.5– 26.7 μg/g. Prenatal exposure interacted withsex, one or more social or environmental covariates for general cognitive ability,overall language ability, and pre-arithmetic achievement. The effects were notconsistent across either endpoints or covariate categories. The authors determinedthat a consistent pattern of effect modification was not observed, suggesting thatthe any statistically significant results were due to chance (Davidson et al., 2004).
276 METHYLMERCURY

The Faroe Islands cohort underwent detailed neurobehavioral examinationat age 14 years. Prenatal exposure to methylmercury was determined by analysesof cord blood, cord tissue, and maternal hair. Of the 1010 living cohort members,878 were available for examination. Eighteen participants with neurologicaldisorders were excluded. The neuropsychological test battery was designed basedon the same criteria as applied at the examination at age 7 years. Multipleregression analysis was carried out and included adjustment for confounders.Indicators of prenatal methylmercury exposure were significantly associated withdeficits in finger tapping speed, reaction time on a continued performance task, andcued naming. Postnatal exposure to methylmercury had no discernible effect.These findings are similar to those obtained at age 7 years, and the relativecontribution of mercury exposure to the predictive power of the multiple regressionmodels was also similar. An analysis of the test score difference between results atage 7 and 14 years suggested that mercury-associated deficits had not changedbetween the two examinations. Exposure to methylmercury was significantlyassociated with deficits in motor, attention, and verbal tests. According to theauthors, the effects on brain function associated with prenatal exposure tomethylmercury appear to be multi-focal and permanent (Debes et al., 2006).
The associations between maternal fish intake during pregnancy andmaternal hair mercury at delivery with visual brain processing among 135 mother–infant pairs was assessed in a prospective study of pregnancy and child cohorts inthe United States of America (USA). Infant cognition by the percent noveltypreference on visual recognition memory testing at age 6 months was determined.Maternal fish consumption averaged 1.2 servings per week during the secondtrimester. Mean maternal hair total mercury was 0.5 μg/g, with 10% of samplesexceeding 1.2 μg/g. Mean visual recognition memory score was 59.8 with a rangeof 10.9–92.5. Higher fish intake was associated with higher infant cognition, afteradjusting for participant characteristics using linear regression. The associationstrengthened after adjustment for maternal hair mercury concentration. For eachadditional weekly fish serving, offspring visual recognition memory score was 4.0points higher. An increase of 1 μg/g in hair mercury concentration was associatedwith a visual recognition memory decrement of 7.5 points. Visual recognitionmemory scores were highest among infants of women who consumed more thantwo weekly servings of fish but had hair mercury concentrations of less than or equalto 1.2 μg/g (Oken et al., 2005).
In a similar study, the impact of long-term exposure to PCBs andmethylmercury on visual brain processing in Canadian Inuit children was assessed.Concentrations of total mercury in blood and PCB 153 in plasma were measured atbirth and again at the time of testing in 102 chidren of preschool age. Relationshipsbetween contaminants and pattern-reversal visual evoked potentials wereassessed by multivariate regression analyses, taking into account several potentialconfounding variables. The possible protective effects of selenium and n-3 PUFAagainst toxicity caused by methylmercury and PCBs were also investigated. Resultsindicate that exposure to methylmercury and PCB from consumption of fish and seamammals were associated with alterations in responses to visual evoked potentials,especially delays in the latency of the N75 and of the P100 components. In contrast,the concomitant intake of n-3 PUFA was associated with a shorter latency of the
METHYLMERCURY 277
P100. No significant interactions between nutrients and contaminants were found.Significant associations were found with concentrations of neurotoxicants in bloodsamples collected at the time of testing at preschool age (Saint-Amour et al., 2006).
The effects of prenatal and postnatal long-term exposure to mercury,polychlorinated PCBs and lead on the neuromotor development of preschoolchildren was assessed in a study of 110 preschool Canadian Inuit children. Bloodmercury, PCBs and lead concentrations were measured in cord blood and at thetime of testing. Gross motor functions were evaluated and a neurologicalexamination was performed. Fine neuromotor performance was assessed usingquantitative measures of postural hand tremor, reaction time, sway oscillations, aswell as alternating and pointing movements. Potential covariates were documentedincluding demographic and familial characteristics, other prenatal neurotoxicants(alcohol, tobacco) and nutrients (selenium, n-3 PUFA). Hierarchical multivariateregression analyses were performed, controlling for significant covariates. Grossmotor development was not linked to prenatal exposures. However, significantassociations were observed between blood lead concentration at testing time andchanges in reaction time, sway oscillations, alternating arm movements and actiontremor. Negative effects of PCBs on neuromotor development were not clearlyobserved, neither were the potential beneficial effects of n-3 PUFA and selenium.Increased action tremor amplitude was related to blood mercury concentrations attesting time, which corroborates an effect reported among adults (Després et al.,2005).
In order to assess the association between mercury exposure in children withautistic spectrum disorder, a cross-sectional cohort study was performed over a5-month period in 2000 to compare the hair and blood mercury concentrations ofchildren with this disorder (n = 82; mean age, 7.2 years) and a control group ofnormal children (n = 55; mean age, 7.8 years). There was no difference in the meanmercury concentrations. The mean blood mercury concentrations for the autisticand control groups were 19.5 and 17.7 nmol/l, respectively (p = 0.15), and themean hair mercury concentrations of the autistic and control groups were 2.26 and2.07 ppm, respectively (p = 0.79). These results indicate that there is no causalrelationship between mercury as an environmental neurotoxin and autism (Ip et al.,2004a).
2.3.2 Neurodevelopment and postnatal exposure to methylmercury in human milkduring infancy
Details of the critical studies of neurodevelopment from the Seychelles andthe Faroe Islands underlying the establishment of the PTWI of 1.6 μg/kg bw in 2004have been described previously (Annex 1, reference 167). Since then, furtherstudies have been published that are relevant to the question of the possibleadditional role of postnatal exposure to methylmercury via human milk incontributing to the neurobehavioural changes.
Earlier observations from the Faroe Islands cohort where the length ofbreastfeeding showed a positive correlation with mercury concentration in the hairof the infants at age 12 months, indicated that, in addition to prenatal exposure,exposure also took place through human milk (Grandjean et al., 1994). In spite of
278 METHYLMERCURY

this, it was noted that breastfed children reached their developmental milestonesbefore formula-fed children (Grandjean et al., 1995), suggesting an overallbeneficial effect of human milk, despite the contamination with mercury. Whenexamined in a series of neurobehavioural tests, in one test (reflecting attention)worse performance at age 7 years was associated with increased hair mercuryconcentrations at age 12 months, irrespective of whether the children werebreastfed or not, but paradoxically, performance on a test of language skillsincreased with increasing hair mercury concentrations at age 12 months (Grandjeanet al., 1999). The picture is further complicated by the observation, derived from ameta-analysis of available studies, that breastfeeding in general is associated withimprovements in neurological and cognitive development across all ages from6 months to 15 years and carries greater benefits in children of low birth weight(Anderson et al., 1999).
The role of breastfeeding on neuropsychological performance at age 7 yearswas examined in the Faroe Islands cohort of 905 children who had relatively highprenatal exposures to mercury. They compared the influence of breastfeedingexclusively for 0–4 months with breastfeeding for more than 4 months as well astotal months of breastfeeding until weaning (0–6 months or > 6 months). All except7.7% of the children were breastfed and 61% were exclusively breastfed for0–4 months. The breastfeeding period exceeded 6 months for 55% of the children;of these only 5% were exclusively breastfed for more than 6 months, the remainderreceived other food in addition to human milk. Children who were breastfed longer(both exclusively and in total) performed slightly better on most neuro-psychologicaltests before adjustment for confounders (e.g. sex of child, parents professionallytrained, father employed at examination, child in day care, etc). This effect wasreduced after adjustment for these confounders, but children breastfed exclusivelyfor more than 4 months or for longer in total still performed slightly better on mosttests, with significantly better scores on the Boston Naming Test and WechslerIntelligence Scale for Children—Revised, Block Designs. After further adjustmentfor cord-blood mercury and child hair mercury, the results were unaffected, exceptfor the Boston Naming Test where the difference became non-significant. Adjustingfor exposure to PCBs did not affect the associations found. Children who were notbreastfed at all generally performed less well on most tests than those that werebreastfed. The authors however, acknowledge the difficulty of differentiatingbetween prenatal and postnatal exposure to mercury, because very few children inthe cohort were not breastfed and most children were exposed to mercury bothprenatally and early postnatally. Thus, in this cohort with relatively high prenatalexposure and demonstrated adverse effects from that exposure, breastfeeding wasnot associated with any deficit in neuropsychological performance at age 7 years,although breastfeeding appeared to be not as beneficial as previously reported byother investigators in non-exposed populations (Jensen et al., 2005).
2.3.3 Neurodevelopment and exposure to methylmercury during childhood
In the re-analysis of the Seychelles (SCDS) data by Huang et al. (2003),described earlier in the section on prenatal exposure, the influence of postnatalexposure on neurodevelopment at age 5.5 years was also re-evaluated. Application
METHYLMERCURY 279

of linear measurement error models did not alter the significance levels for severalbeneficial effects compared with previous linear regression analysis (Davidson etal., 1998).
Murata et al. (2004) have studied the influence of exposure to methylmercuryon brainstem auditory evoked potentials (BAEP) in children from the Faroe Islandscohort. A total of 878 children (87%) from the original cohort were given a thoroughpaediatric examination at age 14 years, hair samples were taken and analysed formercury and BAEPs were determined in 859 of the children. Their hair mercuryconcentrations were increased compared with the previous examination of thesechildren at age 7 years, as published previously (Budtz-Jørgensen et al., 2004); atage 14 years, geometric mean hair-mercury concentrations were 0.96 (range, 0.02–9.7) μg/g compared with 0.60 (range, 0.04–7.5) μg/g at age 7 years. However, thesewere still less than one quarter of the concentration in maternal hair at the time oftheir birth, which was 4.22 (range, 0.2–39.1) μg/g. Audiometry results generallyshowed normal hearing, but in accordance with their findings on the BAEP test atage 7 years (Grandjean et al., 1997), latencies of BAEP peaks III and V andespecially the I–III interpeak interval were delayed in association with prenatalexposure to methylmercury, as measured by cord blood values. The delay wasabout 0.012 ms when cord blood mercury concentration doubled. The regressioncoefficients for the delay in latencies were approximately halved at age 14 yearscompared with age 7 years, suggesting that there may be some degree ofcompensation. More recent exposure, as measured by hair concentrations at age14 years, was associated with a prolongation of the III–V interpeak interval. Thischange was not associated with prenatal exposure to methylmercury and analysisfor exposure to PCBs did not affect the results.
The authors note that all these effects are subtle and not nearly as markedas the changes in BAEP that occur in disease states such as multiple sclerosis,acoustic neuroma or diabetes mellitus. They also comment that previouscalculations based on the most sensitive end-point from all their neuro-psychological evaluations on this cohort, using a benchmark response of 5%,indicate a benchmark dose (BMD) lower 95% confidence limit (BMDL derived fromthe BMD) of about 10 μg/g for maternal hair, but the postnatal BMDL for theprolonged III–V interpeak interval is approximately one half of that. The authorsacknowledge that the statistical uncertainties are such that the difference may notnecessarily reflect the relative toxic potentials of prenatal and postnatal exposures.They also acknowledge that the postnatal exposure estimates were limited and maynot necessarily represent the magnitude of exposure at susceptible time windows.Moreover, biomarkers of prenatal and postnatal exposure were highly associated.However, since biomarkers of prenatal and postnatal exposure were associatedwith effects on different peaks and/or peak intervals, this indicates that thedifferential effects of pre- and postnatal exposure may be robust. The authorsconclude that the significance of postnatal methylmercury exposure needs to bedocumented further in independent studies with more frequent exposureassessments, but that the results suggests vulnerability to neurotoxicity attributableto methyl mercury may extend into the teenage period.
280 METHYLMERCURY
2.3.4 Methylmercury exposure and cardiovascular function in the young
To ascertain whether heart function in childhood is affected by exposure tomethylmercury, the Faroese birth cohort was examined at age 7 and 14 years. Bloodpressure, heart rate variability (HRV) and brainstem auditory evoked potentials(BAEPs) (see above) were measured. Mercury concentrations were determined incord blood as the measure of prenatal exposure and in the child’s hair as a measureof recent exposure. HRV, which reflects the continuous changes in central controlof cardiac autonomic balance, was partitioned into its individual components byspectral analysis and the results expressed in terms of high frequency (HF) and lowfrequency (LF) components. HF components reflect parasympathetic activity andLF components reflect sympathetic activities. A doubling of prenatal methylmercuryexposure was associated with significant decreases of about 6.7% in LF, mainly at7 years of age, and in HF, mainly at 14 years of age. The coefficient of variation ofthe electrocardiograph R-R interval was also significantly decreased with increasingprenatal exposure to methylmercury at age 7 years and at 14 years. No discernibleeffect of methyl-mercury on blood pressure was apparent at age 14 years.Decreased LF was associated with increased latency of the BAEP peak III,but adjustment for prenatal and postnatal exposure substantially attenuatedthis correlation. The authors concluded that prenatal exposure was associatedwith decreased sympathetic and parasympathetic modulation of the HRV at age14 years. The authors hypothesised that both the delay in one of the BAEP latenciesand the effects on HRV parameters may be caused by underlying neurotoxicity ofmethylmercury to brainstem nuclei. The authors speculate on the possible clinicalsignificance of the observed changes, citing clinical studies in adults showing thatdecreased vagal (parasympathetic) tone is associated with an increased risk ofsudden cardiac arrest and coronary artery disease (Grandjean et al., 2004a).
In a similar study to that described above, the subclinical effects of prenatalexposure to methylmercury from fish consumption on the cardiac autonomicfunction were assessed in 136 Japanese children aged 7 years. In the children, cordtissue methylmercury concentration (range, 0.017–0.367, median, 0.089 μg/g) wasnot significantly correlated with hair total mercury at 7 years of age (range, 0.43–6.32, median, 1.66 μg/g). The principal finding was that prenatal exposure tomethylmercury, as measured by cord tissue methylmercury concentration, wasassociated with decreased vagal modulation of cardiac autonomic function, inagreement with the findings in the Faroe Islands cohort at age 14 years. Theseassociations remained after correcting for possible confounders such as age andsex. Hair mercury concentration was not significantly correlated with any cardiacautonomic indicators. The authors concluded that these findings suggest thatprenatal exposure to methylmercury at a median of estimated maternal hair mercuryconcentration at parturition of 2.24 μg/g, may be associated with reducedparasympathetic activity and/or sympathovagal shift (Murata et al., 2006). TheCommittee noted that this is about six times lower than the value used to derive thePTWI in 2003.
METHYLMERCURY 281

2.3.5 Methylmercury exposure and neurological effects in adults
Monoamine oxidase (MAO) regulates biogenic amine concentration in thebrain and peripheral tissue and is known to be a molecular target of mercurycompounds in animal models. Blood platelet MAO-B activity may reflect MAOfunction in the central nervous tissue. The relationship between platelet MAO-B andmercury exposure (blood and hair) in fish-eating adults (n = 127) living along theSt Lawrence River in Canada was assessed. A significant negative association wasobserved between platelet MAO-B activity and blood mercury concentration, but notwith hair mercury concentrations. Multiple linear regression analysis demonstratedthat blood mercury and heavy smoking were associated with reduced platelet MAOactivity in the total population. The reduction in MAO-B activity appeared to beassociated with blood mercury concentrations of greater than 3.4 μg/l (75thpercentile). These results suggest that MAO-B activity in blood platelets may be auseful biomarker to assess the biochemical effects of exposure to mercury (Stamleret al., 2006).
Two groups of 22 Italian adult male subjects who were frequent consumersof tuna and 22 controls were examined in a cross-sectional field study. Theassessment included neurobehavioral tests of vigilance and psychomotor functionand hand tremor measurements. Mercury in urine and serum prolactin weremeasured in all exposed subjects and controls, while measurements of the organiccomponent of mercury in blood (O-Hg) were available for only 10 exposed and sixcontrols. Mercury in urine was significant higher among exposed subjects (median,6.5 μg/g of creatinine; range, 1.8–21.5) than controls (median, 1.5 μg/g of creatinine;range, 0.5–5.3). The median blood concentrations of O-Hg were 41.5 μg/l amongthe tuna-fish eaters and 2.6 μg/l in the control group. Both mercury in urine andO-Hg were significantly correlated with the quantity of fish consumed per week. Theneurobehavioral performance of subjects who consumed tuna fish regularly wassignificantly worse on colour word reaction time, digit symbol reaction time andfinger tapping speed. After accounting for education level and other covariates, themultiple stepwise regression analysis indicated that O-Hg concentration was mostsignificantly associated with individual performance on these tests, accounting forabout 65% of the variance in test scores (Carta et al., 2003).
An annual follow-up involving multiple health examinations in about 1500persons of age 40 years or more took place near Minamata City each summer from1984 to 2004. Case–control studies were designed to estimate the role of riskfactors for various health issues using geographical differences. The results of thestudy are summarized as follows. There were no significant differences in theprevalence of diseases associated with Minamata disease. Subjective complaints,which were related not only to neurological but also to general complaints, wereconsistently much more common in the polluted area than in the control area. Fivepercent of the inhabitants who were not certified as patients with Minimata diseasehad a high predicting index of Minimata disease and therefore could have beenaffected by methylmercury poisoning. No significant differences with respect toactivities of daily living by residential area were observed. It is important to take intoconsideration mental stress not only from the physical effects but also from thesecondary social damage experienced in these areas in making a differentialdiagnosis of Minimata disease (Futatsuka et al., 2005).
282 METHYLMERCURY

The thresholds of touch and two-point discrimination of residents nearthe Shiranui Sea and patients with Minamata disease were examined using thequantifiable instruments. Patients with Minimata disease could perceive thestimulation of touch although their touch thresholds were significantly increased incomparison with those of the control group. Their touch thresholds increased at theproximal extremities and the trunks as well as at the distal extremities. The evenlydistributed increases at both distal and proximal parts indicated that the persistentsomatosensory disturbances were not caused by the injuries to their peripheralnerves. The thresholds of two-point discrimination, which are associated with thefunction of the somatosensory cortex, increased at both forefingers and the lip inboth groups. Apraxia limb kinetics, astereognosis and disorder of active sensation,which are all associated with damage to the somatosensory cortex, were detectedin the patients with Minimata disease. The authors concluded that the persistingsomatosensory disorders after discontinuation of exposure to methylmercury wereinduced by diffuse damage to the somatosensory cortex (Ninomiya et al., 2005).
A psychophysical study of tactile sensation to evaluate the somatosensoryabilities was conducted in subjects living in a methylmercury-polluted area aroundMinamata City, Japan. Control subjects and methylmercury-exposed subjects withand without numbness were included in the study groups. A history of exposure tomethylmercury was taken and a neurological examination was performed.Aluminum-oxide abrasive papers were used as stimuli in a psychophysical sensoryexamination of fine-surface-texture discrimination. Difference thresholds from 3 μmwere calculated by the two-alternative, forced-choice technique. Differencethresholds in control subjects were also calculated. The difference threshold was6.3 μm in exposed subjects with sensory symptoms, 4.9 μm in exposed subjectswithout sensory symptoms, and 2.7 μm in control subjects. Acuity of fine-surface-texture discrimination was disturbed not only in subjects with clinical complaints ofhand numbness, but also in subjects without hand numbness who lived in the districtwhere methylmercury exposure occurred. Sensory testing using a psychophysicaltest of fine-surface-texture discrimination in this population suggests that thenumber of individuals affected by methylmercury exposure in the polluted area wasgreater than previously reported (Takaika et al., 2004).
Neurological symptoms and signs of Minimata disease were assessed inanother Japanese study by assessing neurological signs and symptoms temporallyusing multiple logistic regression analysis. The severity of predictive index in thestudy population declined over a 25 year period. Only a few patients showedaggravation of neurological findings, which were caused by complications such asspinocerebellar degeneration. Patients with chronic Minimata disease who wereolder than age 45 years had several concomitant diseases, so that their clinicalpictures were complicated. It was difficult to statistically differentiate chronicMinimata disease based on sensory disturbance alone (Uchino et al., 2005).
A cross-sectional analysis was used to determine the effect of mercuryconcentrations on neurobehaviour in 474 subjects in the Baltimore Memory Study,a longitudinal study of cognitive decline in people aged 50 to 70 years. Total mercuryin whole blood samples was analysed and multiple linear regression was used toexamine its associations with neurobehavioral test scores. Twenty scores from 12neurobehavioral tests were considered. The median blood mercury concentration
METHYLMERCURY 283

was 2.1 μg/l. After adjustment for covariates, increasing blood mercury wasassociated with worse performance on Rey complex figure delayed recall, a test ofvisual memory. However, increasing blood mercury concentrations were associatedwith better performance on finger tapping, a test of manual dexterity. Overall, theauthors concluded that this study did not provide strong evidence that blood mercuryconcentrations are associated with worse neurobehavioral performance in thispopulation of older urban adults (Weil et al., 2005).
2.3.6 Methylmercury exposure and cardiovascular effects in adults
The association between mercury in blood and 24-h blood pressure in fourgroups of healthy subjects was assessed. The following describes the subjects ineach group: group 1, Danes living in Denmark consuming European food; group 2,Greenlanders living in Denmark consuming European food; group 3, Greenlandersliving in Greenland consuming European food; and group 4, Greenlanders living inGreenland consuming mainly traditional Greenlandic food. Mercury concentrationsin blood were highest in Greenlanders and increased when they lived in Greenlandand consumed traditional Greenlandic food (group 1: 2.2 μg/l (median), group2: 4.8 μg/l, group 3: 10.8 μg/l, and group 4: 24.9 μg/l). The 24-h blood pressure wasthe same in all three groups of Greenlanders. However, 24-h diastolic bloodpressure was significantly lower (71 vs 76 mm Hg) and 24-h pulse pressure wassignificantly higher (54 vs 50 mm Hg) among Greenlanders in comparison withDanes. Mercury in blood was significantly and positively correlated to pulsepressure (the difference between systolic and diastolic pressure). The differencesin pulse pressure were undoubtedly due to the lower diastolic blood pressure notedin the Greenlanders (Pedersen et al., 2005).
The cross-sectional relationship between total blood mercury concentrationand blood pressure was assessed in a representative sample of 1240 women, aged16–49 years, from the National Health and Nutrition Examination Survey (NHANES)1999–2000 in the USA. No overall association was found between blood mercuryand blood pressure in multivariate models. Data by dietary fish intake was stratifiedresulting in 759 consumers of fish and 481 nonconsumers. Total blood mercuryconcentrations averaged 2.3 μg/l for the consumers and 0.8 μg/l for thenonconsumers. For each 1.3 μg/l (interquartile distance) increase in blood mercury,systolic blood pressure significantly increased by 1.83 mm Hg (95% CI, 0.36–3.30)among nonconsumers. A similar pattern was seen for diastolic blood pressure,although it was nonsignificant. No significant effects of blood mercuryconcentrations on blood pressure were seen among consumers of fish. While noadverse effect on blood pressure of mercury exposure at background levels waspresent when considering all study participants, an adverse association was presentamong young and middle-aged women who did not consume fish. The authorsspeculated that fish consumption may counter the effects of mercury on bloodpressure regulation (Vupputuri et al., 2005).
Three Amazonian villages of the Tapajos Basin were studied in relation tofish mercury concentrations, mercury in hair (fish consumption) and erythrocytes,body mass index (body weight/height squared, kg/m2), and blood pressure. Themean concentrations of mercury in fish were higher in predatory (578.6 ng/g) thanin non-predatory species (52.8 ng/g). Overall, only 26% of concentrations of
284 METHYLMERCURY

mercury in fish were greater than 500 ng/g, and only 11% were greater than1000 ng/g. There was no systematic trend in concentrations of mercury in fish fromrivers with a history of gold-mining activities. The biomarker of fish consumption(hair mercury) was significantly associated with erythrocyte mercury (r = 0.5181;p = 0.0001). There was a trend of lower increase in blood pressure with age amongconsumers with a higher consumption. Summary clinical evaluation did not detectneurological complaints compatible with mercury intoxication (paraparesis,numbness, tremor, balancing failure), but endemic tropical diseases such as clinicalhistory of malaria showed a high prevalence (55.4%). Fish is an abundant naturalresource, important in the native diets, that has been historically consumed withoutperceived problems and can easily be traced through hair mercury. The authorsconcluded that exposure to methylmercury in freshwater fish is a less importanthealth issue than endemic infectious diseases such as malaria and lack of basicmedical services (Dorea et al., 2005b).
The incidence of myocardial infarction and death from all causes wasreported during 24 years of follow-up of a prospective cohort study of 1462 womenin Gothenberg, Sweden. There were a total of 87 cases of myocardial infarction, ofwhich 39 died and 253 all-cause deaths. At baseline of the prospective study (1968–1969), sera from participants were collected and stored for future research. Thesera samples were analysed for mercury concentrations in 1992–1993, and thecorrelation between mercury concentrations and disease or death was examined.An inverse correlation, though not statistically significant, was detected formyocardial infarction (p = 0.10 adjusted for age and > 0.20 when adjusted for ageand education) and also for death (p = 0.09). A statistically significant inversecorrelation between serum mercury and death was found when the correlation wasadjusted for both age and education. No correlation coefficients were provided inthe paper (Ahlqwist et al., 1999).
A case–control study nested within a larger ongoing prospective programmeon cardiovascular disease and diabetes prevention was conducted in northernSweden. Participants in the prospective programme had responded to healthsurveys and donated blood samples in 1994 that were stored for future research.From these participants, persons with first myocardial infarction with sufficient bloodsample and without cancer (n = 78) were selected as cases, and persons matchedby age, sex, date of health survey (± 1 year) and geographical region to the caseswere selected as controls (n = 156). The average time to onset of first myocardialinfarction for the cases after responding to the health survey was 18 months. Thecase–control study examined the association between first myocardial infarctionand concentration of mercury in erythrocytes, as well as gluthathione peroxidase inerythrocytes (Ery-GSH-Px) and plasma concentrations of n-3 PUFA eicosapen-taenoic and docosahexaenoic acids (P-PUFA), which the researchers consideredto be biomarkers of fish intake. Fish consumption assessed by questionnaire wasalso evaluated. The results of the study showed a marginally significant inverseassociation between myocardial infarction and erythrocyte mercury in the univariateanalysis. When the range of values for erythrocyte mercury (0.5 to 67 ng Hg/gerythrocytes) was divided into tertiles (< 3, 3–6, and > 6 ng Hg/g erythrocytes), theodds ratio for the highest vs lowest tertile was 0.43 (95% CI, 0.19–0.95). Erythrocytemercury was found to be significantly correlated with reported weekly fishconsumption. P-PUFA also showed an inverse association with myocardial
METHYLMERCURY 285

infarction and was significantly correlated with reported weekly fish consumption.No association between myocardial infarction and Ery-GSH-Px was detected.When erythrocyte mercury and P-PUFA and their interaction were analysed in amultivariate model that adjusted for smoking and body mass index, there was asignificantly lower risk of myocardial infarction for the group that had both higherythrocyte mercury and high P-PUFA (OR = 0.16, 95% CI, 0.04–0.65) (Hallgrenet al., 2001).
The correlation of hair mercury concentration with the risk of acute coronaryevents and cardiovascular and all-cause mortality was assessed in a study of menfrom eastern Finland. The population-based prospective Kuopio Ischaemic HeartDisease Risk Factor Study cohort of 1871 Finnish men aged 42 to 60 years andfree of previous coronary heart disease or stroke at baseline was used. During anaverage follow-up time of 13.9 years, 282 acute coronary events and 132 cases ofcardiovascular disease, 91 cases of coronary heart disease, and 525 all-causedeaths occurred. Men with hair mercury content within the highest third of the range(i.e. > 2.03 μg/g) had an adjusted 1.60-fold (95% CI, 1.24–2.06) risk of acutecoronary event, 1.68-fold (95% CI, 1.15–2.44) risk of cardiovascular disease,1.56-fold (95% CI, 0.99–2.46) risk of coronary heart disease, and 1.38-fold (95%CI, 1.15–1.66) risk of any death compared with men in the lower two thirds. Highmercury content in hair also attenuated the inverse correlations of docosahexaenoicacid plus docosapentaenoic acid concentration with these cardiovascular riskfactors (Virtanen et al., 2005).
The five epidemiological studies of mercury concentrations in adults inrelation to cardiovascular disease or death are shown in Table 1. Three of thesestudies are described in this monograph (Virtanen et al., 2005; Hallgren et al., 2001;Ahlqwist et al., 1999) and two (Guallar et al., 2002; Yoshizawa et al., 2002) in theprevious monograph on methylmercury prepared by the Committee at its sixty-firstmeeting (Annex 1, reference 166). One study (Salonen et al., 1995) in the previousmonograph is not shown in the table because it concerns the same cohort of menin Eastern Finland as that described by Virtanen et al. (2005), with longer follow-up.
As the table demonstrates, the studies are not directly comparable owing todifferent biomarkers for ascertaining total mercury concentrations, i.e. hair,erythrocytes, toenails or serum. Two of the five studies (Virtanen et al., 2005; Guallaret al., 2002) found an increased risk of acute coronary event or myocardial infarctionwith higher mercury concentrations; one study (Hallgren et al., 2001) found adecreased risk of myocardial infarction with higher concentrations of mercury (theauthors consider mercury concentrations to be a biomarker for fish consumption inthis study); and the other two studies (Yoshizawa et al., 2002; Ahlqwist et al., 1999)did not show a statistically significant association between myocardial infarction andmercury concentrations. The reason for the differences in findings across studiesand population groups is not clear but suggests that the evidence for the associationbetween cardiovascular disease and methylmercury exposure is preliminary.
2.3.7 Dose–response assessments
Exposure misclassification always constitutes an issue in dose–responserelationships concerning epidemiology studies in humans. In additional work, theFaroese research team (Grandjean et al., 2005) considered the issue of imprecision
286 METHYLMERCURY

in analyses of mercury in cord blood and maternal hair. Laboratory imprecision forboth chemical analyses was less than 5% coefficient of variation. Factor analysisand structural equation analysis were applied to assess the full extent of theimprecision. Calculated total imprecision exceeded the known laboratory variation:the coefficient of variation was 28–30% for the cord blood mercury concentrationand 52–55% for the maternal hair mercury concentration. These findings illustratethat measurement error may be underestimated if judged solely on the basis of theability of the laboratory to reproduce the data with check analysis. Adjustment bysensitivity analysis is meaningful only if realistic measurement errors are applied(Grandjean et al., 2004b; Budtz-Jørgensen et al., 2004).
2.3.8 Risk–benefit analyses
When exposure recommendations are developed for foods that potentiallyhave both harmful and beneficial qualities, a balance must be struck between theassociated risks and benefits to optimize public health. Although quantitativemethods are commonly used to evaluate health risks, such methods have not beengenerally applied to evaluating the health benefits associated with environmentalexposures. A quantitative method for risk–benefit analysis has been used by severalgroups of investigators that allows for consideration of diverse health end-points(e.g. neurodevelopment, cardiovascular) that differ in their impact (i.e. duration andseverity), using dose–response modelling by estimating the number of quality-adjusted life years saved.
To demonstrate the usefulness of this method, the risks and benefits of fishconsumption were evaluated using a single health risk and health benefit end-point.The benefits of eating fish were defined as the decrease in mortality caused bymyocardial infarction, and risk was defined as the increase in neurodevelopmentaldelay (i.e. delay in talking) resulting from prenatal exposure to methylmercury. Usingthe proposed framework, the net health impact of eating fish was estimated eitherin a whole population or in a population of women of childbearing age and theirchildren. It was demonstrated that across a range of concentrations ofmethylmercury in fish (0–1 mg/kg) and a range of fish consumption levels (0–25 g/day), neurodevelopmental effects in the general population, including the embryoand fetus in women of childbearing age, would have to be weighed 6 times moreand 250 times less than the cardiovascular benefits, when identifying optimal levelsof fish consumption. These methods have the potential to evaluate the merits ofother public health and risk management programmes that involve trade-offsbetween risks and benefits (Ponce et al., 2000).
As part of the effort to quantitatively integrate the benefits of fish consumptionand the risks of exposure to methylmercury, the Harvard Center for Risk Analysisconvened expert panels to quantify the net impact of changes in fish consumptionby the US population of consumers. This included estimates of the effects onprenatal cognitive development, mortality from coronary heart disease, and stroke.Study weights were assigned to account for statistical precision, relevance of threeend-point domains (general intelligence, verbal ability, and motor skills) to predictionof IQ, and age at evaluation. Eight randomized controlled trials comparing cognitivedevelopment in controls and in children who had received supplementation with n-3
METHYLMERCURY 287

Tab
le 1
. Ep
idem
iolo
gic
al s
tud
ies
on
th
e as
soci
atio
n b
etw
een
car
dio
vasc
ula
r d
isea
se o
r d
eath
wit
h m
ercu
ry c
on
cen
trat
ion
sin
ad
ult
s
Aut
hor/
Cou
ntry
Stu
dy d
esig
nS
tudy
par
ticip
ants
Asc
erta
inm
ent o
fm
ercu
ry c
once
ntra
tion
Dis
ease
or d
eath
Res
ults
Gua
llar e
t al.
(200
2)C
ase–
cont
rol
Cas
es: 6
84 m
enT
oena
il H
gF
irst a
cute
Ran
ge in
toen
ail H
g
Eig
ht E
urop
ean
coun
trie
s an
d Is
rael
Con
trol
s: 7
24 m
en(t
oena
ils c
olle
cted
afte
roc
curr
ence
of M
I,an
alys
ed in
1991
–199
2)
MI
conc
entr
atio
ns: 0
.14
to 0
.57
μg/g
(au
thor
spr
esen
ted
aver
ages
in c
ontr
ol p
atie
nts
acro
ss s
tudy
cen
tres
)A
djus
ted
OR
for
MI:
high
est q
uint
ile o
f Hg
com
pare
d w
ithlo
wes
t qui
ntile
: 2.1
6 (9
5% C
I, 1.
09–4
.29)
Yos
hiza
wa
et a
l.(2
002)
US
A
Cas
e–co
ntro
l with
inpr
ospe
ctiv
e co
hort
stud
y
Cas
es: 4
70 m
enC
ontr
ols:
464
men
mat
ched
on
age
and
smok
ing
stat
us
Toe
nail
Hg
(toe
nails
col
lect
edbe
fore
the
onse
t of
CH
D, a
naly
sed
in19
87)
CH
DT
oena
il H
g co
ncen
trat
ion
in c
ontr
ols:
rang
e: 0
.03–
14.6
μg/
gm
ean
(SD
):de
ntis
ts: 0
.91
(1.4
7) μ
g/g
othe
rs: 0
.45
(0.4
0) μ
g/g
Adj
uste
d O
R fo
r C
HD
:hi
ghes
t qui
ntile
of H
g co
mpa
red
with
low
est q
uint
ile in
den
tists
: 0.9
7 (9
5% C
I,0.
63–1
.50)
Adj
uste
d O
R fo
r C
HD
:hi
ghes
t qui
ntile
of H
g co
mpa
red
with
low
est q
uint
ile, e
xclu
ding
den
tists
: 1.2
7(9
5% C
I, 0.
62 to
2.5
9)
Hal
lgre
n et
al.
(200
1)S
wed
en
Cas
e–co
ntro
l with
ina
pros
pect
ive
coho
rtst
udy
Cas
es: 7
8 m
en a
ndw
omen
Hg
in e
ryth
rocy
tes
(blo
od s
ampl
es s
tore
din
198
5 fo
r fu
ture
Firs
t MI
Ran
ge o
f ery
thro
cyte
Hg
conc
entr
atio
n:0.
6–67
ng/
g er
ythr
ocyt
esA
djus
ted
OR
for
MI:
288 METHYLMERCURY

Aut
hor/
Cou
ntry
Stu
dy d
esig
nS
tudy
par
ticip
ants
Asc
erta
inm
ent o
fm
ercu
ry c
once
ntra
tion
Dis
ease
or d
eath
Res
ults
Con
trol
s: 1
56 m
enan
d w
omen
,m
atch
ed fo
r ag
e,se
x, d
ate
and
geog
raph
ic lo
catio
n
rese
arch
pur
pose
s,an
alys
ed 1
998)
in
term
edia
te H
g (3
–6 n
g/g)
com
pare
dw
ith lo
wes
t Hg
(< 3
ng/
g): 0
.9
high
est H
g (>
6 n
g/g)
com
pare
d w
ithlo
wes
t Hg
(< 3
ng/
g): 0
.4 (
95%
CI,
0.19
–0.
95)
Ahl
qwis
t et a
l.(1
999)
Sw
eden
a
Pro
spec
tive
coho
rtst
udy
of w
omen
1462
wom
en,
enro
lled
in19
68–1
969
Ser
um H
g(b
lood
sam
ples
colle
cted
in 1
968–
69,
then
198
0–81
for f
utur
ere
sear
ch; m
ostly
use
dea
rlier
sam
ples
)
MI (
n=
87,
39
died
);al
l-cau
se d
eath
(n=
253
)
An
inve
rse,
but
not
sta
tistic
ally
sig
nific
ant
corr
elat
ion
betw
een
seru
m H
g an
d M
I was
foun
dA
sta
tistic
ally
sig
nific
ant i
nver
seco
rrel
atio
n be
twee
n se
rum
Hg
and
deat
hfr
om a
ll ca
uses
was
foun
d af
ter
adju
stin
gfo
r ag
e an
d ed
ucat
ion
Virt
anen
et a
l.(2
005)
Eas
tern
Fin
land
Pro
spec
tive
coho
rtst
udy
of m
en,
14 y
ear
follo
w-u
p
1871
men
who
wer
efr
ee o
f CV
D a
tba
selin
e (1
984–
1989
)
Hai
r H
g(h
air
colle
cted
bef
ore
onse
t of d
isea
se o
rde
ath,
ana
lyse
d in
1992
–199
3)
Acu
te C
E (
n=
282)
;de
ath
from
CV
D(n
= 1
32),
deat
h fr
om C
HD
(n =
91)
,al
l-cau
se d
eath
(n =
525
)
Hai
r H
g co
ncen
trat
ion:
mea
n: 1
.9 μ
g/g;
rang
e: 0
–15.
7 μg
/gA
djus
ted
RR
for
acut
e C
E:
m
iddl
e th
ird o
f Hg
com
pare
d w
ith lo
wes
tth
ird: 1
.1
high
est t
hird
of H
g co
mpa
red
with
low
est
third
: 1.7
*A
djus
ted
RR
for
CV
D d
eath
:
mid
dle
third
of H
g co
mpa
red
with
low
est
third
: 0.7
hi
ghes
t thi
rd o
f Hg
com
pare
d w
ith lo
wes
tth
ird: 1
.3A
djus
ted
RR
for
CH
D d
eath
:
METHYLMERCURY 289

Aut
hor/
Cou
ntry
Stu
dy d
esig
nS
tudy
par
ticip
ants
Asc
erta
inm
ent o
fm
ercu
ry c
once
ntra
tion
Dis
ease
or d
eath
Res
ults
m
iddl
e th
ird o
f Hg
com
pare
d w
ith lo
wes
tth
ird: 0
.6
high
est t
hird
of H
g co
mpa
red
with
low
est
third
: 1.2
Adj
uste
d R
R fo
r an
y de
ath:
m
iddl
e th
ird o
f Hg
com
pare
d w
ith lo
wes
tth
ird: 0
.9
high
est t
hird
of H
g co
mpa
red
with
low
est
third
: 1.3
**r
ange
of 9
5% C
I abo
ve 1
.0
a Thi
s st
udy
also
exa
min
ed th
e in
cide
nce
of s
trok
e (n
= 7
7), d
iabe
tes
(n =
77)
, and
can
cer
(n =
208
).C
E: c
oron
ary
even
t; C
HD
: cor
onar
y he
art d
isea
se; C
I: co
nfid
ence
inte
rval
; C
VD
: ca
rdio
vasc
ular
dis
ease
; Hg:
mer
cury
; M
I: m
yoca
rdia
l inf
arct
ion;
OR
:od
ds r
atio
; RR
: rel
ativ
e ris
k.
290 METHYLMERCURY

PUFA (seven studies of formula supplementation and one study of maternal dietarysupplementation) were aggregated. The results of this part of the analysis estimatedthat increasing maternal intake of docosahexaenoic acid by 100 mg/day increaseschild IQ by 0.13 points (Cohen et al., 2005b). The other major component of thisassessment considered the impact of prenatal exposure to methylmercury oncognitive development. This analysis aggregated results from three majorprospective epidemiology studies (from the Faroe Islands, Seychelles and NewZealand) to quantify the association between prenatal methylmercury exposure andcognitive development as measured by IQ. The outcome of this analysisdemonstrated that prenatal exposure to methylmercury sufficient to increase theconcentration of mercury in maternal hair at parturition by 1 μg/g decreased IQ by0.7 points. This paper identified important sources of uncertainty influencing thisestimate, and concluded that the plausible range of values for this loss is 0 to 1.5IQ points (Cohen et al., 2005a).
The final integration of the quantitative consideration of risk and benefitshowed that substituting fish with high methylmercury concentrations for fishcontaining less methylmercury in the diet of women of childbearing age would resultin developmental benefits and few negative impacts. However, if women ofchildbearing age instead decrease overall fish consumption, there is a substantialreduction in benefits. If other adults reduce fish consumption, the net public healthimpact is negative. This analysis clearly shows that in considering the risk of anyenvironmental contaminant in a food such as fish without a thorough and robustconsideration of countervailing nutritional risks can result in unintended negativepublic health consequences (Cohen, et al., 2005c).
3. DIETARY INTAKE
3.1 Biomarkers of exposure
3.1.1 Relationships between various biomarkers of exposure
The epidemiological studies have used various biomarkers of exposure,such as the concentrations in blood, hair or cord tissue, making immediatecomparisons between studies difficult. Table 2 compares the mean ratios betweenvarious biomarkers, based on recent publications, to assist in exposurecomparisons between studies. The data in the table are for methylmercury unlessotherwise stated.
3.1.2 Cord tissue as a biomarker of exposure
In the Faroe Islands study, the main biomarkers of exposure to methyl-mercury, i.e. the total mercury concentrations in cord blood and maternal hairobtained at parturition from 447 births, were compared. Umbilical cord tissuemercury was found to correlate closely with mercury in cord blood. Regressionanalyses showed that the cord dry-weight concentration of mercury was almost asgood a predictor of methylmercury-associated neuropsychological deficits at age7 years as was the concentration of mercury in cord blood. The authors noted that
METHYLMERCURY 291

mercury in cord blood is almost entirely in the methylated form and concluded thatanalysis of cord tissue can be used as a valid measure of prenatal exposure tomethylmercury (Grandjean et al., 2005).
The relationship between total mercury and methylmercury concentrationsamong umbilical cord tissue and other tissues as biomarkers of fetal exposure tomethylmercury were studied in a Japanese cohort. A total of 116 paired sampleswere collected in three Japanese districts. Total mercury was measured in hair andcord, while methylmercury was measured in cord tissue and blood and in maternalblood. More than 90% of the mercury in cord tissue, cord blood, and maternal bloodwas methylmercury. Total mercury and methylmercury in cord blood was about twotimes higher than in maternal blood. A strong correlation was found between totalmercury and methylmercury in cord tissue and between cord tissue total mercuryand methylmercury and cord blood mercury (Sakamoto, et al., 2006).
Biomarkers of exposure via human milk
A study in rats has shown that exposure during lactation is less than duringgestation and that brain mercury concentrations decline during lactation. Ten femaleWistar rats were given a diet containing methylmercury at a concentration of 5 mg/kg of diet (approximately equivalent to 0.32 mg/kg bw per day) before mating andduring gestation and lactation. Offspring were provided with the same diet as theirmothers after weaning. All treated offspring matured, with normal body-weight gainand without overt physical signs. They exhibited locomotor and behavioural deficitsat age 5–6 weeks and histopathological changes in the brain postnatally that aretypical of prenatal exposure to methylmercury in rats. At birth, blood and brainmercury concentrations in the offspring were 33 and 4.5 μg/g, respectively,concentrations that were approximately 1.5-fold those of their mothers. At weaningat age 30 days, blood and brain mercury concentrations in the offspring had declinedto 12 and 1 μg/g, respectively (Sakamoto et al., 2002a).
In a subsequent study, the same group evaluated the time course of changesin brain total mercury concentrations after prenatal and postnatal exposure tomethylmercury via the maternal diet. Female Wistar rats were given access adlibitum to a diet containing methylmercury at a concentration of 5 mg/kg of diet(approximately equivalent to 0.32 mg/kg bw per day), and when blood mercuryconcentrations had almost reached a plateau, after 8 weeks, they were mated. Theycontinued on the same diet with access ad libitum during gestation and lactationuntil postnatal day 20. Maternal blood concentrations were lower during pregnancythan at mating, but blood mercury concentrations in the offspring were twice as highas in the mothers on the day of birth. Postpartum, maternal blood concentrationswere higher on day 10 and 20 of lactation, comparable with the values observed atmating. During suckling, blood concentrations of mercury in the offspring declinedrapidly and progressively. The offspring showed no overt signs of toxicity. Fetal brainmercury concentrations were around 4–4.5 μg/g on days 18, 20, and 22 of gestationand at birth, which was about 1.5–2 times higher than corresponding brainconcentrations in the mothers. Postnatally, brain mercury concentrations in theoffspring declined rapidly to about one tenth of that observed at birth; mercuryconcentrations in offspring liver also mirrored the pattern of the brain concentrations(Pan et al., 2004).
292 METHYLMERCURY

Table 2. Relationship between common biomarkers of exposure tomethylmercury
Sample Concentration a Comparison(corrected fordifferent units) b
Meanratio
Reference
Maternal blood atdelivery c
0.45 μg/l — Björnberg et al. (2005)
Cord blood c 0.99 μg/l Maternal blood atdelivery
2.2 Björnberg et al. (2005)
Infant blood at age4 days
1.10 μg/l Maternal blood atdelivery
2.4 Björnberg et al. (2005)
Milk at age 4 days(total mercury) d
0.29 μg/l Maternal blood atdelivery
0.64 Björnberg et al. (2005)
Cord blood 22.6 μgll — 5.4 Budtz-Jorgensen et al.(2004)
Maternal hair (fulllength) (total Hg)
4.22 μg/g Cord blood 187 e Budtz-Jorgensen et al.(2004)
Blood at age 7 years(total Hg)
1.93 μg/l — — Budtz-Jorgensen et al.(2004)
Hair at age 7 years(total Hg)
0.6 μg/g Blood at age7 years
310 f Budtz-Jorgensen et al.(2004)
Blood at age14 years (total Hg)
3.81 μg/l — — Budtz-Jorgensen et al.(2004)
Hair at age 14 years(total Hg)
0.96 μg/g Blood at age14 years
252g Budtz-Jorgensen et al.(2004)
Cord blood (total Hg) 22.4 μg/l — — Grandjean et al. (2005)
Maternal hair (fulllength) (total Hg)
4.17 μg/g Cord blood 187 Grandjean et al. (2005)
Cord tissue (wetweight) (total Hg)
0.025 μg/g Cord blood 1.1 Grandjean et al. (2005)
Cord tissue (dryweight) (total Hg)
0.21 μg/g Cord blood 9.4 Grandjean et al. (2005)
Maternal blood (totalHg)
0.52 μg/l — — Jedrychowski et al.(2005)
Cord blood (total Hg) 0.85 μg/l Maternal blood 1.6 Jedrychowski et al.(2005)
Hg: mercury.a Mean or median as reported.b Assumes that 1 l of blood or milk = 1 kg.c The corresponding concentrations of inorganic mercury were 0.09 μg/l in both maternal and
neonatal infant bloodd The concentrations in milk correlated with maternal blood inorganic mercury concentrations;
other data have shown a correlation between the concentrations in milk and the number ofmaternal amalgam fillings (Da Costa et al., 2005).
e The published mean ratio based on paired data was 370.f The published mean ratio based on paired data was 370.g The published mean ratio based on paired data was 264.
METHYLMERCURY 293

The same group has examined the contribution of mercury exposure viahuman milk to methylmercury concentrations in human infants, in order to evaluatethe relative risks of fetal vs postnatal exposure, based on total mercuryconcentrations in erythrocytes. Seven pairs of maternal and infant blood sampleswere compared at parturition and 3 months after parturition. Six of the mothersconsumed fish two or three times per week and the other mother once a week. Fiveinfants were reared on human milk only and two were reared on human milk,supplemented with milk formula from age 4 weeks and 6 weeks. At parturition,erythrocyte mercury concentrations were higher in umbilical cord (geometric mean,0.011 μg/g) than in the mothers (0.007 μg/g), with a strong correlation between thetwo. During the period of breastfeeding, all the infants showed declines in theirerythrocyte mercury concentrations, reaching a geometric mean value of 0.006 μg/g at age 3 months. Mercury concentrations in human milk (geometric mean, 0.21ng/g) were about 20% of those in maternal plasma; there were significantcorrelations between concentrations of mercury in maternal plasma and in milk, andbetween concentrations of mercury in maternal erythrocytes and in milk, as wasalso reported by Skerfving (1988) and Oskarsson et al. (1996). The study authorsattributed the decline in infant erythrocyte mercury to the low amounts of mercuryin human milk and the rapid growth rate of the infant. Noting the correlationsbetween maternal blood concentrations and the concentrations of mercury inhuman milk, the authors concluded that there need be no concerns aboutbreastfeeding if the concentrations of methylmercury to which the offspring isexposed are low enough during gestation to avoid adverse effects on the fetus(Sakamoto et al., 2002b).
A more recent study confirmed that exposure to methylmercury is higher inthe fetus than in the breastfed infant. Twenty Swedish mothers with limitedconsumption of fish (especially of species potentially high in mercury) and fewamalgam fillings were studied, together with their infants. Exposure to mercury waslow. Methylmercury and inorganic mercury were measured in the blood of themothers and their infants at delivery and when the infants were aged 4 days and13 weeks. Total mercury was measured in human milk collected at 4 days, 6 weeksand 13 weeks after delivery. At delivery, infant blood methylmercury concentrationswere highly correlated with maternal blood concentrations, although infant bloodconcentrations were more than twice as high as maternal ones. The concentrationsof methylmercury in infant blood declined markedly during the 13 weeks after birthfrom a median of 1.1 μg/l at age 4 days to 0.38 μg/l at 13 weeks. Total mercuryconcentrations in human milk decreased significantly from postnatal day 4 (median,0.29 μg/l) to postnatal week 6 (median, 0.14 μg/l), but did not change thereafter.Total mercury concentrations in human milk did not correlate with maternal bloodmethylmercury concentrations but did correlate significantly with methylmercuryconcentrations in infant blood at 13 weeks. Conversely, total mercuryconcentrations in human milk did correlate significantly with maternal bloodinorganic mercury concentrations but did not correlate with inorganic mercuryconcentrations in infant blood at 13 weeks. From these results the study authorsconcluded that exposure to both forms of mercury is higher before birth than duringthe breastfeeding period. Also, that although inorganic mercury is more easilytransported from maternal blood into human milk than methylmercury,
294 METHYLMERCURY

methylmercury contributes more than inorganic mercury to postnatal exposure,probably because it is more readily absorbed by the infant gastrointestinal tract(Björnberg et al., 2005).
The same authors (Björnberg et al., 2005) also discuss the potential of thebreastfeeding infant to excrete methylmercury. They consider it to be limitedbecause demethylating bacteria do not appear in the infant gut until after weaning(Rowland et al., 1983). Consequently, methylmercury would be reabsorbed via theenterohepatic circulation. They found the marked decline in infant blood methyl-mercury concentrations during breastfeeding surprising and they recommendedthat further studies were needed on total excretion of methylmercury in the infant.Although they did note that the decline could be partly related to the rapidlyincreasing body weight and decrease in erythrocyte volume fraction in the infantpostnatally, they may not have considered other factors. These include the higheraffinity of methylmercury for fetal haemoglobin (IPCS, 1990; Stern & Smith, 2003),the decline in concentrations of mercury in human milk during the breastfeedingperiod, and the possibility of uptake of methylmercury by various tissues, includingthe brain. Together all these factors could contribute significantly to the markeddecline of methylmercury concentrations in infant blood (Björnberg et al., 2005).
A study of mercury concentrations in samples of colostrum from human milkfrom urban mothers and from mothers married to fishermen in Taiwan, did not findany significant difference between the two groups, despite higher fish consumptionin the wives of fishermen. The geometric mean values (and ranges) for totalmercury concentrations were 2.02 (0.24–9.35) μg/l in 56 urban mothers and 2.04(0.26–8.62) μg/l in 12 fishermen’s wives, values that are comparable to previouslypublished measurements made in other countries. Some of the urban mothersconsumed more shellfish and raw fish (sushi and sashimi) meals than thefishermen’s wives. The authors estimated that breastfeeding contributed 96.3–99.6% of the total mercury exposure of infants, the remainder coming from air(inhalation) or water (dermal exposure). The concentrations of mercury in colostrumcorresponded to mercury intakes of around 0.3 μg/kg bw per day for urban babies,assuming intakes of 1.04 μg/day and body weights of about 3.5 kg (Chien et al.,2006).
3.1.3 Blood methylmercury concentrations in childhood
The concentrations of methylmercury in hair and whole blood have beenfollowed in the children in the Faroe Islands cohort, for whom the prenatal exposureand neurodevelopmental findings have been described and discussed in detailelsewhere (Annex 1, reference 167 ). This study was designed to further elucidatethe relationship between blood and hair biomarkers for methylmercury exposure,whole blood and hair mercury concentrations in the children at age 7 and 14 years.These children were exposed both prenatally and postnatally via maternalconsumption and subsequently direct consumption of fish and whale. Althoughquestionnaire information was obtained at both ages about the frequency of whaledinners, information on this aspect of the study was not reported. The biomarkerdata showed that postnatal exposure of the children was substantially lower thantheir prenatal exposure. The geometric means (and ranges) for whole bloodmercury concentrations were 1.93 (0.3–12.6) and 3.81 (0.3–39.8) μg/l at age 7 and
METHYLMERCURY 295

14 years, respectively, compared with cord blood concentrations of 22.6(0.9–351) μg/l. Similarly, hair mercury concentrations were 0.60 (0.04–7.5) μg/g and0.96 (0.02–9.7) μg/g at age 7 and 14 years, respectively, compared with values forfull-length maternal hair at the time of birth of 4.22 (0.2–39.1) μg/g (Budtz-Jørgensenet al., 2004).
Total blood mercury has been measured in children aged 1–5 years in theUSA, as part of NHANES since 1999. The findings confirm that blood mercuryconcentrations in young children usually are below levels of concern. During 1999–2002, the geometric mean (and 95th percentile) of total blood mercuryconcentrations was 0.33 μg/l (2.21 μg/l). In almost all cases, inorganic mercury wasnot detectable in blood, indicating that total blood mercury mostly reflected exposureto organic mercury, especially methylmercury (Centers for Disease Control andPrevention, 2004).
3.1.4 Blood mercury concentrations in women of childbearing age
The NHANES has measured blood mercury concentrations in women ofchildbearing age in the USA since 1999. The findings confirm that the blood mercuryconcentrations in this population usually are below levels of concern. During 1999–2002, the geometric mean (and 95th percentile) of total blood mercuryconcentrations for all women of childbearing age was 0.92 μg/l (6.04 μg/l). As forchildren, almost all inorganic blood mercury concentrations were undetectable,indicating that total blood mercury mostly reflected exposure to methylmercury(Centers for Disease Control and Prevention, 2004).
The NHANES for the years 1999–2002 was also used to obtain populationestimates of blood mercury concentrations among women of childbearing ageclassified as belonging to the ‘other’ racial/ethnic group (Asian, Pacific Islander,native American, and multiracial). Blood mercury concentrations in this group (n =140) were compared with those among all other women participants (n = 3497),classified as Mexican American, non-Hispanic black, non-Hispanic white, and‘other’ Hispanic. An estimated 16.6% of the group designated as Asian, PacificIslander, native American, and multiracial had blood mercury concentrations ofgreater than 5.8 μg/l. Among the remaining NHANES participants, 5.1% had bloodmercury concentrations greater than 5.8 μg/l (Hightower et al., 2006).
3.1.5 Biomarkers of co-exposure to other environmental contaminants
The studies from the Faroe Islands have not found a significant interactionbetween exposure to methylmercury and co-exposure to PCBs with respect toneurodevelopment. The extent of co-exposure has been documented in recentpublications, showing that exposure to PCBs in the Faroese population aregenerally higher than those reported elsewhere in Europe and North America, andthat there is also exposure to other persistent organic pollutants, such aspolybrominated diphenyl ethers (PBDEs).
Concentrations of hydroxylated polychlorinated biphenyls (OH-PCBs),PCBs and PBDEs in serum and milk samples from pregnant Faroese women andserum samples from their 7-year-old children were studied to determine the possibleimpact of the consumption of fatty fish and whale blubber on the body burdens of
296 METHYLMERCURY

environmental contaminants. High concentrations of OH-PCBs and PCBs werefound in some of the serum samples, the respective ranges being 19–1800 ng/glipid weight and 150–22 000 ng/g lipid weight. The relative congener distributionswere similar to those observed elsewhere. 4-Hydroxy-2,2,3,4,5,5,6-hepta-chlorobiphenyl was the most abundant OH-PCB metabolite in all samples analysed,with four other OH-PCB congeners as the dominant metabolites. More than 25additional OH-PCBs were detected. Maternal serum was dominated by 2,2',4,4'-tetrabromodiphenyl ether (BDE-47), while 2,2',4,4',5,5'-hexabromodiphenyl ether(BDE-153) prevailed in the children’s serum 7 years later. PBDE was present inserum of both mothers and children up to 3 and 6 ng/g lipid weight, respectively.Concentrations of the 18 PCB congeners analysed in the children’s serum averagedabout 60% of that in their mothers, with median concentrations for both beigngreater than 1 μg/g lipid weight and with similar PCB congener patterns. Serumconcentrations of OH-PCBs from the mothers and their children showed ranges of1.8–36 ng/g wet weight and 0.49–22 ng/g wet weight, respectively, with nearly allOH-PCB congener concentrations being lower in the children. In milk samples OH-PCBs were present in trace amounts only, at levels of approximately 1% of the PCBconcentrations. PBDE concentrations showed a clear increase over time, and theirconcentrations in human milk are among the highest reported so far from Europe,with results of individual samples ranging from 4.7 to 13 ng/g lipid weight. The PBDEconcentrations were similar in both mothers and their children. This study confirmedthe presence of high concentrations of organohalogen substances in the Faroesepopulation (Fangstrom et al., 2002, 2005a, 2005b).
In a follow-up study of the main birth cohort in the Faroe Islands study, datawere collected by questionnaire on potential predictors of persistent organicpollutant concentrations, such as duration of breastfeeding and blubberconsumption. Exposure to PCBs (37 congeners), to p,p’-dichlorodiphenyl trichloro-ethane (p,p’-DDT) and its primary degradate p,p’-dichlorodiphenyl dichloroethylene(p,p’-DDE) was assessed from in utero until age 14 years, using 316 umbilical cordsamples, 124 serum samples collected from participants at approximately age 7years, and 795 serum samples collected from participants at age 14 years.Measurements of more highly chlorinated PCB congeners made on individuals’serum samples collected at age 7 and 14 years were highly correlated. Concentra-tions at age 7 years were generally two to three times higher than at age 14 years.Umbilical cord tissue PCB concentrations were correlated with PCB concentrationsin serum samples at age 7 and at age 14 years. Duration of breastfeeding andconsumption of blubber were significant predictors of serum PCB concentrations atage 7 and 14 years. Multivariate analyses showed that breastfeeding duration wasthe primary contributor to serum concentrations of PCBs at age 7 years, and blubberconsumption was the primary contributor at age 14 years. Thus although consump-tion of pilot whale blubber appears to be a significant source of methylmercury andof PCBs, human milk is only a significant source for PCBs (Barr et al., 2006).
3.1.6 Consumption of fish and whale and exposure to methylmercury
After an official recommendation in the Faroe Islands that women shouldabstain from eating pilot whale because of mercury contamination, a survey wascarried out to obtain information on dietary habits and hair samples for mercury
METHYLMERCURY 297

analysis. A letter was sent to all 1180 women aged 26–30 years who resided withinthe Faroes, and the women were contacted again 1 year later. A total of 415 womenresponded to the first letter; the second letter resulted in 145 repeat hair samplesand 125 new responses. Questionnaire results showed that Faroese women, onaverage, consumed whale meat for dinner only once every second month, but thefrequency and meal size depended on the availability of whale in the community.The geometric mean hair-mercury concentration at the first survey was higher indistricts with available whale than in those without (3.03 vs 1.88 μg/g; p = 0.001).The concentration of mercury also depended on the frequency of whale meatdinners and on the consumption of dried whale meat. The 36 women who did noteat whale meat at all had a geometric mean hair-mercury concentration of 1.28 μg/g. At the time of the second survey, the geometric mean had decreased to 1.77μg/g (p < 0.001), although whale was now available in all districts. In comparisonwith previously published data on hair-mercury concentrations in pregnant Faroesewomen, these results document substantially lower exposures as well as a furtherdecrease temporally associated with the issue of stricter dietary advice (Weihe etal., 2005).
Fetal exposure to mercury was determined in 308 women in the HawaiiIslands by measuring concentrations of mercury in cord blood and analysing theassociation with fish consumption during pregnancy. Of the 308 women who wereenrolled, 275 completed a dietary survey. The mean mercury concentration in cordblood was 4.82 μg/l. A significant relationship was noted between the amount of fishconsumed during pregnancy and elevated mercury concentrations in cord blood(Sato et al., 2006).
The impact of fish consumption on the nutritional status of Indian children ofeastern Amazonia has been evaluated. Weight-for-height Z score was measured,and hair mercury was determined in 203 children (age < 10 years) in three villages.There was significantly higher consumption of fish in Kayabi children (16.6 μg/g, asmeasured by hair mercury concentration) than in children of the villages of Missao-Cururu (4.8 μg/g) and Kaburua (2.9 μg/g). Mean weight-for-height Z scores of -0.27,-0.22, and 0.40 were noted for Kayabi, Missao-Cururu and Kaburua villages,respectively. There was no significant correlation between weight-for-height Z scoreand total hair mercury concentration (Dorea et al., 2005a).
The relationship between dietary habits and exposure to mercury wasstudied in a cohort of Chinese children. The hair and blood mercury concentrationsof children aged more than 3 years were studied. Sociodemographic data, dietaryhabits of the past 6 months, and other risk factors for environmental mercuryexposure were collected from the 137 Chinese children (mean age, 7.2 years)recruited. The mean hair mercury concentration was 2.2 μg/g and the mean bloodmercury concentration was 17.6 nmol/l (3.8 μg/l). There was a strong correlation(r = 0.88) between hair and blood mercury concentrations. Frequency of fishconsumption correlated with hair (r = 0.51) and blood (r = 0.54) mercuryconcentrations. For those children who consumed fish more than three times perweek, hair and blood mercury concentrations were twice as high as in those whoconsumed fish one to three times per week, and three-fold higher than in those whonever consumed fish. Both blood and hair (i.e. tissue) mercury concentrations ofchildren in Hong Kong were elevated and correlated with the frequency of fishconsumption (Ip et al., 2004b).
298 METHYLMERCURY

In the 1999–2000 NHANES, 1250 children aged 1 to 5 years and 2314women aged 16 to 49 years were selected to participate in the survey. The datagathered are based on analysis of cross-sectional data for the non-institutionalized,US household population and are considered to be nationally representative. Thesurvey consisted of interviews conducted in participants’ homes and standardizedhealth examinations conducted in mobile examination centres. Householdinterviews, physical examinations, and blood-mercury concentration assessmentswere performed on 705 children (response rate, 56%) and 1709 women (responserate, 74%). Blood mercury concentrations were approximately three times higher inwomen than in children. The geometric mean concentration of total blood mercurywas 0.34 μg/l in children and 1.02 μg/l in women. Geometric mean mercuryconcentrations were almost four times higher among women who had eaten threeor more servings of fish in the past 30 days compared with women who ate no fishin that period (1.94 μg/l vs 0.51 μg/l) (Schober, 2003).
Exposure to mercury was also assessed in 838 US children, aged 1–5 years,and 1726 women, aged 16–49 years, using hair mercury analysis during the1999–2000 NHANES. The association of hair mercury concentrations withsociodemographic characteristics and fish consumption was reported. Geometricmean hair mercury was 0.12 μg/g in children, and 0.20 μg/g in women. Amongfrequent fish consumers, geometric mean hair mercury concentrations were threetimes higher for women (0.38 vs 0.11 μg/g) and twice as high for children (0.16 vs0.08 μg/g) compared with non-consumers. Hair mercury concentrations wereassociated with age and frequency of fish consumption (McDowell et al., 2004).
3.1.7 Consumption of other foods and exposure to methymercury
The use of fish meal as a source of protein for poultry and swine may leadto exposure to methylmercury in addition to that which arises from the consumptionof fish. A study in Sweden measured concentrations of inorganic mercury andmethylmercury in blood in 9 men and 18 women, aged 20–58 years, who stated thatthey had consumed no fish for a period of 2 years or more. Participants answereda food-frequency questionnaire and reported number of dental amalgam fillings.Methylmercury concentrations in blood were very low. A significant associationbetween the number of dental amalgam fillings and the inorganic mercuryconcentration in blood was found. Total hair mercury concentration was significantlyassociated with methylmercury in blood, but not with the inorganic mercury(Lindberg et al., 2004).
3.2 The effect of GLs for methylmercury on exposure and risk
CCFAC at its Thirty-seventh Session (Codex Alimentarius Commission,2005) asked the Committee to consider the impact on exposure and risk of thecurrent GLs for methylmercury in fish, set at 1 mg/kg for predatory fish, and 0.5 mg/kg for non-predatory fish.1
1 See http://www.codexalimentarius.net/download/standards/21/CXG_007e.pdf
METHYLMERCURY 299

3.2.1 The nature of GLs
Previous meetings of the Committee have considered the dietary impact oflimits for other contaminants on exposure. For instance, differing GLs for aflatoxinM1 and ochratoxin A were evaluated by the Committee at its fifty-sixth meeting in2001 (Annex 1, reference 152). In each of these examples, the effect of setting limitswas found to be minimal, only affecting exposure at the extreme tail of the intakedistributions. It has been noted at previous meetings of the Committee that usingGLs to influence exposure is, in general, not effective until a large fraction of theaffected commodity has been withdrawn from the marketplace.
A GL is risk management tool set to protect a consumer of an affected foodfrom exposure to a toxic dose of a substance. For substances with acutely toxiceffects, GLs that are enforced can limit exposure. However, when the toxic effectof a substance results from long-term exposure, GLs will have a much smallerprotective effect as the consumer will be exposed to the substance at the mean levelof its distribution in the affected food2. The shape of the distribution of the levels ofthe substance in affected food will determine the extent of impact of a GL onexposure. The further the GL is set from the average of the distribution, the smallerthe impact that GL will have on exposure.
In responding to the CCFAC request concerning the dietary impact of GLsfor methylmercury, the Committee noted that no alternatives to the current GLs areunder consideration. The situation is complex as many fish species are consumedas food and the terms predatory and non-predatory species have not been clearlydefined. These terms are primarily used to designate fish that are higher on the foodchain from those lower on the chain. In practice, non-predatory species are thosetypically containing low average concentrations of methylmercury and predatoryspecies are those with higher average concentrations. This is owing to thebioaccumulation of methylmercury, especially in larger, older fish. Anothercomplicating factor is the presumed non-random nature of consumer choice amongfish species, thus fish eaters will experience some weighted average of mercuryconcentrations across species. Because of the nature of mercury accumulation indifferent species, GLs will have differing impacts on individual species, and thus onoverall exposure based on the individual’s choices.
Default assumptions were required for this analysis of the dietary impact ofGLs. The Committee chose to compare the current situation with a scenario whereno GLs are in effect or are enforced.
3.2.2 Data submitted to the Committee
The Committee received dossiers containing total mercury and/ormethylmercury levels in finfish and/or shellfish from France, Japan, and the UnitedKingdom (UK), and obtained additional analytical data from the USA and from thepublished literature. Each of the dossiers contained analyses on individual samples.Additionally, two papers were reviewed from the USA and France, which considered
2 This assumes that the portions consumed over a lifetime are of approximately the samemagnitude, as would be expected for a primary food in the diet.
300 METHYLMERCURY
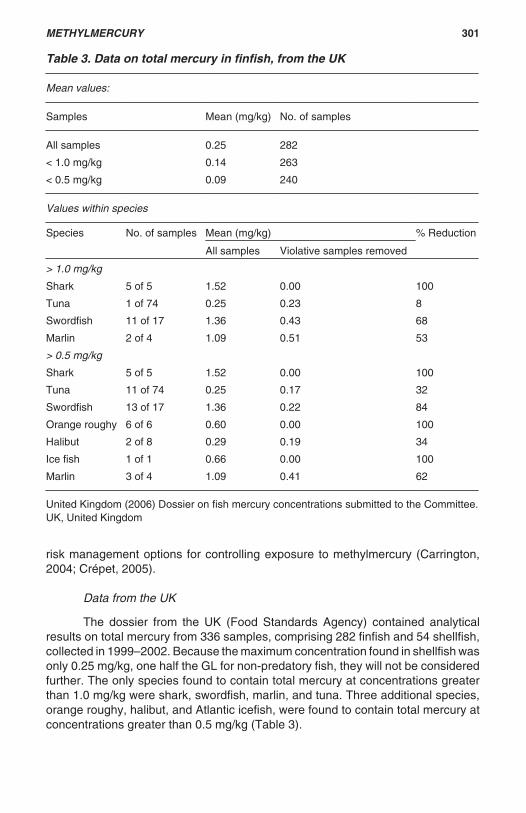
risk management options for controlling exposure to methylmercury (Carrington,2004; Crépet, 2005).
Data from the UK
The dossier from the UK (Food Standards Agency) contained analyticalresults on total mercury from 336 samples, comprising 282 finfish and 54 shellfish,collected in 1999–2002. Because the maximum concentration found in shellfish wasonly 0.25 mg/kg, one half the GL for non-predatory fish, they will not be consideredfurther. The only species found to contain total mercury at concentrations greaterthan 1.0 mg/kg were shark, swordfish, marlin, and tuna. Three additional species,orange roughy, halibut, and Atlantic icefish, were found to contain total mercury atconcentrations greater than 0.5 mg/kg (Table 3).
Table 3. Data on total mercury in finfish, from the UK
Mean values:
Samples Mean (mg/kg) No. of samples
All samples 0.25 282
< 1.0 mg/kg 0.14 263
< 0.5 mg/kg 0.09 240
Values within species
Species No. of samples Mean (mg/kg) % Reduction
All samples Violative samples removed
> 1.0 mg/kg
Shark 5 of 5 1.52 0.00 100
Tuna 1 of 74 0.25 0.23 8
Swordfish 11 of 17 1.36 0.43 68
Marlin 2 of 4 1.09 0.51 53
> 0.5 mg/kg
Shark 5 of 5 1.52 0.00 100
Tuna 11 of 74 0.25 0.17 32
Swordfish 13 of 17 1.36 0.22 84
Orange roughy 6 of 6 0.60 0.00 100
Halibut 2 of 8 0.29 0.19 34
Ice fish 1 of 1 0.66 0.00 100
Marlin 3 of 4 1.09 0.41 62
United Kingdom (2006) Dossier on fish mercury concentrations submitted to the Committee.UK, United Kingdom
METHYLMERCURY 301

Data from France
The dossier submitted by France contained analytical results on totalmercury from 1661 samples; 1254 finfish and 407 shellfish, collected in 1998–2002.Because the maximum concentration found in shellfish was only 0.43 mg/kg, 80%of the GL for non-predatory fish, shellfish were not considered further. The onlyspecies found to contain mercury at concentrations greater than 1.0 mg/kg wereshark, tuna, barracuda, and ray. Three additional species were found to containmercury at concentrations greater than 0.5 mg/kg—rainbow trout, marine fish, andling (Table 4).
Data from the USA
The information received from the USA contained analytical results on totalmercury from 952 samples, comprising 903 finfish and 49 shellfish, collected in2002–2005. The maximum concentration found in shellfish was 0.30 mg/kg, which
Table 4. Data on total mercury in finfish, from France
Mean values:
Samples Mean (mg/kg) No. of samples
All samples 0.099 1254
< 1.0 mg/kg 0.089 1245
< 0.5 mg/kg 0.077 1219
Values within species
Species No. of samples Mean (mg/kg) % Reduction
All samples Violative samples removed
> 1.0 mg/kg
Tuna 2 of 64 0.32 0.28 12
Shark 1 of 16 0.43 0.31 28
Barracuda 5 of 14 0.85 0.59 31
Ray 1 of 23 0.16 0.09 44
> 0.5 mg/kg
Tuna 13 of 64 0.32 0.21 34
Shark 4 of 16 0.43 0.23 47
Barracuda 10 of 14 0.85 0.23 73
Ray 1 of 23 0.16 0.09 44
Rainbow trout 1 of 604 0.05 0.05 0
Marine fish 5 of 91 0.18 0.16 11
Ling 1 of 14 0.26 0.24 8
France (2006) Dossier on fish mercury concentrations submitted to the Committee.
302 METHYLMERCURY

is 60% of the GL for non-predatory fish; these results were not considered further.The only species found to contain mercury at concentrations greater than 1.0 mg/kg were swordfish, tuna, sablefish, bass, and snapper. Seven additional species,orange roughy, bluefish, blackfish, weakfish, char, halibut, and tilefish, were foundto contain mercury at concentrations greater than 0.5 mg/kg (Table 5).
Table 5. Data on total mercury in finfish, from the USA
Mean values:
Samples Mean (mg/kg) No. of samples
All samples 0.27 903
< 1.0 mg/kg 0.25 885
< 0.5 mg/kg 0.19 780
Values within species:
Species No. of samples Mean (mg/kg) % Reduction
All samples Violative samples removed
> 1.0 mg/kg
Swordfish 10 of 14 1.33 0.72 46
Tuna 3 of 531 0.26 0.26 0
Grouper 2 of 30 0.45 0.40 11
Snapper 1 of 26 0.18 0.14 22
Bass 1 of 52 0.32 0.28 13
Sable fish 1 of 2 0.64 0.22 66
> 0.5 mg/kg
Swordfish 13 of 14 1.33 0.16 88
Tuna 54 of 531 0.26 0.22 15
Grouper 8 of 30 0.45 0.29 36
Snapper 1 of 26 0.18 0.14 22
Bass 9 of 52 0.32 0.21 34
Sable fish 1 of 2 0.64 0.22 66
Orange roughy 17 of 29 0.54 0.40 26
Weakfish 4 of 24 0.24 0.16 33
Blackfish 6 of 6 0.61 0.00 100
Char 2 of 26 0.08 0.04 50
Bluefish 6 of 30 0.35 0.31 14
Halibut 1 of 14 0.23 0.21 9
Tilefish 1 of 14 0.13 0.11 15
United States (2006) Private communication on fish mercury concentrations made to theCommittee.
METHYLMERCURY 303

Data from Japan
The information received from Japan contained aggregated analytical resultson total mercury and methylmercury from 227 fish species (including marinemammals) and shellfish. There were 6707 samples (1146 from marine mammals)and 918 shellfish, collected in 2003–2005. The fish species found to contain totalmercury at concentrations greater than 1.0 mg/kg were dolphin (marine mammal),whale (marine mammal), tuna, alfonsino (related to red snapper), swordfish,porpoise (marine mammal), bluefish, halibut, and grouper. Additionally, the follow-ing species were found to have samples containing total mercury at concentrationsgreater than 0.5 mg/kg: rockfish, bluefish, snapper, marlin, stargazer, shark,sablefish, thornyhead, saucord, flounder, yellowtail, fusiliner, seaperch, brotula, seabream, mackerel, and John Dory. Because these data were aggregated, it is notpossible to determine the number of samples or the percentage within a speciesthat exceeded either of the two limits. However, the species that contained mercuryat average concentrations of greater than 1.0 mg/kg were dolphin, whale, marlin,porpoise (all marine mammals), and grouper. The species containing mercury ataverage concentrations greater than 0.5 mg/kg were swordfish, snapper, alfonsino,and shark.
Methylmercury concentrations were also measured in many of the samples.Species found to contain methylmercury at concentrations greater than 1.0 mg/kgwere dolphin, whale, tuna, alfonsino, and swordfish. Yellowtail, seaperch, grouper,shark, sablefish, thornyhead, flounder, snapper, marlin, porpoise, saucord, marlin,rockfish, bluefish, and stargazer were found to have samples containing methylmercury at concentrations greater than 0.5 mg/kg. Again, because these wereaggregated data, it was not possible to determine the number of samples or thepercentage within each species above either of the two limits.
Individual sample raw data were submitted for a number of species knownto contain higher levels of mercury. These were tuna, marlin, swordfish, alfonsino,sablefish shark, red snow crab, and the finely-striated buccinum, a gastropod. Ofthe 501 individual samples measured, 53 (11%) were found to contain total mercuryat greater than 1.0 mg/kg, with 208 (40%) greater than 0.5 mg/kg. The averagemercury content of this sub-sample was 0.54 mg/kg. Exclusion of the samplescontaining mercury at greater than 1.0 mg/kg reduces the average for the remainingsamples to 0.42 mg/kg, while exclusion of all samples containing mercury at greaterthan 0.5 mg/kg lowers the average to 0.27 mg/kg.
The dossier from Japan contained data on the consumption of fish and fishspecies known to be high in mercury (Table 6). The data were compiled in 2001 and2002. Overall mean consumption of fish was found to be approximately 80 g/personper day, with consumption at the 90th percentile being approximately 170 g/personper day. It is important to note that, with the exception of tuna, both canned andfresh (approximately 40% eaters), no species is consumed by more than 5% of thepopulation surveyed, with all except bream species being consumed by less than1% of the survey population. Intakes and percentages of eaters were notsignificantly different for the population subgroups, women aged 19–45 years, andall women aged more than 20 years.
304 METHYLMERCURY

3.2.3 The impact of risk management options on exposure
The Committee considered two recent publications that dealt directly withthe present analysis. A paper from the USA evaluated exposure scenarios basedon curtailing or removing exposure to mercury from fish species known to containmercury at typically high levels (Carrington, 2004). This paper used food intake datafrom the USA with mercury analyses of domestic (USA) and imported seafood. Thescenarios evaluated exposure based on limits on seafood consumption of 6, 12 or18 ounces per week, replacing fish containing mercury at high concentrations withfish containing mercury at intermediate or low concentrations, and consideredexposure when no limits on consumption were necessary, but when fish containingmercury at high concentrations were excluded from the diet. These scenariosbracket the advice given to seafood consumers in the USA concerned with reducingexposure to mercury3. Fifty-one types of finfish and nine shellfish were included. Ofthese, 11 finfish had maximum mercury concentrations greater than 1.0 mg/kg. Gulftilefish was the only type to have a mean concentration greater than 1.0 mg/kg.Additionally, shark, swordfish, king mackerel, grouper, and orange roughy hadmean mercury concentrations greater than 0.5 mg/kg. Water loss on preparationand market share were also taken into consideration in the exposure modelling.
Table 6. Data on total mercury in fish and marine mammals, from Japan
Species of fishor marinemammalconsumed
All people who ate fish or marine mammals
Average(g/day)
50th percentile(g/day)
90th percentile(g/day)
95th percentile(g/day)
No. ofpeople
Average for allfish
82.7 72.0 168.0 208.1 18839
Blue marlin andstriped marlin
69.8 70.0 100.0 138.5 135
Alfonsino 79.2 71.0 133.3 160.0 144
Shark species 76.3 64.0 125.0 125.0 6
Bream species 56.2 43.7 105.0 140.0 708
Tuna species 26.3 18.8 65.3 100.0 6043
Big-eye 88.0 76.0 125.0 250.0 38
Marinemammals
94.1 82.0 150.0 250.0 17
Canned tuna 21.6 17.5 50.0 60.0 1461
Japan (2006) Dossier on fish mercury concentrations submitted to the Committee.
3 The advice issued in the USA concerning mercury recommends that pregnant women (orthose planning on becoming pregnant) avoid consuming shark, swordfish, king mackerel,and tilefish, and include up to 12 ounces per week of a variety of other fish in their diets.
METHYLMERCURY 305

The paper concludes: “In general, reducing overall fish consumption appearsto have more impact on the overall population distributions than reducing oreliminating levels of high-level mercury species only.” With respect to the currentanalysis, reducing or eliminating high-level mercury species is more drastic thansimply removing fish of those species in which the GL is exceeded, which simplyreduces the mean of the remaining distribution of mercury levels in those species.
A second paper, published in 2005, considers the question in the currentanalysis, the effect of enforced GLs on exposure, and the effect of excluding orlimiting predatory fish intake, as in the analysis by Carrington et al., discussed above(Crépet, 2005). In this publication, exposure to methylmercury was determinedusing French data on food intake and analyses of fish and fishery products availablein the French marketplace. Mean mercury contamination levels from 89 individualfood items (from a total of 2818 individual analyses) containing fish were used andcombined with appropriate 7-day average food intakes for the 89 items. Correctionfactors (0.84 for finfish, 0.36 for shellfish and 0.43 for molluscs) were applied toconvert total mercury analyses to methylmercury levels in each food. Actual bodyweights from surveyed consumers in the food intake survey were used.
In one scenario, all predatory fish containing mercury at concentrationsgreater than 1.0 mg/kg and all non-predatory fish (includes all shellfish andmolluscs) with mercury concentrations greater than 0.5 mg/kg were excluded andthe mean mercury concentration of the food type was recalculated. In this scenario,2.3% of predatory fish samples, tuna, shark, swordfish, rays, and marlin, would beexcluded. In a second scenario, all fish containing mercury at concentrations greaterthan 0.5 mg/kg were excluded. In this scenario, 8.8% of predatory fish sampleswould be excluded. In the first scenario, only 27 fish food types had their meanmercury concentration lowered by the exclusion, most by less than 15%. The largestreduction, of 42%, was for fried, simmered, or oven-baked skate. The second, moredrastic scenario resulted in the further lowering of the mean methylmercuryconcentration of 18 fish food types, but did not lower the mean of any food type notaffected by the conditions of the first scenario.
Methylmercury exposures in each scenario were calculated for children aged3–6 years and 7–10 years, and for women of childbearing age, as were theprobabilities of exceeding the PTWI of 1.6 μg/kg bw (Annex 1, reference 166). Inthe first scenario, there were no significant differences between the probabilities ofexceeding the PTWI from compliance with the GLs or baseline (no GLs). In thesecond scenario, for children aged 3–6 or 7–10 years there were also no significantdifferences in the probabilities of exceeding the PTWI, but the difference for womenof childbearing age did reach significance (4.4% for no GLs vs 0.6 for a uniform GLof 0.5 mg/kg). The authors note that the impact of reducing exposure to predatoryfish would be greater for women of childbearing age because products derived frompredatory fish make up a larger proportion of their diets than in the case of children,and is a larger vector of exposure for those that would exceed the PTWI (23% forchildren vs 70% for women).
306 METHYLMERCURY

4. COMMENTS
4.1 Vulnerability of the embryo and fetus
The Committee noted that the new toxicokinetic, toxicological andepidemiological studies available since its previous evaluation in 2003 furtherconfirmed the embryo and fetus as the most vulnerable stage of life with respect tothe adverse effects of methylmercury. The new data do not suggest the need forrevision of the previously established PTWI of 1.6 μg/kg bw, with respect to maternalintakes and this life stage.
4.2 Vulnerability of the infant and child
In reviewing the available studies relevant to risk assessment for infants andyoung children exposed after birth via human milk and via the diet in general, theCommittee noted that few studies have attempted to separate the potential effectsof postnatal exposure to methylmercury from the known neurodevelopmentaleffects of prenatal exposure.
There is clear evidence from the concentrations of mercury in human milkand in the blood of infants that, compared with exposure in utero, postnatal exposureto methylmercury is considerably lower in infants who are breastfed and, similarly,postnatal exposure is lower in those that are formula-fed. The Faroe Islands studyreported earlier developmental milestones in breastfed compared with formula-fedinfants and lack of any independent association between breastfeeding andneurological deficits at age 7 years. The study authors suggested that breastfeedingis beneficial even in a population with a relatively high prenatal exposure tomethylmercury because of maternal consumption of fish and whale. This suggestionis compatible with other extensive data showing that breastfeeding per se offersbenefits for cognitive development.
It is clear from the earlier major poisoning incidents in Japan and Iraq thatmethylmercury did cause neurotoxicity when exposure of children was limited tothe postnatal period. However, the incidents do not give much insight into thequestion of whether children may be more vulnerable than adults to exposure atlow levels, since in most cases there was prenatal as well as postnatal exposureto methylmercury and the exposures were very high. Similarly, while monkeysexposed to methylmercury from birth to early adulthood (age 7 years), but notexposed in utero, showed deficits in fine motor control (clumsiness) beginning inmiddle age and restrictions in visual fields during old age, the exposure levelsin those studies, at 50 μg/kg bw per day, were high relative to dietary exposures inhumans. Data from the Faroe Islands have suggested a subtle but measurableeffect of postnatal exposure on latency in a single interpeak interval in brainstemauditory evoked potentials measured at age 14 years. The health significance ofthis observation, if any, remains unclear.
Knowledge of human brain development raises the theoretical possibility ofcontinuing vulnerability to neurodevelopmental effects from postnatal exposure tomethylmercury, but there is no clear evidence on this. For example, the influenceof exposure to methylmercury on synaptogenesis, which continues well into
METHYLMERCURY 307

adolescence in humans, is not known. However, in rats given methylmercury as asingle, high, oral dose at 8 mg/kg bw administered by gavage during the late fetalperiod, synaptogenesis had been shown to be affected. Similarly, both neuronalmyelination and remodelling of the cortex of the brain occur postnatally in humansand have a protracted time course, continuing through adolescence until aboutage 17 years, but again there was no evidence as to whether exposures tomethylmercury at low levels might affect these potentially vulnerable processes.
In summary, there are insufficient data from the studies previously reviewedby the Committee and the more recent studies reviewed at the present meeting todraw conclusions regarding the vulnerability of infants and children to methyl-mercury. It is clear that they are not more vulnerable than the embryo and fetus, butthe information available to date does not enable any firm conclusions to be drawnon whether infants and children, including adolescents, are more, or less, vulnerablethan adults.
4.3 Vulnerability of adults
For adults, the previously established PTWI of 3.3 μg/kg bw, which wasrevised in 2003, was regarded by the Committee in 1988 at its thirty-third meeting(Annex 1, reference 83) as adequate to take account of neurotoxicity, excludingdevelopmental neurotoxicity; the Committee at its present meeting considered thatthis remained the case. Concerning other health aspects, the Committee gavefurther consideration to previous and more recent studies on methylmercuryexposure and cardiovascular findings and concluded that the weight of evidence atthe current time did not indicate an increased risk of adverse cardiovascular events.The Committee also noted that fish consumption in general is associated withcardiovascular benefits.
4.4 Impact of current GLs for methylmercury in fish on exposure and risk
The Committee evaluated the impact of current Codex GLs formethylmercury in fish (predatory fish, 1.0 mg/kg; non-predatory fish, 0.5 mg/kg) onexposure and risk. Submissions were received from France, Japan, and the UK,and additional information on the distribution of mercury and methylmercury invarious fish species was obtained from the USA. Additionally, two recentpublications concerning risk management options for the control of exposure tomethylmercury were considered by the Committee.
Previous Committees have noted that excluding foodstuffs containing acontaminant at a concentration that is at the high end of a log-normal distribution ofconcentrations is not an effective method for reducing overall exposure to thatcontaminant in the general population. Large proportions of foodstuffs must beexcluded from the market before the average exposure to the contaminant issignificantly reduced. The data from France, Japan, the UK and the USA reviewedat this meeting support this conclusion for methylmercury in fish. In each of thosecountries, the total market—and hence the total distribution of methylmercury inseafood—is dominated by species that do not contain a high concentration ofmercury. If it were the case that seafood consumers randomly chose from the total
308 METHYLMERCURY

market over their lifetime, their mean level of exposure to methylmercury in seafoodwould not be substantially reduced by excluding fish containing methyl-mercury atconcentrations greater than the GLs of 1.0 mg/kg for predatory fish and 0.5 mg/kgfor non-predatory fish, and the numbers of individuals exposed to methylmercury atintakes greater than the PTWI would not be lowered significantly.
For individual consumers whose preferred choice of fish comprises speciesthat are known to accumulate methylmercury at higher concentrations, exclusionfrom their diets of all fish found to exceed the GLs may significantly limit their totalexposure to methylmercury. The information submitted by France, the UK and theUSA showed that excluding fish samples found to contain methylmercury atconcentrations greater than the current Codex GLs would reduce the meanconcentration of methylmercury in those species by 30–100% in fish available onthe market. This would, however, be at the cost of removing the majority of samplesof those species from the market. The French analysis suggests that the impact ofthose exclusions on an individual’s intake of methylmercury may not be great, asthe percentage of women exceeding the PTWI for methylmercury would only bereduced significantly if all fish containing methylmercury at concentrations greaterthan 0.5 mg/kg (one half of the GL for predatory species) were removed from theirdiets, while the percentage of children aged 3–10 years with exposures greater thanthe PTWI would still not be significantly reduced.
In other populations (e.g. Japan, where the mean consumption of seafoodin the population is higher than that in France, the UK or the USA), exclusion fromthe population diet of all fish exceeding the Codex GLs may have a greater impacton the percentage of individuals with exposures greater than the PTWI. It was notpossible from the data submitted by Japan to determine the percentage of samplesin the Japanese market that exceeded the current Codex GLs for each marinespecies, and therefore, not possible to estimate the extent or significance of anyreduction in exposure to methylmercury resulting from the removal of such fish fromthe market. The species containing the highest concentrations of methylmercuryare not consumed by large percentages of the Japanese population, suggestingthat GLs would not be very effective in reducing the overall number of vulnerableindividuals in the population who would have exposures greater than the PTWI.
5. EVALUATION
At its present meeting, the Committee made it clear that the previous PTWIof 3.3 μg/kg bw had, in fact, been withdrawn in 2003. The Committee confirmed theexisting PTWI of 1.6 μg/kg bw, set in 2003, based on the most sensitive toxicologicalend-point (developmental neurotoxicity) in the most susceptible species (humans).However, the Committee noted that life stages other than the embryo and fetusmight be less sensitive to the adverse effects of methylmercury.
In the case of adults, the Committee considered that intakes of up to abouttwo times higher than the existing PTWI of 1.6 μg/kg bw would not pose any risk ofneurotoxicity in adults, although in the case of women of childbearing age, it shouldbe borne in mind that intake should not exceed the PTWI, in order to protect theembryo and fetus.
METHYLMERCURY 309

Concerning infants and children aged up to about 17 years, the data did notallow firm conclusions to be drawn regarding their sensitivity compared with that ofadults. While it was clear that they are not more sensitive than the embryo or fetus,they might be more sensitive than adults because significant development of thebrain continues in infancy and childhood. Therefore, the Committee could notidentify a level of intake higher than the existing PTWI that would not pose a risk ofdevelopmental neurotoxicity for infants and children.
The Committee had previously noted that fish makes an importantcontribution to nutrition, especially in certain regional and ethnic diets. The presentCommittee recommended that the known benefits of fish consumption need to betaken into consideration in any advice aimed at different subpopulations. Riskmanagers might wish to consider whether specific advice should be givenconcerning children and adults, after weighing the potential risks and benefits. TheCommittee was unable to offer any further advice in this regard since it is not withinits remit to examine the beneficial aspects of fish consumption. The Committee alsonoted that the relative benefits of fish consumption will vary from situation tosituation, depending on, for instance, the species of fish consumed and the relativenutritional importance of fish in the diet.
The Committee concluded that the setting of GLs for methylmercury in fishmay not be an effective way of reducing exposure for the general population. TheCommittee noted that advice targeted at population subgroups that might be at riskfrom methylmercury exposure could provide an effective method for lowering thenumber of individuals with exposures greater than the PTWI.
6. REFERENCES
Ahlqwist, M., Bengtsson C., Lapidus, L., Bergdahl I.A., & Schütz, A. (1999) Serum mercuryconcentration in relation to survival, symptoms, and diseases: results from the prospectivepopulation study of women in Gothenburg, Sweden. Acta Odontol. Scand., 57, 168–174.
Anderson, J.W., Johnstone, B.M. & Remley, D.T. (1999) Breast-feeding and cognitivedevelopment: a meta-analysis. Am. J. Clin. Nutr., 70, 525–535.
Barr, D.B., Weihe, P., Davis M.D., Needham, L.L. & Grandjean, P. (2006) Serumpolychlorinated biphenyl and organochlorine insecticide concentrations in a Faroese birthcohort. Chemosphere, 62, 1167–1182.
Björnberg, K.A., Vahter, M., Berglund, B., Niklasson, B., Blennow, M. & Sandborgh-Englund, G.(2005) Transport of methylmercury and inorganic mercury to the fetus and breast-fedinfant. Environ. Health Perspect., 113, 1381–1385.
Budtz-Jorgensen, E., Keiding, N. & Grandjean, P. (2004) Effects of exposure imprecision onestimation of the benchmark dose. Risk Anal., 24, 1689–1696.
Burbacher, T.M., Grant, K.S., Mayfield, D.B., Gilbert, S.G. & Rice, D.C. (2005) Prenatalmethylmercury exposure affects spatial vision in adult monkeys. Toxicol. Appl. Pharmacol.,208, 21–28.
Carrington, C.D., Montwill, B. & Bolger, P.M. (2004) An Intervention Analysis for the Reductionof Exposure to Methylmercury from the Consumption of Seafood by Women of Child-bearing Age. Regul. Toxicol. Pharmacol., 40, 272-280
Carta, P., Flore, C., Alinovi, R., Ibba, A., Tocco, M.G., Aru, G., Carta, R., Girei, E., Mutti, A.,Lucchini, R. & Randaccio, F.S. (2003) Sub-clinical neurobehavioral abnormalities
310 METHYLMERCURY

associated with low level of mercury exposure through fish consumption.Neurotoxicology, 24, 617–623.
Centers for Disease Control and Prevention (2004) Blood mercury levels in young childrenand childbearing-aged women - United States, 1999–2002. Morb. Mortal. Wkly Rep., 53,1018–1020.
Codex Committee on Food Additives and Contaminants (2005) Discussion paper on guidelinelevels for methylmercury in fish. Thirty-seventh Session of the Codex Committee on FoodAdditives and Contaminants. The Hague, the Netherlands, 25–29 April 2005. Rome, Foodand Agriculture Organization of the United Nations (CX/FAC 05/37/35).
Codex Alimentarius Commission (2005) Report of the Thirty-seventh Session of the CodexCommittee on Food Additives and Contaminants, The Hague, The Netherlands, 25–29April 2005. Rome, Food and Agriculture Organization of the United Nations (ALINORM05/28/12; http://www.codexalimentarius.net/download/report/639/al28_12e.pdf).
Chien, L.-C., Han, B.-C., Hsu, C.-S., Jiang, C.-B., You, H.-J., Shieh, M.-J. & Yeh, C.-Y. (2006)Analysis of health risk of exposure to breast milk mercury in infants in Taiwan.Chemosphere, 64, 79–85.
Cohen, J.T., Bellinger, D.C. & Shaywitz, B.A. (2005a) A quantitative analysis of prenatal methylmercury exposure and cognitive development Am. J. Prev. Med., 29, 353–365.
Cohen, J.T., Bellinger, D.C., Connor, W.E. & Shaywitz, B.A. (2005b) A quantitative analysisof prenatal intake of n-3 polyunsaturated fatty acids and cognitive development. Am. J.Prev. Med., 29, 366–374.
Cohen, J.T., Bellinger, D.C., Connor, W.E., Kris-Etherton, P.M., Lawrence R.S., Savitz, D.A.,Shaywitz, B.A. Teutsch, S.M. & Gray, G.M. (2005c) A quantitative risk-benefit analysis ofchanges in population fish consumption. Am. J. Prev. Med., 29, 325–334.
Crépet, A., Tressou, J., Verger, P. & LeBlanc, J.Ch. (2005) Management options to reduceexposure to methyl mercury through the consumption of fish and fishery products by theFrench population. Regul. Toxicol. Pharmacol., 42, 179–189.
Dalgard, C., Grandjean, P., Jorgensen, P.J. & Weihe, P. (1994) Mercury in the umbilical cord:implications for risk assessment for Minamata disease. Environ. Health Perspect., 102,548–550.
Daniels J.L., Longnecker, M.P., Rowland, A.S., Golding, J. & ALSPAC Study Team. Universityof Bristol Institute of Child Health (2004) Fish intake during pregnancy and early cognitivedevelopment of offspring. Epidemiology, 15, 394–402.
Davidson, P.W., Myers, G.J., Cox, C., Axtell, C., Shamlaye, C., Sloane-Reeves, J., Cernichiari,E., Needham, L.L., Choi, A., Wang, Y., Berlin, M. & Clarkson, T.W. (1998) Effects of pre-natal and postnatal methylmercury exposure from fish consumption on neuro-developmental outcomes at 66 months of age in the Seychelles Child Development Study.JAMA, 280, 701–707.
Davidson, P.W., Myers, G.J., Shamlaye, C., Cox, C. & Wilding, G.E. (2004) Prenatal exposureto methylmercury and child development: influence of social factors. Neurotoxicol.Teratol., 26, 553–559.
da Costa, S.L., Malm, O. & Dorea, J.G. (2005) Breast-milk mercury concentrations andamalgam surface in mothers from Brasilia, Brazil. Biol. Trace Elem. Res., 106, 145–151.
Debes, F., Budtz-Jorgensen, E., Weihe, P., White, R.F. & Grandjean, P. (2006) Impact ofprenatal methylmercury exposure on neurobehavioral function at age 14 years.Neurotoxicol. Teratol., 28, 363–375.
Després, C., Beuter, A., Richer, F., Poitras, K., Veilleux, A., Ayotte, P., Dewailly, E., Saint-Amour, D. & Muckle, G. (2005) Neuromotor functions in Inuit preschool children exposedto Pb, PCBs, and Hg. Neurotoxicol. Teratol., 27, 245–257.
Dobbing, J. & Sands, J. (1979) Comparative aspects of the brain spurt. Early Hum. Dev., 3,79–83.
METHYLMERCURY 311

Dorea, J.G., Barbosa, A.C., Ferrari, I. & De Souza, J.R. (2005a) Fish consumption (hairmercury) and nutritional status of Amazonian Amer-Indian children. Am. J. Hum. Biol.,17, 507–514.
Dorea, J.G., de Souza, J.R., Rodrigues, P., Ferrari, I. & Barbosa, A.C. (2005b) Hair mercury(signature of fish consumption) and cardiovascular risk in Munduruku and Kayabi Indiansof Amazonia. Environ. Res., 97, 209–219.
Fangstrom, B., Athanasiadou, M., Grandjean, P., Weihe, P. & Bergman, A. (2002)Hydroxylated PCB metabolites and PCBs in serum from pregnant Faroese women.Environ. Health Perspect., 110, 895–899.
Fangstrom, B., Strid, A., Grandjean, P., Weihe, P. & Bergman, A. (2005a) A retrospectivestudy of PBDEs and PCBs in human milk from the Faroe Islands. Environ. Health., 14,4–12.
Fangstrom, B., Hovander, L., Bignert, A., Athanassiadis, I., Linderholm, L., Grandjean, P.,Weihe, P. & Bergman, A. (2005b) Concentrations of polybrominated diphenyl ethers,polychlorinated biphenyls, and polychlorobiphenylols in serum from pregnant Faroesewomen and their children 7 years later. Environ. Sci. Technol., 39, 9457–9463.
Futatsuka, M., Kitano, T., Shono, M., Nagano, M., Wakamiya, J., Miyamoto, K., Ushijima, K.,Inaoka, T., Fukuda, Y., Nakagawa, M., Arimura, K. & Osame, M. (2005) Long-term follow-up study of health status in population living in methylmercury-polluted area. Environ.Sci.,12, 239–282.
Grandjean, P., Jorgensen, P.J. & Weihe, P. (1994) Human milk as a source of methylmercuryexposure in infants. Environ. Health Perspect., 102, 74–77.
Grandjean, P., Weihe, P. & White, R.F. (1995) Milestone development in infants exposed tomethylmercury from human milk. Neurotoxicology, 16, 27–33.
Grandjean, P., White, R.F., Weihe, P., Debes, F., Araki, S., Murata, K., Sorensen, N., Dahl,R. & Jorgensen, P. J.. (1997) Cognitive deficit in 7-year-old children with prenatal exposureto methylmercury. Neurotoxicol. Teratol., 19, 417–428.
Grandjean, P., Budtz-Jorgensen, E., White, R.F., Jorgensen, P.J., Weihe, P., Debes, F. &Keiding, N. (1999) Methylmercury exposure biomarkers as indicators of neurotoxicity in7-year-old children. Am. J. Epidemiol., 150, 301–305.
Grandjean, P., Murata, K., Budtz-Jorgensen, E. & Weihe, P. (2004a) Cardiac autonomicactivity in methylmercury neurotoxicity: 14-year follow-up of a Faroese birth cohort.J. Pediatr., 144, 169–176.
Grandjean, P., Budtz-Jorgensen, E., Keiding, N. & Weihe, P. (2004b) Underestimation of riskdue to exposure misclassification. Int. J. Occup. Med. Environ. Health., 17, 131–136.
Grandjean, P., Budtz-Jorgensen, E., Jorgensen, P.J. & Weihe, P. (2005) Umbilical cordmercury concentration as biomarker of prenatal exposure to methylmercury. Environ.Health Perspect., 113, 905–908.
Guallar, E., Sanz-Gallardo, M.I., van’t Veer, P., Bode, P., Aro, A., Gomez-Aracena, J., Kark,J.D., Riemersma, R.A., Martin-Moreno, J.M. & Kok, F.J., Heavy Metals and MyocardialInfarction Study Group (2002) Mercury, fish oils, and the risk of myocardial infarction.N. Eng. J. Med., 347, 1747–1754.
Hallgren, C.G., Hallmans, G., Jansson, J.-H., Marklund, S.L., Huhtasaari, F., Schütz, A.,Strömberg, U., Vessby, B. & Skerfving, S. (2001) Markers of high fish intake are associatedwith decreased risk of a first myocardial infarction. Br. J. Nutr., 86, 397–404.
Hightower, J.M., O’Hare, A. & Hernandez, G.T. (2006) Blood mercury reporting in NHANES:identifying Asian, Pacific Islander, Native American, and multiracial groups. Environ. HealthPerspect., 114, 173–175.
Huang, L.-S., Cox, C., Wilding, G.E., Myers, G.J., Davidson, P.W., Shamlaye, C.F.,Cernichiari, E., Sloane-Reeves, J. & Clarkson, T.W. (2003) Using measurement errormodels to assess effects of prenatal and postnatal methylmercury exposure in theSeychelles Child Development Study. Environ. Res., 93, 115–122.
312 METHYLMERCURY

Huang, L.-S., Cox, C., Myers, G.J., Davidson, P.W., Cernichiari, E., Shamlaye, C.F., Sloane-Reeves, J. & Clarkson, T.W. (2005) Exploring non-linear association between prenatalmethylmercury exposure from fish consumption and child development: evaluation of theSeychelles Child Development Study nine-year data using semiparametric additivemodels. Environ. Res., 97, 100–108.
Ip, P., Wong, V., Ho, M., Lee, J. & Wong, W. (2004a) Mercury exposure in children with autismspectrum disorder: case-control study. J. Child Neurol., 19, 431–434.
Ip, P., Wong, V., Ho, M., Lee, J. & Wong, W. (2004b) Environmental mercury exposure inchildren: South China’s experience. Pediatr. Int., 46, 715–721.
Jedrychowski, W., Jankowski, J., Flak, E., Skarupa, A., Mroz, E., Sochacka-Tatara, E. et al.(2005) Effects of prenatal exposure to mercury on cognbitive and psychomotor function inone-year old infants: epidemiologic cohort study in Poland. Ann. Epidemiol., 16, 439–447.
Jensen, T.K., Grandjean, P., Budtz-Jorgensen, E., White, R.F., Debes, F. & Weihe, P. (2005)Effects of breast feeding on neuropsychological development in a community withmethylmercury exposure from seafood. J. Expo. Anal. Environ. Epidemiol., 15, 423–430.
Kakita, A., Wakabayashi, K., Su, M., Yoneoka, Y., Sakamoto, M. & Ikuta, F. (2000a)Intrauterine methylmercury intoxication: consequence of the inherent brain lesions andcognitive dysfunction in maturity. Brain Res., 877, 322–330.
Kakita, A., Wakabayashi, K., Su, M., Sakamoto, M., Ikuta, F. & Takahashi, H. (2000b) Distinctpattern of neuronal degeneration in the fetal rat brain induced by consecutivetransplacental administration of methylmercury. Brain Res., 859, 233–239.
Kakita, A., Wakabayashi, K., Su, M., Piao, Y.-S. & Takahashi, H. (2001) Experimentallyinduced leptomeningeal glioneuronal heterotopia and underlying cortical dysplasia of thelateral limbic area in rats treated transplacentally with methylmercury. J. Neuropathol. Exp.Neurol., 60, 768–777.
Lindberg, A., Bjornberg, K.A., Vahter, M. & Berglund, M. (2004) Exposure to methylmercuryin non-fish-eating people in Sweden. Environ. Res., 96, 28–33.
McDowell, M.A., Dillon, C.F., Osterloh, J., Bolger, P.M., Pellizzari, E., Fernando, R., Montesde Oca, R., Schober, S.E., Sinks, T., Jones, R.L. & Mahaffey, K.R. (2004) Hair mercurylevels in U.S. children and women of childbearing age: reference range data from NHANES1999-2000. Environ. Health Perspect., 112, 1165–1171.
Murata, K., Weihe, P., Budtz-Jorgensen, E., Jorgensen, P.J., & Grandjean, P. (2004) Delayedbrainstem auditory evoked potential latencies in 14-year-old children exposed tomethylmercury. J. Pediatr., 144, 177–183.
Murata, K., Sakamoto, M., Nakai, K., Dakeishi, M., Iwata, T., Liu, X.J. & Satoh, H. (2006)Subclinical effects of prenatal methylmercury exposure on cardiac autonomic function inJapanese children. Int. Arch. Occup. Environ. Health. 79, 379–386.
Myers, G.J., Davidson, P.W., Cox, C., Shamlaye, C.F., Palumbo, D., Cernichiari, E., Sloane-Reeves, J., Wilding, G., Kost, J., Huang, L.-S. & Clarkson, T.W. (2003) Prenatalmethylmercury exposure from ocean fish consumptions in the Seychelles childdevelopment study. Lancet, 361, 1686–1692.
Ninomiya, T., Imamura, K., Kuwahata, M., Kindaichi, M., Susa, M. & Ekino, S. (2005)Reappraisal of somatosensory disorders in methylmercury poisoning. Neurotoxicol.Teratol., 27, 643–653.
Oken, E., Wright, R.O., Kleinman, K.P., Bellinger, D., Amarasiriwardena, C.J., Hu, H., Rich-Edwards, J.W. & Gillman, M.W. (2005) Maternal fish consumption, hair mercury, and infantcognition in a US cohort. Environ. Health Perspect., 113, 1376–1380.
Oskarsson, A., Hallën, I.P. & Sundberg, J. (1995) Exposure to toxic elements via breast milk.Analyst, 120, 765–770.
Oskarsson, A., Schuts, A., Skerfving, S., Hallën, I.P., Ohlin, B. & Lagerkvist, B.J. (1996) Totaland inorganic mercury in breast milk and blood in relation to fish consumption and amalgamfilings in lactating women. Arch. Environ. Health, 51, 234–241.
METHYLMERCURY 313

Pan, H.S., Sakamoto, M., Oliveira, R.B., Liu, X.J., Kakita, A. & Futatsuka, M. (2004) Changesin methylmercury accumulation in the brain of rat offspring throughout gestation and duringsuckling. Toxicol. Environ.Chem., 86, 161–168.
Pedersen, E.B., Jorgensen, M.E., Pedersen, M.B., Siggaard, C., Sorensen, T.B., Mulvad, G.,Hansen, J.C., Asmund, G. & Skjoldborg, H. (2005) Relationship between mercury in bloodand 24-h ambulatory blood pressure in Greenlanders and Danes. Am. J. Hypertens., 18,612–618.
Ponce, R.A., Bartell, S.M., Wong, E.Y., LaFlamme, D., Carrington, C., Lee, R.C., Patrick, D.L.,Faustman, E.M. & Bolger, M. (2000) Use of quality-adjusted life year weights with dose-response models for public health decisions: a case study of the risks and benefits of fishconsumption. Risk Anal., 20, 529–542.
Rice, D.C. (1999) Delayed neurotoxicity in monkeys exposed developmentally tomethylmercury. Neurotoxicology, 10, 645–650.
Rice, D.C. & Barone, S. (2000) Critical periods of vulnerability for developing nervous system:evidence from human and animal models. Environ. Health Perspect., 108, 511–533.
Rice, D.C. & Gilbert, S.G. (1982) Early chronic low-level methylmercury poisoning in monkeysimpairs spatial vision. Science, 216, 759–761
Rice, D.C. & Gilbert, S.G. (1990) Effects of developmental exposure to methyl mercury onspatial and temporal visual function in monkeys. Toxicol. Appl. Pharmacol., 102, 151–163.
Rice, D.C. & Hayward, S. (1999) Comparison of visual function at adulthood and during agingin monkeys exposed to lead or methylmercury. Neurotoxicology, 20, 767–784.
Roegge, C.S., Wang, V.C., Powers, B.E., Klintsova, A.Y., Villareal, S., Greenough, W.T. &Schantz, S.L. (2003) Motor impairment in rats exposed to PCBs and methylmercury duringearly development. Toxicol. Sci., 77, 315–324.
Rowland, I., Robinson, R., Doherty, R. & Landry, T. (1983) Are developmental changes inmethylmercury metabolism and excretion mediated by the intestinal microflora. In:Clarkson, T.W., Nordberg, G.F., Sager, P.R., eds, Reproductive toxicity of metals, NewYork, Plenum Press.
Saint-Amour, D., Roy, M.S., Bastien, C., Ayotte, P., Dewailly, E., Despres, C., Gingras, S. &Muckle, G. (2006) Alterations of visual evoked potentials in preschool Inuit childrenexposed to methylmercury and polychlorinated biphenyls from a marine diet.Neurotoxicology. 27, 567–578.
Sakamoto, M., Kakita, A., Wakabayashi, K., Takahashi, H., Nakano, A. & Agaki, H. (2002a)Evaluation of changes in methylmercury accumulation in the developing rat brain and itseffects: a study with consecutive and moderate dose exposure throughout gestation andlactation periods. Brain Res., 949, 51–59.
Sakamoto, M., Kubota, M., Matsumoto, S., Nakano, A. & Akagi, H. (2002b) Declining risk ofmethylmercury exposure to infants during lactation. Environ. Res., 90, 185–189.
Sakamoto, M., Kakita, A., de Oliveira, R.B., Pan, H.S. & Takahashi, H. (2004a) Dose-dependent effects of methylmercury administered during neonatal brain spurts in rats.Brain Res. Dev. Brain Res., 152, 171–176.
Sakamoto, M., Kubota, M., Liu, X.J., Murata, K., Nakai, K. & Satoh, H. (2004b) Maternal andfetal mercury and n-3 polyunsaturated fatty acids as a risk and benefit of fish consumptionto fetus. Environ. Sci. Technol., 38, 3860–3863.
Sakamoto, M., Kaneoka, T., Murata, K., Nakai, K., Satoh, H. & Akagi, H. (2006) Correlationsbetween mercury concentrations in umbilical cord tissue and other biomarkers of fetalexposure to methylmercury in the Japanese population. Environ. Res., 103, 106–111.
Salonen, J.T., Seppänen, K., Nyyssönen, K., Korpela H., Kauhanen J., Kantola, M.,Tuomilehto, J., Esterbauer, H., Tatzber, F. & Salonen, R. (1995) Intake of mercury fromfish, lipid peroxidation, and the risk of myocardial infarction and coronary, cardiovascular,and any death in Eastern Finnish men. Circulation, 91, 645–655.
314 METHYLMERCURY

Sato, R.L., Li, G.G. & Shaha, S. (2006) Antepartum seafood consumption and mercury levelsin newborn cord blood. Am. J. Obstet. Gynecol., 194, 1683–1638.
Schober, S., Sinks, T.H., Jones, R.L., Bolger, P.M., McDowell, M., Osterloh, J., Garrett, E.S.,Canady, R.A., Dillon, C.F., Sun, Y., Joseph, C.B. & Mahaffey, K.R. (2003) Blood mercurylevels in US children and women of childbearing age, 1999-2000. JAMA, 289, 1667–1674.
Skerfving, S. (1988) Mercury in women exposed to methylmercury through fish consumption,and in their newborn babies and breast milk. Bull. Environ. Contam. Toxicol., 41, 475–482.
Stamler, C.J., Abdelouahab, N., Vanier, C., Mergler, D. & Chan, H.M. (2006) Relationshipbetween platelet monoamine oxidase-B (MAO-B) activity and mercury exposure in fishconsumers from the Lake St. Pierre region of Quebec, Canada. Neurotoxicology,27, 429–436.
Stern, A.H. & Smith, A.E. (2003) An assessment of the cord blood: maternal bloodmethylmercury ratio: implications for risk assessment. Hum. Ecol. Risk Assess., 8,885–894.
Takaika, S., Fujino, T., Sekikawa, T. & Miyaoka, T. (2004) Psychophysical sensoryexamination in individuals with a history of methylmercury exposure. Environ. Res., 95,126–132.
Takeuchi, T. (1982) Pathology of Minamata disease, with special reference to itspathogenesis. Acta Pathol. Jpn, 32(Suppl.1), 73–99.
Uchino, M., Hirano, T., Satoh, H., Arimura, K., Nakagawa, M. & Wakamiya, J. (2005) Theseverity of Minamata disease declined in 25 years: temporal profile of the neurologicalfindings analyzed by multiple logistic regression model. Tohoku J. Exp. Med., 205, 53–63.
Vahter, M., Åkesson, A., Lind, B., Schütz, A. & Berglund, M. (2000) Longitudinal study ofmethylmercury and inorganic mercury in blood and urine of pregnant and lactating women,as well as in umbilical cord blood. Environ. Res., 84, 186–194.
Virtanen, J.K., Voutilainen, S., Rissanen, T.H., Mursu, J., Tuomainen, T.P., Korhonen, M.J.,Valkonen, V.P., Seppanen, K., Laukkanen, J.A. & Salonen, J.T. (2005) Mercury, fish oils,and risk of acute coronary events and cardiovascular disease, coronary heart disease, andall-cause mortality in men in eastern Finland. Arterioscler. Thromb. Vasc. Biol., 25,228–233.
Vupputuri, S., Longnecker, M.P., Daniels, J.L., Guo, X. & Sandler, D.P. (2005) Blood mercurylevel and blood pressure among US women: results from the National Health and NutritionExamination Survey 1999–2000. Environ. Res., 97, 195–200.
Wakabayashi, K., Kakita, A., Sakamoto, M., Su, M., Iwanaga, K. & Ikuta, F. (1995) Variabilityof brain lesions in rats administered methylmercury at various postnatal developmentphases. Brain Res., 705, 267–272.
Weihe, P., Grandjean, P. & Jorgensen, P.J. (2005) Application of hair-mercury analysis todetermine the impact of a seafood advisory. Environ. Res., 97, 200–207.
Weil, M., Bressler, J., Parsons, P., Bolla, K., Glass, T. & Schwartz, B. (2005) Blood mercurylevels and neurobehavioral function. JAMA, 293, 1875–1882.
WHO (1990). Methylmercury (Environmental Health Criteria 101). World Health Organization,Geneva.
Widholm, J.J., Villareal, S., Seegal, R. & Schantz, S.L. (2004) Spatial alternation deficits afterdevelopmental exposure to Aroclor 1254 and/or methylmercury in rats. Toxicol. Sci., 82,577–589.
Yoshizawa, K., Rimm, E.B., Morris, J.S., Spate, V.L., Hsieh, C.C., Spiegelman, D., Stampfer,M.J. & Willett, W.C. (2002) Mercury and the risk of coronary heart disease. N. Eng. J.Med., 347, 1755–1760.
METHYLMERCURY 315


ANNEXES


ANNEX 1
REPORTS AND OTHER DOCUMENTS RESULTING FROM PREVIOUSMEETINGS OF THE JOINT FAO/WHO EXPERT COMMITTEE ON FOOD
ADDITIVES
1. General principles governing the use of food additives (First report of the JointFAO/WHO Expert Committee on Food Additives). FAO Nutrition Meetings ReportSeries, No. 15, 1957; WHO Technical Report Series, No. 129, 1957 (out of print).
2. Procedures for the testing of intentional food additives to establish their safetyfor use (Second report of the Joint FAO/WHO Expert Committee on Food Additives).FAO Nutrition Meetings Report Series, No. 17, 1958; WHO Technical Report Series,No. 144, 1958 (out of print).
3. Specifications for identity and purity of food additives (Antimicrobialpreservatives and Antioxidants) (Third report of the Joint FAO/WHO ExpertCommittee on Food Additives). These specifications were subsequently revised andpublished as Specifications for identity and Purity of food additives, Vol. I.Antimicrobial preservatives and Antioxidants, Rome, Food and AgricultureOrganization of the United Nations, 1962 (out of print).
4. Specifications for identity and purity of food additives (Food colours) (Fourthreport of the Joint FAO/WHO Expert Committee on Food Additives). Thesespecifications were subsequently revised and published as Specifications for identityand purity of food additives, Vol. II. Food colours, Rome, Food and AgricultureOrganization of the United Nations, 1963 (out of print).
5. Evaluation of the carcinogenic hazards of food additives (Fifth report of the JointFAO/WHO Expert Committee on Food Additives). FAO Nutrition Meetings ReportSeries, No. 29, 1961; WHO Technical Report Series, No. 220, 1961 (out of print).
6. Evaluation of the toxicity of a number of antimicrobials and antioxidants (Sixthreport of the Joint FAO/WHO Expert Committee on Food Additives). FAO NutritionMeetings Report Series, No. 31, 1962; WHO Technical Report Series, No. 228, 1962(out of print).
7. Specifications for the identity and purity of food additives and their toxicologicalevaluation: Emulsifiers, stabilizers, bleaching and maturing agents (Seventhreport of the Joint FAO/WHO Expert Committee on Food Additives). FAO NutritionMeetings Series, No. 35, 1964; WHO Technical Report Series, No. 281, 1964 (out ofprint).
8. Specifications for the identity and purity of food additives and their toxicologicalevaluation: Food colours and some antimicrobials and antioxidants (Eighth reportof the Joint FAO/WHO Expert Committee on Food Additives). FAO Nutrition MeetingsSeries, No. 38, 1965; WHO Technical Report Series, No. 309, 1965 (out of print).
9. Specifications for identity and purity and toxicological evaluation of someantimicrobials and antioxidants. FAO Nutrition Meetings Report Series, No. 38A,1965; WHO/Food Add/24.65 (out of print).
10. Specifications for identity and purity and toxicological evaluation of foodcolours. FAO Nutrition Meetings Report Series, No. 38B, 1966; WHO/Food Add/66.25.
11. Specifications for the identity and purity of food additives and their toxicologicalevaluation: Some antimicrobials, antioxidants, emulsifiers, stabilizers, flourtreatment agents, acids, and bases (Ninth report of the Joint FAO/WHO ExpertCommittee on Food Additives). FAO Nutrition Meetings Series, No. 40, 1966; WHOTechnical Report Series, No. 339, 1966 (out of print).
- 319 -

12. Toxicological evaluation of some antimicrobials, antioxidants, emulsifiers,stabilizers, flour treatment agents, acids, and bases. FAO Nutrition MeetingsReport Series, No. 40A, B, C; WHO/Food Add/67.29.
13. Specifications for the identity and purity of food additives and their toxicologicalevaluation: Some emulsifiers and stabilizers and certain other substances (Tenthreport of the Joint FAO/WHO Expert Committee on Food Additives). FAO NutritionMeetings Series, No. 43, 1967; WHO Technical Report Series, No. 373, 1967.
14. Specifications for the identity and purity of food additives and their toxicologicalevaluation: Some flavouring substances and non nutritive sweetening agents(Eleventh report of the Joint FAO/WHO Expert Committee on Food Additives). FAONutrition Meetings Series, No. 44, 1968; WHO Technical Report Series, No. 383, 1968.
15. Toxicological evaluation of some flavouring substances and non nutritivesweetening agents. FAO Nutrition Meetings Report Series, No. 44A, 1968; WHO/Food Add/68.33.
16. Specifications and criteria for identity and purity of some flavouring substancesand non-nutritive sweetening agents. FAO Nutrition Meetings Report Series, No.44B, 1969; WHO/Food Add/69.31.
17. Specifications for the identity and purity of food additives and their toxicologicalevaluation: Some antibiotics (Twelfth report of the Joint FAO/WHO ExpertCommittee on Food Additives). FAO Nutrition Meetings Series, No. 45, 1969; WHOTechnical Report Series, No. 430, 1969.
18. Specifications for the identity and purity of some antibiotics. FAO NutritionMeetings Series, No. 45A, 1969; WHO/Food Add/69.34.
19. Specifications for the identity and purity of food additives and their toxicologicalevaluation: Some food colours, emulsifiers, stabilizers, anticaking agents, andcertain other substances (Thirteenth report of the Joint FAO/WHO Expert Committeeon Food Additives). FAO Nutrition Meetings Series, No. 46, 1970; WHO TechnicalReport Series, No. 445, 1970.
20. Toxicological evaluation of some food colours, emulsifiers, stabilizers,anticaking agents, and certain other substances. FAO Nutrition Meetings ReportSeries, No. 46A, 1970; WHO/Food Add/70.36.
21. Specifications for the identity and purity of some food colours, emulsifiers,stabilizers, anticaking agents, and certain other food additives. FAO NutritionMeetings Report Series, No. 46B, 1970; WHO/Food Add/70.37.
22. Evaluation of food additives: Specifications for the identity and purity of foodadditives and their toxicological evaluation: Some extraction solvents andcertain other substances; and a review of the technological efficacy of someantimicrobial agents. (Fourteenth report of the Joint FAO/WHO Expert Committee onFood Additives). FAO Nutrition Meetings Series, No. 48, 1971; WHO Technical ReportSeries, No. 462, 1971.
23. Toxicological evaluation of some extraction solvents and certain othersubstances. FAO Nutrition Meetings Report Series, No. 48A, 1971; WHO/Food Add/70.39.
24. Specifications for the identity and purity of some extraction solvents and certainother substances. FAO Nutrition Meetings Report Series, No. 48B, 1971; WHO/FoodAdd/70.40.
25. A review of the technological efficacy of some antimicrobial agents. FAO NutritionMeetings Report Series, No. 48C, 1971; WHO/Food Add/70.41.
26. Evaluation of food additives: Some enzymes, modified starches, and certainother substances: Toxicological evaluations and specifications and a review ofthe technological efficacy of some antioxidants (Fifteenth report of the Joint FAO/
ANNEX 1320

WHO Expert Committee on Food Additives). FAO Nutrition Meetings Series, No. 50,1972; WHO Technical Report Series, No. 488, 1972.
27. Toxicological evaluation of some enzymes, modified starches, and certain othersubstances. FAO Nutrition Meetings Report Series, No. 50A, 1972; WHO FoodAdditives Series, No. 1, 1972.
28. Specifications for the identity and purity of some enzymes and certain othersubstances. FAO Nutrition Meetings Report Series, No. 50B, 1972; WHO FoodAdditives Series, No. 2, 1972.
29. A review of the technological efficacy of some antioxidants and synergists. FAONutrition Meetings Report Series, No. 50C, 1972; WHO Food Additives Series, No. 3,1972.
30. Evaluation of certain food additives and the contaminants mercury, lead, andcadmium (Sixteenth report of the Joint FAO/WHO Expert Committee on FoodAdditives). FAO Nutrition Meetings Series, No. 51, 1972; WHO Technical ReportSeries, No. 505, 1972, and corrigendum.
31. Evaluation of mercury, lead, cadmium and the food additives amaranth,diethylpyrocarbamate, and octyl gallate. FAO Nutrition Meetings Report Series, No.51A, 1972; WHO Food Additives Series, No. 4, 1972.
32. Toxicological evaluation of certain food additives with a review of generalprinciples and of specifications (Seventeenth report of the Joint FAO/WHO ExpertCommittee on Food Additives). FAO Nutrition Meetings Series, No. 53, 1974; WHOTechnical Report Series, No. 539, 1974, and corrigendum (out of print).
33. Toxicological evaluation of some food additives including anticaking agents,antimicrobials, antioxidants, emulsifiers, and thickening agents. FAO NutritionMeetings Report Series, No. 53A, 1974; WHO Food Additives Series, No. 5, 1974.
34. Specifications for identity and purity of thickening agents, anticaking agents,antimicrobials, antioxidants and emulsifiers. FAO Food and Nutrition Paper, No. 4,1978.
35. Evaluation of certain food additives (Eighteenth report of the Joint FAO/WHO ExpertCommittee on Food Additives). FAO Nutrition Meetings Series, No. 54, 1974; WHOTechnical Report Series, No. 557, 1974, and corrigendum.
36. Toxicological evaluation of some food colours, enzymes, flavour enhancers,thickening agents, and certain other food additives. FAO Nutrition Meetings ReportSeries, No. 54A, 1975; WHO Food Additives Series, No. 6, 1975.
37. Specifications for the identity and purity of some food colours, enhancers,thickening agents, and certain food additives. FAO Nutrition Meetings ReportSeries, No. 54B, 1975; WHO Food Additives Series, No. 7, 1975.
38. Evaluation of certain food additives: Some food colours, thickening agents,smoke condensates, and certain other substances. (Nineteenth report of the JointFAO/WHO Expert Committee on Food Additives). FAO Nutrition Meetings Series, No.55, 1975; WHO Technical Report Series, No. 576, 1975.
39. Toxicological evaluation of some food colours, thickening agents, and certainother substances. FAO Nutrition Meetings Report Series, No. 55A, 1975; WHO FoodAdditives Series, No. 8, 1975.
40. Specifications for the identity and purity of certain food additives. FAO NutritionMeetings Report Series, No. 55B, 1976; WHO Food Additives Series, No. 9, 1976.
41. Evaluation of certain food additives (Twentieth report of the Joint FAO/WHO ExpertCommittee on Food Additives). FAO Food and Nutrition Meetings Series, No. 1, 1976;WHO Technical Report Series, No. 599, 1976.
42. Toxicological evaluation of certain food additives. WHO Food Additives Series,No. 10, 1976.
ANNEX 1 321

43. Specifications for the identity and purity of some food additives. FAO Food andNutrition Series, No. 1B, 1977; WHO Food Additives Series, No. 11, 1977.
44. Evaluation of certain food additives (Twenty-first report of the Joint FAO/WHOExpert Committee on Food Additives). WHO Technical Report Series, No. 617, 1978.
45. Summary of toxicological data of certain food additives. WHO Food AdditivesSeries, No. 12, 1977.
46. Specifications for identity and purity of some food additives, includingantioxidant, food colours, thickeners, and others. FAO Nutrition Meetings ReportSeries, No. 57, 1977.
47. Evaluation of certain food additives and contaminants (Twenty-second report ofthe Joint FAO/WHO Expert Committee on Food Additives). WHO Technical ReportSeries, No. 631, 1978.
48. Summary of toxicological data of certain food additives and contaminants. WHOFood Additives Series, No. 13, 1978.
49. Specifications for the identity and purity of certain food additives. FAO Food andNutrition Paper, No. 7, 1978.
50. Evaluation of certain food additives (Twenty-third report of the Joint FAO/WHOExpert Committee on Food Additives). WHO Technical Report Series, No. 648, 1980,and corrigenda.
51. Toxicological evaluation of certain food additives. WHO Food Additives Series,No. 14, 1980.
52. Specifications for identity and purity of food colours, flavouring agents, andother food additives. FAO Food and Nutrition Paper, No. 12, 1979.
53. Evaluation of certain food additives (Twenty-fourth report of the Joint FAO/WHOExpert Committee on Food Additives). WHO Technical Report Series, No. 653, 1980.
54. Toxicological evaluation of certain food additives. WHO Food Additives Series,No. 15, 1980.
55. Specifications for identity and purity of food additives (sweetening agents,emulsifying agents, and other food additives). FAO Food and Nutrition Paper,No. 17, 1980.
56. Evaluation of certain food additives (Twenty-fifth report of the Joint FAO/WHOExpert Committee on Food Additives). WHO Technical Report Series, No. 669, 1981.
57. Toxicological evaluation of certain food additives. WHO Food Additives Series,No. 16, 1981.
58. Specifications for identity and purity of food additives (carrier solvents,emulsifiers and stabilizers, enzyme preparations, flavouring agents, foodcolours, sweetening agents, and other food additives). FAO Food and NutritionPaper, No. 19, 1981.
59. Evaluation of certain food additives and contaminants (Twenty-sixth report of theJoint FAO/WHO Expert Committee on Food Additives). WHO Technical Report Series,No. 683, 1982.
60. Toxicological evaluation of certain food additives. WHO Food Additives Series,No. 17, 1982.
61. Specifications for the identity and purity of certain food additives. FAO Food andNutrition Paper, No. 25, 1982.
62. Evaluation of certain food additives and contaminants (Twenty-seventh report ofthe Joint FAO/WHO Expert Committee on Food Additives). WHO Technical ReportSeries, No. 696, 1983, and corrigenda.
63. Toxicological evaluation of certain food additives and contaminants. WHO FoodAdditives Series, No. 18, 1983.
64. Specifications for the identity and purity of certain food additives. FAO Food andNutrition Paper, No. 28, 1983.
ANNEX 1322
65. Guide to specifications, general notices, general methods, identification tests,test solutions, and other reference materials. FAO Food and Nutrition Paper,No. 5, Rev. 1, 1983.
66. Evaluation of certain food additives and contaminants (Twenty-eighth report of theJoint FAO/WHO Expert Committee on Food Additives). WHO Technical Report Series,No. 710, 1984, and corrigendum.
67. Toxicological evaluation of certain food additives and contaminants. WHO FoodAdditives Series, No. 19, 1984.
68. Specifications for the identity and purity of food colours. FAO Food and NutritionPaper, No. 31/1, 1984.
69. Specifications for the identity and purity of food additives. FAO Food and NutritionPaper, No. 31/2, 1984.
70. Evaluation of certain food additives and contaminants (Twenty-ninth report of theJoint FAO/WHO Expert Committee on Food Additives). WHO Technical Report Series,No. 733, 1986, and corrigendum.
71. Specifications for the identity and purity of certain food additives. FAO Food andNutrition Paper, No. 34, 1986.
72. Toxicological evaluation of certain food additives and contaminants. WHO FoodAdditives Series, No. 20. Cambridge University Press, 1987.
73. Evaluation of certain food additives and contaminants (Thirtieth report of the JointFAO/WHO Expert Committee on Food Additives). WHO Technical Report Series,No. 751, 1987.
74. Toxicological evaluation of certain food additives and contaminants. WHO FoodAdditives Series, No. 21. Cambridge University Press, 1987.
75. Specifications for the identity and purity of certain food additives. FAO Food andNutrition Paper, No. 37, 1986.
76. Principles for the safety assessment of food additives and contaminants infood. WHO Environmental Health Criteria, No. 70. Geneva, World Health Organization,1987 (out of print). The full text is available electronically at www.who.int/pcs.
77. Evaluation of certain food additives and contaminants (Thirty-first report of theJoint FAO/WHO Expert Committee on Food Additives). WHO Technical Report Series,No. 759, 1987 and corrigendum.
78. Toxicological evaluation of certain food additives. WHO Food Additives Series,No. 22. Cambridge University Press, 1988.
79. Specifications for the identity and purity of certain food additives. FAO Food andNutrition Paper, No. 38, 1988.
80. Evaluation of certain veterinary drug residues in food (Thirty-second report of theJoint FAO/WHO Expert Committee on Food Additives). WHO Technical Report Series,No. 763, 1988.
81. Toxicological evaluation of certain veterinary drug residues in food. WHO FoodAdditives Series, No. 23. Cambridge University Press, 1988.
82. Residues of some veterinary drugs in animals and foods. FAO Food and NutritionPaper, No. 41, 1988.
83. Evaluation of certain food additives and contaminants (Thirty-third report of theJoint FAO/WHO Expert Committee on Food Additives). WHO Technical Report Series,No. 776, 1989.
84. Toxicological evaluation of certain food additives and contaminants. WHO FoodAdditives Series, No. 24. Cambridge University Press, 1989.
85. Evaluation of certain veterinary drug residues in food (Thirty-fourth report of theJoint FAO/WHO Expert Committee on Food Additives). WHO Technical Report Series,No. 788, 1989.
ANNEX 1 323

86. Toxicological evaluation of certain veterinary drug residues in food. WHO FoodAdditives Series, No. 25, 1990.
87. Residues of some veterinary drugs in animals and foods. FAO Food and NutritionPaper, No. 41/2, 1990.
88. Evaluation of certain food additives and contaminants (Thirty-fifth report of theJoint FAO/WHO Expert Committee on Food Additives). WHO Technical Report Series,No. 789, 1990, and corrigenda.
89. Toxicological evaluation of certain food additives and contaminants. WHO FoodAdditives Series, No. 26, 1990.
90. Specifications for identity and purity of certain food additives. FAO Food andNutrition Paper, No. 49, 1990.
91. Evaluation of certain veterinary drug residues in food (Thirty-sixth report of theJoint FAO/WHO Expert Committee on Food Additives). WHO Technical Report Series,No. 799, 1990.
92. Toxicological evaluation of certain veterinary drug residues in food. WHO FoodAdditives Series, No. 27, 1991.
93. Residues of some veterinary drugs in animals and foods. FAO Food and NutritionPaper, No. 41/3, 1991.
94. Evaluation of certain food additives and contaminants (Thirty-seventh report of theJoint FAO/WHO Expert Committee on Food Additives). WHO Technical Report Series,No. 806, 1991, and corrigenda.
95. Toxicological evaluation of certain food additives and contaminants. WHO FoodAdditives Series, No. 28, 1991.
96. Compendium of food additive specifications (Joint FAO/WHO Expert Committeeon Food Additives (JECFA)). Combined specifications from 1st through the 37thmeetings, 1956–1990. Rome, Food and Agricultural Organization of the United Nations,1992 (2 volumes).
97. Evaluation of certain veterinary drug residues in food (Thirty-eighth report of theJoint FAO/WHO Expert Committee on Food Additives). WHO Technical Report Series,No. 815, 1991.
98. Toxicological evaluation of certain veterinary residues in food. WHO FoodAdditives Series, No. 29, 1991.
99. Residues of some veterinary drugs in animals and foods. FAO Food and NutritionPaper, No. 41/4, 1991.
100. Guide to specifications—general notices, general analytical techniques,identification tests, test solutions, and other reference materials. FAO Food andNutrition Paper, No. 5, Ref. 2, 1991.
101. Evaluation of certain food additives and naturally occurring toxicants (Thirty-ninthreport of the Joint FAO/WHO Expert Committee on Food Additives). WHO TechnicalReport Series No. 828, 1992.
102. Toxicological evaluation of certain food additives and naturally occurringtoxicants. WHO Food Additive Series, No. 30, 1993.
103. Compendium of food additive specifications: Addendum 1. FAO Food andNutrition Paper, No. 52, 1992.
104. Evaluation of certain veterinary drug residues in food (Fortieth report of the JointFAO/WHO Expert Committee on Food Additives). WHO Technical Report Series,No. 832, 1993.
105. Toxicological evaluation of certain veterinary drug residues in food. WHO FoodAdditives Series, No. 31, 1993.
106. Residues of some veterinary drugs in animals and food. FAO Food and NutritionPaper, No. 41/5, 1993.
ANNEX 1324

107. Evaluation of certain food additives and contaminants (Forty-first report of the JointFAO/WHO Expert Committee on Food Additives). WHO Technical Report Series,No. 837, 1993.
108. Toxicological evaluation of certain food additives and contaminants. WHO FoodAdditives Series, No. 32, 1993.
109. Compendium of food additive specifications: Addendum 2. FAO Food andNutrition Paper, No. 52, Add. 2, 1993.
110. Evaluation of certain veterinary drug residues in food (Forty-second report of theJoint FAO/WHO Expert Committee on Food Additives). WHO Technical Report Series,No. 851, 1995.
111. Toxicological evaluation of certain veterinary drug residues in food. WHO FoodAdditives Series, No. 33, 1994.
112. Residues of some veterinary drugs in animals and foods. FAO Food and NutritionPaper, No. 41/6, 1994.
113. Evaluation of certain veterinary drug residues in food (Forty-third report of the JointFAO/WHO Expert Committee on Food Additives). WHO Technical Report Series,No. 855, 1995, and corrigendum.
114. Toxicological evaluation of certain veterinary drug residues in food. WHO FoodAdditives Series, No. 34, 1995.
115. Residues of some veterinary drugs in animals and foods. FAO Food and NutritionPaper, No. 41/7, 1995.
116. Evaluation of certain food additives and contaminants (Forty-fourth report of theJoint FAO/WHO Expert Committee on Food Additives). WHO Technical Report Series,No. 859, 1995.
117. Toxicological evaluation of certain food additives and contaminants. WHO FoodAdditives Series, No. 35, 1996.
118. Compendium of food additive specifications: Addendum 3. FAO Food andNutrition Paper, No. 52, Add. 3, 1995.
119. Evaluation of certain veterinary drug residues in food (Forty-fifth report of the JointFAO/WHO Expert Committee on Food Additives). WHO Technical Report Series,No. 864, 1996.
120. Toxicological evaluation of certain veterinary drug residues in food. WHO FoodAdditives Series, No. 36, 1996.
121. Residues of some veterinary drugs in animals and foods. FAO Food and NutritionPaper, No. 41/8, 1996.
122. Evaluation of certain food additives and contaminants (Forty-sixth report of theJoint FAO/WHO Expert Committee on Food Additives). WHO Technical Report Series,No. 868, 1997.
123. Toxicological evaluation of certain food additives. WHO Food Additives Series,No. 37, 1996.
124. Compendium of food additive specifications: Addendum 4. FAO Food andNutrition Paper, No. 52, Add. 4, 1996.
125. Evaluation of certain veterinary drug residues in food (Forty-seventh report of theJoint FAO/WHO Expert Committee on Food Additives). WHO Technical Report Series,No. 876, 1998.
126. Toxicological evaluation of certain veterinary drug residues in food. WHO FoodAdditives Series, No. 38, 1996.
127. Residues of some veterinary drugs in animals and foods. FAO Food and NutritionPaper, No. 41/9, 1997.
128. Evaluation of certain veterinary drug residues in food (Forty-eighth report of theJoint FAO/WHO Expert Committee on Food Additives). WHO Technical Report Series,No. 879, 1998.
ANNEX 1 325

129. Toxicological evaluation of certain veterinary drug residues in food. WHO FoodAdditives Series, No. 39, 1997.
130. Residues of some veterinary drugs in animals and foods. FAO Food and NutritionPaper, No. 41/10, 1998.
131. Evaluation of certain food additives and contaminants (Forty-ninth report of theJoint FAO/WHO Expert Committee on Food Additives). WHO Technical Report Series,No. 884, 1999.
132. Safety evaluation of certain food additives and contaminants. WHO FoodAdditives Series, No. 40, 1998.
133. Compendium of food additive specifications: Addendum 5. FAO Food andNutrition Paper, No. 52, Add. 5, 1997.
134. Evaluation of certain veterinary drug residues in food (Fiftieth report of the JointFAO/WHO Expert Committee on Food Additives). WHO Technical Report Series, No.888, 1999.
135. Toxicological evaluation of certain veterinary drug residues in food. WHO FoodAdditives Series, No. 41, 1998.
136. Residues of some veterinary drugs in animals and foods. FAO Food and NutritionPaper, No. 41/11, 1999.
137. Evaluation of certain food additives (Fifty-first report of the Joint FAO/WHO ExpertCommittee on Food Additives). WHO Technical Report Series, No. 891, 2000.
138. Safety evaluation of certain food additives. WHO Food Additives Series, No. 42,1999.
139. Compendium of food additive specifications: Addendum 6. FAO Food andNutrition Paper, No. 52, Add. 6, 1998.
140. Evaluation of certain veterinary drug residues in food (Fifty-second report of theJoint FAO/WHO Expert Committee on Food Additives). WHO Technical Report Series,No. 893, 2000.
141. Toxicological evaluation of certain veterinary drug residues in food. WHO FoodAdditives Series, No. 43, 2000
142. Residues of some veterinary drugs in animals and foods. FAO Food and NutritionPaper, No. 41/12, 2000.
143. Evaluation of certain food additives and contaminants (Fifty-third report of the JointFAO/WHO Expert Committee on Food Additives). WHO Technical Report Series,No. 896, 2000
144. Safety evaluation of certain food additives and contaminants. WHO FoodAdditives Series, No. 44, 2000.
145. Compendium of food additive specifications: Addendum 7. FAO Food andNutrition Paper, No. 52, Add. 7, 1999.
146. Evaluation of certain veterinary drug residues in food (Fifty-fourth report of the JointFAO/WHO Expert Committee on Food Additives). WHO Technical Report Series,No. 900, 2001
147. Toxicological evaluation of certain veterinary drug residues in food. WHO FoodAdditives Series, No. 45, 2000.
148. Residues of some veterinary drugs in animals and foods. FAO Food and NutritionPaper, No. 41/13, 2000.
149. Evaluation of certain food additives and contaminants (Fifty-fifth report of the JointFAO/WHO Expert Committee on Food Additives). WHO Technical Report Series No.901, 2001.
150. Safety evaluation of certain food additives and contaminants. WHO FoodAdditives Series, No. 46, 2001.
151. Compendium of food additive specifications: Addendum 8. FAO Food andNutrition Paper, No. 52, Add. 8, 2000.
ANNEX 1326

152. Evaluation of certain mycotoxins in food (Fifty-sixth report of the Joint FAO/WHOExpert Committee on Food Additives). WHO Technical Report Series No. 906, 2002.
153. Safety evaluation of certain mycotoxins in food. WHO Food Additives Series,No. 47/FAO Food and Nutrition Paper 74, 2001.
154. Evaluation of certain food additives and contaminants (Fifty-seventh report of theJoint FAO/WHO Expert Committee on Food Additives). WHO Technical Report Series,No. 909, 2002.
155. Safety evaluation of certain food additives and contaminants. WHO FoodAdditives Series, No. 48, 2002.
156. Compendium of food additive specifications: Addendum 9. FAO Food andNutrition Paper, No. 52, Add. 9, 2001.
157. Evaluation of certain veterinary drug residues in food (Fifty-eighth report of theJoint FAO/WHO Expert Committee on Food Additives). WHO Technical Report Series,No. 911, 2002.
158. Toxicological evaluation of certain veterinary drug residues in food. WHO FoodAdditives Series, No. 49, 2002.
159. Residues of some veterinary drugs in animals and foods. FAO Food and NutritionPaper, No. 41/14, 2002.
160. Evaluation of certain food additives and contaminants (Fifty-ninth report of the JointFAO/WHO Expert Committee on Food Additives). WHO Technical Report Series, No.913, 2002.
161. Safety evaluation of certain food additives and contaminants. WHO FoodAdditives Series, No. 50, 2003.
162. Compendium of food additive specifications: Addendum 10. FAO Food andNutrition Paper No. 52, Add. 10, 2002.
163. Evaluation of certain veterinary drug residues in food (Sixtieth report of the JointFAO/WHO Expert Committee on Food Additives). WHO Technical Report Series,No. 918, 2003.
164. Toxicological evaluation of certain veterinary drug residues in food. WHO FoodAdditives Series, No. 51, 2003.
165. Residues of some veterinary drugs in animals and foods. FAO Food and NutritionPaper, No. 41/15, 2003.
166. Evaluation of certain food additives and contaminants (Sixty-first report of the JointFAO/WHO Expert Committee on Food Additives). WHO Technical Report Series,No. 922, 2004.
167. Safety evaluation of certain food additives and contaminants. WHO FoodAdditives Series, No. 52, 2004.
168. Compendium of food additive specifications: Addendum 11. FAO Food andNutrition Paper, No. 52, Add. 11, 2003.
169. Evaluation of certain veterinary drug residues in food (Sixty-second report of theJoint FAO/WHO Expert Committee on Food Additives). WHO Technical Report Series,No. 925, 2004.
170. Residues of some veterinary drugs in animals and foods. FAO Food and NutritionPaper, No. 41/16, 2004.
171. Toxicological evaluation of certain veterinary drug residues in food. WHO FoodAdditives Series, No. 53.
172. Compendium of food additive specifications: Addendum 12. FAO Food andNutrition Paper, No. 52, Add. 12, 2004.
173. Evaluation of certain food additives (Sixty-third report of the Joint FAO/WHO ExpertCommittee on Food Additives). WHO Technical Report Series, No. 928, 2005.
174. Safety evaluation of certain food additives. WHO Food Additives Series, No 54,2005.
ANNEX 1 327

175. Compendium of food additive specifications: Addendum 13. FAO Food andNutrition Paper, No. 52, Add. 13 (with Errata), 2005.
176. Evaluation of certain food contaminants (Sixty-fourth report of the Joint FAO/WHOExpert Committee on Food Additives). WHO Technical Report Series, No. 930, 2005.
177. Safety evaluation of certain contaminants in food. WHO Food Additives Series, No.55/FAO Food and Nutrition Paper, No. 82, 2006.
178. Evaluation of certain food additives (Sixty-fifth report of the Joint FAO/WHO ExpertCommittee on Food Additives). WHO Technical Report Series, No. 934, 2006.
179. Safety evaluation of certain food additives. WHO Food Additives Series, No. 56,2006.
180. Combined compendium of food additive specifications. FAO JECFA Monographs1, 2005.
181. Evaluation of certain veterinary drug residues in food (Sixty-sixth report of the JointFAO/WHO Expert Committee on Food Additives). WHO Technical Report Series, No.939, 2006.
182. Residue evaluation of certain veterinary drugs. FAO JECFA Monographs 2, 2006.183. Toxicological evaluation of certain veterinary drug residues in food. WHO Food
Additives Series, No. 57, 2006.184. Evaluation of certain food additives and contaminants (Sixty-seventh report of the
Joint FAO/WHO Expert Committee on Food Additives). WHO Technical Report Series,No. 940, 2006.
185. Compendium of food additive specifications. FAO JECFA Monographs 3, 2006.
ANNEX 1328

ANNEX 2
ABBREVIATIONS USED IN THE MONOGRAPHS
3MS Modified Mini-Mental State ExaminationADH alcohol dehydrogenaseADI acceptable daily intakeALAT alanine aminotransferaseALDH aldehyde dehydrogenaseALS amyotrophic lateral sclerosisAOAC Association of Official Analytical ChemistsASAT aspartate aminotransferaseATP adenosine triphosphateAUC area under the curveBAEP brainstem auditory evoked potentialsBMD benchmark-doseBMDL benchmark-dose levelBSID Bayley Scales of Infant Developmentbw body weightcAMP adenosine 3’,5’-cyclic monophosphateCCFAC Codex Commission on Food Additives and ContaminantscDDP cisplatinCmax maximum plasma concentrationCI confidence intervalcoA coenzyme ACNS central nervous systemCT computer tomographyCYP cytochrome P450DDST Denver Developmental Screening TestDEN diethylnitrosamineDES dialysis encephalopathy syndromeDMBA 7, 12-dimethylbenz[a]anthraceneDMH dimethylhydrazineDNA deoxyribonucleic acidECG electrocardiogramELISA enzyme-linked immunosorbent assayF femaleFAO Food and Agriculture Organization of the United NationsGC/MS gas chromatography-mass spectrometryGEMS Global Environmental Monitoring SystemGEMS/Food Global Environment Monitoring System—Food
Contamination Monitoring and Assessment ProgrammeGL guideline levelsGLP good laboratory practiceGSFA General Standard for Food AdditivesGSH glutathione
- 329 -

GST glutathione S-transferaseHDL high-density lipoproteinHF high frequency1H NMR proton nuclear magnetic resonance spectroscopyHPLC high-performance liquid chromatographyHRV heart rate variabilityHS GC/MS gas chromatographic separation and mass spectrometric
with an automated headspace procedureHVP hydrolysed vegetable proteinICP-MS inductively coupled plasma-mass spectrometryIDL intermediate-density lipoproteinIg immunoglobulinIPCS International Programme on Chemical SafetyIQ intelligence quotientkm affinity constantLD50 median lethal doseLDL low-density lipoproteinLF low frequencyLOAEL lowest-observed-adverse-effect levelLOEL lowest-observed-effect levelLSC liquid scintillation countingM maleMAO monoamine oxidaseMCDI MacArthur Communicative Development InventoryMMSE Mini-Mental State ExaminationmRNA messenger RNAMS mass spectrometryMTT 3-(4,5-dimethylthiazole-2-yl)-2,5-diphenyl tetrazolium
bromideNAD+ nicotinamide adenine dinucleotideNADH nicotinamide adenine dinucleotide, reducedNADPH nicotinamide adenine dinucleotide phosphate, reducedNCE normochromatic erythrocytesNHANES National Health and Nutrition Examination SurveyNINCDS United States National Institute of Neurological and
Communicable Disorders and Stroke and AlzheimerDisease and Related Disorders
NOEL no-observed-effect levelO-Hg organic component of mercury in bloodOH-PCB hydroxylated polychlorinated biphenylPARP poly-ADP-ribose polymerasePCB polychlorinated biphenylPBDE polybrominated diphenyl etherPDAT presenile dementia of the Alzheimer typePMTDI provisional maximum tolerable daily intake
ANNEX 2330

PUFA polyunsaturated fatty acidsQA quality assuranceRT-PCR reverse transcription-polymerase chain reactionS9 9000 × g microsomal fraction of rat liverSALP sodium aluminium phosphateSCDS Seychelles Child Development StudySCE sister chromatid exchangeSEC size exclusion chromatographySMR standardized mortality ratioSPMSQ Short Portable Mental Status Questionnairet1/2 half-lifeTOS total organic solidsTPA 12-O-tetradecanoylphorbol-13-acetateTPN long-term parenteral nutritionTPPO triphenyl phosphine oxideUDPGT UDP-glucuronosyltransferaseUK United KingdomUSA United States of AmericaVEP visual evoked potentialsVLDL very-low-density lipoproteinVs versusWHO World Health Organizationw/w weight for weight
ANNEX 2 331


ANNEX 3
SIXTY-SEVENTH MEETING OF THE JOINT FAO/WHO EXPERT COMMITTEEON FOOD ADDITIVES
Rome, 20–29 June 2006
Members
Professor G. Adegoke, Department of Food Technology, University of Ibadan,Ibadan, Nigeria
Professor J. Bend, Professor of Pathology, Paediatrics, Pharmacology andPhysiology, Department of Pathology, Schulich School of Medicine andDentistry, University of Western Ontario, London, Ontario, Canada
Dr M. Bolger, Chief, Risk Assessment Staff, Division of Risk Assessment, UnitedStates (US) Food and Drug Administration, College Park, MD, USA
Dr Y. Kawamura, Section Chief, Division of Food Additives, National Institute ofHealth Sciences, Setagaya, Tokyo, Japan
Dr A.G.A.C. Knaap, Toxicologist, Center for Substances and Integrated RiskAssessment, National Institute of Public Health and the Environment (RIVM),Bilthoven, Netherlands (Joint Rapporteur)
Dr P.M. Kuznesof, Senior Chemist, Office of Food Additive Safety, HFS-205, Centerfor Food Safety and Applied Nutrition, US Food and Drug Administration,College Park, MD, USA (Joint Rapporteur)
Dr J.C. Larsen, Senior Consultant, Division of Toxicology and Risk Assessment,Danish Institute of Food and Veterinary Research, Søborg, Denmark (Vice-Chairman)
Dr A. Mattia, Division Director, Division of Biotechnology and GRAS Notice Review,Office of Food Additive Safety, Center for Food Safety and Applied Nutrition, USFood and Drug Administration, College Park, MD USA.
Mrs I. Meyland, Senior Scientific Adviser, Danish Institute of Food and VeterinaryResearch, Søborg, Denmark (Chairman)
Dr M.V. Rao, Director, Central Laboratories Unit, United Arab Emirates University,Al Ain, United Arab Emirates
Dr J. Schlatter, Head of Food Toxicology Section, Nutritional and ToxicologicalRisks Section, Swiss Federal Office of Public Health, Zurich, Switzerland
Dr P. Verger, Director of INRA Unit 1204—Food risk analysis methodologies,National Institute for Agricultural Research, Paris, France
Professor R. Walker, Emeritus Professor of Food Science, Ash, Aldershot,Hampshire, England
Mrs H. Wallin, Director of the Steering Unit, National Food Safety Authority (Evira),Helsinki, Finland
Dr B. Whitehouse, Consultant, Bowdon, Cheshire, England
Secretariat
Dr S. Barlow, Toxicologist, Brighton, East Sussex, England (WHO TemporaryAdviser)
- 333 -
Dr D. Benford, Principal Toxicologist, Food Standards Agency, London, England(WHO Temporary Adviser)
Ms R. Charrondiere, Nutrition Officer, Nutrition Planning, Assessment andEvaluation Service, Nutrition and Consumer Protection Division, Food andAgriculture Organization, Rome, Italy (FAO Staff Member)
Dr M.L. Costarrica, Senior Officer, Food Quality and Standards Service, Nutritionand Consumer Protection Division, Food and Agriculture Organization, Rome,Italy (FAO Staff Member)
Ms A. de Veer, Deputy Director of the Department of Food and Veterinary Affairs,Chairman of the Codex Committee on Food Additives and Contaminants,Ministry of Agriculture, Nature and Food Quality, The Hague, Netherlands (WHOTemporary Adviser)
Dr M. DiNovi, Supervisory Chemist, Center for Food Safety and Applied Nutrition,US Food and Drug Administration, College Park, MD, USA (WHO TemporaryAdviser)
Dr C.E. Fisher, Consultant, Cambridge, England (FAO Expert)Professor F. Kayama, Division of Environmental Medicine, Center for Community
Medicine, Jichi Medical University, Shimotsuke, Tochi-ken, Japan (WHOTemporary Adviser)
Professor R. Kroes, Institute for Risk Assessment Sciences, Utrecht University,Soest, Netherlands (WHO Temporary Adviser; unable to attend)
Dr S. Lawrie, Food Standards Agency, London, England (FAO Expert)Dr J-C. Leblanc, Head of the Quantitative Risk Assessment Team, French Food
Safety Agency (AFSSA), Maisons Alfort, France (WHO Temporary Adviser)Dr C. Leclercq, Research Scientist, Istituto Nazionale di Ricerca per gli Alimenti
e la Nutrizione (INRAN), Research group on Food Safety Exposure Analysis,Rome, Italy (FAO Expert)
Dr G. Moy, Department of Food Safety, Zoonoses and Foodborne Disease,WorldHealth Organization, Geneva, Switzerland (WHO Staff Member)
Dr I.C. Munro, CanTox Health Sciences International, Mississauga, Ontario,Canada (WHO Temporary Adviser)
Dr A. Nishikawa, Section Chief, Division of Pathology, National Institute of HealthSciences, Setagaya-ku, Tokyo, Japan (WHO Temporary Adviser)
Dr Z. Olempska-Beer, Review Chemist, Center for Food Safety and AppliedNutrition, Office of Food Additive Safety, Division of Biotechnology and GRASNotice Review, US Food and Drug Administration College Park, MD, USA(FAO Expert)
Dr B. Petersen, Director and Principal Scientist, Food and Chemicals Practice,Exponent, Inc., Washington DC, USA (WHO Temporary Adviser; unable toattend)
Mrs M.E.J. Pronk, Center for Substances and Integrated Risk Assessment, NationalInstitute for Public Health and the Environment (RIVM), BA Bilthoven,Netherlands (WHO Temporary Adviser)
Dr N. Schelling, Senior Policy Officer International Food Safety Matters, NationalCoordinator of Codex Alimentarius, Ministry of Agriculture, Nature and FoodQuality, Department of Food Quality and Animal Health, The Hague,Netherlands (WHO Temporary Adviser)
ANNEX 3334

Professor A.G. Renwick, Emeritus Professor, University of Southampton, School ofMedicine, Southampton, England (WHO Temporary Adviser)
Dr K. Schneider, Toxicologist, FoBiG, Forschungs- und BeratungsinstitutGefahrstoffe GmbH, Freiburg, Germany (WHO Temporary Adviser)
Dr J. Smith, Executive Director, Prince Edward Island Food Technology Centre,Charlottetown, Prince Edward Island, Canada (FAO Expert)
Dr D.A. Street, Epidemiologist, Center for Food Safety and Applied Nutrition, UnitedStates Food and Drug Administration, College Park, MD, USA (WHO TemporaryAdviser)
Dr A. Tritscher, WHO Joint Secretary to JECFA and JMPR, InternationalProgramme on Chemical Safety, World Health Organization, Geneva,Switzerland (WHO Joint Secretary)
Professor L. Valente Soares, Food chemist, Food Science Department, StateUniversity of Campinas, Campinas, São Paulo, Brazil (FAO Expert)
Dr A. Wennberg, FAO Joint Secretary to JECFA, Nutrition and Consumer ProtectionDivision, Food and Agriculture Organization, Rome, Italy (FAO Joint Secretary)
Professor G.M. Williams, Professor of Pathology, Department of Pathology, NewYork Medical College, Valhalla, USA (WHO Temporary Adviser)
ANNEX 3 335


ANNEX 4
TOXICOLOGICAL RECOMMENDATIONS AND INFORMATION ONSPECIFICATIONS
Food additives and ingredients evaluated toxicologically or assessed fordietary exposure
Food additive Specificationsa Acceptable daily intake (ADI) and other
toxicological recommendations
Annatto extracts R ADI for bixin: 0–12 mg/kg bw
Applicable to the following annatto extracts, provided
they comply with the respective specifications:
—solvent-extracted bixin ( 85% bixin, 2.5% norbixin)
—aqueous processed bixin ( 25% bixin, 7%
norbixin)
Does not apply to oil-processed bixin ( 10 % bixin)
Group ADI for norbixin and its sodium and potassium
salts: 0–0.6 (expressed as norbixin)
Applicable to the following annatto extracts, provided
they comply with the respective specifications:
—solvent-extracted norbixin ( 85% norbixin)
—alkali-processed norbixin, acid-precipitated ( 35%
norbixin) and not acid precipitated ( 15% norbixin)
In re-evaluating the studies of toxicity with solvent-
extracted bixin (92% bixin) and solvent-extracted
norbixin (91.6% norbixin) and in light of the additional
compositional data, the Committee considered that
ADIs could be allocated to these pigments, on the basis
of studies conducted on the extracts.
The Committee established an ADI for bixin of 0–12
mg/kg bw based on the NOEL of 1311 mg/kg bw per
day from a 90-day study in male rats fed an extract
containing 92% bixin, corrected for pigment content
and applying a safety factor of 100
The Committee established a group ADI for norbixin
and its sodium and potassium salts of 0–0.6 mg/kg bw
(expressed as norbixin) on the basis of the NOEL of
69 mg/kg bw per day from a 90-day study in male rats
fed an extract containing 91.6% norbixin, corrected for
pigment content and applying a safety factor of 100.
- 337 -

Food additive Specificationsa Acceptable daily intake (ADI) and other
toxicological recommendations
On the basis of compositional data and toxicological
data on aqueous processed bixin and alkali-processed
norbixin (acid precipitated), the Committee concluded
that the use of these annatto extracts as sources of
bixin or norbixin would not raise safety concerns,
provided that they complied with the relevant
specifications. Accordingly, the ADIs given above could
be applied to bixin and norbixin derived from these
annatto extracts.
The Committee noted that the pigment in alkali-
processed norbixin (not acid-precipitated) consists of
sodium or potassium salts of norbixin and that
compositional data on this extract, complying with the
specifications, did not raise safety concerns.
Consequently, the Committee concluded that the group
ADI for norbixin and its sodium and potassium salts is
applicable to norbixin salts from this source.
As no NOEL could be identified for oil-processed bixin
and no compositional data were available, the
Committee decided that the above evaluation could not
be applied to this extract.
Assuming all annatto-derived pigment were bixin, the
estimated intake would amount to approximately 0.2%
of the ADI (0–12 mg/kg bw). Assuming all annatto
derived pigment were norbixin, the estimated intake
would amount to approximately 4% of the ADI (0–0.6
mg/kg bw).
Specifications were established for all extracts covered
by the established ADIs, and tentative specifications
were established for oil-processed bixin.
Lycopene
(synthetic)
N The Committee established an ADI of 0–0.5 mg/kg bw
for synthetic lycopene based on the highest dose of
50 mg/kg bw per day tested in the 104-week study in
rats (at which no adverse effects relevant to humans
were induced) and a safety factor of 100. This ADI was
made into a group ADI to include lycopene from
Blakeslea trispora, which was also under consideration
at the present meeting and was considered to be
ANNEX 4338

Food additive Specificationsa Acceptable daily intake (ADI) and other
toxicological recommendations
toxicologically equivalent to chemically synthesized
lycopene.
The estimate of high exposure (> 95th percentile) of
30 mg/person per day, equivalent to 0.5 mg/kg bw per
day, which includes background exposure plus
additional exposure from food additive uses, is
compatible with the ADI.
Lycopene from
Blakeslea trispora
N Lycopene from Blakeslea trispora is considered to be
toxicologically equivalent to chemically synthesized
lycopene, for which an ADI of 0–0.5 mg/kg bw was
established. This was given further credence by the
negative results obtained for lycopene from
B. trispora in two tests for genotoxicity, and the absence
of adverse effects in a short-term toxicity study
considered at the present meeting. The ADI for
synthetic lycopene was therefore made into a group
ADI of 0–0.5 mg/kg bw to include lycopene from
B. trispora.
The exposure estimate is the same as for synthetic
lycopene.
Natamycin
(also known as
pimaricin)
(exposure
assessment)
N The data as a whole, including estimations based on
GEMS/Food Consumption Cluster Diets and
calculations for consumers with a high intake and
children, confirm the results of the assessment made
by the Committee at its fifty-seventh meeting and show
that the current ADI of 0–0.3 mg/kg bw is unlikely to be
exceeded.
Propyl paraben
(also known as
propyl para-
hydroxybenzoate)
W In view of the adverse effects in male rats, propyl
paraben (propyl p-hydroxybenzoate) should be
excluded from the group ADI for the parabens used in
food. This conclusion was reached on the grounds that
the group ADI was originally set on a NOEL of 1000 mg/
kg bw per day for a different toxicological end-point—
growth depression—taken from the range of studies
then available for the methyl, ethyl and propyl
parabens. Propyl paraben has shown adverse effects
in tissues of reproductive organs in male rats at dietary
doses of down to 10 mg/kg bw per day, which is within
the range of the group ADI (0–10 mg/kg bw), with no
NOEL yet identified.
ANNEX 4 339

Food additive Specificationsa Acceptable daily intake (ADI) and other
toxicological recommendations
The specifications for propyl paraben were withdrawn.
The group ADI of 0–10 mg/kg bw for the sum of methyl
and ethyl esters of p-hydroxybenzoic acid was
maintained.
GEMS: Global Environment Monitoring System – Food Contamination Monitoring andAssessment Programme; NOEL: no-observed-effect level.
aN: new specifications prepared; R: existing specifications revised; W: specificationswithdrawn.
Food additives considered for specifications only
Food additive Specificationsa
Acetylated oxidized starch R
Annatto extracts (oil-processed bixin) R, T
Butyl p-hydroxybenzoate (butyl paraben) W
Carob bean gum R, T
Carob bean gum (clarified) N, T
Ethylene oxide W
Guar gum R, T
Guar gum (clarified) N, T
DL-Malic acid and its calcium and sodium
salts
R
Maltitol R
Titanium dioxide R
Zeaxanthin (synthetic) R
aN: new specifications prepared; R: existing specifications revised; T: tentative specifications;W: specifications withdrawn.
ANNEX 4340

Contaminants evaluated toxicologically
Contaminant Tolerable intake and other toxicological recommendations
Aluminium (from
all sources
including food
additives)
PTWI : 1 mg/kg bw expressed as Al
The previously established ADIs and PTWI for aluminium compounds were
withdrawn.
The Committee concluded that aluminium compounds have the potential to
affect the reproductive system and developing nervous system at doses
lower than those used in establishing the previous PTWI and the PTWI was
therefore revised.
The available studies have many limitations and are not adequate for
defining dose–response relationships. The Committee therefore based its
evaluation on the combined evidence from several studies. The relevance
of studies involving administration of aluminium compounds by gavage was
unclear because the toxicokinetics after gavage were expected to differ from
toxicokinetics after dietary administration, and these gavage studies
generally did not report total aluminium exposure including basal levels in
the feed. The studies conducted with dietary administration of aluminium
compounds were considered most appropriate for the evaluation. The
lowest LOELs for aluminium compounds in a range of different dietary
studies in mice, rats and dogs were in the range of 50–75 mg/kg bw per day,
expressed as Al.
The Committee applied an uncertainty factor of 100 to the lower end of this
range of LOELs (50 mg/kg bw per day expressed as Al) to allow for inter-
and intraspecies differences. There are deficiencies in the database,
notably the absence of NOELs in the majority of the studies evaluated and
the absence of long-term studies on the relevant toxicological end-points.
These deficiencies are counterbalanced by the probable lower
bioavailability of the less soluble aluminium compounds present in food.
Overall, it was considered appropriate to apply an additional uncertainty
factor of three. The Committee confirmed that the resulting health-based
guidance value should be expressed as a PTWI, because of the potential
for bioaccumulation.
The Committee noted that the PTWI is likely to be exceeded to a large extent
by some population groups, particularly children, who regularly consume
foods that include aluminium-containing additives. The Committee also
noted that dietary exposure to Al is expected to be very high for infants fed
on soya-based formula.
ANNEX 4 341

Contaminant Tolerable intake and other toxicological recommendations
3-Chloro-1,2-
propanediol
As no new pivotal toxicological studies had become available the Committee
retained the previously established PMTDI of 2 μg/kg bw for 3-chloro-1,2-
propanediol.
Estimated exposures at the national level considered a wide range of foods,
including soy sauce and soy-sauce related products, ranged from 1% to
35% of the PMTDI for average exposure in the general population. For the
consumers at the high percentile (95th), the estimated intakes ranged from
3% to 85% and up to 115% of the PMTDI in young children. These estimates
are based on concentrations of 3-chloro-1,2-propanediol derived before any
remedial action had been taken by government or industry.
The Committee noted that reduction in the concentration of 3-chloro-1,2-
propanediol in soy sauce and related products made with acid-HVP could
substantially reduce the intake of this contaminant by certain consumers of
this condiment.
1,3-Dichloro-2-
propanol
The Committee concluded that the critical effect of 1,3-dichloro-2-propanol
is carcinogenicity. The substance yielded negative results in two new
studies on genotoxicity in vivo, but limitations in these studies and positive
findings in tests for genotoxicity in vitro as well as lack of knowledge on the
modes of action operative at the various tumour locations led the Committee
to the conclusion that a genotoxic mode of action could not be excluded.
Accordingly, the cancer dose–response data were analysed by dose–
response modelling to calculate BMD10 and BMDL10 values.
The Committee concluded that a representative mean intake for the general
population of 1,3-dichloro-2-propanol of 0.051 μg/kg bw per day and an
estimated high-level intake (young children included) of 0.136 μg/kg bw per
day could be used in the evaluation. Comparison of these mean and high-
levels intakes with the lowest BMDL10 of 3.3 mg/kg bw per day, which was
the BMDL10 for incidence data on tumour-bearing animals for all treatment-
affected locations, indicates margins of exposure of approximately 65 000
and 24 000, respectively. Based on these margins of exposure, the
Committee concluded that the estimated intakes of 1,3-dichloro-2-propanol
were of low concern for human health.
The available evidence suggests that 1,3-dichloro-2-propanol occurs at
lower concentrations than 3-chloro-1,2-propanediol in soy sauce and
related products, and also in acid-HVP food ingredients. However, in meat
products the concentrations of 1,3-dichloro-2-propanol are generally higher
than the concentrations of 3-chloro-1,2-propanediol.
Methylmercury The Committee made it clear that the previous PTWI of 3.3 μg/kg bw had,
in fact, been withdrawn in 2003. The Committee confirmed the existing
PTWI of 1.6 μg/kg bw, set in 2003, based on the most sensitive toxicological
ANNEX 4342

Contaminant Tolerable intake and other toxicological recommendations
end-point (developmental neurotoxicity) in the most susceptible species
(humans). However, the Committee noted that life-stages other than the
embryo and fetus may be less sensitive to the adverse effects of
methylmercury.
In the case of adults, the Committee considered that intakes of up to about
two times higher than the existing PTWI of 1.6 μg/kg bw would not pose any
risk of neurotoxicity in adults, although in the case of women of childbearing
age, it should be borne in mind that intake should not exceed the PTWI, in
order to protect the embryo and fetus.
Concerning infants and children aged up to about 17 years, the data do not
allow firm conclusions to be drawn regarding their sensitivity compared to
that of adults. While it is clear that they are not more sensitive than the
embryo or fetus, they may be more sensitive than adults because significant
development of the brain continues in infancy and childhood. Therefore, the
Committee could not identify a level of intake higher than the existing PTWI
that would not pose a risk of developmental neurotoxicity for infants and
children.
The Committee has previously noted that fish makes an important
contribution to nutrition, especially in certain regional and ethnic diets. The
present Committee recommends that the known benefits of fish
consumption need to be taken into consideration in any advice aimed at
different subpopulations. Risk managers may wish to consider whether
specific advice should be given concerning children and adults, after
weighing the potential risks and benefits.
The Committee concluded that the setting of guideline levels for
methylmercury in fish may not be an effective way of reducing exposure for
the general population. The Committee noted that advice targeted at
population subgroups that may be at risk from methyl mercury exposure
may provide an effective method for lowering the number of individuals with
exposures greater than the PTWI.
ADI: acceptable daily intake; Al: elemental aluminium; LOEL: lowest-observed-effect level;NOEL: no-observed-effect level; PMTDI: provisional maximum tolerable daily intake.
ANNEX 4 343