Using image processing to detect and classify narrow-band cricket and frog calls
8
Using image processing to detect and classify narrow-band cricket and frog calls T. Scott Brandes a Tropical Ecology Assessment and Monitoring (TEAM) Initiative, Conservation International, 1919 M Street, NW, Washington, D.C. 20036 Piotr Naskrecki Museum of Comparative Zoology, Harvard University, 26 Oxford Street, Cambridge, Massachusetts 02138 Harold K. Figueroa Bioacoustics Research Program, Cornell Laboratory of Ornithology, 159 Sapsucker Woods Road, Ithaca, New York 14850 Received 4 February 2006; revised 13 July 2006; accepted 22 August 2006 An automatic call recognition ACR process is described that uses image processing techniques on spectrogram images to detect and classify constant-frequency cricket and frog calls recorded amidst a background of evening sounds found in a lowland Costa Rican rainforest. This process involves using image blur filters along with thresholding filters to isolate likely calling events. Features of these events, notably the event’s central frequency, duration and bandwidth, along with the type of blur filter applied, are used with a Bayesian classifier to make identifications of the different calls. Of the 22 distinct sonotypes calls presumed to be species-specific recorded in the study site, 17 of them were recorded in high enough numbers to both train and test the classifier. The classifier approaches 100% true-positive accuracy for these 17 sonotypes, but also has a high false-negative rate over 50% for 4 sonotypes. The very high true-positive accuracy of this process enables its use for monitoring singing crickets and some frog species in tropical forests. © 2006 Acoustical Society of America. DOI: 10.1121/1.2355479 PACS numbers: 43.80.Ev, 43.80.Ka JAS Pages: 2950–2957 I. INTRODUCTION Biodiversity documentation is the first step in its effec- tive conservation. Yet practical implementation of species- level surveys in tropical ecosystems invariably runs into the problem of taxonomic impediment, or the lack of expertise to provide the necessary identification of collected organ- isms. In addition, the need to physically collect specimens to produce species diversity estimates often proves costly, time consuming, and logistically difficult. For some groups of or- ganisms using their acoustic signals provides a viable alter- native to specimen collecting, and allows for monitoring of species richness, presence or absence of indicator species, or even estimates of abundance. 1 Acoustic signaling is a widespread behavior among many terrestrial and aquatic animals. 2 Cicadas, orthopteroid insects crickets, katydids, and relatives, frogs, birds, and bats are only some of the groups that can be monitored acoustically. Crickets Orthoptera: Grylloidea are particu- larly well suited for the purpose of acoustic monitoring be- cause the range of frequencies employed by most species as a whole 1–12 kHz is audible to humans, their signals are simple few species employ frequency modulation, and their calls are species-specific. 3 In most species of crickets the males produce audible calls using a modified area on their first pair of wings known as the stridulatory apparatus. Its basic design consists of a row of teeth on the underside of the right wing the stridula- tory file that produce sounds when rubbed against a hard- ened edge the scraper of the left wing. The signal is ampli- fied by the vibration of a membranous area of the wing the mirror. In some species additional sound amplification and redirection is achieved by using leaves as acoustic baffles, or by singing from horn-shaped burrows. The resulting signal serves primarily as an attractant to conspecific females, and in most cases is unique and easily recognizable. This allows us to record and recognize individual acoustic signatures of each species sonotypes present in an area. The specificity of cricket calls even allows for using them to describe spe- cies in the absence of distinctive morphological characters typically used by insect taxonomists, 4,5 and to use the calls to identify species in the field. 6 In many tropical ecosystems crickets dominate the acoustic space both in terms of the number of species signal- ing at any given moment, and the frequency spectrum of their calls. Most of the cricket calls’ energy is within the audible part of the sound spectrum, and only some members of the subfamily Phalangopsinae produce ultrasonic calls in the range above 22 kHz. 7 This concentration of crickets’ calls within the audible part of the spectrum, and their abun- dance in most ecosystems, makes them ideal candidates for long-term monitoring. At the same time crickets are very sensitive indicators of environmental change, as exemplified recently by the extinction of a number of Hawaiian species a Electronic mail: [email protected] 2950 J. Acoust. Soc. Am. 120 5, November 2006 © 2006 Acoustical Society of America 0001-4966/2006/1205/2950/8/$22.50
-
Upload
independent -
Category
Documents
-
view
3 -
download
0
Transcript of Using image processing to detect and classify narrow-band cricket and frog calls

Using image processing to detect and classify narrow-bandcricket and frog calls
T. Scott Brandesa�
Tropical Ecology Assessment and Monitoring (TEAM) Initiative, Conservation International,1919 M Street, NW, Washington, D.C. 20036
Piotr NaskreckiMuseum of Comparative Zoology, Harvard University, 26 Oxford Street, Cambridge,Massachusetts 02138
Harold K. FigueroaBioacoustics Research Program, Cornell Laboratory of Ornithology, 159 Sapsucker Woods Road,Ithaca, New York 14850
�Received 4 February 2006; revised 13 July 2006; accepted 22 August 2006�
An automatic call recognition �ACR� process is described that uses image processing techniques onspectrogram images to detect and classify constant-frequency cricket and frog calls recorded amidsta background of evening sounds found in a lowland Costa Rican rainforest. This process involvesusing image blur filters along with thresholding filters to isolate likely calling events. Features ofthese events, notably the event’s central frequency, duration and bandwidth, along with the type ofblur filter applied, are used with a Bayesian classifier to make identifications of the different calls.Of the 22 distinct sonotypes �calls presumed to be species-specific� recorded in the study site, 17 ofthem were recorded in high enough numbers to both train and test the classifier. The classifierapproaches 100% true-positive accuracy for these 17 sonotypes, but also has a high false-negativerate �over 50% for 4 sonotypes�. The very high true-positive accuracy of this process enables its usefor monitoring singing crickets �and some frog species� in tropical forests. © 2006 AcousticalSociety of America. �DOI: 10.1121/1.2355479�
PACS number�s�: 43.80.Ev, 43.80.Ka �JAS� Pages: 2950–2957
I. INTRODUCTION
Biodiversity documentation is the first step in its effec-tive conservation. Yet practical implementation of species-level surveys in tropical ecosystems invariably runs into theproblem of taxonomic impediment, or the lack of expertiseto provide the necessary identification of collected organ-isms. In addition, the need to physically collect specimens toproduce species diversity estimates often proves costly, timeconsuming, and logistically difficult. For some groups of or-ganisms using their acoustic signals provides a viable alter-native to specimen collecting, and allows for monitoring ofspecies richness, presence or absence of indicator species, oreven estimates of abundance.1
Acoustic signaling is a widespread behavior amongmany terrestrial and aquatic animals.2 Cicadas, orthopteroidinsects �crickets, katydids, and relatives�, frogs, birds, andbats are only some of the groups that can be monitoredacoustically. Crickets �Orthoptera: Grylloidea� are particu-larly well suited for the purpose of acoustic monitoring be-cause the range of frequencies employed by most species asa whole �1–12 kHz� is audible to humans, their signals aresimple �few species employ frequency modulation�, and theircalls are species-specific.3
In most species of crickets the males produce audiblecalls using a modified area on their first pair of wings known
a�
Electronic mail: [email protected]2950 J. Acoust. Soc. Am. 120 �5�, November 2006 0001-4966/2006/1
as the stridulatory apparatus. Its basic design consists of arow of teeth on the underside of the right wing �the stridula-tory file� that produce sounds when rubbed against a hard-ened edge �the scraper� of the left wing. The signal is ampli-fied by the vibration of a membranous area of the wing �themirror�. In some species additional sound amplification andredirection is achieved by using leaves as acoustic baffles, orby singing from horn-shaped burrows. The resulting signalserves primarily as an attractant to conspecific females, andin most cases is unique and easily recognizable. This allowsus to record and recognize individual acoustic signatures ofeach species �sonotypes� present in an area. The specificityof cricket calls even allows for using them to describe spe-cies in the absence of distinctive morphological characterstypically used by insect taxonomists,4,5 and to use the calls toidentify species in the field.6
In many tropical ecosystems crickets dominate theacoustic space both in terms of the number of species signal-ing at any given moment, and the frequency spectrum oftheir calls. Most of the cricket calls’ energy is within theaudible part of the sound spectrum, and only some membersof the subfamily Phalangopsinae produce ultrasonic calls inthe range above 22 kHz.7 This concentration of crickets’calls within the audible part of the spectrum, and their abun-dance in most ecosystems, makes them ideal candidates forlong-term monitoring. At the same time crickets are verysensitive indicators of environmental change, as exemplified
recently by the extinction of a number of Hawaiian species© 2006 Acoustical Society of America20�5�/2950/8/$22.50

due to invasion of exotic ant species.8 Acoustic monitoringhas already been successfully implemented in detection ofrare or endangered insect species in temperate zones,9 andthe same technique can be used to monitor species richnessand the presence of species indicative of particular changinghabitat parameters in tropical ecosystems.10
Multiple encouraging papers on automated recognitionof bioacoustics signals have been recently published for arange of animals, including bats,11–13 birds,14,15 anurans,16
and Orthoptera.17–19 Since cricket songs have a simple struc-ture, the more involved techniques used in human speechrecognition that have shown promise in bird songidentification,15 such as dynamic time warping and hiddenMarkov models, add unnecessary complication. Current re-search on Orthoptera call recognition17–19 rely heavily ontime-domain signal processing and require a high signal tonoise ratio in order to properly analyze call waveforms. Thissame problem holds true with frequency-domain featurescommonly used in sound recognition such as spectrum fluxand spectral power,20,21 and mixed species choruses that varyin composition make these tools less useful. This reliance onlow background noise severely limits the ability of theseapproaches to accurately identify crickets in tropical rainfor-ests since numerous cricket species often call simultaneouslyand some of the quieter sounds present might be from crick-ets we are trying to detect. In the work presented here, animage processing approach is suggested as a method for de-tecting and classifying cricket �and some frog� calls recordedamidst the constellation of background noises typicallyfound shortly after sunset in tropical forests.
II. MATERIALS AND METHODS
A. Sound recordings
In the work presented here we used field recordings ofcrickets from a lowland rainforest in La Selva BiologicalStation located in NE Costa Rica. Some of the recordingswere made with in-house autonomous recording units thatwere placed midcanopy, and deployed to acoustically moni-
tor crickets nightly for weeks at a time. However, to quickerJ. Acoust. Soc. Am., Vol. 120, No. 5, November 2006 Brand
assemble a library of cricket calls at the site, hand-held re-corders were also used. The autonomous recorders wereplaced midcanopy to effectively record sounds originatingfrom both the canopy and the ground.22 These devices used aPDA to make a 10 min recording nightly, starting 1 h afterlocal sunset. PDAs where chosen since software can be writ-ten for them to make high-quality digital recordings at sched-uled intervals. We used Hewlett Packard iPAC 5555 PDAswith a custombuilt power supply �rechargeable NiMH bat-tery pack� and weatherproof case, and in-house scheduled-recording software.23 The devices record sound at 44.1 kHzwith 16-bit resolution and use a 16-element microphone andamplifier designed by the Bioacoustics Research Program atCornell University. The microphone has a toroid beam-pattern and is very effective at collecting sounds within thecanopy.
A spectrogram of a typical canopy recording is shown inFig. 1; most of the sounds are from crickets and frogs. Thereare at least 8 distinct sonotypes �6 crickets and 2 frogs�present amidst a background of more distant individuals.While the frog calls are known for La Selva, no known li-braries of cricket calls exist for the area. Work is still ongo-ing in assigning species labels to each acoustic signature andin the work presented here we designate our classifications assonotype number.
B. Automatic call recognition „ACR…
The ACR process we use involves operating on a spec-trogram image of a sound. Spectrograms created with a FFTsize of 512 points, a Hanning window, and a 50% windowoverlap provide sufficient resolution in both time �5.8 ms�and frequency �86.1 Hz� to allow detection and classificationof dozens of sonotypes at our site. As shown in Fig. 2, once
FIG. 1. Typical spectrogram of canopy recording. Atleast 8 sonotypes of crickets �1–6� and frogs �7, 8�present.
FIG. 2. Steps in automatic call recognition using the image processing pre-
sented here.es et al.: Detecting narrow-band calls with image processing 2951
the spectrogram is generated, the image is then filtered,events are detected, and finally the events are classified. De-tails for each of these steps follow.
C. Image filtering
The images are filtered in 3 steps. Initially the imagesare broken into 4–5 frequency bands within which to lookfor calls. The image is then sent through a blur filter. Finally,the image is sent through a thresholding filter, where athreshold level is applied independently for each frequencyband.
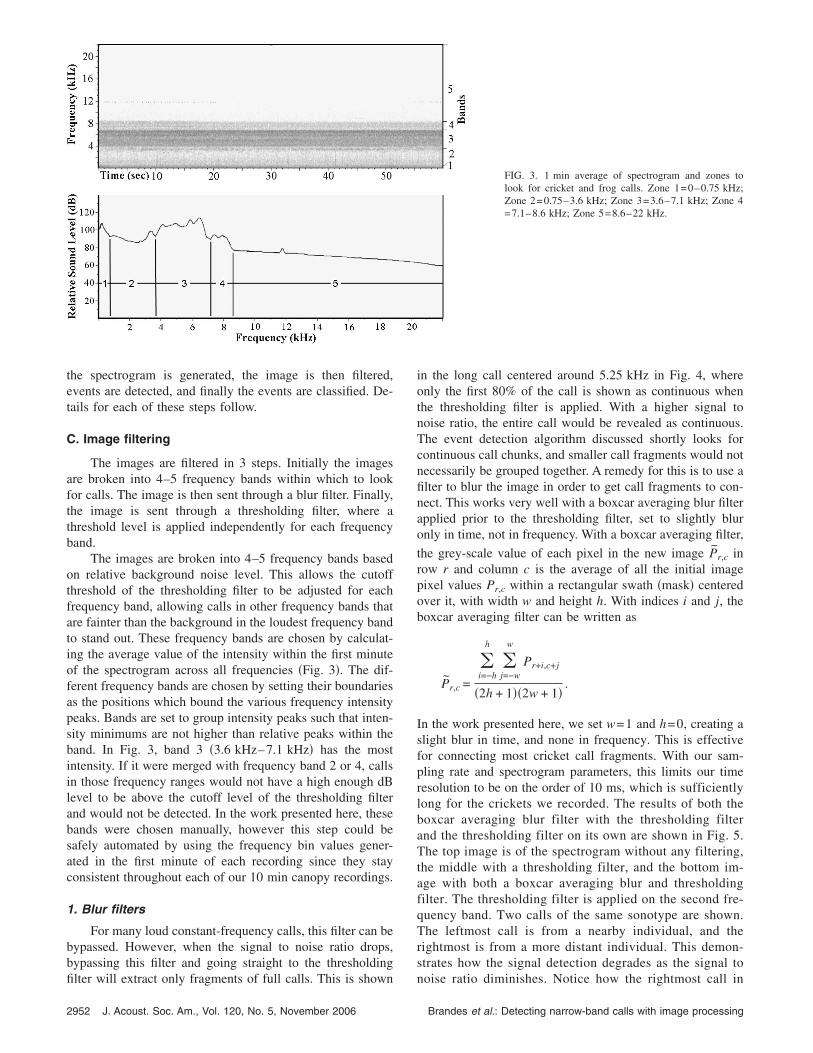
The images are broken into 4–5 frequency bands basedon relative background noise level. This allows the cutoffthreshold of the thresholding filter to be adjusted for eachfrequency band, allowing calls in other frequency bands thatare fainter than the background in the loudest frequency bandto stand out. These frequency bands are chosen by calculat-ing the average value of the intensity within the first minuteof the spectrogram across all frequencies �Fig. 3�. The dif-ferent frequency bands are chosen by setting their boundariesas the positions which bound the various frequency intensitypeaks. Bands are set to group intensity peaks such that inten-sity minimums are not higher than relative peaks within theband. In Fig. 3, band 3 �3.6 kHz–7.1 kHz� has the mostintensity. If it were merged with frequency band 2 or 4, callsin those frequency ranges would not have a high enough dBlevel to be above the cutoff level of the thresholding filterand would not be detected. In the work presented here, thesebands were chosen manually, however this step could besafely automated by using the frequency bin values gener-ated in the first minute of each recording since they stayconsistent throughout each of our 10 min canopy recordings.
1. Blur filters
For many loud constant-frequency calls, this filter can bebypassed. However, when the signal to noise ratio drops,bypassing this filter and going straight to the thresholding
filter will extract only fragments of full calls. This is shown2952 J. Acoust. Soc. Am., Vol. 120, No. 5, November 2006
in the long call centered around 5.25 kHz in Fig. 4, whereonly the first 80% of the call is shown as continuous whenthe thresholding filter is applied. With a higher signal tonoise ratio, the entire call would be revealed as continuous.The event detection algorithm discussed shortly looks forcontinuous call chunks, and smaller call fragments would notnecessarily be grouped together. A remedy for this is to use afilter to blur the image in order to get call fragments to con-nect. This works very well with a boxcar averaging blur filterapplied prior to the thresholding filter, set to slightly bluronly in time, not in frequency. With a boxcar averaging filter,
the grey-scale value of each pixel in the new image P̃r,c inrow r and column c is the average of all the initial imagepixel values Pr,c within a rectangular swath �mask� centeredover it, with width w and height h. With indices i and j, theboxcar averaging filter can be written as
P̃r,c =
�i=−h
h
�j=−w
w
Pr+i,c+j
�2h + 1��2w + 1�.
In the work presented here, we set w=1 and h=0, creating aslight blur in time, and none in frequency. This is effectivefor connecting most cricket call fragments. With our sam-pling rate and spectrogram parameters, this limits our timeresolution to be on the order of 10 ms, which is sufficientlylong for the crickets we recorded. The results of both theboxcar averaging blur filter with the thresholding filterand the thresholding filter on its own are shown in Fig. 5.The top image is of the spectrogram without any filtering,the middle with a thresholding filter, and the bottom im-age with both a boxcar averaging blur and thresholdingfilter. The thresholding filter is applied on the second fre-quency band. Two calls of the same sonotype are shown.The leftmost call is from a nearby individual, and therightmost is from a more distant individual. This demon-strates how the signal detection degrades as the signal to
FIG. 3. 1 min average of spectrogram and zones tolook for cricket and frog calls. Zone 1=0–0.75 kHz;Zone 2=0.75–3.6 kHz; Zone 3=3.6–7.1 kHz; Zone 4=7.1–8.6 kHz; Zone 5=8.6–22 kHz.
noise ratio diminishes. Notice how the rightmost call in
Brandes et al.: Detecting narrow-band calls with image processing

the thresholding only filter is fragmented, whereas the callis continuous with the boxcar averaging blur filter.
Some cricket calls consist of a series of discrete chirpsand this pulse train is repeated periodically. In these cases,applying a Gaussian blur filter
P̃r,c =
�i=−2h
2h
�j=−2w
2w
Pr+i,c+je−�i2/2h2�e−�j2/2w2�
�4h + 1��4w + 1�
can smooth the pulse train into a continuous dash and facili-tate detection. Here, the pixel values of the new image aregenerated on a weighted average �based on a normalizedGaussian distribution� of the pixel values of the initial imagewithin a particular swath centered over each pixel. This canbe seen in Fig. 6 with the sonotype consisting of a pulse trainnear 3 kHz. Images on the left are without the blur filterand the ones on the right are made with a Gaussian blurfilter with w=3 and h=0.5. The lower 2 images show howthe detection results change once the thresholding filter isapplied. In the bottom left image where the blur filter isnot used, each individual pulse is detected, whereas in the
FIG. 4. Thresholding filter example. Calls are separated from the back-ground. Note that the lower frequency call �5.5 kHz� in the filtered image�bottom� becomes fragmented toward the end. The louder calls present re-main intact in the filtered image. Blurring the image before applying thethresholding filter minimizes call fragmentation.
bottom right image where the blur filter is used, the entire
J. Acoust. Soc. Am., Vol. 120, No. 5, November 2006 Brand
pulse train is detected as a single unit. In this image it isalso interesting to see how the 5.5 kHz sonotype standsout more prominently from the background as the image isblurred. In the work presented here, we chose to use bothof these blur filters empirically, based on their perfor-mance, and in the detection process, they are each runindependently on all the sounds and are used to detectdifferent sonotypes. In this way, the type of blur filterused serves as one of the features or parameters withwhich to classify a sonotype.
2. Thresholding filter
The purpose of the thresholding filter is to set a thresh-old of an intensity level required to consider a call present,and to condition the image for the event detection process.This process is done for each frequency band independently,each with a slightly different threshold level. The thresholdlevel for each frequency band is set as an intensity levelrelative to the sound present in that frequency band �basedon a running 10 s average�. For the sound shown in Fig. 3,the sound level is a little higher in bands 3 and 4 than inbands 2 and 5, and a threshold level of 8 dB relative to thewithin-frequency band sound level is used, whereas a 9 dBthreshold is used in bands 2 and 5. No known sonotypesfrom the site are low enough in frequency to be in band 1, soa threshold level on that band was not set. Adjusting thethreshold levels slightly depending on the signal to noiseratio allows the calls to stand out better; however, keepingthe threshold level at 8 dB would have produced good re-sults. For the work presented here, these threshold levels
FIG. 5. Boxcar averaging blur filter with thresholding filter example. Thethresholding filter is used in the bottom 2 images, between750 Hz–3.6 kHz. The boxcar averaging blur filter is applied in the lowerimage. Note how the call fragments of the rightmost call in the middleimage are connected to form a continuous call when both filters are appliedin the bottom image, allowing easier identification. The call on the left isfrom an individual of the same species that is closer to the microphone.
were chosen manually, and better results might be obtainable
es et al.: Detecting narrow-band calls with image processing 2953

in an automated process by running the same sections at arange of threshold levels and using the results that yield themost events.
D. Event detection
After the filtering, a block detection algorithm is run tofind events within the spectrogram that might be cricketcalls. This algorithm goes through the filtered image keepingtrack of blocks of nonblank pixels that meet specific struc-tural requirements based on 4 parameters: maximum band-width �8 pixels, 689 Hz�, maximum time allowed to exceedbandwidth �4 pixels, 23 ms�, minimum duration �3 pixels,17 ms�, and maximum duration �241 pixels, 1.4 s�. The val-ues for these parameters are set near the extreme values ofthe collection of sonotypes to minimize computation time onevents that will not be classified as known sonotypes. Duringthe exploratory phase, when sonotype ranges are being de-termined, this added efficiency can lead to missed calls.Since we are looking for constant-frequency calls, there is anadditional constraint that as the image is swept along thetime axis, at least one pixel in the current time band must fitwithin the frequency bandwidth swept out to that point bythe event. This allows the event bandwidth to increasethroughout a call, but does not allow it to capture steepsweeping calls; though, it could be modified to do so. The“maximum time allowed to exceed bandwidth” parameterallows short-time broadband noise such as a rain drop to notinterfere with detecting a call.
E. Event classification
Once the events in the spectrogram are detected, featuresare automatically measured from these pixel clusters and thecalls are classified as particular sonotypes, or as unknownevents. The features measured from each event are the cen-tral frequency, bandwidth, duration, and type of blur filterused. These features separate the sonotypes recorded at oursite with little overlap, and we designed a Bayesian classifierto label events as belonging to particular sonotypes. Distri-butions of the features of the training set of sonotypes are
used to generate 95% confidence intervals for these features2954 J. Acoust. Soc. Am., Vol. 120, No. 5, November 2006
for each sonotype, and these intervals serve as the decisionbounds for the classifier. For the sonotypes we recordedenough times to both train and test, these 4 features com-pletely separate each sonotype. However, for 2 of the sono-types that we recorded in too low of number to both train andtest the classifier, the additional features of the time gap be-tween similar calls as well as the number of similar calls in apulse train are required to fully separate these sonotypesfrom others. Since we have very few recordings of thesesonotypes, these 2 additional features were not automaticallygenerated in our testing sets, and these additional sonotypeswent undetected in our testing trials �none were even de-tected manually�.
III. FIELD RESULTS
Twenty-two distinct constant-frequency sonotypes wereidentified from the site. Two sonotypes, ST101 and ST102,are from frogs, whereas the remaining sonotypes are fromcrickets. Most of the sonotypes are separable with the centralfrequency, duration, and blur filter used. Figure 7 shows thedistribution of training samples for the 22 sonotypes re-corded, plotted as central frequency vs duration. A Gaussianblur filter is used to find sonotype 2; each of the other 21sonotypes are found by applying a boxcar averaging blurfilter. A 95% confidence interval of the distribution of eachsonotype is shown as an ellipse over the distribution points.A few of the ellipses have some overlap �ST 15, ST 22, ST23� and require additional features for separation. These 95%confidence intervals serve as the decision boundaries for theBayesian classifier. Only 1 call for sonotype 8 and 9 wasfound, so the arbitrarily set confidence interval around themonly serves to show the approximate bounds with which totry to detect those calls �no additional calls were found foreither sonotype�.
A confusion matrix for the 17 sonotypes recordedenough times to both train and test, separated with only 4features �central frequency, duration, bandwidth, and blur fil-ter�, is shown in Table I. Sonotypes 6, 8, 9, 14, and 15,present in Fig. 7, were not found enough times to do both
FIG. 6. Gaussian-blur with thresholding filter example.The blur filter is applied to the images on the right. Inthe lower images, a thresholding filter is applied. Notethat when both filters are applied, the entire pulse trainis selected as the event, not just the individual pulses asin the bottom left image. This facilitates the call recog-nition process. Also notice how the sonotype at 5.5 kHzis more prominent in the blurred image. This showshow blurring can make a pattern more pronounced.
training and testing, and are absent from Table I. “Unknown”
Brandes et al.: Detecting narrow-band calls with image processing

calls are defined as events that have feature values outside ofthe estimated ranges of the sonotypes defined by the trainingset. Since many crickets call in pulse trains, instead of choos-ing training and testing sets randomly, entire pulse trainswere used for either training or testing. This was done bydesignating the first samples of sonotypes found withinsound files manually as the training set, and sonotypes foundmanually in subsequent files as the testing set. Accuracy per-centages from the confusion matrix are shown in Table II,along with the number of training and testing samples.Sample number of test detections are counted as the numberof correct detections of a sonotype during the testing phase.
IV. DISCUSSION
One of the interesting aspects of the sonotypes in Fig. 7is their distribution. The degree to which the sonotype fea-
FIG. 7. �Color online� Two of the features used to separate sonotypes,central frequency and call duration, are shown for 22 sonotypes. The esti-mated 95% confidence interval around the distributions are represented byellipses. Gaps between the sonotypes indicate possible openings for addi-tional species we did not record.
TABLE I. Confusion matrix for 17 sonotypes. Actual classifications are inidentifications are indicated on the diagonal. Events labeled as “unknown”
UNKN ST1 ST2 ST7 ST10 ST11 ST12 ST13 ST
UNKN 32 1 0 0 0 0 0 0ST1 164 44 0 0 0 0 0 0ST2 10 0 46 0 0 0 0 0ST7 2175 0 0 865 0 0 0 0ST10 38 0 0 0 114 0 0 0ST11 10 0 0 0 0 28 0 0ST12 73 0 0 0 0 0 336 0ST13 52 0 0 0 0 0 0 159ST16 134 0 0 0 0 0 0 3ST17 97 0 0 0 0 0 0 0ST18 169 0 0 0 0 0 0 0ST19 35 0 0 0 0 0 0 0ST20 35 0 0 0 0 0 0 0ST21 19 0 0 0 0 0 0 0ST22 33 0 0 0 0 0 0 0ST23 21 0 0 0 0 0 0 0ST101 13 0 0 0 0 0 0 0ST102 608 0 0 0 0 0 0 0
J. Acoust. Soc. Am., Vol. 120, No. 5, November 2006 Brand
ture values overlap provides insight into how accurate theclassifier is. With no overlap in these distributions, the clas-sifier will be 100% accurate in its classifications. The shapeof the collective distribution of sonotype features and thedegree to which this area is filled with sonotypes is alsonoteworthy. The sonotype feature distributions collectivelyin Fig. 7 appear bound by a curve, limiting cricket callsbetween approximately 3 kHz and 12 kHz, and allowing awider range of call durations at the lower frequencies, gradu-ally shortening maximum call duration up to the 12 kHzcalls. It is likely that the bounds of this curve are determinedby the stridulatory apparatus of the crickets at our site. If thearea of usable feature space is bound by cricket physiology,then the degree to which this area is saturated with cricketsonotypes might be insightful in determining the degree towhich the ensemble of cricket species at a site have remained
ftmost column, and the assigned classifications in the topmost row. Correcte classifier are shown in the column labeled “UNKN.”
ST17 ST18 ST19 ST20 ST21 ST22 ST23 ST101 ST102
0 0 0 0 0 0 0 0 00 0 0 0 0 0 0 0 00 0 0 0 0 0 0 0 00 0 0 0 0 0 0 0 00 0 0 0 0 0 0 0 00 0 0 0 0 0 0 0 00 0 0 0 0 0 0 0 00 0 0 0 0 0 0 0 00 0 0 0 0 0 0 0 0
741 0 0 0 0 0 0 0 00 226 0 0 0 0 0 0 00 0 55 0 0 0 0 0 00 0 0 371 0 0 0 0 00 0 0 0 27 0 0 0 00 0 0 0 0 363 0 0 00 0 0 0 0 0 35 0 00 0 0 0 0 0 0 6 00 0 0 0 0 0 0 0 834
TABLE II. Accuracy measures for 17 sonotypes based on the confusionmatrix in Table I.
True positive False negative Train/test detections �N�
ST 1 97.78% 78.85% 3/44ST 2 100% 17.86% 25/46ST 7 100% 71.55% 290/865ST 10 100% 25.00% 20/114ST 11 100% 26.32% 8/28ST 12 100% 17.85% 50/336ST 13 98.15% 24.64% 75/159ST 16 100% 67.82% 24/65ST 17 100% 11.58% 298/741ST 18 100% 42.78% 56/226ST 19 100% 38.89% 15/55ST 20 100% 08.62% 40/371ST 21 100% 41.30% 12/27ST 22 100% 08.33% 50/363ST 23 100% 37.50% 10/35ST 101 100% 68.42% 7/6ST 102 100% 42.16% 279/834
the leby th
16
00000000
65000000000
es et al.: Detecting narrow-band calls with image processing 2955

intact. Gaps in feature space could also be due to lack of timespent collecting recordings for an area, and sonotype over-laps could occur without causing interference problems ifthose species seldom call at the same time of day or year.Interesting gaps that exist in Fig. 7 include the frequencyrange between 8.6 kHz and 11.7 kHz, and calls over 0.3 slong between 3.6 kHz and 5 kHz. Implications for these gapsrequire further study.
For most sonotypes shown in Fig. 7, the duration variesmore than central frequency. Some of this is an accuraterepresentation for the variation in call length, such as forsonotype 16. For other sonotypes, such as sonotype 2, thelower end of the distribution is a little misleadinglystretched. When the sonotypes are recorded with a high sig-nal to noise ratio, their features are measured accurately.However, when the sonotype is fainter, only fragments of thecall are detected. The blur filter goes a long way towardsconnecting these fragments, but with sonotype 2 in particu-lar, the intensity of the call increases throughout the durationof the call �Fig. 6� and the measured duration of the call willvary depending on how loud the quieter beginning of the callis �how far away the insect is from the microphone�. Byaccepting a larger range in the call duration, the Bayesianclassifier is able to detect more distant individuals than itwould otherwise. By increasing the acceptable range of afeature like this, the possibility of misclassification increasesif the range of features of different sonotypes begin to over-lap. To avoid misclassification in this situation, additionalfeatures are needed. Sonotype 2 is the only sonotype listedthat is measured after a Gaussian blur is applied, so the useof the filter itself would safely allow accurate classification ifsonotype 2 had feature distributions that overlapped differentsonotypes.
The central frequency of the sonotypes have somespread to them, some more than others. The variation cap-tured in Fig. 7 mostly reflects the variation within a pulsetrain and the variation between individuals. Air temperaturecan play a large role in central frequency shift of a sonotypebut did not for the work presented here since the air tempera-ture during the recordings varied little within the extremes of22.5 °C and 24.4 °C. In cases where air temperature canchange more dramatically, training set sonotypes need to berecorded at multiple temperatures. Central frequency doesnot noticeably shift as a function of air temperature for allcricket species, but for the species that air temperature doesaffect this way, the shift in central frequency is linear.24,25
For these sonotypes, once the linear relationship betweencentral frequency and air temperature is found, air tempera-ture during a recording should be used as a parameter toestimate the acceptable distribution of central frequencies forthese sonotypes when trying to detect them.
A. Improving performance
The approach to ACR described in this work very accu-rately identifies our sonotypes, but the emphasis is clearly onkeeping a high true-positive accuracy at the expense of false-negative accuracy. Our application is in monitoring sono-
types from canopy recordings, and since most crickets call in2956 J. Acoust. Soc. Am., Vol. 120, No. 5, November 2006
pulse trains, presence and absence can be readily determinedeven by detecting only some of the pulses in those pulsetrains. In general, there is no need to detect each call withinthe entire sequence of calls. Two separate sources of errorarose to lower the true-positive accuracy in 2 sonotypesdown from 100%, although still above 97.5% �Table II�. Inone instance, a consecutive string of sonotype 102 calls com-pletely overlapped to create an event that matched sonotype1. In the other instance, a few faint calls of sonotype 16 haddegraded to the point that they resembled the shorter andsmaller bandwidth calls of sonotype 13. Each of these in-stances point out how the duration and bandwidth featuresdetected from events can lead to some misclassificationswith sonotypes that have overlapping central frequency dis-tributions. To decrease these misclassifications, additionalfeatures such as the time gap between similar events and thenumber of similar events within a specified amount of time�duration of a pulse train� can be used to make accurateidentifications. These features look to have little variance formany of the sonotypes, particularly the short duration oneswhich are more likely to lead to misclassifications. To detectthese features, most of the calls within a sequence of callswill need to be detected. Call sequences recorded with a highsignal to noise ratio have enough of their calls detected tomeasure these features. Requiring these features for classifi-cation would increase the false-negative percentage for thesesonotypes, but would also improve the true-positive percent-age to nearly 100%.
Most crickets call in a rather continuous pulse train, andwhen trying to establish the presence or absence of sono-types, it is not necessary to detect each call within a pulsetrain, only some of them. Table II shows that the false-negative classification percentage of 4 sonotypes is above50%. While not generally a problem when detecting pres-ence or absence of a sonotype, it is desirable for these per-centages to be lower. The reason for these high values ismostly due to not having a wide enough distribution of fea-ture values for those sonotypes. For sonotypes 1 and 101,this is likely due to having small training sets �N=3 and 7,respectfully�. The other 2 sonotypes, ST7 and ST16, havemany more training samples, but they are likely not variedenough. Each training set was chosen as the first sonotypeinstances encountered, not randomized from a group ofknown instances. Randomizing this training process wouldlikely allow the feature distributions for these sonotypes tobe expanded while keeping the number of training samplesthe same.
B. Finding novel calls
When looking at class distributions similar to the onesshown in Fig. 7, the possibility of using clustering techniquesto determine class boundaries in an automated way looksintriguing. In this paper, the class assignment of the trainingsonotypes is done manually by grouping calls that looknearly identical and are often part of a continuous series ofcall sequences, and they are presumed to come from thesame species. If the training was done with isolated calls
recorded with a high signal to noise ratio, using automatedBrandes et al.: Detecting narrow-band calls with image processing

clustering techniques might well be possible. The trainingsets, though, are created from field recordings with variousbackground sounds. This results in miscellaneous noises be-ing classified as events along with sonotypes. Since the sono-types are not necessarily more numerous than miscellaneousnoises, the events are manually classified.
After the training phase, clustering of unknown callsmight provide an automated way to find novel calls, at leastthose that have a duration longer than 0.2 s. Most of theunknown events are short in duration, and applying a mini-mum duration filter goes far towards weeding out events thatare not novel sonotypes. Once enough of these filtered eventsare found, a clustering method such as from Diday26 mightbe useful in finding clusters that correspond to novel sono-types. A dynamic clustering method such as this would likelybe a good choice since it allows the clusters to be elongated,as many of the manually classified sonotype clusters are.
V. CONCLUSIONS
The ACR process described in this paper detectsconstant-frequency cricket and frog calls with a high true-positive accuracy. The accuracy of this approach largely de-pends on how comprehensively sonotypes are known for anarea, and to what extent the sonotype feature values overlap.The success of this process shows that image processingtechniques applied to spectrogram images can provide a use-ful approach in ACR applications. This process works withrecordings made in tropical forests, where multiple speciescan call simultaneously and numerous background noises arepresent, and can be used to monitor presence or absence ofcricket species that have constant-frequency calls, or relativeabundance measures if there are multiple recording loca-tions. Potential for misclassification of cricket sonotypes islargely dependent on how complete the libraries of cricketcalls for an area are, and how well variation in those calls isknown. The more complete an understanding there is for thetype of calls that can be encountered, the more accurately thefeature-space can be partitioned for each sonotype, and themore accurately the automated process will run.
ACKNOWLEDGMENTS
We would like to thank the Gordon and Betty MooreFoundation for funding this work through the Tropical Ecol-ogy, Assessment and Monitoring �TEAM� Initiative in theCenter for Applied Biodiversity Science at Conservation In-ternational �CI�. We would also like to thank the Bioacous-tics Research Program �BRP� at the Cornell University Labof Ornithology for the helpful suggestions and insight fromtheir engineers, as well as for providing their eXtensibleBioAcoustics Toolbox �XBAT�, custom designed softwarefor developing sound recognition algorithms that runs withinMATLAB®, and their custom designed 16-element micro-phones and preamplifier that we acquired through an ongo-ing collaboration CI has with the BRP lab.
1P. F. Fischer, U. Schulz, H. Schubert, P. Knapp, and M. Schmöger, “Quan-titative assessment of grassland quality: Acoustic determination of popu-
lation sizes of Orthopteran indicators species,” Ecol. Appl. 7, 909–920J. Acoust. Soc. Am., Vol. 120, No. 5, November 2006 Brand
�1997�.2W. J. Bailey, Acoustic Behaviour of Insects. An Evolutionary Perspective�Chapman and Hall, London, 1991�.
3K. Riede, “Acoustic monitoring of Orthoptera and its potential for conser-vation,” Journal of Insect Conservation 2, 217–223 �1998�.
4T. J. Walker, “Cryptic species among sound-producing ensiferan Ortho-ptera �Gryllidae and Tettigoniidae�,” Q. Rev. Biol. 39, 345–355 �1964�.
5D. Otte, “The crickets of Hawaii: Origin, systematics and evolution,” Or-thopterists’ Society, Philadelphia, pp. 1–396 �1994�.
6D. R. Ragge and W. J. Reynolds, The Songs of the Grasshoppers andCrickets of Western Europe �Harley, Colchester, 1998�.
7L. Desutter-Grandcolas �personal communication�.8D. Otte �personal communication�.9C. Froehlich and E. Holtzem, “Eine neue Methode zum Auffinden undBestimmen von Heuschrecken �Saltatoria� im Freiland,” Z. angew. Zool.74, 501–503 �1987�.
10F. Nischk and K. Riede, “Bioacoustics of two cloud forest ecosystems inEcuador compared to lowland rainforest with special emphasis on singingcricket species,” in Epiphytes and Canopy Fauna of the Otongan RainForest (Ecuador). Results of the Bonn-Quito Epiphyte Project, Funded bythe Volkswagen Foundation, edited by J. Nieder and W. Barthlott �2001�,Vol. 2, pp. 217–242.
11N. Vaughan, G. Jones, and S. Harris, “Identification of British bat speciesby multivariate analysis of echolocation call parameters,” Bioacoustics 7,189–207 �1997�.
12S. Parsons and G. Jones, “Acoustic identification of 12 species of echolo-cating bats by discriminant function analysis and artificial neural net-works,” J. Exp. Biol. 203, 2641–2656 �2000�.
13S. Parsons, “Identification of New Zealand bats in flight from analysis ofecholocation call by artificial neural networks,” J. Zool. 253, 447–456�2001�.
14S. E. Anderson, A. S. Dave, and D. Margoliash, “Template-based auto-matic recognition of birdsong syllables from continuous recordings,” J.Acoust. Soc. Am. 100, 1209–1219 �1996�.
15J. A. Kogan and D. Margoliash, “Automated recognition of bird songelements from continuous recordings using dynamic time warping andhidden Markov models: A comparative study,” J. Acoust. Soc. Am. 103,2185–2196 �1998�.
16A. Taylor, G. Watson, G. Grigg, and H. McCallum, “Monitoring frogcommunities: An application of machine learning,” in Proceedings of the8th Innovative Applications of Artificial Intelligence Conference �1996�,pp. 1564–1596.
17E. D. Chesmore, O. P. Femminella, and M. D. Swarbrick, “Automatedanalysis of insect sounds using time-encoded signals and expert systems-Anew method for species identification,” in Information Technology, PlantPathology and Biodiversity, edited by P. Bridge, P. Jeffries, D. R. Morse,and P. R. Scott �CAB International, Wallinford, 1998�, pp. 273–287.
18E. D. Chesmore, “Application of time domain signal coding and artificialneural networks to passive acoustical identification of animals,” Appl.Acoust. 62, 1359–1374 �2001�.
19C. Dietrich, G. Palm, K. Riede, and F. Schwenker, “Classification of bioa-coustic time series based on the combination of global and local deci-sions,” Int. J. Pattern Recognit. Artif. Intell. 37, 2293–2305 �2004�.
20C. Xu, N. C. Maddage, and X. Shao, “Automatic music classification andsummarization,” IEEE Trans. Speech Audio Process. 13, 441–450 �2005�.
21L. R. Rabiner and B. H. Juang, Fundamentals of Speech Recognition�Prentice-Hall, New Jersey, 1993�.
22K. Riede, “Bioacoustic monitoring of insect communities in a Borneanrain forest canopy,” in Canopy Arthropods, edited by N. E. Stork, J. Adis,and R. K. Didham �Chapman and Hall, London, 1997�, pp. 442–452.
23T. S. Brandes, “Acoustic Monitoring Protocol,” Tropical Ecology Assess-ment and Monitoring �TEAM� Initiative set of biodiversity monitoringprotocols, Center for Applied Biodiversity Science, Conservation Interna-tional �2005�, http://www.teaminitiative.org �navigate to “Protocols”� �lastvisited September 2006�.
24T. J. Walker, “Factors responsible for intraspecific variation in the callingsongs of crickets,” Evolution �Lawrence, Kans.� 16, 407–428 �1962�.
25H. C. Gerhardt and F. Huber, Acoustic Communication in Insects andAnurans, Common Problems and Diverse Solutions �University of Chi-cago Press, Chicago, 2002�.
26E. Diday, “The dynamic clusters method in nonhierarchical clustering,”
Int. J. Comput. Inf. Sci. 2, 61–68 �1973�.es et al.: Detecting narrow-band calls with image processing 2957