Using Carbon14 Isotope Tracing to Investigate Molecular Structure Effects of the Oxygenate Dibutyl...
12
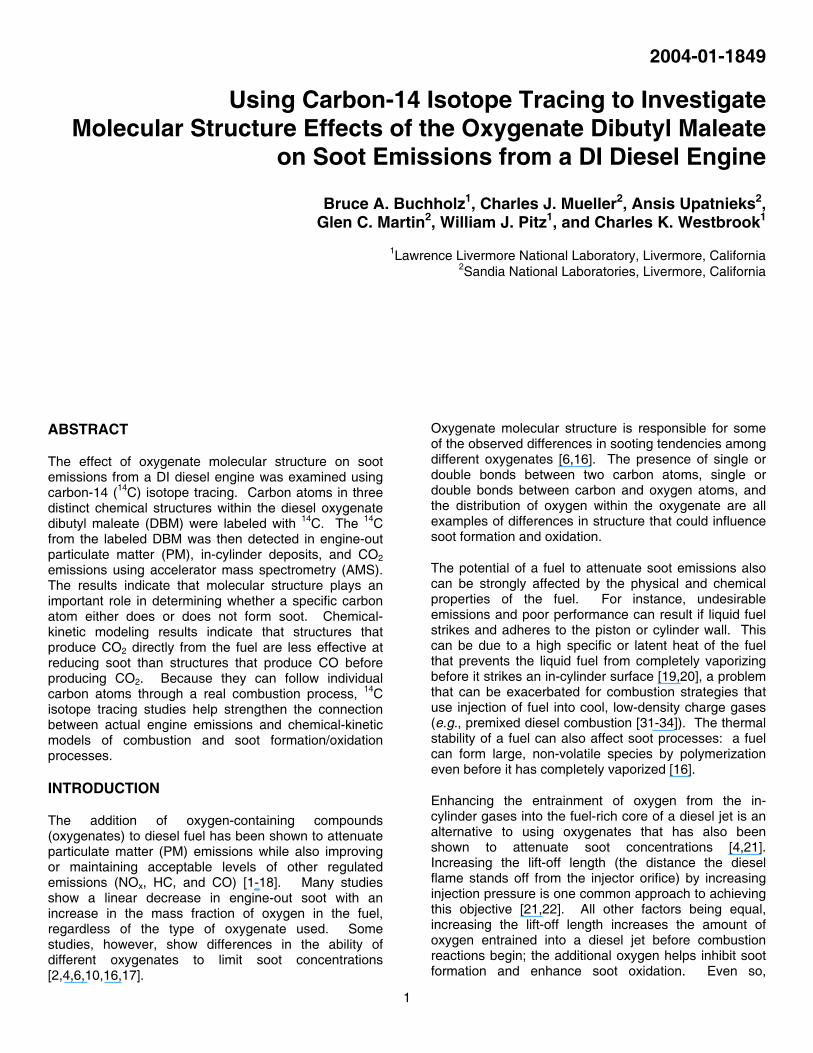
1 2004-01-1849 Using Carbon-14 Isotope Tracing to Investigate Molecular Structure Effects of the Oxygenate Dibutyl Maleate on Soot Emissions from a DI Diesel Engine Bruce A. Buchholz 1 , Charles J. Mueller 2 , Ansis Upatnieks 2 , Glen C. Martin 2 , William J. Pitz 1 , and Charles K. Westbrook 1 1 Lawrence Livermore National Laboratory, Livermore, California 2 Sandia National Laboratories, Livermore, California ABSTRACT The effect of oxygenate molecular structure on soot emissions from a DI diesel engine was examined using carbon-14 ( 14 C) isotope tracing. Carbon atoms in three distinct chemical structures within the diesel oxygenate dibutyl maleate (DBM) were labeled with 14 C. The 14 C from the labeled DBM was then detected in engine-out particulate matter (PM), in-cylinder deposits, and CO 2 emissions using accelerator mass spectrometry (AMS). The results indicate that molecular structure plays an important role in determining whether a specific carbon atom either does or does not form soot. Chemical- kinetic modeling results indicate that structures that produce CO 2 directly from the fuel are less effective at reducing soot than structures that produce CO before producing CO 2 . Because they can follow individual carbon atoms through a real combustion process, 14 C isotope tracing studies help strengthen the connection between actual engine emissions and chemical-kinetic models of combustion and soot formation/oxidation processes. INTRODUCTION The addition of oxygen-containing compounds (oxygenates) to diesel fuel has been shown to attenuate particulate matter (PM) emissions while also improving or maintaining acceptable levels of other regulated emissions (NO x , HC, and CO) [1-18]. Many studies show a linear decrease in engine-out soot with an increase in the mass fraction of oxygen in the fuel, regardless of the type of oxygenate used. Some studies, however, show differences in the ability of different oxygenates to limit soot concentrations [2,4,6,10,16,17]. Oxygenate molecular structure is responsible for some of the observed differences in sooting tendencies among different oxygenates [6,16]. The presence of single or double bonds between two carbon atoms, single or double bonds between carbon and oxygen atoms, and the distribution of oxygen within the oxygenate are all examples of differences in structure that could influence soot formation and oxidation. The potential of a fuel to attenuate soot emissions also can be strongly affected by the physical and chemical properties of the fuel. For instance, undesirable emissions and poor performance can result if liquid fuel strikes and adheres to the piston or cylinder wall. This can be due to a high specific or latent heat of the fuel that prevents the liquid fuel from completely vaporizing before it strikes an in-cylinder surface [19,20], a problem that can be exacerbated for combustion strategies that use injection of fuel into cool, low-density charge gases (e.g., premixed diesel combustion [31-34]). The thermal stability of a fuel can also affect soot processes: a fuel can form large, non-volatile species by polymerization even before it has completely vaporized [16]. Enhancing the entrainment of oxygen from the in- cylinder gases into the fuel-rich core of a diesel jet is an alternative to using oxygenates that has also been shown to attenuate soot concentrations [4,21]. Increasing the lift-off length (the distance the diesel flame stands off from the injector orifice) by increasing injection pressure is one common approach to achieving this objective [21,22]. All other factors being equal, increasing the lift-off length increases the amount of oxygen entrained into a diesel jet before combustion reactions begin; the additional oxygen helps inhibit soot formation and enhance soot oxidation. Even so,
-
Upload
independent -
Category
Documents
-
view
2 -
download
0
Transcript of Using Carbon14 Isotope Tracing to Investigate Molecular Structure Effects of the Oxygenate Dibutyl...
1
2004-01-1849
Using Carbon-14 Isotope Tracing to Investigate Molecular Structure Effects of the Oxygenate Dibutyl Maleate
on Soot Emissions from a DI Diesel Engine
Bruce A. Buchholz1, Charles J. Mueller2, Ansis Upatnieks2, Glen C. Martin2, William J. Pitz1, and Charles K. Westbrook1
1Lawrence Livermore National Laboratory, Livermore, California 2Sandia National Laboratories, Livermore, California
ABSTRACT
The effect of oxygenate molecular structure on soot emissions from a DI diesel engine was examined using carbon-14 (14C) isotope tracing. Carbon atoms in three distinct chemical structures within the diesel oxygenate dibutyl maleate (DBM) were labeled with 14C. The 14C from the labeled DBM was then detected in engine-out particulate matter (PM), in-cylinder deposits, and CO2 emissions using accelerator mass spectrometry (AMS). The results indicate that molecular structure plays an important role in determining whether a specific carbon atom either does or does not form soot. Chemical-kinetic modeling results indicate that structures that produce CO2 directly from the fuel are less effective at reducing soot than structures that produce CO before producing CO2. Because they can follow individual carbon atoms through a real combustion process, 14C isotope tracing studies help strengthen the connection between actual engine emissions and chemical-kinetic models of combustion and soot formation/oxidation processes.
INTRODUCTION
The addition of oxygen-containing compounds (oxygenates) to diesel fuel has been shown to attenuate particulate matter (PM) emissions while also improving or maintaining acceptable levels of other regulated emissions (NOx, HC, and CO) [1-18]. Many studies show a linear decrease in engine-out soot with an increase in the mass fraction of oxygen in the fuel, regardless of the type of oxygenate used. Some studies, however, show differences in the ability of different oxygenates to limit soot concentrations [2,4,6,10,16,17].
Oxygenate molecular structure is responsible for some of the observed differences in sooting tendencies among different oxygenates [6,16]. The presence of single or double bonds between two carbon atoms, single or double bonds between carbon and oxygen atoms, and the distribution of oxygen within the oxygenate are all examples of differences in structure that could influence soot formation and oxidation.
The potential of a fuel to attenuate soot emissions also can be strongly affected by the physical and chemical properties of the fuel. For instance, undesirable emissions and poor performance can result if liquid fuel strikes and adheres to the piston or cylinder wall. This can be due to a high specific or latent heat of the fuel that prevents the liquid fuel from completely vaporizing before it strikes an in-cylinder surface [19,20], a problem that can be exacerbated for combustion strategies that use injection of fuel into cool, low-density charge gases (e.g., premixed diesel combustion [31-34]). The thermal stability of a fuel can also affect soot processes: a fuel can form large, non-volatile species by polymerization even before it has completely vaporized [16].
Enhancing the entrainment of oxygen from the in-cylinder gases into the fuel-rich core of a diesel jet is an alternative to using oxygenates that has also been shown to attenuate soot concentrations [4,21]. Increasing the lift-off length (the distance the diesel flame stands off from the injector orifice) by increasing injection pressure is one common approach to achieving this objective [21,22]. All other factors being equal, increasing the lift-off length increases the amount of oxygen entrained into a diesel jet before combustion reactions begin; the additional oxygen helps inhibit soot formation and enhance soot oxidation. Even so,
2
previous work has shown that when the same amount of oxygen is added by fuel oxygenation and by enhanced entrainment, fuel oxygenation is significantly more effective at attenuating soot concentrations than enhancing entrainment [6]. This result has helped motivate the continued study of oxygenates for diesel fuel.
Previous experiments in our laboratories showed that an ester-type oxygenate (dibutyl maleate, DBM) was less effective at attenuating soot levels than an ether-type oxygenate [6,16]. As a part of Ref. [6], a modeling study was undertaken that developed and used detailed chemical-kinetic mechanisms for reaction of the oxygenates, and reaction-path analyses were conducted to determine the causes of the differences in sooting potential. The reaction-path analysis for the ester-type oxygenate DBM showed that it was less effective at preventing soot formation because it directly formed CO2, effectively “wasting” some of the oxygen chemically bound in the ester structures. The reaction-path analysis also showed that DBM directly forms the soot precursor acetylene from the 2,3-maleate carbon atoms [6].
The present research effort was undertaken to investigate the validity of these conclusions from the modeling study, and to help shed light on other potential mechanisms for the increased soot levels observed when the DBM oxygenate is used. Isotope tracing of 14C using accelerator mass spectrometry (AMS) was selected because it provides a means for experimentally measuring reaction pathways; thus, it can be used to help assess the validity of the conclusions from the numerical modeling study.
Isotope Tracing Using Accelerator Mass Spectrometry – Chemical pathways can be identified through tracing and measurement of uncommon isotopes. Radioisotopes are specific and distinctive because they are extremely rare in natural materials. A radioisotope-labeled compound may have a very high abundance-to-background ratio, but poor signal-to-noise in the isotope detector may obscure this property. Detector sensitivity must increase as the radioactivity of the isotope of interest decreases. Short-lived radioisotopes can be efficiently detected by their radioactive decay events but produce radiation hazards in the laboratory. Longer-lived radioisotopes (e.g., 14C, whose half-life is 5730 y) are inefficiently detected by measuring decay events.
Researchers in the mid-1980s labeled fuel components with 14C and traced the isotope to PM or soot from a diesel engine [24] or a diffusion flame [24,25] using a decay-counting technique. These experiments required special radioactive test facilities to contain a radioactive engine and the large amounts of volatile radioactive compounds needed for decay counting. From a practical standpoint, it is very difficult to use high-level radioactive tracing in a realistic engine environment due
to safety considerations and the production of radioactive wastes.
An alternative to decay counting, accelerator mass spectrometry (AMS) is an isotope-ratio measurement technique developed in the late 1970s as a powerful tool for tracing long-lived radioisotopes in chronometry in the earth sciences and archaeology [28]. The exceptional sensitivity of AMS allows the specificity of the 14C atom to be used while avoiding radiological-safety issues, which in turn permits tracing with actual combustion systems in realistic settings (e.g., road vehicles in conventional dynamometer facilities). The high sensitivity of the AMS technique derives from the fact that the accelerator mass spectrometer separates individual nuclei by mass and then counts them rather than waiting for individual radioactive-decay events.
The contemporary ratio of 14C to total carbon (14C/C) in living things is 1.2 x 10⁻¹². This level is more than three orders of magnitude greater than the ratio of 14C/C in petroleum-derived products (< 1 x 10-15), since fossil fuels are millions of years old. Accordingly, components of bio-derived fuels contain elevated 14C as compared to fossil fuels and are labeled uniformly throughout a molecule. This isotopic elevation is sufficient to trace the fate of bio-derived fuel components in emission products without the addition of radioactive materials. The most common bio-fuels are ethanol, biodiesel, and bio-gas (a substitute for natural gas). The complications of licensing and radioactive waste disposal are completely avoided by using the sensitivity of AMS to measure the “non-radioactive” levels of 14C in bio-derived fuels.
Another approach to labeling a fuel is to synthesize 14C-labeled material and dilute it with petroleum-derived material to yield a contemporary level of 14C. Radiolabeled molecules have the 14C in a specific position within the molecule. The added specificity of position allows investigation of effects of molecular structure on emissions. In each case, the virtual absence of 14C in petroleum-based fuels gives a very low 14C background that facilitates the tracing of carbon atoms from specific bond positions within specific fuel components.
Using an AMS technique developed for radiocarbon dating, 14C from three fuel blends with 14C/C levels less than those found in living organisms was traced against a 14C-free petroleum background. The resultant 14C/C levels in PM, in-cylinder deposits, and CO2 were measured to help enhance the understanding of how molecular structure affects soot emissions and the formation of in-cylinder deposits. If such mechanisms are understood, then combustion modeling can be used to evaluate possible changes in fuel formulation and to suggest possible fuel components that can improve combustion and reduce PM and other emissions.
Combustion modeling assumes that large molecules break down into small components and then build up again during soot formation. If all carbon atoms behave similarly, then there should be little or no difference in the contribution of carbon from aromatics, cyclo-alkanes, alkanes, oxygenated species, etc., in the PM emissions. AMS allows the tracing of specific carbon atoms within fuel components through the combustion process. The experimental information about reaction pathways that is provided by AMS analysis can be used to refine combustion models. The influence of molecular structure on the mechanisms by which a particular fuel molecule breaks into fragments and subsequently builds into soot can be studied. The goal of this work is to apply this technique to the viable diesel oxygenate DBM.
FACILITIES AND OPERATION
ENGINE FACILITY – The Sandia Compression-ignition Optical Research Engine (SCORE) is a single-cylinder version of a Caterpillar® C-10 engine that has been modified to provide extensive optical access to the combustion chamber. The production engine is typically used in Class 7-8 heavy-duty trucks. The basic specifications of the SCORE are provided in Table 1. Specifications of the fuel-injection system are provided in Table 2. The fuel injector was fired every 12th engine cycle (i.e., “skip-fired”) to reduce the required frequency of window cleaning and the risk of window failure due to thermal and mechanical stresses. The optical engine is described in more detail in Refs. [16] and [30].
The optical engine was used in this study for two reasons. First, this work uses the same apparatus that was employed in Refs. [6,16], which yields a detailed and consistent series of measurements for the fuel of
interest. Second, the quantities and costs of labeled fuel required for the optical engine are more manageable because it has only one cylinder and operates in skip-fired mode.
Table 2. Fuel-Injection System Specifications
Injector type Caterpillar HEUI® A Injector model HIA-450 Nozzle style Single-guided VCO Number of orifices 6 Orifice diameter (nom.) 0.163 mm Hydro-erosion 13% Orifice L/D 8.0 Included spray angle 140° Oil rail pressure 20.8 MPa (3000 psig) Max. fuel-injection pressure 142 MPa (20600 psig) Pressure intensification ratio 6.85:1 Valve opening pressure 31 MPa (4500 psig)
Engine operating parameters – The SCORE operating parameters were selected so that the engine load and the charge-gas temperature and pressure at top-dead-center (TDC) under motored operation were matched with previous studies [6,16,30]. Table 3 shows the SCORE operating parameters used in this work, which correspond to a condition of moderate speed, low-to-moderate load, and relatively low engine-out PM emissions.
Table 3. SCORE Operating Parameters
Engine speed 1200 rpm Engine load (gross IMEP) 8.00 bar Mean piston speed 5.60 m/s Exhaust gas recirculation (EGR) none Coolant temperature 95°C Intake air temperature 116°C Intake air pressure 2.30 bar Simulated intake air temperaturea 72°C Simulated intake air pressurea 1.4 bar Motored TDC temperatureb 900 K Motored TDC pressureb 60 bar Motored TDC densityb 23 kg/m3
Exhaust pressure 1.07 bar aValue required to reach TDC condition using geometric
compression ratio of production engine and a polytropic compression exponent of 1.345.
bObtained using intake condition, geometric compression ratio, and a polytropic compression exponent of 1.345.
AMS FACILITY – The samples in this study were analyzed at the Center for AMS at Lawrence Livermore National Laboratory (LLNL) with the HVEE FN system operating at 6.5 MV [26]. All samples were prepared in the LLNL natural carbon preparation laboratory using established methods [27]. A general overview of the AMS technique is provided in the Appendix. The AMS sample preparation method accommodates samples
3
Table 1. SCORE Specifications
Research engine type 1-cyl. vers. of Caterpillar C-10 Cycle 4-stroke CIDI Valves per cylinder 4 Ignition assist (not used) In-cylinder glow plug Bore 125 mm Stroke 140 mm Rated cylinder pressure 14.0 MPa IVOa 32° BTDC exhaust IVCa 153° BTDC compression EVOa 116° ATDC compression EVCa 11° ATDC exhaust Connecting rod length 225 mm Connecting rod offset None Piston bowl diameter 90 mm Piston bowl depth 16.4 mm Squish height 1.5 mm Swirl ratiob 0.59 Displacement per cyl. 1.72 liters Compression ratio 11.27:1 Simulated compr. ratioc 16.00:1 aAll valve timings are for lift ≅ 0.03 mm bMeasured at the Caterpillar Tech. Center using an AVL swirl meter cTDC temperature, pressure, and density in the production engine
are matched in the optical engine by preheating and boosting the pressure of the intake air

containing between 0.05 and 10 mg carbon. Samples containing 0.2-2 mg carbon are preferred for obtaining higher measurement precision and lower systematic backgrounds. Approximately 15,000 14C-AMS samples are measured annually at LLNL with 2-3 measurement days per week.
MATERIALS AND METHODS
Test Fuel – The fuel used in this study was blended from an oxygenate, dibutyl maleate (DBM); a paraffinic hydrocarbon, n-hexadecane; and an ignition improver, 2-ethylhexyl nitrate (Fig. 1). The ignition improver was required to achieve the desired ignition delay of 390 µs under the current operating condition (see Table 3). The fuel composition is provided in Table 4. The fuel is called BM88 because it contains 88 vol% DBM. The high concentration of DBM in the fuel was initially selected to optically study the combustion of the oxygenate without the complication of high dilution in a conventional diesel fuel [16].
A single batch of BM88 was made with unlabeled DBM after using AMS to confirm that the 14C concentrations of all unlabeled fuel components were negligible (14C/C ratios < 10-15). The unlabeled BM88 was then split into three equal volumes that were individually spiked with labeled DBM that was synthesized to have 14C in one of three chemical positions: 1,4-maleate; 2,3-maleate; or 1-butyl (see Fig. 1). The radiolabeled DBM was purchased from Moravek Biochemicals, Inc. of Brea, California and American Radiolabeled Chemicals of St. Louis, Missouri. Each type of radiolabeled DBM was assayed above 98% radiochemical purity in a highly concentrated form. The labeled DBM was serially diluted with unlabeled DBM such that only 20 to 100 picoliters of labeled DBM provided the tracer in each 4-liter volume of BM88 fuel, yielding 14C/C levels less than those found in living organisms. Table 5 lists the
14C/C content of each final blend of labeled BM88 fuel with respect to the modern 14C/C ratio of 1.2 x 10⁻¹².
Lubrication Oil – Preliminary investigations showed significant deposition of lube oil onto PM sample filters during motored cycles. This deposition is attributed to lube oil that leaks between the exhaust valve stems and guides and onto the top of the exhaust valves. Such uncombusted lube oil could be blown into the exhaust stream by aerodynamic forces when the exhaust valves open, resulting in some being collected on the PM sampling filter.
It is not believed that the lube oil originates from the rings at the top of the optical piston because these are lubricated only periodically and sparsely, and no correlation was found between the times of ring lubrication and the amounts of oil on the filters. It is also not believed that the oil originates from the compressor that supplies air to the engine. The compressed air travels through five coalescing filters and a dryer before arriving at the engine. Furthermore, the compressor oil is composed primarily of poly-alpha-olefins, which would tend to polymerize and remain on the filter, not bake off as is observed (see below).
Even though AMS analysis confirmed that the 14C content of the lube oil was negligible, sample contamination by excess carbon from burned or unburned lube oil would suppress the isotope ratios of interest if it were not properly taken into account. To minimize the impact of this issue, an oil was selected that could be removed by baking the filters at relatively low temperatures. The lubrication oil was a poly-isobutylene blend from Red Line Inc. (Benicia, California) that was designed to crack into gas-phase butylenes at temperatures below 300°C.
Collection of Condensed-Phase Samples – A fraction of the exhaust from the engine was drawn through a stainless steel sampling line (915 mm long by 10 mm in
Figure 1. Molecular structures of compounds in BM88 fuel,and nomenclature of carbon positions in DBM.
Table 4. BM88 fuel composition.
Fuel Component Volume %
dibutyl maleate (DBM) 88.0
n-hexadecane 7.0
2-ethylhexyl nitrate 5.0
Table 5. 14C/C ratios of the three labeled BM88 fuel blends relative to the “modern” 14C/C ratio of 1.2 x 10⁻¹² that is found in
living organisms.
Labeled Carbon Position Fraction Modern Carbon
1,4-maleate 0.92
2,3-maleate 0.29
1-butyl 0.83 4
diameter) that was maintained at a temperature of 200°C. PM samples were collected by filtering this stream through 37-mm Gelman Sciences PALLFLEX tissuquartz 2500QAT-UP membrane filters. Before sample acquisition, the quartz filters were pre-combusted at 1173 K for 3 h to remove all carbon residue, and then allowed to cool to 300 K in the furnace before removal. The filters were loaded within 24 h after pre-combustion.
At the given engine load, a minimum of 72 skip-fired cycles (72x12 total cycles) was required to deposit sufficient PM on the filter for isotopic analysis. In practice, however, collecting PM over 216 fired cycles (3x72x12 total cycles) produced a larger sample that was easier to process and analyze by AMS, and this was the approach taken in the current study. Filters were handled with stainless steel forceps and briefly placed on aluminum foil to cool before being placed in individual re-sealable plastic bags that were stored in an opaque envelope. A filter with PM from 1x72x12 motored-only cycles was also collected after each set of 3 skip-fired runs to ascertain the degree of sample contamination from lubrication oil.
The operating conditions produced PM filters loaded with 0.7-1.0 mg total carbon over 3x72x12 cycles. Based on unbaked 1x72x12 motored-only controls with no visible PM, unburned lubrication oil dominated the carbon inventory, accounting for 0.5-0.6 mg carbon. Skip-fired PM filters acquired over 3x72x12 cycles contained 40-70 µg of carbon after removal of lubrication oil and VOF.
After 3x72x12 skip-fired cycles and 1x72x12 motored-only cycles, the surfaces of the quartz windows within the combustion chamber needed to be cleaned of in-cylinder deposits. A large sample (>1 mg C) of in-cylinder deposits was collected from the piston bowl at each cleaning by wiping with a quartz filter (described above) held in a 14C-free silicone rubber fixture. In-cylinder deposit samples were promptly placed in individual re-sealable plastic bags and stored with the exhaust-gas PM filters. All filters were taken to the AMS natural carbon sample preparation laboratory at LLNL for processing upon completion of each day’s experiments.
Collection of Gas Samples – Gas samples were collected over 1x72x12 fired or motored cycles in 10.0- or 12.0-liter Tedlar bags placed after the PM-filter holder in the exhaust line. Each bag had a conventional fill valve and a second septa-seal port. The septa port was used to remove gas for AMS sample preparation. Because ambient air currently contains ~370 ppm (by volume) of CO2, some of which is 14CO2, skip-fired engine operation produced gas samples with significant C and 14C background levels caused by intake air. This background was quantified by analyzing motored-only gas samples from the engine, as described below in the subsection entitled “Background and Contamination
Effects.” The gas sample bags were maintained at temperatures between 290-300 K and processed within several days of collection.
Processing of Condensed-Phase Samples to Remove Volatiles Including Unburned Lubrication Oil – In addition to measuring total PM emissions, it was desired to determine the partitioning of the PM into volatile organic fraction (VOF) and non-volatile fraction (NVF). The VOF/NVF distinction is preferred over other partitioning strategies (e.g., soluble and insoluble organic fractions) because it reflects the physical process employed in practical exhaust aftertreatment devices.
VOF (including unburned lubrication oil) was removed from PM- and in-cylinder-deposit samples and motored-only controls by baking the loaded filters at 330°C for 2 h in a furnace [29]. This procedure to remove the VOF was developed to obtain consistent isotope ratios and mass fraction of the NVF from National Institute of Standards and Technology (NIST) standard reference material (SRM). NIST SRM 2975 (diesel soot) and SRM 1649a (urban dust) are the closest NIST SRMs to exhaust PM. The filters loaded with PM lose mass during the thermal separation and the soot deposits are noticeably lighter in color after baking. The remaining carbon is the NVF. Three out of every four of the skip-fired and motored-only filters were heat-treated to remove lube oil and VOF. The remaining filters served as total carbon controls and monitors of lubrication oil deposition. The VOF was estimated by measuring the difference in mass between the heat-treated and total-carbon samples after lube oil was considered.
DETERMINATION AND SIGNIFICANCE OF ISOTOPE RATIO AND CARBON FRACTION – After contributions from background and contaminant carbon are addressed as described in the Appendix, Eq. A10 is used to determine isotope ratios of interest. In general, the isotope ratio of a given sample type s resulting from fuel with 14C in a given label position p can be expressed as
psunlps
pspsR
CC
C
+=
14, (1)
where Cunl ps is carbon originating from unlabeled positions and has a different value for each p and s. In the current work, the label position p could be 1,4 for 1,4-maleate; 2,3 for 2,3-maleate; or 1-b for 1-butyl maleate. The sample type s could be F for fuel, P for PM, D for in-cylinder deposits, or G for gas. Hence, the isotope ratio of a PM sample resulting from operation with BM88 containing 1,4-maleate 14C DBM would be expressed
PunlP
PPR
4,14,1
4,114
4,1 CC
C
+= . (2)
The significance of the isotope ratio of an emission sample is realized when it is compared to the isotope
5

ratio of the fuel that was used to produce the sample (R1,4F, R2,3F, or R1-bF). For example, if R2,3P/R2,3F > 1, then carbon in the 2,3-maleate position contributed more to PM than would be expected based on its concentration in the fuel. This would indicate that carbon atoms in this bond configuration tend to preferentially form PM. On the other hand, if R2,3P/R2,3F < 1, then the 2,3-maleate configuration would be contributing less than expected to PM emissions. Using this methodology, the effects of molecular structure on various carbon-containing emission products can be studied. As will be shown below, carbon atoms in the three labeled positions contributed differently to PM than their concentrations in the fuel would suggest, indicating significant effects of molecular structure.
Carbon in a given bond configuration typically behaves similarly regardless of isotope. Isotope effects on chemical-kinetic pathways are monitored using 13C/12C, but are slight for our application (see Appendix). Thus, the isotope ratio of a particular carbon position is essentially maintained through the combustion process. Equation 3 expresses this concept mathematically for PM and fuel carbon from the BM88 containing 2,3-maleate 14C DBM:
F
P
F
P
3,214
3,214
3,2
3,2
C
C
C
C= . (3)
Equation 3 can be used to help determine the fraction of the total carbon in the PM that came from a specific carbon position p:
pPunlpP
pPpPF
CC
C
+= . (4)
The denominator of Eq. 4 is measured during sample preparation, and 14CpP is calculated using Eq. 1. 14CpF and CpF can be calculated from the measured isotope ratio of the fuel, RpF, and the ratio CpF/Cunl pF, which is known from the fuel composition. Using 14CpP, 14CpF, CpF, and Eq. 3, CpP can be calculated, and FpP calculated using Eq. 4.
This procedure is used to calculate FpP for each labeled carbon position p. While there is no way to calculate FpP for unlabeled positions, it is noted that all of the remaining carbon atoms in the BM88 fuel (i.e., n-hexadecane, 2-ethylhexyl nitrate, and the 2-, 3-, and 4-butyl positions in DBM) exist in alkyl structures. Hence, the fraction of alkyl carbon in the PM can be calculated by:
bPPPPalkyl FFFF −−−−= 13,24,11 . (5)
RESULTS
NVF PM SAMPLES – Figure 2 depicts the disposition of labeled carbon atoms in the NVF of the PM and in-cylinder deposits. The results have been normalized to the label concentration in each fuel. The error bars
indicate the scatter among four or five replicates of the NVF and in-cylinder deposit measurements. Fuel samples were measured in triplicate.
1,4-maleate carbon – Figure 2 shows that the 1,4-maleate 14C DBM did not contribute to NVF PM or in-cylinder deposits. As will be shown below, it was found that the 1,4-maleate 14C resided entirely in the exhaust CO2. This result indicates that the carbon-oxygen double bond of the ester does not break during combustion, which is in agreement with the results of Refs. [37]. From only the 1,4-maleate-label data it is not clear if the 1,4-maleate carbon makes CO or CO2 directly since almost all CO is further oxidized to CO2 at this high-combustion-efficiency operating condition.
2,3-maleate carbon – The 2,3-maleate 14C DBM was expected to yield relatively large amounts of 14C in the NVF PM since numerical simulations showed that the carbon-carbon double bond tended to produce the soot precursor acetylene. Despite this fact, Fig. 2 shows that the 2,3-maleate carbon atoms in DBM did not produce soot at higher levels than an average carbon atom in the fuel. This result suggests that unsaturated hydrocarbon bonds are not necessarily more prone to form soot than normal alkanes if sufficient oxygen is available. The tendency of the carbon-carbon double bond to form soot may have been suppressed by the oxygen on the 1,4-maleate carbon. If the nearest carbon atoms are provided with oxygen from the fuel, then oxygen from the charge gas may be more available to the carbon-carbon double bond.
1-butyl carbon – The 1-butyl 14C DBM is the most interesting of the labeled carbon atoms (Fig. 2). To fully utilize the oxygen in the DBM, the 1-butyl carbon would remain bonded to the single-bonded oxygen atom in the ester group, first forming CO and then being oxidized to CO2 in the overall lean mixture. In this way, each oxygen atom from the fuel removes one carbon atom from reactions that could lead to soot, and the fuel oxygen is used as efficiently as possible. If the bond between the 1-butyl carbon and the oxygen atom is broken, the effectiveness of the oxygen is severely diminished because both oxygen atoms from the ester stay bonded to a single carbon atom, effectively “wasting” one of the oxygen atoms in the ester group. This direct production of CO2 is discussed in detail in Ref. [6].
Figure 2 shows that the 1-butyl carbon was nearly as likely to form NVF PM as an average carbon atom in the fuel, indicating that the single-bonded oxygen remains bonded to the 1,4-maleate carbon approximately 90% of the time. This result is consistent with chemical kinetic models that predict that much of the single-bonded oxygen in the ester groups actually remains with the 1,4-maleate carbon, which produces CO2 directly and makes DBM a less-than-ideal oxygenate for soot reduction [6].
6
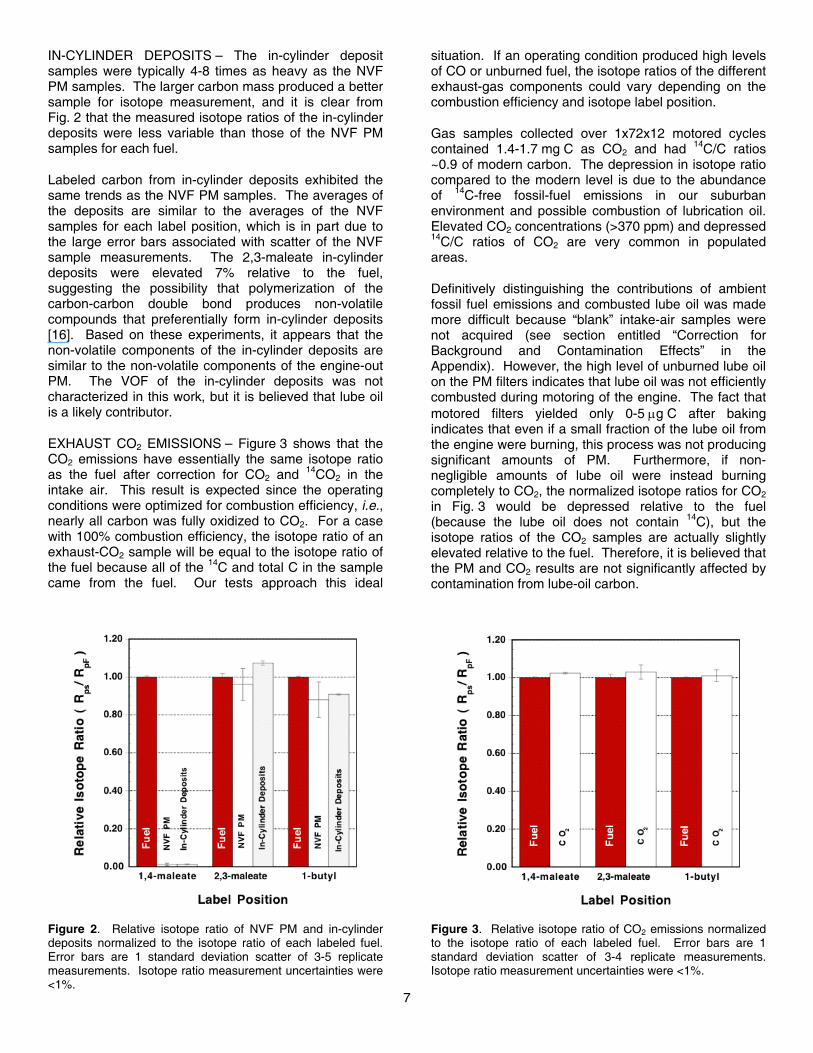
IN-CYLINDER DEPOSITS – The in-cylinder deposit samples were typically 4-8 times as heavy as the NVF PM samples. The larger carbon mass produced a better sample for isotope measurement, and it is clear from Fig. 2 that the measured isotope ratios of the in-cylinder deposits were less variable than those of the NVF PM samples for each fuel.
Labeled carbon from in-cylinder deposits exhibited the same trends as the NVF PM samples. The averages of the deposits are similar to the averages of the NVF samples for each label position, which is in part due to the large error bars associated with scatter of the NVF sample measurements. The 2,3-maleate in-cylinder deposits were elevated 7% relative to the fuel, suggesting the possibility that polymerization of the carbon-carbon double bond produces non-volatile compounds that preferentially form in-cylinder deposits [16]. Based on these experiments, it appears that the non-volatile components of the in-cylinder deposits are similar to the non-volatile components of the engine-out PM. The VOF of the in-cylinder deposits was not characterized in this work, but it is believed that lube oil is a likely contributor.
EXHAUST CO2 EMISSIONS – Figure 3 shows that the CO2 emissions have essentially the same isotope ratio as the fuel after correction for CO2 and 14CO2 in the intake air. This result is expected since the operating conditions were optimized for combustion efficiency, i.e., nearly all carbon was fully oxidized to CO2. For a case with 100% combustion efficiency, the isotope ratio of an exhaust-CO2 sample will be equal to the isotope ratio of the fuel because all of the 14C and total C in the sample came from the fuel. Our tests approach this ideal
situation. If an operating condition produced high levels of CO or unburned fuel, the isotope ratios of the different exhaust-gas components could vary depending on the combustion efficiency and isotope label position.
Gas samples collected over 1x72x12 motored cycles contained 1.4-1.7 mg C as CO2 and had 14C/C ratios ~0.9 of modern carbon. The depression in isotope ratio compared to the modern level is due to the abundance of 14C-free fossil-fuel emissions in our suburban environment and possible combustion of lubrication oil. Elevated CO2 concentrations (>370 ppm) and depressed 14C/C ratios of CO2 are very common in populated areas.
Definitively distinguishing the contributions of ambient fossil fuel emissions and combusted lube oil was made more difficult because “blank” intake-air samples were not acquired (see section entitled “Correction for Background and Contamination Effects” in the Appendix). However, the high level of unburned lube oil on the PM filters indicates that lube oil was not efficiently combusted during motoring of the engine. The fact that motored filters yielded only 0-5 µg C after baking indicates that even if a small fraction of the lube oil from the engine were burning, this process was not producing significant amounts of PM. Furthermore, if non-negligible amounts of lube oil were instead burning completely to CO2, the normalized isotope ratios for CO2 in Fig. 3 would be depressed relative to the fuel (because the lube oil does not contain 14C), but the isotope ratios of the CO2 samples are actually slightly elevated relative to the fuel. Therefore, it is believed that the PM and CO2 results are not significantly affected by contamination from lube-oil carbon.
Figure 2. Relative isotope ratio of NVF PM and in-cylinderdeposits normalized to the isotope ratio of each labeled fuel.Error bars are 1 standard deviation scatter of 3-5 replicatemeasurements. Isotope ratio measurement uncertainties were<1%.
Figure 3. Relative isotope ratio of CO2 emissions normalizedto the isotope ratio of each labeled fuel. Error bars are 1standard deviation scatter of 3-4 replicate measurements.Isotope ratio measurement uncertainties were <1%.
7
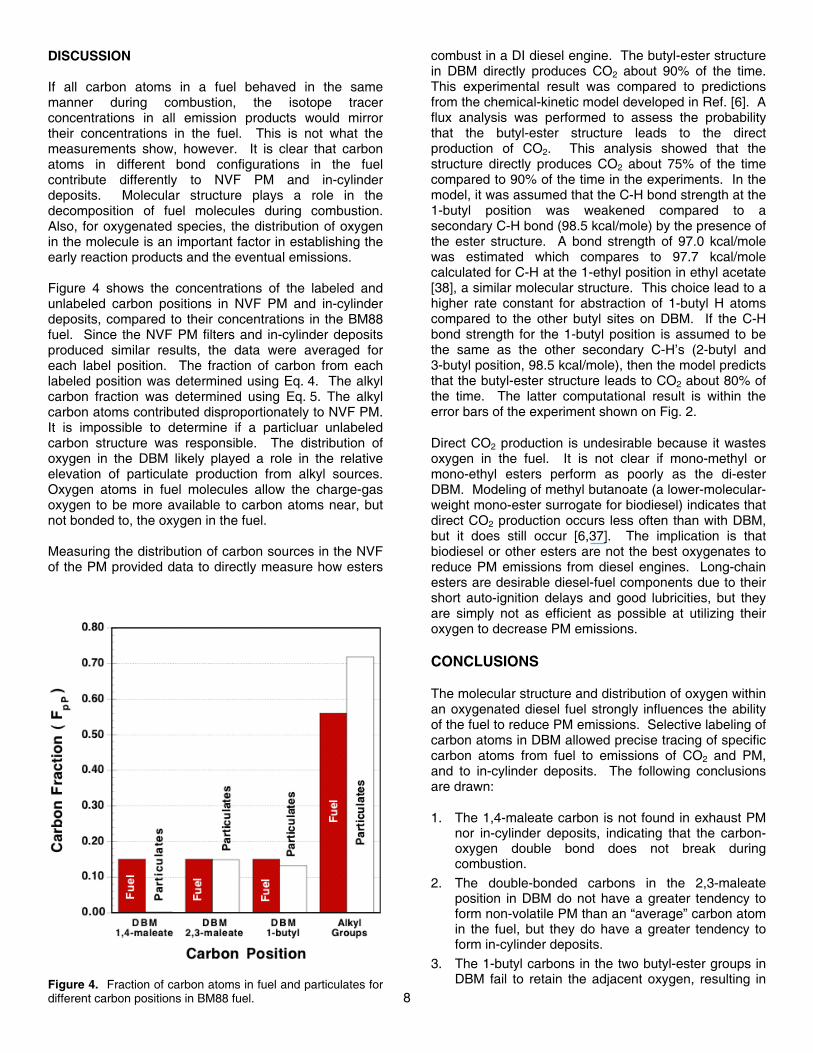
DISCUSSION If all carbon atoms in a fuel behaved in the same manner during combustion, the isotope tracer concentrations in all emission products would mirror their concentrations in the fuel. This is not what the measurements show, however. It is clear that carbon atoms in different bond configurations in the fuel contribute differently to NVF PM and in-cylinder deposits. Molecular structure plays a role in the decomposition of fuel molecules during combustion. Also, for oxygenated species, the distribution of oxygen in the molecule is an important factor in establishing the early reaction products and the eventual emissions. Figure 4 shows the concentrations of the labeled and unlabeled carbon positions in NVF PM and in-cylinder deposits, compared to their concentrations in the BM88 fuel. Since the NVF PM filters and in-cylinder deposits produced similar results, the data were averaged for each label position. The fraction of carbon from each labeled position was determined using Eq. 4. The alkyl carbon fraction was determined using Eq. 5. The alkyl carbon atoms contributed disproportionately to NVF PM. It is impossible to determine if a particluar unlabeled carbon structure was responsible. The distribution of oxygen in the DBM likely played a role in the relative elevation of particulate production from alkyl sources. Oxygen atoms in fuel molecules allow the charge-gas oxygen to be more available to carbon atoms near, but not bonded to, the oxygen in the fuel. Measuring the distribution of carbon sources in the NVF of the PM provided data to directly measure how esters
combust in a DI diesel engine. The butyl-ester structure in DBM directly produces CO2 about 90% of the time. This experimental result was compared to predictions from the chemical-kinetic model developed in Ref. [6]. A flux analysis was performed to assess the probability that the butyl-ester structure leads to the direct production of CO2. This analysis showed that the structure directly produces CO2 about 75% of the time compared to 90% of the time in the experiments. In the model, it was assumed that the C-H bond strength at the 1-butyl position was weakened compared to a secondary C-H bond (98.5 kcal/mole) by the presence of the ester structure. A bond strength of 97.0 kcal/mole was estimated which compares to 97.7 kcal/mole calculated for C-H at the 1-ethyl position in ethyl acetate [38], a similar molecular structure. This choice lead to a higher rate constant for abstraction of 1-butyl H atoms compared to the other butyl sites on DBM. If the C-H bond strength for the 1-butyl position is assumed to be the same as the other secondary C-H’s (2-butyl and 3-butyl position, 98.5 kcal/mole), then the model predicts that the butyl-ester structure leads to CO2 about 80% of the time. The latter computational result is within the error bars of the experiment shown on Fig. 2.
Direct CO2 production is undesirable because it wastes oxygen in the fuel. It is not clear if mono-methyl or mono-ethyl esters perform as poorly as the di-ester DBM. Modeling of methyl butanoate (a lower-molecular-weight mono-ester surrogate for biodiesel) indicates that direct CO2 production occurs less often than with DBM, but it does still occur [6,37]. The implication is that biodiesel or other esters are not the best oxygenates to reduce PM emissions from diesel engines. Long-chain esters are desirable diesel-fuel components due to their short auto-ignition delays and good lubricities, but they are simply not as efficient as possible at utilizing their oxygen to decrease PM emissions.
Figure 4. Fraction of carbon atoms in fuel and particulates fordifferent carbon positions in BM88 fuel.
CONCLUSIONS
The molecular structure and distribution of oxygen within an oxygenated diesel fuel strongly influences the ability of the fuel to reduce PM emissions. Selective labeling of carbon atoms in DBM allowed precise tracing of specific carbon atoms from fuel to emissions of CO2 and PM, and to in-cylinder deposits. The following conclusions are drawn:
1. The 1,4-maleate carbon is not found in exhaust PM nor in-cylinder deposits, indicating that the carbon-oxygen double bond does not break during combustion.
2. The double-bonded carbons in the 2,3-maleate position in DBM do not have a greater tendency to form non-volatile PM than an “average” carbon atom in the fuel, but they do have a greater tendency to form in-cylinder deposits.
3. The 1-butyl carbons in the two butyl-ester groups in DBM fail to retain the adjacent oxygen, resulting in
8

9
the direct production of CO2 approximately 90% of the time. This compares to a model prediction of ~75% of the time, showing that the C-H bond strength at the 1-butyl position assumed in the model was too low. The actual C-H bond strength is probably close to the C-H bond strength at a secondary site in an alkane.
4. The relatively low effectiveness of DBM to attenuate PM emissions is due at least in part to direct production of CO2 from its two ester groups, which effectively wastes nearly half of its oxygen.
5. When the combustion efficiency is high, the isotope ratio of the exhaust CO2 is equal to that of the fuel.
6. The alkyl carbons appear to produce a disproportionate amount of soot under the experimental conditions. Since these carbon atoms were not labeled, it is unclear if a particular fuel component or structure was responsible.
Although not directly measured in these experiments, our results support the argument that distributing oxygen atoms within an oxygenated fuel utilizes the oxygen more efficiently. Avoiding structures like esters that have two oxygen atoms bound to a single carbon prevents the direct production of CO2.
ACKNOWLEDGMENTS
Support for this research was provided by the U.S. Department of Energy, Office of FreedomCAR and Vehicle Technologies. The engine experiments were conducted at the Combustion Research Facility, Sandia National Laboratories, Livermore, California. The accelerator mass spectrometry work was performed under the auspices of the U.S. Department of Energy by the University of California, Lawrence Livermore National Laboratory under Contract No. W-7405-Eng-48. The authors thank program managers Stephen Goguen, Gurpreet Singh, and John Garbak for their support of this work. The authors are also grateful to Caterpillar Inc. for its ongoing commitment to this project, with special thanks to technical contact Kevin Duffy. Thanks also go to Roy Howell of Red Line Inc. for formulating the synthetic lubrication oil that helped make this work possible.
REFERENCES
1. Miyamoto, N., H. Ogawa, N.M. Nurun, K. Obata and T. Arima, "Smokeless, Low NOx, High Thermal Efficiency, and Low Noise Diesel Combustion with Oxygenated Agents as Main Fuel," SAE Paper 980506, SAE Trans. 107, Sect. 4, pp.171-177, 1998.
2. Curran, H.J., E.M. Fisher, P.A. Glaude, N.M. Marinov, W.J. Pitz, C.K. Westbrook, D.W. Layton, P.F. Flynn, R.P. Durrett, A.O. zur Loye, O.C. Akinyemi and F.L. Dryer, “Detailed Chemical Kinetic Modeling of Diesel Combustion with Oxygenated
Fuels,” SAE Paper 2001-01-0653, SAE Trans. 110 2001.
3. Musculus, M.P., J.E. Dec, and D.R. Tree, "Effects of Fuel Parameters and Diffusion Flame Lift-Off on Soot Formation in a Heavy-Duty Diesel Engine," SAE Paper 2002-01-0889, SAE Trans. 111, Sect. 3, 2002.
4. Choi, C.Y. and R.D. Reitz, “An Experimental Study on the Effects of Oxygenated Fuel Blends and Multiple Injection Strategies on DI Diesel Engine Emissions,” Fuel, 78: 1303-1317, 1999.
5. Flynn, P.F., R.P. Durrett, G.L. Hunter, A.O. zur Loye, O.C. Akinyemi, J.E. Dec and C.K. Westbrook, “An Integrated View Combining Laser Diagnostics, Chemical Kinetics, and Emperical Validation,” SAE Paper 1999-01-0509, SAE Trans. 108, Sect 3, 1999.
6. Mueller, C.J., W.J. Pitz, L.M. Pickett, G.C. Martin, D.L. Siebers and C.K. Westbrook, “Effects of Oxygenates on Soot Processes in DI Disel Engines: Experiments and Numerical Simulations,” SAE Paper 2003-01-1791, 2003.
7. Fleisch, T., C. McCarthy, A. Basu, C. Udovich, P. Charbonneau, W. Slodowske, S. Mikkelsen. and J. McCandless, "A New Clean Diesel Technology: Demonstration of ULEV Emissions on a Navistar Diesel Engine Fueled with Dimethyl Ether," SAE Paper 950061, SAE Trans. 104, Sect. 4, 1995.
8. McCormick, R.L., J.D. Ross and M.S. Graboski, "Effect of Several Oxygenates on Regulated Emissions from Heavy-Duty Diesel Engines," Environ. Sci. Tech., 31: 144-1150, 1997.
9. Cheng, A.S. and R.W. Dibble, "Emissions Performance of Oxygenate-in-Diesel Blends and Fischer-Tropsch Diesel in a Compression Ignition Engine," SAE Paper 1999-01-3606, 1999.
10. Gonzalez, M.A., W.J. Piel, T.W. Asmus, W. Clark, J.A. Garbak, E. Liney, M. Natarajan, D.W. Naegeli, D. Yost, E.A. Frame and J.P. Wallace III, “Screening for Advanced Petroleum-Based Diesel Fuels: Part 2—The Effect of Oxygenate Blending Compounds on Exhaust Emissions,” SAE Paper 2001-01-3632, SAE Trans. 110, 2001.
11. Maricq, M.M., R.E. Chase, D.H. Podsiadilik, W.O. Siegel and E.W. Kaiser, "The Effect of Dimethoxy Methane Additive on Diesel Vehicle Particulate Emissions," SAE Paper 982572, SAE Trans. 107, Sect. 4, 1998.
12. Bertoli, C., N. Del Giacomo and C. Beatrice, "Diesel Combustion Improvements by the Use of Oxygenated Synthetic Fuels," SAE Paper 972972, SAE Trans. 106, Sect. 3, 1997.
13. Liotta, F.J. and D.M. Montalvo, "The Effect of Oxygenated Fuels on Emissions from a Modern Heavy-Duty Diesel Engine," SAE Paper 932734, SAE Trans. 102, Sect. 4, 1993.
14. Wang, W.G., D.W. Lyons, N.N. Clark, M. Gautam and P.M. Norton, “Emissions from Nine Heavy Duty Trucks by Diesel and Biodiesel Blend without Engine Modification,” Environ. Sci Tech. 34: 933-939, 2000.
10
15. Buchholz, B.A., A.S. Cheng, R.W. Dibble, C.J. Mueller and G.C. Martin, “Isotope Tracing of Fuel Component Carbon in the Emissions from Diesel Engines,” SAE Paper 2002-01-1942, SAE Trans. 111, 927-938, 2002.
16. Mueller, C.J. and G.C. Martin, “Effects of Oxygenated Compounds on Combustion and Soot Evolution in a DI Diesel Engine: Broadband Natural Luminosity Imaging,” SAE Paper 2002-01-1631, SAE Trans. 111, Sect. 4, 2002.
17. Stoner, M. and T.A. Litzinger, “Effects of Structure and Boiling Point of Oxygenated Compounds in Reducing Diesel Emissions,” SAE Paper 1999-01-1475, 1999.
18. Cheng, A.S., B.A. Buchholz and R.W. Dibble, “The Effect of Oxygenates on Diesel Engine Particulate Matter,” SAE Paper 2002-01-1705, 2002.
19. Siebers, D.L., “Liquid-Phase Fuel Penetration in Diesel Sprays,” SAE Paper 980809, SAE Trans. 107, Sect. 3, 1998.
20. Higgins, B.S., C.J. Mueller and D.L. Siebers, “Measurements of Fuel Effects on Liquid-Phase Penetration of DI Sprays,” SAE Paper 1999-01-0519, SAE Trans. 108, Sect. 3, 1999.
21. Siebers, D.L. and B.S. Higgins, “Flame Lift-Off on Direct-Injection Diesel Sprays Under Quiescent Conditions,” SAE Paper 2001-01-0530, SAE Trans. 110, 2001.
22. Higgins, B.S. and D.L. Siebers, “Measurement of the Flame Lift-Off Location on DI Diesel Sprays Using OH Chemiluminescence,” SAE Paper 2001-01-0918, SAE Trans. 110, 2001.
23. Dec, J.E., “A Conceptual Model of DI Diesel Combustion Based on Laser-Sheet Imaging,” SAE Paper 970873, SAE Trans. 106, Sect. 3, pp.1319-1348, 1997.
24. Homan, H.S. and W.K. Robbins, “A Carbon-14 Tracer Study of the Relative Fractions of Various Fuel Carbons in Soot,” Combust. Flame 63: 177-190, 1986.
25. Schmeider, R.W., “Radiotracer Studies of Soot Formation in Diffusion Flames,” Proc. Combust. Inst., 20: 1025-1033, 1984.
26. Roberts M.L., G.S. Bench, T.A. Brown, M.W. Caffee, R.C. Finkel, S.P. Freeman, L.J. Hainsworth, M. Kashgarian, J.E. McAninch, I.D. Proctor, J.R. Southon and J.S. Vogel, “The LLNL AMS Facility,” Nucl. Instru. Meth. B, 123: 57-61, 1997.
27. Vogel, J.S., J.R. Southon, D.E. Nelson, “Catalyst and Binder Effects in the Use of Filamentous Graphite for AMS,” Nucl. Instrum. Methods Phys. Res. Sect. B, 29: 50-56, 1987.
28. Vogel, J.S., K.W. Turteltaub, R. Finkel and D.E. Nelson, “Accelerator Mass Spectrometry – Isotope Quantification at Attomole Sensitivity,” Anal. Chem. 67: A353-A359, 1995.
29. Buchholz, B.A., C.J. Mueller, G.C. Martin, A.S. Cheng, R.W. Dibble, B.R. Frantz, “Tracing Fuel Component Carbon in the Emissions From Diesel
Engines,” Nucl. Instrum. Methods Phys. Res. Sect. B (in press), 2004.
30. Mueller, C.J. and M.P. Musculus, “Glow Plug Assisted Ignition and Combustion of Methanol in an Optical DI Diesel Engine,” SAE Paper 2001-01-2004, 2001.
31. Yokota, H., Y. Kudo, H. Nakajima, T. Kakegawa and T. Suzuki, "A New Concept for Low Emission Diesel Combustion," SAE Paper 970891, SAE Trans. 106, Sect. 3, 1997.
32. Akagawa, H., T. Miyamoto, A. Harada, S. Sasaki, N. Shimazaki, T. Hashizume and K. Tsujimura, "Approaches to Solve Problems of the Premixed Lean Diesel Combustion," SAE Paper 1999-01-0183, SAE Trans. 108, Sect. 3, 1999.
33. Iwabuchi, Y., K. Kawai, T. Shoji and Y. Takeda, "Trial of New Concept Diesel Combustion System - Premixed Compression-Ignited Combustion," SAE Paper 1999-01-0185, SAE Trans. 108, Sect. 3, 1999.
34. Mueller, C.J., G.C. Martin, T.E. Briggs, and K.P. Duffy, “An Experimental Investigation of In-Cylinder Processes under Dual-Injection Conditions in a DI Diesel Engine,” SAE Paper 2004-01-1843, 2004.
35. Ehmann, W.D. and D.E. Vance, Chap. 10, “Radiotracer Methods” in Radiochemistry and Nuclear Methods of Analysis, John Wiley & Sons, Inc., New York, 1991.
36. Friedlander G. and J.W. Kennedy, Chap. 11, “Tracers in Chemical Applications” in Nuclear and Radiochemistry, John Wiley & Sons, Inc., New York, 1955.
37. Fisher, E.M., W.J. Pitz, H.J. Curran, and C.K. Westbrook, “Detailed Chemical Kinetic Mechanisms for the Combustion of Oxygenated Fuels,” Proc. Combust. Inst., 28:1579-1586, 2000.
38. Bozzelli, J.W. and C.-J. Chen, New Jersey Institute of Technology, Newark, NJ, C-H bond strengths in esters estimated using CBS-Q calculations with corrections from isodesmic reactions, personal communication, 1999.
CONTACT
Bruce A. Buchholz CAMS, L-397 Lawrence Livermore National Laboratory P.O. Box 808 Livermore, CA 94551-9900 VOI: 925-422-1739 FAX: 925-423-7884 Email: [email protected]
ABBREVIATIONS
12C: carbon-12, most common isotope of carbon, natural abundance 98.9%
13C: carbon-13, rare stable isotope of carbon, natural abundance 1.1% 14C: carbon-14, long-lived naturally occurring radioisotope of carbon, natural abundance 1.2 parts per 1012. AMS: accelerator mass spectrometry DBM: dibutyl maleate isotope: atoms of an element that differ in atomic mass; the nuclei of isotopes have the same number of protons but different numbers of neutrons LLNL: Lawrence Livermore National Laboratory NIST: National Institute of Science and Technology NVF: non-volatile fraction
PM: particulate matter SNL: Sandia National Laboratories SRM: standard reference material universal isotopic label: isotope used as labeled tracer is distributed uniformly throughout a molecule VOF: volatile organic fraction
APPENDIX
OVERVIEW OF THE AMS TECHNIQUE – AMS is an isotope ratio mass spectrometry technique where 14C/C mole ratios of carbon samples are normalized to measurements of 4-6 identically prepared standards of known isotope concentration. The isotope ratio of a sample is defined as the total number of moles of 14C from all sources divided by the total number of moles of all carbon isotopes from all sources.
The first step in making an AMS measurement from a carbon sample is to convert all of the carbon in the sample to gaseous CO2 so that the CO2 can be purified. This technique is well established [27]. For a condensed-phase sample (e.g., PM or in-cylinder deposits) on a non-combustible quartz filter, the filter is baked in an oven at 330°C for 2 hours to drive off any volatiles. (In some cases this was not done in order to measure contributions from the volatile organic fraction). The filter is then placed in a quartz tube with solid CuO (and, if the sample is known to contain a large amount of sulfur, silver powder). The quartz tube is evacuated, sealed with a H2/O2 torch, and heated to 900°C for 3.5 hours to oxidize all carbon to CO2. Sulfur and nitrogen oxides, water, and metallic Cu also are produced, as well as AgS (a solid), if silver powder was added.
For exhaust-gas samples in Tedlar bags, a separate gas-handling rig is used to separate the CO2 from unburned hydrocarbons, CO, and other organic species using a series of cold traps. After separation, a 1-5 mg C subsample of CO2 is transferred to a quartz combustion tube and sealed with a H2/O2 torch. From this point on, processing is identical for gaseous and condensed-phase samples since all carbon occurs in the form of CO2.
After each quartz sample tube cools to room temperature, it is placed in a flexible, evacuated chamber. The tube is broken and the gaseous species are transferred for analysis. Any filter remnants, reduced Cu, excess CuO, and AgS are left behind because they are in the solid phase. Water vapor, SO2, and NO2 are removed from the gaseous sample by passing the sample through an isopropanol/dry-ice cold trap. Passing the remaining gas mixture through a liquid-nitrogen cold trap condenses CO2, and any non-condensing gases (e.g., N2, NO, CO) are pumped off and discarded. The CO2 sample is now pure.
The pure CO2 sample is allowed to sublimate in a small fixed volume, after which its partial pressure is measured to determine the total mass of carbon in the sample. This method is more sensitive and more accurate than traditional gravimetric methods that have been previously reported in the literature. It is used to avoid several factors that can cause traditional gravimetric measurements of filters to be misleading: 1) it is difficult to measure 100-µg variations on a 100-mg filter; 2) the filters are fragile and it is easy to lose small pieces on the soot-free border when handling with forceps; 3) the PM deposited on quartz filters has very high specific surface area and readily absorbs water and other molecules from the vapor phase.
After the total carbon mass is measured, the CO2 is cryogenically transferred to individual reactors where it is reduced with hydrogen gas in the presence of an iron catalyst to produce graphitic carbon nanotubes and water. The water is condensed on individual cold fingers adjacent to the reactors. The mixture of solid carbon and iron powder is poured into an aluminum sample holder where it is pounded into a solid sample pellet. The sample holder is placed in the ion source of the accelerator, where it is bombarded with a beam of Cs+ ions, which causes a stream of C- (and ~5% C2-) ions to be produced and drawn into the accelerator.
Operation of the accelerator has been described in detail elsewhere [28]. The AMS instrument separates 14C ions from the sample and “counts” them individually by measuring charge pulses deposited by a 14C-ion beam. At the same time, the current carried by a 13C-ion beam is measured. It is known that
uu kS ⎟
⎟⎠
⎞⎜⎜⎝
⎛=
C
C13
14, (A1)
11
where Su is the signal (14C-ion charge divided by 13C-ion current) from the sample, k is a proportionality constant, and (14C/13C)u is the 14C to 13C isotope ratio of the sample. The signal from a standard reference material with a known isotope ratio also can be measured:
ss kS ⎟
⎟⎠
⎞⎜⎜⎝
⎛=
C
C13
14. (A2)
Equations A1 and A2 can be used to show
ss
u
uSS
⎟⎟⎠
⎞⎜⎜⎝
⎛=⎟
⎟⎠
⎞⎜⎜⎝
⎛
C
C
C
C13
14
13
14. (A3)
However, the parameter we wish to know is
uuuR ⎟
⎟⎠
⎞⎜⎜⎝
⎛
++≡⎟
⎟⎠
⎞⎜⎜⎝
⎛≡
CCC
CCC
141312
1414. (A4)
Information about the relative concentrations of 14C, 13C, and 12C in the sample and the standard must be known to obtain Ru.
Stable isotope ratio mass spectrometry (IRMS, which is conducted using a different instrument than AMS) is used to measure (13C/C)u and (13C/C)s, where
( )su⎟⎠⎞
⎜⎝⎛+=⎟
⎠⎞
⎜⎝⎛
C
CC
C
C13
1313 1 δ . (A5)
Carbon sources may have slightly different 13C/C ratios due to the chemical processes that produced them. Discussions of isotope tracing and the “isotope effect” are available in basic radiochemistry texts [35,36]. The value of δ13C for all samples in this study was found to be -0.027, indicating no isotope effect. Equations A1-A5 can be used to write
( )CCC
C
C13
13
13
14
1 δ+=⎟
⎟⎠
⎞⎜⎜⎝
⎛⎟⎟⎠
⎞⎜⎜⎝
⎛=
s
us
uuu S
SRR . (A6)
The isotope ratio of the standard, Rs = (14C/C)s, is known. Su and Ss are measured using AMS, and δ13C is measured using IRMS; therefore, Ru is known.
CORRECTION FOR BACKGROUND AND CONTAMINATION EFFECTS – The isotope ratios of individual fuel components can generally be measured prior to mixing a test fuel. The isotope ratio of the 14C-labeled fuel tracer is 14Ctracer/Ctracer. In this study, the tracer is 14C-labeled DBM. The contribution from the other fuel components to the measured ratio is 14Cfuel/Cfuel. The background contribution is 14Cbk/Cbk, and the possibility of contamination to the sample is indicated as 14Ccon/Ccon, as shown in Eq. A7.
( )( )
uconbkfueltracer
uconbkfueltracer
u
uuR
CCCC
CCCC
C
C
+++
+++==
1414141414 (A7)
In theory, all the components in Eq. A7 need to be determined by a series of control experiments. In
practice, some components can be minimized by experimental design.
All unburned lube oil is removed from the condensed-phase sample filters by baking prior to analysis. Aside from this difference, the methodology for removing background and contamination effects is effectively the same regardless of the sample type (i.e., gaseous CO2, PM, or in-cylinder deposits) in this work.
First, the isotope ratio of a sample of unlabeled fuel is measured. No 14C was expected because the fuel used in this study was of petroleum origin. The measurements verified that no 14C was present. Thus, (14Cfuel)u = 0 in Eq. A7.
Second, samples are acquired under motored conditions and analyzed. For these “motored” samples,
( )( )motconbk
motconbkmotR
CC
CC
+
+=
1414. (A8)
Since Rmot and (Cbk + Ccon)mot are both measured, (14Cbk + 14Ccon)mot is known. It is assumed that (14Cbk + 14Ccon) and (Cbk + Ccon) are the same whether the engine is motored or fired. Using this information along with the fact that Cu = Ctracer + Cfuel + Cbk + Ccon is measured during sample preparation, (Ctracer + Cfuel)u in Eq. A7 is known.
Third, “blank” samples are acquired. In the case of PM sampling, the blank is just a filter that is exposed to lab air for the duration of a sample acquisition and is then handled in the same manner as a filter loaded with PM. It is assumed that the blank samples contain no 14Ccon or Ccon. This seems reasonable since the largest contributor to Ccon is expected to be burned lube oil, which will not be collected on, e.g., a filter exposed to (or a Tedlar bag filled with) lab air. Isotope-ratio measurements of the lube oil showed that it has no measurable 14C content. The exposure of blanks to other sources of contamination (e.g., finger oils, fibers from cleaning cloths, hairs, etc.) was minimized by procedural means. Hence,
( )( )blankbk
blankbkblankR
C
C14
= . (A9)
Since Rblank and (Cbk)blank are both measured, (14Cbk)blank is known. Furthermore, it is assumed that (14Cbk)blank = (14Cbk)u.
Using the above line of reasoning, all of the terms in Eq. A7 are known, and the desired isotope ratio
fueltracer
tracerRCC
C
+=
14. (A10)
can be determined.
12