Using best–worst scaling to explore perceptions of relative responsibility for ensuring food...
29
1 USING BEST-WORST SCALING TO EXPLORE PERCEPTIONS OF 1 RELATIVE RESPONSIBILITY FOR ENSURING FOOD SAFETY 2 3 PUBLISHED IN FOOD POLICY 4 Seda Erdem, Dan Rigby, and Ada Wossink. (2012). “Using BestWorst Scaling to 5 Explore Perceptions of Relative Responsibility for Ensuring Food Safety“. Food 6 Policy, 37(6): 661670. 7 8 Abstract 9 We examine stakeholders’ perceptions of the share of the overall responsibility of each stage in 10 the food supply chain has in ensuring that the meat people cook and eat at home is safe to 11 consume. We elicit these perceptions of relative responsibility via surveys using the Best-Worst 12 Scaling technique and analyse the data via Bayesian estimation of mixed logit models. Results 13 are reported for two groups of stakeholders: consumers and farmers, and for two meat food 14 chains: chicken and beef. The results reveal that consumers tend to think farmers are more 15 responsible for ensuring meat safety than farmers do. Similarly, farmers tend to think 16 consumers have a greater degree of responsibility than consumers believe they have 17 themselves. Such beliefs might affect stakeholders’ willingness to take actions and reduce 18 hazards in the supply chain. From a policy perspective, the research findings provide useful 19 insights to support policymakers and other decision-makers in the industry in developing 20 mitigation strategies. Communication with consumers and farmers about emerging food safety 21 problems in a supply chain and their involvement in proactive practices would need to be 22 attuned to their subjective perceptions of relative responsibilities in order for integrated risk 23 management systems to be effective. 24 25 JEL codes: Q12, Q18, Q51. 26 Keywords: Best Worst Scaling; Maximum Difference Scaling; responsibility; perceptions; 27 food safety. 28 29
Transcript of Using best–worst scaling to explore perceptions of relative responsibility for ensuring food...
1
USING BEST-WORST SCALING TO EXPLORE PERCEPTIONS OF 1
RELATIVE RESPONSIBILITY FOR ENSURING FOOD SAFETY 2
3
PUBLISHED IN FOOD POLICY 4
Seda Erdem, Dan Rigby, and Ada Wossink. (2012). “Using Best-‐Worst Scaling to 5 Explore Perceptions of Relative Responsibility for Ensuring Food Safety“. Food 6 Policy, 37(6): 661-‐670. 7
8
Abstract 9
We examine stakeholders’ perceptions of the share of the overall responsibility of each stage in 10
the food supply chain has in ensuring that the meat people cook and eat at home is safe to 11
consume. We elicit these perceptions of relative responsibility via surveys using the Best-Worst 12
Scaling technique and analyse the data via Bayesian estimation of mixed logit models. Results 13
are reported for two groups of stakeholders: consumers and farmers, and for two meat food 14
chains: chicken and beef. The results reveal that consumers tend to think farmers are more 15
responsible for ensuring meat safety than farmers do. Similarly, farmers tend to think 16
consumers have a greater degree of responsibility than consumers believe they have 17
themselves. Such beliefs might affect stakeholders’ willingness to take actions and reduce 18
hazards in the supply chain. From a policy perspective, the research findings provide useful 19
insights to support policymakers and other decision-makers in the industry in developing 20
mitigation strategies. Communication with consumers and farmers about emerging food safety 21
problems in a supply chain and their involvement in proactive practices would need to be 22
attuned to their subjective perceptions of relative responsibilities in order for integrated risk 23
management systems to be effective. 24
25
JEL codes: Q12, Q18, Q51. 26
Keywords: Best Worst Scaling; Maximum Difference Scaling; responsibility; perceptions; 27 food safety. 28
29

2
Introduction 30
There has been a growing concern over the human health risks posed by biological, chemical, 31
and physical hazards in the food chain since the first appearance of the term ‘food scares’ in the 32
print media in the mid-1980s (Knowles et al., 2007). An increase in the number of reported 33
food poisoning cases and media coverage have emphasised the need for better safety practices 34
and management of control and information systems (Henson and Caswell, 1999; Garcia et al.; 35
2007; Mensah and Julien, 2011). 36
Following the BSE crisis in 1996, food safety administration underwent reorganization at the 37
EU level and this contributed to an overhaul of existing frameworks for the governance of food 38
safety in most member states (e.g., Bergeaud-Blackler and Ferretti, 2006; Halkier and Holm, 39
2006; Lenz, 2006; Nielsen, 2006). The outcome has been a shift in the focus from a food 40
provisioning perspective to consumer interests and the protection of consumer health. In 41
addition, a change in the societal perspective of the role of the consumer led to modifications of 42
the governance of food risks in many countries as well as at the EU level (Holm and Halkier, 43
2009; Houghton et al., 2008). In the new regulations individual consumers are called upon as 44
independent actors who need to be fully informed about food products and need to be engaged 45
in the decision making process. More integrated management systems that take into account the 46
linked nature of the stages of the food chain (i.e., feed supplier to fork) have been adopted 47
which recognize that at each stage of the food chain, including the domestic kitchen, has a 48
potential impact on the risks to humans associated with the consumption of unsafe foods. 49
Consumers are increasingly assigned responsibility for self-protection (Fisher et al., 2005) 50
rather than the historically more passive role as solely food purchasers. 51
Recent research has focussed on how food risks and food safety are perceived by consumers 52
(e.g., Williams and Hammitt, 2001; Magnusson and Hurti, 2002; Redmond and Griffith, 2004; 53
Siegrist et al., 2009; Webster et al., 2010; Marette et al., 2010) and how they are traded-off 54
against other food characteristics by consumers (e.g., Loureiro and Umberger, 2011; van 55
Wezemael et al., 2011). Another line of research has investigated consumers’ trust in various 56
agents that provide information about food safety, new food technologies and products, as well 57
as consumers’ responses to communication about food risk management (e.g., Frewer et al., 58
2003; van Kleef et al., 2006; Lenz, 2006; Mazzochi et al. 2008; Cope et al., 2010). In contrast, 59
there is little research on how consumers perceive their own responsibility for ensuring food 60
safety and locate this within a broader perspective on responsibility along the chain as a whole. 61
3
The willingness of consumers and other food chain participants to take actions that reduce 62
hazards to human health is influenced by many factors. These include their awareness of these 63
hazards, their ability to take action and the extent to which they think their actions will reduce 64
hazards, as well as the extent to which they believe that even if they do undertake risk-reducing 65
behaviours, the effects of these are, or will be, reduced or eliminated by the actions of others in 66
the chain. In addition, there is variation among individuals’ sense of personal responsibility and 67
willingness to fulfil their own responsibility. 68
The limited literature on consumers’ perceptions of food safety responsibility has a distinct EU 69
perspective. The findings are divergent despite the narrow geographical focus. Kjaernes et al. 70
(2007) surveyed respondents from six EU countries to investigate perceptions of responsibility 71
with respect to food safety, nutrition, animal welfare and the promotion of a healthy diet. 72
Through qualitative statements, consumers compared their own responsibility for food safety 73
with that of governmental agencies. The study did not include other stages of the food chain. 74
The results showed considerable variations between countries with Italians most likely to ‘fully 75
agree’ that consumers were more responsible than government for food safety (35%), followed 76
by Britons (34%), Portuguese (30%), Danes (27%), Germans (25%), and Norwegians (13%). 77
Similarly, Krystallis et al. (2007) presented European consumers and experts with statements 78
on responsibility for protection from food risks, along with other issues, such as consumers’ 79
awareness of food safety, priorities in food risk management, and the role of the media. 80
Krystallis et al. found that consumers emphasised their own responsibility whereas experts 81
viewed food safety as a shared responsibility of mainly the state and producers with a limited 82
role for self-protection by consumers. A contrasting result is reported by van Wezemeal et al. 83
(2010) who conducted focus group sessions in Germany, Spain, France, and the UK and asked 84
beef consumers to indicate who they think is responsible for beef safety. They found that 85
consumers perceived their own responsibility for beef safety as low and tended to allocate 86
responsibility to actors in the early stages of the supply chain, such as farmers, abattoirs, and 87
inspectors. Leikas et al. (2009) found that Finnish consumers allocated responsibility 88
differently depending on the type of food risk, with higher perceived personal controllability 89
predicting higher personal responsibility. This study also showed that the more the food risk is 90
viewed as man-made rather than naturally occurring, the more responsibility is assigned to 91
industry, retailers and society as opposed to consumers themselves. 92
4
In this paper, we analyse both consumers’ and farmers’ perceptions of the relative 93
responsibility associated with sequential stages of the meat supply chain. Compared to the 94
related works discussed above, this research contributes to the literature in three ways. First, we 95
contrast the perception of two stakeholder groups (consumers and farmers) of the responsibility 96
for ensuring food safety in the entire supply chain rather than at a specific stage. The supply 97
chain in our study is composed of ten stages. The multi-dimensionality of the research provides 98
us with more information on the perceptions of food-safety responsibility across the food chain 99
as well as on the difference between stakeholder groups. The approach could, and we believe 100
should, be extended to include agents at other stages of the chain, including abattoir workers, 101
retailers etc. We limit ourselves to just two groups to both highlight the approach and because 102
of the greater challenges involved in gaining access to those involved at some other stages. 103
Second, we focus on two different food systems, namely the beef and the chicken supply chain, 104
and thus compare different food risks. Recent food borne outbreaks and crises associated with 105
beef in the UK (e.g., E. coli 0157 outbreaks and BSE) and the scale of the disease burden from 106
Salmonella and Campylobacter associated with the handling of chicken prepared in domestic 107
kitchen, played an important role in the selection of these food types. 108
From a policy perspective, we believe that the investigation of perceptions of different 109
stakeholder groups on responsibility for food safety, when done at an early stage of strategy 110
development, can provide useful insights to support policymakers and other decision-makers in 111
the industry. For modification of the roles and responsibilities of actors in food safety systems 112
to be effective, account need to be taken of how stakeholders see their own role and 113
responsibility in the food chain. For example, stakeholders might think that their actions to 114
prevent hazards are (likely to be) undermined by others in the chain who feel less responsible 115
for the safety of the food considered. Such a dilemma may then result in a lack of motivation 116
for risk reducing actions. Policy-makers, in this respect, may control such situations by 117
identifying critical control points at each stage of the supply chain and communicating them 118
with each stakeholder group in the chain. This may also enhance awareness among 119
stakeholders about food safety and preventive controls at different stages of the chain. 120
The final contribution of the research is the means by which we investigate stakeholders’ 121
perceptions of relative responsibility. While the majority of papers exploring perceptions of 122
relative responsibility have used focus groups or, for example, responses to stimuli using Likert 123
scales (e.g., ‘strongly agree’ to ‘strongly disagree’) we employ a different methodology to 124
5
identify rankings and scaled allocations of responsibility within the food chain. The innovative 125
technique employed is Best Worst Scaling (BWS), also known as Maximum Difference 126
Scaling, which allows direct assessment of perceptions of relative responsibility for food safety. 127
As we explain in Section 2 while BWS has been developed in the market research literature to 128
understand the relative importance of product or service attributes, we apply it to an abstract 129
concept namely ‘responsibility for food safety’, rather than to a product or a service as is 130
common in recent applications (Lusk and Briggeman, 2009; Mueller et al., 2009; Hein et al., 131
2008). 132
The rest of the paper is organised as follows: Section 2 introduces the methodology, the design 133
of the survey used in achieving the study’s objectives, and the data; Section 3 explains the 134
models estimated to analyse perceptions of responsibility; Section 4 discusses the results before 135
the paper is concluded. 136
1 Methodology 137
2.1 Best-Worst Scaling (BWS) Technique 138
Best-Worst Scaling (BWS) is a form of conjoint analysis that has recently attracted attention in 139
the food and health economics literature (Flynn et al., 2007; Lusk and Briggeman, 2009). The 140
aim is to elicit the relative weight or importance that respondents allocate to items in 141
(sometimes large) sets. Typically these items are product or service attributes where the 142
researcher seeks to understand their relative importance. BWS studies elicit this information in 143
a distinctive form which we now describe. The statistical model estimated with the BW data is 144
described in Section 3. 145
The BWS method was developed by Finn and Louviere (1992) as an extension of Thurstone’s 146
(1927) Method of Paired Comparison (MPC) to elicit consumer preferences. The main idea of 147
MPC is to elicit trade-offs between paired items. BWS is a more general version of MPC since 148
BWS allows the comparison of more than two items in a task in which a respondent chooses 149
the ‘best’ and ‘worst’ (or ‘most’ and ‘least’) items. The pair of items chosen as best/worst 150
exhibits the maximum difference in preference; hence the method is also called Maximum 151
Difference Scaling. The paired best/worst choice provides a great deal of information on 152
consumers’ preferences over the items featured in the set. To illustrate this, assume a subset of 153
four items (e.g., A, B, C, D) selected from a larger set. Assume a respondent chooses A as the 154
‘best’ and D as the ‘worst’ items among the four items. These two selections provide 155
6
information on five of the six possible paired comparisons; we know the respondent prefers A 156
over B, C and D, and also prefers B and C over D. The quantity of preference information 157
obtained from the best/worst selection is the main advantage of BWS over MPC. This even 158
becomes more significant when respondents are asked to make a series of choices which is 159
typical in BWS surveys. 160
BWS is typically employed when preferences are sought over a large number of items. Their 161
ranking according to their importance/preferability may especially become difficult, and prone 162
to anomalous behaviour, when the number of items increases. Rather than ranking the full 163
(large) set of item, BWS breaks this task into more cognitively manageable size. As in the 164
example (i.e., A, B, C, and D), a choice task comprises of a subset of a large set and 165
respondents are asked to make best and worst choices in a series of sets. The amount of 166
information obtained from such repetitive tasks is too large. 167
Other advantages of BWS concern task comprehension and the avoidance of a scale-use bias. 168
The BWS approach is argued to be relatively easy for most respondents to understand. There is 169
evidence that people use better judgment when they only need to evaluate preferences at the 170
extreme rather than preferences in many levels (Louviere, 1993; Marley and Louviere, 2005). 171
As respondents only choose at the extreme, the process is considered ‘scale-free’ (Cohen and 172
Orme, 2004) eliminating the possibility of a scale-use bias (Baumgartner and Steenkamp, 173
2001). Scale bias may involve respondents using only a part of the scale. It avoids ambiguity 174
and differences in interpretation which are endemic to approaches which record responses to 175
stimuli on Likert or Visual Analogue scales. For example, Likert-based approaches require 176
respondents to map their preferences on to the scale in the same way, that is, interpret terms 177
such as ‘strongly agree’ in the same way. Such ambiguity is absent when one only has to select 178
the most and least important items within a set. 179
The BWS approach has been used recently in a number of research areas to evaluate public 180
perceptions of intangible attributes. For example, Auger et al. (2007) examined the attitudes of 181
consumers towards social and ethical issues, such as recycling and human rights, across six 182
countries while Flynn et al. (2007, 2008) examined elderly people’s evaluation of quality of life 183
in terms of different attributes such as attachment, security, enjoyment and control. 184
In this paper, we use BWS to characterise the share of overall responsibility for ensuring food 185
safety that farmers and consumers assign to each stage in the food chain. The collected best-186
7
worst data is analysed to retrieve the estimates for the relative size of responsibility of stages 187
for respondents, which is then used to measure the rankings of all stages in the supply chain 188
with respect to their perceived level of responsibility. We do this, separately, with respect to the 189
beef and chicken that people cook and eat at home. 190
2.2 Survey Design 191
The meat supply chain referred to in the surveys comprised ten stages: feed supplier, farmer, 192
live animal transport, abattoir, meat transport, processor, wholesaler, retailer, and consumers. 193
We further classified retailers as either ‘supermarket’ or ‘local butcher’ to analyse whether 194
respondents view the responsibility associated with these different types of retailer differently. 195
This insight is of interest in particular given food poisoning outbreaks associated with butchers 196
in the UK These include the 2005 E. coli outbreak in South Wales in which contaminated meat 197
was sold by a butcher who did not comply with several Food Safety Regulations resulting in 198
157 identified cases (Pennington, 2009) and the 1996 E. coli outbreak in Scotland in which a 199
butcher sold unfit meat to the public resulting in 496 cases of E. coli O157 (The Pennington 200
Group, 1998). We did not include competent authorities (FSA, Defra, etc) among the supply 201
chain stages to which responsibility shares were to be assigned. This would have introduced 202
ambiguity and overlap into the process – for example if one viewed abattoirs as the most 203
responsible stage within a set, and thought they should undergo a more rigorous inspection 204
regime, then it would be unclear as whether the abattoir or these competent authorities should 205
be identified as the most responsible stage within the set. 206
The experimental design comprised eight blocks of eight sets, and each set included five items 207
(i.e., stages). Each block was then randomly assigned to each respondent. As mentioned, the 208
number of items included in the BWS tasks is important. Tasks comprising more than five 209
items have been to shown to result in greater confusion and fatigue undermining the extra 210
preference information the larger set can in principle yield (Cohen and Orme, 2004; Sawtooth 211
Software, 2007). 212
The selections of five stages in choice tasks satisfy the optimal design characteristics: 213
frequency balance, orthogonality, positional balance, and connectivity among tasks. One-way 214
frequencies show that each stage appears across all eight versions 32 times (i.e., perfectly 215
balanced). The two-way frequencies show that each stage appears 14 times on average with 216
every other stage with a standard deviation of 0.46 (i.e., nearly orthogonal). Positional 217
8
frequencies show that each item appears 6.4 times on average with a standard deviation of 0.49. 218
After ensuring a balanced and nearly orthogonal survey design, tasks were randomised and a 219
participant was randomly assigned to a block. 220
Figure 1 shows an example BWS task used in the surveys. The final framing of the BW survey 221
questions was refined after piloting. This allowed us to identify confusions in wording, lack of 222
understanding, and the time needed to complete the survey. After this pilot, we fine-tuned our 223
design and revised some of the descriptions and presentations rather than the substantive core 224
of the questionnaires. Two versions of the survey were used: the first asked people where they 225
thought lay the greatest responsibility and the least responsibility for ensuring the beef they eat 226
is safe; the second asked the same question regarding chicken (hereafter referred to as ‘beef’ 227
and ‘chicken’ survey). 228
The reason for investigating perceptions of responsibility at beef and chicken supply chains is 229
that the prevalence of food cases is attributable to these products. As reported in Gormley et al. 230
(2011), most of the foodborne outbreaks recorded in England and Wales from 1992 to 2008 are 231
attributable to poultry meat (19.1%), followed by miscellaneous foods1(17.6%) and red meat 232
(15.7%). Focussing on two supply chains allows us to explore whether people perceive 233
responsibility differently in these chains due to recent food borne outbreaks and crises 234
associated with beef in the UK (e.g., E. coli 0157 outbreaks and BSE) and the scale of the 235
disease burden from Salmonella and Campylobacter associated with the handling of chicken 236
prepared in domestic kitchen. 237
2.3 Data Collection 238
We conducted the paper-pen surveys with two stakeholder groups: public and farmers in 239
England and Wales in the summer of 2009. We sampled the non-farming public (hereafter 240
called ‘consumers’) in the city of Manchester at various points randomly, and farmers at five 241
agricultural shows that have high coverage in the UK (Cheshire, Royal Welsh, Nantwich, 242
Garstang, and Romiley Young Farmers Shows)2. Among these shows, the Cheshire and Royal 243
1 Miscellaneous foods include buffet foods, sandwiches and other dishes comprising multiple ingredients.
2 We are aware that there is a possible selection bias in sampling only at agricultural shows. A desire to be able to speak to respondents and clarify any issues regarding interpretation of the survey, combined with the budget constraint, meant we opted to sample farmers at agricultural shows. A more
9
Welsh Shows are the biggest agricultural summer events in the UK. There were approximately 244
80,000 and 220,000 visitors to the Cheshire and Royal Welsh Shows respectively, with farmers 245
from across the country attending the shows. Thus, the farming sample included farmers 246
experienced with a wide range of livestock production systems, such as beef, dairy, sheep, goat, 247
pig and poultry. More than half of the farming sample (51%) was made up of livestock farmers 248
(e.g., dairy, beef, goat, and sheep), 42% was both livestock and poultry farmers, and only 1% 249
was poultry farmers. We excluded from the study consumers who attended the farm shows by 250
asking them whether they work on farms, are involved in farming practices or help friends and 251
family. 252
We interviewed 267 respondents (110 consumers, 157 farmers) who were randomly assigned to 253
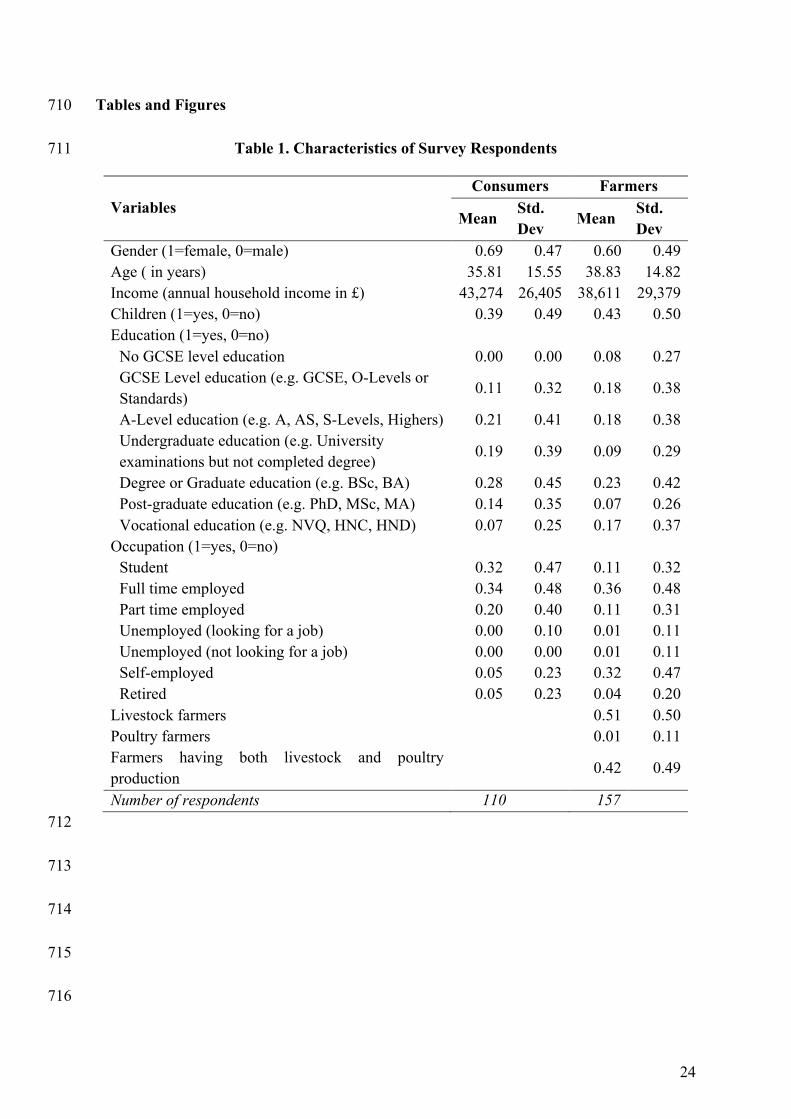
a beef or chicken survey approximately equally. Summary statistics for the respondents are 254
given in Table 1. The two samples are quite similar with respect to the variables, such as 255
gender, age, and having children or not. Both samples are female dominated and most 256
respondents have a completed degree as their highest qualification (28% consumers, 23% 257
farmers) and have full-time jobs (34% consumers, 36% farmers). A higher percentage of 258
consumers are in post-graduate education compared to vocational education, whereas a higher 259
percentage of farmers are in vocational education than in post-graduate education. A 260
comparison with 2001 UK census data shows that the respondents in our study were similar to 261
the general UK population with respect to age, gender, and employment status (majority 30-44 262
years old (23%), female (51%), and full-time employed (41%) in the population). 263
2 Model 264
We analyse respondents’ perceptions of the most and least responsible stages of the supply 265
chain and estimate their allocations of relative responsibility among the stages via estimation of 266
choice models based on Random Utility Theory (RUT). RUT, initiated by Thurstone (1927) 267
and generalised by McFadden (1974), is concerned with modelling human decision-making. It 268
does so in a probabilistic rather than deterministic framework. The general form of the RUT 269
model can be written as: 270
diversely distributed sample could have been achieved via postal or web based sampling but at the cost of personal interaction with respondents which was possible at the shows.
10
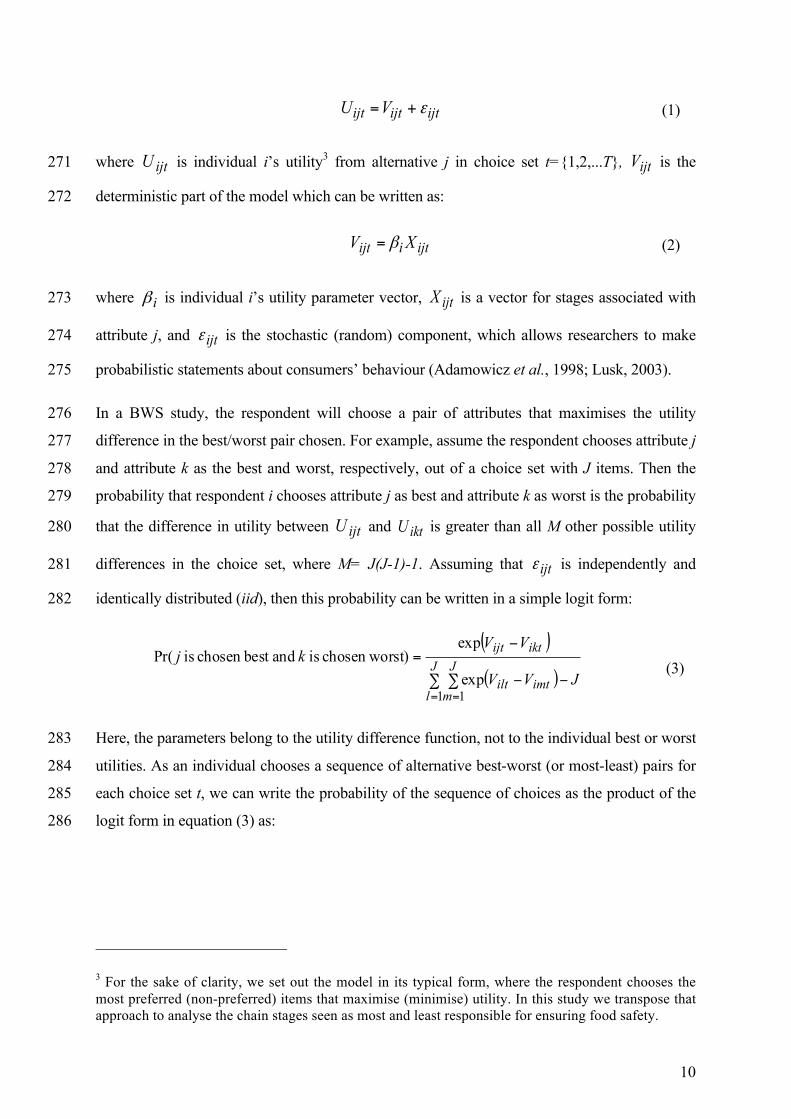
ijtijtijt VU ε+= (1)
where ijtU is individual i’s utility3 from alternative j in choice set t={1,2,...T}, ijtV is the 271
deterministic part of the model which can be written as: 272
ijtiijt XV β= (2)
where iβ is individual i’s utility parameter vector, ijtX is a vector for stages associated with 273
attribute j, and ijtε is the stochastic (random) component, which allows researchers to make 274
probabilistic statements about consumers’ behaviour (Adamowicz et al., 1998; Lusk, 2003). 275
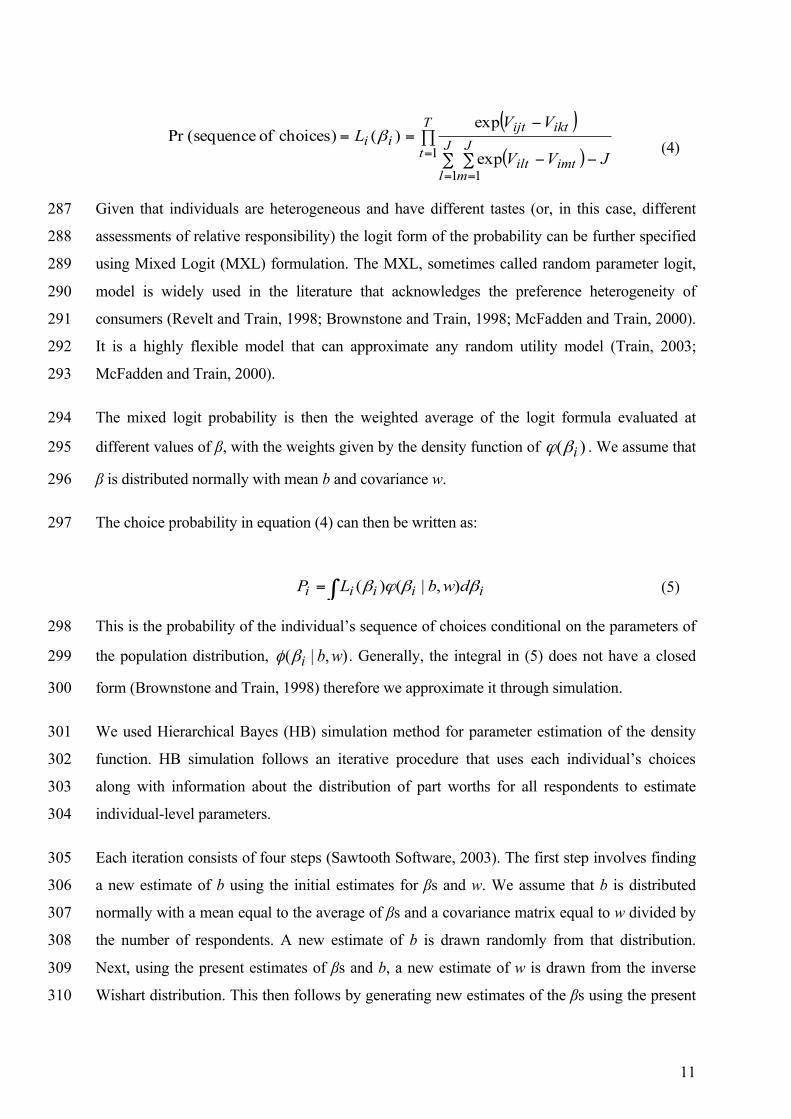
In a BWS study, the respondent will choose a pair of attributes that maximises the utility 276
difference in the best/worst pair chosen. For example, assume the respondent chooses attribute j 277
and attribute k as the best and worst, respectively, out of a choice set with J items. Then the 278
probability that respondent i chooses attribute j as best and attribute k as worst is the probability 279
that the difference in utility between ijtU and iktU is greater than all M other possible utility 280
differences in the choice set, where M= J(J-1)-1. Assuming that ijtε is independently and 281
identically distributed (iid), then this probability can be written in a simple logit form: 282
( )( )∑ ∑ −−
−=
= =
J
l
J
mimtilt
iktijt
JVV
VVkj
1 1exp
expst)chosen wor is andbest chosen is Pr(
(3)
Here, the parameters belong to the utility difference function, not to the individual best or worst 283
utilities. As an individual chooses a sequence of alternative best-worst (or most-least) pairs for 284
each choice set t, we can write the probability of the sequence of choices as the product of the 285
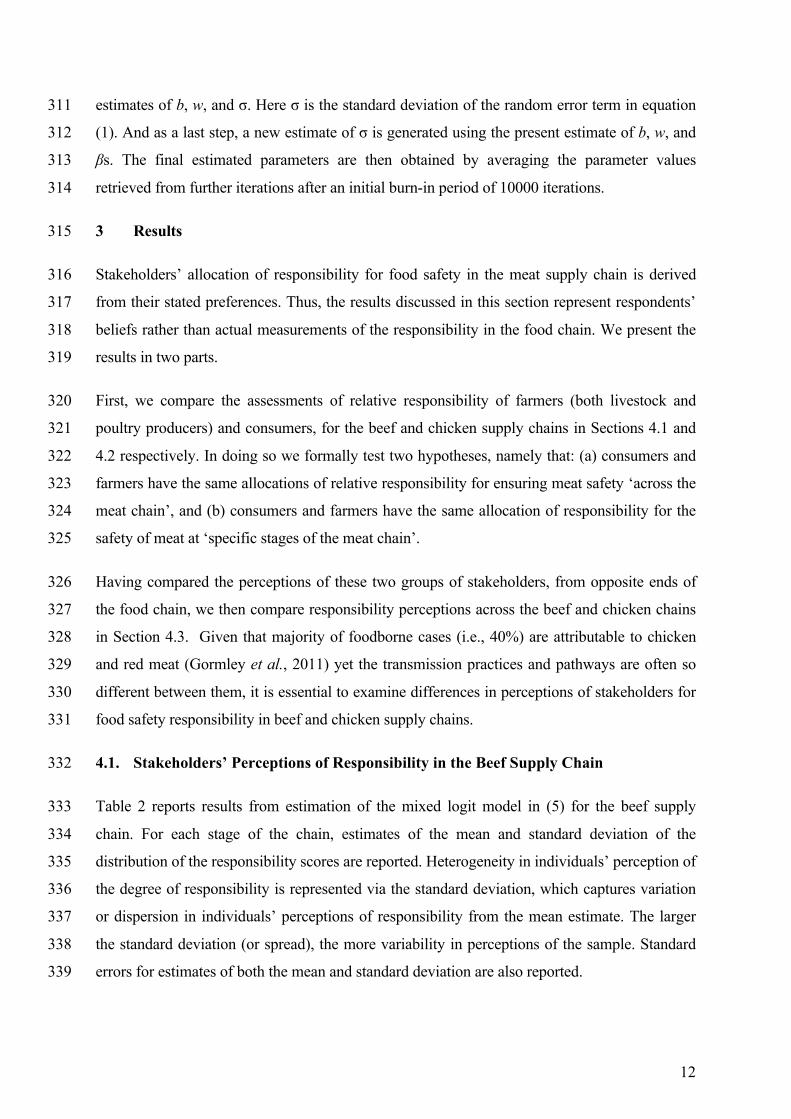
logit form in equation (3) as: 286
3 For the sake of clarity, we set out the model in its typical form, where the respondent chooses the most preferred (non-preferred) items that maximise (minimise) utility. In this study we transpose that approach to analyse the chain stages seen as most and least responsible for ensuring food safety.
11
( )( )
∏
∑ ∑ −−
−==
=
= =
T
t J
l
J
mimtilt
iktijtii
JVV
VVL
1
1 1exp
exp)( choices) of (sequencePr β
(4)
Given that individuals are heterogeneous and have different tastes (or, in this case, different 287
assessments of relative responsibility) the logit form of the probability can be further specified 288
using Mixed Logit (MXL) formulation. The MXL, sometimes called random parameter logit, 289
model is widely used in the literature that acknowledges the preference heterogeneity of 290
consumers (Revelt and Train, 1998; Brownstone and Train, 1998; McFadden and Train, 2000). 291
It is a highly flexible model that can approximate any random utility model (Train, 2003; 292
McFadden and Train, 2000). 293
The mixed logit probability is then the weighted average of the logit formula evaluated at 294
different values of β, with the weights given by the density function of )( iβϕ . We assume that 295
β is distributed normally with mean b and covariance w. 296
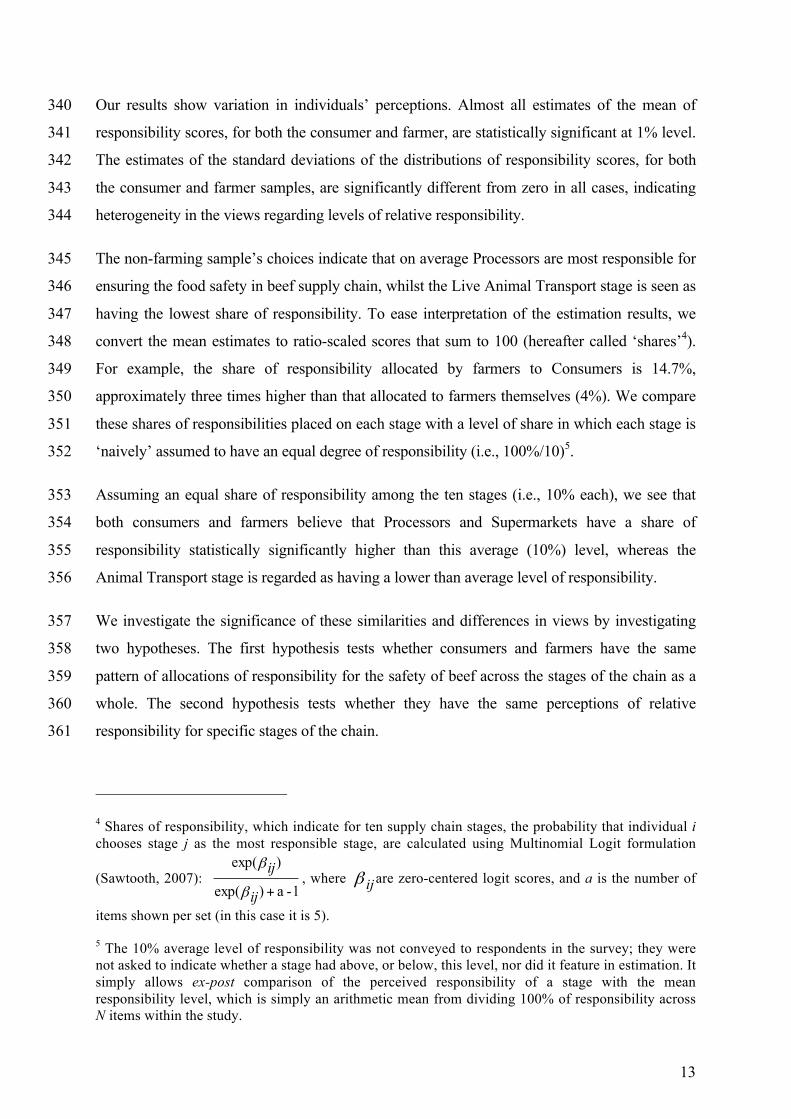
The choice probability in equation (4) can then be written as: 297
iiiii dwbLP ββϕβ ),|()(∫= (5)
This is the probability of the individual’s sequence of choices conditional on the parameters of 298
the population distribution, ),|( wbiβφ . Generally, the integral in (5) does not have a closed 299
form (Brownstone and Train, 1998) therefore we approximate it through simulation. 300
We used Hierarchical Bayes (HB) simulation method for parameter estimation of the density 301
function. HB simulation follows an iterative procedure that uses each individual’s choices 302
along with information about the distribution of part worths for all respondents to estimate 303
individual-level parameters. 304
Each iteration consists of four steps (Sawtooth Software, 2003). The first step involves finding 305
a new estimate of b using the initial estimates for βs and w. We assume that b is distributed 306
normally with a mean equal to the average of βs and a covariance matrix equal to w divided by 307
the number of respondents. A new estimate of b is drawn randomly from that distribution. 308
Next, using the present estimates of βs and b, a new estimate of w is drawn from the inverse 309
Wishart distribution. This then follows by generating new estimates of the βs using the present 310
12
estimates of b, w, and σ. Here σ is the standard deviation of the random error term in equation 311
(1). And as a last step, a new estimate of σ is generated using the present estimate of b, w, and 312
βs. The final estimated parameters are then obtained by averaging the parameter values 313
retrieved from further iterations after an initial burn-in period of 10000 iterations. 314
3 Results 315
Stakeholders’ allocation of responsibility for food safety in the meat supply chain is derived 316
from their stated preferences. Thus, the results discussed in this section represent respondents’ 317
beliefs rather than actual measurements of the responsibility in the food chain. We present the 318
results in two parts. 319
First, we compare the assessments of relative responsibility of farmers (both livestock and 320
poultry producers) and consumers, for the beef and chicken supply chains in Sections 4.1 and 321
4.2 respectively. In doing so we formally test two hypotheses, namely that: (a) consumers and 322
farmers have the same allocations of relative responsibility for ensuring meat safety ‘across the 323
meat chain’, and (b) consumers and farmers have the same allocation of responsibility for the 324
safety of meat at ‘specific stages of the meat chain’. 325
Having compared the perceptions of these two groups of stakeholders, from opposite ends of 326
the food chain, we then compare responsibility perceptions across the beef and chicken chains 327
in Section 4.3. Given that majority of foodborne cases (i.e., 40%) are attributable to chicken 328
and red meat (Gormley et al., 2011) yet the transmission practices and pathways are often so 329
different between them, it is essential to examine differences in perceptions of stakeholders for 330
food safety responsibility in beef and chicken supply chains. 331
4.1. Stakeholders’ Perceptions of Responsibility in the Beef Supply Chain 332
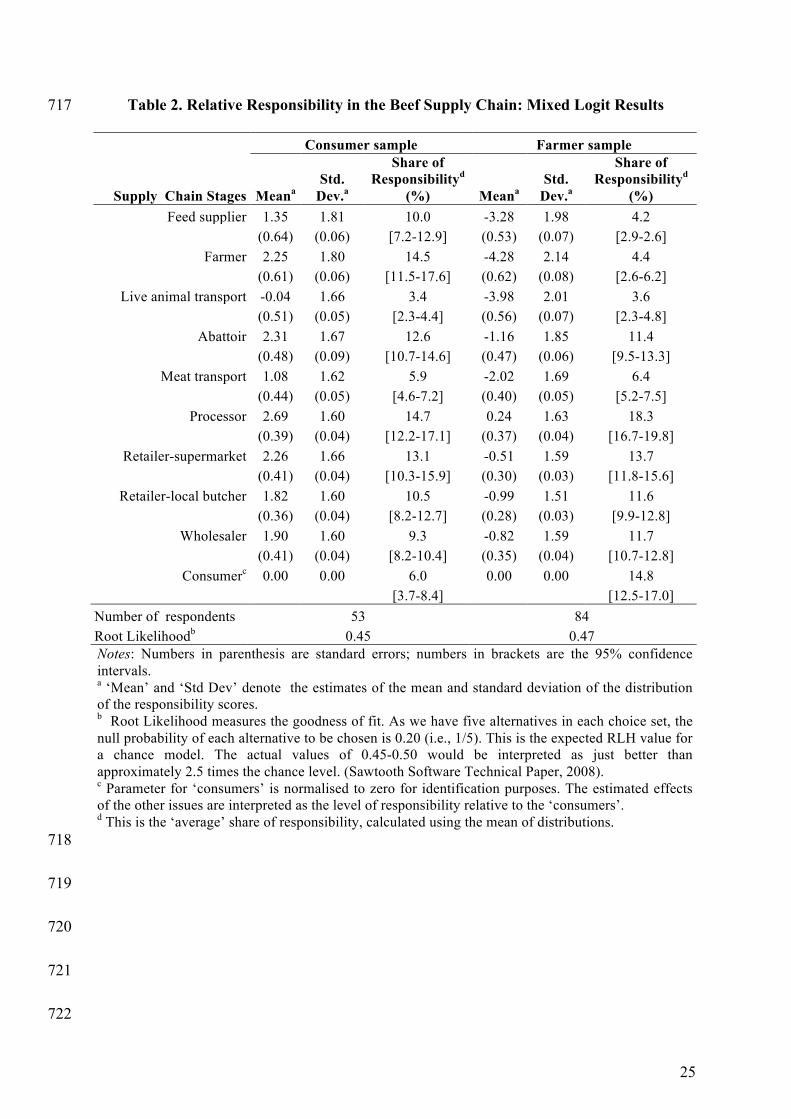
Table 2 reports results from estimation of the mixed logit model in (5) for the beef supply 333
chain. For each stage of the chain, estimates of the mean and standard deviation of the 334
distribution of the responsibility scores are reported. Heterogeneity in individuals’ perception of 335
the degree of responsibility is represented via the standard deviation, which captures variation 336
or dispersion in individuals’ perceptions of responsibility from the mean estimate. The larger 337
the standard deviation (or spread), the more variability in perceptions of the sample. Standard 338
errors for estimates of both the mean and standard deviation are also reported. 339
13
Our results show variation in individuals’ perceptions. Almost all estimates of the mean of 340
responsibility scores, for both the consumer and farmer, are statistically significant at 1% level. 341
The estimates of the standard deviations of the distributions of responsibility scores, for both 342
the consumer and farmer samples, are significantly different from zero in all cases, indicating 343
heterogeneity in the views regarding levels of relative responsibility. 344
The non-farming sample’s choices indicate that on average Processors are most responsible for 345
ensuring the food safety in beef supply chain, whilst the Live Animal Transport stage is seen as 346
having the lowest share of responsibility. To ease interpretation of the estimation results, we 347
convert the mean estimates to ratio-scaled scores that sum to 100 (hereafter called ‘shares’4). 348
For example, the share of responsibility allocated by farmers to Consumers is 14.7%, 349
approximately three times higher than that allocated to farmers themselves (4%). We compare 350
these shares of responsibilities placed on each stage with a level of share in which each stage is 351
‘naively’ assumed to have an equal degree of responsibility (i.e., 100%/10)5. 352
Assuming an equal share of responsibility among the ten stages (i.e., 10% each), we see that 353
both consumers and farmers believe that Processors and Supermarkets have a share of 354
responsibility statistically significantly higher than this average (10%) level, whereas the 355
Animal Transport stage is regarded as having a lower than average level of responsibility. 356
We investigate the significance of these similarities and differences in views by investigating 357
two hypotheses. The first hypothesis tests whether consumers and farmers have the same 358
pattern of allocations of responsibility for the safety of beef across the stages of the chain as a 359
whole. The second hypothesis tests whether they have the same perceptions of relative 360
responsibility for specific stages of the chain. 361
4 Shares of responsibility, which indicate for ten supply chain stages, the probability that individual i chooses stage j as the most responsible stage, are calculated using Multinomial Logit formulation
(Sawtooth, 2007): 1-a)exp(
)exp(
+β
β
ij
ij, where β ijare zero-centered logit scores, and a is the number of
items shown per set (in this case it is 5).
5 The 10% average level of responsibility was not conveyed to respondents in the survey; they were not asked to indicate whether a stage had above, or below, this level, nor did it feature in estimation. It simply allows ex-post comparison of the perceived responsibility of a stage with the mean responsibility level, which is simply an arithmetic mean from dividing 100% of responsibility across N items within the study.
14
Hypothesis A: Consumers and farmers have the same allocations of responsibility for the 362
safety of beef ‘across the supply chain’. 363
To test for systematic differences in the allocations of relative responsibility across stages and 364
between the two stakeholders, individual-specific logit scores were regressed on the stages and 365
the interaction of the stage and the group (i.e., type of stakeholder) considered: 366
𝛽!= α + γn stagen + δn (stagen*group) + εi with n = (1, …, 9) 6 (6)
where stagen with n= (1,…,9) is a binary variable distinguishing the nine stages; group is a 367
binary variable distinguishing the two stakeholders (1=farmer, 0=consumer), and α, γ and δ are 368
parameters to be estimated. 369
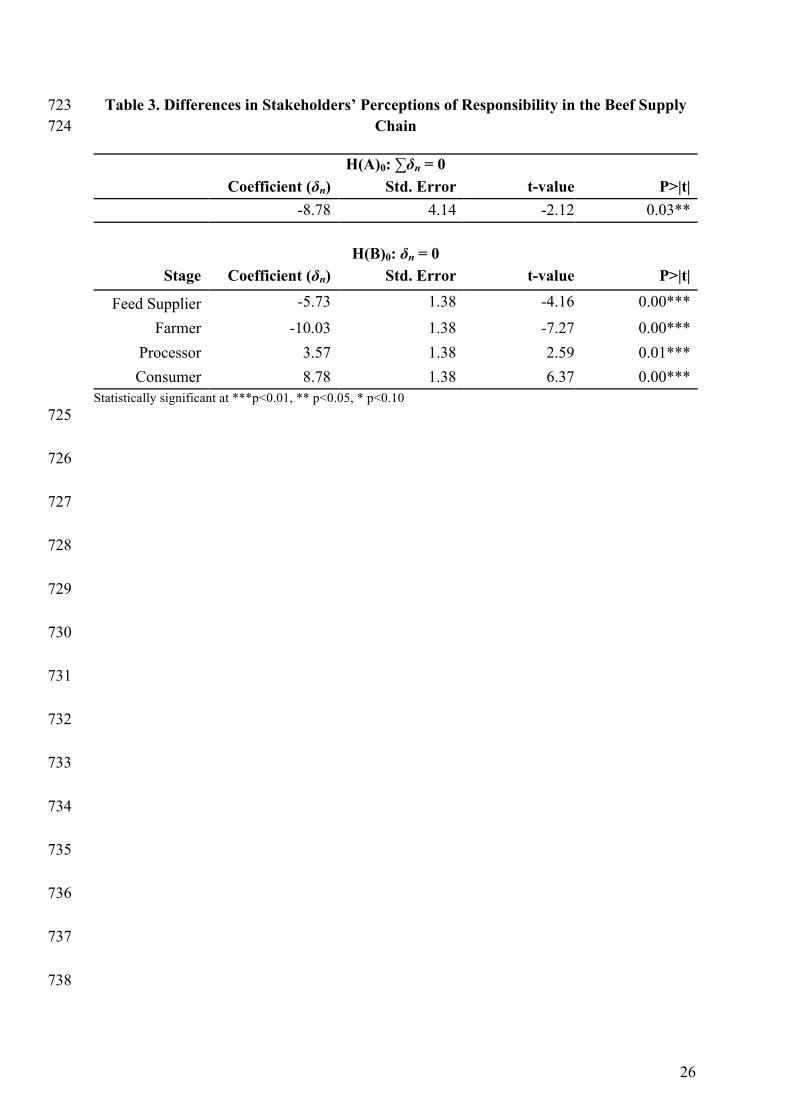
The null hypothesis of no significant differences between consumers’ and farmers’ allocations 370
of responsibility for food safety is H(A)0: ∑δn = 0 (overall distributions of individual-specific 371
scores for the two stakeholders are the same). The test result of the regression analysis in Table 372
3 shows that stakeholders’ perceptions of food safety responsibility in the beef chain are not 373
different from each other at 1% significance level (P>|t|= 0.03). 374
Although consumers and farmers have similar perceptions of responsibility for ensuring that 375
the beef in the supply chain is safe, there may still be differences in their views at specific 376
stages of the chain. Thus, we investigate this further in the following hypothesis: 377
Hypothesis B: Consumers and farmers have the same allocations of responsibility for the 378
safety of beef at a ‘specific stage of the chain’. 379
The null hypothesis here is H(B)0: δn = 0 for n = (1,..., 9) (the distribution of individual-specific 380
scores for stagen is the same for both stakeholders). Although the test result of Hypothesis A 381
reveals that consumers and farmers tend to have similar perceptions of food safety 382
responsibility, the results of tests of Hypothesis B shows that they do have different perceptions 383
of food safety at some stages. As seen from the test results in Table 3, consumers and farmers 384
perceive the responsibility of Feed Supplier, Farmer, Processor, and Consumer differently in 385
the beef supply chain. 386
6 We dropped one of the dummies for stages to prevent the dummy variable trap.
15
Notwithstanding the possible influence of different error variance between the two subsets of 387
respondents, our results show that the share of responsibility allocated by consumers to the 388
Farmer and Feed Supplier is higher than that allocated by farmers by a factor of 3.3 and 2.4, 389
respectively (see Table 2). The share of responsibility allocated by farmers to Processors and 390
Consumers is higher than that of consumers (approximately 1.2 and 2.5 times, respectively). 391
These differences in views are statistically significant at the 1% level, as seen from the test 392
results in Table 3. 393
The results also show that farmers tend to allocate less than 15% of total responsibility to the 394
first three stages of the chain (i.e., feed supplier 4.2%, farmer 4.4.%, live animal transport 395
3.6%), and almost 15% responsibility to Consumers. This observation of a less than an average 396
share of responsibility to one’s own stage of the chain is apparent also in the Consumer sample 397
where 6% of the responsibility is allocated to themselves but around 65% responsibility to 398
initial and mid-stages of the chain. Such beliefs may be due to recent E.coli outbreaks at an 399
abattoir (e.g., 2005 Welsh E.coli outbreak) and farm (e.g., 2009 E.coli outbreak at petting 400
farms) that received a lot of media attention or it may be just a case of individuals’ lack of 401
motivation to take responsibility. 402
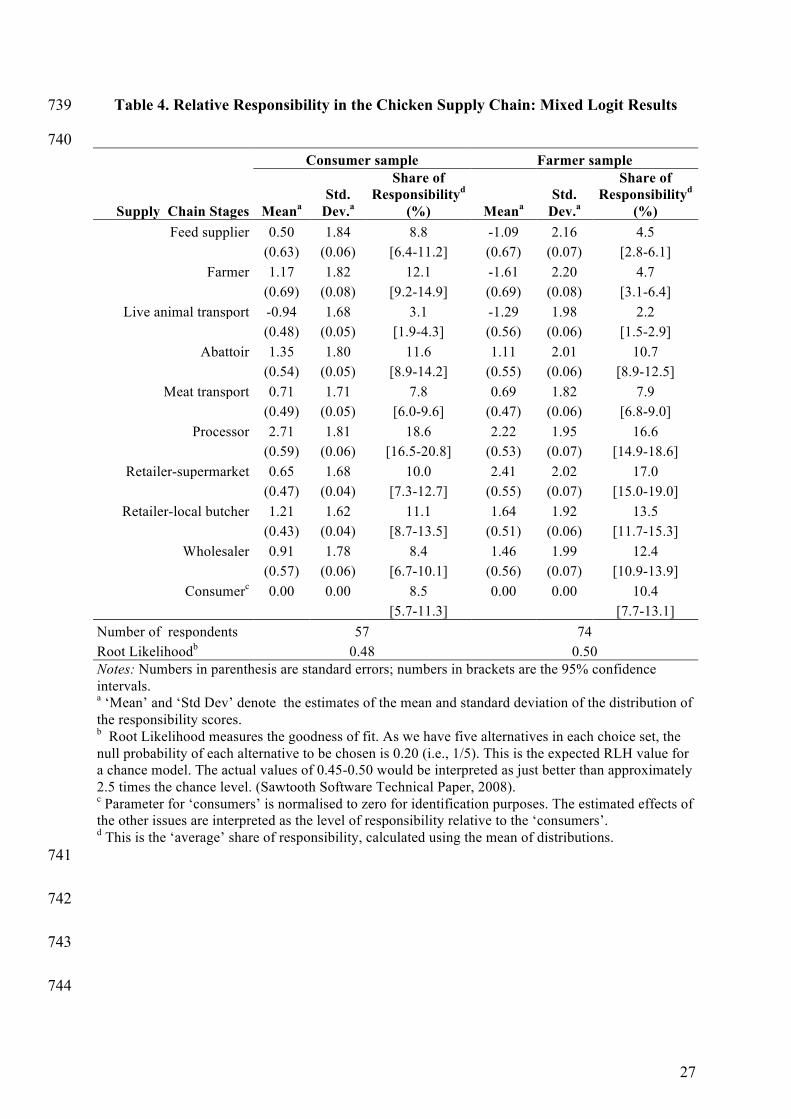
4.2. Stakeholders’ Perceptions of Responsibility in the Chicken Supply Chain 403
Stakeholders’ perceptions of responsibility in the chicken supply chain show some similarities 404
to the results for beef supply chain. As seen in Table 4, almost all coefficient estimates in both 405
samples are statistically significant at 1% level, and significant standard deviations reveal 406
heterogeneity in preferences in both the samples. For consumers, on average, Processors and 407
Farmers are regarded as having the highest share of responsibility in the chicken supply chain. 408
For farmers, Processors and Supermarkets are seen as the most responsible stages. Both 409
samples view Live Animal Transport as the least responsible stage. Using eqn. (6), we repeat 410
the tests undertaken for beef as to whether consumers and farmers have the same perceptions of 411
responsibility ‘across the supply chain’ overall (Hypothesis C) and at ‘specific stages of the 412
chain’ (Hypothesis D). 413
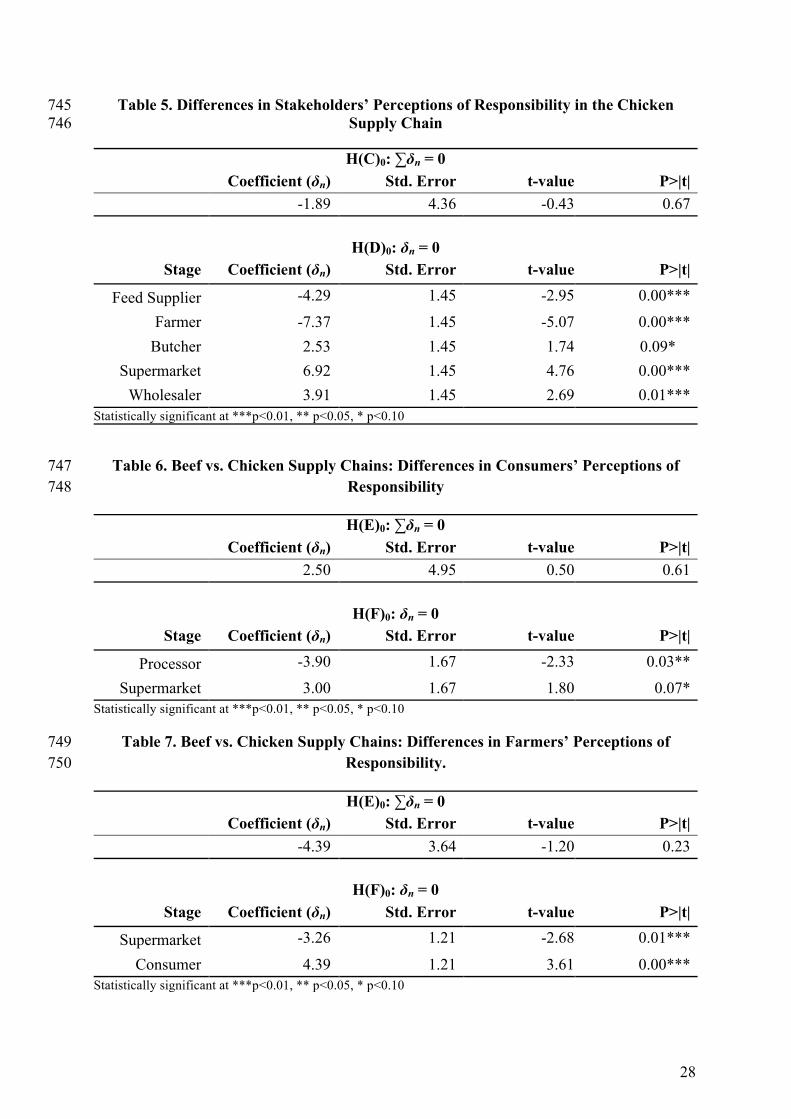
Hypothesis C: Consumers and farmers have the same allocations of responsibility for the 414
safety of chicken ‘across the supply chain’: H(C)0: ∑δn = 0. 415
According to the test results in Table 5, responsibility perceptions of consumers and farmers for 416
the chicken supply chain as a whole show no statistically significant differences at 1% level 417
16
(P>|t|=0.67). Although both groups of stakeholders have similar perceptions of responsibility 418
across the entire supply chain they may allocate different levels of responsibility to specific 419
stages of the chain. We investigate this next. 420
Hypothesis D: Consumers and farmers have the same allocations of responsibility for the 421
safety of chicken at a ‘specific stage of the chain’: H(D)0: δn = 0. 422
Tests of Hypothesis D reveal that consumers and farmers view differently the degree of 423
responsibility associated with Feed Suppliers, Farmers, Butchers, Supermarkets, and 424
Wholesalers (see Table 5). 425
Processor and Supermarket are the stages that consumers and farmers allocate the largest share 426
of responsibility respectively. While consumers allocate slightly higher (approximately 11%) 427
responsibility score to Processor than farmers do, farmers allocate almost 70% more share of 428
responsibility to Supermarket than consumers do. Additionally, Farmers allocate approximately 429
4 times more responsibility to Processor than to Farmer (themselves), whereas consumers 430
allocate approximately 2.5 times more responsibility score to Processor than to Consumer 431
(themselves). The share of responsibility allocated by consumers to the Farmers and Feed 432
Supplier is at least as twice as high than that of farmers (see Table 4). We find that these 433
differences in views are statistically significant at the 1% level. 434
An interesting result from this investigation is that neither consumers nor farmers allocate 435
Consumers a level of responsibility statistically significantly different to the 10%, ‘equal’ share, 436
level, whereas in both chains consumers allocate a far greater responsibility share to Farmers 437
than farmers do themselves. Similar to the beef case, we find that farmers tend to allocate less 438
than an average 10% level of responsibility to themselves in the chicken supply chain. 439
Additionally, Consumers tend to allocate the highest shares of responsibility to the middle 440
stages of the meat food chain whilst farmers tend to allocate the lowest shares of responsibility 441
to first three stages of the chain (approximately 12%) and the highest shares of responsibility to 442
the mid (approximately 33%) and later stages of the chain towards consumers (approximately 443
55%). 444
17
4.3. Comparison of Stakeholders’ Perceptions of Responsibility in Beef and Chicken 445
Supply Chains 446
The results presented in Tables 2 and 4 reveal that the Processor is believed to be the most 447
responsible stage in both supply chains. For consumers, this is followed by Farmer, 448
Supermarket, and Abattoir; whereas for farmers it is followed by Supermarket and 449
Wholesaler. What is striking, considering the farmer’s perceptions of responsibility for food 450
safety in the beef and chicken supply chains, is the very low responsibility assigned by 451
farmers to the first three stages of the chain, including themselves. Consumers’ perception of 452
the responsibility of the early stages is very different. This contrast is stable across the two 453
meat supply chains considered. 454
Tests of the form used above are utilised to see whether the allocations of responsibility overall 455
are the same for the beef and chicken supply chains for the consumer and farmer samples. The 456
results from these tests are given below: 457
Hypothesis E: Consumers (or Farmers) have the same allocations of responsibility for the 458
safety of beef and chicken ‘across the supply chain’: H(E)0: ∑δn = 0 459
The test results show no statistically significant differences in relative responsibility for food 460
safety in the beef and chicken supply chains at the 1% level for consumers (P>|t|=0.61) (Table 461
6) and also for farmers (P>|t|=0.23) (Table 7). However, there are differences regarding the 462
responsibility at specific stages. 463
Hypothesis F: Consumers (or Farmers) have the same allocations of responsibility for the 464
safety of beef and chicken at a ‘specific stage of the chain’: H(F)0: δn = 0 465
The test results in Table 6 indicate that consumers perceive the food safety responsibility of 466
Processors and Supermarkets differently in beef and chicken supply chains. They believe that 467
Processors are more responsible in the chicken chain than in the beef chain and that 468
Supermarkets are more responsible in the beef chain than in the chicken chain. It is surprising 469
that consumers feel that Feed Suppliers, Farmers and Consumers do not have different level of 470
responsibilities between beef and chicken supply chains given the recent history regarding 471
scares and outbreaks associated with the two meats in the UK (e.g., E. coli and BSE in beef, 472
Salmonella and Campylobacter in chicken at domestic kitchens). Hence one may expect 473
different allocations of responsibility to these stages in beef and chicken supply chains. 474
18
The test results for farmers in Table 7 indicate that they place statistically significant share of 475
responsibility on Supermarkets and Consumers. The latter result indicates that farmers view 476
Consumers as more responsible in the beef chain than in the chicken chain. This is somewhat 477
surprising as cases attributable to chicken generally occur in domestic kitchens (Gormley et al., 478
2011), whereas recent well-known food-borne outbreaks attributable to beef (e.g., E. coli) have 479
been due to the mishandling of beef at the food services’ level, e.g., butcher, restaurants 480
(Gormley, 2011; Pennington, 2009). Thus, it would have been conceivable to observe a higher 481
perceived responsibility for consumers regarding chicken than beef. 482
The test result further implies that farmers think that other stages, such as the Feed Supplier, 483
Farmer (themselves), and Abattoirs, are not systematically different with respect to the 484
responsibilities for ensuring safety in beef and chicken chains. For example, farmers consider 485
their own responsibility similar for the chicken and beef supply chains. They also believe that 486
abattoirs are approximately equally responsible for the safety of beef and chicken products. 487
Another result from the analysis also reveals that farmers tend to allocate approximately the 488
same share of responsibility (approximately 12%) to the initial three stages in both beef and 489
chicken supply chains. 490
4 Concluding Remarks 491
This paper investigates stakeholders’ opinions of the degrees of responsibility for food safety 492
for sequential stages in the food chain. The application is for meat prepared and consumed at 493
home and included ten food chain stages (from feed supplier to consumer). Opinions are 494
compared for two stakeholder groups (consumers and farmers) and two types of meat (beef and 495
chicken). 496
Survey data are collected employing the Best-Worst Scaling (BWS) technique. For subsets of 497
food chain stages, respondents are asked to identify the two stages they believe to be the ‘most’ 498
and the ‘least’ responsible for ensuring the meat people consume does not cause them to be ill. 499
The data are statistically analysed with mixed logit models estimated via Bayesian techniques. 500
This study is the first to employ BWS to investigate perceptions of responsibility and food 501
safety. BWS is typically employed when preferences are sought over a large number of items. 502
Feedback from respondents indicate that the BWS-tasks are easy to carry out as respondents 503
face only subsets of the full set of items (albeit repeated ones). Another important advantage of 504
19
the BWS technique is that the statistical analysis of the best-worst choice data provides us 505
direct estimates of the shares of the responsibility attributed to the food chain stages. 506
The results show that consumers tend to think farmers are more responsible for ensuring meat 507
safety than farmers do, whereas farmers tend to think consumers have a greater degree of 508
responsibility than consumers themselves believe. There is a consistent pattern of Farmers and 509
Consumers regarding their own stage of the chain as having a less than average (i.e., less than 510
10%) share of the overall responsibility for ensuring food safety. Consumers allocate 511
responsibility predominantly to the middle stages of the meat food chain. Conversely, farmers 512
allocate more responsibility to the later stages of the chain. We find this pattern both for the 513
chicken and beef chain. 514
Insights from our study may have implications for the development and implementation of food 515
risk management systems. In work on stakeholder involvement, the role of perceptions of 516
responsibilities has received little attention and, when addressed, it has mainly been to consider 517
socio-cultural differences across countries (Kjaernes et al,, 2007; Krystallis et al., 2007; 518
Wezemeal et al.,2010). The results in this paper provide a useful first glance at an important 519
behavioural aspect that needs to be accounted for in the food safety domain at the national 520
level. Communication with consumers and farmers about emerging food safety problems in a 521
supply chain and their involvement in proactive practices would need to be attuned to their 522
subjective perceptions of relative responsibilities in order for integrated risk management 523
systems to be effective. 524
According to the Food and Agriculture Organisation of the United Nations one way of 525
strengthening national food control systems is via addressing food issues from farm to table as 526
a continuum and “recognising that food control is a widely shared responsibility that requires 527
positive interactions between all stakeholders (FAO, 2003, p.10).” As seen from the findings of 528
this study, each stage of the supply chain holds a shared responsibility. However, the level of 529
responsibility these stages believe they have over ensuring food safety is observed to be 530
different. Particularly, for farmers and consumers, we observe the allocation of less than an 531
average share of responsibility to their own role in the meat supply chain. Some of the reasons 532
for such behaviour may be the lack of awareness regarding risks and how to handle them, and 533
the lack of motivation regarding willingness to comply with safe practices. For example, in one 534
of the largest E. coli outbreaks in Wales in 2005 there was evidence that the butcher sold unfit 535
cooked meat and was found to be the sole responsible party. However, the investigation also 536
20
found that other parties in the supply chain (e.g., schools, local council) did not comply with the 537
safe food practices. The roles and responsibilities of organisations and key people were not 538
clear and agreed between stakeholders, and the control and monitoring of working practices 539
and procedures were found to be insufficient (Pennington, 2009, p.13-15). Such a tragic event 540
could have been avoided if all terms and roles were clear and agreed by stakeholders involved. 541
This has provided a good lesson to stakeholders such that the Food Standard Agency issued 542
new guidelines in the wake of the inquiry. These included providing guidance on the use of 543
separate machinery for raw meat and ready to eat foods (Food Standard Agency, 2011). As a 544
policy-maker or a decision-maker it is thus necessary to understand how familiar stakeholders 545
are to food risks and their preventive methods, as well as to understand the extent to which 546
people think their (and others’) actions will reduce risks, before implementing a mitigation 547
strategy. 548
As an extension of the current research, we plan to survey a third stakeholder group, abattoirs, 549
representing a mid-chain group. Such an extension would give a further insight into how 550
stakeholders (initial, mid- and final chain links) allocate the responsibility and perceive their 551
own role in the chain. Another interesting group to interview would be food safety experts —552
the share allocation retrieved from these responses could be used to replace the naïve 553
assumption of equal shares of responsibility among the ten stages (i.e., 10% each). In addition, 554
in further research, it would be interesting to investigate consumers’ and farmers’ responses in 555
relation to their psychometric and socio-demographics characteristics (e.g., level of knowledge, 556
gender, etc) to shed light on how they make decisions. It would also be interesting to research 557
perceptions of the relative responsibility for more specific food safety issues with different 558
impacts on human health, in contrast to the generic description of food safety used here which 559
encompasses diverse aspects from short term food poisoning to longer term issues such as BSE. 560
Last, but not least, following-up stakeholders over a number of years may produce interesting 561
information on how perceptions change over time. This information would also provide insight 562
into the effectiveness of awareness campaigns. 563
Acknowledgement: 564
The research was supported by the Rural Economy and Land Use (RELU) Programme 565
(http://www.abdn.ac.uk/reluecoliproject/index.htm) via funding from the project ‘Reducing E. 566
coli O157 Risk in Rural Communities’ (RES-229-31-0003) and the University of Manchester, 567
UK. We thank members of the project team and seminar participants at the 2010 WCERE 568
21
Congress and the 2010 AAEA and AES meetings for valuable comments. We are also grateful 569
to anonymous reviewers for their valuable comments and suggestions that improved the quality 570
of the paper. 571
References 572
Adak, G. K., Meakins, S. M., Yip, H., Lopman, B. A., & O’Brien, S. J. 2005. Disease Risks 573 from Foods, England and Wales, 1996–2000. Emerging Infectious Diseases, 11(3), 574 365-372. 575
Auger, P., Devinney, T.M., Louviere, J.J. 2007. Using Best-Worst Scaling Methodology to 576 Investigate Consumer Ethical Beliefs across Countries. Journal of Business Ethics 577 70(3), 299-326. 578
Baumgartner, H., Steenkamp, J.-B.E.M., 2001. Response Styles in Marketing Research: A 579 Cross-National Investigation, Journal of Marketing Research 38(May), 143-156. 580
Bergeaud-Blackler, F. and Ferretti, M.P. 2006. More politics, stronger consumers? A new 581 division of responsibility for food in the European Union. Appetite 47(2): 134-142. 582
Campbell, H. and Fitzgerald R., 2001. Food Scares and GM: Ambivalent Technologies, Fear 583 and The Politics of Nostalgia, Paper delivered to ISA 2001 Conference New nature, 584 new cultures, new technologies, Fitzwilliam College, University of Cambridge. 585
Cohen, S.H., Orme, B., 2004. What’s your preference? Asking survey respondents about their 586 preferences creates new scaling decisions, Marketing Research Magazine 16, 33-37. 587
Cope, S., Frewer, L.J, Houghton, J., Rowe, G., Fischer, A.R.H., de Jonge, J., 2010. Consumer 588 perceptions of best practice in food risk communication and management: 589 Implications for risk analysis policy, Food Policy 35(4), 349-357. 590
FAO/WHO, 2003. Assuring Food Safety and Quality: Guidelines for Strengthening National 591 Food Control Systems. FAO Food and Nutrition Paper, 76. 592
Fisher, A.R.H., De Jong, A.E.I., de Jonge R., Frewer, L.J., Nauta, M.J., 2005. Improving 593 Food Safety in the Domestic Environment: The Need for a Transdiscplinary 594 Approach, Risk Analysis 25(3), 503-517. 595
Finn, A., Louviere, J.J., 1992. Determining the Appropriate Response to Evidence of Public 596 Concern: The Case of Food Safety, Journal of Public Policy & Marketing 11(2), 12-597 25. 598
Flynn, T.N., Louviere, J.J., Peters, T.J., Coast, J., 2007. Best-worst scaling: What it can do 599 for health care research and how to do it, Journal of Health Economics 26(1), 171-600 189. 601
Flynn, T.N., Louviere, J.J., Peters, T.J., Coast, J. 2008. Estimating preferences for a 602 dermatology consultation using Best-Worst Scaling: Comparison of various methods 603 of analysis. BMC Medical Research Methodology 8(76). 604
Frewer, L.J., Scholderer, J., Bredahl, L., 2003. Communicating about the risks and benefits of 605 genetically modified foods: The mediating role of trust, Risk Analysis 23(6), 1117-606 1133. 607
Food Standards Agency, 2007. Food chain analysis: overview of hazards and impacts. 608 http://www.food.gov.uk/multimedia/pdfs/foodchainhazardsimpacts 609
Food Standards Agency. 2009. FSA report for the UK survey of Campylobacter and 610 Salmonella contamination of fresh chicken at retail sale. http://www.foodbase.org.uk/ 611 admintools/reportdocuments/351-1-676_B18025.pdf 612
Food Standards Agency. 2011. E. coli O157: control of cross contamination. 613 http://www.food.gov.uk/foodindustry/guidancenotes/hygguid/ecoliguide. 614
22
Garcia, M., Fearne, A., Caswell, J.A., Henson, S., 2007. Co-regulation as a Possible Model 615 for Food Safety Governance: Opportunities for Public-Private Partnerships. Food 616 Policy 32(3), 99-314. 617
Gormley, F.J., Little, C.L., Rawall, I.A., Gillesoie, I.A., LeBaigue, S., Adak, G.K., 2011. A 618 17-year review of foodborn outbreaks: describing the continuing decline in England 619 and Wales (1992-2008), Epidemiology and Infections 139, 688-699. 620
Greene, W.H., 2003. Econometric Analysis. Pearson Education, Inc, Upper Saddle River, 621 New York. 622
Halkier, B. and Holm, B. 2006. Shifting responsibilities for food safety in Europe: An 623 introduction. Appetite 47(2); 127-133. 624
Health Protection Agency. 2006. CDR Weekly, 16(51). Retrieved May, 2012. 625 http://www.hpa.org.uk/cdr/archives/archive06/News/news2806.htm 626
Hein, K.A., Jaeger, S.R., Carr, B.T., Delahunty, C.M., 2008. Comparison of five common 627 acceptance and preference methods, Food Quality and Preference, 19(7), 651-661. 628
Henson, S., Caswell, J., 1999. Food safety regulation: an overview of contemporary issue, 629 Food Policy 24: 589-603. 630
Holm, B. and Halkier, B., 2009. EU Food Safety Policy, localising contested governance. 631 European Societies 11(4): 473-493. 632
Houghton, J.R., Rowe, G., Frewer, L.J., van Kleef, E., Chryssochoidis, G., Kehagia, O., 633 Korzen-Bohr, S., Lassen, J., Pfenning, U., Strada, A., 2008. The quality of food risk 634 management in Europe: Perspectives and priorities. Food Policy 33: 13-26. 635
Jaeger, S.R., Rose, J.M., 2008. Stated choice experimentation, contextual influences and food 636 choice: A case study, Food Quality and Preference 19(6), 539-564. 637
Kjaernes, U., Harvey, M., Warde, A., 2007. Trust in Food: A Comparative and Institutional 638 Analysis: Palgrave Macmillan. Knowles, T., Moody, R., 2007. European food scares 639 and their impact on EU food policy, British Food Journal 109(1), 43-67. 640
Krystallis, A., Frewer, L., Rowe, G., Houghton, J., Kehagia, O., Perrea, T., 2005. A 641 perceptual divide? Consumer and expert attitude to food risk management in Europe, 642 Health Risk & Society 9(4), 407-424. 643
Leikas, S., Lindeman, M., Roininen, K. Lahteenmaki, L., 2009. Who is responsible for food 644 risks? The influence of risk type and risk characteristics, Appetite 53(1): 123-126. 645
Mensah, L.D., Julien, D., 2011. Implementation of food safety management systems in the 646 UK, Food Control 22, 1216-1225. 647
Loureiro, M.L., Umberger, W.J., 2007. A choice experiment model for beef. What US 648 consumer responses tell us about relative preferences for food safety, country-of-649 origin labeling and traceability, Food Policy 32(4), 496-514. 650
Louviere, J.J., 1993. The Best-Worst or Maximum Difference Measurement Model: 651 Applications to Behavioral Research in Marketing. Phoenix, Arizona. 652
Louviere, J.J., Flynn, T.N., 2010. Using Best-Worst Scaling Choice Experiments to Measure 653 Public Perceptions and Preferences for Healthcare Reform in Australia. The Patient: 654 Patient-Centered Outcomes Research, 3, 275-283. 655
Lusk, J.L., Briggeman, B.C., 2009. Food Values, American Journal of Agricultural 656 Economics 91, 184-196. 657
Magnusson, M.K., Hurti, U-K. K., 2002. Consumer attitudes towards genetically modified 658 foods. Appetite 39(1), 9-24. 659
Marley, A., Louviere, J., 2005. Some probabilistic models of Best, Worst, and Best-Worst 660 choices, Journal of Mathematical Psychology 49, 464-480. 661
Marette, S., Roosen, J., Blanchemanche, S., Feinblatt-Meleze, E., 2010. Functional food, 662 uncertainty and consumers’ choices: A lab experiment with enriched yoghurts for 663 lowering cholesterol, Food Policy, 35(5), 419-428. 664
23
Mazzocchi, M., Lobb, A., Trail, W.B., Cavicchi, A., 2008. Food Scares and Trust, Journal of 665 Agricultural Economics 59(1), 2-24. 666
McFadden, D., Train, K., 2000. Mixed MNL models for discrete response, Journal of 667 Applied Econometrics 15(5), 447-470. 668
Mensah, L.D., Julien, D., 2011. Implementation of food safety management systems in the 669 UK, Food Control 22, 1216-1225. 670
Mueller S., Francis I.L., Lockshin L., 2009. Comparison of best-worst and hedonic scaling 671 for the measurement of consumer wine preferences, Australian Journal of Grape and 672 Wine Research 15(3), 205-215. 673
Pennington, H., 2009. The Public Inquiry into the September 2005 Outbreak of E.coli O157 674 in South Wales. http://wales.gov.uk/ecolidocs/3008707/reporten.pdf?lang=en 675
Redmond, E.C., Griffith, C.J., 2004. Consumer perceptions of food safety risk, control and 676 responsibility, Appetite 43(3), 309-313. 677
Sawtooth Software, 2003. The CBC/HB System for Hierarchical Bayes Estimation Version 678 4.0 Technical Paper. Sequim, WA: Sawtooth Software. 679
Sawtooth Software, 2007. The MaxDiff/Web v6.0 Technical Paper. 680 Sawtooth Software, 2008. The CBC System for Choice-Based Conjoint Analysis Technical 681
Paper. Sequim, WA: Sawtooth Software. 682 Siegrist, M., Stampfli, N., Kastenholz, H., 2009. Acceptance of nanotechnology foods: a 683
conjoint study examining consumers’ willingness to buy, British Food Journal, 111(6-684 7), 660-668. 685
The Pennington Group. 1998. Report on the circumstances leading to the 1996 outbreak of 686 infection with E.coli O157 in Central Scotland, the implications for food safety and 687 the lessons to be learned: The Scottish Office. 688
Thurstone, L.L., 1927. A law of comparative judgement, Psychological Review 34, 278–286. 689 van Kleef, E., Frewer, L.J., Chryssochoidis, G.M., Houghton, J.R., Korzen-Bohr, S., 690
Krystallis, T., Lassen, J., Pfenning, U., Rowe, G., 2006. Perceptions of food risk 691 management among key stakeholders: Results from a cross-European study, Appetite 692 47, 46-63. 693
van Wezemael, L., Verbeke, W., Kugler, J.O., de Barcellos, M.D., Grunert, K.G., 2010. 694 European consumers and beef safety: Perceptions, expectations and uncertainty 695 reduction strategies, Food Control 21(6), 835-844. 696
van Wezemael, L., Verbeke, W., Kugler, J.O., Scholderer, J., 2011. European consumer 697 acceptance of safety-improving interventions in the beef chain, Food Control 22(11), 698 1776-1784. 699
Webster, K., Jardine, C., Cash, S.B., McMullen, L.M., 2010. Risk Ranking: Investigating 700 Expert and Public Differences in Evaluating Food Safety Hazards, Journal of Food 701 Protection 73(10), 1875-1885. 702
Williams, P.R.D., Hammitt, J.K., 2001. Perceived risks of conventional and organic produce: 703 Pesticides, pathogens and natural toxins, Risk Analysis 21(2), 319-330. 704
705 706 707 708 709
24
Tables and Figures 710
Table 1. Characteristics of Survey Respondents 711
Variables Consumers Farmers
Mean Std. Dev Mean Std.
Dev Gender (1=female, 0=male) 0.69 0.47 0.60 0.49 Age ( in years) 35.81 15.55 38.83 14.82 Income (annual household income in £) 43,274 26,405 38,611 29,379 Children (1=yes, 0=no) 0.39 0.49 0.43 0.50 Education (1=yes, 0=no)
No GCSE level education 0.00 0.00 0.08 0.27 GCSE Level education (e.g. GCSE, O-Levels or Standards)
0.11 0.32 0.18 0.38
A-Level education (e.g. A, AS, S-Levels, Highers) 0.21 0.41 0.18 0.38 Undergraduate education (e.g. University examinations but not completed degree)
0.19 0.39 0.09 0.29
Degree or Graduate education (e.g. BSc, BA) 0.28 0.45 0.23 0.42 Post-graduate education (e.g. PhD, MSc, MA) 0.14 0.35 0.07 0.26 Vocational education (e.g. NVQ, HNC, HND) 0.07 0.25 0.17 0.37
Occupation (1=yes, 0=no) Student 0.32 0.47 0.11 0.32 Full time employed 0.34 0.48 0.36 0.48 Part time employed 0.20 0.40 0.11 0.31 Unemployed (looking for a job) 0.00 0.10 0.01 0.11 Unemployed (not looking for a job) 0.00 0.00 0.01 0.11 Self-employed 0.05 0.23 0.32 0.47 Retired 0.05 0.23 0.04 0.20
Livestock farmers 0.51 0.50 Poultry farmers 0.01 0.11 Farmers having both livestock and poultry production
0.42 0.49
Number of respondents 110 157 712
713
714
715
716
25
Table 2. Relative Responsibility in the Beef Supply Chain: Mixed Logit Results 717
Consumer sample Farmer sample
Supply Chain Stages Meana Std.
Dev.a
Share of Responsibilityd
(%) Meana Std.
Dev.a
Share of Responsibilityd
(%) Feed supplier 1.35 1.81 10.0 -3.28 1.98 4.2
(0.64) (0.06) [7.2-12.9] (0.53) (0.07) [2.9-2.6]
Farmer 2.25 1.80 14.5 -4.28 2.14 4.4
(0.61) (0.06) [11.5-17.6] (0.62) (0.08) [2.6-6.2]
Live animal transport -0.04 1.66 3.4 -3.98 2.01 3.6
(0.51) (0.05) [2.3-4.4] (0.56) (0.07) [2.3-4.8]
Abattoir 2.31 1.67 12.6 -1.16 1.85 11.4
(0.48) (0.09) [10.7-14.6] (0.47) (0.06) [9.5-13.3]
Meat transport 1.08 1.62 5.9 -2.02 1.69 6.4
(0.44) (0.05) [4.6-7.2] (0.40) (0.05) [5.2-7.5]
Processor 2.69 1.60 14.7 0.24 1.63 18.3
(0.39) (0.04) [12.2-17.1] (0.37) (0.04) [16.7-19.8]
Retailer-supermarket 2.26 1.66 13.1 -0.51 1.59 13.7
(0.41) (0.04) [10.3-15.9] (0.30) (0.03) [11.8-15.6]
Retailer-local butcher 1.82 1.60 10.5 -0.99 1.51 11.6
(0.36) (0.04) [8.2-12.7] (0.28) (0.03) [9.9-12.8]
Wholesaler 1.90 1.60 9.3 -0.82 1.59 11.7
(0.41) (0.04) [8.2-10.4] (0.35) (0.04) [10.7-12.8]
Consumerc 0.00 0.00 6.0 0.00 0.00 14.8
[3.7-8.4]
[12.5-17.0]
Number of respondents 53 84 Root Likelihoodb 0.45 0.47 Notes: Numbers in parenthesis are standard errors; numbers in brackets are the 95% confidence intervals. a ‘Mean’ and ‘Std Dev’ denote the estimates of the mean and standard deviation of the distribution of the responsibility scores. b Root Likelihood measures the goodness of fit. As we have five alternatives in each choice set, the null probability of each alternative to be chosen is 0.20 (i.e., 1/5). This is the expected RLH value for a chance model. The actual values of 0.45-0.50 would be interpreted as just better than approximately 2.5 times the chance level. (Sawtooth Software Technical Paper, 2008). c Parameter for ‘consumers’ is normalised to zero for identification purposes. The estimated effects of the other issues are interpreted as the level of responsibility relative to the ‘consumers’. d This is the ‘average’ share of responsibility, calculated using the mean of distributions. 718
719
720
721
722
26
Table 3. Differences in Stakeholders’ Perceptions of Responsibility in the Beef Supply 723 Chain 724
H(A)0: ∑δn = 0 Coefficient (δn) Std. Error t-value P>|t| -8.78 4.14 -2.12 0.03**
H(B)0: δn = 0
Stage Coefficient (δn) Std. Error t-value P>|t|
Feed Supplier -5.73 1.38 -4.16 0.00***
Farmer -10.03 1.38 -7.27 0.00*** Processor 3.57 1.38 2.59 0.01*** Consumer 8.78 1.38 6.37 0.00***
Statistically significant at ***p<0.01, ** p<0.05, * p<0.10 725
726
727
728
729
730
731
732
733
734
735
736
737
738
27
Table 4. Relative Responsibility in the Chicken Supply Chain: Mixed Logit Results 739
740
Consumer sample Farmer sample
Supply Chain Stages Meana Std.
Dev.a
Share of Responsibilityd
(%) Meana Std.
Dev.a
Share of Responsibilityd
(%) Feed supplier 0.50 1.84 8.8 -1.09 2.16 4.5
(0.63) (0.06) [6.4-11.2] (0.67) (0.07) [2.8-6.1]
Farmer 1.17 1.82 12.1 -1.61 2.20 4.7
(0.69) (0.08) [9.2-14.9] (0.69) (0.08) [3.1-6.4]
Live animal transport -0.94 1.68 3.1 -1.29 1.98 2.2
(0.48) (0.05) [1.9-4.3] (0.56) (0.06) [1.5-2.9]
Abattoir 1.35 1.80 11.6 1.11 2.01 10.7
(0.54) (0.05) [8.9-14.2] (0.55) (0.06) [8.9-12.5]
Meat transport 0.71 1.71 7.8 0.69 1.82 7.9
(0.49) (0.05) [6.0-9.6] (0.47) (0.06) [6.8-9.0]
Processor 2.71 1.81 18.6 2.22 1.95 16.6
(0.59) (0.06) [16.5-20.8] (0.53) (0.07) [14.9-18.6]
Retailer-supermarket 0.65 1.68 10.0 2.41 2.02 17.0
(0.47) (0.04) [7.3-12.7] (0.55) (0.07) [15.0-19.0]
Retailer-local butcher 1.21 1.62 11.1 1.64 1.92 13.5
(0.43) (0.04) [8.7-13.5] (0.51) (0.06) [11.7-15.3]
Wholesaler 0.91 1.78 8.4 1.46 1.99 12.4
(0.57) (0.06) [6.7-10.1] (0.56) (0.07) [10.9-13.9]
Consumerc 0.00 0.00 8.5 0.00 0.00 10.4
[5.7-11.3]
[7.7-13.1]
Number of respondents 57 74 Root Likelihoodb 0.48 0.50 Notes: Numbers in parenthesis are standard errors; numbers in brackets are the 95% confidence intervals. a ‘Mean’ and ‘Std Dev’ denote the estimates of the mean and standard deviation of the distribution of the responsibility scores. b Root Likelihood measures the goodness of fit. As we have five alternatives in each choice set, the null probability of each alternative to be chosen is 0.20 (i.e., 1/5). This is the expected RLH value for a chance model. The actual values of 0.45-0.50 would be interpreted as just better than approximately 2.5 times the chance level. (Sawtooth Software Technical Paper, 2008). c Parameter for ‘consumers’ is normalised to zero for identification purposes. The estimated effects of the other issues are interpreted as the level of responsibility relative to the ‘consumers’. d This is the ‘average’ share of responsibility, calculated using the mean of distributions. 741
742
743
744
28
Table 5. Differences in Stakeholders’ Perceptions of Responsibility in the Chicken 745 Supply Chain 746
H(C)0: ∑δn = 0 Coefficient (δn) Std. Error t-value P>|t| -1.89 4.36 -0.43 0.67
H(D)0: δn = 0
Stage Coefficient (δn) Std. Error t-value P>|t|
Feed Supplier -4.29 1.45 -2.95 0.00***
Farmer -7.37 1.45 -5.07 0.00*** Butcher 2.53 1.45 1.74 0.09*
Supermarket 6.92 1.45 4.76 0.00*** Wholesaler 3.91 1.45 2.69 0.01***
Statistically significant at ***p<0.01, ** p<0.05, * p<0.10
Table 6. Beef vs. Chicken Supply Chains: Differences in Consumers’ Perceptions of 747 Responsibility 748
H(E)0: ∑δn = 0 Coefficient (δn) Std. Error t-value P>|t| 2.50 4.95 0.50 0.61
H(F)0: δn = 0
Stage Coefficient (δn) Std. Error t-value P>|t|
Processor -3.90 1.67 -2.33 0.03**
Supermarket 3.00 1.67 1.80 0.07* Statistically significant at ***p<0.01, ** p<0.05, * p<0.10
Table 7. Beef vs. Chicken Supply Chains: Differences in Farmers’ Perceptions of 749 Responsibility. 750
H(E)0: ∑δn = 0 Coefficient (δn) Std. Error t-value P>|t| -4.39 3.64 -1.20 0.23
H(F)0: δn = 0
Stage Coefficient (δn) Std. Error t-value P>|t|
Supermarket -3.26 1.21 -2.68 0.01***
Consumer 4.39 1.21 3.61 0.00*** Statistically significant at ***p<0.01, ** p<0.05, * p<0.10

29
Figure 1. An Example of a BWS Question 751
752
753
754
755
756
757
758
759
760
761
762
763