
Using Agile Processes to Estimate Effort in Developing Mobile ...
274
An Industrial Study of Effort Estimation in Mobile App Development using Agile Processes Thesis for the degree of Doctor of Philosophy in Computer Science Abdullah Rashed Altaleb Cyber Physical Systems Group School of Electronics and Computer Science Faculty of Engineering and Physical Sciences Building 53, University Rd, Southampton SO171BJ
-
Upload
khangminh22 -
Category
Documents
-
view
0 -
download
0
Transcript of Using Agile Processes to Estimate Effort in Developing Mobile ...

An Industrial Study of Effort Estimation in
Mobile App Development using Agile
Processes Thesis for the degree of Doctor of Philosophy in Computer Science
Abdullah Rashed Altaleb Cyber Physical Systems Group
School of Electronics and Computer Science Faculty of Engineering and Physical Sciences
Building 53, University Rd, Southampton SO171BJ


Page: i
University of Southampton Research Repository
Copyright © and Moral Rights for this thesis and, where applicable, any accompanying data
are retained by the author and/or other copyright owners. A copy can be downloaded for
personal non-commercial research or study, without prior permission or charge. This thesis
and the accompanying data cannot be reproduced or quoted extensively from without first
obtaining permission in writing from the copyright holder/s. The content of the thesis and
accompanying research data (where applicable) must not be changed in any way or sold
commercially in any format or medium without the formal permission of the copyright
holder/s.
When referring to this thesis and any accompanying data, full bibliographic details must be
given, e.g.
Thesis: Author (Year of Submission) "Full thesis title", University of Southampton, name of
the University Faculty or School or Department, PhD Thesis, pagination.
Data: Author (Year) Title. URI [dataset]

Page: ii

Page: iii
Abstract Faculty of Engineering and Physical Sciences
School of Electronics and Computer Science
Thesis for the degree of Doctor of Philosophy
An Industrial Study of Effort Estimation in Mobile App Development using Agile Processes
By
Abdullah Altaleb
Estimates of software effort, size and cost are essential to a project manager, in order to
plan and manage a project to prevent it from failing. The planning and development of
mobile apps are unlike traditional software applications due to the characteristics of the
mobile environment, including high autonomy requirements, market competition and
many other constraints. The aim of this study is to investigate the current state of practice
relating to the essential factors and optimal techniques for effort estimation that help and
support an Agile team to give reliable estimates for developing a mobile app task. The
results of a Systematic Literature Review (SLR) of effort estimation models in mobile app
development are presented; this is followed by a summary of estimation techniques used
across mobile apps. In particular, the focus in the SLR is on the software estimation models
applicable to the Agile Software Development (ASD) process. From the SLR, some research
gaps are suggested, along with possible future work on mobile effort estimation techniques
in ASD. Following this, the research aim and objectives are provided for this study, as well
as appropriate research methods, strategies, plans and designs.
In this study 20 interviews were conducted in 18 different organisations, consisting of both
structured and non-structured questions. The result revealed that Expert Judgment and
Planning Poker were the most used estimation techniques in the organisations. Some
challenges and issues were raised and discussed around these techniques. The results, in
addition, revealed 68 comprehensive factors and appropriate techniques that could be
used in effort estimation for development of a mobile app. A proposed effort estimation
technique has been constructed from the interviews. Moreover, the study presents case
studies in three companies that examined and evaluated their current estimation
techniques. It proposes and has validated an estimation technique to enhance the accuracy
of existing techniques. The study presents the effectiveness of the estimation
factors/predictors in supporting a development team to manage, estimate and create
subtasks for their user stories.

Page: iv

Page: v
Acknowledgements I would like to express my sincere gratitude and appreciation to my supervisor, Dr Andy
Gravell, for invaluable guidance, motivation, patience, support and endless encouragement
to complete my thesis. Also, many thanks go to Dr Rezazadeh for his invaluable feedback
and comments on this study. Huge thanks and appreciation go to all the organisations and
professionals who participated in the survey and case study methods. Special thanks go to
my mother, Ms Aljoharah, for taking care of me after my father died when I was 9 years
old, supporting me to attain my goals. Thanks go to my brother and sisters, who always
supported me during my PhD journey. Thanks are due to my friends and colleagues at the
CPS group: Dr Madini Alassafi, Dr Ahmed Alenezi and Mr Hussain Alhashimi for the
guidance and motivation in my PhD study. Thanks also to the University of Southampton
for providing a well-equipped environment and comfortable atmosphere at the School of
Electronics and Computer Science. I should like to thank the Saudi Arabian Cultural Bureau
SACB for sponsoring my studies and allowing this research to be undertaken.

Page: vi
Table of Contents Abstract ................................................................................................................................. iii
Acknowledgements ............................................................................................................... v
Table of Contents .................................................................................................................. vi
List of Tables ........................................................................................................................ xiii
List of Figures ...................................................................................................................... xvii
Research Thesis: Declaration of Authorship ...................................................................... xxiii
Glossary of Terms and Abbreviations ................................................................................. xxv
Chapter 1: Introduction ......................................................................................................... 1
1.1. Research Structure ...................................................................................................... 2
1.2. Peer-reviewed and Published Work ........................................................................... 2
Chapter 2: Background .......................................................................................................... 5
2.1. Agile Software Development Process ......................................................................... 5
2.2. Mobile Application Development ............................................................................... 7
2.3. Software Effort Estimation .......................................................................................... 8
2.3.1. Software estimation in general ....................................................................... 8
2.3.2. Software estimation in Agile SD .................................................................... 10
2.4. Summary ................................................................................................................... 12
Chapter 3: Research Methodology ...................................................................................... 13
3.1. Research Aim and Objectives .................................................................................... 13
3.2. Conducting the Literature Review ............................................................................ 14
3.3. Research Approach ................................................................................................... 14
3.4. Research Design ........................................................................................................ 15
3.5. Research Strategies and Data Collection Method .................................................... 16
3.6. Time Horizon ............................................................................................................. 20

Page: vii
3.7. Summary .................................................................................................................... 20
Chapter 4: Systematic Literature Review ............................................................................. 21
4.1. Scope and Research Questions ................................................................................. 21
4.1.1. Research scope............................................................................................... 21
4.1.2. The research questions .................................................................................. 21
4.2. Primary and Secondary Search Strategy ................................................................... 22
4.2.1. Search criteria ................................................................................................ 22
4.2.2. Search scope .................................................................................................. 22
4.2.3. Search query .................................................................................................. 23
4.2.4. Inclusion and exclusion criteria ...................................................................... 25
4.3. Study Selection Process ............................................................................................. 26
4.3.1. Screening the less-important search queries ................................................ 26
4.3.2. Screening the normal and highly important search queries ......................... 26
4.3.3. Full text screening .......................................................................................... 27
4.4. Studies Quality Assessment....................................................................................... 29
4.5. Limitations of the Research ....................................................................................... 30
Chapter 5: Literature Review Discussion ............................................................................. 31
5.1. Effort Estimation in Developing Mobile Apps ........................................................... 31
5.1.1. Techniques using metrics/cost drivers for estimation effort ........................ 34
5.1.2. Techniques using functional size measurement ............................................ 35
5.2. Agile Software Development in Mobile Apps ........................................................... 36
5.2.1. Mobile-D approach and an improved Mobile-D approach ............................ 37
5.2.2. Hybrid method approach ............................................................................... 37
5.2.3. Other studies .................................................................................................. 37
5.3. Effort Estimation Factors in Agile Process ................................................................. 38
Page: viii
5.4. Research Gaps ........................................................................................................... 39
5.5. Summary ................................................................................................................... 41
Chapter 6: Data Collection Preparation for the Interviews ................................................. 43
6.1. Understanding the Interview Technique .................................................................. 43
6.2. Method Used to Build the Interview Questions ....................................................... 43
6.3. Interview Approach ................................................................................................... 46
6.4. Sample Size ............................................................................................................... 46
6.5. Pilot Testing ............................................................................................................... 47
6.6. Ethical Considerations ............................................................................................... 47
6.7. Analysis Tools ............................................................................................................ 48
Chapter 7: Analysis and Discussion of the Interview Results .............................................. 49
7.1. Quantitative Analysis ................................................................................................ 49
7.1.1. Experts’ demographic information ................................................................ 50
7.1.2. Mobile platform usage .................................................................................. 53
7.1.3. Effort estimation techniques ......................................................................... 56
7.1.4. Effort estimation factors ................................................................................ 60
7.1.5. Effort estimation accuracy ............................................................................. 76
7.2. Qualitative Analysis ................................................................................................... 77
7.2.1. Effort estimation process .............................................................................. 77
7.2.2. Effort estimation factors ................................................................................ 83
7.2.3. Agile process in mobile app development .................................................... 93
7.3. Analysis Summary and Discussion ............................................................................ 96
7.3.1. Effort estimation techniques ......................................................................... 96
7.3.2. Effort estimation factors ................................................................................ 97
7.3.3. Effort estimation process ............................................................................ 101

Page: ix
7.4. The Initial Proposal of the Effort Estimation Technique ......................................... 103
7.4.1. The background of the proposed estimation technique ............................. 103
7.4.2. The overview of the initial proposal of effort estimation technique. ......... 104
7.4.3. Experts’ opinion on the Checklist’s based technique .................................. 104
7.4.4. The design of the initial proposal of the effort estimation technique ........ 105
7.5. Limitations of the Interview Method ...................................................................... 107
7.6. Summary .................................................................................................................. 108
Chapter 8: Data Collection Preparation for the Case Study .............................................. 109
8.1. Overview of the Case Study .................................................................................... 109
8.2. Objectives of the Study ........................................................................................... 109
8.3. The Case Study and Unit of Analysis ....................................................................... 110
8.4. Case Study Process and Possible Scenarios ............................................................ 111
8.4.1. Step 1: Obtain historical data from previous projects ................................. 112
8.4.2. Step 2: Types of current estimation techniques .......................................... 112
8.4.3. Step 3: Nature of the project ....................................................................... 113
8.4.4. Step 4: Sprint planning, review and retrospective phase ............................ 114
8.5. Case Study Questions and Data Collection Methods .............................................. 117
8.5.1. Data collection method ................................................................................ 117
8.5.2. Selecting the data......................................................................................... 117
8.5.3. Case study questions .................................................................................... 118
8.6. Ethical Considerations ............................................................................................. 121
Chapter 9: Analysis and Discussion of the Case Study Results .......................................... 123
9.1. Case Study at Company A ........................................................................................ 123
9.1.1. Company’s background and project information ........................................ 123
9.1.2. Current situation and proposed estimation method in Company A ........... 124

Page: x
9.1.3. After applying the proposed estimation technique and accuracy’s results 136
9.1.4. Summary of Case Study A ............................................................................ 143
9.2. Case Study at Company B ....................................................................................... 143
9.2.1. Company and project information .............................................................. 143
9.2.2. Current development process of Company B and estimation process ....... 144
9.2.3. Focus group discussion to enhance the self-estimation method................ 147
9.2.4. Result from the suggested method ............................................................. 149
9.2.5. Pearson correlation test .............................................................................. 152
9.2.6. Summary of Case Study B ............................................................................ 153
9.3. Case Study at Company C ....................................................................................... 154
9.3.1. Company and project information .............................................................. 154
9.3.2. Current development process and estimation process in Company C ....... 154
9.4. The concept of the Pair-estimation technique ....................................................... 161
9.5. Limitations of the Research .................................................................................... 162
9.6. Summary ................................................................................................................. 162
Chapter 10: Conclusions and Future Work ........................................................................ 165
10.1. Conclusions ........................................................................................................... 165
10.1.1. Systematic literature Review ....................................................................... 165
10.1.2. Survey Method ............................................................................................ 166
10.1.3. Case Study Method ...................................................................................... 167
10.2. Contributions of the Research .............................................................................. 170
10.3. Future Work .......................................................................................................... 170
References ......................................................................................................................... 173
Appendix A ......................................................................................................................... 183
About the Author ........................................................................................................... 183

Page: xi
Cross-platform Frameworks and Tools Background ...................................................... 183
Appendix B ......................................................................................................................... 185
SLR Query Schema .......................................................................................................... 185
Appendix C ......................................................................................................................... 195
Interview Questions ....................................................................................................... 195
Interview Information .................................................................................................... 196
Quantitative Analysis ...................................................................................................... 198
Qualitative Analysis ........................................................................................................ 231
Appendix D ......................................................................................................................... 233
Case Study Method ........................................................................................................ 233

Page: xii
Page: xiii
List of Tables Table 1: Search scope of the database ................................................................................ 24
Table 2: Query result in detail .............................................................................................. 24
Table 3: Query summary ...................................................................................................... 24
Table 4: Information on selected articles ............................................................................ 27
Table 5: Assessment of selected studies.............................................................................. 30
Table 6: Categories of selected studies ............................................................................... 31
Table 7: Estimation techniques ............................................................................................ 32
Table 8: Size metrics of estimation ...................................................................................... 32
Table 9: Types of mobile operating system ......................................................................... 33
Table 10: Type of mobile app development ........................................................................ 33
Table 11: Domain of datasets used ...................................................................................... 33
Table 12: Development activity ........................................................................................... 34
Table 13: Accuracy metrics and evaluation ......................................................................... 34
Table 14: Social factors of effort estimation in Agile process ............................................. 38
Table 15: Relevant factors in effort estimation and influence on estimation accuracy in
Agile ...................................................................................................................................... 39
Table 16: Data requirement table for the interviews .......................................................... 45
Table 17: Statistical test used in quantitative analysis ........................................................ 49
Table 18: Experts’ work experience countries ..................................................................... 51
Table 19: Experts’ job roles .................................................................................................. 51
Table 20: Work experience in years ..................................................................................... 52
Table 21: Summary of the company types .......................................................................... 53
Table 22: Platform types used by the experts ..................................................................... 54
Table 23: Specific platforms used by the experts ................................................................ 55

Page: xiv
Table 24: Experts’ use of mobile development frameworks ............................................... 55
Table 25: Effort estimation technique question .................................................................. 56
Table 26: Estimation techniques used by the experts ......................................................... 57
Table 27: Measurement type for the estimation technique ................................................ 57
Table 28: Relationship between the estimation techniques with the effort measurement
type ...................................................................................................................................... 58
Table 29: Chi-square and Fisher’s-exact tests ..................................................................... 59
Table 30: Experts’ responses to level of importance of effort estimation factors ............. 62
Table 31: Importance level of the effort estimation factors by experts’ job role ............... 64
Table 32: Mann-Whitney test for the effort estimation factors ......................................... 68
Table 33: One-way ANOVA test for associated factors ....................................................... 73
Table 34: Coefficient correlation for selective effort estimation factors ............................ 75
Table 35: Summary of experts' estimation process ............................................................ 81
Table 36: Relationship between who explains the task and who assigns the effort .......... 82
Table 37: Relationship between who is responsible for a task, and who assigns the effort
............................................................................................................................................. 83
Table 38: Experts’ summary of estimation factors from business complexity perspective 86
Table 39: Experts’ summary of estimation factors from a technical perspective ............... 89
Table 40: An overview of the experts' effort estimation factors suggestion ...................... 92
Table 41: Overview of Agile’s suitability for mobile app development .............................. 95
Table 42: Estimation techniques used by experts by job role ............................................. 96
Table 43: Effort estimation techniques with its measurement type................................... 97
Table 44: Experts’ opinion on Checklist process for effort estimation ............................. 105
Table 45. First milestone questions of the case study process ......................................... 119
Table 46. Second milestone questions of case study process. .......................................... 120
Table 47: Third milestone questions of case study process. ............................................. 121

Page: xv
Table 48: Project team members in Company A ...............................................................124
Table 49: Overall sprint performance before and after the case study ............................137
Table 50: Correlation test for Sprint 4 ...............................................................................141
Table 51: Correlation test for Sprint 5 ...............................................................................142
Table 52: Correlation test for Sprint 6 using pair-estimation technique ...........................142
Table 53: Correlation test for Sprint 7 using pair-estimation technique ...........................142
Table 54: Task performance for Sprint 11 .........................................................................146
Table 55: Team delivery performance per day for Sprint 11 .............................................146
Table 56: Task performance for Sprint 13 .........................................................................150
Table 57: Team delivery performance per day for Sprint 13 .............................................150
Table 58: Correlation test for Sprint 11 to compare the estimated effort to actual effort
............................................................................................................................................152
Table 59: Correlation test for Sprint 13 to compare the estimated effort to actual effort
............................................................................................................................................152
Table 60: Case study participants in Company C ...............................................................154
Table 61: Effort estimation’s accuracy level in the last three sprints in Company C ........156
Table 62: A summary of the Systematic Literature Review objectives .............................165
Table 63: A summary of the survey method’s aim and objectives ....................................167
Table 64: A summary of the case study objectives ............................................................168
Table 65: Query schema .....................................................................................................185
Table 66: Expert’s information ...........................................................................................196
Table 67: Job role distributed by the country work ...........................................................197
Table 68: Companies details for the interview ..................................................................197
Table 69: Experts’ estimation technique in detail .............................................................198
Table 70: Effort estimation factors description .................................................................198
Table 71: Effort estimation frequencies ............................................................................201

Page: xvi
Table 72: Normality test for the estimation factors .......................................................... 204
Table 73: Mann-Whitney ranks for software developer and project managers ............... 208
Table 74: Mann-Whitney ranks for software developer and QA's .................................... 212
Table 75: Mann-Whitney ranks for project managers and QA's ....................................... 216
Table 76: One-way ANOVA test between all the experts job role and factors ................. 224
Table 77: Development performance before the proposed estimation process ............. 236
Table 78: Development performance after the proposed estimation process ................ 237
Table 79: Example of breaking down the user story into small tasks ............................... 240
Table 80: Details of user stories' information for Sprint 11 of case study C ..................... 242
Table 81: Details of user stories' information for Sprint 13 of Case study C ..................... 243
Table 82: Summary of methods used for the 1st and 2nd research questions ................... 245
Table 83: Summary of methods used for the 3rd research question................................. 245
Table 84: Summary of methods used for the 4th, 6th and 7th research questions............. 246

Page: xvii
List of Figures Figure 1: Research methodology activity 13
Figure 2: Deductive research progress 15
Figure 3: Inductive research progress 15
Figure 4: Interview approach 17
Figure 5: Multi-methods (triangulation) 18
Figure 6: Research method overview 19
Figure 7: Article distribution 25
Figure 8: Article summary 27
Figure 9: Selected article summary 27
Figure 10: Research Gaps 41
Figure 11: Experts’ work country 51
Figure 12: Experts’ job roles 51
Figure 13: Job roles of the experts by work country 51
Figure 14: Main job roles of the experts 52
Figure 15: Overview of the company categories 53
Figure 16: Platform type overview 54
Figure 17: Specific platform overview 55
Figure 18: Mobile development frameworks by the experts’ job roles 55
Figure 19: Overview of the measurement types for the estimation techniques 57
Figure 20: Estimation techniques overview 57
Figure 21 Ribbon chart: association between the estimation technique and effort
measurement type 59
Figure 22: Overview of effort estimation factors 61
Figure 23: Example of normal distribution for the Map view factor for software
developers 67

Page: xviii
Figure 24: Example of normal distribution for Sharing factor for QA 67
Figure 25: Mean differences values between experts for Sharing factors as shown in the
Mann Whitney test 70
Figure 26: Mean differences values between experts for Date Storage factors as shown in
the Mann Whitney test 70
Figure 27: Mean differences values between experts for Battery power opt. factors as
shown in Mann Whitney test 70
Figure 28: Mean differences values between experts for Push notification factors as
shown in Mann Whitney test 70
Figure 29: Mean differences between the expert groups for support code reusability
factors 71
Figure 30: Mean differences between the expert groups for searching factors 71
Figure 31: Mean differences between the expert groups for Data storage factors 72
Figure 32: Mean differences between the expert groups for Battery & power factors 72
Figure 33: Mean differences between the expert groups for Booking & reservation factors
72
Figure 34: Mean differences between the expert groups for Knowledge of product
backlog item factors 72
Figure 35: Coefficient correlation between User interface quality and Deadline date
factors 74
Figure 36: Coefficient correlation between Compatibility with previous versions and Data
storage factors 74
Figure 37: Coefficient correlation between Backend system Ava. and Language and
culture diff factors 74
Figure 38: Coefficient correlation between Backlog items complexity and dependency
between Backlog items factors 74
Figure 39: Effort estimation accuracy from the survey 76
Figure 40: Overview of the relationship between who assigns the effort and to whom the
task is explained 82
Page: xix
Figure 41: Overview of the relationship between who assigned the effort and who takes
responsibility for the task 83
Figure 42: Overview of business complexity factors suggested by experts 87
Figure 43: Overview of the technical factors suggested by experts 90
Figure 44: Overview of additional factors suggested by the experts 93
Figure 45: (13) Factors that have a significant relationship, according to the Mann-
Whitney test 98
Figure 46: (4) Factors have a significant relationship with the one-way ANOVA test 98
Figure 47: Relationship between the three factors: Backlog item comp, dev.
Implementation exp. and backlog item dependency 99
Figure 48: Relationship between two factors: interface comp and deadline 100
Figure 49: No relationship between two factors: interrupt handling and push notification
100
Figure 50: (negative relationship) No relationship between two factors: support code
reusability and dependency between backlog item 100
Figure 51: Expert opinion on the estimation process 102
Figure 52: Design process to build the proposed effort estimation technique 107
Figure 53. Case study type: embedded case study 111
Figure 54: Overview of the case study 111
Figure 55: Nature of the project to which to apply the case study and its possibilities. 113
Figure 56: Measurement of the effort estimation accuracy 114
Figure 57: Case study process 115
Figure 58: Performance of the development team for Sprint 4 125
Figure 59: Performance of the development team for Sprint 5 125
Figure 60: Current estimation process in Company A 127
Figure 61: Pair-estimation model 133
Figure 62: Subtasks: Breaking down user stories into independent tasks 136
Page: xx
Figure 63: Burndown chart of the development team for Sprint 6 140
Figure 64: Burndown chart of the development team for Sprint 7 141
Figure 65: Scatter graph for Sprint 4, before the case study 142
Figure 66: Scatter graph for Sprint 5, before the case study 142
Figure 67: Scatter graph for Sprint 7 during the case study 143
Figure 68: Scatter graph for Sprint 6 during the case study 143
Figure 69: Accuracy level of effort estimation methods used in Company B 145
Figure 70: Task accuracy level (estimated vs actual) 147
Figure 71: Burndown chart for Sprint 11 to compare the estimated effort to the actual
and earned effort values 147
Figure 72: Task accuracy level (estimated vs actual) 151
Figure 73: Burndown chart for Sprint 13 to compare the estimated effort to actual and
earned effort values 151
Figure 74: Scatter graph for Sprint 13 153
Figure 75: Scatter graph for Sprint 11 153
Figure 76: Existing effort estimation method in Company C 159
Figure 77: Modified effort estimation method in Company C 160
Figure 78: Sprint accuracy for the last four sprints in Company C 160
Figure 79: Pair-estimation technique 161
Figure 80: Overview of the study methods and process 169
Figure 81: Example of survey questions 195
Figure 82 Mean differences values between factors as shown in Mann-Whitney test: 221
Figure 83 Project manager rank of Sharing factor 222
Figure 84 Software developer rank of Sharing factor 222
Figure 85 Project manager rank of Data storage & memory factor 222
Figure 86 QA rank of Sharing factor 223

Page: xxi
Figure 87 QA rank of Data storage & memory factor 223
Figure 88 Software developer ranked of Data storage & memory factor 223
Figure 89: Correlation for all effort estimation factors 228
Figure 90 Agile estimation factors filtered by expert's job role 229
Figure 91 Functional estimation factors filtered by expert's job role 229
Figure 92 Non-functional estimation factors filtered by expert's job role 230
Figure 93: Project estimation factors filtered by expert's job role 230
Figure 94: Mobile platform estimation factors filtered by expert's job role 230
Figure 95: Example of thematic technique used to summarise and generate themes of the
estimation process from the qualitative question 231
Figure 96 Example of thematic technique used to summarise and generate themes of
additional estimation factors from the qualitative question 232
Figure 97: Email message from the project manager after conducting a group discussion
with the development team 233
Figure 98: Email message of appreciation for the improvement from the client
representative of Organisation T 233
Figure 99: Appreciation letter from the president and CEO of Company A for the positive
results in Project X 234
Figure 100: Researcher being presented by the CEO at Company A with an award for the
case study’s successful results and feedback 235
Figure 101: Distribution of the work progress on Sprint 5 238
Figure 102: Distribution of the work progress on sprint 6 239
Figure 103: distribution of the work progress on sprint 7 239
Figure 104: burn down chart of the development team from sprint 4 until sprint 7 242

Page: xxii

Page: xxiii
Research Thesis: Declaration of Authorship
Print name: Abdullah Rashed Altaleb
Title of thesis: An Industrial Study of Effort Estimation in Mobile App Development
using Agile Processes.
I declare that this thesis and the work presented in it are my own and has been generated
by me as the result of my own original research.
I confirm that:
1. This work was done wholly or mainly while in candidature for a research degree at this
University;
2. Where any part of this thesis has previously been submitted for a degree or any other
qualification at this University or any other institution, this has been clearly stated;
3. Where I have consulted the published work of others, this is always clearly attributed;
4. Where I have quoted from the work of others, the source is always given. With the
exception of such quotations, this thesis is entirely my own work;
5. I have acknowledged all main sources of help;
6. Where the thesis is based on work done by myself jointly with others, I have made clear
exactly what was done by others and what I have contributed myself;
7. Parts of this work have been published as:
Altaleb, A., Al Hashimi, H., & Gravell, A. (2020). A Case Study Validation of the Pair-
estimation Technique in Effort Estimation of Mobile App Development using Agile
processes. In 10th IEEE International Conference on Advanced Computer Information
Technologies (ACIT 2020). IEEE Germany Section, Deggendorf Institute of Technologies,
Germany. (Accepted Paper)
Altaleb, A., Altherwi, M., & Gravell, A. (2020). An Industrial Investigation into Effort
Estimation Predictors for Mobile App Development in Agile Processes. In 9th IEEE
International Conference on Industrial Technology and Management (ICITM 2020). IEEE,
University of Oxford, United Kingdom.

Page: xxiv
Altaleb, A., Altherwi, M., & Gravell, A. (2020). A Pair Estimation Technique of Effort
Estimation in Mobile App Development for Agile Process: Case Study. In ACM International
Conference on Information Science and Systems (ICISS 2020). ACM, Cambridge University,
United Kingdom.
Altaleb, A., & Gravell, A. (2019a). An Empirical Investigation of Effort Estimation in Mobile
Apps Using Agile Development Process. In International Conference on Computer,
Software and Modeling (ICCSM 2019). Barcelona, Spain.
Altaleb, A., & Gravell, A. (2019b). An Empirical Investigation of Effort Estimation in Mobile
Apps Using Agile Development Process. Journal of Software, 14(8), 356–369.
https://doi.org/10.17706/jsw.14.8.356-369 (Extended Paper).
Altaleb, A. R., & Gravell, A. (2018). Effort Estimation across Mobile App Platforms using
Agile Processes: A Systematic Literature Review. Journal of Software, 13(4), 242–259.
https://doi.org/10.17706/jsw.13.4.242-259.
Altherwi, M., Altaleb, A., &Gravell, A. (2020). Programming Language Popularity and Trends
in OSS based on Mining Software Repositories. In 2020 ACM SIGPLAN conference on
Systems, Programming, Languages, and Applications: Software for Humanity (SPLASH
2020). Chicago, USA (Submitted).
Signature: Date: 25 Mar. 2020

Page: xxv
Glossary of Terms and Abbreviations
Agile SD Agile Software Development
API Application Programming interface
App Application
ASD Agile Software Development
BA Business Analyst
Dev Developer
EJ Expert Judgement
FP Function Point
IH Ideal Hour
IT Information Technology
MASAM Mobile Application Software development based on the Agile Methodology
NDA Non-Disclosure Agreement
OS Operating System
P/H Person per Hour
PM Project Manager
PMO Project Management Office
PP Planning Poker
QA Quality Assurance
RQ Research Question
SA System Analyst
SDP Software Development Process
SLR Systematic Literature Review
SP Story Point
UAT User Acceptance Testing
UCP Use-Case Point
UI User Interface
UX User Experience
XP eXtreme Programming


Chapter: Introduction Page: 1
Chapter 1: Introduction
Effort estimation plays an important and critical role in any software project. To generate
contracts, both project managers and clients use effort estimation models to measure the
effort, size, cost and duration involved in designing and implementing a software project.
Good estimation is one of the success factors for companies, as bidding at a good price
could mean that they win a contract bid. Incorrect estimations can negatively affect
companies’ marketing and sales, also leading to monetary losses.
In the past, mobile devices were used only for receiving and sending messages and calls;
today, however, they are becoming essential to modern life. Among the many examples of
smartphone usage are making flight bookings, GPS navigation, banking transactions,
gaming and communicating with others on social media. Mobile applications represent a
new trend in the software industry, and the demand for such apps is set to increase
significantly with mobile technology developments. In fact, there were approximately two
billion smartphone users around the world in 2016, and this figure is expected to reach 2.8
billion by 2018. The revenue from application stores is predicted to reach $189 billion by
2020, up from $88.3 billion in 2016, according to statista.com. Planning and developing a
mobile app is unlike that of traditional software systems in many aspects. Mobile devices
are becoming increasingly complex, and designing their apps presents some special
requirements and constraints that are less commonly found in traditional software.
The main goal of this study is to identify, investigate and validate the effort estimation
factors and techniques for developing mobile apps using the Agile process. This study aims
to present and evaluate a current state of practice for the effort estimation techniques for
mobile app development in Agile processes. Its objectives are to investigate the efficiency
of current estimation techniques in the industrial fields and evaluate their effectiveness in
terms of Agile processes for mobile app development. It also aims to provide propose an
effort estimation technique drawn from multiple Agile professionals across several
organisations to improve the accuracy of existing estimation techniques.
This research study primarily examines the state-of-the-art techniques used in the field of
effort estimation for mobile apps in ASD by means of a Systematic Literature Review (SLR).
The guidelines proposed by Kitchenham and Charters (2007) have been used to construct
this SLR, and no previous literature or studies were found to have empirically validated and
examined effort estimation model for mobile apps. This study identifies, critically evaluates
and integrates the findings of all studies relevant to the topics addressed by the research
questions. This thesis details the SLR and points to some research gaps and future
directions in the field of effort estimation with mobile app developments in ASD.

Chapter: Introduction Page: 2
In addition, this research applied a survey method which collected data from 20 experts to
investigate the current state of practice of effort estimation techniques and factors across
18 companies in various business fields. The collected data have been analysed
quantitatively and qualitatively, and it was found that the Expert Judgment (EJ) and
Planning Poker (PP) techniques are most commonly used for mobile app development in
the Agile process. Moreover, 48 effort estimation factors from previous studies have been
evaluated and 20 further factors obtained that could affect the accuracy of the effort
estimation value. This study details the analysis methods and techniques used, and
provides further results related to mobile app development.
Finally, the researcher applied a case study method which proposed and validated
estimation technique in order to enhance the performance of the existing estimation
techniques from the industry. Three case studies have been applied in three companies,
involving in total around 15 professionals, and examined the efficiency of the
comprehensive estimation factors and predictors collected previously by survey.
1.1. Research Structure
This thesis is organised as follows: Chapter 2 presents a brief background to ASD, the
characteristics of mobile apps and the effort estimation models. The research methodology
is described in Chapter 3, including the research aims, objectives, strategy, design and
approach. The steps in the SLR are detailed in Chapter 4; following this, its results are
discussed, and research gaps, research questions and possible directions for future work
are identified in Chapter 5. In Chapter 6, the details of the data collection preparation and
strategy of the interview method are presented, followed in Chapter 7 by the data
collection analysis and discussion of the interviews. In Chapter 8, the details of the data
collection preparation and strategy of the case study method are presented, followed in
Chapter 9 by the data collection analysis and discussion for the case study. Finally, the
conclusions and future work are presented in Chapter 10.
1.2. Peer-reviewed and Published Work
During the study, the researcher was working on several publications to obtain further
feedback, recommendations and comments from experts related to this research area.
Some of the thesis results and analysis works have been already published in the following
peer-reviewed conferences and journals:
➢ Altaleb, A., Al Hashimi, H., & Gravell, A. (2020). A Case Study Validation of the Pair-
estimation Technique in Effort Estimation of Mobile App Development using Agile
processes. In 10th IEEE International Conference on Advanced Computer Information

Chapter: Introduction Page: 3
Technologies (ACIT 2020). IEEE Germany Section, Deggendorf Institute of Technologies,
Germany. (Accepted Paper)
➢ Altaleb, A., Altherwi, M., & Gravell, A. (2020). An Industrial Investigation into Effort
Estimation Predictors for Mobile App Development in Agile Processes. In 9th IEEE
International Conference on Industrial Technology and Management (ICITM 2020).
IEEE, University of Oxford, United Kingdom.
➢ Altaleb, A., Altherwi, M., & Gravell, A. (2020). A Pair Estimation Technique of Effort
Estimation in Mobile App Development for Agile Process: Case Study. In ACM
International Conference on Information Science and Systems (ICISS 2020). ACM,
Cambridge University, United Kingdom.
➢ Altaleb, A., & Gravell, A. (2019a). An Empirical Investigation of Effort Estimation in
Mobile Apps Using Agile Development Process. In International Conference on
Computer, Software and Modeling (ICCSM 2019). Barcelona, Spain.
➢ Altaleb, A., & Gravell, A. (2019b). An Empirical Investigation of Effort Estimation in
Mobile Apps Using Agile Development Process. Journal of Software, 14(8), 356–369.
https://doi.org/10.17706/jsw.14.8.356-369 (Extended Paper).
➢ Altaleb, A. R., & Gravell, A. (2018). Effort Estimation across Mobile App Platforms using
Agile Processes: A Systematic Literature Review. Journal of Software, 13(4), 242–259.
https://doi.org/10.17706/jsw.13.4.242-259.
➢ Altherwi, M., Altaleb, A., &Gravell, A. (2020). Programming Language Popularity and
Trends in OSS based on Mining Software Repositories. In 2020 ACM SIGPLAN
conference on Systems, Programming, Languages, and Applications: Software for
Humanity (SPLASH 2020). Chicago, USA (Submitted).


Chapter: Background Page: 5
Chapter 2: Background
This chapter gives an overview of effort estimation through ASD and its relationship to
developing mobile apps. In section 2.1, the Agile process and methodologies are discussed.
The characteristics of the mobile app environment and platforms are detailed in section
2.2, comparing mobile app development with traditional software development. Finally, in
section 2.3, an overview of several estimation techniques in software development is
presented, and the most common Agile development techniques are discussed.
2.1. Agile Software Development Process
Before starting to discuss the characteristics of ASD, we need to understand the definition
itself. What does ‘agile’ mean? According to the Cambridge.org dictionary, it means ‘being
able to move quickly and easily’ (Cohen et al., 2003). The definition from the software
engineering point of view is the ability to move quickly and easily to help the software
development process to become more efficient (Pekka Abrahamsson et al., 2002). Software
development is an organised process that involves managing a project so that it is delivered
in an economical, rapid and efficient manner (Rao et al., 2011). Thus, the goal of ASD is to
develop solutions efficiently and deliver projects quickly, with any changes that are
necessary being made rapidly.
Compared with traditional software development, ASD places less emphasis on up-front
plans and strict plan control and more on the flexible mechanisms to facilitate any changes
to the management plan during the project cycle (Rao et al., 2011). There are many ASD
methods (Scrum, Extreme Programming XP, Crystal, Feature Driven Development, Lean
Development, and Dynamic Systems Development Methodology); however, common
characteristics include iterative development to allow the team to adapt to the changes in
the requirements and to interact deeply. Indeed, doing so encourages the development
team to work closely to make decisions immediately and reduce any involvement with
intermediate artefacts.
Agile is an iterative and incremental means of development that promotes frequent
delivery of a product’s features (Hoda et al., 2010). The Agile principle increases
communication so that customers, business people and developers work together
(Pikkarainen et al., 2008). In addition, to achieve the project needs, the emphasis is firmly
on accepting changes to the project requirements and on holding open discussions with
customers, with less reliance on documentation.
In 2001, 17 software practitioners and consultants gathered to compile the Agile Manifesto
(Beck et al., n.d.). This outlines the four core values of ASD upon which all Agile methods
rely on in various ways, favouring:

Chapter: Background Page: 6
1) Individuals and Interaction, over Processes and Tools. This encourages and places
emphasis on teamwork and communication.
2) Working Software, over Comprehensive Documentation. An Agile design requires a
user story that is sufficient for a developer to build the function. The Manifesto
values documentation, yet values operational software even more.
3) Customer Collaboration, over Contract Negotiation.
4) Responding to Change, over Following a Plan.
These four fundamentals are supported by 12 principles that guide the various Agile
methodologies (‘Principles for Agile Manifesto,’ n.d.):
1) Customer satisfaction through early and continuous software delivery.
2) Accommodate changing requirements throughout the development process.
3) Frequent delivery of working software.
4) Collaboration between the business stakeholders and developers throughout the
project.
5) Support, trust, and motivation of the people involved.
6) Enabling face-to-face interactions.
7) Working software is the primary measure of progress.
8) Agile processes to support a consistent development pace.
9) Attention to technical details and a design that enhances agility.
10) Simplicity – develop just enough to get the job done right now.
11) Self-organising teams encourage great architectures, requirements, and designs.
12) Regular reflections on how to become more effective.
There are several Agile development practices; however, Scrum and eXtreme Programming
(XP) are the most popular and commonly adopted methods in companies (Pikkarainen et
al., 2008). Recently, the 13th annual State of Agile survey in 2019 announced that 72% of
the 1,319 respondents reported that Scrum methodology is the most widely practised (36%
of respondents from organisations of less than a thousand people and 46% of those of more
than 5 thousand) (‘13th Annual State of Agile Report’, 2019).
Scrum methodology is a framework to manage and develop a complex product, and various
process and techniques can be employed. Scrum takes an iterative and incremental
approach to control risk and accept change (Schwaber & Sutherland, 2017). The Scrum
team consists of (Schwaber & Sutherland, 2017):
• Product owner: responsible for managing, expressing and ordering the product
backlog items.
• Development team: small number of professionals to undertake the development
work and deliver an increment of the product.

Chapter: Background Page: 7
• Scrum master: individual to promote and support Scrum team, to make sure
everyone understands the Scrum practice and theory.
2.2. Mobile Application Development
Mobile app development differs from traditional software systems development in many
aspects. The traditional methodologies to develop desktop applications are inapplicable to
mobile app development (Ajit Kumar et al., 2016), which faces exceptional constraints and
requirements compared to other software systems (Kaur & Kaur, 2018). It is necessary to
apply appropriate methods that are able to address the challenges. One of the notable
challenges is the multiple platform issue that is encountered. Developers always plan for
and are concerned about the compatibility of their app with all mobile operating systems,
such as IOS, Android, Microsoft Windows Mobile and BlackBerry.
There are three major types of mobile apps, namely mobile web, native and hybrid (A.I.
Wasserman, 2010; Xanthopoulos & Xinogalos, 2013). Mobile web apps are usually based
on common internet technologies, such as HTML and JavaScript, and can be browsed on a
mobile device without the need for an installation process. However, this kind of
application has limited access to the underlying device’s hardware and data, such as GPS,
sensors, camera and memory. A native mobile app is usually developed for a particular
mobile operating system and must be installed on a mobile device via an application store,
such as Google Play or Apple Store, and can access all of a device’s features, such as
hardware components and API. An IDE, supported by special tools, must be used to develop
a native app. This kind of app requires special skills and a high level of experience, in
contrast to mobile web apps, as the source code is not reusable for any other platform. A
hybrid app is a combination of a mobile web and a native app, meaning that the HTML5
app is embedded inside the native container. In other word, a hybrid app is basically a small
website that runs in a browser shell inside an native app, and that can access the platform
layer (‘Ionic Framework’, n.d.).
When developing a mobile app that works on several platforms by means of native
development, for each of the platforms it is necessary to repeat the development process
cycle, including the coding phase (Dalmasso et al., 2013; Ottka, 2015). Web applications
suffer from limited access to a device’s hardware and have no direct access to the lower
level of the API (Lassoff & Stachowitz, 2015). Cross-platform tools, such as PhoneGap,
Xamarin and JQuery-Mobile, are solutions that can create an app for multiple platforms
from a common code base. The design and implementation of the app are undertaken just
once, then it can be deployed to any specific platform after customisation by the tool. The
app will be installed on the mobile device as a native application (Xanthopoulos &
Xinogalos, 2013).

Chapter: Background Page: 8
Additional challenges that differentiate mobile app development from traditional
application systems (Dalmasso et al., 2013; Kaur & Kaur, 2018; Rahimian & Ramsin, 2008;
Rosen & Shihab, 2016) include the wireless communication issue, portability, many
standards, protocols and network technologies, strict time-to-market requirements, and
the mobility issue (autonomy and localisation). Moreover, the limitations of power supply
(battery), processor efficiency, a small sized user interface and memory performance are
other challenges that do not arise with desktop computers (Ajit Kumar et al., 2016;
Hammershoj et al., 2010), and Kumar has presented a detailed analysis of around 12 major
challenges that confront mobile app development.
Further challenges are identified by Rosen and Shihab (2016), whose study analysed and
examined 13 million posts to the popular online forum Stack Overflow and its Q&A site
regarding mobile developers’ challenges and questions. The results revealed that the
challenges and questions fall into the following categories: frequent changes to the stores’
requirements, difficulties with compliance testing, changes to mobile APIs, dealing with
data on mobile devices, sensor handling, UI issues, and screen size and resolutions.
Moreover, a survey was conducted with 12 senior developers to list the challenges facing
the developing of a mobile app (Joorabchi et al., 2013). The study revealed that the most
challenging issues for developers are the multiple mobile platforms, the analysis and
testing tools, and the emulators.
Since this study concentrates on cross-platform mobile app development, there are
multiple frameworks, and developers have their own preferences (Wasserman, 2010), as
shown by a study comparing current cross-platforms (Latif et al., 2016). The preferred
platforms that developers usually rely on for mobile app development are listed in the
Appendix A. Moreover, another study presents the criteria used to select the appropriate
platforms and tools for mobile development (Dalmasso et al., 2013). A developer could
select a specific framework and tools based on five elements: 1. native user experience and
feeling; 2. offline/online usage; 3. compatibility with mobile devices; 4. access to built-in
features; and 5. security (Dalmasso et al., 2013) (see Appendix A for the most common
frameworks and tools). It concludes that the PhoneGap framework involves less memory,
CPU and power consumption, yet has some limitations regarding UI.
2.3. Software Effort Estimation
2.3.1. Software estimation in general
For all software projects, accurate software estimation of any of its aspects is both
interesting and desirable. Predicting the project’s timescale, scheduling the budget and
assessing the necessary resources will help the software project to succeed and avoid
overrun (Nasir, 2006). There are four types of software estimation:

Chapter: Background Page: 9
• Effort estimation: amount of effort to complete a project. It is usually measured by
person/hour or person/month.
• Size estimation: usually measured by number of lines of code (LOC) to implement
the software.
• Cost estimation: funds required to develop the project.
• Schedule estimation: amount of time (duration) required to complete the project.
There are several types of estimation models and techniques that can be used for software
estimation. There is no best approach; indeed, each of them has its pros and cons. The
techniques can be classified into two major types, namely algorithmic and non-algorithmic
(Shekhar & Kumar, 2016). The former is based on equations and mathematics, which are
used to process the software estimation; in contrast, the latter is based on analogy and
deduction. The list below includes some well-known techniques used in the industrial field
(Moløkken & Jørgensen, 2003). The software estimation methods and techniques are as
follows (Nasir, 2006); (Shekhar & Kumar, 2016):
• Analogy-based method: compares a project to a similar project that has already
been completed. This approach relies on historical data from previously completed
projects.
• Top-down method: concerned with the overall characteristics of the software
development, requiring few details about the system. This is the kind of method
used during the early stages of software development.
• Bottom-up method: gauges each software component and combines them to
estimate the overall project.
• Expert Judgment (EJ): one of the most common techniques used in the industries,
it relies on the knowledge of experts.
• Function Point Metrics (FP): more commonly used than LOC, it is a measurement
unit used to compute the amount of software functionality, such as the number of
external inputs, interface files and external enquiries. There are several standards,
such as COSMIC and FiSMA, which have been adapted and have improved the FP
concept.
• Price to Win Estimation: estimations are determined on the basis of the project’s
budget. This technique focuses more on the customer budget than on software
functionalities.
• Artificial Neural Network: this artificial intelligence model is based on training from
historical data.
• Line of Code (LOC): one of the oldest techniques in estimation studies, it is highly
dependent on the source code of the completed software.

Chapter: Background Page: 10
• COCOMO: a constructive cost model developed by (Boehm, 1984). COCOMO is
considered a procedural cost and effort estimation model, and its parameters are
obtained from a previously completed software project.
• Use-case Point method: used when (use-case) UML diagrams are employed in the
design of a software project. It relies on the interactions between user and system
to measure the size and effort of the project.
Britto, Freitas, Mendes and Usman (2014) presented a SLR of effort estimation in the
context of Global Software Development (GSD), and selected five studies from 24
(Björndal et al., 2010; Muhairat et al., 2010; Narendra et al., 2012; Peixoto et al., 2010;
Ramasubbu & Balan, 2012). It concluded that the EJ approach, including Planning Poker
(PP), Delphi and Expert Review, was the most used in effort estimation for GSD.
Furthermore, this study identified a wide range of cost drivers; those of culture, language
and time zone were the most used in estimating effort in GSD projects.
2.3.2. Software estimation in Agile SD
Mike Cohn’s book in Agile estimating and planning answered questions relating to a
project’s size, project scheduling and planning (Cohn, 2005), finding that the story point
and ideal hours/days are the two most common units to express the size measurement of
a user story features or a task. The story point is basically the difficulty level of the user
story, for example: 1, 2, 3, 5 or 8. These number signifies how difficult and complex the
user story is (Cohn, 2005). Another way to measure it is by means of ideal hours. This refers
to the time that could take a developer to complete a certain task without interruptions,
unplanned issues or challenges (Pekka Abrahamsson et al., 2002).
Using a prior SLR (M. Usman, Mendes, Weidt, & Britto, 2014) allows a detailed overview of
the effort and size estimation techniques used in the ASD process. A total of 25 primary
studies were examined, all of which satisfied the inclusion criteria and passed the quality
assessments of this literature review. PP and EJ were the most frequently used techniques
in the ASD process, while story point, use-case point and function point were the most
usual size metrics employed. Of the estimation techniques, 12% studied the estimation
effort during the implementation phase, around 30% in the testing phase and 12% in the
implementation & testing phase; however, none of the primary studies has estimated the
effort in the design or analysis phase of the development process. In what follows, I present
the most important research in terms of relevance to my study:
• Expert Judgement and story point
(Pekka Abrahamsson et al., 2011) proposed a prediction effort model based on user
stories; to achieve this, they employed the eXtreme Programming (XP) method. Using

Chapter: Background Page: 11
this model, certain predictors were extracted from the user story (number of
characters, presence of keywords and priority) for use in the training model.
• Planning Poker and story point
PP is a consensus-based estimation technique used in Agile. It starts by a product owner
reading an Agile user story and describing the necessary features to the estimators. The
estimators, including the development team members, hold up a playing card to convey
an appropriate quantified estimation of the resources required for the user story (Cohn,
2005).
Haugen (2006) conducted an empirical study to examine the PP process undertaken by
a development team to estimate the effort required for a user story. One development
team followed the eXtreme Programming (XP) method and its resulting estimation was
compared to that of the unstructured group. Performance and accuracy using PP were
better than the unstructured group estimation process. Subsequently, Mahnič and
Hovelja (2012) carried out an empirical and detailed study of PP to estimate the user
story during the early stages of the ASD process, to define the release plan. The authors
found that the estimation’s accuracy under PP was greater than that of the individual
experts’ estimates.
• Use-case point
Parvez (2013) designed a new layer to improve two essential factors: efficiency; and
risks involved in estimating the effort needed under the use-case point method. Six
points relate to the implementation of the new model; all increase the performance
and efficiency of the use-case point estimation method.
• COSMIC Functional Size
Hussain, Kosseim and Ormandjieva (2013) addressed certain challenges surrounding
the application of COSMIC in the Agile development process. COSMIC FS is an
international standard based on ISO/IEC for measuring the software functional size of
the user requirement. In their study, COSMIC was found not to be compatible with
Agile, because of the formality level of its user requirement. It needs to be formalised
at a certain level of granularity, where the user communicates with the system, and be
visible to the measurer. However, a preliminary experiment obtained a reasonable
result for an approach that approximates COSMIC FS, based on the informal text user
requirements.
Bilgaiyan, Sagnika, Mishra and Das presented a SLR of software cost estimation in ASD
(Bilgaiyan et al., 2017). The estimation mechanisms examined were Neural Network, EJ, PP
and Use-case point. It was found that EJ was one of the most common among conventional

Chapter: Background Page: 12
estimation techniques in ASD (Gandomani et al., 2014; Grimstad & Jørgensen, 2007;
Jørgensen, 2004b, 2004a; Jørgensen & Grimstad, 2010).
2.4. Summary
This chapter provided an overview of Agile values, principles and methodologies. Scrum is
the Agile methodology most widely used in the industrial fields, according to the annual
State of Agile report. In addition, it gave a background to the various mobile app
development frameworks and gave the main reasons why mobile development is different
from other software development. Finally, it described the various effort estimation
methods used in Agile processes.
Chapter: Research Methodology Page: 13
Chapter 3: Research Methodology
A research project is usually thought of as a series of linked activities that must be followed
in order to undertake and complete the project. These activities vary from one research
project to another. This study it is structured as follows: formulating and clarifying the
research topic, undertaking a critical literature review, devising a research approach,
formulating the research design, research strategy and data collection plan, and analysing
the data (Saunders, Lewis, & Thornhill, 2009; Dudovskiy, 2018).
The first section of this chapter defines the research aim and objectives of this study.
Following this, an overview of the systematic literature review SLR will be provided in
section 2. The research approach and design are stated in sections 3 and 4, respectively.
Lastly, the data collection method and strategies are stated in section 5.
3.1. Research Aim and Objectives
The research aim is to identify the effort estimation factors in the development of mobile
apps and to investigate effort estimation techniques using the Agile process in mobile apps
in the industrial fields. Having a research aim helps to design the research questions, while
the research objectives help to divide the aim into parts. This makes it easy to address each
part individually (Dudovskiy, 2018). The research questions will be stated in Chapter 4 in
order to apply the SLR to answer on these questions.
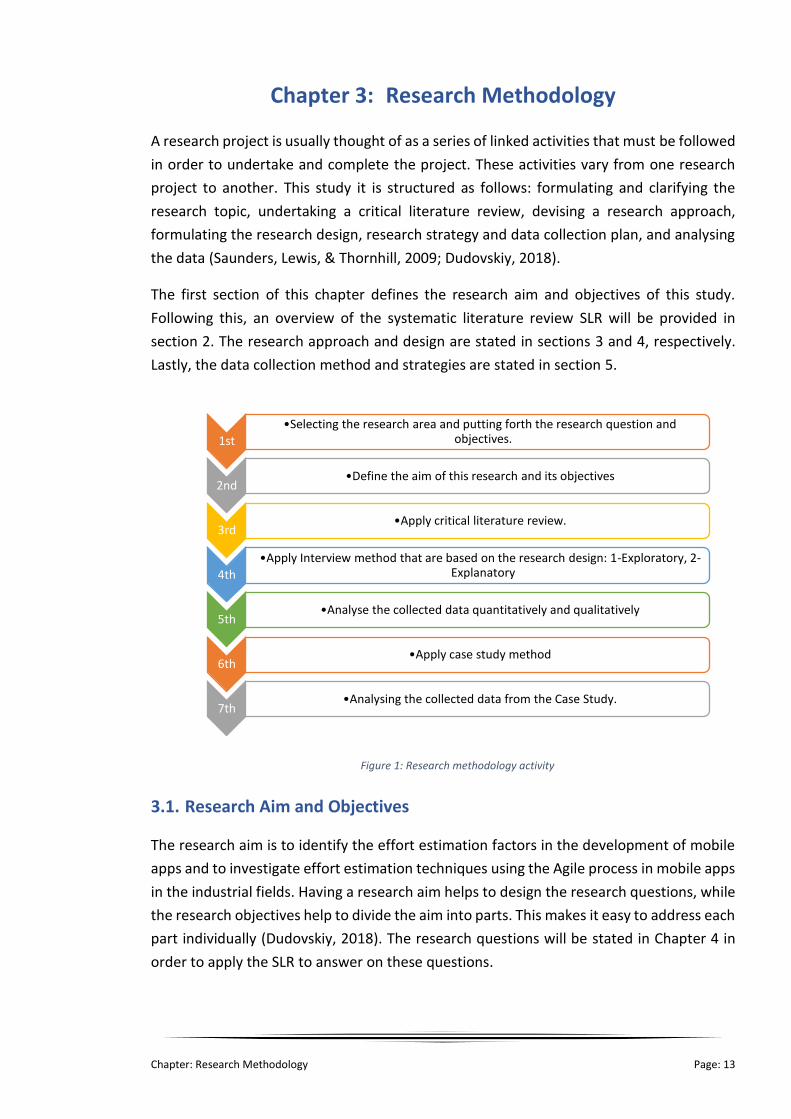
1st
•Selecting the research area and putting forth the research question and objectives.
2nd•Define the aim of this research and its objectives
3rd•Apply critical literature review.
4th
•Apply Interview method that are based on the research design: 1-Exploratory, 2-Explanatory
5th•Analyse the collected data quantitatively and qualitatively
6th•Apply case study method
7th•Analysing the collected data from the Case Study.
Figure 1: Research methodology activity
Chapter: Research Methodology Page: 14
The research objective comprises steps that explain how the research aim is to be
achieved:
• Identify and analyse the factors in the effort estimation techniques and analyse
the Agile process adapted for mobile apps.
• Analyse the existing effort estimation techniques for traditional software
development in ASD and the most frequently used method.
• Identify and explore the relationship between existing Agile effort estimation
techniques for a traditional software and the factors/cost drivers of mobile effort
estimation techniques.
• Validate the efficiency of effort estimation factors for mobile app development.
• Study and assess the impact of the adapted ASD process in mobile apps, alongside
the cost drivers of mobile effort estimation techniques.
3.2. Conducting the Literature Review
A critical literature review provides a strong base for any research project. A Systematic
Literature Review SLR will be used in this study to have a narrative review of the current
state of art and practice of effort estimation techniques for mobile app development in
Agile processes. The critical review, in addition, helps to provide an overview of the current
knowledge to identify relevant methods and gaps in this research project. The SLR will be
presented in Chapter 4.
3.3. Research Approach
Adopting the right approach helps to design a study in an appropriate way; this, in turn,
makes it possible to identify the correct and most suitable approach with which to collect
data. The right approach is concerned with the way in which data are collected to answer
the research question. There are three types of research approach, namely inductive,
deductive and abductive (Dudovskiy, 2018). In this study, the plan is to apply only two
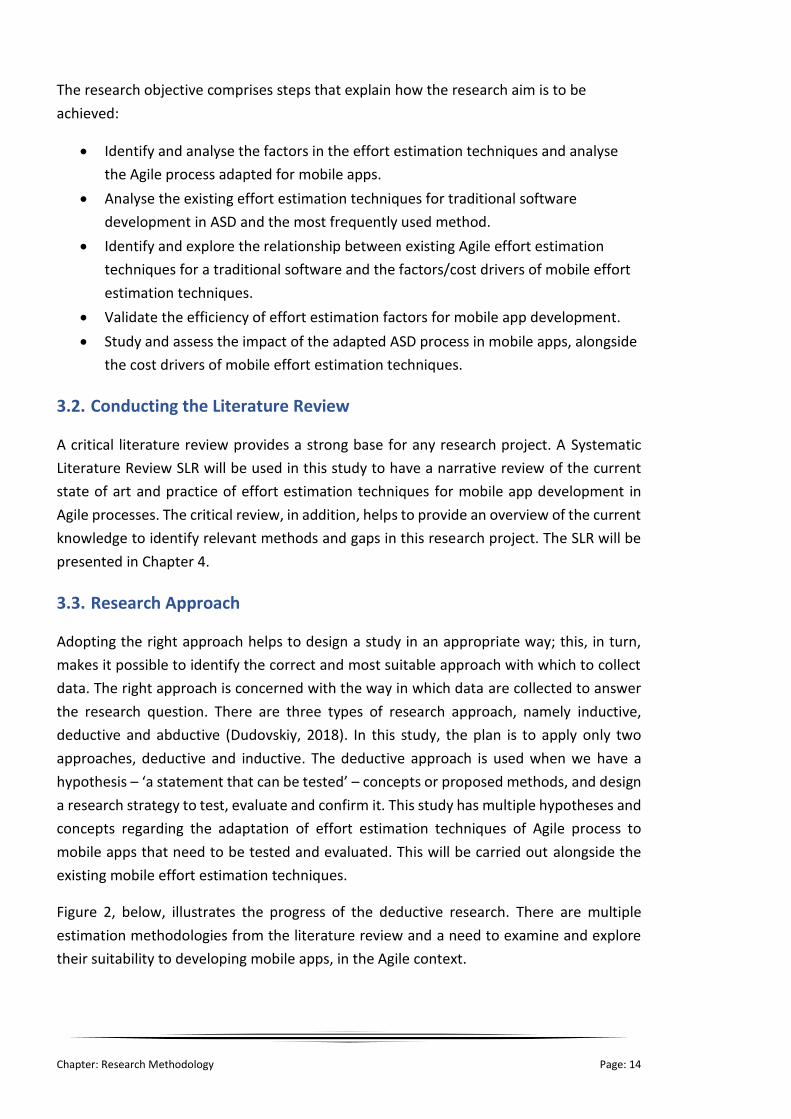
approaches, deductive and inductive. The deductive approach is used when we have a
hypothesis – ‘a statement that can be tested’ – concepts or proposed methods, and design
a research strategy to test, evaluate and confirm it. This study has multiple hypotheses and
concepts regarding the adaptation of effort estimation techniques of Agile process to
mobile apps that need to be tested and evaluated. This will be carried out alongside the
existing mobile effort estimation techniques.
Figure 2, below, illustrates the progress of the deductive research. There are multiple
estimation methodologies from the literature review and a need to examine and explore
their suitability to developing mobile apps, in the Agile context.
Chapter: Research Methodology Page: 15
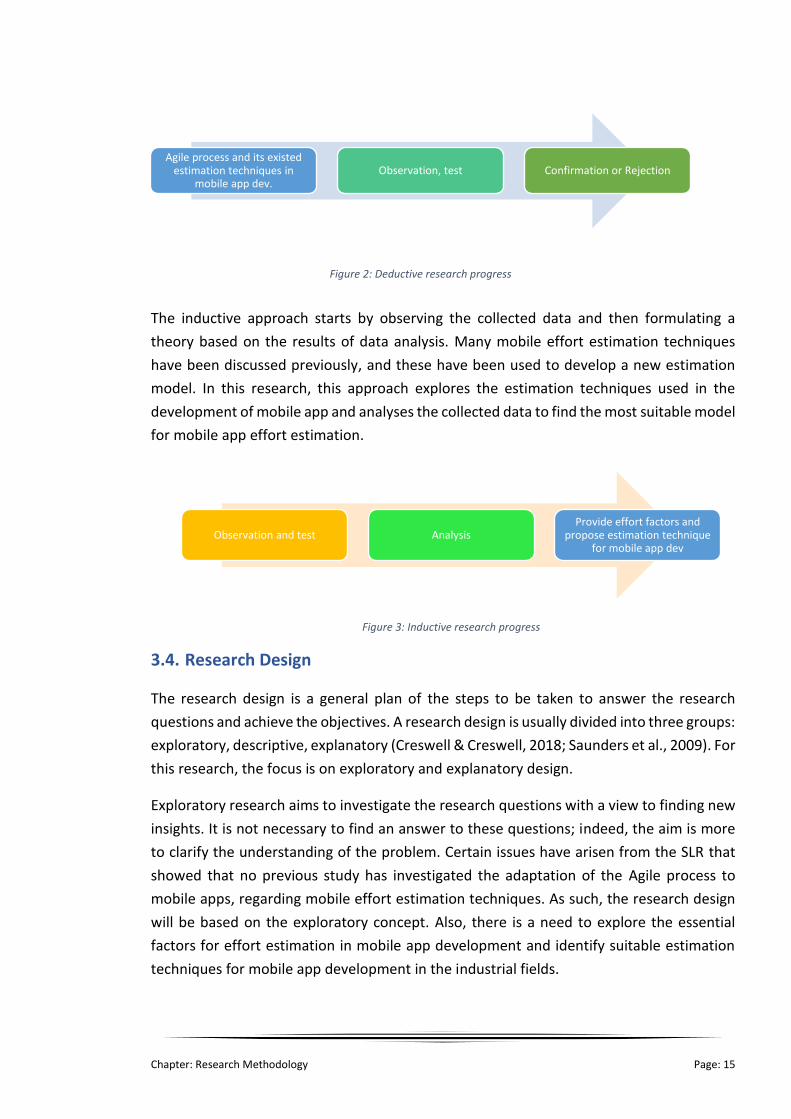
The inductive approach starts by observing the collected data and then formulating a
theory based on the results of data analysis. Many mobile effort estimation techniques
have been discussed previously, and these have been used to develop a new estimation
model. In this research, this approach explores the estimation techniques used in the
development of mobile app and analyses the collected data to find the most suitable model
for mobile app effort estimation.
3.4. Research Design
The research design is a general plan of the steps to be taken to answer the research
questions and achieve the objectives. A research design is usually divided into three groups:
exploratory, descriptive, explanatory (Creswell & Creswell, 2018; Saunders et al., 2009). For
this research, the focus is on exploratory and explanatory design.
Exploratory research aims to investigate the research questions with a view to finding new
insights. It is not necessary to find an answer to these questions; indeed, the aim is more
to clarify the understanding of the problem. Certain issues have arisen from the SLR that
showed that no previous study has investigated the adaptation of the Agile process to
mobile apps, regarding mobile effort estimation techniques. As such, the research design
will be based on the exploratory concept. Also, there is a need to explore the essential
factors for effort estimation in mobile app development and identify suitable estimation
techniques for mobile app development in the industrial fields.
Agile process and its existed estimation techniques in
mobile app dev.Observation, test Confirmation or Rejection
Figure 2: Deductive research progress
Observation and test AnalysisProvide effort factors and
propose estimation technique for mobile app dev
Figure 3: Inductive research progress

Chapter: Research Methodology Page: 16
Explanatory research studies the relationship between variables by analysing the situation
surrounding a problem. From the literature review, a couple of mobile estimation
techniques were identified that rely on certain factors/cost drivers to predict the effort
involved in a mobile app development. Moreover, there were techniques proposed to
estimate the effort in the Agile process, such as the PP technique. This study needs to look
into the relationship between the variables of those techniques in order to find answers to
the research questions and to study how the current effort estimation techniques for Agile
process could be employed in the development of mobile apps.
3.5. Research Strategies and Data Collection Method
There are many research strategies, such as survey, experiment, case study, action reaction
and grounded research. The strategy choice is guided by the research aim, questions and
objectives, available resources and time.
Survey is one of the most frequently used strategies across research projects (Kothari,
2004; Saunders et al., 2009). The strategy is usually applied as part of the deductive
research approach, as discussed previously. The survey approach will answer the ‘who’,
‘what’, ‘where’ and ‘how many’ questions. Moreover, using the survey technique provides
quantitative data that can be analysed statistically in order to identify the relationship
between the collected variables, which subsequently makes it possible to produce a model.
Interview is considered as one of the data collection techniques that belongs to the survey
strategy. Using the interview approach makes it possible to gather and obtain reliable data
that are relevant to the research question and objectives; it also helps to maintain and
structure the research objectives. There are many types of interview: structured
(questionnaires), semi-structured and in-depth interviews. Since the purpose of the
research study design is both exploratory and explanatory in nature, the most suitable
approaches with which to collect data for this study are both standardised and non-
standardised techniques.
• Standardised technique: Structured interviews are based on questionnaires that rely on
predetermined questions. The study will use this method to evaluate and assess current
effort estimation factors and find out their applicability to the mobile app development.
This method will enable the collection of quantifiable data and help to discover the
most suitable estimation technique for mobile app development.
• Non-standardised technique: this includes:
o Semi-structured method: using a list of the areas to be covered in all interviews.
The questions may differ from one interview to another, and this depends on
the conversation flow. Semi-structured interview questions are helpful when it

Chapter: Research Methodology Page: 17
Figure 4: Interview approach
comes to understanding the relationship between variables in an explanatory
study.
o In-depth method: these are informal, and the questions are not defined or
predetermined. The purpose of using this technique in the present research is
to give interviewees the opportunity to speak freely about the topic area. This
method is suitable for an exploratory research design and makes it possible to
seek out new insights and discover what is happening.
In this study, both structured and non-structured interview methods are used for the effort
estimation factors and Agile process adopted in mobile app development. This approach
will help to achieve the research objectives by:
1. Evaluating the current effort estimation factors to find their applicability to mobile
app development in the IT sector.
2. Finding further effort estimation factors for mobile app development that are based
on Expert Judgement in the IT sector.
3. Exploring further the estimation techniques and processes used in the IT sector and
validating their efficiency.
4. Exploring the processes to employ the effort estimation factors for mobile apps in
the Agile process.
5. Examining the applicability of the Agile process in mobile app development and
evaluating the Agile process adopted for mobile apps.
In general, semi-structured and in-depth interviews give the opportunity to probe the
answers provided and let the interviewees explain their responses. Moreover, discussion
with interviewees might lead to new considerations and ideas that have not yet been
thought of or addressed in the research questions and objectives. The interviews will use a
mixed-method approach to collect quantitative and qualitative data at the same time, ‘in
parallel’, as shown in Figure 4.
Semi-Structured In-depth
Method
Interview method
Structured Method
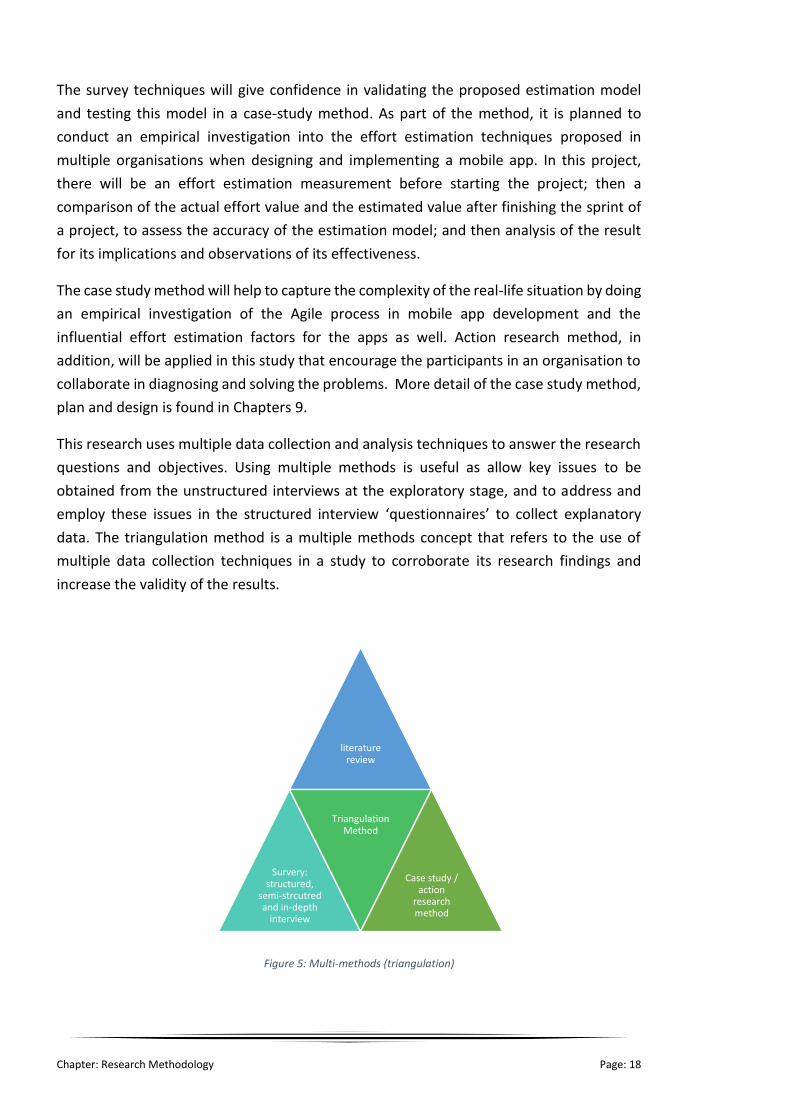
Chapter: Research Methodology Page: 18
The survey techniques will give confidence in validating the proposed estimation model
and testing this model in a case-study method. As part of the method, it is planned to
conduct an empirical investigation into the effort estimation techniques proposed in
multiple organisations when designing and implementing a mobile app. In this project,
there will be an effort estimation measurement before starting the project; then a
comparison of the actual effort value and the estimated value after finishing the sprint of
a project, to assess the accuracy of the estimation model; and then analysis of the result
for its implications and observations of its effectiveness.
The case study method will help to capture the complexity of the real-life situation by doing
an empirical investigation of the Agile process in mobile app development and the
influential effort estimation factors for the apps as well. Action research method, in
addition, will be applied in this study that encourage the participants in an organisation to
collaborate in diagnosing and solving the problems. More detail of the case study method,
plan and design is found in Chapters 9.
This research uses multiple data collection and analysis techniques to answer the research
questions and objectives. Using multiple methods is useful as allow key issues to be
obtained from the unstructured interviews at the exploratory stage, and to address and
employ these issues in the structured interview ‘questionnaires’ to collect explanatory
data. The triangulation method is a multiple methods concept that refers to the use of
multiple data collection techniques in a study to corroborate its research findings and
increase the validity of the results.
literature review
Survery: structured,
semi-strcutred and in-depth
interview
Triangulation Method
Case study / action
research method
Figure 5: Multi-methods (triangulation)

Chapter: Research Methodology Page: 19
For the case study, multiple focus group discussions and observations were held in three
companies in the Kingdom of Saudi Arabia. The case-study methodology and reporting was
conducted following the guidelines and standards for software engineering studies
provided and validated by Runeson and Höst (2009) and Runeson, Höst, Rainer and Regnell
(2012). The first is case study organisation is Company A, which provides mobile app
solutions to clients. This company is in Alkubar, Saudi Arabia. The other two, Company B
and Company C, are in Riyadh.
Figure 6: Research method overview
To sum up, Figure 6 illustrates the research method to be followed in the study. In-depth
and semi-structured methods are used as an exploratory research design to discover what
is happening, to seek new insights and to understand the relationship between the effort

Chapter: Research Methodology Page: 20
estimation factors in ASD for mobile app and across Agile methodologies for mobile
development process. By contrast, structured methods will be used to identify and examine
the effort estimation factors and Agile process in developing mobile apps.
3.6. Time Horizon
Two designs of research methodology can be used to plan a research time horizon (an
investigation that could be taken at a single point in time). One is cross-sectional and, when
the research is noted in a diary or recorded through a series of snapshots, it is longitudinal
(Saunders et al., 2009). The cross-sectional design is applicable to a study to investigate a
particular phenomenon at a particular time, namely the effort estimation factors on mobile
apps that use the ASD process. In addition, a longitudinal design and measurement will be
applied to investigate the estimation effort in each process and iteration of the Agile
method ‘sprint’.
3.7. Summary
This chapter provided a full detailed plan, design, strategy and approach of this research
study. The aim of this study and objectives was set out at the beginning of the chapter.
From the discussion of SLR result from chapter 4, exploratory and explanatory research
designs will be used in this study. The interview method is planned, and the results from
the interview will be validated and confirmed by case study.

Chapter: Systematic Literature Review Page: 21
Chapter 4: Systematic Literature Review
The design of the literature review in this study was inspired by the Evidence-based
Software Engineering (EBSE) model; its guidelines were followed (Kitchenham et al., 2009)
to synthesise the best-quality scientific studies. A mixture of assessment criteria were used
in this SLR, including the AMSAR (A Measurement Tool to Assess Systematic Review)
standard (Shea et al., 2009) and assessment guidelines from Kitchenham and Charters
(2007). These were employed to assess the reliability, validity and feasibility of the
measurement tools in these studies. In the first part of this chapter, the scope of the
research and the research questions are laid out. The second section details the search
strategies and inclusion and exclusion criteria. This literature review will end with a
presentation of the studies’ assessment criteria.
4.1. Scope and Research Questions
4.1.1. Research scope
Before starting the research review, I had to ask myself an important question: is a
systematic review really needed? I had to guard against asking general research questions,
as it would have been difficult to determine the usefulness of the answers obtained. Before
determining the final research questions, it was helpful to break them down into sub-
questions to make them more precise. For the following questions, I used the PICOC model
(Petticrew & Roberts, 2006). This model is very effective when it comes to framing and
considering the components of questions.
Population: Agile Software Development process and mobile app platform projects.
Intervention: Effort/size estimation methodologies/model for mobile apps.
Comparison: Various effort estimation techniques in mobile apps.
Outcome: The precision and accuracy of studies that have focused on effort estimation in
mobile apps.
Context: All studies (empirical, hypotheses) related to Agile SD in effort estimation.
4.1.2. The research questions
RQ1. What methods or techniques have been used to estimate effort in mobile
application development using Agile methods?
RQ2. What are the effort factors and predictors that have been used in software
estimation technique in Agile SD?
RQ3. What are the characteristics of the dataset/knowledge that have been used in
studies to estimate effort in mobile applications?

Chapter: Systematic Literature Review Page: 22
a. What is the type of project (educational/economical, etc.)?
b. What type of framework has been used on the mobile app (mobile
web/native/hybrid application)?
c. What type of operating system has been used on the mobile app
(Android/IOS/Windows OS)?
RQ4. What is the accuracy level and efficiency of using Agile SD to estimate the effort of
mobile application software projects?
4.2. Primary and Secondary Search Strategy
4.2.1. Search criteria
After stating the research questions, I broke them down into terms that I could use to find
relevant articles. I was concerned with a wide range terms to address the questions. Within
the search terms, it was important to include all synonymous words, singular/plural words
and words with alternative spellings. Identifying the major terms from the questions and
obtaining their synonyms and alternatives is one advantage of using the PICOC model.
AND/OR operators were used to link the terms.
It is important to understand how to design the query and state the search criteria. Before
starting, I had to consider which format I wanted to follow. Each library’s database has a
specific format when it comes to building a query to fetch and reiterate data from its
database engine. In this literature review, I was interested in the title, abstract and the
article’s keywords in constructing the search query.
I designed this query using the Google DBSE (Database Searching Engine) and other DB
sources that address using advanced search on search engines. I chose to focus my research
on the following database libraries: IEEE Explore, ACM Digital Library, Scopus, Compendex
and Inspec. This was because they are specialist libraries in the field of computer science
and engineering. Since the Compendex and Scopus libraries have an almost total overlap
(elsevier.com, n.d.), I chose to combine their results. Moreover, I combine the results of
Inspec and WebOfScience, since they have the same query format and the same website
location (http://apps.webofknowledge.com). In the search scope section, I describe in
detail the selected libraries and databases.
4.2.2. Search scope
This literature review encompasses both published and unpublished studies relevant to my
study. Based on the research topic and field (Kitchenham et al., 2009; Siddaway, 2014), it
covers all databases of high-quality and reputable primary published studies related to my
topic questions, as listed in Table 1: Search scope of the database. The unpublished studies
are from other databases that specialise in technical reports, the most common of which is
Chapter: Systematic Literature Review Page: 23
the Directory of Open-Access Repository; this gathers together literature from thousands
of universities across the world. In addition, Google Scholar is one of the most popular
search engines with which to find unpublished studies.
4.2.3. Search query
(effort OR efforts OR cost OR size OR performance) AND (estimation OR estimating OR
estimate OR prediction OR predicting OR predict OR assess OR assessment OR calculate Or
calculation OR measure OR measuring) AND (mobile OR smartphone OR screen touch OR
phone OR apple OR android OR IOS) AND (app OR apps OR application OR applications OR
software OR program OR programs) AND (agile OR “software development” OR scrum OR
XP OR “extreme programming” OR Crystal OR DSDM OR “dynamic system development
method” OR lean).
For each of the database libraries, I followed tips on how to use their database engines to
obtain highly accurate results for articles. As seen in Table 1, I produced a schema of
database queries and their results. Each of the queries generated different results. I
categorised their value and importance into three:
• Very Important Query (VIQ): contains all or most of the terms/ideas of my research
topic. These kinds of research results were usually very close to my topic and were very
relevant; as such, I need to read these papers/articles in more detail. It was rare to have
a large number of results for this query.
• Normal Query (NQ): contains some of the terms/ideas of my research topic. Results
were not close to my topic yet were still relevant. I usually read the abstract and
summary of these articles and assessed whether they were related to my topic. I
designed this query to collect background knowledge on related topics.
• Not Important Query (NIQ): I designed this query to pinpoint all topics that were being
discussed in my research field/area. This helped me to expand my search scope and
acquire more knowledge of what kinds of research have been published in this field
(mobile app software development).

Chapter: Systematic Literature Review Page: 24
Table 1: Search scope of the database
Database name/search engine Search results
IEEE explore 126
ACM Digital 308
Inspec 134
Web Science Core Collection
Scopus 124
Compendex
OpenDOAR 9
Google Scholar (for unpublished works)
The queries in Table 65: Query schema from Appendix B, found 701 articles. Table 2: Query
result in detail, shows the distribution of the queries’ results and their importance.
Table 2: Query result in detail
Query ID Query Importance Result
SQ1 NQ 23
SQ2 VIQ 0
SQ3 VIQ 6
SQ4 VIQ 17
SQ5 NQ 48
SQ6 NQ 7
SQ7 NIQ 293
SQ8 VIQ 8
SQ9 NQ 123
SQ10 NQ 11
SQ11 VIQ 0
SQ12 NIQ 76
SQ13 VIQ 17
SQ14 NQ 32
SQ15 NQ 9
SQ16 VIQ 31
Total result 701
Table 3: Query summary
Query category Number of query results
Very Important 79
Normal 253
Less Important 369
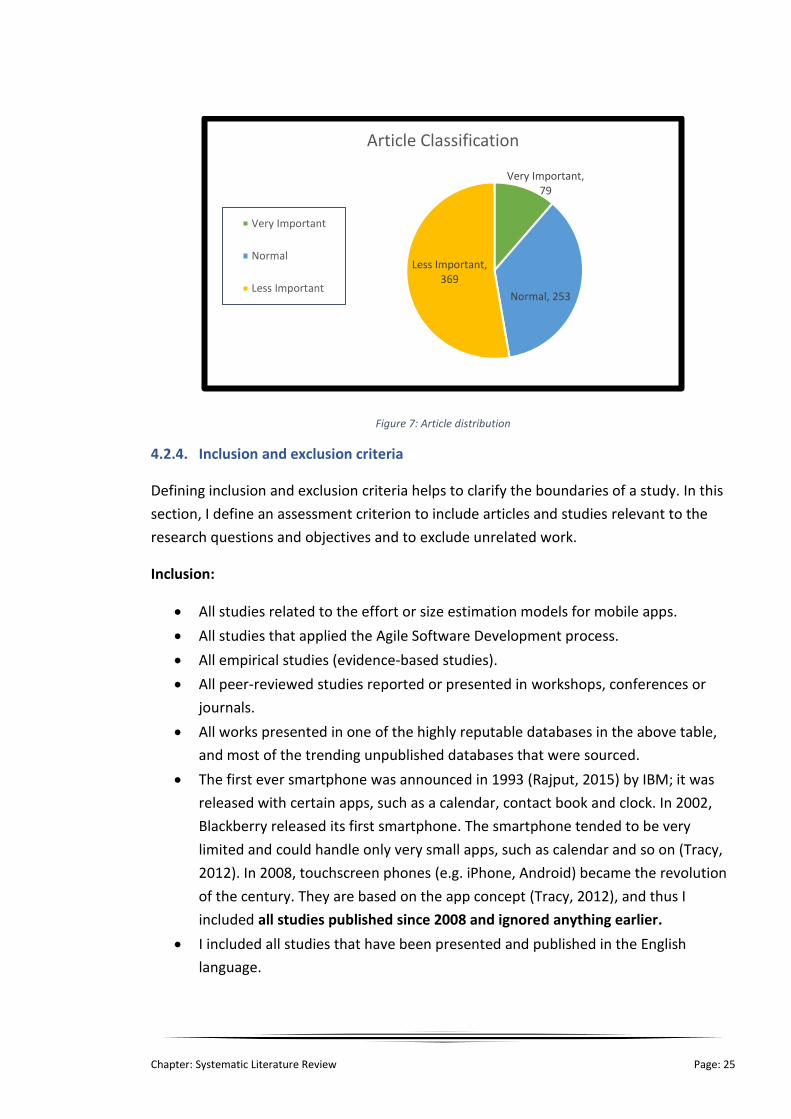
Chapter: Systematic Literature Review Page: 25
Figure 7: Article distribution
4.2.4. Inclusion and exclusion criteria
Defining inclusion and exclusion criteria helps to clarify the boundaries of a study. In this
section, I define an assessment criterion to include articles and studies relevant to the
research questions and objectives and to exclude unrelated work.
Inclusion:
• All studies related to the effort or size estimation models for mobile apps.
• All studies that applied the Agile Software Development process.
• All empirical studies (evidence-based studies).
• All peer-reviewed studies reported or presented in workshops, conferences or
journals.
• All works presented in one of the highly reputable databases in the above table,
and most of the trending unpublished databases that were sourced.
• The first ever smartphone was announced in 1993 (Rajput, 2015) by IBM; it was
released with certain apps, such as a calendar, contact book and clock. In 2002,
Blackberry released its first smartphone. The smartphone tended to be very
limited and could handle only very small apps, such as calendar and so on (Tracy,
2012). In 2008, touchscreen phones (e.g. iPhone, Android) became the revolution
of the century. They are based on the app concept (Tracy, 2012), and thus I
included all studies published since 2008 and ignored anything earlier.
• I included all studies that have been presented and published in the English
language.
Very Important, 79
Normal, 253
Less Important, 369
Article Classification
Very Important
Normal
Less Important

Chapter: Systematic Literature Review Page: 26
Exclusion:
• Any study that did not discuss the effort estimation in mobile app development.
• Any study that did not use ASD methods to undertake the estimation.
• Any study that did not validate its work empirically.
• Any study not published in one of the listed databases.
• Any study not published in the English language.
4.3. Study Selection Process
Data gathered by systematic searches should be documented and organised in an
appropriate format. Due to the large number of results, all the data (701 articles) were
exported to Microsoft Excel for ease of management. The worksheet tabulates their vital
details, such as: 1. Paper name; 2. Publishing year; 3. Author’s name; 4. Abstract; 5. Article
URL; and 6. Search_Query ID(SQ1_SQ16). By managing and grouping the information in one
location, the duplicated articles could be eliminated.
To start screening and filtering the articles, I categorised the process into three phases, as
follows.
4.3.1. Screening the less-important search queries
The less-important queries were found by Search_Query 7 and 12. These queries’ results
were classified as less important, as mentioned in the search query section, and there were
369 articles needing to be filtered. Most were far removed from my own research area,
from a quick skim through their abstracts, such as: mobile network, GPS, mobile signals and
radio, mobile security, mobile energy of phones and consumption, telescope, health field
‘heart pulses’, and so on. I excluded all unrelated studies (354 papers) using the inclusion
and exclusion criteria and moved the relevant ones to the second phase of the search
category.
4.3.2. Screening the normal and highly important search queries
This phase included all studies found by Search_Query 1-6,8-11,13-16, and included all
those that had been passed on from the previous phase. There were 111 unique articles
and 53 duplicated papers (from 236 recorded). Their titles, abstracts and summaries were
read carefully, and the inclusion and exclusion criteria were applied, leaving 35 that
satisfied the inclusion criteria.

Chapter: Systematic Literature Review Page: 27
4.3.3. Full text screening
During this phase, the inclusion and exclusion criteria were applied to all the text in the 35
articles, and 21 that related to the literature review were selected, as shown in Table 4.
Quality assessment criteria were applied to evaluate and establish the quality of their
study.
Table 4: Information on selected articles
Study ID
Article topic Year Author(s)
S1 Software cost estimation for user-centered mobile
app development in large enterprises 2018
Maria Lusky, Christoph Powilat,
Stephan Böhm
S2 A parametric effort estimation model for mobile
apps 2017
Syed Ahmad Shahwaiz, Ali Afzal Malik, Nosheen Sabahat
S3 A set of metrics for the effort estimation of mobile
apps 2017
Gemma Catolino, Pasquale Salza, Carmine Gravino,
Filomena Ferrucci
S4 An empirical validation of mobile application effort
estimation models 2017
Tharwon Arnuphaptrairong and Wachira Suksawasd
S5 Investigating the adoption of Agile practices in
mobile application development 2016
Alan Santos, Josiane Kroll, Afonso Sales, Paulo
Fernandes and Daniel Wildt
S6 COSMIC functional measurement of mobile
applications and code size estimation 2015
Loris D’Avanzo, Filomena Ferrucci, Carmine Gravino,
Pasquale Salza
111, 16%
354, 50%
183, 26%
53, 8%
236, 34%
Papers Summary
Unique Paper Not-related paper
Duplicated paper Identical from Duplicated
Figure 8: Article summary Figure 9: Selected article summary
Included Papers,
35
Excluded paper,
666
Selected Papers
Included Papers Excluded paper

Chapter: Systematic Literature Review Page: 28
S7 Investigating functional and code size measures for
mobile applications 2015
Filomena Ferrucci, Carmine Gravino, Pasquale Salza, and
Federica Sarro
S8 On the use of requirements measures to predict
software project and product measures in the context of Android mobile apps: a preliminary study
2015
Rita Francese, Carmine Gravino, Michele Risi,
Giuseppe Scanniello, and Genoveffa Tortora
S9 Reviews on Agile methods in mobile application
development process 2015
Dewi Mariati Mahmud, and Nur Atiqah Sia Abdullah
S10 Reviews on functional size measurement in mobile
application and UML Model 2015
Nur Atiqah Sia Abdullah, and Nur Ida Aniza Rusli
S11 An analogy-based effort estimation approach for
mobile application development Projects 2014
André Nitze, Andreas Schmietendorf, Reiner Dumke
S12 Measure the functional size of a mobile app: Using the cosmic functional size measurement method
2014 Harold van Heeringen , and
Edwin van Gorp
S13 Mobile application development: How to estimate
the effort 2014
Laudson Silva de Souza and Gibeon Soares de Aquino
S14 Mobile game size estimation: COSMIC FSM rules, UML mapping model and Unity3D game engine
2014 Nur Atiqah Sia Abdullah, Nur Ida Aniza Rusli, Mohd Faisal
Ibrahim
S15 Agile Software Development processes for mobile systems accomplishment evidence and evolution
2013 Luis Corral, Alberto Sillitti,
Giancarlo Succi
S16 Software development processes for mobile
systems: Is Agile really taking over the business? 2013
Luis Corral, Alberto Sillitti, Giancarlo Succi
S17 Measuring mobile application size using COSMIC FP 2013 André Nitze
S18 Agile development methods for mobile applications 2010 Andrei Cristian Spataru
S19 Designing an Agile methodology for mobile software
development: A hybrid method engineering approach
2008 Vahid Rahimian, and Raman
Ramsin
S20 Development process of mobile application SW
based on Agile methodology 2008
Yang-Jae Jeong, Ji-Hyeon Lee, Gyu-Sang Shin
S21 Mobile-D: An Agile approach for mobile application
development 2004
Pekka Abrahamsson, Antti Hanhineva, Hanna Hulkko,
Tuomas Ihme, Juho Jäälinoja, Mikko Korkala, Juha Koskela, Pekka Kyllönen, and Outi Salo

Chapter: Systematic Literature Review Page: 29
4.4. Studies Quality Assessment
The guideline criteria by Kitchenham et al. (2009) and Kitchenham and Charters (2007)
made it possible to assess those studies based on questionnaires. It was important to assess
them to establish which should be focused on and which were of less importance and, in
some cases, could be ignored. The quality assessment criteria supported and provided
further details on the inclusion and exclusion criteria. The checklist was customised by the
suggestions provided by Kitchenham and Charters (2007) and by M. Usman et al. (2014).
Below are the questions used to evaluate the selected studies:
1. Are the research aims clearly specified?
2. Was the study designed to achieve these aims?
3. Are the estimation methods used for mobile apps clearly described and their selection
justified?
4. Are the variables used in the study adequately measured?
5. Are the data collection methods adequately described?
6. Are the statistical techniques used to analyse data adequately described?
7. Does the researcher discuss any problems with the validity/reliability of their results?
8. Are the measures in the study fully defined?
9. Are the study participants or observational units adequately described?
10. Are all the research’s questions answered adequately?
In terms of the answers to these questions, there were three possible options:
• Y: Yes, the answer was explicitly defined in the study = 1 point.
• P: Partially answered by the study = 0.5 point.
• N: No, the answer was not defined = 0 point.
Each study was awarded a score ranging from 0 to 10 points, and any study below 3 was
eliminated from the review. The final scores for the quality assessment for the selected
articles are seen in Table 5. Some were excluded for failing to satisfy the inclusion criteria
(Preuss, 2013), for reporting a study included in another published article (Francese,
Gravino, Risi, Tortora, & Scanniello, 2016; De Souza & De Aquino Jr, 2014) or for a low
assessment score (Balasupramanian et al., 2013).

Chapter: Systematic Literature Review Page: 30
Table 5: Assessment of selected studies
Study ID Score Study ID Score Study ID Score
S1 8 S2 8.5 S3 7
S4 8 S5 5.5 S6 8
S7 8 S8 8.5 S9 5
S10 4.5 S11 6 S12 5
S13 5 S14 5.5 S15 5
S16 5 S17 4.5 S18 4.5
S19 5 S20 5 S21 5
4.5. Limitations of the Research
The major danger is that the queries may have failed to find all the studies relevant to the
SLR. However, to mitigate against this risk, a very deep search strategy was implemented
that used Kitchenham’s standards for software engineering studies (Kitchenham et al.,
2009) and guidelines (Kitchenham & Charters, 2007) to perform the SLR. It resulted in a
good query that contained most of the key words of relevant works concerning Agile
processes, effort estimation and mobile apps. Some aspects of the SLR are subjective. To
mitigate against this effect, the researcher discussed widely and agreed on the findings
presented here.
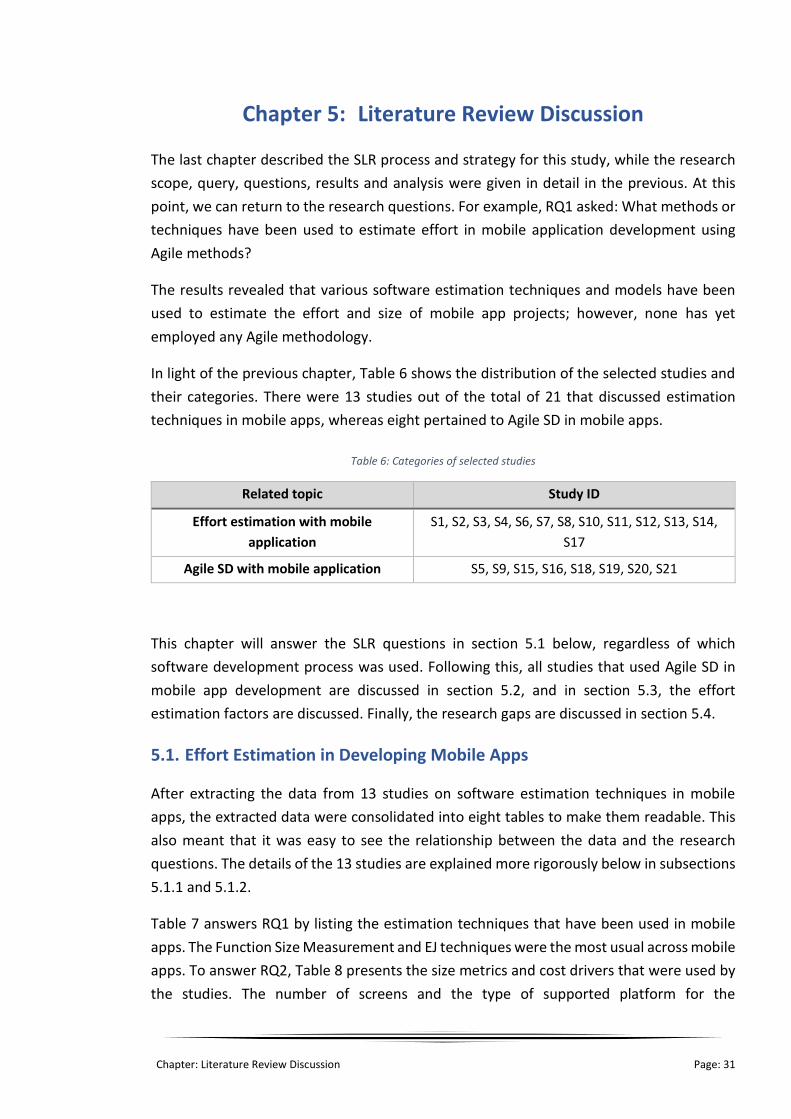
Chapter: Literature Review Discussion Page: 31
Chapter 5: Literature Review Discussion
The last chapter described the SLR process and strategy for this study, while the research
scope, query, questions, results and analysis were given in detail in the previous. At this
point, we can return to the research questions. For example, RQ1 asked: What methods or
techniques have been used to estimate effort in mobile application development using
Agile methods?
The results revealed that various software estimation techniques and models have been
used to estimate the effort and size of mobile app projects; however, none has yet
employed any Agile methodology.
In light of the previous chapter, Table 6 shows the distribution of the selected studies and
their categories. There were 13 studies out of the total of 21 that discussed estimation
techniques in mobile apps, whereas eight pertained to Agile SD in mobile apps.
Table 6: Categories of selected studies
Related topic Study ID
Effort estimation with mobile
application
S1, S2, S3, S4, S6, S7, S8, S10, S11, S12, S13, S14,
S17
Agile SD with mobile application S5, S9, S15, S16, S18, S19, S20, S21
This chapter will answer the SLR questions in section 5.1 below, regardless of which
software development process was used. Following this, all studies that used Agile SD in
mobile app development are discussed in section 5.2, and in section 5.3, the effort
estimation factors are discussed. Finally, the research gaps are discussed in section 5.4.
5.1. Effort Estimation in Developing Mobile Apps
After extracting the data from 13 studies on software estimation techniques in mobile
apps, the extracted data were consolidated into eight tables to make them readable. This
also meant that it was easy to see the relationship between the data and the research
questions. The details of the 13 studies are explained more rigorously below in subsections
5.1.1 and 5.1.2.
Table 7 answers RQ1 by listing the estimation techniques that have been used in mobile
apps. The Function Size Measurement and EJ techniques were the most usual across mobile
apps. To answer RQ2, Table 8 presents the size metrics and cost drivers that were used by
the studies. The number of screens and the type of supported platform for the

Chapter: Literature Review Discussion Page: 32
smartphones were the most common factors to measure the estimation prediction. Table
9, Table 10 and Table 11 answer RQ3 by listing the operating systems (OS) supporting
smartphones and the types of platforms used to develop mobile apps, the domain of this
study. Table 12 investigates the development activity to which the effort estimate is
applied. None of the studies estimated the effort involved in the analysis, design and
testing. For RQ4, Table 14 lists the various prediction accuracy metrics used in the studies.
The estimation technique is the way of carrying out of the estimation process to obtain the
effort value, whereas the size metrics is considered as an effort predictor that has been
used to measure the product size (Muhammad Usman et al., 2017). For example, when a
specialist uses the Expert Judgment (EJ) technique to estimate the effort of a task, and uses
the number of screens metric as a measurement of the complexity of this task; then, the EJ
is the estimation technique and the number of screens is the size metric.
Table 7: Estimation techniques
Estimation techniques Study ID
COSMIC FSM S6, S7, S11, S12, S14, S17
Function Point Analysis S4
FiSMA FSM S13
Expert Judgment S1, S3, S11
Analogy based S3, S11
Regression based S2, S6, S8
Table 8: Size metrics of estimation
Estimation predictor metrics Study ID
Function point size S4, S6, S7, S11, S12, S13, S14, S17
UML diagram S8, S8, S14
Supported Platform type (IOS/Andr./Win./etc.) S2, S3, S11
Supported device (tablet, smartphone) S2, S3, S11
User Interface quality and complexity S2, S3, S4, S11, S13
Backend system availability and Server Config. Flexibility S2, S3, S11
Dev.Team Skills S2, S11
App Development flexibility and Complexity S2, S4, S11
Team Communication, Process complexity and Experience S2, S11
Push Notification S1, S2, S3
Landscape and portrait mode S2, S11
Data Storage and Memory Opt. Complexity S2, S3
Number of Screens S2, S3, S4, S13

Chapter: Literature Review Discussion Page: 33
Number of API party S2, S3
Support Code reusability S2, S4a
Technology Maturity S2, S11
Battery & Power Optimisation S2, S13
Connection (Wirless,Bluetooth,3G,etc) S2, S4, S13
Booking and reservation, Calendar and Time, Map and
localisation, Social Sharing, Searching contents and Messaging S1, S3
Deadline date S3, S4
Number of Functionality/Function Size S3, S4, S8, S8
Number of files, classes, method, statement and LOC S8, S8
Registration & login, Chronological list, Hardware access, File
upload, Comment feature, navigation S1
Interrupt handling S2
Security Analysis Support, Budget for the project, Compatibility
with Previous Version, Multi-languages support, Media support,
and Paying process user feedback
S3
Table 9: Types of mobile operating system
Type of Mobile app Study ID
Android based S6, S7, S8
Apple based ---
Not descried (general smart phone) S1, S2, S3, S4, S11, S12, S13, S14, S17
Table 10: Type of mobile app development
Development type Study ID
Native S8
Web app --
Hybrid --
Across platform S14
Not described (general) S1, S2, S3, S4, S6, S7, S11, S12, S13, S17
Table 11: Domain of datasets used
Domain and type of dataset used Study ID
Industrial S1, S2, S3, S4, S6, S7, S11
Academic S8
Not defined S14, S17
No dataset used S12, S13

Chapter: Literature Review Discussion Page: 34
Table 12: Development activity
Development Activities Study ID
Analysis ---
Design ---
Implementation S6, S7, S8
Testing ---
All S11
Not Defined S1, S2, S3, S4, S12, S13, S14, S17
Table 13: Accuracy metrics and evaluation
Estimation Accuracy Technique Study ID
Mean Magnitude of Relative Error (MMRE) S2, S4, S6, S7
Median Magnitude of Relative Error
(DMRI) S2, S6, S7
Magnitude of Relative Error (MRE) S4
Pred S2, S4, S6, S7
Linear Regression (R2) S2, S6, S7, S8
Mean Absolute Residuals (MAR) S8
Median Absolute Residuals (MdAR) S8
Not Use S3, S11, S13, S14, S17
Other S1 (mean)
5.1.1. Techniques using metrics/cost drivers for estimation effort
This section reviews studies that have used metrics/factors/cost drivers to estimate the
development effort. The most recent was conducted by Catolino, Salza, Gravino and
Ferrucci (2017). Their study identified a set of metrics (e.g. # of static/dynamic pages,
develop new/existing app, etc.) to estimate the development effort of mobile apps in the
early stages of the process. It would be beneficial to use these metrics in any model
estimating the effort involved in developing mobile apps. Catolino’s methodology was
inspired by Mendes and Counsell (2004) in the context of web app development. The study
obtained 41 metrics from 377 quotes that are available online from various companies. The
metrics were then validated and analysed by four expert project managers. Since the study
is recent, it has not yet been evaluated; however, the researcher plans to establish the
validity of these metrics as dependent variables in a prediction model. In another study,
Lusky, Powilat and Böhm (2018) proposed an experience-driven approach to estimating the

Chapter: Literature Review Discussion Page: 35
effort by identifying and validating 16 standard features of mobile apps, with a degree of
customisation level for those features. This approach was based on the Delphi method.
Shahwaiz, Malik and Sabahat (2016) proposed a parametric model to estimate the effort
needed to create mobile apps. They identified 20 effort predictors (e.g. # of screens,
application complexity, memory opt. complexity, etc.) and used an online survey that
resulted in 169 data points for use in their regression-based model. Earlier, Nitze,
Schmietendorf and Dumke (2014) had proposed a conceptual approach using analogy-
based and function point-based techniques to estimate the effort needed for mobile app
development. The method proposed that certain influential factors may affect the
estimation of a project’s cost.
Francese, Gravino, Risi, Scanniello and Tortora (2015) built a formal, regression-based
estimation model to addressed 23 Android mobile apps. Its purpose was to estimate the
effort needed for developing mobile app and the graphical component numbers, based on
information from the project’s requirements, such as number of use cases, classes and
actors. The researcher investigated and the accuracy of this model’s prediction – obtained
from the requirements – by comparison to the effort needed for mobile app development
and the number of graphical components involved. There are four types of Stepwise Linear
Regression (SWLR) model in this article:
• S8a: SWLR Model Built around the Requirement Analysis Document (RAD) variables to predict
the effort.
• S8b: SWLR Model built around the Source Code(SC) variables to predict the effort.
• S8c: SWLR Model built around RAD to predict the number of XMI files and graphical
components.
• S8d: SWLR Model built around SC to predict the number of XMI files and graphical components.
5.1.2. Techniques using functional size measurement
This sub-section focuses on using functional size (FS) measurement to estimate the effort
in developing mobile apps. D’Avanzo, Ferrucci, Gravino and Salza (2015) applied the
COSMIC FS measurement method to mobile apps, with a particular focus on Android OS.
The present study examined how COSMIC FS can be applied successfully in mobile apps
and verifies the usage of functional size to predict the code size (memory size kb) of mobile
apps. This study was empirically validated by extracting the functional user requirement
(FUR) from eight mobile apps from the Google Play Store; next, the data movement (Entry-
E, Exit-E, Write-W and Read-R) was obtained from the FUR. It revealed that the prediction
model is highly accurate. Other studies, such as that conducted by Heeringen and Gorp
(2014), have described guidelines on the application of an approximate method using
COSMIC to measure the functional size of mobile apps in a rapid manner. In a similar vein,

Chapter: Literature Review Discussion Page: 36
André Nitze (2013) examined an adapted version of the COSMIC FP approach and assessed
its suitability to measure the size of mobile apps from the function user requirements.
In addition, Ferrucci, Gravino, Salza and Sarro (2015) investigated the usage of the COSMIC
FS measure to estimate the size (line of code and memory size-byte) of mobile apps. This
study included 13 mobile apps from the Google Play Store, applying the same guidance as
applied by D’Avanzo et al. (2015). A study by Abdullah, Rusli and Ibrahim (2014) is relevant,
which addressed the complexity of game parameters (requirements and characteristics) to
accurately estimate the degree of size and effort needed for mobile game apps. This
adapted COSMIC FSM to estimate the cost and effort incurred when using the Unity3D
game engine; the latter is a multi-platform development tool that allows developers to
create and design 3D games and applications for mobiles. The same authors (Abdullah &
Rusli, 2015) conducted a review of the functional size measurement (FSM) on a mobile app
development using UML modelling methods in terms of the measuring process and rules.
Along similar lines, Souza and Aquino (2014) proposed a new method that is adopted in the
FiSMA method; however, the study suffered from a lack of empirical evidence and no
experts were involved. This approach has not been evaluated, nor has the accuracy of the
predication method been measured. Souza constructed a systematic review that covered
all characteristics of mobile apps and presented the differences between mobile apps and
other traditional software.
An empirical validation study proposed by Arnuphaptrairong and Suksawasd (2017) has
validated and compared the effort estimation accuracy of a traditional effort estimation
model, Function Point method, (S4a) to a proposed method based on the number of
screens of the mobile app (S4b).
5.2. Agile Software Development in Mobile Apps
This section includes all studies that have explored the usage of the ASD process in mobile
apps.
Santos, Kroll, Sales, Fernandes and Wildt (2016) investigated the adoption of Agile methods
during the process of mobile app development. They identified the challenges and reported
the experiences of 20 undergraduate students when adopting mobile practices when
developing mobile apps. The current study earlier noted five major challenges of mobile
app development; by contrast, the authors identified eight advantages of using the Agile
method that their participants benefited from when developing mobile apps.
Corral, Sillitti and Succi (2013b) examined the suitability of the Agile method to meet the
needs of the mobile business environment. The authors discussed the actual use of the
proposed frameworks that adopt Agile methods for the process of mobile app
development. The study revealed that there is a need for evidence-based research to link
Chapter: Literature Review Discussion Page: 37
the proposed frameworks to real project in the IT sector, as it showed a need for actual
evidence-based research that declares which software development process is suitable.
Similar to the above-mentioned study, Corral, Sillitti and Succi (2013a) presented a detailed
review of the Agile-based frameworks currently used in mobile app development, and
discussed their limitations.
Mahmud and Abdullah (2015) reviewed and discussed all studies that have adopted ASD
methods for the mobile app development process. Below, I examine the most important
studies.
5.2.1. Mobile-D approach and an improved Mobile-D approach
P. Abrahamsson et al. (2004) applied a new development process approach that is suitable
for mobile app development. Certain challenges and constraints arise when applying the
Agile SD process to mobile app development, due to the physical and technical
characteristics of the mobile environment (Spataru, 2010; P. Abrahamsson et al., 2004).
The Mobile-D approach is suitable for a small team of developers (10 developers or fewer)
and a short-term development cycle (10 weeks or less). The approach adopts XP
methodology, and is based on the Crystal methodology and Rational Unified Process (RUP).
Spataru (2010) has provided an evaluation on using the Agile methods in the mobile app
development process and proposed a set of improvements.
5.2.2. Hybrid method approach
Rahimian and Ramsin (2008) stated that, while Agile methods are the most appropriate
means of mobile software development through the existing methods, some particular
attributes of mobile devices require certain adjustments so that they match existing
software development methodologies. This study revealed differences between the
development of mobile apps and traditional software development in various aspects:
mobile apps involve special requirements and constraints. Their study constructed a new
methodology known as the Hybrid Methodology design approach. This is structured as a
top-down iterative and incremental process. The framework consists of two major tasks:
Prioritisation of the Requirements; and Iterative Design Engine. The framework combines
ideas from the Adaptive Software Development to ensure more quality assurance
processes and New Product Development (NPD).
5.2.3. Other studies
There are further software development methods proposed for mobile apps, such as Spiral
process (Nosseir et al., 2012), based on a usability-driven model. This focuses on risk
reduction and support iterations to ensure that the requirements are addressed and
validated. Mobile app software development based on the Agile Methodology (MASAM)

Chapter: Literature Review Discussion Page: 38
was adopted in a study proposed by Jeong, Lee, and Shin (2008), closely related to the
Mobile-D approach. MASAM comprises four phases, namely development preparation,
embodiment (representing the customer’s intention), product development, and
commercialisation. SLeSS, MASEF and DSDM are other methodologies that have adapted
the Scrum, XP and Iteration concepts respectively; indeed, all use the Mobile-D approach
as a reference (Mahmud & Abdullah, 2015).
5.3. Effort Estimation Factors in Agile Process
This section investigates studies on the effort estimation factors in the Agile process and
presents those that have provided the most influential factors of effort estimation
accuracy.
Lenarduzzi (2015) conducted semi-structured interviews to evaluate the considerable
social influences on Agile effort estimation. Communication and work pressure are
considered as highly important factors in effort estimation during the Agile process. In this
study, the technique type used in the estimation process is not specified.
Table 14: Social factors of effort estimation in Agile process
Social factors Social factors
Communication process Experience of previous project
Language and culture difference Technical ability
Work pressure Working time
Team size Managerial skills
Work Description
Tanveer, Guzmán and Engel (2016) used case studies and 11 interviews of up to an hour in
SAP, a German company. They assigned them to three Agile development teams to
investigate and understand the estimation process in Agile SDP. This study considered the
factors relevant to the accuracy of estimates. All three teams undertook their estimation
in Scrum at the sprint-planning phase. Teams A and B undertook individual estimations
(person/hour) and Team C undertook it by playing an estimation game (story point). The
interviewees were asked about the factors that they considered during their estimation in
open-ended questions, and some factors were presented for rating by their relevance to
the process. The factors most influential to estimates’ accuracy are shown in Table 15.

Chapter: Literature Review Discussion Page: 39
Table 15: Relevant factors in effort estimation and influence on estimation accuracy in Agile
Factor Factor
Capacity (workload) Dependencies among BLI
Backlog item complexity Clarity of requirement
Developer implementation experience Type of implementation
Developer estimation experience Priority
developer knowledge of system components of backlog item
Muhammad Usman, Britto, Damm and Börstler (2018) conducted a case study at Ericsson
company to identify how effort estimation is carried out using the Agile process in a large-
scale distributed project. This study analysed the accuracy of the estimations and
investigated the factors impacting on their accuracy. The Expert Judgment method was the
approach used to estimate the development effort. Related to this, another study used
several estimation factors in a checklist at three companies and evaluated the results
empirically (Muhammad Usman, Petersen, et al., 2018). The accuracy of the effort
estimation improved in all three. The following factors are identified as potentially
influencing the accuracy of effort estimation:
• Product customisation size: requirement of changes, design and implement the task.
• Customer priority.
• Maturity of the development team: team experience in coding and architecture, and
experience in development of complex tasks.
• Multi-site development: Development team in several geographical locations.
5.4. Research Gaps
From the previous discussion and results, we have seen that various software estimation
techniques have been applied to the development of mobile apps; however, there are gaps
in the research and possible avenues for future work. As seen in Figure 10 in the red plot,
the intersection between Agile SD, effort estimation and mobile app contains many
omissions and future work opportunities that will be discussed:
1) A possible future study could examine the need to employ and validate existing
effort estimation methods using Agile processes, such as Planning Poker, in mobile
app development.
2) The relationship between effort estimation techniques in Agile SD and effort
estimation in mobile app development.
3) There is a need to provide a comprehensive list of factors/predictors for mobile app
developers to help them make accurate estimates.

Chapter: Literature Review Discussion Page: 40
4) One particular research gap calls for study on the relationship between the cost
drivers and effort predictors of effort estimation in Agile SD models and the effort
estimation in mobile app models.
5) Another possible future study could employ the prediction factors and cost drivers
that have been used to estimate the effort involved in Agile methods during mobile
app development.
6) Special attention must be paid to the relationship between the ‘Agile software
process in mobile apps’ AND ‘effort estimation in mobile app development’. This
could be achieved by conducting:
a. A study that investigates the newly-adapted Agile development process in
mobile software development, such as Mobile-D, alongside existing effort
estimation models for mobile apps.
7) Moreover, only one study has applied a cross-platform tool (Unity3D) to estimate
the size of the software application (Abdullah et al., 2014); however, this tool is
primarily designed for game development and is not suitable for industrial
applications (Ottka, 2015). There is a need to conduct more studies on effort
estimation for other cross-platform mobile apps.
8) For the native application development, a regression-based technique has been
applied to estimate the effort needed to develop a mobile app; however, other
estimation models to measure the effort estimation need to be put in place, using
other estimation techniques, such as Planning Poker or Expert Judgment.
9) As observed from earlier studies, there are no estimation techniques for analysing,
designing and testing the development of mobile apps.
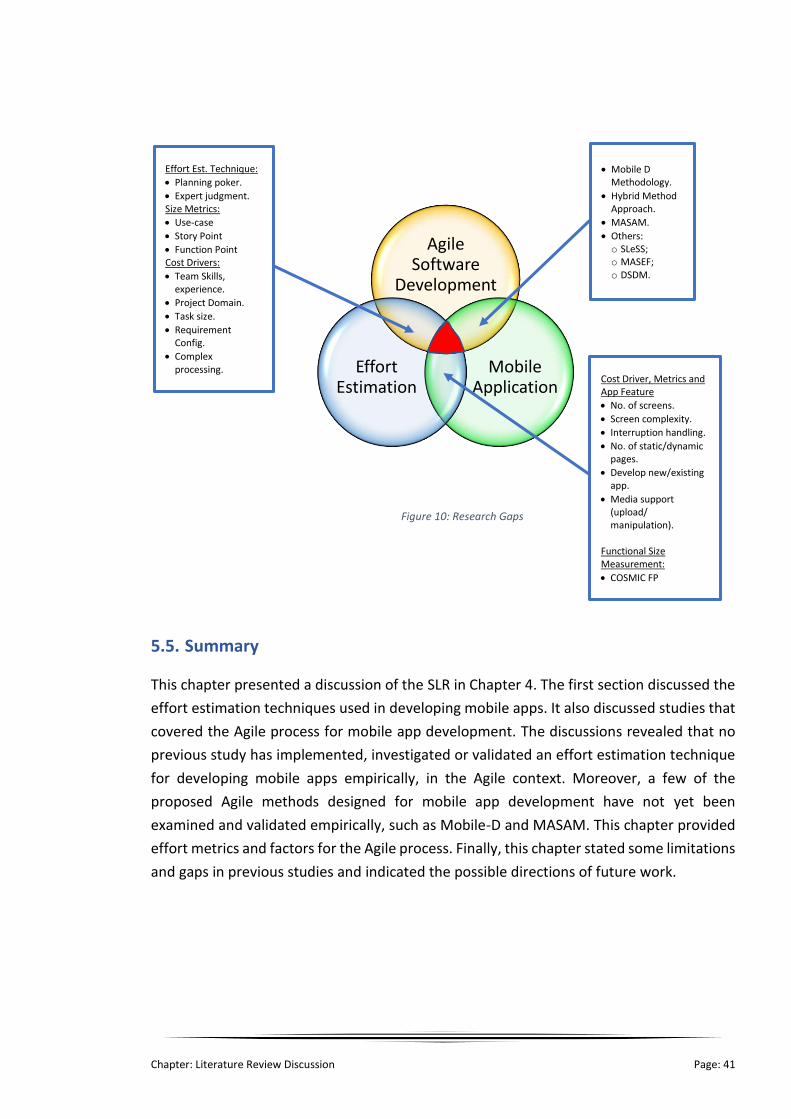
Chapter: Literature Review Discussion Page: 41
Agile Software
Development
Mobile Application
Effort Estimation
Figure 10: Research Gaps
5.5. Summary
This chapter presented a discussion of the SLR in Chapter 4. The first section discussed the
effort estimation techniques used in developing mobile apps. It also discussed studies that
covered the Agile process for mobile app development. The discussions revealed that no
previous study has implemented, investigated or validated an effort estimation technique
for developing mobile apps empirically, in the Agile context. Moreover, a few of the
proposed Agile methods designed for mobile app development have not yet been
examined and validated empirically, such as Mobile-D and MASAM. This chapter provided
effort metrics and factors for the Agile process. Finally, this chapter stated some limitations
and gaps in previous studies and indicated the possible directions of future work.
Effort Est. Technique:
• Planning poker.
• Expert judgment. Size Metrics:
• Use-case
• Story Point
• Function Point Cost Drivers:
• Team Skills, experience.
• Project Domain.
• Task size.
• Requirement Config.
• Complex processing.
• Mobile D Methodology.
• Hybrid Method Approach.
• MASAM.
• Others: o SLeSS; o MASEF; o DSDM.
Cost Driver, Metrics and App Feature
• No. of screens.
• Screen complexity.
• Interruption handling.
• No. of static/dynamic pages.
• Develop new/existing app.
• Media support (upload/ manipulation).
Functional Size Measurement:
• COSMIC FP

Chapter: Literature Review Discussion Page: 42

Chapter: Data Collection Preparation for the Interviews Page: 43
Chapter 6: Data Collection Preparation for the Interviews
In the previous chapter, the overall research methods, process and approaches to be
applied in this research study were described. This chapter details the processes followed
prior to the data collection survey. It consists of seven sections. Section 6.1 gives an
overview of the interview technique used in this study. Section 6.2 explains how the
interview questions were constructed, and what data were required for this study. Section
6.3 explains the approach taken for the interviews in this study. Section 6.4 discusses the
suitability of the sample size for this research, and section 6.5 presents the details on the
pilot test of the interview questions. Section 6.6 explains the ethical considerations for the
interviews. Finally, section 6.7 presents the software tools to will be used in the analysis
phase.
6.1. Understanding the Interview Technique
In this study, there are two parts to the method used: standardised (questionnaires) and
non-standardised (semi-structured and in-depth interview) techniques. The former are
designed to identify and describe the variables in organisational practice, whereas the
latter (semi-structured and in-depth interviews) are to answer complex or open-ended
questions that need further clarification and explanation.
The nature of the questions for the semi-structured interviews makes it suitable to use
‘what’ and ‘how’ questions, along with ‘why’ questions for further exploration. For the in-
depth interviews, there is no predetermined list of questions; during the flow of the
discussion with the interviewee (experts) they will simply be asked about the areas
identified as needing to be explored. The questions for the non-standardised techniques
are used to gather data that are normally analysed qualitatively (Saunders et al., 2009).
There are two main types of questionnaires:
• Self-administered, which are usually completed by respondents via internet or mail.
• Interview-administered, which are recorded by the interviewer in a structured
interview or via telephone.
Interview-administered questionnaires are a more reliable way to ensure that the required
data have been collected from the desired respondents, and so this type is used in this
study due to the nature of the questions.
6.2. Method Used to Build the Interview Questions
An interview usually offers just one chance to collect the data from respondents, and it is
difficult to return to them to ask them for additional information. Therefore, it is necessary
to understand of what kind of data that has to be collected. Moreover, it is important to be
Chapter: Data Collection Preparation for the Interviews Page: 44
precise in designing the study’s interview questions. They should be based on the research
objectives and aim.
For questionnaires, there are three types of variables that can be collected (Dillman, 2000):
• Opinion variables, which rely on a respondent’s feeling or beliefs.
• Behavioural variables, which represent what the experts or their organisation did,
do or will do about a certain action.
• Attribute variables, which represent the respondent’s characteristics.
To build the questionnaire, it was necessary to ensure that the data collection tool was
suitable to answer the research questions and achieve the research objectives. To do so, a
data requirement table was devised, as this is helpful to pose the correct and necessary
questions to obtain the essential data needed for the study (Saunders et al., 2009).

Chapter: Data Collection Preparation for the Interviews Page: 45
Table 16: Data requirement table for the interviews
Research objectives: identify the effort estimation methods in Agile processes for mobile application
development and discover the most appropriate approach. Explain and clarify how the estimation
technique would be applicable for mobile apps using the Agile process. Moreover, investigate how the
Agile process works with mobile app development.
Type of research: exploratory across different industries that apply an effort estimation technique using
an Agile process for mobile development. Also, it explores how organisations apply the estimation
technique in the Agile process.
Investigative question Variable required Detail in which data measured
The effort estimation techniques that
have been used in mobile app
development
Behavioural variable:
What the expert
usually does in their
organisation to
estimate the effort
List of estimation methods and
techniques. Ex: Expert Judgment,
expression based, etc.
From the previous literature review,
several effort estimation factors have
been discovered that need to be
validated for suitability in mobile apps.
Behavioural variable:
What the expert
usually does in their
organisation to
estimate the effort.
Rank the importance level of effort
estimation factors list. Ex: push
notification, complexity of user
story, etc.
Other estimation factors, not
mentioned on the previous list, that
could affect the estimation.
Behavioural and
opinion variables
Any additional estimation factors
that experts use or think will help
in estimation.
Name and type of framework that has
been used in mobile apps. Behavioural variable
List of mobile app development
frameworks. Ex: react-native,
PhoneGap, Xamrine, etc.
Type of operating systems that mobile
apps work on. Behavioural variable List of OS. Ex: IOS, Android, etc.
Accuracy level of the estimation
technique.
Opinion and
behavioural variable.
Multiple choice: overestimated or
underestimated options.
What is the size of mobile app projects? Opinion Multiple Choices: small, medium,
large
Type of software development process
that the expert follows during project. Behavioural
Choices of multiple SDLC: Agile,
waterfall, etc.
The efficiency of the development
process in mobile apps. Opinion
Feeling, excellent, good, neutral,
bad, too bad
Years of experience in mobile
development. Attribute
Allow practitioner to enter a
number
Years of experience in the Agile process. Attribute Allow practitioner to enter a
number
Job position, role and type of
organisation Attribute Manager, programmer, tester, etc
Applicability of the Agile process in
mobile app development
Behavioural and
opinion
Experience results or feelings
(good, neutral, not fit)
Checklist framework for Planning Poker
or Expert Judgement technique Opinion
Feeling what he thinks about this
technique

Chapter: Data Collection Preparation for the Interviews Page: 46
After defining the interview requirements and the type of data to collect, it was possible to
build the interview questions. In the Appendix C, Figure 81 gives the interview questions.
6.3. Interview Approach
Both structured and non-structured methods were used within each interview, which is
termed mixed methods, to help to validate and verify participants’ responses to the
questions. The aim of the interview technique is to enable data to be obtained that answer
the research questions. In an interview, there are several concerns that should be taken
into account (Saunders et al., 2009):
1- Using appropriate language that the interviewee will feel comfortable with.
2- Considering the approach to asking a question, and letting the practitioner talk freely
throughout the in-depth questions.
3- Listening carefully and patiently.
4- Testing and summarising the interviewee’s understanding.
5- Recording the data in various forms:
a. Written, for example: forms and checklists.
b. Audio recorded.
6.4. Sample Size
It is impracticable or impossible to collect data from the entire population, due to the
massive population and challenges such as budget and time constraints, data
manageability and data accessibility. Thus, it is necessary to select a sample to represent
the entire population. There are two main types of sampling: probability sampling and non-
probability sampling.
The first technique is used when the sample is gathered in a process whereby all individuals
have the same chance of being selected from the entire population. That means the
population members are known and they have an equal chance of participating in the
study. By contrast, the second technique does not give all the individuals an equal
opportunity of being selected. Thus, not every member of the population has a chance to
participate. Based on the study’s aim, objectives and questions, the most appropriate
sample selection technique is non-probability sampling.
A sample group of members are not selected randomly, but by the researcher’s criteria.
Non-probability or non-random sampling is an appropriate method when the total
population in unknown. As it is not possible to conduct in-depth interviews and distribute
questionnaires to the entire population, they are conducted with the sample accessible to
the researcher, and this is termed convenience sampling.Since the technique used in this
research is non-probability sampling, there are certain criteria to choose the practitioners.

Chapter: Data Collection Preparation for the Interviews Page: 47
They should satisfy the inclusion criteria to make sure that the data collected have been
obtained from appropriate sources.
Practitioner criteria:
• The practitioner should have experience of effort estimation in software projects and
Agile SDP.
• The practitioner should have practised or been involved in the Agile process on a
software project.
• The practitioner could be a software developer, project manager, code tester, code
reviewer, code quality assurance, software designer, software architect or have any
role relevant to the software development process.
The issue of suitable sample size in non-probability sampling techniques is ambiguous, and
there are no rules (Saunders et al., 2009). However, there are considerations of sample size
that are dependent on the research questions, objectives, what needs to be discovered and
what can be done with the available resources. Based on debates in the literature, it is
recommended to continue collecting qualitative data until the point is reached where
additional data provides few new insights, which is called data saturation (Dworkin, 2012).
It is generally considered that the minimum sample size for interviews is between five and
25 people (Dudovskiy, 2018), while Guest, Bunce and Johnson (2006) offer guidance that
12 in-depth interviews should be sufficient.
6.5. Pilot Testing
Pilot testing of interview questions is a procedure to test the validity of the interview
questions before using them in a study. It is necessary to reveal any weaknesses in the
interview questions (Kothari, 2004). The aim is to make sure the questions are
understandable to the experts and follow a good sequence. The test involved five
participants, two of whom were PhD candidates in computer science and three were senior
mobile developers in an IT company. The participants confirmed the suitability of the
interview questions and their appropriateness.
6.6. Ethical Considerations
Dealing with human participants raises some ethical issues that need to be addressed. The
interview questions were formulated to be respectful and appropriate for the participants.
An information sheet and a consent form were given to all participants to sign before taking
part in the interview to ensure that they were happy to participate and understood what
was involved. To ensure the confidentiality of the participants and build trust between the
researcher and the participants, they were assured that the stored data would not be linked
to their names or their organisation’s name. The data will be stored on secure systems
Chapter: Data Collection Preparation for the Interviews Page: 48
during the research study. Once the research is completed and the results from the data
analysis achieved, the data will be destroyed by deleting all data files relating to the
participants on laptops, desktops, emails and physical data through shredding paper
documents and deleting electronic files, including audio recordings.
Ethical approval was obtained from the Ethics Committee team at the University of
Southampton under reference number: 46055 on 19 December 2018. The application
included multiple forms: the Data Protection Authorities form, which is responsible for
protecting the personal data of the participants; the Participant Information Sheet; the
Consent form; and a Risk Assessment form.
6.7. Analysis Tools
To avoid errors and time-consuming calculations, advanced software was used in this
study. IBM SPSS software offered advanced statistical analysis of the data collected. Also,
Power-BI software was used for data analysis to provide an interactive visualisation of the
data collected and to make them readable and thus facilitate taking decisions quickly. In
addition, NVivo was used in this research study for qualitative analyses to obtain thematic
patterns from the semi-structure interviews. A template was created for the qualitative
data analysis to present the codes and categories of the data that represent the themes
revealed.
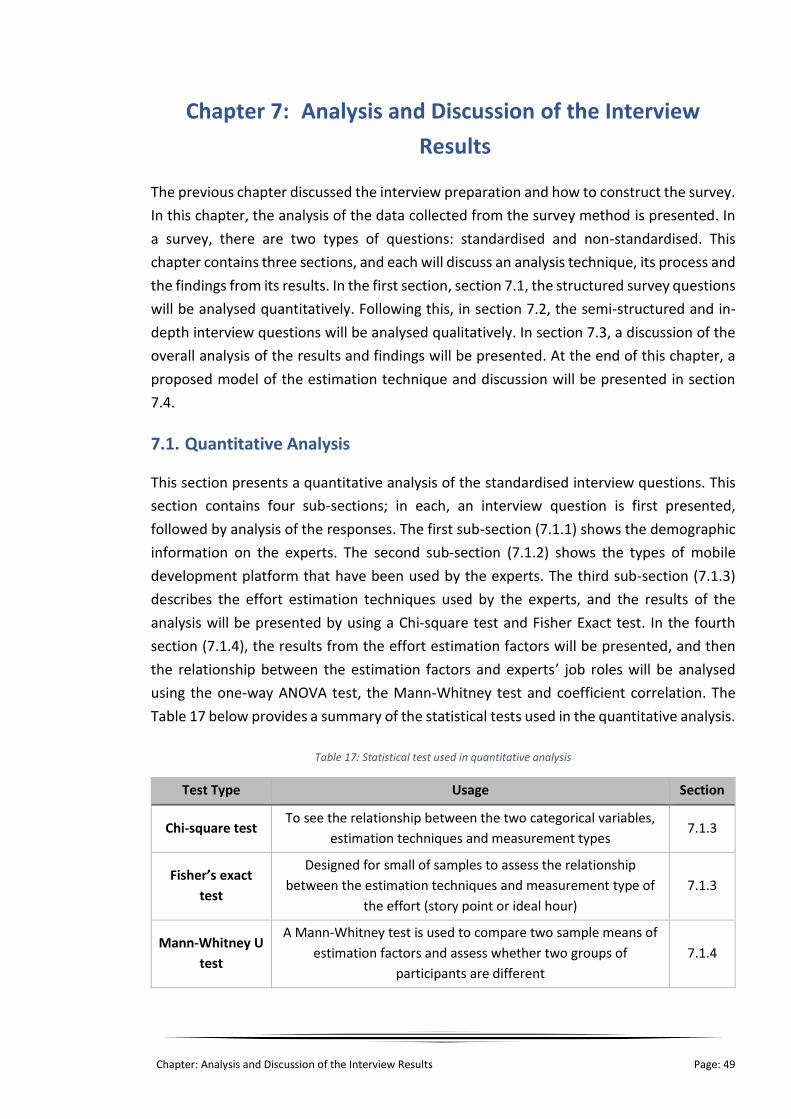
Chapter: Analysis and Discussion of the Interview Results Page: 49
Chapter 7: Analysis and Discussion of the Interview
Results
The previous chapter discussed the interview preparation and how to construct the survey.
In this chapter, the analysis of the data collected from the survey method is presented. In
a survey, there are two types of questions: standardised and non-standardised. This
chapter contains three sections, and each will discuss an analysis technique, its process and
the findings from its results. In the first section, section 7.1, the structured survey questions
will be analysed quantitatively. Following this, in section 7.2, the semi-structured and in-
depth interview questions will be analysed qualitatively. In section 7.3, a discussion of the
overall analysis of the results and findings will be presented. At the end of this chapter, a
proposed model of the estimation technique and discussion will be presented in section
7.4.
7.1. Quantitative Analysis
This section presents a quantitative analysis of the standardised interview questions. This
section contains four sub-sections; in each, an interview question is first presented,
followed by analysis of the responses. The first sub-section (7.1.1) shows the demographic
information on the experts. The second sub-section (7.1.2) shows the types of mobile
development platform that have been used by the experts. The third sub-section (7.1.3)
describes the effort estimation techniques used by the experts, and the results of the
analysis will be presented by using a Chi-square test and Fisher Exact test. In the fourth
section (7.1.4), the results from the effort estimation factors will be presented, and then
the relationship between the estimation factors and experts’ job roles will be analysed
using the one-way ANOVA test, the Mann-Whitney test and coefficient correlation. The
Table 17 below provides a summary of the statistical tests used in the quantitative analysis.
Table 17: Statistical test used in quantitative analysis
Test Type Usage Section
Chi-square test To see the relationship between the two categorical variables,
estimation techniques and measurement types 7.1.3
Fisher’s exact
test
Designed for small of samples to assess the relationship
between the estimation techniques and measurement type of
the effort (story point or ideal hour)
7.1.3
Mann-Whitney U
test
A Mann-Whitney test is used to compare two sample means of
estimation factors and assess whether two groups of
participants are different
7.1.4

Chapter: Analysis and Discussion of the Interview Results Page: 50
Independent
sample test
The independent sample test is used to compare the differences
in the means of the estimation factors between two unrelated
job role groups (Developers. QA and PM)
7.1.4
One-way ANOVA
test
ANOVA tested whether three or more groups of participants are
different in term of their opinion of the estimation factors 7.1.4
Correlation
coefficient test
A coefficient correlation enables us to quantify and assess the
strength of the linear relationship between each of the effort
estimation factors
7.1.4
7.1.1. Experts’ demographic information
During the interviews, several demographic questions were asked of the experts, as
follows:
Questions Answer
Work experience countries
Years of work experience in general
Current positions/role in your employment
Previous positions/roles in your employment history
Name/Nature of organisation you work with (Telecom/IT company/etc.)
The experts answered all the questions, and details of the answers are presented in the
following sections.
Work country and job role
Twenty experts were interviewed for this study, and 17 agreed to being audio recorded,
whereas three refused and so notes were taken of their interviews. As shown in Table 18,
all the experts had worked in Saudi Arabia, and three of them have also worked in the
United States, two in Bahrain and one in India. Figure 11 presents the experts’ countries of
work experience along with the corresponding frequency. Most of the experts have had
multiple roles. From the interviews, Software developer was the most common job role
that was mentioned in response to the question on work history, by 12 experts, and that
of project manager, quality assurance (QA), freelancer, sales and IT director by 5, 5, 4, 2
and 1 experts, respectively. Figure 13 shows the experts’ job roles by their work location.

Chapter: Analysis and Discussion of the Interview Results Page: 51
Table 18: Experts’ work experience countries
Statistic result Per cent of
Cases N Per cent
Country
Saudi Arabia 20 76.9 100.0
United States 3 11.5 15.0
Bahrain 2 7.7 10.0
India 1 3.8 5.0
Total 26 100.0 130.0
Table 19: Experts’ job roles
Responses Per cent of
cases N Per cent
Job Role
Software developer 12 37.5 60.0
Project manager 5 15.6 25.0
QA (tester) 5 15.6 25.0
Freelancer 4 12.5 20.0
Team leader 3 9.4 15.0
Sales 2 6.3 10.0
IT director 1 3.1 5.0
Total 32 100.0 160.0
Figure 12: Experts’ job roles
Figure 13: Job roles of the experts by work country
Figure 11: Experts’ work country

Chapter: Analysis and Discussion of the Interview Results Page: 52
Main job role of the experts
As observed in the responses by the experts, most of them have worked in multiple job
roles; however, it is necessary to categorise the experts by assigning them one main job
role. The reason is that some statistical analysis is required, and it will ensure there is no
interception or overlap between the groups of experts, so each group should be distinct.
Therefore, a one-job role has been assigned to each expert, based on their current job. In
Figure 14 below, the main job roles of the experts are shown. More detail on the experts’
information can be found in Table 66: Expert’s information in the Appendix C.
Years of work experience
The work experience of the all experts ranged from two to nine years. The mean figure
for the experts is 5.70 years, and the standard deviation of the years of experience is
1.867. As can be seen in Table 20, most of the software developers’ experience ranges
from four to six years. Only one IT director took part, and he had worked for roughly four
years.
Table 20: Work experience in years
Years of work experience
Total 2 years 4 years 5 years 6 years 7 years 9 years
Job Role Project manager Count 0 2 0 1 1 1 5
Software developer Count 1 3 2 4 0 2 12
QA Count 0 1 1 2 1 0 5
Freelancer Count 0 1 1 1 0 1 4
Team leader Count 0 0 1 0 1 1 3
Sales Count 0 1 0 0 0 1 2
IT director Count 0 1 0 0 0 0 1
Total Count 1 5 3 6 2 3 20
Figure 14: Main job roles of the experts

Chapter: Analysis and Discussion of the Interview Results Page: 53
Experts’ company type
The experts have worked in 18 organisations, as can be seen in Table 21, which is
categorised into seven groups: Telecommunication companies, IT solutions companies,
Banking, University, Social and insurance companies, Consultation companies and
Government. The majority have worked in IT solutions companies, meaning that seven
groups represent 40% of all company types. The details on the companies’ information can
be found in Table 68 in the Appendix C.
Figure 15: Overview of the company categories
Table 21: Summary of the company types
No. of company Per cent % Cumulative per cent
Category
IT co. 7 38.9 38.9
Telecom co. 2 11.1 50.0
Bank 1 5.6 55.6
Government 2 11.1 66.7
University 2 11.1 77.8
Consultation co. 2 11.1 88.9
Social org 2 11.1 100.0
Total 18 100.0
7.1.2. Mobile platform usage
There are three types of mobile app platforms: native, hybrid and mobile web. A native app
is developed for a specific platform that uses native APIs. A hybrid app is developed by web
technologies, such as HTML, and wrapped in a native container, whereas a mobile web app

Chapter: Analysis and Discussion of the Interview Results Page: 54
is developed by web technologies and used in a web browser. There are further details
about the mobile platform types in Chapter 2.
In the interview, two questions were put to all the experts regarding the type and name
of mobile app platforms and frameworks:
Questions Answer
Which of the following platform types are used during mobile app
development? (native, web-based or hybrid)
Which of the following frameworks are used during your mobile app
development? (Ionic, Android Studio, Swift, etc.)
As seen in Table 22 and Figure 16, most experts have used a hybrid platform in
development, whereas mobile web is less used. Since most usage of platform types is
hybrid, the Ionic is the most commonly used framework for developing mobile apps, used
by around half of the experts, as shown in Table 23 and Figure 17. Android Studio
framework is preferred by the experts for developing native mobile apps. The experts who
liked to use a hybrid platform more than native apps claimed that this was to avoid
developing two apps for two different platforms.
Since several experts were surveyed, with multiple positions and roles during their work
experience, Table 24 shows the distribution of the experts and their preferences for the
various mobile frameworks. Android Studio and Ionic frameworks lead the mobile app
frameworks.
Table 22: Platform types used by the experts
Responses Per cent of
Cases N Per cent
Platform Type hybrid 12 50.0 60.0
native 10 41.7 50.0
web 2 8.3 10.0
Total 24 100.0 120.0
Figure 16: Platform type overview
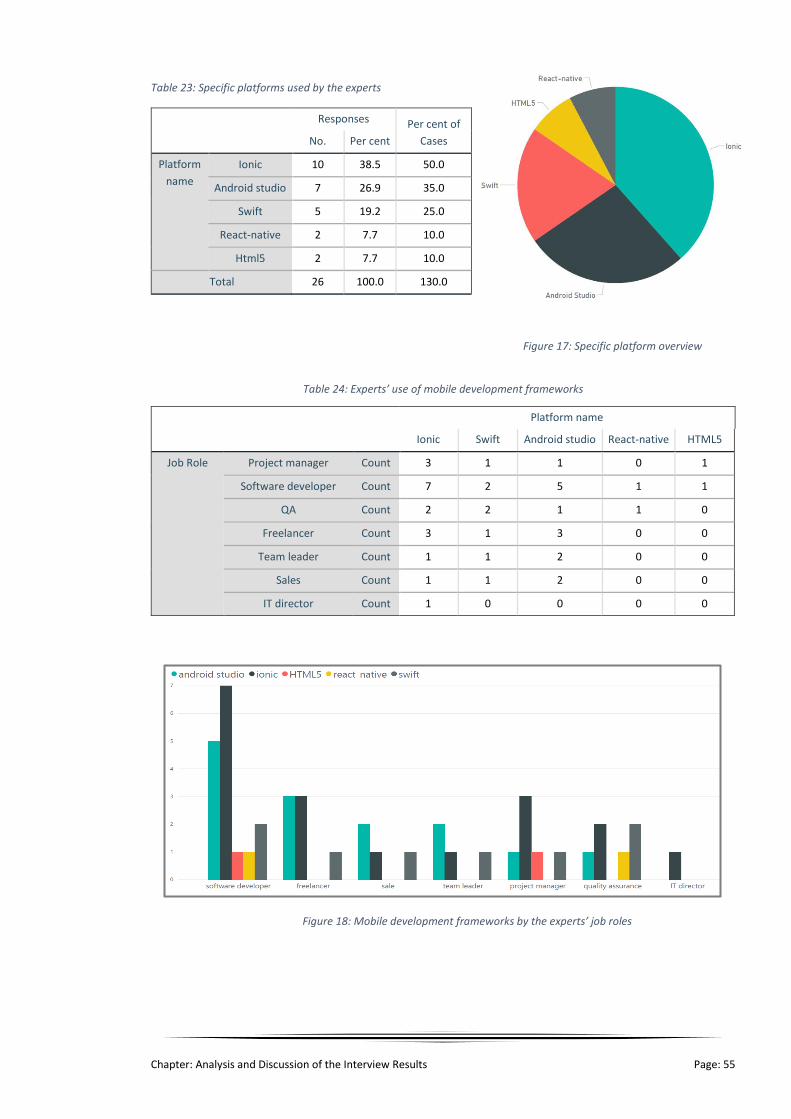
Chapter: Analysis and Discussion of the Interview Results Page: 55
Table 23: Specific platforms used by the experts
Responses Per cent of
Cases No. Per cent
Platform
name
Ionic 10 38.5 50.0
Android studio 7 26.9 35.0
Swift 5 19.2 25.0
React-native 2 7.7 10.0
Html5 2 7.7 10.0
Total 26 100.0 130.0
Table 24: Experts’ use of mobile development frameworks
Platform name
Ionic Swift Android studio React-native HTML5
Job Role Project manager Count 3 1 1 0 1
Software developer Count 7 2 5 1 1
QA Count 2 2 1 1 0
Freelancer Count 3 1 3 0 0
Team leader Count 1 1 2 0 0
Sales Count 1 1 2 0 0
IT director Count 1 0 0 0 0
Figure 17: Specific platform overview
Figure 18: Mobile development frameworks by the experts’ job roles

Chapter: Analysis and Discussion of the Interview Results Page: 56
7.1.3. Effort estimation techniques
During the interview, a question was put to all 20 experts regarding the effort estimation
method for a mobile app development project:
Table 25: Effort estimation technique question
Question: Which of the following effort estimation methods/techniques are used in
your organisation in terms of estimating the effort?
Estimation method Select
Planning Poker ⬜
Expert judgement ⬜
COCOMO ⬜
Delphi ⬜
Analogy ⬜
Use-case point method UCP ⬜
Regression-based ⬜
Other ……………………….
The respondents could select multiple estimation techniques, and there was an empty field
for any further techniques that had been used yet were not one of the options.
As a result, it was found there are only three effort estimation techniques, Expert Judgment
(EJ), Planning Poker (PP) and COCOMO II, used by these experts in the Agile process for
developing mobile apps. More than half the experts had used the EJ technique to estimate
effort, and about 40% had used PP, as shown in Table 26 and Figure 20. Only one had used
COCOMO to estimate effort, as shown in Table 42 in section 7.3, and this expert worked as
a project manager and had used it to obtain an idea of the effort required before a project
started; this case will be discussed in more detail in the results and discussion section later
in this chapter. From Table 26, it can be observed that the percentage of cases columns is
higher than the percentage of responses columns, which means that four of the experts
used multiple estimation techniques (see Table 69: Experts’ estimation technique in detail,
in the Appendix C).
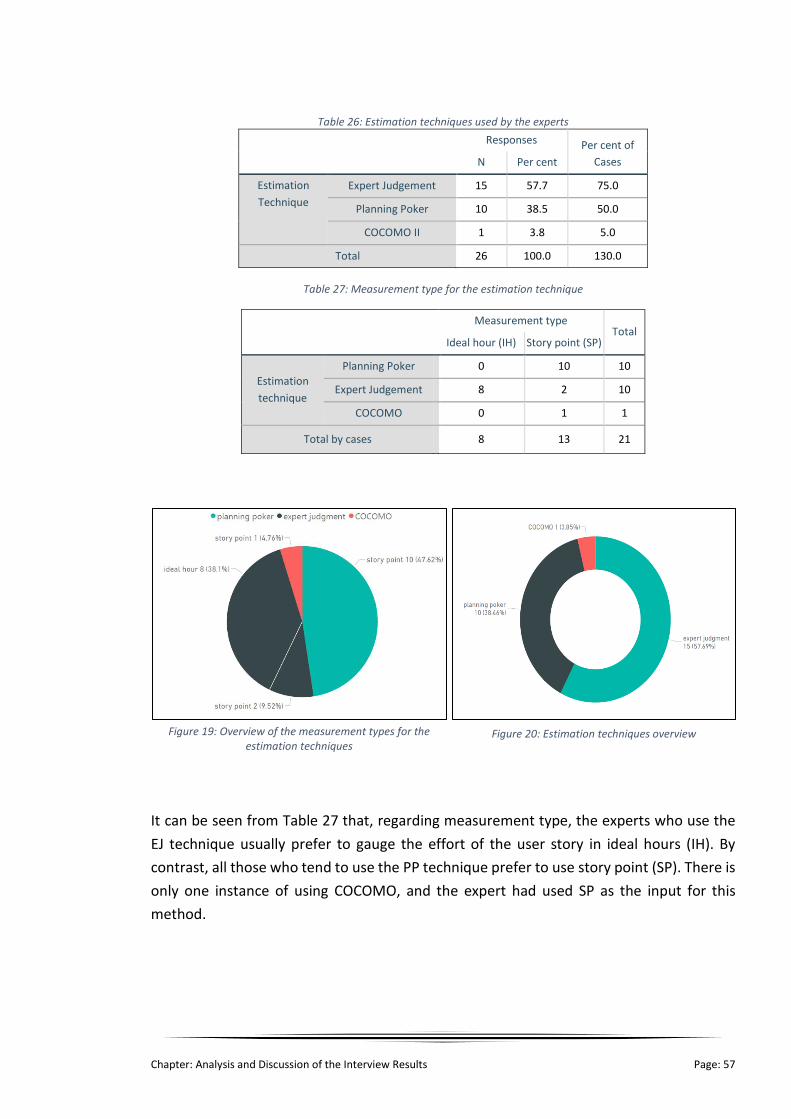
Chapter: Analysis and Discussion of the Interview Results Page: 57
Table 26: Estimation techniques used by the experts
Responses Per cent of
Cases N Per cent
Estimation
Technique
Expert Judgement 15 57.7 75.0
Planning Poker 10 38.5 50.0
COCOMO II 1 3.8 5.0
Total 26 100.0 130.0
Table 27: Measurement type for the estimation technique
Measurement type
Total Ideal hour (IH) Story point (SP)
Estimation
technique
Planning Poker 0 10 10
Expert Judgement 8 2 10
COCOMO 0 1 1
Total by cases 8 13 21
It can be seen from Table 27 that, regarding measurement type, the experts who use the
EJ technique usually prefer to gauge the effort of the user story in ideal hours (IH). By
contrast, all those who tend to use the PP technique prefer to use story point (SP). There is
only one instance of using COCOMO, and the expert had used SP as the input for this
method.
Figure 20: Estimation techniques overview Figure 19: Overview of the measurement types for the estimation techniques

Chapter: Analysis and Discussion of the Interview Results Page: 58
Chi-square test
To see the relationship between the two categorical variables, estimation techniques and
measurement types, the Chi-square test (𝑥2) was used. This made it possible to establish
the extent to which the two variables in different groups are associated. In this case, the
test was to compare the distribution of the estimation techniques, PP and EJ, to the
distribution of the measurement types, IH and SP. If the distribution shows no difference
between the groups, then it can be concluded that the categorical variable and group are
independent.
The Chi-square test equation was performed as: 𝑥2 = ∑ (𝑂−𝐸)2
𝐸 where O is the observed
variable, and E is the expected frequency. In Table 27, the observed values are the
frequency of the experts who were using a specific estimation technique for a specific
measurement type, as shown in Table 28. However, the expected value is that all groups in
the measurement types of IH and SP have equal frequency. For example, there were eight
experts in the IH group, using IH as the measurement type, so the expected value for SP is
four and for EJ is four, as shown in Table 28. The Degree of Freedom (df) is the number of
observations that are free to vary when computing a statistic (Field, Miles & Field, 2018).
As shown in Table 29, the p-value or relationship significance value is an indicator of how
likely it is that the result occurred by chance alone. A probability of 0.05 shows that there
is a 5% chance of the data occurring in this way; and if the p-value is less than 0.05 (P<0.05),
this means that we can be at least 95% sure that the relationship between the data did not
occur by chance, thus there is a significant relationship statistically (Field et al., 2018;
Saunders et al., 2009). The p-value, shown in the Table 29, is 0.0001, which is less than the
significance level (α = 0.05). Therefore, there is a significant association between the
estimation techniques and the measurement types. The results’ findings will be returned
to in section 0.
Table 28: Relationship between the estimation techniques with the effort measurement type
Measurement type
Total Ideal hour Story point
Estimation technique Planning Poker Observed 0 10 10
Expected 4.0 6.0 10.0
Expert Judgement Observed 8 2 10
Expected 4.0 6.0 10.0
Total Observed Count 8 12 20
Expected Count 8.0 12.0 20.0

Chapter: Analysis and Discussion of the Interview Results Page: 59
Fisher’s exact test
The Chi-square test relies on an approximate distribution, thus is not good for a small
number of samples. As can be seen in Table 29, a note for Chi-square testing states that
there are two expected frequencies of less than 5 in Table 28. Therefore, Fisher’s Exact test
is appropriate to cater for this small sample size number and compute the exact probability.
The p-value of Fisher’s test is 0.001 (p<0.05), and it can be said that there is a statistically
significant relationship between the two groups’ variables. The ribbon chart used in Figure
21 can be referred to quickly discover which variable has high usage in each category. The
results will be discussed later in section 7.3: Analysis Summary and Discussion.
Table 29: Chi-square and Fisher’s-exact tests
Value df Significance (2-sided) Exact Sig. (2-sided)
Pearson Chi-square 13.333a 1 .0001
Fisher’s Exact Test .001
No. of Valid Cases 20
Note: (a) 2 cells (50.0%) have expected count less than 5. The minimum expected count is 4.00.
Figure 21 Ribbon chart: association between the estimation technique and effort measurement type

Chapter: Analysis and Discussion of the Interview Results Page: 60
7.1.4. Effort estimation factors
From the Systematic Literature Review (SLR), 48 factors were obtained from previous
studies on effort estimation using the Agile process. These can be categorised into three
groups, as shown in Figure 22, on the basis of the aims and objectives of the studies
examined in the SLR:
1) Mobile factors: these are related to developing mobile apps, and there are three sub-
groups:
a. Functional factors: a factor that is used in the early stages of the
development process to estimate the effort of a software.
b. Non-functional factors: a factor that can be used prior and during the
development process to help to obtain a more accurate estimate.
c. Platform factors: a factor related to the mobile environment.
2) Agile factors: a factor that could effect improvements to the accuracy of the estimation
during the Agile process, and the factors that are considered by the team members
during the estimation.
3) Project factors: factors related to the overall project.
The experts were asked to rate the importance of each of the 48 effort estimation factors.
The responses were on a five-point Likert-style rating scale in which the respondent is asked
how strongly they agree or disagree. The scale is denoted as follows:
5 4 3 2 1 very important
factor Important
factor neutral Not important
factor strongly not important
All 20 experts answered this question and assigned a specific rank to each factor. The
following sections analyse the results for the estimation factors on the basis of frequency,
mean and relationship.

Chapter: Analysis and Discussion of the Interview Results Page: 61
Effort Predictors
Project factors
dealine date
budget project
development type (new or
enhance)
managerial skills
work pressure (work load)
Agile factors
communication process
team process experiance
team size
backlog items complexity
debendency between backlog
itmes
developer implementation
experiance
developer knowledge of backlog items
developer estimation experiance
language and culuture
differences
geographical development
team
item priority
Mobile factors
platform features
terget plateform (IOS, Android)
platform type (native, hybrid)
device support (phone, tablet ,
smartwatch)
Functional features
Registration & login
booking & reservation
payment process
file upload
comment
sharing
map view
localization & tracking
navigation
searching content
messaging
calendar & time
media support
multi-language support
third party authentication
Non-Functional features
Push notification
data storage & memory opti.
complexity
number of screen.
UI quality & complexity
hardware access
interrupt handling
connection (wirless,
bluetooth, 3g etc)
battery & power opti.
security support
dynamicity of the screen
back-end sys & server config
compatibility with previous
version
support code reusability
number of API party
reused code
static & dynamic page view
Figure 22: Overview of effort estimation factors
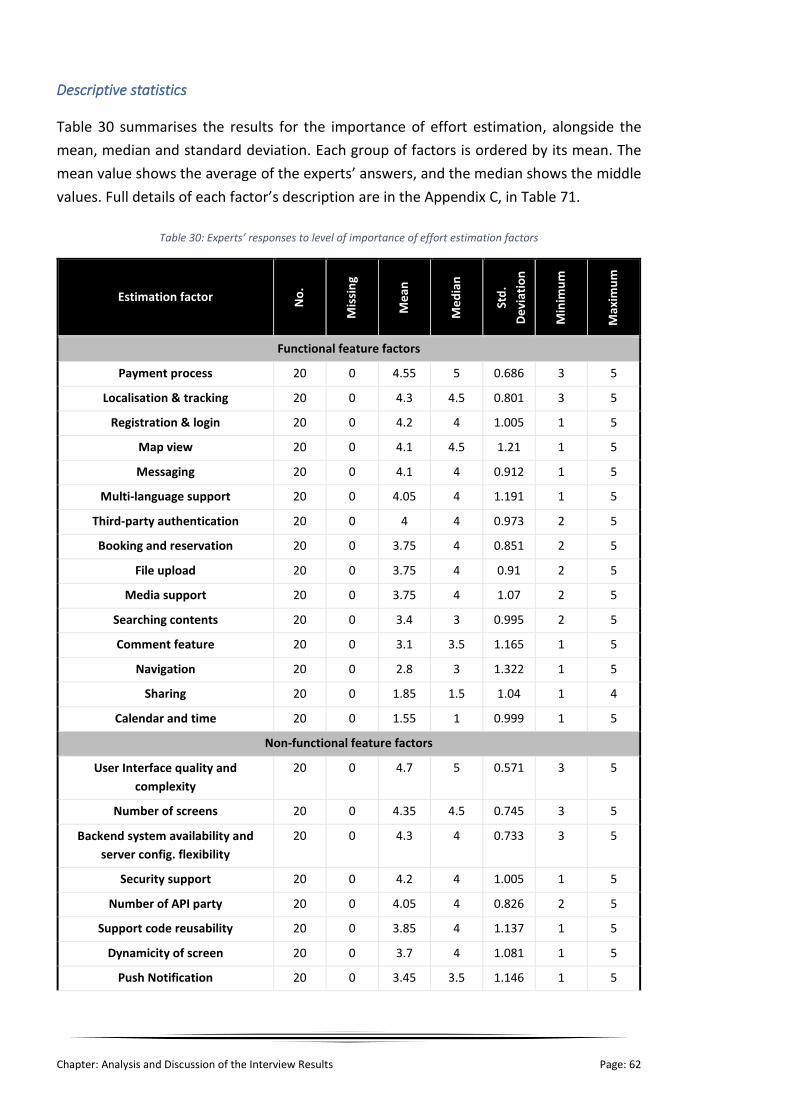
Chapter: Analysis and Discussion of the Interview Results Page: 62
Descriptive statistics
Table 30 summarises the results for the importance of effort estimation, alongside the
mean, median and standard deviation. Each group of factors is ordered by its mean. The
mean value shows the average of the experts’ answers, and the median shows the middle
values. Full details of each factor’s description are in the Appendix C, in Table 71.
Table 30: Experts’ responses to level of importance of effort estimation factors
Estimation factor No
.
Mis
sin
g
Me
an
Me
dia
n
Std
.
De
viat
ion
Min
imu
m
Max
imu
m
Functional feature factors
Payment process 20 0 4.55 5 0.686 3 5
Localisation & tracking 20 0 4.3 4.5 0.801 3 5
Registration & login 20 0 4.2 4 1.005 1 5
Map view 20 0 4.1 4.5 1.21 1 5
Messaging 20 0 4.1 4 0.912 1 5
Multi-language support 20 0 4.05 4 1.191 1 5
Third-party authentication 20 0 4 4 0.973 2 5
Booking and reservation 20 0 3.75 4 0.851 2 5
File upload 20 0 3.75 4 0.91 2 5
Media support 20 0 3.75 4 1.07 2 5
Searching contents 20 0 3.4 3 0.995 2 5
Comment feature 20 0 3.1 3.5 1.165 1 5
Navigation 20 0 2.8 3 1.322 1 5
Sharing 20 0 1.85 1.5 1.04 1 4
Calendar and time 20 0 1.55 1 0.999 1 5
Non-functional feature factors
User Interface quality and
complexity
20 0 4.7 5 0.571 3 5
Number of screens 20 0 4.35 4.5 0.745 3 5
Backend system availability and
server config. flexibility
20 0 4.3 4 0.733 3 5
Security support 20 0 4.2 4 1.005 1 5
Number of API party 20 0 4.05 4 0.826 2 5
Support code reusability 20 0 3.85 4 1.137 1 5
Dynamicity of screen 20 0 3.7 4 1.081 1 5
Push Notification 20 0 3.45 3.5 1.146 1 5

Chapter: Analysis and Discussion of the Interview Results Page: 63
Estimation factor No
.
Mis
sin
g
Me
an
Me
dia
n
Std
.
De
viat
ion
Min
imu
m
Max
imu
m
Compatibility with Previous Version 20 0 3.4 3.5 0.995 1 5
Hardware access 20 0 3.3 3 1.261 1 5
Data storage and memory opt.
complexity.
20 0 3.25 3 1.118 1 5
Battery & power optimisation 20 0 2.9 3 1.21 1 5
Connection (wireless, Bluetooth,
3G, etc.)
20 0 2.55 2.5 1.146 1 5
Interrupt handling 20 0 2.5 2.5 1.192 1 5
Platform factors
Supported platform type
(IOS/Android./Win./etc.)
20 0 4.85 5 0.366 4 5
Platform type (native, hybrid) 20 0 4.85 5 0.489 3 5
Supported device (phone, tablet,
smartwatch)
20 0 4.25 5 0.967 2 5
Agile factors
Communication process 20 0 4.6 5 0.598 3 5
Backlog items complexity 20 0 4.6 5 0.681 3 5
Developer implementation
experience
20 0 4.55 5 0.686 3 5
Developer knowledge of backlog
item
20 0 4.4 5 0.883 2 5
Developer estimation experience 20 0 4.4 5 0.821 2 5
Team process experience 20 0 4.3 4.5 0.801 3 5
Dependency between backlog items 20 0 4.15 4 1.182 1 5
Team size 20 0 4.05 4 0.826 2 5
Geographical of the development
team
20 0 3.8 4 1.24 1 5
Language and culture differences 20 0 2.9 3 1.119 1 5
Project factors
Deadline date 20 0 4.4 5 0.821 2 5
Development type (new or enhanced app)
20 0 4.25 5 1.02 2 5
Work pressure (workload) 20 0 4.2 4.5 1.005 2 5
Item priority 20 0 3.85 4.5 1.309 2 5
Managerial skills 20 0 3.6 4 0.995 2 5
Budget for the project 20 0 2.8 2 1.281 1 5

Chapter: Analysis and Discussion of the Interview Results Page: 64
Table 31: Importance level of the effort estimation factors by experts’ job role
Job role Software developer Project manager / IT
director QA team
Mea
n
Med
ian
N
Std
.
dev
iati
on
Mea
n
Med
ian
N
Std
.
dev
iati
on
Mea
n
Med
ian
N
Std
.
Dev
iati
on
Functional feature factor
Payment process 4.5 5 10 0.85
4.6 5 5 0.548
4.6 5 5 0.548
Localisation & tracking 4.4 5 10 0.843
4.2 4 5 0.837
4.2 4 5 0.837
Registration & login 4.4 4.5 10 0.699
3.6 4 5 1.673
4.4 4 5 0.548
Messaging 4.2 4 10 0.632
4.4 4 5 0.548
3.6 4 5 1.517
Map view 4.1 5 10 1.449
4.4 4 5 0.548
3.8 4 5 1.304
File upload 3.9 4 10 0.876
4.2 4 5 0.837
3 3 5 0.707
Media support 3.8 4 10 1.033
3.8 4 5 1.304
3.6 4 5 1.14
Booking and reservation 3.8 4 10 0.789
3.6 4 5 1.14
3.8 4 5 0.837
Third-party authentication 3.7 4 10 0.949
4.6 5 5 0.548
4 4 5 1.225
Multi-languages support 3.7 4 10 1.494
4.2 4 5 0.837
4.6 5 5 0.548
Searching contents 3.4 3 10 0.699
4.2 5 5 1.095
2.6 2 5 0.894
Comment feature 3.1 3.5 10 1.101
3.6 4 5 1.14
2.6 2 5 1.342
Navigation 2.9 3 10 1.287
3 3 5 1.581
2.4 3 5 1.342
Sharing 2.1 2 10 0.994
2.2 2 5 1.304
1 1 5 0
Calendar and time 1.8 1.5 10 1.229
1.6 1 5 0.894
1 1 5 0
Non-functional feature factors
User Interface quality and complexity
4.8 5 10 0.422
5 5 5 0 4.2 4 5 0.837
Security support 4.6 5 10 0.699
4.2 4 5 0.837
3.4 4 5 1.342
Backend system availability and server config. flexibility
4.5 5 10 0.707
3.8 4 5 0.837
4.4 4 5 0.548
Support code reusability 4.4 4.5 10 0.699
3.8 3 5 1.095
2.8 3 5 1.304

Chapter: Analysis and Discussion of the Interview Results Page: 65
Job role Software developer Project manager / IT
director QA team
Mea
n
Med
ian
N
Std
.
dev
iati
on
Mea
n
Med
ian
N
Std
.
dev
iati
on
Mea
n
Med
ian
N
Std
.
Dev
iati
on
Number of screens 4.1 4 10 0.876
4.6 5 5 0.548
4.6 5 5 0.548
Number of API party 4.1 4 10 0.738
4 4 5 0.707
4 4 5 1.225
Dynamicity of screen 3.9 4 10 1.197
3.4 4 5 1.342
3.6 4 5 0.548
Hardware access 3.8 4 10 1.229
3.4 3 5 0.548
2.2 2 5 1.304
Data storage and memory opt. complexity
3.8 4 10 0.919
3.4 3 5 0.548
2 2 5 1
Compatibility with previous version
3.7 4 10 0.823
3 3 5 0 3.2 4 5 1.643
Push notification 3.6 4 10 1.265
4 4 5 1 2.6 3 5 0.548
Battery & power optimisation
3.3 3.5 10 1.337
3.2 3 5 0.447
1.8 2 5 0.837
Interrupt handling 3.1 3 10 0.994
1.8 1 5 1.304
2 2 5 1
Connection (wireless, Bluetooth, 3G, etc.)
2.4 2 10 0.843
2.6 3 5 1.14
2.8 3 5 1.789
Platform factors
Supported platform type (IOS/Android./Win./etc.)
4.9 5 10 0.316
4.8 5 5 0.447
4.8 5 5 0.447
Platform (native, hybrid) 4.8 5 10 0.632
4.8 5 5 0.447
5 5 5 0
Supported device (phone, tablet, smartwatch)
4.4 5 10 0.843
3.8 4 5 0.837
4.4 5 5 1.342
Agile factors
Communication process 4.7 5 10 0.483
4.4 4 5 0.548
4.6 5 5 0.894
Developer implementation experience
4.5 5 10 0.85
4.4 4 5 0.548
4.8 5 5 0.447
Backlog items complexity 4.4 5 10 0.843
4.8 5 5 0.447
4.8 5 5 0.447
Developer knowledge of backlog item
4.4 5 10 0.843
4.4 4 5 0.548
4.4 5 5 1.342
Team process experience 4.4 5 10 0.843
4.2 4 5 0.837
4.2 4 5 0.837
Developer estimation experience
4.3 5 10 1.059
4.6 5 5 0.548
4.4 4 5 0.548

Chapter: Analysis and Discussion of the Interview Results Page: 66
Job role Software developer Project manager / IT
director QA team
Mea
n
Med
ian
N
Std
.
dev
iati
on
Mea
n
Med
ian
N
Std
.
dev
iati
on
Mea
n
Med
ian
N
Std
.
Dev
iati
on
Team size 3.9 4 10 0.738
4.6 5 5 0.548
3.8 4 5 1.095
Dependency between backlog items
3.9 4.5 10 1.595
4.4 4 5 0.548
4.4 4 5 0.548
Item priority 3.7 4.5 10 1.494
3.8 4 5 1.304
4.2 5 5 1.095
Geographical of the development team
3.6 4 10 1.265
4 4 5 1.225
4 5 5 1.414
Language and culture differences
3 3 10 1.155
2.6 3 5 1.14
3 3 5 1.225
Project factors
Development type (New or enhanced app)
4.5 5 10 0.707
3.8 4 5 1.304
4.2 5 5 1.304
Deadline date 4.4 5 10 0.966
4.6 5 5 0.548
4.2 4 5 0.837
Work pressure (workload) 4.3 4.5 10 0.823
3.6 4 5 1.517
4.6 5 5 0.548
Managerial skills 3.5 3.5 10 1.08
3.8 4 5 0.837
3.6 4 5 1.14
Budget for the project 3.4 3 10 1.43
2.4 2 5 0.894
2 2 5 0.707
Mann-Whitney U test and independent sample test (T-test)
The independent sample test is usually used to compare the differences in the means of
the estimation factors between two unrelated job role groups. The results from the t-test
have been used to determine statistically whether there is a significant difference between
the estimation factors’ means between the experts’ job roles. However, many aspects have
reduced the power independent sample test (t-test) and affected its efficiency (Field et al.,
2018). First, the experts’ responses for effort estimation factors are based on ranking
(ordinal), and the second reason is that some factors are not normally distributed, as shown
in Table 72: Normality test for the estimation factors in the Appendix C, and below in Figure
24 and Figure 23. The third reason is that the sample size for the data collected is small.
Therefore, the non-parametric Mann-Whitney test has been used, which is equivalent to
the independent sample test used to compare the difference between two independent
groups.

Chapter: Analysis and Discussion of the Interview Results Page: 67
A Mann-Whitney test is basically to compare two sample means and assess whether two
groups are different, and it is works by assigning a ranking to each respondent value (5-1)
for each factor. The lowest rank is given the lowest value. There are 48 effort estimation
factors and three expert groups (Software developer, QA and Project manager), so the
following cases were evaluated:
• Whether there are any differences in the effort estimation factors between the
software developers and project managers.
• Whether there are any differences in the effort estimation factors between the
software developers and QAs.
• Whether there are any differences in the effort estimation factors between the
project managers and QAs.
Table 32 shows that there are 13 significant differences (p-value<0.05) observed between
the experts’ job roles and their beliefs about the estimation factors. The experts’ opinions
on the importance level for the Sharing factor are different in the software developers and
in the QA team. As shown in Table 31, the developers and project managers’ mean values
for the Data storage & memory opt factor are 3.8 and 3.4 respectively, which represents
‘important to neutral’; however, the QA teams’ mean and median values is 2, which
represents ‘less important’. Moreover, the experts’ opinions on the Sharing factor show a
significant difference (p-value=0.01<0.05) between the developers and the QA team, and
between the project managers and the QA team, as shown in Table 32.
Figure 23: Example of normal distribution for the Map view factor for software developers
Figure 24: Example of normal distribution for Sharing factor for QA

Chapter: Analysis and Discussion of the Interview Results Page: 68
Table 32: Mann-Whitney test for the effort estimation factors
Main job role Developers vs
Managers Developers vs QAs Managers vs QAs
Mann-
Whitney
Sig. (2-
tailed)
Mann-
Whitney
Sig. (2-
tailed)
Mann-
Whitney
Sig. (2-
tailed)
Sharing 24.5 0.949 7.5 0.019 5 0.050
Registration & login 18.5 0.391 24.000 0.891 9.500 0.504
Payment process 24.5 0.942 24.5 0.942 12.5 1
Booking and reservation 23 0.796 25 1 11.5 0.827
File upload 20 0.517 11.5 0.077 3.5 0.049
Comment feature 19 0.435 19.5 0.472 7 0.23
Navigation 24 0.900 20 0.521 9.5 0.519
Map view 23 0.786 20.5 0.548 9.5 0.504
Localisation & tracking 21 0.590 21 0.59 12.5 1
Searching contents 14.5 0.142 11.5 0.071 3 0.039
Messaging 21 0.572 20.5 0.529 8.5 0.339
Calendar and time 23.5 0.839 12.5 0.065 7.5 0.136
Multi-languages support 22 0.692 15.5 0.203 9 0.419
Media support 24.5 0.949 22.5 0.75 11 0.746
Third-party authentication 11 0.070 19.5 0.48 9 0.419
Number of screens 17 0.290 17 0.29 12.5 1
Push notification 21.5 0.654 10.5 0.067 3 0.033
User Interface quality and
complexity
20 0.299 14 0.104 5 0.053
Number of API party 23 0.787 24 0.895 11 0.735
Support code reusability 16.5 0.263 6.5 0.017 7.5 0.278
Data storage and memory opt.
complexity
17 0.291 4.5 0.01 3 0.033
Interrupt handling 9.5 0.051 11.5 0.084 10.5 0.654
Hardware access 19 0.445 9 0.045 5.5 0.125
Battery & power optimisation 22.5 0.749 9 0.045 2 0.018
Connection (wireless,
Bluetooth,3G, etc.)
21.5 0.651 22 0.704 11.5 0.83
Compatibility with previous
version
10 0.045 22 0.689 10 0.576
Security support 17.5 0.294 8 0.023 8 0.288
Dynamicity of screen 18.5 0.366 16.5 0.255 11 0.699
Backend system availability and
server config. flexibility
13 0.112 21.5 0.629 7 0.212

Chapter: Analysis and Discussion of the Interview Results Page: 69
Main job role Developers vs
Managers Developers vs QAs Managers vs QAs
Mann-
Whitney
Sig. (2-
tailed)
Mann-
Whitney
Sig. (2-
tailed)
Mann-
Whitney
Sig. (2-
tailed)
Supported platform type
(IOS/Android./Win./etc.)
22.5 0.604 22.5 0.604 12.5 1
Supported device (phone, tablet,
smartwatch)
15 0.188 22 0.661 7 0.217
Platform type (native, hybrid) 23 0.679 22.5 0.48 10 0.317
Communication process 17.5 0.280 24 0.874 9 0.403
Team process experience 21 0.590 21 0.59 12.5 1
Team size 12 0.085 24.5 0.947 6.5 0.166
Backlog items complexity 19 0.379 19 0.379 12.5 1
Dependency between backlog
items
24.5 0.947 24.5 0.947 12.5 1
Developer implementation
experience
20.5 0.529 21.5 0.581 7.5 0.221
Developer knowledge of backlog
item
23 0.786 22 0.661 9 0.403
Developer estimation experience 23 0.780 23 0.786 10 0.549
Language and culture differences 20.5 0.566 23.5 0.848 11 0.743
Geographical of the development
team
19.5 0.473 19 0.445 11.5 0.822
Item priority 24.5 0.947 19.5 0.46 10 0.572
Deadline date 24 0.888 20 0.497 9 0.419
Budget for the project 14 0.139 11 0.067 10 0.521
Development type (new or
enhanced app)
17 0.282 23.5 0.834 10 0.575
Managerial skills 21 0.609 23.5 0.849 11.5 0.827
Work pressure (workload) 18.5 0.396 20.5 0.541 8 0.307

Chapter: Analysis and Discussion of the Interview Results Page: 70
Figure 25: Mean differences values between experts for Sharing factors as shown in the Mann Whitney test
Figure 26: Mean differences values between experts for Date Storage factors as shown in the Mann Whitney test
One-way analysis of variance (one-way ANOVA)
In the last test, Mann-Whitney and T-tests were used to assess whether two groups of
experts differed. By contrast, the one-way ANOVA tested whether three or more groups
differed (Saunders et al., 2009). This test compares the means of more than two groups to
determine their association, if any. In this study, there are three main groups of experts,
on the basis of their main job role: Project manager; Software developer; or QA team.
ANOVA tests overall groups – it does not provide specific information on which groups are
affected. For example, if the results tell us that there is a significant difference between
them, we do not know which groups are different from the others, therefore many
assumptions must be made:
• There is a difference between the group software developers and QA team OR
• There is a difference between the group software developers and project managers OR
• There is a difference between the group project managers and QA team OR
• There is a difference between all the groups: software developers, project managers
and QA team.
However, the previous test, Mann-Whitney, shows exactly which groups are affected. The
reason for using the one-way ANOVA test is to confirm the Mann-Whitney test results.
Figure 28: Mean differences values between experts for Push notification factors as shown in Mann Whitney test
Figure 27: Mean differences values between experts for Battery power opt. factors as shown in Mann Whitney test

Chapter: Analysis and Discussion of the Interview Results Page: 71
Table 33 presents the results of the ANOVA test, and there are four significant differences
between the groups of experts: software developers; project managers; and QA team:
1) For the Searching estimation factor, the p-value = 0.029, and the difference is between
the Project manager group and the QA group, as shown in Figure 30.
2) For the Support code reusability factor, the p-value = 0.026, and the difference is
between the software developers group and the QAs group, as shown in Figure 29.
3) For the Data storage and memory optimisation factor, the p-value = 0.005 which
indicates a very significant difference, and the difference is between:
o the Project manager group and the QA group, and
o the Software developer group and the QA group, as shown in Figure 31.
4) For the Battery and power optimisation factor, the p-value = 0.05, which indicates a
small difference, and the difference is between:
o the Project manager group and the QA group, and
o the Software developer group and the QA group, as shown in Figure 32.
Also, it can be observed from the remaining effort estimation factors, shown in Table 33,
that there are no differences in terms of the effort estimations’ mean values between the
expert groups, and there are two examples in Figure 33 and Figure 34 that show that the
differences between the means are very small. For more details about one-way ANOVA
tests for all estimation factors, see Table 76 in the Appendix C.
Figure 30: Mean differences between the expert groups for searching factors
Figure 29: Mean differences between the expert groups for support code reusability factors
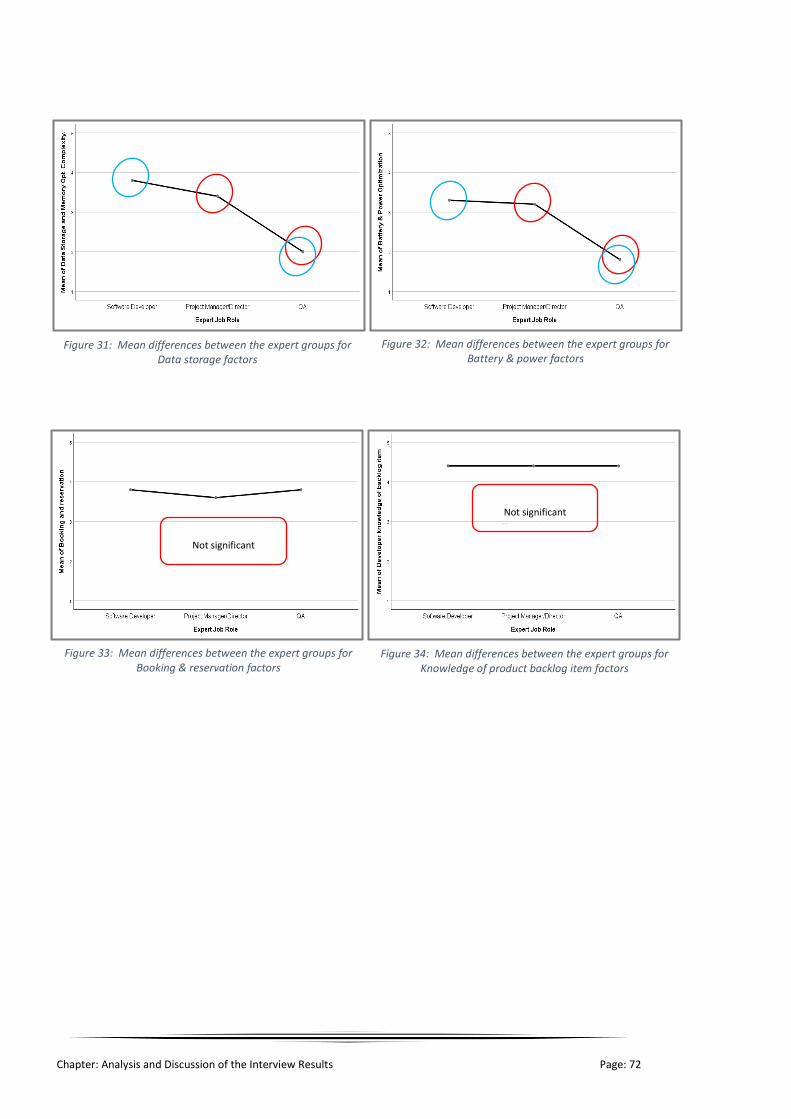
Chapter: Analysis and Discussion of the Interview Results Page: 72
Figure 31: Mean differences between the expert groups for Data storage factors
Figure 32: Mean differences between the expert groups for Battery & power factors
Figure 34: Mean differences between the expert groups for Knowledge of product backlog item factors
Figure 33: Mean differences between the expert groups for Booking & reservation factors
Not significant
difference between
Not significant
difference between

Chapter: Analysis and Discussion of the Interview Results Page: 73
Table 33: One-way ANOVA test for associated factors
Sum of Squares Mean Square F Sig.
Booking and
reservation
Between groups .150 .075 .094 .911
Within groups 13.600 .800
Total 13.750
Localisation &
tracking
Between groups .200 .100 .142 .869
Within groups 12.000 .706
Total 12.200
Searching contents
Between groups 6.400 3.200 4.387 .029
Within groups 12.400 .729
Total 18.800
Support code
reusability
Between groups 8.550 4.275 4.542 .026
Within groups 16.000 .941
Total 24.550
Data storage &
memory opt.
complexity
Between groups 10.950 5.475 7.271 .005
Within Groups 12.800 .753
Total 23.750
Battery & power
optimisation
Between groups 8.100 4.050 3.5 .050
Within groups 19.700 1.159
Total 27.800
Developer
knowledge of
backlog items
Between groups .000 .000 .000 1.000
Within groups 14.800 .871
Total 14.800
Correlation coefficient analysis
A coefficient correlation enables us to quantify and assess the strength of the linear
relationship between each of the effort estimation factors. The correlation value (r) can be
between -1 to 1, if the r value is a positive number +1; this means the two estimation
factors, F1 and F2, for example, are strongly related to each other, and the experts’ ranked
value regards the factors F1 and F2 as close and tending to be similar. In contrast, if the r
value is -1, this mean the two factors, F1 and F2, are strongly related, and the experts’
opinions regarding this factor are contradictory.
Figure 89, in the Appendix C, shows the correlation between the effort estimation factors
for all 20 experts. From the correlation results, it can be observed that there are nine
significant relationships between the 15 effort estimation factors, as shown in Table 34

Chapter: Analysis and Discussion of the Interview Results Page: 74
below. The figures (Figure 37, Figure 38 and Figure 35) are scatter plot representations,
used here to graphically present the significance of the relationship between the two
estimation factors. By contrast, Figure 36, for example, does not show any relationship
between the Compatibility and the Previous version and data storage factors, and the
plotting variables are not close to each other, thus the r=0.52.
Figure 38: Coefficient correlation between Backlog items complexity and dependency between Backlog items factors
Figure 37: Coefficient correlation between Backend system Ava. and Language and culture diff factors
Figure 35: Coefficient correlation between User interface quality and Deadline date factors
Figure 36: Coefficient correlation between Compatibility with previous versions and Data storage factors

Chapter: Analysis and Discussion of the Interview Results Page: 75
Table 34: Coefficient correlation for selective effort estimation factors
Map
vie
wPu
sh
Not
ifica
tion
Supp
ort C
ode
reus
abili
ty
Inte
rrup
t
hand
ling
Use
r Int
erfa
ce
qual
ity a
nd
com
plex
ity
Dead
line
date
Secu
rity
Supp
ort
Deve
lopm
ent
type
(New
or
enha
nced
app
)
Lang
uage
and
cultu
re
diff
eren
ces
Back
-end
syst
em
avai
labi
lity
and
Serv
er
Conf
ig.
Back
log
item
s
com
plex
ity
Depe
nden
cy
betw
een
back
log
item
s
Deve
lope
r
impl
emen
tatio
n ex
perie
nce
Deve
lope
r
know
ledg
e of
back
log
item
Geog
raph
ical
of th
e
deve
lopm
ent
team
Map
vie
w1
0.76
3-0
.218
-0.0
370.
503
0.54
10.
502
0.19
20.
319
0.38
0.24
30.
283
0.37
40.
454
0.33
Push
Not
ifica
tion
0.76
31
-0.0
260.
096
0.61
90.
526
0.37
5-0
.056
0.07
80.
270.
108
0.25
80.
271
0.33
30.
474
Supp
ort C
ode
reus
abili
ty-0
.218
-0.0
261
0.75
7-0
.154
-0.2
140.
534
0.39
7-0
.137
-0.0
7-0
.286
-0.3
35-0
.226
-0.3
04-0
.247
Inte
rrup
t han
dlin
g-0
.037
0.09
60.
757
1-0
.155
-0.1
610.
527
0.45
5-0
.118
0.12
1-0
.195
-0.1
680.
032
-0.1
0
Use
r Int
erfa
ce q
ualit
y an
d
com
plex
ity0.
503
0.61
9-0
.154
-0.1
551
0.71
80.
11-0
.226
0.11
50.
101
0.08
10.
226
0.17
50.
355
0.35
7
Dead
line
date
0.54
10.
526
-0.2
14-0
.161
0.71
81
0.15
30
0.16
0.22
80.
207
0.42
30.
336
0.34
90.
497
Secu
rity
Supp
ort
0.50
20.
375
0.53
40.
527
0.11
0.15
31
0.71
90.
393
0.41
40.
046
0.01
80.
061
0.08
3-0
.008
Deve
lopm
ent t
ype
(New
or
enha
nced
app
)0.
192
-0.0
560.
397
0.45
5-0
.226
00.
719
10.
484
0.38
80.
076
-0.0
760.
019
0-0
.083
Lang
uage
and
cul
ture
diff
eren
ces
0.31
90.
078
-0.1
37-0
.118
0.11
50.
160.
393
0.48
41
0.74
50.
290.
171
0.21
20.
256
0.13
7
Back
-end
syst
em a
vaila
bilit
y an
d
Serv
er C
onfig
. Fle
xibi
lity
0.38
0.27
-0.0
70.
121
0.10
10.
228
0.41
40.
388
0.74
51
0.25
30.
249
0.49
20.
456
0.41
7
Back
log
item
s com
plex
ity0.
243
0.10
8-0
.286
-0.1
950.
081
0.20
70.
046
0.07
60.
290.
253
10.
864
0.72
10.
280.
399
Depe
nden
cy b
etw
een
back
log
item
s0.
283
0.25
8-0
.335
-0.1
680.
226
0.42
30.
018
-0.0
760.
171
0.24
90.
864
10.
736
0.14
10.
417
Deve
lope
r im
plem
enta
tion
expe
rienc
e0.
374
0.27
1-0
.226
0.03
20.
175
0.33
60.
061
0.01
90.
212
0.49
20.
721
0.73
61
0.57
30.
693
Deve
lope
r kno
wle
dge
of b
ackl
og
item
0.45
40.
333
-0.3
04-0
.10.
355
0.34
90.
083
00.
256
0.45
60.
280.
141
0.57
31
0.70
2
Geog
raph
ical
of t
he d
evel
opm
ent
team
0.33
0.47
4-0
.247
00.
357
0.49
7-0
.008
-0.0
830.
137
0.41
70.
399
0.41
70.
693
0.70
21

Chapter: Analysis and Discussion of the Interview Results Page: 76
7.1.5. Effort estimation accuracy
A question was put to all participants concerning the accuracy of their estimates: How
accurate are the effort estimates in your organisation?
The aim of this question was to identify the respondents’ beliefs regarding the accuracy of
the effort estimation process and techniques in their organisation. From Figure 39, we can
observe that 75% of practitioners tended to underestimate the amount of effort involved
in fulfilling a user story, rather than overestimate it. Around 40% stated that they
underestimated the effort value by 25% to 45% of the actual effort involved. The
respondents’ results show that it is rare to overestimate effort by more than 25% of the
actual expended.
Figure 39: Effort estimation accuracy from the survey
A discussion with the practitioners regarding the reasons for inaccurate estimation of a
user story showed that one of the main reasons for the high error in accuracy was the value
being assigned by a team leader or project manager without consulting the developer who
will undertake the task. Another reason was when either the EJ or PP technique is used
alone, as a combination will reduce the error range. Another reason stated was that the
value is estimated by all team members, using the PP technique, yet during the sprint the
task is assigned to just one developer. The developer could be a junior, but the estimated
value may be based on a similar task completed previously by an expert developer. Some
practitioners claimed that there is no clear guidance for giving an estimation value. EJ and
PP suffer from their requirement for formality in the estimation process. Further reasons
are mentioned in the estimation process section.

Chapter: Analysis and Discussion of the Interview Results Page: 77
7.2. Qualitative Analysis
In this section, the qualitative analysis of the semi-structured interviews, which were
designed to answer complex questions, are presented. The nature of the questions put to
the experts were more descriptive and included ‘what’ and ‘how’ questions. Since the
research approach in this study is inductive, the aim was to explore the collected data and
obtain themes from the experts’ responses. Sub-section 7.2.1 discusses the estimation
processes that the experts used in developing apps. Sub-section 7.2.2 discusses additional
factors that the experts rely on for effort estimation. Finally, the experts’ opinions and
experience concerning the Agile process in mobile app development is presented in sub-
section 7.2.3.
7.2.1. Effort estimation process
The question put to the experts was:
Question Answer
How do you estimate the effort of your mobile app project? And what is the
process?
All the experts answered the above question, and the following sections summarise their
description of the processes involved in estimating the effort to fulfill a user story. In the
following, the experts’ answers are categorised on the basis of job role.
1. Project managers
Expert A: The product owner explains a user story in terms of its features to the
development team, and then divides the tasks into subtasks: frontend and backend. For
the initial estimation, the senior developer makes an initial estimation for a user story
before applying Planning Poker with the entire development team. As the IT director, ‘A’
performs this technique to avoid extremely high estimations by the team. After that, all
development team members, including the Scrum master, are asked to participate and
make an estimate for the whole user story. If the estimate by the team member who will
undertake this feature is close to that of the rest of the development team, the group will
use this figure, otherwise the team leader will become involved and ask the developer for
more clarification until they agree on a specific figure. In ‘A’s experience, developers usually
assign a high estimate to a user story to avoid work pressure, and that is why ‘A’ uses a
combination method to assign effort to a task.
Chapter: Analysis and Discussion of the Interview Results Page: 78
Expert I: As a project manager, ‘I’ usually relies on experts from the development team to
assign an expected effort value. Usually, ‘I’ asks a senior developer about their expectations
of a project.
Expert J and R: ‘J’ and ‘R’ had similar opinions on their estimation techniques, and they
usually use PP to estimate the time for a project’s delivery. The reason that they use PP is
because they want to hear feedback from each member of the project and then take the
average for each task. The risk is very high when they rely on an expert from the
development team to estimate the effort, as the expert could leave for any reason, and the
estimates are based on their opinion only. ‘J’ and ‘R’ use the EJ technique only when they
familiar with a project and need very quick feedback from the team. Only ‘J’ uses COCOMO
as an initial estimation for a project, but it is not an accurate technique due to the difficulty
in measuring the complexity of a project, the team’s capability and other reasons.
Expert K: ‘K’ asks the developer to assign an estimate for effort for the task, and then asks
other team members for their estimates. If the difference is not great, ‘K’ confirms the
developer’s estimate; otherwise ‘K’ discusses it with the developer and takes it to make it
more reasonable.
2. Software developers
Expert B: The product owner explains the product backlog items to the entire development
team and answers their questions. After that, the team discusses what kind of task could
be done during the work, based on the previous sprint. As a whole team, a story point is
assigned to every user story in one day. ‘B’ starts with a small task to create a base for the
story point, and then compares the other user stories with the base. ‘B’ uses the Fibonacci
sequence and, when a user story achieves 64 points, divides this story into two or three
subtasks as required. They use PP to simplify the business requirements, make the
requirements of user stories clear to all team members and open up a good discussion.
Expert C: The one who will do the task should be responsible for assigning the effort. The
problem is when a manager assigns an estimation of effort, or lets a backend developer
assign the effort for a frontend task, as then the result for the estimation will not be
accurate, and it could lead to the failure of the task. Moreover, in order to estimate, you
have to be the person doing the task and understand the big picture of the project.
Expert D: A senior developer, ‘D’, assigns the estimated effort and informs the team leader.
Junior developers may estimate effort on the basis of fears about unexpected issues that
could arise during the development. If this is the case, the team leader should sit beside
them to make the task clear, including what kinds of tools are needed, then they can agree
on a fair effort. Sometimes senior developers may assign a high estimation value to a task
that they have not done before. ‘D’ does not believe in assigning an effort by story point,

Chapter: Analysis and Discussion of the Interview Results Page: 79
because it does not help in measuring the actual effort, and prefers to use IH as a
meaningful measurement. When ‘D’ needs to design a user interface for a mobile app, ‘D’
knows how long it could take, for example one day or two to three days, yet cannot say
how many story points are needed.
Experts E and T: At the start, each developer assigns their estimated effort value to their
task, and then discusses this estimated value with the team leader. Following that, the
developer and team leader come up with a final estimated value after discussion. Usually,
team leaders agree with the figure that the developer came up with, unless the developer
assigns a very high estimated value. No one interferes with estimated values, apart from
the developer who is to carry out the task and the team leader.
Expert F: Everyone is assigned a task and then assigns their expected effort value to that
task. After that, each explains the task and effort value to the other team members, and
the whole team discusses the estimate by applying the PP technique. The team accepts the
estimated value if the value is close to the result obtained from PP; otherwise, it asks the
developer to re-estimate that task.
Expert G: If the developer is to undertake the task alone, then the developer assigns the
effort value for the task and then discusses it with the team leader. If a task needs group
work, then the team applies the PP technique by holding a long discussion with all the team
members (developer, tester, designer, etc.) and assigning an effort value at the end. ‘G’
prefers to be assigned a specific task to work alone and not to relate to other team
members, as that requires more communication and could delay the delivery of a user
story.
Expert H and M: The whole team assigns the effort value to each task by applying a PP
technique. It usually takes the average of estimated effort to avoid a second round of PP,
unless the range of estimated values is very wide. ‘M’ reported that the team tried to avoid
individual estimations and instead preferred to discuss all tasks together, to make a user
story clearer.
Expert L: The team leader explains the user story to all team members, who participate by
giving their opinion on this task, and at the end they all assign a value. No specific
techniques are followed.
3. Quality assurance team
Expert N and O: Apply the same method as ‘L’: when the task comes to them, they assign
the estimated effort to the task and let the team leader know how long it could take them.
There is no specific method used, and they consider their approach an EJ technique.

Chapter: Analysis and Discussion of the Interview Results Page: 80
Expert P: There are two techniques. The first is the product owner explaining the detail of
the user story to all the development team members involved in the project. In the
development team are two groups: frontend and backend. One senior expert from each
assigns the effort estimation (story point) to the user story. The second is traditional PP, as
every member gives their opinion until a consensus value is reached. From experience, the
first technique is more accurate, as when PP was applied the developers’ experience was
varied and the team new.
Expert Q and S: Both mentioned that there is no specific method followed in their
companies. The task is assigned to ‘Q’ and ‘S’ by the team leader along with a given
estimated effort. If the deadline arrives and the task is yet not yet finished, they need to
justify the delay.
Summary of estimation process
After describing what the experts do to estimate effort, it is necessary to integrate the
related data from their responses to identify key themes. Also, it is necessary to generate
categories of the estimation processes from the responses and design a matrix to represent
the data. This required computer-aided qualitative data analysis software (CAQDAS), such
as NVivo (Saunders et al., 2009). After applying this software, the coding results were
extracted and organised in a thematic format, as shown in Figure 95 in the Appendix C.
Table 35 is a summary of the key points that compiles the experts’ responses into a coding
system and a brief statement.

Chapter: Analysis and Discussion of the Interview Results Page: 81
Table 35: Summary of experts' estimation process
Respondent
ID
Explain the task
feature to:
Responsibility for
a task:
Estimated effort to a task assigned
by:
The
dev
elo
per
wh
o w
ill d
o t
he
task
All
the
dev
elo
pe
rs
All
dev
elo
per
s
Wh
o w
ill d
o t
he
task
Exp
ert/
sen
ior
dev
elo
pe
r
The
all t
eam
Team
lead
A d
evel
op
er w
ho
do
th
e ta
sk
A ✔ ✔ ✔ ✔ ✔ ✔
B ✔ ✔ ✔
C ✔ ✔ ✔
D ✔ ✔ ✔ ✔
E ✔ ✔ ✔ ✔
F ✔ ✔ ✔ ✔
G ✔ ✔ ✔ ✔ ✔
H ✔ ✔ ✔
I ✔
J ✔ ✔ ✔ ✔
K ✔ ✔ ✔ ✔
L ✔ ✔ ✔
M ✔ ✔ ✔
N ✔ ✔ ✔
O ✔ ✔ ✔
P ✔ ✔ ✔ ✔
Q ✔
R ✔ ✔ ✔ ✔
S ✔
T ✔ ✔ ✔ ✔
Total 5 13 6 11 4 10 8 10
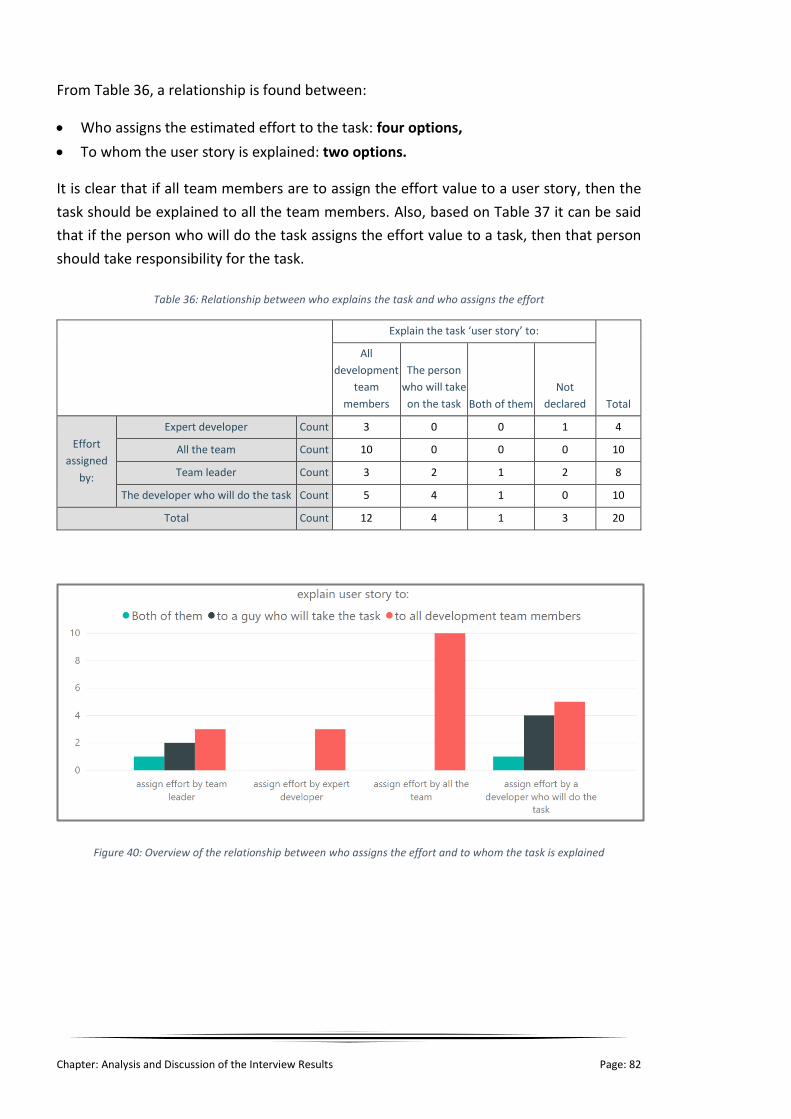
Chapter: Analysis and Discussion of the Interview Results Page: 82
From Table 36, a relationship is found between:
• Who assigns the estimated effort to the task: four options,
• To whom the user story is explained: two options.
It is clear that if all team members are to assign the effort value to a user story, then the
task should be explained to all the team members. Also, based on Table 37 it can be said
that if the person who will do the task assigns the effort value to a task, then that person
should take responsibility for the task.
Table 36: Relationship between who explains the task and who assigns the effort
Explain the task ‘user story’ to:
Total
All
development
team
members
The person
who will take
on the task Both of them
Not
declared
Effort
assigned
by:
Expert developer Count 3 0 0 1 4
All the team Count 10 0 0 0 10
Team leader Count 3 2 1 2 8
The developer who will do the task Count 5 4 1 0 10
Total Count 12 4 1 3 20
Figure 40: Overview of the relationship between who assigns the effort and to whom the task is explained

Chapter: Analysis and Discussion of the Interview Results Page: 83
Table 37: Relationship between who is responsible for a task, and who assigns the effort
Who is responsible for a task
Total
All the team
members
The person who
will do the task Not declared
Assign effort
by:
Expert developer Count 2 1 1 4
All the team Count 6 4 0 10
Team leader Count 1 5 2 8
The developer who will do the task Count 0 10 0 10
Total Count 6 11 3 20
Figure 41: Overview of the relationship between who assigned the effort and who takes responsibility for the task
7.2.2. Effort estimation factors
The following question was put to the experts:
Question Answer
From the previous question, you ranked the importance level of the estimation
factors. Now, are there any additional factors that you rely on during your
estimation?
All the experts answered the above question, and summaries of their responses are
presented below. Some shared the same perspective, as reported, and at the end of each
section a single table shows all the suggested factors. In the following sections, the experts’
responses are categorised on the basis of their opinions about the estimation factors.

Chapter: Analysis and Discussion of the Interview Results Page: 84
1. Factors concerning the complexity of the task
This category contains many factors that experts believe affect the effort estimation of
mobile app development. In the following sections, statements related to the complexity
of business requirements are presented. At the end of the section, the themes from the
experts’ answers are set out, and the thematic coding for the effort factors is presented in
Table 38.
a) Clarity of the task and transaction journey
Experts A and C believe that the user story’s clarity is very important to estimation,
therefore it should be presented in a clear and concise way. The product owner should
focus on the complexity of a user story and how a developer could understand both the
story and beyond. In addition, Expert A mentioned that how, in order to estimate the effort,
a developer should think deeply about how to integrate existing business code into a new
task. Expert F emphasised that to understand the business complexity a developer should
know the transaction journey from the point when a user clicks a button to the point at
which that user receives a response. Expert L mentioned the same issue, in that
development team members must focus on the complexity of the business workflow and
the transaction steps from the beginning until the very end.
b) Rely on another task, use an existing code or have done a similar task before
Experts B and C stated that a developer needs to be concerned about whether an existing
function or code relates to another task. Sometimes, the developer needs only to reuse
this function by calling it up and making a few new functions. Expert P and L explained that
if a task is related to existing code in the system, they need time to understand the existing
code to integrate it with new code, and that there is a chance of this creating new bugs.
Moreover, Experts B, F, G, H, I and J stated that a developer can determine the complexity
of the task by asking this question: Did I do this task before? Did I do a similar task to this?
These remind the developer about previous experiences. Expert F noted that the hardest
task is one that a developer has not done frequently or only once every few years. Expert
C mentioned the same point and was concerned about whether the task is ‘stand alone’ or
if there is dependency on another task. Experts D and H explained that sometimes, if you
have a new task or any similar tasks before, you do not know exactly what kind of tools or
libraries you will need.
c) Thinking about the task scenario and approaches to implement the task
Expert C was concerned about the task scenario and the details of the task. Experts E and
G claimed that a developer should think about the methodology to implement the business
logic and how to achieve all the scenario cases involved in the task. Expert D explained that
to store a picture on a database, for example, a developer needs to think about the best
method to save the picture in a database; if it is possible to save a picture in database as a

Chapter: Analysis and Discussion of the Interview Results Page: 85
binary or to save a picture in a directory; and then how to save the URL of the picture in
the database. Expert F stated that any task that is based on transactional approach (request
- response) is usually easy; however, a task that is based on algorithms or integrations with
other systems is usually hard. Expert K described how sometimes we understand the user
story ‘task’ yet do not know how to implement it, especially if it relates to encryption.
d) Complexity of the application form
Experts B and G mentioned the complexity of application forms, and that sometimes a
customer requires a highly complex form. Expert G added that sometimes a product owner
requires an auto complete for a field, which involves retrieving data from a backend
system. Expert J mentioned an important issue, in that for an application form there are
usually many users who can access the same web form, and for each role there is a separate
form, therefore a developer should consider that this takes more time than a simple form.
Moreover, this expert observed that generating a report form sometimes involves
retrieving data from a complex database schema or from multiple systems, so the effort
varies from one report form to another.
From the previous statements, it can be concluded that the experts’ experience concerning
the effort estimation of user story and complexity can be split into eight factors. These can
be used as a definition of the business requirement complexity. The eight factors that are
recommended for use in effort estimation are:
• The transaction journey (from request until response time)
• The clarity of the business requirements: ‘user story’
• Whether the expert uses existing code or function in a task
• If a task relies on other tasks or is ‘stand alone’
• Investigating all scenario cases for a task
• If the expert undertook a similar task before or not
• The complexity of application forms
• Methods and approaches to implementing business logic into code

Chapter: Analysis and Discussion of the Interview Results Page: 86
Table 38: Experts’ summary of estimation factors from business complexity perspective
Exp
ert
ID Use
existing business & code in
a task
Rely on other task / stand alone
Task scenario
Complexity of
business task and clarity of
task
Did similar
task before
Transaction journey
(request / response)
Complexity of
application form
Method and
approach business
logic into code
A ✔ ✔ ✔
B ✔ ✔ ✔ ✔ ✔
C ✔ ✔ ✔ ✔
D ✔ ✔
E ✔ ✔ ✔
F ✔ ✔ ✔ ✔
G ✔ ✔ ✔ ✔
H ✔ ✔ ✔
I ✔ ✔
J ✔ ✔ ✔ ✔ ✔
K ✔ ✔ ✔
L ✔ ✔ ✔ ✔ ✔
M ✔ ✔ ✔ ✔ ✔
N ✔
O
P ✔ ✔ ✔ ✔
Q ✔ ✔
R ✔ ✔
S ✔ ✔
T ✔ ✔ ✔ ✔
Tota
l
7 7 7 15 12 4 4 7

Chapter: Analysis and Discussion of the Interview Results Page: 87
Figure 42: Overview of business complexity factors suggested by experts
2. Factors for the technical side of the task
Under this category, some of the experts’ experience of estimating the effort involved in
developing mobile apps will be presented. There are six factors that the experts considered.
a) Backend response structure
Expert B said that a developer should be concerned about the structure of the transaction
data when a response comes from the backend, and how the data structure appears.
b) UI animation and graphics
Expert B explained that when developers use a hybrid framework, such as Ionic, they
should think about the data view (UI) in various mobile devices to make sure it is fitted
correctly for all screen devices. Also, Expert E was concerned about whether the screen has
an animation or graphics complexity, when estimating the effort required for a task. Expert
F emphasised UI and UX, and claimed that for a developer this is the most complex phase.
c) Web service, system integration and third-party complexity
Expert B believes that if a developer is to perform a task, he or she should think about how
many web services have to be integrated. Expert F claimed that experience with a task
needs to be integrated into a legacy system. The challenge is that the integration with a
legacy system cannot be done until a bridge system is complete, and this requires
additional effort. Also, Expert F thought about the payload and structure of the data that
pass from the backend to a client’s mobile device through API, as some developers pass a
huge amount of data, which causes a high level of processing in the client’s device. This
means that developers need to deal very carefully with a client’s device, and this requires

Chapter: Analysis and Discussion of the Interview Results Page: 88
time and effort to think about the optimal solution. Expert J explained that a developer
might need time to understand how to integrate code with an existing system or service,
and stated that any change to the existing code could cause new bugs or errors in the
system. Expert T explained that if a task needs to be integrated with another service, it is
complex and needs to be tested further.
d) API: existing and clarity
Expert D explained that clarity of use of an API for a mobile device is helpful for a developer
to give an estimation of the task, such as ‘android.hardware.camera2’ API. Expert F was
concerned at the number of APIs as needed to perform a task. Expert B described the effort
required to connect with a third party for authentication services from Facebook or Twitter,
and how easy it is to connect with these APIs. Another challenge that experts claim is
changes to APIs. Dealing with changing behaviour of API versions is a challenge for
developers, to understand the new set of parameters and response structure.
e) Availability of libraries and tools
Expert D stated that the availability of development tools and libraries helps a developer
to start the task immediately, instead of looking for a suitable tools and setup up from the
development environment. Expert E emphasised the importance of advanced tools, such
as Firebase, which provide powerful features such as managing infrastructure such as
database, tracking services and support for a push notification service, as this allows
developers to carry out their task easily. In Expert G’s experience there are many plugins in
frameworks, such as the Photo-Library plugin in Ionic, and a developer needs to learn and
understand how to use these plugins and think of others that could provide a better
solution. Expert L mentioned the advantage of source code availability on the internet, such
as on the Github or StackOverflow websites, and using it for development, as well as the
availability of problem-solving for errors. In addition, Expert E and N mentioned the build
and deployment tools for their code. They stated that it is necessary to have a continuous
deployment tool for work, to speed up the deployment. The experts also claim that most
current tools and platforms are unreliable due to no or very limited technical support.
f) Local storage database and storage procedures
Expert D stated that a developer needs to think about how to deal with a local storage
‘database’ for mobile devices and backend databases. Expert K was concerned about real-
time communication between the backend and the mobile device database, and
when/how to exchange the data. Expert F and N had experience of unexpected cases
arising during development; Expert N described designing a mobile app so that when the
mobile device was in an isolated area (without a network connection) or offline, the data
for the app was stored on a local device until the connection came back and, when back
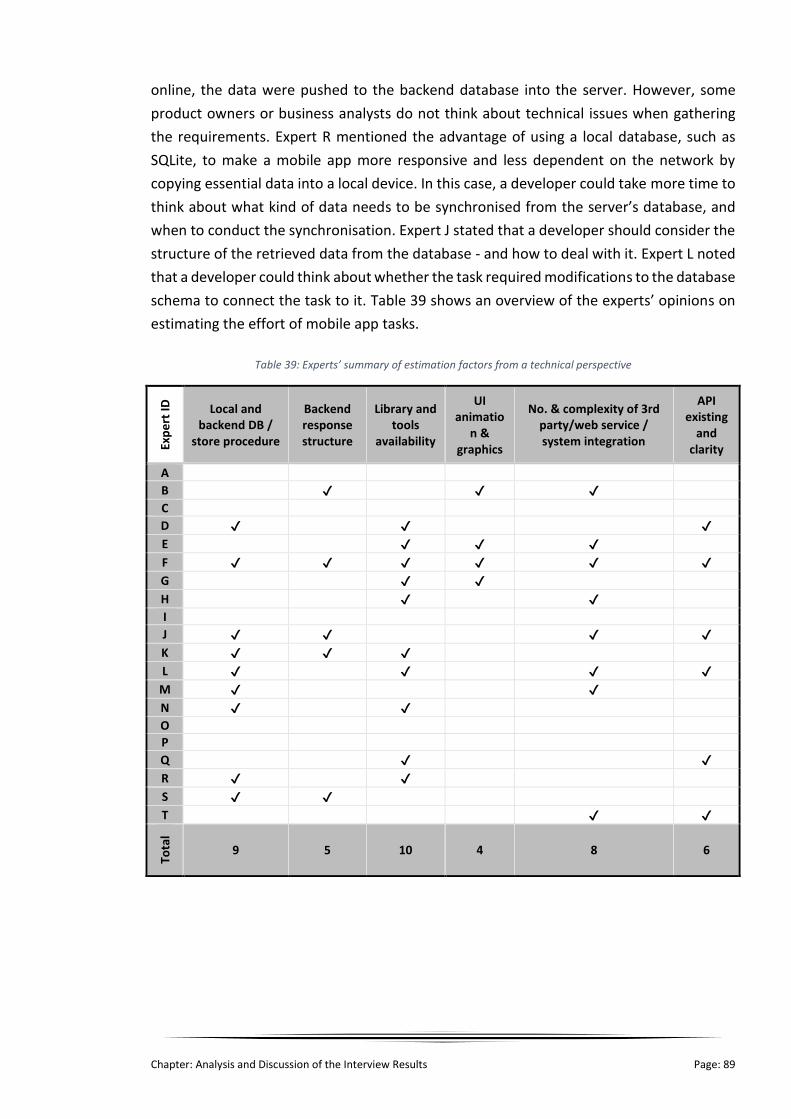
Chapter: Analysis and Discussion of the Interview Results Page: 89
online, the data were pushed to the backend database into the server. However, some
product owners or business analysts do not think about technical issues when gathering
the requirements. Expert R mentioned the advantage of using a local database, such as
SQLite, to make a mobile app more responsive and less dependent on the network by
copying essential data into a local device. In this case, a developer could take more time to
think about what kind of data needs to be synchronised from the server’s database, and
when to conduct the synchronisation. Expert J stated that a developer should consider the
structure of the retrieved data from the database - and how to deal with it. Expert L noted
that a developer could think about whether the task required modifications to the database
schema to connect the task to it. Table 39 shows an overview of the experts’ opinions on
estimating the effort of mobile app tasks.
Table 39: Experts’ summary of estimation factors from a technical perspective
Exp
ert
ID
Local and backend DB /
store procedure
Backend response structure
Library and tools
availability
UI animatio
n & graphics
No. & complexity of 3rd party/web service / system integration
API existing
and clarity
A
B ✔ ✔ ✔
C
D ✔ ✔ ✔
E ✔ ✔ ✔
F ✔ ✔ ✔ ✔ ✔ ✔
G ✔ ✔
H ✔ ✔
I
J ✔ ✔ ✔ ✔
K ✔ ✔ ✔
L ✔ ✔ ✔ ✔
M ✔ ✔
N ✔ ✔
O
P
Q ✔ ✔
R ✔ ✔
S ✔ ✔
T ✔ ✔
Tota
l
9 5 10 4 8 6

Chapter: Analysis and Discussion of the Interview Results Page: 90
Figure 43: Overview of the technical factors suggested by experts
3. Other factors
In this category are further factors that the experts, in their experience, have relied on to
estimate the effort involved in developing a mobile app.
a) Working under pressure
Experts A and C stated that a developer often assigns a high estimation value to the effort
to avoid working under pressure. Therefore, as IT directors, their goal was to make sure
that developers assign a fair effort value to their task and deliver the project on time. Also,
Expert A claimed to push the developers as much as possible to encourage them to be
productive while maintaining a reasonable quality, for them to do their jobs. Expert A
continued, stating that rather than a perfect feature, what was needed is a reasonable
quality of delivery and maintaining the developers’ input. Expert R explained that they
wanted to push many features with reasonable quality in a short time. Expert C described
how, as developers, they are usually under pressure from managers to deliver a task in a
short time, and this will affect the code’s quality.
b) Team members’ movement
Expert A explained that a developer who has to switch from one team to another or
experiences interruptions from team groups is using more effort. Expert J noted the
problem when a developer leaves the development team during the project for any reason,
as this will involve increased effort by the others to deliver tasks by the due date.

Chapter: Analysis and Discussion of the Interview Results Page: 91
c) Team enthusiasm and motivation
Expert A claimed that team engagement and motivation cause dissimilar productivity
among development team members. Expert C explained that when members take
responsibility for the success of the project, it helps to improve the effort put into the task
and ensure delivery on time. Expert M stated that when a team’s members collaborate and
are happy to help each other, this enhances the effort put in.
d) Quality of code and App store standards
Expert A was concerned with the acceptance criteria of the project and said that a task
should satisfy and pass the acceptance criteria, and a developer should consider this during
development and estimation. Expert C discussed this point from another angle and
explained that they are trying to achieve the Quality Triangle concept (quality – cost - time),
but that it is difficult to deliver a high-quality app when there is a limited budget and/or
time. Expert F explained that the Apple Store has policies that a developer should follow,
for example a developer cannot allow the app access to the client’s device’s GPS until the
client gives the app permission. As Expert F stated, they cannot deploy any changes until
Apple Store has given its authority.
e) Prototype and UI design of mobile apps
Experts D, F and J emphasised the crucial issue that a High-Fidelity Design (HFD) is vital for
a developer to provide a high level of detail and functionality in a prototype of the UI of a
mobile app. A prototype could be a sketch or a mock-up design, or implemented by HTML
and JavaScript.
f) Code testing and data validation
Experts E, L, N, P and Q explained that it is necessary to think about all the test cases
scenarios to validate a code. Also, a developer needs to test code before submitting it.
Experts J and L claimed that some tasks are easy to develop but hard to test, and so require
more time to be allocated. Expert E stated that a developer sometimes prefers to have a
log file to trace and record all crashes that could arise in future to help to find errors easily.
Experts E and F mentioned data validation, for example the username not containing a
number, and stated that a developer could take more time to design a data validation on
JavaScript that was not noted in a user story.
Table 40 is an overview of the experts’ experience in estimating the effort of a mobile app’s
tasks.

Chapter: Analysis and Discussion of the Interview Results Page: 92
Table 40: An overview of the experts' effort estimation factors suggestion Ex
per
t ID
Prototype and
fidelity design
Code testing & logs file
Data validati
on
Quality triangle & definition of done
Fit IOS / android
standards
Team enthusiasm
& motivation/
balanced skills
Team member moveme
nt
Pressure time
A ✔ ✔ ✔ ✔
B
C ✔ ✔ ✔
D ✔ ✔
E ✔ ✔ ✔
F ✔ ✔ ✔ ✔
G ✔
H ✔
I
J ✔ ✔ ✔ ✔ ✔ ✔
K ✔
L ✔
M ✔
N ✔
O
P ✔
Q ✔ ✔ ✔
R ✔ ✔
S ✔
T
Tota
l
3 7 4 7 1 5 3 5

Chapter: Analysis and Discussion of the Interview Results Page: 93
Figure 44: Overview of additional factors suggested by the experts
7.2.3. Agile process in mobile app development
This part of this chapter will discuss the suitability of the Agile process for mobile app
development. The experts were given a brief description of other development processes
that used the Agile process, such as Mobile-D. After that, the 20 experts were asked about
the suitability of the Agile process for mobile app development, based on their experience,
and for their opinions of the other development processes. The question was as follows:
Question Answer
Is the Agile process suitable for your organisation? And what do you think of
other development processes?
Experts’ explanations and answers
All the experts answered this question, and all believed that the Agile process is suitable
for mobile app development. The details of the experts’ discussion are presented as
follows:
Expert A had used Scrum framework in their organisation, and explained that Scrum is not
a technique or guidelines with steps to follow; it is framework that can be used to employ
any process or technique on the basis of the development team’s preferences. Therefore,
Agile is suitable for any software development, including mobile apps.

Chapter: Analysis and Discussion of the Interview Results Page: 94
Expert J claimed that Agile is an approach, and it is not related only to software
development but can be used in marketing and other fields. Thus, it is suitable for any
software development and application and more convenient than other processes. Expert
C stated that software development for mobiles or the web is the same concept, because
both are based on code, so thinks that Agile is suitable.
Expert B did not see any real difference when the company applied Agile in mobile
development for both hybrid and mobile web platform, and it worked smoothly.
Nevertheless, ‘B’ wanted to have pair programming in some sprints for complex UI design
since this technique will improve the development. They added that the user interface in
mobile apps, like web user interfaces, is not easy due to the mobile screen being limited in
size and content.
In Expert D’s experience, when the fidelity design of the UI is ready for a user story ‘task’,
the Agile process works well in the development phase. Otherwise, a sprint with Scrum
may run the risk of taking more time to design and implement the UI and UX.
Expert D claimed that pair programming is good for teaching junior developers new
technology. Expert E stated that it wastes time and resources, but it could work in special
cases for a junior developer for learning purposes. Expert H claimed it could work if there
is a new tool or technology that needs to be shared with team members.
Expert K noted that Agile is suitable for mobile app development but that it is difficult to
push the release phases through each sprint to the app’s store, such as AppleStore. Expert
N explained that the only problem with the Agile process for mobile apps is when the
nature of the development platform is native. The development team needs to be
concerned with two developments, and the effort is duplicated in each phase (coding, test,
quality and release). Expert S stated that Agile in mobile usually takes more time than any
other software development. The reason is that developers implement the app in native
yet need to test all mobile device models for Apple and Android. This usually takes longer
time than other software.
Overview of the Agile process in mobile app development
To sum up, Table 41 shows the experts’ opinions on the Agile process in mobile app
development. Also, the table presents the experts’ feedback on pair programming, which
Mobile-D uses. Moreover, the table shows the main challenges of applying the Agile
process in mobile apps. It can be seen that all the experts agree that Agile is suitable for
mobile app development. The main challenges are the multiple mobile development
frameworks and platforms. Another challenge is that the UI and UX for mobile apps take
more time in a sprint and need to be considered throughout, although this issue can be
solved by having pair programming for complex UI that demands collaboration between
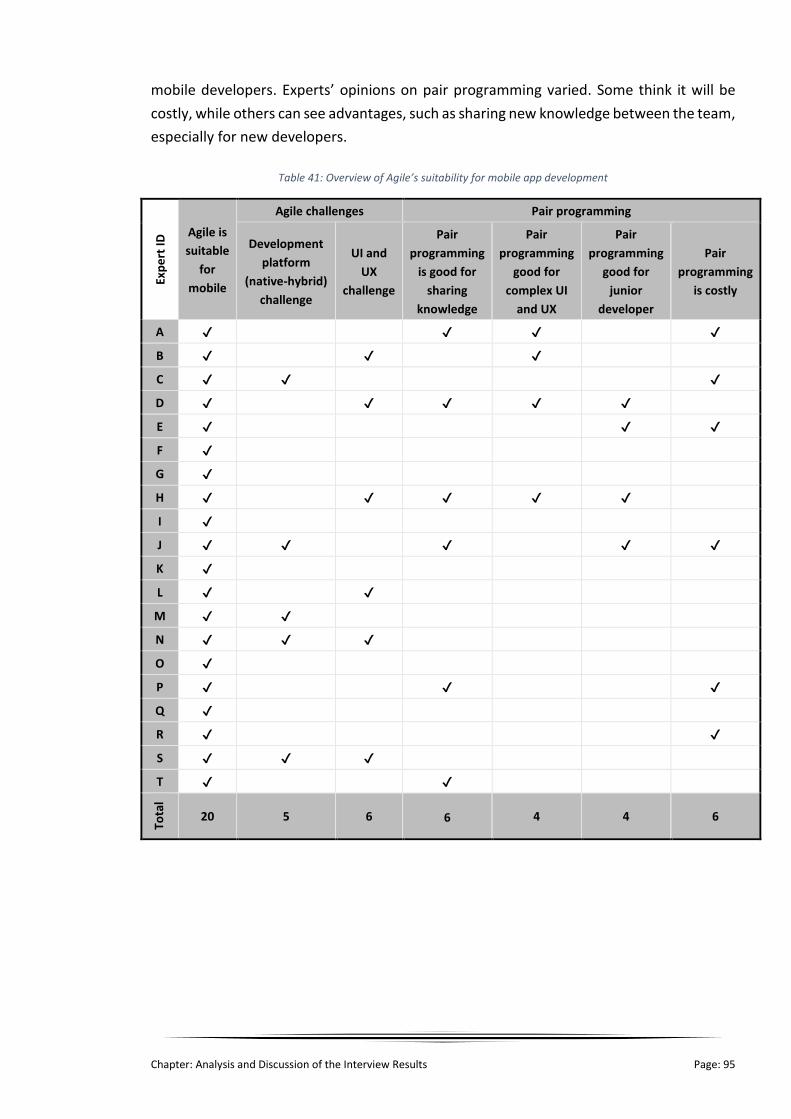
Chapter: Analysis and Discussion of the Interview Results Page: 95
mobile developers. Experts’ opinions on pair programming varied. Some think it will be
costly, while others can see advantages, such as sharing new knowledge between the team,
especially for new developers.
Table 41: Overview of Agile’s suitability for mobile app development
Exp
ert
ID Agile is
suitable
for
mobile
Agile challenges Pair programming
Development
platform
(native-hybrid)
challenge
UI and
UX
challenge
Pair
programming
is good for
sharing
knowledge
Pair
programming
good for
complex UI
and UX
Pair
programming
good for
junior
developer
Pair
programming
is costly
A ✔ ✔ ✔ ✔
B ✔ ✔ ✔
C ✔ ✔ ✔
D ✔ ✔ ✔ ✔ ✔
E ✔ ✔ ✔
F ✔
G ✔
H ✔ ✔ ✔ ✔ ✔
I ✔
J ✔ ✔ ✔ ✔ ✔
K ✔
L ✔ ✔
M ✔ ✔
N ✔ ✔ ✔
O ✔
P ✔ ✔ ✔
Q ✔
R ✔ ✔
S ✔ ✔ ✔
T ✔ ✔
Tota
l
20 5 6 6 4 4 6
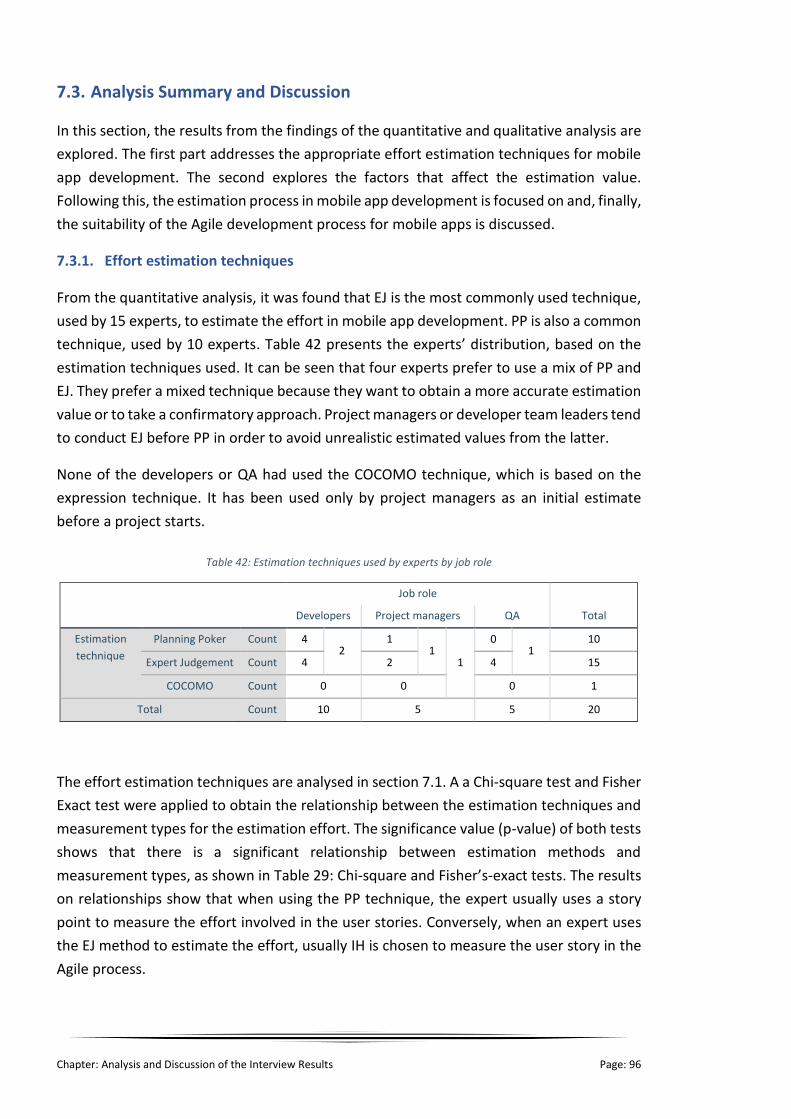
Chapter: Analysis and Discussion of the Interview Results Page: 96
7.3. Analysis Summary and Discussion
In this section, the results from the findings of the quantitative and qualitative analysis are
explored. The first part addresses the appropriate effort estimation techniques for mobile
app development. The second explores the factors that affect the estimation value.
Following this, the estimation process in mobile app development is focused on and, finally,
the suitability of the Agile development process for mobile apps is discussed.
7.3.1. Effort estimation techniques
From the quantitative analysis, it was found that EJ is the most commonly used technique,
used by 15 experts, to estimate the effort in mobile app development. PP is also a common
technique, used by 10 experts. Table 42 presents the experts’ distribution, based on the
estimation techniques used. It can be seen that four experts prefer to use a mix of PP and
EJ. They prefer a mixed technique because they want to obtain a more accurate estimation
value or to take a confirmatory approach. Project managers or developer team leaders tend
to conduct EJ before PP in order to avoid unrealistic estimated values from the latter.
None of the developers or QA had used the COCOMO technique, which is based on the
expression technique. It has been used only by project managers as an initial estimate
before a project starts.
Table 42: Estimation techniques used by experts by job role
Job role
Total Developers Project managers QA
Estimation
technique
Planning Poker Count 4 2
1 1
1
0 1
10
Expert Judgement Count 4 2 4 15
COCOMO Count 0 0 0 1
Total Count 10 5 5 20
The effort estimation techniques are analysed in section 7.1. A a Chi-square test and Fisher
Exact test were applied to obtain the relationship between the estimation techniques and
measurement types for the estimation effort. The significance value (p-value) of both tests
shows that there is a significant relationship between estimation methods and
measurement types, as shown in Table 29: Chi-square and Fisher’s-exact tests. The results
on relationships show that when using the PP technique, the expert usually uses a story
point to measure the effort involved in the user stories. Conversely, when an expert uses
the EJ method to estimate the effort, usually IH is chosen to measure the user story in the
Agile process.
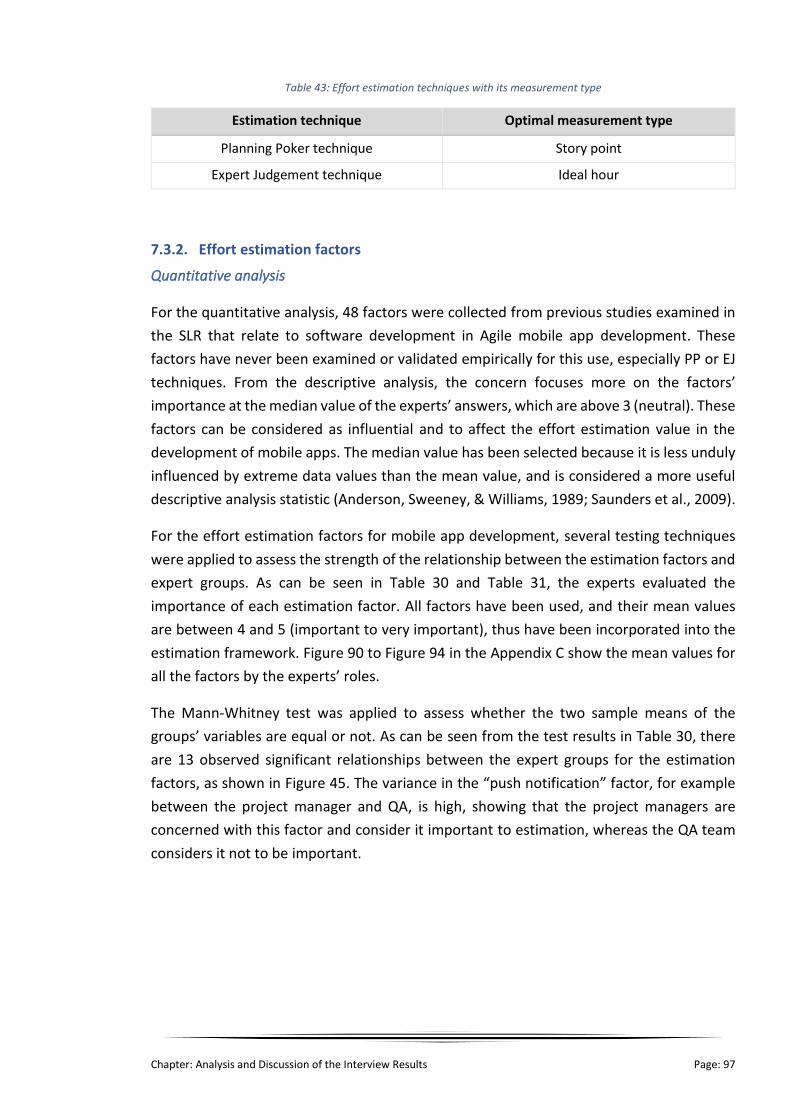
Chapter: Analysis and Discussion of the Interview Results Page: 97
Table 43: Effort estimation techniques with its measurement type
Estimation technique Optimal measurement type
Planning Poker technique Story point
Expert Judgement technique Ideal hour
7.3.2. Effort estimation factors
Quantitative analysis
For the quantitative analysis, 48 factors were collected from previous studies examined in
the SLR that relate to software development in Agile mobile app development. These
factors have never been examined or validated empirically for this use, especially PP or EJ
techniques. From the descriptive analysis, the concern focuses more on the factors’
importance at the median value of the experts’ answers, which are above 3 (neutral). These
factors can be considered as influential and to affect the effort estimation value in the
development of mobile apps. The median value has been selected because it is less unduly
influenced by extreme data values than the mean value, and is considered a more useful
descriptive analysis statistic (Anderson, Sweeney, & Williams, 1989; Saunders et al., 2009).
For the effort estimation factors for mobile app development, several testing techniques
were applied to assess the strength of the relationship between the estimation factors and
expert groups. As can be seen in Table 30 and Table 31, the experts evaluated the
importance of each estimation factor. All factors have been used, and their mean values
are between 4 and 5 (important to very important), thus have been incorporated into the
estimation framework. Figure 90 to Figure 94 in the Appendix C show the mean values for
all the factors by the experts’ roles.
The Mann-Whitney test was applied to assess whether the two sample means of the
groups’ variables are equal or not. As can be seen from the test results in Table 30, there
are 13 observed significant relationships between the expert groups for the estimation
factors, as shown in Figure 45. The variance in the “push notification” factor, for example
between the project manager and QA, is high, showing that the project managers are
concerned with this factor and consider it important to estimation, whereas the QA team
considers it not to be important.

Chapter: Analysis and Discussion of the Interview Results Page: 98
Figure 45: (13) Factors that have a significant relationship, according to the Mann-Whitney test
In addition, a one-way ANOVA test was applied to obtain the relationship between the
factors for all three expert role groups. This result can be used to validate the findings from
the Mann-Whitney test. Four significant differences between factors were obtained, in
terms of experts’ role groups (see Figure 46).
Taking the example of the ‘Support code reusability’ factor, the mean value for software
developers is 4.4, which represents ‘important-very important’. The QA teams, by contrast,
does not believe that ‘Code reusability’ is a matter of importance, since their mean value
is 2.8, which represents ‘neutral-not important’.
Figure 46: (4) Factors have a significant relationship with the one-way ANOVA test
Finally, a coefficient correlation was used to ascertain the strength of the relationship
between two estimation factors. From the correlation results, shown in Table 34:

Chapter: Analysis and Discussion of the Interview Results Page: 99
Coefficient correlation for selective effort estimation factors, a significant relationship was
found for nine estimation factors, highlighted in green. These are positive relationships. It
can be seen that there is a very strong relationship between the following three factors:
1. Backlog item complexity
2. Developer’s implementation experience
3. Dependency between backlog items
Any of these three factors can affect the others, therefore it is possible to see an association
between the three: If an expert is concerned with any, for example ‘Backlog item
complexity’, he/she should think about ‘Backlog item dependency’ and ‘Developer
implementation experience’. This is a positive relationship, as shown in Figure 38, which
means when one factor is considered to be an important factor, the other is important as
well. In addition, there is a positive relationship between the two factors of ‘User interface
quality and complexity’ and ‘Deadline date’ as shown in Figure 48, where the former can
affect the deadline submission of a user story.
Figure 47: Relationship between the three factors: Backlog item comp, dev. Implementation exp. and backlog item dependency

Chapter: Analysis and Discussion of the Interview Results Page: 100
Figure 48: Relationship between two factors: interface comp and deadline
Figure 49: No relationship between two factors: interrupt handling and push notification
Figure 50: (negative relationship) No relationship between two factors: support code reusability and dependency between backlog item
Qualitative analysis
The experts were asked to add further factors that they use during estimation. From the
qualitative analysis, 20 additional factors were obtained that they rely on in the estimation
phase in the Agile process. The effort estimation factors have been categorised according

Chapter: Analysis and Discussion of the Interview Results Page: 101
to the analysis of the experts’ responses and the resulting patterns, themes and coding.
The factors are:
1. The complexity of the user story ‘task’: the experts defined the complexity of the user
story for mobile app projects as follows:
a. The transaction’s journey (from request until response time)
b. The clarity of the business requirement ‘user story’
c. Whether the expert uses an existing code or function in a task
d. If a task relies on other tasks or is stand alone
e. Investigate all scenario cases for a task
f. If an expert conducted a similar task before or not
g. Complexity of the application forms
h. Methods and approaches to implement business logic into a code
2. Technical factors: this factor consists of multiple sub-factors:
a. Library and tools availability
b. Local and backend database / store procedures
c. Number and complexity of third party / web service / system integration
d. Existing API and clarity
e. Backend response structure
f. UI animation and graphics
3. Other factors:
a. Prototype and fidelity design code testing and log files
b. Data validation
c. Quality triangle and definition of IOS / Android standards
d. Team enthusiasm and motivation/ balancing of skills
e. Team member movement
f. Pressure time
Summary
To sum up, all the effort estimation factors were analysed both quantitatively and
qualitatively, and several associations between factors were found. Most factors have a
strong influence on the effort estimation value on the basis of the experts’ evaluations. The
effective factors will be presented in a single table and used in the proposed effort
estimation technique.
7.3.3. Effort estimation process
From the qualitative analysis, each of the experts shared their experience of applying
estimation techniques in their organisation. The answers have been analysed, and
important themes, patterns and relationships between the collected data were recognised
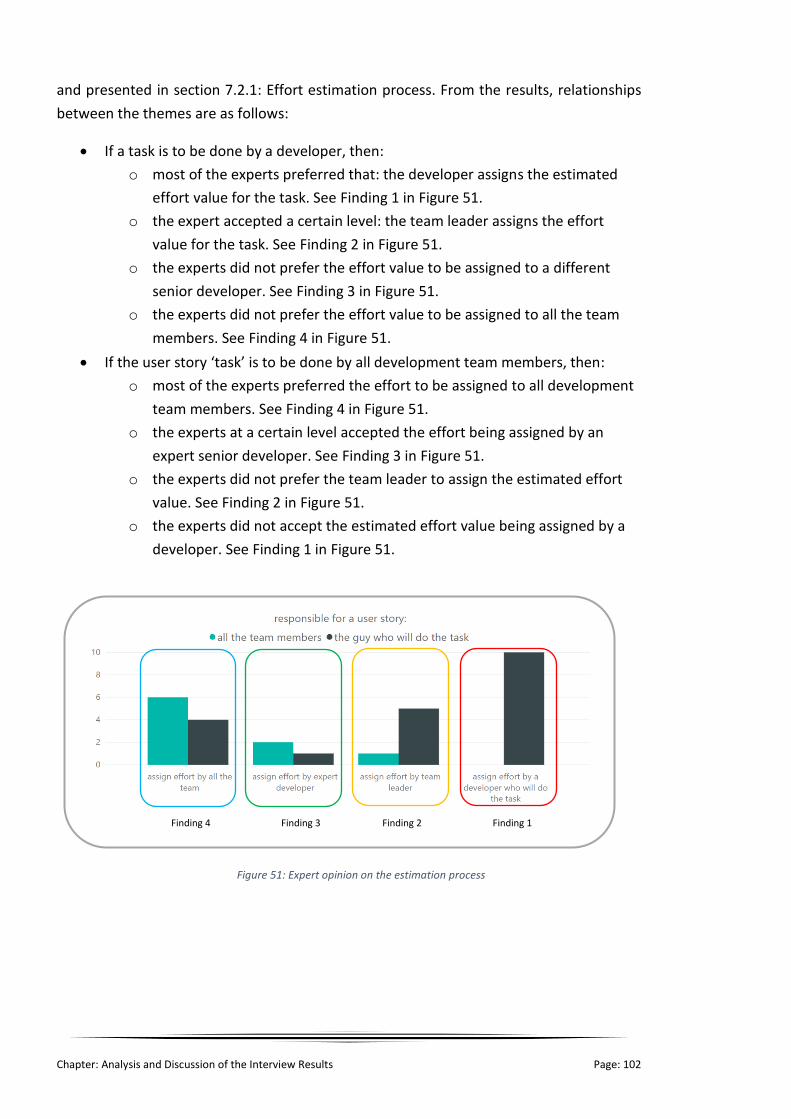
Chapter: Analysis and Discussion of the Interview Results Page: 102
and presented in section 7.2.1: Effort estimation process. From the results, relationships
between the themes are as follows:
• If a task is to be done by a developer, then:
o most of the experts preferred that: the developer assigns the estimated
effort value for the task. See Finding 1 in Figure 51.
o the expert accepted a certain level: the team leader assigns the effort
value for the task. See Finding 2 in Figure 51.
o the experts did not prefer the effort value to be assigned to a different
senior developer. See Finding 3 in Figure 51.
o the experts did not prefer the effort value to be assigned to all the team
members. See Finding 4 in Figure 51.
• If the user story ‘task’ is to be done by all development team members, then:
o most of the experts preferred the effort to be assigned to all development
team members. See Finding 4 in Figure 51.
o the experts at a certain level accepted the effort being assigned by an
expert senior developer. See Finding 3 in Figure 51.
o the experts did not prefer the team leader to assign the estimated effort
value. See Finding 2 in Figure 51.
o the experts did not accept the estimated effort value being assigned by a
developer. See Finding 1 in Figure 51.
Finding 1 Finding 2 Finding 3 Finding 4
Figure 51: Expert opinion on the estimation process

Chapter: Analysis and Discussion of the Interview Results Page: 103
7.4. The Initial Proposal of the Effort Estimation Technique
The previous sections, 7.1, 7.2 and 7.3, presented the analysis of the estimation factors and
techniques used for mobile app development quantitatively and qualitatively, based on the
survey and interviews. Following on from this, the present section provides a proposed
effort estimation technique in a checklist format. The first part of this section provides the
background of the current state of practice and existing models used for estimation of
effort. Section 7.4.2 presents an overview of the proposed effort estimation technique for
mobile apps. Section 7.4.3 presents the opinions of 20 experts on the suggested estimation
technique, as obtained in interviews. Finally, section 7.4.4 provides the full details of the
process and initial design of the proposed effort estimation technique.
7.4.1. The background of the proposed estimation technique
Before discussing the initial proposal of the effort estimation technique, it is necessary to
summarise the research analysis and other articles and studies on effort estimation
techniques. From the results of the data analysis, it was found that the EJ and PP techniques
are the most commonly used by companies to estimate the effort in mobile app
development. From the SLR, few research studies were found to have investigated the EJ
technique for this use. Moreover, other reviews on effort estimation in the Agile process
show that EJ and PP were the most commonly used in the Agile process from 2001 to 2013
(M. Usman et al., 2014). An update of a previous SLR was presented by Dantas (Dantas et
al., 2018). This covers the period from 2014 until 2018 and contains 24 articles, and it
reveals that PP is the most cited article, relying on expert subjective assessment, and story
point as the most reported size metric. Moreover, a survey on the state of practice for
effort estimation in the Agile process involving 60 practitioners in 16 countries shows that
63.3% used PP, 46.67% used analogy and 38.3% estimated effort by EJ, while only 1.67%
used the COCOMO model (Usman, Mendes & Börstler, 2015). To sum up, practitioners rely
on expert subjective assessment to estimate effort, not a formal model. Over a thousand
research studies have reported on formal software development effort estimation models,
yet existing empirical studies show such models are little used (Jørgensen et al., 2009).
There is a debate between Jørgensen and Boehm (2009) over the best approach to
estimating the effort in developing software. The article found that formal models are less
used than EJ, and 10 out of 16 studies show that the EJ-based effort estimation technique
is more accurate than formal models. This debate lists several reasons why EJ is more
accurate and most used. Formal models, such as COCOMO, rely on essential inputs, such
as the line of code of function point, which is based on EJ. As a result, ultimately, accuracy
is based on expert judgement. Magne argues that a combination model, using both a
formal model and expert judgement, are easy to claim yet less easy to implement and
translate into an organisational decision. A better structured process for the EJ model, with

Chapter: Analysis and Discussion of the Interview Results Page: 104
further supporting elements such as a checklist, will improve the effort estimation accuracy
of this model.
7.4.2. The overview of the initial proposal of effort estimation technique.
From the background and analysis, EJ and PP are the most commonly used and suggested
for use in effort estimation. However, these techniques, especially EJ, lack formality. PP has
a clear process for estimation, yet still the development teams assign their estimate figure
on the basis of ad hoc activity in estimation rounds. There is a need to enhance current
estimation techniques.
For this reason, the proposed enhancement will adapt these techniques of PP and EJ, and
will contribute a proposed estimation technique in the current study. A checklist is the
solution proposed to organise the estimation process by documenting the relevant factors
and activities to be considered during the estimation. The checklist is widely used in
software engineering and specifically in effort and cost estimation (Jørgensen, 2004a).
Harvey provides the advantage of using checklist that improve judgment in forecasting by
support people remembering important variables and reduce inconsistency (Harvey, 2001).
Passing and Shepperd evaluated the checklist technique by performing an experiment with
student, and resulted an improvement on the size estimation accuracy (Passing &
Shepperd, 2003). Moreover, the checklist process has been evaluated empirically in three
companies (M. Usman, Petersen et al., 2018), improving the accuracy of effort estimation
in all three companies. There are many advantages in using a checklist in effort estimation
(Furulund & Moløkken-Østvold, 2007; Jørgensen, 2015; Muhammad Usman, Petersen, et
al., 2018), as follows:
• Improving the team’s confidence in estimation.
• Reminding the development team of important factors during the estimation
process.
• Improving the estimation process.
• Helping to understand the implementation of complex tasks by giving an idea of the
tools and libraries that need to be used in this task and of the implementation and
the structure of the tasks’ code.
• It is helpful for a new team member.
7.4.3. Experts’ opinion on the Checklist’s based technique
At the end of each interview, a question was put to the experts about the checklist process
in the estimation technique. Before asking the question, a brief explanation of the checklist
was provided to give them an idea of the checklist method. The question was as follows:

Chapter: Analysis and Discussion of the Interview Results Page: 105
Question Answer
Do you think the Checklist process will help you to improve your estimation
accuracy?
All the experts answered this question, and the results are shown in Table 44 below.
Table 44: Experts’ opinion on Checklist process for effort estimation
Frequency Per cent
Cumulative per
cent
I think it will be helpful 18 90.0 90.0
I do not know 2 10.0 100.0
I do not think it would help 0 0.0 0.0
Total 20 100.0
Ninety per cent of the experts believed that the checklist could help them to consider all
task aspects when estimating the effort required to implement a task. Some interviewees
claimed that there is a danger of omitting important factors during the estimation process
that could affect the estimation value and that the checklist method will encourage
estimators to recall these factors. On the other hand, 10% of the experts did not know if
this model would help to give an estimation value or improve its accuracy. However, no
one thought that this model would not be helpful.
Some experts justified their answers. For example, Expert J explained that a checklist would
act as a guideline for estimation, and Expert K noted that using a checklist would enhance
the accuracy of estimation, and suggested having one for project managers and one for the
development team, as each group has a different interests and perspectives on estimation.
Expert F and M claimed that checklist required less computational process comparing with
other formal techniques, and encourage a developer to have the confident to give the
estimate value.
7.4.4. The design of the initial proposal of the effort estimation technique
Collaboration between development team members is essential to construct the checklist’s
procedure, technique and content. Generating the content can be achieved when the
development team meets and decides on the main and critical factors to be considered
during the estimation process. Understanding the estimation technique is mandatory to
specify how and when to use the checklist during that phase. The development team
members could generate multiple checklist forms for a specific team, based on the roles in

Chapter: Analysis and Discussion of the Interview Results Page: 106
the development cycle. Figure 52 gives an overview of the workflow process for how to
design the proposed estimation technique. The process structure helps the researcher and
experts use the output from the survey method as an input for the upcoming method “case
study” on how to build and generate an estimation technique based on a checklist form.
The process contains from three major elements to proposed effort estimation technique,
and the three elements are:
1) Effort estimation factors for mobile apps: multiple effort estimation factors were
obtained from the SLR, and 20 experts were asked to classify and identify the
important factors before defining further factors for mobile app development. The
factors have been classified as functional, non-functional and development process.
2) Development team members: this is all developers and QAs in the team; it includes
all project managers involved in the project.
3) Estimation techniques: PP and EJ are the most commonly used in the IT sector based
on the SLR and other research studies. The proposed technique need to rely as a
concept on these two estimation techniques.
The effort estimation factors, as described in element (1), need to be discussed with
specialists from several IT companies, in element (2), with concern of the most used
estimation technique in IT market, as explained in element (3). From these three elements,
a deep thinking and group discussion are required with experts from several IT companies
to generate a proposed estimation technique as explained in the element number 4 of the
process:
4) Generate a proposed estimation technique and its process: collaborative work
between the development team or a representative from each team to design a
proposed estimation technique. To generate the proposed technique, there is a
need to:
o undertake collaborative work between the development team members to
refine their current estimation technique and process, and make sure it is
adaptable to their development and organisation process.
o encourage the development team members to use and employ the
estimation factors as a checklist, for example to support them to provide an
accurate estimation.
▪ How to adapt the checklist to an estimation technique
▪ What are the checklist contents
5) As a result of group discussion, an estimation technique will be proposed.

Chapter: Analysis and Discussion of the Interview Results Page: 107
Figure 52: Design process to build the proposed effort estimation technique
7.5. Limitations of the Interview Method
The interview method has limitations in terms of its potential shortcoming in conducting
sessions. One of these is participants fearing to speak freely to share their experience with
the researcher. Another is the researcher could missing part of the interviewee’s dialogue;
moreover, there is a chance that the researcher could misinterpret a participant’s
explanation. To mitigate against these limitations, the researcher constructed a thematic
analysis form to record participants’ responses and re-listened to the audio recordings of
the interviews to ensure a correct interpretation and record of the information.
In addition, it was hard for the researcher to access companies to apply this survey method;
therefore, some of the participants was based on the researcher’s connection. The
researcher has worked for several companies in different countries, and he selected some
of his samples based on these previous work experiences. Moreover, the researcher asked
the participants to nominate other experts to participate in this survey, and this approach
helped the researcher to involve more experts from multiple companies to obtain data
from several resources.
Chapter: Analysis and Discussion of the Interview Results Page: 108
7.6. Summary
This chapter provided the analysis of the survey method both quantitatively and
qualitatively. The survey included semi-structured and structured questions that covered
estimation, using the Agile process, in terms of its techniques, process, accuracy, efficiency
and factors for mobile app development. The survey involved 20 participants across 18
organisations with varied background experience: Quality assurance; mobile developers,
both senior and junior; and Project management. EJ was the most used technique for effort
estimation, used by 75% of participants.
The survey evaluated the 48 factors that could affect effort estimation accuracy; a further
20 factors were provided by the experts. The total number of factors collected and
evaluated is 68, and is regarded as comprehensive. Around half of all estimates of the effort
involved in projects is inaccurate by 25 to 45%. This survey discussed the estimation
processes and methods used in the IT sector and evaluated their efficiency. This chapter
also provided an initial proposal of an effort estimation technique based on a checklist, to
be evaluated and validated as a case study in the IT sector.

Chapter: Data Collection Preparation for the Case Study Page: 109
Chapter 8: Data Collection Preparation for the Case Study
Interviews were conducted with 20 experts from 18 organisations to investigate the state
of practice in effort estimation techniques using Agile processes and the factors affecting
mobile app development. The results described in the previous chapter need now to be
validated in a case study. This chapter provides a clear plan and design for the three case
studies, and the results are given in Chapter 9. The first two sections will discuss the scope
and main objectives. Following this, the possible scenarios and its processes are given in
sections 3 and 4. Lastly, the case study questions and data collection methods are provided
in section 5.
8.1. Overview of the Case Study
Case study can be called a ‘field study’ or ‘observational study’, and involves focusing on a
particular aspect of the research methodology (Runeson et al., 2012). Robson defines case
study as a research strategy that involves an empirical investigation of a specific
contemporary phenomenon within its context, using multiple source of evidence (Robson,
2002). In a software engineering context, a case study is defined as an ‘empirical enquiry
that draws on multiple sources of evidence to investigate one instance (or a small number
of instances) of a contemporary software engineering phenomenon within its real-life
context, especially when the boundary between phenomenon and context cannot be
clearly specified.’ (Runeson et al., 2012). In this case study, there is empirical investigation
of effort estimation techniques in three companies to understand how they estimate the
effort involved in user stories to develop a mobile app and verify the influence of estimation
factors/predictors on the accuracy of the effort estimation. In addition, through the case
study the development teams will be encouraged to incorporate a proposed technique into
their companies' current estimation technique to measure its efficiency.
Several elements need to be considered in the design of the case study (Runeson et al.,
2012; Runeson & Höst, 2009).
8.2. Objectives of the Study
The expected achievement of a case study should be stated as a result of undertaking the
study. In general, there are four types of research design strategy: explanatory,
exploratory, descriptive and improving the research purpose (Runeson et al., 2012;
Saunders et al., 2009). The research design strategy for this study is based on exploratory
and explanatory strategies, as discussed in Chapter 3, to find out the current state of the
practice and seek an explanation for a situation or problem. In this case study, a strategy
to improve certain aspects of estimation accuracy is added.

Chapter: Data Collection Preparation for the Case Study Page: 110
To establish the objective and goal of the case study, a question may be posed to simplify
and make it clear what is expected to be achieved by the case study. The objectives are to:
• Understand the current state of the practice of the estimation process using the Agile
process and its techniques used in mobile app development, and evaluate the accuracy
of the current estimation techniques in an organisation.
• Better understand of estimation method and the factors that affect the accuracy of the
estimation value.
• Explore the effectiveness of the current estimation techniques, PP and EJ, in the context
of mobile app development.
• Explore the challenges that affect estimation accuracy.
• Validate the effectiveness of effort estimation factors/predictors of the estimation
accuracy.
• Examine the validity and effectiveness of the proposed estimation techniques and its
adoption in an organisation.
8.3. The Case Study and Unit of Analysis
The case is usually considering and examining a contemporary phenomenon in the real-life
context based on Yin’s definition (Yin, 2009). In this research study, the research context of
the case will be a mobile app development project using Agile in multiple companies to
examine their effort estimation models and measure their accuracy and efficiency
(Runeson & Höst, 2009; Yin, 2009). There are two types of case study:
• holistic case study, which is examining the case as a whole; and
• embedded case study, which is examining some aspects within the case.
Since case studies are proposed in three companies to investigate their estimation accuracy
over an extended period of time, based on the research context, the embedded case study
design will be used to investigate several issues and aspects. Holistic case study design has
limitations in terms of both access and authority from the companies’ development teams
to assess and measure all aspects and issues. The embedded case study design will
emphasise the investigation into two major aspects within the case:
• The accuracy of the effort estimation for the proposed technique over Agile sprints; and
• The effectiveness of the estimation factors/predictors in the estimation techniques.
The case study will be conducted in companies chosen using the following criteria, to obtain
valuable results from an appropriate domain:
• Projects should follow Agile processes in software development.
• The company has experience of applying Agile processes in software projects.
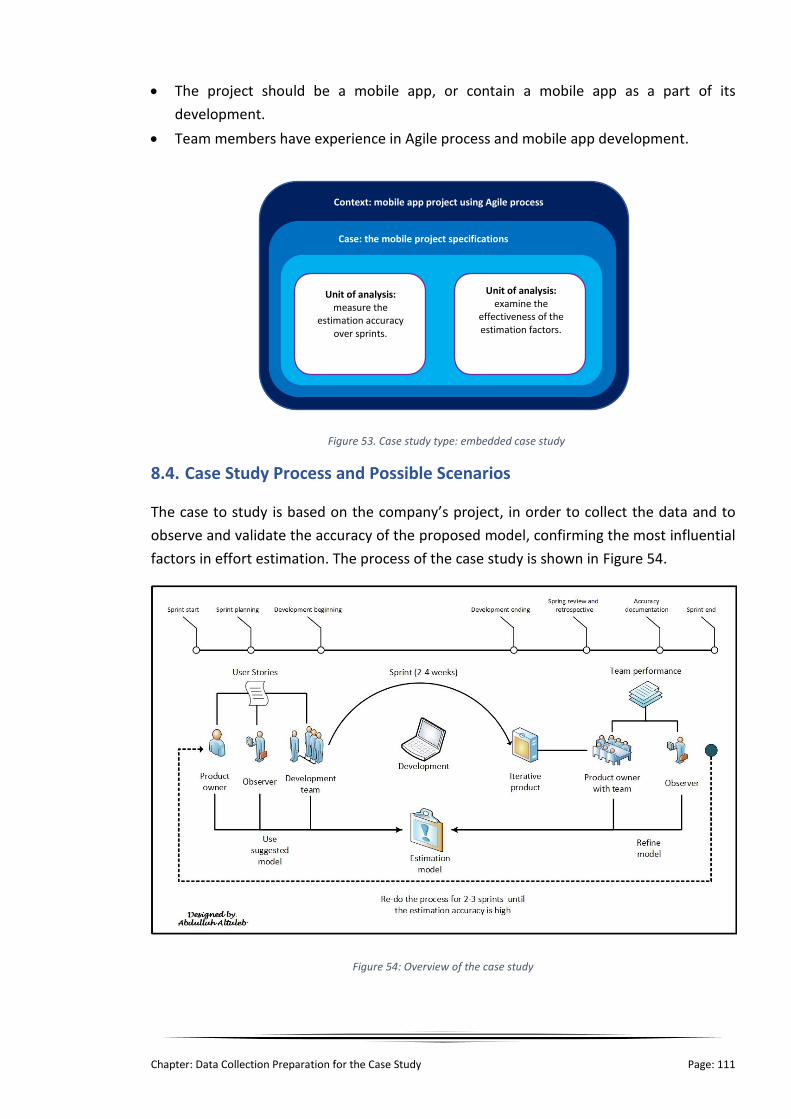
Chapter: Data Collection Preparation for the Case Study Page: 111
• The project should be a mobile app, or contain a mobile app as a part of its
development.
• Team members have experience in Agile process and mobile app development.
8.4. Case Study Process and Possible Scenarios
The case to study is based on the company’s project, in order to collect the data and to
observe and validate the accuracy of the proposed model, confirming the most influential
factors in effort estimation. The process of the case study is shown in Figure 54.
Figure 54: Overview of the case study
Context: mobile app project using Agile process
Case: the mobile project specifications
Unit of analysis: measure the
estimation accuracy over sprints.
Unit of analysis: examine the
effectiveness of the estimation factors.
Figure 53. Case study type: embedded case study

Chapter: Data Collection Preparation for the Case Study Page: 112
The case study in all the companies will be directed and processed as in the following steps.
However, some companies impose limitations and constraints on the accessibility of the
data and/or communication with the development team during the case study. Therefore,
the case study scenarios will be based on the feasibility of access to the information.
8.4.1. Step 1: Obtain historical data from previous projects
At the beginning of the case study, the observer/ the researcher will discuss with the
project manager/product owner the following:
• Previous estimation models or techniques the company has followed in previous
projects.
• Historical data of project and team performance to know the speed of the development
team.
• From the data history, discuss the accuracy of the estimated effort and actual effort of
the project overall and the user stories to establish the accuracy of estimation.
• If historical data of previous projects are not available, for any reason, the project
manager or product owner needs to share a rough guide to the company’s accuracy of
estimation, based on his/her experience, for example within 20 to 30%. The product
owner could consult an appropriate person from the development team to indicate this
accuracy level.
8.4.2. Step 2: Types of current estimation techniques
From the previous data, there are two possibilities:
• If the company has a model or technique to estimate development effort, hold a focus
group meeting with the product owner and the development team to discuss:
o How to improve the existing model or technique.
o Present the proposed technique checklist model and discuss whether the model
could help to improve their estimation.
o How to introduce/adopt the proposed model into the current estimation model.
o Assess the effectiveness of the estimation factors/predictors in terms of
accuracy.
• If the company does not have model or technique to estimate the effort of a user story,
consider whether the company is following an EJ technique, then conduct a focus group
meeting and follow the first option.
The effectiveness of the adoption of the estimation factors and the proposed technique by
the company needs to be measured. In section 4 there is further clarification of the data
collection methods and focus group approach.

Chapter: Data Collection Preparation for the Case Study Page: 113
8.4.3. Step 3: Nature of the project
After conducting the focus group meeting with the development team members, the
observer and product owner will discuss the type of project to start the case study. The
project should satisfy the criteria discussed in the case study context and phenomena from
section 8.2. The case study could be applied to either a new or an existing project.
There are two possibilities for a case study in a company: a new project or a current project.
If the company is planning to start a new project and need to apply the case study to that
project, historical data from previous projects are needed, if available, as discussed in Step
1. On the other hand, if the company is working on an existing/current project, there is a
need to wait until the current sprint is ended, then start the case study on the next sprint.
While waiting for the next sprint, the observer needs to contact the product owner
regarding the performance of the development team and their estimation values. Figure
55 shows a flow chart of the possibilities of working on a project. At this point, the following
information needs to be gathered before proceeding to Step 4, Sprint planning event:
• The historical data of previous project or sprint.
• The current and previous effort estimation technique and model of the company.
• The accuracy of previous estimation from previous project or sprints.
• The type of projects to which to apply the case study, whether a new or existing project.
• Conduct a focus group and discussion on improving the estimation accuracy.
As explained before, some data may not be provided due to companies’ privacy and/or
limited access to the data.
Figure 55: Nature of the project to which to apply the case study and its possibilities.

Chapter: Data Collection Preparation for the Case Study Page: 114
8.4.4. Step 4: Sprint planning, review and retrospective phase
In the sprint-planning phase, the development team members should follow and apply
what was discussed and agreed at the focus group meeting regarding the estimation
process. The observer ensures that the proposed estimation process or technique is
conducted appropriately.
At the end of the sprint, various activities are conducted regarding sprint review and a
retrospective event:
• Obtain the actual and estimated effort for the sprint.
• Compare the estimated effort to the actual effort to measure the accuracy level of
the estimation for the sprint.
• Compare the accuracy level to previous projects at the organisation to measure the
improvement and find out the effect of the proposed technique/process and the
estimation factors/predictors.
Figure 56 shows an overview of measuring the accuracy of effort estimation in a sprint.
Figure 56: Measurement of the effort estimation accuracy
At the sprint review event, there are two possible scenarios we could have:
• If there is improvement in the accuracy of the effort estimation, another focus
group will discuss any suggested improvements in the model to provide more
accuracy in the estimation value. Also, if the accuracy of the effort estimation in the
current sprint is better than previous projects or previous sprint, another sprint will
apply the estimation model to confirm its accuracy and ensure the proposed
method works properly.

Chapter: Data Collection Preparation for the Case Study Page: 115
• If there is no improvement in the accuracy of the effort estimation, another focus
group will diagnose the problem with the model and make suggestions to improve
the estimation of the subsequent sprint.
Figure 57: Case study process


Chapter: Data Collection Preparation for the Case Study Page: 117
8.5. Case Study Questions and Data Collection Methods
8.5.1. Data collection method
This section clarifies the data collection method and approach of the case study. There are
three types of methods of collecting data: direct, indirect and independent. The direct
method involves contact with practitioners in the case study, such as interviews and focus
groups. The indirect method obtains raw data without contact with practitioners, such as
using tools to mentor a practitioner’s performance and productivity. The final approach is
the independent method, which relies on analysis of documentation and reports. In this
case study, both direct and indirect approaches are taken to obtain data for the case study.
The direct method of data collection through a focus group will be used in the case study,
allowing the observer/researcher to maintain full control over the collected data and
obtain them in the required context and form. A focus group is an interview with a group
of participants, asking questions to stimulate discussion and obtain responses. In addition,
a discussion and interview will be conducted with the product owner on the behaviour and
performance of the development team, which represent indirect methods. Moreover,
there will be observations of the development team’s behaviour and approach to
estimating their effort in the sprint planning event to understand their estimation process.
The questions of the case study of both methods, direct and indirect, are discussed in more
detail in the following section.
8.5.2. Selecting the data
As stated in section 8.2, criteria need to be applied to the case study at the organisation.
Since the study takes both direct and indirect methods, more needs to be known about the
source of the data for each. In the focus group, questions will be put to several practitioners
at the same time in one session to obtain new insights and opinions from all practitioners
regarding their estimation techniques’ efficiency, process and potential improvement on
the estimation models currently used in their organisation. From the discussion, results
concerning the estimation model can be confirmed that would be difficult in individual
interviews. Particular topics and issues will be raised in the focus group session to
encourage participants to share their points of view freely to reach consensus. Participants
will be selected for their characteristic and roles, as discussed in section 8.2 and 8.3.
The observation method is another to be used in the case study to collect data. This relies
on the think-aloud protocol, where the observer asks questions of the product owner and
has a discussion about the estimation techniques used in previous project and the main
causes of the low accuracy seen in the project’s documents. Also, during the development
phase of a project, the developer’s behaviour will be observed, if possible, and how they
estimate their user stories and assign an value to each story. Moreover, observations will

Chapter: Data Collection Preparation for the Case Study Page: 118
be made during meetings with the product owner to understand the current estimation
models of the company and the main causes of their low accuracy.
8.5.3. Case study questions
The research questions cover what is required or expected to be found by the case study
in order to satisfy and achieve the case study’s objectives. Usually, the nature of the
research questions in the case study is ‘why’ and ‘how’. The general questions of the case
study are stated as following:
• How did the development team estimate the user story’s effort during sprint
planning?
• What are the existing estimation techniques’ accuracy and performance?
• How can the development team improve the accuracy of the current estimation
technique?
• What is the effectiveness of the estimation factors/predictors and their impact on
the accuracy of the estimation?
The above questions are general enquiries about the estimation technique and processes
that need to be investigated and observed in the case study. In the process, there are three
major milestones, as shown in Figure 57, that involve further investigation and observation
to record and obtain required data:
1) The start of the case study: preparing historical data from previous projects/sprints
and understanding the current estimation technique in the organisation,
2) Before sprint planning event: having a discussion before the event on the suggested
improvement to the current estimation technique, and
3) Sprint review and retrospective event: measuring the accuracy of the estimation
and improving the estimation model, if needed.
For each milestone, the researcher needs to determine which data collection method to
use, then ask questions, observe behaviours and investigate the current situation of the
development team. The following provides the appropriate research method for each
milestone and states the questions to be answered.
Frist milestone questions: at the start of the case study
The main point of the first milestone of this case study is to understand the current status
of the company and the performance and velocity of the development team. Also, in the
first milestone, the estimation technique that has been used in the previous
projects/sprints has to be ascertained. As has been discussed in Step 3 in section 8.4, at the
beginning of the case study there are two possibilities for each case study: working with a
new project; or working on an existing/current project. Moreover, there are two

Chapter: Data Collection Preparation for the Case Study Page: 119
possibilities about the access to data: the company is willing to share their data; or the
company is reluctant. Table 45 presents all the possibilities of the case study project to be
worked to, either in a new or a current project. Table 45 shows the data collection approach
and who is to be involved and participate in this study. The questions are to meet the
various possibilities, based on the project type and data collection method.
Table 45. First milestone questions of the case study process
Project
type
Accessibility of
data
Data collection
method Participants Questions
New
Yes
Indirect method
(observe the raw
data from previous
projects documents)
Observer,
Product owner
What was the estimation technique and
process that used in an old project?
How was the accuracy for each sprint of
the old project?
What was the development team level
of experience, their development
velocity and challenges from an old
project?
No Direct method
(focus group)
Observer,
Product Owner,
Development
Team
What was the estimation technique and
process that you have used?
From your working experience on
previous projects, how was the
estimation accuracy of your
development for the user stories?
What was the challenge of your
estimation?
Existing
Yes
Indirect method
(observe the raw
data from previous
Sprints documents)
Observer,
Product owner
What was the estimation technique and
process that used in previous sprints?
How was the accuracy for previous
sprints of this project?
What was the development team level
of experience, their development
velocity and challenges from previous
sprints?
No Direct method
(focus group)
Observer,
Product owner,
Development team
What was the estimation technique that
you have used?
From your experience of this project,
how was the estimation accuracy of
your development for the sprint?
What was the challenge of your
estimation?
Second milestone questions: before sprint planning event
The second milestone of the case study is basically focused on what to do in the following
sprint of the project, how to estimate the effort of the user stories, and how to improve
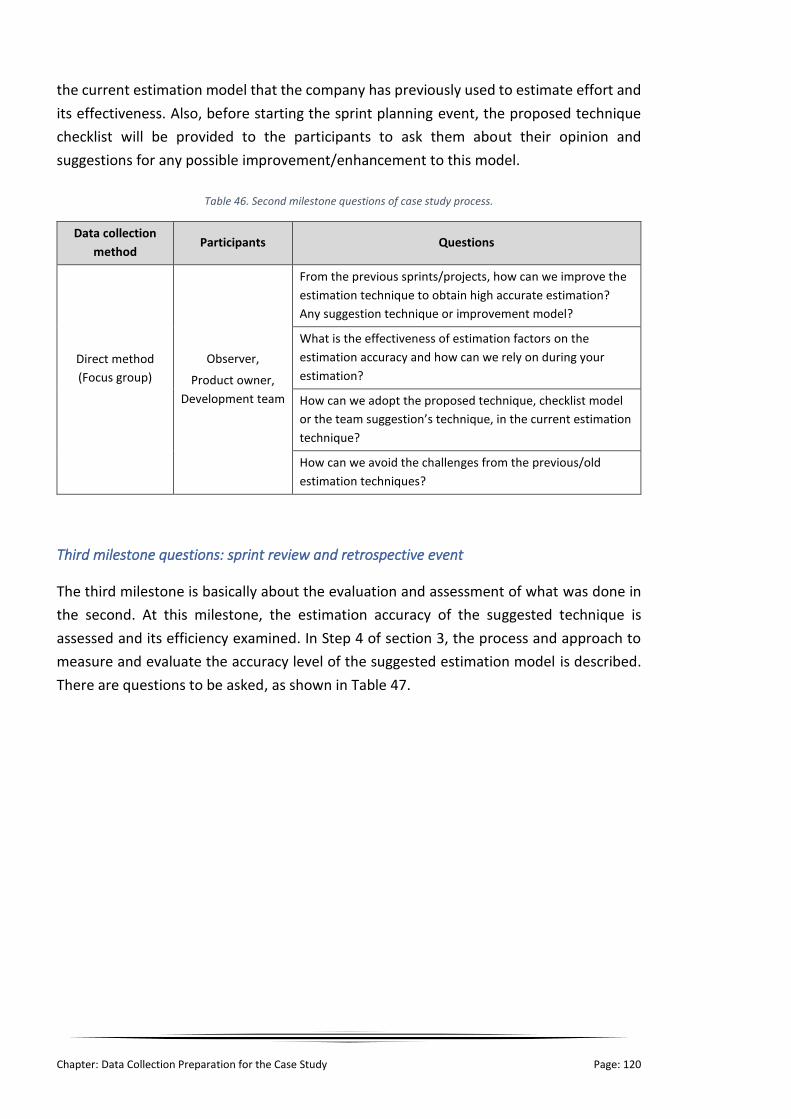
Chapter: Data Collection Preparation for the Case Study Page: 120
the current estimation model that the company has previously used to estimate effort and
its effectiveness. Also, before starting the sprint planning event, the proposed technique
checklist will be provided to the participants to ask them about their opinion and
suggestions for any possible improvement/enhancement to this model.
Table 46. Second milestone questions of case study process.
Data collection
method Participants Questions
Direct method
(Focus group)
Observer,
Product owner,
Development team
From the previous sprints/projects, how can we improve the
estimation technique to obtain high accurate estimation?
Any suggestion technique or improvement model?
What is the effectiveness of estimation factors on the
estimation accuracy and how can we rely on during your
estimation?
How can we adopt the proposed technique, checklist model
or the team suggestion’s technique, in the current estimation
technique?
How can we avoid the challenges from the previous/old
estimation techniques?
Third milestone questions: sprint review and retrospective event
The third milestone is basically about the evaluation and assessment of what was done in
the second. At this milestone, the estimation accuracy of the suggested technique is
assessed and its efficiency examined. In Step 4 of section 3, the process and approach to
measure and evaluate the accuracy level of the suggested estimation model is described.
There are questions to be asked, as shown in Table 47.

Chapter: Data Collection Preparation for the Case Study Page: 121
Table 47: Third milestone questions of case study process.
Data
collection
method
Participants
Accuracy level
(compared
with previous
sprint/project)
Question
Indirect
method
(observation)
Observer,
Product
owner
From the velocity and development performance of
the development team, what is the accuracy level of
the estimation model?
Direct method
(focus group)
Observer,
Product
owner,
Development
team
High
What was the elements that make the suggested
model provide accurate estimation?
What are your suggestions that could make the
proposed model provide more accurate result? If
possible
Same or Low
What was the main challenges that make the
suggested model is not working?
Are there any challenges when you are applying the
proposed model?
How could we improve the model?
8.6. Ethical Considerations
Dealing with human participants raises ethical issues that need to be addressed. The case
study questions and observation scenarios were formulated to be respectful and
appropriate to the participants. An information sheet and a consent form were given to all
participants to sign before taking part in the case study to ensure that they were happy to
participate and understood what was involved. To ensure the confidentiality of the
participants and build trust between the researcher and the participants, they were
assured that the stored data would not be linked to their names or their organisation’s
name. The data will be stored on secure systems during the research study. Once the
research is completed and the results from the data analysis achieved, the data will be
destroyed by deleting all data files relating to the participants on laptops, desktops, emails
and physical data through shredding paper documents and deleting electronic files,
including audio recordings.
Ethical approval was granted by the Ethics Committee team at the University of
Southampton under reference number: 52598 on 29/08/2019. The application included
many forms: Data Protection Authorities form, which is responsible for protecting the
personal data of the participants; the Participant Information Sheet; the Consent form; and
the Risk Assessment form.

Chapter: Analysis and Discussion of the Case Study Results Page: 123
Chapter 9: Analysis and Discussion of the Case Study
Results
This chapter discusses the case studies conducted in three companies. The aim was to
observe the current state of practice in effort estimation techniques used in the companies
and validate their efficiency. This chapter, in addition, validates the proposed estimation
technique in mobile app development project in the Agile process. The first section of this
chapter, section 9.1, presents the first case study analysis and results for Company A.
Following this, the second and third case studies are discussed in section 0 with Company
B, and section 9.2.6 with Company C.
9.1. Case Study at Company A
9.1.1. Company’s background and project information
Company A is in Alkoubar in the Kingdom of Saudi Arabia, and was established early in
2009. It is dedicated to producing technology solutions around the world. The company
holds seven awards from the Saudi government, one for the best promising enterprise in
the eastern province. The company follows ISO-20000 as best practice for IT service
management. It has around 150 employees, mostly specialised software and application
developers.
Company A was happy to participate, and decided to apply this case study to its current
project, ‘Project X’. The project is basically about evaluating the services provided by the
government’s ministries. The company has completed four sprints in this project, and the
duration of each is two weeks. Since the company is working on many projects, this project
consists of five development team members, one product owner and one project manager,
as shown in Table 48.
Action research method was applied at Company A that involved more than solving
problems and providing solutions. The case study allowed investigation of the
phenomenon of the estimation process in the Company A; however, there was further
work to evaluate the current estimation techniques and provide solutions, with direct
contact with the development team members. In the action method, iterative work
assessed the estimation process/technique in each sprint and adjusted the technique until
the problems were solved.

Chapter: Analysis and Discussion of the Case Study Results Page: 124
Table 48: Project team members in Company A
Development member name Years of experience Member role in the team
T-A 4 Mobile app developer
T-B 3 Mobile app developer
T-C 8 Frontend developer
T-D 6 Backend developer
T-E 4 QA
T-F 3 Product owner
T-G 9 Project manager
9.1.2. Current situation and proposed estimation method in Company A
❖ Meeting with project manager before starting the case study to understand the current estimation process and previous sprints’ performance.
The project manager wished to apply the case study to an existing project, ‘Project X’. They
were on Sprint 5 and the duration of the sprint was two weeks. To understand the velocity
and the progress of the development process, the performance of the last four sprints was
examined. The project manager, T-G, was happy to share the progress of the development
team during the last two sprints (Sprints 4 and 5). The company chose to apply this case
study to a development team of five or six members. The details of the team members are
in the following section.
Figure 58 and Figure 59 show the progress of the development team over the last two
sprints. As we can see from the Burndown chart, the development team estimated the user
stories and tasks at 81 to 89 story points and had committed to developing these tasks
within two weeks. In fact, the development team delivered only 10 story points at the
planned end of Sprint 4 and nothing in Sprint 5. The team worked over the weekend to
deliver the rest of the user stories in Sprint 4, and in Sprint 5 the team took three more
days to complete and deliver all the user stories. The estimation technique and reasons for
the underestimation are discussed in the focus group and interview.
The Burndown chart is a graphical representation usually used in an Agile project to help
the product owner with important information about the progress of the sprint (Stacia
Viscardi, 2013). The chart displays how much work remains, in term of hours, in the release
backlog, and provides an indication about the scope of the work of the sprint. The chart
also displays the team working progress through the customer’s user story and the team
alignment with the planned time of the user stories and tasks. The chart provides the total
effort against the completed and planned effort of the sprint.

Chapter: Analysis and Discussion of the Case Study Results Page: 125
In the first group, a question was put to the development team about the causes of failing
to deliver the user stories by the time planned. It listed the points in the next section, and
project manager T-G expressed that the clients changed the requirement of the user story
during the sprints. The project manager and product owner knew that should not happen,
but the clients needed it to be delivered during the current sprint. As seen in Figure 58, at
the end of the first week of Sprint 4 the client requested changes on the current user
stories. The development team claimed these changes required additional efforts, because
it had already started implementing the stories.
Figure 58: Performance of the development team for Sprint 4
Figure 59: Performance of the development team for Sprint 5
0
10
20
30
40
50
60
70
80
90
100
Day 1 Day 2 Day 3 Day 4 Day 5 W/E W/E Day 6 Day7 Day 8 Day 9 Day 10 W/E W/E
sto
ry p
oin
ts b
y h
ou
rs
sprint dates 2 weeks
Sprint 4 burndown chart
remaining work estimated
The Team work over the weekendand take extra 2 days over the print time
0
10
20
30
40
50
60
70
80
90
100
Day 1 Day 2 Day 3 Day 4 Day 5 W/E W/E Day 6 Day 7 Day 8 Day 9 Day 10 W/E W/E Day 1
sto
ry p
oin
ts b
y h
ou
rs
sprint dates 2 weeks
Sprint 5 burndown chart
remaining work estimated
The Team work over the weekend andtake extra 3 days over the print time limit.
No deliveries during the sprint
Adding new user stories during the sprint.
No deliveries during the sprint

Chapter: Analysis and Discussion of the Case Study Results Page: 126
❖ First focus group discussion with the development team to understand their estimation process and their challenges.
A group discussion took place with five members of the development team regarding the
estimation techniques and their accuracy. The session was held prior to the sprint planning
meeting of Sprint 5. The goal of the group discussion was to understand the estimation
techniques used in previous sprints, and the main reasons for the accuracy of the
estimation to be low. There were two group discussions with the development team; the
first was concerned with: understanding the current estimation process of the
development team; and discussing the main causes of the underestimation. The second
was held later on, after the observation was completed by the researcher.
Current estimation technique and process: A question was put to the development team
concerning its estimation process in the last four sprints. The technique used during the
previous sprints was EJ. In this company it works as follows: at the beginning of the sprint
planning, the product owner explains the user story to all development team members.
The user story could include frontend tasks for the web developer, mobile app tasks,
backend tasks or QA tasks. Then, the team members explain what they would do in the
user story. It could be that several share responsibilities for one user story. For example, in
Figure 60, the web developer, QA and mobile developer are involved in one user story. If
there are two web developers in the team, the leader of the web-developing team assigns
the effort for that part to the user story. Also, the team divides the user story into certain
tasks to allow each member to take a task and perform it alone. After assigning the tasks
for the user story, the development team has a short discussion to decide whether to take
on more of the user story or not. The product owner and client usually push the
development team to take on more of the user story to achieve the project delivery plan.
The development team sometimes takes the risk by accepting the pressure from the
product owner and the client and undertakes more.

Chapter: Analysis and Discussion of the Case Study Results Page: 127
Figure 60: Current estimation process in Company A
Main causes of the low-accuracy estimation in the previous sprints: The second part of
the group discussion was about the reasons and main causes of the low accuracy of the
effort estimation in the last four sprints. There were several reasons for the poor estimation
accuracy, and one is that the definition of the user story was unclear to the development
team. The product owner did not have a full understanding of the requirement
specifications of the user story. The client and product owner discussed the user story
during the sprint planning ceremony and gave their suggestions about the needs of the
user story. After their discussion, they explained the user story to the development team.
The discussion and changes in requirements during the sprint planning caused confusion
among the team, and this created ambiguity around the requirements. The researcher
noted this concern, as discussed in more detail in the researcher observation section.
Another concern is that when the team gave its estimation for the user story in the sprint
planning, it asked for clarification of some points in the user story during the sprint. As a
result, this clarification could raise further concerns that need additional time from the
developer - more than they had expected. To avoid this happening again, the development
team overestimates its effort estimation for user stories that are insufficiently clear.
In addition, the development team suffered from external interference that required it to
take on more tasks. The company agreed to deliver all the project requirements in 10
months in the project contract. In fact, the company has an issue with initial estimates for
clients for the overall project. The project manager gives an estimate for the delivery of the

Chapter: Analysis and Discussion of the Case Study Results Page: 128
entire project based on their experience in previous projects, which puts the developers
under pressure and requires them to work beyond their capacity.
❖ Observation of the current estimation process of the development team performance.
The researcher attended the sprint planning meeting for Sprint 5 to observe the
development team’s behaviour when they had a discussion with the product owner and
the client on the user stories. During sprint planning, several issues were observed, as
discussed in the following sections, and these were raised by the researcher and discussed
with the project manager to take action to resolve them.
• Lack of valid justification to the product owner and clients for the effort estimation:
The development team suffered from poor justification of their estimation to the
product owner and customer. It had a challenge to persuade and convince the
customer and product owner of their estimate for the selected user story. For example,
in one case there was a push notification task for which the mobile developer gave an
estimated value as ‘two days’, without any clear plan about what would be done in
those two days. The problem is that the developer sometimes cannot explain why a
task takes that time. The observer asked the developer at the end of the session why it
was hard to explain why this task would take that long, and the answer was that the
product owner and client would question it and argue over the effort assigned. The
client was not happy with any developer’s justification and felt that developers are
incapable of the task, based on their discussion with the project owner. The
development team could not persuade the product owner and customer of their
suggested effort by providing evidence why this effort takes this amount of time.
• Development team under pressure: Following from the previous point, the customer
and product owner put pressure on the development team to take on as much as
possible of the user stories from the product backlog in the sprint. The project delivery
was in deployment and the customer needed to finish this project as soon as possible.
As shown from development team performance in Figure 58, 34 story points were not
completed in Sprint 4. The team expected to do these user stories within the sprint
period, but in fact it faced challenges that it did not expect.
• Mono decision-making on effort estimation: Each member of the development team
gives an effort estimate alone, without negotiating with colleagues, because each
member of the team has their own specialties and the team prefers the person who
will do the task to be responsible for assigning its effort value. If the user story consists
of backend and frontend tasks, usually one of them assigns the effort value for the
whole user story alone. In fact, if the user story contains a backend task, the backend
developer assigns the effort for the whole user story, because they have about six years
of experience and thus leads the user story. This habit causes uncertainty for other tasks
Chapter: Analysis and Discussion of the Case Study Results Page: 129
in this user story and results in accurate estimation value for frontend tasks, for
example.
• No time allocated for taking decisions on effort estimation: There is not enough time
for the development team members to think about what they will do in the task to give
more detailed plans for their task. After the product owner has explained the user story,
the developer who is role related to this task gives an estimate immediately. The
observer counted the period for three members, from the time the product owner
finished explaining the user story to the time when the developer gave their estimate.
The first took 5 seconds, the second around 7 seconds and the third only 4 seconds.
This is a very short time for a developer to think about the effort that a task could be
expected to take.
• Unclear user stories for the product owner and clients: from observations during the
sprint planning event, one of the main issues that the product owner and clients discuss
during the sprint planning event is the functionality of the user story. For example, at
the sprint planning event for Sprint 5, the clients discussed the functionality of the
‘rating feature’ user story. They took about 20 minutes to decide between them what
should be included in this user story. The product owner tried to understand the new
features of this user story from the clients. The development team was in confusion
and waited for the clients to reach their final decision. While it was waiting, its members
were busy trying to understand the previous user story and segment the task between
them. The clients should have had this discussion before the sprint planning and
consulted the product owner about the feasibility of these features for the app.
• User story related to unknown or legacy system: One main challenges for the
development team is being asked to make changes to or investigate a system that its
members know nothing about. They cannot make an estimate for something that they
do not know. There was an instance during sprint planning for Sprint 5 when the
product owner explained a new user story to the development team to make
enhancements to an integrated system. The team did not know what was behind the
system and needed time to understand it before giving an estimate. The client was not
happy with the developers when they were reluctant to give an estimate for that user
story. There is a type of user story called Spikes (Leffingwell, 2011) for exploring, to gain
more knowledge about an existing system. This was later discussed with the
development team to help it to estimate this user story.
• User stories are not broken down into small, manageable tasks: It was hard for the
development team to estimate the entire user story. Usually, story points should be
broken down into small tasks to make it easy to assign an estimated value. Sometimes
the development team gives its estimate in days, ‘two to three days’, for example,
which tends to make the customer and product owner dissatisfied. Also, this high value
is not traceable and manageable by the project manager and developer. An estimate in

Chapter: Analysis and Discussion of the Case Study Results Page: 130
days instead of hours gives the impression to the customer and product owner that the
development team is incapable and ‘lacks technical knowledge’ on this task, or does
not know what it involves. Breaking down the user story into small tasks is helpful for a
developer to manage the time and understand the detailed functionality of the user
story.
• The ‘definition of done’ is not stated and defined well: there were misunderstandings
among the development team and client on the meaning of ‘done’, for the user story.
o Developers assumed that the user story would be ‘done’ after they had finished
doing the ‘development, testing and QA’; however, the customer claimed that
the task is ‘done’ only upon completion of the UAT (user acceptance test), which
was supposed to be undertaken on the customer side.
o The development team claimed that the deployment phase is excluded from its
effort; however, the customer and product owner wanted this phase to be
completed during the sprint. If deployment is included in the sprint, the effort
estimate will be considerable.
• Changed priority of user stories during sprint planning: The priority of the user story
was altered by the product owner and customer midway through the sprint planning
phase.
• Some team members did not participate in the sprint planning event: Backend
developer T-D was absent from the sprint planning event, and T-C spoke to T-D to ask
about the effort required for their user stories. T-D always left at that time to pick up
children from school, yet the client and product owner did not change the time of the
sprint planning.
❖ Second focus group discussion with the development team to improve the estimation process and accuracy.
During Sprint 5, a second group discussion session was held with the development team
members and the project manager to improve the estimation accuracy and process. The
discussion covered the following topics: explain to the team about the main factors that
affect the accuracy of estimates; and provide suggested solutions to resolve their low
accuracy.
Topic 1: Explain to the development team the factors that affect estimation accuracy
In the group discussion session, the observer presented all 68 effort estimation factors,
‘comprehensive factors’, to the development team and discussed their level of impact and
influence on estimation accuracy. The observer explained each to the team members and
asked how they would use them in their effort estimation and to provide the observer with
further factors. The team discussed together and came up with these statements:

Chapter: Analysis and Discussion of the Case Study Results Page: 131
• We can use these factors to let us think more about new user story in more
technical details. Before, we usually compare the new user story with the one that
we did before, but with these factors we can think more in more detail what we can
expect from the user story.
• For example, the transaction journey factor, helps us to think about the structure
of the data that we need to send to the backend and the result data structure from
backend to the frontend. Also, these factors help the backend developer, for
example, to discuss with the mobile app developer about the user story and explain
to each other what who will do this and split the user story into small tasks.
• The factors overall are comprehensive, and we can put them in our mind before we
give an estimation value.
• The effort factors help the development team to break down the user story into
small tasks.
• In order to recall the estimation factors during estimation, the development team
prefers to present the estimation factors using a projector in a meeting room while
the estimators make their decision.
• The development team agrees that the 68 factors are comprehensive, and they do
not have any additional factors.
The mobile developers T-A and T-B added some notes on the segmentation of a user story
into subtasks: ‘The estimation factors help us to break down the user story into small tasks’.
However, both concluded that a task could be developed for two platforms, IOS and
Android, and involves thus different effort estimation values. T-B claimed that the UI design
of a task in Android devices sometimes takes more time than in IOS. The reason is that the
task needs to be tested in multiple Android devices, unlike IOS, as the Android emulator
does not accurately reflect the real UI of Android devices. Also, T-A said: ‘The drag and drop
feature of designing UI in XCode IDE is more supportive and accurate than Android studio’.
Regardless of the pros and cons of each of the mobile framework, IDE, tools and platform,
this argument is debatable, and professionality depends on the developer’s capability and
experience in development skills, and these aspects underpin the six technical factors
mentioned in Chapter 7.
Related to this, the researcher put a question to the development team members on the
comprehensive estimation factors and their relationship to the usability heuristics for
mobile app interfaces from these studies (Ickin et al., 2012; Inostroza et al., 2013; Yáñez
Gómez et al., 2014). Usability heuristics focus on measuring the quality of design in a mobile
app interface, such as customisation and shortcut, minimising the user’s memory load,
consistency, and so on. The development team concluded that these kinds of criteria
usually were deployed during the building phase of product backlog and in the early stage
of gathering the requirements. Designing the UI and UX should be agreed at an early stage
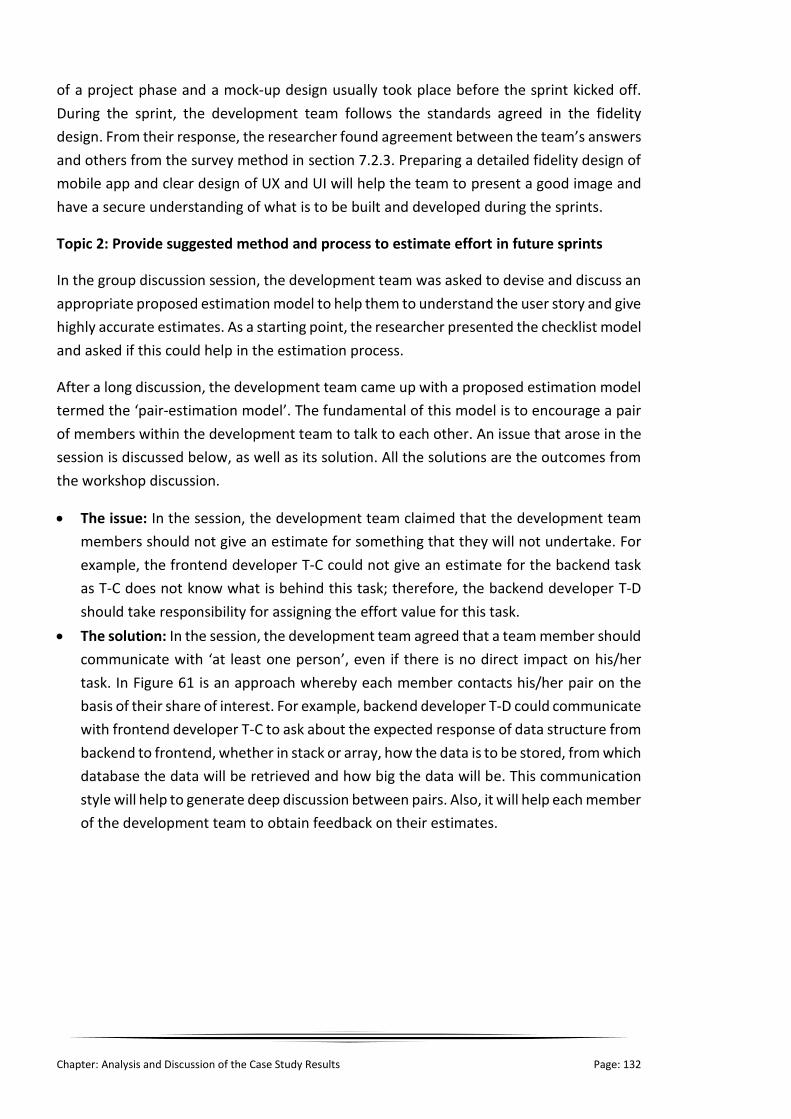
Chapter: Analysis and Discussion of the Case Study Results Page: 132
of a project phase and a mock-up design usually took place before the sprint kicked off.
During the sprint, the development team follows the standards agreed in the fidelity
design. From their response, the researcher found agreement between the team’s answers
and others from the survey method in section 7.2.3. Preparing a detailed fidelity design of
mobile app and clear design of UX and UI will help the team to present a good image and
have a secure understanding of what is to be built and developed during the sprints.
Topic 2: Provide suggested method and process to estimate effort in future sprints
In the group discussion session, the development team was asked to devise and discuss an
appropriate proposed estimation model to help them to understand the user story and give
highly accurate estimates. As a starting point, the researcher presented the checklist model
and asked if this could help in the estimation process.
After a long discussion, the development team came up with a proposed estimation model
termed the ‘pair-estimation model’. The fundamental of this model is to encourage a pair
of members within the development team to talk to each other. An issue that arose in the
session is discussed below, as well as its solution. All the solutions are the outcomes from
the workshop discussion.
• The issue: In the session, the development team claimed that the development team
members should not give an estimate for something that they will not undertake. For
example, the frontend developer T-C could not give an estimate for the backend task
as T-C does not know what is behind this task; therefore, the backend developer T-D
should take responsibility for assigning the effort value for this task.
• The solution: In the session, the development team agreed that a team member should
communicate with ‘at least one person’, even if there is no direct impact on his/her
task. In Figure 61 is an approach whereby each member contacts his/her pair on the
basis of their share of interest. For example, backend developer T-D could communicate
with frontend developer T-C to ask about the expected response of data structure from
backend to frontend, whether in stack or array, how the data is to be stored, from which
database the data will be retrieved and how big the data will be. This communication
style will help to generate deep discussion between pairs. Also, it will help each member
of the development team to obtain feedback on their estimates.

Chapter: Analysis and Discussion of the Case Study Results Page: 133
Figure 61: Pair-estimation model
Topic 3: Discuss with the development team what the researcher observed at the sprint
planning event
Several concerns arose in the previous section regarding the effort estimation process and
technique, and in the group session the observations were shared with the development
team. From the discussion, it was concluded that certain actions needed to be taken during
estimation:
• Break down the task/user story into subtasks that should not take over 8 hours. If a task
reaches 8 hours, as an estimate, the developer needs to divide it into subtasks as shown
in Figure 62. The subtask could include technical subtasks that help the developer to
measure the effort. The effort estimate should be based on hours, not days.
• After breaking down the user story into small tasks, every member of the team takes
the relevant task from the user story and discusses with peers their shared interest,
integrated data, APIs, etc., as shown in Figure 61.
• With an hour or two of the sprint planning event, the development team holds a
meeting to understand the first five to six priority user stories and discusses the effort

Chapter: Analysis and Discussion of the Case Study Results Page: 134
estimation value for each. This allow the development team to understand the user
story and gives them more time to prepare to implement them technically. This
resolves the issue of T-C’s presence to share their suggested effort estimate for their
user stories or tasks.
• The development team should provide reasonable factors to the customer and product
owner and present a good justification for assigning a certain effort value to a user story
or task.
• Although it is agreed that the project manager or Scrum master should prevent
interference from the customer and product owner on assigning an effort value to user
stories, the development team should present a good justification of its estimates to
satisfy them.
• It is agreed that clarity regarding the ‘definition of done’ will improve the accuracy of
the effort estimation; therefore, for each estimate, the development team should
consider the workflow of the user stories process, as follows:
o Action by development team: user stories go through the following stages:
▪ Design the UI
▪ Coding
▪ Testing and QA
▪ Deployment: deploy the user story internally.
o Action on the customer side: after the user story has gone through the previous
stages, the last stage is:
▪ Acceptance testing ‘UAT’: this is conducted on the customer side, and
they should give their estimate for how long each user story will take.
After the UTA stage, the user story may be considered to be done.
• A sprint takes two weeks (10 working days):
o First day for the sprint planning event.
o During the sprint, the development team undertakes the development and,
when each task is finished, deploys it to allow the UAT team to conduct testing
during the sprint.
o Last day for the UAT to undertake testing on the customer side for the final
deployed task.
• The client or product owner should be aware of the consequences of adding or change
a user story during a sprint.
• The development team members should talk to each other. Below is an issue that arose
in the workshop session and a solution:
o The issue: In the workshop session, the development team members claimed
that members should not give estimates for something that they will not
undertake. For example, frontend developer T-C should not give an estimate for

Chapter: Analysis and Discussion of the Case Study Results Page: 135
a backend task because of what lies behind this task; therefore, backend
developer T-D should take responsibility for assigning the effort to this task.
o The solution: the team member should talk with his/her pair to ‘at least one
person’, even if there is no direct impact on their task. In the following diagram
is an approach whereby each member communicate with a peer based on their
interest. For example, backend developer T-D could communicate with frontend
developer, T-C, to ask about the response structure from backend to frontend,
whether in stack or array. This will help each member of the development team
to obtain feedback from peers about their estimates.
• The development team agreed that the PP method does not work properly for them,
based on their experience with this technique in earlier projects, because:
o It takes a long time to hear from each member.
o It allows non-specialist members to give an estimation for a task unrelated to
them: for example, a backend developer would give an estimate for a mobile
app task.
• The development team agreed that estimating the effort of a spike is difficult, due to
the uncertainty beyond investigation and the vagueness of the legacy system; however,
it was agreed that assigning a random or arbitrary value damages the velocity of the
development team and turndown chart. Therefore, it was agreed that the product
owner should assign a sprint with a spike to a member of the team to conduct an initial
investigation, making a corresponding reduction in workload for that member. The
member will continue the investigation until they feel that the investigation may affect
their delivery of the sprint. At the end of the sprint, either the initial investigation is
sufficient or the member provides a rough estimate for a more detailed spike in the
next sprint.

Chapter: Analysis and Discussion of the Case Study Results Page: 136
Figure 62: Subtasks: Breaking down user stories into independent tasks
9.1.3. After applying the proposed estimation technique and accuracy’s results
After constructing the proposed estimation technique from the focus group with the
development team members and the project manager, the team applied the new
estimation technique at the sprint planning event for Sprints 6, 7 and 8. The development
team used the estimation factors to help to achieve a precise estimate, following what they
agreed from the first and second group discussions to enhance estimation accuracy.
In the sprint planning for Sprint 6, the development team had 16 user stories and divided
them into 25 subtasks. The team estimated the user stories and its subtasks as around 165
story points. The team delivered all the subtasks by the end of Sprint 6. The team delivered
the subtasks and user stories frequently and during the planned time, as shown in Figure
63, whereas in Sprints 4 to 5 the team delivered all the user stories at once at the end of
the sprint time frame, as shown in Figure 58 and Figure 59. In Sprint 6, the clients and
product owner were satisfied with the number of tasks delivered. The team took 165 user
stories in a sprint backlog of Sprint 6, compared to around 80 user stories in Sprints 4 and
5. The proposed estimation process and technique make the task more organised and
‘doable’ for team members. Each knows what they will do in the sprint. Moreover, the
quality of the development is enhanced; 11 and 9 bugs from the development were found
in Sprints 6 and 7 respectively, whereas 20 bugs were found in Sprint 4 and 17 in Sprint 5.

Chapter: Analysis and Discussion of the Case Study Results Page: 137
In the sprint review of Sprint 6, the clients were satisfied with the results from the sprint.
The team felt that the user stories were clear enough to provide a good plan and estimate
for this sprint. The estimation technique not only provided an accurate value; it helped the
team to organise the work and allowed it to have a clear plan, permitting delivery of the
tasks on time and informing the stakeholder of the actual effort, keeping them satisfied.
Figure 98 in the Appendix D shows the client representative’s appreciation email to the
project manager and the product owner for the noticeable improvement in Sprint 6, and
the clients were happy that all the user stories were successfully delivered to plan.
Table 49: Overall sprint performance before and after the case study
Before After
Sprint 4 Sprint 5 Sprint 6 Sprint 7 Sprint 8
Number of user stories 8 7 12 4 6
Number of subtasks 0 1 25 35 32
Number of bugs 20 17 11 9 13
Number of estimated story points 89 87 165 161 Not
available
Delivery of story points per day (hours/day)
Mean 9.9 6.7 20.6 16.10 Not
available
Median 0 0 17.5 11 Not
available
Std. dev 25.8 24.1 18.6 15.8 Not
available
❖ Focus group discussion on the sprint retrospective session to validate the result from the development team and researcher observations
At the request of the project manager, the observer did not attend the sprint review;
however, the researcher was allowed to attend the sprint retrospective of Sprint 6, when
the team shared the success story about why it had been unlike previous sprints. T-C said:
‘In this sprint, we organised our work and simplified the complexity of the user stories by
breaking them down into small tasks to allow us to understand the details behind the user
story’. T-E added: ‘The estimation factors are very helpful for us to facilitate the breaking
down and categorisation procedure of the user story into small tasks’. The observer asked
the development team to provide feedback on two points: the effectiveness of the
estimation factors that helped it to provide an accurate estimate; and the feasibility of
using the checklist in the format of factors on printed on paper sheets, instead of
presenting them using a projector. The team’s responses can be summarised as follows:
• The comprehensive factors support the team to divide the user story into subtasks. T-
B said: ‘The overall factors open my mind to break down the complexity of the user
story into small pieces of tasks’. T-A said: ‘UI animation, prototype/fidelity design and

Chapter: Analysis and Discussion of the Case Study Results Page: 138
availability of the API tools are the most factors that help me to think more and deep
about the user story before give my estimation’. T-D noted: ‘Before, I was compare the
new task/user story with similar ones that I have done previously, but now the factors
support me to how facilitate the complex user story and allow me to understand how
to collaborate with my colleagues. For example, I was thinking about the transaction
journey and what is the structure of the request and response.’ The observer
recognised from the team work during Sprint 6 that the members recalled the
explanation of the estimation factors from the projected presentation and broke the
user story into small tasks as shown in Table 79 in the Appendix D. The factors
encouraged the team to evaluate the complexity of the user story and helped them to
translate the complexity into the effort value.
• The project manager, T-G, extracted the burndown chart of Sprint 6, as shown in Figure
63, and noted that the development team continued breaking down the user story
during the sprint development. The concern is that the team identified additional
details of the requirement specification in the user story, resulting in more than they
had expected. This scenario required additional effort above what was initially
expected at the start of the sprint. The project manager said this situation arose
because it was the first sprint for the team using the new estimation method.
• The pair-estimation model encourages the team members to talk to each other. The
team had experienced disorganised discussion that led to misleading estimation values
from nonspecialised people. The proposed ‘pair estimation’ method allows pair
professionals to exchange their opinions, experience and understanding about the user
story specification to achieve a highly accurate prediction.
The number of bugs fell in Sprint 6 compared to previous sprints, as shown in Table 49, and
in Table 77 and Table 78 from the Appendix D. As explained before, the pair-estimation
method allows pair professionals to spend more time delving into the specification of the
user story and interpreting their understanding in a valuable and manageable context. Also,
the proposed model allows the team to spend its time developing without any pressure to
take on more tasks in a short period of time. The breaking down of the user story allows
the QA team to design a test case to verify that the delivery achieves its goal.
The researcher observed that there was no opposition to or negotiation by the client about
the team’s estimate during the sprint planning. In fact, the client and product owner were
happy and satisfied with the team capacity. The team claimed that it had not added much
to the work compared with Sprint 5; members just explained what they intended to do in
more detail and organised their work to make it recognisable and remarkable. In fact, the
new method makes their work measurable and allows them to show off their work and
make it visible. This method also allows the team to manage their work and make it
measurable, so they understand their own capacity.
Chapter: Analysis and Discussion of the Case Study Results Page: 139
The researcher observed and recorded instances when the development team discussed
with the client representative and product owner to gather more information about the
user story and facilitate its breakdown into small tasks. The following dialogue is an
example of how the user story can be discussed during the sprint planning event.
• The team broke down a user story into three subtasks and the product owner asked
the team to give an estimate for the overall user story. T-A asked the product owner
further questions to cover all possibilities and wanted to create further subtasks to
meet all aspects. The story is about allowing the client to send a general notification to
all users, as shown in Table 79 in the Appendix D. The developer asked in which
language the users are to receive the message: in English or Arabic, or both: ‘Are they
going to receive the message with both languages or receive the message by the default
language of the app’. T-A continued to explain the current situation of the app in terms
of its default language, and said, ‘There is no feature that allows the user to select the
default language, therefore we need to add the feature to the settings to allow the user
to select the default language’. At this point, the T-A was able to give an estimate for
this user story and its subtasks. The team took advantage of the estimation factors and
asked the product owner about all possible scenarios before committing to an estimate.
• The members T-A and T-B explained the suggested scenario for sending the notification
to the apps. T-B said: ‘The admin of the app will have a drop-down list to select the
receiver type for this notification. From this selection, there is a sub-role type for this
notification: general notification or send notification to a specific people based on their:
gender/nationality/ location of the user/user age range from …. to …. / etc., and also
we send scheduled notification to the user about the holidays and events etc’. T-B
continued to explain the structure of the push notification form on the apps and the
complexity of the form. Also, the client consulted T-A and T-B: ‘What will the form style
of the notification feature look like?’, and continued to ask for more details of the UI
design of the app form. This kind of communication clarifies the user story and makes
it clear to both the development team members and the clients. T-B said: ‘During the
sprint, we will show you the UI design for this form and ask for your approval before
continuing the development’. The client representative and team discussed the
workflow of the notification message, and T-F and client agreed: ‘A confirmation
message must appear to the Admin user before sending the notification.’
In Sprint 7, the team used the same proposed method and focus to avoid the issues
mentioned in the sprint review and retrospective from Sprint 6. The development team
estimated 161 story points for Sprint 7 and delivered all the tasks on time, as shown in
Figure 64. It also delivered all the user stories on time, with just nine bugs in 35 subtasks,
as shown in Table 49 above and Table 78 in the Appendix D.
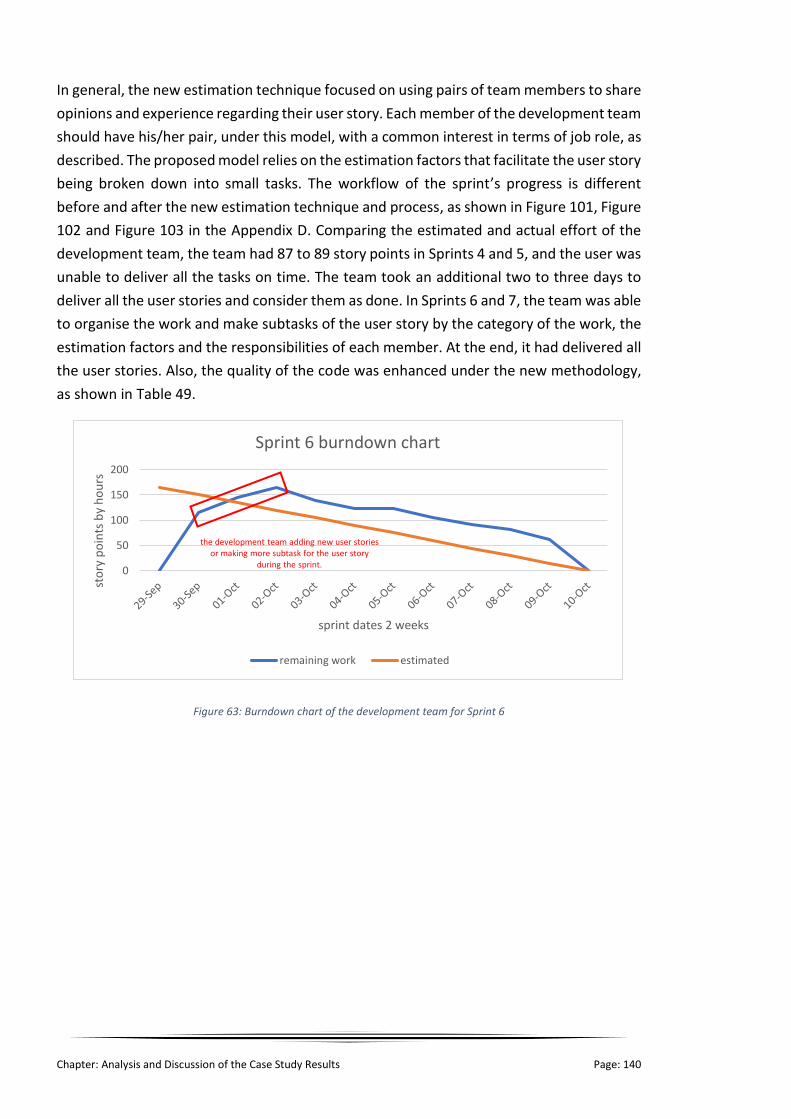
Chapter: Analysis and Discussion of the Case Study Results Page: 140
In general, the new estimation technique focused on using pairs of team members to share
opinions and experience regarding their user story. Each member of the development team
should have his/her pair, under this model, with a common interest in terms of job role, as
described. The proposed model relies on the estimation factors that facilitate the user story
being broken down into small tasks. The workflow of the sprint’s progress is different
before and after the new estimation technique and process, as shown in Figure 101, Figure
102 and Figure 103 in the Appendix D. Comparing the estimated and actual effort of the
development team, the team had 87 to 89 story points in Sprints 4 and 5, and the user was
unable to deliver all the tasks on time. The team took an additional two to three days to
deliver all the user stories and consider them as done. In Sprints 6 and 7, the team was able
to organise the work and make subtasks of the user story by the category of the work, the
estimation factors and the responsibilities of each member. At the end, it had delivered all
the user stories. Also, the quality of the code was enhanced under the new methodology,
as shown in Table 49.
Figure 63: Burndown chart of the development team for Sprint 6
0
50
100
150
200
sto
ry p
oin
ts b
y h
ou
rs
sprint dates 2 weeks
Sprint 6 burndown chart
remaining work estimated
the development team adding new user stories or making more subtask for the user story
during the sprint.

Chapter: Analysis and Discussion of the Case Study Results Page: 141
Figure 64: Burndown chart of the development team for Sprint 7
❖ Result validation using correlation test
In order to validate the findings from the focus group discussions, a statistical correlation
test measured the strength of the association between estimated effort and the actual
effort values during the sprint. As shown in Table 50 and Table 51, the test was applied in
Sprints 4 and 5. The result shows that there is no association between these values, and
this indicates that the team’s development was not performed as expected or planned.
Next, the correlation test was applied to Sprints 6 and 7, after the development team had
started to apply the pair-estimation technique to enhance the accuracy of user story
delivery during the sprint. Table 52 and Table 53 below show that there is a significant
relationship between the estimated effort values and the actual effort, indicating that the
delivery of user stories were delivered as planned and expected when the team used the
proposed pair-estimation technique.
Table 50: Correlation test for Sprint 4
Correlations
Estimated effort Actual effort
Estimated effort in Sprint 4 Pearson Correlation 1 .151
Sig. (2-tailed) .592
Actual effort in Sprint 4 Pearson correlation .151 1
Sig. (2-tailed) .592
0
50
100
150
200
sto
ry p
oin
ts b
y h
ou
rs
sprint dates 2 weeks
Sprint 7 burndown chart
remaining work estimated

Chapter: Analysis and Discussion of the Case Study Results Page: 142
Table 51: Correlation test for Sprint 5
Correlations
Estimated effort Actual effort
Estimated effort in Sprint 5 Pearson Correlation 1 -.048
Sig. (2-tailed) .866
Actual effort in Sprint 5 Pearson correlation -.048 1
Sig. (2-tailed) .866
Table 52: Correlation test for Sprint 6 using pair-estimation technique
Correlations
Estimated effort Actual effort
Estimated effort in Sprint 6 Pearson Correlation 1 .569*
Sig. (2-tailed) .027
Actual effort in Sprint 6 Pearson Correlation .569* 1
Sig. (2-tailed) .027
*. Correlation is significant at the 0.05 level (2-tailed).
Table 53: Correlation test for Sprint 7 using pair-estimation technique
Correlations
Estimated effort Actual effort
Estimated effort in Sprint 7 Pearson Correlation 1 .932**
Sig. (2-tailed) .000
Actual effort in Sprint 7 Pearson Correlation .932** 1
Sig. (2-tailed) .000
**. Correlation is significant at the 0.01 level (2-tailed).
Figure 65: Scatter graph for Sprint 4, before the case study
Figure 66: Scatter graph for Sprint 5, before the case study
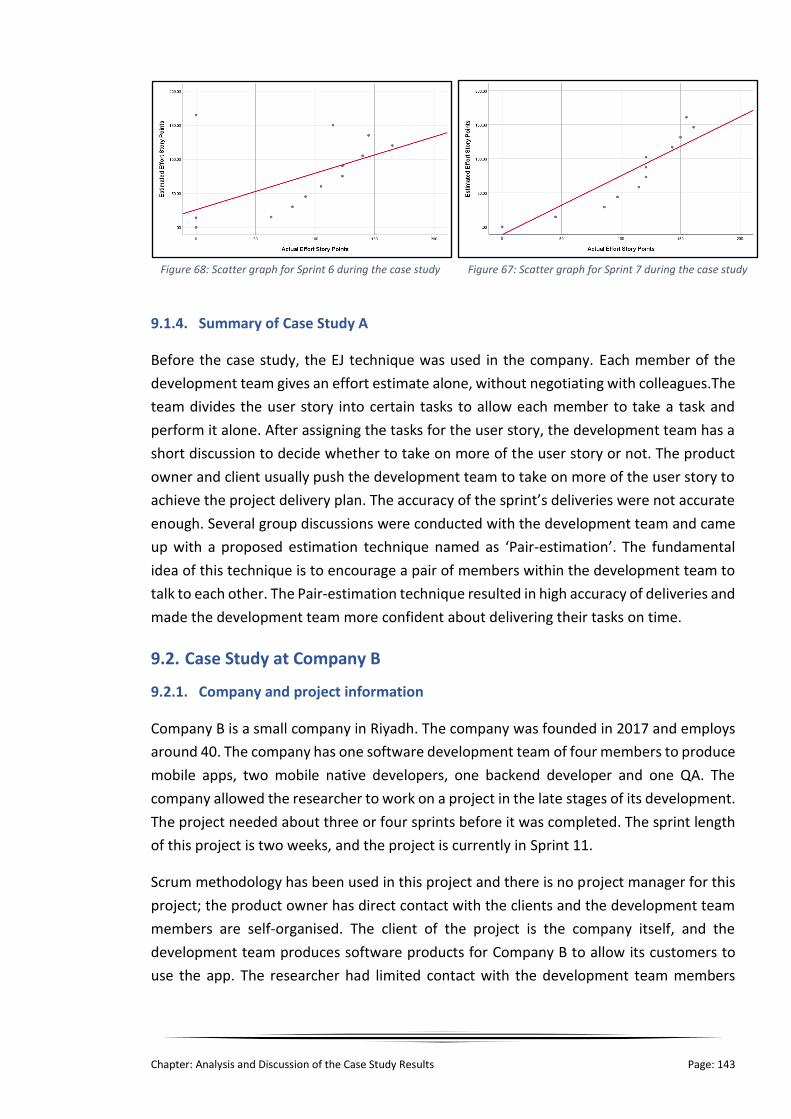
Chapter: Analysis and Discussion of the Case Study Results Page: 143
9.1.4. Summary of Case Study A
Before the case study, the EJ technique was used in the company. Each member of the
development team gives an effort estimate alone, without negotiating with colleagues.The
team divides the user story into certain tasks to allow each member to take a task and
perform it alone. After assigning the tasks for the user story, the development team has a
short discussion to decide whether to take on more of the user story or not. The product
owner and client usually push the development team to take on more of the user story to
achieve the project delivery plan. The accuracy of the sprint’s deliveries were not accurate
enough. Several group discussions were conducted with the development team and came
up with a proposed estimation technique named as ‘Pair-estimation’. The fundamental
idea of this technique is to encourage a pair of members within the development team to
talk to each other. The Pair-estimation technique resulted in high accuracy of deliveries and
made the development team more confident about delivering their tasks on time.
9.2. Case Study at Company B
9.2.1. Company and project information
Company B is a small company in Riyadh. The company was founded in 2017 and employs
around 40. The company has one software development team of four members to produce
mobile apps, two mobile native developers, one backend developer and one QA. The
company allowed the researcher to work on a project in the late stages of its development.
The project needed about three or four sprints before it was completed. The sprint length
of this project is two weeks, and the project is currently in Sprint 11.
Scrum methodology has been used in this project and there is no project manager for this
project; the product owner has direct contact with the clients and the development team
members are self-organised. The client of the project is the company itself, and the
development team produces software products for Company B to allow its customers to
use the app. The researcher had limited contact with the development team members
Figure 68: Scatter graph for Sprint 6 during the case study Figure 67: Scatter graph for Sprint 7 during the case study

Chapter: Analysis and Discussion of the Case Study Results Page: 144
directly to observe their activities; however, the product owner acted as the correspondent
for the case study to answer the case study’s questions as fully as possible.
9.2.2. Current development process of Company B and estimation process
Development process: Company B follows the Scrum methodology of the Agile process.
The development team is self-organised and cross-functional, having individuals with
various functional and domain expertise.
The effort estimation process: Company B applied two estimation processes during all 11
sprints. The first estimation technique was a PP technique, a consensus-based estimation
process commonly used with Agile processes, as discussed in more detail in Chapter 2. Due
to its low accuracy and efficiency, the technique was changed by the company in Sprint 4
to self-estimation. This allows the developer who takes on a task to assign the effort
estimation for that task. Estimation accuracy improved when the company changed from
PP to self-estimation.
There are three reasons why PP did not succeed at this company. The first is the long time
that it took for the estimation procedure to reach a consensus. The PP process involved all
the team members in discussion about a user story or a task over several sessions. It took
about 45 minutes to explain to other team members why one user story involved the
estimated value. On top of that, explaining the PP methods to the team members took
time. The second reason why PP failed is that a member of the team was involved in
estimating tasks that they were not specialised in. In sprint planning, each developer
chooses a task that to do in the sprint, and to let a web developer be involved in estimation
for a mobile app screen task will lead to inaccuracy in estimation. The third reason is the
widely varying level of experience among the team members. Each member had different
capability and skills. They were not full stack developers, and each had tools to use during
the development, therefore, each assigned the estimate according to their capacity.
Self-estimation is an alternative PP technique that allows team members to give their
estimate for a task in a short time. Each provides an estimate based on experience, skills
and profession. For example, a QA member makes the effort estimate on how long the
testing and inspection will take, and the mobile developer estimates how long this feature
or screen will take, and so on. The accuracy improved over the PP technique; however, the
process is still not accurate enough, despite the product owner being satisfied to some
extent with the results. Figure 69 is an accuracy comparison between the two estimation
techniques used in Company B, based on the product owner’s judgement.

Chapter: Analysis and Discussion of the Case Study Results Page: 145
Figure 69: Accuracy level of effort estimation methods used in Company B
Estimation accuracy level
Company B provided the accuracy information of the user stories in Sprint 11. The task
performance in Sprint 11 is shown in Table 54 and Figure 70. There were five user stories
in that sprint, and 12 tasks related to these stories. The development team was able to
deliver only nine, and it spent 129 ideal hours to do so. From the information given on
Sprint 11, the accuracy of this sprint is around 76%. The level was calculated by dividing the
total estimated effort of this sprint with the total of actual effort of the completed tasks
(98/129). From Table 55 and Figure 71, the team development capacity per day is between
12 to 16 ideal hours, apart from the first and last day of the sprint due the sprint planning
session at the start and the sprint review and retrospective at the end. Also from that table,
the development team was be able to deliver 75 ideal hours out of 98 in Sprint 11, and
dividing the earned value with the estimated value (75/98) is 77%, confirming the
estimated effort accuracy of this sprint. The detailed information about the sprint deliveries
and plan are in Table 80 in the Appendix D.
55%-60%70% - 75%
45%-40%30%-25%
0%
20%
40%
60%
80%
100%
Planning Poker technique Self-estimation technique
Estimation Method Accuracy Level
Completed Tasks Not Completed Tasks

Chapter: Analysis and Discussion of the Case Study Results Page: 146
Table 54: Task performance for Sprint 11
Task ID Estimated effort Actual effort for completed task
T1 7 9
T2 8 15
T3 4 8
T4 8 16
T5 10 17
T6 8 15
T7 10 16
T8 8 14
T9 12 19
T10 10 0
T11 5 0
T12 8 0
Total 98 129
Table 55: Team delivery performance per day for Sprint 11
Date Estimated Actual Completed tasks
Sep 22, 2019 7 9 7
Sep 23, 2019 8 15 8
Sep 24, 2019 12 16 4
Sep 25, 2019 10 12 8
Sep 26, 2019 8 14 0
Sep 29, 2019 10 16 10
Sep 30, 2019 8 15 8
Oct 01, 2019 12 14 10
Oct 02, 2019 15 15 8
Oct 03, 2019 8 6 12
Total 98 132 75

Chapter: Analysis and Discussion of the Case Study Results Page: 147
9.2.3. Focus group discussion to enhance the self-estimation method
The researcher held a group discussion interview with the product owner and two
developers from the team to discuss the existing estimation process and how to improve it
to achieve a more accurate estimate. The group discussion goals were to modify the current
model and make sure the team was able to adopt the suggested model. The product owner
02468
101214161820
T1
T2
T3
T4
T5
T6
T7
T8
T9
T10
T11
T12
Estimated VS Completed Effort Tasks
Estimated Effort Actual Effort for completed task
0
20
40
60
80
100
120
140
Sep 22,2019
Sep 23,2019
Sep 24,2019
Sep 25,2019
Sep 26,2019
Sep 29,2019
Sep 30,2019
Oct 01,2019
Oct 02,2019
Oct 03,2019
End
Burndown Chart for Sprint 11
Estimated Actual completed tasks
Figure 70: Task accuracy level (estimated vs actual)
Figure 71: Burndown chart for Sprint 11 to compare the estimated effort to the actual and earned effort values

Chapter: Analysis and Discussion of the Case Study Results Page: 148
and developers emphasised that the estimation model should be easy to understand and
be applied by the development team, and the enhanced model should not take long time
during sprint planning.
Challenges of the self-estimation method: In the group discussion interview, the
researcher asked the members why self-estimation was still not providing good effort
estimation accuracy. The developers claimed that there was no baseline to undertake
estimation. Before, the development team used the PP technique and selected the easiest
user story as the baseline for comparison with other user stories, and then assigned effort
based on the comparison’s differences. The challenge was now how to measure the
differences against other user stories. The team spent time comparing the baseline user
story and figuring out by how much the new user story is bigger than the baseline user
story. The self-estimation method is providing reasonable accuracy compared with PP, as
explained, but still there is no baseline for a team member to rely on to for estimation.
Checklist method: The checklist estimation method was explained to the members, and
they were asked for their opinions on this method. The developers agreed that the checklist
could be incorporated into self-estimation method to facilitate comparison with other user
stories. The effort estimation factors facilitated showing the complexity of the user story
to the development team and allowing them to find attributes to measure the difference
between the user stories.
Development team’s opinion of pair-estimation technique: Another issue arose in the
discussion in that, instead of self-estimation in the sprint planning, the team were
encouraged to try the pair-estimation method. The product owner supported this idea and
believed that this kind of discussion between two developers is better than a one-sided
decision. In the focus group, the two members of the team and product owner agreed that
the technique has good potential to enhance estimation accuracy by helping the pair
developers to have an argument and support to each other to find an appropriate
estimation value. Moreover, the product owner said that pair estimation is better than PP,
in their opinion, for two reasons: reducing the participation of an unrelated person in an
estimation that they have no idea how to develop it; and reducing the time wasted in
multiple estimation rounds. The developers suggested applying this technique in the final
sprint of this project first, to see if there was any improvement on accuracy or not. The
pair-estimation method provided many factors and metrics to help the team, including the
developer, tester and product owner, to establish a baseline and foundation to make the
estimation.

Chapter: Analysis and Discussion of the Case Study Results Page: 149
9.2.4. Result from the suggested method
The product owner explained the pair-estimation method to the development team
members, providing a sheet of paper showing a comprehensive list of estimation factors as
a checklist. Also, the product owner explained the estimation factors to the team, based
on the researcher’s instructions, and applied the method to the last sprint of the project.
The development team applied the pair-estimation technique in Sprint 13, before the last
sprint of this project. From the product owner’s report, the suggested method enhanced
the accuracy of the team’s estimates to some extent, by 10 to 20%, compared to its current
self-estimation method. The suggested method encouraged the pair developers to speak
candidly, without monitoring by the product owner. The suggested method allowed the
team to justify its estimate and defend members’ opinion of the user stories.
With self-estimation, according to the product owner, sometimes developers try to
pretend to themselves that they can do considerable work within a short time to prove
their capability to the product owner or their managers. Sometimes the members cannot
be direct and speak freely to the team. Pair discussion with two members, who feel
comfortable to speak openly, shares the knowledge ability on technical skills, libraries or
tools. The pair-estimation technique supports dialogue between members in a more
practical, advanced and technical manner. In addition, the discussion is highly likely to use
less time than the PP technique. PP involved unrelated specialists in tasks, something that
is not present in the pair-estimation technique. In term of estimation factors/predictors,
the development team concluded that the factors/predictors are good enough to start the
estimation technique for effort estimation; however, the factors/predictor need to be
shaped and enhanced over time to become more detailed and specific to the project.
In Sprint 13, the team estimated four user stories with 93 ideal hours. The four user stories
were broken down into 26 subtasks, as shown in Table 56. The estimation accuracy for
Sprint 13 is around 84%, an improvement of 10% on Sprint 11. The development team
delivered all four user stories with 26 subtasks by the end of the sprint. There are more
details on the user stories and subtasks for Sprint 13 in Table 81 in the Appendix D.
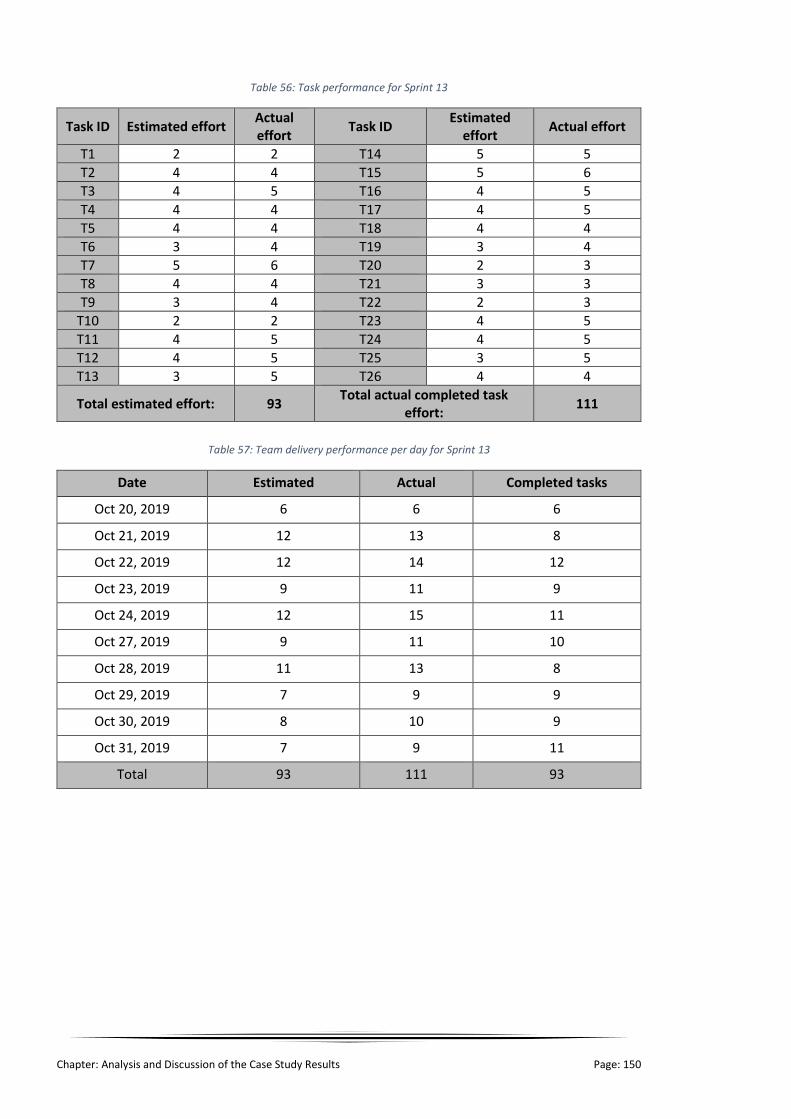
Chapter: Analysis and Discussion of the Case Study Results Page: 150
Table 56: Task performance for Sprint 13
Task ID Estimated effort Actual effort
Task ID Estimated
effort Actual effort
T1 2 2 T14 5 5
T2 4 4 T15 5 6
T3 4 5 T16 4 5
T4 4 4 T17 4 5
T5 4 4 T18 4 4
T6 3 4 T19 3 4
T7 5 6 T20 2 3
T8 4 4 T21 3 3
T9 3 4 T22 2 3
T10 2 2 T23 4 5
T11 4 5 T24 4 5
T12 4 5 T25 3 5
T13 3 5 T26 4 4
Total estimated effort: 93 Total actual completed task
effort: 111
Table 57: Team delivery performance per day for Sprint 13
Date Estimated Actual Completed tasks
Oct 20, 2019 6 6 6
Oct 21, 2019 12 13 8
Oct 22, 2019 12 14 12
Oct 23, 2019 9 11 9
Oct 24, 2019 12 15 11
Oct 27, 2019 9 11 10
Oct 28, 2019 11 13 8
Oct 29, 2019 7 9 9
Oct 30, 2019 8 10 9
Oct 31, 2019 7 9 11
Total 93 111 93

Chapter: Analysis and Discussion of the Case Study Results Page: 151
Figure 73: Burndown chart for Sprint 13 to compare the estimated effort to actual and earned effort values
Table 57 shows the delivery performance for the development team and Figure 73 its
burndown chart. The product owner of the project, in comparing Sprint 11 with Sprint 13,
said that in the former two things helped to estimate the effort accurately: breaking down
the user story into subtasks by the role of the user; and assigning the subtask effort
personally. However, the pair-estimation technique supported the estimate, using a large
0
1
2
3
4
5
6T1
T2T3
T4
T5
T6
T7
T8
T9
T10
T11
T12T13
T14T15
T16
T17
T18
T19
T20
T21
T22
T23
T24
T25T26
Estimated Vs Completed Effort Tasks
Estimated Effort Actual Effort
0
20
40
60
80
100
120
Oct 20,2019
Oct 21,2019
Oct 22,2019
Oct 23,2019
Oct 24,2019
Oct 27,2019
Oct 28,2019
Oct 29,2019
Oct 30,2019
Oct 31,2019
End
Burndown Chart for Sprint 13
Estimated Actual completed tasks
Figure 72: Task accuracy level (estimated vs actual)

Chapter: Analysis and Discussion of the Case Study Results Page: 152
number of estimation predictors to help the team to think deeply about the task
requirements.
9.2.5. Pearson correlation test
In order to validate the findings from the focus group discussions and team performance
outputs, a statistical correlation test measured the degree of the relationship between the
estimated effort values to the actual effort values of completed tasks during the sprint.
Table 58 shows that there is no strong relationship between the estimated and actual effort
values in Sprint 11. By contrast, after the development team applied the pair-estimation
technique in Sprint 13, the association between the estimated and actual effort values is
strong, as shown in Table 59. From the association result, it can be concluded that the
accuracy of the effort estimation in Sprint 13 is higher than in Sprint 11.
Table 58: Correlation test for Sprint 11 to compare the estimated effort to actual effort
Correlation test for Sprint 11
Estimated effort values Actual effort values
Estimated effort values Pearson correlation 1 .440
Sig. (2-tailed) .152
N 12 12
Actual effort values Pearson correlation .440 1
Sig. (2-tailed) .152
N 12 12
Table 59: Correlation test for Sprint 13 to compare the estimated effort to actual effort
Correlation test for Sprint 13
Estimated effort values Actual effort values
Estimated effort values Pearson correlation 1 .832**
Sig. (2-tailed) .000
N 25 25
Actual effort values Pearson correlation .832** 1
Sig. (2-tailed) .000
N 25 25
**. Correlation is significant at the 0.01 level (2-tailed).

Chapter: Analysis and Discussion of the Case Study Results Page: 153
9.2.6. Summary of Case Study B
The company applied the PP estimation technique at the beginning and changed it to self-
estimation technique due to its low accuracy and efficiency. This allows the developer who
takes on a task to assign the effort estimation for that task. The PP did not succeed at this
company due to the long time of the estimation process, level of experience among the
team members and other reasons. Comparing with EJ, the accuracy improved over the PP
technique; however, this is still not accurate enough due the unavailability of the baseline.
The researcher presented the Pair-estimation technique and explained its process to the
development team. The accuracy of the effort estimation was improved from 76% to 84%
after applying the Pair-estimation technique. From the discussion with the product owner,
the accuracy with the proposed technique “Pair-estimation” has potential to improve still
further when the development team adapt to using this technique.
Figure 75: Scatter graph for Sprint 11
Figure 74: Scatter graph for Sprint 13

Chapter: Analysis and Discussion of the Case Study Results Page: 154
9.3. Case Study at Company C
9.3.1. Company and project information
Company C was founded in 2011 in Riyadh, and is owned by the Saudi government. This
company has around 800 employees and is considered as an information technology and
services enterprise that provides e-services and solutions to hundreds of customers, both
in and beyond the Kingdom.
Company C was happy to participate in this case study, giving limited access to its data.
Also, it allowed the researcher to observe the development team without undertaking any
action or making any change to the current processes. The result of applying the proposed
technique was given as general information, without any details of the user story. The
researcher worked closely with two project managers on two projects to monitor and
record the current behaviour of the development team. Also, the researcher provided
suggestions and ideas for enhancements to the project managers to use with their
development teams and then record the results. In general, the company is strict about not
sharing information with a third party, therefore most of the project information is
confidential, under the agreement with the NDA and the study’s ethics regulation number
52598.
In the following sections, further explanation of the case study with Company C is provided.
The result from the case study and suggested model are presented in the coming sections.
Table 60: Case study participants in Company C
Project manager Years of experience Project name
M-A 7 years P-A
M-B 5 years P-B
9.3.2. Current development process and estimation process in Company C
Current development process
In a large organisation, the Agile development process is unlike that in a small- or medium-
sized company. Company C adopted an Agile process in some projects recently, as follows:
• The project manager (PM) is responsible for the project committee and assigns the
solution architect, development team and business owner for the project. Also, the
project manager is responsible for measuring the development performance of the
team and is accountable for managing the project within the approved budget and
Company C’s quality standards.

Chapter: Analysis and Discussion of the Case Study Results Page: 155
• The business analyst (BA) is responsible for developing the documents and analysis
covering all project requirements and stakeholder needs, working together with the
system analyst (SA) team to translate the customer requirements into technical
aspects and provide a business requirement specification to the technical team. The
role is considered as a product owner of the project and collaborates with SA to
facilitate the project in the development team.
• The development team consists of development, integration, quality and
infrastructure professionals working together to deliver continuous development
work over several sprints.
• The sprint length was three weeks on this project, and only one development team
worked on this sprint. The sprint contained sprint planning, development work,
sprint review and sprint retrospective phases. The sprint planning took about three
days and more detail is given in the effort estimation process in the next section.
The sprint development work began after the sprint planning session to undertake
the development of the user stories. The sprint review event at the end of the sprint
with the clients of the project and development team demonstrated the results of
the sprint, then the sprint retrospective allowed enhancements and improvement
by the team.
Current effort estimation process
Based on the discussion with two of the project managers, M-A and M-B, regarding the
estimation process of the development team, the estimation process involves the following
process:
• The BA, with the collaboration of the SA, explains the requirement specification of the
user story to the development team and makes sure that they understand the user
story that is to be delivered in the sprint.
• The development team takes the requirement specification documents of the user
story and each member assigns an estimate to the task that he/she will work on. The
estimation process work is based on individual, not collaborative, work.
• The effort estimation value is returned to the BA and the project manager on the next
day.
• The BA discusses with the project manager the estimation values of the team, and
either they approve it or ask the team to re-evaluate. Also, from the estimation value,
the BA can recognise if the team understands the business requirement properly or not.
o If the task is easy and the team assign a high estimate, the BA asks for
clarification why this it will take that long.

Chapter: Analysis and Discussion of the Case Study Results Page: 156
o If the task is complex and requires many integrations with other components
and the team assigns a low estimate, the BA asks the team why it will be so short
a time and makes sure they understand the task properly.
• Usually, the development team starts development on the third day of the sprint after
the BA and PM accept their estimates.
The estimation accuracy of the last three sprints of Project P-A was given by the project
manager to the researcher, and all three were underestimated by more than 50%. As seen
in Table 61, the accuracy levels in Sprints 2, 3 and 4 are around 25%, 50% and 35%,
respectively. The percentages were given by the project management office PMO in
Company C and are an approximation based on the M-A and M-B’s explanation.
Table 61: Effort estimation’s accuracy level in the last three sprints in Company C
Sprint number Accuracy level
2 25%
3 50%
4 35%
Reasons for low accuracy and proposed solution
During the regular meeting of the two project managers, I met M-A and M-B and discussed
the reasons why the estimation accuracy of this project is unacceptably poor. The project
manager concluded the reasons were as follows:
• The structure and hierarchy of the company does not support the development team
to work independent of external interference. The Agile principle supports the team
being self-organised and taking decisions on the project. The BA and SA team work
under the PMO department, the developers work under the department of application
development and the QA is a separate department, too, and each has its own manager.
There are many departments in this organisation, such as database, security,
integration and system architecture, infrastructure and network. Therefore, the
integration between them involves considerable effort and policies.
• The Agile concept supports a team to work in a cross-functional manner; a big
organisation with a complex structure is not helping the team to work without the
collaboration of other team/departments. The Agile development team consists of
developers and QA members; when a task is done by the team, it has to be passed to
other departments to make sure that the team is following the organisation’s
standards, such as the quality of designing the database schema, hosting the services,
complexity and security of the code, UI and UX standards, and so on.

Chapter: Analysis and Discussion of the Case Study Results Page: 157
• The development team does not use a clear process to arrive at its estimates. Each
member assigns his/her effort estimation for a specific task that he/she will work on.
The individual estimation method does not work properly for the team.
In discussion with the project managers, it was agreed that changes to the company
structure are beyond the scope of this case study, due its hierarchy, and are also out the
project managers’ hands since it requires high-level authorisation from the board of
directors. However, it was agreed to enhance the effort estimation process in the Agile
development team and make changes to the current estimation method. The researcher
shared the experience of Company A with the project managers at Company C and asked
the project managers to adopt that method. The discussion with the project managers
came up with the following suggestion:
• Instead of each member of the development team making his/her estimation alone,
encourage each to share the effort estimation with a partner. The partner could be
selected on the basis of a shared interest of the user story or task, as described in the
proposed estimation technique in Company A.
• Encourage the participation of a representative member from each department in the
sprint planning session, as this is helpful to provide and share their opinion on their
department’s standards and how to meet the development regulations. There are
documents for each department showing their own standards and regulations;
however, these need to be explained to the development team members by
representatives during sprint planning and their questions answered directly. The
representative could participate in the first two or three sprint-planning sessions until
the team feels comfortable with the standards and software architecture. The
representatives are recommended to work with the BA and SA to promote the user
story in the development team and help them to construct the UAT.
• The project managers agree that the effort estimation factors play a vital role in
enhancing the accuracy of the effort estimation and supporting the development team
members to facilitate their tasks by breaking into small, understandable tasks. The
factors can be shared by projector or printed on paper for the development team to
use during the estimation period.
The diagrams in Figure 77 and Figure 76 demonstrate the effort estimation method before
and after the modifications agreed at the meeting with the project managers M-A and M-
B. The project manager M-A agreed to apply the changes to the estimation model with the
development team and notify the relative departments. M-A met the practitioners
responsible to explain the proposed method and ask them to apply it on the next sprint.

Chapter: Analysis and Discussion of the Case Study Results Page: 158
Proposed technique and its result
The proposed technique was to be applied in Project P-A with M-A as project manager.
Project manager M-B only attended the meeting and shared opinions on the estimation
result and technique. In the sprint planning of Sprint 5, the development team followed the
proposed method and the project manager attended the planning session to make sure the
team and all the responsible participants understood and followed the suggested
estimation method. The project manager M-A explained the sequence of estimation
process in the sprint planning as follows:
• First of all, the BA explains the user story to all participants in the sprint planning
session.
• Then the BA asks a representative of each department to provide the acceptance
criteria to achieve the departmental standards.
• The software architect provides the department standards on how the developers do
their codes to make sure the code is reusable and understandable, and also follow the
appropriate design pattern, framework, platform, etc.
• The development team asks questions to make sure the user story and company
standards is clear to them. Then, each member discusses with his/her pair to assign an
effort value for their tasks.
• The estimate is by the development team ‘pair members’, with no interference from
other participants.
• The relevant representative from each department may attend the estimation session
with the development team to help them to assign effort, if required.
• Then, BA and SA decide if the estimate is acceptable or ask for clarification and
justification from the team. The BA wants to make sure the development achieve the
delivery plan agreed with the clients.
At the end of Sprint 5, the project manager M-A shared the accuracy of the effort
estimation. The estimation accuracy was around 70%. The effort estimation accuracy of
Sprint 5 had improved by more than half compared to Sprints 2, 3 and 4, as shown in Figure
78. M-A attributed the improvement to the collaboration of the development team and
the influence of the representative from each department. The effort estimation
factors/predictors had a major influence on enhancing the estimation accuracy, from the
project managers’ observation, and helped the team to evaluate the complexity of the user
story.
The shortfall of 30% in the accuracy level of the effort estimates still required further
investigation and improvement, and it stemmed from the hierarchy of the development
process, not from the development team, according to M-A. There are several
management roles involved in this project, and the adoption of Agile process in this

Chapter: Analysis and Discussion of the Case Study Results Page: 159
company required more investigation. The clients or customer representative in most cases
were unaware about the conflicting requirements of the business, and for this reason there
were sometimes modifications to the specification during the sprint. Moreover, the client
on this project did not attend the sprint planning session to help the BA and SA with further
explanation or enquiries. There were instances where the software requirement
specification was not yet mature enough for the BA and SA, and this misinformation caused
low accuracy in the effort predictions.
Figure 76: Existing effort estimation method in Company C

Chapter: Analysis and Discussion of the Case Study Results Page: 160
Figure 78: Sprint accuracy for the last four sprints in Company C
25%
50%35%
70%
75%
50%65%
30%
0%
20%
40%
60%
80%
100%
Sprint 2 Sprint 3 Sprint 4 Sprint 5
Sprints Accuracy Level
Completed Tasks Not Completed Tasks
Figure 77: Modified effort estimation method in Company C
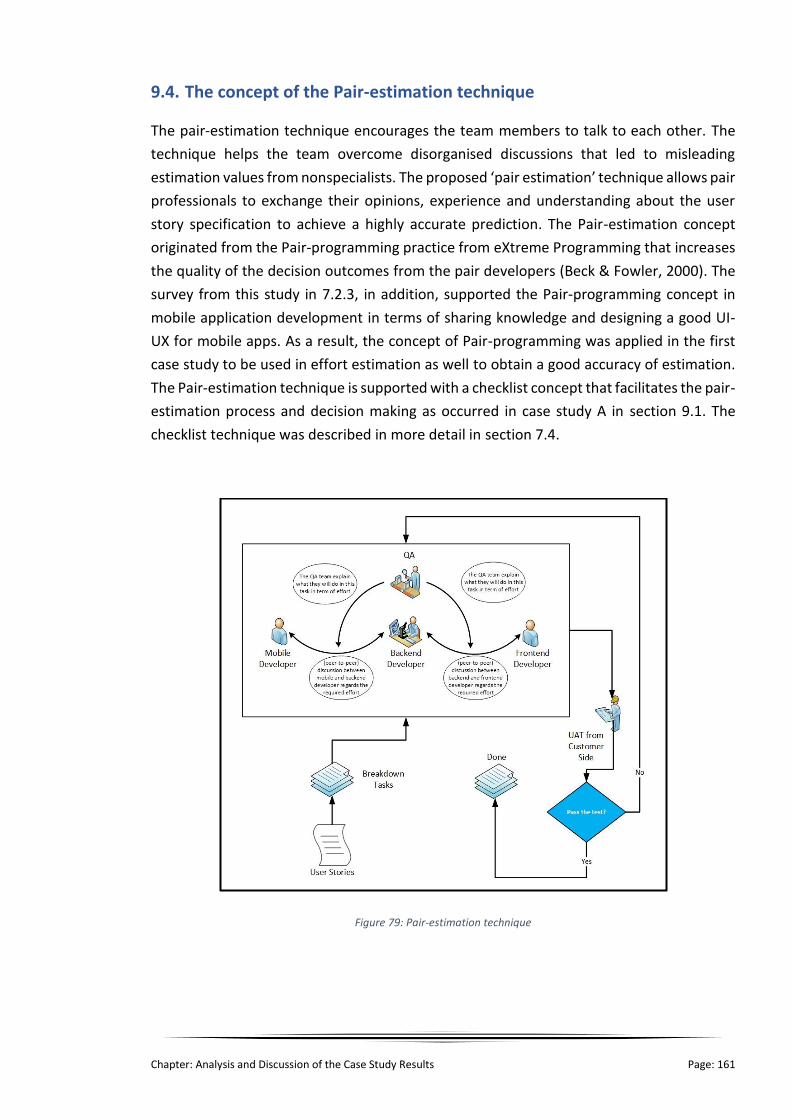
Chapter: Analysis and Discussion of the Case Study Results Page: 161
9.4. The concept of the Pair-estimation technique
The pair-estimation technique encourages the team members to talk to each other. The
technique helps the team overcome disorganised discussions that led to misleading
estimation values from nonspecialists. The proposed ‘pair estimation’ technique allows pair
professionals to exchange their opinions, experience and understanding about the user
story specification to achieve a highly accurate prediction. The Pair-estimation concept
originated from the Pair-programming practice from eXtreme Programming that increases
the quality of the decision outcomes from the pair developers (Beck & Fowler, 2000). The
survey from this study in 7.2.3, in addition, supported the Pair-programming concept in
mobile application development in terms of sharing knowledge and designing a good UI-
UX for mobile apps. As a result, the concept of Pair-programming was applied in the first
case study to be used in effort estimation as well to obtain a good accuracy of estimation.
The Pair-estimation technique is supported with a checklist concept that facilitates the pair-
estimation process and decision making as occurred in case study A in section 9.1. The
checklist technique was described in more detail in section 7.4.
Figure 79: Pair-estimation technique
Chapter: Analysis and Discussion of the Case Study Results Page: 162
9.5. Limitations of the Research
In terms of conducting the case studies, the researcher experienced some difficulties and
challenges in obtaining and recording information on the development teams’
performance and sprint velocity. Some companies were reluctant to share their data and
feared losing clients, which could affect their reputation. However, the researcher
observed and recorded important information to evaluate and validate the proposed
estimation technique. For each case study, there were various types of information;
therefore, every case study had a different type of analysis. There was possibility that the
participants from the three case studies could changed their behaviour in response to their
awareness of being studied, watched or observed for any reason, and this situation known
as the Hawthorne effect. In order to mitigate this risk; however, the researcher handled
the Hawthorne effect by understanding and following the suggested protocols from
(Oswald et al., 2014) that encourage building trust, good communication, friendly
relationship and relaxing with the participants and wearing casual dress. The researcher
had direct contact with the project managers in order to acquire the required data while
the development team not feeling they have been observed. Also, the research ask the
project manager to confirm the observed data to make sure the data has been collected
properly.
9.6. Summary
In this chapter, the proposed effort estimation technique of ‘pair estimation’ was validated
in three companies, resulting in an improvement in estimation accuracy. Company A had
used an EJ technique that allowed one expert from the development team to take control
of estimation for all user stories in the sprint. Sometimes the team used a self-estimation
technique, whereby the developer who is to do the task is responsible for assigning the
effort value to that task. Company A allowed the researcher to undertake more
investigation into the sprint and conduct focus groups to understand the challenges during
the estimation process. The result of the proposed technique, pair estimation, was
enhanced delivery of the user story and its quality in terms of the numbers of defects/bugs.
In Company B, the researcher was able to obtain detailed information on the sprint due the
small size of the company. The company applied pair estimation and the results showed a
positive impact by the proposed technique.
Most of the companies preferred self-estimation to avoid the complexity of the estimation
process and wanted commitment from developers regarding estimates. Companies A and
B concluded that PP technique was not working properly for them due to unrelated
members of the team being involved in the estimation of a task that is not their specialty,
resulting in inaccurate estimation. PP took a long time during sprint planning. In Company
C, the development team suffered from the organisational structure and hierarchy, and the

Chapter: Analysis and Discussion of the Case Study Results Page: 163
researcher had limited access to the sprint data due to the sensitivity of the clients and the
company’s reputation. The researcher contacted the two project managers and PMO
department directly to investigate the estimation challenges, and the pair-estimation
technique enhanced the project’s estimation accuracy, to some extent.

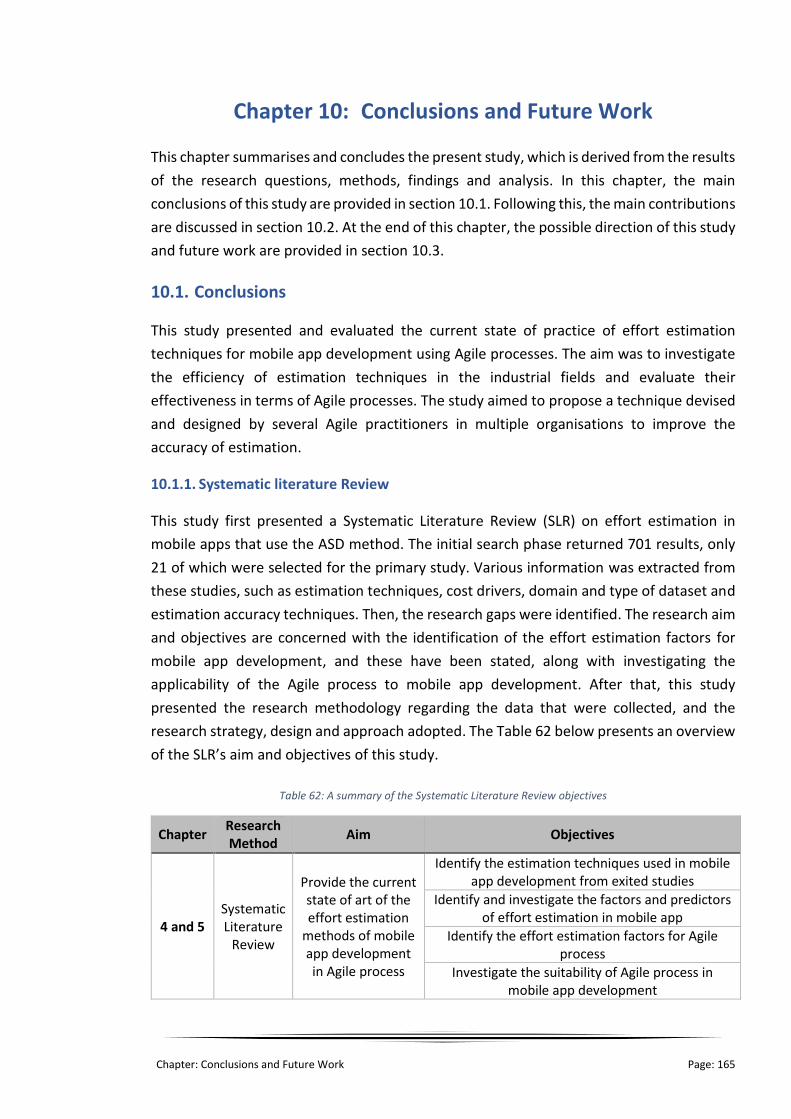
Chapter: Conclusions and Future Work Page: 165
Chapter 10: Conclusions and Future Work
This chapter summarises and concludes the present study, which is derived from the results
of the research questions, methods, findings and analysis. In this chapter, the main
conclusions of this study are provided in section 10.1. Following this, the main contributions
are discussed in section 10.2. At the end of this chapter, the possible direction of this study
and future work are provided in section 10.3.
10.1. Conclusions
This study presented and evaluated the current state of practice of effort estimation
techniques for mobile app development using Agile processes. The aim was to investigate
the efficiency of estimation techniques in the industrial fields and evaluate their
effectiveness in terms of Agile processes. The study aimed to propose a technique devised
and designed by several Agile practitioners in multiple organisations to improve the
accuracy of estimation.
10.1.1. Systematic literature Review
This study first presented a Systematic Literature Review (SLR) on effort estimation in
mobile apps that use the ASD method. The initial search phase returned 701 results, only
21 of which were selected for the primary study. Various information was extracted from
these studies, such as estimation techniques, cost drivers, domain and type of dataset and
estimation accuracy techniques. Then, the research gaps were identified. The research aim
and objectives are concerned with the identification of the effort estimation factors for
mobile app development, and these have been stated, along with investigating the
applicability of the Agile process to mobile app development. After that, this study
presented the research methodology regarding the data that were collected, and the
research strategy, design and approach adopted. The Table 62 below presents an overview
of the SLR’s aim and objectives of this study.
Table 62: A summary of the Systematic Literature Review objectives
Chapter Research Method
Aim Objectives
4 and 5 Systematic Literature
Review
Provide the current state of art of the effort estimation
methods of mobile app development in Agile process
Identify the estimation techniques used in mobile app development from exited studies
Identify and investigate the factors and predictors of effort estimation in mobile app
Identify the effort estimation factors for Agile process
Investigate the suitability of Agile process in mobile app development

Chapter: Conclusions and Future Work Page: 166
10.1.2. Survey Method
Prior to specifying data collection through interviews, the author had prepared likely
techniques. The interview aimed to evaluate the effective factors in enhancing the accuracy
of development teams’ estimates. The interview questions, in addition, aimed to explore
the estimation techniques and processes used in the development of mobile apps and
investigate its validity and efficiency in the context of Agile processes. The author
conducted interviews with 20 experts from 18 different organisations, then the data
collected from the survey and interviews were analysed quantitatively and qualitatively.
The interview included a wide diversity of participants that involved project managers,
mobile developers, backend developers, frontend developers and QA.
Survey result: The interviews revealed that the EJ technique of effort estimation is the one
most commonly used in the development of mobile apps. Development teams tend to use
non-formal models that rely on judgement; however, these techniques suffer from low
accuracy for mobile app development, according to the interviews, and for software in
general from previous studies in the literature. The survey’s results concluded that the
experts preferred to undertake estimation on an individual basis, so each task should be
assigned to one member of the development team. Group-based estimation, such as PP,
leads to inaccuracy due to the varying level of developers’ experience, knowledge,
capability and other factors. The survey, moreover, evaluated the list of comprehensive
factors that influence the accuracy of the effort estimation. At the start, the interviews
evaluated 48 effective factors. Then, the experts provided 20 further factors and explained
more extensively how these could affect the estimation values. The quantitative analysis
of the results showed a relationship between these factors and the opinions of project
managers, developers and QAs.
Preliminary of proposed technique: At the end of Chapter 7 there was a discussion on
formal and non-formal estimation techniques that included the debate between Magne
Jørgensen and Barry Boehm (Jørgensen et al., 2009; Jørgensen & Grimstad, 2010) and other
researchers and specialists from the SLR, such as Mahnič and Hovelja (2012), Tanveer,
Guzmán and Engel (2017) and M. Usman et al. (2015). The results revealed that, while the
experts usually rely on non-formal techniques such as PP and EJ, there is a need for
improvement in their current techniques. A proposed technique was initiated by the
experts’ discussions and evolved into the checklist method of estimation.
The Table 63 summarised the aim and objectives of the survey methods, and provided an
overview of the survey method purpose.

Chapter: Conclusions and Future Work Page: 167
Table 63: A summary of the survey method’s aim and objectives
Chapter Research
Method Aim Objectives
7.1.2
7.1.3 Structured
Interview
To investigate
and understand
the current state
of practice of
effort estimation
in mobile app
development
using Agile from
the industrial
fields
To investigate the effort estimation techniques
that used for mobile app development in
industries
7.1.4
7.1.5
To investigate and evaluate the effort estimation
factors and predictors that influence on the
estimation accuracy
7.2.1
7.3.1
7.3.3
Semi-
structured
interview
To investigate, understand and evaluate the
existed estimation process that used in the IT
companies
To investigate the most used estimation
techniques for mobile app development in the
industrial fields
7.2 To understand the challenges and drawbacks of
the current estimation techniques and process
7.2.2
7.3.2
To gain more additional factors and predictors
that play critical factors to influence on the
estimation accuracy
7.1.5 To understand the estimation accuracy of the
exited estimation techniques
7.4
To improve the
existed
estimation
technique
Enhance the most used existing estimation
techniques
Ask for feedback and opinions about the
preliminary proposed technique
10.1.3. Case Study Method
The case-study method was planned and designed in detail in Chapter 8, which includes
the aim and objectives of the case study. The research scope of the case study and
questions were defined prior to the start of the study. The case study involved three
companies that produce software products including mobile apps.
Case study A: The first case study was in Company A, which involved seven specialists
including mobile developers, QA, a backend developer, frontend developer and project
manager. Focus group discussions and observations were conducted to evaluate the
current estimation process and design the proposed estimation technique. Pair estimation
was proposed, and was applied and evaluated in two sprints, then an evaluation process
compared its efficiency to the existing technique. The result revealed an improvement in
delivering a user story within the planned time over previous sprints in the same project.
The correlation test was applied to compare the estimation efficiency before and after the

Chapter: Conclusions and Future Work Page: 168
proposed technique, and concluded that there was a strong relationship between the
estimated and actual effort when the pair-estimation technique was applied. The
improvement was not only on delivering the story points and tasks within the planned time;
the number of bugs was reduced by 60 to 70%. The pair-estimation technique not only
improves estimates; it encourages strong communication with the client and reduces
wasted time in negotiation with irrelevant people, compared to the PP technique.
Case study B: The second case study validated the results from the first. The pair-
estimation technique was applied at Company B and focus group discussions were held
with the relevant team members to discuss the proposed estimation before applying it to
a sprint. Pair estimation was used in Sprint 13, and the accuracy level of estimation
improved from 76% in Sprint 11 to 85% in Sprint 13. Moreover, from the group discussion,
the development team felt more confident than in the previous sprints, due to the clarity
of the planned tasks and user stories.
Case study C: There were stringent limits on access to data about the development team
and the performance of and information about the sprint. The company did not wish to risk
its reputation and feared sharing the data with others. Therefore, there was limited access
to raw data, but the company shared some analysed data and was willing to improve its
estimation accuracy. The accuracy of effort estimation in a selected project was between
30 and 50%. The error ratio was very high compared to the average in earlier case studies
and the survey of experts. The reason was the multiple levels of management on this
project and the existing estimation process. The type of the project was unique, and the
details of the project requirements were not mature. Nonetheless, the accuracy of the
estimation improved to 70% after using the proposed estimation technique of pair
estimation by making the development team aware of the influence of the effort
estimation factors and predictors of the estimation accuracy, and encouraging them to
delve deeper into the project requirement details.
The Table 64 below provided the summary of the case study method from this study.
Table 64: A summary of the case study objectives
Chapter Research Method Objectives
8 and 9 Action Method /
Case Study
To propose an enhanced technique for the most used
estimation techniques from the industrial fields
To confirm the proposed estimation technique efficiency and
validity
To evaluate the efficiency of the effort estimation factors /
predictors
To evaluate the accuracy of the proposed estimation
technique

Chapter: Conclusions and Future Work Page: 169
Syst
em
atic
Lit
era
ture
Re
vie
w
Inte
rvie
w M
eth
od
C
ase
Stu
dy
Me
tho
d
Explo
ratory an
d In
vestigatio
n Stage
Design the proposed
estimation technique
• Apply Action Method with company A for 2 months to define and evaluate the proposed technique.
• Confirm the efficiency of the estimation factors/predictors on the estimation accuracy
Confirm the validity of the
proposed technique • Confirm the validity of the proposed technique in company B and C.
Define Research Scope
• Identify the Population Intervention, Comparison, Outcome and Context “PICOC” model of the research study
• Identify the research questions
• Define the research design, query, criteria and boundary
Analyse the selected
articles
• Screening and filtering the articles
• Categorised the related work into three groups
Effort estimation
techniques and factors
• Extract estimation techniques that used for mobile app
• Extract estimation techniques that used for Agile processes
• Extract estimation factors / predictors for mobile app dev.
• Extract estimation factors / predictors for Agile processes
Effort estimation in Agile Effort estimation in Mobile
app
Agile processes for Mobile
app development
Evaluate the estimation
techniques
• Involved 20 professionals from 18 different organisations to evaluate the estimation techniques
• Evaluate the estimation process and its suitability in mobile app dev.
Evaluate the estimation
factors and predictors
• Evaluate the suitability of 48 effort estimation factors and predictors in mobile app development
• Provide 20 additional factors that influence on the estimation accuracy
Investigate the challenges
that effect on the
estimation accuracy
• Investigate the estimation process and the challenges during the estimation
• Understand the current estimation accuracy the its causes
Proposed a preliminary
estimation technique
• 20 professionals involved to initiate and design the proposed technique
• Adopting the effort estimation factors in the proposed technique
Explan
atory an
d Eva
luatio
n Stage
C
on
firmatio
n Stage
Figure 80: Overview of the study methods and process

Chapter: Conclusions and Future Work Page: 170
10.2. Contributions of the Research
The aim of the study and its objectives and contributions were shaped and designed clearly
in Chapter 3. The study stated four research questions that have been investigated in the
SLR in Chapter 4. Several research gaps were identified and explained at the end of Chapter
5 after the research questions and the literature review were discussed. Therefore, in this
section, the main contributions of this research study are recapped and listed below:
• To investigate the current state of the practice of effort estimation techniques used
in mobile app development using Agile processes.
• To evaluate the most used estimation techniques in Agile processes, Poker Planning
and Expert Judgment, in the industrial fields for mobile app development.
• To identify the main challenges of current estimation processes and its techniques
from the industry’s perspectives.
• To identify and evaluate a comprehensive list of effort estimation factors and
predictors for mobile app development in the Agile context.
• To measure the effect of effort estimation factors and predictors on estimation
techniques.
• To propose an estimation technique with the collaboration of professionals from
various organisations, and to validate and evaluate its efficiency and accuracy in
Agile mobile app development.
Taking these together, this research identified 68 validated factors that support the Agile
development team to assign the estimated effort for a task. This research designed and
examined the proposed Pair-estimation technique to perform the estimation process
during the sprint in Agile process. The research contribution, in addition, has validated the
most used estimation techniques, Planning Poker and Expert Judgment, and measured
their effectiveness in the Agile process for Mobile app development. There is no best
estimation technique in Agile processes; however, the Pair-estimation technique provided
promising results that have been validated empirically across multiple companies.
10.3. Future Work
Several research gaps were identified from the SLR results and discussions. Some were
discussed and covered in this study and others were not. In addition, this study investigated
the current state of practice in 18 organisations and proposed estimation factors that
improved existing estimation techniques. However, more gaps have arisen during the
investigation. In this section, therefore, possible future works and directions are
highlighted.

Chapter: Conclusions and Future Work Page: 171
One possible future work direction is to meet the need to examine suitable Agile
approaches for mobile app development. This study investigated and validated the effort
estimation of mobile app development in Agile process. Part of this study provided
feedback on the Agile process in mobile app development, as this is within its scope. There
are proposed Agile approaches, such as Mobile-D and MASAM, in mobile app development
that should be examined and validated empirically.
Since this study applied its case studies in three companies in the Kingdom of Saudi Arabia
in cities; further companies, countries and places need to be involved, in future work, to
investigate the current state of practice in activities there and provide more feedback on
existing estimation techniques and the proposed technique. This study, in addition,
provided feedback on one of the most well-known techniques in Agile, PP, from an IT-sector
perspective. The result revealed that PP suffered from challenges mentioned extensively in
Chapter 9. However, this study is the only research to have given empirical feedback on PP
for mobile app development using Agile processes (Altaleb & Gravell, 2018; Britto et al.,
2014; Kaur & Kaur, 2018; M. Usman et al., 2015), alongside the few works that examine PP
activities empirically for Agile process in general. Therefore, there is a potential direction
to investigate the PP technique in mobile app development for Agile processes.
This study provided a comprehensive list of factors from interviews and other research, and
then validated its suitability for mobile app development. There is potential future work to
validate these factors using a greater number of professionals across companies and
countries. Another work could investigate the effort estimation factors for a specific mobile
app platform, either IOS or Android. This study initiated a search for comprehensive factors
across mobile app platforms in general, out of concern at the diversity of mobile platforms,
and a continued investigation could focus on a specific platform to investigate deeper
within API’s complexity, tools and UI-UX features of a mobile platform.


References Page: 173
References 13th Annual State Of Agile Report. (2019). Collabnet VersionOne.
https://www.stateofagile.com/#ufh-i-521251909-13th-annual-state-of-agile-report/473508
Abdullah, N. A. S., & Rusli, N. I. A. (2015). Reviews on Functional Size Measurement in Mobile Application and Uml Model. Proceedings of the 5th International Conference on Computing and Informatics, ICOCI, 122, 353–358.
Abdullah, N. A. S., Rusli, N. I. A., & Ibrahim, M. F. (2014). Mobile Game Size Estimation: COSMIC FSM Rules, UML Mapping Model and Unity3D Game Engine. 2014 IEEE Conference on Open Systems (ICOS), 42–47.
Abrahamsson, P, Hanhineva, A., Hulkko, H., Ihme, T., Jäälinoja, J., Korkala, M., Koskela, J., Kyllönen, P., & Salo, O. (2004). Mobile-D: An agile approach for mobile application development. Proceedings of the Conference on Object-Oriented Programming Systems, Languages, and Applications, OOPSLA, 174–175. https://doi.org/10.1145/1028664.1028736
Abrahamsson, Pekka, Fronza, I., Moser, R., Vlasenko, J., & Pedrycz, W. (2011). Predicting Development Effort from User Stories. 2011 International Symposium on Empirical Software Engineering and Measurement, 400–403. https://doi.org/10.1109/ESEM.2011.58
Abrahamsson, Pekka, Salo, O., Ronkainen, J., & Juhani Warsta. (2002). Agile Software Development Methods: review and analysis. VIT Publications, Espoo, Finland, 478, 1–112.
Ajit Kumar, N., Krishna, K. T. H., & Manjula, R. (2016). Challenges and Best Practices in Mobile Application Development. Imperial Journal of Interdisciplinary Research, 2(12), 1607–1611. https://doi.org/10.1145/3093241.3093245
Altaleb, A. R., & Gravell, A. (2018). Effort Estimation across Mobile App Platforms using Agile Processes: A Systematic Literature Review. Journal of Software, 13(4), 242–259. https://doi.org/10.17706/jsw.13.4.242-259
André Nitze. (2013). Measuring Mobile Application Size Using COSMIC FP. Software Metrik Kongress.
Appcelerator Titanium. (n.d.). http://docs.appcelerator.com/platform
Arnuphaptrairong, T., & Suksawasd, W. (2017). An Empirical Validation of Mobile Application Effort Estimation Models. Proceedings of the International MultiConference of Engineers and Computer Scientists IMECS 2017, II.
Balasupramanian, N., Lakshminarayanan, R., & Balaji, R. D. (2013). Software Engineering Framework using Agile Dynamic System Development Method for Efficient Mobile Application Development. International Journal of Computer Science and Information Security.

References Page: 174
Beck, K., Beedle, M., Bennekum, A. van, Cockburn, A., Cunningham, W., Fowler, M., Grenning, J., Highsmith, J., Hunt, A., Jeffries, R., Kern, J., Marick, B., Martin, R. C., Mellor, S., Schwaber, K., Sutherland, J., & Thomas, D. (n.d.). Manifesto for Agile Software Development. https://agilemanifesto.org/
Beck, K., & Fowler, M. (2000). Planning Extreme Programming. In October.
Bilgaiyan, S., Sagnika, S., Mishra, S., & Das, M. (2017). A systematic review on software cost estimation in Agile Software Development. Journal of Engineering Science and Technology Review, 10(4), 51–64. https://doi.org/10.25103/jestr.104.08
Björndal, P., Smiley, K., & Mohapatra, P. (2010). Global Software Project Management: A Case Study. Lecture Notes in Business Information Processing, 54(January 2016). https://doi.org/10.1007/978-3-642-13784-6
Boehm, B. W. (1984). Software Engineering Economics. IEEE Transactions on Software Engineering. https://doi.org/10.1109/TSE.1984.5010193
Britto, R., Freitas, V., Mendes, E., & Usman, M. (2014). Effort Estimation in Global Software Development: A Systematic Literature Review. 2014 IEEE 9th International Conference on Global Software Engineering, 135–144. https://doi.org/10.1109/ICGSE.2014.11
Catolino, G., Salza, P., Gravino, C., & Ferrucci, F. (2017). A Set of Metrics for the Effort Estimation of Mobile Apps. Proceedings - 2017 IEEE/ACM 4th International Conference on Mobile Software Engineering and Systems, MOBILESoft 2017, 194–198. https://doi.org/10.1109/MOBILESoft.2017.31
Cohen, D., Lindvall, M., & Costa, P. (2003). Agile Software Development. Fraunhofer Center Maryland, 1–64.
Cohn, M. (2005). Agile Estimating and Planning (1st ed.). Prentice Hall.
Corral, L., Sillitti, A., & Succi, G. (2013a). Agile Software Development Processes for Mobile Systems: Accomplishment, Evidence and Evolution. Proceedings of the Mobile Web Information Systems, Springer-Verlag Berlin, August. https://doi.org/10.1007/978-3-642-40276-0
Corral, L., Sillitti, A., & Succi, G. (2013b). Software development processes for mobile systems: Is agile really taking over the business? 1st International Workshop on the Engineering of Mobile-Enabled Systems, MOBS 2013 - Proceedings, 19–24. https://doi.org/10.1109/MOBS.2013.6614218
Creswell, J. W., & Creswell, J. D. (2018). Research design: Qualitative, quantitative, and mixed methods approaches (5th ed.). Sage publications.
D’Avanzo, L., Ferrucci, F., Gravino, C., & Salza, P. (2015). COSMIC functional measurement of mobile applications and code size estimation. Proceedings of the 30th Annual ACM Symposium on Applied Computing - SAC ’15, 1631–1636. https://doi.org/10.1145/2695664.2695948
Dalmasso, I., Datta, S. K., Bonnet, C., & Nikaein, N. (2013). Survey, comparison and

References Page: 175
evaluation of cross platform mobile application development tools. 2013 9th International Wireless Communications and Mobile Computing Conference (IWCMC), 323–328. https://doi.org/10.1109/IWCMC.2013.6583580
Dantas, E., Perkusich, M., Dilorenzo, E., Santos, D. F. S., Almeida, H., & Perkusich, A. (2018). Effort Estimation in Agile Software Development : an Updated Review. June. https://doi.org/10.18293/SEKE2018-003
David R. Anderson, Dennis J. Sweeney, & Thomas A. Williams. (1989). STATISTICS FOR BUSINESS AND ECONOMICS. In Journal of Chemical Information and Modeling. https://doi.org/10.1017/CBO9781107415324.004
De Souza, L. S., & De Aquino Jr, G. S. (2014). Estimating the Effort of Mobile Application Development. CS & IT-CSCP. https://doi.org/10.5121/csit.2014.4405
Dillman, D. A. (2000). Mail and Internet surveys: the tailored design method (2nd ed.). J. Wiley, 2000.
Dudovskiy, J. (2018). The Ultimate Guide to Writing a Dissertation in Business Studies: A Step-by-Step Assistance.
Dworkin, S. L. (2012). Sample size policy for qualitative studies using in-depth interviews. Archives of Sexual Behavior, 41(6), 1319–1320. https://doi.org/10.1007/s10508-012-0016-6
elsevier.com. (n.d.). How do Scopus and Compendex differ? http://jp.elsevier.com/__data/assets/pdf_file/0019/176302/How-do-Scopus-and-Compendex-differ-final.pdf
Ferrucci, F., Gravino, C., Salza, P., & Sarro, F. (2015). Investigating Functional and Code Size Measures for Mobile Applications. Proceedings - 41st Euromicro Conference on Software Engineering and Advanced Applications, SEAA 2015, 365–368. https://doi.org/10.1109/SEAA.2015.23
Field, A., Miles, J., & Field, Z. (2018). Discovering Statistics Using IBM SPSS Statistics. In Statistics. https://doi.org/10.1111/insr.12011_21
Francese, R., Gravino, C., Risi, M., Scanniello, G., & Tortora, G. (2015). On the Use of Requirements Measures to Predict Software Project and Product Measures in the Context of Android Mobile Apps: A Preliminary Study. Proceedings - 41st Euromicro Conference on Software Engineering and Advanced Applications, SEAA 2015, ii, 357–364. https://doi.org/10.1109/SEAA.2015.22
Francese, R., Gravino, C., Risi, M., Tortora, G., & Scanniello, G. (2016). Estimate method calls in Android apps. Proceedings of the International Workshop on Mobile Software Engineering and Systems - MOBILESoft ’16. https://doi.org/10.1145/2897073.2897113
Furulund, K. M., & Moløkken-Østvold, K. (2007). Increasing software effort estimation accuracy - Using experience data, estimation models and checklists. Proceedings - International Conference on Quality Software, Qsic, 342–347.

References Page: 176
https://doi.org/10.1109/QSIC.2007.4385518
Gandomani, T. J., Wei, K. T., & Binhamid, A. K. (2014). A case study research on software cost estimation using experts’ estimates, Wideband Delphi, and Planning Poker technique. International Journal of Software Engineering and Its Applications, 8(11), 173–182. https://doi.org/10.14257/ijseia.2014.8.11.16
Grimstad, S., & Jørgensen, M. (2007). Inconsistency of expert judgment-based estimates of software development effort. Journal of Systems and Software, 80(11), 1770–1777. https://doi.org/10.1016/j.jss.2007.03.001
Guest, G., Bunce, A., & Johnson, L. (2006). How Many Interviews Are Enough? Field Methods, 18(1), 59–82. https://doi.org/10.1177/1525822X05279903
Hammershoj, A., Sapuppo, A., & Tadayoni, R. (2010). Challenges for mobile application development. 14th International Conference on Intelligence in Next Generation Networks (ICIN 2010) and Second International Workshop on Business Models for Mobile Platforms (BMMP 2010), 1–8. https://doi.org/10.1109/ICIN.2010.5640893
Harvey, N. (2001). Improving Judgment in Forecasting. https://doi.org/10.1007/978-0-306-47630-3_4
Haugen, N. C. (2006). An empirical study of using planning poker for user story estimation. Proceedings - AGILE Conference, 2006, 2006, 23–31. https://doi.org/10.1109/AGILE.2006.16
Heeringen, H. Van, & Gorp, E. Van. (2014). Measure the functional size of a mobile app: Using the cosmic functional size measurement method. Proceedings - 2014 Joint Conference of the International Workshop on Software Measurement, IWSM 2014 and the International Conference on Software Process and Product Measurement, Mensura 2014, 11–16. https://doi.org/10.1109/IWSM.Mensura.2014.8
Hoda, R., Kruchten, P., Noble, J., & Marshall, S. (2010). Agility in Context. OOPSLA ’10: Proceedings of the ACM International Conference on Object Oriented Programming Systems Languages and Applications, 74–88. https://doi.org/https://doi.org/10.1145/1869459.1869467
Hussain, I., Kosseim, L., & Ormandjieva, O. (2013). Approximation of COSMIC functional size to support early effort estimation in Agile. Data and Knowledge Engineering, 85, 2–14. https://doi.org/10.1016/j.datak.2012.06.005
Ickin, S., Wac, K., Fiedler, M., Janowski, L., Hong, J. H., & Dey, A. K. (2012). Factors influencing quality of experience of commonly used mobile applications. IEEE Communications Magazine, 50(4), 48–56. https://doi.org/10.1109/MCOM.2012.6178833
Inostroza, R., Rusu, C., Roncagliolo, S., & Rusu, V. (2013). Usability heuristics for touchscreen-based mobile devices: Update. ACM International Conference Proceeding Series, 2241, 24–29. https://doi.org/10.1145/2535597.2535602
Ionic Framework. (n.d.). https://ionicframework.com

References Page: 177
Jeong, Y. J., Lee, J. H., & Shin, G. S. (2008). Development process of mobile application SW based on agile methodology. International Conference on Advanced Communication Technology, ICACT, 1, 362–366. https://doi.org/10.1109/ICACT.2008.4493779
Joorabchi, M. E., Mesbah, A., & Kruchten, P. (2013). Real challenges in mobile app development. International Symposium on Empirical Software Engineering and Measurement, 15–24. https://doi.org/10.1109/ESEM.2013.9
Jørgensen, M. (2004a). A review of studies on expert estimation of software development effort. Journal of Systems and Software, 70(1–2), 37–60. https://doi.org/10.1016/S0164-1212(02)00156-5
Jørgensen, M. (2004b). Top-down and bottom-up expert estimation of software development effort. Information and Software Technology, 46(1), 3–16. https://doi.org/10.1016/S0950-5849(03)00093-4
Jørgensen, M. (2015). A Preliminary Checklist for Software Cost Management.
Jørgensen, M., Boehm, B., & Rifkin, S. (2009). Software development effort estimation: Formal models or expert judgment? IEEE Software, 26(2), 14–19. https://doi.org/10.1109/MS.2009.47
Jørgensen, M., & Grimstad, S. (2010). Software Development Effort Estimation — Demystifying and Improving Expert Estimation. Simula Research Laboratory, pp 381-403. https://doi.org/https://doi.org/10.1007/978-3-642-01156-6_26
jQuery-Mobile website. (n.d.). http://jquerymobile.com/
Kaur, A., & Kaur, K. (2018). Systematic literature review of mobile application development and testing effort estimation. Journal of King Saud University - Computer and Information Sciences, November. https://doi.org/10.1016/j.jksuci.2018.11.002
Kitchenham, B., & Charters, S. (2007). Guidelines for performing Systematic Literature reviews in Software Engineering Version 2.3. Software Engineering Group, School of Computer Science and Mathematics, Keele University, 45(4ve), 1051. https://doi.org/10.1145/1134285.1134500
Kitchenham, B., Pearl Brereton, O., Budgen, D., Turner, M., Bailey, J., & Linkman, S. (2009). Systematic literature reviews in software engineering - A systematic literature review. Information and Software Technology, 51(1), 7–15. https://doi.org/10.1016/j.infsof.2008.09.009
Kothari, C. R. (2004). Research Methodology, Methods and Techniques (second). New Age International (P) Ltd.
Lassoff, M., & Stachowitz, T. (2015). Mobile App Development with HTML5. LearnToProgram, Inc.
Latif, M., Lakhrissi, Y., Nfaoui, E. H., & Es-Sbai, N. (2016). Cross platform approach for mobile application development: A survey. 2016 International Conference on Information Technology for Organizations Development (IT4OD), 1–5.

References Page: 178
https://doi.org/10.1109/IT4OD.2016.7479278
Leffingwell, D. (2011). Agile Software Requirements: Lean Requirements Practices for Teams, Programs, and the Enterprise. In Networks.
Lenarduzzi, V. (2015). Could social factors influence the effort software estimation? Proceedings of the 7th International Workshop on Social Software Engineering - SSE 2015, September, 21–24. https://doi.org/10.1145/2804381.2804385
Lusky, M., Powilat, C., & Böhm, S. (2018). Software Cost Estimation for User-Centered Mobile App Development in Large Enterprises. Springer International Publishing AG 2018.
Mahmud, D. M., & Abdullah, N. A. S. (2015). Reviews on Agile Methods in Mobile Application Development Process. 9th Malaysian Software Engineering Conference, Dec. 2015, 161–165.
Mahnič, V., & Hovelja, T. (2012). On using planning poker for estimating user stories. Journal of Systems and Software, 85(9), 2086–2095. https://doi.org/10.1016/j.jss.2012.04.005
Mendes, E., & Counsell, S. (2004). Investigating Early Web Size Measures for Web Cost Estimation. The Journal of Systems and Software 77 (2005), 1–28.
Moløkken, K., & Jørgensen, M. (2003). A review of surveys on software effort estimation. Proceedings of the 2003 International Symposium on Empirical Software Engineering, 1325, 8. https://doi.org/10.1109/ISESE.2003.1237981
Muhairat, M., Al-Daajeh, S., & Al-Qutaish, R. (2010). The Impact of Global Software Development Factors on Effort Estimation Methods. European Journal of Scientific Research, 46(2), 221–232.
Narendra, N. C., Ponnalagu, K., Zhou, N., & Gifford, W. M. (2012). Towards a Formal Model for Optimal Task-Site Allocation and Effort Estimation in Global Software Development. 2012 Annual SRII Global Conference IEEE, 470–477. https://doi.org/10.1109/SRII.2012.58
Nasir, M. (2006). A survey of software estimation techniques and project planning practices. Proc. - Seventh ACIS Int. Conf. on Software Eng., Artific. Intelligence, Netw., and Parallel/Distributed Comput., SNPD 2006, Including Second ACIS Int. Worshop on SAWN 2006, 305–310. https://doi.org/10.1109/SNPD-SAWN.2006.11
Nitze, A., Schmietendorf, A., & Dumke, R. (2014). An analogy-based effort estimation approach for mobile application development projects. Proceedings - 2014 Joint Conference of the International Workshop on Software Measurement, IWSM 2014 and the International Conference on Software Process and Product Measurement, Mensura 2014, 99–103. https://doi.org/10.1109/IWSM.Mensura.2014.9
Nosseir, A., Flood, D., Harrison, R., & Ibrahim, O. (2012). Mobile Development Process Spiral. IEEE, 281–286.

References Page: 179
Oswald, D., Sherratt, F., & Smith, S. (2014). Handling the Hawthorne effect: The challenges surrounding a participant observer. Review of Social Studies. https://doi.org/10.21586/ross0000004
Ottka, S. (2015). Comparison of mobile application de- velopment tools for multi-platform in- dustrial applications. Aalto University School of Science.
Parvez, A. W. M. M. (2013). Efficiency factor and risk factor based user case point test effort estimation model compatible with agile software development. Proceedings - 2013 International Conference on Information Technology and Electrical Engineering: “Intelligent and Green Technologies for Sustainable Development”, ICITEE 2013, 113–118. https://doi.org/10.1109/ICITEED.2013.6676222
Passing, U., & Shepperd, M. (2003). An experiment on software project size and effort estimation. Proceedings - 2003 International Symposium on Empirical Software Engineering, ISESE 2003. https://doi.org/10.1109/ISESE.2003.1237971
Peixoto, C. E. L., Audy, J. L. N., & Prikladnicki, R. (2010). Effort Estimation in Global Software Development Projects: Preliminary Results from a Survey. 2010 5th IEEE International Conference on Global Software Engineering, 123–127. https://doi.org/10.1109/ICGSE.2010.22
Petticrew, M., & Roberts, H. (2006). Systematic Reviews in the Social Sciences. Blackwell publishing. https://doi.org/10.1002/9780470754887
PhoneGap. (n.d.). https://phonegap.com/
Pikkarainen, M., Haikara, J., Salo, O., Abrahamsson, P., & Still, J. (2008). The impact of agile practices on communication in software development. Empirical Software Engineering, 13(3), 303–337. https://doi.org/10.1007/s10664-008-9065-9
Preuss, T. (2013). Mobile applications, function points and cost estimating. International Cost Estimation & Analysis Association Conference.
Principles for Agile Manifesto. (n.d.). Agilealliance.Org. https://www.agilealliance.org/agile101/12-principles-behind-the-agile-manifesto/%0A
Rahimian, V., & Ramsin, R. (2008). Designing an agile methodology for mobile software development: a hybrid method engineering approach. Second International Conference on Research Challenges in Information Science, 337–342. https://doi.org/10.1109/RCIS.2008.4632123
Rajput, M. (2015). Tracing the History and Evolution of Mobile Apps. https://tech.co/mobile-app-history-evolution-2015-11
Ramasubbu, N., & Balan, R. K. (2012). Overcoming the Challenges in Cost Estimation for Distributed Software Projects. Proceedings - International Conference on Software Engineering, 91–101. https://doi.org/10.1109/ICSE.2012.6227203
Rao, K. N., Naidu, G. K., & Chakka, P. (2011). A study of the Agile software development

References Page: 180
methods, applicability and implications in industry. International Journal of Software Engineering and Its Applications, 5(2), 35–46.
Robson, C. (2002). Real World Research. 2nd. In Edition. Blackwell Publishing. Malden.
Rosen, C., & Shihab, E. (2016). What are mobile developers asking about? A large scale study using stack overflow. Empirical Software Engineering, 21(3), 1192–1223. https://doi.org/10.1007/s10664-015-9379-3
Runeson, P., & Höst, M. (2009). Guidelines for conducting and reporting case study research in software engineering. Empirical Software Engineering, 14(2), 131–164. https://doi.org/10.1007/s10664-008-9102-8
Runeson, P., Höst, M., Rainer, A., & Regnell, B. (2012). Case Study Research in Software Engineering: Guidelines and Examples. In Case Study Research in Software Engineering: Guidelines and Examples. https://doi.org/10.1002/9781118181034
Santos, A., Kroll, J., Sales, A., Fernandes, P., & Wildt, D. (2016). Investigating the adoption of agile practices in mobile application development. ICEIS 2016 - Proceedings of the 18th International Conference on Enterprise Information Systems, 1(Iceis), 490–497. https://doi.org/10.5220/0005835404900497
Saunders, M., Lewis, P., & Thornhill, A. (2009). Research Methods for Business Students (5th ed.). Pearson Education.
Schwaber, K., & Sutherland, J. (2017). The Scrum Guide: The Definitive The Rules of the Game. Scrum.Org and ScrumInc. https://doi.org/10.1053/j.jrn.2009.08.012
Shahwaiz, S. A., Malik, A. A., & Sabahat, N. (2016). A Parametric Effort Estimation Model for Mobile Apps. 2016 19th International Conference (INMIC), IEEE.
Shea, B. J., Hamel, C., Wells, G. A., Bouter, L. M., Kristjansson, E., Grimshaw, J., Henry, D. A., & Boers, M. (2009). AMSTAR is a reliable and valid measurement tool to assess the methodological quality of systematic reviews. Journal of Clinical Epidemiology, 62(10), 1013–1020. https://doi.org/10.1016/j.jclinepi.2008.10.009
Shekhar, S., & Kumar, U. (2016). Review of Various Software Cost Estimation Techniques. International Journal of Computer Applications, 141(11).
Siddaway, A. (2014). What is a Systematic Literature Review and How do I do one? What Is a Systematic Literature Review and How Do I Do One?, 1–13.
Souza, L. S. De, & Aquino, G. S. De. (2014). Mobile Application Development : How to Estimate the Effort? Springer International Publishing Switzerland, 63–72.
Spataru, A. C. (2010). Agile development methods for mobile applications. The University of Edinburgh, Edinburgh, 1–68. https://doi.org/10.1007/978-981-4451-63-5
Stacia Viscardi. (2013). The Professional Scrum Master’s Handbook. Packt Publishing.
Tanveer, B., Guzmán, L., & Engel, U. M. (2017). Effort estimation in agile software development: Case study and improvement framework. Journal of Software: Evolution

References Page: 181
and Process, 29(11), e1862. https://doi.org/10.1002/smr.1862
Tanveer, B., Guzmán, L., & Engel, U. M. (2016). Understanding and improving effort estimation in Agile software development. Proceedings of the International Conference on Software and System Processes- ICSSP ’16, 41–50. https://doi.org/10.1145/2904354.2904373
Tracy, K. (2012). Mobile Application Development Experiences on Apple’s iOS and Android OS. IEEE Potentials, 31, 30–34. https://doi.org/10.1109/MPOT.2011.2182571
Usman, M, Mendes, E., & Börstler, J. (2015). Effort estimation in Agile software development: A survey on the state of the practice. ACM International Conference Proceeding Series, 27-29-Apri. https://doi.org/10.1145/2745802.2745813
Usman, M, Mendes, E., Weidt, F., & Britto, R. (2014). Effort estimation in Agile Software Development: A systematic literature review. ACM International Conference Proceeding, 82–91. https://doi.org/10.1145/2639490.2639503
Usman, Muhammad, Börstler, J., & Petersen, K. (2017). An Effort Estimation Taxonomy for Agile Software Development. International Journal of Software Engineering and Knowledge Engineering, 27(04), 641–674. https://doi.org/10.1142/S0218194017500243
Usman, Muhammad, Britto, R., Damm, L. O., & Börstler, J. (2018). Effort estimation in large-scale software development: An industrial case study. Information and Software Technology, 99(February), 21–40. https://doi.org/10.1016/j.infsof.2018.02.009
Usman, Muhammad, Petersen, K., Börstler, J., & Santos Neto, P. (2018). Developing and using checklists to improve software effort estimation: A multi-case study. Journal of Systems and Software, 146, 286–309. https://doi.org/10.1016/j.jss.2018.09.054
Wasserman, A. I. (2010). Software engineering issues for mobile application development. Proceedings of the FSE/SDP Workshop on Future of Software Engineering Research. ACM, 2010., 397–400. https://doi.org/10.1145/1882362.1882443
Xanthopoulos, S., & Xinogalos, S. (2013). A comparative analysis of cross-platform development approaches for mobile applications. Proceedings of the 6th Balkan Conference in Informatics on - BCI ’13, 213. https://doi.org/10.1145/2490257.2490292
Yáñez Gómez, R., Cascado Caballero, D., & Sevillano, J.-L. (2014). Heuristic Evaluation on Mobile Interfaces: A New Checklist. The Scientific World Journal, 2014, 434326. https://doi.org/10.1155/2014/434326
Yin, R. K. (2009). Case Study Research Design and Methods Fourth Edition. In Applied Social Research Methods Seiries.

References Page: 182

Appendix A Page: 183
Appendix A
About the Author
Abdullah Altaleb is a PhD candidate specialising in Software Engineering at the University
of Southampton, United Kingdom. The author accomplished his master’s degree in
software engineering at Southern Methodist University in Dallas, Texas in the United
States. The author worked at the GOSI and NIC organisation as a software and application
developer for four years, with a focus on the Java EE platform. He also worked at MRN Inc.
as a software architect in San Jose, California. Abdullah is certified in CABA, which is
associated with the business analysis profession, and in Scrum Master.
Cross-platform Frameworks and Tools Background
• PhoneGap: an open-source framework from Adobe considered to be one of the most
popular hybrid cross-platform framework for mobile app development. Apache
Cordova is the engine that powers PhoneGap, which acts as a container or wrapper for
web technologies such as HTML, JavaScript and CSS in a mobile app (‘PhoneGap,’ n.d.).
Thus, the framework does not convert the HTML and JavaScript into native code;
however, it allows access to native device functionality (APIs) and lets the web
technologies execute within a wrapper targeted on each platform (Android, IOS, etc.).
• Ionic: a powerful HTML5 open-source framework that helps to build native-style mobile
user interface for hybrid mobile app development. It require a native wrapper, such as
PhoneGap, to run as a native app (‘Ionic Framework,’ n.d.). Ionic uses a lot of
functionality of AngularJS; however, it provides additional components for mobile app
development.
• Xamarin: a cross-platform framework from Microsoft that promises to build native app
for multiple platform (IOS, Android and Windows) using a single code C# language,
which means the application has all the native features. The Xamarin platform consists
of the Mono .Net framework, which provides cross-platform implementation features.
Appendix A Page: 184
• Appcelerator Titanium: an open-source framework that allow a developer to build a
cross-platform native mobile app using JavaScript APIs. Titanium SDK consist of a set of
Nodejs services and other supporting tools that work alongside with native SDK tool
chains (‘Appcelerator Titanium,’ n.d.). Hyperloop is a compiler that turns the JavaScript
into native code and have direct access to native APIs.
• Angularjs: is a client-side JavaScript framework to build a dynamic web app, single page
application and support MVC concept.
• Nodejs: is an open-source JavaScript runtime environment that allows JavaScript code
to be executed on the server-side.
• Smartface: a framework to develop a native IOS and Android mobile app. Smartface
uses a standard JavaScript OS engine such as V8 for Android and JavaScript Core for IOS.
This framework offers What You See Is What You Gets (WYSIWYG) editor for native UI
development. Moreover, it supports a single code base, which avoids designing UI
separately for each target environment. That means developing and designing just one
app interface and deploying on various device OS. Smartface is the only cross-platform
to support IOS development on Windows OS.
• jQuery-Mobile: a framework designed for cross-platform mobile web apps integrated
with HTML5, CSS, jQuery and jQuery UI. This framework offers Ajax navigation for page
transition and supports several touch-event UI widgets. This framework is not
considered as either a hybrid or an interpreted approach, but as a web application
approach (Latif et al., 2016; (‘jQuery-Mobile website,’ n.d.).
• React-native: an open-source framework from Facebook for building a mobile app using
ReactJS and JavaScript.

Appendix B Page: 185
Appendix B
SLR Query Schema
Table 65: Query schema
Query ID Command Query Query
Category Results Validity/comments
IEEE: Search by documents title
IEEE
(Search
query 1)
("Document Title":effort OR
"Document Title":cost OR
"Document Title":size)
AND
("Document Title":estimation OR
"Document Title":estimate OR
"Document Title":estimating OR
"Document Title":predict* OR
"Document Title":prediction OR
"Document Title":assess* OR
"Document Title":assessment OR
"Document Title":calculation OR
"Document Title":calculating OR
"Document Title":calculate)
AND
("Document Title":mobile OR
"Document Title":*phone* OR
"Document Title":touchscreen OR
"Document Title":smartphone)
Normal 23 This query was designed
to obtain all of the
published articles related
to effort estimation with
mobiles. I ignored the
Agile SD on this query.
IEEE
(Search
query 2)
("Document Title":effort OR
"Document Title":cost OR
"Document Title":size)
AND
("Document Title":estimation OR
"Document Title":estimate OR
"Document Title":estimating OR
"Document Title":predict* OR
"Document Title":prediction OR
"Document Title":assess* OR
"Document Title":assessment OR
"Document Title":calculation OR
"Document Title":calculating OR
Very
Important
Zero When I added the Agile or
all the synonymous words
to the previous search
query, there was no
result.
The indication was very
good for this paper, thus
meaning that no previous
publication exists
concerning this topic.

Appendix B Page: 186
Query ID Command Query Query
Category Results Validity/comments
"Document Title":calculate)
AND
("Document Title":mobile OR
"Document Title":*phone* OR
"Document Title":touchscreen OR
"Document Title":smartphone)
AND
("Document Title":agile OR
"Document Title":"software
development" OR
"Document Title":scrum OR
"Document Title":XP OR
"Document Title":"extreme
programming" OR
"Document Title":crystal OR
"Document Title":DSDM OR
"Document Title":"dynamic system
development method" OR
"Document Title":lean)
IEEE
(Search
query 3)
("Document Title":effort OR
"Document Title":cost OR
"Document Title":size)
AND
("Document Title":estimation OR
"Document Title":estimate OR
"Document Title":estimating OR
"Document Title":predict* OR
"Document Title":prediction OR
"Document Title":assess* OR
"Document Title":assessment OR
"Document Title":calculation OR
"Document Title":calculating OR
"Document Title":calculate)
AND
("Document Title":mobile OR
"Document Title":*phone* OR
"Document Title":touchscreen OR
"Document Title":smartphone)
AND
("Document Title":app OR
"Document Title":apps OR
Very
Important
6 I used the (search query 1)
and added the
“application” and its
synonym. There were only
four results related to this
query.
This result was similar to
those of the papers shown
in query 1.
I will focus on and read
these papers in more
detail.
Updated 11-9-2017
All the results in this
document were included
in Search query 3. As such,
the results in this file were
ignored.
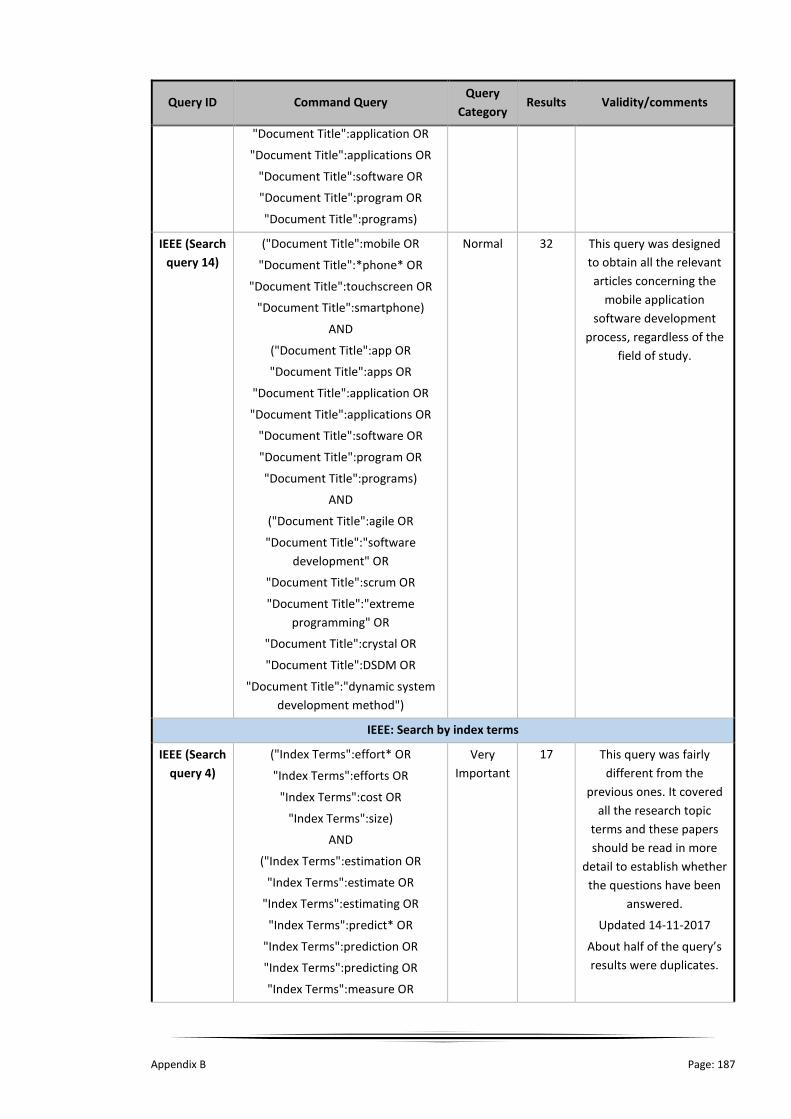
Appendix B Page: 187
Query ID Command Query Query
Category Results Validity/comments
"Document Title":application OR
"Document Title":applications OR
"Document Title":software OR
"Document Title":program OR
"Document Title":programs)
IEEE (Search
query 14)
("Document Title":mobile OR
"Document Title":*phone* OR
"Document Title":touchscreen OR
"Document Title":smartphone)
AND
("Document Title":app OR
"Document Title":apps OR
"Document Title":application OR
"Document Title":applications OR
"Document Title":software OR
"Document Title":program OR
"Document Title":programs)
AND
("Document Title":agile OR
"Document Title":"software
development" OR
"Document Title":scrum OR
"Document Title":"extreme
programming" OR
"Document Title":crystal OR
"Document Title":DSDM OR
"Document Title":"dynamic system
development method")
Normal 32 This query was designed
to obtain all the relevant
articles concerning the
mobile application
software development
process, regardless of the
field of study.
IEEE: Search by index terms
IEEE (Search
query 4)
("Index Terms":effort* OR
"Index Terms":efforts OR
"Index Terms":cost OR
"Index Terms":size)
AND
("Index Terms":estimation OR
"Index Terms":estimate OR
"Index Terms":estimating OR
"Index Terms":predict* OR
"Index Terms":prediction OR
"Index Terms":predicting OR
"Index Terms":measure OR
Very
Important
17 This query was fairly
different from the
previous ones. It covered
all the research topic
terms and these papers
should be read in more
detail to establish whether
the questions have been
answered.
Updated 14-11-2017
About half of the query’s
results were duplicates.

Appendix B Page: 188
Query ID Command Query Query
Category Results Validity/comments
"Index Terms":measurement)
AND
("Index Terms":mobile OR
"Index Terms":phone OR
"Index Terms":smartphone OR
"Index Terms":touchscreen OR
"Index Terms":*phone*)
AND
("Index Terms":app OR
"Index Terms":apps OR
"Index Terms":application OR
"Index Terms":applications OR
"Index Terms":software OR
"Index Terms":project OR
"Index Terms":projects)
AND
("Index Terms":agile OR
"Index Terms":“software
development” OR
"Index Terms":scrum OR
"Index Terms":XP OR
"Index Terms":“extreme
programming” OR
"Index Terms":crystal OR
"Index Terms":DSDM OR
"Index Terms":“dynamic system
development method”)
IEEE: Search by abstract
IEEE (Search
query 5)
("Abstract":effort* OR
"Abstract":efforts OR
"Abstract":cost) AND
("Abstract":estimation OR
"Abstract":estimate OR
"Abstract":estimating OR
"Abstract":predict* OR
"Abstract":prediction OR
"Abstract":predicting OR
"Abstract":measure OR
"Abstract":measurement)
AND
("Abstract":mobile OR
Normal 48

Appendix B Page: 189
Query ID Command Query Query
Category Results Validity/comments
"Abstract":phone OR
"Abstract":smartphone OR
"Abstract":touchscreen OR
"Abstract":*phone* OR
"Abstract":apple OR
"Abstract":android)
AND
("Abstract":app OR
"Abstract":apps OR
"Abstract":application OR
"Abstract":applications OR
"Abstract":software OR
"Abstract":project OR
"Abstract":projects)
AND
("Abstract":agile OR
"Abstract":“software development”
OR
"Abstract":scrum OR "Abstract":XP
OR
"Abstract":“extreme programming”
OR
"Abstract":crystal OR
"Abstract":DSDM OR
"Abstract":“dynamic system
development method”)
ACM: Search by title and term index
ACM
(Search
query 6)
acmdlTitle:(+(effort efforts cost size)
+(estimate estimation estimating
prediction predicting predict
measure measurement) +(mobile
mobiles phone phones smartphone
apple android "screen touch"
screentouch touchphone "touch
phone"))
7 Three of these papers
were included and
duplicated in query 7.
ACM: Search by abstract
ACM
(Search
query 7)
recordAbstract:(+(effort efforts cost
costs) +(estimate estimation
estimating prediction predicting
predict measure measurement)
+(mobile mobiles phone phones
smartphone apple android "screen
touch" screentouch touchphone
Not
Important
293 The result was huge. I
obtained many results
that were not related to
my topic, such as energy
consumption, network,
malware detection and so
on. As such, it is my

Appendix B Page: 190
Query ID Command Query Query
Category Results Validity/comments
"touch phone") +(apps app
application applications software
project projects program))
feeling that I must
conduct another filter to
emphasise the most
important articles which
have discussed my topic.
ACM
(Search
query 8)
recordAbstract:(+(effort efforts cost
costs) +(estimate estimation
estimating prediction predicting
predict measure measurement)
+(mobile mobiles phone phones
smartphone apple android "screen
touch" screentouch touchphone
"touch phone") +(apps app
application applications software
project projects program programs)
+(agile "software development"
scrum XP "extreme programming"
crystal DSDM "dynamic system
development method" lean))
AND
I combined the previous query with
the following one :
acmdlTitle:(+(mobile mobiles phone
phones smartphone apple android
"screen touch" screentouch
touchphone "touch phone") +(apps
app application applications
software project projects program)
+(agile "software development"
scrum XP "extreme programming"
crystal DSDM "dynamic system
development method" lean))
Very
Important
8 This query yielded only six
articles. Some of them
were included in Search
query 6, thus meaning
that a great deal of
attention will be paid to
these research matches or
those relevant to my
topic.
Updated 11-10-2017
All the research results
were duplicates and were
included in query 7. As
such, I will focus on the
duplicated ones.
Inspec And WebOfScience: Search by topic
Inspec
(Search
query 9)
(TS=((effort OR efforts OR cost OR
size) AND (estimation OR estimating
OR estimate OR prediction OR
predicting OR predict OR assess OR
assessment OR calculate Or
calculation OR measure OR
measuring) AND ( mobile OR
smartphone OR "screen touch" OR
phone OR apple OR android OR IOS)
AND (app OR apps OR application
OR applications OR software OR
Normal 123 TS = Topic that covers all
abstract and topic field
terms.
Many studies are
duplicated on IEEE.
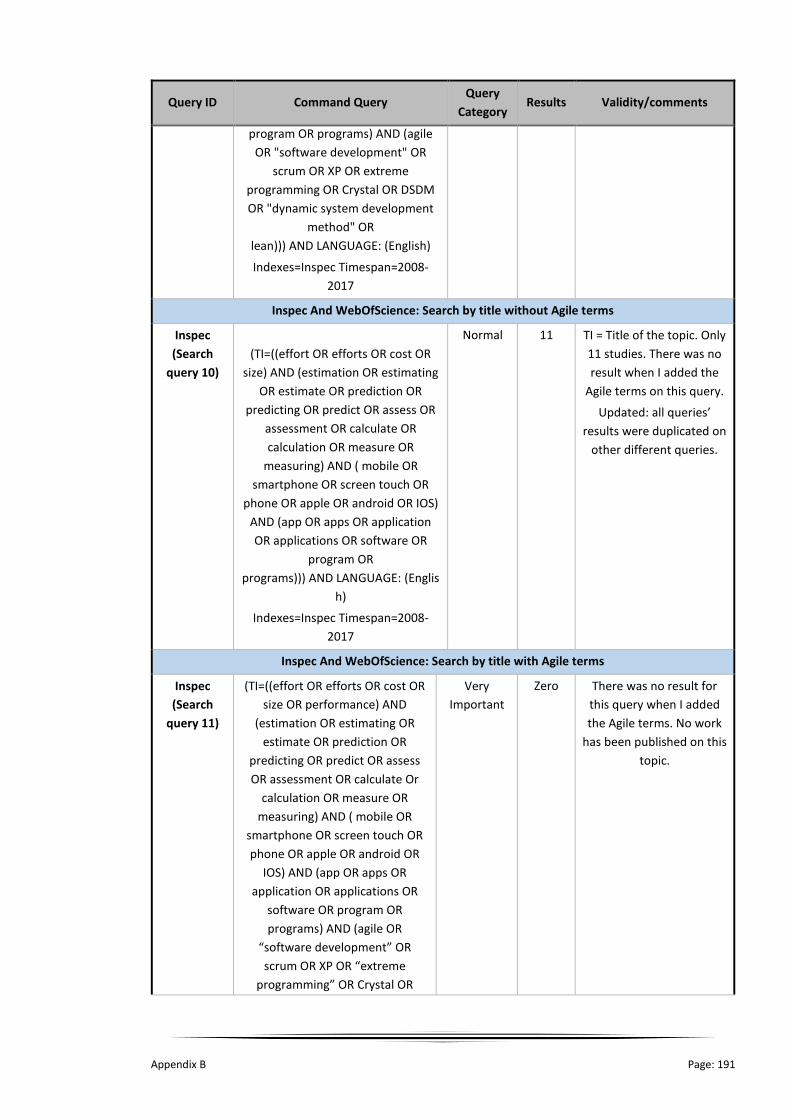
Appendix B Page: 191
Query ID Command Query Query
Category Results Validity/comments
program OR programs) AND (agile
OR "software development" OR
scrum OR XP OR extreme
programming OR Crystal OR DSDM
OR "dynamic system development
method" OR
lean))) AND LANGUAGE: (English)
Indexes=Inspec Timespan=2008-
2017
Inspec And WebOfScience: Search by title without Agile terms
Inspec
(Search
query 10)
(TI=((effort OR efforts OR cost OR
size) AND (estimation OR estimating
OR estimate OR prediction OR
predicting OR predict OR assess OR
assessment OR calculate OR
calculation OR measure OR
measuring) AND ( mobile OR
smartphone OR screen touch OR
phone OR apple OR android OR IOS)
AND (app OR apps OR application
OR applications OR software OR
program OR
programs))) AND LANGUAGE: (Englis
h)
Indexes=Inspec Timespan=2008-
2017
Normal 11 TI = Title of the topic. Only
11 studies. There was no
result when I added the
Agile terms on this query.
Updated: all queries’
results were duplicated on
other different queries.
Inspec And WebOfScience: Search by title with Agile terms
Inspec
(Search
query 11)
(TI=((effort OR efforts OR cost OR
size OR performance) AND
(estimation OR estimating OR
estimate OR prediction OR
predicting OR predict OR assess
OR assessment OR calculate Or
calculation OR measure OR
measuring) AND ( mobile OR
smartphone OR screen touch OR
phone OR apple OR android OR
IOS) AND (app OR apps OR
application OR applications OR
software OR program OR
programs) AND (agile OR
“software development” OR
scrum OR XP OR “extreme
programming” OR Crystal OR
Very
Important
Zero There was no result for
this query when I added
the Agile terms. No work
has been published on this
topic.
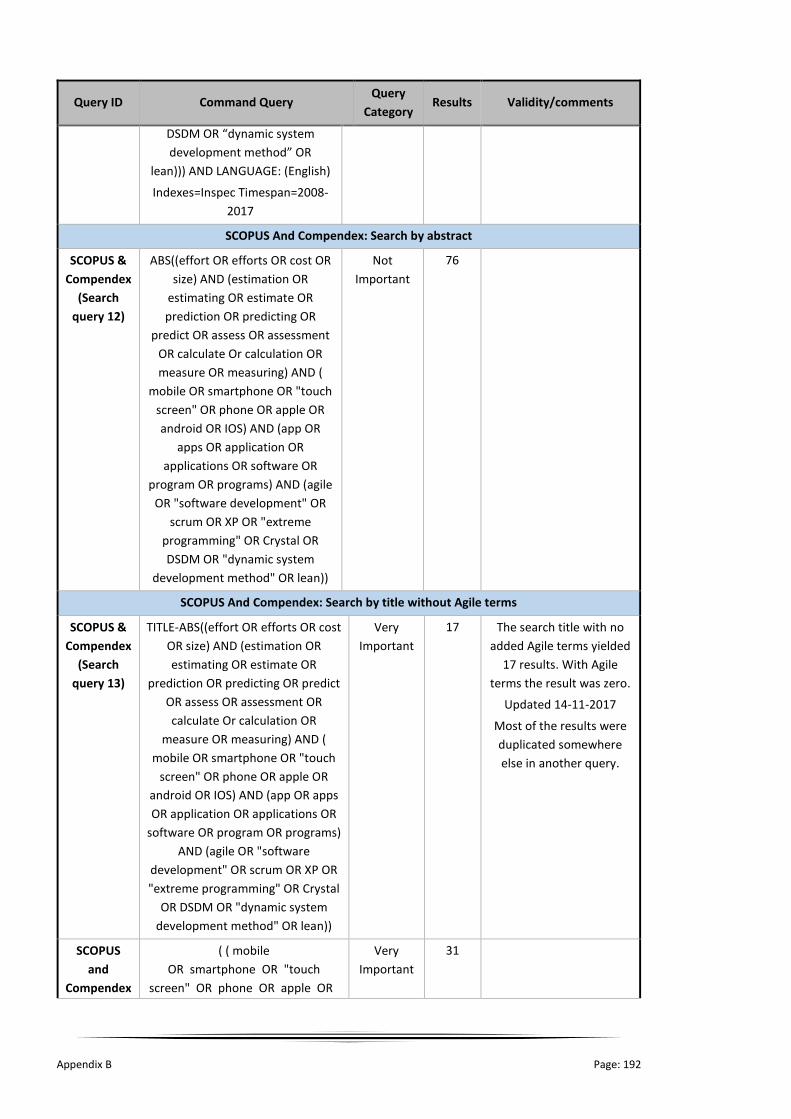
Appendix B Page: 192
Query ID Command Query Query
Category Results Validity/comments
DSDM OR “dynamic system
development method” OR
lean))) AND LANGUAGE: (English)
Indexes=Inspec Timespan=2008-
2017
SCOPUS And Compendex: Search by abstract
SCOPUS &
Compendex
(Search
query 12)
ABS((effort OR efforts OR cost OR
size) AND (estimation OR
estimating OR estimate OR
prediction OR predicting OR
predict OR assess OR assessment
OR calculate Or calculation OR
measure OR measuring) AND (
mobile OR smartphone OR "touch
screen" OR phone OR apple OR
android OR IOS) AND (app OR
apps OR application OR
applications OR software OR
program OR programs) AND (agile
OR "software development" OR
scrum OR XP OR "extreme
programming" OR Crystal OR
DSDM OR "dynamic system
development method" OR lean))
Not
Important
76
SCOPUS And Compendex: Search by title without Agile terms
SCOPUS &
Compendex
(Search
query 13)
TITLE-ABS((effort OR efforts OR cost
OR size) AND (estimation OR
estimating OR estimate OR
prediction OR predicting OR predict
OR assess OR assessment OR
calculate Or calculation OR
measure OR measuring) AND (
mobile OR smartphone OR "touch
screen" OR phone OR apple OR
android OR IOS) AND (app OR apps
OR application OR applications OR
software OR program OR programs)
AND (agile OR "software
development" OR scrum OR XP OR
"extreme programming" OR Crystal
OR DSDM OR "dynamic system
development method" OR lean))
Very
Important
17 The search title with no
added Agile terms yielded
17 results. With Agile
terms the result was zero.
Updated 14-11-2017
Most of the results were
duplicated somewhere
else in another query.
SCOPUS
and
Compendex
( ( mobile
OR smartphone OR "touch
screen" OR phone OR apple OR
Very
Important
31

Appendix B Page: 193
Query ID Command Query Query
Category Results Validity/comments
(Search
Query 16)
android OR ios ) AND ( app OR a
pps OR application OR applicatio
ns OR software OR program OR
programs ) AND ( agile ) )
OpenDOAR/Google Scholar: search manually by using the query criteria
OpenDOAR
Scholar
(Search
query 15)
(effort OR efforts OR cost) AND
(estimation OR estimating OR
estimate OR prediction OR
predicting OR predict) AND (mobile
OR smartphone OR screen touch
OR phone) AND (app OR apps OR
application OR software) AND (agile
OR “software development” OR
scrum)
Normal 9 This search was conducted
manually because
OpenDOAR has many
repositories and I had to
use some of those which
were related to my topic
and obtain all topics
pertaining to my research.

Appendix B Page: 194

Appendix C Page: 195
Appendix C
Interview Questions
Figure 81: Example of survey questions

Appendix C Page: 196
Interview Information
Table 66: Expert’s information
Expert ID
Expert Name
Main Job’s Role
Position Role (current/previous) Worked at Company
ID
Year of Experienc
e
A Anonymous Project
Manager IT Director, software analyst, junior
developer CO_2,
CO_3, CO_8 4
B Anonymous Software
Developer Senior developer, junior dev
CO_2, CO_3, CO_9
4
C Anonymous Software
Developer Sales, senior developer, freelancer
CO_1, CO_4, CO_13
9
D Anonymous Software
Developer Team leader, senior developer
CO_1, CO_3, CO_10
5
E Anonymous Software
Developer Senior dev, junior developer
CO_4, CO_11
6
F Anonymous Software
Developer Senior developer, freelancer CO_3, CO_7 4
G Anonymous Software
Developer Senior dev, integration dev
CO_2, CO_3, CO_10
6
H Anonymous Software
Developer team leader, senior dev, senior soft
engineer CO_4, CO_17
9
I Anonymous Project
Manager Project manager
CO_4, CO_15
9
J Anonymous Project
Manager Senior Project manager, Agile coach
CO_1, CO_4, CO_5
7
K Anonymous Project
Manager Project manager, Pre-Sale, Teacher
assistant CO_14, CO_18
4
L Anonymous Software
Developer senior dev, junior developer
CO_3, CO_13
5
M Anonymous Software
Developer Senior dev, junior developer
CO_1, CO_2, CO_3
6
N Anonymous Quality
Assurance Assistant project manager, software
tester CO_4 7
O Anonymous Quality
Assurance Quality assurance CO_4 6
P Anonymous Quality
Assurance Quality assurance leader CO_7,
CO_11, CO_12
5.5
Q Anonymous Quality
Assurance Quality assurance CO_4 4
R Anonymous Project
Manager Project manager, junior developer
CO_3, CO_6, CO_16
6
S Anonymous Quality
Assurance Quality assurance CO_4 5
T Anonymous Software
Developer junior developer CO_1 2

Appendix C Page: 197
Table 67: Job role distributed by the country work
Country
Total Saudi Arabia USA Bahrain India
Job Role project manager Count 5 3 0 0 5
software developer Count 12 2 1 0 12
QA Count 5 0 1 1 5
freelancer Count 4 0 1 0 4
team leader Count 3 0 0 0 3
sale Count 2 1 0 0 2
IT director Count 1 1 0 0 1
Total Count 20 3 2 1 20
Table 68: Companies details for the interview
company ID company name category location employee size
CO_01 Anonymous Telecom Saudi Arabia 17000
CO_02 Anonymous IT Co. Saudi Arabia 300
CO_03 Anonymous Social Org Saudi Arabia 1200
CO_04 Anonymous IT Co. Saudi Arabia 1600
CO_05 Anonymous Bank Saudi Arabia 13077
CO_06 Anonymous Government Saudi Arabia 3500
CO_07 Anonymous Telecom Bahrain 6200
CO_08 Anonymous University USA 3700
CO_09 Anonymous Social Co. Saudi Arabia 15
CO_10 Anonymous IT Co. Saudi Arabia 450
CO_11 Anonymous Consultation Co. India 20000
CO_12 Anonymous IT Co. Saudi Arabia 250
CO_13 Anonymous Security Co. Saudi Arabia 100
CO_14 Anonymous University USA 800
CO_15 Anonymous Gov Saudi Arabia 1800
CO_16 Anonymous IT Co. USA 20
CO_17 Anonymous IT Co. Saudi Arabia 150
CO_18 Anonymous Consultation Co. USA 3000
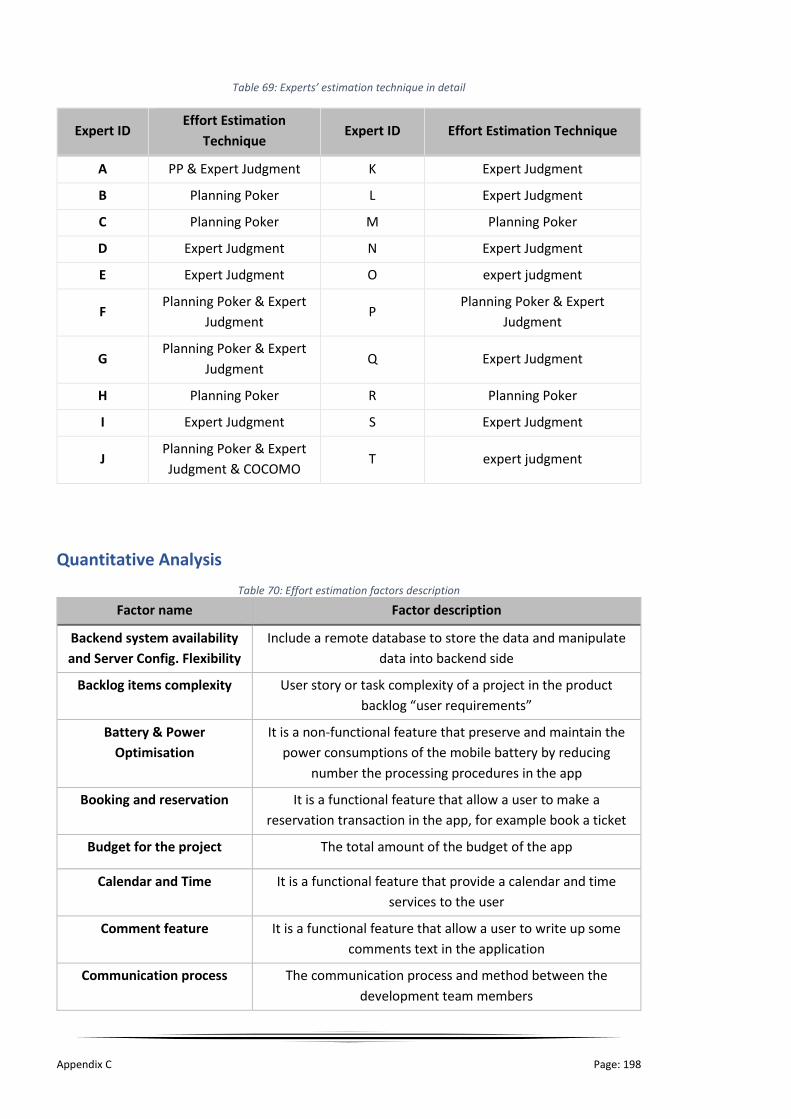
Appendix C Page: 198
Table 69: Experts’ estimation technique in detail
Expert ID Effort Estimation
Technique Expert ID Effort Estimation Technique
A PP & Expert Judgment K Expert Judgment
B Planning Poker L Expert Judgment
C Planning Poker M Planning Poker
D Expert Judgment N Expert Judgment
E Expert Judgment O expert judgment
F Planning Poker & Expert
Judgment P
Planning Poker & Expert
Judgment
G Planning Poker & Expert
Judgment Q Expert Judgment
H Planning Poker R Planning Poker
I Expert Judgment S Expert Judgment
J Planning Poker & Expert
Judgment & COCOMO T expert judgment
Quantitative Analysis
Table 70: Effort estimation factors description
Factor name Factor description
Backend system availability
and Server Config. Flexibility
Include a remote database to store the data and manipulate
data into backend side
Backlog items complexity User story or task complexity of a project in the product
backlog “user requirements”
Battery & Power
Optimisation
It is a non-functional feature that preserve and maintain the
power consumptions of the mobile battery by reducing
number the processing procedures in the app
Booking and reservation It is a functional feature that allow a user to make a
reservation transaction in the app, for example book a ticket
Budget for the project The total amount of the budget of the app
Calendar and Time It is a functional feature that provide a calendar and time
services to the user
Comment feature It is a functional feature that allow a user to write up some
comments text in the application
Communication process The communication process and method between the
development team members

Appendix C Page: 199
Factor name Factor description
Compatibility with Previous
Version
Support previous version of the mobile app.
Connection
(Wirless,Bluetooth,3G,etc)
The mobile connection method, if there any restriction on the
connection
Data Storage and Memory
Opt. Complexity
Local or remote storage of the data, and following the
memory optimisation instruction of the mobile device to
maintain the memory space
Deadline date The delivery date of the app that given from the client
Dependency between
backlog items
The dependency between the user stories or tasks in a project
requirement
Developer estimation
experience
Number of years practicing the effort estimation process for
user stories or tasks
Developer implementation
experience
Number of years practicing the development of mobile app
Developer knowledge of
backlog item
Level of understanding the requirement and needs from a user
story or a task
Development type (New or
enhanced app)
Whether the application is new or already exists
Dynamicity of screen Number of dynamic pages in the app, and is the page static or
dynamic. For example, the page view change based on the role
of the user
File upload It is a functional feature that allow a user to upload a file into
the app.
Geographical of the
development team
The physical location of the development team member
Hardware access Complexity of accessing to the hardware components of the
mobile device through API
Interrupt handling The user can return to an application after he quit from the
app or switching from app to another
Item priority the importance level of a user story to be delivered as soon as
possible
Language and culture
differences
The culture and language differences between the
development team members
Localisation & tracking It is a functional feature that allow the app use GPS service to
track and localise the movement of the user
Managerial skills The skills of the leader and his ability to manage the project
recourses

Appendix C Page: 200
Factor name Factor description
Map view It is a functional feature that allow a user to access to map
service
Media support It is a functional feature that allow a user to use, watch the
media in the app
Messaging It is functional feature that allow the user to communicate
between each other
Multi-languages support It is a feature that allow the user to select an appropriate
language of the app
Navigation The structure of the user position in the app. The user needs
to know where to go, how to get any point in the app and
where he is in the app
Number of API party Total number of third-party application and APIs that used to
integrate the application with other services
Number of Screen Total number of screen (UI) that used in the application
Payment process It is a feature that could be provided to the user to make a
payment transaction
Platform type (native, hybrid) Whether the application use native or hybrid framework, such
as swift framework for native or Ionic framework for hybrid
Push Notification It is a feature that is available in the mobile app to present a
pop up message in the mobile screen
Registration & login It is a function feature that allow the user to access the
application.
Searching contents It is a functional feature that allow a user to look up for a
content entire the application
Security Support The information security level of the user data in the app
Sharing It is a functional feature that allow a user to share the app
content to another user or other social network, for example
share your location to someone else
Support Code reusability The development team member builds reusable code to be
used again for any purpose
Supported device (phone,
tablet, smartwatch)
Does the app support multiple mobile devices
Supported Platform type
(IOS/Android./Win./etc.)
Is the app support multiple operating system of mobile device
Team process experience The knowledge of the development team about the Agile
process and development process
Team size Number of the development team member

Appendix C Page: 201
Factor name Factor description
Third-party authentication Login or register through social media services such as
User Interface quality and
complexity
The level of details on the user interface (UI) of the mobile app
Work pressure (workload) heavy work needs to be submitted on short time (limited time)
Table 71: Effort estimation frequencies
Estimation factor Very
important important Neutral
Less
important
Very less
important Total
Sharing 0% 10% 15% 25% 50% 100%
Registration & login 45% 40% 10% 0% 5% 100%
Payment process 65% 25% 10% 0% 0% 100%
Booking and reservation 20% 40% 35% 5% 0% 100%
File upload 25% 30% 40% 5% 0% 100%
Comment feature 5% 45% 15% 25% 10% 100%
Navigation 10% 20% 35% 10% 25% 100%
Map view 50% 30% 5% 10% 5% 100%
Localisation & tracking 50% 30% 20% 0% 0% 100%
Searching contents 20% 15% 50% 15% 0% 100%
Messaging 30% 60% 5% 0% 5% 100%
Calendar and time 5% 0% 5% 25% 65% 100%
Multi-languages support 40% 45% 5% 0% 10% 100%
Media support 30% 30% 25% 15% 0% 100%
Third-party
authentication
35% 40% 15% 10% 0% 100%
Number of screens 50% 35% 15% 0% 0% 100%
Push notification 20% 30% 30% 15% 5% 100%
User Interface quality and
complexity
75% 20% 5% 0% 0% 100%
Number of API party 30% 50% 15% 5% 0% 100%
Support Code reusability 35% 30% 25% 5% 5% 100%
Data storage and memory
opt. Complexity
10% 35% 35% 10% 10% 100%

Appendix C Page: 202
Estimation factor Very
important important Neutral
Less
important
Very less
important Total
Interrupt handling 5% 15% 30% 25% 25% 100%
Hardware access 20% 25% 30% 15% 10% 100%
Battery & power
optimisation
10% 20% 35% 20% 15% 100%
Connection (Wireless,
Bluetooth, 3G, etc.)
5% 15% 30% 30% 20% 100%
Compatibility with
previous version
10% 40% 35% 10% 5% 100%
Security support 45% 40% 10% 0% 5% 100%
Dynamicity of screen 15% 60% 15% 0% 10% 100%
Backend system
availability and Server
Config. Flexibility
45% 40% 15% 0% 0% 100%
Supported platform type
(IOS/android./Win./etc.)
85% 15% 0% 0% 0% 100%
Supported device (phone,
tablet, smartwatch)
55% 20% 20% 5% 0% 100%
Platform type (native,
hybrid)
90% 5% 5% 0% 0% 100%
Communication process 65% 30% 5% 0% 0% 100%
Team process experience 50% 30% 20% 0% 0% 100%
Team size 30% 50% 15% 5% 0% 100%
Backlog items complexity 70% 20% 10% 0% 0% 100%
Dependency between
backlog items
45% 45% 0% 0% 10% 100%
Developer
implementation
experience
65% 25% 10% 0% 0% 100%
Developer knowledge of
backlog item
60% 25% 10% 5% 0% 100%
Developer estimation
experience
55% 35% 5% 5% 0% 100%
Language and culture
differences
10% 15% 40% 25% 10% 100%
Geographical of the
development team
35% 35% 10% 15% 5% 100%

Appendix C Page: 203
Estimation factor Very
important important Neutral
Less
important
Very less
important Total
Item priority 50% 10% 15% 25% 0% 100%
Deadline date 55% 35% 5% 5% 0% 100%
Budget for the project 20% 5% 15% 55% 5% 100%
Development type (New
or enhanced app)
55% 25% 10% 10% 0% 100%
Managerial skills 20% 35% 30% 15% 0% 100%
Work pressure
(workload)
50% 30% 10% 10% 0% 100%

Appendix C Page: 204
Table 72: Normality test for the estimation factors
Factor Job Role Kolmogorov-Smirnova Shapiro-Wilk
Statistic df Sig. Statistic df Sig.
Sharing
Software Developer
.240 10 .107 .886 10 .152
Project Manager/Director
.221 5 .200* .902 5 .421
QA . 5 . . 5 .
Registration & amp; login
Software Developer
.305 10 .009 .781 10 .008
Project Manager/Director
.201 5 .200* .881 5 .314
QA .367 5 .026 .684 5 .006
Payment process
Software Developer
.422 10 .000 .628 10 .000
Project Manager/Director
.367 5 .026 .684 5 .006
QA .367 5 .026 .684 5 .006
Booking and reservation
Software Developer
.245 10 .091 .820 10 .025
Project Manager/Director
.237 5 .200* .961 5 .814
QA .231 5 .200* .881 5 .314
File upload
Software Developer
.248 10 .082 .805 10 .017
Project Manager/Director
.231 5 .200* .881 5 .314
QA .300 5 .161 .883 5 .325
Comment feature
Software Developer
.293 10 .015 .810 10 .019
Project Manager/Director
.237 5 .200* .961 5 .814
QA .273 5 .200* .852 5 .201
Navigation
Software Developer
.231 10 .139 .924 10 .392
Project Manager/Director
.136 5 .200* .987 5 .967
QA .273 5 .200* .852 5 .201
Map view
Software Developer
.333 10 .002 .693 10 .001
Project Manager/Director
.367 5 .026 .684 5 .006
QA .221 5 .200* .902 5 .421
Localisation & amp; tracking
Software Developer
.362 10 .001 .717 10 .001
Project Manager/Director
.231 5 .200* .881 5 .314
QA .231 5 .200* .881 5 .314
Searching contents
Software Developer
.416 10 .000 .650 10 .000
Project Manager/Director
.367 5 .026 .684 5 .006
QA .349 5 .046 .771 5 .046
Messaging
Software Developer
.324 10 .004 .794 10 .012
Project Manager/Director
.367 5 .026 .684 5 .006
QA .404 5 .008 .768 5 .044
Calendar and Time Software Developer
.335 10 .002 .662 10 .000

Appendix C Page: 205
Factor Job Role Kolmogorov-Smirnova Shapiro-Wilk
Statistic df Sig. Statistic df Sig.
Project Manager/Director
.349 5 .046 .771 5 .046
QA . 5 . . 5 .
Multi-languages support
Software Developer
.380 10 .000 .728 10 .002
Project Manager/Director
.231 5 .200* .881 5 .314
QA .367 5 .026 .684 5 .006
Media support
Software Developer
.181 10 .200* .895 10 .191
Project Manager/Director
.221 5 .200* .902 5 .421
QA .237 5 .200* .961 5 .814
Third-party authentication
Software Developer
.224 10 .168 .911 10 .287
Project Manager/Director
.367 5 .026 .684 5 .006
QA .300 5 .161 .833 5 .146
Number of Screen
Software Developer
.248 10 .082 .805 10 .017
Project Manager/Director
.367 5 .026 .684 5 .006
QA .367 5 .026 .684 5 .006
Push Notification
Software Developer
.324 10 .004 .849 10 .056
Project Manager/Director
.241 5 .200* .821 5 .119
QA .367 5 .026 .684 5 .006
User Interface quality and complexity
Software Developer
.482 10 .000 .509 10 .000
Project Manager/Director
. 5 . . 5 .
QA .231 5 .200* .881 5 .314
Number of API party
Software Developer
.254 10 .067 .833 10 .036
Project Manager/Director
.300 5 .161 .883 5 .325
QA .300 5 .161 .833 5 .146
Support Code reusability
Software Developer
.305 10 .009 .781 10 .008
Project Manager/Director
.367 5 .026 .684 5 .006
QA .221 5 .200* .902 5 .421
Data Storage and Memory Opt. Complexity
Software Developer
.286 10 .020 .885 10 .149
Project Manager/Director
.367 5 .026 .684 5 .006
QA .241 5 .200* .821 5 .119
Interrupt handling
Software Developer
.240 10 .107 .886 10 .152
Project Manager/Director
.330 5 .079 .735 5 .021
QA .241 5 .200* .821 5 .119
Hardware access
Software Developer
.236 10 .123 .841 10 .046
Project Manager/Director
.367 5 .026 .684 5 .006
QA .221 5 .200* .902 5 .421
Battery & amp; Power Optimisation
Software Developer
.200 10 .200* .932 10 .466
Project Manager/Director
.473 5 .001 .552 5 .000
QA .231 5 .200* .881 5 .314

Appendix C Page: 206
Factor Job Role Kolmogorov-Smirnova Shapiro-Wilk
Statistic df Sig. Statistic df Sig.
Connection (Wirless,Bluetooth,3G,etc)
Software Developer
.282 10 .023 .890 10 .172
Project Manager/Director
.237 5 .200* .961 5 .814
QA .243 5 .200* .894 5 .377
Compatibility with Previous Version
Software Developer
.342 10 .002 .841 10 .045
Project Manager/Director
. 5 . . 5 .
QA .287 5 .200* .914 5 .490
Security Support
Software Developer
.416 10 .000 .650 10 .000
Project Manager/Director
.231 5 .200* .881 5 .314
QA .473 5 .001 .552 5 .000
Dynamicity of screen
Software Developer
.333 10 .002 .778 10 .008
Project Manager/Director
.473 5 .001 .552 5 .000
QA .367 5 .026 .684 5 .006
Backend system availability and Server Config. Flexibility
Software Developer
.360 10 .001 .731 10 .002
Project Manager/Director
.231 5 .200* .881 5 .314
QA .367 5 .026 .684 5 .006
Supported Platform type (IOS/Android./Win./etc.)
Software Developer
.524 10 .000 .366 10 .000
Project Manager/Director
.473 5 .001 .552 5 .000
QA .473 5 .001 .552 5 .000
Supported device (phone, tablet, smartwatch)
Software Developer
.362 10 .001 .717 10 .001
Project Manager/Director
.231 5 .200* .881 5 .314
QA .473 5 .001 .552 5 .000
Platform type (native, hybrid)
Software Developer
.524 10 .000 .366 10 .000
Project Manager/Director
.473 5 .001 .552 5 .000
QA . 5 . . 5 .
Communication process
Software Developer
.433 10 .000 .594 10 .000
Project Manager/Director
.367 5 .026 .684 5 .006
QA .473 5 .001 .552 5 .000
Team process experience
Software Developer
.362 10 .001 .717 10 .001
Project Manager/Director
.231 5 .200* .881 5 .314
QA .231 5 .200* .881 5 .314
Team size
Software Developer
.254 10 .067 .833 10 .036
Project Manager/Director
.367 5 .026 .684 5 .006
QA .372 5 .022 .828 5 .135
Backlog items complexity
Software Developer
.362 10 .001 .717 10 .001
Project Manager/Director
.473 5 .001 .552 5 .000
QA .473 5 .001 .552 5 .000
Dependency between backlog items
Software Developer
.325 10 .004 .694 10 .001
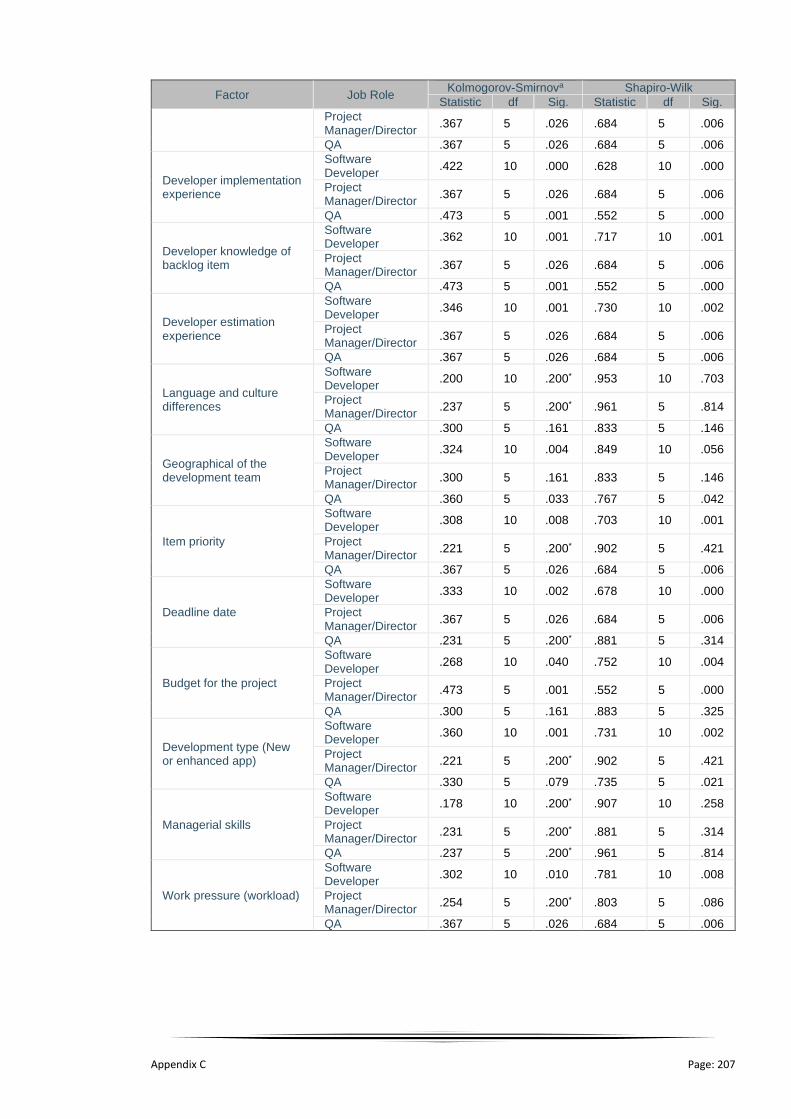
Appendix C Page: 207
Factor Job Role Kolmogorov-Smirnova Shapiro-Wilk
Statistic df Sig. Statistic df Sig.
Project Manager/Director
.367 5 .026 .684 5 .006
QA .367 5 .026 .684 5 .006
Developer implementation experience
Software Developer
.422 10 .000 .628 10 .000
Project Manager/Director
.367 5 .026 .684 5 .006
QA .473 5 .001 .552 5 .000
Developer knowledge of backlog item
Software Developer
.362 10 .001 .717 10 .001
Project Manager/Director
.367 5 .026 .684 5 .006
QA .473 5 .001 .552 5 .000
Developer estimation experience
Software Developer
.346 10 .001 .730 10 .002
Project Manager/Director
.367 5 .026 .684 5 .006
QA .367 5 .026 .684 5 .006
Language and culture differences
Software Developer
.200 10 .200* .953 10 .703
Project Manager/Director
.237 5 .200* .961 5 .814
QA .300 5 .161 .833 5 .146
Geographical of the development team
Software Developer
.324 10 .004 .849 10 .056
Project Manager/Director
.300 5 .161 .833 5 .146
QA .360 5 .033 .767 5 .042
Item priority
Software Developer
.308 10 .008 .703 10 .001
Project Manager/Director
.221 5 .200* .902 5 .421
QA .367 5 .026 .684 5 .006
Deadline date
Software Developer
.333 10 .002 .678 10 .000
Project Manager/Director
.367 5 .026 .684 5 .006
QA .231 5 .200* .881 5 .314
Budget for the project
Software Developer
.268 10 .040 .752 10 .004
Project Manager/Director
.473 5 .001 .552 5 .000
QA .300 5 .161 .883 5 .325
Development type (New or enhanced app)
Software Developer
.360 10 .001 .731 10 .002
Project Manager/Director
.221 5 .200* .902 5 .421
QA .330 5 .079 .735 5 .021
Managerial skills
Software Developer
.178 10 .200* .907 10 .258
Project Manager/Director
.231 5 .200* .881 5 .314
QA .237 5 .200* .961 5 .814
Work pressure (workload)
Software Developer
.302 10 .010 .781 10 .008
Project Manager/Director
.254 5 .200* .803 5 .086
QA .367 5 .026 .684 5 .006

Appendix C Page: 208
Table 73: Mann-Whitney ranks for software developer and project managers
Factor Job Role N Mean Rank Sum of Ranks
Sharing
Software Developer 10 7.95 79.50
Project Manager/Director 5 8.10 40.50
Total 15
Registration & amp; login
Software Developer 10 8.65 86.50
Project Manager/Director 5 6.70 33.50
Total 15
Payment process
Software Developer 10 8.05 80.50
Project Manager/Director 5 7.90 39.50
Total 15
Booking and reservation
Software Developer 10 8.20 82.00
Project Manager/Director 5 7.60 38.00
Total 15
File upload
Software Developer 10 7.50 75.00
Project Manager/Director 5 9.00 45.00
Total 15
Comment feature
Software Developer 10 7.40 74.00
Project Manager/Director 5 9.20 46.00
Total 15
Navigation
Software Developer 10 7.90 79.00
Project Manager/Director 5 8.20 41.00
Total 15
Map view
Software Developer 10 8.20 82.00
Project Manager/Director 5 7.60 38.00
Total 15
Localisation & tracking
Software Developer 10 8.40 84.00
Project Manager/Director 5 7.20 36.00
Total 15
Searching contents
Software Developer 10 6.95 69.50
Project Manager/Director 5 10.10 50.50
Total 15
Messaging
Software Developer 10 7.60 76.00
Project Manager/Director 5 8.80 44.00
Total 15
Calendar and time
Software Developer 10 8.15 81.50
Project Manager/Director 5 7.70 38.50
Total 15
Multi-languages support Software Developer 10 7.70 77.00
Project Manager/Director 5 8.60 43.00

Appendix C Page: 209
Factor Job Role N Mean Rank Sum of Ranks
Total 15
Media support
Software Developer 10 7.95 79.50
Project Manager/Director 5 8.10 40.50
Total 15
Third-party authentication
Software Developer 10 6.60 66.00
Project Manager/Director 5 10.80 54.00
Total 15
Number of screens
Software Developer 10 7.20 72.00
Project Manager/Director 5 9.60 48.00
Total 15
Push notification
Software Developer 10 7.65 76.50
Project Manager/Director 5 8.70 43.50
Total 15
User Interface quality and
complexity
Software Developer 10 7.50 75.00
Project Manager/Director 5 9.00 45.00
Total 15
Number of API party
Software Developer 10 8.20 82.00
Project Manager/Director 5 7.60 38.00
Total 15
Support Code reusability
Software Developer 10 8.85 88.50
Project Manager/Director 5 6.30 31.50
Total 15
Data storage and memory
opt. Complexity.
Software Developer 10 8.80 88.00
Project Manager/Director 5 6.40 32.00
Total 15
Interrupt handling
Software Developer 10 9.55 95.50
Project Manager/Director 5 4.90 24.50
Total 15
Hardware access
Software Developer 10 8.60 86.00
Project Manager/Director 5 6.80 34.00
Total 15
Battery & power optimisation
Software Developer 10 8.25 82.50
Project Manager/Director 5 7.50 37.50
Total 15
Connection
(Wirless,Bluetooth,3G,etc)
Software Developer 10 7.65 76.50
Project Manager/Director 5 8.70 43.50
Total 15
Compatibility with previous
version
Software Developer 10 9.50 95.00
Project Manager/Director 5 5.00 25.00
Total 15

Appendix C Page: 210
Factor Job Role N Mean Rank Sum of Ranks
Security support
Software Developer 10 8.75 87.50
Project Manager/Director 5 6.50 32.50
Total 15
Dynamicity of screen
Software Developer 10 8.65 86.50
Project Manager/Director 5 6.70 33.50
Total 15
Backend system availability
and Server Config. Flexibility
Software Developer 10 9.20 92.00
Project Manager/Director 5 5.60 28.00
Total 15
Supported platform type
(IOS/android./Win./etc.)
Software Developer 10 8.25 82.50
Project Manager/Director 5 7.50 37.50
Total 15
Supported device (phone,
tablet, smartwatch)
Software Developer 10 9.00 90.00
Project Manager/Director 5 6.00 30.00
Total 15
Platform type (native, hybrid)
Software Developer 10 8.20 82.00
Project Manager/Director 5 7.60 38.00
Total 15
Communication process
Software Developer 10 8.75 87.50
Project Manager/Director 5 6.50 32.50
Total 15
Team process experience
Software Developer 10 8.40 84.00
Project Manager/Director 5 7.20 36.00
Total 15
Team size
Software Developer 10 6.70 67.00
Project Manager/Director 5 10.60 53.00
Total 15
Backlog items complexity
Software Developer 10 7.40 74.00
Project Manager/Director 5 9.20 46.00
Total 15
Dependency between
backlog items
Software Developer 10 7.95 79.50
Project Manager/Director 5 8.10 40.50
Total 15
Developer implementation
experience
Software Developer 10 8.45 84.50
Project Manager/Director 5 7.10 35.50
Total 15
Developer knowledge of
backlog item
Software Developer 10 8.20 82.00
Project Manager/Director 5 7.60 38.00
Total 15
Software Developer 10 7.80 78.00

Appendix C Page: 211
Factor Job Role N Mean Rank Sum of Ranks
Developer estimation
experience
Project Manager/Director 5 8.40 42.00
Total 15
Language and culture
differences
Software Developer 10 8.45 84.50
Project Manager/Director 5 7.10 35.50
Total 15
Geographical of the
development team
Software Developer 10 7.45 74.50
Project Manager/Director 5 9.10 45.50
Total 15
Item priority
Software Developer 10 7.95 79.50
Project Manager/Director 5 8.10 40.50
Total 15
Deadline date
Software Developer 10 7.90 79.00
Project Manager/Director 5 8.20 41.00
Total 15
Budget for the project
Software Developer 10 9.10 91.00
Project Manager/Director 5 5.80 29.00
Total 15
Development type (New or
enhanced app)
Software Developer 10 8.80 88.00
Project Manager/Director 5 6.40 32.00
Total 15
Managerial skills
Software Developer 10 7.60 76.00
Project Manager/Director 5 8.80 44.00
Total 15
Work pressure (workload)
Software Developer 10 8.65 86.50
Project Manager/Director 5 6.70 33.50
Total 15

Appendix C Page: 212
Table 74: Mann-Whitney ranks for software developer and QA's
Factor Job Role N Mean Rank Sum of Ranks
Sharing
Software Developer 10 9.75 97.50
QA 5 4.50 22.50
Total 15
Registration & amp; login
Software Developer 10 8.10 81.00
QA 5 7.80 39.00
Total 15
Payment process
Software Developer 10 8.05 80.50
QA 5 7.90 39.50
Total 15
Booking and reservation
Software Developer 10 8.00 80.00
QA 5 8.00 40.00
Total 15
File upload
Software Developer 10 9.35 93.50
QA 5 5.30 26.50
Total 15
Comment feature
Software Developer 10 8.55 85.50
QA 5 6.90 34.50
Total 15
Navigation
Software Developer 10 8.50 85.00
QA 5 7.00 35.00
Total 15
Map view
Software Developer 10 8.45 84.50
QA 5 7.10 35.50
Total 15
Localisation & amp; tracking
Software Developer 10 8.40 84.00
QA 5 7.20 36.00
Total 15
Searching contents
Software Developer 10 9.35 93.50
QA 5 5.30 26.50
Total 15
Messaging
Software Developer 10 8.45 84.50
QA 5 7.10 35.50
Total 15
Calendar and time
Software Developer 10 9.25 92.50
QA 5 5.50 27.50
Total 15
Multi-languages support Software Developer 10 7.05 70.50
QA 5 9.90 49.50

Appendix C Page: 213
Factor Job Role N Mean Rank Sum of Ranks
Total 15
Media support
Software Developer 10 8.25 82.50
QA 5 7.50 37.50
Total 15
Third-party authentication
Software Developer 10 7.45 74.50
QA 5 9.10 45.50
Total 15
Number of screens
Software Developer 10 7.20 72.00
QA 5 9.60 48.00
Total 15
Push notification
Software Developer 10 9.45 94.50
QA 5 5.10 25.50
Total 15
User Interface quality and
complexity
Software Developer 10 9.10 91.00
QA 5 5.80 29.00
Total 15
Number of API party
Software Developer 10 7.90 79.00
QA 5 8.20 41.00
Total 15
Support Code reusability
Software Developer 10 9.85 98.50
QA 5 4.30 21.50
Total 15
Data Storage and Memory Opt.
Complexity.
Software Developer 10 10.05 100.50
QA 5 3.90 19.50
Total 15
Interrupt handling
Software Developer 10 9.35 93.50
QA 5 5.30 26.50
Total 15
Hardware access
Software Developer 10 9.60 96.00
QA 5 4.80 24.00
Total 15
Battery & amp; power
optimisation
Software Developer 10 9.60 96.00
QA 5 4.80 24.00
Total 15
Connection
(Wirless,Bluetooth,3G,etc)
Software Developer 10 7.70 77.00
QA 5 8.60 43.00
Total 15
Compatibility with previous
version
Software Developer 10 8.30 83.00
QA 5 7.40 37.00
Total 15

Appendix C Page: 214
Factor Job Role N Mean Rank Sum of Ranks
Security support
Software Developer 10 9.70 97.00
QA 5 4.60 23.00
Total 15
Dynamicity of screen
Software Developer 10 8.85 88.50
QA 5 6.30 31.50
Total 15
Backend system availability
and Server Config. Flexibility
Software Developer 10 8.35 83.50
QA 5 7.30 36.50
Total 15
Supported platform type
(IOS/android./Win./etc.)
Software Developer 10 8.25 82.50
QA 5 7.50 37.50
Total 15
Supported device (phone,
tablet, smartwatch)
Software Developer 10 7.70 77.00
QA 5 8.60 43.00
Total 15
Platform type (native, hybrid)
Software Developer 10 7.75 77.50
QA 5 8.50 42.50
Total 15
Communication process
Software Developer 10 7.90 79.00
QA 5 8.20 41.00
Total 15
Team process experience
Software Developer 10 8.40 84.00
QA 5 7.20 36.00
Total 15
Team size
Software Developer 10 7.95 79.50
QA 5 8.10 40.50
Total 15
Backlog items complexity
Software Developer 10 7.40 74.00
QA 5 9.20 46.00
Total 15
Dependency between backlog
items
Software Developer 10 7.95 79.50
QA 5 8.10 40.50
Total 15
Developer implementation
experience
Software Developer 10 7.65 76.50
QA 5 8.70 43.50
Total 15
Developer knowledge of
backlog item
Software Developer 10 7.70 77.00
QA 5 8.60 43.00
Total 15
Software Developer 10 8.20 82.00
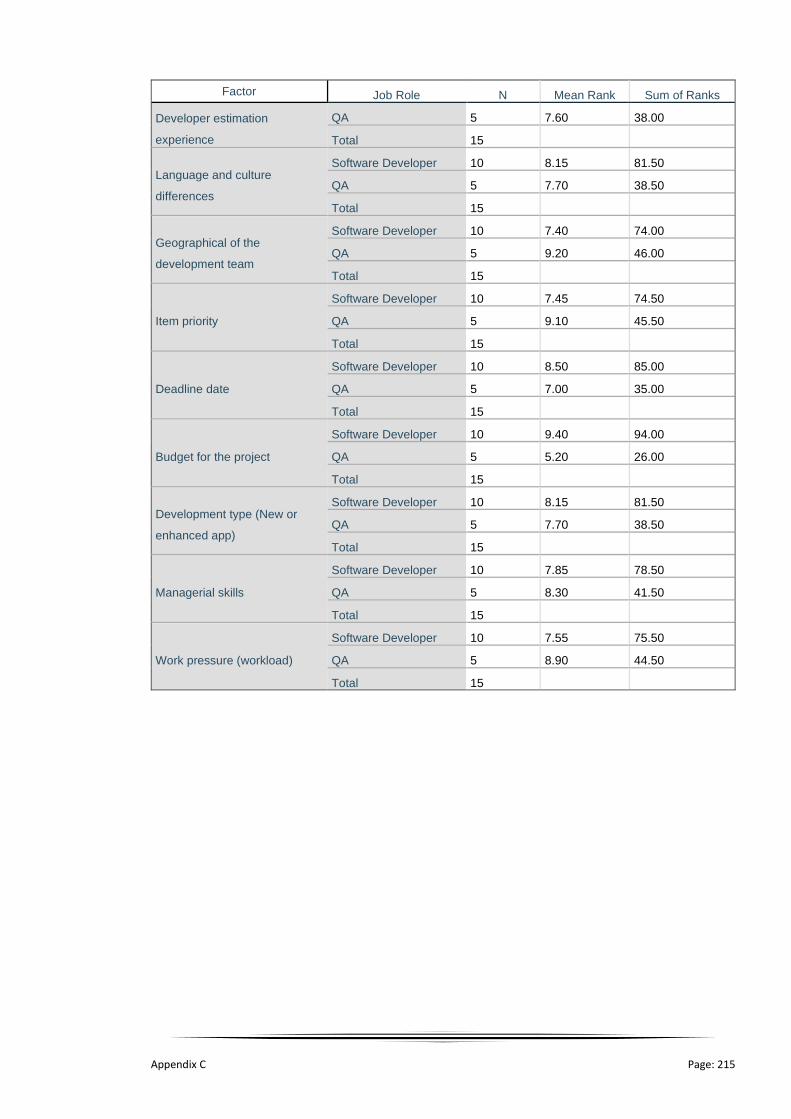
Appendix C Page: 215
Factor Job Role N Mean Rank Sum of Ranks
Developer estimation
experience
QA 5 7.60 38.00
Total 15
Language and culture
differences
Software Developer 10 8.15 81.50
QA 5 7.70 38.50
Total 15
Geographical of the
development team
Software Developer 10 7.40 74.00
QA 5 9.20 46.00
Total 15
Item priority
Software Developer 10 7.45 74.50
QA 5 9.10 45.50
Total 15
Deadline date
Software Developer 10 8.50 85.00
QA 5 7.00 35.00
Total 15
Budget for the project
Software Developer 10 9.40 94.00
QA 5 5.20 26.00
Total 15
Development type (New or
enhanced app)
Software Developer 10 8.15 81.50
QA 5 7.70 38.50
Total 15
Managerial skills
Software Developer 10 7.85 78.50
QA 5 8.30 41.50
Total 15
Work pressure (workload)
Software Developer 10 7.55 75.50
QA 5 8.90 44.50
Total 15

Appendix C Page: 216
Table 75: Mann-Whitney ranks for project managers and QA's
Factor Job Role N Mean Rank Sum of Ranks
Sharing
Project Manager/Director 5 7.00 35.00
QA 5 4.00 20.00
Total 10
Registration & amp; login
Project Manager/Director 5 4.90 24.50
QA 5 6.10 30.50
Total 10
Payment process
Project Manager/Director 5 5.50 27.50
QA 5 5.50 27.50
Total 10
Booking and reservation
Project Manager/Director 5 5.30 26.50
QA 5 5.70 28.50
Total 10
File upload
Project Manager/Director 5 7.30 36.50
QA 5 3.70 18.50
Total 10
Comment feature
Project Manager/Director 5 6.60 33.00
QA 5 4.40 22.00
Total 10
Navigation
Project Manager/Director 5 6.10 30.50
QA 5 4.90 24.50
Total 10
Map view
Project Manager/Director 5 6.10 30.50
QA 5 4.90 24.50
Total 10
Localisation & amp; tracking
Project Manager/Director 5 5.50 27.50
QA 5 5.50 27.50
Total 10
Searching contents
Project Manager/Director 5 7.40 37.00
QA 5 3.60 18.00
Total 10
Messaging
Project Manager/Director 5 6.30 31.50
QA 5 4.70 23.50
Total 10
Calendar and time
Project Manager/Director 5 6.50 32.50
QA 5 4.50 22.50
Total 10
Multi-languages support Project Manager/Director 5 4.80 24.00
QA 5 6.20 31.00

Appendix C Page: 217
Factor Job Role N Mean Rank Sum of Ranks
Total 10
Media support
Project Manager/Director 5 5.80 29.00
QA 5 5.20 26.00
Total 10
Third-party authentication
Project Manager/Director 5 6.20 31.00
QA 5 4.80 24.00
Total 10
Number of screens
Project Manager/Director 5 5.50 27.50
QA 5 5.50 27.50
Total 10
Push notification
Project Manager/Director 5 7.40 37.00
QA 5 3.60 18.00
Total 10
User Interface quality and
complexity
Project Manager/Director 5 7.00 35.00
QA 5 4.00 20.00
Total 10
Number of API party
Project Manager/Director 5 5.20 26.00
QA 5 5.80 29.00
Total 10
Support Code reusability
Project Manager/Director 5 6.50 32.50
QA 5 4.50 22.50
Total 10
Data storage and memory
opt. Complexity.
Project Manager/Director 5 7.40 37.00
QA 5 3.60 18.00
Total 10
Interrupt handling
Project Manager/Director 5 5.10 25.50
QA 5 5.90 29.50
Total 10
Hardware access
Project Manager/Director 5 6.90 34.50
QA 5 4.10 20.50
Total 10
Battery & amp; power
optimisation
Project Manager/Director 5 7.60 38.00
QA 5 3.40 17.00
Total 10
Connection
(Wirless,Bluetooth,3G,etc)
Project Manager/Director 5 5.30 26.50
QA 5 5.70 28.50
Total 10
Compatibility with previous
version
Project Manager/Director 5 5.00 25.00
QA 5 6.00 30.00
Total 10

Appendix C Page: 218
Factor Job Role N Mean Rank Sum of Ranks
Security support
Project Manager/Director 5 6.40 32.00
QA 5 4.60 23.00
Total 10
Dynamicity of screen
Project Manager/Director 5 5.80 29.00
QA 5 5.20 26.00
Total 10
Backend system availability
and Server Config. Flexibility
Project Manager/Director 5 4.40 22.00
QA 5 6.60 33.00
Total 10
Supported Platform type
(IOS/Android./Win./etc.)
Project Manager/Director 5 5.50 27.50
QA 5 5.50 27.50
Total 10
Supported device (phone,
tablet, smartwatch)
Project Manager/Director 5 4.40 22.00
QA 5 6.60 33.00
Total 10
Platform type (native, hybrid)
Project Manager/Director 5 5.00 25.00
QA 5 6.00 30.00
Total 10
Communication process
Project Manager/Director 5 4.80 24.00
QA 5 6.20 31.00
Total 10
Team process experience
Project Manager/Director 5 5.50 27.50
QA 5 5.50 27.50
Total 10
Team size
Project Manager/Director 5 6.70 33.50
QA 5 4.30 21.50
Total 10
Backlog items complexity
Project Manager/Director 5 5.50 27.50
QA 5 5.50 27.50
Total 10
Dependency between
backlog items
Project Manager/Director 5 5.50 27.50
QA 5 5.50 27.50
Total 10
Developer implementation
experience
Project Manager/Director 5 4.50 22.50
QA 5 6.50 32.50
Total 10
Developer knowledge of
backlog item
Project Manager/Director 5 4.80 24.00
QA 5 6.20 31.00
Total 10
Project Manager/Director 5 6.00 30.00
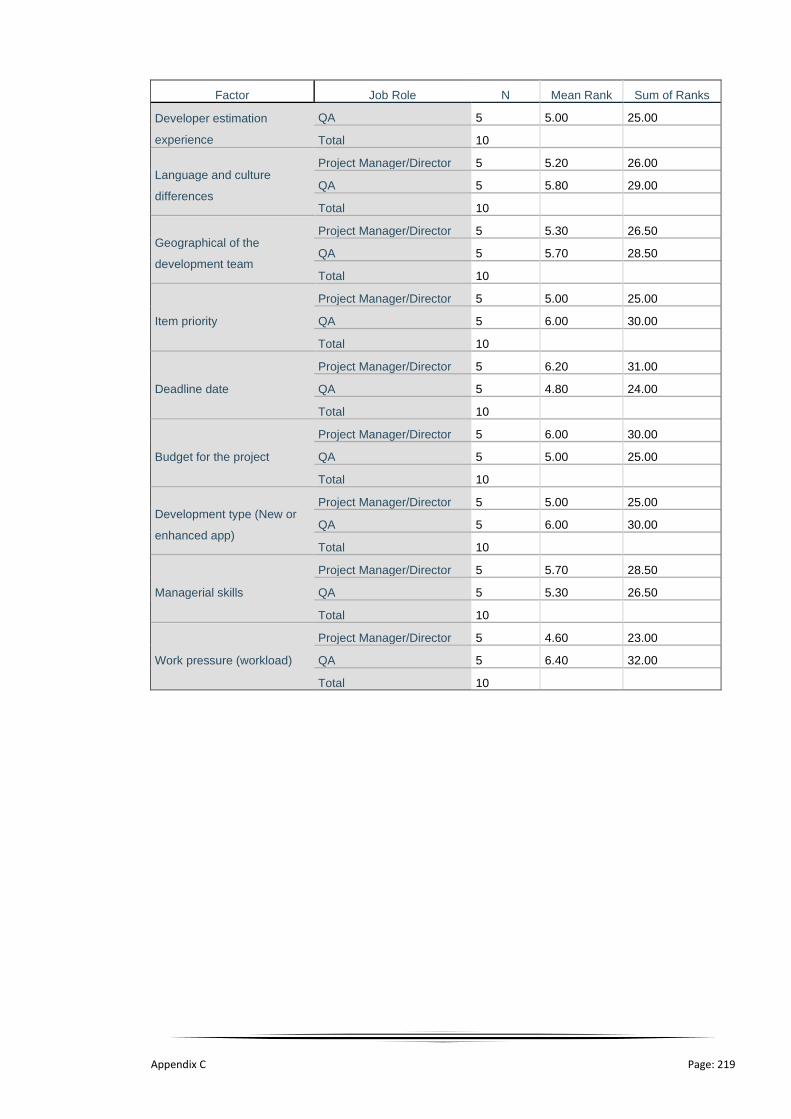
Appendix C Page: 219
Factor Job Role N Mean Rank Sum of Ranks
Developer estimation
experience
QA 5 5.00 25.00
Total 10
Language and culture
differences
Project Manager/Director 5 5.20 26.00
QA 5 5.80 29.00
Total 10
Geographical of the
development team
Project Manager/Director 5 5.30 26.50
QA 5 5.70 28.50
Total 10
Item priority
Project Manager/Director 5 5.00 25.00
QA 5 6.00 30.00
Total 10
Deadline date
Project Manager/Director 5 6.20 31.00
QA 5 4.80 24.00
Total 10
Budget for the project
Project Manager/Director 5 6.00 30.00
QA 5 5.00 25.00
Total 10
Development type (New or
enhanced app)
Project Manager/Director 5 5.00 25.00
QA 5 6.00 30.00
Total 10
Managerial skills
Project Manager/Director 5 5.70 28.50
QA 5 5.30 26.50
Total 10
Work pressure (workload)
Project Manager/Director 5 4.60 23.00
QA 5 6.40 32.00
Total 10

Appendix C Page: 220
0
1
2
3Developer
ProjectManager
QA
Sharing
0
2
4
6Developer
ProjectManager
QA
File upload
0
2
4
6Developer
ProjectManager
QA
Searching content
0
1
2
3
4Developer
ProjectManager
QA
Push notification
0
2
4
6Developer
ProjectManager
QA
Support code reusability
0
1
2
3
4Developer
ProjectManager
QA
Data storage and Mem Opt

Appendix C Page: 221
Figure 82 Mean differences values between factors as shown in Mann-Whitney test:
0
1
2
3
4Developer
ProjectManager
QA
Hardware access
0
1
2
3
4Developer
ProjectManager
QA
Batter & power Opt
0
1
2
3
4Developer
ProjectManager
QA
Compatibility with previous version
0
2
4
6Developer
ProjectManager
QA
Security support
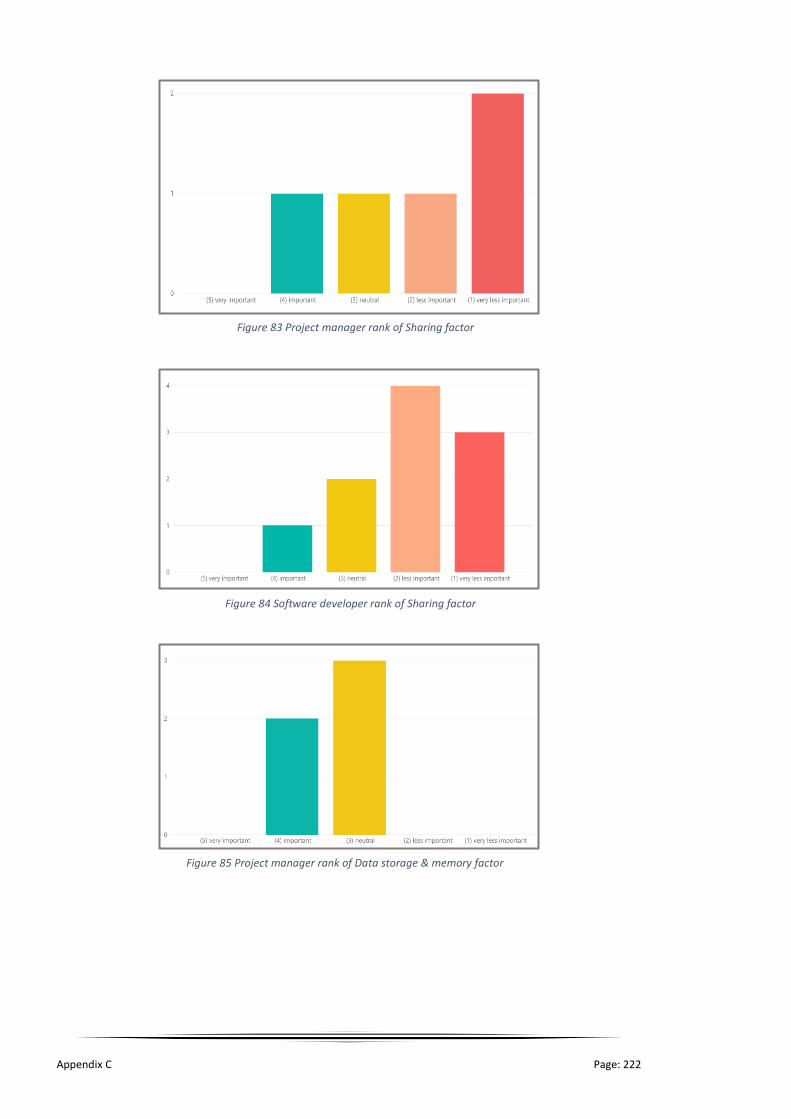
Appendix C Page: 222
Figure 83 Project manager rank of Sharing factor
Figure 84 Software developer rank of Sharing factor
Figure 85 Project manager rank of Data storage & memory factor

Appendix C Page: 223
Figure 86 QA rank of Sharing factor
Figure 87 QA rank of Data storage & memory factor
Figure 88 Software developer ranked of Data storage & memory factor

Appendix C Page: 224
Table 76: One-way ANOVA test between all the experts job role and factors
Sum of Squares df Mean Square F Sig.
Sharing Between Groups 4.850 2 2.425 2.626 .101
Within Groups 15.700 17 .924
Total 20.550 19
Registration & login Between Groups 2.400 2 1.200 1.214 .321
Within Groups 16.800 17 .988
Total 19.200 19
Payment process Between Groups .050 2 .025 .048 .953
Within Groups 8.900 17 .524
Total 8.950 19
Booking and reservation Between Groups .150 2 .075 .094 .911
Within Groups 13.600 17 .800
Total 13.750 19
File upload Between Groups 4.050 2 2.025 2.942 .080
Within Groups 11.700 17 .688
Total 15.750 19
Comment feature Between Groups 2.500 2 1.250 .912 .420
Within Groups 23.300 17 1.371
Total 25.800 19
Navigation Between Groups 1.100 2 .550 .291 .751
Within Groups 32.100 17 1.888
Total 33.200 19
Map view Between Groups .900 2 .450 .284 .756
Within Groups 26.900 17 1.582
Total 27.800 19
Localisation & tracking Between Groups .200 2 .100 .142 .869
Within Groups 12.000 17 .706
Total 12.200 19
Searching contents Between Groups 6.400 2 3.200 4.387 .029
Within Groups 12.400 17 .729
Total 18.800 19
Messaging Between Groups 1.800 2 .900 1.093 .358
Within Groups 14.000 17 .824
Total 15.800 19
Calendar and time Between Groups 2.150 2 1.075 1.088 .359
Within Groups 16.800 17 .988
Total 18.950 19
Multi-languages support Between Groups 2.850 2 1.425 1.005 .387
Within Groups 24.100 17 1.418

Appendix C Page: 225
Sum of Squares df Mean Square F Sig.
Total 26.950 19
Media support Between Groups .150 2 .075 .059 .943
Within Groups 21.600 17 1.271
Total 21.750 19
Third-party authentication Between Groups 2.700 2 1.350 1.500 .251
Within Groups 15.300 17 .900
Total 18.000 19
Number of screens Between Groups 1.250 2 .625 1.142 .342
Within Groups 9.300 17 .547
Total 10.550 19
Push notification Between Groups 5.350 2 2.675 2.320 .129
Within Groups 19.600 17 1.153
Total 24.950 19
User Interface quality and
complexity
Between Groups 1.800 2 .900 3.477 .054
Within Groups 4.400 17 .259
Total 6.200 19
Number of API party Between Groups .050 2 .025 .033 .968
Within Groups 12.900 17 .759
Total 12.950 19
Support Code reusability Between Groups 8.550 2 4.275 4.542 .026
Within Groups 16.000 17 .941
Total 24.550 19
Data Storage & Memory
Opt. Complexity.
Between Groups 10.950 2 5.475 7.271 .005
Within Groups 12.800 17 .753
Total 23.750 19
Interrupt handling Between Groups 7.300 2 3.650 3.150 .069
Within Groups 19.700 17 1.159
Total 27.000 19
Hardware access Between Groups 8.600 2 4.300 3.384 .058
Within Groups 21.600 17 1.271
Total 30.200 19
Battery & amp; power
optimisation
Between Groups 8.100 2 4.050 3.5 .050
Within Groups 19.700 17 1.159
Total 27.800 19
Connection
(Wirless,Bluetooth,3G,etc)
Between Groups .550 2 .275 .192 .827
Within Groups 24.400 17 1.435
Total 24.950 19
Compatibility with
previous version
Between Groups 1.900 2 .950 .956 .404
Within Groups 16.900 17 .994
Total 18.800 19

Appendix C Page: 226
Sum of Squares df Mean Square F Sig.
Security Support Between Groups 4.800 2 2.400 2.833 .087
Within Groups 14.400 17 .847
Total 19.200 19
Dynamicity of screen Between Groups .900 2 .450 .359 .703
Within Groups 21.300 17 1.253
Total 22.200 19
Backend system
availability and Server
Config. Flexibility
Between Groups 1.700 2 .850 1.700 .212
Within Groups 8.500 17 .500
Total 10.200 19
Supported platform type
(IOS/android./Win./etc.)
Between Groups .050 2 .025 .170 .845
Within Groups 2.500 17 .147
Total 2.550 19
Supported device (phone,
tablet, smartwatch)
Between Groups 1.350 2 .675 .700 .510
Within Groups 16.400 17 .965
Total 17.750 19
Platform type (native,
hybrid)
Between Groups .150 2 .075 .290 .752
Within Groups 4.400 17 .259
Total 4.550 19
Communication process Between Groups .300 2 .150 .392 .681
Within Groups 6.500 17 .382
Total 6.800 19
Team process experience Between Groups .200 2 .100 .142 .869
Within Groups 12.000 17 .706
Total 12.200 19
Team size Between Groups 2.050 2 1.025 1.599 .231
Within Groups 10.900 17 .641
Total 12.950 19
Backlog items complexity Between Groups .800 2 .400 .850 .445
Within Groups 8.000 17 .471
Total 8.800 19
Dependency between
backlog items
Between Groups 1.250 2 .625 .420 .664
Within Groups 25.300 17 1.488
Total 26.550 19
Developer
implementation
experience
Between Groups .450 2 .225 .450 .645
Within Groups 8.500 17 .500
Total 8.950 19
Developer knowledge of
backlog item
Between Groups .000 2 .000 .000 1.000
Within Groups 14.800 17 .871
Total 14.800 19
Between Groups .300 2 .150 .204 .817

Appendix C Page: 227
Sum of Squares df Mean Square F Sig.
Developer estimation
experience
Within Groups 12.500 17 .735
Total 12.800 19
Language and culture
differences
Between Groups .600 2 .300 .220 .805
Within Groups 23.200 17 1.365
Total 23.800 19
Geographical of the
development team
Between Groups .800 2 .400 .239 .790
Within Groups 28.400 17 1.671
Total 29.200 19
Item priority Between Groups .850 2 .425 .228 .799
Within Groups 31.700 17 1.865
Total 32.550 19
Deadline date Between Groups .400 2 .200 .274 .763
Within Groups 12.400 17 .729
Total 12.800 19
Budget for the project Between Groups 7.600 2 3.800 2.737 .093
Within Groups 23.600 17 1.388
Total 31.200 19
Development type (New
or enhanced app)
Between Groups 1.650 2 .825 .775 .476
Within Groups 18.100 17 1.065
Total 19.750 19
Managerial skills Between Groups .300 2 .150 .138 .872
Within Groups 18.500 17 1.088
Total 18.800 19
Work pressure (workload) Between Groups 2.700 2 1.350 1.391 .276
Within Groups 16.500 17 .971
Total 19.200 19

Appendix C Page: 228
Figure 89: Correlation for all effort estimation factors

Appendix C Page: 229
Figure 90 Agile estimation factors filtered by expert's job role
Figure 91 Functional estimation factors filtered by expert's job role

Appendix C Page: 230
Figure 92 Non-functional estimation factors filtered by expert's job role
Figure 93: Project estimation factors filtered by expert's job role
Figure 94: Mobile platform estimation factors filtered by
expert's job role

Appendix C Page: 231
Qualitative Analysis
Figure 95: Example of thematic technique used to summarise and generate themes of the estimation process from the qualitative question

Appendix C Page: 232
Figure 96 Example of thematic technique used to summarise and generate themes of additional estimation factors from the qualitative question

Appendix D Page: 233
Appendix D
Case Study Method
Figure 97: Email message from the project manager after conducting a group discussion with the development team
Figure 98: Email message of appreciation for the improvement from the client representative of Organisation T

Appendix D Page: 234
Figure 99: Appreciation letter from the president and CEO of Company A for the positive results in Project X
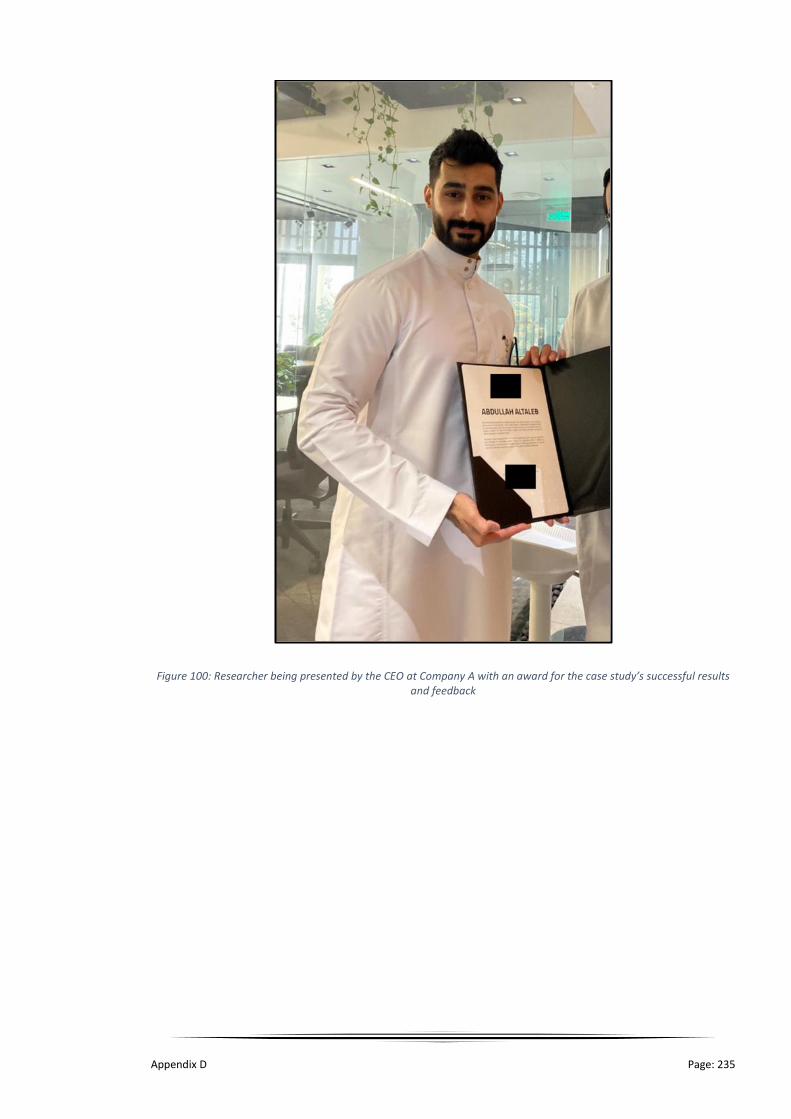
Appendix D Page: 235
Figure 100: Researcher being presented by the CEO at Company A with an award for the case study’s successful results and feedback

Appendix D Page: 236
Table 77: Development performance before the proposed estimation process
Sprint
number Sprint Performance before applying the proposed model
Sprint 4
Sprint 5
80
20
44
Sprint Backlog Item result
User stoies Tasks Bugs Test case
71
17
39
Sprint Backlog Item result
User stoies Tasks Bugs Test case

Appendix D Page: 237
Table 78: Development performance after the proposed estimation process
Sprint
number Sprint Performance after applying the proposed model
Sprint 6
Sprint 7
12
25
1174
Sprint Backlog Item result
User stoies Tasks Bugs Test case
4
35
9
54
Sprint Backlog Item result
User stoies Tasks Bugs Test case

Appendix D Page: 238
Sprint
number Sprint Performance after applying the proposed model
Sprint 8
Figure 101: Distribution of the work progress on Sprint 5
6
32
13
64
Sprint Backlog Item result
User stoies Tasks Bugs Test case
0
5
10
15
20
25
30
work progress and workflow in sprint 5
In Progress Dev Complete Dev Testing Complete QA UAT

Appendix D Page: 239
Figure 102: Distribution of the work progress on sprint 6
Figure 103: distribution of the work progress on sprint 7
0
5
10
15
20
25
30
35
40
45
50
29-Sep 30-Sep 01-Oct 02-Oct 03-Oct 04-Oct 05-Oct 06-Oct 07-Oct 08-Oct 09-Oct 10-Oct
work progress and workflow in sprint 6
In Progress Dev Complete Dev Testing Complete QA UAT
0
10
20
30
40
50
60
70
80
90
100
13-Oct 14-Oct 15-Oct 16-Oct 17-Oct 18-Oct 19-Oct 20-Oct 21-Oct 22-Oct 23-Oct 24-Oct
work progress and workflow in sprint 7
In Progress Dev Complete Dev Testing Complete QA UAT
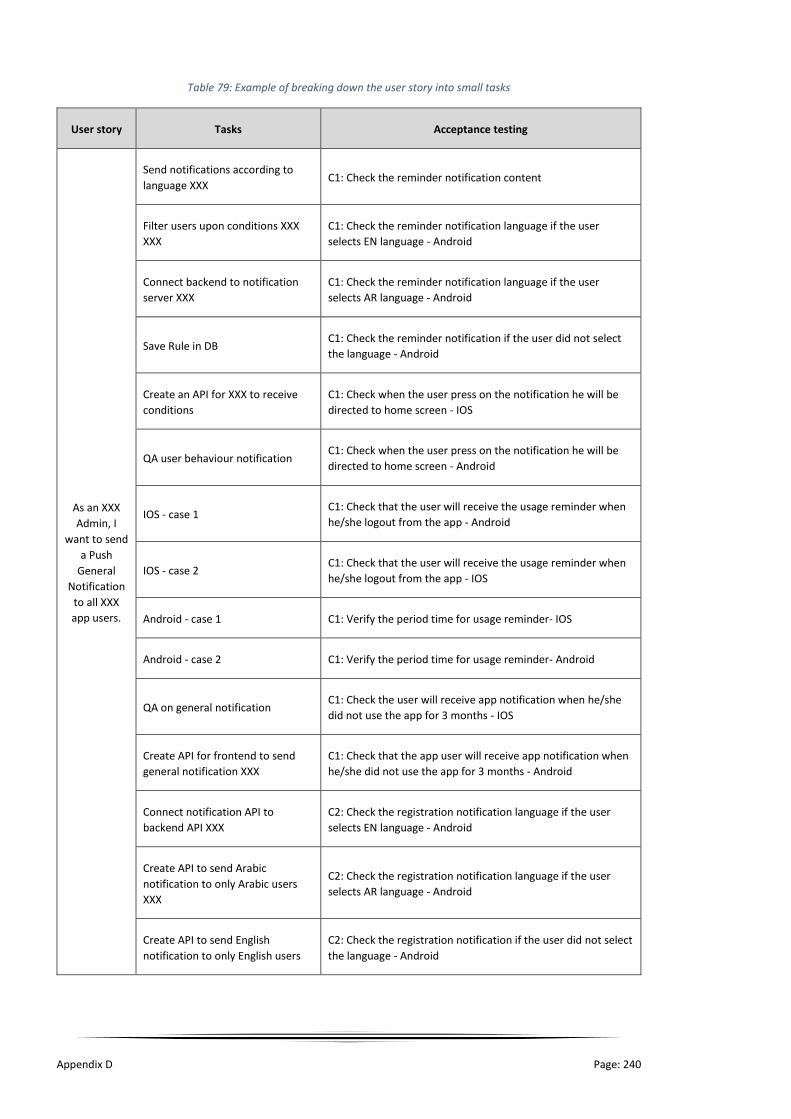
Appendix D Page: 240
Table 79: Example of breaking down the user story into small tasks
User story Tasks Acceptance testing
As an XXX
Admin, I
want to send
a Push
General
Notification
to all XXX
app users.
Send notifications according to
language XXX C1: Check the reminder notification content
Filter users upon conditions XXX
XXX
C1: Check the reminder notification language if the user
selects EN language - Android
Connect backend to notification
server XXX
C1: Check the reminder notification language if the user
selects AR language - Android
Save Rule in DB C1: Check the reminder notification if the user did not select
the language - Android
Create an API for XXX to receive
conditions
C1: Check when the user press on the notification he will be
directed to home screen - IOS
QA user behaviour notification C1: Check when the user press on the notification he will be
directed to home screen - Android
IOS - case 1 C1: Check that the user will receive the usage reminder when
he/she logout from the app - Android
IOS - case 2 C1: Check that the user will receive the usage reminder when
he/she logout from the app - IOS
Android - case 1 C1: Verify the period time for usage reminder- IOS
Android - case 2 C1: Verify the period time for usage reminder- Android
QA on general notification C1: Check the user will receive app notification when he/she
did not use the app for 3 months - IOS
Create API for frontend to send
general notification XXX
C1: Check that the app user will receive app notification when
he/she did not use the app for 3 months - Android
Connect notification API to
backend API XXX
C2: Check the registration notification language if the user
selects EN language - Android
Create API to send Arabic
notification to only Arabic users
XXX
C2: Check the registration notification language if the user
selects AR language - Android
Create API to send English
notification to only English users
C2: Check the registration notification if the user did not select
the language - Android

Appendix D Page: 241
User story Tasks Acceptance testing
Modify notification API to receive
English and Arabic notifications
Confirmation message must appear to the Admin user before
cancel the notification (General)
Create API to take language of
user from mobile app and save in
db
C2: Check if the user updates the app will not receive register
notification- IOS
Create wireframe XXX C2: Check the registration notification language if the user
selects EN language-IOS
Connection with API (General) XXX C2: Check the registration notification language if the user
selects AR language-IOS
On submit validate fields (General) C2: Check the registration notification if the user did not select
the language- IOS
Change fields depending on type
(General) XXX C2: Check the registration notification content
Applying new design for create
notification pop up (General) XXX
C2: Check when the user press on the notification he will be
directed to home registered screen - Android
Add Create Notification button
XXX
C2: Check when the user press on the notification he will be
directed to home registered screen - IOS
C2: Check the user will be notified if he/she did not complete
registration-Android
C2: Check the user will be notified if he/she did not complete
registration-IOS
XXX: means the data is private and hidden upon the case study ethics and regulation number 52598.
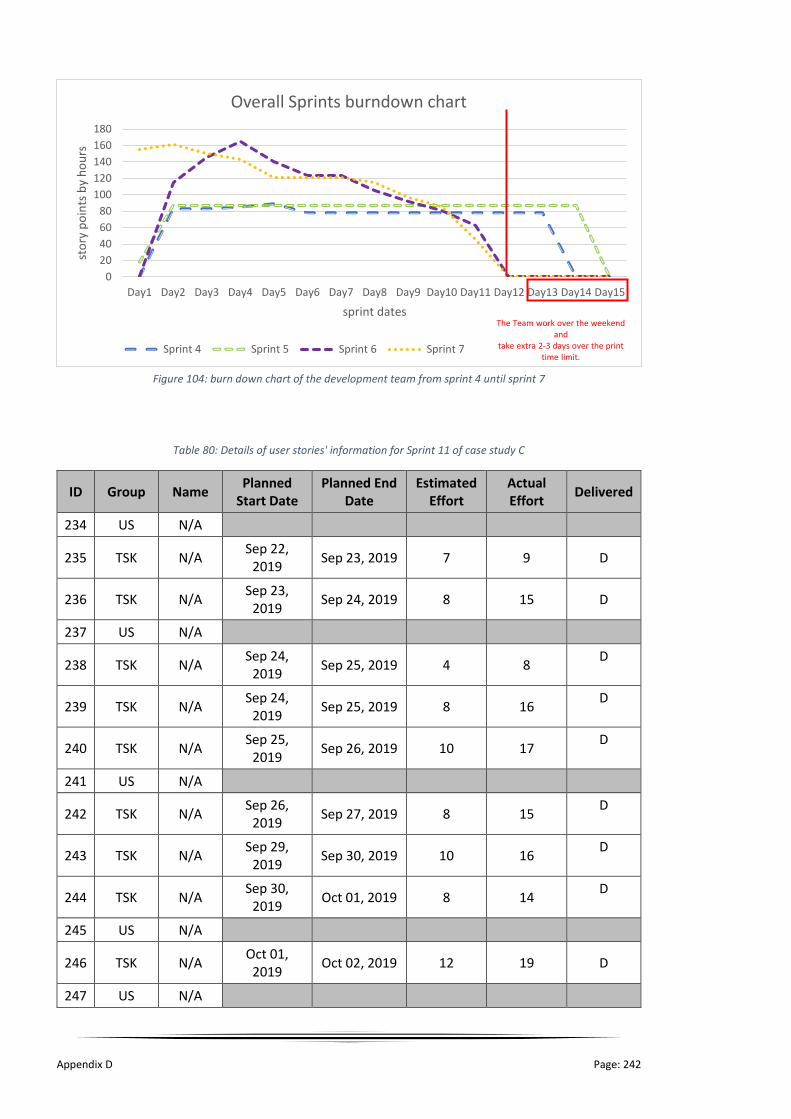
Appendix D Page: 242
Figure 104: burn down chart of the development team from sprint 4 until sprint 7
Table 80: Details of user stories' information for Sprint 11 of case study C
ID Group Name Planned
Start Date Planned End
Date Estimated
Effort Actual Effort
Delivered
234 US N/A
235 TSK N/A Sep 22,
2019 Sep 23, 2019 7 9 D
236 TSK N/A Sep 23,
2019 Sep 24, 2019 8 15 D
237 US N/A
238 TSK N/A Sep 24,
2019 Sep 25, 2019 4 8
D
239 TSK N/A Sep 24,
2019 Sep 25, 2019 8 16
D
240 TSK N/A Sep 25,
2019 Sep 26, 2019 10 17
D
241 US N/A
242 TSK N/A Sep 26,
2019 Sep 27, 2019 8 15
D
243 TSK N/A Sep 29,
2019 Sep 30, 2019 10 16
D
244 TSK N/A Sep 30,
2019 Oct 01, 2019 8 14
D
245 US N/A
246 TSK N/A Oct 01, 2019
Oct 02, 2019 12 19 D
247 US N/A
0
20
40
60
80
100
120
140
160
180
Day1 Day2 Day3 Day4 Day5 Day6 Day7 Day8 Day9 Day10 Day11 Day12 Day13 Day14 Day15
sto
ry p
oin
ts b
y h
ou
rs
sprint dates
Overall Sprints burndown chart
Sprint 4 Sprint 5 Sprint 6 Sprint 7
The Team work over the weekend and
take extra 2-3 days over the print time limit.

Appendix D Page: 243
ID Group Name Planned
Start Date Planned End
Date Estimated
Effort Actual Effort
Delivered
248 TSK N/A Oct 02, 2019
Oct 03, 2019 10 3 NC ND
249 TSK N/A Oct 02, 2019
Oct 03, 2019 5 0 ND
250 TSK N/A Oct 03, 2019
Oct 04, 2019 8 0 ND
Table 81: Details of user stories' information for Sprint 13 of Case study C
ID Group Name Planned
Start Date
Planned End
Date
Estimated
Effort
Actual
Effort Delivered
269 US N/A
270 TSK N/A Oct 20,
2019 Oct 21, 2019 2 2 D
271 TSK N/A Oct 20,
2019 Oct 21, 2019 4 4
D
272 TSK N/A Oct 21,
2019 Oct 22, 2019 4 5
D
273 TSK N/A Oct 21,
2019 Oct 22, 2019 4 4
D
274 TSK N/A Oct 21,
2019 Oct 22, 2019 4 4
D
275 TSK N/A Oct 22,
2019 Oct 23, 2019 3 4
D
276 N/A
277 TSK N/A Oct 22,
2019 Oct 23, 2019 5 6
D
278 TSK N/A Oct 22,
2019 Oct 23, 2019 4 4
D
279 TSK N/A Oct 23,
2019 Oct 24, 2019 3 4
D
280 TSK N/A Oct 23,
2019 Oct 24, 2019 2 2
D
281 TSK N/A Oct 23,
2019 Oct 24, 2019 4 5
D
282 TSK N/A Oct 24,
2019 Oct 25, 2019 4 5
D

Appendix D Page: 244
ID Group Name Planned
Start Date
Planned End
Date
Estimated
Effort
Actual
Effort Delivered
283 TSK N/A Oct 24,
2019 Oct 25, 2019 3 5
D
284 TSK N/A Oct 24,
2019 Oct 25, 2019 5 5
D
285 N/A
286 TSK N/A Oct 27,
2019 Oct 28, 2019 5 6
D
287 TSK N/A Oct 27,
2019 Oct 28, 2019 4 5
D
288 TSK N/A Oct 28,
2019 Oct 29, 2019 4 5
D
289 TSK N/A Oct 28,
2019 Oct 29, 2019 4 4
D
290 TSK N/A Oct 28,
2019 Oct 29, 2019 3 4
D
291 N/A
292 TSK N/A Oct 29,
2019 Oct 30, 2019 2 3
D
293 TSK N/A Oct 29,
2019 Oct 30, 2019 3 3
D
294 TSK N/A Oct 29,
2019 Oct 30, 2019 2 3
D
295 TSK N/A Oct 30,
2019 Oct 31, 2019 4 5
D
296 TSK N/A Oct 30,
2019 Oct 31, 2019 4 5
D
297 TSK N/A Oct 31,
2019 Nov 01, 2019 3 5
D
298 TSK N/A Oct 31,
2019 Nov 01, 2019 4 4
D

Appendix D Page: 245
Table 82: Summary of methods used for the 1st and 2nd research questions
Question Method Purpose Chapter
What are the effort
estimation factors and
predictors that have
been used in software
estimation technique in
Agile software
development process?
Systematic
Literature
Review
To provide the estimation factors and
predictors that influence on the effort
estimation
4 and 5
Structured
interview
To evaluate the existed factors and
predictors and measure its suitability
for mobile app development
6 and 7
Semi-structured
interview
To provide additional factors from the
industrial fields that influence on the
accuracy of the effort estimation
6 and 7
What is the influence
of the estimation
factors on the
estimation accuracy?
Case Study and
Action Method
To examine the efficiency of the effort
estimation factors and predictors in
the development team from industrial
fields
8 and 9
Table 83: Summary of methods used for the 3rd research question
Question Method Purpose Chapter
What methods or
technique have been
used to estimate effort
in mobile application
development using
Agile process?
Systematic
Literature
Review
To identify and investigate the current
state of art of effort estimation
techniques for mobile app in Agile
context
4 and 5
Structured
interview
To identify the effort estimation
techniques in the current state of
practice
6 and 7
Semi-structured
interview
To understand the process of the effort
estimation technique from the
industrial fields
6 and 7
Case Study and
Action Method
To understand the existing estimation
technique and measure its efficiency
with the development team
8 and 9
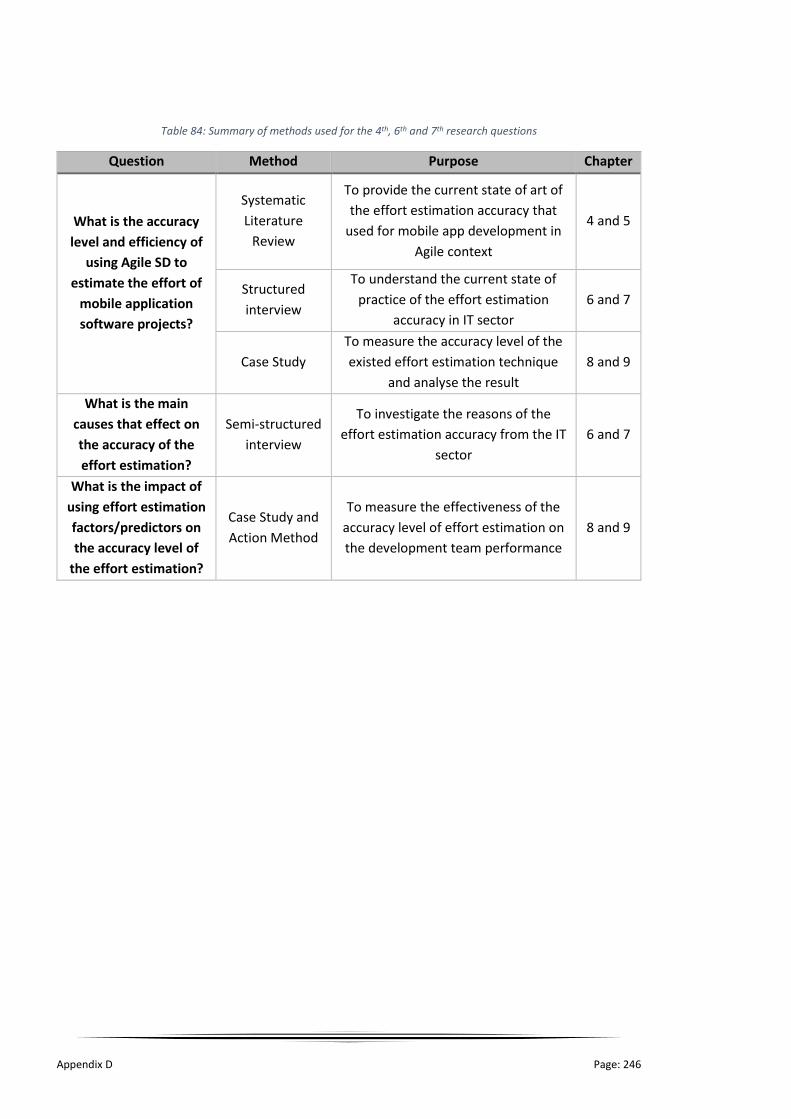
Appendix D Page: 246
Table 84: Summary of methods used for the 4th, 6th and 7th research questions
Question Method Purpose Chapter
What is the accuracy
level and efficiency of
using Agile SD to
estimate the effort of
mobile application
software projects?
Systematic
Literature
Review
To provide the current state of art of
the effort estimation accuracy that
used for mobile app development in
Agile context
4 and 5
Structured
interview
To understand the current state of
practice of the effort estimation
accuracy in IT sector
6 and 7
Case Study
To measure the accuracy level of the
existed effort estimation technique
and analyse the result
8 and 9
What is the main
causes that effect on
the accuracy of the
effort estimation?
Semi-structured
interview
To investigate the reasons of the
effort estimation accuracy from the IT
sector
6 and 7
What is the impact of
using effort estimation
factors/predictors on
the accuracy level of
the effort estimation?
Case Study and
Action Method
To measure the effectiveness of the
accuracy level of effort estimation on
the development team performance
8 and 9