Agile manufacturing from a statistical perspective - Wikimedia ...
88
Agile Manufacturing from a Statistical Perspective NISTIR 5573 Robert G. Easterling New Initiatives Department Sandia National Laboratories Albuquerque, NM 87185 U.S. DEPARTMENT OF COMMERCE Technology Administration National Institute of Standards and Technology Statistical Engineering Division Gaithersburg, MD 20899 QC 100 .U56 NO. 5573 1995 NIST
-
Upload
khangminh22 -
Category
Documents
-
view
1 -
download
0
Transcript of Agile manufacturing from a statistical perspective - Wikimedia ...

Agile Manufacturing from aStatistical Perspective
NISTIR 5573
Robert G. EasterlingNew Initiatives DepartmentSandia National Laboratories
Albuquerque, NM 87185
U.S. DEPARTMENT OF COMMERCETechnology Administration
National Institute of Standards
and Technology
Statistical Engineering Division
Gaithersburg, MD 20899
QC
100
.U56
NO. 5573
1995
NIST

NISTIR 5573
Agile Manufacturing from aStatistical Perspective
Robert G. EasterlingNew Initiatives DepartmentSandia National Laboratories
Albuquerque, NM 87185
U.S. DEPARTMENT OF COMMERCETechnology Administration
National Institute of Standards
and Technology
Statistical Engineering Division
Gaithersburg, MD 20899
October 1995
C.
U.S. DEPARTMENT OF COMMERCERonald H. Brown, Secretary
TECHNOLOGY ADMINISTRATIONMary L. Good, Under Secretary for Technology
NATIONAL INSTITUTE OF STANDARDSAND TECHNOLOGYArati Prabhakar, Director

j
I
,5
,1
NISTER 5573
AGILE MANUFACTURING FROM ASTATISTICAL PERSPECTIVE
Robert G. Easterling*
New Initiatives Department
Sandia National Laboratories
Albuquerque, NM 87185
Abstract
The objective of agile manufacturing is to provide the ability to quickly realize high-quality,
highly-customized, in-demand products at a cost commensurate with mass production. More
broadly, agility in manufacturing, or any other endeavor, is defined as change-proficiency — the
ability to thrive in an environment of unpredictable change. This report discusses the general
direction of the agile manufacturing initiative, including research programs at the National
Institute of Standards and Technology (NIST), the Department of Energy, and other government
agencies, but focuses on agile manufacturing from a statistical perspective. The role of statistics
can be important because agile manufacturing requires the collection and communication of
process characterization and capability information, much of which will be data-based. The
statistical community should initiate collaborative work in this important area.
* This work was performed while the author was a Visiting Researcher at the Statistical
Engineering Division, National Institute of Standards and Technology, Gaithersburg, MD. The
report will also be published as a Sandia report, SAND95-1552
2

TABLE OF CONTENTS
INTRODUCTION AND SUMMARY 4
Introduction 4
Summary 4
AGILITY AND AGILE MANUFACTURING 6
A Brief History of Manufacturing 6
Agility 6
Change-Thrivability 7
Agility, Statistically Speaking 8
Measuring Agility 10
AGILE Manufacturing 12
MANUFACTURING PROCESS MODELING 15
Materials Processing Models 17
Semiconductor Processing Models 19
Discrete Parts Manufacturing Process Modeling 20
PROCESS MODELING: STATISTICAL CONSIDERATIONS 20
Model Validation 22
Computer Experiments 23
Comment 25
Process Capability Prediction 26
Process Capability Prediction Based on Physical Experimentation 26
Process Capability Prediction Based on Mathematical Models 27
Tolerance Allocation 29
AGILE MANUFACTURING AND QUALITY 29
Integrated Product and Process Design 30
Process Control 3
1
Process Change-Over 3
1
Short-Run Process Control 31
Final Product Testing 31
Framework for Quality Assurance 32
THE AGILE MANUFACTURING RESEARCH AGENDA 33
ARPA 33
TEAM (Technologies Enabling Agile Manufacturing) 35
NIST AGILE Manufacturing Projects 35
A-PRIMED 36
Other Research 38
CONCLUSION 38
ACKNOWLEDGMENTS 38
REFERENCES 40
3


AGILE MANUFACTURING FROM ASTATISTICAL PERSPECTIVE
INTRODUCTION AND SUMMARY
Introduction
Agile manufacturing, and, more generally,
agility, have become topics of considerable
interest to industry -- a source of ideas,
conferences, organizations, and funding.
Agility is broadly defined by the Agility
Forum (an industry-led, government-funded
organization established by the lacocca
Institute at Lehigh University) as the ability
to thrive in a continuously changing,
unpredictable environment (Dove 1994),
More concretely, agile manufacturing is
thought of as the ability to quickly realize
(design, produce, and deliver) totally new,
customized, high-quality products at prices
commensurate with mass production. To
accomplish this, a structure that is
envisioned is a "virtual enterprise" in which
various resources, or processes, are linked,
sometimes across corporate lines, in a type
of partnership that goes beyond traditional
supplier-producer relationships.
Agility, as "change-thrivability," is
obviously a desirable ability, from the
personal to the organizational to the
corporate to the national levels. Nobody
could be against it. The challenge is how to
achieve it. The virtual enterprise is seen as
an important ingredient. But of course
there are other possible success ingredients,
such as flexibility, leanness, total quality^
management, process re-engineering,
customer-focus, and many others. And as a
statistician, I think overt statistical thinking
and methods -- data-driven decision-
making, ferreting out and eliminating or
controlling sources of variability, etc. —
also enhance an enterprise's chance of
success or its thrivability in the face of
change. With this motivation, then, I
decided to explore the concept of agility
and the possible role of statistics in agility.
Many authors have written on statistical
needs in industry (see, e.g., Hoerl et al.
1993 and their references), with an
emphasis in recent years on the relationship
of statistics to quality. There are other
aspects of industry that warrant statistical
participation, one of which potentially is
agile manufacturing. Thus, the focus of this
report is the potential role of statistics as an
enabler of agile manufacturing. Whether or
not Total Quality Management in its
various incarnations fades from the
limelight in favor of something else, say re-
engineering, or maybe even agility, the
constant need remains for statisticians to
help industry make better products, more
consistently, quickly, and economically.
Useful, usable data-based information is
essential to good industrial practice, under
any banner, and that need provides
opportunities for statistics.
Summary
The broad, current definition of agility as
thriving on unpredictable change has led to
the development, by the Agility Forum, of a
structure, or a framework, for addressing
“change-proficiency.” Change-proficiency
is not a characteristic limited to virtual
enterprises, so this structure can apply to
individual organizations, product lines, or
work stations. Change-management is a
recurring theme in industry, with an
extensive literature, so it remains to be seen
whether the agility perspective will b ring
something new to change-proficiency.
But, what is the agility perspective? What
does one do to become agile? By the broad
definition, anything that works (thrives on
4

change) must be agile. Thus, widely
disparate examples of successfully dealing
with unpredictable change, with no other
constraints, are not very helpfiil. For
example, an agility instance I have seen
cited is the hiring by one company of a
CEO from an unrelated industry. The
structure developed by the Forum for
evaluating an operation's change-
proficiency in various domains, plus the
development of reference models of "best
agile practices" should help define agility in
practical ways.
In statistical terms, agility is a dependent
variable. Development of a theory of
agility means the identification of
predictors of agility — industrial practices
that increase the probability of thriving in
an environment of unpredictable change.
Examples and case studies can suggest
predictors, but caution is warranted in
inferring a cause-and-effect relationship in
such observational data. What works for
one company in its environment may not
work at all for another company and its
environment. Ideally, one would test
theories in controlled experiments, but
company-level, or product line-level
experiments are generally infeasible.
Government funded research could
undertake such experiments.
Change-proficiency theories can be
interesting, but the real opportunities for
statistics lie in agile manufacturing — quick
realization of high-quality, highly
customized products, at competitive cost.
Predictable, well-characterized, and well-
controlled manufacturing processes are
required in order to rapidly reconfigure
manufacturing processes to produce
products that meet particular customer
needs, and much of the process information
required to support successful reconfig-
uration will be statistical in nature.
Mathematical models of processes are
needed in order to make design and
production process decisions much more
rapidly than can be done by iterative
physical testing. While these models are
often physics-based, there are statistical
issues in the estimation of model
parameters and in the validation of models
experimentally. Agile design decision-
making, however, may require models of
relationships that are not typically
addressed theoretically, so the development
of empirical models is also needed, a point
that has been made in the materials
processing area by Szekely and Trapaga
(1994). A NISS (National Institute of
Statistical Sciences)-NIST workshop report
(Karr 1994) points further to the
opportunities for statistical-materials
sciences collaboration in developing the
process understanding and analytical tools
that will permit agile manufacturing. The
availability of computer models and the
need to extract information from them lead
to computer experiments and raise
experimental design issues that the
statistical community has been addressing
in recent years. Predicting process
capability via process models, as opposed
to process exercising, also poses interesting
statistical problems.
Much industrial statistical practice is
quality-related and the national quality
thrust of recent years has invigorated
industrial statistical practice. Quality is one
element of agile manufacturing — it's
assumed that high-quality will be achieved.
Actually accomplishing that, in the
dynamic, short production run (lot size of
one?) world of agile manufacturing will
require the (continued) development and
application of new statistical methods. It is
also apt to require deep immersion by
statisticians in product realization projects,
rather than the role of a consulting
specialist. The goals of agile manu-
facturing — faster, better, cheaper — extend
beyond the traditional bounds of quality,
say process characterization and control.
5

s'.'l
K
i'
f'
and they will endure, whether under the
heading of agile manufacturing or some
other banner. Statisticians and statistical
methods can make important contributions
to achieving these goals.
Research under the heading of agile
manufacturing generally deals with the
infrastructure for linking together the
processes required by an enterprise and for
moving information across those con-
nections. Presently, there seems to be little
statistical content in infrastructure issues,
but at some point standards for the
transmittal of statistical information
pertaining to processes will become
important. A Sandia demonstration project,
though, has provided an opportunity for the
development and testing of statistical
qualification methods in agile manu-
facturing.
The goal of agile manufacturing — quick,
economical realization of high-quality,
customized product — is important to
industrial competitiveness and survival.
The routes to that goal may differ from
industry to industry and company to
company. Common to all, though, is the
need to provide information that can be
readily used to decrease design and
production time and cost. Modem data
generation, storage, and analysis capabil-
ities pose new problems and opportunities
for the statistical extraction of information
from data. But, the opportunity has to be
seized. Statistics can be (or at least
perceived to be) a speed-bump rather than a
speed-enhancer on the road to progress.
Our personal and professional agility are
worth some thought.
In sum, I encourage statisticians to seek out
collaborative opportunities to help industry
realize the goals of agile manufacturing.
This report describes in general the sort of
work that is needed, but it is the day to day,
in-depth project involvement that will lead
to success.
AGILITY AND AGILEMANUFACTURING
A Brief History of Manufacturing
A century ago, manufacturing was
accomplished by craftsmen. A single
craftsman made a rifle; a team of craftsmen
made a locomotive. Then, to meet the
needs of mass production, came inter-
changeable parts (achieved by variance
reduction) and the assembly line. Straight
line production is susceptible to bottlenecks
and breakdowns, so flexible manufacturing
systems evolved, whereby alternate paths
through a production network were
possible. Leanness in manufacturing has to
do with the elimination of waste and non-
value-adding operations (which can also be
variance-introducers), and can be related to
flexibility. If a machine, or work cell, or
technician is flexible enough to do more
than one job, the operation is leaner
because of not having to have two
dedicated machines. (Reader's Digest joke:
To the old saw about how the optimist and
pessimist see the half-full (-empty) glass of
water, there is added the efficiency (re-
engineering, lean, ... ) expert who says,
"Whoa. Looks like you've got twice as
much glass as you need.") Agility, then, is
to be the next step beyond flexibility.
Agility
(This discussion is drawn largely from
Nagel and Dove (1991) and Dove (1994)
plus my experiences as a member of the
Agility Forum's Agile Operations Focus
Group. Dove (1995), which appeared after
this report was largely written, is the
6

t
I'
i
I
iI
Forum’s most recent exposition on agility.)
The vision set forth (Nagel and Dove 1991)
by the team that launched the agile
manufacturing initiative is that the agile
enterprise will be able to rapidly create
totally new products, not just flexibly
produce a particular product. Stated more
fully, the agile enterprise will quickly
produce high quality, highly customized
products, usually in low volume, at the
same cost levels achievable by mass
production. The phrase sometimes used is
"mass customization." Horse shoes one
day; engine blocks the next. Further, in
some contexts, the product is to be readily
upgradeable in the hands of the customer, a
la some computers. All this is to be
achieved by linking together resources and
processes, oftentimes across corporate
lines, thus forming a "virtual enterprise,"
supported by an information infrastructure
and system of standards that smoothly
accomplish the linkage and implemented by
a workforce that correctly and efficiently
uses and communicates the information
made available, to produce a customized
product. Then, after delivering the product,
the enterprise will dissolve and reform in
other configurations to produce other
products. To a degree, the concept of mass
customization is a return to craftwork
(Headline, Wall Street Journal, Oct. 24,
1994: "Back to the Past: Some Plants,
Especially in Japan, Are Switching to Craft
Work From Assembly Lines"), but on a
larger scale and with more fluidity and
speed.
Agility in manufacturing is not explicitly
defined in Nagel and Dove (1991). Thus,
the implication is that the dictionary
definition applies: agile — "marked by
ready ability to move with quick easy
grace;" agility — "nimbleness, dexterity"
(Webster's Ninth New Collegiate
Dictionary). Subsequent work on
developing the concept and providing the
credentials for a new paradigm, represented
by Dove (1994, 1995), has led to the greatly
expanded definition given above: ability to
thrive on unpredictable change. The
apparent connection is that in order to
thrive on unpredictable change, an
enterprise must be able to rapidly create
totally new products (as opposed to rapid
improvements or modifications of existing
product lines). This ability is to be derived
from the ability to quickly reconfigure
processes and resources to achieve creation
of a new product ("reconflgurable
everything" is the phrase used). Further,
agility, under the broad definition, is not
restricted to manufacturing and it can be
applied to various levels within an
enterprise — a department, a machine, a
product line, a service organization — and
not just to a cross-corporate virtual
enterprise.
Change-Thrivability
Companies have always had to deal with
changing environments — buggy-makers
became automobile makers; some thrived,
most disappeared. Management texts and
journals must, I would guess, be filled with
case studies and theories of success.
Currently, U.S.-Asian joint ventures in
automobile production are examples of
reconfigurability as a survival/thrival
technique. Whether the current rate of
change, or the nature of current changes, is
dramatically different from the past, as
advocates of agility and other avenues to
success maintain, and render earlier
solutions inadequate, is an issue that I'll
leave to the specialists. There is always a
tendency, though, call it proximity bias or
short-term memory, to regard the present
environment as dramatically more chal-
lenging than anything our predecessors saw
and therefore there is a need for new
solutions.
7

Whatever the nature and pace of change,
today's businesses need to deal with today's
changing environments. How do they do
it? Is there any underlying theory of
thrivability? Are there tools that help 'do
agility'? What changes should be made on
the factory floor? Several years ago there
was a spate of books on change manage-
ment, but these seem focused on the
sociological aspects of adapting to or
surviving change that is thrust upon one, or
they dealt with the methods by which an
enlightened or frightened management
could bring change to their organizations.
The current hot management topic, re-
engineering, continues the change theme
and deals with radically changing internal
processes and often reducing the work-
forces that run those processes. (A change-
survival approach that appeals to me, which
is the bane of change-theorists, but will
someday have its 1 5 minutes of fame, is the
science of 'muddling through,' which I once
saw in an article — British, I believe.)
The agility proponents appear to be
broadening the change-management
perspective by considering the technical
aspects of change — how do you design a
system, or a company, or a department to
be change-proficient? — and going beyond
survival to "thrival." Also, rather than the
ability to make a specific change, the agility
focus is on the ability to respond to future,
unanticipated, repeated changes in the
environment. But even if there were
nothing new in the objective of change-
proficiency, in a dynamic world there is
need to rethink change as the times change.
For example, computing and commun-
ications power, the ability to rapidly
generate, process, and exchange massive
amounts of information (not just data), is
both a part of today's unpredictably
changing environment and a provider of the
technological tools that make new modes of
change-proficiency possible. So, new tools
for change-proficiency are available and
agility provides a vehicle for their appli-
cation. Agility, as change-proficiency, is in
an early stage of development, and it
remains to be seen whether this perspective
will add to our understanding of change.
Agility, Statistically Speaking
Agility, in statistical terms, is a dependent
variable, a response variable, not a set of
independent variables that "causes" this
response. Its definition doesn't provide or
suggest the means by which that result is to
be attained. The leading candidate
independent variable, by the discussion
above, is reconfigurability: "Reconfig-
urable everything" (it is said) leads to the
ability to thrive in an environment of
unpredictable change. But, that's a difficult
theory to test and to put into practice and
one can conjecture about other causal, or at
least contributing variables, such as
concurrent engineering, computer-aided
everything, automation, visionary leaders,
flat management structures, empowered
work teams, and many more. The
definition of agility invites such conjec-
tures. Sorting it all out, finding methods
that, in advance, can be claimed to have an
appreciable probability of success, is an
objective of the Agility Forum and agility
research sponsors. To date, the search for
independent variables has led to the
collection of examples and the development
of "reference models," which are
collections of best agile practices, and to a
focus on smaller organizational units than a
virtual corporation.
The breadth of the Agility Forum definition
of agility can lead to putting everything
good under the heading of agility (if it
works, it's agile). Doing so, though, dilutes
the concept and confuses people trying to
understand what is new and unique about
agility. More specific examples can help to
characterize agility in practice and one can
8

also examine collections of examples to try
to identify common contributors to agility.
While such information can be useful, the
(statistical) cautions one should apply to
observational data are very appropriate.
Just because Company A attributes its
success on Project P, in environment E, to
its use of method X, doesn't mean that
Company B, in environment F, can expect
success if it uses method X. Either
'lurking,' unrecognized or unattributed
variables, by themselves or in conjunction
with method X, or environmental differ-
ences may invalidate such an inference. Afamiliar example is that some American
companies found that some Japanese
quality practices were not a "treatment" that
could be applied to their company and get
the desired response. The "Hawthorne
effect," improvement due just to the
attention given a project, rather than the
method tested, may also be at work.
Further, there is a selection bias: we don't
know how many other companies tried
method X and were not successful.
Typically, the search for examples begins
with a survey asking for success stories and
typically the response rate is very low,
clearly a further source of selection bias. In
reliability terms, success stories provide
numerator data, not denominator data, so
probability of success cannot be estimated.
Lack of a control (e.g., a parallel project
that used method Y, a standard method) and
lack of replication also limit the ability to
draw inferences from examples.
One way to overcome the limitations of
observational studies would be to conduct
designed experiments, but that is generally
not feasible in a commercial manufacturing
setting. For example, it's generally not
possible to have two or more teams take on
the same project by different methods. All
one can often do when a new approach is
tested, is to measure its value by
comparison to a previous project under the
old approach. Reduced cycle times, costs,
etc., if achieved, are attributed to the newapproach. Some sort of subjective standard
error is used to decide when the reduction is
more than just (random) noise. This
attribution may be warranted at least in
part, but separating out the method's effect
from general learning effects and the
Hawthorne effect may be impossible. In
these circumstances, face validity of anec-
dotal evidence is generally what one has to
rely on in inferring the success of a newmethod. If multiple companies (or a whole
country, say Japan) replicate tests of
method X, then the combined results should
be more convincing (providing non-
successes are not screened out). I'm not
aware (not having searched the
management literature) whether any such
meta-analyses have been carried out. In
this vein, though, recent news stories
reported a follow-up study of companies
identified in the Peters and Waterman
(1982) book, In Search of Excellence, that
found their stock performance had not
exceeded overall stock averages. While
stock performance may not be the best
measure of excellence, the notion of
looking for consistent effects across
multiple "trials" of a method is statistically
correct. Both the average and the
variability of those effects are informative.
To some extent government- and industry-
funded work in industry, university, and
government laboratories, taken together, is
an experiment in agility methods. Looking
at that program from an experimental
design point of view (Are there controls,
replication?) might be informative.
It is interesting to contrast the way in which
new industrial procedures are adopted with
the way in which new medical procedures
are adopted. Medical procedures require
fairly strong experimental proof of efficacy
and the lack of harmful side effects.
Industrial/management procedures require
publicity, charismatic advocates, and a
9

I
j

good collection of anecdotes. Experi-
menting on companies, or product lines
within companies, is different from
experimenting on patients, but the
similarities, and differences, and the
benefits provided by clean experimental
evidence are worth thinking about.
Examining sets of examples and identifying
common apparent contributors to success is
sometimes called 'benchmarking.' I'm
aware of two agility benchmarking studies:
One, by the Agility Forum (Goldman 1992)
selected four characteristics of agility:
information-sharing, man-machine inter-
face, concurrency, and level of cooperative
development across companies, and asked
companies to compare successful and not
so successful projects with respect to these
characteristics. Contributing factors to
success were identified as: simulation/
modeling techniques, design technologies,
flexible production techniques, and
information technologies. Another
benchmarking study, Hilton and Gill (1994)
attributed leading companies' success in
quickly and efficiently launching new
products to the "use of cross-functional
teams, a standardized development process,
and a partnership approach to supplier
management" — not exactly the dramatic
stuff of a new paradigm. Further study
would be required to tell whether consistent
evidence on the contributors to agile
success was found in the two studies.
Another means by which the concept of
agility is being developed is by focusing on
smaller units than the cross-corporate
virtual enterprise. A work cell, a product
line, a business system, a department, etc.,
can all have features that allow them to
thrive in a changing environment. One can
also have temporary organizations created
within a corporation. While this would just
be a project team, hardly a new concept,
agility ideas may have something to offer in
how those teams are created, supported, and
managed. To characterize agility at these
lower levels, the Agility Forum is
sponsoring focus groups that will collect
best practices in very specific areas and
assemble them into "reference models" of
agility. Further, as described in the
following paragraphs, it is defining "best"
from an agility perspective, which is not
necessarily the same as, say, a profitability
perspective. Where best practices are not
very agile, constructs of what would be
agile will be developed. For these
reference models to be useful it will be
necessary, following the discussion of the
previous paragraphs, to provide as muchinformation about the environmental
context as possible, and to probe these best
practices for hints of lurking variables.
(Note. My cautionary remarks are not
meant to discourage learning from others'
experience — what are the alternatives? —
but to point out ways in which that learning
might be enhanced.)
Measuring Agility
Dove (1994) has initiated the development
of a structure, a set of principles underlying
agility, by identifying domains in which an
organization has to be proficient at change.
That is, to thrive in an environment of
unpredictable change, an organism has to
be proficient at changing itself to cope with
and capitalize on environmental change —
industrial Darwinism or Lamarckism, if you
will. (Actually, agility advocates say that
adaptation won't keep up; DNA alteration is
needed.) At any rate, eight change domains
have been identified and are listed in Table
1. The terminology in Table 1 requires
some elaboration. I would express the
Table 1 domains, in general terms, by
saying that you have to be proficient at
changing what you produce, how much you
produce, the configuration of your
processes and resources, your resource mix,
and your fundamental concepts; further.
10

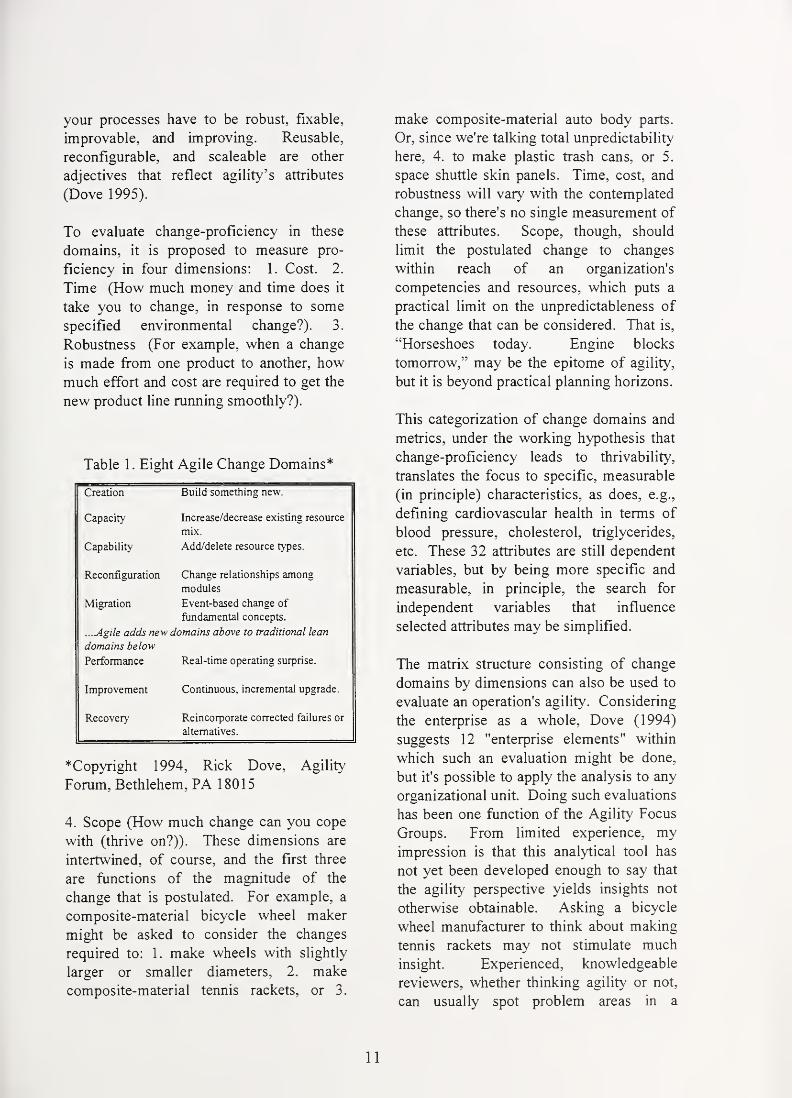
your processes have to be robust, fixable,
improvable, and improving. Reusable,
reconfigurable, and scaleable are other
adjectives that reflect agility’s attributes
(Dove 1995).
To evaluate change-proficiency in these
domains, it is proposed to measure pro-
ficiency in four dimensions: 1. Cost. 2.
Time (How much money and time does it
take you to change, in response to some
specified environmental change?). 3.
Robustness (For example, when a change
is made from one product to another, howmuch effort and cost are required to get the
new product line running smoothly?).
Table 1. Eight Agile Change Domains*
Creation Build something new.
Capacity Increase/decrease existing resource
mix.
Capability Add/delete resource types.
Reconfiguration Change relationships among
modules
Migration Event-based change of
fundamental concepts.
...Agile adds new domains above to traditional lean
domains below
Performance Real-time operating surprise.
Improvement Continuous, incremental upgrade.
Recovery Reincorporate corrected failures or
alternatives.
*Copyright 1994, Rick Dove, Agility
Forum, Bethlehem, PA 18015
4. Scope (How much change can you cope
with (thrive on?)). These dimensions are
intertwined, of course, and the first three
are functions of the magnitude of the
change that is postulated. For example, a
composite-material bicycle wheel maker
might be asked to consider the changes
required to: 1. make wheels with slightly
larger or smaller diameters, 2. make
composite-material termis rackets, or 3.
make composite-material auto body parts.
Or, since we're talking total unpredictability
here, 4. to make plastic trash cans, or 5.
space shuttle skin panels. Time, cost, and
robustness will vary with the contemplated
change, so there's no single measurement of
these attributes. Scope, though, should
limit the postulated change to changes
within reach of an organization's
competencies and resources, which puts a
practical limit on the unpredictableness of
the change that can be considered. That is,
“Horseshoes today. Engine blocks
tomorrow,” may be the epitome of agility,
but it is beyond practical planning horizons.
This categorization of change domains and
metrics, under the working hypothesis that
change-proficiency leads to thrivability,
translates the focus to specific, measurable
(in principle) characteristics, as does, e.g.,
defining cardiovascular health in terms of
blood pressure, cholesterol, triglycerides,
etc. These 32 attributes are still dependent
variables, but by being more specific and
measurable, in principle, the search for
independent variables that influence
selected attributes may be simplified.
The matrix structure consisting of change
domains by dimensions can also be used to
evaluate an operation's agility. Considering
the enterprise as a whole. Dove (1994)
suggests 12 "enterprise elements" within
which such an evaluation might be done,
but it's possible to apply the analysis to any
organizational unit. Doing such evaluations
has been one function of the Agility Focus
Groups. From limited experience, myimpression is that this analytical tool has
not yet been developed enough to say that
the agility perspective yields insights not
otherwise obtainable. Asking a bicycle
wheel manufacturer to think about making
tennis rackets may not stimulate much
insight. Experienced, knowledgeable
reviewers, whether thinking agility or not,
can usually spot problem areas in a
11

production process, including areas that are
lacking in or degrading to change-
proficiency, but these are apt to be well-
recognized by members of the organization
being reviewed.
(As a personal aside, I would note that
while the activities of the Agile Operations
Focus Group in which I have participated
have had limited explicit statistical content,
this participation has been very valuable in
providing a context in which to examine
statistical aspects of agility. It is also
useful, I think, to examine one's personal
and organizational skills in terms of
proficiency in the various change domains.
Statistical practice has some inherent agility
skills in that statisticians can be quickly
reconfigured. We can plug our methods
into a wide variety of applications
(enterprises). One of my professors, Carl
Marshall, expressed the following
sentiment which has remained with me:
"The nice thing about statistics is that the
nouns may change, but the verbs stay the
same." That is, bushels of com one day,
microelectronic chips the next, but ANOVA(analysis of variance) endures.
(Organizationally, though, we need to pay
attention to our change-proficiency. Weface unpredictable changes in the
environments in which statistical organ-
izations function. Companies and agencies
can suddenly reorganize in ways that can
profoundly alter the working relationships
and clientele that a statistical organization
has established. The quality boom provided
a boost for some statistical groups, witness
the various university Quality Centers that
sprang up, but what next? Recent AmStat
News articles have discussed with alarm the
dissolution of and attacks on institutional
statistical groups.
inherently collaborative discipline, the
agility model of floating alliances is
appropriate. We need to initiate, establish,
and contribute importantly to alliances in
emerging areas, such as the subject of this
report, agile manufacturing.)
Agile Manufacturing
Outside the Forum, agility in manufacturing
(or, agile manufacturing), I believe, is
generally still defined, in line with the
original Agility Fomm vision (Nagel and
Dove 1991), as the ability to quickly realize
highly customized, high-quality product,
generally in low volume, but at a cost
corresponding to mass production. (I don't
think, however, that the condition that this
product literally be "totally new" is
imposed. You've got to stay within reach of
your core competencies, which, of course,
can change over time.) This definition,
which is recognizably related to the
dictionary definition (nimbleness), trans-
lates more readily (than change-thrivability)
into engineering approaches such as
concurrent engineering, the use of
mathematical models and computer
simulation to reduce design and test times,
technology improvement, automation, and
real-time process monitoring and control.
Improved manufacturing architectures, such
as flexibility and reconfigurability, also fit
in here. Of course, technology does not
exist in a vacuum, so the surrounding and
sometimes supporting business, engineer-
ing, and cultural practices are also
important contributors to product realiza-
tion and they need to be designed to
facilitate the speed and cost-effectiveness
of the endeavour, i.e., to be agile. All this
is evidence of change-proficiency, but is
not tantamount to it.
A full airing of these issues is outside the
scope of this report, and I can offer no
solutions except to note that, as an
12
The balance of this report will focus on
agile manufacturing as rapid, customized-
product realization. In the preceding pages.

I've dealt at some length, however, with
agility in the broad sense, because that is
the direction the agile manufacturing
initiative has moved. And it does provide
an appropriate backdrop: rapid realization
of customized products will require change-
proficiency. I'm concerned, though, that
rapid (customized) product realization,
reconfigurability, and change-thrivability
are all getting so mixed up that the concept
of agile manufacturing will suffer because
of it.
Reducing product realization cycle times
and costs, from concept to delivered
product, has long been an imperative for
industiy’ and will continue to be, whether
under the heading of agile manufacturing,
quality improvement, re-engineering, or
something else. While some industries maysurvive, even thrive, for some periods of
status quo operations ("If it ain't broke,
don't fix it."), competition generally
disrupts this state of complacency. If there
is a constant it is the need for improve-
ment. And, as long as some fraction of the
population has enquiring minds and tolerant
management, people will seek better ways
of doing things, some evolutionary, some
revolutionary'. Agile manufacturing
continues the industrial imperative for
reduced product realization time and costs
and adds the imperative for customized,
economical, low-volume production.
On the matter of terminology, it may be
useful to distinguish betw^een advanced
manufacturing and agile manufacturing.
Advanced manufacturing, in my under-
standing, refers to the new technologies —
the processes and equipment — by w'hich
raw materials are transformed into
products. Clearly, new manufacturing
technology is often aimed at faster product
realization, reduced cost, and higher quality
" less time, less rework, less variability —
and so it contributes to agile manufacturing.
Agile manufacturing, though, refers to the
coordination of manufacturing technologies
(not all of which need be considered
"advanced") in order to rapidly realize
customized product. It also refers to the
supporting mechanisms and business and
engineering practices by which this can
smoothly happen. For example, data bases
and software support systems that help a
design team quickly and intelligently
choose among design options are
contributors to agile manufacturing.
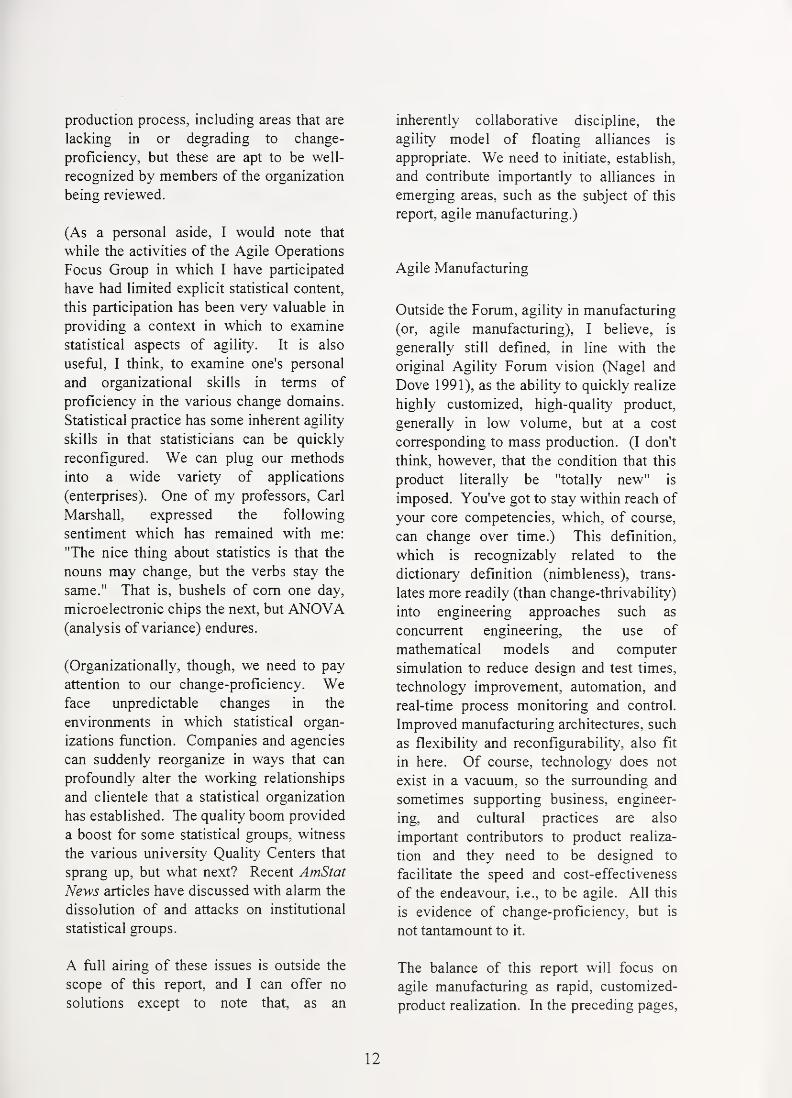
Figure 1 is my depiction of agile
manufacturing. At the upper right of the
figure is the enterprise's objective — a
product aimed at satisfying a customer's
requirements in terms of cost, performance,
production-volume, and schedule. Pro-
ducing that product requires the linkage of
several processes. The figure illustrates a
serial linkage, in which the output of each
process is input, possibly along with other
inputs, for the next process. More complex
arrangements are, of course, possible.
Next, Figure 1 shows that for each process,
the producer, conceptually, has various
alternatives from which to choose. These
alternatives could be different equipment,
different parameter settings on the same
equipment, different potential partners (in
the sense of forming a virtual enterprise),
distinctly different processes (such as the
use of different chemicals in a cleaning
process), etc. The decision problem is to
choose among the alternatives for each
process in order to yield a product that
meets or exceeds customer requirements in
performance, cost, volume, and schedule.
The agile challenge is to make these
decisions quickly and intelligently (right, or
nearly right, the first time). Achieving this
means having viable choices at your
disposal and having enough information
about them to make good choices. Making
different choices for different products and
customers represents the reconfigurability
discussed above.
13

As indicated, meeting the agile
manufacturing challenge requires infor-
mation — a lot of information, but not so
much as to overload the recipient's capacity
and not so overladen with noise that the
signal is obscured. It is the generation and
management of appropriate information
that is the backbone of agile enterprises.
One will not have the luxury of developing
new processes, evaluating and comparing
Figure 1. Conceptual Model of Agile Manufacturing
alternatives, then designing, building, and
testing prototypes for several iterations
until arriving at a successful product design.
Instead, one needs readily available and
understandable information pertaining to
the alternative processes and their
interfaces, plus the ability to predict the
characteristics of the product that will
emerge from a selected candidate set of
processes. Good, trustworthy predictions
would mean that few, if any, prototype-
build and design-tweaking iterations would
be required before actual production.
Morton (1994) in a wide-ranging and
entertaining survey of manufacturing
technology, published in The Economist,
cites agile manufacturing as "(o)ne of the
most influential visions of future
manufacturing in the past few years," and
describes the importance of predictability in
the following terms:
The precondition (to agile
manufacturing) that matters
most ... is predictability. The
essence of agility is
sensitivity to time. The
different companies involved
have to know their capa-
bilities exactly, and the time
they take exactly. This is
what new factory manage-
ment technologies make
possible. When a virtual
enterprise is assembling
itself, it has to know
14

I
precisely the dimensions of
its parts, not in breadth,
length, and depth, but in
terms of such things as
process time and quality. At
present, few companies can
accurately measure them-
selves in many of these
dimensions.
One might statistically quibble with
"exactly," but the point is unarguable: To
successfully and quickly assemble a virtual
enterprise, whether across-companies, as in
the grand vision of agile manufacturing, or
across departments within a company, the
players' capabilities have to be known
(well-estimated) and predictable -- they
won't go unstable in a new enterprise.
Measuring a company or a process in the
dimensions of time, quality, and capability,
with adequate and appropriate accuracy and
precision, is in part a statistical problem.
The other precondition cited by Morton
(1994) is that these new dimensional
measurements be clearly communicated.
Achieving clear communication will
require standards for communicating
information that goes far beyond part
geometry, for example, to include process
time, capability, and quality, as just
indicated. He states, "interoperability will,
in the end, matter more than pure
performance, and assuring that systems in
different companies work together will
definitely require standards." This points to
an already-existing NIST role in agile
manufacturing and Morton cites STEP (the
developing standard for the exchange of
product data) in this regard. The role of
statistics in formulating how to
communicate estimates, standard errors,
variance components, degrees of freedom,
and the like, pertaining to a process's
characterization (quality), needs to be
considered.
The two fundamental problems in agile
manufacturing are thus (1) determining
what information should be developed and
provided and (2) determining how that
information should be communicated.
Because much information is data-based,
statistics is inevitably involved. The
following sections discuss various aspects
of this involvement.
MANUFACTURING PROCESSMODELING
There are two basic ways to make process
predictions. One is to have data bases of
the results of exercising various processes
under various conditions. These could be
searched to compare and select from
alternatives for a given process. As an
example, one of the Year 2006 agile
manufacturing scenarios described in Nagel
and Dove (1991) features the Factory
America Network, which "provide(s)
elaborately cross-indexed information about
manufacturing capabilities, materials
handling facilities, software development,
engineering services of every kind,
hardware and software product availability
(together with price and performance data),
marketing, and customer service expertise."
Statistical issues in this context pertain to
how information, such as the environmental
conditions under which a process was
operated, recognizable variance com-
ponents, and the uncertainty in the
estimates of process characteristics, should
be conveyed.
The second way to make process
predictions is through mathematical
models. Predictions, in the agile,
customized product world, are apt to be
needed for conditions for which a process
has not been run, or at least not run
extensively enough to adequately
15

characterize the process. At the
development stage, there will be a need to
make predictions for processes that mayonly exist on paper. In some cases, it maybe possible to estimate process performance
by interpolating between or extrapolating
beyond neighboring process data (bearing
in mind the general caveats mentioned
above about the risks of drawing inferences
from observational data), but there will also
be a need to predict where no one has gone
before. Further, to make predictions over
combinations of processes, as illustrated by
Fig. 1, and to try to optimize the
combinations, a multiple data base search
approach is apt to be unwieldy or
infeasible. Mathematical models for
processes, if they model the appropriate
relationships and characteristics and are
trustworthy, thus offer a second way to
make process predictions for single
processes and, if compatible, across
combinations of processes. The Year 2006
scenarios in Nagel and Dove (1991) reflect
the important role of mathematical
modeling in agile manufacturing as follows:
"Intensive use of computing power allows
the properties of new products and the
behaviors of new manufacturing processes
to be predicted in advance."
There is an extensive amount of work going
on today in the development and use of
mathematical models to reduce design and
evaluation time. "Virtual manufacturing,"
"virtual testing," and the "factory in a
computer" are all expressions of this role
for mathematical models. A commonly
cited example is the Boeing 111 airplane,
which was designed and analyzed in the
computer so that the first unit built could
also be the first unit flown. No mock-ups
were required to assure that its parts would
fit. At General Motors, the concept is
"math-based vehicle development"
(Cowger 1994 and McDonald 1993),
referring to testing the engineering and
manufacturing intent of a product via math
models and computer simulation, rather
than physical build and test. Processes that
have been modeled pertain to applications
that include sheet metal forming,
aerodynamics, throughput analysis, heat
flow, and structural analysis. An example
cited by Cowger (1994) of the agility gains
attributable to math modeling is that the
time required to design an automobile hood
has been reduced from 90 days to one day.
The type of model required to support agile
manufacturing is one that predicts product
performance characteristics as a function of
design and process variables. In Fig. 1, the
product characteristics of interest for the
final product include things such as fit and
strength, in the case of mechanical
products; output voltage, current, and other
electrical properties for electrical and
electronic products; reliability indicators in
either case, such as the stress (e.g.,
mechanical load or voltage) at which failure
occurs and time-to-failure under various
environmental conditions; and cost, in the
traditional cost of materials and labor sense,
but also environmental and maintenance
costs over product lifetime. Time-to-
produce is another important cost variable
in agile manufacturing. Process variables
include raw material characteristics,
environmental conditions during produc-
tion, and process settings, such as feeds and
speeds for machining processes and
temperatures and deposition rates for
chemical processes. For a performance
characteristic such as reliability, reliability
models need to fold in use conditions and
their effect on performance. In general,
such integrated process-to-product-to-
performance models are not available. The
complexity and multidimensionality of the
relationships are daunting. Nevertheless,
models of pieces of the total process can be
useful in making design decisions. Worktowards integration, as discussed in the
following paragraphs, is required, though, if
these mathematical models are to be most
16

J-t,:>Vi?:<^-r^ ft; .: lil
!»'' ^ -» m}-
u
litS ;'? j* s
t._ tinl; .:'ffl i,
M!1'
».TS?^J , ;'j;U
t
1
lA.-'lt S',' >'''/.
I^SPSSB" m^r\.. kfm^r-.
V''-- w*’wi‘^'' '''*« •.’f/v'v(.»r-*_r*,^.
,’rlV
|/;/^jt n y»‘. ':; !
Ml;
rPljM'
jiaR!
u ’c'^Tf’ri’iO
‘i>S'>^ WriliJ '^ :Xl;:lti^' '< '.-..y^
•^U:' '
> ,.-o#M-;>l 4
1!.'
'
'""- -
"''' "
::' '-’ m-'ih'
:.3Si%y!t*^," i^., ,: 'iJti<S»
w3
»j!U'
|!''Msil'^/' & '
V ®,„
:3K;:
'[.-f'lrTili.,;;
'**••. 1 V '
aiMiMiiHMilSfil

effectively used in achieving rapid
realization of customized products.
Materials Processing Models
A glance at current scientific and
engineering literature shows the widespread
effort in developing mathematical models
of processes pertaining to manufacturing.
Any attempt to categorize, summarize, and
evaluate the status of such modeling in the
context of agile manufacturing is well
beyond the scope of this report. A recent
paper, Szekely and Trapaga (1994)
(abbreviated in the following paragraphs as
ST), however, provides a very useful
perspective on the mathematical modeling
of materials processing operations, so I will
summarize and comment on their view.
Because materials properties are
fundamental determinants of performance,
this body of modeling is a major portion of
potential process modeling. Readers
familiar with the status of modeling in other
areas, such as casting, machining, and
assembling can evaluate the extent to which
the materials processing perspective of
Szekely and Trapaga applies in those areas.
In their review of materials modeling, ST
indicate that "while major advances are
being made in both the software and the
hardware used in materials modeling work,
and in the range of problems that are now
being successfully tackled, most of the
modeling work to date does not address the
critical problems faced by the materials
industry, namely the potential market for a
new product, the trade-offs between cost
and performance, manufacturability, and
environmental impact." Making such trade-
offs and evaluations is the agile manu-
facturing challenge represented by Figure 1.
ST's explanation for the lack of modeling
work on these critical problems is that
"very different groups of the (materials)
community, with very different skills and
attitudes, tend to study process on the one
hand and product on the other."
ST's recommended future directions point
to opportunities for statistics (though not
called out by them explicitly). In their
discussion of models, they distinguish two
types: mechanistic models, which are based
on fundamental physical and chemical
relationships such as mass and energy
conservation, and simulation (or empirical)
models, which "seek to mimic a system
mathematically, invoking experimental
information, without paying particular
attention to the process mechanisms
involved." In passing, I would note that
mechanistic models also only mimic a
system mathematically, because, in general,
they cannot capture all the physics and
chemistry of a complex relationship and
therefore have to make simplifying
assumptions. They also may invoke
experimental information to estimate
certain parameters within the mechanistic
model. Mechanistic modeling is generally
the strict purview of physicists and
chemists, but statistical aspects include the
design and analysis of experiments to
validate a model, estimate its parameters,
and characterize the residual variation of
the difference between model predictions
and experimental data (because there will
be some) and the corresponding statistical
precision of the parameter estimates..
Empirical model building is in the realm of
conventional statistics. Recent years have
seen a great deal of growth, not all of it in
the statistical literature, in the development
of methods for fitting empirical models in
complex, nonlinear, high-dimensional
situations, so statistical tools and the
computing resources to implement them are
extensive (ST mention neural nets). The
possibilities are considerably richer than the
polynomial models that some might
associate with statistical modeling. The
traditional statistical issues of design.
17

,>w,
'j
.
v'j \;;:»
:%' a^'^.v', ,^4f^jr To
il’ii,W -
‘-M k)'1^: >-''..t U/
:c*T:*vh‘ ..t r !*J 'Vtlj ,rTO ». •’ f-jjj^q:- .'.<^:
',3.} * 'SM: ''^K .i^'i ^*v:*^,.:' %" .t^ n V.
.:it ^_-.J ti-, -if^yr.xno;* hnu
^ - ^ :ii-r V.r^i.'T 5nIj#i-‘?*'T
,(ii'
,
'
'^.' /J.'siy-'*'‘
3r-V..i
^ *"’•»' tit-'^ *,J i \* V*
f rllUi tf^^v,..!} ^nlj
rr.T' t vi.'j ',j
.»’ •"* >
1?%
ai''•
f 'i t*^' )^i' ^*4.,
i'*'
- - < >
siW^
•'. •.•»U^ ni
'
. >^ ,,'.' 4i.;
ii/*
'%"’*"a. bjJ(->
' fHij»Mf^'' # ,^=; ::aw- u> %
,#^>.'j-,V4l> 'rr^^.a
'
'
; mm ^ hm.
'fi^r' '^'i^,' ^
'•'
,
il!^>•m:,^^-n'd^ m «3Nf"' ,."
A>y^'.jsfe;4 '’ .t-’.'f.rmtr-'^**
1
I•ia
estimation, and uncertainty characterization
still apply to these new methods, however.
Also, it should be recognized that modeling
need not be at one of two poles:
mechanistic or empirical, since it's both
possible and advisable for empirical
modelers to pay attention to process
mechanisms. For example, if physics
indicates that a product characteristic
depends on two processing parameters only
through their ratio, then the empirical
model should capture that relationship, not
force-fit a polynomial in the separate
parameters. Black-box modeling should
become gray-box. There is a clear need and
an opportunity to combine subject-matter
and statistical expertise in the development
of useful mathematical models. Will that
opportunity be seized? Theorists will have
to overcome a disdain of empirical
modeling; statisticians will have to be
willing to learn and more able to embody
theoretical understanding than the black-
box approach requires. Truly collaborative
relationships will have to be established.
ST, recognizing that mechanistic models
are not apt to be able to bridge the gap
between process and product, support a
statistical view by stating that a "major
advance could be made by the effective
blending of mathematical (meaning
mechanistic) modeling and empirical
components." For example (my example),
a mechanistic model might predict physical
characteristics of a fabricated part, as a
function of dominant process parameters.
Predicting the (statistical) distribution of
cycles to failure, though, as a function of
these part characteristics, might require a
designed experiment and subsequent
empirical fit. Combining the models
provides a means of predicting reliability as
a function of process parameters.
ST also bring out the need to keep in mind
the objective of model-building. Research
objectives lead to deeper models of
phenomena and increasing precision.
Production problem-solving (and agile
design decision-making) may need only a
quick, approximate model that addresses
major parts of the production process,
rather than one micro-phenomenon within
it. ST's concluding comment is that
progress on issues pertaining to integration
of process and product models "may
provide a much greater impetus for newproduct and process development than the
refinement of the micromodels that seems
to be the major objective of most current
research."
Where Szekely and Trapaga provide a
glimpse of the statistical role in the
development of process-to-product-to-
performance modeling in the materials
sciences, that role is the centerpiece of a
recent workshop, reported by Karr (1994).
The workshop, alliteratively sponsored by
NISS (the National Institute of Statistical
Sciences) and NIST, defined the problem
by stating that the key needs for materials
science, as an enabler of industrial
competitiveness, "are to design components
with desired performance, fabricated from
materials with desired properties, and the
processes to produce these components and
materials via control of microstructure"
(emphasis in original). Further, "(t)he
ultimate goals are to optimize materials
properties and increase reliability of
components and systems." To which, from
the agility perspective, I would add that
design and optimization must be rapid.
Accomplishing all this, the workshop
concluded, will require statistical methods
and the close collaboration of materials
scientists with statisticians because
"modem materials science is embedded in a
'sea' of statistics" (but not drowning, I
hope). The argument behind this image is
that the complexity of materials structure
means that "intrinsic variability can only be
characterized statistically." Furthermore,
"(k)ey experimental data are uncertain and
18

'."if
'
X' Niv itvfv'SSs^ '. -ir #'
'p.W .itiyw ,
.V': '^: 'l-
,>i^,^,7r .., ^fr;>
4>;rEl'!>v.
rl^'C^ '*6- '.iV^rf#!^*”' '
i.'“'
•' “-''^
;;4 “-f j|:»<i.
'^' [kA 's'k
.'ylt
-t, ..
.
.mi^i ^0myK^ # ^^0^: i0{'
•'#^.^ Aj^-‘-^k i .t^, fit^:mir
i ..^^iS^^. ^0^ M'
^ sjyfei:'v^vti‘ir
'
'
«.-vtv';-jiBat'-iiif\^ .irii i)|^i
*-5) '>w4i .,.<• \ \’^%!n
:- r-- If;.;, t.:*fxam
jlfts ^0 r??4h=fr. . ...’
^
,1 ’.'Mr 'X:0it:\:
:vU^ir7‘ii ,4Ai^|aaip';. Xurt ^''JifflibitfSJ , I Sf'
"** '-« »i-
'yi><
«tte'"«'
,^!;./^',
' -5 5r»‘/i>'v
iw;^]
- ’) r.?i)ah'r?rujr'4©
^^•f -I piv ,•{
«• Xi* .'(' .'<4‘ r,.*'
rKW’'i 'V.'.^-'l,iw*V^' ;/^\,./l:.;®»!tv'''!''.'ffc'
ifr,..':i)®.,ife
fX i«aif
! _'^jjj^i-'.’’'^' ..Siv 4 'i; 1 . . .;«jkt'’lb... li-:J'®'^Mi^:ays i *4'
u!^spa3
,tfil ?.* tit
^''
illt' "= ti^MnUh^'•: T ''/''» iL... '.^
..
'••‘•..
.. 'n^.-.- -.'- : 1
w-j-
. At IT: h
,
0^ #
•E"^'
% aWioci'.)a 5»d!
'
-yi .
'Mft
'
-ixiiitt
1
incomplete. Relations among structure,
properties, performance and processing,
derived from a combination of experiment
analytical modeling and numerical
modeling, require statistical character-
izations." (This last sentence relates
directly to the point made by ST about the
need for blending of modeling approaches.)
The workshop report (Karr 1994) elaborates
on these themes and provides several
examples.
The combined perspectives of ST and Karr
(1994) clearly identify the problems that
exist and the approaches that need to be
taken. Statistics should be an important
contributor to solutions that can greatly
reduce product realization time and enhance
quality. The extent to which statisticians
are already collaborating with materials
scientists in developing the models needed
by industry', and the prospects for healthy
growth in those collaborations, are
questions I caimot evaluate. Perhaps a
follow-up query' of workshop participants
should take place. Statisticians should take
the initiative to fmd out about materials
science work being conducted at their
institutions and look for opportunities to
participate. The workshop report (Karr
1994) would be a good letter of
introduction. Similar comments apply to
other areas of manufacturing-process model
development. Product performance
depends on properties of its materials and
the geometric shape in which it is rendered,
so the integration of materials and forming
and shaping models is apt to be required in
order to predict product performance from
process characteristics.
Semiconductor Processing Models
Blakey and Zirkle (1994) provide an
industrial perspective on semiconductor
modeling. They describe a conceptual
sequence of models in the following order:
equipment-process-device-circuit. That is,
output from a process model, say, is
(potentially) input to a device model. In
their view, equipment modeling is in its
early stages and the device-to-circuit link is
often neglected. Integration of simulation
tools has progressed to the point that
“interfaces between most major tools are
widely available ... and there is some
automatic scheduling of multiple runs for
optimization and statistical design,” but
they anticipate continued improvement in
this area through standardization, natural
language interfaces, and expert systems.
Blakey and Zirkle (1994) cite the potential
benefits of simulation — reduced physical
testing time and costs — and current
difficulties in achieving those benefits.
These include “unsophisticated” use,
“inappropriate concentrations” of use (by
specialists only), unrealistic expectations,
and difficulties in measuring the benefits of
using simulation tools. As an example of
unsophisticated use they describe the
practice of adjusting input parameters in
order to make simulation output match
experimental data, a process sometimes
known as “tuning.” When the tuned model
is used for subsequent “what-if’ studies,
“the naive adjustment of an inappropriate
subset of parameters can, and often does,
lead to dangerously misleading results.” As
a technical concern related to statistical
issues, they also note that since semi-
conductor processing is quite complex,
often involving more than 100 steps,
“(w)hen simulating an entire process the
errors and uncertainties in the simulation
compound at each step. It is consequently
not yet possible to obtain accurate
predictions of final structures by simulating
a state-of-the-art process from start to
finish.”
NIST researchers Bennett and Lowney
(1994) explore the field of semiconductor
device simulation at considerable depth.
19

':. ri.r»
:{;
\2^ .^'
V URfU
r>Ki<r^t ,'. ‘^^v :iif|‘
.?e. J ir,
^Itmu^
iii''''ji_
<iiitisiu4' ’-fer ->
,
'
j^'":'t " ^4-' ’
'
'^y^:' '-s*^ h -
. v‘* ' >i>1
.,’ tli^w 5^4, X ^;i,.-.u^
jjR^ t nvjai'.E f^’-.f '^i?iji'?r«5^„ii'0 V'?;^i:r.»ih irti-
sr^^r.;Vl’; -'‘rti ,
si;.;*' ''
i^d*’-'
''Ij'fi'
: iiAH,
V f.i. ^d'
''
'•
'
' -sril^i 4i^ Lviavsj!?2
^^Hll^-'’f, i^i %i^
'"fiiV i',^
-
'rift
#:|!I(B.!1>*!vvW>*'^®" '."""^
'€ •
'
fr ',. ...
Tfr^^ l»4^-fiaSw fr.M. T#i<r“ a r . 7»4
i^ > <Av {'^
. .t*((i*i!’ .. "."#!'
i^: x^O’U i^f^ «i1 './_ /., /_’’
„. >v%
" '"^" jJttWti»‘
‘mJi} -^my
v---!^'r' .'IiJv j,iUi{Ji|!^
'^--
i |5;'t.':W 7='^ 7,:
‘ji
L£^ tflUh'
*^ii^
w.-; tm‘^0^m »/%-- ''T
fjk- t .-
7 ^jt;/i,.';'.r'"*'^;'.:^,fU?.*
^,7v:;::::7^:|S^. ; ‘x'fhW
2
“'‘.s h^ i‘ j.#«.
:7I -.:1 Vt 7 %>'^’: 7^ /'i^i^sy•^^^
t;*
'
.N7','7- v;'I^PV: rt,
; ; 7^^ 'Mm ¥ ^
: i..:r!
' f> vrhvfein*
%^'i4hjmb *ytrl ,;;^ilt»i ^iffr
m.
Their perspective on empirical-mechanistic
modeling questions is that “Conventional
procedures for determining model
parameters ... rely very much upon
empirical relations, and give acceptable
results for transistors with dimensions
greater than about a micrometer. Such
empirical procedures may not give reliable
results for smaller transistors and they most
likely will not be adequate for future
devices that have features sizes less than
about 0.2 mm.” In that situation, “one also
needs device physics, based on first
principles, to understand problems that
arise in making reliable devices and to
develop strategies to overcome design
limits.” The authors go on to develop
"improved device physics (IDP)" models
and show an example of situations in which
IDP models provide considerably more
accurate predictions of transistor gains than
conventional (empirical) device models.
The semiconductor field has also seen the
integration of simulation models with
experimental design and analysis software
to facilitate the use of simulation in
evaluating alternate device designs. Wonget al. (1992) describe a Simulation
Experiment Workbench that includes
models relating device (e.g., resistor,
transistor) structure to electrical behavior
and experimental design and analysis
packages for designing, running, and
analyzing the results of experiments in
which the device structure parameters are
varied. The authors note a need to develop
similar tools for process design.
Discrete Parts Manufacturing Process
Modeling
In a NIST survey of methodologies of
representing manufacturing process
capabilities, Algeo (1994) focuses on
information models (models for informa-
tion flow among manufacturing functions),
but also addresses mathematical models of
processes. This survey provides a helpful
entry into the literature pertaining to
process modeling. One reference, Konig
and Knop (1992), addresses the mechanistic
vs. empirical modeling question in the
context of grinding processes. They note
the advantages of mechanistic modeling in
terms of breadth of applicability and
theoretical soundness, but cite the difficulty
of modeling all the complex thermo-
mechanical, grain-level, fundamental-
physics relationships in grinding, and in
taking measurements that provide estimates
of the coefficients in these relationships.
Alternatively, at least for industrial
production planning, they find empirical
modeling to be satisfactory and illustrate
the use of sums of exponentials to model
product characteristics as a function of
grinding process parameters.
Algeo (1994), in contrasting the state of
industrial practice with state-of-the-art
methodology, notes that "in production
environments, representations of manu-
facturing process capabilities appear to be
gradually migrating from printed media to
electronic media. In many companies,
handbooks are still the reference of choice"
Further, at this early stage, there is a
multiplicity ofways of representing process
capabilities, so, in line with Morton (1994),
she recommends developing a standard
framework, terminology, and process
taxonomy to facilitate the communication
of process capability information.
PROCESS MODELING: STATISTICALCONSIDERATIONS
In this section I will elaborate on some of
the issues raised in the previous section. As
20

‘y>
1(K-'
V' ’ '1^?i
'
% ilW ,: '!hf;?^
ii\ ''ifiTiKlis' jt*L4 “.. it.w
^1;
w. ^iasliU
'-m^m
’S]
^:4 /''W'4.^%4^0^, P^A
tee': ; t'
.b'«^".T . W?/'
'""'i•:"0.'i'^'
' -'5;
I^
. H ''’' <&:.. *g
m
'
.^f',! 4^4^^- 'viSM' '^f ^ ,i!:iii<5i'anrkif
*
;: <#'
^hifm> '. b
^ 5* 'wti
^ ^4:^ mi^ifUirhi tn siui nfin t hcn^-
AV *':. -.Vf-vY<4a'f«^.'s #*},'< ‘Ti
iVl-lnS^'
Wfi- .. A
:';;-i3E-:'; -^J
••..•..• .'. • .•..
.
', -’'A''
'-m^mr .•tn
4 ^rt ^ ti:^js YV! 4 *-..
'^(iW ..^;(tp'i^ IK''**'
' -4
'SN/r#^ i' ! i) ;v,^A^-,
'A*' T>, '
,':i^y':‘-:, i^^,
rjrp!' j
.1pk4^^^: ..f ('.'•xr YY.... '.-mv
fiim .
44^^' '
..
^
j
; 'j•
' '
"l^'i ^>/;''
,
ilfyf ,
: ^ ^:ty, '
'
m^: -^4^^ iy^^ s m4^m ««£^’
- vi'-^v
j:i!^>;S^3 fC'l ^!'*>f)ij'18iairte
/-' ^: •’.'ll •|,
!:
V ' '.'•^l> i’''" ' ••' ''^ ‘-‘ •'* '-’'•V''-
'•'•-'.'•..’i«
'' '
''’.'a.''>'"'' ’r'""
'
1'",, ''i''t''' -
..
''.. t'^
' '
'
y,.,*' '
.'' ./'Y'''
V.4 ... ‘i.
'/ ,YY
^
li? A lo r£in . /V :
.;y.’v
,.*' “
1
'
'- icai'^.:•
4js>jbom ^^3 ...Yir'>!
34^4'C-Y
'
''ii
a vehicle for considering these issues,
consider the following model for the
process-to-product-to-performance situa-
tion. Let w denote the controllable process
parameters, such as speeds and feeds of a
milling process. These parameters
influence product characteristics, x, such as
dimensional deviations from target values,
but they don't necessarily determine these
characteristics because other uncontrolled
or uncontrollable influences combine with
w to determine x. Conceptually, this
relationship can be expressed as: ^ = g(>v,
e^), where represents all the extraneous
influences. Similarly, x influences product
performance along with other influences
such as the use environment, so = h(^, ey).
More generally, it might be the case that
some of the process parameters and process
"noise factors" also influence x in ways not
manifested in so = h(^, w', ey,
where the primes denote subsets of the
original vectors.
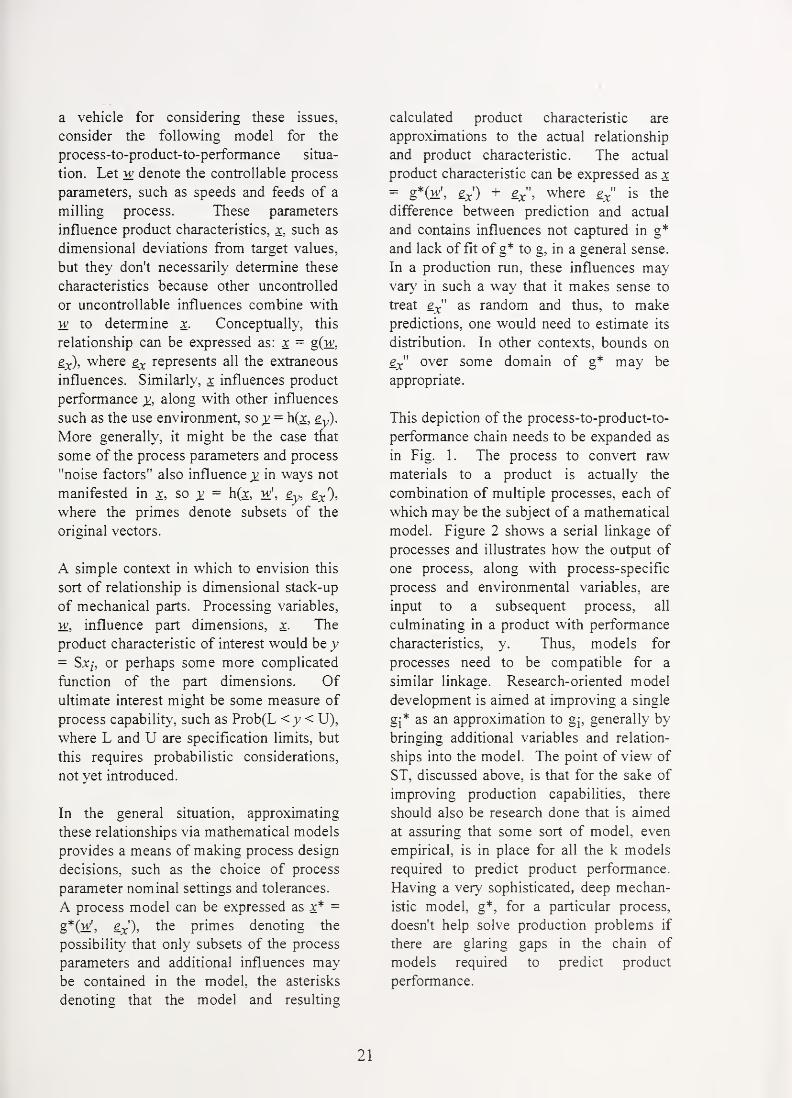
A simple context in which to envision this
sort of relationship is dimensional stack-up
of mechanical parts. Processing variables,
w, influence part dimensions, x. The
product characteristic of interest would be y= Sxj, or perhaps some more complicated
function of the part dimensions. Ofultimate interest might be some measure of
process capability, such as Prob(L <y< U),
where L and U are specification limits, but
this requires probabilistic considerations,
not yet introduced.
In the general situation, approximating
these relationships via mathematical models
provides a means of making process design
decisions, such as the choice of process
parameter nominal settings and tolerances.
A process model can be expressed as x* =
g*(w',£;c')’
primes denoting the
possibility that only subsets of the process
parameters and additional influences maybe contained in the model, the asterisks
denoting that the model and resulting
calculated product characteristic are
approximations to the actual relationship
and product characteristic. The actual
product characteristic can be expressed as x= g*(w', fjc') where is the
difference between prediction and actual
and contains influences not captured in g*
and lack of fit of g* to g, in a general sense.
In a production run, these influences mayvary in such a way that it makes sense to
treat as random and thus, to make
predictions, one would need to estimate its
distribution. In other contexts, bounds on
over some domain of g* may be
appropriate.
This depiction of the process-to-product-to-
performance chain needs to be expanded as
in Fig. 1. The process to convert raw
materials to a product is actually the
combination of multiple processes, each of
which may be the subject of a mathematical
model. Figure 2 shows a serial linkage of
processes and illustrates how the output of
one process, along with process-specific
process and environmental variables, are
input to a subsequent process, all
culminating in a product with performance
characteristics, y. Thus, models for
processes need to be compatible for a
similar linkage. Research-oriented model
development is aimed at improving a single
gj* as an approximation to gj, generally by
bringing additional variables and relation-
ships into the model. The point of view of
ST, discussed above, is that for the sake of
improving production capabilities, there
should also be research done that is aimed
at assuring that some sort of model, even
empirical, is in place for all the k models
required to predict product performance.
Having a very sophisticated, deep mechan-
istic model, g*, for a particular process,
doesn't help solve production problems if
there are glaring gaps in the chain of
models required to predict product
performance.
21

: .}i. .;• 7"'
i ‘i -'
'
";'i'
- v
f:'
.,. Sm #W^f-
^1
,mnsu s inm
'^:.i
3
I
i J^-'i. ., >?i' i'"*:'*
.r 'i^
A
^ ' "' '"
.&
l^r ,..» - i -t-i.'! -fli r?t ‘«^.is
-
1’^ "'ri:' i
€1
I
;urcw^ ,^*lii.itei 1^4, .• " '^•
i ;:. in'.- -iAi’.jV
^ s ^imIw
-"---. ._ Jm .
Figure 2. Modeling Framework
Model Validation
One value of a model is that it can provide
predictions for process configurations,
designs, settings, or environments not
previously observed, but no matter the
theoretical soundness of a mechanistic
model, there is still generally a need to
check its predictions against data from an
experiment or the actual process. This can
be a contentious issue. For example, a
Washington Post article (October 14, 1994)
described a controversy over the credibility
of predictions of improved Patriot
antiballistic missile reliability based on
simulations (the term is here being used in
the general sense, not ST's categorization of
an empirical model), in the absence of field
tests against actual Scud missiles. ( In a
reverse twist on this issue, I recently heard
about an experimental program, well-run by
all accounts, that had its funding canceled
because its experimental results did not
match the predictions of a state-of-the-art
computer model.) I asked the provider of
fluid dynamic codes what provided
assurance that applying a code in a new
situation would yield trustworthy results.
The answer was, "Well, I try to get a little
data." Deciding how much data and at what
conditions, i.e., settings of the model inputs,
W and e', is a difficult and important, and in
part a statistical, issue. The model may be
designed to be used over an extensive
multidimensional domain. Testing, for
economic reasons, can only be done at a
small number of points in that space. Howto choose? Consider the problem of
estimating Patriot reliability over a wide
range of encounter scenarios. Subject-
matter expertise and theory can help narrow
the choice of test conditions, but where
tests have not been done, one often has to
22

O-'
»V-.,
,
= •-' 7%'t *’ «'-*?fev''^’^V.t5,W; Muf* ^. . .
•.'. •.*.
‘ 4\/v y.
'
<!'W .. .
’' .WA'..« 3^"
’^.:ii'i:'. ^ ^ ,
.^. , -If - , r •c-
‘'1
S' 'a'.';:,,i;,
•Jf, *,
S.A
f'/ip''’' "A
‘ 1!,
1
:;i
* 4-'% f ^-ssi - /. ^/i t '<'%W^' ®ji% -ij#
^{4f' ;|^
-».i’‘
''
^^ «i V ‘- ^! ,r:^r; * %j. mUil ' i-'*
K%i ^'^ii .;i2i
.•'•j.rilfe
.'<A* He#' -* '"?' IMk iif^Ti?-
/; .:,wl -'O.i; ,-»?»' *-’'"'»!S^^
‘jH’t :
V- ^m.
Ml mi
Mil
'jmi'Mm,:..:
.
• '''. '• ^v '•I/ .
' „.•
UT. Mfi"A :
:., ^
"# ,k'
rely on face validity — the simulation
results look reasonable.
The need to validate computer predictions
is well-recognized by the modeling
communities. Thus, various groups have
assembled benchmark sets of data against
which modelers can test their models. For
example, a NATO aerospace group recently
published 39 test cases pertaining to air
flow around aircraft and missile
configurations (AGARD 1994). In the
semiconductor area, Meyyappan (1994)
notes that "(T)here is a critical need for
benchmark experiments in the field of
semiconductor processing," and goes on to
offer this perspective on mechanistic and
empirical models:
When quantitatively accurate
predictions are required, the
need for validation and
benchmark experiments be-
comes essential. A case in
point is the role of models in
real-time process control. At
present, development of
process control strategies is
based on data from many
well-designed experiments
[5]. The data is (sic) fitted
into empirical models using
Box response surface [9] or
Taguchi orthogonal arrays
[10]. This approach is
complex, time-consuming
and expensive. Computa-
tional modeling is ideally
suited to replace the above
procedure.
So, here is a case in which mechanistic
modeling is suggested as a cost-effective
alternative to empirical modeling.
Experimental models that are rich can
require extensive experimentation, data
collection, and analysis to develop.
Mechanistic models can be intrinsically
rich. The amount of experimentation, data,
and analysis required to validate that
richness should be less than the amount
required to construct a comparably rich
empirical model. These are issues that need
to be examined at some depth. In some
circles there is a euphoric sense that
computer models can virtually eliminate the
need for physical experimentation.
A problem that can occur in model
validation efforts is that some key model
inputs may not be measurable in an
experimental or field situation. This can
lead to tuning exercises, trial and error
attempts to plug in physically reasonable
values to improve the match of model and
data. The interplay of tuning and validation
is another issue that deserves some thought.
Incidentally, a designed experiment ap-
proach to multi-parameter tuning may make
the search more efficient.
Computer Experiments
One way to focus model validation tests is
to first identify what model inputs are the
dominant influences on model output.
Then, the validation experiment could focus
on whether those influences are properly
characterized by the model. In a complex
model, such as one incorporating finite
element analysis, it may not be at all clear
what the dominant inputs are. Designed
experiments are one way to attempt to
identify dominant inputs. These "computer
experiments," so called because they are
experiments in which the experimental
apparatus is a computer code, can also be
used to obtain faster-running, more "agile,"
models that might be required, in the
context of Fig. 1, to help a decision-maker
choose among alternative processes or to
select desirable process settings. Another
need for faster-running models is in a
Monte Carlo analysis, as described in a
subsequent section on virtual prediction.
23

e
’ji! "'‘i,
''** "i>
'
; y,(f. JMWHjl T
£)'
1^v.'' “
#-!'=•>^7
^;i!' .."i
Y... vnf^-.4
. 'i <3,'l
ls»<«';4wsfc; : ' *4.:
( <
I'S ‘ .-
' j?^W' ^'
4^^^- T ;»'* -3
„(,». iiv f^^yPX ip'.i?
-• ii;.* -• ^’?.-- : ' !?• ^ C t'^ -^'
' • ‘jY’ '/ v*?;.., '. >«ii
^^iilKnllli*iilrjrti
%':;^'• Onr^ ‘
V
,
x’imi tl _:. ;^.Hn!|
^ f<i. ’ryimm'''''
•^,’ .: £„ ^\ 7MQ?J * -ttTfjiiitj
..
'"
:.S' ''.•ft"
<?i
.S-^I|»«V (•<'
'“'f!
“ " "(r-m y»‘' -p- feliSSi
fSut'v}', '^:lS^Y4fSi|^
''-j-;
'kj;& -^l/f
.^'A .^'v.... T P' ^ .
"'C^,
M,
i-.\s i>*'^*:)f.‘. 'UijL',. : T’^'
Vi;i£rpr^.^,t3'ifi c^it:j|rvr,j
:,>i ‘ '•s^i5 '
'
:(^ <.i.. iTn^nri
•3 ; tit}' ' r^ - ‘^j
# N^Ca-- »'.«/.:;
YiS - N:.
‘ft
^41 jRj^l*
^'xv^^:ira3i:;; S.'
^
,s|x-VTT;;jrp -iiij^T ' ,^.H|
ma'
'at _i ^alj!i|>*>;'>- 'i4iail'
.1
- J'i ^ - 5.T
Ir-^. *J t
t' i '%'v
'tj^ if.
-3 ; - i,
• '^‘-i 1 •'4 -
''V*"4?'
ri^,^, •.**ir'l. X' u’f
4t tr^
.Xrv,
imiiimnyi:* .*
»v-isii«6afte j^hfpsiH 1. 4(1^

The design and analysis of computer
experiments has received a fair amount of
attention in recent years (see, e.g., Morris et
al. 1993, Welch et al. 1992, and Sacks et al.
1989 and references therein). As
mathematical models become increasingly
important in supporting agile manufac-
turing, computer experiments on those
models, and the communication of their
results to people involved in selecting or
optimizing processes, will become more
important in the manufacturing arena. The
approaches taken in the referenced articles
are generally much different from those
used in the design and analysis of physical
experiments, so the differences are worth
examining. Some particular contrasts:
• In a computer experiment, all the
variables that might influence the
result, namely the model inputs and
internal parameters, are known and
controlled; they have to be given values
in order to run the model. In a physical
experiment, there may be a compar-
atively small number of known and
controlled potentially influencing
variables and a large number that are
uncontrolled. Thus, repeating a compu-
ter experiment yields identical results
(excluding the case in which the
computer calculation draws on random
numbers) while repeating a physical
experiment does not (at some level of
resolution).
• In a computer experiment, because
there are conventionally a large number
of explanatory variables (model inputs),
all of which are apparent and
controllable, there is a tendency to
include a large number of variables in
the design, in the sense that their values
are deliberately varied over the set of
runs. In a physical experiment, there is
a tendency to focus first on variables
thought to be important and build a
design primarily on them. Variables
not included in the design are either
overlooked, deliberately held constant,
or allowed or encouraged, via
randomization, to vary freely (but their
values would be unknown and thus
could not be part of any model-
building, except in the sense of
characterizing residual variation). In a
computer experiment, in order to
randomize over thought-to-be extran-
eous variables, one would have to
assume probability distributions for
them, which might be difficult to
justify. In a physical experiment,
"nature" distributes these variables (to
the extent allowed by the experiment
protocol).
• Even in the case of a similar number of
variables to be included in the design,
experimental designs are very different
for computer and physical experiments.
Computer experimenters tend to use
very highly fractionated multi-level
designs. For example, a Latin
hypercube design (see, e.g., McKay et
al. 1979) for 32 runs in 10 variables is a
32"^ fraction of a 32 factorial. The
design for a physical experiment in this
case is apt to have only two or three
levels of each variable, say a 2^^"^
fractional factorial, or perhaps a L27
design for three-level factors,
augmented with a few other points, or
an orthogonal main effects design for a
mixed number of levels. Part of the
appeal of the designs with more levels,
less orthogonality, is that when extreme
effect sparsity permits projection on to
a small number of input variables, the
multi-level designs provide detailed
information about the nature of the
relationship. Similar projections for
two- or three- level factorials result in a
lot of redundancy. (In a physical
experiment, this redundancy would at
least provide degrees of freedom for
24

'i '
'
‘ ;%ft-'^>'-j',^;'
md
-zF'"--
iK'"“‘Jf
.A* '_
. ft '
.
m 5<fT
;,fiii va^
./1|^
'f- "f 1 n ’'•
^ ;.
^.;':>viV'i«il--'^|^
,V ' %# #!,'*;
:'’^ vt M '
.1 «^'®|-'?^.t’!^|ii^,.
'jj'
.^vl#' 1^ ^y^'W.^t0J .If
'
rl.,^^ ..
hf' Vui.n^f}m
z Z '4^-,
'
'^nrpfir/t ,JpEBtUj
tadl^JMli ,4ft!K»ip
S jeai
‘i; ,w,.^-' si^.'.v^v ; ^*|ir-.;x','^
'^'m v.u.tt<v^
''
jTift
IH^ k n-: imii
^ic>
^^OTT:;yj 'r. 7?Gt' u.»->li i^):/^,^'
vt ?=V
-id u ;/<«« <' 'k>"*'
<
== i>/I./'.. •- ’ r^OPi'*’
t^/iT.' *'E3
::4*1 Pi,,
:< V5i ' -'
^li$0...m '$
'*: ,||'': >«, .,.• .ty*^is5|iLI
f '"’1^
i ai mm- .
^.J ^.^- /i ft .II* f
'*‘; 4 i#i<C0
i:-' ^ ^ ^ Nv
i;:Olfti’lL..- ' ••^‘>4 * li5i- u
'
’#^'
hWU;^^
'
%. ' %v »
# : jfeft%
,
« ?jf|
^'i -- ..5=^
6f/W-',>1'
' 4 '>
^4;. m
m
:’7 '
l.vr*s 0’A''^»-t;'*^
M u -^tau:, . :ii .*
:4M .lijgifii i4^ij r^ldtim'^
-idi v'i^iTtwwi
’ 4'«''':' ;>'
... - Ml. ®4>r»;.w..
'
..' #. liMra'•^4r ,,
w
'•'-isv' \>cifim
Q>-',}<r.Utl\J ^'r
*.. jU ,J: - ’. ^^idlLi'^cV
-aK{^-\ ^ -'i •^ <»;f«f
' 4JK;..-:T |#x -vM-jf. ,
”• m .=>v> J-zr.h'^r7Ust^‘-^fl^
4 .) ,Jii:?Jlfdi: 'l»^"..?<5£f'' 4, .
'
.
'
V4
4
.:.VNiT
1f:>|. !4,t*”4
Itii^ lu ol •
?wdfej•
*‘1 T i:'v:i ' -»ttMfl
^::•- . ^-', 1 :' p ^dahjM? ^V.i*l!a£<|^
:1I^5 , r-^*; :. ...l;'J/.-:-r. ,_i^:,.^^A
%^ .;
:
^tj % xt^ftivirMJr'* 4 Af^ .
^ W/a^ ..ft' Ati .'w r 1
.
«t^ ggcms (iJ #.
-
*:J»'J¥--t«. 3!tt3ll£Sa[«l '^v '

estimating the error variance — not an
objective in a computer experiment.)
• Computer and physical experiments
have different design ancestries. Early
computer experiments were, in essence,
a means of numerical integration:
Given input-variable probability
distributions, the objective was to
convolute these to approximate the
probability distribution of the output
variables. Thus, by using a Monte
Carlo approximation to numerical
integration, random, or constrained
random (especially Latin hypercube),
selection of inputs constituted the
"design" of the computer experiment.
These pseudo-random results could
subsequently be analyzed, much as in
the case of observational data, to try to
identify dominant influential variables
and to fit simplified models. Physical
experiments have not had the
distribution-approximation objective,
the nearest analogy being to draw a
random sample from a defined
population in order to estimate the
distribution of some characteristic of
individuals in the population. Whenvariable screening, or simplified-model
fitting became the objective, computer
experimenters have either continued to
use Latin hypercube designs (e.g.,
Welch et al. 1992) or have tended to
use a number of levels somewhat
intermediate between the extremes just
discussed, selecting designs from the
very large number of possible
combinations, e.g., 5^^, by various
optimality criteria (Morris 1994).
• The fitting functions tend to differ. The
primary approach of computer experi-
menters is to represent the computer
model as a realization of a stochastic
process and use smoothing methods,
such as kriging, to obtain a simplified
model. Such fits have the desirable
feature that the fitting function passes
through the observed results, which, of
course, are known exactly. Physical
experiments could be similarly fitted,
but are conventionally fitted by
polynomial models, perhaps using
transformed variables, or by theory-
based functions. These need only pass
close to the observed results (within
experimental error, which is not of
interest in computer experiments).
Fitting stochastic process models can
be quite computing-intensive (as can
the selection of a design). Fitting
regression models can be quite
analysis-intensive, as different func-
tional forms, transformations, and other
tricks of the trade are tried.
Comment
I tend to favor approaching computer
experiments essentially as I would approach
physical experiments (Easterling 1989)
because the fact that the experimental
apparatus is a computer model doesn't seem
to me to warrant a whole change of
perspective. That is, if I had a table of
results from a lab experiment in
temperature, pressure, and humidity, I
wouldn't interpret it as a realization of a
random process and therefore fit a spatial
covariance function (treating temperature,
pressure, and humidity as spatial
dimensions), and I doubt that manycomputer experimenters would either, so I
don't see how being told that the table was
computer-generated would motivate a
dramatic change of approach. If told the
objective was to smooth a function through
the tabled values, then, as a mechanical
means of doing so. I'd choose some multi-
dimensional smoother, recognizing that (at
least for me) this is a somewhat arbitrary
choice among the myriad of possibilities. I
might use cross-validation to provide some
guidance. If told the objective was to find
25

^iiW:
^ *ii'
;^pt..i^:;
f,l.•-::.
*,> .ip^Ov> V. j
'ii)
4wuf*-..:
",_
' > ,-,ITi'"i
m .a g-"-
-'j
lit .,.: Mf ./'^mir^^i-^i}m
T iNtta
W'-'iC
:
;'V'
r'to'i t.S/V'?
, .i?Iii
^1# ' .;r .g;
«<• .Vi!.*
w 5ii4' -^ ^t< ;': ''•‘^j'f/‘<f1|
'' '3"
.VK ];-; • "V. ,-r<# ft’,.,:. '^3
',’^w;*»f)C#jn;2«i3!:;i ''’I - -.-
">-4d'>
"“fe' - ^
m
’' Mymy
S' M
"y
dominant variables, I'd take a more
conventional regression approach, for the
sake of familiarity and interpretability.
Standard errors are a problem in this case,
but I'm not sure the standard errors of
prediction provided by a kriging analysis,
e.g., are really more interpretable.
The different fitting approaches can be
contrasted as follows. In general, a model
output, X, is treated as a realization of
^ = g(>v) + e(w),
with g() representing signal, e() noise.
Conventional regression modeling tries to
capture all the structure in g, leaving e to
look like pure noise (independent,
identically distributed). The random
process approach tries to capture all the
structure in the covariance function for e,
often letting g be a constant. For a set of
deterministic computer model runs, it's hard
to claim either is right (particularly in the
calculation of standard errors); either maybe useful for certain purposes.
For the design of a computer experiment, I
would use factorial-based designs, modified
to overcome the projection shortcomings
mentioned above. Thus, in the example,
rather than a 2^^’^ design, say at comers of
the (±1) cube, I might run a 2^^"^ at ±1
plus a 2^^'^ at comers of a ±a cube, with a
equal to 1/3, say, or maybe 1/2. Or, I might
mn an orthogonal array of 10 four-level
factors in 32 mns. Then, if the model is
dominated by only two variables, there are
16 points on which to characterize this
relationship. These suggestions pertain,
though, to a black box approach. On a real
problem, I would want to select levels and
design the experiment based on subject-
matter insights, but still with a factorial
orientation. I would also advocate a
sequential strategy in exploring these
complex, high-dimensional relationships in
order to test and improve predictions.
Process Capability Prediction
The product and process designer, facing
design options as in Fig. 1, needs
information pertaining to the probability
that a process will yield output that will
meet design requirements. This
characteristic of a process is generally
referred to as process capability and various
indices have been created to try to
summarize a process's capability. In this
report, though, capability refers more
broadly to any comparison of a process
output distribution to requirements, such as
specification limits, for that output.
Prediction is the term used because the
context is the prediction of a process to be
used in the future, possibly in a different
configuration than in the past, or of a
process that does not yet exist. Three
situations will be considered:
• The process exists and has been
exercised or is available for
experimentation
• A prototype or laboratory version of the
process is available for experimentation
A mathematical model of the process is
available.
Process Capability Prediction Based on
Physical Experimentation
Historical data from a process could be
summarized as follows: At process setting,
w/, product characteristic x has a distribu-
tion with (estimated) mean, mj, and
standard deviation, s/. (In some cases, it
would also be appropriate to include
variance components, such as variability
among machines, operators, or set-ups.) Aprocess capable of being operated at
various settings could be summarized by
such statements at different settings. Arobust process would have essentially the
26

<$•
same output distribution over a wide range
of process settings. The variability
represented by these distributions results
from the variability of influences on the
process not controlled by w/,
such as
variability in incoming material and the
environment in which the process is being
operated. If this process is being
reconfigured into a new manufacturing
system, these influences may change,
resulting in different distributions. This
possibility needs to be considered before
past experience is accepted as a prediction
of future performance. Enough information
needs to be provided to make an
engineering judgment that previous
experience is applicable, or it may be
necessary to conduct test runs under the
altered conditions. Demonstrated process
robustness -- takes a licking and keeps on
ticking ” is a boon to reconfigurability.
Similar concerns pertain to using lab or
prototype test assessments of variability as
predictions of actual use of the process.
The "cause system" influencing variability
in the lab may be much different from that
in the field, so theory, or an empirical
bridge, is required to make the connection.
Historical data may not lend themselves to
ready summarization, as described, so it
may be necessary to run an experiment on
the actual or prototype process. To do so,
the design issues discussed above for
computer experiments need to be
addressed. In particular, of all the possible
influences on the process, denoted by (w,
e), some will be controlled and varied
according to the experimental design, some
will be held constant, and some will be
allowed to vary freely. The same issues
have to be addressed if the objective of the
experiment is to provide a basis for fitting
an empirical model that can be used to
mathematically represent the process. For
the sake of providing information on
reconfigurability, the span of conditions
over which to experiment is apt to be wider
than would be done for a dedicated process
because of the need to use a process in
different circumstances and in different
combinations. It behooves the "owner" of a
process who wants to play in the
reconfigurability arena to characterize that
process as broadly as possible and make the
information known to enterprise manage-
ment (prospective suitors).
Assessing process capability requires
comparing an estimated output distribution
to specification limits for that output.
However, when a process is operated, it is
generally operated under conditions that
require it to meet certain tolerances. In
fact, a tolerance could be, in essence, a
process setting in w'. For example, a
machine tool is operated to produce parts
with certain dimensions falling within
specified tolerances. The machinist will
design a sequence of rough and finish cuts
to achieve this quality. Thus, the output
distribution will (generally) fall within
those tolerances and it may not be clear
whether the basic process has this
capability, whether herculean efforts are
required, or whether acceptable product has
been achieved by scrapping and reworking
parts produced from what is really an
incapable process. Cost, processing time,
and first-pass acceptance data may reveal
the difference between a capable process
and a highly inspected and screened
incapable one. It would be better, however,
to have pre-screening process output
distributions to use in evaluating a process
against requirements that are possibly
different from the ones in force at the time.
Process Capability Prediction Based on
Mathematical Models
If a math model, g*(H:', e'), exists, then
process capability can be predicted by
propagating estimated, or assumed
27

distributions of the process arguments
through that model. Complex, long-
running models may not be feasible for
such Monte Carlo exercises, so simpler
models, obtained either by simplifying the
mechanistic model or by developing
empirical models from computer
experiments, may be required. Statistical
problems arising in this situation are the
approach to model-fitting, already
discussed, and the estimation of
distributions of the process arguments.
To summarize the issues in process
prediction in a specific situation, consider
the following simple relationships:
X = a. + bw +y=o + dx + ey
That is, suppose theor>^ indicates that
product characteristic x is linearly related to
process variable w, but with some residual
error, e^. Similarly, performance
characteristic y is linearly related to x, with
residual error ey. Further, suppose that the
residual errors are modeled as random
variables that will var>’ in production with
mean zero, and standard deviations, s^^. and
s^. Also, in a production environment, wwill vary’ according to some distribution,
say with mean m-^ and standard deviation
s-^^. (For example, the process may specify
a particular temperature, but the
imperfection of temperature control results
in variable actual temperature.) Now,
suppose that all of these (statistical model)
parameters have to be estimated. From
these estimates, the resulting distribution of
y can be estimated to have a mean of
My = g + ad ^ bdniy^
and a variance of
Sy^ = b^d^Sy^^ + d^SQ^ + Sy-,
where English letters represent estimates of
their Greek counterparts. There are two
major statistical problems to address in this
situation: 1. How precise are these two
estimates? Can their statistical uncertainty
be characterized by standard errors or
confidence limits? (We need some
indication of statistical uncertainty in order
to be able to compare alternative processes
or just to know how well process capability
is being predicted.) 2. How should the
experiments or data collection efforts from
which these estimates are to be obtained be
sized and designed in order to achieve a
desired degree of precision? Even for these
simple linear relationships, addressing these
questions is not straightforward. Initial
steps are reported in Easterling (1995).
Addressing these questions for multi-
dimensional, complex relationships is going
to be a formidable challenge.
Any prediction is limited, of course, by the
quality of the models and the data on which
it is based. Thus, until the point at which
the producer is very sure of the process and
product models, the next step would be to
build and test some (small) number of
prototypes in order to be sure that things
can operate as predicted. Determining a set
of conditions under which to build and test
prototypes and determining what per-
formance constitutes adequate agreement
with predictions is another area of potential
statistical involvement. The issues are
analogous to those in deciding what
physical tests are required to validate a
single model.
There is a similar situation in reliability
prediction: Given component test data and
a system reliability^ model, the analysis
objective is to predict system reliability and
evaluate the statistical uncertainty^ of that
prediction. In the agile manufacturing
context, we will have process data and a
manufacturing system model that links
these processes to product performance. In
28

the reliability situation, a system designer
may have choices among components and
other design features such as system
architecture, so the predictions would be
used in making design decisions. As in the
process capability situation, reliability
predictions are conditioned on assumptions
that the system operates as modeled and the
component data are representative of in-use
functioning. Some limited number of
system tests are necessary for checking
these assumptions. Further, the reverse
problem of deciding on a suite of
component test plans that will yield a
system reliability prediction with
predetermined precision has also been
addressed (Easterling, et al., 1991). In
reliability, though, the type of data, e.g.,
binary pass/fail data, and system model
considered, typically sums and products of
component failure probabilities, are apt to
be simpler than the process characterization
data and process and product models
envisioned here, so extending the reliability
analogy to the agile manufacturing context
will require considerable effort. The
approach will have to be to simplify the
models and focus on the dominant
contributors of performance.
Tolerance Allocation
In passing, I would note that the Fig. 1
schematic can also apply to the problem of
tolerance allocation. Suppose that final
product characteristics are required to fall
within some tolerance intervals about target
values for those characteristics. Achieving
this will require the specification of
tolerances for various part characteristics,
say, for the case of mechanical assemblies.
The different parts could be built to
different tolerances, at different costs. The
problem is to decide how to allocate the
tolerances, assuring that the final product
requirements will be met, at minimum cost.
Solution requires a model relating part
dimensions to final product characteristics,
reasonable cost estimates, and reasonable
estimates of the distributions of parts
characteristics for each alternative toler-
ance. A recent reference is Zhang and
Wang (1993). Statistical issues that arise
are the same as in the above discussion of
predicting the capability of a production
process created by the linkage of several
individual processes.
AGILE MANUFACTURING ANDQUALITY
In the agile manufacturing world
envisioned in Nagel and Dove (1991),
quality is assumed. You're not even in the
game if you cannot make high-quality
products, quickly and economically, and if
you are not attentive to customer current
and potential future needs, from whence
will come the market for new, customized
product. Low-volume production and the
need for rapid, economical product
realization means that scrap, rework, and
product inspection and testing must all be
minimized. Production processes will have
to be not only capable, predictable, and
continuously improved as customer needs
evolve, but they must also be
reconfigurable and robust to recon-
figuration. Modem quality assurance has
evolved from inspection and testing to an
emphasis on process understanding, design,
monitoring, and control, but the needs of
agile manufacturing ought to accelerate that
evolution.
In a broader sense of quality, agile
manufacturing, in its model of cross-
corporate cooperation in virtual enterprises,
even among companies that might be
competing in other arenas (as in automobile
29

joint ventures), reflects Deming's views on
the quality and productivity advantages of
cooperation over competition. It should be
recognized, though, that reconfiguration
can be anti-quality if it results in the
introduction of extraneous sources of
variation. For agility to work, echoing the
remarks of Morton (1994) cited earlier,
process interfaces will have to be worked
very carefully and processes will have to be
quite stable and predictable to avoid
surprises in production. On the social side,
quickly establishing trust as configurations
among companies, or organizations within
companies, change may also be an obstacle
to successful agile manufacturing.
Achieving quality in agile manufacturing
begins with the design of both the product
and the manufacturing process. Process
monitoring and control then help assure that
the design intent is achieved. Ideally, there
would be no need for final-product
inspection and certification, but in practice,
some product testing will often be needed.
Mathematical process modeling, as
described in the previous section, will help
achieve "agile quality assurance," by
contributing to process design and control,
but there are additional aspects, and
corresponding statistical roles, that will be
discussed in this section.
Integrated Product and Process Design
Integrated Product and Process Design
(IPPD) is the term used to represent the
concurrent design of a product and its
production processes so as best to use
existing manufacturing processes or to
develop new processes in a timely manner
that will be highly capable of producing the
product. (Concurrent engineering is
another term used interchangeably with
IPPD, though some argue one is a subset of
the other.) As an engineering practice,
IPPD is approached by establishing product
teams early in the design process that
include manufacturing personnel. Thus, it
is by forced early communication that
production problems are prevented. It is
my impression that industrial statisticians
are not generally part of these integrated
design teams -- they more often play the
role of a specialist called in to help address
specific problems — but the opportunity to
be well-immersed in a design project can
enhance the contribution a statistician can
make to the project when statistical
approaches to problem-solving are required.
A case in point is Sandia's A-PRIMEDproject, described in a subsequent section.
There is a need, though, to go beyond the
avoidance of production problems via early
communication and to try to optimize (or at
least greatly improve) the product design
and production processes. Designs
generally begin at a point and then are
improved one factor at a time as problems
are encountered and resolved. Having all
the players involved at the start can speed
up this process and multiple engineering
insights can greatly help in negotiating a
high-dimensional design space. A more
systematic exploration of the product and
process "parameter space," however, can
lead to solutions that might otherwise be
missed. This is where the "factorial"
perspective of a statistical team member
can make a contribution (and it's a
contribution that the specialist might never
be called on to make). Experimentation
that plays design features against
alternative production processes (or process
settings) can provide the basis for
optimization. The genius of the Taguchi
approach (see, e.g., Nair 1992 and Kacker,
1985) to robust design (in this case, a
product design that is robust to production
process noise) is that it calls for early
experimentation that simultaneously
addresses product and process designs.
Technical issues pertaining to experimental
design and data analysis can sometimes
obscure the basic fact that experimenting
30

'V?
'^1
•A .»fe^'-^
*w»:' } '\w?:»t=?f|’
<i‘- '‘'is4' * rs:^". -'VX/iqi
1^ ^'-^4ife '^^vii^'V-wift, Ji'y^
.^^V 4i< !;'iii^>t' '1^4*i^.'^- -f^-
^ HI - ''
". ‘i
:
^jkiBm^S^Mp
y, .v, Sp*!«'ifSfc\;
fMd;^-V- - - ^^^''W*: v. r. '.y,..^:
:
fete:
' ^-
'.:•
,. ; :J'
ivt '’HPHj^H^ilcitii^. 'j.''> ' ^w.fcv^
>fi»f f^i^.>-I^VrjlH 4'^.^fijM)jj|5|^
' '’SRlS'' >'.'«1f| rjoi-‘^tell»*! j;it S^if
H^ui* -jA^' ;
:'
' 1 J>r||^;:'y>:f ;: 'v'':|m«^;;;.;||p; ’;,^ ^1, y'f('> .
k'
'
^ '
.
Ui "-f »|fS^KI^^t^fyFiSt^
v»4’ -•
-1^0 .1 o' v.:.iHJfhikKi^2
,.-
'‘'' ^-jWPW' •v-CyiiiJHiiS.'^'i^
^iiim tmmivsst 1^
a‘
'
vi" -
'
:r^:^
%m'. ...... .
im bum, i t
^’•-
., .'i'-' l)%^_ a %''/ rn4r.d} Its f£"-M.j
:«.»• P"*^'' ''
;|^l-^dW' 'UuQ?ii ,a'IVJ
vifi ^.‘ ..K3rtin d4i
M *Ti'n
with the right factors, over the right ranges,
at the right time in the product design cycle
can be the key to real quality and
productivity breakthroughs.
Process Control
Real-time process control, by which
process deviations from target can be
sensed and translated into course
corrections, is another means by which
quality assurance can be provided in agile
manufacturing. A considerable amount of
engineering and statistical work is aimed at
the development of process controllers.
Statistical and engineering approaches often
differ, but some recent work that blends
them is Montgomery et al. (1994) and
Vander Wiel et al. (1992).
An example of statistical modeling for the
purpose of real-time process control is
provided by a recent NIST project (Rudder
et al. 1992). In a milling operation,
temperature affects cutting accuracy and
temperature can vary as a piece is milled.
Quality could be improved if in-process
temperature changes could be detected and
translated into compensating modifications
of the tool path (this assuming that process
parameters, such as speed, feed rate, and
coolant, have been determined that reduce
temperature fluctuations to the extent
possible, but that the remaining temperature
effects still need to be compensated for).
To this end, a vertical axis milling machine
has been extensively instrumented, data
collected, and empirical models developed.
Process Change-Over
Agile, customized production can call for
frequent process change-overs, say- from
one recipe to another. Time and cost are
saved if the new process can be targeted
quickly, without a lot of tweaking and
stabilizing. Statistical aspects of this
problem pertain to the development of data-
based decision rules for accomplishing the
change-over and these have recently been
addressed by Faltin et al. (1994) at General
Electric. Other work in this area is Hu(1994).
Short-Run Process Control
Traditional quality assurance requires a
substantial amount of production to
establish statistical control limits against
which subsequent production is to be
compared. Recent statistical work is aimed
at modifying this approach for use with
very limited amounts of data (Quesenberry
1991 and Crowder 1992). The ability to
detect process shifts via product-specific,
low-volume or short-run (lot size 1?) data,
though, may be so limited as to be not
worth the effort. Inspection against
specification limits, not statistical control
limits, may be all that can be done.
Applying statistical process control to
processes that are repeatedly used, in
different configurations and for different
products, perhaps, is more appropriate.
Some adjustment for configuration differ-
ences may be required to make cross-
configuration data compatible.
Final Product Testing
Qualification or certification of product can
inhibit agility (quote from industry
colleague: "Measurement is killing us!,"
meaning the time and expense). Twoapproaches to reducing the measurement
burden are (1) to reduce the amount of
measurements and (2) to reduce the time
required for necessary measurements.
Reducing the number of measurements
required, especially at the final product
stage, can be accomplished by eliminating
redundant or noninformative measure-
31

3
>i»S<* • ':.
^. .vi^
L -V: : ti^N;0ra.. <ii
'it -
y';-WtoL',;:'ft^L.i««4A - fincv.'v
/ %ajr
II j
4"’^r: ;r^ ^m'ini-^'St ftth^p
(3k.:l*'?%ij.iV’tf-..v ,^^J?t0bi^t<riaiti
|l|||^J^lfftj1^
-ms :|i|:kiHi te ;?iF^
,(' r.««.'3*I^TJ.«!r
f,.» ?!/:
..... .. t^ 'J*^’*
ht,^'UMd 0.r^ V, 51 iL'tmsqjOfW?t^
if : -sA* ^mt'hb^': fii :v€^/}; tit55p
Mt9%
.aV
-^AUc
:
0'
a .vj-" .'^ ;-' tig’ ‘-4fc;^ ^nS'filivXm
Wi •.
. •
.ja r:^.'
:v'\:.:.,a;
ments; statistical methods can be used to
achieve this dimension reduction. Better
still, the elimination of the need to do final
product tests via process understanding,
control, and monitoring of process variables
can greatly reduce the qualification
component of the product realization cycle.
To reduce the time required to take
measurements, methods such as on-
machine inspection of mechanical parts (as
opposed to moving a part from the machine
on which it is produced to a special
measurement station) are being developed.
Because some machine biases may also be
present in on-machine measurements, not
all off-machine measurements may be
eliminatable. Statisticians can help qualify
on-machine measurements by the design
and analysis of studies that compare on-
machine measurement to off-machine
measurements by standard methods, such as
via coordinate measuring machines.
Framework for Quality Assurance
The mathematical framework presented
above for relating process variables, w, to
product characteristics, x, to product per-
formance variables, jk, also provides a
framework for quality assurance. Post-
production quality assurance focuses on y.
Each unit produced is measured for form,
fit, and function to the maximum extent
possible and acceptance is based on those
measurements. Performance characteristics
that can only be measured destructively,
such as lifetime, or burst pressure, might be
measured on a sampling basis. By this
approach, which might be labeled
traditional quality assurance, the burden of
proof that the realized product meets
requirements is provided by tests on the
final product. While such testing
maximizes the realism of a quality
evaluation, it can be expensive and tardy in
identifying process problems.
Alternatively, if the relationship between
product characteristics, x, and performance
variables, is well-understood, measure-
ments ofX can provide the basis for product
acceptance. For example, deflection under
some nondegrading load might be a good
predictor of breaking strength, which could
only be measured destructively, so
measured deflection would be a surrogate
for breaking strength and product
acceptance could be based on meeting
requirements in terms of deflection.
Moving further upstream, if the relationship
of deflection to process parameters, w and
environmental parameters e is understood,
then deflection can be controlled by
controlling w and e. The product and
performance characteristics, x and x might
never need to be measured, or at most be
measured on a sampling basis.
Process monitoring and product testing,
perhaps on a sampling basis, provide an
ensemble of w, e, x, and x data. It seems to
me that there ought to be ways to use all of
these data simultaneously, in ways other
than just comparing them to their
specifications, to provide assurance that
processes and product are on target and to
detect departures from target. For example,
the (x, x) data could be used to check that
the assumed relationship between them has
not changed. That evidence should add
quantifiable assurance to that provided by
the separate comparison of x and x to their
requirements.
All of these relationships, of course, are
what underlies design. In order to achieve
product that meets customer requirements
in terms of x the product should have
characteristics x that meet certain require-
ments (the designer says). Achieving this
requires manufacturing processes that run at
settings w under environmental conditions e
that both fall within prescribed limits. The
ability to set limits on w, e, and x is derived
from the understanding of the relationships
32

H'. ^r4i:.'‘v
^M^i.^,,4 I-,
&
",
gffl^.'pu^titSt-icJto'
Him•1^1 #- i^m^r asmliorr r.T
-5',
J^t^'.^'^^irui .trMi.'':^tsJ2iwkei
>;>» ^ftfr £JOl>;v4S5^Xf i>,;ii;.^;;
4j ir,?• :# ^%., H^
Ijj^^
-i - wifi:r- i-U-i-J
^ i/.-TvS;} .J.»:t(AJ.
1^4-jj,*;
' <»*, )!<(
’
;,^j
\^^4iMi^,,^%i .ftotess(iiij4&
-^iii-* '<»’43il^^^k:*^i hM ip^klm^iu 11 iirHwr':*"
^ /*ma%jt^utk3(n !5ict.ib<r»-
ii^., . f"1S!^L
'!•' V^
'
I'
. ".''“.S'vT" .' .%r' miipiii .pr^ fT i
jV '>\:;.'':Vj
:'
rni•'
'
Is*- **^01. 'Jl"?
h i'K^uXyf f,.^ i‘>»^^ •
•I
-'il
t'A''':'
4'P-!E
_ '5i4«i^
'-‘m. # fj'^:
^ '* jKW.-- '\.f.<^-'- ^' \- '•'.
,’^,:»p, mmm^- 1^.
.
*!€#*»i#t#. rt.'-«#flki*„ '-:
*«?<iWs*fe lii its^
#r
e4c. 4- v^tfkdttv^
'
..
'
^{ls.^tu,8^» (Ite’i’ 'iofhit;'fi':"t3'
'• tjvtepivoliq i;Jil
V -jE.' .
'
,,-^v--''43ae4'T^^ %':t-v !^''d s^in/b «•• mnt,4 v9Jni J.^tii ?.« i?'»ui
.ihMQTiiYP
iMdIiW 9?& *4i|l|. ,‘i6«JT|:
-
.
Jsobw,. I*.ta
«4t ^ kmimxT^two .ii ^%siwliv»
t
(i;
ite'
of these variables to x- When that
relationship is not well-understood,
conservative margins are used to provide
assurance that realized product will meet
customer requirements. Compensations for
measurement uncer-tainty introduce further
conservatism. Improved understanding,
reflected in improved mathematical models
of the relationships, and improved
measurement precision can lead to reduced
margins and reduced costs. — i.e., greater
agility.
THE AGILE MANUFACTURINGRESEARCH AGENDA
As a developing concept, agile manu-
facturing is the subject of ongoing research
and development. Government funding for
such research, that I am aware of, is coming
from the Departments of Defense, Energy,
and Commerce and the National Science
Foundation. This section describes some of
those programs, with emphasis on statistical
aspects of that research. Of course, all
research and development, government or
privately funded, that is aimed at reducing
product realization time also contributes to
agile manufacturing. Numerous statistical
opportunities exist in the development and
testing of new manufacturing technologies
and many government, academic, and
industrial statisticians are involved in this
research.
With respect to agile manufacturing, in
brief, the Advanced Research Projects
Agency (ARPA) of the Department of
Defense funds the Agility Forum, in part to
help set the research agenda in agility.
ARPA then funds particular research
programs. The Department of Energy is
sponsoring agile manufacturing R&D at its
national laboratories and a lab/industry
program called TEAM (Technologies
Enabling Agile Manufacturing). The
National Science Foundation sponsors agile
manufacturing research at three AMRIs(Agile Manufacturing Research Institutes).
These are located at the University of Texas
at Arlington, Rensselaer Polytechnic
Institute, and the University of Illinois and
focused on three manufacturing sectors:
electronics, aerospace, and machine tools,
respectively. NIST, in addition to
supporting the Agility’ Forum and TEAMthrough membership on various panels, has
internal programs pertaining to the
infrastructure of agile manufacturing and
also funds some industry programs through
the Advanced Technology Program. This
section briefly describes these programs
with focus on their statistical aspects.
ARPA
The ARPA request for proposals for its
Agile Manufacturing Initiative, issued as a
Broad Area Aimouncement (BAA) in the
summer of 1994, begins with a sweeping
description of agility:
"Agility in manufacturing is
viewed as the ability to thrive
in an environment of
continuous and often unantic-
ipated change through an
enterprise geared toward
’reconfigurable everything.'
Agility addresses ... business
practices; the culture of
management and employees;
financial control and opera-
tions; relationships of the
customer, assembler, and
supplier; manufacturing pro-
cess integration with design,
information systems to
support decision making,
(and) information systems for
empowering workers; ac-
counting systems to reflect
33

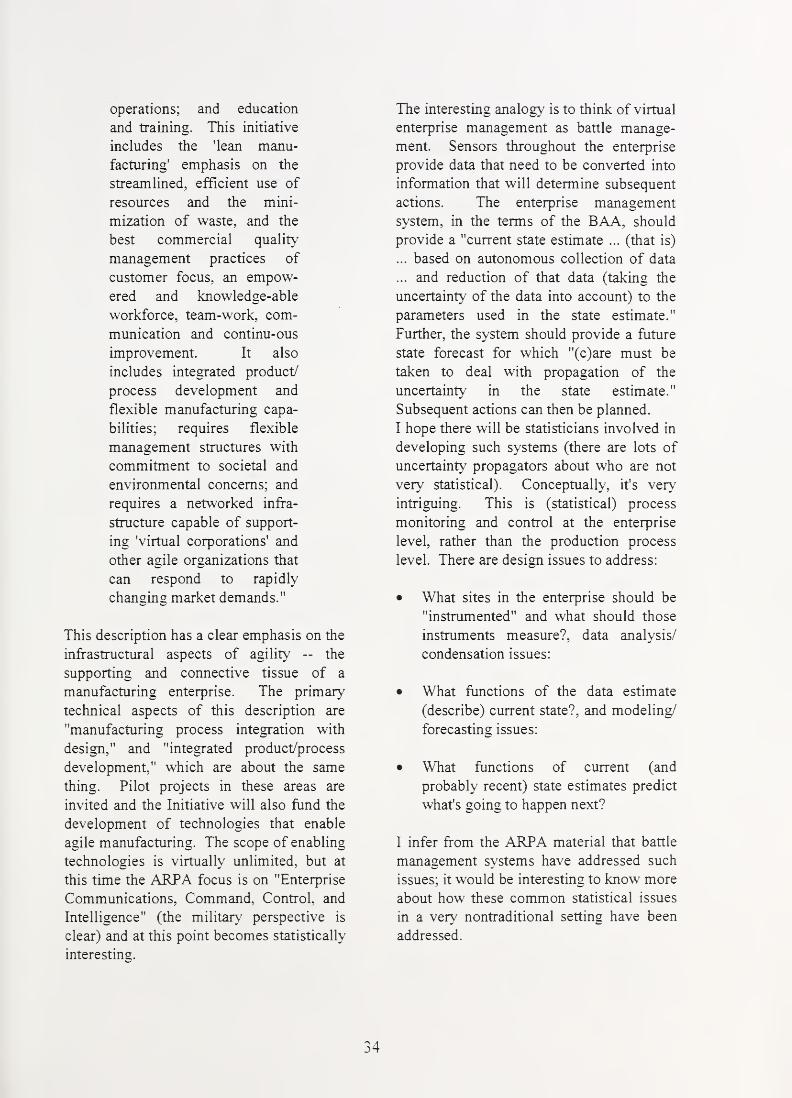
operations; and education
and training. This initiative
includes the ’lean manu-
facturing' emphasis on the
streamlined, efficient use of
resources and the mini-
mization of waste, and the
best commercial quality
management practices of
customer focus, an empow-
ered and knowledge-able
workforce, team-work, com-
munication and continu-ous
improvement. It also
includes integrated product/
process development and
flexible manufacturing capa-
bilities; requires flexible
management structures with
commitment to societal and
environmental concerns; and
requires a networked infra-
structure capable of support-
ing 'virtual corporations' and
other agile organizations that
can respond to rapidly
changing market demands."
This description has a clear emphasis on the
infrastructural aspects of agility — the
supporting and connective tissue of a
manufacturing enterprise. The primary
technical aspects of this description are
"manufacturing process integration with
design," and "integrated product/process
development," which are about the same
thing. Pilot projects in these areas are
invited and the Initiative will also fund the
development of technologies that enable
agile manufacturing. The scope of enabling
technologies is virtually unlimited, but at
this time the ARPA focus is on "Enterprise
Communications, Command, Control, and
Intelligence" (the military perspective is
clear) and at this point becomes statistically
interesting.
The interesting analogy is to think of virtual
enterprise management as battle manage-
ment. Sensors throughout the enterprise
provide data that need to be converted into
information that will determine subsequent
actions. The enterprise management
system, in the terms of the BAA, should
provide a "current state estimate ... (that is)
... based on autonomous collection of data
... and reduction of that data (taking the
uncertainty of the data into account) to the
parameters used in the state estimate."
Further, the system should provide a future
state forecast for which "(c)are must be
taken to deal with propagation of the
uncertainty in the state estimate."
Subsequent actions can then be planned.
I hope there will be statisticians involved in
developing such systems (there are lots of
uncertainty propagators about who are not
very statistical). Conceptually, it's very
intriguing. This is (statistical) process
monitoring and control at the enterprise
level, rather than the production process
level. There are design issues to address:
• What sites in the enterprise should be
"instrumented" and what should those
instruments measure?, data analysis/
condensation issues:
• What functions of the data estimate
(describe) current state?, and modeling/
forecasting issues:
• What functions of current (and
probably recent) state estimates predict
what's going to happen next?
I infer from the ARPA material that battle
management systems have addressed such
issues; it would be interesting to know more
about how these common statistical issues
in a very nontraditional setting have been
addressed.
34

I
!
1
5
, .)
! <
'
!
^1
X '
fi 1

TEAM (Technologies Enabling Agile
Manufacturing)
The basic goal of the TEAM project
(TEAM 1994) is to make available, to
industry, the manufacturing technology
resources developed in the DOE's nuclear
weapons complex and, with industry
leadership and participation, to apply both
DOE and industry technologies, as
appropriate, to agile manufacturing
demonstration projects. The program is
DOE-funded, with matching industry
participation and participation from NIST
and other government agencies.
TEAM is divided into the following five
"thrust areas:"
Product Design and Enterprise Concurrency
— design tools and approaches that speed
the transition of designs to production
• Virtual Manufacturing — modeling and
simulation tools to evaluate and
improve products and processes
• Manufacturing Planning and Control --
tools for quick selection of resources,
process optimization, process planning,
numerical control, work instructions,
scheduling and tracking
• Intelligent Closed-Loop Processing —
advanced sensing and control technol-
ogies that provide rapid response
• Integration — tools for communication
and information transfer.
Methods, models, and software are to be
identified in all of these areas and then
tested and demonstrated on real products in
three areas of application: material removal,
sheet metal forming, and electronic/
electromechanical assembly. Primarily,
TEAM will deploy existing technology, not
undertake research and development,
though it can be expected that application
of the existing tools is apt to require
development of interfaces.
NIST Agile Manufacturing Projects
Much NIST work contributes to rapid
realization of high-quality product
primarily through metrology and standards,
so this work is a part of general agile
manufacturing research and development.
For example, quicker, more accurate
measurement methods and improved
process monitoring and control systems, as,
e.g., the milling machine control study cited
above (Rudder et al. 1992), contribute to
industry agility.
At the virtual enterprise level of agility,
NIST internal projects stem from its
responsibilities in developing manufactur-
ing applications of the National Information
Infrastructure, stated in Bloom (1994) as:
"Implementation of the Nil concept for
manufacturing will allow such capabilities
as: (1) customers to "custom design"
products, (2) companies to form alliances
needed to produce new products (i.e., Agile
Manufacturing), (3) small to medium size
companies to interact with large companies
for bidding on products (i.e., the Virtual
Enterprise), (4) software system brokers to
"rent" sophisticated manufacturing systems
tools, and (5) rapid access to manufacturing
knowledge by the product designers that
will enable enterprises to use concurrent
engineering practices." The NIST program
pertaining to these objectives is the Systems
Integration for Manufacturing Program
(SIMA) which is focused on interface
standards by which the communication and
integration possibilities of the Nil can be
realized. SIMA has four program elements:
Manufacturing Systems Environment —
models and software for integrating
manufacturing systems
35

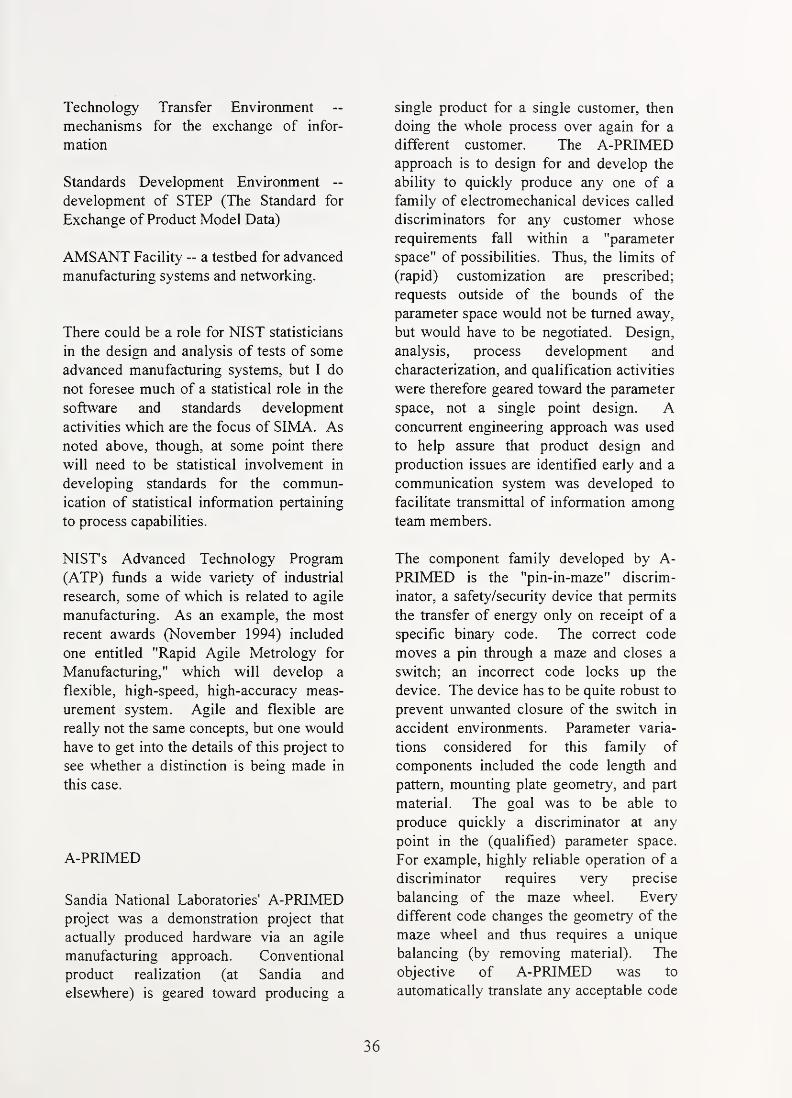
Technology Transfer Environment
mechanisms for the exchange of infor-
mation
Standards Development Environment ~development of STEP (The Standard for
Exchange of Product Model Data)
AMSANT Facility — a testbed for advanced
manufacturing systems and networking.
There could be a role for NIST statisticians
in the design and analysis of tests of some
advanced manufacturing systems, but I do
not foresee much of a statistical role in the
software and standards development
activities which are the focus of SIMA. As
noted above, though, at some point there
will need to be statistical involvement in
developing standards for the commun-
ication of statistical information pertaining
to process capabilities.
NIST's Advanced Technology Program
(ATP) funds a wide variety of industrial
research, some of which is related to agile
manufacturing. As an example, the most
recent awards (November 1994) included
one entitled "Rapid Agile Metrology for
Manufacturing," which will develop a
flexible, high-speed, high-accuracy meas-
urement system. Agile and flexible are
really not the same concepts, but one would
have to get into the details of this project to
see whether a distinction is being made in
this case.
A-PRIMED
Sandia National Laboratories' A-PRIMEDproject was a demonstration project that
actually produced hardware via an agile
manufacturing approach. Conventional
product realization (at Sandia and
elsewhere) is geared toward producing a
single product for a single customer, then
doing the whole process over again for a
different customer. The A-PRIMEDapproach is to design for and develop the
ability to quickly produce any one of a
family of electromechanical devices called
discriminators for any customer whose
requirements fall within a "parameter
space" of possibilities. Thus, the limits of
(rapid) customization are prescribed;
requests outside of the bounds of the
parameter space would not be turned away,
but would have to be negotiated. Design,
analysis, process development and
characterization, and qualification activities
were therefore geared toward the parameter
space, not a single point design. Aconcurrent engineering approach was used
to help assure that product design and
production issues are identified early and a
communication system was developed to
facilitate transmittal of information among
team members.
The component family developed by A-
PRIMED is the "pin-in-maze" discrim-
inator, a safety/security device that permits
the transfer of energy only on receipt of a
specific binary code. The correct code
moves a pin through a maze and closes a
switch; an incorrect code locks up the
device. The device has to be quite robust to
prevent unwanted closure of the switch in
accident environments. Parameter varia-
tions considered for this family of
components included the code length and
pattern, mounting plate geometry, and part
material. The goal was to be able to
produce quickly a discriminator at any
point in the (qualified) parameter space.
For example, highly reliable operation of a
discriminator requires very precise
balancing of the maze wheel. Every
different code changes the geometry of the
maze wheel and thus requires a unique
balancing (by removing material). The
objective of A-PRIMED was to
automatically translate any acceptable code
36

fi ^'!0^ ^i^iM
Mm-
m
i' ,i:?;:,4 ^|j;^;* r,t
I «
^1
1
1^ 'irfe
:,''4':
ij
%
«|I 4^:^' lit t?^ >
'#v ii^-4^ ^^' i ,i^':j^,;#^q'/V,
^4^1; p,
’
'm,
r^'''
Sf
f«j,'
I
'
.
'
,
' 4?5 'a .
'
'
' ,
' ^
li' V Vf ' ,- ,Tl.
" : .:. 'r-M -'^"'
'
#; ':
mM-
'WM >'lJ^H'i^P mii
'^^^^:^ ik ’W:im;^. »# is:"':
h
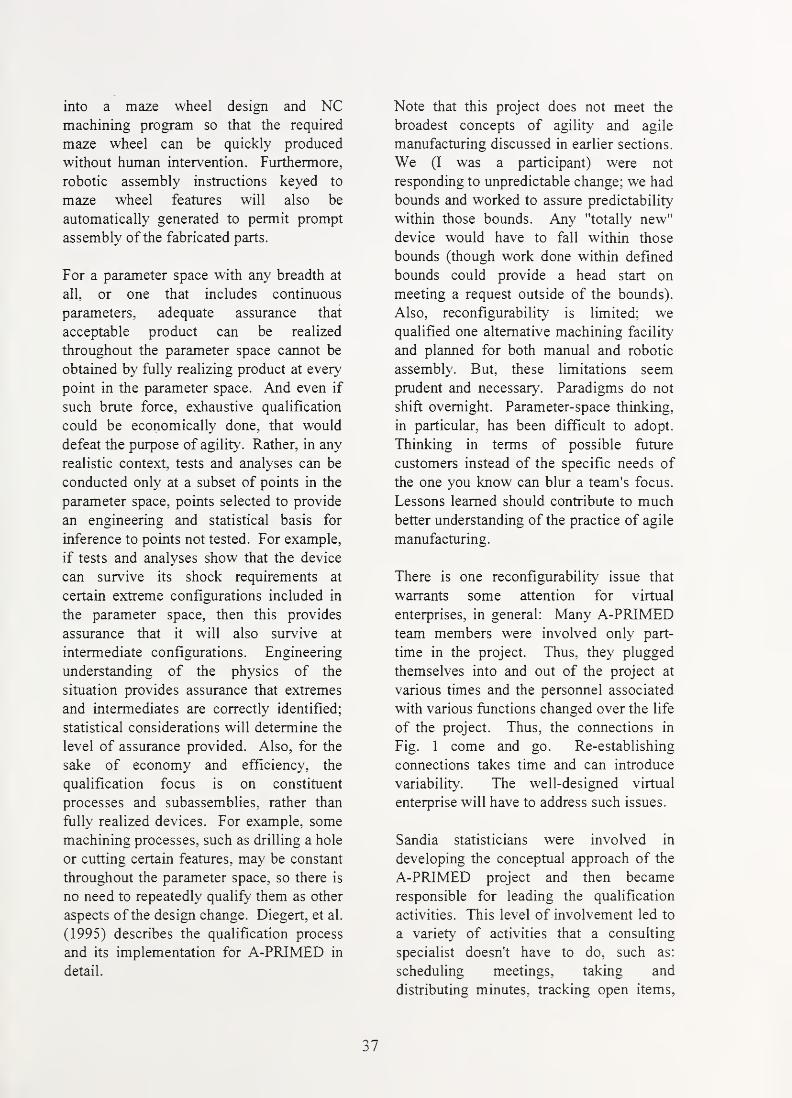
into a maze wheel design and NCmachining program so that the required
maze wheel can be quickly produced
without human intervention. Furthermore,
robotic assembly instructions keyed to
maze wheel features will also be
automatically generated to permit prompt
assembly of the fabricated parts.
For a parameter space with any breadth at
all, or one that includes continuous
parameters, adequate assurance that
acceptable product can be realized
throughout the parameter space cannot be
obtained by fully realizing product at every
point in the parameter space. And even if
such brute force, exhaustive qualification
could be economically done, that would
defeat the purpose of agility. Rather, in any
realistic context, tests and analyses can be
conducted only at a subset of points in the
parameter space, points selected to provide
an engineering and statistical basis for
inference to points not tested. For example,
if tests and analyses show that the device
can survive its shock requirements at
certain extreme configurations included in
the parameter space, then this provides
assurance that it will also survive at
intermediate configurations. Engineering
understanding of the physics of the
situation provides assurance that extremes
and intermediates are correctly identified;
statistical considerations will determine the
level of assurance provided. Also, for the
sake of economy and efficiency, the
qualification focus is on constituent
processes and subassemblies, rather than
fully realized devices. For example, some
machining processes, such as drilling a hole
or cutting certain features, may be constant
throughout the parameter space, so there is
no need to repeatedly qualify them as other
aspects of the design change. Diegert, et al.
(1995) describes the qualification process
and its implementation for A-PRIMED in
detail.
Note that this project does not meet the
broadest concepts of agility and agile
manufacturing discussed in earlier sections.
We (I was a participant) were not
responding to unpredictable change; we had
bounds and worked to assure predictability
within those bounds. Any "totally new"
device would have to fall within those
bounds (though work done within defined
bounds could provide a head start on
meeting a request outside of the bounds).
Also, reconfigurability is limited; wequalified one alternative machining facility
and planned for both manual and robotic
assembly. But, these limitations seem
prudent and necessary. Paradigms do not
shift overnight. Parameter-space thinking,
in particular, has been difficult to adopt.
Thinking in terms of possible future
customers instead of the specific needs of
the one you know can blur a team's focus.
Lessons learned should contribute to muchbetter understanding of the practice of agile
manufacturing.
There is one reconfigurability issue that
warrants some attention for virtual
enterprises, in general: Many A-PRIMEDteam members were involved only part-
time in the project. Thus, they plugged
themselves into and out of the project at
various times and the personnel associated
with various functions changed over the life
of the project. Thus, the connections in
Fig. 1 come and go. Re-establishing
connections takes time and can introduce
variability. The well-designed virtual
enterprise will have to address such issues.
Sandia statisticians were involved in
developing the conceptual approach of the
A-PRIMED project and then became
responsible for leading the qualification
activities. This level of involvement led to
a variety of activities that a consulting
specialist doesn't have to do, such as:
scheduling meetings, taking and
distributing minutes, tracking open items.
37


reminding, coaxing, and wheedling. The
parameter space qualification efforts
became the prime way by which design and
production interface issues were identified
and coherently addressed. A myriad of
"things happen" between the high-level
concepts and goals of agile manufacturing
and the actual production of functioning,
highly-customized devices and the A-
PRIMED history, if it is written, should be
quite helpful in identifying the sorts of
problems that can be encountered and in
pointing toward solutions.
Other Research
The 1994 ORSA/TIMS (Operations
Research and Management Science
societies) conference included three
sessions on agile manufacturing and several
other papers on the topic. These
presentations tended to deal with
conceptual and infrastructural aspects of
agile manufacturing. Modeling by the
OR/MS community is primarily what I
would call factory-level modeling, models
that deal with tasks such as scheduling,
provisioning, and transporting, rather than
the physics of a manufacturing process.
This sort of modeling would seem,
therefore, to be quite appropriate to virtual
enterprise modeling (and I would note that
the TEAM project, discussed above,
includes an enterprise modeling task). All
the statistical issues pertaining to parameter
estimation, validation, etc., discussed above
for process models, also are pertinent in this
case. Integrating process and enterprise
models is the overall objective discussed
above by Szekely and Trapaga (1994).
Spring Research Conference (SRC) on
Statistics in Industry and Technology, June
1994.
This conference, which I immodestly
mention because of my familiarity with it
as Program Chair, did not have any papers
that addressed agile manufacturing per se,
but there were numerous papers pertaining
to the statistical aspects that have been
discussed in this report. The conference
illustrated the breadth of potential statistical
opportunities for helping industry achieve
more rapid, economical product realization
and shows that the sorts of statistical
participation called for in this report are
occurring.
CONCLUSION
The goal of agile manufacturing — quick,
economical realization of high-quality,
customized product -- is important to
industrial competitiveness and survival.
The routes to that goal may differ from
industry to industry and company to
company. That is the point of the scenarios
in Nagel and Dove (1991). Common to all,
though, is the need to provide information
that can be readily used to decrease design
and production time and cost and maintain
and improve high quality. This report
presents my perspective, which is
concerned with statistical aspects of this
information. Other perspectives, and
particular technologies (electronic systems,
mechanical assemblies, materials process-
ing, ...), will raise many other issues.
Concurrent, multi-disciplinary work will be
required to translate general principles of
agile manufacturing into successful
production and delighted (or astonished)
customers. Let's start now.
ACKNOWLEDGMENTS
My thanks go to Dick Schwoebel, Sandia,
and Bob Lundegard, NIST, who encouraged
and supported my participation in the NISTResearch Fellowship program. I would also
like to express my appreciation to Rick
Dove of the Agility Forum and to members
of the Agile Operations Focus Group for
38


partially educating me on the topic of
agility in manufacturing. Thanks also to
Rodema Ashby, Sandia, and the A-
PRIMED project team for providing
additional opportunities to explore the role
of statistics in agile manufacturing. The
report benefited from reviews by Nien-Fan
Zhang, NIST; Sue Hartman, Resultant
Manufacturing Services, and Kathleen
Diegert, Chris Forsythe, and Joe Baxter, all
of Sandia, and from discussions of
computer experiments with Max Morris,
Oak Ridge National Laboratory.
39

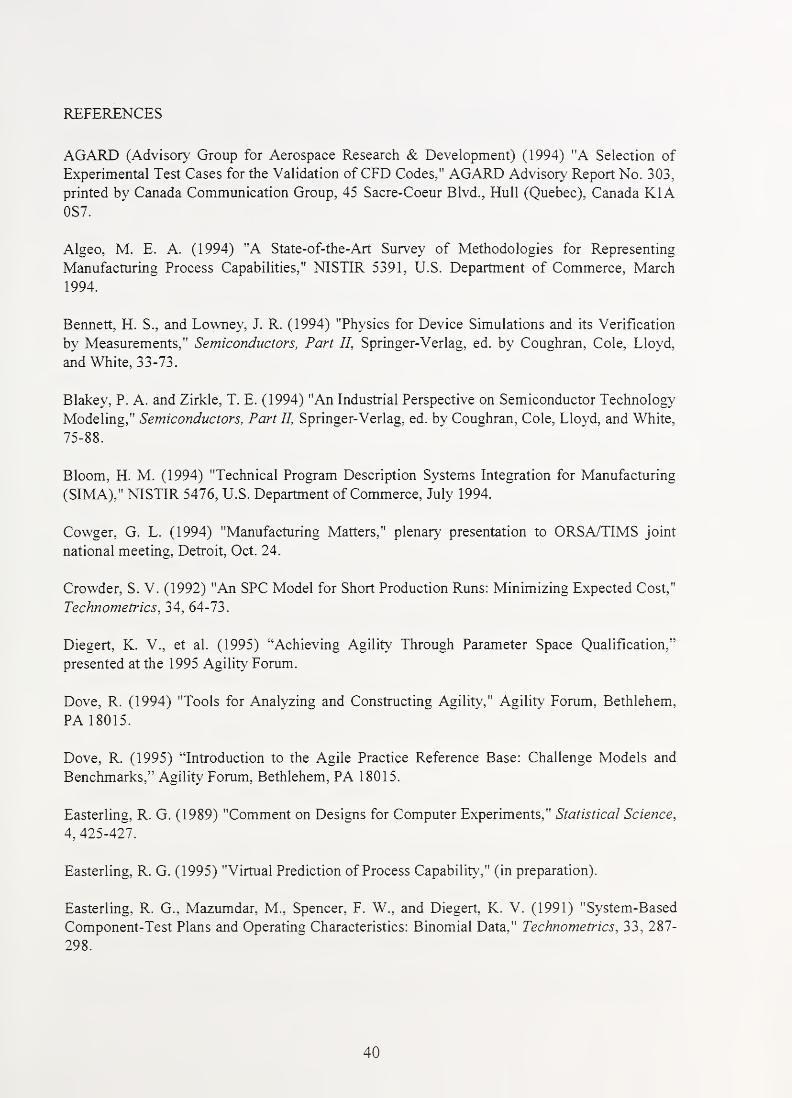
REFERENCES
AGARD (Advisory Group for Aerospace Research & Development) (1994) "A Selection of
Experimental Test Cases for the Validation of CFD Codes," AGARD Advisory Report No. 303,
printed by Canada Communication Group, 45 Sacre-Coeur Blvd., Hull (Quebec), Canada KIA0S7.
Algeo, M. E. A. (1994) "A State-of-the-Art Survey of Methodologies for Representing
Manufacturing Process Capabilities," NISTIR 5391, U.S. Department of Commerce, March
1994.
Bennett, H. S., and Lowney, J. R. (1994) "Physics for Device Simulations and its Verification
by Measurements," Semiconductors, Part II, Springer-Verlag, ed. by Coughran, Cole, Lloyd,
and White, 33-73.
Blakey, P. A. and Zirkle, T. E. (1994) "An Industrial Perspective on Semiconductor Technology
Modeling," Semiconductors, Part II, Springer-Verlag, ed. by Coughran, Cole, Lloyd, and White,
75-88.
Bloom, H. M. (1994) "Technical Program Description Systems Integration for Manufacturing
(SIMA)," NISTIR 5476, U.S. Department of Commerce, July 1994.
Cowger, G. L. (1994) "Manufacturing Matters," plenary presentation to ORSA/TIMS joint
national meeting, Detroit, Oct. 24.
Crowder, S. V. (1992) "An SPC Model for Short Production Runs: Minimizing Expected Cost,"
Technometrics, 34, 64-73.
Diegert, K. V., et al. (1995) “Achieving Agility Through Parameter Space Qualification,”
presented at the 1995 Agility Forum.
Dove, R. (1994) "Tools for Analyzing and Constructing Agility," Agility Forum, Bethlehem,
PA 18015.
Dove, R. (1995) “Introduction to the Agile Practice Reference Base: Challenge Models and
Benchmarks,” Agility Forum, Bethlehem, PA 18015.
Easterling, R. G. (1989) "Comment on Designs for Computer Experiments," Statistical Science,
4, 425-427.
Easterling, R. G. (1995) "Virtual Prediction of Process Capability," (in preparation).
Easterling, R. G., Mazumdar, M., Spencer, F. W., and Diegert, K. V. (1991) "System-Based
Component-Test Plans and Operating Characteristics: Binomial Data," Technometrics, 33, 287-
298.
40

Faltin, F., Runger, G. and Vandeven, M. (1994) "Set-Up control for Short Run Processes,"
presented at the Spring Research Conference on Statistics in Industry and Technology, June IS-
IS, 1994.
Goldman, S. L., ed.. Benchmarking Agility, lacocca Institute, Lehigh University, Bethlehem, PA18015
Hilton, P. D. and Gill, G. K. (1994) "Achieving Agility: Lessons from the Leaders,"
Manufacturing Review!
,
7, 172-179.
Hoerl, R. W., Hooper, J. H., Jacobs, P. J., and Lucas, J. M. (1993) "Skills for Industrial
Statisticians to Survive and Prosper in the Emerging Quality Environment," The American
Statistician, 47 280-292.
Hu, A. (1994) "Run-by-Run Control of Flexible Manufacturing Processes: A Bayesian
Approach to Combining SPC and Feedback Control," presented at the Spring Research
Conference on Statistics in Industry and Technology, June 13-15, 1994.
Jain, S. (1994) "Manufacturing Validation: A Key Enabler for Agile Manufacturing,"
presentation at ORSA/TIMS Detroit Conference, October, 1994.
Kacker, R. N. (1985) "Off-Line Quality Control, Parameter Design, and the Taguchi Method,"
Joicmal ofQuality Technology, 17, 176-209.
Karr, A. F. (1994) Statistics and Materials Science, Technical Report #4, National Institute of
Statistical Sciences, P.O. Box 14162, Research Triangle Park, NC 27709
Konig, W. and Knop, M. (1992) "Methods for Predicting Process Behaviour in Grinding,"
Robotics & Computer-Integrated Manufacturing, 9, 395-406.
McDonald, G. C. (1993) personal communication.
McKay, M. D., Conover, W. J., and Beckkman, R. J. (1979) "A Comparison of Three Methods
for Selecting Values of Input Variables in the Analysis of Output From a Computer Code,"
Technometrics, 21, 239-245.
Meyyappan, M. (1994) Computational Modeling in Semiconductor Processing, Artech House,
685 Canton St., Norwood, MA 02062
Montgomery, D. C., Keats, J. B., Runger, G. C., and Messina, W. S. (1994) "Integrating
Statistical Process Control and Engineering Process Control," Journal of Quality Technology,
26, 79-87.
Morris, M. D. (1994) "Some Recent Developments in the Design and Analysis of Computer
Experiments and an Input Screening Example," NIST seminar presentation, Nov. 16.
Morris, M. D., Mitchell, T. J., and Ylvisaker, D. (1993) "Bayesian Design and Analysis of
Computer Experiments: Use of Derivatives in Surface Prediction," Technometrics, 35 243-255.
41

'M
iff;: »J?'
Wt
V i* ,ti#-
:
M ,.,
,, a
'SP r
Y'. i<|l,
’
iitii'>)<r! i-'- r^' /^JO^O
*-'l/r^' j ). r
.4I«V
!t*•"
..
i*i! 'y.’ .^i*x?4"
l‘V<‘-’,» 4®?|‘W- ' -i it't''':'. t j 4 -'
fc'='+*
Vtt'‘\ ' -.-
£^.,v3i
S*ir: :r
m..-
V< .iii<v!rtr^ r- 'ix • ;.-(*4'.: ' >41 A / A T
-f ':; Ci \" -Oir-ot ..V«^"i*>Y ru
^ '.i, v'J
Morton, O. (1994) "Manufacturing Technology," The Economist, March 5, 1994, 3-18.
Nagel, R. N., and Dove, R. (1991) 21st Century Manufacturing Enterprise Strategy, lacocca
Institute, Lehigh University, Bethlehem, PA 18015
Nair, V. N. (1992) "Taguchi's Parameter Design: A Panel Discussion," Technometrics, 34, 127-
161.
Peters, T., and Waterman, R. H., Jr., (1982) In Search of Excellence . Harper and Row.
Quesenberry, C. P. (1991) "SPC Q Charts for Start-Up Processes and Short or Long Runs,"
Journal ofQuality Technology, 23, 213-224.
Rudder, F., Guthrie, W., Filliben, J. (1992) "Methodology for Characterizing Temperature-
Related Positioning Errors of a Vertical Axis Milling Machine," NIST internal report.
Sacks, J. Welch, W. J., Mitchell, T. J., and Wynn, H. P. (1989) "Design and Analysis of
Computer Experiments" (with discussion). Statistical Science, 4, 409-435.
Szekely, J. and Trapaga, G. (1994) "Some Perspectives on the Mathematical Modeling of
Materials Processing Operations," Modelling and Simulation in Materials Science and
Engineering, 2, 809-828.
TEAM Program Office (1994) "TEAM Strategic Plan, Books 1 and 2," Oak Ridge National
Laboratory.
Vander Wiel, S. A., Tucker, W. T., Faltin, F. W., and Doganaksoy, N. (1992) "Algorithmic
Statistical Process Control: Concepts and an Application," Technometrics, 34, 286-297.
Welch, W. J., Buck, R. J., Sacks, J., Wynn, Y. P., Mitchell, T. J., and Morris, M. D. (1992)
"Screening, Predicting, and Computer Experiments," Technometrics, 34, 15-25.
Wong, W. T., Pan, J. Y-C., and Plummer, J. D. (1992) "Virtual Factory-Based Environment for
Semiconductor Device Development," Proceedings of 1992 lEEE/SEMT International
Semiconductor Manufacturing Science Symposium, 117-123.
Zhang, C. and Wang, H. (1993) "The Discrete Tolerance Optimization Problem,"
Manufacturing Review, 6, 60-71.
42

i;
‘'i
i:
I|!
ij
1 .
I!
I'
i!
i:
l
I
i!
'l:;
il
'1
l;:
:i^
i'
1: