User Manual TDS7404, TDS7254 & TDS7154 Digital ...
396
User Manual TDS7404, TDS7254 & TDS7154 Digital Phosphor Oscilloscopes 071-0879-03 This document supports firmware version 2.0.0 and above. www.tektronix.com
-
Upload
khangminh22 -
Category
Documents
-
view
3 -
download
0
Transcript of User Manual TDS7404, TDS7254 & TDS7154 Digital ...
User Manual
TDS7404, TDS7254 & TDS7154
Digital Phosphor Oscilloscopes
071-0879-03
This document supports firmware version 2.0.0and above.
www.tektronix.com
Copyright © Tektronix, Inc. All rights reserved.
Tektronix products are covered by U.S. and foreign patents, issued and pending. Information in this publication supercedes
that in all previously published material. Specifications and price change privileges reserved.
Tektronix, Inc., P.O. Box 500, Beaverton, OR 97077-0001
TEKTRONIX and TEK are registered trademarks of Tektronix, Inc.
TekConnect, TekVISA, FastFrame, and VocalLink are registered trademarks of Tektronix, Inc.
WARRANTY
Tektronix warrants that the products that it manufactures and sells will be free from defects in materials and
workmanship for a period of one (1) year from the date of shipment. If this product proves defective during its
warranty period, Tektronix, at its option, will either repair the defective product without charge for parts and labor,
or provide a replacement in exchange for the defective product.
This warranty applies only to products returned to the designated Tektronix depot or the Tektronix authorized
representative from which the product was originally purchased. For products returned to other locations,
Customer will be assessed an applicable service charge. The preceding limitation shall not apply within the
European Economic Area, where products may be returned for warranty service to the nearest designated service
depot regardless of the place of purchase.
In order to obtain service under this warranty, Customer must provide the applicable office of Tektronix or its
authorized representative with notice of the defect before the expiration of the warranty period and make suitable
arrangements for the performance of service. Customer shall be responsible for packaging and shipping the
defective product to the service center designated by Tektronix or its representative, with shipping charges
prepaid. Tektronix or its representative shall pay for the return of the product to Customer. Customer shall be
responsible for paying any associated taxes or duties.
This warranty shall not apply to any defect, failure or damage caused by improper use or improper or inadequate
maintenance and care. Tektronix shall not be obligated to furnish service under this warranty:
a) to repair damage resulting from attempts by personnel other than Tektronix representatives to install, repair or
service the product;
b) to repair damage resulting from improper use or connection to incompatible equipment;
c) to repair any damage or malfunction caused by the use of non-Tektronix supplies or consumables;
d) to repair a product that has been modified or integrated with other products when the effect of such
modification or integration increases the time or difficulty of servicing the product; or
e) to repair damage or malfunction resulting from failure to perform user maintenance and cleaning at the
frequency and as prescribed in the user manual (if applicable).
THE ABOVE WARRANTIES ARE GIVEN BY TEKTRONIX WITH RESPECT TO THIS PRODUCT IN LIEU OF
ANY OTHER WARRANTIES, EXPRESS OR IMPLIED. TEKTRONIX AND ITS VENDORS DISCLAIM ANY
IMPLIED WARRANTIES OF MERCHANTABILITY OR FITNESS FOR A PARTICULAR PURPOSE. TEKTRONIX’
RESPONSIBILITY TO REPAIR OR REPLACE DEFECTIVE PRODUCTS IS THE SOLE AND EXCLUSIVE
REMEDY PROVIDED TO THE CUSTOMER FOR BREACH OF THIS WARRANTY. TEKTRONIX AND ITS
VENDORS WILL NOT BE LIABLE FOR ANY INDIRECT, SPECIAL, INCIDENTAL, OR CONSEQUENTIAL
DAMAGES IRRESPECTIVE OF WHETHER TEKTRONIX OR THE VENDOR HAS ADVANCE NOTICE OF THE
POSSIBILITY OF SUCH DAMAGES.

TDS7404, TDS7254 & TDS7154 Digital Phosphor Oscilloscopes User Manual i
Table of Contents
General Safety Summary xi. . . . . . . . . . . . . . . . . . . . . . . . . . . . . . . . . . .
Preface xiii. . . . . . . . . . . . . . . . . . . . . . . . . . . . . . . . . . . . . . . . . . . . . . . . . . .About This Manual xiii. . . . . . . . . . . . . . . . . . . . . . . . . . . . . . . . . . . . . . . . . . . . . . .Related Manuals and Online Documents xiv. . . . . . . . . . . . . . . . . . . . . . . . . . . . . .Contacting Tektronix xv. . . . . . . . . . . . . . . . . . . . . . . . . . . . . . . . . . . . . . . . . . . . .
Getting Started
Product Description 1--1. . . . . . . . . . . . . . . . . . . . . . . . . . . . . . . . . . . . . . . .Models 1--1. . . . . . . . . . . . . . . . . . . . . . . . . . . . . . . . . . . . . . . . . . . . . . . . . . . . . . . .Key Features 1--1. . . . . . . . . . . . . . . . . . . . . . . . . . . . . . . . . . . . . . . . . . . . . . . . . . . .Product Software 1--2. . . . . . . . . . . . . . . . . . . . . . . . . . . . . . . . . . . . . . . . . . . . . . . .Software Upgrade 1--3. . . . . . . . . . . . . . . . . . . . . . . . . . . . . . . . . . . . . . . . . . . . . . . .
Installation 1--5. . . . . . . . . . . . . . . . . . . . . . . . . . . . . . . . . . . . . . . . . . . . . . .Unpacking 1--5. . . . . . . . . . . . . . . . . . . . . . . . . . . . . . . . . . . . . . . . . . . . . . . . . . . . . .Checking the Environment Requirements 1--6. . . . . . . . . . . . . . . . . . . . . . . . . . . . .Connecting Peripherals 1--6. . . . . . . . . . . . . . . . . . . . . . . . . . . . . . . . . . . . . . . . . . . .Powering On the Oscilloscope 1--8. . . . . . . . . . . . . . . . . . . . . . . . . . . . . . . . . . . . . .Shutting Down the Oscilloscope 1--9. . . . . . . . . . . . . . . . . . . . . . . . . . . . . . . . . . . .Creating an Emergency Startup Disk 1--10. . . . . . . . . . . . . . . . . . . . . . . . . . . . . . . . .Backing Up User Files 1--10. . . . . . . . . . . . . . . . . . . . . . . . . . . . . . . . . . . . . . . . . . . .Installing Software 1--11. . . . . . . . . . . . . . . . . . . . . . . . . . . . . . . . . . . . . . . . . . . . . . .Enabling Your LAN and Connecting to a Network 1--13. . . . . . . . . . . . . . . . . . . . . .Setting up a Dual Display 1--14. . . . . . . . . . . . . . . . . . . . . . . . . . . . . . . . . . . . . . . . . .
Incoming Inspection 1--17. . . . . . . . . . . . . . . . . . . . . . . . . . . . . . . . . . . . . . .Assemble Equipment 1--17. . . . . . . . . . . . . . . . . . . . . . . . . . . . . . . . . . . . . . . . . . . . .Self Tests 1--17. . . . . . . . . . . . . . . . . . . . . . . . . . . . . . . . . . . . . . . . . . . . . . . . . . . . . . .Functional Tests 1--19. . . . . . . . . . . . . . . . . . . . . . . . . . . . . . . . . . . . . . . . . . . . . . . . .Perform the Extended Diagnostics 1--27. . . . . . . . . . . . . . . . . . . . . . . . . . . . . . . . . . .
Accessories & Options 1--29. . . . . . . . . . . . . . . . . . . . . . . . . . . . . . . . . . . . . .Options 1--29. . . . . . . . . . . . . . . . . . . . . . . . . . . . . . . . . . . . . . . . . . . . . . . . . . . . . . . .Accessories 1--31. . . . . . . . . . . . . . . . . . . . . . . . . . . . . . . . . . . . . . . . . . . . . . . . . . . . .
Operating Basics
Operational Maps 2--1. . . . . . . . . . . . . . . . . . . . . . . . . . . . . . . . . . . . . . . . .
Documentation Map 2--2. . . . . . . . . . . . . . . . . . . . . . . . . . . . . . . . . . . . . . .
System Overview Maps 2--3. . . . . . . . . . . . . . . . . . . . . . . . . . . . . . . . . . . . .Functional Model Map 2--3. . . . . . . . . . . . . . . . . . . . . . . . . . . . . . . . . . . . . . . . . . . .Process Overview Map 2--5. . . . . . . . . . . . . . . . . . . . . . . . . . . . . . . . . . . . . . . . . . . .
User Interface Map -- Complete Control and Display 2--6. . . . . . . . . . . .
Front Panel I/O Map 2--7. . . . . . . . . . . . . . . . . . . . . . . . . . . . . . . . . . . . . . .
Display Map -- Single Graticule 2--8. . . . . . . . . . . . . . . . . . . . . . . . . . . . . .
Front-Panel Map -- Quick Access to Most Often Used Features 2--9. . . .
Table of Contents
ii TDS7404, TDS7254 & TDS7154 Digital Phosphor Oscilloscopes User Manual
Rear Panel I/O Map 2--10. . . . . . . . . . . . . . . . . . . . . . . . . . . . . . . . . . . . . . .
Reference
Overview 3--1. . . . . . . . . . . . . . . . . . . . . . . . . . . . . . . . . . . . . . . . . . . . . . . . .
Acquiring Waveforms 3--3. . . . . . . . . . . . . . . . . . . . . . . . . . . . . . . . . . . . . .Signal Connection and Conditioning 3--4. . . . . . . . . . . . . . . . . . . . . . . . . . . . . . . . .
Connecting and Conditioning Your Signals 3--5. . . . . . . . . . . . . . . . . . . . . . . .To Set Up Signal Input 3--8. . . . . . . . . . . . . . . . . . . . . . . . . . . . . . . . . . . . . . . .To Autoset the Oscilloscope 3--11. . . . . . . . . . . . . . . . . . . . . . . . . . . . . . . . . . . .To Reset the Oscilloscope 3--13. . . . . . . . . . . . . . . . . . . . . . . . . . . . . . . . . . . . . .To Get More Help 3--13. . . . . . . . . . . . . . . . . . . . . . . . . . . . . . . . . . . . . . . . . . . .Input Conditioning Background 3--14. . . . . . . . . . . . . . . . . . . . . . . . . . . . . . . . .
Setting Acquisition Controls 3--20. . . . . . . . . . . . . . . . . . . . . . . . . . . . . . . . . . . . . . .Using the Acquisition Controls 3--21. . . . . . . . . . . . . . . . . . . . . . . . . . . . . . . . . .To Set Acquisition Modes 3--28. . . . . . . . . . . . . . . . . . . . . . . . . . . . . . . . . . . . . .To Start and Stop Acquisition 3--30. . . . . . . . . . . . . . . . . . . . . . . . . . . . . . . . . . .To Set Roll Mode 3--31. . . . . . . . . . . . . . . . . . . . . . . . . . . . . . . . . . . . . . . . . . . .
Acquisition Control Background 3--32. . . . . . . . . . . . . . . . . . . . . . . . . . . . . . . . . . . .Acquisition Hardware 3--32. . . . . . . . . . . . . . . . . . . . . . . . . . . . . . . . . . . . . . . . .Sampling Process 3--33. . . . . . . . . . . . . . . . . . . . . . . . . . . . . . . . . . . . . . . . . . . . .Sampling Modes 3--33. . . . . . . . . . . . . . . . . . . . . . . . . . . . . . . . . . . . . . . . . . . . .Waveform Record 3--34. . . . . . . . . . . . . . . . . . . . . . . . . . . . . . . . . . . . . . . . . . . .Real-Time Sampling 3--35. . . . . . . . . . . . . . . . . . . . . . . . . . . . . . . . . . . . . . . . . .Equivalent-Time Sampling 3--35. . . . . . . . . . . . . . . . . . . . . . . . . . . . . . . . . . . . .Interpolation 3--37. . . . . . . . . . . . . . . . . . . . . . . . . . . . . . . . . . . . . . . . . . . . . . . .Interleaving 3--37. . . . . . . . . . . . . . . . . . . . . . . . . . . . . . . . . . . . . . . . . . . . . . . . .
Using Fast Acquisition Mode 3--38. . . . . . . . . . . . . . . . . . . . . . . . . . . . . . . . . . . . . . .Using Fast Acquisitions 3--39. . . . . . . . . . . . . . . . . . . . . . . . . . . . . . . . . . . . . . . .To Turn Fast Acquisitions On and Off 3--41. . . . . . . . . . . . . . . . . . . . . . . . . . . .To Set Display Format 3--44. . . . . . . . . . . . . . . . . . . . . . . . . . . . . . . . . . . . . . . . .
Using FastFrame 3--45. . . . . . . . . . . . . . . . . . . . . . . . . . . . . . . . . . . . . . . . . . . . . . . . .Using FastFrame Acquisitions 3--46. . . . . . . . . . . . . . . . . . . . . . . . . . . . . . . . . .To Set FastFrame Mode 3--47. . . . . . . . . . . . . . . . . . . . . . . . . . . . . . . . . . . . . . .Time Stamping Frames 3--48. . . . . . . . . . . . . . . . . . . . . . . . . . . . . . . . . . . . . . . .
Triggering 3--51. . . . . . . . . . . . . . . . . . . . . . . . . . . . . . . . . . . . . . . . . . . . . . . .Triggering Concepts 3--53. . . . . . . . . . . . . . . . . . . . . . . . . . . . . . . . . . . . . . . . . . . . . .
The Trigger Event 3--53. . . . . . . . . . . . . . . . . . . . . . . . . . . . . . . . . . . . . . . . . . . .Trigger Sources 3--53. . . . . . . . . . . . . . . . . . . . . . . . . . . . . . . . . . . . . . . . . . . . . .Trigger Types 3--54. . . . . . . . . . . . . . . . . . . . . . . . . . . . . . . . . . . . . . . . . . . . . . . .Trigger Modes 3--54. . . . . . . . . . . . . . . . . . . . . . . . . . . . . . . . . . . . . . . . . . . . . . .Trigger Holdoff 3--55. . . . . . . . . . . . . . . . . . . . . . . . . . . . . . . . . . . . . . . . . . . . . .Trigger Coupling 3--56. . . . . . . . . . . . . . . . . . . . . . . . . . . . . . . . . . . . . . . . . . . . .Horizontal Position 3--56. . . . . . . . . . . . . . . . . . . . . . . . . . . . . . . . . . . . . . . . . . .Slope and Level 3--56. . . . . . . . . . . . . . . . . . . . . . . . . . . . . . . . . . . . . . . . . . . . . .Delayed Trigger System 3--57. . . . . . . . . . . . . . . . . . . . . . . . . . . . . . . . . . . . . . .
Triggering from the Front Panel 3--57. . . . . . . . . . . . . . . . . . . . . . . . . . . . . . . . . . . . .Access Procedures 3--57. . . . . . . . . . . . . . . . . . . . . . . . . . . . . . . . . . . . . . . . . . . .To Check Trigger Status 3--61. . . . . . . . . . . . . . . . . . . . . . . . . . . . . . . . . . . . . . .
Additional Trigger Parameters 3--63. . . . . . . . . . . . . . . . . . . . . . . . . . . . . . . . . . . . . .Advanced Triggering 3--67. . . . . . . . . . . . . . . . . . . . . . . . . . . . . . . . . . . . . . . . . . . . .
Table of Contents
TDS7404, TDS7254 & TDS7154 Digital Phosphor Oscilloscopes User Manual iii
To Trigger on a Glitch 3--72. . . . . . . . . . . . . . . . . . . . . . . . . . . . . . . . . . . . . . . . .To Trigger on a Runt Pulse 3--74. . . . . . . . . . . . . . . . . . . . . . . . . . . . . . . . . . . . .Trigger Based on Pulse Width 3--77. . . . . . . . . . . . . . . . . . . . . . . . . . . . . . . . . . .To Trigger Based on Transition Time 3--79. . . . . . . . . . . . . . . . . . . . . . . . . . . . .Trigger Based on Pulse Timeout 3--82. . . . . . . . . . . . . . . . . . . . . . . . . . . . . . . . .Trigger on a Pattern 3--84. . . . . . . . . . . . . . . . . . . . . . . . . . . . . . . . . . . . . . . . . . .To Trigger on a State 3--87. . . . . . . . . . . . . . . . . . . . . . . . . . . . . . . . . . . . . . . . . .To Trigger on Setup/Hold Time Violations 3--88. . . . . . . . . . . . . . . . . . . . . . . . .
Sequential Triggering 3--92. . . . . . . . . . . . . . . . . . . . . . . . . . . . . . . . . . . . . . . . . . . . .Using Sequential Triggering 3--92. . . . . . . . . . . . . . . . . . . . . . . . . . . . . . . . . . . .To Trigger on a Sequence 3--96. . . . . . . . . . . . . . . . . . . . . . . . . . . . . . . . . . . . . .
Comm Triggering (Option SM Only) 3--99. . . . . . . . . . . . . . . . . . . . . . . . . . . . . . . . .Serial Pattern Triggering (Option ST Only) 3--99. . . . . . . . . . . . . . . . . . . . . . . . . . . .
Displaying Waveforms 3--101. . . . . . . . . . . . . . . . . . . . . . . . . . . . . . . . . . . . . .Using the Waveform Display 3--102. . . . . . . . . . . . . . . . . . . . . . . . . . . . . . . . . . . . . . .
Using the Display 3--103. . . . . . . . . . . . . . . . . . . . . . . . . . . . . . . . . . . . . . . . . . . .To Display Waveforms in the Main Graticule 3--107. . . . . . . . . . . . . . . . . . . . . .
Setting Zoom Controls 3--109. . . . . . . . . . . . . . . . . . . . . . . . . . . . . . . . . . . . . . . . . . . .Using with Waveforms 3--109. . . . . . . . . . . . . . . . . . . . . . . . . . . . . . . . . . . . . . . .To Zoom Waveforms 3--109. . . . . . . . . . . . . . . . . . . . . . . . . . . . . . . . . . . . . . . . . .
Customizing the Display 3--114. . . . . . . . . . . . . . . . . . . . . . . . . . . . . . . . . . . . . . . . . .Using Display Controls 3--114. . . . . . . . . . . . . . . . . . . . . . . . . . . . . . . . . . . . . . . .Set Display Styles 3--118. . . . . . . . . . . . . . . . . . . . . . . . . . . . . . . . . . . . . . . . . . . .Customize Graticule and Waveforms 3--120. . . . . . . . . . . . . . . . . . . . . . . . . . . . .
Measuring Waveforms 3--123. . . . . . . . . . . . . . . . . . . . . . . . . . . . . . . . . . . . .Taking Automatic Measurements 3--124. . . . . . . . . . . . . . . . . . . . . . . . . . . . . . . . . . . .
Using Automatic Measurements 3--125. . . . . . . . . . . . . . . . . . . . . . . . . . . . . . . . .To Take Automatic Measurements 3--128. . . . . . . . . . . . . . . . . . . . . . . . . . . . . . .To Localize a Measurement 3--131. . . . . . . . . . . . . . . . . . . . . . . . . . . . . . . . . . . .
Taking Cursor Measurements 3--133. . . . . . . . . . . . . . . . . . . . . . . . . . . . . . . . . . . . . . .Using Cursors 3--134. . . . . . . . . . . . . . . . . . . . . . . . . . . . . . . . . . . . . . . . . . . . . . .To Set the Cursor Sources 3--137. . . . . . . . . . . . . . . . . . . . . . . . . . . . . . . . . . . . . .
Taking Histograms 3--139. . . . . . . . . . . . . . . . . . . . . . . . . . . . . . . . . . . . . . . . . . . . . . .Using Histograms 3--140. . . . . . . . . . . . . . . . . . . . . . . . . . . . . . . . . . . . . . . . . . . .To Start and Reset Histogram Counting 3--141. . . . . . . . . . . . . . . . . . . . . . . . . . .Histogram Measurements 3--142. . . . . . . . . . . . . . . . . . . . . . . . . . . . . . . . . . . . . .
Optimizing Measurement Accuracy 3--142. . . . . . . . . . . . . . . . . . . . . . . . . . . . . . . . . .To Compensate the Oscilloscope 3--143. . . . . . . . . . . . . . . . . . . . . . . . . . . . . . . .To Connect the Probe Calibration Fixture 3--144. . . . . . . . . . . . . . . . . . . . . . . . .To Calibrate Probes 3--147. . . . . . . . . . . . . . . . . . . . . . . . . . . . . . . . . . . . . . . . . . .To Compensate Passive Probes 3--149. . . . . . . . . . . . . . . . . . . . . . . . . . . . . . . . . .To Deskew Channels 3--150. . . . . . . . . . . . . . . . . . . . . . . . . . . . . . . . . . . . . . . . . .
Serial Mask Testing 3--153. . . . . . . . . . . . . . . . . . . . . . . . . . . . . . . . . . . . . . . . . . . . . .
Creating and Using Math Waveforms 3--155. . . . . . . . . . . . . . . . . . . . . . . . .Defining Math Waveforms 3--156. . . . . . . . . . . . . . . . . . . . . . . . . . . . . . . . . . . . . . . . .
Using Math 3--157. . . . . . . . . . . . . . . . . . . . . . . . . . . . . . . . . . . . . . . . . . . . . . . . .To Define a Math Waveform 3--162. . . . . . . . . . . . . . . . . . . . . . . . . . . . . . . . . . . .
Operations on Math Waveforms 3--165. . . . . . . . . . . . . . . . . . . . . . . . . . . . . . . . . . . . .Using Math Waveforms 3--166. . . . . . . . . . . . . . . . . . . . . . . . . . . . . . . . . . . . . . . .To Use Math Waveforms 3--166. . . . . . . . . . . . . . . . . . . . . . . . . . . . . . . . . . . . . . .
Defining Spectral Math Waveforms 3--170. . . . . . . . . . . . . . . . . . . . . . . . . . . . . . . . . .
Table of Contents
iv TDS7404, TDS7254 & TDS7154 Digital Phosphor Oscilloscopes User Manual
Using Spectral Math Controls 3--171. . . . . . . . . . . . . . . . . . . . . . . . . . . . . . . . . . .Recognizing Aliasing 3--192. . . . . . . . . . . . . . . . . . . . . . . . . . . . . . . . . . . . . . . . .To Select a Predefined Spectral Math Waveform 3--194. . . . . . . . . . . . . . . . . . . .To Define a Spectral Math Waveform 3--195. . . . . . . . . . . . . . . . . . . . . . . . . . . .
Data Input/Output 3--207. . . . . . . . . . . . . . . . . . . . . . . . . . . . . . . . . . . . . . . . .Saving and Recalling a Setup 3--207. . . . . . . . . . . . . . . . . . . . . . . . . . . . . . . . . . . . . . .
To Save Your Setup 3--210. . . . . . . . . . . . . . . . . . . . . . . . . . . . . . . . . . . . . . . . . . .To Recall Your Setup 3--213. . . . . . . . . . . . . . . . . . . . . . . . . . . . . . . . . . . . . . . . . .
Saving and Recalling Waveforms 3--215. . . . . . . . . . . . . . . . . . . . . . . . . . . . . . . . . . .To Save Your Waveform 3--216. . . . . . . . . . . . . . . . . . . . . . . . . . . . . . . . . . . . . . .To Recall Your Waveform 3--220. . . . . . . . . . . . . . . . . . . . . . . . . . . . . . . . . . . . . .To Clear References 3--222. . . . . . . . . . . . . . . . . . . . . . . . . . . . . . . . . . . . . . . . . .
Exporting and Copying Waveforms 3--225. . . . . . . . . . . . . . . . . . . . . . . . . . . . . . . . . .To Export Your Waveform 3--226. . . . . . . . . . . . . . . . . . . . . . . . . . . . . . . . . . . . .To Use an Exported Waveform 3--234. . . . . . . . . . . . . . . . . . . . . . . . . . . . . . . . . .To Copy Your Waveform 3--236. . . . . . . . . . . . . . . . . . . . . . . . . . . . . . . . . . . . . .
Printing Waveforms 3--240. . . . . . . . . . . . . . . . . . . . . . . . . . . . . . . . . . . . . . . . . . . . . .To Print from Front Panel 3--240. . . . . . . . . . . . . . . . . . . . . . . . . . . . . . . . . . . . . .To Print from Menu Bar 3--240. . . . . . . . . . . . . . . . . . . . . . . . . . . . . . . . . . . . . . .To Set Up the Page 3--240. . . . . . . . . . . . . . . . . . . . . . . . . . . . . . . . . . . . . . . . . . .To Preview the Page 3--242. . . . . . . . . . . . . . . . . . . . . . . . . . . . . . . . . . . . . . . . . .To Print Using Print Screen 3--243. . . . . . . . . . . . . . . . . . . . . . . . . . . . . . . . . . . . .To Date/Time Stamp Hardcopies 3--244. . . . . . . . . . . . . . . . . . . . . . . . . . . . . . . .
Remote Communication 3--245. . . . . . . . . . . . . . . . . . . . . . . . . . . . . . . . . . . . . . . . . . .
Accessing Online Help 3--247. . . . . . . . . . . . . . . . . . . . . . . . . . . . . . . . . . . . . .How to Use Online Help 3--247. . . . . . . . . . . . . . . . . . . . . . . . . . . . . . . . . . . . . . . . . .
Appendices
Appendix A: Specifications A--1. . . . . . . . . . . . . . . . . . . . . . . . . . . . . . . . . .Product and Feature Description A--1. . . . . . . . . . . . . . . . . . . . . . . . . . . . . . . . . . . .
Acquisition Features A--2. . . . . . . . . . . . . . . . . . . . . . . . . . . . . . . . . . . . . . . . . .Signal Processing Features A--2. . . . . . . . . . . . . . . . . . . . . . . . . . . . . . . . . . . . .Display Features A--3. . . . . . . . . . . . . . . . . . . . . . . . . . . . . . . . . . . . . . . . . . . . .Measurement Features A--3. . . . . . . . . . . . . . . . . . . . . . . . . . . . . . . . . . . . . . . . .Trigger Features A--3. . . . . . . . . . . . . . . . . . . . . . . . . . . . . . . . . . . . . . . . . . . . . .Convenience Features A--4. . . . . . . . . . . . . . . . . . . . . . . . . . . . . . . . . . . . . . . . .
Specification Tables A--5. . . . . . . . . . . . . . . . . . . . . . . . . . . . . . . . . . . . . . . . . . . . . .
Appendix B: Automatic Measurements Supported B--1. . . . . . . . . . . . . .Levels Used in Taking Amplitude, Timing, and Area Measurements B--4. . . . . . . .Levels Used in Taking Eye Measurements (Option SM Only) B--6. . . . . . . . . . . . .
P Values B--6. . . . . . . . . . . . . . . . . . . . . . . . . . . . . . . . . . . . . . . . . . . . . . . . . . . .T1 Values B--7. . . . . . . . . . . . . . . . . . . . . . . . . . . . . . . . . . . . . . . . . . . . . . . . . . .T2 Values B--7. . . . . . . . . . . . . . . . . . . . . . . . . . . . . . . . . . . . . . . . . . . . . . . . . . .DCD Values B--7. . . . . . . . . . . . . . . . . . . . . . . . . . . . . . . . . . . . . . . . . . . . . . . . .
Appendix C: Cleaning C--1. . . . . . . . . . . . . . . . . . . . . . . . . . . . . . . . . . . . . .Exterior Cleaning C--1. . . . . . . . . . . . . . . . . . . . . . . . . . . . . . . . . . . . . . . . . . . . . . . .Flat Panel Display Cleaning C--1. . . . . . . . . . . . . . . . . . . . . . . . . . . . . . . . . . . . . . . .
Appendix D: Menu Bar Commands D--1. . . . . . . . . . . . . . . . . . . . . . . . . .File Commands D--1. . . . . . . . . . . . . . . . . . . . . . . . . . . . . . . . . . . . . . . . . . . . . . . . . .Edit Commands D--3. . . . . . . . . . . . . . . . . . . . . . . . . . . . . . . . . . . . . . . . . . . . . . . . .
Table of Contents
TDS7404, TDS7254 & TDS7154 Digital Phosphor Oscilloscopes User Manual v
Vertical Commands D--3. . . . . . . . . . . . . . . . . . . . . . . . . . . . . . . . . . . . . . . . . . . . . .Horizontal and Acquisition Commands D--4. . . . . . . . . . . . . . . . . . . . . . . . . . . . . . .Trigger Commands D--5. . . . . . . . . . . . . . . . . . . . . . . . . . . . . . . . . . . . . . . . . . . . . . .Display Commands D--6. . . . . . . . . . . . . . . . . . . . . . . . . . . . . . . . . . . . . . . . . . . . . . .Cursors Commands D--8. . . . . . . . . . . . . . . . . . . . . . . . . . . . . . . . . . . . . . . . . . . . . . .Measure Commands D--9. . . . . . . . . . . . . . . . . . . . . . . . . . . . . . . . . . . . . . . . . . . . . .Masks Commands (Option SM Only) D--10. . . . . . . . . . . . . . . . . . . . . . . . . . . . . . . .Math Commands D--11. . . . . . . . . . . . . . . . . . . . . . . . . . . . . . . . . . . . . . . . . . . . . . . . .Utilities Commands D--11. . . . . . . . . . . . . . . . . . . . . . . . . . . . . . . . . . . . . . . . . . . . . .Help Commands D--12. . . . . . . . . . . . . . . . . . . . . . . . . . . . . . . . . . . . . . . . . . . . . . . . .
Glossary
Index
Table of Contents
vi TDS7404, TDS7254 & TDS7154 Digital Phosphor Oscilloscopes User Manual
List of Figures
Figure 1--1: Locations of peripheral connectors on rear panel 1--7. . . . .
Figure 1--2: Line fuse and power cord connector locations,
rear panel 1--8. . . . . . . . . . . . . . . . . . . . . . . . . . . . . . . . . . . . . . . . . . . . .
Figure 1--3: On/Standby switch location 1--9. . . . . . . . . . . . . . . . . . . . . . .
Figure 1--4: Drag area for Windows task bar 1--16. . . . . . . . . . . . . . . . . . .
Figure 1--5: Universal test hookup for functional
tests -- CH 1 shown 1--20. . . . . . . . . . . . . . . . . . . . . . . . . . . . . . . . . . . . .
Figure 1--6: Channel button location 1--20. . . . . . . . . . . . . . . . . . . . . . . . . .
Figure 1--7: Setup for time base test 1--22. . . . . . . . . . . . . . . . . . . . . . . . . . .
Figure 1--8: Setup for trigger test 1--24. . . . . . . . . . . . . . . . . . . . . . . . . . . . .
Figure 1--9: Setup for the file system test 1--26. . . . . . . . . . . . . . . . . . . . . . .
Figure 3--1: Input and Acquisition Systems and Controls 3--4. . . . . . . . .
Figure 3--2: Setting vertical range and position of input channels 3--16. .
Figure 3--3: Varying offset moves the vertical acquisition
window on the waveform 3--17. . . . . . . . . . . . . . . . . . . . . . . . . . . . . . . .
Figure 3--4: Horizontal Acquisition window definition 3--18. . . . . . . . . . .
Figure 3--5: Common trigger, record length, and acquisition
rate for all channels 3--20. . . . . . . . . . . . . . . . . . . . . . . . . . . . . . . . . . . . .
Figure 3--6: Roll mode 3--26. . . . . . . . . . . . . . . . . . . . . . . . . . . . . . . . . . . . . .
Figure 3--7: Aliasing 3--27. . . . . . . . . . . . . . . . . . . . . . . . . . . . . . . . . . . . . . . .
Figure 3--8: Digitizer configuration 3--33. . . . . . . . . . . . . . . . . . . . . . . . . . .
Figure 3--9: Digital acquisition — sampling and digitizing 3--33. . . . . . . .
Figure 3--10: The waveform record and its defining parameters 3--34. . .
Figure 3--11: Real-time sampling 3--35. . . . . . . . . . . . . . . . . . . . . . . . . . . . .
Figure 3--12: Equivalent-time sampling 3--36. . . . . . . . . . . . . . . . . . . . . . .
Figure 3--13: Normal DSO Acquisition and Display mode
versus Fast Acquisition mode 3--40. . . . . . . . . . . . . . . . . . . . . . . . . . . . .
Figure 3--14: Normal DSO and Fast Acquisition displays 3--41. . . . . . . . .
Figure 3--15: Fast Acquisition XY display 3--44. . . . . . . . . . . . . . . . . . . . . .
Figure 3--16: FastFrame 3--45. . . . . . . . . . . . . . . . . . . . . . . . . . . . . . . . . . . .
Figure 3--17: FastFrame time stamp 3--50. . . . . . . . . . . . . . . . . . . . . . . . . .
Figure 3--18: Triggered versus untriggered displays 3--53. . . . . . . . . . . . .
Figure 3--19: Triggered versus untriggered displays 3--55. . . . . . . . . . . . .
Figure 3--20: Holdoff adjustment can prevent false triggers 3--56. . . . . . .
Figure 3--21: Slope and level controls help define the trigger 3--57. . . . . .
Table of Contents
TDS7404, TDS7254 & TDS7154 Digital Phosphor Oscilloscopes User Manual vii
Figure 3--22: Example advanced trigger readout 3--67. . . . . . . . . . . . . . . .
Figure 3--23: Violation zones for Setup/Hold triggering 3--71. . . . . . . . . .
Figure 3--24: Triggering on a Setup/Hold time violation 3--91. . . . . . . . . .
Figure 3--25: Triggering with Horizontal Delay off 3--93. . . . . . . . . . . . . .
Figure 3--26: Triggering with Horizontal Delay on 3--94. . . . . . . . . . . . . .
Figure 3--27: Trigger and Horizontal Delay summary 3--95. . . . . . . . . . . .
Figure 3--28: Display elements 3--102. . . . . . . . . . . . . . . . . . . . . . . . . . . . . . .
Figure 3--29: Horizontal Position includes time to Horizontal
Reference 3--106. . . . . . . . . . . . . . . . . . . . . . . . . . . . . . . . . . . . . . . . . . . . .
Figure 3--30: Graticule, Cursor, and Automatic measurements 3--123. . . .
Figure 3--31: Annotated display 3--124. . . . . . . . . . . . . . . . . . . . . . . . . . . . . .
Figure 3--32: High/Low tracking methods 3--126. . . . . . . . . . . . . . . . . . . . . .
Figure 3--33: Reference-level calculation methods 3--127. . . . . . . . . . . . . . .
Figure 3--34: Horizontal cursors measure amplitudes 3--134. . . . . . . . . . . .
Figure 3--35: Components determining Time cursor readout
values 3--135. . . . . . . . . . . . . . . . . . . . . . . . . . . . . . . . . . . . . . . . . . . . . . . .
Figure 3--36: Horizontal histogram view and measurement data 3--139. . .
Figure 3--37: Pass/Fail mask testing 3--153. . . . . . . . . . . . . . . . . . . . . . . . . . .
Figure 3--38: Spectral analysis of an impulse 3--156. . . . . . . . . . . . . . . . . . .
Figure 3--39: Functional transformation of an acquired
waveform 3--156. . . . . . . . . . . . . . . . . . . . . . . . . . . . . . . . . . . . . . . . . . . . .
Figure 3--40: Derivative math waveform 3--160. . . . . . . . . . . . . . . . . . . . . . .
Figure 3--41: Peak-peak amplitude measurement of a derivative
waveform 3--161. . . . . . . . . . . . . . . . . . . . . . . . . . . . . . . . . . . . . . . . . . . . .
Figure 3--42: Duration and resolution control effects 3--172. . . . . . . . . . . . .
Figure 3--43: Definition of gate parameters 3--173. . . . . . . . . . . . . . . . . . . . .
Figure 3--44: Effects of frequency domain control adjustments 3--175. . . .
Figure 3--45: Effects of adjusting the reference level 3--176. . . . . . . . . . . . .
Figure 3--46: Effects of adjusting the reference level offset
control 3--177. . . . . . . . . . . . . . . . . . . . . . . . . . . . . . . . . . . . . . . . . . . . . . . .
Figure 3--47: Example of the effects of setting the phase
suppression threshold 3--179. . . . . . . . . . . . . . . . . . . . . . . . . . . . . . . . . . .
Figure 3--48: Windowing the time domain record 3--181. . . . . . . . . . . . . . .
Figure 3--49: Example of scallop loss for a Hanning window
without zero fill 3--183. . . . . . . . . . . . . . . . . . . . . . . . . . . . . . . . . . . . . . . .
Figure 3--50: Time and frequency graphs for the
Gaussian window 3--184. . . . . . . . . . . . . . . . . . . . . . . . . . . . . . . . . . . . . .
Figure 3--51: Time and frequency domain graphs for the
Rectangular window 3--185. . . . . . . . . . . . . . . . . . . . . . . . . . . . . . . . . . . .
Table of Contents
viii TDS7404, TDS7254 & TDS7154 Digital Phosphor Oscilloscopes User Manual
Figure 3--52: Time and frequency graphs of the
Hamming window 3--186. . . . . . . . . . . . . . . . . . . . . . . . . . . . . . . . . . . . . .
Figure 3--53: Time and frequency graphs for the
Hanning window 3--187. . . . . . . . . . . . . . . . . . . . . . . . . . . . . . . . . . . . . . .
Figure 3--54: Time and frequency graphs for the
Kaiser-Bessel window 3--188. . . . . . . . . . . . . . . . . . . . . . . . . . . . . . . . . . .
Figure 3--55: Time and frequency graphs of the
Blackman-Harris window 3--189. . . . . . . . . . . . . . . . . . . . . . . . . . . . . . .
Figure 3--56: Time and frequency domain graphs for the
Flattop2 window 3--190. . . . . . . . . . . . . . . . . . . . . . . . . . . . . . . . . . . . . . .
Figure 3--57: Tek Exponential window in the time and the
frequency domains 3--191. . . . . . . . . . . . . . . . . . . . . . . . . . . . . . . . . . . . .
Figure 3--58: How aliased frequencies appear in a spectral
waveform 3--193. . . . . . . . . . . . . . . . . . . . . . . . . . . . . . . . . . . . . . . . . . . . .
Figure 3--59: Auto-increment file name feature 3--209. . . . . . . . . . . . . . . . .
Figure 3--60: Print window 3--240. . . . . . . . . . . . . . . . . . . . . . . . . . . . . . . . . .
Figure 3--61: Hardcopy formats 3--241. . . . . . . . . . . . . . . . . . . . . . . . . . . . . .
Figure 3--62: Page setup window 3--242. . . . . . . . . . . . . . . . . . . . . . . . . . . . .
Figure 3--63: Print preview window 3--243. . . . . . . . . . . . . . . . . . . . . . . . . . .
Figure B--1: Levels used to determine measurements B--5. . . . . . . . . . . .
Figure B--2: Eye-diagram and optical values B--6. . . . . . . . . . . . . . . . . . .
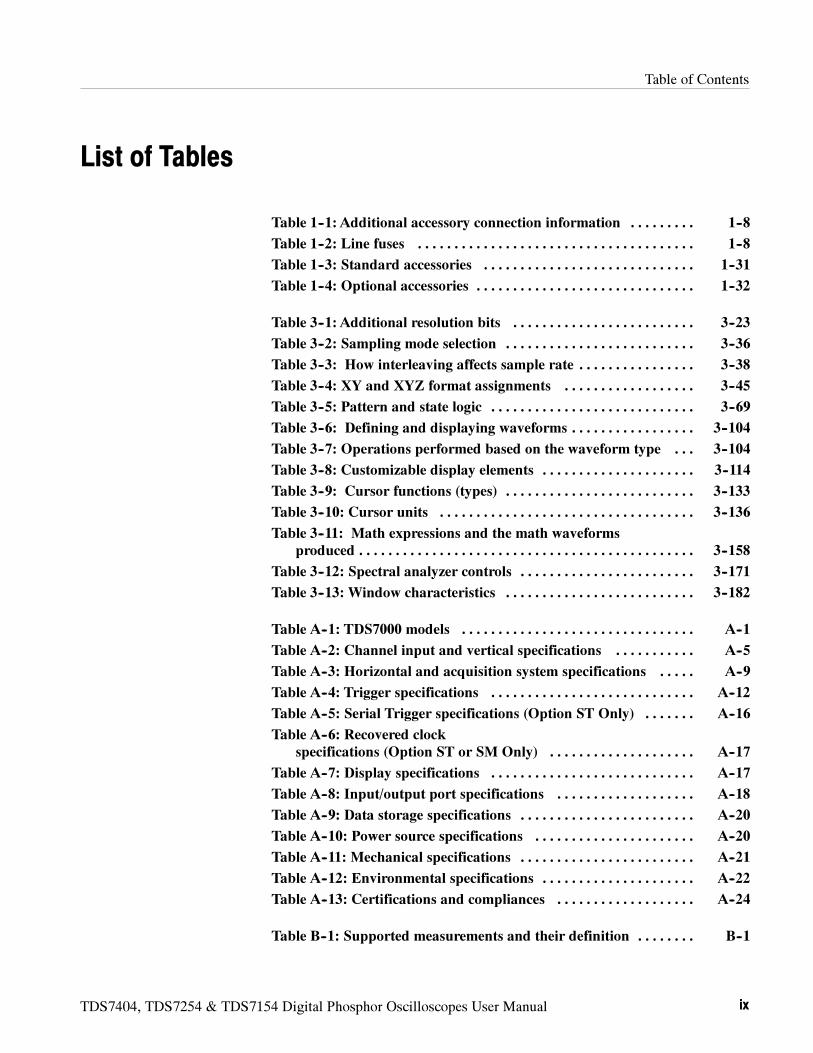
Table of Contents
TDS7404, TDS7254 & TDS7154 Digital Phosphor Oscilloscopes User Manual ix
List of Tables
Table 1--1: Additional accessory connection information 1--8. . . . . . . . .
Table 1--2: Line fuses 1--8. . . . . . . . . . . . . . . . . . . . . . . . . . . . . . . . . . . . . .
Table 1--3: Standard accessories 1--31. . . . . . . . . . . . . . . . . . . . . . . . . . . . .
Table 1--4: Optional accessories 1--32. . . . . . . . . . . . . . . . . . . . . . . . . . . . . .
Table 3--1: Additional resolution bits 3--23. . . . . . . . . . . . . . . . . . . . . . . . .
Table 3--2: Sampling mode selection 3--36. . . . . . . . . . . . . . . . . . . . . . . . . .
Table 3--3: How interleaving affects sample rate 3--38. . . . . . . . . . . . . . . .
Table 3--4: XY and XYZ format assignments 3--45. . . . . . . . . . . . . . . . . .
Table 3--5: Pattern and state logic 3--69. . . . . . . . . . . . . . . . . . . . . . . . . . . .
Table 3--6: Defining and displaying waveforms 3--104. . . . . . . . . . . . . . . . .
Table 3--7: Operations performed based on the waveform type 3--104. . .
Table 3--8: Customizable display elements 3--114. . . . . . . . . . . . . . . . . . . . .
Table 3--9: Cursor functions (types) 3--133. . . . . . . . . . . . . . . . . . . . . . . . . .
Table 3--10: Cursor units 3--136. . . . . . . . . . . . . . . . . . . . . . . . . . . . . . . . . . .
Table 3--11: Math expressions and the math waveforms
produced 3--158. . . . . . . . . . . . . . . . . . . . . . . . . . . . . . . . . . . . . . . . . . . . . .
Table 3--12: Spectral analyzer controls 3--171. . . . . . . . . . . . . . . . . . . . . . . .
Table 3--13: Window characteristics 3--182. . . . . . . . . . . . . . . . . . . . . . . . . .
Table A--1: TDS7000 models A--1. . . . . . . . . . . . . . . . . . . . . . . . . . . . . . . .
Table A--2: Channel input and vertical specifications A--5. . . . . . . . . . .
Table A--3: Horizontal and acquisition system specifications A--9. . . . .
Table A--4: Trigger specifications A--12. . . . . . . . . . . . . . . . . . . . . . . . . . . .
Table A--5: Serial Trigger specifications (Option ST Only) A--16. . . . . . .
Table A--6: Recovered clock
specifications (Option ST or SM Only) A--17. . . . . . . . . . . . . . . . . . . .
Table A--7: Display specifications A--17. . . . . . . . . . . . . . . . . . . . . . . . . . . .
Table A--8: Input/output port specifications A--18. . . . . . . . . . . . . . . . . . .
Table A--9: Data storage specifications A--20. . . . . . . . . . . . . . . . . . . . . . . .
Table A--10: Power source specifications A--20. . . . . . . . . . . . . . . . . . . . . .
Table A--11: Mechanical specifications A--21. . . . . . . . . . . . . . . . . . . . . . . .
Table A--12: Environmental specifications A--22. . . . . . . . . . . . . . . . . . . . .
Table A--13: Certifications and compliances A--24. . . . . . . . . . . . . . . . . . .
Table B--1: Supported measurements and their definition B--1. . . . . . . .
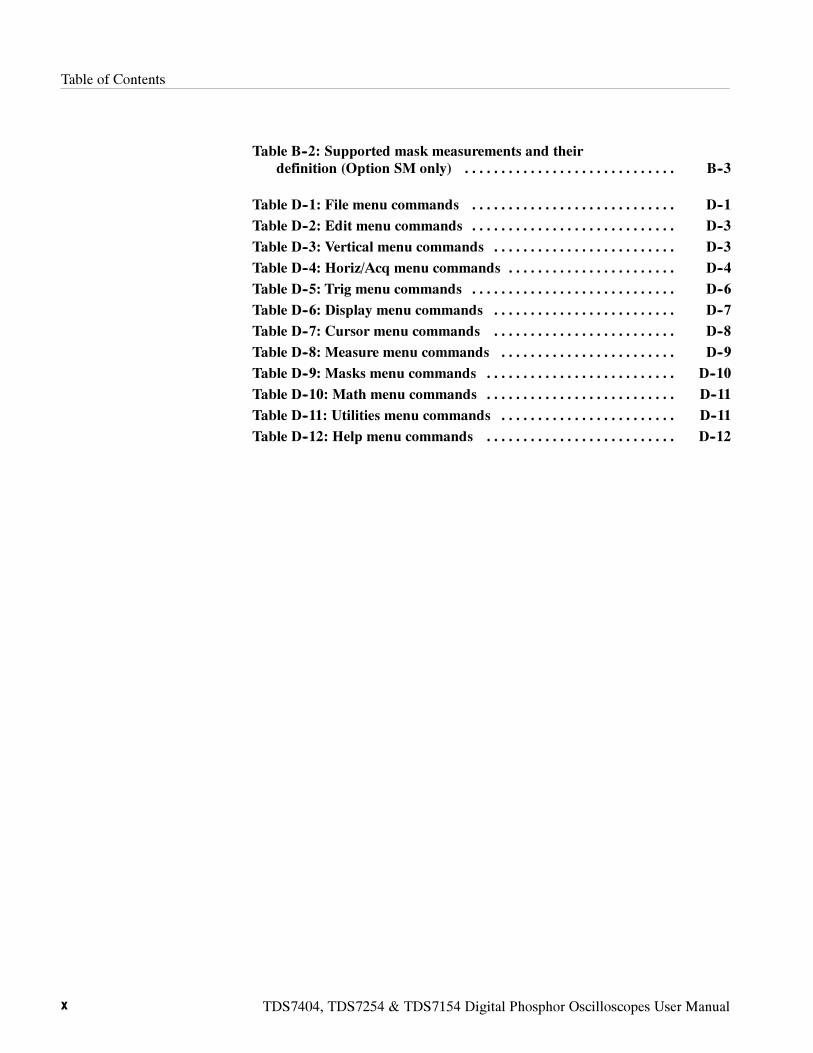
Table of Contents
x TDS7404, TDS7254 & TDS7154 Digital Phosphor Oscilloscopes User Manual
Table B--2: Supported mask measurements and their
definition (Option SM only) B--3. . . . . . . . . . . . . . . . . . . . . . . . . . . . .
Table D--1: File menu commands D--1. . . . . . . . . . . . . . . . . . . . . . . . . . . .
Table D--2: Edit menu commands D--3. . . . . . . . . . . . . . . . . . . . . . . . . . . .
Table D--3: Vertical menu commands D--3. . . . . . . . . . . . . . . . . . . . . . . . .
Table D--4: Horiz/Acq menu commands D--4. . . . . . . . . . . . . . . . . . . . . . .
Table D--5: Trig menu commands D--6. . . . . . . . . . . . . . . . . . . . . . . . . . . .
Table D--6: Display menu commands D--7. . . . . . . . . . . . . . . . . . . . . . . . .
Table D--7: Cursor menu commands D--8. . . . . . . . . . . . . . . . . . . . . . . . .
Table D--8: Measure menu commands D--9. . . . . . . . . . . . . . . . . . . . . . . .
Table D--9: Masks menu commands D--10. . . . . . . . . . . . . . . . . . . . . . . . . .
Table D--10: Math menu commands D--11. . . . . . . . . . . . . . . . . . . . . . . . . .
Table D--11: Utilities menu commands D--11. . . . . . . . . . . . . . . . . . . . . . . .
Table D--12: Help menu commands D--12. . . . . . . . . . . . . . . . . . . . . . . . . .
TDS7404, TDS7254 & TDS7154 Digital Phosphor Oscilloscopes User Manual xi
General Safety Summary
Review the following safety precautions to avoid injury and prevent damage tothis product or any products connected to it. To avoid potential hazards, use thisproduct only as specified.
Only qualified personnel should perform service procedures.
While using this product, you may need to access other parts of the system. Readthe General Safety Summary in other system manuals for warnings and cautionsrelated to operating the system.
Use Proper Power Cord. Use only the power cord specified for this product andcertified for the country of use.
Connect and Disconnect Properly. Do not connect or disconnect probes or testleads while they are connected to a voltage source.
Ground the Product. This product is grounded through the grounding conductorof the power cord. To avoid electric shock, the grounding conductor must beconnected to earth ground. Before making connections to the input or outputterminals of the product, ensure that the product is properly grounded.
Observe All Terminal Ratings. To avoid fire or shock hazard, observe all ratingsand markings on the product. Consult the product manual for further ratingsinformation before making connections to the product.
Do Not Operate Without Covers. Do not operate this product with covers or panelsremoved.
Use Proper Fuse. Use only the fuse type and rating specified for this product.
Avoid Exposed Circuitry. Do not touch exposed connections and componentswhen power is present.
Wear Eye Protection.Wear eye protection if exposure to high-intensity rays orlaser radiation exists.
Do Not Operate With Suspected Failures. If you suspect there is damage to thisproduct, have it inspected by qualified service personnel.
Do Not Operate in Wet/Damp Conditions.
Do Not Operate in an Explosive Atmosphere.
Keep Product Surfaces Clean and Dry.
Provide Proper Ventilation. Refer to the manual’s installation instructions fordetails on installing the product so it has proper ventilation.
To Avoid Fire orPersonal Injury
General Safety Summary
xii TDS7404, TDS7254 & TDS7154 Digital Phosphor Oscilloscopes User Manual
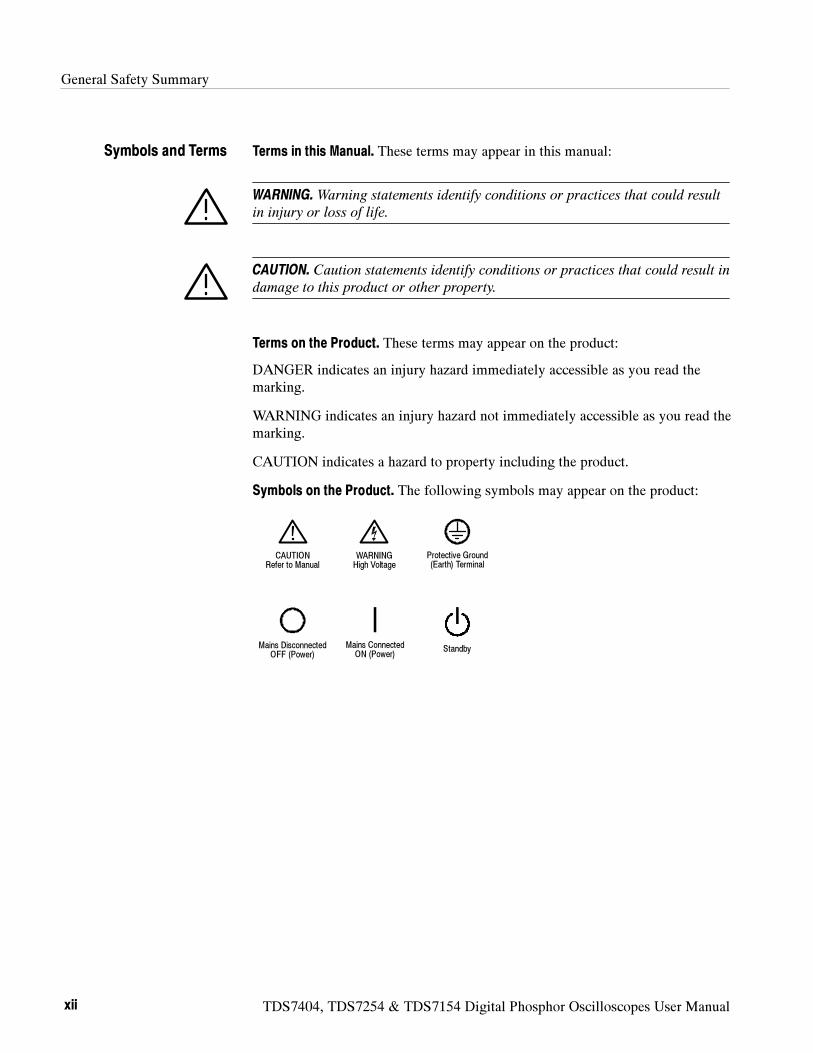
Terms in this Manual. These terms may appear in this manual:
WARNING.Warning statements identify conditions or practices that could result
in injury or loss of life.
CAUTION. Caution statements identify conditions or practices that could result in
damage to this product or other property.
Terms on the Product. These terms may appear on the product:
DANGER indicates an injury hazard immediately accessible as you read themarking.
WARNING indicates an injury hazard not immediately accessible as you read themarking.
CAUTION indicates a hazard to property including the product.
Symbols on the Product. The following symbols may appear on the product:
CAUTIONRefer to Manual
WARNINGHigh Voltage
Protective Ground(Earth) Terminal
Mains DisconnectedOFF (Power)
Mains ConnectedON (Power)
Standby
Symbols and Terms
TDS7404, TDS7254 & TDS7154 Digital Phosphor Oscilloscopes User Manual xiii
Preface
This is the user manual for the oscilloscope. It covers the following information:
Describes the capabilities of the oscilloscope, how to install it and reinstallits software
Explains how to operate the oscilloscope: how to control acquisition of,processing of, and input/output of information
Lists specifications and accessories of the oscilloscope
About This Manual
This manual is composed of the following chapters:
Getting Started shows you how to configure and install your oscilloscopeand provides an incoming inspection procedure.
Operating Basics uses maps to describe the various interfaces for controllingthe oscilloscope, including the front panel and the software user interface.These maps provide overviews of the product and its functions from severalviewpoints.
Reference comprises an encyclopedia of topics (see Overview on page 3--1)that describe the oscilloscope interface and features, and gives backgroundand basic information on how to use them. (The online help onboard theoscilloscope application describes the interface, features, and their usage;detailed descriptions of all programming commands are found in theTDS7000 Series & CSA7000 Series Programmer Online Guide manual.)
Appendices provides additional information including the specifications,measurements, and cleaning information.
Preface
xiv TDS7404, TDS7254 & TDS7154 Digital Phosphor Oscilloscopes User Manual
Related Manuals and Online Documents
This manual is part of a document set of standard-accessory manuals and onlinedocumentation; this manual mainly focuses on installation, background, and userinformation needed to use the product features. See the following list for otherdocuments supporting oscilloscope operation and service. (Manual part numbersare listed in Accessories & Options on page 1--29.)
Document name Description
TDS7000 Series Online Help An online help system, integrated with the User Interface application that ships with thisproduct. The help is preinstalled in the oscilloscope.
TDS7000 Series References A quick reference to major features of the oscilloscope and how they operate.
TDS7000 Series & CSA7000 SeriesProgrammer Online Guide
An alphabetical listing of the programming commands and other information related tocontrolling the oscilloscope over the GPIB1.
TDS7000 Series Service Manual Describes how to service the oscilloscope to the module level. This optional manualmust be ordered separately.
Option SM Serial Mask TestingOption ST Serial Pattern Trigger User Manual
Describes how to use the serial mask testing and serial pattern triggers options.
1 Located on the TDS7000 Series Product Software CD. See CD instructions for installation instructions.
For more information on how the product documentation relates to theoscilloscope operating interfaces and features, see Documentation Map onpage 2--2.
Preface
TDS7404, TDS7254 & TDS7154 Digital Phosphor Oscilloscopes User Manual xv
Contacting Tektronix
Phone 1-800-833-9200*
Address Tektronix, Inc.Department or name (if known)14200 SW Karl Braun DriveP.O. Box 500Beaverton, OR 97077USA
Web site www.tektronix.com
Sales support 1-800-833-9200, select option 1*
Service support 1-800-833-9200, select option 2*
Technical support Email: [email protected]
1-800-833-9200, select option 3*
6:00 a.m. -- 5:00 p.m. Pacific time
* This phone number is toll free in North America. After office hours, please leave avoice mail message.Outside North America, contact a Tektronix sales office or distributor; see theTektronix web site for a list of offices.

Preface
xvi TDS7404, TDS7254 & TDS7154 Digital Phosphor Oscilloscopes User Manual
TDS7404, TDS7254 & TDS7154 Digital Phosphor Oscilloscopes User Manual 1- 1
Product Description
This chapter describes the TDS7000 Series Digital Phosphor Oscilloscopes andtheir options. Following this description are three sections:
Installation shows you how to configure and install the oscilloscope, as wellas how to reinstall the system software included with the product.
Incoming Inspection provides a procedure for verifying basic operation andfunctionality.
Accessories & Options lists the standard and optional accessories for thisproduct.
Models
This manual supports the following oscilloscopes:
TDS7404 Digital Phosphor Oscilloscope
TDS7254 Digital Phosphor Oscilloscope
TDS7154 Digital Phosphor Oscilloscope
Differences between the oscilloscopes will be called out when necessary;otherwise, the material applies to all oscilloscopes. The word “oscilloscope”refers to all products.
Key Features
TDS7000 Series oscilloscopes are high performance solutions for verifying,debugging, and characterizing sophisticated electronic designs. The seriesfeatures exceptional signal acquisition performance, operational simplicity, andopen connectivity to the design environment. Classic analog-style controls, alarge touch-sensitive display, and graphical menus provide intuitive control.Open access to the Windows operating system enables unprecedented customiza-tion and extensibility. Key features include:
Up to 4 GHz bandwidth and 20 GS/s real time sampling rate, depending onthe model
Record lengths up to 32,000,000 samples, depending on option
Fast acquisition at up to 400,000 acquisitions per second for analogoscilloscope emulation and isolation of data-dependent failures during
Product Description
1- 2 TDS7404, TDS7254 & TDS7154 Digital Phosphor Oscilloscopes User Manual
conformance/performance testing and for examination of very low-levelsignals in pseudo-random bit streams
2% DC vertical gain accuracy
Four input channels (each with 8-bit resolution), CH 3 signal output, andauxiliary trigger input and output
Sample, envelope, peak-detect, high-resolution, and average acquisitionmodes
Full programmability, with an extensive GPIB-command set and a message-based interface
Trigger modes include edge (up to 3 GHz bandwidth), logic, pulse, andsequence
Powerful built-in measurement capability, including histograms, automaticmeasurements, and measurement statistics
A large 10.4 inch (264.2 mm) color display that supports color grading ofwaveform data to show sample density
An intuitive, graphical user interface (UI), with online help that is built inand available on screen
Internal, removable disk storage
Wide array of probing solutions
Serial mask testing, serial pattern triggering, triggering on communicationssignals, eye pattern measurements, and a waveform database mode areavailable with options. Use of these optional features is described in theOption SM Serial Mask Testing and Option ST Serial Pattern Trigger User
Manual
Product Software
The oscilloscope includes the following software:
System Software, which includes a specially configured version ofWindows 98, comes preinstalled on the oscilloscope. Windows 98 is theoperating system on which the user-interface application of this product runs,and provides an open desktop for you to install other compatible applica-tions. Do not attempt to substitute any version of Windows that is notspecifically provided by Tektronix for use with your oscilloscope.
Product Description
TDS7404, TDS7254 & TDS7154 Digital Phosphor Oscilloscopes User Manual 1- 3
TDS7000 Product Software. Comes preinstalled on the oscilloscope. Thissoftware, running on Windows 98, is the oscilloscope application. Thissoftware starts automatically when the oscilloscope is powered on, andprovides the user interface (UI) and all other oscilloscope control functions.You can also minimize the oscilloscope application.
Support Software. Not preinstalled on the oscilloscope. The ProductSoftware compact disc, included with the oscilloscope, contains additionalsoftware and files that may be useful to you:
Readme file. This file contains release notes and updates that could notbe included in other product documentation.
GPIB Programmer Online Help software. This software, in an onlinehelp format, contains the information you need to program the oscillo-scope through its GPIB interface. A printable PDF file of this informa-tion is also available on the compact disc.
Performance Verification Procedures. The compact disc containssoftware and instructions to perform a semi-automated performanceverification as well as instructions to perform a manual performanceverification.
See the instructions for the Product Software compact disc for informationabout installing the support software.
Occasionally new versions of software for your oscilloscope may becomeavailable at our web site. See Contacting Tektronix on page xv in Preface.
Software Upgrade
Tektronix may offer software upgrade kits for the oscilloscope. Contact yourTektronix service representative for more information (see Contacting Tektronix
on page xv).

Product Description
1- 4 TDS7404, TDS7254 & TDS7154 Digital Phosphor Oscilloscopes User Manual
TDS7404, TDS7254 & TDS7154 Digital Phosphor Oscilloscopes User Manual 1- 5
Installation
This chapter covers installation of the oscilloscope, addressing the followingtopics:
Unpacking on page 1--5
Checking the Environment Requirements on page 1--6
Connecting Peripherals on page 1--6
Powering On the Oscilloscope on page 1--8
Powering Off the Oscilloscope on page 1--9
Creating an Emergency Startup Disk on page 1--10
Backing Up User Files on page 1--10
Installing Software on page 1--11
Connecting to a Network on page 1--13
CAUTION. Be sure to create your emergency startup disk as described on
page 1--10. You may need that disk if you ever need to reinstall Windows 98 from
the oscilloscope hard drive.
Unpacking
Verify that you have received all of the parts of your oscilloscope. The graphicalpacking list shows the standard accessories that you should find in the shippingcarton (probes depend on the option you ordered.) You should also verify thatyou have:
The correct power cord for your geographical area.
The compact discs that include copies of the software installed on theoscilloscope and additional support software that may be useful to you: theOperating System Restore, Product Software, and Optional ApplicationsSoftware. Store the product software in a safe location where you can easilyretrieve it.
Installation
1- 6 TDS7404, TDS7254 & TDS7154 Digital Phosphor Oscilloscopes User Manual
NOTE. The certificate of authenticity (Windows 98 licence agreement) is attached
to the rear of your oscilloscope. This certificate proves your ownership of the
Windows operating system in your oscilloscope. Without this certificate, you
might have to purchase a new Windows license if the hard disk in your oscillo-
scope ever needs rebuilding or replacement.
All the standard and optional accessories that you ordered.
Remember to fill out and send in the customer registration card.
Checking the Environment Requirements
Read this section before attempting any installation procedures. This sectiondescribes site considerations, power requirements, and ground connections foryour oscilloscope.
The oscilloscope is designed to operate on a bench or on a cart in the normalposition (on the bottom feet). For proper cooling, at least three inches (7.62 cm)of clearance is required on both sides of the oscilloscope, and the bottomrequires the clearance provided by the oscilloscope feet.
If you operate the oscilloscope while it is resting on the rear feet, make sure thatyou properly route any cables coming out of the rear of the oscilloscope to avoiddamaging them.
CAUTION. Keep the bottom and sides of the oscilloscope clear of obstructions to
ensure proper cooling.
The Specifications in Appendix A list the operating requirements for theoscilloscope. Power source, temperature, humidity, and altitude are listed.
Connecting Peripherals
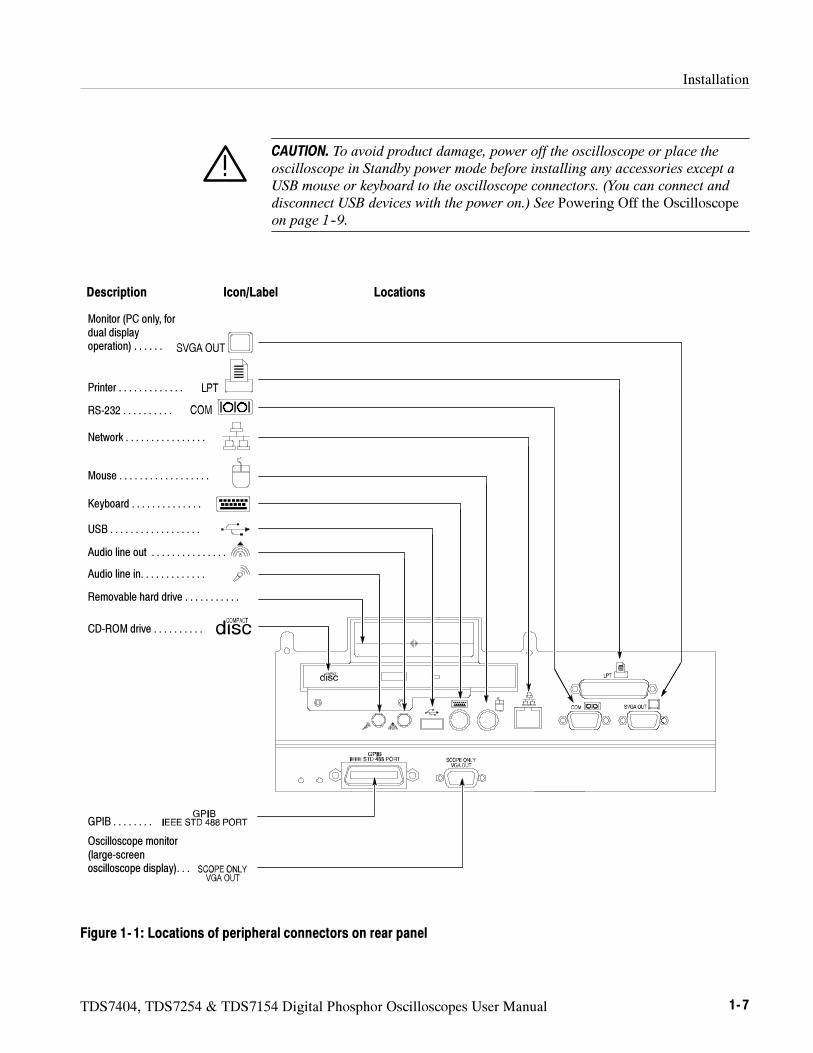
The peripheral connections are the same as those you would make on a personalcomputer. The connection points are shown in Figure 1--1. See Table 1--1 onpage 1--8 for additional connection information.
Site Considerations
Operating Requirements
Installation
TDS7404, TDS7254 & TDS7154 Digital Phosphor Oscilloscopes User Manual 1- 7
CAUTION. To avoid product damage, power off the oscilloscope or place the
oscilloscope in Standby power mode before installing any accessories except a
USB mouse or keyboard to the oscilloscope connectors. (You can connect and
disconnect USB devices with the power on.) See Powering Off the Oscilloscopeon page 1--9.
Monitor (PC only, fordual displayoperation) . . . . . .
Printer . . . . . . . . . . . . .
RS-232 . . . . . . . . . .
Network . . . . . . . . . . . . . . . .
Mouse . . . . . . . . . . . . . . . . . .
Keyboard . . . . . . . . . . . . . .
USB . . . . . . . . . . . . . . . . . .
CD-ROM drive . . . . . . . . . .
GPIB . . . . . . . .
Oscilloscope monitor(large-screenoscilloscope display). . .
Card Slot . . . . . .
Description Icon/Label Locations
Audio line out . . . . . . . . . . . . . . .
Audio line in. . . . . . . . . . . . .
Removable hard drive . . . . . . . . . . .
Figure 1- 1: Locations of peripheral connectors on rear panel
Installation
1- 8 TDS7404, TDS7254 & TDS7154 Digital Phosphor Oscilloscopes User Manual
Table 1- 1: Additional accessory connection information
Item Description
Monitor If you use a non-standard monitor, you may need to change theWindows 98 display settings to achieve the proper resolutionfor your monitor. To set up a dual display, see page 1--14.
Printer Connect the printer to the EPP (enhanced parallel port)connector directly. If your printer has a DB-25 connector, usethe adapter cable that came with your printer to connect to theEPP connector. For information on printer usage, see PrintingWaveforms on page 3--240.
Rackmount Refer to the Rackmount Installation Instructions for informationon installing the rackmount kit.
Other Refer to the Readme file on the Product Software CD forpossible additional accessory installation information notcovered in this manual.
Powering On the Oscilloscope
Follow these steps to power on the oscilloscope for the first time.
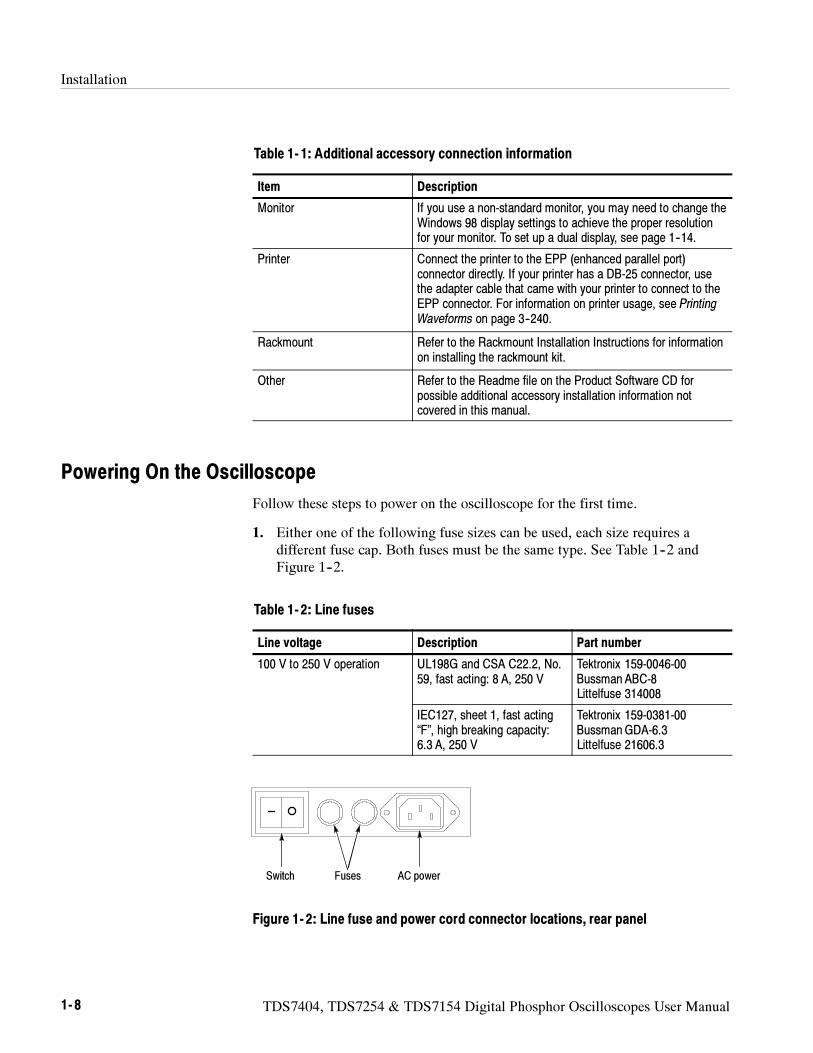
1. Either one of the following fuse sizes can be used, each size requires adifferent fuse cap. Both fuses must be the same type. See Table 1--2 andFigure 1--2.
Table 1- 2: Line fuses
Line voltage Description Part number
100 V to 250 V operation UL198G and CSA C22.2, No.59, fast acting: 8 A, 250 V
Tektronix 159-0046-00Bussman ABC-8Littelfuse 314008
IEC127, sheet 1, fast acting“F”, high breaking capacity:6.3 A, 250 V
Tektronix 159-0381-00BussmanGDA-6.3Littelfuse 21606.3
Fuses AC powerSwitch
Figure 1- 2: Line fuse and power cord connector locations, rear panel
Installation
TDS7404, TDS7254 & TDS7154 Digital Phosphor Oscilloscopes User Manual 1- 9
CAUTION. Connect the keyboard, mouse, and other accessories before applying
power to the product.
2. Connect the power cord.
3. If you have an external monitor, connect the monitor to the oscilloscope (seeSetting Up a Dual Display on page 1--14), connect the power cord, andpower on the monitor.
4. Turn the Power switch on at the rear panel. (See Figure 1--2 on page 1--8 forswitch location.)
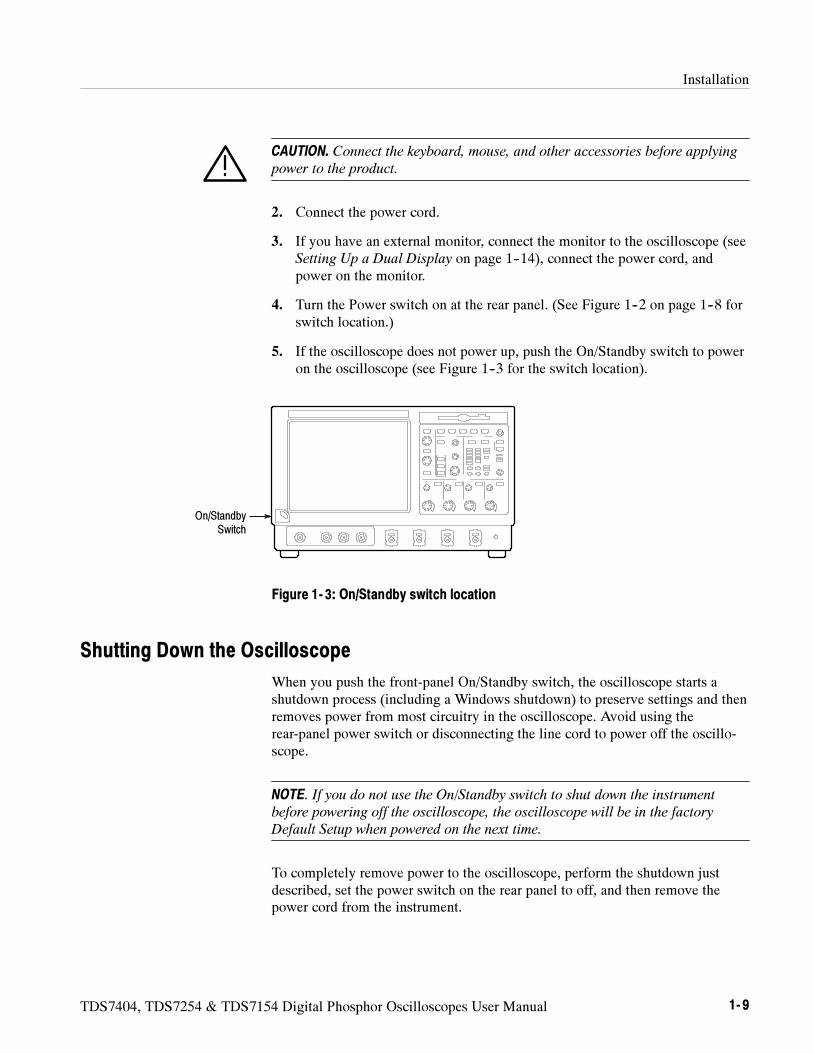
5. If the oscilloscope does not power up, push the On/Standby switch to poweron the oscilloscope (see Figure 1--3 for the switch location).
On/StandbySwitch
Figure 1- 3: On/Standby switch location
Shutting Down the Oscilloscope
When you push the front-panel On/Standby switch, the oscilloscope starts ashutdown process (including a Windows shutdown) to preserve settings and thenremoves power from most circuitry in the oscilloscope. Avoid using therear-panel power switch or disconnecting the line cord to power off the oscillo-scope.
NOTE. If you do not use the On/Standby switch to shut down the instrument
before powering off the oscilloscope, the oscilloscope will be in the factory
Default Setup when powered on the next time.
To completely remove power to the oscilloscope, perform the shutdown justdescribed, set the power switch on the rear panel to off, and then remove thepower cord from the instrument.
Installation
1- 10 TDS7404, TDS7254 & TDS7154 Digital Phosphor Oscilloscopes User Manual
Creating an Emergency Startup Disk
Now that you have completed the basic installation process, you should create anemergency startup disk that you can use to restart your oscilloscope in case of amajor hardware or software failure. You should create this disk, and then store itin a safe place.
CAUTION. Create this disk and store it in a safe place. It may allow you to
recover your Windows 98 installation without rebuilding the entire oscilloscope
hard disk.
The emergency startup disk contains basic files to restart your oscilloscope. Italso contains files to check and format the hard disk.
Follow these steps to create the emergency startup disk:
1. Minimize the oscilloscope application by selecting Minimize in the Filemenu.
2. Click the Windows Start button, point to Settings, and click Control Panel.
3. In the Control Panel window, double-click Add/Remove Programs.
4. Click the tab for the Startup Disk page.
5. Insert a floppy disk into the disk drive and follow the on-screen instructionsto create the startup disk.
Backing Up User Files
You should always back up your user files on a regular basis. Use the Back Uptool to back up files stored on the hard disk. The Back Up tool is located in theSystem Tools folder in the Accessories folder.
1. If the Windows backup program is not installed on your oscilloscope,perform the following steps:
a. Minimize the oscilloscope application by selecting Minimize in the Filemenu
b. Click the Windows Start button, Settings, and then Control Panel
c. Double click Add/Remove Programs to display the dialog box
d. Click the Windows Setup tab
e. Under Components, double click System Tools
f. Select the Backup check box and then click OK
Installation
TDS7404, TDS7254 & TDS7154 Digital Phosphor Oscilloscopes User Manual 1- 11
g. Select Apply, wait for the installation to complete, and then restart theoscilloscope
2. Minimize the oscilloscope application by selecting Minimize in the Filemenu.
3. Click the Windows Start button.
4. Select Programs, Accessories, System Tools, Backup in the Start menu.
5. Use the backup tool that displays to select your backup media and to selectthe files and folders that you want to back up. Use the Windows online helpfor information on using the Backup tool. You can back up to the floppydrive or to a third-party storage device over the printer port (rear panel).
Installing Software
The oscilloscope system and application software is preinstalled at the factory. Ifyou have to reinstall the software for any reason, refer to the instructions thataccompany the CDs that are shipped with the oscilloscope. If you need to restorethe operating system, you also need the Windows licence information from theCertificate of Authenticity that is shipped with the oscilloscope.
Read the software release notes README.TXT ASCII file on the product-soft-ware CD before performing installation procedures. This file contains additionalinstallation and operation information that supercedes other product documenta-tion.
To view the README.TXT file, open the Notepad Windows accessory and openthe file on the Product Software CD.
The Product Software CD also contains accessory software and files that you canchoose to install in the oscilloscope or in another computer. Refer to theinstructions that accompany the CD for installation information.
GPIB Programmer Online Help Software.You can install the GPIB Programmeronline help on the oscilloscope, but it may be more convenient to install it on thePC that is functioning as the GPIB system controller. From the system controller,you can copy and paste commands from the help directly into your test pro-grams. The programmer information contains the following content:
GPIB configuration information for the oscilloscope
Lists of the command groups and the commands they contain
Detailed command descriptions including syntax and examples
Software Release Notes
Accessory Software
Installation
1- 12 TDS7404, TDS7254 & TDS7154 Digital Phosphor Oscilloscopes User Manual
Status and error messages
Programming examples
The CD also contains a printable version of the programmer information, in theform of a PDF file.
Manual Performance Verification Procedure. This is a printable PDF file thatdescribes how to verify the oscilloscope performance using generic testequipment.
Optional Accessory Software. The Optional Applications Software CD containsprograms that you can install and run five times per application. You can thenpurchase an upgrade from Tektronix if you decide that you want to continue touse the application. Refer to the instructions that accompany the CD forinstallation information.
You can install desktop application software on the oscilloscope. The oscillo-scope has been tested with the following software products installed:
Microsoft Office 98 (including Word, Excel, Powerpoint, and Access)
MathCad
MATLAB
Other software products may be compatible but have not been tested byTektronix. If the oscilloscope malfunctions after you install software you shoulduninstall the software and then reinstall the oscilloscope application to restoreproper operation.
Exiting the Oscilloscope Application.Before installing other desktop applications,you should exit the oscilloscope application. Follow these steps to exit theoscilloscope application:
NOTE. If not using a USB keyboard and mouse, you must cycle the power after
attaching your keyboard and mouse.
1. Connect a keyboard and mouse to the oscilloscope.
2. While holding down the CTRL and ALT keys, press the DELETE key.
3. In the Close Program dialog box, select TDS7000 and then select End Task
to stop the oscilloscope application.
4. If a confirmation dialog box appears, select End Task again.
Desktop Applications
Installation
TDS7404, TDS7254 & TDS7154 Digital Phosphor Oscilloscopes User Manual 1- 13
5. Press the CTRL, ALT, and DELETE keys again.
6. In the Close Program dialog box, select Windowsscopeservices and thenselect End Task.
7. If a confirmation dialog box appears, select End Task again.
8. Press the CTRL, ALT, and DELETE keys a third time.
9. In the Close Program dialog box, verify that the tasks TDS7000 andWindowsscopeservices are not running, and then select Cancel to close thedialog box.
The oscilloscope application will restart after you restart the entire system,following the installation of the desktop application software.
Some options contain software that needs to be installed and/or enabled. To dothe installation, follow the specific instructions that come with the option.
Tektronix provides a key that you must enter (one time) to enable all the optionsthat you have purchased for your oscilloscope. To enter the key, select Option
Installation in the Utilities menu, and then follow the on-screen instructions.
Enabling Your LAN and Connecting to a Network
You can connect the oscilloscope to a network to enable printing, file sharing,internet access, and other communications functions. Before you make theconnection, do the following steps to enable network access to the oscilloscope:
1. Begin with the oscilloscope power shut down.
2. Attach a keyboard and mouse to the oscilloscope.
3. Power on the oscilloscope.
4. As the oscilloscope begins to boot, press the F2 key on the keyboardrepeatedly until the message “Entering SETUP” (Loading SETUP on someinstruments) appears.
5. In the BIOS Setup Utility use the right-arrow key on the keyboard tohighlight the Advanced menu at the top of the screen.
6. Use the arrow down key to highlight PCI Configuration (PeripheralConfiguration on some instruments) in the Advanced screen, and then pressEnter.
7. Use the arrow down key to highlight Embedded Ethernet Controller (LANDevice on some instruments) in the Peripheral Configuration screen, andthen press Enter.
Options
Installation
1- 14 TDS7404, TDS7254 & TDS7154 Digital Phosphor Oscilloscopes User Manual
8. Use the arrow up or down key to highlight Enabled and then press Enter.
9. Press the F10 key to save and exit. Confirm the Save of Configurationchanges when you are prompted on screen.
10. Use the Windows network setup utility to define the oscilloscope as anetwork client and configure it for your network. You can find the networksetup utility in the Windows Start menu if you select Settings > Control
Panel and then double click Network. You should consult your networkadministrator for specific instructions to make these settings.
NOTE. If you want to disable network access for the oscilloscope, perform the
above procedure except substitute Disabled for the command listed in step 8. The
oscilloscope will boot faster with network access disabled.
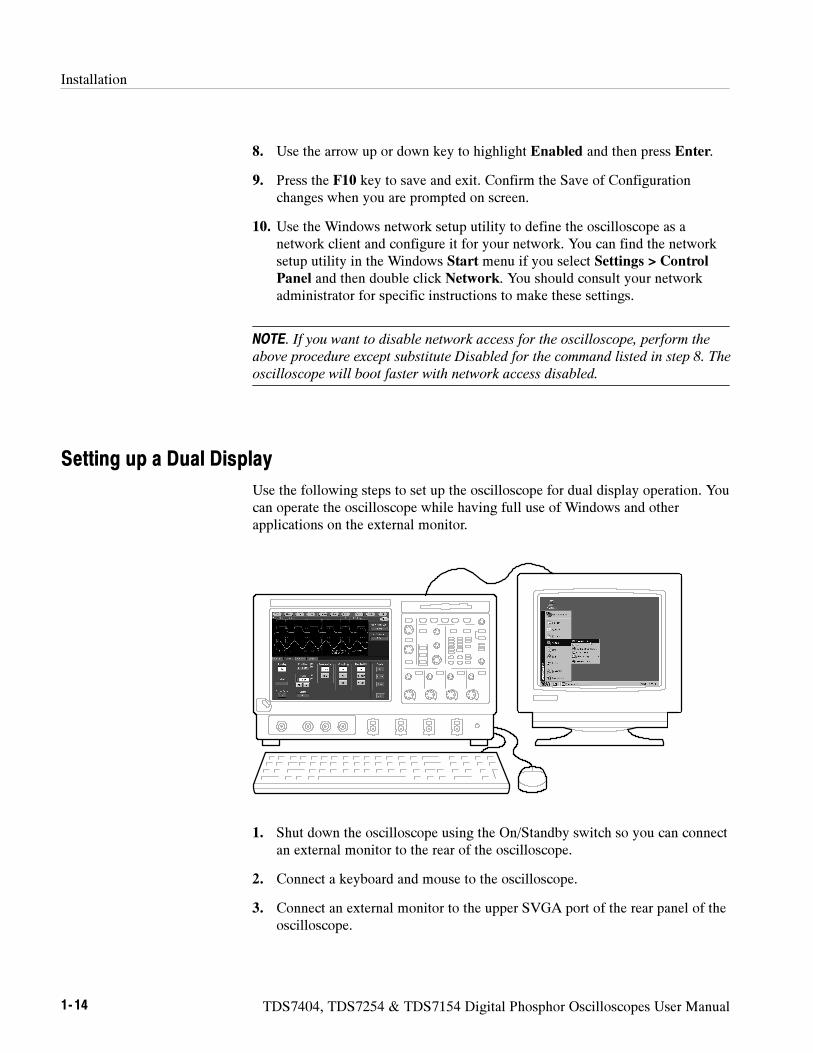
Setting up a Dual Display
Use the following steps to set up the oscilloscope for dual display operation. Youcan operate the oscilloscope while having full use of Windows and otherapplications on the external monitor.
1. Shut down the oscilloscope using the On/Standby switch so you can connectan external monitor to the rear of the oscilloscope.
2. Connect a keyboard and mouse to the oscilloscope.
3. Connect an external monitor to the upper SVGA port of the rear panel of theoscilloscope.
Installation
TDS7404, TDS7254 & TDS7154 Digital Phosphor Oscilloscopes User Manual 1- 15
4. Power on the oscilloscope and the external monitor.
5. Watch for a message on the external monitor telling you that Windows hassuccessfully initialized the display adapter.
6. The oscilloscope should detect that the new monitor was connected. Followthe instructions on the oscilloscope display to install new drivers for themonitor.
7. Type a Control-M to minimize the oscilloscope application.
8. In the Windows desktop, right click the mouse and then select Properties todisplay the Display Properties dialog box.
9. Select the Settings tab and click the grayed-out monitor in the display box.
10. Click yes when you are prompted to enable the new monitor.
11. Set the resolution you want to use on the external monitor.
12. Click on the external monitor in the display box and drag it to the correctorientation.
CAUTION. Do not change the resolution or color settings for the internal LCD
monitor. The internal resolution must be 640 x 480 and the color setting must be
High Color (16 bit).
13. Click OK to apply the settings. The new monitor will display additionaldesktop area.
To make the best use of the new display area, do these additional steps to movethe Windows controls to the external monitor:
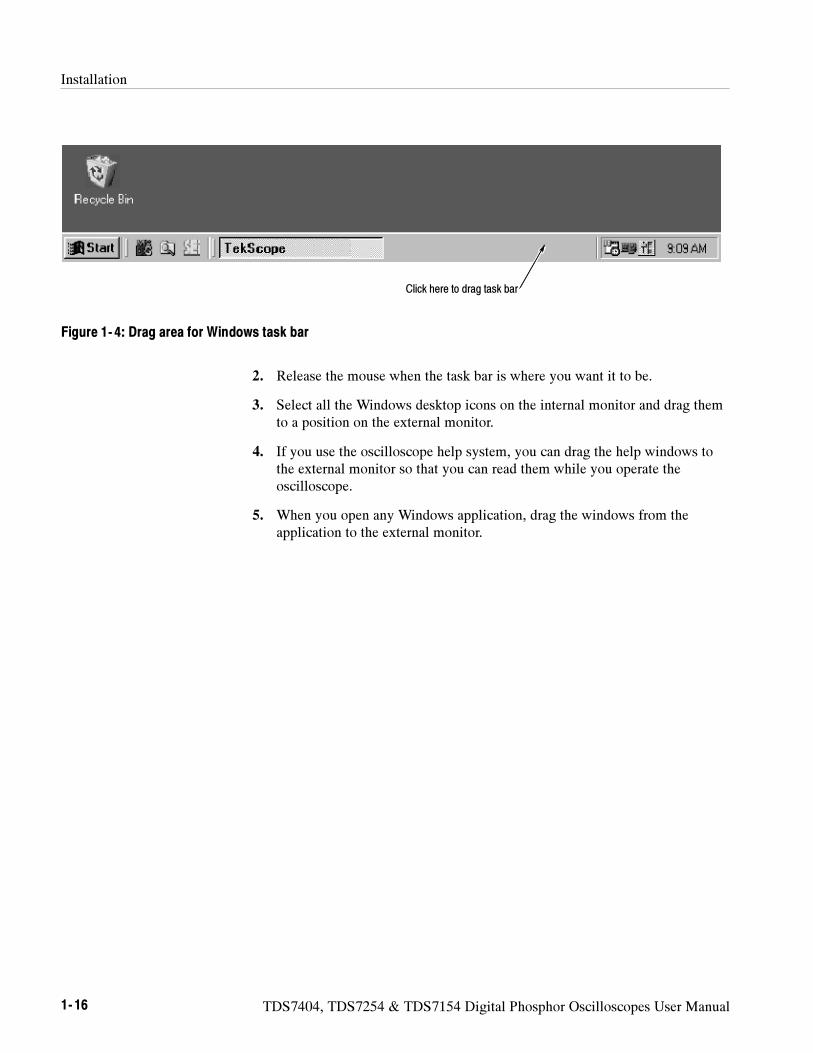
1. Click (and hold) on the Windows task bar in the area shown in Figure 1--4and then drag it upwards and toward the external monitor. The task bar willfirst go to the side of the internal monitor, then to the side of the externalmonitor and finally to the bottom of the external monitor.
Installation
1- 16 TDS7404, TDS7254 & TDS7154 Digital Phosphor Oscilloscopes User Manual
Click here to drag task bar
Figure 1- 4: Drag area for Windows task bar
2. Release the mouse when the task bar is where you want it to be.
3. Select all the Windows desktop icons on the internal monitor and drag themto a position on the external monitor.
4. If you use the oscilloscope help system, you can drag the help windows tothe external monitor so that you can read them while you operate theoscilloscope.
5. When you open any Windows application, drag the windows from theapplication to the external monitor.
TDS7404, TDS7254 & TDS7154 Digital Phosphor Oscilloscopes User Manual 1- 17
Incoming Inspection
This chapter contains instructions for performing the Incoming Inspection
Procedure. This procedure verifies that the oscilloscope is operating correctlyafter shipment, but does not check product specifications. This procedurecontains the following parts:
Self Tests on page 1--17 provides instructions for performing the internalself tests.
Functional Tests on page 1--19 measures the time- and amplitude-referencesignals at the PROBE COMPENSATION connector.
Perform Extended Diagnostics on page 1--27 provides instructions forperforming internal self calibration and the extended diagnostics.
If the oscilloscope fails any test within this section, it may need service. Tocontact Tektronix for service, see Contacting Tektronix on page xv of Preface.
Make sure you have put the oscilloscope into service as detailed in Installation
starting on page 1--5. Then assemble the following test equipment and precedewith the procedures that follow.
Assemble Equipment
Self tests do not require any test equipment. The functional tests require thefollowing test equipment:
A P7240 probe
A probe calibration and deskew fixture, Tektronix part number 067-0405-xx
One BNC cable, such as Tektronix part number 012-0076-xx
One 1.44 Mbyte, 3.5 inch formatted disk to check the file system
One TCA-BNC TekConnect adapter, or one SMA male-to-BNC femaleadapter, such as Tektronix part number 015-1018-xx
Self Tests
This procedure uses internal routines to verify that the oscilloscope functions andwas adjusted properly. No test equipment or hookups are required.
Incoming Inspection
1- 18 TDS7404, TDS7254 & TDS7154 Digital Phosphor Oscilloscopes User Manual
Equipmentrequired
None
Prerequisites Power on the oscilloscope and allow a 20 minute warm-up before doingthis procedure.
1. Verify that internal diagnostics pass: Do the following substeps to verifypassing of internal diagnostics.
a. Display the System diagnostics menu:
If the oscilloscope is in tool-bar mode, click theMENU button toput the oscilloscope into menu bar mode.
From the Utilities menu, select Instrument Diagnostics . . . . Thisdisplays the diagnostics control window.
b. Run the System Diagnostics:
First disconnect any input signals and probes from all four channels.
Click the Run button in the diagnostics control window.
c. Wait: The internal diagnostics do an exhaustive verification of properoscilloscope function. This verification will take five to fifteen minutes.When the verification is finished, the resulting status will appear in thediagnostics control window.
d. Verify that no failures are found and reported on-screen. All tests shouldpass.
e. Run the signal-path compensation routine:
From the Utilities menu, select Instrument Calibration . . . . Thisdisplays the oscilloscope calibration control window.
If required because the oscilloscope is in service mode, select theSignal Path button under Calibration Area.
Touch the Calibrate button to start the routine.
f. Wait: Signal-path compensation may take five to ten minutes to run.
g. Confirm signal-path compensation returns passed status: Verify that theword Pass appears in the oscilloscope calibration control window.
2. Return to regular service: Click the Close button to exit the oscilloscopecalibration control window.
Incoming Inspection
TDS7404, TDS7254 & TDS7154 Digital Phosphor Oscilloscopes User Manual 1- 19
Functional Tests
The purpose of these procedures is to confirm that the oscilloscope functionsproperly. A list of required test equipment is shown on page 1--17.
NOTE. These procedures verify functions; that is, they verify that the oscilloscope
features operate. They do not verify that they operate within limits.
Therefore, when the instructions in the functional tests that follow call for you to
verify that a signal appears on-screen “that is about five divisions in amplitude”
or “has a period of about six horizontal divisions,” and so forth, do NOT
interpret the quantities given as limits.
NOTE. DO NOT make changes to the front-panel settings that are not called out
in the procedures. Each verification procedure will require you to set the
oscilloscope to certain default settings before verifying functions. If you make
changes to these settings, other than those called out in the procedure, you may
obtain invalid results. In this case, redo the procedure from step 1.
When you are instructed to push a front-panel button or screen button, the button
may already be selected (its label will be highlighted). If this is the case, it is not
necessary to push the button.
Equipmentrequired
One P7240 probe
One probe calibration and deskew fixture
One BNC cable
Prerequisites None
1. Initialize the oscilloscope: Push the front-panel DEFAULT SETUP button.
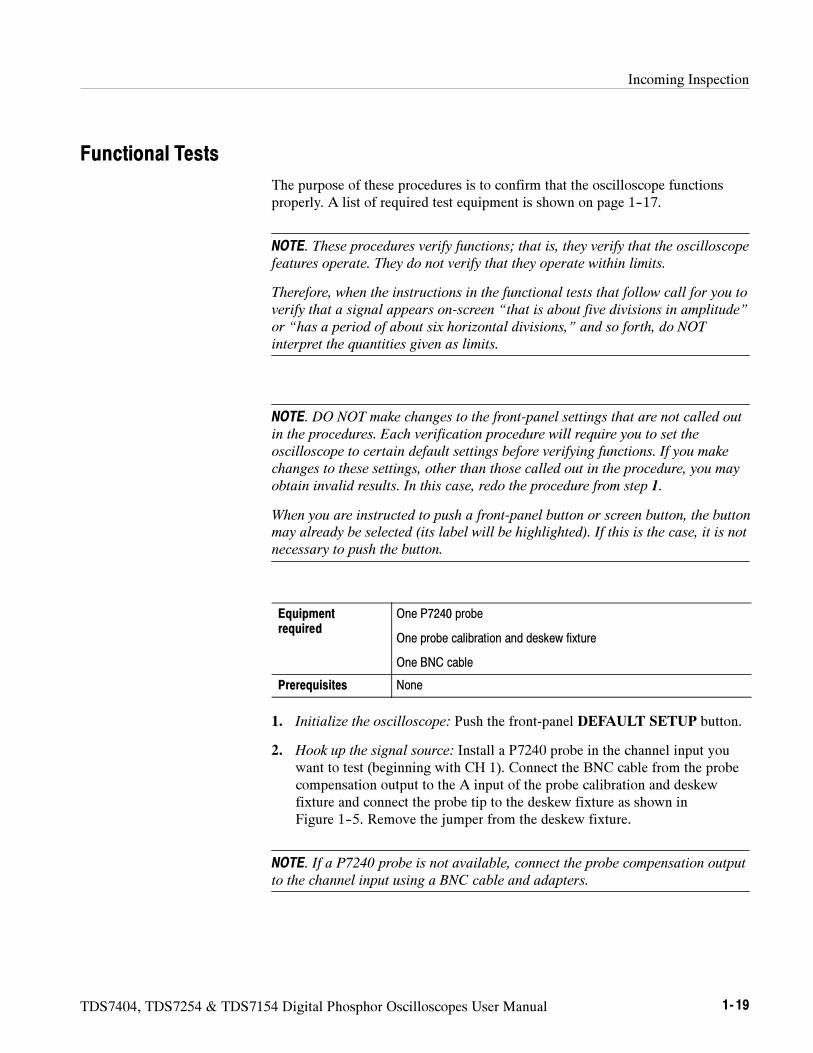
2. Hook up the signal source: Install a P7240 probe in the channel input youwant to test (beginning with CH 1). Connect the BNC cable from the probecompensation output to the A input of the probe calibration and deskewfixture and connect the probe tip to the deskew fixture as shown inFigure 1--5. Remove the jumper from the deskew fixture.
NOTE. If a P7240 probe is not available, connect the probe compensation output
to the channel input using a BNC cable and adapters.
Incoming Inspection
1- 20 TDS7404, TDS7254 & TDS7154 Digital Phosphor Oscilloscopes User Manual
Connect the probe tip to theshort pin and the probe ground
to the long pin as shown
A
TDS7000 oscilloscope
BNC cable from PROBECOMPENSATION output to the Ainput of the Probe Calibration
and Deskew Fixture
Removethe jumper
Figure 1- 5: Universal test hookup for functional tests - CH 1 shown
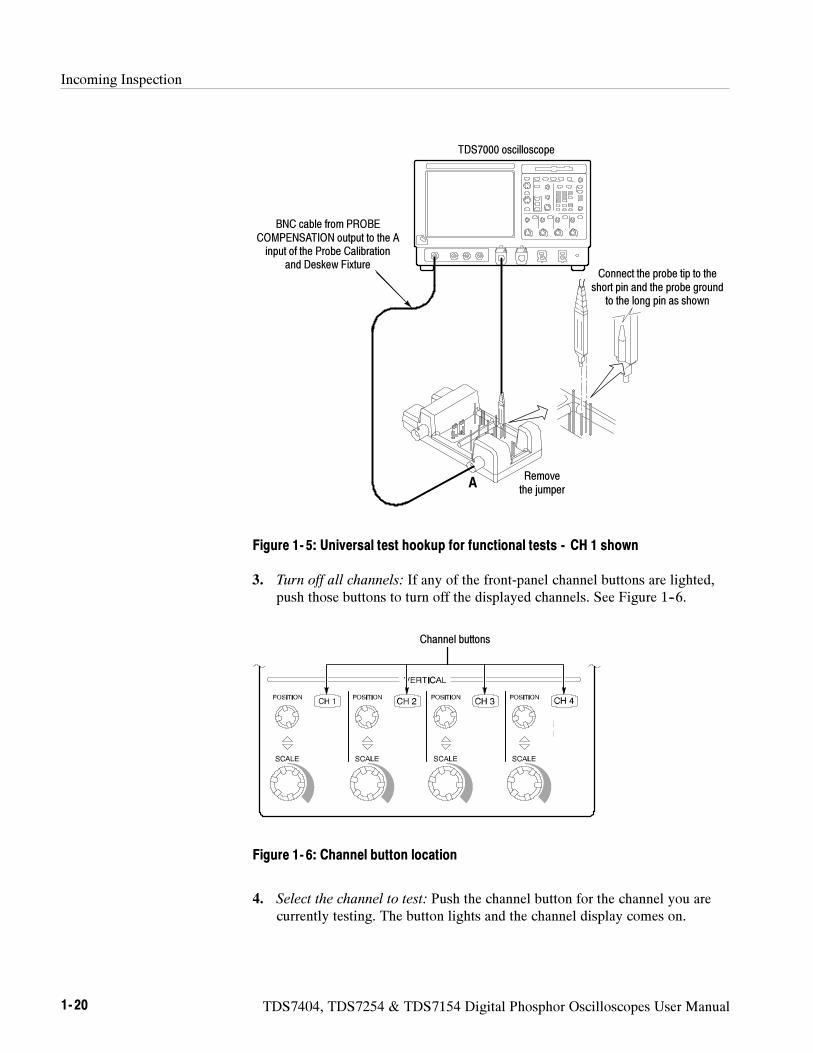
3. Turn off all channels: If any of the front-panel channel buttons are lighted,push those buttons to turn off the displayed channels. See Figure 1--6.
Channel buttons
Figure 1- 6: Channel button location
4. Select the channel to test: Push the channel button for the channel you arecurrently testing. The button lights and the channel display comes on.
Incoming Inspection
TDS7404, TDS7254 & TDS7154 Digital Phosphor Oscilloscopes User Manual 1- 21
5. Set up the oscilloscope:
Push the front panel AUTOSET button. This sets the horizontal andvertical scale and vertical offset for a usable display and sets the triggersource to the channel you are testing.
Touch the Vert button and then touch Offset. Confirm that the Ch1Offset is 1.8 V (0.0 V if not using a P7240 probe).
6. Verify that the channel is operational: Confirm that the following statementsare true.
The vertical scale readout for the channel under test shows a setting ofabout 100 mV (500 mV if not using a P7240 probe), and a square-waveprobe-compensation signal about 4 divisions (0.5 divisions if not using aP7240 probe) in amplitude (about 400 mV) is on-screen.
The front-panel vertical POSITION knob (for the channel you aretesting) moves the signal up and down the screen when rotated.
Turning the vertical SCALE knob counterclockwise (for the channel youare testing) decreases the amplitude of the waveform on-screen, turningthe knob clockwise increases the amplitude, and returning the knob to100 mV (500 mV if not using a P7240 probe) returns the amplitude toabout 4 divisions (0.5 divisions if not using a P7240 probe).
7. Verify that the channel acquires in all acquisition modes: From theHoriz/Acq menu, select Horizontal/Acquisition Setup . . . . Click theAcquisition tab in the control window that displays. Click each of the fiveacquisition modes and confirm that the following statements are true (seeUsing the Acquisition Controls on page 3--21 for more information).
Sample mode displays an actively acquiring waveform on-screen. (Notethat there is a small amount of noise present on the square wave).
Peak Detect mode displays an actively acquiring waveform on-screenwith the noise present in Sample mode “peak detected.”
Hi Res mode displays an actively acquiring waveform on-screen with thenoise that was present in Sample mode reduced.
Average mode displays an actively acquiring waveform on-screen withthe noise reduced.
Envelope mode displays an actively acquiring waveform on-screen withthe noise displayed.
8. Test all channels: Repeat steps 2 through 7 until all four input channels areverified.
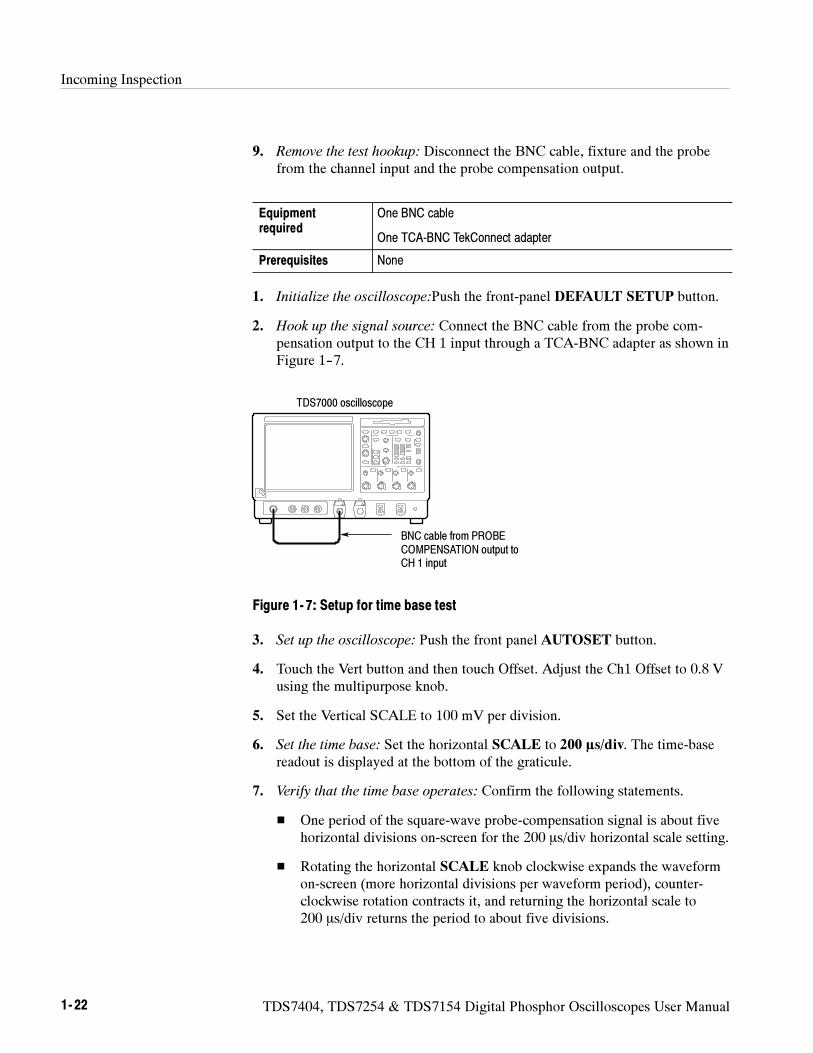
Incoming Inspection
1- 22 TDS7404, TDS7254 & TDS7154 Digital Phosphor Oscilloscopes User Manual
9. Remove the test hookup: Disconnect the BNC cable, fixture and the probefrom the channel input and the probe compensation output.
Equipmentrequired
One BNC cable
One TCA-BNC TekConnect adapter
Prerequisites None
1. Initialize the oscilloscope:Push the front-panel DEFAULT SETUP button.
2. Hook up the signal source: Connect the BNC cable from the probe com-pensation output to the CH 1 input through a TCA-BNC adapter as shown inFigure 1--7.
TDS7000 oscilloscope
BNC cable from PROBECOMPENSATION output toCH 1 input
Figure 1- 7: Setup for time base test
3. Set up the oscilloscope: Push the front panel AUTOSET button.
4. Touch the Vert button and then touch Offset. Adjust the Ch1 Offset to 0.8 Vusing the multipurpose knob.
5. Set the Vertical SCALE to 100 mV per division.
6. Set the time base: Set the horizontal SCALE to 200 s/div. The time-basereadout is displayed at the bottom of the graticule.
7. Verify that the time base operates: Confirm the following statements.
One period of the square-wave probe-compensation signal is about fivehorizontal divisions on-screen for the 200 s/div horizontal scale setting.
Rotating the horizontal SCALE knob clockwise expands the waveformon-screen (more horizontal divisions per waveform period), counter-clockwise rotation contracts it, and returning the horizontal scale to200 s/div returns the period to about five divisions.
Incoming Inspection
TDS7404, TDS7254 & TDS7154 Digital Phosphor Oscilloscopes User Manual 1- 23
The horizontal POSITION knob positions the signal left and righton-screen when rotated.
8. Verify horizontal delay:
a. Center a rising edge on screen:
Set the horizontal POSITION knob so that the rising edge where thewaveform is triggered is lined up with the center horizontalgraticule.
Change the horizontal SCALE to 20 s/div. The rising edge of thewaveform should remain near the center graticule and the fallingedge should be off screen.
b. Turn on and set horizontal delay:
From the Horiz/Acq menu, select Horizontal/Acquisition
Setup . . . .
Click the Horizontal tab in the control window that displays.
Click the Delay Mode button to turn delay on.
Double click the Horiz Delay control in the control window todisplay the pop-up keypad. Click the keypad buttons to set thehorizontal delay to 500 s and then click the ENTER key.
c. Verify the waveform: Verify that a falling edge of the waveform is withina few divisions of center screen.
d. Adjust the horizontal delay: Rotate the upper multipurpose knob tochange the horizontal delay setting. Verify that the falling edge shiftshorizontally. Rotate the front-panel horizontal POSITION knob. Verifythat this knob has the same effect (it also adjusts delay, but only whendelay mode is on).
e. Verify the delay toggle function:
Rotate the front-panel horizontal POSITION knob to center thefalling edge horizontally on the screen.
Change the horizontal SCALE to 40 ns/div. The falling edge of thewaveform should remain near the center graticule. If not, readjust thedelay setting to center the falling edge.
Push the front-panel DELAY button several times to toggle delay offand on and back off again. Verify that the display switches quicklybetween two different points in time (the rising and falling edges ofthis signal).
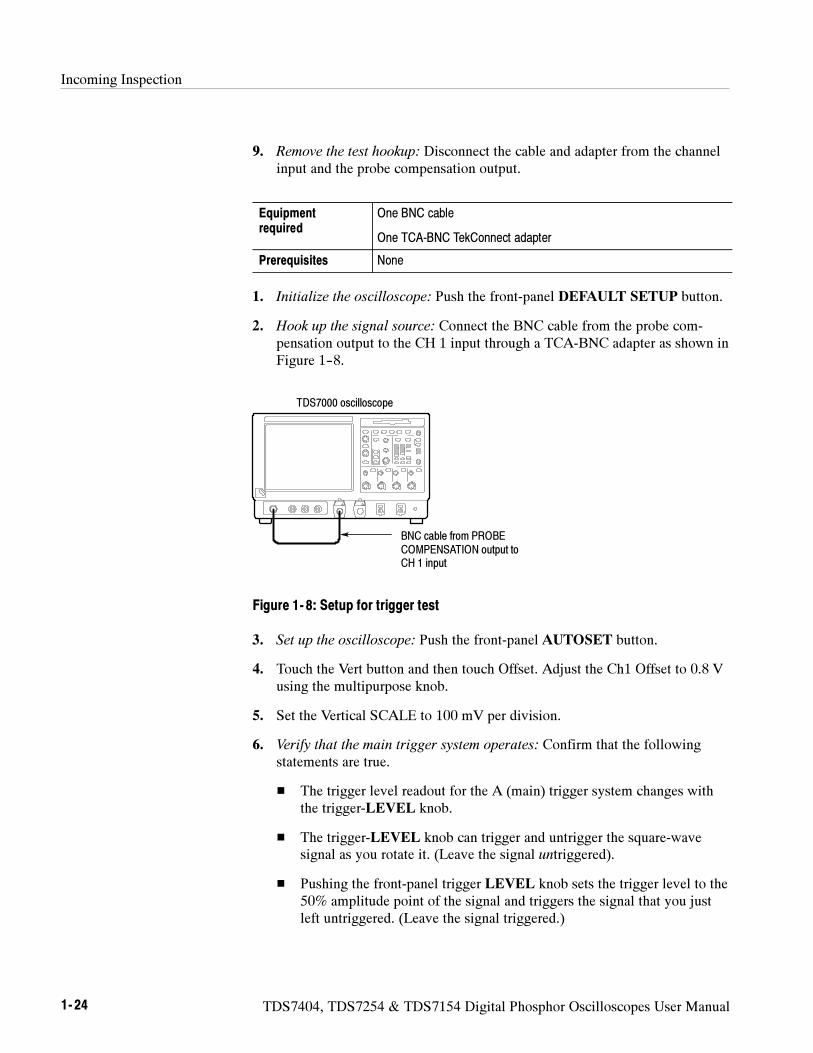
Incoming Inspection
1- 24 TDS7404, TDS7254 & TDS7154 Digital Phosphor Oscilloscopes User Manual
9. Remove the test hookup: Disconnect the cable and adapter from the channelinput and the probe compensation output.
Equipmentrequired
One BNC cable
One TCA-BNC TekConnect adapter
Prerequisites None
1. Initialize the oscilloscope: Push the front-panel DEFAULT SETUP button.
2. Hook up the signal source: Connect the BNC cable from the probe com-pensation output to the CH 1 input through a TCA-BNC adapter as shown inFigure 1--8.
TDS7000 oscilloscope
BNC cable from PROBECOMPENSATION output toCH 1 input
Figure 1- 8: Setup for trigger test
3. Set up the oscilloscope: Push the front-panel AUTOSET button.
4. Touch the Vert button and then touch Offset. Adjust the Ch1 Offset to 0.8 Vusing the multipurpose knob.
5. Set the Vertical SCALE to 100 mV per division.
6. Verify that the main trigger system operates: Confirm that the followingstatements are true.
The trigger level readout for the A (main) trigger system changes withthe trigger-LEVEL knob.
The trigger-LEVEL knob can trigger and untrigger the square-wavesignal as you rotate it. (Leave the signal untriggered).
Pushing the front-panel trigger LEVEL knob sets the trigger level to the50% amplitude point of the signal and triggers the signal that you justleft untriggered. (Leave the signal triggered.)
Incoming Inspection
TDS7404, TDS7254 & TDS7154 Digital Phosphor Oscilloscopes User Manual 1- 25
7. Verify that the delayed trigger system operates:
a. Set up the delayed trigger:
From the Trig menu, select A→B Sequence . . . . This displays theA→B Sequence tab of the trigger setup control window.
Click the Trig After Time button under A Then B.
Click the B Trig Level control in the control window.
b. Confirm that the following statements are true:
The trigger-level readout for the B trigger system changes as youturn the lower multipurpose knob.
As you rotate the lower multipurpose knob, the square-waveprobe-compensation signal can become triggered and untriggered.(Leave the signal triggered.)
c. Verify the delayed trigger counter:
Double click the Trig Delay control to pop up a numeric keypad forthat control.
Click on the keypad to enter a trigger delay time of 1 second andthen click Enter.
Verify that the trigger READY indicator on the front panel flashesabout once every second as the waveform is updated on-screen.
8. Remove the test hookup: Disconnect the cable and adapter from the channelinput and the Probe Compensation output.
Equipmentrequired
One BNC cable
One TCA-BNC TekConnect adapter
One 1.44 Mbyte, 3.5 inch DOS-compatible formatted disk.
Prerequisites None
1. Initialize the oscilloscope: Push the front-panel DEFAULT SETUP button.
2. Hook up the signal source: Connect the BNC cable from the probe com-pensation output to the CH 1 input through a TCA-BNC adapter as shown inFigure 1--9.
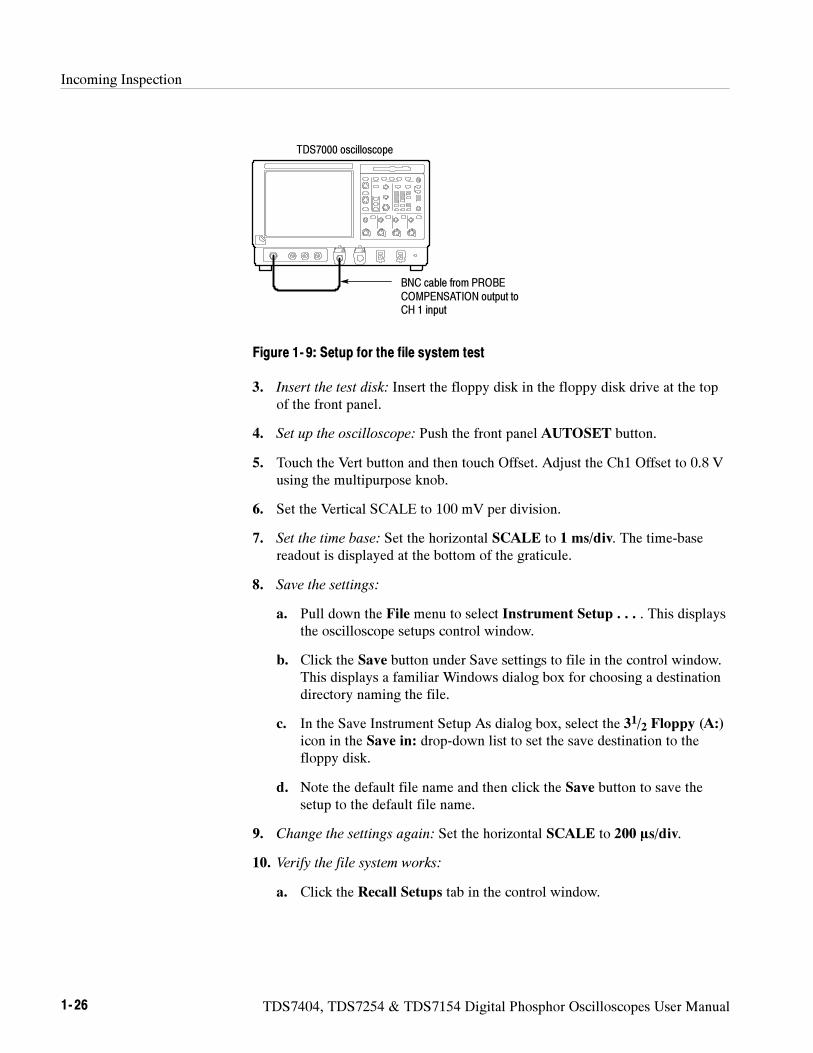
Incoming Inspection
1- 26 TDS7404, TDS7254 & TDS7154 Digital Phosphor Oscilloscopes User Manual
TDS7000 oscilloscope
BNC cable from PROBECOMPENSATION output toCH 1 input
Figure 1- 9: Setup for the file system test
3. Insert the test disk: Insert the floppy disk in the floppy disk drive at the topof the front panel.
4. Set up the oscilloscope: Push the front panel AUTOSET button.
5. Touch the Vert button and then touch Offset. Adjust the Ch1 Offset to 0.8 Vusing the multipurpose knob.
6. Set the Vertical SCALE to 100 mV per division.
7. Set the time base: Set the horizontal SCALE to 1 ms/div. The time-basereadout is displayed at the bottom of the graticule.
8. Save the settings:
a. Pull down the File menu to select Instrument Setup . . . . This displaysthe oscilloscope setups control window.
b. Click the Save button under Save settings to file in the control window.This displays a familiar Windows dialog box for choosing a destinationdirectory naming the file.
c. In the Save Instrument Setup As dialog box, select the 31/2 Floppy (A:)
icon in the Save in: drop-down list to set the save destination to thefloppy disk.
d. Note the default file name and then click the Save button to save thesetup to the default file name.
9. Change the settings again: Set the horizontal SCALE to 200 s/div.
10. Verify the file system works:
a. Click the Recall Setups tab in the control window.
Incoming Inspection
TDS7404, TDS7254 & TDS7154 Digital Phosphor Oscilloscopes User Manual 1- 27
b. Click the Recall button under Recall settings from file in the controlwindow. This displays a familiar Windows dialog box for locating thesettings file that you want to recall.
c. In the Recall Instrument Setup dialog box, select the 31/2 Floppy (A:)
icon in the Look in: drop-down list.
d. Locate and then double click in the dialog box on the setup file that youpreviously stored.
e. Verify that the oscilloscope retrieved the saved setup from the disk. Dothis by noticing the horizontal SCALE is again 1 ms and the waveformshows ten cycles just as it did when you saved the setup.
11. Remove the test hookup:
a. Disconnect the probe and adapter from the channel input and the probecompensation output.
b. Remove the floppy disk from the floppy disk drive.
Perform the Extended Diagnostics
Extended diagnostics and self calibration perform a more detailed functionalitycheck than the incoming inspection and Power-on diagnostics.
NOTE. Allow a 20-minute warm-up before running the self calibration.
Disconnect any attached probes from the oscilloscope. Then select the Utilitiesmenu. Run the self calibration followed by the extended diagnostics by firstselecting the Instrument Calibration (see page 3--142 for additional informationon signal path compensation) and then the Instrument Diagnostics tabs. Resultsof the tests display on their property pages.
To check the hardware and Windows software underlying the TDS oscilloscopeUI (user interface), run the QA+Win32 diagnostics from the Windows Startmenu:
1. Exit the oscilloscope application before running the external diagnostics.
a. Display the Task Manager by pressing CTRL, ALT, and Delete.
b. Select TDS7000 and then touch End Task.
Checking the UnderlyingSystem (Optional)
Incoming Inspection
1- 28 TDS7404, TDS7254 & TDS7154 Digital Phosphor Oscilloscopes User Manual
NOTE. About 10 seconds after touching End Task, a program not responding
window may appear. If it does, touch End Task.
c. Display the Task Manager by pressing CTRL, ALT, and Delete.
d. Select Windowsscopeservices and then touch End Task.
2. Click Start, then click Programs in the Start Menu. Finally, click SykesDiagnostics and then QA+Win32.
3. Click the Quick Test button to run the diagnostics suite.
4. Check test results in scrollable results listing in the lower left corner of theQAPlus test window. All tests except the audio test should pass.
5. Dismiss the QAPlus/Win diagnostics: Select Exit in the File menu.
6. Restart your oscilloscope UI software: Click Start, then click Programs inthe Start Menu. Finally, click Tektronix Oscilloscope and then TekScope.
TDS7404, TDS7254 & TDS7154 Digital Phosphor Oscilloscopes User Manual 1- 29
Accessories & Options
This section lists the standard and optional accessories available for theoscilloscope, as well as the product options.
Options
The following options can be ordered for the oscilloscope:
Option 1K: K4000 Instrument Cart
Option 1R: Rack Mount Kit (includes: hardware and instructions forconverting to rackmount configuration)
Option 1M: Long record length: 500 ksamples per channel, 2 Msamplesmaximum
Option 2M: Long record length: 2 Msamples per channel, 8 Msamplesmaximum
Option 3M: Long record length: 4 Msamples per channel, 16 Msamplesmaximum
Option 4M: Long record length: 8 Msamples per channel, 32 Msamplesmaximum
Option 37: Add one P6245, 1.5 GHz, active probe (TDS7154 only)
Option 39: Add one P6248, 1.7 GHz, active probe (TDS7154 only)
Option 51: Add one P7240, 4 GHz, active probe (TDS7404 and TDS7254only)
Option 52: Add one P7330, 3 GHz, differential probe (TDS7404 andTDS7254 only)
International Power Cords Options:
Option A1 -- Universal European 230 V, 50 Hz
Option A2 -- United Kingdom 230 V, 50 Hz
Option A3 -- Australian 230 V, 50 Hz
Option A5 -- Switzerland 230 V, 50 Hz
Option AC -- China 230 V, 50 Hz
Option A99 -- No power cord
Accessories & Options
1- 30 TDS7404, TDS7254 & TDS7154 Digital Phosphor Oscilloscopes User Manual
Option CP2: TDSCPM2--ANSI/ITU Telecomm Pulse Compliance Testingapplication (Requires Option SM)
Option J1: TDSJIT2 Jitter Analysis application
Option J2: TDSDDM2 Disk Drive Measurements application
Option JT3: TDSJIT3 Advanced Jitter Analysis application with random anddeterministic jitter analysis
Option CP2: TDSCPM2 Compliance Testing for ITU-T G.703 andANSI T1.102 communications standards
Option USB: TDSUSBS--USB2.0 Compliance Test application (Softwareonly)
Option SM: Serial Communications Mast Testing
Option ST: Serial Pattern Triggering
Option UB2: TDSUSB2 Compliance Testing for USB1.0/USB2.0 standards
Option TDS7UP: Field upgrade options. Many are available. ContactTektronix (see page xv) for a complete list of available TDS7UP options
Service offerings:
Opt. C3: Calibration services extended to cover three years
Opt. C5: Calibration services extended to cover five years
Opt. D1: Calibration data report
Opt. D3: Test Data for calibration services in Opt. C3
Opt. D5: Test Data for calibration services in Opt. C5
Opt. R3: Repair warranty extended to cover three years
Opt. R5: Repair warranty extended to cover five years
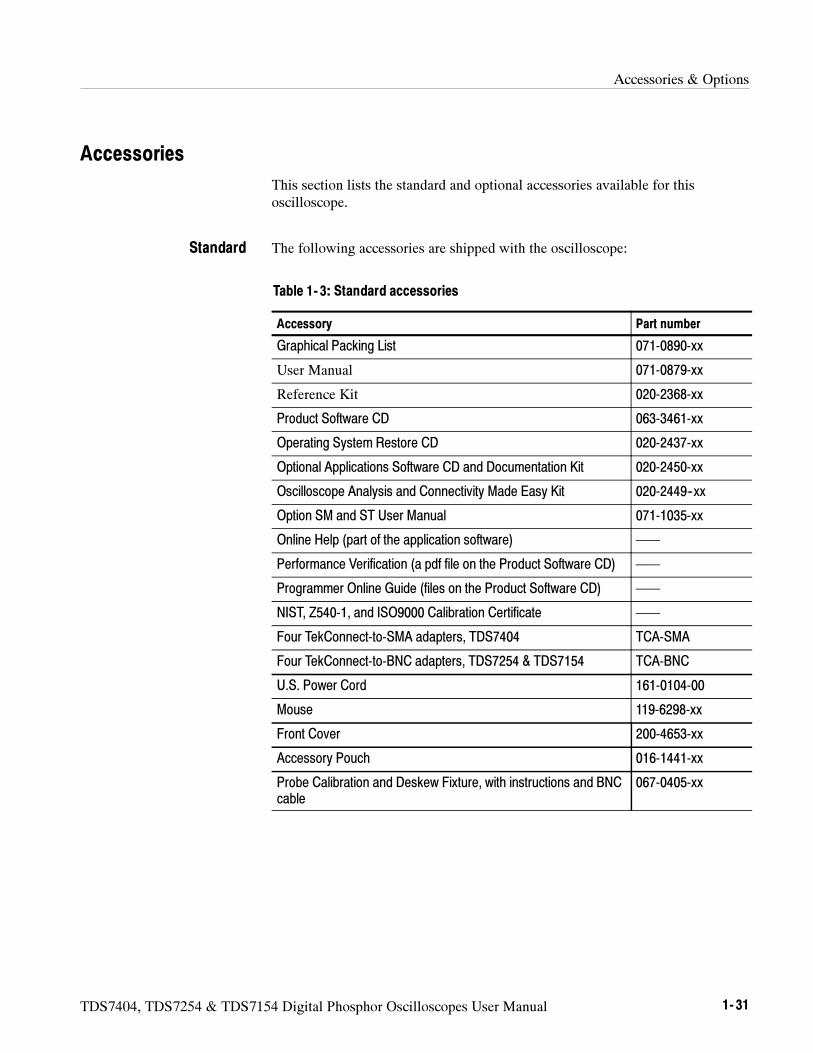
Accessories & Options
TDS7404, TDS7254 & TDS7154 Digital Phosphor Oscilloscopes User Manual 1- 31
Accessories
This section lists the standard and optional accessories available for thisoscilloscope.
The following accessories are shipped with the oscilloscope:
Table 1- 3: Standard accessories
Accessory Part number
Graphical Packing List 071-0890-xx
User Manual 071-0879-xx
Reference Kit 020-2368-xx
Product Software CD 063-3461-xx
Operating System Restore CD 020-2437-xx
Optional Applications Software CD and Documentation Kit 020-2450-xx
Oscilloscope Analysis and Connectivity Made Easy Kit 020-2449--xx
Option SM and ST User Manual 071-1035-xx
Online Help (part of the application software) ——
Performance Verification (a pdf file on the Product Software CD) ——
Programmer Online Guide (files on the Product Software CD) ——
NIST, Z540-1, and ISO9000 Calibration Certificate ——
Four TekConnect-to-SMA adapters, TDS7404 TCA-SMA
Four TekConnect-to-BNC adapters, TDS7254 & TDS7154 TCA-BNC
U.S. Power Cord 161-0104-00
Mouse 119-6298-xx
Front Cover 200-4653-xx
Accessory Pouch 016-1441-xx
Probe Calibration and Deskew Fixture, with instructions and BNCcable
067-0405-xx
Standard
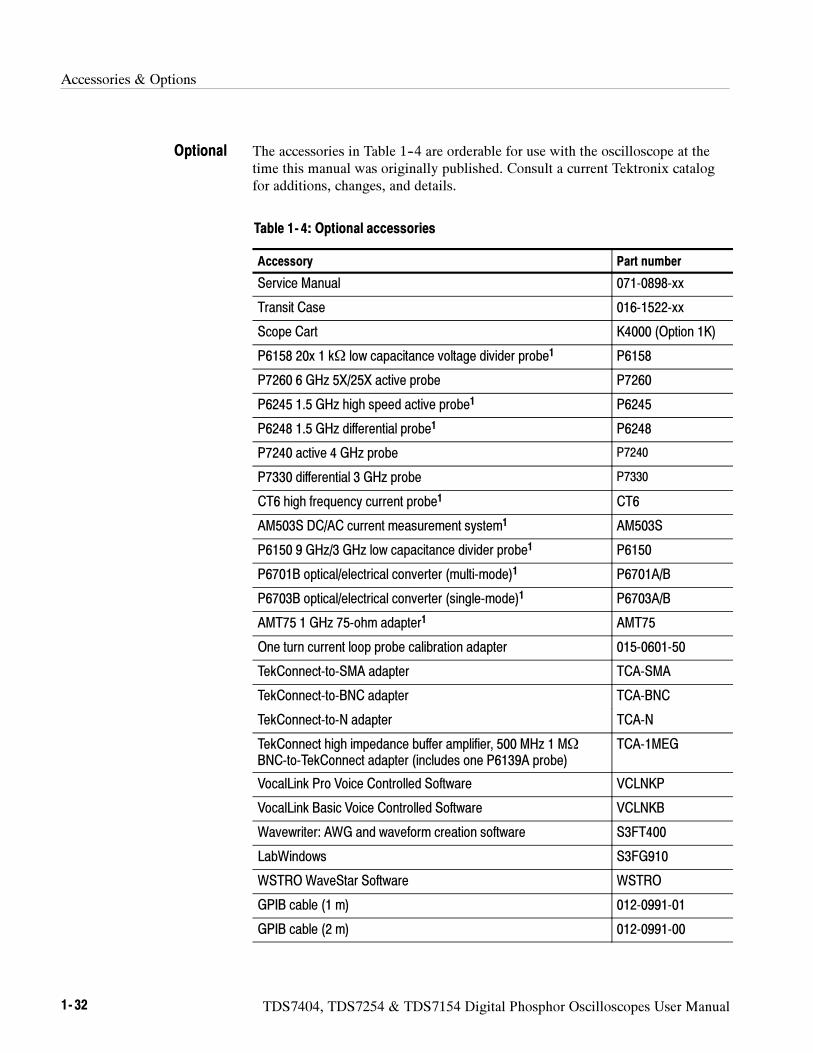
Accessories & Options
1- 32 TDS7404, TDS7254 & TDS7154 Digital Phosphor Oscilloscopes User Manual
The accessories in Table 1--4 are orderable for use with the oscilloscope at thetime this manual was originally published. Consult a current Tektronix catalogfor additions, changes, and details.
Table 1- 4: Optional accessories
Accessory Part number
Service Manual 071-0898-xx
Transit Case 016-1522-xx
Scope Cart K4000 (Option 1K)
P6158 20x 1 kΩ low capacitance voltage divider probe1 P6158
P7260 6 GHz 5X/25X active probe P7260
P6245 1.5 GHz high speed active probe1 P6245
P6248 1.5 GHz differential probe1 P6248
P7240 active 4 GHz probe P7240
P7330 differential 3 GHz probe P7330
CT6 high frequency current probe1 CT6
AM503S DC/AC current measurement system1 AM503S
P6150 9 GHz/3 GHz low capacitance divider probe1 P6150
P6701B optical/electrical converter (multi-mode)1 P6701A/B
P6703B optical/electrical converter (single-mode)1 P6703A/B
AMT75 1 GHz 75-ohm adapter1 AMT75
One turn current loop probe calibration adapter 015-0601-50
TekConnect-to-SMA adapter TCA-SMA
TekConnect-to-BNC adapter TCA-BNC
TekConnect-to-N adapter TCA-N
TekConnect high impedance buffer amplifier, 500 MHz 1 MΩBNC-to-TekConnect adapter (includes one P6139A probe)
TCA-1MEG
VocalLink Pro Voice Controlled Software VCLNKP
VocalLink Basic Voice Controlled Software VCLNKB
Wavewriter: AWG and waveform creation software S3FT400
LabWindows S3FG910
WSTRO WaveStar Software WSTRO
GPIB cable (1 m) 012-0991-01
GPIB cable (2 m) 012-0991-00
Optional
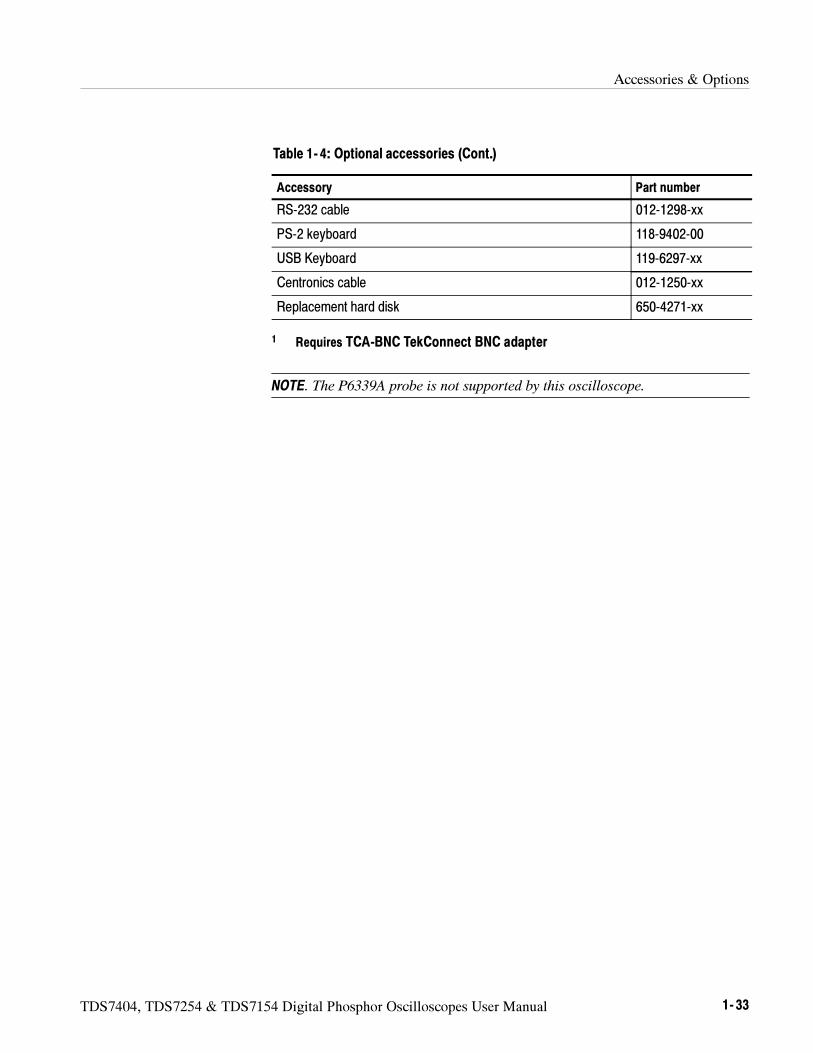
Accessories & Options
TDS7404, TDS7254 & TDS7154 Digital Phosphor Oscilloscopes User Manual 1- 33
Table 1- 4: Optional accessories (Cont.)
Accessory Part number
RS-232 cable 012-1298-xx
PS-2 keyboard 118-9402-00
USB Keyboard 119-6297-xx
Centronics cable 012-1250-xx
Replacement hard disk 650-4271-xx
1 Requires TCA-BNC TekConnect BNC adapter
NOTE. The P6339A probe is not supported by this oscilloscope.

Accessories & Options
1- 34 TDS7404, TDS7254 & TDS7154 Digital Phosphor Oscilloscopes User Manual
TDS7404, TDS7254 & TDS7154 Digital Phosphor Oscilloscopes User Manual 2- 1
Operational Maps
This chapter acquaints you with how the oscilloscope functions and operates. Itconsists of several maps that describe the system, its operation, and its documen-tation:
Documentation Map, on page 2--2, lists the documentation that supports theoscilloscope.
System Overview Maps on page 2--3, describe the high-level operating blocksand operating cycle of the oscilloscope.
User-Interface Map, on page 2--6, describes the elements of the User Interface(UI) application, which provides complete control of the oscilloscope.
Front-Panel Map, on page 2--9, describes the elements of the oscilloscopefront panel and cross references information relevant to each element.
DisplayMap, on page 2--8, describes elements and operation of single-graticuleand multiple-graticule displays.
Front Panel I/OMap, on page2--7, describes input/output ports andperipherals.
Tutorial (How to?) procedures are available online, as part of the online help.
For information on configuring and installing your oscilloscope, refer toChapter 1, Getting Started.
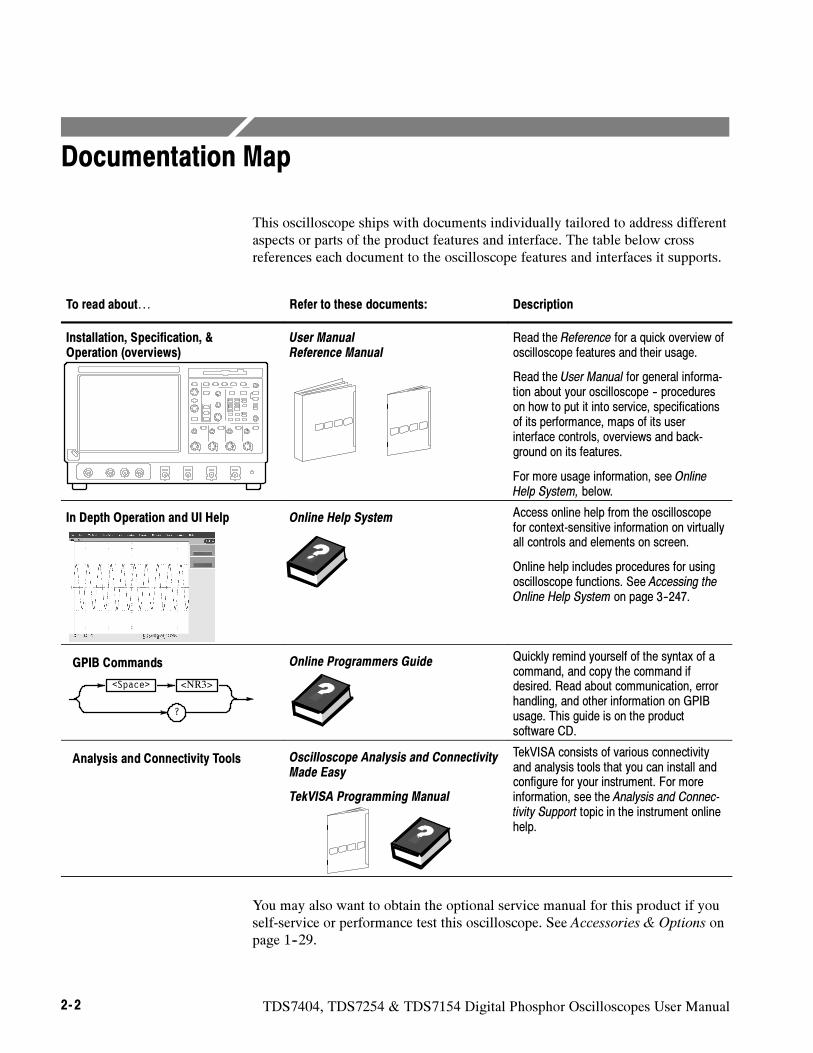
2- 2 TDS7404, TDS7254 & TDS7154 Digital Phosphor Oscilloscopes User Manual
Documentation Map
This oscilloscope ships with documents individually tailored to address differentaspects or parts of the product features and interface. The table below crossreferences each document to the oscilloscope features and interfaces it supports.
To read about… Refer to these documents: Description
Installation, Specification, &Operation (overviews)
User ManualReference Manual
Read the Reference for a quick overview ofoscilloscope features and their usage.
Read the User Manual for general informa-tion about your oscilloscope -- procedureson how to put it into service, specificationsof its performance, maps of its userinterface controls, overviews and back-ground on its features.
For more usage information, see OnlineHelp System, below.
In Depth Operation and UI Help Online Help System Access online help from the oscilloscopefor context-sensitive information on virtuallyall controls and elements on screen.
Online help includes procedures for usingoscilloscope functions. See Accessing theOnline Help System on page 3--247.
<NR3><Space>
?
GPIB Commands Online Programmers Guide Quickly remind yourself of the syntax of acommand, and copy the command ifdesired. Read about communication, errorhandling, and other information on GPIBusage. This guide is on the productsoftware CD.
Analysis and Connectivity Tools Oscilloscope Analysis and ConnectivityMade Easy
TekVISA Programming Manual
TekVISA consists of various connectivityand analysis tools that you can install andconfigure for your instrument. For moreinformation, see the Analysis and Connec-tivity Support topic in the instrument onlinehelp.
You may also want to obtain the optional service manual for this product if youself-service or performance test this oscilloscope. See Accessories & Options onpage 1--29.
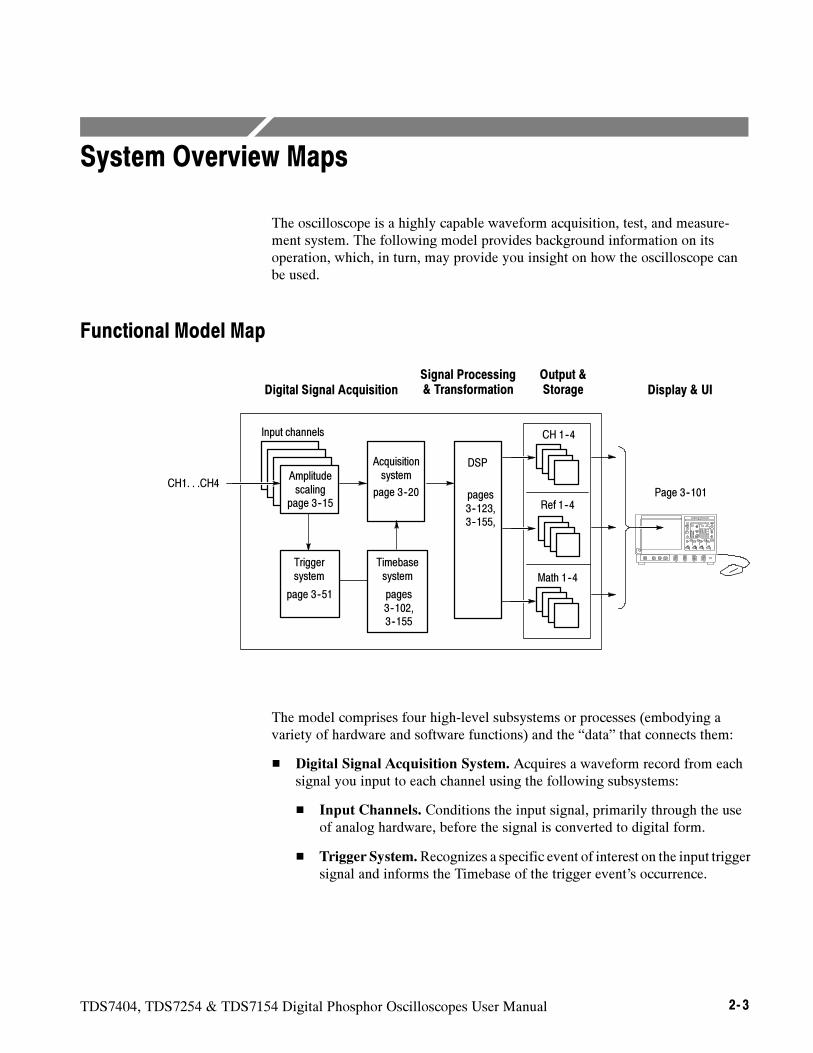
TDS7404, TDS7254 & TDS7154 Digital Phosphor Oscilloscopes User Manual 2- 3
System Overview Maps
The oscilloscope is a highly capable waveform acquisition, test, and measure-ment system. The following model provides background information on itsoperation, which, in turn, may provide you insight on how the oscilloscope canbe used.
Functional Model Map
Input channels
Timebasesystem
CH 1--4
CH1. . .CH4
Math 1--4
Acquisitionsystem
DSP
Output &StorageDigital Signal Acquisition
Amplitudescaling
page 3--15page 3--20 pages
3--123,3--155,
pages3--102,3--155
Triggersystem
page 3--51
Ref 1--4
Display & UISignal Processing& Transformation
Page 3--101
The model comprises four high-level subsystems or processes (embodying avariety of hardware and software functions) and the “data” that connects them:
Digital Signal Acquisition System. Acquires a waveform record from eachsignal you input to each channel using the following subsystems:
Input Channels. Conditions the input signal, primarily through the useof analog hardware, before the signal is converted to digital form.
Trigger System.Recognizes a specific event of interest on the input triggersignal and informs the Timebase of the trigger event’s occurrence.
System Overview Maps
2- 4 TDS7404, TDS7254 & TDS7154 Digital Phosphor Oscilloscopes User Manual
Timebase System. Tells the Acquisition system to start an acquisitioncycle (that is, to convert from analog to digital). In more general terms,synchronizes the capturing of digital samples in the Acquisition systemto the trigger events generated from the Trigger system.
Acquisition System. Performs the actual A/D conversion and storing ofdigital samples.
DSP Transformation System. Performs a variety of transformations oroperations, beginning with the most fundamental data element(s) in thesystem, the Channel Waveform(s). Waveform math operations, automaticmeasurements, spectral waveforms, and histogram generation are examples.
Input/Output Systems. Provides output (and sometimes input) ofoscilloscope-data elements in a form suitable to the user and also providesuser input control.
The process overview that follows describes each step in the top-level cycle ofoscilloscope operation.
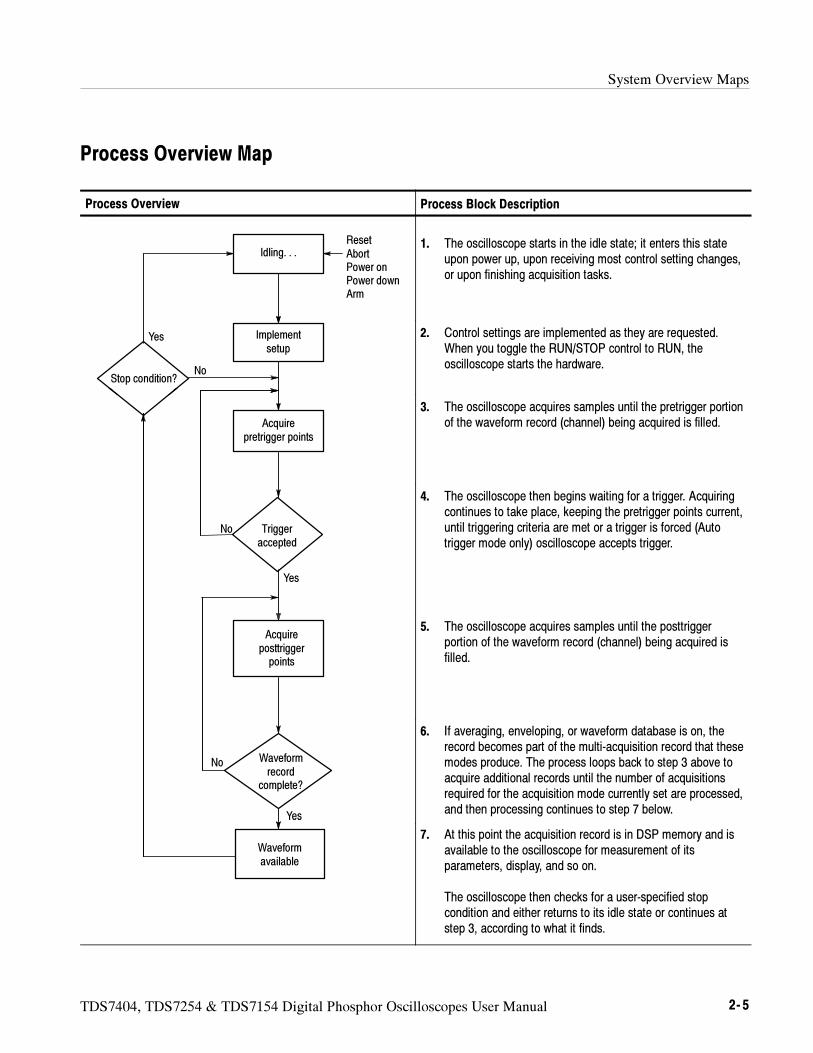
System Overview Maps
TDS7404, TDS7254 & TDS7154 Digital Phosphor Oscilloscopes User Manual 2- 5
Process Overview Map
Process Overview Process Block Description
Idling. . .ResetAbortPower onPower downArm
1. The oscilloscope starts in the idle state; it enters this stateupon power up, upon receiving most control setting changes,or upon finishing acquisition tasks.
Implementsetup
Stop condition?
Yes
No
2. Control settings are implemented as they are requested.When you toggle the RUN/STOP control to RUN, theoscilloscope starts the hardware.
Acquirepretrigger points
3. The oscilloscope acquires samples until the pretrigger portionof the waveform record (channel) being acquired is filled.
Triggeraccepted
Yes
No
4. The oscilloscope then begins waiting for a trigger. Acquiringcontinues to take place, keeping the pretrigger points current,until triggering criteria are met or a trigger is forced (Autotrigger mode only) oscilloscope accepts trigger.
Acquireposttriggerpoints
5. The oscilloscope acquires samples until the posttriggerportion of the waveform record (channel) being acquired isfilled.
Waveformrecord
complete?
No
Yes
6. If averaging, enveloping, or waveform database is on, therecord becomes part of the multi-acquisition record that thesemodes produce. The process loops back to step 3 above toacquire additional records until the number of acquisitionsrequired for the acquisition mode currently set are processed,and then processing continues to step 7 below.
Waveformavailable
Yes
7. At this point the acquisition record is in DSP memory and isavailable to the oscilloscope for measurement of itsparameters, display, and so on.
The oscilloscope then checks for a user-specified stopcondition and either returns to its idle state or continues atstep 3, according to what it finds.
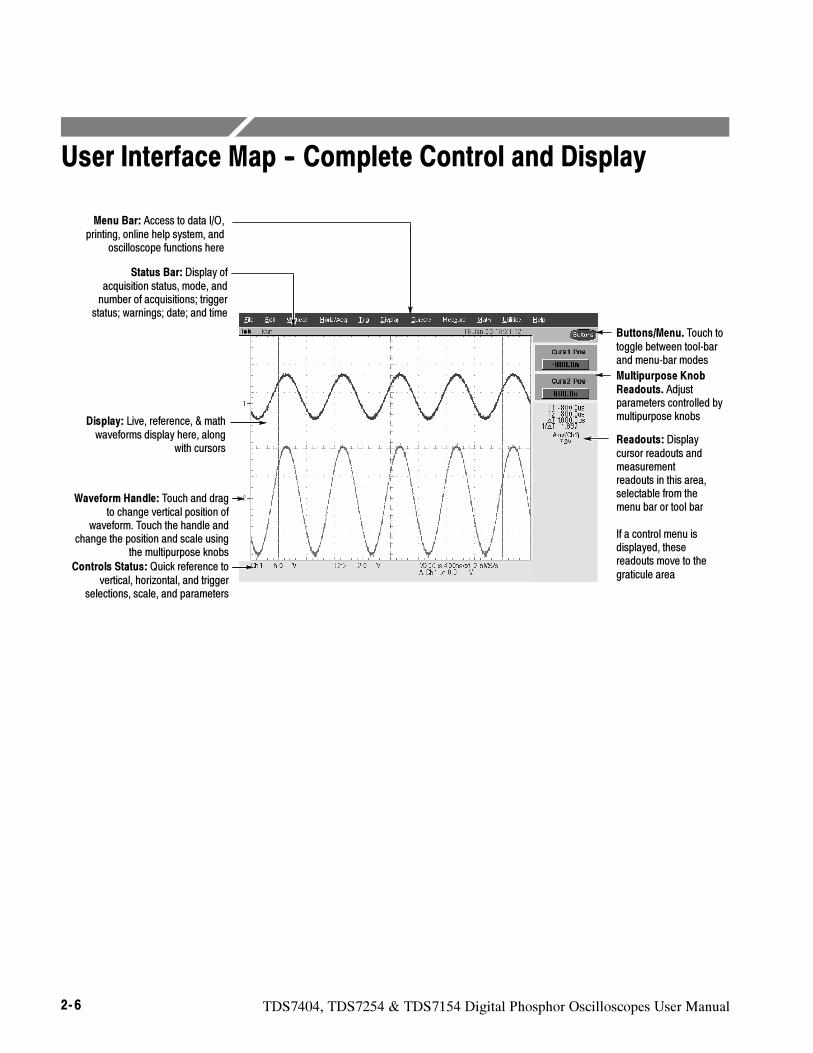
2- 6 TDS7404, TDS7254 & TDS7154 Digital Phosphor Oscilloscopes User Manual
User Interface Map -- Complete Control and Display
Menu Bar: Access to data I/O,printing, online help system, and
oscilloscope functions here
Status Bar: Display ofacquisition status, mode, andnumber of acquisitions; trigger
status; warnings; date; and time
Display: Live, reference, & mathwaveforms display here, along
with cursorsReadouts: Displaycursor readouts andmeasurementreadouts in this area,selectable from themenu bar or tool bar
If a control menu isdisplayed, thesereadouts move to thegraticule area
Controls Status: Quick reference tovertical, horizontal, and trigger
selections, scale, and parameters
Multipurpose KnobReadouts. Adjustparameters controlled bymultipurpose knobs
Buttons/Menu. Touch totoggle between tool-barand menu-bar modes
Waveform Handle: Touch and dragto change vertical position of
waveform. Touch the handle andchange the position and scale using
the multipurpose knobs
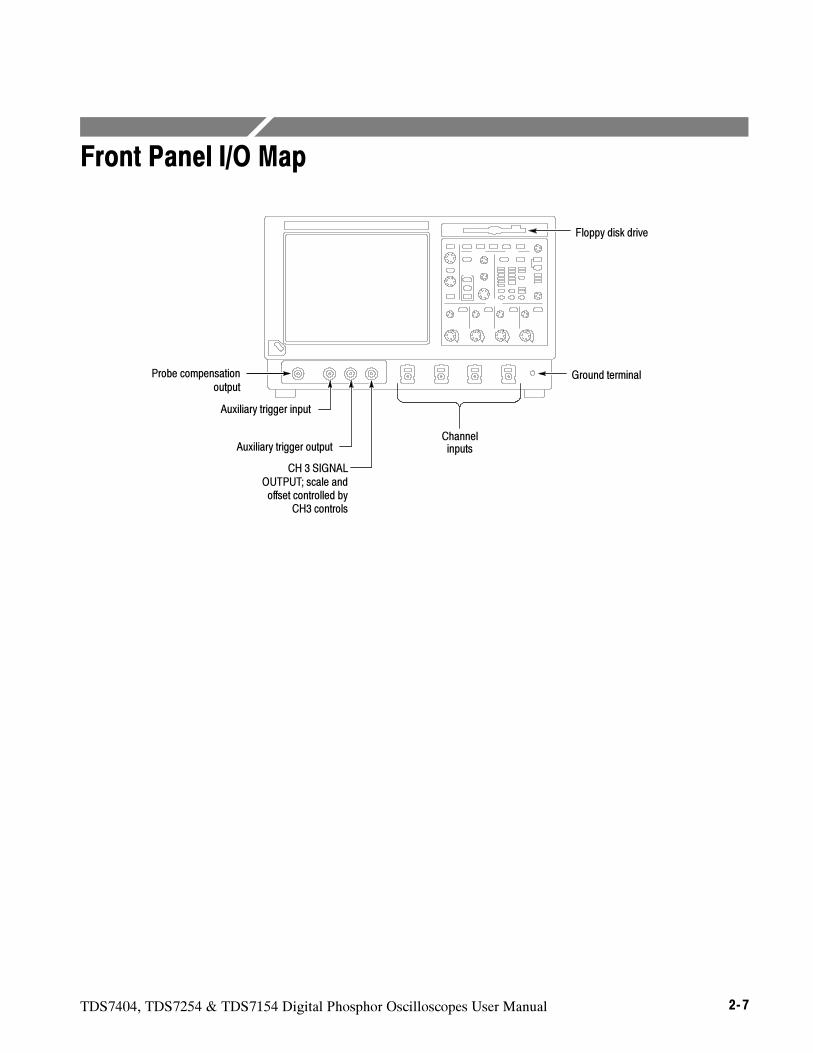
TDS7404, TDS7254 & TDS7154 Digital Phosphor Oscilloscopes User Manual 2- 7
Front Panel I/O Map
Floppy disk drive
Auxiliary trigger input
Auxiliary trigger output
CH 3 SIGNALOUTPUT; scale andoffset controlled by
CH3 controls
Probe compensationoutput
Ground terminal
Channelinputs
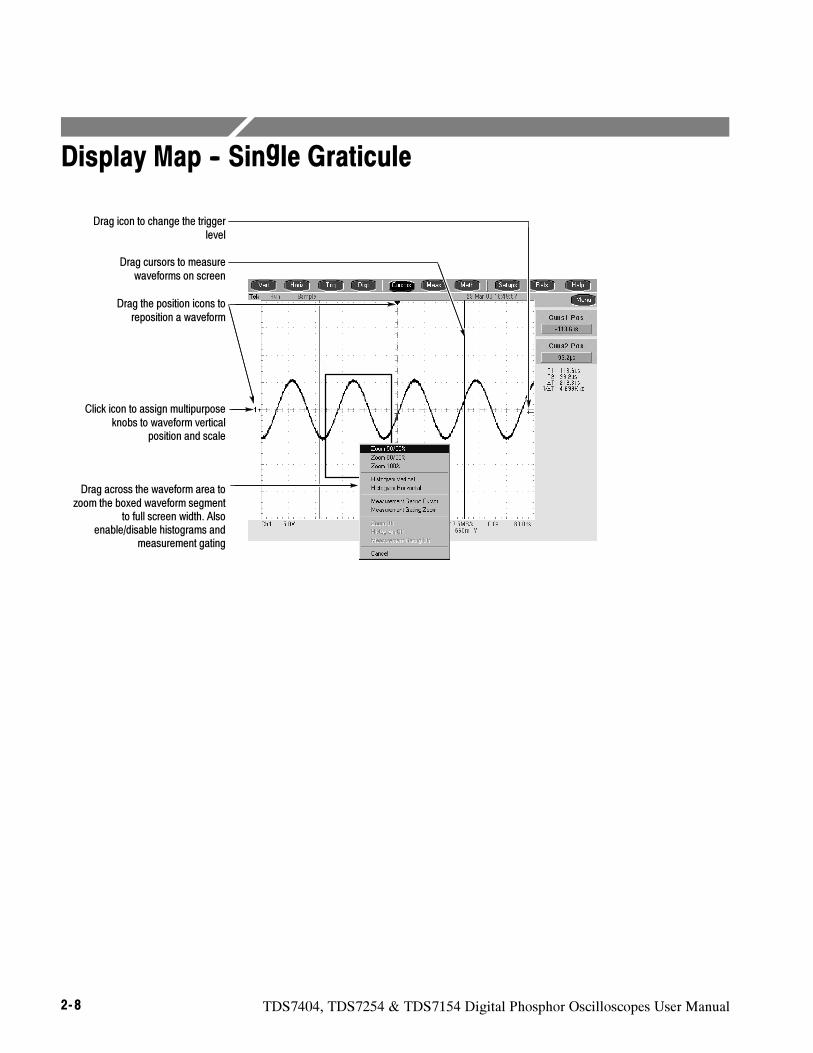
2- 8 TDS7404, TDS7254 & TDS7154 Digital Phosphor Oscilloscopes User Manual
Display Map -- Single Graticule
Drag the position icons toreposition a waveform
Drag across the waveform area tozoom the boxed waveform segment
to full screen width. Alsoenable/disable histograms and
measurement gating
Drag cursors to measurewaveforms on screen
Click icon to assign multipurposeknobs to waveform vertical
position and scale
Drag icon to change the triggerlevel
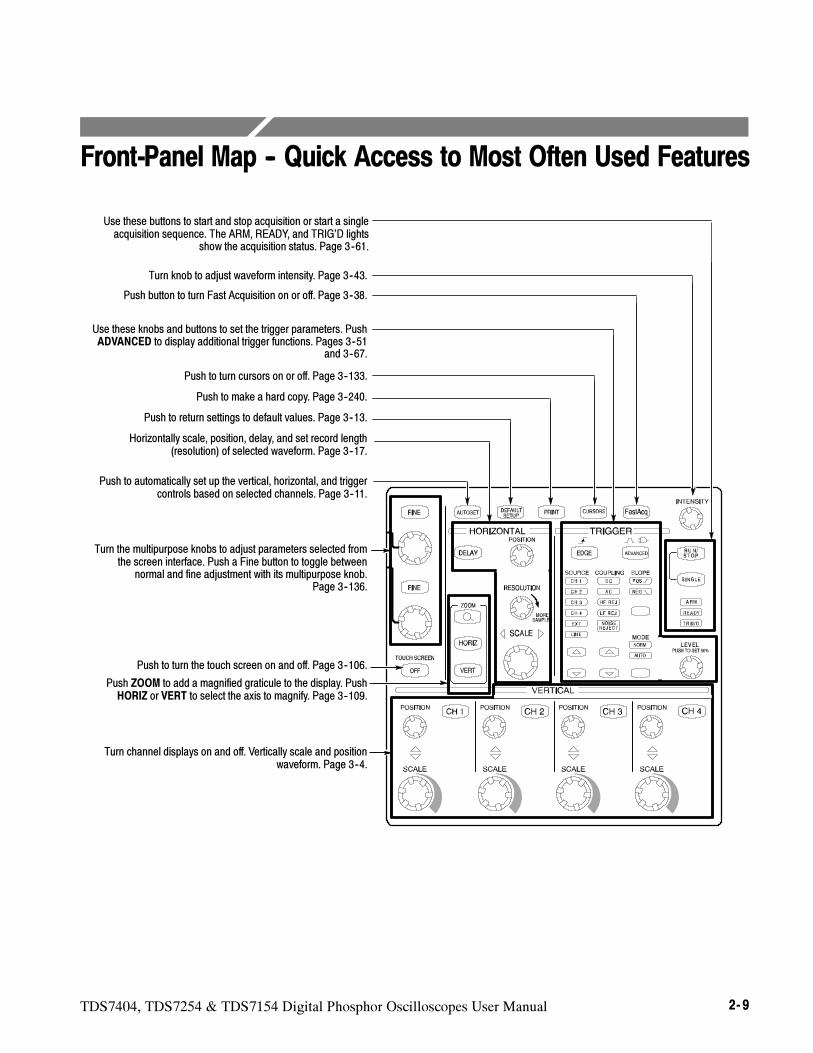
TDS7404, TDS7254 & TDS7154 Digital Phosphor Oscilloscopes User Manual 2- 9
Front-Panel Map -- Quick Access to Most Often Used Features
Push to turn the touch screen on and off. Page 3--106.
Use these buttons to start and stop acquisition or start a singleacquisition sequence. The ARM, READY, and TRIG’D lights
show the acquisition status. Page 3--61.
Push to make a hard copy. Page 3--240.
Push to automatically set up the vertical, horizontal, and triggercontrols based on selected channels. Page 3--11.
Push to return settings to default values. Page 3--13.
Turn channel displays on and off. Vertically scale and positionwaveform. Page 3--4.
Horizontally scale, position, delay, and set record length(resolution) of selected waveform. Page 3--17.
Turn knob to adjust waveform intensity. Page 3--43.
Push to turn cursors on or off. Page 3--133.
Turn the multipurpose knobs to adjust parameters selected fromthe screen interface. Push a Fine button to toggle between
normal and fine adjustment with its multipurpose knob.Page 3--136.
Push button to turn Fast Acquisition on or off. Page 3--38.
Use these knobs and buttons to set the trigger parameters. PushADVANCED to display additional trigger functions. Pages 3--51
and 3--67.
Push ZOOM to add a magnified graticule to the display. PushHORIZ or VERT to select the axis to magnify. Page 3--109.
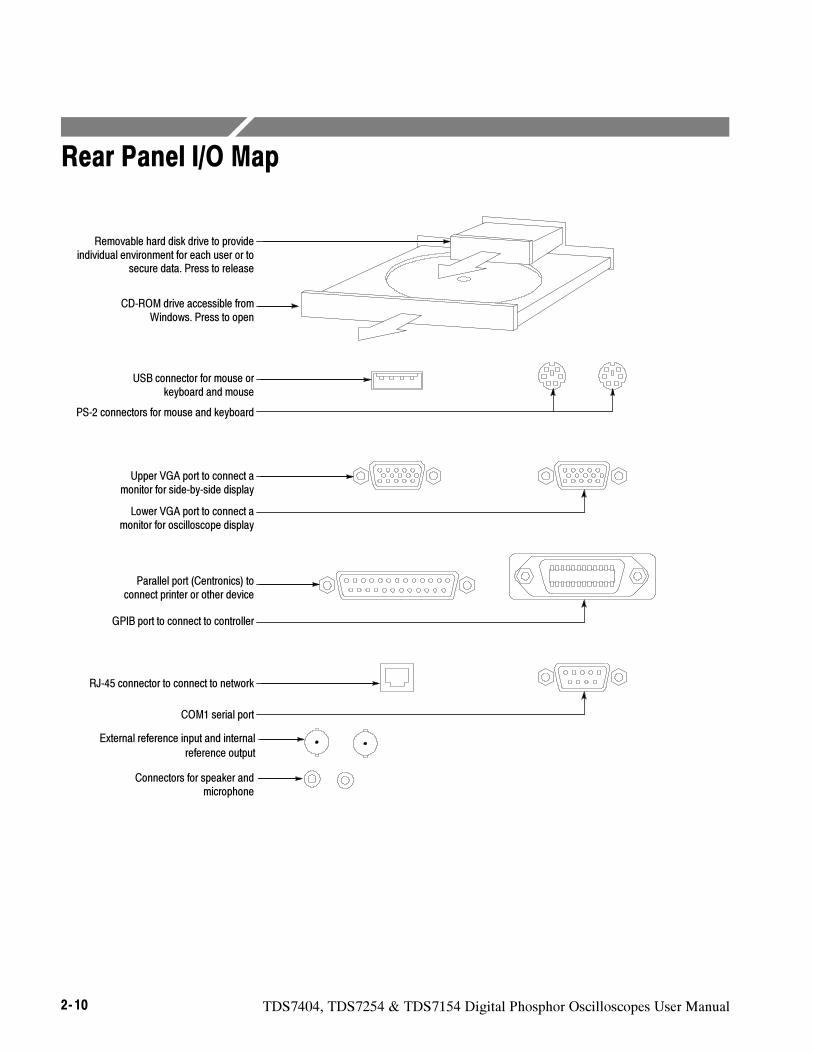
2- 10 TDS7404, TDS7254 & TDS7154 Digital Phosphor Oscilloscopes User Manual
Rear Panel I/O Map
RJ-45 connector to connect to network
Removable hard disk drive to provideindividual environment for each user or to
secure data. Press to release
USB connector for mouse orkeyboard and mouse
COM1 serial port
Upper VGA port to connect amonitor for side-by-side display
Lower VGA port to connect amonitor for oscilloscope display
PS-2 connectors for mouse and keyboard
Parallel port (Centronics) toconnect printer or other device
GPIB port to connect to controller
PCMCIA slots for two type-1 cards,two type-2 cards, or one type-3 card
CD-ROM drive accessible fromWindows. Press to open
Connectors for speaker andmicrophone
External reference input and internal
reference output
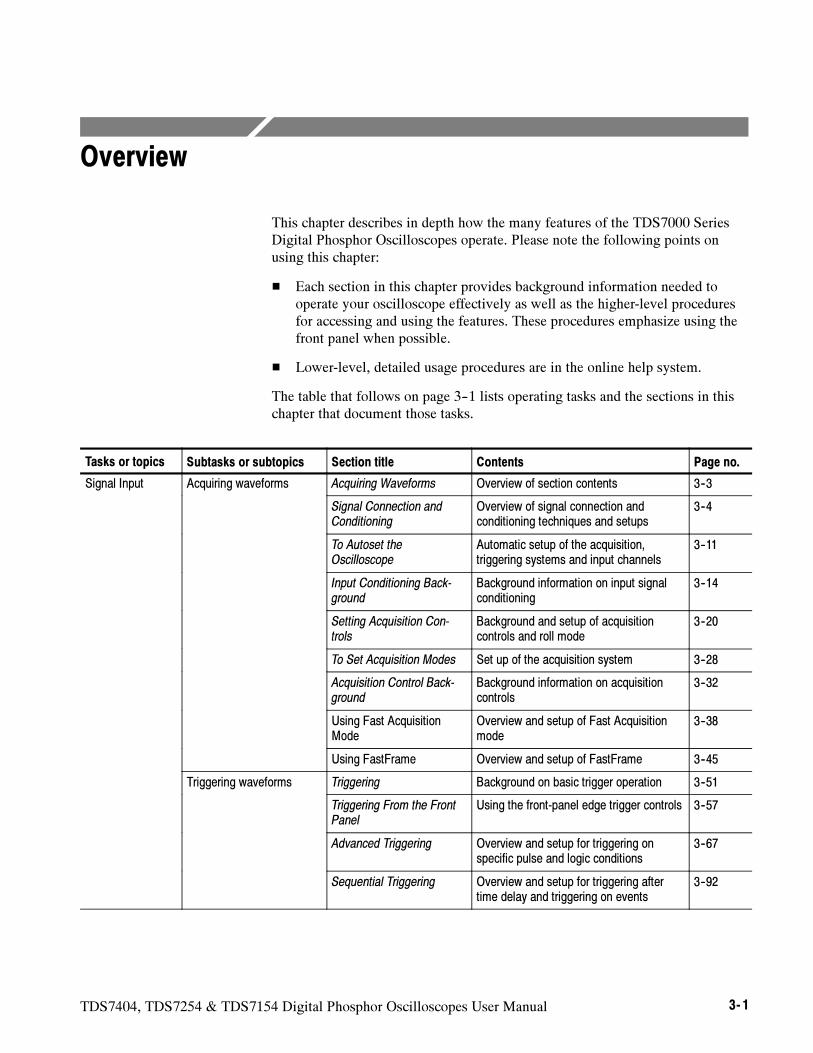
TDS7404, TDS7254 & TDS7154 Digital Phosphor Oscilloscopes User Manual 3- 1
Overview
This chapter describes in depth how the many features of the TDS7000 SeriesDigital Phosphor Oscilloscopes operate. Please note the following points onusing this chapter:
Each section in this chapter provides background information needed tooperate your oscilloscope effectively as well as the higher-level proceduresfor accessing and using the features. These procedures emphasize using thefront panel when possible.
Lower-level, detailed usage procedures are in the online help system.
The table that follows on page 3--1 lists operating tasks and the sections in thischapter that document those tasks.
Tasks or topics Subtasks or subtopics Section title Contents Page no.
Signal Input Acquiring waveforms Acquiring Waveforms Overview of section contents 3--3
Signal Connection andConditioning
Overview of signal connection andconditioning techniques and setups
3--4
To Autoset theOscilloscope
Automatic setup of the acquisition,triggering systems and input channels
3--11
Input Conditioning Back-ground
Background information on input signalconditioning
3--14
Setting Acquisition Con-trols
Background and setup of acquisitioncontrols and roll mode
3--20
To Set Acquisition Modes Set up of the acquisition system 3--28
Acquisition Control Back-ground
Background information on acquisitioncontrols
3--32
Using Fast AcquisitionMode
Overview and setup of Fast Acquisitionmode
3--38
Using FastFrame Overview and setup of FastFrame 3--45
Triggering waveforms Triggering Background on basic trigger operation 3--51
Triggering From the FrontPanel
Using the front-panel edge trigger controls 3--57
Advanced Triggering Overview and setup for triggering onspecific pulse and logic conditions
3--67
Sequential Triggering Overview and setup for triggering aftertime delay and triggering on events
3--92
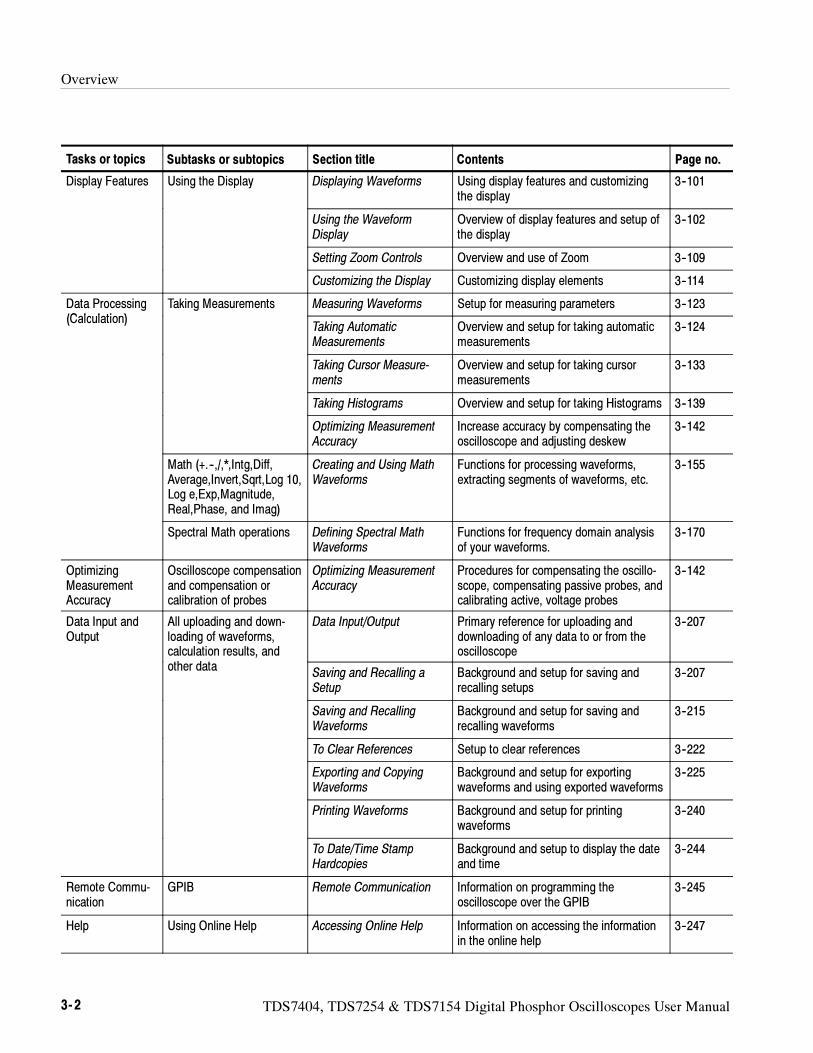
Overview
3- 2 TDS7404, TDS7254 & TDS7154 Digital Phosphor Oscilloscopes User Manual
Tasks or topics Page no.ContentsSection titleSubtasks or subtopics
Display Features Using the Display Displaying Waveforms Using display features and customizingthe display
3--101
Using the WaveformDisplay
Overview of display features and setup ofthe display
3--102
Setting Zoom Controls Overview and use of Zoom 3--109
Customizing the Display Customizing display elements 3--114
Data Processing(C l l ti )
Taking Measurements Measuring Waveforms Setup for measuring parameters 3--123(Calculation)
Taking AutomaticMeasurements
Overview and setup for taking automaticmeasurements
3--124
Taking Cursor Measure-ments
Overview and setup for taking cursormeasurements
3--133
Taking Histograms Overview and setup for taking Histograms 3--139
Optimizing MeasurementAccuracy
Increase accuracy by compensating theoscilloscope and adjusting deskew
3--142
Math (+.--,/,*,Intg,Diff,Average,Invert,Sqrt,Log 10,Log e,Exp,Magnitude,Real,Phase, and Imag)
Creating and Using MathWaveforms
Functions for processing waveforms,extracting segments of waveforms, etc.
3--155
Spectral Math operations Defining Spectral MathWaveforms
Functions for frequency domain analysisof your waveforms.
3--170
OptimizingMeasurementAccuracy
Oscilloscope compensationand compensation orcalibration of probes
Optimizing MeasurementAccuracy
Procedures for compensating the oscillo-scope, compensating passive probes, andcalibrating active, voltage probes
3--142
Data Input andOutput
All uploading and down-loading of waveforms,calculation results, andh d
Data Input/Output Primary reference for uploading anddownloading of any data to or from theoscilloscope
3--207
,other data
Saving and Recalling aSetup
Background and setup for saving andrecalling setups
3--207
Saving and RecallingWaveforms
Background and setup for saving andrecalling waveforms
3--215
To Clear References Setup to clear references 3--222
Exporting and CopyingWaveforms
Background and setup for exportingwaveforms and using exported waveforms
3--225
Printing Waveforms Background and setup for printingwaveforms
3--240
To Date/Time StampHardcopies
Background and setup to display the dateand time
3--244
Remote Commu-nication
GPIB Remote Communication Information on programming theoscilloscope over the GPIB
3--245
Help Using Online Help Accessing Online Help Information on accessing the informationin the online help
3--247
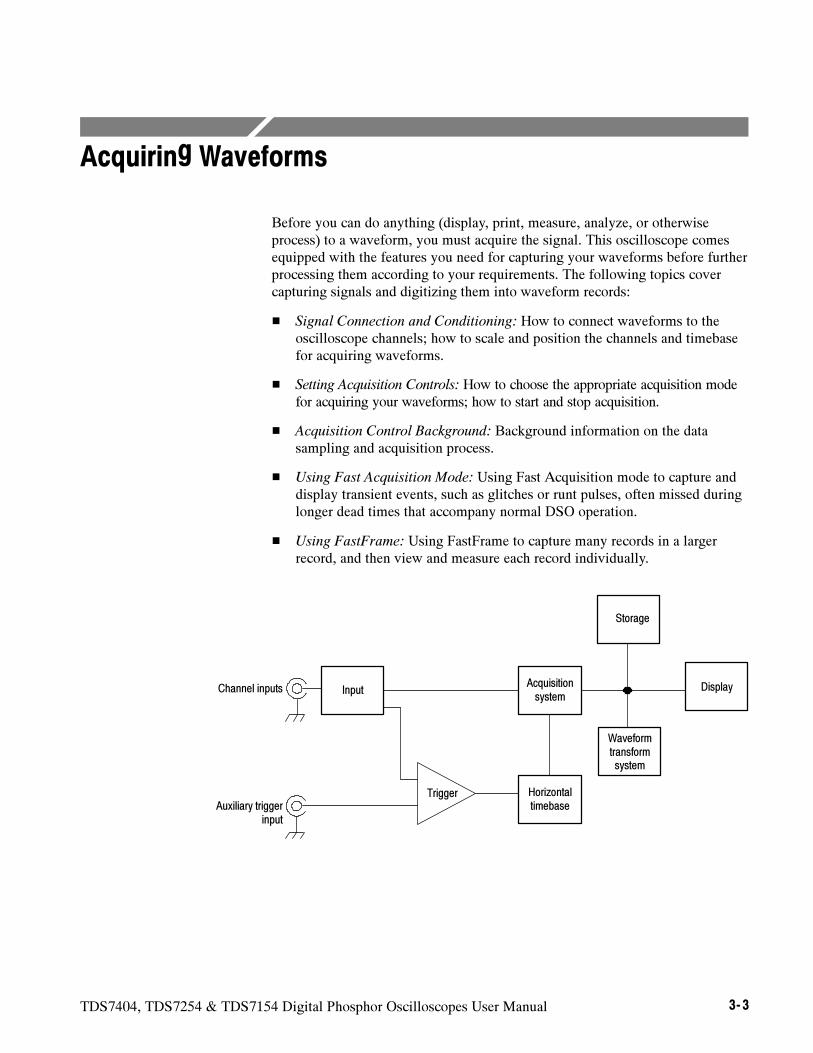
TDS7404, TDS7254 & TDS7154 Digital Phosphor Oscilloscopes User Manual 3- 3
Acquiring Waveforms
Before you can do anything (display, print, measure, analyze, or otherwiseprocess) to a waveform, you must acquire the signal. This oscilloscope comesequipped with the features you need for capturing your waveforms before furtherprocessing them according to your requirements. The following topics covercapturing signals and digitizing them into waveform records:
Signal Connection and Conditioning: How to connect waveforms to theoscilloscope channels; how to scale and position the channels and timebasefor acquiring waveforms.
Setting Acquisition Controls: How to choose the appropriate acquisition modefor acquiring your waveforms; how to start and stop acquisition.
Acquisition Control Background: Background information on the datasampling and acquisition process.
Using Fast Acquisition Mode: Using Fast Acquisition mode to capture anddisplay transient events, such as glitches or runt pulses, often missed duringlonger dead times that accompany normal DSO operation.
Using FastFrame: Using FastFrame to capture many records in a largerrecord, and then view and measure each record individually.
Acquisitionsystem
Input Display
Storage
Waveformtransformsystem
Horizontaltimebase
Trigger
Channel inputs
Auxiliary triggerinput
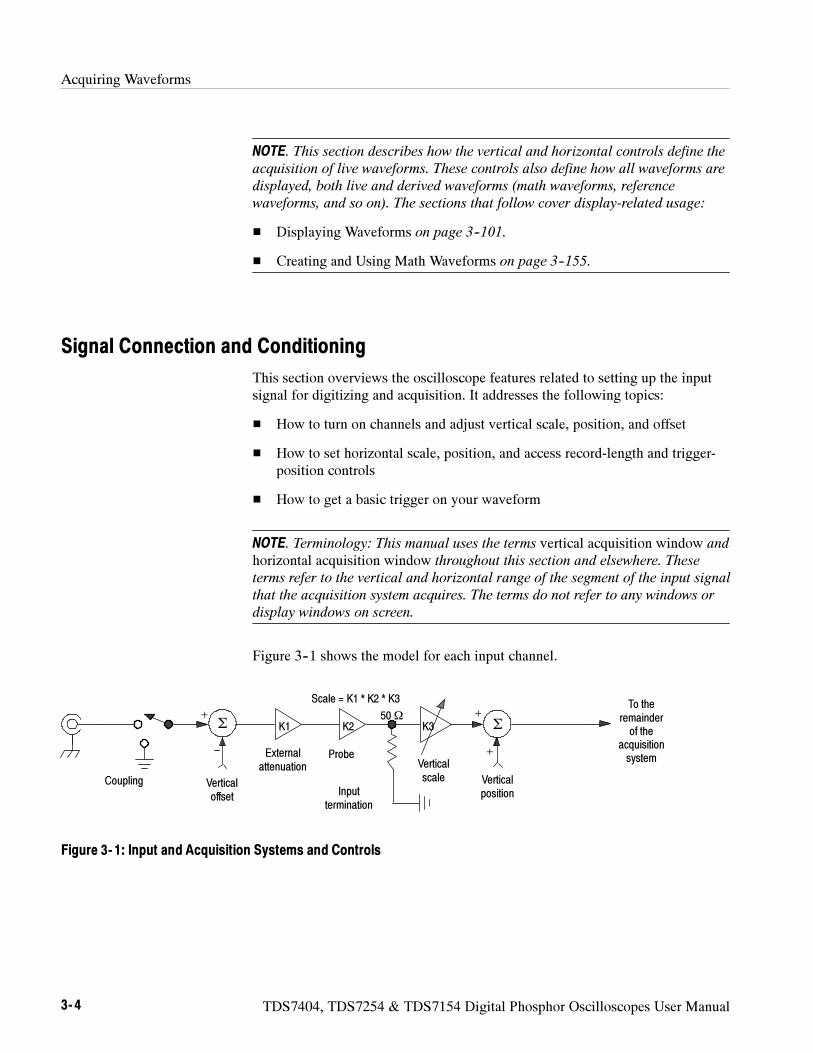
Acquiring Waveforms
3- 4 TDS7404, TDS7254 & TDS7154 Digital Phosphor Oscilloscopes User Manual
NOTE. This section describes how the vertical and horizontal controls define the
acquisition of live waveforms. These controls also define how all waveforms are
displayed, both live and derived waveforms (math waveforms, reference
waveforms, and so on). The sections that follow cover display-related usage:
Displaying Waveforms on page 3--101.
Creating and Using Math Waveforms on page 3--155.
Signal Connection and Conditioning
This section overviews the oscilloscope features related to setting up the inputsignal for digitizing and acquisition. It addresses the following topics:
How to turn on channels and adjust vertical scale, position, and offset
How to set horizontal scale, position, and access record-length and trigger-position controls
How to get a basic trigger on your waveform
NOTE. Terminology: This manual uses the terms vertical acquisition window and
horizontal acquisition window throughout this section and elsewhere. These
terms refer to the vertical and horizontal range of the segment of the input signal
that the acquisition system acquires. The terms do not refer to any windows or
display windows on screen.
Figure 3--1 shows the model for each input channel.
+
---
+
+
ΣΣ
Verticaloffset
CouplingInput
termination
Verticalscale Vertical
position
To theremainderof the
acquisitionsystem
Bandwidthlimit
Scale = K1 * K2 * K3
Externalattenuation
Probe
K1 K2 K350Ω
Figure 3- 1: Input and Acquisition Systems and Controls
Acquiring Waveforms
TDS7404, TDS7254 & TDS7154 Digital Phosphor Oscilloscopes User Manual 3- 5
Use input conditioning to ensure the oscilloscope acquires the data that you wantto display, measure, or otherwise process. To ensure the best possible data fordisplaying and further processing, do the following:
Set the vertical scale to control the size of the vertical acquisition windowfor each channel in order to capture part or all of the vertical amplitude of theinput signal. When vertical scaling is set to capture only a fraction of theinput signal range (for increased detail), the vertical offset control may beused to determine which portion of the input signal is captured by thevertical acquisition window.
Set horizontal scale to control the size of the horizontal acquisition windowin order to capture as much as you want of the input signal(s). Set thehorizontal position to delay the window relative to a trigger and to controlwhere in the input signal (data stream) that the horizontal acquisitionwindow acquires.
For more background on acquisition window concepts, see Input ConditioningBackground on page 3--14.
The oscilloscope can automatically obtain and display a stable waveform ofusable size. Pushing the Autoset button automatically sets up the oscilloscopecontrols based on the characteristics of the input signal. Autoset is much fasterand easier than a manual control-by-control setup.
The oscilloscope can also be reset to its factory default settings.
Usage of some input conditioning controls or features may be limited when othercontrol settings are in effect. Voltage offset is incompatible with referencewaveforms because offset is an acquisition control.
Read the following topics related to waveform acquisition; they provide detailsthat can make it easier to set up and acquire your waveforms.
Probes and Signal Connection. Select the probe or cable that brings the signal intothe oscilloscope. Choose the probe or cable that best fits your acquisition task,whether it’s connecting an active probe to test a digital circuit, or connecting to atest fixture through SMA cables to characterize a device. The connection to theoscilloscope depends on your application.
Tektronix provides a variety of probes and cables for this product. For a list ofprobes available for use, see Accessories and Options on page 1--29. You canalso check your Tektronix catalog for connection accessories that may supportyour application. More information about your probes can be found in yourprobes user manual.
Connecting andConditioning Your Signals
Acquiring Waveforms
3- 6 TDS7404, TDS7254 & TDS7154 Digital Phosphor Oscilloscopes User Manual
Four acquisition channels are available. Each channel can be displayed as awaveform or can contribute waveform data to other waveforms (math andreference waveforms for example).
Coupling.All oscilloscopes and probes specify a maximum signal level. (SeeSpecifications in your user manuals for exact limits.) Exceeding the limit, evenmomentarily, may damage the input channel. Use external attenuators ifnecessary to prevent exceeding the limits.
Coupling determines whether an input signal is directly connected to the inputchannel or not connected at all. These choices are refereed to as DC coupling andGND coupling.
The input resistance of each input channel is 50 Ω. To properly terminate signalsin other impedance environments, use an adapter.
All probes expect a specific coupling and input termination. Both coupling andinput termination resistance are displayed on screen.
Scaling and Positioning. These key controls determine the portion of the inputsignal presented to the acquisition system:
Set vertical scaling, positioning, and DC offsets to display the features ofinterest on your waveform and avoid clipping. (See Note that follows.)Vertical Acquisition Window Considerations on page 3--15 describes thevertical acquisition window.
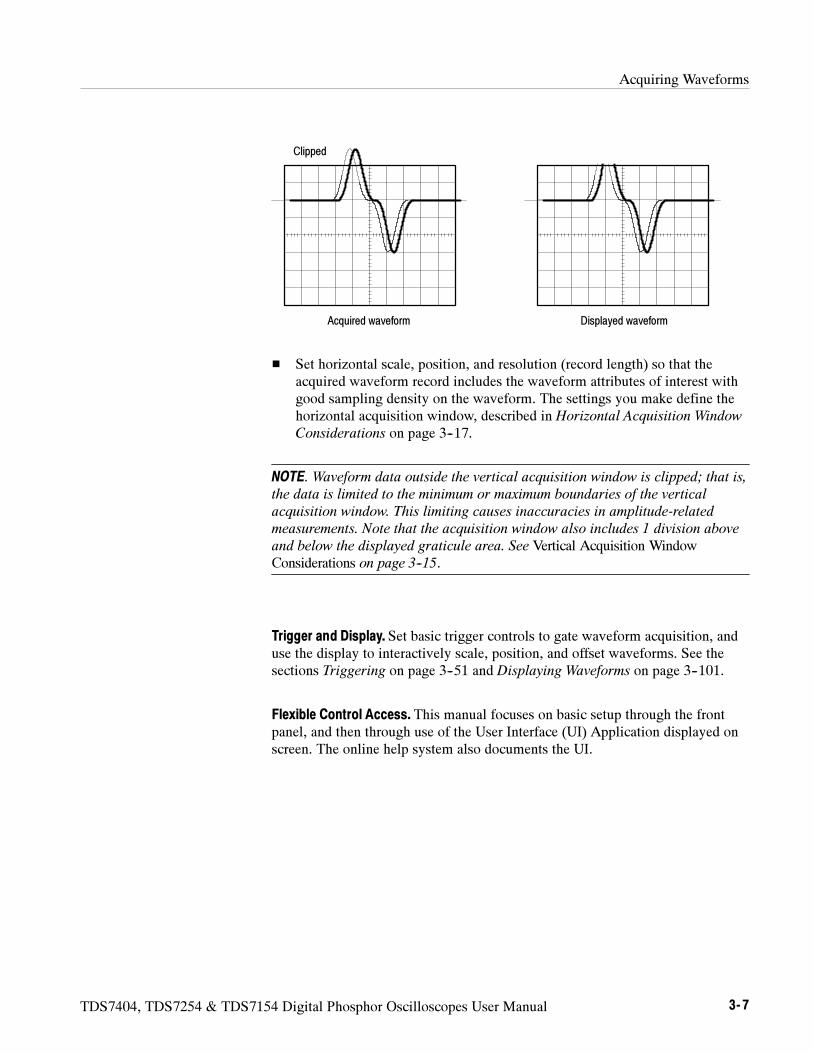
Acquiring Waveforms
TDS7404, TDS7254 & TDS7154 Digital Phosphor Oscilloscopes User Manual 3- 7
Clipped
Acquired waveform Displayed waveform
Set horizontal scale, position, and resolution (record length) so that theacquired waveform record includes the waveform attributes of interest withgood sampling density on the waveform. The settings you make define thehorizontal acquisition window, described in Horizontal Acquisition Window
Considerations on page 3--17.
NOTE. Waveform data outside the vertical acquisition window is clipped; that is,
the data is limited to the minimum or maximum boundaries of the vertical
acquisition window. This limiting causes inaccuracies in amplitude-related
measurements. Note that the acquisition window also includes 1 division above
and below the displayed graticule area. See Vertical Acquisition WindowConsiderations on page 3--15.
Trigger and Display. Set basic trigger controls to gate waveform acquisition, anduse the display to interactively scale, position, and offset waveforms. See thesections Triggering on page 3--51 and Displaying Waveforms on page 3--101.
Flexible Control Access. This manual focuses on basic setup through the frontpanel, and then through use of the User Interface (UI) Application displayed onscreen. The online help system also documents the UI.
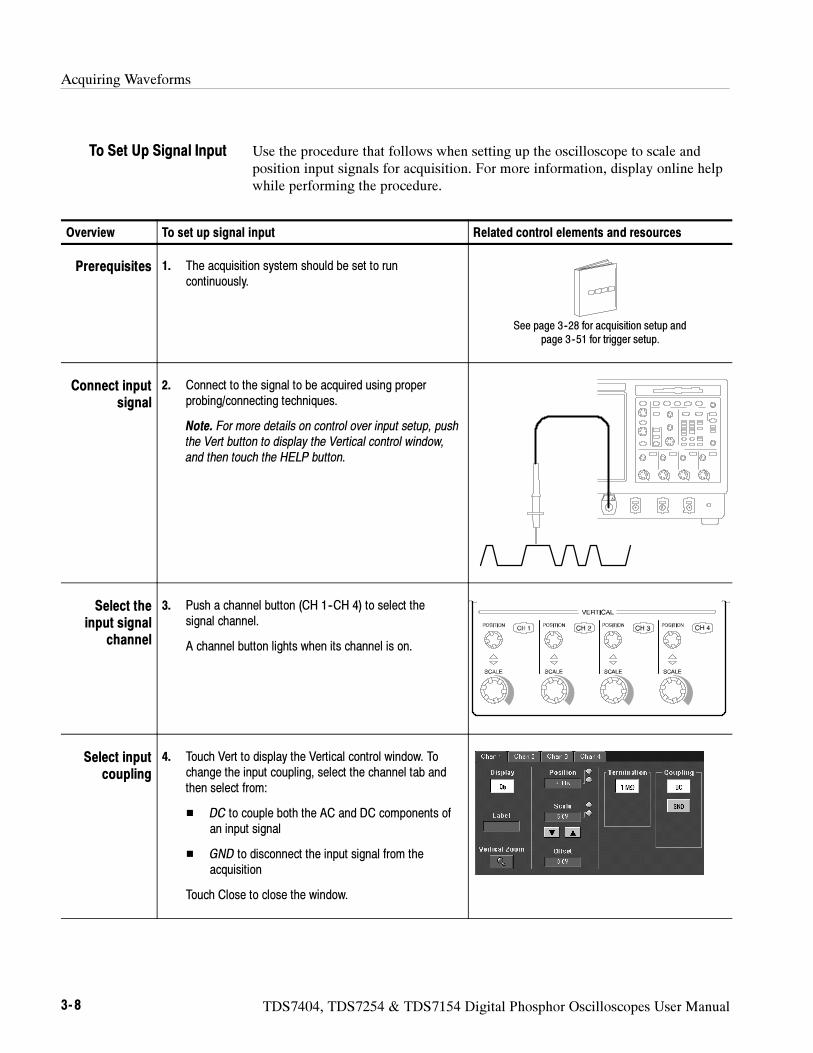
Acquiring Waveforms
3- 8 TDS7404, TDS7254 & TDS7154 Digital Phosphor Oscilloscopes User Manual
Use the procedure that follows when setting up the oscilloscope to scale andposition input signals for acquisition. For more information, display online helpwhile performing the procedure.
Overview To set up signal input Related control elements and resources
Prerequisites 1. The acquisition system should be set to runcontinuously.
See page 3--28 for acquisition setup andpage 3--51 for trigger setup.
Connect inputsignal
2. Connect to the signal to be acquired using properprobing/connecting techniques.
Note. For more details on control over input setup, pushthe Vert button to display the Vertical control window,and then touch the HELP button.
Select theinput signal
channel
3. Push a channel button (CH 1--CH 4) to select thesignal channel.
A channel button lights when its channel is on.
Select inputcoupling
4. Touch Vert to display the Vertical control window. Tochange the input coupling, select the channel tab andthen select from:
DC to couple both the AC and DC components ofan input signal
GND to disconnect the input signal from theacquisition
Touch Close to close the window.
To Set Up Signal Input
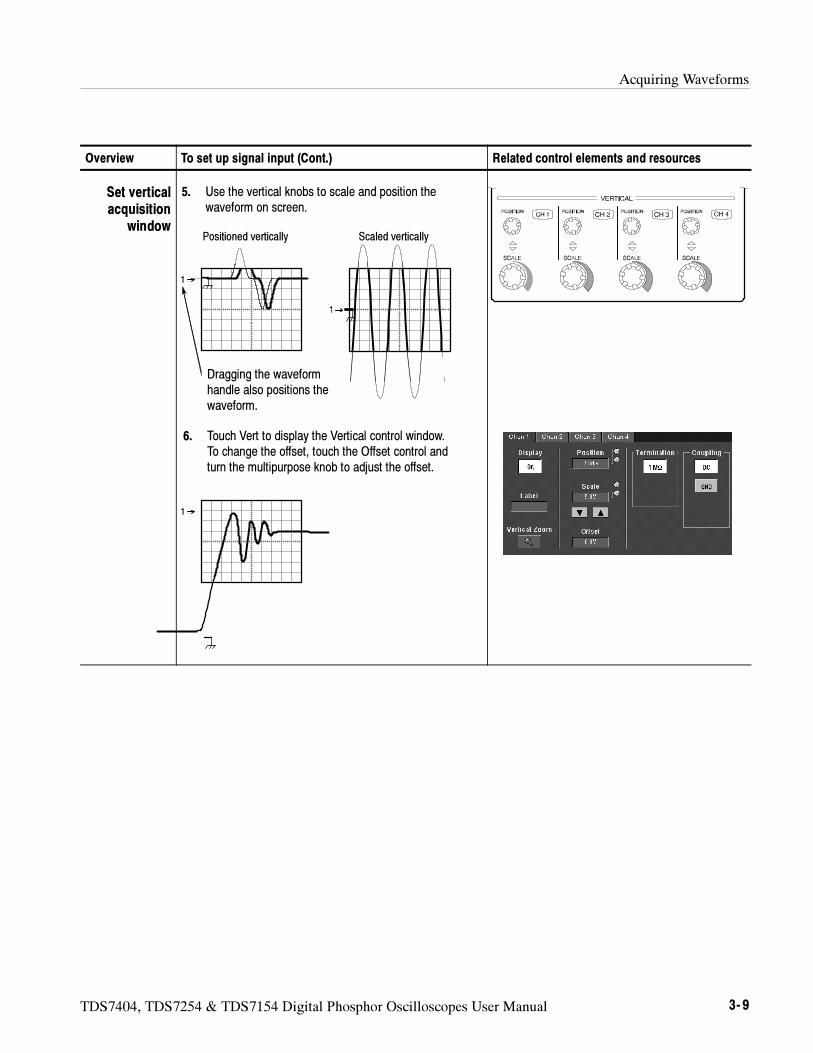
Acquiring Waveforms
TDS7404, TDS7254 & TDS7154 Digital Phosphor Oscilloscopes User Manual 3- 9
Overview Related control elements and resourcesTo set up signal input (Cont.)
Set verticalacquisition
window
5. Use the vertical knobs to scale and position thewaveform on screen.
Positioned vertically Scaled vertically
6. Touch Vert to display the Vertical control window.To change the offset, touch the Offset control andturn the multipurpose knob to adjust the offset.
Dragging the waveformhandle also positions thewaveform.
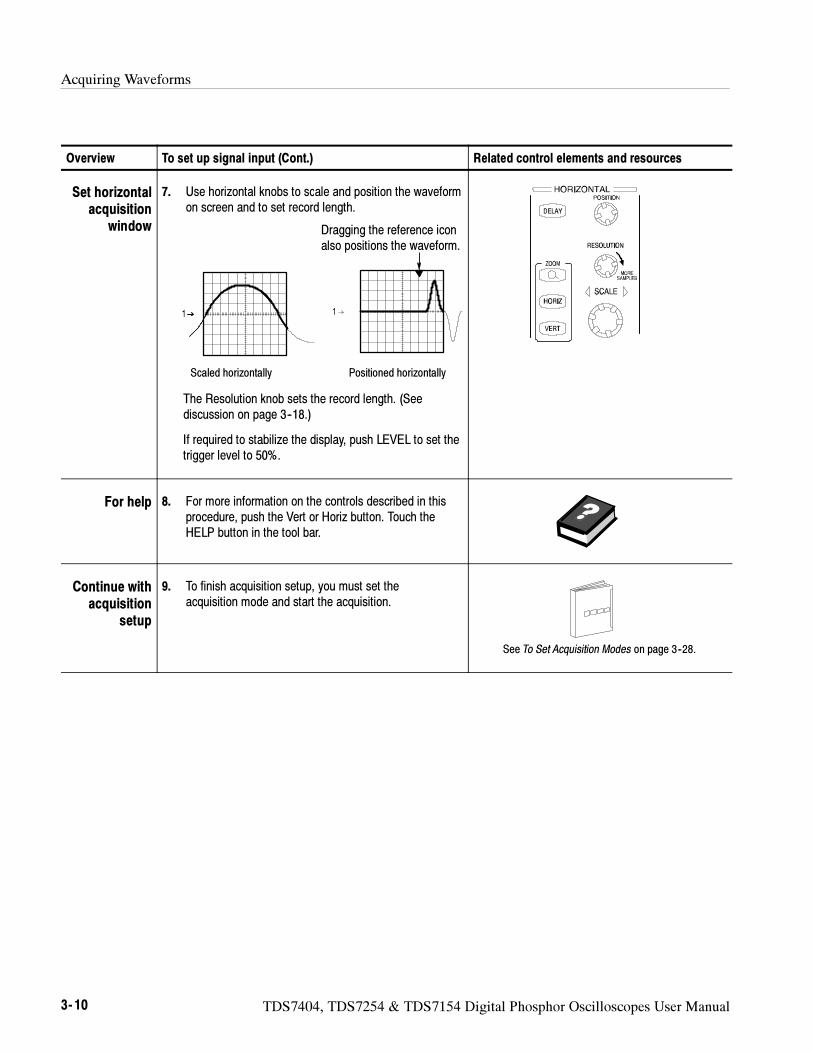
Acquiring Waveforms
3- 10 TDS7404, TDS7254 & TDS7154 Digital Phosphor Oscilloscopes User Manual
Overview Related control elements and resourcesTo set up signal input (Cont.)
Set horizontalacquisition
window
7. Use horizontal knobs to scale and position the waveformon screen and to set record length.
Positioned horizontallyScaled horizontally
The Resolution knob sets the record length. (Seediscussion on page 3--18.)
If required to stabilize the display, push LEVEL to set thetrigger level to 50%.
Dragging the reference iconalso positions the waveform.
For help 8. For more information on the controls described in thisprocedure, push the Vert or Horiz button. Touch theHELP button in the tool bar.
Continue withacquisition
setup
9. To finish acquisition setup, you must set theacquisition mode and start the acquisition.
See To Set Acquisition Modes on page 3--28.
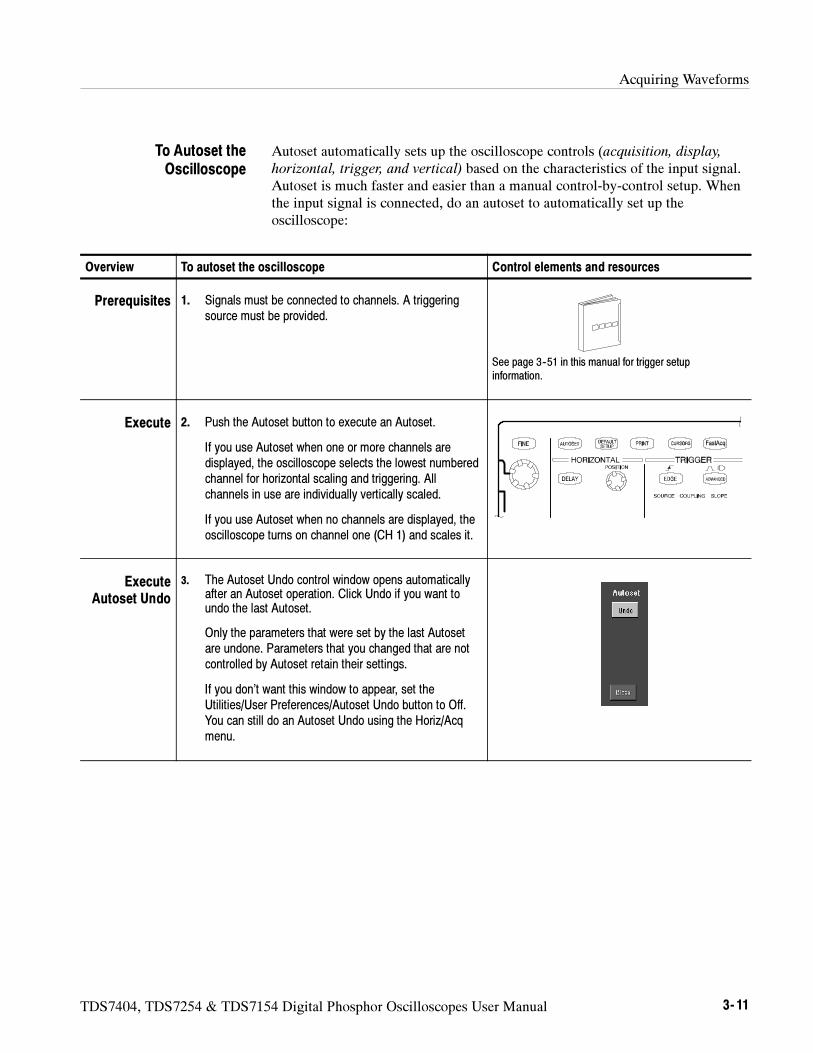
Acquiring Waveforms
TDS7404, TDS7254 & TDS7154 Digital Phosphor Oscilloscopes User Manual 3- 11
Autoset automatically sets up the oscilloscope controls (acquisition, display,horizontal, trigger, and vertical) based on the characteristics of the input signal.Autoset is much faster and easier than a manual control-by-control setup. Whenthe input signal is connected, do an autoset to automatically set up theoscilloscope:
Overview To autoset the oscilloscope Control elements and resources
Prerequisites 1. Signals must be connected to channels. A triggeringsource must be provided.
See page 3--51 in this manual for trigger setupinformation.
Execute 2. Push the Autoset button to execute an Autoset.
If you use Autoset when one or more channels aredisplayed, the oscilloscope selects the lowest numberedchannel for horizontal scaling and triggering. Allchannels in use are individually vertically scaled.
If you use Autoset when no channels are displayed, theoscilloscope turns on channel one (CH 1) and scales it.
ExecuteAutoset Undo
3. The Autoset Undo control window opens automaticallyafter an Autoset operation. Click Undo if you want toundo the last Autoset.
Only the parameters that were set by the last Autosetare undone. Parameters that you changed that are notcontrolled by Autoset retain their settings.
If you don’t want this window to appear, set theUtilities/User Preferences/Autoset Undo button to Off.You can still do an Autoset Undo using the Horiz/Acqmenu.
To Autoset theOscilloscope
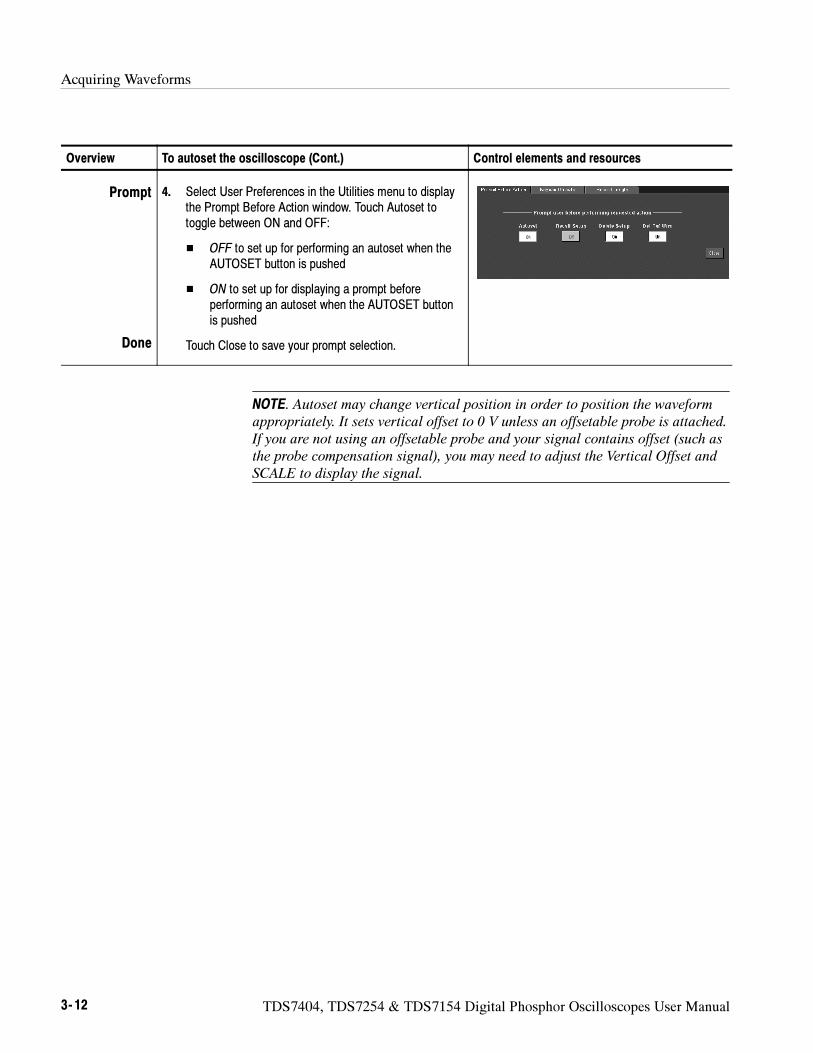
Acquiring Waveforms
3- 12 TDS7404, TDS7254 & TDS7154 Digital Phosphor Oscilloscopes User Manual
Overview Control elements and resourcesTo autoset the oscilloscope (Cont.)
Prompt
Done
4. Select User Preferences in the Utilities menu to displaythe Prompt Before Action window. Touch Autoset totoggle between ON and OFF:
OFF to set up for performing an autoset when theAUTOSET button is pushed
ON to set up for displaying a prompt beforeperforming an autoset when the AUTOSET buttonis pushed
Touch Close to save your prompt selection.
NOTE. Autoset may change vertical position in order to position the waveform
appropriately. It sets vertical offset to 0 V unless an offsetable probe is attached.
If you are not using an offsetable probe and your signal contains offset (such as
the probe compensation signal), you may need to adjust the Vertical Offset and
SCALE to display the signal.
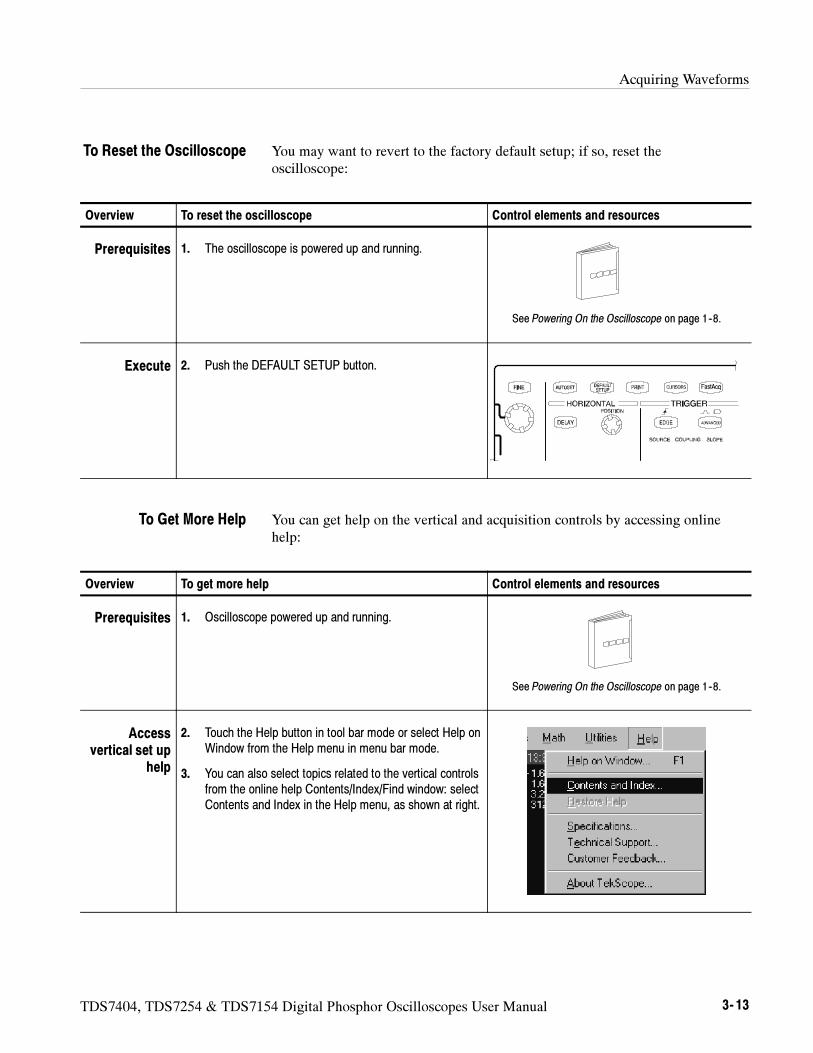
Acquiring Waveforms
TDS7404, TDS7254 & TDS7154 Digital Phosphor Oscilloscopes User Manual 3- 13
You may want to revert to the factory default setup; if so, reset theoscilloscope:
Overview To reset the oscilloscope Control elements and resources
Prerequisites 1. The oscilloscope is powered up and running.
See Powering On the Oscilloscope on page 1--8.
Execute 2. Push the DEFAULT SETUP button.
You can get help on the vertical and acquisition controls by accessing onlinehelp:
Overview To get more help Control elements and resources
Prerequisites 1. Oscilloscope powered up and running.
See Powering On the Oscilloscope on page 1--8.
Accessvertical set up
help
2. Touch the Help button in tool bar mode or select Help onWindow from the Help menu in menu bar mode.
3. You can also select topics related to the vertical controlsfrom the online help Contents/Index/Find window: selectContents and Index in the Help menu, as shown at right.
To Reset the Oscilloscope
To Get More Help
Acquiring Waveforms
3- 14 TDS7404, TDS7254 & TDS7154 Digital Phosphor Oscilloscopes User Manual
This section contains background information that can help you more effectivelyset up the acquisition window of each channel.
Input.Keep in mind this oscilloscope samples in real-time or random equivalent-time; both sampling systems provide pre-trigger information by using the triggerto stop an already running acquisition. Both sampling systems also sample theinput after it is scaled, providing improved input protection and dynamic range.
CAUTION. Do not overdrive the inputs and observe static-safe procedures
Autoset Considerations.Autoset acquires samples from the input signal andattempts to take the following actions based on the input data:
Evaluate the amplitude range of the input signals and set the size and verticaloffset of the vertical acquisition window to acquire the signal with goodresolution, but without clipping.
Set the trigger to the approximate midlevel of the signal being autoset andswitches to edge trigger mode.
Evaluate the signal transitions and set the horizontal scale to produce awaveform display of 2 or 3 cycles of the input signal.
Sometimes Autoset cannot produce a correct display due to the nature of theinput signal; if so, you may have to adjust the scale, trigger, and acquisitioncontrols manually. Some conditions that can cause Autoset to fail are:
No signal present
Signals with extreme or variable duty cycles
Signals with multiple or unstable signal periods
Signals with too low amplitude
No recognizable trigger signal
Signals with a frequency <20 Hz
Signals with a frequency above the bandwidth of the oscilloscope
Signals with high offset and low peak-to-peak variations, such as the probecompensation signal
Input ConditioningBackground
Acquiring Waveforms
TDS7404, TDS7254 & TDS7154 Digital Phosphor Oscilloscopes User Manual 3- 15
Vertical Acquisition Window Considerations.You can set the vertical size,position, and offset of each channel independently of other channels. Verticalscale and offset specify the vertical acquisition window for each channel. Parts ofthe signal amplitude that fall within the vertical window are acquired; partsoutside (if any) are not.
The offset control subtracts a constant DC level from the input signal before thevertical scale factor is applied, and the vertical position control adds a constantnumber of divisions of signal after the scale factor is applied to the resultingdifference.
The vertical scale and position controls have the following effects on the verticalacquisition window and the displayed waveform:
The vertical volts per division you set determines the vertical size of theacquisition window, allowing you to scale it to contain all of a waveformamplitude or only part. Figure 3--2 on page 3--16 shows two verticalacquisition windows that contain the entire waveform, but only one windowcontains the entire waveform in the graticule on screen.
NOTE. Amplitude-related automatic measurements (for example, peak-to-peak
and RMS) will be accurate for vertical windows like those shown in Figure 3--2a
and b because neither waveform is clipped (that is, both waveforms are
acquired). But if signal amplitude were to extend outside the vertical acquisition
window, the data acquired is clipped. Clipped data causes inaccurate results if
used in amplitude-related automatic measurements. Clipping also causes
inaccurate amplitude values in waveforms that are stored or exported for use in
other programs.
If the scale of a math waveform is changed so that the math waveform is clipped,
it will not affect amplitude measurements on that math waveform.
The vertical position adjusts the acquisition, and therefore the display, of theacquired waveform relative to the vertical acquisition window. Figure 3--2bshows how vertical position moves the acquired waveform vertically in theacquisition window to place the acquired waveform in the graticule display.
As you vary vertical position, the vertical acquisition window moves up anddown (±5 divisions) on the waveform. With input signals that are smallerthan the window, it appears the waveform moves in the window. Actually,the position moves the vertical acquisition window up and down on the inputsignal.
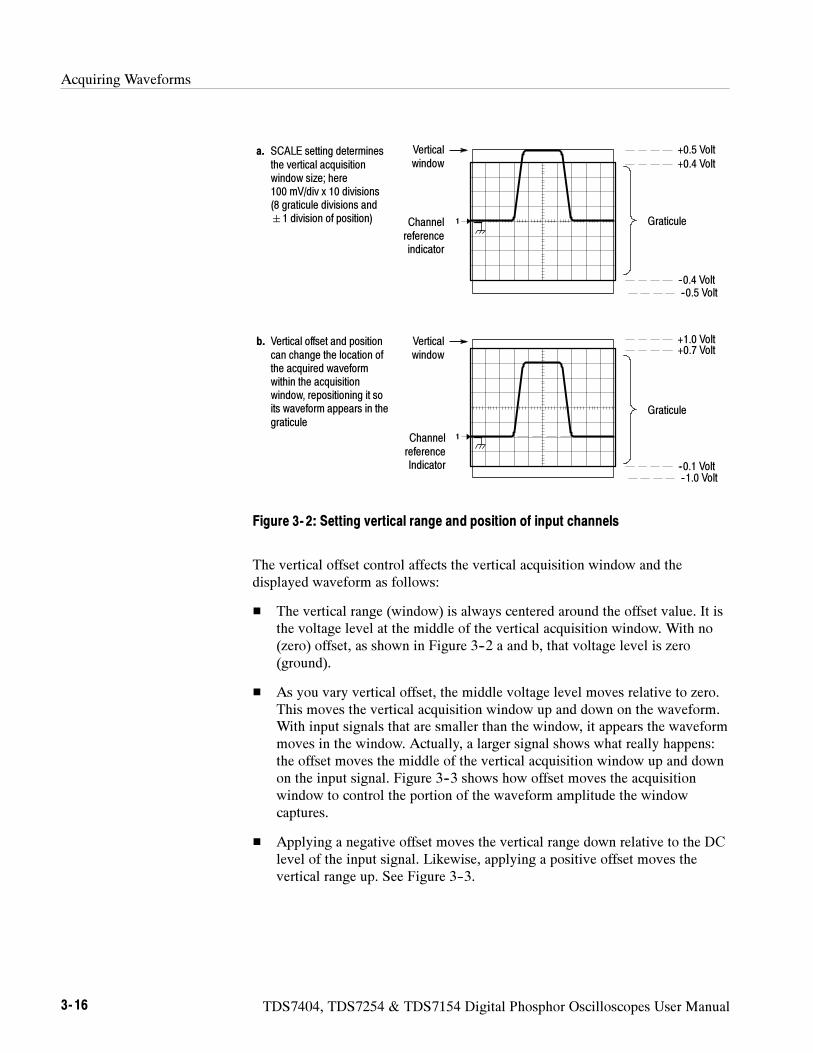
Acquiring Waveforms
3- 16 TDS7404, TDS7254 & TDS7154 Digital Phosphor Oscilloscopes User Manual
a. SCALE setting determinesthe vertical acquisitionwindow size; here100 mV/div x 10 divisions(8 graticule divisions and1 division of position)
+0.4 Volt
--0.4 Volt
b. Vertical offset and positioncan change the location ofthe acquired waveformwithin the acquisitionwindow, repositioning it soits waveform appears in thegraticule
Verticalwindow
Channelreferenceindicator
Graticule
+0.7 Volt
--0.1 Volt
Verticalwindow
ChannelreferenceIndicator
Graticule
+0.5 Volt
--0.5 Volt
+1.0 Volt
--1.0 Volt
1
1
Figure 3- 2: Setting vertical range and position of input channels
The vertical offset control affects the vertical acquisition window and thedisplayed waveform as follows:
The vertical range (window) is always centered around the offset value. It isthe voltage level at the middle of the vertical acquisition window. With no(zero) offset, as shown in Figure 3--2 a and b, that voltage level is zero(ground).
As you vary vertical offset, the middle voltage level moves relative to zero.This moves the vertical acquisition window up and down on the waveform.With input signals that are smaller than the window, it appears the waveformmoves in the window. Actually, a larger signal shows what really happens:the offset moves the middle of the vertical acquisition window up and downon the input signal. Figure 3--3 shows how offset moves the acquisitionwindow to control the portion of the waveform amplitude the windowcaptures.
Applying a negative offset moves the vertical range down relative to the DClevel of the input signal. Likewise, applying a positive offset moves thevertical range up. See Figure 3--3.
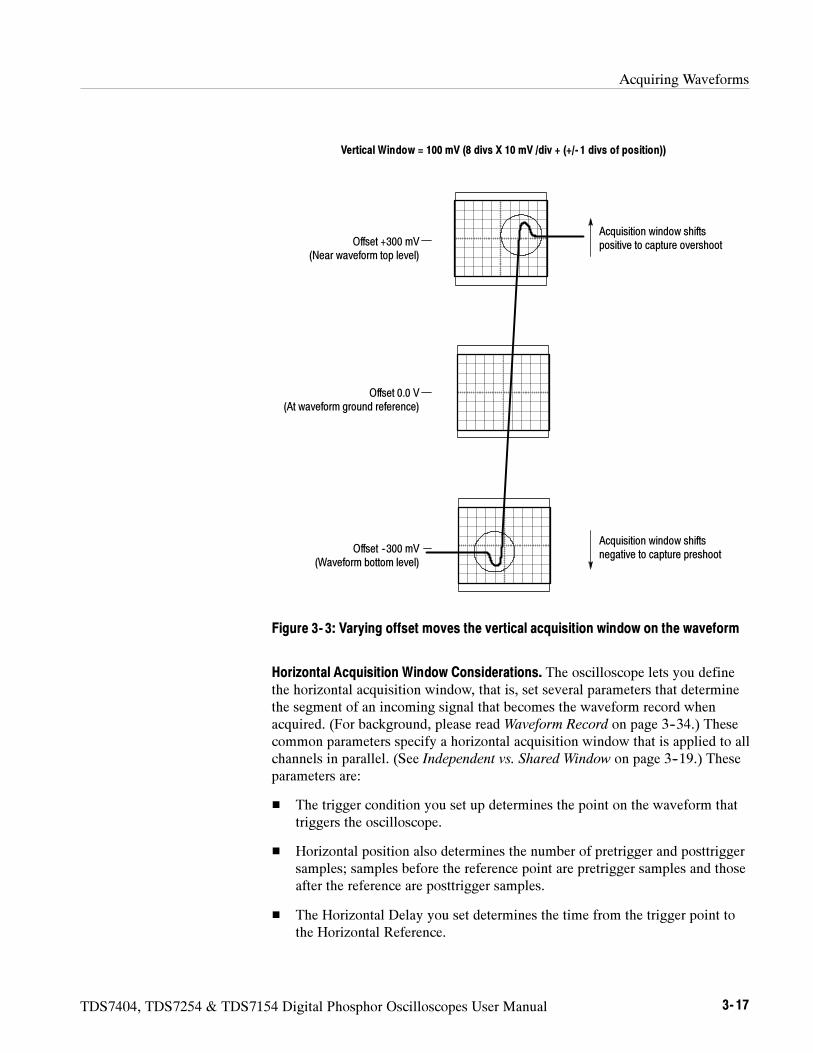
Acquiring Waveforms
TDS7404, TDS7254 & TDS7154 Digital Phosphor Oscilloscopes User Manual 3- 17
Offset 0.0 V(At waveform ground reference)
Offset +300 mV(Near waveform top level)
Vertical Window = 100 mV (8 divs X 10 mV /div + (+/- 1 divs of position))
Acquisition window shiftspositive to capture overshoot
Acquisition window shiftsnegative to capture preshoot
Offset --300 mV(Waveform bottom level)
Figure 3- 3: Varying offset moves the vertical acquisition window on the waveform
Horizontal Acquisition Window Considerations. The oscilloscope lets you definethe horizontal acquisition window, that is, set several parameters that determinethe segment of an incoming signal that becomes the waveform record whenacquired. (For background, please read Waveform Record on page 3--34.) Thesecommon parameters specify a horizontal acquisition window that is applied to allchannels in parallel. (See Independent vs. Shared Window on page 3--19.) Theseparameters are:
The trigger condition you set up determines the point on the waveform thattriggers the oscilloscope.
Horizontal position also determines the number of pretrigger and posttriggersamples; samples before the reference point are pretrigger samples and thoseafter the reference are posttrigger samples.
The Horizontal Delay you set determines the time from the trigger point tothe Horizontal Reference.
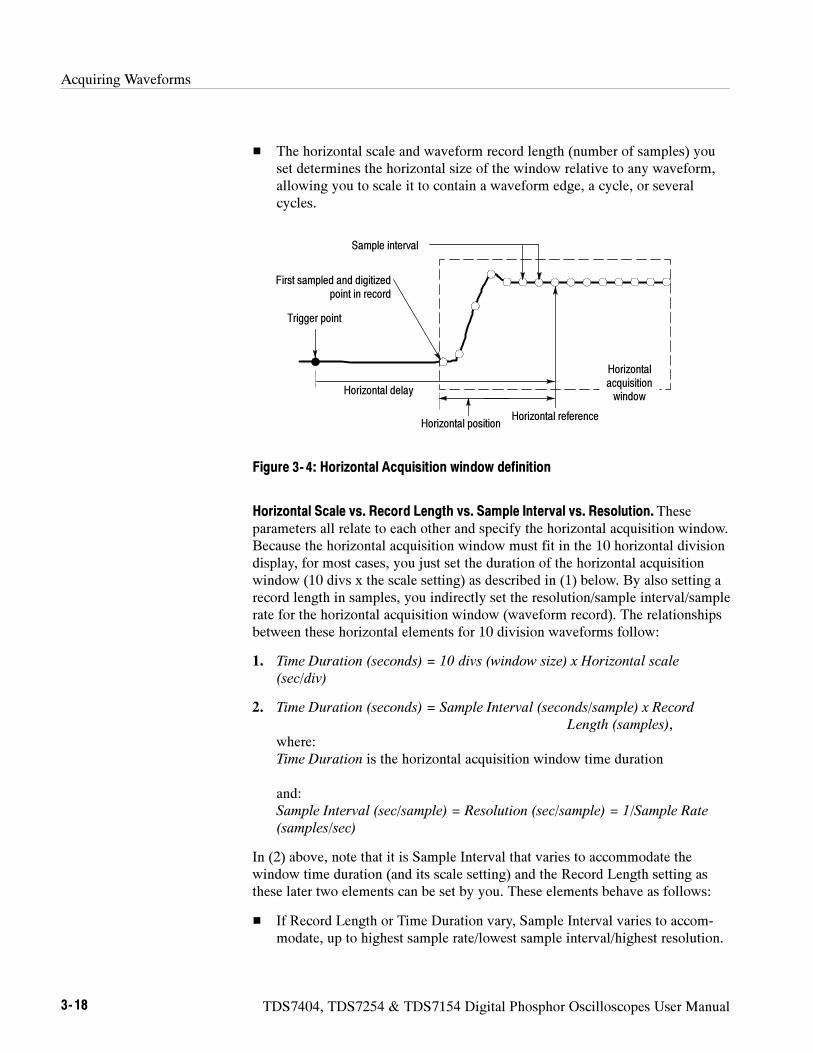
Acquiring Waveforms
3- 18 TDS7404, TDS7254 & TDS7154 Digital Phosphor Oscilloscopes User Manual
The horizontal scale and waveform record length (number of samples) youset determines the horizontal size of the window relative to any waveform,allowing you to scale it to contain a waveform edge, a cycle, or severalcycles.
Sample interval
First sampled and digitizedpoint in record
Horizontal reference
Trigger point
Horizontal delay
Horizontalacquisitionwindow
Horizontal position
Figure 3- 4: Horizontal Acquisition window definition
Horizontal Scale vs. Record Length vs. Sample Interval vs. Resolution. Theseparameters all relate to each other and specify the horizontal acquisition window.Because the horizontal acquisition window must fit in the 10 horizontal divisiondisplay, for most cases, you just set the duration of the horizontal acquisitionwindow (10 divs x the scale setting) as described in (1) below. By also setting arecord length in samples, you indirectly set the resolution/sample interval/samplerate for the horizontal acquisition window (waveform record). The relationshipsbetween these horizontal elements for 10 division waveforms follow:
1. Time Duration (seconds) = 10 divs (window size) x Horizontal scale
(sec/div)
2. Time Duration (seconds) = Sample Interval (seconds/sample) x Record
Length (samples),where:Time Duration is the horizontal acquisition window time duration
and:Sample Interval (sec/sample) = Resolution (sec/sample) = 1/Sample Rate
(samples/sec)
In (2) above, note that it is Sample Interval that varies to accommodate thewindow time duration (and its scale setting) and the Record Length setting asthese later two elements can be set by you. These elements behave as follows:
If Record Length or Time Duration vary, Sample Interval varies to accom-modate, up to highest sample rate/lowest sample interval/highest resolution.
Acquiring Waveforms
TDS7404, TDS7254 & TDS7154 Digital Phosphor Oscilloscopes User Manual 3- 19
If Sample Interval reaches its lower limit, Record Length must decrease ifTime Duration decreases (you set faster scale settings), or Time Durationmust increase (forcing slower scale settings) if Record Length increases (youset longer record lengths). The equation becomes:
Maximum Record Length = Time Duration ÷ Min Sample Interval
For example, at 200 ps/div and 10 divisions, the record length must be500 points:
Max Rec Length 500 samples = (10 divs x 200 ps/div)÷ 4 ps/sample
Max Rec Length = 500 samples
NOTE. As implied from the operation just described, resolution and the equiva-
lent elements, sample interval and sample rate (see equation 2 above), are not
settable directly, but are derived. You can, however, check the resolution at
anytime in the resolution readout. Also note, that the Resolution control actually
adjusts the record length to increase sample density.
The above discussion also assumes that horizontal scale is held constant. You
can, however, choose to hold the sample rate constant instead, by selecting HoldSample Rate Constant in the Utilities, User Preferences menu.
Independent vs. Shared Window. The oscilloscope applies the same horizontalacquisition window to all channels from which it acquires data. Unlike thevertical acquisition window that you size and offset independently for eachchannel, the same time/div, resolution (record length), and horizontal position(from the same trigger point) apply to all channels simultaneously. In otherwords, one trigger, from a single trigger source, will locate a common horizontalacquisition window for all active channels, which you can shift in parallel bysetting the horizontal position control.
The horizontal acquisition window determines the waveform records extractedfrom all signals present at all active channels. You can think of the horizontalacquisition window as cutting across any input signals present in the inputchannels to extract the same slice of time into waveform records. See Figure 3--5.
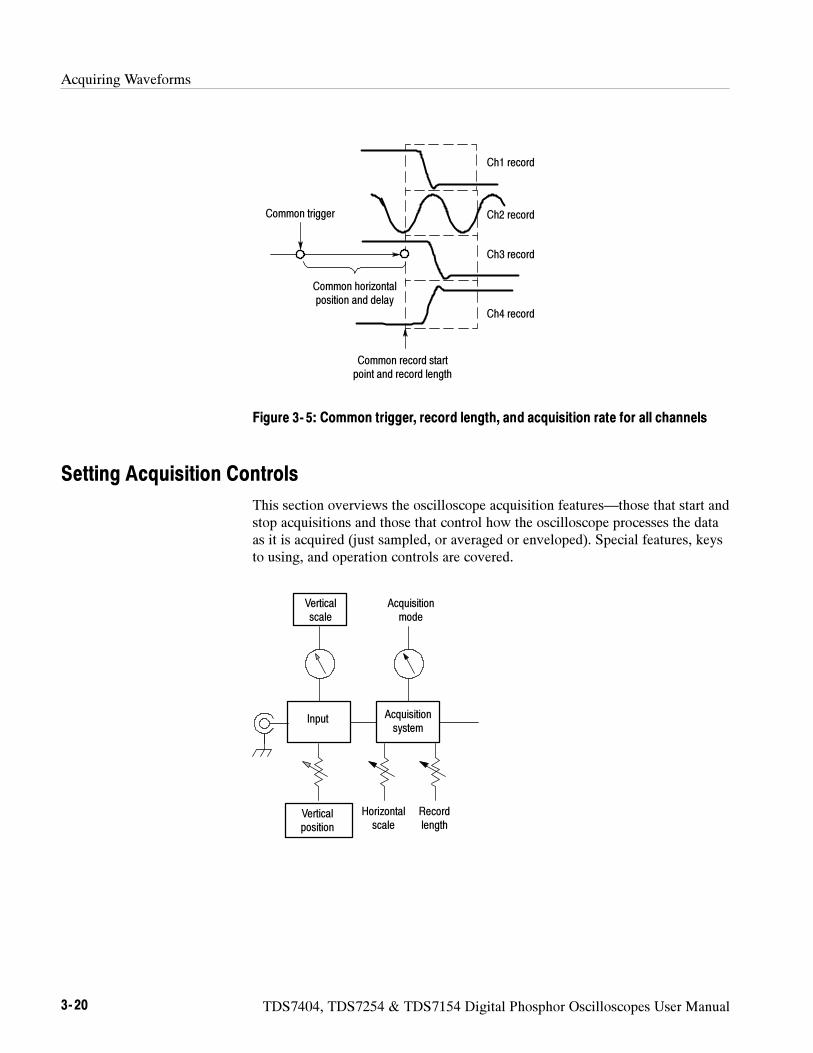
Acquiring Waveforms
3- 20 TDS7404, TDS7254 & TDS7154 Digital Phosphor Oscilloscopes User Manual
Ch4 record
Ch3 record
Ch2 record
Ch1 record
Common horizontalposition and delay
Common trigger
Common record startpoint and record length
Figure 3- 5: Common trigger, record length, and acquisition rate for all channels
Setting Acquisition Controls
This section overviews the oscilloscope acquisition features—those that start andstop acquisitions and those that control how the oscilloscope processes the dataas it is acquired (just sampled, or averaged or enveloped). Special features, keysto using, and operation controls are covered.
Verticalscale
Verticalposition
Horizontalscale
Acquisitionsystem
Input
Acquisitionmode
Recordlength
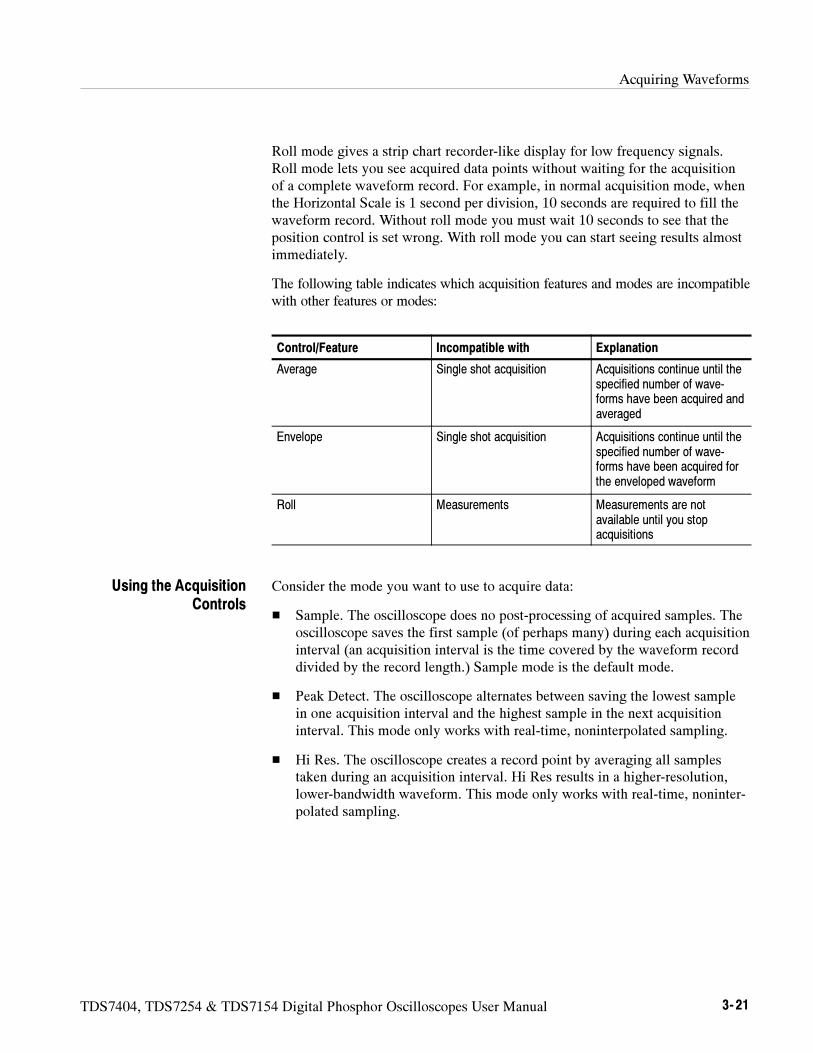
Acquiring Waveforms
TDS7404, TDS7254 & TDS7154 Digital Phosphor Oscilloscopes User Manual 3- 21
Roll mode gives a strip chart recorder-like display for low frequency signals.Roll mode lets you see acquired data points without waiting for the acquisitionof a complete waveform record. For example, in normal acquisition mode, whenthe Horizontal Scale is 1 second per division, 10 seconds are required to fill thewaveform record. Without roll mode you must wait 10 seconds to see that theposition control is set wrong. With roll mode you can start seeing results almostimmediately.
The following table indicates which acquisition features and modes are incompatiblewith other features or modes:
Control/Feature Incompatible with Explanation
Average Single shot acquisition Acquisitions continue until thespecified number of wave-forms have been acquired andaveraged
Envelope Single shot acquisition Acquisitions continue until thespecified number of wave-forms have been acquired forthe enveloped waveform
Roll Measurements Measurements are notavailable until you stopacquisitions
Consider the mode you want to use to acquire data:
Sample. The oscilloscope does no post-processing of acquired samples. Theoscilloscope saves the first sample (of perhaps many) during each acquisitioninterval (an acquisition interval is the time covered by the waveform recorddivided by the record length.) Sample mode is the default mode.
Peak Detect. The oscilloscope alternates between saving the lowest samplein one acquisition interval and the highest sample in the next acquisitioninterval. This mode only works with real-time, noninterpolated sampling.
Hi Res. The oscilloscope creates a record point by averaging all samplestaken during an acquisition interval. Hi Res results in a higher-resolution,lower-bandwidth waveform. This mode only works with real-time, noninter-polated sampling.
Using the AcquisitionControls
Acquiring Waveforms
3- 22 TDS7404, TDS7254 & TDS7154 Digital Phosphor Oscilloscopes User Manual
A key advantage of Hi Res is its potential for increasing vertical resolutionregardless of the input signal. Table 3--1 indicates that you can obtain up to13 significant bits with Hi res mode. The instrument uses 16-bit memory.This is allocated as 15 bits + 1 sign bit. Round-off errors and internal noiselimit the effective bits for Hi Res mode and signal averaging to about13 bits. You can calculate the theoretical number of bits of enhancementusing the following formula where Nd is the number of points acquiredduring a sample interval:
Bit of enhancement = 0.5 log2 *Nd
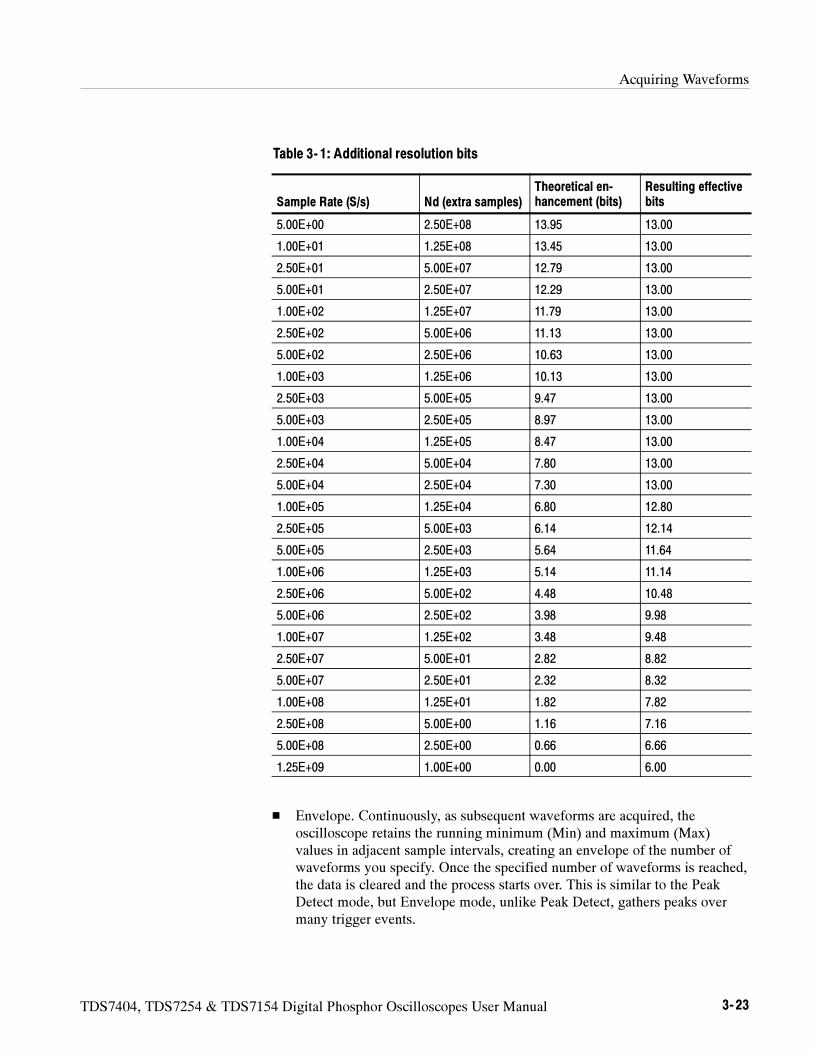
Acquiring Waveforms
TDS7404, TDS7254 & TDS7154 Digital Phosphor Oscilloscopes User Manual 3- 23
Table 3- 1: Additional resolution bits
Sample Rate (S/s) Nd (extra samples)Theoretical en-hancement (bits)
Resulting effectivebits
5.00E+00 2.50E+08 13.95 13.00
1.00E+01 1.25E+08 13.45 13.00
2.50E+01 5.00E+07 12.79 13.00
5.00E+01 2.50E+07 12.29 13.00
1.00E+02 1.25E+07 11.79 13.00
2.50E+02 5.00E+06 11.13 13.00
5.00E+02 2.50E+06 10.63 13.00
1.00E+03 1.25E+06 10.13 13.00
2.50E+03 5.00E+05 9.47 13.00
5.00E+03 2.50E+05 8.97 13.00
1.00E+04 1.25E+05 8.47 13.00
2.50E+04 5.00E+04 7.80 13.00
5.00E+04 2.50E+04 7.30 13.00
1.00E+05 1.25E+04 6.80 12.80
2.50E+05 5.00E+03 6.14 12.14
5.00E+05 2.50E+03 5.64 11.64
1.00E+06 1.25E+03 5.14 11.14
2.50E+06 5.00E+02 4.48 10.48
5.00E+06 2.50E+02 3.98 9.98
1.00E+07 1.25E+02 3.48 9.48
2.50E+07 5.00E+01 2.82 8.82
5.00E+07 2.50E+01 2.32 8.32
1.00E+08 1.25E+01 1.82 7.82
2.50E+08 5.00E+00 1.16 7.16
5.00E+08 2.50E+00 0.66 6.66
1.25E+09 1.00E+00 0.00 6.00
Envelope. Continuously, as subsequent waveforms are acquired, theoscilloscope retains the running minimum (Min) and maximum (Max)values in adjacent sample intervals, creating an envelope of the number ofwaveforms you specify. Once the specified number of waveforms is reached,the data is cleared and the process starts over. This is similar to the PeakDetect mode, but Envelope mode, unlike Peak Detect, gathers peaks overmany trigger events.
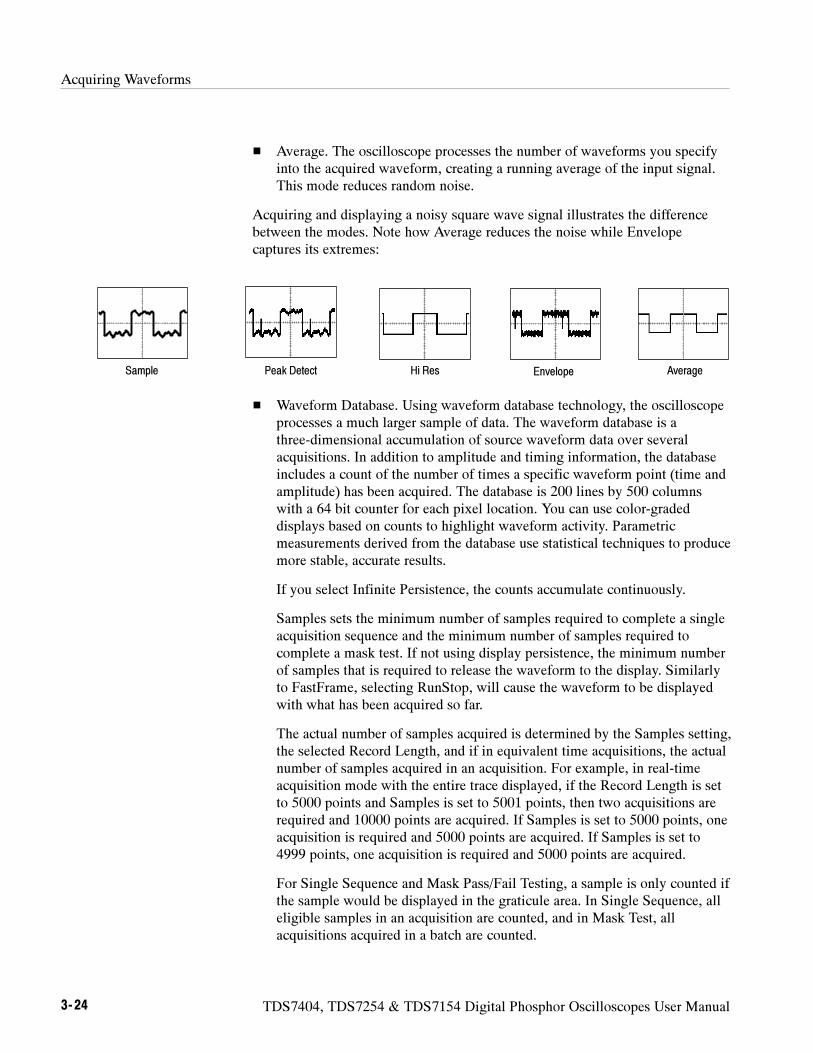
Acquiring Waveforms
3- 24 TDS7404, TDS7254 & TDS7154 Digital Phosphor Oscilloscopes User Manual
Average. The oscilloscope processes the number of waveforms you specifyinto the acquired waveform, creating a running average of the input signal.This mode reduces random noise.
Acquiring and displaying a noisy square wave signal illustrates the differencebetween the modes. Note how Average reduces the noise while Envelopecaptures its extremes:
Sample Envelope AveragePeak Detect Hi Res
Waveform Database. Using waveform database technology, the oscilloscopeprocesses a much larger sample of data. The waveform database is athree-dimensional accumulation of source waveform data over severalacquisitions. In addition to amplitude and timing information, the databaseincludes a count of the number of times a specific waveform point (time andamplitude) has been acquired. The database is 200 lines by 500 columnswith a 64 bit counter for each pixel location. You can use color-gradeddisplays based on counts to highlight waveform activity. Parametricmeasurements derived from the database use statistical techniques to producemore stable, accurate results.
If you select Infinite Persistence, the counts accumulate continuously.
Samples sets the minimum number of samples required to complete a singleacquisition sequence and the minimum number of samples required tocomplete a mask test. If not using display persistence, the minimum numberof samples that is required to release the waveform to the display. Similarlyto FastFrame, selecting RunStop, will cause the waveform to be displayedwith what has been acquired so far.
The actual number of samples acquired is determined by the Samples setting,the selected Record Length, and if in equivalent time acquisitions, the actualnumber of samples acquired in an acquisition. For example, in real-timeacquisition mode with the entire trace displayed, if the Record Length is setto 5000 points and Samples is set to 5001 points, then two acquisitions arerequired and 10000 points are acquired. If Samples is set to 5000 points, oneacquisition is required and 5000 points are acquired. If Samples is set to4999 points, one acquisition is required and 5000 points are acquired.
For Single Sequence and Mask Pass/Fail Testing, a sample is only counted ifthe sample would be displayed in the graticule area. In Single Sequence, alleligible samples in an acquisition are counted, and in Mask Test, allacquisitions acquired in a batch are counted.
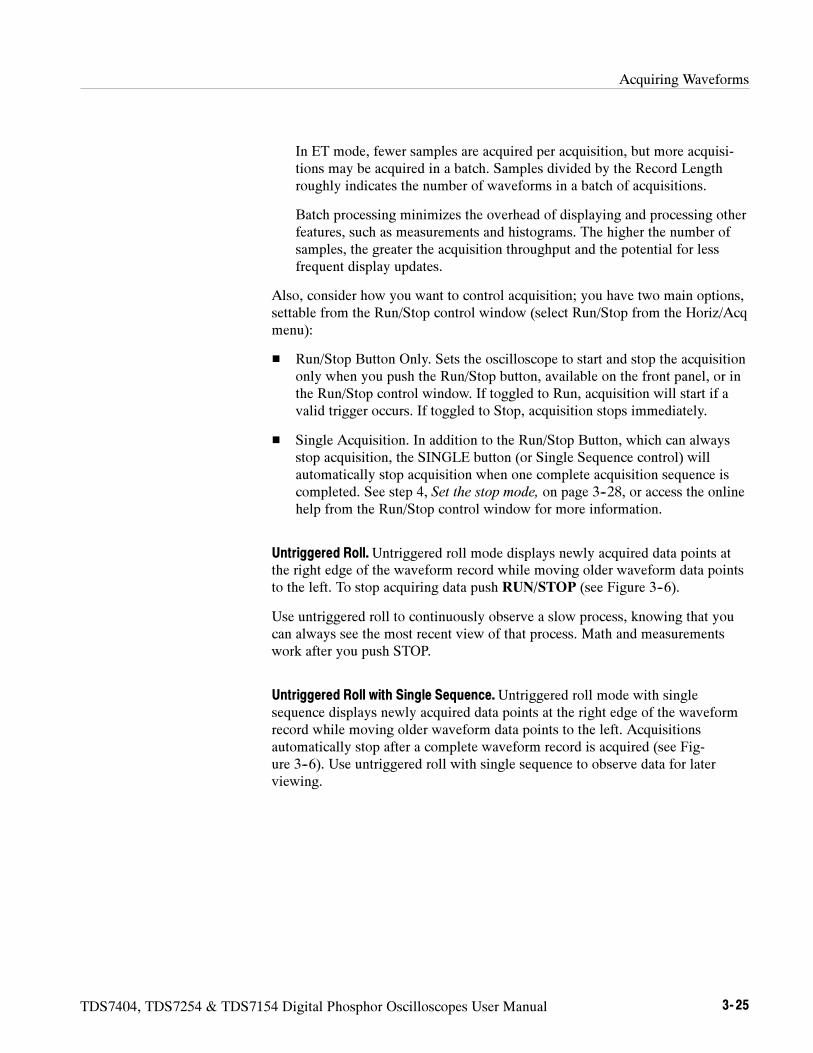
Acquiring Waveforms
TDS7404, TDS7254 & TDS7154 Digital Phosphor Oscilloscopes User Manual 3- 25
In ET mode, fewer samples are acquired per acquisition, but more acquisi-tions may be acquired in a batch. Samples divided by the Record Lengthroughly indicates the number of waveforms in a batch of acquisitions.
Batch processing minimizes the overhead of displaying and processing otherfeatures, such as measurements and histograms. The higher the number ofsamples, the greater the acquisition throughput and the potential for lessfrequent display updates.
Also, consider how you want to control acquisition; you have two main options,settable from the Run/Stop control window (select Run/Stop from the Horiz/Acqmenu):
Run/Stop Button Only. Sets the oscilloscope to start and stop the acquisitiononly when you push the Run/Stop button, available on the front panel, or inthe Run/Stop control window. If toggled to Run, acquisition will start if avalid trigger occurs. If toggled to Stop, acquisition stops immediately.
Single Acquisition. In addition to the Run/Stop Button, which can alwaysstop acquisition, the SINGLE button (or Single Sequence control) willautomatically stop acquisition when one complete acquisition sequence iscompleted. See step 4, Set the stop mode, on page 3--28, or access the onlinehelp from the Run/Stop control window for more information.
Untriggered Roll.Untriggered roll mode displays newly acquired data points atthe right edge of the waveform record while moving older waveform data pointsto the left. To stop acquiring data push RUN/STOP (see Figure 3--6).
Use untriggered roll to continuously observe a slow process, knowing that youcan always see the most recent view of that process. Math and measurementswork after you push STOP.
Untriggered Roll with Single Sequence.Untriggered roll mode with singlesequence displays newly acquired data points at the right edge of the waveformrecord while moving older waveform data points to the left. Acquisitionsautomatically stop after a complete waveform record is acquired (see Fig-ure 3--6). Use untriggered roll with single sequence to observe data for laterviewing.
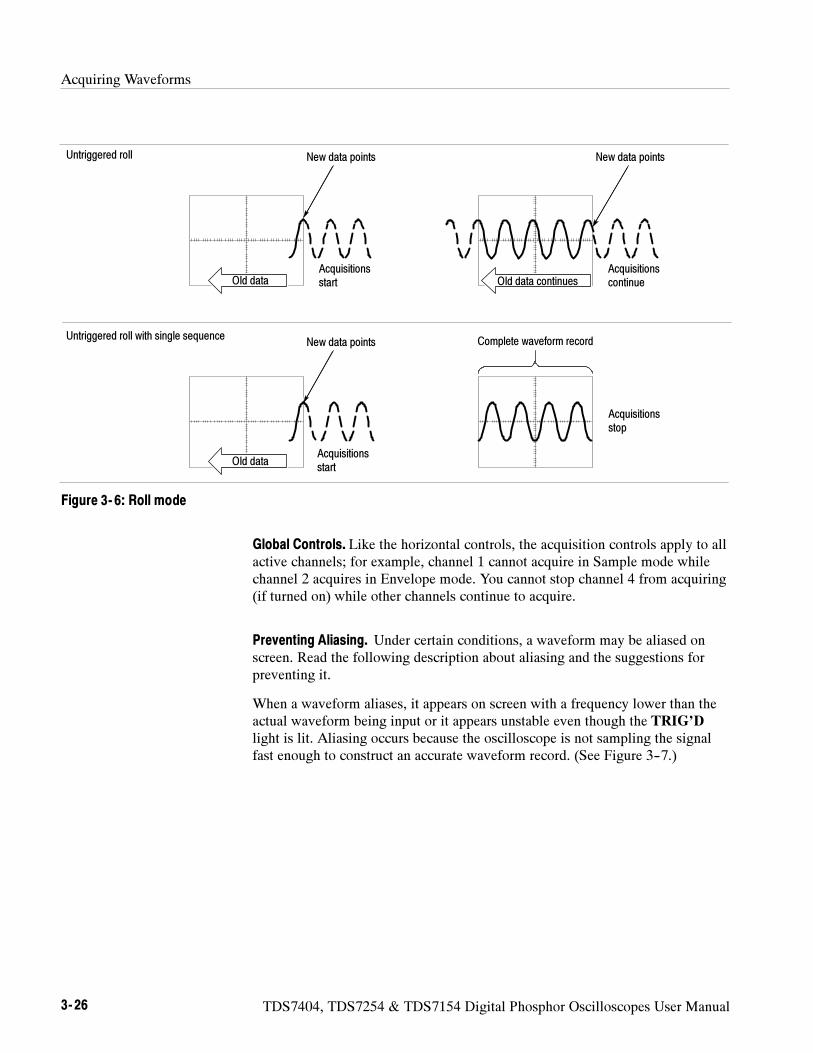
Acquiring Waveforms
3- 26 TDS7404, TDS7254 & TDS7154 Digital Phosphor Oscilloscopes User Manual
Acquisitionscontinue
Untriggered roll
Complete waveform record
Acquisitionsstop
Untriggered roll with single sequence
Acquisitionsstart
New data points
Acquisitionsstart
New data points New data points
Old Data ContinuesOld data continuesOld DataOld data
Old DataOld data
Figure 3- 6: Roll mode
Global Controls. Like the horizontal controls, the acquisition controls apply to allactive channels; for example, channel 1 cannot acquire in Sample mode whilechannel 2 acquires in Envelope mode. You cannot stop channel 4 from acquiring(if turned on) while other channels continue to acquire.
Preventing Aliasing. Under certain conditions, a waveform may be aliased onscreen. Read the following description about aliasing and the suggestions forpreventing it.
When a waveform aliases, it appears on screen with a frequency lower than theactual waveform being input or it appears unstable even though the TRIG’D
light is lit. Aliasing occurs because the oscilloscope is not sampling the signalfast enough to construct an accurate waveform record. (See Figure 3--7.)
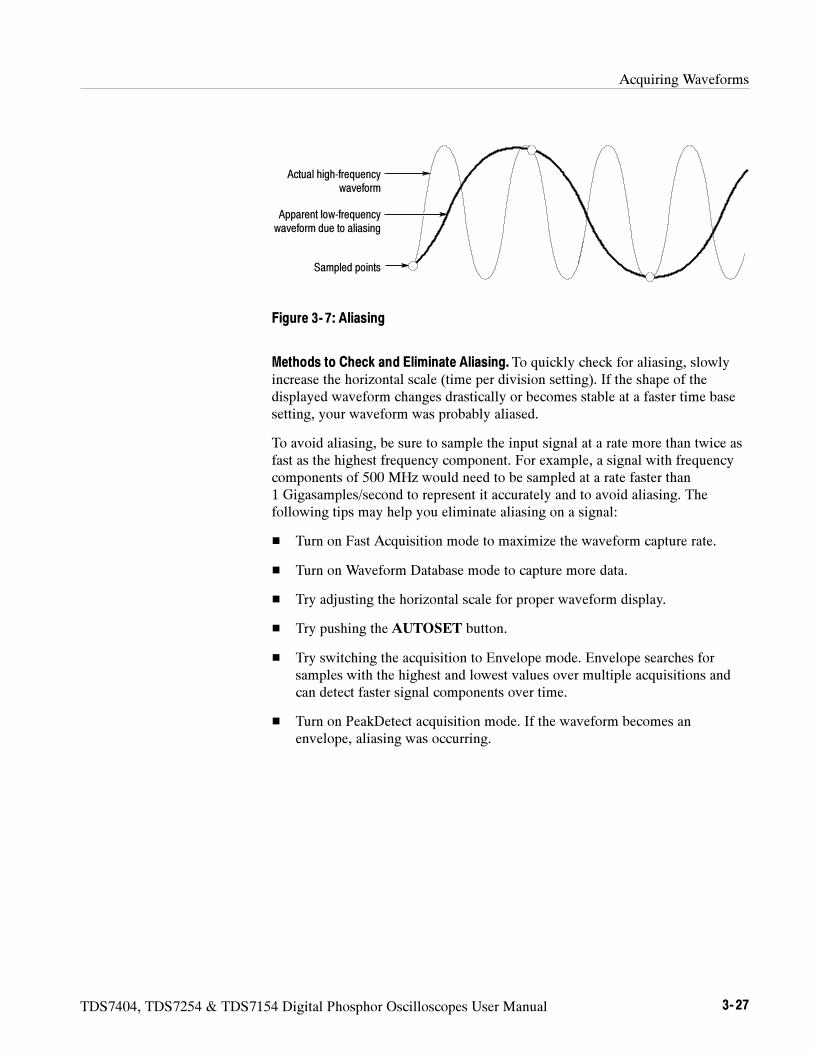
Acquiring Waveforms
TDS7404, TDS7254 & TDS7154 Digital Phosphor Oscilloscopes User Manual 3- 27
Actual high-frequencywaveform
Apparent low-frequencywaveform due to aliasing
Sampled points
Figure 3- 7: Aliasing
Methods to Check and Eliminate Aliasing.To quickly check for aliasing, slowlyincrease the horizontal scale (time per division setting). If the shape of thedisplayed waveform changes drastically or becomes stable at a faster time basesetting, your waveform was probably aliased.
To avoid aliasing, be sure to sample the input signal at a rate more than twice asfast as the highest frequency component. For example, a signal with frequencycomponents of 500 MHz would need to be sampled at a rate faster than1 Gigasamples/second to represent it accurately and to avoid aliasing. Thefollowing tips may help you eliminate aliasing on a signal:
Turn on Fast Acquisition mode to maximize the waveform capture rate.
Turn on Waveform Database mode to capture more data.
Try adjusting the horizontal scale for proper waveform display.
Try pushing the AUTOSET button.
Try switching the acquisition to Envelope mode. Envelope searches forsamples with the highest and lowest values over multiple acquisitions andcan detect faster signal components over time.
Turn on PeakDetect acquisition mode. If the waveform becomes anenvelope, aliasing was occurring.
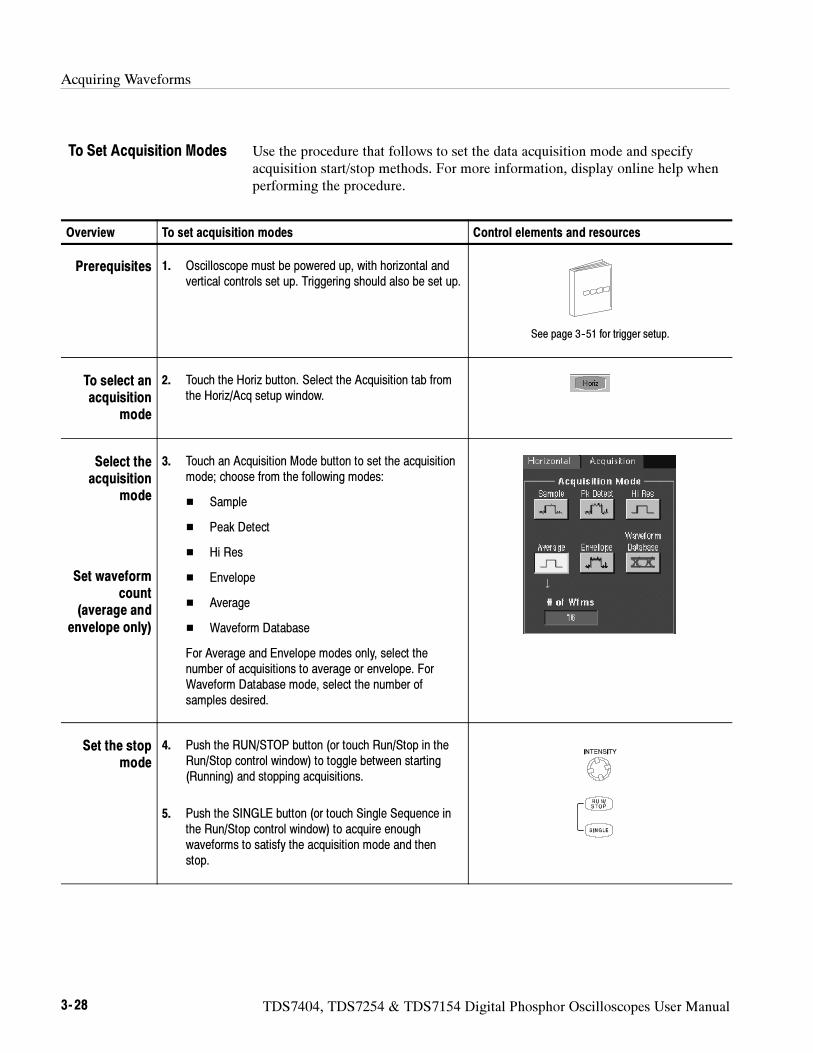
Acquiring Waveforms
3- 28 TDS7404, TDS7254 & TDS7154 Digital Phosphor Oscilloscopes User Manual
Use the procedure that follows to set the data acquisition mode and specifyacquisition start/stop methods. For more information, display online help whenperforming the procedure.
Overview To set acquisition modes Control elements and resources
Prerequisites 1. Oscilloscope must be powered up, with horizontal andvertical controls set up. Triggering should also be set up.
See page 3--51 for trigger setup.
To select anacquisition
mode
2. Touch the Horiz button. Select the Acquisition tab fromthe Horiz/Acq setup window.
Select theacquisition
mode
Set waveformcount
(average andenvelope only)
3. Touch an Acquisition Mode button to set the acquisitionmode; choose from the following modes:
Sample
Peak Detect
Hi Res
Envelope
Average
Waveform Database
For Average and Envelope modes only, select thenumber of acquisitions to average or envelope. ForWaveform Database mode, select the number ofsamples desired.
Set the stopmode
4. Push the RUN/STOP button (or touch Run/Stop in theRun/Stop control window) to toggle between starting(Running) and stopping acquisitions.
5. Push the SINGLE button (or touch Single Sequence inthe Run/Stop control window) to acquire enoughwaveforms to satisfy the acquisition mode and thenstop.
To Set Acquisition Modes
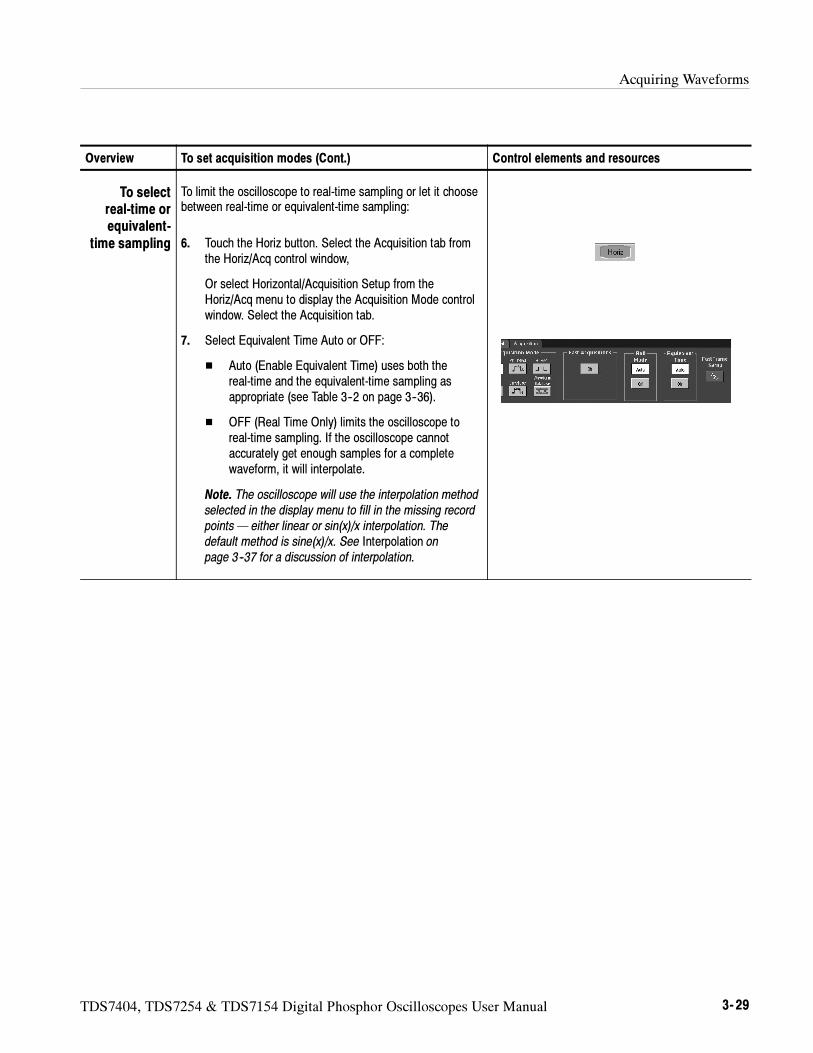
Acquiring Waveforms
TDS7404, TDS7254 & TDS7154 Digital Phosphor Oscilloscopes User Manual 3- 29
Overview Control elements and resourcesTo set acquisition modes (Cont.)
To selectreal-time orequivalent-
time sampling
To limit the oscilloscope to real-time sampling or let it choosebetween real-time or equivalent-time sampling:
6. Touch the Horiz button. Select the Acquisition tab fromthe Horiz/Acq control window,
Or select Horizontal/Acquisition Setup from theHoriz/Acq menu to display the Acquisition Mode controlwindow. Select the Acquisition tab.
7. Select Equivalent Time Auto or OFF:
Auto (Enable Equivalent Time) uses both thereal-time and the equivalent-time sampling asappropriate (see Table 3--2 on page 3--36).
OFF (Real Time Only) limits the oscilloscope toreal-time sampling. If the oscilloscope cannotaccurately get enough samples for a completewaveform, it will interpolate.
Note. The oscilloscope will use the interpolation methodselected in the display menu to fill in the missing recordpoints — either linear or sin(x)/x interpolation. Thedefault method is sine(x)/x. See Interpolation onpage 3--37 for a discussion of interpolation.
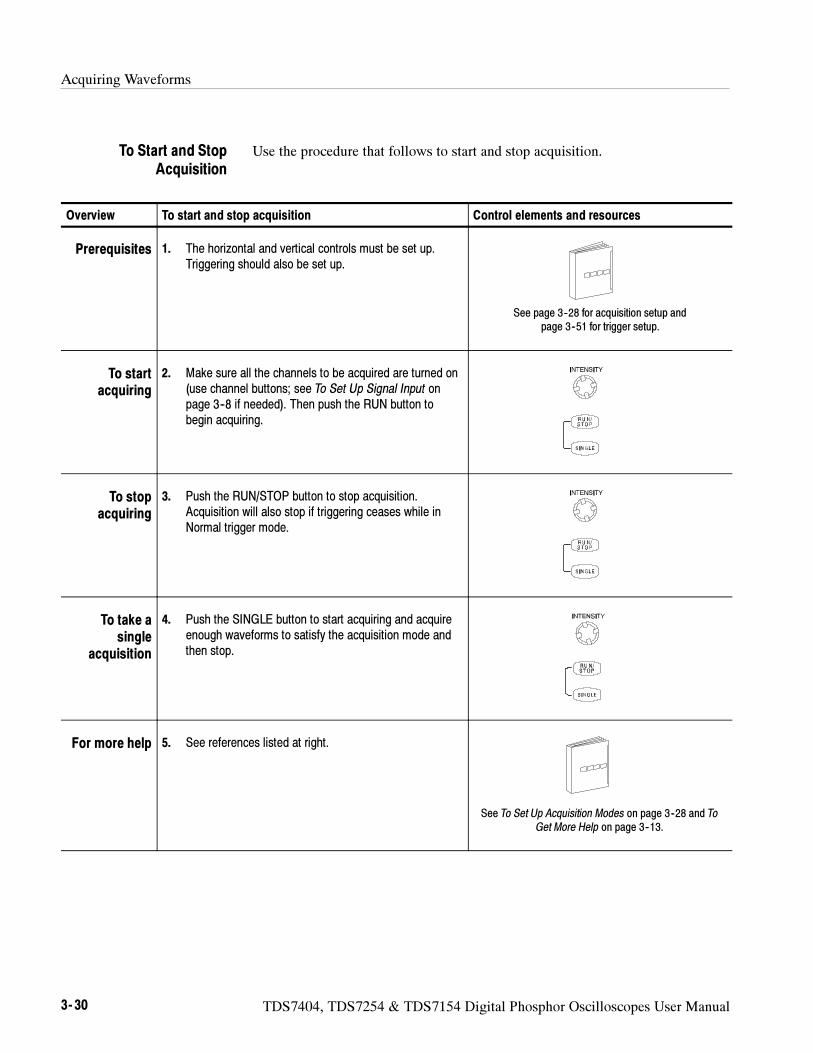
Acquiring Waveforms
3- 30 TDS7404, TDS7254 & TDS7154 Digital Phosphor Oscilloscopes User Manual
Use the procedure that follows to start and stop acquisition.
Overview To start and stop acquisition Control elements and resources
Prerequisites 1. The horizontal and vertical controls must be set up.Triggering should also be set up.
See page 3--28 for acquisition setup andpage 3--51 for trigger setup.
To startacquiring
2. Make sure all the channels to be acquired are turned on(use channel buttons; see To Set Up Signal Input onpage 3--8 if needed). Then push the RUN button tobegin acquiring.
To stopacquiring
3. Push the RUN/STOP button to stop acquisition.Acquisition will also stop if triggering ceases while inNormal trigger mode.
To take asingle
acquisition
4. Push the SINGLE button to start acquiring and acquireenough waveforms to satisfy the acquisition mode andthen stop.
For more help 5. See references listed at right.
See To Set Up Acquisition Modes on page 3--28 and ToGet More Help on page 3--13.
To Start and StopAcquisition
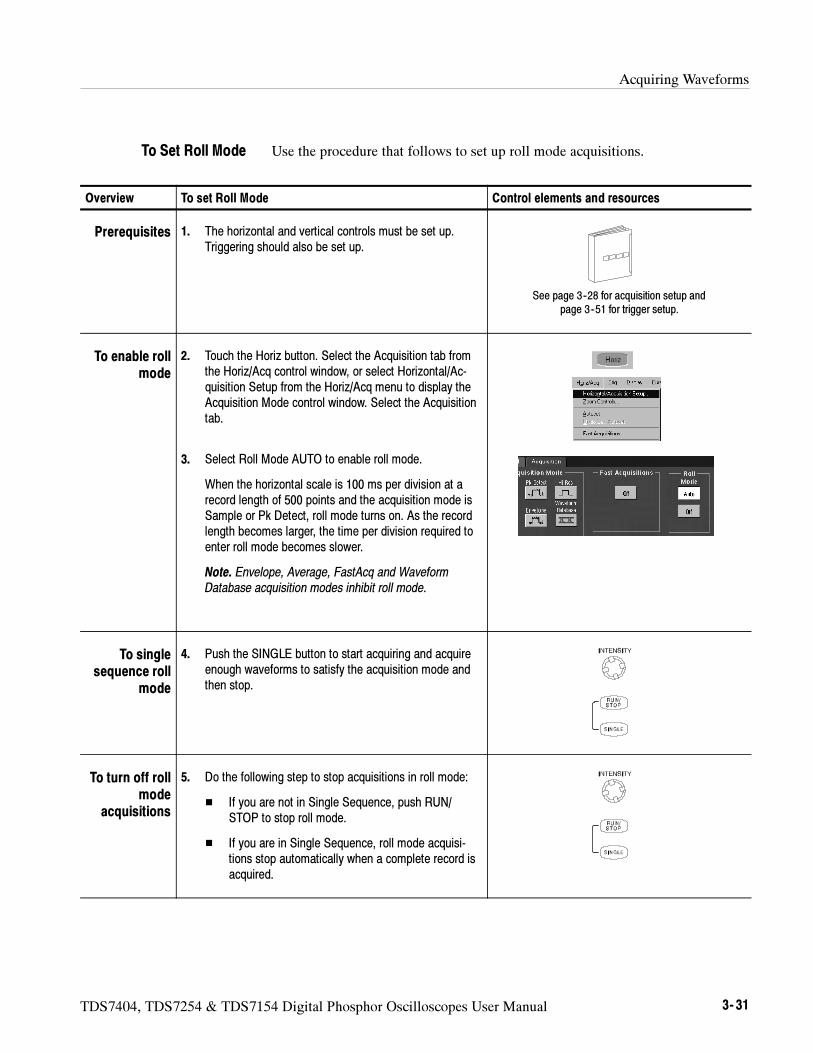
Acquiring Waveforms
TDS7404, TDS7254 & TDS7154 Digital Phosphor Oscilloscopes User Manual 3- 31
Use the procedure that follows to set up roll mode acquisitions.
Overview To set Roll Mode Control elements and resources
Prerequisites 1. The horizontal and vertical controls must be set up.Triggering should also be set up.
See page 3--28 for acquisition setup andpage 3--51 for trigger setup.
To enable rollmode
2. Touch the Horiz button. Select the Acquisition tab fromthe Horiz/Acq control window, or select Horizontal/Ac-quisition Setup from the Horiz/Acq menu to display theAcquisition Mode control window. Select the Acquisitiontab.
3. Select Roll Mode AUTO to enable roll mode.
When the horizontal scale is 100 ms per division at arecord length of 500 points and the acquisition mode isSample or Pk Detect, roll mode turns on. As the recordlength becomes larger, the time per division required toenter roll mode becomes slower.
Note. Envelope, Average, FastAcq and WaveformDatabase acquisition modes inhibit roll mode.
To singlesequence roll
mode
4. Push the SINGLE button to start acquiring and acquireenough waveforms to satisfy the acquisition mode andthen stop.
To turn off rollmode
acquisitions
5. Do the following step to stop acquisitions in roll mode:
If you are not in Single Sequence, push RUN/STOP to stop roll mode.
If you are in Single Sequence, roll mode acquisi-tions stop automatically when a complete record isacquired.
To Set Roll Mode
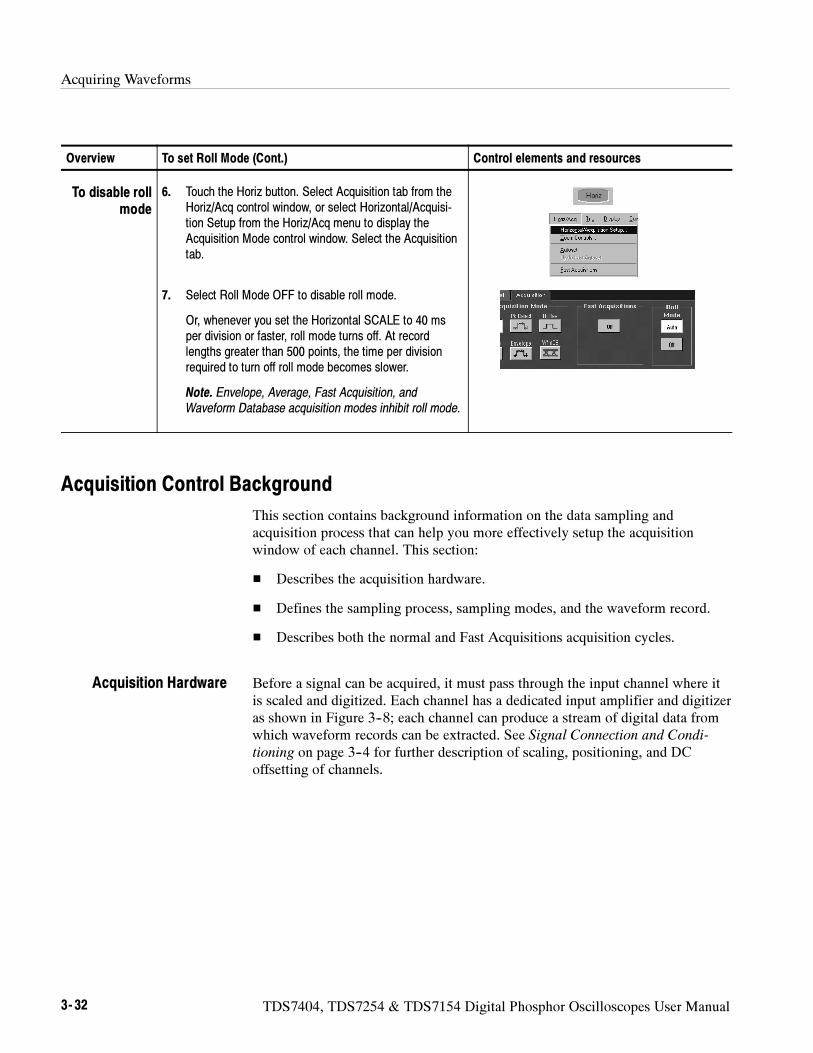
Acquiring Waveforms
3- 32 TDS7404, TDS7254 & TDS7154 Digital Phosphor Oscilloscopes User Manual
Overview Control elements and resourcesTo set Roll Mode (Cont.)
To disable rollmode
6. Touch the Horiz button. Select Acquisition tab from theHoriz/Acq control window, or select Horizontal/Acquisi-tion Setup from the Horiz/Acq menu to display theAcquisition Mode control window. Select the Acquisitiontab.
7. Select Roll Mode OFF to disable roll mode.
Or, whenever you set the Horizontal SCALE to 40 msper division or faster, roll mode turns off. At recordlengths greater than 500 points, the time per divisionrequired to turn off roll mode becomes slower.
Note. Envelope, Average, Fast Acquisition, andWaveform Database acquisition modes inhibit roll mode.
Acquisition Control Background
This section contains background information on the data sampling andacquisition process that can help you more effectively setup the acquisitionwindow of each channel. This section:
Describes the acquisition hardware.
Defines the sampling process, sampling modes, and the waveform record.
Describes both the normal and Fast Acquisitions acquisition cycles.
Before a signal can be acquired, it must pass through the input channel where itis scaled and digitized. Each channel has a dedicated input amplifier and digitizeras shown in Figure 3--8; each channel can produce a stream of digital data fromwhich waveform records can be extracted. See Signal Connection and Condi-
tioning on page 3--4 for further description of scaling, positioning, and DCoffsetting of channels.
Acquisition Hardware
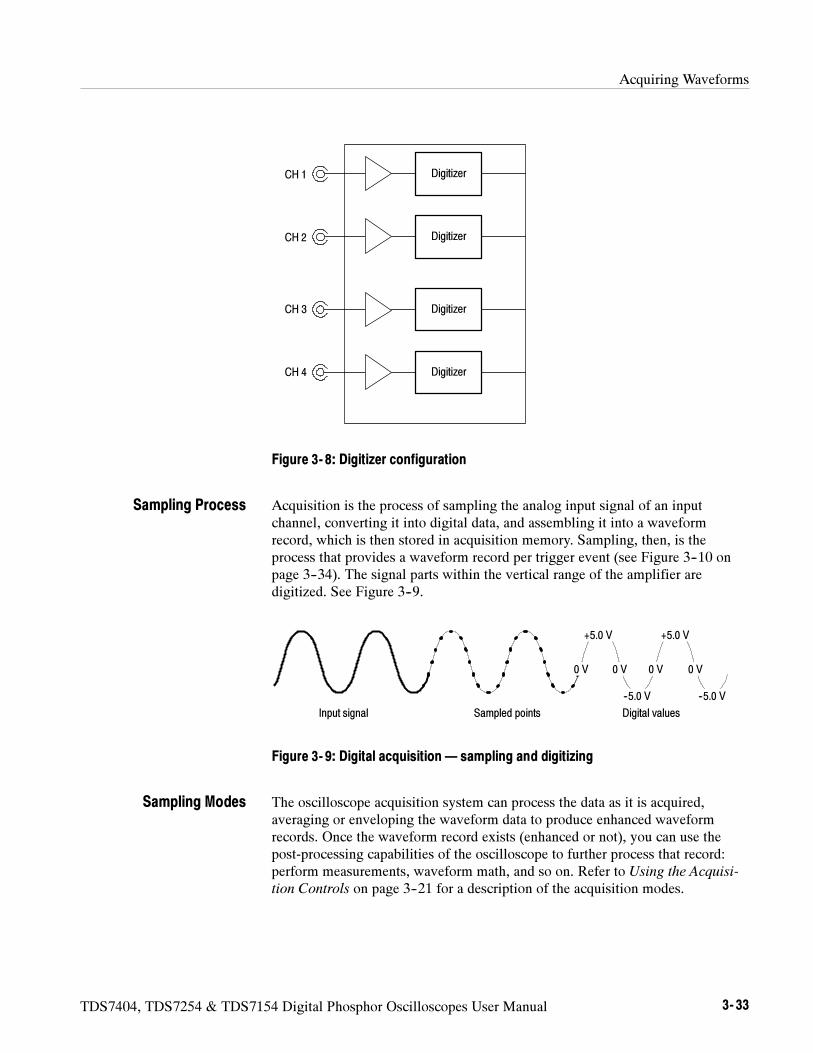
Acquiring Waveforms
TDS7404, TDS7254 & TDS7154 Digital Phosphor Oscilloscopes User Manual 3- 33
DigitizerCH 1
DigitizerCH 2
DigitizerCH 3
DigitizerCH 4
Figure 3- 8: Digitizer configuration
Acquisition is the process of sampling the analog input signal of an inputchannel, converting it into digital data, and assembling it into a waveformrecord, which is then stored in acquisition memory. Sampling, then, is theprocess that provides a waveform record per trigger event (see Figure 3--10 onpage 3--34). The signal parts within the vertical range of the amplifier aredigitized. See Figure 3--9.
Input signal Sampled points Digital values
+5.0 V
--5.0 V
+5.0 V
--5.0 V
0 V 0 V 0 V 0 V
Figure 3- 9: Digital acquisition — sampling and digitizing
The oscilloscope acquisition system can process the data as it is acquired,averaging or enveloping the waveform data to produce enhanced waveformrecords. Once the waveform record exists (enhanced or not), you can use thepost-processing capabilities of the oscilloscope to further process that record:perform measurements, waveform math, and so on. Refer to Using the Acquisi-
tion Controls on page 3--21 for a description of the acquisition modes.
Sampling Process
Sampling Modes
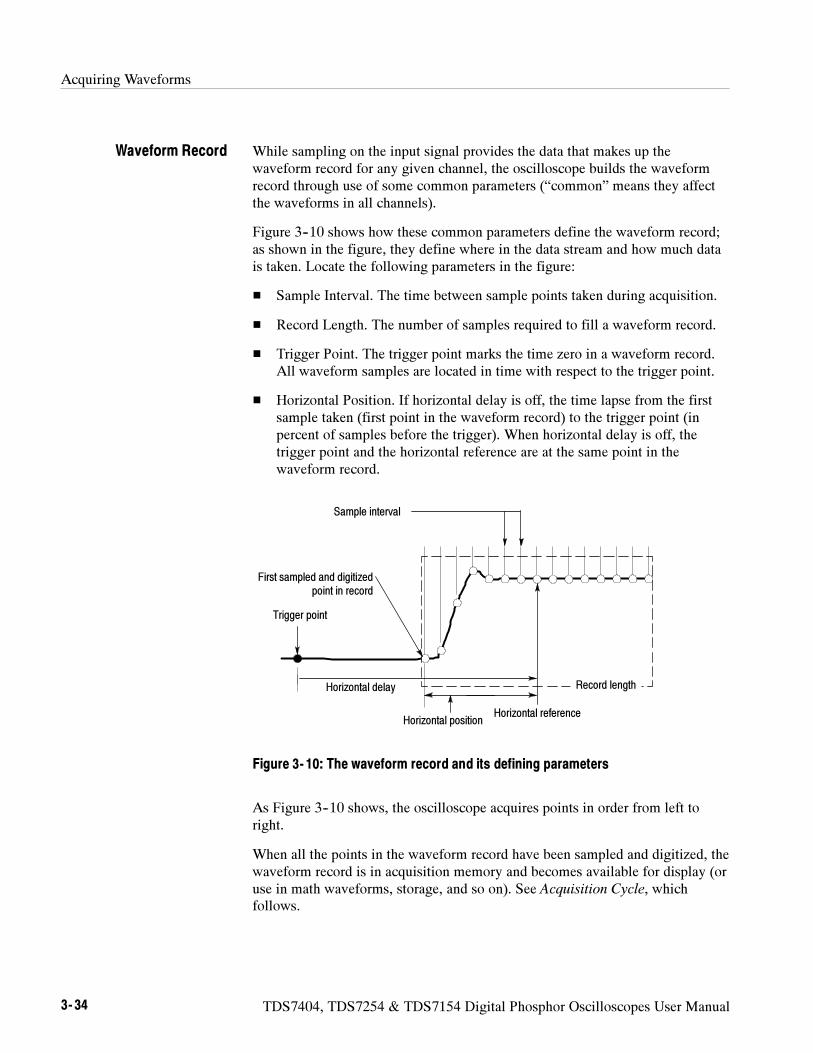
Acquiring Waveforms
3- 34 TDS7404, TDS7254 & TDS7154 Digital Phosphor Oscilloscopes User Manual
While sampling on the input signal provides the data that makes up thewaveform record for any given channel, the oscilloscope builds the waveformrecord through use of some common parameters (“common” means they affectthe waveforms in all channels).
Figure 3--10 shows how these common parameters define the waveform record;as shown in the figure, they define where in the data stream and how much datais taken. Locate the following parameters in the figure:
Sample Interval. The time between sample points taken during acquisition.
Record Length. The number of samples required to fill a waveform record.
Trigger Point. The trigger point marks the time zero in a waveform record.All waveform samples are located in time with respect to the trigger point.
Horizontal Position. If horizontal delay is off, the time lapse from the firstsample taken (first point in the waveform record) to the trigger point (inpercent of samples before the trigger). When horizontal delay is off, thetrigger point and the horizontal reference are at the same point in thewaveform record.
Sample interval
First sampled and digitizedpoint in record
Horizontal reference
Trigger point
Horizontal delay Record length
Horizontal position
Figure 3- 10: The waveform record and its defining parameters
As Figure 3--10 shows, the oscilloscope acquires points in order from left toright.
When all the points in the waveform record have been sampled and digitized, thewaveform record is in acquisition memory and becomes available for display (oruse in math waveforms, storage, and so on). See Acquisition Cycle, whichfollows.
Waveform Record
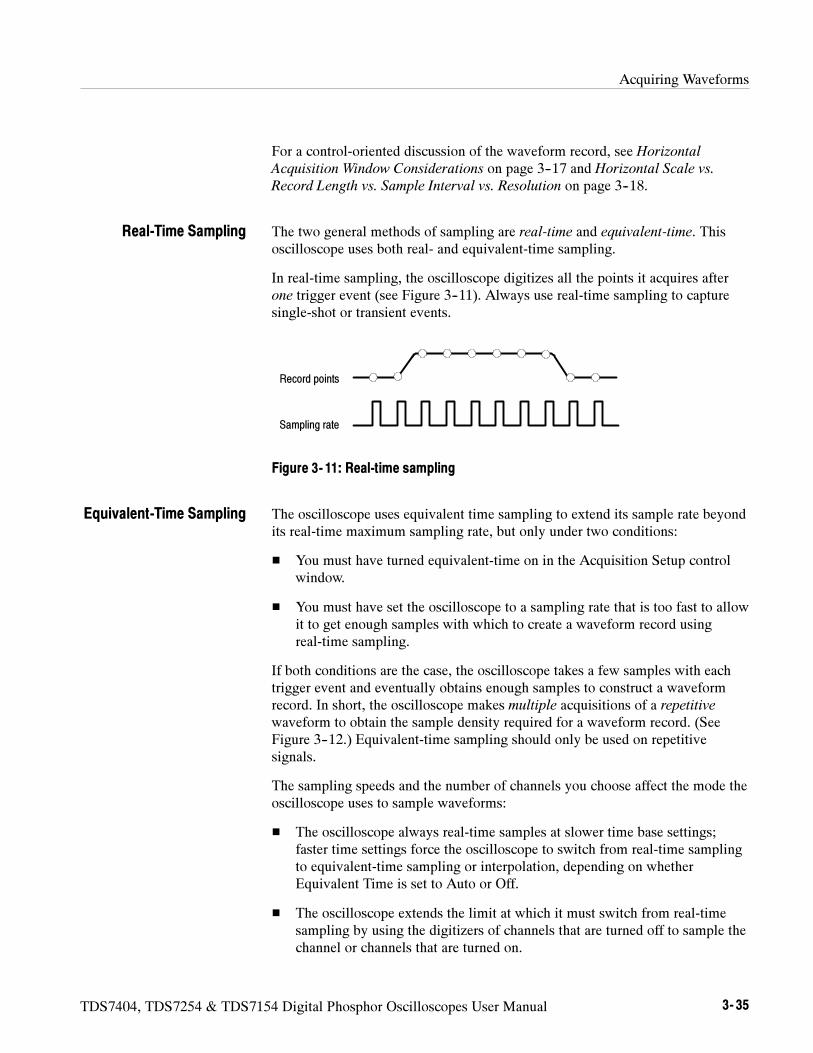
Acquiring Waveforms
TDS7404, TDS7254 & TDS7154 Digital Phosphor Oscilloscopes User Manual 3- 35
For a control-oriented discussion of the waveform record, see HorizontalAcquisition Window Considerations on page 3--17 and Horizontal Scale vs.
Record Length vs. Sample Interval vs. Resolution on page 3--18.
The two general methods of sampling are real-time and equivalent-time. Thisoscilloscope uses both real- and equivalent-time sampling.
In real-time sampling, the oscilloscope digitizes all the points it acquires afterone trigger event (see Figure 3--11). Always use real-time sampling to capturesingle-shot or transient events.
Sampling rate
Record points
Figure 3- 11: Real-time sampling
The oscilloscope uses equivalent time sampling to extend its sample rate beyondits real-time maximum sampling rate, but only under two conditions:
You must have turned equivalent-time on in the Acquisition Setup controlwindow.
You must have set the oscilloscope to a sampling rate that is too fast to allowit to get enough samples with which to create a waveform record usingreal-time sampling.
If both conditions are the case, the oscilloscope takes a few samples with eachtrigger event and eventually obtains enough samples to construct a waveformrecord. In short, the oscilloscope makes multiple acquisitions of a repetitivewaveform to obtain the sample density required for a waveform record. (SeeFigure 3--12.) Equivalent-time sampling should only be used on repetitivesignals.
The sampling speeds and the number of channels you choose affect the mode theoscilloscope uses to sample waveforms:
The oscilloscope always real-time samples at slower time base settings;faster time settings force the oscilloscope to switch from real-time samplingto equivalent-time sampling or interpolation, depending on whetherEquivalent Time is set to Auto or Off.
The oscilloscope extends the limit at which it must switch from real-timesampling by using the digitizers of channels that are turned off to sample thechannel or channels that are turned on.
Real-Time Sampling
Equivalent-Time Sampling
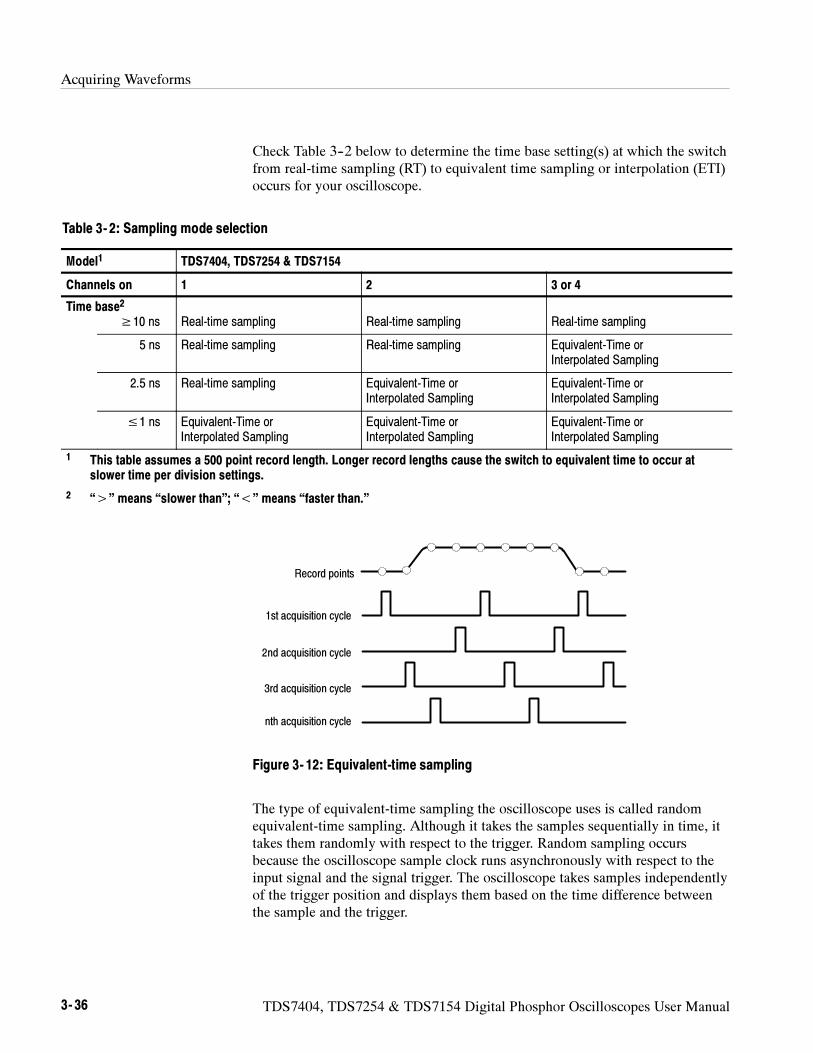
Acquiring Waveforms
3- 36 TDS7404, TDS7254 & TDS7154 Digital Phosphor Oscilloscopes User Manual
Check Table 3--2 below to determine the time base setting(s) at which the switchfrom real-time sampling (RT) to equivalent time sampling or interpolation (ETI)occurs for your oscilloscope.
Table 3- 2: Sampling mode selection
Model1 TDS7404, TDS7254 & TDS7154
Channels on 1 2 3 or 4
Time base2
≥10 ns Real-time sampling Real-time sampling Real-time sampling
5 ns Real-time sampling Real-time sampling Equivalent-Time orInterpolated Sampling
2.5 ns Real-time sampling Equivalent-Time orInterpolated Sampling
Equivalent-Time orInterpolated Sampling
≤1 ns Equivalent-Time orInterpolated Sampling
Equivalent-Time orInterpolated Sampling
Equivalent-Time orInterpolated Sampling
1 This table assumes a 500 point record length. Longer record lengths cause the switch to equivalent time to occur atslower time per division settings.
2 “>” means “slower than”; “<” means “faster than.”
1st acquisition cycle
3rd acquisition cycle
nth acquisition cycle
2nd acquisition cycle
Record points
Figure 3- 12: Equivalent-time sampling
The type of equivalent-time sampling the oscilloscope uses is called randomequivalent-time sampling. Although it takes the samples sequentially in time, ittakes them randomly with respect to the trigger. Random sampling occursbecause the oscilloscope sample clock runs asynchronously with respect to theinput signal and the signal trigger. The oscilloscope takes samples independentlyof the trigger position and displays them based on the time difference betweenthe sample and the trigger.
Acquiring Waveforms
TDS7404, TDS7254 & TDS7154 Digital Phosphor Oscilloscopes User Manual 3- 37
Your oscilloscope can interpolate between the samples it acquires. Like forequivalent time sampling, it does so only when it does not have all the realsamples it needs to fill its displayed waveform. For instance, setting ZOOM toprogressively larger amounts of expansion. The oscilloscope then interpolates tocreate the intervening points in the displayed waveform. If the time per divisionis set fast enough to require equivalent time but equivalent time is disabled, theinstrument interpolates points. There are two options for interpolation: linear orsin(x)/x. (The oscilloscope can also equivalent-time sample to acquire moresamples; see Equivalent-Time Sampling on page 3--35.)
Linear interpolation. Linear interpolation computes record points between actualacquired samples by using a straight line fit. It assumes all the interpolatedpoints fall in their appropriate point in time on that straight line. Linearinterpolation is useful for many waveforms such as pulse trains.
Sin(x)/x interpolation. Sin(x)/x interpolation computes record points using a curvefit between the actual values acquired. It assumes all the interpolated points fallalong that curve. Sin(x)/x is particularly useful when acquiring more roundedwaveforms such as sine waves. Actually, it is appropriate for general use,although it may introduce some overshoot or undershoot in signals with fast risetimes, especially if you use zoom and the waveform edges are undersampled.
NOTE. When using either type of interpolation, you may want to set the display
style so that the real samples are displayed and interpolated samples are
dimmed. The instructions under Select the Display Style on page 3--118 explain
how to turn on intensified samples.
The oscilloscope can interleave its channels to attain higher digitizing rateswithout equivalent time sampling. The oscilloscope applies the digitizingresources of unused channels (that is, channels that are turned off) to samplethose that are in use (turned on). Table 3--3 lists how interleaving more than onedigitizer to sample a channel extends the maximum digitizing rate.
Once you set horizontal scale to exceed the maximum digitizing rate for thenumber of channels in use (see Table 3--3), the oscilloscope will not be able toget enough samples to create a waveform record. At that point, the oscilloscopewill switch from real to equivalent time sampling to obtain additional samples.(See Equivalent-Time Sampling on page 3--35.)
Interpolation
Interleaving
Acquiring Waveforms
3- 38 TDS7404, TDS7254 & TDS7154 Digital Phosphor Oscilloscopes User Manual
Table 3- 3: How interleaving affects sample rate
Number ofchannels in Maximum digitizing rate when real-time samplingchannels inuse
TDS7404 TDS7254 TDS7154
One 20 GS/sec 20 GS/sec 20 GS/sec
Two 10 GS/sec 10 GS/sec 10 GS/sec
Three or Four 5 GS/sec 5 GS/sec 5 GS/sec
Using Fast Acquisition Mode
This section describes how to use Fast Acquisition mode and how it differs fromnormal acquisition mode.
Fast acquisition mode reduces the dead time between waveform acquisitions thatnormally occur when digitizing storage oscilloscopes (DSOs) acquire wave-forms. This dead-time reduction enables Fast Acquisition mode to capture anddisplay transient events, such as glitches or runt pulses, often missed duringlonger dead times that accompany normal DSO operation. Fast Acquisitionmode can also display waveform phenomena at an intensity that reflects theirrate-of-occurrence.
Fast XY and XYZ modes also provide intensity information by acceptingcontinuous, non-triggered data from the input channels.
Measurements and histograms are done directly on the two dimensional array ofdisplay pixels. In infinite persistence mode, the array accumulates moreinformation and measurements are more accurate.
Some modes/features are incompatible with Fast Acquisitions mode and if youselect them they will inhibit Fast Acquisitions:
FastFrame and Zoom modes
Envelope, Average, waveform database, Hi Res, and Single AcquisitionSequence acquisition modes
Interpolation (equivalent time sampling is used instead)
Vectors when in equivalent time mode (waveforms are displayed usingDots). To determine under what conditions the oscilloscope normallyinterpolates or uses equivalent time, see Equivalent-Time Sampling onpage 3--35.
Math waveforms
Measurements on channels when in Fast XY or XYZ
Acquiring Waveforms
TDS7404, TDS7254 & TDS7154 Digital Phosphor Oscilloscopes User Manual 3- 39
Mask testing with Option SM
If you select any of these modes before or while Fast Acquisitions is on, theywill inhibit, temporarily turn off, Fast Acquisitions mode.
Consider the mode you want to use to acquire data:
Automatic Selection. Fast Acquisitions automatically selects record length andsample rate to optimize the displayed image by optimizing live time andminimizing dead time. Fast Acquisitions selects sample rates up to 1.25 GS/sand record lengths up to 1000000 and compresses them to 500 pixels to producethe maximum display content.
Waveform Capture Rate. Figures 3--13 and 3--14 illustrate how Fast Acquisitionsmode differs from the normal acquisition mode used by digital storage oscillo-scopes. Note that normal mode follows a “capture waveform-digitize waveform-update waveform memory-display waveform” cycle. Normal mode misses shortterm events occurring during the long dead times. Typical waveform capturerates are 50 waveforms per second.
Fast Acquisitions mode increases the waveform capture rate to up to 400,000waveforms per second, updating the waveform array many times betweendisplays. This very fast capture rate greatly increases the probability that runts,glitches, and other infrequent events will accumulate in waveform memory. Theoscilloscope then displays the waveform at the normal display rate. You cancontrol the waveform intensity using adjustable or automatic brightness (see Toadjust the intensity on page 3--43 for more information).
Fast Acquisitions mode adds intensity or gray scale information, like an analogoscilloscope, to each point in the waveform array. The waveform array is a threedimensional array, two dimensions of display pixels and a third dimension ofpixel values. Display pixel values are incremented each time they are written bya waveform acquisition.
Using Fast Acquisitions
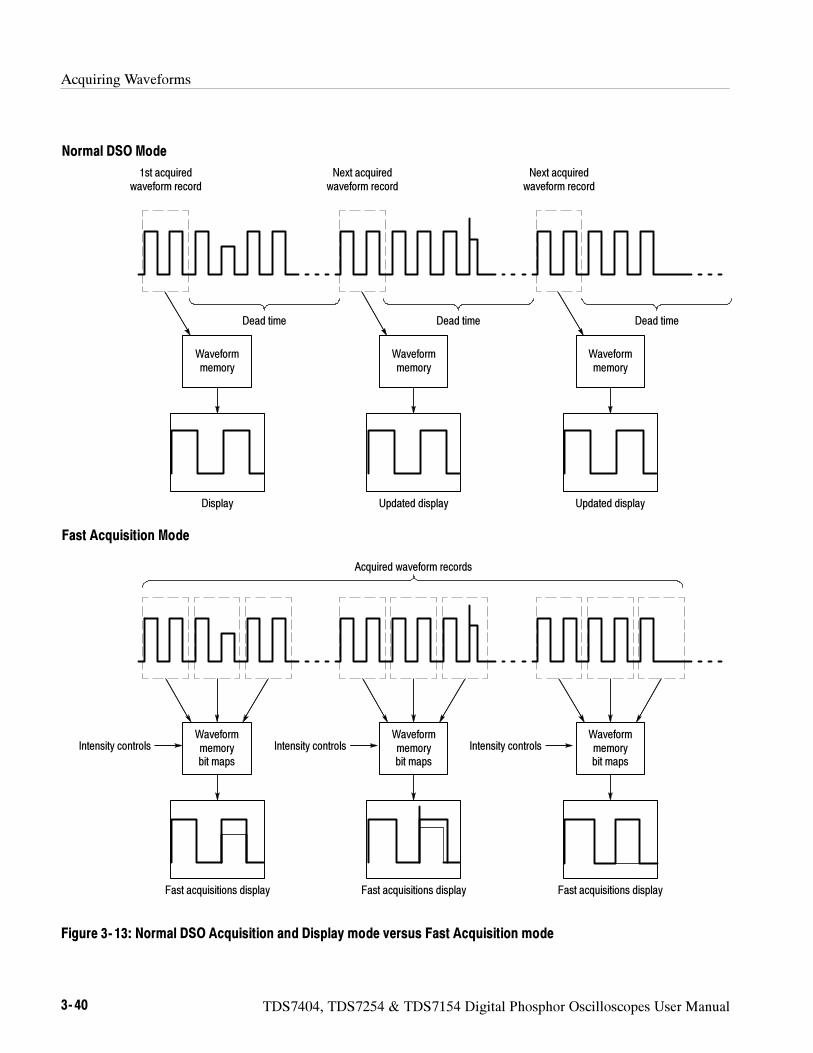
Acquiring Waveforms
3- 40 TDS7404, TDS7254 & TDS7154 Digital Phosphor Oscilloscopes User Manual
Next acquiredwaveform record
Next acquiredwaveform record
Acquired waveform records
Display Updated display Updated display
Fast acquisitions display Fast acquisitions display Fast acquisitions display
Dead time Dead time Dead time
Normal DSO Mode
Fast Acquisition Mode
1st acquiredwaveform record
Waveformmemorybit maps
Waveformmemory
Waveformmemory
Waveformmemory
Waveformmemorybit maps
Waveformmemorybit maps
Intensity controls Intensity controls Intensity controls
Figure 3- 13: Normal DSO Acquisition and Display mode versus Fast Acquisition mode
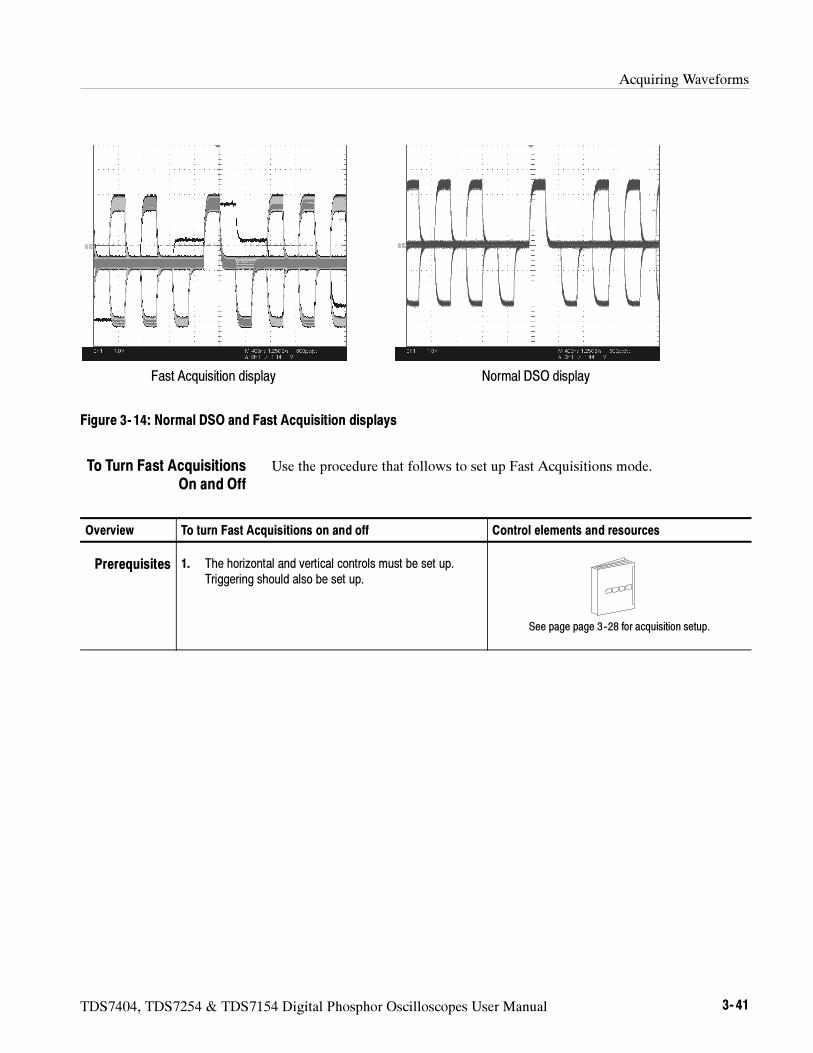
Acquiring Waveforms
TDS7404, TDS7254 & TDS7154 Digital Phosphor Oscilloscopes User Manual 3- 41
Fast Acquisition display Normal DSO display
Figure 3- 14: Normal DSO and Fast Acquisition displays
Use the procedure that follows to set up Fast Acquisitions mode.
Overview To turn Fast Acquisitions on and off Control elements and resources
Prerequisites 1. The horizontal and vertical controls must be set up.Triggering should also be set up.
See page page 3--28 for acquisition setup.
To Turn Fast AcquisitionsOn and Off
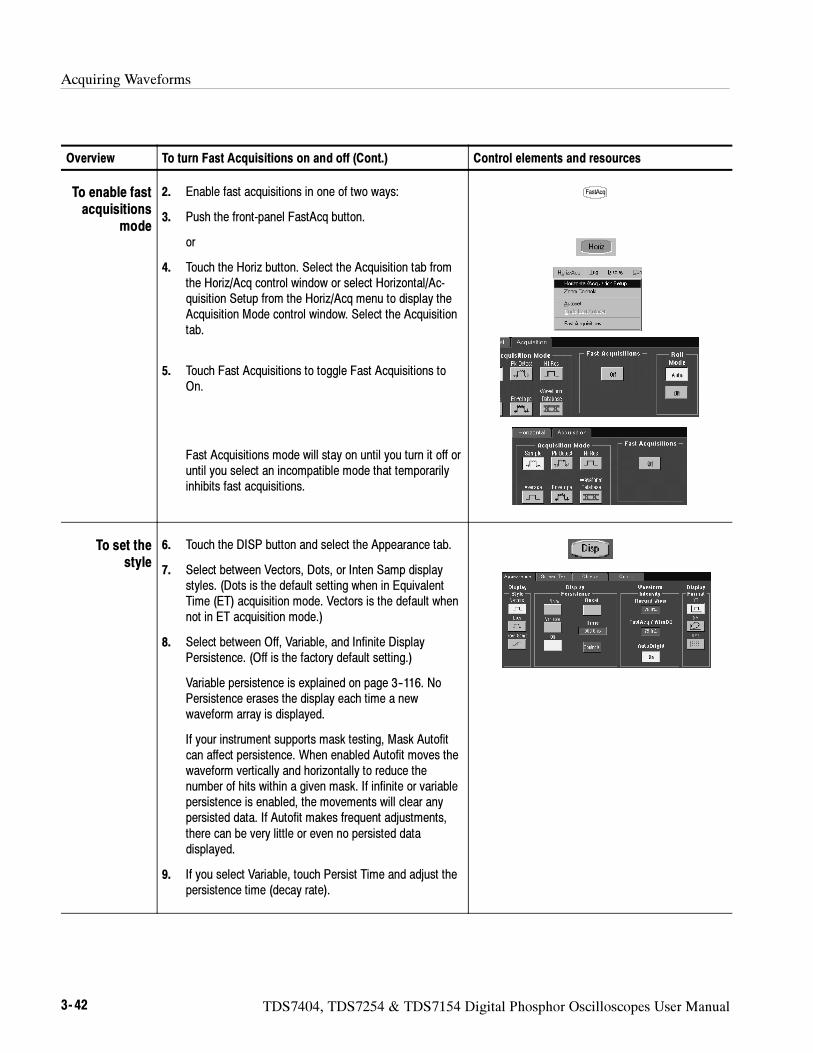
Acquiring Waveforms
3- 42 TDS7404, TDS7254 & TDS7154 Digital Phosphor Oscilloscopes User Manual
Overview Control elements and resourcesTo turn Fast Acquisitions on and off (Cont.)
To enable fastacquisitions
mode
2. Enable fast acquisitions in one of two ways:
3. Push the front-panel FastAcq button.
or
4. Touch the Horiz button. Select the Acquisition tab fromthe Horiz/Acq control window or select Horizontal/Ac-quisition Setup from the Horiz/Acq menu to display theAcquisition Mode control window. Select the Acquisitiontab.
5. Touch Fast Acquisitions to toggle Fast Acquisitions toOn.
Fast Acquisitions mode will stay on until you turn it off oruntil you select an incompatible mode that temporarilyinhibits fast acquisitions.
To set thestyle
6. Touch the DISP button and select the Appearance tab.
7. Select between Vectors, Dots, or Inten Samp displaystyles. (Dots is the default setting when in EquivalentTime (ET) acquisition mode. Vectors is the default whennot in ET acquisition mode.)
8. Select between Off, Variable, and Infinite DisplayPersistence. (Off is the factory default setting.)
Variable persistence is explained on page 3--116. NoPersistence erases the display each time a newwaveform array is displayed.
If your instrument supports mask testing, Mask Autofitcan affect persistence. When enabled Autofit moves thewaveform vertically and horizontally to reduce thenumber of hits within a given mask. If infinite or variablepersistence is enabled, the movements will clear anypersisted data. If Autofit makes frequent adjustments,there can be very little or even no persisted datadisplayed.
9. If you select Variable, touch Persist Time and adjust thepersistence time (decay rate).
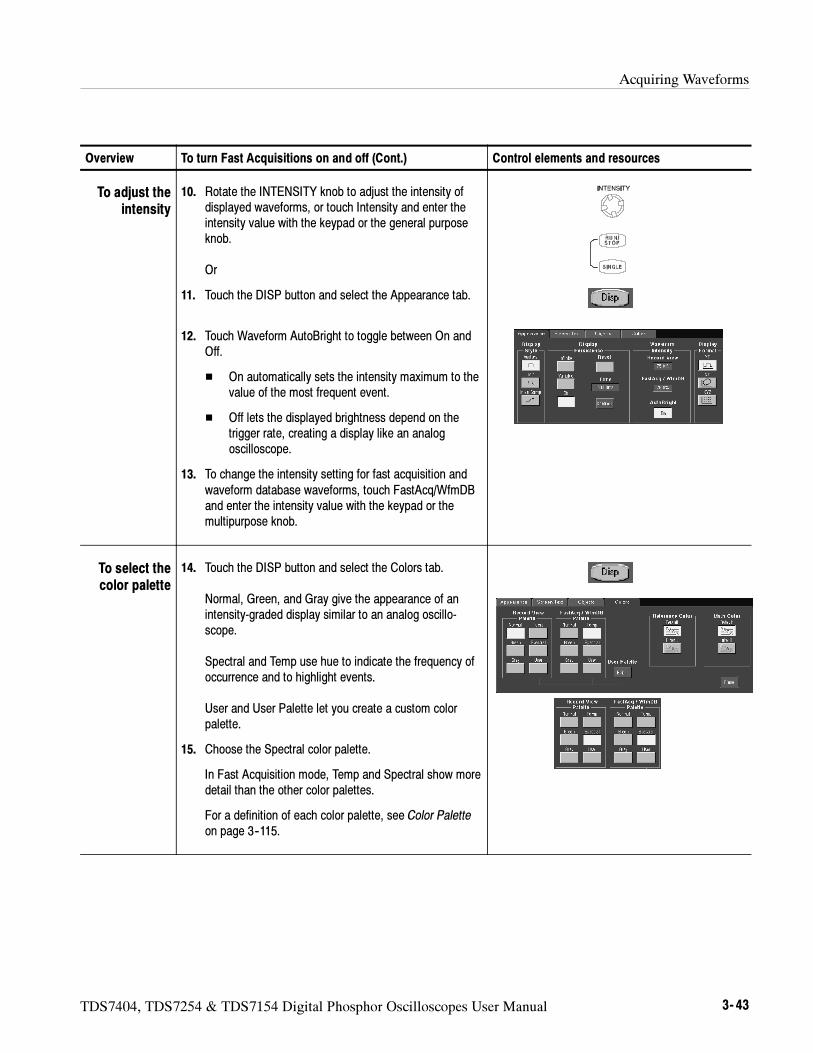
Acquiring Waveforms
TDS7404, TDS7254 & TDS7154 Digital Phosphor Oscilloscopes User Manual 3- 43
Overview Control elements and resourcesTo turn Fast Acquisitions on and off (Cont.)
To adjust theintensity
10. Rotate the INTENSITY knob to adjust the intensity ofdisplayed waveforms, or touch Intensity and enter theintensity value with the keypad or the general purposeknob.
Or
11. Touch the DISP button and select the Appearance tab.
12. Touch Waveform AutoBright to toggle between On andOff.
On automatically sets the intensity maximum to thevalue of the most frequent event.
Off lets the displayed brightness depend on thetrigger rate, creating a display like an analogoscilloscope.
13. To change the intensity setting for fast acquisition andwaveform database waveforms, touch FastAcq/WfmDBand enter the intensity value with the keypad or themultipurpose knob.
To select thecolor palette
14. Touch the DISP button and select the Colors tab.
Normal, Green, and Gray give the appearance of anintensity-graded display similar to an analog oscillo-scope.
Spectral and Temp use hue to indicate the frequency ofoccurrence and to highlight events.
User and User Palette let you create a custom colorpalette.
15. Choose the Spectral color palette.
In Fast Acquisition mode, Temp and Spectral show moredetail than the other color palettes.
For a definition of each color palette, see Color Paletteon page 3--115.
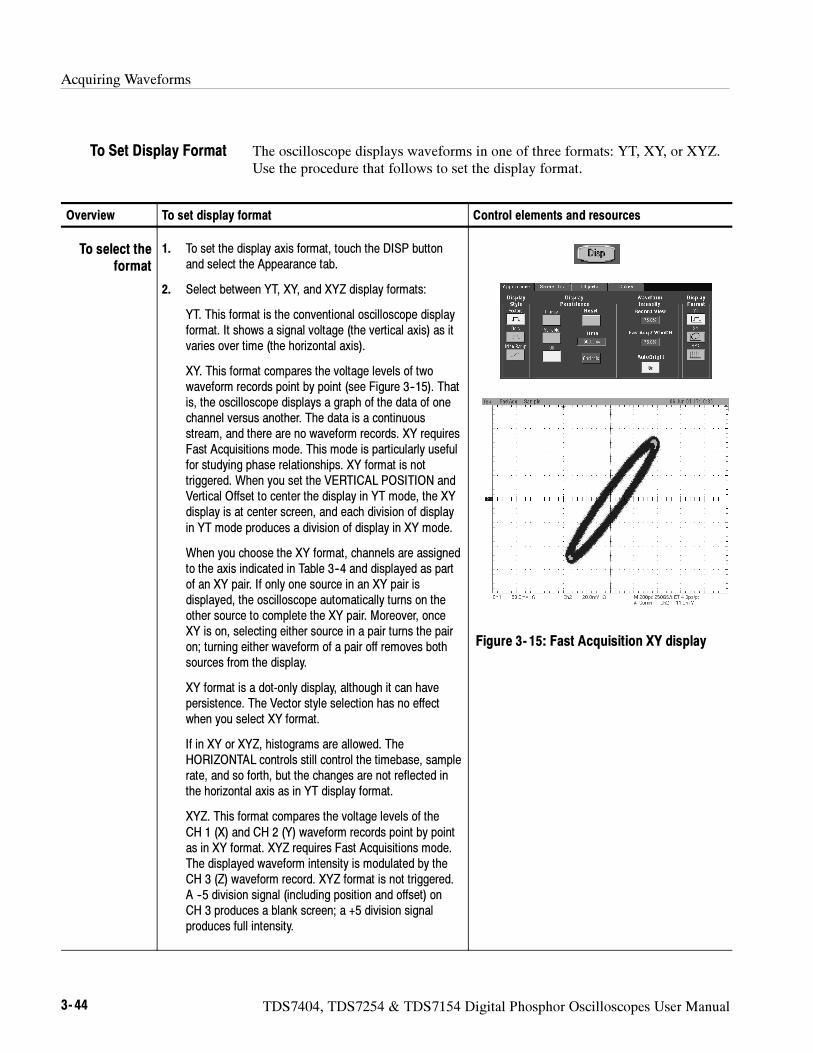
Acquiring Waveforms
3- 44 TDS7404, TDS7254 & TDS7154 Digital Phosphor Oscilloscopes User Manual
The oscilloscope displays waveforms in one of three formats: YT, XY, or XYZ.Use the procedure that follows to set the display format.
Overview To set display format Control elements and resources
To select theformat
1. To set the display axis format, touch the DISP buttonand select the Appearance tab.
2. Select between YT, XY, and XYZ display formats:
YT. This format is the conventional oscilloscope displayformat. It shows a signal voltage (the vertical axis) as itvaries over time (the horizontal axis).
XY. This format compares the voltage levels of twowaveform records point by point (see Figure 3--15). Thatis, the oscilloscope displays a graph of the data of onechannel versus another. The data is a continuousstream, and there are no waveform records. XY requiresFast Acquisitions mode. This mode is particularly usefulfor studying phase relationships. XY format is nottriggered. When you set the VERTICAL POSITION andVertical Offset to center the display in YT mode, the XYdisplay is at center screen, and each division of displayin YT mode produces a division of display in XY mode.
When you choose the XY format, channels are assignedto the axis indicated in Table 3--4 and displayed as partof an XY pair. If only one source in an XY pair isdisplayed, the oscilloscope automatically turns on theother source to complete the XY pair. Moreover, onceXY is on, selecting either source in a pair turns the pairon; turning either waveform of a pair off removes bothsources from the display.
XY format is a dot-only display, although it can havepersistence. The Vector style selection has no effectwhen you select XY format.
If in XY or XYZ, histograms are allowed. TheHORIZONTAL controls still control the timebase, samplerate, and so forth, but the changes are not reflected inthe horizontal axis as in YT display format.
XYZ. This format compares the voltage levels of theCH 1 (X) and CH 2 (Y) waveform records point by pointas in XY format. XYZ requires Fast Acquisitions mode.The displayed waveform intensity is modulated by theCH 3 (Z) waveform record. XYZ format is not triggered.A --5 division signal (including position and offset) onCH 3 produces a blank screen; a +5 division signalproduces full intensity.
Figure 3- 15: Fast Acquisition XY display
To Set Display Format
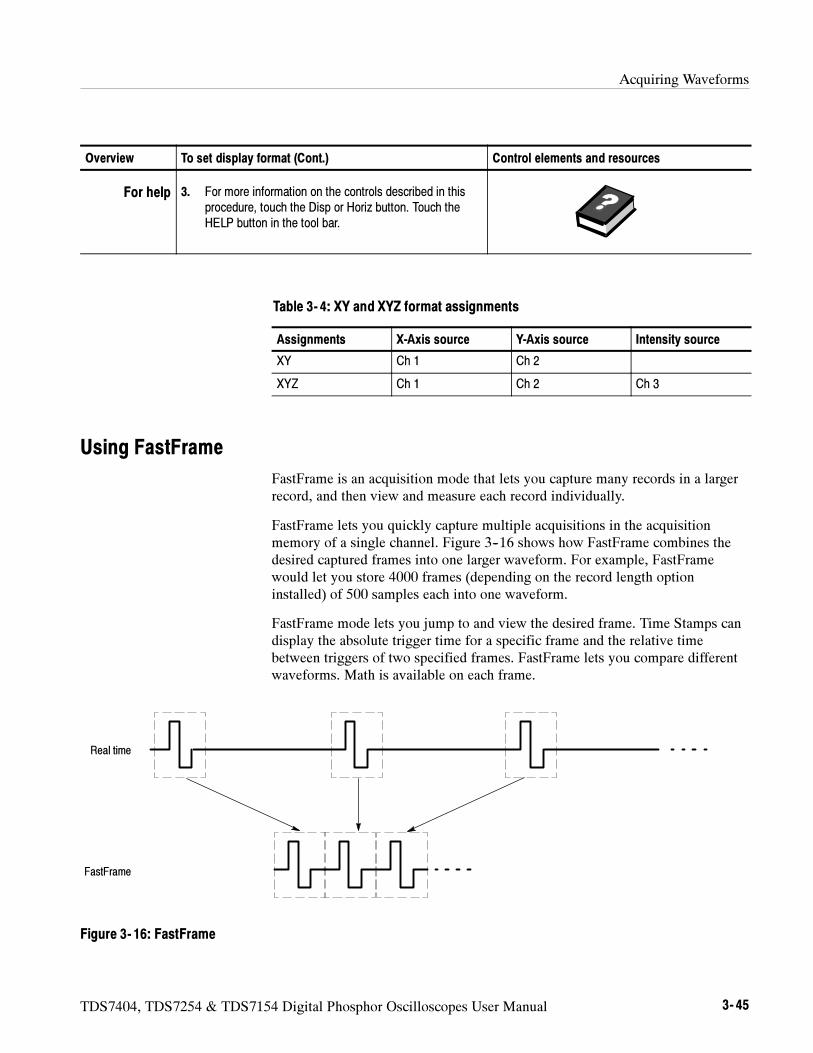
Acquiring Waveforms
TDS7404, TDS7254 & TDS7154 Digital Phosphor Oscilloscopes User Manual 3- 45
Overview Control elements and resourcesTo set display format (Cont.)
For help 3. For more information on the controls described in thisprocedure, touch the Disp or Horiz button. Touch theHELP button in the tool bar.
Table 3- 4: XY and XYZ format assignments
Assignments X-Axis source Y-Axis source Intensity source
XY Ch 1 Ch 2
XYZ Ch 1 Ch 2 Ch 3
Using FastFrame
FastFrame is an acquisition mode that lets you capture many records in a largerrecord, and then view and measure each record individually.
FastFrame lets you quickly capture multiple acquisitions in the acquisitionmemory of a single channel. Figure 3--16 shows how FastFrame combines thedesired captured frames into one larger waveform. For example, FastFramewould let you store 4000 frames (depending on the record length optioninstalled) of 500 samples each into one waveform.
FastFrame mode lets you jump to and view the desired frame. Time Stamps candisplay the absolute trigger time for a specific frame and the relative timebetween triggers of two specified frames. FastFrame lets you compare differentwaveforms. Math is available on each frame.
Real time
FastFrame
Figure 3- 16: FastFrame
Acquiring Waveforms
3- 46 TDS7404, TDS7254 & TDS7154 Digital Phosphor Oscilloscopes User Manual
FastFrame is not compatible with other features or modes:
Equivalent Time
Histograms
Fast Acquisitions
Average
Envelope
Waveform Database
Consider the following operating characteristics when using FastFrame:
You can push RUN/STOP to terminate a FastFrame sequence. If any frameswere acquired, they are displayed. If no frames were acquired, the previousFastFrame waveform is displayed.
Because FastFrame introduces additional processing time into the operationcycle of acquire, process, and display, its best to use Single SequenceAcquisition (see Acquire menu, Stop After menu). With Single Sequenceselected, you will see the current acquisition sequence; otherwise, the displaylags the current sequence by one sequence. You can also see the currentsequence by pushing the RUN/STOP button to stop the acquisition.
FastFrame reduces the time required before the trigger is rearmed, whilepreserving the individual subrecords, a detail lost in Fast Acquisitions whichwrites all acquired records to a single pixel map.
Using FastFrameAcquisitions
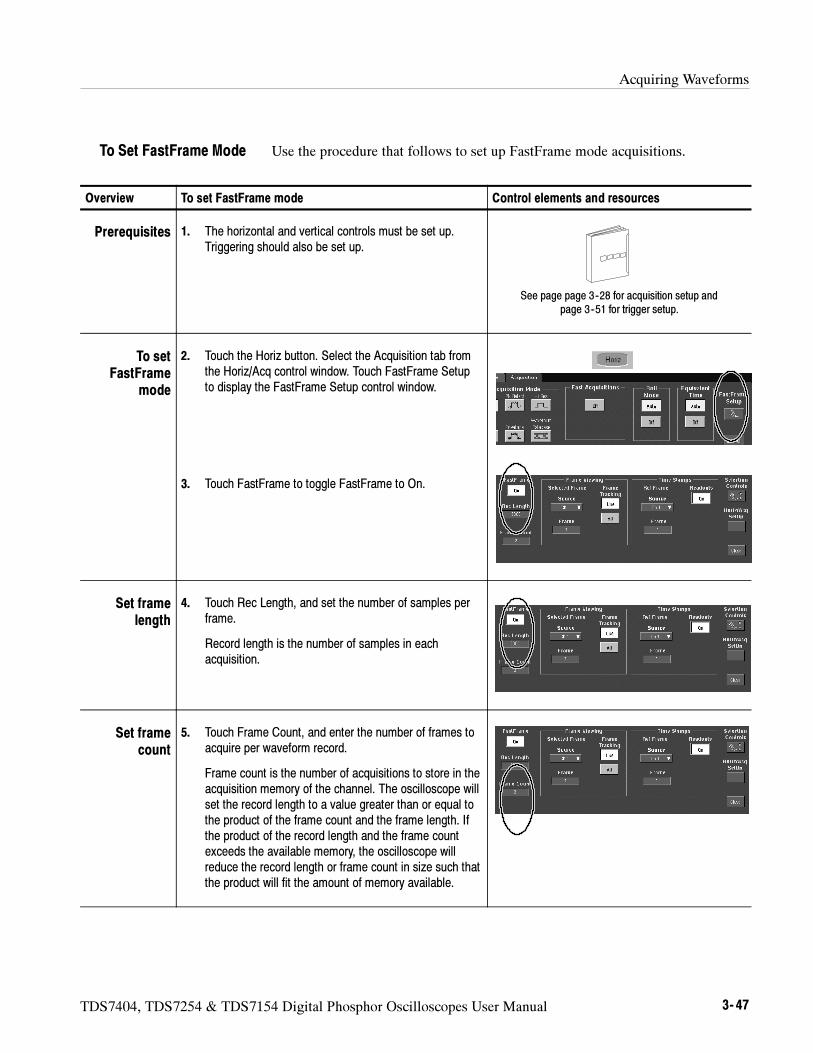
Acquiring Waveforms
TDS7404, TDS7254 & TDS7154 Digital Phosphor Oscilloscopes User Manual 3- 47
Use the procedure that follows to set up FastFrame mode acquisitions.
Overview To set FastFrame mode Control elements and resources
Prerequisites 1. The horizontal and vertical controls must be set up.Triggering should also be set up.
See page page 3--28 for acquisition setup andpage 3--51 for trigger setup.
To setFastFrame
mode
2. Touch the Horiz button. Select the Acquisition tab fromthe Horiz/Acq control window. Touch FastFrame Setupto display the FastFrame Setup control window.
3. Touch FastFrame to toggle FastFrame to On.
Set framelength
4. Touch Rec Length, and set the number of samples perframe.
Record length is the number of samples in eachacquisition.
Set framecount
5. Touch Frame Count, and enter the number of frames toacquire per waveform record.
Frame count is the number of acquisitions to store in theacquisition memory of the channel. The oscilloscope willset the record length to a value greater than or equal tothe product of the frame count and the frame length. Ifthe product of the record length and the frame countexceeds the available memory, the oscilloscope willreduce the record length or frame count in size such thatthe product will fit the amount of memory available.
To Set FastFrame Mode
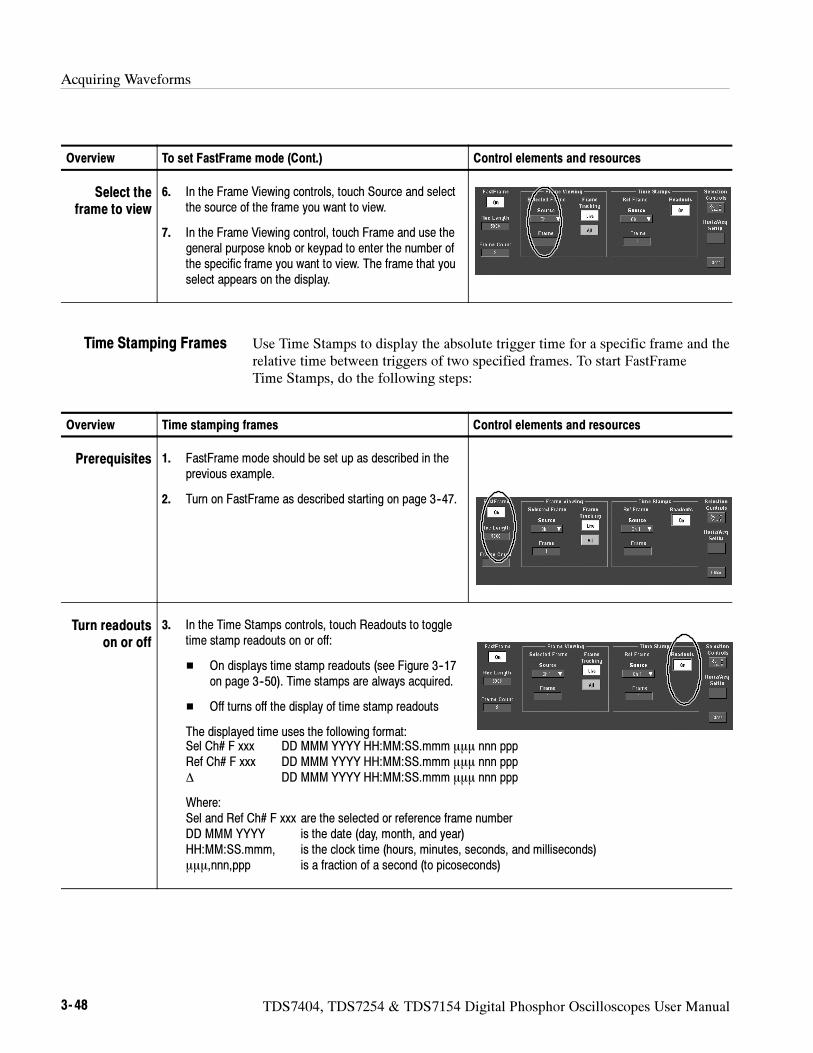
Acquiring Waveforms
3- 48 TDS7404, TDS7254 & TDS7154 Digital Phosphor Oscilloscopes User Manual
Overview Control elements and resourcesTo set FastFrame mode (Cont.)
Select theframe to view
6. In the Frame Viewing controls, touch Source and selectthe source of the frame you want to view.
7. In the Frame Viewing control, touch Frame and use thegeneral purpose knob or keypad to enter the number ofthe specific frame you want to view. The frame that youselect appears on the display.
Use Time Stamps to display the absolute trigger time for a specific frame and therelative time between triggers of two specified frames. To start FastFrameTime Stamps, do the following steps:
Overview Time stamping frames Control elements and resources
Prerequisites 1. FastFrame mode should be set up as described in theprevious example.
2. Turn on FastFrame as described starting on page 3--47.
Turn readoutson or off
3. In the Time Stamps controls, touch Readouts to toggletime stamp readouts on or off:
On displays time stamp readouts (see Figure 3--17on page 3--50). Time stamps are always acquired.
Off turns off the display of time stamp readouts
The displayed time uses the following format:Sel Ch# F xxx DD MMM YYYY HH:MM:SS.mmm nnn pppRef Ch# F xxx DD MMM YYYY HH:MM:SS.mmm nnn ppp∆ DD MMM YYYY HH:MM:SS.mmm nnn ppp
Where:Sel and Ref Ch# F xxx are the selected or reference frame numberDD MMM YYYY is the date (day, month, and year)HH:MM:SS.mmm, is the clock time (hours, minutes, seconds, and milliseconds),nnn,ppp is a fraction of a second (to picoseconds)
Time Stamping Frames
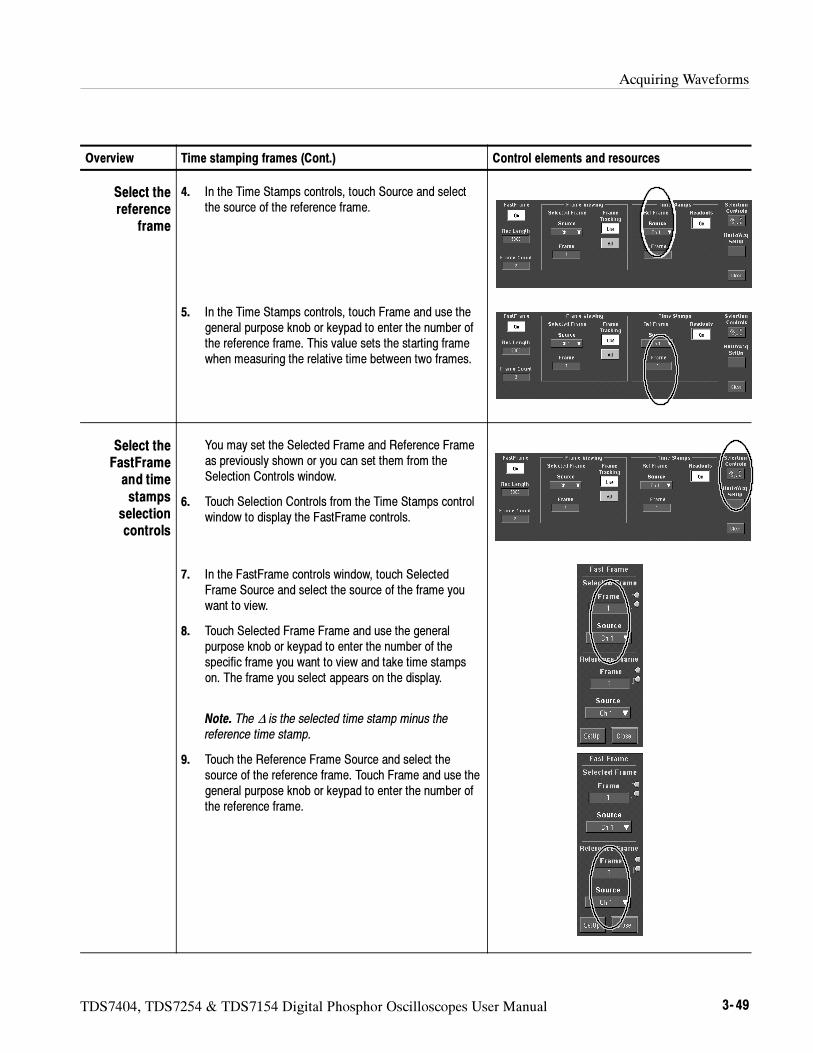
Acquiring Waveforms
TDS7404, TDS7254 & TDS7154 Digital Phosphor Oscilloscopes User Manual 3- 49
Overview Control elements and resourcesTime stamping frames (Cont.)
Select thereference
frame
4. In the Time Stamps controls, touch Source and selectthe source of the reference frame.
5. In the Time Stamps controls, touch Frame and use thegeneral purpose knob or keypad to enter the number ofthe reference frame. This value sets the starting framewhen measuring the relative time between two frames.
Select theFastFrameand timestamps
selectioncontrols
You may set the Selected Frame and Reference Frameas previously shown or you can set them from theSelection Controls window.
6. Touch Selection Controls from the Time Stamps controlwindow to display the FastFrame controls.
7. In the FastFrame controls window, touch SelectedFrame Source and select the source of the frame youwant to view.
8. Touch Selected Frame Frame and use the generalpurpose knob or keypad to enter the number of thespecific frame you want to view and take time stampson. The frame you select appears on the display.
Note. The ∆ is the selected time stamp minus thereference time stamp.
9. Touch the Reference Frame Source and select thesource of the reference frame. Touch Frame and use thegeneral purpose knob or keypad to enter the number ofthe reference frame.
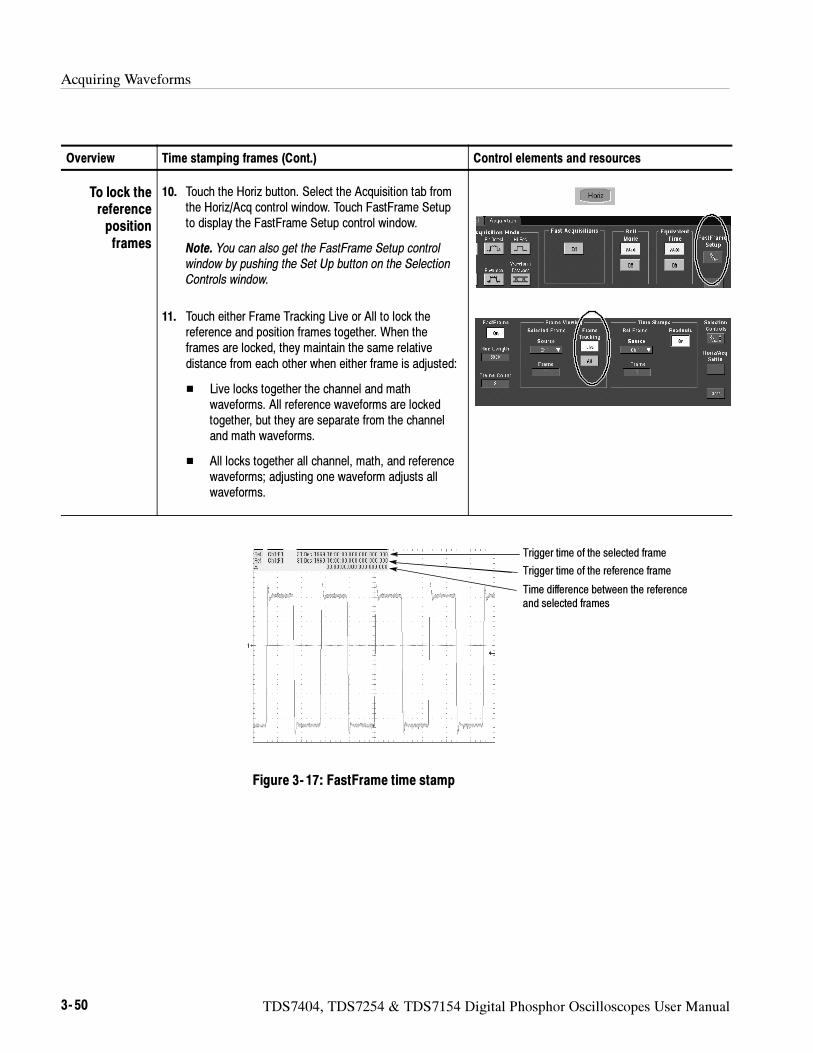
Acquiring Waveforms
3- 50 TDS7404, TDS7254 & TDS7154 Digital Phosphor Oscilloscopes User Manual
Overview Control elements and resourcesTime stamping frames (Cont.)
To lock thereferencepositionframes
10. Touch the Horiz button. Select the Acquisition tab fromthe Horiz/Acq control window. Touch FastFrame Setupto display the FastFrame Setup control window.
Note. You can also get the FastFrame Setup controlwindow by pushing the Set Up button on the SelectionControls window.
11. Touch either Frame Tracking Live or All to lock thereference and position frames together. When theframes are locked, they maintain the same relativedistance from each other when either frame is adjusted:
Live locks together the channel and mathwaveforms. All reference waveforms are lockedtogether, but they are separate from the channeland math waveforms.
All locks together all channel, math, and referencewaveforms; adjusting one waveform adjusts allwaveforms.
Time difference between the referenceand selected frames
Trigger time of the reference frame
Trigger time of the selected frame
Figure 3- 17: FastFrame time stamp
TDS7404, TDS7254 & TDS7154 Digital Phosphor Oscilloscopes User Manual 3- 51
Triggering
To properly acquire data, that is, to use the oscilloscope to sample a signal anddigitize it into a waveform record that you want to measure or otherwise process,you need to set up the trigger conditions. This section provides background on,and the procedures for using, the basic elements of triggering: source, holdoff,mode, and so on. This section covers the following topics:
Triggering Concepts which describes some basic principles of triggering andthe following trigger elements: type, source, coupling, holdoff, mode,and so on
Triggering from the Front Panel which describes how to use the front-paneltriggering controls each of which is common to most of the trigger types theoscilloscope provides
Additional Trigger Parameters which describes how to access commontrigger functions in the Trigger control window
Advanced Triggering which describes trigger types that you can use toisolate specific signal phenomena
Sequential Triggering which describes how to combine the A (Main) and B(Delayed) trigger systems to capture unique events
Comm Triggering (Option SM only) which describes triggering on commu-nications signals
Serial Pattern Triggering (Option ST only) which describes triggering onserial data patterns
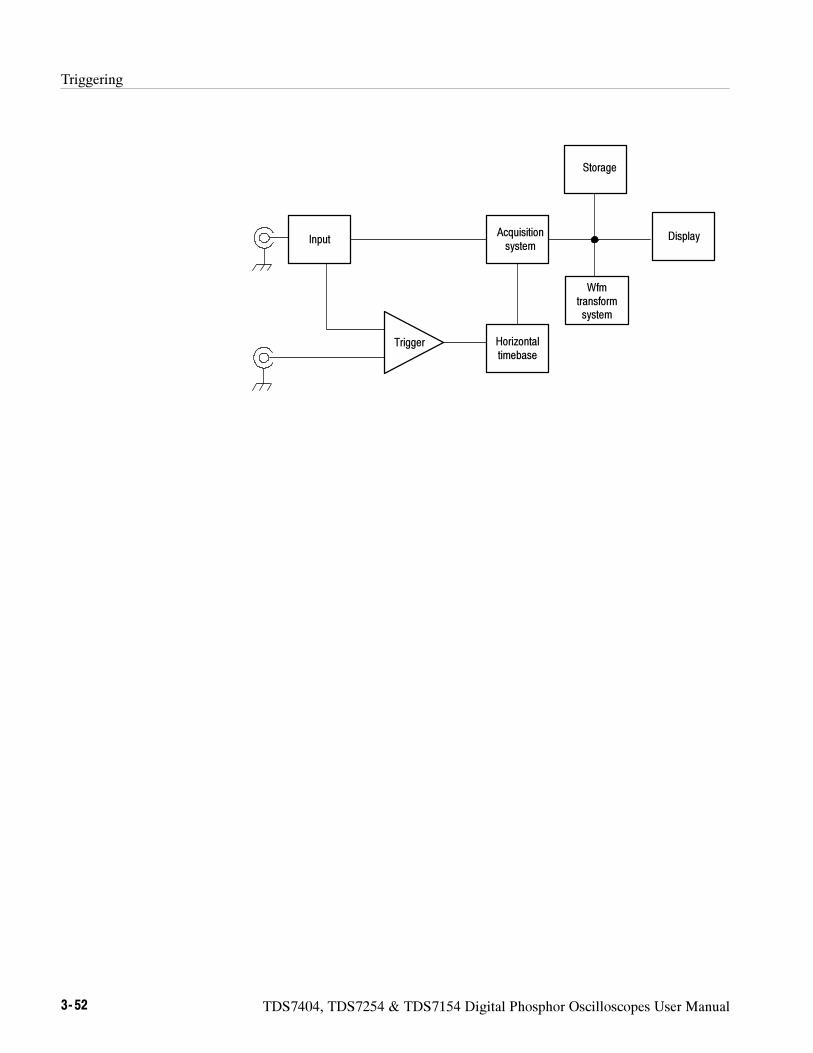
Triggering
3- 52 TDS7404, TDS7254 & TDS7154 Digital Phosphor Oscilloscopes User Manual
Acquisitionsystem
Input Display
Storage
Wfmtransformsystem
Horizontaltimebase
Trigger
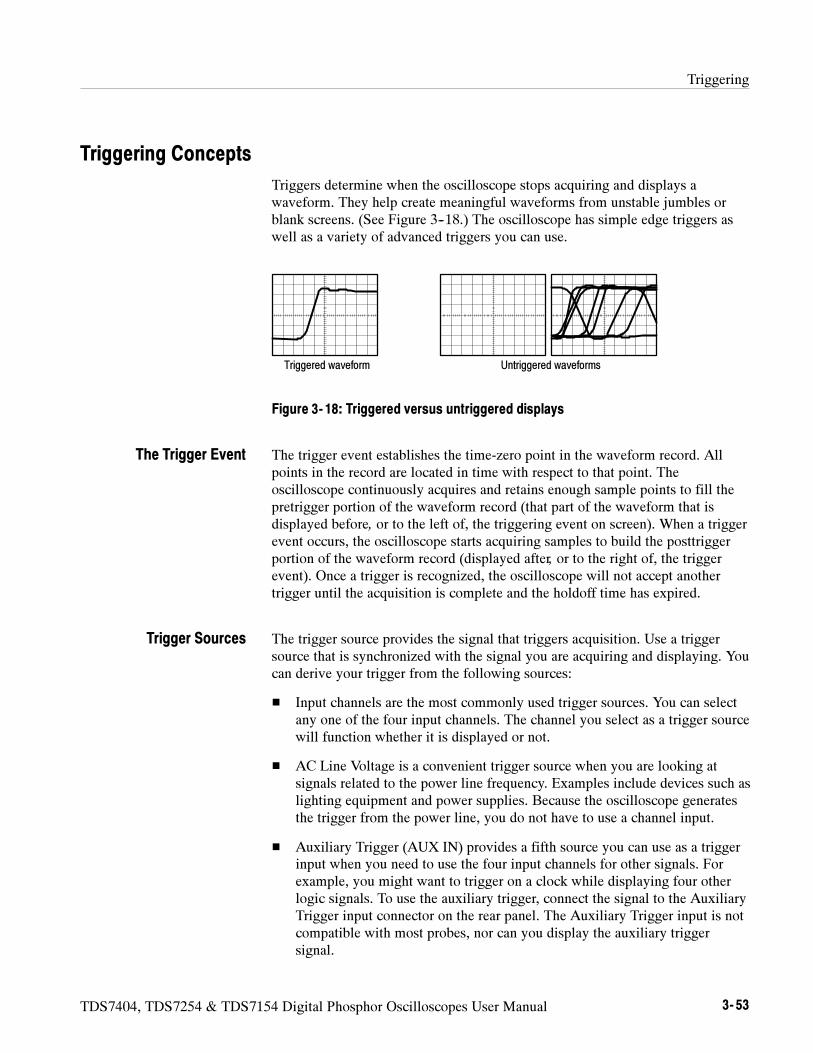
Triggering
TDS7404, TDS7254 & TDS7154 Digital Phosphor Oscilloscopes User Manual 3- 53
Triggering Concepts
Triggers determine when the oscilloscope stops acquiring and displays awaveform. They help create meaningful waveforms from unstable jumbles orblank screens. (See Figure 3--18.) The oscilloscope has simple edge triggers aswell as a variety of advanced triggers you can use.
Triggered waveform Untriggered waveforms
Figure 3- 18: Triggered versus untriggered displays
The trigger event establishes the time-zero point in the waveform record. Allpoints in the record are located in time with respect to that point. Theoscilloscope continuously acquires and retains enough sample points to fill thepretrigger portion of the waveform record (that part of the waveform that isdisplayed before, or to the left of, the triggering event on screen). When a triggerevent occurs, the oscilloscope starts acquiring samples to build the posttriggerportion of the waveform record (displayed after, or to the right of, the triggerevent). Once a trigger is recognized, the oscilloscope will not accept anothertrigger until the acquisition is complete and the holdoff time has expired.
The trigger source provides the signal that triggers acquisition. Use a triggersource that is synchronized with the signal you are acquiring and displaying. Youcan derive your trigger from the following sources:
Input channels are the most commonly used trigger sources. You can selectany one of the four input channels. The channel you select as a trigger sourcewill function whether it is displayed or not.
AC Line Voltage is a convenient trigger source when you are looking atsignals related to the power line frequency. Examples include devices such aslighting equipment and power supplies. Because the oscilloscope generatesthe trigger from the power line, you do not have to use a channel input.
Auxiliary Trigger (AUX IN) provides a fifth source you can use as a triggerinput when you need to use the four input channels for other signals. Forexample, you might want to trigger on a clock while displaying four otherlogic signals. To use the auxiliary trigger, connect the signal to the AuxiliaryTrigger input connector on the rear panel. The Auxiliary Trigger input is notcompatible with most probes, nor can you display the auxiliary triggersignal.
The Trigger Event
Trigger Sources
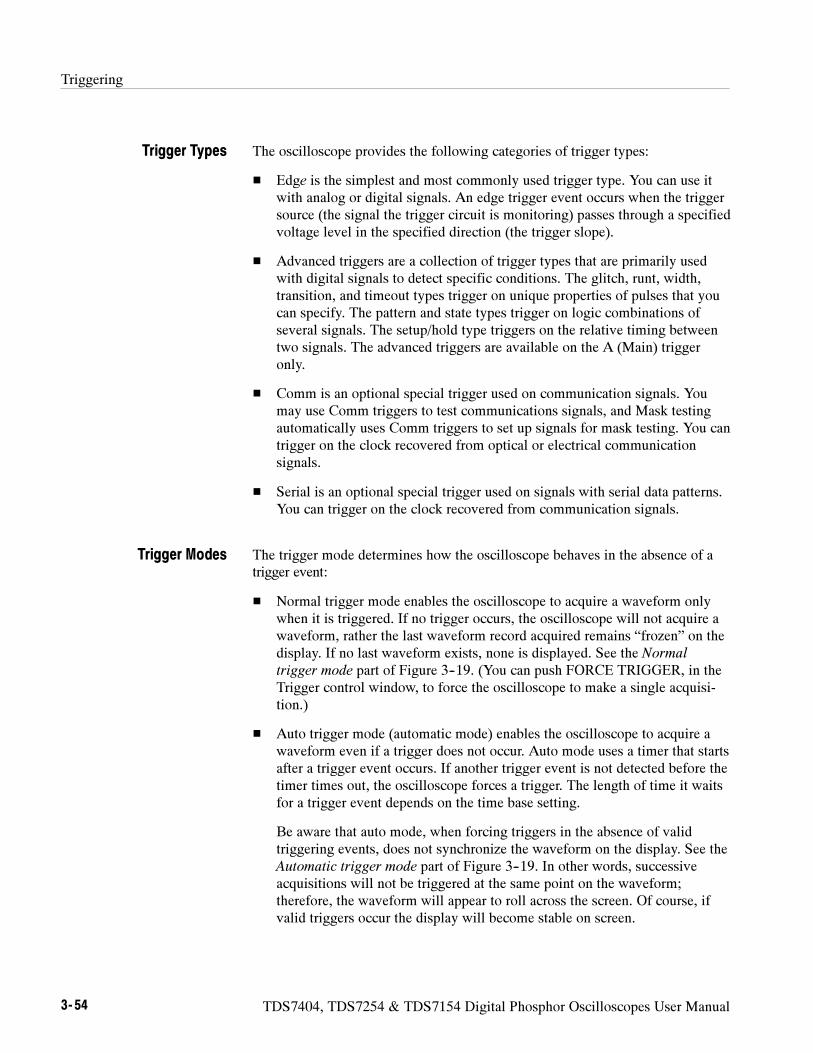
Triggering
3- 54 TDS7404, TDS7254 & TDS7154 Digital Phosphor Oscilloscopes User Manual
The oscilloscope provides the following categories of trigger types:
Edge is the simplest and most commonly used trigger type. You can use itwith analog or digital signals. An edge trigger event occurs when the triggersource (the signal the trigger circuit is monitoring) passes through a specifiedvoltage level in the specified direction (the trigger slope).
Advanced triggers are a collection of trigger types that are primarily usedwith digital signals to detect specific conditions. The glitch, runt, width,transition, and timeout types trigger on unique properties of pulses that youcan specify. The pattern and state types trigger on logic combinations ofseveral signals. The setup/hold type triggers on the relative timing betweentwo signals. The advanced triggers are available on the A (Main) triggeronly.
Comm is an optional special trigger used on communication signals. Youmay use Comm triggers to test communications signals, and Mask testingautomatically uses Comm triggers to set up signals for mask testing. You cantrigger on the clock recovered from optical or electrical communicationsignals.
Serial is an optional special trigger used on signals with serial data patterns.You can trigger on the clock recovered from communication signals.
The trigger mode determines how the oscilloscope behaves in the absence of atrigger event:
Normal trigger mode enables the oscilloscope to acquire a waveform onlywhen it is triggered. If no trigger occurs, the oscilloscope will not acquire awaveform, rather the last waveform record acquired remains “frozen” on thedisplay. If no last waveform exists, none is displayed. See the Normaltrigger mode part of Figure 3--19. (You can push FORCE TRIGGER, in theTrigger control window, to force the oscilloscope to make a single acquisi-tion.)
Auto trigger mode (automatic mode) enables the oscilloscope to acquire awaveform even if a trigger does not occur. Auto mode uses a timer that startsafter a trigger event occurs. If another trigger event is not detected before thetimer times out, the oscilloscope forces a trigger. The length of time it waitsfor a trigger event depends on the time base setting.
Be aware that auto mode, when forcing triggers in the absence of validtriggering events, does not synchronize the waveform on the display. See theAutomatic trigger mode part of Figure 3--19. In other words, successiveacquisitions will not be triggered at the same point on the waveform;therefore, the waveform will appear to roll across the screen. Of course, ifvalid triggers occur the display will become stable on screen.
Trigger Types
Trigger Modes
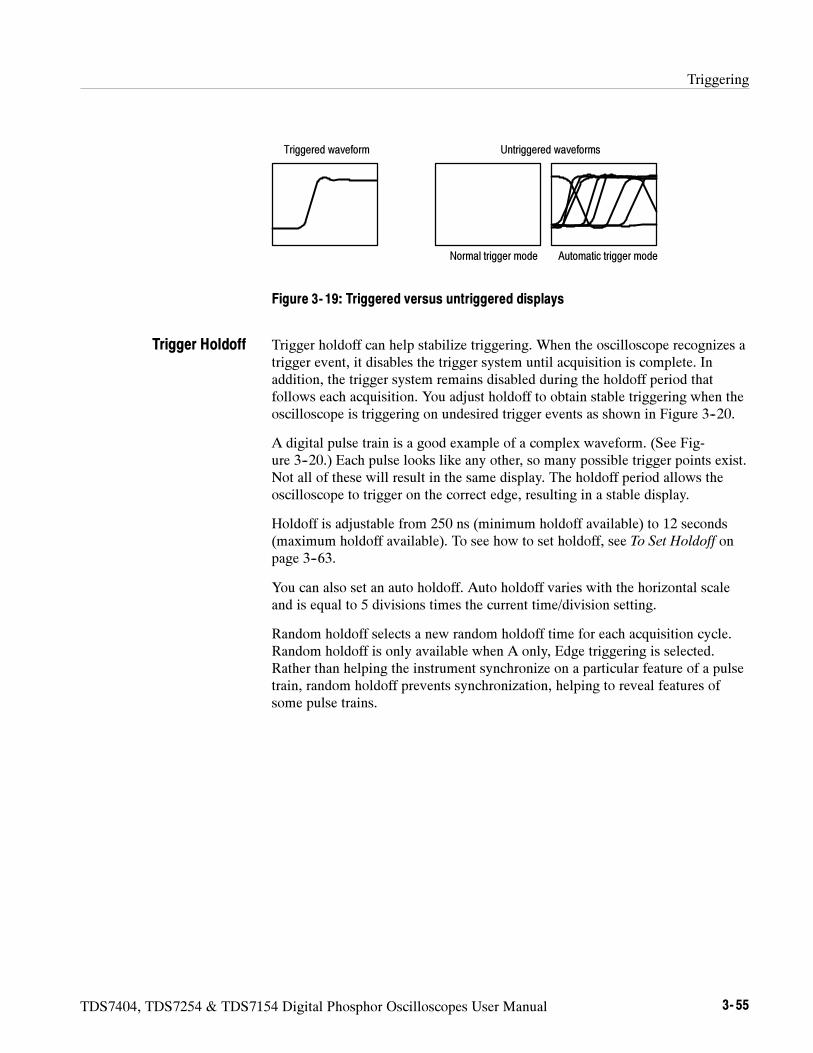
Triggering
TDS7404, TDS7254 & TDS7154 Digital Phosphor Oscilloscopes User Manual 3- 55
Triggered waveform Untriggered waveforms
Normal trigger mode Automatic trigger mode
Figure 3- 19: Triggered versus untriggered displays
Trigger holdoff can help stabilize triggering. When the oscilloscope recognizes atrigger event, it disables the trigger system until acquisition is complete. Inaddition, the trigger system remains disabled during the holdoff period thatfollows each acquisition. You adjust holdoff to obtain stable triggering when theoscilloscope is triggering on undesired trigger events as shown in Figure 3--20.
A digital pulse train is a good example of a complex waveform. (See Fig-ure 3--20.) Each pulse looks like any other, so many possible trigger points exist.Not all of these will result in the same display. The holdoff period allows theoscilloscope to trigger on the correct edge, resulting in a stable display.
Holdoff is adjustable from 250 ns (minimum holdoff available) to 12 seconds(maximum holdoff available). To see how to set holdoff, see To Set Holdoff onpage 3--63.
You can also set an auto holdoff. Auto holdoff varies with the horizontal scaleand is equal to 5 divisions times the current time/division setting.
Random holdoff selects a new random holdoff time for each acquisition cycle.Random holdoff is only available when A only, Edge triggering is selected.Rather than helping the instrument synchronize on a particular feature of a pulsetrain, random holdoff prevents synchronization, helping to reveal features ofsome pulse trains.
Trigger Holdoff
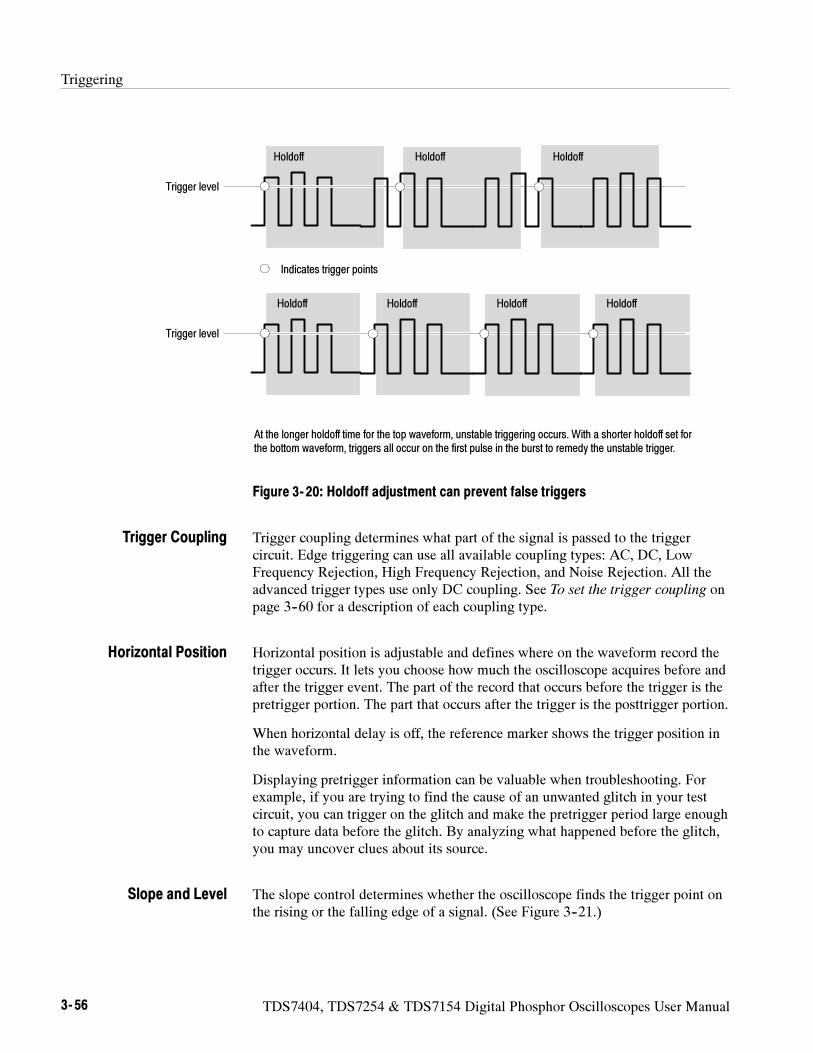
Triggering
3- 56 TDS7404, TDS7254 & TDS7154 Digital Phosphor Oscilloscopes User Manual
Indicates trigger points
Trigger level
At the longer holdoff time for the top waveform, unstable triggering occurs. With a shorter holdoff set forthe bottom waveform, triggers all occur on the first pulse in the burst to remedy the unstable trigger.
Holdoff Holdoff Holdoff
Trigger level
Holdoff Holdoff Holdoff Holdoff
Figure 3- 20: Holdoff adjustment can prevent false triggers
Trigger coupling determines what part of the signal is passed to the triggercircuit. Edge triggering can use all available coupling types: AC, DC, LowFrequency Rejection, High Frequency Rejection, and Noise Rejection. All theadvanced trigger types use only DC coupling. See To set the trigger coupling onpage 3--60 for a description of each coupling type.
Horizontal position is adjustable and defines where on the waveform record thetrigger occurs. It lets you choose how much the oscilloscope acquires before andafter the trigger event. The part of the record that occurs before the trigger is thepretrigger portion. The part that occurs after the trigger is the posttrigger portion.
When horizontal delay is off, the reference marker shows the trigger position inthe waveform.
Displaying pretrigger information can be valuable when troubleshooting. Forexample, if you are trying to find the cause of an unwanted glitch in your testcircuit, you can trigger on the glitch and make the pretrigger period large enoughto capture data before the glitch. By analyzing what happened before the glitch,you may uncover clues about its source.
The slope control determines whether the oscilloscope finds the trigger point onthe rising or the falling edge of a signal. (See Figure 3--21.)
Trigger Coupling
Horizontal Position
Slope and Level
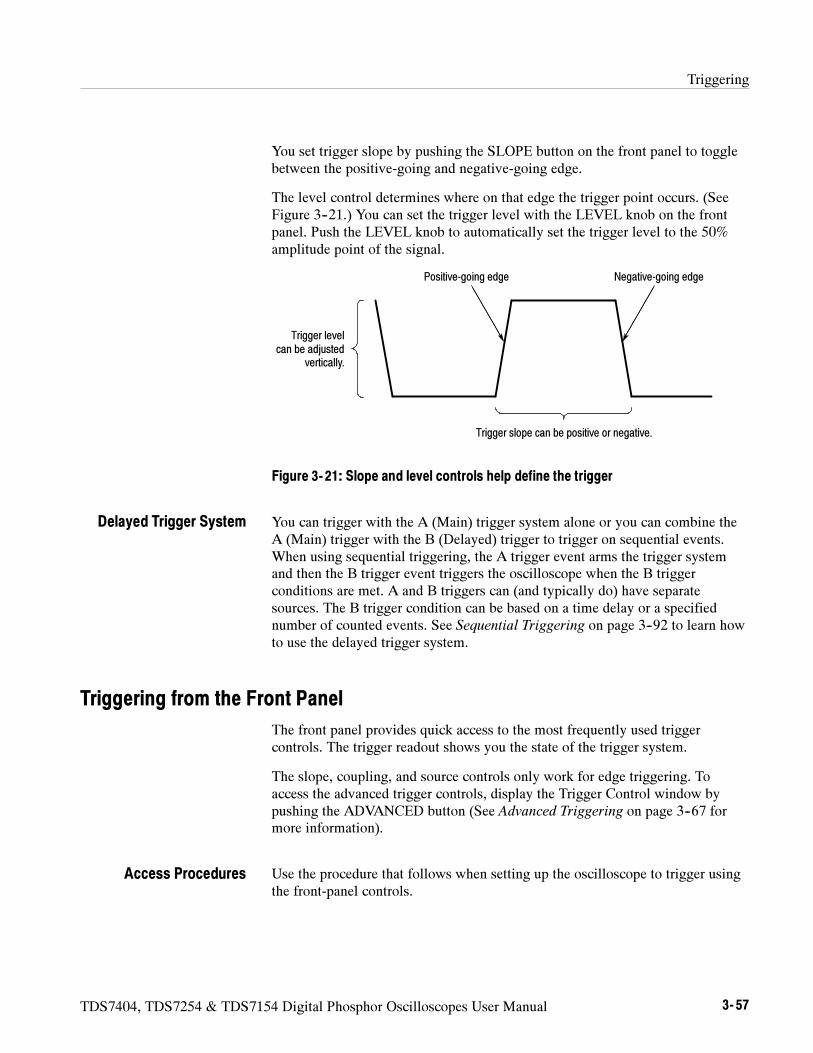
Triggering
TDS7404, TDS7254 & TDS7154 Digital Phosphor Oscilloscopes User Manual 3- 57
You set trigger slope by pushing the SLOPE button on the front panel to togglebetween the positive-going and negative-going edge.
The level control determines where on that edge the trigger point occurs. (SeeFigure 3--21.) You can set the trigger level with the LEVEL knob on the frontpanel. Push the LEVEL knob to automatically set the trigger level to the 50%amplitude point of the signal.
Positive-going edge Negative-going edge
Trigger slope can be positive or negative.
Trigger levelcan be adjusted
vertically.
Figure 3- 21: Slope and level controls help define the trigger
You can trigger with the A (Main) trigger system alone or you can combine theA (Main) trigger with the B (Delayed) trigger to trigger on sequential events.When using sequential triggering, the A trigger event arms the trigger systemand then the B trigger event triggers the oscilloscope when the B triggerconditions are met. A and B triggers can (and typically do) have separatesources. The B trigger condition can be based on a time delay or a specifiednumber of counted events. See Sequential Triggering on page 3--92 to learn howto use the delayed trigger system.
Triggering from the Front Panel
The front panel provides quick access to the most frequently used triggercontrols. The trigger readout shows you the state of the trigger system.
The slope, coupling, and source controls only work for edge triggering. Toaccess the advanced trigger controls, display the Trigger Control window bypushing the ADVANCED button (See Advanced Triggering on page 3--67 formore information).
Use the procedure that follows when setting up the oscilloscope to trigger usingthe front-panel controls.
Delayed Trigger System
Access Procedures
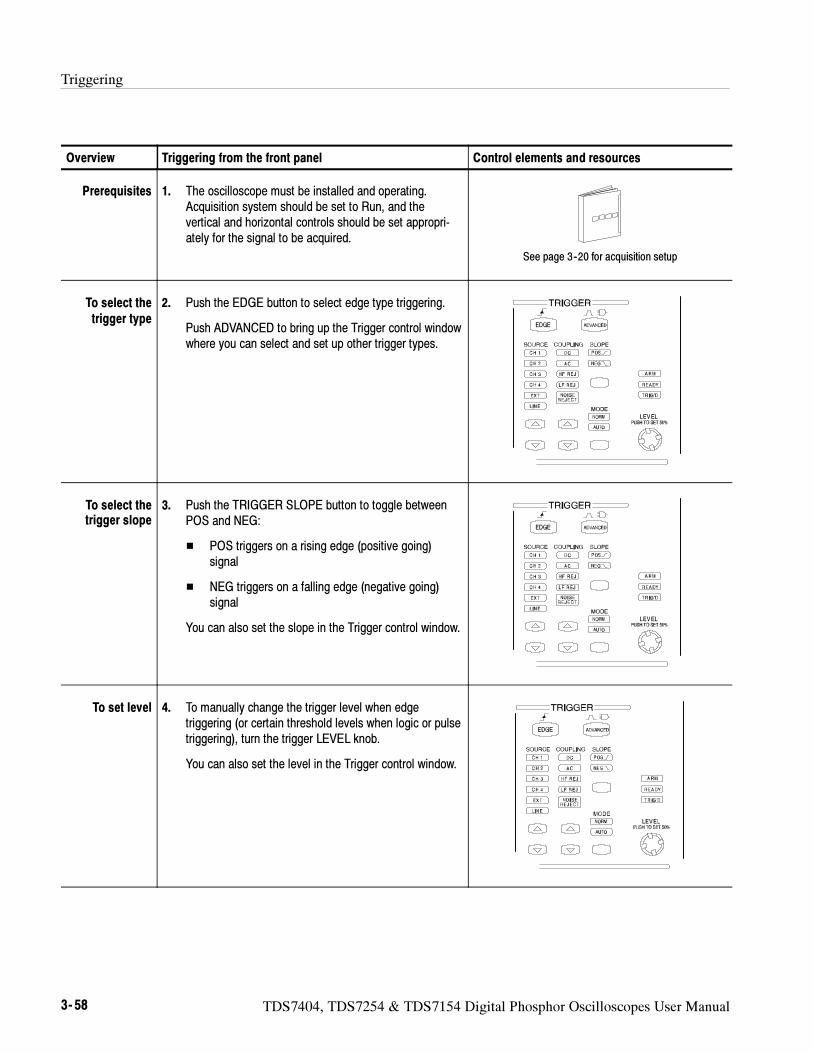
Triggering
3- 58 TDS7404, TDS7254 & TDS7154 Digital Phosphor Oscilloscopes User Manual
Overview Triggering from the front panel Control elements and resources
Prerequisites 1. The oscilloscope must be installed and operating.Acquisition system should be set to Run, and thevertical and horizontal controls should be set appropri-ately for the signal to be acquired.
See page 3--20 for acquisition setup
To select the
trigger type
2. Push the EDGE button to select edge type triggering.
Push ADVANCED to bring up the Trigger control windowwhere you can select and set up other trigger types.
To select thetrigger slope
3. Push the TRIGGER SLOPE button to toggle betweenPOS and NEG:
POS triggers on a rising edge (positive going)signal
NEG triggers on a falling edge (negative going)signal
You can also set the slope in the Trigger control window.
To set level 4. To manually change the trigger level when edgetriggering (or certain threshold levels when logic or pulsetriggering), turn the trigger LEVEL knob.
You can also set the level in the Trigger control window.
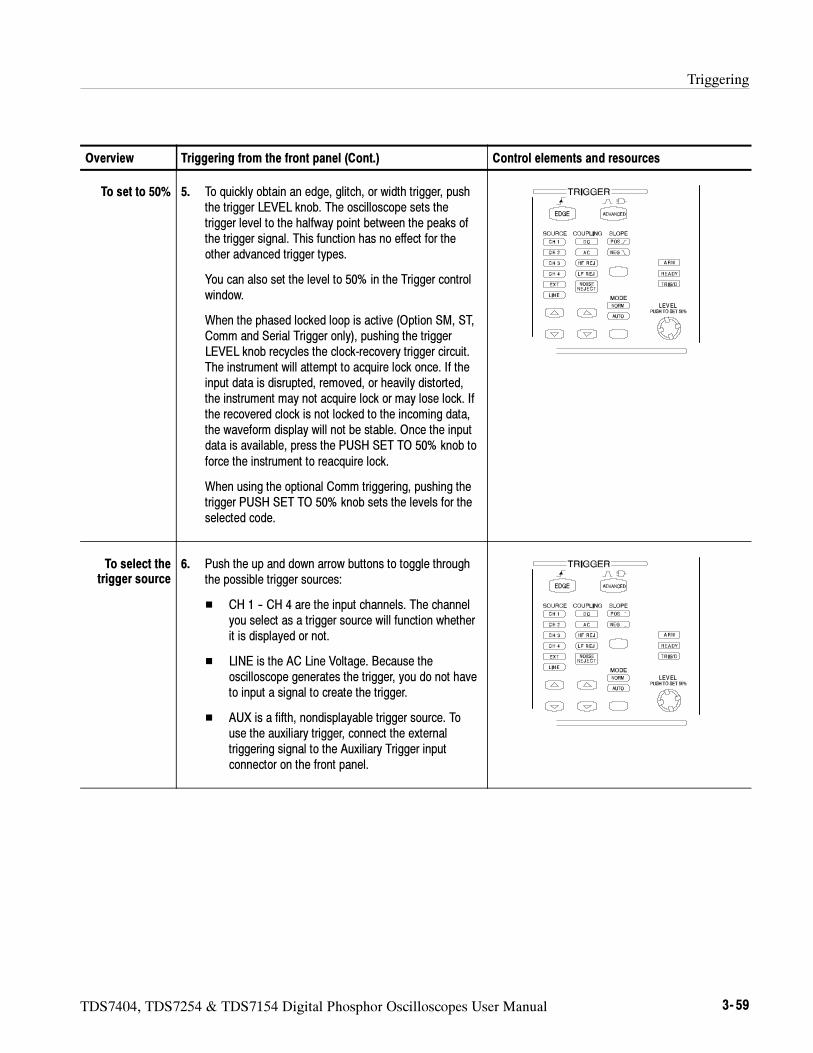
Triggering
TDS7404, TDS7254 & TDS7154 Digital Phosphor Oscilloscopes User Manual 3- 59
Overview Control elements and resourcesTriggering from the front panel (Cont.)
To set to 50% 5. To quickly obtain an edge, glitch, or width trigger, pushthe trigger LEVEL knob. The oscilloscope sets thetrigger level to the halfway point between the peaks ofthe trigger signal. This function has no effect for theother advanced trigger types.
You can also set the level to 50% in the Trigger controlwindow.
When the phased locked loop is active (Option SM, ST,Comm and Serial Trigger only), pushing the triggerLEVEL knob recycles the clock-recovery trigger circuit.The instrument will attempt to acquire lock once. If theinput data is disrupted, removed, or heavily distorted,the instrument may not acquire lock or may lose lock. Ifthe recovered clock is not locked to the incoming data,the waveform display will not be stable. Once the inputdata is available, press the PUSH SET TO 50% knob toforce the instrument to reacquire lock.
When using the optional Comm triggering, pushing thetrigger PUSH SET TO 50% knob sets the levels for theselected code.
To select thetrigger source
6. Push the up and down arrow buttons to toggle throughthe possible trigger sources:
CH 1 -- CH 4 are the input channels. The channelyou select as a trigger source will function whetherit is displayed or not.
LINE is the AC Line Voltage. Because theoscilloscope generates the trigger, you do not haveto input a signal to create the trigger.
AUX is a fifth, nondisplayable trigger source. Touse the auxiliary trigger, connect the externaltriggering signal to the Auxiliary Trigger inputconnector on the front panel.
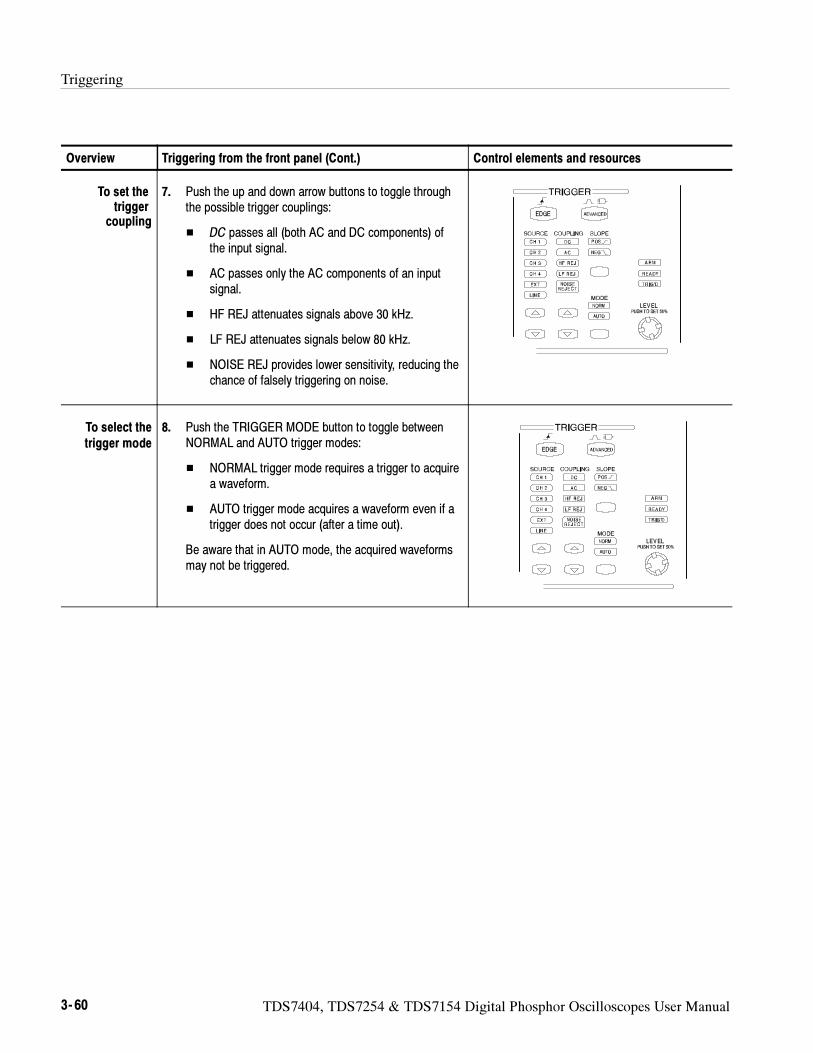
Triggering
3- 60 TDS7404, TDS7254 & TDS7154 Digital Phosphor Oscilloscopes User Manual
Overview Control elements and resourcesTriggering from the front panel (Cont.)
To set thetrigger
coupling
7. Push the up and down arrow buttons to toggle throughthe possible trigger couplings:
DC passes all (both AC and DC components) ofthe input signal.
AC passes only the AC components of an inputsignal.
HF REJ attenuates signals above 30 kHz.
LF REJ attenuates signals below 80 kHz.
NOISE REJ provides lower sensitivity, reducing thechance of falsely triggering on noise.
To select the
trigger mode
8. Push the TRIGGER MODE button to toggle betweenNORMAL and AUTO trigger modes:
NORMAL trigger mode requires a trigger to acquirea waveform.
AUTO trigger mode acquires a waveform even if atrigger does not occur (after a time out).
Be aware that in AUTO mode, the acquired waveformsmay not be triggered.
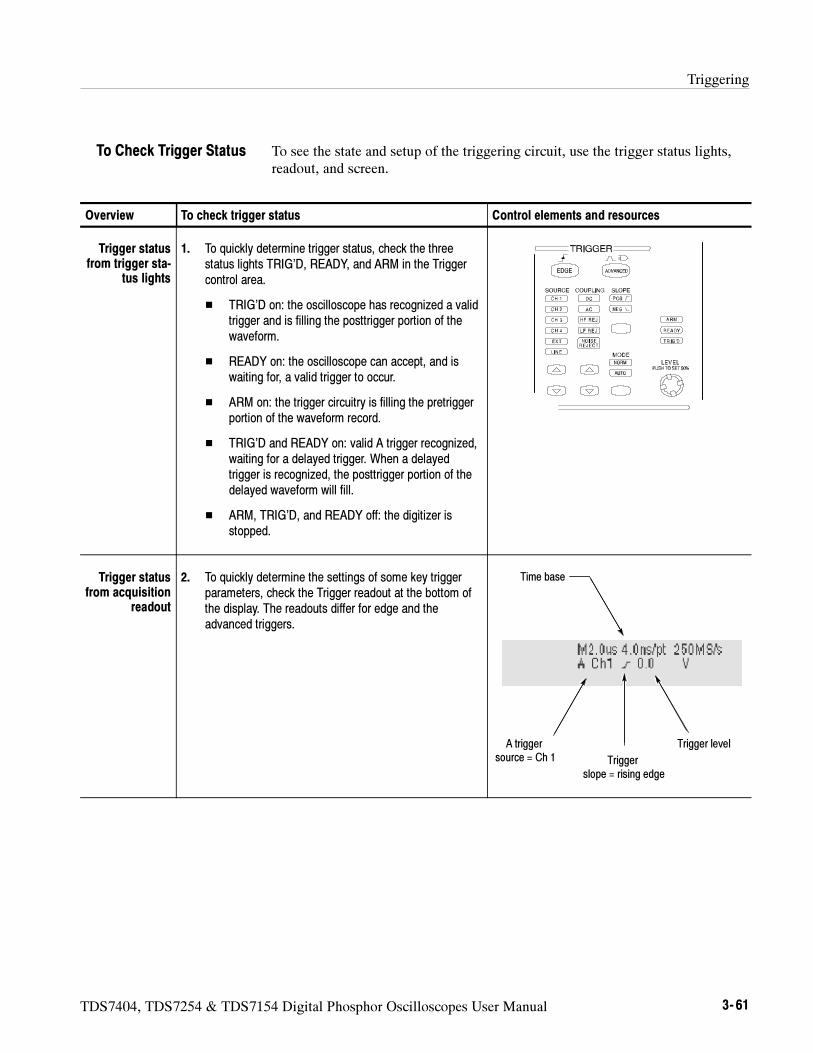
Triggering
TDS7404, TDS7254 & TDS7154 Digital Phosphor Oscilloscopes User Manual 3- 61
To see the state and setup of the triggering circuit, use the trigger status lights,readout, and screen.
Overview To check trigger status Control elements and resources
Trigger statusfrom trigger sta-
tus lights
1. To quickly determine trigger status, check the threestatus lights TRIG’D, READY, and ARM in the Triggercontrol area.
TRIG’D on: the oscilloscope has recognized a validtrigger and is filling the posttrigger portion of thewaveform.
READY on: the oscilloscope can accept, and iswaiting for, a valid trigger to occur.
ARM on: the trigger circuitry is filling the pretriggerportion of the waveform record.
TRIG’D and READY on: valid A trigger recognized,waiting for a delayed trigger. When a delayedtrigger is recognized, the posttrigger portion of thedelayed waveform will fill.
ARM, TRIG’D, and READY off: the digitizer isstopped.
Trigger statusfrom acquisition
readout
2. To quickly determine the settings of some key triggerparameters, check the Trigger readout at the bottom ofthe display. The readouts differ for edge and theadvanced triggers.
Time base
A triggersource = Ch 1 Trigger
slope = rising edge
Trigger level
To Check Trigger Status
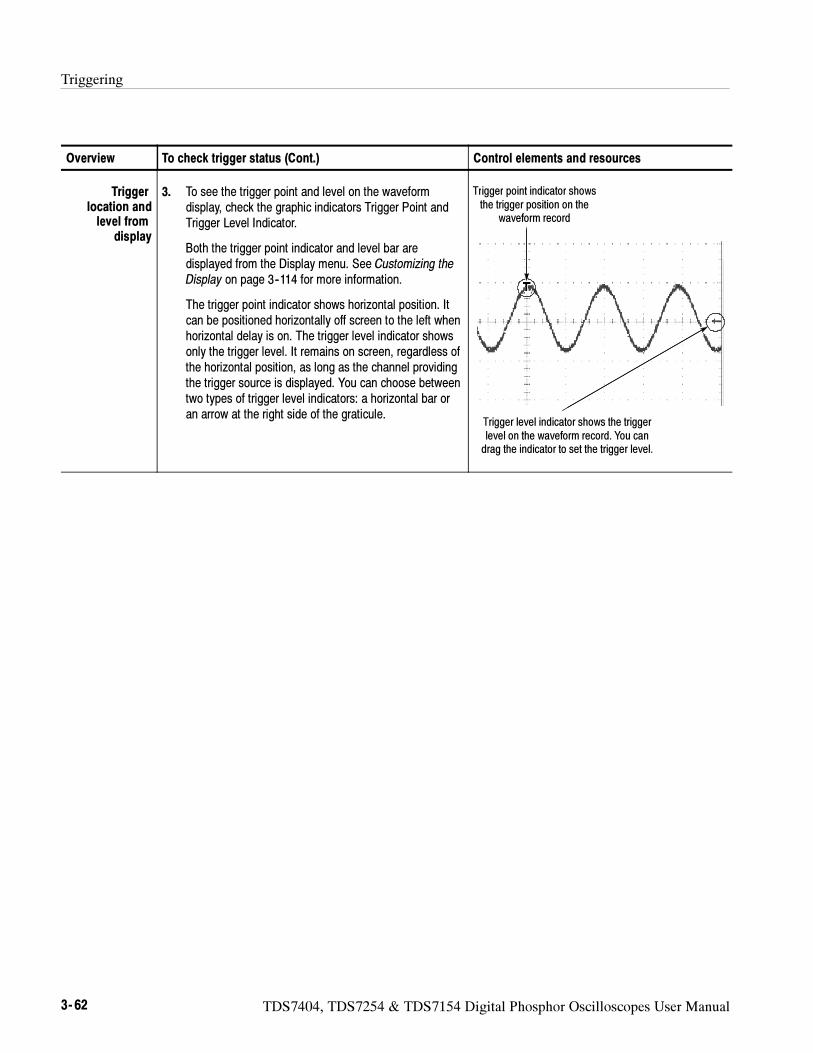
Triggering
3- 62 TDS7404, TDS7254 & TDS7154 Digital Phosphor Oscilloscopes User Manual
Overview Control elements and resourcesTo check trigger status (Cont.)
Triggerlocation andlevel from
display
3. To see the trigger point and level on the waveformdisplay, check the graphic indicators Trigger Point andTrigger Level Indicator.
Both the trigger point indicator and level bar aredisplayed from the Display menu. See Customizing theDisplay on page 3--114 for more information.
The trigger point indicator shows horizontal position. Itcan be positioned horizontally off screen to the left whenhorizontal delay is on. The trigger level indicator showsonly the trigger level. It remains on screen, regardless ofthe horizontal position, as long as the channel providingthe trigger source is displayed. You can choose betweentwo types of trigger level indicators: a horizontal bar oran arrow at the right side of the graticule.
Trigger point indicator showsthe trigger position on the
waveform record
Trigger level indicator shows the triggerlevel on the waveform record. You candrag the indicator to set the trigger level.
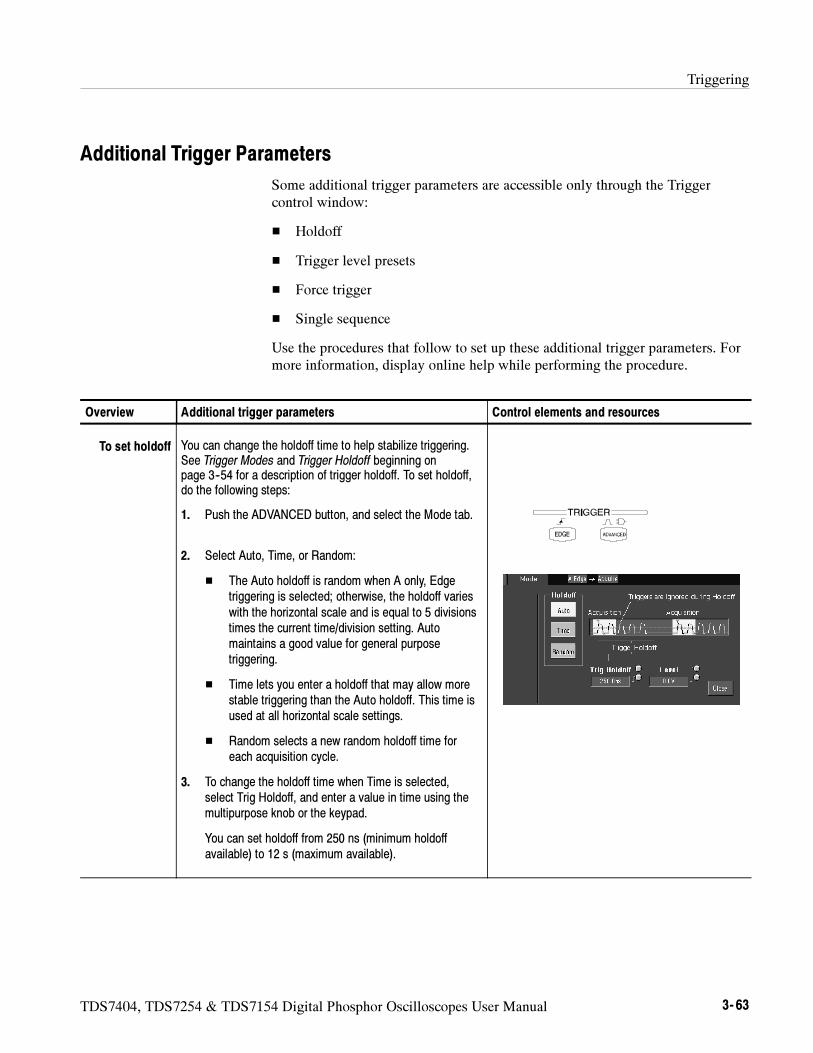
Triggering
TDS7404, TDS7254 & TDS7154 Digital Phosphor Oscilloscopes User Manual 3- 63
Additional Trigger Parameters
Some additional trigger parameters are accessible only through the Triggercontrol window:
Holdoff
Trigger level presets
Force trigger
Single sequence
Use the procedures that follow to set up these additional trigger parameters. Formore information, display online help while performing the procedure.
Overview Additional trigger parameters Control elements and resources
To set holdoff You can change the holdoff time to help stabilize triggering.See Trigger Modes and Trigger Holdoff beginning onpage 3--54 for a description of trigger holdoff. To set holdoff,do the following steps:
1. Push the ADVANCED button, and select the Mode tab.
2. Select Auto, Time, or Random:
The Auto holdoff is random when A only, Edgetriggering is selected; otherwise, the holdoff varieswith the horizontal scale and is equal to 5 divisionstimes the current time/division setting. Automaintains a good value for general purposetriggering.
Time lets you enter a holdoff that may allow morestable triggering than the Auto holdoff. This time isused at all horizontal scale settings.
Random selects a new random holdoff time foreach acquisition cycle.
3. To change the holdoff time when Time is selected,select Trig Holdoff, and enter a value in time using themultipurpose knob or the keypad.
You can set holdoff from 250 ns (minimum holdoffavailable) to 12 s (maximum available).
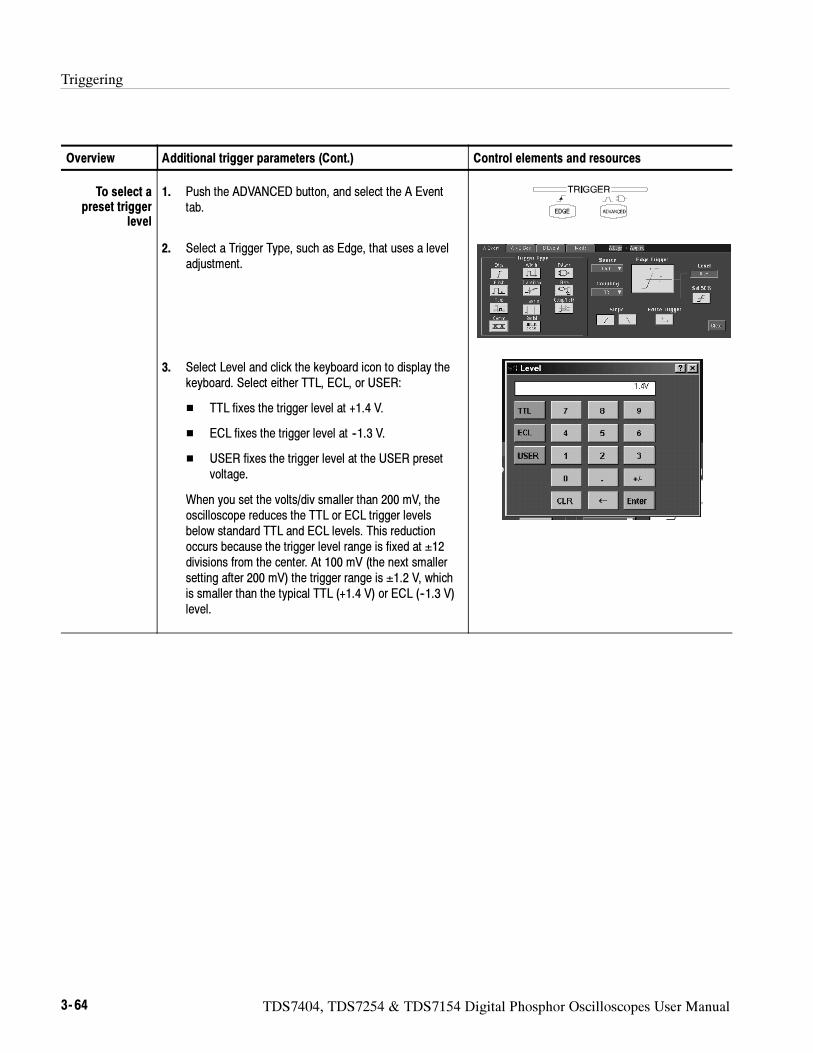
Triggering
3- 64 TDS7404, TDS7254 & TDS7154 Digital Phosphor Oscilloscopes User Manual
Overview Control elements and resourcesAdditional trigger parameters (Cont.)
To select apreset trigger
level
1. Push the ADVANCED button, and select the A Eventtab.
2. Select a Trigger Type, such as Edge, that uses a leveladjustment.
3. Select Level and click the keyboard icon to display thekeyboard. Select either TTL, ECL, or USER:
TTL fixes the trigger level at +1.4 V.
ECL fixes the trigger level at --1.3 V.
USER fixes the trigger level at the USER presetvoltage.
When you set the volts/div smaller than 200 mV, theoscilloscope reduces the TTL or ECL trigger levelsbelow standard TTL and ECL levels. This reductionoccurs because the trigger level range is fixed at ±12divisions from the center. At 100 mV (the next smallersetting after 200 mV) the trigger range is ±1.2 V, whichis smaller than the typical TTL (+1.4 V) or ECL (--1.3 V)level.
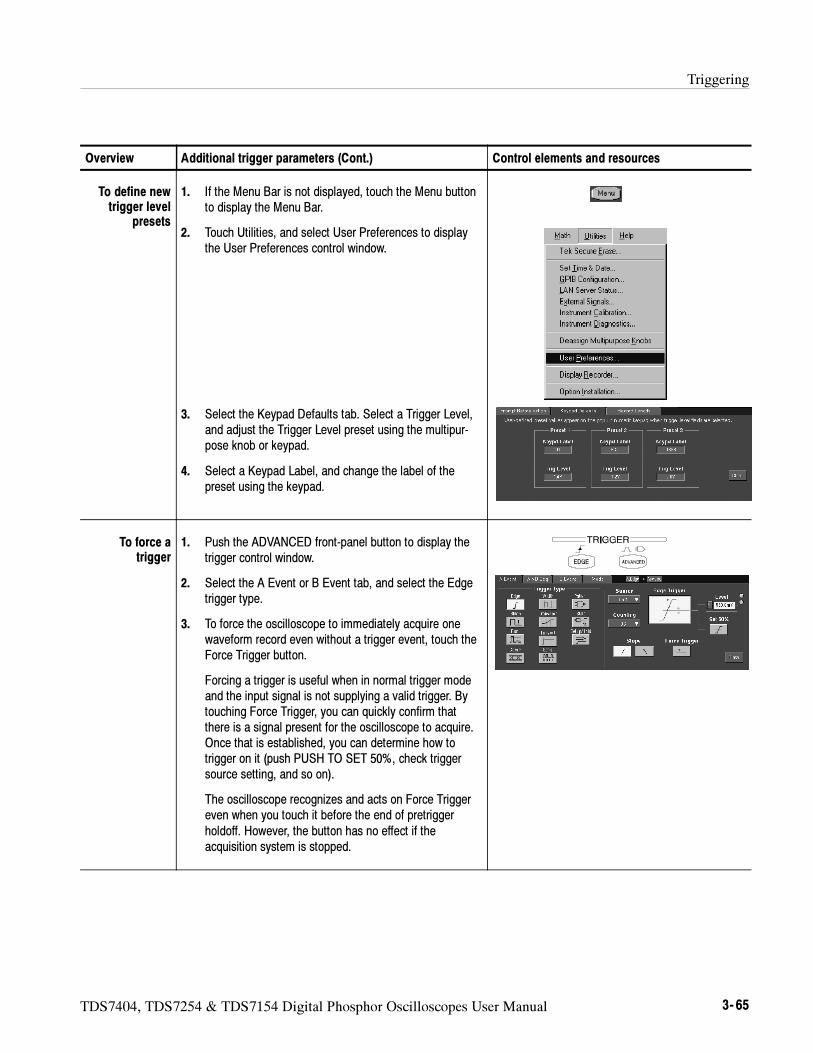
Triggering
TDS7404, TDS7254 & TDS7154 Digital Phosphor Oscilloscopes User Manual 3- 65
Overview Control elements and resourcesAdditional trigger parameters (Cont.)
To define newtrigger level
presets
1. If the Menu Bar is not displayed, touch the Menu buttonto display the Menu Bar.
2. Touch Utilities, and select User Preferences to displaythe User Preferences control window.
3. Select the Keypad Defaults tab. Select a Trigger Level,and adjust the Trigger Level preset using the multipur-pose knob or keypad.
4. Select a Keypad Label, and change the label of thepreset using the keypad.
To force atrigger
1. Push the ADVANCED front-panel button to display thetrigger control window.
2. Select the A Event or B Event tab, and select the Edgetrigger type.
3. To force the oscilloscope to immediately acquire onewaveform record even without a trigger event, touch theForce Trigger button.
Forcing a trigger is useful when in normal trigger modeand the input signal is not supplying a valid trigger. Bytouching Force Trigger, you can quickly confirm thatthere is a signal present for the oscilloscope to acquire.Once that is established, you can determine how totrigger on it (push PUSH TO SET 50%, check triggersource setting, and so on).
The oscilloscope recognizes and acts on Force Triggereven when you touch it before the end of pretriggerholdoff. However, the button has no effect if theacquisition system is stopped.
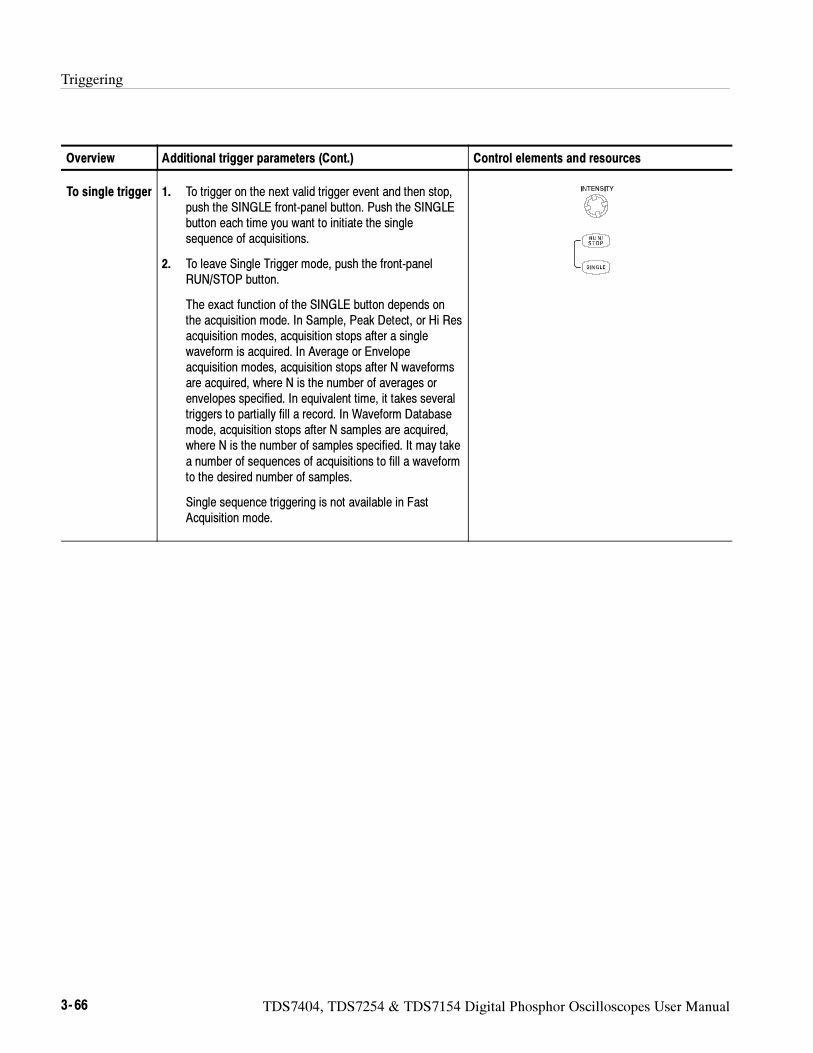
Triggering
3- 66 TDS7404, TDS7254 & TDS7154 Digital Phosphor Oscilloscopes User Manual
Overview Control elements and resourcesAdditional trigger parameters (Cont.)
To single trigger 1. To trigger on the next valid trigger event and then stop,push the SINGLE front-panel button. Push the SINGLEbutton each time you want to initiate the singlesequence of acquisitions.
2. To leave Single Trigger mode, push the front-panelRUN/STOP button.
The exact function of the SINGLE button depends onthe acquisition mode. In Sample, Peak Detect, or Hi Resacquisition modes, acquisition stops after a singlewaveform is acquired. In Average or Envelopeacquisition modes, acquisition stops after N waveformsare acquired, where N is the number of averages orenvelopes specified. In equivalent time, it takes severaltriggers to partially fill a record. In Waveform Databasemode, acquisition stops after N samples are acquired,where N is the number of samples specified. It may takea number of sequences of acquisitions to fill a waveformto the desired number of samples.
Single sequence triggering is not available in FastAcquisition mode.
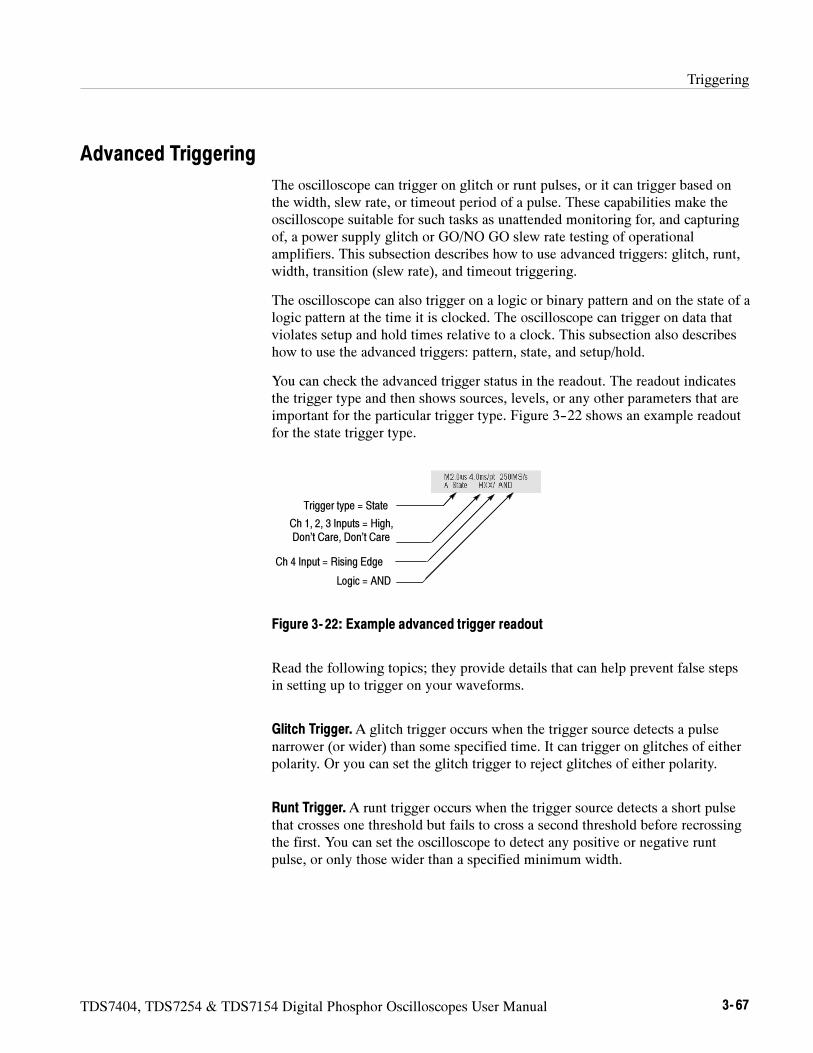
Triggering
TDS7404, TDS7254 & TDS7154 Digital Phosphor Oscilloscopes User Manual 3- 67
Advanced Triggering
The oscilloscope can trigger on glitch or runt pulses, or it can trigger based onthe width, slew rate, or timeout period of a pulse. These capabilities make theoscilloscope suitable for such tasks as unattended monitoring for, and capturingof, a power supply glitch or GO/NO GO slew rate testing of operationalamplifiers. This subsection describes how to use advanced triggers: glitch, runt,width, transition (slew rate), and timeout triggering.
The oscilloscope can also trigger on a logic or binary pattern and on the state of alogic pattern at the time it is clocked. The oscilloscope can trigger on data thatviolates setup and hold times relative to a clock. This subsection also describeshow to use the advanced triggers: pattern, state, and setup/hold.
You can check the advanced trigger status in the readout. The readout indicatesthe trigger type and then shows sources, levels, or any other parameters that areimportant for the particular trigger type. Figure 3--22 shows an example readoutfor the state trigger type.
Trigger type = State
Ch 1, 2, 3 Inputs = High,Don’t Care, Don’t Care
Ch 4 Input = Rising Edge
Logic = AND
Figure 3- 22: Example advanced trigger readout
Read the following topics; they provide details that can help prevent false stepsin setting up to trigger on your waveforms.
Glitch Trigger.A glitch trigger occurs when the trigger source detects a pulsenarrower (or wider) than some specified time. It can trigger on glitches of eitherpolarity. Or you can set the glitch trigger to reject glitches of either polarity.
Runt Trigger.A runt trigger occurs when the trigger source detects a short pulsethat crosses one threshold but fails to cross a second threshold before recrossingthe first. You can set the oscilloscope to detect any positive or negative runtpulse, or only those wider than a specified minimum width.
Triggering
3- 68 TDS7404, TDS7254 & TDS7154 Digital Phosphor Oscilloscopes User Manual
Width Trigger.A width trigger occurs when the trigger source detects a pulse thatis inside or, optionally, outside some specified time range (defined by the upperlimit and lower limit). The oscilloscope can trigger on positive or negative widthpulses.
Transition Trigger.A transition (slew rate) trigger occurs when the trigger sourcedetects a pulse edge that transitions (slews) between two amplitude levels at arate faster or slower than you specify. The oscilloscope can trigger on positive ornegative transitions. You can also think of transition triggering as triggeringbased on the slope (change in voltage/change in time) of a pulse edge.
Timeout Trigger.A timeout trigger occurs when the trigger source does not detectan expected pulse transition. If the pulse transition occurs prior to a specifiedtimeout time (the expected case) then no trigger results.
Pattern Trigger.A pattern trigger occurs when the logic inputs to the logicfunction you select cause the function to become TRUE (or at your optionFALSE). When you use a pattern trigger, you define:
The precondition for each logic input — logic high, low, or do not care (thelogic inputs are channels 1, 2, 3, and 4)
The Boolean logic function — select from AND, NAND, OR, and NOR
The condition for triggering — whether the trigger occurs when the Booleanfunction becomes TRUE (logic high) or FALSE (logic low), and whether theTRUE condition is time qualified
The pattern (and state) logic choices are summarized in Table 3--5.
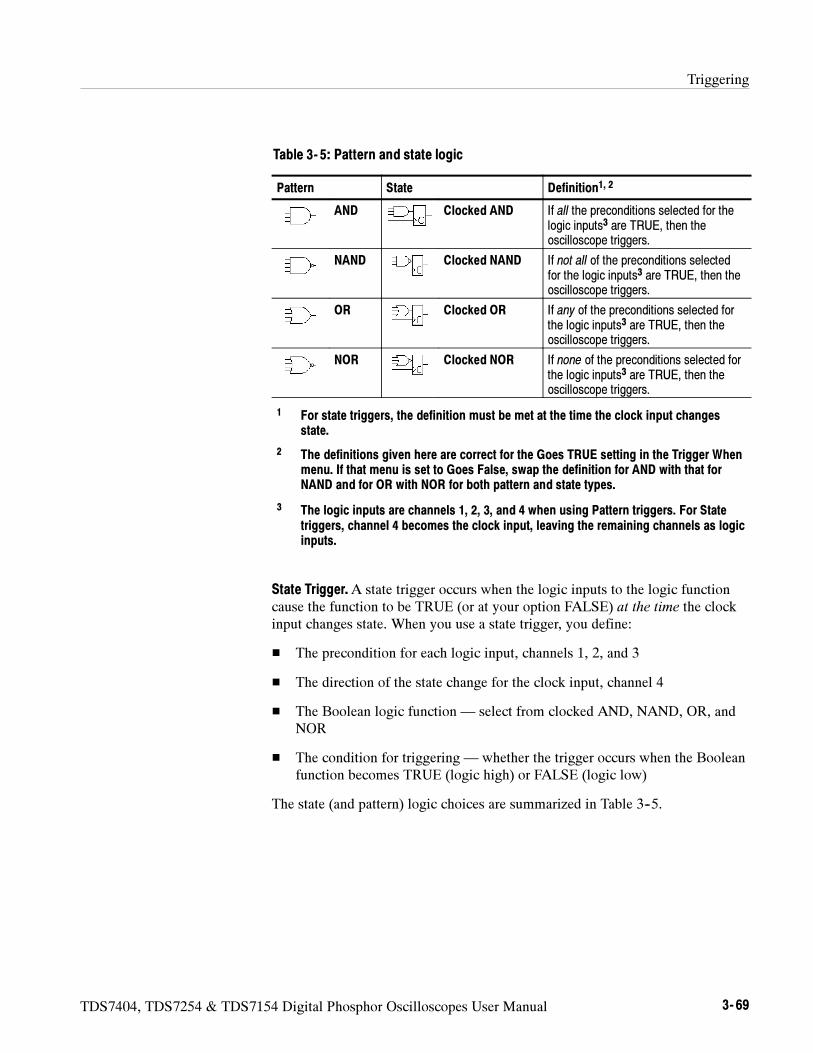
Triggering
TDS7404, TDS7254 & TDS7154 Digital Phosphor Oscilloscopes User Manual 3- 69
Table 3- 5: Pattern and state logic
Pattern State Definition1, 2
AND Clocked AND If all the preconditions selected for thelogic inputs3 are TRUE, then theoscilloscope triggers.
NAND Clocked NAND If not all of the preconditions selectedfor the logic inputs3 are TRUE, then theoscilloscope triggers.
OR Clocked OR If any of the preconditions selected forthe logic inputs3 are TRUE, then theoscilloscope triggers.
NOR Clocked NOR If none of the preconditions selected forthe logic inputs3 are TRUE, then theoscilloscope triggers.
1 For state triggers, the definition must be met at the time the clock input changesstate.
2 The definitions given here are correct for the Goes TRUE setting in the Trigger Whenmenu. If that menu is set to Goes False, swap the definition for AND with that forNAND and for OR with NOR for both pattern and state types.
3 The logic inputs are channels 1, 2, 3, and 4 when using Pattern triggers. For Statetriggers, channel 4 becomes the clock input, leaving the remaining channels as logicinputs.
State Trigger.A state trigger occurs when the logic inputs to the logic functioncause the function to be TRUE (or at your option FALSE) at the time the clockinput changes state. When you use a state trigger, you define:
The precondition for each logic input, channels 1, 2, and 3
The direction of the state change for the clock input, channel 4
The Boolean logic function — select from clocked AND, NAND, OR, andNOR
The condition for triggering — whether the trigger occurs when the Booleanfunction becomes TRUE (logic high) or FALSE (logic low)
The state (and pattern) logic choices are summarized in Table 3--5.
Triggering
3- 70 TDS7404, TDS7254 & TDS7154 Digital Phosphor Oscilloscopes User Manual
Setup/Hold Trigger.A setup/hold trigger occurs when a logic input changes stateinside of the setup and hold times relative to the clock. When you use setup/holdtriggering, you define:
The channel containing the logic input (the data source) and the channelcontaining the clock (the clock source)
The direction of the clock edge to use
The clocking level and data level that the oscilloscope uses to determine if aclock or data transition has occurred
The setup and hold times that together define a time range relative to the clock
Data that changes state within the setup/hold violation zone triggers theoscilloscope. Figure 3--23 shows how the setup and hold times you choosepositions this zone relative to the clock.
Setup/hold triggering uses the setup/hold violation zone to detect when data isunstable too near the time it is clocked. Each time trigger holdoff ends, theoscilloscope monitors the data and clock sources. When a clock edge occurs, theoscilloscope checks the data stream it is processing (from the data source) fortransitions occurring within the setup/hold violation zone. If any occur, theoscilloscope triggers with the trigger point located at the clock edge.
Positive settings for both setup and hold times (the most common application)locate the setup/hold violation zone so it spans the clocking edge. (See the topwaveform in Figure 3--23.) The oscilloscope detects and triggers on data thatdoes not become stable long enough before the clock (setup time violation) orthat does not stay stable long enough after the clock (hold time violation).
Negative settings for setup or hold times skew the setup/hold violation zone tolocate it before or after the clocking edge. (See the bottom and center waveformsof Figure 3--23.) The oscilloscope can then detect and trigger on violations of atime range that occurs before or one that occurs after the clock.
NOTE. Keep the hold-time setting to no more than 2.5 ns less than one-half the
clock period (hold time≤ (period/2) -- 2.5 ns) or the oscilloscope cannot trigger
(this assumes a 50% duty cycle clock).
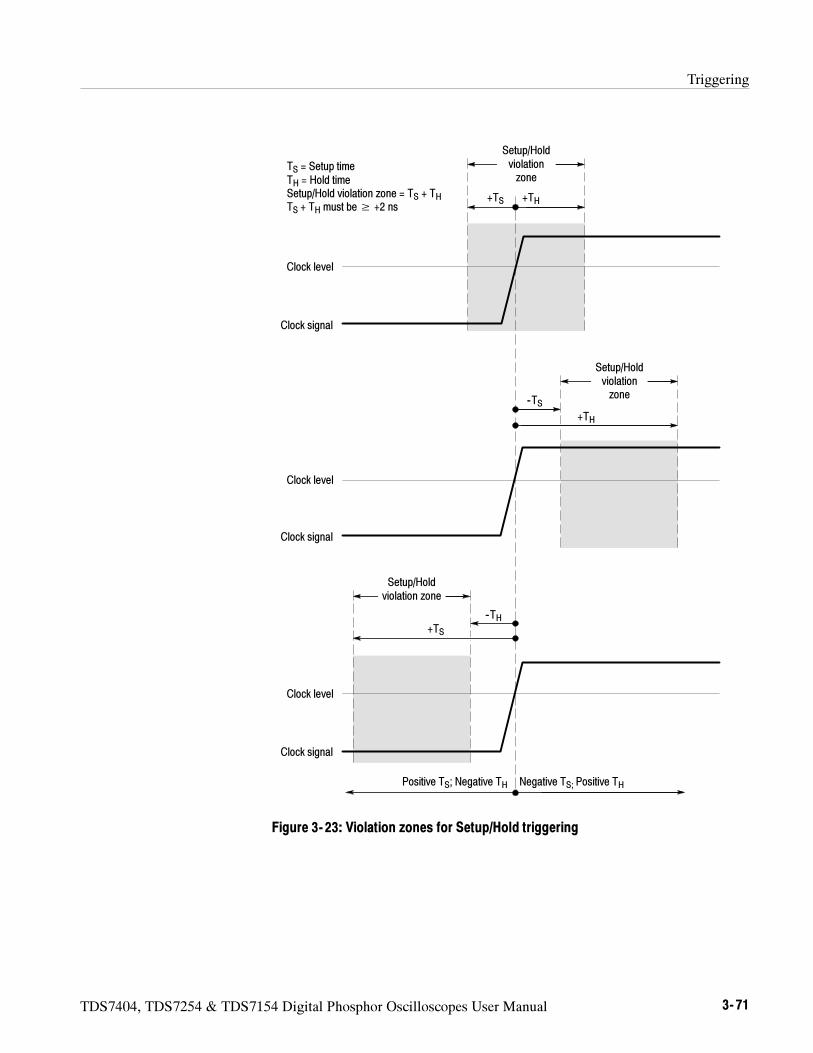
Triggering
TDS7404, TDS7254 & TDS7154 Digital Phosphor Oscilloscopes User Manual 3- 71
Clock signal
Clock level
TS = Setup timeTH = Hold timeSetup/Hold violation zone = TS + THTS + TH must be≥ +2 ns
Clock signal
Clock level
Clock signal
Clock level
Negative TS; Positive THPositive TS; Negative TH
+TH
+TH
--TS
--TH+TS
+TS
Setup/Holdviolationzone
Setup/Holdviolationzone
Setup/Holdviolation zone
Figure 3- 23: Violation zones for Setup/Hold triggering
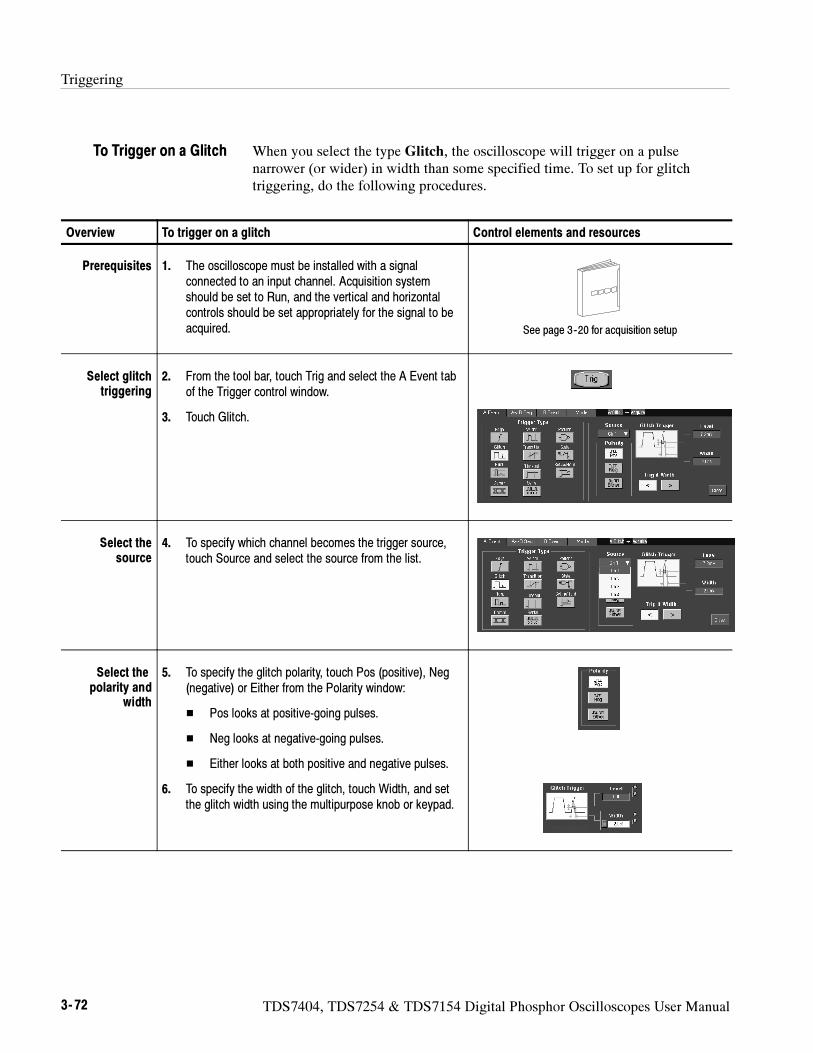
Triggering
3- 72 TDS7404, TDS7254 & TDS7154 Digital Phosphor Oscilloscopes User Manual
When you select the type Glitch, the oscilloscope will trigger on a pulsenarrower (or wider) in width than some specified time. To set up for glitchtriggering, do the following procedures.
Overview To trigger on a glitch Control elements and resources
Prerequisites 1. The oscilloscope must be installed with a signalconnected to an input channel. Acquisition systemshould be set to Run, and the vertical and horizontalcontrols should be set appropriately for the signal to beacquired. See page 3--20 for acquisition setup
Select glitchtriggering
2. From the tool bar, touch Trig and select the A Event tabof the Trigger control window.
3. Touch Glitch.
Select thesource
4. To specify which channel becomes the trigger source,touch Source and select the source from the list.
Select thepolarity and
width
5. To specify the glitch polarity, touch Pos (positive), Neg(negative) or Either from the Polarity window:
Pos looks at positive-going pulses.
Neg looks at negative-going pulses.
Either looks at both positive and negative pulses.
6. To specify the width of the glitch, touch Width, and setthe glitch width using the multipurpose knob or keypad.
To Trigger on a Glitch
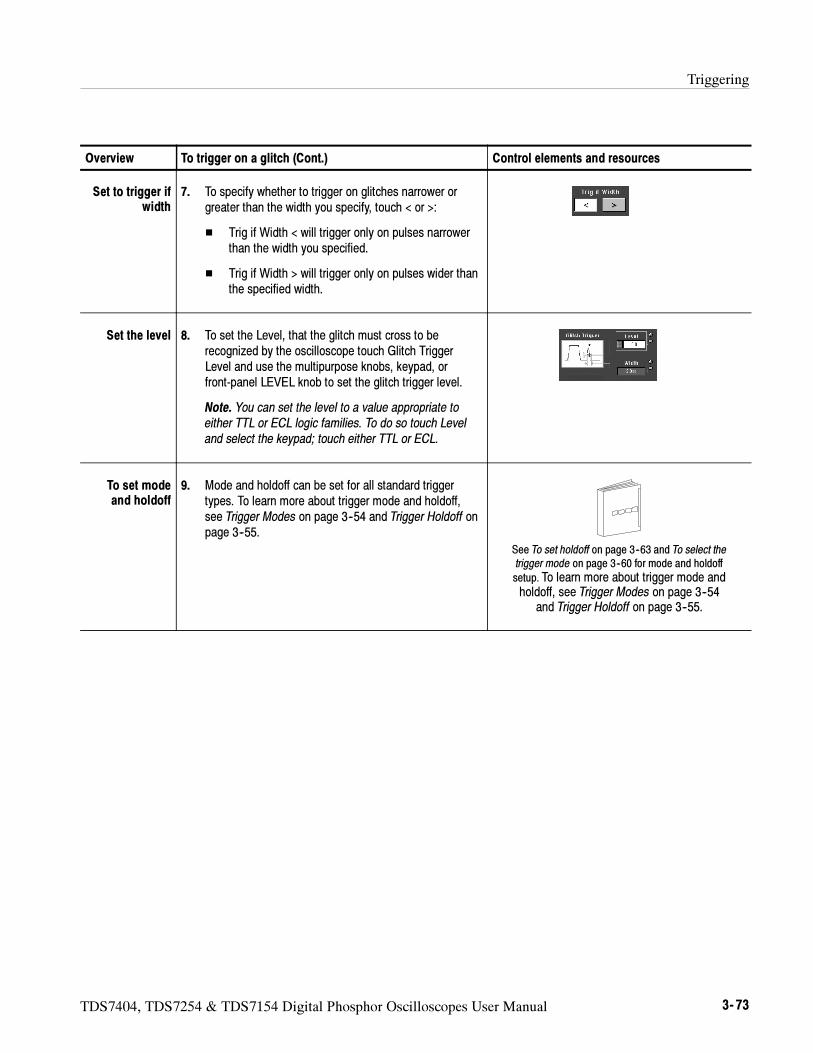
Triggering
TDS7404, TDS7254 & TDS7154 Digital Phosphor Oscilloscopes User Manual 3- 73
Overview Control elements and resourcesTo trigger on a glitch (Cont.)
Set to trigger ifwidth
7. To specify whether to trigger on glitches narrower orgreater than the width you specify, touch < or >:
Trig if Width < will trigger only on pulses narrowerthan the width you specified.
Trig if Width > will trigger only on pulses wider thanthe specified width.
Set the level 8. To set the Level, that the glitch must cross to berecognized by the oscilloscope touch Glitch TriggerLevel and use the multipurpose knobs, keypad, orfront-panel LEVEL knob to set the glitch trigger level.
Note. You can set the level to a value appropriate toeither TTL or ECL logic families. To do so touch Leveland select the keypad; touch either TTL or ECL.
To set modeand holdoff
9. Mode and holdoff can be set for all standard triggertypes. To learn more about trigger mode and holdoff,see Trigger Modes on page 3--54 and Trigger Holdoff onpage 3--55.
See To set holdoff on page 3--63 and To select thetrigger mode on page 3--60 for mode and holdoff
setup. To learn more about trigger mode andholdoff, see Trigger Modes on page 3--54
and Trigger Holdoff on page 3--55.
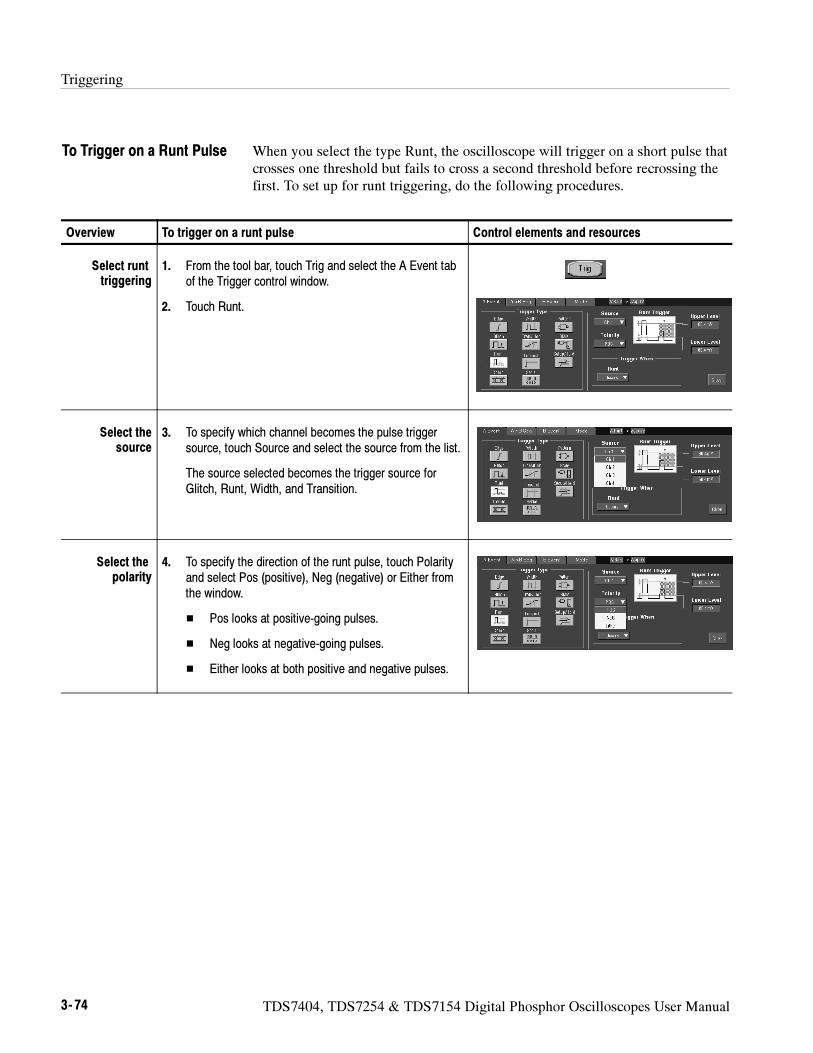
Triggering
3- 74 TDS7404, TDS7254 & TDS7154 Digital Phosphor Oscilloscopes User Manual
When you select the type Runt, the oscilloscope will trigger on a short pulse thatcrosses one threshold but fails to cross a second threshold before recrossing thefirst. To set up for runt triggering, do the following procedures.
Overview To trigger on a runt pulse Control elements and resources
Select runttriggering
1. From the tool bar, touch Trig and select the A Event tabof the Trigger control window.
2. Touch Runt.
Select thesource
3. To specify which channel becomes the pulse triggersource, touch Source and select the source from the list.
The source selected becomes the trigger source forGlitch, Runt, Width, and Transition.
Select thepolarity
4. To specify the direction of the runt pulse, touch Polarityand select Pos (positive), Neg (negative) or Either fromthe window.
Pos looks at positive-going pulses.
Neg looks at negative-going pulses.
Either looks at both positive and negative pulses.
To Trigger on a Runt Pulse
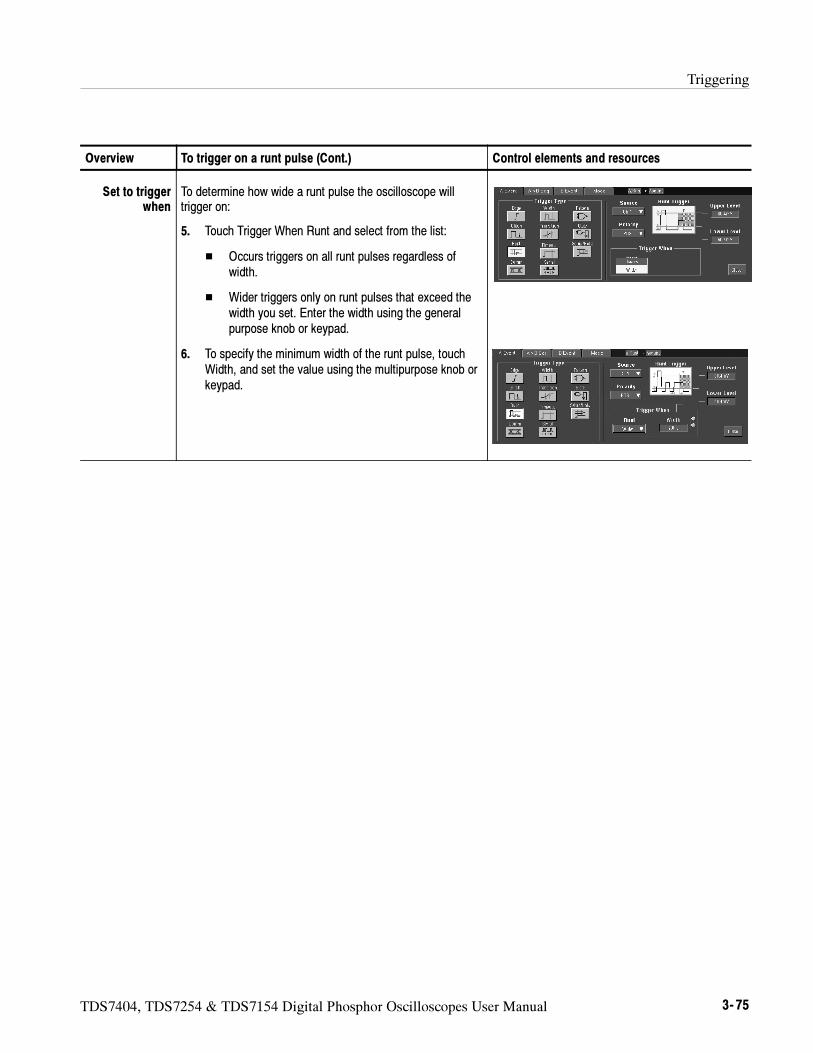
Triggering
TDS7404, TDS7254 & TDS7154 Digital Phosphor Oscilloscopes User Manual 3- 75
Overview Control elements and resourcesTo trigger on a runt pulse (Cont.)
Set to triggerwhen
To determine how wide a runt pulse the oscilloscope willtrigger on:
5. Touch Trigger When Runt and select from the list:
Occurs triggers on all runt pulses regardless ofwidth.
Wider triggers only on runt pulses that exceed thewidth you set. Enter the width using the generalpurpose knob or keypad.
6. To specify the minimum width of the runt pulse, touchWidth, and set the value using the multipurpose knob orkeypad.
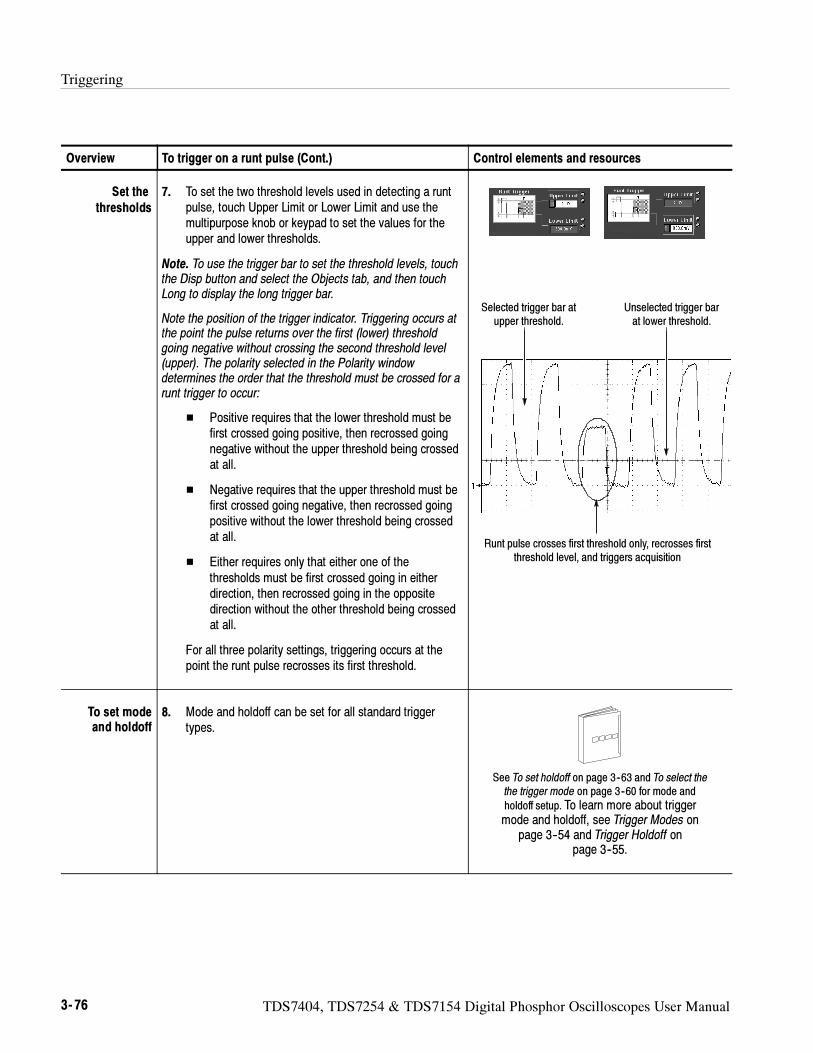
Triggering
3- 76 TDS7404, TDS7254 & TDS7154 Digital Phosphor Oscilloscopes User Manual
Overview Control elements and resourcesTo trigger on a runt pulse (Cont.)
Set the
thresholds
7. To set the two threshold levels used in detecting a runtpulse, touch Upper Limit or Lower Limit and use themultipurpose knob or keypad to set the values for theupper and lower thresholds.
Note. To use the trigger bar to set the threshold levels, touchthe Disp button and select the Objects tab, and then touchLong to display the long trigger bar.
Note the position of the trigger indicator. Triggering occurs atthe point the pulse returns over the first (lower) thresholdgoing negative without crossing the second threshold level(upper). The polarity selected in the Polarity windowdetermines the order that the threshold must be crossed for arunt trigger to occur:
Positive requires that the lower threshold must befirst crossed going positive, then recrossed goingnegative without the upper threshold being crossedat all.
Negative requires that the upper threshold must befirst crossed going negative, then recrossed goingpositive without the lower threshold being crossedat all.
Either requires only that either one of thethresholds must be first crossed going in eitherdirection, then recrossed going in the oppositedirection without the other threshold being crossedat all.
For all three polarity settings, triggering occurs at thepoint the runt pulse recrosses its first threshold.
Selected trigger bar atupper threshold.
Runt pulse crosses first threshold only, recrosses firstthreshold level, and triggers acquisition
Unselected trigger barat lower threshold.
To set modeand holdoff
8. Mode and holdoff can be set for all standard triggertypes.
See To set holdoff on page 3--63 and To select thethe trigger mode on page 3--60 for mode and
holdoff setup. To learn more about triggermode and holdoff, see Trigger Modes on
page 3--54 and Trigger Holdoff onpage 3--55.
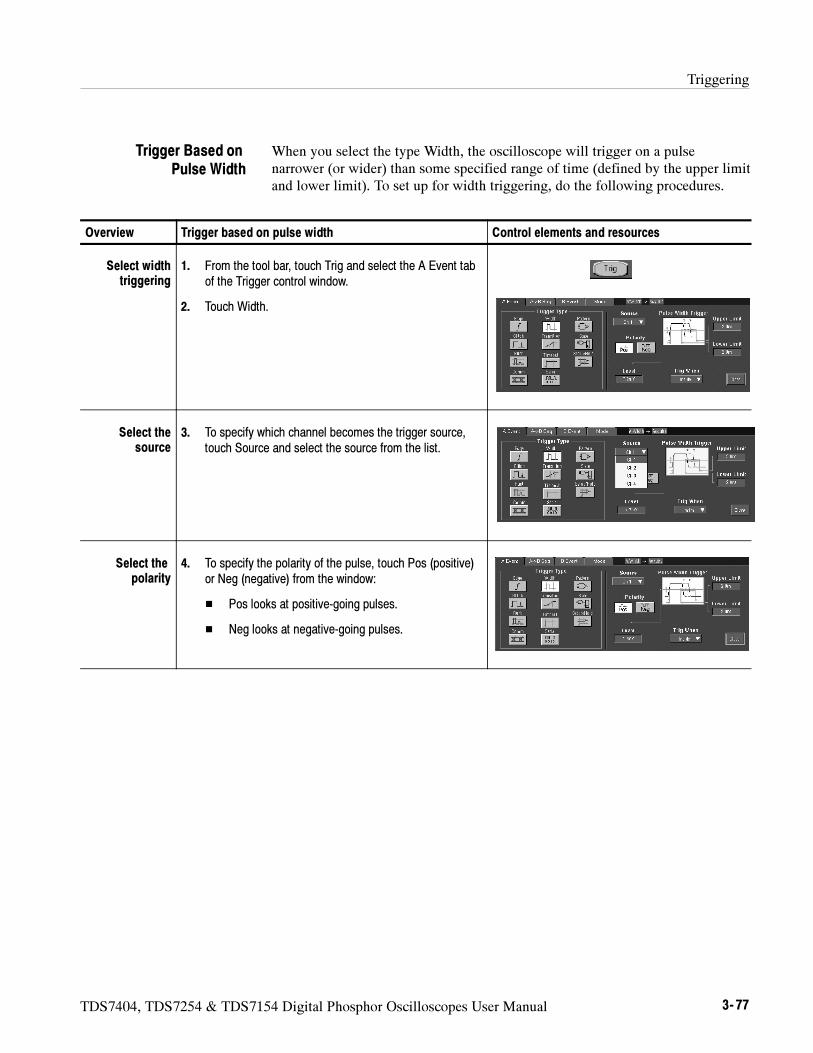
Triggering
TDS7404, TDS7254 & TDS7154 Digital Phosphor Oscilloscopes User Manual 3- 77
When you select the type Width, the oscilloscope will trigger on a pulsenarrower (or wider) than some specified range of time (defined by the upper limitand lower limit). To set up for width triggering, do the following procedures.
Overview Trigger based on pulse width Control elements and resources
Select widthtriggering
1. From the tool bar, touch Trig and select the A Event tabof the Trigger control window.
2. Touch Width.
Select thesource
3. To specify which channel becomes the trigger source,touch Source and select the source from the list.
Select thepolarity
4. To specify the polarity of the pulse, touch Pos (positive)or Neg (negative) from the window:
Pos looks at positive-going pulses.
Neg looks at negative-going pulses.
Trigger Based onPulse Width
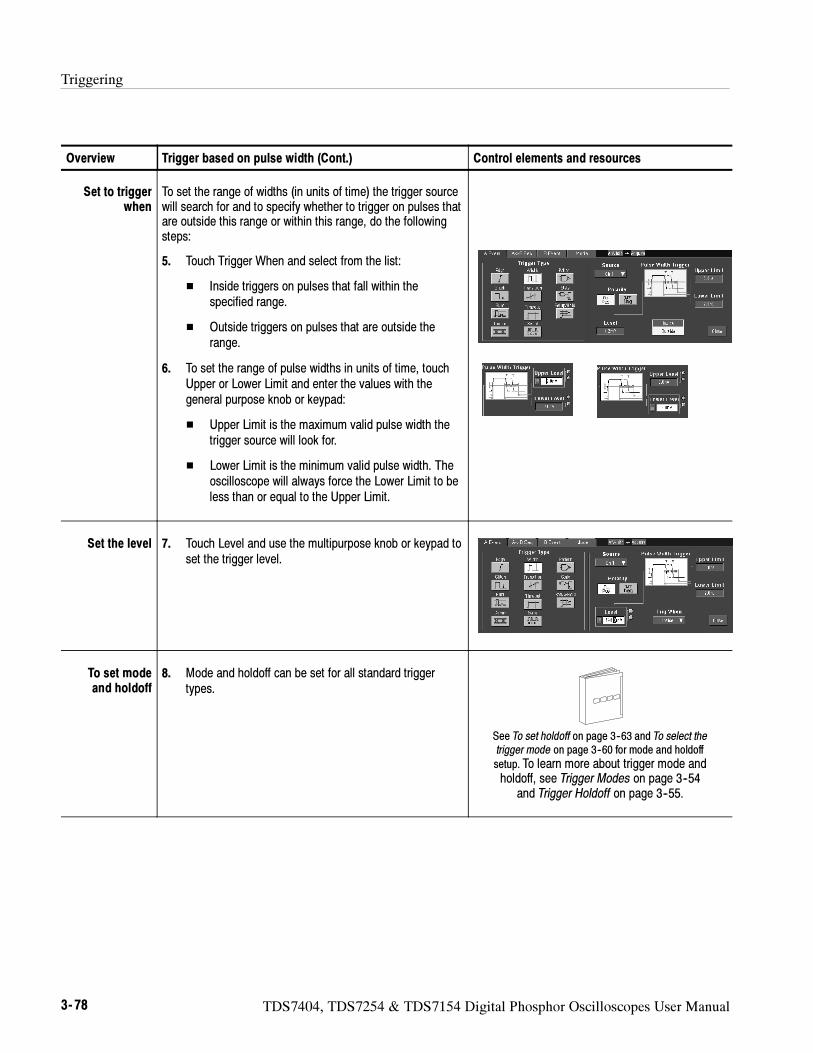
Triggering
3- 78 TDS7404, TDS7254 & TDS7154 Digital Phosphor Oscilloscopes User Manual
Overview Control elements and resourcesTrigger based on pulse width (Cont.)
Set to triggerwhen
To set the range of widths (in units of time) the trigger sourcewill search for and to specify whether to trigger on pulses thatare outside this range or within this range, do the followingsteps:
5. Touch Trigger When and select from the list:
Inside triggers on pulses that fall within thespecified range.
Outside triggers on pulses that are outside therange.
6. To set the range of pulse widths in units of time, touchUpper or Lower Limit and enter the values with thegeneral purpose knob or keypad:
Upper Limit is the maximum valid pulse width thetrigger source will look for.
Lower Limit is the minimum valid pulse width. Theoscilloscope will always force the Lower Limit to beless than or equal to the Upper Limit.
Set the level 7. Touch Level and use the multipurpose knob or keypad toset the trigger level.
To set modeand holdoff
8. Mode and holdoff can be set for all standard triggertypes.
See To set holdoff on page 3--63 and To select thetrigger mode on page 3--60 for mode and holdoff
setup. To learn more about trigger mode andholdoff, see Trigger Modes on page 3--54
and Trigger Holdoff on page 3--55.
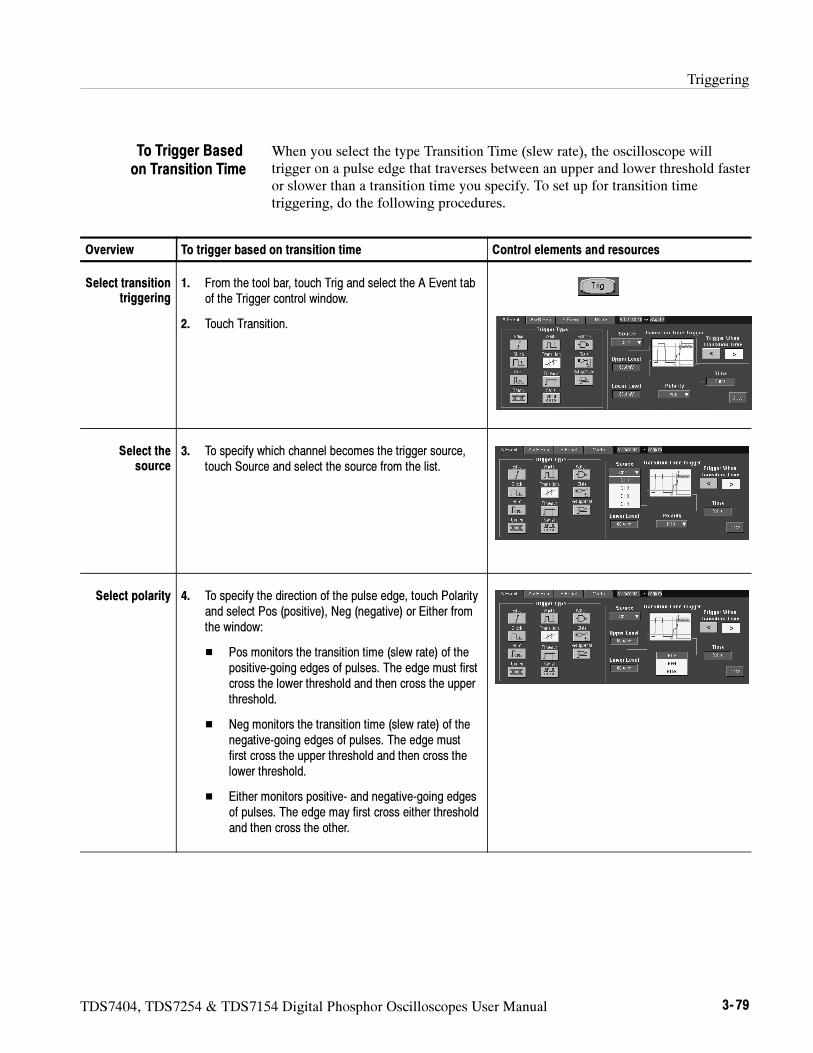
Triggering
TDS7404, TDS7254 & TDS7154 Digital Phosphor Oscilloscopes User Manual 3- 79
When you select the type Transition Time (slew rate), the oscilloscope willtrigger on a pulse edge that traverses between an upper and lower threshold fasteror slower than a transition time you specify. To set up for transition timetriggering, do the following procedures.
Overview To trigger based on transition time Control elements and resources
Select transitiontriggering
1. From the tool bar, touch Trig and select the A Event tabof the Trigger control window.
2. Touch Transition.
Select thesource
3. To specify which channel becomes the trigger source,touch Source and select the source from the list.
Select polarity 4. To specify the direction of the pulse edge, touch Polarityand select Pos (positive), Neg (negative) or Either fromthe window:
Pos monitors the transition time (slew rate) of thepositive-going edges of pulses. The edge must firstcross the lower threshold and then cross the upperthreshold.
Neg monitors the transition time (slew rate) of thenegative-going edges of pulses. The edge mustfirst cross the upper threshold and then cross thelower threshold.
Either monitors positive- and negative-going edgesof pulses. The edge may first cross either thresholdand then cross the other.
To Trigger Basedon Transition Time
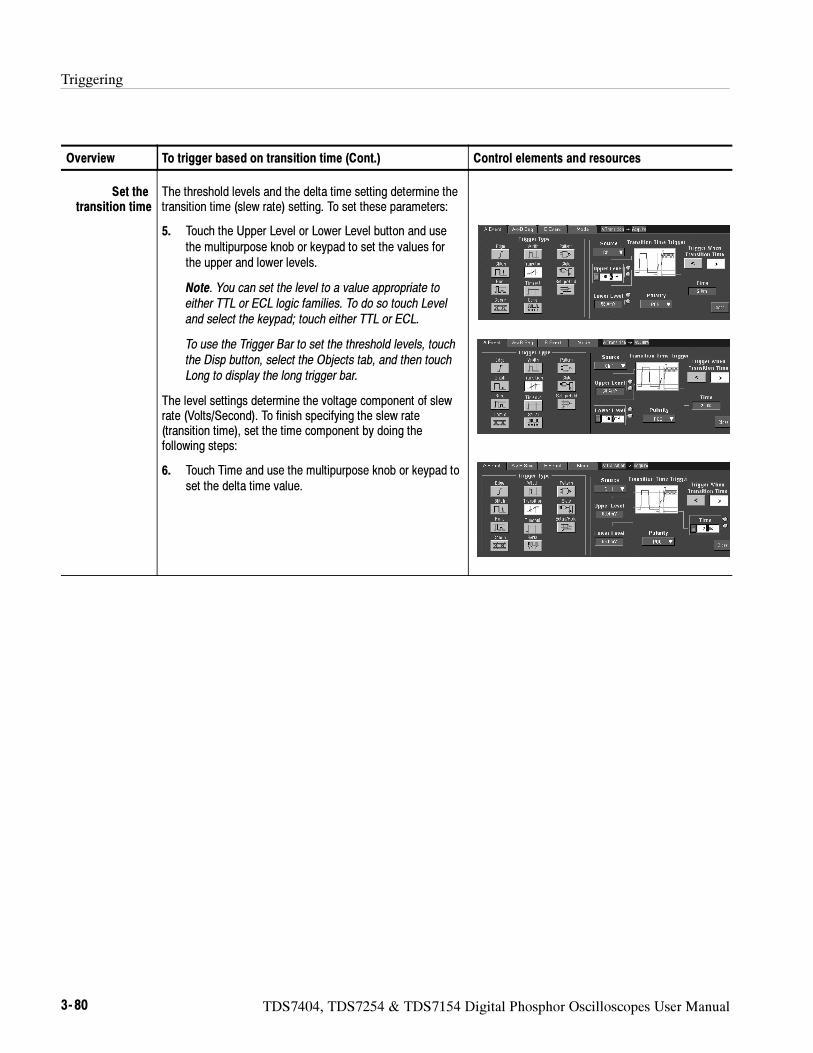
Triggering
3- 80 TDS7404, TDS7254 & TDS7154 Digital Phosphor Oscilloscopes User Manual
Overview Control elements and resourcesTo trigger based on transition time (Cont.)
Set thetransition time
The threshold levels and the delta time setting determine thetransition time (slew rate) setting. To set these parameters:
5. Touch the Upper Level or Lower Level button and usethe multipurpose knob or keypad to set the values forthe upper and lower levels.
Note. You can set the level to a value appropriate toeither TTL or ECL logic families. To do so touch Leveland select the keypad; touch either TTL or ECL.
To use the Trigger Bar to set the threshold levels, touchthe Disp button, select the Objects tab, and then touchLong to display the long trigger bar.
The level settings determine the voltage component of slewrate (Volts/Second). To finish specifying the slew rate(transition time), set the time component by doing thefollowing steps:
6. Touch Time and use the multipurpose knob or keypad toset the delta time value.
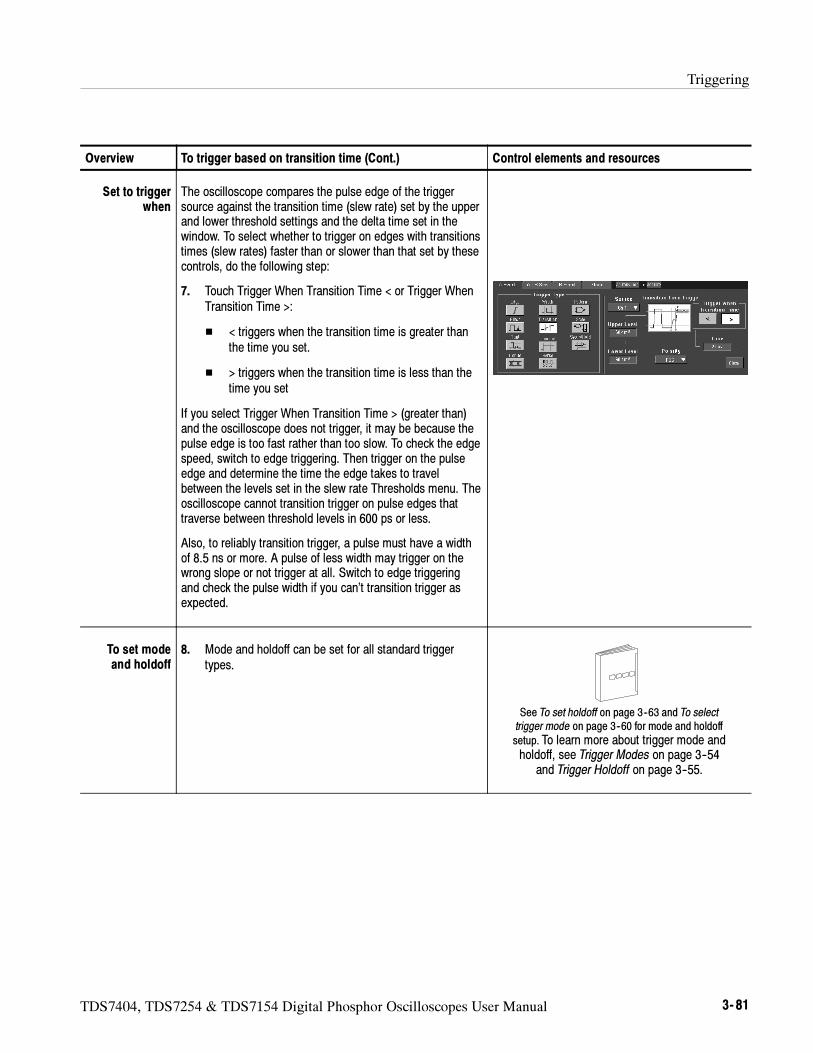
Triggering
TDS7404, TDS7254 & TDS7154 Digital Phosphor Oscilloscopes User Manual 3- 81
Overview Control elements and resourcesTo trigger based on transition time (Cont.)
Set to triggerwhen
The oscilloscope compares the pulse edge of the triggersource against the transition time (slew rate) set by the upperand lower threshold settings and the delta time set in thewindow. To select whether to trigger on edges with transitionstimes (slew rates) faster than or slower than that set by thesecontrols, do the following step:
7. Touch Trigger When Transition Time < or Trigger WhenTransition Time >:
< triggers when the transition time is greater thanthe time you set.
> triggers when the transition time is less than thetime you set
If you select Trigger When Transition Time > (greater than)and the oscilloscope does not trigger, it may be because thepulse edge is too fast rather than too slow. To check the edgespeed, switch to edge triggering. Then trigger on the pulseedge and determine the time the edge takes to travelbetween the levels set in the slew rate Thresholds menu. Theoscilloscope cannot transition trigger on pulse edges thattraverse between threshold levels in 600 ps or less.
Also, to reliably transition trigger, a pulse must have a widthof 8.5 ns or more. A pulse of less width may trigger on thewrong slope or not trigger at all. Switch to edge triggeringand check the pulse width if you can’t transition trigger asexpected.
To set modeand holdoff
8. Mode and holdoff can be set for all standard triggertypes.
See To set holdoff on page 3--63 and To selecttrigger mode on page 3--60 for mode and holdoff
setup. To learn more about trigger mode andholdoff, see Trigger Modes on page 3--54
and Trigger Holdoff on page 3--55.
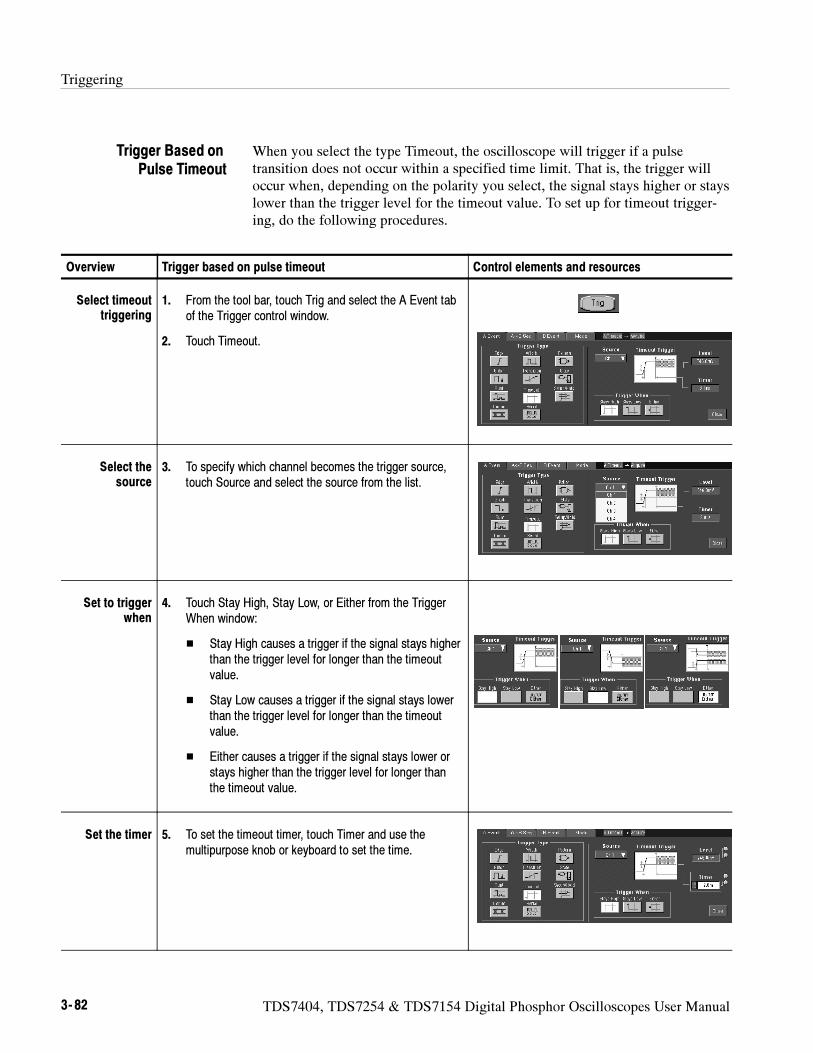
Triggering
3- 82 TDS7404, TDS7254 & TDS7154 Digital Phosphor Oscilloscopes User Manual
When you select the type Timeout, the oscilloscope will trigger if a pulsetransition does not occur within a specified time limit. That is, the trigger willoccur when, depending on the polarity you select, the signal stays higher or stayslower than the trigger level for the timeout value. To set up for timeout trigger-ing, do the following procedures.
Overview Trigger based on pulse timeout Control elements and resources
Select timeouttriggering
1. From the tool bar, touch Trig and select the A Event tabof the Trigger control window.
2. Touch Timeout.
Select thesource
3. To specify which channel becomes the trigger source,touch Source and select the source from the list.
Set to triggerwhen
4. Touch Stay High, Stay Low, or Either from the TriggerWhen window:
Stay High causes a trigger if the signal stays higherthan the trigger level for longer than the timeoutvalue.
Stay Low causes a trigger if the signal stays lowerthan the trigger level for longer than the timeoutvalue.
Either causes a trigger if the signal stays lower orstays higher than the trigger level for longer thanthe timeout value.
Set the timer 5. To set the timeout timer, touch Timer and use themultipurpose knob or keyboard to set the time.
Trigger Based onPulse Timeout
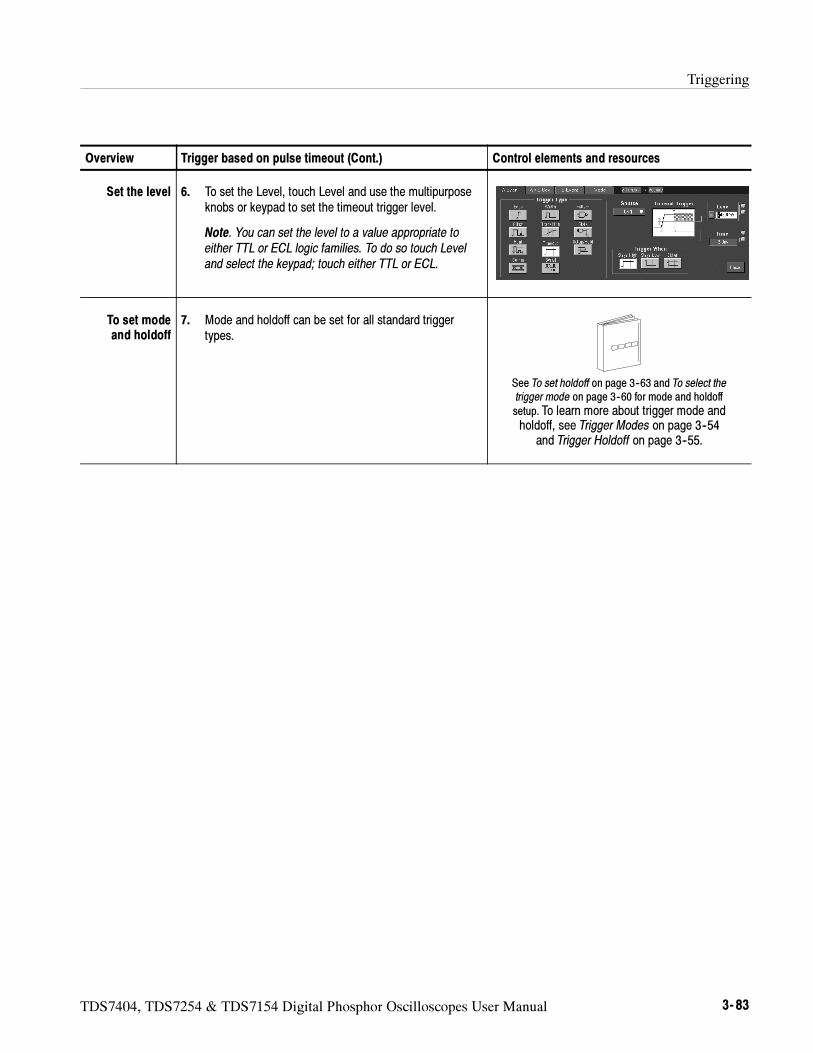
Triggering
TDS7404, TDS7254 & TDS7154 Digital Phosphor Oscilloscopes User Manual 3- 83
Overview Control elements and resourcesTrigger based on pulse timeout (Cont.)
Set the level 6. To set the Level, touch Level and use the multipurposeknobs or keypad to set the timeout trigger level.
Note. You can set the level to a value appropriate toeither TTL or ECL logic families. To do so touch Leveland select the keypad; touch either TTL or ECL.
To set modeand holdoff
7. Mode and holdoff can be set for all standard triggertypes.
See To set holdoff on page 3--63 and To select thetrigger mode on page 3--60 for mode and holdoff
setup. To learn more about trigger mode andholdoff, see Trigger Modes on page 3--54
and Trigger Holdoff on page 3--55.
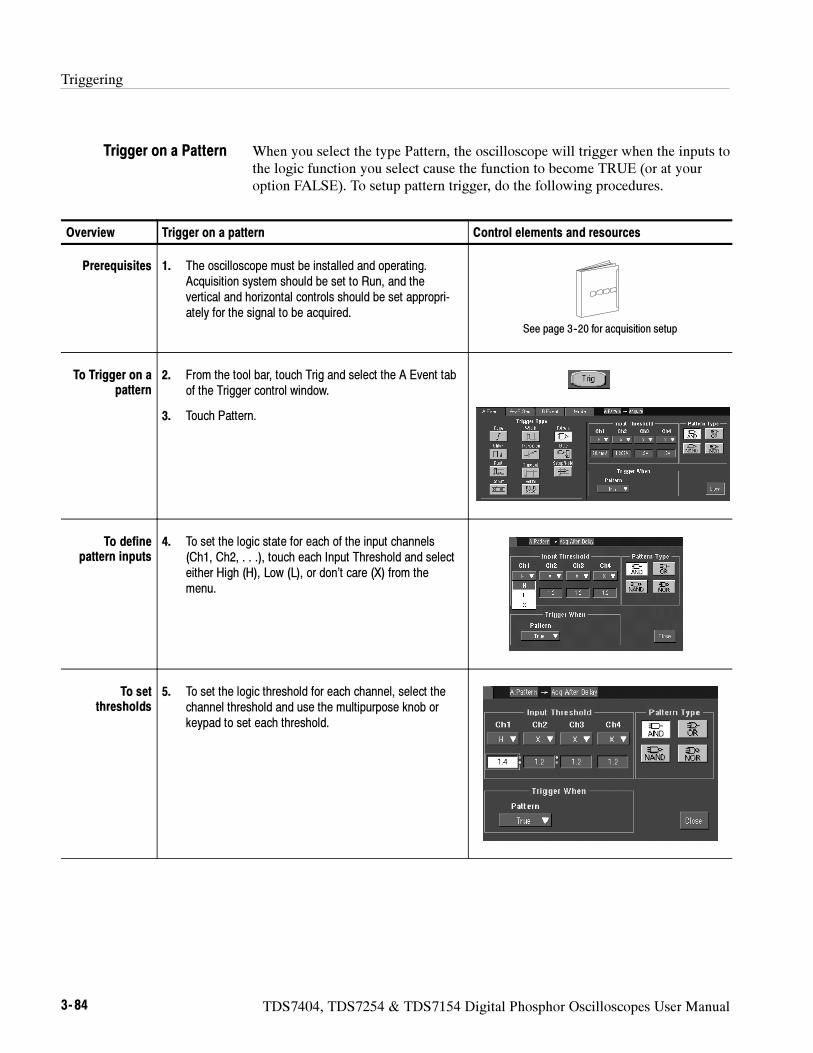
Triggering
3- 84 TDS7404, TDS7254 & TDS7154 Digital Phosphor Oscilloscopes User Manual
When you select the type Pattern, the oscilloscope will trigger when the inputs tothe logic function you select cause the function to become TRUE (or at youroption FALSE). To setup pattern trigger, do the following procedures.
Overview Trigger on a pattern Control elements and resources
Prerequisites 1. The oscilloscope must be installed and operating.Acquisition system should be set to Run, and thevertical and horizontal controls should be set appropri-ately for the signal to be acquired.
See page 3--20 for acquisition setup
To Trigger on apattern
2. From the tool bar, touch Trig and select the A Event tabof the Trigger control window.
3. Touch Pattern.
To definepattern inputs
4. To set the logic state for each of the input channels(Ch1, Ch2, . . .), touch each Input Threshold and selecteither High (H), Low (L), or don’t care (X) from themenu.
To setthresholds
5. To set the logic threshold for each channel, select thechannel threshold and use the multipurpose knob orkeypad to set each threshold.
Trigger on a Pattern
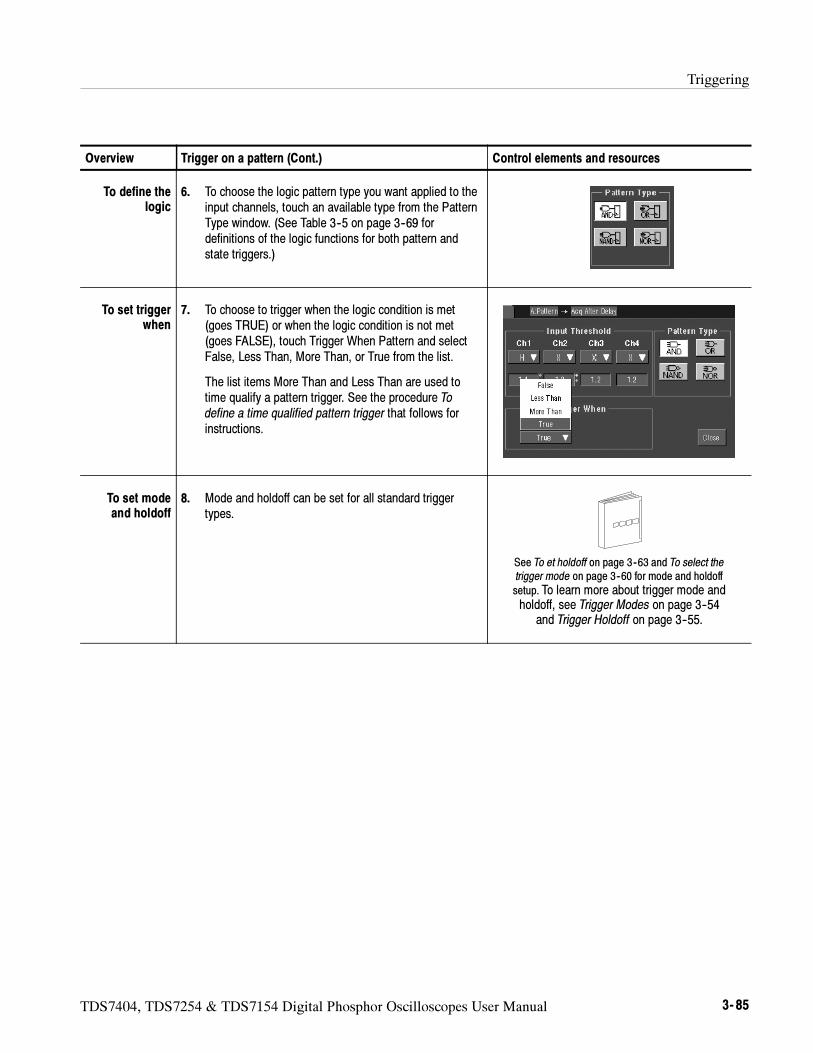
Triggering
TDS7404, TDS7254 & TDS7154 Digital Phosphor Oscilloscopes User Manual 3- 85
Overview Control elements and resourcesTrigger on a pattern (Cont.)
To define thelogic
6. To choose the logic pattern type you want applied to theinput channels, touch an available type from the PatternType window. (See Table 3--5 on page 3--69 fordefinitions of the logic functions for both pattern andstate triggers.)
To set triggerwhen
7. To choose to trigger when the logic condition is met(goes TRUE) or when the logic condition is not met(goes FALSE), touch Trigger When Pattern and selectFalse, Less Than, More Than, or True from the list.
The list items More Than and Less Than are used totime qualify a pattern trigger. See the procedure Todefine a time qualified pattern trigger that follows forinstructions.
To set modeand holdoff
8. Mode and holdoff can be set for all standard triggertypes.
See To et holdoff on page 3--63 and To select thetrigger mode on page 3--60 for mode and holdoff
setup. To learn more about trigger mode andholdoff, see Trigger Modes on page 3--54
and Trigger Holdoff on page 3--55.
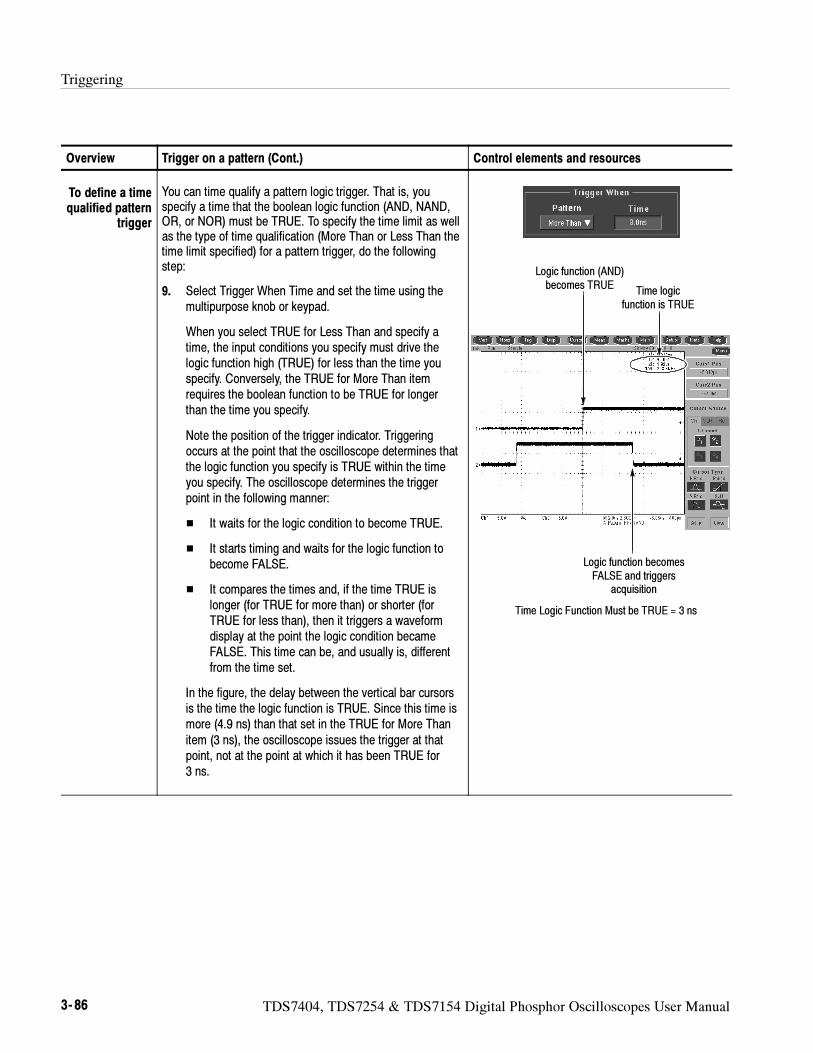
Triggering
3- 86 TDS7404, TDS7254 & TDS7154 Digital Phosphor Oscilloscopes User Manual
Overview Control elements and resourcesTrigger on a pattern (Cont.)
To define a timequalified pattern
trigger
You can time qualify a pattern logic trigger. That is, youspecify a time that the boolean logic function (AND, NAND,OR, or NOR) must be TRUE. To specify the time limit as wellas the type of time qualification (More Than or Less Than thetime limit specified) for a pattern trigger, do the followingstep:
9. Select Trigger When Time and set the time using themultipurpose knob or keypad.
When you select TRUE for Less Than and specify atime, the input conditions you specify must drive thelogic function high (TRUE) for less than the time youspecify. Conversely, the TRUE for More Than itemrequires the boolean function to be TRUE for longerthan the time you specify.
Note the position of the trigger indicator. Triggeringoccurs at the point that the oscilloscope determines thatthe logic function you specify is TRUE within the timeyou specify. The oscilloscope determines the triggerpoint in the following manner:
It waits for the logic condition to become TRUE.
It starts timing and waits for the logic function tobecome FALSE.
It compares the times and, if the time TRUE islonger (for TRUE for more than) or shorter (forTRUE for less than), then it triggers a waveformdisplay at the point the logic condition becameFALSE. This time can be, and usually is, differentfrom the time set.
In the figure, the delay between the vertical bar cursorsis the time the logic function is TRUE. Since this time ismore (4.9 ns) than that set in the TRUE for More Thanitem (3 ns), the oscilloscope issues the trigger at thatpoint, not at the point at which it has been TRUE for3 ns.
Logic function (AND)becomes TRUE
Logic function becomesFALSE and triggers
acquisition
Time logicfunction is TRUE
Time Logic Function Must be TRUE = 3 ns
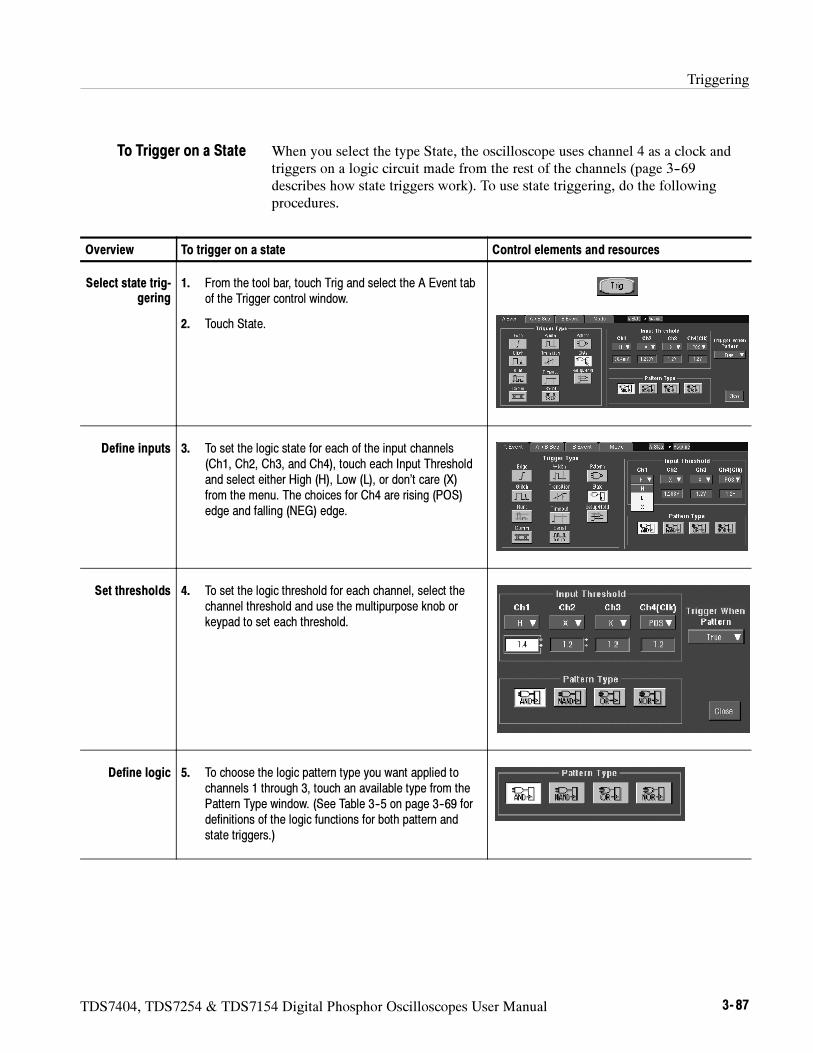
Triggering
TDS7404, TDS7254 & TDS7154 Digital Phosphor Oscilloscopes User Manual 3- 87
When you select the type State, the oscilloscope uses channel 4 as a clock andtriggers on a logic circuit made from the rest of the channels (page 3--69describes how state triggers work). To use state triggering, do the followingprocedures.
Overview To trigger on a state Control elements and resources
Select state trig-gering
1. From the tool bar, touch Trig and select the A Event tabof the Trigger control window.
2. Touch State.
Define inputs 3. To set the logic state for each of the input channels(Ch1, Ch2, Ch3, and Ch4), touch each Input Thresholdand select either High (H), Low (L), or don’t care (X)from the menu. The choices for Ch4 are rising (POS)edge and falling (NEG) edge.
Set thresholds 4. To set the logic threshold for each channel, select thechannel threshold and use the multipurpose knob orkeypad to set each threshold.
Define logic 5. To choose the logic pattern type you want applied tochannels 1 through 3, touch an available type from thePattern Type window. (See Table 3--5 on page 3--69 fordefinitions of the logic functions for both pattern andstate triggers.)
To Trigger on a State
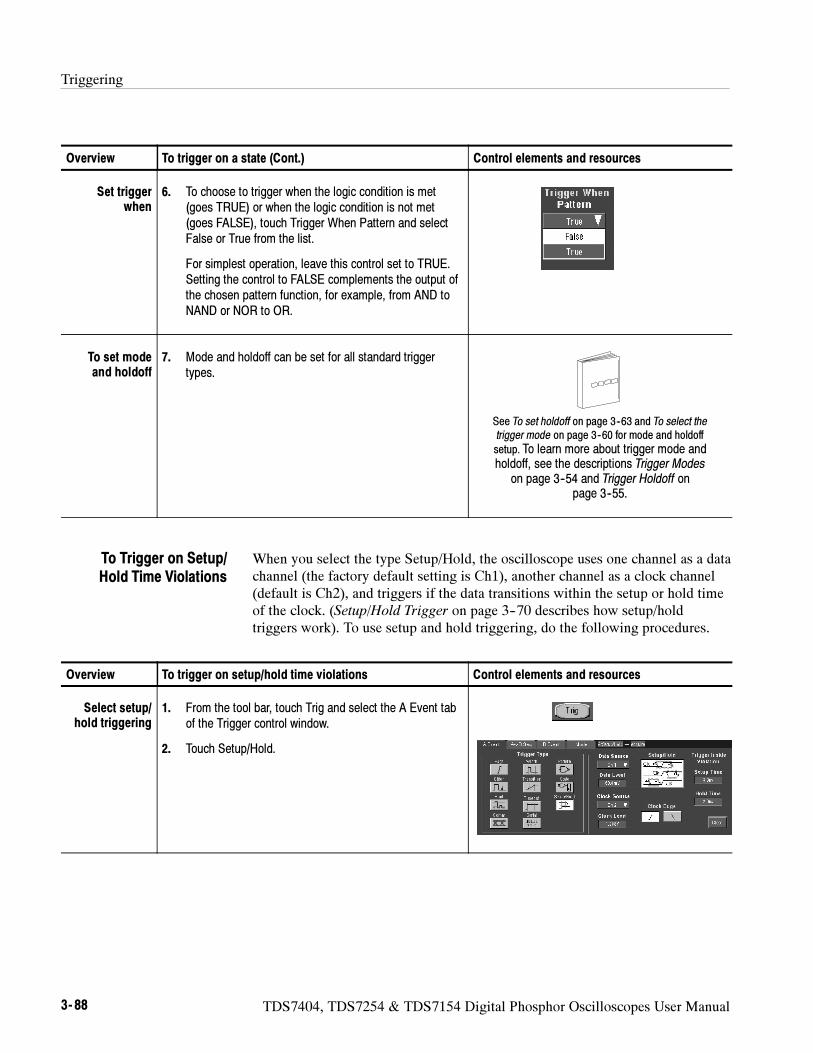
Triggering
3- 88 TDS7404, TDS7254 & TDS7154 Digital Phosphor Oscilloscopes User Manual
Overview Control elements and resourcesTo trigger on a state (Cont.)
Set triggerwhen
6. To choose to trigger when the logic condition is met(goes TRUE) or when the logic condition is not met(goes FALSE), touch Trigger When Pattern and selectFalse or True from the list.
For simplest operation, leave this control set to TRUE.Setting the control to FALSE complements the output ofthe chosen pattern function, for example, from AND toNAND or NOR to OR.
To set modeand holdoff
7. Mode and holdoff can be set for all standard triggertypes.
See To set holdoff on page 3--63 and To select thetrigger mode on page 3--60 for mode and holdoff
setup. To learn more about trigger mode andholdoff, see the descriptions Trigger Modes
on page 3--54 and Trigger Holdoff onpage 3--55.
When you select the type Setup/Hold, the oscilloscope uses one channel as a datachannel (the factory default setting is Ch1), another channel as a clock channel(default is Ch2), and triggers if the data transitions within the setup or hold timeof the clock. (Setup/Hold Trigger on page 3--70 describes how setup/holdtriggers work). To use setup and hold triggering, do the following procedures.
Overview To trigger on setup/hold time violations Control elements and resources
Select setup/hold triggering
1. From the tool bar, touch Trig and select the A Event tabof the Trigger control window.
2. Touch Setup/Hold.
To Trigger on Setup/Hold Time Violations
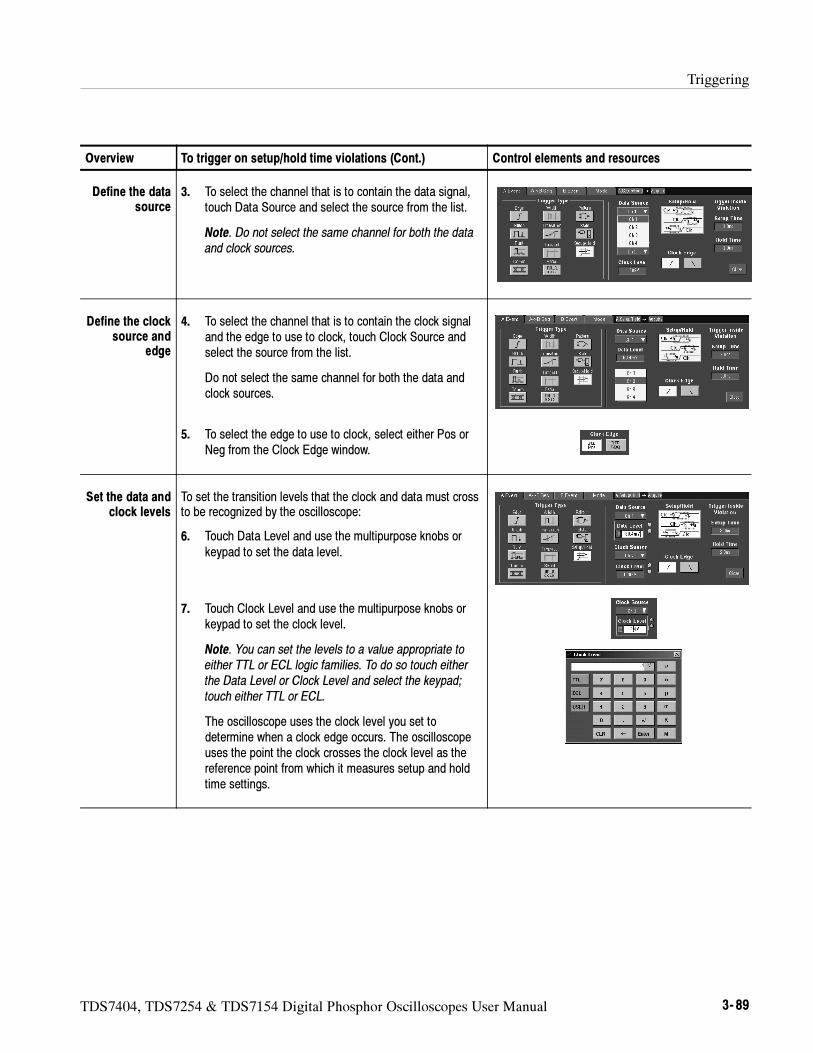
Triggering
TDS7404, TDS7254 & TDS7154 Digital Phosphor Oscilloscopes User Manual 3- 89
Overview Control elements and resourcesTo trigger on setup/hold time violations (Cont.)
Define the datasource
3. To select the channel that is to contain the data signal,touch Data Source and select the source from the list.
Note. Do not select the same channel for both the dataand clock sources.
Define the clocksource and
edge
4. To select the channel that is to contain the clock signaland the edge to use to clock, touch Clock Source andselect the source from the list.
Do not select the same channel for both the data andclock sources.
5. To select the edge to use to clock, select either Pos orNeg from the Clock Edge window.
Set the data andclock levels
To set the transition levels that the clock and data must crossto be recognized by the oscilloscope:
6. Touch Data Level and use the multipurpose knobs orkeypad to set the data level.
7. Touch Clock Level and use the multipurpose knobs orkeypad to set the clock level.
Note. You can set the levels to a value appropriate toeither TTL or ECL logic families. To do so touch eitherthe Data Level or Clock Level and select the keypad;touch either TTL or ECL.
The oscilloscope uses the clock level you set todetermine when a clock edge occurs. The oscilloscopeuses the point the clock crosses the clock level as thereference point from which it measures setup and holdtime settings.
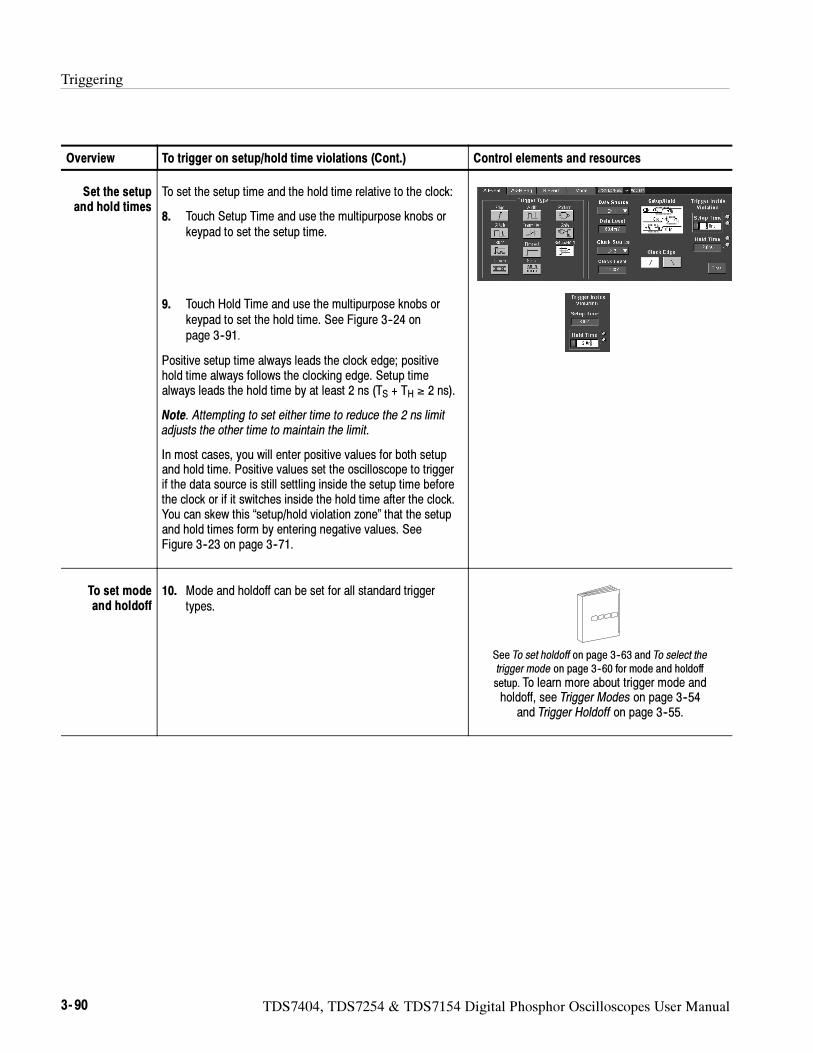
Triggering
3- 90 TDS7404, TDS7254 & TDS7154 Digital Phosphor Oscilloscopes User Manual
Overview Control elements and resourcesTo trigger on setup/hold time violations (Cont.)
Set the setupand hold times
To set the setup time and the hold time relative to the clock:
8. Touch Setup Time and use the multipurpose knobs orkeypad to set the setup time.
9. Touch Hold Time and use the multipurpose knobs orkeypad to set the hold time. See Figure 3--24 onpage 3--91.
Positive setup time always leads the clock edge; positivehold time always follows the clocking edge. Setup timealways leads the hold time by at least 2 ns (TS + TH ≥ 2 ns).
Note. Attempting to set either time to reduce the 2 ns limitadjusts the other time to maintain the limit.
In most cases, you will enter positive values for both setupand hold time. Positive values set the oscilloscope to triggerif the data source is still settling inside the setup time beforethe clock or if it switches inside the hold time after the clock.You can skew this “setup/hold violation zone” that the setupand hold times form by entering negative values. SeeFigure 3--23 on page 3--71.
To set modeand holdoff
10. Mode and holdoff can be set for all standard triggertypes.
See To set holdoff on page 3--63 and To select thetrigger mode on page 3--60 for mode and holdoff
setup. To learn more about trigger mode andholdoff, see Trigger Modes on page 3--54
and Trigger Holdoff on page 3--55.
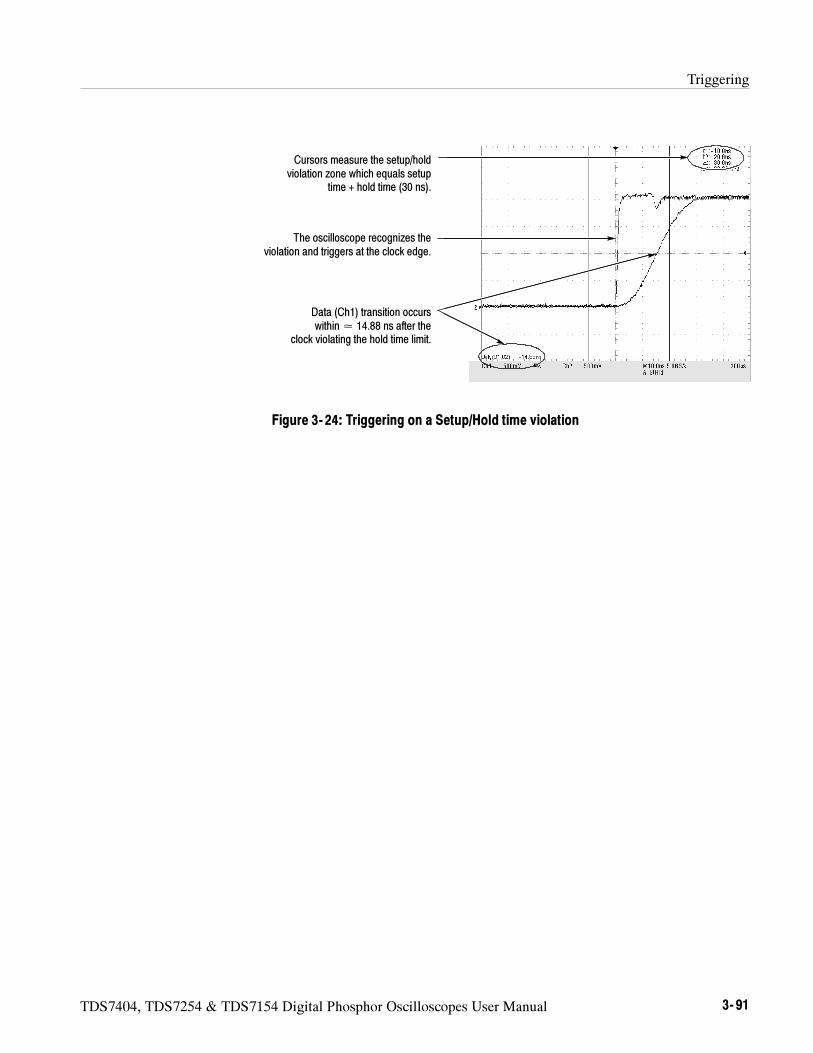
Triggering
TDS7404, TDS7254 & TDS7154 Digital Phosphor Oscilloscopes User Manual 3- 91
Data (Ch1) transition occurswithin 14.88 ns after the
clock violating the hold time limit.
The oscilloscope recognizes theviolation and triggers at the clock edge.
Cursors measure the setup/holdviolation zone which equals setup
time + hold time (30 ns).
Figure 3- 24: Triggering on a Setup/Hold time violation
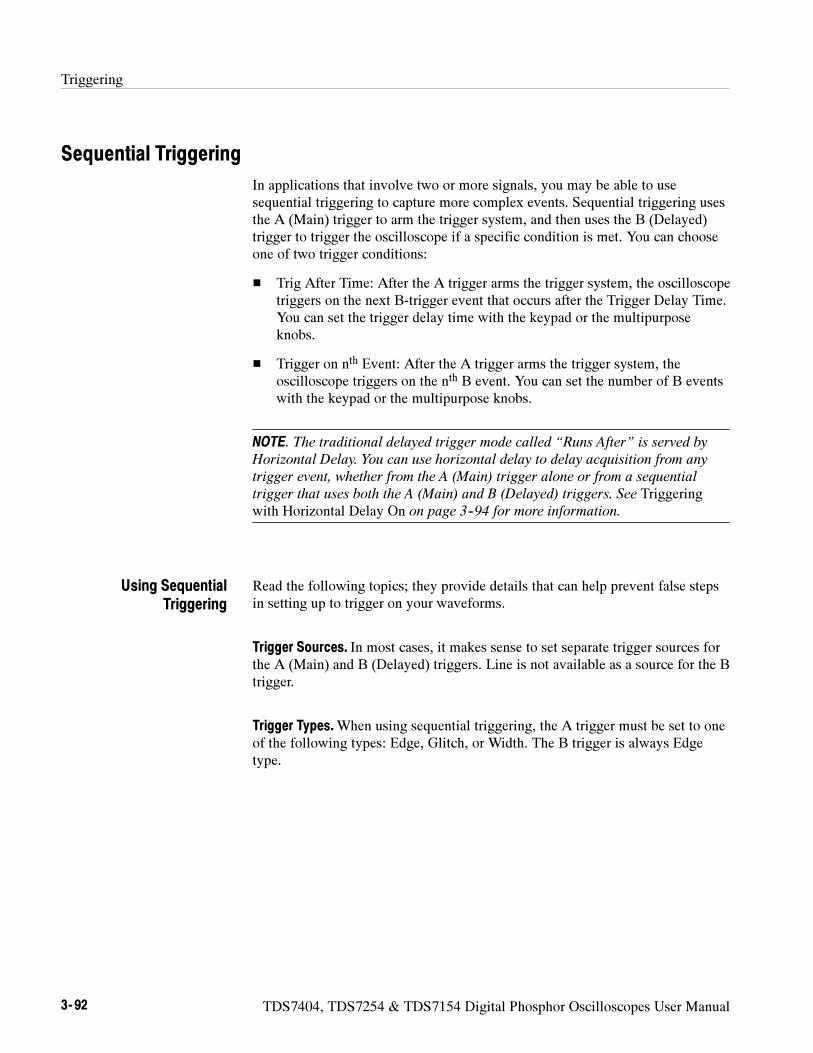
Triggering
3- 92 TDS7404, TDS7254 & TDS7154 Digital Phosphor Oscilloscopes User Manual
Sequential Triggering
In applications that involve two or more signals, you may be able to usesequential triggering to capture more complex events. Sequential triggering usesthe A (Main) trigger to arm the trigger system, and then uses the B (Delayed)trigger to trigger the oscilloscope if a specific condition is met. You can chooseone of two trigger conditions:
Trig After Time: After the A trigger arms the trigger system, the oscilloscopetriggers on the next B-trigger event that occurs after the Trigger Delay Time.You can set the trigger delay time with the keypad or the multipurposeknobs.
Trigger on nth Event: After the A trigger arms the trigger system, theoscilloscope triggers on the nth B event. You can set the number of B eventswith the keypad or the multipurpose knobs.
NOTE. The traditional delayed trigger mode called “Runs After” is served by
Horizontal Delay. You can use horizontal delay to delay acquisition from any
trigger event, whether from the A (Main) trigger alone or from a sequential
trigger that uses both the A (Main) and B (Delayed) triggers. See Triggeringwith Horizontal Delay On on page 3--94 for more information.
Read the following topics; they provide details that can help prevent false stepsin setting up to trigger on your waveforms.
Trigger Sources. In most cases, it makes sense to set separate trigger sources forthe A (Main) and B (Delayed) triggers. Line is not available as a source for the Btrigger.
Trigger Types.When using sequential triggering, the A trigger must be set to oneof the following types: Edge, Glitch, or Width. The B trigger is always Edgetype.
Using SequentialTriggering
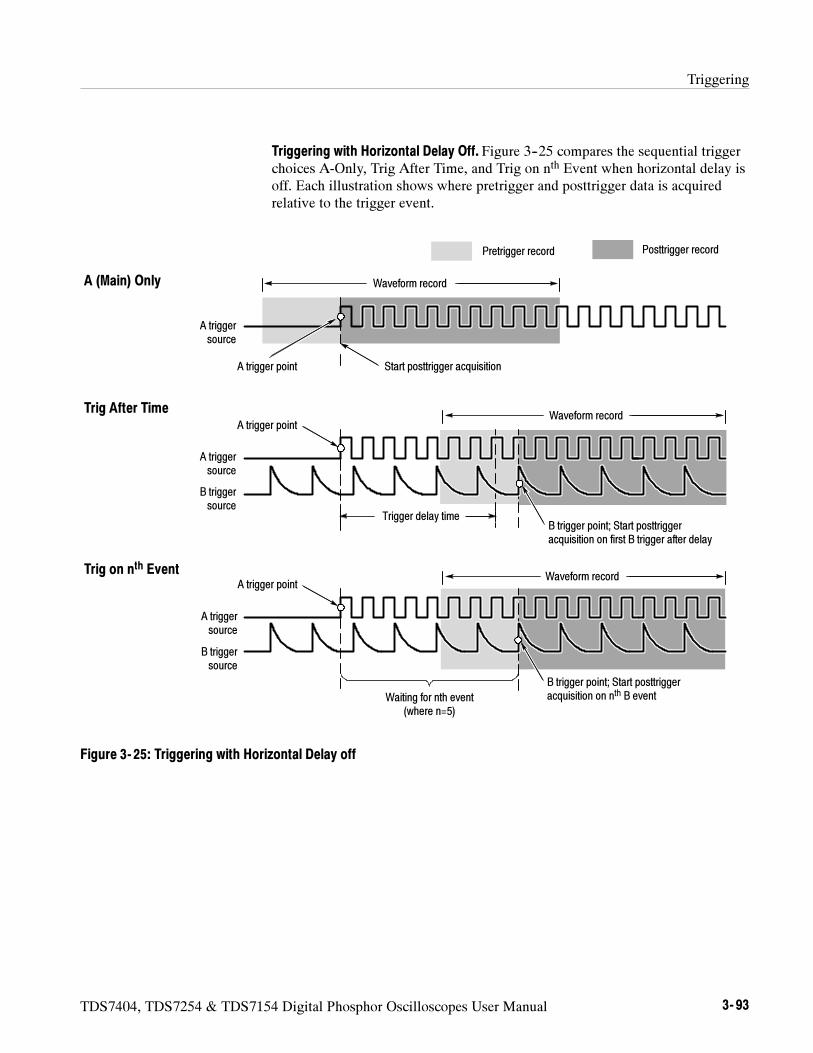
Triggering
TDS7404, TDS7254 & TDS7154 Digital Phosphor Oscilloscopes User Manual 3- 93
Triggering with Horizontal Delay Off. Figure 3--25 compares the sequential triggerchoices A-Only, Trig After Time, and Trig on nth Event when horizontal delay isoff. Each illustration shows where pretrigger and posttrigger data is acquiredrelative to the trigger event.
Trigger delay time
Waiting for nth event(where n=5)
A trigger point Start posttrigger acquisition
A triggersource
Trig on nth Event
A triggersource
B triggersource
B trigger point; Start posttriggeracquisition on first B trigger after delay
Waveform record
A triggersource
B triggersource
Trig After Time
A (Main) Only
Pretrigger record Posttrigger record
Waveform record
Waveform record
A trigger point
A trigger point
B trigger point; Start posttriggeracquisition on nth B event
Figure 3- 25: Triggering with Horizontal Delay off
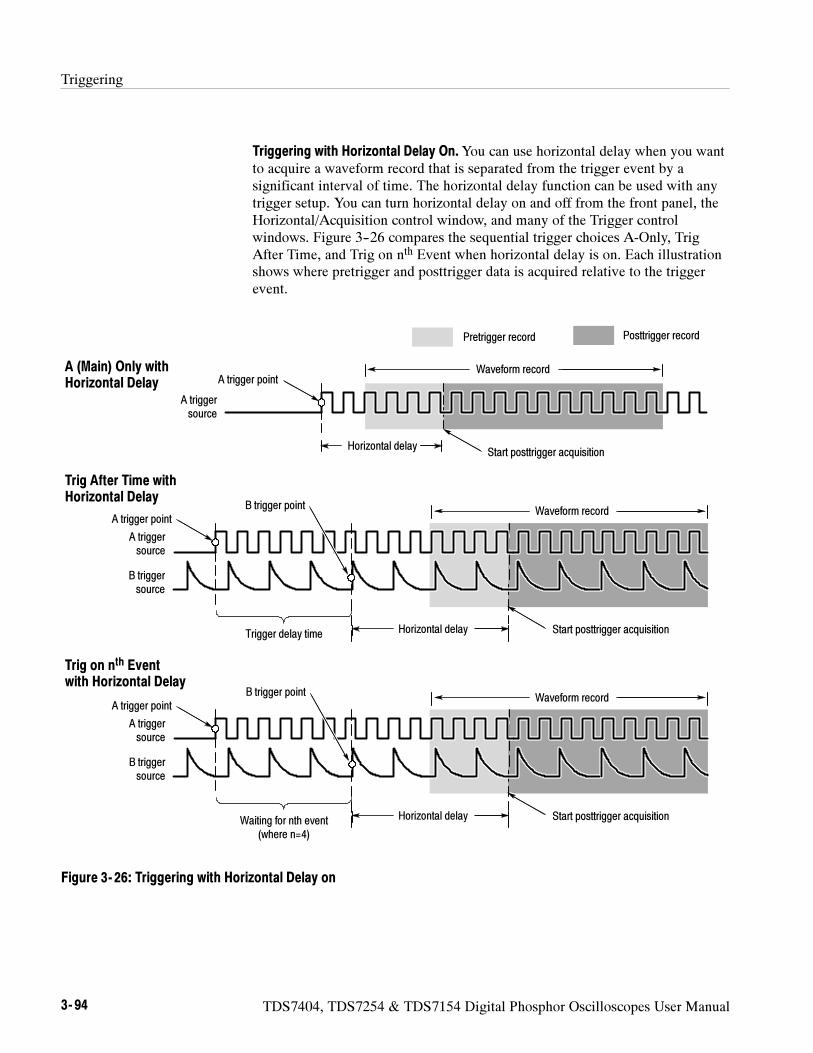
Triggering
3- 94 TDS7404, TDS7254 & TDS7154 Digital Phosphor Oscilloscopes User Manual
Triggering with Horizontal Delay On.You can use horizontal delay when you wantto acquire a waveform record that is separated from the trigger event by asignificant interval of time. The horizontal delay function can be used with anytrigger setup. You can turn horizontal delay on and off from the front panel, theHorizontal/Acquisition control window, and many of the Trigger controlwindows. Figure 3--26 compares the sequential trigger choices A-Only, TrigAfter Time, and Trig on nth Event when horizontal delay is on. Each illustrationshows where pretrigger and posttrigger data is acquired relative to the triggerevent.
Horizontal delay
Horizontal delay
A trigger point
Start posttrigger acquisition
A triggersource
Waveform recordA (Main) Only withHorizontal Delay
Pretrigger record Posttrigger record
Waiting for nth event(where n=4)
Trig on nth Eventwith Horizontal Delay
A triggersource
B triggersource
Waveform recordA trigger point
Start posttrigger acquisition
Horizontal delayTrigger delay time
Trig After Time withHorizontal Delay
A triggersource
B triggersource
Waveform recordA trigger point
Start posttrigger acquisition
B trigger point
B trigger point
Figure 3- 26: Triggering with Horizontal Delay on
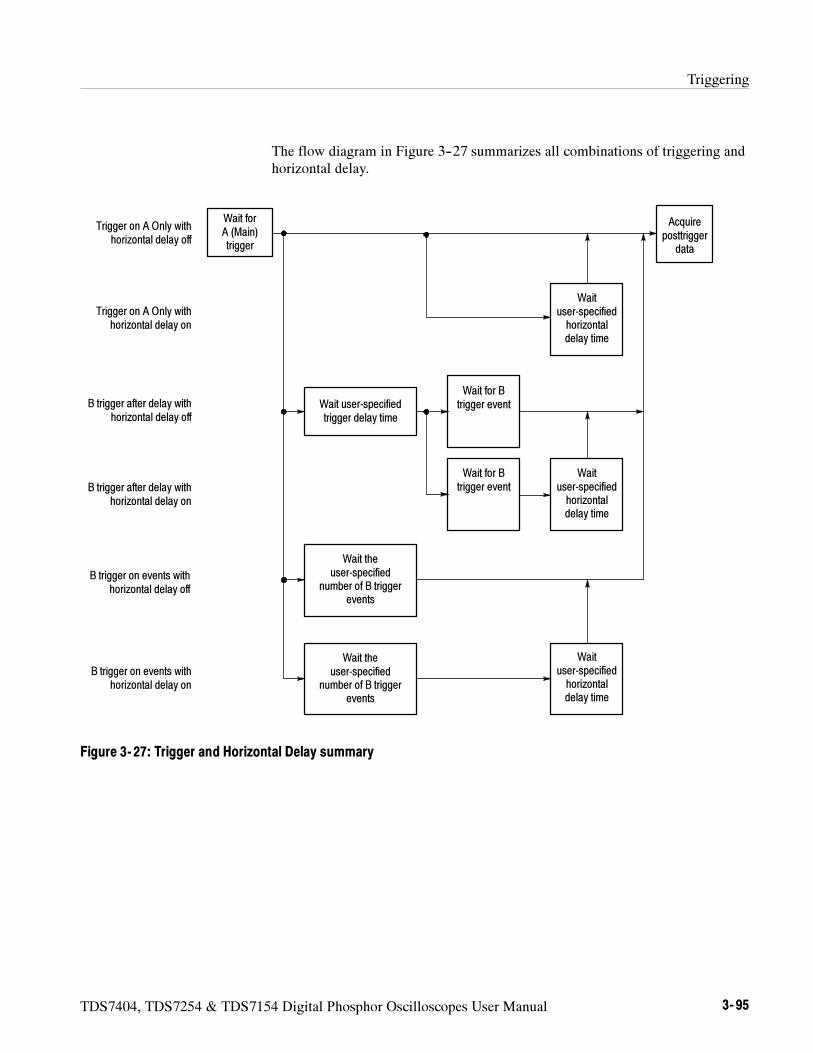
Triggering
TDS7404, TDS7254 & TDS7154 Digital Phosphor Oscilloscopes User Manual 3- 95
The flow diagram in Figure 3--27 summarizes all combinations of triggering andhorizontal delay.
Wait forA (Main)trigger
B trigger after delay withhorizontal delay off
Wait for Btrigger event
Acquireposttrigger
data
Wait theuser-specified
number of B triggerevents
Wait user-specifiedtrigger delay time
Waituser-specifiedhorizontaldelay time
Wait theuser-specified
number of B triggerevents
B trigger on events withhorizontal delay off
B trigger on events withhorizontal delay on
Waituser-specifiedhorizontaldelay time
B trigger after delay withhorizontal delay on
Wait for Btrigger event
Waituser-specifiedhorizontaldelay time
Trigger on A Only withhorizontal delay on
Trigger on A Only withhorizontal delay off
Figure 3- 27: Trigger and Horizontal Delay summary
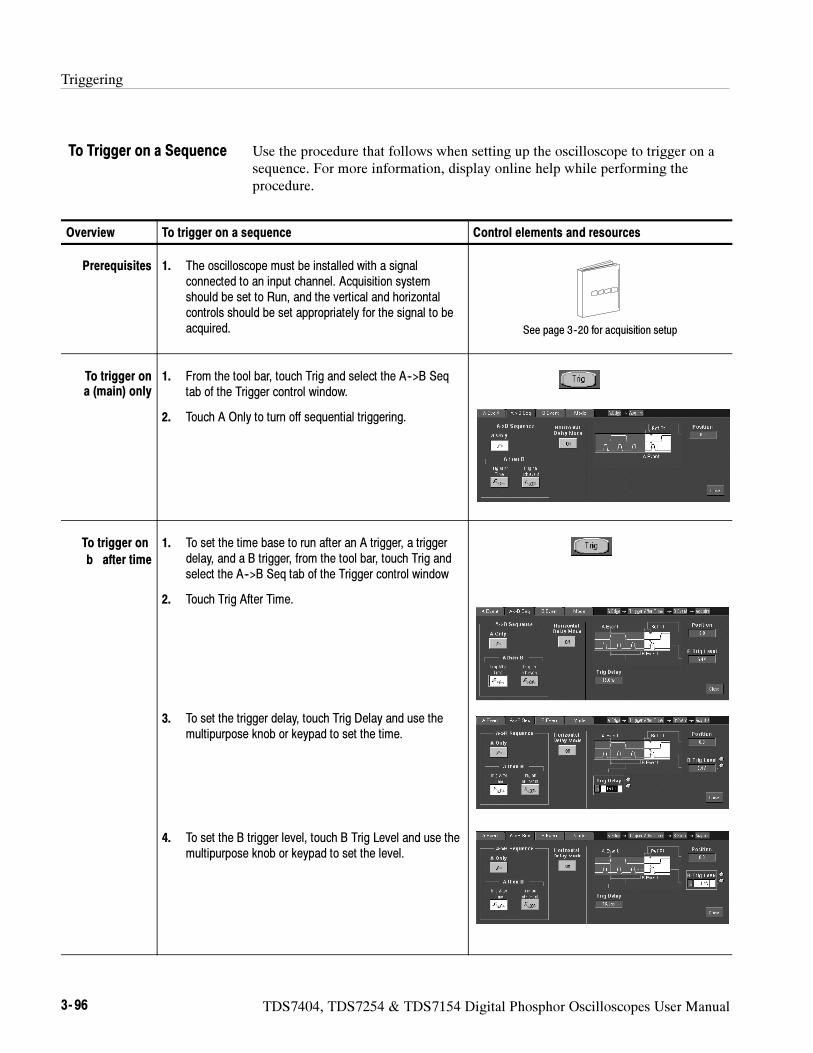
Triggering
3- 96 TDS7404, TDS7254 & TDS7154 Digital Phosphor Oscilloscopes User Manual
Use the procedure that follows when setting up the oscilloscope to trigger on asequence. For more information, display online help while performing theprocedure.
Overview To trigger on a sequence Control elements and resources
Prerequisites 1. The oscilloscope must be installed with a signalconnected to an input channel. Acquisition systemshould be set to Run, and the vertical and horizontalcontrols should be set appropriately for the signal to beacquired. See page 3--20 for acquisition setup
To trigger ona (main) only
1. From the tool bar, touch Trig and select the A-->B Seqtab of the Trigger control window.
2. Touch A Only to turn off sequential triggering.
To trigger on
b after time
1. To set the time base to run after an A trigger, a triggerdelay, and a B trigger, from the tool bar, touch Trig andselect the A-->B Seq tab of the Trigger control window
2. Touch Trig After Time.
3. To set the trigger delay, touch Trig Delay and use themultipurpose knob or keypad to set the time.
4. To set the B trigger level, touch B Trig Level and use themultipurpose knob or keypad to set the level.
To Trigger on a Sequence
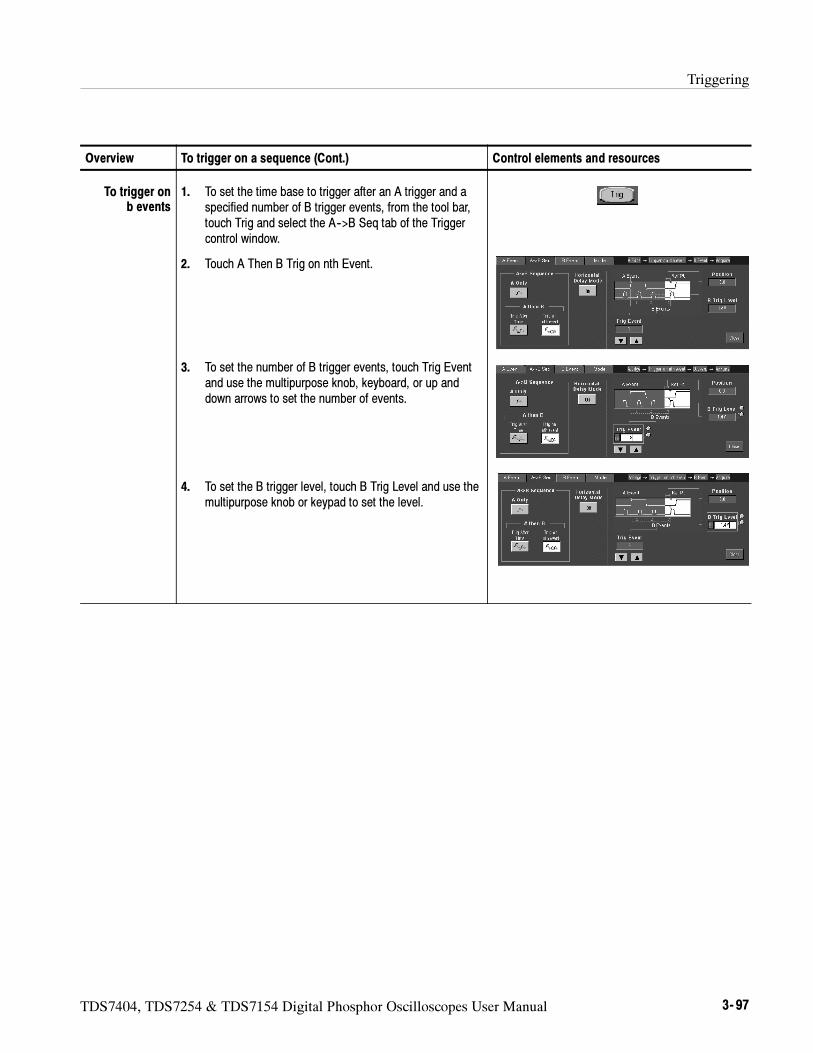
Triggering
TDS7404, TDS7254 & TDS7154 Digital Phosphor Oscilloscopes User Manual 3- 97
Overview Control elements and resourcesTo trigger on a sequence (Cont.)
To trigger onb events
1. To set the time base to trigger after an A trigger and aspecified number of B trigger events, from the tool bar,touch Trig and select the A-->B Seq tab of the Triggercontrol window.
2. Touch A Then B Trig on nth Event.
3. To set the number of B trigger events, touch Trig Eventand use the multipurpose knob, keyboard, or up anddown arrows to set the number of events.
4. To set the B trigger level, touch B Trig Level and use themultipurpose knob or keypad to set the level.
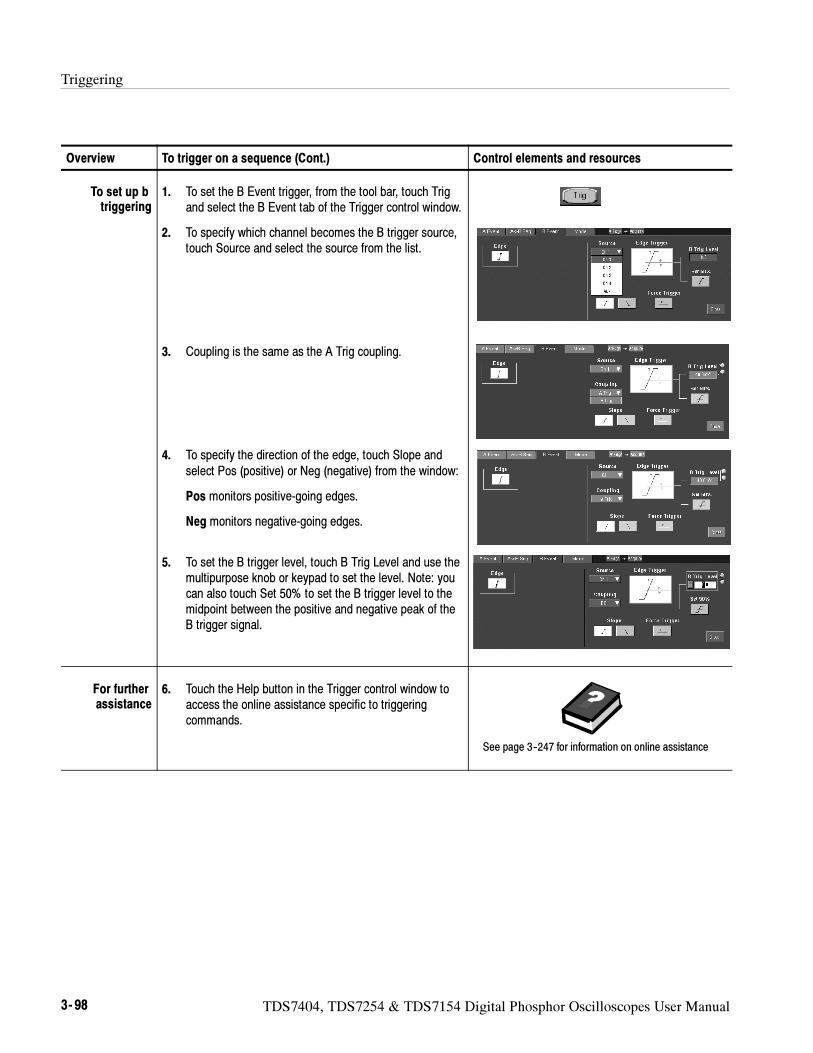
Triggering
3- 98 TDS7404, TDS7254 & TDS7154 Digital Phosphor Oscilloscopes User Manual
Overview Control elements and resourcesTo trigger on a sequence (Cont.)
To set up btriggering
1. To set the B Event trigger, from the tool bar, touch Trigand select the B Event tab of the Trigger control window.
2. To specify which channel becomes the B trigger source,touch Source and select the source from the list.
3. Coupling is the same as the A Trig coupling.
4. To specify the direction of the edge, touch Slope andselect Pos (positive) or Neg (negative) from the window:
Pos monitors positive-going edges.
Neg monitors negative-going edges.
5. To set the B trigger level, touch B Trig Level and use themultipurpose knob or keypad to set the level. Note: youcan also touch Set 50% to set the B trigger level to themidpoint between the positive and negative peak of theB trigger signal.
For furtherassistance
6. Touch the Help button in the Trigger control window toaccess the online assistance specific to triggeringcommands.
See page 3--247 for information on online assistance
Triggering
TDS7404, TDS7254 & TDS7154 Digital Phosphor Oscilloscopes User Manual 3- 99
Comm Triggering (Option SM Only)
The oscilloscope can trigger on communication signals. For detailed informationon using comm triggering to trigger on your communications signals see theCSA7000, TDS7000 & TDS6000 Series Options SM Serial Mask Testing and
Option ST Serial Triggering User Manual.
NOTE. The instrument will attempt to acquire lock once. If the input data is
disrupted, removed, or heavily distorted, the instrument may not acquire lock or
may lose lock. If the recovered clock is not locked to the incoming data, the
waveform display will not be stable. Once the input data is available, press the
PUSH TO SET 50% knob to force the instrument to reacquire lock.
Serial Pattern Triggering (Option ST Only)
In applications that involve signals with serial data patterns, you may be able touse serial pattern triggering to capture more complex events. Serial triggerprovides a direct means to analyze pattern dependent issues, even on a single-shot basis. Acquisition of low power signals can be enhanced by combiningserial trigger and signal averaging to reduce random noise. You can specifypatterns with up to 32 bits, including don’t-care bits. The serial trigger systemcan be clocked from an external source or from internal clock recovery. Serialpattern trigger operates on NRZ-encoded signals at data rates up to 1.25 Gb/s.
For detailed information on using serial pattern triggering to trigger on yourserial pattern data signals see the CSA7000, TDS7000 & TDS6000 Series
Options SM Serial Mask Testing and Option ST Serial Triggering User Manual.
NOTE. The instrument will attempt to acquire lock once. If the input data is
disrupted, removed, or heavily distorted, the instrument may not acquire lock or
may lose lock. If the recovered clock is not locked to the incoming data, the
waveform display will not be stable. Once the input data is available, press the
PUSH SET TO 50% knob to force the instrument to reacquire lock.

Triggering
3- 100 TDS7404, TDS7254 & TDS7154 Digital Phosphor Oscilloscopes User Manual
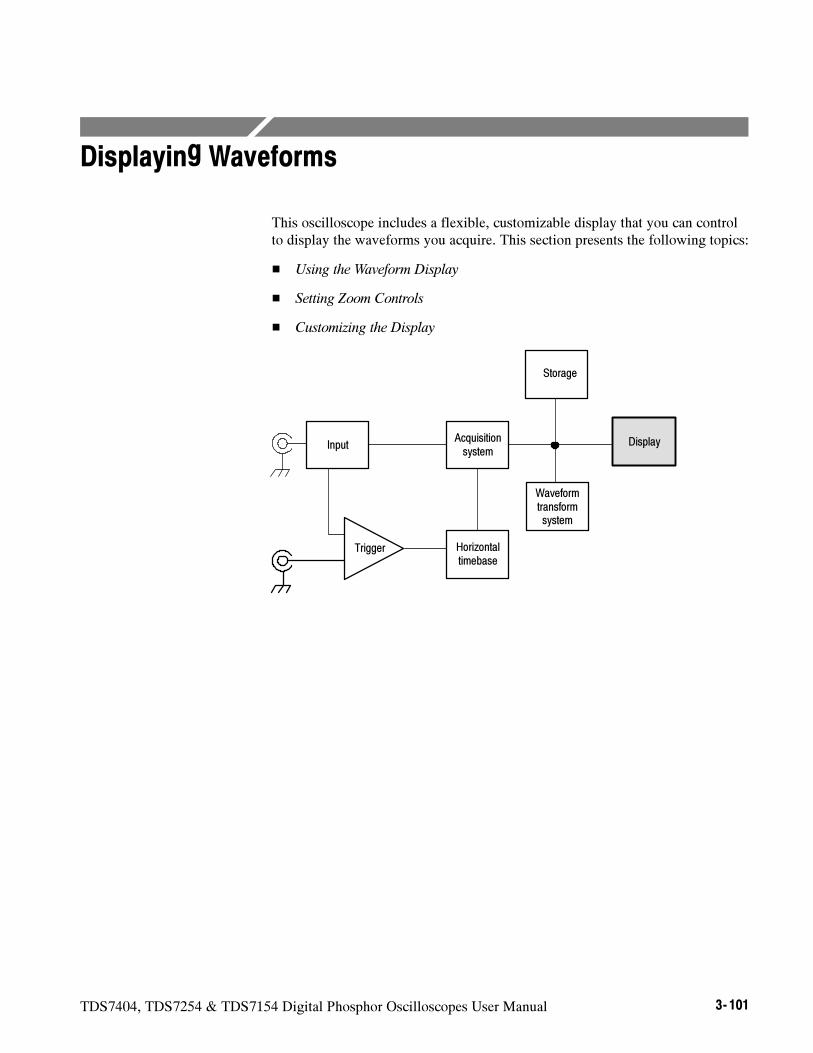
TDS7404, TDS7254 & TDS7154 Digital Phosphor Oscilloscopes User Manual 3- 101
Displaying Waveforms
This oscilloscope includes a flexible, customizable display that you can controlto display the waveforms you acquire. This section presents the following topics:
Using the Waveform Display
Setting Zoom Controls
Customizing the Display
Acquisitionsystem
Input Display
Storage
Waveformtransformsystem
Horizontaltimebase
Trigger
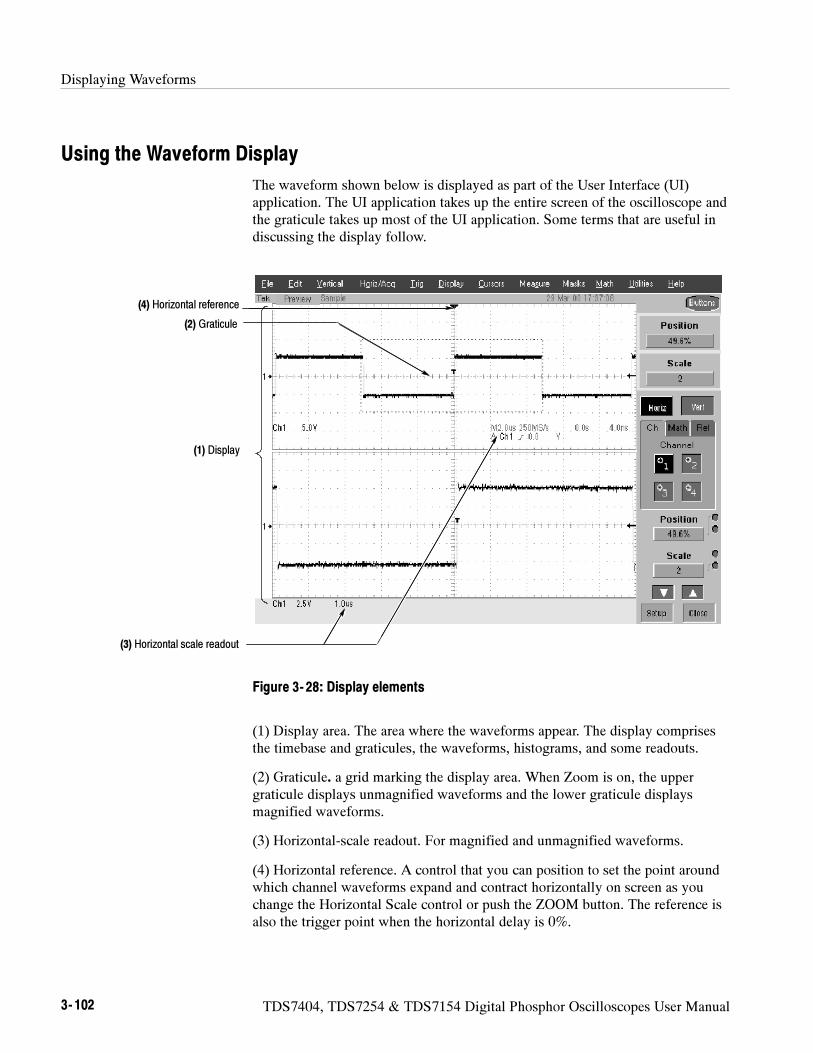
Displaying Waveforms
3- 102 TDS7404, TDS7254 & TDS7154 Digital Phosphor Oscilloscopes User Manual
Using the Waveform Display
The waveform shown below is displayed as part of the User Interface (UI)application. The UI application takes up the entire screen of the oscilloscope andthe graticule takes up most of the UI application. Some terms that are useful indiscussing the display follow.
(4) Horizontal reference
(1) Display
(3) Horizontal scale readout
(2) Graticule
Figure 3- 28: Display elements
(1) Display area. The area where the waveforms appear. The display comprisesthe timebase and graticules, the waveforms, histograms, and some readouts.
(2) Graticule. a grid marking the display area. When Zoom is on, the uppergraticule displays unmagnified waveforms and the lower graticule displaysmagnified waveforms.
(3) Horizontal-scale readout. For magnified and unmagnified waveforms.
(4) Horizontal reference. A control that you can position to set the point aroundwhich channel waveforms expand and contract horizontally on screen as youchange the Horizontal Scale control or push the ZOOM button. The reference isalso the trigger point when the horizontal delay is 0%.
Displaying Waveforms
TDS7404, TDS7254 & TDS7154 Digital Phosphor Oscilloscopes User Manual 3- 103
Touch Screen (not shown). A feature that lets you touch on-screen controls ortouch and drag screen objects to operate the oscilloscope.
Some features of the display follow.
Flexible Display Control. Front-panel knobs and buttons support quick access tothe most often used adjustments — those that display, position, and scalewaveforms. Mouse, keyboard, and touchscreen interfaces support complete setupof all the display parameters. Anything you can do with the mouse, you can dowith the touch screen.
Fast Access to Zoom.Waveform inspection has never been easier. Just touch anddrag a box around the feature of interest and select zoom from the choicesoffered, and the feature of interest displays zoomed in the magnified graticule.
Acquisition Preview. When the next acquisition is delayed due to slow triggersor long acquisition duration, acquisition preview attempts to show what the nextacquisition will look like. Acquisition preview does not re-calculate mathwaveforms or represent changes in trigger levels, trigger modes, or differentacquisition modes. Acquisition preview waveforms can’t be saved as data.
Read the following topics; they provide the details that can help you set up theoscilloscope display so that it best supports your data-analysis tasks.
Waveform Display. In general, the method of displaying a waveform is to definethe waveform, if necessary (math and reference waveforms), and then turn it on.Table 3--6 summarizes this process as it applies to the different waveforms.
Using the Display
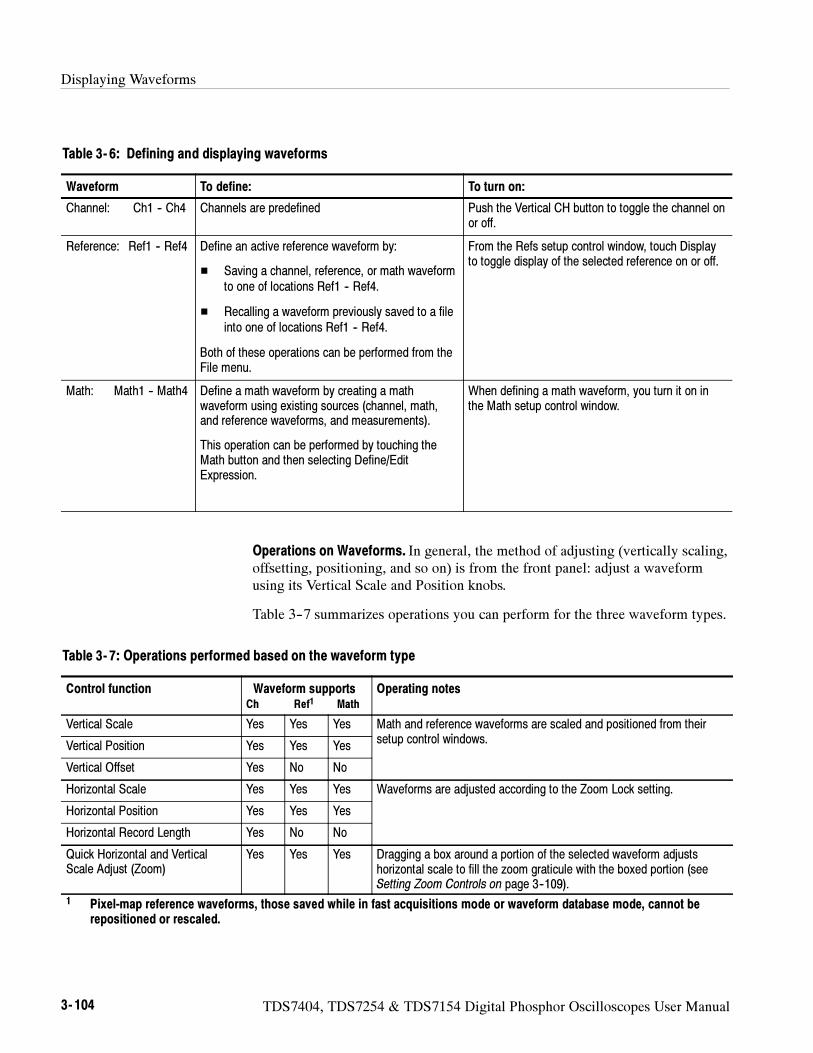
Displaying Waveforms
3- 104 TDS7404, TDS7254 & TDS7154 Digital Phosphor Oscilloscopes User Manual
Table 3- 6: Defining and displaying waveforms
Waveform To define: To turn on:
Channel: Ch1 -- Ch4 Channels are predefined Push the Vertical CH button to toggle the channel onor off.
Reference: Ref1 -- Ref4 Define an active reference waveform by:
Saving a channel, reference, or math waveformto one of locations Ref1 -- Ref4.
Recalling a waveform previously saved to a fileinto one of locations Ref1 -- Ref4.
Both of these operations can be performed from theFile menu.
From the Refs setup control window, touch Displayto toggle display of the selected reference on or off.
Math: Math1 -- Math4 Define a math waveform by creating a mathwaveform using existing sources (channel, math,and reference waveforms, and measurements).
This operation can be performed by touching theMath button and then selecting Define/EditExpression.
When defining a math waveform, you turn it on inthe Math setup control window.
Operations on Waveforms. In general, the method of adjusting (vertically scaling,offsetting, positioning, and so on) is from the front panel: adjust a waveformusing its Vertical Scale and Position knobs.
Table 3--7 summarizes operations you can perform for the three waveform types.
Table 3- 7: Operations performed based on the waveform type
Control function Waveform supportsCh Ref1 Math
Operating notes
Vertical Scale Yes Yes Yes Math and reference waveforms are scaled and positioned from theirt t l i dVertical Position Yes Yes Yes setup control windows.
Vertical Offset Yes No No
Horizontal Scale Yes Yes Yes Waveforms are adjusted according to the Zoom Lock setting.
Horizontal Position Yes Yes Yes
Horizontal Record Length Yes No No
Quick Horizontal and VerticalScale Adjust (Zoom)
Yes Yes Yes Dragging a box around a portion of the selected waveform adjustshorizontal scale to fill the zoom graticule with the boxed portion (seeSetting Zoom Controls on page 3--109).
1 Pixel-map reference waveforms, those saved while in fast acquisitions mode or waveform database mode, cannot berepositioned or rescaled.
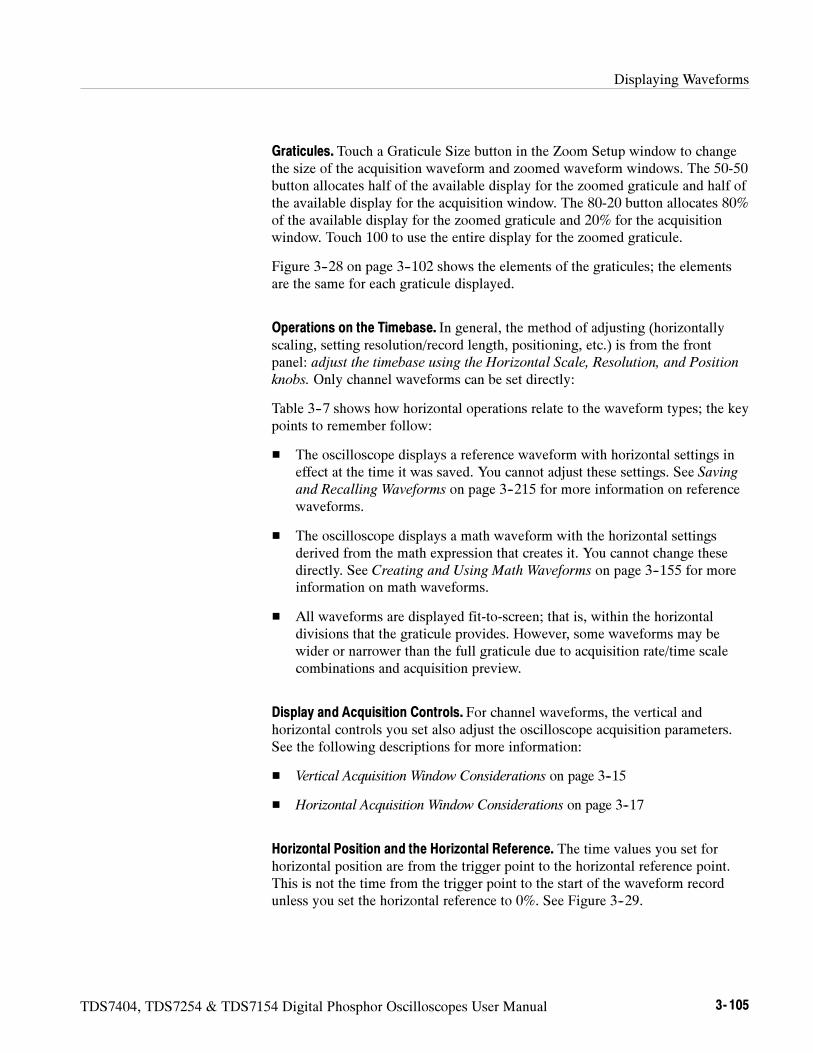
Displaying Waveforms
TDS7404, TDS7254 & TDS7154 Digital Phosphor Oscilloscopes User Manual 3- 105
Graticules. Touch a Graticule Size button in the Zoom Setup window to changethe size of the acquisition waveform and zoomed waveform windows. The 50-50button allocates half of the available display for the zoomed graticule and half ofthe available display for the acquisition window. The 80-20 button allocates 80%of the available display for the zoomed graticule and 20% for the acquisitionwindow. Touch 100 to use the entire display for the zoomed graticule.
Figure 3--28 on page 3--102 shows the elements of the graticules; the elementsare the same for each graticule displayed.
Operations on the Timebase. In general, the method of adjusting (horizontallyscaling, setting resolution/record length, positioning, etc.) is from the frontpanel: adjust the timebase using the Horizontal Scale, Resolution, and Position
knobs. Only channel waveforms can be set directly:
Table 3--7 shows how horizontal operations relate to the waveform types; the keypoints to remember follow:
The oscilloscope displays a reference waveform with horizontal settings ineffect at the time it was saved. You cannot adjust these settings. See Savingand Recalling Waveforms on page 3--215 for more information on referencewaveforms.
The oscilloscope displays a math waveform with the horizontal settingsderived from the math expression that creates it. You cannot change thesedirectly. See Creating and Using Math Waveforms on page 3--155 for moreinformation on math waveforms.
All waveforms are displayed fit-to-screen; that is, within the horizontaldivisions that the graticule provides. However, some waveforms may bewider or narrower than the full graticule due to acquisition rate/time scalecombinations and acquisition preview.
Display and Acquisition Controls. For channel waveforms, the vertical andhorizontal controls you set also adjust the oscilloscope acquisition parameters.See the following descriptions for more information:
Vertical Acquisition Window Considerations on page 3--15
Horizontal Acquisition Window Considerations on page 3--17
Horizontal Position and the Horizontal Reference. The time values you set forhorizontal position are from the trigger point to the horizontal reference point.This is not the time from the trigger point to the start of the waveform recordunless you set the horizontal reference to 0%. See Figure 3--29.
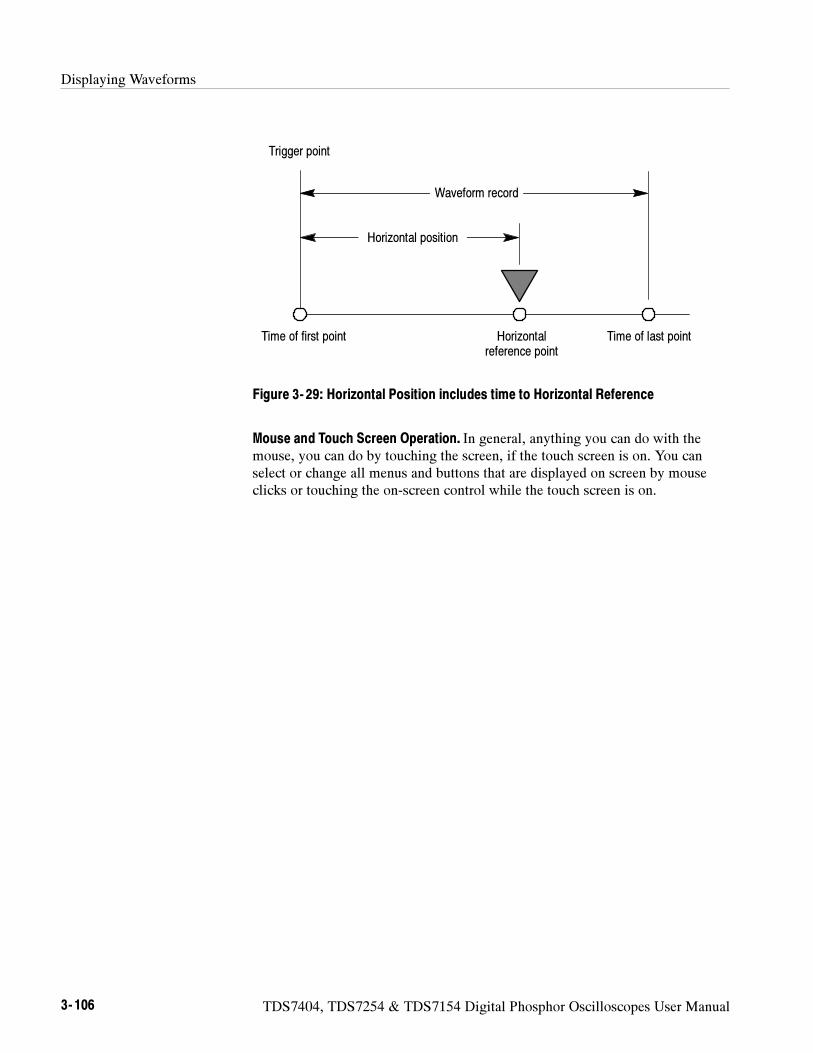
Displaying Waveforms
3- 106 TDS7404, TDS7254 & TDS7154 Digital Phosphor Oscilloscopes User Manual
Time of first point Horizontalreference point
Time of last point
Trigger point
Horizontal position
Waveform record
Figure 3- 29: Horizontal Position includes time to Horizontal Reference
Mouse and Touch Screen Operation. In general, anything you can do with themouse, you can do by touching the screen, if the touch screen is on. You canselect or change all menus and buttons that are displayed on screen by mouseclicks or touching the on-screen control while the touch screen is on.
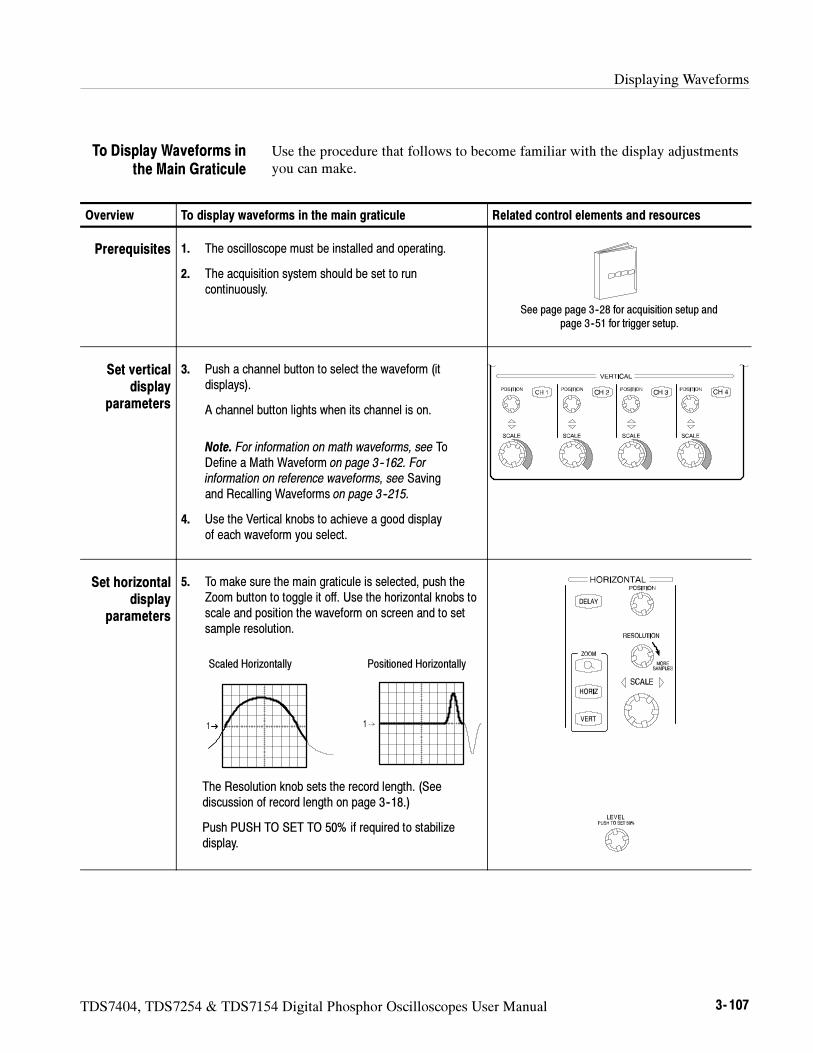
Displaying Waveforms
TDS7404, TDS7254 & TDS7154 Digital Phosphor Oscilloscopes User Manual 3- 107
Use the procedure that follows to become familiar with the display adjustmentsyou can make.
Overview To display waveforms in the main graticule Related control elements and resources
Prerequisites 1. The oscilloscope must be installed and operating.
2. The acquisition system should be set to runcontinuously.
See page page 3--28 for acquisition setup andpage 3--51 for trigger setup.
Set verticaldisplay
parameters
3. Push a channel button to select the waveform (itdisplays).
A channel button lights when its channel is on.
Note. For information on math waveforms, see ToDefine a Math Waveform on page 3--162. Forinformation on reference waveforms, see Savingand Recalling Waveforms on page 3--215.
4. Use the Vertical knobs to achieve a good displayof each waveform you select.
Set horizontaldisplay
parameters
5. To make sure the main graticule is selected, push theZoom button to toggle it off. Use the horizontal knobs toscale and position the waveform on screen and to setsample resolution.
Positioned HorizontallyScaled Horizontally
The Resolution knob sets the record length. (Seediscussion of record length on page 3--18.)
Push PUSH TO SET TO 50% if required to stabilizedisplay.
To Display Waveforms inthe Main Graticule
Displaying Waveforms
3- 108 TDS7404, TDS7254 & TDS7154 Digital Phosphor Oscilloscopes User Manual
Overview Related control elements and resourcesTo display waveforms in the main graticule (Cont.)
Adjust thehorizontalreference
6. To adjust the point around which the waveformsexpand and contract, touch the Horizontal Referenceand drag it left or right on screen.
Move the Horizontal Reference along the horizontalaxis until it aligns to the point on the waveform youwant to be stationary on screen.
Note. If Delay is off, Horizontal Reference is thesame as Horizontal Position.
7. Release the Horizontal Reference, and then adjustthe Horizontal Scale.
Horizontal reference
Quick-adjustthe timebase
(zoom)
8. To quickly rescale a portion of a channel waveform soit expands to fill the 10 divisions on screen, touch anddrag across the segment of the waveform that youwant to see in greater detail. Then select Zoom50/50%, Zoom 80/20%, or Zoom 100% from thedrop-down list to magnify the highlighted waveformsegment.
Note. The oscilloscope displays the box-enclosedarea on the waveform magnified in the graticule.
Explore thezoom controls
9. The next procedure deals with setting up andcontrolling Zoom.
See Setting Zoom Controls on page 3--109.
Displaying Waveforms
TDS7404, TDS7254 & TDS7154 Digital Phosphor Oscilloscopes User Manual 3- 109
Setting Zoom Controls
The oscilloscope can expand or compress (zoom in or out) on a waveformwithout changing the acquisition parameters (sample rate, record length, and soon). This section describes how to use Zoom and how it interacts with theselected waveform.
Use Zoom (push the ZOOM button) when you want to expand a waveform toinspect small feature(s) on that waveform or compare the feature to the non-zoomed waveform(s). For example, to temporarily expand the front corner of apulse to inspect its aberrations, use Zoom to expand it horizontally andvertically.
To help you use zoom effectively, consider how it operates on waveforms. Whenin zoom mode, the oscilloscope vertically expands or contracts one waveform ata time. Also, the oscilloscope only vertically positions one waveform at a timewhen in Zoom.
When zooming horizontally, Zoom expands either the waveform you select, alllive waveforms, or all live and reference waveforms, depending on the setting forHorizontal Lock in the Zoom menu.
When zooming horizontally or vertically, Zoom expands or contracts thewaveform by the zoom scale factor.
Use the procedure that follows to zoom a waveform. For more information,display online help when performing the procedure.
Overview To zoom waveforms Control elements and resources
Prerequisites 1. The oscilloscope must be installed and operating.Oscilloscope must be powered up, with horizontal andvertical controls and triggering set up.
See page 3--51 for trigger setup.
Using with Waveforms
To Zoom Waveforms
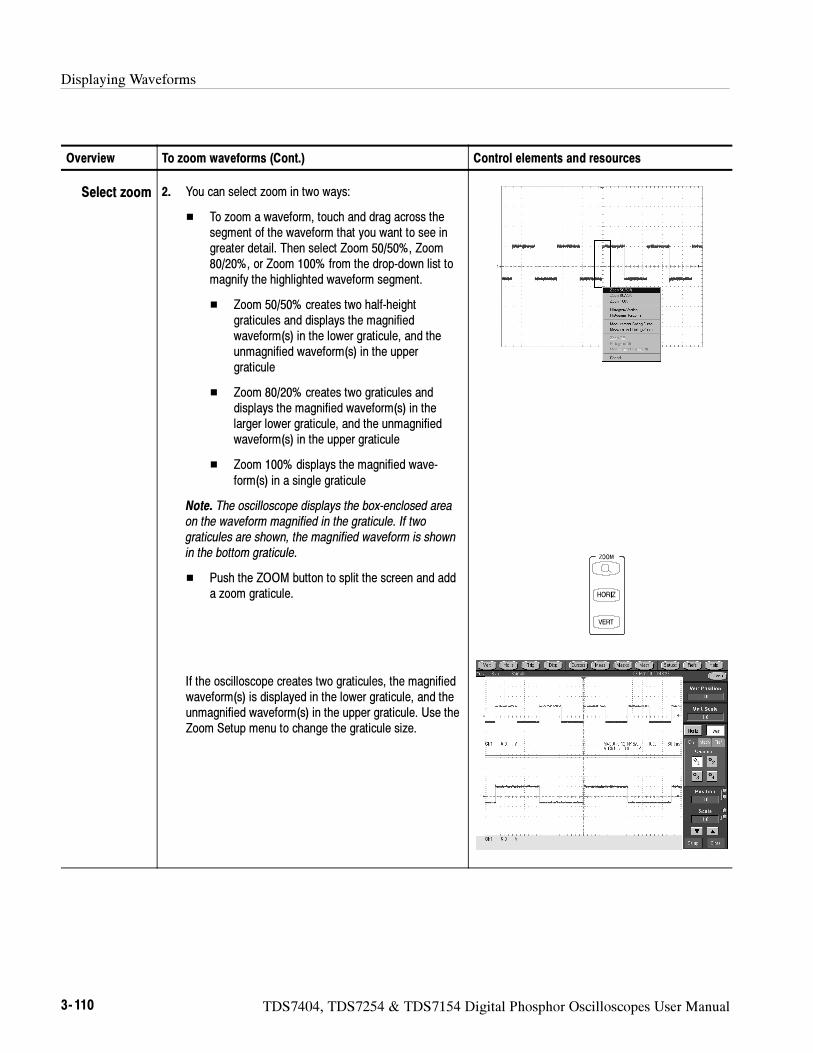
Displaying Waveforms
3- 110 TDS7404, TDS7254 & TDS7154 Digital Phosphor Oscilloscopes User Manual
Overview Control elements and resourcesTo zoom waveforms (Cont.)
Select zoom 2. You can select zoom in two ways:
To zoom a waveform, touch and drag across thesegment of the waveform that you want to see ingreater detail. Then select Zoom 50/50%, Zoom80/20%, or Zoom 100% from the drop-down list tomagnify the highlighted waveform segment.
Zoom 50/50% creates two half-heightgraticules and displays the magnifiedwaveform(s) in the lower graticule, and theunmagnified waveform(s) in the uppergraticule
Zoom 80/20% creates two graticules anddisplays the magnified waveform(s) in thelarger lower graticule, and the unmagnifiedwaveform(s) in the upper graticule
Zoom 100% displays the magnified wave-form(s) in a single graticule
Note. The oscilloscope displays the box-enclosed areaon the waveform magnified in the graticule. If twograticules are shown, the magnified waveform is shownin the bottom graticule.
Push the ZOOM button to split the screen and adda zoom graticule.
If the oscilloscope creates two graticules, the magnifiedwaveform(s) is displayed in the lower graticule, and theunmagnified waveform(s) in the upper graticule. Use theZoom Setup menu to change the graticule size.
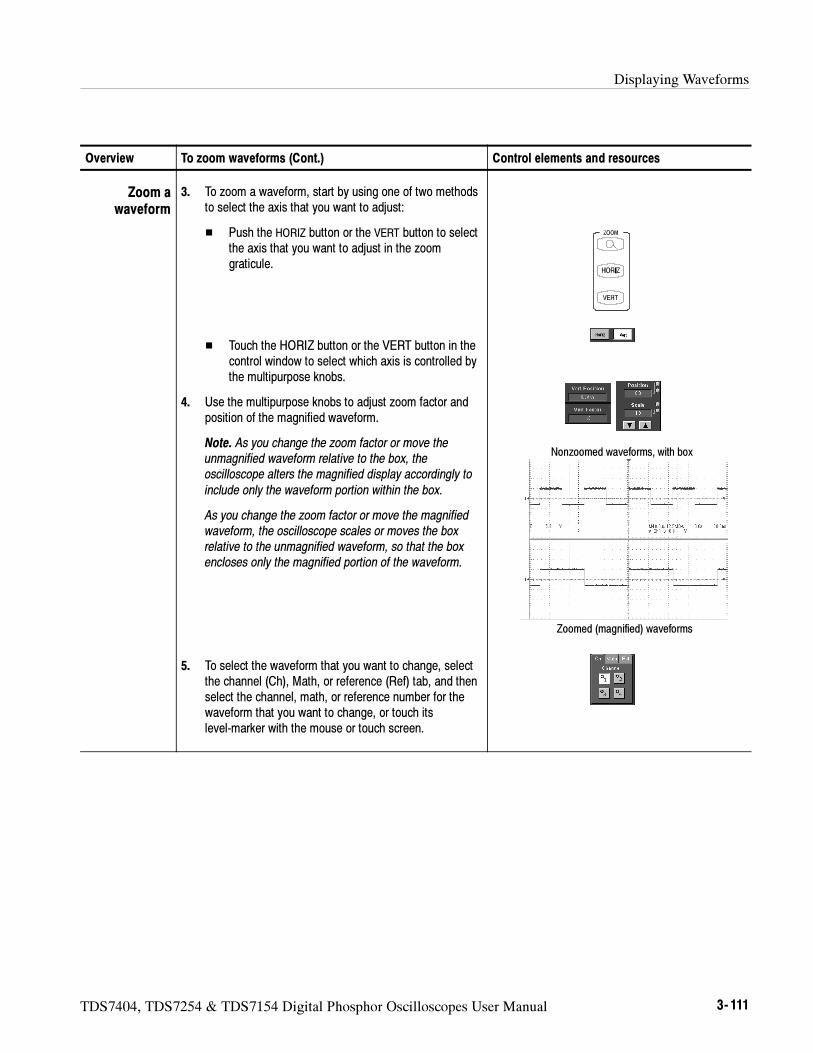
Displaying Waveforms
TDS7404, TDS7254 & TDS7154 Digital Phosphor Oscilloscopes User Manual 3- 111
Overview Control elements and resourcesTo zoom waveforms (Cont.)
Zoom awaveform
3. To zoom a waveform, start by using one of two methodsto select the axis that you want to adjust:
Push the HORIZ button or the VERT button to selectthe axis that you want to adjust in the zoomgraticule.
Touch the HORIZ button or the VERT button in thecontrol window to select which axis is controlled bythe multipurpose knobs.
4. Use the multipurpose knobs to adjust zoom factor andposition of the magnified waveform.
Note. As you change the zoom factor or move theunmagnified waveform relative to the box, theoscilloscope alters the magnified display accordingly to
include only the waveform portion within the box.
As you change the zoom factor or move the magnifiedwaveform, the oscilloscope scales or moves the boxrelative to the unmagnified waveform, so that the boxencloses only the magnified portion of the waveform.
5. To select the waveform that you want to change, selectthe channel (Ch), Math, or reference (Ref) tab, and thenselect the channel, math, or reference number for thewaveform that you want to change, or touch itslevel-marker with the mouse or touch screen.
Zoomed (magnified) waveforms
Nonzoomed waveforms, with box
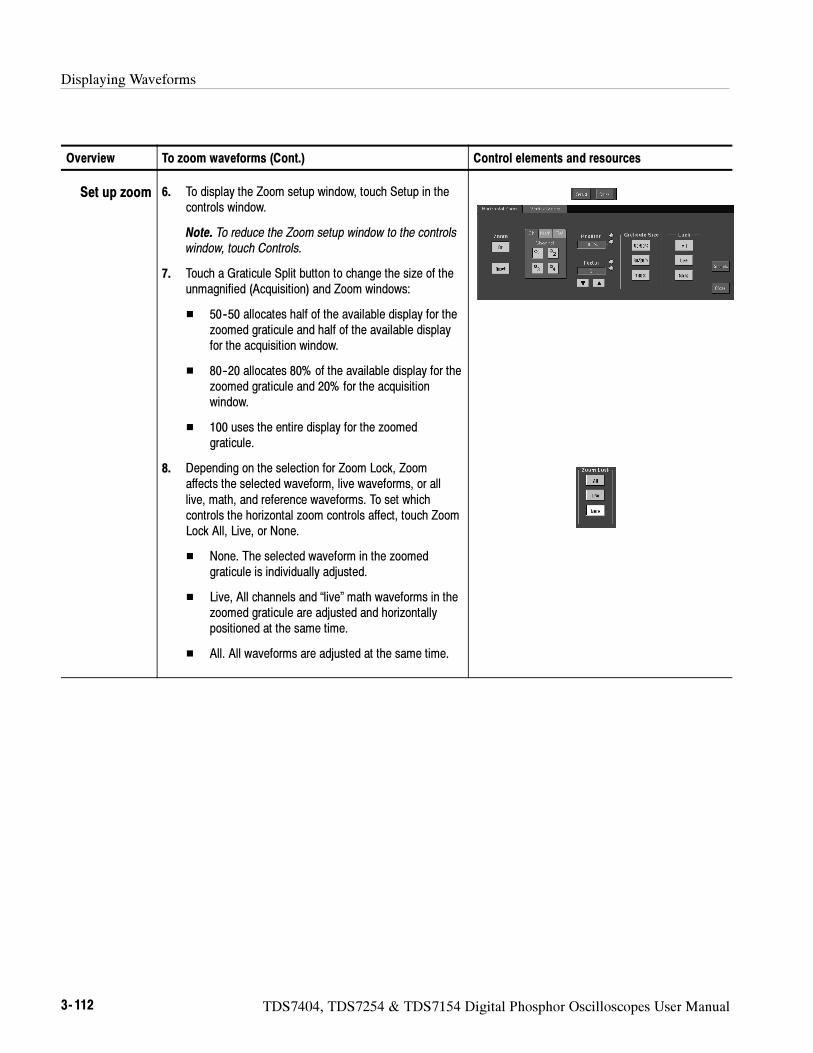
Displaying Waveforms
3- 112 TDS7404, TDS7254 & TDS7154 Digital Phosphor Oscilloscopes User Manual
Overview Control elements and resourcesTo zoom waveforms (Cont.)
Set up zoom 6. To display the Zoom setup window, touch Setup in thecontrols window.
Note. To reduce the Zoom setup window to the controlswindow, touch Controls.
7. Touch a Graticule Split button to change the size of theunmagnified (Acquisition) and Zoom windows:
50--50 allocates half of the available display for thezoomed graticule and half of the available displayfor the acquisition window.
80--20 allocates 80% of the available display for thezoomed graticule and 20% for the acquisitionwindow.
100 uses the entire display for the zoomedgraticule.
8. Depending on the selection for Zoom Lock, Zoomaffects the selected waveform, live waveforms, or alllive, math, and reference waveforms. To set whichcontrols the horizontal zoom controls affect, touch ZoomLock All, Live, or None.
None. The selected waveform in the zoomedgraticule is individually adjusted.
Live, All channels and “live” math waveforms in thezoomed graticule are adjusted and horizontallypositioned at the same time.
All. All waveforms are adjusted at the same time.
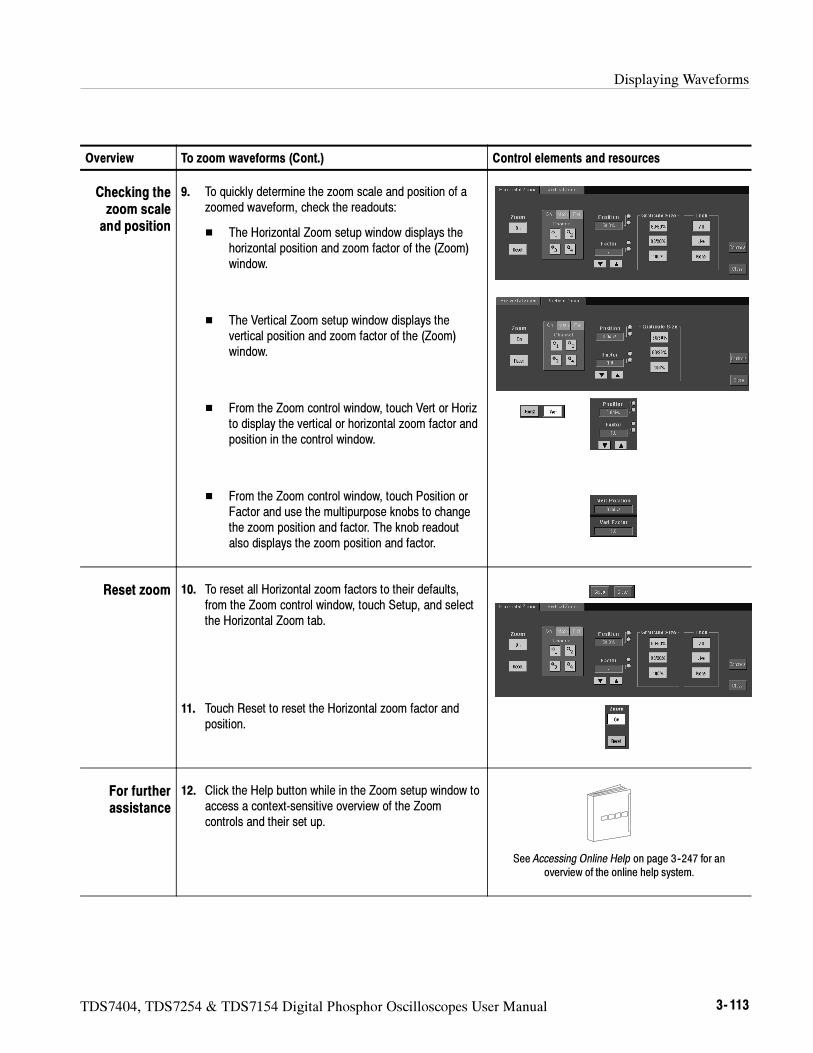
Displaying Waveforms
TDS7404, TDS7254 & TDS7154 Digital Phosphor Oscilloscopes User Manual 3- 113
Overview Control elements and resourcesTo zoom waveforms (Cont.)
Checking thezoom scaleand position
9. To quickly determine the zoom scale and position of azoomed waveform, check the readouts:
The Horizontal Zoom setup window displays thehorizontal position and zoom factor of the (Zoom)window.
The Vertical Zoom setup window displays thevertical position and zoom factor of the (Zoom)window.
From the Zoom control window, touch Vert or Horizto display the vertical or horizontal zoom factor andposition in the control window.
From the Zoom control window, touch Position orFactor and use the multipurpose knobs to changethe zoom position and factor. The knob readoutalso displays the zoom position and factor.
Reset zoom 10. To reset all Horizontal zoom factors to their defaults,from the Zoom control window, touch Setup, and selectthe Horizontal Zoom tab.
11. Touch Reset to reset the Horizontal zoom factor andposition.
For furtherassistance
12. Click the Help button while in the Zoom setup window toaccess a context-sensitive overview of the Zoomcontrols and their set up.
See Accessing Online Help on page 3--247 for anoverview of the online help system.
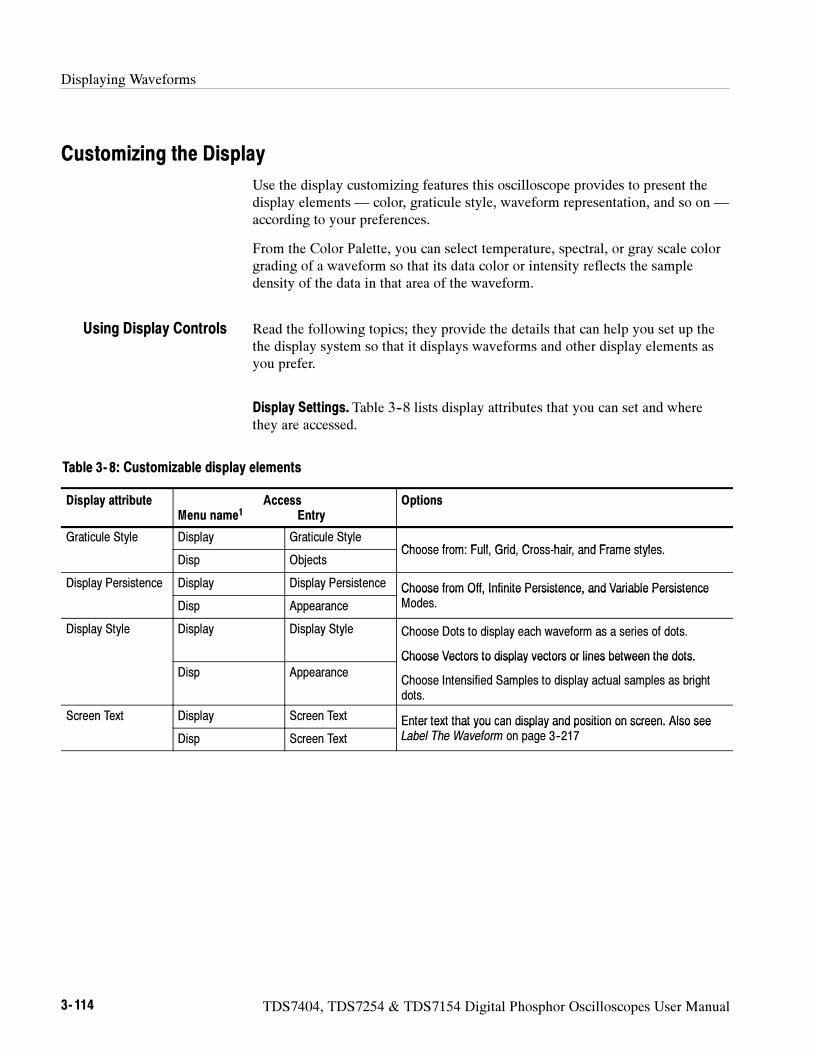
Displaying Waveforms
3- 114 TDS7404, TDS7254 & TDS7154 Digital Phosphor Oscilloscopes User Manual
Customizing the Display
Use the display customizing features this oscilloscope provides to present thedisplay elements — color, graticule style, waveform representation, and so on —according to your preferences.
From the Color Palette, you can select temperature, spectral, or gray scale colorgrading of a waveform so that its data color or intensity reflects the sampledensity of the data in that area of the waveform.
Read the following topics; they provide the details that can help you set up thethe display system so that it displays waveforms and other display elements asyou prefer.
Display Settings. Table 3--8 lists display attributes that you can set and wherethey are accessed.
Table 3- 8: Customizable display elements
Display attribute AccessMenu name1 Entry
Options
Graticule Style Display Graticule StyleChoose from: Full Grid Cross hair and Frame styles
Disp ObjectsChoose from: Full, Grid, Cross-hair, and Frame styles.
Display Persistence Display Display Persistence Choose from Off, Infinite Persistence, and Variable Persistence
Disp Appearance
Choose from Off, Infinite Persistence, and Variable PersistenceModes.
Display Style Display Display Style Choose Dots to display each waveform as a series of dots.
Choose Vectors to display vectors or lines between the dots.Disp Appearance
Choose Vectors to display vectors or lines between the dots.
Choose Intensified Samples to display actual samples as brightdots.
Screen Text Display Screen Text Enter text that you can display and position on screen. Also see
Disp Screen Text
Enter text that you can display and position on screen. Also seeLabel The Waveform on page 3--217
Using Display Controls
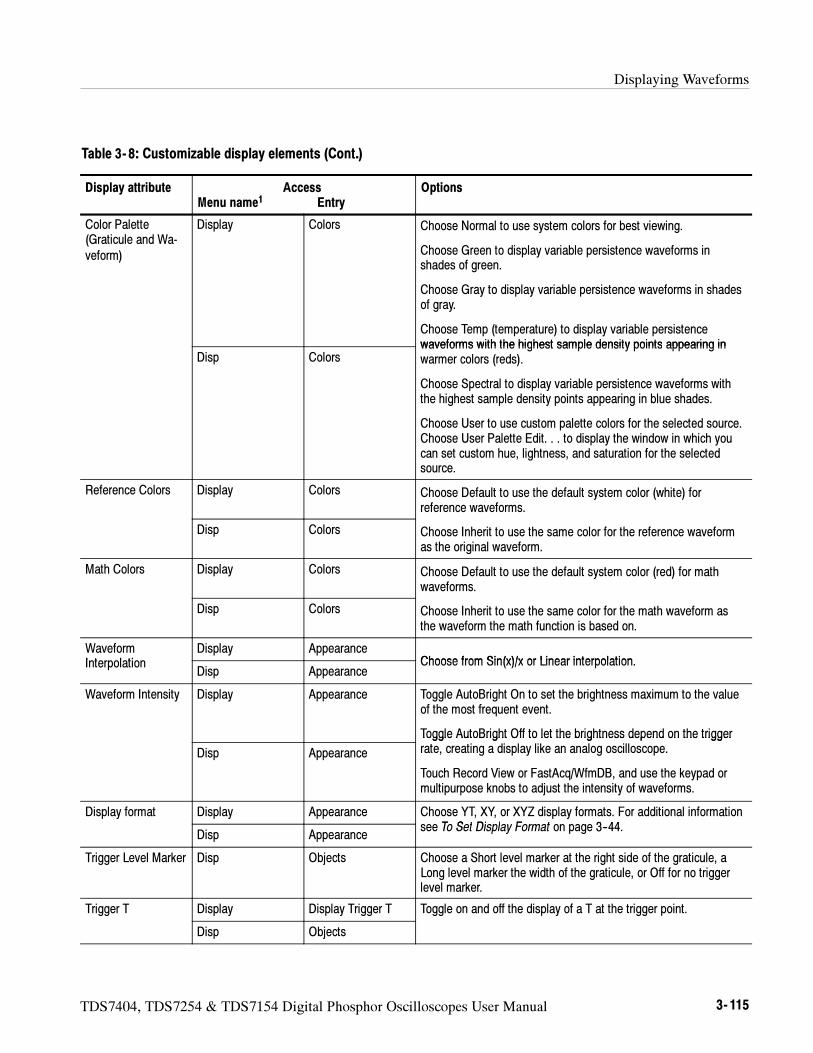
Displaying Waveforms
TDS7404, TDS7254 & TDS7154 Digital Phosphor Oscilloscopes User Manual 3- 115
Table 3- 8: Customizable display elements (Cont.)
Display attribute OptionsAccessMenu name1 Entry
Color Palette(Graticule and Wa-veform)
Display Colors Choose Normal to use system colors for best viewing.
Choose Green to display variable persistence waveforms inshades of green.
Choose Gray to display variable persistence waveforms in shadesof gray.
Choose Temp (temperature) to display variable persistencewaveforms with the highest sample density points appearing in
Disp Colorswaveforms with the highest sample density points appearing inwarmer colors (reds).
Choose Spectral to display variable persistence waveforms withthe highest sample density points appearing in blue shades.
Choose User to use custom palette colors for the selected source.Choose User Palette Edit. . . to display the window in which youcan set custom hue, lightness, and saturation for the selectedsource.
Reference Colors Display Colors Choose Default to use the default system color (white) forreference waveforms.
Disp Colors Choose Inherit to use the same color for the reference waveformas the original waveform.
Math Colors Display Colors Choose Default to use the default system color (red) for mathwaveforms.
Disp Colors Choose Inherit to use the same color for the math waveform asthe waveform the math function is based on.
WaveformI t l ti
Display AppearanceChoose from Sin(x)/x or Linear interpolationInterpolation
Disp AppearanceChoose from Sin(x)/x or Linear interpolation.
Waveform Intensity Display Appearance Toggle AutoBright On to set the brightness maximum to the valueof the most frequent event.
Toggle AutoBright Off to let the brightness depend on the trigger
Disp Appearance
Toggle AutoBright Off to let the brightness depend on the triggerrate, creating a display like an analog oscilloscope.
Touch Record View or FastAcq/WfmDB, and use the keypad ormultipurpose knobs to adjust the intensity of waveforms.
Display format Display Appearance Choose YT, XY, or XYZ display formats. For additional informationT S t Di l F t 3 44
Disp Appearancesee To Set Display Format on page 3--44.
Trigger Level Marker Disp Objects Choose a Short level marker at the right side of the graticule, aLong level marker the width of the graticule, or Off for no triggerlevel marker.
Trigger T Display Display Trigger T Toggle on and off the display of a T at the trigger point.
Disp Objects
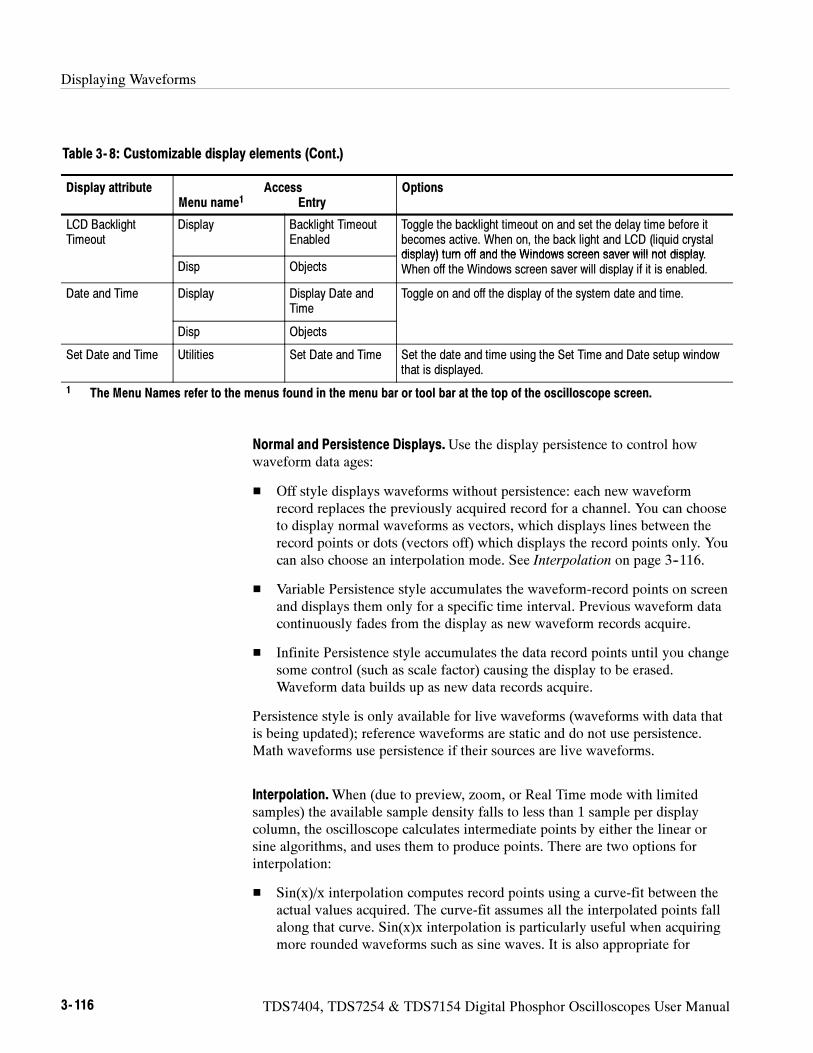
Displaying Waveforms
3- 116 TDS7404, TDS7254 & TDS7154 Digital Phosphor Oscilloscopes User Manual
Table 3- 8: Customizable display elements (Cont.)
Display attribute OptionsAccessMenu name1 Entry
LCD BacklightTimeout
Display Backlight TimeoutEnabled
Toggle the backlight timeout on and set the delay time before itbecomes active. When on, the back light and LCD (liquid crystaldisplay) turn off and the Windows screen saver will not display
Disp Objectsdisplay) turn off and the Windows screen saver will not display.When off the Windows screen saver will display if it is enabled.
Date and Time Display Display Date andTime
Toggle on and off the display of the system date and time.
Disp Objects
Set Date and Time Utilities Set Date and Time Set the date and time using the Set Time and Date setup windowthat is displayed.
1 The Menu Names refer to the menus found in the menu bar or tool bar at the top of the oscilloscope screen.
Normal and Persistence Displays.Use the display persistence to control howwaveform data ages:
Off style displays waveforms without persistence: each new waveformrecord replaces the previously acquired record for a channel. You can chooseto display normal waveforms as vectors, which displays lines between therecord points or dots (vectors off) which displays the record points only. Youcan also choose an interpolation mode. See Interpolation on page 3--116.
Variable Persistence style accumulates the waveform-record points on screenand displays them only for a specific time interval. Previous waveform datacontinuously fades from the display as new waveform records acquire.
Infinite Persistence style accumulates the data record points until you changesome control (such as scale factor) causing the display to be erased.Waveform data builds up as new data records acquire.
Persistence style is only available for live waveforms (waveforms with data thatis being updated); reference waveforms are static and do not use persistence.Math waveforms use persistence if their sources are live waveforms.
Interpolation.When (due to preview, zoom, or Real Time mode with limitedsamples) the available sample density falls to less than 1 sample per displaycolumn, the oscilloscope calculates intermediate points by either the linear orsine algorithms, and uses them to produce points. There are two options forinterpolation:
Sin(x)/x interpolation computes record points using a curve-fit between theactual values acquired. The curve-fit assumes all the interpolated points fallalong that curve. Sin(x)x interpolation is particularly useful when acquiringmore rounded waveforms such as sine waves. It is also appropriate for
Displaying Waveforms
TDS7404, TDS7254 & TDS7154 Digital Phosphor Oscilloscopes User Manual 3- 117
general use, although it may introduce some overshoot or undershoot insignals with fast rise times.
Linear interpolation computes record points between actual acquired samplesby using a straight-line-fit. The straight-line-fit assumes all the interpolatedpoints fall in their appropriate point in time on that straight line. Linearinterpolation is useful for many waveforms such as pulse trains.
Interpolation is used whenever the displayed sample density falls below 1 sampleper column. If the acquired record length is 500 points, zoom of 2x requiresinterpolation. If instead, the record length of the acquisition is 100K, horizontalzoom of 200x produces 1 sample per column (100,000/500 = 200); therefore,you will see interpolated samples starting at the next scale setting.
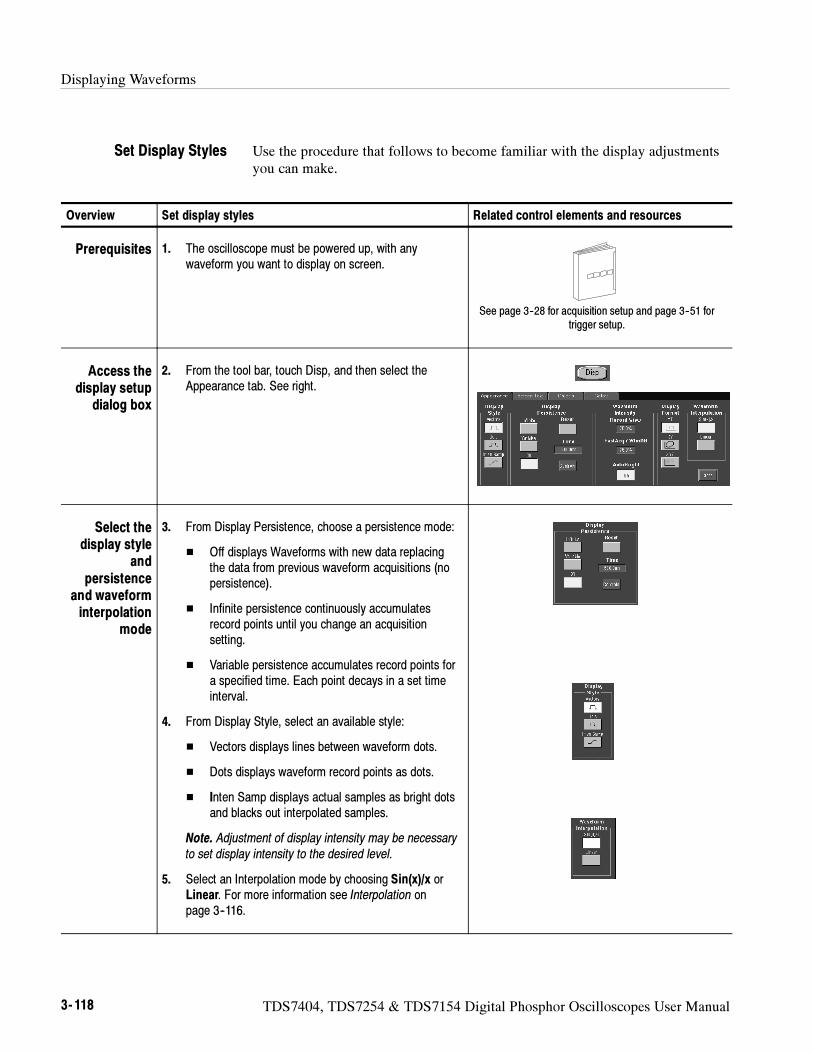
Displaying Waveforms
3- 118 TDS7404, TDS7254 & TDS7154 Digital Phosphor Oscilloscopes User Manual
Use the procedure that follows to become familiar with the display adjustmentsyou can make.
Overview Set display styles Related control elements and resources
Prerequisites 1. The oscilloscope must be powered up, with anywaveform you want to display on screen.
See page 3--28 for acquisition setup and page 3--51 fortrigger setup.
Access thedisplay setup
dialog box
2. From the tool bar, touch Disp, and then select theAppearance tab. See right.
Select thedisplay style
andpersistence
and waveforminterpolation
mode
3. From Display Persistence, choose a persistence mode:
Off displays Waveforms with new data replacingthe data from previous waveform acquisitions (nopersistence).
Infinite persistence continuously accumulatesrecord points until you change an acquisitionsetting.
Variable persistence accumulates record points fora specified time. Each point decays in a set timeinterval.
4. From Display Style, select an available style:
Vectors displays lines between waveform dots.
Dots displays waveform record points as dots.
Inten Samp displays actual samples as bright dotsand blacks out interpolated samples.
Note. Adjustment of display intensity may be necessary
to set display intensity to the desired level.
5. Select an Interpolation mode by choosing Sin(x)/x orLinear. For more information see Interpolation onpage 3--116.
Set Display Styles
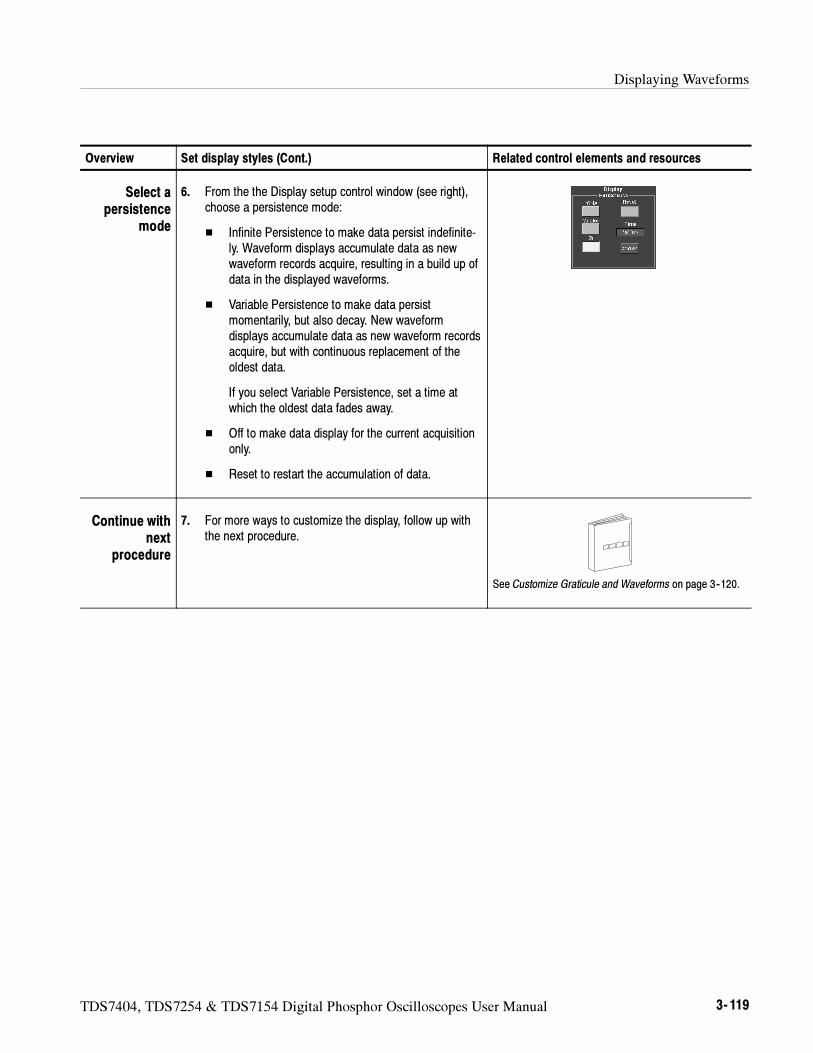
Displaying Waveforms
TDS7404, TDS7254 & TDS7154 Digital Phosphor Oscilloscopes User Manual 3- 119
Overview Related control elements and resourcesSet display styles (Cont.)
Select apersistence
mode
6. From the the Display setup control window (see right),choose a persistence mode:
Infinite Persistence to make data persist indefinite-ly. Waveform displays accumulate data as newwaveform records acquire, resulting in a build up ofdata in the displayed waveforms.
Variable Persistence to make data persistmomentarily, but also decay. New waveformdisplays accumulate data as new waveform recordsacquire, but with continuous replacement of theoldest data.
If you select Variable Persistence, set a time atwhich the oldest data fades away.
Off to make data display for the current acquisitiononly.
Reset to restart the accumulation of data.
Continue withnext
procedure
7. For more ways to customize the display, follow up withthe next procedure.
See Customize Graticule and Waveforms on page 3--120.
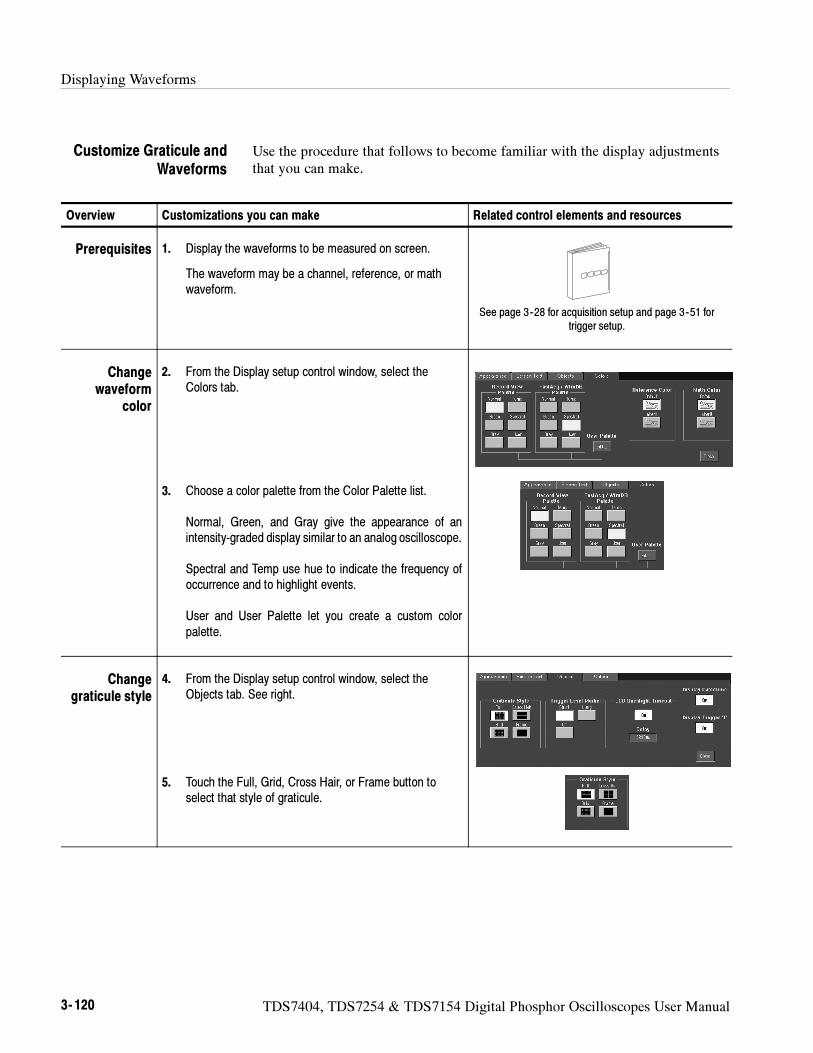
Displaying Waveforms
3- 120 TDS7404, TDS7254 & TDS7154 Digital Phosphor Oscilloscopes User Manual
Use the procedure that follows to become familiar with the display adjustmentsthat you can make.
Overview Customizations you can make Related control elements and resources
Prerequisites 1. Display the waveforms to be measured on screen.
The waveform may be a channel, reference, or mathwaveform.
See page 3--28 for acquisition setup and page 3--51 fortrigger setup.
Changewaveform
color
2. From the Display setup control window, select theColors tab.
3. Choose a color palette from the Color Palette list.
Normal, Green, and Gray give the appearance of anintensity-graded display similar to an analog oscilloscope.
Spectral and Temp use hue to indicate the frequency ofoccurrence and to highlight events.
User and User Palette let you create a custom colorpalette.
Changegraticule style
4. From the Display setup control window, select theObjects tab. See right.
5. Touch the Full, Grid, Cross Hair, or Frame button toselect that style of graticule.
Customize Graticule andWaveforms
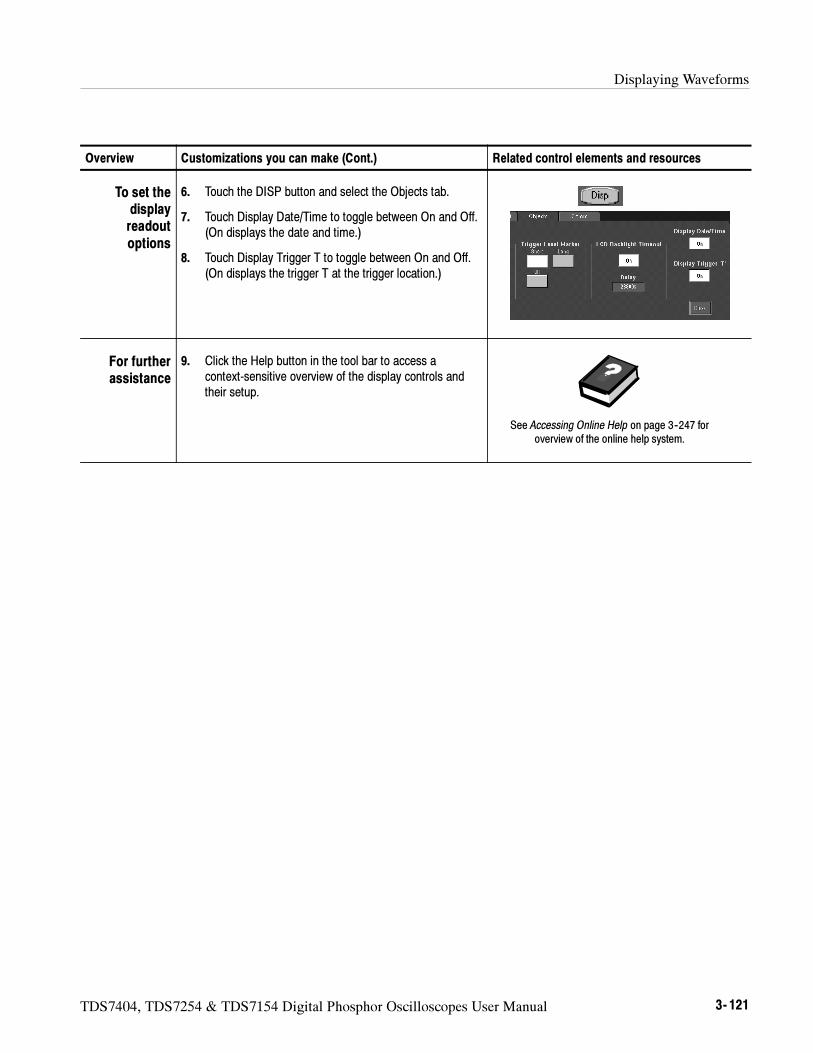
Displaying Waveforms
TDS7404, TDS7254 & TDS7154 Digital Phosphor Oscilloscopes User Manual 3- 121
Overview Related control elements and resourcesCustomizations you can make (Cont.)
To set thedisplayreadoutoptions
6. Touch the DISP button and select the Objects tab.
7. Touch Display Date/Time to toggle between On and Off.(On displays the date and time.)
8. Touch Display Trigger T to toggle between On and Off.(On displays the trigger T at the trigger location.)
For furtherassistance
9. Click the Help button in the tool bar to access acontext-sensitive overview of the display controls andtheir setup.
See Accessing Online Help on page 3--247 foroverview of the online help system.

Displaying Waveforms
3- 122 TDS7404, TDS7254 & TDS7154 Digital Phosphor Oscilloscopes User Manual
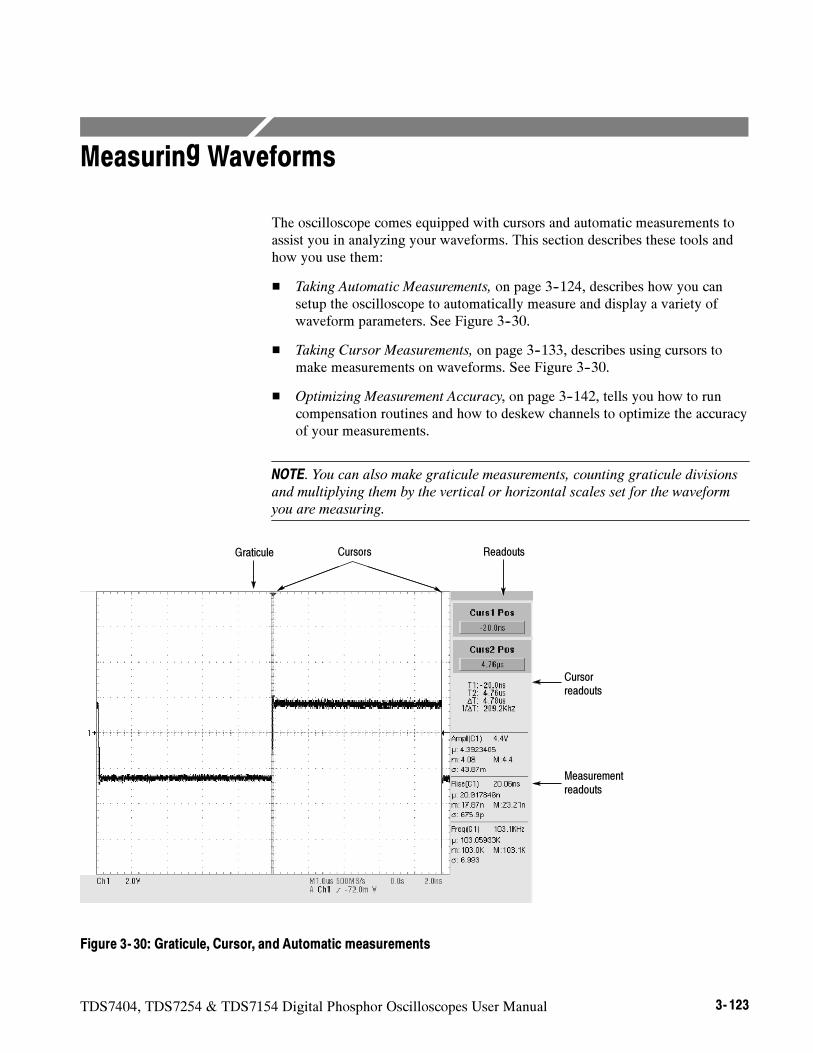
TDS7404, TDS7254 & TDS7154 Digital Phosphor Oscilloscopes User Manual 3- 123
Measuring Waveforms
The oscilloscope comes equipped with cursors and automatic measurements toassist you in analyzing your waveforms. This section describes these tools andhow you use them:
Taking Automatic Measurements, on page 3--124, describes how you cansetup the oscilloscope to automatically measure and display a variety ofwaveform parameters. See Figure 3--30.
Taking Cursor Measurements, on page 3--133, describes using cursors tomake measurements on waveforms. See Figure 3--30.
Optimizing Measurement Accuracy, on page 3--142, tells you how to runcompensation routines and how to deskew channels to optimize the accuracyof your measurements.
NOTE. You can also make graticule measurements, counting graticule divisions
and multiplying them by the vertical or horizontal scales set for the waveform
you are measuring.
ReadoutsGraticule Cursors
Measurementreadouts
Cursorreadouts
Figure 3- 30: Graticule, Cursor, and Automatic measurements
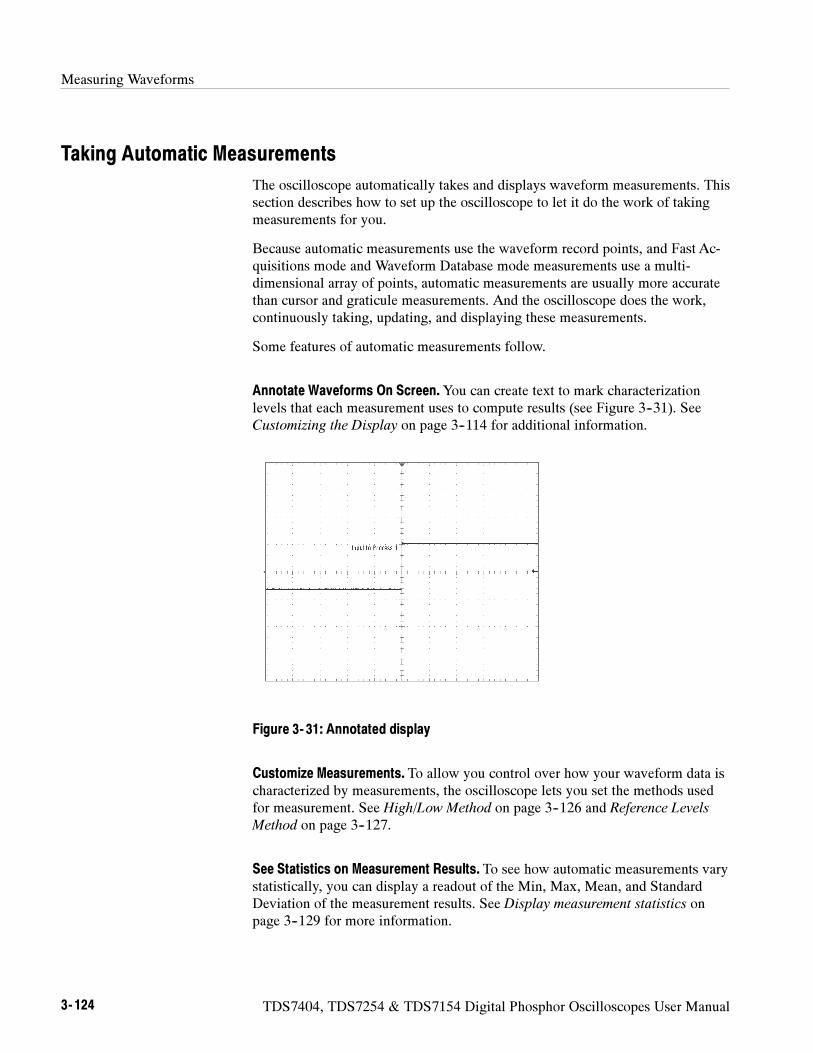
Measuring Waveforms
3- 124 TDS7404, TDS7254 & TDS7154 Digital Phosphor Oscilloscopes User Manual
Taking Automatic Measurements
The oscilloscope automatically takes and displays waveform measurements. Thissection describes how to set up the oscilloscope to let it do the work of takingmeasurements for you.
Because automatic measurements use the waveform record points, and Fast Ac-quisitions mode and Waveform Database mode measurements use a multi-dimensional array of points, automatic measurements are usually more accuratethan cursor and graticule measurements. And the oscilloscope does the work,continuously taking, updating, and displaying these measurements.
Some features of automatic measurements follow.
Annotate Waveforms On Screen.You can create text to mark characterizationlevels that each measurement uses to compute results (see Figure 3--31). SeeCustomizing the Display on page 3--114 for additional information.
Figure 3- 31: Annotated display
Customize Measurements. To allow you control over how your waveform data ischaracterized by measurements, the oscilloscope lets you set the methods usedfor measurement. See High/Low Method on page 3--126 and Reference Levels
Method on page 3--127.
See Statistics on Measurement Results. To see how automatic measurements varystatistically, you can display a readout of the Min, Max, Mean, and StandardDeviation of the measurement results. See Display measurement statistics onpage 3--129 for more information.
Measuring Waveforms
TDS7404, TDS7254 & TDS7154 Digital Phosphor Oscilloscopes User Manual 3- 125
Select Measurement Parameters.You can select from an extensive range ofparameters to measure; for a list, see Appendix B: Automatic Measurements
Supported.
Measure Part of a Waveform.You can feed the entire waveform to a measurementor limit the measurement to a segment of the waveform. By default, theoscilloscope takes each automatic measurement over the entire waveform record,but you can use measurement gates to localize each measurement to a section ofa waveform (see To Localize a Measurement on page 3--131).
Select Measurement Sources. Select from these measurement sources: channel,Reference, and math waveforms.
Take Measurements on a Frame. In FastFrame, measurements are taken only onthe displayed frame.
Read the following topics; they provide the details that can help you set upautomatic measurements so that they best support your data-analysis tasks.
Measurement Selection. The oscilloscope takes automatic measurements of thefollowing categories: Amplitude, Timing, More, Histogram, and Comm. CheckAppendix B: Automatic Measurements Supported for a listing of the measure-ments that you can choose.
Number of Measurements. The oscilloscope can take and update up to eightmeasurements at one time. You can apply measurements to any combination ofsources (described below). You can take all eight measurements on Ch1 forexample or you can take measurements on Ch1 -- Ch4, Math1 -- Math4, Ref1 --Ref4, or a histogram.
Measurement Sources.All channel, reference, and math waveforms can serve assources for automatic measurements.
Some measurements, such as delay and phase, require two sources. For example,delay would be used to measure an input from one measurement source (forexample, C1) with respect to an output in another source (C2).
Using AutomaticMeasurements
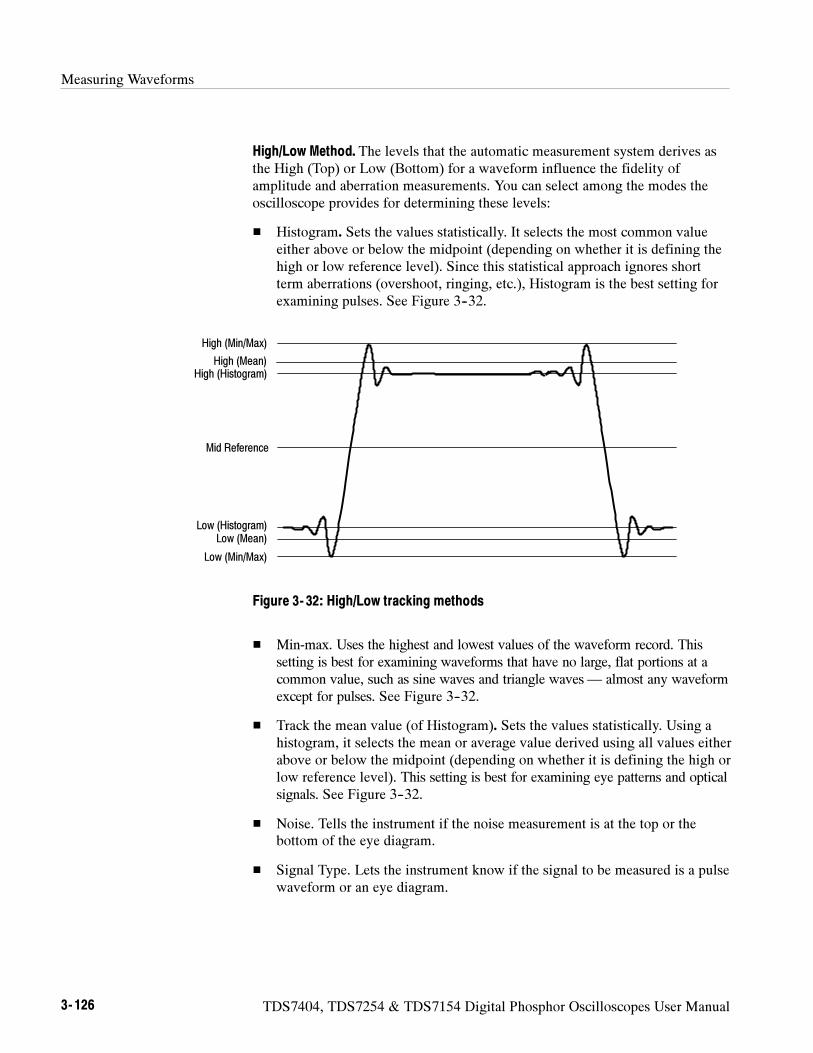
Measuring Waveforms
3- 126 TDS7404, TDS7254 & TDS7154 Digital Phosphor Oscilloscopes User Manual
High/Low Method. The levels that the automatic measurement system derives asthe High (Top) or Low (Bottom) for a waveform influence the fidelity ofamplitude and aberration measurements. You can select among the modes theoscilloscope provides for determining these levels:
Histogram. Sets the values statistically. It selects the most common valueeither above or below the midpoint (depending on whether it is defining thehigh or low reference level). Since this statistical approach ignores shortterm aberrations (overshoot, ringing, etc.), Histogram is the best setting forexamining pulses. See Figure 3--32.
High (Histogram)
Low (Histogram)
Low (Min/Max)
High (Min/Max)
High (Mean)
Low (Mean)
Mid Reference
Figure 3- 32: High/Low tracking methods
Min-max. Uses the highest and lowest values of the waveform record. Thissetting is best for examining waveforms that have no large, flat portions at acommon value, such as sine waves and triangle waves— almost any waveformexcept for pulses. See Figure 3--32.
Track the mean value (of Histogram). Sets the values statistically. Using ahistogram, it selects the mean or average value derived using all values eitherabove or below the midpoint (depending on whether it is defining the high orlow reference level). This setting is best for examining eye patterns and opticalsignals. See Figure 3--32.
Noise. Tells the instrument if the noise measurement is at the top or thebottom of the eye diagram.
Signal Type. Lets the instrument know if the signal to be measured is a pulsewaveform or an eye diagram.
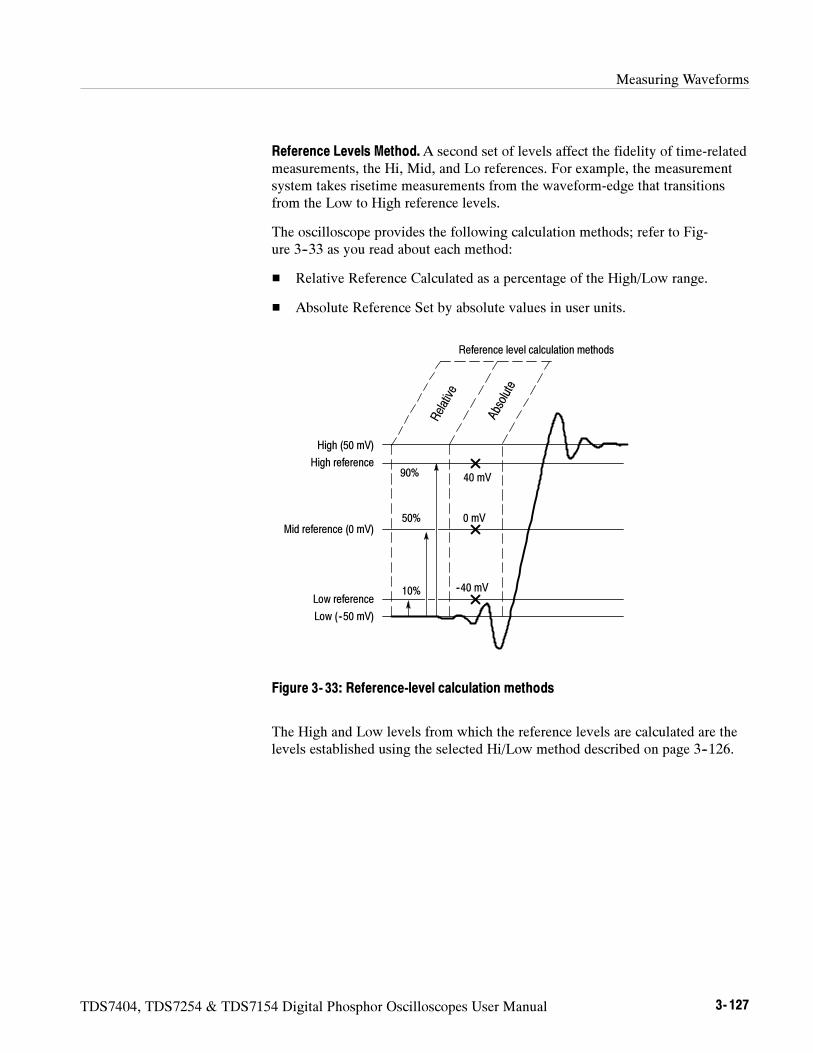
Measuring Waveforms
TDS7404, TDS7254 & TDS7154 Digital Phosphor Oscilloscopes User Manual 3- 127
Reference Levels Method.A second set of levels affect the fidelity of time-relatedmeasurements, the Hi, Mid, and Lo references. For example, the measurementsystem takes risetime measurements from the waveform-edge that transitionsfrom the Low to High reference levels.
The oscilloscope provides the following calculation methods; refer to Fig-ure 3--33 as you read about each method:
Relative Reference Calculated as a percentage of the High/Low range.
Absolute Reference Set by absolute values in user units.
Reference level calculation methods
High (50 mV)
High reference
Mid reference (0 mV)
Low reference
Low (--50 mV)
90%
10% --40 mV
40 mV
50% 0 mV
Figure 3- 33: Reference-level calculation methods
The High and Low levels from which the reference levels are calculated are thelevels established using the selected Hi/Low method described on page 3--126.
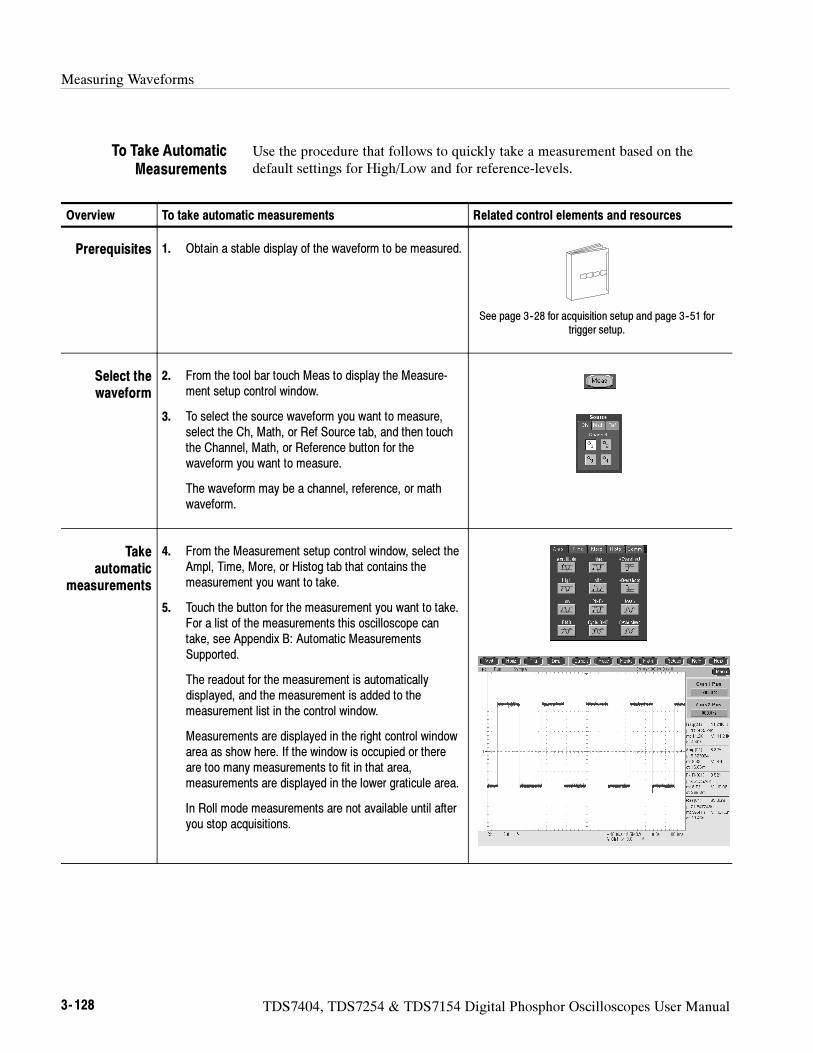
Measuring Waveforms
3- 128 TDS7404, TDS7254 & TDS7154 Digital Phosphor Oscilloscopes User Manual
Use the procedure that follows to quickly take a measurement based on thedefault settings for High/Low and for reference-levels.
Overview To take automatic measurements Related control elements and resources
Prerequisites 1. Obtain a stable display of the waveform to be measured.
See page 3--28 for acquisition setup and page 3--51 fortrigger setup.
Select thewaveform
2. From the tool bar touch Meas to display the Measure-ment setup control window.
3. To select the source waveform you want to measure,select the Ch, Math, or Ref Source tab, and then touchthe Channel, Math, or Reference button for thewaveform you want to measure.
The waveform may be a channel, reference, or mathwaveform.
Takeautomatic
measurements
4. From the Measurement setup control window, select theAmpl, Time, More, or Histog tab that contains themeasurement you want to take.
5. Touch the button for the measurement you want to take.For a list of the measurements this oscilloscope cantake, see Appendix B: Automatic MeasurementsSupported.
The readout for the measurement is automaticallydisplayed, and the measurement is added to themeasurement list in the control window.
Measurements are displayed in the right control windowarea as show here. If the window is occupied or thereare too many measurements to fit in that area,measurements are displayed in the lower graticule area.
In Roll mode measurements are not available until afteryou stop acquisitions.
To Take AutomaticMeasurements
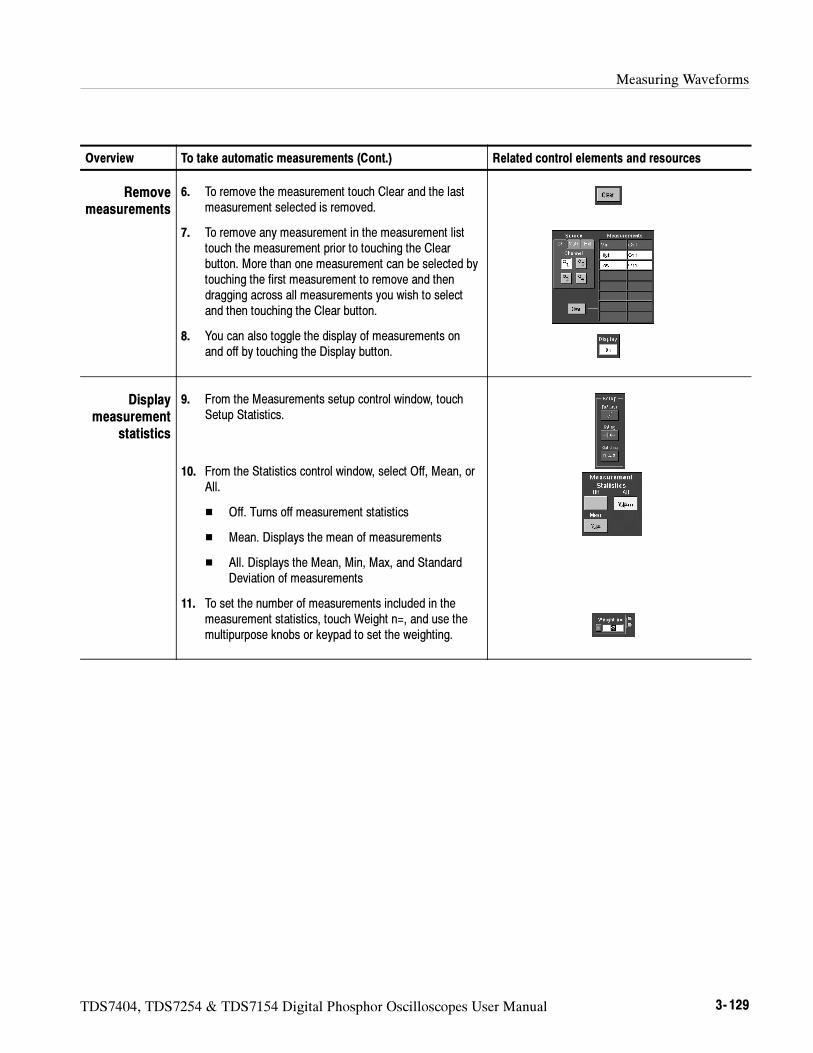
Measuring Waveforms
TDS7404, TDS7254 & TDS7154 Digital Phosphor Oscilloscopes User Manual 3- 129
Overview Related control elements and resourcesTo take automatic measurements (Cont.)
Removemeasurements
6. To remove the measurement touch Clear and the lastmeasurement selected is removed.
7. To remove any measurement in the measurement listtouch the measurement prior to touching the Clearbutton. More than one measurement can be selected bytouching the first measurement to remove and thendragging across all measurements you wish to selectand then touching the Clear button.
8. You can also toggle the display of measurements onand off by touching the Display button.
Displaymeasurement
statistics
9. From the Measurements setup control window, touchSetup Statistics.
10. From the Statistics control window, select Off, Mean, orAll.
Off. Turns off measurement statistics
Mean. Displays the mean of measurements
All. Displays the Mean, Min, Max, and StandardDeviation of measurements
11. To set the number of measurements included in themeasurement statistics, touch Weight n=, and use themultipurpose knobs or keypad to set the weighting.
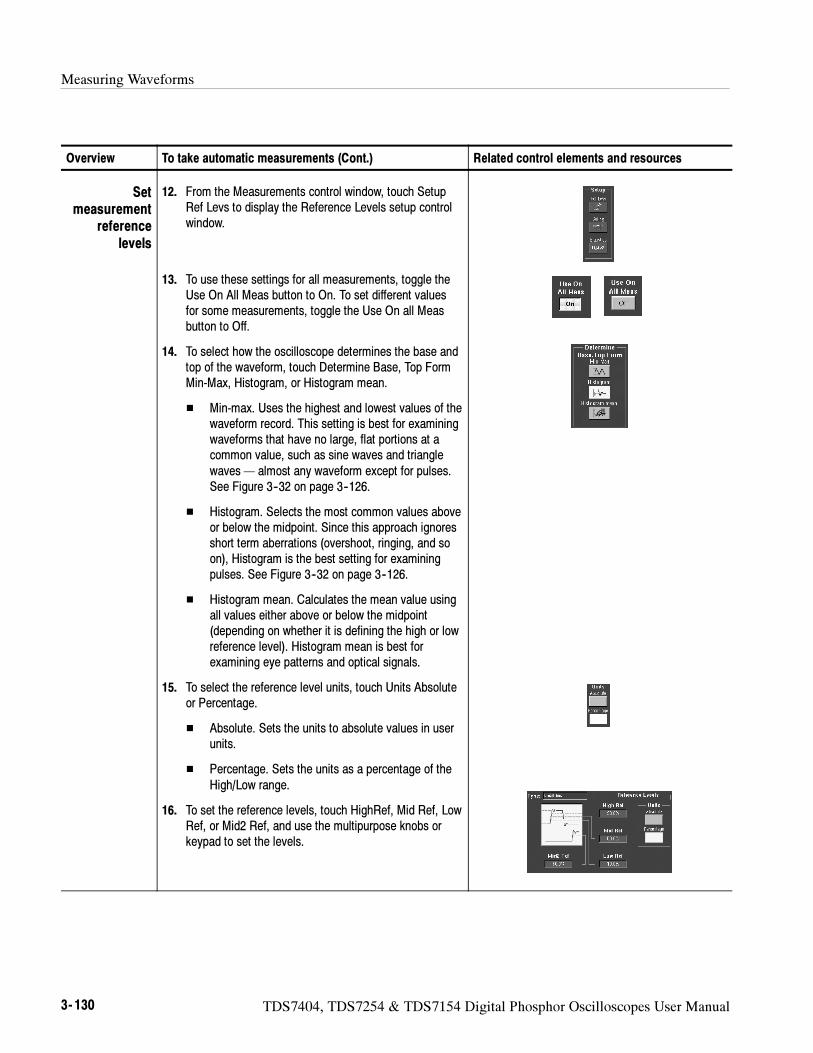
Measuring Waveforms
3- 130 TDS7404, TDS7254 & TDS7154 Digital Phosphor Oscilloscopes User Manual
Overview Related control elements and resourcesTo take automatic measurements (Cont.)
Setmeasurement
referencelevels
12. From the Measurements control window, touch SetupRef Levs to display the Reference Levels setup controlwindow.
13. To use these settings for all measurements, toggle theUse On All Meas button to On. To set different valuesfor some measurements, toggle the Use On all Measbutton to Off.
14. To select how the oscilloscope determines the base andtop of the waveform, touch Determine Base, Top FormMin-Max, Histogram, or Histogram mean.
Min-max. Uses the highest and lowest values of thewaveform record. This setting is best for examiningwaveforms that have no large, flat portions at acommon value, such as sine waves and trianglewaves— almost any waveform except for pulses.See Figure 3--32 on page 3--126.
Histogram. Selects the most common values aboveor below the midpoint. Since this approach ignoresshort term aberrations (overshoot, ringing, and soon), Histogram is the best setting for examiningpulses. See Figure 3--32 on page 3--126.
Histogram mean. Calculates the mean value usingall values either above or below the midpoint(depending on whether it is defining the high or lowreference level). Histogram mean is best forexamining eye patterns and optical signals.
15. To select the reference level units, touch Units Absoluteor Percentage.
Absolute. Sets the units to absolute values in userunits.
Percentage. Sets the units as a percentage of theHigh/Low range.
16. To set the reference levels, touch HighRef, Mid Ref, LowRef, or Mid2 Ref, and use the multipurpose knobs orkeypad to set the levels.
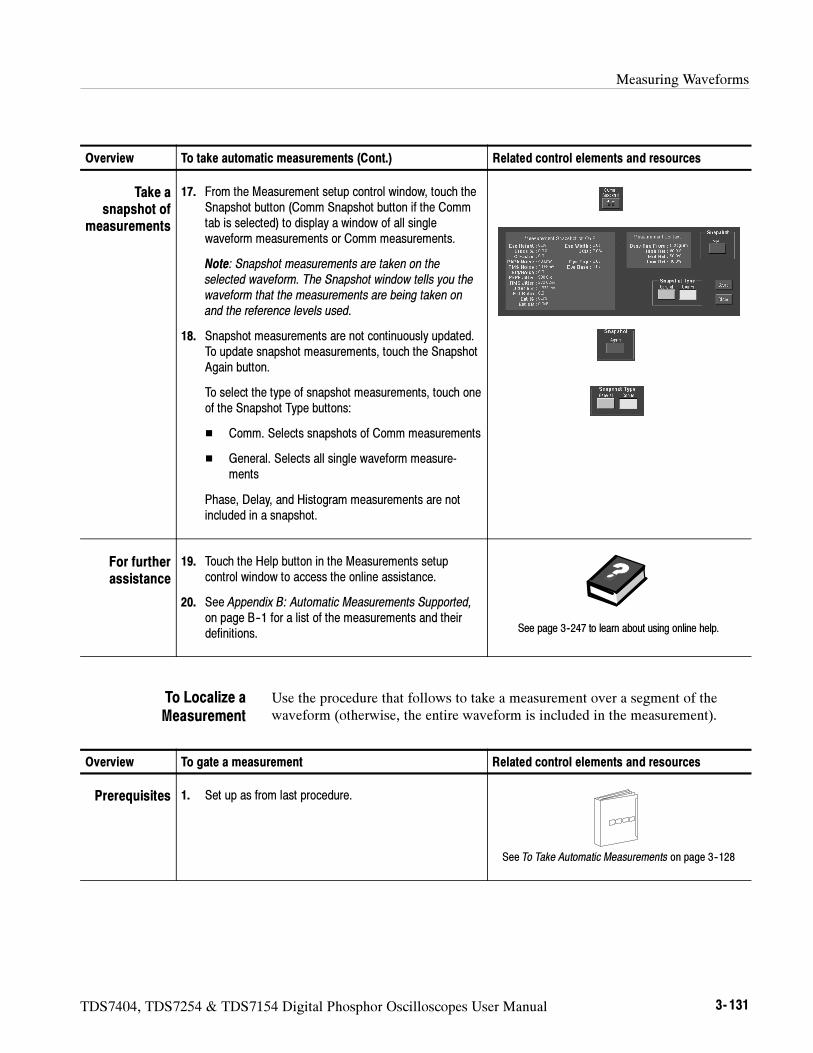
Measuring Waveforms
TDS7404, TDS7254 & TDS7154 Digital Phosphor Oscilloscopes User Manual 3- 131
Overview Related control elements and resourcesTo take automatic measurements (Cont.)
Take asnapshot of
measurements
17. From the Measurement setup control window, touch theSnapshot button (Comm Snapshot button if the Commtab is selected) to display a window of all singlewaveform measurements or Comm measurements.
Note: Snapshot measurements are taken on theselected waveform. The Snapshot window tells you thewaveform that the measurements are being taken onand the reference levels used.
18. Snapshot measurements are not continuously updated.To update snapshot measurements, touch the SnapshotAgain button.
To select the type of snapshot measurements, touch oneof the Snapshot Type buttons:
Comm. Selects snapshots of Comm measurements
General. Selects all single waveform measure-ments
Phase, Delay, and Histogram measurements are notincluded in a snapshot.
For furtherassistance
19. Touch the Help button in the Measurements setupcontrol window to access the online assistance.
20. See Appendix B: Automatic Measurements Supported,on page B--1 for a list of the measurements and theirdefinitions. See page 3--247 to learn about using online help.
Use the procedure that follows to take a measurement over a segment of thewaveform (otherwise, the entire waveform is included in the measurement).
Overview To gate a measurement Related control elements and resources
Prerequisites 1. Set up as from last procedure.
See To Take Automatic Measurements on page 3--128
To Localize aMeasurement
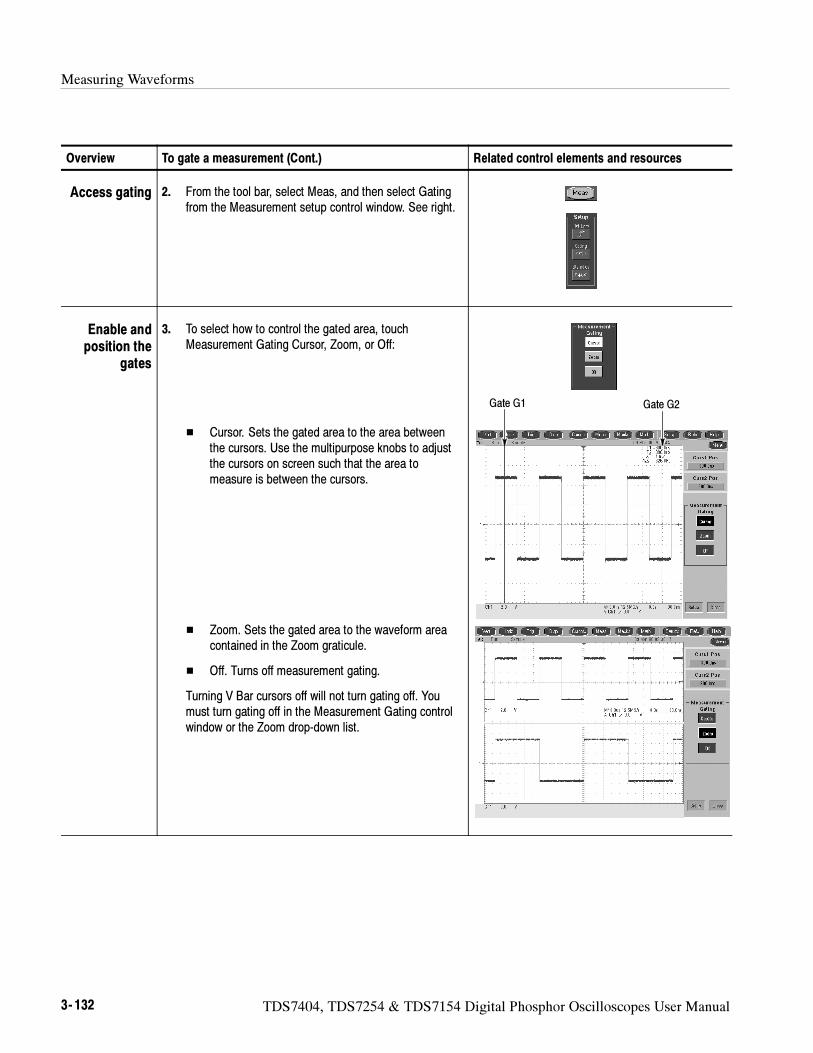
Measuring Waveforms
3- 132 TDS7404, TDS7254 & TDS7154 Digital Phosphor Oscilloscopes User Manual
Overview Related control elements and resourcesTo gate a measurement (Cont.)
Access gating 2. From the tool bar, select Meas, and then select Gatingfrom the Measurement setup control window. See right.
Enable andposition the
gates
3. To select how to control the gated area, touchMeasurement Gating Cursor, Zoom, or Off:
Cursor. Sets the gated area to the area betweenthe cursors. Use the multipurpose knobs to adjustthe cursors on screen such that the area tomeasure is between the cursors.
Zoom. Sets the gated area to the waveform areacontained in the Zoom graticule.
Off. Turns off measurement gating.
Turning V Bar cursors off will not turn gating off. Youmust turn gating off in the Measurement Gating controlwindow or the Zoom drop-down list.
Gate G1 Gate G2
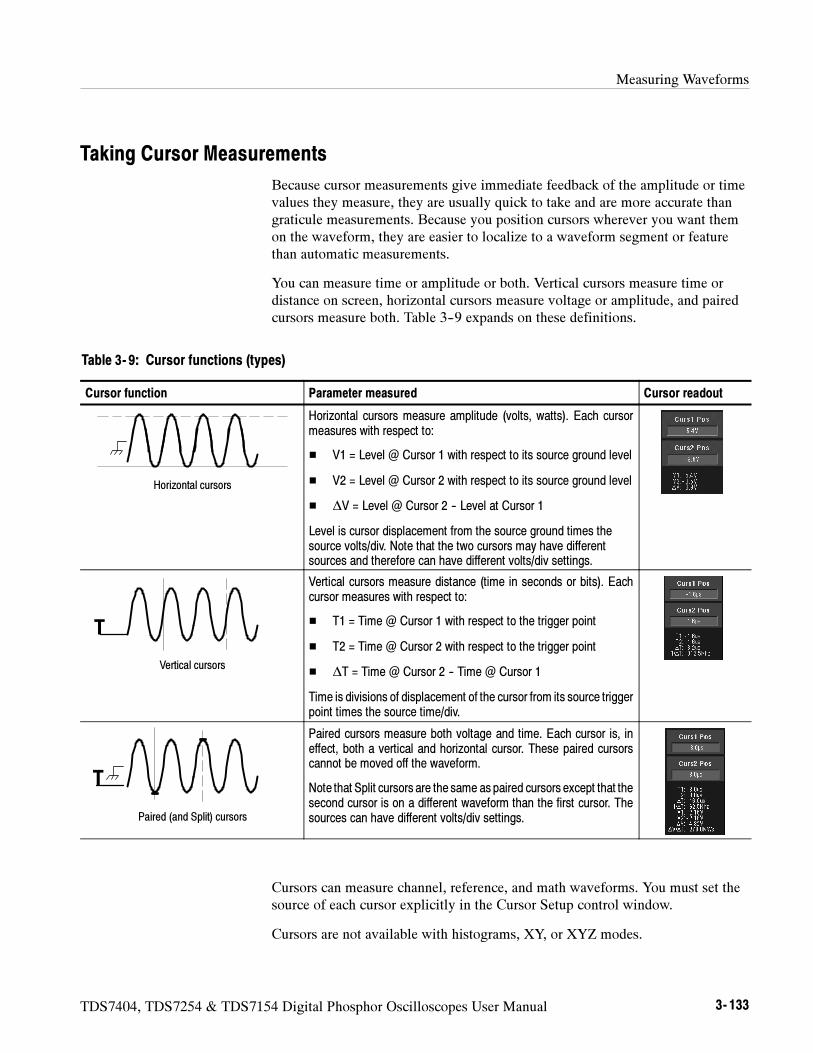
Measuring Waveforms
TDS7404, TDS7254 & TDS7154 Digital Phosphor Oscilloscopes User Manual 3- 133
Taking Cursor Measurements
Because cursor measurements give immediate feedback of the amplitude or timevalues they measure, they are usually quick to take and are more accurate thangraticule measurements. Because you position cursors wherever you want themon the waveform, they are easier to localize to a waveform segment or featurethan automatic measurements.
You can measure time or amplitude or both. Vertical cursors measure time ordistance on screen, horizontal cursors measure voltage or amplitude, and pairedcursors measure both. Table 3--9 expands on these definitions.
Table 3- 9: Cursor functions (types)
Cursor function Parameter measured Cursor readout
Horizontal cursors
Horizontal cursors measure amplitude (volts, watts). Each cursormeasures with respect to:
V1 = Level @ Cursor 1 with respect to its source ground level
V2 = Level @ Cursor 2 with respect to its source ground level
∆V = Level @ Cursor 2 -- Level at Cursor 1
Level is cursor displacement from the source ground times thesource volts/div. Note that the two cursors may have differentsources and therefore can have different volts/div settings.
Vertical cursors
T
Vertical cursors measure distance (time in seconds or bits). Eachcursor measures with respect to:
T1 = Time @ Cursor 1 with respect to the trigger point
T2 = Time @ Cursor 2 with respect to the trigger point
∆T = Time @ Cursor 2 -- Time @ Cursor 1
Time is divisions of displacement of the cursor from its source triggerpoint times the source time/div.
Paired (and Split) cursors
T
Paired cursors measure both voltage and time. Each cursor is, ineffect, both a vertical and horizontal cursor. These paired cursorscannot be moved off the waveform.
Note that Split cursors are the same as paired cursors except that thesecond cursor is on a different waveform than the first cursor. Thesources can have different volts/div settings.
Cursors can measure channel, reference, and math waveforms. You must set thesource of each cursor explicitly in the Cursor Setup control window.
Cursors are not available with histograms, XY, or XYZ modes.
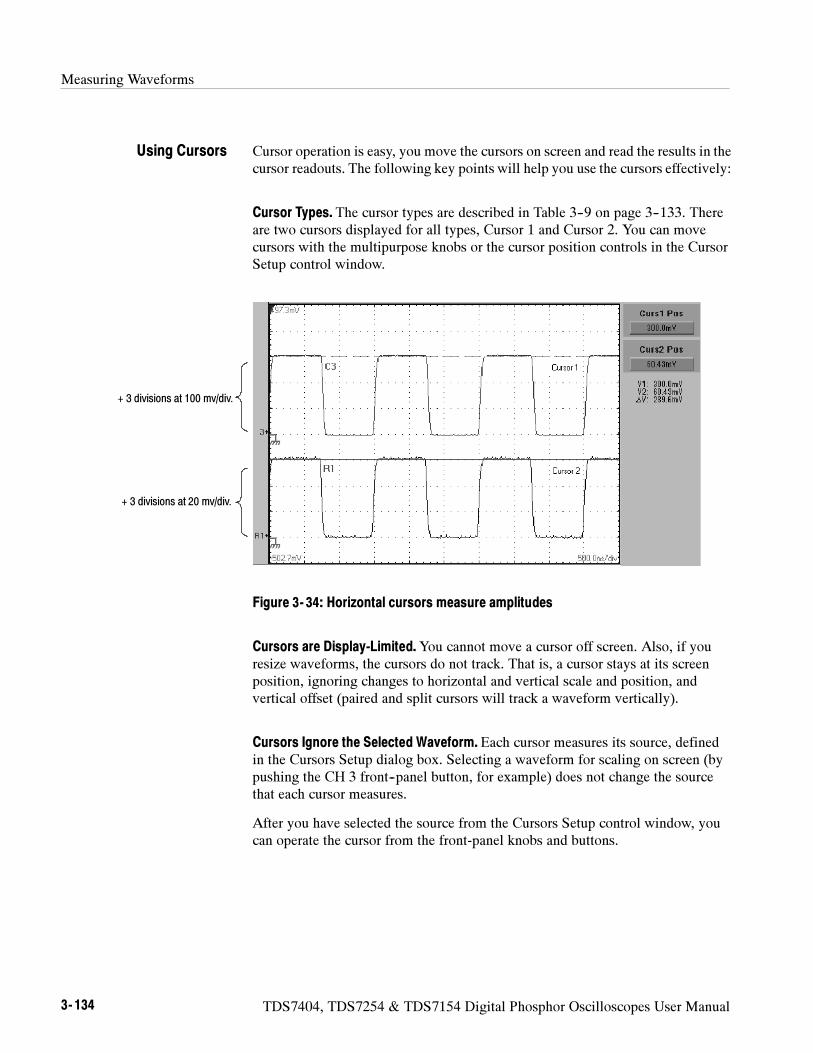
Measuring Waveforms
3- 134 TDS7404, TDS7254 & TDS7154 Digital Phosphor Oscilloscopes User Manual
Cursor operation is easy, you move the cursors on screen and read the results in thecursor readouts. The following key points will help you use the cursors effectively:
Cursor Types. The cursor types are described in Table 3--9 on page 3--133. Thereare two cursors displayed for all types, Cursor 1 and Cursor 2. You can movecursors with the multipurpose knobs or the cursor position controls in the CursorSetup control window.
+ 3 divisions at 100 mv/div.
+ 3 divisions at 20 mv/div.
Figure 3- 34: Horizontal cursors measure amplitudes
Cursors are Display-Limited.You cannot move a cursor off screen. Also, if youresize waveforms, the cursors do not track. That is, a cursor stays at its screenposition, ignoring changes to horizontal and vertical scale and position, andvertical offset (paired and split cursors will track a waveform vertically).
Cursors Ignore the Selected Waveform. Each cursor measures its source, definedin the Cursors Setup dialog box. Selecting a waveform for scaling on screen (bypushing the CH 3 front--panel button, for example) does not change the sourcethat each cursor measures.
After you have selected the source from the Cursors Setup control window, youcan operate the cursor from the front-panel knobs and buttons.
Using Cursors
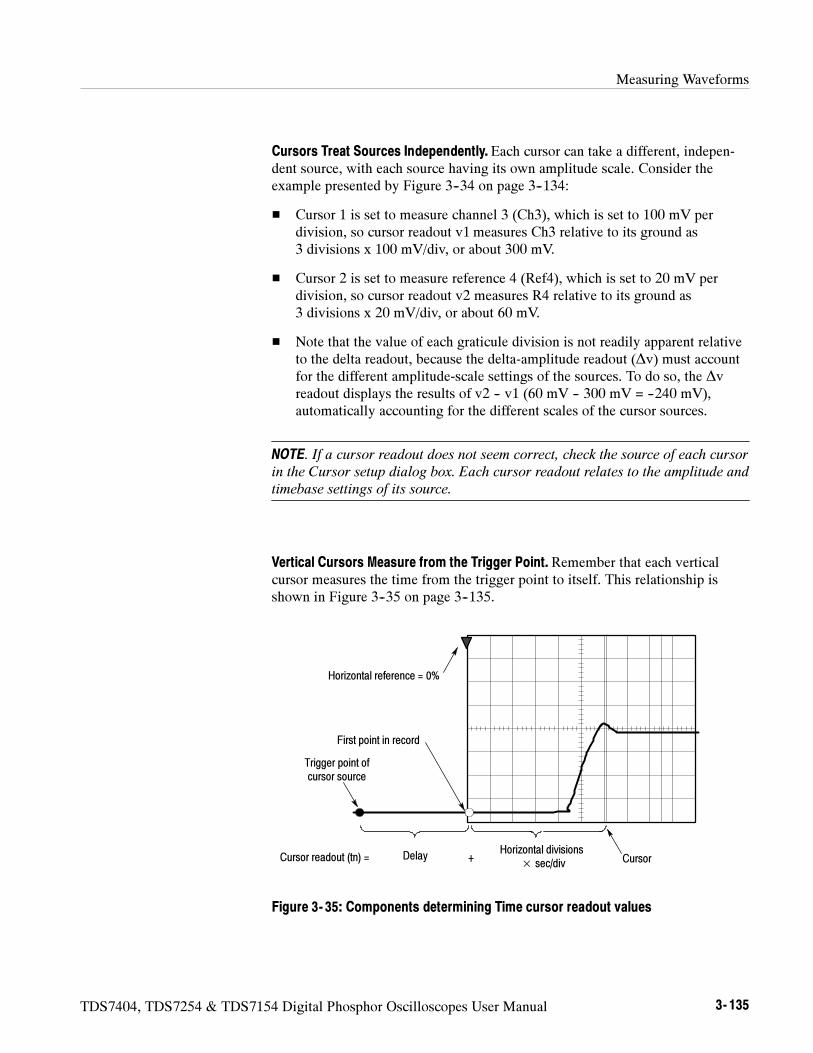
Measuring Waveforms
TDS7404, TDS7254 & TDS7154 Digital Phosphor Oscilloscopes User Manual 3- 135
Cursors Treat Sources Independently. Each cursor can take a different, indepen-dent source, with each source having its own amplitude scale. Consider theexample presented by Figure 3--34 on page 3--134:
Cursor 1 is set to measure channel 3 (Ch3), which is set to 100 mV perdivision, so cursor readout v1 measures Ch3 relative to its ground as3 divisions x 100 mV/div, or about 300 mV.
Cursor 2 is set to measure reference 4 (Ref4), which is set to 20 mV perdivision, so cursor readout v2 measures R4 relative to its ground as3 divisions x 20 mV/div, or about 60 mV.
Note that the value of each graticule division is not readily apparent relativeto the delta readout, because the delta-amplitude readout (∆v) must accountfor the different amplitude-scale settings of the sources. To do so, the ∆vreadout displays the results of v2 -- v1 (60 mV -- 300 mV = --240 mV),automatically accounting for the different scales of the cursor sources.
NOTE. If a cursor readout does not seem correct, check the source of each cursor
in the Cursor setup dialog box. Each cursor readout relates to the amplitude and
timebase settings of its source.
Vertical Cursors Measure from the Trigger Point. Remember that each verticalcursor measures the time from the trigger point to itself. This relationship isshown in Figure 3--35 on page 3--135.
First point in record
Delay
Trigger point ofcursor source
Horizontal divisions× sec/div+ CursorCursor readout (tn) =
Horizontal reference = 0%
Figure 3- 35: Components determining Time cursor readout values
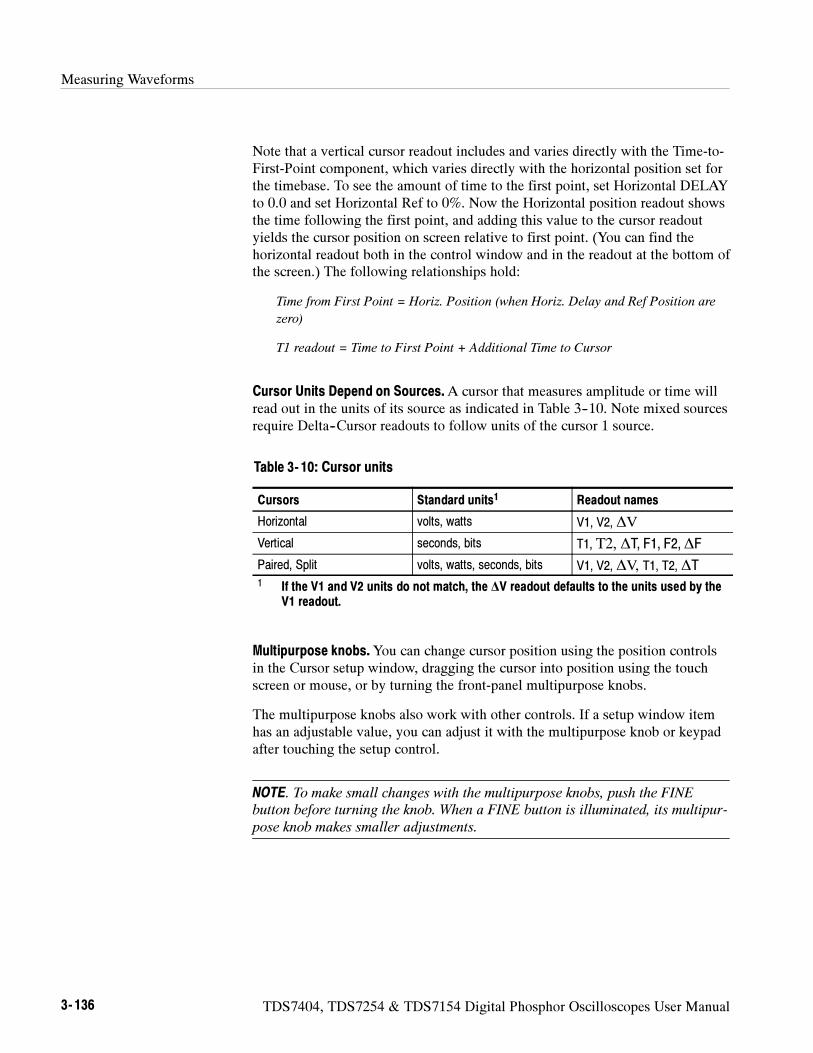
Measuring Waveforms
3- 136 TDS7404, TDS7254 & TDS7154 Digital Phosphor Oscilloscopes User Manual
Note that a vertical cursor readout includes and varies directly with the Time-to-First-Point component, which varies directly with the horizontal position set forthe timebase. To see the amount of time to the first point, set Horizontal DELAYto 0.0 and set Horizontal Ref to 0%. Now the Horizontal position readout showsthe time following the first point, and adding this value to the cursor readoutyields the cursor position on screen relative to first point. (You can find thehorizontal readout both in the control window and in the readout at the bottom ofthe screen.) The following relationships hold:
Time from First Point = Horiz. Position (when Horiz. Delay and Ref Position are
zero)
T1 readout = Time to First Point + Additional Time to Cursor
Cursor Units Depend on Sources.A cursor that measures amplitude or time willread out in the units of its source as indicated in Table 3--10. Note mixed sourcesrequire Delta--Cursor readouts to follow units of the cursor 1 source.
Table 3- 10: Cursor units
Cursors Standard units1 Readout names
Horizontal volts, watts V1, V2, ∆V
Vertical seconds, bits T1, Τ2, ∆T, F1, F2,∆F
Paired, Split volts, watts, seconds, bits V1, V2, ∆V, T1, T2, ∆T1 If the V1 and V2 units do not match, the ∆V readout defaults to the units used by the
V1 readout.
Multipurpose knobs.You can change cursor position using the position controlsin the Cursor setup window, dragging the cursor into position using the touchscreen or mouse, or by turning the front-panel multipurpose knobs.
The multipurpose knobs also work with other controls. If a setup window itemhas an adjustable value, you can adjust it with the multipurpose knob or keypadafter touching the setup control.
NOTE. To make small changes with the multipurpose knobs, push the FINE
button before turning the knob. When a FINE button is illuminated, its multipur-
pose knob makes smaller adjustments.
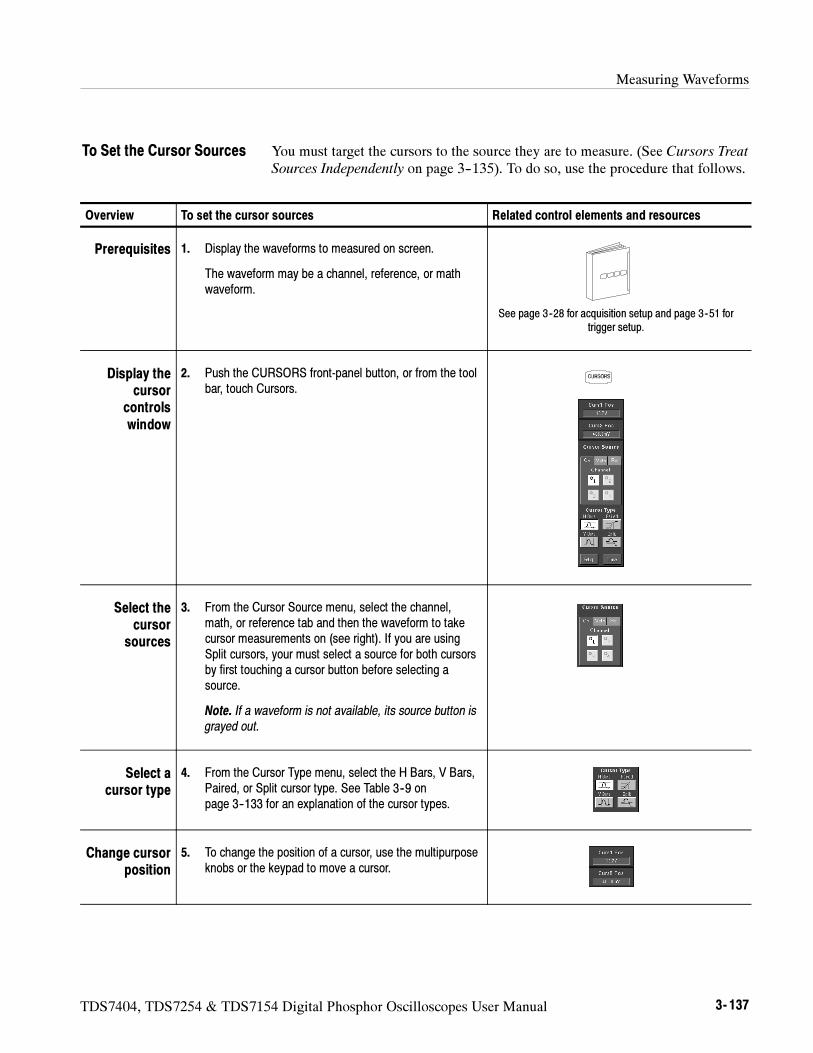
Measuring Waveforms
TDS7404, TDS7254 & TDS7154 Digital Phosphor Oscilloscopes User Manual 3- 137
You must target the cursors to the source they are to measure. (See Cursors TreatSources Independently on page 3--135). To do so, use the procedure that follows.
Overview To set the cursor sources Related control elements and resources
Prerequisites 1. Display the waveforms to measured on screen.
The waveform may be a channel, reference, or mathwaveform.
See page 3--28 for acquisition setup and page 3--51 fortrigger setup.
Display thecursor
controlswindow
2. Push the CURSORS front-panel button, or from the toolbar, touch Cursors.
Select thecursor
sources
3. From the Cursor Source menu, select the channel,math, or reference tab and then the waveform to takecursor measurements on (see right). If you are usingSplit cursors, your must select a source for both cursorsby first touching a cursor button before selecting asource.
Note. If a waveform is not available, its source button isgrayed out.
Select acursor type
4. From the Cursor Type menu, select the H Bars, V Bars,Paired, or Split cursor type. See Table 3--9 onpage 3--133 for an explanation of the cursor types.
Change cursorposition
5. To change the position of a cursor, use the multipurposeknobs or the keypad to move a cursor.
To Set the Cursor Sources
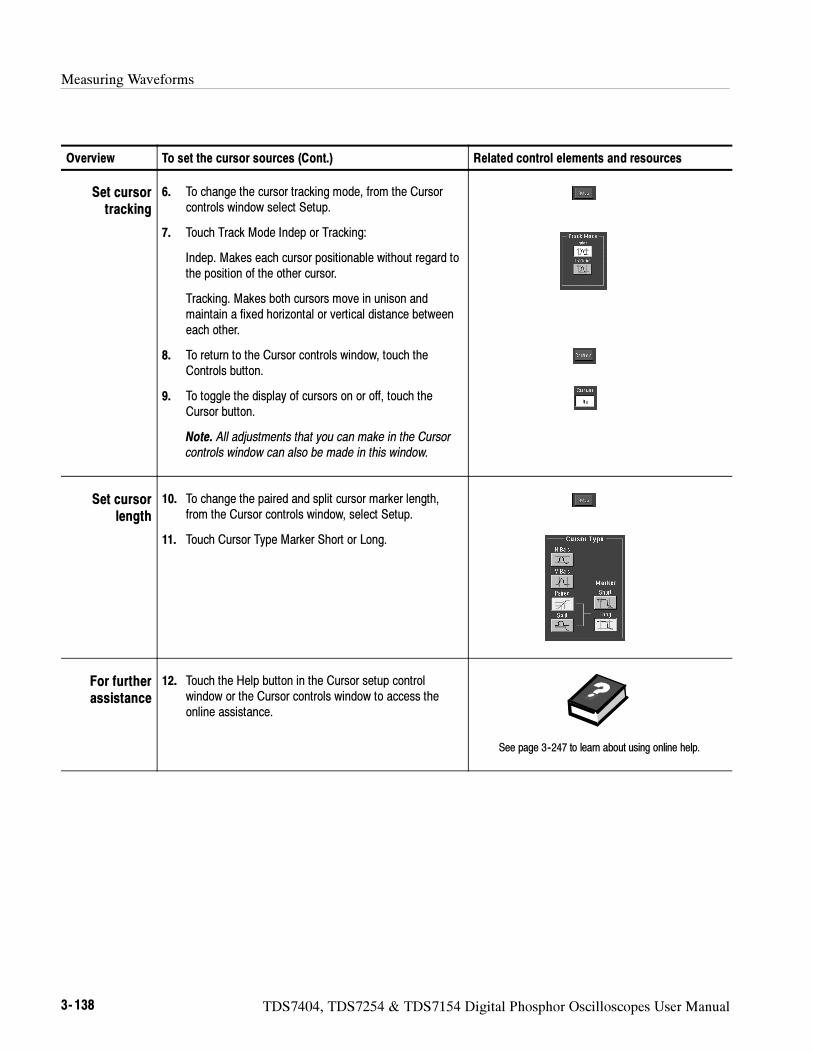
Measuring Waveforms
3- 138 TDS7404, TDS7254 & TDS7154 Digital Phosphor Oscilloscopes User Manual
Overview Related control elements and resourcesTo set the cursor sources (Cont.)
Set cursortracking
6. To change the cursor tracking mode, from the Cursorcontrols window select Setup.
7. Touch Track Mode Indep or Tracking:
Indep. Makes each cursor positionable without regard tothe position of the other cursor.
Tracking. Makes both cursors move in unison andmaintain a fixed horizontal or vertical distance betweeneach other.
8. To return to the Cursor controls window, touch theControls button.
9. To toggle the display of cursors on or off, touch theCursor button.
Note. All adjustments that you can make in the Cursorcontrols window can also be made in this window.
Set cursorlength
10. To change the paired and split cursor marker length,from the Cursor controls window, select Setup.
11. Touch Cursor Type Marker Short or Long.
For furtherassistance
12. Touch the Help button in the Cursor setup controlwindow or the Cursor controls window to access theonline assistance.
See page 3--247 to learn about using online help.
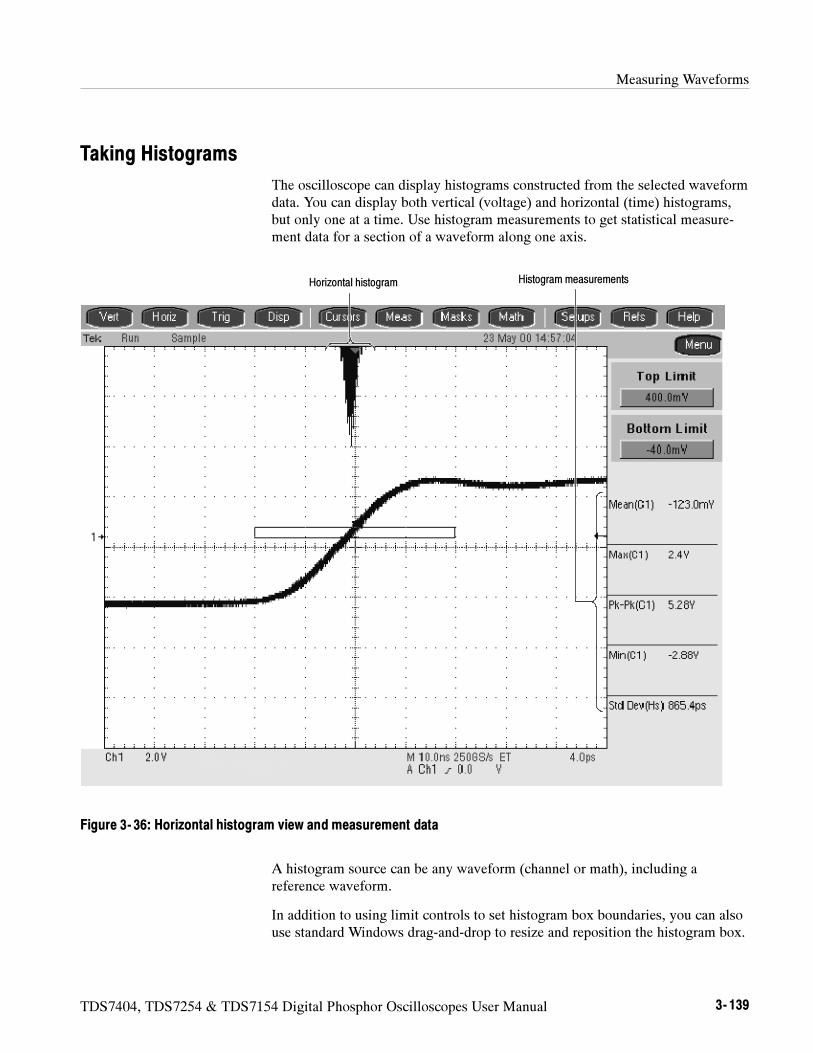
Measuring Waveforms
TDS7404, TDS7254 & TDS7154 Digital Phosphor Oscilloscopes User Manual 3- 139
Taking Histograms
The oscilloscope can display histograms constructed from the selected waveformdata. You can display both vertical (voltage) and horizontal (time) histograms,but only one at a time. Use histogram measurements to get statistical measure-ment data for a section of a waveform along one axis.
Horizontal histogram Histogram measurements
Figure 3- 36: Horizontal histogram view and measurement data
A histogram source can be any waveform (channel or math), including areference waveform.
In addition to using limit controls to set histogram box boundaries, you can alsouse standard Windows drag-and-drop to resize and reposition the histogram box.
Measuring Waveforms
3- 140 TDS7404, TDS7254 & TDS7154 Digital Phosphor Oscilloscopes User Manual
Histograms are not available in FastFrame or Zoom modes.
Histogram Size. The maximum vertical histogram size is 200. The maximumhorizontal size is 500.
Histogram Counting Stays On. Turning on histograms starts histogram countingand data accumulation. A sample histogram display is shown in Figure 3--36.Histogram data is continuously accumulated until you explicitly turn offhistograms. This allows you to continue collecting histogram data even whenyou turn off the histogram display.
Using Histograms
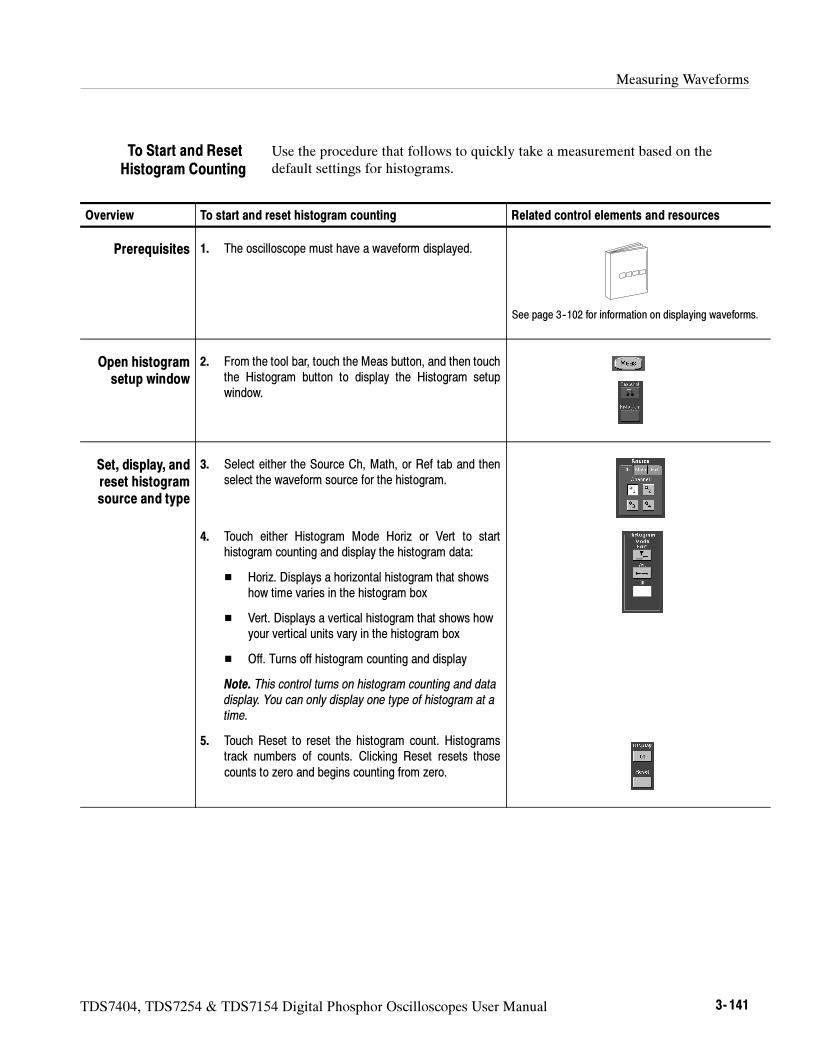
Measuring Waveforms
TDS7404, TDS7254 & TDS7154 Digital Phosphor Oscilloscopes User Manual 3- 141
Use the procedure that follows to quickly take a measurement based on thedefault settings for histograms.
Overview To start and reset histogram counting Related control elements and resources
Prerequisites 1. The oscilloscope must have a waveform displayed.
See page 3--102 for information on displaying waveforms.
Open histogramsetup window
2. From the tool bar, touch the Meas button, and then touchthe Histogram button to display the Histogram setupwindow.
Set, display, andreset histogramsource and type
3. Select either the Source Ch, Math, or Ref tab and thenselect the waveform source for the histogram.
4. Touch either Histogram Mode Horiz or Vert to starthistogram counting and display the histogram data:
Horiz. Displays a horizontal histogram that showshow time varies in the histogram box
Vert. Displays a vertical histogram that shows howyour vertical units vary in the histogram box
Off. Turns off histogram counting and display
Note. This control turns on histogram counting and datadisplay. You can only display one type of histogram at atime.
5. Touch Reset to reset the histogram count. Histogramstrack numbers of counts. Clicking Reset resets thosecounts to zero and begins counting from zero.
To Start and ResetHistogram Counting
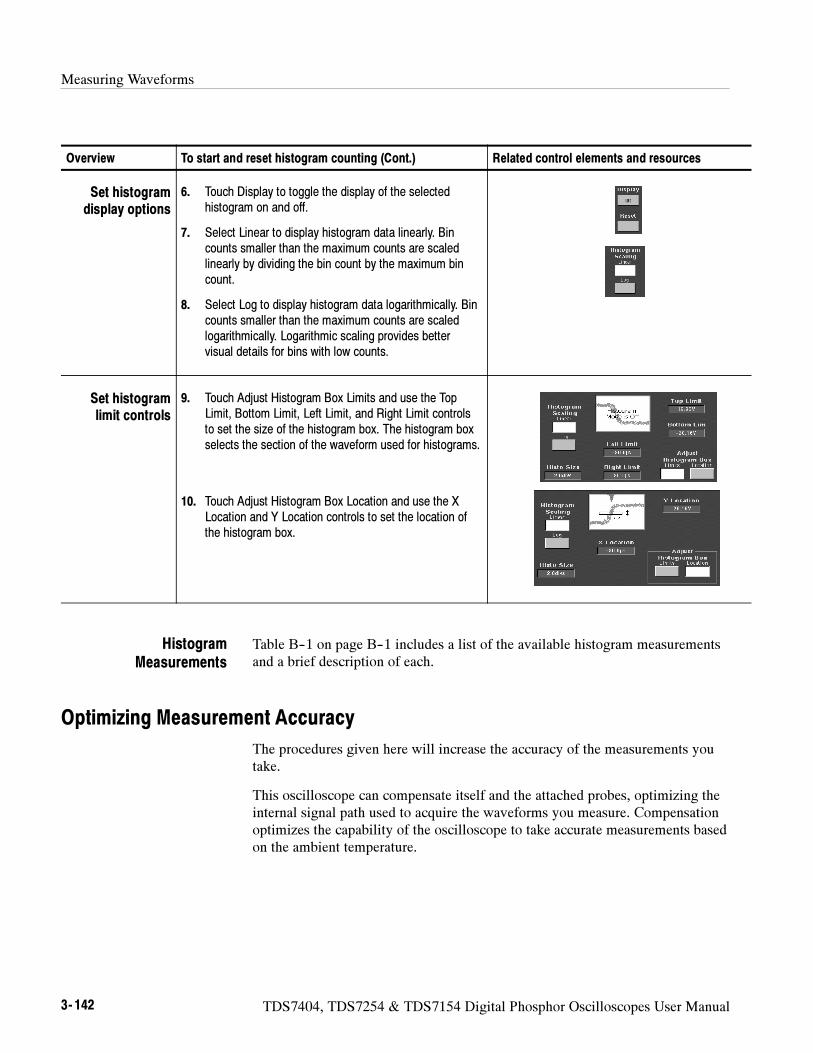
Measuring Waveforms
3- 142 TDS7404, TDS7254 & TDS7154 Digital Phosphor Oscilloscopes User Manual
Overview Related control elements and resourcesTo start and reset histogram counting (Cont.)
Set histogramdisplay options
6. Touch Display to toggle the display of the selectedhistogram on and off.
7. Select Linear to display histogram data linearly. Bincounts smaller than the maximum counts are scaledlinearly by dividing the bin count by the maximum bincount.
8. Select Log to display histogram data logarithmically. Bincounts smaller than the maximum counts are scaledlogarithmically. Logarithmic scaling provides bettervisual details for bins with low counts.
Set histogramlimit controls
9. Touch Adjust Histogram Box Limits and use the TopLimit, Bottom Limit, Left Limit, and Right Limit controlsto set the size of the histogram box. The histogram boxselects the section of the waveform used for histograms.
10. Touch Adjust Histogram Box Location and use the XLocation and Y Location controls to set the location ofthe histogram box.
Table B--1 on page B--1 includes a list of the available histogram measurementsand a brief description of each.
Optimizing Measurement Accuracy
The procedures given here will increase the accuracy of the measurements youtake.
This oscilloscope can compensate itself and the attached probes, optimizing theinternal signal path used to acquire the waveforms you measure. Compensationoptimizes the capability of the oscilloscope to take accurate measurements basedon the ambient temperature.
HistogramMeasurements
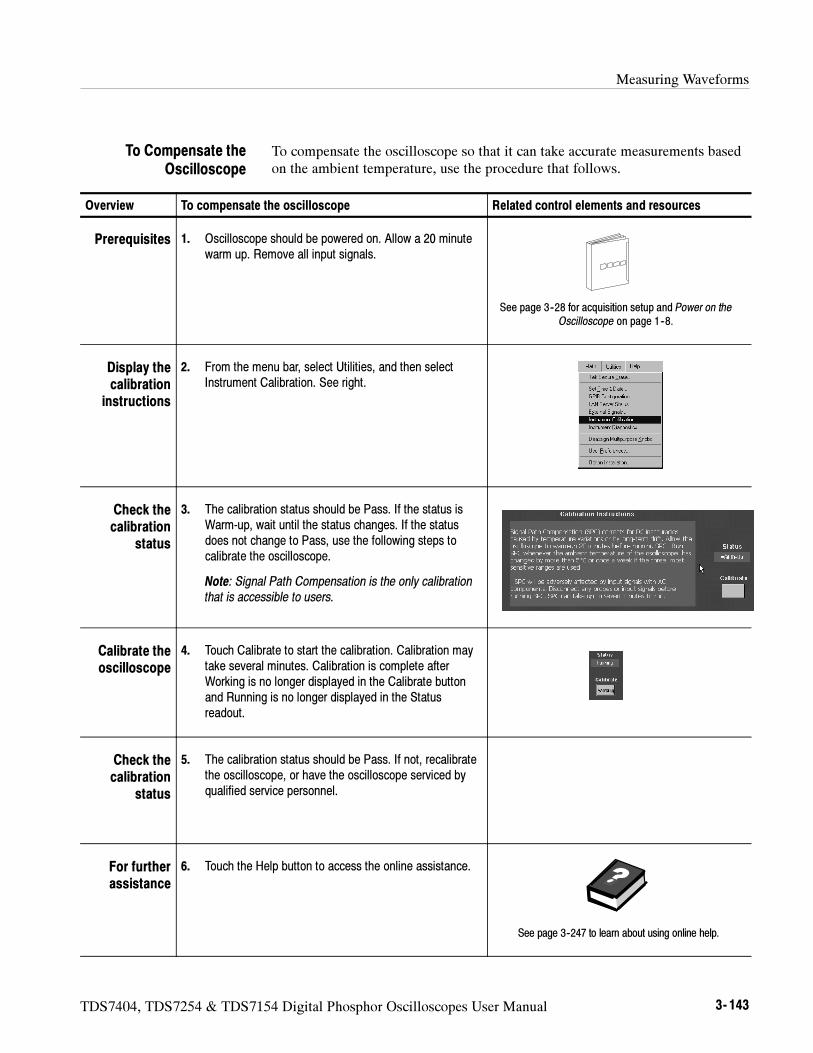
Measuring Waveforms
TDS7404, TDS7254 & TDS7154 Digital Phosphor Oscilloscopes User Manual 3- 143
To compensate the oscilloscope so that it can take accurate measurements basedon the ambient temperature, use the procedure that follows.
Overview To compensate the oscilloscope Related control elements and resources
Prerequisites 1. Oscilloscope should be powered on. Allow a 20 minutewarm up. Remove all input signals.
See page 3--28 for acquisition setup and Power on theOscilloscope on page 1--8.
Display thecalibration
instructions
2. From the menu bar, select Utilities, and then selectInstrument Calibration. See right.
Check thecalibration
status
3. The calibration status should be Pass. If the status isWarm-up, wait until the status changes. If the statusdoes not change to Pass, use the following steps tocalibrate the oscilloscope.
Note: Signal Path Compensation is the only calibrationthat is accessible to users.
Calibrate theoscilloscope
4. Touch Calibrate to start the calibration. Calibration maytake several minutes. Calibration is complete afterWorking is no longer displayed in the Calibrate buttonand Running is no longer displayed in the Statusreadout.
Check thecalibration
status
5. The calibration status should be Pass. If not, recalibratethe oscilloscope, or have the oscilloscope serviced byqualified service personnel.
For furtherassistance
6. Touch the Help button to access the online assistance.
See page 3--247 to learn about using online help.
To Compensate theOscilloscope
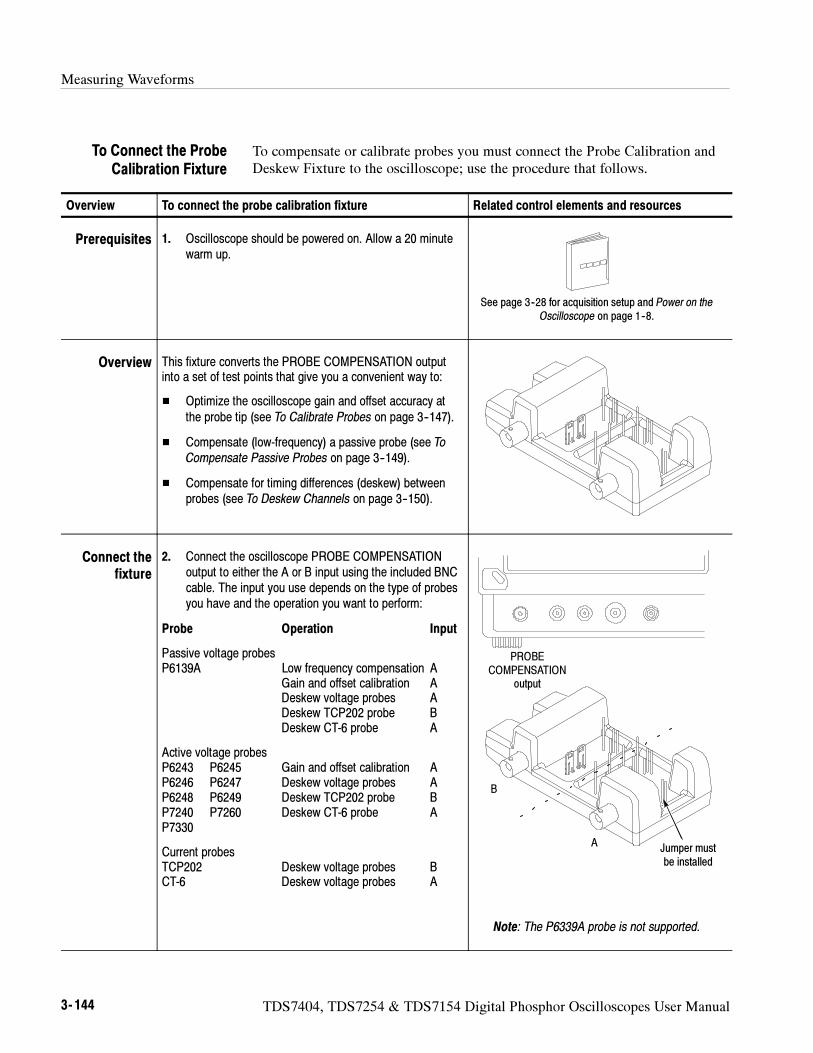
Measuring Waveforms
3- 144 TDS7404, TDS7254 & TDS7154 Digital Phosphor Oscilloscopes User Manual
To compensate or calibrate probes you must connect the Probe Calibration andDeskew Fixture to the oscilloscope; use the procedure that follows.
Overview To connect the probe calibration fixture Related control elements and resources
Prerequisites 1. Oscilloscope should be powered on. Allow a 20 minutewarm up.
See page 3--28 for acquisition setup and Power on theOscilloscope on page 1--8.
Overview This fixture converts the PROBE COMPENSATION outputinto a set of test points that give you a convenient way to:
Optimize the oscilloscope gain and offset accuracy atthe probe tip (see To Calibrate Probes on page 3--147).
Compensate (low-frequency) a passive probe (see ToCompensate Passive Probes on page 3--149).
Compensate for timing differences (deskew) betweenprobes (see To Deskew Channels on page 3--150).
Connect thefixture
2. Connect the oscilloscope PROBE COMPENSATIONoutput to either the A or B input using the included BNCcable. The input you use depends on the type of probesyou have and the operation you want to perform:
Probe Operation Input
Passive voltage probesP6139A Low frequency compensation A
Gain and offset calibration ADeskew voltage probes ADeskew TCP202 probe BDeskew CT-6 probe A
Active voltage probesP6243 P6245 Gain and offset calibration AP6246 P6247 Deskew voltage probes AP6248 P6249 Deskew TCP202 probe BP7240 P7260 Deskew CT-6 probe AP7330
Current probesTCP202 Deskew voltage probes BCT-6 Deskew voltage probes A
A
B
PROBECOMPENSATION
output
Jumper mustbe installed
Note: The P6339A probe is not supported.
To Connect the ProbeCalibration Fixture
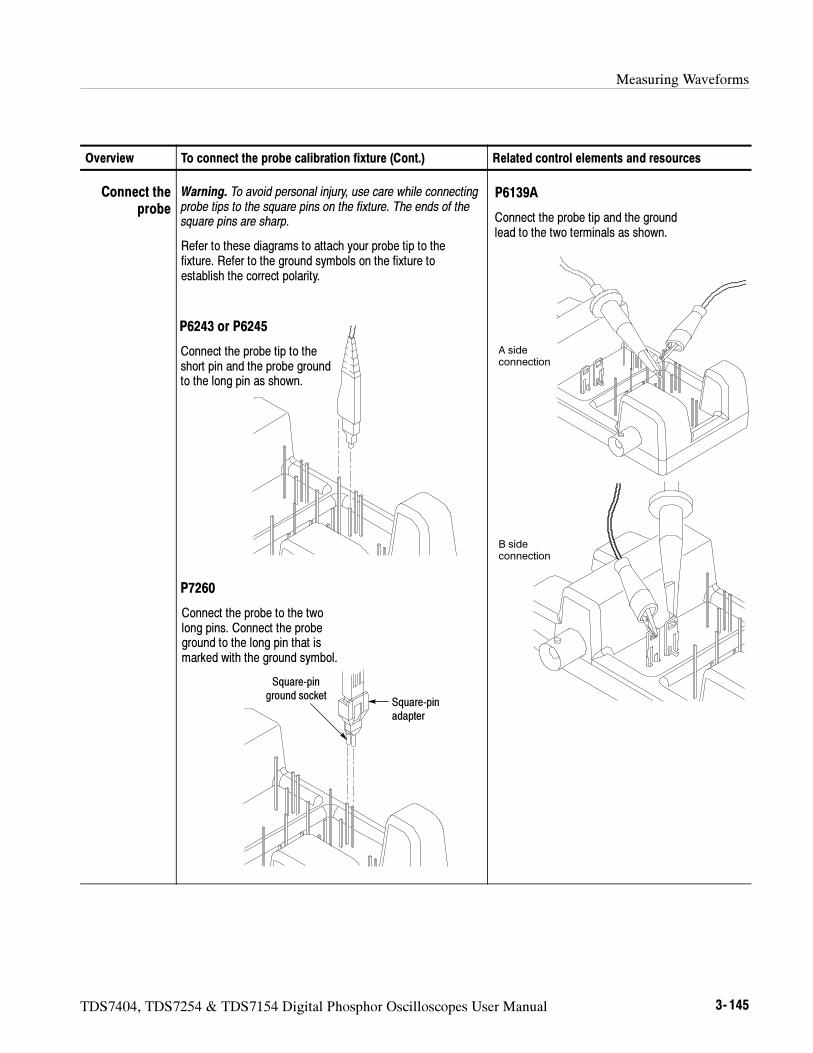
Measuring Waveforms
TDS7404, TDS7254 & TDS7154 Digital Phosphor Oscilloscopes User Manual 3- 145
Overview Related control elements and resourcesTo connect the probe calibration fixture (Cont.)
Connect theprobe
Warning. To avoid personal injury, use care while connectingprobe tips to the square pins on the fixture. The ends of thesquare pins are sharp.
Refer to these diagrams to attach your probe tip to thefixture. Refer to the ground symbols on the fixture toestablish the correct polarity.
P6243 or P6245
Connect the probe tip to theshort pin and the probe groundto the long pin as shown.
Square-pinadapter
Square-pinground socket
P7260
Connect the probe to the twolong pins. Connect the probeground to the long pin that ismarked with the ground symbol.
P6139A
Connect the probe tip and the groundlead to the two terminals as shown.
B side
connection
A side
connection
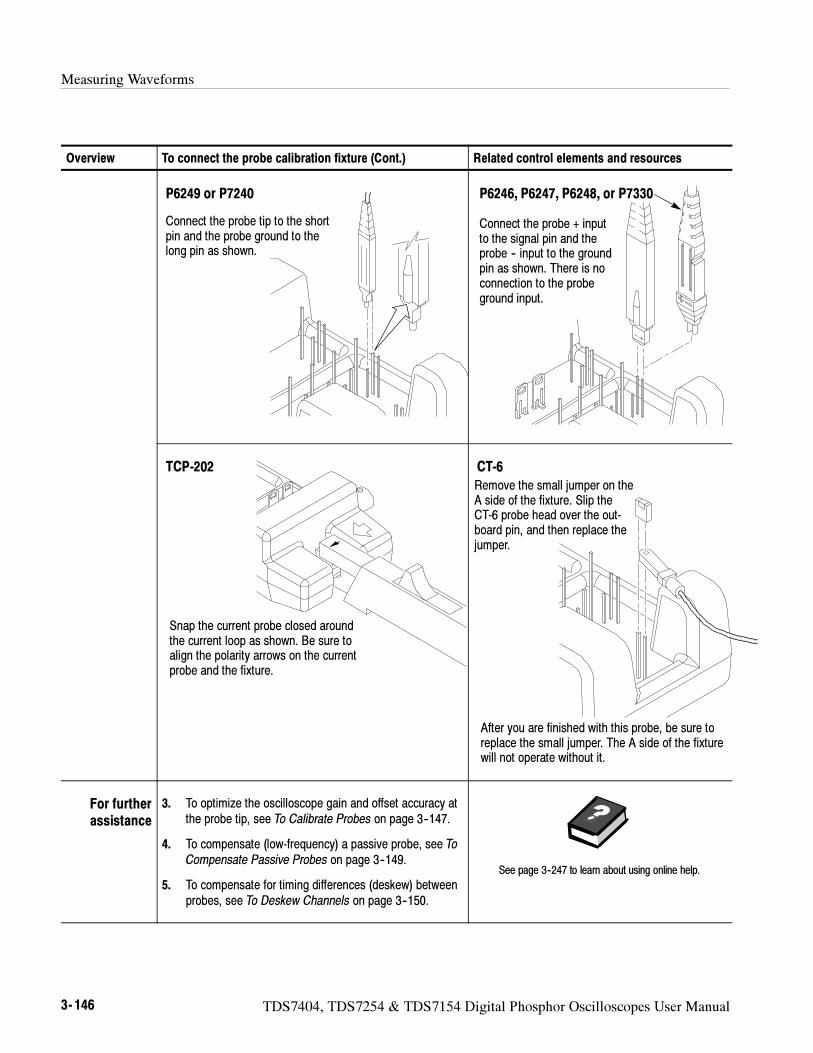
Measuring Waveforms
3- 146 TDS7404, TDS7254 & TDS7154 Digital Phosphor Oscilloscopes User Manual
Overview Related control elements and resourcesTo connect the probe calibration fixture (Cont.)
P6249 or P7240
Connect the probe tip to the shortpin and the probe ground to thelong pin as shown.
P6246, P6247, P6248, or P7330
Connect the probe + inputto the signal pin and theprobe -- input to the groundpin as shown. There is noconnection to the probeground input.
TCP-202
Snap the current probe closed aroundthe current loop as shown. Be sure toalign the polarity arrows on the currentprobe and the fixture.
CT-6
After you are finished with this probe, be sure toreplace the small jumper. The A side of the fixturewill not operate without it.
Remove the small jumper on theA side of the fixture. Slip theCT-6 probe head over the out-board pin, and then replace thejumper.
For furtherassistance
3. To optimize the oscilloscope gain and offset accuracy atthe probe tip, see To Calibrate Probes on page 3--147.
4. To compensate (low-frequency) a passive probe, see ToCompensate Passive Probes on page 3--149.
5. To compensate for timing differences (deskew) betweenprobes, see To Deskew Channels on page 3--150.
See page 3--247 to learn about using online help.
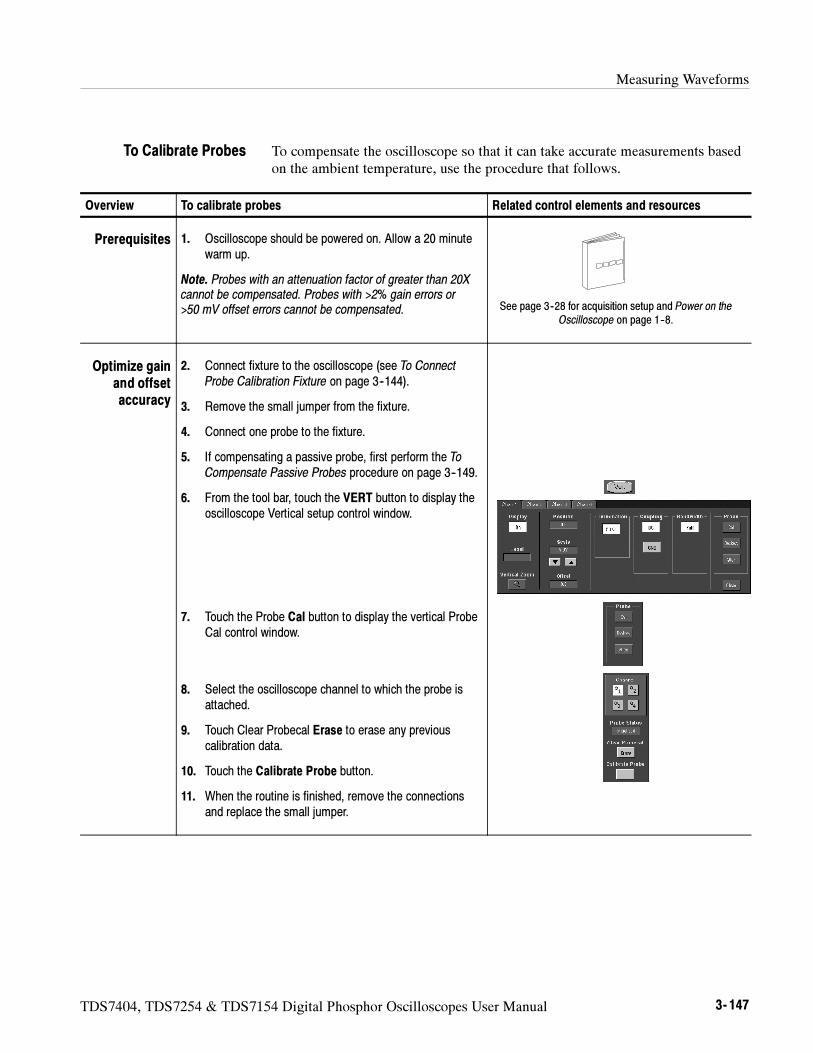
Measuring Waveforms
TDS7404, TDS7254 & TDS7154 Digital Phosphor Oscilloscopes User Manual 3- 147
To compensate the oscilloscope so that it can take accurate measurements basedon the ambient temperature, use the procedure that follows.
Overview To calibrate probes Related control elements and resources
Prerequisites 1. Oscilloscope should be powered on. Allow a 20 minutewarm up.
Note. Probes with an attenuation factor of greater than 20Xcannot be compensated. Probes with >2% gain errors or>50 mV offset errors cannot be compensated. See page 3--28 for acquisition setup and Power on the
Oscilloscope on page 1--8.
Optimize gainand offsetaccuracy
2. Connect fixture to the oscilloscope (see To ConnectProbe Calibration Fixture on page 3--144).
3. Remove the small jumper from the fixture.
4. Connect one probe to the fixture.
5. If compensating a passive probe, first perform the ToCompensate Passive Probes procedure on page 3--149.
6. From the tool bar, touch the VERT button to display theoscilloscope Vertical setup control window.
7. Touch the Probe Cal button to display the vertical ProbeCal control window.
8. Select the oscilloscope channel to which the probe isattached.
9. Touch Clear Probecal Erase to erase any previouscalibration data.
10. Touch the Calibrate Probe button.
11. When the routine is finished, remove the connectionsand replace the small jumper.
To Calibrate Probes
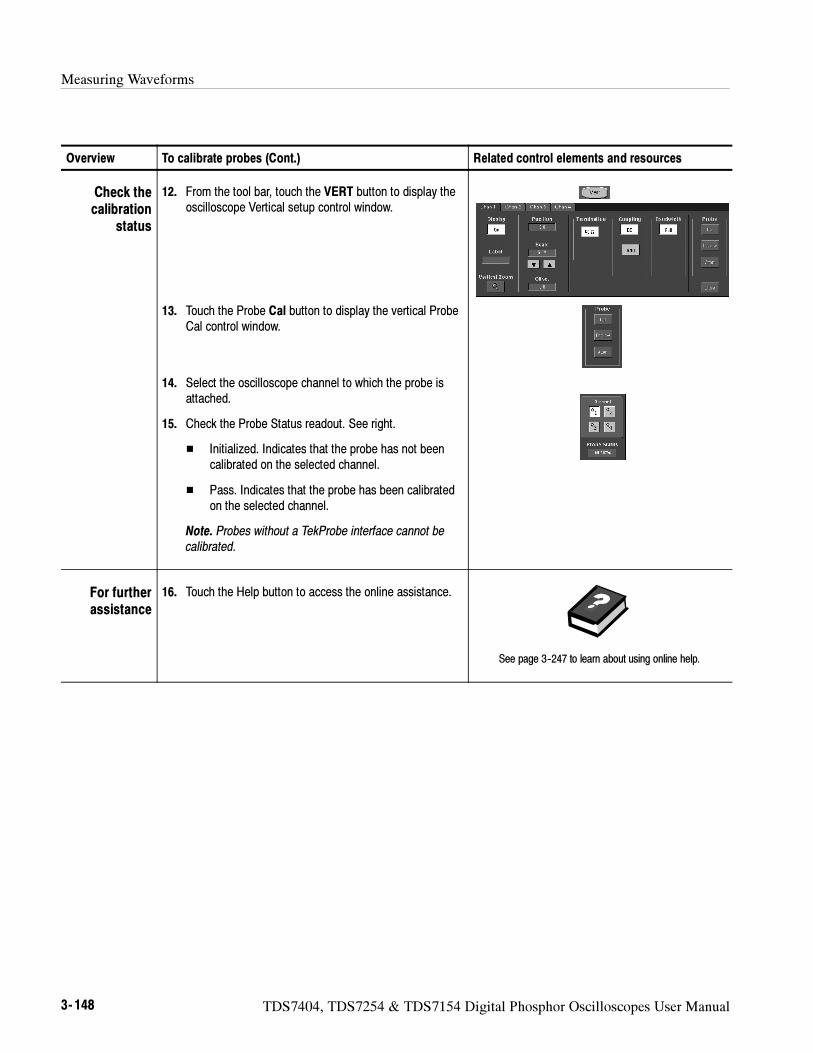
Measuring Waveforms
3- 148 TDS7404, TDS7254 & TDS7154 Digital Phosphor Oscilloscopes User Manual
Overview Related control elements and resourcesTo calibrate probes (Cont.)
Check thecalibration
status
12. From the tool bar, touch the VERT button to display theoscilloscope Vertical setup control window.
13. Touch the Probe Cal button to display the vertical ProbeCal control window.
14. Select the oscilloscope channel to which the probe isattached.
15. Check the Probe Status readout. See right.
Initialized. Indicates that the probe has not beencalibrated on the selected channel.
Pass. Indicates that the probe has been calibratedon the selected channel.
Note. Probes without a TekProbe interface cannot becalibrated.
For furtherassistance
16. Touch the Help button to access the online assistance.
See page 3--247 to learn about using online help.
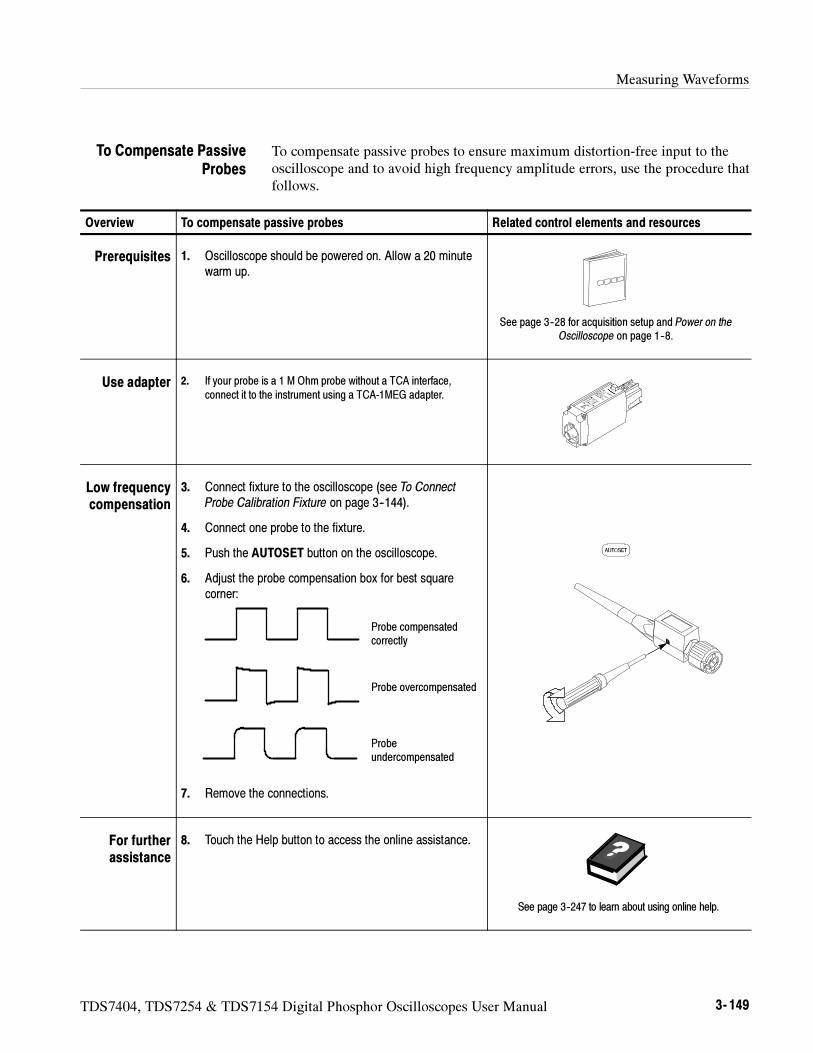
Measuring Waveforms
TDS7404, TDS7254 & TDS7154 Digital Phosphor Oscilloscopes User Manual 3- 149
To compensate passive probes to ensure maximum distortion-free input to theoscilloscope and to avoid high frequency amplitude errors, use the procedure thatfollows.
Overview To compensate passive probes Related control elements and resources
Prerequisites 1. Oscilloscope should be powered on. Allow a 20 minutewarm up.
See page 3--28 for acquisition setup and Power on theOscilloscope on page 1--8.
Use adapter 2. If your probe is a 1 M Ohm probe without a TCA interface,
connect it to the instrument using a TCA-1MEG adapter.
Low frequencycompensation
3. Connect fixture to the oscilloscope (see To ConnectProbe Calibration Fixture on page 3--144).
4. Connect one probe to the fixture.
5. Push the AUTOSET button on the oscilloscope.
6. Adjust the probe compensation box for best squarecorner:
Probe compensatedcorrectly
Probe overcompensated
Probeundercompensated
7. Remove the connections.
For furtherassistance
8. Touch the Help button to access the online assistance.
See page 3--247 to learn about using online help.
To Compensate PassiveProbes
Measuring Waveforms
3- 150 TDS7404, TDS7254 & TDS7154 Digital Phosphor Oscilloscopes User Manual
You can adjust a relative time delay for each channel. This lets you align thesignals to compensate for signals that may come in from cables of differinglengths. The oscilloscope applies deskew values after it completes eachacquisition; therefore, the deskew values do not affect logic triggering. Also,deskew has no affect on XY and XYZ display formats.
Overview To deskew channels Related control elements and resources
Prerequisites 1. Oscilloscope should be powered on. Allow a 20 minutewarm up.
See page 3--28 for acquisition setup and Power on theOscilloscope on page 1--8.
To Deskew Channels
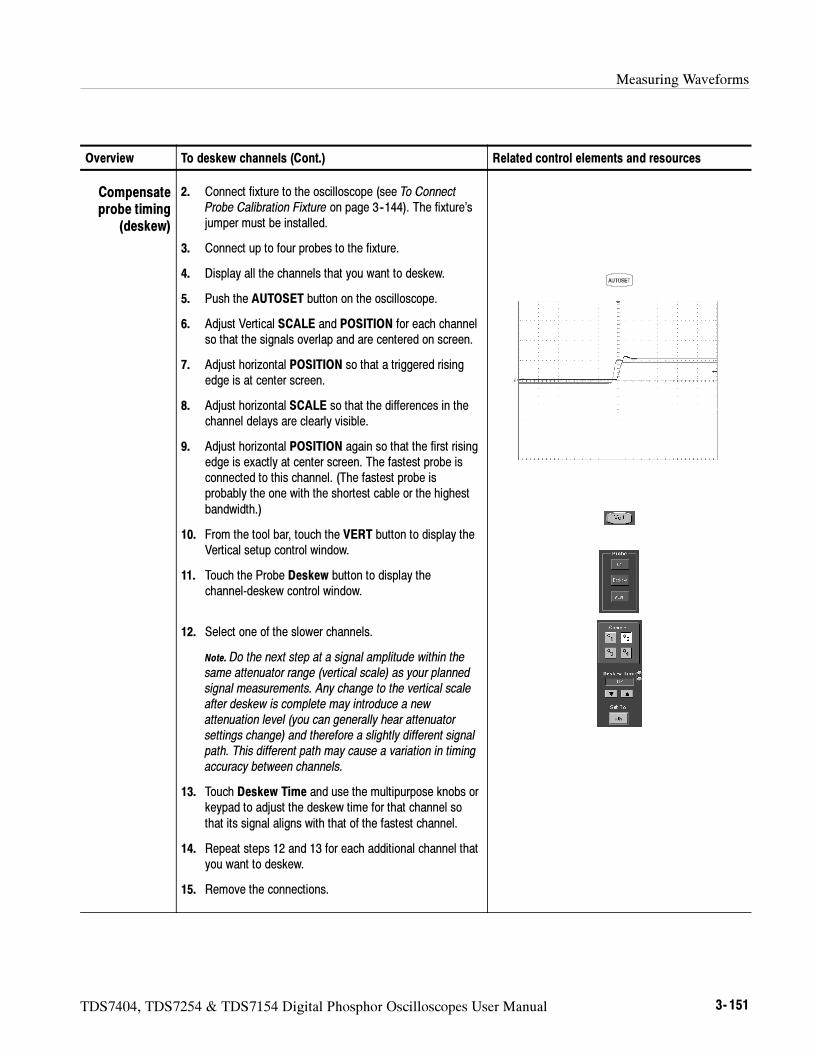
Measuring Waveforms
TDS7404, TDS7254 & TDS7154 Digital Phosphor Oscilloscopes User Manual 3- 151
Overview Related control elements and resourcesTo deskew channels (Cont.)
Compensateprobe timing
(deskew)
2. Connect fixture to the oscilloscope (see To ConnectProbe Calibration Fixture on page 3--144). The fixture’sjumper must be installed.
3. Connect up to four probes to the fixture.
4. Display all the channels that you want to deskew.
5. Push the AUTOSET button on the oscilloscope.
6. Adjust Vertical SCALE and POSITION for each channelso that the signals overlap and are centered on screen.
7. Adjust horizontal POSITION so that a triggered risingedge is at center screen.
8. Adjust horizontal SCALE so that the differences in thechannel delays are clearly visible.
9. Adjust horizontal POSITION again so that the first risingedge is exactly at center screen. The fastest probe isconnected to this channel. (The fastest probe isprobably the one with the shortest cable or the highestbandwidth.)
10. From the tool bar, touch the VERT button to display theVertical setup control window.
11. Touch the Probe Deskew button to display thechannel-deskew control window.
12. Select one of the slower channels.
Note. Do the next step at a signal amplitude within thesame attenuator range (vertical scale) as your plannedsignal measurements. Any change to the vertical scaleafter deskew is complete may introduce a newattenuation level (you can generally hear attenuatorsettings change) and therefore a slightly different signalpath. This different path may cause a variation in timingaccuracy between channels.
13. Touch Deskew Time and use the multipurpose knobs orkeypad to adjust the deskew time for that channel sothat its signal aligns with that of the fastest channel.
14. Repeat steps 12 and 13 for each additional channel thatyou want to deskew.
15. Remove the connections.
Measuring Waveforms
3- 152 TDS7404, TDS7254 & TDS7154 Digital Phosphor Oscilloscopes User Manual
Overview Related control elements and resourcesTo deskew channels (Cont.)
For furtherassistance
16. Touch the Help button to access the online assistance.
See page 3--247 to learn about using online help.
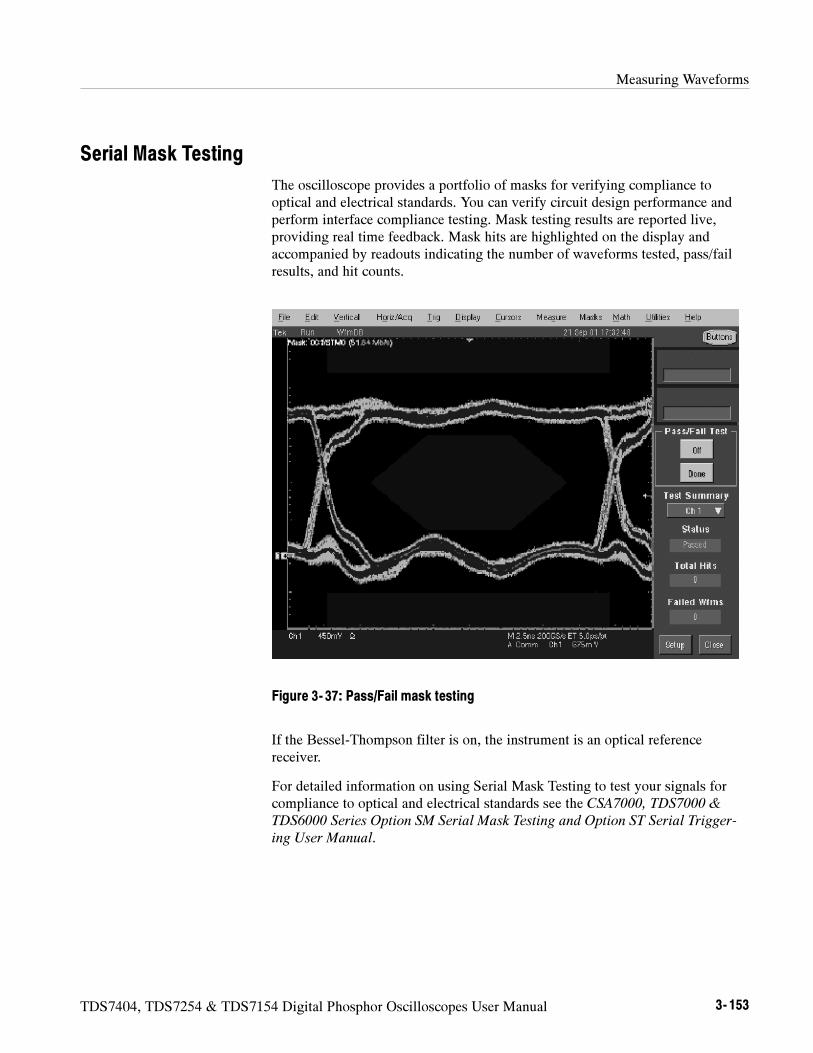
Measuring Waveforms
TDS7404, TDS7254 & TDS7154 Digital Phosphor Oscilloscopes User Manual 3- 153
Serial Mask Testing
The oscilloscope provides a portfolio of masks for verifying compliance tooptical and electrical standards. You can verify circuit design performance andperform interface compliance testing. Mask testing results are reported live,providing real time feedback. Mask hits are highlighted on the display andaccompanied by readouts indicating the number of waveforms tested, pass/failresults, and hit counts.
Figure 3- 37: Pass/Fail mask testing
If the Bessel-Thompson filter is on, the instrument is an optical referencereceiver.
For detailed information on using Serial Mask Testing to test your signals forcompliance to optical and electrical standards see the CSA7000, TDS7000 &
TDS6000 Series Option SM Serial Mask Testing and Option ST Serial Trigger-
ing User Manual.

Measuring Waveforms
3- 154 TDS7404, TDS7254 & TDS7154 Digital Phosphor Oscilloscopes User Manual
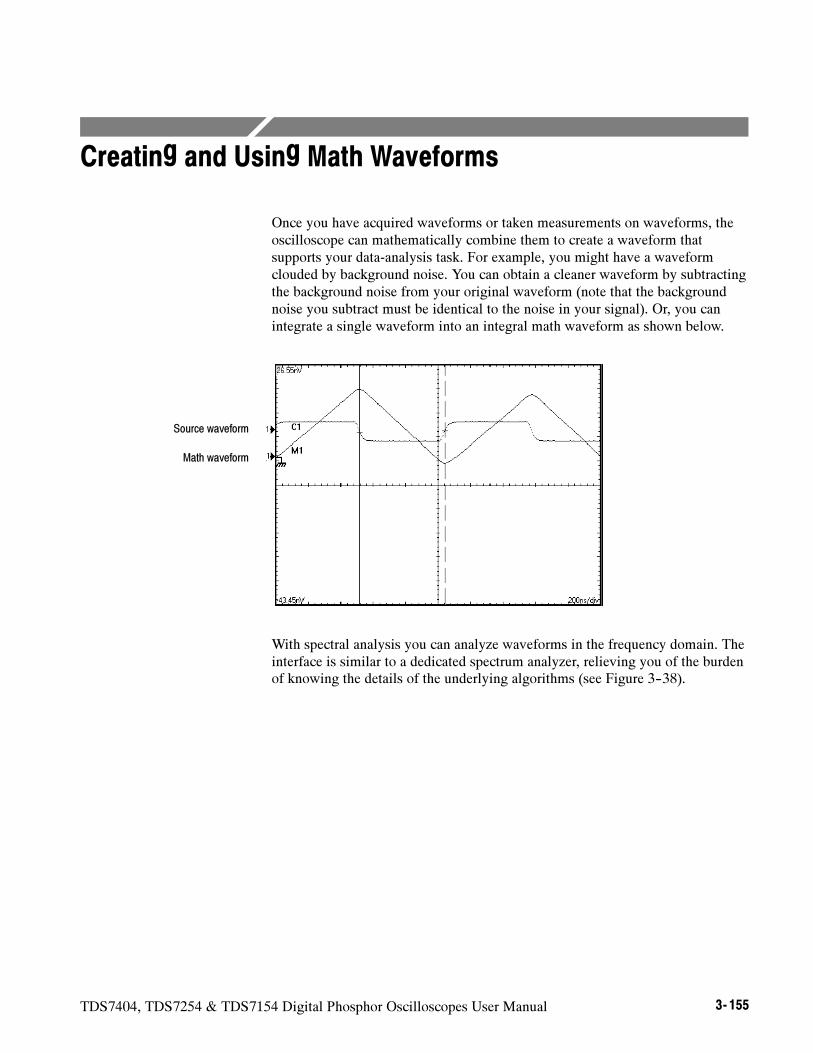
TDS7404, TDS7254 & TDS7154 Digital Phosphor Oscilloscopes User Manual 3- 155
Creating and Using Math Waveforms
Once you have acquired waveforms or taken measurements on waveforms, theoscilloscope can mathematically combine them to create a waveform thatsupports your data-analysis task. For example, you might have a waveformclouded by background noise. You can obtain a cleaner waveform by subtractingthe background noise from your original waveform (note that the backgroundnoise you subtract must be identical to the noise in your signal). Or, you canintegrate a single waveform into an integral math waveform as shown below.
Source waveform
Math waveform
With spectral analysis you can analyze waveforms in the frequency domain. Theinterface is similar to a dedicated spectrum analyzer, relieving you of the burdenof knowing the details of the underlying algorithms (see Figure 3--38).
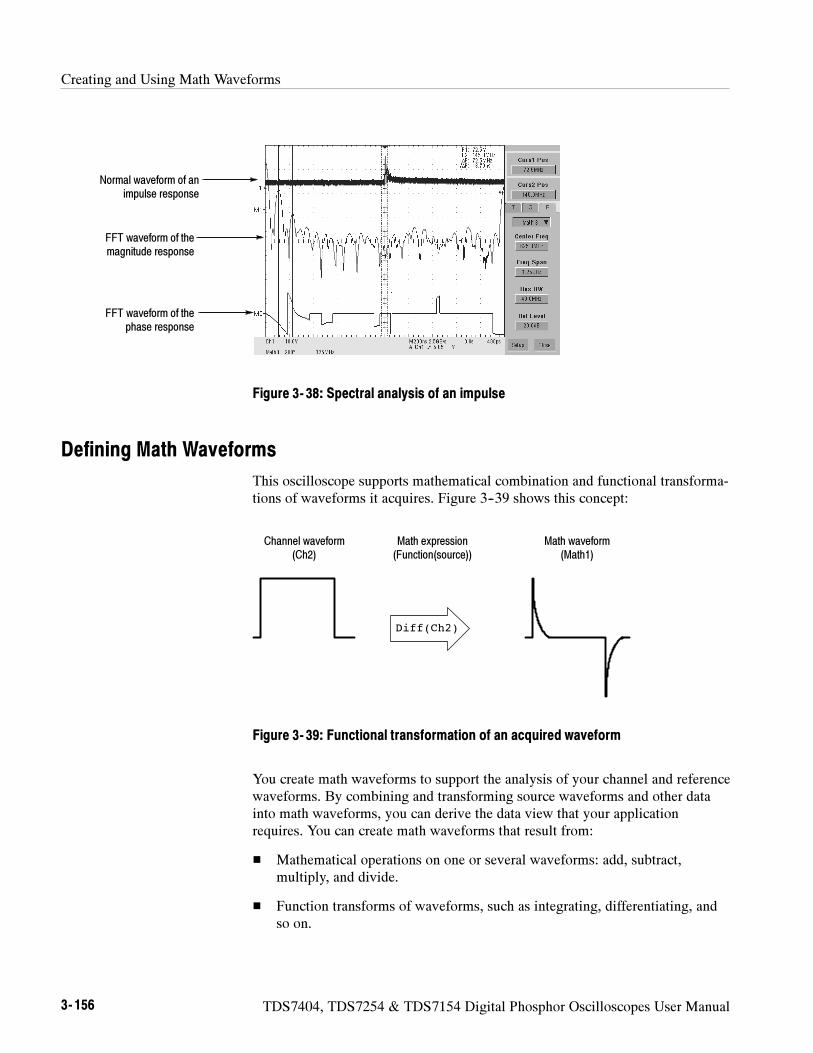
Creating and Using Math Waveforms
3- 156 TDS7404, TDS7254 & TDS7154 Digital Phosphor Oscilloscopes User Manual
Normal waveform of animpulse response
FFT waveform of themagnitude response
FFT waveform of thephase response
Figure 3- 38: Spectral analysis of an impulse
Defining Math Waveforms
This oscilloscope supports mathematical combination and functional transforma-tions of waveforms it acquires. Figure 3--39 shows this concept:
Channel waveform(Ch2)
Math waveform(Math1)
Diff(Ch2)
Math expression(Function(source))
Figure 3- 39: Functional transformation of an acquired waveform
You create math waveforms to support the analysis of your channel and referencewaveforms. By combining and transforming source waveforms and other datainto math waveforms, you can derive the data view that your applicationrequires. You can create math waveforms that result from:
Mathematical operations on one or several waveforms: add, subtract,multiply, and divide.
Function transforms of waveforms, such as integrating, differentiating, andso on.
Creating and Using Math Waveforms
TDS7404, TDS7254 & TDS7154 Digital Phosphor Oscilloscopes User Manual 3- 157
spectral analysis of waveforms, such as an impulse.
You can create up to four math waveforms; see Using Math on page 3--157 formore examples.
Math waveforms can be used in other math. Math waveforms autoscale when themath waveform is first defined and turned on. Advanced functions, such asintegrate, differentiate, average, square root, and log, can be taken on singlewaveforms or complicated expressions.
Measurement scalars can be used in expression; for example, you can use themeasurement feature this oscilloscope provides to measure the average of awaveform and subtract it from the original waveform to define a new mathwaveform.
In FastFrame, math is applied to each frame.
Some operations that you cannot use with math waveforms follow:
Circular Math-on-Math, Measurements in Math, and Measurements on
Math -- You cannot use circular definitions of math waveforms.For example, if you defineMath2 = Ch1 -- Math1, and then define a second math waveform asMath3 = Ch2 + Math2, you cannot define a third math waveform asMath1 = Math2 + Ch3. If you do, the Math1 definition is rejected with anerror because a circular definition is not allowed.
Fast Acquisition -- Math is not allowed in Fast Acquisition mode.
Roll Mode -- Math is updated when acquisition is stopped.
Measurements -- Meas1 -- Meas8 are allowed in a math definition, but notmeasurement functions, such as rise (Ch1).
The following topics provide details that can help you create the math waveformthat best supports your data-analysis tasks.
How to Create.You create math waveforms when you create a math expression.You do so by applying numerical constants, math operators and functions tooperands, which can be channel waveforms, reference waveforms, mathwaveforms, or measurements (scalars). You can display and manipulate thesederived math waveforms much like you can the channel and reference wave-forms (see Operations on Math Waveforms on page 3--165).
Using Math
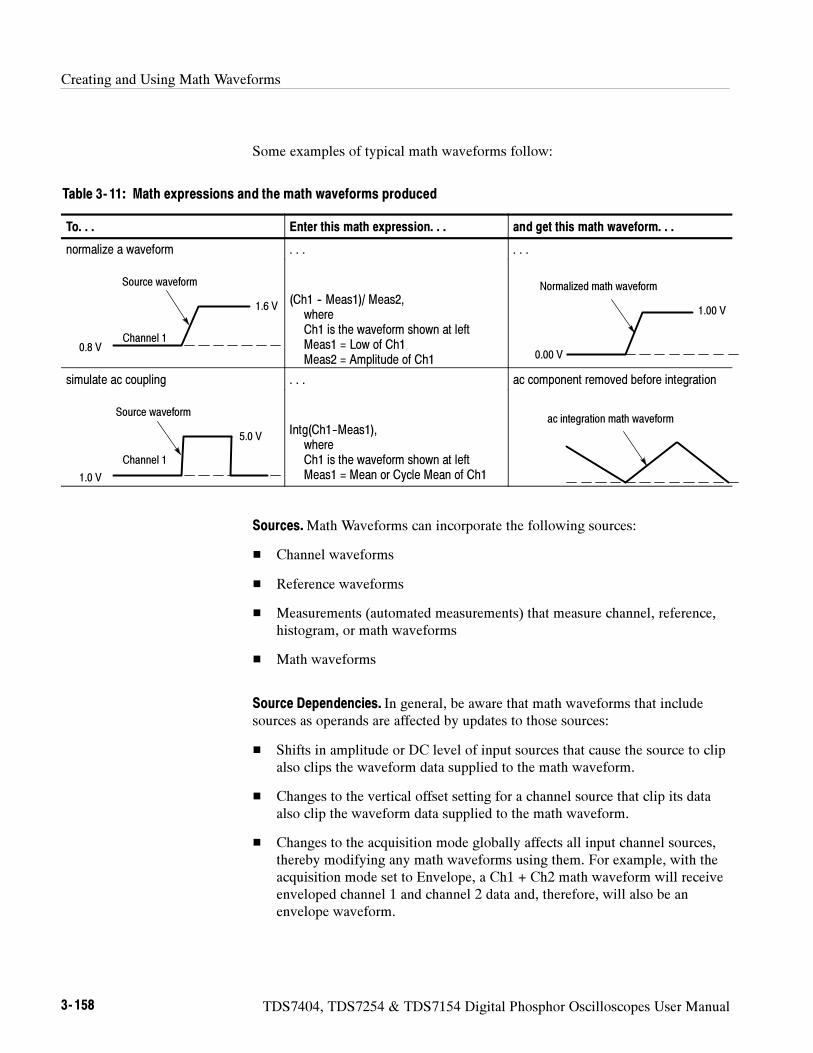
Creating and Using Math Waveforms
3- 158 TDS7404, TDS7254 & TDS7154 Digital Phosphor Oscilloscopes User Manual
Some examples of typical math waveforms follow:
Table 3- 11: Math expressions and the math waveforms produced
To. . . Enter this math expression. . . and get this math waveform. . .
normalize a waveform . . . . . .
Channel 1
Source waveform
1.6 V
0.8 V
(Ch1 -- Meas1)/ Meas2,whereCh1 is the waveform shown at leftMeas1 = Low of Ch1Meas2 = Amplitude of Ch1
1.00 V
0.00 V
Normalized math waveform
simulate ac coupling . . . ac component removed before integration
Channel 1
Source waveform
5.0 V
1.0 V
Intg(Ch1--Meas1),whereCh1 is the waveform shown at leftMeas1 = Mean or Cycle Mean of Ch1
ac integration math waveform
Sources.Math Waveforms can incorporate the following sources:
Channel waveforms
Reference waveforms
Measurements (automated measurements) that measure channel, reference,histogram, or math waveforms
Math waveforms
Source Dependencies. In general, be aware that math waveforms that includesources as operands are affected by updates to those sources:
Shifts in amplitude or DC level of input sources that cause the source to clipalso clips the waveform data supplied to the math waveform.
Changes to the vertical offset setting for a channel source that clip its dataalso clip the waveform data supplied to the math waveform.
Changes to the acquisition mode globally affects all input channel sources,thereby modifying any math waveforms using them. For example, with theacquisition mode set to Envelope, a Ch1 + Ch2 math waveform will receiveenveloped channel 1 and channel 2 data and, therefore, will also be anenvelope waveform.
Creating and Using Math Waveforms
TDS7404, TDS7254 & TDS7154 Digital Phosphor Oscilloscopes User Manual 3- 159
Clearing the data in a waveform source causes a baseline (ground) to bedelivered to any math waveform that includes that source until the sourcereceives new data.
Expression Syntax.You build math waveforms using the Define/Edit Expressioncontrol window. To help you create valid math waveforms, this window blocksmost illegal entries by disabling any window element that would create aninvalid entry in the math waveform expression.
The syntax that follows describes valid math expressions, which can be quitecomplex (in excess of 100 characters long):
<MathWaveform> := <Expression>
<Expression> := <UnaryExpression> | <BinaryExpression>
<UnaryExpression> := <UnaryOperator> ( <Term> )| <UnaryOperator> ( <Expression> )
<BinaryExpression> := <Term> <BinaryOperator> <Term> | <Scalar><BinaryOperator> <Term> | <Term> <BinaryOperator> <Scalar>
<Term> := <Waveform> | ( <Expression> )
<Scalar> := <Integer> | <Float> | <Meas--Result>
<Waveform> := <ChannelWaveform> | <ReferenceWaveform> | <MathWaveform>
<ChannelWaveform> := Ch1 | Ch2 | Ch3 | Ch4
<ReferenceWaveform> := Ref1 | Ref2 | Ref3 | Ref4
<MathWaveform> := Math1 | Math2 | Math3 | Math4
<UnaryOperator> := Invert | Derivative | Integral | Average | Max | Min| Exp | log 10 | log e | sqrt | Spectral Magnitude| Spectral Phase | Spectral Real | Spectral Imag
<BinaryOperator> := + | -- | / | * | == | != | < | <= | > | >= |
<Meas--Result> := meas1 | meas2 | meas3 | meas4 | meas5 | meas6 | meas7 | meas8
Waveform Differentiation. The math capabilities of the oscilloscope includewaveform differentiation. This allows you to display a derivative math waveformthat indicates the instantaneous rate of change of the waveform acquired.
Derivative waveforms are used in the measurement of slew rate of amplifiers andin educational applications. You can create a derivative math waveform and thenuse it as a source for another derivative waveform. The result is the secondderivative of the waveform that was first differentiated.
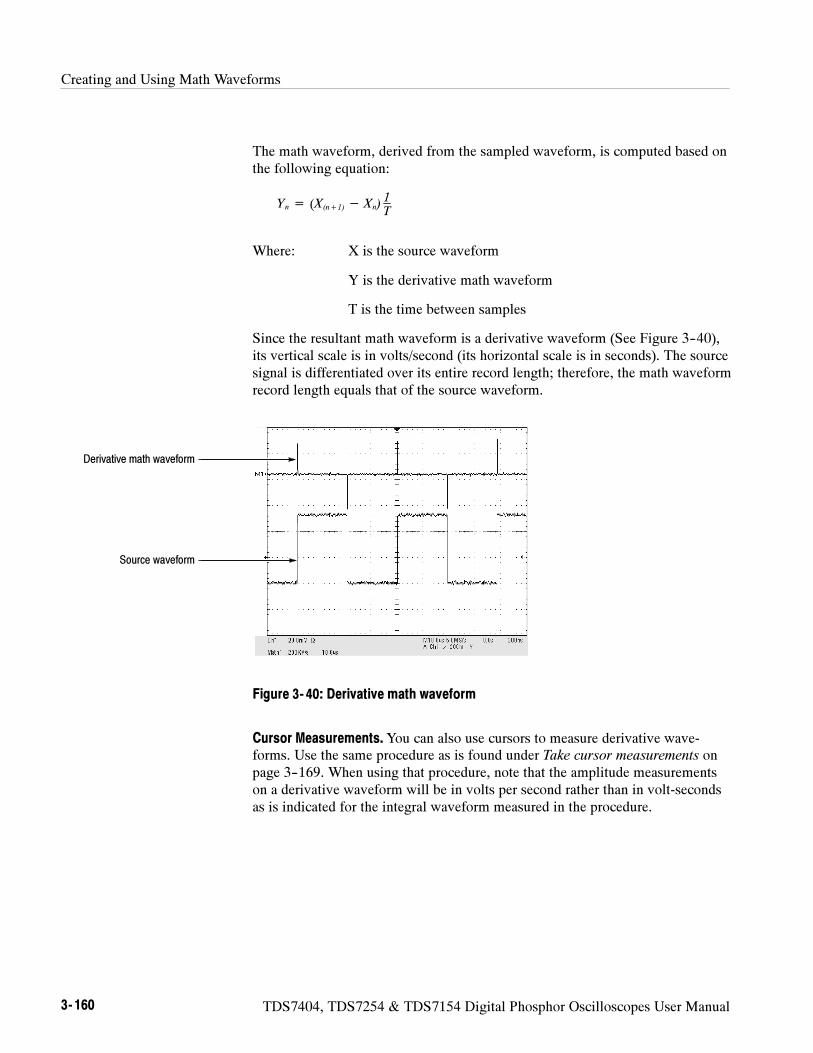
Creating and Using Math Waveforms
3- 160 TDS7404, TDS7254 & TDS7154 Digital Phosphor Oscilloscopes User Manual
The math waveform, derived from the sampled waveform, is computed based onthe following equation:
Yn = (X(n+1) − Xn)1T
Where: X is the source waveform
Y is the derivative math waveform
T is the time between samples
Since the resultant math waveform is a derivative waveform (See Figure 3--40),its vertical scale is in volts/second (its horizontal scale is in seconds). The sourcesignal is differentiated over its entire record length; therefore, the math waveformrecord length equals that of the source waveform.
Derivative math waveform
Source waveform
Figure 3- 40: Derivative math waveform
Cursor Measurements.You can also use cursors to measure derivative wave-forms. Use the same procedure as is found under Take cursor measurements onpage 3--169. When using that procedure, note that the amplitude measurementson a derivative waveform will be in volts per second rather than in volt-secondsas is indicated for the integral waveform measured in the procedure.
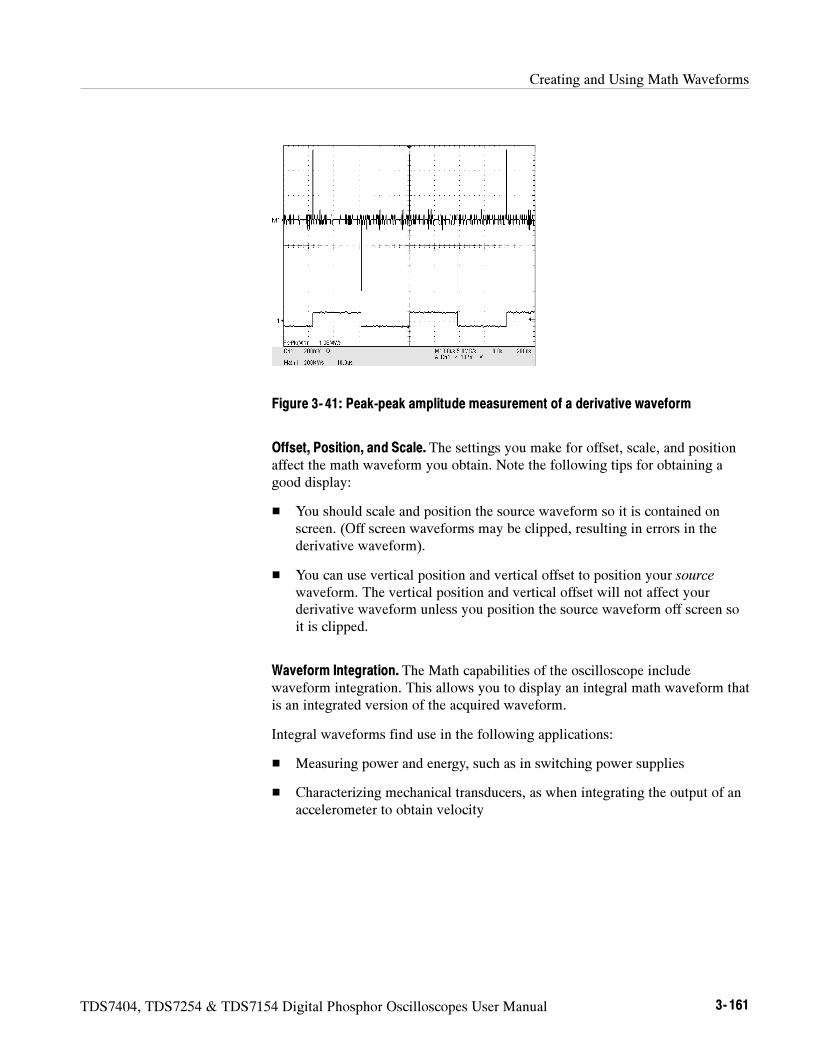
Creating and Using Math Waveforms
TDS7404, TDS7254 & TDS7154 Digital Phosphor Oscilloscopes User Manual 3- 161
Figure 3- 41: Peak-peak amplitude measurement of a derivative waveform
Offset, Position, and Scale. The settings you make for offset, scale, and positionaffect the math waveform you obtain. Note the following tips for obtaining agood display:
You should scale and position the source waveform so it is contained onscreen. (Off screen waveforms may be clipped, resulting in errors in thederivative waveform).
You can use vertical position and vertical offset to position your sourcewaveform. The vertical position and vertical offset will not affect yourderivative waveform unless you position the source waveform off screen soit is clipped.
Waveform Integration. The Math capabilities of the oscilloscope includewaveform integration. This allows you to display an integral math waveform thatis an integrated version of the acquired waveform.
Integral waveforms find use in the following applications:
Measuring power and energy, such as in switching power supplies
Characterizing mechanical transducers, as when integrating the output of anaccelerometer to obtain velocity
Creating and Using Math Waveforms
3- 162 TDS7404, TDS7254 & TDS7154 Digital Phosphor Oscilloscopes User Manual
The integral math waveform, derived from the sampled waveform, is computedbased on the following equation:
y(n) = scale
n
Σi = 1
x(i)+ x(i− 1)2
T
Where: x(i) is the source waveform
y(n) is a point in the integral math waveform
scale is the output scale factor
T is the time between samples
Since the resultant math waveform is an integral waveform, its vertical scale is involt-seconds (its horizontal scale is in seconds). The source signal is integratedover its entire record length; therefore, the math waveform record length equalsthat of the source waveform.
Offset and Position. When creating integrated math waveforms from live channelwaveforms, consider the following topics:
You should scale and position the source waveform so it is contained onscreen. (Off screen waveforms may be clipped, which will result in errors inthe integral waveform).
You can use vertical position and vertical offset to position your sourcewaveform. The vertical position and vertical offset will not affect yourintegral waveform unless you position the source waveform off screen so itis clipped.
DC Offset. The source waveforms that you connect to the oscilloscope oftenhave a DC offset component. The oscilloscope integrates this offset along withthe time varying portions of your waveform. Even a few divisions of offset in thesource waveform may be enough to ensure that the integral waveform saturates(clips), especially with long record lengths.
Use the procedure that follows when defining a math waveform. Remember, youshould first ensure that the sources you use exist. Acquisitions should be runningor the channels should already be on, and reference waveform sources shouldcontain saved waveforms, and so on. These sources do not have to be displayedto be used.
To Define a MathWaveform
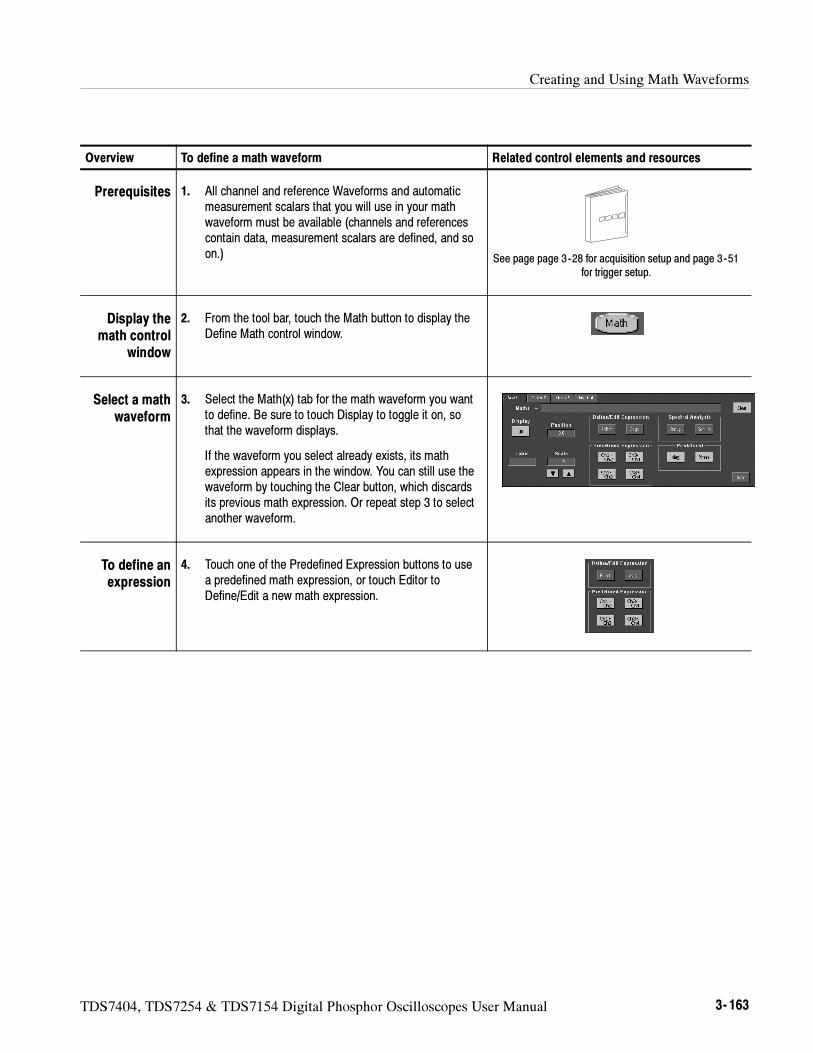
Creating and Using Math Waveforms
TDS7404, TDS7254 & TDS7154 Digital Phosphor Oscilloscopes User Manual 3- 163
Overview To define a math waveform Related control elements and resources
Prerequisites 1. All channel and reference Waveforms and automaticmeasurement scalars that you will use in your mathwaveform must be available (channels and referencescontain data, measurement scalars are defined, and soon.) See page page 3--28 for acquisition setup and page 3--51
for trigger setup.
Display themath control
window
2. From the tool bar, touch the Math button to display theDefine Math control window.
Select a mathwaveform
3. Select the Math(x) tab for the math waveform you wantto define. Be sure to touch Display to toggle it on, sothat the waveform displays.
If the waveform you select already exists, its mathexpression appears in the window. You can still use thewaveform by touching the Clear button, which discardsits previous math expression. Or repeat step 3 to selectanother waveform.
To define anexpression
4. Touch one of the Predefined Expression buttons to usea predefined math expression, or touch Editor toDefine/Edit a new math expression.
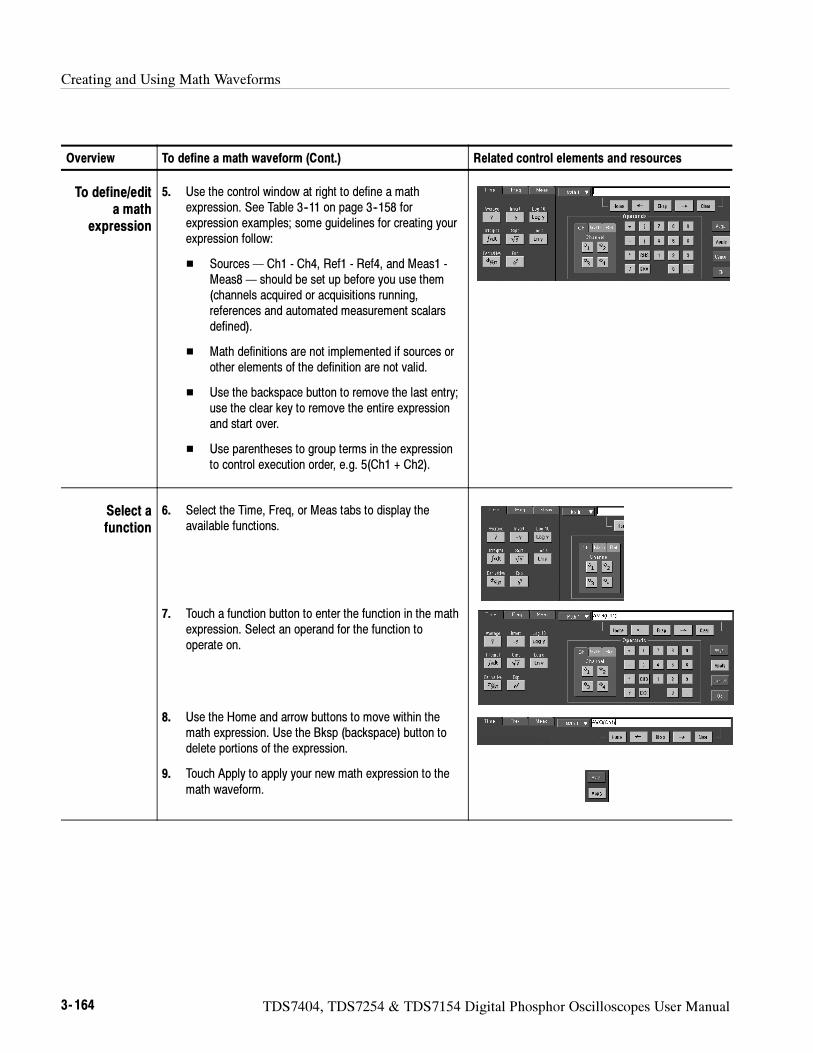
Creating and Using Math Waveforms
3- 164 TDS7404, TDS7254 & TDS7154 Digital Phosphor Oscilloscopes User Manual
Overview Related control elements and resourcesTo define a math waveform (Cont.)
To define/edita math
expression
5. Use the control window at right to define a mathexpression. See Table 3--11 on page 3--158 forexpression examples; some guidelines for creating yourexpression follow:
Sources— Ch1 - Ch4, Ref1 - Ref4, and Meas1 -Meas8— should be set up before you use them(channels acquired or acquisitions running,references and automated measurement scalarsdefined).
Math definitions are not implemented if sources orother elements of the definition are not valid.
Use the backspace button to remove the last entry;use the clear key to remove the entire expressionand start over.
Use parentheses to group terms in the expressionto control execution order, e.g. 5(Ch1 + Ch2).
Select afunction
6. Select the Time, Freq, or Meas tabs to display theavailable functions.
7. Touch a function button to enter the function in the mathexpression. Select an operand for the function tooperate on.
8. Use the Home and arrow buttons to move within themath expression. Use the Bksp (backspace) button todelete portions of the expression.
9. Touch Apply to apply your new math expression to themath waveform.
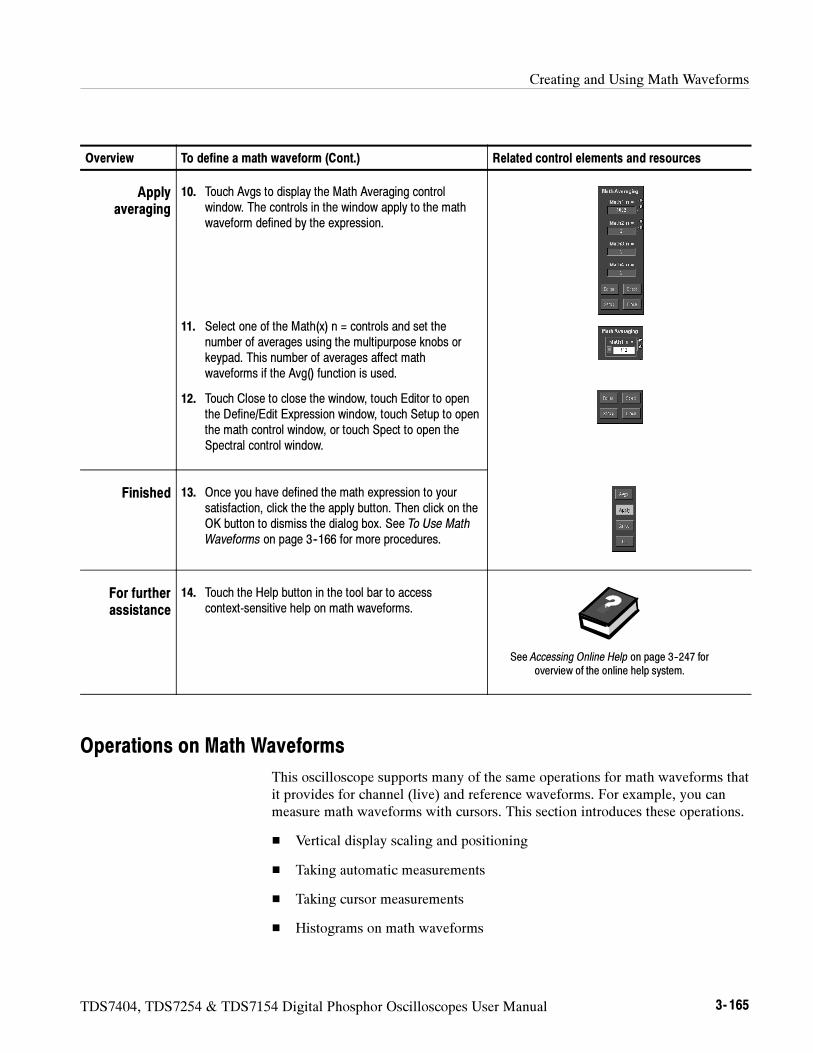
Creating and Using Math Waveforms
TDS7404, TDS7254 & TDS7154 Digital Phosphor Oscilloscopes User Manual 3- 165
Overview Related control elements and resourcesTo define a math waveform (Cont.)
Applyaveraging
10. Touch Avgs to display the Math Averaging controlwindow. The controls in the window apply to the mathwaveform defined by the expression.
11. Select one of the Math(x) n = controls and set thenumber of averages using the multipurpose knobs orkeypad. This number of averages affect mathwaveforms if the Avg() function is used.
12. Touch Close to close the window, touch Editor to openthe Define/Edit Expression window, touch Setup to openthe math control window, or touch Spect to open theSpectral control window.
Finished 13. Once you have defined the math expression to yoursatisfaction, click the the apply button. Then click on theOK button to dismiss the dialog box. See To Use MathWaveforms on page 3--166 for more procedures.
For furtherassistance
14. Touch the Help button in the tool bar to accesscontext-sensitive help on math waveforms.
See Accessing Online Help on page 3--247 foroverview of the online help system.
Operations on Math Waveforms
This oscilloscope supports many of the same operations for math waveforms thatit provides for channel (live) and reference waveforms. For example, you canmeasure math waveforms with cursors. This section introduces these operations.
Vertical display scaling and positioning
Taking automatic measurements
Taking cursor measurements
Histograms on math waveforms
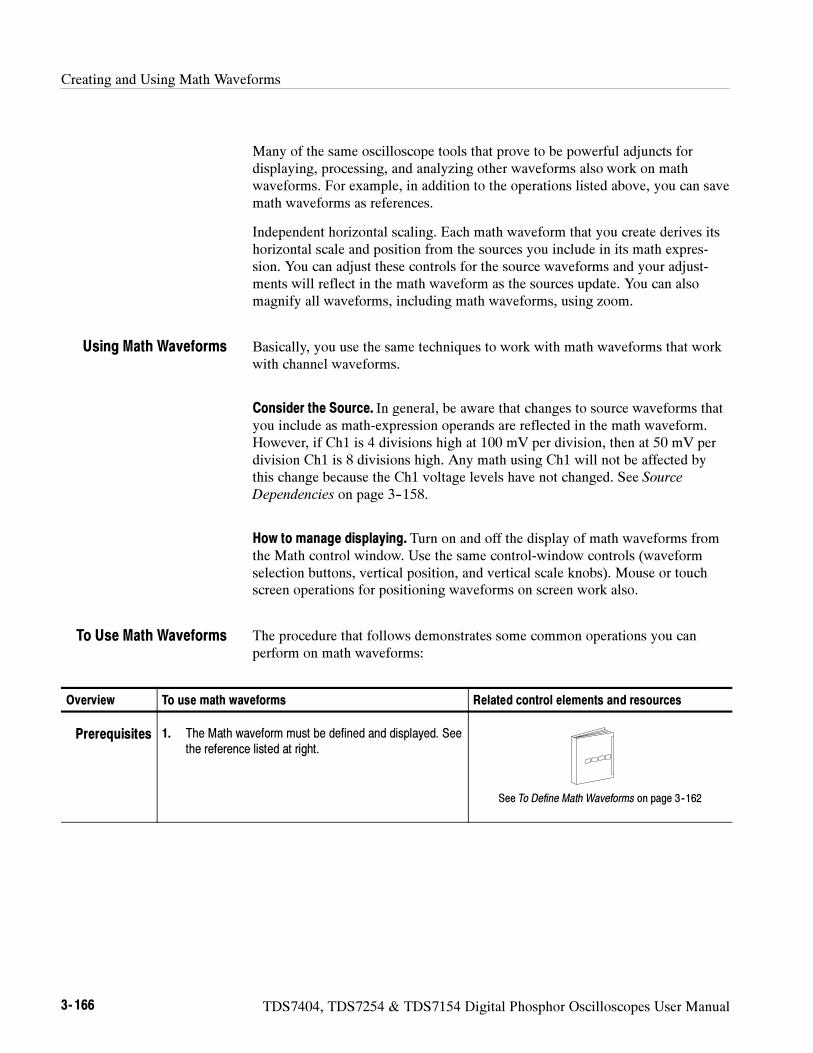
Creating and Using Math Waveforms
3- 166 TDS7404, TDS7254 & TDS7154 Digital Phosphor Oscilloscopes User Manual
Many of the same oscilloscope tools that prove to be powerful adjuncts fordisplaying, processing, and analyzing other waveforms also work on mathwaveforms. For example, in addition to the operations listed above, you can savemath waveforms as references.
Independent horizontal scaling. Each math waveform that you create derives itshorizontal scale and position from the sources you include in its math expres-sion. You can adjust these controls for the source waveforms and your adjust-ments will reflect in the math waveform as the sources update. You can alsomagnify all waveforms, including math waveforms, using zoom.
Basically, you use the same techniques to work with math waveforms that workwith channel waveforms.
Consider the Source. In general, be aware that changes to source waveforms thatyou include as math-expression operands are reflected in the math waveform.However, if Ch1 is 4 divisions high at 100 mV per division, then at 50 mV perdivision Ch1 is 8 divisions high. Any math using Ch1 will not be affected bythis change because the Ch1 voltage levels have not changed. See SourceDependencies on page 3--158.
How to manage displaying. Turn on and off the display of math waveforms fromthe Math control window. Use the same control-window controls (waveformselection buttons, vertical position, and vertical scale knobs). Mouse or touchscreen operations for positioning waveforms on screen work also.
The procedure that follows demonstrates some common operations you canperform on math waveforms:
Overview To use math waveforms Related control elements and resources
Prerequisites 1. The Math waveform must be defined and displayed. Seethe reference listed at right.
See To Define Math Waveforms on page 3--162
Using Math Waveforms
To Use Math Waveforms
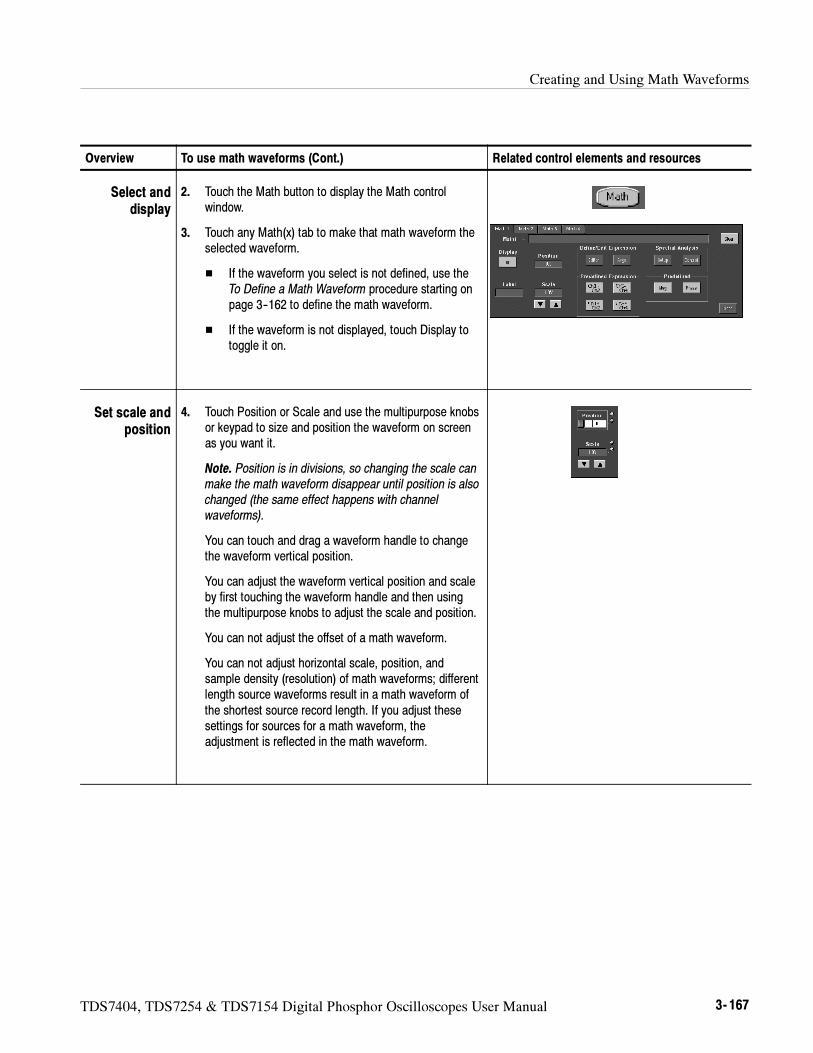
Creating and Using Math Waveforms
TDS7404, TDS7254 & TDS7154 Digital Phosphor Oscilloscopes User Manual 3- 167
Overview Related control elements and resourcesTo use math waveforms (Cont.)
Select anddisplay
2. Touch the Math button to display the Math controlwindow.
3. Touch any Math(x) tab to make that math waveform theselected waveform.
If the waveform you select is not defined, use theTo Define a Math Waveform procedure starting onpage 3--162 to define the math waveform.
If the waveform is not displayed, touch Display totoggle it on.
Set scale andposition
4. Touch Position or Scale and use the multipurpose knobsor keypad to size and position the waveform on screenas you want it.
Note. Position is in divisions, so changing the scale canmake the math waveform disappear until position is alsochanged (the same effect happens with channelwaveforms).
You can touch and drag a waveform handle to changethe waveform vertical position.
You can adjust the waveform vertical position and scaleby first touching the waveform handle and then usingthe multipurpose knobs to adjust the scale and position.
You can not adjust the offset of a math waveform.
You can not adjust horizontal scale, position, andsample density (resolution) of math waveforms; differentlength source waveforms result in a math waveform ofthe shortest source record length. If you adjust thesesettings for sources for a math waveform, theadjustment is reflected in the math waveform.
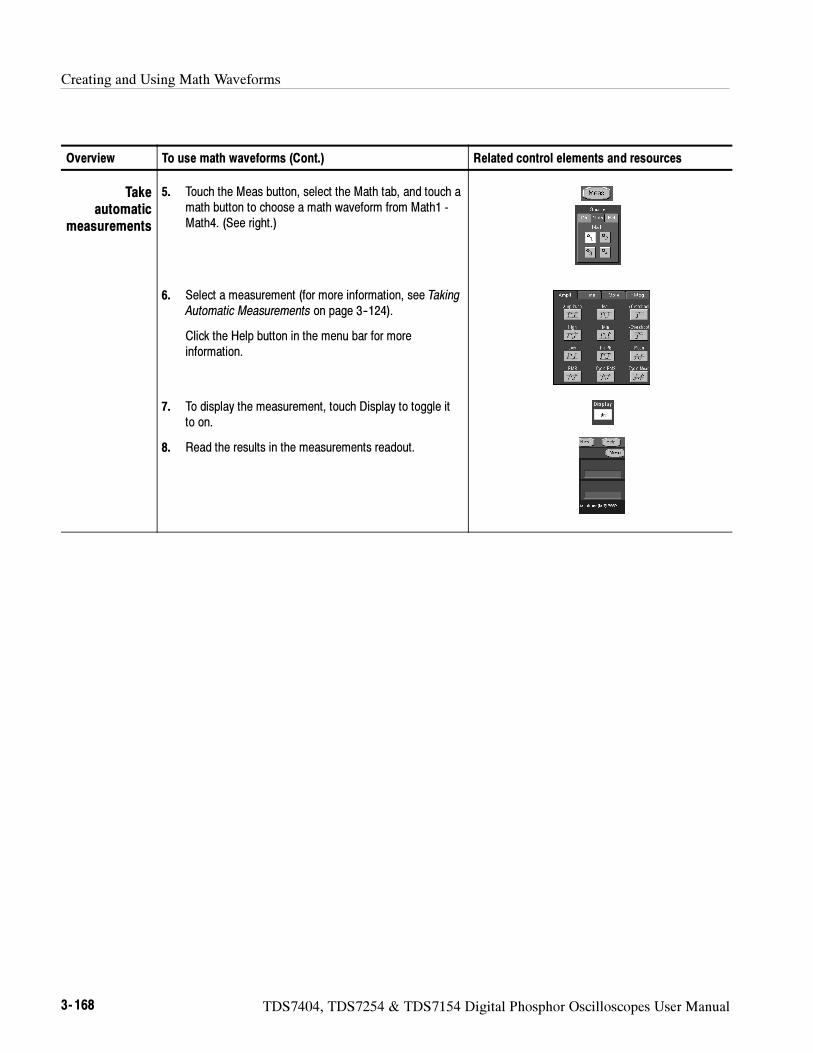
Creating and Using Math Waveforms
3- 168 TDS7404, TDS7254 & TDS7154 Digital Phosphor Oscilloscopes User Manual
Overview Related control elements and resourcesTo use math waveforms (Cont.)
Takeautomatic
measurements
5. Touch the Meas button, select the Math tab, and touch amath button to choose a math waveform from Math1 -Math4. (See right.)
6. Select a measurement (for more information, see TakingAutomatic Measurements on page 3--124).
Click the Help button in the menu bar for moreinformation.
7. To display the measurement, touch Display to toggle itto on.
8. Read the results in the measurements readout.
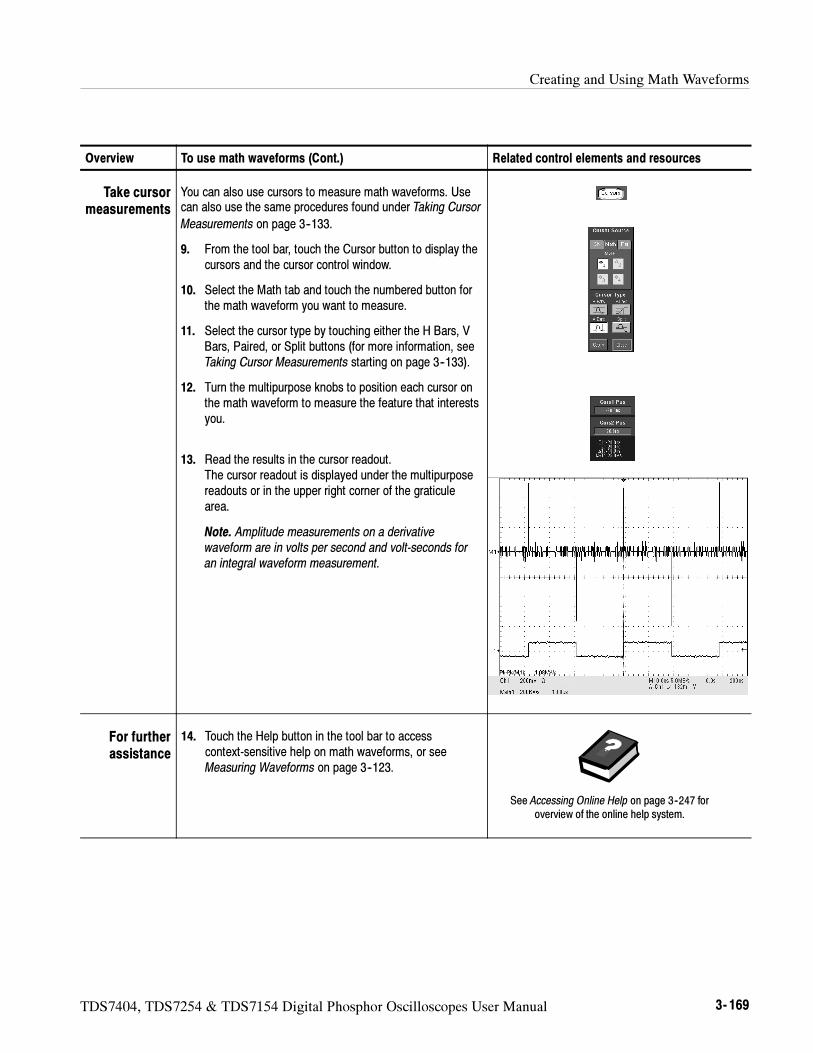
Creating and Using Math Waveforms
TDS7404, TDS7254 & TDS7154 Digital Phosphor Oscilloscopes User Manual 3- 169
Overview Related control elements and resourcesTo use math waveforms (Cont.)
Take cursormeasurements
You can also use cursors to measure math waveforms. Usecan also use the same procedures found under Taking CursorMeasurements on page 3--133.
9. From the tool bar, touch the Cursor button to display thecursors and the cursor control window.
10. Select the Math tab and touch the numbered button forthe math waveform you want to measure.
11. Select the cursor type by touching either the H Bars, VBars, Paired, or Split buttons (for more information, seeTaking Cursor Measurements starting on page 3--133).
12. Turn the multipurpose knobs to position each cursor onthe math waveform to measure the feature that interestsyou.
13. Read the results in the cursor readout.The cursor readout is displayed under the multipurposereadouts or in the upper right corner of the graticulearea.
Note. Amplitude measurements on a derivativewaveform are in volts per second and volt-seconds foran integral waveform measurement.
For furtherassistance
14. Touch the Help button in the tool bar to accesscontext-sensitive help on math waveforms, or seeMeasuring Waveforms on page 3--123.
See Accessing Online Help on page 3--247 foroverview of the online help system.
Creating and Using Math Waveforms
3- 170 TDS7404, TDS7254 & TDS7154 Digital Phosphor Oscilloscopes User Manual
Defining Spectral Math Waveforms
The math capabilities of the oscilloscope include spectrum analysis of awaveform. This section describes a spectral analyzer that allows you to controlthe analysis intuitively with time domain and frequency domain controls. Thesecontrols merge the time domain controls with the frequency domain controls toprovide a complete spectral analyzer.
Signals may be represented by their characteristics in both the time and thefrequency domain. By combining and transforming source waveforms intospectral math waveforms, you can simultaneously view signal characteristics inboth domains.
This spectral analyzer provides a complete set of controls and features that allowyou to make time and frequency domain measurements without the need to learnextensive details about FFT algorithms.
Frequency Domain Controls: You can operate the spectral analyzer usingtraditional spectrum analyzer controls. You can set the center frequency,span, and resolution bandwidth directly.
Time Domain Controls: The spectral analyzer has time domain controls forthe acquired waveform. These controls set the time duration and theresolution time between samples. You can easily set the required sample rateand record length.
Gating Controls: These controls are the bridge that connect the time domainto the frequency domain. You can perform spectral analysis on a gated regionof the input waveform. This gating also determines the resolution bandwidthof the analyzer.
Window Functions: There are eight different window functions that shapethe filter response of the spectral analyzer.
Magnitude Versus Frequency: You may choose to display data in dB orlinear mode. You may display the real or imaginary parts of the spectralmagnitude only. Ref level offset and reference level controls give completecontrol over the vertical position and offset of the spectrum. The log zero dBref level may be dialed in manually or set to dBm with a single button touch.
Phase Versus Frequency: You may display phase data as a function offrequency in radians or degrees. You may zero the noise phase for magni-tudes below a threshold level. Finally, you may select Phase unwrap anddθ/dω, group delay.
Spectral Averaging: You may turn on averaging in the frequency domainfor phase and magnitude waveforms.
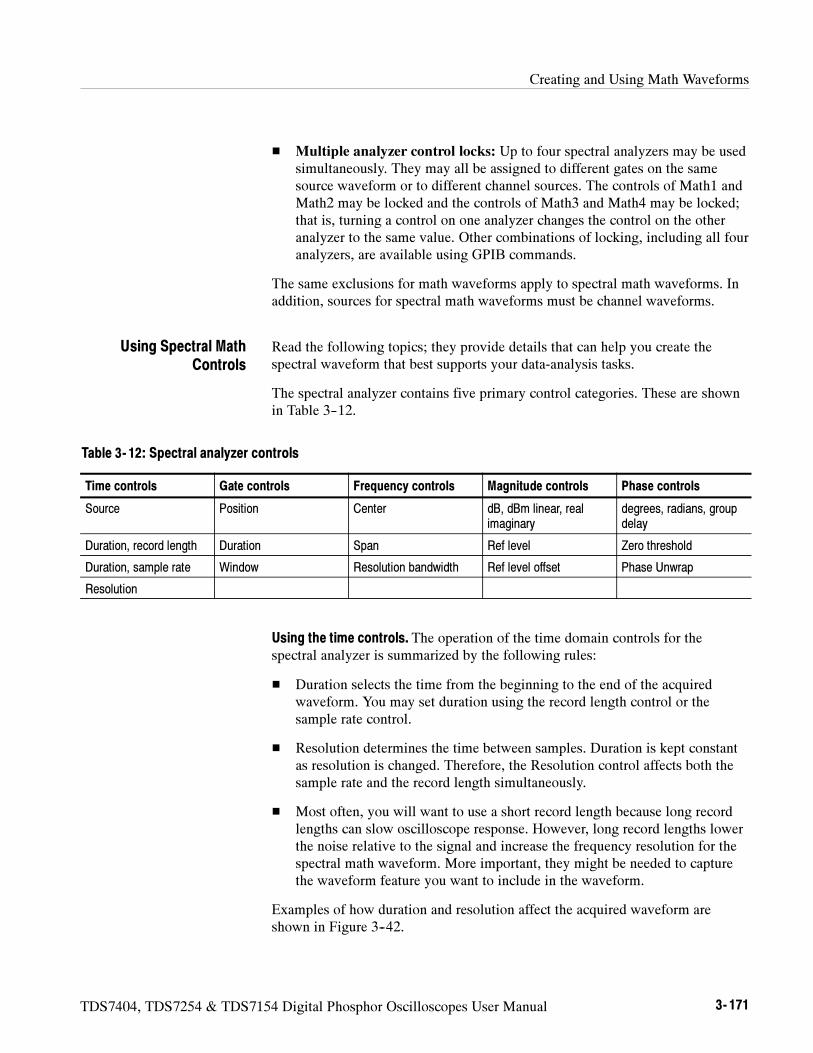
Creating and Using Math Waveforms
TDS7404, TDS7254 & TDS7154 Digital Phosphor Oscilloscopes User Manual 3- 171
Multiple analyzer control locks: Up to four spectral analyzers may be usedsimultaneously. They may all be assigned to different gates on the samesource waveform or to different channel sources. The controls of Math1 andMath2 may be locked and the controls of Math3 and Math4 may be locked;that is, turning a control on one analyzer changes the control on the otheranalyzer to the same value. Other combinations of locking, including all fouranalyzers, are available using GPIB commands.
The same exclusions for math waveforms apply to spectral math waveforms. Inaddition, sources for spectral math waveforms must be channel waveforms.
Read the following topics; they provide details that can help you create thespectral waveform that best supports your data-analysis tasks.
The spectral analyzer contains five primary control categories. These are shownin Table 3--12.
Table 3- 12: Spectral analyzer controls
Time controls Gate controls Frequency controls Magnitude controls Phase controls
Source Position Center dB, dBm linear, realimaginary
degrees, radians, groupdelay
Duration, record length Duration Span Ref level Zero threshold
Duration, sample rate Window Resolution bandwidth Ref level offset Phase Unwrap
Resolution
Using the time controls. The operation of the time domain controls for thespectral analyzer is summarized by the following rules:
Duration selects the time from the beginning to the end of the acquiredwaveform. You may set duration using the record length control or thesample rate control.
Resolution determines the time between samples. Duration is kept constantas resolution is changed. Therefore, the Resolution control affects both thesample rate and the record length simultaneously.
Most often, you will want to use a short record length because long recordlengths can slow oscilloscope response. However, long record lengths lowerthe noise relative to the signal and increase the frequency resolution for thespectral math waveform. More important, they might be needed to capturethe waveform feature you want to include in the waveform.
Examples of how duration and resolution affect the acquired waveform areshown in Figure 3--42.
Using Spectral MathControls
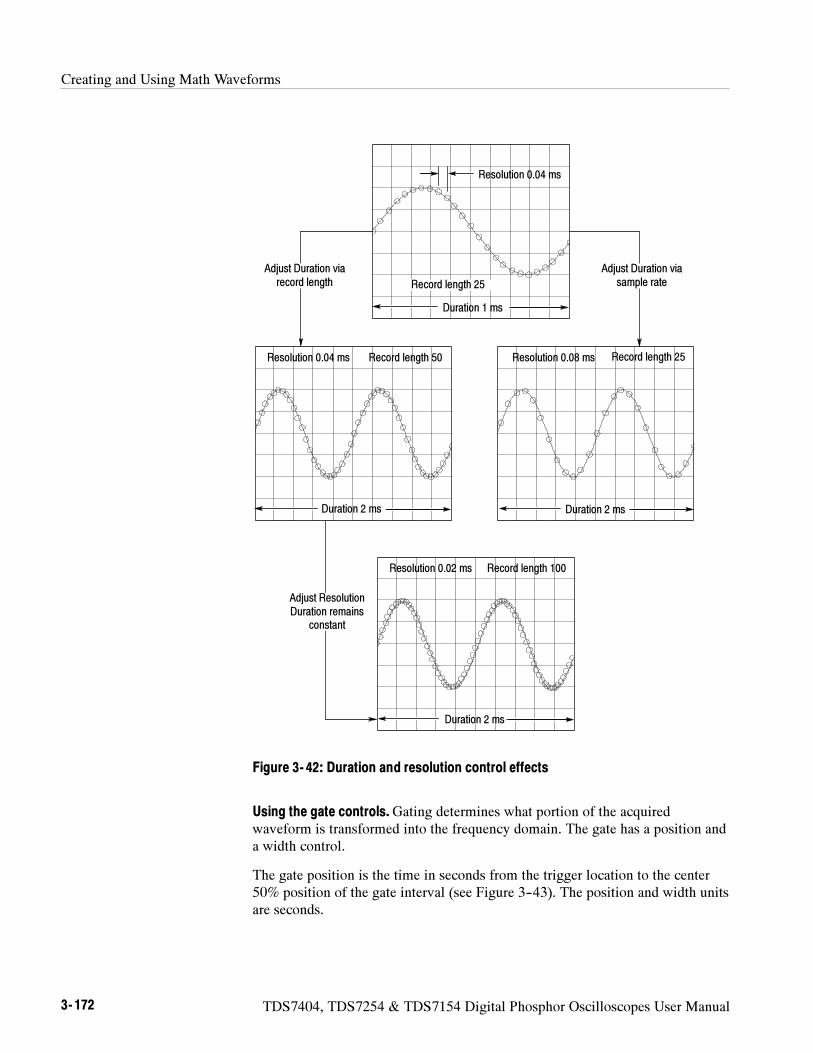
Creating and Using Math Waveforms
3- 172 TDS7404, TDS7254 & TDS7154 Digital Phosphor Oscilloscopes User Manual
Resolution 0.04 ms
Duration 1 ms
Record length 25
Record length 50
Duration 2 ms
Resolution 0.04 ms Record length 25
Duration 2 ms
Resolution 0.08 ms
Duration 2 ms
Record length 100Resolution 0.02 ms
Adjust Duration viasample rate
Adjust Duration viarecord length
Adjust ResolutionDuration remains
constant
Figure 3- 42: Duration and resolution control effects
Using the gate controls.Gating determines what portion of the acquiredwaveform is transformed into the frequency domain. The gate has a position anda width control.
The gate position is the time in seconds from the trigger location to the center50% position of the gate interval (see Figure 3--43). The position and width unitsare seconds.
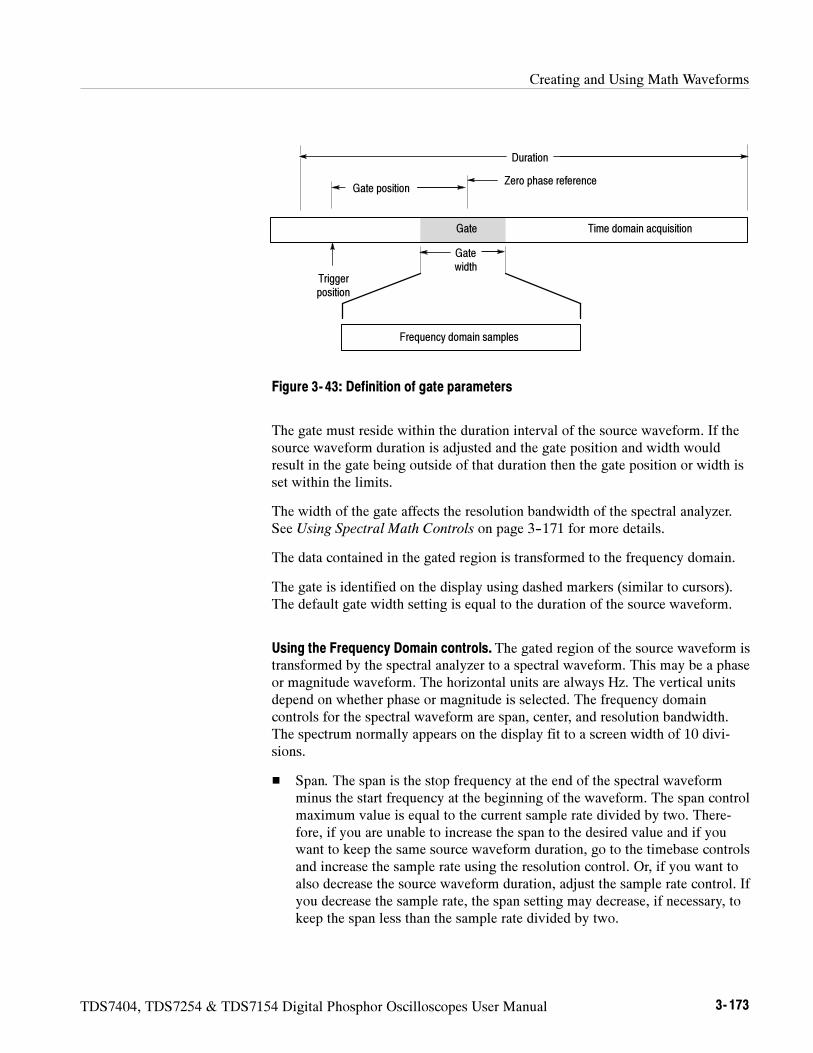
Creating and Using Math Waveforms
TDS7404, TDS7254 & TDS7154 Digital Phosphor Oscilloscopes User Manual 3- 173
Gatewidth
Zero phase reference
Time domain acquisition
Frequency domain samples
Gate position
Gate
Triggerposition
Duration
Figure 3- 43: Definition of gate parameters
The gate must reside within the duration interval of the source waveform. If thesource waveform duration is adjusted and the gate position and width wouldresult in the gate being outside of that duration then the gate position or width isset within the limits.
The width of the gate affects the resolution bandwidth of the spectral analyzer.See Using Spectral Math Controls on page 3--171 for more details.
The data contained in the gated region is transformed to the frequency domain.
The gate is identified on the display using dashed markers (similar to cursors).The default gate width setting is equal to the duration of the source waveform.
Using the Frequency Domain controls. The gated region of the source waveform istransformed by the spectral analyzer to a spectral waveform. This may be a phaseor magnitude waveform. The horizontal units are always Hz. The vertical unitsdepend on whether phase or magnitude is selected. The frequency domaincontrols for the spectral waveform are span, center, and resolution bandwidth.The spectrum normally appears on the display fit to a screen width of 10 divi-sions.
Span. The span is the stop frequency at the end of the spectral waveformminus the start frequency at the beginning of the waveform. The span controlmaximum value is equal to the current sample rate divided by two. There-fore, if you are unable to increase the span to the desired value and if youwant to keep the same source waveform duration, go to the timebase controlsand increase the sample rate using the resolution control. Or, if you want toalso decrease the source waveform duration, adjust the sample rate control. Ifyou decrease the sample rate, the span setting may decrease, if necessary, tokeep the span less than the sample rate divided by two.
Creating and Using Math Waveforms
3- 174 TDS7404, TDS7254 & TDS7154 Digital Phosphor Oscilloscopes User Manual
Center: This is the frequency at the center of the spectral waveform. Centeris equal to the start frequency plus one half of the span. The adjustmentrange depends on the sample rate and the current span setting. Rememberthat the span must always be in the interval of zero to one half of the samplerate. Where one end of the span goes to DC or Nyquist, depending on whichdirection the center frequency is adjusted, the span decreases to allow thecenter frequency to go further in the direction it is being adjusted. If you areunable to increase the center to the desired value then increase the samplerate using either the sample rate or resolution controls. You may also changesample rate by using the HORIZONTAL SCALE knob on the oscilloscopefront panel.
Resolution Bandwidth, RBW: This is the 3 dB down bandwidth of thespectral analyzer frequency response to a sine wave input. The resolutionbandwidth is affected by two parameters.
Different window functions produce different filter response shapes inthe spectrum and result in different resolution bandwidths.
The gate width, of the input data, affects the resolution bandwidth(RBW). Gate width has units of seconds. The resolution bandwidthdirectly controls the gate width, but the numerical value is entered inunits of Hz. Therefore, the time domain gate markers move as you adjustthe RBW control.
RBW =Window Bin Width
Gate Width
Where the Window Bin Width is the resolution bandwidth in units of bins. Itdepends on what window function is used. The gate width is in units ofseconds.
Figure 3--44 demonstrate the effects of adjusting center frequency and span.Center frequency is a horizontal position control for the spectrum. Span is ahorizontal scale control. Resolution bandwidth usually adjusts the bandwidthof the analyzer filters without affecting the span and center frequency.
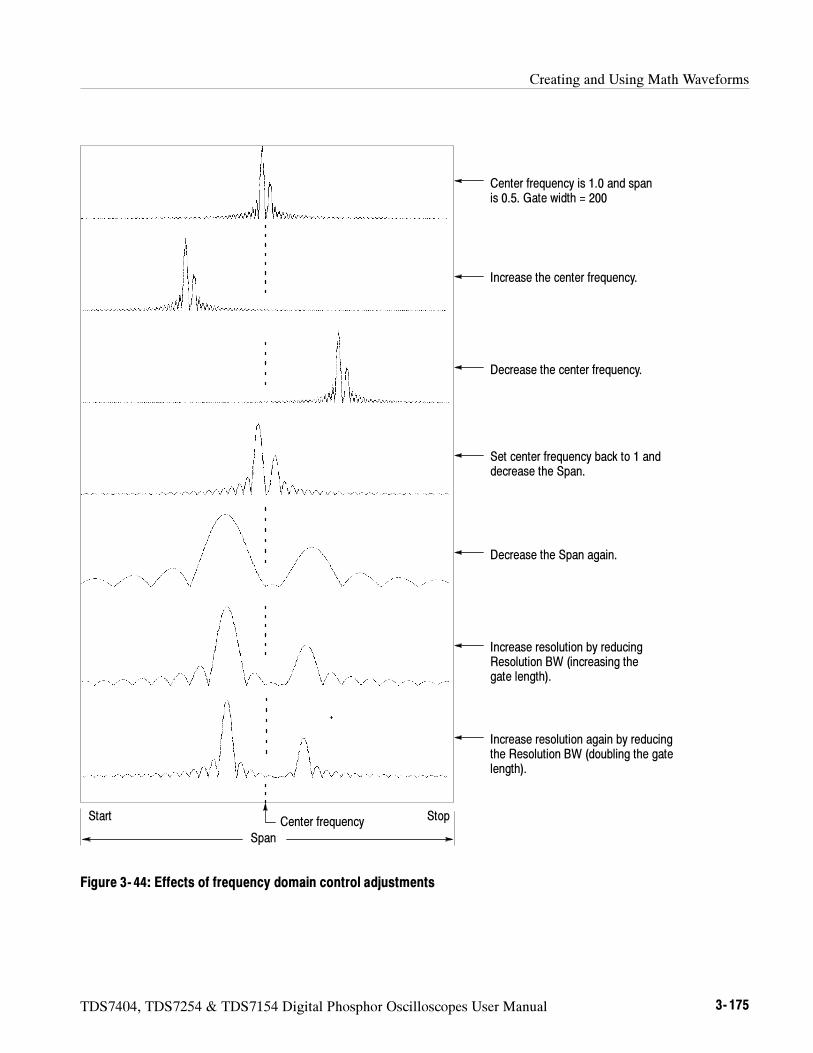
Creating and Using Math Waveforms
TDS7404, TDS7254 & TDS7154 Digital Phosphor Oscilloscopes User Manual 3- 175
Center frequencySpan
Center frequency is 1.0 and spanis 0.5. Gate width = 200
Increase the center frequency.
Decrease the center frequency.
Set center frequency back to 1 anddecrease the Span.
Decrease the Span again.
Increase resolution by reducingResolution BW (increasing thegate length).
Increase resolution again by reducingthe Resolution BW (doubling the gatelength).
Start Stop
Figure 3- 44: Effects of frequency domain control adjustments
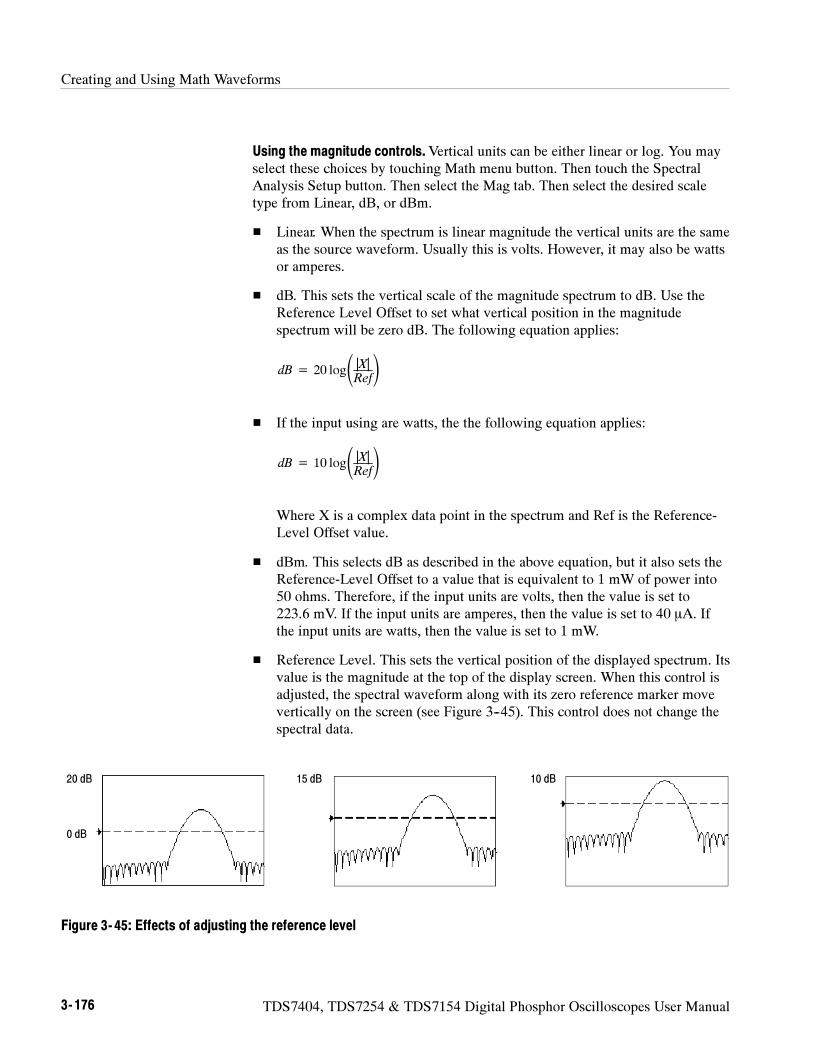
Creating and Using Math Waveforms
3- 176 TDS7404, TDS7254 & TDS7154 Digital Phosphor Oscilloscopes User Manual
Using the magnitude controls.Vertical units can be either linear or log. You mayselect these choices by touching Math menu button. Then touch the SpectralAnalysis Setup button. Then select the Mag tab. Then select the desired scaletype from Linear, dB, or dBm.
Linear. When the spectrum is linear magnitude the vertical units are the sameas the source waveform. Usually this is volts. However, it may also be wattsor amperes.
dB. This sets the vertical scale of the magnitude spectrum to dB. Use theReference Level Offset to set what vertical position in the magnitudespectrum will be zero dB. The following equation applies:
dB = 20 log |X|Ref
If the input using are watts, the the following equation applies:
dB = 10 log |X|Ref
Where X is a complex data point in the spectrum and Ref is the Reference-Level Offset value.
dBm. This selects dB as described in the above equation, but it also sets theReference-Level Offset to a value that is equivalent to 1 mW of power into50 ohms. Therefore, if the input units are volts, then the value is set to223.6 mV. If the input units are amperes, then the value is set to 40 A. Ifthe input units are watts, then the value is set to 1 mW.
Reference Level. This sets the vertical position of the displayed spectrum. Itsvalue is the magnitude at the top of the display screen. When this control isadjusted, the spectral waveform along with its zero reference marker movevertically on the screen (see Figure 3--45). This control does not change thespectral data.
0 dB
20 dB 15 dB 10 dB
Figure 3- 45: Effects of adjusting the reference level
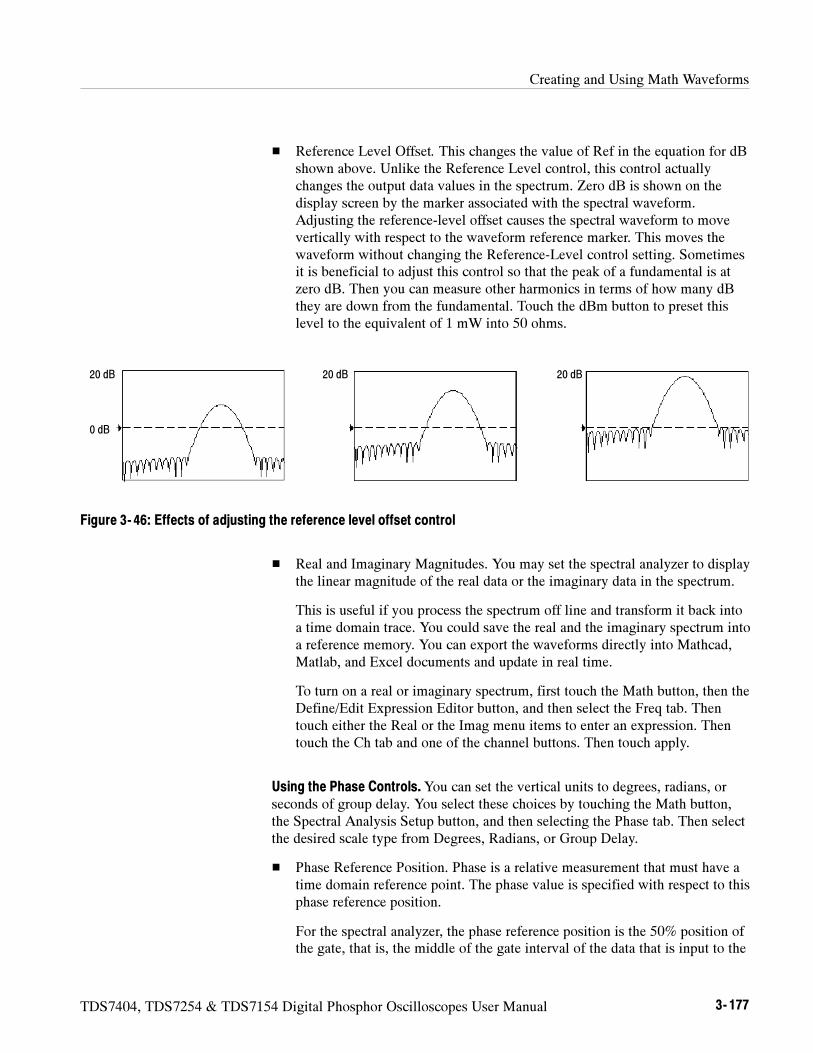
Creating and Using Math Waveforms
TDS7404, TDS7254 & TDS7154 Digital Phosphor Oscilloscopes User Manual 3- 177
Reference Level Offset. This changes the value of Ref in the equation for dBshown above. Unlike the Reference Level control, this control actuallychanges the output data values in the spectrum. Zero dB is shown on thedisplay screen by the marker associated with the spectral waveform.Adjusting the reference-level offset causes the spectral waveform to movevertically with respect to the waveform reference marker. This moves thewaveform without changing the Reference-Level control setting. Sometimesit is beneficial to adjust this control so that the peak of a fundamental is atzero dB. Then you can measure other harmonics in terms of how many dBthey are down from the fundamental. Touch the dBm button to preset thislevel to the equivalent of 1 mW into 50 ohms.
0 dB
20 dB 20 dB 20 dB
Figure 3- 46: Effects of adjusting the reference level offset control
Real and Imaginary Magnitudes. You may set the spectral analyzer to displaythe linear magnitude of the real data or the imaginary data in the spectrum.
This is useful if you process the spectrum off line and transform it back intoa time domain trace. You could save the real and the imaginary spectrum intoa reference memory. You can export the waveforms directly into Mathcad,Matlab, and Excel documents and update in real time.
To turn on a real or imaginary spectrum, first touch the Math button, then theDefine/Edit Expression Editor button, and then select the Freq tab. Thentouch either the Real or the Imag menu items to enter an expression. Thentouch the Ch tab and one of the channel buttons. Then touch apply.
Using the Phase Controls.You can set the vertical units to degrees, radians, orseconds of group delay. You select these choices by touching the Math button,the Spectral Analysis Setup button, and then selecting the Phase tab. Then selectthe desired scale type from Degrees, Radians, or Group Delay.
Phase Reference Position. Phase is a relative measurement that must have atime domain reference point. The phase value is specified with respect to thisphase reference position.
For the spectral analyzer, the phase reference position is the 50% position ofthe gate, that is, the middle of the gate interval of the data that is input to the
Creating and Using Math Waveforms
3- 178 TDS7404, TDS7254 & TDS7154 Digital Phosphor Oscilloscopes User Manual
spectral analyzer. This is true for all window functions except for the TekExponential window. This window has the reference point at the 20%position of the gate.
Phase Unwrap. The spectral analyzer produces phase values from --π toπ radians or --180 to 180 degrees. However, when you perform impulseresponse testing and the phase is continuous, then phase values outside theseranges may occur. The spectral analyzer then wraps the data with disconti-nuities in the display from +180 to --180 degrees. Phase unwrap will displaythe correct result by unwrapping the phase.
Phase unwrap is only valid when the phase spectrum is a continuousfunction of frequency. Therefore, do not use it when analyzing the harmoniccontent of the typical repetitive signal.
Suppression Threshold. Random noise in the spectrum may have phasevalues over the entire range. This could make the phase display unusable.However, you can set the suppression threshold control to a level in dB. Thephase of any complex spectral points with a magnitude below this thresholdis set to zero.
Phase Unwrap Algorithm. The algorithm searches for the largest magnitudein the current span. Phase unwrap is then performed in both directions infrequency from that point. This results in a stable phase unwrap.
Phase Spectrum dejitter. An instrument acquisition system jitters by onesample interval. Signals at the Nyquist frequency only have two samples percycle. This would cause 180 of phase jitter if it were not corrected. Theinstrument phase spectrum is dejittered so that accurate measurements ofphase are obtained from DC to the Nyquist frequency.
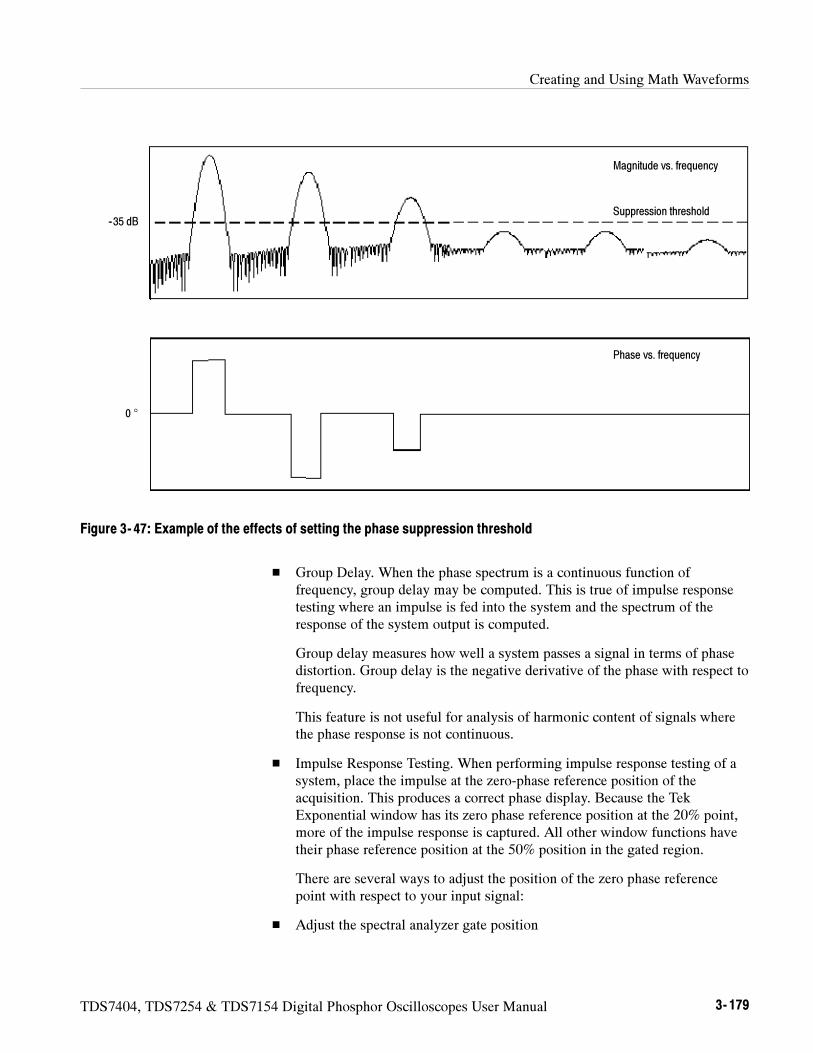
Creating and Using Math Waveforms
TDS7404, TDS7254 & TDS7154 Digital Phosphor Oscilloscopes User Manual 3- 179
--35 dB
0 °
Magnitude vs. frequency
Suppression threshold
Phase vs. frequency
Figure 3- 47: Example of the effects of setting the phase suppression threshold
Group Delay. When the phase spectrum is a continuous function offrequency, group delay may be computed. This is true of impulse responsetesting where an impulse is fed into the system and the spectrum of theresponse of the system output is computed.
Group delay measures how well a system passes a signal in terms of phasedistortion. Group delay is the negative derivative of the phase with respect tofrequency.
This feature is not useful for analysis of harmonic content of signals wherethe phase response is not continuous.
Impulse Response Testing. When performing impulse response testing of asystem, place the impulse at the zero-phase reference position of theacquisition. This produces a correct phase display. Because the TekExponential window has its zero phase reference position at the 20% point,more of the impulse response is captured. All other window functions havetheir phase reference position at the 50% position in the gated region.
There are several ways to adjust the position of the zero phase referencepoint with respect to your input signal:
Adjust the spectral analyzer gate position
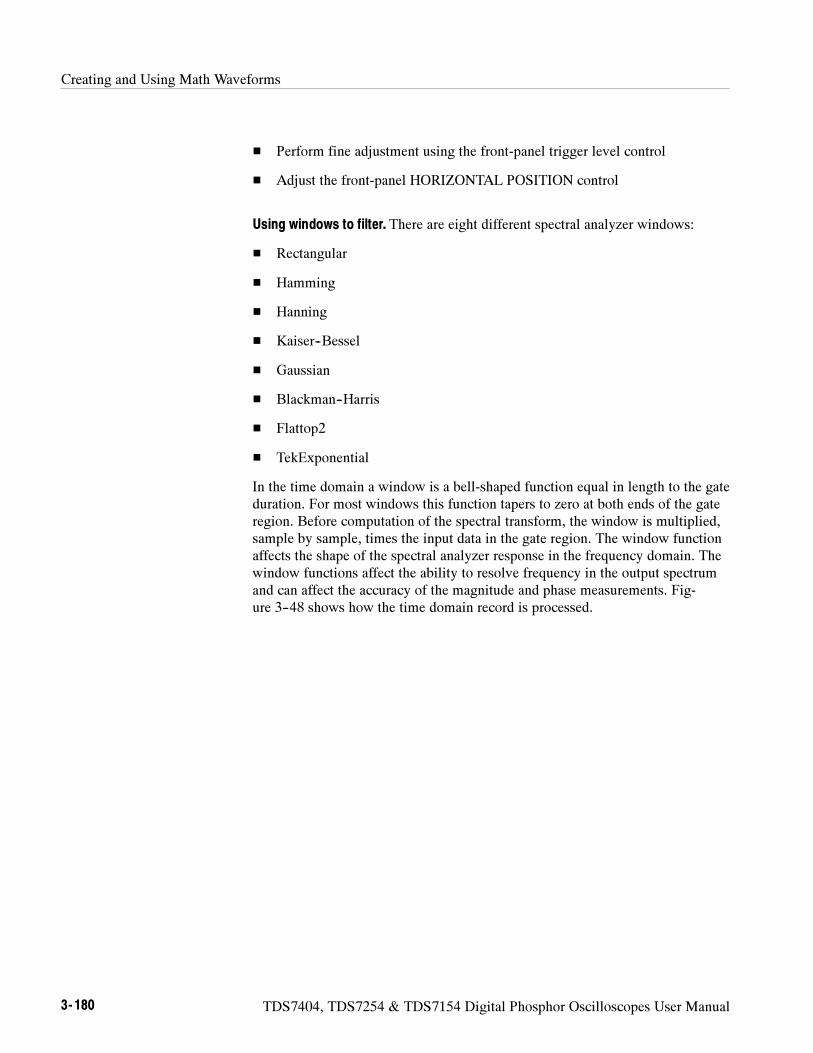
Creating and Using Math Waveforms
3- 180 TDS7404, TDS7254 & TDS7154 Digital Phosphor Oscilloscopes User Manual
Perform fine adjustment using the front-panel trigger level control
Adjust the front-panel HORIZONTAL POSITION control
Using windows to filter. There are eight different spectral analyzer windows:
Rectangular
Hamming
Hanning
Kaiser--Bessel
Gaussian
Blackman--Harris
Flattop2
TekExponential
In the time domain a window is a bell-shaped function equal in length to the gateduration. For most windows this function tapers to zero at both ends of the gateregion. Before computation of the spectral transform, the window is multiplied,sample by sample, times the input data in the gate region. The window functionaffects the shape of the spectral analyzer response in the frequency domain. Thewindow functions affect the ability to resolve frequency in the output spectrumand can affect the accuracy of the magnitude and phase measurements. Fig-ure 3--48 shows how the time domain record is processed.
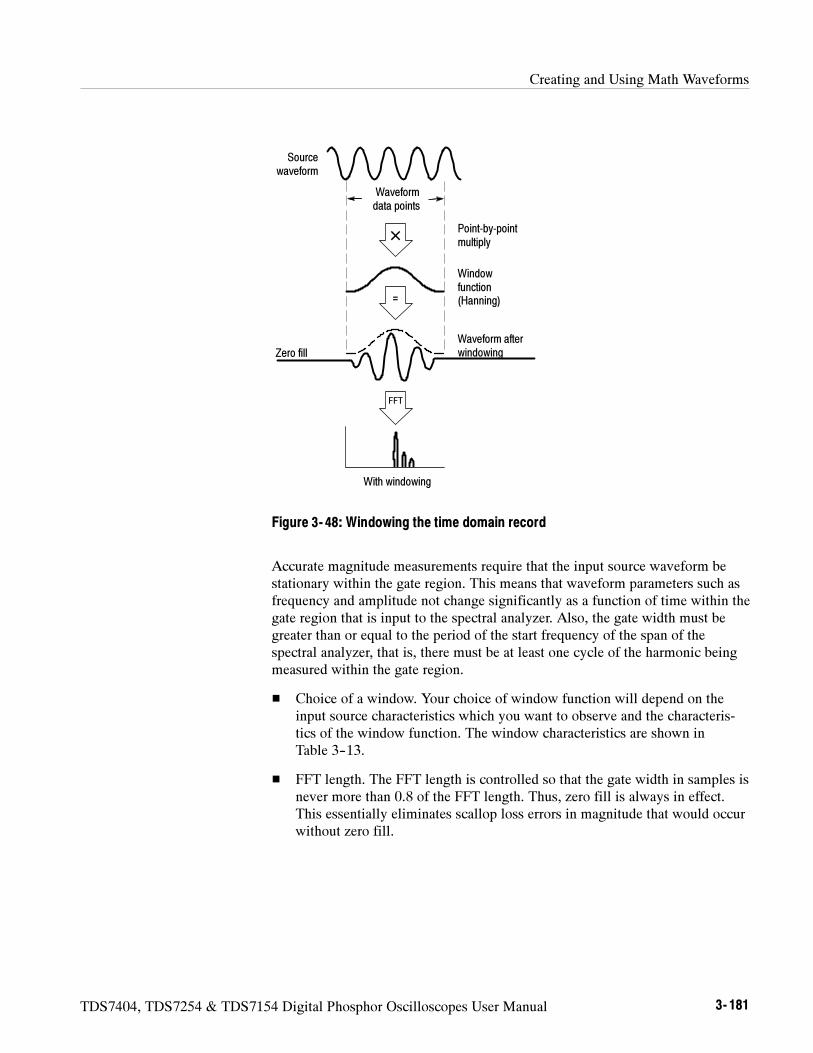
Creating and Using Math Waveforms
TDS7404, TDS7254 & TDS7154 Digital Phosphor Oscilloscopes User Manual 3- 181
Sourcewaveform
Waveform afterwindowing
Windowfunction(Hanning)
FFT
×
=
Point-by-pointmultiply
With windowing
Waveformdata points
Zero fill
Figure 3- 48: Windowing the time domain record
Accurate magnitude measurements require that the input source waveform bestationary within the gate region. This means that waveform parameters such asfrequency and amplitude not change significantly as a function of time within thegate region that is input to the spectral analyzer. Also, the gate width must begreater than or equal to the period of the start frequency of the span of thespectral analyzer, that is, there must be at least one cycle of the harmonic beingmeasured within the gate region.
Choice of a window. Your choice of window function will depend on theinput source characteristics which you want to observe and the characteris-tics of the window function. The window characteristics are shown inTable 3--13.
FFT length. The FFT length is controlled so that the gate width in samples isnever more than 0.8 of the FFT length. Thus, zero fill is always in effect.This essentially eliminates scallop loss errors in magnitude that would occurwithout zero fill.
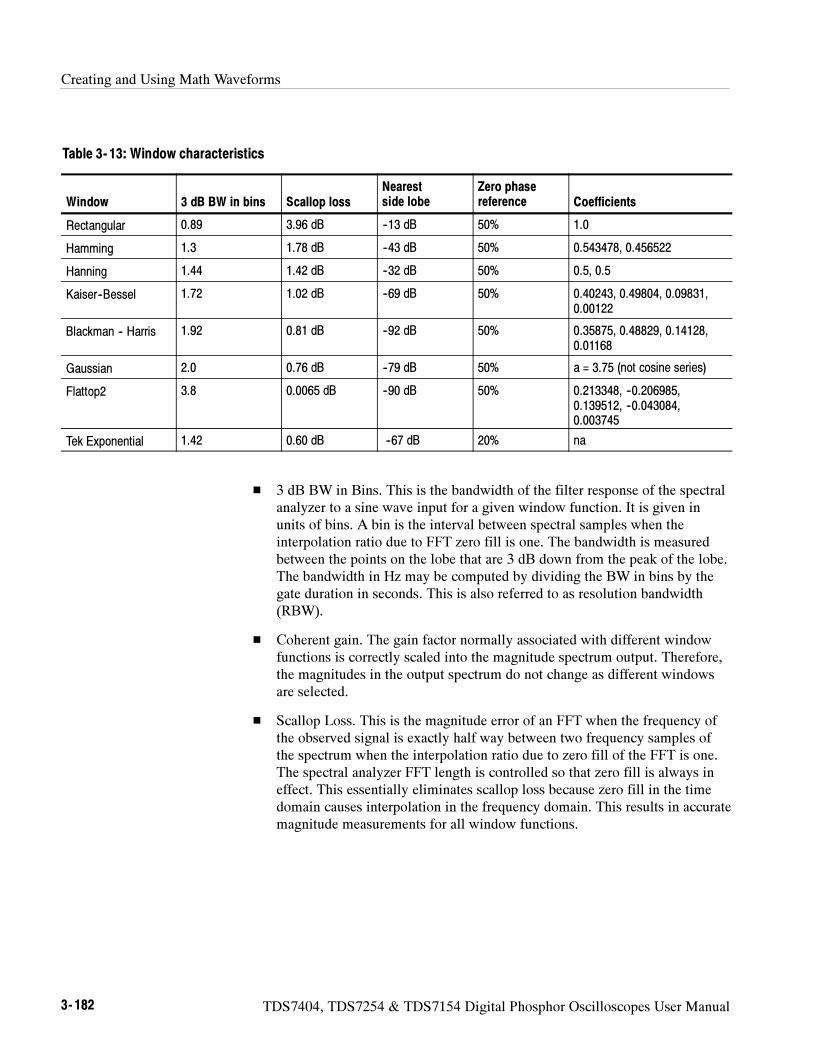
Creating and Using Math Waveforms
3- 182 TDS7404, TDS7254 & TDS7154 Digital Phosphor Oscilloscopes User Manual
Table 3- 13: Window characteristics
Window 3 dB BW in bins Scallop lossNearestside lobe
Zero phasereference Coefficients
Rectangular 0.89 3.96 dB --13 dB 50% 1.0
Hamming 1.3 1.78 dB --43 dB 50% 0.543478, 0.456522
Hanning 1.44 1.42 dB --32 dB 50% 0.5, 0.5
Kaiser--Bessel 1.72 1.02 dB --69 dB 50% 0.40243, 0.49804, 0.09831,0.00122
Blackman -- Harris 1.92 0.81 dB --92 dB 50% 0.35875, 0.48829, 0.14128,0.01168
Gaussian 2.0 0.76 dB --79 dB 50% a = 3.75 (not cosine series)
Flattop2 3.8 0.0065 dB --90 dB 50% 0.213348, --0.206985,0.139512, --0.043084,0.003745
Tek Exponential 1.42 0.60 dB --67 dB 20% na
3 dB BW in Bins. This is the bandwidth of the filter response of the spectralanalyzer to a sine wave input for a given window function. It is given inunits of bins. A bin is the interval between spectral samples when theinterpolation ratio due to FFT zero fill is one. The bandwidth is measuredbetween the points on the lobe that are 3 dB down from the peak of the lobe.The bandwidth in Hz may be computed by dividing the BW in bins by thegate duration in seconds. This is also referred to as resolution bandwidth(RBW).
Coherent gain. The gain factor normally associated with different windowfunctions is correctly scaled into the magnitude spectrum output. Therefore,the magnitudes in the output spectrum do not change as different windowsare selected.
Scallop Loss. This is the magnitude error of an FFT when the frequency ofthe observed signal is exactly half way between two frequency samples ofthe spectrum when the interpolation ratio due to zero fill of the FFT is one.The spectral analyzer FFT length is controlled so that zero fill is always ineffect. This essentially eliminates scallop loss because zero fill in the timedomain causes interpolation in the frequency domain. This results in accuratemagnitude measurements for all window functions.
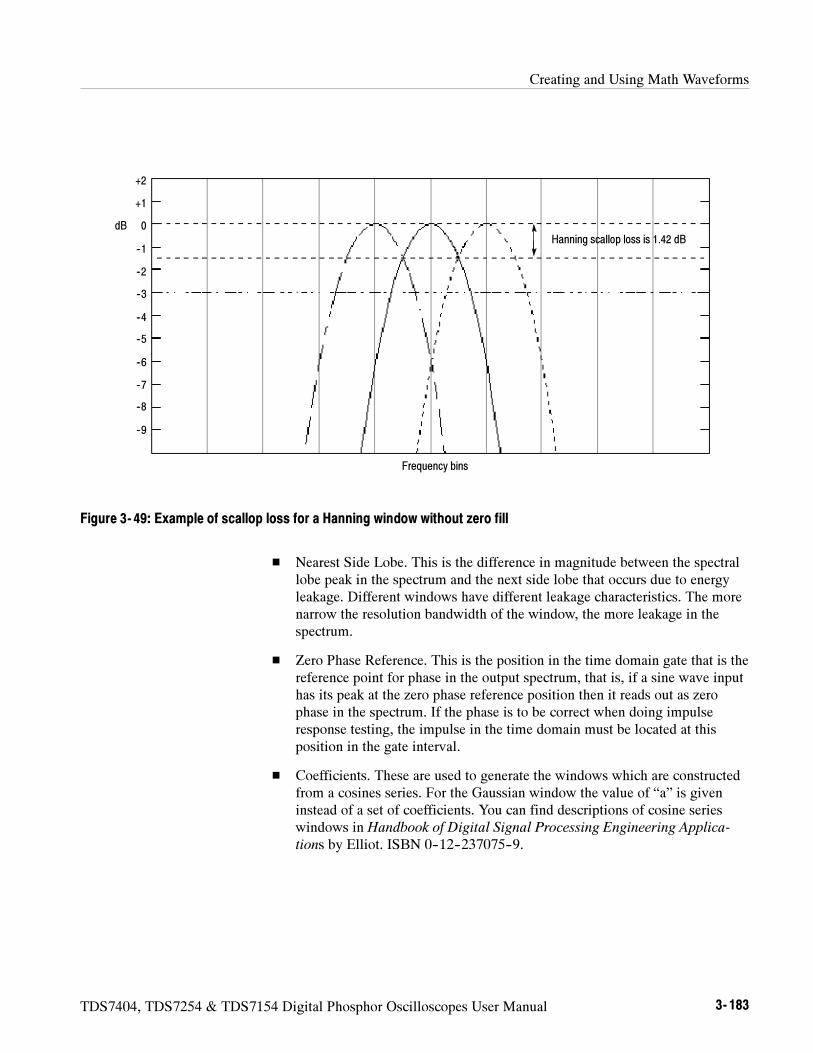
Creating and Using Math Waveforms
TDS7404, TDS7254 & TDS7154 Digital Phosphor Oscilloscopes User Manual 3- 183
--10
Hanning scallop loss is 1.42 dB
Frequency bins
+2
+1
0
--1
--2
--3
--4
--5
--6
--7
--8
--9
dB
Figure 3- 49: Example of scallop loss for a Hanning window without zero fill
Nearest Side Lobe. This is the difference in magnitude between the spectrallobe peak in the spectrum and the next side lobe that occurs due to energyleakage. Different windows have different leakage characteristics. The morenarrow the resolution bandwidth of the window, the more leakage in thespectrum.
Zero Phase Reference. This is the position in the time domain gate that is thereference point for phase in the output spectrum, that is, if a sine wave inputhas its peak at the zero phase reference position then it reads out as zerophase in the spectrum. If the phase is to be correct when doing impulseresponse testing, the impulse in the time domain must be located at thisposition in the gate interval.
Coefficients. These are used to generate the windows which are constructedfrom a cosines series. For the Gaussian window the value of “a” is giveninstead of a set of coefficients. You can find descriptions of cosine serieswindows in Handbook of Digital Signal Processing Engineering Applica-
tions by Elliot. ISBN 0--12--237075--9.
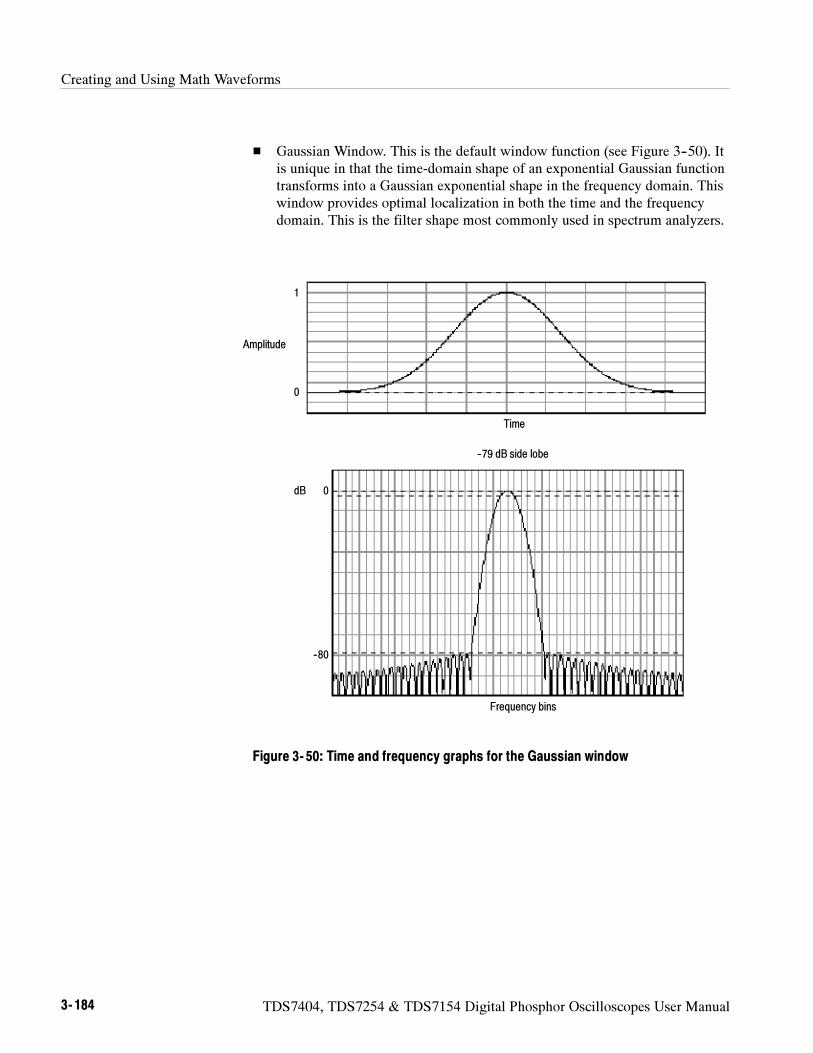
Creating and Using Math Waveforms
3- 184 TDS7404, TDS7254 & TDS7154 Digital Phosphor Oscilloscopes User Manual
Gaussian Window. This is the default window function (see Figure 3--50). Itis unique in that the time-domain shape of an exponential Gaussian functiontransforms into a Gaussian exponential shape in the frequency domain. Thiswindow provides optimal localization in both the time and the frequencydomain. This is the filter shape most commonly used in spectrum analyzers.
1
0
Amplitude
Time
--79 dB side lobe
0
--80
dB
Frequency bins
Figure 3- 50: Time and frequency graphs for the Gaussian window
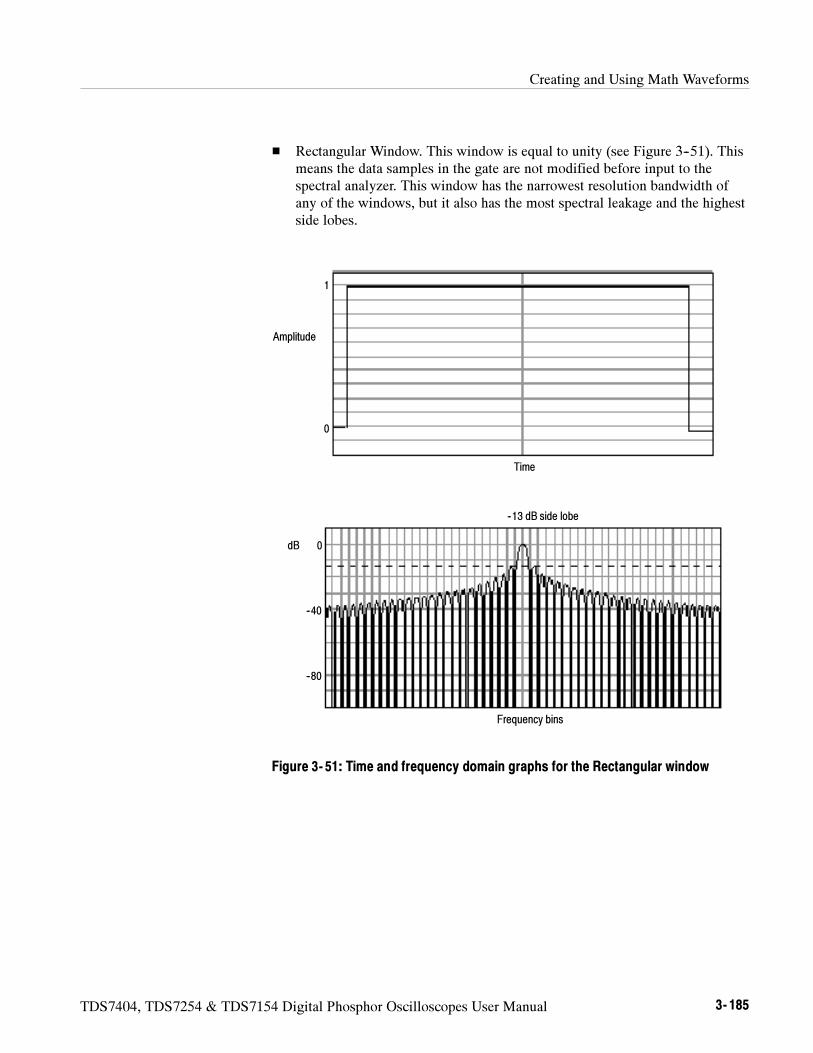
Creating and Using Math Waveforms
TDS7404, TDS7254 & TDS7154 Digital Phosphor Oscilloscopes User Manual 3- 185
Rectangular Window. This window is equal to unity (see Figure 3--51). Thismeans the data samples in the gate are not modified before input to thespectral analyzer. This window has the narrowest resolution bandwidth ofany of the windows, but it also has the most spectral leakage and the highestside lobes.
1
0
Amplitude
Time
--13 dB side lobe
0
--80
dB
Frequency bins
--40
Figure 3- 51: Time and frequency domain graphs for the Rectangular window
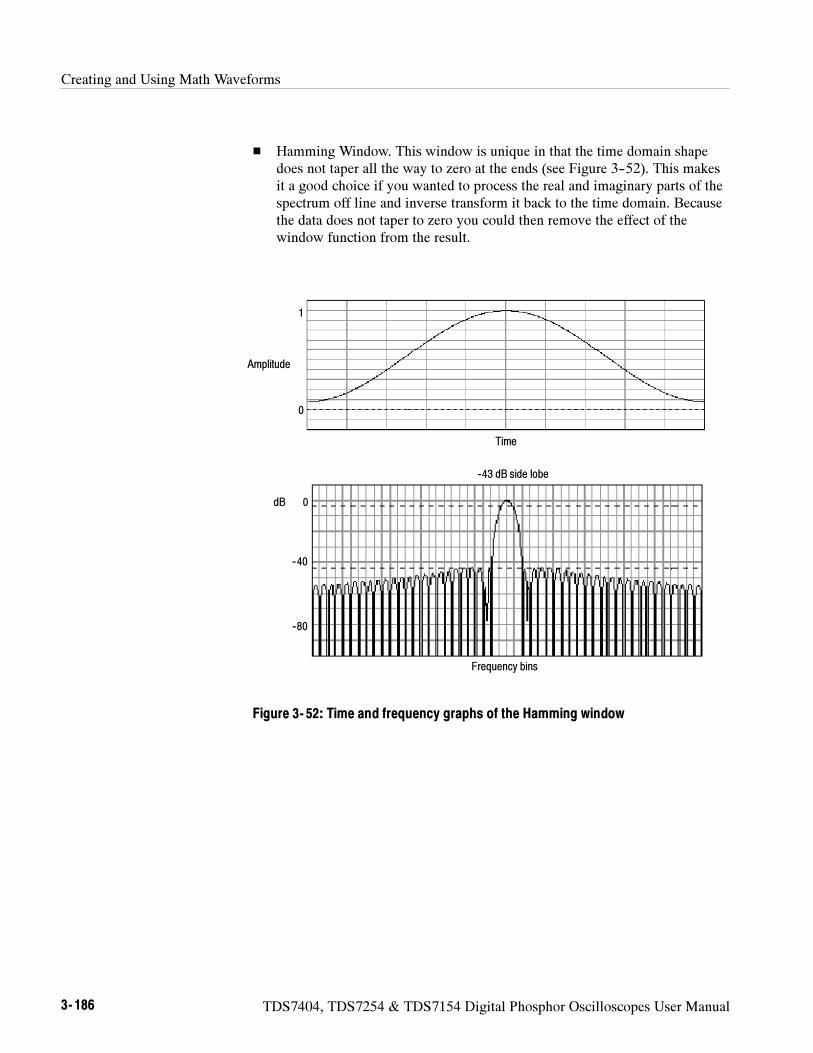
Creating and Using Math Waveforms
3- 186 TDS7404, TDS7254 & TDS7154 Digital Phosphor Oscilloscopes User Manual
Hamming Window. This window is unique in that the time domain shapedoes not taper all the way to zero at the ends (see Figure 3--52). This makesit a good choice if you wanted to process the real and imaginary parts of thespectrum off line and inverse transform it back to the time domain. Becausethe data does not taper to zero you could then remove the effect of thewindow function from the result.
1
0
Amplitude
Time
--43 dB side lobe
0
--80
dB
Frequency bins
--40
Figure 3- 52: Time and frequency graphs of the Hamming window
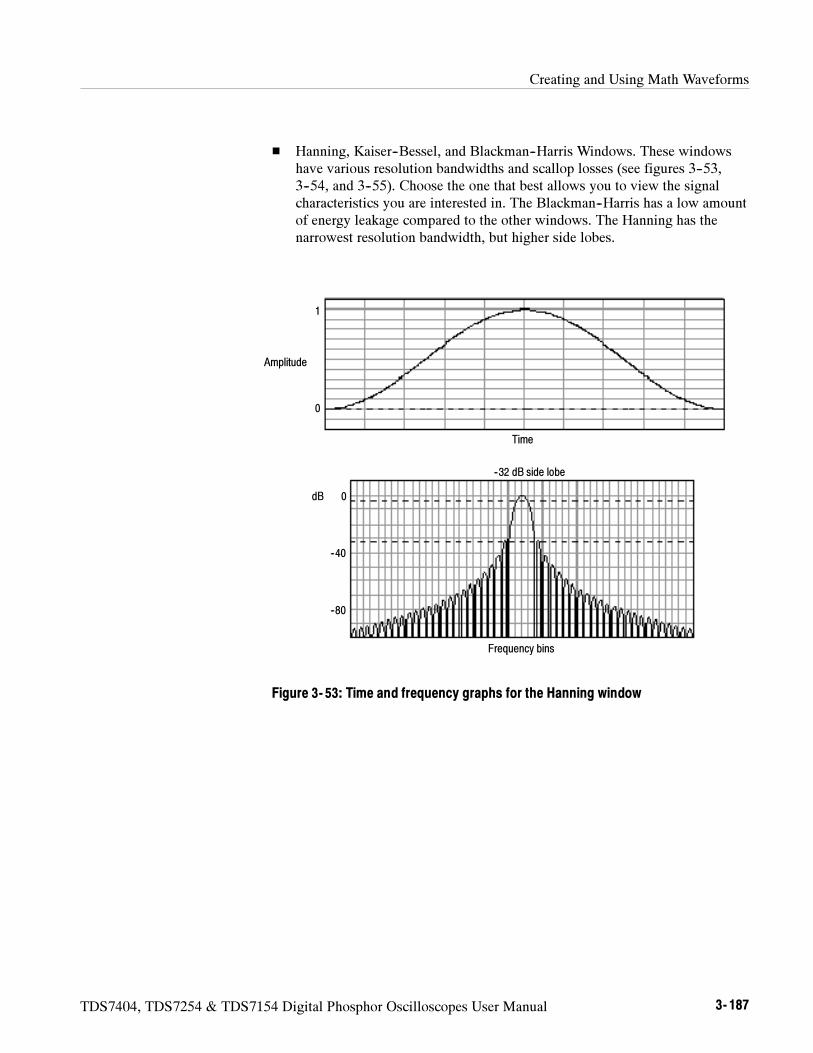
Creating and Using Math Waveforms
TDS7404, TDS7254 & TDS7154 Digital Phosphor Oscilloscopes User Manual 3- 187
Hanning, Kaiser--Bessel, and Blackman--Harris Windows. These windowshave various resolution bandwidths and scallop losses (see figures 3--53,3--54, and 3--55). Choose the one that best allows you to view the signalcharacteristics you are interested in. The Blackman--Harris has a low amountof energy leakage compared to the other windows. The Hanning has thenarrowest resolution bandwidth, but higher side lobes.
1
0
Amplitude
Time
--32 dB side lobe
0
--80
dB
Frequency bins
--40
Figure 3- 53: Time and frequency graphs for the Hanning window
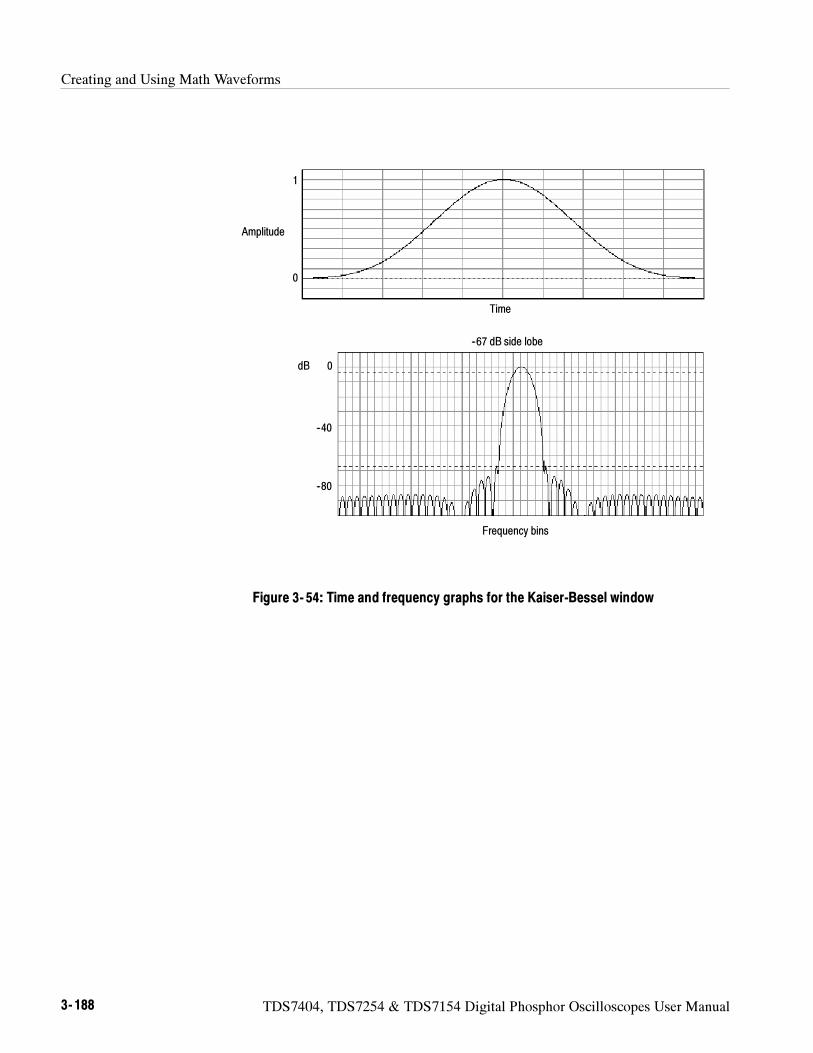
Creating and Using Math Waveforms
3- 188 TDS7404, TDS7254 & TDS7154 Digital Phosphor Oscilloscopes User Manual
1
0
Amplitude
Time
--67 dB side lobe
0
--80
dB
Frequency bins
--40
Figure 3- 54: Time and frequency graphs for the Kaiser-Bessel window
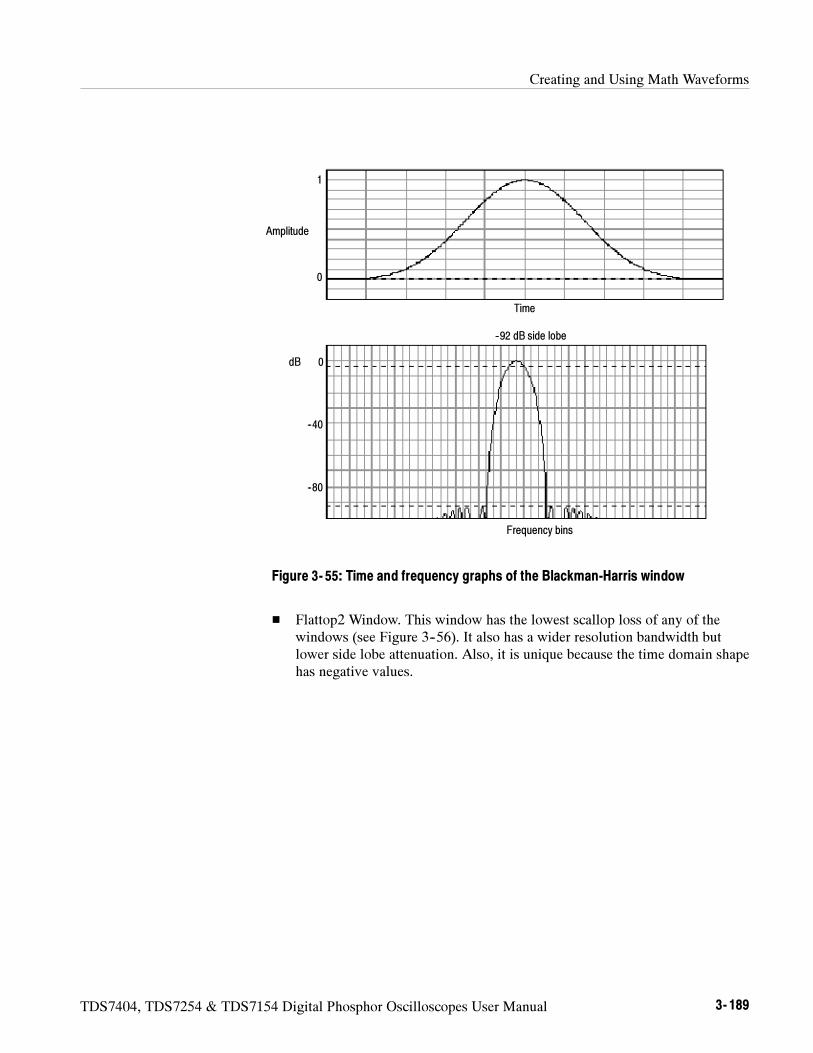
Creating and Using Math Waveforms
TDS7404, TDS7254 & TDS7154 Digital Phosphor Oscilloscopes User Manual 3- 189
1
0
Amplitude
Time
--92 dB side lobe
0
--80
dB
Frequency bins
--40
Figure 3- 55: Time and frequency graphs of the Blackman-Harris window
Flattop2 Window. This window has the lowest scallop loss of any of thewindows (see Figure 3--56). It also has a wider resolution bandwidth butlower side lobe attenuation. Also, it is unique because the time domain shapehas negative values.
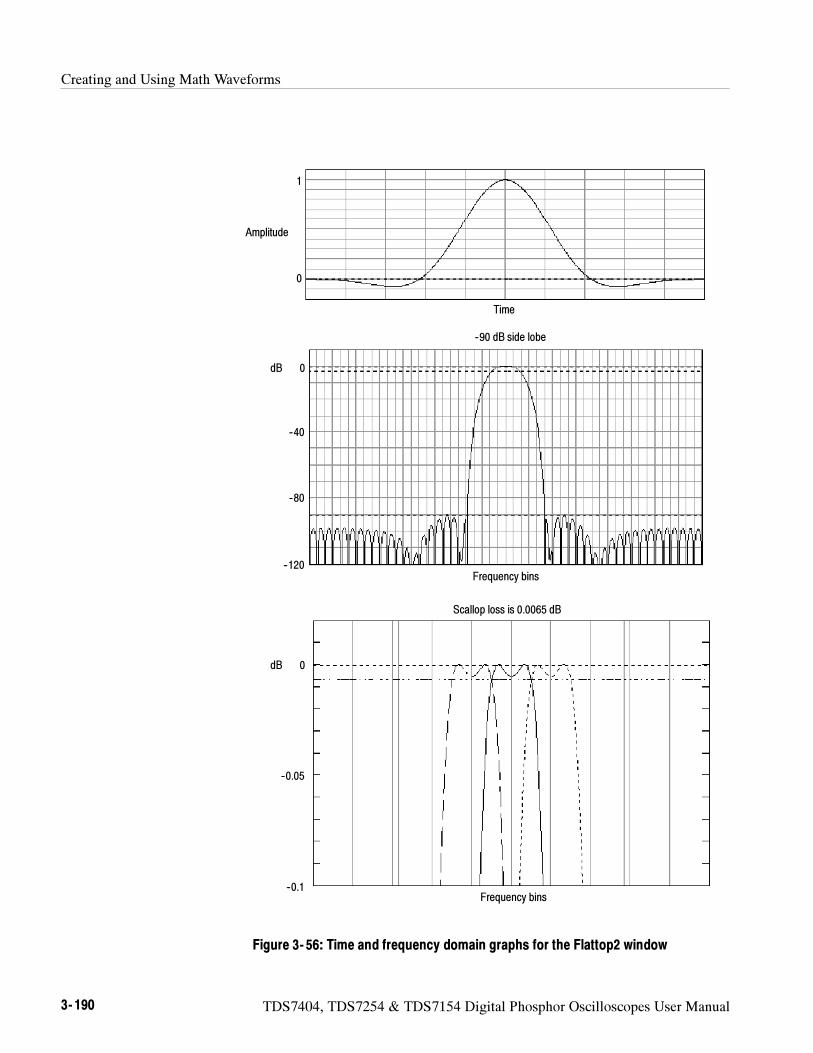
Creating and Using Math Waveforms
3- 190 TDS7404, TDS7254 & TDS7154 Digital Phosphor Oscilloscopes User Manual
1
0
Amplitude
Time
--90 dB side lobe
0
--80
dB
Frequency bins
--40
--120
0dB
--0.05
--0.1
Scallop loss is 0.0065 dB
Frequency bins
Figure 3- 56: Time and frequency domain graphs for the Flattop2 window
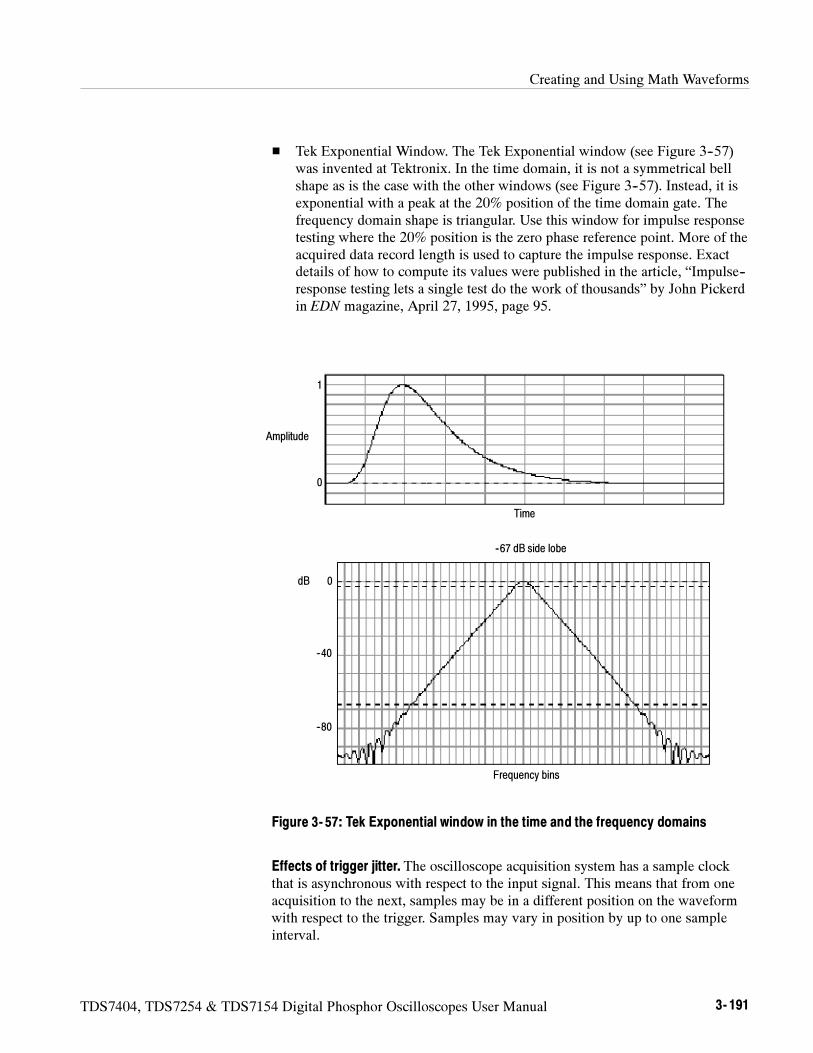
Creating and Using Math Waveforms
TDS7404, TDS7254 & TDS7154 Digital Phosphor Oscilloscopes User Manual 3- 191
Tek Exponential Window. The Tek Exponential window (see Figure 3--57)was invented at Tektronix. In the time domain, it is not a symmetrical bellshape as is the case with the other windows (see Figure 3--57). Instead, it isexponential with a peak at the 20% position of the time domain gate. Thefrequency domain shape is triangular. Use this window for impulse responsetesting where the 20% position is the zero phase reference point. More of theacquired data record length is used to capture the impulse response. Exactdetails of how to compute its values were published in the article, “Impulse--response testing lets a single test do the work of thousands” by John Pickerdin EDN magazine, April 27, 1995, page 95.
1
0
Amplitude
Time
--67 dB side lobe
0
--80
dB
Frequency bins
--40
Figure 3- 57: Tek Exponential window in the time and the frequency domains
Effects of trigger jitter. The oscilloscope acquisition system has a sample clockthat is asynchronous with respect to the input signal. This means that from oneacquisition to the next, samples may be in a different position on the waveformwith respect to the trigger. Samples may vary in position by up to one sampleinterval.
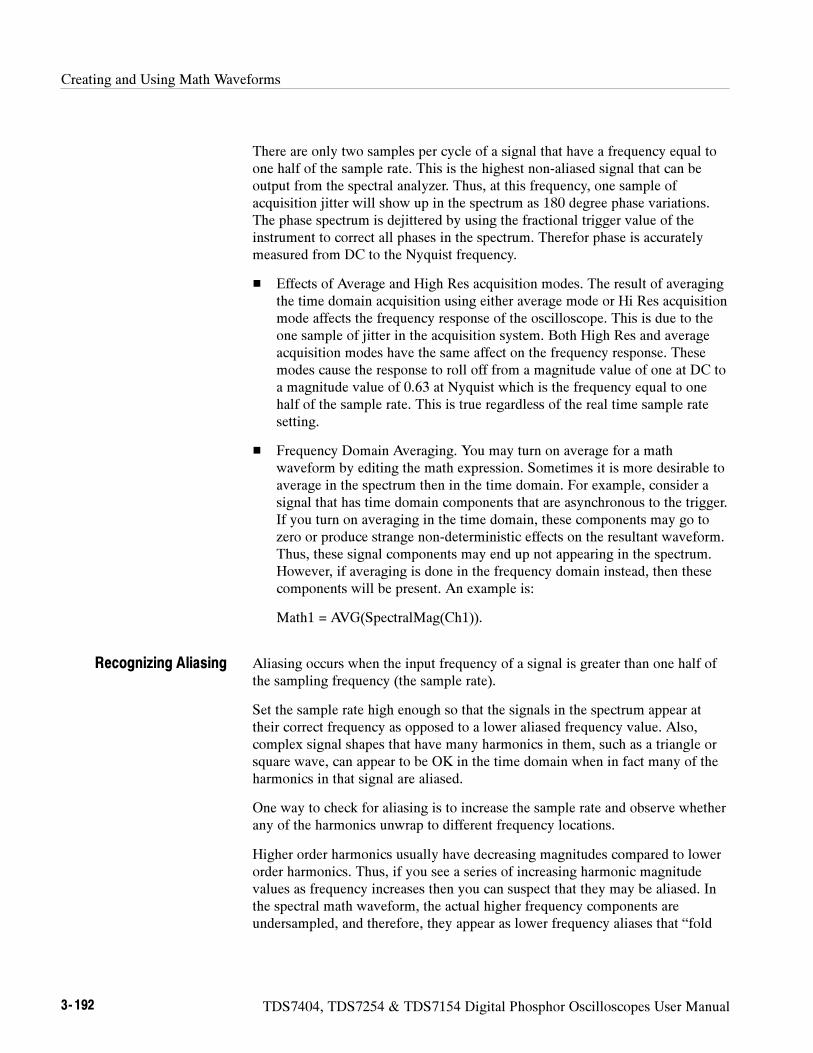
Creating and Using Math Waveforms
3- 192 TDS7404, TDS7254 & TDS7154 Digital Phosphor Oscilloscopes User Manual
There are only two samples per cycle of a signal that have a frequency equal toone half of the sample rate. This is the highest non-aliased signal that can beoutput from the spectral analyzer. Thus, at this frequency, one sample ofacquisition jitter will show up in the spectrum as 180 degree phase variations.The phase spectrum is dejittered by using the fractional trigger value of theinstrument to correct all phases in the spectrum. Therefor phase is accuratelymeasured from DC to the Nyquist frequency.
Effects of Average and High Res acquisition modes. The result of averagingthe time domain acquisition using either average mode or Hi Res acquisitionmode affects the frequency response of the oscilloscope. This is due to theone sample of jitter in the acquisition system. Both High Res and averageacquisition modes have the same affect on the frequency response. Thesemodes cause the response to roll off from a magnitude value of one at DC toa magnitude value of 0.63 at Nyquist which is the frequency equal to onehalf of the sample rate. This is true regardless of the real time sample ratesetting.
Frequency Domain Averaging. You may turn on average for a mathwaveform by editing the math expression. Sometimes it is more desirable toaverage in the spectrum then in the time domain. For example, consider asignal that has time domain components that are asynchronous to the trigger.If you turn on averaging in the time domain, these components may go tozero or produce strange non-deterministic effects on the resultant waveform.Thus, these signal components may end up not appearing in the spectrum.However, if averaging is done in the frequency domain instead, then thesecomponents will be present. An example is:
Math1 = AVG(SpectralMag(Ch1)).
Aliasing occurs when the input frequency of a signal is greater than one half ofthe sampling frequency (the sample rate).
Set the sample rate high enough so that the signals in the spectrum appear attheir correct frequency as opposed to a lower aliased frequency value. Also,complex signal shapes that have many harmonics in them, such as a triangle orsquare wave, can appear to be OK in the time domain when in fact many of theharmonics in that signal are aliased.
One way to check for aliasing is to increase the sample rate and observe whetherany of the harmonics unwrap to different frequency locations.
Higher order harmonics usually have decreasing magnitudes compared to lowerorder harmonics. Thus, if you see a series of increasing harmonic magnitudevalues as frequency increases then you can suspect that they may be aliased. Inthe spectral math waveform, the actual higher frequency components areundersampled, and therefore, they appear as lower frequency aliases that “fold
Recognizing Aliasing
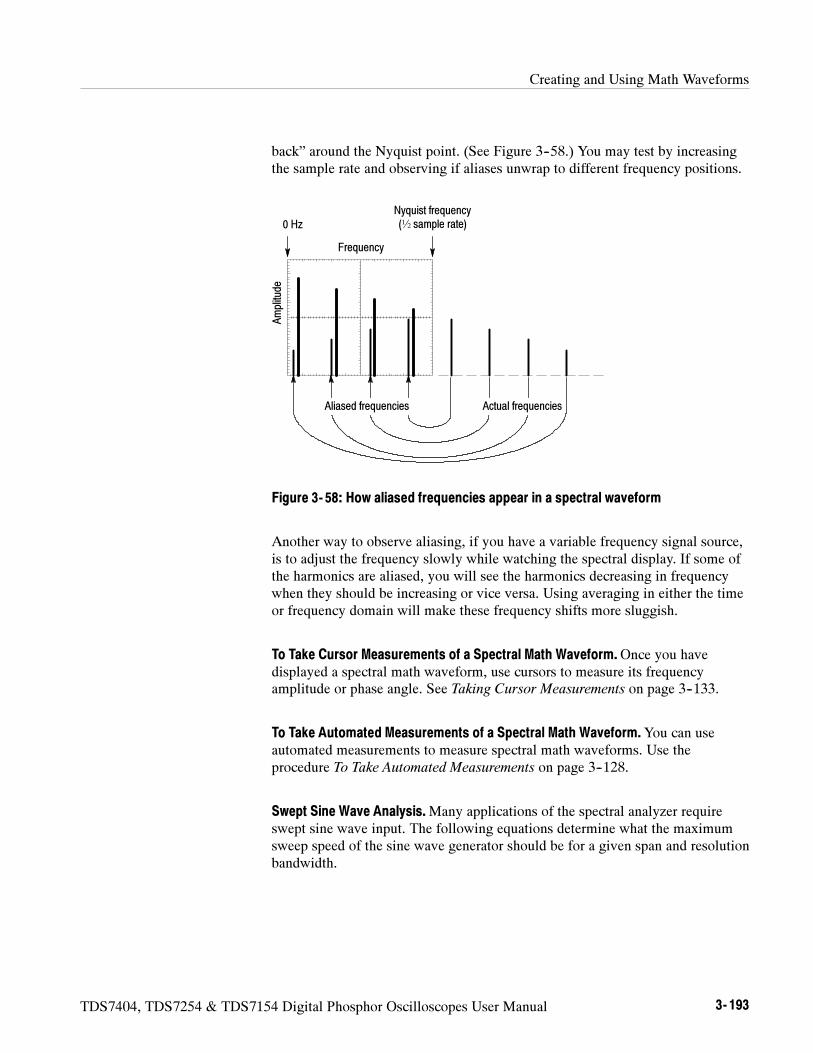
Creating and Using Math Waveforms
TDS7404, TDS7254 & TDS7154 Digital Phosphor Oscilloscopes User Manual 3- 193
back” around the Nyquist point. (See Figure 3--58.) You may test by increasingthe sample rate and observing if aliases unwrap to different frequency positions.
Frequency
Amplitude
Aliased frequencies Actual frequencies
0 Hz
Nyquist frequency(½ sample rate)
Figure 3- 58: How aliased frequencies appear in a spectral waveform
Another way to observe aliasing, if you have a variable frequency signal source,is to adjust the frequency slowly while watching the spectral display. If some ofthe harmonics are aliased, you will see the harmonics decreasing in frequencywhen they should be increasing or vice versa. Using averaging in either the timeor frequency domain will make these frequency shifts more sluggish.
To Take Cursor Measurements of a Spectral Math Waveform.Once you havedisplayed a spectral math waveform, use cursors to measure its frequencyamplitude or phase angle. See Taking Cursor Measurements on page 3--133.
To Take Automated Measurements of a Spectral Math Waveform.You can useautomated measurements to measure spectral math waveforms. Use theprocedure To Take Automated Measurements on page 3--128.
Swept Sine Wave Analysis.Many applications of the spectral analyzer requireswept sine wave input. The following equations determine what the maximumsweep speed of the sine wave generator should be for a given span and resolutionbandwidth.
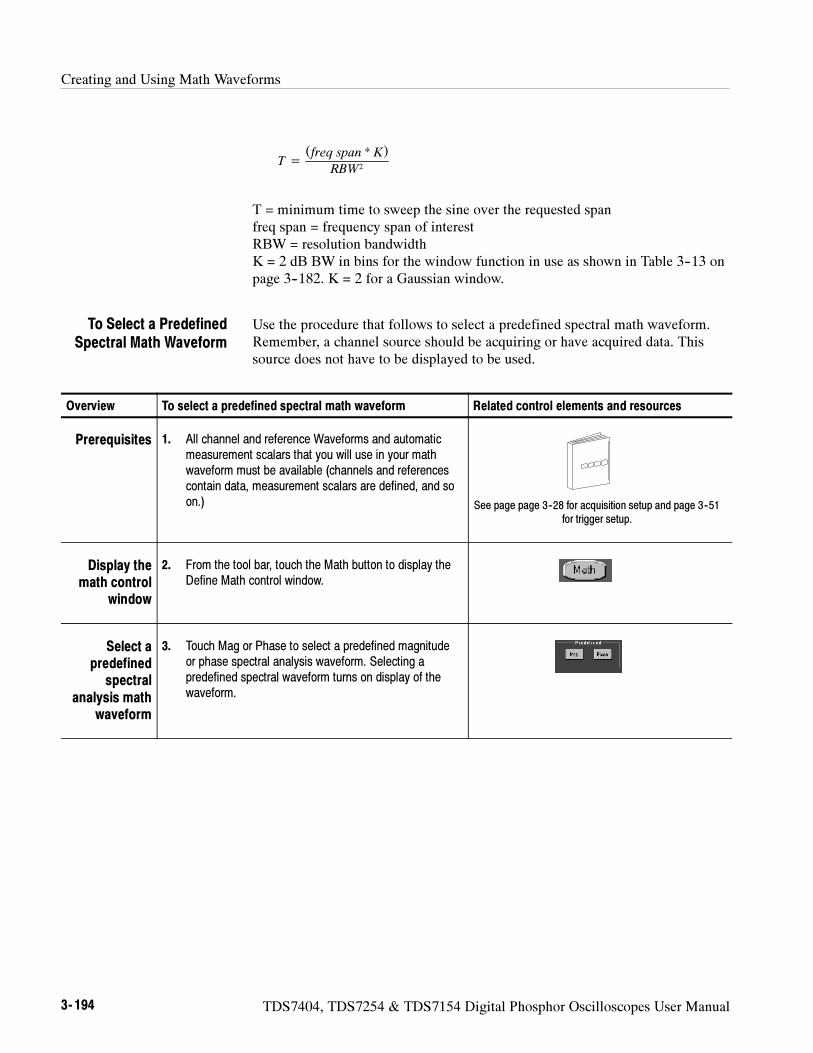
Creating and Using Math Waveforms
3- 194 TDS7404, TDS7254 & TDS7154 Digital Phosphor Oscilloscopes User Manual
T =
(freq span * K)
RBW2
T = minimum time to sweep the sine over the requested spanfreq span = frequency span of interestRBW = resolution bandwidthK = 2 dB BW in bins for the window function in use as shown in Table 3--13 onpage 3--182. K = 2 for a Gaussian window.
Use the procedure that follows to select a predefined spectral math waveform.Remember, a channel source should be acquiring or have acquired data. Thissource does not have to be displayed to be used.
Overview To select a predefined spectral math waveform Related control elements and resources
Prerequisites 1. All channel and reference Waveforms and automaticmeasurement scalars that you will use in your mathwaveform must be available (channels and referencescontain data, measurement scalars are defined, and soon.) See page page 3--28 for acquisition setup and page 3--51
for trigger setup.
Display themath control
window
2. From the tool bar, touch the Math button to display theDefine Math control window.
Select apredefined
spectralanalysis math
waveform
3. Touch Mag or Phase to select a predefined magnitudeor phase spectral analysis waveform. Selecting apredefined spectral waveform turns on display of thewaveform.
To Select a PredefinedSpectral Math Waveform
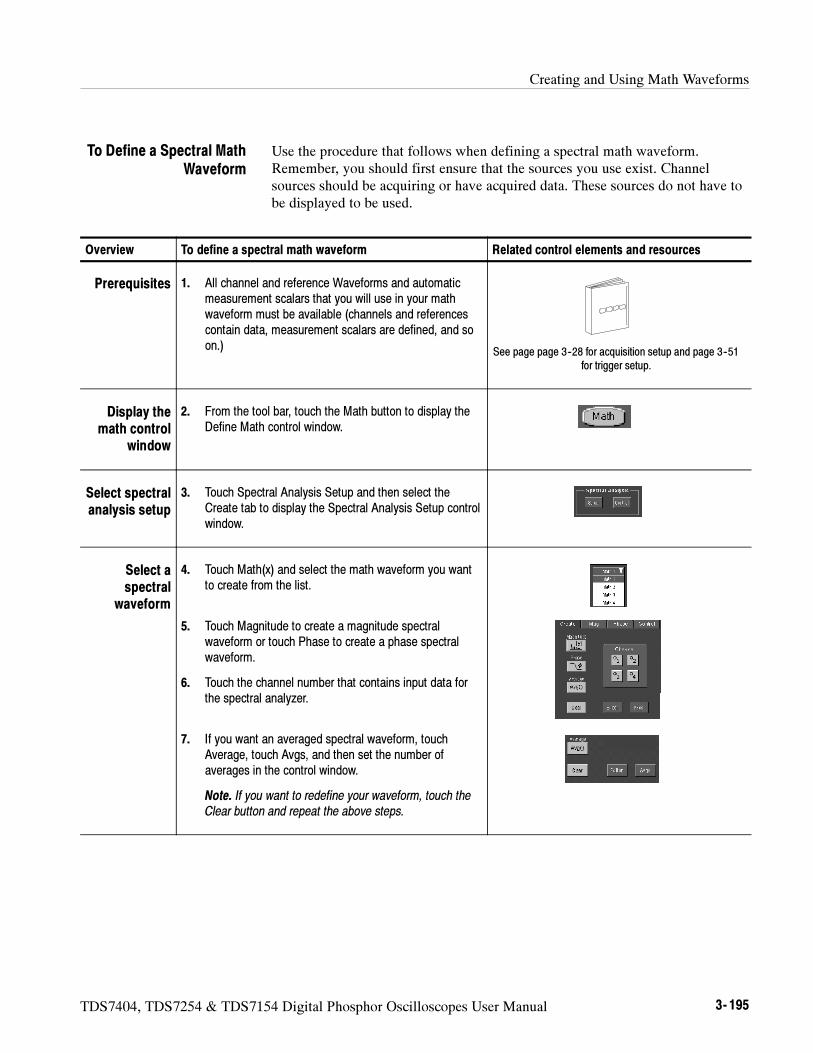
Creating and Using Math Waveforms
TDS7404, TDS7254 & TDS7154 Digital Phosphor Oscilloscopes User Manual 3- 195
Use the procedure that follows when defining a spectral math waveform.Remember, you should first ensure that the sources you use exist. Channelsources should be acquiring or have acquired data. These sources do not have tobe displayed to be used.
Overview To define a spectral math waveform Related control elements and resources
Prerequisites 1. All channel and reference Waveforms and automaticmeasurement scalars that you will use in your mathwaveform must be available (channels and referencescontain data, measurement scalars are defined, and soon.)
See page page 3--28 for acquisition setup and page 3--51for trigger setup.
Display themath control
window
2. From the tool bar, touch the Math button to display theDefine Math control window.
Select spectralanalysis setup
3. Touch Spectral Analysis Setup and then select theCreate tab to display the Spectral Analysis Setup controlwindow.
Select aspectral
waveform
4. Touch Math(x) and select the math waveform you wantto create from the list.
5. Touch Magnitude to create a magnitude spectralwaveform or touch Phase to create a phase spectralwaveform.
6. Touch the channel number that contains input data forthe spectral analyzer.
7. If you want an averaged spectral waveform, touchAverage, touch Avgs, and then set the number ofaverages in the control window.
Note. If you want to redefine your waveform, touch theClear button and repeat the above steps.
To Define a Spectral MathWaveform
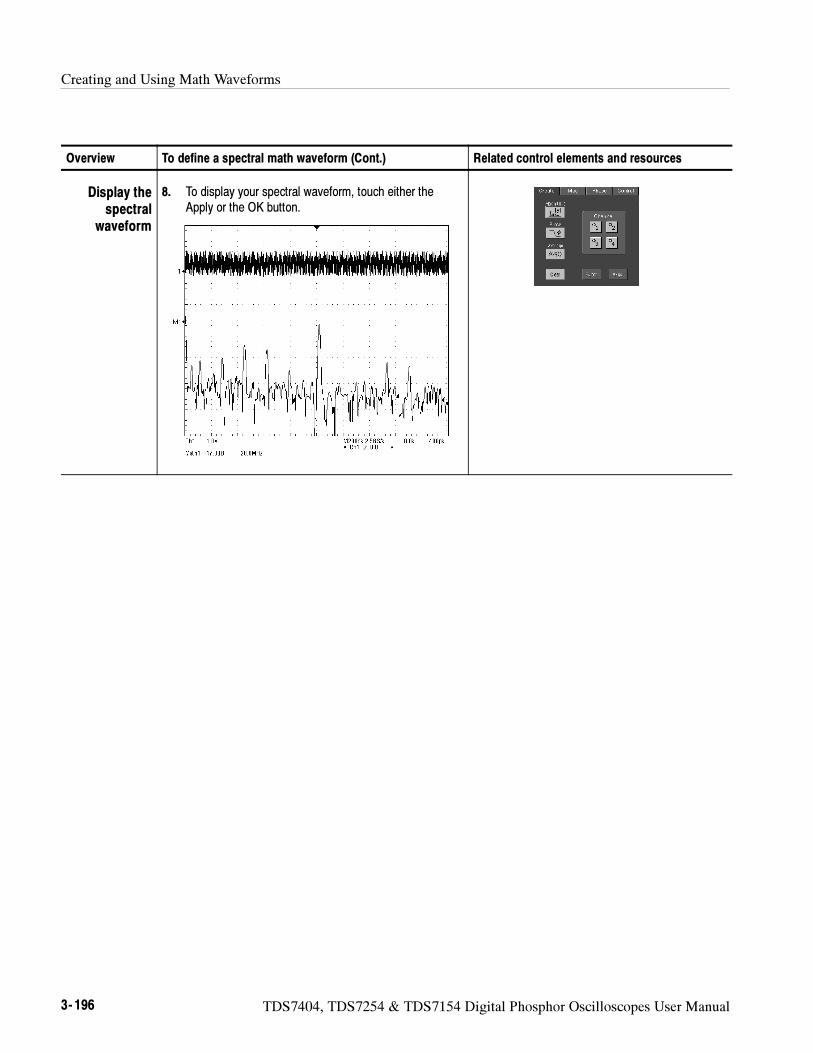
Creating and Using Math Waveforms
3- 196 TDS7404, TDS7254 & TDS7154 Digital Phosphor Oscilloscopes User Manual
Overview Related control elements and resourcesTo define a spectral math waveform (Cont.)
Display thespectral
waveform
8. To display your spectral waveform, touch either theApply or the OK button.
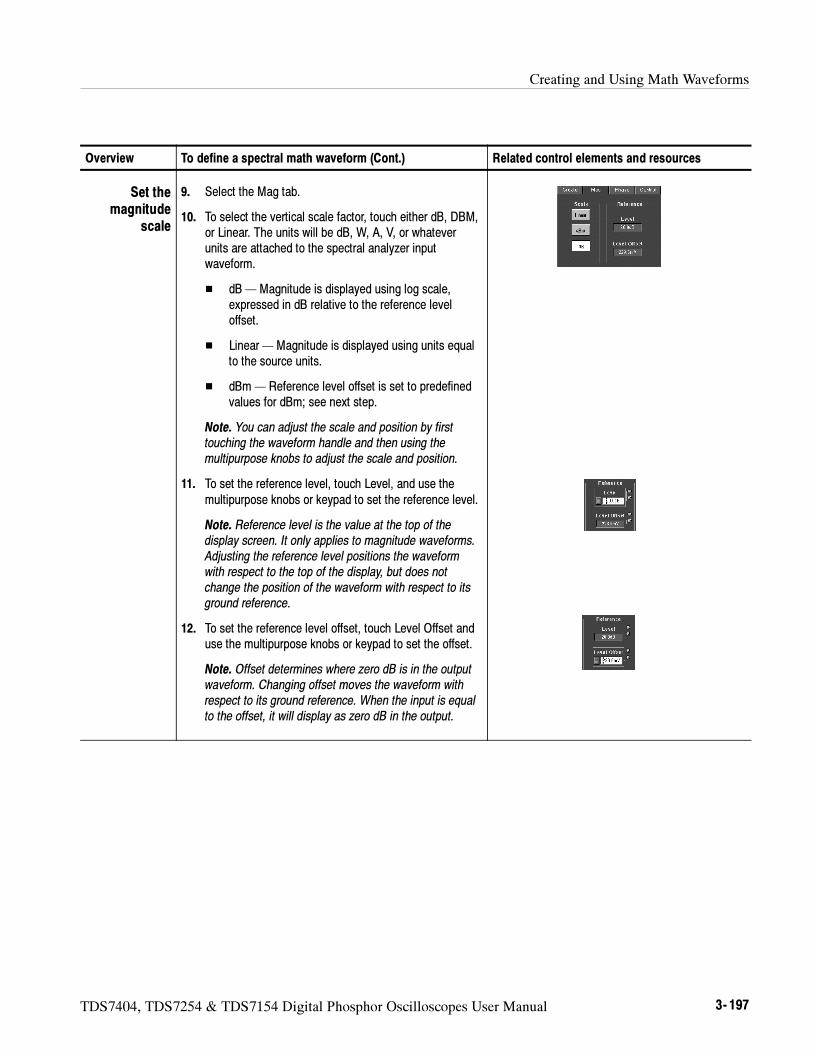
Creating and Using Math Waveforms
TDS7404, TDS7254 & TDS7154 Digital Phosphor Oscilloscopes User Manual 3- 197
Overview Related control elements and resourcesTo define a spectral math waveform (Cont.)
Set themagnitude
scale
9. Select the Mag tab.
10. To select the vertical scale factor, touch either dB, DBM,or Linear. The units will be dB, W, A, V, or whateverunits are attached to the spectral analyzer inputwaveform.
dB— Magnitude is displayed using log scale,expressed in dB relative to the reference leveloffset.
Linear— Magnitude is displayed using units equalto the source units.
dBm — Reference level offset is set to predefinedvalues for dBm; see next step.
Note. You can adjust the scale and position by firsttouching the waveform handle and then using themultipurpose knobs to adjust the scale and position.
11. To set the reference level, touch Level, and use themultipurpose knobs or keypad to set the reference level.
Note. Reference level is the value at the top of thedisplay screen. It only applies to magnitude waveforms.Adjusting the reference level positions the waveformwith respect to the top of the display, but does notchange the position of the waveform with respect to itsground reference.
12. To set the reference level offset, touch Level Offset anduse the multipurpose knobs or keypad to set the offset.
Note. Offset determines where zero dB is in the outputwaveform. Changing offset moves the waveform withrespect to its ground reference. When the input is equalto the offset, it will display as zero dB in the output.
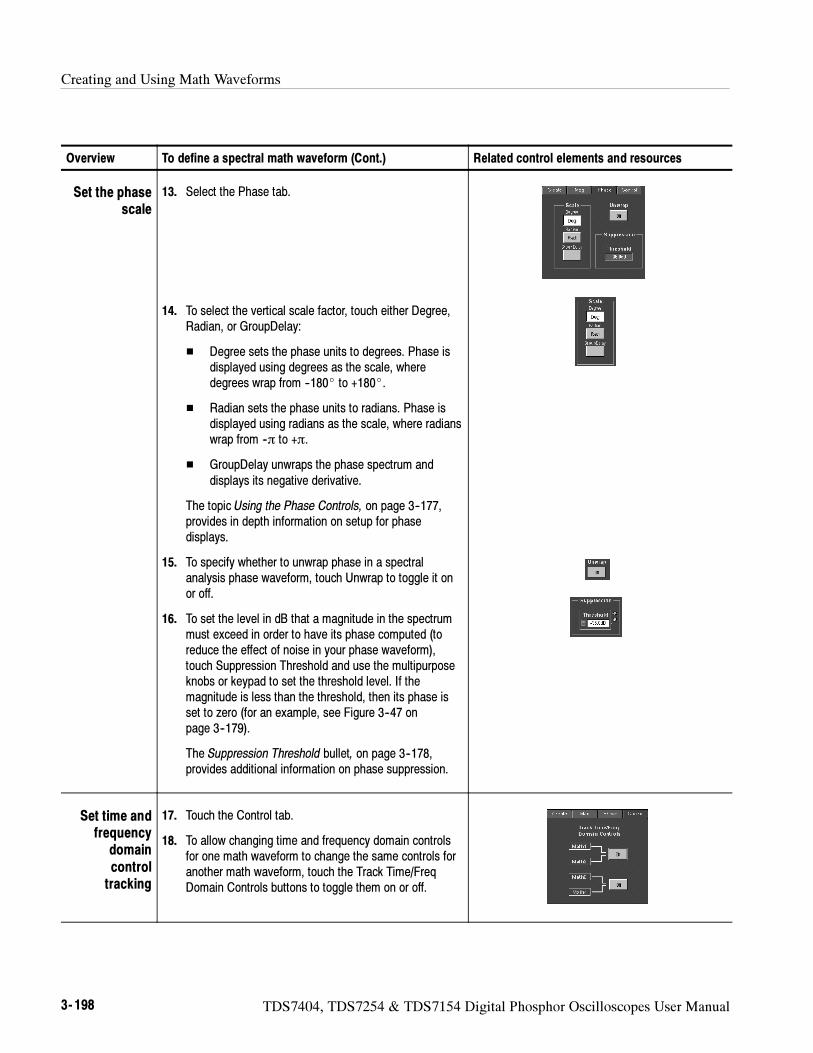
Creating and Using Math Waveforms
3- 198 TDS7404, TDS7254 & TDS7154 Digital Phosphor Oscilloscopes User Manual
Overview Related control elements and resourcesTo define a spectral math waveform (Cont.)
Set the phasescale
13. Select the Phase tab.
14. To select the vertical scale factor, touch either Degree,Radian, or GroupDelay:
Degree sets the phase units to degrees. Phase isdisplayed using degrees as the scale, wheredegrees wrap from --180 to +180.
Radian sets the phase units to radians. Phase isdisplayed using radians as the scale, where radianswrap from --π to +π.
GroupDelay unwraps the phase spectrum anddisplays its negative derivative.
The topic Using the Phase Controls, on page 3--177,provides in depth information on setup for phasedisplays.
15. To specify whether to unwrap phase in a spectralanalysis phase waveform, touch Unwrap to toggle it onor off.
16. To set the level in dB that a magnitude in the spectrummust exceed in order to have its phase computed (toreduce the effect of noise in your phase waveform),touch Suppression Threshold and use the multipurposeknobs or keypad to set the threshold level. If themagnitude is less than the threshold, then its phase isset to zero (for an example, see Figure 3--47 onpage 3--179).
The Suppression Threshold bullet, on page 3--178,provides additional information on phase suppression.
Set time andfrequency
domaincontroltracking
17. Touch the Control tab.
18. To allow changing time and frequency domain controlsfor one math waveform to change the same controls foranother math waveform, touch the Track Time/FreqDomain Controls buttons to toggle them on or off.
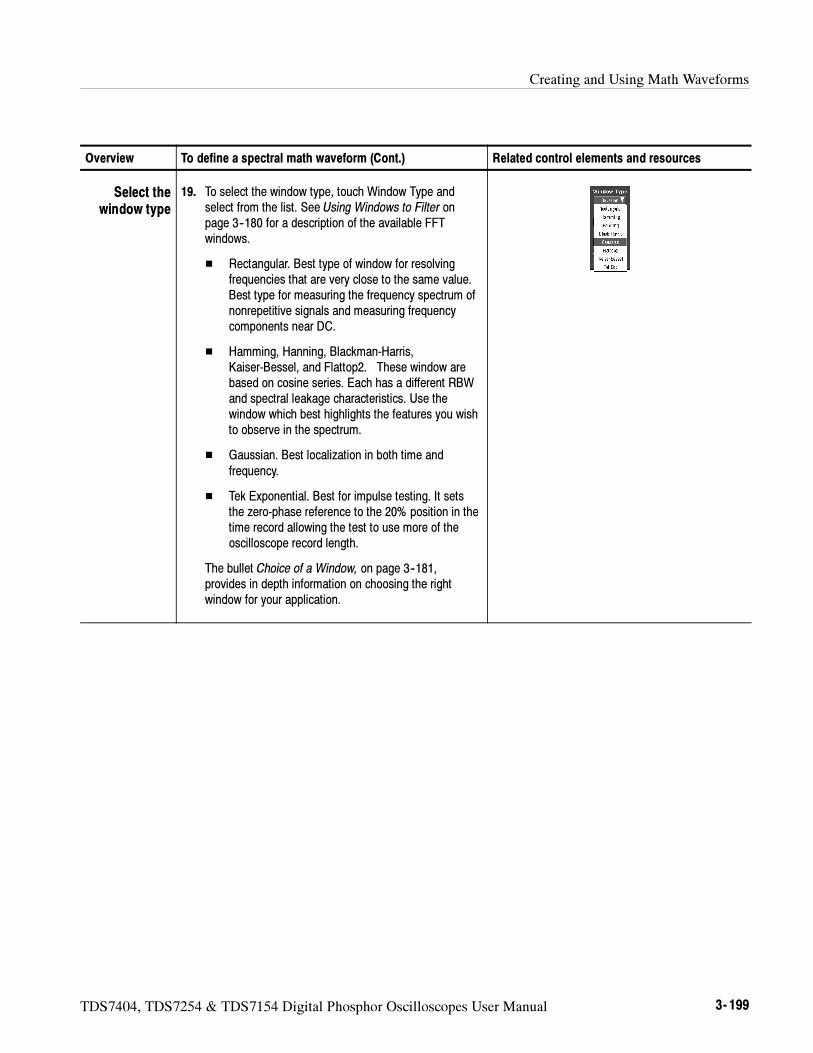
Creating and Using Math Waveforms
TDS7404, TDS7254 & TDS7154 Digital Phosphor Oscilloscopes User Manual 3- 199
Overview Related control elements and resourcesTo define a spectral math waveform (Cont.)
Select thewindow type
19. To select the window type, touch Window Type andselect from the list. See Using Windows to Filter onpage 3--180 for a description of the available FFTwindows.
Rectangular. Best type of window for resolvingfrequencies that are very close to the same value.Best type for measuring the frequency spectrum ofnonrepetitive signals and measuring frequencycomponents near DC.
Hamming, Hanning, Blackman-Harris,Kaiser-Bessel, and Flattop2. These window arebased on cosine series. Each has a different RBWand spectral leakage characteristics. Use thewindow which best highlights the features you wishto observe in the spectrum.
Gaussian. Best localization in both time andfrequency.
Tek Exponential. Best for impulse testing. It setsthe zero-phase reference to the 20% position in thetime record allowing the test to use more of theoscilloscope record length.
The bullet Choice of a Window, on page 3--181,provides in depth information on choosing the rightwindow for your application.
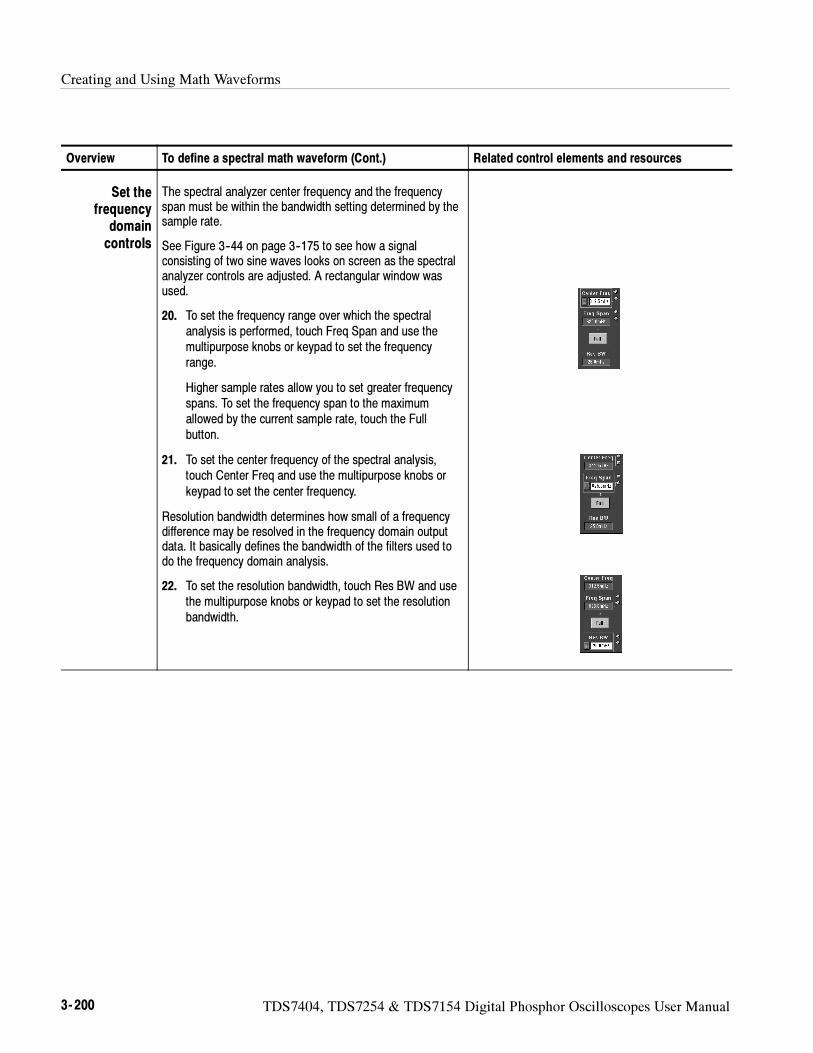
Creating and Using Math Waveforms
3- 200 TDS7404, TDS7254 & TDS7154 Digital Phosphor Oscilloscopes User Manual
Overview Related control elements and resourcesTo define a spectral math waveform (Cont.)
Set thefrequency
domaincontrols
The spectral analyzer center frequency and the frequencyspan must be within the bandwidth setting determined by thesample rate.
See Figure 3--44 on page 3--175 to see how a signalconsisting of two sine waves looks on screen as the spectralanalyzer controls are adjusted. A rectangular window wasused.
20. To set the frequency range over which the spectralanalysis is performed, touch Freq Span and use themultipurpose knobs or keypad to set the frequencyrange.
Higher sample rates allow you to set greater frequencyspans. To set the frequency span to the maximumallowed by the current sample rate, touch the Fullbutton.
21. To set the center frequency of the spectral analysis,touch Center Freq and use the multipurpose knobs orkeypad to set the center frequency.
Resolution bandwidth determines how small of a frequencydifference may be resolved in the frequency domain outputdata. It basically defines the bandwidth of the filters used todo the frequency domain analysis.
22. To set the resolution bandwidth, touch Res BW and usethe multipurpose knobs or keypad to set the resolutionbandwidth.
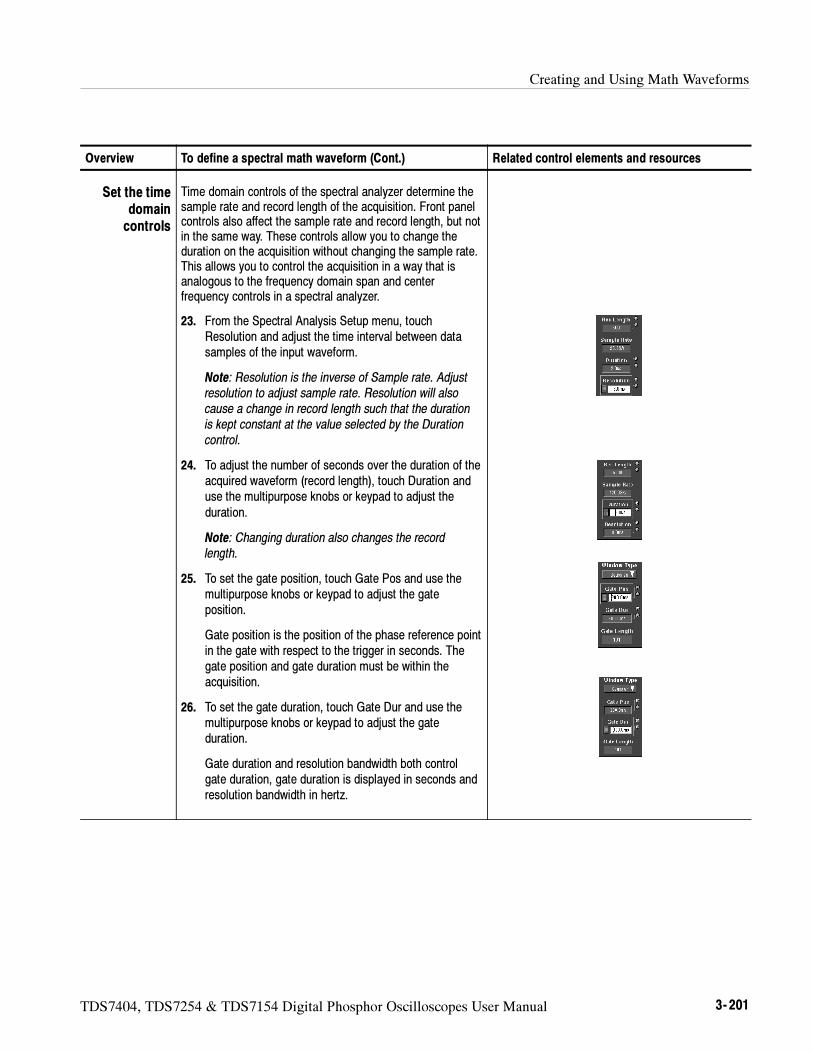
Creating and Using Math Waveforms
TDS7404, TDS7254 & TDS7154 Digital Phosphor Oscilloscopes User Manual 3- 201
Overview Related control elements and resourcesTo define a spectral math waveform (Cont.)
Set the timedomaincontrols
Time domain controls of the spectral analyzer determine thesample rate and record length of the acquisition. Front panelcontrols also affect the sample rate and record length, but notin the same way. These controls allow you to change theduration on the acquisition without changing the sample rate.This allows you to control the acquisition in a way that isanalogous to the frequency domain span and centerfrequency controls in a spectral analyzer.
23. From the Spectral Analysis Setup menu, touchResolution and adjust the time interval between datasamples of the input waveform.
Note: Resolution is the inverse of Sample rate. Adjustresolution to adjust sample rate. Resolution will alsocause a change in record length such that the durationis kept constant at the value selected by the Durationcontrol.
24. To adjust the number of seconds over the duration of theacquired waveform (record length), touch Duration anduse the multipurpose knobs or keypad to adjust theduration.
Note: Changing duration also changes the recordlength.
25. To set the gate position, touch Gate Pos and use themultipurpose knobs or keypad to adjust the gateposition.
Gate position is the position of the phase reference pointin the gate with respect to the trigger in seconds. Thegate position and gate duration must be within theacquisition.
26. To set the gate duration, touch Gate Dur and use themultipurpose knobs or keypad to adjust the gateduration.
Gate duration and resolution bandwidth both controlgate duration, gate duration is displayed in seconds andresolution bandwidth in hertz.
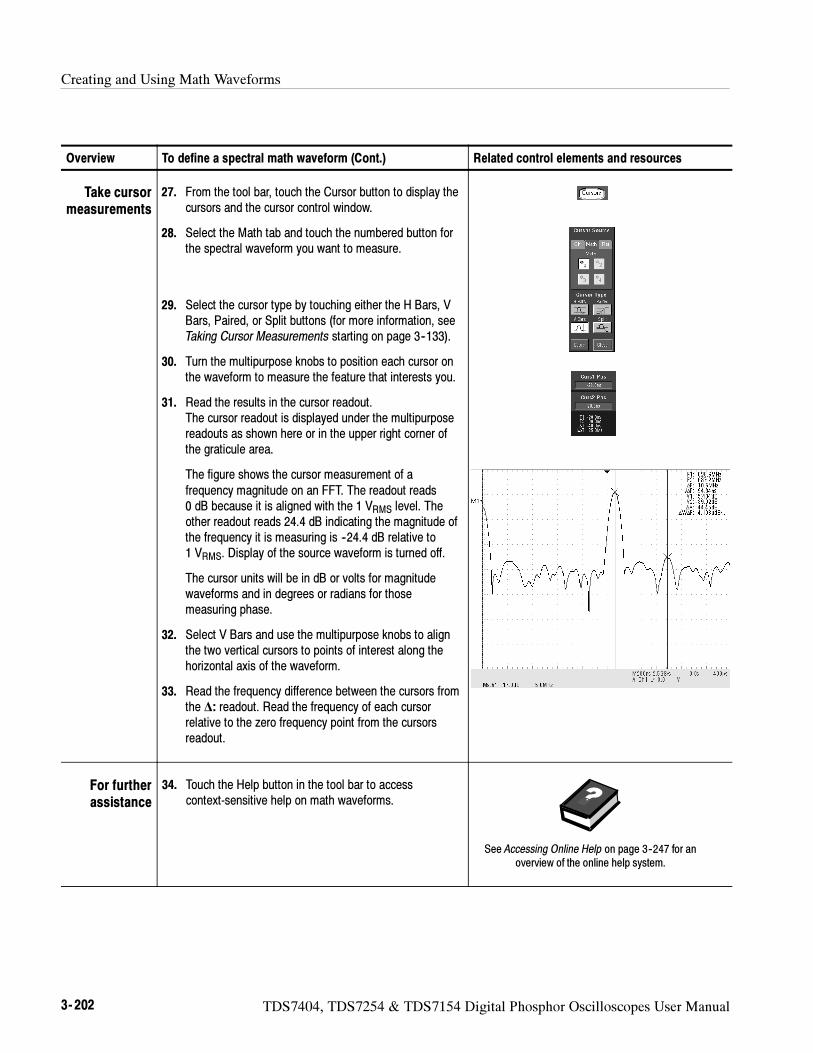
Creating and Using Math Waveforms
3- 202 TDS7404, TDS7254 & TDS7154 Digital Phosphor Oscilloscopes User Manual
Overview Related control elements and resourcesTo define a spectral math waveform (Cont.)
Take cursormeasurements
27. From the tool bar, touch the Cursor button to display thecursors and the cursor control window.
28. Select the Math tab and touch the numbered button forthe spectral waveform you want to measure.
29. Select the cursor type by touching either the H Bars, VBars, Paired, or Split buttons (for more information, seeTaking Cursor Measurements starting on page 3--133).
30. Turn the multipurpose knobs to position each cursor onthe waveform to measure the feature that interests you.
31. Read the results in the cursor readout.The cursor readout is displayed under the multipurposereadouts as shown here or in the upper right corner ofthe graticule area.
The figure shows the cursor measurement of afrequency magnitude on an FFT. The readout reads0 dB because it is aligned with the 1 VRMS level. Theother readout reads 24.4 dB indicating the magnitude ofthe frequency it is measuring is --24.4 dB relative to1 VRMS. Display of the source waveform is turned off.
The cursor units will be in dB or volts for magnitudewaveforms and in degrees or radians for thosemeasuring phase.
32. Select V Bars and use the multipurpose knobs to alignthe two vertical cursors to points of interest along thehorizontal axis of the waveform.
33. Read the frequency difference between the cursors fromthe ∆: readout. Read the frequency of each cursorrelative to the zero frequency point from the cursorsreadout.
For furtherassistance
34. Touch the Help button in the tool bar to accesscontext-sensitive help on math waveforms.
See Accessing Online Help on page 3--247 for anoverview of the online help system.
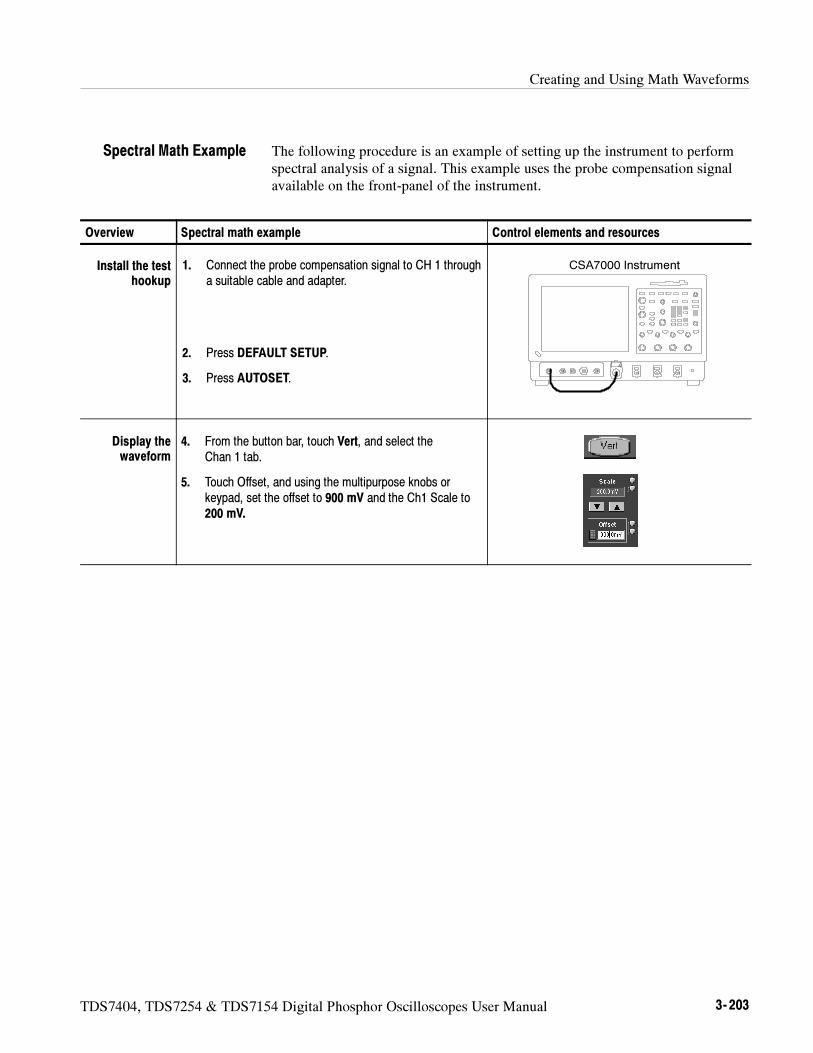
Creating and Using Math Waveforms
TDS7404, TDS7254 & TDS7154 Digital Phosphor Oscilloscopes User Manual 3- 203
The following procedure is an example of setting up the instrument to performspectral analysis of a signal. This example uses the probe compensation signalavailable on the front-panel of the instrument.
Overview Spectral math example Control elements and resources
Install the testhookup
1. Connect the probe compensation signal to CH 1 througha suitable cable and adapter.
2. Press DEFAULT SETUP.
3. Press AUTOSET.
CSA7000 Instrument
Display thewaveform
4. From the button bar, touch Vert, and select theChan 1 tab.
5. Touch Offset, and using the multipurpose knobs orkeypad, set the offset to 900 mV and the Ch1 Scale to200 mV.
Spectral Math Example
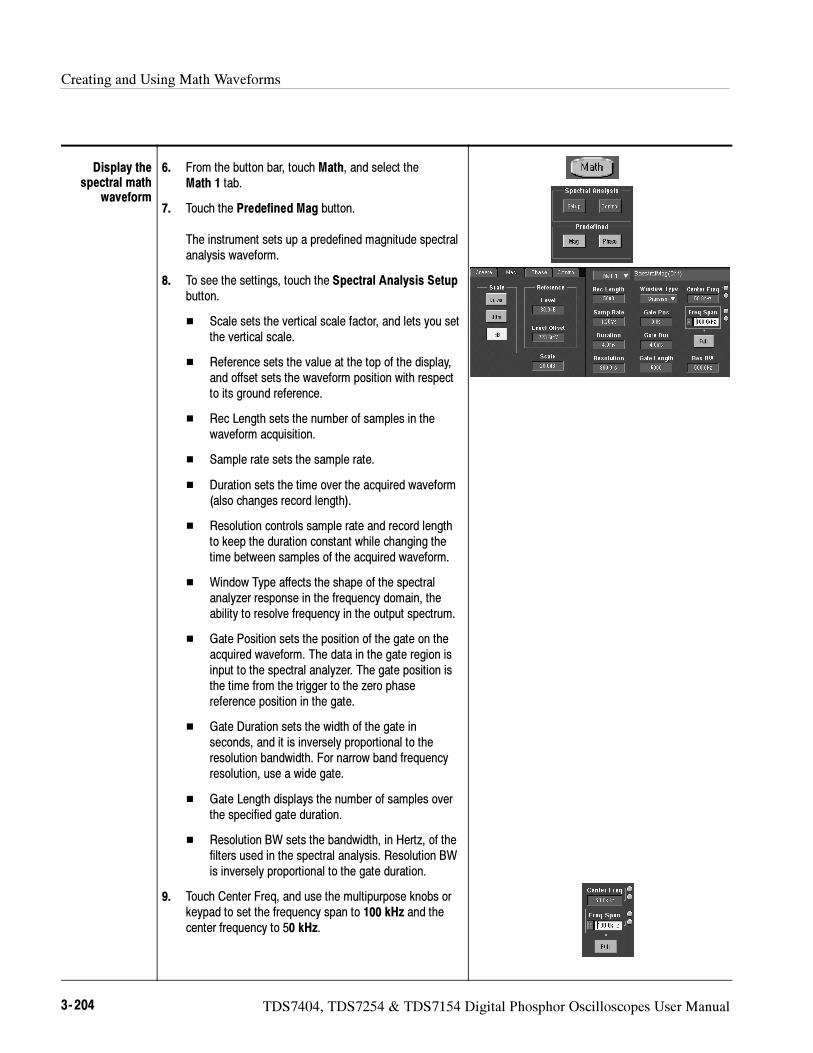
Creating and Using Math Waveforms
3- 204 TDS7404, TDS7254 & TDS7154 Digital Phosphor Oscilloscopes User Manual
Display thespectral math
waveform
6. From the button bar, touch Math, and select theMath 1 tab.
7. Touch the Predefined Mag button.
The instrument sets up a predefined magnitude spectralanalysis waveform.
8. To see the settings, touch the Spectral Analysis Setupbutton.
Scale sets the vertical scale factor, and lets you setthe vertical scale.
Reference sets the value at the top of the display,and offset sets the waveform position with respectto its ground reference.
Rec Length sets the number of samples in thewaveform acquisition.
Sample rate sets the sample rate.
Duration sets the time over the acquired waveform(also changes record length).
Resolution controls sample rate and record lengthto keep the duration constant while changing thetime between samples of the acquired waveform.
Window Type affects the shape of the spectralanalyzer response in the frequency domain, theability to resolve frequency in the output spectrum.
Gate Position sets the position of the gate on theacquired waveform. The data in the gate region isinput to the spectral analyzer. The gate position isthe time from the trigger to the zero phasereference position in the gate.
Gate Duration sets the width of the gate inseconds, and it is inversely proportional to theresolution bandwidth. For narrow band frequencyresolution, use a wide gate.
Gate Length displays the number of samples overthe specified gate duration.
Resolution BW sets the bandwidth, in Hertz, of thefilters used in the spectral analysis. Resolution BWis inversely proportional to the gate duration.
9. Touch Center Freq, and use the multipurpose knobs orkeypad to set the frequency span to 100 kHz and thecenter frequency to 50 kHz.
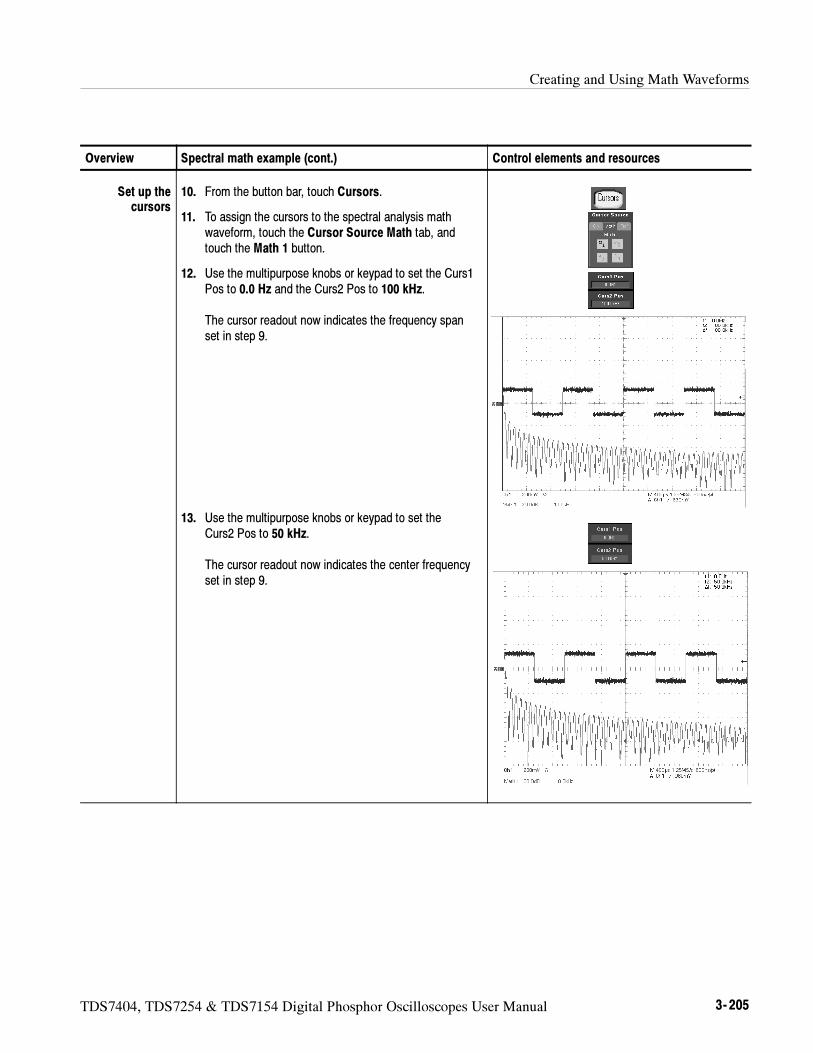
Creating and Using Math Waveforms
TDS7404, TDS7254 & TDS7154 Digital Phosphor Oscilloscopes User Manual 3- 205
Overview Control elements and resourcesSpectral math example (cont.)
Set up thecursors
10. From the button bar, touch Cursors.
11. To assign the cursors to the spectral analysis mathwaveform, touch the Cursor Source Math tab, andtouch the Math 1 button.
12. Use the multipurpose knobs or keypad to set the Curs1Pos to 0.0 Hz and the Curs2 Pos to 100 kHz.
The cursor readout now indicates the frequency spanset in step 9.
13. Use the multipurpose knobs or keypad to set theCurs2 Pos to 50 kHz.
The cursor readout now indicates the center frequencyset in step 9.
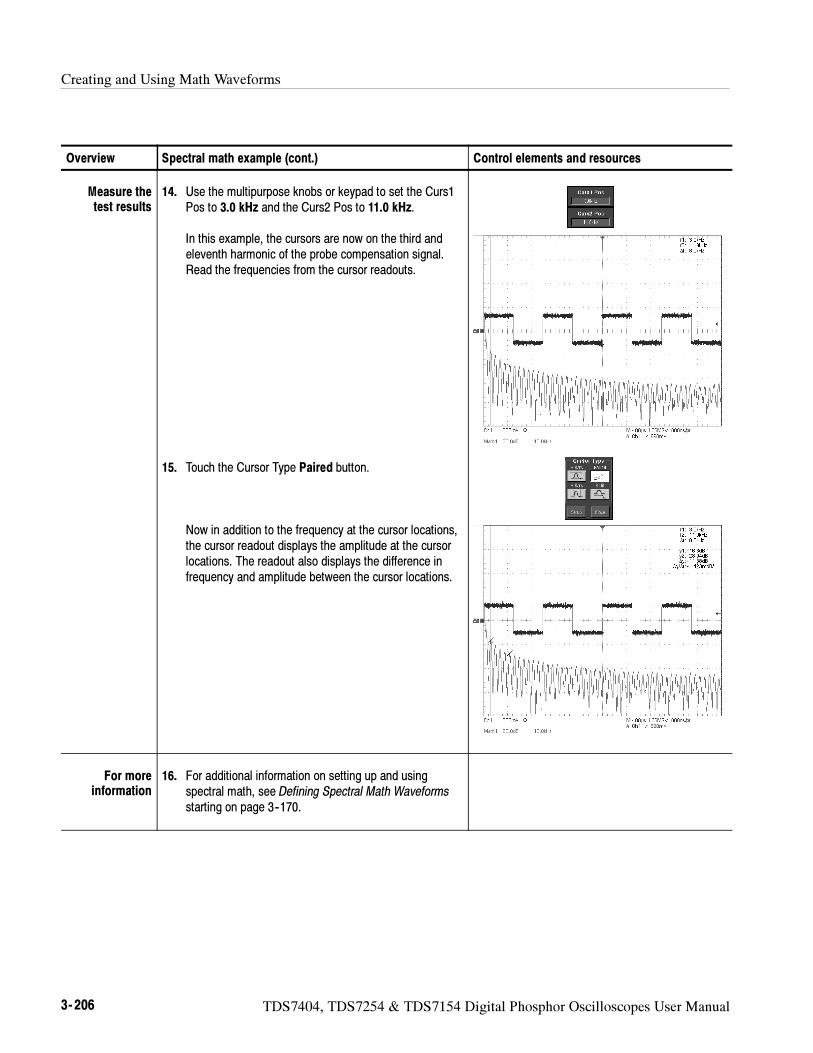
Creating and Using Math Waveforms
3- 206 TDS7404, TDS7254 & TDS7154 Digital Phosphor Oscilloscopes User Manual
Overview Control elements and resourcesSpectral math example (cont.)
Measure thetest results
14. Use the multipurpose knobs or keypad to set the Curs1Pos to 3.0 kHz and the Curs2 Pos to 11.0 kHz.
In this example, the cursors are now on the third andeleventh harmonic of the probe compensation signal.Read the frequencies from the cursor readouts.
15. Touch the Cursor Type Paired button.
Now in addition to the frequency at the cursor locations,the cursor readout displays the amplitude at the cursorlocations. The readout also displays the difference infrequency and amplitude between the cursor locations.
For moreinformation
16. For additional information on setting up and usingspectral math, see Defining Spectral Math Waveformsstarting on page 3--170.
TDS7404, TDS7254 & TDS7154 Digital Phosphor Oscilloscopes User Manual 3- 207
Data Input/Output
This section describes the input and output capabilities of your oscilloscope.Specifically, it covers:
Saving and Recalling a Setup on page 3--207
Saving and Recalling Waveforms on page 3--215
Exporting and Copying Waveforms on page 3--225, including exporting andcopying of images, waveforms, measurements, and histograms
Printing Waveforms on page 3--240
Remote Communication on page 3--245
Saving and Recalling a Setup
This oscilloscope can save a number of different oscilloscope setups for laterrecall, limited only by the space you have to store the setups.
By saving and recalling different setups, you can switch from setup to setupwithout having to first manually record your settings and then manually setthem. This capability is helpful when you want to:
Save and recall a setup that optimizes the oscilloscope for displaying andanalyzing a certain signal.
Save a series of setups to help automate a procedure through recall of asequence of saved setups as part of performance of the procedure.
Export a setup for sharing with a second oscilloscope.
The Save-Setup and the Recall-Setup control windows provide for including andviewing comments with your saved setups. You can store information, readableupon recall, that describes each setup you save and its intended application.
If you do not have a keyboard connected, you can still enter comments and namesetup files. The Save and Recall Setup windows include the Virtual Keyboard.When you touch or click a setup name, the oscilloscope displays a keyboard onscreen that you can use with your mouse or the touch screen to enter thesetup-path name, setup-file name, and comment.
Data Input/Output
3- 208 TDS7404, TDS7254 & TDS7154 Digital Phosphor Oscilloscopes User Manual
The oscilloscope excludes the following items when saving setups:
Waveforms in Ch1 to Ch4 and references (Ref1-Ref4). Control settings(scale, position, and so on) are saved but not the waveform data. Upon recallof the setup, the settings are applied, but the data is not restored.
Waveforms in Math Waveforms (Math1-Math4). Control settings and themath expression are retained but not the waveform data. Upon setup recall,however, the recalled math waveform expressions will be applied, but mathwaveform data is not restored.
User Options that are stored in the Windows Registry. These include alloptions accessed by first selecting Utilities (menu bar), and then UserPreferences (Utilities menu).
You cannot recall into a channel or a math waveform. The oscilloscope recallseach waveform into one of the reference waveform locations (Ref1-Ref4).
If you want to save a waveform in a useful format for other applications, such asa spreadsheet, use the export function (see Exporting and Copying Waveforms onpage 3--225).
A few things to remember when saving and recalling setups follow:
All Settings are Retained. The oscilloscope includes almost all oscilloscopesettings, with a few exceptions (such as user options) in the saved setup.
Retaining Current Settings. Recalling a setup replaces the current setup with therecalled setup. If you do not want to lose your current setup, save it to its ownsetup file for later recall before you recall a setup.
Avoiding Setup/Waveform Mismatches. Saved setups may contain settingsinappropriate for waveforms currently in your oscilloscope. For example: if yousave a setup that displays a math waveform that is the inverse of reference 1,when you recall the setup, if the reference is empty, the math and referencewaveforms are not displayed.
Auto-increment file name in the Save As and Export dialog boxes, enablessaving numerous files without entering a file name each time. To auto-incrementfile names, select Auto-increment file name on the dialog box as shown inFigure 3--59.
Using Auto-IncrementFile Name
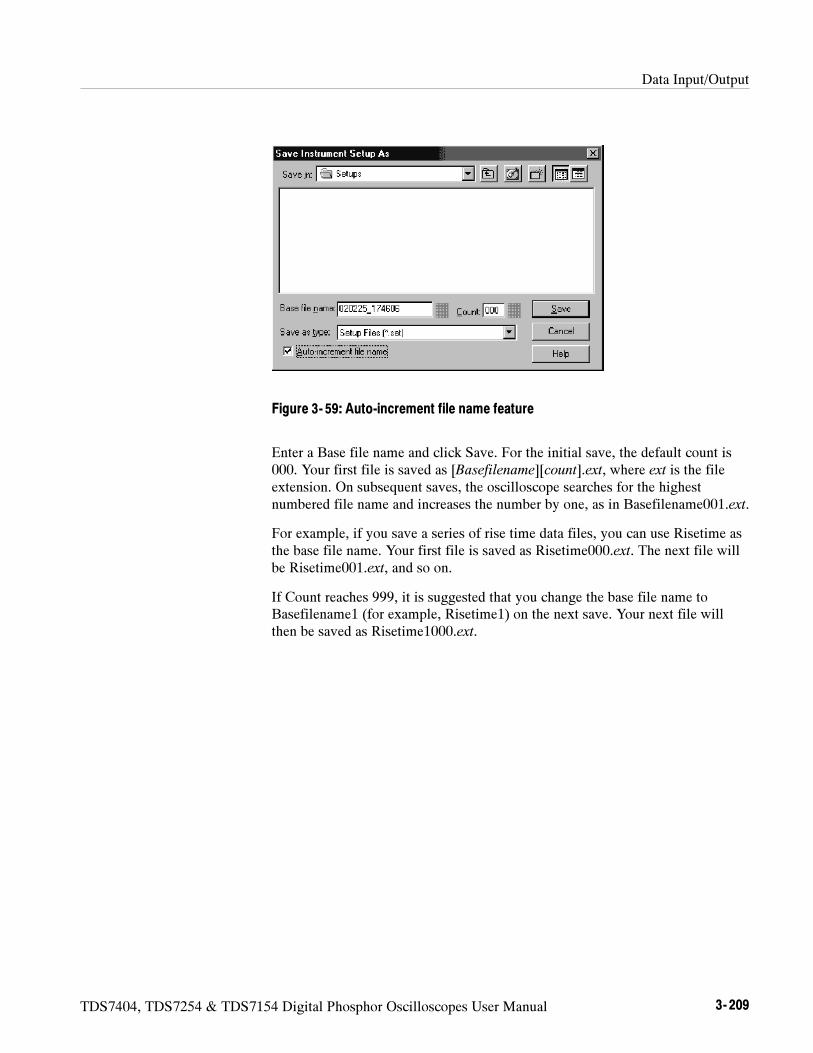
Data Input/Output
TDS7404, TDS7254 & TDS7154 Digital Phosphor Oscilloscopes User Manual 3- 209
Figure 3- 59: Auto-increment file name feature
Enter a Base file name and click Save. For the initial save, the default count is000. Your first file is saved as [Basefilename][count].ext, where ext is the fileextension. On subsequent saves, the oscilloscope searches for the highestnumbered file name and increases the number by one, as in Basefilename001.ext.
For example, if you save a series of rise time data files, you can use Risetime asthe base file name. Your first file is saved as Risetime000.ext. The next file willbe Risetime001.ext, and so on.
If Count reaches 999, it is suggested that you change the base file name toBasefilename1 (for example, Risetime1) on the next save. Your next file willthen be saved as Risetime1000.ext.
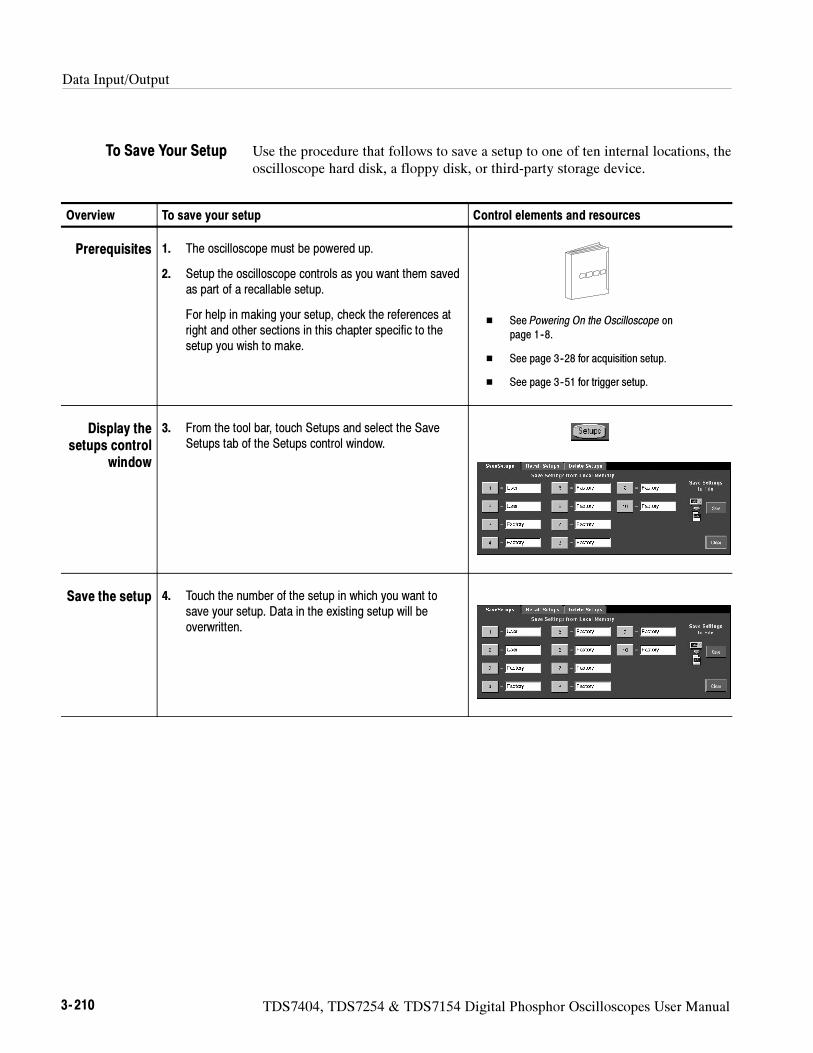
Data Input/Output
3- 210 TDS7404, TDS7254 & TDS7154 Digital Phosphor Oscilloscopes User Manual
Use the procedure that follows to save a setup to one of ten internal locations, theoscilloscope hard disk, a floppy disk, or third-party storage device.
Overview To save your setup Control elements and resources
Prerequisites 1. The oscilloscope must be powered up.
2. Setup the oscilloscope controls as you want them savedas part of a recallable setup.
For help in making your setup, check the references atright and other sections in this chapter specific to thesetup you wish to make.
See Powering On the Oscilloscope on
page 1--8.
See page 3--28 for acquisition setup.
See page 3--51 for trigger setup.
Display thesetups control
window
3. From the tool bar, touch Setups and select the SaveSetups tab of the Setups control window.
Save the setup 4. Touch the number of the setup in which you want tosave your setup. Data in the existing setup will beoverwritten.
To Save Your Setup
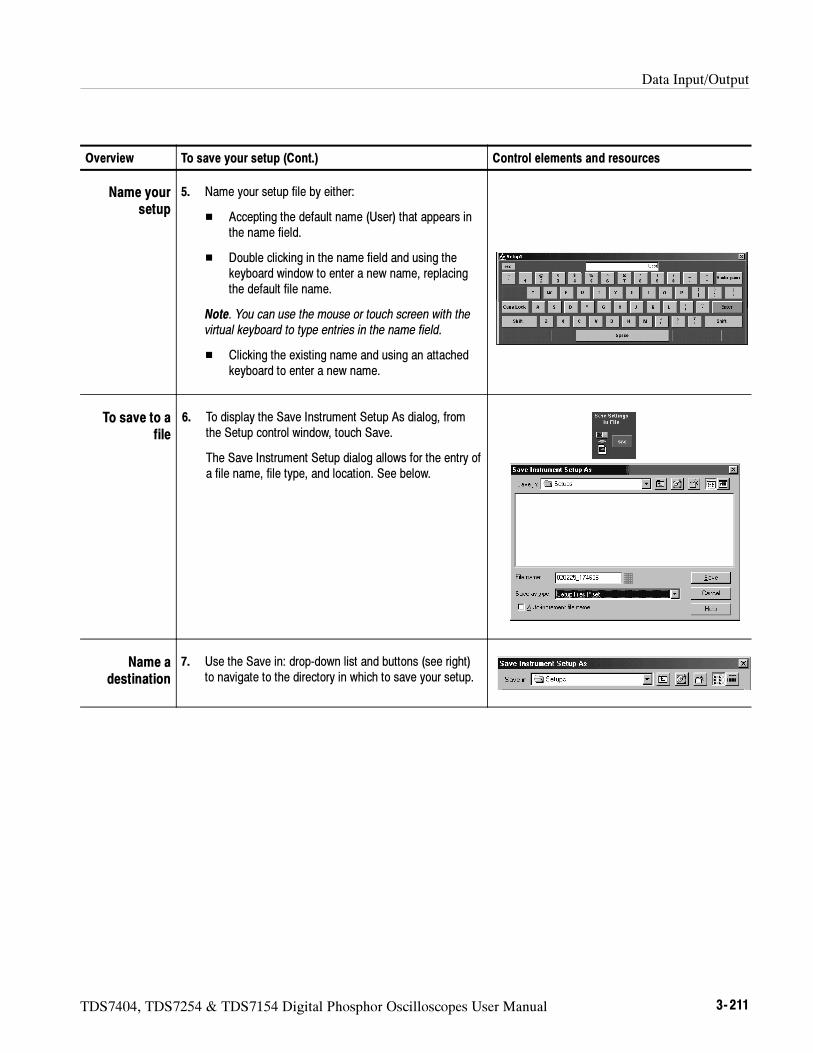
Data Input/Output
TDS7404, TDS7254 & TDS7154 Digital Phosphor Oscilloscopes User Manual 3- 211
Overview Control elements and resourcesTo save your setup (Cont.)
Name yoursetup
5. Name your setup file by either:
Accepting the default name (User) that appears inthe name field.
Double clicking in the name field and using thekeyboard window to enter a new name, replacingthe default file name.
Note. You can use the mouse or touch screen with thevirtual keyboard to type entries in the name field.
Clicking the existing name and using an attachedkeyboard to enter a new name.
To save to afile
6. To display the Save Instrument Setup As dialog, fromthe Setup control window, touch Save.
The Save Instrument Setup dialog allows for the entry ofa file name, file type, and location. See below.
Name adestination
7. Use the Save in: drop-down list and buttons (see right)to navigate to the directory in which to save your setup.
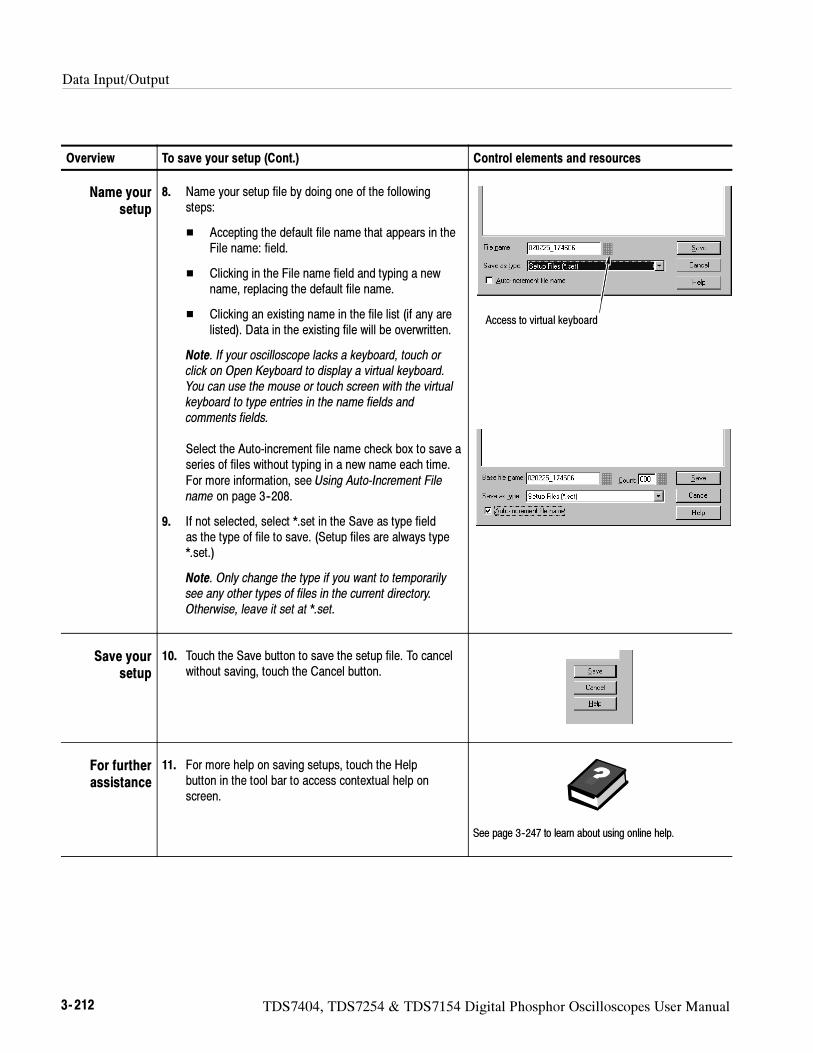
Data Input/Output
3- 212 TDS7404, TDS7254 & TDS7154 Digital Phosphor Oscilloscopes User Manual
Overview Control elements and resourcesTo save your setup (Cont.)
Name yoursetup
8. Name your setup file by doing one of the followingsteps:
Accepting the default file name that appears in theFile name: field.
Clicking in the File name field and typing a newname, replacing the default file name.
Clicking an existing name in the file list (if any arelisted). Data in the existing file will be overwritten.
Note. If your oscilloscope lacks a keyboard, touch orclick on Open Keyboard to display a virtual keyboard.You can use the mouse or touch screen with the virtualkeyboard to type entries in the name fields andcomments fields.
Select the Auto-increment file name check box to save aseries of files without typing in a new name each time.For more information, see Using Auto-Increment Filename on page 3--208.
9. If not selected, select *.set in the Save as type fieldas the type of file to save. (Setup files are always type*.set.)
Note. Only change the type if you want to temporarilysee any other types of files in the current directory.Otherwise, leave it set at *.set.
Access to virtual keyboard
Save yoursetup
10. Touch the Save button to save the setup file. To cancelwithout saving, touch the Cancel button.
For furtherassistance
11. For more help on saving setups, touch the Helpbutton in the tool bar to access contextual help onscreen.
See page 3--247 to learn about using online help.
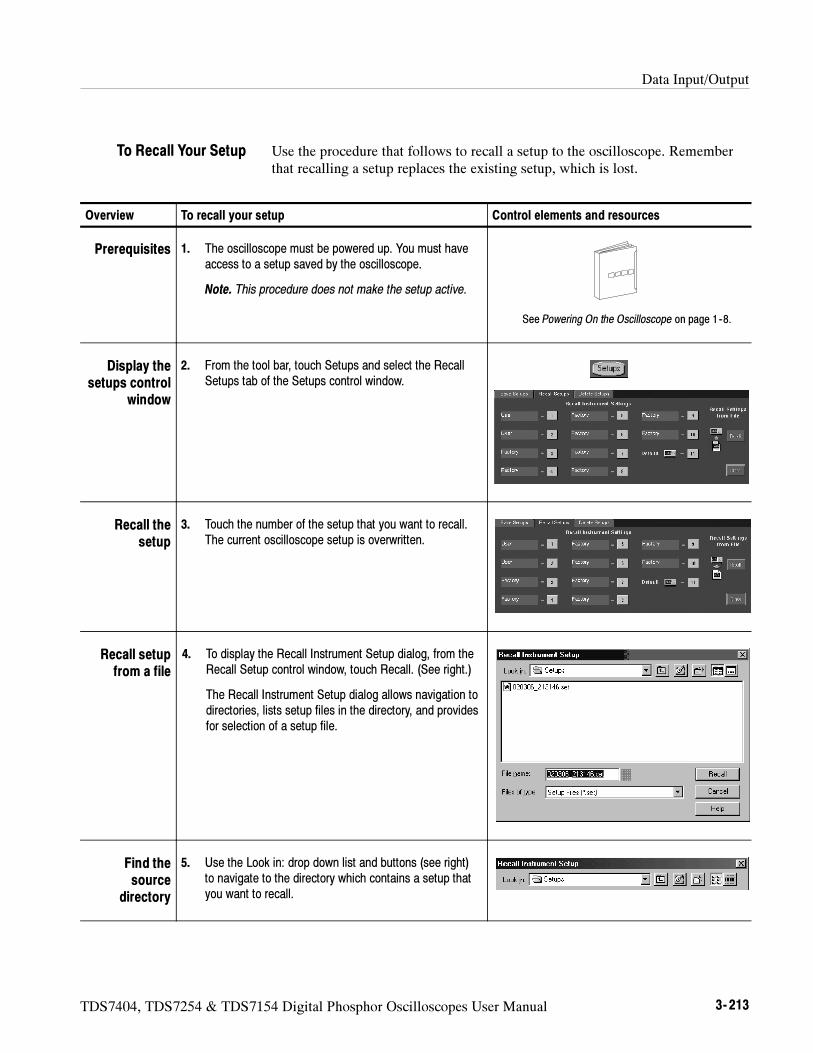
Data Input/Output
TDS7404, TDS7254 & TDS7154 Digital Phosphor Oscilloscopes User Manual 3- 213
Use the procedure that follows to recall a setup to the oscilloscope. Rememberthat recalling a setup replaces the existing setup, which is lost.
Overview To recall your setup Control elements and resources
Prerequisites 1. The oscilloscope must be powered up. You must haveaccess to a setup saved by the oscilloscope.
Note. This procedure does not make the setup active.
See Powering On the Oscilloscope on page 1--8.
Display thesetups control
window
2. From the tool bar, touch Setups and select the RecallSetups tab of the Setups control window.
Recall thesetup
3. Touch the number of the setup that you want to recall.The current oscilloscope setup is overwritten.
Recall setupfrom a file
4. To display the Recall Instrument Setup dialog, from theRecall Setup control window, touch Recall. (See right.)
The Recall Instrument Setup dialog allows navigation todirectories, lists setup files in the directory, and providesfor selection of a setup file.
Find thesource
directory
5. Use the Look in: drop down list and buttons (see right)to navigate to the directory which contains a setup thatyou want to recall.
To Recall Your Setup
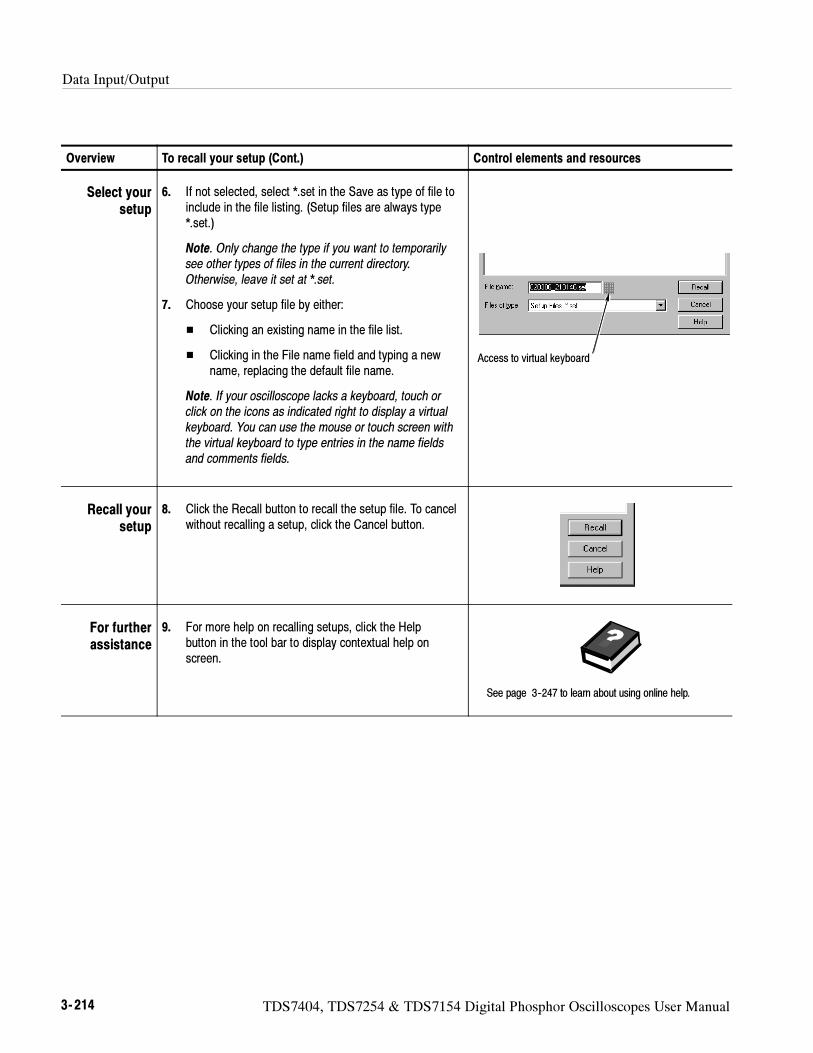
Data Input/Output
3- 214 TDS7404, TDS7254 & TDS7154 Digital Phosphor Oscilloscopes User Manual
Overview Control elements and resourcesTo recall your setup (Cont.)
Select yoursetup
6. If not selected, select *.set in the Save as type of file toinclude in the file listing. (Setup files are always type*.set.)
Note. Only change the type if you want to temporarilysee other types of files in the current directory.Otherwise, leave it set at *.set.
7. Choose your setup file by either:
Clicking an existing name in the file list.
Clicking in the File name field and typing a newname, replacing the default file name.
Note. If your oscilloscope lacks a keyboard, touch orclick on the icons as indicated right to display a virtualkeyboard. You can use the mouse or touch screen withthe virtual keyboard to type entries in the name fieldsand comments fields.
Access to virtual keyboard
Recall yoursetup
8. Click the Recall button to recall the setup file. To cancelwithout recalling a setup, click the Cancel button.
For furtherassistance
9. For more help on recalling setups, click the Helpbutton in the tool bar to display contextual help onscreen.
See page 3--247 to learn about using online help.
Data Input/Output
TDS7404, TDS7254 & TDS7154 Digital Phosphor Oscilloscopes User Manual 3- 215
Saving and Recalling Waveforms
This oscilloscope can save any number of waveforms, limited only by the spaceyou have to store them.
By saving a waveform, you can recall it at a later time for comparison, evalua-tion, and documentation. This capability is helpful when you want to:
Recall a waveform for further evaluation or comparison with other wave-forms.
Extend the waveform carrying capacity of the oscilloscope. The oscilloscopesupports four reference, four channel, and four math waveforms. If you wantmore than four references, you can save the additional reference to disk forrecall later.
The Reference-Waveform control window contains a Label field for includingcomments with your saved waveforms. That way, you can store information,readable upon recall, describing each waveform that you save.
Virtual Keyboarding. If you do not have a keyboard connected, you can stillenter comments and name waveform files. The Reference control windowincludes a Keyboard button. When you touch or click it, the oscilloscopedisplays a virtual keyboard on screen that you can use with your mouse or thetouch screen to enter the waveform-path name, file name, and comment.
You cannot recall a waveform into a channel or a math waveform. Theoscilloscope recalls each waveform into one of the reference waveform locations(Ref1-Ref4).
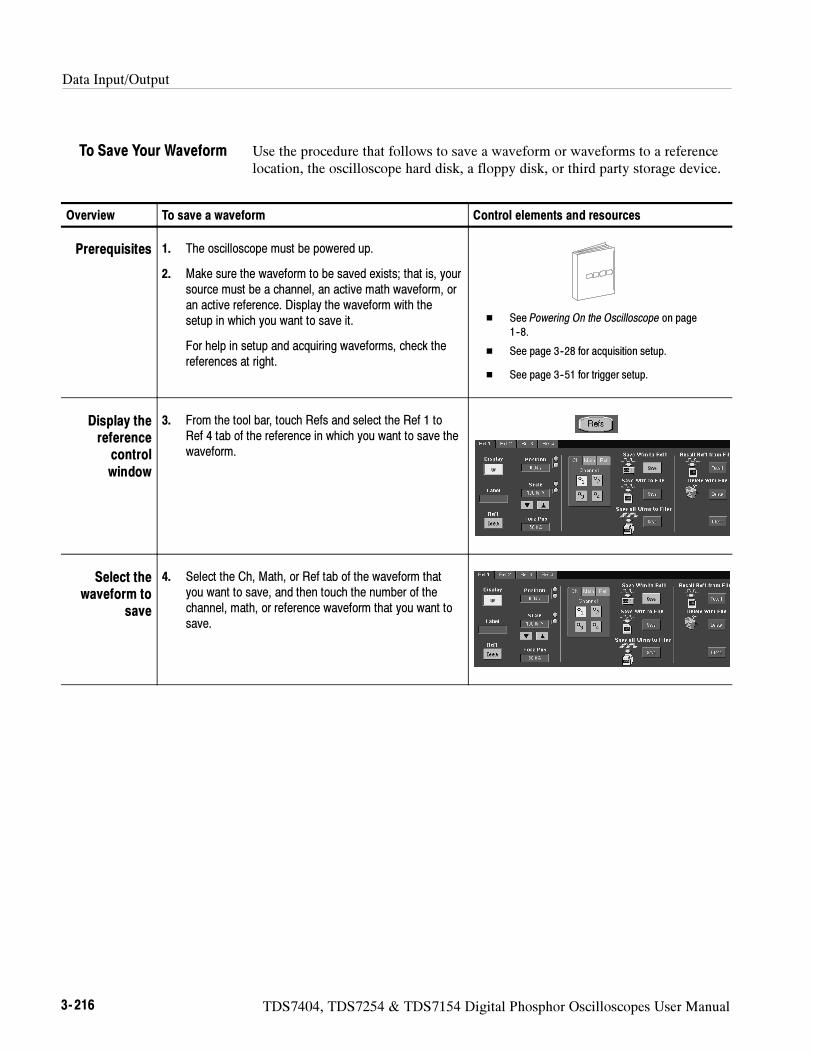
Data Input/Output
3- 216 TDS7404, TDS7254 & TDS7154 Digital Phosphor Oscilloscopes User Manual
Use the procedure that follows to save a waveform or waveforms to a referencelocation, the oscilloscope hard disk, a floppy disk, or third party storage device.
Overview To save a waveform Control elements and resources
Prerequisites 1. The oscilloscope must be powered up.
2. Make sure the waveform to be saved exists; that is, yoursource must be a channel, an active math waveform, oran active reference. Display the waveform with thesetup in which you want to save it.
For help in setup and acquiring waveforms, check thereferences at right.
See Powering On the Oscilloscope on page
1--8.
See page 3--28 for acquisition setup.
See page 3--51 for trigger setup.
Display thereferencecontrolwindow
3. From the tool bar, touch Refs and select the Ref 1 toRef 4 tab of the reference in which you want to save thewaveform.
Select thewaveform to
save
4. Select the Ch, Math, or Ref tab of the waveform thatyou want to save, and then touch the number of thechannel, math, or reference waveform that you want tosave.
To Save Your Waveform
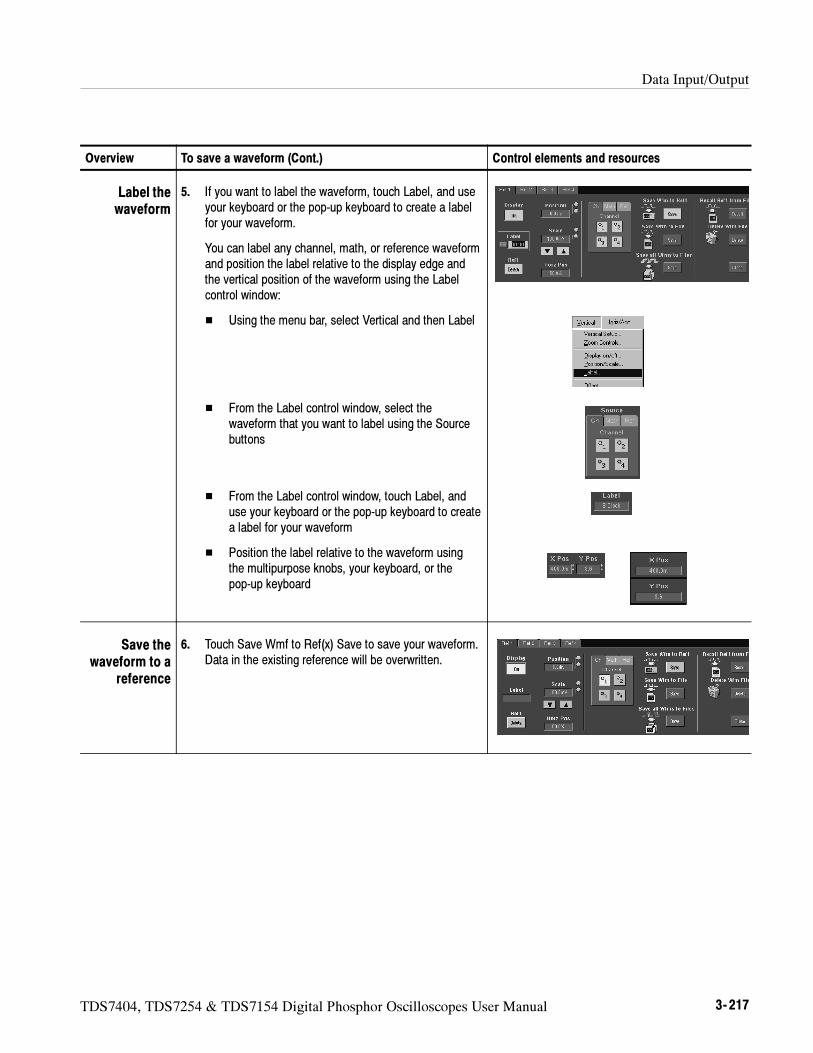
Data Input/Output
TDS7404, TDS7254 & TDS7154 Digital Phosphor Oscilloscopes User Manual 3- 217
Overview Control elements and resourcesTo save a waveform (Cont.)
Label thewaveform
5. If you want to label the waveform, touch Label, and useyour keyboard or the pop-up keyboard to create a labelfor your waveform.
You can label any channel, math, or reference waveformand position the label relative to the display edge andthe vertical position of the waveform using the Labelcontrol window:
Using the menu bar, select Vertical and then Label
From the Label control window, select thewaveform that you want to label using the Sourcebuttons
From the Label control window, touch Label, anduse your keyboard or the pop-up keyboard to createa label for your waveform
Position the label relative to the waveform usingthe multipurpose knobs, your keyboard, or thepop-up keyboard
Save thewaveform to a
reference
6. Touch Save Wmf to Ref(x) Save to save your waveform.Data in the existing reference will be overwritten.
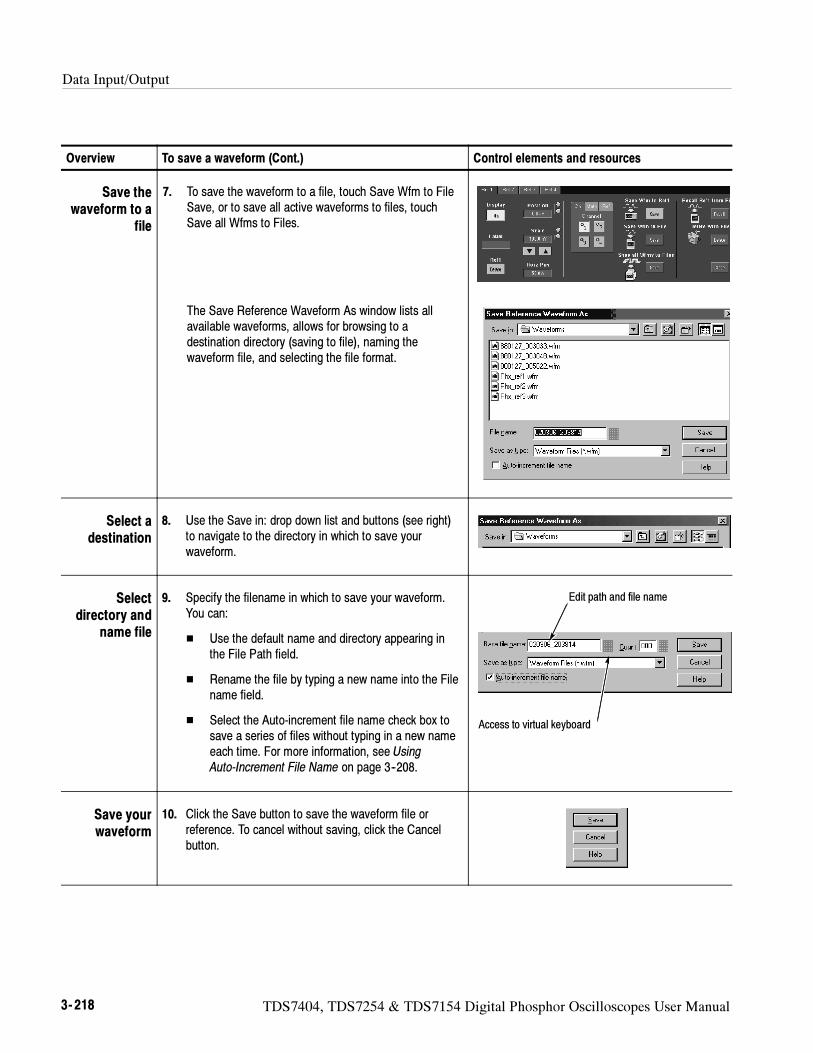
Data Input/Output
3- 218 TDS7404, TDS7254 & TDS7154 Digital Phosphor Oscilloscopes User Manual
Overview Control elements and resourcesTo save a waveform (Cont.)
Save thewaveform to a
file
7. To save the waveform to a file, touch Save Wfm to FileSave, or to save all active waveforms to files, touchSave all Wfms to Files.
The Save Reference Waveform As window lists allavailable waveforms, allows for browsing to adestination directory (saving to file), naming thewaveform file, and selecting the file format.
Select adestination
8. Use the Save in: drop down list and buttons (see right)to navigate to the directory in which to save yourwaveform.
Selectdirectory and
name file
9. Specify the filename in which to save your waveform.You can:
Use the default name and directory appearing inthe File Path field.
Rename the file by typing a new name into the Filename field.
Select the Auto-increment file name check box tosave a series of files without typing in a new nameeach time. For more information, see UsingAuto-Increment File Name on page 3--208.
Edit path and file name
Access to virtual keyboard
Save yourwaveform
10. Click the Save button to save the waveform file orreference. To cancel without saving, click the Cancelbutton.
Data Input/Output
TDS7404, TDS7254 & TDS7154 Digital Phosphor Oscilloscopes User Manual 3- 219
Overview Control elements and resourcesTo save a waveform (Cont.)
For furtherassistance
11. For more help on saving waveforms, touch the Helpbutton in the tool bar to access the contextual onlinehelp.
See page 3--247 to learn about using online help.
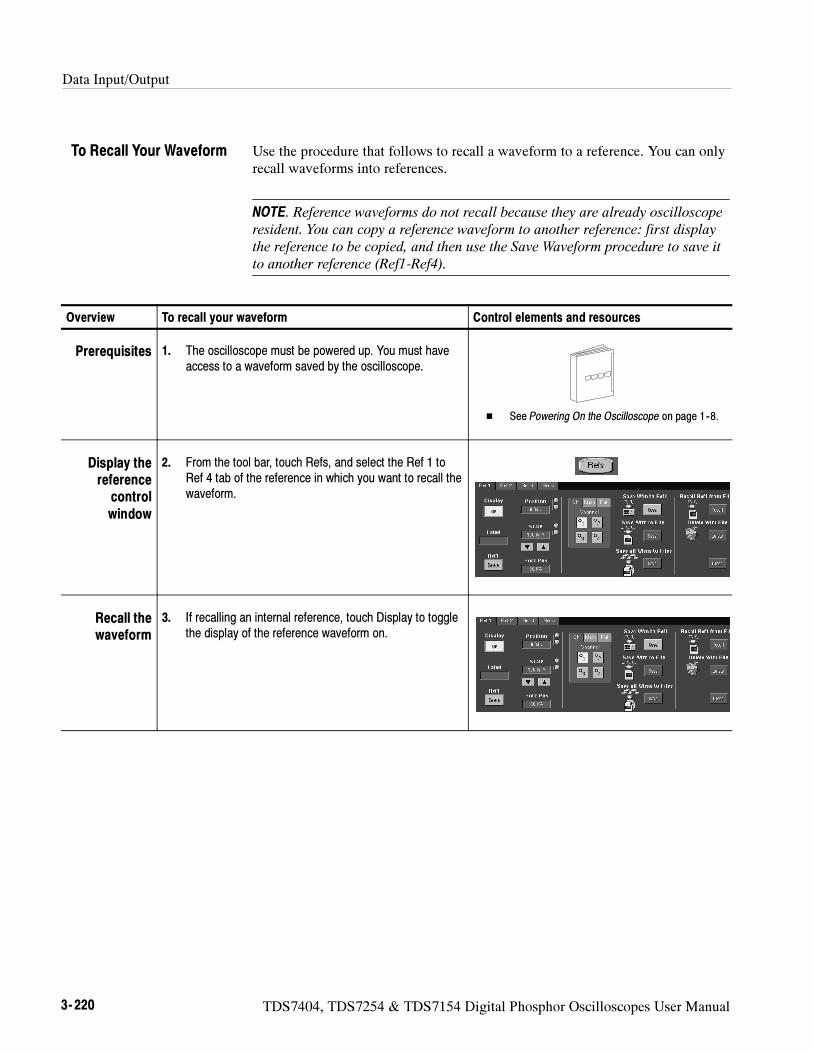
Data Input/Output
3- 220 TDS7404, TDS7254 & TDS7154 Digital Phosphor Oscilloscopes User Manual
Use the procedure that follows to recall a waveform to a reference. You can onlyrecall waveforms into references.
NOTE. Reference waveforms do not recall because they are already oscilloscope
resident. You can copy a reference waveform to another reference: first display
the reference to be copied, and then use the Save Waveform procedure to save it
to another reference (Ref1-Ref4).
Overview To recall your waveform Control elements and resources
Prerequisites 1. The oscilloscope must be powered up. You must haveaccess to a waveform saved by the oscilloscope.
See Powering On the Oscilloscope on page 1--8.
Display thereferencecontrolwindow
2. From the tool bar, touch Refs, and select the Ref 1 toRef 4 tab of the reference in which you want to recall thewaveform.
Recall thewaveform
3. If recalling an internal reference, touch Display to togglethe display of the reference waveform on.
To Recall Your Waveform
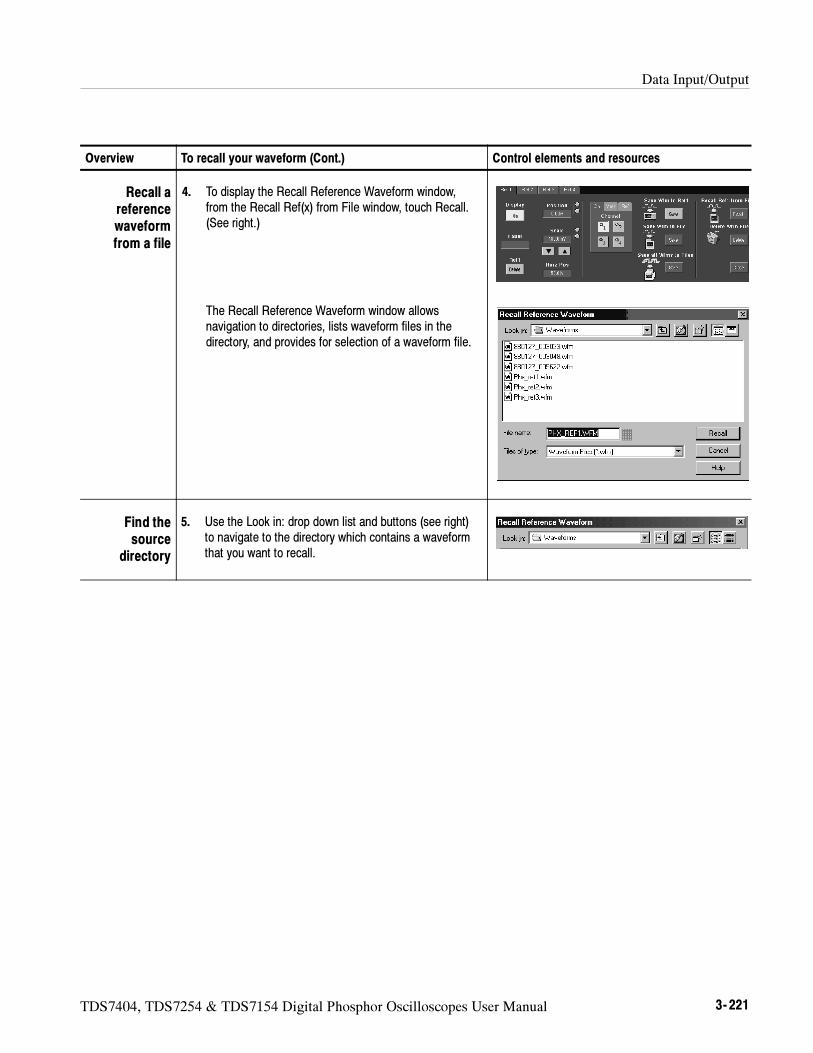
Data Input/Output
TDS7404, TDS7254 & TDS7154 Digital Phosphor Oscilloscopes User Manual 3- 221
Overview Control elements and resourcesTo recall your waveform (Cont.)
Recall areferencewaveformfrom a file
4. To display the Recall Reference Waveform window,from the Recall Ref(x) from File window, touch Recall.(See right.)
The Recall Reference Waveform window allowsnavigation to directories, lists waveform files in thedirectory, and provides for selection of a waveform file.
Find thesource
directory
5. Use the Look in: drop down list and buttons (see right)to navigate to the directory which contains a waveformthat you want to recall.
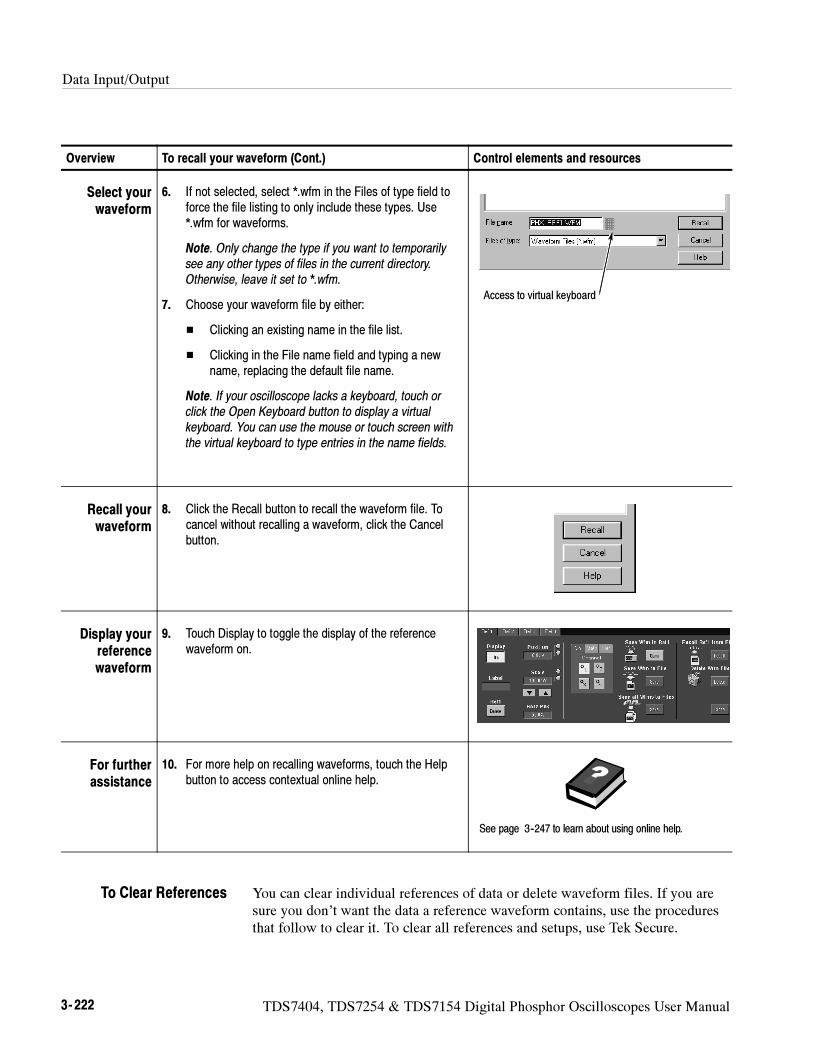
Data Input/Output
3- 222 TDS7404, TDS7254 & TDS7154 Digital Phosphor Oscilloscopes User Manual
Overview Control elements and resourcesTo recall your waveform (Cont.)
Select yourwaveform
6. If not selected, select *.wfm in the Files of type field toforce the file listing to only include these types. Use*.wfm for waveforms.
Note. Only change the type if you want to temporarilysee any other types of files in the current directory.Otherwise, leave it set to *.wfm.
7. Choose your waveform file by either:
Clicking an existing name in the file list.
Clicking in the File name field and typing a newname, replacing the default file name.
Note. If your oscilloscope lacks a keyboard, touch orclick the Open Keyboard button to display a virtualkeyboard. You can use the mouse or touch screen withthe virtual keyboard to type entries in the name fields.
Access to virtual keyboard
Recall yourwaveform
8. Click the Recall button to recall the waveform file. Tocancel without recalling a waveform, click the Cancelbutton.
Display yourreferencewaveform
9. Touch Display to toggle the display of the referencewaveform on.
For furtherassistance
10. For more help on recalling waveforms, touch the Helpbutton to access contextual online help.
See page 3--247 to learn about using online help.
You can clear individual references of data or delete waveform files. If you aresure you don’t want the data a reference waveform contains, use the proceduresthat follow to clear it. To clear all references and setups, use Tek Secure.
To Clear References
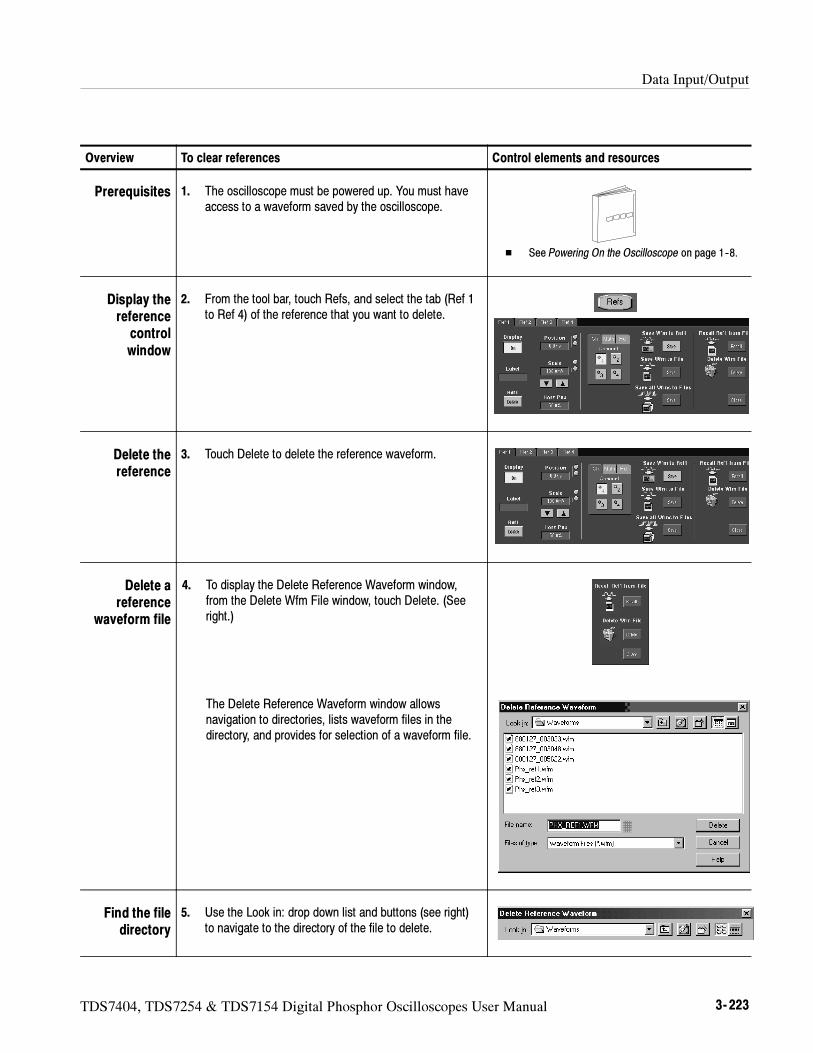
Data Input/Output
TDS7404, TDS7254 & TDS7154 Digital Phosphor Oscilloscopes User Manual 3- 223
Overview To clear references Control elements and resources
Prerequisites 1. The oscilloscope must be powered up. You must haveaccess to a waveform saved by the oscilloscope.
See Powering On the Oscilloscope on page 1--8.
Display thereferencecontrolwindow
2. From the tool bar, touch Refs, and select the tab (Ref 1to Ref 4) of the reference that you want to delete.
Delete thereference
3. Touch Delete to delete the reference waveform.
Delete areference
waveform file
4. To display the Delete Reference Waveform window,from the Delete Wfm File window, touch Delete. (Seeright.)
The Delete Reference Waveform window allowsnavigation to directories, lists waveform files in thedirectory, and provides for selection of a waveform file.
Find the filedirectory
5. Use the Look in: drop down list and buttons (see right)to navigate to the directory of the file to delete.
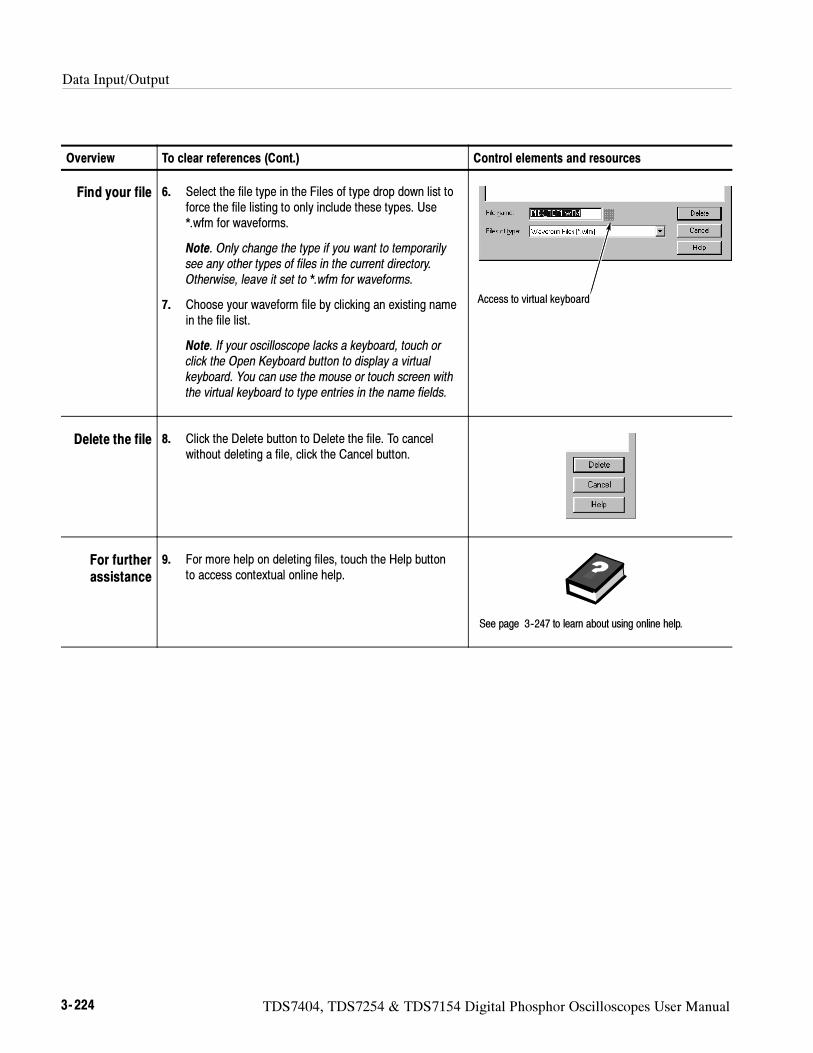
Data Input/Output
3- 224 TDS7404, TDS7254 & TDS7154 Digital Phosphor Oscilloscopes User Manual
Overview Control elements and resourcesTo clear references (Cont.)
Find your file 6. Select the file type in the Files of type drop down list toforce the file listing to only include these types. Use*.wfm for waveforms.
Note. Only change the type if you want to temporarilysee any other types of files in the current directory.Otherwise, leave it set to *.wfm for waveforms.
7. Choose your waveform file by clicking an existing namein the file list.
Note. If your oscilloscope lacks a keyboard, touch orclick the Open Keyboard button to display a virtualkeyboard. You can use the mouse or touch screen withthe virtual keyboard to type entries in the name fields.
Access to virtual keyboard
Delete the file 8. Click the Delete button to Delete the file. To cancelwithout deleting a file, click the Cancel button.
For furtherassistance
9. For more help on deleting files, touch the Help buttonto access contextual online help.
See page 3--247 to learn about using online help.
Data Input/Output
TDS7404, TDS7254 & TDS7154 Digital Phosphor Oscilloscopes User Manual 3- 225
Exporting and Copying Waveforms
This oscilloscope also supports export of waveform data to a file. The oscillo-scope can export waveforms, images, and measurements in several formats. Youcan also copy waveform data to the clipboard for use with other applications.
By exporting a waveform, you can use it with other analysis tools, such asspreadsheets or math-analysis applications.
A few things to remember when exporting waveforms follow:
Waveforms export as a series of comma-separated values (CSV), which areamplitudes without units. There is no timing information, but data is placed inthe file in sequence from the first sample in the waveform record to the last.
Because the waveforms are exported as CSV, without timing and scalinginformation, the oscilloscope does not import these waveforms directly. If youintend to recall a waveform later, save it (see the procedure To Save Your
Waveform on page 3--216) instead of exporting it.
You may also choose to copy a waveform and paste it directly into an applicationsuch as Microsoft Word or Excel. If so, select your waveform, and then selectCopy in the Edit menu.
File Formats. To make exported files more useful, you may select a file formatusable by your analysis tools:
Numeric. Creates files (.txt) in a numeric format usable by text and wordprocessors.
Text. Creates files (.txt) in a text format usable by text and word processors.
Bitmap. Creates files (.bmp) in a bitmap file format usable by many graphicprograms.
JPEG. Creates files (.jpg) in a compressed image format usable by manygraphic programs.
PNG. Creates files (.png) in a compressed image format that is nonlossy.
Spreadsheet. Creates files (.CSV) in a format usable by spreadsheets (Excel,Lotus 1-2-3, and Quattro Pro).
MathLab. Creates files (.DAT) in a format usable by MathLab.
MathCad. Creates files (.DAT) in a format usable by MathCad.
Note that the MathCad file is an ASCII file, the first four values of whichcontain header information:
The first header value holds the record length.
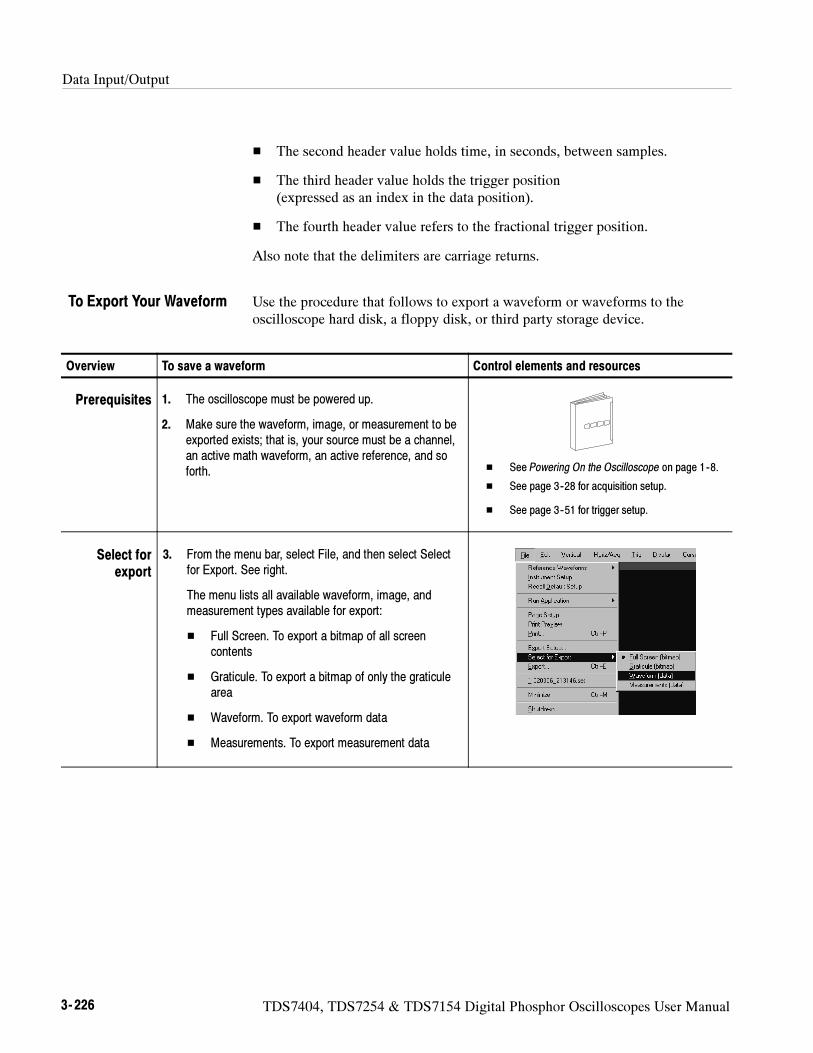
Data Input/Output
3- 226 TDS7404, TDS7254 & TDS7154 Digital Phosphor Oscilloscopes User Manual
The second header value holds time, in seconds, between samples.
The third header value holds the trigger position(expressed as an index in the data position).
The fourth header value refers to the fractional trigger position.
Also note that the delimiters are carriage returns.
Use the procedure that follows to export a waveform or waveforms to theoscilloscope hard disk, a floppy disk, or third party storage device.
Overview To save a waveform Control elements and resources
Prerequisites 1. The oscilloscope must be powered up.
2. Make sure the waveform, image, or measurement to beexported exists; that is, your source must be a channel,an active math waveform, an active reference, and soforth. See Powering On the Oscilloscope on page 1--8.
See page 3--28 for acquisition setup.
See page 3--51 for trigger setup.
Select forexport
3. From the menu bar, select File, and then select Selectfor Export. See right.
The menu lists all available waveform, image, andmeasurement types available for export:
Full Screen. To export a bitmap of all screencontents
Graticule. To export a bitmap of only the graticulearea
Waveform. To export waveform data
Measurements. To export measurement data
To Export Your Waveform
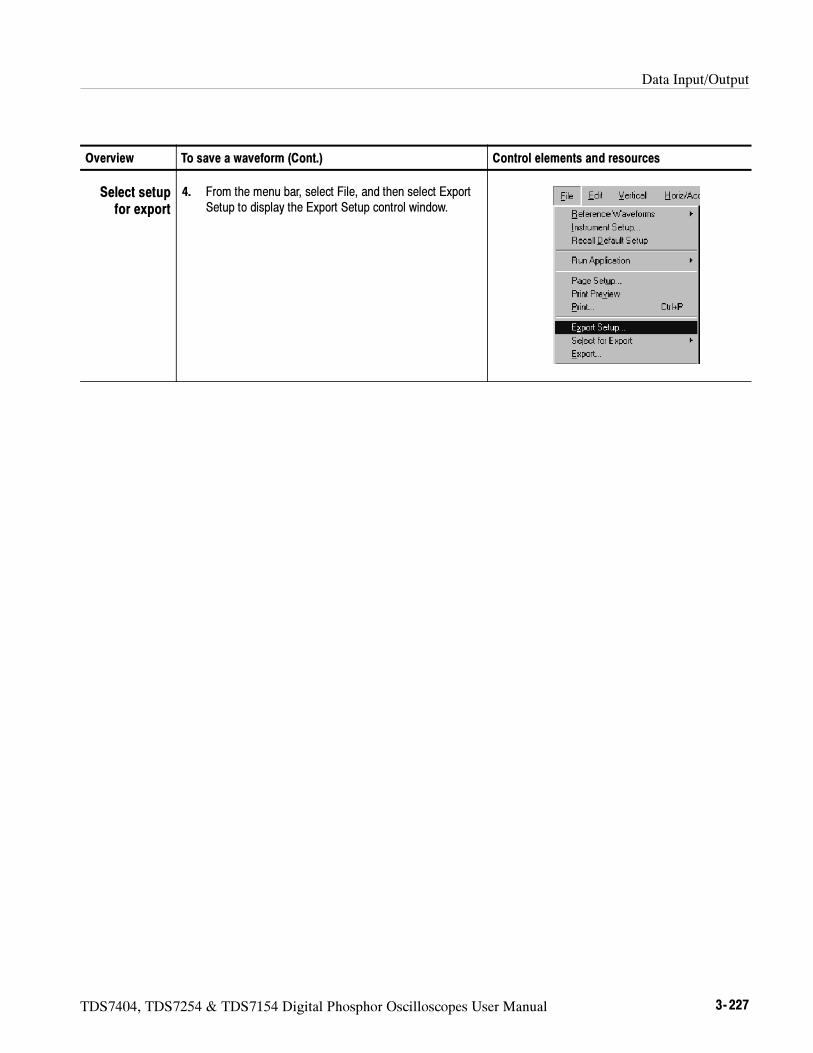
Data Input/Output
TDS7404, TDS7254 & TDS7154 Digital Phosphor Oscilloscopes User Manual 3- 227
Overview Control elements and resourcesTo save a waveform (Cont.)
Select setupfor export
4. From the menu bar, select File, and then select ExportSetup to display the Export Setup control window.
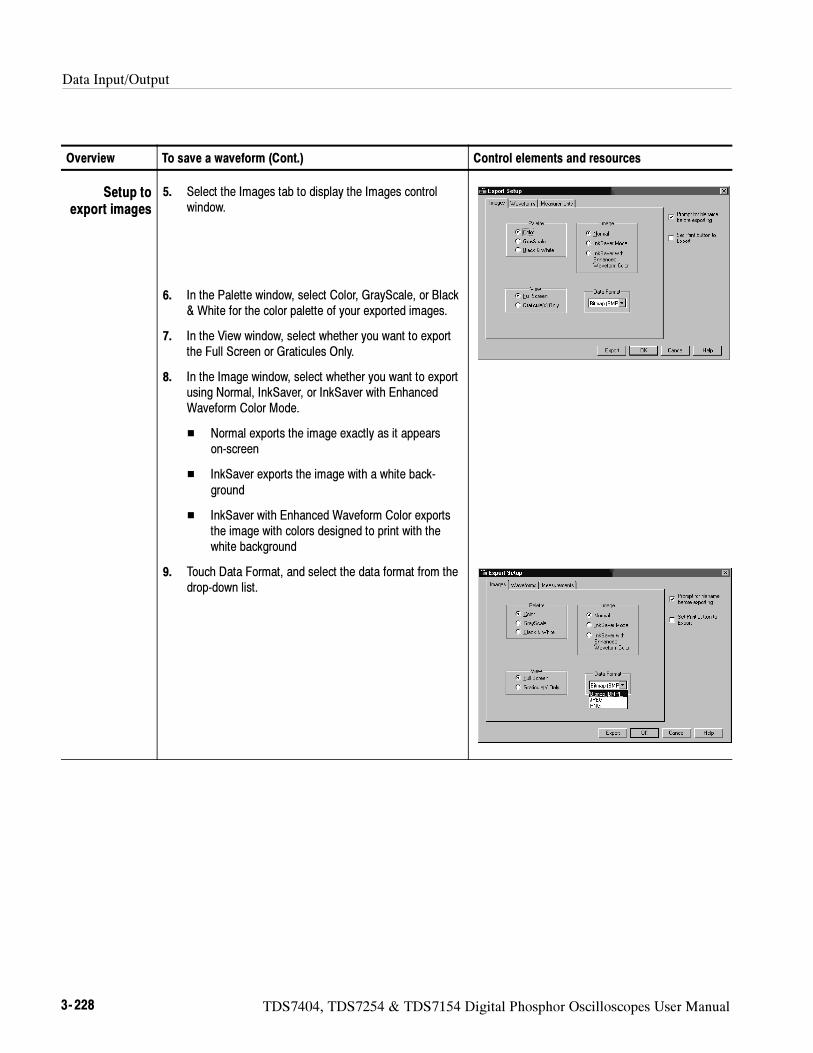
Data Input/Output
3- 228 TDS7404, TDS7254 & TDS7154 Digital Phosphor Oscilloscopes User Manual
Overview Control elements and resourcesTo save a waveform (Cont.)
Setup toexport images
5. Select the Images tab to display the Images controlwindow.
6. In the Palette window, select Color, GrayScale, or Black& White for the color palette of your exported images.
7. In the View window, select whether you want to exportthe Full Screen or Graticules Only.
8. In the Image window, select whether you want to exportusing Normal, InkSaver, or InkSaver with EnhancedWaveform Color Mode.
Normal exports the image exactly as it appearson-screen
InkSaver exports the image with a white back-ground
InkSaver with Enhanced Waveform Color exportsthe image with colors designed to print with thewhite background
9. Touch Data Format, and select the data format from thedrop-down list.
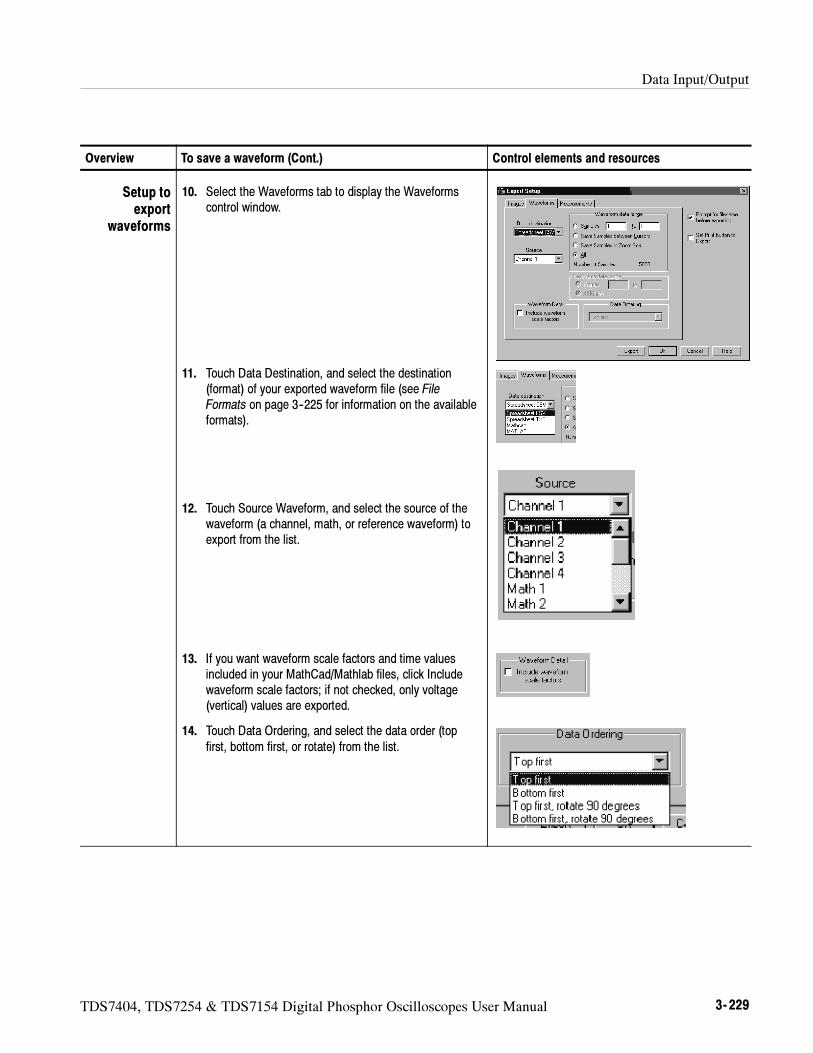
Data Input/Output
TDS7404, TDS7254 & TDS7154 Digital Phosphor Oscilloscopes User Manual 3- 229
Overview Control elements and resourcesTo save a waveform (Cont.)
Setup toexport
waveforms
10. Select the Waveforms tab to display the Waveformscontrol window.
11. Touch Data Destination, and select the destination(format) of your exported waveform file (see FileFormats on page 3--225 for information on the availableformats).
12. Touch Source Waveform, and select the source of thewaveform (a channel, math, or reference waveform) toexport from the list.
13. If you want waveform scale factors and time valuesincluded in your MathCad/Mathlab files, click Includewaveform scale factors; if not checked, only voltage(vertical) values are exported.
14. Touch Data Ordering, and select the data order (topfirst, bottom first, or rotate) from the list.
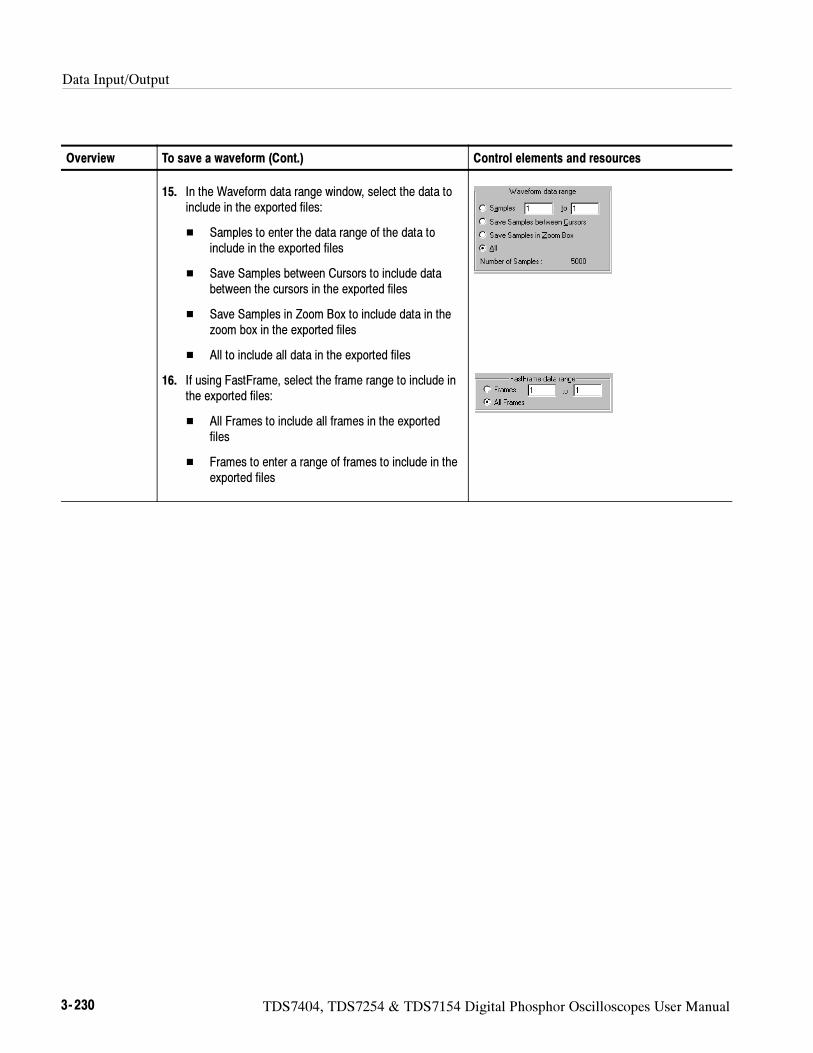
Data Input/Output
3- 230 TDS7404, TDS7254 & TDS7154 Digital Phosphor Oscilloscopes User Manual
Overview Control elements and resourcesTo save a waveform (Cont.)
15. In the Waveform data range window, select the data toinclude in the exported files:
Samples to enter the data range of the data toinclude in the exported files
Save Samples between Cursors to include databetween the cursors in the exported files
Save Samples in Zoom Box to include data in thezoom box in the exported files
All to include all data in the exported files
16. If using FastFrame, select the frame range to include inthe exported files:
All Frames to include all frames in the exportedfiles
Frames to enter a range of frames to include in theexported files
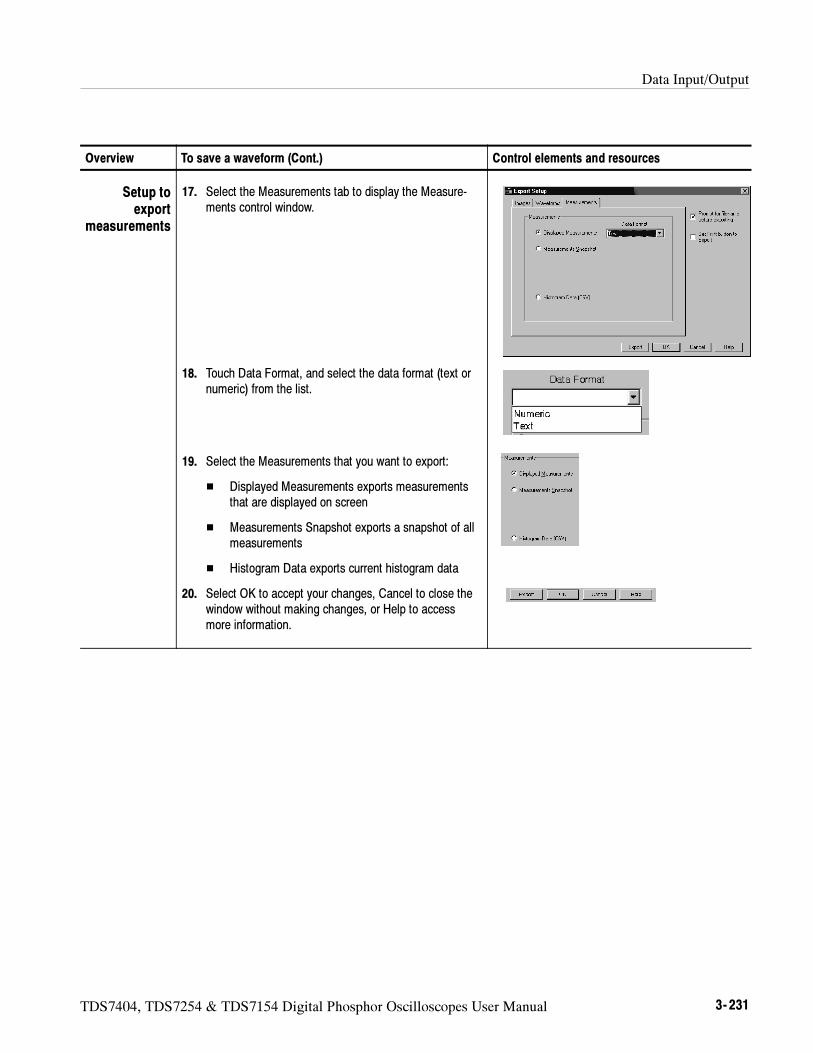
Data Input/Output
TDS7404, TDS7254 & TDS7154 Digital Phosphor Oscilloscopes User Manual 3- 231
Overview Control elements and resourcesTo save a waveform (Cont.)
Setup toexport
measurements
17. Select the Measurements tab to display the Measure-ments control window.
18. Touch Data Format, and select the data format (text ornumeric) from the list.
19. Select the Measurements that you want to export:
Displayed Measurements exports measurementsthat are displayed on screen
Measurements Snapshot exports a snapshot of allmeasurements
Histogram Data exports current histogram data
20. Select OK to accept your changes, Cancel to close thewindow without making changes, or Help to accessmore information.
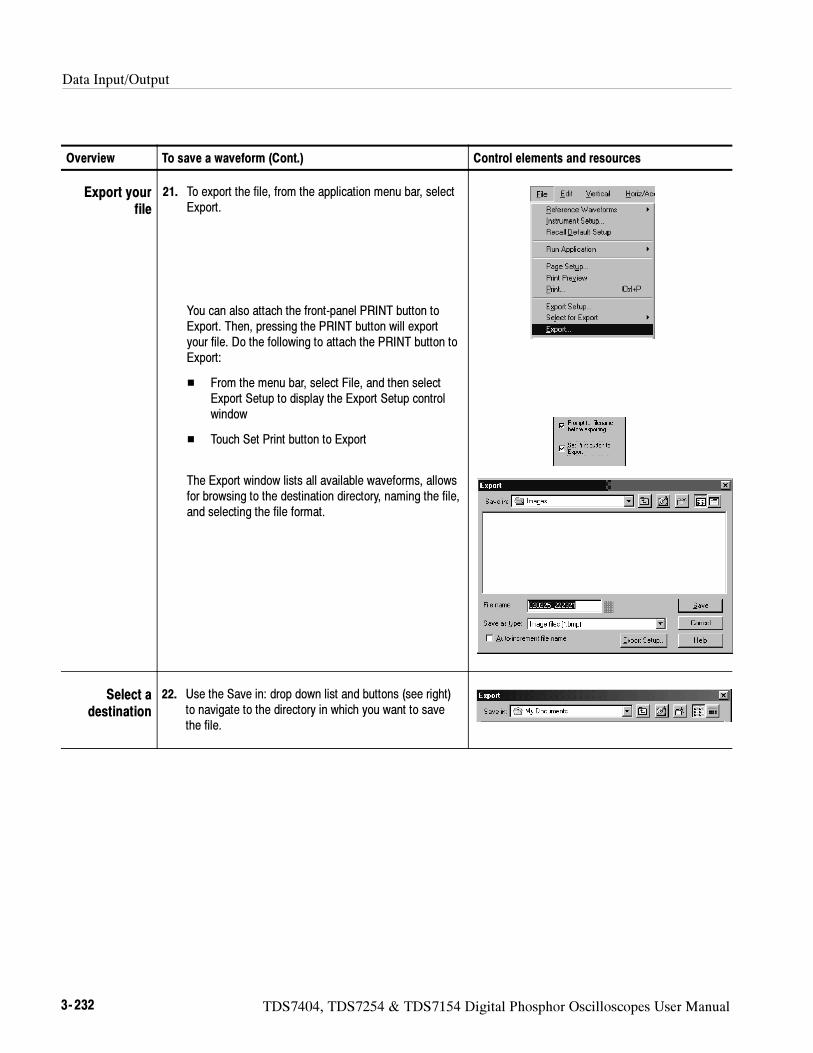
Data Input/Output
3- 232 TDS7404, TDS7254 & TDS7154 Digital Phosphor Oscilloscopes User Manual
Overview Control elements and resourcesTo save a waveform (Cont.)
Export yourfile
21. To export the file, from the application menu bar, selectExport.
You can also attach the front-panel PRINT button toExport. Then, pressing the PRINT button will exportyour file. Do the following to attach the PRINT button toExport:
From the menu bar, select File, and then selectExport Setup to display the Export Setup controlwindow
Touch Set Print button to Export
The Export window lists all available waveforms, allowsfor browsing to the destination directory, naming the file,and selecting the file format.
Select adestination
22. Use the Save in: drop down list and buttons (see right)to navigate to the directory in which you want to savethe file.
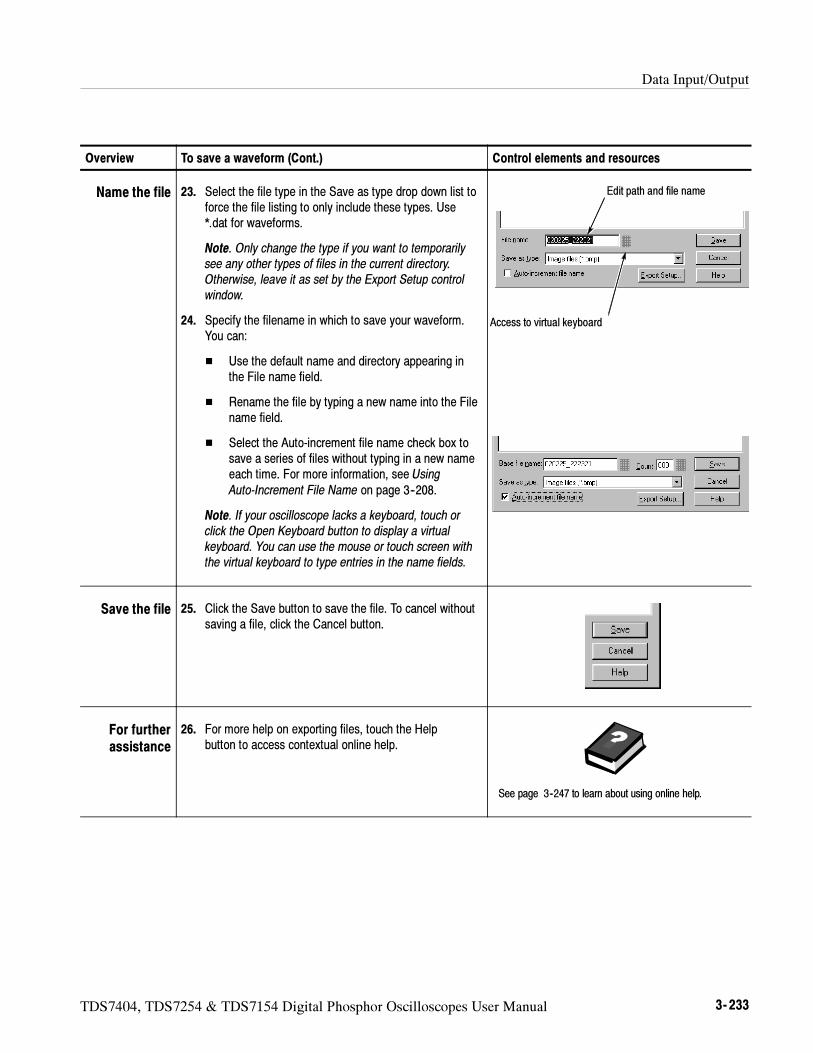
Data Input/Output
TDS7404, TDS7254 & TDS7154 Digital Phosphor Oscilloscopes User Manual 3- 233
Overview Control elements and resourcesTo save a waveform (Cont.)
Name the file 23. Select the file type in the Save as type drop down list toforce the file listing to only include these types. Use*.dat for waveforms.
Note. Only change the type if you want to temporarilysee any other types of files in the current directory.Otherwise, leave it as set by the Export Setup controlwindow.
24. Specify the filename in which to save your waveform.You can:
Use the default name and directory appearing inthe File name field.
Rename the file by typing a new name into the Filename field.
Select the Auto-increment file name check box tosave a series of files without typing in a new nameeach time. For more information, see UsingAuto-Increment File Name on page 3--208.
Note. If your oscilloscope lacks a keyboard, touch orclick the Open Keyboard button to display a virtualkeyboard. You can use the mouse or touch screen withthe virtual keyboard to type entries in the name fields.
Access to virtual keyboard
Edit path and file name
Save the file 25. Click the Save button to save the file. To cancel withoutsaving a file, click the Cancel button.
For furtherassistance
26. For more help on exporting files, touch the Helpbutton to access contextual online help.
See page 3--247 to learn about using online help.
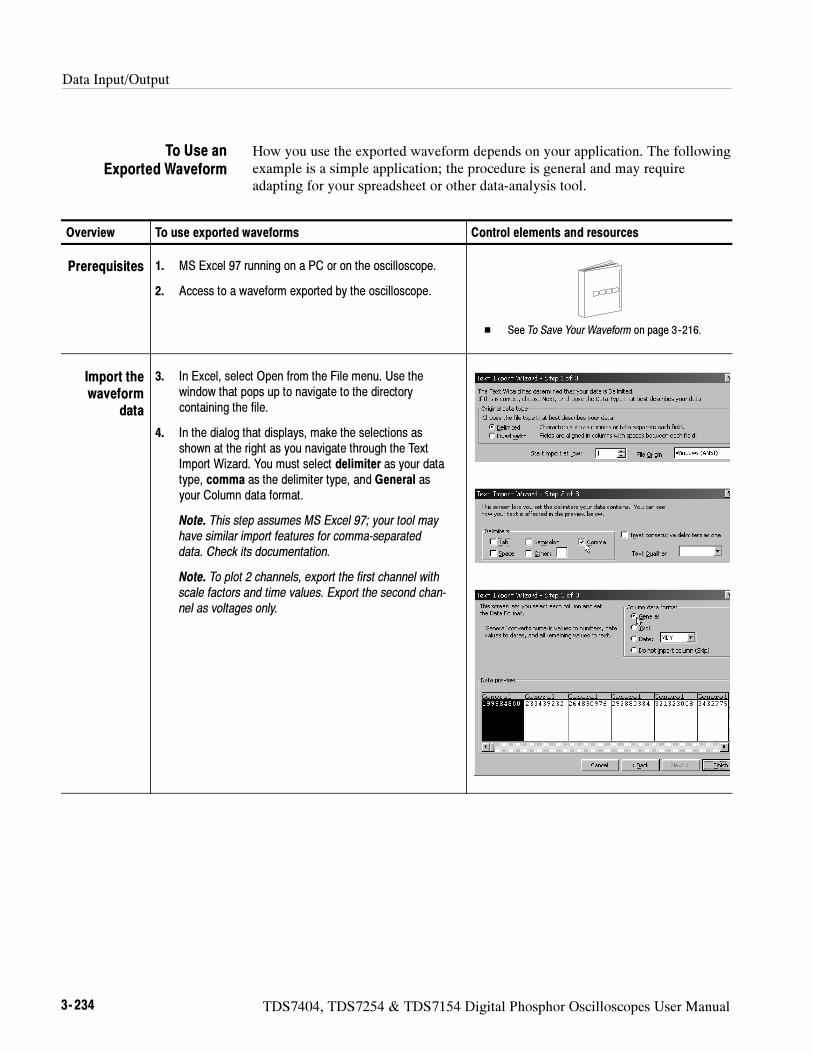
Data Input/Output
3- 234 TDS7404, TDS7254 & TDS7154 Digital Phosphor Oscilloscopes User Manual
How you use the exported waveform depends on your application. The followingexample is a simple application; the procedure is general and may requireadapting for your spreadsheet or other data-analysis tool.
Overview To use exported waveforms Control elements and resources
Prerequisites 1. MS Excel 97 running on a PC or on the oscilloscope.
2. Access to a waveform exported by the oscilloscope.
See To Save Your Waveform on page 3--216.
Import thewaveform
data
3. In Excel, select Open from the File menu. Use thewindow that pops up to navigate to the directorycontaining the file.
4. In the dialog that displays, make the selections asshown at the right as you navigate through the TextImport Wizard. You must select delimiter as your datatype, comma as the delimiter type, and General asyour Column data format.
Note. This step assumes MS Excel 97; your tool mayhave similar import features for comma-separateddata. Check its documentation.
Note. To plot 2 channels, export the first channel withscale factors and time values. Export the second chan-nel as voltages only.
To Use anExported Waveform
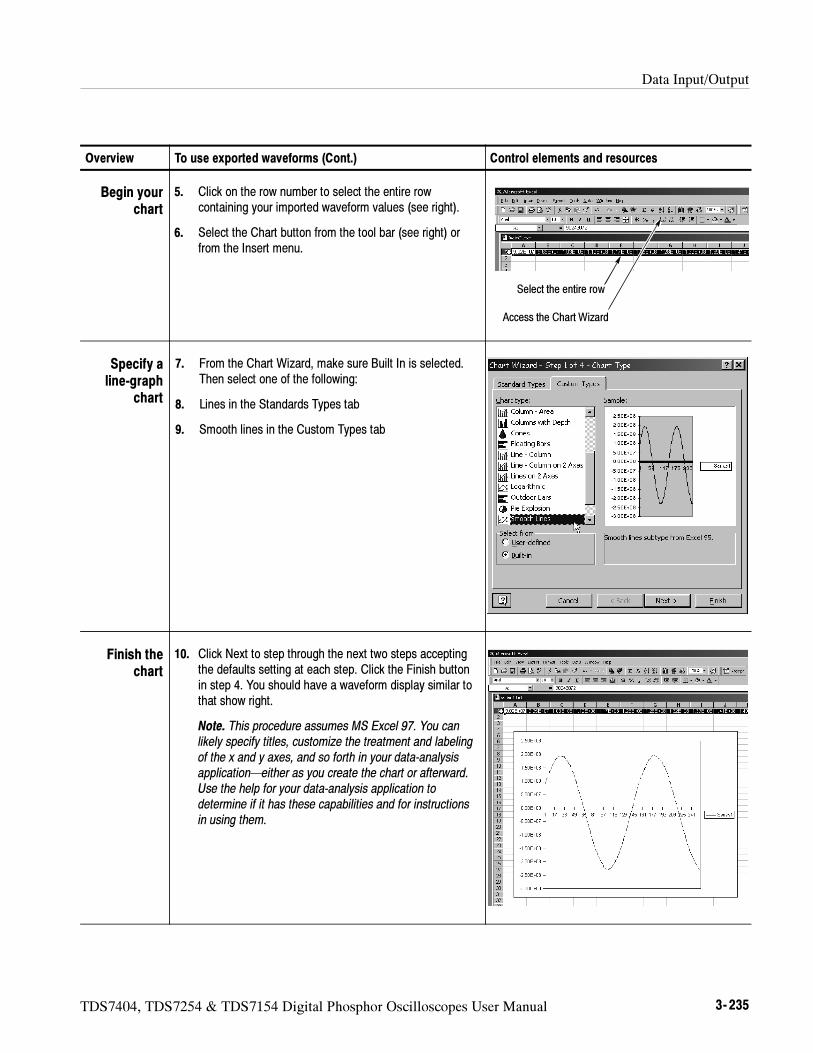
Data Input/Output
TDS7404, TDS7254 & TDS7154 Digital Phosphor Oscilloscopes User Manual 3- 235
Overview Control elements and resourcesTo use exported waveforms (Cont.)
Begin yourchart
5. Click on the row number to select the entire rowcontaining your imported waveform values (see right).
6. Select the Chart button from the tool bar (see right) orfrom the Insert menu.
Access the Chart Wizard
Select the entire row
Specify aline-graph
chart
7. From the Chart Wizard, make sure Built In is selected.Then select one of the following:
8. Lines in the Standards Types tab
9. Smooth lines in the Custom Types tab
Finish thechart
10. Click Next to step through the next two steps acceptingthe defaults setting at each step. Click the Finish buttonin step 4. You should have a waveform display similar tothat show right.
Note. This procedure assumes MS Excel 97. You canlikely specify titles, customize the treatment and labelingof the x and y axes, and so forth in your data-analysisapplication—either as you create the chart or afterward.Use the help for your data-analysis application todetermine if it has these capabilities and for instructionsin using them.
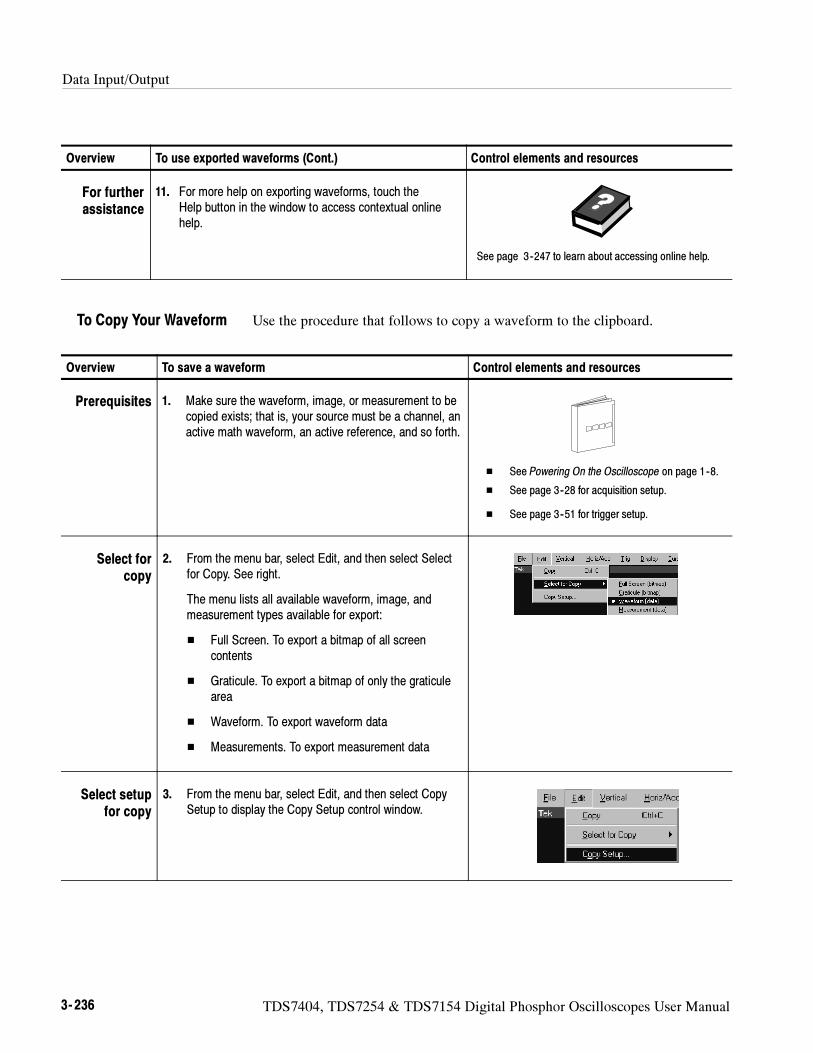
Data Input/Output
3- 236 TDS7404, TDS7254 & TDS7154 Digital Phosphor Oscilloscopes User Manual
Overview Control elements and resourcesTo use exported waveforms (Cont.)
For furtherassistance
11. For more help on exporting waveforms, touch theHelp button in the window to access contextual onlinehelp.
See page 3--247 to learn about accessing online help.
Use the procedure that follows to copy a waveform to the clipboard.
Overview To save a waveform Control elements and resources
Prerequisites 1. Make sure the waveform, image, or measurement to becopied exists; that is, your source must be a channel, anactive math waveform, an active reference, and so forth.
See Powering On the Oscilloscope on page 1--8.
See page 3--28 for acquisition setup.
See page 3--51 for trigger setup.
Select forcopy
2. From the menu bar, select Edit, and then select Selectfor Copy. See right.
The menu lists all available waveform, image, andmeasurement types available for export:
Full Screen. To export a bitmap of all screencontents
Graticule. To export a bitmap of only the graticulearea
Waveform. To export waveform data
Measurements. To export measurement data
Select setupfor copy
3. From the menu bar, select Edit, and then select CopySetup to display the Copy Setup control window.
To Copy Your Waveform
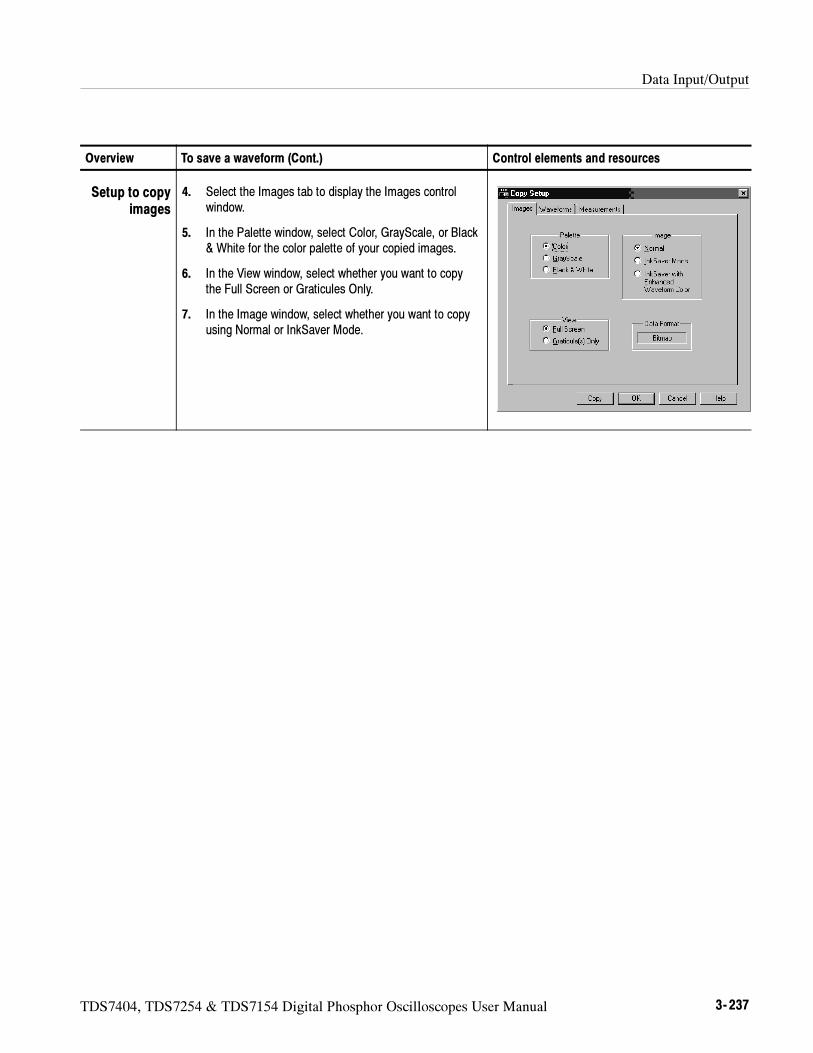
Data Input/Output
TDS7404, TDS7254 & TDS7154 Digital Phosphor Oscilloscopes User Manual 3- 237
Overview Control elements and resourcesTo save a waveform (Cont.)
Setup to copyimages
4. Select the Images tab to display the Images controlwindow.
5. In the Palette window, select Color, GrayScale, or Black& White for the color palette of your copied images.
6. In the View window, select whether you want to copythe Full Screen or Graticules Only.
7. In the Image window, select whether you want to copyusing Normal or InkSaver Mode.
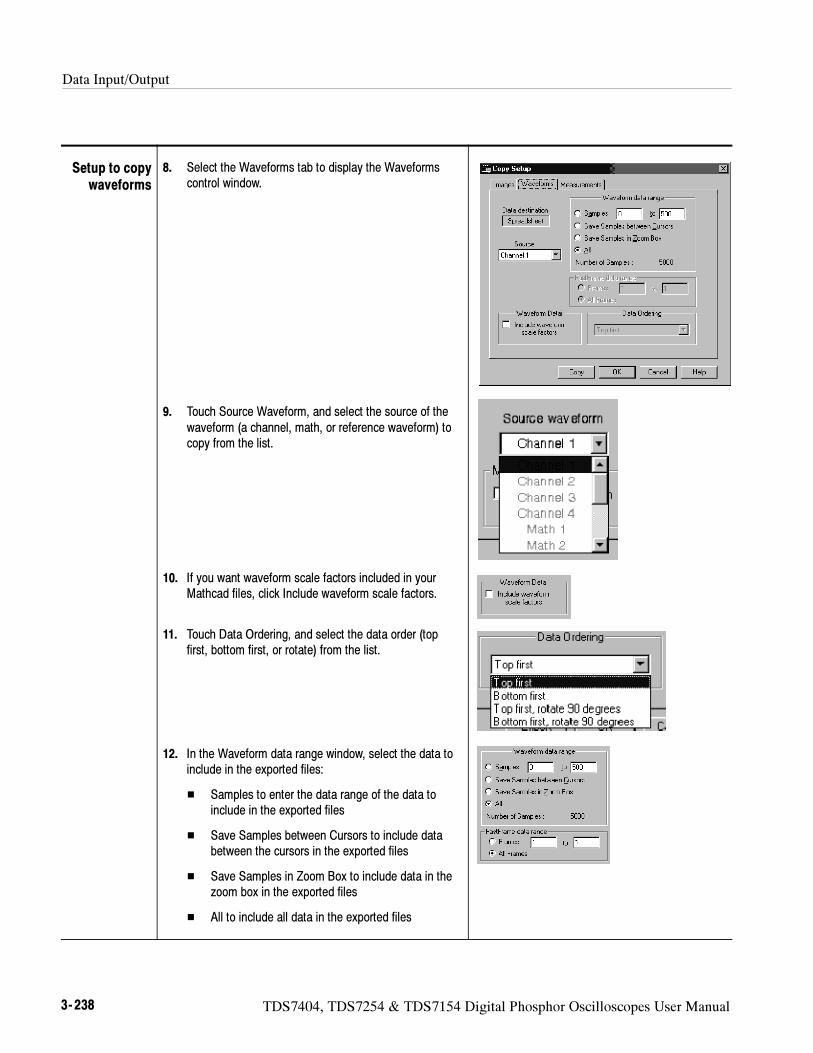
Data Input/Output
3- 238 TDS7404, TDS7254 & TDS7154 Digital Phosphor Oscilloscopes User Manual
Setup to copywaveforms
8. Select the Waveforms tab to display the Waveformscontrol window.
9. Touch Source Waveform, and select the source of thewaveform (a channel, math, or reference waveform) tocopy from the list.
10. If you want waveform scale factors included in yourMathcad files, click Include waveform scale factors.
11. Touch Data Ordering, and select the data order (topfirst, bottom first, or rotate) from the list.
12. In the Waveform data range window, select the data toinclude in the exported files:
Samples to enter the data range of the data toinclude in the exported files
Save Samples between Cursors to include databetween the cursors in the exported files
Save Samples in Zoom Box to include data in thezoom box in the exported files
All to include all data in the exported files
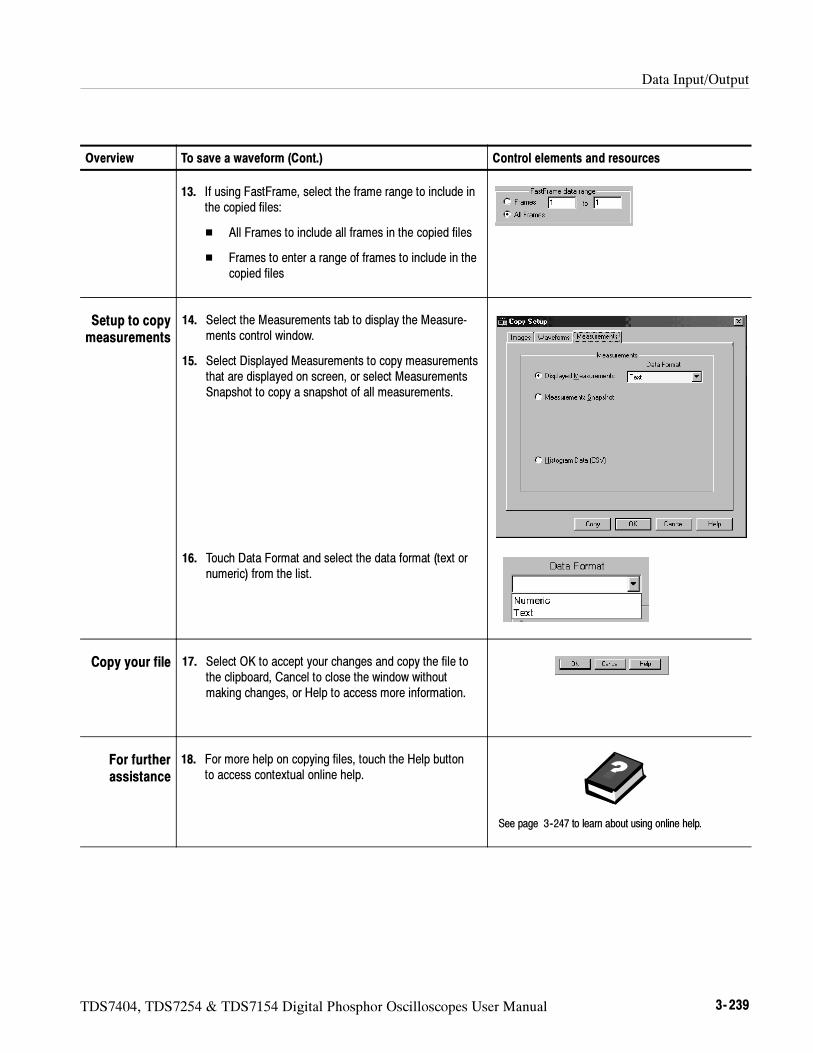
Data Input/Output
TDS7404, TDS7254 & TDS7154 Digital Phosphor Oscilloscopes User Manual 3- 239
Overview Control elements and resourcesTo save a waveform (Cont.)
13. If using FastFrame, select the frame range to include inthe copied files:
All Frames to include all frames in the copied files
Frames to enter a range of frames to include in thecopied files
Setup to copymeasurements
14. Select the Measurements tab to display the Measure-ments control window.
15. Select Displayed Measurements to copy measurementsthat are displayed on screen, or select MeasurementsSnapshot to copy a snapshot of all measurements.
16. Touch Data Format and select the data format (text ornumeric) from the list.
Copy your file 17. Select OK to accept your changes and copy the file tothe clipboard, Cancel to close the window withoutmaking changes, or Help to access more information.
For furtherassistance
18. For more help on copying files, touch the Help buttonto access contextual online help.
See page 3--247 to learn about using online help.
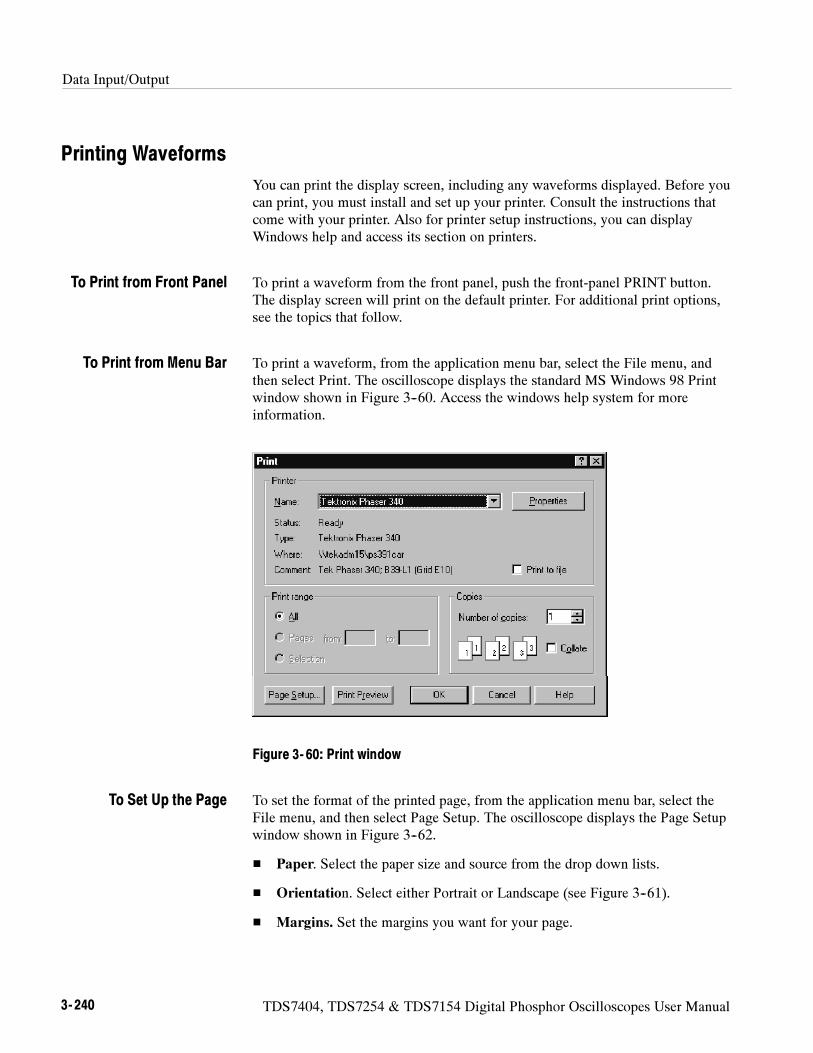
Data Input/Output
3- 240 TDS7404, TDS7254 & TDS7154 Digital Phosphor Oscilloscopes User Manual
Printing Waveforms
You can print the display screen, including any waveforms displayed. Before youcan print, you must install and set up your printer. Consult the instructions thatcome with your printer. Also for printer setup instructions, you can displayWindows help and access its section on printers.
To print a waveform from the front panel, push the front-panel PRINT button.The display screen will print on the default printer. For additional print options,see the topics that follow.
To print a waveform, from the application menu bar, select the File menu, andthen select Print. The oscilloscope displays the standard MS Windows 98 Printwindow shown in Figure 3--60. Access the windows help system for moreinformation.
Figure 3- 60: Print window
To set the format of the printed page, from the application menu bar, select theFile menu, and then select Page Setup. The oscilloscope displays the Page Setupwindow shown in Figure 3--62.
Paper. Select the paper size and source from the drop down lists.
Orientation. Select either Portrait or Landscape (see Figure 3--61).
Margins. Set the margins you want for your page.
To Print from Front Panel
To Print from Menu Bar
To Set Up the Page
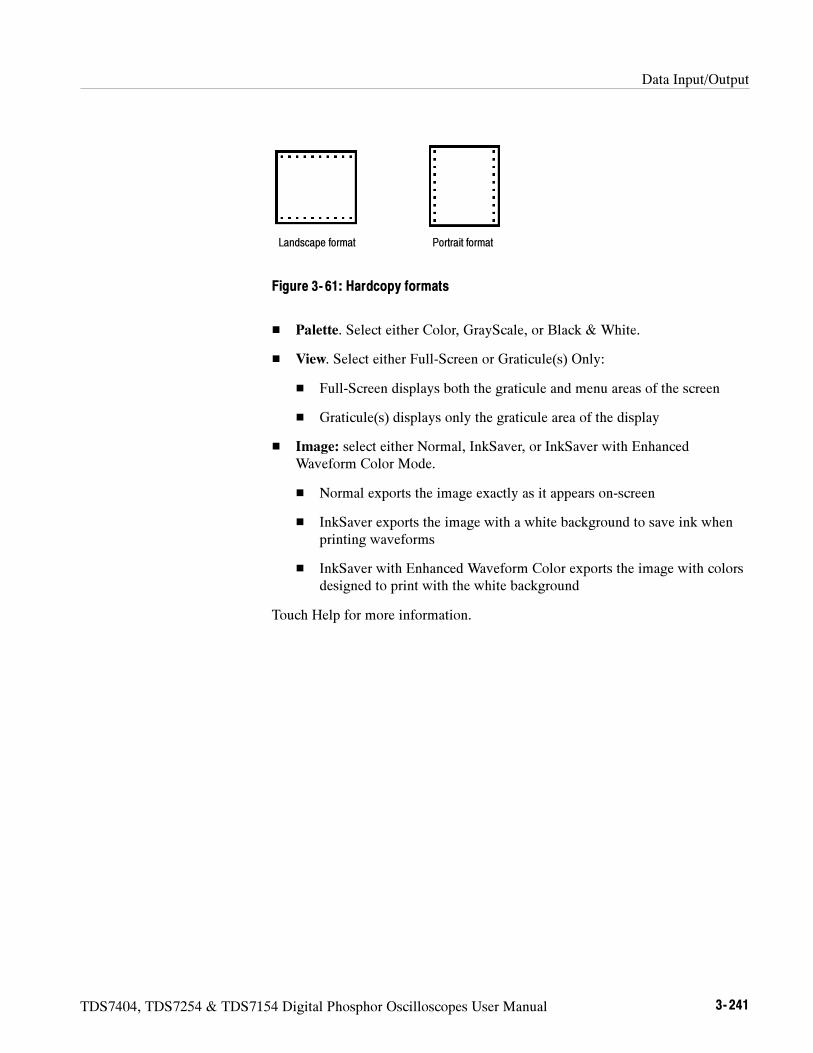
Data Input/Output
TDS7404, TDS7254 & TDS7154 Digital Phosphor Oscilloscopes User Manual 3- 241
Landscape format Portrait format
Figure 3- 61: Hardcopy formats
Palette. Select either Color, GrayScale, or Black & White.
View. Select either Full-Screen or Graticule(s) Only:
Full-Screen displays both the graticule and menu areas of the screen
Graticule(s) displays only the graticule area of the display
Image: select either Normal, InkSaver, or InkSaver with EnhancedWaveform Color Mode.
Normal exports the image exactly as it appears on-screen
InkSaver exports the image with a white background to save ink whenprinting waveforms
InkSaver with Enhanced Waveform Color exports the image with colorsdesigned to print with the white background
Touch Help for more information.
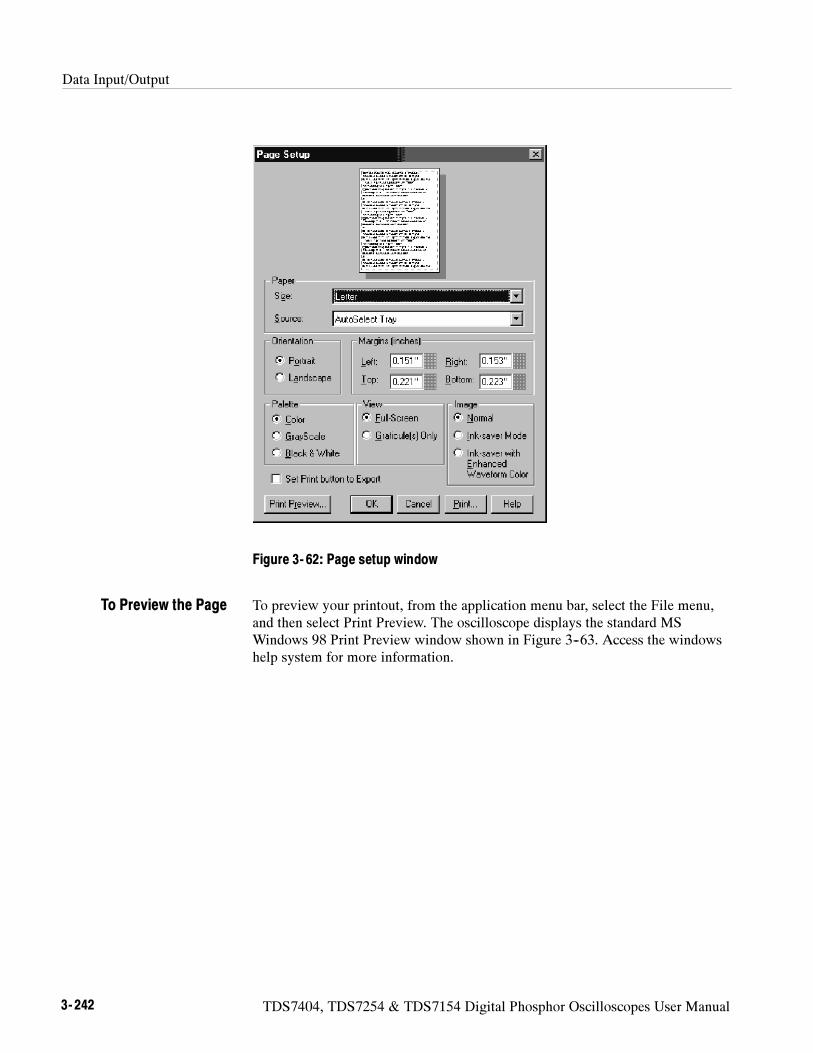
Data Input/Output
3- 242 TDS7404, TDS7254 & TDS7154 Digital Phosphor Oscilloscopes User Manual
Figure 3- 62: Page setup window
To preview your printout, from the application menu bar, select the File menu,and then select Print Preview. The oscilloscope displays the standard MSWindows 98 Print Preview window shown in Figure 3--63. Access the windowshelp system for more information.
To Preview the Page
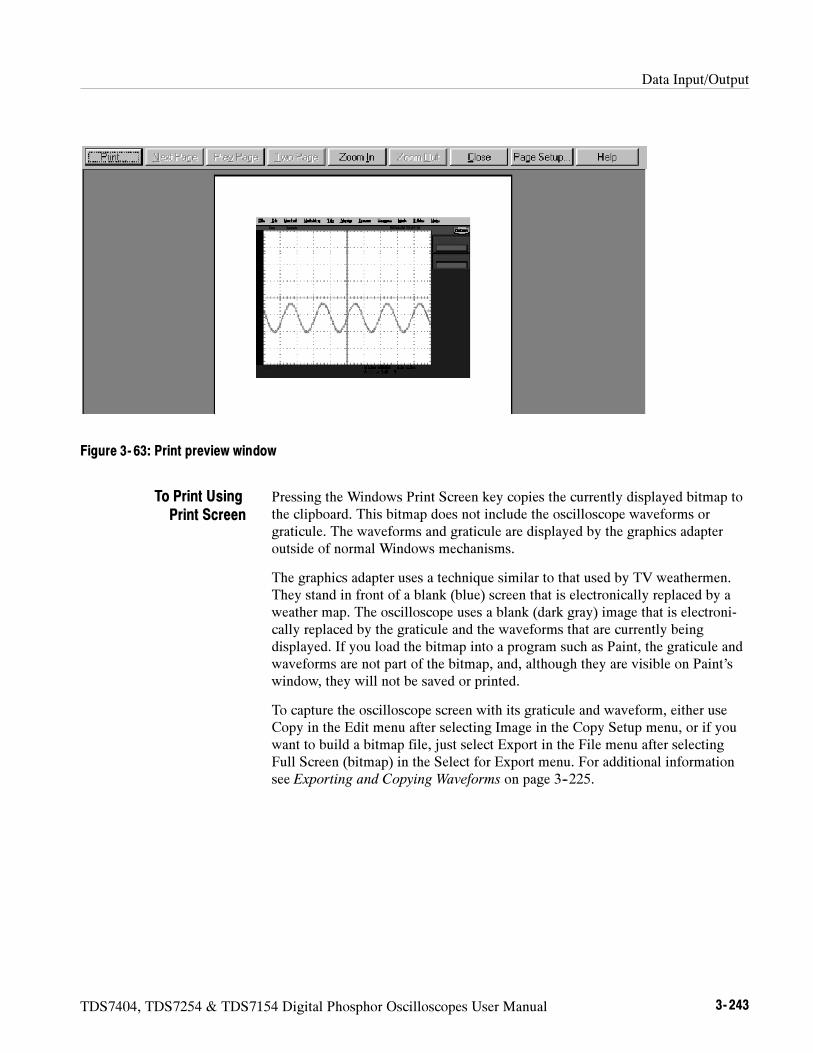
Data Input/Output
TDS7404, TDS7254 & TDS7154 Digital Phosphor Oscilloscopes User Manual 3- 243
Figure 3- 63: Print preview window
Pressing the Windows Print Screen key copies the currently displayed bitmap tothe clipboard. This bitmap does not include the oscilloscope waveforms orgraticule. The waveforms and graticule are displayed by the graphics adapteroutside of normal Windows mechanisms.
The graphics adapter uses a technique similar to that used by TV weathermen.They stand in front of a blank (blue) screen that is electronically replaced by aweather map. The oscilloscope uses a blank (dark gray) image that is electroni-cally replaced by the graticule and the waveforms that are currently beingdisplayed. If you load the bitmap into a program such as Paint, the graticule andwaveforms are not part of the bitmap, and, although they are visible on Paint’swindow, they will not be saved or printed.
To capture the oscilloscope screen with its graticule and waveform, either useCopy in the Edit menu after selecting Image in the Copy Setup menu, or if youwant to build a bitmap file, just select Export in the File menu after selectingFull Screen (bitmap) in the Select for Export menu. For additional informationsee Exporting and Copying Waveforms on page 3--225.
To Print UsingPrint Screen
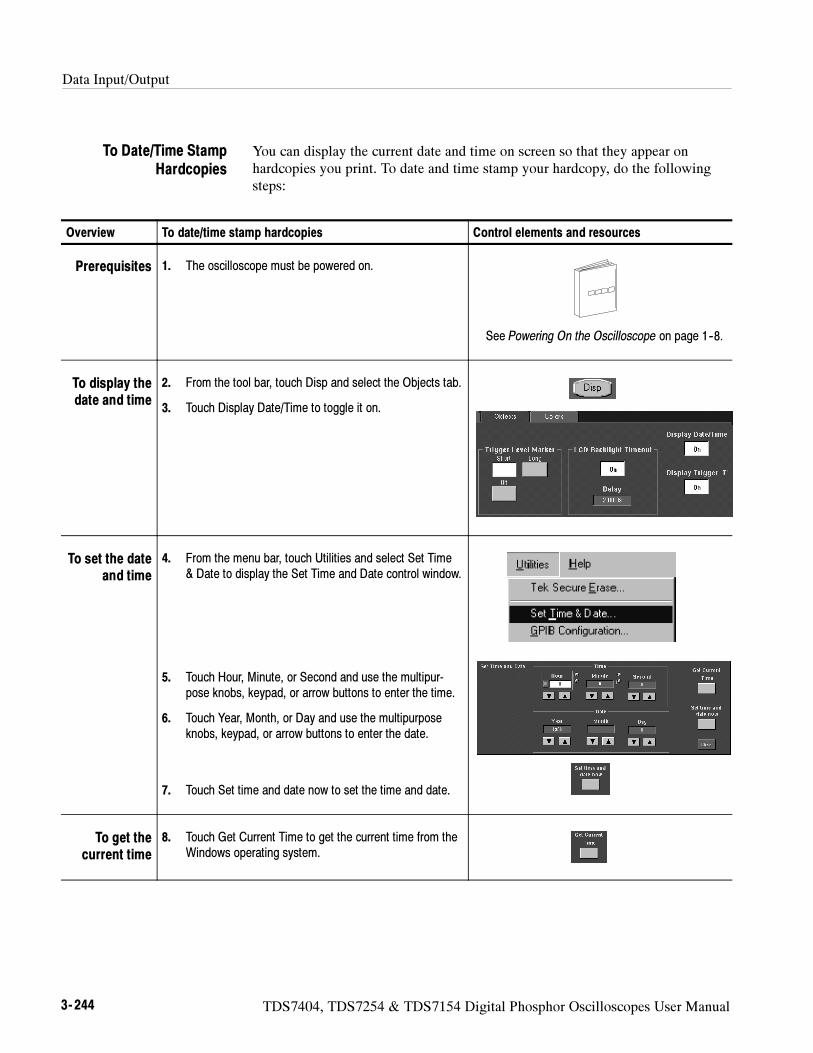
Data Input/Output
3- 244 TDS7404, TDS7254 & TDS7154 Digital Phosphor Oscilloscopes User Manual
You can display the current date and time on screen so that they appear onhardcopies you print. To date and time stamp your hardcopy, do the followingsteps:
Overview To date/time stamp hardcopies Control elements and resources
Prerequisites 1. The oscilloscope must be powered on.
See Powering On the Oscilloscope on page 1--8.
To display thedate and time
2. From the tool bar, touch Disp and select the Objects tab.
3. Touch Display Date/Time to toggle it on.
To set the dateand time
4. From the menu bar, touch Utilities and select Set Time& Date to display the Set Time and Date control window.
5. Touch Hour, Minute, or Second and use the multipur-pose knobs, keypad, or arrow buttons to enter the time.
6. Touch Year, Month, or Day and use the multipurposeknobs, keypad, or arrow buttons to enter the date.
7. Touch Set time and date now to set the time and date.
To get thecurrent time
8. Touch Get Current Time to get the current time from theWindows operating system.
To Date/Time StampHardcopies
Data Input/Output
TDS7404, TDS7254 & TDS7154 Digital Phosphor Oscilloscopes User Manual 3- 245
Remote Communication
Remote communication is performed through the GPIB interface. Consult theonline Programmer Guide for help with establishing remote communication andcontrol of the oscilloscope.
To access the Programmer Guide, locate the Product Software CD that wasshipped with the oscilloscope. Install the CD in the personal computer that youwant to use, typically your oscilloscope controller. Follow the directions in theCD booklet.
You can install the guide in the oscilloscope, but that may not be convenientbecause it will cover the oscilloscope screen.
For information on connecting the oscilloscope to a network to enable printing,file sharing, internet access, and other communications functions, see Connect-ing to a Network on page 1--13.

Data Input/Output
3- 246 TDS7404, TDS7254 & TDS7154 Digital Phosphor Oscilloscopes User Manual
TDS7404, TDS7254 & TDS7154 Digital Phosphor Oscilloscopes User Manual 3- 247
Accessing Online Help
This manual represents only part of the user assistance available to you — theonline help system, integrated as part of the oscilloscope user interface, providesquick-to-access support for operating this oscilloscope. This section describes thehelp system and how to access it.
This oscilloscope provides the following help resources online:
Help Topics
Programmers Guide
Much of the information you need to operate this oscilloscope and use iteffectively is found online, where you can quickly access it and display it onyour oscilloscope screen. You need to access the online documentation for mostoperating information.
A few keys to remember when using online help follow:
Use online help when you want to minimize interruption to your work flow.Help Topics are there when you need to probe more deeply into featureoperation.
Use the manuals for instructions on putting the oscilloscope into service, forprocedures on reinstalling its product software, for listings of specifications,and for overviews of features and their operation.
Use the online programmers guide, either displayed on the oscilloscopescreen, or on your windows-equipped PC, for support on operating theoscilloscope from the GPIB.
How to Use Online Help
Use the procedure steps that follow to access contextual help and to learn how tosearch the help system for more information.
Overview To use online help Control elements and resources
Prerequisites 1. The oscilloscope must be powered up and running.
See Installation, page 1--5.
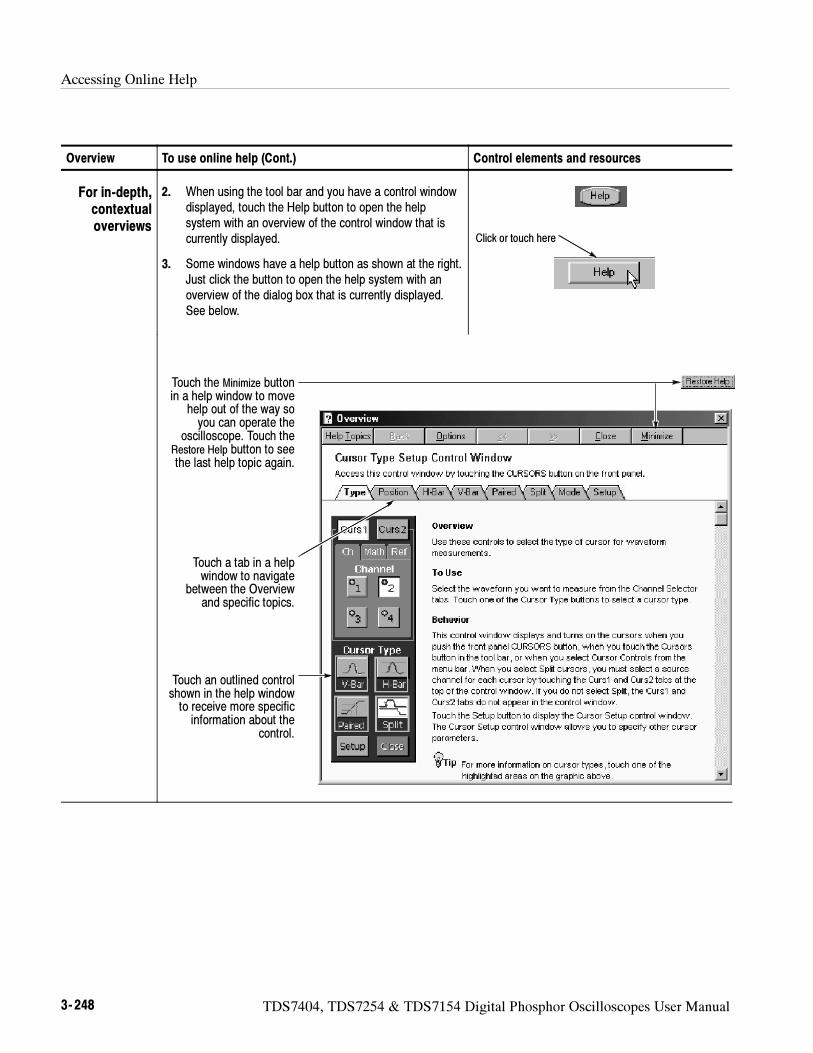
Accessing Online Help
3- 248 TDS7404, TDS7254 & TDS7154 Digital Phosphor Oscilloscopes User Manual
Overview Control elements and resourcesTo use online help (Cont.)
For in-depth,contextualoverviews
2. When using the tool bar and you have a control windowdisplayed, touch the Help button to open the helpsystem with an overview of the control window that iscurrently displayed.
3. Some windows have a help button as shown at the right.Just click the button to open the help system with anoverview of the dialog box that is currently displayed.See below.
Click or touch here
Touch an outlined controlshown in the help windowto receive more specificinformation about the
control.
Touch a tab in a helpwindow to navigate
between the Overviewand specific topics.
Touch the Minimize buttonin a help window to move
help out of the way soyou can operate the
oscilloscope. Touch theRestore Help button to seethe last help topic again.
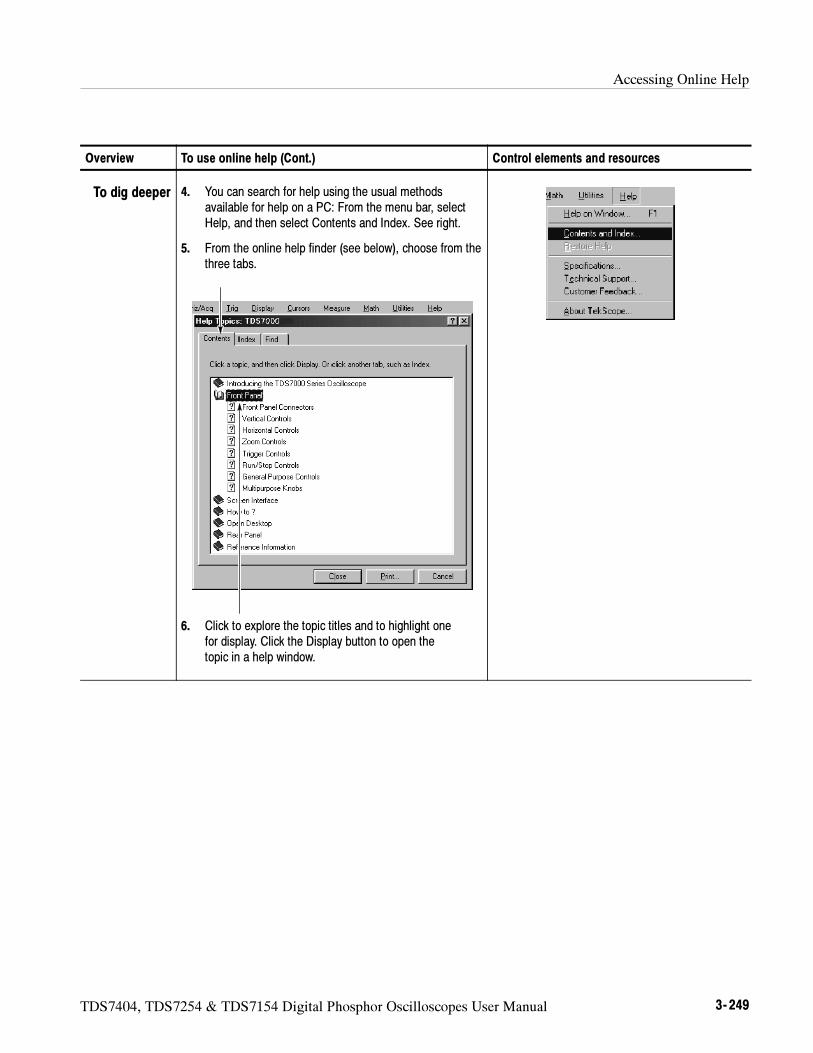
Accessing Online Help
TDS7404, TDS7254 & TDS7154 Digital Phosphor Oscilloscopes User Manual 3- 249
Overview Control elements and resourcesTo use online help (Cont.)
To dig deeper 4. You can search for help using the usual methodsavailable for help on a PC: From the menu bar, selectHelp, and then select Contents and Index. See right.
5. From the online help finder (see below), choose from thethree tabs.
6. Click to explore the topic titles and to highlight onefor display. Click the Display button to open thetopic in a help window.
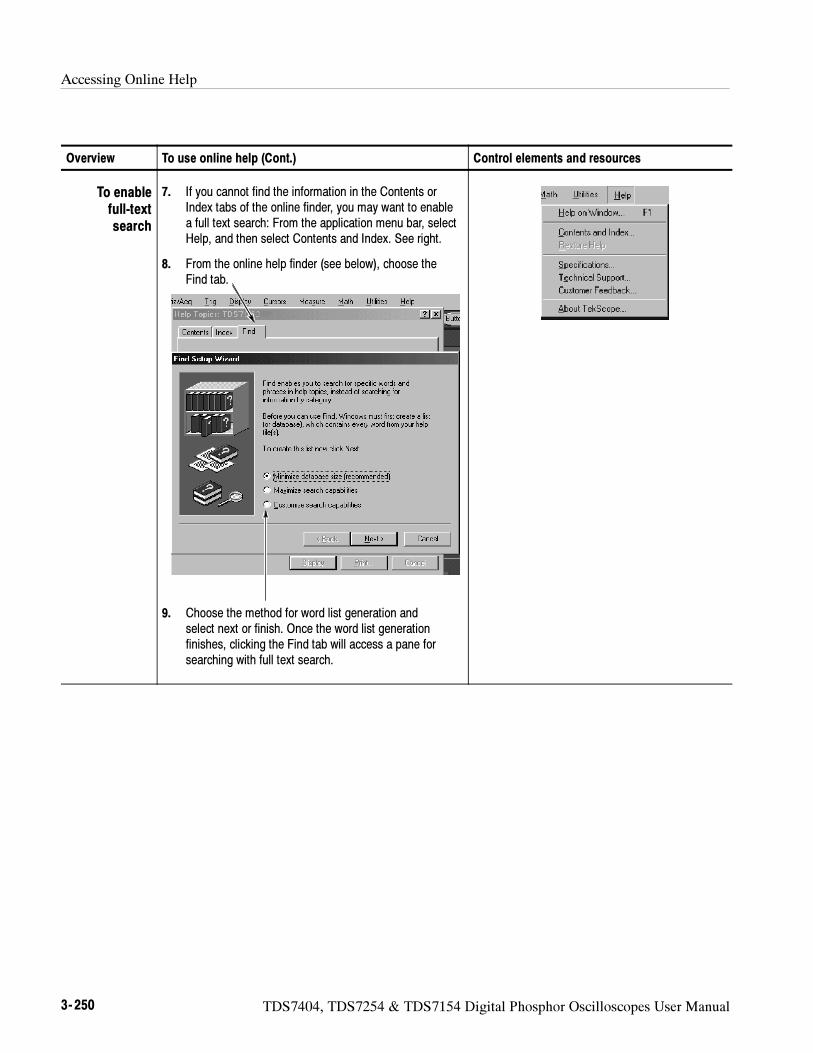
Accessing Online Help
3- 250 TDS7404, TDS7254 & TDS7154 Digital Phosphor Oscilloscopes User Manual
Overview Control elements and resourcesTo use online help (Cont.)
To enablefull-textsearch
7. If you cannot find the information in the Contents orIndex tabs of the online finder, you may want to enablea full text search: From the application menu bar, selectHelp, and then select Contents and Index. See right.
8. From the online help finder (see below), choose theFind tab.
9. Choose the method for word list generation andselect next or finish. Once the word list generationfinishes, clicking the Find tab will access a pane forsearching with full text search.
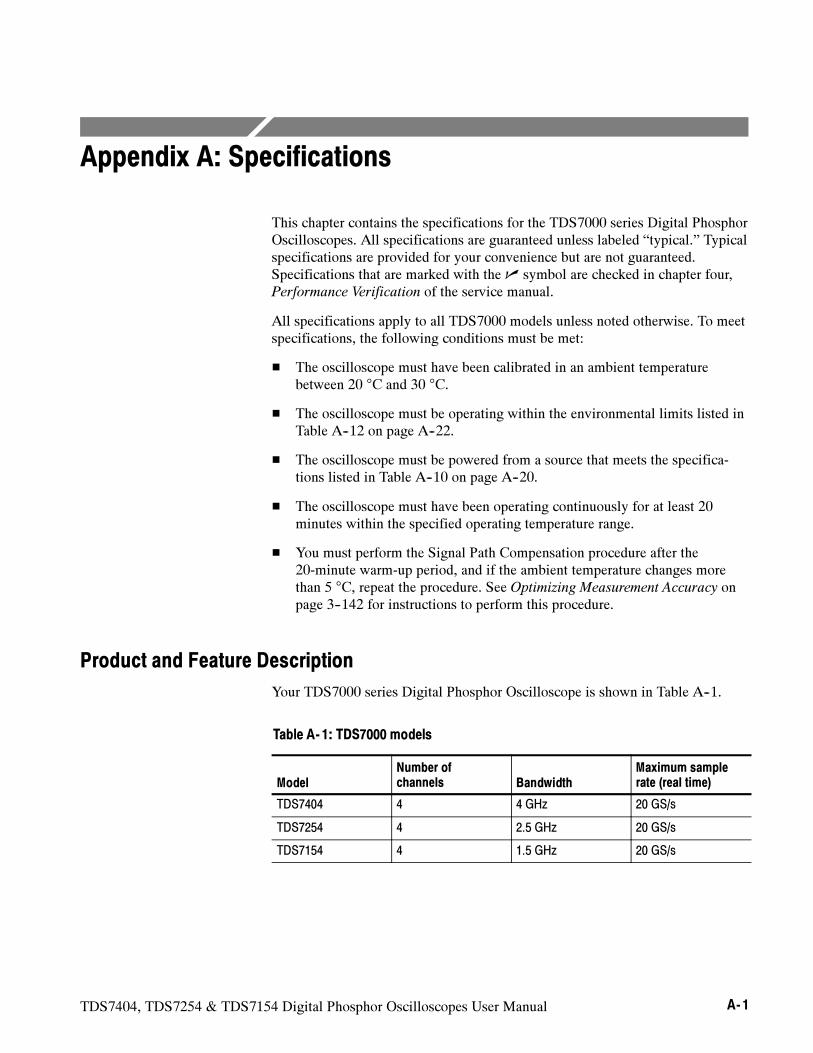
TDS7404, TDS7254 & TDS7154 Digital Phosphor Oscilloscopes User Manual A- 1
Appendix A: Specifications
This chapter contains the specifications for the TDS7000 series Digital PhosphorOscilloscopes. All specifications are guaranteed unless labeled “typical.” Typicalspecifications are provided for your convenience but are not guaranteed.Specifications that are marked with the symbol are checked in chapter four,Performance Verification of the service manual.
All specifications apply to all TDS7000 models unless noted otherwise. To meetspecifications, the following conditions must be met:
The oscilloscope must have been calibrated in an ambient temperaturebetween 20 °C and 30 °C.
The oscilloscope must be operating within the environmental limits listed inTable A--12 on page A--22.
The oscilloscope must be powered from a source that meets the specifica-tions listed in Table A--10 on page A--20.
The oscilloscope must have been operating continuously for at least 20minutes within the specified operating temperature range.
You must perform the Signal Path Compensation procedure after the20-minute warm-up period, and if the ambient temperature changes morethan 5 °C, repeat the procedure. See Optimizing Measurement Accuracy onpage 3--142 for instructions to perform this procedure.
Product and Feature Description
Your TDS7000 series Digital Phosphor Oscilloscope is shown in Table A--1.
Table A- 1: TDS7000 models
ModelNumber ofchannels Bandwidth
Maximum samplerate (real time)
TDS7404 4 4 GHz 20 GS/s
TDS7254 4 2.5 GHz 20 GS/s
TDS7154 4 1.5 GHz 20 GS/s
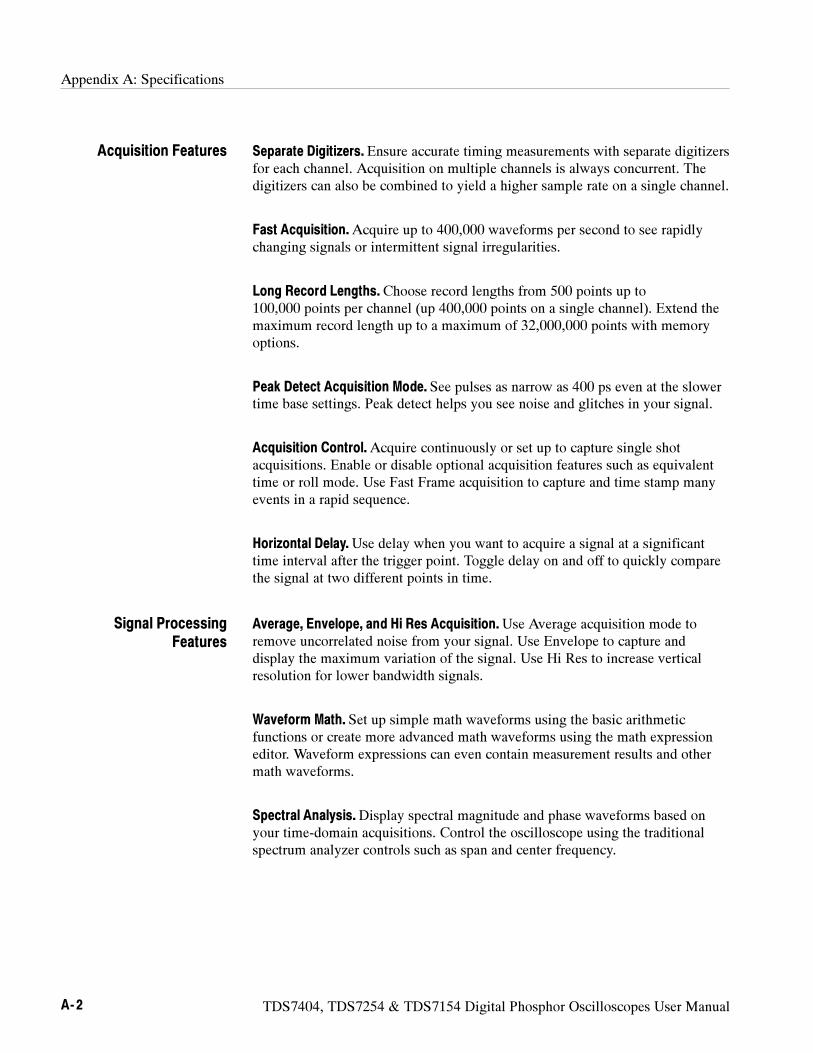
Appendix A: Specifications
A- 2 TDS7404, TDS7254 & TDS7154 Digital Phosphor Oscilloscopes User Manual
Separate Digitizers. Ensure accurate timing measurements with separate digitizersfor each channel. Acquisition on multiple channels is always concurrent. Thedigitizers can also be combined to yield a higher sample rate on a single channel.
Fast Acquisition.Acquire up to 400,000 waveforms per second to see rapidlychanging signals or intermittent signal irregularities.
Long Record Lengths. Choose record lengths from 500 points up to100,000 points per channel (up 400,000 points on a single channel). Extend themaximum record length up to a maximum of 32,000,000 points with memoryoptions.
Peak Detect Acquisition Mode. See pulses as narrow as 400 ps even at the slowertime base settings. Peak detect helps you see noise and glitches in your signal.
Acquisition Control.Acquire continuously or set up to capture single shotacquisitions. Enable or disable optional acquisition features such as equivalenttime or roll mode. Use Fast Frame acquisition to capture and time stamp manyevents in a rapid sequence.
Horizontal Delay.Use delay when you want to acquire a signal at a significanttime interval after the trigger point. Toggle delay on and off to quickly comparethe signal at two different points in time.
Average, Envelope, and Hi Res Acquisition.Use Average acquisition mode toremove uncorrelated noise from your signal. Use Envelope to capture anddisplay the maximum variation of the signal. Use Hi Res to increase verticalresolution for lower bandwidth signals.
Waveform Math. Set up simple math waveforms using the basic arithmeticfunctions or create more advanced math waveforms using the math expressioneditor. Waveform expressions can even contain measurement results and othermath waveforms.
Spectral Analysis.Display spectral magnitude and phase waveforms based onyour time-domain acquisitions. Control the oscilloscope using the traditionalspectrum analyzer controls such as span and center frequency.
Acquisition Features
Signal ProcessingFeatures
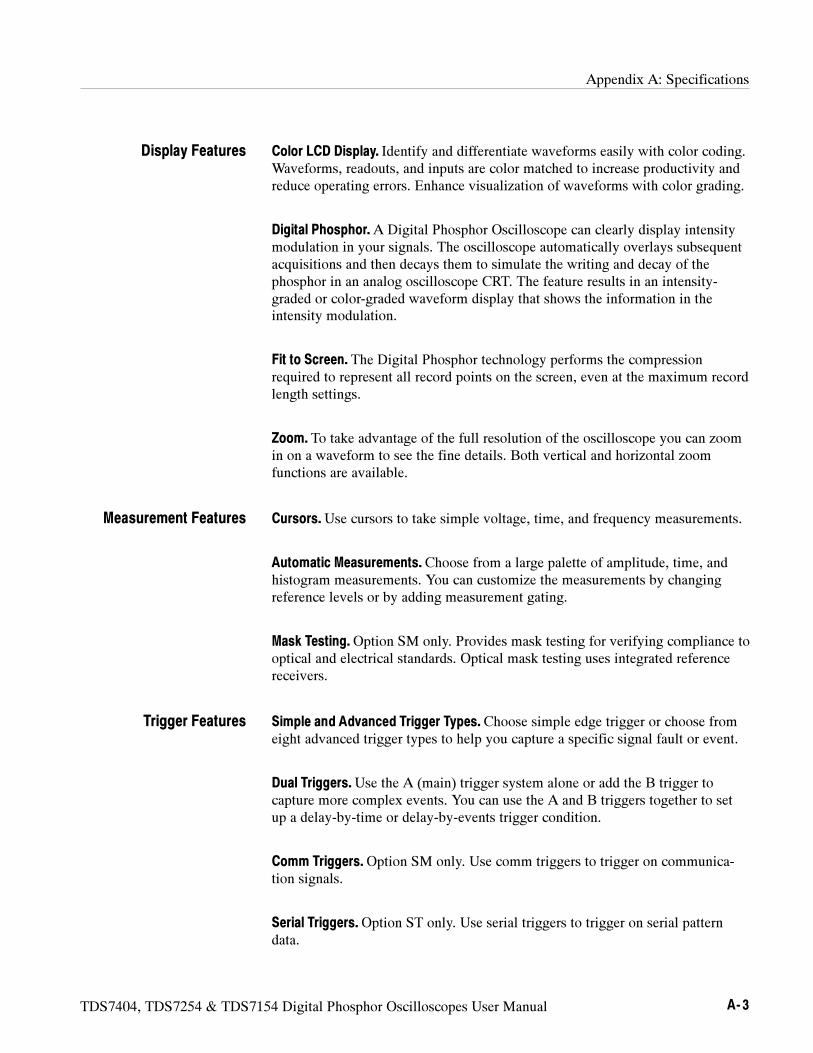
Appendix A: Specifications
TDS7404, TDS7254 & TDS7154 Digital Phosphor Oscilloscopes User Manual A- 3
Color LCD Display. Identify and differentiate waveforms easily with color coding.Waveforms, readouts, and inputs are color matched to increase productivity andreduce operating errors. Enhance visualization of waveforms with color grading.
Digital Phosphor.A Digital Phosphor Oscilloscope can clearly display intensitymodulation in your signals. The oscilloscope automatically overlays subsequentacquisitions and then decays them to simulate the writing and decay of thephosphor in an analog oscilloscope CRT. The feature results in an intensity-graded or color-graded waveform display that shows the information in theintensity modulation.
Fit to Screen. The Digital Phosphor technology performs the compressionrequired to represent all record points on the screen, even at the maximum recordlength settings.
Zoom. To take advantage of the full resolution of the oscilloscope you can zoomin on a waveform to see the fine details. Both vertical and horizontal zoomfunctions are available.
Cursors.Use cursors to take simple voltage, time, and frequency measurements.
Automatic Measurements. Choose from a large palette of amplitude, time, andhistogram measurements. You can customize the measurements by changingreference levels or by adding measurement gating.
Mask Testing.Option SM only. Provides mask testing for verifying compliance tooptical and electrical standards. Optical mask testing uses integrated referencereceivers.
Simple and Advanced Trigger Types. Choose simple edge trigger or choose fromeight advanced trigger types to help you capture a specific signal fault or event.
Dual Triggers.Use the A (main) trigger system alone or add the B trigger tocapture more complex events. You can use the A and B triggers together to setup a delay-by-time or delay-by-events trigger condition.
Comm Triggers.Option SM only. Use comm triggers to trigger on communica-tion signals.
Serial Triggers.Option ST only. Use serial triggers to trigger on serial patterndata.
Display Features
Measurement Features
Trigger Features
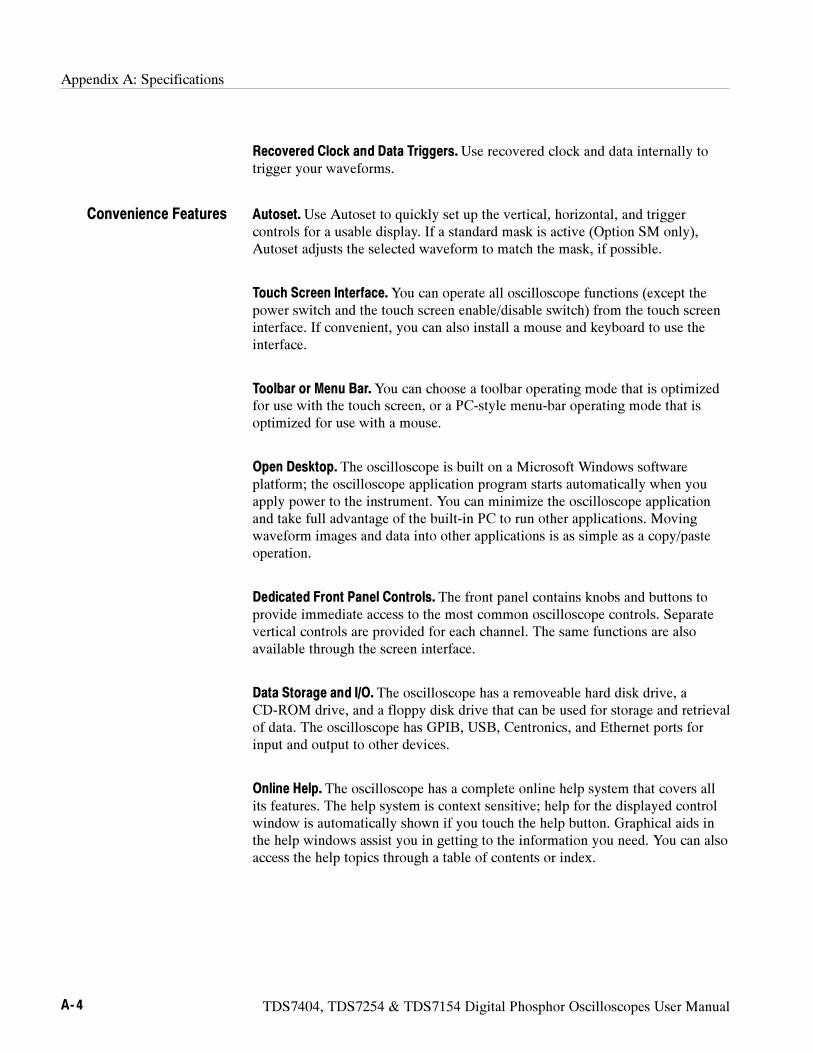
Appendix A: Specifications
A- 4 TDS7404, TDS7254 & TDS7154 Digital Phosphor Oscilloscopes User Manual
Recovered Clock and Data Triggers.Use recovered clock and data internally totrigger your waveforms.
Autoset.Use Autoset to quickly set up the vertical, horizontal, and triggercontrols for a usable display. If a standard mask is active (Option SM only),Autoset adjusts the selected waveform to match the mask, if possible.
Touch Screen Interface.You can operate all oscilloscope functions (except thepower switch and the touch screen enable/disable switch) from the touch screeninterface. If convenient, you can also install a mouse and keyboard to use theinterface.
Toolbar or Menu Bar.You can choose a toolbar operating mode that is optimizedfor use with the touch screen, or a PC-style menu-bar operating mode that isoptimized for use with a mouse.
Open Desktop. The oscilloscope is built on a Microsoft Windows softwareplatform; the oscilloscope application program starts automatically when youapply power to the instrument. You can minimize the oscilloscope applicationand take full advantage of the built-in PC to run other applications. Movingwaveform images and data into other applications is as simple as a copy/pasteoperation.
Dedicated Front Panel Controls. The front panel contains knobs and buttons toprovide immediate access to the most common oscilloscope controls. Separatevertical controls are provided for each channel. The same functions are alsoavailable through the screen interface.
Data Storage and I/O. The oscilloscope has a removeable hard disk drive, aCD-ROM drive, and a floppy disk drive that can be used for storage and retrievalof data. The oscilloscope has GPIB, USB, Centronics, and Ethernet ports forinput and output to other devices.
Online Help. The oscilloscope has a complete online help system that covers allits features. The help system is context sensitive; help for the displayed controlwindow is automatically shown if you touch the help button. Graphical aids inthe help windows assist you in getting to the information you need. You can alsoaccess the help topics through a table of contents or index.
Convenience Features
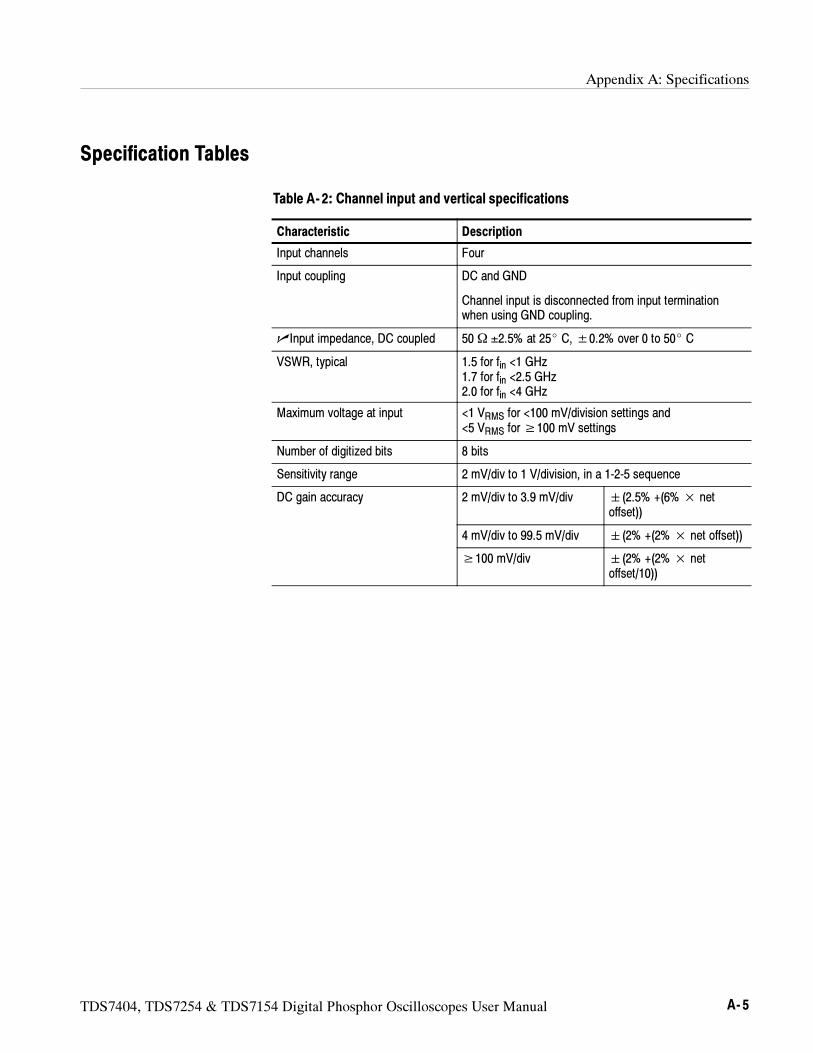
Appendix A: Specifications
TDS7404, TDS7254 & TDS7154 Digital Phosphor Oscilloscopes User Manual A- 5
Specification Tables
Table A- 2: Channel input and vertical specifications
Characteristic Description
Input channels Four
Input coupling DC and GND
Channel input is disconnected from input terminationwhen using GND coupling.
Input impedance, DC coupled 50Ω ±2.5% at 25 C, ±0.2% over 0 to 50 C
VSWR, typical 1.5 for fin <1 GHz1.7 for fin <2.5 GHz2.0 for fin <4 GHz
Maximum voltage at input <1 VRMS for <100 mV/division settings and<5 VRMS for≥100 mV settings
Number of digitized bits 8 bits
Sensitivity range 2 mV/div to 1 V/division, in a 1-2-5 sequence
DC gain accuracy 2 mV/div to 3.9 mV/div (2.5% +(6%× netoffset))
4 mV/div to 99.5 mV/div (2% +(2%× net offset))
≥100 mV/div (2% +(2%× netoffset/10))
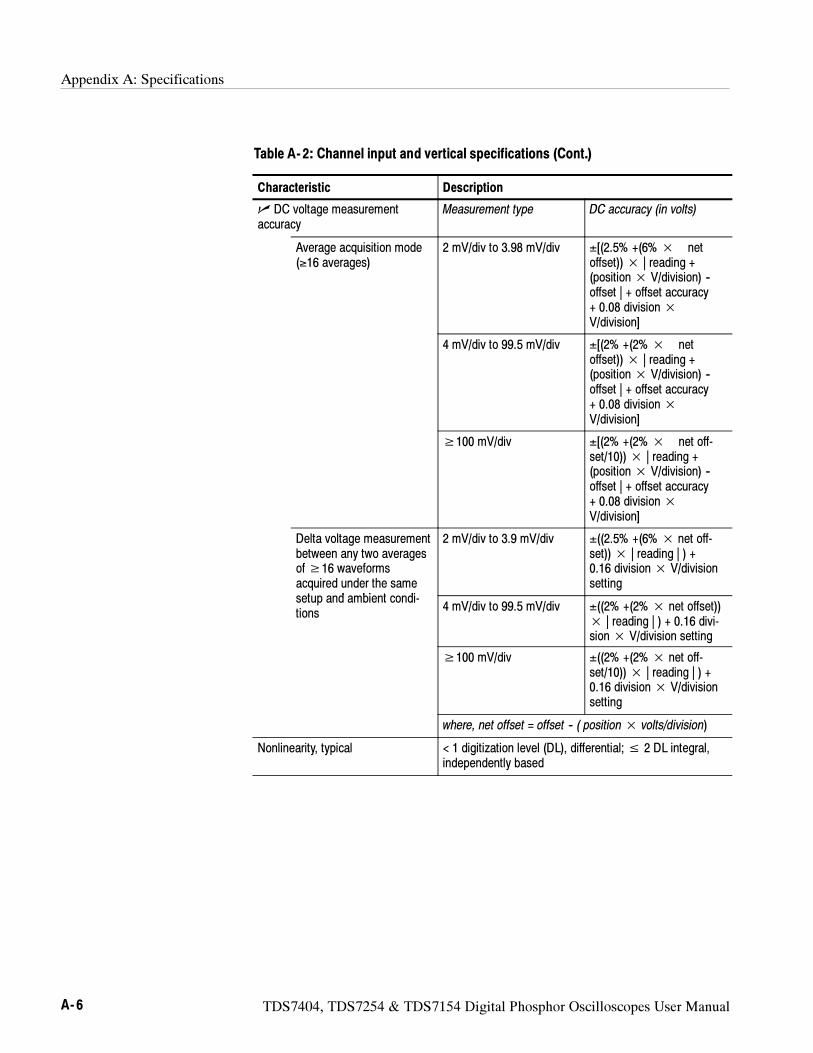
Appendix A: Specifications
A- 6 TDS7404, TDS7254 & TDS7154 Digital Phosphor Oscilloscopes User Manual
Table A- 2: Channel input and vertical specifications (Cont.)
Characteristic Description
DC voltage measurementaccuracy
Measurement type DC accuracy (in volts)
Average acquisition mode(≥16 averages)
2 mV/div to 3.98 mV/div ±[(2.5% +(6%× netoffset))× | reading +(position× V/division) --offset | + offset accuracy+ 0.08 division×V/division]
4 mV/div to 99.5 mV/div ±[(2% +(2%× netoffset))× | reading +(position× V/division) --offset | + offset accuracy+ 0.08 division×V/division]
≥100 mV/div ±[(2% +(2%× net off-set/10))× | reading +(position× V/division) --offset | + offset accuracy+ 0.08 division×V/division]
Delta voltage measurementbetween any two averagesof≥16 waveformsacquired under the samet d bi t di
2 mV/div to 3.9 mV/div ±((2.5% +(6%× net off-set))× | reading | ) +0.16 division× V/divisionsetting
setup and ambient condi-tions
4 mV/div to 99.5 mV/div ±((2% +(2%× net offset))× | reading | ) + 0.16 divi-sion× V/division setting
≥100 mV/div ±((2% +(2%× net off-set/10))× | reading | ) +0.16 division× V/divisionsetting
where, net offset = offset -- ( position× volts/division)
Nonlinearity, typical < 1 digitization level (DL), differential;≤ 2 DL integral,independently based
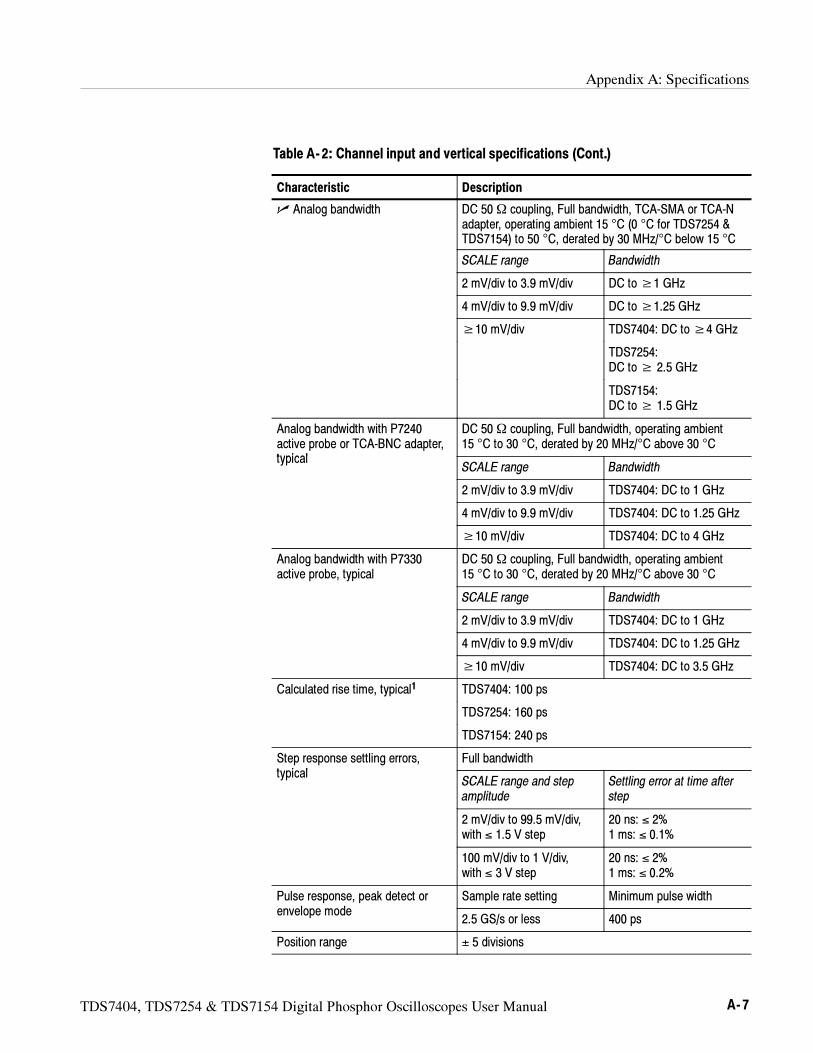
Appendix A: Specifications
TDS7404, TDS7254 & TDS7154 Digital Phosphor Oscilloscopes User Manual A- 7
Table A- 2: Channel input and vertical specifications (Cont.)
Characteristic Description
Analog bandwidth DC 50Ω coupling, Full bandwidth, TCA-SMA or TCA-Nadapter, operating ambient 15 °C (0 °C for TDS7254 &TDS7154) to 50 °C, derated by 30 MHz/°C below 15 °C
SCALE range Bandwidth
2 mV/div to 3.9 mV/div DC to≥1 GHz
4 mV/div to 9.9 mV/div DC to≥1.25 GHz
≥10 mV/div TDS7404: DC to≥4 GHz
TDS7254:DC to≥ 2.5 GHz
TDS7154:DC to≥ 1.5 GHz
Analog bandwidth with P7240active probe or TCA-BNC adapter,typical
DC 50Ω coupling, Full bandwidth, operating ambient15 °C to 30 °C, derated by 20 MHz/°C above 30 °C
typicalSCALE range Bandwidth
2 mV/div to 3.9 mV/div TDS7404: DC to 1 GHz
4 mV/div to 9.9 mV/div TDS7404: DC to 1.25 GHz
≥10 mV/div TDS7404: DC to 4 GHz
Analog bandwidth with P7330active probe, typical
DC 50Ω coupling, Full bandwidth, operating ambient15 °C to 30 °C, derated by 20 MHz/°C above 30 °C
SCALE range Bandwidth
2 mV/div to 3.9 mV/div TDS7404: DC to 1 GHz
4 mV/div to 9.9 mV/div TDS7404: DC to 1.25 GHz
≥10 mV/div TDS7404: DC to 3.5 GHz
Calculated rise time, typical1 TDS7404: 100 ps
TDS7254: 160 ps
TDS7154: 240 ps
Step response settling errors,t i l
Full bandwidthtypical
SCALE range and stepamplitude
Settling error at time afterstep
2 mV/div to 99.5 mV/div,with ≤ 1.5 V step
20 ns: ≤ 2%1 ms: ≤ 0.1%
100 mV/div to 1 V/div,with ≤ 3 V step
20 ns: ≤ 2%1 ms: ≤ 0.2%
Pulse response, peak detect orl d
Sample rate setting Minimum pulse widthenvelope mode
2.5 GS/s or less 400 ps
Position range ± 5 divisions
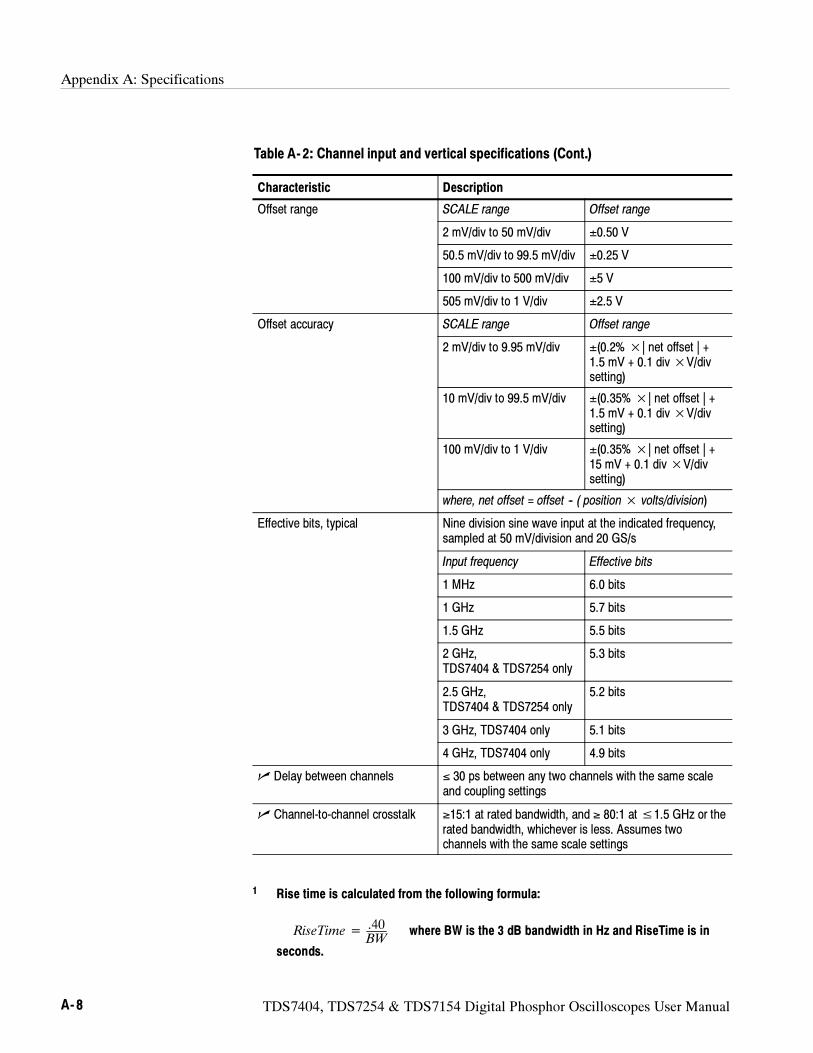
Appendix A: Specifications
A- 8 TDS7404, TDS7254 & TDS7154 Digital Phosphor Oscilloscopes User Manual
Table A- 2: Channel input and vertical specifications (Cont.)
Characteristic Description
Offset range SCALE range Offset range
2 mV/div to 50 mV/div ±0.50 V
50.5 mV/div to 99.5 mV/div ±0.25 V
100 mV/div to 500 mV/div ±5 V
505 mV/div to 1 V/div ±2.5 V
Offset accuracy SCALE range Offset range
2 mV/div to 9.95 mV/div ±(0.2%×| net offset | +1.5 mV + 0.1 div×V/divsetting)
10 mV/div to 99.5 mV/div ±(0.35%×| net offset | +1.5 mV + 0.1 div×V/divsetting)
100 mV/div to 1 V/div ±(0.35%×| net offset | +15 mV + 0.1 div×V/divsetting)
where, net offset = offset -- ( position× volts/division)
Effective bits, typical Nine division sine wave input at the indicated frequency,sampled at 50 mV/division and 20 GS/s
Input frequency Effective bits
1 MHz 6.0 bits
1 GHz 5.7 bits
1.5 GHz 5.5 bits
2 GHz,TDS7404 & TDS7254 only
5.3 bits
2.5 GHz,TDS7404 & TDS7254 only
5.2 bits
3 GHz, TDS7404 only 5.1 bits
4 GHz, TDS7404 only 4.9 bits
Delay between channels ≤ 30 ps between any two channels with the same scaleand coupling settings
Channel-to-channel crosstalk ≥15:1 at rated bandwidth, and ≥ 80:1 at≤1.5 GHz or therated bandwidth, whichever is less. Assumes twochannels with the same scale settings
1 Rise time is calculated from the following formula:
RiseTime =.40
BWwhere BW is the 3 dB bandwidth in Hz and RiseTime is in
seconds.
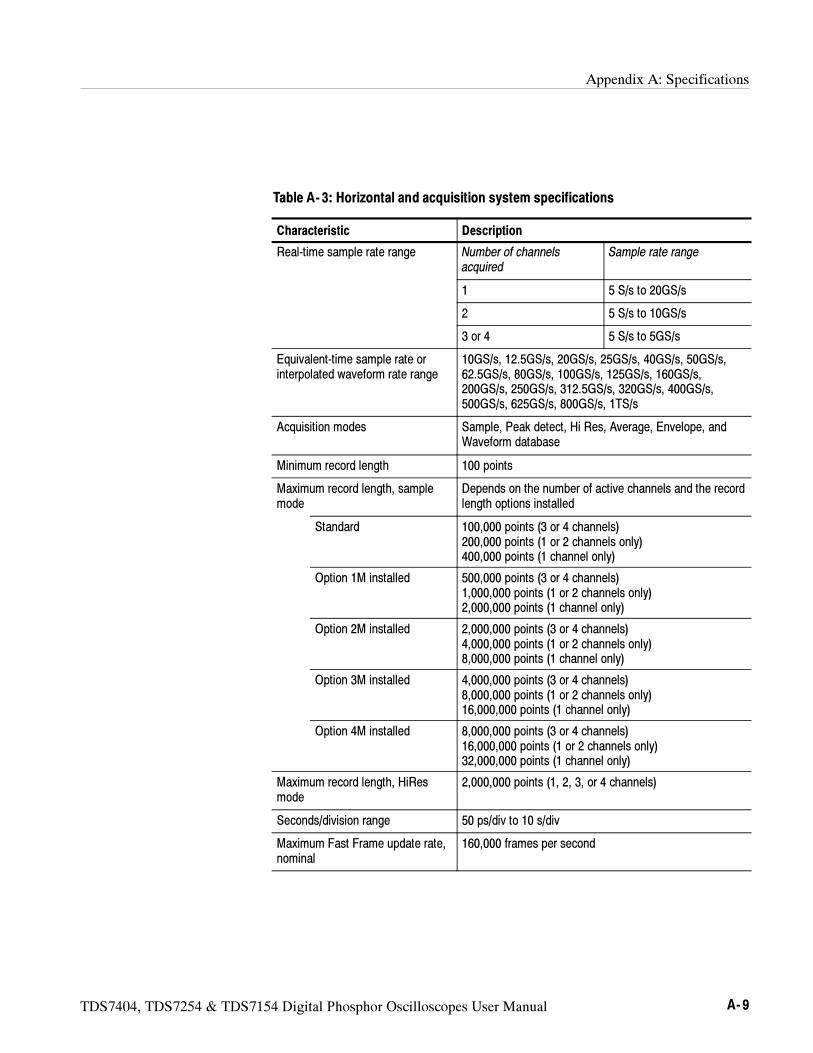
Appendix A: Specifications
TDS7404, TDS7254 & TDS7154 Digital Phosphor Oscilloscopes User Manual A- 9
Table A- 3: Horizontal and acquisition system specifications
Characteristic Description
Real-time sample rate range Number of channelsacquired
Sample rate range
1 5 S/s to 20GS/s
2 5 S/s to 10GS/s
3 or 4 5 S/s to 5GS/s
Equivalent-time sample rate orinterpolated waveform rate range
10GS/s, 12.5GS/s, 20GS/s, 25GS/s, 40GS/s, 50GS/s,62.5GS/s, 80GS/s, 100GS/s, 125GS/s, 160GS/s,200GS/s, 250GS/s, 312.5GS/s, 320GS/s, 400GS/s,500GS/s, 625GS/s, 800GS/s, 1TS/s
Acquisition modes Sample, Peak detect, Hi Res, Average, Envelope, andWaveform database
Minimum record length 100 points
Maximum record length, samplemode
Depends on the number of active channels and the recordlength options installed
Standard 100,000 points (3 or 4 channels)200,000 points (1 or 2 channels only)400,000 points (1 channel only)
Option 1M installed 500,000 points (3 or 4 channels)1,000,000 points (1 or 2 channels only)2,000,000 points (1 channel only)
Option 2M installed 2,000,000 points (3 or 4 channels)4,000,000 points (1 or 2 channels only)8,000,000 points (1 channel only)
Option 3M installed 4,000,000 points (3 or 4 channels)8,000,000 points (1 or 2 channels only)16,000,000 points (1 channel only)
Option 4M installed 8,000,000 points (3 or 4 channels)16,000,000 points (1 or 2 channels only)32,000,000 points (1 channel only)
Maximum record length, HiResmode
2,000,000 points (1, 2, 3, or 4 channels)
Seconds/division range 50 ps/div to 10 s/div
Maximum Fast Frame update rate,nominal
160,000 frames per second
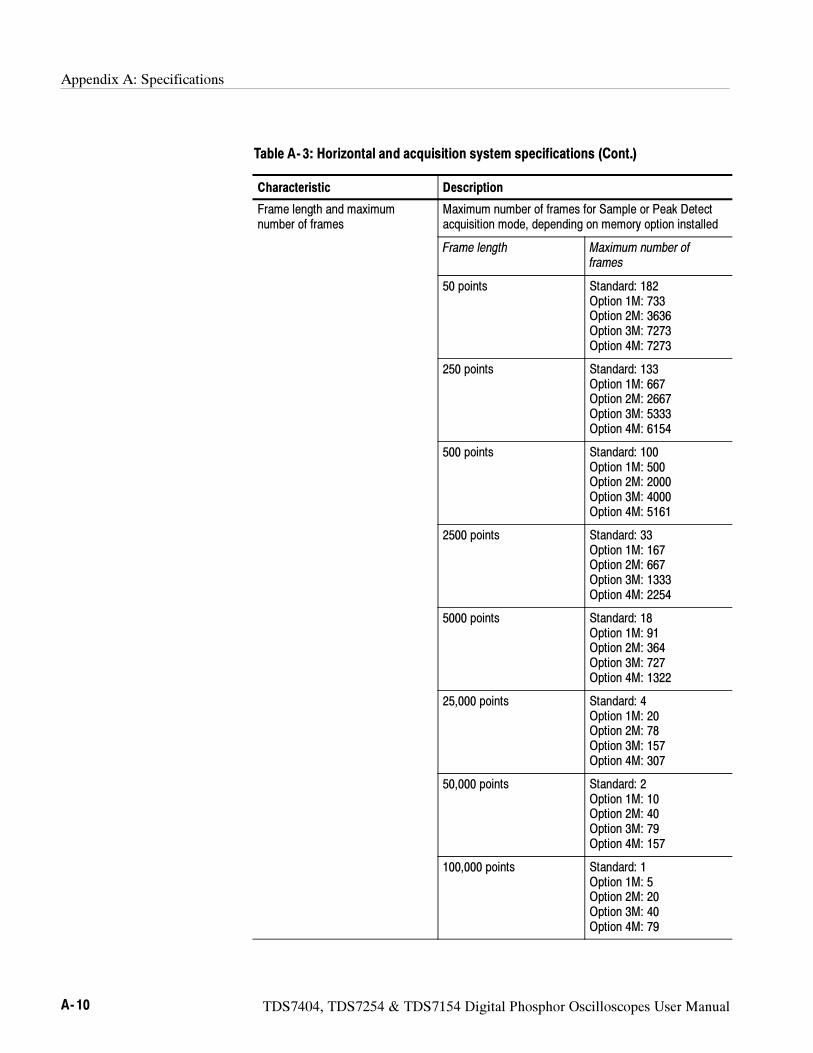
Appendix A: Specifications
A- 10 TDS7404, TDS7254 & TDS7154 Digital Phosphor Oscilloscopes User Manual
Table A- 3: Horizontal and acquisition system specifications (Cont.)
Characteristic Description
Frame length and maximumnumber of frames
Maximum number of frames for Sample or Peak Detectacquisition mode, depending on memory option installed
Frame length Maximum number offrames
50 points Standard: 182Option 1M: 733Option 2M: 3636Option 3M: 7273Option 4M: 7273
250 points Standard: 133Option 1M: 667Option 2M: 2667Option 3M: 5333Option 4M: 6154
500 points Standard: 100Option 1M: 500Option 2M: 2000Option 3M: 4000Option 4M: 5161
2500 points Standard: 33Option 1M: 167Option 2M: 667Option 3M: 1333Option 4M: 2254
5000 points Standard: 18Option 1M: 91Option 2M: 364Option 3M: 727Option 4M: 1322
25,000 points Standard: 4Option 1M: 20Option 2M: 78Option 3M: 157Option 4M: 307
50,000 points Standard: 2Option 1M: 10Option 2M: 40Option 3M: 79Option 4M: 157
100,000 points Standard: 1Option 1M: 5Option 2M: 20Option 3M: 40Option 4M: 79
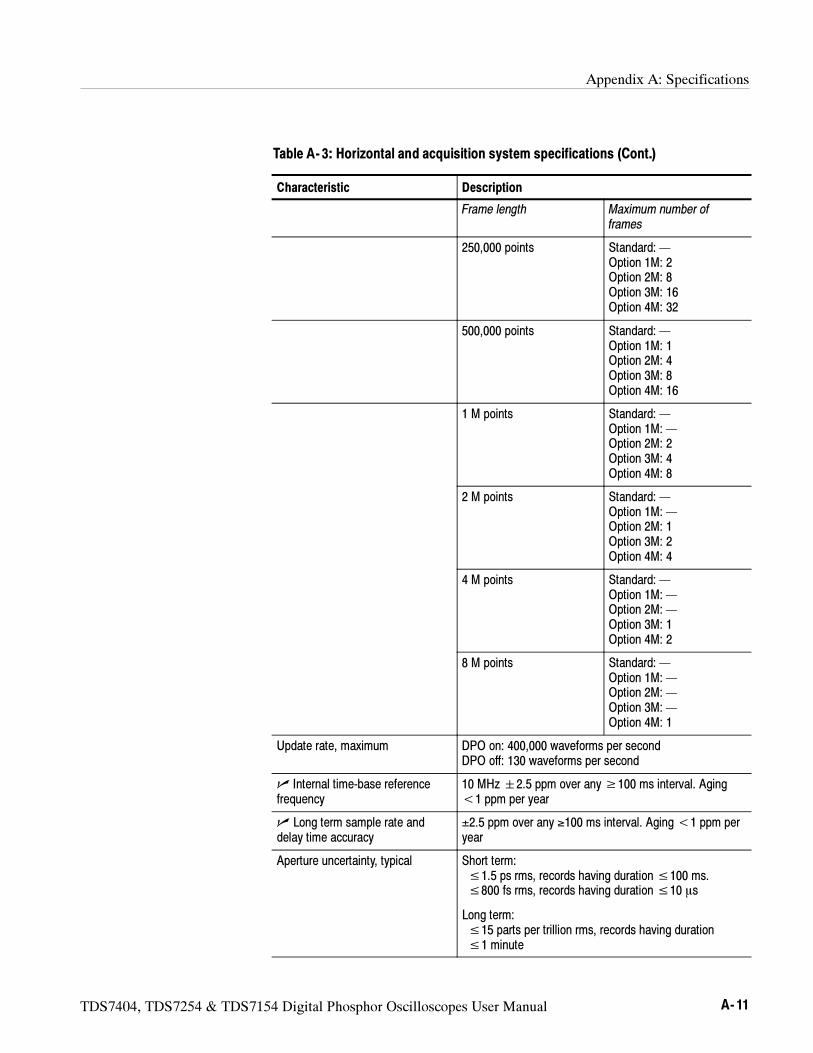
Appendix A: Specifications
TDS7404, TDS7254 & TDS7154 Digital Phosphor Oscilloscopes User Manual A- 11
Table A- 3: Horizontal and acquisition system specifications (Cont.)
Characteristic Description
Frame length Maximum number offrames
250,000 points Standard: —Option 1M: 2Option 2M: 8Option 3M: 16Option 4M: 32
500,000 points Standard: —Option 1M: 1Option 2M: 4Option 3M: 8Option 4M: 16
1 M points Standard: —Option 1M: —Option 2M: 2Option 3M: 4Option 4M: 8
2 M points Standard: —Option 1M: —Option 2M: 1Option 3M: 2Option 4M: 4
4 M points Standard: —Option 1M: —Option 2M: —Option 3M: 1Option 4M: 2
8 M points Standard: —Option 1M: —Option 2M: —Option 3M: —Option 4M: 1
Update rate, maximum DPO on: 400,000 waveforms per secondDPO off: 130 waveforms per second
Internal time-base referencefrequency
10 MHz2.5 ppm over any≥100 ms interval. Aging<1 ppm per year
Long term sample rate anddelay time accuracy
±2.5 ppm over any ≥100 ms interval. Aging<1 ppm peryear
Aperture uncertainty, typical Short term:≤1.5 ps rms, records having duration≤100 ms.≤800 fs rms, records having duration≤10 s
Long term:≤15 parts per trillion rms, records having duration≤1 minute
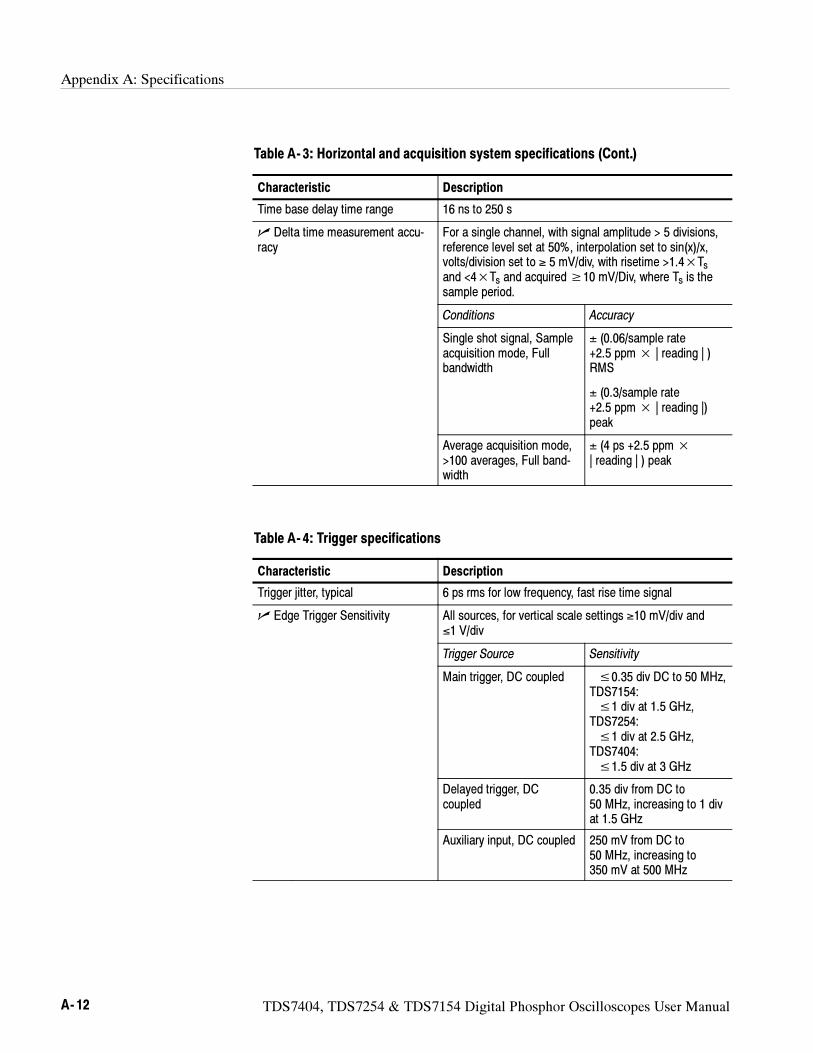
Appendix A: Specifications
A- 12 TDS7404, TDS7254 & TDS7154 Digital Phosphor Oscilloscopes User Manual
Table A- 3: Horizontal and acquisition system specifications (Cont.)
Characteristic Description
Time base delay time range 16 ns to 250 s
Delta time measurement accu-racy
For a single channel, with signal amplitude > 5 divisions,reference level set at 50%, interpolation set to sin(x)/x,volts/division set to ≥ 5 mV/div, with risetime >1.4×Tsand <4×Ts and acquired≥10 mV/Div, where Ts is thesample period.
Conditions Accuracy
Single shot signal, Sampleacquisition mode, Fullbandwidth
± (0.06/sample rate+2.5 ppm× | reading | )RMS
± (0.3/sample rate+2.5 ppm× | reading |)peak
Average acquisition mode,>100 averages, Full band-width
± (4 ps +2.5 ppm×
| reading | ) peak
Table A- 4: Trigger specifications
Characteristic Description
Trigger jitter, typical 6 ps rms for low frequency, fast rise time signal
Edge Trigger Sensitivity All sources, for vertical scale settings ≥10 mV/div and≤1 V/div
Trigger Source Sensitivity
Main trigger, DC coupled ≤0.35 div DC to 50 MHz,TDS7154:≤1 div at 1.5 GHz,
TDS7254:≤1 div at 2.5 GHz,
TDS7404:≤1.5 div at 3 GHz
Delayed trigger, DCcoupled
0.35 div from DC to50 MHz, increasing to 1 divat 1.5 GHz
Auxiliary input, DC coupled 250 mV from DC to50 MHz, increasing to350 mV at 500 MHz
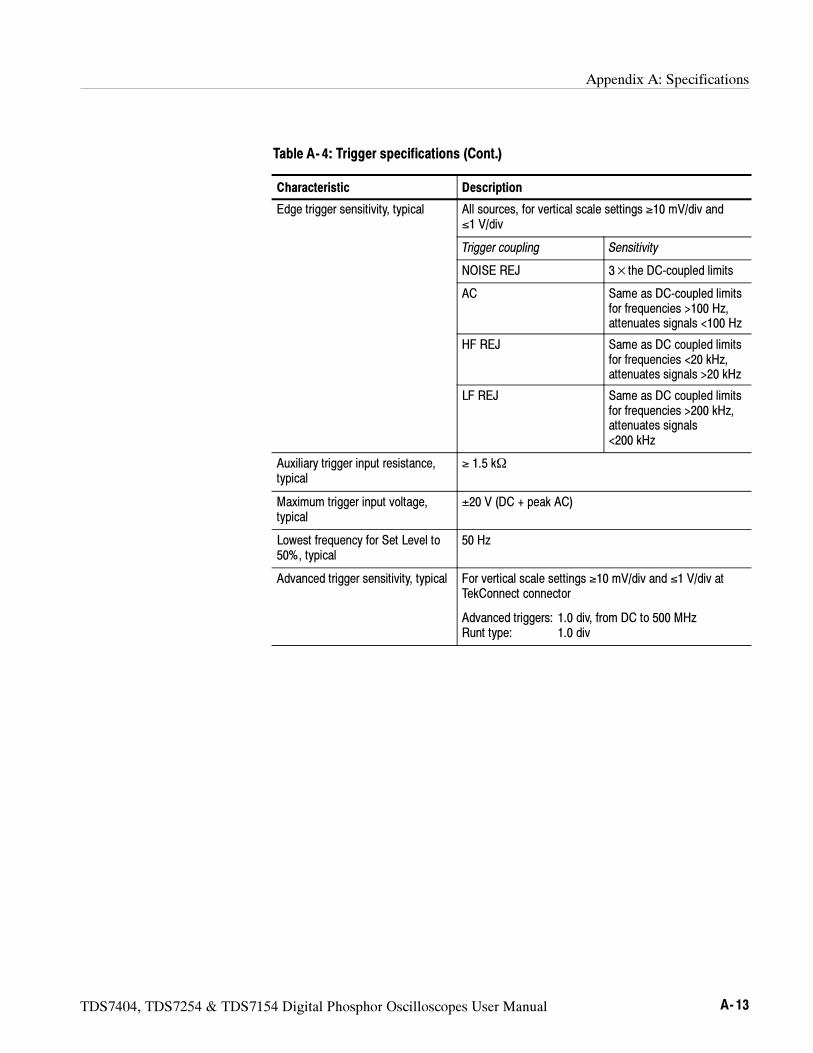
Appendix A: Specifications
TDS7404, TDS7254 & TDS7154 Digital Phosphor Oscilloscopes User Manual A- 13
Table A- 4: Trigger specifications (Cont.)
Characteristic Description
Edge trigger sensitivity, typical All sources, for vertical scale settings ≥10 mV/div and≤1 V/div
Trigger coupling Sensitivity
NOISE REJ 3×the DC-coupled limits
AC Same as DC-coupled limitsfor frequencies >100 Hz,attenuates signals <100 Hz
HF REJ Same as DC coupled limitsfor frequencies <20 kHz,attenuates signals >20 kHz
LF REJ Same as DC coupled limitsfor frequencies >200 kHz,attenuates signals<200 kHz
Auxiliary trigger input resistance,typical
≥ 1.5 kΩ
Maximum trigger input voltage,typical
±20 V (DC + peak AC)
Lowest frequency for Set Level to50%, typical
50 Hz
Advanced trigger sensitivity, typical For vertical scale settings ≥10 mV/div and ≤1 V/div atTekConnect connector
Advanced triggers: 1.0 div, from DC to 500 MHzRunt type: 1.0 div
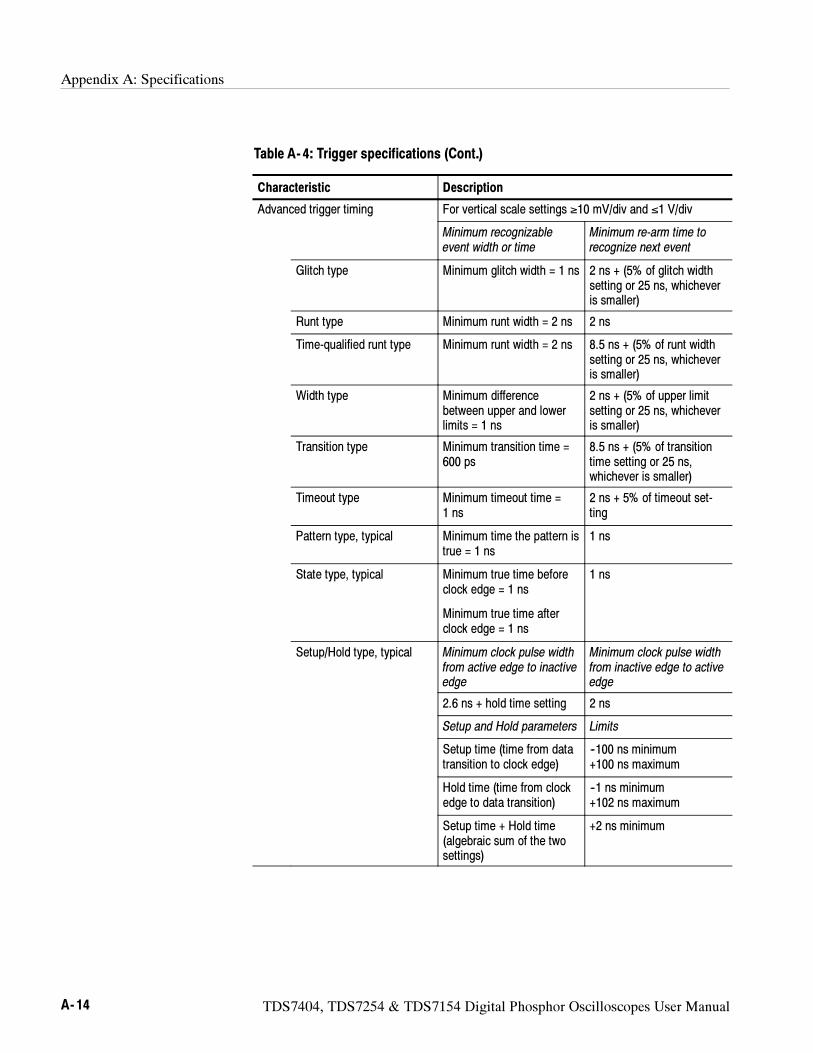
Appendix A: Specifications
A- 14 TDS7404, TDS7254 & TDS7154 Digital Phosphor Oscilloscopes User Manual
Table A- 4: Trigger specifications (Cont.)
Characteristic Description
Advanced trigger timing For vertical scale settings ≥10 mV/div and ≤1 V/div
Minimum recognizableevent width or time
Minimum re-arm time torecognize next event
Glitch type Minimum glitch width = 1 ns 2 ns + (5% of glitch widthsetting or 25 ns, whicheveris smaller)
Runt type Minimum runt width = 2 ns 2 ns
Time-qualified runt type Minimum runt width = 2 ns 8.5 ns + (5% of runt widthsetting or 25 ns, whicheveris smaller)
Width type Minimum differencebetween upper and lowerlimits = 1 ns
2 ns + (5% of upper limitsetting or 25 ns, whicheveris smaller)
Transition type Minimum transition time =600 ps
8.5 ns + (5% of transitiontime setting or 25 ns,whichever is smaller)
Timeout type Minimum timeout time =1 ns
2 ns + 5% of timeout set-ting
Pattern type, typical Minimum time the pattern istrue = 1 ns
1 ns
State type, typical Minimum true time beforeclock edge = 1 ns
Minimum true time afterclock edge = 1 ns
1 ns
Setup/Hold type, typical Minimum clock pulse widthfrom active edge to inactiveedge
Minimum clock pulse widthfrom inactive edge to activeedge
2.6 ns + hold time setting 2 ns
Setup and Hold parameters Limits
Setup time (time from datatransition to clock edge)
--100 ns minimum+100 ns maximum
Hold time (time from clockedge to data transition)
--1 ns minimum+102 ns maximum
Setup time + Hold time(algebraic sum of the twosettings)
+2 ns minimum
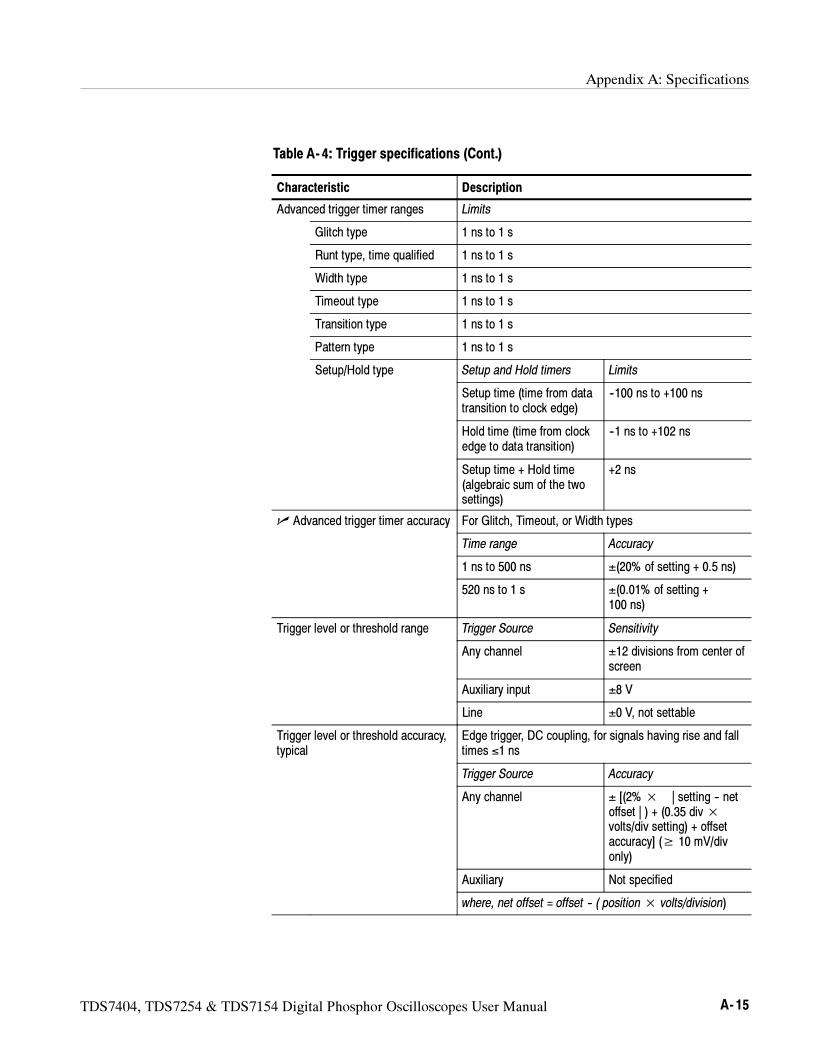
Appendix A: Specifications
TDS7404, TDS7254 & TDS7154 Digital Phosphor Oscilloscopes User Manual A- 15
Table A- 4: Trigger specifications (Cont.)
Characteristic Description
Advanced trigger timer ranges Limits
Glitch type 1 ns to 1 s
Runt type, time qualified 1 ns to 1 s
Width type 1 ns to 1 s
Timeout type 1 ns to 1 s
Transition type 1 ns to 1 s
Pattern type 1 ns to 1 s
Setup/Hold type Setup and Hold timers Limits
Setup time (time from datatransition to clock edge)
--100 ns to +100 ns
Hold time (time from clockedge to data transition)
--1 ns to +102 ns
Setup time + Hold time(algebraic sum of the twosettings)
+2 ns
Advanced trigger timer accuracy For Glitch, Timeout, or Width types
Time range Accuracy
1 ns to 500 ns ±(20% of setting + 0.5 ns)
520 ns to 1 s ±(0.01% of setting +100 ns)
Trigger level or threshold range Trigger Source Sensitivity
Any channel ±12 divisions from center ofscreen
Auxiliary input ±8 V
Line ±0 V, not settable
Trigger level or threshold accuracy,typical
Edge trigger, DC coupling, for signals having rise and falltimes ≤1 ns
Trigger Source Accuracy
Any channel ± [(2%× | setting -- netoffset | ) + (0.35 div×volts/div setting) + offsetaccuracy] (≥ 10 mV/divonly)
Auxiliary Not specified
where, net offset = offset -- ( position× volts/division)
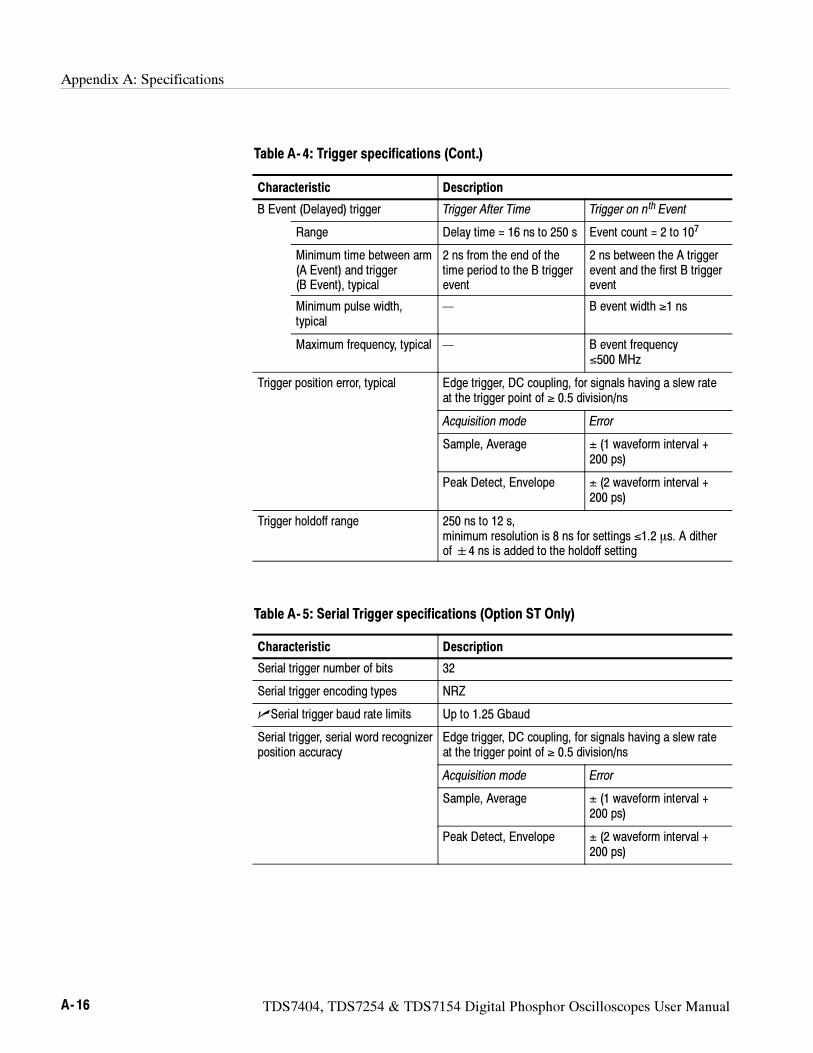
Appendix A: Specifications
A- 16 TDS7404, TDS7254 & TDS7154 Digital Phosphor Oscilloscopes User Manual
Table A- 4: Trigger specifications (Cont.)
Characteristic Description
B Event (Delayed) trigger Trigger After Time Trigger on nth Event
Range Delay time = 16 ns to 250 s Event count = 2 to 107
Minimum time between arm(A Event) and trigger(B Event), typical
2 ns from the end of thetime period to the B triggerevent
2 ns between the A triggerevent and the first B triggerevent
Minimum pulse width,typical
— B event width ≥1 ns
Maximum frequency, typical — B event frequency≤500 MHz
Trigger position error, typical Edge trigger, DC coupling, for signals having a slew rateat the trigger point of ≥ 0.5 division/ns
Acquisition mode Error
Sample, Average ± (1 waveform interval +200 ps)
Peak Detect, Envelope ± (2 waveform interval +200 ps)
Trigger holdoff range 250 ns to 12 s,minimum resolution is 8 ns for settings ≤1.2 s. A ditherof4 ns is added to the holdoff setting
Table A- 5: Serial Trigger specifications (Option ST Only)
Characteristic Description
Serial trigger number of bits 32
Serial trigger encoding types NRZ
Serial trigger baud rate limits Up to 1.25 Gbaud
Serial trigger, serial word recognizerposition accuracy
Edge trigger, DC coupling, for signals having a slew rateat the trigger point of ≥ 0.5 division/ns
Acquisition mode Error
Sample, Average ± (1 waveform interval +200 ps)
Peak Detect, Envelope ± (2 waveform interval +200 ps)
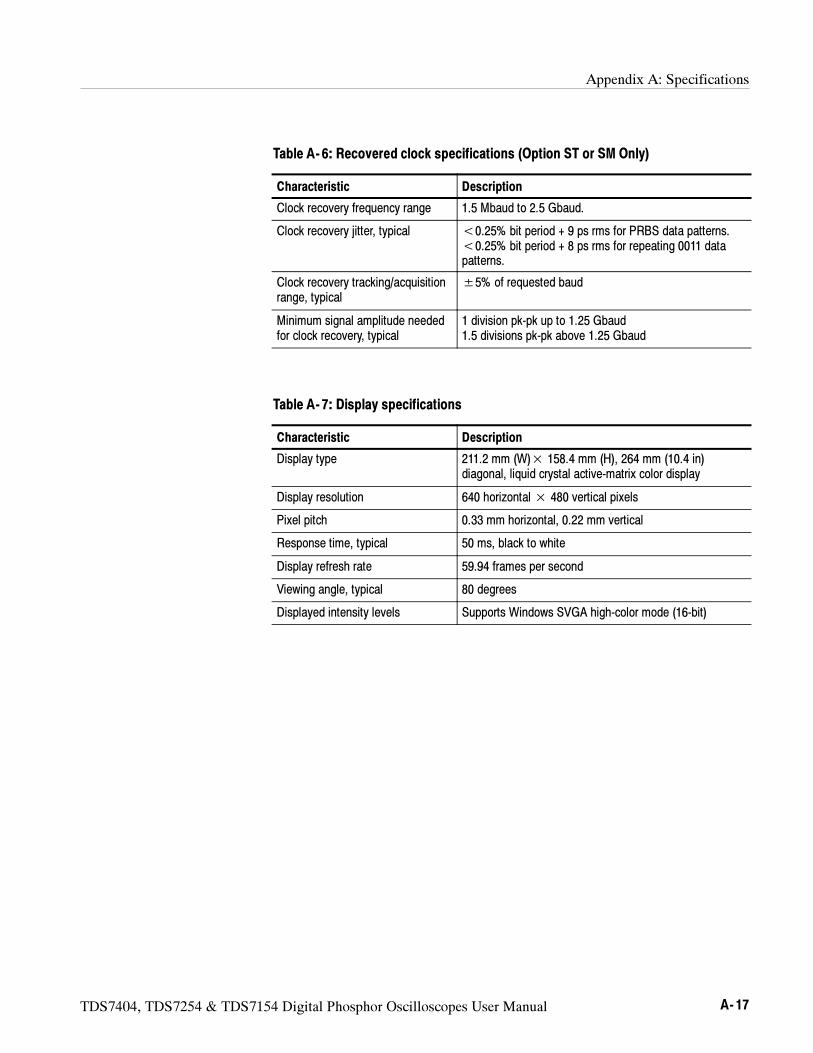
Appendix A: Specifications
TDS7404, TDS7254 & TDS7154 Digital Phosphor Oscilloscopes User Manual A- 17
Table A- 6: Recovered clock specifications (Option ST or SM Only)
Characteristic Description
Clock recovery frequency range 1.5 Mbaud to 2.5 Gbaud.
Clock recovery jitter, typical <0.25% bit period + 9 ps rms for PRBS data patterns.<0.25% bit period + 8 ps rms for repeating 0011 datapatterns.
Clock recovery tracking/acquisitionrange, typical
±5% of requested baud
Minimum signal amplitude neededfor clock recovery, typical
1 division pk-pk up to 1.25 Gbaud1.5 divisions pk-pk above 1.25 Gbaud
Table A- 7: Display specifications
Characteristic Description
Display type 211.2 mm (W)× 158.4 mm (H), 264 mm (10.4 in)diagonal, liquid crystal active-matrix color display
Display resolution 640 horizontal× 480 vertical pixels
Pixel pitch 0.33 mm horizontal, 0.22 mm vertical
Response time, typical 50 ms, black to white
Display refresh rate 59.94 frames per second
Viewing angle, typical 80 degrees
Displayed intensity levels Supports Windows SVGA high-color mode (16-bit)
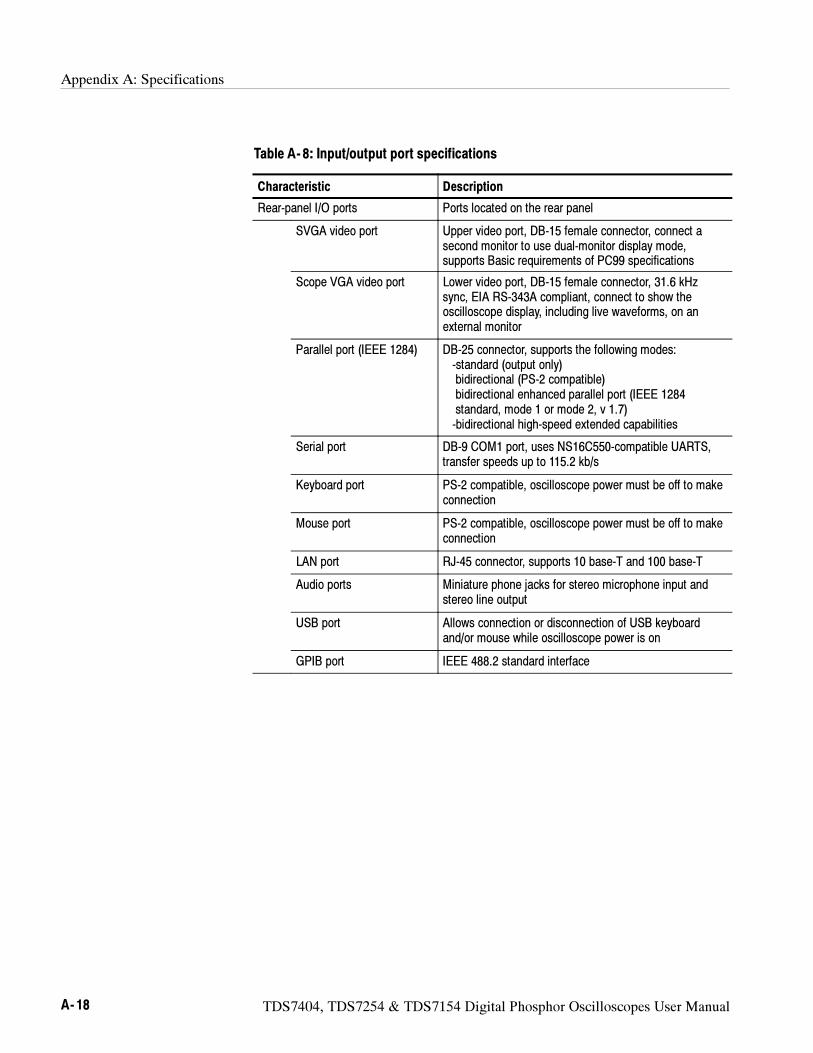
Appendix A: Specifications
A- 18 TDS7404, TDS7254 & TDS7154 Digital Phosphor Oscilloscopes User Manual
Table A- 8: Input/output port specifications
Characteristic Description
Rear-panel I/O ports Ports located on the rear panel
SVGA video port Upper video port, DB-15 female connector, connect asecond monitor to use dual-monitor display mode,supports Basic requirements of PC99 specifications
Scope VGA video port Lower video port, DB-15 female connector, 31.6 kHzsync, EIA RS-343A compliant, connect to show theoscilloscope display, including live waveforms, on anexternal monitor
Parallel port (IEEE 1284) DB-25 connector, supports the following modes:-standard (output only)bidirectional (PS-2 compatible)bidirectional enhanced parallel port (IEEE 1284standard, mode 1 or mode 2, v 1.7)-bidirectional high-speed extended capabilities
Serial port DB-9 COM1 port, uses NS16C550-compatible UARTS,transfer speeds up to 115.2 kb/s
Keyboard port PS-2 compatible, oscilloscope power must be off to makeconnection
Mouse port PS-2 compatible, oscilloscope power must be off to makeconnection
LAN port RJ-45 connector, supports 10 base-T and 100 base-T
Audio ports Miniature phone jacks for stereo microphone input andstereo line output
USB port Allows connection or disconnection of USB keyboardand/or mouse while oscilloscope power is on
GPIB port IEEE 488.2 standard interface
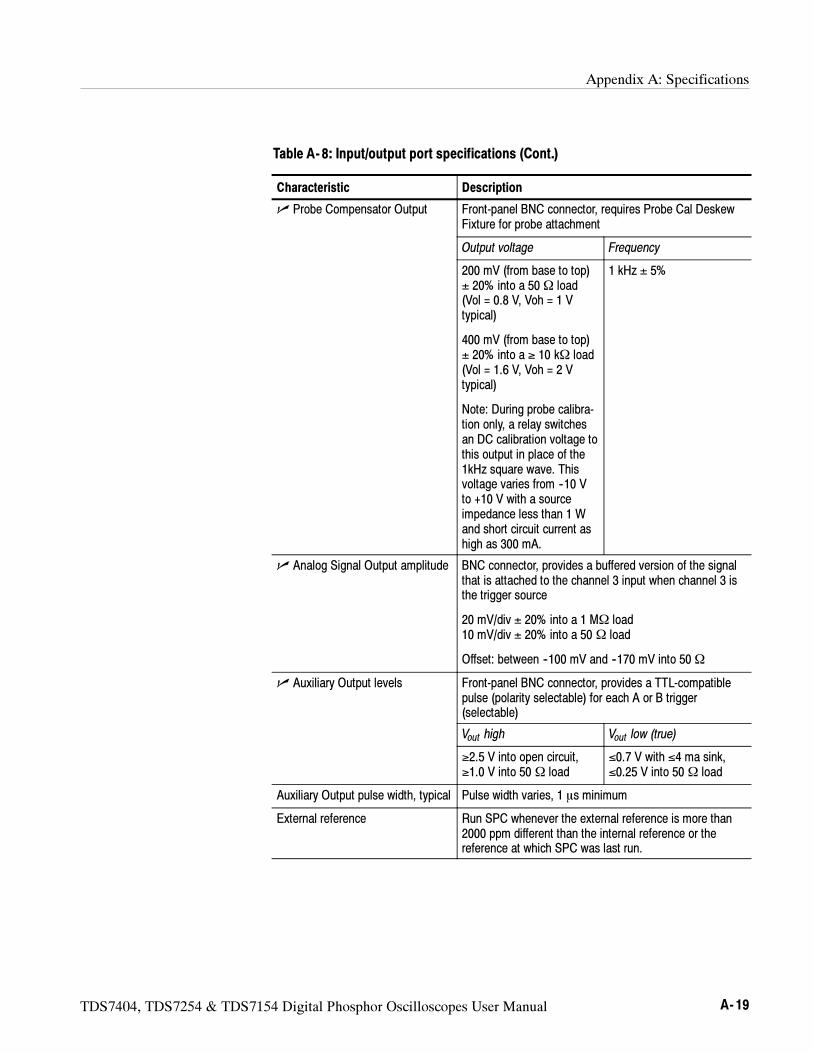
Appendix A: Specifications
TDS7404, TDS7254 & TDS7154 Digital Phosphor Oscilloscopes User Manual A- 19
Table A- 8: Input/output port specifications (Cont.)
Characteristic Description
Probe Compensator Output Front-panel BNC connector, requires Probe Cal DeskewFixture for probe attachment
Output voltage Frequency
200 mV (from base to top)± 20% into a 50Ω load(Vol = 0.8 V, Voh = 1 Vtypical)
400 mV (from base to top)± 20% into a ≥ 10 kΩ load(Vol = 1.6 V, Voh = 2 Vtypical)
Note: During probe calibra-tion only, a relay switchesan DC calibration voltage tothis output in place of the1kHz square wave. Thisvoltage varies from --10 Vto +10 V with a sourceimpedance less than 1 Wand short circuit current ashigh as 300 mA.
1 kHz ± 5%
Analog Signal Output amplitude BNC connector, provides a buffered version of the signalthat is attached to the channel 3 input when channel 3 isthe trigger source
20 mV/div ± 20% into a 1 MΩ load10 mV/div ± 20% into a 50 Ω load
Offset: between --100 mV and --170 mV into 50Ω
Auxiliary Output levels Front-panel BNC connector, provides a TTL-compatiblepulse (polarity selectable) for each A or B trigger(selectable)
Vout high Vout low (true)
≥2.5 V into open circuit,≥1.0 V into 50 Ω load
≤0.7 V with ≤4 ma sink,≤0.25 V into 50 Ω load
Auxiliary Output pulse width, typical Pulse width varies, 1 s minimum
External reference Run SPC whenever the external reference is more than2000 ppm different than the internal reference or thereference at which SPC was last run.
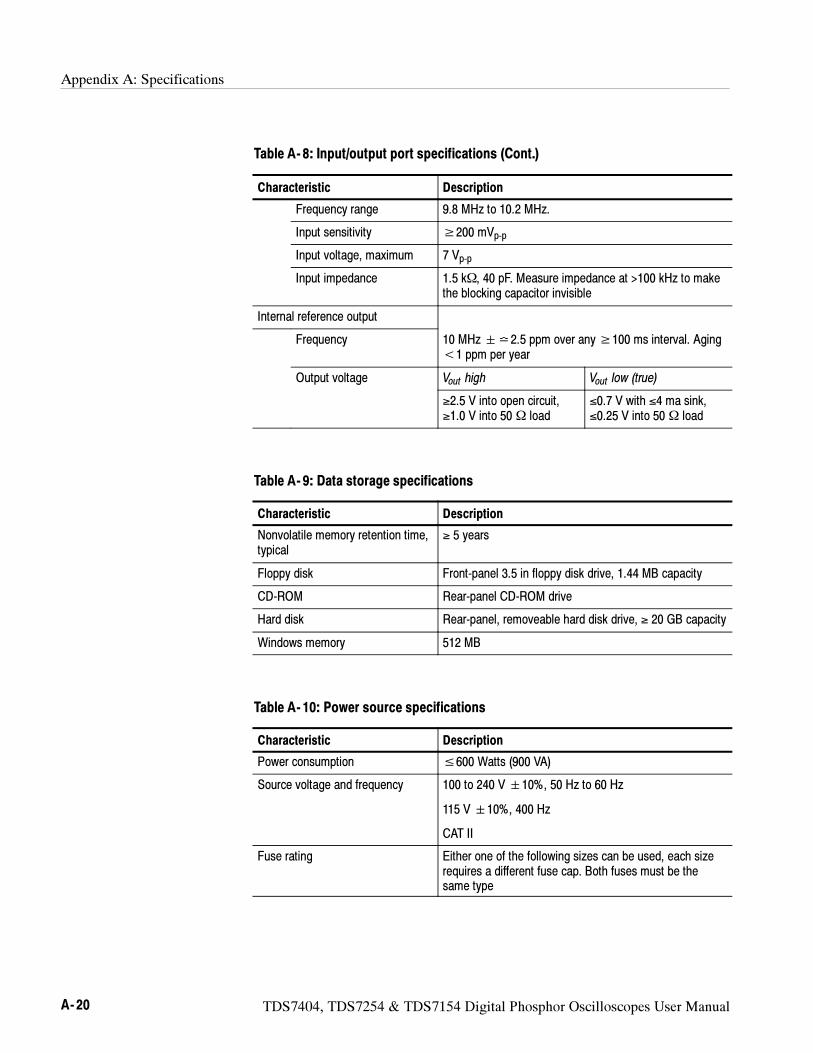
Appendix A: Specifications
A- 20 TDS7404, TDS7254 & TDS7154 Digital Phosphor Oscilloscopes User Manual
Table A- 8: Input/output port specifications (Cont.)
Characteristic Description
Frequency range 9.8 MHz to 10.2 MHz.
Input sensitivity ≥200 mVp-p
Input voltage, maximum 7 Vp-p
Input impedance 1.5 kΩ, 40 pF. Measure impedance at >100 kHz to makethe blocking capacitor invisible
Internal reference output
Frequency 10 MHz2.5 ppm over any≥100 ms interval. Aging<1 ppm per year
Output voltage Vout high Vout low (true)
≥2.5 V into open circuit,≥1.0 V into 50 Ω load
≤0.7 V with ≤4 ma sink,≤0.25 V into 50 Ω load
Table A- 9: Data storage specifications
Characteristic Description
Nonvolatile memory retention time,typical
≥ 5 years
Floppy disk Front-panel 3.5 in floppy disk drive, 1.44 MB capacity
CD-ROM Rear-panel CD-ROM drive
Hard disk Rear-panel, removeable hard disk drive, ≥ 20 GB capacity
Windows memory 512 MB
Table A- 10: Power source specifications
Characteristic Description
Power consumption ≤600 Watts (900 VA)
Source voltage and frequency 100 to 240 V10%, 50 Hz to 60 Hz
115 V10%, 400 Hz
CAT II
Fuse rating Either one of the following sizes can be used, each sizerequires a different fuse cap. Both fuses must be thesame type
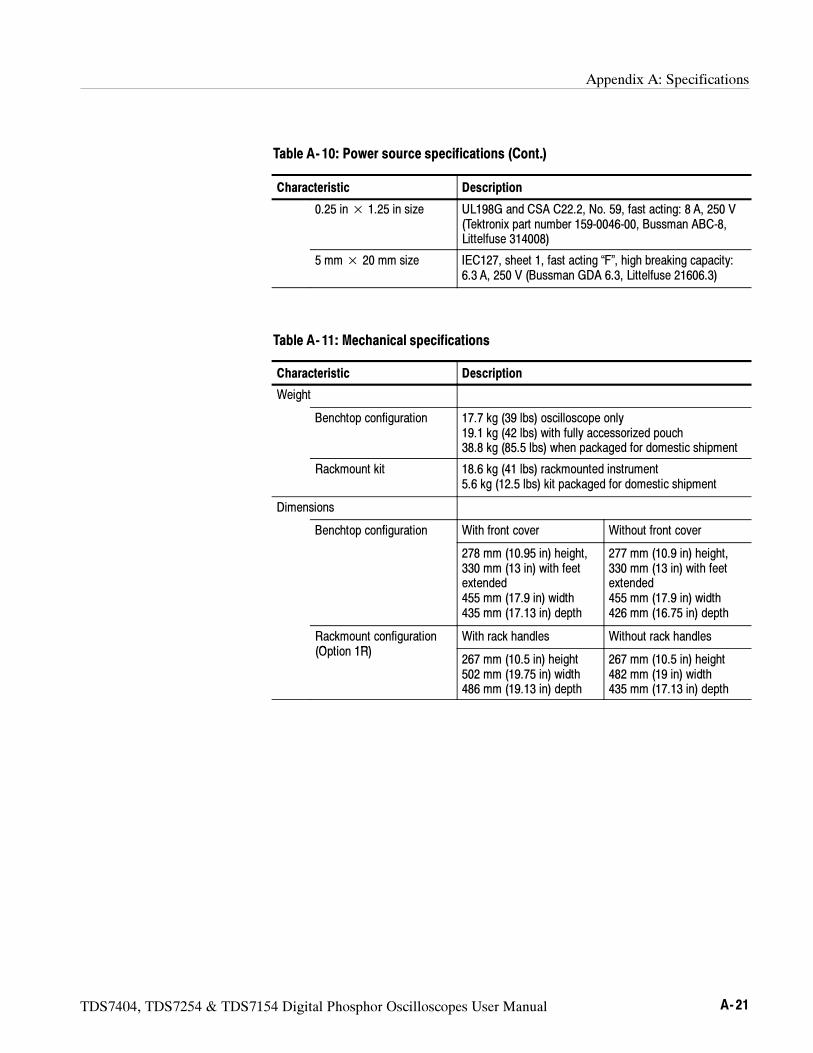
Appendix A: Specifications
TDS7404, TDS7254 & TDS7154 Digital Phosphor Oscilloscopes User Manual A- 21
Table A- 10: Power source specifications (Cont.)
Characteristic Description
0.25 in× 1.25 in size UL198G and CSA C22.2, No. 59, fast acting: 8 A, 250 V(Tektronix part number 159-0046-00, Bussman ABC-8,Littelfuse 314008)
5 mm× 20 mm size IEC127, sheet 1, fast acting “F”, high breaking capacity:6.3 A, 250 V (Bussman GDA 6.3, Littelfuse 21606.3)
Table A- 11: Mechanical specifications
Characteristic Description
Weight
Benchtop configuration 17.7 kg (39 lbs) oscilloscope only19.1 kg (42 lbs) with fully accessorized pouch38.8 kg (85.5 lbs) when packaged for domestic shipment
Rackmount kit 18.6 kg (41 lbs) rackmounted instrument5.6 kg (12.5 lbs) kit packaged for domestic shipment
Dimensions
Benchtop configuration With front cover Without front cover
278 mm (10.95 in) height,330 mm (13 in) with feetextended455 mm (17.9 in) width435 mm (17.13 in) depth
277 mm (10.9 in) height,330 mm (13 in) with feetextended455 mm (17.9 in) width426 mm (16.75 in) depth
Rackmount configuration(O ti 1R)
With rack handles Without rack handles(Option 1R)
267 mm (10.5 in) height502 mm (19.75 in) width486 mm (19.13 in) depth
267 mm (10.5 in) height482 mm (19 in) width435 mm (17.13 in) depth
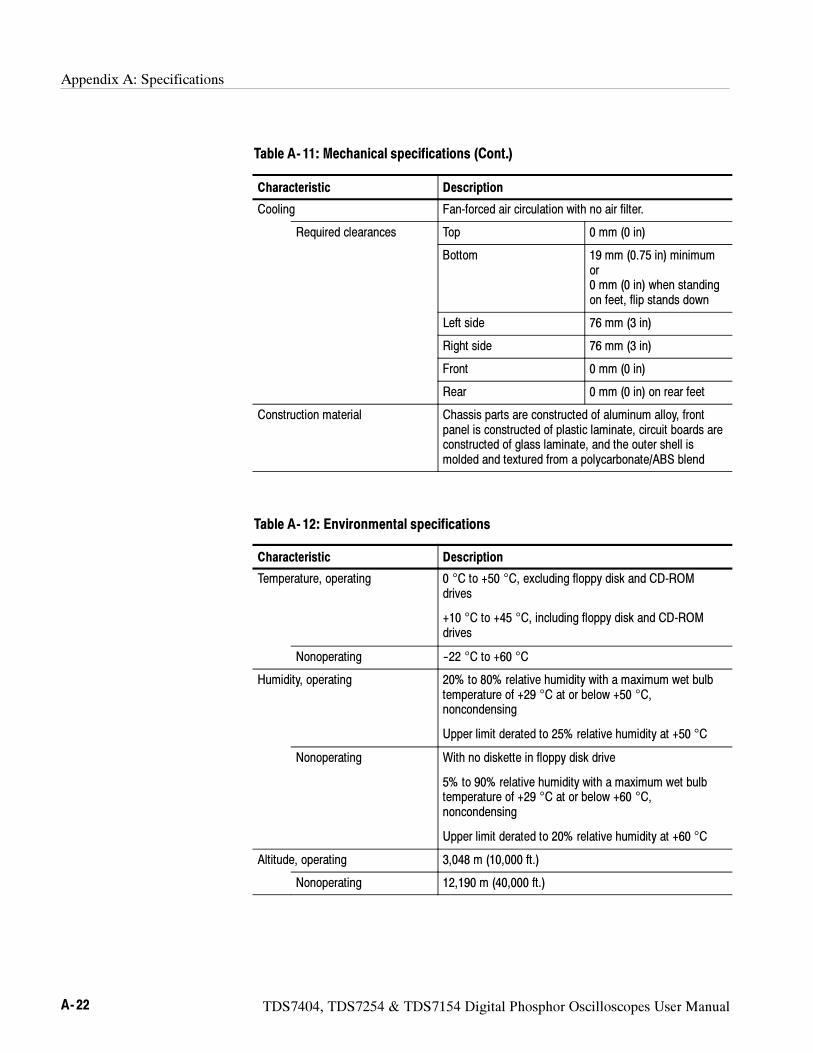
Appendix A: Specifications
A- 22 TDS7404, TDS7254 & TDS7154 Digital Phosphor Oscilloscopes User Manual
Table A- 11: Mechanical specifications (Cont.)
Characteristic Description
Cooling Fan-forced air circulation with no air filter.
Required clearances Top 0 mm (0 in)
Bottom 19 mm (0.75 in) minimumor0 mm (0 in) when standingon feet, flip stands down
Left side 76 mm (3 in)
Right side 76 mm (3 in)
Front 0 mm (0 in)
Rear 0 mm (0 in) on rear feet
Construction material Chassis parts are constructed of aluminum alloy, frontpanel is constructed of plastic laminate, circuit boards areconstructed of glass laminate, and the outer shell ismolded and textured from a polycarbonate/ABS blend
Table A- 12: Environmental specifications
Characteristic Description
Temperature, operating 0 °C to +50 °C, excluding floppy disk and CD-ROMdrives
+10 °C to +45 °C, including floppy disk and CD-ROMdrives
Nonoperating --22 °C to +60 °C
Humidity, operating 20% to 80% relative humidity with a maximum wet bulbtemperature of +29 °C at or below +50 °C,noncondensing
Upper limit derated to 25% relative humidity at +50 °C
Nonoperating With no diskette in floppy disk drive
5% to 90% relative humidity with a maximum wet bulbtemperature of +29 °C at or below +60 °C,noncondensing
Upper limit derated to 20% relative humidity at +60 °C
Altitude, operating 3,048 m (10,000 ft.)
Nonoperating 12,190 m (40,000 ft.)
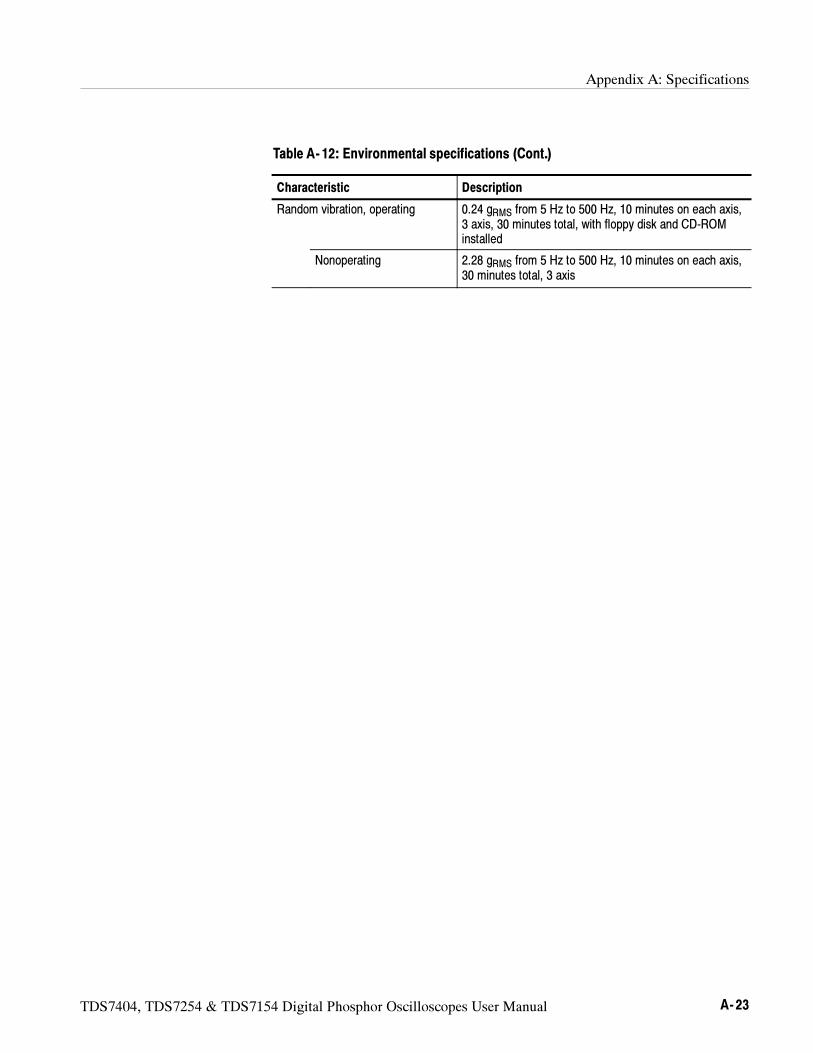
Appendix A: Specifications
TDS7404, TDS7254 & TDS7154 Digital Phosphor Oscilloscopes User Manual A- 23
Table A- 12: Environmental specifications (Cont.)
Characteristic Description
Random vibration, operating 0.24 gRMS from 5 Hz to 500 Hz, 10 minutes on each axis,3 axis, 30 minutes total, with floppy disk and CD-ROMinstalled
Nonoperating 2.28 gRMS from 5 Hz to 500 Hz, 10 minutes on each axis,30 minutes total, 3 axis
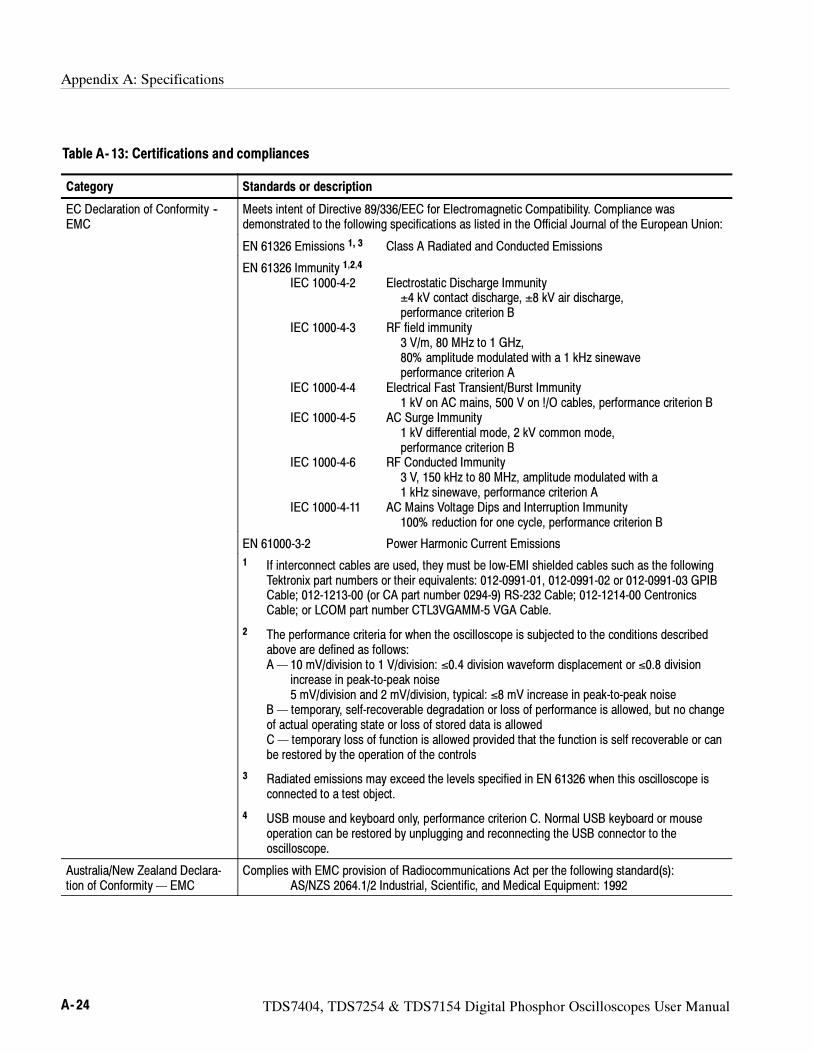
Appendix A: Specifications
A- 24 TDS7404, TDS7254 & TDS7154 Digital Phosphor Oscilloscopes User Manual
Table A- 13: Certifications and compliances
Category Standards or description
EC Declaration of Conformity --EMC
Meets intent of Directive 89/336/EEC for Electromagnetic Compatibility. Compliance wasdemonstrated to the following specifications as listed in the Official Journal of the European Union:
EN 61326 Emissions 1, 3 Class A Radiated and Conducted Emissions
EN 61326 Immunity 1,2,4
IEC 1000-4-2 Electrostatic Discharge Immunity±4 kV contact discharge, ±8 kV air discharge,performance criterion B
IEC 1000-4-3 RF field immunity3 V/m, 80 MHz to 1 GHz,80% amplitude modulated with a 1 kHz sinewaveperformance criterion A
IEC 1000-4-4 Electrical Fast Transient/Burst Immunity1 kV on AC mains, 500 V on !/O cables, performance criterion B
IEC 1000-4-5 AC Surge Immunity1 kV differential mode, 2 kV common mode,performance criterion B
IEC 1000-4-6 RF Conducted Immunity3 V, 150 kHz to 80 MHz, amplitude modulated with a1 kHz sinewave, performance criterion A
IEC 1000-4-11 AC Mains Voltage Dips and Interruption Immunity100% reduction for one cycle, performance criterion B
EN 61000-3-2 Power Harmonic Current Emissions
1 If interconnect cables are used, they must be low-EMI shielded cables such as the followingTektronix part numbers or their equivalents: 012-0991-01, 012-0991-02 or 012-0991-03 GPIBCable; 012-1213-00 (or CA part number 0294-9) RS-232 Cable; 012-1214-00 CentronicsCable; or LCOM part number CTL3VGAMM-5 VGA Cable.
2 The performance criteria for when the oscilloscope is subjected to the conditions describedabove are defined as follows:A— 10 mV/division to 1 V/division: ≤0.4 division waveform displacement or ≤0.8 division
increase in peak-to-peak noise5 mV/division and 2 mV/division, typical: ≤8 mV increase in peak-to-peak noise
B— temporary, self-recoverable degradation or loss of performance is allowed, but no changeof actual operating state or loss of stored data is allowedC— temporary loss of function is allowed provided that the function is self recoverable or canbe restored by the operation of the controls
3 Radiated emissions may exceed the levels specified in EN 61326 when this oscilloscope isconnected to a test object.
4 USB mouse and keyboard only, performance criterion C. Normal USB keyboard or mouseoperation can be restored by unplugging and reconnecting the USB connector to theoscilloscope.
Australia/New Zealand Declara-tion of Conformity— EMC
Complies with EMC provision of Radiocommunications Act per the following standard(s):AS/NZS 2064.1/2 Industrial, Scientific, and Medical Equipment: 1992
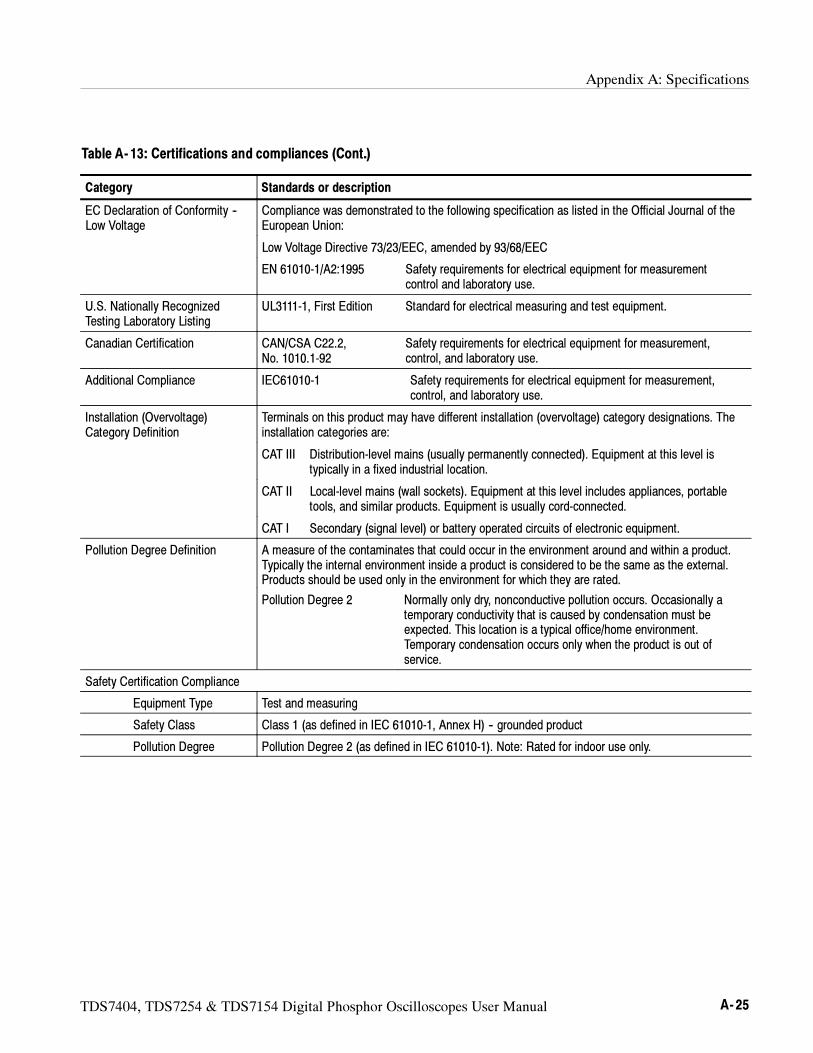
Appendix A: Specifications
TDS7404, TDS7254 & TDS7154 Digital Phosphor Oscilloscopes User Manual A- 25
Table A- 13: Certifications and compliances (Cont.)
Category Standards or description
EC Declaration of Conformity --Low Voltage
Compliance was demonstrated to the following specification as listed in the Official Journal of theEuropean Union:
Low Voltage Directive 73/23/EEC, amended by 93/68/EEC
EN 61010-1/A2:1995 Safety requirements for electrical equipment for measurementcontrol and laboratory use.
U.S. Nationally RecognizedTesting Laboratory Listing
UL3111-1, First Edition Standard for electrical measuring and test equipment.
Canadian Certification CAN/CSA C22.2, Safety requirements for electrical equipment for measurement,No. 1010.1-92 control, and laboratory use.
Additional Compliance IEC61010-1 Safety requirements for electrical equipment for measurement,control, and laboratory use.
Installation (Overvoltage)Category Definition
Terminals on this product may have different installation (overvoltage) category designations. Theinstallation categories are:
CAT III Distribution-level mains (usually permanently connected). Equipment at this level istypically in a fixed industrial location.
CAT II Local-level mains (wall sockets). Equipment at this level includes appliances, portabletools, and similar products. Equipment is usually cord-connected.
CAT I Secondary (signal level) or battery operated circuits of electronic equipment.
Pollution Degree Definition A measure of the contaminates that could occur in the environment around and within a product.Typically the internal environment inside a product is considered to be the same as the external.Products should be used only in the environment for which they are rated.
Pollution Degree 2 Normally only dry, nonconductive pollution occurs. Occasionally atemporary conductivity that is caused by condensation must beexpected. This location is a typical office/home environment.Temporary condensation occurs only when the product is out ofservice.
Safety Certification Compliance
Equipment Type Test and measuring
Safety Class Class 1 (as defined in IEC 61010-1, Annex H) -- grounded product
Pollution Degree Pollution Degree 2 (as defined in IEC 61010-1). Note: Rated for indoor use only.

Appendix A: Specifications
A- 26 TDS7404, TDS7254 & TDS7154 Digital Phosphor Oscilloscopes User Manual
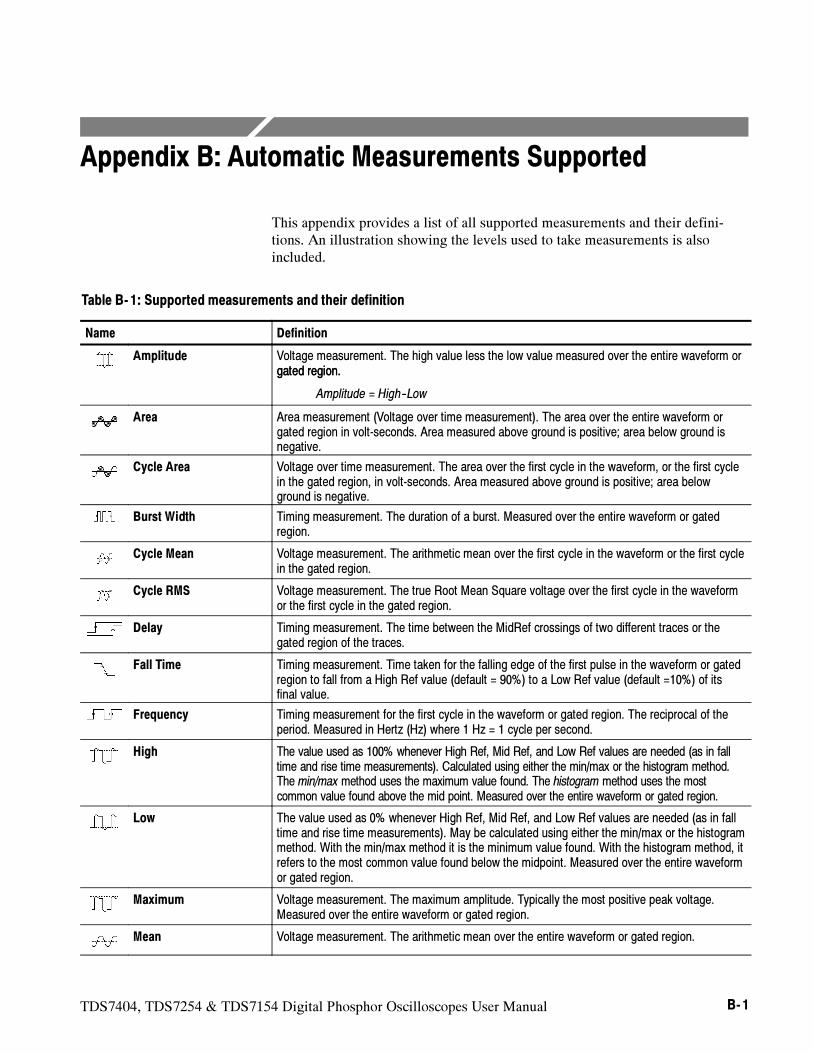
TDS7404, TDS7254 & TDS7154 Digital Phosphor Oscilloscopes User Manual B- 1
Appendix B: Automatic Measurements Supported
This appendix provides a list of all supported measurements and their defini-tions. An illustration showing the levels used to take measurements is alsoincluded.
Table B- 1: Supported measurements and their definition
Name Definition
Amplitude Voltage measurement. The high value less the low value measured over the entire waveform orgated region.gated region.
Amplitude = High--Low
Area Area measurement (Voltage over time measurement). The area over the entire waveform orgated region in volt-seconds. Area measured above ground is positive; area below ground isnegative.
Cycle Area Voltage over time measurement. The area over the first cycle in the waveform, or the first cyclein the gated region, in volt-seconds. Area measured above ground is positive; area belowground is negative.
Burst Width Timing measurement. The duration of a burst. Measured over the entire waveform or gatedregion.
Cycle Mean Voltage measurement. The arithmetic mean over the first cycle in the waveform or the first cyclein the gated region.
Cycle RMS Voltage measurement. The true Root Mean Square voltage over the first cycle in the waveformor the first cycle in the gated region.
Delay Timing measurement. The time between the MidRef crossings of two different traces or thegated region of the traces.
Fall Time Timing measurement. Time taken for the falling edge of the first pulse in the waveform or gatedregion to fall from a High Ref value (default = 90%) to a Low Ref value (default =10%) of itsfinal value.
Frequency Timing measurement for the first cycle in the waveform or gated region. The reciprocal of theperiod. Measured in Hertz (Hz) where 1 Hz = 1 cycle per second.
High The value used as 100% whenever High Ref, Mid Ref, and Low Ref values are needed (as in falltime and rise time measurements). Calculated using either the min/max or the histogram method.The min/max method uses the maximum value found. The histogram method uses the mostcommon value found above the mid point. Measured over the entire waveform or gated region.
Low The value used as 0% whenever High Ref, Mid Ref, and Low Ref values are needed (as in falltime and rise time measurements). May be calculated using either the min/max or the histogrammethod. With the min/max method it is the minimum value found. With the histogram method, itrefers to the most common value found below the midpoint. Measured over the entire waveformor gated region.
Maximum Voltage measurement. The maximum amplitude. Typically the most positive peak voltage.Measured over the entire waveform or gated region.
Mean Voltage measurement. The arithmetic mean over the entire waveform or gated region.
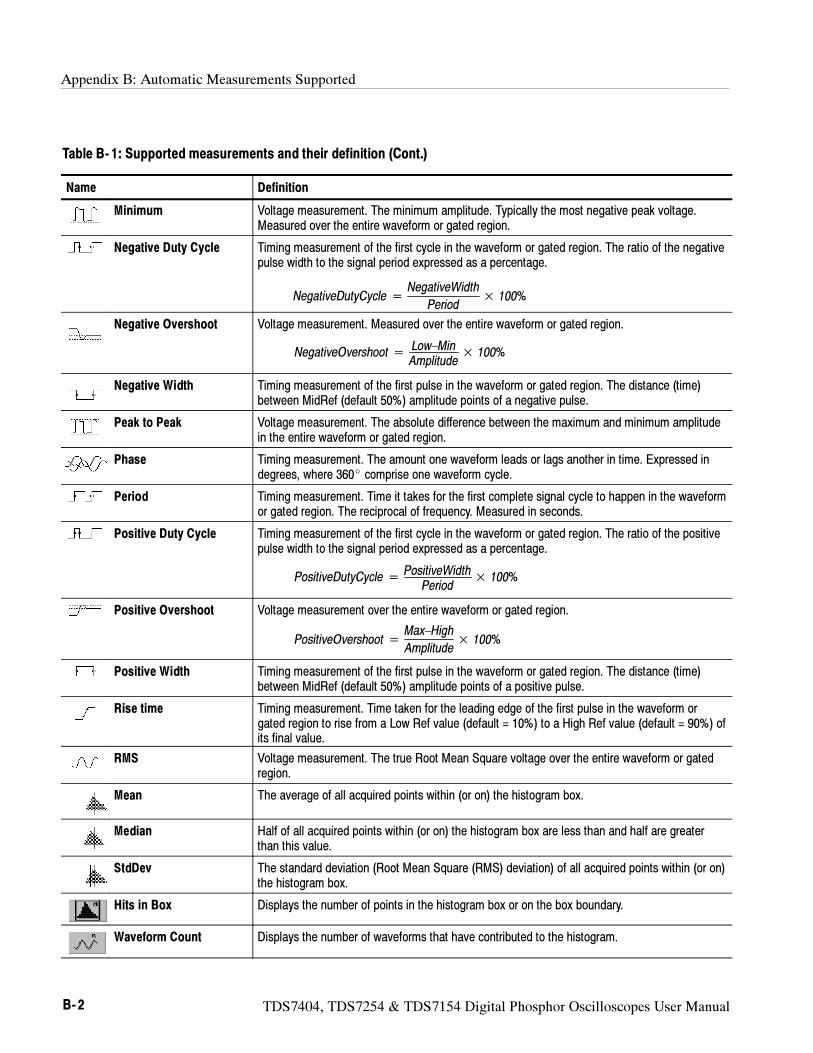
Appendix B: Automatic Measurements Supported
B- 2 TDS7404, TDS7254 & TDS7154 Digital Phosphor Oscilloscopes User Manual
Table B- 1: Supported measurements and their definition (Cont.)
Name Definition
Minimum Voltage measurement. The minimum amplitude. Typically the most negative peak voltage.Measured over the entire waveform or gated region.
Negative Duty Cycle Timing measurement of the first cycle in the waveform or gated region. The ratio of the negativepulse width to the signal period expressed as a percentage.
NegativeDutyCycle =NegativeWidth
Period× 100%
Negative Overshoot Voltage measurement. Measured over the entire waveform or gated region.
NegativeOvershoot =Low–MinAmplitude
× 100%
Negative Width Timing measurement of the first pulse in the waveform or gated region. The distance (time)between MidRef (default 50%) amplitude points of a negative pulse.
Peak to Peak Voltage measurement. The absolute difference between the maximum and minimum amplitudein the entire waveform or gated region.
Phase Timing measurement. The amount one waveform leads or lags another in time. Expressed indegrees, where 360 comprise one waveform cycle.
Period Timing measurement. Time it takes for the first complete signal cycle to happen in the waveformor gated region. The reciprocal of frequency. Measured in seconds.
Positive Duty Cycle Timing measurement of the first cycle in the waveform or gated region. The ratio of the positivepulse width to the signal period expressed as a percentage.
PositiveDutyCycle =PositiveWidth
Period× 100%
Positive Overshoot Voltage measurement over the entire waveform or gated region.
PositiveOvershoot =Max–High
Amplitude× 100%
Positive Width Timing measurement of the first pulse in the waveform or gated region. The distance (time)between MidRef (default 50%) amplitude points of a positive pulse.
Rise time Timing measurement. Time taken for the leading edge of the first pulse in the waveform orgated region to rise from a Low Ref value (default = 10%) to a High Ref value (default = 90%) ofits final value.
RMS Voltage measurement. The true Root Mean Square voltage over the entire waveform or gatedregion.
Mean The average of all acquired points within (or on) the histogram box.
Median Half of all acquired points within (or on) the histogram box are less than and half are greaterthan this value.
StdDev The standard deviation (Root Mean Square (RMS) deviation) of all acquired points within (or on)the histogram box.
Hits in Box Displays the number of points in the histogram box or on the box boundary.
Waveform Count Displays the number of waveforms that have contributed to the histogram.
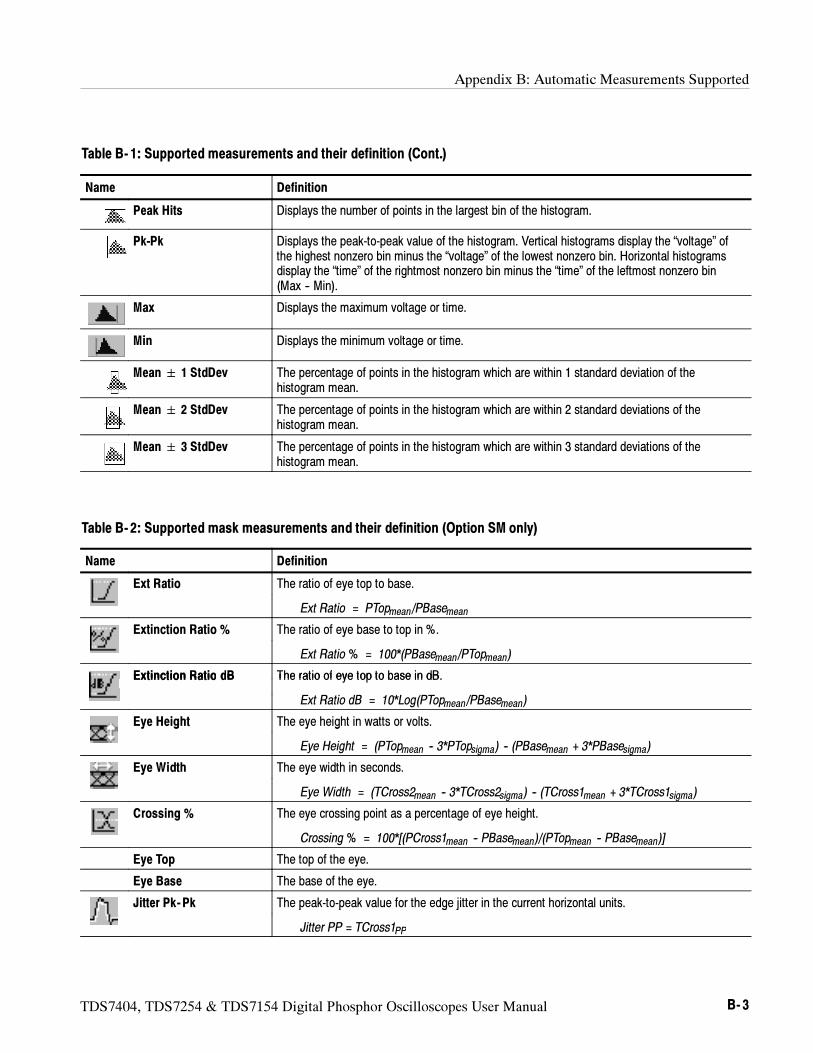
Appendix B: Automatic Measurements Supported
TDS7404, TDS7254 & TDS7154 Digital Phosphor Oscilloscopes User Manual B- 3
Table B- 1: Supported measurements and their definition (Cont.)
Name Definition
Peak Hits Displays the number of points in the largest bin of the histogram.
Pk-Pk Displays the peak-to-peak value of the histogram. Vertical histograms display the “voltage” ofthe highest nonzero bin minus the “voltage” of the lowest nonzero bin. Horizontal histogramsdisplay the “time” of the rightmost nonzero bin minus the “time” of the leftmost nonzero bin(Max -- Min).
Max Displays the maximum voltage or time.
Min Displays the minimum voltage or time.
Mean 1 StdDev The percentage of points in the histogram which are within 1 standard deviation of thehistogram mean.
Mean 2 StdDev The percentage of points in the histogram which are within 2 standard deviations of thehistogram mean.
Mean 3 StdDev The percentage of points in the histogram which are within 3 standard deviations of thehistogram mean.
Table B- 2: Supported mask measurements and their definition (Option SM only)
Name Definition
Ext Ratio The ratio of eye top to base.y p
Ext Ratio = PTopmean /PBasemean
Extinction Ratio % The ratio of eye base to top in %.y p
Ext Ratio % = 100*(PBasemean /PTopmean )
Extinction Ratio dB The ratio of eye top to base in dBExtinction Ratio dB The ratio of eye top to base in dB.
Ext Ratio dB = 10*Log(PTopmean /PBasemean )
Eye Height The eye height in watts or volts.y g y g
Eye Height = (PTopmean -- 3*PTopsigma ) -- (PBasemean + 3*PBasesigma )
Eye Width The eye width in seconds.y y
Eye Width = (TCross2mean -- 3*TCross2sigma ) -- (TCross1mean + 3*TCross1sigma )
Crossing % The eye crossing point as a percentage of eye height.
Crossing % = 100*[(PCross1mean -- PBasemean )/(PTopmean -- PBasemean )]
Eye Top The top of the eye.
Eye Base The base of the eye.
Jitter Pk-Pk The peak-to-peak value for the edge jitter in the current horizontal units.p p g j
Jitter PP = TCross1PP
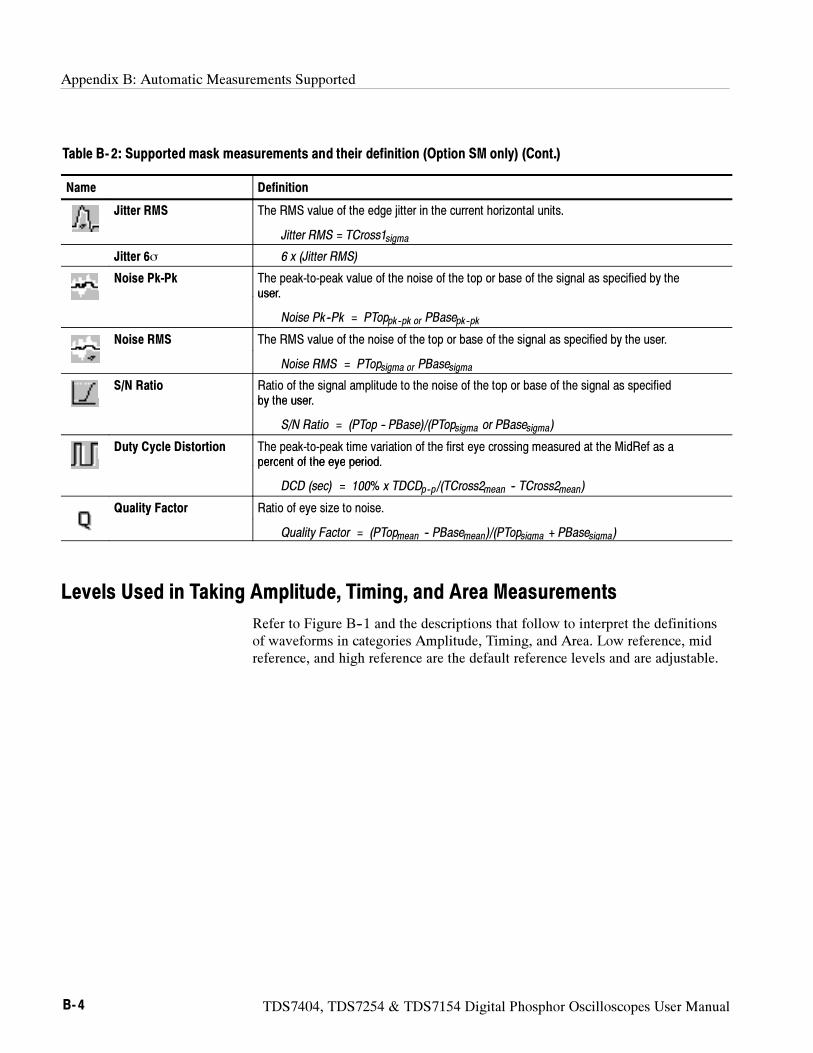
Appendix B: Automatic Measurements Supported
B- 4 TDS7404, TDS7254 & TDS7154 Digital Phosphor Oscilloscopes User Manual
Table B- 2: Supported mask measurements and their definition (Option SM only) (Cont.)
Name Definition
Jitter RMS The RMS value of the edge jitter in the current horizontal units.
Jitter RMS = TCross1sigma
Jitter 6σ 6 x (Jitter RMS)
Noise Pk-Pk The peak-to-peak value of the noise of the top or base of the signal as specified by theuser.user.
Noise Pk--Pk = PToppk--pk or PBasepk--pk
Noise RMS The RMS value of the noise of the top or base of the signal as specified by the user.p g p y
Noise RMS = PTopsigma or PBasesigma
S/N Ratio Ratio of the signal amplitude to the noise of the top or base of the signal as specifiedby the user.by the user.
S/N Ratio = (PTop -- PBase)/(PTopsigma or PBasesigma )
Duty Cycle Distortion The peak-to-peak time variation of the first eye crossing measured at the MidRef as apercent of the eye period.percent of the eye period.
DCD (sec) = 100% x TDCDp--p /(TCross2mean -- TCross2mean )
Quality Factor Ratio of eye size to noise.y y
Quality Factor = (PTopmean -- PBasemean )/(PTopsigma + PBasesigma )
Levels Used in Taking Amplitude, Timing, and Area Measurements
Refer to Figure B--1 and the descriptions that follow to interpret the definitionsof waveforms in categories Amplitude, Timing, and Area. Low reference, midreference, and high reference are the default reference levels and are adjustable.
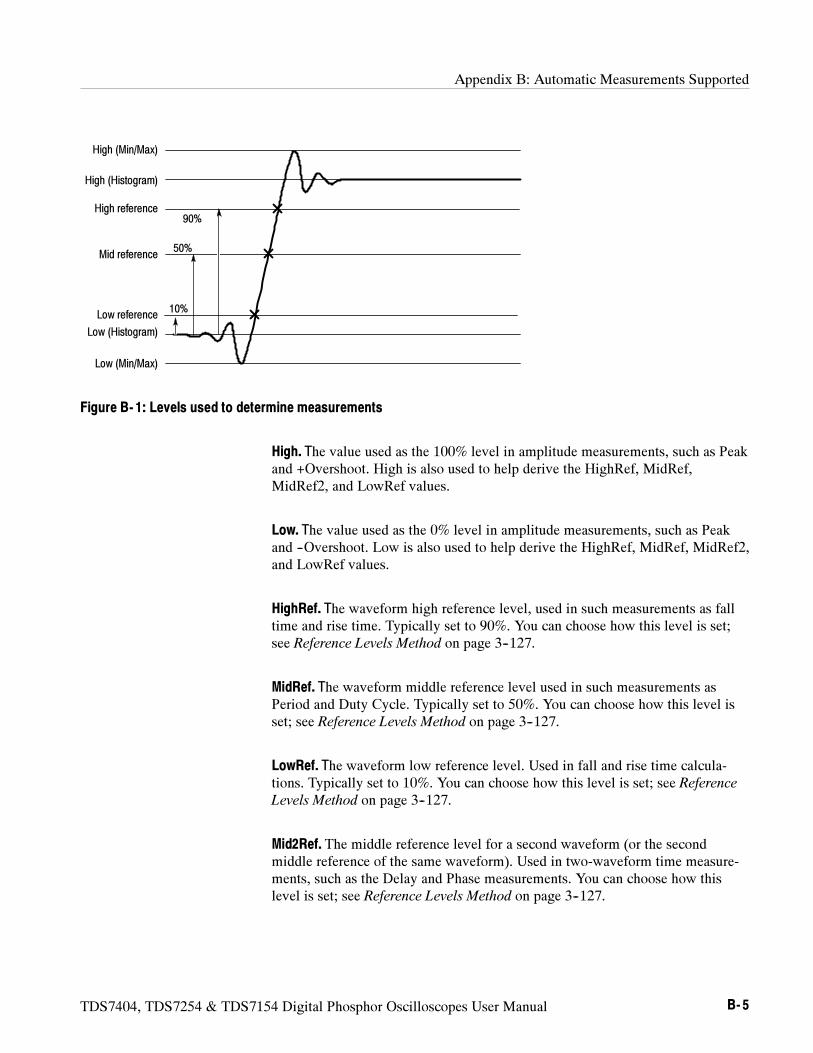
Appendix B: Automatic Measurements Supported
TDS7404, TDS7254 & TDS7154 Digital Phosphor Oscilloscopes User Manual B- 5
High (Histogram)
Low (Histogram)
Low (Min/Max)
High (Min/Max)
Mid reference
High reference90%
10%
50%
Low reference
Figure B- 1: Levels used to determine measurements
High. The value used as the 100% level in amplitude measurements, such as Peakand +Overshoot. High is also used to help derive the HighRef, MidRef,MidRef2, and LowRef values.
Low. The value used as the 0% level in amplitude measurements, such as Peakand --Overshoot. Low is also used to help derive the HighRef, MidRef, MidRef2,and LowRef values.
HighRef. The waveform high reference level, used in such measurements as falltime and rise time. Typically set to 90%. You can choose how this level is set;see Reference Levels Method on page 3--127.
MidRef. The waveform middle reference level used in such measurements asPeriod and Duty Cycle. Typically set to 50%. You can choose how this level isset; see Reference Levels Method on page 3--127.
LowRef. The waveform low reference level. Used in fall and rise time calcula-tions. Typically set to 10%. You can choose how this level is set; see ReferenceLevels Method on page 3--127.
Mid2Ref. The middle reference level for a second waveform (or the secondmiddle reference of the same waveform). Used in two-waveform time measure-ments, such as the Delay and Phase measurements. You can choose how thislevel is set; see Reference Levels Method on page 3--127.
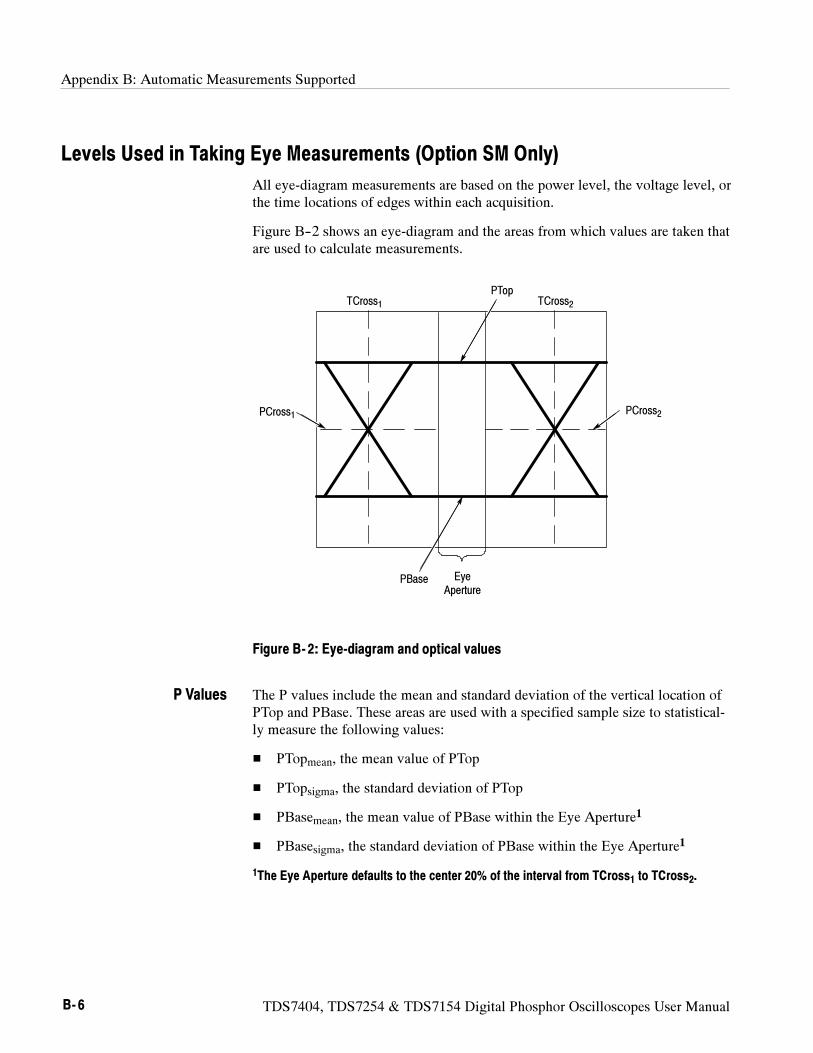
Appendix B: Automatic Measurements Supported
B- 6 TDS7404, TDS7254 & TDS7154 Digital Phosphor Oscilloscopes User Manual
Levels Used in Taking Eye Measurements (Option SM Only)
All eye-diagram measurements are based on the power level, the voltage level, orthe time locations of edges within each acquisition.
Figure B--2 shows an eye-diagram and the areas from which values are taken thatare used to calculate measurements.
TCross1 TCross2
PBase
PTop
PCross1 PCross2
EyeAperture
Figure B- 2: Eye-diagram and optical values
The P values include the mean and standard deviation of the vertical location ofPTop and PBase. These areas are used with a specified sample size to statistical-ly measure the following values:
PTopmean, the mean value of PTop
PTopsigma, the standard deviation of PTop
PBasemean, the mean value of PBase within the Eye Aperture1
PBasesigma, the standard deviation of PBase within the Eye Aperture1
1The Eye Aperture defaults to the center 20% of the interval from TCross1 to TCross2.
P Values
Appendix B: Automatic Measurements Supported
TDS7404, TDS7254 & TDS7154 Digital Phosphor Oscilloscopes User Manual B- 7
The T1 values are vertical and horizontal values associated with the leftmostcrossing point. These areas are used to establish the following directions:
TCross1mean, the horizontal mean of the left crossing point at TCross1
TCross1sigma, the horizontal standard deviation of the left crossing pointat TCross1
TCross1p-p, the horizontal peak-to-peak deviation of the left crossing pointat TCross1
PCross1mean, the vertical mean of the left crossing point at PCross1
The T2 values are vertical and horizontal values associated with the rightmostcrossing point. These areas are used to establish the following directions:
TCross2mean, the horizontal mean of the right crossing point at TCross2
TCross2sigma, the horizontal standard deviation of the right crossing pointat TCross2
TCross2p-p, the horizontal peak-to-peak deviation of the right crossing pointat TCross2
The duty cycle distortion (DCD) values are horizontal values associated with therightmost crossing point at 50% of the eye height. These areas are used toestablish the DCDp-p, the horizontal peak-to-peak deviation of the left crossingpoint at half the height of the eye.
T1 Values
T2 Values
DCD Values

Appendix B: Automatic Measurements Supported
B- 8 TDS7404, TDS7254 & TDS7154 Digital Phosphor Oscilloscopes User Manual
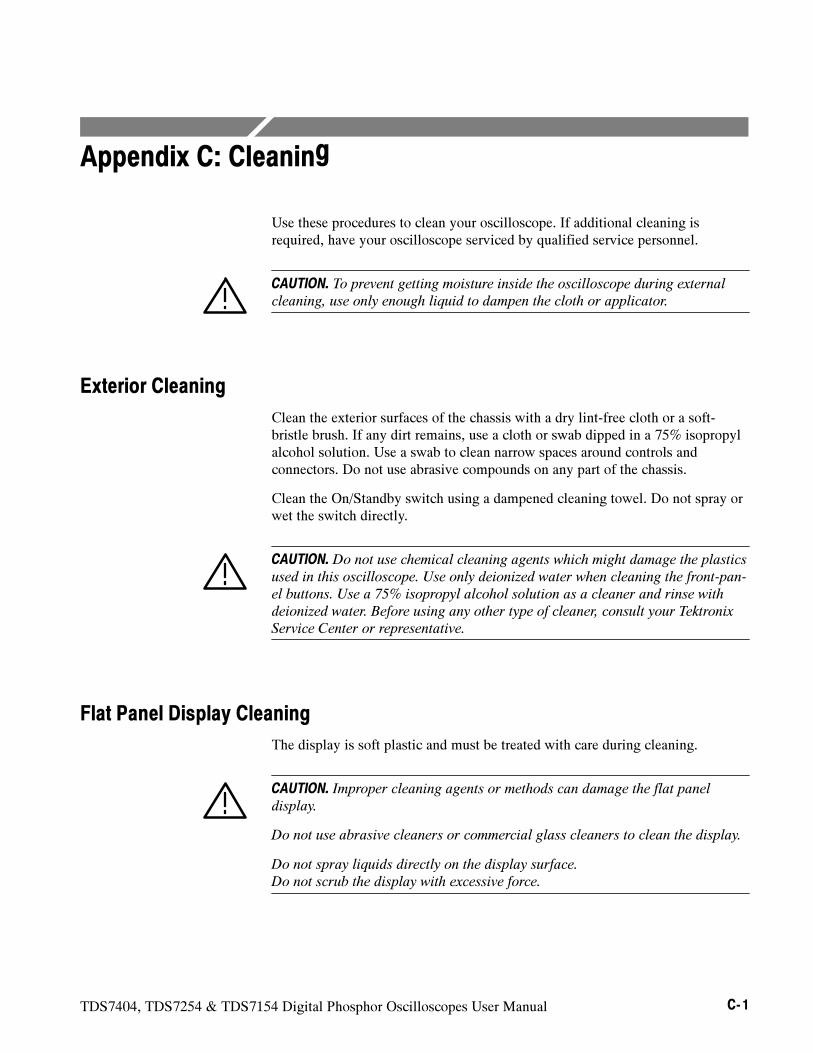
TDS7404, TDS7254 & TDS7154 Digital Phosphor Oscilloscopes User Manual C- 1
Appendix C: Cleaning
Use these procedures to clean your oscilloscope. If additional cleaning isrequired, have your oscilloscope serviced by qualified service personnel.
CAUTION. To prevent getting moisture inside the oscilloscope during external
cleaning, use only enough liquid to dampen the cloth or applicator.
Exterior Cleaning
Clean the exterior surfaces of the chassis with a dry lint-free cloth or a soft-bristle brush. If any dirt remains, use a cloth or swab dipped in a 75% isopropylalcohol solution. Use a swab to clean narrow spaces around controls andconnectors. Do not use abrasive compounds on any part of the chassis.
Clean the On/Standby switch using a dampened cleaning towel. Do not spray orwet the switch directly.
CAUTION. Do not use chemical cleaning agents which might damage the plastics
used in this oscilloscope. Use only deionized water when cleaning the front-pan-
el buttons. Use a 75% isopropyl alcohol solution as a cleaner and rinse with
deionized water. Before using any other type of cleaner, consult your Tektronix
Service Center or representative.
Flat Panel Display Cleaning
The display is soft plastic and must be treated with care during cleaning.
CAUTION. Improper cleaning agents or methods can damage the flat panel
display.
Do not use abrasive cleaners or commercial glass cleaners to clean the display.
Do not spray liquids directly on the display surface.
Do not scrub the display with excessive force.
Appendix C: Cleaning
C- 2 TDS7404, TDS7254 & TDS7154 Digital Phosphor Oscilloscopes User Manual
Clean the flat panel display surface by gently rubbing the display with aclean-room wipe (such as Wypall Medium Duty Wipes, #05701, available fromKimberly-Clark Corporation).
If the display is very dirty, moisten the wipe with distilled water or a 75%isopropyl alcohol solution and gently rub the display surface. Avoid using excessforce or you may damage the plastic display surface.
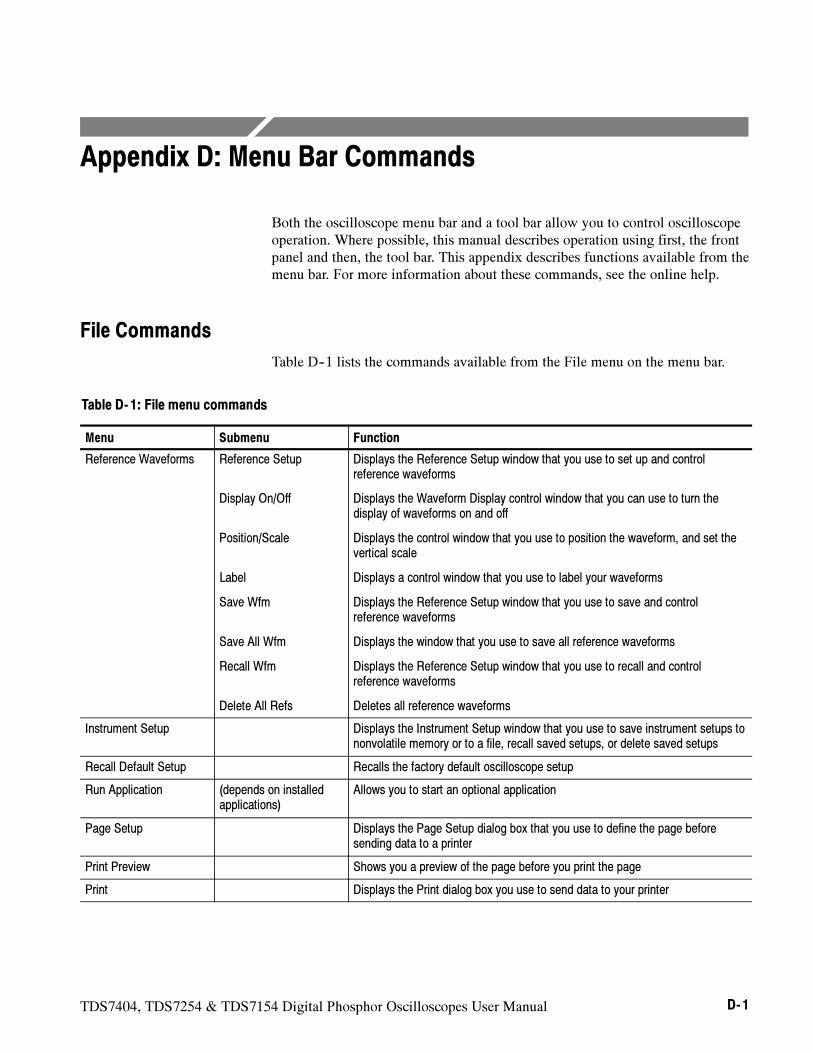
TDS7404, TDS7254 & TDS7154 Digital Phosphor Oscilloscopes User Manual D- 1
Appendix D: Menu Bar Commands
Both the oscilloscope menu bar and a tool bar allow you to control oscilloscopeoperation. Where possible, this manual describes operation using first, the frontpanel and then, the tool bar. This appendix describes functions available from themenu bar. For more information about these commands, see the online help.
File Commands
Table D--1 lists the commands available from the File menu on the menu bar.
Table D- 1: File menu commands
Menu Submenu Function
Reference Waveforms Reference Setup
Display On/Off
Position/Scale
Label
Save Wfm
Save All Wfm
Recall Wfm
Delete All Refs
Displays the Reference Setup window that you use to set up and controlreference waveforms
Displays the Waveform Display control window that you can use to turn thedisplay of waveforms on and off
Displays the control window that you use to position the waveform, and set thevertical scale
Displays a control window that you use to label your waveforms
Displays the Reference Setup window that you use to save and controlreference waveforms
Displays the window that you use to save all reference waveforms
Displays the Reference Setup window that you use to recall and controlreference waveforms
Deletes all reference waveforms
Instrument Setup Displays the Instrument Setup window that you use to save instrument setups tononvolatile memory or to a file, recall saved setups, or delete saved setups
Recall Default Setup Recalls the factory default oscilloscope setup
Run Application (depends on installedapplications)
Allows you to start an optional application
Page Setup Displays the Page Setup dialog box that you use to define the page beforesending data to a printer
Print Preview Shows you a preview of the page before you print the page
Print Displays the Print dialog box you use to send data to your printer
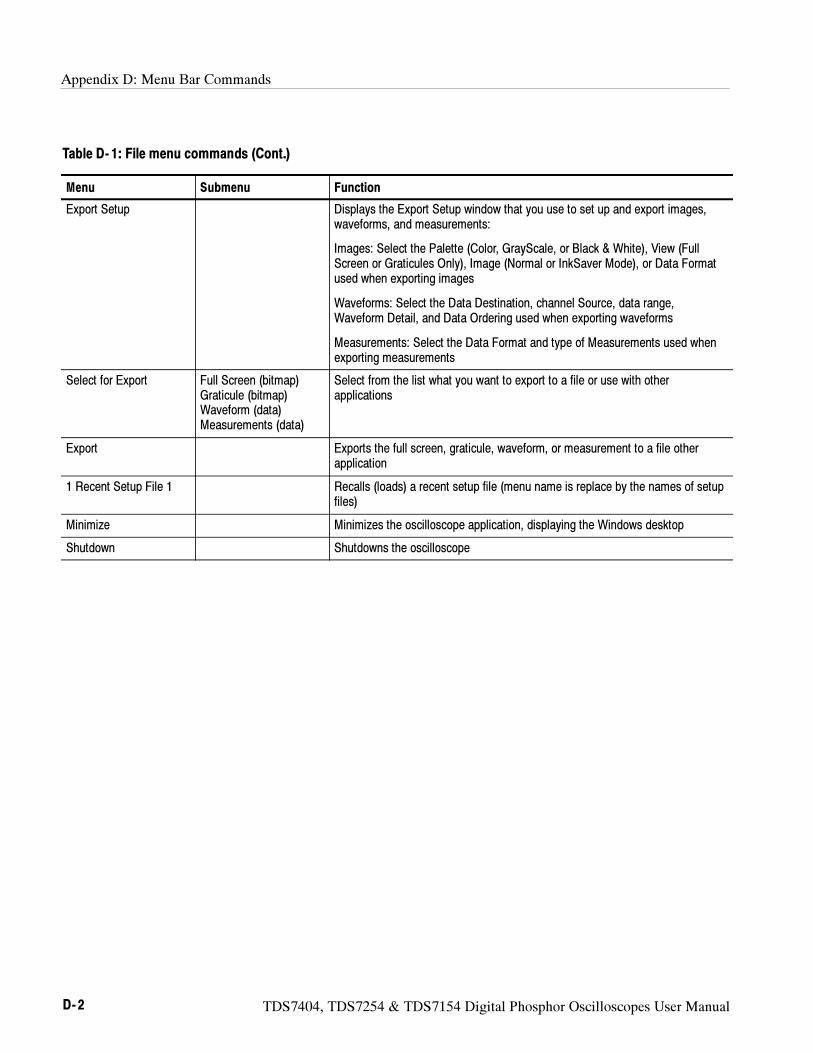
Appendix D: Menu Bar Commands
D- 2 TDS7404, TDS7254 & TDS7154 Digital Phosphor Oscilloscopes User Manual
Table D- 1: File menu commands (Cont.)
Menu FunctionSubmenu
Export Setup Displays the Export Setup window that you use to set up and export images,waveforms, and measurements:
Images: Select the Palette (Color, GrayScale, or Black & White), View (FullScreen or Graticules Only), Image (Normal or InkSaver Mode), or Data Formatused when exporting images
Waveforms: Select the Data Destination, channel Source, data range,Waveform Detail, and Data Ordering used when exporting waveforms
Measurements: Select the Data Format and type of Measurements used whenexporting measurements
Select for Export Full Screen (bitmap)Graticule (bitmap)Waveform (data)Measurements (data)
Select from the list what you want to export to a file or use with otherapplications
Export Exports the full screen, graticule, waveform, or measurement to a file otherapplication
1 Recent Setup File 1 Recalls (loads) a recent setup file (menu name is replace by the names of setupfiles)
Minimize Minimizes the oscilloscope application, displaying the Windows desktop
Shutdown Shutdowns the oscilloscope
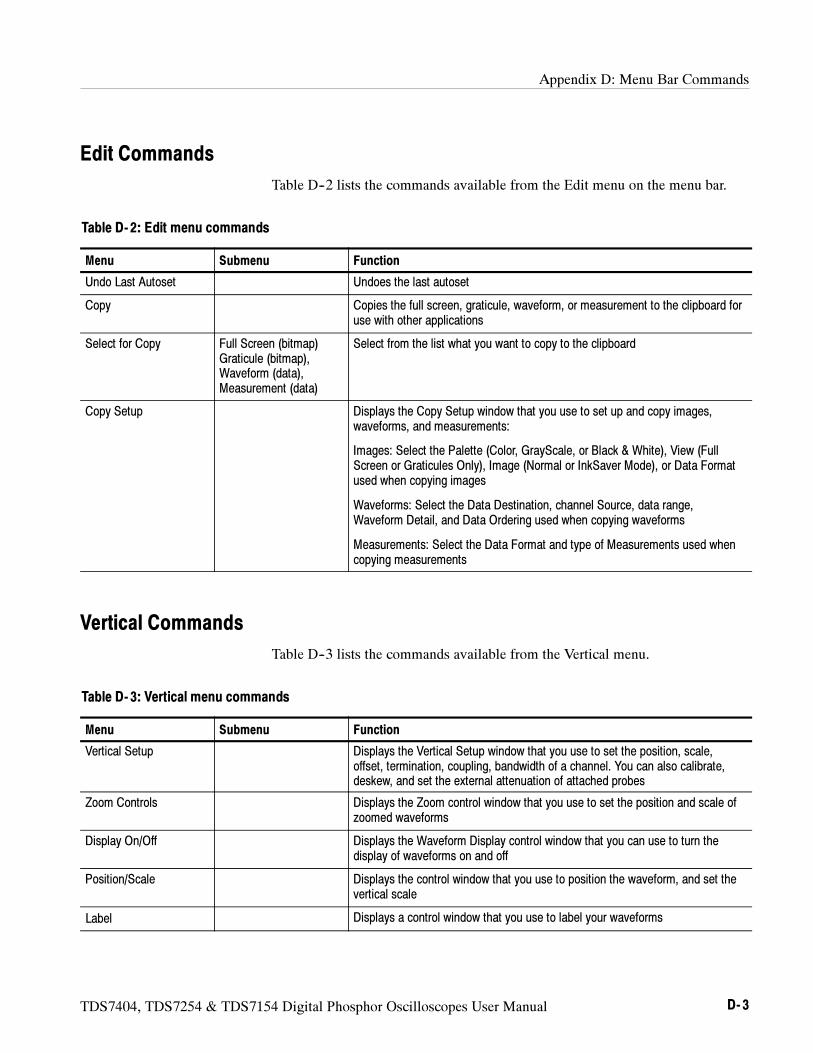
Appendix D: Menu Bar Commands
TDS7404, TDS7254 & TDS7154 Digital Phosphor Oscilloscopes User Manual D- 3
Edit Commands
Table D--2 lists the commands available from the Edit menu on the menu bar.
Table D- 2: Edit menu commands
Menu Submenu Function
Undo Last Autoset Undoes the last autoset
Copy Copies the full screen, graticule, waveform, or measurement to the clipboard foruse with other applications
Select for Copy Full Screen (bitmap)Graticule (bitmap),Waveform (data),Measurement (data)
Select from the list what you want to copy to the clipboard
Copy Setup Displays the Copy Setup window that you use to set up and copy images,waveforms, and measurements:
Images: Select the Palette (Color, GrayScale, or Black & White), View (FullScreen or Graticules Only), Image (Normal or InkSaver Mode), or Data Formatused when copying images
Waveforms: Select the Data Destination, channel Source, data range,Waveform Detail, and Data Ordering used when copying waveforms
Measurements: Select the Data Format and type of Measurements used whencopying measurements
Vertical Commands
Table D--3 lists the commands available from the Vertical menu.
Table D- 3: Vertical menu commands
Menu Submenu Function
Vertical Setup Displays the Vertical Setup window that you use to set the position, scale,offset, termination, coupling, bandwidth of a channel. You can also calibrate,deskew, and set the external attenuation of attached probes
Zoom Controls Displays the Zoom control window that you use to set the position and scale ofzoomed waveforms
Display On/Off Displays the Waveform Display control window that you can use to turn thedisplay of waveforms on and off
Position/Scale Displays the control window that you use to position the waveform, and set thevertical scale
Label Displays a control window that you use to label your waveforms
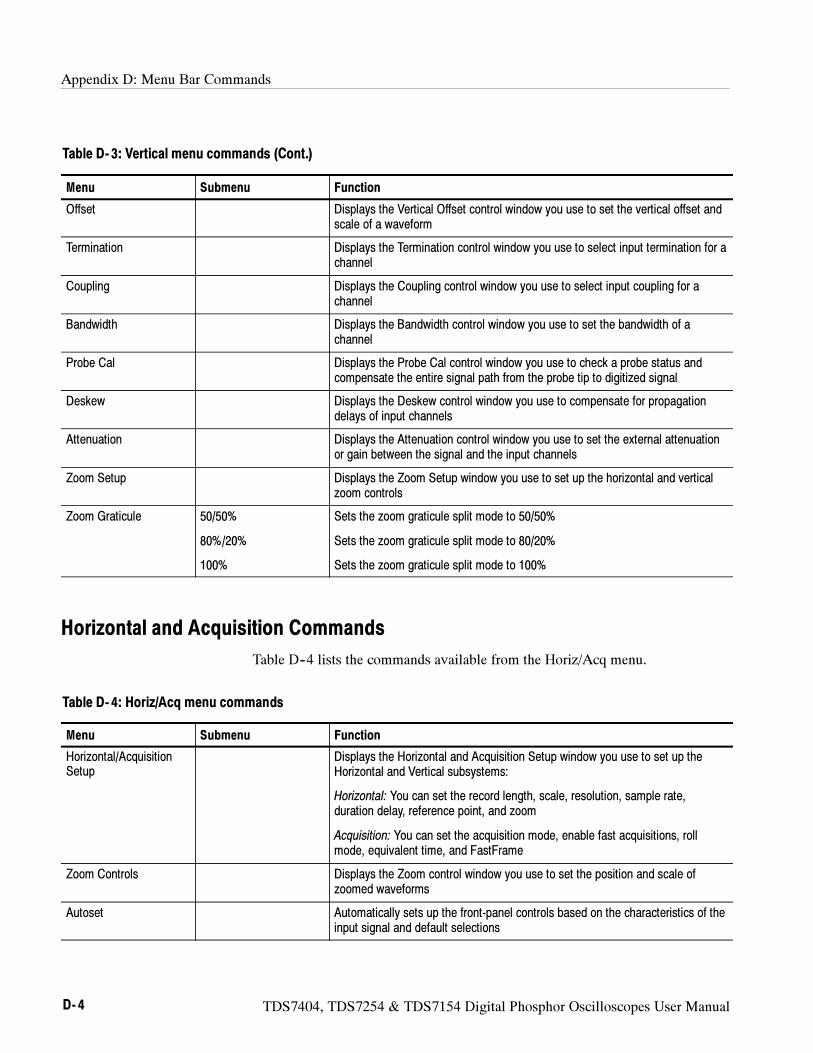
Appendix D: Menu Bar Commands
D- 4 TDS7404, TDS7254 & TDS7154 Digital Phosphor Oscilloscopes User Manual
Table D- 3: Vertical menu commands (Cont.)
Menu FunctionSubmenu
Offset Displays the Vertical Offset control window you use to set the vertical offset andscale of a waveform
Termination Displays the Termination control window you use to select input termination for achannel
Coupling Displays the Coupling control window you use to select input coupling for achannel
Bandwidth Displays the Bandwidth control window you use to set the bandwidth of achannel
Probe Cal Displays the Probe Cal control window you use to check a probe status andcompensate the entire signal path from the probe tip to digitized signal
Deskew Displays the Deskew control window you use to compensate for propagationdelays of input channels
Attenuation Displays the Attenuation control window you use to set the external attenuationor gain between the signal and the input channels
Zoom Setup Displays the Zoom Setup window you use to set up the horizontal and verticalzoom controls
Zoom Graticule 50/50%
80%/20%
100%
Sets the zoom graticule split mode to 50/50%
Sets the zoom graticule split mode to 80/20%
Sets the zoom graticule split mode to 100%
Horizontal and Acquisition Commands
Table D--4 lists the commands available from the Horiz/Acq menu.
Table D- 4: Horiz/Acq menu commands
Menu Submenu Function
Horizontal/AcquisitionSetup
Displays the Horizontal and Acquisition Setup window you use to set up theHorizontal and Vertical subsystems:
Horizontal: You can set the record length, scale, resolution, sample rate,duration delay, reference point, and zoom
Acquisition: You can set the acquisition mode, enable fast acquisitions, rollmode, equivalent time, and FastFrame
Zoom Controls Displays the Zoom control window you use to set the position and scale ofzoomed waveforms
Autoset Automatically sets up the front-panel controls based on the characteristics of theinput signal and default selections
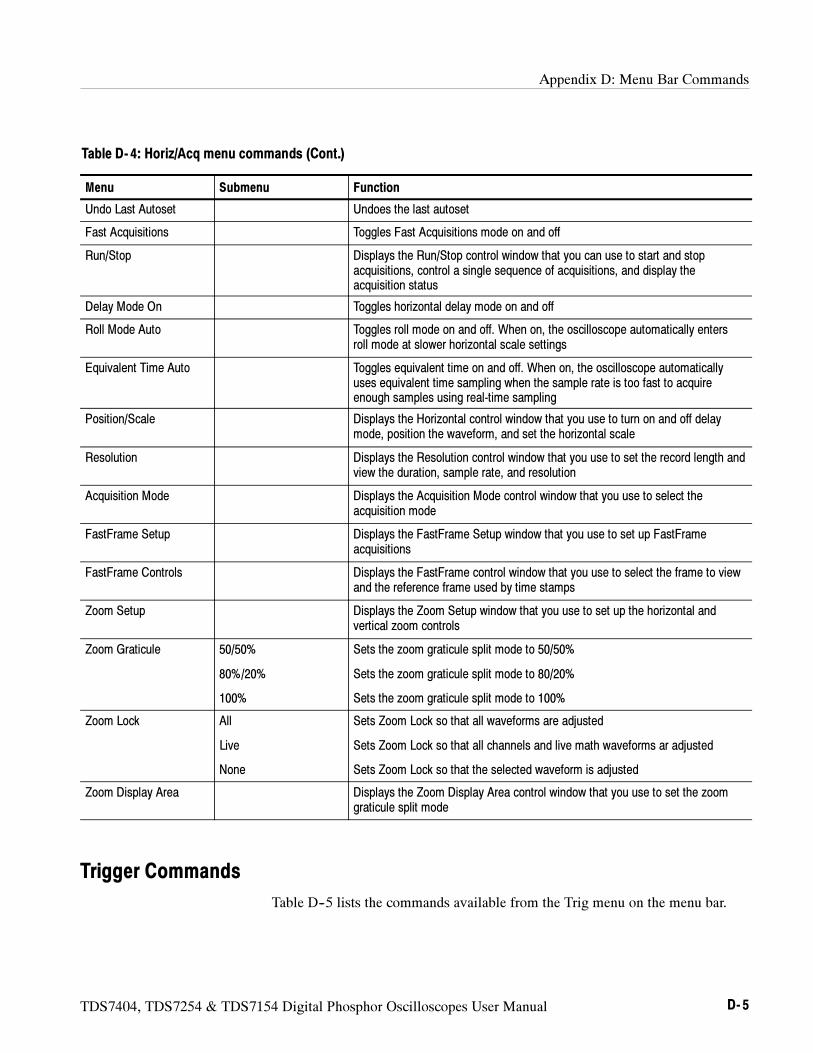
Appendix D: Menu Bar Commands
TDS7404, TDS7254 & TDS7154 Digital Phosphor Oscilloscopes User Manual D- 5
Table D- 4: Horiz/Acq menu commands (Cont.)
Menu FunctionSubmenu
Undo Last Autoset Undoes the last autoset
Fast Acquisitions Toggles Fast Acquisitions mode on and off
Run/Stop Displays the Run/Stop control window that you can use to start and stopacquisitions, control a single sequence of acquisitions, and display theacquisition status
Delay Mode On Toggles horizontal delay mode on and off
Roll Mode Auto Toggles roll mode on and off. When on, the oscilloscope automatically entersroll mode at slower horizontal scale settings
Equivalent Time Auto Toggles equivalent time on and off. When on, the oscilloscope automaticallyuses equivalent time sampling when the sample rate is too fast to acquireenough samples using real-time sampling
Position/Scale Displays the Horizontal control window that you use to turn on and off delaymode, position the waveform, and set the horizontal scale
Resolution Displays the Resolution control window that you use to set the record length andview the duration, sample rate, and resolution
Acquisition Mode Displays the Acquisition Mode control window that you use to select theacquisition mode
FastFrame Setup Displays the FastFrame Setup window that you use to set up FastFrameacquisitions
FastFrame Controls Displays the FastFrame control window that you use to select the frame to viewand the reference frame used by time stamps
Zoom Setup Displays the Zoom Setup window that you use to set up the horizontal andvertical zoom controls
Zoom Graticule 50/50%
80%/20%
100%
Sets the zoom graticule split mode to 50/50%
Sets the zoom graticule split mode to 80/20%
Sets the zoom graticule split mode to 100%
Zoom Lock All
Live
None
Sets Zoom Lock so that all waveforms are adjusted
Sets Zoom Lock so that all channels and live math waveforms ar adjusted
Sets Zoom Lock so that the selected waveform is adjusted
Zoom Display Area Displays the Zoom Display Area control window that you use to set the zoomgraticule split mode
Trigger Commands
Table D--5 lists the commands available from the Trig menu on the menu bar.
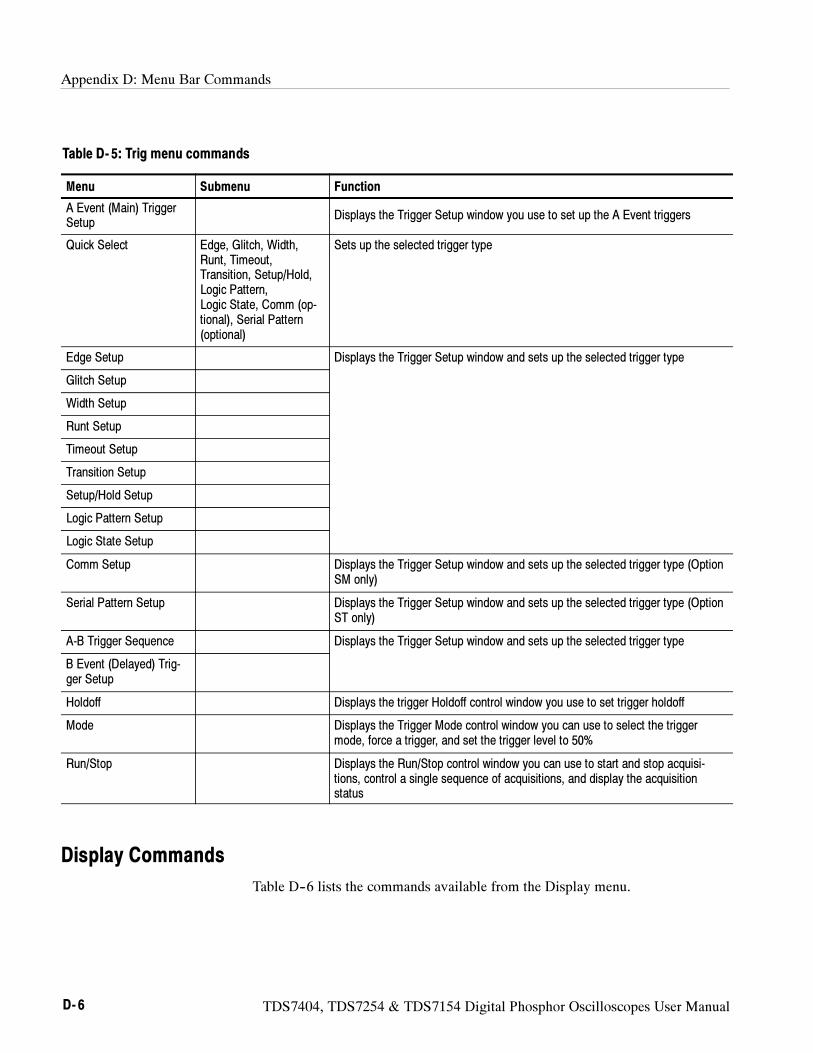
Appendix D: Menu Bar Commands
D- 6 TDS7404, TDS7254 & TDS7154 Digital Phosphor Oscilloscopes User Manual
Table D- 5: Trig menu commands
Menu Submenu Function
A Event (Main) TriggerSetup
Displays the Trigger Setup window you use to set up the A Event triggers
Quick Select Edge, Glitch, Width,Runt, Timeout,Transition, Setup/Hold,Logic Pattern,Logic State, Comm (op-tional), Serial Pattern(optional)
Sets up the selected trigger type
Edge Setup Displays the Trigger Setup window and sets up the selected trigger type
Glitch Setup
Width Setup
Runt Setup
Timeout Setup
Transition Setup
Setup/Hold Setup
Logic Pattern Setup
Logic State Setup
Comm Setup Displays the Trigger Setup window and sets up the selected trigger type (OptionSM only)
Serial Pattern Setup Displays the Trigger Setup window and sets up the selected trigger type (OptionST only)
A-B Trigger Sequence Displays the Trigger Setup window and sets up the selected trigger type
B Event (Delayed) Trig-ger Setup
Holdoff Displays the trigger Holdoff control window you use to set trigger holdoff
Mode Displays the Trigger Mode control window you can use to select the triggermode, force a trigger, and set the trigger level to 50%
Run/Stop Displays the Run/Stop control window you can use to start and stop acquisi-tions, control a single sequence of acquisitions, and display the acquisitionstatus
Display Commands
Table D--6 lists the commands available from the Display menu.
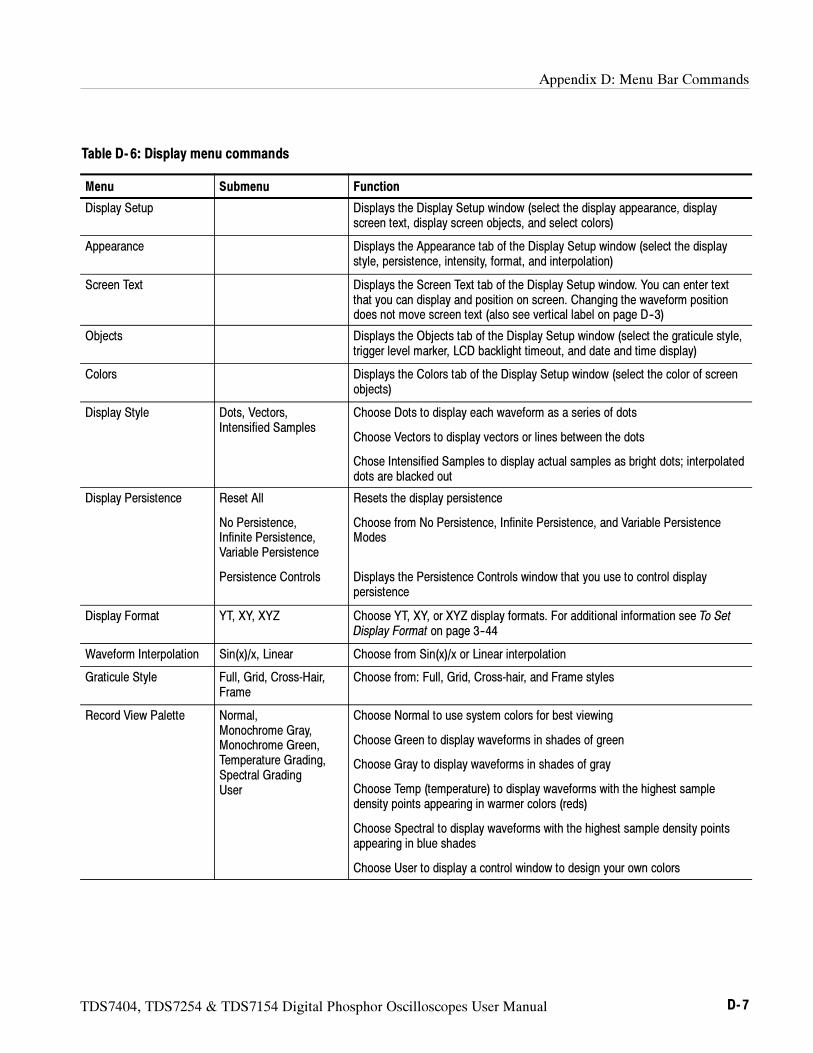
Appendix D: Menu Bar Commands
TDS7404, TDS7254 & TDS7154 Digital Phosphor Oscilloscopes User Manual D- 7
Table D- 6: Display menu commands
Menu Submenu Function
Display Setup Displays the Display Setup window (select the display appearance, displayscreen text, display screen objects, and select colors)
Appearance Displays the Appearance tab of the Display Setup window (select the displaystyle, persistence, intensity, format, and interpolation)
Screen Text Displays the Screen Text tab of the Display Setup window. You can enter textthat you can display and position on screen. Changing the waveform positiondoes not move screen text (also see vertical label on page D--3)
Objects Displays the Objects tab of the Display Setup window (select the graticule style,trigger level marker, LCD backlight timeout, and date and time display)
Colors Displays the Colors tab of the Display Setup window (select the color of screenobjects)
Display Style Dots, Vectors,Intensified Samples
Choose Dots to display each waveform as a series of dots
Choose Vectors to display vectors or lines between the dots
Chose Intensified Samples to display actual samples as bright dots; interpolateddots are blacked out
Display Persistence Reset All
No Persistence,Infinite Persistence,Variable Persistence
Persistence Controls
Resets the display persistence
Choose from No Persistence, Infinite Persistence, and Variable PersistenceModes
Displays the Persistence Controls window that you use to control displaypersistence
Display Format YT, XY, XYZ Choose YT, XY, or XYZ display formats. For additional information see To SetDisplay Format on page 3--44
Waveform Interpolation Sin(x)/x, Linear Choose from Sin(x)/x or Linear interpolation
Graticule Style Full, Grid, Cross-Hair,Frame
Choose from: Full, Grid, Cross-hair, and Frame styles
Record View Palette Normal,Monochrome Gray,Monochrome Green,Temperature Grading,Spectral GradingUser
Choose Normal to use system colors for best viewing
Choose Green to display waveforms in shades of green
Choose Gray to display waveforms in shades of gray
Choose Temp (temperature) to display waveforms with the highest sampledensity points appearing in warmer colors (reds)
Choose Spectral to display waveforms with the highest sample density pointsappearing in blue shades
Choose User to display a control window to design your own colors
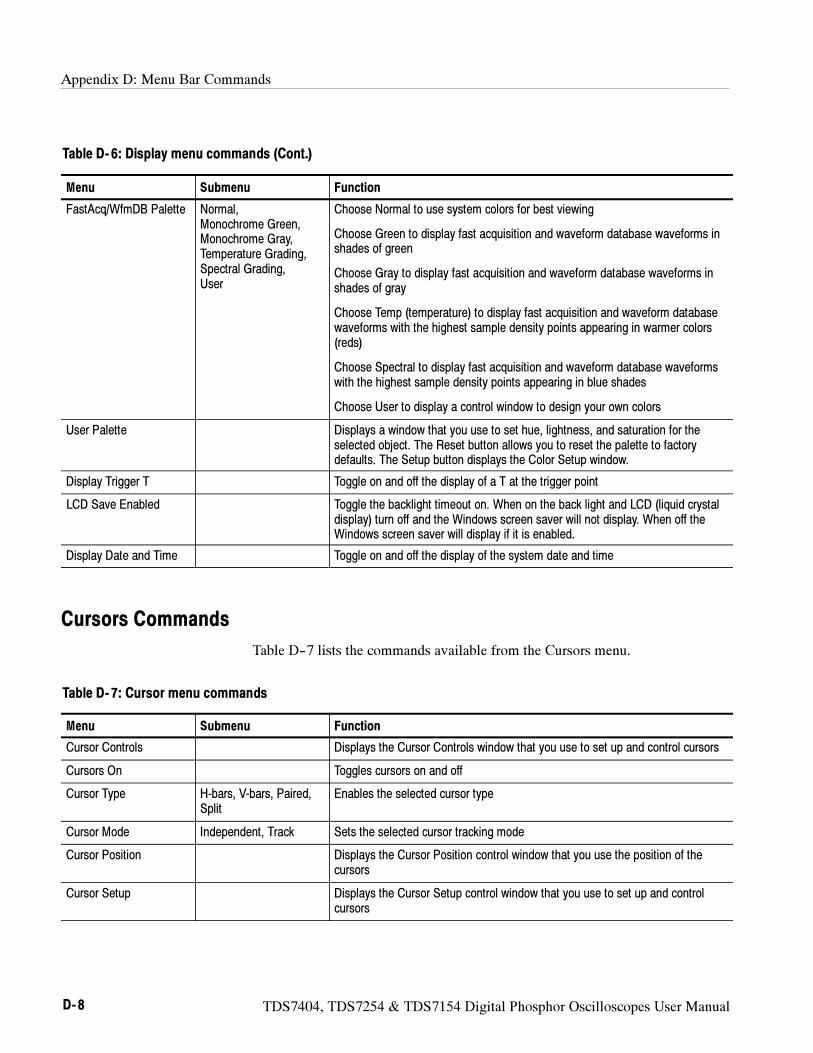
Appendix D: Menu Bar Commands
D- 8 TDS7404, TDS7254 & TDS7154 Digital Phosphor Oscilloscopes User Manual
Table D- 6: Display menu commands (Cont.)
Menu FunctionSubmenu
FastAcq/WfmDB Palette Normal,Monochrome Green,Monochrome Gray,Temperature Grading,Spectral Grading,User
Choose Normal to use system colors for best viewing
Choose Green to display fast acquisition and waveform database waveforms inshades of green
Choose Gray to display fast acquisition and waveform database waveforms inshades of gray
Choose Temp (temperature) to display fast acquisition and waveform databasewaveforms with the highest sample density points appearing in warmer colors(reds)
Choose Spectral to display fast acquisition and waveform database waveformswith the highest sample density points appearing in blue shades
Choose User to display a control window to design your own colors
User Palette Displays a window that you use to set hue, lightness, and saturation for theselected object. The Reset button allows you to reset the palette to factorydefaults. The Setup button displays the Color Setup window.
Display Trigger T Toggle on and off the display of a T at the trigger point
LCD Save Enabled Toggle the backlight timeout on. When on the back light and LCD (liquid crystaldisplay) turn off and the Windows screen saver will not display. When off theWindows screen saver will display if it is enabled.
Display Date and Time Toggle on and off the display of the system date and time
Cursors Commands
Table D--7 lists the commands available from the Cursors menu.
Table D- 7: Cursor menu commands
Menu Submenu Function
Cursor Controls Displays the Cursor Controls window that you use to set up and control cursors
Cursors On Toggles cursors on and off
Cursor Type H-bars, V-bars, Paired,Split
Enables the selected cursor type
Cursor Mode Independent, Track Sets the selected cursor tracking mode
Cursor Position Displays the Cursor Position control window that you use the position of thecursors
Cursor Setup Displays the Cursor Setup control window that you use to set up and controlcursors
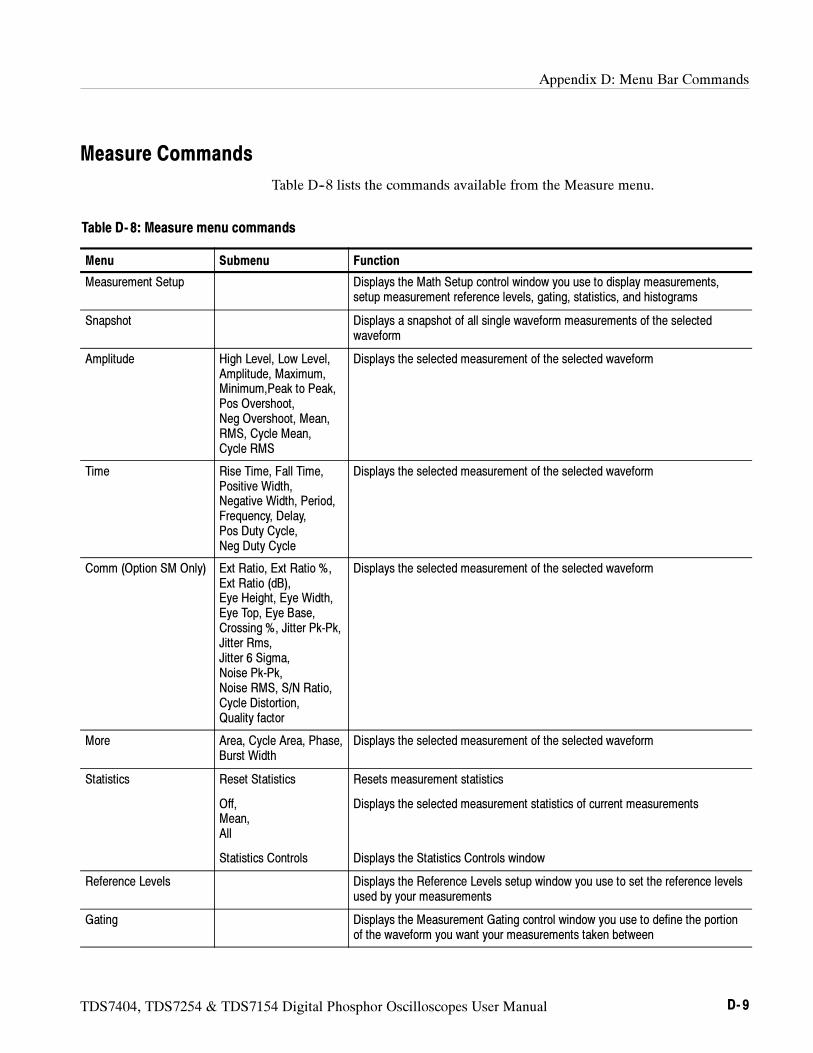
Appendix D: Menu Bar Commands
TDS7404, TDS7254 & TDS7154 Digital Phosphor Oscilloscopes User Manual D- 9
Measure Commands
Table D--8 lists the commands available from the Measure menu.
Table D- 8: Measure menu commands
Menu Submenu Function
Measurement Setup Displays the Math Setup control window you use to display measurements,setup measurement reference levels, gating, statistics, and histograms
Snapshot Displays a snapshot of all single waveform measurements of the selectedwaveform
Amplitude High Level, Low Level,Amplitude, Maximum,Minimum,Peak to Peak,Pos Overshoot,Neg Overshoot, Mean,RMS, Cycle Mean,Cycle RMS
Displays the selected measurement of the selected waveform
Time Rise Time, Fall Time,Positive Width,Negative Width, Period,Frequency, Delay,Pos Duty Cycle,Neg Duty Cycle
Displays the selected measurement of the selected waveform
Comm (Option SM Only) Ext Ratio, Ext Ratio %,Ext Ratio (dB),Eye Height, Eye Width,Eye Top, Eye Base,Crossing %, Jitter Pk-Pk,Jitter Rms,Jitter 6 Sigma,Noise Pk-Pk,Noise RMS, S/N Ratio,Cycle Distortion,Quality factor
Displays the selected measurement of the selected waveform
More Area, Cycle Area, Phase,Burst Width
Displays the selected measurement of the selected waveform
Statistics Reset Statistics
Off,Mean,All
Statistics Controls
Resets measurement statistics
Displays the selected measurement statistics of current measurements
Displays the Statistics Controls window
Reference Levels Displays the Reference Levels setup window you use to set the reference levelsused by your measurements
Gating Displays the Measurement Gating control window you use to define the portionof the waveform you want your measurements taken between
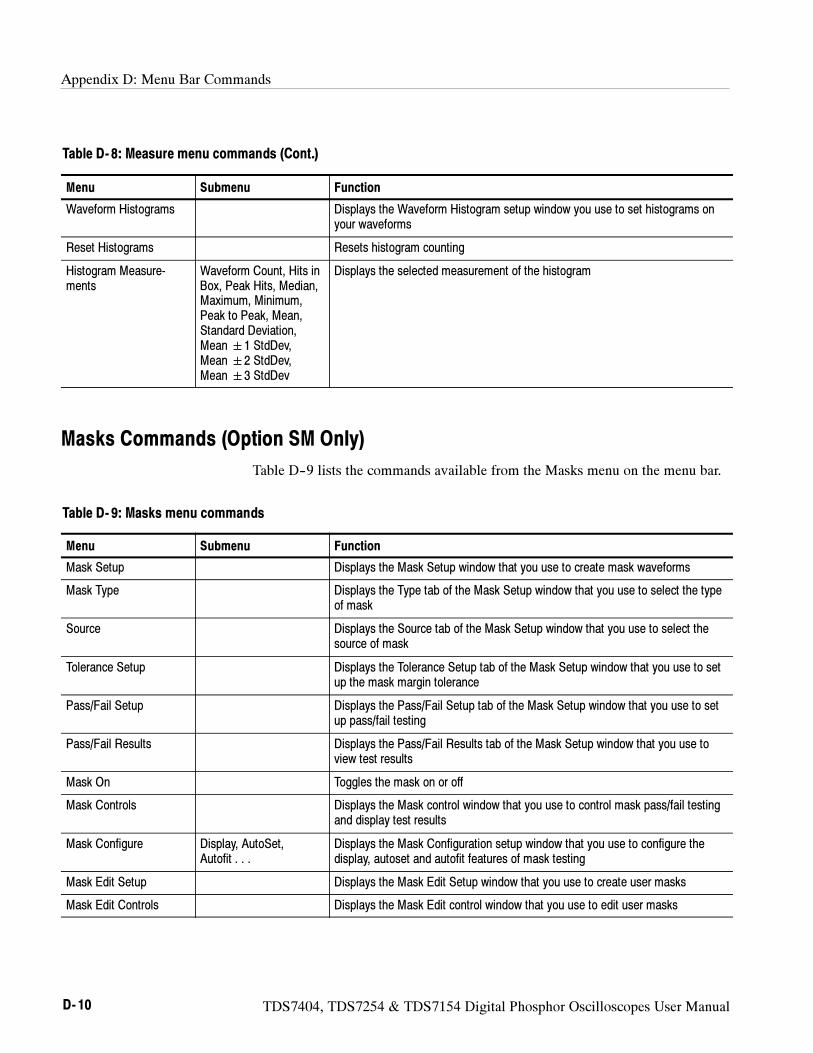
Appendix D: Menu Bar Commands
D- 10 TDS7404, TDS7254 & TDS7154 Digital Phosphor Oscilloscopes User Manual
Table D- 8: Measure menu commands (Cont.)
Menu FunctionSubmenu
Waveform Histograms Displays the Waveform Histogram setup window you use to set histograms onyour waveforms
Reset Histograms Resets histogram counting
Histogram Measure-ments
Waveform Count, Hits inBox, Peak Hits, Median,Maximum, Minimum,Peak to Peak, Mean,Standard Deviation,Mean1 StdDev,Mean2 StdDev,Mean3 StdDev
Displays the selected measurement of the histogram
Masks Commands (Option SM Only)
Table D--9 lists the commands available from the Masks menu on the menu bar.
Table D- 9: Masks menu commands
Menu Submenu Function
Mask Setup Displays the Mask Setup window that you use to create mask waveforms
Mask Type Displays the Type tab of the Mask Setup window that you use to select the typeof mask
Source Displays the Source tab of the Mask Setup window that you use to select thesource of mask
Tolerance Setup Displays the Tolerance Setup tab of the Mask Setup window that you use to setup the mask margin tolerance
Pass/Fail Setup Displays the Pass/Fail Setup tab of the Mask Setup window that you use to setup pass/fail testing
Pass/Fail Results Displays the Pass/Fail Results tab of the Mask Setup window that you use toview test results
Mask On Toggles the mask on or off
Mask Controls Displays the Mask control window that you use to control mask pass/fail testingand display test results
Mask Configure Display, AutoSet,Autofit . . .
Displays the Mask Configuration setup window that you use to configure thedisplay, autoset and autofit features of mask testing
Mask Edit Setup Displays the Mask Edit Setup window that you use to create user masks
Mask Edit Controls Displays the Mask Edit control window that you use to edit user masks
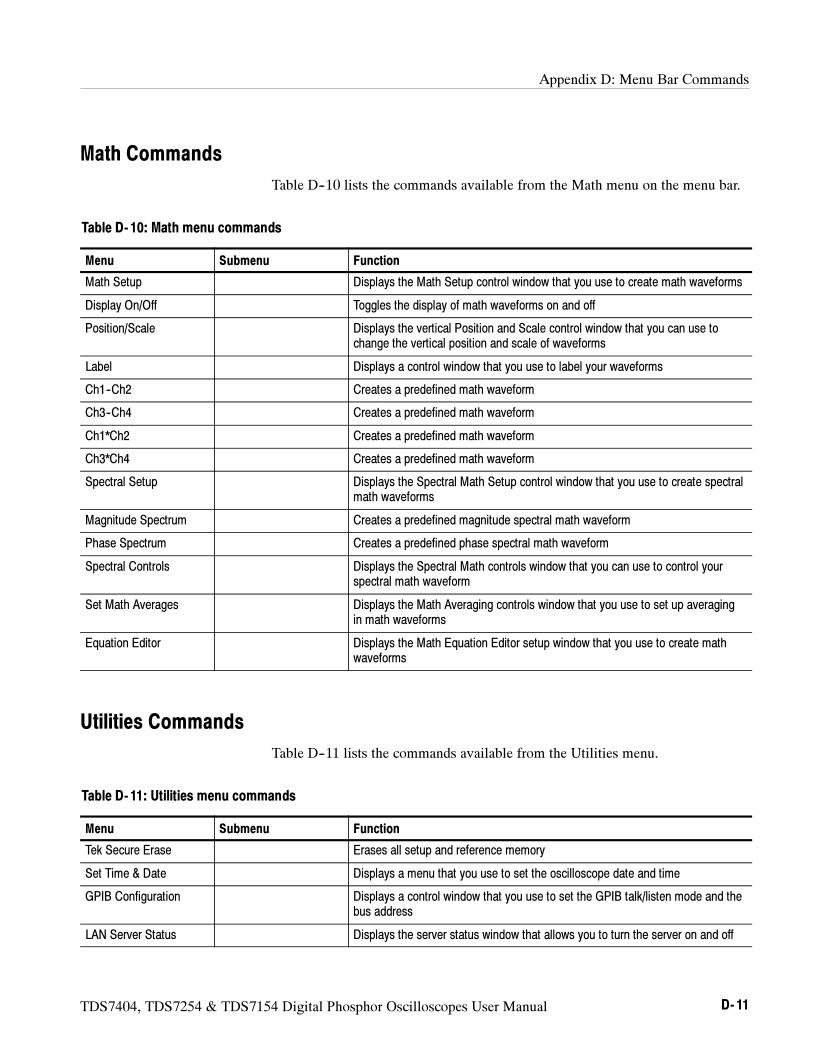
Appendix D: Menu Bar Commands
TDS7404, TDS7254 & TDS7154 Digital Phosphor Oscilloscopes User Manual D- 11
Math Commands
Table D--10 lists the commands available from the Math menu on the menu bar.
Table D- 10: Math menu commands
Menu Submenu Function
Math Setup Displays the Math Setup control window that you use to create math waveforms
Display On/Off Toggles the display of math waveforms on and off
Position/Scale Displays the vertical Position and Scale control window that you can use tochange the vertical position and scale of waveforms
Label Displays a control window that you use to label your waveforms
Ch1--Ch2 Creates a predefined math waveform
Ch3--Ch4 Creates a predefined math waveform
Ch1*Ch2 Creates a predefined math waveform
Ch3*Ch4 Creates a predefined math waveform
Spectral Setup Displays the Spectral Math Setup control window that you use to create spectralmath waveforms
Magnitude Spectrum Creates a predefined magnitude spectral math waveform
Phase Spectrum Creates a predefined phase spectral math waveform
Spectral Controls Displays the Spectral Math controls window that you can use to control yourspectral math waveform
Set Math Averages Displays the Math Averaging controls window that you use to set up averagingin math waveforms
Equation Editor Displays the Math Equation Editor setup window that you use to create mathwaveforms
Utilities Commands
Table D--11 lists the commands available from the Utilities menu.
Table D- 11: Utilities menu commands
Menu Submenu Function
Tek Secure Erase Erases all setup and reference memory
Set Time & Date Displays a menu that you use to set the oscilloscope date and time
GPIB Configuration Displays a control window that you use to set the GPIB talk/listen mode and thebus address
LAN Server Status Displays the server status window that allows you to turn the server on and off
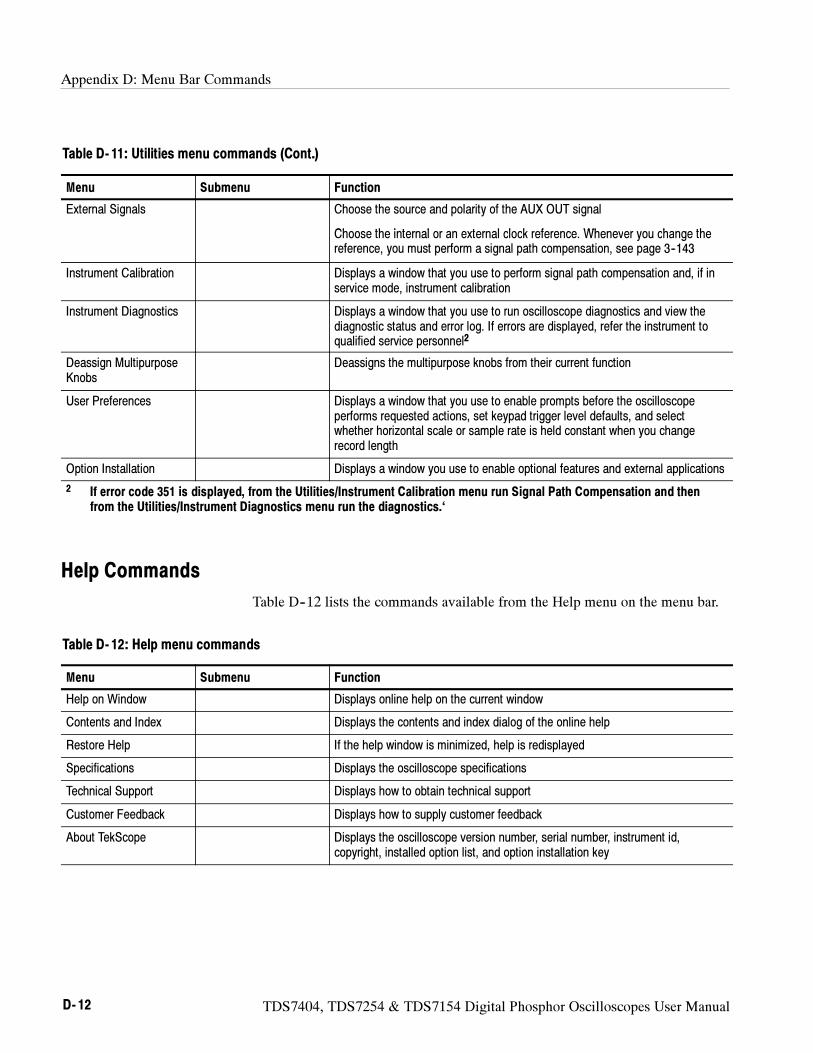
Appendix D: Menu Bar Commands
D- 12 TDS7404, TDS7254 & TDS7154 Digital Phosphor Oscilloscopes User Manual
Table D- 11: Utilities menu commands (Cont.)
Menu FunctionSubmenu
External Signals Choose the source and polarity of the AUX OUT signal
Ch th i t l t l l k f Wh h thChoose the internal or an external clock reference. Whenever you change thereference, you must perform a signal path compensation, see page 3--143
Instrument Calibration Displays a window that you use to perform signal path compensation and, if inservice mode, instrument calibration
Instrument Diagnostics Displays a window that you use to run oscilloscope diagnostics and view thediagnostic status and error log. If errors are displayed, refer the instrument toqualified service personnel2
Deassign MultipurposeKnobs
Deassigns the multipurpose knobs from their current function
User Preferences Displays a window that you use to enable prompts before the oscilloscopeperforms requested actions, set keypad trigger level defaults, and selectwhether horizontal scale or sample rate is held constant when you changerecord length
Option Installation Displays a window you use to enable optional features and external applications
2 If error code 351 is displayed, from the Utilities/Instrument Calibration menu run Signal Path Compensation and thenfrom the Utilities/Instrument Diagnostics menu run the diagnostics.‘
Help Commands
Table D--12 lists the commands available from the Help menu on the menu bar.
Table D- 12: Help menu commands
Menu Submenu Function
Help on Window Displays online help on the current window
Contents and Index Displays the contents and index dialog of the online help
Restore Help If the help window is minimized, help is redisplayed
Specifications Displays the oscilloscope specifications
Technical Support Displays how to obtain technical support
Customer Feedback Displays how to supply customer feedback
About TekScope Displays the oscilloscope version number, serial number, instrument id,copyright, installed option list, and option installation key
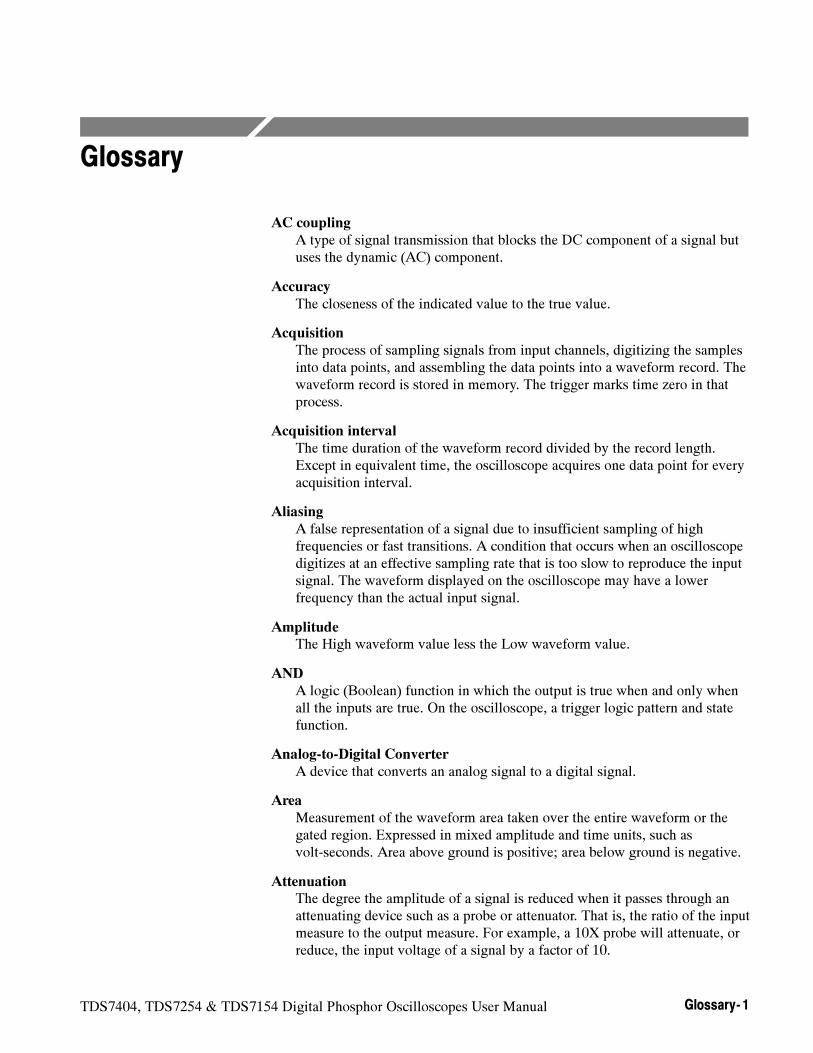
TDS7404, TDS7254 & TDS7154 Digital Phosphor Oscilloscopes User Manual Glossary- 1
Glossary
AC coupling
A type of signal transmission that blocks the DC component of a signal butuses the dynamic (AC) component.
Accuracy
The closeness of the indicated value to the true value.
Acquisition
The process of sampling signals from input channels, digitizing the samplesinto data points, and assembling the data points into a waveform record. Thewaveform record is stored in memory. The trigger marks time zero in thatprocess.
Acquisition interval
The time duration of the waveform record divided by the record length.Except in equivalent time, the oscilloscope acquires one data point for everyacquisition interval.
Aliasing
A false representation of a signal due to insufficient sampling of highfrequencies or fast transitions. A condition that occurs when an oscilloscopedigitizes at an effective sampling rate that is too slow to reproduce the inputsignal. The waveform displayed on the oscilloscope may have a lowerfrequency than the actual input signal.
Amplitude
The High waveform value less the Low waveform value.
AND
A logic (Boolean) function in which the output is true when and only whenall the inputs are true. On the oscilloscope, a trigger logic pattern and statefunction.
Analog-to-Digital Converter
A device that converts an analog signal to a digital signal.
Area
Measurement of the waveform area taken over the entire waveform or thegated region. Expressed in mixed amplitude and time units, such asvolt-seconds. Area above ground is positive; area below ground is negative.
Attenuation
The degree the amplitude of a signal is reduced when it passes through anattenuating device such as a probe or attenuator. That is, the ratio of the inputmeasure to the output measure. For example, a 10X probe will attenuate, orreduce, the input voltage of a signal by a factor of 10.
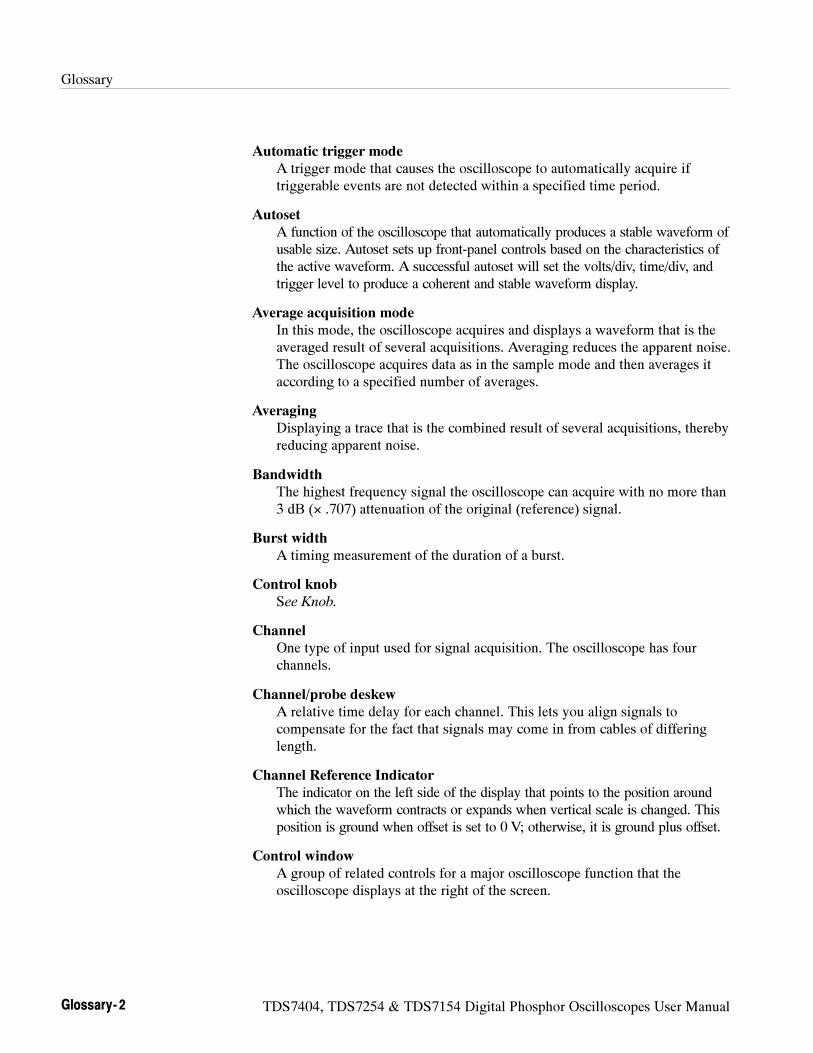
Glossary
Glossary- 2 TDS7404, TDS7254 & TDS7154 Digital Phosphor Oscilloscopes User Manual
Automatic trigger mode
A trigger mode that causes the oscilloscope to automatically acquire iftriggerable events are not detected within a specified time period.
Autoset
A function of the oscilloscope that automatically produces a stable waveform ofusable size. Autoset sets up front-panel controls based on the characteristics ofthe active waveform. A successful autoset will set the volts/div, time/div, andtrigger level to produce a coherent and stable waveform display.
Average acquisition mode
In this mode, the oscilloscope acquires and displays a waveform that is theaveraged result of several acquisitions. Averaging reduces the apparent noise.The oscilloscope acquires data as in the sample mode and then averages itaccording to a specified number of averages.
Averaging
Displaying a trace that is the combined result of several acquisitions, therebyreducing apparent noise.
Bandwidth
The highest frequency signal the oscilloscope can acquire with no more than3 dB (× .707) attenuation of the original (reference) signal.
Burst width
A timing measurement of the duration of a burst.
Control knob
See Knob.
Channel
One type of input used for signal acquisition. The oscilloscope has fourchannels.
Channel/probe deskew
A relative time delay for each channel. This lets you align signals tocompensate for the fact that signals may come in from cables of differinglength.
Channel Reference Indicator
The indicator on the left side of the display that points to the position aroundwhich the waveform contracts or expands when vertical scale is changed. Thisposition is ground when offset is set to 0 V; otherwise, it is ground plus offset.
Control window
A group of related controls for a major oscilloscope function that theoscilloscope displays at the right of the screen.
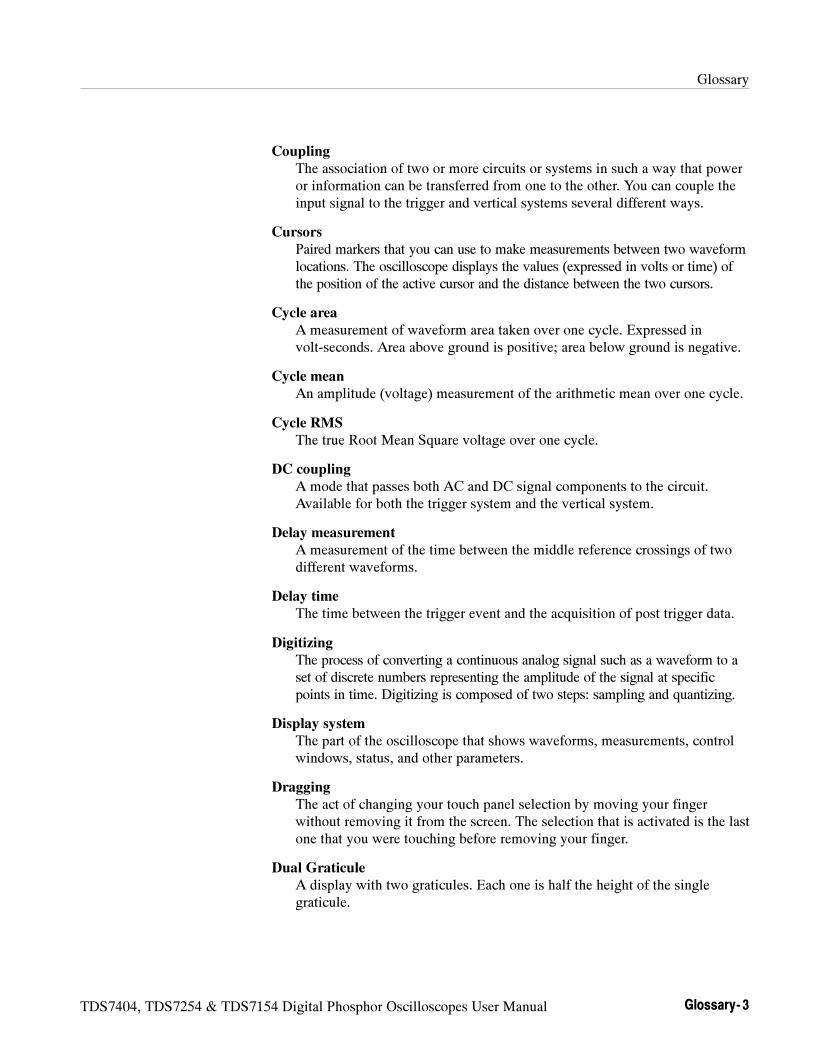
Glossary
TDS7404, TDS7254 & TDS7154 Digital Phosphor Oscilloscopes User Manual Glossary- 3
Coupling
The association of two or more circuits or systems in such a way that poweror information can be transferred from one to the other. You can couple theinput signal to the trigger and vertical systems several different ways.
Cursors
Paired markers that you can use to make measurements between two waveformlocations. The oscilloscope displays the values (expressed in volts or time) ofthe position of the active cursor and the distance between the two cursors.
Cycle area
A measurement of waveform area taken over one cycle. Expressed involt-seconds. Area above ground is positive; area below ground is negative.
Cycle mean
An amplitude (voltage) measurement of the arithmetic mean over one cycle.
Cycle RMS
The true Root Mean Square voltage over one cycle.
DC coupling
A mode that passes both AC and DC signal components to the circuit.Available for both the trigger system and the vertical system.
Delay measurement
A measurement of the time between the middle reference crossings of twodifferent waveforms.
Delay time
The time between the trigger event and the acquisition of post trigger data.
Digitizing
The process of converting a continuous analog signal such as a waveform to aset of discrete numbers representing the amplitude of the signal at specificpoints in time. Digitizing is composed of two steps: sampling and quantizing.
Display system
The part of the oscilloscope that shows waveforms, measurements, controlwindows, status, and other parameters.
Dragging
The act of changing your touch panel selection by moving your fingerwithout removing it from the screen. The selection that is activated is the lastone that you were touching before removing your finger.
Dual Graticule
A display with two graticules. Each one is half the height of the singlegraticule.
Glossary
Glossary- 4 TDS7404, TDS7254 & TDS7154 Digital Phosphor Oscilloscopes User Manual
Fast Acquisition mode
A mode that increases the waveform capture rate to up to 400,000 wave-forms per second. This very fast capture rate greatly increases the probabilitythat runts, glitches, and other short term changes will accumulate inwaveform memory. The oscilloscope then displays the waveform at thenormal display rate using variable or infinite persistence. This display modeemulates the display of an analog oscilloscope.
Edge Trigger
Triggering occurs when the oscilloscope detects the source passing through aspecified voltage level in a specified direction (the trigger slope).
Envelope acquisition mode
A mode in which the oscilloscope acquires and displays a waveform thatshows the variation extremes of several acquisitions.
Equivalent-time sampling (ET)
A sampling mode in which the oscilloscope acquires signals over manyrepetitions of the event. These oscilloscopes use a type of equivalent-timesampling called random equivalent-time sampling, which uses an internalclock that runs asynchronously with respect to the input signal and the signaltrigger. The oscilloscope takes samples continuously, independent of thetrigger position, and displays them based on the time difference between thesample and the trigger. Although the samples are taken sequentially in time,they are random with respect to the trigger.
Fall Time
A measurement of the time it takes for the trailing edge of a pulse to fallfrom a HighRef value (typically 90%) to a LowRef value (typically 10%) ofits amplitude.
Frequency
A timing measurement that is the reciprocal of the period. Measured in Hertz(Hz) where 1 Hz = 1 cycle per second.
Gated Measurements
A feature that lets you limit automated measurements to a specified portionof the waveform. You define the area of interest using the vertical cursors.
Glitch positive trigger
Triggering occurs if the oscilloscope detects positive spike widths less thanthe specified glitch time.
Glitch negative trigger
Triggering occurs if the oscilloscope detects negative spike widths less thanthe specified glitch time.
Glitch either trigger
Triggering occurs if the oscilloscope detects either positive or negative spikewidths less than the specified glitch time.
Glossary
TDS7404, TDS7254 & TDS7154 Digital Phosphor Oscilloscopes User Manual Glossary- 5
GPIB (General Purpose Interface Bus)
An interconnection bus and protocol that allows you to connect multipleinstruments in a network under the control of a controller. Also known asIEEE 488 bus. It transfers data with eight parallel data lines, five controllines, and three handshake lines.
Graticule
A grid on the display screen that creates the horizontal and vertical axes. Youcan use it to visually measure waveform parameters.
Ground (GND) coupling
Coupling option that disconnects the input signal from the vertical system.
Hardcopy
An electronic copy of the display in a format useable by a printer or plotter.
Hi Res acquisition mode
An acquisition mode in which the oscilloscope averages all samples takenduring an acquisition interval to create a record point. That average results ina higher-resolution, lower-bandwidth waveform. That mode only works withreal-time, non-interpolated sampling.
High
The value used as 100% in automated measurements (whenever high ref,mid ref, and low ref values are needed as in fall time and rise time measure-ments). May be calculated using either the min/max or the histogrammethod. With the min/max method (most useful for general waveforms), it isthe maximum value found. With the histogram method (most useful forpulses), it refers to the most common value found above the mid point.
Holdoff, trigger
The time after a trigger signal that elapses before the trigger circuit willaccept another trigger signal. Trigger holdoff helps ensure a stable display.
Horizontal acquisition window
The range of the segment of the input signal that the acquisition systemacquires.
Horizontal bar cursors
The two horizontal bars that you position to measure the voltage parametersof a waveform. The oscilloscope displays the value of the active (moveable)cursor with respect to ground and the voltage value between the bars.
Horizontal Reference Point
The point about which the trace is expanded or contracted when horizontalsize adjustments are made. The horizontal reference point remains anchoredas the rest of the trace grows or shrinks around it.
Initialize
Setting the oscilloscope to a completely known, default condition.
Glossary
Glossary- 6 TDS7404, TDS7254 & TDS7154 Digital Phosphor Oscilloscopes User Manual
Interpolation
The way the oscilloscope calculates values for record points when theoscilloscope cannot acquire all the points for a complete record with a singletrigger event. That condition occurs when the oscilloscope is limited to realtime sampling and the time base is set to a value that exceeds the effectivesample rate of the oscilloscope. The oscilloscope has two interpolationoptions: linear or sin(x)/x interpolation.
Linear interpolation calculates record points in a straight-line fit between theactual values acquired. Sin(x)/x computes record points in a curve fitbetween the actual values acquired. It assumes all the interpolated points fallin their appropriate point in time on that curve.
Intensity
Display brightness.
Interleaving
A method by which these oscilloscopes attain higher digitizing speeds. Theoscilloscope applies the digitizing resources of unused channels (that is,channels that are turned off) to sample those that are in use (turned on).Table 3--3 on page 3--38 lists acquisition rates vs. number of channels thatare on.
Knob
A rotary control.
Knob Resolution
The amount of change caused by each click of a knob.
Live Waveforms
Waveforms that can update as the acquisition system updates them. Channelwaveforms are live waveforms; reference waveforms are not. Mathwaveforms are live if they contain live waveforms in their expressions: Ch1+ Ref1 defines a live math waveform; Ref1 + Ref2 does not.
Logic state trigger
The oscilloscope checks for defined combinatorial logic conditions onchannels 1, 2, and 3 on a transition of channel 4 that meets the set slope andthreshold conditions. If the conditions of channels 1, 2, and 3 are met thenthe oscilloscope triggers.
Logic pattern trigger
The oscilloscope triggers depending on the combinatorial logic condition ofchannels 1, 2, 3, and 4. Allowable conditions are AND, OR, NAND, and NOR.
Low
The value used as 0% in automated measurements (whenever high ref, midref, and low ref values are needed as in fall time and rise time measure-ments). May be calculated using either the min/max or the histogrammethod. With the min/max method (most useful for general waveforms), it is
Glossary
TDS7404, TDS7254 & TDS7154 Digital Phosphor Oscilloscopes User Manual Glossary- 7
the minimum value found. With the histogram method (most useful forpulses), it refers to the most common value found below the mid point.
Maximum
Amplitude (voltage) measurement of the maximum amplitude. Typically themost positive peak voltage.
Mean
Amplitude (voltage) measurement of the arithmetic mean over the entirewaveform.
Measurement
An automated numeric readout that the oscilloscope provides directly fromthe displayed trace in real time, without operator intervention.
Measurement Parameter
One of several controls that the oscilloscope operator can exercise over theautomated measurement process.
Measurement Statistics
The accumulation of a history of individual measurement readouts, showingthe mean and standard deviation of a selected number of samples.
Measurement Tracking
The process of automatically adjusting the measurement parameters to reflectchanges in the trace.
Minimum
Amplitude (voltage) measurement of the minimum amplitude. Typically themost negative peak voltage.
Multipurpose knobs
Front-panel knobs you can use to change the value of the assigned parameter.
NAND
A logic (Boolean) function in which the output of the AND function iscomplemented (true becomes false, and false becomes true). On theoscilloscope, that is a trigger logic pattern and state function.
Negative duty cycle
A timing measurement representing the ratio of the negative pulse width tothe signal period, expressed as a percentage.
Negative overshoot measurement
Amplitude (voltage) measurement.
NegativeOvershoot =Low−MinAmplitude
× 100%
Glossary
Glossary- 8 TDS7404, TDS7254 & TDS7154 Digital Phosphor Oscilloscopes User Manual
Negative width
A timing measurement of the distance (time) between two amplitudepoints — falling-edgeMidRef (default 50%) and rising-edgeMidRef (default50%)— on a negative pulse.
Normal trigger mode
A mode on which the oscilloscope does not acquire a waveform recordunless a valid trigger event occurs. It waits for a valid trigger event beforeacquiring waveform data.
NOR
A logic (Boolean) function in which the output of the OR function iscomplemented (true becomes false, and false becomes true). On theoscilloscope, a trigger logic pattern and state function.
OR
A logic (Boolean) function in which the output is true if any of the inputs aretrue. Otherwise the output is false. On the oscilloscope, a trigger logicpattern and state function.
Oscilloscope
An instrument for making a graph of two factors. These are typically voltageversus time.
Peak Detect acquisition mode
A mode in which the oscilloscope saves the minimum and maximumsamples over two adjacent acquisition intervals. For many glitch-free signals,that mode is indistinguishable from the sample mode. (Peak detect mode workswith real-time, non-interpolation sampling only.)
Peak-to-Peak
Amplitude (voltage) measurement of the absolute difference between themaximum and minimum amplitude.
Period
A timing measurement of the time covered by one complete signal cycle. Itis the reciprocal of frequency and is measured in seconds.
Persistence
The amount of time a data point remains displayed. There are threepersistence modes available in the oscilloscope Variable, Infinite and Off.
Phase
A timing measurement between two waveforms of the amount one leads orlags the other in time. Phase is expressed in degrees, where 360 compriseone complete cycle of one of the waveforms. Waveforms measured should beof the same frequency or one waveform should be a harmonic of the other.
Glossary
TDS7404, TDS7254 & TDS7154 Digital Phosphor Oscilloscopes User Manual Glossary- 9
Pixel
A visible point on the display. The oscilloscope display is 640 pixels wideby 480 pixels high.
Positive duty cycle
A timing measurement of the ratio of the positive pulse width to the signalperiod, expressed as a percentage.
Positive overshoot
Amplitude (voltage) measurement.
PositiveOvershoot =Max− High
Amplitude× 100%
Positive width
A timing measurement of the distance (time) between two amplitudepoints — rising-edgeMidRef (default 50%) and falling-edgeMidRef (default50%)— on a positive pulse.
Posttrigger
The specified portion of the waveform record that contains data acquiredafter the trigger event.
Pretrigger
The specified portion of the waveform record that contains data acquiredbefore the trigger event.
Principal Power Switch
The master power switch located on the rear panel of the oscilloscope.
Probe
An input device.
Probe compensation
Adjustment that improves low-frequency response of a probe.
Pulse trigger
A trigger mode in which triggering occurs if the oscilloscope finds a pulse,of the specified polarity, with a width between, or optionally outside, theuser-specified lower and upper time limits.
Quantizing
The process of converting an analog input that has been sampled, such as avoltage, to a digital value.
Real-time sampling
A sampling mode where the oscilloscope samples fast enough to completelyfill a waveform record from a single trigger event. Use real-time sampling tocapture single-shot or transient events.
Glossary
Glossary- 10 TDS7404, TDS7254 & TDS7154 Digital Phosphor Oscilloscopes User Manual
Record length
The specified number of samples in a waveform.
Reference memory
Memory in an oscilloscope used to store waveforms or settings. You can usethat waveform data later for processing. The oscilloscope saves the data evenwhen the oscilloscope is turned off or unplugged.
Reference Waveforms
Waveforms that are static, not live (see live waveforms). Referencewaveforms are channel or math waveforms that you save to references. Oncesaved, they do not update.
Rise time
The time it takes for a leading edge of a pulse to rise from a LowRef value(typically 10%) to a HighRef value (typically 90%) of its amplitude.
RMS
Amplitude (voltage) measurement of the true Root Mean Square voltage.
Runt trigger
A mode in which the oscilloscope triggers on a runt. A runt is a pulse thatcrosses one threshold but fails to cross a second threshold before recrossingthe first. The crossings detected can be positive, negative, or either.
Sample acquisition mode
The oscilloscope creates a record point by saving the first sample duringeach acquisition interval. That is the default mode of the acquisition.
Sample interval
The time interval between successive samples in a time base. For real-timedigitizers, the sample interval is the reciprocal of the sample rate. Forequivalent-time digitizers, the time interval between successive samplesrepresents equivalent time, not real time.
Sampling
The process of capturing an analog input, such as a voltage, at a discretepoint in time and holding it constant so that it can be quantized. Two generalmethods of sampling are: real-time sampling and equivalent-time sampling.
Screen text
Lines displayed on screen that you use to indicate measurement referencelevels and points that an automatic measurement is using to derive themeasurement value.
Setting
The state of the front panel and system at a given time.
Glossary
TDS7404, TDS7254 & TDS7154 Digital Phosphor Oscilloscopes User Manual Glossary- 11
Setup control window
A group of related controls for a major oscilloscope function that theoscilloscope displays across the bottom of the screen.
Setup/Hold trigger
A mode in which the oscilloscope triggers when a data source changes statewithin the setup or hold time relative to a clock source. Positive setup timesprecede the clock edge; positive hold times follow the clock edge. The clockedge may be the rising or falling edge.
Selected waveform
The waveform on which all measurements are performed, and which isaffected by vertical position and scale adjustments. The light over one of thechannel selector buttons indicates the current selected waveform.
Slew Rate trigger
A mode in which the oscilloscope triggers based on how fast a pulse edgetraverses (slews) between an upper and lower threshold. The edge of thepulse may be positive, negative, or either. The oscilloscope can trigger onslew rates faster or slower than a user-specified rate.
Slope
The direction at a point on a waveform. You can calculate the direction bycomputing the sign of the ratio of change in the vertical quantity (Y) to thechange in the horizontal quantity. The two values are rising and falling.
Statistical Measurement
An automated measurement that is derived from color graded waveform dataand is based on histograms computed at the crossing levels. A statisticalmeasurement can be selected only in color graded display mode.
Tek Secure
This feature erases all waveform and setup memory locations (setup memoriesare replaced with the factory setup). Then it checks each location to verifyerasure. This feature finds use where this oscilloscope is used to gathersecurity sensitive data, such as is done for research or development projects.
Time base
The set of parameters that let you define the time and horizontal axisattributes of a waveform record. The time base determines when and howlong to acquire record points.
Timeout trigger
A trigger mode in which triggering occurs if the oscilloscope does NOT finda pulse, of the specified polarity and level, within the specified time period.
Trace
The visible representation of an input signal or combination of signals.Identical to waveform.
Glossary
Glossary- 12 TDS7404, TDS7254 & TDS7154 Digital Phosphor Oscilloscopes User Manual
Trace Expression
The definition of what the trace displays. It can include one or more channelscombined arithmetically and modified by functions.
Trigger
An event that marks time zero in the waveform record. It results in acquisi-tion and display of the waveform.
Trigger level
The vertical level the trigger signal must cross to generate a trigger (on edgetrigger mode).
Vertical acquisition window
The vertical range of the segment of the input signal that the acquisitionsystem acquires.
Vertical bar cursors
The two vertical bars you position to measure the time parameter of awaveform record. The oscilloscope displays the value of the active (move-able) cursor with respect to the trigger and the time value between the bars.
Waveform
The shape or form (visible representation) of a signal.
Waveform database mode
An acquisition mode that processes and displays a larger sample of data. Thewaveform database is a three-dimensional accumulation of source waveformdata over several acquisitions. In addition to amplitude and timing informa-tion, the database includes a count of the number of times a specificwaveform point has been acquired.
Waveform interval
The time interval between record points as displayed.
XY format
A display format that compares the voltage level of two waveform recordspoint by point. It is useful for studying phase relationships betweentwo waveforms.
XYZ format
A display format that compares the voltage level of two waveform recordspoint by point as in XY format. The displayed waveform intensity ismodulated by the CH 3 (Z) waveform record.
YT format
The conventional oscilloscope display format. It shows the voltage of awaveform record (on the vertical axis) as it varies over time (on thehorizontal axis).
TDS7404, TDS7254 & TDS7154 Digital Phosphor Oscilloscopes User Manual Index- 1
Index
Symbols<, A Trigger control window, 3--73>, A Trigger control window, 3--73
Numbers1 recent setup file 1, D--2100%, Zoom, D--450/50%, Zoom, D--480/20%, Zoom, D--4
AA event (main) trigger setup, D--6A Only, trigger, how to set up, 3--96A Only, A Trigger control window, 3--96A Then B, A-->B Seq Trigger control window, 3--96,
3--97A Trigger
holdoff, 3--63level presets, 3--64, 3--65trigger when, 3--86
A Trigger control window, 3--72, 3--74, 3--79, 3--82,3--84, 3--87, 3--88, 3--96, 3--98
<, 3--73>, 3--73A Only, 3--96AND, 3--85, 3--87Ch1, Ch2 ..., 3--72, 3--74, 3--77, 3--79, 3--82, 3--84,
3--87, 3--89, 3--98clock source, 3--89data source, 3--89define inputs, 3--84, 3--87, 3--89, 3--90define pattern type, 3--85, 3--87delay time, 3--96either, 3--72, 3--74, 3--77, 3--79, 3--98falling edge, 3--87, 3--89FALSE, 3--85, 3--88glitch, 3--72, 3--73level, 3--73, 3--78, 3--83logic, 3--84, 3--87, 3--88NAND, 3--85, 3--87negative, 3--72, 3--74, 3--77, 3--79, 3--98NOR, 3--85, 3--87OR, 3--85, 3--87pattern, 3--84polarity and width, 3--72, 3--74, 3--77
positive, 3--72, 3--74, 3--77, 3--79, 3--98pulse, 3--72, 3--74, 3--77, 3--79, 3--82rising edge, 3--87, 3--89runt, 3--74set thresholds, 3--84, 3--87set to ECL, 3--80set to TTL, 3--80setup/hold, 3--88slew rate, 3--79source, 3--72, 3--74, 3--77, 3--79, 3--82state, 3--87thresholds, 3--76, 3--80timeout, 3--82timer, 3--82transition, 3--79Trig Delay, 3--96trigger when, 3--85, 3--88TRUE, 3--85, 3--88width, 3--77
A Trigger levelECL, 3--64, 3--65TTL, 3--64, 3--65user, 3--64, 3--65
A-->B Seq Trigger control window, 3--96, 3--97A Then B, 3--96, 3--97B Trig Level, 3--97B trigger level, 3--97Trig Event, 3--97trigger events, 3--97
A->b trigger sequence, D--6About TekScope, D--12Absolute reference, 3--127AC coupling, Glossary--1AC line voltage, trigger input, 3--53, 3--59Access vertical set up help, 3--13Accessories, 1--29
optional, 1--32standard, 1--31
Accessory software, 1--11Accuracy, Glossary--1
gain and offset, 3--147Acquiring and displaying waveforms, 3--3Acquisition, Glossary--1
input channels and digitizers, 3--32interval, Glossary--1modes, Envelope, 3--46record, 3--34sampling (see sampling), 3--33
Index
Index- 2 TDS7404, TDS7254 & TDS7154 Digital Phosphor Oscilloscopes User Manual
Acquisition controlsacquisition control background, 3--32acquisition hardware, 3--32aliasing illustrated, 3--27average, 3--24, 3--28condition, 3--25envelope, 3--23, 3--28equivalent-time sampling, 3--35equivalent-time sampling, illustrated, 3--36global controls, 3--26Hi Res, 3--21, 3--28intensity, 3--43interleaving, 3--37interpolation, 3--37linear interpolation, 3--37methods to check and eliminate aliasing, 3--27OFF (real time only), 3--29peak detect, 3--21, 3--28preventing aliasing, 3--26real-time sampling, 3--35record length, 3--34repetitive signal, 3--29roll, 3--25RUN/STOP, 3--28Run/Stop button only, 3--25sample, 3--21, 3--28sample interval, 3--34sampling and acquisition mode, 3--35sampling mode selection, 3--36sampling modes, 3--33sampling process, 3--33select the acquisition mode, 3--28set the stop mode, 3--28set waveform count (average and envelope only),
3--28sin(x)/x interpolation, 3--37SINGLE, 3--25, 3--28single sequence, 3--25single sequence off, 3--28to disable roll mode, 3--32to enable roll mode, 3--31to select an acquisition mode, 3--28to select real-time or equivalent-time sampling, 3--29to set acquisition modes, 3--28to set roll bode, 3--31to single sequence roll mode, 3--31to start acquiring, 3--30to start and stop acquisition, 3--30to stop acquiring, 3--30to take a single acquisition, 3--30to turn off roll mode acquisitions, 3--31trigger point, 3--34untriggered roll, 3--25
untriggered roll with single sequence, 3--25using, 3--21using fast acquisition mode, 3--38using FastFrame, 3--45waveform database, 3--24, 3--28waveform record, 3--34
Acquisition mode, D--5spectral math, 3--192
Acquisition modes, incompatible with fast acquisitions,3--38
Acquisition overview, 3--32Acquisition preview, 3--103Acquisition setup, D--4Address, Tektronix, xvAdvanced, 3--67Aliasing, 3--26, 3--192, Glossary--1
eliminating, 3--27illustrated, 3--27recognizing, 3--192
All, D--9Amplitude, B--1, D--9, Glossary--1Analog-to-digital converter, Glossary--1Analyzer Control Locks, 3--171AND, Glossary--1AND, A Trigger control window, 3--85, 3--87Annotate waveforms on screen, 3--124Annotated display, 3--124Appearance, D--7Applications, 1--12
derivative math waveforms, 3--159integral math waveforms, 3--161optional, 1--12
Area, B--1, D--9, Glossary--1Attenuation, Glossary--1Attenuation, input, D--4Auto--increment file name, 3--208, 3--212, 3--218,
3--233Auto--increment filename, 3--208AutoBright, 3--115Automated measurements, 3--124
of FFT math waveforms, 3--193Automatic measurements, 3--123
high and low levels defined, B--5levels used in taking, B--4, B--6reference levels defined, B--5reference levels defined (eye pattern/optical), B--6
Automatic trigger mode, 3--54, 3--60, Glossary--2Autoset, 3--14, D--4, Glossary--2
how to execute, 3--11undoing, 3--11undo, D--5
Autoset Undo, 3--11Autoset undo, D--3
Index
TDS7404, TDS7254 & TDS7154 Digital Phosphor Oscilloscopes User Manual Index- 3
AUX Out configuration, D--12Auxiliary trigger, 3--53, 3--59Average, 3--24, 3--28, 3--46
incompatible with fast acquisitions, 3--38Average acquisition mode, Glossary--2Averaging, Glossary--2
spectral math, 3--192
BB event (delayed) trigger setup, D--6B Trig Level, A-->B Seq Trigger control window, 3--97B Trigger control window, source, 3--98B trigger level, A-->B Seq Trigger control window,
3--97backing up user files, 1--10Backlight timeout, 3--116, D--8Bandwidth, D--4, Glossary--2Bitmap, file format, 3--225Blackman-Harris, 3--180, 3--182, 3--187, 3--199Burst width, B--1, D--9Button
DELAY, 3--57FORCE TRIG, 3--65SET LEVEL TO 50%, 3--59SINGLE TRIG, 3--66ZOOM, 3--110zoom, 3--109
CCalibrate probes, 3--147Calibrate the oscilloscope, 3--143Calibration instructions, 3--143Calibration status, 3--143, 3--148CD--ROMs, optional applications, 1--12Center, 3--174Ch1 -- Ch2, D--11Ch1 * Ch2, D--11Ch1, Ch2 ..., A Trigger control window, 3--72, 3--74,
3--77, 3--79, 3--82, 3--84, 3--87, 3--89, 3--98Ch3 -- Ch4, D--11Ch3 * Ch4, D--11CH3 signal output, 2--7Channel, Glossary--2, Glossary--6, Glossary--10
readout, 3--113trigger input, 3--53, 3--59
Channel, 3--125Channel configuration, 3--33Channel reference indicator, Glossary--2Channel--probe deskew, 3--150, Glossary--2
Channelsdeskew, 3--150digitizer configuration, 3--32shared horizontal window, 3--19shared parameters, illustrated, 3--20
Circuit loading, Glossary--3Cleaning
exterior, C--1flat panel display, C--1
clear all references and setups, 3--222Clipping
derivative math waveforms, 3--161how to avoid, 3--161, 3--162integral math waveforms, 3--162
Clock source, A Trigger control window, 3--89Color
math, 3--115palette, 3--115, D--7, D--8reference, 3--115
Color palette, 3--43, 3--115, 3--120, D--7, D--8changing, 3--120definition, 3--115, D--7, D--8
Colors, D--7Comm, D--9Comm setup, D--6Comm triggering, 3--99Comm, trigger, D--6Communication, remote, 3--245Configuration
software installation, 1--11–1--13System, 1--5
Connect input signal, 3--8Connecting and conditioning your signals, 3--5connecting peripherals, 1--6connection to a LAN, 1--13connection to a network, 1--13connectivity tools, 2--2Contacting Tektronix, xvContents and index, D--12Control knob, Glossary--2Control window, Glossary--2
A Trigger, 3--72, 3--74, 3--79, 3--82, 3--84, 3--87,3--88, 3--96
A-->B Seq Trigger, 3--96, 3--97B trigger, 3--98
Controlling Data Input and Output, 3--207Copy, D--3Copy a waveform, 3--236Copy setup, D--3Copy waveforms, 3--236Copying waveforms, 3--225
Index
Index- 4 TDS7404, TDS7254 & TDS7154 Digital Phosphor Oscilloscopes User Manual
Coupling, 3--6, D--4ground, Glossary--5trigger, 3--56
creating, emergency startup disk, 1--10Creating and Using Math Waveforms, 3--155Cross-hair, graticule, 3--120, D--7Crossing %, B--3, D--9Cursor, 3--132
controls, D--8marker length, 3--138Measurements, 3--202measurements, 3--123, 3--133mode, D--8position, 3--137, D--8sources, 3--137tracking, 3--138type, 3--137, D--8types, 3--134units, 3--136
Cursor controls window, 3--137Cursor Measurements, 3--202Cursor readout, V-Bars, 3--202Cursors, 3--133, Glossary--3
using, 3--134with derivative waveforms, 3--160, 3--169with FFT waveforms, 3--193, 3--202
Cursors menucursor controls, D--8cursor mode, D--8cursor position, D--8cursor setup, D--8cursor type, D--8h-bars, D--8independent, D--8paired, D--8split, D--8track, D--8v-bars, D--8
Customer feedback, D--12Customize measurements, 3--124Customizing the display, 3--114Cycle area, B--1, D--9, Glossary--3Cycle distortion, B--4, D--9Cycle mean, B--1, D--9, Glossary--3Cycle RMS, B--1, D--9, Glossary--3
DData, controlling input and output, 3--207Data Input/Output, 3--207
All Settings are Retained, 3--208Avoiding Setup/Waveform Mismatches, 3--208
Begin your chart, 3--235Bitmap, file format, 3--225Copy Your File, 3--239copying waveforms, 3--225Delete a Reference Waveform File, 3--223Delete the File, 3--224Delete the Reference, 3--223Display the Reference Control Window, 3--216,
3--220, 3--223Display the Setups Control Window, 3--210, 3--213Display Your Reference Waveform, 3--222Export Your File, 3--232Exporting and Copying Waveforms, 3--225File Formats, 3--225Find the File Directory, 3--223Find the Source Directory, 3--213, 3--221Find Your File, 3--224Finish the chart, 3--235Hardcopy Formats, 3--241Import the waveform data, 3--234JPEG, file format, 3--225Label the Waveform, 3--217Margins, 3--240MathCad, file format, 3--225MathLab, file format, 3--225Name a destination, 3--211Name the File, 3--233Name your setup, 3--211, 3--212Numeric, file format, 3--225Orientation, 3--240Page setup window, 3--242Palette, 3--241Paper, 3--240Print preview window, 3--243Print window, illustration, 3--240Printing Waveforms, 3--240Recall a Reference Waveform From a File, 3--221Recall Setup From a File, 3--213Recall the Setup, 3--213Recall the Waveform, 3--220Recall your setup, 3--214Recall Your Waveform, 3--222Remote Communication, 3--245Retaining Current Settings, 3--208Save the File, 3--233Save the Setup, 3--210Save the Waveform to a File, 3--218Save the Waveform to a Reference, 3--217Save your setup, 3--212Save your waveform, 3--218Saving and Recalling a Setup, 3--207Saving and Recalling Waveforms, 3--215
Index
TDS7404, TDS7254 & TDS7154 Digital Phosphor Oscilloscopes User Manual Index- 5
Select a Destination, 3--218, 3--232Select directory and name file, 3--218Select for Copy, 3--236Select for Export, 3--226Select Setup for Copy, 3--236Select Setup for Export, 3--227Select the Waveform to Save, 3--216Select your setup, 3--214Select Your Waveform, 3--222Setup to Copy Images, 3--237Setup to Copy Measurements, 3--239Setup to Copy Waveforms, 3--238Setup to Export Images, 3--228Setup to Export Measurements, 3--231Setup to Export Waveforms, 3--229Specify a line-graph chart, 3--235Spreadsheet, file format, 3--225Text, file format, 3--225To Clear References, 3--222To Copy Your Waveform, 3--236To Date/Time Stamp Hardcopies, 3--244To Display the Date and Time, 3--244To Export Your Waveform, 3--226To Get the Current Time, 3--244To Preview the Page, 3--242To Print from Front Panel, 3--240To Print from Menu Bar, 3--240To Recall Your Setup, 3--213To Recall Your Waveform, 3--220To Save to a File, 3--211To Save Your Setup, 3--210To Save Your Waveform, 3--216To Set the Date and Time, 3--244To Set up the Page, 3--240To Use an Exported Waveform, 3--234View, 3--241
Data input/outputimage, 3--241save all waveforms to files, 3--218setup to export histograms, 3--231using auto--increment filename, 3--208
Data Source, A Trigger control window, 3--89Date and time
display, 3--116, D--8displaying, 3--244set, 3--116setting, 3--244
Date/Time, on hardcopies, 3--244dB, 3--197DC coupling, Glossary--3DC offset, with math waveforms, 3--162Deassign multipurpose knobs, D--12Default setup, how to execute, 3--13
Define inputs, A Trigger control window, 3--84, 3--87,3--89, 3--90
Define pattern type, A Trigger control window, 3--85,3--87
Defining and displaying waveforms, 3--104Degree, 3--198Delay, D--9DELAY button, 3--57Delay measurement, Glossary--3Delay mode on, D--5Delay time, Glossary--3
A Trigger control window, 3--96Delayed runs after time, 3--57Delayed trigger, 3--57
how to set up, 3--96Delayed triggerable on events, 3--57Delete all refs, D--1Derivative math waveform, 3--160
applications, 3--159derivation of, 3--160procedure for measuring, 3--160, 3--169record length of, 3--160
Descriptionkey features, 1--1Product, 1--1
Deskew, 3--150, D--4, Glossary--2channels, 3--150vertical controls window, 3--150
Diagnostics, D--12Differentiation
of a derivative, 3--159waveform, 3--159
Digitizing, Glossary--3process, defined, 3--33
Displaycustomizing, 3--114date and time, D--8elements, 3--102format, 3--115, D--7persistence, 3--114, D--7settings, 3--114setup, 3--118, D--7style, 3--114, D--7styles, 3--118system, Glossary--3
Display area, zoom, D--5Display control, 3--103Display control window
dots, 3--116infinite persistence, 3--116variable persistence, 3--116vectors, 3--116
Display controls, intensity, 3--43
Index
Index- 6 TDS7404, TDS7254 & TDS7154 Digital Phosphor Oscilloscopes User Manual
Display menuappearance, D--7color palette, D--7, D--8colors, D--7cross-hair, D--7display date and time, D--8display format, D--7display persistence, D--7display setup, D--7display style, D--7Display trigger T, D--8dots, D--7frame, D--7full, D--7graticule style, D--7grid, D--7infinite persistence, D--7intensified samples, D--7intensity, 3--43LCD backlight enabled, D--8linear, D--7monochrome gray, D--7, D--8monochrome green, D--7, D--8n, D--7, D--8no persistence, D--7objects, D--7persistence controls, D--7reset all, D--7screen text, D--7sin(x)/x, D--7spectral grading, D--7, D--8temperature grading, D--7, D--8user palette, D--7, D--8variable persistence, D--7vectors, D--7waveform intensity, 3--43waveform interpolation, D--7XY, 3--44xy, D--7XYZ, 3--44xyz, D--7YT, 3--44yt, D--7
Display on/off, D--1, D--3, D--10, D--11Display trigger T, D--8Displaying waveforms, 3--101
access the display Setup dialog box, 3--118acquisition preview, 3--103adjust the horizontal reference, 3--108backlight timeout, 3--116change graticule style, 3--120change waveforms colors, 3--120checking the zoom scale and position, 3--113
color palette, 3--115customizable display elements, 3--114customize graticule & waveforms, 3--120customizing the display, 3--114date and time, 3--116defining and displaying waveforms, 3--104display and acquisition controls, 3--105display control, 3--103display elements, 3--102display format, 3--115display persistence, 3--114display settings, 3--114display style, 3--114dots, 3--114, 3--118explore the zoom controls, 3--108graticule, 3--102, 3--120graticule area, 3--102graticule style, 3--114graticules, 3--105horizontal position, 3--104, 3--106horizontal position and the horizontal reference,
3--105horizontal record length, 3--104horizontal reference, 3--102, 3--106horizontal scale, 3--104horizontal zoom, 3--113horizontal-scale readout, 3--102infinite persistence, 3--116, 3--118, 3--119intensified samples, 3--114, 3--118intensity, 3--115interpolation, 3--115, 3--116LCD backlight, 3--116linear, 3--118linear interpolation, 3--117math colors, 3--115mouse, 3--106mouse and touch screen operation, 3--106normal and persistence displays, 3--116operations on the timebase, 3--105operations on waveforms, 3--104operations performed based on the waveform type,
3--104persistence, 3--119persistence displays, 3--116quick adjust the timebase (zoom), 3--108record length, 3--104reference colors, 3--115reset zoom, 3--113scale, 3--104screen saver, 3--116screen text, 3--114select a persistence mode, 3--119select the display persistence, 3--118
Index
TDS7404, TDS7254 & TDS7154 Digital Phosphor Oscilloscopes User Manual Index- 7
select the display style, 3--118select zoom, 3--110set date and time, 3--116set display styles, 3--118set horizontal display parameters, 3--107set up zoom, 3--112set vertical display parameters, 3--107setting zoom controls, 3--109sin(x)/x interpolation, 3--116sine(x)/x, 3--118to display waveforms in the main graticule, 3--107to zoom waveforms, 3--109touch screen, 3--103, 3--106trigger level marker, 3--115trigger T, 3--115using display controls, 3--114using the display, 3--103using the waveform display, 3--102using zoom with waveforms, 3--109variable persistence, 3--116, 3--118, 3--119vectors, 3--114, 3--118vertical offset, 3--104vertical position, 3--104vertical scale, 3--104vertical zoom, 3--113waveform display, 3--103waveform intensity, 3--115waveform interpolation, 3--115waveforms, 3--120xy, 3--115xyz, 3--115yt, 3--115zoom, 3--103, 3--104, 3--108zoom a waveform, 3--111zoom position, 3--113zoom reset, 3--113zoom scale, 3--113
Dots, 3--114, 3--116, 3--118, D--7display control window, 3--116
DPO, Glossary--4Dragging, Glossary--3Dual display setup, 1--14Dual graticule, Glossary--3duration, 3--171Duty cycle, Glossary--7, Glossary--9Duty cycle distortion, B--4
EECL, 3--73, 3--80, 3--83, 3--89
A Trigger level, 3--64, 3--65
Edgesetup, D--6trigger, 3--54, D--6, Glossary--4
Edit menucopy, D--3copy setup, D--3full screen, D--3graticule, D--3measurement, D--3select for copy, D--3waveform, D--3
Either, A Trigger control window, 3--72, 3--74, 3--77,3--79, 3--98
Envelope, 3--23, 3--28, 3--46acquisition mode, 3--46incompatible with fast acquisitions, 3--38
Envelope acquisition mode, Glossary--4environment requirements, 1--6Equation editor, D--11Equivalent time auto, D--5Equivalent-time sampling, 3--35, 3--46
random, Glossary--4erase all references and setups, 3--222Error log, D--12Ethernet, 3--245Excel, 3--234exiting the application, 1--12Export, D--2
Save format, 3--225Export setup, D--2Export waveforms, 3--226Exporting files using PRINT button, 3--232Exporting waveforms, 3--225Ext ratio, D--9Ext ratio (dB), D--9Ext ratio %, D--9External reference, 2--10, D--12External signals, D--12Extinction ratio, B--3Extinction ratio %, B--3Extinction ratio dB, B--3Eye base, B--3, D--9Eye height, B--3, D--9Eye top, B--3, D--9Eye width, B--3, D--9
FFall time, B--1, D--9, Glossary--4Falling edge, A Trigger control window, 3--87, 3--89FALSE, A Trigger control window, 3--85, 3--88
Index
Index- 8 TDS7404, TDS7254 & TDS7154 Digital Phosphor Oscilloscopes User Manual
Fast acquisition, 3--38, 3--46automatic selection, 3--39normal DSO and fast acquisition displays, 3--41to adjust the intensity, 3--43to enable fast acquisitions mode, 3--42to select the color palette, 3--43to select the format, 3--44to set display format, 3--44to set the display readout options, 3--121to set the style, 3--42to turn fast acquisitions on and off, 3--41using fast acquisition mode, 3--38using fast acquisitions, 3--39vs. normal DSO mode (illustrated), 3--40waveform capture rate, 3--39
Fast acquisitions, D--5Fast acquisitions mode, modes incompatible with, 3--38Fast Fourier Transforms, description, 3--170FastFrame, 3--45, 3--125, 3--157
controls, D--5FastFrame time stamp, illustrated, 3--50incompatible with fast acquisitions, 3--38interactions, 3--46RUN/STOP, 3--46select the FastFrame and time stamps selection
controls, 3--49select the frame to view, 3--48select the reference frame, 3--49set frame count, 3--47set frame length, 3--47setup, D--5time stamping frames, 3--48to lock the reference position frames, 3--50to set FastFrame mode, 3--47turn readouts on or off, time stamps, 3--48using FastFrame acquisitions, 3--46
FastFrame mode, using, 3--47FastFrame setup, horizontal menu, 3--47, 3--50FFT math waveform
automated measurements of, 3--193phase suppression, 3--198procedure for displaying, 3--195procedure for measuring, 3--193, 3--202
file formats, 3--225File menu
1 recent setup file !, D--2delete all refs, D--1display on/off, D--1export, D--2export setup, D--2full screen, D--2graticule, D--2instrument setup, D--1
label, D--1measurements, D--2minimize, D--2page setup, D--1position/scale, D--1print, D--1print preview, D--1recall default setup, D--1recall waveform, D--1reference setup, D--1reference waveforms, D--1run application, D--1save waveform, D--1select for export, D--2shutdown, D--2waveform, D--2
Flat panel display, cleaning, C--1Flattop2 window, 3--180, 3--182, 3--189Flexible control access, 3--7FORCE TRIG button, 3--65Frame
graticule, 3--120, D--7horizontal menu, 3--48
Frame count, horizontal menu, 3--47Frame length, horizontal menu, 3--47Frame, horizontal menu, 3--49Frequency, B--1, D--9, Glossary--4Frequency Domain Controls, 3--170Front panel, triggering, 3--57Front-panel controls, INTENSITY, 3--43Full, graticule, 3--120, D--7Full screen, D--2, D--3fuses, 1--8
Ggate controls, 3--172Gated measurements, Glossary--4Gating, 3--132, D--9Gating Controls, 3--170Gaussian window, 3--180, 3--182, 3--184General purpose knob, Glossary--7Glitch either trigger, Glossary--4Glitch negative trigger, Glossary--4Glitch setup, D--6Glitch trigger, 3--67, D--6, Glossary--4
how to set up, 3--72Glitch, A Trigger control window, 3--72, 3--73GPIB, 3--245, Glossary--5
configuration, D--11remote communication, 3--245
Index
TDS7404, TDS7254 & TDS7154 Digital Phosphor Oscilloscopes User Manual Index- 9
Graticule, 3--102, D--2, D--3, Glossary--5100% zoom, D--550/50% zoom, D--580/20% zoom, D--5area, 3--102measurements, 3--123style, 3--114, 3--120, D--7Zoom, D--5
Graticule Size button, 3--105Graticule Split, 3--112Graticules, 3--105Grid graticule, 3--120, D--7Ground coupling, Glossary--5GroupDelay, 3--198
HHamming window, 3--180, 3--182, 3--186, 3--199Hanning window, 3--180, 3--182, 3--187, 3--199Hardcopy, Glossary--5Hardcopy Formats, 3--241H-bars, D--8Help, 3--247
for in-depth contextual overviews, 3--248how to get, 3--13how to use online help, 3--247to dig deeper, 3--249to enable full-text search, 3--250
Help menu, D--12about TekScope, D--12contents and index, D--12customer feedback, D--12help on window, D--12restore help, D--12specifications, D--12technical support, D--12
Help on window, D--12Hi Res, 3--21
acquisition mode, Glossary--5incompatible with fast acquisitions, 3--38
High, B--1, Glossary--5High level, D--9High/low method, 3--126Histogram, 3--130
limit controls, 3--142Histogram counting
resetting, 3--141starting, 3--141
Histogram mean, 3--130Histogram measurements, D--10Histogram setup window, 3--141Histograms, 3--46, 3--139, 3--153
Hits in box, B--2, D--10Holdoff, D--6
A Trigger, 3--63trigger, 3--55
Holdoff, trigger, Glossary--5Horiz/acq, run/stop, D--5Horiz/acq menu
acquisition mode, D--5autoset, D--4delay mode on, D--5equivalent time auto, D--5fast acquisitions, D--5FastFrame controls, D--5FastFrame setup, D--5horizontal/acquisition setup, D--4position/scale, D--5resolution, D--5roll mode auto, D--5zoom controls, D--4zoom setup, D--5
Horizontalacquisition window, Glossary--5acquisition window considerations, 3--17acquisition window, illustrated, 3--18bar cursors, Glossary--5delay, 3--95position, 3--56, 3--104, 3--105record length, 3--104scale, 3--18, 3--104
Horizontal cursors, 3--133Horizontal menu
FastFrame Setup, 3--47FastFrame setup, 3--50frame count, 3--47frame length%, 3--47frame%, 3--48, 3--49
Horizontal offset, overview, 3--17Horizontal reference, 3--102, 3--105Horizontal reference point, Glossary--5Horizontal scale, 3--104Horizontal scale and offset, setting up, overview, 3--17Horizontal scale vs. record length vs. sample interval
vs. resolution, 3--18Horizontal zoom, 3--113Horizontal/acquisition setup, D--4Horizontal-scale readout, 3--102
IImage, printing, 3--241Impulse Response Testing, 3--179
Index
Index- 10 TDS7404, TDS7254 & TDS7154 Digital Phosphor Oscilloscopes User Manual
Incoming Inspection Procedure, 1--17–1--28Test Equipment, 1--17
Independent, D--8Independent vs. shared Window, 3--19Index, Reference, 3--1Infinite persistence, 3--118, 3--119, D--7
display control window, 3--116Initialize, Glossary--5Input, 3--207Input conditioning background, 3--14Input coupling, 3--8
AC, 3--8DC, 3--8GND, 3--8
Installation, 1--5–1--16incoming inspection procedure, 1--17option, D--12software installation, 1--11–1--13
Instrument diagnostics, D--12Instrument id, D--12Instrument setup, D--1Integral math waveform, 3--162
applications, 3--161derivation of, 3--162record length of, 3--162
Integration, Waveform, 3--161Inten samp, 3--118Intensified samples, 3--118, D--7Intensity, 3--43, Glossary--6
display menu, 3--43Waveform, 3--115
Interleaving, 3--37, Glossary--6Internal reference, 2--10, D--12Interpolation, 3--37, 3--115, 3--116, D--7, Glossary--6
incompatible with DPO, 3--38Introduction, to this manual, xiii
JJitter 6 sigma, B--4, D--9Jitter pk--pk, D--9Jitter pk-pk measurement, B--3Jitter RMS, B--4Jitter rms, D--9JPEG, file format, 3--225
KKaiser-Bessel window, 3--180, 3--182, 3--187Knob, Glossary--6
general purpose, Glossary--7multipurpose, 3--136
resolution, Glossary--6trigger MAIN LEVEL, 3--57
LLabel, D--1, D--3, D--11Label the Waveform, 3--217LAN, enabling, 1--13LAN connection, 1--13LCD backlight enabled, D--8LCD backlight timeout, 3--116, D--8Level
A Trigger control window, 3--73, 3--78, 3--83trigger, 3--56
Level presets, 3--64A Trigger, 3--65
line, trigger input, 3--53, 3--59Linear, 3--118, D--7Linear interpolation, 3--37, 3--117, Glossary--6Lock
all zoom, D--5zoom, D--5
Locklive zoom, D--5None zoom, D--5
Logic pattern setup, D--6Logic pattern, trigger, D--6Logic state setup, D--6Logic state, trigger, D--6Logic trigger, 3--69
definitions, 3--69pattern, Glossary--6state, 3--68, 3--69, Glossary--6
Logic triggering, 3--67Logic, A Trigger control window, 3--87, 3--88
logic, 3--84pulse, 3--72
Logic, main trigger menu, pulse, 3--79, 3--82Low, B--1, Glossary--6Low frequency compensation, 3--149Low level, D--9Low method, 3--126
MMagnitude spectrum, D--11Magnitude Verses Frequency, 3--170Main trigger menu
polarity, 3--74, 3--77, 3--79, 3--98pulse, 3--79, 3--82Set to 50%, 3--59state, 3--87, 3--88
Index
TDS7404, TDS7254 & TDS7154 Digital Phosphor Oscilloscopes User Manual Index- 11
true for less than, 3--86true for more than, 3--86width, 3--72, 3--75
Manualspart numbers, 1--31related, xiv
Margins, printing, 3--240Mask testing, 3--153
example, 3--203hookup, 3--203
Math, overview, 3--155Math color, 3--115Math menu
Ch1 -- Ch2, D--11Ch1 * Ch2, D--11Ch3 -- Ch4, D--11Ch3 * Ch4, D--11display on/off, D--10, D--11equation editor, D--11label, D--11magnitude spectrum, D--11math setup, D--10, D--11phase spectrum, D--11position/scale, D--10, D--11set math averages, D--11spectral controls, D--11spectral setup, D--11
Math setup, D--10, D--11Math Waveforms
Apply Averaging, 3--165Consider the Source, 3--166Creating and Using Math Waveforms, 3--155Cursor Measurements, 3--160Defining Math Waveforms, 3--156Defining Spectral Math Waveforms, 3--170
See also Spectral Mathderivative. See Derivative math waveformDerivative Math Waveform, illustration, 3--160Differentiation, 3--159Display the Math Control Window, 3--163Expression Syntax, 3--159FastFrame, 3--157Functional transformation of an acquired waveform,
illustration, 3--156How to Create, 3--157How to manage displaying, 3--166integral. See Integral math waveformOffset, Position, and Scale, 3--161Operations on Math Waveforms, 3--165Peak-Peak Amplitude Measurement of a Derivative
Waveform, illustration, 3--161Select a Function, 3--164Select a Math Waveform, 3--163
Select and Display, 3--167Set Scale and Position, 3--167Source Dependencies, 3--158Sources, 3--158Spectral analysis of an impulse, illustration, 3--156Spectral Math Waveforms, 3--170Take Automatic Measurements, 3--168Take Cursor Measurements, 3--169To Define a Math Waveform, 3--162To Define an Expression, 3--163To Define/Edit a Math Expression, 3--164To use, 3--166To Use Math Waveforms, 3--166Using Math, 3--157Using Math Waveforms, 3--166Waveform Differentiation, 3--159Waveform Integration, 3--161
Math waveforms, 3--125disallowed in DPO, 3--38incompatible with fast acquisitions, 3--38
MathCad, file format, 3--225MathLab, file format, 3--225Max, 3--129Maximum, B--1, D--9, D--10, Glossary--7Mean, 3--129, B--1, B--2, D--9, D--10, Glossary--7Mean +-- 1 stddev, B--3Mean +-- 2 stddev, B--3Mean +-- 3 stddev, B--3Measure menu
all, D--9amplitude, D--9area, D--9burst width, D--9Comm, D--9crossing %, D--9cycle area, D--9cycle distortion, D--9cycle mean, D--9cycle RMS, D--9delay, D--9ext ratio, D--9ext ratio (dB), D--9ext ratio %, D--9eye height, D--9eye top, D--9eye width, D--9fall time, D--9frequency, D--9gating, D--9high level, D--9histogram measurements, D--10hits in box, D--10jitter 6 sigma, D--9
Index
Index- 12 TDS7404, TDS7254 & TDS7154 Digital Phosphor Oscilloscopes User Manual
jitter pk--pk, D--9jitter rms, D--9low level, D--9maximum, D--9, D--10mean, D--9, D--10mean +--1 stddev, D--10mean +--2 stddev, D--10mean +--3 stddev, D--10measurement setup, D--9median, D--10minimum, D--9, D--10more, D--9neg duty cycle, D--9neg overshoot, D--9negative width, D--9noise pk--pk, D--9noise RMS, D--9off, D--9peak hits, D--10peak-to-peak, D--9, D--10period, D--9phase, D--9pos duty cycle, D--9pos overshoot, D--9positive width, D--9reference levels, D--9reset histograms, D--10reset statistics, D--9rise time, D--9RMS, D--9s/n ratio, D--9snapshot, D--9standard deviation, D--10statistics, D--9statistics controls, D--9time, D--9value count, D--10value mean, D--9waveform histograms, D--10
Measurement, D--3, Glossary--7amplitude, B--1, Glossary--1area, B--1, Glossary--1burst width, B--1, Glossary--2crossing %, B--3cycle area, B--1, Glossary--3cycle mean, B--1, Glossary--3cycle RMS, B--1, Glossary--3delay, Glossary--3duty cycle, Glossary--7, Glossary--9duty cycle distortion, B--4extinction ratio, B--3extinction ratio %, B--3extinction ratio dB, B--3
eye base, B--3eye height, B--3eye top, B--3eye width, B--3fall time, B--1frequency, B--1, Glossary--4gated, Glossary--4high, B--1, Glossary--5hits in box, B--2jitter 6 sigma, B--4jitter pk-pk, B--3jitter RMS, B--4low, B--1, Glossary--6maximum, B--1, Glossary--7mean, B--1, B--2, Glossary--7mean +-- 1 stddev, B--3mean +-- 2 stddev, B--3mean +-- 3 stddev, B--3median, B--2minimum, B--2, Glossary--7negative duty cycle, B--2negative overshoot, B--2negative width, B--2noise pk-pk, B--4noise RMS, B--4overshoot, Glossary--9peak hits, B--3peak-to-peak, B--2, Glossary--8period, B--2, Glossary--8phase, B--2, Glossary--8pk-pk, B--3positive duty cycle, B--2positive overshoot, B--2positive width, B--2propagation delay, B--1quality factor, B--4rise time, B--2, Glossary--10RMS, B--2, Glossary--10S/N ratio, B--4stddev, B--2undershoot, Glossary--7waveform count, B--2width, Glossary--8, Glossary--9
Measurement accuracy, ensuring maximum,3--142–3--154
Measurement parameter, Glossary--7Measurement setup, D--9Measurement statistics, 3--129, Glossary--7Measurement tracking, Glossary--7Measurements, D--2
automated, 3--124Classes of, 3--123cursor, 3--133
Index
TDS7404, TDS7254 & TDS7154 Digital Phosphor Oscilloscopes User Manual Index- 13
high and low levels defined, B--5levels used in taking, B--4, B--6reference levels defined, B--5reference levels defined (eye pattern/optical), B--6
Measuring waveforms, 3--123absolute reference, 3--127access gating, 3--132annotate waveforms on screen, 3--124annotated display, 3--124automatic measurements, 3--123calibrate the oscilloscope, 3--143change cursor position, 3--137channel, 3--125check the calibration status, 3--143, 3--148compensate probe timing (deskew), 3--151components determining time cursor readout values,
3--135connect the fixture, 3--144connect the probe, 3--145connect the probe calibration fixture, 3--144cursor, 3--132cursor measurements, 3--123cursor types, 3--133, 3--134cursor units depend on sources, 3--136cursors are display limited, 3--134cursors ignore the selected waveform, 3--134cursors treat sources independently, 3--135customize measurements, 3--124display measurement statistics, 3--129display the calibration instructions, 3--143display the cursor controls window, 3--137enable & position the gates, 3--132FastFrame, 3--125gates, 3--125gating, 3--132graticule, cursor and automatic measurements,
3--123high/low method, 3--126histogram, 3--126, 3--130histogram counting, 3--140histogram counting stays on, 3--140histogram mean, 3--130histogram measurements, 3--142histogram size, 3--140horizontal cursors, 3--133horizontal histogram view and measurement data,
illustrated, 3--139indep, cursor, 3--138low frequency compensation, 3--149math waveforms, 3--125max, 3--129mean, 3--129measure part of a waveform, 3--125
measurement gating, 3--132measurement selection, 3--125measurement sources, 3--125min, 3--129min-max, 3--126, 3--130multipurpose knobs, 3--136number of measurements, 3--125open histogram setup window, 3--141optimize gain and offset accuracy, 3--147optimizing measurement accuracy, 3--142paired cursors, 3--133reference levels method, 3--127reference-level calculation methods, 3--127references, 3--125relative reference, 3--127remove measurements, 3--129see statistics on measurement results, 3--124select a cursor type, 3--137select measurement parameters, 3--125select measurement sources, 3--125select the cursor sources, 3--137select the waveform, 3--128set cursor marker length, 3--138set cursor tracking, 3--138set display and reset histogram source and type,
3--141set histogram display options, 3--142set histogram limit controls, 3--142set measurement reference levels, 3--130sources, 3--125split cursors, 3--133standard deviation, 3--129statistics, 3--124take a snapshot of measurements, 3--131take measurements on a frame, 3--125taking automatic measurements, 3--124taking cursor measurements, 3--133taking histograms, 3--139, 3--153to calibrate probes, 3--147to compensate passive probes, 3--149to compensate the oscilloscope, 3--143to deskew channels, 3--150to set the cursor sources, 3--137to start and reset histogram counting, 3--141to take automatic measurements, 3--128tracking, cursor, 3--138using automatic measurements, 3--125using cursors, 3--134using histograms, 3--140vertical cursors, 3--133vertical cursors measure from the trigger point,
3--135zoom, 3--132
Index
Index- 14 TDS7404, TDS7254 & TDS7154 Digital Phosphor Oscilloscopes User Manual
Median, B--2, D--10Min, 3--129
take automatic measurements, 3--128Minimize, D--2Minimum, B--2, D--9, D--10, Glossary--7Min-max, 3--130Mode, sampling, 3--33Mode, acquisition, D--5Mode, trigger, D--6Monochrome gray, D--7, D--8Monochrome green, D--7, D--8More, D--9Mouse, 3--106Multipurpose knobs, 3--136, D--12
NNAND, Glossary--7NAND, A Trigger control window, 3--85, 3--87Neg duty cycle, D--9Neg overshoot, D--9Negative duty cycle, B--2Negative overshoot, B--2Negative width, B--2, D--9Negative, A Trigger control window, 3--72, 3--74, 3--77,
3--79, 3--98network connection, 1--13No persistence, D--7Noise
reducing in phase FFTs, 3--198reducing in phase waveforms, 3--178
Noise pk--pk, D--9Noise pk-pk measurement, B--4Noise RMS, B--4, D--9NOR, Glossary--8NOR, A Trigger control window, 3--85, 3--87Normal trigger mode, 3--54, 3--60, Glossary--8Normal, display, D--7, D--8Numeric, file format, 3--225Nyquist frequency, 3--192
OObjects, display, D--7Off, D--9OFF (real time only), acquisition controls, 3--29Offset, D--4
DC. See DC Offsetvertical, 3--15, 3--161, 3--162
Online help, 3--247operating requirements, 1--6Option installation, 1--13, D--12
Option key, 1--13Option software, 1--13Optional accessories, 1--32Options key, D--12Options list, D--12OR, Glossary--8OR, A Trigger control window, 3--85, 3--87Orientation, printing, 3--240Oscilloscope, Glossary--8Output, 3--207Overshoot, Glossary--9
Ppage preview, 3--242Page setup, D--1Paired, D--8Palette, printing, 3--241Paper, printing, 3--240Pattern trigger, 3--68, 3--84
how to setup, 3--84Peak detect, 3--21, 3--28Peak detect acquisition mode, Glossary--8Peak hits, B--3, D--10Peak-to-peak, B--2, D--9, D--10Peak-to-peak, Glossary--8Performance Verification
Of Functions, 1--19Self Tests, 1--17
performance verification, 1--12Period, B--2, D--9, Glossary--8peripheral, connecting, 1--6Persistence, 3--116Persistence controls, D--7Phase, B--2, D--9, Glossary--8Phase spectrum, D--11Phase suppression, 3--178Phase Verses Frequency, 3--170Phone number, Tektronix, xvPixel, Glossary--9Pk-pk, B--3Plug&play Software, 1--11–1--16Polarity and width, A Trigger control window, 3--72,
3--74, 3--77Polarity, main trigger menu, 3--74, 3--77, 3--79, 3--98Pos duty cycle, D--9Pos overshoot, D--9Position, vertical, 3--161, 3--162, D--3Position/scale, D--1, D--3, D--5, D--10, D--11Positive duty cycle, B--2Positive overshoot, B--2Positive width, B--2, D--9
Index
TDS7404, TDS7254 & TDS7154 Digital Phosphor Oscilloscopes User Manual Index- 15
Positive, A Trigger control window, 3--72, 3--74, 3--77,3--79, 3--98
Posttrigger, 3--53, Glossary--9powering off, 1--9powering on, 1--8Preferences, D--12Pretrigger, 3--53, Glossary--9Principal power switch, Glossary--9Print, D--1Print Preview, 3--243Print preview, D--1Printing, 3--240
waveforms, 3--240Probe
Accessories, 1--32cal, D--4calibrate, 3--147calibration fixture, 3--144compensate timing, 3--151compensation, Glossary--9definition, Glossary--9low frequency compensation, 3--149
Probe--channel deskew, 3--150, Glossary--2Probes and signal connection, 3--5Product
accessories, 1--29Description, 1--1software, 1--2
Product support, contact information, xvprogrammer help, 1--11Propagation delay, B--1Pulse trigger, Glossary--9Pulse triggering, 3--67
A Trigger control window, 3--74Pulse, A Trigger control window, 3--72, 3--77, 3--79,
3--82
QQ factor, B--4Quality factor, B--4, D--9Quantizing, Glossary--9quitting the application, 1--12
RRadian, 3--198Range, vertical input, 3--15Readout
channel, 3--113cursor, V-Bars, 3--202trigger, 3--61
Real-time sampling, 3--35, Glossary--9Recall default setup, D--1Recall waveform, D--1Recalling a setup, 3--207Recalling a waveform, 3--215Recent setup file, D--2Record, acquisition, shared by all channels, 3--19Record Length, 3--171
derivative math waveforms, 3--160integral math waveforms, 3--162
Record length, 3--18, 3--104, Glossary--10defined, 3--34
Recovered clock, 3--54, 3--99Rectangular window, 3--180, 3--182, 3--185, 3--199Reference
clock, 2--10, D--12color, 3--115levels, 3--130levels method, 3--127memory, Glossary--10setup, D--1waveforms, D--1, Glossary--10
Reference selection, D--12Reference-level calculation methods, 3--127References, 3--125
Clear, 3--222clearing, 3--222Delete, 3--222
Related Manuals, xivRelative reference, 3--127Release Notes, for Plug & Play Software, 1--11Remote communication, 3--245Remove measurements, 3--129repetitive signal, 3--29Reset all, D--7Reset histogram counting, 3--141Reset histograms, D--10Reset statistics, D--9reset zoom factors, zoom menu, 3--113Resolution, 3--18, 3--171, D--5Resolution Bandwidth, 3--174, 3--200Restore help, D--12Rise time, B--2, D--9, Glossary--10Rising edge, A Trigger control window, 3--87, 3--89RMS, B--2, D--9, Glossary--10Roll mode
auto, D--5illustrated, 3--26incompatible with fast acquisitions, 3--38untriggered, 3--25untriggered, with single sequence, 3--25using, 3--31
Run application, D--1
Index
Index- 16 TDS7404, TDS7254 & TDS7154 Digital Phosphor Oscilloscopes User Manual
RUN/STOP, 3--28, 3--46Run/stop, D--5, D--6Run/Stop button only, 3--25Runt setup, D--6Runt trigger, 3--67, D--6, Glossary--10
A Trigger control window, 3--74how to set up, 3--74–3--100
SS/N ratio, B--4, D--9Sample, 3--21, 3--28Sample acquisition mode, Glossary--10Sample interval, 3--18, Glossary--10
defined, 3--34Sample rate, maximum, 3--38Samples, number of, 3--24Sampling, 3--35, Glossary--10
modes, 3--33process, defined, 3--33process, illustrated, 3--33–3--38
Sampling and acquisition mode, 3--35Save format, Export, 3--225Save waveform, D--1Saving a setup, 3--207Saving a waveform, 3--215Scale, 3--104
horizontal, D--5vertical, 3--161, D--1, D--3
Scaling and positioning, 3--6Screen saver, 3--116, D--8Screen text, 3--114, D--7, Glossary--10Second monitor setup, 1--14Select for copy, D--3Select for export, D--2Select input coupling, 3--8Select polarity, 3--79Select the input signal channel, 3--8Select waveform interpolation, 3--118Selected waveform, Glossary--11Selecting zoom, 3--110Sequential triggering, 3--92Serial number, D--12Serial pattern setup, D--6Serial pattern triggering, 3--99Serial pattern, trigger, D--6Service support, contact information, xvSet FFT Vert Scale, 3--197Set horizontal acquisition window, 3--10SET LEVEL TO 50% button, 3--59Set math averages, D--11Set thresholds, A Trigger control window, 3--84, 3--87
Set time & date, D--11Set to 50%, main trigger menu, 3--59Set to ECL, A Trigger control window, 3--80Set to TTL, A Trigger control window, 3--80Set vertical acquisition window, 3--9Set/hold trigger, 3--70Setting, Glossary--10Setting acquisition controls, 3--20Setting vertical range and position, 3--16Setup
control window, Glossary--11dual display, 1--14file, D--2recalling, 3--207saving, 3--207second monitor, 1--14
Setup/hold setup, D--6Setup/hold trigger, 3--70, D--6
how to set up, 3--88maximum hold time, 3--70negative setup or hold times, 3--70positive setup or hold times, 3--70trigger point location, 3--70
Shutdown, D--2Shutting down, 1--9Signal connection and conditioning, 3--4SIGNAL OUTPUT, 2--7Signal path compensation, 3--142–3--154Sin(x)/x, 3--118, D--7Sin(x)/x interpolation, 3--37, 3--116, Glossary--6SINGLE, 3--25, 3--28Single sequence, 3--25Single sequence off, 3--28SINGLE TRIG button, 3--66Single-shot sampling, 3--35site considerations, 1--6Slew rate trigger, 3--68, Glossary--11
600 ps limitation, 3--817.5 ns limitation, 3--81how to set up, 3--79–3--100
Slope, Glossary--11Slope, trigger, 3--56Snapshot, D--9Snapshot of measurements, 3--131Software, upgrade, 1--3Software Installation, 1--11–1--13Source
A Trigger control window, 3--72, 3--74, 3--77, 3--79,3--82
B Trigger control window, 3--98Sources, 3--125Span, 3--173
Index
TDS7404, TDS7254 & TDS7154 Digital Phosphor Oscilloscopes User Manual Index- 17
Specificationshelp menu, D--12instrument, A--1
Spectral analysis, displaying phase, 3--198Spectral analyzer controls, 3--200Spectral Averaging, 3--170Spectral controls, D--11Spectral grading, D--7, D--8Spectral Math
3 dB BW in bins, 3--182acquisition mode, 3--192Affects of frequency domain control adjustments,
illustrated, 3--175Affects of trigger jitter, 3--191Aliasing, 3--192averaging, 3--192bandwidth, 3--200Blackman-Harris, 3--180, 3--182, 3--187, 3--199Center, 3--174center frequency, 3--200, 3--202Coefficients, 3--182, 3--183Coherent gain, 3--182dB, 3--176, 3--197dBm, 3--176, 3--197Defining Spectral Math Waveforms, 3--170Definition of gate parameters, illustrated, 3--173degree, 3--198Display the Math Control Window, 3--194, 3--195Display the Spectral Waveform, 3--196duration, 3--171, 3--201Duration and resolution control effects, illustrated,
3--172Example of scallop loss for a Hanning Window
without zero fill, illustration, 3--183Example of the effects of setting the Phase Suppres-
sion Threshold, illustrated, 3--179Flattop2 window, 3--180, 3--182, 3--189, 3--199Frequency Domain Controls, 3--170frequency domain span, 3--201frequency range, 3--200frequency span, 3--200gate controls, 3--172gate duration, 3--201gate position, 3--201Gating Controls, 3--170Gaussian window, 3--180, 3--182, 3--184, 3--199Group Delay, 3--179, 3--198Hamming window, 3--180, 3--182, 3--186, 3--199Hanning window, 3--180, 3--182, 3--187, 3--199How aliased frequencies appear in a spectral
waveform, illustrated, 3--193Impulse Response Testing, 3--179Kaiser-Bessel window, 3--180, 3--182, 3--187, 3--199
Linear, 3--176, 3--197Magnitude Verses Frequency, 3--170Multiple Analyzer Control Locks, 3--171Nearest Side Lobe, 3--182, 3--183phase reference point, 3--201Phase Reference Position, 3--177Phase Unwrap, 3--178Phase Verses Frequency, 3--170radian, 3--198Real and Imaginary Magnitudes, 3--177Recognizing Aliasing, 3--192record length, 3--171, 3--201Rectangular window, 3--180, 3--182, 3--185, 3--199reducing noise, 3--198Reference Level, 3--176Reference Level Offset, 3--177resolution, 3--171, 3--201Resolution Bandwidth, 3--174, 3--200, 3--201sample rate, 3--200, 3--201scale factor, 3--197, 3--198Scallop Loss, 3--182Select a Predefined Spectral Analysis Math
Waveform, 3--194Select a Spectral Waveform, 3--195Select Spectral Analysis Setup, 3--195Select the Window Type, 3--199Set the Frequency Domain Controls, 3--200Set the Magnitude Scale, 3--197Set the Phase Scale, 3--198Set the Time Domain Controls, 3--201Set Time and Frequency Domain Control Tracking,
3--198Span, 3--173Spectral Analyzer controls, 3--171Spectral Averaging, 3--170Suppression Threshold, 3--178Take Cursor Measurements, 3--202Tek Exponential window, 3--180, 3--182, 3--191,
3--199Tek Exponential window in the time and the
frequency domains, illustration, 3--191Time and frequency domain graphs for the Flattop2
window, illustration, 3--190Time and frequency domain graphs for the Rectan-
gular window, illustration, 3--185Time and frequency graphs for the Gaussian
window, illustration, 3--184Time and frequency graphs for the Hanning Window,
illustration, 3--187Time and frequency graphs for the Kaiser-Bessel
window, illustration, 3--188
Index
Index- 18 TDS7404, TDS7254 & TDS7154 Digital Phosphor Oscilloscopes User Manual
Time and frequency graphs of the Blackman-Harriswindow, illustration, 3--189
Time and frequency graphs of the Hammingwindow, 3--186
Time Domain Controls, 3--170To Define A Spectral Math Waveform, 3--195To Select a Predefined Spectral Math Waveform,
3--194To Take Automated Measurements of a Spectral
Math Waveform, 3--193To Take Cursor Measurements of a Spectral Math
Waveform, 3--193unwrap phase, 3--198Using Spectral Math Controls, 3--171Using the Frequency Domain controls, 3--173Using the gate controls, 3--172Using the magnitude controls, 3--176Using the Phase controls, 3--177Using the time controls, 3--171Using windows to filter, 3--180Window characteristics, 3--180, 3--182Window Functions, 3--170Windowing the Time Domain Record, illustrated,
3--181Zero Phase Reference, 3--182, 3--183
Spectral mathFFT length, 3--181phase unwrap
algorithm, 3--178dejitter, 3--178
swept sine wave analysis, 3--193Spectral math waveform
aliasing, 3--192phase suppression, 3--178undersampling, 3--192zero phase reference, 3--183
Spectral Math Waveforms. See Spectral MathSpectral setup, D--11Split, D--8Split cursors, 3--133Spreadsheet, file format, 3--225Standard, accessories, 1--31Standard deviation, 3--129, D--10Start histogram counting, 3--141startup disk, creating, 1--10State, main trigger menu, 3--87, 3--88State trigger, 3--69, 3--87
how to set up, 3--87Statistical measurement, Glossary--11Statistics, 3--129, D--9
on measurement results, 3--124Statistics controls, D--9
Status, calibration, 3--143, 3--148Stddev, B--2
TTrig events, A-->B Seq Trigger control window, 3--97Technical support, D--12
contact information, xvTek Exponential window, 3--180, 3--182, 3--191Tek Secure, 3--222, D--11, Glossary--11Tektronix, contacting, xvTekVISA, 2--2Temperature compensation, 3--142–3--154Temperature grading, D--7, D--8Termination, D--4Test Equipment, for Incoming Inspection Procedure,
1--17Text
file format, 3--225On screen, 3--114on screen, D--7
Thresholds, A Trigger control window, 3--76, 3--80Time, D--9
get current, 3--244Time base, Glossary--11Time cursor readout values, 3--135Time Domain Controls, 3--170Timebase, 3--105Timeout, trigger, D--6Timeout trigger, 3--68, 3--82, Glossary--11
A Trigger control window, 3--82how to set up, 3--82
Timer, A Trigger control window, 3--82To autoset the instrument, 3--11To get more help, 3--13To reset the instrument, 3--13Touch screen, 3--103, 3--106Trace, Glossary--11Trace expression, Glossary--12Track, D--8Transition
setup, D--6trigger, 3--68, D--6
Trig delay, A Trigger control window, 3--96Trigger, 3--53, Glossary--12
A Only, 3--96AC line voltage, 3--53, 3--59auxiliary, 3--53, 3--59coupling, 3--56delay, 3--57edge, 3--54, Glossary--4
Index
TDS7404, TDS7254 & TDS7154 Digital Phosphor Oscilloscopes User Manual Index- 19
glitch, 3--67, 3--72, Glossary--4holdoff, 3--55level, 3--56, Glossary--12line, 3--53, 3--59logic, 3--67, 3--69Marker, 3--115mode, 3--54pattern, 3--68, 3--84position, 3--56pulse, 3--67readout, 3--61runt, 3--67, 3--74, Glossary--10setup/hold, 3--70, 3--88slew rate, 3--68, Glossary--11slope, 3--56source, 3--53state, 3--69, 3--87status lights, 3--61timeout, 3--68, 3--82, Glossary--11transition, 3--68types, 3--58width, 3--68, 3--77
Trigger after A, 3--96Trigger after events, 3--97Trigger after time, 3--96
how to set up, 3--96Trigger and display, 3--7Trigger events, A-->B Seq Trigger control window,
3--97Trigger level marker, 3--115Trigger MAIN LEVEL knob, 3--57, 3--58Trigger menu
a event (main) trigger setup, D--6a->b trigger sequence, D--6b event (delayed) trigger setup, D--6comm, D--6comm setup, D--6edge, D--6edge setup, D--6glitch, D--6glitch setup, D--6holdoff, D--6logic pattern, D--6logic pattern setup, D--6logic state, D--6logic state setup, D--6mode, D--6quick select, D--6run/stop, D--6runt, D--6runt setup, D--6serial pattern, D--6serial pattern setup, D--6
setup/hold, D--6setup/hold setup, D--6timeout, D--6timeout setup, D--6transition, D--6transition setup, D--6width, D--6width setup, D--6
Trigger overview, 3--51Trigger point, defined, 3--34Trigger setup, D--6Trigger status lights, 3--61Trigger T, 3--115, D--8Trigger when
A Trigger, 3--86A Trigger control window, 3--85, 3--88transition is <, A Trigger control window, 3--81transition time >, A Trigger control window, 3--81
Trigger, delayed, how to set up, 3--96Trigger, glitch, how to set up, 3--72Trigger, runt, how to set up, 3--74–3--100Trigger, slew rate, how to set up, 3--79–3--100Trigger, timeout, how to set up, 3--82Trigger, width, how to set up, 3--77–3--100Triggering
advanced, 3--54advanced triggering, 3--67comm triggering, 3--54, 3--99define inputs, 3--87define logic, 3--87define the clock source and edge, 3--89define the data source, 3--89delayed trigger system, 3--57edge, 3--54glitch trigger, 3--67horizontal position, 3--56logic trigger definitions, 3--69overview of, 3--51pattern trigger, 3--68posttrigger, 3--53pretrigger, 3--53runt trigger, 3--67select glitch triggering, 3--72select runt triggering, 3--74select setup/hold Triggering, 3--88select the polarity, 3--74, 3--77select the polarity and width, 3--72select the source, 3--72, 3--74, 3--77, 3--79, 3--82select timeout triggering, 3--82select transition triggering, 3--79select width triggering, 3--77sequential triggering, 3--92serial pattern triggering, 3--54, 3--99
Index
Index- 20 TDS7404, TDS7254 & TDS7154 Digital Phosphor Oscilloscopes User Manual
set the data and clock levels, 3--89set the level, 3--73, 3--78, 3--83set the setup and hold times, 3--90set the thresholds, 3--76set the timer, 3--82set the transition time, 3--80set thresholds, 3--87set to trigger if width, 3--73set to trigger when, 3--75, 3--78, 3--81, 3--82set trigger when, 3--88setup/hold trigger, 3--70slope and level, 3--56state trigger, 3--69the trigger event, 3--53timeout trigger, 3--68to check trigger status, 3--61to define a time qualified pattern trigger, 3--86to define new trigger level presets, 3--65to define pattern inputs, 3--84to define the logic, 3--85to force a trigger, 3--65to select a preset trigger level, 3--64to select the trigger mode, 3--60to select the trigger slope, 3--58to select the trigger source, 3--59to select the trigger type, 3--58to set holdoff, 3--63to set level, 3--58to set mode and holdoff, 3--73, 3--76, 3--78, 3--81,
3--83, 3--85, 3--88, 3--90to set the trigger coupling, 3--60to set thresholds, 3--84to set to 50%, 3--59to set trigger when, 3--85to set up B Triggering, 3--98to single trigger, 3--66to trigger based on transition time, 3--79to trigger on A (Main) only, 3--96to trigger on a glitch, 3--72to trigger on a pattern, 3--84to trigger on a runt pulse, 3--74to trigger on a state, 3--87to trigger on B After Time, 3--96to trigger on B Events, 3--97to trigger on setup/hold time violations, 3--88transition trigger, 3--68trigger and horizontal delay summary, 3--95trigger based on pulse timeout, 3--82trigger based on pulse width, 3--77trigger coupling, 3--56trigger holdoff, 3--55trigger location and level from display, 3--62trigger modes, 3--54
trigger on a pattern, 3--84trigger sources, 3--53, 3--92trigger status from acquisition readout, 3--61trigger status from trigger status lights, 3--61trigger types, 3--54, 3--92triggering concepts, 3--53triggering from the front panel, 3--57triggering with horizontal delay off, 3--93triggering with horizontal delay on, 3--94using sequential triggering, 3--92width, 3--68
Triggering from the front panel, 3--57True for less than, main trigger menu, 3--86True for more than, main trigger menu, 3--86TRUE, A Trigger control window, 3--85, 3--88TTL, 3--73, 3--80, 3--83, 3--89
A Trigger level, 3--65trigger level, 3--64
UUndershoot, Glossary--7Undo, autoset, D--5Undo autoset, D--3unpacking, 1--5Update, Software, 1--3Upgrade, software, 1--3URL, Tektronix, xvuser files, backing up, 1--10User palette, D--7, D--8User preferences, D--12USER, A Trigger level, 3--64, 3--65Using the acquisition controls, 3--21Using the waveform display, 3--102Utilities menu
AUX Out configuration, D--12deassign multipurpose knobs, D--12external signals, D--12GPIB configuration, D--11instrument calibration, D--12instrument diagnostics, D--12option installation, D--12reference selection, D--12set time and date, D--11Tek Secure, D--11user preferences, D--12
VValue count, D--10Value mean, D--9
Index
TDS7404, TDS7254 & TDS7154 Digital Phosphor Oscilloscopes User Manual Index- 21
Variable persistence, 3--118, 3--119, D--7display control window, 3--116
Variable persistence, display control window, 3--116Varying vertical offset, 3--17V-bars, D--8Vectors, 3--114, 3--116, D--7
display control window, 3--116Vectors display, incompatible with DPO, 3--38Verification, Incoming Inspection Procedure, 1--17Version number, D--12Vertical
acquisition window, Glossary--12acquisition window considerations, 3--15bar cursors, Glossary--12control window, deskew, 3--150cursors, 3--133, 3--135deskew, 3--150, Glossary--2
Vertical menuattenuation, D--4bandwidth, D--4coupling, D--4deskew, D--4display on/off, D--3label, D--3offset, D--4position/scale, D--3probe cal, D--4termination, D--4vertical setup, D--3zoom controls, D--3zoom setup, D--4
Vertical offset, 3--104discussion on setting, 3--15
Vertical position, 3--104Vertical range, discussion on setting, 3--15Vertical scale, 3--104Vertical scale and offset
illustrated, 3--16uses for, 3--5
Vertical setup, D--3purpose, 3--5
Vertical window, overview, 3--14, 3--15View, printing, 3--241Virtual keyboard, control window, 3--207, 3--215Voltage
overrange and underrange points, 3--15overview, 3--15
WWaveform, D--2, D--3, Glossary--12
acquiring and displaying of, 3--3copying, 3--225differentiation, 3--159displaying, 3--101exporting, 3--225interval, Glossary--12printing, 3--240recalling, 3--215Save Formats, 3--225saving, 3--215
Waveform clipping. See ClippingWaveform count, B--2Waveform database, 3--24, 3--28, 3--46, Glossary--12Waveform display, 3--103Waveform FFTs, 3--170Waveform histograms, D--10Waveform integration, 3--161Waveform intensity, 3--115Waveform intensity, display menu, 3--43Waveform interpolation, 3--115, D--7Waveform record, 3--34
definition applied to all channels, 3--19illustrated, 3--34, 3--135spectral source, long versus short, 3--171
Waveformsand zoom, 3--109Clear, 3--222Delete, 3--222Measuring, 3--123
Web site address, Tektronix, xvWidth, Glossary--8, Glossary--9
setup, D--6trigger, D--6
Width trigger, 3--68, 3--77A Trigger control window, 3--77how to set up, 3--77–3--100main trigger menu, 3--72, 3--75
Window, 3--180Blackman-Harris, 3--199characteristics, 3--182characteristics of, 3--180Flattop2, 3--199functions, 3--170Gaussian, 3--199
Index
Index- 22 TDS7404, TDS7254 & TDS7154 Digital Phosphor Oscilloscopes User Manual
Hamming, 3--199Hanning, 3--199Kaiser--Bessel, 3--199rectangular, 3--199rectangular vs. bell-shaped, 3--185selecting, 3--181Tek Exponential, 3--199
Windows, descriptions of, 3--199
XXY, D--7
format, 3--44, Glossary--12XYZ, D--7
format, 3--44, Glossary--12
YYT, D--7
format, 3--44, Glossary--12
ZZero phase reference point, 3--183
establishing for impulse testing, 3--183
Zoom, 3--103, 3--104, 3--109–3--122, 3--132100%, D--4, D--550/50%, D--4, D--580/20%, D--4, D--5a waveform, 3--111and waveforms, 3--109button, 3--110controls, D--3, D--4display area, D--5feature, 3--109Graticule, D--5incompatible with fast acquisitions, 3--38lock, D--5lock all, D--5lock live, D--5lock none, D--5setup, D--4, D--5
Zoom graticule, D--4Zoom menu, reset zoom factors, 3--113Zoom Setup control window, 3--105