Usefulness of coarse grain data on forest management to improve bird abundance models
11
PLEASE SCROLL DOWN FOR ARTICLE This article was downloaded by: [Bani, Luciano] On: 12 March 2010 Access details: Access Details: [subscription number 919839323] Publisher Taylor & Francis Informa Ltd Registered in England and Wales Registered Number: 1072954 Registered office: Mortimer House, 37- 41 Mortimer Street, London W1T 3JH, UK Italian Journal of Zoology Publication details, including instructions for authors and subscription information: http://www.informaworld.com/smpp/title~content=t741771159 Usefulness of coarse grain data on forest management to improve bird abundance models D. Massimino a ; V. Orioli a ; F. Pizzardi a ; R. Massa a ; L. Bani a a Dipartimento di Scienze dell'Ambiente e del Territorio, Università degli Studi di Milano-Bicocca, Milano, Italy First published on: 15 January 2010 To cite this Article Massimino, D., Orioli, V., Pizzardi, F., Massa, R. and Bani, L.(2010) 'Usefulness of coarse grain data on forest management to improve bird abundance models', Italian Journal of Zoology, 77: 1, 71 — 80, First published on: 15 January 2010 (iFirst) To link to this Article: DOI: 10.1080/11250000802658058 URL: http://dx.doi.org/10.1080/11250000802658058 Full terms and conditions of use: http://www.informaworld.com/terms-and-conditions-of-access.pdf This article may be used for research, teaching and private study purposes. Any substantial or systematic reproduction, re-distribution, re-selling, loan or sub-licensing, systematic supply or distribution in any form to anyone is expressly forbidden. The publisher does not give any warranty express or implied or make any representation that the contents will be complete or accurate or up to date. The accuracy of any instructions, formulae and drug doses should be independently verified with primary sources. The publisher shall not be liable for any loss, actions, claims, proceedings, demand or costs or damages whatsoever or howsoever caused arising directly or indirectly in connection with or arising out of the use of this material.
Transcript of Usefulness of coarse grain data on forest management to improve bird abundance models

PLEASE SCROLL DOWN FOR ARTICLE
This article was downloaded by: [Bani, Luciano]On: 12 March 2010Access details: Access Details: [subscription number 919839323]Publisher Taylor & FrancisInforma Ltd Registered in England and Wales Registered Number: 1072954 Registered office: Mortimer House, 37-41 Mortimer Street, London W1T 3JH, UK
Italian Journal of ZoologyPublication details, including instructions for authors and subscription information:http://www.informaworld.com/smpp/title~content=t741771159
Usefulness of coarse grain data on forest management to improve birdabundance modelsD. Massimino a; V. Orioli a; F. Pizzardi a; R. Massa a; L. Bani a
a Dipartimento di Scienze dell'Ambiente e del Territorio, Università degli Studi di Milano-Bicocca,Milano, Italy
First published on: 15 January 2010
To cite this Article Massimino, D., Orioli, V., Pizzardi, F., Massa, R. and Bani, L.(2010) 'Usefulness of coarse grain data onforest management to improve bird abundance models', Italian Journal of Zoology, 77: 1, 71 — 80, First published on: 15January 2010 (iFirst)To link to this Article: DOI: 10.1080/11250000802658058URL: http://dx.doi.org/10.1080/11250000802658058
Full terms and conditions of use: http://www.informaworld.com/terms-and-conditions-of-access.pdf
This article may be used for research, teaching and private study purposes. Any substantial orsystematic reproduction, re-distribution, re-selling, loan or sub-licensing, systematic supply ordistribution in any form to anyone is expressly forbidden.
The publisher does not give any warranty express or implied or make any representation that the contentswill be complete or accurate or up to date. The accuracy of any instructions, formulae and drug dosesshould be independently verified with primary sources. The publisher shall not be liable for any loss,actions, claims, proceedings, demand or costs or damages whatsoever or howsoever caused arising directlyor indirectly in connection with or arising out of the use of this material.

Usefulness of coarse grain data on forest management to improve birdabundance models
D. MASSIMINO, V. ORIOLI, F. PIZZARDI, R. MASSA, & L. BANI*
Dipartimento di Scienze dell’Ambiente e del Territorio, Universita degli Studi di Milano-Bicocca, Milano, Italy
AbstractWe tested the use of coarse grain data on forest management systems to improve habitat suitability models in predictingdistribution and abundance of five bird species, nesting in broadleaf forests in Lombardy (Italy). They were the long-tailedtit Aegithalos caudatus, marsh tit Poecile palustris, blue tit Cyanistes caeruleus, wood nuthatch Sitta europaea and short-toedtree-creeper Certhia brachydactyla. Bird data were collected from 4552 point counts from 1992 to 2002. To model thehabitat suitability for each species, we used generalized linear models with negative binomial distribution and log linkfunction. Environmental predictors were land-use fractional covers, forest isolation, elevation, slope, aspect, and coarsegrain data on forest management systems aggregated for administrative provinces. They were selected by a stepwiseprocedure based on the Bayesian Informative Criterion. Predictors on forest management system were useful to improvemodel fit for all cavity-nesting species, which was also shown to be affected by forest isolation. The long-tailed tit, which isnot an obligate cavity nester, did not exhibit any preference with respect either to forest management or isolation.
Keywords: Birds, forest isolation, forestry data, generalized linear models, habitat suitability models
Introduction
Understanding the factors that determine species
distribution and abundance is necessary to undertake
effective conservation actions, for example to contrast
the decline of endangered species, select conservation
priority areas (e.g. Maiorano et al. 2006; Rondinini
et al. 2006; Zielinski et al. 2006; Tapia et al. 2007) or
assess the effects of environmental changes (e.g. Berry
et al. 2002; Thuiller 2003; Araujo et al. 2004; Puglisi
et al. 2005; Seoane et al. 2006). For this reason,
habitat suitability models (HSMs) have been increas-
ingly used in the last decades. HSMs aim to describe
relationships between environmental variables and
species distribution and/or abundance. This is done
using a wide array of statistical methods that relate
field observations to environmental predictors.
Nowadays, digital land use maps are available over
large areas. Such maps classify the land cover
according to a large number of classes, which are
frequently used as environmental predictors, often
with topographic and/or climatic variables (e.g.
Seoane et al. 2003; Posillico et al. 2004; Virkkala et al.
2005; Tapia et al. 2007). Nevertheless, HSMs based
on land use, topographic and climatic predictors may
sometimes show large difference between predicted
and observed values (Massimino 2004). This can be
due to inadequacy of the modelling technique,
unsaturated habitats (Cardillo et al. 1999; Tyre et al.
2001) or failure to include significant environ-
mental predictors (Crawley 1993; Guisan & Thuiller
2005), whose selection is often critical and strongly
dependent on the type of selection strategy used
(Araujo & Guisan 2006). Moreover, occurrence of
many species can be influenced by environmental
characteristics or processes that are difficult to
measure, or at least have not been measured
adequately. In the case of forest species, the environ-
mental characteristics influencing their presence and
abundance can be the amount of forest cover, size
and isolation of forest patches, edge effect, and age
and structure of stands (Villard et al. 1999; Hobson &
Bayne 2000; Giese & Cuthbert 2003; Kurosawa &
Askins 2003; Batari & Baldi 2004; Herrmann et al.
2005; Venier & Pearce 2005; Bani et al. 2006). While
forest cover and landscape and patch metrics can be
obtained or derived from land-use digital maps, data
on forest structure are rarely available over large areas.
*Correspondence: L. Bani, Department of Environmental and Landscape Sciences, University of Milano-Bicocca, Piazza della Scienza 1, Milano 20126, Italy.
Tel: +39 02 64482944. Email: [email protected]
Italian Journal of Zoology, March 2010; 77(1): 71–80
ISSN 1125-0003 print/ISSN 1748-5851 online # 2010 Unione Zoologica Italiana
DOI: 10.1080/11250000802658058
Downloaded By: [Bani, Luciano] At: 12:57 12 March 2010

In the case of Lombardy (northern Italy), data on
forest structure are not available over the whole
region. The need to produce reliable habitat
suitability models for bird species prompted us to
test the use of coarse grain data (available only at
province level) on the percentage of forest manage-
ment systems, which are the major determinant of
habitat structure in our forests, that are all subjected
to silvicultural practices. We also used an index of
forest patch isolation (Bani et al. 2006) derived from
the proximity index calculated by the FRAGSTATS
program (McGarigal & Marks 1995).
The species considered were the long-tailed tit
Aegithalos caudatus (Linnaeus, 1758), marsh tit
Poecile palustris (Linnaeus, 1758), blue tit Cyanistes
caeruleus (Linnaeus, 1758), wood nuthatch Sitta
europaea Linnaeus, 1758 and short-toed tree-creeper
Certhia brachydactyla Brehm, 1820. They all are
typical of broadleaf forests and sensitive to fragmen-
tation, but show different selectivity to the forest
structure (Bani et al. 2006). In our study area the
marsh tit, wood nuthatch and short-toed tree-
creeper need mature forests, the blue tit can also
use intermediate seral stages, while the long-tailed tit
may breed in forests of any age (Bani et al. 2006).
Materials and methods
Study area
Our study was carried out in the Lombardy region
(northern Italy). Approximately 25% of the study
area is covered by forests, of which 63% are
broadleaf, 22% coniferous and 15% mixed. The
great majority (94%) of broadleaf forests, the focus
of this research, are managed as coppice, but there
are considerable differences among provinces in the
proportion of compound coppice (coppice with
standards of several age classes): in the western
provinces compound coppice prevails, while in the
central and eastern provinces simple coppice (with
or without standards) is predominant (Figure 1).
Faunal and environmental data
Bird data were collected by means of the unlimited
distance point-count technique, which consists of
recording each bird seen or heard in a 10-min
session (Blondel et al. 1981). This technique
provides values of relative bird abundance (Blondel
et al. 1970; Bibby et al. 2000). Point counts were
conducted during the breeding season from sunrise
to 11 am in good weather (sunny to cloudy, without
rain or strong wind) (Fornasari et al. 1998). From
1992 to 2002 we performed 4552 sample points
evenly distributed across the entire study area.
Distances between sampling locations were at least
1000 m.
Land-use variables were derived from the
1:10,000 DUSAF (Destinazione d’Uso dei Suoli
Agricoli e Forestali [Classification of Agricultural
and Forest Lands]; ERSAF 2002) digital map with
20-m ground resolution. They were measured as the
fractional cover in a 500-m radius circle centred on
each sample point. Since the classification of non-
forest areas was too detailed for our aims, we
aggregated the original 61 land-use classes into 16
main classes. We added an interaction term between
all forests and all open environments to account for
changes in suitability at ecotones.
Topographic variables were obtained from a
Digital Elevation Model. They were elevation,
square elevation, slope and exposure, the last
calculated as the sine and cosine of the aspect.
Forest patch isolation was also derived from the
DUSAF digital map. It was measured by the
FRAGSTATS Proximity Index (McGarigal &
Marks 1995), modified by Bani et al. (2006). The
FRAGSTATS Proximity Index of a patch equals
zero if there are no other patches of the same
category (in our case broadleaf forest patches) within
the proximity radius and increases as the area
occupied by surrounding patches increases and/or
their distances from the focal patch decrease. The
Modified Proximity Index (MPI; Bani et al. 2006)
for a patch is defined as the product of its Proximity
Index and area. In our case study we used a 2500-m
proximity radius, which avoided considering neigh-
bouring forest patches separated by the highest
mountain ridges, a potentially important barrier
during animal dispersal. The values of the natural
logarithm of the MPI were calculated for each
broadleaf forest patch in the study area and then
assigned to sample points contained in them. Points
within 500 m from a broad-leaved forest patch were
assigned its proximity value, while points more than
500 m far from a broadleaf forest were assigned a
value of zero.
Data on forest management systems (see
Figure 1), updated in 1997 and only available at
provincial level for each of the former 11 provinces
of Lombardy, came from the Regional Statistical
Yearbook (1997). We assumed that in each point the
apportionment of broad-leaved forests in each
management system were the same throughout the
province. Therefore we assigned to each sample
point the fraction of broadleaf forests managed,
respectively, as simple coppice, compound coppice
and high forest, according to the province where the
point was located. We then multiplied the fractions
72 D. Massimino et al.
Downloaded By: [Bani, Luciano] At: 12:57 12 March 2010

of management types by the broadleaf forest frac-
tional cover in the 500-m radius circle around each
point. In this way, we split the broadleaf forest land-
use variable in three different variables according to
the different management types.
Table I summarizes the environmental predictor
variables used, their abbreviations and ranges in the
study area.
Statistical analysis
To model the habitat suitability for each considered
species, we used generalized linear models (GLMs),
which have proven effective in several studies (e.g.
Martinez et al. 2003; Thuiller 2003; Randin et al.
2006; Brotons et al. 2007; Rodriguez-Estrella 2007).
Models were performed with negative binomial error
distribution and log link function, as are appropriate
for overdispersed count data (Bliss & Fisher 1953;
Quinn & Keough 2002):
E yð Þ~exp Sbxð Þ
where E(y) is the expected value of the dependent
variable (number of birds counted in each point
count) and S bx is the linear predictor, a linear
Figure 1. Broadleaf forest surface in each Lombardy province. The bar height is proportional to the surface and numbers below the bars are
the percentages of each management system.
Forest management and bird abundance 73
Downloaded By: [Bani, Luciano] At: 12:57 12 March 2010

combination of parameters b and independent
variables x, which are the environmental variables
listed in Table I.
To obtain a good and parsimonious model,
independent variables were selected by a stepwise
procedure based on the Bayesian Informative
Criterion (BIC), which chose the model that
minimizes the log-likelihood minus the number of
parameters multiplied by the logarithm of the sample
size (see Burnham & Anderson 2002). Generalized
Linear Regression and BIC stepwise selection of
variables were performed using S-PLUS software
Version 7.0 (S-PLUS 2005).
Model goodness-of-fit was evaluated by residual
deviance, which expresses the discrepancy between
observed and fitted values (see Quinn & Keough
2002). The lower the ratio between the residual and
null deviance, the better is the model capacity to fit
the data.
For each of the five species, we cross-validated the
GLMs by a leave-more-out procedure (see Guisan &
Thuiller 2005), randomly splitting the samples into
four equal-sized subsets. Each GLM was then run
four times, using three subsets as the training set and
the other as the test set. We computed the residual
deviance as the discrepancy between the fitted values
estimated by the model built on the training set and
the observed values in the test sets. The residual
deviance so calculated was then compared to the
residual deviance of the suitability GLM to assess
the predictive ability of the model (Vernier et al.
2002).
Equations resulting from GLMs were used to
draw habitat suitability maps by using a
Geographical Information System.
Results
The stepwise procedure based on the BIC selected
final models with 7–14 independent variables,
explaining between 17.9 and 43.0% of the null
deviance. Similar values were obtained in validation,
with a loss of deviance explained ranging between
1.2 and 5.0%. Model summaries (null deviance,
residual deviance, percent of deviance explained by
the model residual deviance in validation and
percent of deviance explained in validation) are
given in Table II.
Table III shows the environmental predictor vari-
ables for each species and their coefficients, standard
errors and t values. The marsh tit, blue tit, wood
nuthatch and short-toed tree-creeper had positive
coefficients for the MPI, broadleaf forests managed
as high forest and either a positive coefficient for
broadleaf forests managed as compound coppice or
a negative coefficient for those managed as simple
coppice. The long-tailed tit did not exhibit any
preference with respect either to forest management
or patch isolation.
Table I. Environmental predictor variables and their range in the study area.
Abbreviation Description Range in the study area
E Elevation 0.005–3.996 km
C Cosine of the aspect 21–1
S Sine of the aspect 21–1
P Slope 0–84.6uART Artificial surfaces 0–1
ARA Non-irrigated arable land 0–1
RIC Rice fields 0–1
PER Permanent crops 0–1
PAS Pastures 0–1
HET Heterogeneous agricultural areas 0–1
BROSEMP Broad-leaved forests managed as simple coppice 0–0.91
BROCOMP Broad-leaved forests managed as compound coppice 0–0.76
BROHIGH Broad-leaved forests managed as high forest 0–0.23
CON Coniferous forests 0–1
MIX Mixed forests 0–1
GRA Natural grasslands 0–1
MOO Moors and heathland 0–1
WAT Water courses, beaches, dunes, sands 0–1
ROC Bare rock 0–1
SPA Sparsely vegetated areas 0–1
WET Wetlands 0–1
O All open areas landscapes 0–1
F All forests 0–1
Ln(MPI) Natural logarithm of the Modified Proximity Index 0–17.0
74 D. Massimino et al.
Downloaded By: [Bani, Luciano] At: 12:57 12 March 2010

The maps of habitat suitability and abundance of
detected birds for each species are given in Figure 2.
Discussion
In this research we tested the use of coarse grain data
on forest management systems, which are major
determinants of forest structure in Lombardy, com-
bined with land use, topographic and landscape
variables to model the habitat suitability of five forest
species. Although data on forest management were
available only as overall values over each of the former
11 provinces, they were effective in improving
performance of habitat suitability models for four
out of five species. We can infer the importance of
forestry data from the inclusion in the final model of
variables concerning forest management. Their coef-
ficients, estimated by the GLM, were significantly
different, which means that broad-leaved forests have
different suitability according to their management.
Since bird data were collected during an 11-year
period, our models rely on the assumption that no
important changes occurred in land use and forest
management. Although detailed data are not avail-
able year-by-year, percent changes in urban, agri-
cultural and forest areas in our study area were less
than 3% between 1992 and 2005 (ARPA 2002,
2006) and changes in forest management systems
were around 0.06% between 1992 and 1997, the last
year for which forest data are available (Regional
Statistical Yearbook 1997).
Of all common forest species breeding in the study
area, the five considered here were the most sensitive
to anthropogenic disturbances to forests (Bani et al.
2006). Among them, marsh tit, wood nuthatch and
short-toed tree-creeper, which are cavity nesters
(Harrap & Quinn 1996), were proven to be the
most selective for forest structure (Bani et al. 2006).
For these three species, the stepwise procedure used
in this research selected both the variable of broad-
leaf forests managed as high forest and the variable
of broadleaf forests managed as compound coppice.
High forests had quite obviously the highest coeffi-
cient. Nevertheless, the maximum fractional cover of
this variable throughout the region is 0.23. On the
other hand, compound coppices, which are fairly
common in the western part of the study area, had
lower but highly significant (P , 0.0001 in all three
models) positive coefficients. It results in remarkable
differences between abundances estimated in com-
pound coppice and in simple coppice forests. All
other variables being equal, in areas completely
covered with broadleaf forests the abundance of
short-toed tree-creeper, marsh tit and wood
nuthatch is estimated, respectively, 69.9, 21.7 and
9.1 times greater in the case of compound coppice
than in simple coppice.
This confirms that data on forest management
systems, although aggregated over provinces, are
useful to improve habitat suitability models for these
structure-sensitive species, whose abundance is
strongly affected by silvicultural practices.
The blue tit is also a cavity nester, therefore rather
selective for the forest structure. However, when
natural tree cavities are scarce, it is able to use other
natural or artificial sites, such as wall crevices or
ground holes (Harrap & Quinn 1996). The stepwise
procedure selected the simple coppice variable with
a negative coefficient. Its abundance in areas
completely covered with broadleaf forest is estimated
2.6 times greater in compound coppice than in
simple coppice.
These four species were also affected by forest
fragmentation. Their environmental suitability mod-
els included the logarithm of MPI with a significant
positive coefficient.
In the case of the long-tailed tit model only, no
variable concerning forest management was selected.
Although in other areas the long-tailed tit was
proven to be selective for forest structure, proportion
and isolation of suitable habitat (Gaston 1973;
Jansson & Angelstam 1999), in our study area it
seemed to be rather generalist. The species did not
appear to be affected even by fragmentation, as the
logarithm of MPI was excluded by the stepwise
procedure. This may suggest a higher dispersal
ability of the long-tailed tit compared to the other
four species (Harrap & Quinn 1996).
The results obtained in this research have practical
implications for the conservation of forest species.
Table II. Summaries of the habitat suitability models for each species.
Species Null deviance Residual deviance
Deviance explained by
the model (%)
Residual deviance in
validation
Deviance explained in
validation (%)
Long-tailed tit 2200.0 1806.5 17.9 1873.4 14.8
Marsh tit 2548.8 1511.1 40.7 1569.1 38.4
Blue tit 5074.6 3500.3 31.0 3560.6 29.8
Wood nuthatch 2146.6 1318.0 38.6 1395.7 35.0
Short-toed tree-creeper 1368.1 779.3 43.0 848.3 38.0
Forest management and bird abundance 75
Downloaded By: [Bani, Luciano] At: 12:57 12 March 2010
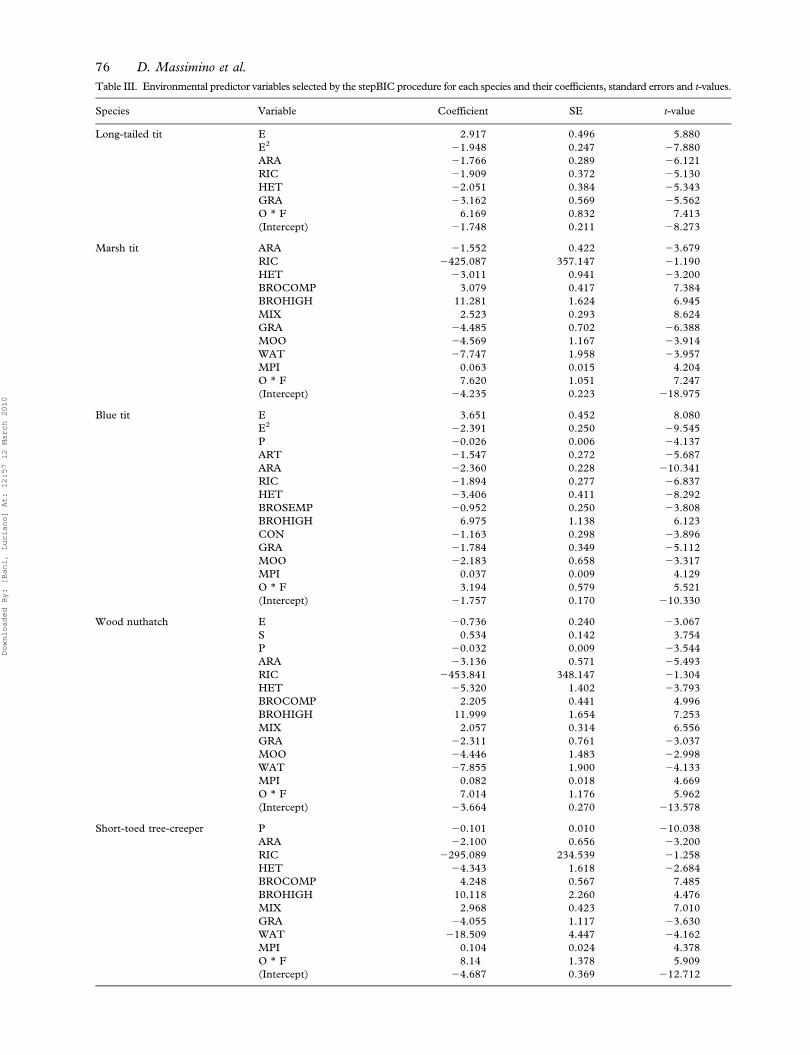
Table III. Environmental predictor variables selected by the stepBIC procedure for each species and their coefficients, standard errors and t-values.
Species Variable Coefficient SE t-value
Long-tailed tit E 2.917 0.496 5.880
E2 21.948 0.247 27.880
ARA 21.766 0.289 26.121
RIC 21.909 0.372 25.130
HET 22.051 0.384 25.343
GRA 23.162 0.569 25.562
O * F 6.169 0.832 7.413
(Intercept) 21.748 0.211 28.273
Marsh tit ARA 21.552 0.422 23.679
RIC 2425.087 357.147 21.190
HET 23.011 0.941 23.200
BROCOMP 3.079 0.417 7.384
BROHIGH 11.281 1.624 6.945
MIX 2.523 0.293 8.624
GRA 24.485 0.702 26.388
MOO 24.569 1.167 23.914
WAT 27.747 1.958 23.957
MPI 0.063 0.015 4.204
O * F 7.620 1.051 7.247
(Intercept) 24.235 0.223 218.975
Blue tit E 3.651 0.452 8.080
E2 22.391 0.250 29.545
P 20.026 0.006 24.137
ART 21.547 0.272 25.687
ARA 22.360 0.228 210.341
RIC 21.894 0.277 26.837
HET 23.406 0.411 28.292
BROSEMP 20.952 0.250 23.808
BROHIGH 6.975 1.138 6.123
CON 21.163 0.298 23.896
GRA 21.784 0.349 25.112
MOO 22.183 0.658 23.317
MPI 0.037 0.009 4.129
O * F 3.194 0.579 5.521
(Intercept) 21.757 0.170 210.330
Wood nuthatch E 20.736 0.240 23.067
S 0.534 0.142 3.754
P 20.032 0.009 23.544
ARA 23.136 0.571 25.493
RIC 2453.841 348.147 21.304
HET 25.320 1.402 23.793
BROCOMP 2.205 0.441 4.996
BROHIGH 11.999 1.654 7.253
MIX 2.057 0.314 6.556
GRA 22.311 0.761 23.037
MOO 24.446 1.483 22.998
WAT 27.855 1.900 24.133
MPI 0.082 0.018 4.669
O * F 7.014 1.176 5.962
(Intercept) 23.664 0.270 213.578
Short-toed tree-creeper P 20.101 0.010 210.038
ARA 22.100 0.656 23.200
RIC 2295.089 234.539 21.258
HET 24.343 1.618 22.684
BROCOMP 4.248 0.567 7.485
BROHIGH 10.118 2.260 4.476
MIX 2.968 0.423 7.010
GRA 24.055 1.117 23.630
WAT 218.509 4.447 24.162
MPI 0.104 0.024 4.378
O * F 8.14 1.378 5.909
(Intercept) 24.687 0.369 212.712
76 D. Massimino et al.
Downloaded By: [Bani, Luciano] At: 12:57 12 March 2010

Although the overall area of forest in Europe has
greatly increased since the 1960s (EEA 2003),
ecologically high-quality old-growth forests have
been almost completely replaced by intensively
managed forests or plantations whose structure is
poorly suited to host most cavity-nesting species
Figure 2. Maps of habitat suitability and abundance of birds detected in each point count. Dashed areas are major lakes.
Forest management and bird abundance 77
Downloaded By: [Bani, Luciano] At: 12:57 12 March 2010

(Tucker & Evans 1997), which are likely to suffer
detrimental impacts and population declines.
Among the species considered in this research, the
marsh tit underwent the largest decline in north-west
Europe during 1990–2000, so that it was included
among the Species of European Conservation
Concern (BirdLife International 2004). Wood
nuthatch and short-toed tree-creeper seem more
stable, although the former’s sizeable population in
France suffered a large decline (255%) in 1990–
2000 (BirdLife International 2004). To combat their
decline, semi-natural forests should be restored to
natural old-growth conditions where possible
(Tucker & Evans 1997). Unfortunately this is
unfeasible in the intensively exploited forests of the
study area, but a pragmatic objective could be
restoring natural features such as mixtures of
different tree age classes, some old-growth trees
and dead wood. At a minimum, simple coppices
should be converted into compound coppices, which
appear more suitable for the most selective cavity
nesters.
Acknowledgements
We thank the Agricultural and Forest Service of
Lombardy Regional Administration for financing
bird surveys. We are also grateful to three anon-
ymous referees for their helpful suggestions.
References
Araujo MB, Cabeza M, Thuiller W, Hannah L, Williams PH.
2004. Would climate change drive species out of reserves? An
assessment of existing reserve-selection methods. Global
Change Biology 10:1618–1626.
Araujo MB, Guisan A. 2006. Five (or so) challenges for species
distribution modelling. Journal of Biogeography 33:1677–
1688.
Figure 2. Continued.
78 D. Massimino et al.
Downloaded By: [Bani, Luciano] At: 12:57 12 March 2010

ARPA. 2002. Segnali ambientali della Lombardia. Rapporto sullo
stato dell’ambiente-2002. Milano: Agenzia Regionale per la
Protezione dell’Ambiente della Lombardia, Regione
Lombardia.
ARPA. 2006. Rapporto sullo stato dell’ambiente. Edizione 2006.
Milano: Agenzia Regionale per la Protezione dell’Ambiente
della Lombardia, Regione Lombardia.
Bani L, Massimino D, Bottoni L, Massa R. 2006. A multiscale
method for selecting indicator species and priority conserva-
tion areas: A case study for broadleaved forests in Lombardy,
Italy. Conservation Biology 20:512–526.
Batari P, Baldi A. 2004. Evidence of an edge effect on avian nest
success. Conservation Biology 18:389–400.
Berry PM, Dawson TP, Harrison PA, Pearson RG. 2002.
Modelling potential impacts of climate change on the
bioclimatic envelope of species in Britain and Ireland. Global
Ecology and Biogeography 11:453–462.
Bibby CJ, Burgess ND, Hill DA, Mustoe S. 2000. Bird census
techniques. London: Academic Press.
BirdLife International. 2004. Birds in Europe: Population
estimates, trends and conservation status. Cambridge:
BirdLife International. 374 p.
Bliss CI, Fisher RA. 1953. Fitting the negative binomial
distribution to biological data. Biometrics 9:176–200.
Blondel J, Ferry C, Frochot B. 1970. La methode des indices
ponctuels d’abondance (I.P.A.) ou des releves d’avifaune par
‘‘stations d’ecoute’’. Alauda 38:55–71.
Blondel J, Ferry C, Frochot B. 1981. Point counts with unlimited
distance. Studies in Avian Biology 6:414–420.
Brotons L, Herrando S, Pla M. 2007. Updating bird species
distribution at large spatial scales: Applications of habitat
modelling to data from long-term monitoring programs.
Diversity and Distributions 13:276–288.
Burnham KP, Anderson DR. 2002. Model selection and multi-
model inference: A practical information-theoretic approach.
2nd ed. New York: Springer-Verlag.
Cardillo M, Macdonald DW, Rushton SP. 1999. Predicting
mammal species richness and distributions: Testing the
effectiveness of satellite-derived land cover data. Landscape
Ecology 14:423–435.
Crawley MJ. 1993. GLIM for ecologists. Oxford: Blackwell Science.
EEA. 2003. Europe’s environment. The third assessment.
Environmental assessment report no. 10. Copenhagen:
European Environment Agency. 344 p.
ERSAF. 2002. Destinazione d’Uso dei Suoli Agricoli e Forestali
(DUSAF). Milano: Ente Regionale per i Servizi all’Agricoltura
e alle Foreste della Lombardia.
Fornasari L, Bani L, de Carli C, Massa R. 1998. Optimum design
in monitoring common birds and their habitat. Gibier Faune
Sauvage 15:309–322.
Gaston AJ. 1973. The ecology and behaviour of the Long-tailed
Tit. Ibis 115:330–351.
Giese CLA, Cuthbert FJ. 2003. Influence of surrounding
vegetation on woodpecker nest tree selection in oak forests of
the Upper Midwest, USA. Forest Ecology and Management
179:523–534.
Guisan A, Thuiller W. 2005. Predicting species distribution:
Offering more than simple habitat models. Ecology Letters
8:993–1009.
Harrap S, Quinn D. 1996. Tits, nuthatches and treecreepers.
London: Helm.
Herrmann HL, Babbitt KJ, Baber MJ, Congalton RG. 2005.
Effects of landscape characteristics on amphibian distribution
in a forest-dominated landscape. Biological Conservation
123:139–149.
Hobson KA, Bayne E. 2000. The effects of stand age on avian
communities in aspen-dominated forests of central
Saskatchewan, Canada. Forest Ecology and Management
136:121–134.
Jansson G, Angelstam P. 1999. Threshold levels of habitat
composition for the presence of the long-tailed tit (Aegithalos
caudatus) in a boreal landscape. Landscape Ecology
14:283–290.
Kurosawa R, Askins RA. 2003. Effects of habitat fragmentation
on birds in deciduous forests in Japan. Conservation Biology
17:695–707.
Maiorano L, Falcucci A, Boitani L. 2006. Gap analysis of
terrestrial vertebrates in Italy: Priorities for conservation
planning in a human dominated landscape. Biological
Conservation 133:455–473.
Martinez JA, Serrano D, Zuberogoitia I. 2003. Predictive models
of habitat preferences for the Eurasian eagle owl Bubo bubo: A
multiscale approach. Ecography 26:21–28.
Massimino D. 2004. Valutazione della qualita dei corpi forestali
dell’area orobica mediante bioindicatori [dissertation].
Milano: University of Milano-Bicocca, 129 p. Available:
Biblioteca Nazionale Centrale di Firenze; CF020041625.
McGarigal K, Marks BJ. 1995. FRAGSTATS: Spatial pattern
analysis program for quantifying landscape structure. General
technical report PNW-GTR-351. Portland: U.S. Department
of Agriculture Forest Service, Pacific Northwest Research
Station.
Posillico M, Alberto MIB, Pagnin E, Lovari S, Russo L. 2004. A
habitat model for brown bear conservation and land use
planning in the central Apennines. Biological Conservation
118:141–150.
Puglisi L, Adamo MC, Baldaccini NE. 2005. Man-induced
habitat changes and sensitive species: A GIS approach to the
Eurasian Bittern (Botaurus stellaris) distribution in a
Mediterranean wetland. Biodiversity and Conservation
14:1909–1922.
Quinn JP, Keough MJ. 2002. Experimental design and data
analysis for biologists. Cambridge: Cambridge University
Press.
Randin CF, Dirnbock T, Dullinger S, Zimmermann NE,
Zappa M, Guisan A. 2006. Are niche-based species distribu-
tion models transferable in space? Journal of Biogeography
33:1689–1703.
Regional Statistical Yearbook. 1997. Agriculture, forestry, hunt-
ing and fisheries. Forest areas and wood production. Milano:
Regione Lombardia, Unioncamere Lombardia, ISTAT.
Available: http://www.ring.lombardia.it/asrnewe/index.html.
Accessed Feb 2008 22.
Rodriguez-Estrella R. 2007. Land use changes affect distribu-
tional patterns of desert birds in the Baja California peninsula,
Mexico. Diversity and Distributions 13:877–889.
Rondinini C, Chiozza F, Boitani L. 2006. High human density in
the irreplaceable sites for African vertebrates conservation.
Biological Conservation 133:358–363.
Seoane J, Justribo JH, Garcia F, et al. 2006. Habitat-suitability
modelling to assess the effects of land-use changes on
Dupont’s lark Chersophilus duponti: A case study in the Layna
Important Bird Area. Biological Conservation 128:241–252.
Seoane J, Vinuela J, Diaz-Delgado R, Bustamante J. 2003. The
effects of land use and climate on red kite distribution in the
Iberian peninsula. Biological Conservation 111:401–414.
S-PLUS. 2005. S-PLUS 7.0 for Windows. Seattle: Insightful
Corporation.
Tapia L, Dominguez J, Rodriguez L. 2007. Modelling habitat
use and distribution of golden eagles Aquila chrysaetos in a
Forest management and bird abundance 79
Downloaded By: [Bani, Luciano] At: 12:57 12 March 2010

low-density area of the Iberian Peninsula. Biodiversity and
Conservation 16:3559–3574.
Thuiller W. 2003. BIOMOD – optimizing predictions of species
distributions and projecting potential future shifts under global
change. Global Change Biology 9:1353–1362.
Tucker GM, Evans MI. 1997. Habitats for birds in Europe: A
conservation strategy for the wider environment. Cambridge:
BirdLife International.
Tyre AJ, Possingham HP, Lindenmayer DB. 2001. Inferring
process from pattern: can territory occupancy provide infor-
mation about life history parameters? Ecological Applications
11:1722–1737.
Venier LA, Pearce JL. 2005. Boreal bird community response to jack
pine forest succession. Forest Ecology and Management 217:19–36.
Vernier PR, Schmiegelow FKA, Cumming SG. 2002. Modeling
bird abundance from forest inventory data in the boreal
mixed-wood forests of Canada. In: Scott JM, Heglund PJ,
Morrison ML, Haufler JB, Raphael MG, Wall WA,
Samson FB, editors. Predicting species occurrences. Issues
of accuracy and scale. Washington: Island Press. pp. 559–
571.
Villard MA, Trzcinski MK, Merriam G. 1999. Fragmentation
effects on forest birds: Relative influence of woodland cover
and configuration on landscape occupancy. Conservation
Biology 13:774–783.
Virkkala R, Luoto M, Heikkinen RK, Leikola N. 2005.
Distribution patterns of boreal marshland birds: Modelling
the relationships to land cover and climate. Journal of
Biogeography 32:1957–1970.
Zielinski WJ, Carroll C, Dunk JR. 2006. Using landscape
suitability models to reconcile conservation planning for two
key forest predators. Biological Conservation 133:409–430.
80 D. Massimino et al.
Downloaded By: [Bani, Luciano] At: 12:57 12 March 2010