Use of the Scan Statistic on Disaggregated Province-Based Data: Foot-and-Mouth Disease In Iran
11
Use of the scan statistic on disaggregated province-based data: Foot-and-mouth disease in Iran Andres M. Perez * , Mark C. Thurmond, Paul W. Grant, Tim E. Carpenter Foot-and-Mouth Disease Surveillance and Modeling Laboratory, Center for Animal Disease Modeling and Surveillance, Department of Medicine and Epidemiology, School of Veterinary Medicine, University of California, Davis, CA 95616, USA Abstract The spatial scan statistic was applied to density-smoothed data that approximated the spatial distribution within the area and reduced the potential bias produced when location data have been aggregated for large areas. The method is illustrated, using data on the location of foot-and-mouth disease (FMD) outbreaks in Iran. Data examined were 4477 FMD outbreaks reported on a per province basis between June 1996 and September 2003. A kernel density of the outbreak locations was estimated, using a fixed radius and the centroid of each province as the designated location of all cases reported for the province. The radius that produced a density map with the highest correlation with expert opinion was 48 (latitude/longitude). Livestock density was used as a proxy for the underlying population at risk of acquiring FMD. Livestock and outbreak density maps were overlain to obtain the number of outbreaks and livestock in each of 15,599 cells covering the mapped surface of the country. A spatial scan statistic was applied to the density-smoothed data assuming that the outbreaks had a Poisson distribution. Results were compared with those obtained using a spatial scan statistic on provincially aggregated data. Application of the spatial scan statistic on the density- smoothed data allowed identification of clusters (P < 0.01) related more to the actual geographic www.elsevier.com/locate/prevetmed Preventive Veterinary Medicine 71 (2005) 197–207 * Corresponding author. Tel.: +1 530 297 4621; fax: +1 530 752 0414. E-mail address: [email protected] (A.M. Perez). 0167-5877/$ – see front matter # 2005 Elsevier B.V. All rights reserved. doi:10.1016/j.prevetmed.2005.07.005
-
Upload
independent -
Category
Documents
-
view
1 -
download
0
Transcript of Use of the Scan Statistic on Disaggregated Province-Based Data: Foot-and-Mouth Disease In Iran

Use of the scan statistic on disaggregated
province-based data: Foot-and-mouth
disease in Iran
Andres M. Perez *, Mark C. Thurmond, Paul W. Grant,Tim E. Carpenter
Foot-and-Mouth Disease Surveillance and Modeling Laboratory,
Center for Animal Disease Modeling and Surveillance, Department of Medicine and Epidemiology,
School of Veterinary Medicine, University of California, Davis, CA 95616, USA
Abstract
The spatial scan statistic was applied to density-smoothed data that approximated the spatial
distribution within the area and reduced the potential bias produced when location data have been
aggregated for large areas. The method is illustrated, using data on the location of foot-and-mouth
disease (FMD) outbreaks in Iran. Data examined were 4477 FMD outbreaks reported on a per
province basis between June 1996 and September 2003. A kernel density of the outbreak locations
was estimated, using a fixed radius and the centroid of each province as the designated location of all
cases reported for the province. The radius that produced a density map with the highest correlation
with expert opinion was 48 (latitude/longitude). Livestock density was used as a proxy for the
underlying population at risk of acquiring FMD. Livestock and outbreak density maps were overlain
to obtain the number of outbreaks and livestock in each of 15,599 cells covering the mapped surface
of the country. A spatial scan statistic was applied to the density-smoothed data assuming that the
outbreaks had a Poisson distribution. Results were compared with those obtained using a spatial scan
statistic on provincially aggregated data. Application of the spatial scan statistic on the density-
smoothed data allowed identification of clusters (P < 0.01) related more to the actual geographic
www.elsevier.com/locate/prevetmed
Preventive Veterinary Medicine 71 (2005) 197–207
* Corresponding author. Tel.: +1 530 297 4621; fax: +1 530 752 0414.
E-mail address: [email protected] (A.M. Perez).
0167-5877/$ – see front matter # 2005 Elsevier B.V. All rights reserved.
doi:10.1016/j.prevetmed.2005.07.005

distribution of cases (expert opinion) and of animals at risk, than to the distribution of the provinces.
Significant clusters of FMD were identified that coincided with roads, neighboring countries, and
high-density population areas, suggesting that the region may represent a route for cross-continent
transmission of FMD.
# 2005 Elsevier B.V. All rights reserved.
Keywords: Foot-and-mouth disease; Iran; Epidemiology; Spatial distribution; Spatial scan statistic
1. Introduction
Foot-and-mouth disease (FMD) is considered one of the most important livestock
diseases impacting global agricultural production (James and Rushton, 2002). Endemic
FMD is typically found in some of the poorest regions of the world, and imposes severe
restrictions to economic development of affected countries that can least afford
investments in prevention, control, and eradication.
Iran has one of the highest reported rates of FMD cases per year. Because of the high
incidence of FMD (including serotypes A, Asia 1 and O), the large number of new variants
of virus identified in the last 7 years, and possible trans-boundary transmission from Iran to
Turkey and Greece, the region is considered a key focus for worldwide control of FMD
(Sumption, 2003). Prerequisite to efficiently targeting control resources is a clear
understanding of where FMD is likely to appear, and what specific predisposing factors
might be associated with high-risk regions. Spatial analysis is an approach that can be
helpful in controlling FMD transmission by identifying specific high-risk areas of the
country that would be logical foci of control efforts.
The scan statistic (Kulldorff and Nagarwalla, 1995) has been one of the most popular
techniques to assess spatial clustering of animal diseases during the last 5 years, including
blowfly strike in Queensland, Australia (Ward and Carpenter, 2000), bovine tuberculosis in
Argentina (Perez et al., 2002), FMD in Argentina (Perez et al., 2004), and bovine
paratuberculosis in Indiana (Ward and Perez, 2004). Briefly, the test sequentially centers
circles in each location where information is available and compares the ratio of cases to
controls (or population at risk) for the area inside the circle with the ratio outside the circle.
The maximum radius of the circle is variable, and may be set based on some knowledge
about the epidemiology of the disease or on the purpose of the study. Two drawbacks are
associated with this technique. First, it assumes that clusters are circular. Second, when
individual locations are unknown, a simplifying assumption has to be made that cases and
controls, or population at risk, are located at a single geographic point. Depending on the
scale at which aggregation occurs and the objectives of the researcher, this assumption can
be very important.
The FMD outbreaks in Iran are reported to the International Office des Epizooties (OIE)
on a provincial basis (OIE, 2004). Thus, the aggregation of data, both for cases and for the
population at risk, at a single location ignores the actual distribution within the province
and, instead, assumes the data are distributed randomly within the province.
The goal of this paper is to identify high-risk areas of FMD in Iran, by applying the
spatial scan statistic to disaggregated density-smoothed data.
A.M. Perez et al. / Preventive Veterinary Medicine 71 (2005) 197–207198

2. Methods
The number of FMD outbreaks for each of the 28 provinces reported by Iran to the OIE
from June 1996 through September 2003 was obtained from the OIE Handistatus file (OIE,
2004). Essentially, outbreaks in this database are defined as ‘‘. . . occurrence of the diseasein question in an agricultural establishment, breeding establishment or premises, including
all buildings and all adjoining premises, where animals are present’’ (OIE, 2004). Because
4 of the current provinces in Iran were created after June 1996, information was organized
according to the 24 original provinces and the number of outbreaks in the provinces of
Ardabil, Kermanshah, Qom, Qazvin, and Golestan was added to those reported in the
provinces of Azarbayjan-e Khavari, Bakhtaran, Markazi, Zanjan, and Mazandaran,
respectively (Fig. 1a).
Cases were geo-located in the centroid of each province. To disaggregate these
locations, the map surface of Iran was divided into 15,599 cells of 100 km2 (i.e.,
10 km � 10 km) and the spatial distributions of cases were smoothed using a kernel
density function. The kernel density assigns a number of cases to the cell where the
centroid of the province is located and scales the remaining cases over a circular area
emanating from the centroid for a distance defined by a radius. The selection of the
radius, which may be thought of as the sphere of influence, can significantly affect results
and their interpretation. As the radius increases, local information may be diluted and
smoother or more gradual differences in the distribution of cases are predicted. The
selection of the radius length for the kernel density in this study was based on estimated
case locations derived from expert opinion (Dr. Iradj Nowrouzian, personal
communication). The expert based his opinion on a study of the distribution of FMD
in Iran during the same period studied here (Bakhtiari, 2003) and from which
information on the actual location of cases was available. Six different kernel density
outbreak maps were created using radii of from 18 to 68 latitude/longitude, and they thenwere compared with a map of the most likely distribution of FMD in Iran created in a
blinded manner through consultation with the expert. The values estimated in each of the
15,599 cells, using the kernel densities, were paired with the map created from expert
opinion. The map for which the distribution had the highest correlation, as estimated by
the R-Spearman test, with values obtained from expert opinion was considered the best
fit of the distribution of FMD.
A digital 3 min (approximately 5–6 km) resolution map of the predicted density
(animals/km2) of cattle, water buffalo, and small ruminants in Iran was obtained from the
Animal Health and Production Division of the Food and Agriculture Organization (FAO)
(Fig. 1b). These livestock densities were predicted, in 2001, using information from a
national animal census in Iran and from agro-climatic and remote-sensed data, using a
multivariable regression model (FAO, 2003a). The data, represented by maps for the kernel
density of outbreaks and the densities of cattle and small ruminants, were overlapped to
obtain a density of outbreaks per 100 km2 as well as the density per ruminant at risk per
100 km2 in each of the 15,599 cells. The program was written in perl (http://www.perl.
com/) and was used to obtain latitude, longitude, and values for density of outbreaks and of
ruminants for each cell. The program code can be obtained at http://fmd.ucdavis.edu/iran-
code1.html.
A.M. Perez et al. / Preventive Veterinary Medicine 71 (2005) 197–207 199

A.M. Perez et al. / Preventive Veterinary Medicine 71 (2005) 197–207200
Fig. 1. (a) Administrative division and boundaries of Iran. (b) Livestock (cattle and small ruminants) density of
livestock in Iran (FAO, 2003a).

The values of the number of cases and of the population at risk per 100 km2 estimated in
each cell were rounded to the nearest integer. The predicted number of outbreaks per
ruminant-at-risk was assumed to be Poisson distributed and was analyzed using a spatial
scan statistic (Kulldorff and Information Management Services Inc., 2003) with a 100 km
maximum size window, which was equivalent to a radius of 10 cell lengths. Windows were
allowed to overlap and clusters of cells at a significantly (P < 0.05) higher risk than the
mean risk for all cells were identified.
High-risk areas also were estimated, using the spatial scan statistic on the provincial
data with a maximum window size that captured up to 50% of the population at risk, as
recommended by Kulldorff et al. (1998). The proportion of locations from which FMD
virus was isolated, between 1996 and 2003, in the clusters identified by each of the
techniques was compared. Data on latitude and longitude of FMD virus isolates were
provided by the World Reference Laboratory for Foot-and-Mouth Disease, Institute for
Animal Health (WRLFMD), Pirbright, United Kingdom.
The mean distance between the centroid of each province (where data initially were
aggregated) and the centroid of the nearest predicted cluster was compared with the mean
distance between 24 randomly selected locations and the centroid of the nearest predicted
cluster using a t-test. If these distances were similar, it could be assumed that the results
were unlikely to be affected by the similar shape of the functions.
3. Results
The total number of outbreaks reported from June 1996 to September 2003 was 4477.
The median number of reported outbreaks per province was 125.5 (min–max: 24–665). A
radius of 48 (about 400 km) generated the kernel density of reported outbreaks (Fig. 2) that
had the highest correlation (Fig. 3, R-Spearman test = 0.823) with the geographic
distribution of FMD outbreaks estimated from expert opinion (Fig. 4). For example, Iran
reported 482 outbreaks in the northwestern province of Azarbayjan-e Khavari. The area of
the province is 65,938 km2. The kernel density of FMD outbreaks using a radius of 48predicted a total number of 396 outbreaks in the province (659 cells of 100 km2 with an
average of 0.6 outbreaks per cell (i.e., 60 outbreaks per 10,000 km2) (Fig. 2). The highest
number of cases, according to the expert opinion, and the highest density of OIE-reported
outbreaks were located in northwestern Iran (Figs. 2 and 4). The only significant cluster
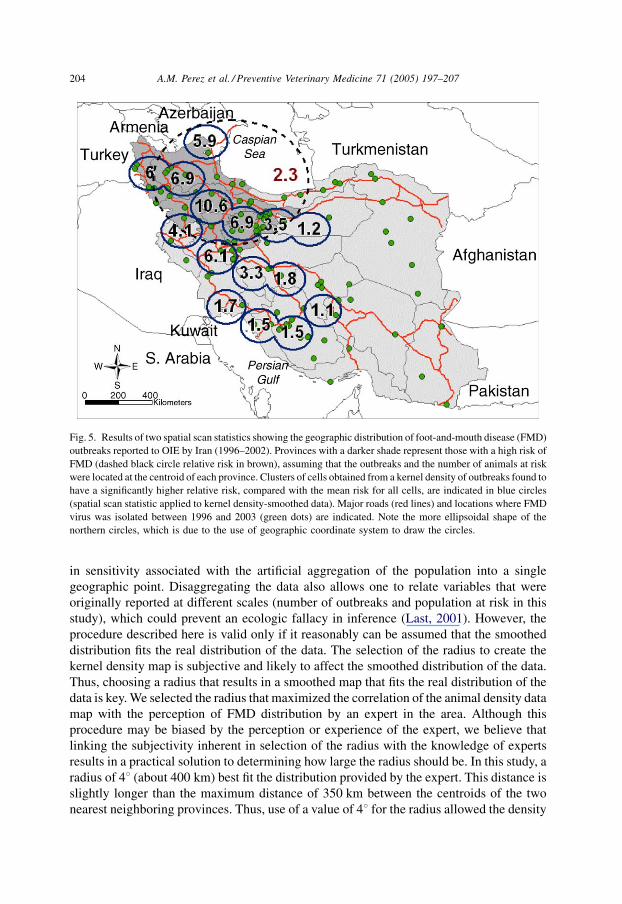
found, using the spatial scan statistic on the aggregated data, was located in this region
(Fig. 5). This cluster was centered in the Gilan Province and encompassed 8 of the 24
provinces. The relative risk (RR) of FMD in the cluster area was 2.3, compared with the
mean risk in the remainder of the country.
Fifteen significant (P < 0.01) clusters, ranging in RR from 1.1 to 10.6, were detected
using the spatial scan statistic applied to density-smoothed data (Fig. 5). Most of these
clusters appeared as three sets of contiguous chains running east and west along the central
plateau on the northern and southern Iraqi border, with the RR generally diminishing as one
moved east. Clusters also were identified next to the Turkish, Armenian, and Azerbaijani
borders. The clusters with the highest risk (RR � 4.0) tended to be located in northwestern
Iran.
A.M. Perez et al. / Preventive Veterinary Medicine 71 (2005) 197–207 201

The distance between the centroid of each province and the center of the nearest
predicted cluster (mean = 144 km, S.D. = 137.7 km) was similar (P > 0.05) to the mean
distance between the 24 randomly selected locations and the centroid of the nearest
predicted cluster (mean = 199 km, S.D. = 166.4 km). None of the centers of the
predicted clusters was located in the same cell as the centroid of the provinces. The
minimum distance between the center of a cluster and the centroid of a province was
20 km.
FMD virus was isolated in 97 different locations in Iran between 1996 and 2003.
Fifty-three (55%) and 46 (47%) of the isolates were included in the clusters estimated
using the smoothed distribution and the aggregated distribution of cases, respectively.
A.M. Perez et al. / Preventive Veterinary Medicine 71 (2005) 197–207202
Fig. 2. Kernel density map of 4477 foot-and-mouth disease outbreaks reported to OIE by Iran (1996–2002),
created using a radius of 48. The centers of the circles indicate the centroid of each province, with the number of
outbreaks reported for each. The insets show kernel density maps using a radius of 18 (upper) and 68 (lower).
Fig. 3. Correlation (R-Spearman test) between kernel density of foot-and-mouth disease outbreaks reported in
Iran (1996–2002) for six radii and an expected distribution of outbreaks derived from expert opinion.

Thirty-two (33%) of the virus isolate locations were included in the high-risk areas
estimated using both procedures. The locations where FMD virus was isolated were at
higher risk (RR = 1.9; 95% CI = 1.2–3.1) of being included in a cluster estimated using
the density-smoothed data than being included in a cluster estimated using the scan
statistic applied to the aggregated data. One cluster (RR = 1.2), estimated using the scan
statistic applied to smoothed data, did not include any location where FMD virus was
isolated (Fig. 5).
4. Discussion
The spatial scan statistic has been one of the most commonly used techniques to address
spatial clustering of animal diseases. Advantages of the technique include the ability to: (a)
identify specific high-risk areas, (b) quantify risk, (c) apply the test to different types of
data (case-control or case-population at risk), (d) control for uneven population size, and
(e) evaluate covariates. A major drawback of the technique can occur if cases and controls
(or population at risk) are assumed to be aggregated at a single point. Although this
simplification may be reasonable for studies of populations in small areas (e.g. cities), it
may not be appropriate when a population is dispersed over a relatively large geographic
area, such as a province.
Smoothing the distribution of cases and populations at risk in a region allows for a more
meaningful interpretation of the spatial distribution of a disease by addressing the decrease
A.M. Perez et al. / Preventive Veterinary Medicine 71 (2005) 197–207 203
Fig. 4. Expert opinion of the estimated geographic distribution of foot-and-mouth disease in Iran (Dr. Iradj
Nowrouzian, personal communication). Each cell is 18 latitude � 18 longitude.
in sensitivity associated with the artificial aggregation of the population into a single
geographic point. Disaggregating the data also allows one to relate variables that were
originally reported at different scales (number of outbreaks and population at risk in this
study), which could prevent an ecologic fallacy in inference (Last, 2001). However, the
procedure described here is valid only if it reasonably can be assumed that the smoothed
distribution fits the real distribution of the data. The selection of the radius to create the
kernel density map is subjective and likely to affect the smoothed distribution of the data.
Thus, choosing a radius that results in a smoothed map that fits the real distribution of the
data is key.We selected the radius that maximized the correlation of the animal density data
map with the perception of FMD distribution by an expert in the area. Although this
procedure may be biased by the perception or experience of the expert, we believe that
linking the subjectivity inherent in selection of the radius with the knowledge of experts
results in a practical solution to determining how large the radius should be. In this study, a
radius of 48 (about 400 km) best fit the distribution provided by the expert. This distance is
slightly longer than the maximum distance of 350 km between the centroids of the two
nearest neighboring provinces. Thus, use of a value of 48 for the radius allowed the density
A.M. Perez et al. / Preventive Veterinary Medicine 71 (2005) 197–207204
Fig. 5. Results of two spatial scan statistics showing the geographic distribution of foot-and-mouth disease (FMD)
outbreaks reported to OIE by Iran (1996–2002). Provinces with a darker shade represent those with a high risk of
FMD (dashed black circle relative risk in brown), assuming that the outbreaks and the number of animals at risk
were located at the centroid of each province. Clusters of cells obtained from a kernel density of outbreaks found to
have a significantly higher relative risk, compared with the mean risk for all cells, are indicated in blue circles
(spatial scan statistic applied to kernel density-smoothed data). Major roads (red lines) and locations where FMD
virus was isolated between 1996 and 2003 (green dots) are indicated. Note the more ellipsoidal shape of the
northern circles, which is due to the use of geographic coordinate system to draw the circles.

of outbreaks in a given province to be influenced by the density of outbreaks in at least its
nearest neighboring province.
By considering the underlying distribution of outbreaks, we were able to examine for
clusters in 15,599 100 km2 cells, rather than in only 24 provinces. Fifteen clusters were
detected using the density-smoothed data, most (eight) of which were not included in the
single cluster identified by the spatial scan statistic used on aggregated data (Fig. 5). The
density-smoothed approach produced a range of relative risk estimates (1.1–10.6)
compared to the single estimate (2.3) generated from the traditional approach. Thus, this
application of the spatial scan statistic to density-smoothed data provided considerable
refinement in the size and location of clusters. This inference is supported by the finding
that clusters estimated using the smoothed data included more sites where FMD was
isolated, compared to the single large cluster identified using the aggregated data
(P < 0.05). We acknowledge that this improvement in the sensitivity may lead to a
decrease in the specificity of the scan statistic. Smoothing the distribution of the data results
in a high number of points, increasing the chances of identifying false positive clusters. For
example, one of the 15 clusters did not include (although narrowly) the location of isolates
of FMD virus. However, the high correlation between the expected distribution of the data,
as obtained from the expert opinion, and the smoothed distribution of the data suggests that
the product of the smoothing more closely mimics the real distribution of the FMD cases.
Moreover, when examining small geographic units of only 100 km2, the detection of
clusters is not constrained by the artificial administrative boundaries of the provinces. For
example, the single cluster detected using the spatial scan statistic on provincial data was
centered in Gilan province and included 8 of 24 provinces (Figs. 1a and 5). Gilan was not
included, however, in any of the clusters estimated using the smoothed data, suggesting that
Gilan was encompassed in the cluster estimated using the aggregated data only because of
its close proximity with high-risk provinces. Thus, use of the traditional spatial scan
statistic with aggregated data led to an inflated estimate of risk of FMD for the Gilan
province.
We were concerned that the circular shape of the distribution used to smooth the data
might influence the results of the scan statistic. Clusters could be centered in the centroid of
the province where data were allocated previously to smooth the distribution and a higher
weight is imposed when a kernel density is used. In our study, the distances between the
centers of the clusters and the centroids of the provinces were not different from those of
randomly selected points (P > 0.05), suggesting that the circular shape of the kernel
density did not affect the results of the scan statistic.
The use of spatial scan statistics, even if applied to smoothed data, may result in
potential bias due towhat is referred to as the edge effect, whereby areas along the edge of a
region being studied can be misclassified because data outside the region are not
considered in the analysis. That is, the window used in the spatial scan statistic in some
cases may extend into areas outside the study region to include a neighboring area for
which there are no data. If the neighboring area has no population at risk, such as a sea, then
the edge effect is controlled because the ratio of cases to controls does not change.
However, if the circular window includes a neighboring region that potentially contains
cases and animals at risk, such as a land mass of a neighboring country, and if that
information is not included in the analysis, the risk for the region under study may be either
A.M. Perez et al. / Preventive Veterinary Medicine 71 (2005) 197–207 205

under- or over-estimated, depending on the risk in the neighboring country. In the study
here, information on FMD outbreaks in neighboring countries was not included in the
analysis. Smoothing the distribution of the data increases the number of points that are
close to the map borders and may potentially increase the effect of the edge. However, this
potential problem is largely compensated by reducing the size of the windowwhen data are
smoothed. Thewindow that identified the cluster using the aggregated data included part of
Azerbaijan and Armenia (Fig. 5). Thus, the results should be interpreted only under the
assumption that the ratio of cases to population at risk in the area of the circle
encompassing Azerbaijan and Armenia is similar to that in the circle encompassing Iran.
Accommodation of the assumption of equal ratios is easier when the spatial scan statistic is
applied to smoothed data because the distances between neighboring locations (cells) are
much smaller than those for the aggregated data locations (provinces). The window size we
used on the density-smoothed data (100 km radius) was selected to minimize an edge-
effect. We believe that the selection of a small window size when smoothed data are
analyzed permits the reasonable assumption that the ratio of cases is similar in neighboring
locations at both sides of the country border.
Lack of information on number of livestock or herds spatially and temporally
disaggregated prevented the use of techniques of time–space clustering analysis. As a
consequence temporal aggregation of the data was necessary. Thus, the results represent an
estimate of the 7-year average of the risk of FMD outbreaks in Iran. The estimates of
livestock distribution predicted by FAO in 2001 were assumed to represent the average
distribution of livestock during this 7-year period. Most of the clusters estimated when the
spatial scan statistic was applied to density-smoothed data were located in the central
plateau and western Iran, wherein are located numerous roads and markets and a very
dense human population (Statistical Centre of Iran, 2003). The geographic relation of these
clusters with the grazing areas of Iran may indicate an association between FMD and the
traditional nomadic routes in Central Asia. These routes, generally known as the ‘‘ruminant
street’’, have been proposed as the main route of FMD transmission between the Indian
subcontinent and the Middle East (WRLFMD, 2002).
The only possible trans-boundary association with FMD suggested by results on the
aggregated data was along the Turkish and Transcaucasian borders. Results from analysis
of the density-smoothed data, however, suggested an additional clustering of FMD along
the Iraq border. Trans-boundary migration of animals between Iraq and Iran is well known
and the border of Iran was considered to be the highest risk area for trans-boundary
livestock disease transmission in the event of a humanitarian crisis in Iraq (FAO, 2003b). It
is interesting to note that the distribution of chains of clusters, estimated when the spatial
scan statistic was applied to smoothed data (Fig. 5), coincides generally with the major
regional roads, which also would be the most likely routes of nomadic and trans-human
movements across the Iraq/Iran border.
5. Conclusion
This paper presents a methodology to estimate spatial distribution of outbreaks with
aggregated data, using a combination of expert opinion, kernel density estimates, and
A.M. Perez et al. / Preventive Veterinary Medicine 71 (2005) 197–207206

spatial scan statistic. The geographic similarity of the location and direction of chains of
FMD clusters with roads, densely populated areas, and neighboring countries suggests that
the region may represent a route for transmission of FMD through Central Asia.
Acknowledgements
The project was funded in part by the Armed Forces Medical Intelligence Center. We
gratefully acknowledge Dr. Iradj Nowrouzian, School of Veterinary Medicine, University
of Tehran, Iran, for assistance in interpreting the reporting system and providing expert
opinion about the distribution of FMD in Iran. Geospatial locations where FMD virus has
been isolated were kindly provided by the World Reference Laboratory for Foot-and-
Mouth Disease, Institute for Animal Health (WRLFMD), Pirbright, United Kingdom.
References
Bakhtiari, S., 2003. Epidemiological dynamic of FMD in Iran using geographical information system. DVM
Thesis. No. 2881, March. Supervised by Iradj Nowrouzian, Faculty of Veterinary Medicine, The University of
Tehran, Tehran, Iran.
FAO, 2003a. FAO/AGA Project, Working Livestock Distribution Data in Asia. http://ergodd.zoo.ox.ac.uk/
agaagdat/index.htm.
FAO, 2003b. EMPRES Project, Emergency Preparedness in Animal Health in Iraq and the Middle East, issued on
07/03/2003 through the EMPRES mailing list. http://www.fao.org/livestock/agah/empres/warn_mes/
warn15.htm.
James, A.D., Rushton, J., 2002. The economics of foot and mouth disease. Rev. Sci. Tech. 21, 637–644.
Kulldorff, M., Nagarwalla, N., 1995. Spatial disease clusters: detection and inference. Stat. Med. 14, 799–810.
Kulldorff, M., Athas, W.F., Feurer, E.J., Miller, B.A., Key, C.R., 1998. Evaluating cluster alarms: a space-time
scan statistic and brain cancer in Los Alamos, New Mexico. Am. J. Public Health. 88, 1377–1380.
Kulldorff, M., Information Management Services Inc., 2003. SaTScan v4.0: Software for the Spatial and Space–
Time Scan Statistics. http://www.satscan.org/.
Last, J.M., 2001. A Dictionary of Epidemiology, fourth ed. Oxford University Press, New York, pp. 56–57.
OIE, 2004. Monthly Incidence of Foot-and-Mouth Disease Outbreaks by Location in Iran (1996–2003). http://
www.oie.int/hs2/zi_pays_mald.asp?c_pays=90&annee=1996&c_mald=2.
Perez, A.M., Ward, M.P., Torres, P., Ritacco, V., 2002. Use of spatial statistics and monitoring data to identify
clustering of bovine tuberculosis in Argentina. Prev. Vet. Med. 56, 63–74.
Perez, A.M., Ward, M.P., Carpenter, T.E., 2004. Epidemiological investigations of the 2001 foot-and-mouth
disease outbreak in Argentina. Vet. Rec. 154, 777–782.
Statistical Centre of Iran, 2003. Selected Statistical Yearbook Data. http://www.sci.or.ir/english/sel/index.htm.
Sumption, K., 2003. Foot-and-Mouth Surveillance Support for Central Asia. Report of the 35th Session of
EUFMD. Rome (Appendix 9).
Ward, M.P., Carpenter, T.E., 2000. Techniques for analysis of disease clustering in space and in time in veterinary
epidemiology. Prev. Vet. Med. 45, 257–284.
Ward,M.P., Perez, A.M., 2004. Association between soil type and paratuberculosis in cattle herds. Am. J. Vet. Res.
65, 10–14.
WRLFMD, 2002. Report from the OIE/FAO World Reference Laboratory for Foot-and-Mouth Disease. Virus
Strain Identification for the Years 2000–2001. http://www.iah.bbsrc.ac.uk/virus/Picornaviridae/Aphthovirus/
index.html.
A.M. Perez et al. / Preventive Veterinary Medicine 71 (2005) 197–207 207