
Statistic in Your World - Welcome to the Mathematics ...
330
Statistics in Your World Level 1 Practice Makes Perfect Tidy Tables Leisure for Pleasure If at First Getting it Right Level 2 On the Ball Seeing is Believing Authors Anonymous Level 3 Multiplying People Pupil Poll Car Careers Phoney Figures Cutting it Fine Level 4 Choice or Chance Figuring the Future Testing Testing Probability Games
-
Upload
khangminh22 -
Category
Documents
-
view
3 -
download
0
Transcript of Statistic in Your World - Welcome to the Mathematics ...

Statistics in Your World Level 1
Practice Makes Perfect
Tidy Tables
Leisure for Pleasure
If at First
Getting it Right
Level 2
On the Ball
Seeing is Believing
Authors Anonymous
Level 3
Multiplying People
Pupil Poll
Car Careers
Phoney Figures
Cutting it Fine
Level 4
Choice or Chance
Figuring the Future
Testing Testing
Probability Games

Schools Council Project on Statistical Educationrhis Project has been based in the Department of Probability and Statistics at the UniversityIf Sheffield from 1975 to 1980. Its brief was: to assess the present situation of statisticalrlucation in schools; to survey the needs.of teachers of statistics; to devise detailed proposals'or the implementation of the teaching ideas; and to produce teaching materials.
Project Team
Director: Peter Holmes (l975~ )Deputy Director: Neil Rubra (l975~78), Daphne Turner (1978~
Project Officers
Ramesh Kapadia (1975-79), Alan Graham (1976-77), Barbara Cox (1979-80)
General Noteslages with the preflX R are resource pages or reference pages for pupil use. (In many caseshey are designed as worksheets.) In the pupil unit these are referred to as 'page RI', etc.
lermission need not be sought to reproduce copies of the R sheets provided that copies arenade only in the educational establishment in which they are to be used and that such copiesre not sold, hired or lent to any other indivdual, organization or establishment.
lections or questions marked with an asterisk are optional to the main thrust in the unit.:Ometimes they are for the more able pupils, sometimes they are for reinforcement and some~
imes they consist of simpler work for the less able pupils and lead to an easier conclusionhan the main unit. In each case detailed comments on the particular purpose will be found inhe appropriate section of the teacher's notes.
1lree different typefaces are used in the pupil units. Text in roman-type (like this) is for pupils:> read or for the teacher to introduce. Questions to promote thought and for group or classliscussion are printed in italics. Instructions telling pupils to do things and questions forlupils to answer are printed in bold.
Statistics in your world
PRACTICEMAKES
PERFECT
TEACHERS' NOTES
LEVEL 1
Published for the Schools Council by
FOULSHAM EDUCATIONAL

Contents
Brief Description
Aims and Objectives
Prerequisites
Equipment and Planning
Detailed NotesSection ASection BSection CSection D
Answers
Test QuestionsAnswers
Connections with OtherUnits in the Project
R pages on pages i0-13.
Page3
33344489
151517
18
Brief DescriptionThe general theme of this unit is to see if one can improve on certain taskswith practice. The comparison uses simple statistical techniques, anddiscussions help lay an intnitive feel for the sort of conclusion that can bedrawn in such circumstances. Since reaction times are often included inscience courses at about this age and the ability to estimate lengths andtimes is an essential part ofany scientific training, this unit has major linkswith the work of the science department.
Design time: 4 hours
Aims and ObjectivesOn completion ofthis unit pupils should he able to calculatea simple range,find a mode and draw a scattergram. They will have practised tallying,completing tables, drawing bar charts and (in an optional section)calculating a mean. They meet examples ofdrawing inferences from tables,bar charts and scattergrarns, of simple aspects of experimental design, oftrends and their interpretation and of the comparison of two sampledistributions. They should be more aware ofthe way variability can make itdifficult to see trends.
PrerequisitesPupils need to be able to measure a line to the nearest tcm, to read a nonlinear scale to the nearest unit and to complete simple tables by tallying.Some experience in drawing simple bar charts is desirable but not essential.They will need to know the order of the integers.
Schools Council Project on Statistical Education
Published byW. Foulsham & Co. Ltd., Yeovll Road, Slough, Berks
@ Schools Council Publications 1980
ISBN 0-572-01097-4
PRINTED IN HONG KONG
'Equipmentand PlanningRulers and squared paper are required throughout the unit. A scale fortapingon to a 30 em ruler is provided on page RI (in which case scissors andsellotape are required). Aiternatively, the scalecan be copied on to pieces ofstiff card 30 em long. Section B5 is optional for pupils who have hadprevious experience with calculating a mean. Blank tables for the varioussections are provided on pages RI and R2.
The main theme is: 'Do your skills improve with practice?'. This isintroduced in general terms in the short Section A. Sections Band Cintroduce two particular skills reaction times in catching a ruler andestimating lengths. The effect of practice on these skills and on estimatingtimes is considered in Section D.
3

The class data are going to be analysed in several ways in subsequentsections. Pupils must therefore keep a record of their results. If you wishthem to do B4, then the data should be recorded on the blackboard thus:
One pupil holds the ruler, as shown in the pupil's notes, with the zero marklevel with the upper edge of his partner's thumb.
Without warning the first pupil lets go of the ruler. Without moving hishand downwards, the second pupil tries to catch the ruler as qnickly as hecan.
Possible questions that can be asked of the data are listed below.
(i) Is the reaction time of the writing hand quicker than that for thenon-wri ting hand?
(ii) How much variability in reaction times is there over the class?(iii) (In coeducational schools) Are girls' reactions quicker than boys'
reactions?
Find the reading on the ruler level with the top ofthumb. Using the scale onthe ruler, find out the reaction time in hundredths ofa second. Ifthe rulerisnot caught, record a time of 25 hundredths ofa second. Repeat a secondtime with the same hand and use this time for your results. Repeat with theother hand.
This table gives an accurate way of calibrating the ruler (see page RI).T =Time in hundredths of a second D = Distance in mm from zero
Reaction times
Non-writing hand Writing handPupil's name
T 5 5t 6 6t 7 7t 8 8t 9 9t 10 10t 11 11 t
0 12·3 14·8 17·6 20·7 24 27·6 31·4 35·4 40 44 49 54 59 65
T 12 12+ 13 13t 14 14t 15 15t 16 16t 17 17t 18
0 71 77 83 89 96 103 110 118 125 133 142 150 159
T 1St 19 19t 20 20t 21 21t 22 22+ 23 23t 24 24t
0 168 177 186 196 206 216 227 237 248 259 271 282 294
Detailed Notessection lit.
The problems involved can be set in a wider context with such questions asthe following. How accurate were you when you first threw and caught aball? Are you any better now? Why have you improved? Is everyone asgood as everyone else at this? Would they be if they had more practice?How qnickly do you react? Can you dodge snowballs? Can you run fastereach year? Can you calculate bettereach year? Can you go on improvingforever? Does practice always help?
The discussion can be led'towards: 'Are you quicker at doing things withyour right hand or your left hand?' (and hence bring out that any ,comparison should be between 'writing hands' of different pupils ratherthan 'right hands'). Which would you expect to show a greaterimprovement with practice - writing ornon-writing hands? (Possibly nonwriting, as the writing hand will already be good.) Lead on to the droppingruler experiment of Section B.
Secllon B
This first experiment is not described in detail in the pupils' notes becauseof the need to ensure rapid understanding by the pupils. It is important thatboth the amount ofpractice is minimal and that the pupil understands whathe has to do. Experience has shown that it is easier for pupils to use a 30 cmruler for the experiment than a piece of stiff card marked with anacceleration scale. With less able pupils the experiment can be done solelyusing the centimetre scale of the ruler. There is, however, an importantscience concept that can be referred to here ifthe other scale is used, Le. thatit is acceleration not velocity which is constant, and it is the reaction timesin which we are interested. Hence we suggest that the scale given on page Rlbe stuck on the ruler for this experiment.
As a further link with science it would be useful to discuss the experimentaldesign. Clearly it is important that all pupils do the same amount ofpractice and use either their writing or their non-writing hand first. Theadvantage ofthe latter is that pupils expect to be faster with their writinghand! An alternative is for one ofeach pair of pupils to use a different handfirst.
Instructions
Work in pairs. Rest your arm ona desk with your hand just over the edge.Keep your thumb and first finger about one centimetre apart.
4 5
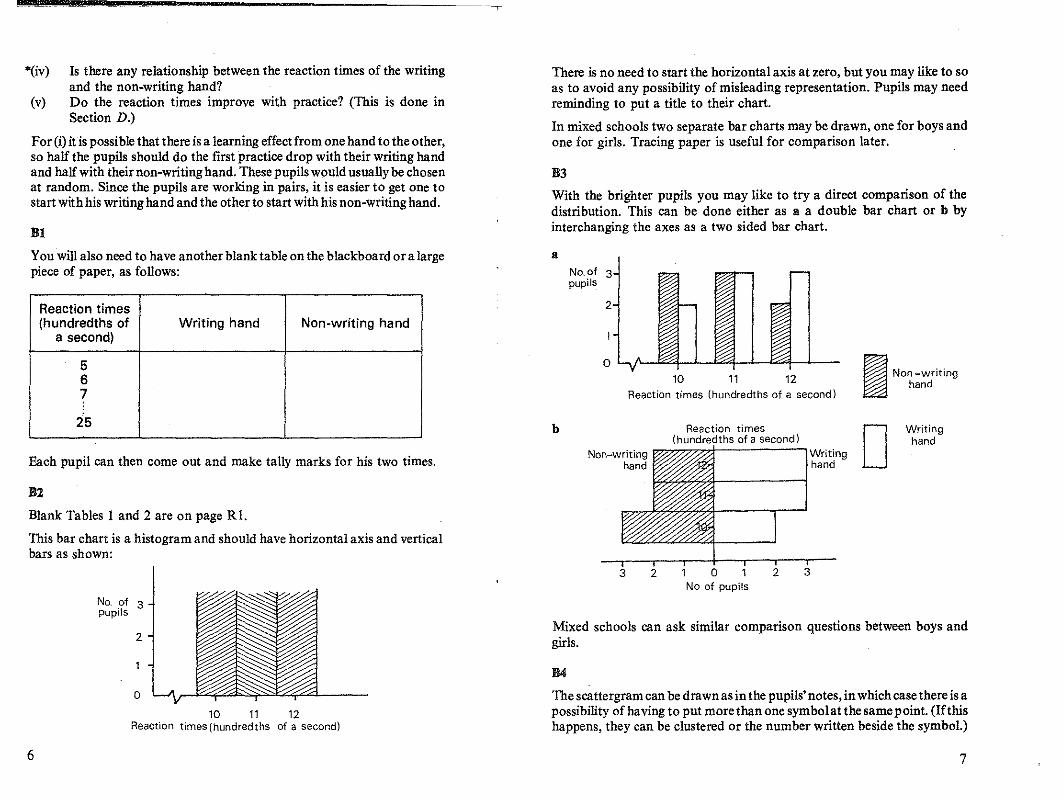
*(iv) Is there any relationship between the reaction times of the writingand the non-writing hand?
(v) Do the reaction times improve wit.h practice? (This is done inSection D.)
For{i) itis possible that there is a learning effect from one hand to the other,so half the pupils should do the first practice drop with their writing handand half with their non-writing hand. These pupils would usually be chosenat random. Since the pupils are working in pairs, it is easier to get one tostart with his writing hand and the other to start with his non-writing hand.
Dl
There is no need to start the horizontal axis at zero, but you may like to soas to avoid any possibility of misleading representation. Pupils may needreminding to put a title to their chart.
In mixed schools two separate bar charts may be drawn, one for boys andone for girls. Tracing paper is useful for comparison later.
:113
With the brighter pupils you may like to try a direct comparison of thedistribution. This can be done either as a a double bar chart or b byinterchanging the axes as a two sided bar chart.
aNo.of 3pupils
I Non-writinghand
Writinghando
10 11 12
Reaction times (hundredths of a second)
2
o
Reaction times{hundredths of a second}
Non-writing '~~~I----lwriting~nd~ hand
b
Reaction times(hundredths of Writing hand Non-writing hand
a second)
567
25
You will also need to have another blank table on the blackboard or a largepiece of paper, as follows:
Each pupil can then come out and make tally marks for his two times.
:112
Blank Tables I and 2 are on page R 1.
This bar chart is a histogram and should have horizontal axis and verticalbars as shown:
Mixed schools can ask similar comparison questions between boys andgirls.
The scattergram can be drawn as in the pupils' notes, in which case there is apossibility of having to put more than one symbolat the same point. (Ifthishappens, they can be clustered or the number written beside the symbol.)
No. of 3pupils
2
o10 11 12
Reaction times (hundredths of a second)
3 2 1 0 1No of pupils
2 3
6 7

Alternatively, the diagram can be drawn as below and the symbols enteredinto the appropriate squares. Pupils 'may need help in interpreting it. Lookfor things such as most non-writing hands are slower than writing hands orquick reaction times tend to occur with both hands.
-i---+----L---L---i10+ 1+ : : II I I I II I I I I
-+---~---+---~---~I 1+ 10 I iI I I I II I I II I I
·-r- --L----l----J.-----lI I I II 1 I I I
"BS
10
10 11 12 13
Line 1 Line 2 Line 3 Line 4 Line 5
Guesses too high2em
(+) 1tem1 emtern
0
ternH 1 em
1tem2 em
Guesses too low
C4This is an optional section for those pupils who know, or can easily be told,how to calculate means. The comparison could be of the form 'the meantime for writing hands was ..... hundredths ofa second less than the meanthne for non-writing hands',
Section CNotice that in this section no help is given in the guessing. This contrastswith Section D3 where we hope to see some learuing from experiencetaking place.Cl
The blank Table 3 is on page R2. Lengths are measured in centimetresthroughout.
C2
The actual lengths ofthe lines are (I) 5 cm (2) 6tcm(3)4cm(4)9cmand (5)3t cm.
To collect the pupils' data draw a blank table on the blackboard for tallycharts to be filled in by the pupils.
8
The discussion of the class's results could include the following points:
The table gives the distribution of estimates for each line. Look for suchthings as the bias in estimates, range in estimates, whetherverticallines areconsistently underestimated and which lines were overestimated by mostpeople.
The above can be a time-consuming exercise, and it would be valuable tohave the blackboard (or OHP sheet) prepared in advance. Alternatively, itmay not be necessary to analyse all five lines in this way.
In C4 we take the absolute values ofall the errors, i.e. ignoring the + andsigns, to give some measure of the pupil's accuracy. In this way two errorsof, say, +5 and -5, show up as being worse than two errors of+2 and +I.
With brighter pupils you might like to take the + and -signs into account.A mean of 0 here tells you that the estimates were unbiased.
Section D
This section takes up the experiments of Sections Band C to see if pupilsimprove with practice. If time is short, the class could do one or other ofDl, D2 or D3. Alternatively, one-third of the class could do Dl, one-thirdD2 and one-third D3. One difficulty of measuring improvements is thatpupils who are good initially do not have room for improvement. Anotheris that variability of results sometimes makes it hard to spot trends.
(Text continued after the R pages)
9

(/)
c:o.~
.!:l:0:Ja.13c::JoU(/)
'0o.c"en@
oZ
0).,.S-§..,.~ ~
"'<::~'"j CI).E:CI) .~
rV
1 ~~
'"
<V'
.l!1
""rV
~R
Ot1.tOO~ &st>--fo~
::-
~
I
.s -g(/)
1
-", :a§<:::J'- '" 0-t) .S'5cts.~
~~ ci">,Z~c::_0
Uc::- ".l!1 E~ i=h
10 11

-tv
w
R2
Table 3 Length of lines
Line 1 Line 2 Line 3 Line 4 Line 5
My guess em
True length em
Difference em
+ or-
Table 4 Estimating time
Trial number 1 2 3 4 5 6 7 8 9 10
My guess (sees)
Correct time(sees)
Error (sees)
Guess too high(+) or too low H
Table 5 Reaction times
Trial number 1 2 3 4 5 6 7 8 9 10
Reaction time
Table 6 Line guessing
Line 1 Line 2 Line 3 Line 4 Line 5
My guess em
True length em
Difference em
+or-
© Schools Council Publications 1980
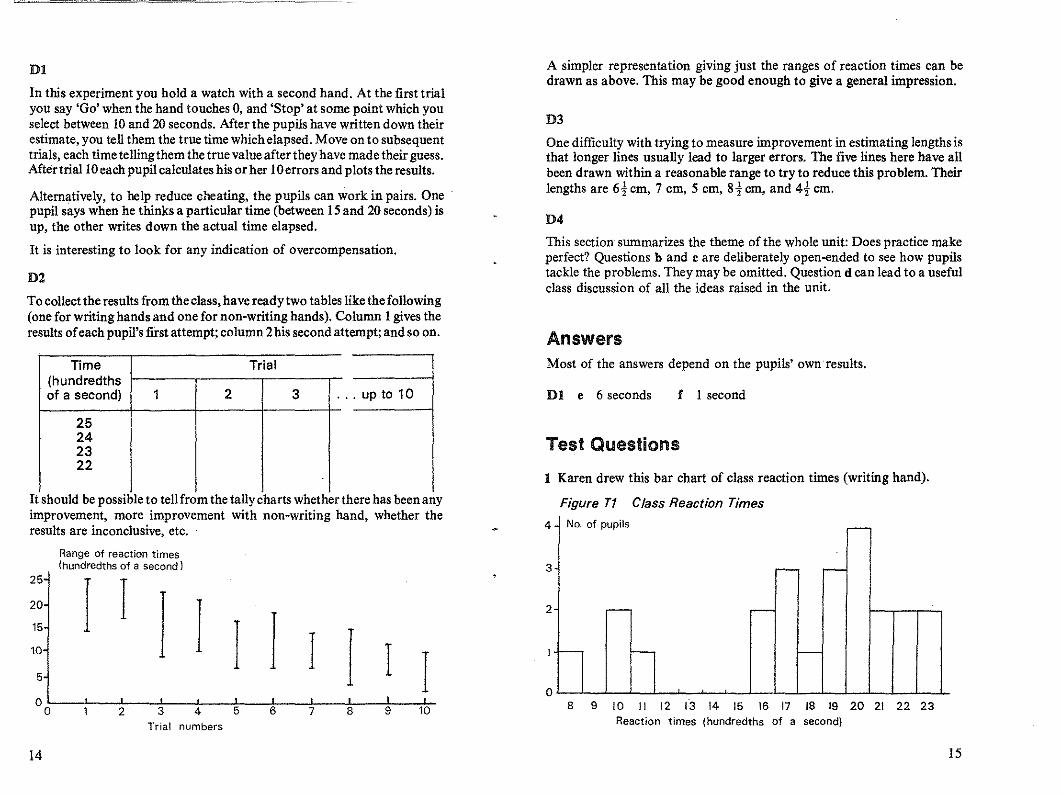
D1
In this experiment you hold a watch with a second hand. At the first trialyou say 'Go' when the hand touches 0, and 'Stop' at some point which youselect between 10 and 20 seconds. Mter the pupils have written down theirestimate, you tell them the true time which elapsed. Move on to subsequenttrials, each time tellingthem the true value after they have made their guess.Mter trial IO each pupil calculates his orher 10errors and plots the results.
Alternatively, to help reduce cheating, the pupils can work in pairs. Onepupil says when he thinks a particular time (between 15 and 20 seconds) isup, the other writes down the actual time elapsed.
It is interesting to look for any indication of overcompensation.
D2
To collect the results from the class, have ready two tables like the following(one for writing hands and one for non-writing hands). Column I gives thereSUlts ofeach pupil's first attempt; column 2his second attempt; and so on.
A simpler representation giving just the ranges of reaction times can bedrawn as above. This may be good enough to give a general impression.
D3
One difficulty with trying to measure improvement in estimating lengths isthat longer lines usually lead to larger errors. The five lines here have allbeen drawn within a reasonable range to try to reduce this problem. Theirlengths are 6tcm, 7 em, 5 em, stem, and 4t em.
D4
This section summarizes the theme of the whole unit: Does practice makeperfect? Questions band c are deliberately open-ended to see how pupilstackle the problems. They may be omitted. Question d can lead to a usefulclass discussion of all the ideas raised in the unit.
Answers
It should be possible to tell from the tally charts whether there has been anyimprovement, more improvement with non-writing hand, whether theresults are inconclusive, etc.
Range of reaction times{hundredths of a second 1
25
I I20 I 115
I I I10 I I I5
00 2 3 4 5 6 7 8 9 10
Trial numbers
14 15
Most of the answers depend on the pupils' own results.
f I second
No. of pupils r---
- r--
.-- -
f-- f-- I--
Dl e 6 seconds
8 9 10 II 12 13 14 15 16 17 18 19 20 21 22 23Reaction times (hundredths of a second)
Test Questions
3
2
o
4
1 Karen drew this bar chart of class reaction times (writing hand).
Figure T1 Class Reaction Times
.. up to 10
Time Trial(hundredthsof a second) 1 2 3
25242322

a What was the mode (or modal) time?b What were the fastest and the slowest times recorded in her class?c What was the range of times recorded?d How many pupils recorded the fastest time?e How many pupils recorded the slowest time?f How many pupils recorded a time of II second or less?
100
2 Table T1 shows the reaction times with writing and non-writing hand of23 pupils in Karen's class.
Table T1 Class reaction times (both hands]
Reaction times (hundredths of a second)
Writing hand Non-writing hand
1 16 182 20 213 18 194 19 225 8 9
Boys 6 22 207 10 128 17 159 19 20
10 10 1411 17 13
12 20 1913 21 2214 11 1415 23 2116 22 18
Girls 17 19 2118 21 1719 16 1420 23 2421 20 2022 20 2223 17 12
a Plotthese results as a scattergram. Use a '+' for a boy and an '0' for agirl.
b Write two sentences commenting on these results.
16
3 David guessed the lengths of five lines. Mter each guess he was told thecorrect answer before guessing the length of the next line. His results areshown in Table T2.
Table T2 David's lines
1 2 3 4 5True David's David's Guess too high (+)
length guess error or too lowl-)
Line 1 5 em 7tem 2t em +Line 2 6 em 8 emLine 3 7tem 5temLine 4 3 em 4 emLine 5 6tem 6 em
a Copy and complete Table T2.b Plot the results on a graph.c Use the figures in column 4 to calculate David's mean error.d David said his guesses improved with practice. Do you agree? Give a
reason.
Answers
1 a 20 hundredths of a secondb 8 hundredths of a second, 23 hundredths of a secondc 15 hundredths of a seconddle2f4
2 a Watch for labelling of axes, accuracy ofplotted points and title tothe graph.
b In general: boys' reaction times were quicker than girls' reactiontimes; times with writing hand were less than times with nonwriting hand.
3 a Column 4: 2i em) 2 em, 2 em, 1 em, ternColumn 5: +, -, +. :--
b Watch for plotting above and below the x-axis, using the+ andsigus as appropriate.
c Mean (absolute) error is 1=It cm(If + and - signs are taken into account, the mean is tcm).
d Yes. His (absolute) error became less over the five lines.
17

Connections with Other Published Units fromthe Project 1: :;
~ ..00 ~
l' .. :I:~ ~0> a: .f "ii: ~u. 00 C
Other Unlls at the Same level (level 1) 00 - .E.'!:: ~ ...9l :;; 0> i!.c 0> 1:g> ~
C
Shaking a Six Being Fair to Ernie Wheels and Meals ~ C :;; "",~ 'E ~,-
>- 0 ->- 00" E ..Probability Games Ifat first. .. Leisure for Pleasure " "
~
~B ";:: '" Cl ;:: w '"Tidy Tables :g0-"l 1: .c :e,~ 1: « 00 00"'- 00 00
~~ .. - .. .. .. ~
Units at Other levels In the Same or Allied Areas of the Curriculum " 00 00 .. ~ '" E'''' .. .. ~- ~:I: ~ :I:
~~ ~ ~ :;;.c :;;" :;; ..
Getting it Right a:: 0:: .S - .~ " ClLevel 2 Seeing is Believing -go: "c " c
g ~~u. c .. c ..
~.2 .E.'!:: ltl;~ "0> .. 0> i!oS i! 1: ~.E !!lg> 00 c 00 c :cLevel 3 Net Catch Cutting it Fine "" ~.-
0.;:;: 0; :;; "" ..~ ~ 0 ~ 0 - .c- 00 00" .c" .cE .c E .. 0.. 'a; 38 5<3 5 &:
'" -' 5w w '"Level 4 Smoking and Health
This unit is particularlY relevant to: Science, Mathematics, 00 ~ 0>.~ ~
00:;.. 'c c .. ..
,~ 'S' '"~ tb ,~~ E l' ~ :I::;;
,~ " 0;UJ ..
0>:;;,
"Interconnecllons between Concepts and Techniques Used In these '" B BCl" w ~ <Xl :0: "ooCc .. .g ~ .~~~.~£ c '" ..Units .. 'm ,~ ::0 g>00 0> 0 U. ~.- (/) CD ....0; C "
0> CD.g .;: .= a Q)~:i2:;; 0> C
'" oS c 'a; coO ........ ~ >- 0
These are detailed in the following table, The code number in the left-hand .c; .. 'a; '03::I'OU)'Ui .c"E5 .c; ~ 5;::ww <Xl w o::lo.:t:(!)Z
column refers to the items spelled out in more detail in Chapter 5 ofTeaching Statistics 11-16, S
c00
0.. 00
An item mentioned under Statistical Prerequisites needs to be covered~ " 'C:;;
.9l..
S C 0-
before this unit is taught, Units which introduce this idea or technique are 0- .g Eil' E 0
listed alongside, " c 'in !!l ~
.~ '" " I ~ "~ '" 0- 1:An item mentioned under Idea or Technique Used is not specifically ,~ 0- :g 0 'm-
~c
150-
~ ,S? 0-introduced or necessarily pointed out as such in the unit. There may be one ~ 1;
'" ~ 10 15 " 00',:0 15
,!2' :;~
c .9lor more specific examples of a more general concept, No previous ~ 0"- .~ "
C 0- " '''' 0- ~ti 0 ~.
.~ ~ Eexperience is necessary with these items before teaching the unit, but more - ..~
0- S 10 S .... > ~ ,~ " :§ .. .c;
practice can be obtained before or afterwards by using the other units listed ~ .. .. 'C ~ .. " ~~
5 " .. .c 0. .~ " ! ~
,~ e;, ~ E > 00 ..00 " E ~
in the two columns alongside, E c '5 .. " ~ :0 ~ " .~.c
';;; 0 0 .. ..'"
~ :11..
~ ~ ~00 m '0 E
0> .2 E c ,E .Ec ,gAn item mentioned under Idea or Technique Introduced occurs specifically c .~ 1: > c
.~ 00 ,g ~ E~
c :0 0
in the unit and, if a technique, there will be specific detailed instruction for " 0 ,~ 0 0 " ~
2 .. " ~ " 0 .~0> 'C 0
:c c .. ccarrying it out. Further practice and reinforcement can be carried out by 1;;
.c; ~ 0> 0> 0> '0 0- 1:0 00 ..c ~ c c c c 'C 0- .. E
~using the other units listed alongside, 0 .. ~ ';;; ';;; 'in .. 00
'" 0U <Xl U :;) :;) :;) > Ci 0: U
'" .. .. .. .c ~
OJ~ 0
" 0 N "! N ~ N .c; ~0 .Eu z N N - - - - - M "' "'
18 19

1:5 CodeIdea or Technique Used Introduced in
No. Also Used in
Sv Inference from tables Wheels and Meals Shaking a Six Seeing is BelievingLeisure for Pleasure Cutting it FineTidy TablesNet CatchSmoking and Health
Sz Detecting trends Cutting it FineSmoking and Health
Idea or Technique Introduced Also Used in
2.2e Bar chart for continuous data Wheels and Meals Leisure for Pleasure Seeing is Believing
2.2m Scattergrams Wheels and Meals Smoking and Health
3.1a Mode for discrete data Shaking a Six Leisure for Pleasure Seeing is Believing
3.1c Mean for small data set If at first .. , Seeing is Believing Getting it RightCutting it Fine Smoking and Health
4.1a Range If at first ... Cutting it Fine
Sc Reading time series Cutting it Fine
Se Comparing directly comparable data Cutting it Fine Smoking and Health
SI Elements of design of experiments
en"1J...
en » '"" '" enr:: ;:;. r
~~~ 3 0 $ Cll ~ ~~ ~ !r7<" r:: Cll "!2.. :T So 0 Cll 0 0 Cll :T r::-'-. """l t""'!'" ~ -. 0 t""'!'" -0 G) "0 5· """l t:r CD"""l ;:):J 5' '" Cll :J n' -e' 0 :T Cll _. CO Vl '" $ en Cll Cll COCO.~ ::.: Vl CO - r:: 0 .....:J » 0" '" ~ -Vl _ "~ ~t""'!'"CD <t""'!'" ;:)n~-' -. ~=~- ~o
~~-o;:)~o -.t""'!'" CDm~O ooO;:)m-.CD~m-."""lroF~~~·CCD,-o~5·ZCll<"""lC~~ro;:)Ot""'!'"~m~;:)~-o~·_Clln~ or:: CO 0_7"'Cll ..... :J" ~Cl.-_"'"g; ::c "Cll CD' 0 :T U "1J _ .....0 ::!! '" ..... 1:5" _. = :T -< _. G) Jl CO 7 -; Cll 0
-CDC~m~m=CD~ C"""l~~"""lroro3~m"""lm~rommm~ t""'!'"- ~o~mcCD-·~-o<~ t""'!'"3~ CDt:r OO ,"1J_r::Cl.-Vl:J uU- ........ CllCOCll---O Cllen",-r:::J
mt""'!'""""lCD;:)cnO-;:)nCD"""l~"""lm;:)mc CD n-.-CD"""l-.<~CDx~mro=roCD~mmt""'!'"m<~=m oo~xmmCDro
2=rCll......;:;:CD(/l
:J...2:(/l
(/l11l:::!.11l(/l

Statistics in your world
PRACTICEMAKES
PERFECT
Published for the Schools Council by
FOUlSHAM EDUCATIONAL
ContentsPage
A Improving with Practice 3B Reaction Times 4Bl Catching a Ruler 4B2 Class Results (non~writing hand) 5 ,B3 Class Results (writing hand) 6B4 Plotting Both Reaction Times 6
*B5 Mean Times 8
C Lengths of Lines 8Cl Guessing the Lengths 9C2 How Accurate? 10C3 Your Errors 11C4 How Good Were You on Average? 11
D Improving with Practice 11Dl Estimating Time 12D2 Reaction Times 13D3 Guessing Lengths 14D4 Does Practice Make Perfect? 16
Some sections are marked with an asterisk*. Your teacher will tellyou whether to try these sections.R Pages Your teacher will provide these for you.
The Schools Council Project on Statistical Education
Published byW. Foulsham & Co. Ltd., Yeovil Road, Slough, Berks
Cartoons by Colin Whittock
@ Schools Council Publications 1980
ISBN 0-572-01070-2
PRINTED IN HONG KONG
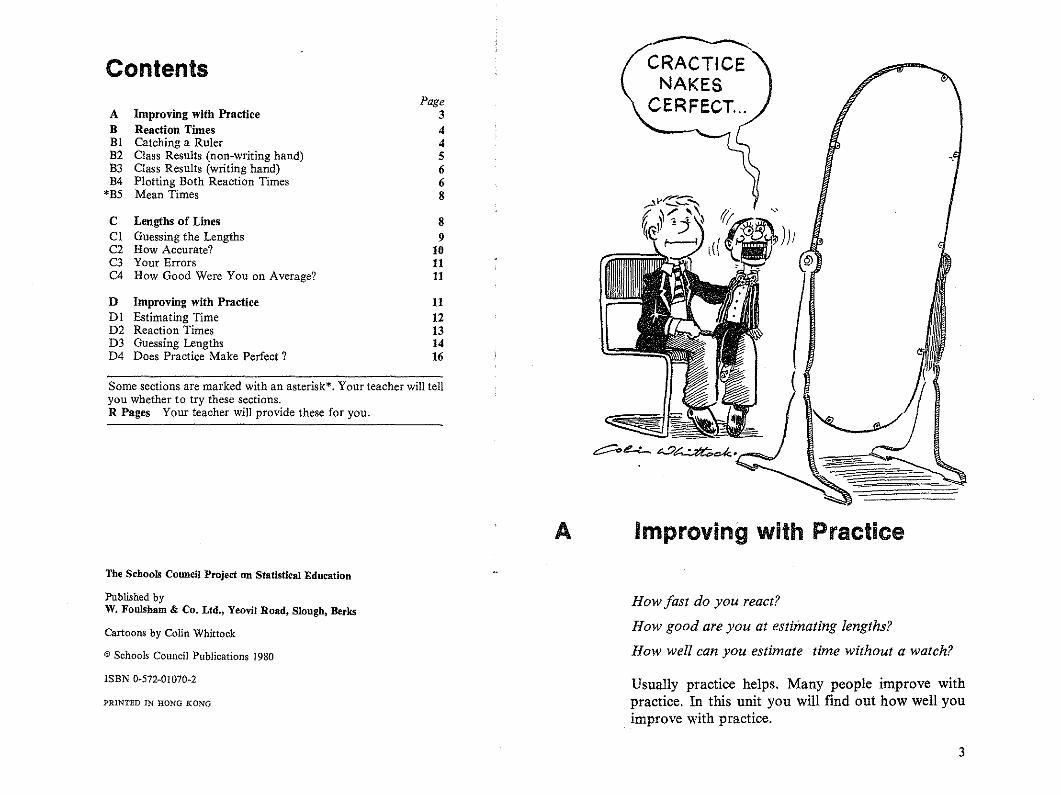
A Improving with Practice
How fast do you react?
How good are you at estimating lengths?
How well can you estimate time without a watch?
Usually practice helps. Many people improve withpractice. In this unit you will find out how well youimprove with practice.
3

Class Results (non-writing hand)
c Find the reaction time with your non-writing hand.Write it down.
d Find the reaction time with your writing hand.Write it down.
e Give your results to your teacher.f Complete Tables 1 and 2 on page RI.
Reaction times (non-writing hand), Parkville School
You will need Table I and squared paper.
a Write down the slowest reaction time.b Write down the quickest reaction time.c Subtract the quickest reaction time from the slowest
reaction time.
This is the RANGE of the class reaction times using thenon-writing hand.
The children in Class 2c at Parkville School did thesame experiment. Their results are shown as a bar chartin Figure 1.
Number ofchildren
- ~
- r- r-
- c- c-
- n n f-
Figure 1
3
2
5
o
4
B2
Catching a Ruler
You will need:Page RI, some sellotape and a 30 cm ruler.
Work with a partner.
a Cut out Figure 7 from page Rl and tape it to yourruler.
Your teacher will explain in detail what you have to do.Your partner will hold the ruler just above your hand.As soon as he lets go, you have to catch it between yourfinger and thumb. The markings on the ruler tell youhow long it took you to react.
b Practice ONCE ONLY with each hand.
When you have had this one practice, drop the ruleronce more through each hand.
Reaction Times
,~ '"" "..
""• "" '""" "" "
",""
B
B1
5 6 7 8 9 10 II 12 13 14 15 16 17 18 19 20 21 22 23 24 25Reaction times (hundredths of a second)
4 5

14
15 Reaction times(hundredths of a second)
83
d Draw a bar chart to show your class results fromTable 1.
At Parkville the most common reaction time (the onewith the tallest bar) is 18 hundredths of a second. We
say that the MODE is/;O seconds.
e Write down the mode for your class results.
Class Results (writing hand)
You will need Table 2 and squared paper.
a Draw a bar chart to show your class results with thewriting hand (Tahle 2).
h Write down the mode.c Write down the slowest reaction·time.
d Write down the fastest reaction time.e Write down the range of the reaction times.
Compare the results of the writing hand with those ofthe non-writing hand.
f Which hand had the higher mode (slower reactiontime)?
g Which hand had the greater range (more variation)?
Figure 2
13
12ucro.c
II'".S
.~ 10I
C0
Z
Figure 2 shows the results of two pupils. The reactiontime with the writing hand is on the horizontal scale,with the other hand on the vertical scale. The point (+)on the left is of a boy whose reaction times were 10hundredths of a second with the writing hand. and 12hundredths of a second with the other hand. The point(0) on the right shows the results of a girl with areaction timefor the writing hand of 13 hundredths of asecond and II hundredths of a second with the otherhand.
a Make a diagram like this which has a point for eachpupil in your class.
Reaction times for our class
+
o
Reaction times(hundredths of a second)
10 II 12 13 14 15
84
6
Plotting 80th Reaction Times
You will need a sheet of squared paper.
Writing hand
This sort of diagram is called a SCATTERGRAM.
b Can you see any patterns?
c What does your scattergram suggest about reactiontimes?
7

*135 Mean Times
You will need Tables I and 2.
a Add up the reaction times with the writing hand ofall the pupils in your class.
b Divide this by the number ofpupils in the class. Younow have the mean reaction time with the writinghand.
c Find the mean reaction time with the non-writinghand.
d Which hand gave the larger mean?e Was this what you expected?f Why?
JI=
1J
C1
Figure 3
Guessing the Lengths
You will need Table 3 on page R2.
Five lines
3
2
5
4
Lengths of LinesNormally you use a ruler to measure and draw lines.This next experiment is to find out how good you are atguessing lengths. Later on we shall see if you improvewith practice.
c
8
This page is long. Put your ruler away.
Figure 3 shows five lines.
a Guess the length ofline 1 to the nearest t centimetre.b Write your guess on the first row of Table 3 in the
first column.c Guess the lengths of the other four lines. Write
down your guesses in Table 3.
9

C2
10
How Accurate?
You will need Table 3.
Do not begin this section until you have guessed thelength of all five lines.
a Measure each line with your ruler. Write down theresults in the second row of the table.
b Find the error for each line, i.e. the differencebetween your guess and the true length. Write downthese results in the third row of the table.
c If your guess was too high, put a 'i-' sign in the lastrow. Ifyour guess was too low, put a' -' sign in thelast row. If your guess was exactly right, leave thelast row blank.
d Give your results to your teacher.
C3
C4
D
Your Errors
You will need Table 3.
The differences in row 3 of Table 3 are your errors.
a How many of your five guesses were too low?
b Which guess had the biggest error?c Which guess had the smallest error?
People often make bigger errors with longer lines.
d Did you?
How Good Were You on Average?
You can now calculate your mean error.
a Add your five differences together (row 3). Writedown the total. This is the total error.
b Divide this total by 5 to get the mean error.
c Copy and complete:My mean error shows that on average my guesseswere in error by em.
Your teacher will discuss the class results with you.
Improving with Practice
The next three experiments are to show how much youcan improve with practice.
11

Reaction Times
You will need Table 5 on page R2.
Do your reaction times improve with practice?
Work with a partner.
a Do the falling ruler experiment 10 times. One ofyou use the writing hand, the other use the nonwriting hand. Record your results on Table 5.
b Plot your results on a graph.Make sure your scale can show the full range of timesyou took.
Figure 4 was drawn from Stephen's results. Hisestimates had improved by the tenth trial.
e What was Stephen's biggest error (+ or - )?. f What was Stephen's smallest error (+or - )?
Look at the pattern of your graph.
g Find the largest and smallest errors.h Have your results shown improvement?
D2
+ +
++ +
Trial number
2 3 4 5 6 7 8 9 10+
++
+
Estimating Time
You will need:Table 4 on page R2 and a piece of squared paper.
How good are you at counting seconds without a watchto help you?
Your teacher will explain this experiment to you.
a Record your results in Table 4.
b Work out the error for each trial.
c If your guess was too high, put a '+' sign in thebottom row. If your guess was too low, put a '-'sign in the bottom row. If the guess was exactlyright, leave the last row blank.
d Plot your errors on a graph like Figure 4.
Stephen's results
D1
Figure 4
-I
~ -2o£ -3
E+4-'"
£+3~+2m~
'" +1
Error(seconds)
+6 ++5
~m-4,~
'" -5
-6
12 13

20
Reaction times(hundredths of a second)
Figure 5
15
Robert's reaction times
++
+
Figure 6
In Section C you guessed the lengths of five lineswithout being told your errors. Figure 6 shows fivemore lines. This time you will see if your guessesimprove with practice when you measure the lengthsimmediately after you have guessed.
Five more lines
++
5 -l
10
5
++
++
+
2
4
3
2 3 4 5 6 7 8 9 10
D3
14
Trial number
Figure 5 shows Robert's results.
c What would you expect to see in the diagram ifyouimprove with practice?
d Did you improve?e Describe your results in a few sentences.
f Give your results to your teacher.
Your teacher will discuss the class results with you.
Guessing Lengths
You will need Table 6 on page R2, and a ruler.
a Guess the length of the first line to the nearest tcentimetre.
b Write down your guess in Table 6.c Measure the length of the first line. Write this down
in Table 6.d Work out your error and say whether your guess
was too high (+) or too low ( - ).e Repeat a to d for the next line. Continue until you
have measured all five lines.
Look at your errors in Table 6.
f Have you improved?
15

D4 Does Practice Make Perfect?
Sections D1 to D3 all tried to see ifyou improved withpractice.
a Did practice help you in these experiments?
In b and c there are two more experiments you can doto see if you improve with practice. Do one of them.Make out your own tables and graphs.
b Time how long it takes you to copy 100 words froma school textbook. See if you get quicker withpractice.
c Work with a partner. Set each other 10 arithmeticproblems. Answer the problems as quickly as youcan and see how many you get right. Continue andsee if you get more right with practice.
d Write down three more things that you do, wherepractice is important for improvement.
16
Schools Council Project on Statistical Educationills Project has been based in the Department of Probability and Statistics at the University. Sheffield from 1975 to 1980. Its brief was: to assess the present situation of statisticallucation in schools; to survey the needs of teachers of statistics; to devise detailed proposals,r the implementation of the teaching ideas; and to produce teaching materials.
Project Team
Director: Peter Holmes (1975- )Deputy Director: Neil Ruhra (1975-78), Daphne Turner (1978-
Project Officers
Ramesh Kapadia (I975-79), Alan Graham (1976-77), Barhara Cox (I979-80)
I
Statistics in your world
General Notesiges with the prefix R are resource pages or reference pages for pupil use. (In many casesey are designed as worksheets.) In the pupil unit these are referred to as 'page RI'. etc.
mnission need not be sought to reproduce copies of the R sheets provided th~t copies areade only in the educational establishment in which they are to be used and that such copiese not sold. hired or lent to any other indivdual, organization or establishment.
~tions or questions marked with an asterisk are optional to the main thrust in the unit.)metimes they are for the more able pupils, sometimes they are for reinforcement and somenes they consist of simpler work for the less able pupils and lead to an easier conclusion.an the main unit. In each case detailed comments on the particular purpose will be found in.e appropriate section of the teacher's notes.
hree different typefaces are used in the pupil units. Text in roman-type (like this) is for pupilsI read or for the teacher to introduce. Questions to promote thought and for group or classscussion are printed in italics. Instructions telling pupils to do things and questions forlpils to answer are printed in bold.
TI Y TABLES
TEACHERS' NOTES
LEVEL 1
Published for the Schools Council by
FOUlSHAM EDUCATIONAL

IS
Contents
Brief Description
Aims and Objectives
Prereqnisites
Eqnipment and Planning
Detailed Note.Section ASection BSection C
Answers
Test QuestiollS
An.wers
Connections with OtherUnits in the Project
R page. on pages 10-17.
Page3
33
34456
7
19
20
22
Brief Description
This unit introduces pupils to statistical tables, explaininghowto compose,read and clarify them. Data considered deal with domestic fIres, leisureactivities, road accidents and employment.
Design time: 4 hours
Aims and ObjectivesThe aim of this unit is to help pupils understand and read informationwhich is laid out in tabular form, and learn how to simplifY data to bringout significant patterns. .
On completion of this unit pupils should be able to construct their ownsingle variable frequency tables, two-way classifIcation tables and to readindividual figures from published tables. They will have practised drawingsimple inferences from both types of table. They will also have practisedmaking tables s.impler to read; completing tables from bar cbarts, sortingout simple data and drawing bar charts. They should be more aware ofsources of data, correct practice in titling and annotating data and theconflict between readability and loss of information.
AcknowledgementsThe publishers and Project team extend their thanks toHer Majesty's Stationery Office for granting permissionto reproduce or adapt statistics pUblished in SocialTrends, Department of Employment Gazette and RoadAccidents, Great Britain, which are Crown Copyright.
Schools Council Project on Statistical Education
Published byW. Foulsham & Co, Ltd., Yeovll Road, Slough, Berks
@ Schools Council PUblications 1980
ISBN 0-572-01094-X
PRINTED IN HONG KONG
PrerequisitesAdding of up to six digits, rounding to the nearest ten, hundred orthousand and expressing one number as a fraction of another. Pupilsshould have had previous experience in drawing up simple bar charts.
Equipment and PlanningCalculators would be useful to aid addition, but they are not essential.
Data from the class, needed in A2 and A6, can be obtained by a show ofbands. Since complex issues are raised, especially in Section C, some classdiscussion is desirable. The arrangement of the unit is that Section A dealswith the construction of tables, Section B looks at annotations and titlingand Section C deals with some methods of simplifying and interpretingtabulated da fa
The following reference may be ofvaluefor Section C3: Data Reduction byA.S.c. Ehrenburg (Wiley, 1975), Chapter 1.
3

Detailed NotesCopies of all tables are included in the R pages for easy reference. Thejournal Social Trends is a useful source for further data.
Many of the tables have been adapted (e.g. by changing percentages tofrequencies) from tbe source to make them easier to work with.
Section A
At
Table I is given in the text to provide a useful discussion point to start theunit. It is also reproduced as Table 8 on page RI for ease ofreference later.The questions remind pupils that not all tables are statistical, but all conveyinformation.
A2
The unit deals only with discrete data, not with the compilation of classintervals. All data come initially in an unsorted form and have to be sortedbefore they are of much use.
If e is done, it will be necessary to collate the selections from thepupils. This can conveniently be done using the blackboard. It is importantto make sure that pupils do not use too many categories ofsweets. One wayof doing this is to nominate a few general categories from which they mustchoose. Remind them to include the total frequency in their table. Analternative survey would be favourite drinks.
A3
This takes the sorting one stage further, to bar charts, and indicates howsome questions then become easier to answer.
A4
In this section we proceed the other way round. Data given in the form ofabar chart are written in tabular form. It is not practical to collect class databere as tben it would be necessary to d,aw the table first. This sectIOnincludes the first introduction to reading tables.
*A5
An optional exercise for reinforcement provides a check on the basic workbefore continuing to two-way tables.
4
A6
This again starts with given data so that pupils practise reading the table.Then they can collect their own data and draw up the table for them. Thiscollection of class data needs organizing.
A suggestion for single-sex classes is instead of using Boys and Glrlsto useOldest In the family and Not oldest in thefamily. Single children count asOldest.
Pupils should notice that the sum of the row totals should equal the sum ofthe column totals. This is the number of pupils in the class.
A7
This returns to Table I (reproduced as Table 8 on page RI) and is anexercise in reading a harder table. Questions f and g start to draw simplecomparisons and lead towards inference, e.g. Where should the fire brigadeconcentrate its fire prevention advertising?
With pupils of lower ability, further reinforcement may be necessary at thisstage. This can be done either by using collected data (e.g. a vehicle survey),or using further tables from sources such as Social Trends.
Secllon B
This section brings out the importance offour things: a cleartitle, the data,use of footnotes and quoting the source. BI-4 take each of these in turn,using Table I as the main example.
HI
Titles often show the incompatible demands ofaccuracy ofdescription andbrevity for ease of reading. They should indicate clearly what the data areabout.
B2
Since many data, particularly sociological and economic data, changerapidly, it is important to indicate the date to which they apply.
B3
The source should be given in sufficient detail to allow others to trace it andfind out further details of meaning, background, method ofcollection, andso on.
5

Al ab
Footnotes are often used to help clear up problems of defmition andnomenclature, explain changes in method of collection and give furtherdetails that cannot be included in a row or column heading.
B5
An exercise on leisure activities using Table 9 on page R2 to bring togetherthe work of BI to B4. (Note the distinction between United Kingdom andGreat Britain; the former includes Northern Ireland.) Question g showsthat tables should be consistent and can often be checked in this way.
B6
A rather harder exercise on accidents uses the two-way Table 10 on pageR2. In the discussion on questions d and e comparisons can be made forFatal and Serious or for Slight injuries. Comparisons may also be made inrelative terms (using proportions) or in absolute terms (using differences).The age range 5-9 shows the greatest sex differences.
The difference between numbers ofslight injuries to 15 and 16 year old boysand girls are too small to be significant. It appears that carefulness on theroad by boys and girls at these ages is about the same. The large differencesat the younger age, with young boys being far more prone to accident thanyoung girls, may reflect different games played, attitudes to life, and so on.
It may be desirable with some groups to omit one or other ofthese last twosections.
Seellon C
This section is concerned with reading difficult tables and making themeasier to read. Two techniques of simplifying the tables are introduced:
(i) Reduce the number of digits printed in the table. Although thismeans that accuracy is lost, it makes the individual items mucheasier to identify, and in many cases this accuracy may be sufficientto give a general impression.
(il) Put the columns in decreasing order of total, or average, from theleft. It is then easier to pick out anomalies and simple relationships.
A more able group could perhaps go on to convert actual figures topercentages, as is often done to make a table clearer.
Before attempting this section pupils must be able to round figures to theneacest ten, hundred or thousand.
6
CI
Table 9 on page R2 is rewritten as Table 11 with figures rounded to thenearest hundred. If pupils find this task difficult, it may be preferable tobegin with a class discussion. The pupils' text does contain an instruction toask for help if necessary. It also tells pupils to show the teacher their tablefor checking. This may be more easily done by a self-ehecking system. Itshould be obvious that the general picture is made clearer butaccuracy hasbeen lost.
C2
This is a parallel exercise to CI and can be used as reinforcement. In bothCI and C2 rounding may result in the columns not adding to the roundedtotal.
C3
This is definitely a harder section. Class discussion on the value ofchangingthe order of columns is probably useful, otherwise the way it shows upexceptions to the pattern may not be seen. A new table is introducedbecause it shows more clearly the advantages of the method than the othertables in the unit. Tables 8 and 9 can also be re-orderedin this way(numbers to the nearest hundred) and yield some interesting information.Table 10 shows no exceptions to the general pattern when rewritten in thisway, and it is the exceptions that are interesting.
Answers
Bus or train timetableMultiplication table or ready reckoner
c Lesson timetableA2 a 5 b Guitar
c Guitar 4; drums I; accordion I; tin whistle 2d 4/11
7

A3 a 6p b 12pc The bar chart is the most obvious way. However, in a
distribution of this kind, the table is easy to read.
A4 a 4 II Brown 5), blond 3, red I, black 2d 10 e 9 f 9/10
AS II 5 + 10 + IS + 25 + 30 + 20 + IS + 10 = 130c 4 d 15,30
A6 a .8 II 4 c 14 d 10 e 28f 8/18 or 4/9 g 6/10 or 3/5II Girls - a larger proportion owned bicycles
A7 a 50900 b 7848 c 3300d 1547 e 255 f kitcheng Cooking
a Bed-sitting rooms have been counted as bedrooms.b Hallc 'Elsewhere or not known'
a 1976II I year, 1st January to 31st December, 1976c The data are meaningless without a date as the incidence offires
varies considerably from year to year.
(Hundreds)
c The numbers are easier to find and simpler to read.d There is a loss of accuracy. Answer may be given as, e.g. 30
instead of 30 hundred.e 49 hundred f 52 hundred g 28 hundred
C2 a Table 10 becomes:
(Hundreds)
Age
0-4 5-9 10-14 15 16
Males Fatal and Serious 10 27 15 2 2Slight 24 68 41 4 5
Females Fatal and Serious 6 13 11 1 2Slight 15 39 34 5 5
Often Sometimes Never or Like to, buthardly ever no chance
Reading 30 51 27 3Outdoor games 42 39 27 3Swimming 23 49 30 9Indoor games 28 36 36 11TV 72 32 6 1Parties 21 53 29 8Dances 44 34 27 6Voluntary work 8 33 52 18
a 0-16 yearsII Between lst Jan. 1975 and 31st Dec. 1975c Age IS - slight; age 16 - slightd Age 5 to 9. See detailed notes.e See detailed notes.
CI a Table II becomes:
,86
b See detailed notes.
a Table I conforms to the rules.II Table 2 does not have a title, date or source. Table 3 does not
have a title, date or source.
a Domestic fires in the United Kingdom, by cause and room oforigin.
c United Kingdom (England, Wales, Scotland, Northern Ireland)d In homes
a Social Trends
a 'Frequency of selected leisure activities reported by 16 year olds,1974'
c 1974 d Social Trends e 11070f England, Scotland, Wales (Great Britain)g Because II 070 pupils replied to each category of activities
III
B5
113
JIl4
112
(Text continued after the R pages)
8 9

o Table 5 Favourite sweets in our class
Type of sweet Frequency
Total
Table 6 Colour of hair of 10 pupils
Colour Frequency
Brown
Total
•
Table 7 Number of peas in a pod
Number of peas Frequency
0
1
2
3
4
5
6
7
Total
Table 8 Domestic fires in the United Kingdom: by cause androom of origin, 1976
Number of fires started in
Kitchen Bedroom' Living HaW Roof Elsewhere3 Total4
Cause room space or not known number
Cooking 17226 174 - - - - 17000Space heating 504 1400 2352 168 - 1176 6000Smoking materials 342 1482 1216 76 - 684 4000Children 132 990 330 165 33 1650 3000Wiring installations 403 403 310 527 155 1302 3000Chimneys 153 272 289 17 255 714 2000TV and radio 17 51 1547 - - 85 2000Other 2840 3124 1704 710 426 5396 14000
Total all causes 21617 7896 7748 1663 869 11007 .51000
--1 'Includes bedMsitting rooms3 Includes fires which started outside and spread to the building
© Schools Council Publications 1980
2 Includes stairs and corridors4 Totals have been rounded to the nearest thousand
(Source: Social Trends, No.8, 1977, page 197)

~
N
~
w
R2
Table 9 Frequency ofselected leisure activities reported by 16 year olds, 1974,,2
Activity Often Sometimes Never or Like to, but.
hardly ever no chance
Reading books (apart from 2989 5092 2657 332school work/homework)Playing outdoor games/sports 4207 3874 2657 332Swimming 2325 4871 2989 885Playing indoor games/sports 2806 3572 3572 1120Watching TV 7195 3210 554 111Going to parties 2103 5314 2878 775Dancing at discos, etc. 4427 3432 2657 554Voluntary work to help others 775 3321 5203 1771
1 Total sample size:;;: 11070 persons 2 Figures are for Great Britain
(Source: Social Trends, No.8, 1977, page 184)
Table 10 Pedestrian casualties, 1975: severity, sex and age
Age (years)
0-4 5-9 10-14 15 16
Fatal ern! SOOous 999 2688 1485 187· ~17-3-·Males
Slight 2420 6799 4128 433 457
Fatal and Serious 584 1289 1136 139 164Females
Slight 1506 3947 3441 481 458
(Source: RoadAccidents, Great Britain. 1975 (HMSO). From Tables 26 and 27.)
Table 11 Frequency ofselectedleisure activities reported,by 16 year olds, 1974
(Hundreds)
Activity Often Sometimes Never or Like to, buthardly ever no chance
Reading books 30 51Playing outdoor games/sports 42Swimming 23 9Playing indoor games/sports 28Watching TV 72Going to parties 21Dancing at discos, etc. 44 27Voluntary work 8
© Schools Council Publications 1980

R3
Table 12 Regional analysis of unemployment: February 10, 1977
~
c '"c0 • • '" •'" '" '" ;;~(J c
.~~ c c c •
t: ~.... 0 • .!!! .!!!.",
:Cl... 0, • '"
..- • '" C;;:: '" .= f ;;::~ c iii iii c ~. ~ • <t. .c • .!!! •.co. ~ .c .'" .c .c • .c~. • ~
~ ~
t: "'E ~ ~ • ~ ~o 0 • • 0 • ~ ~ ;; 0 ~
o • ~ • 0~ • ~ 0 0 0 0 0"'. Cl w '" w ~:r. z z ;;:: '" Z
Length of time on registerMalesup to 2 weeks 12124 11845 2814 5799 6700 4498 6946 9657 5567 3858 9547 -over 2 and up to 4 weeks 9786 10018 2320 5242 5877 3671 5768 9024 4744 3757 8644 -over 4 and up to 8 weeks 14226 13465 3185 7875 7746 5541 7778 13318 6236 5210 14840 -over 8 weeks 93938 91989 20785 64299 71836 43116 64997 116676 60657 46581 93518 -Total 130074 127317 29104 83215 . 92159 56826 85489 148675 77204 59406 126549 39521
Femalesup to 2 weeks 5091 4182 817 2305 2670 1593 2561 4080 2203 1709 4468 -over 2 and up to 4 weeks 4207 3460 763 2200 2582 1417 2200 3903 1912 1730 4328 -over 4 and up to 8 weeks 5797 4559 1068 3319 3801 2395 3415 5726 3117 2578 7494 -over 8 weeks 27908 23123 5600 20153 24761 13415 19857 36641 21431 15868 36733 -Total 43003 35324 8248 27977 33814 18820 28033 50350 28663 21885 53023 17139
t Figures for Northern Ireland showing the length of time on the register areavailable only quarterly in respect of March. June. September and December.
© Schools Council Publications 1980
14
(Source: Department of Employment Gazette, March 1977, page 278)
15

-0'-
--.l
Table 13 Regional Analysis of Unemployment: February 10,1977
(Numbers in thousands)
RegionLength of timeon register SE GL EA SW WM EM Y+H NW N W SC NI
MalesUp to 2 weeks 12 12 3 6 7 5 7 10 6 4 10 -Over 2 and upto 4 weeks 10 6 9 -Over 4 and upto 8 weeks 14 8 15 -Over 8 weeks 94 72 94 -
Total 130 127 29 83 92 57 85 149 77 59 127 39
FemalesUp to 2 weeks 5 3 5 -Over 2 and upto 4 weeks 4 3 4 -Over 4 and upto 8 weeks 6 4 7Over 8 weeks 28 25 37 -Total 43 35 8 28 34 19 28 50 29 22 53 17
(Source: Department of Employment Gazette, March 1977, page 278)
Table 14 As Table 13 but with the columns reordered
(Numbers in thousands)
Region
Length of timeNW SC SE GL WM Y+H SW N W EM NI EAon register
Males0-2 weeks 10 10 12 12 7 7 6 6 4 5 - 32-4 weeks 9 9 104-8 weeks 13 15 14Over 8 weeks 117 94 94 .
Total 149127130127 92 85 83 77 59 57 39 29
Female0-2 weeks 4 5 52-4 weeks 4 4 44-8 weeks 6 7 6Over 8 weeks 37 37 28
Total 50 53 43 35 34 28 28 29 22 19 17 8
(Source: Department ofEmployment Gazette, March 1977, page 278)
© Schools Council Publications 1980

SE GL EA SW WM EM Y+H NW N W SC NI
Males0-2 12 12 3 6 7 5 7 10 6 4 10 -2-4 10 10 2 5 6 4 6 9 5 4 9 _.4-8 14 13 3 8 8 6 8 13 6 5 15 -8+ 94 92 21 64 72 43 65 117 61 47 94
Total 130 127 29 83 92 57 85 149 77 59 127 39
Females0-2 5 4 1 2 3 2 3 4 2 2 5 -2-4 4 3 1 2 3 1 2 4 2 2 4 -4-8 6 5 1 3 4 2 3 6 3 3 7 -8+ 28 23 6 20 25 13 20 37 21 16 37 -
Total 43 35 8 28 34 19 28 50 29 22 53 17
NW SC SE GL WM Y+H SW N W EM NI EA
Male0-2 10 10 12 12 7 7 6 6 4 5 - 32-4 9 9 10 10 6 6 5 5 4 4 - 24-8 13 15 14 13 8 8 8 6 5 6 - 38+ 117 94 94 92 72 65 64 64 47 43 - 21
Total 149127130 127 92 85 83 77 59 57 39 29
Female0-2 4 5 5 4 3 3 2 2 2 2 - 12-4 4 4 4 3 3 2 2 2 2 1 - 14-8 6 7 6 5 4 3 3 3 3 2 - 18+ 37 37 28 23 25 20 20 21 16 13 - 6
Total 50 53 43 35 34 28 28 29 22 19 17 8
C3 a Table 13 becomes:
b Table 14 becomes:
(Thousands)
(Thousands)
Test Questions1 Name a kind of TABLE which has numbers in it.
Give an example of DATA you could find in a table.
2 On July 4, 1977, 25 pupils from Class lu in the MandonhamComprehensive School took a swimming test. The numbers of widthsswum without touching down were:
5,4,1,0,5,6,4,7,3,4,3;2,5,5,4,1,0,3,4,6,8,4,3,5,9a Show the data in a frequency table.b One ofthe pieces of information below can only be read from the data
list above. Which is it? (All the others are easier to read from the table.)(i) The number of pupils who swam five widths
(ii) The number of widths swum by the sixth pupil(iii) The number of widths with the highest frequency(iv) The highest frequency
3 In question 2, the first 10 figures were the girls' results.Complete this two-way table:
Number ofwidths
Less than 4 4 or more
Girls
Boys
Total
4 Every statistical table should have a TITLE.
Write down a title for the table in Question 3.Name two other things a statistical table should have.Write down one of these for the table in Question 3.
5 a The table (shown overleaf) mentions 2486 casualties altogether.Over what period of time did these happen?
b How many more people were slightly injured than seriously injured?c On which classes of road were the largest number of people killed?d On which class of road was the smallest number killed?e On motorways there were fewer slight injuries than there were serious
injuries. For which other type of road is this true? Give a possiblereason.
19

b Either alter the row order to T A CUB Mor round numbers to nearest hundred (or nearest ten).Advantage:Table is easier to read (or equivalent)
Disadvantage:Loss of information,or deaths too few to show,or loss of distinction between numbers of serious and slight
4 Any appropriate titleA statistical table should also have:A date and a source (for secondary data)
For the table in Question 3 the date is July 4, 1977.
5 a One year - January I to December 31 1974b 35 (1224-1189)c Trunk roads and A roads d Broadse Because traffic is faster moving so any injury is more likely to be
severe.
6 a
Casualties in road accidents. Northamptonshire, 1974
Class of road Fatal Serious Slight Total (all(killed) injuries injuries casualties)
Motorway 4 88 78 170Trunk roads 25 290 321 636A roads 25 311 296 632Broads 1 85 86 172C roads 12 242 252 506Unclassified roads 6 173 191 370
Total (all roads) 73 1189 1224 2486
(Source: Northamptonshire Transport Policies andProgramme, 1976-1977)
6 a Re-write the table from Question 5, addingtogetherfataland seriousinjuries and writing the answer in one column.
b Simplify the table in one other way. (Hint: either think about thenumbers or the order of the columns.) Give one advantage and onedisadvantage of your table.
Answers
1 Any suitable examples of tables and data are acceptable.2 a b (iI)
Number ofwidths Pupils
0 21 22 13 44 65 56 27 18 19 1
25
3Under 4 4 and over Total
Girls 3 7 1080ys 6 9 15
Totals 9 16 25
Class of Fatal and Slight Allroad serious accidents
M 92 78 170T 315 321 636A 336 296 632B 86 86 172C 254 252 506U 179 191 370
All roads 1262 1224 2486
20 21
cocfj;:t;;c8
.J:;
'"m:I:"CC
'"coc
:;;oE
UJ
Wheels and MealsIfat first ...
Sampling the CensusEqual Pay
Being Fair to ErniePractice makes Perfect
Level4 Figuring the FutureSmoking and Health
Shaking a SixProbability GamesLeisure for Pleasure.
Other Units at the Same Level (Level 1)
Units at Other Levels In the Same orAllied Areas of the Curriculum
Level3 Car Careers
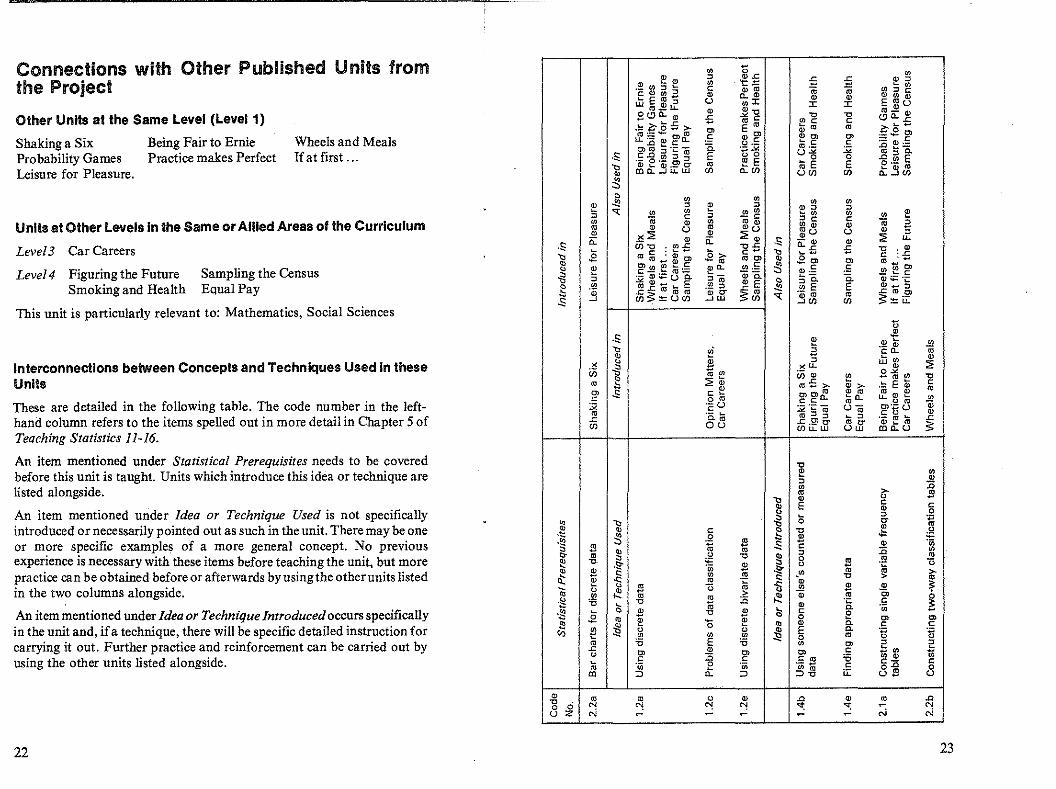
Connections with Other Published Units fromthe Project
This unit is particUlarly relevant to: Mathematics, Social Sciences
Interconnections between Concepts and Techniques Used In theseUnits
These are detailed in the following table. The code number in the lefthand column refers to the items spelled out in more detail in Chapter 5 ofTeaching Statistics 11-16.
An item mentioned under Statistical Prerequisites needs to be coveredbefore this unit is taught. Units which introduce this idea or technique arelisted alongside.
An item mentioned under Idea or Technique Used is not specificallyintroduced or necessarily pointed out as such in the unit. There may be oneor more specific examples of a more general concept. No previousexperience is necessary with these items before teaching the unit, but morepractice can be obtained before or afterwards by using the other units listedin the two columns alongside.
An item mentioned under Idea or Technique Introducedoccurs specificallyin the unit and, if a technique, there will be specific detailed instruction forcarrying it out. Further practice and reinforcement can be carried out byusing the other units listed alongside.
'"N
N'""! .0
NN
22 23

Being Fair to ErnieLeisure for Pleasure
Tidy TablesWheels and Meals
Shaking a SixPractice Makes Perfect
Probability GamesIf at Fi rst , , .
Authors AnonymousOn the Ball
Seeing is BelievingFair Play
Opinion MattersGetting it Right
Car CareersPhoney Figures
Net CatchCutting it Fine
Multiplying PeoplePupil Poll
Choice or ChanceSampling the Census
Testing TestingRetail Price Index
Figuring the FutureSmoking and Health
Equal Pay
Other titles in this series
.0
'">'"
24
Schools Council Project on Statistical EducationThis Project has been based in the Department of Probability and Statistics at the Universityof Sheffield from 1975 to 1980. Its brief was: to assess the present situation of statisticaleducation in sChools; to survey the needs of teachers of statistics; to devise detailed proposalsf?r the implementation of the teaching ideas; and to produce teaching materials.
Project Team
Director: Peter Holmes (1975~ )Deputy Director: Neil Rubra (1975~78). Daphne Turner (1978~
Project Officers
Ramesh Kapadia (1975-79), Alan Graham (1976-77), Barbara Cox (1979-80)
General NotesPages with the prefix R are resource pages or reference pages for pupil use. (In many casesthey are designed as worksheets.) In the pupil unit these_are referred to as 'page Rl', etc.
Permission need not be sought to reproduce copies of the R sheets provided that copies aremade only in the educational establishment in which they are to be used and that such copiesare not sold, hired or lent to any other indivduaI. organization or establishment
Sections or questions marked with an asterisk are optional to the main thrust in the unit.Sometimes they are for the more able pupils, sometimes they are for reinforcement and some~
times they consist of simpler work for the less able pupl1s and lead to an easier conclusionthan the main unit. In each case detailed comments on the particular purpose will be found inthe appropriate section of the teacher's notes.
Three different typefaces are used in the pupil units. Text in roman type (like this) is for pupilsto read or for the teacher to introduce. Questions to promote thought and for group or classdiscussion are printed in italics. Instructions telling pupils to do things and questions forpupils to answer are printed in bold.
1
Statistics in your world
LEISUREFOR PLEASURE
TEACHERS' NOTES
LEVEL 1
Published for the Schools Council by
FOUlSHAM EDUCATIONAL
Contents
Brief Description
Aims and Objectives
Prerequisites
Equipment and Planning
Detailed NotesSection ASection BSection C
Answers
Test QuestionsAnswers
Connections with OtherUuits in the Project
R pages on pages 8-13.
Page3
3
3
3
445
1415
1617
18
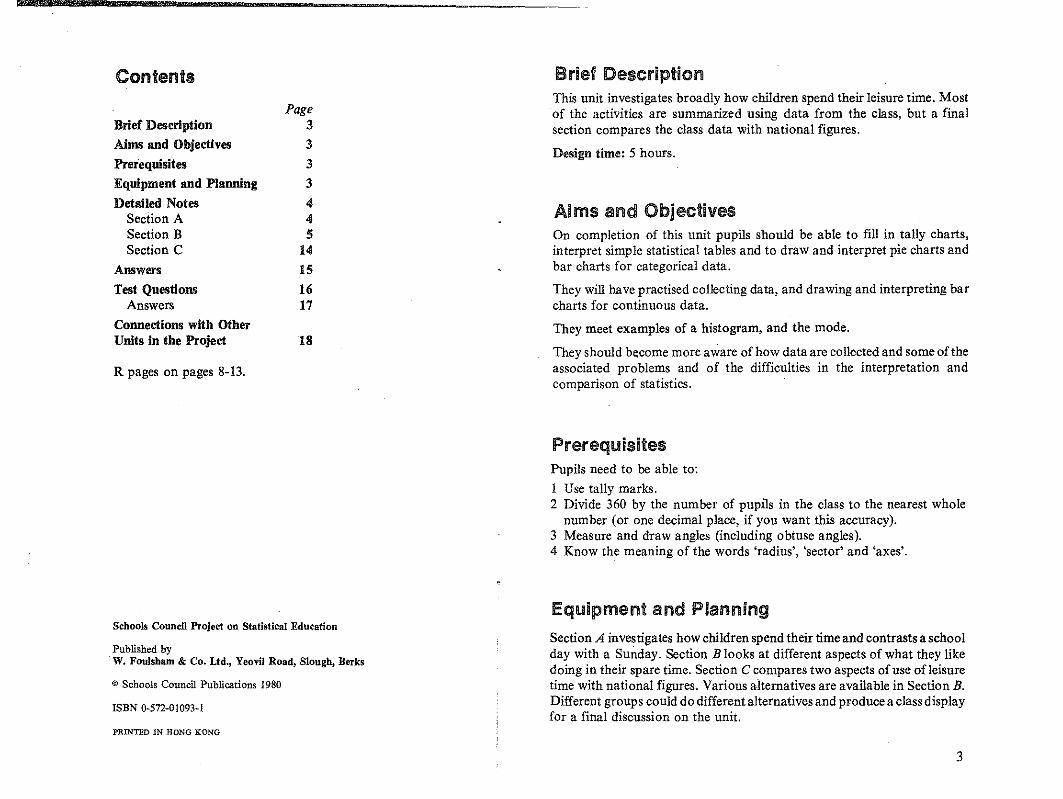
Brief DescriptionThis unit investigates broadly how children spend their leisure time. Mostof the activities are summarized using data from the class, but a finalsection compares the class data with national figures.
Design time: 5 hours.
Aims and ObjectivesOn completion of this unit pupils should be able to fill in tally charts,interpret simple statistical tables and to draw and interpret pie charts andbar charts for categorical data.
They will have practised collecting data, and drawing and interpreting barcharts for continuous data.
They meet examples of a histogram, and the mode.
They should become more aware of how data are collected and some oftheassociated problems and of the difficulties in the interpretation andcomparison of statistics.
PrerequisitesPupils need to be able to:
I Use tally marks.2 Divide 360 by the number of pupils in the class to the nearest whole
number (or one decimal place, if you want this accuracy).3 Measure and draw angles (including obtuse angles).4 Know the meaning of the words 'radius', 'sector' and 'axes'.
Schools Council Project on Statistical Education
Published byW. Foulsham & Co. Ltd., Yeavi) Road, Slough, Berks
@ Schools Council Publications 1980
ISBN 0-572-01093-1
PRINTED IN HONG KONG
Equipment and Planning
Section A investigates how children spend their time and contrasts a schoolday with a Sunday. Section B looks at different aspects of what they likedoing in their spare time. Section C compares two aspects of use of leisuretime with national figures. Various alternatives are available in Section B.Different groups could do different alternatives and produce a class displayfor a final discussion on the unit.
3
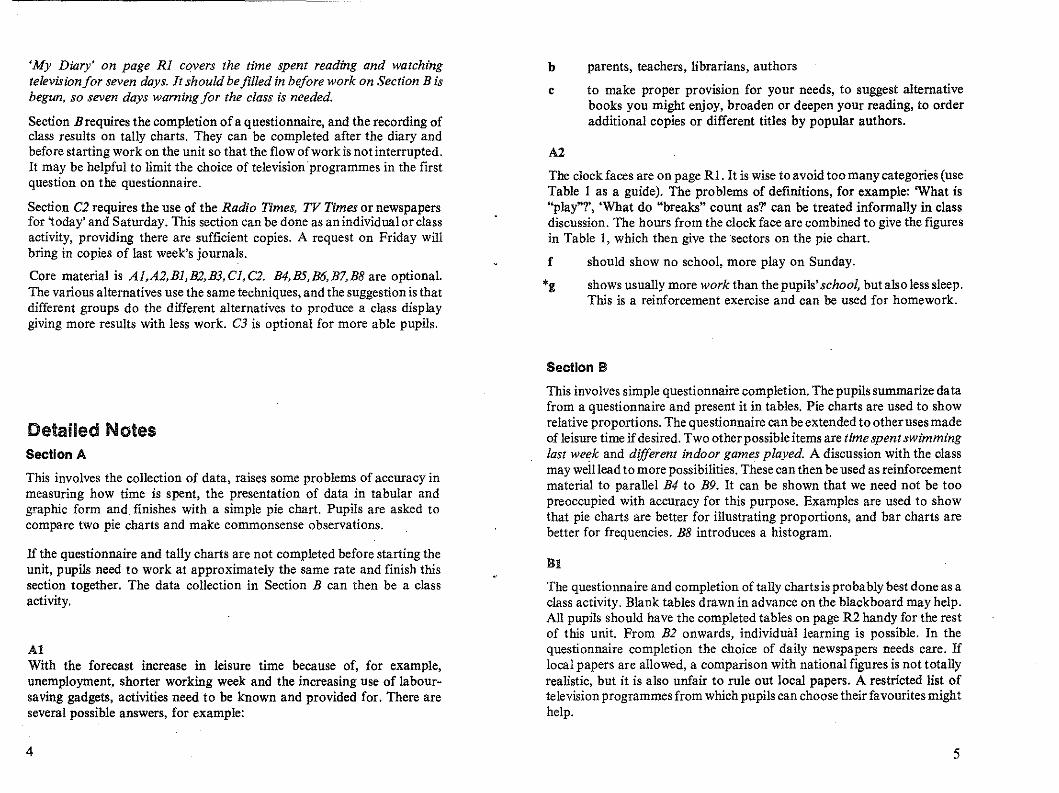
'My Diary' on page RI covers the time spent reading and watchingtelevision for seven days. It should befilled in before work on Section B isbegun, so seven days warning for the class is needed.
Section Breqnires the completion ofa questionnaire, and the recording ofclass results on tally charts. They can be completed after the diary audbefore starting work on the unit so that the flow ofwork is notinterrupted.It may be helpful to limit the choice of television programmes in the firstquestion on the questionnaire.
Section C2 requires the use of the Radio Times, TV Times or newspapersfor 'today' and Saturday. This section can be done as anindividualorclassactivity, providing there are sufficient copies. A request on Friday willbring in copies of last week's journals.
Core material is AI,A2,BI,B2,B3,CI,C2. B4,B5,B6,B7,B8 are optional.The various alternatives use the same techniques, and the suggestion is thatdifferent groups do the different alternatives to produce a class displaygiving more results with less work. C3 is optional for more able pupils.
Detailed NotesSection A
This involves the collection of data, raises some problems of accuracy inmeasuring how time is spent, the presentation of data in tabular andg.caphic form and. finishes with a simple pie chart. Pupils are asked tocompare two pie charts and make commonsense observations.
If the questionnaire and tally charts are not completed before starting theunit, pupils need to work at approximately the same rate and finish thissection together. The data collection in Section B can then be a classactivity.
AlWith the forecast increase in leisure time because of, for example,unemployment, shorter working week and the increasing use of laboursaving gadgets, activities need to be known and provided for. There areseveral possible answers, for example:
4
b parents, teachers, lib~arians, authors
c to make proper provision for your needs, to suggest alternativebooks you might enjoy, broaden or deepen your reading, to orderadditional copies or different titles by popular authors.
A2
The clock faces are on page RI. It is wise to avoid too many categories (useTable I as a guide). The problems of definitions, for example: 'What is"play"?', 'What do "breaks" count as?' can he treated informally in classdiscussion. The hours from the clock face are combined to give the figuresin Table I, which then give the sectors on the pie chart.
f shOUld show no school, more play on Sunday.
*g shows usually more work than the pupils' school, but also less sleep.This is a reinforcement exercise and can he used for homework.
Section B
This involves simple questionnaire completion. The pupils summarize datafrom a questionnaire and present it in tables. Pie charts are used to showrelative proportions. The questionnaire can be extended to other uses madeof leisure time ifdesired. Two other possible items are time spent SWimminglast week and different indoor games played. A discussion with the classmay well lead to more possibilities. These can then be used as reinforcementmaterial to parallel B4 to B9. It can be shown that we need not be toopreoccupied with accuracy for this purpose. Examples are used to showthat pie charts are better for illustrating proportions, and bar charts arebetter for frequencies. B8 introduces a histogram.
BI
The questionnaire and completion of tally charts is probably best done as aclass activity. Blank tables drawn in advance on the blackboard may help.All pupils should have the completed tables on page R2 handy for the restof this unit. From B2 onwards, individual learning is possible. In thequestionnaire completion the choice of daily newspapers needs care. Iflocal papers are allowed, a comparison with national figures is not totallyrealistic, but it is also unfair to rule out local papers. A restricted list oftelevision programmes from which pupils can choose their favourites mighthelp.
5

B2
Squared paper is helpful. Figure 3 can be used to give an example of amode. If this is the first time these pupils have met a pie chart and theirarithmetical ability is low, it may be helpful to give fictitious data for a classof 36 (or 30 or 24) pupils.
Taking 360jn to the nearest whole number for the usual class size makesvery little difference to the final appearance ofthe pie chart if the sectors aredrawn in increasing order ofsize. The error is shown in the followingtable.
Class Angle Overallsize (to nearest error
degree per pupil) (degrees)
25 14 (14-!-) +10 (-2·5)26 14 -1427 13 +928 13 -429 12 (12-!-) +12(-2·5)30 12 031 12 (11-!-) -12 (+3·5)32 11 +833 11 -334 11 (10-!-) -14 (+3)35 10 +1036 10 0
When the pie chart is drawn as described, the overall error gets included inthe largest sector. It is least noticeable here, and this should be pointed outto pupils.
More able pupils may find ilmore satisfying to work the angle per pupil toone decimal place; the final check of adding the sector angles to see if youget 3600 is then more accurate. Visually, the pie charts differ little. Pupilsneed to be told how accurately they are to calculate their angles. Moreaccurate figures for Creektown School pie chart are as follows:
336~ = 11'3 (to one decimal place)
6
Table 3 (more accurately)
Title Number Angleof pupils (degrees)
Other 3 34 (33'9)Batman 4 45 (45'2)Dr Who 5 57 (56'5)Bionic Woman 8 90 (90'4)Match of the Day 12 136 (135'6)
The first pie chart drawn by the class is probably best done as a classactivity. The teacher's (and later the pupils') judgement is needed for the piechart radius. Although the largest sector is approximate, a roughmeasurement of it can be made bearing in mind the overal1 error(see table).Some classes may benefit from being told that pie charts do not necessarilyhave to be drawn in increasing order of sector size. Some children like toshade or colour the pie chart.
There may be a wide choice of favourite television programmes. Arestricted list from which the pupils may choose their favourites millhthelp,for example, Match ofthe Day, Bionic Woman, Batman, Dr Who, Starskyand Hutch and Blue Peter.
g and i are most easily answered from the bar chart.
hand j are most easily answered from the pie chart.
B3
This section shows 'numbers of viewers out of a known population',whereas B1 shows proportions, and Shows that some pupils like severaltelevision programmes. The frequencies obtained here can be much higherthan those obtained for 'Favourite programmes'. The modal column is agood indicator of popularity, and relates to viewingaudience figures. Theremay be a wide choice of programmes watched regularly. As in 82, arestricted list from which pupils can choose may help. This could perhapsbe the same as their list of 'Favourite programmes'.
" The data are nominal, so ideally the bars should be separate.'e For more able pupils. The set of frequencies is not mutual1y
exclusive, and the pie chart can be misleading.
(Text continued after the R pag~s)
7

00R1
MY DIARY
Sun Mon Tues Wed Thurs' Fri Sat Total
Time reading (hours andminutes; not schoolwork)
Time watching TV(hours and minutes)
QUESTIONNAIRE
What is your favourite television programme?Which programmes do you watch regularly?Which sport do you most enjoy playing?Which sport do you most enjoy watching?Which musical instrument (if any) do you play?Which club or young people's organization do you belong to (if any)?What are your other hobbies?How many hours did you spend reading last week?How many hours did you spend watching television last week?Which national daily newspaper(s) is taken by your family?Which Sunday newspaper(s) is taken by your family?
SECTION A2
midnight I midday12,00
midnight I midday12,00
Today Sunday
evening afternoon evening afternoon
6,00pm 6,00pm
PIE CHART
I i\ I I\ I I\ I I\ I\ I I "
............... \ I I ","".......... \1/,,-/''X" _------:,.?-71\':::--
... I I \ ......../" I I \ "
/' I \ ......../ I I \
I I \/ I \.
I I
SundayI II\ I /\. I /
\ I, I I ,-
.......... , \ I I .,.-........ \ I / .... '"
.... .....'4t'- - - - - - .;....-----::7/1\ .............
.",. / I \ ............ "" / I \. ...... ...... / / I \
I I '\I I \
I I
Today
""Each sector represents 1 hour,
© Schools Council Publications 1980
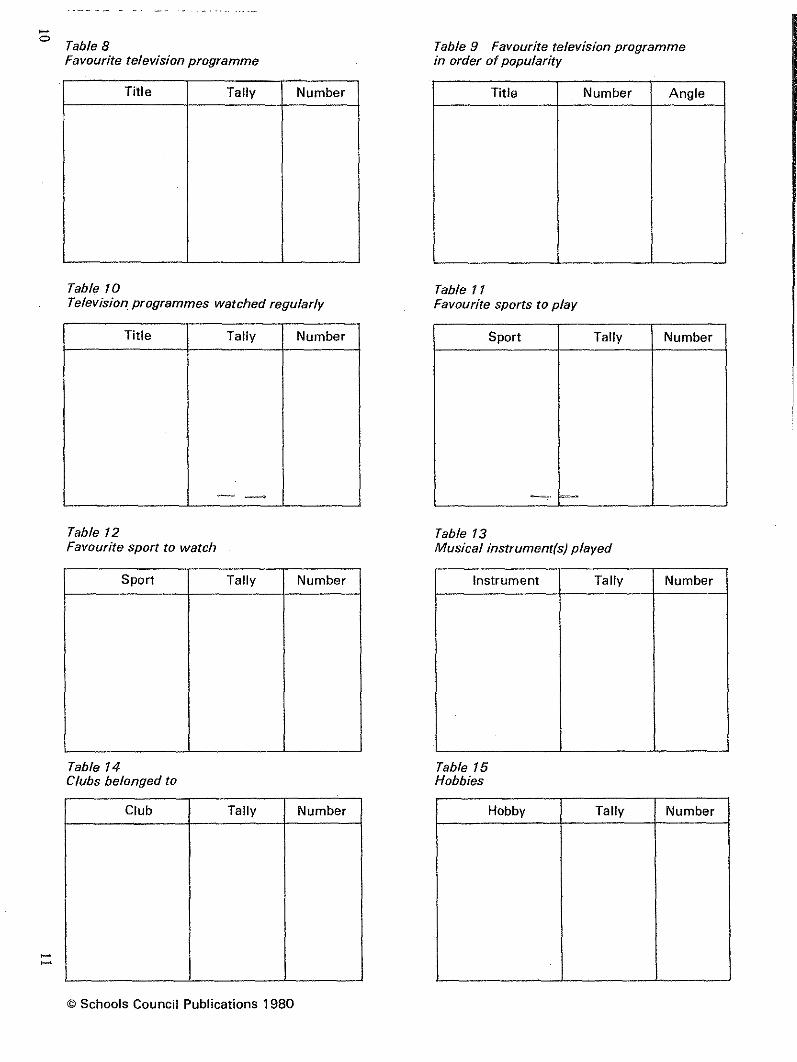
-o Table 8Favourite television programme
Table 9 Favourite television programmein order of popularity
Title Tally Number Title Number Angle
Table 10Television programmes watched regularly
Title Tally Number
----. --"'>'
Table 12Favourite sport to watch
Table 11Favourite sports to play
Sport Tally Number
--....... =--
Table 13Musical instrument(s) played
--
Sport
Table 14Clubs belonged to
Club
Tally
Tally
Number
Number
Instrument
Table 15Hobbies
Hobby
Tally
Tally
Number
Number
© Schools Council Publications 1980

~
IV
Time spent reading
Time in hours Tally Number
less than 22 but less than 44 but less than 66 but less than 88 but less than 10
10 but less than 1212 but less than 14
Table 18National daily newspapers taken
,,,,, ... "'p.... H ",,,u~ .... ,,tt~ ~C'C"h""'''''
Time in hours Tally Number
less than 55 but less than 10
10 but less than 1515 but less than 2020 but less tha n 2525 but less than 3030 but less than 3535 but less than 4040 but less tha n 45
Name Tally NumberTable 19Sunday newspapers taken
Name Tally Number
~
'"
SECTION C TELEVISION PROGRAMMES
Table 20 Channel:
Type of programme Tonight 4.00-10.00 pm (minutes)
News and current affairsComedy and varietyPlays and filmsSportChildren's programmesRegular seriesOther
Table 21 Channel:
Today - all day Saturday - all dayType of programme (hours and minutes) (hours and minutes)
News and current affairsComedy and varietyPlays and filmsSportChildren's programmesRegular seriesOther
© Schools Council Publications 1980

*B4 - B8
These options give the possibility ofgetting different pupils to do differentbar/pie charts and to build up a wider view of the class leisure activities bydisplaying the charts. It is suggested that pupils do one of B4 and B5,followed by one of B6,B7 and B8. More than this can be done ifreinforcement is needed. The instruction 'Write two sentences ..... .' is toencourage the pupils to interpret their pictorial representation ofstatistics.
B9
The class intervals have been carefully chosen to make the histogram easyto draw. Note that 'exactly 2 hours' goes into the '2 but less than 4 hours'category. Encourage pupils to complete their diary as accurately as possible(not rounding to the nearest -t or :f hour) to minimize this boundaryproblem. Since all class intervals are equal, this representation can beconsidered as both a bar chart and histogram. Strictly speaking, in ahistogram it is the area of the rectangle that represents the frequency; in abar chart it is the height that represents the frequency. Hence the distinctionis unimportant when the class intervals are all equal and none is openended. It may be necessary to choose different limits for your class intervalsif the distribution of time spent reading is not like the one illustrated.
Section C
This covers simple interpretation and comparison of statistics,particularly the comparison between class data and national aggregates. Itcan be done as an individual, group or class activity, depending on thenumher of Radio Times, TV Times or newspapersavailable.
CI
This bar chart is similar to that in B9. If you calculate the class meanviewing time from the original figures to compare with the publishedfigures, pupils may find this interesting but difficult. A discussion on'average' is possible. Pupils may need help with the class intervals for CIa.Cld requires an arrow to show the national mean on the class distribution.This gives a quick visual comparison of the class and national figures.
The national figures quoted came from surveys carried out for the BBC.
14
C2
The programmes from 4.00 to 10.00 p.m. can easily be put on a pie chart,since this is 360 minutes. The problem of programmes running from, forexample, 9.30 to 10.30 pm may arise when 4.00 to 10.00 pm is beingconsidered. The problems of definition have to be faced squarely here.Magic Roundabout could be considered under 'Comedy' or 'Children'sprogrammes'. It does not matter what decisions are made, but they must beconsistent and clearly explained in any comment on the figures. Usuallyprogrammes from 4.00 pm to the early evening would be 'Children'sprogrammes'.
It may be interesting to compare BBCI with lTV. Different groups ofchildren could do each. It is left to the teacher to tell the children whichchannel to choose. It may be best to use BBCI and lTV onlyfor C2a to C2d;BBC2 programmes often do not begin until later in the evening.
When comparing the whole of the weekday with the whole of Saturday,different groups could look at TTV and BBC. Different total hours ofbroadcasting on the various days and channels mean that simple pie chartsare inappropriate.
*C3
For more able pupils. The pie charts show the proportion of differentnewspapers taken and NOT the proportion of families. This means there isno 'None' category, allowance is made for families who take more than onepaper, and there is direct comparability with national figures. A truenational comparison with the national daily papers taken can only be madeby iguoring local and evening papers.
National sales are given in the unusual unit 'hundreds ofthousands' to helpcomputation. Social Trends gives the figures in thousands, and it is usual toquote the figures as multiples of 103
'. The comparison in e should havesome mention of the class not being a representative sample of thenewspaper-buying public. The differences show the ways in which it is notrepresentative.
Different groups of children could do C3a, e, e or C3b, d, e.
AnswersSee detailed notes.
Numerical answers depend on the answers to the questionnaire.
15

Test Questions1 Here is how John spentthe 12 hours from 6.00am to 6.00 pm on a certain
day.Sleeping 2 hours Eating 1 hourSchool 5 hours Play 3 hoursOther I hourDraw a pie chart to show this information.
2 The 32 pupils in Class Ib at Park House Middle School gave thefollowing information:
Musical instrument played Favourite colour
The favourite animals of Class 1c
Animal Number
Cat 3Dog 10Lion 4Elephant 3Rabbit 5Horse 6Gerbil 2Other 3
36
a Draw a bar chart to show the musical instruments played.b Why is the total greater than 32?
'c Why would it be misleading to draw a pie chart for these data?d Draw a pie chart to show favourite colours. (360 + 32 =lIt)e Which colours are the favourite of more than a quarter of the class?
3 The same 32 pupils measured the time spent watching television lastweek. Here are their answers in hours.
PianoRecorderTrumpetClarinetViolinGuitarNone
MilJ.lIf.lltf wrIIIII
,1MJ.lIf J.Iff IIII
Red·BlueGreenYellowOrange
J.lIf 11111111J.Hfwrll.I#tII
a Draw a bar chart to show their favourite animals.b Draw a pie chart to show their favourite animals .
Use your bar chart and pie chart to ansWer these Questions:
c How many pupils liked rabbits best?d Which animal was the favourite of more than a quarter of the class?e What fraction of the class voted for the most popular animal?f What is your favourite animal? Ifyou had been an extra member of
class Ic. how would your answer have altered:(i) your original bar chart(li) your original pie chart
6± 12 15± 18 21 0 3 7 10 14 2 23 9 8 14 17
16 12 3 o 4 5 12 15 18 3 4± 7 9 II 22 I
a Draw up a tally chart using the categories 'less than 5hours', '5 but lessthan 10 hours', etc.
b Plot your results as a histogram.c Use the histogram to write two sentences about these pupils' television
viewing.
4 Oass Ic at Newtown School decided to find out which were theirfavourite animals. They filled in a questionnaire and recorded theirresults in a frequency table:
16
Answers
2 b Some pupils play more than one musical instrument.*c The fractions on the pie chart would not be fractions of the number of
pupils in the class.e Red, green
4 c 5 d Dog e 10 or 2.-36 18
17

~
cu::."
Fair Play
Pupil Poll
Equal Pay
Wheels and MealsIfatfirst. ..
Opinion Matters
Cutting it FinePhoney Figures
Sampling the CensusSmoking and Health
Being Fair to ErniePractice makes Perfect
Other Units at the Same Level (Level 1)
Level 2 On the Ball
Level3 Car CareersMultiplying People
Shaking a SixProbability GamesTidy Tables
Level4 Figuring the FutureRetail Price Index
Units at Othar Levels In the Same or Allied Areas of the Curriculum
Connections with Other Published Units fromthe Project
ro~-
~coz
~." .00uz
This unit is particularly relevant to: Humanities, Social Sciences,Mathematics.
Interconnections between Concepts and Techniques Used in theseUnits
These are detailed in the following table. The code number in the left-handcolumn refers to the items spelled out in more detail in Chapter 5 ofTeaching Statistics 11-16.
An item mentioned under Statistical Prerequisites needs to be coveredbefore this unit is taught. Units which introduce this idea or technique arelisted alongside.
An item mentioned under Idea or Technique Used is not specificallyintroduced or necessarily pointed out as such in the unit. There may be oneor more specific examples of a more general concept. No previousexperience is necessary with these items before teaching the unit, but morepractice can be obtained before or afterwards by using the other units listedin the two columns alongside.
An item mentioned under Idea or Technique Introducedoccurs specificallyin the unit and, if a technique, there will be specific detailed instruction forcarrying it out. Further practice and reinforcement can be carried out byusing the other units listed alongside.
18 19

'"oCode
Idea or Technique Introduced Also Used inNo.
l.4a Directly counted or measured data Shaking a Six Being Fair to Ernie Fair PlayCutting it Fine Sampling the Census Retail Price Index
2.2a Bar chart for discrete data Shaking a Six Being Fair to Ernie Probability GamesPractice makes Perfect Tidy Tables Car CareersCutting it Fine Multiplying People Phoney FiguresPupil Poll Sampling the Census Smoking and Health
·2.2c Pie charts, constant radius
2.2e Bar charts for continuous data Wheels and Meals Practice makes Pertect
2.21 Histogram for grouped data Cutting it Fine
3.1a Mode for discrete data Shaking a Six Practice makes Pertect Car CareersPhoney Figures Sampling the Census Equal Pay
5a Reading tables Shaking a Six Being Fair to Ernie Wheels and MealsProbability Games If at first ..• ' Tidy TablesOn the Ball Opinion Matters Car CareersMultiplying People Phoney Figures Figuring the FutureSampling the Census Retail Price Index Smoking and HealthEqual Pay
5b Reading bar charts, histograms, pie charts Being Fair to Ernie Wheels and Meals Tidy TablesCar Careers Cutti ng it Fi ne Multiplying PeoplePhoney Figl;'res Smoking and Health
5c Reading time series Car Careers Cutting it Fine Multiplying PeoplePhoney Figures Figuring the Future
5v Inference from tables Shaking a Six Wheels and Meals Practice makes PerfectTidy Tables On the Ball Car CareersCutting it Fine Multiplying People Phoney FiguresFiguring the Future Sampling the Census Retail Price IndexSmoking and Health Equal Pay
"U(J) ci
(J) .." Ql ~ C) r
3~~ 3 0 s: ~ ~ ~~ ~ ~~~ C (1) .• -O::r!::. ~ 0 (1) 0 0 (1) ::r c-·-. -,: .-+ .. -. 0'-+ v G) "'0 3' -,: cr 7 CD -,:::J::l~Ql(1)::l~ ~o ::r (1)- ~ ~ Ql~(J)(1) (1){QCO -J =.: en ce \" _ C 0 .-+:J \,.l..oI 0- m - -+.CO ~.-+m <.-+ ::Jn~-' _. ~~_.~~CJ)~o~m'-+~::J~o _.~ CDm::J 0 CJ)O:Jm=comm-.-,:!.
~:J~~.ceco-':~~:JZ<-,:ce:J~rn::Jo'-+~CJ)~:J~~-':c~(1)2-jooC {Q!.."o-·S:Ql~~::l~~"U::l~ -8,. ~.." (1) _ -0 "U _. _." ~ _. _. ::r -< - ... , {Q:;;> -j (1)~~c- CD-J=CD.-+o~~~m~mCD3~mCD ~mmmro~~~:Jm o~mcCD-'~~< '-+3~mco~m-,:
"UQlc~-~::l"U-O-·~~(1){Q(1)--roo (1) (J)Ql-C::lm~~m~cnO-~oro-,:~-,:m~mc CDO_.-CD-,:-.<~roxceCJ)co=mro~moo.-+CJ)<~=OO OO~XCJ)ooroco
$?::r(j)......;+CD~
:::I....::ri.ii.(/)(j)...iii·~

Statistics in your world
LEISUREFOR PLEASURE
Published for the Schools Council by
FOUlSHAM EDUCATIONAL

ContentsPage
A Leisure Time 3Al Some Questions 3A2 Today 4
B Leisure Activity 6
Bl What Do You Do? 6B2 Favourite Television Programmes 6B3 Regular Viewing 10
*B4 Playing Sport 10*B5 Watching Sport 10*B6 Musical Instruments 11*B7 Youth Clubs 11*B8 Hobbies 11
B9 How Much Do You Read? 12
C The National Picture 13 A Leisure TimeCl How Much Television? 13C2 What Kind of Programmes? 14C3 Which Newspapers Do You Read? 15 Ai Some Queslions
Some sections are marked with an asterisk*. Your teacher will tellyou whether to try these sections.R Pages Your teacher will provide these for you.
AcknowledgementsThe publishers and Project team extend their thanks to Her Majesty'sStationery Office for granting permission to reproduce or-adapt statisticsfrom Social Trends and Britain 1978, An official handbook, which areCrown Copyright.
The Schools Council Project on Statistical Education
Published byW. FouIsbam & Co. Ltd., Yeovil Road, Slough, Berks
Cartoons by Colin Whittock
@> Schools Council Publications 1980
ISBN 0-572·010664
PRINTED IN HONG KONG
We all have some time to spend as we want. In thefuture we expect people to have even more spare time.We want to make the best use of this leisure time.
Think about these questions:
What do you do in your spare time?How long do you spend watching television?Which programmes do you prefer?What games do you play?What kind of books do you read?
a Write down some things you do in your spare time.b Who would like to know which books you read?
c Why?
On page Rl there is a section called 'My Diary'. Duringthe next seven days note down the amount of time youspend each day watching television and the amount oftime you spend reading. Do not count time readingschoolwork.
3

A2
Figure 1
Today
Spare time is leisure time. Let's see how you spendtoday.
On page RI you will find a c10ckface headed 'Today'.The clock face is to show how you will spend thisafternoon and evening (from midday to midnight).
a Start at midday and.show how you will spend the 12hours until midnight today. Your c10ckface shouldlook a bit like the one drawn in Figure 1.
midnight I midday
12.00
Figure 2
c Complete the clockface on page Rl to show whatyou did last Sunday (from midday to midnight).
d Make a table like Table 1. Put in your figures forlast Sunday.
The times from Table 1 can be put on to a circle. Thereis now only one section for each activity. This circlerepresents the 12 hours today from midday tomidnight, but it is not a c1ockface. It is called a PIE
CHART.
Here is the pie chart for our Table 1 figures.
Time spent today
(evening I-~__-=::"'I;,
\\
afternoon
)
Table 1
4
6.00pm
b Make a table like Table 1. Put in your figures fortoday.
My time today
Activity Time in hours
Eat %+ %= 1Play 1 + 3 = 4School 2%=2%Sleep 3=3Other(including travel) %+%+%=1%
360 degrees represent 12 hours30 degrees represent 1 hour
e Complete the two pie charts on page Rl. Theseshow how you spent your time today and lastSunday.
f How do your two pie charts differ?*g Find out how a working adult you know spent his
time today.Draw a pie chart for him.
How is it different from yours?Did he have less leisure time than you?
5
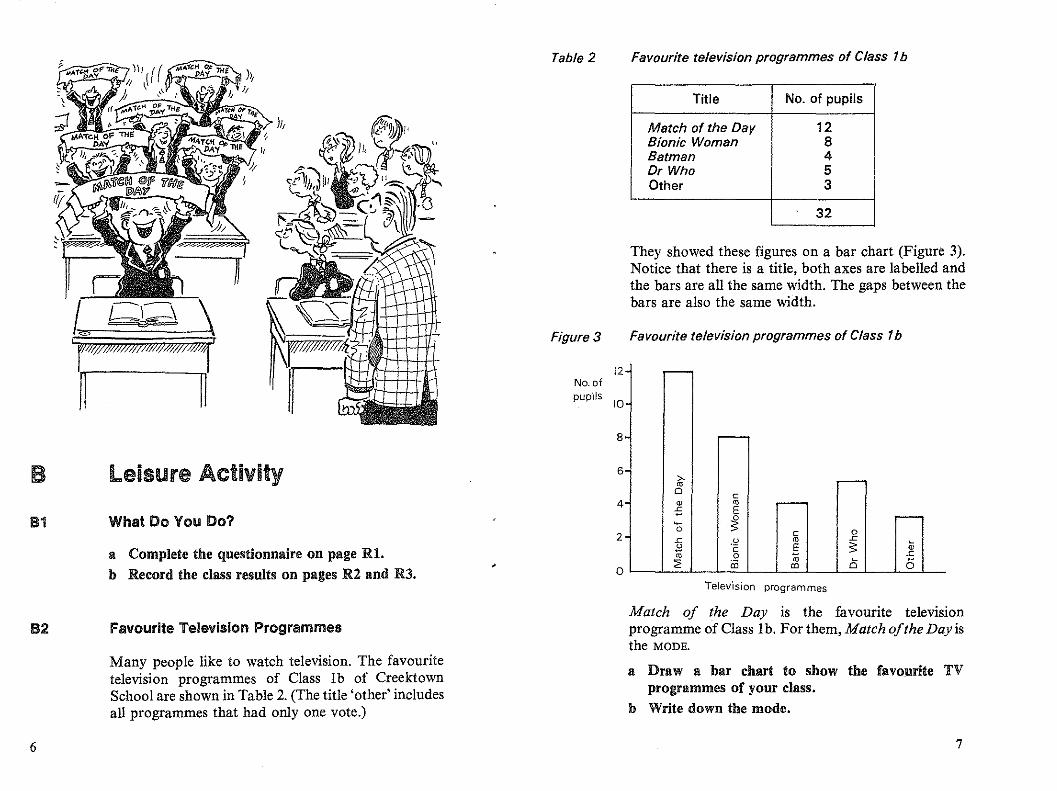
81 What Do You Do?
Favourite television programmes of Class 1b
They showed these figures on a bar chart (Figure 3).Notice that there is a title, both axes are labelled andthe bars are all the same width. The gaps between thebars are also the same width.
Telev'lsion programmes
Favourite television programmes of Class 1b
Title No. of pupils
Match of the Day 12Bionic Woman 8Batman 4Dr Who 5Other 3
32
· ~
,.
· ~
· >. ~ro0 cID ro ~
oS E~
~ ~0 c 0Ie g ro Ie cB c § S IDro .2 Ie
:;; ro 0 5ell ell
4
6
a
2
12
8
No. ofpup'rls
10
Figure 3
Table 2
leisure Activity
a Complete the questionnaire on page Rt.b Record the class results on pages R2 and R3.
B
82 Favourite Television Programmes
Many people like to watch television. The favouritetelevision programmes of Class Ib of CreektownSchool are shown in Table 2. (The title 'other' includesall programmes that had only one vote.)
Match of the Day is the favourite televisionprogramme of Class lb. For them, Match ofthe Day isthe MODE.
a Draw a bar chart to show the favourite TVprogrammes of your class.
b Write down the mode.
6 7

Table 3
8
The class decided to show their favourite TVprogrammes on a pie chart. The pie chart representsthe whole class. The 360 degrees ofthe circle are sharedequally between the pupils in the class. There are 32children in Class Ib at Creektown School.
32 children take up the 360 degrees in the circle. Each
child is represented by 33~ degrees.
33~ is II degrees to the nearest degree.
So each child is represented by II degrees.
12 pupils are represented by 12 X 11 degrees, that is, 132degrees.
Table 3shows Class Ib's completed favourite televisionprogramme figures.
They put the programmes in order with the mostpopular one last to help draw their pie chart.
Favourite television programmes of Class 1b
Programme No. of pupils Angle
Other 3 11 ° x 3 = 33°Batman 4 11 ° x 4= 44°Dr Who 5 110 x 5 = 55°Bionic Woman 8 11 ° x 8= 88°Match of the Day 12 11°x 12 =132°
c Put your class's favourite television programmes inorder of popularity on Table 9 on page H2.
d Work out the number of degrees for each pupil inyour class.
e Work out tile number of degrees for eachprogramme and complete Table 9.
The pie chart for Class Ib of Creektown School isshown in Figure 4.
IJ
jj
Figure 4 Favourite televisionprogrammes ofClass 1b
Match of
the Day
Use the following to help you draw your pie chart.Your teacher will tell you how accurately to calculateyour angles.
f Draw a circle, radius about 3 or 4 cm.Draw a vertical liue from tile centre upwards.Measure tile smallest angle, draw the sector andlabel it. ('Other' in Class 1b).Measure the next smallest angle, draw the sectorand label it. (Batman).
Continue until there is only the largest sector left.Label it. (Match of the Day).
Use your bar chart and your pie chart to answer thesequestions.
g How many programmes received only one vote?h Was any programme the favourite of more than a
quarter of the class?How many pupils voted for the most popularprogramme?
j About what fraction of the class voted for the mostpopular programme?
k Look again at the last four questions.Which did the bar chart help you to answer?Which did the pie chart help you to answer?
9

83
Table 4
Regular Viewing
Many people watch some programmes regularly aswell as having a favourite.
Class 1b of Creektown School regularly watch thetelevision programmes shown in Table 4.
Programmes regularly watched by Class 1b
*B6 Musical instruments
Draw a bar chart to show the number of pupils in yourclass playing different musical instruments. Include abar labelled 'None' for those pupils who do not playamusical instrument. Write two sentences about thechart.
Title No. of pupils
Match of the Day 20Bionic woman 18Dr Who 18Batman 15Charlie's Angels 12Other 10
*B7 'Youth Clubs
Draw a bar chart to show the number of children inyour class belonging to various youth clubs or similarorganizations. Include a bar labelled 'None' for thosepupils who do not belong to an organization. Writetwo sentences about the chart.
·B5 Watching Sport
·B4
a Draw a bar chart to show programmes watchedregularly by your class.
b Which programme is watched regularly by mostpupils? Is this the same as your class's favouritetelevision programme?
*c Why is it misleading to draw a pie chart to illustratethese regularly watched programmes?
Playing Sport
Draw a pie chart showing the sports your class mostenjoys playing. Write two sentences about the chart.
Draw a pie chart showing the sports your class mostenjoys watching. Write two sentences about the chart.
*88 Hobbles
Draw a bar chart to show the hobbies of ehildren inyour class. Write two sentences about the chart.
10 11

Time spent reading by Class 1b last week
They drew a bar chart of their results.
The same Class 1bat Cteektown School looked at theirreading habits. They made a table of their findings.
People do many different things in their spare time.Some play games. Some watch sport. Others joinchoirs. Some enjoy gardening. Most people read anewspaper or watch TV sometimes.
a Draw a bar chart to show the number ofhours spentwatching television last week by pupils in your class.
b How many hours does the largest group of pupilswatch television?
c Is this what you expected?
The National Picture
A bar chart of this type is sometimes called aHISTOGRAM.
a Draw a bar chart to show the time per week spentreading by your class.
b At Creektown School most pupils spent less thantwo hours reading last week. Make two similarstatements about your class.
cC1 How Much Television?
10864Hours per week
2
~-
f--
-2
oo
8
10
4
6
12No. ofpupils
Reading time of Class 1b last week
How Much Do You Read?
Notice that:The horizontal axis is marked from 0 to 10.The vertical lines are drawn at 2,4,6,8 and 10 hours.The bars touch each other.
Time in hours Tally No. of pupils
Less than 2 illt.utt 102 or more but less than 4 lilt II 74 or more but less than 6 lilt II 76 or more but less than 8 lilt 58 or more but less than 10 III 3
32
Figure 5
Table 5
89
12 13

Table 6
Table 6 shows the average number of hours spent eachweek watching television in 1977.
Television viewing in the UK(average weeklyhours).1977
Age group February August
5-14 22'0 19'015-19 17'6 15'0
(Source: Social Trends)
d What was the average number of viewing hours foryour age group in February 1977? Mark this with anarrow on the horizontal axis of your bar chart.Mark also the August 1977 average viewing hoursfor your age group.
e Why do you think the August figure is lower thanthe Fehruary figure?
f Why do you think the 15-19 age group watch lessthan the 5-14 age group?
g Write two sentences comparing television viewingby your class with the national picture.
a Find out how many minutes each programme is on.
Fill in Table 20 on page R3.
From 4.00 to 10.00 pm is 360 minutes.
b Sbow these 360 minutes of television programmeson a pie chart (for example, 30 degrees willrepresent 30 minutes).
c Write two sentences about your pie chart.d Write two sentences comparing your pie chart with
that of someone who did another channel.
Find either BBC1, BBC2 or lTV programmes for thewhole of today and for Saturday. Your teacher will tellyou which channel to use.
e Calculate how long each type of programme isshown. Record your answers in Table 21 on pagero.
f Draw two bar charts to show how long each type ofprogramme is on. One bar chait is for today'sprogrammes, the other bar chart is for Saturday'sprogrammes.
g Write down two differences between your two barcharts.
C2 What Kind of Programmes?
You will need a copy of the Radio Times, TV Times ora newspaper. Your teacher will tell you which channelto choose. Find tonight's programmes from 4.00 to10.00 pm. Fit each programme into one, and only one,of these types:
·C3 Which Newspapers Do You Read?
14
News and current affairsChildren's programmesRegular series,
e.g. Panorama
Comedy and varietyPlays and filmsSportOther programmes
a Draw a pie chart to show the different national dailypapers taken by families in your class.
b Draw a pie chart to show the different Sundaynewspapers taken.
15

Table 7
16
Table 7 shows the average number of copies of eachissue of different newspapers sold in 1977. The numberof copies sold is caned the newspaper's 'circulation'.
Newspaper circulation in hundreds ofthousands (1977)
Daily paper Circulation
Daily Mirror 38Sun 37Daily Express 24Daily Mail 18Daily Telegraph 13The Guardian 3The Times 3
136 hundredthousand
(13600000)
Sunday paper Circulation
News of the World 49Sunday Mirror 40Sunday People 39Sunday Express 33Sunday Times 14Sunday Telegraph 8The Observer 7
190 hundredthousand
(19000000)
(Source: Britain 1978, An official handbook, HMSO)
c Draw a pie chart to show the daily papers sold in1977. (360/136 = 206)
d Draw a pie chart to show the Sunday newspaperssold in 1977. (360/190 = 1,9)
e Compare your pie charts from the class data withthe national picture. Are they similar? What isdifferent? Why do you think this is?

Schools Council Project on Statistical Educationfhis Project has been based in the Department of Probability and Statistics at the University)f Sheffield from 1975 to 1980. Its brief was: to assess the present situation of statisticalrlucation in schools; to survey the needs of teachers of statistics; to devise detailed proposalshr the implementation of the teaching ideas; and to produce teaching materials.
Project Team
Director: Peter Holmes (l975~ )Deputy Director: Neil Rubra (1975~78), Daphne Turner (1978~
Project Officers
Ramesh Kapadia (1975-79), Alan Graham (1976-77), Barbara Cox (1979-80)
General Notes)ages with the prefIx R are resource pages or reference pages for pupil use. (In many caseshey are designed as worksheets.) In the pupil unit these_are referred to as 'page RI', etc.
Statistics in your world
)ermission need not be sought to reproduce copies of the R sheets provided that copies arenade only in the educational establishment in which they are to be used and that such copies.re not sold, hired or lent to any other indivdual, organization or establishment.
lections or questions marked with an asterisk are optional to the main thrust in the unit.lometimes they are for the more able pupils, sometimes they are for reinforcement and some~
lInes they consist of simpler work for the less able pupils and lead to an easier conclusionhan the main unit. In each case detailed comments on the particular purpose will be found inhe appropriate section of the teacher's notes.
~hre(.. different typefaces are used in the pupil units. Text in roman type (like this) is for pupilso read or for the teacher to introduce. Questions to promote thought and for group or Classuscussion are printed in italics. Instructions telling pupils to do things and questions forlupils to answer are printed in bold.
IF AT FIRST
TEACHERS' NOTES
LEVEL 1
Published for the Schools Council by
FOUlSHAM EDUCATIONAL
III II!

Contents
Brier Description
Aims and Objectives
Prerequisites .
Equipment and Planning
Detailed NotesSection ASection BSection C
Answers
Test QnestionsAnswers
Connections with OtherUnits in the Project
R pages on pages 10-17.
Page33
334578
181819
20
Brief DescriptionThe central theme is that of using simulation to model real-life situations.Children often collect sets of cards; the fIrst simulation investigates howlong it would take to collect a set of four. Other simulations use dice andrandom numbers to model booking seats on a minibus, finding the rightkey for a door, the weather and being stopped at traffIc lights.
Design time: 5 hours (B4 and C3 optional)
Aims and ObjectivesOn completion of this unit pupils should be able to set up, and improve ifnecessary, a simulation using (i) playing cards, (il) a die; and (iii) a randomnumber table; to model simple real-life situations.
They will have practised the use ofa random number table to select series ofrandom numbers to suit varying probability requirements.
They meet examples of everyday situations which can be replaced (tovarious degrees of accuracy) by simple probability models and simulated inthe classroom.
They should be more aware of the advantages and possible disadvantagesof replacing real-life situations by models.
PrerequisitesPupils should be familiar with simple fractions and proportions, andshould be able to carry out division to one decimal place.
Schools Council Project on Statistical Education
PUblished byW. Foulsharn & Co. Ltd., Yeovil Road, Slough, Berks
@ Schools Council Publications 1980
ISBN 0-572-01099-0
PRINTED IN HONG KONG
Equipment and PlanningDice and packs of playing cards are required for the class, ideally one foreach pair of pupils.
The record pages RI to R3 contain blank tables and answers to becompleted. Page R4 is a set of random number tables.
Concepts in probability are ratherdifficu1t; consequently the success ofthisunit depends greatly on the level of participation of the teacher. It is notrecommended that this material be treated Wholly as individually-basedlearning.
3

Section A is intended for all pupils and develops the idea ofa simulation asan experiment which models the essential features ofthe real-life situation.Two problems are investigated: the collection of sets of cards, or the like,and the operation of a minibus service.
Section B introduces random numbers and random number tables. B4 isoptional, designed for more able pupils, and develops the use of randomnumbers beyond the general demands of the unit.
Section C provides further practice in the use of random numbers bymodifying the minibus example. It introduces two further, moresophisticated situations (one optional in C3, again for more able pupils):key selection and the passage through two sets of traffic lights.
Detailed NotesWhen probability is used to model real-life situations, the calculations canbecome quite complex. This is apparent from the theoretical solutionspresented later.
This unit helps pupils bnild up an intuition for such ideas. It shows howreal-life events can be likened to random processes by assigning andcombining the relevant probabilities. The rules of probability are thusbeing built on intuitive foundations.
Monte Carlo methods are used - this means using random numbers forsimulating chance events. A single trialis unpredictable, but repeated trialsindicate the distribution of results that might be expected. This requiresmany results. It is suggested that class results be combined, though it isessential that all pupils do some simulations individually. They thendevelop a feeling for probability by seeing random events in differentsettings.
As described in Section A below, it is better to start with random numbergenerators: spinning discs, tossing coins, throwing dice, etc. Class resultscan be used to illustrate that all digits, pairs of digits, and so on appearindependently and with equal frequency in the long run.
These features of random numbers are crucial and could be emphasized byusing biased spinners. They are also considered in the Level One unit BeingFair to Ernie.
The object is to develop aleelfor random numbers. The simulations in thisunit use randomizing devices to model ideal problems.
4
Teachers desiring to find out more about theoretical aspects of simulationcould consult the following books.
I Monte Carlo Methods, by J. D. Hammersley and D. C. Handscomb,(Methuen, London, 1964.) This deals with some of the theory.
2 The Teaching 01 Probability and Statistics, A. Engel in L. Rade (ed)(Ahnqvist and Wiksell, Stockholm, 1970; disttibuted in this country byJohn Wiley). This looks at some simulations that can be done byschoolchildren.
Section A
We suggest that you introduce this section with a class demonstration anddiscussion. Throw a die, call Heads if an even number results, call Tailswhen odd. Repeat this several times, then ask the pupils to guess the rule.Alternatively, call Boy for odd and Girlfor even to simulate births by sex.
This can lead to the consideration of the possible advantages anddisadvantages of simulations: speed, convenience, danger of oversimplification. One can then show that many aspects of the real world canbe considered as chance events that can be modelled by the appropriate useof random numbers, for example, male/female birth, car Ivan passing,rain/dry.
Thus instead of a real process, it is sufficient to show the output of arandomizing device, even though equally likely probabilities may not beinvolved. This is the essence of Monte Carlo methods.
Two particular simulations are suggested in the pupil notes for discussion.Tossing a coin four times can simulate the number of boys and girls in afamily, using Heads for girls and Tails for boys. Book cricket is a gameplayed by following a text and using a=maiden ball, b=bowled, c=caught,d =2 runs, e =I run, 1= 4, g =6, etc.
Pupils may well have their own rules for this game, which is not aparticUlarly realistic model of a game of cricket, since little attempt hasbeen made to match up the probabilities.
Pupils may benefit from a demonstration ofAI and A2 from the teacher. Ifresources are short, AI and A2 could be attempted bydifferent parts oftheclass. A whole pack of cards is not essential, though equal numbers ofeachsuit are; the replacement of cards is necessary if there are only a few cards,but this is difficult to organize.
5

At
The first example should be familiar to pupils, and the teacher may findcurrent examples a useful aid.
Questions 8, b and c are intended for discussion and could be extendedfurther if required to d 6 cards and e 12 cards.
The pupils may require some help in the execution of the experiment.Teachers may consider the use of a flow chart to clarify instructions. Ablank table, Table 2, on page Rl is provided for recording the results.Collect the class results for pupils to use in A2.
A2
The cards involve selection without replacement, and so the probabilitiesdo change after each card is drawn. This makes it slightly quickerto collecta set (the mean is reduced by about 0'3). It should take, on average, abouteight cards to complete a set, but the distribution is rather skewed. c israther difficult theoretically.
Class results could be collected with a table running from 4 (the leastnecessary) to about 25, though theoretically 40 might be required. Hthere istime, a bar chart could be drawn to illustrate the skewed distribution.
A3
The minibus problem is a standard one with bookings: it is binomial withn =12 and p =i. An owner would probably not overbook, but with presenteconomic stringencies it might make the difference between profit and loss.However, overbooking can result in disgruntled customers who aretumedaway. Certaiuly airlines have overbooked and been taken to court for it.
Here dice are used to simulate chance, and pupils may need extra guidanceon how to perform the experiment and fill the table. Table 3 on page RI isprovided for recording individual results. Class results should be collectedand discussed, as five is rather a small sample size.
Question c is a comment on individual experiments and may be taken up aspart of the class discussions arising from d and e.
It is possible that an unacceptable number ofpeople may be turned away.The equally likely hypothesis is tenuous. People may come withoutbooking. Demand may vary.
6
Section B
Random numbers are introduced in this section. Pupils may experiencedifficulties and will certainly benefit from class discussion, withconsiderable teacher involvement.
It may be useful to try to show children that numbers called out by them 'atrandom' are not really random. Ask them all to write down a number 'atrandom' choosing from the numbers 0 to 9. Collect the results. Usuallythere are fewer zeros than would be expected from genuine randomnumbers.
A point worth stressing is how to get a probability of 1 in 6, by ignoring7,8,9 and O. One could introduce modulo method (as outlined in B2 for achance of 1 in 2) but this is left to the discretion of the teacher.
Brighter pupils may appreciate trying to make more efficient use of therandom number tables by minimizing the number of digits that have to bediscarded. Thus a probahility of 1in 3 is tbe same as 3 in 9, and all digits 1 to9 can be used with only the zero being discarded. 4 out of7 is the same as 56out of98, and so a more efficient use oftwo-figure random numbers can bemade, and so on.
The use ofrandom numbers is also covered in the Level One unit Being Fairto Ernie.
III
If time is available, pupils could usefully construct and use their own tableof random numbers from dice throws.
112
Page R2 provides copies of the extract of the random number table used inillustrations and can be used as a work-sheet.
You might like to consider the introduction of the following method for achance of I in 2:
If the number is 0,2,4,6 or 8, the event takes place.If the number is 1,3,5,7 or 9, the event does not take place.
113
This is a further development of the ideas in B2. The results obtained in1128, b, and c, may be helpfUl in 1138, c and d.
7

C3
C2
This section is optional and is intended for more able pupils. Class resultscould be compiled before answering e. The traffic light example can beillustrated by a tree diagram:
This situation may be introduced by demonstrating with, say, three similarkeys for a classroom or cupboard door. The three ways ofchoosing shouldconfirm what one could guess beforehand yet it is still worthwhile to showhow one can use the simulations. The advantage of the simulations is that itgives some measure of the difference in efficiency between the variousmethods. This wouid take a long time experimentally. If time is short, onlyone simulation need be done, but it is desirable to use several to show howyou can adapt the basic model to fit the different situations.
Tables 5, 6 and 7 on page R3 are provided forthe recording ofthe results ofa, band c respectively.
Clear runt.,2ndlights
1stlights
":84
This section is optional and intended for more able pupils. It applies theideas already introdnced to probabilities requiring the selection of twodigit random numbers.
You may consider refining methods for b 7 in 30, and d 1 in 13, to makemore efficient use of the random number table.
You might consider using local weather data to relate to local events. Forexample how many school cricket matches are likely to be rained ofrthisseason, based on the proportion of days when there is sufficient rain tocause this. Another possibility is to consider how many times a week youare likely to have to water an outside plant which requires water or rainevery other day.
The data used to introduce this section was obtained from SheffieldWeather Summary 1976 (Sheffield City Museums).
The random numbers model is quite crude, since it implies independence ofweather from day to day.
If3 in 5 is written as 6 in 10, the simulation can use all the random numberswith:
If the number is 1,2,3,4,5 or 6, it rains.If the number is 7,8,9 or 0, it does not rain.
Section C
In this section we return to the minibus problem and introduce othersituations which can be simulated with the help of the random numbertable provided with this unit.
~go
%stop
~ stop2.,215
Stop at 2ndlights only
Stop at 1stlights only
If built-up by pupils or on the blackboard, red and green lines may enhancethis diagram.
The experimental proportions will not be identical to the theoreticalprobabilities, but the multiplication rule will still hold. This can be usedwith more able pupils to help lay the foundations of multiplication ofprobabilities. .
(Text contmued after the R pages)
Cl
Another piece of information is introduced in the minibus problem. This isdesigned mainly to afford pupils practice in the use of random numberswithout making them consider something new.
Table 4 on page Rl is provided for recording individual results. Again, itwould be helpful to compile class results before the discussion. In thediscussion, you may wish to include:
e Have any important features been ignored?How might they be taken into account?
~ stop4 Stop at
15 both lights
8 9

~
o
Table 2
R1
~
~
Trial Guess Number ofcards used
1
2
3
4
5
6
78
9
10
Totals
Table 3
Person Total Tick ifnumber minibus
Trip of seats is over-1 2 3 4 5 6 7 8 9 10 11 12 filled booked
1
2
34
5
Table 4
Person Total Tick ifnumber minibus
Trip of seats is over-1 2 3 4 5 6 7 8 9 10 11 12 filled booked
1
2
34
5
© Schools Council Publications 1980

R2-tvSection 82
a For a probability of 1 in 5:
If the number is the person does not come.If the nu mber is the person does come.If the nu mber is we go to the next number.
9 1 9 3 8 8 5 6 3 5
7 6 9 7 3 5 1 9 3 7
4 6 6 0 7 4 6 5 0
5 8 0 8 7 3 4 2 9 7
2 0 4 2 6 4 6 8 0 0
So a list we could use is
b For a probability of 1 in 8:
If the nu mber is the person does not come.II the nu mber is the person does come.II the nu mber is we go to the next number.
9 1 9 3 8 8 5 6 3 5
7 6 9 7 3 5 1 9 3 7 - -4 6 6 0 7 4 6 5 0
5 8 0 8 7 3 4 2 9 7
2 0 4 2 6 4 6 8 0 0
So a list we couId use is
c For a probabil ity of 1 in 10
II the number is the person does not come.II the number is the person does come.II the nu mber is we go to the next number.
9 1 9 3 8 8 5 6 3 5
7 6 9 7 3 5 1 9 3 7
4 6 6 0 7 4 6 5 0
5 8 0 8 7 3 4 2 9 7
2 0 4 2 6 4 6 8 0 0
So a list we could use is
-w© Schools Council Publications 1980

Table 5
Trial· KevNumber ofkeys tried
1
2
3
4
5
Table 5
Trial KeyNumber ofkeys tried
1
2
3
4
5
Table 7
Trial KeyNumber ofkeys tried
1
23
45
14
Table 8
TrialStopped at Stopped at Number offirst lights second lights times stopped
12345
6789
10
1112131415
1617181920
© Schools Council Publications 1980
15

-'"
'"
R4
Random numbers
77 04 01 09 73 89 84 35 77 76 12 39 43 64 97 40 83 99 18 2639 00 29 43 44 23 01 92 63 88 89 61 91 67 90 04 22 34 19 9363 78 56 92 64 87 82 73 33 53 25 36 40 91 19 52 36 4091 1952 67 36 19 67 84 34 55 97 37 92 30 27 26 71 04 71 78 38 155821590607575799404347180362914160904513
24 65 06 55 72 0487 31 29 39 56 29 93 95 65 90 95 99 87 4666 36 07 93 49 2002 59 48 54 35 73 34 68 72 44 28 8744 81097710525252652915828123569982210162819814 56 32 69 71 27 29 74 87 24 79 42 66 10 50 75 47 8708 2635 84 64 56 47 54 11 22 93 84 75 65 06 91 47 47 67 25 97 25
08 35 58 9406 0402 41 56 90 12 38 09 87 20 22 20 30 72 5139 8492 6936 4742 0972 2820 6390 6724 5654 27· 12 89162061327591501653518314309383745931708154 35 42 49 55 57 13 50 70 03 72 39 48 67 94 73 37 67 13 3966 2974 71 55 6088 0810 6208 1055 2851 8652 7500 14
59 0051 6044 72 59 53 94 22 10 7438 5443 4345 2991 7443 45 29 91 74 43 58 08 72 99 89 09 38 66 75 45 49 0047 4275 4788 5925 21 04 61 07 1440 7342 6867 2568 7698 4528 8046 57 74 8062 57 51 32 33 42 06 56 17 81 94 25 05 6358 6221 9986' 5890 7887 0596 5738 1437 3505 51 87 25
87 71 56 03 6,5 03 11 69 23 98 78 64 52 19 04 99 04 73 90 48412195963483031631721150654758806892798277 93 27 40 49 08 05 83 42 49 80 95 99 46 24 51 85 74 13 8381 27 96 2442 13 33 55 25 65 91 39 43 36 8,3 32 40 32 48 7193 44 83 25 03 62 06 48 98 74 38 18 76 63 58 44 87 58 91 26
47 04 95 29 28 67 85 59 17 41 49 89 23 35 50 90 28 97 55 8620 52 82 47 00 24 00 46 69 91 07 37 21 93 54 92 73 09 06 0836 6747·4703 1669 5048 4170 9726 4330 5210 1685 0335 60 74 94 29 8489 72 57 65 49 30 11 61 54 88 18 85 68 3237 8042 5020 0957 5841 6842 62 17 '11 94 9881 9804 49
10 91 74 06 38 02 57 04 25 67 52 47 72 59 62 22 42 4498 2610 17 59 75 76 7467 12 19 68 34 28 32 54 11 80 14 51 42 0742 45 57 52 07 84 44 43 01 65 20 56 64 01 46 39 26 73 83 9201 611896233641 0157 70202964904977 41 32859374 91 20 6607 6281 51 40 5826 21 96 98 14 5769 9699 86
30 25 71 25 27 2069 11 38 51 41 67 45 95 22 35 55 75 36 2084 6438 2768 6101 9031 5818 77 70 7915 2955 1020 1828 69 32 14 56 22 86 7048 2483 87 16 63 66 62 21 74 98 043840210672 81045741981260982411513427024906 36 38 42 84 53 41 95 37 29 48 68 72 86 22 22 71 76 85 09
30 36 31 16 12 35 75 25 20 31 83 5084 83 34 07 37 45 09 73188776435663196536861447868630974808804932 7017 6875 9852 0567 68.22 9480 1805 9028 4540 5266 60 69 56 87 43 72 87 76 43 40 66 08 77 50 43 70 91 86 5432 6071 4728 0621 6363 1625 3221 3562 4720 4208 87
43 89 32 54 85 23 87 6087 38 11 47 76 85 83 97 89 52 11 5649 55 09 63 51 1526 48 22 9940 82 75 31 19 71 87 57 58 6700 04 13 23 93 86 64 21 15 55 69 21 19 54 22 57 61 46 85 7099 50 06 22 15 92 33 21 68 45 25 97 27 21 06 67 93 15 96 298062341507513499933731965485393794109151
© Schools Council Publications 1980

Answers
Test QuestionsI By giving an example explain what is a simulation.
2 Write down two advantages and one disadvantage of a simulation.
3 In a list of random numbers, what is the chance that the next numberwill be: ,,7 b An even number
b 5114566541331.
14~.3 43563 41.6 6~_6
<I The chance that Fred wakes up late is 2 in 7.We can simulate this using random numbers:
If the number is 1, 2 Fred wakes up late.If the number if 3,4,5,6,7 Fred does not wake up late.
From the list of random numbers given below:
" Make out a list of the random numbers you would need for theexperiment.
b Underline each nnmber in your list which means that Fred is late.
52148956659413080318
10042394356342866726
<I a 5214566541331
142343563426626
Answers
I An experiment which uses a randomizing device to model anothersituation
2 Advantages: quick and easyDisadvantages: may not be a very good model
3 J b 1" 10 ;:
5 Write down a rule for simulating a chance of"lin8 b 2in5 c 4in9
6 The Sheffield Weather Summary 1976 shows that there were six rainydays in April 1976. Describe a simulation to find out how many rainydays there would be in one week.
5 e.g." 1; 2,3,4,5,6,7,8; 9,0; are the three categories.b 1,2; 3,4,5; 6,7,8,9,0; are the three categories.
or 1,2,3,4; -5,6,7,8,9,0; are the first two categories.c 1,2,3,4; 5,6,7,8,9; 0; are the three categories.
6 P(rain) = 3~ =f = foUse 1,2 for a rainy day,
3,4,5,6,7,8,9;0 for a non-rainy day.Read off seven random digits to fmd out the simulated number ofrainy days.
b See detailed notes.
" 51937
Many possibilities, e.g." 1 the person does not come
2,3,4,5, the person does come6,7,8,9,0, ignore
b Use 1; 2,3,4,5,6,7,8; 9,0; as the three categories.c Use 1; 2 to 9 and 0; as the first two categories.
Many possibilities e.g." Use 1,2; 3,4,5; 6,7,8,9,0; as the three categories.b Use 1,2,3,4; 5,6,7; 8,9,0; as the three categories.c Use 1,2,3; 4,5,6,7,8; 9,0; as the three categories.d Use 1,2,3; 4,5,6,7,8,9,0; as the first two categories.
Results will vary.
" The mean should be about 6.1
b The mean should be about 5,.c The mean should be about 3t.
a %. b t·f The exact probabilities are l~' 1~' t .
C3
B3
CI
C2
BI
B2
" See detailed notes.c See detailed notes.
A2 "The mean should be about 8.b 4 and 40 are the minimum and maximum possible values.f See detailed notes. g See detailed notes.
A3 b Using binomial withn= 12,p=i theoretical answers for five" trials are: 1'35,0'56,1'48, 1'61.c See detailed notes. d See detailed notes.e See detailed notes.
Al
18 19

mcu:
Net CatchMultiplying People
Seeing is BelievingGetting it Right
Being Fair to Ernie Wheels and MealsPractice makes Perfect Leisure for Pleasure
Car CareersCutting it Fine
On the BanFair Play
Level 3
Level 2
Connections with Other Pubiished Units fromthe Project
Shaking a SixProbability gamesTidy Tables
Other Units allhe Same Level (Level 1)
Units al Other Levels In the Same or Allied Areas of Ihe Curriculum
Level 4 Choice or Chance Testing Testing
This unit is particularly relevant to: Mathematics.
Interconnections between Concepts and Techniques Used In IheseUnits
x
"'
o'"co...~
m :gE 10III :0E E.g e 00
-c0> 0>0.£ C +:ia. 0. 2E E 5-rn rn 0U) U) 0.
These are detailed in the fonowing.table. The code number in the left-handcolumn refers to the items spelJed out in more detail in Chapter 5 ofTeaching Statistics 11-16.
An item mentioned under Statistical Prerequisites needs to be coveredbefore this unit is taught. Units which introduce this idea or technique arelisted alongside.
An item mentioned under Idea or Technique Used is not specificalJyintroduced or necessarily pointed out as such in the unit. There may be oneor more specific examples of a mOre general concept. No previousexperience is necessary with these items before teaching the unit, but morepractice can be obtained before or afterwards by using the other units listedin the two columns alongside.
An item meniioned under Idea or Technique Introducedoccurs specifical1yin the unit and, if a technique, there wi11 be specific detailed instruction forcarrying it out. Further practice and reinforcement can be carried out byusing the other units listed alongside.
20 21
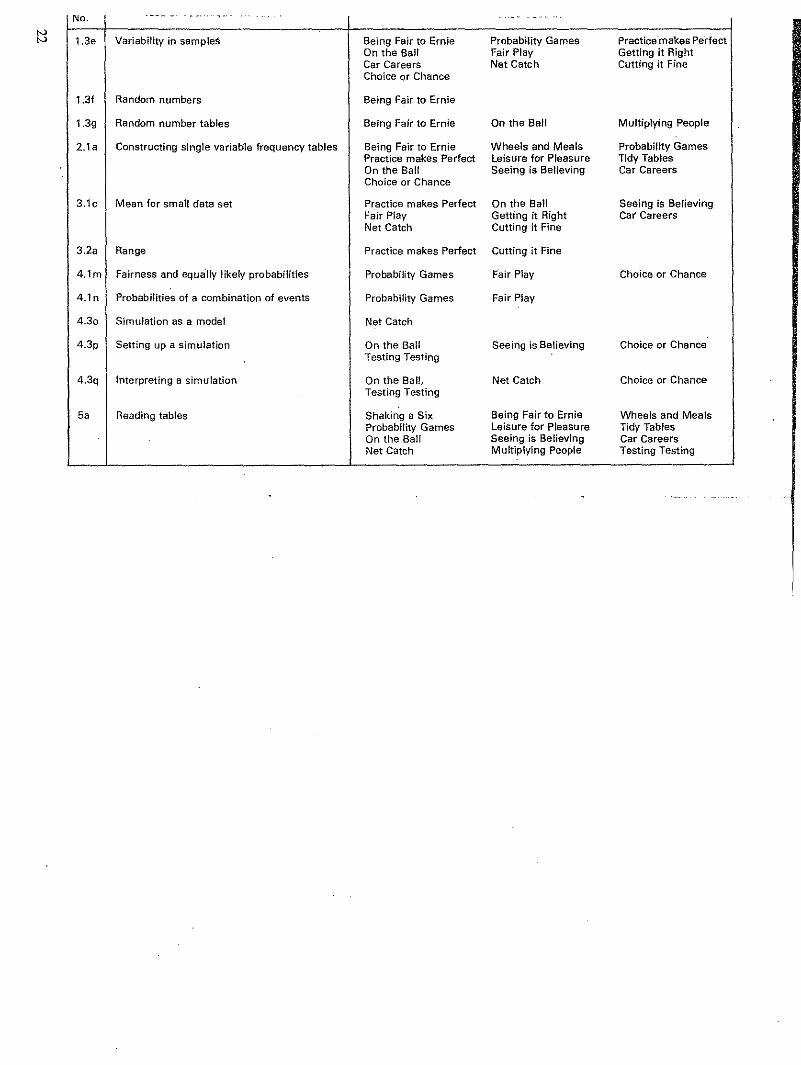
~
No. ... -- ... -- ... ' -. .- . ..-- - - -..
1.3. Variability in samples Being Fair to Ernie Probability Games Practice'makes PerfectOn the Ball Fair Play Getting it RightCar Careers Net Catch Cutting it FineChoice or Chance
1.31 Random numbers Being Fair to Ernie
1.39 Random number tables Being Fair to Ernie On the Ball Multiplying People
2.1 a Constructing single variable frequency tables Being Fair to Ernie Wheels and Meals Probability GamesPractice makes Perfect Leisure for Pleasure Tidy TablesOn the Ball Seeing is Believing Car CareersChoice or Chance
3.1c Mean for small data set Practice makes Perfect On the Ball Seeing is BelievingFair Play Getting it Right Cal' CareersNet Catch Cutting it Fine
3.2a Range Practice makes Perfect Cutting it Fine
4.1m Fairness and equa'lIy likely probabilities Probability Games Fair Play Choice or Chance
4.10 Probabilities of a combination of events Probability Games Fair Play
4.30 Simulation as a model Net Catch
4.3p Setting up a simulation On the Ball Seeing is Believing Choice or ChanceTesting Testing
4.3q Interpreting a simulation On the Ball, Net Catch Choice or ChanceTesting Testing
5a Reading tables Shaking a Six Being Fair to Ernie Wheels and MealsProbability Games Leisure for Pleasure Tidy Tables
. On the Ball Seeing is Believing Car CareersNet Catch Multiplying People Testing Testing

)! Other titles in this series
Being Fair to ErnieLeisure for Pleasure
Tidy TablesWheels and Meals
Shaking a SixPractice Makes Perfect
Probability GamesIf at First ...
Authors AnonymousOn the Ball
Seeing is BelievingFair Play
Opinion MattersGetting it Right
Car CareersPhoney Figures
Net CatchCutting it Fine
Multiplying PeoplePupil Poll
Choice or ChanceSampling the Census
Testing TestingRetail Price Index
Figuring the FutureSmoking and Health
. Equal Pay

Statistics in your world
IF T FIRST m m m
Published for the Schools Council by
FOUlSHAM EDUCATIONAL

ContentsPage
A Simple Simulations 3Al Collecting Cards 3A2 Describing the Results 4A3 Is there Room on the Bus? 5
B Random Numbers 7BI Random Number Tables 7B2 Using Random Numbers 8B3 Rain or Shine? 10
*B4 Two-figure Random Numbers 11
C More Simulations 12Cl The Minibus 12C2 Which Key? 12
*C3 Traffic Lights 14
Some sections are marked with an asterisk*. Your teacher will tellyou whether to try these sections.R Pages Your teacher will provide these for you.
The Schools Council Project on Statistical Education
Published byW. Foulsham & Co. Ltd., YeovU Road, Slough, Berks
Cartoons by Colin Whittock
@ Schools Council Publications 1980
ISBN 0-572-01072-9
PRINTED IN HONG KONG
A
Ai
Simple Simulations
Discuss with your teacher how you can toss coins tomake up families of boys and girls, and how you canplay book cricket.
These are simulations where you don't look at realfamilies or play real cricket. You set up a system whichcopies the main features of the real thing.
Collecting Cards
You will need a pack of cards and page RI.
Have you ever collected a set of cards or medals? Theycan be given with packets oftea orcornflakes, or with agallon of petrol. You often get the same card more thanonce.
There is one card in each packet of tea.
About how many packets oftea would you needfor aset with:a One cardb Two cardsc Four cards
3

A2
4
Instead of actually buying packets of tea you can trythis experiment, called a SIMULATION.
Imagine that you are collecting a set of four playingcards, one of each suit.
Follow the instructions below carefully. Use Table 2 onpage RI to record your results.
d Turn out your pack of cards.Guess the number of cards you think you will needto make a complete set.Write down your guess on the second column ofTable 2.Shuffie the pack.Turn over the cards one at a time. Place them inpiles according to suit.
STOP as soon as you have at least one card of eachsuit.Count the total number of cards you have putdown.Write down that number in the last column.Replace the cards in the pack.
Repeat the experiment until you have 16 results.
Your teacher will collect your results.
Describing the Results
a Find the MEAN of the 16 results.(To do this add up the numbers in the last columnand divide by 10.)
b Write down the smallest number of cards youneeded.Write down the largest number ofcards you needed.Find the RANGE for your 16 results.(To do this take the smaller number away from thelarger one.)
A3
c What fraction of your 16 results needed fewer thansix cards?
d What fraction needed more than 16 cards?
e What fraction needed exactly seven cards?f Find the mean and range of the class results.g How has this experiment helped you to decide how
many packets you need buy to get a complete set?
is Ihere Room on the Bus?
You will need a six-sided die, and page Rl.
Albert Ward runs a minibus from his village to a localtown. The bus has 10 seats. On market days it is verypopUlar and more than 10 people want to book seats.
However, some of the people who book do not come.Empty seats mean less profit. Albert has found thatabout one person in six does not come. So he decides totake more than 10 bookings. He expects some peoplenot to come.
How many bookings do you think he should take?Whatproblems could this number o/bookings cause?
5
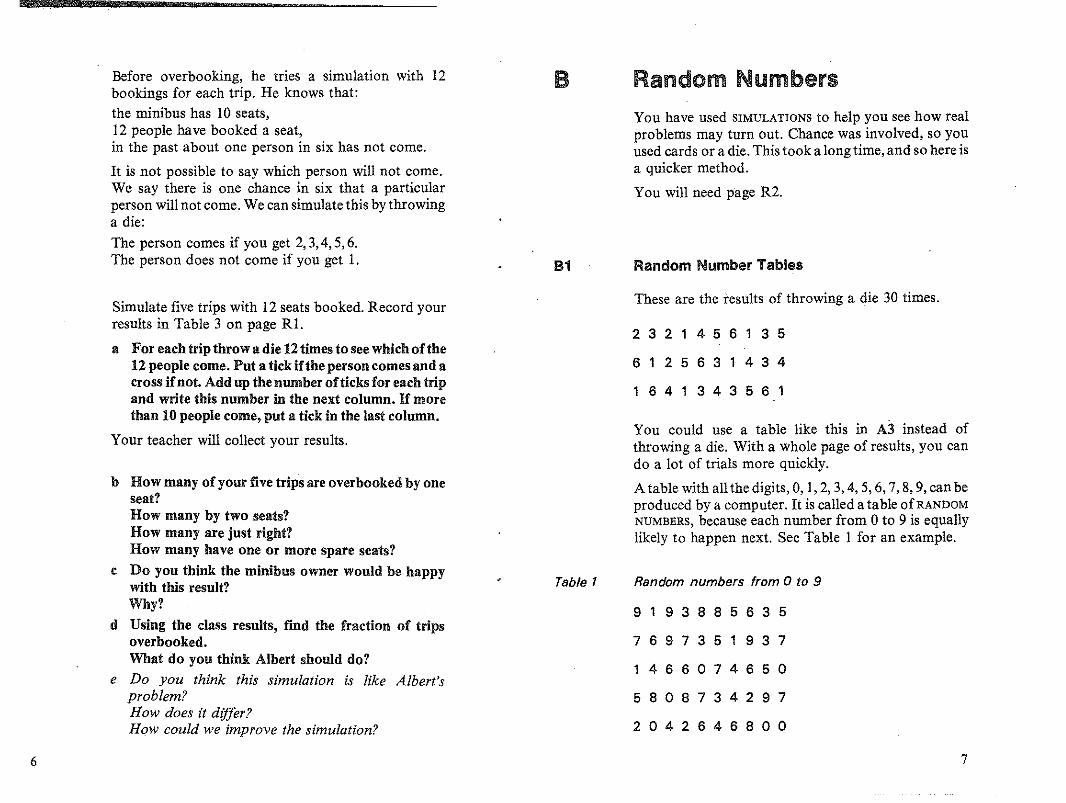
6
Before overbooking, he tries a simulation with 12bookings for each trip. He knows that:
the minibus has 10 seats,12 people have booked a seat,in the past about one person in six has not come.
It is not possible to say which person will not come.We say there is one chance in six that a particularperson will not come. We can simulate this by throwinga die:
The person comes if you get 2,3,4,5,6.The person does not come if you get I.
Simulate five trips with 12 seats booked. Record yourresults in Table 3 on page Rl.
a For each trip throw a die 12 times to see which ofthe12 people come. Put a tick ifthe person comes and across ifnot. Add up the number ofticks for each tripand write this numher in the next column. If morethan 10 people come, put a tick in the last column.
Your teacher will collect your results.
b How many of your five trips are overbooked hy oneseat?How many by two seats?How many are just right?How many have one or more spare seats?
c Do you think the minihus owner would be happywith this result?Why?
d Using the class results, f'md the fraction of tripsoverbooked.What do you think Albert should do?
e Do you think this simulation is like Albert'sproblem?How does it differ?How could we improve the simulation?
131
Table 1
Random NumbersYou have used SIMULATIONS to help you see how realproblems may turn out. Chance was involved, so youused cards or a die. This took a long time, and so here isa quicker method.
You will need page R2.
Random Number Tables
These are the results of throwing a die 30 times.
232 1 456 1 3 5
6 1 2 5 631 434
164 1 343 5 6 1
You could use a table like this in A3 instead ofthrowing a die. With a whole page of results, you cando a lot of trials more quickly.
A table with all the digits, 0, I, 2, 3, 4, 5, 6, 7, 8, 9, can beproduced by a computer. It is called a table ofRANDOMNUMBERS, because each number from 0 to 9 is equallylikely to happen next. See Table I for an example.
Random numbers from 0 to 9
9 1 9 3 8 8 563 5
7 697 3 5 1 937
14660 7 4 6 5 0
5 8 087 342 9 7
2 042 6 4 6 8 0 0
7

8
To obtain random numbers.
Rule 1Start anywhere: touch the random number table andwrite down the number nearest your finger.
Rule 2Move your finger in any direction on the table. Keep itmoving in this direction.
Rule 3Write down each figure you touch. Do not miss anyout.
For example, starting on the second line we get:
76973a Write down the next five random numbers from the
table.b Use Table 1 to write down 10 random numbers.
"'<:.-"="---
~~==-...... ==i=-..• , -- .. It
,tff
82 Using Random Numbers
You will need page R2.
Albert Ward can use random numbers for his minibusproblem. On average, out ofevery six seats booked oneperson did not come. This is a probability of one in six.
I1
!
He needs six digits: I, 2, 3, 4, 5 and 6.
If the number is 1, the person d.oes not come.If the number is 2, 3, 4, 5, 6, the person does come.If the number is 7, 8, 9, 0, we go to the next number.
Table 1 gives:
,9' 1 .9' 3 .S' .8'" 5 6 3 5
76f?f7351f?f37
1466.0"74650'
58'.0"8'7342.8"7
2.0426468'.0".0"
So a possible list of random numbers is:
1, 3, 5, 6, 3, 5, 6, 3, 5, 1, 3, 1 4, 6, 6, .The person does not come where the number isunderlined.
Using this list of numbers, the results for A3 wouldbegin this way:
NumberTrip Person booking Total over~
1 2 3 4 5 6 7 8 9 10 11 12 booked
1 X VVVVVVVV X V X 9
2 VVV";VVVVVVVV 12 2
3 VVVV4
5
You can see that we would need to have many morerandom numbers.
9

83
10
If there is a chance that one person in four will notcome, we need the numbers 1,2,3,4. We say that:
If the number is 1, the person does not come.If the number is 2,3,4, the person does come.If the number is 5,6,7,8,9, we go to the next number.
Our random number table gives
.9'1.9'3-8"".9'.5'B'3.5'
7B'.9'73.5'"1.9'37
14B'-8""Z74B'.5'"Z
So we could use the list:
.!-, 3, 3, 3,.!-, 3, .!-,4, 4, ....
Use page R2 to show in the same way what you woulddo if the probability was:
a 1 in 5 (i.e. j )b 1 in 8 (i.e. 4)c lin 10 (i.e.:Io )
Rain or Shine?
The Sheffield Weather Summary for 1976 shows thatthere were 18 rainy days in September. We estimate theprobability of a rainy day In the following Septemberas 18, or 3 in 5.
30To sImulate the weather we need the numbers1,2,3,4,5. We say that:
If the number is 1,2,3, it rains.If the number is 4,5, it will be dry.If the number is 0,6,7,8,9, we go to the next number.
A possible list of random numbers is:1,~,5,~,5,~,5,!,~,!,4,4,5,5,1,4,l,l,4,~,4 ...
*84
The rainy days are underlined. So in the first weekthere are four rainy days.
Write down a similar method ifthe prohability ofrainis:
a 2 in 5 (i.e. ~ )b 4 in 7 (i.e. 1)c 3 in 8 (i.e. i )d 3 in 10 (i.e.:Io )
Two-figure Random Numbers
If we need bigger random numbers we must read fromthe table two digits at a time. Starting on the secondline of Table 1 we get:
76, 97, 35, 19, 37, 14, 66, 07, 46, 50, ...
If we need to simulate a probability of7 in 60, we couldsay that:If the number is 01,02.03,04,05,06,07, it happens.If the number is 08,09,10, ....... 59, 60, it does nothappen.If the number is 61, 62, 98,99,00, we go to the nextnumber.
So our list becomes 35,19,37,14,07,46,50, ...
The event happens on the fifth trial.
a Write down 20 two-digit random numbers frompage R4.
Which of these would you use for a probability of:
b 7 in 30 (i.e. lo )c 11 in 70 (i.e. f.!- )d 1 in 13 (i.e. t,- )e In each list underline the numbers which show that
the event takes place.
11

C More Simulations
C1
C2
12
For these simulations use the random number table onpage R4.The numbers are printed in pairs, but you can readthem one at a time.28 37 49 86 gives 2 8 3 7 4 9 8 6.
The Minibus
You will need page RI.
Albert Ward decides to run his minibus on a Saturday.
On Saturdays out of every 8 people who book 7 come.
Here we need the digits 1,2,3,4,5,6,7,8
If the number is 1, the person does not come.If the number is 2,3,4,5,6,7,8, the person does come.If the number is 9,0, we go to the next number.
a Carry out this simulation for five trips. Record yourresults on Table 4 of page Rl.
b How many times were there too many passengers?c How many times was there one empty seat?d How many times were there two or more empty
seats?
Discuss your results with a friend.
Which Key?
You will need page R3.
A man has six keys in his pocket. He returns home lateone night when it is very dark. He takes a key to openthe door. If it is the wrong key, he drops it back into hispocket and picks out another. (It could be the sameone!)
/1=1
How many keys does he need to try?
You can simulate this using random numbers fromI to 6.
If the number is I, it is the correct key and the trial iscomplete.If the number is 2,3,4,5,6, it is the wrong key and hemust try again.Ignore numbers 7,8,9, and O.In a simulation 6,4,5, I, he needed to try four times.
a Carry out this simulation five times. Record theresults of each trial in Table 5 on page R3. Find themean of the five trials.
13

Another night the man thinks more carefully. Ifa keydoes not fit, he takes a different one before putting thelast key back into his pocket.
For this simulation you must not use a number if it isthe same as the one before.
b Do this five times. Record the results ofeach trial onTable 6 on Page R3. Find the mean ofthe five trials.
The next time the man thinks very carefully. If the keydoes not fit, he puts it back into another pocket. Thistime a random number cannot be repeated at all so, atmost, he tries all six keys.
c Do this five times. Record the results ofeach trial inTable 7 on page R3. Find the mean ofthe five trials.
d Which of the three ways is the fastest? Which is theslowest?
Is this what you would expect?
*C3 Traffic lights
You will need page R3.
Fred passes through two sets of traffic lights eachmorning. He has timed both of them. He finds that thefirst set shows green for 30 seconds out of 50 seconds.
a What is the probability that Fred does not stop atthe first set of traffic lights?
Write out a method, as in B3, for simulating thisprobability using random numbers.
The second set of traffic lights shows green for 30seconds out of 90 seconds.
b What is the probability that Fred does not stop atthe second set of traffic lights?
c Write out a method for simulating this probabilityusing random numbers.
14
To simulate Fred's journey through both sets of trafficlights you must choose two random numbers.
Use the first one to decide whether Fred stops at thefirst set of lights.
Use the second one to decide whether Fred stops at thesecond set of lights.
d Do this simulation 20 times. Enter your results inTable 8 on Page R3.
e How many times did Fred have to stop at:both sets of lights,only one set of lights,neither set of lights?
f Use the results from c to estimate the probabilitythat:Fred will stop at both sets of traffic lights.Fred stops at only one set of traffic lights.Fred will not have to stop at all.
15

Schools Council Project on Statistical EducationThis Project has been based in the Department of Probability and Statistics at the Universityof Sheffield from 1975 to 1980. Its brief was: to assess the present situation of statisticaleducation in schools; to survey the needs ofteachers of statistics; to devise detailed proposalsf?r the implementation of the teaching ideas; and to produce teaching materials.
Project Team
Director: Peter Holmes (1975~ )Deputy Director: Neil Rubra(1975-78), Daphne Turner (1978-
Project Officers
Ramesh Kapadia (1975-79), Alan Graham (1976-77), Barbara Cox (1979-80)
-,-
Statistics in your world
General NotesPages with the prefix R are resource pages or reference pages for pupil use. (In many casesthey are designed as worksheets.) In the pupil unit these. are referred to as 'page RI', etc.
Permission need not be sought to reproduce copies of the R sheets provided that copies aremade only in the educational establishment in which they are to be used and that such copiesare not sold, hired or lent to any other indivdual, organization or establishment.
Sections or questions marked with an asterisk are optional to the main thrust in the unit.Sometimes they are for the more able pupils, sometimes they are for reinforcement and sometimes they consist of simpler work for the less able pupils and lead to an easier conclusionthan the main unit. In each caSe detailed comments on the particular purpose will be found inthe appropriate section of the teacher's notes.
GETTIIT RI
GHT
Three different typefaces are used in the pupil units. Text in roman type (like this) is for pupilsto read or for the teacher to introduce. Questions to promote thought and for group or classdiscussion are printed in italics. Instructions telling pupils to do things and questions forpupils to answer are printed in bold. TEACHERS' NOTES
LEVEL 2
Published for the Schools Council by
FOULSHAM EDUCATIONAL

Contents
Brief Description
Aims and Objectives
Prerequisites
Equipment and Planning
Detailed NotesSection ASection BSection CSection D
Answers
Test QuestionsAnswers
Connections with OtherUnits in the Project
R pages on pages 8 and 9.
Page3
3
3
3
4567
101212
14
Brief DescriptionThis unit discusses appropriate levels of accuracy in various contexts. Itdistinguishes between variation from human error and bias from faultyinstruments. It shows that using the mean reduces variation anddemonstrates how to spot bias. Finally it discnsses sensible answers inconversions and calculations.
Design Time: 4 hours
Aims and ObjectivesOn completion of this unit pupils should appreciate the appropriate level ofaccuracy to use in measurements and calculations and the distinctionbetween variation and bias in causing errors. An optional section explainswhy the mean is likely to give a more accurate answer.
Pupils will have practised using the mean and collecting data. They shouldbe more aware of the meaning of bias and variability and see how bias canbe useful. They also see an axample of using randomness in understandingerrors.
Pupils are introduced to the idea of outliers and the range ofa distribution.
PrerequisitesPupils need to understand significaut figures and be aware of Imperialunits. They should be able to work with decimal and directed numbers andcalculate the mean of a set of individual results.
Schools Council Project on Statistical Education
Published byw. FouIsb!l-m & Co. Ltd., Yeovil Road, Slough, Berks
@ Schools Council Publications 1981
ISBN 0-572-01105-9
PRINTED IN HONG KONG
Equipment and PlanningAll pupils will need rulers and protractors. Pupils also need cm squaredpaper, tracing paper and an A4 sheet of paper in Section A2. Classmeasurements for Section B3 need to be collected, perhaps on theblackboard. Dolly paper with dots at the vertices of I em squares would beuseful for Section B5.
Section B6 needs eight matchboxes, eight envelopes and about 100 metalwashers or objects of similar weight. The experiment can be done by pupilsindividually whilst the class is working through Section A. Section D is an
3

option for more able pupils. For Section D2 each pupil or group of pupilsrequires four cubes or dice, two faces on each to be marked -1, 0 and 1respectively; alternatively coding could be used.
Detailed Notes
Section A
The opening qnestions are designed to promote a discussion on the level ofaccuracy appropriate in various situations. In some scientific experimentstiming needs to be very precise; in others precision is not so important.Pupils should realize the need to think about the context in order to decidethe level of accuracy required.
A2
The difference between 0'56 and 0'57litres can be demonstrated as two 5mlmedicine spoonfuls. Measuring the amount of milk poured into a cup for acup of tea (in ml) will also help pupils see the futility of quoting fivesignificant figures for the conversion factor in this context.
Other examples where more accuracy is needed are (i) scientificexperiments and (ii) timing in modern sports events such as at the OlympicGames. Electronic calculators usually give too many figures for sensibleaccuracy.
A3
Some explicit examples in which pupils need to assess whether the accuracyis at the right level are given.
A4
These give examples where mathematics teachers may face increasingproblems with the advent of calculators for pupils. Pupils may not befamiliar with the formulae used. The diameter of a lOp piece is 2'8 em.
AS
This gives two more examples where figures are given too accurately (acommon abuse of statistics). The football figures were presumably the'gate' fignres. Other people also watched the match, e.g. the managers and
4
trainers, policemen, St John's Ambulance men. It is impossible to count thepopulation of a country like India to the nearest one, and in any case thepopulation is changing almost every minute.
Section B
Here pupils make some measurements of their own to provide concretedata for discussion of levels of accuracy.
HI
Pupils are left to find their own way of measuring the diagonal, which isbigger than their rulers. They may need to bereminded ofa method ofusingpart squares to find the area of the given region: the region could be tracedand em square graph paper used. The traced map could then be used inSection B5 with dotty paper.
This section shows the degree of variability that can be expected in fairlysimple circumstances. It is worthwhile using other data from the sciencedepartment to amplify this section. An example is the timing ofthe fall ofaball-bearing through a viscous fluid.
H2
Pupils should see that John's results are not accurate enough, while Ann'sare too precise. You could illustrate this practically. Pass round two sheetsof paper 25 em and 30 em long. Ask pupils to mark one as I (longer), s(shorter) without lining one against the other. Similarly, pass round twosheets 25'71 and 25'72 em long (as near as possible) for pupils todistinguish.
H3
Pupils are asked to choose a sensible answer, after discarding outliers. Theywill need the class measurements from Section BI. The 8'2 was measured ininches, not centimetres. Clearly this is a major error and should not beconsidered in the same light as the other readings. Distinguishing errorsand outliers is not easy. Anything well outside three standard deviationsfrom the mean of all the data could be ignored.
H4
This uses the mean to reduce variation and improve accuracy.
5

B5
Here dotty paper and randomness are used to estimate area. Further verbalinstructions may be needed by slower pupils. The rule of counting the dotsis equivalent to counting each'square if its centre is in the region. The dotscan be thought of as being ahhe centres of the centimetre square grid. Asmall piece of tracing paper, but large enough to cover the region, should beused.
116
This experiment shows that, although individuals may have widely varyinganswers, the class answer can be surprisingly accurate. You need eightidentical matchboxes. In seven boxes put in 6, 8, 10, 12, 14, 16 and 18washers, and in the eighth 'standard' box put in 13 washers. Other identicalmetal objects such as screws could be used instead. The idea is that it shouldnot be easy to tell by hand the differences in weight. You need sevenenvelopes and about 100 slips of paper marked I, h, or s. Pupils take it inturn to compare each of the seven boxes with the standard one and put theappropriate slip of paper in the appropriate envelope. At the end, count upthe results and give the true order to the class.
Section C
Accuracy depends on being unbiased and on minimizing variation.
Cl
Both Ann's and Barry's results are biased to the right, but Ann is moreaccurate than Barry. This section shows how one might spot bias.
C2
Pupils are given examples ofmeasurements in which they have to decide onbias. They may need reminding that a set ofmeasurements is to be assessed,not each individual measurement in a, b.
C3
Biased estimates are useful in situations where errors in one direction canlead to problems or even disasters. Pupils could be encouraged to give theirown examples.
6
C4
Normal advice for the mean is one significant figure more than the originaldata, but clearly this rule depends on the size of sample. This could bementioned to pupils here.
'Section D
This optional section introduces a very simple probability model to try tohelp explain why using the mean of a number of readings is likely to bemore accurate than one reading.
D1
Here the improvement from one measurement to the mean of twomeasurements is investigated theoretically. Two measurements give:
Mean error -1 -t 0 -} 1
Proportion 1 £ ;2 £ 19 9 9 9 9
Oearly this is an improvement.
D2
The distribution of the mean of four measurements is simUlated using cubesor dice. The numbers -1,0, I should be stuck on the faces of the cubes. Thetheoretical possibilities are:
Mean -1 _1. _.1 1 0 t -} % 1error 4 2 -,
Pro-1 4 10 16 19 16 10 4 1
portion81 81 81 81 81 81 81 81 81
·012 ·049 ·123 ·196 ·235 ·198 ·123 ·049 ·012
The line graph of the simulation should show the greater concentrationnear 0 and hence the greater likelihood of being near the accurate answer. Ifyou don't have any plain cubes, then ordinary dice can be used and coded asdescribed in the pupil unit.
(Text continued after the R pages)
7

00
Table 2
R1
Mean error in two measurements
Second measurement
-1 0
First -1measurement
o
-1 -t
1:
Table 3 Proportions of each mean error with two measurements
Mean error -1 ,0 1: 1-,
Proportion 1 2§ §
...--- '=-'I" .-- ""'-""-'
Table 4 Four measurements
'0
Total errOr Mean error Tally Frequency Proportion
-4
-3
-2
-1
0
1
2
3
4
Total 40
© Schools Council Publications 1981

Answers
A2 a No, Housewives don't measure so accurately in cooking
A3 a Too accurate; 100 metresb Too accurate; 114 g (or even 100 g)c Sensibled Not accurate enough; about 22'7 (or 23) litrese Not accurate enough; about $13,91 with the exchange rate
quotedf Too accurate; 36'9°Cg Too accurate; 4047 sq metres (or 4000 m2)
h Not accurate enough; 2tdNot accurate enough; 2'27 (or 2t) kg
A4 a Not accurate enough; 8'8 ernb Sensiblec Too accurate; 6'16 sq ern
AS a People may be there illegally; 39600 or 40000b The population is not static each hour, never mind per day!
534300000
BlB2
B3
Cl
C2
10
a About36'4cm b About43°;134° c Aboutl8sqcm
a Yes; nob No; not accurate enough; noc No; nod No; too accuratee Probably measured the acute angle
a 8'2; measured in inches not centimetresb Variation due to human (or instrument) error; also all sheets of
paper may not be identical in sizec 20'8 ernd 20'6 to 20'9 ern
b Rifle biased, or possibly bad aimingc Bad aiming; rifle biased and they didn't allow for itf Yes
a 1, unbiased; 2, biased below; 3, biased above;' 4, unbiasedb 1, unbiased; 2, biased above; probably read from the end of the
ruler, not the zero markc Unbiasedd Biased abovee Biased below
C3 Answers here are open to discussiona Over 120 feetb About 250-270, depending on evenness and exact dimensions
of walls (certainly more than 242)c Slightly smaller and use putty (it is impossible to cut off, say, 0'3
ern, if too large,)d About 60p (more than SOp)e Probably three rolls, depending on walls, windows, doorways
and pattern 'drop'f About 170 erng About 48 mphh Just less; easier to add more
Dl b
Table 2
Second measurement
-1 0
-1 -1 ,0
First-,
measurement 0 ,0 ,-, ,
0 ,,
c 3/9= 1/3d See detailed notes,
11
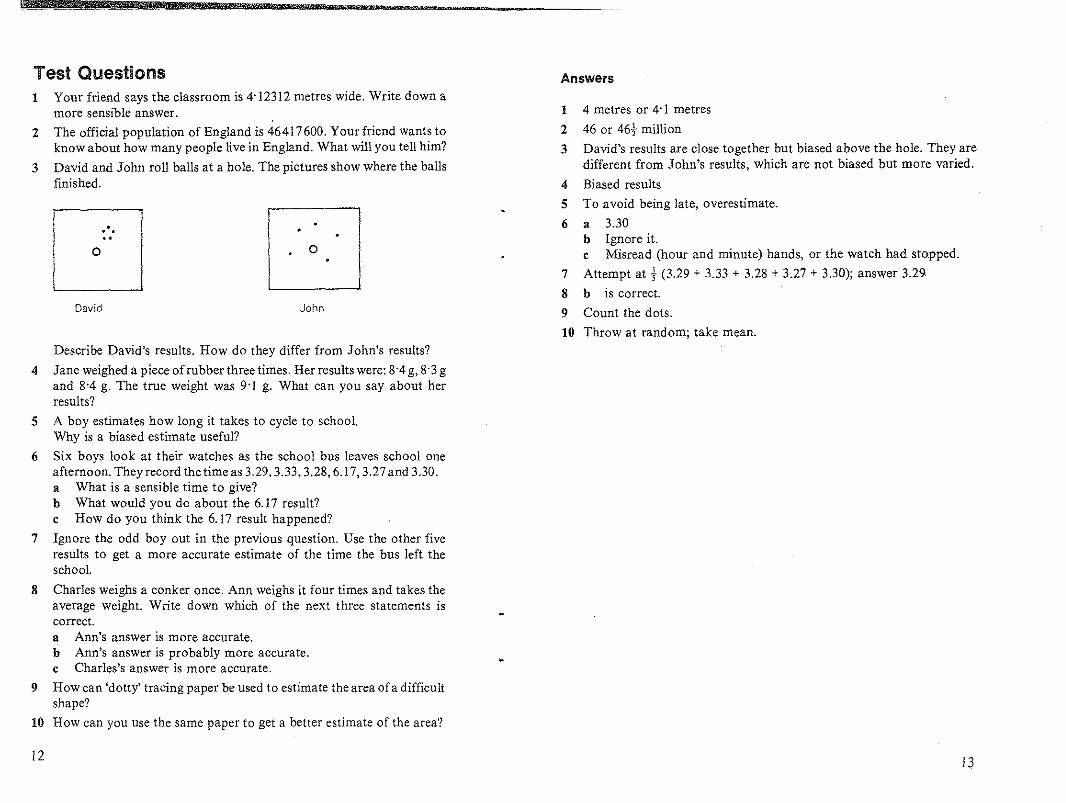
Test Questions AnswersYour friend says the classroom is 4'12312 metres wide. Write down amore sensible answer.The official population of England is 46417600. Yourfriend wants toknow about how many people live in England. What will you tell him?
David and John roll balls at a hole. The pictures show where the ballsfinished.
o
4 metres or 4'1 metres
46 or 46-} million
David's results are close together but biased above the hole. They aredifferent from John's results, which are not biased but more varied.
Biased results
To avoid being late, overestimate.
a 3.30b Ignore it.c Misread (hour and minute) hands, or the watch had stopped.
Attempt at +(3.29 + 3.33 + 3.28 + 3.27 + 3.30); answer 3.29
b is correct.
7
89 Count the dots.
10 Throw at random; take mean.
4
5
6
1
2
3
o
John
...
David
2
3
1
Describe David's results. How do they differ from John's results?
4 Jane weighed a piece of rubber three times. Herresults were: 8'4 g, 8'3 gand 8'4 g. The true weight was 9'1 g. What can you say about herresults?
5 A boy estimates how long it takes to cycle to school.Why is a biased estimate useful?
6 Six boys look at their watches as the school bus leaves school oneafternoon. They record the time as 3.29,3.33,3.28,6.17,3.27 and 3.30.a What is a sensible time to give?b What would you do about the 6.17 result?c How do you think the 6. 17 result happened?
7 Ignore the odd boy out in the previous question. Use the other fiveresults to get a more accurate estimate of the time the bus left theschool.
8 Charles weighs a conker once. Ann weighs it four times and takes theaverage weight. Write down which of the next three statements iscorrect.a Ann's answer is more accurate.b Ann's answer is probably more accurate.c Charles's answer is more accurate.
9 How can 'dotty' tracing paper be used to estimate the area ofa difficultshape?
10 How can you use the same paper to get a better estimate of the area?
12 13

Connections with Other Published Units from~
the Project • "0D- E ~0 >"• cB • 0 •Other Units at the Same Level (Level 2) u. 0- c c C0> C 0 u: u: =L.'i:.c c «2: 0_
U'- ,- ,- ro ,--> ~ c
Authors Anonymous On the Ball Seeing is Believing roD- " 00> 0>
~.~t).,j;;; 0,_ .§ .§'S .c c
Fair Play Opinion Matters "0;"3 ':)'0. " " c "• Z2: «0 u u OU
:'SUnits at Other Levels in the Same or Allied Areas of the Curriculum 0 u uco
" • 4!' .c't
Levell Practice makes Perfect If at first. .. 0 0 "u. u. 0
r 0~ ~ :r:
Level 3 Cutting it Fine Multiplying People • • • • ·s B "~ c c ~o .- u: 0 " :;; c
Net Catch E';: E " 2: :.c 0
~.~..., >-:!:: • :'S >-
_ U0>
g~.~C 0 ~- c
't~ .§ .g 0 0 0: " ro "Level4 Smoking and Health co 'c ~u 0m'~ ; u --ro- " '", E
" " ~ 'm ro 0
u.u ::::u..U u. 0 ~ :=Z (f)
This unit is particularly relevant to: Science, Mathematics.u
~ • -5Interconnections between Concepts and Techniques Used in these 0> 0> " 't:
,S 0 • ro j!c c E u. 0 0
Units " '> '> >- ~ :r: 0• •• •• • •u ro ro c~ " u.
.g 0 0 cro ro cE 0 0>
These are detailed in the following table. The code number in the left-hand g ,~ ,~« cr .>0> '>'
-" 0> 0> ~u ~.S:
~column refers to the items spelled out in more detail in Chapter 5 of c c 0 '~a..":'::
'm 'm -5 :;; u " 0
Teaching Statistics 11-16. 0 • " e';o E "(f) (f) « := a...lL(J) 2:
An item mentioned under Statistical Prerequisites needs to be coveredbefore this unit is taught. Units which introduce this idea or technique arelisted alongside. ;g
0'0 "An item mentioned under Idea or Technique Used is not specifically • " '0D- o
u B •introduced or necessarily pointed out as such in the unit. There may be one ~ E .g C• 'w 'c"more specific examples of a more general concept. No previous :~ " g ;g '" 0or 0 ,5 u
:'S '"0
experience is necessary with these items before teaching the unit, but more '"'0
" >0 c • '0 '3, 0 .g , c
practice can be obtained before or afterwards by using the other units listed et, ,;,- c .2 ~.;,- 0
in the two columns alongside. c s c .g " '6
" '" 0 ;g '" ro .a ~~u
.~u 0 0
~u 'C • '0
~ 0 ;g '0 '" t> D- ~
An item mentioned under Idea or Technique Introducedoccurs specifically -13 , ro 0 ~ , 'w '6 E ro'0 " 0 ~
;:; 0E 0 0 ro
• roin the unit and, if a technique, there will be specific detailed instruction for '" ro B "ro U E ~ c_
:2~ :2 e ~ ,5 o 0
carrying it out. Further practice and reinforcement can be carried out by 0 ~ .s '0 .'0
'0 u C - c~
E'O~
~ 0>0
using the other units listed alongside. '6 0 E .:§ 'f;; g ~~ u "-" 0> 0> • 0- O>~• ~ :0 c" ro
c c c c _0 '= c 0
0 • ." 'w e o 0 ro ';j) (J)
Z U ::0 ::0 u. (f)0 > ::0 E
• 0 0 .a u u • .a'0,
"! "! "! '" '" "o 0uz
14 15

'" Code Idea or Technique Introduced Also Used inNo.
3.1 c Mean for small data set Practice makes Perfect If at first .. Authors AnonymousOn the Ball Seeing is Believing Fair PlayNet Catch Cutting it Fine Smoking and Health
4.11 Bias (as in biased dice)
5d Spotting possible errors (outliers) as not fitting Cutting it Fine Multiplying People Smoking and Healthgeneral pattern
5; Estimating population figures from samples On the Ball Seeing is Believing Fair PlayNet Catch Smoking and Health
5w Large samples are better for inference On the BaH Fair Play Net Catch
._~
-0(f) ~
(f)~ Ol (f) ~ ~ ~3-. 3():S: _ ~ -o~ < _roOCO::O ~ C W :J ~" < (J)tll
Ctll ~:J - 0 tll 0 Otll :J C-A ~ -I =: 0 ~ -0 G) -0 -. 0" tll ~::>S' :::;. Ol tll ::> -. .;:;' () :J tll -. ,~ ii1 0l:S: (f) tll tll COCO -' =ClJCO (') ~C 0 ...... :::J ~ -0"'0,) - -n
CO ~~tll <~ ::>()~_. -. ~_-A:J(J)-IO~m~~~~O _.~ roW:::J 0 ClJO:::Jm=romQ,)_.~~.
F:::J~~·coro'~~:::J~<~cc:::J~ro:::JO"""~CIJ~:::J~~~c~tllg-l()()C CO~~()-:S:Ol~~::>~~-o::>~ -8Ol ~ ~ - -0 -0 _. _. Ol ~ -. _. :J < _. U I CO "" -I tll-~c-wro~=ro~ncc,~ro~roro3~rorom~wmm
ro ...... :::J~:::Jm O~IDCro-·~~< ...... 3~ roO"'CIJ,-oOlC~_(J)::>-o-O-·~~tllCOtll-_·roo tll(f)Ol-C::>ID~~m:::Jc(')o_:::Joro,~,ro:::JQ,)C roo-.-ro~-.<~roXCCCIJro=roro~ClJCIJ"CIJ<CC=CIJ CIJ"xClJoorom
2::rt1l......;:;:COtil
::l...;r.(J)tilt1l:::!.t1l(J)

Statistics in your world
GETTINGIT RIGHT
Published for the Schools Council by
FOUlSHAM EDUCATIONAL
ContentsPage
A Sensible Accuracy 3
Al How Accurate? 3A2 Pouring Milk 4A3 Changing Units 4
*A4 Mathematical Calculations 5A5 Other Figures 6
B How Accurate? 6
BI Measuring 6B2 Some Results 8
B3 Class Results 8
B4 The Mean 10B5 Estimating More Accurately 10
*B6 Boxes 11
C Bias 12
CI -Target 12
C2 Spotting Bias 14C3 Useful Bias 15C4 Summary 16
D Is the Mean Better? 17
DI One or Two Measurements? 17D2 Taking Four Measurements 19
Some sections are marked with an asterisk*. Your teacher will tellyou whether to try these sections.R Pages Your teacher will provide these for you.
The Schools Council Project on Statistical Education
Published byW. Foulsham & Co. Ltd., Yeovil Road, Slough, Berks
Cartoons by Colin Whittock
@ Schools Council Publications 1981 .
ISBN 0-572-01078-8
PRINTED IN HONG KONG
A
Ai
---------ACt:OROING TO MY NEWSUPllp~UARrZ WAlCH,TilESUN IS FAST. .• .!
Sensible Accuracy
How Accurate?
Discuss these questions:Do the clocks you use keep good time?Would you notice if a clock gained one second everyweek?Is your ruler accurate enough for your mathematicsand science lessons?How well can you measure?How accurately do you need to measure?
In science it is sometimes important to be veryaccurate: that is why quartz watches were invented.
But if you are seeing how fast a lake freezes at twodegrees of frost, timing to the nearest hour is sufficient:an ordinary clock would do.
3
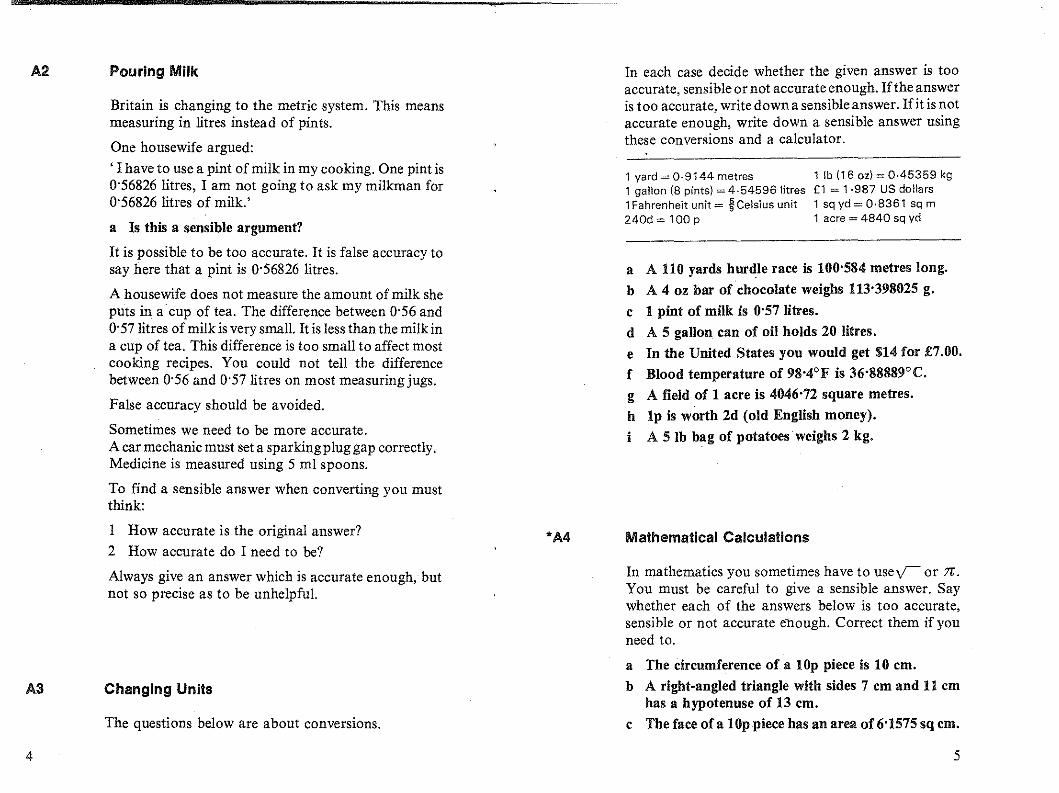
In each case decide whether the given answer is tooaccurate, sensible or not accurate enough. Ifthe answeris too accurate, write down a sensible answer. Ifit is notaccurate enough, write down a sensible answer usingthese conversions and a calculator.
a A 110 yards hurdle race is 100'584 metres long.
b A 4 oz bar ofchocolate weighs 113'398025 g.
c 1 pint of milk is 0'57 Iitres.d A 5 gallon can of oil holds 20 Iitres.
e In the United States you would get $14 for £7.00.
f Blood temperature of 98'4°F is 36·88889°C.g A field of 1 acre is 4046'72 square metres.
h Ip is worth 2d (old English money).
i A 5 Ib bag of potatoes weighs 2 kg.
A2 Pouring Milk
Britain is changing to the metric system. This meansmeasuring in litres instead of pints.
One housewife argued:
, I have to use a pint of milk in my cooking. One pint is0'56826 litres, I am not going to ask my milkman for0'56826 litres of milk.'
a Is this a sensible argument?
It is possible to be too accurate. It is false accuracy tosay here that a pint is 0'56826 litres.
A housewife does not measure the amount ofmilk sheputs in a cup of tea. The difference between 0'56 and0'57litres of milk is very small. It is less than the milk ina cup of tea. This difference is too small to affect mostcooking recipes. You could not tell the differencebetween 0'56 and 0'57litres on most measuring jugs.
Faise accuracy should be avoided.
Sometimes we need to be more accurate.A car mechanic must set a sparkingpluggap correctly.Medicine is measured using 5 ml spoons.
To find a sensible answer when converting you mustthink:
1 yard=O·9144metres1 gallon (8 pintsl = 4·545961itres1Fahrenheit unit = fCelsius unit240d = 100 P
1 Ib (16 oz) = 0·45359 kg£1 = 1 ·987 US dollars1 sqyd=0·8361 sqm1 acre = 4840 sq yd
A3
4
I How accurate is the original answer?
2 How accurate do I need to be?
Always give an answer which is accurate enough, butnot so precise as to be unhelpful.
Changing Units
The questions below are about conversions.
*A4 Mathematical Calculations
In mathematics you sometimes have to useV or Tt:.
You must be careful to give a sensible answer. Saywhether each of the answers below is too accurate,sensible or not accurate enough. Correct them if youneed to.
a The circumference of a lOp piece is 10 cm.
b A right-angled triangle with sides 7 cm and 11 cmhas a hypotenuse of 13 cm.
c The face of a lOp piece has an area of 6'1575 sq cm.
5

AS Other Figures
Sometimes people give figures which are too accurate.It may not be possible to count or measure soaccurately. For each example below, say why the figureis too accurate and give a sensible answer.
a 39621 people watched last week's home derby.
b There are 534270805 people in India today.
Figure 1 Two angles
B How Accurate?
81 Measuring
You will need a ruler, a protractor, tracing papermarked with a square cm grid and a sheet of paper.
a Find, as accurately as you can, the distance in cmfrom one corner to the opposi~e corner of the sheetof paper (the diagonal).
b Measure angles 1 and 2 in Figure 1 as accurately asyou can. Record your results.
6
2
c Find the area of Figure 2 in sq cm.It is a map of Lough Neagh in Northern Ireland.
Figure 2 Lough Neagh
7

John Ann
Paper 35 em {to nearest 5 em} 35·831 em (to nearest 1/1000 em)Angle 1 40° (to nearest 1CO) 43·7° (to nearest 1/10°)Angle 2 130° (to nearest 10°) 46· 7° (to nearest 1/10°)Region 20 sq em {to nearest 18,21 sq em (to nearest
5 sq em) 1/100 sq em)
'EM.,
B2
B3
8
Some Results
a John measured the paper to the nearest 5 em. Couldyou tell the difference between a sheet 35 em longand another 40 em long?Is it sensible to measure to the nearest 5 em?
b Do you think John used his protractor and squaredpaper as accurately as he could? Why? Are hisanswers sensible?
c Ann measured the area of the region to the nearest160 sq em.Could you tell the difference between an area of18'21 sq em and an area of18'22 sq em? Is it sensibleto measure to the nearest 1io sq em?
d Do you think Ann used her ruler to give a sensibleanswer? Why?
e In fact Ann obviously measured angle 2 incorrectly.Explain what might have happened.
Class Results
Twelve members of Class 2X got these results inmeasuring the width of a sheet of paper in em:
20'8, 20'8, 20'9, 20'7, 8'2, 20'6,20'8, 20'8, 20'7, 20'8, 20'9, 20'7.
The answers are not all the same because differentpupils have measured the width. However, one resultfor Class 2X is obviously wrong.
a Write down this answer and try to explain whatmight have happened.
The other II results are nearly the same; but they arenot wrong.
b Why do you think they differ? How would youdecide what answer to give?
c Copy and complete this sentence with a sensibleanswer:The width measured by Class 2X is about em.
d Copy and complete this sentence (ignoring theresult 8'2 em):The results·of Class 2X ranged from em to em.
You will need your class measurements from yourteacher. Look at each set of measurements, startingwith the lengths.
e Is any measurement a lot different from the rest? Ifso, tell your teacher and try to find out why. Cross itout of your results.
f Write down the lowest measurement and thehighest measurement. What is a sensible answer forthe measuremeut?
g Repeat e and f for your class answers on the twoangles.
h Repeat e and f for your class answers on the area ofthe region.
*j Sometimes errors can arise from faulty measuringinstruments. Check your ruler with that of a friendby placing the rulers edge to edge. Check yourprotractor by measuring angles 1 and 2 withsomeone else's protractor. Write down what youfind.
9

B4
B5
The Mean
When results vary, we can use the arithmetic mean toget a more accurate answer. Class 2X left out the S'2cm(which was wrong) and found the mean of their results.
(20'S +20'S +20'9+ 20'7 +20'6+ 20'S + 20'S+ 20'7 + 20'S+ 20'9 + 20'7)cm + II
:: 20'77 cm (to two decimal places)
Notice that they gave their answer to two decimalplaces, because taking the mean should give a slightlymore accurate answer.
a Find the mean of~your class results on the length ofthe diagonal.
b Find the mean of your class results on the twoangles.
c Write down two sentences describing your results.
Estimating More Accurately
b Place your tracing paper to cover the region inFigure 2 so that as few dots as possible are inside.Write down the number of dots inside.
Now place your tracing paper to cover the region sothat as many dots as possible are inside, and writedown that number.
Use these two numbers to give estimated limits tothe area of the region.
c Let your tracing paper fall to cover the region.Write down the number of dots inside the region.
d Repeat c until you have 10 results. Find the mean ofyour 10 results to estimate the area of the region.
e Write a sentence describing your results.
In this section you have seen that when different peoplemeasure the same thing they get different answers. Youmay also get different answers when you measure thesame thing twice yourself. This is called human error.
One way to reduce human error and variability is totake several results and find the mean. But you mustmake sure that all the answers you use are sensible: ifone answer is obviously wrong, you should ignore it.
The dots are the centres of I em squares.
Finding the area of the lake in Section H1 was not easybecause you had to count part squares. You can get amore accurate answer by repetition.
a On tracing paper, draw aset ofdots at 1 cm intervalslike this. Cover the whole sheet.
10
• • • •
rl
*B6 Boxes
Sometimes you need to guess weights, perhaps incooking or when buying food. If you do not havescales, you can try comparing weights.
In this experiment your teacher will give you sevenboxes (A,B,C,D,E.F.G) and a standard box (Z).Compare box A with box Z. If box A is lighter thanbox Z, put a slip of paper marked I in envelope A. Ifbox A is heavier, use anh; ifitis the same, uses. Repeatfor the other six boxes.
II

Your teacher will give you the class results.
a Work out the 'score' for each box, h - I. Put theboxes in order, starting with the lightest. Thestandard box has a score of O.
b Compare your class results with the true orderwhich your teacher will give you.
Ann's shots are close together.They are to one side of the target. Her aim is biased.
Barry's shots show greater variation.They are to one side of the target. His aim is biased.
Ann and Barry look at their results. They decide tohave another go with the same rifle. But they agree toaim left of centre. Figure 4 shows their "results.
c Bias
Figure 4 Second attemptAnn - Barry
@•
•
Ann and Barry go to a fairtogether. They try their luckshooting at a target. They each use the same rifle andget the results shown in Figure 3. The cross (x) marksthe bull's-eye.
Target ShootingC1
Figure 3 First attempt
a Write one sentence comparing Ann's and Barry'sresults.
b No shots hit the left-hand side of the target. Why doyou think this might happen?
c Why do you think neither ofthem hiithe buIl's-eye?
Ann Barry d Write two sentences to compare their results thistime.
e Have a look at your answer to b. If you want tochange it, write your new version now.
Look at Ann's results. The first time all her shots wereclose together on the right. The second time, with thesame rifle she aimed to the left and all her shots wereclose to the bull's-eye. The rifle must have been BIASED
to the right.
f Are Barry's results better when he aims to the left?On his second attempt, Barry's shots still vary widely.His shots now balance round the centre.His aim is now unbiased. But he is not accurate.
On her second attempt, Ann's shots still do not varymuch.They are also unbiased. Her shooting is accurate.
12 13

C2
14
Spotting Bias
Sometimes a measuring instrument is biased. All itsmeasurements may be too low or too high. It is notalways easy to spot bias, except by checking withanother instrument (which you know is correct).
Below are some measurements made with differentinstruments. You have to decide whether or not eachinstrument is biased. Remember that themeasurements will vary a little because ofhuman error;you are looking for bias. Look at the set of readings foreach instrument or example. In each case write onlyone of the following:
biased above unbiased or biased below
a Water boils at 100°C.(i) Thermometer 1: 100°C, 100°C, 101°C, 99°C,
100°C(il) Thermometer 2: 97° C, 98° C, 9So C, 99° C,
90°C(iii) Thermometer 3: 104°C, 100°C, 107°C, 10SoC,
103°C, 99°C(iv) Thermometer 4: 98°C, 101°C, 100°C, 101°C,
100°C
C3
b The diagonal of a S em square is 7'1 em,(i) Ruler 1: 7'0 em, 7'2 em, 7'2 em, 7'1 em, 7'1 em(il) Ruler 2: 6'4 em, 6'3 em, 6'S em, 6'3 em, 6'S em
If the same ruler was used in both cases, suggestwhat might have happened,
c Colin uses his calculator to add up some figures,
d A teacher measures the heights of a class of girlswhen they are wearing shoes,
e Sarah weighs with a pair of scales and then fmdssome plasticine underneath the scale in which sheputs weights,
f Give an example ofa measurement which is biased,
g Give an example of a measurement which isunbiased,
In science and elsewhere we usually want measurements which are unbiased. Unbiased measurementscan be either side of the accurate answer; on averagethey will be correct.
Useful Bias
Sometimes it is useful to take biased measurements.We have already seen that measurements can varybecause of human or instrument error. This variationcould lead to a disaster. Read the example below to seehow bias can help.
An engineer estimates a bridge can carry a load of 190tons. Because of variation in manUfacture, the bridgemay ouly be able to support 180 tons. If 19 ten-tonlorries cross together, the bridge would collapse. Toavoid this the engineer would give a biased estimate ofhow much the bridge could carry, perhaps 150 tons. Inthis way he can allow for variation. He knows thebridge will be safe if the load is never more than 150tons.
15
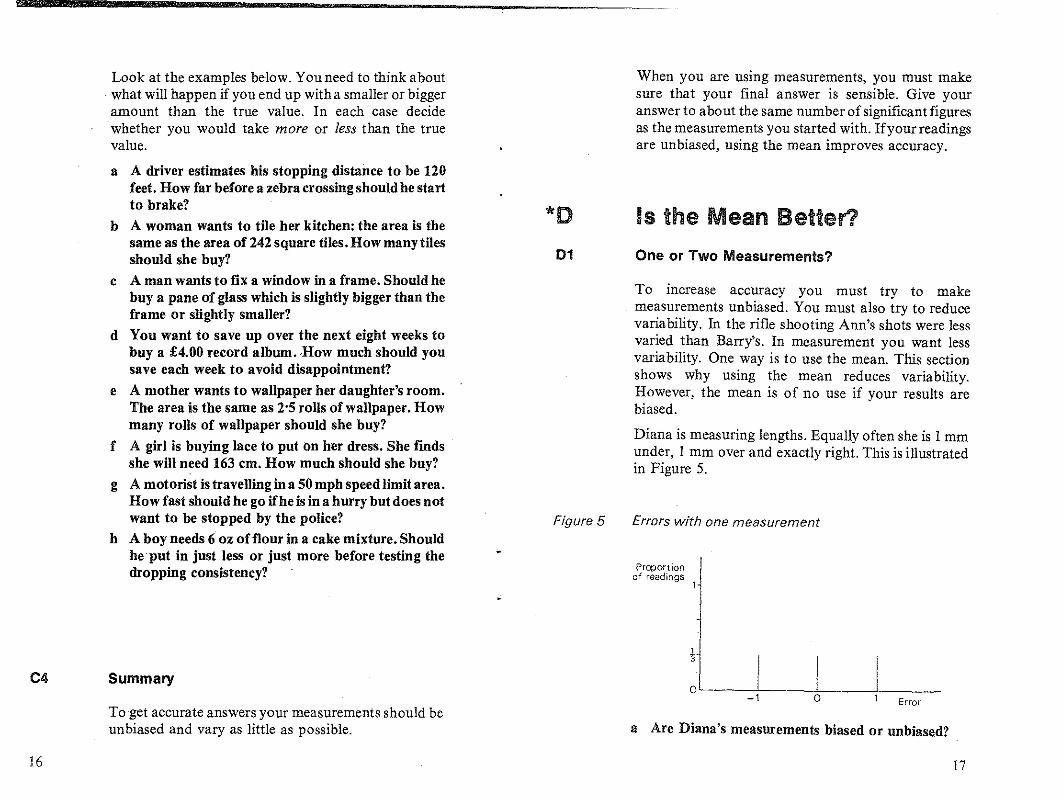
04
16
Look at the examples below. You need to think aboutwhat will happen if you end up with a smaller or biggeramount than the true value. In each case decidewhether you would take more or less than the truevalue.
a A driver estimates his stopping distance to be 120feet. How far before a zebra crossing shonld he startto brake?
b A woman wants to tile her kitchen: the area is thesame as the area of 242 square tiles. How many tilesshould she buy?
c A man wants to fix a window in a frame. Should hebuy a pane of glass which is slightly bigger than theframe or slightly smaller?
d You want to save up over the next eight weeks tobuy a £4.00 record album•.How much should yousave each week to avoid disappointment?
e A mother wants to wallpaper her daughter's room.The area is the same as 2'5 rolls of wallpaper. Howmany rolls of wallpaper should she buy?
f A girl is buying lace to put on her dress. She findsshe will need 163 em. How much should she buy?
g A motorist is travelling in a 50 mph speed limit area.How fast should he go ifhe is in a hurry but does notwant to be stopped by the police?
h A boy needs 6 oz offlour in a cake mixture. Shouldhe put in just less or just more before testing thedropping consistency?
Summary
To get accurate answers your measurements should beunbiased and vary as little as possible.
*D
D1
Figure 5
When you are using measurements, you must makesure that your final answer is sensible. Give youranswer to about the same number ofsignificant figuresas the measurements you started with. Ifyour readingsare unbiased, using the mean improves accuracy.
Is the Mean Better?
One or Two Measurements?
To increase accuracy you must try to makemeasurements unbiased. You must also try to reducevariability. In the rifle shooting Ann's shots were lessvaried than Barry's. In measurement you want lessvariability. One way is to use the mean. This sectionshows why using the mean reduces variability.However, the mean is of no use if your results arebiased.
Diana is measuring lengths. Equally often she is I mmunder, I mm over and exactly right. This is illustratedin Figure 5.
Errors with one measurement
Proportionof readings
O'------,;----±---__-!- _Error
a Are Diana's measurements biased or unbiased?
17

Table 1
18
Diana decides to take pairs of measurements and findthe mean.
There are nine different outcomes, shown in Table 1.
e.g. a first measurement with error -1, followed by asecond measurement with error -1, gives a totalerror of -2, which is a mean error of -1.
Total error in two measurements
Second measurement
-1 0
First -1 -2 -1 0measurement 0 -1 0 1
1 0 1 2
Table 2 on page RI shows the mean error for some ofthese figures.
b Complete Table 2.
From Table 2 you can see that one out of the nineoutcomes gives a mean error of-I. As a proportion this. lIS 9"
Two out of the nine outcomes give a mean error of+As a proportion this is i.c Calculate the proportion of times her mean error is
O.d Complete Table 3 on page R1.e Plot the proportion of different size errors as a line
graph.f Write a sentence describing how taking the mean of
two readings improves accuracy over taking onereading.
02 Taking Four Measurements
Suppose Diana took the mean of four measurements.It is difficult to work out proportions in the same'way.We can see what happens by throwing cubes or dice.
You will need four cubes (or dice),
On each of the four cubes mark two faces-I, two faces 0and two faces +1. When you throw the cubes, the facesshow the error Diana made so that -1, -1, 0, 1 gives atotal error of -1, which is a mean error of -of.(If you have dice use the following code:one and two become -1; three and four become O;jiveand six become +1),
a Throw the cubes. Add the numbers to get the totalerror. Make a tally mark in Table 4 on page R1.
b Repeat until you have 40 throws.
c Complete Table 4.d Plot the proportion of different size mean errors as
a line graph.e What proportion of your results gave zero mean
error?f What proportion of your results gave a mean error
of -lor +1?g Write two sentences comparing the mean errors of
four measurements with the error when only onemeasurement is taken.
19

Schools Council Project on Statistical Educationfhis Project has been based in the Department of Probability and Statistics at the University)f Sheffield from 1975 to 1980. Its brief was: to assess the present situation of statisticalxlucation in schools; to survey the needs of teachers of statistics; to devise detailed proposalsor the implementation of the teaching ideas; and to produce teaching materials.
Projeet Team
Director: Peter Holmes (l975~ )Deputy Director: Neil Rubra (1975-78), Daphne Turner (1978~
Project Officers
Ramesh Kapadia (1975-79), Alan Graham (1976-77), Barbara Cox (1979-80)
Statistics in your world
General Notes?ages with the preflx R are resource pages or reference pages for pupil use. (In many caseshey are designed as worksheets.) In the pupil unit these are referred to as 'page Rl', etc.
)ermission need not be sought to reproduce copies of the R sheets provided that copies arenade only in the educational establishment in which they are to be used and that such copies,re not sold, h!red or lent to any other indivdual, organization or establishment.
,cctions or questions marked with an asterisk are optional to the main thrust in the unit.;ometimes they are for the more able pupils. sometimes they are for reinforcement and someimes they consist of simpler work for the less able pupils and lead to an easier conclusionhan the main unit. In each case detailed comments on the particular purpose will be found inhe appropriate section of the teacher's notes.
l'hree different typefaces are used in the pupil units. Text in roman type (Wee this) is for pupilso read or for the teacher to introduce. Questions to promote thought and for group or classliscussion are printed in italics. Instructions telling pupils to do things and questions formpils to answer are printed in bold.
N THE B
TEACHERS' NOTES
LEVEL 2
LL
Published for the Schools Council by
FOUlSHAM EDUCATIONAL

Contents
Brief Description
.•...•.~a~!I·Objg~!~""C'P¥~t~quiSite& ""\1
Equipment and Planning
Detailed NotesSection ASection BScction CSection DSection E
Answers
Test QuestionsAnswers
Connections.with Other., "
tl~~r~,t~~,toject;;~ ~~cc~l
R pages on pages 8 and 9,
Page3
3
444566
7
1011
I3rief'Des~rlption' .c;"'-""'- , .. ,
This unit looks,at the results· qbtajned and.g'1als sCOr,ed.i~.Enilish l"agnefootbalL It is sh0'1:' that the proportion ~f h~mewins and ofother resuitssettles down.•. These are used lcipredict results. with reasonable s~n:cess,particullidywhen cClnip,u'eil to newspaper' forecasts',The number of goalsscor"dn'1w'td~)'s. is.c'1wp"n;,l tOt\1",nuwl)e',§£'1re.d ~QcY"a,s ,ag(). ,,' .,...'
DesIgri'tiili~\'Ab'6ni'Yhdtits .....'"
Aims and ObjectivesOn completion of this unit pupils should he ablet~. p~e),no~11relativ"
frequencies to estimate probabilities and to use proha'I)ilitles iIi'predicfingfuture events,
They will become more aware ofth~fact that relativefrequencies d(;'s~m~i1own,theprob1eln§ ofcd~paringsetsofdata arld·theneedfor.additionalinfotlnlitioIi'to' draw 'more1'eliable\:Onblusions'They practise'caJCulatingtlie meaH;piCkingdiit'othersuiriirtaty'statisticsfrOiri i:llitaarldplottingdataasa'iilne~series oH'a graph. '
-' ..•. ,,, ':' 1-' i 1-, n"
A.n''1ptiQIl8I ; "x.tellsion,' '1(liJ·f,~ec; '1l()t,,~ ..gel",'Y), fl'/q~id,e~ ,'1'r"£tl",,,i,llcompleting a two-way table and investigating pattern. ·w!+ic,n,."werg"., .
PrerequisitesPupils need to be familiar with tally marks and with calculating thearithmetic mean of ungrouped data. They will need to do long division;convert fractions 'to decimals,andworktq.·two .·significant, ,figu,es:calculators would help here; Afamiliadty with the ,use of fll11downum,b,ertables would' be useful-but' is '110t essential.· .
Sc~ools Council_~oJ~~t_~n~ S~lltisticaJ ~~~at1<,)D
" ,.Pijbb!h;dlly,;·., , ."'." ..',' ." .. '..... .. ., •.•.'W,"Foulsham' &:-,eo.,'ttd.j::-.yeoviJ;:Road,~SldughlBerks
@ Schools Council Publications 1980
ISBN 0-572-0IlOJ-6
PRINTED IN HONG KONG
Equipment,andP.!·anning·"f)1is'urtit ne"els, tob,,'d'o;'e auringtpd/oqtballseas'1n, pr~fdrablyat " tImewh"n matches ~l:eunlikeIYJo becallcell~d(beforeD~beni.ber or afterFebru~ry).· ..... .' .... ..
Results from last Saturday's matches are required for BI, though the givenresults could be used. Avoid any Saturday when Cup matches are beingplayed. In Section D predictions need to be checked, so there will be a gap
3

between D2d and D2e: the class could continue with Section E and returnto D2 later. Football results are published in most Sunday newspapers,special Saturday papers and in some newspapers on Monday.
Random number tables are needed in Section D. Calculators are useful inB2, Cl, C2 and' Section E. Graph paper is also needed in Section E.
Pupils could work through the whole unit individually, though classdiscussion of certain points is recommended (class results are needed inClb).
Detailed Notes
Section A
The opening section reminds pupils what is meant by a score draw, etc., andposes the general questions considered by the unit. Recently each teamscored an average of just over a goal per match, though Liverpool did dorather better in the 1978/79 season - a statistical freak perhaps. Moregoals were scored 20 years ago when leading goal-scorers averaged a goalper match: relevant data is considered in Section E. Prediction of results isdone in Section D.
Section B
HI
It is recommended that recent results are used as they will have more impactand significance. It is probably easiest to read out the results while pupilscomplete Table 2, though pupils could bring in results themselves.
If many matches are cancelled because of bad weather, it may be better topostpone starting the unit, though pools panel forecasts could be used. It isalso best to avoid Saturdays when Cup matches are played. There aregenerally more draws than away wins. You may like to discuss why thedistinction between a no-score draw and a score draw was introduced: toincrease the chances of a higher payout, because of the preponderance ofdraws.
Reinforcement is possible here and in B2, Cl by using the printed results aswell as more recent ones.
4
The results can also be collated with tally marks on a two-way 7 X 7 matrixwith home goals (0-6) along the top and away goals (0-6) on the verticalaxis. The diagonal from top left to bottom right will show draws; above arehome wins, below are away wins. This does takeextra time but throws upinteresting patterns and provides practice in completing a two-way table.Questions on reading a two-way table can also be set, for example, thenumber of matches where the total goals scored is 5 or the number ofmatches where the home team scores two goals or two more than the awayteam.
H2
It is not entirely valid to make predictions from just one Saturday. Oneneeds to collect results over a longer period to make a fair comparison ofgoals scored in different divisions. In 1975/76 there was no clear difference.The relevant data can befound in the three references listed after E2. Pupilsmay need reminding that one divides by 11 or 12 in g.
Section C
CI
This introduces the idea of probability in a known situation (like balls in abag) but using real data. Pupils need to make a dot 'at random', though thisis hard to achieve in practice. The dot needs to be chosen fairly: perhaps theresults page could be put down 'randomly'. Itcould be done by writing eachresult on a slip of paper and choosing one from all the slips. Note that classresults are needed in Clb.
You could discuss the 'pin' and other methods of doing the pools with theclass. The Rothschild report suggests picking from the last teams ratherthan the first teams for big prizes. This assumes that, altboughdraws occurrandomly in matches, fewer people choose draws neartheend than near thebeginning of the table. If this is true, tben one is less likely to have to share aprize with other people if one chooses from the end of the list.
C2
The major difference between this section and Cl is that in Cl all the resultsare known, and probabilities were assigned by choosing at random from aknown population. Here we use past results to estimate probabilities forfuture unknown results.
5

T
The~idea hereisthat the proportions do setde~down(anexample Ofthe lawof large numberS)'and 'can be used forprediction>Plipils may like to copydown Table4 in answeting,a. Ifreinforcementofthis'ideaisrieeded,theawaywiris ,'and,draws ,forTable kare 'given below:
Away Wins '13; 2f,' 27,'36;42,52;448Draw~';" 14' 28~'39' 5265"80';561
'.~.:~".:;_;"" _:::' ',,,;' :,',' ~:' , __,',:: ~•. ,:_.,.:.l< ::::,"',:< :';> __",' .... ,;':'., ..."., .. _'._, <_;':,':>'
I'),T~l>I~1menl)WlJer of matchesplay~dis the ac:C:l)mulatioQ ,of matcl\~splayedduring lhe season. ,~ ~ ~ "
The advantage of the home team does not matter so much in the League, astwo matches are played between each pair ofclubs, each club playing onceat home., It is~ more important for C1Ip matches.
:':.: "" ..' ;: \ ' , ;: ! /: c'.. : ,,!,.... ;;'::,' _ ", :'-:.: ;:_: ',,: ;- - .. ::' '.:-~ ':; ':: .. :: c·;. -.'
SectlorfD
Dl
Here random prediction is contrasted to newspaper forecasting and oftendoes surprisingly well. Pupils may need more explanation oIl how th~
random numbers are used in predicting. " ,~
There are problems in deciding which prediction method is best, Dlb. #onepr,edict~ aUw"tches to b~ home wins, ~ne wpuld e"pect half to be right;th')ssimpl)'getting diem'"s!: right is ri'ot ir sufficient criterion:Theiemuslbediscrirrihiaiioninthepredidion.' ' ~" ~,~ , '
D2
Pupils predict results for next week and compare with newspaperforecasts,TIlese ~reusually puplish~d .in~aily Pape~s ~n T')esd~ysorWeclnesd"ysand forthefo1l0\Vingweek inthe, Sunday papers. Therewill1'e ai>reak afterD2d; p~pifsCo'tild ~turntp I>2eafi.ercompletinjfSectionEorwaiiiIlguntilthe,relevirIitmatches'have beenpmyed:Squaredpapercolild be u,sed fOr theforeca,s! result8;'thi"lllakeschecking 'the'foreca,S1:seasie'r:' ' ,,~
;>,. >
Section E
El
Data aregiven'on goals ,scored ,by, tl\e, First.Division'teams in 1957/8 and1977/8;':lmtially ':pupils·areasked ,to. ,summarize ·the,data,andmakecomparisons; calculators may be useful here.
6
We used a Wilcoxon test to compare goals scored in 1957/8 and 1977/8.The goals scored are put in order (for both seasons), and the ranks for1957/8 (which include the first 10) are totalled. The sum of ranks here is314, which is significant at least at the 0'001 level.
E2
Here more data are presented to make a more meaningful'comparison.Pupils may need help in choosing scales in a; b can be plotted on the same'graph\vilh'Yerticalline,s to ,showthe range in each year. E2e can be treatedas an open,clas~discussion.J~ossible~easonsare:footballis a more tacticalgaWe:'- it i§ea,sic:r to plan to, stopggals than to' score them; there is more
',nbriey info<iib,iIl; thheslilt'(winmng)is'm6teimpottant nowadays than"tlje'tl1ethod; go;il!,eep~r~,:aie:mote,valued (and may have improved).
'Further data;hiaybe~fouhdiilthe RotJu!,an'sFootbali Yearbook (Queenfm,n.e'Press),PlaYfairF{()()tbali An!,1f(lI{Quc:en Anne Press) and the bookof tl\e, Foptbqil}"fai{JIe,):ables (Cplllns). ~
.. , o.~. .. ',.... ,;' ..
',A' ~ a F~ih;'m, h~me~n; Bury, no~score draw; Reading, away win';;b. Yes'
:Bld:'"Fo{ourresult":'22homewiri,,, 11 away wins.c~e '.;1;3'; fA3
"B'pTlje::i\nswersreferto'ourresultswhich will probably differ fromthose used by pupils. • ,~ ,b Division 1:,16/ 14j30Division2:22j10j32
Division 3:14/11/25 'I>ivision,4:19j16j35c ','Yes,:possiblY.There Will pe ~vatiation; one needs to see results
over"severai months to pickoutpatlerns.'dNO" ~~ ~~ ,~~' ~ ,~, ,,~
~'eResu,its~o;enevenilmonths,'f "lYfore"g'ames'jn'DliVisions 3 and 4 than Divisions I and 2II 2'73, 2'91,2;08,2'92
Cl d 0'48, 0'24, 0'065, 0'28.C2 a 0'41, 0'46, 0'50, 0'49, 0'50, 0'49, 0'50.
01 a 13, 13, 10, 17, 14 b Daily Mirror, Sun
El c 1721, 1213 d 78, 56 e 51, 26 f 104, 76
(Text continued after the R pages)
7

00
'0
R1
Table 8 Random numbers
77 04 01 09 73 89 84 35 77 76 12 39 43 64 97 40 83 99 18 2639 00 29 43 44 23 01 92 63 88 89 61 91 67 90 04 22 34 19 9363 78 56 92 64 87 82 73 33 53 25 3640 91 19 52 36 40 91 1952 67 36 19 67 8434 55 97 37 92 30 27 26 71 04 71 78 38 155821590607575799404347180362914160904513
24 6506 55 72 04 87 31 29 39 56 29 93 95 65 90 95 99 87 4666 36 07 93 49 2002 59 48 54 35 73 34 68 72 44 28 8744 8109 77 10 5252 5265 2915 8281 2356 9982 21 01 6281 98145632697127297487247942661050754787082635 84 64 56 47 54 11 22 93 84 75 65 06 91 47 47 67 25 97 25
08 35 58 9406 0402 41 56 90 12 38 09 87 20 22 20 30 72 5139 84 92 69 36 4742 09 72 28 20 63 90 67 24 56 54 27 12 8916 2061 3275 91 50 1653 51 83 1430 9383 7459 31 70 8154 35 42 49 55 57 13 5070 03 72 39 48 67 94 73 37 67 13 396629747155608808106208105528518652750014
59 0051 6044 72 59 5394 22 10 7438 5443 4345 2991 7443 45 29 91 74 43 58 08 72 99 89 09 38 66 75 45 49 0047 4275 4788 5925 21 04 61 07 1440 7342 6867 2568 7698 4528 8046 57 74 8062 57 51 32 33 42 06 56 17 81 94 25 05 6358 62 21 99 86 58 90 78 87 05 96 57 38 14 37 35 05 51 87 25
87 71 56 03 6,5 03 11 69 23 98 78 64 52 19 04 99 04 73 90 48412195963483031631721150654758806892798277 93 27 40 49 08 05 83 42 49 80 95 99 46 24 51 85 74 13 8381 27 96 2442 13 33 55 25 65 91 39 43 36 83 3240 32 48 7193 44 83 25 03 62 06 48 98 74 38 18 76 63 58 44 87 58 91 26
- -47 04 95 29 28 67 85 59 17 41 49 89 23 35 50 90 28 97 55 8620 5282 4700 2400 4669 91 07 3721 9354 9273 0906 0836 6747 4703 1669 5048 41 70 9726 4330 52 10 1685 0335 6074 9429 84 89 72 57 65 49 30 11 61 54 88 18 85 68 3237 8042 5020 0957 5841 5842 62 17 11 94 9881 9804 49
10 91 74 06 38 02 57 04 25 67 52 47 72 59 62 22 42 44 98 26101759757674671219683428325411801451420742 45 57 52 07 84 44 43 01 65 20 56 64 01 46 39 26 73 83 92016118962336410157702029649049774132859374 91 20 6607 6281 51 40 5826 21 96 98 14 5769 9699 86
30 25 71 25 27 20 69 11 38 51 41 67 45 95 22 35 55 75 36 2084 64 38 27 68 61 01 90 31 58 18 77 70 79 15 29 55 10 20 1828 69 32 14 56 22 86 7048 24 83 87 16 63 66 62 21 7498 043840210672 81045741981260982411513427024906 36 38 42 84 53 41 95 37 29 48 68 72 86 22 22 71 76 85 09
30 36 31 16 12 35 75 25 20 31 83 5084 83 34 07 37 45 09 7318 87 76 43 56 63 19 65 36 86 14 47 86 86 30 97 48 08 80 4932 7017 6875 9852 0567 68,22 9480 1805 9028 4540 5266 60 69 56 87 43 72 87 76 43 40 66 08 77 50 43 70 91 86 543260714728062163631625322135624720420887
43 89 32 54 85 23 87 60 87 38 11 47 76 85 83 97 89 52 1"1 56495509635115264822994082753119718757586700 04 13 23 93 86 64 21 15 55 69 21 19 54 22 57 61 46 85 7099500622159233216845259727210667931596298062341507513499933731965485393794109151
© Schools Council Publications 1980

Test QuestionsJohn is keen on European football, He collected tbe results of 50 matches:
35 home wins 5 away wins 10 draws90 home goals 35 away goals
1 Use John's results to estimate the probability in future Europeanmatches of:a A home win ,Il An away \.Vi!1 "c", A draw
2 Find the average ~u~ber"f ~Qal~SCQredj~ 1!)~50 I)1atcties.•
3 John wants to guess'~e'~esult~~lt~~,ne~t10I)1~t~he~t~;bepl~yed.Be,decides to use ra\jdom ntlmb~rs.,The'resuli is il home win (H)iftlienumber is 1,2,3,4,5ilY,7ian'away~h1:tA) ifihe'n1ul\ller is8;a"d a'drilW(D) if the number;i(9;f);', ,", ,
He uses the randQfurlllI)1bh tibfebelo\V, starting lit thebeki~riingOfthe'line. Use the table ic"predicftheresuiisof20matches, writinglf;Aor:D,
52144902 19 3L;2S.155FOIJ~09,9t9452 43
Oohn finds the re~iutsofthe ,,'0&1'50 inatcil~sinEurope;info~tb~il:
}.37 home wins!fAwaywirls "9: draws i" ', Estimate, using ali'i!ieijslven resiiiis;'the pr6bahility in future EuropeilIl
•:a~h~~~~ win ';'Il a\Vay~~;~A(jiaw" Would these pro!1apiljlies bemqre.'\"curate, tha!1,those,i!1 QJ1estlqrL)?,
:"c:. Give a reason. ., (', ~-~, e
5 The table below giy~~ ~he~um~er9fgoillr~cOF~4il) Di~i~i9!1 ~ln 19~NLiand in 1970jl. For'ea6hseas'onfihd themeaullumberotgoals scored'" and the range of"goals,'scored; 'Wrile twdsentenCes'comp)iring;t!ie
number of goals sc()red.",.1950/1 8274 7§'6213e7631 64,5348.81,
63 507'4'(;653'6352 64'53 64481970/1 57 73M'65 '5462'60 5958 5458
61 52 oil 51 46293846 oil 3735How would you make a fairer comparison ofthe goals scored in Division2 in the 1950s and the 1970s?
10
Answers"" " ,1 35" 7 5" I \0" I 2 2'5.
50 10' 50 10' 50 53XXXXXAAa~~~~~~~~~~~
4 ?Jr IgO"lab; yes, more rqs,u!t~,'\ls,ed 'V"
5 64'2,48-82; 51'9, 29-73, More'goals'scoredin 1950 than'19!70;srnallerrange in 1950, even poor teams scored quite a lot of goals. Figures fromother seasons are needed to make a betler comparison.
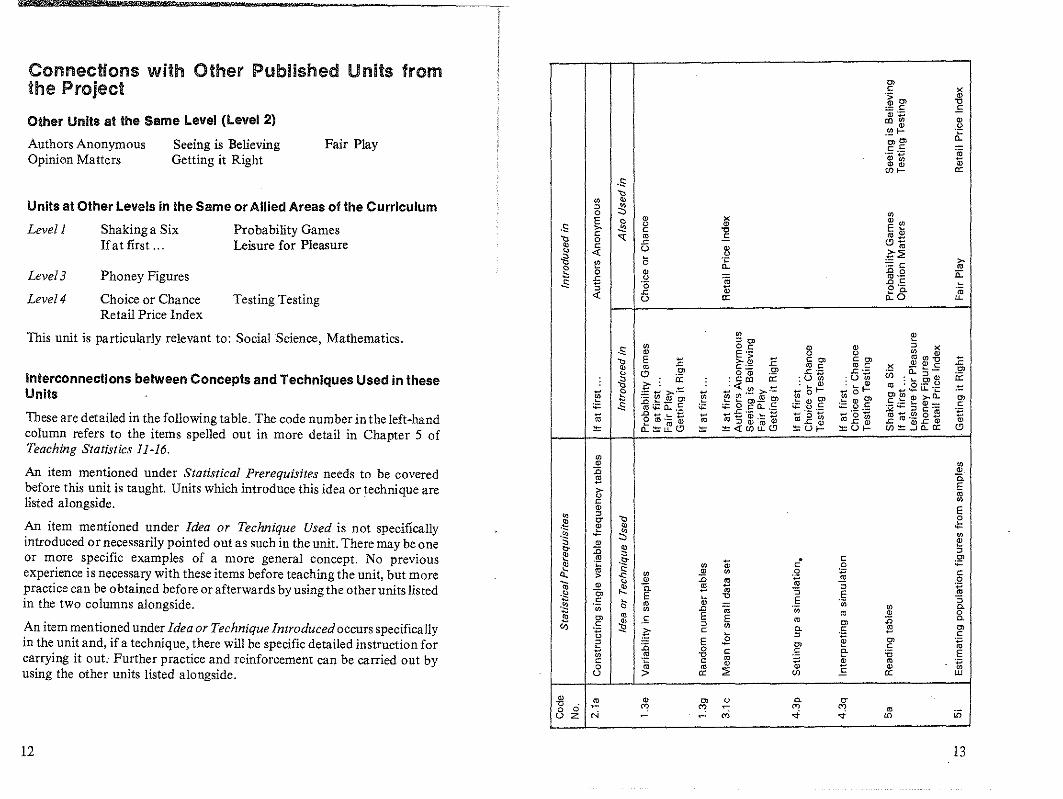
Connections with Other Published Units from0>the Project c ~
.~ en ""0
~.g EOther Units at the Same Level (Level 2) 00 0 "" ,~
.~ l- e:0>0>Authors Anonymous Seeing is Believing Fair Play c£
*,- ~
Opinion Matters Getting it Right " 0"""H- a:,S
""0 "Units at Other Levels in the Same or Allied Areas of the Curriculum ~ :'30 0E 0 " ~
"00 "Levell Shaking a Six Probability Games ,S >- ~ C "0 E ~
""c
'" m E mE0 .c "1iiIfat first." Leisure for Pleasure " c U "0 « 0 ~:;;-5 0 (; &: =c: >-m0 (; " .0 0 a::Level3 Phoney Figures " m ,-.c 0 'm .0 c.s; ;; '0 0; e '0. 'm« .c
Level 4 Choice or Chance Testing Testing u a: .. 0 "-
Retail Price Index
This unit is particularly relevant to: Social Science, Mathematics, 0 e~O>0 o c " "
~~'S " E';; 0 0 o "E 1" 1" Co> Co> m0"O 1""" >-"
" " C" m c:.= m C me ~ a:: :5- ,2'0 "0>
o ",2' ,c.;::; ,C';::; inInterconnections between Concepts and Techniques Used in these -5 ii: ' coo a: 'U 0 ,U 0
ro ; 0 .2>.~a:
'" - ~~.~ >-,,::: ~o~ ~o~ .... _lL. ... ~
Units~
0 .- .... >-'-
~ ~.~ ~ ~~" ;::lI)roOl ~ .... OJ'!!! C'l o 0> o 0> 0>
~;;:a::£.:Q) c :;: ~.S C.s; :;::: 0 cll...s :>E';::; ::2:: ~ C'ro .~rn .gm.=~ 1ii ..... .c:. 'iii ... ;= rt;:g~ ~ ltI'Q5,gQ")These are detailed in the following table, The code number in the left-hand ttl S Q)'m l1) ttl.c ~
'" o'::=tfCD '" ::t:«C/)u.(9 :::::(.)1- :t:<..)f..... U):t:...Ja.c::: "column refers to the items spelled out in more detail in Chapter 5 ofTeaching Statistics 11-16,
0
" 0
An item mentioned under Statistical Prerequisites needs to be covered :0 "1'i 0.Ebefore this unit is taught. Units which introduce this idea or technique are r; m0listed alongside, C
" E0 ~
"" 0
" 0"
'"An item mentioned under Idea or Technique Used is not specifically ," ~ ~,~ 0
introduced or necessarily pointed out as such in the unit. There may be one ~ " "e
t> :0 ~
or more specific examples of a more general concept. No previous " .~~ . C ~t ,I<
0 1D c ,£experience is necessary with these items before teaching the unit, but more <t ~
~ 0 .s> 0 .Q lii c"" 00 " .0 1'i rnpractice can be obtained before or afterwards by using the other units listed <i; " ~ 0. 1'i ~ '.,
0> m ." ,§ m.~ E " "0 E ."c - " 0in the two columns alongside, .~ 'm 0 m
.0 'm 0 c.0 m m " 0~ 0> m E E E m :0 c.
C ~ ~ 0>An item mentioned under Idea or Technique Introduced occurs specifically '" 0 c. E 1'i 0>.~
~c
" ~ Ein the unit and, if a technique, there will be specific detailed instruction for 2 E O? 0> i5 0> 1ii:0 c
1;; 0 C C e- 'i5 E,m "0 m 'Bcarrying it ouL Further practice and reinforcement can be carried out by c c " m .~0 :0 m " " .E "using the other units listed alongside, u > a: :;; Ul a: UJ
" ;:: " 0> 0 C. 0""0 0 "1 '" '" '" m0
'" '" iiiu z N '" "'
12 13

'I:"
";,,.~ " .1"'
;.( ,i! i ~, "\
'{ '"'
~i·-:dS';1 '. ,i«(; ~,! ,,:;;::.
Testing Testing
Seeing is Believing
Fair Play
t~~Xf~~ ,t~:~iM:~;", ,.
Testing Testing
Testing Testing
Also Used in
Getting it Right
leisure, for, PleasureRetail Price Index
Retail Price Index
"';"i ',)':'1;
If at first ."
Choice or Chance
eRciiGeUot':'!cH~Hbeb'.',)' 1'.,p,! '~I', ',,~\' ,.' ",'"
Fair Play
If at first "., Testing Testing
,..,":<.;'."l"
Shaking; a SixPhoney Figures
Fair Play
Probability GamesCh'6ice','or Chance
'il:;.l 'li; ,;,,-:Ot;i',,' ".;'
;3';il,f,' i bl)(:O:" ;U;~i';~):
Probabi Iity, Games.;. \~ ;';:.1 ~!", .:..b:"': ',."j
n\:.;:': L;i'; !l I::: !i.:lJ'L><" bi!Oil\.Authdrs'A'ponymous
FirbBEiBili i;2(;',;{mes:: :', ':,; rx,,· <.' fY:,~;" :j ;,) Ci.'"
Sh~ki~g' a Six
pb,&~,~y ~\~~.,~~t~r' '-'~~'~~!Ml' ~ S,i~
<,-,,'
,';'(;'!I',1-, "'(\~S" '''':ii
Idea or Technique Introduced
Large 'samples better for inference
,,1- ,J,,"''''''lUsing relative frequency to estimateprobabilities
Comparing actual with expected values
Comparing directly comparable data
Inference from table's-'"
Plotting time series
Probability in single sample from knownpopulation
Eq~tlUy,Ai~~IYcwobabilitiesas expectedrelative frequEmcies
Non~equally likely probabilities as theU,mit of relative frequendes
,'.:,:,,.:.,.,';:',,,'-:1 '.: 'C:'.'.'.:'-' "li":)'.'·
- I Code...No.-2.2j
4.1c
4.1d
4.1e
4.11
5e
5v
5w
5x
'-:'(',.,:\,->,,", \"C, ',I
''':-''

Statistics in your world
ON THE BALL
Published for ~he Schools Council by
FOUlSHAM EDUCATIONAL

ContentsPage
A The Game 3
B Saturday~ ~atches 4BI Collecting Results 4B2 Comparing Divisions 6
C What Are the Chances? 7
CI Picking Results 7C2 Settling Down 8
D Newspaper Predictions 10DI Predicting Results 10D2 Filling the Pools 11
E Goals Galore 12
El Two Seasons 12E2 Two Decades 14 A The Game
In the first match Manchester United is the home team;the result is a score draw.
a For each oUhe other three matches, write down thehome team and say whether the result is a home win,away win, score draw or no-score draw.
b Do you think home teams are more likely to winthan away teams?
c About how many goals per game do you think arescored in professional football?
d Were more goals scored 20 years ago?e How can you predict next week's results?
In this unit you will be investigating data to helpanswer these questions.
Here are some football results:Some sections are marked with an asterisk*. Your teacher will tellyou whether to try these sections.R Pages Your teacher will provide these for you.
AcknowledgementsThe publishers and Project team extend their thanks to the Football Leaguefor granting permission to reproduce certain football results and to thefollowing newspapers for allowing reproduction of certain pools forecasts:Daily Mail, Yorkshire Post, The Sun, Daily Mirror.
The Schools Council Project on Statistical Education
Published byW. FouJsham & Co. Ltd., YeoviI Road, Slough, Berks
Cartoons by Colin Whittock
@ Schools Council Publications 1980
ISBN 0-572_01074-5
PRINTED IN HONG KONG
Manchester United 2Fulham 2Bury 0Reading 0
LeedsSunderlandHullTorquay
21o3
3

Results of one Saturday's matches
5
a Do you think there were more draws or away wins?
It is easier to answer questions like this ifthe scores arein a table.
b Draw a table like Table 2.
DIVISION THREE (continued)
Chesterfield 2 Swansea 1Exeter 0 Gillingham 0Hull City 1 Peterborough 1Oxford Utd 0 Tranmere 0Rotherham 0 Sheffield W 1Shrewsbury 2 Mansfield 2Walsall 1 Southend 1Colchester 3 Swindon 2
112o21o1o134
NorthamptonAldershotTorquayStockportDarlingtonWigan AthHerefordGrimsbyBradford CHalifaxNewportWimbledon
DIVISION FOURBarnsley 1Bournemth 0Crewe 6Doncaster 2Hartlepool 0Huddersfield 1Portsmouth 1Port Vale 1Reading 3Rochdale 1Scunthorpe 2York City 1
Result Tally Total
Home win
Away win
Score draw
No-score draw
Table 2
B Saturday's Matches
B1 Collecting Results
First we look at some results from a Saturday in 1978.Use scores from last Saturday instead if your teacherhas them.
Table 1 Football results 7. 10.78
DIVISION ONEArsenal 1 Aston Villa 1Birmingham 1 Man City 2Bolton 3 Leeds 1Coventry 2 Ipswich 2Derby 1 Chelsea 0Everton 0 Southampton 0Man United 3 Middlesbro 2Norwich 1 Liverpool 4Notts F 3 Wolverhampton 1QPR 1 Bristol City 0WBA 0 Tottenham 1
DIVISION TWOBristol R 4 Blackburn 1Burnley 1 Oldham 0Cambridge U 1 Preston 0Cardiff 2 Notts Co 3Crystal Pal 3 Brighton 1Fulham 2 Stoke C 0Luton 2 Wrexham 1Newcastle 1 Leicester 0Sheffield Utd 3 Sunderland 2West Ham 3 Millwall 0Charlton 0 Orient 2
DIVISION THREEBlackpool 2 Lincoln 0Brentford 0 Bury 1Carlisle 1 Plymouth 1Chester 2 Watford 1
4
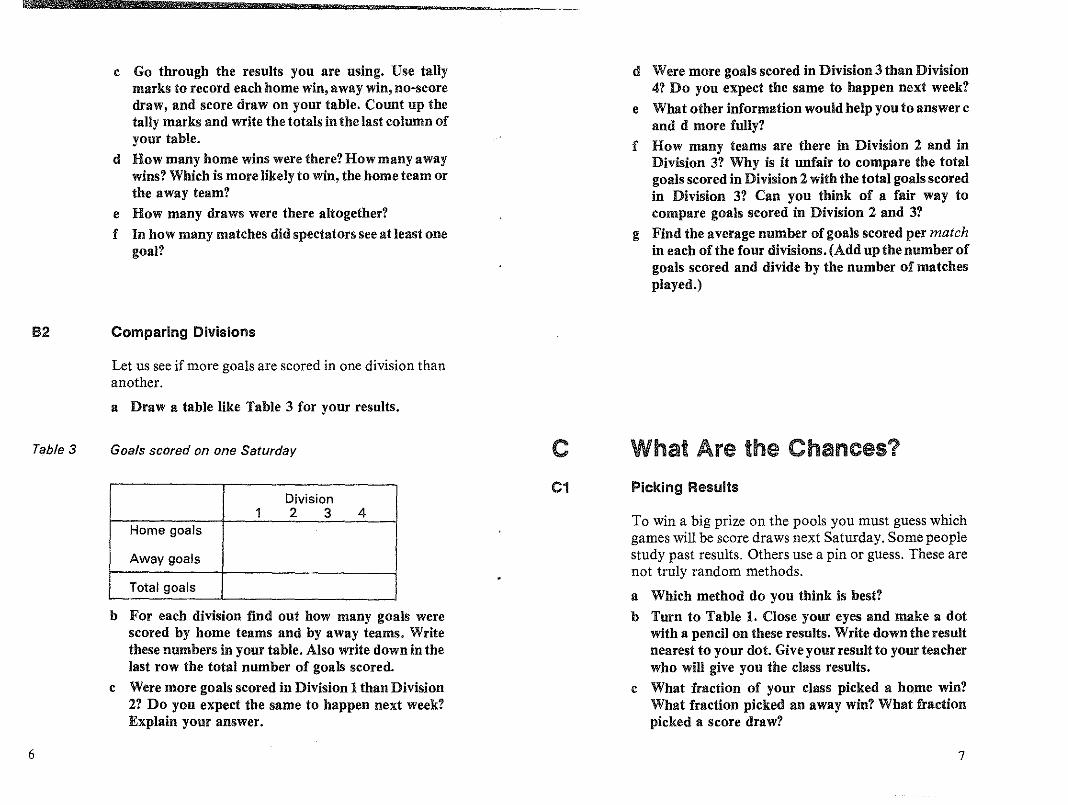
c Go through the results you are using. Use tallymarks to record each home win, away win, no-scoredraw, and score draw on your table. Count up thetally marks and write the totals in the last column ofyour table.
d How many home wins were there? How many awaywins? Which is more likely to win, the home team orthe away team?
e How many draws were there altogether?f In how many matches did spectators see at least one
goal?
82 Comparing Divisions
Let us see if more goals are scored in one division thananother.
a Draw a table like Table 3 for your results.
d Were more goals scored in Division 3 than Division4? Do you expect the same to happen next week?
e What other information would help you to answer cand d more fully?
f How many teams are there in Division 2 and inDivision 3? Why is it unfair to compare the totalgoals scored in Division 2 with the total goals scoredin Division 3? Can you think of a fair way tocompare goals scored in Division 2 and 3?
g Find the average number of goals scored per matchin each of the four divisions. (Add up the number ofgoals scored and divide by the number of matchesplayed.)
Table 3
6
Goals scored on one Saturday
Division1 2 3 4
Home goals
Away goals
Total goals
b For each division find out how many goals werescored by home teams and by away teams. Writethese numbers in your table. Also write down in thelast row the total number of goals scored.
c Were more goals scored in Division 1 than Division2? Do you expect the same to happen next week?Explain your answer.
cC1
What Are the Chances?
Picking Results
To win a big prize on the pools you must guess whichgames will be score draws next Saturday. Some peoplestudy past results. Others use a pin or guess. These arenot truly random methods.
a Which method do you think is best?b Turn to Table 1. Close your eyes and make a dot
with a pencil on these results. Write down the resultnearest to your dot. Give your result to your teacherwho will give you the class results.
c What fraction of your class picked a home win?What fraction picked an away win? What fractionpicked a score draw?
7

In Table 1 there are 46 matches: 22 home wins, 11 awaywins, 10 score draws and 3 no-score draws.
Fraction of away wins = ~~ = 0·24 (to 2 sigJigs)
The chance that a match picked at random is an awaywin is 0'24. Another word for chance is probability. Wewrite, using Table 1 results:Probability (picking an away win) = 0·24
d Using Table 1 results, write down, to 2 slg. figs: fProbability (picking a home win)Probability (picking a score draw)Probability (picking a no-score draw)Probability (picking a draw)
Table 4 Home wins 1975-6
All Saturday Home Fraction:matches wins Matches home wins/played before matches
Aug 22, 1975 19 46 19/46=0041Aug 29, 1975 41 90Sept 4, 1975 65 131Sept 11,1975 85 173Sept 18, 1975 109 216Sept 25, 1975 126 258 1261258=0'49
All season 1019 2028
C2
8
Settling Down
Since the games in Table I have already happened weknow the probability of a draw if one of these games ispicked at random.
Usually, however, we want to predict draws for nextweek. One Saturday's results give some idea of whatmight happen next Saturday. But results are not thesame every Saturday. Some weeks there are few drawsand big prizes on the Pools. Other weeks there aremany draws. It is better to collect more results becausethe proportions settle down. We use these proportionsto estimate the probabilities for future games.
In Table 4, home wins over the first few weeks of the1975/76 season are given. The first line shows thenumber of home wins in the 46 matches played onAugust 22, 1975. The second line shows the number ofhome wins in the 90 matches played on August 22, 1975and August 29, 1975, the first two Saturdays of theseason. Each of the next four lines then adds in theresults of another week. The last line shows the numberof home wins and matches played in the whole season.
II,
a Use a calculator to help you complete the lastcolumn to 2 significant figures. Write the answers inyour book.
b As more results are included, what happens to thefraction of home wins?
There is a similar pattern for away wins and draws.Over the whole season, the proportion of home wins isabout 0'5; for away wins it is about 0·2; for draws it isabout 0'3. These figures give us an idea of what toexpect in the future.
We say:
Probability (home win) = 0'5Probability (away win) = 0·2Probability (draw) = 0·3
Clearly, the home team has an advantage. Someonesaid that the away team should get both points even ifthe result is a draw.
*c Do you think that would be fair?*d Can you think of any other way of removing the
advantage to the home team?
9

DD1
Table 5
Newspaper Predictions
Predicting Results
Every week some daily newspapers try to predict theresults of the next Saturday's matches. Table 5 givesthe predictions by four newspapers and with randomnumbers for one Saturday's results from the fourdivisions. The final row gives the actual results in thesame order. The correct predictions are underlined.
Predicting results
a How many correct results did each predict?
The random predictions were done using a table ofrandom numbers. If the number was 1, 2, 3, 4 or 5, ahome win was predicted. If the number was 6, 7 or 8, adraw was predicted. If the number was 9 or 0, an awaywin was predicted.
b Whose predictions are best? Whose predictions areworst? Whose predictions would you use?
*c Use your own table of random numbers to make'predictions' for the 46 matches played on October7, 1978. Count how many you get correct.
Div.3 Div.4
Daily Mail XX2X11X11.?12 11$111211 !XYorkshire Post nXXX1X1$111X ~2112X11!1
The Sun 1XX211X11X12 1~11!X11!X
Daily Mirror gXX1.?X~1.f.1X 1~1~!.21111
Random ! 12X.?1122111 212211X21X
Results 1211222XX2X1 XXXX11X212
Div.1 Div.2
Daily Mail Xg12X!2!1~ 1X1111211
Yorkshire Post 111$1XXX2X1$1$ 1X1l!1211
The Sun 11 1!X1X2111 XX1!11211Daily Mirror 11~12XXX!1~ XX1!!1211Random 1X1X1~X1X1$1 1X11X2211
Results 11X112111XX 21X11XXX2
10
X =Draw 1 =Home win 2 =Away win
D2 Filling the PoolS
Find two newspapers which list the matches to beplayed next Saturday.
a Make a table like Table 5.b Forecast the results of next Saturday's matches.c Write down the predictions from two newspapers.d Use random numbers to make predictions.
Get the actual results when the matches have beenplayed. Your parents may be interested in yourpredictions.
e Underline each correct prediction.f Count the number of correct predictions in each
method. Which was the most successful method ofprediction? Which was the least successful?
g Which was the most successful method ofprediction for your class as a whole?
You may like to write to the newspapers concernedabout your results.
11
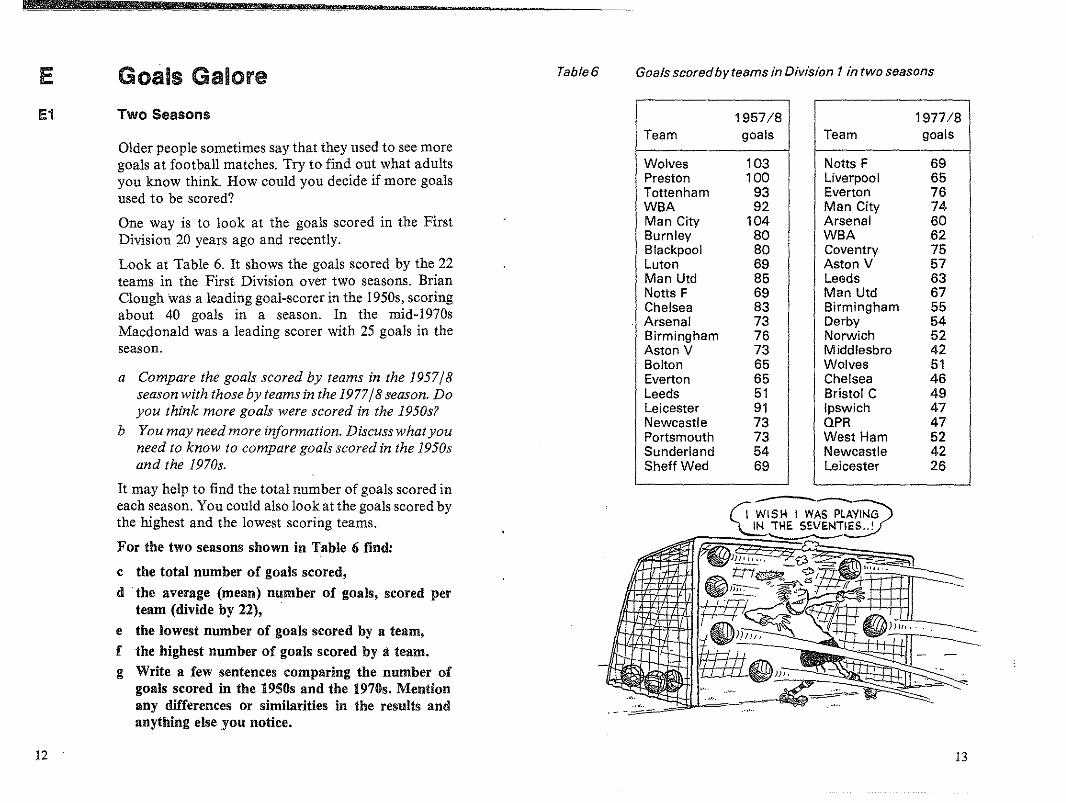
E Goals Galore Table 6 Goals scoredby teams in Division t in two seasons
1:1 Two Seasons
Older people sometimes say that they used to see moregoals at football matches. Try to find out what adultsyou know think. How could you decide if more goalsused to be scored?
One way is to look at the goals scored in the FirstDivision 20 years ago and recently.
Look at Table 6. It shows the goals scored by the 22teams in the First Division over two seasons. BrianClough was a leading goal-scorer in the 1950s, scoringabout 40 goals in a season. In the mid-1970sMacdonald was a leading scorer with 25 goals in theseason.
a Compare the goals scored by teams in the 1957/8season with those by teams in the 1977/8 season. Doyou think more goals were scored in the 1950s1
b You may need more information. Discuss what youneed to know to compare goals scored in the 1950sand the 1970s.
It may help to find the total number of goals scored ineach season. You could also look at the goals scored bythe highest and the lowest scoring teams.
For the two seasons shown in Table 6 find:
c the total number of goals scored,d the average (mean) number of goals, scored per
team (divide by 22),
e the lowest number of goals scored by a team,f the highest number of goals scored by Ii team.g Write a few sentences comparing the number of
goals scored in the 1956s and the 1976s. Mentionany differences or similarities in the results andanything else you notice.
12
1957/8Team goals
Wolves 103Preston 100Tottenham 93WBA 92Man City 104Burnley 80Blackpool 80Luton 69Man Utd 85Notts F 69Chelsea 83Arsenal 73Birmingham 76Aston V 73Bolton 65Everton 65Leeds 51Leicester 91Newcastle 73Portsmouth 73Sunderland 54Sheff Wed 69
1977/8Team goals
Notts F 69Liverpool 65Everton 76Man City 74Arsenal 60WBA 62Coventry 75Aston V 57Leeds 63Man Utd 67Birmingham 55Derby 54Norwich 52Middlesbro 42Wolves 51Chelsea 46Bristol C 49Ipswich 47QPR 47West Ham 52Newcastle 42Leicester 26
13
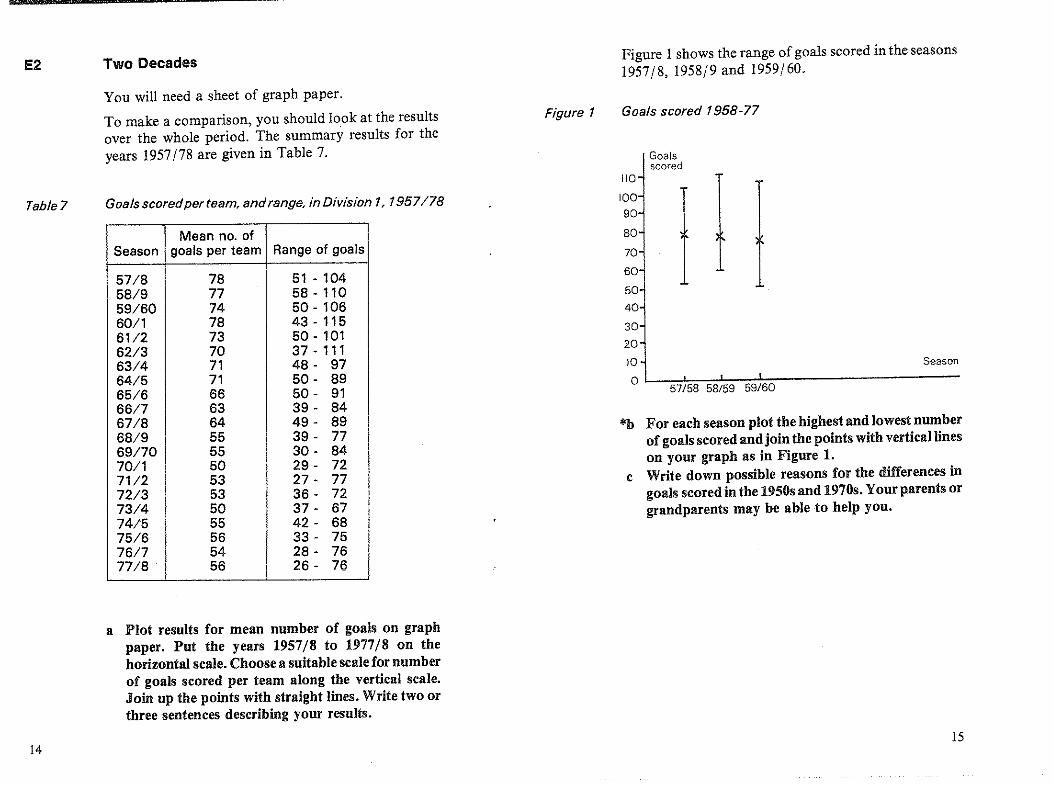
Season
E2
Tab/e7
14
Two Decades
You will need a sheet of graph paper.
To make a comparison, you should look at the resultsover the whole period. The summary results for theyears 1957/78 are given in Table 7.
Goals scoredper team, andrange, in Division 1, 1957/78
Mean no. ofSeason goals per team Range of goals
57/8 78 51 - 10458/9 77 58 - 11059/60 74 50 - 10660/1 78 43-11561/2 73 50 - 10162/3 70 37 - 11163/4 71 48 - 9764/5 71 50 - 8965/6 66 50 - 9166/7 63 39 - 8467/8 64 49 - 8968/9 55 39 - 7769170 55 30 - 8470/1 50 29 - 727112 53 27 - 7772/3 53 36 - 7273/4 50 37 - 6774/5 55 42 - 6875/6 56 33 - 757617 54 28 - 7677/8 56 26 - 76
a Plot results for mean number of goals on graphpaper. Put the years 1957/11 to 1977/8 on thehorizontal scale. Choose a suitable scale for numberof goals scored per team along the vertical scale.Join up the points with straight lines. Write two orthree sentences describing your results.
Figure 1
Figure 1 shows the range of goals scored in the seasons1957/8, 1958/9 and 1959/60.
Goals scored 1958-77
Goalsscored
110
100
90
80
70
60
50
40
30
20
10
oL.--="'=__'-__I-----------57/58 58/59 59/60
*b For each season plot the highest and lowest numberof goals scored and join the points with vertical lineson your graph as in Figure 1.
c Write down possible reasons for the differences ingoals scored in the 1950s and 1970s. Your parents orgrandparents may be able to help you.
15
, . School~ CoUncil 'Project C?n ,Statistical EducationThis Projecthas been: ba,sed in.Jhe Department of Probability and Statistics at the Universityof- Sheffi~~d from -1975 to 1980. Its brief was: to assess the present situation of statisticaleducation in schools{fo survey the needs of teachers of statistics; to devise detailed proposalsfC!r theimp~ementati0!l oft~e teaching ideas; and to., produce"teaching materials.
Project Team.
Director: Peter'Holmes (197~- )Deputy:q'irector: Neil- Rubra (1975-78), Daphne Turner (I978~
:;~ Project Officers
Ramesh Kapadia (1975-79), Alan Graham (1976-77), Barbara Cox (1979-80)
General NotesPliges with the':pre~LX R:are, resourc~ pages or reference pages for pupil use. (In many casesthey·~e designed as worksheets.)1n'tlle p\lpil unit these.ar~'referredto as (page RI', etc.
permis~l:on.need not ~{sh~ght to reproduce copies of the It sheets provided that copies are.-mad~~ 'only'in t~e educationaLes~ablish.mentin which they are to be used and that such copiesarel?:0t's?ld, hired or lenttQ any'oth~r indivdpal, organizatiC!n or establishment.
Sections or questions"marked' with'an asterisk are optional to the main thrust in the unit.. Som.~1im~;.t;heJ'.arefqrtheIPbr~,ab~epupils·;some~imes :they are for reinforcement and some~
times ·{h.ey Consist:ot~simpler. work for the"less able pupils and lead to an easier conclusionthan t~e'in~ un~t'-:.In,eachcase detailed CO(llments on the particular purpose will be found inth'e.appioppate.~e~Hoifof-the,teacher:s n'o~s.
Three·9iffeqmtD:,pefaces artfus~dln the pupil units. Text inroman type (like this) is for pupilsto read·or for:th'e tea.c1}~~t€;dntroduce. Questions to promote thought and for group or class
. discussi()n ';are' printed/in .'iralics~ Instructions telling pupils to do things and questions forp.upils ~(.f'a.nswrr are printed in,bold. '
"
Statistics in your world
SEEIN ISBELIEVING
TEACHERS' NOTES
LEVEL 2
Published for the Schools Council by
FOUlSHAM EDUCATIONAL

Contents
Brief Description
Aims and Objectives
Prerequisites
Equipment and Planuing
Detailed NotesSection ASection BSection CSection D
Answers
Test QuestionsAnswers
Connections witb OtherUuits in the Project
R pages on pages 12-17
Page3
3
3
3
779
18
18
1921
22
Brief DescriptionPupils' reactions to a number of optical illusions give a rough measure of thepower of each illusion using ordinal scales. Three of the illusions arefollowed up in detail. Optional sections include the magnitude of the deception measured on interval and ratio scales, and the differences betweennominal, ordinal, interval and ratio scales.
Design time: 4-5 hours
Aims and ObjectivesOn completion of this unit pupils should be able to calculate a mode fordiscrete ordinal and discrete interval data. They will have practisedcalculating the median and the mean ofa frequency distribution on discretedata, using the mode, median and mean as representative measures;collecting and recording data in tables and bar charts and interpreting thisdata.
Those who complete the optional sections are introduced to a simple use ofchange of origin; the differences between nominal, ordinal, interval andratio scales; and which of the mean, median and mode is appropriate foreach scale.
Schools Council Project on Statistical Education
Published byW. Foulsham & Co. Ltd., Yeovil Road, Slough, Berks
© Schools Council Publications 1981
ISBN 0-572-01102-4
PRINTED IN HONG KONG
PrerequisitesPupils will need to be able to read a scale to the nearest 2 millimetres, carryout simple multiplication of decimals, divide by the number ofpupils in theclass, correct to one place of decimals and (for those who do C6}add andmultiply positive and negative numbers to one decimal place. Those whodo Section D will need to be able to read flow charts. It will help if pupilshave previously drawn simple bar charts, but they can refer to examples inthe text for help. The method of finding the median as the value assigned tothe middle item in a small ordered set of items should be known.
Equipment and PlanningThe illusions are on page RI and questions about them on page R2. Thequestions can be answered on page R2 or on a separate piece of paper. Classresults can be entered in the tables on page R3.
3

Illusion 7 is not given on the page of illusions, since it depends on surpriseand little study time. You will need to prepare it yourself either by drawingit on a large piece of paper, on the back ofa roller blackboard (make sure itdoes not come round upside down) or on an overhead transparency. It isshown here. Take care to space the words out as shown.
The two part lines A and B must be parallel. Stick parts I and 2 on the base.The arrow on the slide, marked 'Read here', lines up with the scale on the2mm square graph paper. This scale should be marked and numbered incentimetres. Zero on the scale should be opposite the arrow on the slidewhen the slide has not been moved. The part lines A and B should be atabout 30° with the vertical.
A
BIRD
IN THE
THE HAND
Blank tables are given on sheet R3 for use with Sections Bl and C. Squaredpaper or graph paper will be needed for the bar charts. Calculators may befound useful in Sections C4 and C6.
Section C needs some simple apparatus made out ofcard, as follows. Allowyourself one hour to make this apparatus.
Experiment 120cm
2
Experiment 2
16 em
25em
Base
(black card)
5
Cut out the T-shaped hole. Stick the squared paper scale into the positionshown. Stick the top layer on the base. The arrow on the slide should pointto zero when C is level with D.
Slide
2 mm square
c7n / graph paper
lIJTop layer (white)
4
2
0c
I !Oem IA B
2em
2cm
Base
IQem 3em 3cm 4cm
0 rJ10
~~ g2 2mm square
o graph paperA here
Part 1 Slide Part 2
4
15 ~====:::::===i===i=~em

Experiment 3
20cm
and C4b are to reinforce techniques of calculation. They can be omitted bybrigbter pupils. Other optional sections (C3, C6 and D) are more difficultand need only be done by brighter pupils.
15cm
Detailed Notes
Top
20cm
Bcm20cm
3cm I ), , I I I
SlideBcm
Spacers
Glue the spacers underneath the top, leaving room for the slide to fitbetween them. Mark the scale on the slide faintly in centimetres, subdividedinto 2 mm intervals. Make sure the line and the arrow markings are bold.The model can be made more sturdy by including another 20 x IS cm pieceof card as a base.
Underlying the whole unit are two themes. One relates to the four types ofscale - nominal, ordinal, interval and ratio -and the differences betweenthem. These are brought out explicitly in optional Section D, but areimplicit in the core work in which pupils work with both ordinal andinterval scales. The second theme is increased sophistication inmeasurement, illustrated by the power of optical illusions. The firstmeasure is based on the number of pupils with the right answer, The secondapproach measures the amount of error in the class answers.
Section A introduces the idea of optical illusions. Section B tests sevenillusions and does a simple analysis using modes and medians on ordinalscales. Section C looks quantitatively at three of the illusions, using aninterval scale as a more refined measure. Section D makes more explicit thedifferences between the four different types of scale. Optional Sections B7
6
Section A
This section sets the scene for the later optical illusions. There is no 'correct'answer to the first two drawings. The wrong lines are joined in the twopronged fork, giving the impression of three rods. It may be useful toextend the discussion slightly to discuss accuracy of scientific observationwith problems of colour, measurement and parallax.
Section B
HI
It is advisable to outline the procedure to the pupils before showing themthe two pages of illusions and questions. It is very important to stress thatthe aim is to test not the pupils, but the illusions. They should write downwhat appears to be the correct answer at first sight. Do all that you can todiscourage cheating. An element of surprise is needed in illusion 7, which isdescribed under 'Equipment and Planning'.
The correct answers are ld, 2c, 3a, 4b, 5b, 6b, and 7 'A bird in the the hand'(note the repeated 'the').
Predrawn tables on the blackboard are a convenient way to coUect theclass results quickly. With an even number of pupils in the class, add in yourown results to make an odd number. This will help in Section B6.
B2
Pupils can work on question a while the class results of BIb are beingcollected. Here a simple measure of a successful illusion is used. The mostsuccessful illusion is the one that fools most people. We can thus use theclass results to measure, for this particular class, which is the mostsuccessfUl illusion. It is the one with the fewest correct answers. This roughand-ready measure of an illusion's success can be compared and contrastedwith the more refined methods in Section C later,
7

B3
The mode is the particular answer given by more pupils than any otheranswer. This is not necessarily the correct answer.
B4
An ordinal scale is one which has an order inherent in the nature of thevariable. In the illusions there are variables based on positions on a line(illusion I), lengths of lines (illusion 6) and on size (illusions2to 5).These allgive ordinal scales. It would not be appropriate to use alphabetical order inillusion 6 and call this an ordinal scale, since the assigning of letters to thelines is essentially arbitrary and the question asked one to consider thelengths of the lines. With an ordinal scale more information is retainedwhen keeping this order in tabulation' and in drawing bar charts (B5). Itwould generally be considered incorrect not to put the variable on thehorizontal axis in one of the two proper orders.
B6
Calculating the median involves putting the pupils in order. So medianscan only be defined when the data are measured on at least an ordinal scale,The formula 'look at the value ofthe-j-(n + I )thpupi]' is hinted at in the pupilnotes. You can make this more explicit ifyou wish. The only problem ariseswhen n is even and the two middle pupils disagree. For example, if n = 34,and the 17th pupil says 'line GH' and the 18th pupil says 'line CD', thenthere imo median. It is to avoid this problem that we suggest you make surethere is an odd number of answers to the illusions (by incorporating yourown answers if necessary). The more general problem is then treated in C2.In cases where the ordinal scale- is numerical, then conventionally themedian is defined as the mean of the answers of the two middle pupils. Butthis can be misleading, and the convention is more useful with interval andratio scales.
Reinforcement work on the median may well be needed here (and perhapsalso for C2).
2 School Mathematics ProjeCt Book C, pages 149-161 (CambridgeUniversity Press, 1970)
With brighter pupils you might like to take the opportunity of pointing o~t
the difference between NOMINAL and ORDINAL scales. ThiS lSfollowed up III
Section D. A nominal scale has no underlying order. For example, in'Favourite sports' there is no reason to prefer the order (soccer, cricket,tennis) to (tennis, soccer cricket). In an ordinal scale there is an underlyingorder. In illusion 6 the lines EF, AB, GHand CD had lengths 5'5, 6'0, 6'2and 6'5 em, respectively. They were ordered by length, and lhe question wasabout length, so we have an ordinal scale. But the difference between EFand AB (0'5 em) is not of the same magnitude as the difference between ASand GH (0'2 em). An ordinal scale just shows the order, it does not haveequal differences between successive values of the variables.
Section C
Cl
The three experiments are refined versions ofthe illusions numbered I to 3.By using an interval scale measured in millimetres we can assess the ~eg~ee
of bias imparted by each illusion., You WIll need to do some IllItlalexperimenting with your own models to find the appropriate figures toinsert in the first columns of the tables on page R2. The expenments can bedone while the class is completing Section B. One way ofcollecting the classresults is to have the children enter their results in blank tables on theblackboard. These can then be copied by the pupils on to the R2 pages forfuture use.
Each pupil should do each experiment as it is passed round the class.
The problem with class intervals is avoided in the text, and can be similarlyavoided in class. Otherwise, any problem can be overcome by (i) reducingthe size of the model, or (ii) marking the scale:
11,0
in effect doing the class interval work for the pupils.
*B7
Further imaginary results for another class are included here forreinforcement, if thought necessary.
Two useful textbook references are:
I Modem Mathematics for Schools by Scottish Mathematics Group,Book 4, pages 214-220, (Blackie/Chambers, 1973)
114
11,8
or whatever is appropriate
8 9

C2
The experimental results are measured on an interval scale (see notes underC5). An interval scale is ordered, so we can calculate medians as well asmodes. As it stands, the first direct reference to the correct answers is in C5.You may wish to give them at this stage; they will be needed eventually. Themethod of measuring (to the nearest 2 mm) has effectively changed acontinuous variable to a discrete variable, so the calculation of the medianfollows the same pattern as in Section B. If you think pupils do not need thepractice, each pupil need do question c for only one of the experiments.You can arrange so that each experiment is analysed by a third ofthe pupilsand the answers given to the other pupils for later use.
'C3
This optional section provides histograms of the results, although the termis not used in the pupil notes.
C4
With an interval scale we can find a mean as well as a median. The methoddescribed here leads to the later use of the formula:
_ '};fxx='};f
Multiplication is shown as a quicker way of carrying out the requiredadditions. Less able pupils may well require help here. Question c showswhy it is not possible to get a mean for ordinal data. Clearly (l x 'line P') +(9 x 'line Q'), etc., has no meaning. A common, but wrong, method is togive the numbers 1, 2, 3 ... to ordinal data and use these to calculate amean.
Reinforcement work may be needed here. For examples see SchoolMathematics Project, Book F, pages 72-74, and most recent mathematicstextbooks.
C5
This section attempts to compare the power ofeach illusion by means ofthemagnitude of the bias or error induced in the class results. The median andmean are taken as being 'representative' of the class. Each pupil needs toknow the correct answers and class means and medians for the threeexperiments.
10
J
In Sections CI to C5 all the measurements are on an interval scale. SectionC6 moves on to a ratio scale. This is followed up in Section D but can beanticipated here if it helps brighter pupils. The answers 11'6 cm, 11'8 cm,etc., were all in centimetres. An interval ofone centimetre from 11 to 12 is ofexactly the same length as that from 12 to 13. An ordered scale with equalintervals is called an INTERvAL SCALE. But a reading of 0 cm does not meanthat there is no error. A reading of 12 cm is closer than a reading of2 cm,but it is not six times as good. In our experiment 12 cm is below the correctanswer by 0'4 cm; 2 cm is below the correct answer by 10'4 cm. So in thiscase 2 cm is 26 times as bad as 12 cm. In an interval scale the zero does notmean 'nothing', and we cannot compare results by multiplication.
However, in this case and in many others, we can get these extra propertiesby a simple change oforigin. This is done in Section C6by measuring errors .from the correct position. In this case 0 does mean no error, and an error of2 cm is twice the error of 1 cm. We now have a RATIO SCALE. From datameasured on interval and ratio scales we can calculate means as well asmedians and modes. All this information is summarized in the flow chart inSection D.
For pupils who are not proceeding to Section D it is useful to summarizethe main points made about calculating modes, medians and means withexamples. The mode can always be calculated (although it is not alwaysunique). The median can be calculated only when the scale is ordered, andhence not for nominal scales. The mean can only be calculated when there isat least an interval scale.
'C6
This optional section is especially for those who are to do Section D. Itcould also be done by older pupils too, if so desired.
The allocation of the signs + and - to errors above and below the correctanswer is arbritary. It is appropriate to attach signs to the errors here since amean of zero would mean that the illusion had no overall effect on the class.This would not show up ifall the errors were treated as positive. Pupils mayneed help in working out the '};fx. It is probably easiest to add all thenegative part totals, separately add all the positive part totals, and thencombine these two totals to get the final answer. A convenient method is touse two columns.
(Text continued after the R pages)
II

~
<Xlen~LL00
Bo()oc
·0.;::Cllro 0 .>1:0"a.
00 "I c
"0U!!200
00000J::
"(/)@
00U
(/) illZQ(/)
~ ::J0:: ..J
0='wIf-
o..OCC(/)
x
u
N
12 13

~
""R2
ILLUSION ANSWERS
Tick the answer you think is correct. Do not use a ruler to help you:
The line X goes behind the black rectangle and comes out the other side.Which line is it?
a line P b line Q cline R d line S
2 Which is true?
a AB is shorter than CD.b AB and CD are the same length.c AB is longer than CD.
3 Ignore the arrowheads. Which is true?
a AB is shorter than CD.b AB and CD are the same length.c AB is longer than CD.
4 Look at the two small squares. Which is true?
a The black square is smaller than the white square.b The two squares are the same size.c The black square is larger than the white square.
5 Look at the two centre circles. Which is true?
a The circle at the left is smaller than the circle on the right.b The two circles are the same size.c The circle on the left is larger than the circle on the right.
6 Which line is longest?
a AB b CD c EF d GH
~
V>
7 The words in the triangle were:
© Schools Council Publications 1981

-'" SECTION B1: CLASS RESULTS
Number of pupils
a
b
c
d
2 Number of pupils
a
b
c'.
3 Number of pupils
a
b
c
4
7
Number of pupils
a
b
c
Number of pupils
Right
Wrong
5 Number of pupils
a
b
c
6 Number of pupils
a
b
c
d
--l
SECTION C: INDIVIDUAL RESULTS
Experiment 1 ..... cm.
CLASS RESULTS
Experiment 1
Reading Number of Partpupils totals
Total
Experiment 2 ..... cm.
Experiment 2
Reading Number of Partpupils totals
Total
Experiment 3 ..... cm.
Experiment 3
Reading Number of Partpupils totals
Total
© Schools Council Publications 1981

Test Questions
I 25 children were playing in a field with a cricket ball to see who could·throw it the greatest distance. The field was marked in coloured zones.Red was nearest, blue furthest away. Their results are shown in Table 1.
Could be correct.
I RatioIntervalInterval
b
b Class 2Z
d
'Favourite games' is on a nominal scale.'Bed times' is on an interval scale.Median number of goals must be a whole number (or possibly ending in 0·5 if an even number of matches).Could be correct. f Could be correct.Four is the middle pupil, not the median.Nominal j Interval k Nominal
m Ratio n Ratio p Interval qNominal s Ratio t Ratio u
c
e
r
gh
B7 a Line CD
C2 a 11·8 cm
C4 a See detailed notes.
D a
This optional section makes more explicit the differences between nominal,ordinal, interval and ratio scales. The notes under Sections B4, B6 and C5are relevant here. The use of nominal, ordinal, interval and ratio scales cutsacross the more usual discrete f continuous dichotomy. Thefollowingtablegives examples:
Nominal Ordinal Interval Ratio
Discrete Favourite Position Adult shoe Number ofpet in family. sizes peas in
youngest (British a podto oidest system)
Continuous - 10 Time on 24 Weightmeasure- hour clockments (unless
midnight isa genuinezero)
'Section 0
c
c
B5 ab
A ab Table 1 Class results
Zone Numberof children
Blue 1Orange 8Red 5White 2Yellow g
Blue
White
Yellow
Orange
Red
t
a How many balls landed in the zone nearest the start line?b The order of zones in Table 1 is not the best to use. Why?c Rewrite Table 1 with the zones in a better order.d Find the median zone.
Throw from here
ZonesEither two black faces or a vase.Most people see 9, some see 10.Most people see 10; those who saw 10 in b should now see 9.
d There appear to be 3 at the left, but only 2 at the right.
B2 The correct answers are:I d, 2 C, 3 G, 4 b, 5 b, 6 band 7 'A bird in the the hand'.
B4 b P, Q, R, S (or S, R, Q, P)c Illusions 2 and 3: AB is shorter than CD; AB and CD are the same
length; AB is longer than CD (or the reverse order)Illusions 4 and 5: Answer G, answer b, answer c (or the reverseorder)
Figure 2Figure 2It makes it easier to answer questions like a and b. It shows thedistribution more clearly.
Answers
18 19

0/
2 Table 2 shows the results obtained by a class of 29 pupils, who carriedout the experiment to make the bars of the T the same length. Thecorrect answer is 10-0 em.
a How many pupils had the right answer?b The mode and median can be used to represent the class answers.
What else can be used?e What is the mode of their answers?d Copy and complete Table 3.
Table 2 Length in em Number of pupils
9·2 49·4 89·6 79·8 5
10·0 310·2 2
Total 29
g Copy and complete Table 4.h Find the mean length of the answers.
Questions 3 and 4 are for those who completed Section D.
*3 What is wrong with each of these statements?a Our class wrote down their favourite pets. The median was the cat.b Our class lined up in order of height. The mode height was Jim
Brown.e I arrived home from school at 4 o'clock. Jane arrived home at 8
o'clock. We should have arrived at 3.30 pm. She was twice as late asI was.
d The mean subject in our class is English.
*4 For each of the following, do you have a nominal, ordinal, interval orratio scale? (Use the flow chart to help you.)a High jump heightsb Favourite football teamse Weights of pupils in your classd Time you arrive at school each morning
20
e What is the number of the 'middle' pupil? Find the median length oftheir answers.
f Use the median to measure the class error. (Correct length 10·0 em)
Answers
21
d Intervale Ratiob NominalRatio
'Pets' is nominal scale. No median with nominal scale.Mode could be Jim's height - not Jim.'Time' is interval scale. Twice as late implies ratio scale. Actuallynine times as late when measured from 3.30 on a ratio scale.Can't have mean with nominal scale.
a 5b Not in order of distance from the 'throw' line.e Table rewritten with order R, 0, Y, W, B or B, W, Y, 0, Rd Orange (zone of the 13th pupil)
3 b The mean e 9·4 emComplete third column: 1 to 4, 5 to 12, 13 to 19,20 to 24, 25 to 27,28 to 29Pupil number 15. Median length is 9·6 em(Median) class error is 10·0 - 9·6 = 0·4 em.Third column should read 36·8, 75·2, 67·2,49·0,30·0,20·4. Totalis 278·6.
Mean length is 2~~.6 em = 9·61 em (9·6 to I decimal place)
1
2 ad
efg
h
*3 abe
d
*4 a
Length in em Number of pupils Pupils numbered
9·2 4 1 to 49-4 8 5 to9·6 7 to9·8 5 to
10·0 3 to10·2 2 to 29
. Length in em Number of pupils Part totals
9·2 4 36·89·4 89·6 7 67·29·8 5 49·0
10·0 310·2 2
Total 29
Table 3
Table 4

Connections with Other Published Units fromthe Project
•ou::
C>c'E~
u
oo'2'Cio
Fair Play
Cutting it FinePhoney Figures
Net CatchMultiplying People
Practice makes Perfect If at first ...Shaking a Six
Levell
Other Units at the Same Level (Level 2)
Authors Anonymous On the BallOpinion Matters Getting it Right
Level3
Units at Other Levels in the Same or Allied Areas of the Curriculum
Level4 Smoking and Health
>en.0en
roen
roNN
"~oE>
x 0.- 0(floroo<{g>~.- 0~.cro~.c~
(flo<{
•"0.o 0uz
This unit is particularly relevant to: Science, Mathematics.
Interconnections between Concepts and Techniques Used in theseUnits
These are detailed in the following table. The code number in the left-handcolumn refers to the items spelled out in more detail in Chapter 5 ofTeaching Statistics 11-16.
An item mentioned under Statistical Prerequisites needs to be coveredbefore this unit is taught. Units which introduce this idea or technique arelisted alongside.
An item mentioned under Idea or Technique Used is not specificallyintroduced or necessarily pointed out as such in the unit. There may be oneor more specific examples of a more general concept. No prevIOusexperience is necessary with these items before teaching the unit, but morepractice can be obtained before or afterwards by using the other units listedin the two columns alongside.
An item mentioned under Idea or Technique Introduced occurs specificallyin the unit and, if a technique, there will be specific detailed instructionforcarrying it out. Further practice and reinforcement can be carried out byusing the other units listed alongside.
22 23

tv..,. Code Idea or Technique Introduced Also Used inNo.
1.28 Using discrete data Shakit"lg a Six If at first ... Tidy TablesAuthors Anonymous Fair Play Opi~jon MattersGetting it Right .Net Catch Cutting it FineMultiplying People Phoney Figures
1.2b Using continuous data Practice makes Perfect Getting it Right Cutting it Fine
1.2d Different types of data
2,2e Bar chart for continuous data Practice makes Perfect Authors Anonymous
3.1a Mode for discrete data Shaking a Six Seeing is Believing Authors AnonymousPhoney Figures
3.1c Mean for small data set Practice makes Perfect If at first ... Authors AnonymousOn the Ball Fair Play Getting it RightNet Catch Cutting it Fine Phoney FiguresSmoking and Health
3.lt Mean for frequency distribution Authors Anonymous Fair Play Cutting it Fine
3.1h Median from cumulative frequencies (discretedata)
w w »." ro W C.3- 3 0 ~ CD ~o (Q::O"O C .' :::T
~CCD~=:::T ~ -U ~o !. 0_.~~~ 0 U/U ~ ~
~~roCD~- ~o :::T CD- (Q W(Q(Q =W(Q () -c 0 ~ ~. '"
-r'l ~. r+ CD -< r+ :J ()~. 0-' 00' 0 ....mr+v:J~o -'r+ CDm~ :J
lr:J ::T::!. CO CD ~ -0~ 5' Z -< -"t CO :J -n CO :J 0C Q.CD ~ -jOOc (Q ~ ."O-'~ro !..~~"' :::c." ~ ~"O -U .-' 0 -'. ro ~ "' _. _. :>;-<~ - w (J) ~ -. (J) ~ (Q ::0 ~ ~ (J) (J) 3-CDS:J~:Jm-o·-nmc@,_.~-o<'~mc~_,oo:J-oU-·r+~CDcaCD--·mom~~CD:JcnO_:JnCD~::T~m:JO)c-< ::r CD X c.c 00 CD = CD CD =r.w 00 r+ 00 -< to = (j)
-u~
ro() r
-u ::t. < !. CO~a < We'Do (J) :::T c-'tr' CD~:Jro ~WCD (J)(Q
- 0" ro :::T iii" ....3 .... ."-h -. 7' -,00) ;.:t. CD, 0), 0) -. """ ~.r+< (j) C::J~-o~-n ::::In._.-+_. G) -U (Q. "'" -j (J) 0(h 0) CD 0)' ::::::. Q) Q) m~ 3. =+"(J) 0" W ~
(J)Wro-C~CD 0 -. _ CP ~ -.CIJ r+ X (f) (f) ,q) CT>
9;:r(\).......;::;:CD'"::lgiii'
'"(\):::!.(\)
'"

Statistics in your world.
SEEI 'ISBELIEVING
Published for the Schools Council by
FOUlSHAM EDUCATIONAL
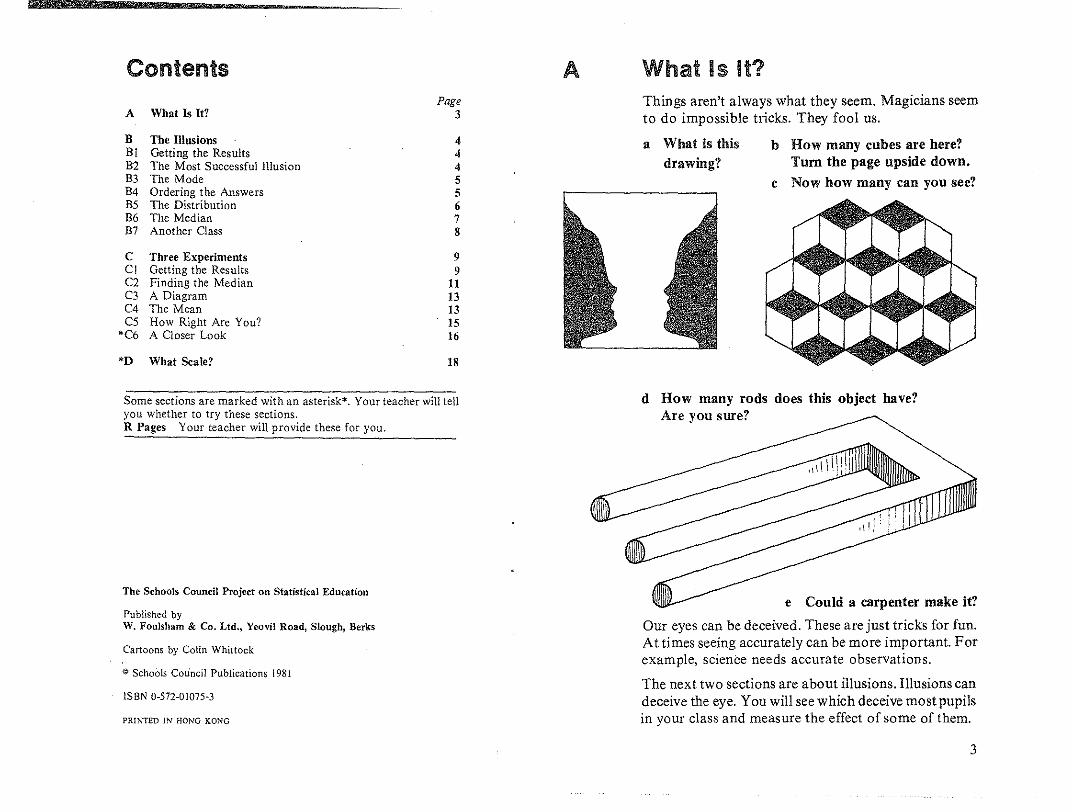
ContentsPage
A What Is It? 3
B The Illusions 4Bi Getting the Results 4B2 The Most Successful Illusion 4B3 The Mode 5B4 Ordering t he Answers 5B5 The Distribution 6B6 The Median 7B7 Another Class 8
C Three Experiments 9CI Getting the Results 9C2 Finding the Median 11C3 A Diagram 13C4 The Mean 13C5 How Right Are You? 15
*C6 A Closer Look 16
*D What Scale? 18
Some sections are marked with an asterisk*. Your teacher will tellyou whether to try these sections.R Pages Your teacher will provide these for you,
The Schools Council Project on Statistical Education
Published- byW. FouIsham & Co. Ltd., YeovH Road, Slough, Berks
Cartoons by Colin Whittock
© Schools Cou'ncil Publications 1981
ISBN 0-572-01075-3
PRI1\TED IN HONG KONG
A What is it?Things aren't always what they seem. Magicians seemto do impossible tricks. They fool us.
a What is this b How many cubes are here?drawing? Tum the page upside down.
c Now how many can you see?
d How many rods does this object have?Are you sure?
e Could a carpenter make it?
Our eyes can be deceived. These are just tricks for fun.At times seeing accurately can be more important. Forexample, science needs accurate observations.
The next two sections are about illusions. Illusions candeceive the eye. You will see which deceive most pupilsin your class and measure the effect of some of them.
3

;;
81
B2
4
The Illusions
Getting the Results
You will need pages Rl, R2 and R3.
REMEMBER: WE ARE TESTING THE ILLUSIONS.WE ARE NOT TESTING YOU!
You will not be asked how many you got right.
Write down the answer that looks correct.
Do not use a ruler.
a Look at the illusions on page Rl quickly one at atime. Answer the questions on page R2.
Your teacher will collect the results.
b Record on page R3 the class results which yourteacher will give you.
The Most Successful Illusion
a Find the correct answer to each illusion. Use Ii rulerwhere necessary.
h Tick the correct answer on page R3.
c Write down how many pupils had the correctanswer to each illusion.
Illusions aim to fool people. The least successful foolsfewest people and has most correct answers. The mostsuccessful illusion fools most people and has fewestcorrect answers.
In your class:
d Which illusion was the least successful?
e Which illusion was the most successful?f Write down the illusions in order of their success.
Put the most successful one last.
83
Table 1
B4
The Mode
The 29 children in Class 2J looked at illusion 6 on pageRl. Their results are shown in Table 1.
Class 2J's answer to IIJuslon 6
Answer Number of pupils
IineAB 7line CD 8lineEF 1lineGH 13
In Class 2J more pupils answered 'line GR' than anyother line.
For Class 2J line GR is the MODE. The mode is theanswer that most pupils chose.
Use your class results to answer these questions abouteach of the seven illusions.
a Which is the mode?
b Is the mode the correct answer?c Write down a sentence about the results altogether.
Ordering the Answers
The true lengths of the lines in illusion 6 are:
AB =6'0 cm, CD =6'5 cm,EF= 5'5 cm and GR= 6'2 cm.
lllusion 6 asked for the longest line.
These lengths can be put in order oflength (5'5, 6'0, 6'2,6'5).
We can put the lines in the same order (EF, AB, GH,CD).
This is the order of lines based on length.
5

Table 2
Table 2 shows the results of Class 2J put in this order.
Class 2J's answer to illusion 6
Figure 1Class 2J: Results of Illusion 6
Figure 2Class 2J: Results of illusion 6.Lines chosen in order of length
85
6
Answer Number of pupils
lineEF 1IineAB 7IineGH 13line CD 8
a Make a table to show your class results to illusion 6,with the answers in order of length.
Illusion I asked about the position of four lines.
b Put the four possible answers to illusion 1 in orderbased on position. Write down your class results inthe same order.
Illusions 2 to 5 ask about size.
c Put the three possible answers to one of these fourillusions in an order based on size.
The Distribution
We can show the results of illusion 6 as a bar chart.
Figure I uses Class 21's original order from Table I.Figure 2 uses Class 2J's order based on size fromTable 2.
The arrows point to the longest line (the correctanswer).
No_ of No. of
15- pupils15 pupils
1r--
110- lO-
r-- r--r--
5- 5
0 r--1 0 r--1
AS CD EF GH EF AS GH CDLine chosen Line chosen
Which figure makes it clear that:
a Most pupils chose the second longest line,b Very few pupils chose the shortest line?
c How is Figure 2 better than Figure I?d Draw a bar chart ofyour class answers to illusion 6.
Put the lines in order of increasing length. Leavegaps between the bars.
e Write down two sentences about your class resultsin illusion 6.
86 The Median
The lines in illusion 6 have been put in order of lengthby Class 2J. We can put the pupils in the same order bylooking at their answers.
The pupil who said 'line EF' is pupil number 1.The 7 pupils who said 'lineAB' are numbered 2 to 8.The 13 pupils who said 'line GH' are numbered 9 to 21.The 8 pupils who said 'line CD' are numbered 22 to 29.
7

These figures are shown in Table 3. Table 4 Class 2Z: Illusion 6
Table 3 Class 2J: Illusion 6. Numbering the pupJ'ls
Line Number of pupils Pupils numbered
EF 1 1AS 7 2 to 8GH 13 9 to 21CD 8 22 to 29
Line Number of pupils
EF 1AS 4GH 7CD 13
b On which of the two classes was the illusion moreeffective, Class 2Z or Class 2J?
Three Experiments
a Pull the slide until you think that line B carries onfrom line A. Read the scale to the nearest 2millimetres.
b Write down your answer on page R3.
12108r
4
2
o
slidet
Getting the Results
Experiment 1
Here we take a closer look at the first three illusions.We shall see how effective they are. You will need thethree experimental models and page R3. Do theexperiments in Ct. Your teacher will give you theequipment.
c
C1
Pupil number 15 is the middle pupil. 14 pupils choselines the same length or shorter; the other 14 chose linesthe same length or longer.
His answer is called the MEDIAN. The median is theanswer of the middle person. In Class 2J the mediananswer is line GH.
a Make a table like Table 3 of your class results.
b What is the number of the middle pupil?c What is the median?
d Was the class median the correct answer?
Class 2J were trying to find the longest offour lengths.The median helps to show how well they did.
GH, the median, is the second longest length. So atleast half the class chose the correct or next-to-correctlength.
e Draw a bar chart ofyour class answers to illusion 1.
f Find the median.
Another Class
Table 4 shows the results obtained by Class 2Z forillusion 6.
a What is the median of these results?
*B7
8 9

12
8
Class 2J: Results of experiment 1
Finding the Median
The experiments gave lengths in centimetres. Thelengths can be put in order. We can use this order whendrawing tables or diagrams. We can also use it tocalculate a median.
The 29 children in Class 2J did experiment 1. Theirresults are given in Table 5.
Reading(to nearest 2 mm) Number of pupils
11 ·4 em 211 ·6 em 011-8 em 812·0 em 712·2 em 412-4 em 412·6 em 012·8 em 4
Total 29
C2
Table 5
B
Read here ~ 4D
A
-E---SlideR~ here"",0 4 8 12
"'",/C ~ ~
Experiment 3
e Pull the slide until you think CB is the same lengthas BA. Read the scale to the nearest 2 millimetres.
f Write down your answer on page R3.
Your teacher will record the class results and give themto you. You will need them for the next section.
g Copy the class results on page R3.
Experiment 2
Slide i
c Pull the slide until you think CD is the same lengthas AB. Read the scale to the nearest 2 millimetres.
d Write down your answer on page R3.
10 11

We can put the pupils in order by looking at theiranswers. The two pupils who said 11'4 em arenumbered I and 2. No pupils said 11'6 em, so the eightpupils who said 11'8 em are numbered 3 to 10' and soon.
These figures are shown in the third column ofTable 6.
C3
Figure 3
A Diagram
A diagram can help to interpret the figures in Table 4.Look at Figure 3.
Class 2J: Results of experiment 1
ReadingPupils numbered(to nearest 2 mm) Number of pupils
11 ·4 em 2 1 to 211·6 em 011·8 em 8 3 to 1012·0 em 7 11 to 1712·2 em 4 18 to 2112·4 em 4 22 to 2512·6 em 012·8em 4 26 to 29
No. of>- pupils
l-
Ie
I
2
4
6
8
o
10Class 2J: Results of experiment 1Table 6
The Mean
In your experiments everyone recorded lengths. There.were probably several different answers. We can findthe 'average' length estimated by the class. This is calledthe MEAN length.
Notice that:
The bars touch.The bar for 11'8 em goes from 11'7 to 11'9 em. This isbecause any length between 11'7 and 11'9, read to thenearest 2 mm, is 11'8 em.
a Choose one of the experiments your class did.
llIustrate the results on a diagram like Figure 3.
Pupil number 15 (the 'middle' pupil) said 12'0 em. Themedian is 12'0 em.
In Class 2J there is an odd number of pupils (29), sothere is one middle pupil (the 15th). With an evennumber of pupils there will be two in the middle. Themedian is then taken as the mean of their two answers.For example:
Suppose another pupiljoined Class 2J, and his answerto experiment I was 12'8 em. Then, of the 30 pupils,numbers 15 and 16 are the middle ones. Their answersare both 12'0 em, so the median ist(12'O + 12'0) em =12'0 em.
a What is the mode for Class 2J in experiment I?
b For experiments 1,2 and 3, draw a table like Table 6to show your class results.
c Calculate the median.
d Write down the mode.
C4
IIA 11·8 120 122Length(cm)
124
12 13

Reading in em Number of pupils Part totals in em
11-4 2 (11-4 x 2) 22-811 -6 0 011 -8 8 (11-8 x 8) 94-412-0 7 84-012-2 4 48-812-4 4 49-612-6 0 012-8 4 51 -2
Total 29 350-8
Table 7
14
One way to find the mean is to add all the individnalpupil readings and then divide by the number of pupils_For example:
If five pupils had separate readings of 11-0 em, 11-4 em,12-2 em, 11-6 em and 11-4 em, the mean would be:
(11-0 + 11-4 + 12-2 + 11-6 + 11-4) -7- 5 (the number ofpupils)
So in this case the mean would be 5~-6 em =II-52 em_
(This is 11-5 em to 1 decimal place_)
This method will give the correct answer, but takesquite a longtime if there are many pupils_ An easier andquicker way is to use multiplication to help theaddition_ Look at Table 7_
The two pupils' readings of 11-4 em add up to 22-8 em(11-4 em x 2)_
The eight pupils' readings of 11-8 em add up to 94-4em (11-8 em x 8); and so on_
The total of all the class readings is 350'8 em_
So the mean is 3;~-8 em = 12-1 em to I decimal place_
Class 2J: Experiment 1
a Find the class mean of one of your threeexperiments.
*b Find the class mean of each of the other twoexperiments.
c In illusion 1, Section B, the answers were 'line P','line Q', 'line R' and 'line S'. Why can't you find aclass mean for these answers?
d Copy the summary given below.
Summary
We have used three different ways to find one figure torepresent the class answers:
MODE: This is the answer given by the greatestnumber of pupils_
MEDIAN: Thisis the answer chosen by the middle pupilwhen the pupils' answers are put in thecorrect order_
MEAN: This is found by adding all the answers andthen dividing by the number of pupils_
None of these answers is necessarily the correct one_
C5 How Right Are You?
It is unlikely that everybody had the correct answer toany of the experiments_ If they did, the experiment wasnot very effective! But how near to the correct answerdid you get"
Class 2J found the accurate answer to their experiment 1_ It was 12-4 em_ Only five pupils had the correctanswer. Twenty-five pupils had answers which weretoo low_
The class median was 12-0 em_ This was not exactlyright.
15

Reading Error No. of Part totals Pupils(em) (em) pupils of errors numbered
11 -4 -1·0 2 -2·0 1 and 211 ·6 -0·8 0 011 ·8 -0·6 8 -4·8 3 to 1012·0 -0-4 7 -2·8 11t01712·2 -0·2 4 -0·8 18 to 2112·4 0 4 0 22 to 2512·6 0·2 0 012·8 0-4 4 1 ·6 26 to 29
Total 29 -8·8
'C6
16
Using the median as the class answer, we can say thatthe class error was:12'4 em - 12'0 em = 0'4 em
The class mean was 12'1 em. This was not exactly right.Using the mean as the class answer, we can say the classerror was:12'4 em - 12'1 em =0'3 em
Ask your teacher for the correct answer to each of thethree experiments. Answer questions a to e for eachexperiment.
a How many pupils were right?b How many pupils had answers that were too low?
*c If you drew a diagram in Section C3, mark thecorrect answer on it.
d Calculate your class error using the median.
e Calculate your class error using the mean. (Yourteacher will tell you the class mean ifyou did not doC4b.)
f Using the median, which experiment gave thelargest class error?
g Using the mean, which experiment gave the largestclass error?
A Closer Look
Table 8 shows the errors In Class 21's answers toexperiment I.
Errors are measured from the true length of 12'4 em.They are found by taking 12'4 em from each answer.
Answers below 12'4 em give negative errors.Answers above 12'4 em give positive errors.
Table 8 Class 2J: Errors In results ofexperiment 1
Correct answer = 12·4 em
An error of 0 means the answer was correct, i.e. noerror.
An error of -4 mm is twice the error of -2 mm.
We can find the mode, median and mean of theseerrors.
We can also draw diagrams.
For Class 2J:
The median error was -0'4 em (the error of the'middle' pupil number 15).
The mean error was - 8'8 em = -0'3 em29
Draw a blank table like Table 8. Put in the results ofone of your experiments.
a Fill in the last two columns.
b Find the mean error. Compare it with the meanerror in Section C5. What do you notice?
c Find the median error. Compare it with the medianerror in Section C5. What do you notice?
17

*[) What Scale? Your teacher will explain this flow chart to you. It willhelp you to say which scale you are using.
Throughout this unit you have been looking atillusions and experiments. Did you notice that youhave had different types ofanswer? We say the answersare measured on different SCALES. In illusion 7 you wereeitherright or wrong. When making a table of results, itdoes not matter which order you put these two answersin. Another example where order does not matter is inlisting pupils' favourite sports. It would not matter ifyou put the answers in the order 'soccer, cricket, tennis'or 'tennis, soccer, cricket'. When the order does notmatter, we have a NOMINAL scale. Since there is nocorrect order we can calculate a mode but not a medianOr a mean.
Look atthe values
of yourvariable
Is therea proper
order?
NO
Type ofscale
Nominal
You canfind:
Mode
Example
Favourite pet
18
In illusion 6 there was a proper order. The lines wereput in order of length. But the difference between linesEF and AB was not the same as that between AB andGH. The order was important, but the answers werenot equally spaced. In this case we have an ORDINAL
scale. With an ordinal scale we can find modes andmedians, but no t means.
When you did the experiments in Cl, you measuredyour answers to the nearest 2 mm. The answers can beput in order of length, and every 2 mm interval is thesame length. On the other hand, an answer of0 mmdidnot mean that you had made no mistake. This is anexample of an INTERVAL scale. With an interval scalewe can find modes, medians and means.
In Section C6 you measured errors to the nearest 2mm.The errors can be put in order oflength. Every 2 mm isthe same length, and an error of 0 mm means that therewas no mistake. An error of 12 mm is twice the error of6 mm. These measurements are on a RATIO scale. Witha ratio scale we can find modes, medians and means.We can also divide two answers to find how muchbigger one is than the other.
YES
Are thedifferences
betweensuccessivevalues allthe same?
YES
Does zeroreally mean
nothing?
YES
NOInterval
Ratio
ModeMedian
Mode,MedianMean
Mode,MedianMean
Mathematicalability usingthe scale:very poor,poor.average,good.very good
Temperaturein °C
Weight
19

20
Some of these statements must be wrong. Say whichand give a reason:
a The median game in our class is football.
b The mean age of our class is 12'6 years.c Our baby goes to bed at 4 o'clock. I go at 8 o'clock.
That is twice as late.
d The median number of goals scored by ourfootballteam is 2'3.
e The mean adult shoe size is 6'8.f The mode eye colour in our class is brown.
g The median weight of seven pupils is four.
For each of the following say whether you have anominal, ordinal, interval or ratio scale:
h Children's names j Bedtimesk Songs learned at school I Value of coinsm Heights of children n Rainfallp Temperature 0 C q Adult shoe sizesr Colour ofeyess Goals scored hy football teamst Long-jump distances u Birth dates

Schools Council Project on Statistical EducationThis Project has been based in the Department of Probability and Statistics at the Universityof Sheffield from 1975 to 1980. Its brief was: to assess the present situation of statisticaleducation in schools; to survey the needs of teachers of statistics; to devise detailed proposalsf?f the implementation of the teaching ideas; and to produce teaching materials.
Project Team
Director: Peter Holmes (1975- )Deputy Director: Neil Rubra (1975-78), Daphne Turner (1978-
Project Officers
Rarnesh Kapadia (1975-79), Alan Graham (1976-77), Barbara Cox (1979-80)
General NotesPages with the prefIx R are resource pages or reference pages for pupil use. (In many casesthey are designed as worksheets.) In the pupil unit these_are referred to as 'page Rl', etc.
Permission need not be sought to reproduce copies of the R sheets provided that copies aremade only in the educational establishment in which they are to be used and that such copiesare not sold. hired or lent to any other indivdual. organization or establishment
Sections or questions marked with an asterisk are optional to the main thrust in the unit.Sometimes they are for the more able pupils. sometimes ,they are for reinforcement and sometimes they consist of simpler work for the less able pupils and lead to an easier conclusionthan the main unit. In each case detailed comments on the particular purpose will be found inthe appropriate section of the teacher's notes.
Three different typefaces are used in the pupil units. Text in roman type (like this) is for pupilsto read or for the teacher to introduce. Questions to promote thought and for group or classdiscussion are printed in italics. Instructions telling pupils to do things and questions forpupils to answer are printed in bold.
Statistics in your world
AUTHORSA Y US
TEACHERS' NOTES
LEVEL 2
Published for the Schools Council by
FOUlSHAM EDUCATIONAL

Contents
Brief Description
Aims and Objectives
Prerequisites
Equipment and Planning
Detailed NotesSection ASection BSection CSection D
Summary Statistics
Test QuestionsAnswers
Connections with OtherUnits in the Project
R pages on pages 14-29
Page3
3
3
3
4567
8
911
30
Brief DescriptionThe unit encourages pupils to look for patterns in word length, sentencelength, and summary statistics among different passages from the sameauthor and between different authors, to establish which two of threepassages are by the same author.
Design time: 3-4 hours
Aims and ObjectivesOn completion of the unit pupils should have an appreciation of how thesummary statistics can be used in inference, in particular as clues toauthorship. They will have practised summarizing data in tables, includingusing class intervals, calculating a mean from raw data, drawing bar chartsand identifying the mode or modal class. They will also have used simpleproportions and the range, and will be expected to compare such summarystatistics obtained from different sources.
They should be more aware of the effects of extreme values in thecalculation of the mean through the effect of short sentences as used indirect speech. Optional sections include the calculation of the mean fromgrouped data and with the use of the mid-point ofan interval. Comparisonof the accuracy of the means calculated in different ways is also mentioned.
AcknowledgementsThe pUblishers and Project team gratefully extend theirthanks to Faber and Faber for granting permission to quoteextracts from The Lord of the Flies and The Spire: and toThomas Nelson & Sons for granting permission to quotefrom Prester John.
Schools Council Project on Statistical Education
Published byW. Foulsham & Co. Ltd., Yeavil Road, Slough, Berks
@ Schools Council Publications 1981
ISBN 0-572-01100-8
PRINTED IN HONG KONG
PrerequisitesThere are no statistical prerequisites. Pupils need to be able to use simpleproportions and correct numbers to 1 decimal place.
Equipment and PlanningThe unit is flexible in use. Initially pupils are guided through the analysis ofthe given passage A, and are expected to analyse a passage 30 sentenceslong of their own choosing. This can be passage B, or another one takenfrom a reading book, or one of their own essays. The use of individualpassages provides variety and plenty ofdata for comparison, but is difficultto mark.
Care is needed in drawing conclusions from passages containing a greatdeal ofdirect speech, since this increases the proportion ofshort sentences.Contrasts can usefully be drawn between books read by first-year pupils
. and those read by adults, or books written in different centuries.
3
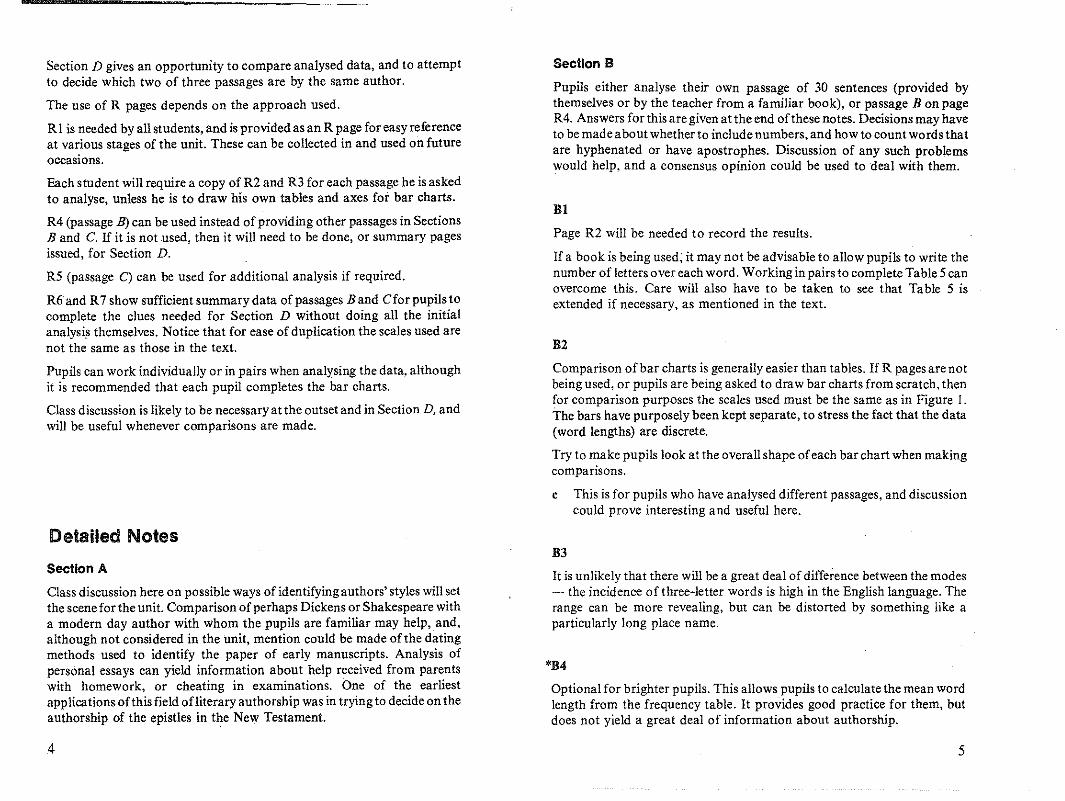
Section D gives an opportunity to compare analysed data, and to attemptto decide which two of three passages are by the same author.
The use of R pages depends on the approach used.
RI is needed by all students, and is provided as an R page for easy referenceat various stages of the unit. These can be collected in and used on futureoccasions.
Each student will require a copy of R2 and R3 for each passage he is askedto analyse, unless he is to draw his own tables and axes for bar charts.
R4 (passage lJ) can be used instead of providing other passages in SectionsBand C. If it is not used, then it will need to be done, or summary pagesissued, for Section D.
R5 (passage C) can be used for additional analysis if required.
R6and R7 show sufficient summary data of passages Band Cforpupilstocomplete the clues needed for Section D without doing all the initialanalysis themselves. Notice that for ease of duplication the scales used arenot the same as those in the text.
Pupils can work individually or in pairs when analysing the data, althoughit is recommended that each pupil completes the bar charts.
Class discussion is likely to be necessary at the outset and in Section D, andwill be useful whenever comparisons are made.
Detailed Notes
Seelion A
Class discussion here on possible ways of identifying authors' styles will setthe scene for the unit. Comparison of perhaps Dickens or Shakespeare witha modern day author with whom the pupils are familiar may help, and,although not considered in the unit, mention could be made of the datingmethods used to identify the paper of early manuscripts. Analysis ofpersonal essays can yield information about help received from parentswith homework, or cheating in examinations. One of the earliestapplications ofthis field ofliterary authorship was in trying to decide on theauthorship of the epistles in the New Testament.
4
Seelion B
Pupils either analyse their own passage of 30 sentences (provided bythemselves or by the teacher from a familiar book), or passage B on pageR4. Answers for this are given at the end ofthese notes. Decisions may haveto be made about whether to include numbers, and how to count words thatare hyphenated or have apostrophes. Discussion of any such problemswould help, and a conseusus opinion could be used to deal with them.
BI
Page R2 will be needed to record the results.
If a book is beiug used; it may not be advisable to allow pupils to write thenumber of letters over each word. Working in pairs to complete Table 5 canovercome this. Care will also have to be taken to see that Table 5 isextended if necessary, as mentioned in the text.
B2
Comparison ofbar charts is generally easier than tables. If R pages are notbeing used, or pupils are being asked to draw bar charts from scratch, thenfor comparison purposes the scales used must be the same as in Figure I.The bars have purposely been kept separate, to stress the fact that the data(word lengths) are discrete.
Try to make pupils look at the overall shape ofeach bar chart when makingcomparisons.
c This is for pupils who have analysed different passages, and discussioncould prove interesting and useful here.
B3
It is unlikely that there will be a great deal of difference between the modes- the incidence of three-letter words is high in the English langnage. Therange can be more revealiug, but can be distorted by something like aparticularly long place name.
*B4
Optional for brighter pupils. This allows pupils to calculate the mean wordlength from the frequency table. It provides good practice for them, butdoes not yield a great deal of information about authorship.
5

BS
Since the mode and, to some extent, the range are not necessarily gooddiscriminators, proportions are sometimes used. Again the pupils shouldbe warned to look out for possible distortions due to the repeated use ofaparticular word.
Nevertheless, comparisons provide interestiug results, particularly if the:~
pupils have analysed different passages. The use of 100 words in eaqh'"passage makes the comparisons easier.
Section C
Sentence length is usually more helpful in the analysis of literary style thanword length·, but difficulties cau arise if the passage contaius much directspeech.
CI
It is easier if this is done in pairs, with one person counting the number ofwords and the other recording the results.
It is recommended that the individual sentence lengths be recorded to assistin the calculation of the mean and the range.
Pupils are then expected to find the range and the modal class, andcompare them with those for passage A. Care will have to be taken indeciding the mode if any additional figures have been more convenientlygrouped into an interval of width greater than five.
'C4An opportunity exists here for brighter pupils to calculate the mean from agrouped frequency table. Explanation may be necessary of how to find themid-point of the class interval, why this is necessary, and the implicationsof using it.
b 14·0 is from the original raw data. Some accuracy has been lost ingrouping the data.
c Calculations may have to be based on a grouped frequency table whenthe raw data are not available or are too unwieldly to handle.
CS
Proportions oflong and short sentences are considered to be one of the bestclues to authorship. Indeed, some authors repeatedly use such longsentences that this is often a good place to start an investigation.
Comparison of books written in the 19th century with those of the 20thcentury show a marked difference in sentence length proportions.
Section D
The approach here depends on what has been done before, but it gives thepupils a chance to practise the techniques at the same time as trying toidentify authorship. Item 4, 'Mean word length', has an asterisk, since theequivalent section earlier in the unit (B4) was also denoted as bemgoptional for brighter pupils.
This is best done using a calculator to add up the number of words persentence already listed. Some may prefer to count the individual words inthe passage. Comparison ofmean sentence lengths for descriptive passagescau be very revealing.
C2
Bars have again been kept separate because of the use of discrete data. Ifthe ability of the class is high, there may be a case for introducing theapproximation to continuous data here, using a horizontal axis as shown:
C3
with the bars touching at the marked points.
Ifpassage B has already been analysed in the previous section, then allpupils can analyse passage C (if further practice is required) or use thesummary data on page R7.
Ifpassage B has not been analysed and further practice is required, thenhalf the class can do passage Band the rest passage C. If no further practiceis required, then the summary sheets on pages R6 and R7 will both berequired. These sheets contain enough information for summary statisticsto be calculated.
Pupils should make a check list of the clues meutioned in the summary,insert the relevant answers for each of the three passages (they will need tolook through the unit for the summary statistics for passage A), aud thenlook for similarities or differences. Mention should be made of the use ofdirect speech in passages A and C.
Dl
15·510·55·50·5
6 7

Summary Statistics
Words PassageS Passage C
Mode 3 letters 3 lettersRange 10 letters 10 lettersMean 3·9 letters 4·5 lettersProportion of long
words (8 or more) 3/100 1/100Proportion of short
words (3 or less) 49/100 39/100
Sentences PassageS Passage C
Mode 16-20 words 1-5 wordsRange 33 words 34 wordsMean 20 words 10·5 wordsProportion of long
sentences (26 or more) 6/30 2/30Proportion of short
sentences (5 or less) 0/30 10/30(influencedby directspeech)
The passages are taken from:
Passage AThe Lord of the Flies by William Golding (Faber and Faber)
Passage BPrester John by John Buchan (Thomas Neison & Sons)
Passage C'The Spire by William Golding (Faber and Faber)
Test Questions
Answer all questions on the sheet provided (R8).
1 Word lengthTable I shows the number ofletters in thefirst 100 words of a,passagefrom a novel.
Table 1
Word length Number of words
1 92 203 244 195 86 97 48 59 0
10 011 012 113 1
Total 100
a Use this information to complete the bar chart on the answer sheet.Give the chart a title and label the axes.
b Find:I the mode of word lengths,2 the range of word lengths;3 the proportion of long words (8 or more letters),4 the proportion of short words (3 letters or less),
and record your answers in the appropriate spaces on theanswer sheet.
8
2 Sentence lengthThe number of words in the first 30 sentences of the passage were:
13, 7, 31, 9, 15, 22, 12, 14, 6, 355, 25, 14, 18, 33, 20, 5, 11, 13, 16
10, 10, 5, 30, 6, 22, 18, 22, 6, 8
a Use tally marks to complete Table 2 on the answer sheet and draw abar chart on the axes provided.
9

Answers
no'
,
, ..... ',ii.':,;...
,', " .. : ~,,,'
, ':'".
12 1310 II
".
- ...... '
9
"r0~"e,,:=.,~,'..·,,':,', ""':l loc' ,,':e:..."'ie:.:'"''co
,,-
765
Word length -no. of letters
, '.
.
, ..
,,'
4
I
I
. ,..F" .' >'
" -
. i", . '
I
b I Mode of word lengths = 3 letters2 Range of word lengths = 12 letters3 Proportion of long words =7/1004 Proportion of short words = 53/ 100
Mean is not asked for, but if calculated gives 3'8 letters.
Sentence lengths
a See Table 2 and bar chart overleaf.
2
Preliminary requirementsTo complete this test each pupil will require:
(i) A copy of the test questions.(ii) A copy of the test answer sheet on page R8, unless they are to draw the
tables and diagrams for themselves.(iii) Access to pages R6 and R7 that were used with the unit.
1 Word lengths
a Bar chart showing length of 100 words
5
30 I .
I' : 'I' ·c....25
..20 I···"
15 .n.o _on. ':" •
I no n ,"_.
10 r- I.....,1 I
I IIn I.,.2
b Find:1 the modal class,2 the range of sentence lengths,3 the mean sentence length,4 the proportion of long sentences (26 words or more),5 the proportion of short sentences (5 words or less).
3 Which author?
You will need pages R6 and R7 and the summary statistics below toprovide the information for this question.
The author of the passage used in this test wrote either passage Barpassage C.
a Use your answers to the test questions and the information youhave been given to decide which passage the author wrote.Write your answers on the reverse side of the answer sheet,stating your reasons.
Summary Statistics
Passage B Passage C
WordsMode 3 letters 3 lettersRange 10 letters 10 lettersMean 3·9 letters 4·5 lettersProportion of long
words (8 or more) 3/100 1/100Proportion of short
words (3 or less) 49/100 39/100
SentencesMode 16-20 words 1-5 wordsRange 33 words 34 wordsMean 20 words 10·5 wordsProportion of long
sentences (26 or more) 6/30 2/30Proportion of short
sentences (5 or less) 0/30 10/30(influencedby directspeech)
10 11

12
· Table 2
Sentence Tally marks Number oflength sentences
1- 5 III 3
6-10 J,H{ III 8
11-15 )ill II 7
16-20 1111 4
21-25 1111 4
26-30 I 1
31-35 III 3
I Total 30
Bar chart showing lengths of 30 sentences
1-5 6-10 11-15 16-20 21-25 26-30 31-35Sentence length - no. of words
b I Modal class is 6-10 words.2 Range of sentence length is 30 words.3 Mean sentence length is 15·4 words (from original data);
15·2 words (from grouped frequency table).4 Proportions of long sentences is 4/30.5 Proportions of short sentences is 3/30
3 The test passage is from Free Fall by William Golding, hence thecorrect answer is passage C.
Comparison of word lengths may lead pupils to conclude passage B isby the same author as the test passage. The work covered in the unitshould, however, make them doubt the use of word lengths as a goodindicator.
Comparisons of the bar charts of sentence lengths shows a reasonablesimilarity between passage C and the test passage.
(Text continued after the R pages)
13

R1
PASSAGE A
After' they4 had' eaten' Ralph' and' the' biguns' set' out' along' the'
beach'. They' left4 Piggy' propped' up' on' the' platform'. This4 day'
promised', like4 the'others', to' be'a1sunbath' under' a 1 blue' dome4• The'
beach' stretched' awaY' before' them' in' a 1 gentle' curve' till'
perspective! I drew4 it2 into4 oneJ with4 the3 forest6; for3 the3 day3 was3 not3
advanced' enough' to' be' obscured' by' the' shifting' veils' of' mirage'.
Under' Ralph's' direction', they' picked' a 1careful' way' along' the' palm4
terrace', rather' than' dare' the' hot' sand' down4 by' the' water'. He'let'
Jack'lead' the' way', and' Jack'i trod with theatrical caution though they
could have seen an enemy twenty yards away. Ralph walked in the rear,
thankful to have escaped responsibility for a time.
Simon, walking in front of Ralph, felt a Dicker of incredulity - a beast
with claws that scratched, that sat on a mountain-top, that left no tracks
and yet was not fast enough to catch Samneric. However Simon thought of
the beast, there rose before his inward sight the picture of a human at once
heroic and sick.
He sighed. Other people could stand up and speak to an assembly,
apparently, without that dreadful feeling of the pressure of personality;
could say what they would as though they were speaking to only one
person. He stepped aside and looked back. Ralph was coming along,
14
holding his spear over his shoulder. Diffidently, Simon allowed his pace to
slacken until he was walking side by side with Ralph and looking up at him
through the coarse black hair that fell now to his eyes. Ralph glanced
sideways, smiled constrainedly as though he had forgotten that Simon had
made a fool of himself, then looked away again at nothing. For a moment
or two Simon was happy to be accepted and then he ceased to think about
himself. When he bashed into a tree Ralph looked sideways impatiently
and Robert sniggered. Simon reeled and a white spot on his forehead
turned red and trickled. Ralph dismissed Simon and returned to his
personal hell. They would reach the castle some time; and the chief would
have to go forward.
Jack came trotting back.
'We're in sight now:
'All right. We'll get as close as we can.'
He followed Jack towards the castle where the ground rose slightly. On
their left was an impenetrable tangle of creepers and trees.
'Why couldn't there be something in that?'
'Because you can see. Nothing goes in or out.'
'What about the castle then?'
© Schools Council Publications 1981
15

'"@
en":T00iF(")0c::>""c:2:o'Ol~
0':>
'"~'"(Xl~
........ v ~ .
Table 5 Word lengths of 100 words
Word Tally marks Numberlength of words
1 .
2
3
4
5
6
7
8
9
10
11
12
I Total 100
Figure 3 Bar chart of word lengths
-~, '--
-+ 'i ',' !,II . "H-j
" !. ' .i. r i,i' 1·+ ...• j.. r: HTi \ I
•• '....i' "Hi ·i
'i i'"
i'
ii IiT
'j .- iT' ..•.L 'j- .
I,
'. ..li
"
,
iF,,
"I Ii ..
"" , ....• ,1 ii IiI
H
"i'., j ',
•
'Ii iT.
"'.)
',' li 1; .. ,,iiL,
" U
.... : i'·.··'j i.
,,- I,
,"" t." ..j ii, -,''iI'l, " iii
letters, longest word had-->
25
20
15
10
5
Mode
Range
2 3 4 5 6 7
Word length - no of letters
letters. Shortest word had
letters = letters.
8 9 10 II .12
letters.

~ Passage used: Individual sentence lengths:
Table 6 Sentence lengths of 30 sentences
Class interval: Number ofSentence length Tally marks sentences(number of words)
1- 5
6-10
11-15
16-20
21-25
26-30"
31-35
36-40
41-45
Figure 4 Bar chart of sentence lengths
'0
12
II
10
.9
8
7
6
5
4
3
2
I~' ,f')!; :: • ' i,' ',', ";'i;';"i.:'::'" i I: ',:"i:1:\iii :, :"I~ I: ,'" 'I,' ',i :,' I i.'1 'i

R4
PASSAGE B
To' begin' with4 , it' was' no light task to fight one's way through the
dense undergrowth ofthe lower slopes. Every kind ofthom bush lay in wait
for my skin, creepers tripped me up, high trees shut out the light, and I was
'in mortal fear lest a black mamba might appear out of the tangle. It grew
very hot, and screes above the thicket were blistering to the touch. My
tongue, too, stuck to the roof of my mouth with thirst.
The first chimney I tried ran out on the face into nothingness, and I had
to make a dangerous descent. The second was a deep gully, but so choked
with rubble that after nearly braining myself I desisted. Still going
eastwards, I found a sloping ledge which took me to a platform from which
ran a crack with a little tree growing in it. My glass showed me that beyond
this tree the crack broadened into a clearly defined chimney which led to the
top. If I can once reach that tree, I thought, the battle is won.
The crack was only a few inches wide, large enough to let in an arm and a
foot, and it ran slant-wise up a perpendicular rock. I do not think I realised
how bad it was till I had gone too far to return. Then my foot jammed, and I
paused for breath with my legs and arms cramping rapidly. I remember that
I looked to the west, and saw through the sweat which kept dropping into
my eyes that about half a mile off a piece of cliff which looked unbroken
from the foot had a fold in it to the right. The darkness ofthe fold showed
me thatit was a deep, narrow gully. However, I had no time to think ofthis,
20
for I was fast in the middle of my confounded crack. With immense labour I
found a chockstone above my head, and managed to force my foot free.
The next few yards were not so difficult, and then I stuck once more.
For the crack suddenly grew shallow as the cliff bulged out above me. I
had almost given up hope, when I saw that about three feet above my head
grew the tree. If I could reach it and swing out I might hope to pull myself
up to the ledge on which it grew. I confess it needed all my courage, for I did
not know but that the tree might be loose, and that it and I might go rattling
down four hundred feet. It was my only hope, however, so I set my teeth,
and wriggling up a few inches, made a grab at it. Thank God it held, and
with a great effort I pulled my shoulder over the ledge, and breathed freely.
My difficulties were not ended, but the worst was past. The rest of the
gully gave me good and safe climbing, and presently a very limp and weary
figure lay on the cliff"top. It took me many minutes to get back my breath
and to conquer the faintness which seized me as soon as the need for
exertion was over.When I scrambled to my feet and looked round, I saw a wonderful
prospect. It was a plateau like the high-veld, only covered with bracken and
little bushes like hazels. Three or four miles off the ground rose, and a
Shallow vale opened. But in the foreground, half a mile or so distant, a lake
lay gleaming in the sun.
© Schools Council Publications 1981
21

R5
PASSAGE C
One delver relaxed, and smeared a hand over his sweaty face. The other
disappeared from sight and began to make grunting noises. The master
builder knelt down quickly, his hands on the edge of a slab, and leaned still
further forward.
'Anything?'
'Nothing, master. Come-hup!'
The man's head appeared and his two hands. He held the ironrod in both
of them, one thumb marking a distance, the other on the shining point. The
master builder inspected the rod slowly from one thumb to the other. He
looked through Jocelin, shaped his lips to whistle but made no sound.
Jocelin understood that he was ignored, and turned away to examine the
nave. He caught sight of the white, noble head of Anselm where he sat two
hundred yards away by the west door, obeying the letter ofhis instructions,
but out of earshot and ahnost out of sight. Jocelin felt a sudden return of
pain that the man should look like one thing and behave like another; a
touch of astonishment t00, and incredulity. If he wants to behave like a
child, let him sit there till he grows to the stone! I shall say nothing.
He turned back to the master builder, and this time knew himself to be
recognised.
22
'Well Roger my son?'The master builder straightened up, knocked the dust from his knees,
then brushed it from his hands. The delvers were at work again, scrape,
chunk.'Did you understand what you saw, reverend fatherT
'Only that the legends are true. But then; legends are always true.'
'You priests pick and choose.'
You priests.I must be careful not to anger him, he thought. As long as he does what I
want, let him say what he likes.'Confess, my son. I told you the building was a miracle and you would
not believe me. Now your eyes have seen.'
© Schools Council Publications 1981
23
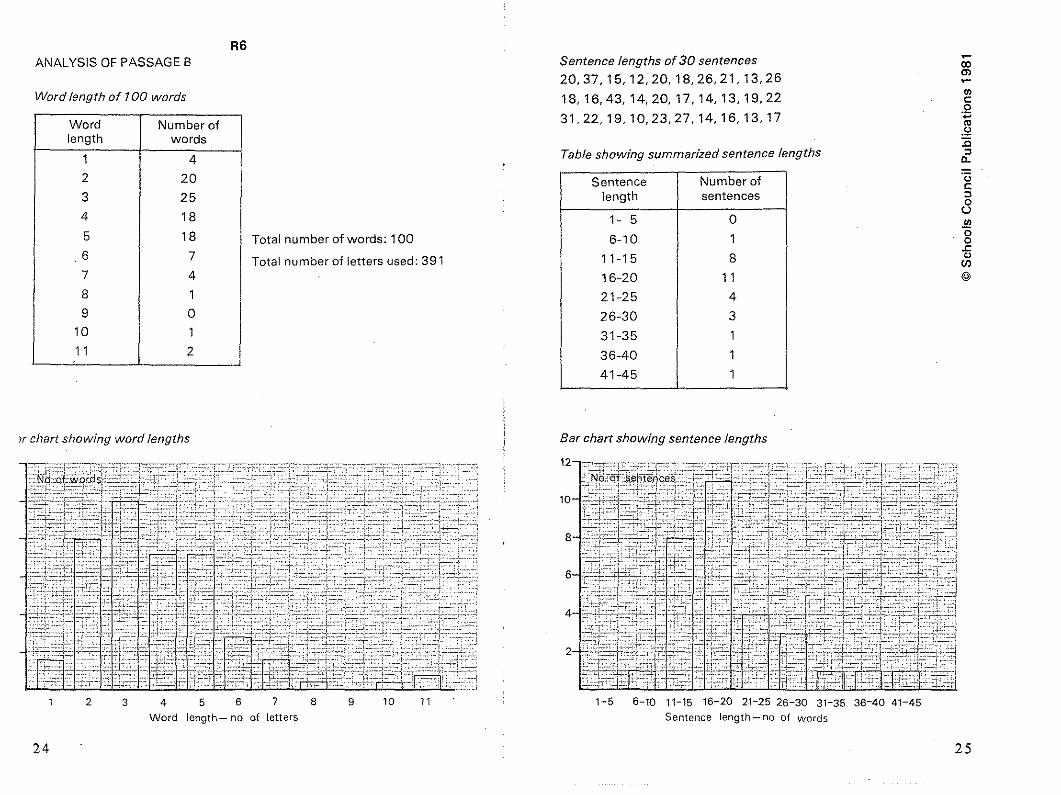
R6ANALYSIS OF PASSAGE B
Word length of 700 words
Word Number oflength words
1 42 20
3 25
4 18
5 18
6 7
7 4
8 1
9 °10 1
11 2
Total number of words: 100
Total number of letters used: 391
Sentence lengths of 30 sentences
20,37,15,12,20,18,26,21,13,26
18,16,43,14,20,17,14,13,19,22
31,22,19,10,23,27,14,16,13,17
Table showing summarized sentence lengths
Sentence Number oflength sentences
1- 5 °6-10 1
11-15 8
16-20 11
21-25 4
26-30 3
31-35 1
36-40 1
41-45 1
Ulc.2CO.\1:0:::l
0.
'0C:::l
<3.!!!.oo.cCJ
CIl©
]{ chart showing word lengths Bar chart showing sentence lengths
-- ~-.'.~<,='
--" ,"'_:-
"CO ~~~~~
~: ,..~
6-10 11-15 16-20 21-25 26-30 31-35 36-40 41-45
Sentence length - no of words
12
10
8-~
6
4,-'?:
2.~,
c;~,--
::1-511
,,-"'~~ "
<~~-
'~~- .~',~'-, , ~~
-',
~ ,~-
10
~~,~ ~- ~
9
~ -, ',-~
Ef~ Ii- ~
3 4 5 6 7 8Word length - no. of letters
d
2
24 25
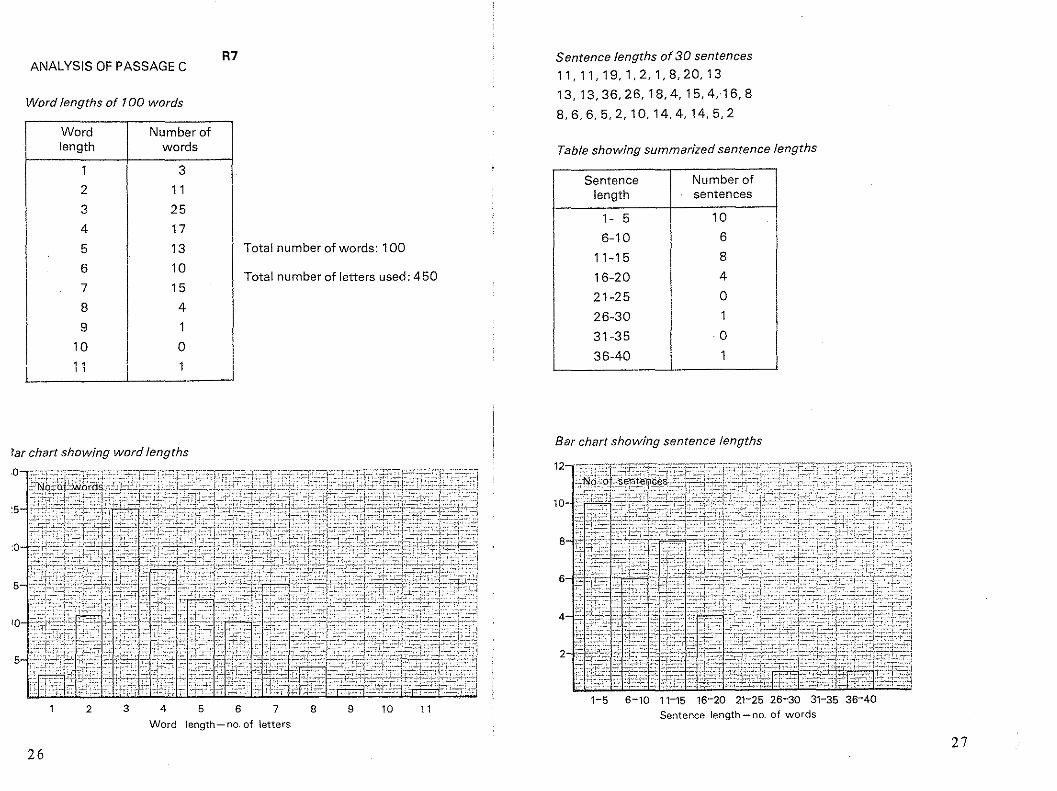
ANALYSIS OF PASSAGE C
Word lengths of 100 words
R7
Word Number oflength words
1 3
2 11
3 25
4 17
5 13
6 10
7 15
8 4
9 1
10 01 • 1, I
Total number of words: 100
Total number of letters used: 450
Sentence lengths of30 sentences
11,11,19,1,2, 1,8,20, 13
13,13,36,26,18,4,15,4"16,8
8,6,6,5,2,10,14,4,14,5,2
Table showing summarized sentence lengths
Sentence Number oflength sentences
1- 5 10
6-10 6
11-15 8
16-20 4
21-25 0
26-30 1
31-35 0
36-40 1
27
;'"_e ;'::_..~ ; icC :.e ',' ;c (:'.:ecl'" ;" C;-"
-, .. ': " ,'-; --,..,C;-',- '" - ..:'''' j
"" , - ;'"
""" ::= '-, co·', "
I~, ' ,:' ,
L-' .:'," "
., i ..
-'::..
_,e:,::",~;~,;ee' " ,
IJ~~~;J
... r:f 21-5 6-10 11-15 16-20 21-25 26-30 31-35 36-40
Sentence length-no. of words
2
6
8
4
Bar chart showing sentenca lengths
12
10
111093 4 5 6 7 8Word length - no. of letters
2
26
5
I~ ~~of(C',' L,' 'TC
,,'
5:C.. " "'-
:" ; _,' C;~ -cc-' ,,"- _c;, ' "
,;' ;,T C' '
,,-
,-' :::.r,
cc' I''::·: ::; ~, lc;·: ,- ' ,.;
I.: = ':': .'c-' CC" ',,,- .', ,"c. :,,";."
,,,;'" "c, C', ;,_: - -,eeF
,C- ',=,,',.,;.--' "~,. ee-
L:==---=: .:c
I "I' c:"
'.:e' :.,-
5
lar chart showing word lengths
,0
'a
10

tv00
TEST ANSWER SHEET
1 Word lengths
Name:
a 30"1f?ffff!:TT:IT
20
15
65432
1O:~IIII~illllllilllllllilllfi1[~~II~I!I~:I:II!~I;li[~1il1111,I5 'i
b 1 Mode of word lengths
2 Range of word lengths =
3 Proportion of long words
4 Proportion of short words =
letters
letters
2 Sentence lengths
a Table 2
Sentence Tally marks Number oflength sentences
1- 5
6-10
11-15
16-20
21-25,
26-30
31-35
I Total 30
12, I;H:H' lrfl~~jilllflif~ID~I~_~illtl,~11o-l+ifiV,tHi
4
2l1liII1II111-5 6-10 11-15
b 1 Modal class is words.
2 Range of sentence lengths is
3 Mean sentence length is
4 Proportion of long sentences is
5 Proportion of short sentences is
words.
words.
tv\0 3 Record your decision, giving reasons, on the reverse of this sheet.
© Schools Council Publications 1981

Connections with Other' Pubiished Units fromthe Project $
"0- ~ "" 0$ $ ~
$
Other Units at the Same Level (Level 2) ;ea. 3roo> ro 0>:2:£:::: :;: u: >-On the Ball Seeing is Believing Fair Play c >- 0 C >- rooc.~ 0 $ a:
Opinion Matters Getting it Right 'c .;:;;:::; 'c c.S ._ :; 0- '0. 0 "" 82~
-" .~
$ ° a. ~
::sUnits at Other Levels In the Same or Allied Areas of the Curriculum c
'"« .SLevel3 Multiplying People Pupil Poll 0> $ 0>
" c 0- c
Phoney Figures -"$ "
0"
-"$ ::s .~ $ .~0>" "
a.
".- " cOCo> "' 0> "'>.<::: u: -"! "=c
.~This unit is particularly relevant to: English, Humanities, Mathematics. >- « .- 0 's:.ro 0> >- ro 0> a. 0- 0>
- C $ a: c_ cCL._ .c: ::E... :::: 0 'ii) '5. .~
'il) Q.l .c .;;;$ " " $
Interconnections between Concepts and Techniques Used In these ~<9a. ~ Ula. :;: Ul
Units
These are detailed in the following table. The code number in the left-hand ·s 0> $ $ 0> 0> 0> $C
" 0-0-
c c c 0-
column refers to the items spelled out in more detail in Chapter 5 of " " " " "$ "_ 0
0 1" 0u .~ $ -" $ $ .~ .~ .~ $
Teaching Statistics II-l6.· .g " - o>a. a. " " "0> a.
"' ttl a: 0> =0> "' "' "' ::::0: 0>g.~
:;:_c ro c"= .~ .~
ro_ cc ';;2- 0 co':;' .- 0 "' .- ~An item mentioned under Statistical Prerequisites needs to be covered .s 0> a. $0- 0> a. 0> 0> $g' C.
Co c c.
'SE c_ c c £'B 'Pbefore this unit is taught. Units which introduce this idea or technique are .~ :S'E~ ~ 'iii '5. .~ .~
"3$ g~2 " c " $ " '" m c $
listed alongside. Ul a. 0:;: Ula. Ul Ul 0<9 :;:
An item mentioned under Idea or Technique Used is not specificallyintroduced or necessarily pointed out as such in the unit. There may be one c "0 $
specific examples of a more general concept. No previous'P :0
or more ro " 1')"3 $
experience is necessary with these items before teaching the unit, but more • " c. u >-0 .g 0$ ~ c
practice can be obtained before or afterwards by using the other units listed.", ::s c..~ '0 g $
ro "~ • $ C'in the two columns alongside. "" ~ " c .s $ ro
~ ." '0 ~ ~ '"c '0 ::t~ $ "An item mentioned under Idea or Technique Introduced occurs specifically -c ." :0
*'0
0 C
" C ro "in the unit and, if a technique, there will be specific detailed instruction for .. ,::: 0 -c 'c '0 " 1;;.g 'fJ ~ 0 ro $0 l'!a ,::: > " "carrying it out. Further practice and reinforcement can be carried out by .~
0
" ~ c ro ro• ro '" - $
~'0
"'" ~ " ." E 0 0> 0 $
using the other units listed alongside. " " c " 0 - '0to '0 ro • ." '0 0 ~
<"! u E ~ " 2 0 "~~ ,g 0> ,g " E "0 c '0 " "0
" 0> 'E " " " ro" " " U'0 E .S 2 ro ro ,g ,g0> $ 0- 0; -" -" $ C ro
$ :0 0 uc c E c "
'0 ro '00 ." e ro 0 ~ ro 0 $ 0
Z :::> a. Ul U "' "' :;: :;: :;:
$ ro 0 ro ro ro $ ro 0 $'0 •
'" '" '" N N -00 N N N '" M '"uz
30 31

w..., CodeNo. Idea or Technique Introduced Also Used;n
3.1f Mean for frequency distribution Seeing is Believing Fair Play
3.2a > Range Phoney Fi€lures
3.2b Fractiles (intuitive)
5a Reading tables Seeing is Believing Opinion Matters Multiplying PeoplePhoney Figures
5e Comparing directly ~omparable data On the Ball
50 Use of a test statistic
55 Comparison of two, samples
5u Inference from bar chart Multiplying People Phoney Figures
"C/l 'C/l~ m C/l ~ U ~3- 3() $: CD ~ ,,~ < _roo CO::O..,..." c :::r ., ~I < en CD
CCD ~~ - 0 CD 0 OCD ~ c-'Co, ~ --I _0 0 ~ "G) -0 :::;. , 0" "::::> CD ,:::J:::J~roCD:::J-· ~O() ~ CD-o _ m m~C/lCD CDCO
CO.-l =cncc (') ~c a rl::J '-kl _C"'m - -hco ~~CD <~ :::J()~- _. > __ ~~m--lO~mrl~::J~o -.~ mm~o enO::Jm=rorom-_.,m
W~~~·ccCD.,~~3·~<.,co::J~m::J·o~~cn~::J~~~·C CD~--I()()C CO~~()_'$:m~~:::J~~,,:::J~ -o~
:r: ~ CD -0 ,,_. _. m ~ -. _. ~ < _. u, CO"::::> --I CDm c- m~=CD~O(Q.,::om"mCD3~mCD ~roIDm
CDrl::J~::Jm o~rocm-.=~< rl3~mCDtTcn.,"mc~-om:::J"-o-'~'CDCOCD--roo CDC/lm-C:::Jro~.,CD,::Jc(')O_::Jom.,~.,ID::JIDC CDo CD.,-·<~CDxccenCD=CDCD:::renenrlen<(Q=cn WrlxencnCDCD
5?::TCD...r+;:j.'
c»'":::sr+2:mmCD::!.CDCIl

Statistics in your world
AUTHORSNONYMOUS
Published for the Schools Council by'
FOUlSHAM EDUCATIONAL

IT
ContentsPage
A Introduction 3
B Word Length 481 Try it Yourself with Numbers 582 Using Bar Charts 683 The Mode and the Range 7
*B4 Mean Word Length 885 Proportions 9
C Sentence Length 10CI Analysing Sentences 10C2 Bar Charts for Sentence Length 12,C3 Mean Sentence Length 13
*C4 Calculating the Mean Again 14CS Comparing Proportions 15
D Summary 15DI Detective Work 16
Some sections are marked with an asterisk*. Your teacher will tellyou wheth.er to try these sections.R Pages Your teacher will provide these for you.
The Schools Council Project on Statistical Education
Published byW. Foulsham & Co. Ltd., YeovU Road, Slough, Berks
Cartoons by Colin Whittock
© Schools CounCil Publications 1981
ISBN 0-572-01073-7
PRINTED IN HONG KONG
A Introduction
a Who wrote Shakespeare's plays?
This is not such a silly question as it might at firstappear, Some people say Shakespeare wasn't cleverenough to write them, Some say they were written byFrancis Bacon,
Several centuries ago two people, Madison andHamilton, wrote some essays about the Americanconstitution, At the time they did not tell other peoplewho wrote which essay,
A few years later they fell out, and there were disputesas to who wrote which essay,
b How can anyone decide?
Statistics can help, and in this unit you will learn howto look for statistical clues,
You will study two passages and see what they can tellus about the way the authors wrote,
You will compare the lengths of the words in eachpassage, You will also compare the lengths of thesentences used, The first passage is analysed for you,The second passage you will do yourself,
3

WEItOME TO
l1ANfAII1~WILGWrH(}Yil~()GIKYtJlW1I?NPR{)8W ILllLlANT'Y$//f.!([)SO(JO((JOCH, d?'!l:'. rOlllL NAVE To j':-.!.!.CIIAI(t;EIT- TI/£Y~ . i't \)Crows To RH'/L ...
. EV4N................ ,._••-, •._._- -4...... -- • .._~_ ..,. THe.-_.-.- -...- - -_.,..._-_.~- .. - SIt;/oIWIlITEI4
Word Tally marks Numberlength of words
1 1111 42 J.Hf J.Hf II 123 J.Hf mr mr J.Hf J.Hf II 274 J.Ilf J.Ilf J.Ilf J.Ilf II 225 J.Ilf J.Hf III 136 J.Ilf 1111 97 J.Ilf 58 J.Ilf I 69 I 1
10 011 I 112 0
Total 100
B
Table 1
4
Word length
You will need passage A on page R I.
The line / marks off the first 100 words. Each of these100 words is marked with the number of letters itcontains.
Table I shows the result of this investigation.
Word lengths of 100 words in passage A
81 Try it Yourself with Numbers
You will need a passage 30 sentences long. Yourteacher will tell you which one to use.
a Put a mark after the first 100 words of the passage.
b Over the top of each word write the number ofletters it contains.
You will now need page R2.
c Fill in the spa:ce at the top ofthe page with details ofthe passage you are using.
d Look at Table 5 on page R2. Have you any wordswith more than 12 letters in your passage? Ifso, usethe blank rows for these, by writing in the number ofletters in the first column.
e Now read each number in turn from your passageand insert a tally mark for each word, against theappropriate number in column 2. Remember thatevery fifth tally mark is drawn across the previousfour to make a gate (.Ill:l).
f Count up the tally marks and complete the thirdcolumn of Table 5. Check that the numbers in thiscolumn add up to 100.
g Compare the word lengths in your passage withthose in passage A. Write two sentences to describewhat you notice.
5

B2 Using BarCharts
Sometimes it is not easy to compare numbers in tables.It is sometimes better to draw a diagram.
Here is a bar chart of the results obtained in Table I.
*c Are they very similar?
Write two sentences to describe what you notice.
'= 25'l'EARf>
The Mode and the Range
Look again at Figure I. You willnotice that the highestcolumn is for words of 3 letters.
We say the MODE is 3 letters.
a What is the mode for your results in Figure 3?
Write the answer in the space provided on R2.
Another useful clue can be the RANGE. This is thedifference between the highest and lowest values.
In Table I the shortest word had I letter, and thelongest word had I I letters.
The range is I I - I letters = 10 letters.
b Fill in the spaces under Figure 3 on page R2 andwork out the range.
Compare your mode and range with those ofpassage A.
c Write down what you notice.
SEIIITE!JCE LENGTHBAR CHART
B3
12II109876543
Word length (No. of letters)
Bar chart of word lengths, passage A
You will need Figure 3 on page R2.
a Draw a bar chart, similar to Figure 1, ofyourresultsin Table 5.
You need to make the horizontal line longer if any ofyour words contain more than 12 letters.
Compare your Figure 3 with Figure I.
b Are they very similar or very different?
Write down what you notice.
Compare your Figure 3 with that of someone who hasanalysed a different passage.
2
No. of words
~
r-
-
~r-
- -
-n - r-I
,-, ,....---,
Figure 1
5
o
10
15
30
20
25
6 7 "·,'I!1;
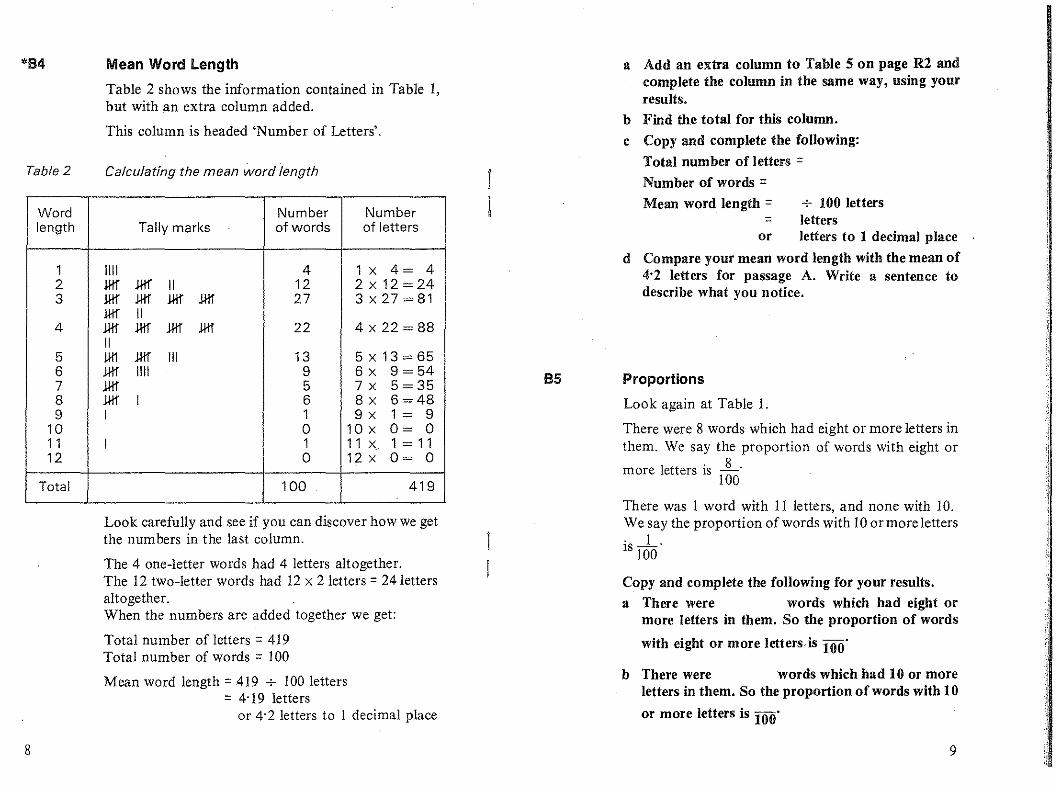
Word Number Numberlength Tally marks of words of letters
1 1111 4 1 x 4= 42 J.Itf J!lf II 12 2 x 12 =243 J.Itf J.Itf J.Itf J.Itf 27 3x27=81
J.Itf II4 J.Itf J.Itf J.Itf J.Itf 22 4 x 22 = 88
II5 lli1 J!lf III 13 5 x 13 = 656 J.Itf 1111 9 6 x 9= 547 J.Itf 5 7 x 5=358 J.Itf I 6 8 x 6=489 I 1 9 x 1 = 9
10 0 10 x 0= 011 I 1 11 x" 1 = 1112 0 12 x 0= 0
Total 100 419
*84
Table 2
8
Mean Word length
Table 2 shows the information contained in Table I,but with an extra column added.
This column is headed 'Number of Letters'.
Calculating the mean word length
Look carefully and see if you can discover how we getthe numbers in the last column.
The 4 one-letter words had 4 letters altogether.The 12 two-letter words had 12 x 2 letters = 24 lettersaltogether.When the numbers are added together we get:
Total number of letters = 419Total number of words = 100
Mean word length =419 + 100 letters= 4'19 letters
or 4'2 letters to I decimal place
a Add an extra column to Table 5 on page R2 andcomplete the column in the same way, using yourresults.
b Find the total for this column.
c Copy and complete the following:
Total number of letters =Number of words =Mean word length = + 100 letters
= lettersor letters to 1 decimal place
d Compare your mean word length with the mean of4'2 letters for passage A. Write a sentence todescribe what you notice.
85 Proportions
Look again at Table I.
There were 8 words which had eight or more letters inthem. We say the proportion of words with eight or
more letters is I~o'
There was I word with 11 letters, and none with 10.We say the proportion of words with 10 ormore letters. 1.IS 100
Copy and complete the following for your results.
a There were words which had eight ormore letters in them. So the proportion of words
with eight or more letters.is 100'
b There were words which had 10 or moreletters in them. So the proportion of words with 10
or more letters is 100'
9

C Sentence length
Analysing Sentences
Look again at passage A on page R 1. The 30 sentencescontain the following number of words:
The shortest sentence contained two words, and thelongest sentence contained 35 words.
Table 3 summarizes these results.
Sentence lengths in passage A
Class interval:Sentence length Tally Number of
(number of words) marks sentences
1- 5 J.Hj II 76-10 J.Hj I 6
11-15 J.Hj III 816-20 I 121-25 1111 426-30 031-35 1111 4
Total 30
b Make a list of the number ofwords in each sentenceof your passage, recording the numbers in the spaceon page R3.
c Use tally marks to record the sentence lengths inTable 6 on page R3.
You may need to add some extra rows ifyou have anysentences containing more than 45 words.
d Total the tally marks and complete the columnheaded 'Number of sentences'.
The range for sentence length in passage A is (35-2)words = 33 words.
e Find the range for your passage.
Most of the sentences in passage A had less than 15words; the group with the most sentences was 11-15words.
We say the MODAL CLASS is 11-15 words per sentence.
f Find the modal class for your passage.
g Compare your table, range and modal class withthose that passage A, and write two or threesentences describing what younotice.
Table 3
35; 22, 2, 34,9, 15, 4, 4,5
14, 35, 22, 22, 13,32, 24,' 19, 13, 13,II, II, 7, 4, 5,
Another way of looking at the way authors write is tocount the number of words used in each sentence.Some authors use long sentences, others prefer shortones.
Remember a sentence ends with a full stop (.), questionmark (?) or exclamation mark (!) and the next sentencewill begin with a capital letter, so this sentence is thirtywords long.
13, 8,6, 10,2, 7,
c There were words which had three or lessletters in them. So the proportion of words with
three or less is 100'
d Compare your proportions with those for passageA. Write a sentence describing what you notice.
You will need page R3.
a Write the title of the passage used and the name ofthe author at the top of the page.
C1
10 11

IIjl
Mean Sentence length
It is possible to work out the mean number of wordsper sentence.
For passage A:
Total number of words =421Total number of sentences = 30
Mean number of words per sentence =421 -;- 30 words= 14'0 words
a Find the total number of words used in yourpassage.
A calculator may help.
b Copy and complete:Total number of words =The number of sentences = 30Mean number of words per sentence
= -;- 30 words= words
c Compare your mean with the 14'0 words forpassage A, and write a sentence stating what younotice.
!SENTENCE - I\.. 0 b MONTHS,
C3Bar Charts for Sentence length
It may help to compare the passages if you draw a barchart of the sentence lengths.
Figure 2 is a bar chart of the results given in Table 3.Notice that each bar corresponds to one row ofTable 3.
Bar chart of sentence lengths, passage A
a Using the axes of Figure 4 on page R3, draw a barchart of your results.
You may need to add extra bars if you have anysentences with more than 45 words in them.
The highest bar in Figur'e 2 is for the interval 11-15words. This was the modal class we found in SectionCl.
b Check that your highest bar corresponds to yourmodal class.
c Compare your bar chart (Figure 4) with Figure 2and write a sentence to describe what you notice.
1 5 6-10 11-15 16-20 21-25 26-30 31-35
Sentence le.19th (No. of words)
No_ of sentences
:- ,--
..---..---
- .-- .--
n2
o
8
6
C2
4
Figure 2
10
12 13

Class interval: MidpointSentence length Number of of class Number
(number of words) sentences interval of words
1- 5 7 3 7x3= 216-10 6 8 6x8= 48
11-15 8 13 10416-20 1 18 1821-25 4 23 9226-30 0 28 03.1-35 4 33 132
Total 30 - 415
C5 Comparing Proportions
Sometimes it is the proportion of long or shortsentences that gives us the best clue to authorship.
In passage A:
Proportion of sentences with 26 words or more is-.±..30
*C4
Table 4
14
Calculating the Mean Again
The mean for passage A can also be calculated from thesummarized information in Table 3. This is shown inTable 4.
Sentence lengths in passage A
415Mean = 30 words = 13'8 words
a Why is this mean (13'S words) different from theanswer in Section C3 (14'0 words)?
b Which is the more accurate answer? Why?
c When would a mean have to be calculated from atable?
d Add two extra columns to Table 6 on page R3.Label the first one 'Midpoint of class interval'.
Most of the numbers in this column will be the same as·in Table 4. The last entries may be different ifyou haveextra rows at the end.
Label the last column 'Number of words'.
e Calculate the figures for this column and find thetotal ..
f Calculate the mean.
D
g Compare this mean with your answer to questionC3b. Write a sentence stating anything you noticeabout the two answers.
Proportion of sentences with 5 words or less is 1-.30
a Copy and complete for your passage:
The proportion ofsentences with 26 words or moreis
The proportion of sentences with 5 words or lessis
b Compare your proportions with those ofpassage A.
Write a sentence describing what you notice.
c What could affect the proportion ofshort sentencesin a passage?
SummaryWe can compare two passages to see how the literarystyles used by the authors differ, by looking forstatistical clues. .
Statistical clues can be found by comparing:
Words, including:
I Length of words used
2 Mode word length
3 Range of word length
15

*4 Mean word length
5 Proportion of long words used6 Proportion of short words used
Sentences, including:I Lengths of sentences, i.e. how many words they
contain2 Mode sentence length (usually a modal class)
3 Range of sentence length4 Mean sentence length
5 Proportion of long sentences
6 Proportion of short sentences
We would expect books written by the same author tohave roughly similar answers to each of the clues listed.
If there are many marked differences, then it is likelythat the books are by different authors.
D1 Detective Work
You are going to compare two passages with passage Ato decide which is the odd one out.
The same author wrote two of the passages, and adifferent author wrote the third.
Your teacher will give you details of the passages.
a For these passages, find the answers to the cluesabove.Which two passages are by the same author? Stateyour reasons.
16

,
Schools Council Project on Statistical EducationThis Project has been based in the Department of Probability and Statistics at the Universityof Sheffield from 1975 to 1980. Its brief was: to assess the present situation of statisticaleducation in schools; to survey the needs of teachers of statistics; to devise detailed proposalsfor the implementation of the teaching ideas; and to produce teaching materials.
Project Team
Director: Peter Holmes (1975- )Deputy Director: Neil Rubra (1975-78), Daphne Turner (1978~
Project Officers
Ramesh Kapadia (1975-79), Alan Graham (1976-77), Barhara Cox (1979-80)
Statistics in your world
General NotesPages with the prefix R are resource pages or reference pages for pupil use. (In many casesthey are designed as worksheets.) In the pupil unit these are referred to as 'page RI', etc.
Permission need not be sought to reproduce copies of the R sheets provided that copies aremade only in the educational establishment in which they are to be used and that such copiesare not sold, hired or lent to any other indivdual, organization or establishment
Sections or questions marked with an asterisk are optional to the main thrust in the unit.Sometimes they are for the more able pupils, sometimes they are for reinforcement and sometimes they consist of simpler work for the less able pupils and lead to an easier conclusionthan the main unit. In each case detailed comments on the particular purpose will be found inthe appropriate section of the teacher's notes.
Three different typefaces are used in the pupil units. Text in roman type (like this) is for pupilsto read or for the teacher to introduce. Questions to promote thought and for group or Classdiscussion are printed in italics. Instructions telling pupils to do things and questions forpupils to answer are printed in bold.
MULTIPLYIPEOPLE
TEACHERS' NOTES
LEVEL 3
G
Published for the Schools Council by
FOUlSHAM EDUCATIONAL

Contents
Brief Description
Aims and Objectives
Prerequisites
Eqnipment and Planning
Detailed NotesSection ASection BSection CSection D
Answers
Test QuestionsAnswers
Connections with OtherUnits in the Project
R pages on pages 6-11
Page
3
3
3
3
45
1313
15
1717
18
Brief DescriptionHow many people are there in the world, and how rapidly is the populationgrowing? Starting with population data from 1650 to the present day,projections are made for the future, and some ofthe implications discussed.SUbsequent sections illustrate the demographic techniques of populationpyramids and birth and death rates as they affect growth.
Design time: 4 hours
Aims and ObjectivesOn completion ofthis unit pupils should be able to draw, read and interpretpopulation pyramids, make simple projections from graphs and tables andcalculate and use crude birth rates and crude death rates. They will havepractised interpreting simple tables, plotting time series, questioningassumptions, drawing inferences, identifying modal groups and drawingtime charts. They will be more aware ofthe problems ofcolleetingdata andobtaining accurate census figures, and of the implications of birth anddeath rates to future population trends.
.PrerequisitesPupils should be able to plot points on a graph, join them with a smoothcurve and extrapolate, and draw bar charts. They. should also be familiarwith percentages.
Equipment and Planning
Schools Council Project on Statistical Education
Published byW. Foulsham & Co. Ltd., Yeovil Road, Slough, Berks
@ Schools Council Publications 1981
ISBN 0-572-01102-4
PRINTED II': HONG KONG
A calculator would be useful for Sections C and D. Graph paper is neededfor Section B. Pages RI to R3 contain partly completed tables and graphs.
Section A begins with a discussion on the meaning of overpopulation andmoves on to looking at the actual data and making predictions for thefuture. Section Bintroduces population pyramids to make points about theimplications ofage distribution within the population. It looks initially at atown where there are many retired people and compares this with anew town. It then moves on to looking at some figures for continents.
3

A2
Section A
Al
Detailed Notes
AS
Overpopulation leads to overcrowding. The decrease in the number ofhectares (including desert) available per person from 1650 to 1975 isdramatic, and shows the gain in food supplies due to improved agriculturetechniques. Figure 7 on page RI is needed for this section. The sectionleading to e and Cmakes most forcefully the point that things cannot go onas they are, but this has been made optional because many pupils are put offby the large numbers involved.
initial population figures accurately as will be realized by considering thepractical difficulties involved.
An example of 'inaccuracy' in population estimates occurred recentlywhen a certain developing country was required to give an estimate of its
. present population to two different international organizations. Oneestimate was to be used as a basis for the allocation of aid to that country,while the other was to determine its liability to an African EconomicCommunity of which it was a member. The two estimates differed by some30%! (See also Reference I, for a general discussion.)
Past estimates are not as likely to be as accurate as present estimates, since,with the growth ofcivilization and communications, it is now easierto keeptrack of everybody. Some of the problems of doing this are covered in theunit Sampling the Census.
Present trends may well not continue into the future; indeed in the longterm they cannot, as is brought out in the next section. The illustrations areofearthquake, storm, flood, atomic war, drought and scientific discoveries.The last could work in two ways. By improving medical care death rates canbe lowered; by developing safe methods of contraception birth rates can belowered. One major factor not illustrated is famine due to food shortage.
1950
2070
1900
1610
1850
1170
1800
910
1750
730
1700
630
1650
540
DatePopulation(millions)
A3
Section C introduces the crude birth rate and crude death rate, and SectionD is a simulation showing the effect of birth and death rates on a fictitiouspopulation of rats.
Overpopulation is not a simple idea. Discussion may centre on, for example,whether it means that there are a lot of people, there is a high populationdensity or the country is not self-sufficient in food. Countries that may bementioned as having overpopulation problems include India, Pakistan,Indonesia, Latin America and some African countries.
These stick diagrams also show the increase by crowding more stick men inthe same size circle. This is followed up in Section A5. The populationfigures are quoted to the nearest hundred million. If more accurate figuresare required than those, Table T I can be used.
Table T1 World population figures
Without the 1975 data the other points seem to lie on a reasonable curve.The 1975 figures show a dramatic rise over the previous 25 years, and it isnot easy to draw a reasonable curve to project through to the year 2000 AD.This serves to emphasize the difficulty of making such projections and theamount of legitimate variability that there may be in these estimates. Astraight line extension of the curve can lead to a gross underestimate.
A6
This section summarizes the main lesson of Section A.
Section B
Bl
A4
The accuracy ofa projection depends on the accuracy of the initial data andon the validity of the underlying assumptions. It is not easy to get even the
The 'picture' of the population pyramid (Figure 2) should be clear enoughfor most pupils but may need explaining to some. It can be described as twohorizontal histograms side by side sharing the same vertical axis. The
(Text continued after the R pages)
4 5

'" R1
Figure 6 World population
8000
7000
6000
5000
4000
3000
2000
1000
:U: u, ".\ I ':1 CI :,"~WI
I.Ii.:!, i
I:'~
, '
~[:i
- I:, ,',
, ,"
,'ii:'"
,1, I .\
I: :1iILn : :
:: : ' i:, lL I: I:i" Ii I:
1650 17M 1750 18'00 1850 19'00 1950
Year
2000
Figure 7 Amount of land per person
35
30
25
20
15
10
5
I' , '); i I II "
,I
'i,
, i
II' , ' I·,
:" I,
I : '.!, , ,: ,.,
: !,
: ,
11'I : !i 1,
1650 1700 1750 1800 1850 1900 1950 2000Year
-..l
© Schools Council Publications 1981

00 R2
Figure 8 Population pyramid, England and Wales, 79,75
Age In years
I, i,l 'i, ',', " 'i" "I ',: !!i : i: 'i!
,,1 I '"," ,', ::;'1 ",
,. i<i!
I
i
i;I '" ' iIi i' i,'
i',::;' '. : '
ifI,!: i , : I, I , : ': ,,' i, i , ! I,
6 5 4 3 2 2 3 4 5 6
Males (millions) Females (millions)
Table 6 Number of dirty rats each year
Age of rats in years TotalYear 0-1 1-2 2-3 3-4 population
15t 250 250 250 0 750
2nd 250 200 200 0
3rd 200 160 0 560
4th 0
5th 0 448
6th 128 0
7th 0
8th 0
9th 0
10th 0
© Schools Council Publications 1981
'"

o
:1 I !:, :.~:, 'I :':..!
!
Female
140 120 100 80 60 40 20 o 20 40 60 80 100 120 140No. of rats
YEAR 2
Age in years
Male Female
140 120 100 80 60 40 20 o
Age in years
20 40 60 80 100 120 140No, of rats
YEAR 3
Male
!:i ., I i' i , ! ':,
:: ,I :. ,;! ' , !I: !; '.- "
! ,! . I
'.., ,
, .
I ' Ii ' I;• Ii; i ,'; :
~ I: ' ii ",""'1 . . '!V ..
Female
140 120 100 80 60 40 20 o
Age in years
20 40 60 80 100 120 140No, of rats
YEAR 4
Male
, ,II'
1.1 "
! Ii ':;i ,i. ,I :'. ,. ':- ,
ii: i·' iI :
"
Ii ii I, ,. ..i; i r. I· ili'i I: il', : ,
Female
140 120 100 80 60 40 20 o
Age in years
20 40 60 80 100 120 140No. of rats
YEAR 5
Male
iJi-i,
, ':", 1""li'I:!!\: ; ,;1,;;),' ! ", , Ii ,
i), \f'.:f! , I :-'!'; 't , . :
" ',
•
, : i'L"
:',J: . ' ,.
i! ': i ill' "
I .. i:i, \ II ,: 'i': , i·i
ii·1 '!:i: 11,i ii .[ :, I,
Female
140 120 100 80 60 40 20 o
Age in years
20 40 60 80 100 120 140No. of rats
--
YEAR 6
Mole
'i :i ! " II .'; I' i ! • 'i l,{! I,' i"
: 'L!
i': 1"
,Ii I, I: :, ! 'i Ii I. ,
Female
140 120 100 80 60 40 20
© Schools Council Publications 1981
o 20 40 60' 80 100 120 140No. of Tats

questions concentrate mainly on reading the population pyramid. Theaccurate figures are given in Table T2.
Table T2 Population (in thousands! of Worthing, 1971
Age 0-14 15-29 30-44 45-59 60-74 75+
Men 7 ·1 6·1 5·2 6·2 8-4 3·7
Women 6·7 6·3 5·6 8-4 15·0 9·8
The figures for Worthing and for England and Wales (Table 3) are given asactual numbers rather than as the proportions or percentages used later.
In j it is hoped that pupils will spot the large number ofolder women andthe disproportionate number of old people altogether. They may needsome explanation about Worthing being a place where people retire to.Question n raises some of the social implications of having a populationwhich has a large proportion of retired people. How do amenities get paidfor?
The age groups have each been given as a range of 15 years (so that 75+ hasbeen interpreted as 75 to 89). This means that the bars of the histogram inthe pyramid are all the same width, and populations can be read off fromthe lengths of the bars.
B2
In contrast with Worthing, Skelmersdale is a new town with a lot of youngpeople. This is hinted at in a and followed up in the comparative questionson the population pyramids. These pyramids are plotted using percentagesso that the overall area of each is the same and the comparison can be mademore easily. The large number of young people is Skelmersdale leads us toexpect higher population growth in h.
B3
The developing country pyramid is number (iii), and hence in Figure 5 it ispopulation pyramid number I which is of Africa. In the other pyramids theeffect of war is seen on the 50-54 age group and their children in the 25-29age group. This is more pronounced in population pyramid number 4, sothis is of USSR and number 3 is of Western Europe. It may be interestingalso to discuss the shape of the population pyramid of North America.
12
B4
Population pyramids only give ages, not occupations. Problems in d mayconcentrate on population growth in Africa, large numbers of youngdependents in Africa, old dependents in North America, few children inUSSR leading to a lower working population later, etc.
Section C
This section is simply the definition and application of two formulae. Ifdivision is a problem, then a calculator may save considerable time. Thesemeasures are termed 'crude' in that they relate births Ideaths to the wholepopulation. They are not in any way 'age-specific'.
C1
Instead of the crude birth rate, the number of births is often measuredagainst the number of women of child-bearing age. The last four calculations of b indicate how the birth rate has changed in the UK during thiscentury. The effect of even small changes on population projections can beseen in the projections published by the Office of Population Censuses andSurveys.
C2
The crude death rate can be made less crude by analysing it withinparticular age groups. The crude death rate seems to show Worthing as anunhealthy place, but it is mainly due to the large number of elderly peopleliving there. The explanation of d is that the population grew during thesame period.
Section 0
The simulations suggested here are deterministic, but do give someindication of the effect of births and deaths. Figure 8 and Table 6 from pageR2 are required for this section.
DI
Notice that it is one-fifth of the rats which die at the end of years 0-1 and1-2. The key to the size of theuext generation lies with the numberoffertile
13
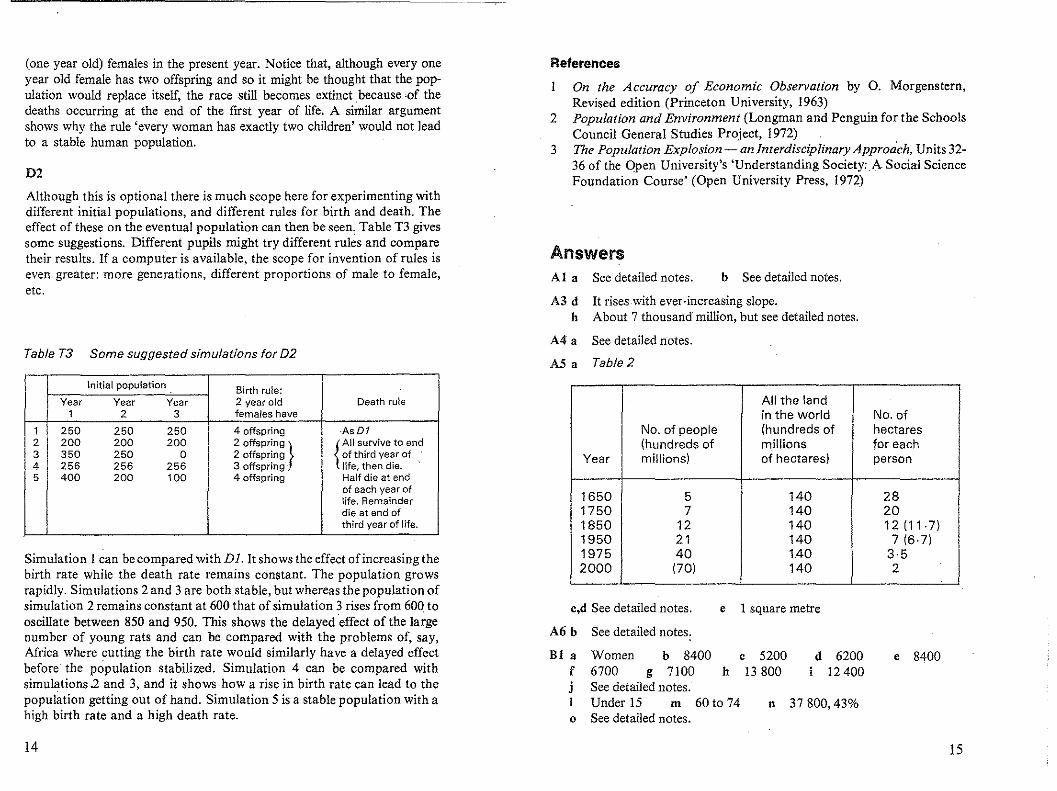
---------------------- ~-----
A3 d It rises with ever-increasing slope.h About 7 thousand million, but see detailed notes.
A4 a See detailed notes.
AS a Table 2
References
On the Accuracy of Economic Observation by O. Morgenstern,Revised edition (Princeton University, 1963)
2 Population and Environment (Longman and Penguin for the SchoolsCouncil General Studies Project, 1972)
3 The Population Explosion - an Interdisciplinary Approa"ch, Units 3236 of the Open University's 'Understanding Society:~ASocial ScienceFoundation Course' (Open University Press, 1972)
(one year old) females in the present year. Notice that, although everyoneyear old female has two offspring and so it might be thought that the population would replace itself, the race still becomes extinct because 'of thedeaths occurring at the end of the first year of life. A similar argumentshows why the rule 'every woman has exactly two children' would not leadto a stable human population.
D2
Although this is optional there is much scope here for experimenting withdifferent initial populations, and different rules for birth and death. Theeffect of these on the eventual population can then be seen, Table T3 givessome suggestions. Different pupils might try different rules and comparetheir results. If a computer is available, the scope for invention of rules iseven greater: more generations, different proportions of male to female,etc.
Table T3 Some suggested simulations for D2
AnswersAI a See detailed notes. b See detailed notes.
All the landin the world No. of
No. of people (hundreds of hectares(hundreds of millions for each
Year millionsl of hectares) person
1650 5 140 281750 7 140 201850 12 140 12(11·7)1950 21 140 7 (6·7)1975 40 140 3·52000 (70) 140 2
e 1 square metre
e 8400d 620012400
37800,43%n
c 520013800h
Women b 84006700 g 7100See detailed notes.Under 15 m 60 to 74See detailed notes.o
c,d See detailed notes.
A6 b See detailed notes.
Bl afjI
Simulation 1can be compared with Dl. It shows the effect of increasing thebirth rate While the death rate remains constant. The population growsrapidly. Simulations 2 and 3 are both stable, but whereas the population ofsimulation 2 remains constant at 600 that of simulation 3 rises from 600 tooscillate between 850 and 950. This shows the delayed "effect of the largenumber of young rats and can be compared with the problems of, say,Africa where cutting the birth rate would similarly have a delayed effectbefore the population stabilized. Simulation 4 can be compared withsimulations:2 and 3, and it shows how a rise in birth rate can lead to thepopulation getting out of hand. Simulation 5 is a stable population with ahigh birth rate and a high death rate.
Initial population Birth rule:Year Year Year 2 year old Death rule
1 2 3 females have
1 250 250 250 4 offspring ,AsD12 200 200 200 2 offSpring} { All survive to end3 350 250 0 2 offspring of third year of .4 256 256 256 3 offspring life, then die. .5 400 200 100 4 offspring Half die at end
of each year oflife, Remainderdie at end ofthird year of life.
14 15

82 c Worthing d Skelmersdale e Skelmersdale Test Questions
Dl a Table 6
Age of rats TotalYear oto 1 1 to 2 2 to 3 over 3 population
1st 250 250 250 0 7502nd 250 200 200 0 6503rd 200 200 160 0 5604th 200 160 160 0 5205th 160 160 128 0 4486th 160 128 128 0 416
7th 128 128 102 0 3588th 128 102 102 0 3329th 102 102 82 0 286
(extinct)
24·0Lancaster 11·1, Leicester 14·6, Northampton 15 ·8, Essex 15·0,NW Wales 13·1, UK(l901) 28·9, UK(l921) 22·7, UK(l95 I) 16·8,UK(l971) 15·4.
deaths ... thousandWorthing 25·4, Skelmersdale 7·4Lancaster 15·7, Leicester 10·6, Northampton 11·1, Essex 12·6,NW Wales 15·3, UK(l901) 16·3, UK(l921) 12·7, UK(l95 I) 11·8,UK(l971) 11·78See detailed notes.
Age Men(%) Women(%)
0-14 11 1115-29 10 1030-44 11 1145-59 9 1160+ 7 9
48 52
Answers
I Draw a smooth curve through the points and extend it.
2 These are usually more children than adults.
3 A very large proportion of the population is children; there is a highbirth rate and a fairly high death rate.
5 Crude death rate.
6 Number of births in the year x 1000Year populatlOn
To estimate future population figures
5 In a town or country we can measure 'the number of deaths in a year forevery 1000 people in the population'. What is this measure called?
6 What is a crude birth rate? What do we use this for?
7 In a town whose population was 23 000 during a certain year, the number of deaths was 210 and the number of births was 400. Calculate (i)the crude death rate, and (ii) the crude birth rate.
I If you are given a graph of world population over the last 100 years,how can you make a projection of future populations?
2 A population pyramid shows the proportion of men and women atdifferent ages. Why is it usually wider at the bottom than at the top?
3 Developing countries usually have population pyramids with very widebases. What does this tell us?
4 Draw a population pyramid from the following data for England andWales (1951).
b Africa (No. I)
(iu) b See detailed notes.
Old-age pensioners and schoolchildrenAfrica d See detailed notes.
CIab
C2 abc
c
d
83 a
84 a
7 (il) 400 = 17.423
16 17

m~~
cou::>mco
.<=n.
Cutting it Fine
Leisure for Pleasure
Seeing is Believing
Sampling the CensusRetail Price Index
Levell If at first ...
Level2 Authors AnonymousGetting it Right
Level4 Fignring The FutureSmoking and Health
Olher Units at the Same Level (Level 3)
Car Careers Net CatchPhoney Figures Pupil Poll
Units at Other Levels In the Same or Allied Areas of the Curriculum
Connections with Other Published Units fromthe Project
mEm
~0.
I
This unit is particularly relevant to: Humanities, Social Science, IntegratedScience, Mathematics.
Interconnections between Concepts and Techniques Used in theseUnits
These are detailed in the following table. The code number in the left-handcolumn refers to the items spelled out in more detail in Chapter 5 ofTeaching Statistics 11-16.
An item mentioned under Statistical Prerequisites needs to be coveredbefore this unit is taught. Units which introduce this idea or technique arelisted alongside.
An item mentioned under Idea or Technique Used is not specificallyjntroduced or necessarily pointed out as such in the unit. There may be oneor more specific examples of a more general concept. No previousexperience is necessary with these items before teaching the unit, but morepractice can be obtained before or afterwards by using the other units listedin the two columns alongside.
An item mentioned upder Idea or Technique Introducedoccurs specificallyin the unii and, if a technique, there will be specific detailed instruction forcarrying it out. Further practice and reinforcement can be carried out byusing the other units listed alongside.
~ • ro00 N Nuz N N
.0NN ro
'"
18 19

IVo Code
Ideas or Techniques Introduced Also Used inNo.
2.2n Population pyramids
3.3c Crude birth and death rate Smoking and Health
4.3a Assumptions behind simple models Net Catch
4.30 Simulation as a model Net Catch
4.39 Interpreting a simulation Net Catch
5b Reading bar charts, histog'rams and pie charts Leisure for Pleasure Seeing is Believing Car CareersCutting it Fine Phoney Figures Smoking and Health·
5c Reading time series Leisure for Pleasure Car Careers Cutting it FinePhoney Figures Figuring the Future
5d Spotting possible errors (outliers) as not Getting it Right Cutting it Fine , Smoking and Healthfitting general pattern
5u Inference from bar charts If at first .. , Authors Anonymous Car CareersPhoney Figures Smoking and Health
5v Inference from tables Leisure for Pleasure Seeing is Believing Car CareersNet Catch Cutting it Fine Phoney FiguresFiguring the Future Sampling the Census Retail Price IndexSmoking and Health
5z Detecting trends Multiplying People Cutting it Fine Phoney FiguresSampling the Census Smoking and Health
5aa Making proje~tions Figuring the Future Sampling the Census
-0~ ~
~ 0> ?!: (") r3~ 3~::;: ~ r+ -o~ < I.OJ0<0::0 -0" c w OS .... " < "'(1)'" C (1) -I - OS::::" -0 ~ 0 I. 0 Q.. (1) ;;: C::;'-.~~ -'0 ~ U/U ~ ~ V7 - ~-:J~0>(1):J~ ~O OS (1)_. <0 '" 0>~~(1) (1)<0<O.~ =.:"'<0 -C 0 r+:J ..... _0"0> osii) ..... ~~ ~~m <~ ~n~-' _. y~=~ ~O II
'ro~~~~O _.~ mro~O mO~m-·mmro_·~~.E::.I ::::r :::!.c.a CD ~ ~t5' ~ Z< ~ c.a ~ "OJ ~ 0 ~ -< m c: ~ ~ ~ ~c~(1)g-l~oc <oa"TlO-::;:o>(1)r+:J"Tl~-o:J~ _r+OI "Tl ' , -0 -0 -. -. Q) r+ _. =: OS -< - .... , <0:::> -I (1)~CDC~~~~=ro~nc.a~~~~CDCD3@ro~m~mmm~,~ ~- ~O"roCCD-'~~<~ ~3~ m~w~
~~c~-·m::.l vu-·~~mc.aCD--·~O CDOOm-C~ro~~ro~cno_~nCD~::::r~m~mc CDn_._ro~_.<::::rroxc.awro=mm::::rww~w<c.a=w w~xwwmCD
52::rCD......;:;:CD'":J...2:'"'"CD...CO''"

Statistics in your world
MULTIPLYINGPEPLE
Published for the Schools Council by
FOUlSHAM EDUCATIONAL

Some sections are marked with an asterisk*. Your teacher will tellyou whether to try these sections.R Pages Your teacher will provide these for you.
AcknowledgementsThe publishers and Project team extend their thanks to the Office ofPopulation. Censuses and Surveys and Her Majesty's Stationery Office forgranting permission to reproduce or adapt statistics that have appeared intheir publications.
Contents
.A How Many People?AI Population ExplosionA2 Stick DiagramsA3 . Projecti"onsA4 How Accurate?A5 How Much Land?A6 Why has the World Population Increased?
B Population PyramidsBI How Many of Each AgeB2 Comparing TownsB3 Comparing CountriesB4 What About the Workers?
C Hatches and DispatchesCI Birth RateC2 Death Rate
D Generation GameD I Rules of the Game
*D2 Not-so-dirty Rats
Page3334578
99
121315
161618
191920
A
A1
A2
Figure 1
How Many People?
Population Explosion
People sometimes speak of the 'population explosion'.This means a rapid increase in the number of people.
Overpopulation is a growing world problem. Manycountries are finding it more and more difficult to feedand clothe their fast-increasing population.
a What do you think is meant by saying a country isoverpopulated?
b Name two countries which you think areexperiencing a problem with overpopulation.
Slick Diagrams
Let us look atworld population growth since the 1600s.Figure I is a diagram showing world populations fordifferent years.
A stick man has been drawn for every 100 millionpeople. (l00 million people is about twice the presentpopulation of England and Wales.)
World population, 1690 to 1850
The Schools Council Project on Statistical Education
Published byW. Foulsham & Co. Ltd., Yeovil Road, Slough, Berks
Cartoons by Colin Whittock
@ Schools Council Publications 198J
1650 1750 1850
ISBN 0-572-01083-4
PRIXTED IN HO~G I<;ONG key f represents 100 million people
3

Date 1650 1700 1750 1800 1850 1900 1950
Total worldpopulation 500 600 700 900 1200 1600 2100(millions)
Table 1
A3
4
Table 1 gives the information which was used to drawthe three diagrams of Figure 1.
World population, 1650 to 1950
(Source: UN Statistics)
a Draw diagrams similar to those of Figure 1 for theyears 1700, 1800, 1900 and 1950.
Projections
You will need page RI.
We are going to estimate the future population. Suchan estimate is called a PROJECTION.
a Plot the data of Table 1 on to Figure 60n page RI.
A4
An extra piece of information is that the worldpopulation reached 4000 million in 1975.
b Put this information on to your graph.c Draw a smooth curve to pass through all your
plotted points.d What do you notice about the slope of the curve?
Look again at Table 1.
e Make a guess at what the population is likely to bein the year 2000.
Now turn back to the graph.
f Continue the curve (using a dotted line) up to andpast the year 2000.
g How does the reading from the graph for the year2000 compare with your guess from the table?
Most people find it easier to project using a graphicalmethod rather than the table.
h Copy and complete:'Assuming that present trends of world populationgrowth continue, my population projection for theyear 2000 AD is people.'
How Accurate?
The kind of projection we have just looked at is roughand ready and makes two assumptions.
First, it assumes that past and present measurementsare accurate.
a Do you think that past measurements were asaccurate as present measurements? Hnot, why not?
b Give two reasons why present measurements maynot be accurate.
The projection also assumes that present trends willcontinue in the future.
5 It.

All the landin the world
No. of people (hundreds of(hundreds of millions of No. of hectares
Year miilions) hectares) for each person
1650 5 140 140+5=281750 1401850 1401950 1401975 1402000 140
Population compared with land area
How Much land?
Look back again at your graph in Figure 6. It can beseen that the world population is increasing veryquickly indeed. But we need an idea of how quickly itreally is increasing.
How does it compare with the amount of landavailable? The land area of the world (includingdeserts) is about 14 thousand million hectares. (Ahectare is 10000 square metres.)
a Using the information from Table 1 and A3h, copyand complete Table 2 and work out how much landthere was for every person in those years. Thefigurefor 1650 has been entered for you.
The six pictures opposite show ways in which worldpopulation growth may be affected.
c Write down what the six illustrations represent.How might they affect population growth?
d Add some· more ideas of your own of things thatcould affect population growth.
e What do you think is most likely to slow downpopulation growth?
AS
Table 2
6 7

The first entry of Table 2 is shown in the graph ofFigure 7 on page R I.
b Complete Figure 7 using the data in Table 2.
c What do you notice about the amount of landavailable per person?
d Write two sentences to describe what might happenin the future.
*One population proj.ection for the year 2500 AD, basedon present growth patterns, is 140 million millionpeople. Land area is about 140 million million squaremetres.
*e How much land does this give for each person?*f Why is this projection not likely to be anywhere
near correct? What can you say about future.population growth trends compared with thepresent?
B
B1
Population Pyramids
How Many of Each Age?
To make more accurate population projections weneed to know not only how many people there are atpresent, but also their sex and how old they are. Apopulation of 10.million people all over 65 years oldwill not grow. A population of 5 million men and 5million women all aged between 20 and 40 years oldwill grow.
This information is often drawn as a POPULATION
PYRAMID which shows the number of men and thenumber of women in each age group. Figure 2 showsthe population pyramid for the seaside town ofWorthing on 25 April, 1971. The figures for the menare on the left. The figures for the women are on theright. The total population was 88500.
Figure 2 Population by age and sex for Worthing on 25 Apr", 1971
Age in years
Population pyramids can be drawn for largepopulations (e.g. for a country) and for smallpopulations (e.g. a particular town).
.. ........
... : :. .
. . .. : c·:," ,"':2 4 I; 8 10 1'2 14 16
Females (thousands)
....~ • ." .. .. . :c... :.. :.~
. ...... .'
.. .': .. ... I''.'C'..
...
D:=,~ is:E10 8 6 4 2
Males (thousands)However, world population growth may be sloweddown by natural disasters such asor changes in health patterns such as
Why Has the World Population Increased?
a Write out the two items from the list below whichyou believe most influence the size of worldpopulation.More people living in citiesMore babies being bornMore immigrationPeople living longerMore people working in factories
b Copy and complete:'There is a population explosion because
A6
8 9

10
If your job is to build a school, a sports centre oran oldpeople's home in a town, it is not enough to know howmany people live there. You also need to know howmany young people and how many old people thereare. A population pyramid gives this information.
Study the population pyramid in Figure 2 carefully,then answer the following questions.
a Are there more men or more women in Worthing?
b How many women are there aged 45-59?
c How many men are there aged 30-44?d How many men are there aged 45-59?
e How many men are there aged 60-74?
f How many girls are there aged under IS?g How many boys are there aged under IS?
h How many children are there aged under IS?
How many people are there aged 15-29?
j Comment on anything unusual you notice aboutthis distribution.
Let us see if the age distribution of Worthing is typicalof the rest of the country.
k Using the information in Table 3, draw apopulation pyramid in Figure 8 on page R2.
Look carefully a t the population pyramids for Englandand Wales and for Worthing, and then answer thefollowing questions. The modal age group is the onewith the highest population.
What is the modal age group for males and femalesin England and Wales?
m What is the modal age group in Worthing?
n How many people in Worthing are of working age(say IS-59 years)? What percentage is this of thetotal popUlation of Worthing?
o How might your conclusion affect town planning inWorthing?
Table 3 Mid-year population ofEngland and Wales, 1975
Population Imillions)
Age in years Males Females
under 15 5·8 5·515-29 5·5 5·230-44 4·4 4·345-59 4·3 4-460-74 3·2 4·075+ 0·8 1· 7
Totai 24·0 25·1
ISource: opes Monitor, PP2, 76/1)
(Note: These are approximate figures.)
11

Percentage ofpopulation in different age groups,Worthing and Skelmersdale (1975)
b Copy out Table 4. Use the information in this tableto draw a population pyramid for Wortffing andanother for Skelmersdale.
82 Comparing Towns
You will need a sheet of graph paper.
As you have seen, population pyramids are importantfor planning towns.
Figure 3 shows people waiting at bus stops in Worthingand Skelmersdale.
Table 4
Worthing Skelmersdale
c Which town has the larger percentage of old people(i.e. over 60)?
d Which town has the larger percentage of people inthe age groups between 15 and 45?
e Which town has the larger percentage of childrenunder 15?
f Briefly describe the population of both towns.g Write down a list of special amenities needed by
each town (e.g. schools, old people's homes).
h Which of these two towns can expect to face animmediate problem of large population growth?
Figure 3 Two bus stops
BW5STOP
Worthing
BW5S'fOP
Skelmersdale
Agein years Males Females
under 15 7·9 7·815-29 7·0 7-430-44 6·1 6·545-59 6·7 8·960-74 9-4 16·375+ 4-4 11 ·5
Agein years Males Females
under 15 16·8 16·415-29 13·2 14·030-44 10·3 9·545-59 6·3 6·060-74 2·9 3·575+ 0·3 0·8
12
a What main difference between Worthing andSkelmersdale is illustrated in Figure 3?
To compare age distributions between two towns, wesometimes draw population pyramids showing thepercentage of the population" in each year group. Thismakes it easier to compare the shape of the pyramids.
83 Comparing Countries
The fastest-growing populations tend to be in thepoorest countries. This brings enormous problems.
13

For instance, in a developing country a lot of childrenare born (though many die before they are five), andfew people live beyond 50 years of age. In a moredeveloped country fewer babies are born, and peoplelive longer.
a Bearing these points in mind, try to decide which ofthe population pyramids in Figure 4 represents thepopulation of a poor (or developing) country.
Figure 5
The four pyramids in Figure 5 represent thepopulations in 1970 of North America, USSR, Africaand Western Europe, but not in that order.
Note: They show population proportions, notpopulation size.
Population ofNorth America, USSR, Africa and WesternEurope (1970)
Age in years
43North America
b Write down which you think is which.
Here are some clues to help you.
Africa should have a high birth rate and low lifeexpectancy.
Both Western Europe and USSR suffered in WorldWar2 (1939-1945), USSR more than Western Europe.
9
4
9
4
9 W-4
i9L...-
4I-;-
t-I- ,-I-
9 - l- I-I-4 >-- J=ITr- '-'J .-\ I-.....J
l--9 I - -I I I9~ I
'--I I I--- ;-h
80+
75-7
70-7
65-6
60-6
55-5
50-5
45-4
40-4
35-3
30-3
25-29
20-2415-1
10-14
5·0·4
Age
I II I
I II I
Age
Figure 4 Three population pyramids
Age
I II I
I II I
*I I
~I IM F
You wish to know how many people there are in eachof the following groups:
Soldiers, nurses, old age pensioners, factory workers,school children
What About the Workers?84
II
III
II I
_..L..--1__-l.-__-..l1_ ~F
14 15
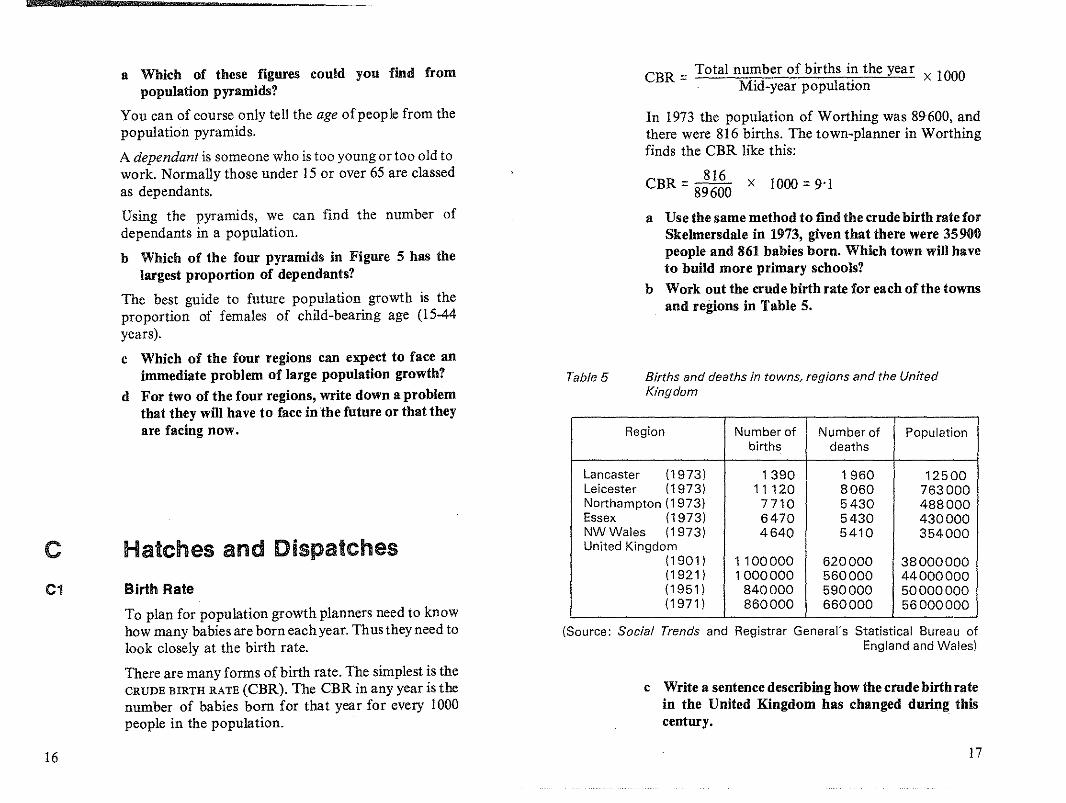
(Source: Social Trends and Registrar General's Statistical 8ureau ofEngland and Walesl
Region Number of Number of Populationbirths deaths
Lancaster (1973) 1390 1960 12500Leicester (19731 11120 8060 763000Northampton (1973) 7710 5430 488000Essex (1973) 6470 5430 430000NWWaies (19731 4640 5410 354000United Kingdom
(19011 1100000 620000 38000000(1921 ) 1000000 560000 44000000(1951 ) 840000 590000 50000000(1971 ) 860000 660000 56000000
a Which of these figures could you find frompopulation pyramids?
You can of course only tell the age ofpeople from thepopulation pyramids.
A dependant is someone who is too young or too old towork. Normally those under 15 or over 65 are classedas dependants.
Using the pyramids, we can find the number ofdependants in a population.
b Which of the four pyramids in Figure 5 has thelargest proportion of dependants?
The best guide to future population growth is theproportion of females of child-bearing age (15-44years).
c Which of the four regions can expect to face animmediate problem of large population growth?
d For two of the four regions, write down a problemthat they will have to face in the future or that theyare facing now.
C Hatches and Dispatches
Ci Birth Rate
To plan for population growth planners need to knowhow many babies are born each year. Thus they need tolook closely at the birth rate.
There are many forms of birth rate. The simplest is theCRUDE BIRTH RATE (CBR). The CBR in any year is thenumber of babies born for that year for every 1000people in the population.
16
Table 5
CBR = Total nU~ber of births i? the year x 1000. Mld-year populatlOn
In 1973 the population of Worthing was 89600, andthere were 816 births. The town-planner in Worthingfinds the CBR like this:
816CBR =89600 x 1000 =9-1
a Use the same method to find the crude birth rate forSkehnersdale in 1973, given that there were 35900people and 861 babies born. Which town will haveto build more primary schools?
b Work out the crude birth rate for each of the townsand regions in Table 5.
Births and deaths in towns. regions and the UnitedKingdom
c Write a sentence describing how the crude birth ratein the United Kingdom has changed during thiscentury.
17

C2 Death Rate
Planners also need to know how many people die eachyear. The CRUDE DEATH RATE (CDR) is obtained in thesame way as the CBR, except that it concerns deathsinstead of births.
a Copy and complete the following:The crude death rate (CDR) is the number of
in that year for every people ofthe population.
h FInd out the CDR for Skelmersdale and Worthingin 1973.
In 1973 there were 2272 deaths in Worthing(population 89600).In 1973 there were 265 deaths in Skelmersdale(popUlation 35900).
c Work out the crude death rate for the towns andregions In Table 5.
The number of deaths in the United Kingdomincreased from Inl to 1971, but the crude death ratefell during the same period.
d Can you explaIn this?
D
D1
Generation Game
The Rules of the Game
You will need pages R2 and R3.
Scientists are worried that the lovable little furrycreature, the 'dirty rat' (RattusfilthicusJis dying out. Acareful study of their life-cycle was made.
This showed:
lOne-filth of the rats die on their first birthday.2 One-fifth of the surviving rats die on their second
birthday.
3 All rats surviving then die on their third birthday.4 The female always gives birth to one male and one
female rat at the beginning ofher second year oflife.
There are only 750 rats left. (250 baby rats, 250 ratsbetween I and 2 years old and 250 between 2 and 3years old; there are equal numbers of each sex in eachgroup)
18 19

When the total population falls below 300, the rats giveup in despairand become extinct. You are going to findthe year when they all die off!
Table 6 on page R2 starts to show the number of rats ineach age group every year for the 10 years.
a Complete the table for the first six years.
Figure 9 on page R3 shows the population pyramidsfor the first three years.
b Draw the population pyramids for the next threeyears.
c Draw a graph to show the total population eachyear. Use a scale of 1 cm to represent 1 year alongthe bottom. (Make sure that your scale on thebottom goes along to 12 years.)
d Now make a projection for the year inwhich the ratsbecome extinct.
You can check your projection by continuing Table 6until the total population falls below 300.
*02 Not-so-dirty Rats
The dirty rats decide to improve their public health. Asa resultfewerrats die at the end oftheir first and secondyears. Play the generation game with different birthand death rates to see how they affect populationchanges.
20

Schools Couneil Project on Statistical EducationThis Project has been based in the Department of Probability and Statistics at the Universityof Sheffield from 1975 to 1980. Its brief was: to assess the present situation of statisticaleducation in schools; to survey the needs of teachers of statistics; to devise detailed proposalsfor the implementation of the teaching ideas; and to produce teaching materials.
Project Team
Director: Peter Holmes (1975- )Deputy Director: Neil Rubra (1975-78), Daphne Turner (1978-
Project Officers
Ramesh Kapadia (1975-79), Alan Graham (1976-77), Barbara Cox (1979-80)
General NotesPages with the prefIx R are resource pages or reference pages for pupil use. (In many casesthey are designed as worksheets.) In the pupil unit these. are referred to as 'page RI', etc.
Permission need not be sought to reproduce copies of the R sheets provided that copies aremade only in the educational establishment in which they are to be used and that such copiesare not sold, hired or lent to any other indivdual, organization or establishment.
Sections or questions marked with an asterisk are optional to the main thrust in the unit.Sometimes they are for the more able pupils, sometimes they are for reinforcement and sometimes they consist of simpler work for the less able pupils and lead to an easier conclusionthan the main unit. In each case detailed comments on the particular purpose will be found inthe appropriate section of the teacher's notes.
Three different typefaces are used in the pupil units. Text in roman type (like this) is for pupilsto read or for the teacher to introduce. Questions to promote thought and for group or classdiscussion are printed in italics. Instructions telling pupils to do things and questions forpupils to answer are printed in bold.
Statistics in your world
PUPIL POLL
TEACHERS' NOTES
LEVEL 3
Published for the Schools Council by
FOUlSHAM EDUCATIONAL

Contents
Brief Description
Aims and Objectives
Prerequisites
Equipment and Planning
Detailed NotesSection ASection. BSection CSection D
Test QuestionsAnswers
Connections witb OtherUnits in the Project
R pages on pages 8 and 9
Page3
3
3
3
446
11
1213
14
Brief DescriptionThis unit explains the basic techniques involved in opinion polls. It iscentred around a practical poll to find out pupils' favourite records, and thewider implications to all polls are stressed throughout. Both random andstratified sampling are introduced.
Design time: About 6 hours
Aims and ObjectivesPupils will learn how to conduct an opinion poll and identify possiblepitfalls. On completion of the unit they will know.that a sample needs to berepresentative and will be able to choose a random sample and a stratifiedsample to help ensure this.
They meet examples of samples which are unrepresentative through beingtoo small, self-selected or clearly biased in nature. They carry out one coinplete survey and plan another. They will be more aware of the practicalproblems that arise in data collection and the relationship between sampleand population. They practise filling in tables, using random number tables,drawing bar charts and writing a report on a statistical experiment.
PrerequisitesPupils should be able to use random number tables, draw barcharts, maketally charts, multiply whole numbers by a fraction and round to the nearestwhole number.
Schools Council Project on Statistical Education
Published byw. Foulsham & Co. Ltd., Yeovil Road, Slough, Berks
© Schools Council Publications 1981
ISBN 0-572-01 I I1-)
PRI:"<TED IN HONG KONG
Equipment and PlanningEach pupil will need a sheet of random number tables. For the school poll,class lists for the first five years and the total numbers of pupils in each yearare required. A list of the current 'Top 30' long-playing albums is alsoneeded. These are published in New Musical Express, Melody Maker andSounds. Graph paper is required in Sections C and D. A calculator will beuseful for C6. Sections B2, B3 and C7 are optional. It is possible to end theunit with Section C and return to Section D at a later date.
3

Detailed Notes
Section A
This section introduces the opinion poll and the idea ofa sample. It sets thescene for the rest of the unit. As such, it would be valuable to use thissection for discussion on the purpose of polls, what sort of information maybe required and how it may be used.
Surveys are conducted on many diverse topics. A list of those reported tothe Survey Control Unit is published in Statistical News. Most of those inAI are selected from these lists. Two major companies involved in opinionpolls are National Opinion Polls and Gallup Polls, whose most publicizedpolls are those concerning prediction of election results.
Al
Pupils are invited to match up the organizations who commissioned thepolls with the topics and the relevant population. The poll on the reliabilityof cars was run by the Consumers' Association, who questioned drivers (2).The Department ofIndustry carried out the poll on the Recycling ofWasteMaterials by interviewing adults (3). The Ministry of Agriculture, Fisheriesand Food asked farmers about growing lettuce under glass (4). Doctorsasked mothers about the decline in breast feeding (5).
A2
The poll on the reliability of cars is used to introduce the purpose of andthe background work to a poll, including the need to take a sample. Thepurpose of the poll which the pupils will carry out in C8 is also introduced.It is important to get the purpose of the poll clearly defined, since this willdetermine who should be asked and the nature of the questions. Thequestions raised can act as a basis for discussion to help pupils appreciatehow each stage of the unit will lead up to the poll. No definite answers areexpected: these will emerge as work through the unit progresses. Somepoints relating to these questions are made in D2.
Section B
This section deals with whom and what to ask to obtain the informationyou need. After discussion, it may be suitable for homework.
Bl
All questions here relate to the proposed school record library. Asking
4
,
.f
pupils which albums they would like to borrow has the advantage that itlinks directly with the purpose of the library. The disadvantage is thatpupils may not know what is available. Asking a local shop about sales hasthe advantage of showing which is popular. A disadvantage is that sales aremade to people of all ages, not just school pupils. Asking pupils whichalbums they like best has the advantage of finding out pupils' preferences.A disadvantage is that some will write down more titles than others andtheir views will be over-represented. Asking pupils which they would b,uyhas the advantage of finding the pupils' favourite records. A disadvantageis that the records they might buy are not necessarily those that they mightwant to borrow.
A list of the 'Top 30' restricts choice and simplifies the analysis of results.Any that do not appearin the 'Top 30' will almost certainly not bethe mainfavourites at the moment.
*B2
This section is optional and allows for further work on collecting therequired information by referring to the weekly 'Top 30' singles charts.
Asking a sample of record shops about their sales is the method least opento abuse. It is the method that is used, with the check that if a record goes upmore than 10 places, the returns for that record are scrutinized to see ifoneparticular shop or area is involved.
The numberof requests is a self-selected sample, and ignores people who donot write in. It can also be easily 'fixed' by phoney requests. The panel ofdisc jockeys may not be representative and could be affected by selfinterests. Sampling record buyers would be too time-consuming to repea teach week. The number of times a record is played on the radio may wellreflect the views of an individual producer or disc jockey.
*B3
B3 is optional and raises the problem of how to choose which shops to putin the samp Ie. In choosing a local sample, one could choose at random fromthe larger shops' these should be more representative than the smaller ones.A wide geographical spread ofshops is needed to ensurefull representationof national views.
The 'Top 30' singles gain much publicity from the TV and radioprogrammes featuring them. Other 'Top 30s' are not featured to that extenton programmes.
5
114
Here we identify the populations for a survey. It is important to determinewhom to ask and start with the correct total population (sampling frame),although this may be difficult or even impossible. It may be different fordifferent purposes. The population could be as follows:
School dinners: (i) all pupils in the school, (il) all pupils who take dinner,(iii) all pupils and staff, etc.
Airports: (i) all travellers using the airport on a given day, (ii) all people inthe airport on a given day, etc.
Parks: (i) all people in the town, (ii) all people who use a park in the town,etc. (To ask people in the park at a particular time would yield a biasedsample.)
Section C
This section contains the actual record album poll in C8. The early parts ofthe section deal with the distinctions between good and bad samples. Arandom sample and a stratified sample are taken and compared to see howwell they represent the population. A report of the poll is written.
Some of the work in C3 and C4 may be omitted or replaced by discussion.For the pupil poll, the simplest way may be to take samples from pupils inthe first five years, depending on your school. The total population shouldbe under 1000, otherwise four-figure random numbers are needed. Toavoid this, you could use only the first three or four year groups. The classlists of these years and the total number in each year will be required.
Cl
a It is extremely time-eonsumingand difficult to question all the pupils inthe school and to analyse their replies. A sample is easier to do.
b A sample should be chosen fairly and be representative of thepopulation. It is possible that a fair method may give anunrepresentative sample (e.g. a random sample ofpupils could containonly girls from one year, although this is very unlikely in a largesample.)
c The fairest methods are to choose every tenth pupil and to ask one in tenpupils from each year group. Slight variations on these are expandedlater. Th~ former is a systematic sample, and a fuller condition of
6
J
fairness requires that a random process be used to select the personfrom the first ten. Asking 50 pupils in the playground may give toomany younger pupils, boys playing football or girls skipping. Asking 50pupils from one year group ignores all other year groups. The schoolmagazine gives a self-selected sample and ignores all those who do notrespond. Asking four pupils from each class is only fair if all classes arethe same size. Using volunteers from assembly gives another selfselected sample and will get those with strong opinions. Asking only fivepupils as they enter school gives too small a sample. Inviting pupils toattend a meeting gives another self-selected sample.
C2
There are many examples ofbad sampling. It is important to bear them inmind. Polling by telephone only includes people with a telephone, and thisprinciple led to a wrong prediction in the 1936 US presidential poll. TheScottish newspaper example is a self-selected sample, while the next sampleis too small. The post office sample is likely to be heavily weighted towardsmothers. The first 10 people off a bus gives too small a sample, whilst thelast example is likely to omit those with knowledge about fashionableteenage clothes. The parents may well be at work while the teenagers are atschool or work.
C3
This section provides pictorial clues to badly chosen samples. Each of thegroups at the bus stops can be related to particular activities at certaintimes, e.g. pupils travelling to school, football or rugby supporters going toa match and housewives shopping.
C4
Pupils may need more help in the use of random number tables and whereto find them. They are introduced in the Level One units Being Fair to Ernieand Ifatfirst . .. It is usual to ignore repeats, although one could use thesame pupil's view twice. In this case both methods are fair: the distinction isbetween sampling without and with replacement. Either can be valid, but itis important to decide which you mean to do (and why) before you begin.
c The second method would lend itself more easily to a large population.
(Text continued after the R pages)
7

00 Table 3 Opinion pollsR1
Opinion poll on: Information wanted by: Whom to ask:
1 Holiday intentions English Tourist Board Adults
2 Reliability of cars
3 Recycling waste materials
4 Growth of lettuce under glass
5 Decline in breast feeding
Table 4 Numbers ofpupils in each year Total no. of pupils =
7 2 3 4 5
Year Number of pupils Calculation Stratified sample size Random sample size
1st
2nd
3rd
4th
5th
,-"- "-
@(j)()::T00en00c:>2.
"crro''"~0':>
'"~(J)co
-0
--l -<0~ w '" ~ '"'" '"en ~
£,.
Zc3rr'"OJ ~
0~
<0~
'""'
"
Q;1".n;-O)
~".~o-.,c;
"'"b'..,'"'"g.
~-§~
"1'oOJ
'"'";;)"'.~Q.
t
£,.
Zc3rr'"OJ ~
0~
<0~
'""'
"
;;;;".n;-O)
~".
~o-.,c;
"'"b'..,'"'"g.
~-§~
"1'oOJ
'"Ql"g-OJto
'"i

C5
A simple random sample is drawn. This may be doneas a class activity witheach pupil (or pair of pupils) taking one class list with numbers allocatedaccordingly across all the lists. The sample size of 50 may be varied,depending on what is a convenient sample size for the stratified sample (inC6) in your particular school. As the two samples are to be compared, it issimpler if the sample sizes are equal. It may be helpful to obtain an extrathree Or four 'reserves' for this sample, as reserves may be needed for thestratified sample in C6. Reserves will be used in carrying out the poll withthe stratified sample if any of the sample are absent.
e If the stratified sample of C6 is to be used in the actual poll, it is onlynecessary here to write down the names of pupils from one form or year.
The class will need to know the numbers of pupils in each year to completecolumn 5 of Table 3. They may be able to decide whether each year is fairlyrepresented (i.e. in proportion to the numbers in each year of thepopulation) simply by inspection. It is unlikely that each year will be fairlyrepresented, hence the suggestion of the stratified sample in C6.
C6
A stratified sample is drawn up according to the numbers of pupils in eachyear. It is possible to stratify according to sex as well as age if there aregrounds for belief that choice of record album will vary from boys to girls.This is more complicated but could be considered by the most able classes.
a Selecting 10 from each year would be unfair if there were differentnumbers of pupils in each year.
The method of finding the number of pupils to be asked in each stratum(year group) is shown by a worked example using different numbers. Asimpler example may help less able pupils see the principle. For example:
StratifiedYear No. of pupils sample no.
1 70 72 120 123 100 104 90 95 120 12
Total 500 50
A sample of 50 is 5~~' i.e. lb of the school, so we need lb of each year. It
10
may be necessary to adjust the figures slightly if rounding leads to a samplesize other than 50. Reserves for each year should be chosen before carryingout the poll. It may be interesting to see if some years needed significantlymore reserves than others.
·C7
Bar charts are drawn to enable the comparison ofthe numbers in each yearin each of the two samples (from C5 and C6) to be made with the numbersof pupils in each year ofthe population. An alternative way would be to usepercentages and draw up a table. The comparison should show that thestratified sample is the more representative, and so this gives the list ofpupils to be used in the poll in C8.
C8
It is important that the actual poll is carried out and the results analysed.The actual questioning of the sample can be carried out by the pupils atregistration or other convenient time, and their results brought to the nextlesson to be collated. An alternative is to enlist the help of form teachers.The collation can be carried out asa class activity with each pupil recordingthe number of votes for each album as.they are read out. A discussion ofthepoll is beneficial as a prelude to writing the report. This should be one pieceof continuous prose, not a list ofanswers to the listed points which are givenpurely as a guide to the structure and content of the report.
Section 0
DI
Here some artificial results are presented of 1000 pupils to enable acomparison between random and stratified sampling. This section could bedone in groups and the results pooled, with some doing the random sample,some the stratified sample and others obtaining the overall results. Thestratified sample may be obtained by taking every twelfth (or fourteenth),having chosen the first out of the first twelve (or fourteen) at random,rather than use random numbers.
Bar charts are used to help make the comparison between the random andstratified samples, although percentages and/or pie charts could beemployed. Stratification does make a difference as the first year prefer B,the second year prefer A, while the third year prefer C. The overall result is348/311/341.
11

D2
Test Questions
This section applies general principles in specific polls. This should helppupils remember the wider implications of polling and would make suitablehomework rna teriaL You may like to add alternative suggestions to the listof possible polls. These may be either topical or of particular interest inyour school, e.g. uniform, youth clubs and year councils.
Here are three >opinion polls that might be carried out:
a Find the views of pupils on school dinners.b Find out whether Scotland wants a separate government.c Find out whether a new type of washing powder will selL
For each poll decide who might be interested. Choose from this list:Manufacturers Pilots School caretakersHousewives Parliament School cooks c Manufacturers
c Housewives
b Parliament
b Scottish people
I a School cooks
2 a Pupils
Answers
You want to find out the views of the pupils and teachers (together) onclassical music.a Give one reason why you might use a stratified sample.b In a stratified sample of size 65, how many teachers would you
interview?
7 You are to do a survey on which magazines should be in the schoollibrary. You decide to ask a sample of pupils.a What do you want to find out?b Who might use the information you collect?c Whom will you ask?d How will you choose your sample?e What problems may occur in interviewing? How would you over
come them?f How will you present your results?
Poll cPoll bPoll a
2 For the same polls decide whom you might ask. Choose from this list:Scottish people Farmers PupilsHousewives Teachers Tourists in ScotlandPoll a Poll b Poll c
3 Explain why the following samples chosen for the three polls are notrepr(':sentative.Poll a: Ask the first 25 pupils in the dinner queue.Poll b: Ask people who wrote to their MP about the subject.Poll c: Ask only three housewives at a supermarket.
4 A youth club has a free ticket for a concert each week. Which of thesethree methods is the fairest way of deciding which members should haveit? Explain why the other two are not fair.a Give it to the first member to arrive.b Put the names of the members in a hat and draw one.e Let the youth leader decide.
5 600 people attend a concert. Their seats are numbered from 1 to 600.How would you choose a random sample of 25?
6 A school has 50 teachers. It also has 600 pupils of whom:300 are aged 11 to 13; 200 are aged 14 to 16; 100 are aged 17 to 19.
3 a It depends on who rushes fastest (or whether there are 'early' dinners for teams or a rotating system of forms is used).
b This is a self-selected sample. c This is too small a sample.
4 b is the fairest. In the others, each member does not have equalchances.
5 Use a 3-digit random number table. Use nos 1-600, ignore 601-999.
6 a To make sure each group is represented proportionately. b 5
7 Possible answers are as follows:a Which magazines would be read by pupils if the library stocked
them.b The school librarian.c A sample of pupils from the whole schooLd A sample stratified according to age (and/or sex).e Pupils absent; try later.
Pupils refusing to answer; report this or perhaps use reserves.Pupils not being aware of possible magazines; give a list ofmagazines for a choice to be made.
f In a ranked list, or a bar chart or (if appropriate) a pie chart and as awritten report.
12 13

Connections with Other Published Units from_
-5the Project 00 x ro
~ E m m>- " J:
~c E "Other Units at the Same level (level 3) a
m cc •:;; <! .~ .cB '"Car Careers Net Catch Cutting it Fine c ~ ii:. ro c
0 a U :;,Multiplying People Phoney Figures ·c -5 ." 0
.Q. 0 ;; ;; E0 .S <! 0: Z If>
"Units at Other levels in the Same or Allied Areas of the Curriculum m:3
__ _0 -5 0
Levell Being Fair to Ernie Wheels and Meals 0 0
'" ~ '"
_0 0
"< Ox c ro c xE E_ m
·5 m m mLeisure for Pleasure >- >- ." .~J: U "c c -"c "0 m E.S 0 0 <l.- ·s .. _ c
-5c c " m "' " . mLevel2 Authors Anonymous Opinion Matters " <! <! .E .g " .c~'"
.c '"um m B .~ B .s tu
~ ~ m<l. :3 " c~ • '" ·.- • 0.Level 4 Sampling the Census Retail Price Index 0 0 "- U c u-5 U '§g .c -5 .§'§ 0 ;; •• ~ E ;; E
Smoking and Health " 0 m m .!2 m ro m
""<! <! --'0: "< Z If> Ulf> Z If> 0:
This unit is particularly relevant to: Humanities, General Knowledge,_
-5Mathematics) Commerce. m 0m
_5 ·s
_0 ro m
·c ro_
"ro_ E m 'f ~
ill m • m m "
_>- J: Wm
~:;; m u :;;S ~ c "0
B ii: .g "'O~tIl:::l ~0
~ c Eif ~
_Interconnecllons between Concepts and Techniques Used In these "0
c:?:. $'!?c • :;; ;;;c
.B g m.c <! m .~ .t: m .c." • ro m ~ m u ~ '" ~ ~
uUnits ~
_m oS (/) C '- >- "~ ~ c
~'" • c ro ;;;.. - 0 (lJ Q) ro ro 0 ro :;, Cl£ .2'" 5 ~h:u c UU U U U Um -5 0 c~ .sc
_J:: '- ... 0 " ~ ~ E .- ~
~ ~ ;;These are detailed in the following table. The code number in the left-hand •• .c •• S 0. ttl..c ro m 0 m 0 ""' 3: --' OU<l. uZ <! U If> ",u U 0 U .zcolumn refers to the items spelled out in more detail in Chapter 5 ofTeaching Statistics 11-16.
c_
.g_
An item mentioned under Statistical Prerequisites needs to be covered m:0 ro m
"5 0.before this unit is taught. Units which introduce this idea or technique are e "
_
" m E>- m 0 0 m
" •listed alongside. u u g_
uw c " .g " c c
:~m m m c .c E ~0 :3 • g c u ,g :§An item mentioned under Idea or Technique Used is not specifically 0' ;;; ~
0S, £ m "0
""'g
_introduced or necessarily pointed out as such in the unit. There may be one 0- , ::r "5 '" m
~ m .!1" '0 m c 5 .B:0, .. " :a.or more specific examples of a more general concept. No previolls ~
c c .!1" ~0 .g; '" ;;;ro "" 0 " E e .c
_'[ij u
.~
_c • • "experience is necessary with these items before teaching the unit, but more .. m ~ m "" ro m m cu E'
_"0 C m:0 > u ~ .g .0~ , ro
~ E S cpractice can be obtained before or afterwards by using the other units listed e m 0 ~ E
_-" "0 0 ro ~.:g 0> m • .";;; c • w ." i5 m ro ;;; '§. w w "3 roin the two columns alongside. J! :!! ro w u m " w.0 ." m m E E m
" :~ e 0. 0 0 m'" E '" '0 :!! ,g ,g 0' " 0.0 c '0 " E '"An item mentioned under Idea or Technique Introduced occurs specifically .c " c Ec 'u_
_.~ '" '" " ro m
~ .§E to E .s c 0
_ro
in the unit and, if a technique, there will be specific detailed instruction for 2 ro :3 ~
_'" "0 0 m
_0 1;; .c m 0. c m '" E m" u :0 • E E ~ '0
_c E'carrying it out. Further practice and reinforcement can be carried out by c c
~ e ·0 0 c • ." -g• 0 m ro • :;; ii5 •0: U "' <l. > If> If> 11: :J W --'using the other units listed alongside.m
'" ~ro u ro .0 "0 m .c u
"0 •~ N '" ~ ~ ~ ~ ~ ~ ": ~o 0 inuZ - N N - '" - - - - - - '"
14 15

Other titles in this series
Being Fair to ErnieLeisure for Pleasure
Tidy TablesWheels and Meals
Shaking a SixPractice Makes Perfect
Probability GamesIf at First ...
Authors AnonymousOn the Ball
Seeing is BelievingFair Play
Opinion MattersGetting it Right
Car CareersPhoney Figures
Net CatchCutting it Fine
Multiplying PeoplePupil Poll
Choice or ChanceSampling the Census
Testing TestingRetail Price Index
Figuring the FutureSmoking and Health
Equal Pay
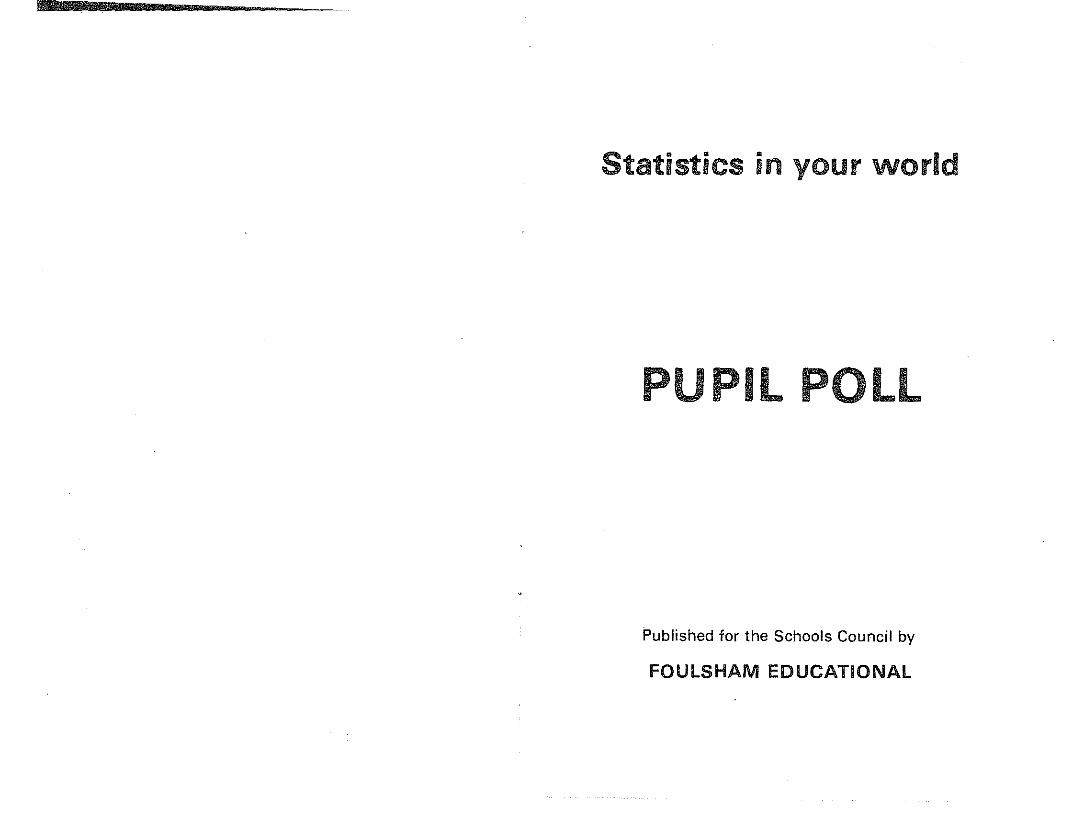
Statistics in your world
PUPIL POLL
Published for the Schools Council by
FOUlSHAM EDUCATIONAL

Contents
A Opinion ponsPage
3Al Who Asks Whom about What? 3A2 How to Find Out 3
B Asking Questions 4BI What Questions Will You Ask? 4B2 What Is the Top 30? 5
*B3 Which Shops? 6B4 Whom Should You Ask? 6
C Good Samples, Bad Samples and the Poll 7Cl Selecting the People to Ask 7C2 What a Poor Choice! SC3 Who's in the Queue? SC4 Four from the Class 9C5 Who Will Represent the School 10C6 Some from Each Year 11
*C7 Which Is the Better Sample? 12CS What Are the Favourite Albums? 13
D Samples and Polls 14DI Which Is the Most Popular Group? 14D2 Choose Your Own Poll 16
Some sections are marked with an asterisk*. Your teacher will tellyou whether to try thes.e sections.R Pages -Your teacher will provide these for you.
The Schools Council Project on Statistical Education
Published byW. Foulsham & Co. Ltd., Yeovil Road, Slough, Berks
Cartoons by Colin Whittock
@Schools Council PUbJica~ions 1981
ISBN 0-572-0IOS4-2
PRINTED IN HONG KONG
A.
A1
A2
Opinion Polls
Who Asks Whom About What?
The police may want to investigate opinions on speedlimits. Planners may want to ask residents about roadplans. To do this they question the relevant people.This is cal!ed an OPINION POLL.
The English Tourist Board wanted to find out aboutpeople's holiday intentions. They questioned adults inan opinion poll.
Table 3 on page RI gives a list of opinion polls.
a For each poll, write down in column 2 a group whomight want information from the poll. Choose fromthis list:Department of IndustryMinistry of Agriculture Food and FisheriesDoctorsConsumers' Association
b Write in column 3 whom they might ask. Choosefrom this list:Farmers Mothers Adults Drivers
How to Find Out
The Consumers' Association said: 'Over the years,British cars have built up a reputation for poorreliability. Is the reputation justified? Or is the poorreliability of only one or two makes a slur on all?'(Motoring Which?, January 1978).
To find out the answers, the Consumers' Associationhas to question drivers. It is impossible to question al!drivers, SO they ask a smal!er number, a SAMPLE ofdrivers.
3

B
All the drivers make upthe POPULAnON whose opinionis wanted. A sample is a smaller group chosen from thepopulation.
Before carrying out such a poll, you have to answerthese questions:What do you want to find out?What questions will you ask?Whom should you ask?How many people will you ask?How. will you select the people to ask?
Suppose your school is going to set up a library ofrecord albums for pupils to borrow.
a Why might the school want to start such a library?
You have been asked to conduct an opinion poll to findout which albums pupils like.
b Discuss the five questions above.
You will find out the answers as you progress throughthe unit.
Asking Questions
*B2
Ask pupils which five albums they like to borrow froma library.Ask a local shop which albums have been sold.Ask pupils which albums they like best.Ask pupils which five albums they would buy if theyhad the money.
a Copy down each method. Write down anyadvantages and disadvantages.The first one has been done for you.
There is another method. Make a list of the Top 30albums and ask pupils to choose their five favourites.You will do this later.
What Is the Top 30?
The top records are played each week on radio andtelevision. The BBC has to find out what the Top 30singles are. Here are a few methods they could use.(The method should be quick, accurate and not beeasily 'fiddled'.)
Count how often records are requested on the radio.Ask a panel of disc jockeys.Ask a sample of record buyers.Ask a sample of shops about their record sales.Count how often records are played on the radio.
a Which method do you tbink is best? Why?
b Write down why you think each of the othermethods is not so good.
81 What Questions Will You Ask?
You want to find which albums the school should buy,Here are some ways to find out which are popular:
Ask the pupils which albums they bought last month.Disadvantage: Some pupils cannot afford to buy the
albums they like.Advantage: Pupils usually buy the albums they like
best.
4
*B3 Which Shops?
Suppose you had to ask a sample of shops about theirrecord sales.
a How would you choose your sample:from those in the nearest large town?to represent all parts of the country fairly?
5

84
c
C1
6
b Write down a reason for preferring larger shops tovery small ones.
c How could you find out if one shop was fiddling itsresults?
There are other Top 30s besides pop singles, e.g.classics, albums, country-and-western.
d Pick one of these and explain why it is not as widelyused.
Whom Should You Ask?
In a poll you must ask relevant people. You should notask people who are not concerned. In the enquiry oncar reliability, questioning tmly young children wouldmake no sense.
a Copy down each poll below, and write down whomyou would ask. The first one has been done for you.
A poll on voting in an election(Adults on the register of voters)A poll on school dinnersA poll on facilities (e.g. shops, restaurants) at anairportA poll on how parks in a town can be improved.
Good Samples, Bad Samplesand the Poll
Selecting the People to Ask
In your poll for the record album library, you will haveto decide which pupils to ask.
C2
a Write down the disadvantages of asking all thepupils in the school. Write down one advantage inasking only a sample.
b How will you select a sample ofpupils?
The sample should be representative of the school.Every pupil should have the same chance of beingchosen.
c Copy down each method below. Write down·whether it is fair. Give yourreasons. Only two ofthemethods are sure to be fair. The first one has beendone for you.
Choose everyone in your class only.Unfair because no other class has a chance of beingasked.
Choose 50 pupils in the playground.
Take a school list and choose every 10th pupil.
Choose 50 pupils from your year group.
Take the first. 50 replies to questions in the schoolmagazme.
Ask four pupils from each class in the school.
Announce the poll in assembly and ask the first 50pupils who volunteer.
Ask I in every 10 pupils from each year group.
Ask five pupils as they come into school.Invite pupils to attend a meeting and ask those whoattend.
What a Poor Choice!
Below there are some examples where the sample wasnot well chosen.Remember that a sample should be representative.
a Copy down each example and try to say whether itis a bad sample. The first onehas been done for you.
7
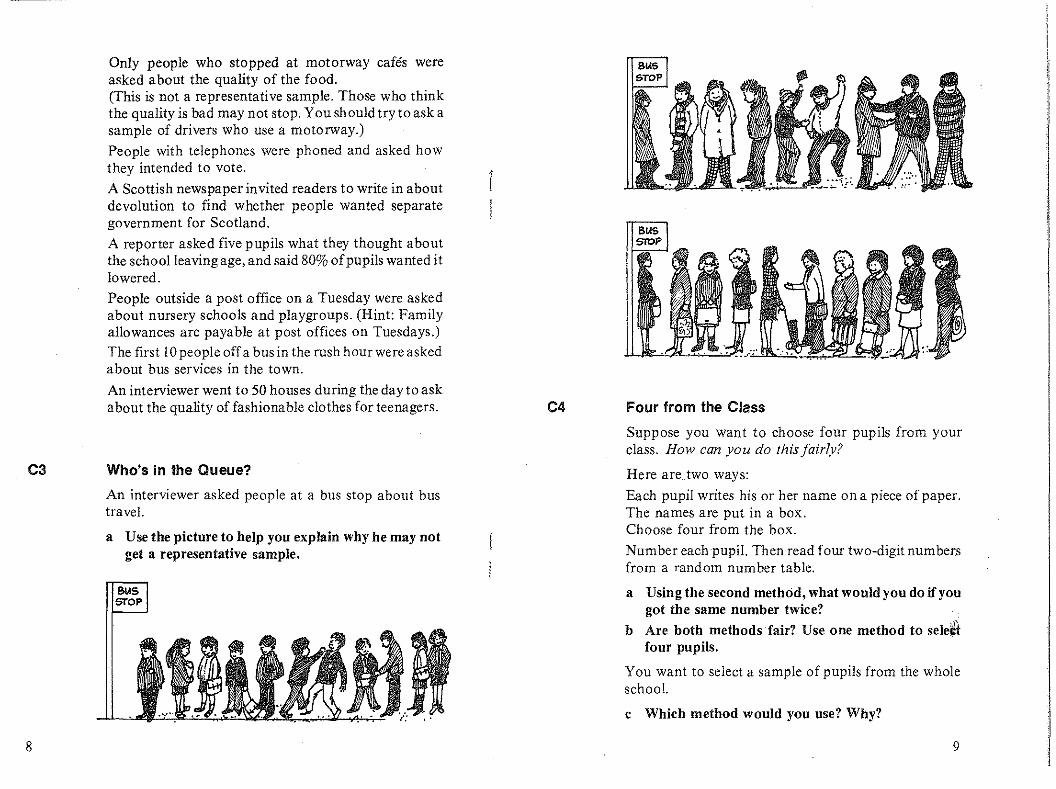
C3
8
Only people who stopped at motorway cafes wereasked about the quality of the food.(This is not a representative sample. Those who thinkthe quality is bad may not stop. You should try to ask asample of drivers who use a motorway.)
People with telephones were phoned and asked howthey intended to vote.
A Scottish newspaper invited readers to write in aboutdevolution to find whether people wanted separategovernment for Scotland.
A reporter asked five pupils what they thought aboutthe school leaving age, and said 80% ofpupils wanted itlowered.
People outside a post office on a Tuesday were askedabout nursery schools and playgroups. (Hint: Familyallowances are payable at post offices on Tuesdays.)The first 10 people offa bus in the rush hour were askedabout bus services in the town.
An interviewer went to 50 houses during the day to askabout the quality of fashionable clothes for teenagers.
Who's in the Queue?
An interviewer asked people at a bus stop about bustravel.
a Use the picture to help you explain why he may notget a representative sample.
BIASSTOP
1I
C4
BUSSTOP
Four from the Class
Suppose you want to choose four pupils from yourclass. How can you do this fairly?
Here are two ways:
Each pupil writes his or her name on a piece of paper.The names are put in a box.Choose four from the box.
Number each pupil. Then read four two-digit numbersfrom a random number table.
a Using the second method, what would you do ifyougot the same number twice?
b Are both methods fair? Use oue method to sel~tfour pupils.
You want to select a sample of pupils from the wholeschool.
c Which method would you use? Why?
9

7 2 3 4Number of Stratified
Year pupils Calculation sample size
1 94 50 x 94 = 7·8 8602
86 50 86 7 ·1 72 602 x =
147 50 147 12·2 123 602 x =
4 159 50 x 159 = 13·2 13602
116 50 116 9·6 105 602 x =
Total 602 50
C5
C6
10
Who Will Represent the School?
You are going to use a fair method to select a sample ofpupils from the school. The sample should berepresentative of the school. You will need a list of thepupils you want to survey. You will choose a sample of50 pupils. Your teacher will guide you. We considertwo methods.
The first method gives a SIMPLE RANDOM SAMPLE. Everypupil has the same chance of being chosen.
a Give each pupil a number starting at 001. Does theorder in whieb the pupils are numbered matter?
b Read three-digit numbers from a random numbertable until you have chosen 50 different pupils.
c Write down the names and years of pupils you havechosen. This is your random sample.
You have used a fair method to select a randomsample. We want to know if the sample isrepresentative. You can use Table 4 on page RI to helpyou answer this.
d Fill in the numbers of pupils in each year of theschool in the second column of Table 4.
e Count the numbers of pupils in each year in yoursample. Pnt these numbers in the fifth column of thetable headed 'Random sample size'.
f Is each year group reasonably represented?
Suppose your random sample contained only pupilsfrom the first year.
g What would you do.?
One answer is given in Section C6.
Some from Each Year
Pupils of different ages may have different favouritealbums. You may want to be sure each age is fairly
Table 7
represented. To do this we choose a STRATIFIED
SAMPLE.
One way to do this would be to select 10 pupils fromeach year group.
a Why might this be unfair?
Table I shows the number of pupils in each year atLogsville Comprehensive School. There are 602 pupilsaltogether in the five years.
Pupils at Logsvi//e Comprehensive School
We want to choose a sample of size 50 out of 602.
This is 6~~ of the pupils.
To be fair we should choose this fraction of each year.
In year I there are 94 pupils.
io~ of94 is 7'8. This number is in column 3 of Table I.
II

'C7
12
We can only choose a whole number of pupils so wechoose the nearest whole number to 7'8, which is 8.This number is put in column 4.
The figures for the other four years are worked out inthe same way.
Complete Table 4 on page Rl as follows:
b Fill in the total number of pupils.c Write down 50 as a fraction of the total number of
pupils.d Work out this fraction of the number of pupils in
each year. Write your answer in column 3.e Write these to the nearest whole number in column
4.f Check that the total sample size is 50 (orvery near to
50).Why might it not be exactly 50?
Your Table 4 now shows how many pupils to choosefrom each year to give a stratified sample.
g Use random numbers to select pupils from your listfor this stratified sample. Write down the namesand forms of the pupils you have chosen.
Which Is the Better Sample?
Using Table 4:
a Draw a bar chart showing the numbers of pupils ineach year group in the school.
b Draw a bar chart to show how many pupils wereselected from each year in the random sample (thefirst one).
C8
c Draw a bar chartto show your stratified sample (thesecond one).
d Which is the more representative sample?
What Are the Favourite Albums?
Your teacher will help you through this section.
a Decide on the sample of pupils you will ask.
b Make a list of the top 30 albums.cAsk tbe pupils in your chosen sample to choose
their five favourite albums from your list. Put tallymarks against the list.
d Count the votes for each album.
e Put the albums in the order of the votes cast.
f Write a report on your opinion poll. You shouldinclude in your report a few sentences on each of thefollowing:The purpose of the poll.How you selected the sample.What questions you asked.How you drew up the list of albums.What problems you met in questioning the pupils,e.g. absentees, pupils did not understand thequestions.How you overcame these problems.How you analysed all the results.Whether the sample .was a good one (i.e.representative).Whether the poll could be improved, if so how.What you think the five most popularalbums in theschool are.
13

Third Year (300 pupils)
CCCBCCBCCC ACBCcccccc BCCCCCCccc CCCCCCABCC CCCBCCCCCC 701 - 750CCBCCCCCCA CCCBCCCCCC CCBCCCACCA CCCCCBCSCC CCBCCCCBBC 751 ~ 800
CCBCCCCCBC BCCCACCCCC CCCCCCBCCA CCCCCCCCBC CCCCCBCBCC 801 ~ 850BCBCCCCCBC CCACCCBCBC CCCCCCBCCC CCBCCCCACA CCCCCCCBCB 851 - 900
CCCBCCCCBC CCCBCCCACC CCCCCSACCC CCBCCCBCCC CCCCCCCCCC 901 ~ 950CBCCCCCCBB CCCCCCACCC BCCCCCBCAC CCCCCCBCCC B8CCCCCBCC 951 ~ 1000
Second Year (400 pupils)AABABAAAAB BACAAAAACA AABAAAAACB BAAMABAAA ABAAABAAAC 301 - 350AABAACAAAB AAACCBAAAA ABAAAACAAA BAABAAA88A ABAAACAAAA 351 - 400AAABAAAABA BBAAACAAA BAAABA88AA AAAABAAACA AABABAAAAA 401 - 450BABBAAAAA ACAAAAAAAB CAAAAAABAA AACACAAAAB ABAAACAAAA 451 - 500
ABBAAAAABA BBAACACAAA AABAAABBAB AAAACAAAAB AAAAAAAABB 501 ~ 550BAAAAAAAAA AAAABCAAAB ACAABAAAAA AABAAAACAC AAAAAAAABA 551 - 600ABAAABAAAA AAABABBCAA ABAAAAAABB AAABAACAAA AAAAABAAAA 601 - 650ACAAABABBA AAAABABBBA AABBBCABBB BAAAACAAAA BABBAAAABB 651 - 700
Numbers
1 - 5051 -100
101-150
151-200201 - 250251 - 300
Popular groups at Newtown Lower School
BBACCABCSB BABBBABABC C.BABBCBBBC CAC88ABBBC BBABBAAACBACCB88ABBC BBA888CBBB CBBBBBCBBA CBCCBCC888 BABCCSBBCCBBABCCBCBB BBCSBBBBCC AB88CBBABB BCA88BCSBC CAAABCBBBB
BBAB8ABBCC BCABBBBBCB AABBBBCBC8 BBCBABBCBB 88ABBCCBAABECBBABBBC BASCCCBCBB ABCABBBBCB BCBAABBBCC CS88CBABB8
ABBBCBCBBA BCBBBCBBAB ABBCBCBBDB ABBBBCBCCB BBBBABCABB
d Choose the pupils in the stratified sample usingrandom numbers. Record the number of votes foreach group in Table 6 on page Rl.
e Complete Table 6 by fmding the total number ofvotes for each group from the sample.
f Draw a bar chart to show these results.
g Find the actual number of votes for each group bycounting all the results (get a friend to help you).
h Draw a bar chart to show these results.
Compare your results and bar charts with a friend's.Which sample was the more representative?
j Compare your sample results with the completeresults. Which sample was the more representatjve?
First Year (300 pupils)
Table 2
SCHOOl. PO~~
W@1?13~@~
~ill€JUm~~ ,T~E MOSi POPUL~fI. '
(;ROl.-\p
% 3
Samples and Polls
Which Is the Most Popular Group?
In Newtown Lower School there are 1000 pupils. Eachpupil was asked to pick a favourite group from:
A Accidentals B Buskers C Caterwaul
You will predict the popularity of each group usingsamples. The favourite groups are given in Table 2.
a Use random numbers to choose a sample of 50pupils from all three years. Using tally marks,record the number ofvotes for each group from thisrandom sample in Table 5 on page Rl.
b Draw a bar chart to show the pumber of votes foreach group.
You are going to choose a stratified sample of 50pupils. In Newtown Lower School, there are 1000pupils. In the first year, there are 300 pupils. Thestratified sample will contain:
I~o x 300 first year pupils, i.e. 15 pupils.
c There are 400 pupils in the second year and 300pupils in the third year. How many second year andhow many third year pupils will there be in thestratified sample?
D
D1
14 15

D2 Choose Your Own Poll
In an opinion poll you should consider the followingquestions:
a What do you want to find out and why?
This will help exact wording of questions.
b Who might use the iriformation you collect?
This affects what sort of questions to ask.
c Whom will you ask?
You must include all relevant people as possibilities.
d What questions will you ask?You must phrase questions simply, clearly andconcisely. It is useful to test the questions first.
e How many people will you ask?
If there are not too many you could ask everyone (acensus). Larger samples are generally more accurate.Most samples are in the range 50 t6 3000.
f How will you choose your sample?
This is very important. You must choose a fair andrepresentative sample.
g How will you present your results?
You should write a report describing what you did andwhat you found.
a Choose one Qf the following snrveys. Describe howyou would carry it out. Use the above questions tohelp you describe what you would do.A traffic survey to investigate the number,frequency and type of vehicles using a particularroad near the school.
A survey of which magazines should be in theschool library.
A survey to find out which foods the school tuck. shop ought to sell.
16

Schools Councll Project on Statistical EducationThis Project has been based in the Department of Probability and Statistics at the Universityof Sheffield from 1975 to 1980. Its brief was: to assess the present situation of statisticaleducation in schools; to survey the needs of teachers of statistics; to devise detailed proposalsfor the implementation of the teaching ideas; and to produce teaching materials.
Project Team
Director: Peter Holmes (l975~ )Deputy Director: Neil Rubra (1975-78), Daphne Turner (1978-
Project Officers
Ramesh Kapadia (1975-79), Alan Graham (1976-77), Barbara Cox (1979-80)
Statistics in your world
General NotesPages with the prefix R are resource pages or reference pages for pupil use. (In many casesthey are designed as worksheets.) In the pupil unit these are referred to as 'page RI' , etc.
Permission need not be sought to reproduce copies of the R sheets provided that copies aremade only in the educational establishment in which they are to be used and that such copiesare not sold, hired or lent to any other indivdual. organization or establishment.
Sections or questions marked with an asterisk are optional to the main thrust in the unit.Sometimes they are for the more able pupils, sometimes they are for reinforcement and sometimes they consist of simpler work for the less able pupils and lead to an easier conclusionthan the main unit. In each case detailed comments on the particular purpose will be found inthe appropriate section of the teaCher's notes.
c R AREERSThree different typefaces are used in the pupil units. Text in roman type (like this) is for pupilsto read or for the teacher to introduce. Questions to promote thought and for group or Classdiscussion are printed in italics. Instructions telling pupils to do things and questions forpupils to answer are printed in bold.
TEACHERS' NOTES
LEVEL 3
Published for the Schools Council by
FOULSHAM EDUCATIONAL

•
Contents
Brief Description
Aims and Objectives
Prerequisites
Equipment and Planning
Detailed NotesSection ASection BSection C
Answers
Test QuestionsAnswers
Connections with OtherUnits in the Project
R pages on pages 8 and 9.
Page3
3
3
3
456
101113
14
Brief DescriptionPupils conduct a survey to investigate the ages ofcars. They are encouragedto discover why the sample may be biased and are led to investigate officialpublished figures to enable them to answer other questions about cars.
Design time: 4-5 hours
Aims and ObjectivesOn completion of this unit pupils should be able to conduct a simplecounting survey and represent the resuits on a bar chart. They will havepractised working with published data, reading tables, drawinghistograms, calculating means and drawing simple inferences fromtabulated data.
The pupils should be more aware of possible bias in sampling; how data arecollected in different circumstances; some of the problems that arise inconnection with data collection, sources of published data; and thedifficulties that can arise in interpretation and comparison of statistics.
AcknowledgementsThe publishers and Project team would like to thank HerMajesty's Stationery Office for granting permission toreproduce or adapt statistics that have appeared in TransportStatistics, Great Britain.
Schools Council Project on Statistical Education
Published byW. Foulsham & Co. Ltd., Yeovil Road, Slough, Berks
© Schools Council Publications 1981
ISBN 0-572-01106-7
PRINTED IN HONG KONG
PrerequisitesPupils need to be a ble to (i) convert fractions to decimals, (ii) plot points fora time series, (iii) use tally marks, (iv) draw a bar chart and (v) work withpercentages and change fractions to decimals and percentages.
The optional section involves calculating a mean of a frequencydistribution. It will help if. they have met this technique before.
Equipment and PlanningSection A2 involves carrying out a survey of the last letters of car numberplates, and this will need planning. Page Rl is used to record the results.The unit starts with a discussion of some of the questions that people maywant to know about cars and uses the results ofthe survey to estimate someanswers. Since the local survey is bound to be biased, as is shown bycomparing the estimates from the local survey with the national figuresavailable, time is taken to look at the effect of bias. Section Cuses nationalfigures to look at the number of new cars produced and to calculate themean age of cars on the road and the scrapping rate. A final optionalsection estimates the age distribution of scrapped cars and calculates themean life of a car.
3

Section B4 is optional and gives practice in estimation calculations firstintroduced in RI. C5 is a harder optional section for brighter pupils only.Individual harder questions are marked with an asterisk.
Calculators would be useful for Sections Band C. It is possible to interruptthe unit at the end of Section B and return later to Section C.
Detailed Notes:
Section A
At
The questions are designed to iultiate a discussion. To find out how longcars last, the age at which the car is scrapped is required. The growth rate ofthe total number of cars can be determined from the total numbers licensedeach year. A direct method is to use published data (in the Monthly Digestof Statistics). There is a time lag between the collection of data: andpublication (perhaps as much as two years). Records are now being keptcentrally at the Driver and Vehicle Licensing Centre, Swansea. Answerscan also be estimated from surveys which provide current data morequickly, but great care is needed, as shown in this unit.
A2
The system of indicating the year by the end registration letter should bediscussed with the pupils. It was changed in 1967 after pressure from carmanufacturers to boost mid-year sales. There should be fewer E registeredthan D registered cars, but this may not show up, because of smallnumbers. The letters I, and 0 were omitted to avoid confusion with thenumbers I and O. Qis used for cars which have been registered buton whichno tax has yet been paid.
To carry out the survey, each group ofthree pupils will need page RI and anaid for counting up to 200 (eg. tallying or a list of numbers from I to 200).Decide in advance where to take the survey. There should be a reasonabletraffic flow. It may be possible to carry out the survey for homework. Ifthere is little traffic, results could be combined over severalcarefully chosentime-periods (to avoid double-eounting). It is important that pupils carryout a survey to enable them to become aware of the ensuing problems. Thepupils should be reminded about road safety prior to the survey. A car parkcould be used for further -data.
Only private cars and vans are considered in the survey, because other
4
vehicles, such as lorries or buses, have a different life-span. In 1975 theaverage annual distance travelled by cars was 8600 miles; buses and coachestravelled 26800 miles, whilst goods vehicles travelled 13700 miles(Transport Statistics 1965-75). Cars with foreign registration plates are notincluded because their age is not obvious. Cars with 'personalized' numberplates are usually too few to have any significant effect, except perhaps atsome rally: one would get new cars showing old registration plates.
A3
The results given in Table 2are to help pupils analyse their own results. Thesurvey was carried out at 9 a. m. on one ofthe main roads leading intoRochdale. The distribution has few T registered cars because the surveywas conducted at the end of August. The first class in the table 'F andearlier' may include some personalized plates. The first class in the pupils'table could be a later letter than F, depending on the current letter.
A4
Care is needed when combining separate samples. Results can only becombined if one can be fairly confident that a car will not have beenincluded more than once. Perhaps only some results can be combined.
Section B
Bl
The pupils calculate an estimate of the N registered cars in Britain. Part ewill not apply if combined class results are used. Pupils should be madeaware that all estimates are only approximate. These particular estimateswill also be biased because of the method of sampling used.
Some pupils might find it easier to work with fractions (such as 21~r! and
cancel rather than with decimals.
B2
The results of the analysis clearly show the bias in the Rochdale sample.Further cfflculations for other letter registrations can be done.
B3
Pupils should write down their own answers to the questions, but a finalclass discussion would set these in perspective.
5

At 8 a.m. a higher proportion of newer company vehicles might be noticed.On early closing day the bias would be against the cars of local shoppersand/or the second car of the family (which may be older). These groupsmight feature more strongly in a sample on the town car park, which is lessdependent on vehicle-traffic-hours. There would be a different distributionin a strategic highly priced park than a long-stay cheaper (or free) one, orthe school car park. A sample outside a secondhand car centre would bebiased towards older cars, while that in an area ofexpensive houses mightcontain a higher proportion of newer cars. Onan industrial estate there arelikely to be many business cars, which will be of recent registration. Thesewould not feature to such an extent in a survey done on a Sunday. Onmotorways, representative of longer, faster journeys, newer cars wouldtend to predominate.
*B4
The survey was carried out on the Friday of a Bank Holiday weekend andprovides the data for extra practice on previous work in the section. Thenumber of touring caravans in Britain is an estimated figure, based on thenumbers produced, their life span and use. The work assumes that touringcaravans are not left on anyone site or that those left on sites over theseason will be towed by cars of the same age distribution. These factors canbe discussed as sources of bias. Estimates can be obtained for otherregistration letters.
Section C
Cl
Discussion on listing large numbers in terms of thousands in tables may bebeneficial. A common error in reading such tables isto forget thatthe unitsare thousands. The early questions are simple, to help pupils famaliarizethemselves with the table. They may require help in plotting the axis in e.
A more SUbtle point in the analysis of the time series is that the proportionof new cars can appear to fall even when the number of cars is stillincreasing, because it is expressed as a fraction of a growing fleet.Economic factors may also be brought into the discussion of trends. Aftera time there will probably be an upturn, because cars have a limited lifespan.
C2
Parts a and b may be omitted by the more able pupils. The column 'Average
6
age' in Table 5 may need explaining. The rationale for the last part of thehistogram may be expanded upon - it assumes an even distribution ofcarsover the 4-year period. The data are plotted (from 0 to 20 years) on thehistogram in an opposite direction to that of the har chart in A3 (from'Fand earlier' to current letter). If the sample were representative and thepresent distribution similar to that in 1977, one would get a mirror image.
If pupils have not used the mean of a distribution before, part f may beomitted (see Cutting it Fine or Seeing is Believing for work on the mean).The pupils may need help in calculating the mean.
The formula 'il; may be mentioned to brighter pupils who have already
met the notation.
C3
The growth in the car population has been levelling off. This could bebecause ofsaturation or a poor economy, or both. Growth is calculated as aproportion of stock at the beginulng of the year (and similarly in the nextsection for cars scrapped). Weaker pupils may prefer to omit part c.
C4
The scrapping rate has fluctuated over the years - it is also affected byeconomic upswing or depression. Weaker pupils may prefer to omit parts band c.
*C5
This part may be found difficult by some pupils. All may requlre furtherexplanation of Table 6. There are a number of hidden assumptions in thecalculations, necessitated by lack ofdata. The yearofthe first registration isgiven only for two-year periods. The average ages taken in 1973 and 1975are the mid-points of the class intervals. The results are based on a samplefirst taken in 1973, so it cannot include all the cars registered in that year;hence these have been omitted. The average age at scrapping is also themid-point ofan interval; a carregistered in December 1972, but scrapped in1973 could be '0' years old, while a car registered in January 1971, butscrapped in December 1974, would be 4 years old. 2 is taken as the midpoint.
The data refer only to private cars.
The histogram gives a visual impression of the lifetime of cars. The meanage is more difficult to ascertain but provides a definite figure.
(Text continued after the R pages)
7

00 Rl
Registration Tally marks Total
letter
No letter
A
B
C
D
E
F
G
H
J
K
L
MN'-·-· -='"'\
P
R
S
T
V
W
X
y
Z
Total
Date:
Time:
Place:
-.0 © Schools Council Publications 1981

m
Answers Test Questions
End registration letter J K L M N P R S TotalNumber of cars 9 15 24 29 26 30 32 14 200
Table T1 Car survey results, 20 January, 1978
Give one reason for conducting a vehicle survey.
Table Tl shows the results ofa car survey. It was taken on a Fridaymorning, 10.30 a.m. to 11.30 a.m., on a city ring road.
a How many cars had no end letter?b Which was the first letter to have more registration than this?
o Copy and complete:Half the cars were registered in the year of the letter ... orlater.
a What is the advantage ofadding results from surveys done indifferent places?
b One group of pupils did a car survey at one end of a road;another group did a survey at the other end ofthe road. Theycombined their results. Why might this be misleading?
a What is the fraction of H-registered cars in Table Tl?b There were approximately 15 million cars licensed in
January 1978. Use your answer to 4a to estimate the numberof these that were H-registered.
Notice when and where the survey in question 2 was carried out.a Which of the following would you expect to feature most in
the survey?
Shopping traffic Business carsHoliday traffic New deliveries to garages
How would you expect the results to differ:
b On a free town centre car park, again on Friday morning?
o On a coast road during a Sunday afternoon in summer?
8 C D E F G H021 223 6
None A4 1
End registration letterNumber of cars
I
2
3
5:,-
Al See detailed notes.
A2 See detailed notes.
A3 See detailed notes.
BI f See detailed notes.
B2 0 See detailed notos.
B3 Seo detailed notes.
B4 a 51200 b 12800 0 ]]2000
CI 0 8247000, ]]515000, 14047000d 1972, e 1964, f 1975
C2 a 2006 thousand; 7, b 1260 thousand, ]]o 18 years; 137000e See detailed notes.f (2125), (8289), 14395, 14042, (16533),13860,8606,3510, (4932).
Total 86292 (thousand oar-years)Mean age = 86292 = 6'14 (6) years
14040C3 a 655000,780000, 142000, 108000
b 1975o 0'0543, N%, 0'0613, 6'1%, 0'0105, 1'1%,0'0079,0'8%
C4 a 1008000, 865000, 1092000, 1059000b 0'0836, 8'4%, 0'068, 6'8%, 0'0809, 8'1%, 0'0776, 7'8%o Smaller
C5 a (II), 82, 172, (442), 651, 364, (512)b Mean age = 23988 = 10'7 years
2234
References
Monthly Digest of Statistics (Central Statistical Office)
Transport Statistics in Great Britain (Dept. of Transport)
Vital Statistics about the Caravan Industry (National Caravan Council)
10 11

Answers
6 a 1971, 1972, 1973 b 1967, 1968, 1970c 78500, 78800d 300 e 2- f 1000
785g 5481 h 4481 4481
78600
c
a
To determine the ages of vehicles and related ideas, e.g. scrappingrate, growth rate, in the area where the survey is carried out
a 4 bH eNa To increase the sample sizeb Most of the cars would have been included twice; the surveys
are not independent.
2- (.2..-) b 450000100 200
Business carsMore shoppers' cars, which would tend to be older vehiclesFewer business vehicles; relatively older cars would be on theroad
ab
It would contain a smaller percentage of women (and a greaterpercentage of men).
4
5
1
7
23
(Source: Transport Statistics, Great Britain, 1965-75)
Table T2 Buses licensed and first registered 1965-75
Table T2 gives the number of new buses compared to all buseslicensed that year.
a In which years were new buses more than 7% of the totallicensed that year?
b In which year were new buses less than 6'5% of the totallicensed that year?
e How many buses were there in 1966; in 1967?d How many more buses were there in 1967 than in 19661e Write the increase in buses in 1967 (from 1966) as a fraction
of the number of buses in 1966 (use your answers to e and d)f How many more buses were there in 1975 than in 1974?g How many new buses were there in 1975?h How many buses were scrapped from 1974 to 1975?
What fraction of the 1974 buses were scrapped between 1974and 1975?
A survey· of shoppers is made between 10.30and 11.300na Tuesdaymorning. The sample contains 85% women.What difference would you expect to find in a survey taken duringthe same hours on a Saturday?
Licences current First registeredYear (thousands) Number Percentage
1965 81·7 5474 .6·71966 78·5 5399 6·91967 78·8 5007 6·41968 79·7 5135 6-41969 79·1 5134 6·51970 77·8 5018 6-41971 78·1 6213 8·01972 76·7 6440 8-41973 78·8 7177 9·21974 78·6 5220 6·61975 79·6 5481 6·9
6
7
12 13

x
'"
w~
"'"u:i>co.cn.
roco
wtro.cU
roNN
•"C.00uz
Multiplying People
Leisure for Pleasure
Sampling the CensusEqual Pay
Cutting it FinePupil Poll
Opinion Matters
Figuring the FutureRetail Price Index
Ifatfirst ...Tidy Tables
Level2
Level4
Levell
Net CatchPhoney Figures
Other units at the Same Level (Level 3)
Units at Other Levels In the Same or Allied Areas of the Curriculum
Connections with Other Published Units fromthe Project
Interconnections between Concepts and Techniques Used In theseUnits
These are detailed in the following table. The code number in the left-handcolumn refers to the items spelled out in more detail in Chapter 5 ofTeaching Statistics 11-16.
An item mentioned under Statistical Prerequisites needs to be coveredbefore this unit is taught. Units which introduce this idea or technique arelisted alongside.
An item mentioned under Idea or Technique Used is not specificallyintroduced or necessarily pointed out as such in the unit. There may be oneor more specific examples of a more general concept. No previousexperience is necessary with these items before teaching the unit, but morepractice can be obtained before or afterwards by using the other units listedin the two columns alongside.
An item mentioned under Idea or Technique Introduced occurs specificallyin the unit and, if a technique, there will be specific detailed instruction forcarrying it out.. Further practice and reinforcement can be carried out byusing the other units listed alongside.
This unit is particularly relevant to: Social Sciences, Mathematics.
14 15

""
CodeNo. Idea or Technique Introduced Also Used In
1.2c Problems of data classification Leisure for Pleasure Tidy Tables Opinion MattersPhoney Figures Pupil Poll Sampling the CensusEqual Pay
1.3b Sampling frpm a large population Net Catch Pupil Poll Retail Price Index
1.3e Variability in samples If at first ... Net Catch Cutting it FinePupil Poll
1.3h Biased samples Net Catch Pupil Poll
2.2g Histogram for grouped data
3.1a Mode for discrete data Leisure for Pleasure Phoney Figures Sampling the CensusEqual Pay
5a Reading tables If at first ... Leisure for Pleasure Tidy TablesOpinion Matters Net Catch Multiplying PeoplePhoney Figures Figuring the Future Retail Price IndexEqual Pay
5b Reading bar charts histograms pie charts Leisure for Pleasure Tidy Tables Cutting it FineMultiplying ~eople Phoney Figures
5c Reading time series Leisure for Pleasure Cutting it Fine MUltiplying PeoplePhoney Figures Figuring the Future
5; Estimating population figures from samples Net Catch Pupil Poll Retail Price Index
5k Variability of estimates Seeing is Believing Pupil Poll Figuring the Future
5u Inference from bar charts If at first ... Multiplying People Phoney Figures
5v Inference from tables Leisure for Pleasure Tidy Tables Net CatchMultiplying People Phoney Figures Figuring the FutureSampling the Census Retail Price Index Equal Pay
5, Detecting trends Cutting it Fine Multiplying People Phoney FiguresSamplin~ the Census Equal Pay
(
-0(j) ~
(j) 0:> » ~ ,3~ 3~ $: (j) S -o~ < ~OJOCO::O -0" c CD :T ~O < CIlCD7'" C CD -l _:T - ~ ~ 0 ~" 0 0 CD :T C::;'_.~~ --0 ~ v U/U ~ ~ cr ro~_::l ::;' 0:> CD ::l;::;" -0' () :T CD _, .~ CIl 0:> $: (j) CD CD COCO~:=':CIlCO" -c 0 ... ::l ~ 0"-~ ~~ro <~ ~n~-· -- >~_.~~W~~~m~~~~O ~.~ rom~O wO~w~romm-.~~.
Eo..::l:T-'COCD~-oco::ll-<~co::l~OJ::lO"'-<CIl~::l~-o~CD0-l ~c CO ()-,~o:>CD ... ::l~ ::lo..-_ ...
~X~!CD~~~-o~~~o:>"'~~=:T-<~G)~CO~-lCDO-CD C::lCIl::lO:>-CD "CO~::o ... CDCD3C1lO:>~0:>~0:>0:>m~-~ ~ ~o~mcm--~~<OJ "'3~ rocrW~u~Co..-'CIl::l u-o-"'~CDCOCD--' 0 CD (j)o:>-C::lm~~ro~coO_~oro~~~m~wc roO-.-ro~-.<~rox~wro=roro~wW~W<D='W w~xwmroro
S?:TIII.......;:i:COIII
:i"....:Tiii'IIIIII:!.toIII

Statistics in your world
CAR CAREERS
Published for the Schools Council by
FOUlSHAM EDUCATIONAL

ContentsPage
A Collecting Information 3Al Some Questions 3A2 Car Survey 4A3 Results 6A4 Class Results 6
B Estimating Answers 8Bl How Many N-Cars? 8B2 R-Cars 9B3 Different Samples 9
*B4 Cars and Caravans 10
C National Figures 11Cl New Cars 11C2 How Old? 12C3 More and More Cars 14C4 Scrapping Cars 14
'C5 How Long Do Cars Last 15
Some sections afe marked with an asterisk*. Your teacher will tellyou whether to try these sections.R Pages Your teacher will provide these for you.
AcknowledgementsThe publishers and Project team would like to thank Her Majesty'sStationery Office and the Central Statistical Office for granting permissionto reproduce or adapt statistics that have appeared in Transport Statistics,Great Britain, and Monthly Digest of Statistics.
The Schools Council Project on Statistical Education
Published byW. Foulsham & Co. Ltd., Yeovil Road, Slough, Berks
Cartoons by Colin Whittock
@ Schools Council Publications 1981
ISBN 0-572-01079-6
PRINTED IN HONG KONG
A
Ai
Collecting Information
Some Questions
Below are some statements and questions about cars.Discuss how you could find the answers.
Car firms want to know how long spares for eachmodel of car need to be made. People want to knowhow long cars are likely to last.
a How long do cars last?
As people get richer, more people buy cars.b How qUickly is the number ofcars growtng? How
many cars are there in Britain?c Who might need this information?
3
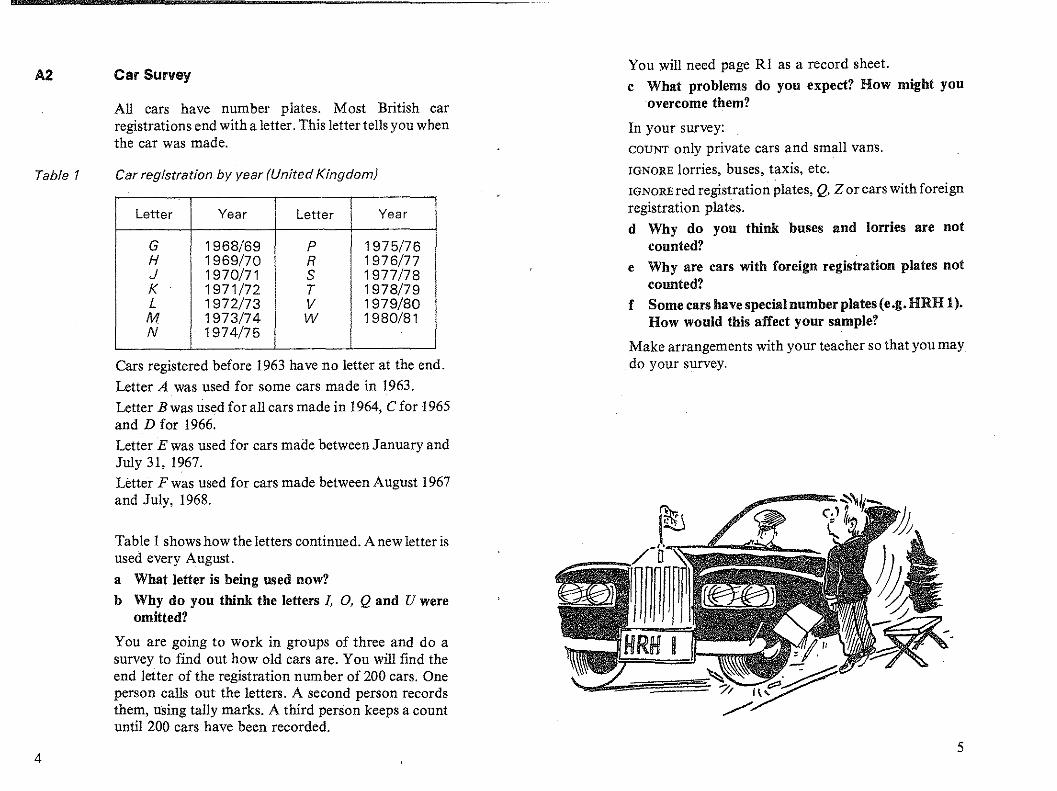
.0.2
Table 1
4
Car Survey
All cars have number plates. Most British carregistrations end with a letter. This letter tells you whenthe car was made.
Car registration by year (United Kingdom)
Letter Year Letter Year
G 1968/69 P 1975/76H 1969/70 R 1976/77J 1970/71 S 1977/78K 1971/72 T 1978/79L 1972/73 V 1979/80M 1973/74 W 1980/81N 1974/75
Cars registered before 1963 have no letter at the end.
Letter A was used for some cars made in 1963.
Letter Bwas used for all cars made in 1964, Cfor 1965and D for 1966.
Letter E was used for cars made between January andJuly 31, 1967.
Letter F was used for cars made between August 1967and July, 1968.
Table 1 shows how the letters continued. A new letter isused every August.
a What letter is being used now?
b Why do you think the letters L 0, Q and U wereomitted?
You are going to work in groups of three and do asurvey to find out how old cars are. You will find theend letter of the registration number of 200 cars. Oneperson calls out the letters. A second person recordsthem, using tally marks. A third person keeps a countuntil 200 cars have been recorded.
You :will need page R1 as a record sheet.
c What problems do you expect? How might youovercome them?
In your survey:COUNT only private cars and small vallS.
IGNORE lorries, buses, taxis, etc.IGNORE red registration plates, Q. Z or cars with foreignregistration plates.d Why do you think buses and lorries are not
counted?e Why are cars with foreign registration plates not
counted?f Some cars have special number plates (e.g. HRH 1).
How would this affect your sample?
Make arrangements with your teacher so that you maydo your survey.
5

AS Results Table 2 Results ofRochdale car survey
Figure 1 Rochdale car survey
No of cars
TsRpK L M N
Registration letter
JHG
Registration Number ofletter cars
F and earlier 6G 6H 5J 11K 14L 16M 16N 17P 29R 28S 41T 11
Total 200
Fand
earlier
c--
~,.-
,.-,...- ,.-
-- c--
nnno
10
30
40
20
Table 2 gives the results of a survey done in: Rochdaleon Thursday, August 31, 1978. Figure 1 shows thesame results as a bar chart.
If you combine your results with others, you will get abigger sample of cars.
a When might it be misleading to combine results?
b When is it reasonable to add results together?c Is it sensible to add your class results?You must be careful not to count the same cars at thesame time, twice.
a Make a table of your results.
b Draw a bar chart of your results. This shows theDISTRIBUTION of your sample.
Of all tr c letters in the Rochdale sample, S was themost common. S is called the MODE ofthe distribution.
c What is the mode of your distribution?
d There are more S-registered cars than T-registeredcars in the Rochdale sample - Why? (Hint - lookat the month when the survey was made.)
e Which letter is being used now? Is this the mostcommon in your sample? Can you explain?
f In the Rochdale sample, there are only six cars withthe letter F or earlier. There are about the samenumber with the letter Gor H. Why? Write a similarstatement about the older cars of your sample.
g Half the cars in the Rochdale sample were Pregistered or newer. Write a similar statement aboutyour sample.
h Write two sentences to describe your results.
A4 Class Results
6 7

B
81
8
How Many N-Cars?
You can use your results to estimate the number ofcarsof a particular age in Britain, e.g. N-registered.
a How many cars did you count altogether? TheRochdale sample counted 200.
b How many N-registered cars were there? TheRochdale sample had 17.
c What is the fraction of N-registered cars? Thefraction in the Rochdale sample was 17 or 0'085.
200The licensing office at Swansea knows how many carsare licensed each year. The numbers are published inthe Monthly Digest ofStatistics. At present there areabout 15 000 000 cars on the road.
You have estimated the fraction of N-registered cars inyour sample. If you multiply this fraction by15 000 000, you get an estimate of the number of Nregistered cars altogether.
The Rochdale sample estimates 0'085 x 15 000 000 cars=1 275 000 N-registered cars.
d Estimate the number of N-registered cars usingyour results.
e Compare your results with those of other classmembers. Why are they different?
f Do any of the estimates give the correct answer?Give a reason for your answer.
f1
B2
B3
R-Cars
a Work out the fraction of R-registered cars in yoursample.
b Use this to estimate the number ofR-registered carsin Britain.
The Rochdale fraction is i~o = 0'14.
The Rochdale estimate for R-registeredcars is:0'14 x 15 000 000 = 2 100 000.
In fact there were about I 270 000 R-registered carsproduced altogether. The Rochdale estimate is toohigh. The Rochdale sample does not fairly representthe cars on the road in Britain. The sample is unfair orbiased.
c Was your sample biased? Write down one reasonwhy it might be biased.
Different Samples
How would the results of your sample have beendifferent if you had carried it out:
a at 8 a.m.,b on an early closing day,c in a town car park,d outside a secondhand car sales centre,e in a part of town with a lot of expensive houses,f in an industrial estate,g on a Sunday,h on a motorway?
Now write down reasons why your sample isprobably biased.
j How could you get a less biased sample?
9
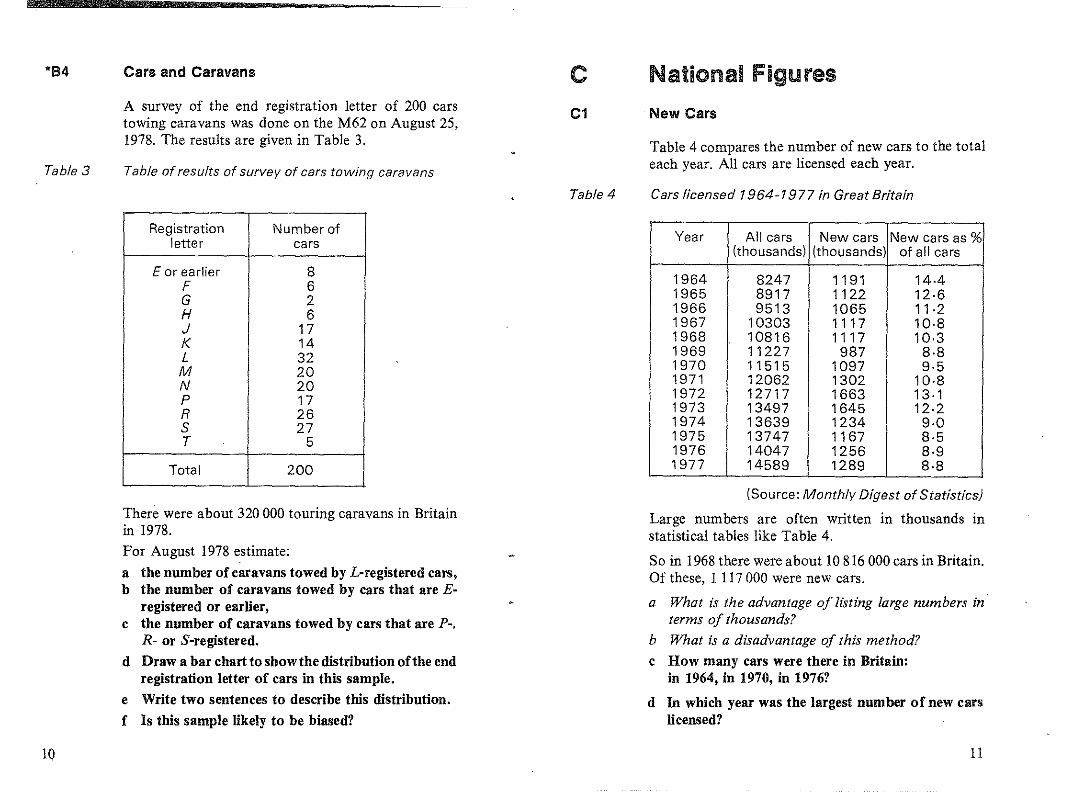
*134
Table 3
10
Cars and Caravans
A survey of the end registration letter of 200 carstowing caravans was done on the M62 on August 25,1978. The results are given in Table 3.
Table of results of survey of cars towing caravans
Registration Number ofletter cars
E or earlier 8F 6G 2H 6J 17K 14L 32M 20N 20P 17R 26S 27T 5
Total 200
There were about 320000 touring caravans in Britainin 1978.For August 1978 estimate:
a the number of caravans towed by L-registered cars,b the number of caravans towed by cars that are E-
registered or earlier,c the number of caravans towed by cars that are po,
R- or S-registered.
d Draw a bar chart to show the distribution ofthe endregistration letter of cars in this sample.
e Write two sentences to describe this distribution.
f Is this sample likely to be biased?
cC1
Table 4
National figures
New Cars
Table 4 compares the number of new cars to the totaleach year. All cars are licensed each year.
Cars licensed 1964-1977 in Great Britain
Year All cars New cars New cars as %(thousands) (thousands) of all cars
1964 8247 1191 14·41965 8917 1122 12·61966 9513 1065 11 ·21967 10303 1117 10·81968 10816 1117 10·31969 11227 987 8·81970 11515 1097 9·51971 12062 1302 10·81972 12717 1663 13·11973 13497 1645 12·21974 13639 1234 9·01975 13747 1167 8·51976 14047 1256 8·91977 14589 1289 8·8
(Source: Monthly Digest of Statistics)
Large numbers are often written in thousands instatistical tables like Table 4.
So in 1968 there were about 10 816 000 cars in Britain.Of these, 1 117 000 were new cars.
a What is the advantage of listing large numbers interms of thousands?
b What is a disadvantage of this method?
c How many cars were there in Britain:in 1964, in 1970, in 1976?
d In which year was the largest number of new carslicensed?
11

Age (years) Average age No. of cars Number of(thousands) car-years
(thousands)
o and under 2 1 2125 21252 and under 4 3 2763 82894 and under 6 5 28796 and under 8 7 20068 and under 10 9 1837 16533
10 and under12 11 126012 and under 14 13 66214 and under 16 15 23416 and under 20 18 274 4932
Total 14040
I
C2
Table 5
12
e In which year was the percentage of new carshighest?
f In which year was the percentage of new carslowest?
g Draw a graph to show the percentages of new carseach year. (Put 'Years' along the horizontal axis.)
At the end of 1973 there was a shortage of petrol, andprices rose rapidly.h What effect do you think this petrol crisis had on the
sales of cars?i Comment on the general pattern shown by your
graph. When was the percentage ofnew cars falling?When was it rising?
How Old?
Ages of cars on January 1, 1977
(Source: Transport Statistics, Great Britain, 1966-76)
On January I, 1977, there were 2 125000 cars undertwo years old. Their average age was one year.
Use Table 5 to answer questions a to c about cars onJanuary I, 1977.a How many cars were over six and under eightyears
old? What was their average .age?b How many cars were over 10 and under 12 years
old? What was their average age?
c There were 274 000 cars over 16 and under 20 yearsold. What was their average age? Assume that274000 cars were equally spread over the four-yearperiod (so there will be the same number over 16and under 18, as over 18 and under 20 years old).How many mil be over 18 and under 20 years old?
d Plot the figures of Table 5 in a diagram with 'Age'on the horizontal axis and 'Number of cars' on thevertical axis. For the period over 16 and under 20years, draw one block, assuming the 274000 carsare shared equally between the two categories '16and under 18' and '18 and under 20'.
This diagram is called a HISTOGRAM.
e Compare the histogram with your bar chart ofSection A3. Why are the shapes different? (Hint:how old are the cars at the right-hand end ofthe axisin the bar chart?)
* There are 2125 thousand cars with an average age ofone year. The total of all their ages will be 2125thousand years. Similarly the total age of the 2763thousand three-year old cars is 2763 x 3 = 8289thousand years. We call this the number cif car-years.
Some of these figures are given in the last column ofTable 5.
*f Copy and complete the last column of Table 5 andfind the total number of car-years.
The MEAN age of the cars can be found by dividing thetotal number of car-years by the total number of cars.
*g Find the MEAN age of the cars.
13

How long Do Cars last?
Ages of cars - 1973. 1975 (thousands)
a Use your answers to Section C3 a to work out howmany cars were scrapped:in 1972, in 1973, in 1974 and in 1975.
* The proportion of cars scrapped in 1970 was:Number of cars scrapped in 1970 = 809000
Total number of cars in 1969 11227000= 0'0721 or 7'21 %
*b Find the proportion of cars' scrapped:in 1972, 1973, 1974 and 1975.
Look at your answers to C3b and C4b. Copy andcomplete the foUowing sentence:
*c During the years 1964 to 1977, the larger theincrease in number of cars from one year to thenext, the the number of cars scrapped.
809000
288000
1097000The number of new cars in 1970 was:Subtract the increase from 1969to 1970, which was:
So, the number of cars scrappedin 1970 was:
Table 6
·C5
* The proportional increase in 1970 over 1969 is:
Increase from 1969 to 1970 288 000=Total number in 1969 II 227000
= 0'0257 or 2'57%
a How many more cars were there:in 1972 than in 1971,in 1973 than in 1972,in 1974 than in 1973,in 1975 than in 1974?
b Which of the years from 1971 to 1975 (inclusive)was worst for the manufacturers?
More and More Cars
We can find out how many more cars there are eachyear by subtraction.
For example: to find the increase in the number ofcarson the road from 1969 to 1970, look at Table 4.
The total number of cars in 1970 is: 11 515000Subtract the total number of carsin 1969, which is: II 227000So, the increase in number of carsfrom 1969 to 1970 is: 288000
C3
"c Find the proportional increase:in 1972 over 1971,in 1973 over 1972,in 1974 over 1973,in 1975 over 1974.
C4 Scrapping Cars
From Table 4 we see there were 1 097 000 new carsregistered in 1970. The increase from 1969 to 1970 wasonly 228 000. Some cars must have been scrapped. Wecan find this number by subtraction.
Year of 1st Average age Number Number' Age at Car-Registration 1973 1975 1973 1975 scrapped scrapping years
1971/72 1 3 2871 2860 11 2 221969/70 3 5 2061 1979 41967/68 5 7 2157 1985 61965/66 7 9 1996 1554 442 81963/64 9 11 1547 896 101961/62 11 13 677 313 12Before 1961 15 17 770 258 512 16
(Source: Transport Statistics, Great Britain 1973. 1975)
1 This excludes some cars scrapped before they were one year old. This is likely to be a smallnumber (e.g. those involved in serious accidents),
14 15

16
Surveys of car ages were done in 1973 and 1975 (as inSection Cl). We can use these to find out how long carslast. Look at the first line of Table 6.
Cars first registered in 1971(72 will be on average oneyear old in 1973. In 1975, i.e. two years later, they willbe three years old.
There were 2871 thousand of these cars in 1973, butonly 2860 thousand of them in 1975.
The difference (2871 - 2860 = II thousand) must havebeen scrapped. So, between 1973 and 1975, IIthousand cars were scrapped, with an average age oftwo years.
a How many cars were scrapped in each age group?EITHER
b Plot the ages of cars scrapped as a histogram.
OR
There were II thousand two-year old cars scrapped, sotheir total age was 2 x 11 thousand =22 thousandyears. This figure is listed in the column headed caryears.
c Copy and complete Table 6 and find the mean ageof cars scrapped between 1973 and 1975. (Ifyou arenot sure, look back to Clf.)

Schools Council Project on Statistical EducationThis Project has been based in the Department of Probability and Statistics at the Universityof Sheffield from 1975 to 1980. Its brief was: to assess the present situation of statisticaleducation in schools; to survey the needs of teachers of statistics; to devise detS11ed proposalsfor the implementation of the teaching ideas; and to produce teaching materials.
Project Team
Director: Peter Holmes (1975- )Deputy Director: Neil Rubra (1975~78), Daphne Turner (1978-
Project Officers
Ramesh Kapadia (1975-79), Alan Graham (1976-77), Barbara Cox (1979-80)
Statistics in your world
General NotesPages with the preflx R are resource pages or reference pages for pupil use. (In many casesthey are designed as worksheets.) In the pupil unit these are referred to as 'page R I', etc.
Permission need not be sought to reproduce copies of the R sheets provided that copies aremade only in the educational establishment in which they are to be used and that such copiesare not sold, hired or lent to any· other indivdual, organization or establishment.
Sections or questions marked with an asterisk are optional to the main thrust in the unit.Sometimes they are for the more able pupils, sometimes they are for reinforcement and sometimes they consist of simpler work for the less able pupils and lead to an easier conclusionthan the main unit In each case detailed comments on the particular purpose will be found inthe appropriate section of the teacher's notes.
PHFI
NEYURES
Three different typefaces are used in the pupil units. Text in roman type (like this) is for pupilsto read or for the teacher to introduce. Questions to promote thought and for group or Classdiscussion are printed in italics. Instructions telling pupils to do things and questions forpupils to answer are printed in bold. TEACHERS' NOTES
LEVEL 3
Published for the Schools Council by
FOUlSHAM EDUCATIONAL

AcknowledgementsThe pUblishers and the Project team gratefully extendtheir thanks to Her Majesty's Stationery Office forgranting permission to reproduce statistics fromPopulation Trends; and the Birmingham AirportAuthority for permission to use statistics from theiryearly handbooks.
Contents
Brief Description
Aims and Objectives
Prerequisites
Equipment and Planning
Detailed NotesSection ASection BSection C
Answers
Test QuestionsAnswers
Connections with OtberUnits in the Project
page3
33
3
567
12
1315
16
Brief DescriptionPupils are introduced to various abuses of statistics, including errors inrepresentation and presentation and errors of omission.
Design time: About 4 hours
Aims and ObjectivesOn completing this unit pupils should be able to criticize constructively anyof the more common misuses of data in advertising or argument.Specifically, they should be able to identify bar charts using bars ofdifferent widths, the omission 0 fscales, the use ofa false origin, percentagescalculated on the wrong base, the use ofmeaningless phrases (such as 'up to20%'), the use of exaggerated scales, false prediction lines, and truestatements selected only because they support an argument. They should beaware of the effect of these abuses on the general impression given. Theyshould know the true measures of 'average' and the differences betweenthem.
They will have practised drawing bar charts, drawing graphs oftime series,making up theii, own misleading representations, calculating a median anda mean, reading tables, and using data in an argument.
They will be more aware of tbe ways statistics can be used and abused, ofthe need to look back at the original data, of the need to look at all theappropriate data, of the effect ofvariability and ofthe fact that many itemsmay be better than the average, but they are not necessarily the best.
PrerequisitesPupils need to be able to draw a bar chart, plot points on a graph and beable to calculate a simple mean and find the mode.
Schools Council Project on Statistical Education
Published byW. Foulsham & Co. Ltd., Yeovil Road, Slough, Berks
@ Schools Council Publications 1981
ISBN 0-572-01107-5
PRINTED IN HONG KONG
Equipment and PlanningIt is most desirable that, before beginning this unit, pupils should collectexamples of advertisements from newspapers, magazines and televisionthat use statistical terms or ideas. This collection then forms the basis oftheinitial discussion and some of the later work. Graph paper is needed, but noother extra material is essential.
3

Section A introduces some of the better-known techniques of misleadingstatistical representation. Section B looks briefly at some of the problemsconnected with the word 'average'. Section Cshows how even the truth cimbe misleading if only selected truths are quoted. It is set in the context of adebate on extending Birmingham Airport; an alternative in these teachers'notes uses immigration as the subject under discussion.
Detailed Notes'There are lies, damned lies and statistics'. 'You can prove anything withstatistics'. 'He uses statistics like a drunkard uses a lamp-post: for supportrather than illumination.'
These are just a few quotations warning of the dangers of abuses instatistics. It is highly desirable that the general citizen be aware of theselimitations. FOfoften the misrepresentations are not sophiSticated, yet theycan still be damaging and misleading. It is hoped that a carefulexamination of a few commoner abuses will lead pupils to a greater criticalawareness of dealing with statistical data.
Below is presented a list of different types ofabuses of statistics and somegeneral principles in helping to spot them. It is not an exhaustive list. Someof these could be investigated through suitable examples from newspapers,magazines or television.
It would be worthwhile giving the pupils a list of these abuses anddiscussing them at the end of the unit.
Abuses
Eye compares volumes or areas rather than lengths in diagrams(AI,B4).
2 Different size pie charts can distort differences unfairly.
3 Spurious accuracy (8'387% of people, etc.)
4 Quoting figures out or' context (Al,B2,C!).
5 Lack of scale or curtailed scale (A 1).
6 Prediction and difficulties entailed (AI, Cl).
7 Using the particular 'average' which sounds best (B2,B4).
8 Bad or misleading questions on a questionnaire.
9 Self-select sample answering a questionnaire.
10 Inferring individual results from an average, and ignoring spread (B4).
4
II Spurious or irrelevant connections (Al,B5, Cl).
12 Quoting meaningless or irrelevant figures (Al,Cl).
13 Selecting only the data which support an argument (B2, Cl).
Ahnost any statistical technique can be abused.
The sort ofquestious one should ask when dealing with possible abuses are:Who says so? On what evidence? What is missing? Does it make sense?
Section A
It is valuable and instructive for pupils to make up a scrapbook or collageof advertisements which misuse statistics. Advertisements are designed tosell, and the temptation to overstate one's case is often very strong. It isinteresting to see how often it is difficult to find the price of a product. Theinitial discussion in s is to set the scene for a more detailed study in the nextsections. Try to get the pupils to identify themselves with the detectives ofFact Ferrets.
Al
The widening of the bars and their shading should be apparent to the pupilsin s. They may also notice the fat happy cat and the thin miserable cat. Thepossibility of using a false zero, and its effect, is seen in part 2 of Figure 2,and this is perhaps the most misleading representation. Since the bars aredifferent in part I it follows that the answer to c is 3. An underlyingassumption is that 'more means better'; it is possible to have too much ofsome ofthese ingrediants.
A2
The 'save 50%' is a common error. The saving should be based on theoriginal price not the sale price, as is brought out in a and b. 'Up to 20%extra' could, of course, include 'down to 100% less'. There is no indicationwhat the 20% is of. Does it mean that the tin of Catchunks weighing 480gcontains 20% more goodness than the one weighing 400g, Or is it making acomparison with some other cat food? This supposes that we know what ismeant by 'goodness', and this is followed up in A4.
A3
Questions s, band c show how the graph has a false zero and anexaggerated scale. The figures on the vertical axis have then been omittedto give a distorted picture of a fairly minimal increase in sales.
5

A4
The points made here are more subtle, and pupils may benefit from a classdiscussion before answering the questions.
AS
This section gives pupils a chance to put into practice the faults they haveseen in the previous sections and criticize (ferret out) the attempts of theirfriends. This could be done for homework. To draw together all the pointsfrom Section A it is suggested that pupils should in e look again at all thecollected advertisements.
Section B
This section deals mainly with various abuses of the term 'average', eitherby not indicating whether it is the mean, the median or the mode that isbeing quoted, or by quoting an 'average' value when it is the variability thatis more important. B4 is optional and looks at some fallacies connectedwith proportions. In the text the fuller phrase 'arithmetic mean' has beenused. In practice this is often just abbreviated to 'mean', especially whenthere is no danger of confusiou with other 'means', such as the harmonicmean and the geometric mean.
III
Pupils may need some guidance in drawing the bar chart (or vertical linechart). A linear scale from £0 to £500 should be used on the horizontal axisto show the distribution, with the large gap between £100 and £490.
112
With a skewed distribution like this the mean is affected by the singlepayment of £490, and the mode takes no account of figures above thelowest category of£50. Putting the wages in order gives the median £60, thewage of the 13th person. If a single figure has to be given for wages, themedian is the least misleading here.
113
The first three statements all make the point that a single figure issometimes useless, and that the distribution as a whole is important. Thispoint is also made in the fourth statement, with house prices ranging sowidely and being different in different parts ofthe country. The illustration
6
to the fourth statement also shows another form <if visualmisrepresentation. Does the eye see ratios ofJengths, areas or volumes? Theratio of the lengths is 2: I, areas 4: I and volumes 8: J.
*114
These inferences are incorrect because of the proportions involved. Morepeople drive in the daytime so, of course, there are more accidents.Suppose, for example, in statement 3, that 95% of drivers wear seat belts (itis compulsory by law) and that I driver in 100 is injured. Then out ofevery10000 drivers there will be 100 injured, and 90 of these will be wearing seatbelts. The figures are shown in Table TJ.
Table T1 Seat belts and injuries !fictitious)
Wearing belt Notwearing belt
Injured 90 10Not injured 9410 490
9500 500 10000.
From this it will be seen that the probability of injury when wearing a
seat belt is 9~go =0'009, whereas the probability of injury when not
wearing a seat belt is 51000 = 0'02, which is much higher'.
This method is explained morefully in the Level Four unit Testing Testing.
Section C
This is an important section because statistics are often misquoted. Errorsthrough omission or careful selection are hardest to spot, yet unfortunatelyare widely prevalent. It is relatively easy to make emotive and biasedspeeches as quoted. It is much harder to make a clear analysis, and this isnot usually as interesting to listen to or read.
The local resident has carefully chosen his years. 1974 was thefirst year formany years that passenger figures dropped. The aircraft figures in 1973were higher than neighbouring years, and those in 1958 were lower thanneighbouring years, so the ratio is artificially high. It is arguable whether
7

modern a-ircraft all make more noise than older ones. The airportspokesman chooses his figures just as carefully to achieve the oppositeeffect.
Table T2 gives the full version of Table 6 in the pupils' notes.
Some other points that may come up in discussion are as follows.
1 Aircraft are larger and therefore carry more passengers.
2 Therefore the number of passengers can increase somewhatindependently of aircraft numbers.
3 As aircraft are larger, longer runways may well be necessary.
4 More passenger facilities will be needed as numbers increase.
S Existing facilities should be taken into account.
Table T2 Traffic statistics, 1955-1977Passengers Freight
6 Some of the aircraft are privately or company owned and thereforecarry small numbers of passengers.
7 Other aircraft just stop to refuel.
8 Some aircraft carry freight (see Table T2, the full version of Table 6).
9 Access to the airport has been improved (extra bus routes, theinternational railway station)
10 National Exhibition Centre: this will attract passengers who wouldpreviously have used Heathrow or Gatwick.
11 Bearing point lOin mind, increased international business would seem. to be the result of the NEC development leading to more air traffic at
Birmingham Airport.
12 Larger aircraft can be noiser.
Aircraft
Year Passengers Year Freight Year Commercial Non-commercial Total(short tons) aircraft movements aircraft movements
1955 108666 1955 614 1955 6951 5145 120961956 154806 1956 686 1956 9627 12342 219691957 182919 1957 751 1957 10898 21736 326341958 168893 1958 849 1958 9710 15172 248821959 188065 1959 1214 1959 9174 22587 317611960 283833 1960 2530 1960 13779 17407 311861961 329862 1961 2069 1961 13402 21654 350561962 348319 1962 2057 1962 12845 19143 319881963 386419 1963 2220 1963 13311 21608 349191964 431806 1964 2630 1964 14264 25944 402081965 469511 1965 3004 1965 14287 33672 479591966 534558 1966 4585 1966 14345 31388 457331967 564418 1967 4752 " 1967 15089 36615 517041968 572172 1968 5486 1968 15287 39081 543681969 630735 1969 5598 1969 14330 32240 465701970 702559 1970 6 111 .," 1970 14344 31984 463281971 855485 1971 5342 1971 15978 42291 582691972 969718 1972 4750 1972 19068 43279 623471973 1181687 1973 3869 1973 21586 43690 652761974 1056002 1974 3435 1974 20397 39188 595851975 1130040 1975 3004 1975 19971 42472 624431976 1157635 1976 2920 1976 21936 44374 663101977 1113745 1977 3568 1977 21800 44284 66084
(Source: Birmingham Airport Handbook 1976, 1977, 1978)
8 9

In the original tested version of this unit there was a discussion onimmigration, with a prejudiced speaker using selected statistics to make hispoint. In areas where race was not a' sensitive issue this was well received,you may like to use it for reinforcement of the ideas of Section C.
Table T3 gives the migration figures for 1966, 1972 and 1974.
Table T3 Migration to and from Great Britain (thousands per year)
New OtherYear Commonwealth' Countries Total
1966 Immigrants 76 143 219Emigrants 42 260 302
1972 Immigrants 84 138 222Emigrants 45 188 233
1974 Immigrants 51 132 183Emigrants 30 239 269
(Source: Population Trends 7)
1 New Commonwealth"excludes Australia, New Zealand and Canada.
The pupils can then be asked the following questions.
a How many people left Britain in 1972?
b How many people entered Britain in 1974?
c In 1966 were there more immigrants to Britain than emigrants fromBritain?
d By how many did the population change? Which way?
e Describe the trend in immigration.
After being told the definitions that an immigrant is someone who comes toBritain to settle and an emigrant is someone who leaves Britain to settleelsewhere they can then be shown this emotive speech.
'In 1966 over 75000 black immigrants came to settle in England.This swelled to a massive 84000 in 1972.At this rate over 100000 will come each year in the 1980s.We cannot continue to absorb such large numbers.OUf country is getting more and more crowded.We must stop immigration now, let us make England great again.'
10
fJ
They can then be asked:
f Take each of the sentences in the speech, your answers to a to e, andthe figures in the Table T3 to criticize the speech. Is the speech fair?
Points that might be made on each of the sentences in the speech are:
Sentence 1Not all people coming from the New Commonwealth are black: some areBritish returning home. In 196642000 people went out to those countries.There have always been more white immigrants than black immigrants intoBritain.
Sentence 2In 1972 General Amin declared 'Uganda for Ugandans'. About 26000people migrated to Britain because of this. So the figure for 1972 is higherfor special reasons. 84000 is small compared with Britain's population of54000000.
Sentence 3In fact the trend of immigration from the New Commonwealth has been
•downwards. The figure dropped to 52600 in 1973 and 51 500 in 1974. Thereis no evidence to support the figure of 100000.
Sentences 4 and 5For many years more people have left Britain than have come here to settle.There have been more emigrants than immigrants. Britain is not gettingmore crowded because of migration.
Sentence 6This links immigration with 'greatness' without explanation. There is noevidence given of any connection.
It might also be worth emphasizing that matters are rarely as simple as theyappear. Britons are hardly the ones to criticize migration. The followingpoints could be made as background.
A large proportion, if not a majority, of Americans, Canadians,Australians, New Zealanders, etc., are descendants of Britons. Is GreatBritain their home? Could they all return if they wished to?
2 African Asians
(i) These were taken to Africa as part ofthe development o'f the BritishEmpire and hav.e been there for several generations.
11

(ii) India has no more obligation to them than the UK has toAmericans wishing to migrate here. It is a poorer country than theUK with a major population problem. In fact, however, India didaccept large numbers of refugees.
(iii) An obligation to these people had been entered into by succeedingBritish Governments. But it is fair to say that at the time it was notrealized that the numbers wishing to migrate would be so large.
3 West Indians and Moslem Asians
Many of these were drawn here by British organizations, withGovernment agreement, to help run the London Underground,railways and hospital services, to do jobs that, at the wages offered atthat time, Britons were not interested in doing.
4 Immigration of other nationalities to run restaurants, etc. Fish andchips are no longer the only take-away food available.
Pupils can then be asked to write a fair speech on immigration.
Test Questions
I An advertisement for Bark, 'the dog food made from trees,' says:
Compare Bark with other dog foods.
Bark Other dog foods
-
,....w
toE c c c~ E '" ~ 'm'u ;:! 0 l? m 0ro '> <t ro <t(,) (,)
Bark beats ali!
The true figures (in standard units) are shown in Table 1.
Table 1 Bark and the average of other dog foods
Al a See detailed notes. b Probably (Ii) c See detailed notes.
Answers
A3 e Similar to that in b d That in a e See detailed notes.
A4 See detailed notes.
Bl a Last column of table is (£550), (£360), £400, £200, £490.Total £2000
b 25
A2 a 75p, 50p, 25p, -j- b 33-j-% e See detailed notes.
Protein Vitamins Calcium
Bark 24 20 21
Average dog food 23 18 20
a Write down four ways in which the advertisement is misleading.b Draw a fair bar chart showing the figures of Table 1.
2 Bark also advertises:
B3 a See detailed notes.
*B4 a See detailed notes.
e a See detailed notes. b See detailed notes.e 1113745 - 572172 = 541573 d 66084 - 54 368 = 11 716e See detailed notes.
B2 ae
The mean and the mode£490 - £50 = £440
b 80,60, 50e The median
Buy one, get one free!
Save 100%
What is the true saving?
12 13

3 Bark's sales for the years 1976 to 1980 are shown in Table 2.
Table 2 Sales of Bark
Year 1976 1977 1978 1979 1980
Sales530 533 534 540 550
(thousands of tins)
Draw a misleading graph of these figures so that Bark's sales appear tobe rising rapidly.
4 'On average it costs £20 to repair my motorbike. I have £25 so I canafford to have it repaired'.What is wrong with this argument?
5 Table 3 shows, to the nearest thousand, the number of votes cast atthree successive elections for the candidates of the three main politicalparties in one constituency.
Table 3
1st election 2nd election 3rd election
%of %of %ofthose those those
Party Votes voting Votes 'voting Votes voting
Conservatives 8000 40% 10000 33% 12000 30%Labour 10000 50% 15000 50% 18000 45%Liberal 2000 10% 5000 17% 10000 25%
Total votes 20000 30000 40000
Total number of people eligible to vote: 10000
Write down:a Two facts that the Conservatives could state to show they were
doing welLb Two Jacts that Labour supporters could state to show they were
doing well.e Two facts that Liberal supporters could state to show they were
doing welL
14
Answers
I a Bars different width; no numbers on vertiC'al axis; vertical scale doesnot start from zero; better than average does not mean better thanall; choosing three particular contents, why not others?
2 50%
4 Does not allow much for variability, which is not quoted. Average £20could give a single bill well over £25.
5 There are many answers. Some possibilities are given below:
a Every election we gained more votes. The percentage of people voting Labour has been dropping. Liberals have never been able to getmore than a quarter of the votes.
. b We have won all the elections. Every time we get increasingly morevotes than the Conservatives. The percentage of people voting Conservative is dropping steadily.
c Every time we have had an increase in the number of our voters. Wehave gained a bigger percentage of the votes cast at each election.Conservatives and Labour are each getting a decreasing percentageof the votes at each election. We had five times as many votes in thethird election as we did in the first.
15

Connections with Other Published Units from~
~~
"the Project " $ ~ ~~
0 - cE 0-$ "ro >- ~u
,$" C "- $ ~ cOther Units at the Same Level (Level 3) "- 0 0)';:; • u::
.8c
'"<{3s: t:\) "0 .-~ EO i:§ '" "- '"Car Careers Net Catch CUlling it Fine ~ c c
"i!u,~ 0. ·c .is. "EMultiplying People Pupil Poll ~ ""--sE "·m .~ J~~U5
.2' " 0.... ~ "- u
"$Units at Other Levels in the Same or Allied Areas of the Curriculum :')0
~
" ~Levell Leisure for Pleasure " " ~ $ ~.~ 0 " "i5. "E ~ "" ro
$'0 .~ ,
Level2 Authors Anonymous On the Ball $ >- $ "$
" ~c c~ "-~0 c "- $
~ ~ $.g ~ u: w·- Q) ~ '"Seeing is Believing c ,-,-I.1-.c :') '.c0 < 0;
~ 4? ~.~ ~$ C $ $-
" ~ ~
'"e ~ 0 ~ ~'".s ro IDroOlc ro 0- " ro (3.§Level 4 Figuring the Future Sampling the Census 0 u c ~u,!::·:::: u ." "
U.c :B '~'-~6> "3 " "",~ " ~ ro ro'"
< U U .30UU: u :2 u uw:::This umt IS particularly relevant to: General Knowledge, Humanities,Mathematics, Commerce.
~ ~ ~ ~
~ " " " "'" '" .~ '" $ ~ ~ o ~ $
" C C C - C cE ~ "i5.0-$ $Interconnections between Concepts and Techniques Used in these ~ ., .,
".,
~u u >-u 0ro $ .~ • .~ •$ ~ $ C $Units ii: :g .. .g .. "- $
'"0.c "-
ro ro ro "'''' c_ ='"'"
0 .S OJ '" <'" ro C.~ .~ " .~ >-c .£ ~ C 00";;'These are detailed in the following table. The code number in the left-hand ~ '" '" .s '" E-~ "i5.
.... :=~:2-C C C 00-
column refers to the items spelled out in more detail in Chapter 5 of " ·m ·m ·m "'E E'" E
:;::;~~
C "•• $ $ $ " ro ro " roTeaching Statistics 11-16. .... <I> <I> <I> :2<1> <I> <<I> 0:2
An item mentioned under Statistical Prerequisites needs to be covered ro;
before this unit is taught. Units which introduce this idea Or technique are "0"0
listed alongside. ~
"" $~
~
~ " ro .gAn item mentioned under Idea or Technique Used is not specifically • $
." ~ E gintroduced or necessarily pointed out as such in the unit. There may be one .~ ;:,
"~ $ .s"" ~ "0 Cor more specific examples of a mOre general concept. No previous • .~ ~ • .g- $l' c ~ ~ ~
experience is necessary with these items before teaching the unit, but more '" C $.~ ro"- "
u u.. ~0 u c
:f:practice can be 0 btained before or afterwards by using the other units listed 0;
""u 0 '".g ~ S ~ ~
~ - ~
"0""
~
in the two columns alongside. .~0 .$ ro ro
~S ro S m >- "0 - <3 •S ro:!! ro .. u $ 0
S .~
'""0 "0 • C ro roAn item mentioned under Idea or Technique Introduced occurs specifically $ $ ro mro $ C
"·c
""0 $
E 0 0- ro'0in the unit and, if a technique, there will be specific detailed instruction for ~
$ ~
~> ·E~ ~ E E :E ~
carrying it out. Further practice and reinforcement can be carried out by t
'"m
0 ~ $ '" E '"ro 'i5 ~.c '" .~
C $ Cusing the other units listed alongside. u $ C '" '" 0 'i5 :0 'B"0 ro C C to ro ro e .!?~ 0 • ·w ·w .. $
ro :2 :;; ::> ::> ii: a: a: "- "-
$ ro ;". ~ro .0 .0 ;". U
~"000 "! OJ "= "! .c "!uz N cO cO N .,,: en N
16 17

~
00 Code Idea or Technique IntroducedNo. Also Used in .
3.1b Median for small data set Seeing is Believing
3.28 Range Authors Anonymous Cutting it Fine Figuring the Future
3.20 Dispersion in a distribution or population
5a Reading tables Leisure for Pleasure Authors AnonymOlls On the BallSeeing is Believing Car Careers Net CatchMultiplying People Figuring the Future
5b Reading bar charts, histograms and pie charts Leisure for Pleasure Seeing is Believing tar CareersCutting it Fine Multiplying People
5c Reading time series Leisure for Pleasure Car Careers Cutting it FineMultiplying People Figuring the Future
5f Comparing date when adjustments have to bemade
5u Inference from bar charts Authors Anonymous. Car Careers Multiplying People
5v Inference from tables leisure for Pleasure On the Ball Seeing is BelievingCar Careers Net Catch Cutting it FineMultiplying Peop'le Figuring the Future Sampling the Census
5z Detecting trends Car Careers Cutting it Fine Multiplying PeopleSampling the Census

Other titles in this series
Being Fair to ErnieLeisure for Pleasure
Tidy TablesWheels and Meals
Shaking a SixPractice Makes Perfect
Probability GamesIf at First ...
Authors AnonymousOn the Ball
Seeing is BelievingFair Play
Opinion MattersGetting it Right
Car CareersPhoney Figures
Net CatchCutting it Fine
Multiplying PeoplePupil Poll
Choice or ChanceSampling the Census
Testing TestingRetail Price Index
Figuring the FutureSmoking and Health
Equal Pay

Statistics in your world
PHONEYFI URES
Published for the Schools Council by
FOUlSHAM EDUCATIONAL

Some sections are marked with an asterisk*. Your teacher will tellyou whether to try these sections.R Pages Your teacher will provide these for you.
AcknowledgementThe pUblishers and Project team extend their thanks to the Civil AviationAuthority for granting permission to reproduce or adapt statistics fromAirporr Guide, -1976.
Contents
A AdvertisementsA1 First Advertisement for CatchunksA2 March Advertisements for CatchunksA3 June Advertisement for CatchunksA4 More DeceitA5 Breakfast Cereals
B What Is Typical?BI Weekly Wages82 The Average?B3 What Is Average and Is It Enough?
*B4 More Faults
C The Booming Airport
Page34689
10
1111121214
14
A
/;", NOT PAFT - TilEIO'TIIB? BRANp f 1$
CAROBOARP I•
Advertisements
The Schools Council Project on Statistical Education
Published byW. Foulsham & Co. Ltd•• Yeovil Road, Slough, Berks
Cartoons by Colin Whittock
@ Schools Council Publications 1981
ISBN 0-572-01080-X
PRINTED'm HONG KONG
-, Advertising agents specialize in wntmg advertisements. Their job is to help the manufacturer sellhisproduct. Sometimes they may use statistics.
Make a collection of advertisements that use statistics.
a What do you think of the way they use statistics?
You will see that advertisers sometimes use statistics indevious ways. We now look at some fictitiousadvertisements to see more clearly how statistics aremisused. We call the advertising agency Sly Sellers andthe product Catchunks.
3

Ai
Figure 1
First Advertisement for Catchunks
In January 1979 Catchunks published the advertisement shown. in Figure I.
First advertisement for Catchunks
Cool cats just love crispy, crunchy Catchunks.More and more cats prefer it to other cat foods.No wonder with all these nutrients!
c ~ E c ~ E'iii E ~ 'iii E .2(; ro '13 (; ro -":i' 0; :i' ro<t f- U <t f- U
Average cat food CATCHUNKS
Figure 2 Protein content of Catchunks and average cat food:three charts
Protein content
15
10
5
oDoesn't your cat deserve the best? Average cat food CATCHUNKS
Table t
a How does this advertisement mislead?
There are several organizations which try to find outthe real facts. One of these we call Fact Ferrets. Theirfirst job is to get the correct figures in standard units.These are shown in Table I.
Content ofCatchunks and average cat food(standard units)
Protein content
13
12
II
10
Protein contentProtein Phosphorus Thiamine Calcium
Average 11 6 7 8cat food
Catchunks 13 4 11 10
In the Catchunks advertisement no units were given.
Figure 2 shows three ways of putting the units on a barchart showing the protein content.
4
"
j
Average cat food
15
10
5
oAverage cat food
CATCHUNKS
CATCHUNKS
5

A2
Look at the three charts in Figure 2.
b Which chart makes Catchunks look much betterthan average cat food?
c Which chart is the fairest? Why are the others notfair?
d Using all the figures found by Fact Ferrets, draw afair bar chart for the Catchunks advertisement.Remember to use bars the same width. Label yourchart 'Food content of average cat food andCatchunks' .
e Compare your bar chart with the Januaryadvertisement. Which is the fairer? In what wayshave Sly Sellers distorted their charts.
f Using the figures for 'phosphorus' from Table 1,draw a misleading diagram to show that the averagecat food is much better than Catchunks.
March Advertisements for Catchunks
In March Catchunks used two different advertisements. These are shown in Figure 3.
2nd advertisement
CATCHUNKS
Up to 20% extra goodness.
Make your cat happy.
Buy Catchunks today!
Fact Ferrets looked at the first March advertisement.They knew that the usual price of a tin of Catchunkswas 25p. They did not agree that there was a saving of50%.
a Copy and complete the following to find out why.
Price of one tin of Catchunks = 25p
Cost of three tins bought separately = 25p x 3= P
Cost of two tins (plus one free tin) =25p x 2= P
Figure 3 March advertisements for Catchunks
15t advertisement
CATCHUNKS SPECJAl OFFER - SAVE 50%
1
Amount saved with the one free tin =
Fraction saved when buying three tins:
= amount savedcost of 3 tins bought separately
p
6
Buy two tins and we give you one: COMPLETELY FREE!
-----=b Change this fraction to a percentage.
Fact Ferrets did not like the second Marchadvertisement either. They said that 10% or even 0%was included in the phrase 'up to 20%'.
c What do you think 'up to 20% extra' might mean?
7

A3
Figure 4
Table 2
8
June Advertisement for Calchunks
You will need a sheet of graph paper.
In June Sly Sellers tried to persuade people to buymore Catchunks by showing how sales figures hadincreased. Figure 4 shows their advertisement.
June advertisement for Catchunks
CATCHUNKSSales
1975 1976 1977 1978 Year
More and more people are buyin8 CATCHUNK$.
Don't let your cat miss out.
Give your cat the break he deserves.
Break open a tin of CATCHUNKS today.
Fact Ferrets found the true sales figures, which areshown in Table 2.
Sales of Catchunks, 1975 to 1978
Year 1975 1976 1977 1978
Sales(thousands 204 210 212 216of tins)
A4
a Plot the figures from Table 2 on a graph. Use avertical axis from 0 to 300 thousand tins with a scaleof 50 thousand tins per centimetre square.
d Draw another graph of the sales figures. This timeuse a vertical axis from 200 to 220 thousand tinswith a scale of 5 thousand tins per centimetresquare.
c Which graph do you think was used in the Juneadvertisement? Why?
d Which is the fairer graph to use?e How have Sly Sellers made the graph in their
advertisement misleading?
More Deceit
Fact· Ferrets found more in these advertisementsdesigned to mislead. Some of their comments andquestions are given below.
a Think about each and write two or threesentencessaying what you think.
January Advertisement
What is the 'average' cat food? This average cat foodhad fewer of the nutrients than Catchunks. Doesthis mean all cat foods are worse than Catchunks?
2 'Cats prefer Catchunks'. What evidence is there forthis? How could you find out?
3 Catchunks may contain less of other nutrients.What other vitamins and minerals does a cat need?Is it better to have more of these items, or can youhave too much?
4 The bars on the Catchunks graph are shaded andthere is a picture of a fat happy cat there. How doesthis affect the advertisement?
5 There is no mention of price or amount ofcat food.Catchunks may be more expensive than the averagecat food. How can you assess value for money?
9

Second March Advertisement
6 They claim 'Up to 20% extra goodness', Moregoodness than what? Does this make it the best?What is 'goodness'? Can it be measured?
June Advertisement7 What is the dotted line for? Why is it so steep? Is it
fair?
b Can you find any other errors in theseadvertisements?
a Make up a misleading advertisement for Sunwheat.Write down how you have misused statistics in it.
b Look at your friend's advertisement. Write downhow he has misused statistics.
Look again at the advertisements collected by the class,
c Write down all the mistakes and attempts tomislead that you can fmd.
B What Is Typical?
Percentage of man's daily requirement per bowl
'"c
c c '> E>- 'E ro0> 'iii 'i= c :0~ ~ ,!!1 0 '(3
~ c" 2 .0 roc J:: a: z ro ,gUJ 0- f- U
Sunwheat 4 5 9 2 7 2 13Average
4 6 3 3 8 2 9cereal
A5
Table 3
Table 4
10
Breakfast Cereals
You will need a sheet of graph paper.
Sly Sellers has been given information shown in Tables3 and 4 on a new breakfast cereal, Sunwheat, and anaverage cereal.
Contents of Sunwheat and the average breakfast cereal
Sales of Sunwheat
Year 1975 1976 1977 1978
Sunwheat sales(thousands 107 111 114 115of packets)
B1
Table 5
Weekly Wages
Sly Sellers received a strange request recently, Themanager and the Workers' Union from the samefactory each asked the agency to work out the averagewage, The weekly wages are shown in Table 5,
Weekly wages
Number ofWages employees Money paid
£50 11 £550£60 6 £360£80 5
£100 2£490 1
Total
a Copy down the table. Complete it to find the weeklywage bill,
b How many employees are there in the factory?
c Draw a bar chart to show the wages.
11
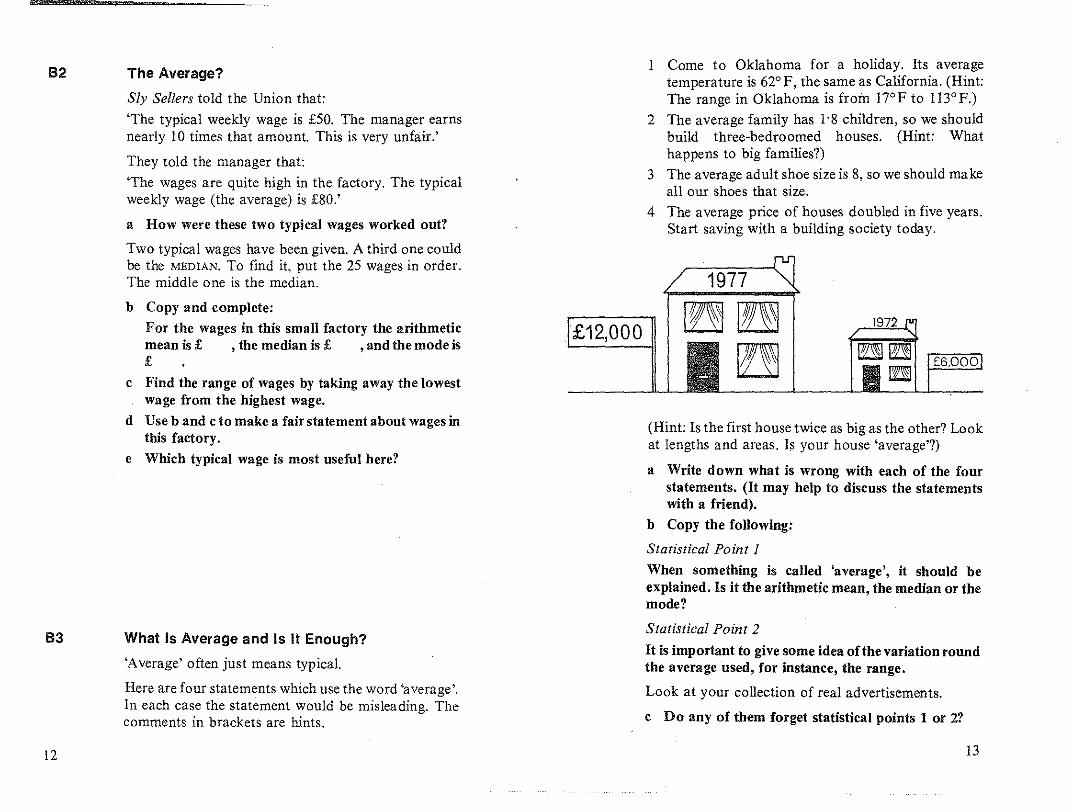
1972
1977
I Come to Oklahoma for a holiday. Its averagetemperature is 62°F, the same as California. (Hint:The range in Oklahoma is from \7°F to Il3° F.)
2 The average family has 1'8 children, so we shouldbuild three-bedroomed houses. (Hint: Whathappens to big families?)
3 The average adult shoe size is 8, so we should makeall our shoes that size.
4 The average price of houses doubled in five years.Start sav10g with a building society today.
£6.000
(Hint: Is the first house twice as big as the other? Lookat lengths and areas. Is your house 'average'?)
a Write down what is wrong with each of the fourstatements. (It may help to discuss the statementswith a friend).
b Copy the following:
Statistical Point I
When something is called 'average', it should beexplained. Is it the arithmetic mean, the median or themode?
Statistical Point 2
It is important to give some idea ofthe variation roundthe average used, for instance, the range.
Look at your collection of real advertisements.
c Do any of them forget statistical points 1 or 2?
£12,000
The Average?
Sly Sellers told the Union that:
'The typical weekly wage is £50. The manager earnsnearly 10 times that amount. This is very unfair.'
They told the manager that:
'The wages are quite high in the factory. The typicalweekly wage (the average) is £80.'
a How were these two typical wages worked out?
Two typical wages have been given. A third one couldbe the MEDIAN. To find it, put the 25 wages in order.The middle one is the median.
b Copy and complete:
For the wages in this small factory the arithmeticmean is £ , the median is £ , and the mode is£
c Find the range of wages by taking away the lowestwage from the highest wage.
d Use band c to make a fair statement about wages 10this factory.
e Which typical wage is most useful here?
What Is Average and Is It Enough?
'Average' often just means typical.
Here are four statements which use the word 'average'.In each case the statement would be misleading. Thecomments in brackets are hints.
82
83
12 13

*84 More Faults
Here are some mqre suspect statements that FactFerrets discovered.
I Only half as many road accidents happen in thedark as happen in daylight, so it is safer to drive atnight.
2 Most people who clean their teeth need to havefillings, so cleaning teeth is a waste of time.
3 90% of those injured in road accidents in Australiawore seat belts. It is safer not to wear seat belts.
a Write down what is wrong with each of thesestatements.
Table 6
Speech ofairport expansion scheme expert
'The number of passengers passing through theterminal continues to grow; there was a tenfoldincrease in the number of passengers between 1955 and1975. This shows the demand there is. When youconsider that there were less than twice the number ofplanes landing in 1974 than there were 15 years earlierin 1959, it is clear that planes are becoming larger andwe are using them more efficiently. Bigger aeroplanesneed longer runways. We are providing a service to thecommunity, and the airport must be expanded and begiven better facilities.'
Table 6 shows the number of passengers and aircraftover the years 1955 to 1977.
Passengers and aircraft at Birmingham Airport1955 to 1977 (selected years)
C The Booming AirportIn the 1970s there was a major debate about the futureof Birmingham's Airport. Arguments became quiteheated, and both sides tried to use statistics to supporttheir case. Local residents did not want the airport toexpand and claimed that expansion was neithernecessary nor desirable. The airport planners arguedthat the airport was congested and that there was arising demand for its services. Comments from twospeeches are given below.
Local resident's speech'The number of passengers using the airport is notrising; indeed there was a drop in the number ofpassengers· in 1974. There were nearly three times asmany aircraft landing in 1973 as there were 15 yearsearlier in 1958. When you consider the amount ofnoisethese extra planes make, it is clear that enough isenough, and the airport should not be expanded.'
14
Year No. of No. ofpassengers aircraft
1955 108666 120961956 154806 219691957 182919 326341958 168893 248821959 188065 317611960 283833 31 1861962 348319 319881964 431806 402081966 534553 457331968 572172 543681970 702559 463281972 969718 623471973 1181687 652761974 1056002 595851975 1130040 624431976 1157635 663101977 1113745 66084
(Source: Civil Aviation Authority StatisticsAirport Guide)
15

16
a Use the figures in Table 6 to comment on the twospeeches. Do you think the speeches were fair?
h Did either of the speakers tell any lies? Even if theydid not, why might their speeches still uot be fair?
c How many more passengers were there in 1977 thaniu 1968?
d How many more aircraft were there in 1977 thau in1968?
Some aircraft carry freight, not passengers.
e Why do you think the number of aircraft has notrisen proportionately as much as the number ofpassengers?
Discuss the following questions with a friend.
What facilities are there at an airport?
Do they all need extending?
Do the numbers ofpassengers and aircraft show thatthe airport needs extending?
What other information might you need to help youdecide?
f Use the results of your discussion and the figuresfrom Table 6 to write two lists. Oue list is of thearguments for expansion of the airport, the otherlist is arguments against the expansion of theairport.

Schools Council Project on Statistical EducationThis Project has been based in the Department of Probability and Statistics at the Universityof Sheffield from 1975 to 1980. Its brief was; to assess the present situation of statisticaleducation in schools; to survey the needs of teachers of statistics; to devise detailed proposalsfor the implementation of the teaching ideas.; and to produce teaching materials.
Project Team
Director: Peter Holmes (1975~ )Deputy Director: Neil Rubra (l975~78), Daphne Turner (1978~
Project Officers
Ramesh Kapadia (1975-79),Alan Graham (1976-77), Barbara Cox (1979-80)
Statistics in your world
LEVEL 3
TEACHERS' NOTES
General NotesPages with the prefIx R are resource pages or reference pages for pupil use. (In many casesthey are designed as worksheets.) In the pupil unit these are referred to as 'page Rl'. etc.
Permission need not be sought to reproduce copies of the R sheets provided· that copies aremade only in the educational establishment in which they are to be used and that such copiesare not sold, hired or lent to any other indivdual, organization or establishment.
Sections or questions marked with an asterisk are optional to the main thrust in the unit.Sometimes they are for the more able pupils, sometimes they are for reinforcement and sometimes they consist of simpler work for the less able pupils and lead to an easier conclusionthan the main unit. In each case detailed comments on the particular purpose will be found inthe appropriate section of the teacher's notes.
Three different typefaces are used in the pupil units. Text in roman type (like this) is for pupilsto read or for the teacher to introduce. Questions to promote thought and for group or classdiscussion are printed in italics. Instructions telling pupils to do things and questions forpupils to answer are printed in bold.
UTTIIT FI
GE
Published for the Schools Council byFOUlSHAM EDUCATIONAL
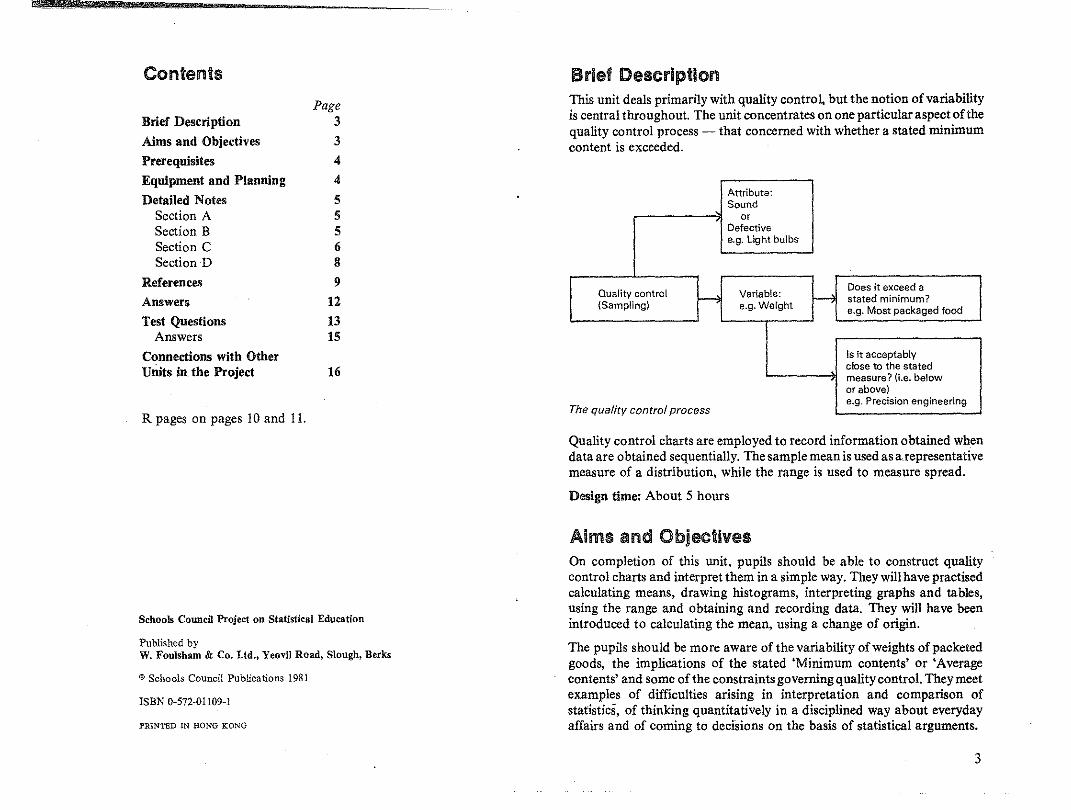
R pages on pages 10 and 11.
Connections with Otherutiits In. the Project 16
Contents
Brief Description
Aims and Objectives
Prerequisites
Equipment and Planning
Detailed NotesSection ASection BSection CSectionD
References
Answers
Test QuestionsAnswers
Page3
3
4
4
55568
9
121315
Brief DescriptionThis unit deals primarily with quality control, but the notion of variabilityis central throughout. The unit concentrates on one particular aspect ofthequality control process - that concerned with whether a stated minimumcontent is exceeded.
Attribute:Sound
orDefectivee.g. Light bulbs
Quality control Variable:Does it exceed a
'-l i--l stated minimum?(Sampling) e.g. WeIght e.g. Most packaged food
Is It acceptablyclose to the statedmeasure? {i.e. belowor above}
The quality control processe.g. Precision engineering
Quality control charts are employed to record information obtained whendata are obtained sequentially. The sample mean is used as a.representativemeasure of a distribution, while the range is used to measure spread.
Design time: About 5 hours
Schools Council Project on Statistical Education
Published byW. Foulsham & Co. Ltd., Yeovil Road, Slough, Berks
@ Schools Council Publications 1981
ISBN 0-572-01109-1
PRINTED IN HONG KONG
Aims and ObjectivesOn completion of this unit, pupils should be able to construct qualitycontrol charts and interpret them in a simple way. They will have practisedcalculating means, drawing histograms, interpreting graphs and tables,using the range and obtaining and recording data. They will have beenintroduced to calculating the mean, using a change of origin.
The pupils should be more aware of the variability of weights ofpacketedgoods, the implications of the stated 'Minimum contents' or 'Averagecontents' and some of the constraints governing quality control. They meetexamples of difficulties arising in interpretation and comparison ofstatistics, of thinking quantitatively in a disciplined way about everydayaffairs and of coming to decisions on the basis of statistical arguments.
3

ii
PrerequisitesPupils should he able to draw axes for graphs, plot points and performsimple operations with directed numbers. Subsection D2j, which isoptional, requires an awareness of percentages.
Familiarity with the mean and bar charts would make progress easier but isnot essential
Equipment and PlanningSection A invites pupils to think about the notions of 'Average contents','Minimum contents' and 'Overweight' and provides a context for the workof the next two sections.
In Section B th, pupils play two games to develop the concepts of (i)overweights and (il) the constraints governing quality control, Le. thatproduction of underweights can lead to legal action while that ofoverweights can lead to financial problems.
About 250 (or at least 200) small cubes will be required by each pair ofpupils for the games. Larger groups can be used if necessary. Beads,counters, small stones, plastic coins, small squares of card will sufficeinstead of cubes but each group of250 must be homogeneous. Some pupilscan work on Section C while others work on Section B to cut down thenumber of cubes required.
In Section C, pupils find the mean overweight of a sample ofloaves (datasupplied in text) and use page RI. They progress to construct a qualitycontrol chart for eight such samples. Graph paper is reqnired. C3 isoptional to reiuforce the ideas of this section.
The flow of the unit would not be unduly interrupted if Section D is notcontinued until a later date.
In Section D bags of.crisps are weighed. The overweights are analysed bymeans of a quality control chart and a histogram. D4 is an optional sectionin which the mean for ratio data with class intervals is calculated using achange of origin. This section and D2j may not be suitable for weakerpupils.
Twenty-five bags of crisps and a fast weighing balance accurate to I g willbe required for each group. The number of groups may be determined bythe amount of equipment available. If the collection of data is done as aclass activity, it may he started as pupils are approaching the end ofSection C.
4
Graph paper is required, preferably of large size (to fit the histogram nextto the quality control chart.)
Detailed Notes
Section A
A1
This section lends itself to class discussion. Reference may he made topackets offood at home, and some ofthese may be used in the classroom. Itmay be worth emphasizing that as well as expecting a lower mean for apacket marked 'Average contents 100 grams' than for a packet marked'Minimum contents 100 grams', this system is less easily checked by thecustomers, since they will have no idea ofwhat might constitute acceptablevariation. European practice incorporates tests which check that not morethan I in 40 of the packets weigh below a certain minimum. Price may helower for packets marked 'Average' rather than 'Minim.um'.
A2
The precis of The Grocer article helps to set a realistic context. The notionof the British practice ofgoods sold by 'Minimum contents' is reinforced.
Section B
B1
The purpose of the game is to help the participants develop a concept ofoverweight. The variation in weights during a production process issimulated by the pupils' estimates of piles of 16 cubes made within a timelimit. Their record of 'weights' (asked for in a) is referred to in B2b. Youmay need to demonstrate the game and explain the rules. Sufficientcounters should be made available to avoid undue constraint.
B2
The introduction of a fine for 'underweight' loaves shou.a help to make thepupils aware of the two directional nature of the constraints which governquality control and discourage the production ofunderweights. From thefirm's viewpoint, while underweight goods may be more profitable in theshort term, possible legal action and loss of reputation offset this.
5

Consistently overweight goods may be costly or uncompetitive ifaccounted for in the price. These points can be brought out in a classdiscussion.
The general trend is for the overweight to increase. Action should be takento decrease the mean weight. Random variation exists about the trend.
2
The goods are consistently overweight. Again random variation exists.Action should be taken to decrease the mean weight.
Section C
C1
From the sample of 10 loaves, the mean weight and the mean overweightare calculated separately, underweights being considered as negativeoverweights. The pupils are encouraged in part f to deduce that;
Mean overweight =Mean weight - 400
This method is used later to find mean overweights. This idea is used in D4as a method for calculating means using a change of origin, i.e.
Mean weight = Mean overweight + 400where 400 has been subtracted to change the origin.
Questions j to m indicate that a change of origin does not give a change ofrange; 428 - 394 =34 =28 - (-6)
Overweight +
+
+ + ++ + ++ + +
+ + +
Sample number
C2 3+
Pupils use the method from CHto find the mean overweights for the eightsamples and then construct the quality control chart. The sequence of thepoints shows two basic trends - downwards for samples I-3 and upwardsfor samples 4-7. The inference is that adjustments were made after sample 3and maybe sample 7.
The three charts shown below are suitable for reinforcement of ideas oninterpretation of charts and what action should be taken.
Overweight
++
+
+
+
1
Overweight
++
+
+ +
+
+
++
+ +
+
++ +
Sample number
+
+
6
Sample number The variability in overweights is progressively and systematically. increasing. Action should be taken to reduce this variability.
7

, §
C3
This section is optional and may be used as a reinforcement exercise,perhaps for homework. It is similar in nature to C2. The quality controlchart, however, indicates a downward trend in the number of matchesbeing put into boxes. The production manager will be alerted to a possiblefault by the non-random pattern emerging and should· take acition toincrease the number of matches being packed into a box. Despite this, theoverall mean for the eight samples is 40 matches per box.
Secllon D
The school tuck shop may lend the crisps, suitable balances may beobtained from the science department.
Ideally all the bags of crisps should be (i) made by the same firm, (ii) of thesame flavour and (iii) stamped with a net weight. Some aren't marked withnet weight, but this information may be obtained by telephoning themannfacturers. (Different flavours have different weights, not because ofthe flavour, which is only in the added salt, but because they come fromdifferent production runs.)
D1
The pupils obtain the data themselves by weighing 25 bags of crisps andthen calculate the overweights. If the actual weighing proves impossible,the following data may be used;
Twenty-five bags of Walkers plain crisps (minimum conients 24:5 grams)were weighed. The mean net weight was 29:4 grams. The bag weighed 2grams (to the nearest gram), and the following are the weights of bag andcontents, to the nearest gram.
D2
The work in this section assumes a minimum weight of 24t grams.However, if the only bags obtainable are marked with a net weight equaltoa whole number ofgrams, the scale on the chart in Figure 2 will have to beoffset by tg (Le., to -3tg, -ltg, tg, 2tg, 4fg, etc.). This is because manyof the weights will fall on the boundaries between classes, thereby causingproblems with the histogram. The overweights calculated in the last sectionare now analysed in a quality control chart and the variation in weight ofthe middle 60% of the bags is measured using its range.
D3
The histogram is constructed alongside the quality control chart to showthe distribution of overweights. In c the pupils are encouraged to find themean overweight of the distribution shown on the histogram. Technically,this is an estimate of the mean as;
2 bags are assumed to be overweight by 1 gram,7 bags are assumed to be overweight by 3 grams,6 bags are assumed to be overweight by 5 grams, etc.
This may only be fully appreciated by the more able pupils.
D4
Parts a, band c, of this optional section serve to reinforce Section D3 incalculating the mean give-away weight. In d the mean weight of a bag isdeduced, i.e.
Mean weight of a bag = 24'5 + mean overweight
Thus the mean of the distribution of weights has been calculated using achange of origin to 24'5. The large give-away weight in f is to avoid anypossibility of prosecution.
This section is suitable for the more able pupils.
3636303133
3132293134
3331302831
3330333531
2728303428
References
A. Huitson and J. Keen, Essentials ofQuality Control (Heinemann, 1965).M.J. Moroney, Facts from Figures, Chapter 11 (Pelican, 1951)F. Mosteller et 01, Statistics by Example; Book 3 Detecting Patterns, pages29-32 (Addison-Wesley, 1973)
Alternatively, the above data could be used for a reinforcement exercise.
8
(Text continued after the R pages)
9

•• ...,.':::1', ....> U, ........... UU~..:.> v, .... ,,"IJ"
Weight of Net weight Overweight
full bag of crisps
- . 1-0
-o . _."' .. _- _. -_. . - - O· _ ..•. __ ._-
Weight of loaf (grams) Overweight (grams)
415 15
394 -6
408
422
428
397
425
406
414
421
Total overweight
Table 5 Mean overweights of eight samples of loaves
Sample no. Mean weight Mean overweightper loaf (grams) (grams)
1 413
2 405
3 396-
4 402
5 418
6 422
7 428
8 428
Table 7 Overweights of 1000 bags of crisps
Weight of empty packet
Weight printed on packet
grams.
grams.
t Zero means that the packet contains exactly 24·5 grams.
Overweight Mean overweight Give-away(grams) No. of bags (grams) weight
12 and under 14 6 13 6 x 13=78
10 and under 12 12 12 x =8 and under 10 86 =6 and under 8 221 7 =4 and under 6 320 =2 and under 4 290 =Ot and under 2 63 =
-2 and under 0 1 =-4 and under-2 1 -3 1 x (-3) =-3
-- Total no. of bags = 1000 Total give-away weight =
© Schools Council Publications 1981

Answers Test Questions
30+
++ +
++
+
0+..,.-r2-~ -4'-'-'-5-6;-'-7;-'-8"'-Sample number-10
Meanover- 20weight{grams) 10
1 Bacon can be bought for the same price in packets marked either'Minimum weight 500 grams' or 'Average weight 500 grams'.a What is the advantage to the customer ofbuying the packet marked
'Minimum weight 500 grams'?b What is probably true about the mean weight of bacon in packets
marked 'Minimum weight 500 grams'?
2 A firm sells cheese in packets marked 'Minimum contents 250 grams'.Give one reason each why the firm does not want to produce:a many underweight packets,b many greatly overweight packets.
3 Tea is put into packets marked 'Minimum contents 125 grams'. Asample of five packets is taken from the first batch of the day. Theresults of weighing each bag to the nearest gram are:128 grams, 126 grams, 127 grams, 124 grams, 130 gramsa What is the mean weight of tea in a packet?b What is the mean overweight of tea in a packet?c What is the range of these packets?
4 The quality control chart in Figure Tl is for eight samples taken duringa day's production of biscuits. The biscuits are in packets labelled'Minimum contents 300 grams'.
Figure T1 Ouaiity controi chart
Column 3 Column 4
13 6 x 13 = 7811 12x11= 132
9 86 x 9= 7747 221 x 7 = 15475 320 x 5 = 16003 290 x 3= 8701 63 x 1= 63
-1 1 x -1 = -1-3 1 x -3= -3
Total give-away weight = 5060
Al a and b See detailed notes.
A2 a more than 400 grams b 4/5c Mean is likely to be more than 400 grams.
H2 d and e See detailed notes.
Cl a 4130 grams b 413 gramsc 15, -6, 8, 22, 28, -3,25, 6, 14, 21
Negative means it is underweight.d 130 grams e 13 grams f See detailed notes.g 428 grams h 394 grams i 34 gramsj 28 grams k -6 grams 1 34 gramsm They are the same.
C2 a No b 13, 5, -4, 2, 18, 22, 28, 28e Too heavy f Samples 1, 2, 3g Sample 3. They increased the amount of dough being used.
C3 b Sample 1c, d, e, f See detailed notes.
D4 a
b 5060 grams c 5'06 gramsf See detailed notes.
d 29'56 grams
a Which samples, if any, had a mean weight per packet of less than300 grams?
b What was the mean weight per packet in sample 6?c In one sample, the packets could be accurately labelled 'Average
contents 300 grams'. Which sample is this?d What action might the production manager want to take to correct
any fault in this process?
12 13

5 Soap powder is packed in cartons marked 'Minimum contents 870grams'. A sample of 10 boxes was taken every hour duringthe day. Themean net weight of powder was calculated. Table Tl shows the results.
Table T1
f The production manager took action during the day. When do youthink this was done?
g Draw a histogram on the right of the quality control chart to showthe distribution of the mean overweights. Put the numbers on theaxes clearly.
a The mean overweight of a packet in each sample is listed in column3 of Table Tl. Complete this column.
b Draw a quality control chart for these figures on the axes in FigureT2 below.
c Calculate the mean overweight per packet for all eight samples.d The results from the first four samples show a trend. Describe this
trend.e When samples 5, 6, 7and 8 were taken, was the process producing:
cartons that were too heavy, orcartons that were too light, orcartons that were about right?
30 Mean overweight(grams)
5
-15
15
25
-5
Figure T3
Mean overweight(grams)
The packet is very likely to contain more than 500 grams.The mean weight is likely to be more than 500 grams.
May be taken to court and fined or suffer loss of reputation.Causes financial loss or is uncompetitive if accounted for in theprice.
127 grams b 2 grams c 6 grams
Sample I b 320 grams c Sample 3He would want to eliminate the systematic increase in overweights,and reduce the mean overweight.
(25), 15, -7, (-18),5, (7), -5,2
Figure T2
30 Mean overweight-+ (grams)
20
c 3 gramsd The trend shows that the mean net weight per packet was
decreasing over the period when the first four samples were taken.e . About right f After sample 4 g See Figure T3.
10
+0
2 3 4 5 6 7 8 5 4++ samgle Number of-10 num er packets
-20 +
Answers
1 ab
2 ab
3 a
<I ad
5 abFigure T3 Histogram
Mean overweight 30(grams)
20
10
05 4 3 2Frequency -10 •
-20
Sample Mean net weight Mean overweightnumber per packet (grams) per packet (grams)
1 895 252 8853 8634 852 -185 8756 877 77 8658 872
20
10
o+-r~~~~~~~-
jl2345678
-10 Sample number
-20
Figure T2 Dualitv control chart
14 15
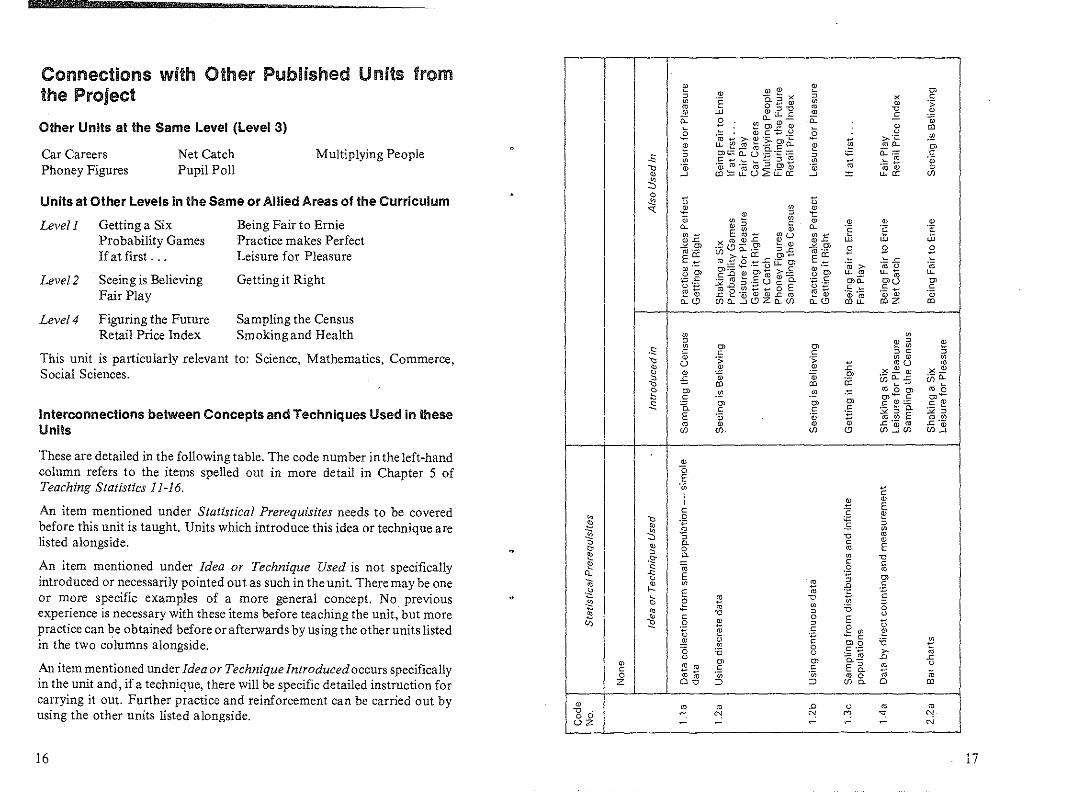
'"c"
.~..OJ.~
'"c';;;o
<J)
•'cWB
Oro >w..ro",0:
.s: .::::• roOJw..
'"c".~..OJ.~
'"c•••<J)
'"c"
.~..co.~
'"c•••<J).
00
"00c•U•£:'".~0.Ero
<J)
Multiplying People
Sampling the CensusSmoking and Health
Being Fair to ErniePractice makes PerfectLeisure for Pleasure
Getting it Right
Net CatchPupil Poll
Car CareersPhoney Figures
Levell Getting a SixProbability GamesIfat first ...
Level 2 Seeing is BelievingFair Play
Level 4 Figuring the FutureRetail Price Index
Other Units at the Same level (level 3)
Interconnections between Concepts and Techniques Used in theseUnits
This unit is particularly relevant to: Science, Mathematics, Commerce,Social Sciences.
Units at Other levels in the Same or Allied Areas of the Curriculum
Connections with Other Published Units fromthe Project
These are detailed in the following table. The code number in the left-handcolumn refers to the items spelled out in more detail in Chapter 5 ofTeaching Statistics 11-16.
An item mentioned under Statistical Prerequisites needs to be coveredbefore this unit is taught. Units which introduce this idea or technique arelisted alongside.
An item mentioned under Idea or Technique Used is not specificallyintroduced or necessarily pointed out as such in the unit. There may be oneor more specific examples of a more general concept. No previousexperience is necessary with these items before teaching the unit; but morepractice can be obtained before or afterwards by using the other units listedin the two columns alongside.
An item mentioned under Idea or Technique Introduced occurs specificallyin the unit and, if a technique, there will be specific detailed instruction forcarrying it out. Further practice and reinforcement can be carried out byusing the other units listed alongside.
•
o"0 .o 0uz
•coZ
o0.E.~
roN
ro"!N
16 17
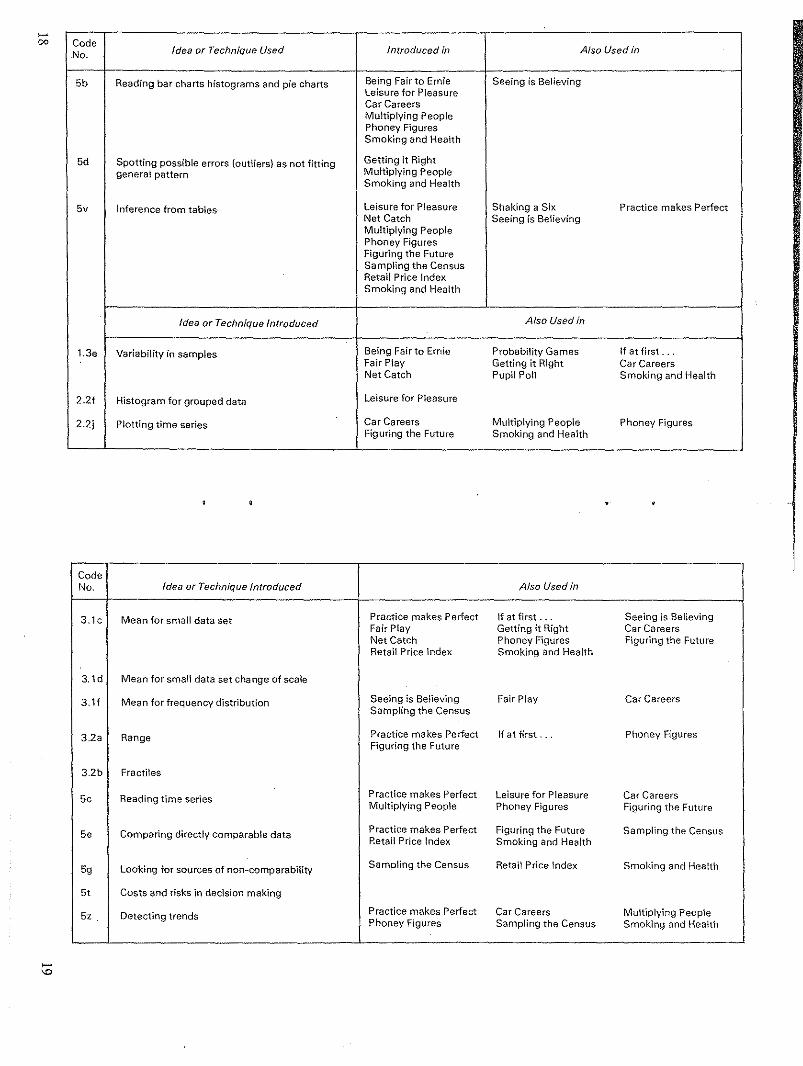
00
\0
CodeNo. Idea or Technique Used Introduced in Also Used in
5b Reading bar charts histograms and pie charts Being Fair to Ernie Seeing is BelievingLeisure for PleasureCar CareersMultiplying PeoplePhoney FiguresSmoking and Health
5d Spotting possible errors (outliers) as not fitting Getting it Rightgeneral pattern Multiplying People
Smoking and Health
5v Inference from tables Leisure for Pleasure Shaking a Six Practice makes PerfectNet Catch Seeing is BelievingMultiplying PeoplePhoney FiguresFiguring the FutureSampling the CensusRetail Price IndexSmoking and Health
Idea or Technique Introduced Also Used in.
1.3e Variability in samples Being Fair to Ernie Probability Games If at first.Fair Play Getting it Right Car CareersNet Catch Pupil Poll Smoking and Health
2.21 Histogram for grouped data Leisure for Pleasure
2.2j Plotting time series Car Careers Multiplying People Phoney FiguresFiguring the Future Smoking and Health
CodeNo. Idea or Technique Introduced Also Used in
3.1c Mean for small data set Practice makes Perfect If at first .. Seeing is BelievingFair Play Getting it Right Car CareersNet Catch Phoney Figures Figuring the FutureRetail Price Index Smoking and Health
3.1d Mean for small data set change of scale
3.1f Mean for frequency distribution Seeing is Believing Fair Play Car CareersSampling the Census
3.2a Range Practice makes Perfect If at first. Phoney FiguresFiguring the Future
3.2b Fractiles
5c Reading time series Practice makes Perfect Leisure for Pleasure Car CareersMultiplying People Phoney Figures Figuring the Future
5. Comparing directly comparable data Practice makes Perfect Figuring the Future Sampling the CensusRetail Price Index Smoking and Health
59 Looking for sources of non-comparability Sampling the Census Retail Price Index Smoking and Health
5t Costs and risks in decision making
5z. Detecting trends Practice makes Perfect Car Careers Multiplying PeoplePhoney Figures Sampling the Census Smoking and Health

Other titles in this series
Being Fair to ErnieLeisure for Pleasure
Tidy TablesWheels and Meals
Shaking a SixPractice Makes Perfect
Probability GamesIf at First ...
Authors AnonymousOn the Ball
Seeing is BelievingFair Play
Opinion MattersGetting it Right
Car CareersPhoney Figures
Net CatchCutting it Fine
Multiplying PeoplePupil Poll
Choice or ChanceSampling the Census
Testing TestingRetail Price Index
Figuring the FutureSmoking and Health
Equal Pay

Statistics in your world
UTTIIT FI E
Published for the Schools Council by
FOUlSHAM EDUCATIONAL

Goulash
Averageweight500g
Frankfurters
Averageweight300g
ApfelStrudel
Averagecontents200g
Sugar
Minimumcontents
1 kg
Flour
Minimumcontents
1·5 kg
Minimumweight100g
Chocolate
BI'itlsh or Continental
Porridge
Minimumcontents750g
A
Some sections are marked with an asterisk*. Your teacher will tellyou whether to try these sections.R Pages Your teacher will provide these for you.
AcknowledgementsThe publishers and the Project team would like to thank the publishers ofThe Grocer for granting permission to reproduce part of an article thatappeared in the issue of February 14, 1976. They also gratefullyacknowledge the assistance given to them by members of the potato crispindustry.
ContentsPage
A British or Continental 3Al How Much in a Packet? 4A2 Are Loaves Underweight? 4
B Grab tbe Dough 6BI A Game of Skill 6B2 ~ines for Underweigh~ Loaves 7
C Is the Quality Coutrolled? 8CI Sample from the First Batch 8C2 A Full Day's Work 9
*C3 Are there Enough Matches in a Box? 11
D Are Crisps Overweight? 12DI Weighing the Crisps 12D2 The Crisp Chart 13D3 Average Contents of Crisp Packets 14
*D4 Give-away Weights 16
Snails
Averagecontents750g
The Schools Council Project on Statistical Education
Published byW. Foulsham & Co. Ltd., YeoviJ Road, Slough, Berks
Cartoons by Colin Whittock
Averagecontents
150 g CONTINENT
@ Schools Council Publications 1981
ISBN 0-572-01082-6
PRINTED IN HONG KONG
3
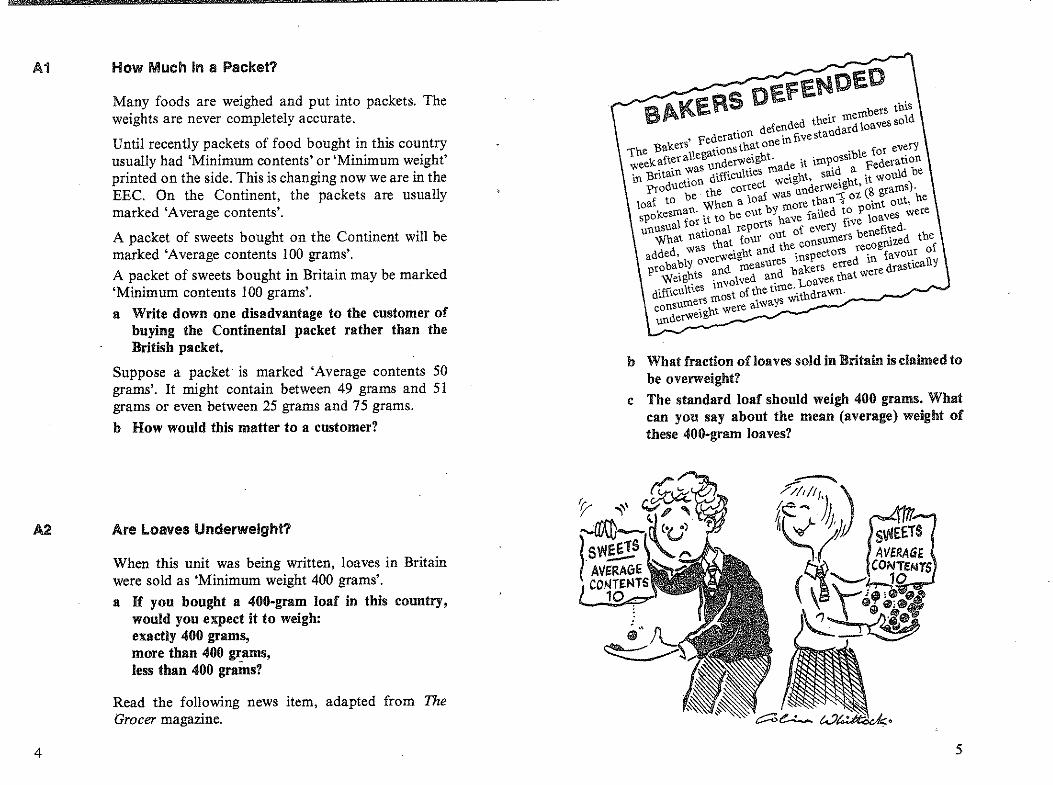
How Much in a Packet?
Many foods are weighed and put into packets. Theweights are never completely accurate.
Until recently packets of food bought in this countryusually had 'Minimum contents' or 'Minimum weight'printed on the side. This is changing now we are in theEEC. On the Continent, the packets are usuallymarked 'Average contents'.
A packet of sweets bought on the Continent will bemarked 'Average contents 100 grams'.
A packet of sweets bought in Britain may be marked'Minimum contents 100 grams'.a Write down one disadvantage to the customer of
buying the Continental packet rather than theBritish packet.
Suppose a packet is marked 'Average contents 50grams'. It might contain between 49 grams and 51grams or even between 25 grams and 75 grams.
b How would this matter to a customer?
Are Loaves Underweight?
When this unit was being written, loaves in Britainwere sold as 'Minimum weight 400 grams'.
a If you bought a 400-gram loaf in this country,would you expect it to weigh:exactly 400 grams,more than 400 grams,less than 400 grams?
Read the following news item, adapted from TheGrocer magazine.
. DEfENDEDYO AKERS m'oers thisg . defended their :~ loaves sold
, Federatlon in{we standThe Bakers ations that one . for ever"}weekaft~rall:; underVl~ight. a.de it i:rn~oSSl:leFederatiOnin Britaln :' diff1.culues 111 eight) sal~ it would be
productlOUthe correct w uuderWe,ght, (0 grams).'oe I at was -r 02 0 he
loaf to When a 0 ore thaD- 4 oint out,s'Pokesroan~ it to be out bY: ve failed t? ~ loaves wereunusual foatlona1 reports ut of every fl'Vbeneflted. h
What nas that four ~ the consumers recogniZ.ed t efadded, 'oN verweight an inspectors d in favO':! ~proba?lY 0 and measur~s bakers erre ere drasuca Y
Welg,:ts involved at; Loaves that wdifflcul
t1eSost of the t1ym:~e~·.'~.~~d~!::a".::."'_'''''_../"_umers m lwaYs Wll.·Hcons _ ht were a
underwelg
b What fraction of loaves sold in Britain is claimed tobe overweight?
c The standard loaf should weigh 400 grams. Whatcan you say about the mean (average) weight ofthese 400-gram loaves?
4 5
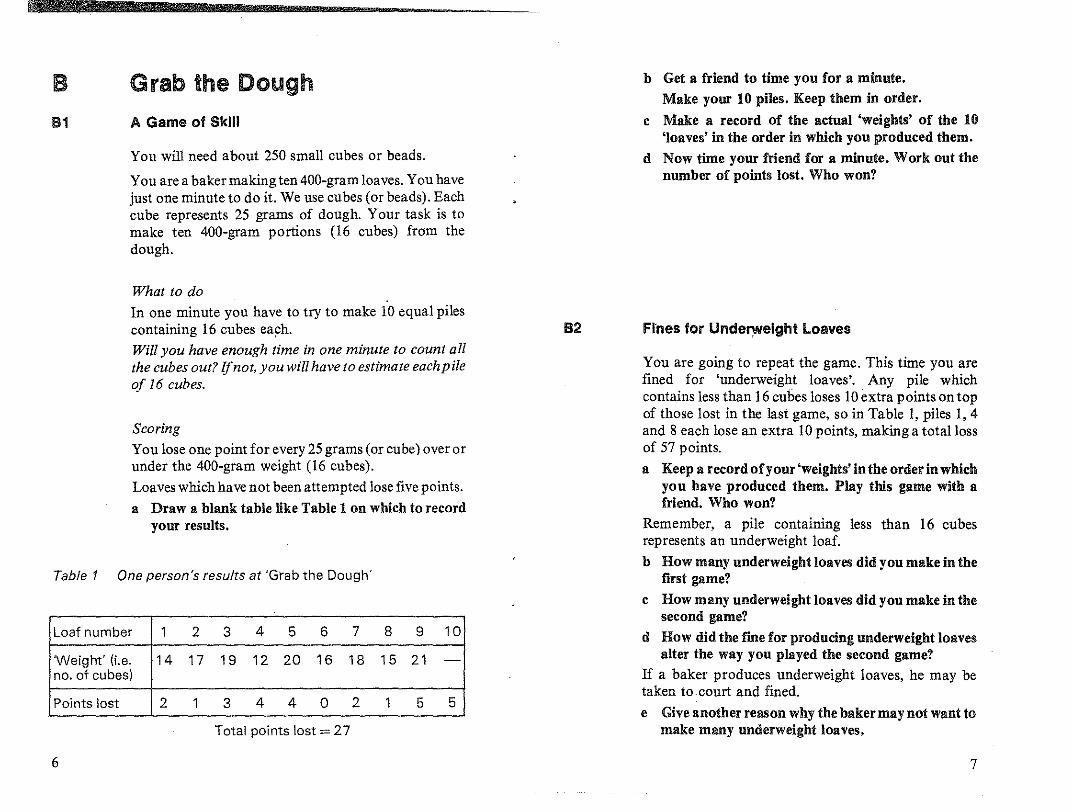
B
81
Grab the Dough
A Game of Skill
You will need about 250 small cubes or beads.
You are a baker making ten 400-gram loaves. You havejust one minute to do it. We use cubes (or beads). Eachcube represents 25 grams of dough. Your task is tomake ten 400-gram portions (16 cubes) from thedough.
b Get a friend to time you for a minute.Make your 10 piles. Keep them in order.
c Make a record of the actual 'weights' of the 10'loaves' in the order in which you produced them.
d Now time your friend for a minute. Work out thenumber of points lost. Who won?
What to doIn one minute you have to try to make 10 equal pilescontaining 16 cubes eaph.Will you have enough time in one minute to count allthe cubes out? lfnot, you willhave to estimate eachpileof 16 cubes.
ScoringYou lose one point for every 25 grams (or cube) over orunder the 400-gram weight (16 cubes).
Loaves which have not been attempted lose five points.
a Draw a blank table like Table 1 on which to recordyour results.
Table lOne person's results at 'Grab the Dough'
Loaf number 1 2 3 4 5 6 7 8 9 10
'Weight' (i.e. 14 17 19 12 20 16 18 15 21 -no, of cubes)
Points lost 2 1 3 4 4 0 2 1 5 5
Total points lost = 27
6
B2 FI'nes for Undel'lfllelght loaves
You are going to repeat the game. This time you arefined for 'underweight loaves'. Any pile whichcontains less than 16 cubes loses 10 extra points on topof those lost in the last game, so in Table 1, piles 1,4and 8 each lose an extra 10 points, making a total lossof 57 points.
a Keep a record ofyour 'weights' in the order in whichyou have produced them. Play this game with afriend. Who won?
Remember, a pile containing less than 16 cubesrepresents an underweight loaf.
b How many underweight loaves did you make in thefirst game?
c How many underweight loaves did you make in thesecond game?
d How did the fme for producing underweight loavesalter the way you played the second game?
If a baker produces underweight loaves, he may betaken to court and fined.
e Give another reason why the bakermay not want tomake many underweight loaves.
7

CC1
8
Is the Quality Controlled?
Sample from the First Batch
A baker aims to make 400-gram loaves. To findwhether he is producing overweight or underweightloaves, he weighs a sample of 10 loaves from his firstbatch. His results (in grams) were:415 394 408 422 428
397 425 406 414 421
The weights ofthe loaves were all different. To find theMEAN (average) weight of the loaves, we use:
. (Total weight of all loaves)MEAN weight = (Number of loaves)
a What is the total weight of these 111 loaves?
b Find the mean weight of these 10 loaves.
The loaf weighing 415 grams contained an extra 15grams of bread. The loaf weighing 394 grams was 6grams short. In these two loaves, the total weight ofextra bread was 15 - 6 =9 grams, i.e. the totaloverweight of these two loaves was 9 grams.
.The weights of these loaves are recorded in Table 4 onpage Rl.
c Complete the table by subtracting 400 from theweight of each loaf. The first two examples havebeen done for you. The second one is negative.What does this mean?
d What is the total overweight of the 10 loaves?
e Use your answer to d to find the mean overweight ofthe 111 loaves.
f Write down another method of working out themean overweight. (Hint: look at your answer to b.)
Can you think ofa way ofmeasuring the variation inweight of these 10 loaves?
l1
t"I
C2
Table 2
One way is to subtract the smallest from the largest.The result is called the RANGE.
g What is the weight of the heaviest loaf!
h What is the weight of the lightest loaf?What is the range (in weight) of these loaves?
j How much overweight is the heaviest loaf?k How much overweight is the lightest loaf (it is
negative)?What is the range in amounts overweight?
m How does your answer to I compare with that to i?
A Full Day's Work
You will need a sheet of graph paper.
The baker weighs a sample of 10 loaves every hour. Theweights from the first sample have already been givenin Section Cl. Each hour he works outthe mean weightof his sample. Table 2 gives the eight sample meansobtained during the day.
Mean weights of loaves
Sample Mean weight of10 loaves (grams)
1 4132 4053 3964 4025 4186 4227 4288 428
9

The baker was aiming to produce 400-gram loaves. Insample 3, the mean weight was only 396 grams, so themean overweight was 396g - 400g = - 4 grams.
a Is the mean overweight of anY other samplenegative?
b Fill in the mean overweights of the eight samples inTable 5 on page Rl.
The mean overweight ofeach sample can be plotted ona QUALITY CONTROL CHART like the one below. Noticethat the zero line is where the mean weight of thesample is exactly 400 grams.
·CS
The baker knows the usual pattern of points on hischart. He can quickly see when somethinggoes wrong.
What do you think he looks jar?e Look at the last three samples. Are the loaves
generally too heavy, too light or about right?f For part of the day, the mean weight of successive
samples decreased. Which samples were these?g After which sample do you think that tile baker
made some adjustments? What effect did they have?
Are There Enough Matches In a Box?
Actual mean weight of sample should be 400 grams
Quality control chart - mean overweights of eightsamples of loaves
c Draw the axes for a quality control chart, like theones above, on your piece of graph paper.
d Plot the mean overweights of each sample that youfound in b.
The first point has already been plotted on the chartabove.
Sample number
The zero line on the quality control chart for thesefigures represents 40 matches. The vertical axis goesfrom - 3 to +3 and is labelled 'Mean numQer ofmatches over 40'.
Sample Mean number ofmatches per box
1 422 413 414 405 406 397 398 38
A firm sells matches in boxes marked 'Averagecontents 40 matches'. A sample of 10 boxes was takenfrom the production line every hour. The contents ofeach box were counted. The mean number of matchesper box was calculated. The results are given in Table 3.
Mean number of matches per boxTable 3
8765
40 Meanoverweight(grams)
30
20
+10
02 3 4
-10
-.20
Figure 1
10 11
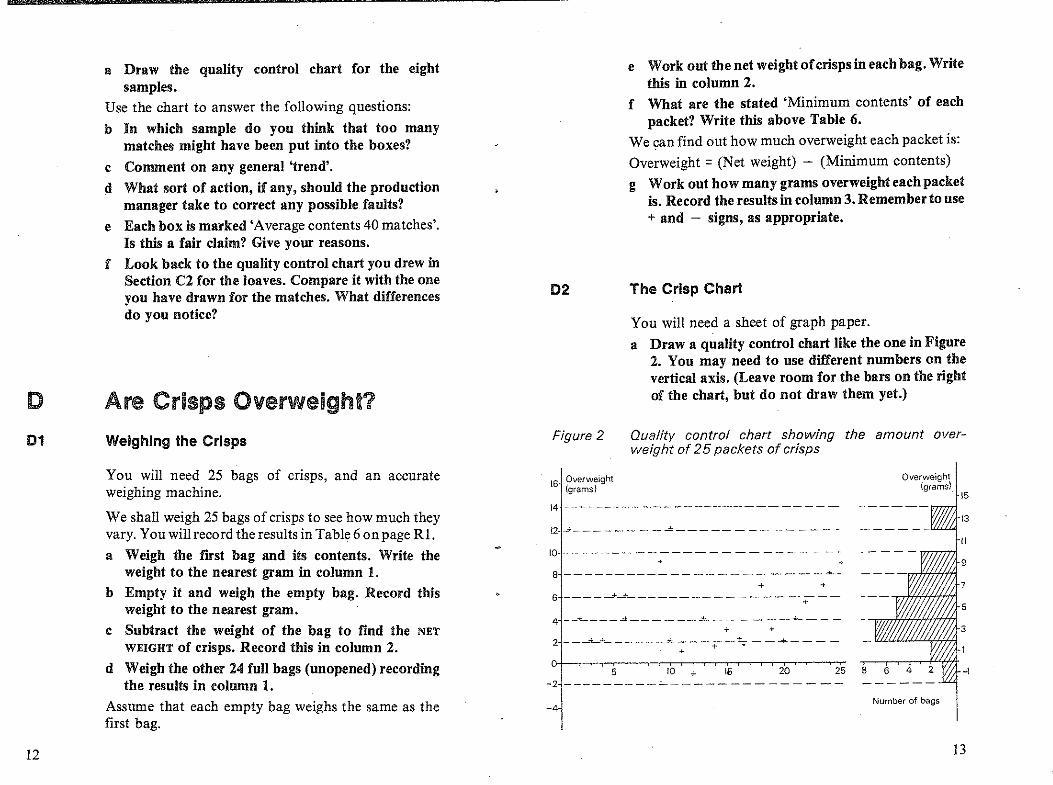
D
D1
a Draw the quality control chart for the eightsamples.
Use the chart to answer the following questions:
b In which sample do you think that too manymatches might have been put into the boxes?
c Comment on any general 'trend'.
d What sort of action, if any, should the productionmanager take to correct any possible faults?
e Each box is marked 'Average contents 40 matches'.Is this a fair claim? Give your reasons.
f Look back to the quality control chart you drew inSection C2 for the loaves. Compare it with the oneyou have drawn for the matches. What differencesdo you notice?
Are Crisps Overweight?
Weighing the Crisps
D2
Figure 2
e Work out the net weight ofcrisps in each bag. Writethis in column 2.
f What are the stated 'Minimum contents' of eachpacket? Write this above Table 6.
We can find out how much overweight each packet is:
Overweight = (Net weight) - (Minimum contents)
g Work out how many grams overweight each packetis. Record the results in column 3. Remember to use+ and - signs, as appropriate.
The Crisp Chart
You will need a sheet of graph paper.
a Draw a quality control chart like the one in Figure2. You may need to use different numbers on thevertical axis. (Leave room for the bars on the rightof the chart, but do not draw them yet.)
Quality control chart showing the amount overweight of 25 packets of crisps
12
You will need 25 bags of crisps, and an accurateweighing machine.
We shall weigh 25 bags of crisps to see how much theyvary. You will record the results in Table 6 on page Rl.
a Weigh the rlfst bag and its contents. Write theweight to the nearest gram in column 1.
b Empty it and weigh the empty bag. Record thisweight to the nearest gram.
c Subtract the weight of the bag to find the NET
WEIGHT of crisps. Record this in column 2.
d Weigh the other 24 full bags (unopened) recordingthe results in column 1.
Assume that each empty bag weighs the same as thefirst bag.
16 Overweight(grams}
14 -~------ -------------- -- - --
12 -::!'------- - -...±----- - - - --- - --
10 -----------------------*+ +
8 ---------------------- .... -+ +
6 -----..:!'-.....::!-------------------+
4 --~--_...±---¥----.±..--- - --+----+ +
2 ---+-+------±...---+-i::: - -...,;,..---+
of-,-~~~~~~~~~~~~~~~5 10+ Ii) 20 25
-2 ---------.:.---------------
-4
Overweight(grams).
15
Number of bags
13

Use your quality control chart to answer thesequestions.(The answers from Figure 2 are shown in brackets.)
b How many underweight bags were there? (1)
c How many bags were more than 2 gramsoverweight? (22)
d How many bags were overweight? (24)
e What proportion of bags were overweight? (24/25)
f What was the range of weights of bags of crisps?(-1 g to 12'5 g, a range of 13'5 g)
In questions g, hand i, ignore the five heaviest and thefive lightest bags. This leaves IS bags.
g What is the heaviest weight among these 15 bags?(7'5 g)
h What is the lightest weight among these 15 bags?(2'5 g)
i What is the range of weights among these 15 bags?(5 g)
IS bags out of all the 25 bags is:
IS x lOa % of the bags =60% of the bags25 ICopy out the following sentence, filling in the missingfigure.
*j The range of weight of the middle 60% of the bagsis
D3 Average Contents of Crisp Packets
In the quality control chart in Figure 2, two bags werebetween a and 2 grams overweight. The meanoverweight of those two bags is I gram.
a Which bar on the right of the chart represents thesetwo bags?
14
The bars together make up a HISTOGRAM.
b Take out the quality control chart that you drew ofthe crisps. On it draw a histogram from your ownfigures. Arrange it like the one in Figure 2.
One way of finding the mean overweight ofthe packetsof crisps is to add up the overweights and divide by thenumber of packets. .
Can you think of a quicker way? (Hint: Use thehistogram.)
c Find the mean overweight by the quickest way youcan.
IS
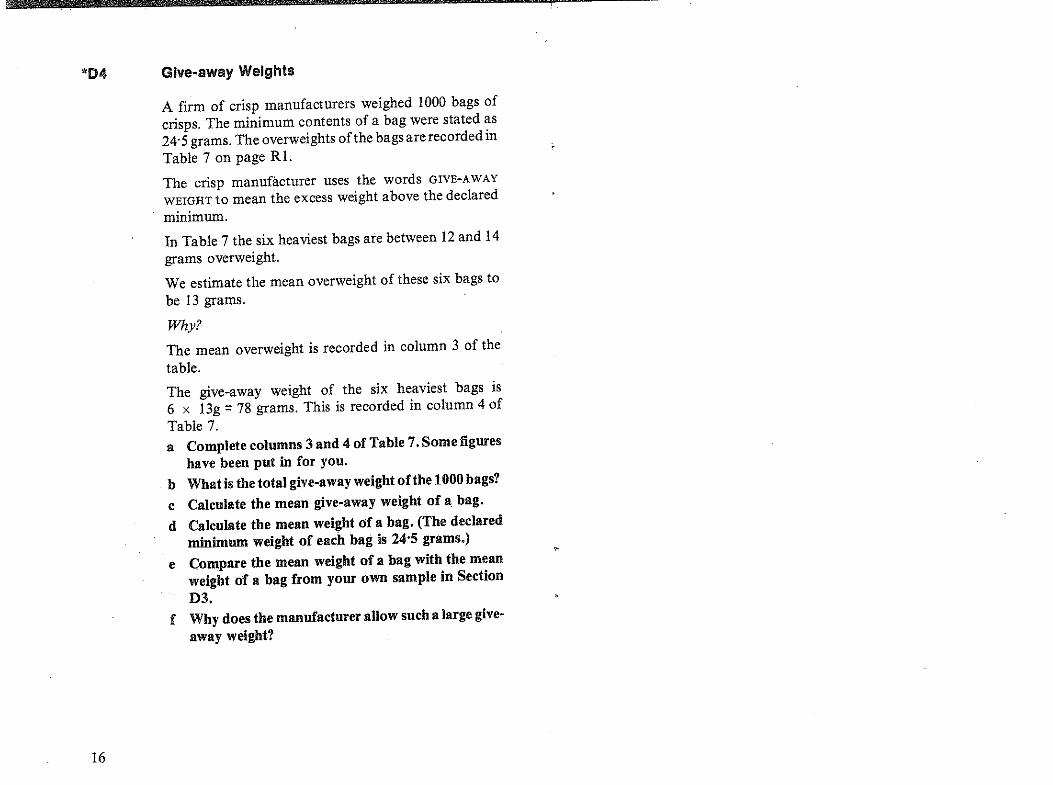
"D4 Give-away Weights
A firm of crisp manufacturers weighed 1000 bags ofcrisps. The minimum contents of a bag were stated as24'5 grams. The overweights of the bags are recorded inTable 7 on page Rl.
The crisp manufacturer uses the words GIVE-AWAY
WEIGHT to mean the excess weight above the declaredminimum.
In Table 7 the six heaviest bags are between 12 and 14grams overweight.
We estimate the mean overweight of these six bags tobe 13 grams.
Why?
The mean overweight is recorded in column 3 of thetable.
The give-away weight of the six heaviest bags is6 x 13g = 78 grams. This is recorded in column 4 ofTable 7.a Complete columns 3 and 4 of Table 7. Some figures
have been put in for you.b What is the total give-away weight ofthe 1000bags?
c Calculate the mean give-away weight of a bag.d Calculate the mean weight of a bag. (The declared
minimum weight of each bag is 24'S grams.)
e Compare the mean weight of a bag with the meanweight of a bag from your own sample in Section03.
f Why does the manufacturer allow such a large giveaway weight?
16

Schools Council Project on Statistical EducationThis Project has been based in the Department of Probability and Statistics at the Universityof Sheffield from 1975 to 1980. Its brief was: to assess the present situation of statisticaleducation in schools; to survey the needs of teachers of statistics; to devise detailed proposalsfor the implementation of the teaching ideas; and to produce teaching materials.
Project Team
Director: Peter Holmes (1975- )Deputy Director: Neil Rubra (1975-78)" Daphne Turner (1978-
Project Officers
Ramesh Kapadia (1975-79), Alan Graham (1976-77), Barbara Cox (1979-80)
General NotesPages with the prefix R are resource pages or reference pages for pupil use. (In many casesthey are designed as worksheets.) In the pupil unit these are referred to as 'page RI', etc.
Permission need not be sought' to reproduce copies of the R sheets provided that copies aremade only in the educational establishment in which they are to be used and that such copiesare not sold, hired or lent to any other indivdual, organization or establishment.
Sections or questions marked with an asterisk are optional to the main thrust in the unit.Sometimes they are for the more able pupils, sometimes they are for reinforcement and sometimes they consist of simpler work for the less able pupils and lead to an easier conclusionthan the main unit. In each case detailed comments on the particular purpose will be found inthe appropriate section of the teacher's notes.
Three different typefaces are used in the pupil units. Text in roman type (like this) is for pupilsto read or for the teacher to introduce. Questions to promote thought and for group or classdiscussion are printed in italics. Instructions telling pupils to do things and questions forpupils to answer are printed in bold.
Statistics in your world
CHOICER CHA CE
TEACHERS' NOTES
LEVEL 4
Published for the Schools Council by
FOUlSHAM EDUCATIONAL

Contents
Brief Description
Aims and Objectives
Prerequisites
Equipment and Planuing
Detailed NotesSection ASection BSection CSection DSection E
Answers
Test QuestionsAnswers
Connections with OtherUnits in the Project
R pages on pages 8-1i
Page3
3
3
3
4567
12121416
18
Brief DescriptionPupils investigate the effects of chance in a variety of situations, and areasked to question the meaning and validity of advertising claims.
Design time, 3-4 hours
Aims and ObjectivesBy the end of Section C pupils should be able to list all possible outcomesfor a simple experiment, assign probabilities when these outcomes areequally likely, and add these simple probabilities to obtain the probabilitiesof compound events. They will have practised tallying, completing tables,calculating proportions and completing tree diagrams. They will be moreaware of some of the problems in designing experiments, the effect ofchance, the connection between relative frequency of success andprobability, and that probabilities lie. between 0 and 1.
Those who finish the completeunit will also be able to assign probabilitiesfrom counting the equally likely events on a tree diagram. They will havepractised combining probabilities of mutually exclusive events, calculatingbinomial coefficients and applying them to finding the probabilities ofobtaining 2 successes out of4and 8 successes out of 10 when the probabilityof a success iS1-' They will be more aware of the properties of the binomialdistribution and of how probabilities can be linked with such statements as'8 out of 10 cats prefer Whiskas'.
PrerequisitesPupils need to be able to (i) convert fractions into decimal fractions inSection B (using a calculator ifavailable) and (il) recognize Pascal's trianglein the optional EI.
Equipment and PlanningSchools Council Project on Statistical Education
Published byW. Foulsham & Co. Ltd., Yeovtl Road, Slough, Berks
@ Schools Council Publications 1981
ISBN 0-572-01112-1
PRINTED IN HONG KONG
The unit can be used. in two ways:
As a complete whole, requiring a copy of pages R I and R2 for eachpupil;
2 In two stages:(1) Sections A, B, C, which require a copy of page R 1for each pupil.(il) Sections A I, D, E, which require a copy ofpage R2 for each pupiL
3

If, however, pupils are already familiar with probability and tree diagrams,then it is possible to omit Sections A2, B, C. If time and ability permit, allthe tree diagrams and tables could be drawn by the pupil"instead ofusing Rpages.
The simulation in Bl requires the class to be divided into groups of four,although ifthe class is small, they can work in threes, or even individually.
Each group requires three identical pieces of paper or carefully cut card,one ofeach marked A, B Or C. Sections C and D can be done individually,although discussion of possible outcomes is to be encouraged.
C6 can be short-circuited by more able pupils, by moving directly from thediscussion question to questions f and g.
C7 is optional reinforcement, while other asterisked sections or questionsare for more able pupils. They can be omitted without destroying the threadof the unit.
Detailed Notes
Section A
At
This introduces pupils to the possible ways of interpreting statementsapparently based on statistical trials. Class discussion may help here.
a Pupils should be encouraged to think of other meanings. Their owninterpretation should be recorded as they will refer back to it later.
b Pupils should appreciate that the cat may not distinguish between thecat foods. Some comments may reflect a mistrust of advertising claimsin general. This could usefully be followed up by a discussion oftheIBA Code of Advertising Standards and Practice, copies of which areobtainable free from the Independent Broadcasting Authority, 70Brompton Road, London, SW3 lEY.
A2
Here it is unlikely that the 100 people would all be coffee experts.Discussion could usefully include:
(i) the likely effect of bias if the competition were held in a shop renownedfor its choice ofcoffee beans, compared with a stand in a supermarket.
4
(ii) such possibilities as 80 people getting it right or 20 people getting itright.
a If the coffees tasted the same, then the competitors would be aware thatthey were just guessing'. Getting the right answer is just a matter ofluck.
b If the coffees tasted different, then the competitors would notnecessarily be prepared to ·admit they Were guessing. Nevertheless,unless the competitors were regular coffee drinkers it is unlikely thatmany would have the skill to distinguish the tastes correctly.
Section B
Ht
This will require a copy of page RI for each pupil.
The simulation should produce a reasonable distribution of possibleoutcomes. It is necessary to stress the need to shuffle the papers, to foldthem in the same way and to select without looking.
Some ability groups may find this experiment more interesting ifa financialelement is introduced at the end. For example, you can suggest a prize of20p if all three letters are in the correct envelopes, 5p if one only is in thecorrect envelope and a penalty of lOp if all the letters are incorrectlyaddressed. These amounts can then be applied to the successes actuallyachieved and the outcomes in the tree diagrams to see the actual andexpected profit to be made. Table TI shows the profit for each of the sixoutcomes.
Table Tl Profit on putting letters in envelopes
Outcome No. correct Profit
ABC 3 20pA CB 1 5pBAC 1 5pBCA 0 -10pCAB 0 -10pCBA 1 5p
Totai profit (6 outcomes) 15p
So on six outcomes we should expect a profit of 15p, i.e. an expected profitof 2-j-p per experiment.
5

B2,
Some help may be required with transfer of results from Table 510 Table 6,
a-e Tally marks could be used to assist this process,
d Some mention of 'If two right, then the third one must be' is required.
e Calculators might help here.
r This is probably best done by the teacher writing the results on theblackboard to obtain totals for each outcome, and then pupils enteringthem in Ta ble 6. Invite comments from pupils on proportions obtained.This links later with C5, Look for tendencies to stability as the numberof trials is increased.
B3
a In only 15 trials it is possible that all six arrangements may not occur, Ifvery few of the arrangements occur, then this raises questions about theway the group did the simulation, This may provide a useful reminderof the need to ensure standard practices in any simulation,
Section C
The link is made here to the theoretical situation, and the tendency of theproportions, in the long run, to approximate to the theoreticalprobabilities, The introduction is made by means of tree diagrams,
C3
Pupils are asked to copy the summary for completeness, but this could beomitted, Illustration by means of points on a probability number line, asshown here, may help,
Outcome Group Class Proba bility,
proportions proportions
ABC 0, 0, 0,17ocorrect 0, 0, 0,331 correct 0, 0, 0,5oor 3 correct 0, 0, 0·5
It IS expected that the class proportIOns will be much nearer theprobabilities than the group proportions.
C6
If confident and accurate replies are given to the discussion question, movedirectly to rand g.
'C7
Optional reinforcement.
g Some pupils may need help here. Intuitively some will probably say 5,but if the ability of the class is high it would be advantageous to showthat 5 is the most likely outcome when the probability of success is i-
Section D
In this section pupils extend the application of tree diagrams from twopeople to three and four people.
The probability of success used is +to ease the calculation. Stressthroughout that results are obtained by guessing. i.e. by chance,
D2
Figure 4 and Table 7 can be copied and completed if this is preferred,
6
Notice the need for addition of proportions in d. It might help to draw anoutline table on the blackboard for pupils to copy and fill in their ownproportions, for example:
oI
l'PrOb (2 correct}
Impossible
C5
il'
Prob (Q correct)l'Prob (1 c:)~: ~:Gtl
tProb (0, 1 or 3 correct)
Certainty
D3
a Probabilities are not the same,
g Make certain that their answer here is compared with their guess in a.
Probability (lout of 2 guess correctly) =t= 0'5
Probability (2 out of 4 guess correctly) =6 r6 I =i =0'375
(Text continued after the R pages)
7 I
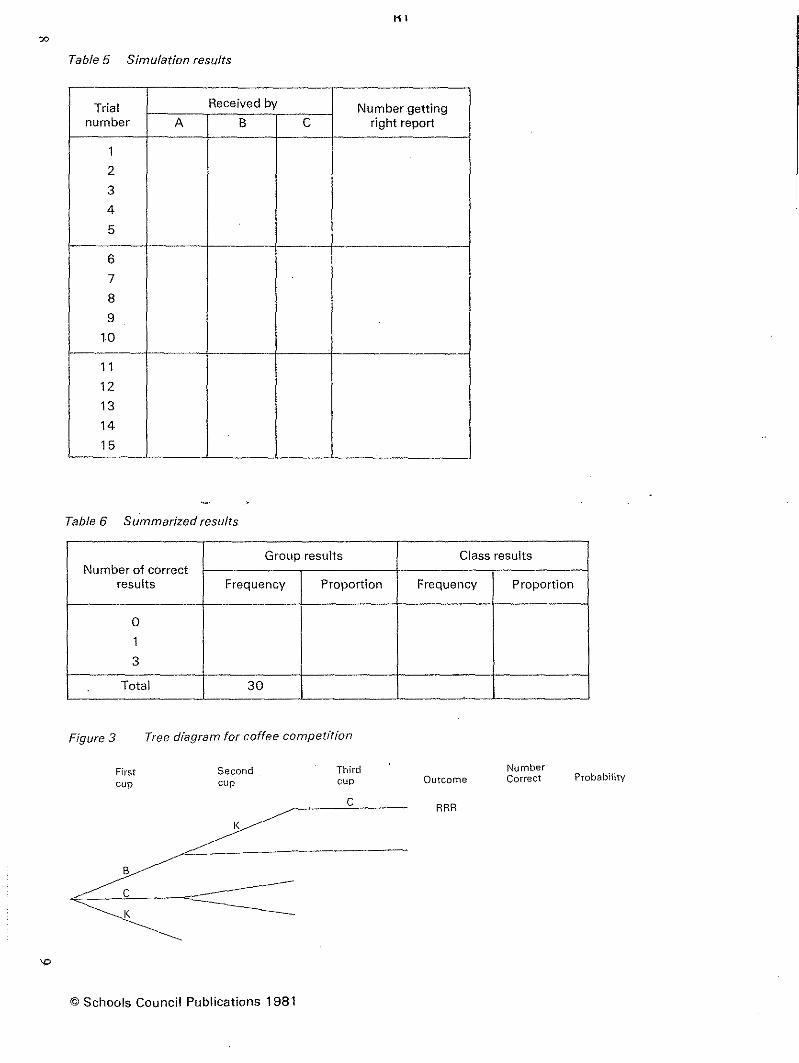
00
Table 5 Simulation results
ttl
Trial Received by Number gettingnumber A B C right report
1
2
3
4
5
6
7
8
9
10
11
12
13
14
15
Table 6 Summarized results
Group resuits Class resultsNumber of correct
results Frequency Proportion Frequency Proportion
0
1
3
Total 30
Figure 3 Tree diagram for coffee competition
'"
Firstcup
8
cK
Secondcup
K~
Thirdcup
c
Outcome
RRR
NumberCorrect Probability
© Schools Council Publications 1981

Tree diagram showing outcomes for three people
R2
Figure 5 Tree diagram showing outcomes for four people
Firstperson
Secondperson First
personSecondperson
Thirdperson
Fourthperson Outcome Probability
R
R
R W
W
W R
R
R W
Summarized results for three people
,ber right Possible ways Number of ways Probability
0 WWW 1 ~8
1 WWR, WRW, RWW 3
2 RRW
3
fatal 8 1
10
w R
© Schools Council Publications 1981
11
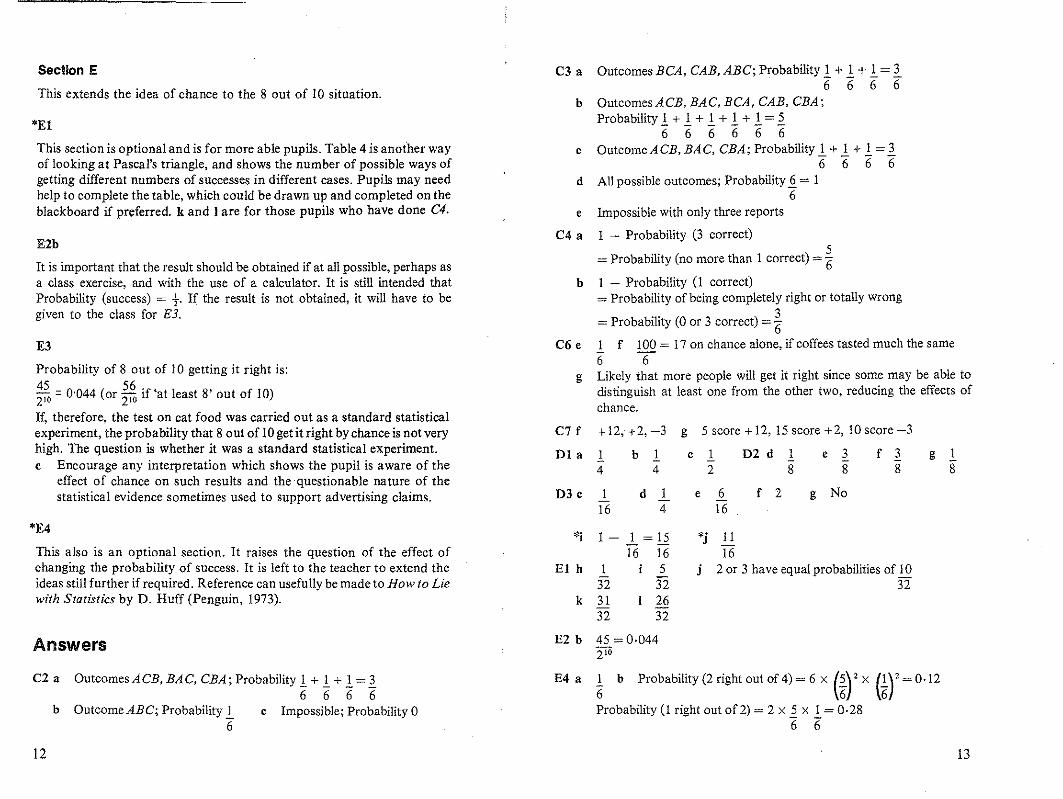
Section E
This extends the idea of chance to the 8 out of 10 situation.
'El
This section is optional and is for more able pupils. Table 4 is another wayof looking at Pascal's triangle, and shows the number of possible ways ofgetting different numbers of successes in different cases. Pupils may needhelp to complete the table, which could be drawn up and completed on theblackboard if preferred. k and I are for those pupils who bave done C4.
E2b
It is important that the result should be obtained if at all possible, perhaps asa class exercise, and with the use of a calculator. It is still intended thatProbability (success) = t. If the result is not obtained, it will have to begiven to the class for E3.
E3
Probability of 8 out of 10 getting it right is:45 56 .210 = 0'044 (or 210 if 'at least 8' out of 10)
If, therefore, the test on cat food was carried out as a standard statisticalexperiment, the probability that 8 out of 10 get it right by chance is not veryhigh. The question is whether it was a standard statistical experiment.c Encourage any interpretation which shows the pupil is aware of the
effect of chance on such results and the questionable nature of thestatistical evidence sometimes used to support advertising claims.
C3 a Outcomes BCA, CAB, ABC; Probability 1 + 1 + 1 = 36" 6" 6" 6"
b Outcomes ACB, BAG, BCA, CAB, CBA;Probability 1 + 1 + 1 + 1 + 1 = 5
"6 "6 "6 (5 (5 (5c Outcome ACB, BAC, CBA; Probability 1 + 1 + 1 = 3
"6 "6 "6 "6d All possible outcomes; Probability£. = 1
6e Impossible with only three reports
C4 a 1 - Probability (3 correct)
= Probability (no more than 1 correct) = %b 1 - Probability (l correct)
= Probability of being completely right or totally wrong
= Probability (0 or 3 correct) =iC6 e 1. f 100 = 17 on chance alone, if coffees tasted much the same
6 6g Likely that more people will get it right since some may be able to
distinguish at least one from the other two, reducing the effects ofchance.
C7 f +12,+2, -3 g 5 score + 12, 15 score +2, 10 score-3
Dl a 1. b 1. c 1 D2 d 1 e 3 f 3 g 14 4 2 8 8 8 8
D3c 1 d 1 e 6 f 2 g No16 4 16
'E4
This also is an optional section. It raises the question of the effect ofchanging the probability of success. It is left to the teacher to extend theideas still further if required. Reference can usefully be madeto How to Liewith Statistics by D. Huff (Penguin, 1973).
Answers
*i 1 - 1 = 15- -16 16
EI h 1 532 32
k 31 2632 32
E2 b 45 = 0-0442 10
*j 1116
j 2 or 3 have equal probabilities of 1032
b Outcome ABC; Probability 1"6
C2 a Outcomes ACB, BAC, CBA; Probability 1. + 1. + 1. = 1.666 6
c Impossible; Probability 0
E4 a i b Probability (2 right out of 4) = 6 x (i)' x (if = 0-12
Probability (l right out of 2) = 2 x 5 x 1 = 0-28"6 6"
12 13

Test Questionsb Copy and complete Figure 2 to show the possible outcomes.
Tree diagram for three people trying the cheese test1 Three cards, a Jack, a Queen and a King, are shurned and then turnedup one at a time.a Copy and complete Figure 1 to show the possible outcomes.b Fill in the column headed 'Probability'.Find:c Probability (order is JQK)d Probability (the second card is a King)e If the experiment were done 100 times, about how often would you
expect the Jack to be the first card?
Figure 2
1stperson
2ndperson
E
3rdperson
E
NZ
Outcome Probability
Figure 1 Tree diagram showing results from three cards
1stcard
J
Q
K
2ndcard
Q
K
3rdcard
_______K _Outcome
JQK
ProbabilityE
NZ
NZ
Total
Total
2 Write down the probability ofa an impossible event,b a certain event~
Using the possible outcomes from the three cards in question I, give anexample of:c an impossible event,d a certain event.
3 A person is given a piece of cheese. He is told it is either English cheddaror New Zealand cheddar, and is asked to say which.a If he just guesses, what is the probability he will be right?Three people are asked to do the cheese test. Suppose they all guess.The possible outcomes can be shown in a tree diagram.
14
c Fill in the column headed 'Probability'.Suppose it was English cheddar. Find:d Probability (all 3 right)e Probability (exactly 1 right)f Probability (all wrong)g Probability (exactly 2 right)h Probability (at least 1 right)
4 You are not expected to draw a tree diagram or do 'any calculations toanswer this question.Suppose six people were asked to do the cheese test and they all guesseda What is the most likely number that would get it right?b Is the Probability (2 right out of 6) the same, more than, or less than
Probability (l right out of3)?
15

Answers 3 Figure 2
I a, b 1st 2nd 3rdperson person person Outcome Probability
Figure 7RRR t
E1st 2nd 3rd
RRW 1card card Outcome Probability
"8cardNZ
KJQK 1- E
6RWR 1
Q E "8Q 1 NZ
JKQ "8 E~K N2 RWW
J J 1K QKJ "8
J...Q NZ E WRR 8K QJK 1 EK J "6NZ N2
WRW ...LJ Q 1 8KJQ "6E 1Q
J 1 WWR "8KQJ "6N2 1
Total WWW "8
lotal
d Probability (all three right) = .!.8
e Probability (exactly 1 right) = ~
8
e Probability (order is JQK) = .!.6
d Probability (the second card is a king) = 2:6
e Probability (Ist card is a Jack) = 2:6
In 100 trials, expected number = 100 x 2: '" 336
2 a Probability (impossible event) = 0b Probability (a certain event) = I
Various possibilities exist for e and d; some suggestions are listed here:e Pwbability (of getting an ace)
Probability (not a court card)Probability (exactly 2 out of 3 in correct order of JQK)
d Probability (outcome cOJ]tains a Jack, Queen and a King)Probability (three different cards)Probability (obtaining three court cards)
16
f
g
h
4 a
Probability (all wrong) = .!.8
Probability (exactly 2 right) = ~
8Probability (at least I right) = '!..
83 b Less than; Probability (I right out of 3) = l
8Probability (2 right out of6) = 15
64but pupils are not expected to work this out
17


i"0> 0> 0>
B~c c c ~
t; 'ti t; '.• • • :<5 Other titles in this series>- f- f- f-
~O>m 0> 0> 0> i" c0: c c c -.: ';::
" "t; .~ 't; ~ ~
'ro • • • m 0> Being Fair to Ernie~ f- f- f- -,-
-~
Leisure for Pleasure'
,STidy Tables
"m Wheels and Meals•• E
::') m Shaking a Sixc '"" ro ro .~ Practice Makes Perfect'« 1" >- aJ aJ :3~m • •'" 0: .p .p mO: Probability Games.
ro -g .:::'ro c c " m If at First." •
" ~ 0 0 o.~
Authors AnonymousOn the Ball'
m m •• • '§Seeing is Believing'
E E 0> 0>m m c w oS Fair Play'" '" 't; 0
.~ .~~_ m
• .~~~ Opinion Mattersf-:a :5 0> 1" 1" ~.O>
m m c'" '" Ol..c .:= Getting it Right'
"' "' 'iii c~~
2 2 • ro ro .- c U)
0. 0. f- - " ~o~ Car Careers'Phoney Figures .
Net Catch
"Cutting it Fine.
• m m~
,~ • Multiplying People..g
~~
g ro Pupil Poll •:E m f! >
~m • "0
"' E • ~Choice or Chance.
• 2 0 E~ 0- " ';5 •.S; >- ~
0- Sampling the Censusc "iE 0 C
0- X
'"X •
~ ~ - c .g • .c Testing Testing0 "iE
.~
0 b .~-'" 0> "0 '" m- ro c 0 m S c Retail Price Index·c
~ 'E E s E 0> rom 0- ~ m E ';; ';; ~ Figuring the Future:1! • 0 m ';; • to
"0 0 m m "0 mmc ·15 c 0> b 0>Smoking and Health
m 0 0- C Cm m '" ~ .~ l'l 'Cm E m 0> c m Equal Pay0 • s c " • 0-E " E 'B
~E E
'ro >- Vi • • 0~ <f) <f) w u
• E 0 0 0- 0-"0,o 0 ~ M M M xuz -i -i -i -i -i Ui '"
20

Statistics in your world
RHOI
HE
NeE
Published for the Schools Council by
FOUlSHAM EDUCATIONAL

'm
ContentsPage
A What's What? 3AI Advertising Claims 3A2 Taste Testing 4
B The Effects of Chance 481 Whose Report? 482 Collecting Results Together 683 Which Order? 7
C Probabilities 8CI Theory 8C2 Other Probabilities 9C3 Combining Probabilities 9
*C4 Probability Connections 10C5 Proportions and Probabilities 11C6 The Coffee Problem 12
*C7 Multiple Choice 13
D Taste Testing 14DI Is It Butter? 14D2 Three People 15D3 More People 16 AE More People 16
*EI Can We Go Further? 16 A1E2 Comparing Probabilities 18E3 Were You Right? 19E4 Changing the Chance 20
Some sections are marked with an asterisk*. Your teacher will tellyou whether to try these sections.R Pages Your teacher will provide these for you,
The Schools Council Project on Statistical Education
Published byW. Foulsham & Co. Ltd't Yeovil Ro~dt Slough, Berks
Cartoons by Colin Whittock
@ Schools Council Publications 1981
ISBN 0-572-01085-0
PRINTED IN HONG KONG
~OUTOFV@DRIVE,SON 6R'BBLEY~ BRAKES
What's What?
Advertising Claims
'8 out of 10 owners said their cats prefer Whiskas'claims a television advertisement.
Does this mean that Whiskas is very much better thanother cat foods?
a Write down what you think the advertisementmeans.
A cat is given two bowls ofcat food, only one ofwhichcontains Whiskas. It eats the Whiskas and leaves theother one. Some people say that this shows the catprefers Whiskas, but this may not be true.
b Make a list of possible reasons why the cat mayignore the second bowl.
It may have been chance that the cat ate the Whiskasfirst, and was then full up.
3

.11.2
B
Taste Testing
In a competition 100 people were each offered threecups of coffee. They were told that one was Brazilian,one Continental and one Kenyan. They were asked totaste the coffee and then to identify which was which.
A prize was offered to anyone who named each sort ofcoffee correctly.
a What would you expect to happen if the coffeestasted the same?
b What would you expect to happen if the coffeestasted different?
Even if there is no difference in taste, orthe pec;ple whoentered the competition knew nothing about coffee, afew people may identify the coffees correctly, just byguessing, by CHANCE alone.
In this unit we shall be looking at how often suchresults can happen just by chance.
The Effects of ChanceSimilar chance situations occur in everyday life. Whatis sometimes meant to be a well-planned event can turninto disaster if things are left to chance.
You can try this out a number of times and see whathappens. This is called a SIMULATION.
You will each need a copy of page RI.
Your teacher will divide the class into groups of 4. Ineach group one person is to be the teacher, and theothers are A. Smith, B. Smith and C. Smith. Makecertain you know who you are meant to be and don'tchange.
Each group needs three identical slips of paper, onelabelled' A, the second B and the third C. Fold themexactly the same way so that the letter does not show.The teacher then shuffles the papers. A. Smith choosesone, without looking. B. Smith then chooses another,without looking, and C. Smith takes the last one.
a Look at the letters and record the results in Table 5on page Rl. Under each column headed A, B or C,record the letter on the piece of paper received bythat person.
For example, if A gets report B, B gets report A andC gets his own, then the first line of your table wouldlook like this:
Trial Received by Number gettingnumber A B C right report
1 B A C 1
B1Whose Report?
Let us look at the possible effect of chance in school.
In one class there are three people whose surname isSmith: A. Smith, B. Smith and C. Smith.
The class teacher is somewhat absent-minded and isnot very careful when he puts their reports intoenvelopes at the end of term.
a What is the chance that he willget the right report inthe correct envelope for each pupil?
4
J
Notice that each letter must appear once and only oncein each row.
In the example above, only C got the right report. sothe last column contains a 1.
a In the last column of Table 5 record how manypeople received the right report each time.
b Fold the papers over again, all in the same way,hand them back to the 'teacher', and repeat theprocess until you have 15 results.
5

No. of correctGroup results Class results
results Frequency Proportion Frequency Proportion
0 4 145 =0·27 38 38
120 = 0·32
1 8 8 58 Jill... = 0-4815=0.53 120
3 3 3 23 li=0.1815=0.20 120
Total 15 1 120 1
B2
Table 1
6
Collecting Results Together
a How often did you get no (0) correct results? Putthis number in the fustspace in the column headed'Group results: Frequency' in Table 6 on page Rl.
b How often did you get one correct result? Put thisnumber under the one you have just recorded.
c Complete this column on Table 6. The total shouldcome to 15.
d Did you ever get exactly two letters correct? Whynot? Write a statement under Table 6 to explain whyit is impossible to get exactly two correct.
Let us look at the results more closely.
You had 15 goes. So did J. Jones. His version of Table6 looked like this:
Summarized results forJ. Jones
To find the numbers to complete column 3, J. Jonesreasoned like this: I had 0 correct results four times outof 15 goes.
As a proportion of the total of 15, this is:4 7 15 =0'2666
= 0'27 to 2 decimal places
He completed the rest of the column in the same way.
B3
e Complete column 3 of Table 6.
f Collect all the results for each group in your class.Enter these under the heading 'Class results:Frequency'. Work out the proportions for yourclass, and record them in the last column ofTable 6.
Look at the two columns of figures headed'Proportion' .
g Why do you think the two columns do not show thesame figures? If the simulation were carried outanother 120 times, what do you think would happento the proportions?
Which Order?
Look back at your results in Table 5. Where there arethree correct, the order of the letters was ABC.Look at the other results.
a Write down all the different arrangements of theletters A, B and C that occur in your answers.
b Can YClU find any other arrangements that don'tappear in your table? Ifso, write them down. Thereshould be six altogether.
7

Probability (A CB) =
Tree diagrams of possible outcomes
Taken Taken Actual Number2nd 3,d order correct Probability
CABC 3 1
;;B
BACB
1
C;;
CBAC l
A 6
C ABCA 0 l
6
A B 1CAB 0 "6
BA
CSA1"6
C3
cC1
Figure 1
Taken1st
A
B
C
8
Probabilities
Theory
The six possible arrangements, or OUTCOMES, from thesimulation are summarized in the tree diagram inFigure 1.
Look carefully at the diagram and make sure youunderstand it.
The first person can choose from three.The second person can choose from two.The third person has the one left over.
a Ifyou made your choices/airly in the simulation, doyou think anyone outcome is more likely than anyother?
If not, each outcome must be equally likely. There aresix outcomes altogether. We expect each outcome to
Occur ..1 of the time if done many times.6
~;i
C2
1We write: Probability (ABC) = 6
16
b Write down two similar statements.
Other Probabilities
No-one receives the correct report when the outcome isBCA or CAB.So, if the simulation is done many times, we expect to
1 1 2 f h .get 0 correct on - + - =-6 0 t e tImes.6 6
We write: Probability (0 correct) = ~
Use tbe tree diagram and a similar argument to find:
a Probability (1 correct)b Probability (3 correct)c Probability (2 correct)
Combining Probabilities
The tree diagram also provides information for otherprobabilities.
Suppose we want to find the probability of gettingeither 1 or 3 correct. This means getting A CB, CBA,BAC or ABC.
There are four possible ways. The probability of each. 1
of these four ways IS'6"
In the long run we therefore expect to get 1 or 3 correct
on t of the times.
. 4We write: Probability (either I or 3 correct) = '6
9

*C4
10
Use the tree diagram and similar reasoning to find:
a Probability (either 0 or 3 correct)b Probability (either 0 or 1 correct)c Probability (either 1 or 2 correct)d Probability (0, 1 or 3 correct)
You found that it was never possible to get exactly 2correct. We say this is an impossible event and so:Probability (2 correct) =O.Probability (4 correct) = 0 too.
e Why?
Getting 0, I or 3 right is certain to happen, soProbability (0, I or 3 correct) =1. You have worked outother probabilities and in each case the answer wasbetween 0 and 1.
f Copy the following:
All probabilities must be between or equal to 0 or 1.An event which is impossible has probability O.An event which is certain has probability 1.
The nearer a probability is to 1, the more likely theevent is to happen.The nearer a probability is to 0, tbe less likely theevent is to happen.
Probability Connections
If we do not get 0 correct, we must get I or 3correct, i.e.at least I right. Notice that:
Probability (0 correct) = i and
Probability (at least I right) = ~ = I - iIn this example:Probability (at least I right) is I - Probability (0correct).
Use your answers to C2 and C3 to find the connectionbetween:
f
!
III
C5
a Probability (3 correct) and Probability (no morethan 1 correct).
b Probability (1 correct) and the probability of beingright or totally wrong.
Proportions and Probabilities
Look again at Table 6.
Write down two answers for each ofthe following, thefirst answer for your own results, the second for theclass results.
a Proportion of outcomes which give all correct.
b Proportion of outcomes which give 0 correct.
c Proportion of outcomes which give 1 correct.
d Proportion of outcomes which give 0 or 3 correct.
We have already found the corresponding probabilitiesfor these outcomes. They are:
Probability (all correct) = i (= 0'17)
Probability (0 correct) =i (0'33)
Probability (I correct) = ~ (= 0'5)
Probability (either 0 or 3 correct) =~ (= 0'5)
e Compare the proportions from your results withthese probabilities. Write a sentence describingwhat you find.
f Compare the proportions from the class results withthese probabilities. Write a sentence describingwhat you find.
g Write a sentence to explain any differences orsimilarities that you may have found in youranswers to e and f.
II

C6 The Coffee Problem
Let us see how the theory applies to the coffeecompetition mentioned in Section A. The coffees aregiven in the order Brazilian, Kenyan and Continental.
a What is the chance that a person identifies the threecoffees correctly?
., b To find out, complete the tree diagram Figure 3 onpage Rl. The first brauches of the tree are done foryou.
c The correct order is B K C; complete the columnheaded 'Number correct'.
d Complete the column headed 'Probabilities'.
You should have said that the probabilities in each case
were i' and found that the completed tree diagram
looked rather like the tree diagram in Figure 1.
e What is the probability that one person gets them allin the right order?
·C7
Suppose you were organizing the competition, and youexpected 100 people to enter.
f How many prizes would you expect to provide?
g Would you change this number if you knew thecoffees tasted very different? Explain your answer.
Multiple Choice
A multiple choice question on a history paper askedcandidates to arrange the battles of Verdun, Marneand the second battle of Ypres in date order, startingwith the earliest.
John knows no history, but decides to guess.
a What is the chance that he will get full marks?
b To find out, draw and complete an outline treediagram similar to the one started in Figure 3 onpage Rl.
c Using the letters M, Y, V, complete the tree diagramto show all the possible outcomes.
d Ifthe correct order is MYV, complete the columnheaded 'Number correct'.
e Complete the column headed 'Probabilities'.
f What is the probability that John gets them all inthe right order?
g Suppose a class of30 pupils all guessed. How manywould you expect to get full marks?
*h Suppose the class all guessed and marks are given +4for a battle in the right position and - 1 for a battlein the wrong position. This would mean that a pupilwriting VYM would earn -1 + 4 -1 =+2. What arethe possibie marks? You may find it helpful to addan extra column headed 'Marks obtained' at the endof the tree diagram.
*i How many people would you expect to get eachpossible mark?
12 13
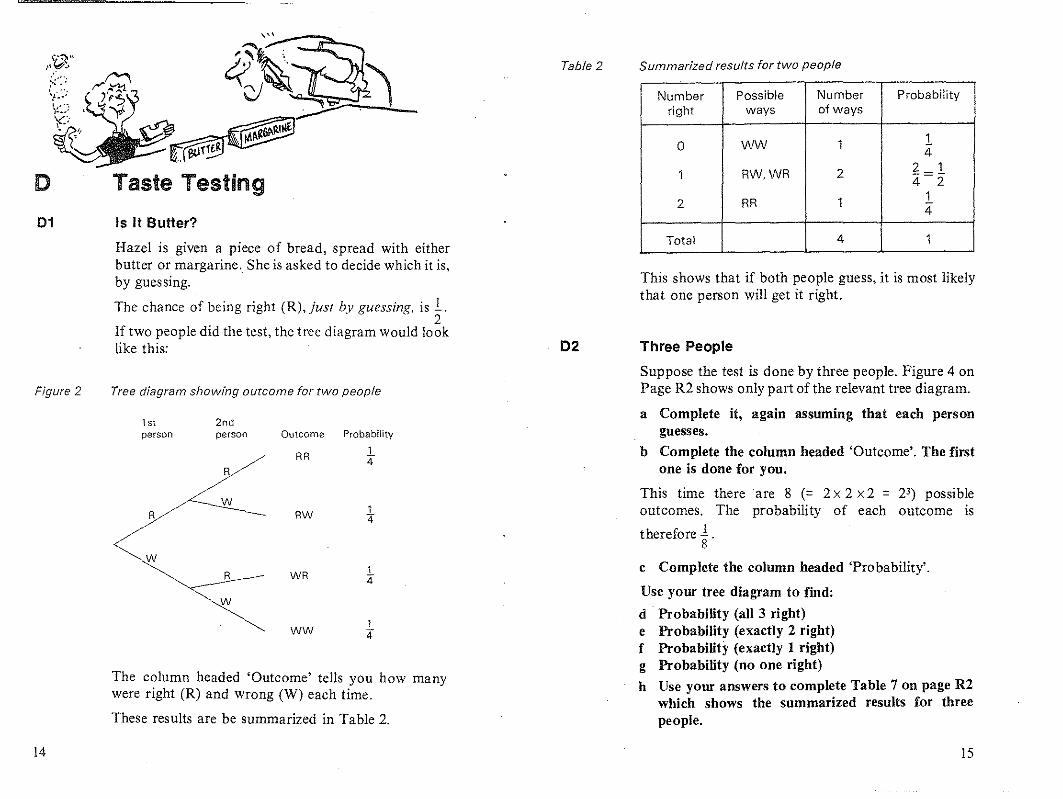
D Taste Testing
01 Is It Butter?
Hazel is given a piece of bread, spread with eitherbutter or margarine. She is asked to decide which it is,by guessing.
The chance of being right (R), Just by guessing. is 1.2
If two people did the test, the tree diagram would looklike this:
The column headed 'Outcome' tells you how manywere right (R) and wrong (W) each time.
These results are be summarized in Table 2.
14
Table 2
02
Summarized results for two people
Number Possible Number Probabilityright ways of ways
0 WW 1 14
1 RW.WR 2 2 14=2
2 RR 1 14
Total 4 1
This shows that if both people guess, it is most likelythat one person will get it right.
Three People
Suppose the test is done by three people. Figure 4 onPage R2 shows only part of the relevant tree diagram.
a Complete it, again assuming that each personguesses.
b Complete the column headed 'Outcome'. The firstone is done for you.
This time there are 8 (= 2x 2 x2 = 23) possibleoutcomes. The probability of each outcome is
therefore i.c Complete the column headed 'Probability'.
Use your tree diagram to find:
d Probability (all 3 right)e Probability (exactly 2 right)f Probability (exactly 1 right)g Probability (no one right)h Use your answers to complete Table 7 on page R2
which shows the summarized results for threepeople.
15

E More People
*E1 Can We Go Further?
Figure 5 is rather large and unwieldy.
Number guessing
1 2 3 4 5
0 1 1 11 2 3 4
Number of 2 1 3 6right 3 1 4answers 4 1
5
Total number8of ways 4 16
Number Possible Number Probabilityright ways of ways
0 WWWW 1 116
1RWWW,WRWW
4 .±WWRW,WWWR 16
WWRR, VVRRVV, RRWW6
62 VVRVVR,RVVRVV,R\NVVR 16
3VVRRR, RVVRR
4 .±RRVVR, RRRVV 16
11
4 RRRR 16
. Total 16 1
The results are shown in Table 3.
Summarized results for four people
Table 4 shows the number of ways two, three and fourpeople can guess correctly. The figures come fromTables 2, 7 and 3.
Summarized results for different numbers of people
Table 3
Table 4
More People
a Is the probahility of one person out oftwo guessingcorrectly the same as two people out of fourguessing correctly? Write down what you think.
Figure 5 on page R2 shows the tree diagram when fourpeople guess. It is not complete.
b Complete it, and the columns headed 'Outcome'and 'Probability', again assuming everyone guesses.
Notice there are now 16 (= 2 x 2 x 2 x 2 = 24 ) possibleoutcomes.
Use the tree diagram to find:
c Probahility (all 4 right)d Probability (exactly 3 right)e Probability (exactly 2 right)
See also if you can answer these questions:
f What is the most likely number of people to guesscorrectly?
g Is the probability of two out of four getting it rightthe same as the probability ofone out of two gettingit right? Use your answers to e and DIe.
h Was your answer to D3a correct?
*i What is the probability of at least one person beingright when four people do the test?
*j What is the probability ofat least two people beingwrong when four people do the test?
D3
16 17
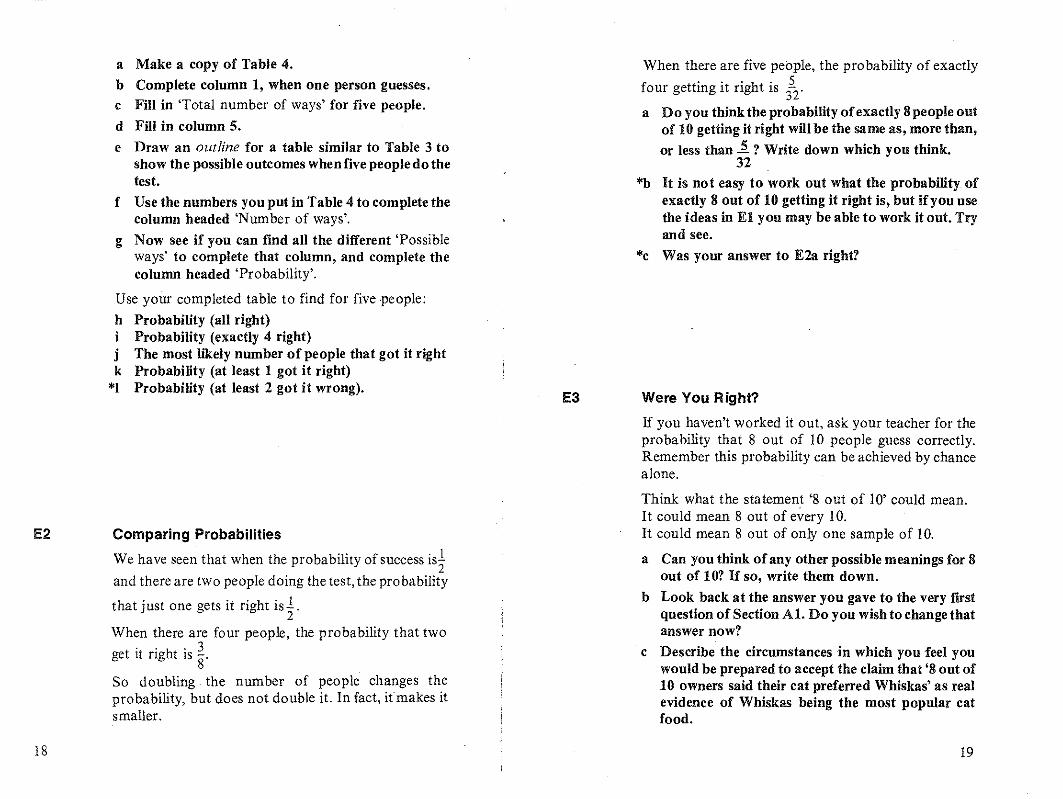
E2
18
a Make a copy of Table 4.b Complete column 1, when one person guesses.c Fill in 'Total number of ways' for five people.
d Fill in column 5.
e Draw an outline for a table similar to Table 3 toshow the possible outcomes when five people do thetest.
f Use the numbers you put in Table 4 to complete thecolumn headed 'Number of ways'.
g Now see if you can find all the different 'Possibleways' to complete that column, and complete thecolumn headed 'Probability'.
Use your completed table to find for five .people:
h Probability (all right)Probability (exactly 4 right)
j The most likely number of people that got it rightk Probability (at least 1 got it right)
*1 Probability (at least 2 got it wrong).
Comparing Probabilities
We have seen that when the probability of success ist
and there are two people doing the test, the probability
that just one gets it right ist.
When there are four people, the probability that two. . h . 3
get It ng t IS 8"'So doubling the number of people changes theprobability, but does not double it. In fact, itmakes itsmaller.
E3
When there are five people, the probability of exactly
four getting it right is f2'a Do you think the probability ofexactly 8people out
of 10 getting it right will be the same as, more than,or less than -i ? Write down which you think.
32*b It is not easy to work out what the probability of
exactly 8 out of 10 getting it right is, but ifyou usethe ideas in El you may be able to work it out. Tryand see.
*c Was your answer to E2a right?
Were You Righi?
If you haven't worked it out, ask your teacher for theprobability that 8 out of 10 people guess correctly.Remember this probability can be achieved by chancealone.
Think what the statement '8 out of 10' could mean.It could mean 8 out of every 10.It could mean 8 out of only one sample of 10.
a Can you think ofany other possible meanings for 8out of 10? If so, write them down.
b Look back at the answer you gave to the very firstquestion of Section AI. Do you wish to change thatanswer now?
c Describe the circumstances in which you feel youwould be prepared to accept the claim that '8 out of10 owners said their cat preferred Whiskas' as realevidence of Whiskas being the most popular catfood.
19

E4 Changing the Chance
Suppose there were five pieces ofbread with margarineon and only one with butter.
a What is the chance of identifying the piece withbutter by guesswork?
b Find the Probability (exactly 1 person right out of2) in this case. Compare this answer with the oneyou gave in DIe.
c Write down what you notice.
d Find the Probability (exactly 2 people right out of4)in this case. Compare this answer with the one yougave in D3c.
e Write down what you notice.
Suppose the experiment in Section Al involved onebowl of Whiskas and five other bowls of different catfood.
f Would you be more convinced of the advertiser'sclaim? Give reasons.
20

Schools Council Project on Statistical EducationThis Project has been based in the Department of Probability and Statistics at the Universityof Sheffield from 1975 to 1980. Its brief was: to assess the present situation of statisticaleducation in schools; to survey the needs of teachers of statistics; to devise detailed proposalsf?r the implementation of the teaching ideas; and to produce teaching materials.
Project Team
Director: Peter Holmes (1975- )Deputy Director: Neil Rubra (1975-78), Daphne Turner (1978-
Project Officers
Ramesh Kapadia (1975-79), Alan Graham (1976-77), Barbara Cox (1979-80)
General NotesPages with the prefIx R are resource pages or reference pages for pupil use. (In many casesthey are designed as worksheets.) In the pupil unit these, are referred to as 'page Rl', etc.
Permission need not be sought to reproduce copies of the R sheets provided that copies aremade only in the educational establishment in which they are to be used and that such copiesare not sold, hired or lent to any other indivdual, organization or establishment.
Sections or questions marked with an asterisk are optional to the main thrust in the unit.Sometimes they are for the more able pupils, sometimes they are for reinforcement and sometimes they consist of simpler work for the less able pupils and lead to an easier conclusionthan the main unit. In each case detailed comments on the particular purpose will be found inthe appropriate section of the teacher's notes.
Three different typefaces are used in the pupil units. Text in roman type (like this) is for pupilsto read or for the teacher to introduce. Questions to promote thought and for group or classdiscussion are printed in italics. Instructions telling pupils to do things and questions forpupils to answer are printed in bold.
Statistics in your world
FI URINGTHE FUTURE
TEACHERS' NOTES
LEVEL 4
Published for the Schools Council by
FOULSHAM EDUCATIONAL

Contents
Brief Description
Aims and Objectives
Prereqnisites
Equipment and Planning.Detailed Notes
Section ASection BSection CSection DSection E
Answers
Test QuestionsAnswers
Connections with OtherUnits in the Project
R pages on pages 8 and 9.
Page3
3
3
3
346
101012
1212
14
Brief DescriptionThe theme of the unit is to build upa statisticalpicture over the period 1965to 1977 and use a trend line to predict figures. The data used includetelevision licences, cinema attendances and admission charges, telegramsand telephones.
Design time: 4 hours (excluding optional sections)
Aims and ObjectivesAfter working through the unit, pupils should be able to plot time seriesand fit a trend line (where appropriate) by eye, passing through thebivariate mean. They should be able to interpolate and extrapolate fromthe line and interpret the results constructively, but with due caution.Pupils practise calculating means, reading tables and comparing graphs.Optional sections for brighter pupils include fitting a smooth curve by eyeto data, checkinghow good a line is by lookingat deviations, and amendingthe trend line as a result of obtaining further data.
PrerequisitesFamiliarity with decimals, millions and billions (109) is assumed.
Experience ofchoosing scales and plotting is required. It is assumed pupilscan calculate the mean of ungrouped data. The optional section ondeviations requires familiarity with negative numbers.
Equipment and PlanningGraph paper and rulers (preferably transparent) are required. Calculatorsand tracing paper may be useful.
Detailed NotesSchools Council Project on Statistical Education
Published byW. FouJsbam & Co. Ltd., Yeovil Road, Slough, Berks
© Schools Council Publications 1981
ISBN 0-572-OIIl6-4
PRINTED IN HONG KONG
Section A
This sets the scene for the unit and can be used for an opening discussion.The idea is to study changes over a period of years and to use the figures tomake predictions about future events.
You could discuss with pupils which figures are most appropriate to buildup a statistical picture oftheir lifetimes and how the relevant data might be
3

obtained, Much of the data will be found in the Annual Abstract ofStatistics or Social Trends, Other interesting topics not mentioned in theunit include sales of LP and singles records, and the number ofmotorcycleregistrations,
Section B
The figures discussed here concern television, which was a luxury 30 yearsago, Now over 95% of households have a set, and colour television isbecoming increasingly popular,
Bt
A simple method of prediction, using the mean annual increase, is given,
d Using the mean annual increase gives an estimated figure for 1975 of:
17'3 + 17'.3 - 13'6 million = 17'8 million8
e No, The licence fee is paid per household,Estimates for Great Britain, in 1971, gave 18 million households withan average household size of 3,
Notice that the licences refer to the UK and that the figures showneither the number of television owners who have no licence nor thenumber of households with more than one television set.
B2
a Pupils may need help in choosing scales for the graph, Comparison oflines used for prediction in f is easier if all pupils use the same scale,'Lines can then be traced and overlaid on a neighbour's axes,
c The points lie approximately in a straight line, and the line can beextended to allow prediction.
e Pupils use interpolation to check if the line they have drawn gives areasonable answer.
f Estimates obtained from the linear regression line give:
1975 - 18'0 million 1977 - 18'9 million 1985 - 22'4 million
Clearly pupils' results may vary considerably from these estimates, andthe variations between pupils' estimates can make useful discussionpoints on ways of improving the line, Lines can be compared by usingtracing paper.
4
B3
Pupils should be made aware that the farther they are away from knowndata when they predict, the greater is the chance of larger error,
c It is likely that a 'ceiling' will be reached, unless the number ofhouseholds continues to increase, since the number of licences islimited to the number of households,
*B4
This optional section investigates upper and lower limits on prediction,using the greatest and smallest known annual increases,
a The largest annual increase is 0'8 million (1967-1968), so the highestnumber likely in 1975 is:
17'3 + 0'8 million = 18'1 million
b Using the same annual increases, and using 1975 limits to predict 1976,and 1976 to predict 1977 gives:
1976: lowest limit 17'4 + 0'1 million =17'5 millionhighest limit 18'1 + 0'8 million =18'9 million
1977: lowest limit 17'5 + 0'1 million =17'6 millionhighest limit 18'9 + 0'8 million = 19'7 million
Notice that the range between the limits in 1975 was 0'7 million, in 1976was 1'4 million and in 1977 was 2'1 million, Clearly, the longer theperiod over which prediction is made, the greater is the range and theless reliable the prediction,
This introduces the need to update predictions every time further dataare available,
An actual value could lie outside the predicted range, This happened in1976, Using the true 1975 figure, the estimated rangefor 1976would be:
17'7 + 0'1 million to 17'7 + 0'8 million= 17'8 million to 18'5 million
In fact the actual value for 1976 was 17'7 million,
*DS
This optional section is for brighter pupils or can be done by faster workingpupils in a mixed ability situation, while others catch up. It can be omittedwithout destroying the thread of the unit.
5

Cl
This indicates that colour licences exceeded black and white in the period1976-1977.
1976 1977
Colour 8,6 9·9Black and white 9'1 8·1
Not all data approximate successfully to a straight line, and this sectiongives pupils a chance to fit smooth curves 'by eye' and to use the curves tomake predictions.
Later years give (in millions):
Section C
This section uses data from cinema attendances and admission charges,which are obviously connected, but which have also been influenced by therise in popularity of television over this period of time.
Pupils are now expected to improve their attempts to draw lines of best fitby ensuring that they pass through the bivariate mean in addition topassing as close to the other points as possible.
This explains how to calculate and plot the bivariate mean, which occurs at(1970,204'3). Pupils should be encouraged to use the same scales to allowcomparisons in the optional question h. Suggested scales are I em for I yearon the horizontalllxis and 2 em for 50 million on the vertical axis.
e It is hoped that pupils will feel intuitively that the line should passthrough the central point, since it is a point which takes every point intoaccount.
g Estimates from the least squares regression line give:
1976 - 81'5 million1977 - 61'0 million
Predictions are unlikely to be as accurate as these, of course.
'h This is for faster pupils, While the slower ones catch up. It can beomitted without destroying the thread of the unit.
C2
Price increases are often percentage increases, rather than absoluteincreases.
6
It is not, therefore, expected that a straight line increase should fit thesedata well. Pupils may comment on this fact when they try to draw the line.This is followed up in the optional C3.
b The bivariate mean is (1970, 33'8).
Estimates from the least squares regression line give:
d 1976 - 57'lp1977 - 61'OpAnswers within a reasonable range of these would be acceptable.
e The attendance line has a negative slope; the admission charges line apositive slope. An opportunity exists here to discuss the relationbetween costs and revenue and break-even points.
Possible outcomes are lower attendances~increased charges.
Lower prices would lead to higher attendances, but these are unlikely tobe sufficient to offset the effects of inflation on staff wages, etc.
f The additional data show the Iineto be even less suitable as a predictor.
Despite the steep rise in prices, the attendances have not droppeddramatically over the same period. Mention could be made of the risein average wage rates over the same period.
'C3
This is optional for those pupils who did B5, and follows on from C2.
The figures approximate quite well to an exponential curve. It is expectedthat the estimates from the curve will match more closely to the true valuesthan those obtained from the line.
'C4
This gives optional reinforcement on calculating bivariate means, andadjusting trend lines to pass through this central point.
Useful comparisons can then be made of original estimates with estimatesobtained from the new trend line.
It is possible that their original estimates may be nearerthe real figures thantheir new ones. This can be discussed. It should not be allowed to discreditvalues obtained from a line through the bivariatemean, but does illustratethe inapplicability of fitting straight lines to data which have a limitingceiling.
(Text continued after the R pages)
7

00 R1
Table 8 Deviations of cinema attendances from thetrend line drawn
Actual AttendanceYear attendance from 9raph Deviation
(millions) (millions) I
1965 327
1966 289
1967 265
1968 237
1969 215
1970 193
1971 176
1972 157
1973 134
1974 138
1975 116
0-=--. <: ... ,,,,,,,,, ~__ ..._
Table 9 Deviations and squared deviations
Year Deviation Squared deviations(millions) (millions of millions)
1965
1966
1967
1968
1969
1970
1971
1972
1973
1974
1975
Total squared deviations
© Schools Council Publications 1981
'0

E3
Estimates from the least squares regression line give:
b The centre of the time period is midway between 1969 and 1970.
c The data for telegrams fit a straight line far less well than those fortelephone calls, which may affect the accuracy of predictions.
*g New means, including 1975, 1976 and 1977 figures are:
Telegrams - 7'3 million; telephone calls - 11'3 billion
The centre of the time period is 1971.
Estimates for 1985 from the new regression line give:
Telegrams - 2'5 million, telephone calls - 20'9 billion.
j Sudden changes cannot be foreseen, yet may drastically affect futureevents, so up-to-date data must be used wherever possible.
1975 1977 1985
Telegrams (millionsl 6·0 5·3 3·7
Telephone calls (billions) 14·9 16·8 20·6
a
b
D2
Deviations given in Table 4 are those obtained from the least squaresregression line drawn in Figure 2. Pupils should not be expected tounderstand how to draw this line.
e Adding all the deviations should produce zero. Rounding errors mayaffect the total, however. Other suggestions include lookingfor the linegiving the smallest maximum absolute deviation, orthe smallest sum ofthe absolute deviations.
D1
No justification is given for this method here. It is meant as a little lightrelief to see who can produce the smallest sum ofsquares. The least squaresmethod is widely used, since if the underlying distribution is normal, theleast squares method gives the maximum likelihood estimates for theparameters of the line. The total 1328 is from the least squares regressionline, with deviations rounded to integers; it is unlikely to be bettered.
·Sectlon D
This is optional throughout. Page Rl will be required if pupils are notexpected to make copies of Tables 4 and 5.
Section E
This is mainly for reinforcement, but does include the idea of plotting twosets of data on the same axes, using different vertical axes, and optionalupdating of lines in the light of further information.
E1
a Telephones are cheaper and quicker to use, and get an instant reply.
b I Telegrams produce a written record of the message..
2 Telegrams can be read when a person arrives at the office; telephonecalls require both people to be available simultaneously.
c The GPO need information for updating equipment, training, etc.
E4
a, b Encourage pupils to think of possible ideas for the changing fortunes oftelegrams and telephones.
c Telex systems have the advantage of using the speed oftelephone lines,while giving a permanent record.
Comparable figures for telex connections are:
Year 1966 1967 1968 1969 1970 1971
Connections 17·0 19·4 22·2 25·7 29·1 32·9(millions)
E2
Telephone calls are recorded in billions. In government publications abillion is a thollsand million (109).
Year 1972 1973 1974 1975 1976 1977
Connections 37·8 43·1 49·0 54·2 59·1 64·8(millions)
10 11

E5
Pupils will not produce identical statements in their summaries. Individualinterpretation of results can provide points for discussion.
e Other possibilities include those mentioned in Section A.
Answers
Bl a 13'6 million; 17'3 million b 3'7 millionc 0'46 million or 460 thousand d About 17'8 millione See detailed notes.
B3 c See detailed notes.
*B4 a 0'8 million (1967-8); 18'1 million b See detailed notes.
Cl c 2247/11 = 204'3
C2 c 372/11 = 33'8 or 34p
Dl e 0 f See detailed notes. g See detailed notes.
E2 b Telegrams: 81'6 million/IO =8'2 millionTelephone calls: 97'7 billjonjlO =Q'~ billion
Test QuestionsTable TI shows the distance travelled in Britain, 1955-1975, by fourdifferent means of transport. The units are given as 'Billions of passengerkilometres'. A passenger-kilometre means I person travelled 1 kilometre;15 passenger-kilometres could mean 15peopleeach travelled I kilometre; 3people each travelled 5 kilometres; or I person travelled 10 kilometres andanother person travelled 5 kilometres.
1 Give two possible meanings for 18 passenger-kilometres.
Table T1 Distances travelled in Britain 1955-75(Billions of passenger-kilometres)
Method of trallsport 1955 1960 1965 1970 1975
Rail 38 40 35 36 35Bus and coach 80 71 63 56 54Air 0·3 0·8 1·7 2·0 2·2Private cars 87 144 233 306 357
2 8 By which method was travel decreasing during the 20 years?
12
b By which methods was travel increasing during the 20 years?
3 On graph paper prepare a vertical scale from 0 to 100 billion passengerkm, and a horizontal scale from 1955 to 1995.a Use + signs to plot the rail figures from Table Tl.b Draw a straight line close to the + points, showing the trend in rail
travel.c Use 0 signs to plot the bus figures from Table Tl.d Calculate the arithmetic mean of the five figures of bus travel, and
plot the central point.e Draw a trend line of bus travel passing through the central point.
Extend both the lines you have drawn as far as your scale allows.
4 8 How much travel would you expect by rail in 1980?b How much travel would you expect by bus and coach in 1980?c In which year would you expect passenger-km travelled by rail to
equal passenger-km by bus and coach? Why might this not be anaccurate answer? .
5 In 1973 private car travel was 360 billion passenger-km.Why do you think the 1975 figure was less?
6 Here is travel by two of the other methods of transport in 1973:Rail, 35; bus, and coach, 54 billion passenger-km.
Plot these points on your graph (but don't draw in new lines).8 How would this affect your answer in 48 for 1980 rail travel.b How would it affect your answer for 1980 bus travel to question 4b?c How might you change your answer to 4o?
Answers
1 Possible answers include:1 person travelled 18 km. 2 people travelled 9 km each.3 people travelled 6 km each.2 people travelled 5 km, and 1 person travelled 8 km.
2 8 Bus and coach b Private cars; Air
3 d 64'8 (65); central point (1965, 65)
4 Answers depend on graphs drawn.c About 1990 would be fair. Uncertainty is due to extrapolation.
S Petrol prices rose steeply; shortage of oil; inflation led to economies.
6 8 Rail travel would be 8 little more than at first thought (reduced rateof decline).
b Bus travel would be higher.c The date would be much later, if it ever happens.
13

Testing TestingEqualPay
Cutting it FinePhoney Figures
Tidy Tables
Sampling the CensusSmoking and Health
Leisure for Pleasure
FairPlay
Car CareersMultiplying People
Connections with Other Published Units fromthe Project
Levell
Level2
Level3
Choice or ChanceRetail Price Index
Units at Other Levels In the Same or Allied Areas of the Curriculum
Other Units at the Same Level (Level 4)
mNcO
m~
N
~'0.o 0uz
These are detailed in the following table. The code number in the left-handcolumn refers to the items spelled out in more detail in Chapter 5 ofTeaching Statistics 11-16.
An item mentioned under Statistical Prerequisites needs to be coveredbefore this unit is taught. Units which introduce this idea or technique arelisted alongside.
An item mentioned under Idea or Technique Used is not specificallyintroduced or necessarily pointed out as such in the unit. There may be oneor more specific examples of a more general concept. No previousexperience is necessary with these items before teaching the unit, but morepractice can be obtained before or afterwards by using the other units listedin the two columns alongside.
An item mentioned under Idea or Technique Introducedoccurs specificallyin the unit and, if a technique, there will be specific detailed instruction forcarrying it out. Further practice and reinforcement can be carried out byusing the other units listed alongside.
This unit is particularly relevant to: Social Sciences, General Knowledge,Mathematics, Economics, Commerce
Interconnections between Concepts and Techniques Used In theseUnits
14 15

-0-- CodeNo. Idea or Technique Introduced Also Used in
2.2j Plotting time series Car Careers Cutting it Fine Multiplying PeoplePhoney Figures Smoking and Health
3.4b Assumptions behind fitting a line
3.4c Drawing a trend Hne by eye
3.4e Conditions for best fit
5a Reading tables Leisure for Pleasure Tidy Tables Car CareersMultiplying People Phoney Figures Sampling the CensusTesting Testing Retail Price Index Smoking and HealthEqual Pay
50 Reading time series Leisure for Pleasure Car Careers Cutting it FineMultiplying People Phoney Figures
5e Comparing directly comparable data Cutting it Fine Sampling the Census Retail Price IndexSmoking and Health Equal Pay
5k Variability of estimates Car Careers
5x Comparing actual with expected values Fair Play Car Careers Choice or ChanceTesting Testing
5v Inference from tables Leisure for Pleasure Tidy Tables Car CareersCutting it Fine Multiplying People Phoney FiguresRetail Price Index Smoking and Health Equal Pay
5aa Making projections Multiplying People Sampling the Census
"~ ,~ 0> » ~ r3~ 3():S: ~ S ,,~ ~ ~roOCO::O "O~ c: 0 CO :r O'CO ~ enco~C:CO-l __ - _ _ 0 - c:-'- • ..,.-l- -. 0'-" v G) "0 ;:)' -c 0" CD -c::J::l 3" 0> CO ::l _. -5" () :r CO _. CO en O>:S: ~ CO CO COCOCO=~coo -c: O .... ::l »-~o>:r~ ~~- __ .... m ~d ::l()~o-' ~O ~=~o> -10-~.-l- v~ ~o ;:) ~ CD W;:) ~ m -'ro m -'-c ~
..am~~~'~CD-c~~~coZ<-c~::J~ro::JO.-l-~w~::J~~~·_m0-l ()c: CO ()_.7 m .... ::l~ ::lQ.-_ ....~ :r: ~ m m () ~"O ,,_ ~ 0> .... ~ ~" =: :r -< _. G) "m CO 7 -I CO 0- - co--·co ()co ::o-'mm3'0> ~o>o>-mS;:)~;:)m-o~mc@_.~~< ~3~IDCDO"W~"~c:Q.-.en::l""O-·.... ,coCOco--roo m~o>-C:::lID.-l--cCD::JCOO_;:)OCD..,~-cID::Jmc CDo_._CD-c_.<~roX~wro=CDCD~WW.-l-W<~=W W.-..XWWCDCD
o...:r1Il.....;:;:1Ilen:::l...:renen1Il:::!.1IlUl

Statistics in your world
FI URINGTHE FUTURE
Published for the Schools Council by
FOULSHAM EDUCATIONAL

In 10 years much can change. The sixties were noexception.The Beatles started a revolution in music. For the firsttime more LP records were sold than singles.
BBC2 started in the sixties, and colour was added in1968.Large finds of natural gas made this the cheapest fuel.
During the seventies unemployment rose to- over 1tmillion people.The price of a cinema ticket went up from 20p in 1966to 70p in 1976.In the seventies the pocket calculator became morepopular and more powerful but cheaper.a What changes have happened in your lifetime?In this unit you will be studying figures which showchanges over a period of years. You will be using thefigures to predict what might happen in the future.
ContentsPage
A The Swinging Sixties, the Soaring Seventies 3
B Television 4BI Licences 4B2 Predicting from a Graph 4B3 Checking Predictions 6
*B4 Estimates and their Limits 6B5 Colour v Black-and-white 7
C Improving your Line 9C1 Using the Central Point 9C2 Making Comparisons 10C3 Curve v Line 11C4 Checking Trend Lines 11
*D Deviations 12*D1 Consider Deviations 12*D2 The Least Squares Method 14
E Telecommunications 16E1 Telegrams and Telephones 16E2 More Details 16E3 Predictions 18E4 Interpreting Trends 19E5 Britain Past and Present 20
Some sections 'are marked with an asterisk*. Your teacher will tellyou whether to try these sections.R Pages Your teacher will provide these for you.
AcknowledgementThe publishers and Project team would like to thank Her Majesty'sStationery Office for granting permission to reproduce or adapt statisticsthat have appeared in Annual Abstracts.
The Schools Council Project on Statistical Education
Published byW. Foulsham & Co. Ltd., Yeovi) Road, Slough, Berks
Cartoons by Colin Whittock
© Schools Council Publications 1981
ISBN 0-572-0lDS9-3
PRINTED IN HONG KONG
,.....--..---..[SWINGING!5~
9o
The Swinging Sixties,Soaring Seventies
the
3

131
Table 1
Television
Licences
Television was invented less than fifty years ago.Nowadays most households have a television. Table 1shows the growing number of homes licensed to watchtelevision in the period 1966 to 1974.
Television licences current in the U.K. (March 31)
(Millions)
Figure 1
25 Number{millions}
The horizontalscale should run from 1966 to 1985, thevertical scale from 10-25 million. (Why not 0-25million?)The zig-zag on the vertical axis is to show that the scalestarts at 10 million and not at O.
Make sure the axes are labelled.
Axes for 'Television licences'
Year 1966 1967 1968 1969 1970 1971 1972 1973 1974
Number 13·6 14·3 15·1 15·5 15·9 16·0 16·7 17 ·1 17 ·3
20
15
132
4
(Source: AnnualAbstracts)
Remember that the figures are in millions.
a Write down how many licences were current in 1966and in 1974.
b How many more licences were current in 1974 thanin 1966?
c Use your answer to b to work out the mean numberof extra licences issued each year over this period.
d About how many licences do you think were issuedin 1975?Who might need to know?
e Do the figures in Table 1 show how many peoplewatch television?Explain your answer.
Predicting from a Graph
It is often easier to predict the future by using a graph.a Choose a suitable scale and copy Figure 1.
10
f, " ,Year
b Plot the points from Table 1 on your graph. Giveyour graph a title.
c Are the points nearly in a straight line? Unot, checkthat you have plotted them correctly.
d Use a (transparent) ruler to fmd the straight linewhich you think passes closest to most of themarked points. Some of the points should be abovethe line, others below. Draw this line in pencil.Extend your line past 1974.
e According to the line you have drawn, how manylicences were issued in 1969? It sbould be between 15and 16 million.
f Use your line to predict the number of licences in1975, 1977 and 1985.
5

Year 1967 1968 1969 1970 1971 1972 1973 1974 1975
Colour 0 0·02 0·1 0·3 0·6 1·6 3·3 5·6 7·6
Black-and- 14·3 15·1 15-4 15·6 15·4 15·1 13·8 11·7 10·1white
B3
"84
6
Checking Predictions
In fact there were 17'7 million licences in 1975 and 18'0million licences in 1977 (17'701 million in 1975 and17'994 million in 1977).
a Find the differences between your estimates in B2fand the true fi gures.
These differences are called ERRORS.
b Which estimate had the largest error?Why do you think this is so?
The graph shows that the number of licences issued hasincreased since 1966.
c Do you think that the number oflicences will go onincreasing?Give reasons and use figures to support youranswer.
Estimates and their limits
Estimates can never be exact. When estimating, it isuseful to give a range of values between which theactual value is likely to lie.Here is one method to work out the range for 1975.The smallest yearly increase in Table 1 is 0'1 million,from 1970 to 1971. It is reasonable to assume that theincrease from 1974 to 1975 will not be less. So wepredict the number of licences in 1975 will be at least17'3 + 0'1 million =17'4 million.
a In a similar way find the largest annual increase inTable 1. Use it to predict the highest number oflicences likely in 1975. Does the estimate you madefor 1975 in B2flle between these highest and lowestvalues?
B5
Table 2
b Using your answers to B4a, work out correspondinghighest and lowest estimates for 1976 and 1977.
Does the estimate you made for 1977 in B2f liebetween these values?
c Copy and complete:
If the number of current television licencescontinued to grow in the same way as ithad over theprevious nine years, I would expect there were atleast million and at the most
million licences held in 1977.
Colour v Black-and-White
It is not always possible to draw a straight line whichclosely fits the points.
Sometimes a smooth curve can be used instead. It isunlikely that any smooth curve will pass through all thepoints. Instead we look for a smooth curve whichpasses close to most of the marked points.
Here is such a case. More and more people areswitching to colour television. This is shown in Table 2.
Television licences current in the U.K. (March 31)
(Millions)
(Source:Annual Abstracts)
7
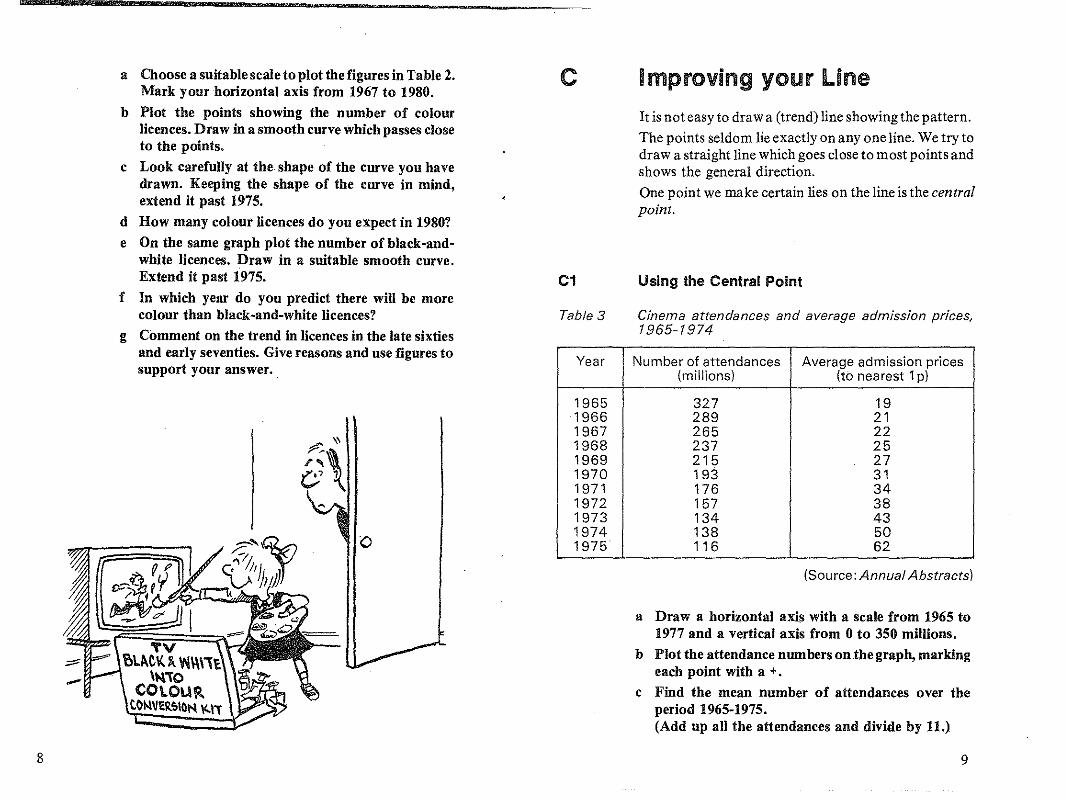
Year Number of attendances Average admission prices(millions) (to nearest 1p)
1965 327 19'1966 289 211967 265 221968 237 251969 215 271970 193 311971 176 341972 157 381973 134 431974 138 501975 116 62
8
a Choose a suitable scale to plot the figures in Table 2.Mark your horizontal axis from 1967 to 1980.
b Plot the points showing the number of colourlicences. Draw in a smooth curve which passes closeto the points.
c Look carefully at the shape of the curve you havedrawn. Keeping the shape of the curve in mind,extend it past 1975.
d How many colour licences do you expect in 1980?
e On the same graph plot the number of black-andwhite licences. Draw in a suitable smooth curve.Extend it past 1975.
f In which year do you predict there will be morecolour than black-and-white licences?
g Comment on the trend in licences in the late sixtiesand early seventies. Give reasons and use figures tosupport your answer.
~ \\.:,\c' !\
c
C1
Table 3
Improving your line
It is not easy to draw a (trend) line showing the pattern.
The points seldom lie exactly on anyone line. We try todraw a straight line which goes close to most points andshows the general direction.
One point we make certain lies on the line is the centralpoint.
Using the Central Point
Cinema attendances and average admission prices.1965-1974
(Source: AnnualAbstracts)
a Draw a horizontal axis with a scale from 1965 to1977 and a vertical axis from 0 to 350 millions.
b Plot the attendance numbers onthe graph, markingeach point with a +.
c Find the mean number of attendances over theperiod 1965-1975.(Add up all the attendances and divide by 11.)
9

The middle of the time period lies on the line through1970.
d Plot the mean number of attendances on thishalfway line.
This is called the CENTRAL POINT.
e Why should the line pass through this point?
f Now use a transparent ruler and draw in your trendline, making sure it passes through the centralpointand is as close to the other points as possible.
Some of the points wi1l1ie above the line and somebelow.
g Use your line to predict the attendances for 1976and 1977.
*h Compare your predictions with those of yourneighbours. If they are very different, compare yourtrend lines. Tracing paper may help ifyou have usedthe same scales.
The actual values were:1976 - 104 millions1977 - 103 millions
i Find the errors in your estimates.
r,
l
C3
e Look at the trend line you drew for cinemaattendance and compare it with this one. Try todraw some conclusions about the future of cinemaattendances, and make a list of possible outcomes.
The actual figures for cinema admission prices were:1976 - 73p 1977 - 83p
f Does this new information affect your answer to e?Try to answer e again, using this new information.
Curve v Line
Look again at the points you plotted for average prices.
a Do you think the points look as though they shouldlie on a straight line?
Try to draw a curve which fits the data more closely.
b Use your curve to estimate the admission chargesfor 1976 and 1977. Compare these answers with theones you obtained from the straight line, and writedown what you notice.
d Which gave the better estimates - the straight lineor the curve? Explain your answer.
C2 Making Comparisons
a Plot the average prices given in Table 3 against timein years, on a graph.
b Work out the mean admission charge and plot thecentral point.
c Draw in the trend line, making sure it passesthrough the central point.
d Extend the line and use it to predict averageadmission charges for 1976 and 1977.
10
C4 Checking Trend Lines
Look back at the lines you drew in Section B2.
a Work out the position of the central point for thosedata, and plot it on your graph.
b Does your line pass through that point? !fnot, drawa trend line through the central point and use thisline to give new estimates of the figures for 1975,1977 and 1985.
c Compare these estimates with your previous ones.Which are nearer the actual figures?
11

*0 Deviations Figure 2 Cinema attendances (in millions), 1965-1974, witha possible trend line
You can draw many lines through the central point,including a horizontal one.Why would this not be a sensible line?The best trend line is one that takes account of all thepoints fairly.One way to check this is to find the vertical distances ofindividual points from the line drawn. These distancesare called DEVIAnONS.
The deviations should be as small as possible.
350 Attendance {millions}
300
250x
*01
Table 4
Considering Deviations
Figure 2 shows the cinema attendance figures of Table3 and a possible trend line. Notice that it passesthrough the central point. Some of the deviations aremarked in. All are given in Table 4.
Deviations of cinema attendances given from thetrend line drawn
(Millions)
200
150
100
50
'" _Central point
12
1 2 3 4Actual Attendances
Year attendances from graph Deviations
1965 327 307 +201966 289 286 + 31967 265 266 -11968 237 245 - 81969 215 225 -101970 193 204 -111971 176 184 - 81972 157 163 - 61973 134 143 - 91974 138 122 +161975 . 116 102 +14
o L-1~96-5---19-6-7---1g""T6-9---1-9r71---19'73-----c19'"7-5---1:::gT::n:-Year
The deviation is the difference between the actualattendance and the attendance obtained from the trendline.Notice that if a point is above the line, it has been givena positive (+) deviation and if below a negative (-)deviation.
13

"D2
14
a Make a copy of Table 4, leaving the last twocolumns blauk, or use Table 8 on page Rl.
b Using the line you drew in Section Cl, read offvalues to complete column 3.
c Work out the deviations, and complete column 4.d How can these deviations be used to check which is
the best line?
One possible suggestion is to add al1 the deviationstogether.e What would this give for Table 4?
f What happens if you do this in your own mhle?g Can you give a reason? If so, write it down.
h Suggest other ways these deviations could be used.In each case check the effect ofthe suggestion on thefigures in Table 4 and also on your own figures.
The least Squares Method
The usual method is this. Square the deviations andfind their total.A line close to the points will have a smal1 sum.A line far from the points wil1 have a large sum.The line with the smallest value is best.
Table 5 shows the squared deviations obtained fromTable 4.
Remember the deviations are in millions (106), so thesquared deviations are in millions of millions (l012).
a Make a similar table using your deviations, orcomplete Table 9 on page Rl.
b Compare your total with that in Table 5. Which isthe smaller?
Table 5 Deviations and squared deviations
SquaredYear Deviations deviations
1965 +20 4001966 + 3 91967 - 1 11968 - 8 641969 -10 1001970 -11· 1211971 - 8 641972 - 6 361973 - 9 811974 +16 2561975 +14 196
Total 1328
c Compare your total with those of other people inthe class.What is the smallest total?Have you checked their arithmetic?Does the line that gives the smallest total seem to hea good fit?
Tables similar to 4 and 5 can be drawn for any set ofdata.
*d Repeat the process for the line you drew in SectionC2. What is the smallest total this time?
15

Ill!!
Telecommunications
E1 Telegrams and Telephones
As society advances we rely more and more oncommunications. Sometimes older methods arereplaced by new ones.
Telegrams are an example. In the fifties, business and(private) individuals sent about 25 million inlandtelegrams a year. Nowadays less than a quarter of thatnumber are sent. More people have telephones.
a Why do you think people prefer using a telephoneto sending telegrams?
b Write down one advantage of telegrams overtelephones.
c Who needs to know about the number of telephonecalls made and telegrams sent?
Table 6
Figure 3
Inland telegrams sent and telephone calls, 19651974
Year No. of inland No. of telephone(to March 31) telegrams calls
(millions) (billions)
1965 10·5 6·31966 9·8 6·91967 9·1 7·41968 8·5 7·91969 7·8 8·61970 7·9 9·61971 6·7 10·71972 6·8 12·01973 7·3 13·51974 7·2 14·8
(Source: Annual Abstracts)
Telegrams sent and telephone calls
E2 More Details
Telegramssent(millions)
Telephonecalls
(billions)
Table 6 shows the number of inland telegrams sent andtelephone calls made over the period 1965 to 1974.
Notice that the telegrams are counted in millions, butthe telephone calls are counted in billions (l billion =1000 million).
a Plot the information in Table 6 on a graph.
Both sets of figures can be plotted on the samegraph. Use two vertical axes. as shown in Figure 3.Note that the scales will need to be different. Plotthe telegrams with dots • and the telephone callswith crosses +.
16
1965 1967 1969 1971 1973 1975 1977 1979 1981
Year
b Find the mean number of telephone calls and oftelegrams sent per annum. Notice that there are 10years this time. Think carefully where the centralpoints should be in each case, and plot them.
c Draw a line of best fit for each set of figures.Use the central point to help you. Draw the line fortelegrams in one colour and that for telephone callsin another.
17

E3
Table 7
18
/ \
Predictions
a Use your line to estimate the number of telegramssent in 1975, 1977 and 1981.
b "Use your line to estimate the number of telephonecalls made in 1975, 1977 and 1981.
c WWch of these predictions do you think will be themost accurate? Give reasons.
The figures for 1975, 1976 and 1977 are shown inTable 7.
Annual number of telegrams sent and telephonecalls made, 1975-1977
Year Telegrams Telephone calis(millions) (billions)
1975 6·2 15·81976 4·2 16·11977 3·4 16·7
(Source: AnnualAbstracts)
d Find the difference between your estimates fortelegrams sent and the correct answers given inTable 7. Make sure you state the units.
E4
e Find the difference between your estimates fortelephone calls and the correct answers given inTable 7.
f Are there any surprising differences? Write downwhat surprised you most about your answers to dand e.
*g Plot the correct telegram figures for 1975, 1976 and1977 on your graph.Work out and plot a new central point for the 13years 1965-1977.Draw in a new trend line and use tWs line to find anew estimate for 1981.
*h Find the difference between tbe two estimates younow have for 1981. Which is more likely to be right?Explain your answer.
*i In a similar way find a new estimate for telephonecalls in 1981 and compare it with your previousestimate.
j Why is it necessary to use the most recent dataavailable when making estimates of fnture events?
Interpreting Trends
Look at the graph you have drawn of inland telegramsand telephone calls in the 10 years 1965-1974.
a What happened to the number of telegrams sent?Why do you tWnk this is so? Do you think the trendwill continue?
b What happened to the number of telephone calls?Why do you tWnk this is so? Do you think the trendwill continue?
c Write down any other tecbnological developmentsthat you tWnk may affect these trends, and thepossible effects on them.
19

E5 Britain Past and Present
You have studied how various figures changed in 10years. Some figures relate to private use, some toindustrial use.a Describe in a few sentences what the television
figures show about Britain.b Describe in a few sentences what the cinema figures
show about Britain.c Describe in a few sentences what the telephone
figures show about Britain.d Describe in a few sentences what the telegram
figures show about Britain.e Write down some other figures you might collect to
show statistically how Britain changed over thesame period of time.
20

Schools Council Project on Statistical EducationThis Project has been based in the Department of Probability and Statistics at the Universityof Sheffield from 1975 to 1980. Its brief was: to assess the present situation of statisticaleducation in schools; to survey the needs of teachers of statistics; to devise detailed proposalsf?f the implementation of the teaching ideas; and to produce teaching materials.
Project Team
Director: Peter Holmes (1975- )Deputy Director: Neil Rubra (1975-78), Daphne Turner (1978-
Project Officers
Ramesh Kapadia (1975-79), Alan Graham (1976-77), Barbara Cox (1979-80)
General NotesPages with the prefix R are resource pages or reference pages for pupil use. (In many casesthey are designed as worksheets.) In the pupil unit these. are referred to as 'page RI', etc.
Permission need not be sought to reproduce copies of the R sheets provided that copies aremade only in the educational establishment in which they are to be used and that such copiesare not sold, hired or lent to any other indivdual, organization or establishment.
Sections or questions marked with an asterisk are optional to the main thrust in the unit.Sometimes they are for the more able pupils, sometimes they are for reinforcement and sometimes they consist of simpler work for the less able pupils and lead to an easier conclusionthan the main unit. In each case detailed comments on the particular purpose will be found inthe appropriate section of the teacher's notes.
Three different typefaces are used in the pupil units. Text in roman type (like this) is for pupIlsto read or for the teacher to introduce. Questions to promote thought and for group or classdiscussion are printed in italics. Instructions telling pupils to do things and questions forpupils to answer are printed in bold.
Statistics in your world
TESTI GTESTING
TEACHERS' NOTES
LEVEL 4
Published for the Schools Council by
FOUlSHAM EDUCATIONAL

Contents
Brief Description
Aims and Objectives
Prerequisites
Equipment and Planuing
Detailed NotesSection ASection BSection CSection D
Answers
Test QuestionsAnswers
Connections with OtherUnits in the Project
R pages on pages 10-11
Page33
3
3
4467
8
1214
16
Brief DescriptionThe unit discusses the use of the breathalyser and mass radiography withthe use of tree diagrams, the ideas of conditional probability and theoccurrence of errors.
Design time: 4-5 hours
Aims and ObjectivesOn completion of this unit pupils should have some appreciation ofrandom selection, Type I and Type II errors, conditional probability, andhave been introduced to tl\e relationship:P(A!B) X PCB) =p(AnB).
By the end of Section B they will have practised reading a two-way table,drawing tree diagrams and looking for multiplicative connections betweenprobabilities. They will have used two-figure random number tables in asimulation, used tally marks to record results, and should be more aware ofrandom variations.
In Sections C and D pupils are made aware that the same set of data canproduce more than one tree diagram, whilst Section D gives practice incompiling a two-way table from a tree diagram in order to reinterpret thedata.
PrerequisitesIt is assumed that pupils have some familiarity with the idea of probability,especially as expected relative frequency, and that probability can beestimated from a sample relative frequency. Pupils will need to be able toexpress proportions as fractions and multiply fractions, simplifying wherenecessary.
EqUipment and PlanningSchools Council Project on Statistical Education
Published byW. Foulsham & Co. Ltd., Yeovil Road; Slough, Berks
© Schools Council Publications !981
ISBN 0-572-01 I14-8
PRINTED IN HONG KONG
Two-figure random number tables are required in B2. Generally it isexpected that pupils will work individually, but it may be helpful for themto work in pairs in B2, with one person reading the table, and the otheridentifying and recording the outcome. Class discussion of the italicizedquestions is to be encouraged. Shorthand notations for probabilities, e.g.Prob(AI B). Prob (A nB) have not been used in the pupil unit, but could beused where appropriate if desired.
3
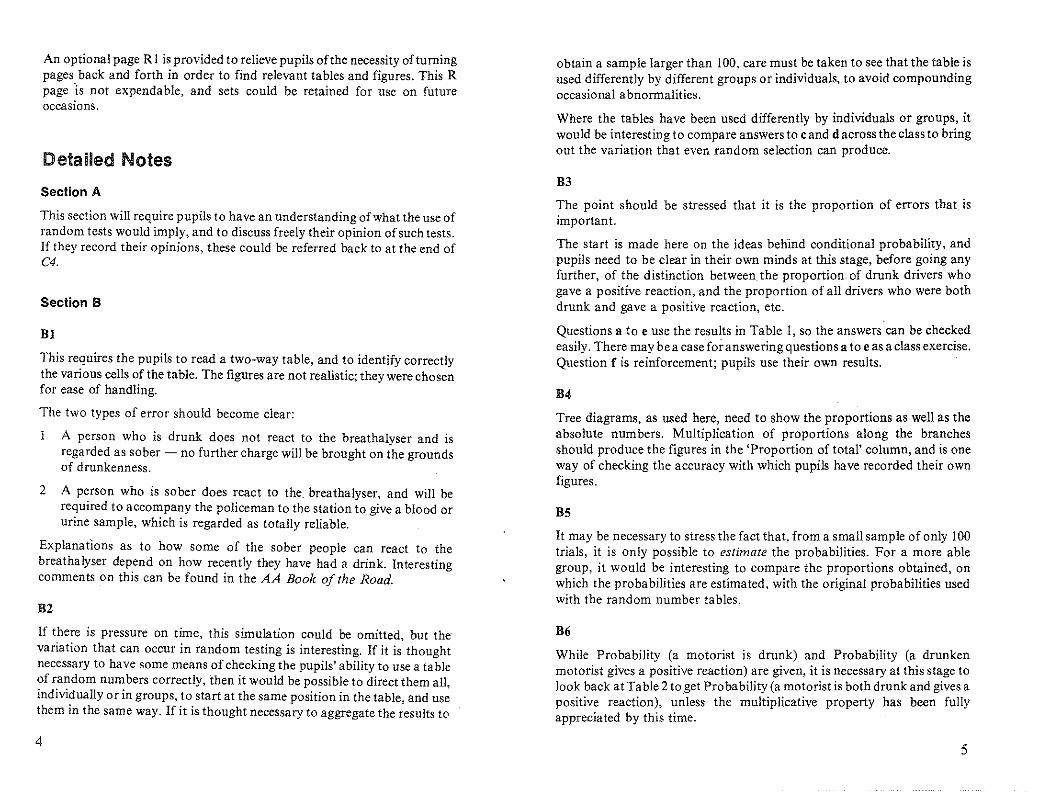
An optional page RI is provided to relieve pupils ofthe necessity oftumingpages back and forth in order to find relevant tables and figures. This Rpage 'is not expendable, and sets could be retained for use on futureoccasions.
Detailed Notes
Section A
This section will require pupils to have an understanding ofwhat the use ofrandom tests would imply, and to discuss freely their opinion ofsuch tests.If they record their opinions, these could be referred back to at the end ofC4.
Section B
BI
This requires the pupils to read a two-way table, and to identify correctlythe various cells of the table. The figures are not realistic; they were chosenfor ease of handling.
The two types of error should become clear:
A person who is drunk does not react to the breathalyser and isregarded as sober - no further charge will be brought on the groundsof drunkenness.
2 A person who is sober does react to the, breathalyser, and will berequired to accompany the policeman to the station to give a blood orurine sample, which is regarded as totally reliable.
Explanations as to how some of the sober people can react to thebreathalyser depend on how recently they have had a drink. Interestingcomments on this can be found in the AA Book of the Road.
B2
If there is pressure on time, this simulation could be omitted, but thevariation that can occur in random testing is interesting. If it is thoughtnecessary to have some means ofchecking the pupils' ability to use a tableof random numbers correctly, then it would be possible to direct them all,individually or in groups, to start at the same position in the table, and usethem in the same way. If it is thought necessary to aggregate the results to
4
obtain a sample larger than 100, care must be taken to see that the table isused differently by different groups or individuals, to avoid compoundingoccasional abnormalities.
Where the tables have been used differently by individuals or groups, itwould be interesting to compare answers to cand d across the class to bringout the variation that even random selection can produce.
B3
The point should be stressed that it is the proportion of errors that isimportant.
The start is made here on the ideas behind conditional probability, andpupils need to be clear in their own minds at this stage, before going anyfurther, of the distinction between the proportion of drunk drivers whogave a positive reaction, and the proportion of all drivers who were bothdrunk and gave a positive reaction, etc.
Questions a to e use the results in Table I, so the answers can be checkedeasily. There may be a caseforanswering questions a to e as a class exercise.Question f is reinforcement; pupils use their own results.
B4
Tree diagrams, as used here, need to show the proportions as well as theabsolute numbers. Multiplication of proportions along the branchesshould produce the figures in the 'Proportion of total' column, and is oneway of checking the accuracy with which pupils have recorded their ownfigures.
B5
It may be necessary to stress the fact that, from a small sample of only 100trials, it is only possible to estimate the probabilities. For a more ablegroup, it would be interesting to compare the proportions obtained, onwhich the probabilities are estimated, with the original probabilities usedwith the random number tables.
B6
While Probability (a motorist is drunk) and Probability (a drunkenmotorist gives a positive reaction) are given, it is necessary at this stage tolook back at Table 2 to get Probability (a motorist is both drunk and gives apositive reaction), u~less the multiplicative property has been fullyappreciated by this time.
5

Section C
C1
Here the more likely outcome of using the breathalyseris investigated. Thissection encourages pupils to read the original table in another way, andleads on to a different form of tree diagram, where the original analysis ison the basis ofpositive or negative reaction to the breathalyser. It should bemade clear to pupils that the entries in the column 'Proportion oftotal' inFigure 2 are the same as those in Figure 1, but their order of occurrence isnecessarily different.
Pupils should be made aware that if the breathalyser alone is used, thenthose drivers who give a negative reaction will be regarded as sober, and thetwigs at the end of the second branch will never be drawn.
d 'The most important error' depends on who is making the judgment. Adrunk driver may be glad to get a negative reaction, but other roadusers may not be so happy. A sober driver who gets a positive reactionis subjected to extra worry and time wasting.
e Improve the breathalyser; but this may mean it is less easy and moreexpensive to use.
C3
This could eventually be extended to include a formal introduction toBayes' theorem in the form:
P bP(+ve! sober).P(sober)
(so erl+ve) = P(+v~ sober).P(sober) + P(+vel drunk).P(drunk)
using the probabilities obtained in B6.
C4
There is an opportunity here for the effects of other probabilities on theextent of the errors to be considered. The use of 1000 people should limitthe occurrence of fractions.
C5
This is intended to be an open-ended section and one that will depend for itssuccess and effectiveness on the appreciation by the pupils of the likelyoutcomes from other ways of selecting which drivers to test. It will benecessary to consider P(drunkl another offence has been committed) andP(another offence has been committedj drunk). Theoretical values will have
6
to be assigned to these probabilities before any useful discussion can takeplace. With a less able group this may not be feasible. It is necessary topoint out to all pupils the inherent difficulties in taking a truly randomsample of all motorists. Even systematic sampling of every tenth vehicle,with the first vehicle selected by means of random selection, limits the population to those motorists who happen to be on that road at that time, andmay, if carried out strictly in accordance with instructions, lead to motoristswho commit a traffic offence not being breathalysed.
Comparison of individual answers to C4c and their first answer in A couldprove interesting,
Section D
D1
This section requires pupils to work backwards from a tree diagram to atwo-way table. It also contains a social message: that positive reaction tomass radiography does not necessarily imply the existence of tuberculosis(TB). The suggestion ofconsidering 100000 people is to make it more likelythat the proportions suggested by the probabilities will be applicable. andto ensure that no fractions occur in the table. Less able pupils may need acalculator to help with the arithmetic.
P(has TB) =10100' P(+v~has TB) =.22... P(+ve!hasn't TB) =...!..-
100 10
Positive99 99160
Has TB 1001
fOOO Negative1
100100000
Positive1
10 9900Hasn't TB
999fOOO 99900
~ 89910910
Total 100000
7

Positive Negative Total
HasTB 99 1 100Hasn't TB 9990 89910 99900
Total 10089 89911 100000
CIa 31 b 23 c 6
d8 23
f6 63
31e
31 69g
69
h23 8
j31
100 100 100
*k 8 31 8(d x j = i)31 x 100= 100
23 31 23 (e x j = k)31 x 100= 100
g A person with TB does not react (has clear photograph),A person who doesn't have TB does react (has mark on thephotograph), The first is the more serious error. Mention the effect onthe person, contact with other people, etc.
B6 a
b
e
P(drunk) x P(+v~drunk) = P(+ve and drunk)
70 10 7100 c 100 d 100
70 10 7100 x 100 = 100
P(sober) x P(+v~sober) = P(+ve and sober)
AnswersBI a 29 b 31 c Six regarded as sober
d Eight regarded as drunk - need to take further test
B3 a8
b ...2- 6d
8 63100 100
c 6'29 71,8'71 e71
B4 e29 6 6 71 8 8 71 63 63100 x 29 = 100; 100 x 71 = 100; 100 x 71 = 100
B5 a8
b8 71
d23 23
f29
71 100c
100 100e
29 100
8 71 8g 71x100=100 (axc=b)
P(+v~sober) x P(sober) = P(+ve and sober)
23 29 2329 x 100 = 100 (e x f = d)
P(+v~drunk) x P(drunk) = P(+ve and drunk)
8
*C3 B5g gives P(+v~sober) x P(sober) = P(+ve and sober)
C Ik gives P(sobe~+ve) x P(positive) = P(+ve and sober)giving P(+v~sober) x P(sober) = P(sobe~+ve) x P(Positive)
Dl e 89·911, If 10089,9990
h P(has TBI+ve reaction) = 1~689 = 0,0098 (2 sig, figs)
(Text continued after the R pages)
9

Table 1 Results of 100 tests of the breathalyser
Positive Negative Total
Drunk 23 6 29Sober 8 63 71
Total 31 69 100
R1
Figure 1 Tree diagram showing proportions obtained from Table 1 Figure 2 Tree diagram showing further results from Table 1
Number Proportion of total Number Proportion of total
Positive 23 ..zsL Drunk 23 n.23 100 23 10029 3'f
Drunk 29 Positive 31..2.R- _6_
31....L100 Negative 6 100 Sober 8100 100
269
JL31
100 100
Positive DrunkJL 8 8 669 ....L
Sober 71 100 6 1002L Negative100 71 -illL 69100
NegativeJ& Sober
II 63 100 ~§ 63 1&71 100
Total 100 Total 100
© Schools Council Publications 1981
10 11

Test Questions100 people were given a blood test, and 40 of them were found to be drunk.A breathalyser was then tested by these 100 people. 90% of the drunkpeople reacted positively, while 80% of the sober people reacted negatively.These results are to be summarized in a tree diagram.
Figure 1 Tree diagram showing outcome of 100 tests
Probability
36100
48TOO
1 Copy Figure 1. Fill in the ends of the branches and complete the columnheaded 'Probability'.
2 a Find the Probability (a driver is both drunk and reacts positively).b Find the Probability (a driver is drunk).
The Probability (a drunk driver reacts positively) is ~~.
c Write an equation involving ~~, multiplication, and you~ answers toa and b.
d Write the same equation, using probabilities instead of fractions.
3 Use the same tree diagram to fmd:a Probability (a driver is sober),b Probability (a driver is both sober and reacts positively to the test),c Probability (a sober driver reacts positively to the test).d Write an equation involving multiplication and your answers to a, b
and c.e Write the same equation, using probabilities instead of fractions.
12
4 Copy Table I and use the information from your tree diagram to complete it.
Table 1 Outcome of 100 tests
Reacts Reactspositively negativeiy Total
Drunk 36 40Sober
Total 100
5 Copy Figure 2 and use the information in Table I to complete it.
Figure 2 Testing the breathafyser
Number Probability
Drunk
Positivereaction
Sober
100
DrunkNegativereaction
Sober
Total 100
6 A driver was stopped and asked to take a breathalyser test.a What two types of error could occur?b According to Figure I, which was the most likely to occur?
Suppose 100 motorists were stopped.c How much of Figure 2 could be drawn?
13

c
e
d
3 a
Reacts Reactspositively negatively Total
Drunk 36 4 40Sober 12 48 60Total 48 52 100
4
6 a A drunk driver can have a negative reaction: he will be allowed to gofree.A sober driver can have a positive reaction: he will need to have ablood test.
b Probability (a drunk driver reacts negatively) = ~ = 110
Probability (a sober driver reacts positively) = ~~ = ~The second type of error is more likely to occur.
c All but the last two twigs at the end of the second branch.
5 Figure 2
Number Probability
36 .1.§...Drunk 100
Positive 48reaction 12
Sober 12100
100
Drunk - 4 -±-Negative 100reaction 52
SOber 4848100
Total 100
Probability (a driver is sober) = 16~0
b Probability (a driver is both sober and reacts positively to the test)12
= 100
Probability (a sober driver reacts positively to the test) = ~~
12 60 1260 x 100= 100Probability (a sober driver reacts positively to the test) x Probability(a driver is sober) = Probability (a driver is both sober and reactspositively to the test)i.e. P(sj+ve) x peS) = P (Sf\+ve)
Answers
1 Figure 7
Number Probability
Positive 36 .1.§...reaction 100
40Drunk 4 -±-Negative 100
reaction100
Positive
Soberreaction 12 12
10060
Negative 48 ~reaction 100
Total 100
2 a Probability (a driver is botb drunk and reacts positively) = 13060
b Probability (a driver is drunk) = 16~
36 40 36c 40 x 100 = 100
d Probability ( a drunk driver reacts positively) x Probability (a driveris drunk) = Probability (a driver is both drunk and reacts positively)i.e. P(L1+ ve) x P(D) = P(D 11 +ve)
14 15

Connections with Other Published Units fromthe Project x
$-0
Other Units at the Same Levei (Level 4)oS
ro $ ro.~ >
'" >- 0: ro '"Choice or Chance Figuring the Future Sampling the Census $
ro "- $
cE ii: "§ ro cERetail Price Index Smoking and Health Equal Pay 0c 'm $ 0' c
0 ~ a: w 0
Units at Other Leveis in the Same or Allied Areas of the Curriculum00 00
Being Fair To Ernie .~ .~0 0
Levell Shaking a Six 00 00 00 -00
" $ $ "C C X $
Probability Games Ifat first ... $ 0 E $ $ $ $ E0 c :'S u U -0.g ro ro$ $ oS ro
~ co cE cE coLevel2 On the Ball Fair Play 1:: u .f"
c $
~"ro "1 '" '" .g
-" :a '" "( oS .S "- :0$ $0 ro cE 0. 0.
.~ro
This unit is particularly relevant to: Social Science, Mathematics, Sciences. "6 .0 E E .0~ 2 c ro ro 2u "- 0 w w a: "-
interconnections between Concepts and Techniques Used in theseUnits .~
00
"$
$$ " X0
$ • 'c il $
These are detailed in the following table. The code number in the left-handc E 0
X W 0-0.~ X ro ro .g ~ c
.-~ co '-·0• Q) ~
column refers to the items spelled out in more detail in Chapter 5 of w Wu~ 1:: w~
ro ro " ro.:: :-S.~ >-Teaching Statistics 11-16. '" ",0
:0 -" 0'1 ttl ...... C) ..... roc C $ c LL 12 cll.Q..
'" ~.~ ro :;;: O>:;;·c:: Cii.0ro ro 0 2
ro c ...... :::l2':::l
An item mentioned under Statistical Prerequisites needs to be covered ~ ~~ J:.. 'w tt1.~ (I) 0-W wu "- (/)co::!::u.O':tu
before this unit is taught. Units which introduce this idea or technique arelisted alongside.
An item mentioned under Idea or Technique Used is not specificallyintroduced or necessarily pointed out as such in the unit. There may be one 0
-0 ~
"or more specific examples of a more general concept. No previous 2 ~ • C00 0 :'S .2
experience is necessary with these items before teaching the unit, but more $ $ 00 C 5." 0. ro • 0.~ x 00 ~ C ." .0
practice can be obtained before or afterwards by using the other units listed ~ 00$
~ ." ro "00- m 00
".2 "5 1;;
in the two columns alongside. ~$ ro
-<0 :; 0. '00 00 :0~
0 $0
~ 0>$0 ro ,::: 0.
00 ~ .0 "in )'l $ ~o.An item mentioned under Idea or Technique Introduced occurs specifically ;;; 0 :0 (f)
2 - 002' :oE.g 0.00 0 ro ro ro ro
in the unit and, if a technique, there will be specific detailed instruction for > J5 .~ >.:E ro U -0 -'" .000.~
0 o 0 - 0 ~ro $ ro 2 E
carrying it out. Further practice and reinforcement can be carried out byC
" C ~~ :; :;~
$ 0.. E 00 0.00 -0 '0 $>0 -0 ro ,g - "using the other units listed alongside. '" 0' -0' 2:-0' 0 ~
:0 0-
! $ $ - $ )'l C ~~J;: ~J: 00 '" .22
" £g; 0'$ E $ .E '" ~ $-s $ > $ e 0. C l' Ero co+;; C';:; :0 0 E '0.. o ro0-'" e 00 ro ";;;; e
0'-is
ro $ 00 roa: w ~ z~ "- w a: wo.
$ ::. 0 -0 0 $ .0-go N "! '" rouz ~ ~ ~ <n in
16 17

00
I.,..ooe Idea or Technique Introduced Also Used inNo.
1.48 Data by direct counting or measuring Shaking a Six Being Fair to Ernie Fair PlaySampling the Census Retail Price Index
2.1b Own two-way classification tables
4.1e Probability in sampling from unknown population Probability Games On the Ball Choice or Chance
4.11 Using relative frequency to estimate future Shaking a Six If at first .. On the Ballprobabilities
4.1j Assigning probabilities to events Choice or Chance
4.1k Conditional probability
4.10 Systematic counting of outcomes Probability Games Fair Play Choice or Chance
4.2d Multiplying conditional probabilities
4.2f Use of tree diagrams with probabilities
4,30 Simulation as a model Choice or Chance
4.3p Setting up a simulation If at first ... On the Ball Choice or Chance
4.3q Interpreting a simulation If at first. On the Ball Choice or Chance
5h Reading bivariate data Sampling the Census Smoking and Health
5m Two types of error in inference
5n Relative importance of the two types of error
5x Comparing actual with expected values Being Fair to Ernie Probability Games If at first ...On the BaH Fair Play Choice or ChanceFiguring the Future

Other titles in this series
Being Fair to ErnieLeisure for Pleasure
Tidy TablesWheels and Meals
Shaking a SixPractice Makes Perfect
Probability GamesIf at First ...
Authors AnonymousOn the Ball
Seeing is BelievingFair Play
Opinion MattersGetting it Right
Car CareersPhoney Figures
Net CatchCutting it Fine
Multiplying PeoplePupil Poll
Choice or ChanceSampling the Census
Testing TestingRetail Price Index
Figuring the FutureSmoking and Health
Equal Pay

Statistics in your world
TESTINTESTING
Published for the Schools Council by
FOUlSHAM EDUCATIONAL

Contents·Page
A Random Testing 3
B Looking at Errors 5BI Testing the Breathalyser 5B2 100 Random Tests 6B3 Proportions 8B4 Tree Diagrams 10B5 Estimating Probabilities 11B6 Theoretical Probabilities 12
C Other Probabilities 14CI What Does a Positive Reaction Mean? 14C2 Practice Makes Perfect - or Does it? 16
'C3 Connecting Probabilities 16'C4 Querying the Assumptiohs 16C5 Should Random Breath Tests Be Allowed? 17
D Another Example 18DI Mass Radiography 18
Some sections are marked with an asterisk*. Your teacher will tellyou whether to try these sections.R Pages Your teacher will provide these for yOll.
The Schools Council Project on Statistical Education
Published byW. Foulsham & Co. Ltd., Yeovil Road, Slough, Berks
Cartoons by Colin Whittock
@ Schools Council Publications 1981
ISBN 0-572-01087-7
PR1:-n'ED 11': HONG KONG
A Random Testing
POLICE DEMANDRANDOM BREATH TESTS!
What would be your reaction to a headline like this? Israndom testing a good idea?
Consider the following information before you make ajudgement.
At present the law allows police to breathalyse a driverof a moving car only if he is committing anotheroffence.
Random breath tests would mean the police would beallowed to take a random selection of drivers and askeach one to take the breathalyser test.
How would the police take a random selection ofdrivers?
If random breath tests were introduced, any motoristmight be stopped and tested. More guilty motoristswould be caught.
3
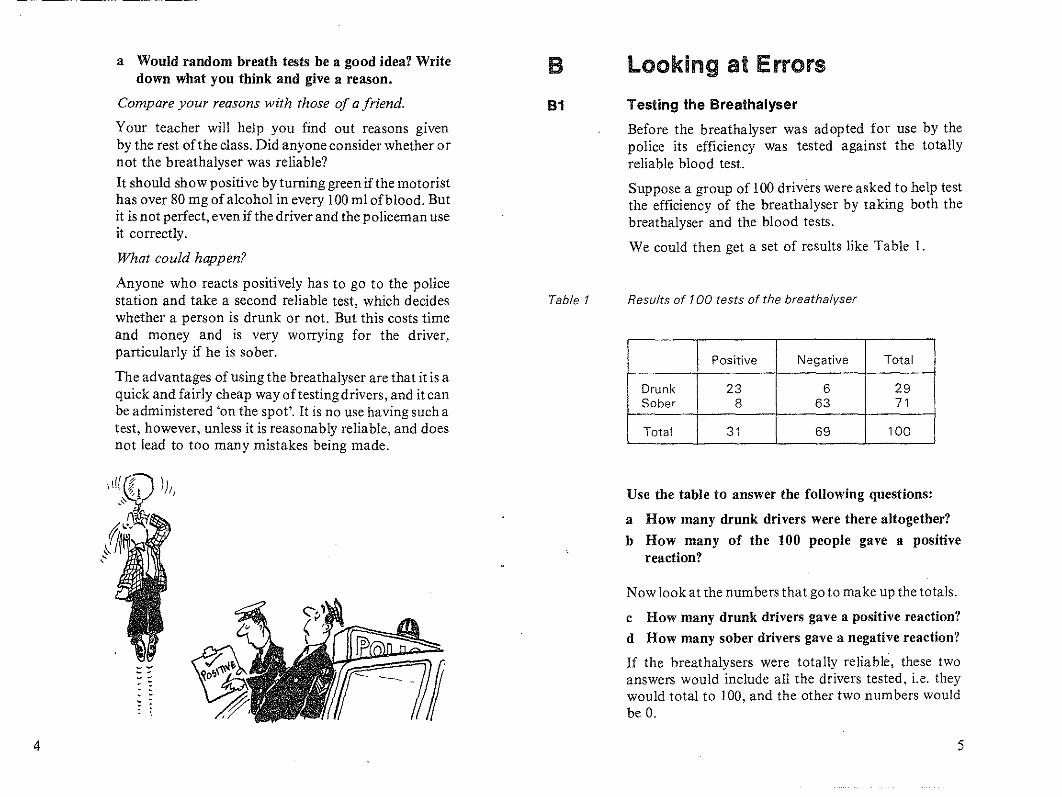
a Would random breath tests be a good idea? Writedown what you think and give a reason.
Compare your reasons with those of a friend.
Your teacher will help you find out reasons givenby the rest ofthe class. Did anyone consider whether ornot the breathalyser was reliable?
It should show positive by turning green if the motoristhas over 80 mg of alcohol in every 100 ml ofblood. Butit is not perfect, even if the driver and the policeman useit correctly.
What could happen?
Anyone who reacts positively has to go to the policestation and take a second reliable test, which decideswhether a person is drunk or not. But this costs timeand money and is very worrying for the driver,particularly if he is sober.
The advantages of using the breathalyser are that it is aquick and fairly cheap way of testing drivers, and itcanbe administered 'on the spot'. It is no use having such atest, however, unless it is reasonably reliable, and doesnot lead to too many mistakes being made.
81
Table 1
Looking at Errors
Testing the 8reathalyser
Before the breathalyser was adopted for use by thepolice its efficiency was tested against the totallyreliable blood test.
Suppose a group of 100 drivers were asked to help testthe efficiency of the breathalyser by taking both thebreathalyser and the blood tests.
We could then get a set of results like Table 1.
Results of 100 tests of the breathalyser
Positive Negative Total
Drunk 23 6 29Sober 8 63 71
Total 31 69 100
4
Use the table to answer the following questions:
a How many drunk drivers were there altogether?
b How many of the 100 people gave a positivereaction?
Now look at the numbers that goto make up the totals.
c How many drunk drivers gave a positive reaction?
d How many sober drivers gave a negative reaction?
If the breathalysers were totally reliable, these twoanswers would include all the drivers tested, i.e. theywould total to 100, and the other two numbers wouldbe O.
5
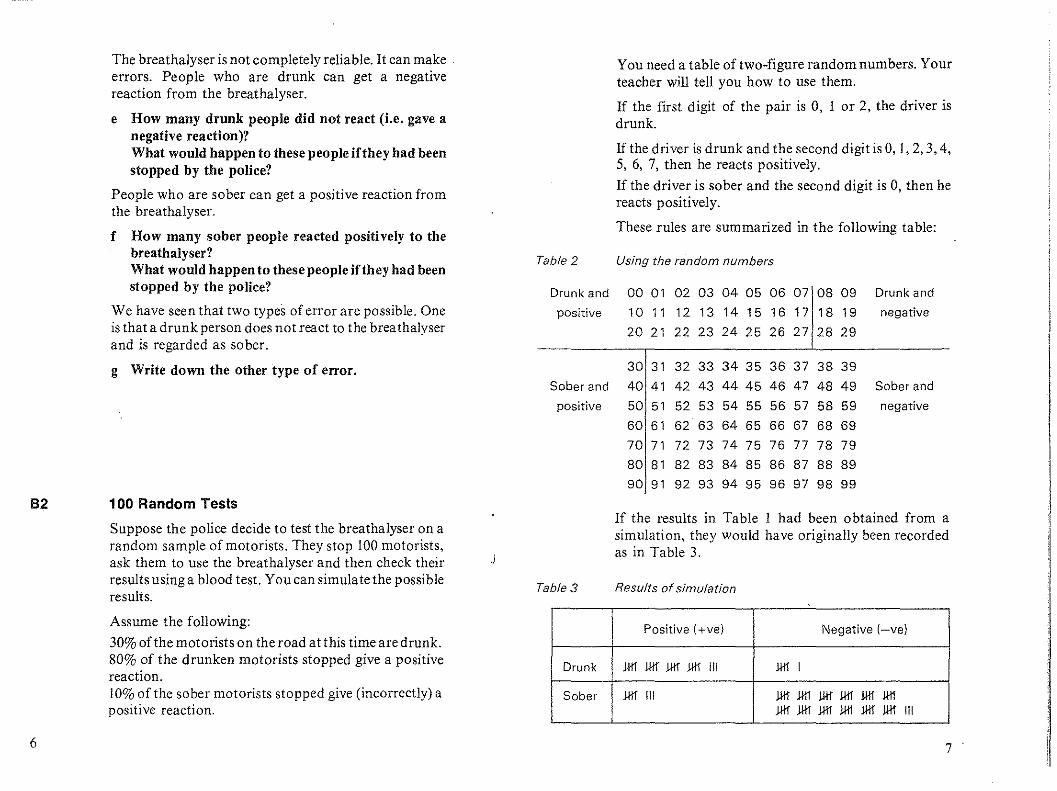
The breathalyser is not completely reliable. It can makeerrors. People who are drunk can get a negativereaction from the breathalyser.
e How many drunk people did not react (i.e. gave anegative reaction)?What would happen to these people ifthey had beenstopped by the police?
People who are sober can get a positive reaction fromthe breathalyser.
f How many sober people reacted positively to thebreathalyser?What would happen to these people ifthey had beenstopped by the police?
We have seen that two types of error are possible. Oneis that a drunk person does not react to the breathalyserand is regarded as sober.
g Write down the other type of error.
You need a table of two-figure random numbers. Yourteacher will tell you how to use them.
If the first digit of the pair is 0, I or 2, the driver isdrunk.
If the driver is drunk and the second digit is 0, 1,2,3,4,5, 6, 7, then he reacts positively.
If the driver is sober and the second digit is 0, then hereacts positively.
These rules are summarized in the following table:
Table 2 Using the random numbers
Drunk and 00 01 02 03 04 05 06 07 08 09 Drunk and
positive 10 11 12 13 14151617 18 19 negative
20 21 22 23 24 25 26 27 28 29
30 31 32 33 34 35 36 37 38 39Sober and 40 41 42 43 44 45 46 47 48 49 Sober and
positive 50 51 52 53 54 55 56 57 58 59 negative
60 61 62 63 64 65 66 67 68 6970 71 72 73 74 75 76 77 78 7980 81 82 83 84 85 86 87 88 8990 91 92 93 94 95 96 97 98 99
Positive (+ve) Negative I-ve)
Drunk JilllllflllfJ.H! III J.H!I
Sober Jill III J.H!J.H!J.H!J.H!J.H!J.H!J.H!J.H!J.H!J.H!J.H!J.H! III
82
6
100 Random Tests
Suppose the police decide to test the breathalyser on arandom sample of motorists. They stop 100 motorists,ask them to use the breathalyser and then check theirresults using a blood test. You can simulate the possibleresults.
Assume the following:
30% of the motorists on the road atthis time are drunk.80% of the drunken motorists stopped give a positivereaction.10% of the sober motorists stopped give (incorrectly) apositive reaction.
.J
Table 3
If the results in Table I had been obtained from asimulation, they would have originally been recordedas in Table 3.
Results of simulation
7

133
8
a Draw a blank table like Table 3. Read off 100 twofigure random numbers, and record your results onyour table.
b Draw a blank table like Table 1 and use it to recordthe fmal figures from your simulations.
Use your results to answer the following questions:
c How many drunk drivers were there altogether?
d How many of tbe 100 people gave a positivereaction?
e How many drunk people gave a negative reaction to.the breatbalyser?What would happen to these people if thebreathalyser alone had been used?
f How many sober people reacted positively to thebreathalyser?What would happen to these people?
g How do your results compare with the results inTable 1? Are more errors made? Write a sentence todescribe what you find.
Proportions
Much as everyone would like the breathalyserto workperfectly, it doesn't, so we have to be prepared for'unfair' results from it. Whether we collected 10 resultsor 1000 results, there could still be errors. What isimportant is the proportion of errors.
Table I shows that the proportion who were both
drunk and reacted positively is ?go'Use Table 1 to find:
a The proportion of people who were both sober andreacted positively'
b The proportion of people who were both drunk andreacted negatively.
,J
Suppose we consider only those who were drunk.There were 29 of these.
23 of these 29 gave a positive reaction.
Therefore, we say the proportion of drunk drivers who
gave a positive reaction, i.e. did react, is ~~.
Use Table 1 to answer the following:
c Of the 29 who were drunk, how many gave anegative reaction, i.e. did not react? Whatproportion of the drunk drivers is this?
d How many were sober? Of these, how many didreact? What proportion of the sober drivers didreact?
e What proportion of the sober drivers did not react?
f Now answer questions a to e using the results youobtained from your simulation.
9

Tree diagram showing proportions obtained from Table 1
Tree Diagrams
The information in Table I and the proportions wehave just found can be summarized in a tree diagram. Notice that:
B4
Figure 1
Positive2329
Drunk 2929100 Negative
629
100
Positive
JLSober 71
71100 71
Negative6371
Number
23
6
8
63
Proportion of total
23100
6100
.JL100
--"l100
In the 'Proportion of total' column we havel~O'
29 x 23 = 23100 29 100
d Look at the numbers you have put on the topbranches of your treeDo these multiply together to produce the firstanswer in your 'Proportion of total' column? Ifso,write down the mUltiplication sum and answer.
e Look at the rest of Figure 1. Does the sameconnection work for any of the other branches? Ifso, write them down.
f Look at the rest of your tree diagram. Does thesame connection work for any other of yourproportions? If so, write them down.
10
Total 100
a Make a copy of the tree diagram, but in the hoxesput the proportions obtained from your simulation.Some of these will be the answers you gave to B2f.Others you will have to work out for yourself.
b Complete the column headed 'Number' using yourfigures.
c Complete the column headed 'Proportion of total',again using your figures.
Look at the numbers in the boxes in Figure 1.
Along the top branches we have I~O and ~~.
B5 Estimating PrObabilities
If the results are collected for a large number of teststhen the proportions that are obtained will tend to thePROBABILITY that something occurs.
For example, on the basis of our evidence we canestimate the probability that the drunk driver reactspositively to the test is 23. The probability that any
29driver is both drunk and reacts positively is estimatedto be 23 .
100
Make sure you understand the difference betweenthese last two statements. Ask your teacher for help ifyou don't understand.
11

24=100
= 80 =..§...100 10
Wc say that:Probability (a motorist is drunk)
We also say that:Probability (a drunken motorist
gives a positive reaction)
Table 2 shows that, in the long run:Probability (a motorist is both drunk
and gives a positive reaction)
3 8 24But 10 x 10= 100
Using the facts that:
l~ = Probability (a motorist is drunk)
12~ = Probability (a motorist is both drunk.and gIves a posItIve reactIOn)
180 =Probability (adrunken ?,otorist .
gIVes a pOSItive reactIOn)
Use the proportions in Figure 1 to estimate:
a the probability that a sober driver reacts positivelyto the test;
b the probability that any driver is both sober andreacts positively to the test;
c the probability that a driver is sober;
d the probability that a driver is both drunk andreacts positively to the test;
e the probability that a drunk driver reacts positivelyto the test;
f the probability that a driver is drunk.
Look at your answers to a, b, and c. Two ofthe answersshould multiply together to give the third.
g Write down these fractions as a multiplication sumwith answer.
h Do the same for your answers to d, e, and f.
Repeat questions a to h using the results obtainedfrom your simulation.
86
12
Theoretical Probabilities
The figures you have used were based on a sample of100 random numbers. Proportions can only beexpected to approximate to the theoretical probabilities in the long run, which means many more than100 trials.
It would be from large numbers of trials that thepercentages used in Section H2 were obtained.
Look back at H2.
We assumed that 30% of the motorists on the road atthis time were drunk.
W · h . 3 8 24a rite t e connectIOn 10 x 10 = 100
in terms of probabilities, without using numbers.
Use the percentages given in H2 to write down:
b Probability (a motorist is sober)
c Probability (a sober motorist gives a positivereaction)
Use Table 2 to help you find:
d Probability (a motorist is sober and gives a positivereaction).
e Write down the multiplication sum that connectsthe fractions in your answers to b, c and d.
f Write the sum down in terms of probabilities,without using fractions.
13
IiI,"!!
I

Tree diagram showing further results from Table 1
Other Probabilities
Using Figure 2. estimate the following:
d Probability (a driver who gives a positive reaction issober) .
e Probability (a driver who gives a positive reaction isdrunk)
f Probability (a driver who gives a negative reactionis drunk)
g Probability (a driver who gives a negative reactionis sober)
h Probability (a driver is both drunk and gives apositive reaction)
Probability (a driver is both sober and gives apositive reaction)
j Probability (a driver gives a positive reaction)
*k Can you find a relationship between some of theanswers to d to j. If so, write it down first as amultiplication sum involving fractions and then inwords, using probabilities.
Make a copy of Figure 2, but insert the figuresobtained from your version of Table 1.
m Work out the proportions based on your figuresand insert them in the boxes.
n Use your tree diagram to find the answers to d to jfrom your simulation.
i!.fAi'S rHE SECONP'~,,, ')ONE IlIi'S c,!V£N uS if.I~
NEGrAiIVE.. .•
8100
23100
6100
63100
Proportion of towl
8
23
Number
Drunk2331
Total 100
Sober8
3i
31
Drunk
....2..~6
69~
S~~~6369
What Does a Positive Reaction Mean?
Look back at Table 1.
a How many drivers gave a positive reaction?
b Of these, how many were drunk?
c Of those who gave a negative reaction, how manywere drunk?
it is possible to draw a different tree diagram from theinformation contained in the table.
Positive31
100
Negative69100
cC1
Figure 2
100
14 15

C2
*C3
*C4
16
Practice Makes Perfect - or Does It?
When the breathalyser is administered by a policemanand the driver reacts negatively, he will not be asked togive a blood sample.
It will never be known whether he was drunk and thebreathalyser was at fault, or whether he was reallysober.
a Which of the two tree diagrams, Figure 1 or Figure2, best represents this situation?
b How much of the tree diagram would it be possibleto complete?
c Which error will be identified?
d Which is the most important error? Why?
It is obviously important to make the number oferrorsas small as possible.
e How can this best be done?
Connecting Probabilities
Look back at your answers to B5g and Clk. They havea lot in common, bnt do not say the same thing. Canyou find any connection kJetween them?
Querying the Assumptions
Do you think that the assumptions in Section B2 wererealistic? Discuss this and make other, more realisticsuggestions.
a Use these suggestions to draw and complete a treediagram like Figure 1. You may find it helpful toassume that lOOO people were tested.
b Use your new tree diagram to estimate theprobabilities required in B5.
C5 Should Random Breath Tests Be Allowed?
We have looked at possible results, assuming that thepolice are allowed to use random breath tests. We haveseen that errors can occur, that innocent people canappear to be drunk, and guilty people can appear to besober. We know that these same mistakes will occurwhenever the breathalyser is used, whether it is usedrandomly or not.
How then shall we decide whether or not to use randomtesting?
We need to consider the alternative, which we will callselective testing, as it exists at the moment.
Remember that at the present time the policeman ismore likely to pick on a drunken motorist to test than ifhe chooses whom to test strictly at random. But unlessthe driver has done something wrong, or has a light notworking, at present the policeman cannot stop him.
So there are likely to be many drunken motorists whodo not get stopped. What we need to consider is thenumber of errors that occur now and compare it withthe errors likely if random tests were used.
We also need to consider how many more drunkenmotorists would be caught if random tests wereallowed.
Which is better, random testing or selective testing?You will need to make some more assumptions anddiscuss this with your teacher before you have enoughevidence to come to any conclusion.
a Write down anything you need to know before youcan come to a decision.
b Compare answers with other members of the classand see if you can decide which is better, randomtesting or selective testing.
c Write a statement when you have decided and giveyour reasons.
17

D
D1
18
PL~RSE EMPJY'lOUR
POCKETS
(t~I I
'.:::::""- ( \
Another Example
Mass Radiography
X-ray photographs can be used to detect tuberculosis(TB). Mass X-ray is a quick and cheap method. Itallows everyone who is in the area, or working at aparticular firm, to have their chests X-rayed at a mobileX-ray unit. It takes only a few minutes and does noteven require people to undress. But it is not completelyreliable. The photographs may show a mark (positivereaction) or not (negative reaction). If a person hastuberCUlosis, there is a 99% chance that it will showpositive. If a person does not have tuberculosis, there isa 10% chance that the photograph will not be clear, andthis will be taken as a positive reaction. People showinga positive reaction are asked to come for another morereliable but more expensive test.
At present about I person in every 1000 hastuberculosis.
a Draw a tree diagram like that in Figure 1Instead of 'Drunk' write 'Has TB'.Instead of 'Sober' write 'Hasn't TB'.
b In the boxes write the appropriate probabilities,based on the information above.
Suppose 100000 people were examined.
c On your tree diagram, write the expected number ofpeople to which each branch refers.
d Draw an outline table like Table 1, labelling therows 'Has TB' and 'Hasn't TB. Use your answers toc to complete the table. Fill in the appropriate totalfigures for the rows and columns.
Use your table to find the following:
e How many gave a negative reaction? How many ofthese had tUberculosis?
f How many gave a positive reaction? How many ofthese did not have tuberculosis?
e and f indicate two errors that can be made.
g What are they? Which is the most serious error?
h Ifyou were one of the 100000 people and you had apositive reaction, what is the probability that youhave tuberculosis?
19

Statistics in your world
PR B BILITYES
Published for the Schools Council by
FOUlSHAM EDUCATIONAL

Contents
A Is it Fair?Al Odds and EvensA2 Another Look at the ResultsA3 Unbiased DiceA4 Which One Happened?A5 Likely or Unlikely?A6 Assigning Probabilities
*A7 Other Dice and SpinnersA8 Adding Two Dice
*A9 Multiplying Two Dice
B More GamesBl An Obstacle Race
*B2 American Football*B3 Coin Tennis
*C Trains and Boats and Planes
Page3346688
101011
12121414
15
A
A1
In this unit you will be playing games with dice andcoins and looking at the results.
Is it Fair?
Odds and Evens
You will need a die and page Rl.Alan and Brian are playing a game. Each player startswith nine counters. Alan chooses odds, Brian evens.They throw a die.
For the odd numbers
Some sections are marked with an asterisk*. Your teacher will tellyou whether to try these sections.R Pages Your teacher will provide these for you.
The Schools Council Project on Statistical Education
Published byW. Foulsharn & Co. Ltd., Yeovil Road, Slough, Berks
Cartoons by Colin Whittock Table 1
Alan gains I or 3 or 5 counters from Brian.
For the even numbers
D O· [J.or or 1/1 I)
C III e 1/1 (l
Brian gains 2 or 4 or 6 counters from Alan.
They go on playing until one of them runs out ofcounters.
a In how many ways can Alan gain some counters?
b In how many ways can Brian gain some counters?c Do you think this is a fair game?
Table I shows the result of a game.
Odds and Evens - Alan and Brian's game
@ Schools Council Publications 1980
ISBN 0-572-01071-0
PRINTED IN HONG KONG
The die shows 1 1 1 4 255 6 5 4 5 2 3 2 3
Counters gained by A A A B B A A B A B A BA B A
3
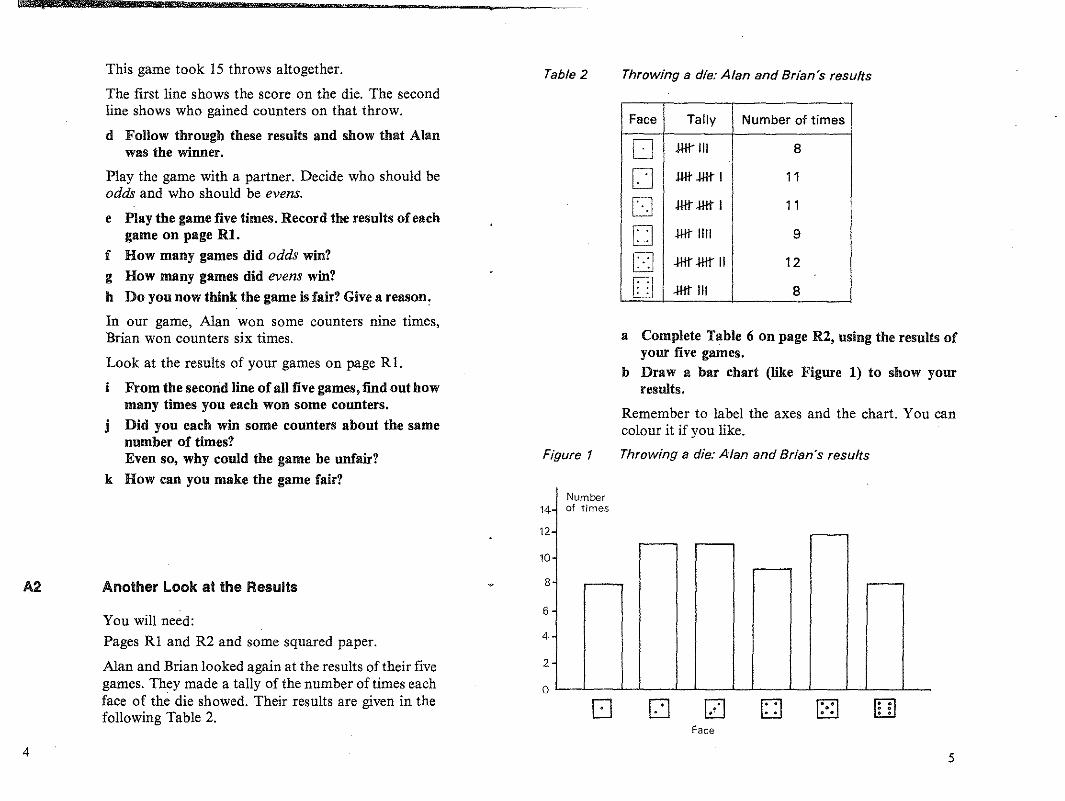
Throwing a die: Alan and Brian's results
a Complete Table 6 on page R2, using the results ofyour five games.
b Draw a bar chart (like Figure 1) to show yourresults.
Remember to label the axes and the chart. You cancolour it if you like.
Throwing a die: Alan and Brian's results
Face Tally Number of times
0 .wr III 8
D .lilt .wt I 11
0 .wt.wt I 11
D .wt 1111 9
D -Htr .wt II 12..
D.. -Htr III 8
This game took 15 throws altogether.
The first line shows the score on the die. The secondline shows who gained counters on that throw.
d Follow through these results and show that Alanwas the winner.
Play the game with a partner. Decide who should beodds and who should be evens.
e Play the game five times. Record the results ofeachgame on page Rt.
f How many games did odds win?g How many games did evens win?
h Do you now think the game is fair? Give a reason,
In our game, Alan won some counters nine times,Brian won counters six times.
Look at the results of your games on page Rl.
i From the second line of all five games, find out howmany times you each won some counters.
j Did you each win some counters about the samenumber of times?Even so, why could the game be unfair?
k How can you make the game fair?
A2 Another Look at the Results
You will need:
Pages RI and R2 and some squared paper.
Alan and Brian looked again at the results of their fivegames. They made a tally of the number of times eachface of the die showed. Their results are given in thefollowing Table 2.
4
Table 2
Figure 1
Number14 of times
12
10
8
6
4
2
0
[] o [2JFace
R~
F.'1~ [].. ...
5

Look at the heights of the bars in your bar chart.
c Are the bars all nearly the same height?d What would you think about the die if one bar was
much higher than the others?e Do the heights ofthe bars on your chart vary more
than you would expect from a normal die?
A3 Unbiased Dice
If one face ofa die turns up considerably more than anyother, we say that the die is BIASED.
A die which is not biased is fair, or UNBIASED.
An ordinary die is usually accepted as fair. At anythrow, each face has an equal chance of appearing ontop.We are as likely to get[JasDoras any otherface.
With an unbiased die on a large number of throws, wewould expect each face to appear about the samenumber of times. (Look at your bar chart).
The six faces are equally likely. We say that theprobability of gettingD is t, because it is one of sixequally likely faces.
a Copy the following sentence.
When throwing a fair die, the probability (D) =t.b Write down a similar statement for two ofthe other
five faces.
Which One Happened?
An unbiased die was thrown 60 times. The results wererecorded in a FREQUENCY TABLE. A frequency tableshows how often (frequently) a particularvalue occurs.
6
Table 3
The results are in one of the four columns of Table 3.The other three have been made up. Look at each onecarefully.
Sixty throws of a die
Frequency
Score 0) (ii) (iii) (iv)
D 10 12 11 6
D 10 14 23 4
0 10 8 7 5
CJ 10 11 8 14..
[J 10 9 1 16. .
D 10 6 10 15...
a Copy out Table 3.b Which results do you think really happened?c Why do you think the others were the made-up
results?(Drawing bar charts for each column may help youto decide.)
SIXTY THRowsOFA VIE
SCORE FREQUENCY
\TIl 60
; .:::.:: '..~',\".' ,
7

a How can wefind the probability ofgetting
0, 0'or .. ?.... ....
j Are all of your answers, from a to f, fractions?
k What words would you use to describe hand i?
If something is impossible, it has probability O. Ifsomething is certain, it has probability 1. All the otherprobabilities are between 0 and 1. We can also usedecimal numbers between 0 and 1 for probabilities.
The probability scale
These are two faces out of six equally likely faces.
So probability (getting [J' or 8) =f =t ... .. UUse a similar method to work out the probability ofgetting:b A two or a fourc Three or lessd More than four
e Less than sixf An even number
g A multiple of three
h A seven
i Six or less
Certain
•
0·9,50/50
•
ImposSible
Figure 2[I
It is possible to get each ofthe results (i), (ii), (iii), (iv) inTable 3 by throwing a die 60 times.
We cannot predict exactly what will happen. We canonly say that some results are more likely than others,or that they are more or less probable than others.
likely or Unlikely?
Here is a list of phrases used to describe probabilitiesVery likely, fifty-fifty, probable, impossible,highly improbable, certain, unlikely
a Try to put them in order, from lowest to highestprobabilities. The list is begun below:Impossible, , fifty-fifty,
, very likely,Write down some other words you use to describeprobabilities.
c Read through the statements below:1 It will snow next Christmas Day.2 You will watch television tonight.3 You will get to school on time tomorrow (or
Monday).4 You will pass a horse and cart on the way home
from school.5 You will buy a new record next month.6 You will grow to be taller than your mother.
Copy down each statement. Against it write a wordfrom the above list to describe how likely it is to betrue.
d Make up some statements of your own and decidehow likely they are.
AS
less likely more likely
AS Assigning Probabilities
Suppose we throw a die.
What decimal numbers would you use to describethe probabilities of each of the statements 1 to 6 inA5c?
8 9

"A7
Table 4
10
Other Dice and Spinners
You will need other shaped dice and spinners.
a Do some experiments to find the probabilities ofdifferent faces or sectors.
Adding Two Dice
You will need:
Two dice, nine counters and page R2.
This is a game for two players. Alan and Brian play thegame. They throw two dice and add the score shown oneach die.
If the sum is 2, 3, 4, 5, 10, 11, or 12, Alan takes onecounter from the pile. If thc sum is 6, 7, 8, or 9, Briantakes one counter from the pile.
The first player with five counters is the winner. Theresults of their game are shown in Table 4.
Alan andBrian:Results ofadding two dice game
Sum of scores 8 6 7 10 5 7 5 7
Counter won by B B B A A B A B
"A9
Check that Brian is the winner.
a Do you think it is a fair game? Give reasons for youranswer.
b Play the game 10 times. One of you is A(for Alan),the other B. Record the results of each game in thesame way as the example.
c How many games did A win?d How many games did B win?e Make a tally oftheresults ofyour 10 games in Table
7 on page R2.Give your results to your teacher.
f Combine your results with the others from yourclass. Complete Table 7.
g Which sum happened most often? Which sumhappened least often?(There may be more than one answer to eachquestion.)
h Do you now think the game is fair? Give a reason.
*i Design a fair game for adding two dice.
Multiplying Two Dice
You will need two dice and nine counters.
This is a variation of the last game. Throw two dice,and multiply the scores shown on each die.
For a score of less than 13, A takes one counter fromthe pile. For a score of more than 18, B takes onecounter from the pile.
The first player to have five counters wins the game.
a Who do you think is more likely to win the game?
b Play the game a few times and try to decide whetherit is fair.
11

An Obstacle Race
IbUse two dice
-G~i~-;"U;;;-or
7
"Use two dice--G-et;S~;;~f-
2 or 3
Start
The first pair of obstacles
To get past an obstacle, you must follow theinstructions in the box.
If you choose la, you must throw two dice. When youget a sum of 2 or 3, you cim move on to the nextobstacle.If you choose 1b, you must throw two dice. You canmove to the next obstacle when you throw a sum of7.
Look at the class results ofthrowing two dice in Table 7on page R2.
a How many times was the sum equal to 2?b How many times was the sum equal to 3?c How many times was the sum equal to 2 or 3?
d How many times was the sum equal to 7?e Which obstacle would you choose to begin the race?
The complete obstacle course is shown in Figure 3.Each competitor chooses one obstacle from each pairto make four obstacles altogether.
f Do some experiments to help you to choose theeasier obstacles.
Select a partner, decide upon your routes, and thenrace to see who wins. At each turn, follow theinstructions in the box. If you are successful, move onto the next obstacle, otherwise try again on your nextturn. Good Luck!
Figure 4
4bUse one coin
-Oeta1-lead"--
48Use two dice
-(ref;s~mof -more thana
.•. '
The first pair of obstacles is shown again in Figure 4.
You will need two dice, two coins and page R2.
Every year class lZ at Wombleside School invents agame of chance. This year they have designed anobstacle race. To make it more exciting, the obstaclescome in pairs. Each competitor chooses one from eachpair.
Competitors are allowed to practise. This helps themchoose their route more skilfully. The obstacles mustbe tackled in the correct order.
The obstacle race
More Games
"Use two dice--Getasumo*(
2 or 3
IbUse two dice
-Getasumor~
7
Figure 3
B
B1
1213

,a' • Goal I
"82
Figure 5
A •
American Football
You will need a die and a counter.
Figure 5 represents a football pitch, with the ball in thecentre.
Pitch for American football game
• B
Throw a die. If the score is 5 or 6, A 'kicks' the balltowards E, 5 or 6 spaces. If the score is 1, 2, 3 or 4, B'kicks' the ball towards A, 1, 2, 3 or 4 spaces.
a Play the game 16 times, using a marker for the ball.Make a note ofthe winner of each game. Give yourresults to your teacher.
Combine your results with the others from your classwho played this game.
b How many times did A win?c How many times did B win?
d Is it a fair game? Give reasons for your answer.
*e
Figure 6
Two services are allowed. H or TH give a good service;TT gives a double fault, and B wins the point.
If the service is good, B tosses a coin.If the outcome is heads, it is a good stroke; if tails, thepoint is lost.
This continues until the point is lost. Playa series ofrallies, scoring as in tennis.
a Is it a fair game? If not, who has an advantage?b To make the game more realistic, try different
chance methods (e.g. dice or spinners) to decidewhether a serve or return is good.
Trains and Boats and PlanesYou will need some coloured pencils. If you do nothave any, you could use different shadings.
John has a picture of a boat with two sails.
John's boat
"a3 Coin Tennis
You will need two coins.
This game is based on tennis but uses coins. There aretwo players, A and B. Each has a coin.
A serves by tossing a coin. If the outcome is heads H,the service is good; if tails T, there is a fault.
14
He has three different colours. He wants to use all threecolours, so he decides to use a different colourfor eachpart.
15

Figure 7
16
a How many different ways can John colour the twosails?
b How many different ways can he colour the wholeboat?
c Compare your answers with those of a friend.
John found a fourth different coloured pencil hidden inhis case. So he can use any three of the four colouredpencils.
d How many ways can he now colour the two sails?e How many different ways can he now colour the
boat?
Lynn has a picture of a train, which has three carriagesand an engine.
Lynn's train
Lynn only has two coloured pencils. She will have tocolour some parts, or even the whole train, the samecolour.
f How many different ways can she colour the engineand IlI"st carriage?
g How many different ways can she colour the wholetrain?
Remember that each part can be shaded with only onecolour.
h Compare your answers with those of a friend.Make up some examples of _your own, for example,aeroplanes, houses, flags. Start with four or fewerparts.i Can you see any pattern in your results?