Conceptualization and Usability Evaluation - Archive ouverte ...

Loughborough UniversityInstitutional Repository
Usability of geographicinformation: currentchallenges and future
directions
This item was submitted to Loughborough University’s Institutional Repositoryby the/an author.
Citation: BROWN, M. ... et al, 2013. Usability of geographic informa-tion: current challenges and future directions. Applied Ergonomics, 44 (6),pp.855–865.
Additional Information:
• This is the author’s version of a work that was accepted for publication inApplied Ergonomics. Changes resulting from the publishing process, suchas peer review, editing, corrections, structural formatting, and other qual-ity control mechanisms may not be reflected in this document. Changesmay have been made to this work since it was submitted for publication. Adefinitive version is available at: http://dx.doi.org/10.1016/j.apergo.2012.10.013
Metadata Record: https://dspace.lboro.ac.uk/2134/10355
Version: Accepted for publication
Publisher: c© Elsevier
Please cite the published version.

This item was submitted to Loughborough’s Institutional Repository (https://dspace.lboro.ac.uk/) by the author and is made available under the
following Creative Commons Licence conditions.
For the full text of this licence, please go to: http://creativecommons.org/licenses/by-nc-nd/2.5/
Usability of Geographic Information Page 1
1
(NOTE: This is the accepted version (final draft post-refereeing) of the peer-reviewed paper made available through the Loughborough University Repository. While the general content of this paper is very similar to that of the publisher’s version, it is highly recommended that the reader reads and cites the publisher’s version).
Usability of Geographic Information; Current Challenges and Future Directions
Brown M.1,2, Sharples S.2, Harding J.3, Parker C. J.4, Bearman N.5, Maguire M.4, Forrest D.6, Haklay M.7 and Jackson M.8.
1 Horizon Digital Economy Research, University of Nottingham, Innovation Park, Nottingham, NG7
2TU, UK
2Human Factors Research Group, Faculty of Engineering, University of Nottingham, University Park Nottingham, NG7 2RD, UK
3Ordnance Survey, Adanac Drive, Southampton, SO16 0AS, UK
4 Loughborough Design School, Loughborough University, Loughborough, LE11 3TU, UK
5 School of Environmental Sciences, University of East Anglia, Norwich, NR4 7TJ, UK
6 School of Geographical and Earth Sciences, University of Glasgow, Glasgow, G12 8QQ, UK
7Department of Civil, Environment and Geomatic Engineering, Faculty of Engineering Sciences, University College London, Gower Street, London, WC1E 6BT, UK
8Centre for Geospatial Sciences, Faculty of Engineering, University Park Nottingham, NG7 2RD, UK
Brown M., Sharples S., Harding J., Parker C. J., Bearman N., Maguire M., Forrest D., Haklay M. & Jackson M. 2012, “Usability of Geographic Information; Current Challenges and Future Directions”, Applied Ergonomics, [In Press].
ABSTRACT: The use of Geographic Information or GI, has grown rapidly in recent years. Previous research has identified the importance of usability and user centred design in enabling the proliferation and exploitation of GI. However, the design and development of usable GI is not simply a matter of applying the tried and tested usability methods that have been developed for software and web design. Dealing with data and specifically GI brings with it a number of issues that change the way usability and user centred design can be applied. This paper describes the outcomes of a workshop held in March 2010 exploring the core issues relating to GI usability. The workshop brought together an international group of twenty experts in both human factors and GI, from a wide range of academic and industrial backgrounds. These experts considered three key issues, the stakeholders in GI, key challenges applying usability to GI and the usability methods that can be successfully applied to GI. The result of this workshop was to identify some areas for future research, such as the production of meaningful metadata and the implications of blurring of the line between data producers and data consumers.
KEYWORDS: Data Usability, GIS, GI, VGI, User

Usability of Geographic Information Page 2
2
1 Introduction
1.1 Background
Digital geographic datasets and software systems to work with the data were first developed in the 1950s and 1960s for primarily military and government uses. Meanwhile while more commercial applications of Geographic Information Systems (GIS) were developed from the late 1960s (Haklay and Skarlatidou, 2010). Until the accessibility of data via the internet, and the availability of more consumer focused applications, geographic data was mainly used by small, highly trained groups of experts who manipulated and transformed data using specialist software for specific purposes. Many initiatives, including internet mapping, user-generated data, the UK’s data.gov.uk site and OS OpenDataTM have made a large number of data sets freely available to all, extending the diversity of data users in terms of skills, background and experience. As a consequence of this it can no longer be assumed that data will be used only by expert users or viewed via a specific GI application or tool. When GI applications were used primarily by expert users, the principal focus was on the power of the analysis and the granularity of the underlying data. Users could be assumed to have undergone training or a learning period with a specific GI tool, and also to have a background (e.g. geography) that meant that they understood specialist terminology. Additionally, they were familiar with constructs such as ontologies that are commonly used in GI – essentially the users, developers and data providers all belonged to the same relatively homogenous group. A consequence of this was that there was little focus on design principles, either with the interface used to manipulate data or the underlying data sets. With the increased accessibility of GI applications the relative importance of attention to design principles is increased. The range of geographic data in use today is increasing. A few examples of GI applications to emerge in recent years are:
Viewing of map images on PCs or Smartphones via the internet or by download, for example; Google Maps, Bing® Maps, OS OpenDataTM, OS getamapTM, and OpenStreetMap.
Data built for more interaction or analytical purposes, such as network based data used to support navigation in and out of vehicles. For example, data used within TomTom® or Garmin® navigation systems.
Detailed large scales geographic information used, for example for urban planning purposes and evaluation of environmental impact.
1.2 The Usability of Geographic Information
Many studies have examined the way in which such data should be presented to the user (Haklay and Skarlatidou, 2010). However, this paper considers a change in focus from the usability of the presentation interfaces for Geographic Information (GI) to the usability of the data itself. Harding et al. (2009) articulated this as a fundamental element of realising the value of GI. Whilst a user may not pay attention or even be aware of the different ways in which a geographic data set is designed or organised, the decisions that are made by data producers at the data creation level will have a fundamental influence on the overall user experience. Therefore, this paper argues that that in addition to application of user centred design principles to the interfaces used for GI data applications, there is a key role for user centred design principles when applied to the design of GI data.
In terms of Usability, it can be defined as referring to the “extent to which a product can be used by specified users to achieve specified goals with effectiveness, efficiency and satisfaction in a specified context of use” (ISO 9241-11, 1998). This definition is accepted by many in the field of ergonomics and human factors, but is challenging when it comes to the consideration of GI. Firstly, the definition assumes that there will be a specified and thus (by implication known user) a goal and context of use. In fact, the designer of GI, who is responsible for organising and structuring data sets and associated attributes, may only have a broad knowledge of who the types of user groups are likely to be. Additionally they may not know what the users’ specific goal or context of use may be. An example of this may be that the same data set may be used by a council officer with some GIS expertise, or a non-expert viewer examining the flood risk associated with their home. These two people may be

Usability of Geographic Information Page 3
3
using the same data set, but have different goals and be viewing that data set using different applications. The data set could be. For example, a database containing a set of data points, lines and polygons that cover the geographical area of interest. Each data entry could also include attributes that provide more detail about the data – for example, a data line that is a road centre line might include attributes such as the road classification (A road, B road etc.), road surface, road name and geographic co-ordinates. The interface for the council officer might be a dedicated GIS tool such as ArcGIS® that allows the officer to view a map of the data, choose the way in which data are represented, select different ‘layers’ of data to be viewed (an example of a layer might be ‘inland water’ or ‘spot heights’ – selection of a layer decides whether or not these layers are seen by the user and thus the complexity of the image viewed by the user), edit and analyse the data. The interface for the home owner might be a web service such the UK Environment AgencyTM’s Flood Map, that may draw on the same source databases but has more tightly defined viewing and analysis options.
The goals of effectiveness, efficiency and satisfaction remain important to GI, with each aspect affecting fitness for purpose and overall user experience. Well-designed GI will allow a user to complete their task effectively (e.g. make the correct decision with regards to a planning application), efficiently (e.g. in a timely manner, without making too many errors) and with satisfaction (e.g. the data format should not be frustrating to use, the user guide should be easy to understand for example); embodying the fundamentals of human factors usability. The role of the ergonomics and human factors community is critical here to ensure that existing knowledge from other domains is transferred. Domains of relevance, where users are interacting with information but the design of the information as well as the way in which it is represented is important, might include process control or intelligent infrastructure within maintenance systems (e.g. Dadashi et al., in press).
In response to these challenges, a community is forming, primarily in the UK but with international partners, to identify the specific challenges and requirements associated with usability of GI. Four workshops with this aim have now been conducted, supported by Ordnance Survey®1 and organised together with the University of Nottingham and University College London. The first workshop brought the community of researchers interested in the challenge of GI usability together and identified some initial challenges faced in GI design (Harding et al., 2009). This paper presents the output from the second workshop that was held in March 2010 where a structured discussion and card sorting activity, building on those challenges identified in the first workshop, was held focusing on identifying GI usability challenges, stakeholders and methods applicable to GI usability evaluation. The data from these activities are presented, and the issues highlighted in each of the key areas identified are then discussed in further detail with reference to current literature.
It is worth noting that throughout this paper the term Geographic Information (GI) will be used to refer to any set of data containing geographic components. In many domains a clear distinction is made between data and information, for example Hayes (1993) defines data as real world facts that are processed by users to become information. However in Geographic Information Science) a subtly different differentiation is made. Geographic data can be defined as the raw co-ordinates and geometry that are collected by a surveyor; GI refers to these underlying data and the associated attributes that adds meaning to the data. According to Hayes, both of these would constitute data, but to avoid confusions these terms will be used as defined by the field of Geographic Information Science.
Additionally, throughout this paper a number of issues emerge that relate to existing concepts and debates within Human Factors; in particular issues associated with data complexity, automation, context of use and consistency/transfer. These will be considered more fully in the section 4, where links are made between these existing concepts and the potential which human factors offers in informing the design of future GI systems.
1 The national mapping agency of Great Britain, which provides a range of geographic information products for use by government, business and individuals

Usability of Geographic Information Page 4
4
2 Method
2.1 Participants
The day long workshop was attended by 20 delegates with an active interest in the usability of geographic information from various different perspectives. Of these participants seven work with GI in an industrial setting and thirteen academics working with GI, usability or both. Overall, the level of experience of the delegates relating to GI and/or usability ranged from three to thirty years with the majority of participants based in the United Kingdom. The workshop call for participation emphasised that the focus of the workshop was on the usability of GI itself, rather than the usability of system interfaces.
2.2 Procedure
Participants were asked in advance of attending the workshop to consider the following questions:
1. Who do you consider are key stakeholders in GI usability? 2. What do you consider are the three main usability challenges for geographic information or
data? 3. What methods could be used to evaluate GI usability?
At the workshop, participants were asked to write responses to the above questions on labelled cards.
For question 2, each participant verbally presented their three challenges written on the cards and placed them in turn on a table in the centre of the room. As each participant added their challenges to the set they were asked to place them close to similar challenges in order to form thematic groups, in conjunction with the session facilitator, so that grouping headings/categories emerged. Once this process was complete and all challenges had been added, these groupings were reviewed, amended and agreed by all participants.
A similar process was performed for questions 1 and 3, with broad groupings of the stakeholder types and of evaluation methods applicable to geographic data usability being identified before being confirmed by discussion after the meeting. The document describing groupings was then circulated to all workshop participants after the workshop for confirmation or amendment.
3 Results
The results are in three main sections. Firstly, the key stakeholders in GI use, design and development are identified. Next the specific usability challenges for GI as emerging from the workshop are described. Finally, the identified methods that have potential to be used to design usable GI are briefly presented.
3.1 Key Stakeholders in GI design, development and use
This topic was explored in order to understand who the users of GI will be, and what their potentially different abilities, tasks and requirements might comprise of. Three broad groupings of stakeholders have been identified as GI end users, developers and data producers. We will also talk about the importance of user generated data and how this trend changes the relationships between traditional stakeholders.
3.1.1 GI end users
This stakeholder group refers to the end users of GI products. These groups encompass the wider spectrum of GI including the creators and users of internet based map mashups (combination, visualisation, and aggregation of data) and users of GI which has been created by potentially untrained volunteers (Goodchild, 2007b; Haklay et al., 2008) . The GI end user groups identified during the workshop were:

Usability of Geographic Information Page 5
5
Public and community groups (e.g. rambling associations, cyclists, environmental action groups)
Government (e.g. town planners, refuse collection co-ordinators) Commercial Companies (e.g. insurance sector) Education (e.g. schools, universities).
3.1.2 Developers
The second stakeholder group refers to a range of different organisations that develop both GI and the systems with which it is used. Data developers (e.g. Satellite navigation system developers) have an important role in enhancing and translating GI for specific uses. It is also important to consider those that design and develop the software systems (e.g. GIS, navigation applications) into which GI will be loaded.
3.1.3 Data producers
The final stakeholder group referred to in this paper is comprised of those who actually produce GI in the first instance (e.g. Ordnance Survey, Google®). Such organisations can be in the public, private, or volunteer sector, and create the data for others to enhance, transform and use. The process of data creation will normally include data collection (e.g. conducting the geographic survey) and data collation (transforming the collected data into am appropriate database form).
Professional data providers often have a need to recover costs of production or generate further revenue from the data that is produced. It is important to realise that this revenue may be from sale of the data itself, or may be from products that are derived from the source data (e.g. generalised maps, satellite navigation applications etc.) or through services generated through attracting users to the data source (e.g. through advertising). Depending on the country, there may also be a governmental responsibility for a particular producer to ensure that their coverage meets specified levels of completeness or detail. Recent years have seen a rise in not for profit and non-professional data providers (Goodchild, 2007b). As discussed throughout this paper there are also a growing number of non-professional data producers that are not held to such restrictions.
3.1.4 User-generated geographic content and its stakeholders
The relatively recent emergence of Volunteered Geographic Information (VGI) and non-expert users of geographic tools has blurred the boundaries between data producers, developers and consumers. VGI (or crowd-sourced data) can be described as GI that has been collected outside of the professional context, either for personal or public use, but always shared with the wider community. It is becoming increasingly used and is changing the landscape of GI, and associated usability issues. In addition, VGI and user-generated geographic data that is mined, is increasingly being used to populate GI sources.
In the domain of education, a distinction can be drawn between those who use VGI to achieve their goals and those who research VGI. Predominantly, research into VGI has been conducted within the US, UK and Germany in the fields of Computer Science (University of Heidelberg, 2010), Geography (Goodchild, 2007b), Geographic Information Science (Du et al., 2011; Haklay et al., 2010; Jackson et al., 2010) and Human Factors (Parker et al., 2011). Looking at uses in education, VGI products such as OpenStreetMap have been considered as a tool to help engage interactivity in the classroom between students and geography (Zentai, 2007). Despite this consideration and possibly due to its novelty and the relative low usability of its platforms (e.g. OpenRouteFinder - University of Heidelberg, 2010) there is limited evidence to support the notion of VGI being currently used in such a way. However, Tsou and Yanow (2010) commented that along with web-mapping technology, wireless mobile-mapping, desktop visualisation and crowd-sourcing, VGI offers great potential for emphasising spatial literacy, qualitative reasoning and in the general education of GIS.
Coote and Rackham (2008) propose that VGI stakeholders can be divided into four categories: consumers, special interest groups, local communities and professionals. These categories, as

Usability of Geographic Information Page 6
6
described below, have been shown to be useful in understanding the relationship between VGI stakeholders, and more importantly, in understanding how each user group perceives the VGI data differently and how this may relate to their activities, relationships and outlook on the world (Parker et al., 2010).
Consumers. Focused on the completeness of the GI relative to their requirements. While they are less reliant on high accuracy information to conduct their activities, if the datasets do not contain sufficient attributes then the consumer may switch to an alternative product which does offer them.
Special Interest Groups (SIGs). Predominantly volunteer GI relative to their interest, and thus see any parts which do not fit their requirements as opportunities for development and challenges. In producing this information, they aim for their information to be used in map mash-ups (where mash-ups are combinations of different data sources) by others.
Local Communities. Have positive change in their community at the heart of their activities. Consequently, as with consumers, they are willing to use information sets for only as long as their accuracy, completeness and usability allow for their message to be effectively communicated.
Professionals. Seek both the ability to mash-up the information with other sources and for that information to have sufficient detail within an appropriate tolerance to successfully produce products of value. Unlike special interest groups, professionals are concerned with the data validity and how inaccuracies may hurt their business position.
Importantly, the categorisation of Coote and Rackham (2008) is complimentary to the outcomes of the workshop this paper is based upon. Here, professionals may be seen as either creators of developers, LCs creators or users, SIGs as creators or developers, or Consumers as users. Although the various stakeholders of GI may have common factors of interest, their positional bias and purpose of use for GI means they may perceive the same piece of information differently. This has important implications for understanding usability of GI. For example if GI is intended for use internationally it must use terms that will have the same meaning for all users (and developers and producers), or at least explain technical terms sufficiently to correct for possible differences in how they are understood/interpreted.
3.2 Specific Usability challenges for GI data
The following core themes emerged as usability challenges for GI usability:
New Directions of GI use Data Metadata User needs and control Standardisation and Interoperability
Figure 1 (below) shows these five key issues and their constituent elements that were identified during the card sorting exercise conducted during the expert user workshop. The comments and views of workshop participants are described in further detail in the following sections.

Usability of Geographic Information Page 7
7
Figure 1. Usability issues associated with GI as identified at workshop
3.2.1 New directions of GI use
The use of GI has changed dramatically in the past decade and continues to do so; in particular users themselves are being encouraged to ‘crowd-source’ to gather data. These changes present a number of challenges for the design of GI. An increasingly important consideration is data ease of access and use within an increasingly connected and linked online environment (Hunter et al., 2003). However, recent examples of data use have demonstrated that perhaps a determinant of data selection is data accessibility rather than underlying data quality (Goodchild, 2008). The tools available to manipulate data, their compatibility and consistency with other development toolkits can therefore be important factors impacting GI use.
As VGI is a relatively new concept (Goodchild, 2007a), it is currently difficult to fully understand its scope and role in society. In an effort to bound the role of VGI in the modern technical landscape a plethora of terminology has been formed by its researchers, creating what Crampton (2008) described as an ‘interestingly messy’ thesaurus of phrases describing its application. Rather than be caught up in this trend for generating new buzz words, it is worth remembering that the data being discussed here is very much GI, regardless of its volunteer or professional source. Haklay et.al. (2008) commented that despite all the advances in GIS, nothing is actually new; just online and interactive. A prime example of what we now term VGI was put forward by Goodchild (2007b) in the form of the Christmas Bird Count, starting in 1900 (Butcher, 1990), 36 years before Alan Turing’s conceptualisation of the algorithm and computation (Gray, 1999).
What may be considered new is the distribution and ease of access of GI tools (Ewert and Hollenhorst, 1989). Here the greatest tool in the armoury of VGI application is the mashup; described as “new services built from the code and functions of two or more different, sometimes disparate, projects” (Miller, 2006). A good example of this is HousingMaps (2008) which displays property listings from Craigslist on the online Google MapsTM allowing prospective buyers to search properties not just by type but by their geographic location. It may be comfortably assumed that in some form, almost every user of the internet will come into contact with a mashup on a regular basis. However, this too is not a new concept, as can be seen in one of the most famous historical examples, the Cholera Map of Dr John Snow (1854). Similar to the generation of a modern mashup, Snow took an existing street map and overlaid numerous data sets of deaths linked to cholera to demonstrate the

Usability of Geographic Information Page 8
8
geographic link between death rates and the Broad Street pump water source. Another relatively new trend in GI that was identified during the workshop was that of 3D data (the representation of geographic objects with 3D geometry and attributes, however this issue was not explored in depth and lies outside the scope of this paper.
3.2.2 Data quality, language, quantity and detail
There are a number of aspects relating to the data itself that need specific consideration within the realm of usability. First, the interrelated components of data models (e.g. entities or objects and their relationships representing aspects of the real world), specification and actual data content are key in terms of for what purpose and how the user might be able to use the data. In essence geographic information datasets are representations of the real world, made up of these components. The data model governs how the content in the dataset is structured, which in turn affects efficiency of use for a user’s particular goal. For instance the efficiency of running a particular query on a dataset will be affected by the way the dataset is structured and indexed. This issue has parallels within the field of human computer interaction where previous work has for example examined the impact of system delay on user experience (Sears, Jacko and Borella, 1997).Here, it was identified that there is a negative impact of long system delay on user experience.
At the heart of GI data sets there are usually classifications of real world objects or features (e.g. buildings, roads, water bodies etc.) and types of attributes that are associated with these objects (e.g. building use, road driving restrictions). Exactly how real world features are classified and the terminology used in the classification is a major factor in their usability. For example, the congruence of the label or classification with a user’s own understanding of that object or feature is key. This can be related to the concept of a user mental model. It has been demonstrated in contexts such as process control that if a system represents data in a form that is consistent with the user’s underlying understanding of the way in which the system operates then the operator’s actions are likely to be more efficient and less error prone (Carroll and Olson, 1987). Key to this representation in the context of GI is the way in which the data are classified – so the list of different data types will be directly influenced by the classification assigned at the stage of GI data design.
Symbols such as in cartography or on road signage offer an opportunity to overcome limitations or ambiguities in language. But if we are considering either the potential for display of GI on small screen interfaces or even in text based devices, or the use of consistent terms within aspects of GI such as metadata, there remains a need to describe geographical attributes of data using words. From a technical and practical point of view, the terminology used needs, as far as possible, to indicate a mutually exclusive and exhaustive non-ambiguous data classification that is intuitive both to trained GI users and those who have not had formal training. Within the context of conventional design the use of metaphors to enable non-expert users to understand terminology is common (e.g. file, cut, paste) but there is a different challenge in the context of GI – there is no need for a metaphor as the attribute or object being described is a real thing. However, the challenge is often in selecting the appropriate descriptive term for a known object – for example, should something be described as a ‘road’ or a ‘street’? The use of consistent terminology is critical to the effective use of GI data, but is not necessarily intuitive, and may impose high cognitive load if specific terms are not easily accessible for the user.
Relating to data specification and content, data quality is a further important factor affecting data usability. Commonly broken down into: positional accuracy, attribute accuracy, currency, completeness, logical consistency and lineage (Devillers and Jeansoulin, 2006; ISO/DIS 19157, 2006), the quality of a geographic dataset can have significant implications for the dataset’s fitness for purpose. In addition, communicating information about a dataset’s data quality in a meaningful way to users is itself an area with usability issues. This has analogies with the issues of user trust in technology in general, and data in particular. Muir & Moray (1996) have demonstrated the strong positive relationship between trust in automation and automation use stating “operators used automation they trusted and rejected automation they distrusted”. This is likely to apply in the context of GI data –in this case the perceived quality of the data is likely to have an impact on the

Usability of Geographic Information Page 9
9
extent to which it is trusted. One specific indicator of data quality may be a clear statement of the source of the data. This may be explicit, such as in the name of the data file, or implicit, such as a specific font or style being associated with a particular data provider. This indicator of provenance may influence user trust in the data and their resultant use of the data though research suggests that such influence may be less than previously thought (Idris et al., 2011).
The issues mentioned in 3.2.1 are also important here. If using a professionally produced dataset it is reasonable to expect that coverage will be relatively consistent over a defined area. Such assurances cannot be assumed with data sources such as VGI which very much depends on volunteers being interested in providing information for a specific area and there is no guarantee that all areas will generate interest. This lack of completeness may not be apparent in the dataset. As recently as 2008, half of the town of Helensburgh in Scotland was shown in very great detail on OpenStreetMap, but the other half appeared as open countryside. A user unfamiliar with the area could only assume the town was less extensive than is actually the case (OSM, 2011).
Discussion and research on positional data quality has tended to focus on quantitative aspects of absolute accuracy, but datasets can include data that are a matter of interpretation and degrees of uncertainty. For example, in a geological survey, the interface between two rock types may be seen very clearly and measured precisely where there is an outcrop. Secondly it may also be confidently inferred from certain topographic features in other areas, even if not directly visible, or thirdly it may be an interpretation of a geologist elsewhere. While it may be possible to capture these differences as quality attributes of the boundary data, the interpreted parts may vary in quality depending on the experience of the geologist and other conditions.
Beyond the usability of a single dataset, the user experience may also be affected by the dataset interoperability. Here, the degree to which different data models, specifications and content classifications are interoperable can give rise to usability issues; difficulties caused by differences in language and semantics used, for example. Indeed there can be a lack of consistency in the way in which data are labelled within a GI dataset, as well as between datasets.
Finally, the sheer volume of data within datasets can cause usability issues in certain use contexts. For example user efficiency may be hampered by processing data given the constraints of their application, or the fact that only certain elements of a dataset are of actual use but are inseparable from quantities of other data that are not required. Understanding different user groups’ needs for types of information and levels of detail is the key to addressing this problem.
3.2.3 Metadata
Another important aspect of data quality is metadata (supporting data that helps to understand the quality, source and accuracy of GI). An example of metadata might be a statement of time, date and method with which a data point was surveyed. Metadata has been an issue of debate in both research and practice of GIS since the early 1990s (Guptill, 2011). As datasets started to multiply in size and in use, there was a need to provide a greater level of cataloguing information for dataset search and enabling user assessment of fitness for purpose. This need is partially due to the fact that GIS analysis usually utilise multiple sources of information, usually provided by different organisations. For example, a GIS will often be used to combine background mapping data from one source with task specific data sets (e.g. land registry entries, population densities, postcode information) from other sources. In addition, the GI analysis is influenced by properties of the datasets, which are not apparent only by analysing the data content itself. For example, without explicit metadata it is difficult to determine at what level of precision the data was captured. Ultimately, this issue means that a user may have difficulties ascertaining how fit for purpose the data are for a specific task.
Standards have been developed for metadata, for example by the Federal Geographic Data Committee in the US, and by the International Organisation of Standards (ISO 19115, 2003). These standards are agreed, but not universally complied with. However, one of the major problems with GI is not the lack of standards, but that despite the creation of standards and the integration of metadata tools
Usability of Geographic Information Page 10
10
within popular software packages, the uptake and recording of metadata by data producers tends to be low. This may be because this aspect of data collection is not seen as part of the main goal of the task. There are analogies to this in other types of work tasks – for example, it has been noted in safety-critical contexts, such as railway maintenance, that operatives place an emphasis on performing the primary aspects of the task safely and in a timely manner. In many cases they will complete the paperwork associated with the task (where the paperwork is analogous to the secondary aspect of the task) either sometime after task completion, or in some cases even in advance of the task, thus reducing the value of the information for analytical purposes (Ryan, personal communication).
While many users claim to know about the value of metadata when they are looking for information, they tend not to produce it for the information that they are creating (Batcheller, 2007). There are therefore three ways of addressing this. The first is to make the production of metadata part of the primary task (particularly from a temporal perspective, ensuring that metadata is collected at the same time as primary data). An example of where this happens already is in the cockpit checklist run through by pilots – as the different elements of the pre-flight check are completed they are recorded (normally by the co-pilot) as the task is completed, rather than before or after task completion. A second approach is to automate the process of metadata generation; this is happening in a number of ubiquitous computing applications (e.g. when a person sends a tweet the number of times their tweet is forwarded (re-tweeted) or selected as a favourite is recorded automatically). Finally, an approach could be to increasingly demonstrate the value of the metadata to the user to encourage behaviour change. Theories such as the Theory of Planned Behaviour (Ajzen, 1991) have already demonstrated the role of value in influencing behaviour and behaviour change; however changing the perceived value of an activity can be a long-term and challenging process.
Part of the issue with metadata, in the production of GI, is integration of the creation of metadata with the data producer’s task. This is usually an additional job that is required at the end of a process, when the producer wants to move to another task, and they may not at that point understand the value of good quality detailed and consistent metadata to eventual users (such as capture date and methods of capture). Frequently metadata has to be manually input rather than automatically generated which also has workload and time implications.
Another challenge with metadata is that this information is usually provided at the data file level, rather than at the feature or object level within the dataset. It does not provide the granularity of knowing when a specific part of the data file was updated. This issue is especially important with heterogeneous sources of GI, such as the emerging information from crowd-sourcing activities. In these cases information needs to be provided at the object level with an assessment of the quality of the information so users can decide if it is fit for their use.
While professional bodies such as National Mapping Organisations use standardised metadata in their datasets, VGI systems such as OpenStreetMap utilise a less structured system where contributors may associate points with some standardised metadata, or their own free form descriptions. While some propose that Linus’s Law2 should result in volunteer generated sources of data with levels of accuracy and quality equal to that of professional sources (Haklay et al., 2010; Hall, 2007; Mummidi and Krumm, 2008), it appears that due to the high level of technical skill required to make corrective edits, actions to make alterations stay within a development core. Thus, the potentially powerful mechanism for error correction never achieves its full potential (Dawson, 2010; Fildes, 2011; Goodchild, 2008). While making direct links to other crowd-sourced projects such as Wikipedia is initially tempting, key differences exist. This is most notable in how Wikipedia is a repository of the crowd’s collective knowledge, whereas VGI datasets are a repository of crowd measurements and opinions. While vocal calls for the greater involvement of professionals in enhancing the content of Wikipedia may be found (Keen, 2007), further research is needed to understand the impact of
2 “Given a large enough beta-tester and co-developer base, almost every problem will be characterized quickly and the fix will be obvious to someone” (Raymond, 1999)

Usability of Geographic Information Page 11
11
involving professional cartographers within VGI projects.
Finally, there is perhaps a temptation to specify metadata requirements that capture as much information as possible. It is important that GI designers consider what constitutes critical or relevant metadata, and specify data collection frameworks to emphasise the collection of these particularly important elements. This process may be done through ordering metadata elements in order of importance to users or likely level of interest among them. This situation does present a paradox however: to know what is critical, a designer should have knowledge about the user, task and context; yet different metadata may afford or offer the potential for GI to be used by new and perhaps unexpected or opportune users, tasks and contexts.
Therefore, the issues associated with metadata can be identified as creating a virtuous cycle in which potential users find metadata meaningful, and by making metadata easier to record, ensure that the metadata are in fact recorded.
Figure 2. Suggested relationship between metadata recording, user motivation and perceived GI product quality
Figure 2 attempts to represent the relationship between these issues in a diagram. It hypothesises that there is a cyclical relationship between metadata recording and perceived quality of GI. By making the process of recording metadata easier, data producers may be more motivated to compile metadata in an accurate and complete manner. This motivation can take the form of having intuitive attribute classifications, appropriate levels of detail in metadata requested, clear indications of information required in metadata, and automated support for metadata collection where possible. By demonstrating the potential value to users of having better metadata within a product, producers may be encouraged to therefore complete metadata more effectively. It is acknowledged that this is perhaps a rose-tinted view of user and producer motivation and behaviour (Malhotra and Galletta, 2003), but at the very least provides a basis for understanding at which points in GI design the developers should focus on if they wish to encourage the complete collection and use of metadata. It also points towards the potential value of greater automation of data capture. As it becomes easier to capture (some) metadata simultaneously (e.g. with GPS and wireless internet) the system could provide certain aspects such as automatically recording the make and model of device, and the mode of operation.
3.2.4 User needs and control
A distinction needs to be made between the characteristics of GI expert users and lay-users. GI experts will be familiar with downloading datasets, manipulating them in their own packages, understanding the technical terminology, and appreciating the uncertainties of specific datasets. This should not underestimate the complexity of some GI elements such as complex vector geometry types that present a steep learning curve for most users. However the basic understanding of GIS concepts that experts have will mean that they require less introductory support and much more in depth support and information. Non expert users however will have more basic needs as discussed below.

Usability of Geographic Information Page 12
12
Non-expert GI users are a relatively heterogeneous group. Among this group there will be diversity of user experience and expertise and they will not necessarily have GI training. There are a number of problems that lay-users will tend to face when using geographic data. These include:
Lack of context: the user may be unaware of the amount of data required to meet their goal, and can be in danger of selecting a dataset that is too limited to provide the contextual information they need. Therefore appropriately labelling and describing data is critical to ensuring user goals are met.
Lack of control: in order to ‘protect’ the user from complexities of the data the extent to which they are able to edit or manipulate the data is often restricted – this is similar to a new irony of automation highlighted by Sharples (2009).
Understanding the significance of data: If, for example, a series of maps shows population movement into a region over time the uninformed user may not know whether these changes are significantly different from other regions or the rest of the country as a whole.
3.2.5 Standardisation and Interoperability
Standardisation in general is a key challenge for GI design. For example, in the discussion of metadata, one potential element that may facilitate appropriate upload of metadata was identified as clear and easy to use intuitive standardised categories.
In data production, standardisation can be applied at a very fine grained level and therefore imply that survey and data capture procedures are standardised. This level of standardisation would mean that there is an inherent commonality in the underlying survey techniques and their application such that the potential detail captured has a common specification (coverage, resolution, currency, etc.) and that this is at a common level of precision and accuracy, with metadata likewise standardised. Standardisation can also be applied to the data model into which data are captured, or can simply mean that at the scale of presentation, any cartographic generalisation adopted and the symbolisation adopted for visualisation is common.
Incompatible standards (in for example data specification or file format) are often cited as problems when using GI and a significant portion of any GI project is taken up with obtaining the data and converting it into a suitable format for the program being used. Effective standardisation would reduce the time taken importing and converting data and allow more time to be spent on the project itself rather than preparation of the data. It is generally accepted that geographic data needs to be in specified formats, to enable programs to open and save data, and data to be shared between different people, from the level of one user emailing files to another user to multiple users accessing the same data set across an internal network or the external Internet. If there are standard conversion processes for moving between different formats then this is achievable. However if there are not standard conversion processes, as is often the case at the moment, the conversion between different formats can alter the data and result in inconsistencies which is a particular problem if different people use different conversion methods while working on the same project.
There are a number of Open Geospatial Consortium (OGC, 2011a), and International Standards Organisation (ISO) standards relating to geographic information but often these have not been used widely and other standards have become common, such as Word, Shape File and KML (Harding et al., 2009). While some of these have been adopted as an official standard by OGC / ISO (OGC, 2011b), others were originally proprietary (ESRI, 1998; Microsoft, 2008) but made openly available after pressure from the user community. These 'standards' are the ones that frequently are adopted, even if they are not official standards.
An area of debate in this field relates to the inherent tension between standardisation and progress. Standards tend to emphasise conservatism – it takes time to get to a stage where standards are recognised as being needed and then more time to establish the standards and implement them. In the fast moving technological context of geo data collection, analysis and presentation the technology and associated methodologies and uses of data have moved on by the time the standards have been

Usability of Geographic Information Page 13
13
adopted. This situation leaves us with the challenge of developing a balance between implementing stringent standards – improving productivity, usability and aiding communication, and moving beyond those standards to allow for progress in both technology and theory.
Interoperability, on the other hand, refers to a more typical situation where data capture techniques and processes may be variable and the data formats may vary but where “standardisation” is achieved in the sense that the data held in one format can be converted into the other format such that all of the data can then be operated on by the same software.
3.3 Methods / Approaches to design Usable GI
In order to address the challenges to make GI more usable a number of methods may be applied to inform and evaluate development. However, there is a need to either adapt these methods or consider particular factors before their application. These methods are outlined below (Table 1) with reference to literature with further information. Specific considerations associated with the methods’ use in GI are described.
Table 1. Methods of creating usable GI
Method Brief Description Considerations for GI
Stakeholder Analysis (Taylor, 1990)
Stakeholders are grouped and described in order to identify key characteristics that could influence design.
GI products tend to have a huge range of potential stakeholders. In order to allow for this it is necessary to either group stakeholders into large loosely defined groups (reducing the specificity of findings) or dedicate a large amount of time/resources to ensure all stakeholders are allowed for. In addition, how these stakeholders interact with the GI is heavily influenced by the various interfaces and translators that these stakeholders use to view and interact with it. Therefore information on interface and translator use should be analysed for each group.
User surveys and questionnaires (Robson, 2011)
Whether in paper-based or electronic form, questionnaires and surveys offer a method to discover what people think and feel about a particular issue, existing product or service.
If questions are about specific aspects of GI, respondents may struggle to distinguish the characteristics of the GI, from the interface used to present it. Therefore, questions should be phased carefully to ensure responses are specific to the GI itself. It is also best practice to collect information about which interface and/or translators respondents use with the GI, as either could heavy influence even the most carefully worded questions.
User interviews (Macaulay, 1996)
Interviews are conducted talking to the user, either face-to-face or on the telephone.
Similarly to User Surveys and Questionnaires, Interview responses can be heavily influenced by both interface/GI confusion and the effects of using different translators and interfaces. Providing examples of GI products is a good stimulus for more detailed feedback. This can be particularly valuable in establishing user needs and preferences if considering filtering of GI for non-expert users.

Usability of Geographic Information Page 14
14
Focus groups (Krueger and Casey, 2009)
Focus groups offer a method of gathering information from a group of people in an open discussion on how they think and feel about a particular issue, product or service.
The variety of stakeholders and subsequent variability of experiences they bring to the group can be an issue when applying this method to GI. Participants can be invited to bring examples of GI products they currently find useful and/or could be enhanced, in order to set a common ground for discussion. Level of technical competence should be considered when identifying participants for focus groups, if it is too varied in a single group users may become left out or bored by the discussions that emerge.
Observation (Preece et al., 1994)
Watching what actually takes place when users interact with a system and recording events that are considered to be of importance.
When analysing observation data it is important to consider to what extent the users interactions are influenced by the GIS rather than the GI itself. Shortcuts and workarounds developed to deal with issues grounded in the GIS could completely change the way users interact with the GI being investigated.
Task Analysis (Kirwan and Ainsworth, 1992)
Task analysis involves learning about users' goals, what they want to do with a system and how they work with it. It also allows learning about specific tasks users must perform to meet those goals and what steps they take to accomplish them.
Again the complex interaction between GI, GIS and translators must be considered when applying this method. This complexity means that even very similar goals are often completed using very different processes, thus limiting the generalizability of any findings.
Personas (Cooper, 2004)
A persona is a fictional person who represents a major user group for the GI product. Several personas may be developed from other user methods to represent a range of user or stakeholder types.
Personas help identify major user groups when working with GI, but you must ensure they accurately represent the range of possible interface and translation solutions users may be working with.
Scenarios (Rosson and Carroll, 2002)
Scenarios are “informal narrative descriptions” (Rosson and Carroll, 2002) describing human activities or tasks. They capture user behaviour, experiences, and implicitly their needs, in a way that can be easily understood as a way to help formulate requirements.
Scenarios can be used with walkthroughs of a task to develop each scenario further to clarify user needs in a useful way prior to developing a rapid prototype of a GI product. This method is particularly useful for identifying and reporting non-expert use of GI or opportunities for mash-ups that may have implications for data detail or compatibility.
Card Sort Card sorting is a way to involve users in grouping
In terms of GI this method is especially useful for organising data layers and attribution
Usability of Geographic Information Page 15
15
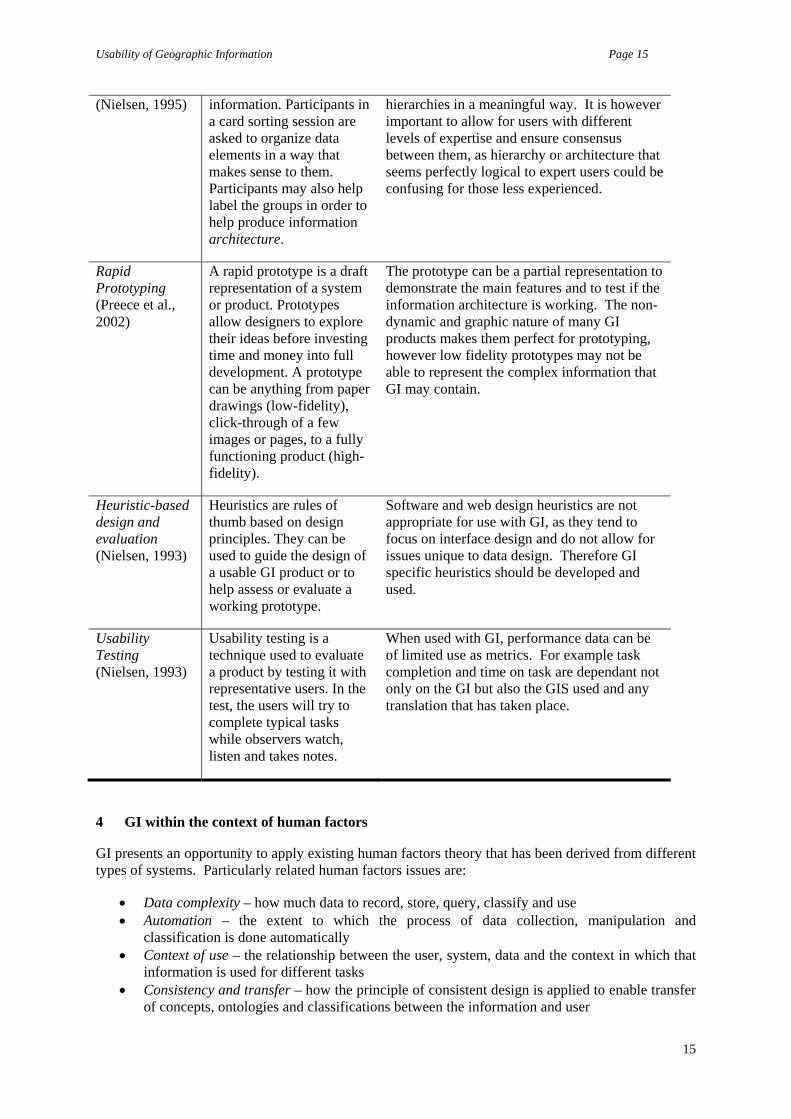
(Nielsen, 1995) information. Participants in a card sorting session are asked to organize data elements in a way that makes sense to them. Participants may also help label the groups in order to help produce information architecture.
hierarchies in a meaningful way. It is however important to allow for users with different levels of expertise and ensure consensus between them, as hierarchy or architecture that seems perfectly logical to expert users could be confusing for those less experienced.
Rapid Prototyping (Preece et al., 2002)
A rapid prototype is a draft representation of a system or product. Prototypes allow designers to explore their ideas before investing time and money into full development. A prototype can be anything from paper drawings (low-fidelity), click-through of a few images or pages, to a fully functioning product (high-fidelity).
The prototype can be a partial representation to demonstrate the main features and to test if the information architecture is working. The non-dynamic and graphic nature of many GI products makes them perfect for prototyping, however low fidelity prototypes may not be able to represent the complex information that GI may contain.
Heuristic-based design and evaluation (Nielsen, 1993)
Heuristics are rules of thumb based on design principles. They can be used to guide the design of a usable GI product or to help assess or evaluate a working prototype.
Software and web design heuristics are not appropriate for use with GI, as they tend to focus on interface design and do not allow for issues unique to data design. Therefore GI specific heuristics should be developed and used.
Usability Testing (Nielsen, 1993)
Usability testing is a technique used to evaluate a product by testing it with representative users. In the test, the users will try to complete typical tasks while observers watch, listen and takes notes.
When used with GI, performance data can be of limited use as metrics. For example task completion and time on task are dependant not only on the GI but also the GIS used and any translation that has taken place.
4 GI within the context of human factors
GI presents an opportunity to apply existing human factors theory that has been derived from different types of systems. Particularly related human factors issues are:
Data complexity – how much data to record, store, query, classify and use Automation – the extent to which the process of data collection, manipulation and
classification is done automatically Context of use – the relationship between the user, system, data and the context in which that
information is used for different tasks Consistency and transfer – how the principle of consistent design is applied to enable transfer
of concepts, ontologies and classifications between the information and user
Usability of Geographic Information Page 16
16
Advanced techniques in collecting geographic data have led to an increase in the complexity and granularity of data sets. This, along with increased opportunities for application of multiple classifications to individual and groups of data points can rapidly lead to vast data sets which need to somehow be managed and used by a user or set of users. Within human factors it has been acknowledged that people develop adaptive strategies to cope with complexity (Woods and Cook, 2002). The design of information has the potential to either facilitate or disable the ability of an individual to develop such strategies and cope with the complexity that is encountered. Indeed, Flemish et al. (2008) state “the science of human factors has to be continuously developed such that it can help to handle the technological complexity without adding new complexity” (Flemisch et al., 2008). The data presented in this paper does however appear to suggest that the problem of managing complexity in large GI data sets is likely to increase; confounded by the desirability to use such data on small screen devices.
Automation is an interesting concept when applied to GI, as it is probably the element that has most enabled the user group of GI to extend from expert users to those less familiar with GI concepts. However, in traditional contexts in which automation has been studied - such as process (Bainbridge, 2007) and transport control (Sharples, 2009) - the emphasis has been on changing the way in which a user either interacts with technology or in which data are presented to support decision making and strategy selection (Parasuraman et al., 2000). However, in the case of GI the automation is primarily focussed on data processing and conversion; what needs to be further understood is whether the introduction of this automation, which results in the protection of the user, in fact reduces the quality of the mental model of that user. This is similar to the new irony of automation proposed by Sharples (2009) where it is suggested that “the need for the user to choose to seek to actively understand how the automation works in order to fully reap its benefits, despite the aim of that automation potentially being to actually conceal the complexity of its workings”.
Context of use has been seen as an important aspect of human factors for many years (Maguire, 2001), but this is not the case when we look at the history of GI. Assumed commonalities such as levels of expertise, software, hardware and display types, between the development and use contexts for GI meant that for many years context of use was in the main, not considered. Recent years have brought about many challenges to this assumption though the explosion in GI users and uses (Harding et al., 2009). Bevan and MacLeod’s (1994) fundamental work on Usability in Context has highlighted the importance of understanding context of use as a precursor to understanding the usability of any system. Initial work exploring GI context of use (Brown et al., 2011) and the findings presented above suggest that context of use is a complex issue within GI, as software and translation context must be considered in addition to the traditional aspects such as physical, technical and social environment.
Finally, the principle of consistency to support positive transfer between systems, and the need to distinguish between different functions or operations is highlighted. O’Hara et al. (2008) described the role of consistency in soft controls; stating that operators may well commit slips by incorrectly operating the wrong control if two interfaces look alike. This can be reversed if we wish to encourage the same operation on similar looking interfaces and is a principle commonly applied within human computer interaction; e.g. the eight golden rules (Shneiderman and Plaisant, 2004). However, in the case of GI, rather than the interfaces used to control them, the issue of consistency applies to underlying ontologies or classifications used to define data sets rather than the methods of interacting with them. The data presented here highlights that at present there are no data structure formats that are consistently applied. Therefore users are unable to form appropriate schemata (Lodge et al., 1991) to enable transfer of knowledge between different data sets. This suggests a need for consistent systems of GI data classification or ontology to be applied at different levels of granularity and different tasks.
5 Conclusions
This paper has identified issues associated with usability of GI. It has highlighted specific challenges

Usability of Geographic Information Page 17
17
associated with conducting analysis and developing understanding of the usability of a data product, rather than the interface used to represent that data.
It is important that those producing data, whether in a professional or volunteer context, are able to understand the opportunities to support usability of GI and ultimately GIS. The ways in which usability can be supported can be broadly classified in two ways – firstly by specifically influencing GI characteristics, by design, and secondly by developing understanding of the influence of enablers; factors that facilitate (or inhibit) the use of GI. Figure 3 was produced during on-going discussions after the workshop and describes these different elements.
Figure 3. GI characteristics, enablers and resulting user behaviour
We also suggest that the potential power or influence of GI usability is in ensuring that there is good feedback between the understanding or measurement of user behaviour, whether this be how the GI is used, how the user makes decisions based on their use of GI, or how valuable they believe the GI is to their task, whether a leisure or work based application. Usability and human factors methods can help to ensure that this feedback is obtained.
In addition to the range of ways that GI characteristics can influence use, it is apparent that the range of users and stakeholders of GI is increasing. The increasingly diverse range of uses, data sources, stakeholders and users offers great opportunities to harnessing potential of GI, but GI needs to be designed in a way to support these diverse needs.
5.1 Future research
The discussion topics presented in this paper represent some of the areas that future research should focus on. The five key issues raised; VGI, data quality, metadata, standards, and user behaviour, are closely related and only by exploring all of them and their impact on users can we fully understand this area. In addition, there is a lot of scope for exploring other aspects of Human Factors in this context, as discussed in earlier
GI datasets are potentially powerful and valuable tools that can help people to achieve tasks more effectively. Additionally, appropriate data allow the user to harness the potential of other novel communications, navigation, planning and decision making technologies. However, it is critical that the usability of the GI itself is considered, as the way in which this GI can be used is increasingly

Usability of Geographic Information Page 18
18
diverse. This paper has worked from a multi-disciplinary perspective, with contributions from the GI and human factors community to outline the key challenges associated with GI usability, identify stakeholder groups and propose initial methods that can be used to support this activity. It is hoped that by adopting this multidisciplinary approach and by addressing usability, the value of GI can be of benefit to as wide a range of users as possible.
6 Acknowledgements
First of all we would like to thank all of the attendees of the 2nd Workshop of Geographic Information Usability for their valuable contributions. We would also like to thank University College London, the University of Nottingham, ICA Commission on Use and User Issues and Ordnance Survey for their support of this workshop series. This work was carried out in collaboration with Horizon Digital Economy Research, through the support of RCUK grant EP/G065802/1 and the Knowledge Transfer Partnership scheme (KTP_070110) through the support of the Technology Strategy Board.
7 References
Ajzen, I., 1991. The Theory of Planned Behavior, Organization Behaviour and Human Decision Processes, 50, 179-211.
Bainbridge, W.S., 2007. The Scientific Research Potential of Virtual Worlds. Science 317, 472-476.
Batcheller, J., 2007. Automating Geospatial Metadata Generation- An Integrated Data Management and Documentation Approach. Computers and Geosciences, 34, 4, 387-398.
Bevan, N., MacLeod, M., 1994. Usability measurement in context. Behav. Inf. Technol. 13, 132-145.
Brown, M., Sharples, S., Harding, J., 2011. When maps go bad: exploring the interaction between software and data usability. Contemporary Ergonomics and Human Factors 2011: Proceedings of the International Conference on Ergonomics & Human Factors 2011. April 12-14, Martin Anderson. CRC Press, London, UK.
Butcher, G.S., 1990. Audubon Christmas Bird Counts. Biol. Rep. U. S. Fish Wildl. Serv. 90.
Carroll, J., Olson, J. R., 1987. Mental Models in Human-Computer Interaction. Research Issues About What the User of Software Knows. National Academy Press, Washington D.C., USA.
Cooper, A., 2004. The Inmates are Running the Asylum, 2nd ed. SAMS Publishing, USA.
Coote, A., Rackham, L., 2008. Neogeography Data Quality - is it an issue? Proceedings of AGI Geocommunity '08. September 23-25, , 1. Chris Holcroft. Association for Geographic Information (AGI), Stratford-Upon-Avon, UK.
Crampton, J.W., 2008. Cartography: maps 2.0. Prog. Hum. Geogr. 33, 91-100.
Dadashi, N., Wilson, J., Golightly, G., Sharples, S., In press. Practical use of work analysis to support rail electrical control room: a case of alarm handling. Proceedings of the Institution of Mechanical Engineers, Part F, Journal of Rail and Rapid Transit.
Dawson, K. 2010, February 15th-last update, Technology: Are All Bugs Shallow? Questioning Linus's Law. Available: http://tech.slashdot.org/story/10/02/16/0151226/Are-All-Bugs-Shallow-Questioning-Linuss-Law [2011, February 3rd].

Usability of Geographic Information Page 19
19
Devillers, R., Jeansoulin, R., 2006. Fundamentals of Spatial Data Quality. ISTE Ltd., London, UK.
Du, H., Anand, S., Morley, J., Leibovici, D., Hart, G., Jackson, M.J., 2011. Developing Open source based tools for geospatial integration. Third Open Source GIS Conference. June 21-22, , Third Open Source GIS Conference. Anonymous Nottingham University, UK, http://uiwapmds01.nottingham.ac.uk/QCSPlace/ondemand/Events11/7d8bc2498a866ad3d798dabe34/run.htm.
ESRI. 1998, July-last update, ESRI Shapefile Technical Description [Homepage of ESRI], [Online]. Available: http://www.esri.com/library/whitepapers/pdfs/shapefile.pdf [2011, February 1st].
Ewert, A.W., Hollenhorst, S., 1989. Testing the Adventure Model: Empirical Support for a Model of Risk Recreation Participation. J Leisure Res 21, 124-139.
Fildes, J. 2011, January 14th-last update, Jimmy Wales says Wikipedia too complicated for many [Homepage of BBC News], [Online]. Available: http://www.bbc.co.uk/news/technology-12171977 [2011, January 17th].
Flemisch, F., Schieben, A., Kelsch, J., Löper, C., 2008. Automation spectrum, inner/outer compatibility and other potentially useful human factors concepts for assistance and automation, in de Waard, D., Flemisch, F., Lorenz, B., Oberheid, H., Brookhuis, K. (Eds.), Human Factors for Assistance and Automation. Shaker Publishing, Maastricht, NL, pp. 1-16.
Floyd, I.R., Jones, M.C., Rathi, D., Twidale, M.B., 2007. Web mash-ups and patchwork prototyping: User-driven technological innovation with web 2.0 and open source software. Hawaii International Conference on System Sciences. , 1454. Anonymous Citeseer, .
Goodchild, M.F., 2008. Spatial accuracy 2.0. Spatial Uncertainty: Proceedings of the Eighth International Symposium on Spatial Accuracy Assessment in Natural Resources and Environmental Sciences. June 25th - 27th, , 1-7. J. -X Zhang and Michael F. Goodchild. World Academic Union, Liverpool, UK.
Goodchild, M.F., 2007a. Citizens as Sensors: The world of Volunteered Geography. GeoJournal 69, 211-221.
Goodchild, M.F., 2007b. Citizens as Voluntary Sensors: Spatial Data Infrastructure in the World of Web 2.0. Int. J. Spatial Data Infra. Res. 2, 24-32.
Gray, P. 1999, March 29th-last update, Time 100: Alan Turing [Homepage of Time], [Online]. Available: http://205.188.238.181/time/time100/scientist/profile/turing.html [2010, September 17th].
Guptill, S.C., 2011. Metadata and data catalogues, in Longley, P.A., Goodchild, M.F., Maguire, D.J., Rhind, D.W. (Eds.), Geographical Information Systems, 2nd ed. Wiley, Canada, pp. 677-692.
Haklay, M., Ather, A., Basiouka, S., 2010. How Many Volunteers Does It Take to Map An Area Well? Proceedings of the GIS Research UK 18th Annual Conference. 14-16 April, , 193-196. Mordechai Haklay, Jeremy Morley and Hanif Rahemtulla. University College London, .
Haklay, M., Singleton, A., Parker, C., 2008. Web mapping 2.0: the Neogeography of the Geoweb. Geography Compass 2, 2011-2039.
Haklay, M., Skarlatidou, A., 2010. Human-computer interaction and geospatial technologies –

Usability of Geographic Information Page 20
20
context, in Haklay, M. (Ed.), Interacting with Geospatial Technologies. Wiley-Blackwell, UK, pp. 3-18.
Hall, M. 2007, August 6th-last update, On the Mark: Will Democracy Vote the Experts Off the GIS Island?[Homepage of Computer World], [Online]. Available: http://www.computerworld.com/s/article/299936/Will_Democracy_Vote_the_Experts_Off_the_GIS_Island_ [2009, November 18th].
Harding, J., Sharples, S., Haklay, M., Burnett, G., Dadashi, Y., Forrest, D., Maguire, M., Parker, C.J., Ratcliff, L., 2009. Usable geographic information – what does it mean to users? Proceedings of the AGI GeoCommunity ’09 Conference. 23rd-24th September, Anonymous AGI GeoCommunity, http://www.agi.org.uk/SITE/UPLOAD/DOCUMENT/Events/AGI2009/papers/JennyHarding.pdf.
Hayes, R.M., 1993. Management of Information. Inform Process Manag 29, 1-11.
HousingMaps. 2008, March 5th-last update, HousingMaps - Seattle, USA [Homepage of HousingMaps], [Online]. Available: http://www.housingmaps.com [2010, December 27th].
Hunter, G.J., Wachowicz, M., Bregt, A.K., 2003. Understanding Spatial Data Usability. Data Science Journal 2, 79-89.
Idris, N.H., Jackson, M.J., Abrahart, R.J., 2011. Credibility Labelling in Map Mash-up Design: Influence on Users’ Judgement. EuroSDR / ISPRS Workshop on Web Cartography. May 5-6, Anonymous http://www.nateko.lu.se/eurosdr/index_files/Nurul_Idris_%20Paper_Webcartography_final.pdf, Lund, Sweden.
ISO 19115, 2003. Geographic information - Metadata.
ISO 9241-11, 1998. Ergonomic requirements for office work with visual display terminals (VDT)s - Part 11 Guidance on usability.
ISO/DIS 19157, 2006. Geographic information - Data quality.
Jackson, M.J., Rahemtulla, H., Morley, J., 2010. The Synergistic Use of Authenticated and Crowd-Sourced Data for Emergency Response. Proc. 2nd Int. Workshop on Validation of Geo-Information Products for Crisis Management (VALGEO). October 11-13, , 91-99. C. Corbane, D. Carrion, M. Broglia and M. Pesaresi. European Commision Joint Research Centre, Ispra, Italy.
Keen, A., 2007. The Cult of the Amateur. Nicholas Brealey Publishing, Finland.
Kirwan, B., Ainsworth, L.K., 1992. A Guide to Task Analysis. Taylor and Francis, PA, USA.
Krueger, R.A., Casey, M.A., 2009. Focus Groups: A Practical Guide for Applied Research, Fourth ed. Sage Publications Ltd, London, UK.
Lodge, M., McGraw, K.M., Conover, P.J., Feldman, S., Miller, A.H., 1991. Where is the schema? Critiques. Amer. Polit. Sci. Rev. 85, 1357-1380.
Macaulay, L.A., 1996. Requirements Engineering. Springer-Verlag, London, UK.

Usability of Geographic Information Page 21
21
Maguire, M.C., 2001. Context of use within usability activities. Int. J. Hum-Comput. St. 55, 453-483.
Malhotra, Y., Galletta, D., 2003. Role of Commitment and Motivation in Knowledge Management Systems Implementation: Theory, Conceptualization, and Measurement of Antecedents of Success. 36th Annual Hawaii Int. Conf. on System Sciences. January 6-9, , 115-125. Anonymous IEEE Computer Society, Big Island, HI, USA.
Microsoft. 2008, February 15th-last update, Microsoft Office Word 97-2007 Binary File Format Specification [Homepage of Microsoft], [Online]. Available: http://download.microsoft.com/download/0/B/E/0BE8BDD7-E5E8-422A-ABFD-4342ED7AD886/Word97-2007BinaryFileFormat(doc)Specification.pdf [2011, February 1st].
Miller, C.C., 2006. A beast in the field: The Google Maps mashup as GIS/2. Cartographica: The International Journal for Geographic Information and Geovisualization 41, 187-199.
Muir, B., Moray, N., 1996. Trust in Automation. Part II. Experimental Studies of Trust and Human Intervention in a Process Control Simulation, Ergonomics, 36, 3, 429-460.
Mummidi, L., Krumm, J., 2008. Discovering points of interest from users' map annotations. GeoJournal 72, 215-227.
Nielsen, J. 1995, May 25th-last update, Card Sorting to Discover the Users' Model of the Information Space [Homepage of Jakob Nielsen], [Online]. Available: http://www.useit.com/papers/sun/cardsort.html [2011, March 29th].
Nielsen, J., 1993. Usability Engineering. Moran Kaufmann, USA.
O’Hara, J., Higgins, J., Brown, W., 2008. Human Factors Considerations with Respect to Emerging Technology in Nuclear Power Plants. U.S. Nuclear Regulatory Commission, Washington, DC, USA.
OGC. 2011a, Geography Markup Language [Homepage of Open Geospatial], [Online]. Available: http://www.opengeospatial.org/standards/gml [2011, February 1st].
OGC. 2011b, KML [Homepage of Open Geospatial], [Online]. Available: http://www.opengeospatial.org/standards/kml [2011, February 1st].
OSM. 2011, October 21st-last update, OpenStreetMap [Homepage of the OpenStreetMap Project], [Online]. Available: http://www.openstreetmap.org [2011, October 21st].
Parasuraman, R., Sheridan, T.B., Wickens, C.D., 2000. A model for types and levels of human interaction with automation. IEEE T SYST MAN CY A 30, 286-297.
Parker, C.J., May, A.J., Mitchell, V., 2011. Relevance of Volunteered Geographic Information In A Real World Context. Proceedings of GIS Research UK 19th Annual Conference. April 27-29, Anonymous GIS Research UK, University of Portsmouth.
Parker, C.J., May, A.J., Mitchell, V., 2010. An Exploration of Volunteered Geographic Information Stakeholders. Proceedings of the GIS Research UK 18th Annual Conference. 14-16 April 2010, , 137-142. Mordechai Haklay, Jeremy Morley and Hanif Rahemtulla. UCL, University College London.
Preece, J., Rogers, Y., Sharp, H., Benyon, D., Holland, S., Carey, T., 1994. Human-Computer Interaction. Pearson Education Limited, Essex, England.
Usability of Geographic Information Page 22
22
Preece, J., Rogers, Y., Sharpe, H., 2002. Interaction Design: Beyond Human-Computer Interaction. John Wiley & Sons, United States of America.
Raymond, E., 1999. The Cathedral and the Bazaar. Knowledge, Technology & Policy 12, 23-49.
Robson, C., 2011. Chapter 8: Surveys and Questionnaires, in Robson, C. (Ed.), Real World Research, Third ed. Blackwell Publishers Ltd., Oxford, UK, pp. 227-267.
Rosson, M.B., Carroll, J.M., 2002. Usability Engineering: Scenario-Based Development of Human-Computer Interaction. Morgan Kaufmann, San Francisco, USA.
Sears, A., Jacko, J., Borelaa, M., 1997. Internet Delay Effects: How Users Perceive Quality, Organisation, and Ease of Use of Information, CHI '97 Extended Abstracts on Human Factors in Computing Systems: Looking to the Future. ACM, New York, USA.
Sharples, S., 2009. Automation and Technology in 21st Century Work and Life, in Bust, P.D. (Ed.), Contemporary Ergonomics. Taylor & Francis, London, UK, pp. 208-217.
Shneiderman, B., Plaisant, C., 2004. Designing the User Interface: Strategies for Effective Human-Computer Interaction, Fourth ed. Addison Wesley, Boston, MA, USA.
Snow, J., 1854. On the Mode of Communication of Cholera, Second ed. John Churchill, London, UK.
Tapscott, D., Williams, A.D., 2008. Wikinomics: How Mass Collaboration Changes Everything, Expanded ed. Atlantic Books, UK.
Taylor, B., 1990. The HUFIT planning analysis and specification toolset. INTERACT 90 - 3rd IFIP International Conference on Human-Computer Interaction. August 27-31, , 371-376. Dan Diaper, David J. Gilmore, Gilbert Cockton and Brian Shackel. North-Holland Publishing Co., Cambridge, UK.
Tsou, M., Yanow, K., 2010. Enhancing General Education with Geographic Information Science and Spatial Literacy. URISA Journal 22, 45-54.
University of Heidelberg. 2010, February 17th-last update, OpenRouteService [Homepage of Department of Geography (Chair of GIScience) University of Heidelberg], [Online]. Available: http://129.206.229.146/openrouteservice/?lang=en# [2010, March 25th].
Woods, D.D., Cook, R.I., 2002. Nine Steps to Move Forward from Error. Cogn Technol Work 4, 137-144.
Zentai, L., 2007. Application of web 2.0 in cartographic education: Is it time for Cartography 2.0? 23rd International Cartographic Conference, 2001. Anonymous http://www.mtakpa.hu/kpa/download/1146685.pdf.
Copyright © 2022 FDOKUMEN