US Army Corps - of Engineers - DTIC
396
AD-A250 064 US Army Corps of Engineers Toxic and Hazardous Materials Agency Report No. CETHA-TS-CR-91055 FINAL REPORT Evaluation of a Fluidized-Bed Paint Stripper at Red River Army Depot ' DTIC SLECTF April 1992 MAY,12 1992 Contract No. DAAA15-88-D-0001 1 Task Order No. 0005 Prepared by: IT Environmental Programs, Inc. 11499 Chester Road Cincinnati, OH 45246 Prepared for: U.S. Army Toxic and Hazardous Materials Agency Aberdeen Proving Ground, Maryland 21010-5423 Distribution Unlimited 92-12464 THAMA Form 45, 1 Jul 90 J ii iI i 11 L I f1",111,; , [ 1 ;l1
-
Upload
khangminh22 -
Category
Documents
-
view
0 -
download
0
Transcript of US Army Corps - of Engineers - DTIC

AD-A250 064
US Army Corpsof EngineersToxic and HazardousMaterials Agency
Report No. CETHA-TS-CR-91055FINAL REPORT
Evaluation of aFluidized-Bed Paint Stripper atRed River Army Depot
' DTICSLECTF
April 1992 MAY,12 1992Contract No. DAAA15-88-D-0001 1Task Order No. 0005
Prepared by:
IT Environmental Programs, Inc.11499 Chester RoadCincinnati, OH 45246
Prepared for:
U.S. Army Toxic and Hazardous Materials AgencyAberdeen Proving Ground, Maryland 21010-5423
Distribution Unlimited92-12464
THAMA Form 45, 1 Jul 90 J ii iI i 11L I f1",111,; , [ 1 ;l1

I-I-I
The views, opinions, and/or findings contained in this report should not be construed
as an official Department of the Army position, policy, or decision, unless so desig-
nated by other documentation.The use of trade names in this report does not constitute an off,cia' endorsement orapproval of the use of such commercial products. This report may not be cited forpurposes of advertisement.
IIIII
II
Unc las s ified
SEC UR I T-Y CLASSIF I CATION .OF T HIS P A C
Form ApprovedREPORT DOCUMENTATION PAGE OMB No. O704 088
la REPORT SECURITY CLASSI;HCATI'Of. lb RESTRICTIVE NI'ARKINGS
Unclassified2& SECURITY CLASSIFICAT!ON AijTHORIr'y 3 DISTRiBIJTiQt4 AVAILA5ILITy OF :Z;Q0OT
2b DECLASSIFICATION/DOWNGRADING SCHEDULE Uni14 mi ted
4 PERFORMING ORGANiZAT:ON REPORr NUMBER(S) S. MONITORING ORGANIZAT:O.N REPORT NUMBER(S)
PI' 3769-5,'JTI: 8160041 CETHA-TS-CR-0110556a. NAME OF PERFORMING ORGANIZATION 6 b OFFICE SYMBOL 7a. NAME OF M0ONiTORIN.G ORGANIZA71ON
IT Environmental Programs, Inc. (if applicable) U.S. Corps of EngineersI _______ Toxic and Hazardous '11aterials AqenCy
6c. ADDRESS (City. State, and ZIP Code) 7b ADDRESS (City. State, and ZIP Code)11499 Chester Road Attn: CETHA-TS-DCincinnati, Ohilo 4,5246 1Aberdeen Proving Ground, t.D 2190-5401
8a. NAME OF FUNDING /,SPONSORiNJG T8b OFFICE SYMBO0L 9. PROCUREMENT INSTRUMENT IDENTIFICATION NUMBERORGANIZATION U. S. Armv (if applicable) Contract tHo. DAAA15-8S-D-0001
Corp,,, of Engineers ThArlA jCVTHrlx-TS-D Task Order No. 00058c. ADDRESS (City, State, and ZIP Code) 10 cOURZCE OF FUNDING NUMBERS
Attn: CEHTA-TS-D PROGRAM PROJECT TASK WORK UNIT
Aberdeen Proving Ground, H1D 2190-5401 ELEMENT NO INO NO. ~ ACCESSION NO
*ii- TI~iLE (include Security Classification)
Evaluation of a Fluidized-Bed Paint Stripper at Red River Army Deoot
12 PERSONAL AUTHOR(S)
F.. Ress' and P. Hiove13a. TYPE OF REPORT 13b TIME COVERED 14 DATE OF REPORT (Year, Month. Day) 15 PAGE COUNT*Final FROM 7/'89 To- 4/92 1992, April 15 39316. SUPPLEMENTARY NOTAliION
~17 COSATI CODES 18 SUBJECT TERMS (Continue onv reverse if necessary and identify by block number)FIELD GROUP SUB-GROUP ' Paint stripping
0 Fluidized bedA~5TRCT ~Hazardous waste minimization
19. A3TAT(Continue on rev~r~e if neceisary and identify by block number)Hazardous waste Minimization is one of the most pressing environmental issues facing theU.S. Army depots today. The U.S. Army Toxic and Hazardous Materials Agency (USATHAMA)coducts research and development to support Army depots in developing programs and tech-
nologies to reduce the generation of hazardous waste. Degreasing and chemical paint re-moval processes at Army depots generate significant quantities of hazardous waste. Fluid-ized-bed paint stripping (FBPS), which has the potential to reduce the quantity of wastegenerated during paint removal, was selected by USATI-AMA for a field demonstration. TheFBPS was believed to have the potential to be substituted for the chemical paint strippingand degreasing Of Some parts. This report presents the results of a field evalluation ofthis technology conducted at the Red River Army Depot (RRAD). The following were theobjectives of the demonstration tests:
20 fh:STRIBUTION /AVAILA8:LITY OF ABSTPACT 21 AB3STRACT SECURITY CLASSIFICATION
12UNCLASSIFIEDfUNLIM:TED 0l SAME AS RPT 0 OIC USERS Unclassi fiedZZ3 NAME OF RESPONSIBLE IN- 2.1 22TFIFPHoNF(clude Area Code) 122c OFFICE SYMBOLR. Jackson 40/67-12 CETHA-TS-D
DD FOrm 1473, JUN 86 Pre-vious editions are obsolete SECURITY CLASSIFICATION OF THIS PAGE
Unclassi fied

Unclassified
SECURITY CLASSI-CATION O THIHS PAGE
19. Abstract (continued)
0 To determine whether the FBPS could be used to remove paint, grease, and oil fromparts processed at RRAD.
o To develop operating parameters for the FBPS.o To determine the impact of the FBPS on hazardous waste generation at RRAD and the
relative cost of its use.o To evaluate the air emissions from the FBPS operation.
The FBPS uses hot (600 to 1000°F) aluminum oxide (alumina) as a heat-transfer medium. Airpassing up through the bed keeps the medium fluidized. The parts are lowered into thefluidized bed, where organic components of surface contamination and finishes pyrolyzeinto carbon oxides and other products of combustion (which are then completely combustedin an afterburner). The treated part retains a loosely adhering char made up of the inor-ganic components of its finish.
The unit tested was manufactured by Procedyne Corp. of New Brunswick, New Jersey. Itconsists of an electrically heated fluidized bed (Model PCS-4848), a fluidized-bed coolingstation (Model QB-4848), a natural-gas-fired afterburner (Model AB-30-2), and a variable-throat venturi gas scrubber (W.W. Sly Manufacturing Co. Size 1). The system also includesa monorail hoist and emis;ions-control-equipment housing. Demonstration testing tookplace between November 1990 and March 1991.
The FBFS is not a suitable replacement for chlorinated solvent stripping systems currentlyused to remove paint from aluminum and aluminum alloy parts. When exposed to 700 to 800°Ftemperatures for the 1-hour residence time required to pyrolize paint, aluminum parts lostessentially all of their hardness (temper). A heat-treatment step could be added to re-temper these parts, hut thus would be impractical.
In most cases, the FBPS car remove paint from nonaluminum and non-heat-sensitive parts"without affecting temper or causing warpage or shape distortion. However, not all non-aluminum, non-heat-sensitive parts can be processed in the FBPS. Some parts (e.g., thinvent covers) may be warped hy the process. Additionally, this treatment is not suitablefor parts with crevices, channels, or cavities that would retain the FBPS medium and thusbe difficult to clean afterward (e.g., engine blocks). Therefore, FBPS cannot eliminatethe need for caustic stripping. The cost per part for the FBPS treatment is 70 to 130percent higher than for caustic stripping, depending on the number of shifts the FBPS isoperated.
Metals present in paints and coatings stripped from parts accumulate in the fluidized-bedand will result in it being classified as a RCRA-characteristic hazardous waste. Inasmuchas the FBPS generates less waste on a per-part basis compared with caustic stripping, theoverall amount of waste generated would be reduced regardless of the percentage of partstreated in the FBPS. Air emissions were controlled by the system and were within theconstraints of the State permit. Scrubber water retained some of the metals, but it wasacceptable for treatment in the onsite IWTP.
These conclusions are based on testing conducted under controlled conditions and non-continuous operation, and the- should be verified by further analysis.
Unclassified

CONTENTS
Figures iiiTablesAcknowledgments iv
1. Introduction 1-1
2. Fluidized-Bed Paint Stripper 2-12.1 Fluidized beds 2-12.2 Emission control system 2-82.3 System controls 2-92.4 Equipment purchase and installation 2-11
3. Demonstration Testing 3-13.1 Test plan 3-13.2 Test results 3-23.3 Environmental emissions measurements 3-10
4. System Comparisons 4-14.1 FBPS 4-14.2 Aqueous caustic paint-stripping systems 4-44.3 Comparison of the two systems 4-5
5. Conclusions 5-1
Appendices
A. Description of Red River Army Depot Activities A-1B. Test Plan for Evaluating the Procedyne F:uidized-Bed Paint Stripper at
Red River Army Depot B-1C. Parts Included in the FBPS Evaluation C-1
D. Atmospheric Emission Test Report D-1
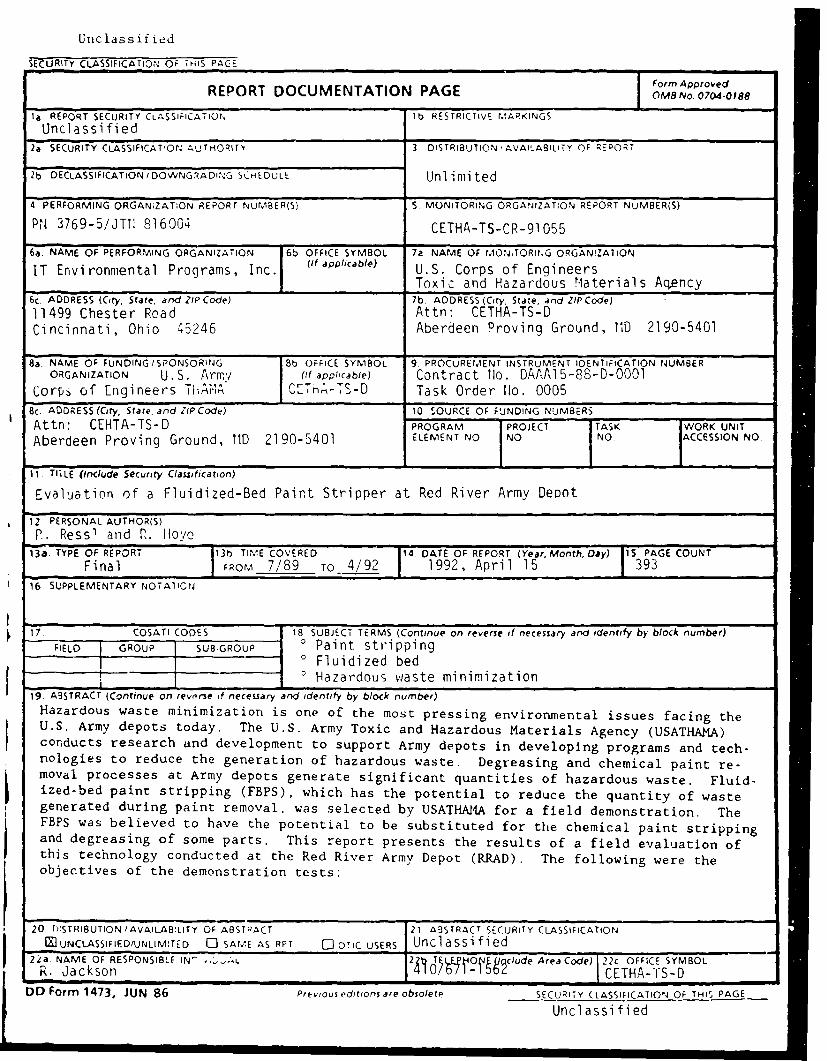
FIGURES
SNumber E_
2-1 General Arrangement of the FBPS Installed at RRAD 2-2
2-2 Parts Load Being Lifted Into the FBPS 2-3
2-3 Section Through FBPS Showing Major Features 2-5
2-4 Fluidizing Hot Bed 2-6
2-5 Explosion Vent 2-7
2-6 FBPS Control Panel 2-10
3-1 Rockwell Hardness Vs. Temperature for 4140 Low-Alloy Steels 3-8
TABLES
Number Pag
3-1 Effects of Temperature and Treatment Duration on Paint Removal 3-4
3-2 Effect of FBPS Treatment on Aluminum Parts 3-6
3-3 Effects of FBPS Treatment on Steel Parts 3-7
3-4 Summary of Atmospheric Emissions of Particulates and Metals 3-11
3-5 Total Metals in the Scrubber Effluent 3-12
3-6 Analysis of Metals in the Fluidized-Bed Media 3-12
4-1 Annual Costs of thc FBPS 4-3
4-2 Capital Costs of the Aqueouz C.austic Paint-SOripping System 4-4
4-3 Annual Costs of the Aqueous Caustic Solvent-Based Paint-Stripping
System 4-6
iii

ACKNOWLEDGMENTS
IT Environmental Programs, Inc. (ITEP, formerly PEI Associates, Inc.) prepared
this report under contract to the U.S. Army Toxic and Hazardous Materials Agency
(USATHAMA). Mr. Ronald P. Jackson, Jr., was the USATHAMA Project Officer.
Personnel at Red River Army Depot (RRAD) provided site support, test parts,
and facility operators to assist in the conduct of this project. Mr. Edward Hanna, Pro-
duction Engineer, ITEP's contact at RRAD, coordinated the activities of RRAD person-
nel ancl site support. Mr. Johnny Gross, Supervisor at North Wash Rack, provided
technical manuals, test parts, and site support for the testing. Mr. Isaac Pichard, a
North Wash Rack operator, was trained by Procedyne Corporation (the manufacturer
of the fluidized-bed paint stripper) and operated the equipment throughout the testing.
Richard W. Gerstle served as ITEP's Project Director, and Robert A. Ressl was
the Project Manager Additional technical input was provided by John Spessard,
David Pomerantz, Cindy Shires, and Jeffrey Davis.
Ao Wooe For
1 TIS GPA&IDTIC TABI , 0c 8 d !
TJustficuitio
By--Distri but±ora/
Availability Codeg
Avail -n-d/o --
1it Spoolac i
iv I j "

SECTION 1
INTRODUCTION
Hazardous waste minimization is one of the most pressing environmental issues
facing U.S. Army depots today. The U.S. Army Toxic and Hazardous Materials Agen-
cy (USATHAMA) conducts research and development to support Army depots in the
development of programs and technologies to reduce the generation of hazardous
waste. Degreasing and chemical paint removal processes conducted at Army depots
generate significant quantities of hazardous waste. Fluidized-bed paint stripping
(FBPS), which has the potential of reducing waste generated during paint removal,
was selected by USATHAMA for a field demonstration. For some parts, the FBPS has
the potential for being substituted for caustic stripping and degreasing. This report
incorporates the results of a field evaluation of this technology conducted at the Red
River Army Depot (RRAD). IT Environmental Programs, Inc., performed this evaluation
under contract to USATHAMA.
The objectives of the demonstration tests were as follows:
1) To determine whether the FBPS could be used to remove paint, grease,and oil from parts processed at RRAD.
2) To develop operating parameters for the FBPS.
3) To determine the impact of the FBPS on hazardous waste generation atRRAD and its relative cost.
4) To evaluate air emissions generated by the FBPS operation.
The fluidized-bed technology was originally developed as a heat-treating meth-
od for metal parts rather than for the removal of paint or organic material. The main
advantages of the fluidized bed over simple atmospheric heat-treatment furnaces are a
1-1

superior heat-transfer rate and the precise control of temperatures and atmospheres in
the heat-treatment furnace. More recently, the FBPS technology has been used pri-
marily for cleaning paint application equipment and fixtures and for removal of plastics
from injection molding dies. In most of these applications, the parts processed are
made of similar metals and have similar surface coatings. As a paint and grease strip-
per, the FBPS is simpler to operate than other alternatives (e.g., a molten salt bath). A
major advantage FBPS offers is the possibility of replacing at least some of the toxic
chemicals now used to remove paint and grease. A disadvantage of FBPS is that it
generates carbon monoxide and unburned hydrocarbons because the concentration
of oxygen in the fluidizing air is inadequate to allow complete combustion of the paint
constituents, plastic coatings, or rubber. Precautions are taken, however, to prevent a
buildup of pyrolysis products that could be combustible and/or explosive. Another
disadvantage is that not all metal parts can be treated in the FBPS.
Activities at RRAD include vehicle repair, small arms repair, equipment stocking
programs, and warehousing. One of the primary activities, repair of Army vehicles, in-
cludes two basic programs: 1) inspection and repair, and 2) complete rebuilding of
vehicles and components. The inspection and repair program entails disassembling
the vehicle and repairing those components that need repair. The rebuilding program
entails complete disassembly of the vehicle, replacement or refurbishment of all com-
ponents, and reassembly. Both programs involve paint-stripping operations that gen-
erate wastes.
The type of vehicles processed at RRAD varies. For example, during the Middle
East conflict in 1990 and 1991, depot activities changed from the predominant task of
complete rebuilds of the Type 113 family of vehicles to the exclusive task of inspecting
and repairing Bradley fighting vehicles. A description of activities conducted at RRAD
is included in Appendix A.
Section 2 of this report describes the FBPS process, equipment, and operation.
Section 3 describes the demonstration testing performed under this task. Section 4
compares the FBPS with existing parts-cleaning processes used at RRAD. Section 5
presents the conclusions drawn from the FBPS demonstration and evaluation at
RRAD.
1-2

SECTION 2
FLUIDIZED-BED PAINT STRIPPER
The FBPS process uses hot (600 to 10000 F) aluminum oxide (alumina) as a
heat-transfer medium. Air passing up through the bed keeps the media fluidized.
Parts to be cleaned are lowered into the fluidized bed, which quickly heats the part
and its surface coatings (paint, grease, oil, etc.) to a temperature at which organic
components of surface contamination and finishes pyrolyze into carbon oxides and
other products of combustion. Emissions from the process are completely combusted
in an afterburner. The treated part retains a loosely adhering char made up of the
inorganic components of its finish.
This section describes the specific FBPS evaluated at RRAD. This unit, manu-
factured by Procedyne Corp. of New Brunswick, New Jersey, consists of an electri-
cally heated fluidized bed (Model PCS-4848), a fluidized-bed cooling station (Model
QB-4848), a natural-gas-fired afterburner (Model AB-30-2), and a variable-throat venturi
gas scrubber (W.W. Sly Manufacturing Co. Size 1). The system also includes a mono-
rail hoist and housing for the emissions-control equipment. The general arrangement
of the system is shown in Figures 2-1 and 2-2.
2.1 Fluidized Beds
Two distinct beds are used in the system: a hot bed and a cold bed. The hot
bed, where pyrolysis of the coatings takes place, is kept at operating temperature by
electric heaters wrapped around the vessel. Although the cold bed is similar to the
hot bed in terms of fluidization, it is surrounded by a cooling-water jacket instead of a
series of electrical heaters. The cold bed is used to cool the parts after the organics
have been pyrolyzed. The hot and cold beds each have diameters of 48 inches and
2-1

0
oz
I-aa
- C
F'a
0 ~ ~ ~~ __ __ _ __
-T c
z
z >)
0
W C
o 0
00cc cc-
2-2-

vim
Figure 2-2. Parts load being lifted into the FBPS.
2-3
effective bed depths of 48 inches. An electric chain hoist on a monorail located above
the bed is used to raise and lower parts into the FBPS for treatment (Figure 2-3).
The Procedyne FBPS equipment uses a patented arrangement of air diffusion
nozzles and a diffusion plate to achieve fluidization. The nozzles are arranged in a
uniform pattern in the diffusion plate, which is welded into the bottom of the fluidizing
vessel. The installed unit uses 200-mesh alumina in the bed and uses air as the fluid-
izing gas. Alumina has the advantage of being chemically nonreactive and available in
the required size and density range. Other nonreacting materials, such as silicon diox-
ide (silica) and titanium dioxide (titania) or alumina of a different mesh size could be
used, but some modifications (e.g., different air velocities) would be required. Al-
though other gases (e.g., nitrogen or carbon dioxide) could be used as fluidizing gas-
es, air has the advantages of being readily available and providing the oxygen required
for pyrolysis of organic matter in the coatings.
While the parts are in the hot bed, some surface coatings may come off the
parts as flakes; these flakes generally float on top of the fluidized bed. A photograph
of a hot bed in its fluidized state (Figure 2-4) shows "bubbles" of sand on top of the
bed and a small accumulation of removed surface coatings. Parts that become dis-
lodged from the parts basket fall into the fluidized bed and sink to the bottom, where
they remain until the bed medium is replaced.
During the processing of a normal load of parts, the co icentration of oxygen in
the fluidizing air will be inadequate to allow compl.te combustion of the paint constitu-
ents, plastic coatings, or rubber. Therefore, carbon monoxide and unburned hydro-
carbons will be generated during pyrolysis of these materials. The products of pyroly-
sis are combustible volatile organic compounds (VOCs), which are burned in the sys-
tem's afterburner. Low-pressure steam is bled into the space above the fluidized bed.
The steam prevents a buildup of pyrolysis products that could be combustible and/or
explosive. As a further precaution, the hot bed is equipped with an explosion vent
(Figure 2-5). The furnace housing (Figure 2-2) is used to control emissions during
loading and unloading operations that occur while the lid is removed from the hot and
cold fluidized beds.
2-4

0 "z -
FUJME CONTROL SYSI E MCr
EXPLOSIONVENTLI
STEAM SUPPLY
FLUIDIZING BED
0
W (2
BASKT RADIANT HEAER
Figre2-..Setio.thouh.F...howngmajr.fatuesE........ .........TECHNOLOGY..
..O.........
.. .. .. .

I
I
I
LL
Io
CM
7_
2-
I°
I

Figure 2-5. Explosion vent.
2-7

During the lowering of the parts into the fluidized bed, the lid of the bed is re-
moved. Therefore, any fumes that are carried up and out of the bed escape the pri-
mary fume capture system and are contained by the furnace housing. Once the lid is
in place, these emissions are gradually evacuated from the housing. They are then
combined with the other emissions from the hot bed and burned in the afterburner.
The furnace housing is an integral part of the support mechanism for the over-
head monorail and hoist. The hoist raises and lowers baskets full of parts into and out
of the hot and cold fluidized beds. The monorail provides a track for the hoist that
moves the parts baskets from the loading and unloading areas to the hot and cold
beds. The chain for the hoist passes through a narrow slot at the top of the furnace
housing. This slot is sealed with rubber flaps, and the doors at each end of the hous-
ing are closed before the baskets are put into the furnace so as to control fugitive
emissions; however, some emissions do escape. The housing has two 12-in.2 side
windows and an interior light to provide visibility for the operator.
During normal operation, parts are placed in one of four baskets having an
inside diameter of 45 in. and an inside depth of 22 in. The baskets can be modified to
accommodate specific parts. The 45-inch inside diameter restricts the size of parts
that can be processed in the FBPS baskets; however, larger parts can be hung by a
chain and lowered directly into the beds without the use of the baskets.
2.2 Emission Control System
The afterburner can heat air emissions to 1400°F and introduce sufficient ex-
cess air to burn VOCs completely. The afterburner provides a 0.4-seccnd retention
time for the gases, which insures complete combustion. At 14000 F, typical VOC pollu-
tants are destroyed in 0.1 second in the afterburner. (Exceptions include black smoke
and carbon particulates greater than 10 gm in diameter, which may require up to
1 second at 1400 F to be destroyed fully.) Afterburners are normally designed with a
0.3- to 0.5-second residence time for a safety factor. Texas Air Control Board (TACB)
regulations require afterburners to be designed on the basis of a 0.4-second residence
time at 1400° F. A "wet cap" attached to the discharge end of the afterburner cools
2-8

the discharge gases to approximately 150° F. This cooling permits the use of lower-
temperature blowers and ducts for the system's exhaust. A pilot flame is maintained
in a low-fire mode to insure that no unsafe flameout conditions occur as a result of a
temporary drop in fume concentration in the process off-gas or a temporary interrup-
tion of the off-gas stream.
The RRAD FBPS has a variable-throat wet venturi scrubber designed for a pres-
sure drop of 4 inches. The adjustable-throat feature optimizes scrubbing efficiency by
maintaining the optimum pressure drop for removal of particulates and absorbing gas-
eous pollutants. This, combined with the unit's energy-regaining section, significantly
reduces power consumption and operating costs.
2.3 System Controls
The following controls are installed on the FBPS system at RRAD:
o Hot-bed temperature controller and manual fluidizing air control.o Cooling-bed water on/off and manual fluidizing air control.o Afterburner temperature control and manual wet cap water control.o Manual venturi throat adjustor and waterflow control.o Automatic system monitor for low hot-bed fluidization, low afterburner
gas flow or flameout, and afterburner overtemperature.
The hot-bed temperature controller controls the flow of electricity to the heaters,
which in turn control the hot-bed temperature. Automatic shutoff controls prevent
overheating. Off/on controls on the cold-bed water jacket conserve cooling water
when the cold bed is not in service. Manual fluidizing air controls are used to maintain
the hot- and cold-bed airflow and to keep the beds fluidized. Temperature sensors
and controls on the afterburner monitor the incinerator operation, and the manual
waterflow controls on the water cap maintain the afterburner gas discharge tempera-
ture at 1500F. The venturi scrubber has a manually operated, adjustable, venturi
throat opening and waterflow controls. The FBPS has automatic monitors with auto-
matic shutoffs for hot-bed operating parameters. Figure 2-6 is a photograph of the
FBPS control panel.
2-9

Figure 2-6. FBPS control panel.
2-10

Procedures for startup of the FBPS are as follows:
o Turn the bed heaters on.o When the bed reaches the desired temperature, start the afterburner.o When the afterburner reaches the required temperature, the hoist can be
operated.o Turn cooling-bed water and air on manually as needed.o When the system is operating, turn on the wet cap and venturi water
supply.
An alarm will sound if the temperature of the afterburner exhaust exceeds set
limits. Fluidizing air is shut off automatically if the afterburner shuts down.
2.4 Equipment Purchase and Installation
Although fluidized-bed technology has been used in petroleum refineries, chemi-
cal reactors, combustion processes, and metal heat-treating processes, its, use for
paint removal is a relatively new development; therefore, only three potential equip-
ment vendors were identified. Of these three, only Procedyne Corporation had in-
stalled equipment in the United States and was able to provide the necessary support
for installing the equipment and training the operators. Procedyne's primary involve-
ment with the fluidized-bed technology has been for metal heat treatment.
As described in the following paragraphs, a few equipment and procedural
modifications were made to the FBPS system installed at RRAD. First, interior lighting
was installed in the closed cabinet, which enables operators to view and position the
baskets properly. The low-pressure steam-injection system mentioned earlier in this
section was an add-on design incorporated to prevent the accumulation of ignitable
hydrocarbon vapors above the hot bed. This safety feature is intended to prevent
explosions caused by ignition of the confined VOCs.
The FBPS purchased for this demonstration is the type typically used for heat-
treating metal parts; it was redesigned for this application. When this system is used
for heat treatment, bed media are replaced infrequently. Because bed media in an
FBPS operated as a paint stripper (such as the one at RRAD) will be replaced more
frequently, provisions should be made to simplify bed changeouts. As-built drawings
should be requested for the equipment at the time of purchase. Such drawings are
2-11

necessary for those who purchase a fluidized bed for paint stripping, as they are less
likely to be familiar with the equipment and its utility requirements than are purchasers
from the metal heat-treating industry. The Procedyne FBPS equipment was skid-
mounted and modularized, which facilitated field assembly.
2-12
I i L
SECTION 3
DEMONSTRATION TESTING
Demonstration testing of the FBPS took place at RRAD between November
1990 and March 1991. During this time, approximately 35 tests were run on parts.
Tests were also run on scrap parts, paint hooks, and panels to determine optimum
temperatures for the removal of various types of paints.
This section covers the field testing, the character of the parts encountered at
RRAD, the operating parameters, and the test results. Some equipment testing per-
formed at the manufacturer's facility and metallurgical testing performed by an inde-
pendent laboratory are also discussed. A copy of the detailed test plan prepared prior
to testing is presented in Appendix B.
3.1 Test Plan
The primary objectives of the field testing were to determine to what extent the
FBPS can replace chemical paint stripping, to establish when it can be used to remove
other organic coatings (e.g., oi!s and grease), and to determine its effects on waste
generation. Secondary objectives of the field testing were to establish specific oper-
ating conditions for the parts and coating systems processed in the FBPS and to train
RRAD personnel to operate the system.
The first step involved categorizing the parts processed at RRAD and identifying
those that would be suitable candidates for testing in the FBPS. When available, part
specification drawings were used to obtain the following information about the parts:
o The metal alloys usedo Any metal treatment (e.g., heat treatment and hardening)o Electroplated coatingso Conversion coatings
3-1

o Type of paint usedo Welds, soldering, brazing, and other treatments that could be affected by
processing in the FBPS
The test program established which parts processed in the FBPS could be re-
painted and returned to service and how the current RRAD procedures would have to
be modified to accomplish this. The test program also established optimum FBPS op-
erating parameters and how these parameters would have to be modified based on
what was being processed in the FBPS. Postprocess testing of parts processed in the
FBPS included hardness testing, checking for changes in part dimensions, and visual
examinations for warping, staining, and other damage.
The second step of the test plan involved characterization of air emissions and
wastes generated by the FBPS. Metals present in coatings and removed in the FBPS
could contribute to both hazardous waste generation and air emissions. These metals
could 1) leave the FBPS with the part (which means the downstream processing would
have to deal with their disposal); 2) contaminate the fluidizing medium (which would
require eventual disposal of the medium); 3) be deposited inside the FBPS (which
would force an eventual shutdown and cleaning); or 4) exit the FBPS with the exhaust
gas (which could become air emissions). Air emissions of VOCs, metals, and particu-
lates were measured, and the fate of heavy metals and combustible paint char was
determined. Based on environmental sampling data (Subsection 3.3), the water scrub-
ber and incinerator provide adequate control of emissions.
3.2 Test Results
3.2.1 Effects on Paints and Coatings
Some scrap parts were tested (production parts were not available) to deter-
mine the effectiveness of the fluidized bed in the removal of paints and coatings found
at RRAD. The parts tested were aluminum brackets used for a chair replacement and
a seat belt replacement. Because several of these parts were available in three or four
coating types, they provided an excellent source of test materials for investigation of
the effect of temperature on the various coatings.
3-2

The effectiveness of the FBPS on these parts was evaluated by using a stan-
dardized procedure to abrade the surface of the part after it was processed in the
FBPS. This procedure entailed the use of a commercially available scouring pad from
the Scotch Company, which is commonly used as a cleaning pad at the depot. This
pad, which consists of an abrasive material on a nylon webbing matrix, is typically
used to spot-clean corrosion off of metal parts. The test procedure consisted of treat-
ing parts in the FBPS at specific temperatures believed to bracket the optimum operat-
ing temperature for the particular paint. The processed part was removed from the
FBPS and cleaned with the test pads to remove the char. The relative effort required
to remove the char (i.e., the number of strokes required to clean lie part) was record-
ed. This information served as an indicator of the effectiveness of the FBPS in break-
ing down the paint. Table 3-1 shows the results of this testing. These data dem-
onstrate that a temperature of 750*F and a 1-hour residence time were adequate to
char the paint systems sufficiently to provide a cleanable part. Although some coat-
ings were effectively treated at lower temperatures and shorter tii,,es, 750 *F for 1 hour
appeared to be the minimum temperature and time capable of producing reliable re-
sults for all coatings.
3.2.2 Effects on Base Metal
The FBPS treatment can definitely affect the characteristics of the part's base
metal. Warpage and shape distortion can occur and render the part useless. The
FBPS treatment can also alter the heat treatment or temper of the metal. Tests dem-
onstrated that aluminum parts could not be treated in the FBPS because, in all cases,
the process softened the metal. This effect is shown in Table 3-2, which presents se-
lected hardness data on typical aluminum parts processed in the FBPS. Appendix C
presents a list of the metal parts evaluated during this project, which includes the alu-
minum parts evaluated and rejected for processing in the FBPS. In general, the only
parts suitable for FBPS treatment are those made of steels that are not heat-treated or
steels on which heat-treatment temperatures are high enough to preclude their being
affected by processing in the FBPS.
3-3
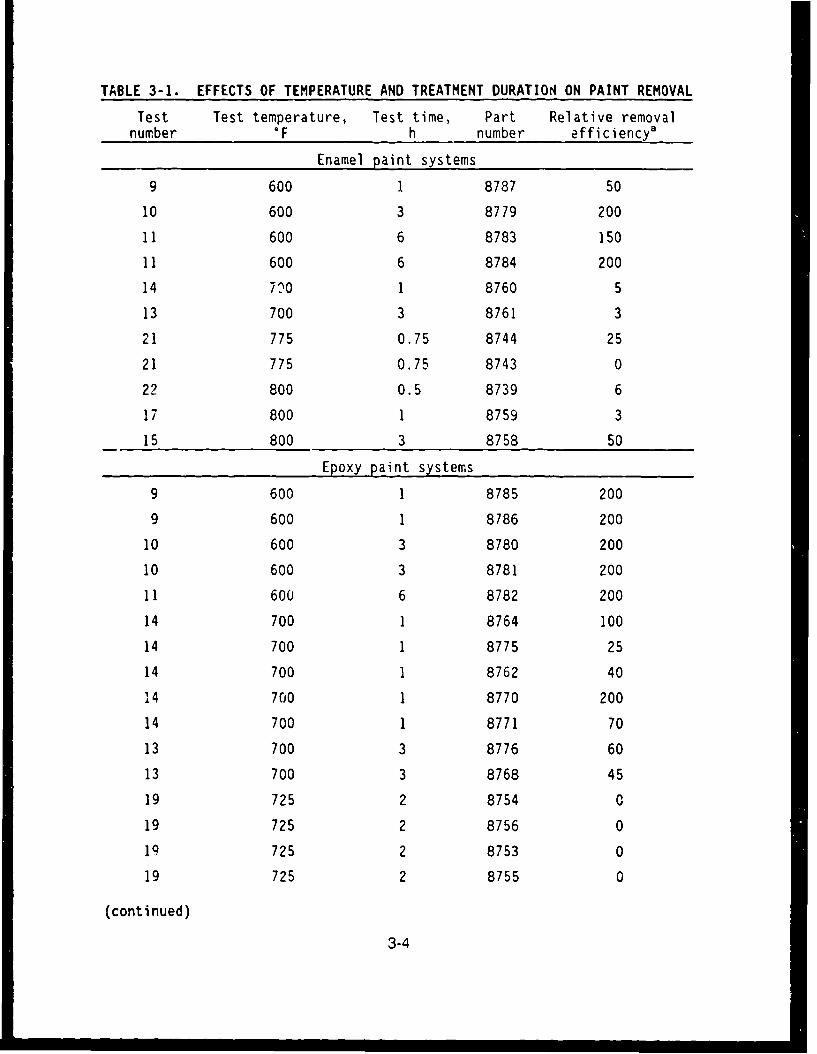
TABLE 3-1. EFFECTS OF TEMPERATURE AND TREATMENT DURATION ON PAINT REMOVAL
Test Test temperature, Test time, Part Relative removalnumber F h number efficiencya
Enamel paint systems
9 600 1 8787 50
10 600 3 8779 200
11 600 6 8783 150
11 600 6 8784 200
14 7M0 1 8760 5
13 700 3 8761 3
21 775 0.75 8744 25
21 775 0.75 8743 0
22 800 0.5 8739 6
17 800 1 8759 3
15 800 3 8758 50
Epoxy paint systems
9 600 1 8785 200
9 600 1 8786 200
10 600 3 8780 200
10 600 3 8781 200
11 600 6 8782 200
14 700 1 8764 100
14 700 1 8775 25
14 700 1 8762 40
14 700 1 8770 200
14 700 1 8771 70
13 700 3 8776 60
13 700 3 8768 45
19 725 2 8754 0
19 725 2 8756 0
19 725 2 8753 0
19 725 2 8755 0
(continued)
3-4

TABLE 3-1 (continued)
Test Test temperature, Test time, Part Relative removalnumber °F h number efficiencya
19 725 2 8755 0
19 725 2 8752 3
20 750 1 8774 3
20 750 1 8749 1
20 750 1 8750 3
21 775 0.75 8747 3
21 775 0.75 8737 15
21 775 0.75 8736 20
21 775 0.75 8745 3
21 775 0.75 8751 10
22 800 0.5 3740 0
22 800 0.5 8738 6
17 800 1 8777 5
17 800 1 8763 10
17 800 1 8772 1
15 800 3 8767 50
15 800 3 8765 20
15 800 3 8773 10
15 800 3 8769 0a Relative paint removal efficiency indicates the ease with which char was
removed from the treated part. The greater the number, the more diffi-cult the removal, which means less-efficient treatment. A zero indi-cates all char was removed by the FBPS. The highest possible number toindicate the degree of remuval difficulty is 200.
3-5

TABLE 3-2. EFFECT OF FBPS TREATMENT ON ALUMINUM PARTS
Hardness Rockwell "B"
Part number Description Before After
5127238 Air horn 35 20
5133296 Air horn base 35 0
8763560 Spring spool 40 0
10232625 Access door 36 0
10943071 Battery rack 35 0
10949605 Fuel cell cover 30 0
12292439 Motor support 38 0
12292441 Mr , rlamp 27 0
12298112 Sa. Ly handle 10 0
3-6

Five steel parts routinely processed at RRAD (Table 3-3) were considered good
candidates for FBFS treatment. Not only are these parts typical of the kinds of parts
most suitable for processing in the FBPS, they were also available in sufficient quantity
for use in this evaluation. The hardness data presented in Table 3-3 demonstrate that
the parts listed (except for the bearings) are unaffected by FBPS processing. The
bearings are not suitable for this treatment because the FBPS processing will destroy
the oil impregnation and possibly alter the shape or temper of the bearings.
TABLE 3-3. EFFECTS OF FBPS TREATMENT ON STEEL PARTS
Hardness (Rockwell -C)a
Assembly item number Part number Part Steel
and description description alloy Before After
P/N 12253143 i0866131 Spindle 4140H 36.4 37.2Idler aim 12253144 Arm 4140H 35.7 36.0
11633894 Bearing OL16 31.9 33.0
P/N 12268700 11660930 Trunio:n 4140H 32.5 32.8Road wheel arm assembly 8756363 Arm F54145H 33.6 33.9
10866123 Spindle 4140H 33.7 33.5MS35624-50 Pliug Unknown 35.1 34.6
P/N 12253578 11669367 Spindle F54142 40.0 39.7Idler arm 11669358 Housing 4140iH la. 381.2
11669365 Bearing OL'6 80.0 67.7
P/N 12276657 .2276657 flousing FS4130 3 6 .7 b36.7bRoad wheel housing support Bearing 0L16 68.8 68.2
P/N 10918159 10918160 Housing CSGRD115-95 28.9 28.9Road wheel housing Support
All parts were sectioned, and metallurgical samples were prepared from the sections. One-half of thesection was tested, and the results were reported as the "before"; the other half was processed in theFBPS for I hour at 8006F before being tested, and the results were reported as the "after" measurement.
Results are reported as Rockwell hardness "B" scale.
The relationship between hardness and temperature for a specific alloy can be
determined from standard material handbooks. These data can be used to determine
whether the FBPS processing will affect the metal. Figure 3-1 shows this hardness-
versus-temperature relationship for 4140 low-alloy steel. The figure demonstrates that
a Rockwell "C" hardness of 45 is achieved at 8000 F. A part [e.g., Part No. 11660930 -
Trunion (Table 3-3)1 would be unaffected by FE8PS treatment at 800 *F because its
Rockwell "C" hardness (33) is below curve. Similar data for the remaining parts are
also available.
3-7

60-
50
40HARDNESS
(ROCKWELL "C") 30 -
20 -
10-
0-
0 200 400 600 800 1000 1200 1400
TEMPERATURE, OF
Figure 3-1. Rockwell hardness vs. temperature for 4140 low-alloy steels.
3-8
3.2.3 Effect on Parts Processing
The only special preprocessing required prior to FBPS treatment is the removal
of significant organic components (e.g., large fabric sections or rubber sections) that
may be present on the part. Processing of parts after paint stripping would be virtually
unchanged by incorporation of the FBPS. The one exception to this is the need to re-
move any bed media remaining in or on the part. This would only be a concern for
parts that have internal machined or bearing surfaces or parts containing small pas-
sages that could become clogged with the bed media and therefore require special
cleaning. For example, engine heads and blocks would not be suitable candidates for
FBPS processirg becausn they contain numerous small passages and internal cavi-
ties.
The FBPS would not entirely eliminate either of the existing chemical paint-strip-
ping processes at RRAD. Each process (methylene chloride and caustic stripping)
woula still be needed for parts that are not suitable for processing in the FBPS. Be-
cause the aluminum parts found at RRAD are heat-treated, they cannot be processed
in the FBPS and would continue to be processed in the methylene chloride paint-strip-
ping process. The FBPS would reduce the number of steel parts stripped in the caus-
tic stripping process. A comparison of the quantities of waste generated by these
stripping methods is presented in Section 4.
Parts processed in the fluidized bed were found to require a followup white
metal blasting that took about the same length of time as the blasting required after
chemical stripping. Parts having machined surfaces (e.g., road arms) do not require
blasting; these parts are chemically treated and then cleaned by hand. When these
types of parts were processed in the FBPS, however, the final hand-cleaning operation
was found to be unnecessary. Road arms that were processed in the FBPS, however,
had to be processed with a corrosion remover because the fluidized bed had little or
no effect on corrosion removal.
3-9

3.3 Environmental Emissions Measurements
Evaluation of environmental emissions was part of the overall evaluation of the
FBPS (see Appendix D). The FBPS generates the following waste streams: 1) air ex-
haust from the afterburner and scrubber systems, 2) water discharge from the scrub-
ber system, 3) dust collected in the cyclone separator on the ventilation system be-
tween the fluidized bed and the afterburner, and 4) fluidized-bed media. These envi-
ronmental measurements were made over a relatively short test period. The types
and number of parts processed and the kinds of paints treated during this test may
not be representative of the types and number that would be routinely processed if the
FBPS were operated continuously during regular production. Therefore, the measure-
ments (i.e., quantification of metals in discharges) can only serve as indicators of
waste-stream characteristics.
Table 3-4 presents the quantities of four metals (cadmium, chromium, lead, and
zinc) found in the afterburner and scrubber system exhaust air. These data indicate
that controlled emissions of each of these metals from the FBPS would be less than
0.5 Ib/h. Emissions from the FBPS are regulated under the Texas Air Control Board's
Standard Exemption No. 87, which covers heat-cleaning devices. This Standard Ex-
emption limits the emission of any air contaminant to a maximum of 0.5 lb/h and
2.0 tons/yr. Atmospheric emission testing indicated that the irpcinerator completely
burned essentially all organic matter and that the FBPS is not a significant source of
VOC emissions (Appendix D). These results are consistent with the process operating
parameters submitted to the Texas Air Control Board when the unit was installed and
permitted for operation.
Table 3-5 presents results of sampling for these same metals in the liquid efflu-
ent from the scrubber system. Concentrations of metals in this discharge are ac-
ceptable for treatment at the industrial wastewater treatment plant located ,t RRAD.
Table 3-6 presents analyses of metals in the fluidized-bed media contained in
the hot bed and the cold bed, and the media collected in the cyclone separator. This
material (particularly the cyclone separator dust) is contaminated with metals that
could make it a RCRA-characteristic hazardous waste. Although the Toxic
3-10

U*) ) -e In 4n LA LA L
C,)
MU V) Ln Ln (D V) In LUn
c t-CU
- ~ ~ ~ ~ L (D. LA L A ( J n to4A 2 2 2 2 2 .0
W CO 2- C
chV
0 In ) (0 LA #D ID %n w In 00Lc) .I w 1w .Ii~ ~ aI I
'a - o m w Lj w'. 'D
Z ~ ~ ~ ~ ~ ~ ~ L 0 U IJ L L .I L L -)-
I CL (VU)~~ ~ IC) c.) r w0 ( '. .) ~ (
v 0 > 3Ifo Qooc
U.) 5' CA C
06 -T c (
4-0 GO a). 4 7. C I
z) -q U.
O c
0
LL. ... c. 02 0) m (
U') C2- . )vi L.. 0V) cu. 0. N ' -
0 0V >I .
co co co.. co to~ ej r- Q
I- 0 )CO C) - Q
'0 C) C 2 0 >
0.) - 0I
c
>. 0. -CZ C
LI c L L C n % ý CD
a- c-. CL Q. C
W- C) 0 ) ,) - ') C) 0 M -. Q 62
LS LI tn V(~) IVIV 0 M
a. C .0 .- 3 -11 O 0 C CL

TABLE 3-5. TOTAL METALS IN THE SCRUBBER EFFLUENTa
(mg/L)
Sample ID Cadmium Chromium Lead Zinc
30 0.004 0.083 <0.02 0.08231 0.002 0.030 0.0041 0.03132 <0.002 0.007 0.0007 0.02134 0.007 0.064 <0.02 0.20
Detection limit 0.002 0.006 0.02 0.008a The samples were collected as a series of grab sampling during the
emission tests. Samples 30 and 34 were taken while cadmium- andzinc-plated parts were being processed in the FBPS, and Sample 32was collected while aluminum-plated parts were being processed.
TABLE 3-6. ANALYSIS OF METALS IN THE FLUIDIZED-BED MEDIAa
(mg/9)
Sample description Cadmium Chromium Lead Zinc
Virgin material <0.2 9.8 0.7 2.9Cold-bed pretest 1.7 13 18 16Cold-bed posttest 2.8 15 23 22Hot-bed pretest 5.5 24 e3 34Hot-bed posttest 26.7 14.3 25.9 38.4Cyclone dust 40.4 35.1 77.5 161Detection limit 0.2 0.3 0.4 0.5
a Results are for total metals.
3-12
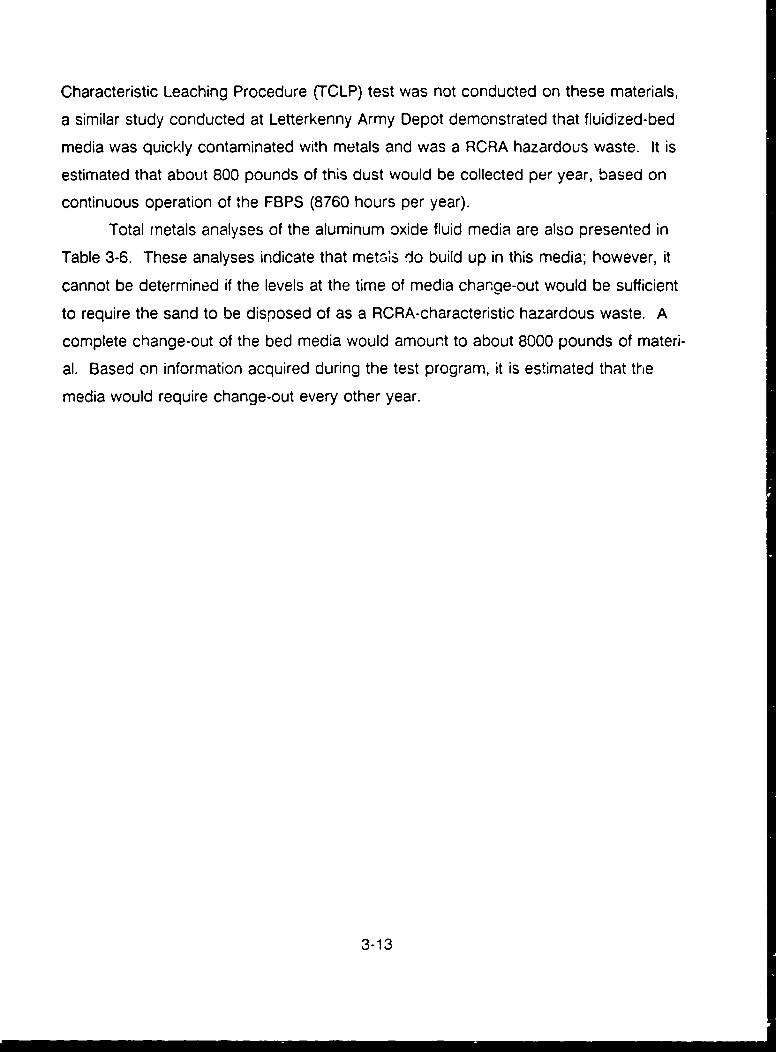
Characteristic Leaching Procedure (TCLP) test was not conducted on these materials,
a similar study conducted at Letterkenny Army Depot demonstrated that fluidized-bed
media was quickly contaminated with metals and was a RCRA hazardous waste. It is
estimated that about 800 pounds of this dust would be collected per year, based on
continuous operation of the FBPS (8760 hours per year).
Total metals analyses of the aluminum oxide fluid media are also presented in
Table 3-6. These analyses indicate that mets;s do build up in this media; however, it
cannot be determined if the levels at the time of media change-out would be sufficient
to require the sand to be disposed of as a RCRA-characteristic hazardous waste. A
complete change-out of the bed media would amount to about 8000 pounds of materi-
al. Based on information acquired during the test program, it is estimated that the
media would require change-out every other year.
3-13

SECTION 4
SYSTEM COMPARISONS
For comparison purposes, this section presents operational, waste generation,
and cost data for each of the two paint-stripping systems evaluated at RRAD--the
FBPS and aqueous caustic paint stripping--which represent two alternatives for strip-
ping paint from nonaluminum parts. Sizing of the systems and production capacities
are based on operating practices at RRAD.
4.1 FBPS
4.1.1 Operational Data
Heating-bed temperatures must be in excess of 6500 F to remove paint from
metal parts in the FBPS. In this study and a parallel study conducted by USATHAMA
at LEAD, such temperatures were found to cause aluminum to lose its temperature
hardness (temper). Because it is impractical to incorporate a heat-treatment step to
restore temper in the RRAD paint-removal operations, the FBPS is suitable for paint
removal on nonaluminum alloy parts only, which are not affected by the FBPS operat-
ing temperatures.
Paint, rubber, plastic, oil, grease, and other organic coatings or residues are
removed by the FBPS. Also, parts treated in the FBPS do not have to be cleaned in a
vapor degreaser before treatment.
Some safety concerns are associated with the use of a high-temperature pyroly-
sis treatment system. These include burn hazards and the control of toxic off-gases
(e.g., carbon monoxide, nitrogen oxides, and formaldehyde). Engineering controls,
safeguards, and monitoring are required to minimize worker exposures.
4-1

4.1.2 Waste Generation
Metals present in paints, coatings, and electroplates will accumulate in the
FBPS media. Organics are destroyed through pyrolysis or are volatilized in the hot
bed and destroyed in the afterburner. Although not confirmed by testing during the
program at RRAD, it is assumed that this accumulation of metals will eventually impart
the characteristic of RCRA toxicity to the meaia and cause it to be regulated as a
RCRA hazardous waste. The companion FBPS project conducted at LEAD demon-
strated that the media became contaminated with lead and was RCRA hazardous (by
TCLP testing) after only three runs. During the LEAD study, testing was conducted
with large loads of parts coated with lead-based paints. Because lead-based paints
are still relatively common in coatings stripped at RRAD, it is anticipated that spent
FBPS media will be classified as a hazardous waste. The manufacturer recommends
a biannual bed change-out, which would generate about 4000 lb of hazardous waste
per year. Based on information obtained during the LEAD study, about 3 lb of con-
taminated media per hour of operation would be lost through carryover, dragout, and
fugitive dust. This represented a more significant waste stream than that produced by
bed change-out. Operations of the FBPS at RRAD, however, included methods to
collect carryover and dragout and return it to the fluid bed, which eliminated this po-
tential waste.
4.1.3 Capital and Annual Costs
The estimated installed capital cost of the FBPS ($512,000) reflects the actual
installed cost of the demonstration unit at RRAD.
Table 4-1 presents estimated annual costs of the FBPS. Treatment of a road
arm (Part No. 8756363) was used as the basis for costs. A production rate of
250 parts per week was used as the basis for calculation; this rate was based on ob-
servation and best engineering judgment. The per-part cost of $9.51 for the FBPS
reflects RRAD operations and could differ at other locations.
4-2

TABLE 4-1. ANNUAL COSTS OF THE FBPS
(1991 dollars)
I tern Cost
Labor
Operating labor, 2080 h at $20/h 41,600
Maintenance labor, 150 h at $20/h 3,000
Total 44,600
Raw Materials
Aluminum oxide makeup, 0.5 lb/h at $1.20/lb 1,250
Aluminum oxide change-out, every 2 years 2,500
Spare parts, 1 percent of capital cost 5,120
Total 8,870
Utilities
Electricity, average of 37 kWh, at 4.2d/h, 2080 h 3,230
Water, 250 gal/h at 0.46/1000 gal, 2080 h 230
Natural gas for incinerator, 0.2 million Btu/h at $3/h, 2080 h _1,250
Total 4,710
Waste Disposal and Treatment
Water, 250 gal/h at 0.46/1000 gal, 2080 h 230
Aluminum oxide made up and changed at 1.5 lb/h at 45€/h, 2080 h 1,400
Paint char disposal, 20,000 ft2 of 10 mil coating, 100 b/ft, 380
50 percent to char at 45t/lb
Total 2,010
Capital Recoverya
15 years, 9 percent interest ($512,000 x 0.12394) 63,460
TOTAL ANNUAL COST 123,650
250 road arms per week, 52 weeks = 13,000 road arms
COST PER ROAD ARM 9.51
a Based on methods contained in Grant, E. L., and W. G. Iresor. Principles of
Engineering Economics. Fifth Edition. Ronald Press Co., New York, 1970.
4-3
4.2 Aqueous Caustic Paint-Stripping Systems
4.2.1 Operational Data
Parts treated by caustic stripping must first undergo vapor degreasing. Any
rubber or plastic must be removed from the parts.
Past operational practices at RRAD incorpora~ed corrosion removal with caustic
stripping. This was accomplished by mixing the corrosion-removal chemicals with the
caustic paint stripper, which allowed corrosion and paint io be removed in one opera-
tion. Current operations use separate tanks for these solutions.
The caustic stripper system involves no unique safety requirements other than
those normally in place during the handling of heated corrosive liquids.
4.2.2 Waste Generation
Because cc."taminants gradually build up in the caustic solution and impede its
effectiveness, the solu'ion must be periodically disposed of and replaced with fresh
solution. Caustic stripping at RRAD generates both liquids and sludges that are classi-
fied as RCRA hazardous waste. Other waste streams generated by the caustic strip-
ping process include overflow from the rinse tank, which is discharged to the onsite
industrial waste treatment plant (IWTP), and spent TCA and vapor degreasing resi-
dues, which are disposed of offsite as hazardous waste.
4.2.3 Capital and Annual Costs
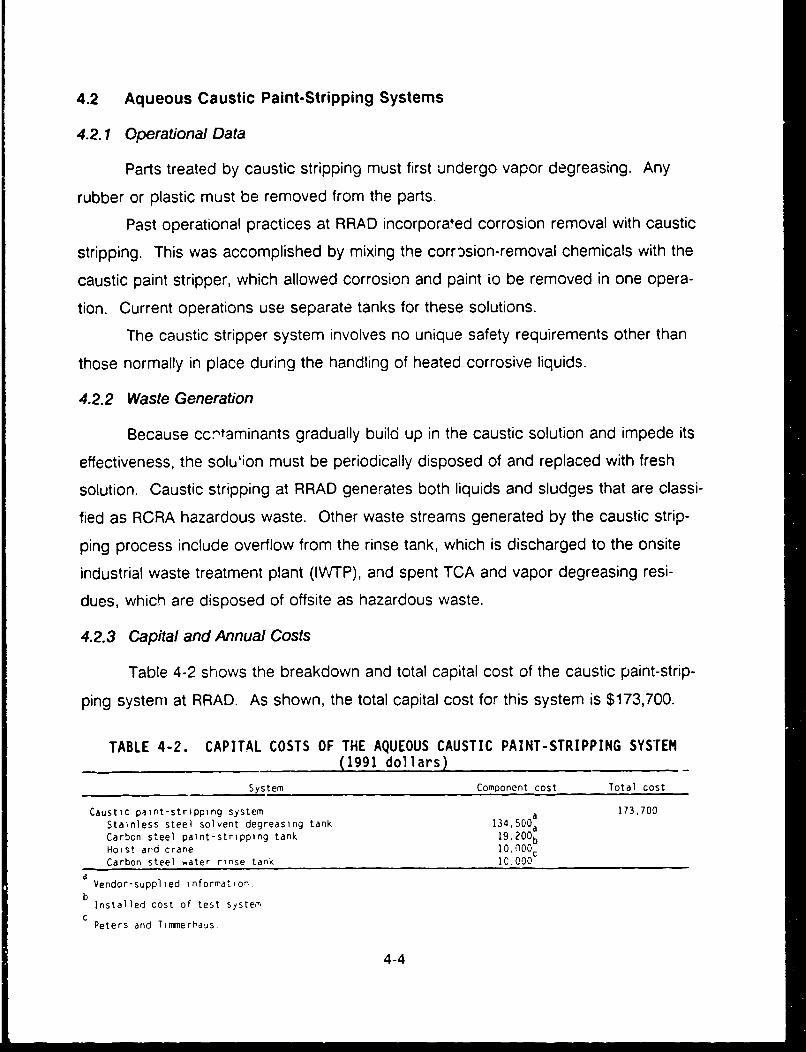
Table 4-2 shows the breakdown and total capital cost of the caustic paint-strip-
ping system at RRAD. As shown, the total capital cost for this system is $173,700.
TABLE 4-2. CAPITAL COSTS OF THE AQUEOUS CAUSTIC PAINT-STRIPPING SYSTEM
(1991 dollars)
System Component cost Total cost
Caustic paint-stripping system 500a 173,700
Stainless steel solvent degreasing tank 134. a
Carbon steel paint-stripping tank 19,200bHoist and crane 10, OO)
Carbon steel water rinse tank IC.O00d Vendor-supplied information,.
b Installed cost of test system.
C
Peters and Tirmierhaus
4-4

Table 4-3 presents the estimated annual costs of the aqueous caustic paint-
stripping system. The production rate used in this calculation was 750 parts per week,
based on observation and best engineering judgment. The estimated cost per part is
$4.11.
4.3 Comparison of the Two Systems
As indicated in the preceding discussions, the cost of the FBPS is more than.
twice that of the caustic stripping system, and it has only about 30 percent of the pro-
duction capacity. Matching the production capacity of a solvent-based system would
require either the purchase of a second FBPS or the operation of one unit on a multi-
shift basis. The latter would be the less costly option. Adding a second shift would
double all the operating costs in Table 4-1 except the capital recovery factor and result
in a total cost of $183,840 per year. Based on processing 13,000 parts per year per
shift, the operating cost per part would be about $7.10.
Another noteworthy difference in tho twvo systems involves safety. The FBPS
poses some safety concerns that would have to be minimized through engineered
controls, safeguards, and monitoring. The caustic stripping system, on the other
hand, involves no unique safety requirements other than those normally in place dur-
ing the handling of heated corrosive liquids.
The difference in waste generation is of primary interest. Wastes are generated
in the form of accumulated metals in the media of the FBPS system. This spent media
waste is expected to be regulated as RCRA hazardous waste. In the caustic stripping
system, contaminants build up in the caustic solution and impede its effectiveness.
This solution and associated sludges must be disposed of and replaced with fresh
solution. At RRAD, both liquids and sludges that are classified as RCRA hazardous
waste are generated. Other hazardous wastes generated by the caustic stripping sys-
tem that must be disposed of offsite include spent TCA and vapor degreasing resi-
dues.
4-5

TABLE 4-3. ANNUAL COSTS OF THE AQUEOUS CAUSTICSOLVENT-BASED PAINT-STRIPPING SYSTEM
(1991 dollars)
Item Cost
Labor
Operating labor, 4160 h at $20/h 83,200Maintenance labcr, 150 h at $20/h 3,000
Total 86,200
Raw Materials
Biannual replacement of paint stripper, 2500 gal at 60¢/gal 1,500Caustic makeup, 200 lb/day, 7t/lb, 260 days 3,640Trichloroethane losses, 5 gal/day, 260 days at $6.02/gal 7,830Spare parts, 1 percent of capital cot 1,740
Total 14,710
Utilities
Electricity, 25 kW, 2080 h at 4.2C/kWh 2,180Chilled water for degreaser coils, 1000 gal/h at $3/1000 gal, 6,240
2080 hSteam, 500 lb/h at ý3/1000 1b, 2080 h 3,120Rinse water, 1000 .1/h at $0.46/1000 gal, 2080 h 960
Total 12,500
Waste Disposal and Treatment
Degreaser sludge disposal, 5 gal/day, 260 days, 11 lb/gal, 6,44045€/lb
Water, 2000 gal/h at 46¢/1000 gal, 2080 h 1,910Spent stripper disposal, biannual replacement, 2500 gal, 10,130
9 lb/gal, 45t/lbPaint sludge, 60,000 ft 2 of lO-mil coating, 100 lb/ft3 , 6,750
1/3 paint, 2/3 water and solvent
Total 25,230
Capital Recoverya
15 years, 9 percent interest ($173,700 x 0.12394) 21,530
TOTAL ANNUAL COST 160,170
750 Road arms per week, 52 weeks = 39,000 road arms
COST PER ROAD ARM 4.11a Based on methods contained in Grant, E. L., and W. G. Iresor. Principles of
Engineering Economics. Fifth Edition. Ronald Press Co., New York, 1970.
4-6

SECTION 5
CONCLUSIONS
The FBPS is not a suitable replacement for the chlorinated solvent stripping sys-
tems currently used to remove paint from aluminum and aluminum alloy parts at
RRAD. When exposed to 700 to 800 * F temperatures for the 1-h residence time re-
quired to pyrolize paint, aluminum parts lost essentially all of their hardness (temper).
To use the FBPS to treat aluminum parts would require the addition of a heat-treat-
ment step, which would be impractical.
In most cases, the FBPS can remove paint from nonaluminum and non-heat-
sensitive parts without affecting the temper or causing warpage or shape distortion;
however, some parts (such as thin vent covers) may be warped. Although degreasing
is not required before treatment, the cost of using FBPS is significantly higher than the
cost of using the caustic stripper system. Costs per part for the FBPS treatment are
70 to 130 percent higher, depending on the number of shifts the system is operated.
Because not all nonaluminum non-heat-sensitive parts can be processed in the FBPS,
it cannot be used to eliminate caustic stripping. This treatment would not be suitable
for parts with crevices, channels, or cavities that would retain FBPS media and be diffi-
cult to clean afterward (e.g., engine blocks).
Metals present in the paints and coatings stripped from parts treated in the
FBPS accumulate in the bed media. These metals would likely cause the bed material
to be a RCRA-characteristic hazardous waste because of toxicity. Because media
dragout and dusts were captured and recycled, the volume of this waste was estimat-
ed to be much less in this system than in the FBPS tested at LEAD. The FBPS gener-
ates less waste on a per-part basis; therefore, the overall amount of waste generated
would be reduced regardless of the percentage of the parts treated in the FBPS. Air
5-1

emissions were adequately controlled by the system and were within the constraints of
the State permit. Scrubber water retained some of the metals, but it was still accept-
able for treatment in the onsite IWTP.
Because these conclusions are based on testing conducted under controlled
conditions and noncontinuous operation, they shou!d be verified by further analysis.
5-2
II

APPENDIX A
DESCRIPTION OF RED RIVER ARMY DEPOT ACTIVITIES
A-1

APPENDIX A
DESCRIPTION OF RED RIVER ARMY DEPOT ACTIVITIES
In addition to being a repository for weapons and ammunitions, RRAD has
multiple other missions. A primary mission is the maintenance of selected military
vehicles. This maintenance activity is the subject of this summary. The maintenance
responsibility at the Depot varies, depending on military vehicles being used in the
field. Principally, RRAD is responsible for maintaining 2- to 10-ton trucks, trailers,
113-type armored personnel carriers (M577 Armored Command Post, M106 Self-Pro-
pelled Mortar, M741 Vulcan Weapons Carrier, M730 Chaparral Missile Carrier, etc.),
and Bradley tanks. It also performs some maintenance on pickup trucks and other
types of vehicles. Figure A-1 is a photograph of a typical truck processed at RRAD.
The Depot operates several types of programs for military vehicles, including in-
spection and repair programs, complete tear-down/rebuild programs, engine stocking
programs, etc. These programs can be subdivided by the following activities: compo-
nent tear-dowvn, component cleaning, component rebuild, assembly, and stocking.
Vehicles received at RRAD are stored outside in large lots. When orders are
received regarding which vehicles are to be repaired, the fue! is drained from these
vehicles and they are moved into the disassembly area.
In the disassembly area, the large, heavy, track components and some of the
exterior armament components are removed from the vehicle. It is then moved to a
separate disassembly area, where the engines, transmissions, and remaining interior
components are removed. When the vehicle has been stripped down to the hull, it is
steam-washed. The remaining components are shipped either to further disassembly
A-2

a)(I)U)a)C-)00�
C-)
0�
a)
0)
P3

areas or to disposal/salvage. Some components are only partially disassembled and
others are completely disassembled before cleaning. For example, the engines are
moved to an engine disassembly area, where they are completely dismantled.
The amount of disassembly done on the vehicle depends on whether it is a
complete tear-down/rebuild candidate or is scheduled for inspection and repair. The
Depot's missions change as the requirements of the military commands change.
Inspection and repair (I&R) are common programs at RRAD. In the I&R pro-
grams, the vehicle is only disassembled to the point required for inspection and repair.
This program typically involves removal of such items as engines, transmissions, and
tracks; it usually does not include all the internal and external components.
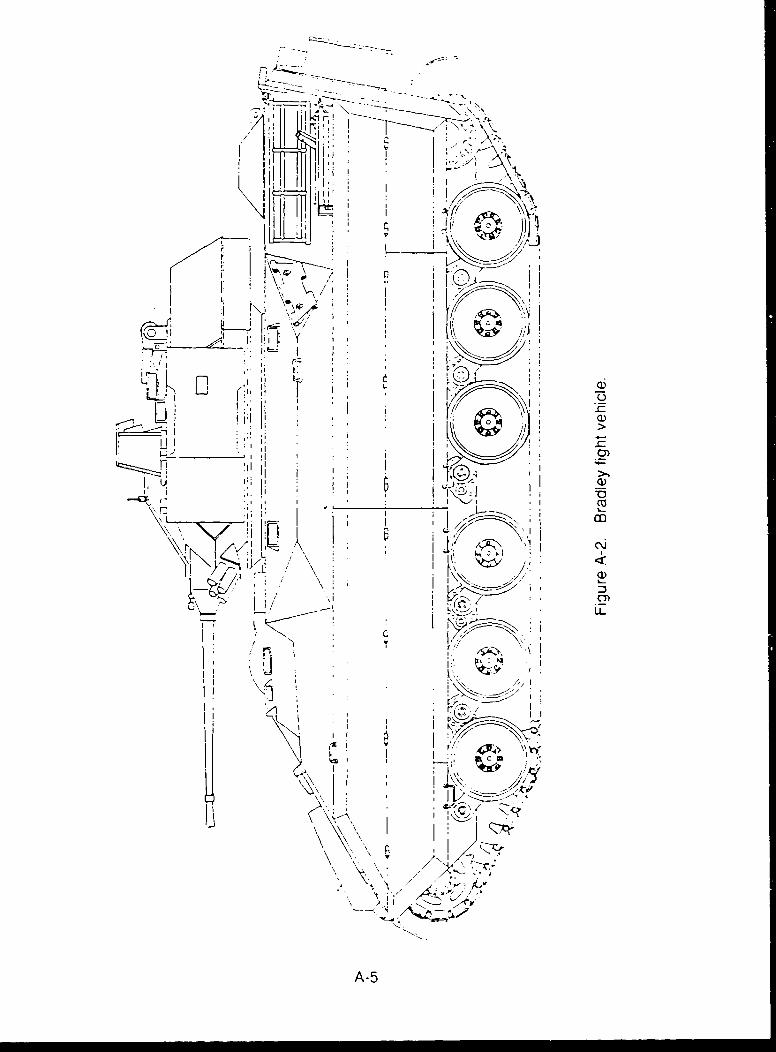
There are several variations of the basic Bradley tank and the M113 vehicles
(the two vehicle types from which parts were selected for evaluation in the FBPS).
The two basic variations in the Bradley (A-1 and A-2) differ primarily in engine size and
armament. Several of the other variations deal with the housing configuration (loca-
tions of holes, exhaust ports, and other minor differences). Figure A-2 shows a sche-
matic side view of a complete Bradley.
The Type-113 vehicle includes a more extensive number of variations--12 basic
variations and several minor variations. Figure A-3 shows the 12 basic vehicle types in
the 113 family of vehicles, and Figure A-4 shows a schematic side view of a complete
113 Tracked Armored Personnel Carrier. Each of these different vehicles carries differ-
ent identification name plates, but all are similar with regard to engines, transmissions,
and basic running gear and chassis design.
The Depot is divided into several specific areas for cleaning and repair, includ-
ing Buildings 333, 345, 348, and the Body Shop. Each of these buildings has numer-
ous processing areas. Building 345, for example, contains several cleaning shops,
welding shop areas, disassembly and repair areas, transmission and hydraulic repair
areas, a plating shop, machine shops, and various office areas.
When the vehicles are released for repair, they are taken to Building 345, first
floor (345-1), Row 1, Column W, where the tracks and the largest parts are removed.
A-4
10)
L I Z
r Ir
'IA-5

I.AL.
NO
Figure A-3. M113A2 family
A-6

-�Z� �
. /r �'"-
I.
/
II � L
* a)
C)-�
CC* o
Ka)
4- 0..
. -. -oa)0
cAeH �8 EA:I I
'I A�i2. a)il 'I I
t�K 0cv4- ¶ ii - 4-
t 0.00 -,
4. I *
'-'--S *�Z)1-i I '-.
N a)-4 r- 4-
C I - �if cOo
0 U-
'1
p.-,
A-7

Figure A-5 shows a schematic of a Bradley tank, and Figure A-6 is a photograph of an
actual Bradley tank with the side armor removed in thisi area.
After the parts removal in Building 345, the vehicles are moved either to tempo-
rary storage or to Building 333. In Building 333, the vehicle is first taken to the hull
disassembly area, where the remaining parts are removed and placed in pallets. Fig-
ure A-7 is a photograph of a vehicle being disassembled in this area.
At this disassembly area, parts are broken down into several categories: those
requiring further disassembly, those to be cleaned, and those intended for salvage.
Some of the parts sent to cleaning are not fully disassembled. Parts to be cleaned are
distributed to the following areas: Body shop, Building 345 wash rack, sand blasting,
Building 348 wash rack, or Building 345 Line 10. Some parts are cleaned and then
disassembled further; some are cleaned and then worked on as assemblies. The
degree of disassembly and whether the part is cleaned before further disassembly
depends on the workload as well as the specific configuration of the parts. Those
determinations are typically made by the Depot and are subject to change depending
upon the processing capabilities at the time the parts are processed.
The cleaning activities at RRAD are divided into the following general categories:
washing, abrasive cleaning, degreasing, chemical cleaning, and manual cleaning with
various brushes and other mechanical methods. Washing includes steam cleaning,
soap-and-water wash, and water blast. Abrasive cleaning includes walnut hull, silica
sand, stainless steel shot, aluminum oxide grit, glass bead, etc. Those operations are
carried out in automated blast cabinets (for things such as the vehicle hulls), in small
hand cabinets (for some smaller components), in larger fully enclosed cabinets (for
larger parts), or in rotoblast type equipment. Degreasing involves the use of such
components as 1,1,1-trichloroethane vapor degreasing and other degreasing agents
(e.g., Stoddard solvent). Chemical cleaning includes various paint-stripping agents,
such as methylene chloride and caustics, as well as various rust-removal and corro-
sion-removal components.
Parts considered to be candidates for the fluidized-bed paint stripper were
found in various cleaning and disassembly areas. During repair programs, vehicles of
A-8

KT* 4
27A
-~ 229
- 10
-A-

VU)
0E0)
0)C
-o0
EU)
V0)
0-cU,
0)
1��
'C0�I-.0)00'C�1�
c64:0)1...
0)
A-iO

0-
CIc-)
L0-co0
AA CL

a specific type are accumulated and all vehicles of that particular type are processed
together. This produces specific collections of parts for cleaning and rebuilding at
different times within the Depot. Typical campaigns can last from a few weeks to
years, and different campaigns can be ongoing simultaneously in different parts of the
Depot. Therefore, different collections of parts were available at different times for
evaluation in the FBPS.
The three major cleaning areas from which parts were taken are Building 348
(although RRAD discontinued use of this building shortly after all field data were taken,
it was active during the testing and a discussion of nctivities in that building is still
relevant to this report); Building 345, first floor (North Wash Rack); and Building 345,
second floor. Each of these areas had several cleaning lines.
The various cleaning processes affected by the FBPS in each area can be divid-
ed into three general categories: degreasing, aluminum or nonferrous cleaning, and
ferrous cleaning. Early in the evaluation of the FBPS, aluminum parts were eliminated
as candidates for processing in the FBPS because the operating temperatures re-
moved temper from aluminum parts and all aluminum parts investigated at RRAD were
so treated or conditioned. Therefore, only the ferrous cleaning operations are affected
by operation of the FBPS. Current processing at RRAD includes corrosion-removal
and paint-stripping operations. Inasmuch as FBPS does not remove corrosion, chemi-
cal corrosion treatment is still required on many FBPS candidate parts. Thus, the
current chemical cleaning operations would have to be modified if the FRPS were
used. Such modifications are the subject of other ongoing studies at RRAD and other
depots and are not addressed in this report.
A-12

APPENDIX B
TEST PLAN FOR EVALUATING THE PROCEDYNEFLUIDIZED-BED PAINT STRIPPER AT
RED RIVER ARMY DEPOT
B-1

SIII-III
TEST PLAN FOR EVALUATING THE PRUCEDYNEFLUIDIZED-BED PAINT STRIPPER AT
RED RIVER ARMY DEPOT
II
Prepared byPEI Associates Inc.1006 North Bowen Rd.
Arlington, Texas 76012 1
I
PN 3769-5 1II
Prepared forUnited States Army
Toxic and Hazardous Materials AgencyAberdeen Proving Grounds
Baltimore, Maryland
April 1990
B-2i

Revision No. 0
Section No.Page of ofDate May 5, 1990
CONTENTS
Section Page
Figures ivTables vPreamble iv
I Introducticn I- 1
II Objectives of the Test Plan II- 1A. Define Fluidized Bed Paint Stripper
Operating Conditions II- 1B. Establish Incidental Effects of the
Fluidized Bed Paint Stripper on Coatingsand Metals II- 7
C. Prepare a Technical Report on the Appro-priate Uses of the Fluidized Bed PaintStripper II- 7
D. Train RRAD Operating and MaintenancePersonnel II- 8
E. Environmental Emission Testing II- 8
III Test Parameters III- 1A. Pre-Fluidized Bed Paint Stripper III- 3.B. Fluidized Bed Paint Stripper II- 3C. Post-Fluidized Bed Paint Stripper III- 4D. Parts Evaluation and Control III- iE. Part Finishing Systems III- 6
IV Categorize Parts IV- 1A. Part is Free-Flowing IV- 7B. Minimize Combustibles IV- 7C. Environmental Emissions (Cadmium, Zinc,
PVC's, Oil and Grease, Etc.) IV- 8D. Size, Shape, and Coating IV-1IE. Structural and/or Mechanical Integrity IV-11F. Excluded Parts IV-13
V Parts Data V- 1A. Uniquely Mark Parts V- !B. Record Part Numbers V- 2C. Obtain Part Drawings V- 2
8-3

I
Revision No. 0Section No.Page ofDate May 5, 1990
CONTENTS (continued)
Section Page iD. Record Complete Information on Data Sheets V- 6E. Maintain Computerized Data Base of Parts V-14
VI Pre-Operational Testing VI- 1
VII Operation Demonstration VII- 1 1VIII Operational Tests VIII- 1
IX Data Evaluation IX- 1X Report X- 1 I
A. Introduction X- 1B. Description of Parts Tested X- 1C. Description of Test Results X- 2D. Discussion of the Evaluation Criteria X- 2E. Recount the Operational Test Parameters X- 2F. Present the Recommended Parts Control
Parameters X- 2 _G. Recommended Additional Testing X- 3
H. Conclusions X- 3
I
IUI
B-4
l-

Revision No. 0Section No.Page ofDate May 5, 1990
TABLES
Number Page
1 Processing Conditions III- 5
2 Part Geometry and Quantity of Plating IV-10
IB-5
I

I
Revision No. 0Section No.Page _ of
Date May 5, 1990
UFIGURES 1
Number PaQe
1 Overall decision process IV- 2
2 Block 1 - decision tree to decide if a part 3should be processed IV- 3
3 Continuation of Block 1 of processing decisiontree IV- 4
4 Block 2 - decision tree to decide if part wassuccessfully processed IV- 5
5 Block 3 - successful reuse decision tree IV- 6
6 Part-specific data collection sheet andIinstructions V- 3
7 Completed data sheet data sheet V- 5 38 Test data sheet and instructions V- 7
9 Completed example test data sheet V- 9
10 Pre- and post-processing data and instructions V-10 311 Completed pre/post-processing data sheet for a
specific part V-12 312 Completed pre/post-processing data sheet for a
specific part V-13
IIU
I

Revision No. 0Section No.Page _ ofDate May 5, 1990
PREAMBLE
This test plan is a numbered, controlled circulation docu-ment. It is intended that periodic updates will be developed andissued to the Plan Holders. The updates will be replacement/ad-ditional pages. Each Plan Holder (listed below) is responsiblefor maintaining his plan current. If there are any questions orcomments direct them to the Project Manager.
Robert ResslPEI Associates, Inc.1006 N. Bowen RoadArlington, Texas 76012(817) 460-0777
Planno. Elan holder Affiliation
1. Ed Hanna RRAD2. Ron Jackson USATHAMA3. Dick Gerstle PEI4. FBPS operator RRAD5. PEI onsite coordinator PEI6. Project Manager PEI
Revision History
SItem Date
D InXitial Issue Df Test Plan May 5, 1990
B-7

IRevision No. 0Section No. IPage 1 of 3Date May 5. 1990
SECTION I. INTRODUCTION
This test plan provides specific information on parts pro-
cessed in the fluidized bed paint stripper (FBPS) at the Red 3River Army Depot (RRAD) will be evaluated. Included is a brief
introduction on how the fluidized bed works, a discussion of the
test objectives, and specific test procedures and methodologies.
The U.S. Army Toxic and Hazardous Material Agency (USATHAMA), 3through its contractor, PEI Associates, will purchase and install
a Procedyne Corporation FBPS at the RRAD. The FBPS is a produc-
tion unit used to remove paint, oils, and greases from metal Iparts by immersing the parts in a fluidized bed of aluminum oxide
granules maintained at temperatures high enough to pyrolyze or-
ganic matter. Typical temperatures range from 700 to 1,000°F
with residence times in the bed of approximately one hour. Usu- 3ally there is insufficient oxygen in the bed to support combus-
tion. Therefore, organic matter on the parts and in the coatings
(paints and primers) are pyrolyzed in the FBPS to carbon and
carbon monoxide. An inline gas-fired incinerator burns the car-
bon monoxide and fluidizing bed gases. The products of combus-
tion are exhaustad through a water venturi scrubber to the atmo-
sphere. 3During the pyrolization, the binders (organic compounds) in
the paints and primers are destroyed. Once the binders are de- 3stroyed, the part is left coated with a loosely adhering char
composed of carbon and inorganic paint pigments. Plans are to
remove the char using a low-energy shotblaster or other removal
techniques, thus, leaving the part ready for recoating. IThe FBPS is an alternative to solvent-based paint stripping
systems. Solvent-based paint stripping systems typically use
methylene chloride and other chlorinated solvents. The solvents 3
B-8I

Revision No. 0Section No. IPage 2 of 3Date May 5, 1990
chemically destroy the organic binders in the paint. Once de-
stroyed, the remaining coating material is removed with washing
action or shotblasting before recoating.
Typically, chemical paint stripping solvents are toxic and
volatile. Methylene chloride, the most commonly used solvent, is
especially volatile (boiling point 40°C or 104°F). The chemical
paint stripping process generates sludge. The sludge consists of
stripped coatings contaminated with paint stripper solvents. The
sludge is listed as a categorical hazardous waste and must be
disposed of as such. PEI and USATHAMA believe that installation
of the FBPS will reduce atmospheric releases of stripper con-
pounds (mostly chlorinated solvents) and reduce the volume of
hazardous wastes requiring disposal. Therefore, the objective of
this test program is to demonstrate that the use of a FBPS will
reduce hazardous waste while satisfactorily removing coatings (or
assisting removal) and facilitate reuse of parts at the RRAD.
A FBPS is an alternative to chemical paint stripping. How-
ever, the FBPS uses high temperatures that may affect the parts
(temper, hardness, metallurgy, physical dimensions etc.). There-
fore, this project must, besides determining the FBPS's useful-
ness as a hazardous waste minimization process, determine which
parts can be processed in the FBPS and the appropriate processing
steps and conditions. This test plan defines how this will be
done.
The test plan is divided into sections. Section II discuss-
es the objectives of the test plan. Section III discusses the
test parameters. Section IV describes the methods of parts cate-
gorization, procedures for determining if processing should be
attempted, and a part's ranking system that allows processing of
the most likely candidate parts first. Section IV also includes
several decision trees that describe how the categorizing and
ranking are done. Section V presents the forms used to record
parts data on the evaluated parts. Section VI describes
B-9

Revision No. 0Section No. IPage 3 of 3Date May 5. 1990
pre-operational testing planned for selected parts. The pre-
operational testing provides more detailed data used to revise
the test plan before the actual operational testing in the demon-
stration bed. Section VII discusses operational test data and
the how the data will be used in the operational demonstration
testing. Section VIII discusses the operationdl tests. Section
IX discusses how data is evaluated. Section X describes sections
of the report prepared after completion of the testing.
The test plan is a fluid document that will be revised as 3the testing progresses. The test plan will be maintained in a
loose-leaf binder and periodically updated. Distribution of the 3document is controlled and each copy numbered and assigned to a
specific user. Updates will be issued on an as needed basis to
the plan holders. The plan holders will be responsible for re-
placing the revised pages and removing and discarding replaced
pages. Each page will be identified by revision number, section,
page number, and revision date. A revision history is included
in the Preamble. 3
IIIIII
B-lO i
I

Revision No. 0Section No. IIPage _1_ of aDate May 5. 19.90
SECTION II. OBJECTIVES OF THE TEST PLAN
The FBPS testing has five objectives:
" "Find appropriate FBPS operating conditions for variousparts/coating systems.
° Establish the effect of the FBPS on the cleaned parts.
° Prepare a technical report on the appropriate uses ofthe FBPS.
° Train RRAD personnel to operate and maintain the FBPS.
Determine the FBPS effect on waste generation at RRAD.
This section of the test plan outlines how the testing pro-
cedures will be used to meet the objectives. Processed parts
will be identified and data on their "before" and "after" condi-
tions recorded. Satisfactory demonstration of the FBPS operation
may require additional processing (for example, parts may require
secondary cleaning in a low-energy shotblaster). Also, parts may
require additional processing, such as heat treating, chemical
washing, coating treatments, etc. Once cleaned, parts will be
reconditioned, pending satisfactory evaluation, and placed back
in service. No part will be placed in service until the project
manager determines that the FBPS did not adversely affect the
part.
Parts will be evaluated in a step-wise fashion. For exam-
ple, the condition of parts before the FBPS, after the FBPS,after secondary cleaning, after intermediate treating, after
final recoating/reconditioning. Such a step-wise evaluation
process will simplify evaluations and be more effective in the
management of available resources.
B-1 1
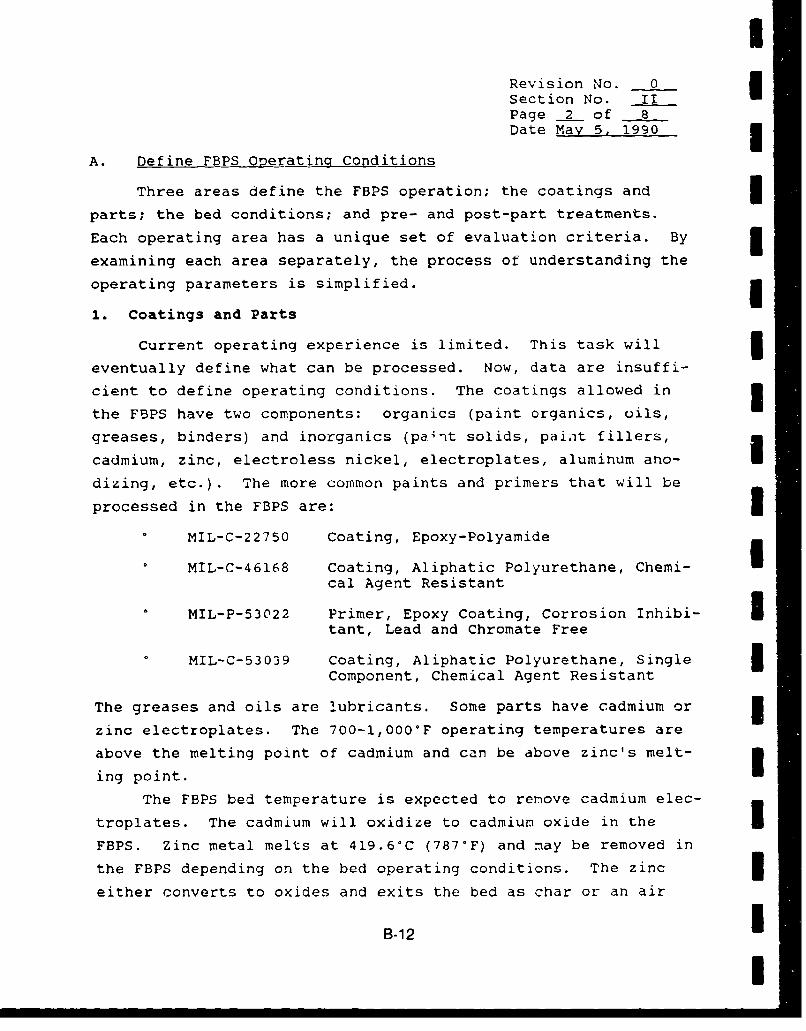
I
Revision No. 0Section No. n-Page 2 of 8Date Mav 5, 1990
A. Define FBPS Operating Conditions
Three areas define the FBPS operation; the coatings and
parts; the bed conditions; and pre- and post-part treatments.
Each operating area has a unique set of evaluation criteria. By 3examining each area separately, the process of understanding the
operating parameters is simplified.
1. Coatings and Parts
Current operating experience is limited. This task will 3eventually define what can be processed. Now, data are insuffi-
cient to define operating conditions. The coatings allowed in
the F5PS have two components: organics (paint organics, oils,
greases, binders) and inorganics (paint solids, paint fillers,
cadmium, zinc, electroless nickel, electroplates, aluminum ano-
dizing, etc.). The more common paints and primers that will be
processed in the FBPS are: 3MIL-C-22750 Coating, Epoxy-Polyamide
MIL-C-46168 Coating, Aliphatic Polyurethane, Chemi- Ical Agent Resistant
MIL-P-53022 Primer, Epoxy Coating, Corrosion Inhibi- itant, Lead and Chromate Free
MIL-C-53039 Coating, Aliphatic Polyurethane, Single
Component, Chemical Agent Resistant
The greases and oils are lubricants. Some parts have cadmium or
zinc electroplates. The 700-1,000°F operating temperatures are
above the melting point of cadmium and can be above zinc's melt-
ing point.
The FBPS bed temperature is expected to remove cadmium elec-
troplates. The cadmium will oxidize to cadmium oxide in the
FBPS. Zinc metal melts at 419.6°C (787-F) and may be removed in
the FBPS depending on the bed operating conditions. The zinc
either converts to oxides and exits the bed as char or an air
B-12i
!

Revision No. 0Section No. IIPage• of 8Date May 5, 1990
contaminant, or liquefies and remains in the bed on coo-e- bed
parts until physically removed. Part of the test progr ; is to
determine the fate of zinc and cadmium electroplates in the bed.
These and other heavy metals are potentially damaging to the
environment and require special attention before processing.
Most of the other inorganic coatings (including paint inorganics)
will not be removed in the FBPS. For example, chromium and nick-
el electroplates, anodized aluminum coatings, aluminum chromate
conversion coatings, and zinc phosphate steel coatings should be
unaffected by the FBPS.
Evaluation of the parts is necessary since the project ob-
jectives include verification of the effect of the FBPS on the
inorganic coatings. Normal processing requires dimensional
checking of hard chrome and nickel plated parts (mostly bear-
ings). This information is also used to verify dimensional sta-
bility after cleaning. These surfaces are replated, if neces-
sary, after cleaning to restore them dimensionally. Other
cleaning processes typically remove the other coatings as part of
the reconditioning process. While heating may weaken these coat-
ings through thermal stress, differential expansion between the
base metal and plating, and phase changes, the FBPS will not
appreciably remove them.
Thousands of parts are possibly processed at RRAD. The
testing will identify the various metal parts. Metal parts pro-
cessed in the FBPS are possibly aluminum alloys (5083, 5086, and
6061), aluminum castings (355 or 356), carbon steel, cast iron,
and possibly stainless steel. Metals processed frequently re-
ceived tempering treatments such as H32, H1ll, H321, T4, T6, and
T823. The testing includes assessment of the effect of the FBPS
on temper. The test program includes testing to restore temper,
if necessary, and includes in the project recommendations operat-
ing procedures to restore temper.
B-13

|I'
Revision No. 0Section No. IIPage 4__ of 8Date May 5, 1990
Specific types of parts must be excluded from the FBPS. For
examine, polyvinyl chloride (PVC) and other plastics cannot with-
stand the operating temperatures of the FBPS. Under the bed
conditions, these components will burn/pyrolyze and be destroyed.
Additionally, because of their high organic content, they can
produce more pyrolysis products than the system can handle and
atmospheric emissions not permitted for the system. Parts con- itaining plastics, such as Part Number 11634072, Cover, Insulated,
cannot be processed in the FBPS. Parts with solder connections
should not be processed in the FBPS since the solder will melt,
destroy the connections, and possibly cause unpermitted emis-
sions. Parts having components that would be destroyed at the
FBPS operating temperatures should not be processed in the FBPS.
This test plan proposes to uF shotblasting to remove the
char residue from parts after pyr -is in the FBPS. Therefore,
parts that cannot be shotblasted may be unsuitable for cleaning i
in the FBPS. For example, Part Number 11010703, Scoop Disc Sub-
assembly (an aluminum casting); the specifications prohibit shot- i
blasting the part. Similar restrictions may make other parts
unsuitable candidates for processing in the FBPS unless the use 3of low energy shotblasting or other cleaning techniques are ac-
ceptable alternative cleaning systems. Special consideration of
steel shot cleaning is required for cleaning of aluminum parts to
prevent steel contamination of the aluminum parts.
Magnesium parts cannot withstand bed operating temperatures. iBed conditions could cause magnesium parts to ignite and cause
significant damage to the system through fire or explosion.
2. Bed Conditions
The bed conditions are complex and the testing will inves- Itigate only four bed variables: I-
1. bed atmosphere,2. part geometry,
B-14 i
!

Revision No. 0Section No. IIPage 5 of 8Date May 5. 1990
3. bed temperature, and4. bed residence time.
Testing will review other bed conditions but not thoroughly in-
vestigate them; these inciude:
1. Cooling rates2. Cooling medium (sand, water, air, etc.)3. Heat transfer medium4. Long-term bed effects (greater than three months of
operation)5. Multiple cycles through the bed6. Synergistic effects of mixtures of various coatings and
base metals and of simultaneously and sequentiallyprocessed parts.
Normally the bed atmosphere is reducing, using compressed
air for fluidization. Combustible materials will only partially
burn in the bed. If possible the testing will investigate the
effects of a nitrogen atmosphere on various part parameters.
Also, steam and argon may be investigated as fluidizing media to
understand how changes in the bed atmosphere affect the various
parts. Primary investigations will be with atmospheric air, and
all other atmospheres will be judged in relationship to the pri-
mary operating conditions. The plan will not attempt to vary
fluidization rates; manufacturers recommendations will be fol-
lowed.
Bed temperatures can be varied from amLient to 1,000°F. The
testing will experimentally set bed temperatures. Initially the
bed temperatures are estimated to vary from 700-900'F with a
nominal temperature of 750°F. The testing will determine the ef-
fect of bed temperature on the part/coating system and the opti-
mum system cycle time.
Residence time and bed temperature are closely related; the
testing will investigate both. A typical bed residence time is
30 minutes at 650°F for an acrylic paint and up to two huurs for
a high solids chemical resistant epoxy paint system. Testing
will determine optimum times for various paint/part systems based
B-15

I
Revision No. 0Section No. IITPage 6 of 8Date May 5. 1990 3
on minimum residence time to produce a satisfactorily cleaned
part. This includes the influence of downstream processes to
remove char.
The FBPS will remove different coatings. These coatings Iwill include:
1. Epoxy-Polyamide (MIL-C-227501),2. Aliphatic Polyurethane (MIL-C-46168), [3. Epoxy Coating Primer, and4. A second Aiiphatic Polyurethane (MIL-C-53039). I
Some coatings may be more difficult to remove and require adjust-
ing the FBPS operating parameters to obtain satisfactory results.
The shape, type of metal, and arrangement of the parts in
the FBPS may influence ope--ting parameters. Evaluation of base
metal and part geometry .pendent upon variables, such as:
Time fc•r a -rL to come to bed temperature. For exam-
ple, a thin part may come to bed temperature fasterthan a thick part, such as a motor block, and require Iless time in the bed.
Ratio of recessed areas to flat exposed surfaces. 3Coatings may be removed from a flat coated surfacefaster than form a recessed surface.
Variations in base metal coating systems. For example,epoxy coatings may be removed from aluminum at a dif-ferent rate than from stcel.
Tempered and/or heat treated parts may not be suitable can-
didates for FBPS cleaning. This test plan describes testing be- 3fore and after the FBPS to determine the effects of the FBPS on
such parts. Varying operating conditions may minimize or elimi-
nate damage to these parts.
3. Pre- and Post-Part Treatments 3Included in this test plan are procedures for tracking and
evaluating the effects on parts of pre- and post-treatments, the
effect of these treatments on the operation of the FBPS, and on
B-16

Revision No. 0Section No. IIPage 7 of 8Date May 5, 1990
the part's suitability for cleaning in the FBPS. Testing will
collect data on current pre- and post-treatments and establish
this as a base of comparison. Once a base of comparison is set
for a part and coating system, the effect of varying the pre- and
post-treatments will be investigated. The investigation will
determine if such treatments have a beneficial effect. Benefi-
cial effects are such things as better finished part quality,
reduced enerqy usage, reduced generation of hazardous waste,
reduced use of cleaning agents, reduced atmospheric emissions,
etc.
B. Establish Incidental Effects of the FBPS on Coatings and
Metals
The FBPS is not intended to remove or effect nickel and
chromium electroplates, anodized aluminum coatings, aluminum
chrome conversion coatings, zinc phosphate steel coatings, and
metal heat treatments. Except hard chrome and nickel plated
bearings, further processing removes and replaces these coatings.
Testing identified in this test plan and done on plated bearings
will determine the effects, if any, of the FBPS on the nickel and
chromium electroplates.
Cleaning parts in the FBPS at 700 to 1,000°F may affect
metal heat treatment and tempering. This plan establishes test
procedures to determine the effects of the FBPS on heat treated
parts.
C. Prepare a Technical Report on the Appropriate Uses of theFBPS
This test plan describes the what, why and how of testing.
The test plan also describes how the information collected will
be reported. The reporting serves to inform RRAD of the test
results and will guide other Depots and potential users of the
FBPS in establishing operating conditions. The technical report
produced from this study will include details on the following:
B-17

U
Revision No. 0Section No. IIPage 8 of 8Date May 5. 1990
1. Part description2. Coating description3. FBPS description4. Emissions testing results5. Parts/coatings evaluations6. Recommendations
Results of the tests will be included in the technical re-
port. Accepted quality control procedures will be followed in
all testing and referenced in this test plan and report.
D. Train RRAD Operating and Maintenance Personnel
The FBPS will provide satisfactory service only if properly
operated and maintained. While Procedyne Corporation, the equip-
ment vendor, will provide most of the formal training, the test
program will provide hands-on training and experience. The test
program will provide an improved understanding of the selection
of proper operating parameters and parts that must be kept out ot
the system (soldered electrical connections, for example). The
test plan establishes training procedures and how additional
information learned during the test period will be incorporated 5in the operating manual and taught to the system operators.
E. Environmental Emission Testing I
PEI will conduct atmospheric emission testing as part of the
complete test program. A separate test plan will be developed Ifor the environmental emissions testing. This test plan will
include procedures for controlling operations during environmen- 5tal emissions tests and on coordinating testing of the FBPS and
the atmospheric emissions test. 3
II
B-18 I
I
Revision No. 0Section No. IIIPage 1 of 7Date May 5, 1990
SECTION III. TELT PARAMETERS
The testing is divided into• the following segments to facil-itate evaluation of the test results and simplify data collec-tion: Pre-FBPS , FBPS, Post-FBPS, and Parts Finishing Systems.
Each of these segments represents unique data collection andtesting. Evaluation of the project by segments will reduce the
amount of data collection and the complexity associated with de-termining vhat parts to process and how to process them. Step-wise evaluation is practical because these processes are indepen-
dent. Additionally, a stepwise evaluation facilitates ranking
parts and makes processing the most likely candidate parts first
practical.
A. Pre-Fluidized Bed Paint Stripper
Parts cleaned in the FBPS have been processed some before
I reaching the FBPS. Some of these pre-FBPS processing steps maybe important in the overall determination of the effect of the
FBPS on the part. The FBPS's usefulness can fairly be determinedonly by understanding these operations and how they affect the
FBPS operation.
The pre-FBPS operations consist mostly of cleaning (steam,chemical baths, chemical washing, water washing, etc.) and disas-sembly. Steam cleaning is used to remove surface grime. It is
also useful for reducing the oil and grease load to the FBPS.The removal of surface grime may be necessary as a particulateemissions reduction technique or to prevent excessive buildup of
particles in the FBPS that do not fluidize properly. Where pos-
sible or useful steam cleaning will be used on parts prior toprocessing in the FBPS. Likewise chemical washing either as an
additive to a steam or high pressure water wash or in a wash tank
IB-19

Ii
Revision No. 0Section No. IIIPage 2 of 7Date May 5. 1990
can be used to reduce oil and grease, and grime loads to the FBPS
before processing.
One of the intentions of the testing is to try and eliminate
vapor degreasing even though vapor degreasing could be useful
(like steam cleaning and chemical washing) to reduce the quantity
of combustible material charged into the FBPS. Depending on the Itype of part and quantity of combustible material on a part vapor
degreasing or other degreasing techniques may be necessary on
parts before processing in the FBPS.
Further disassembly may be required for some parts. For
example, a part may be damaged if processed in the FBPS with
bearings in place. If the bearing will be removed and replaced
after cleaning, removing the bearing before processing may pre-
vent possible damage to the part because of differential thermal Uexpansion. However, if the bearing can be left on the part while
processing in the FBPS without adverse affects then further dis-
assemble would not be necessary. Additionally, disassembly may
be useful as a size reduction technique or to improve the "free 3flowing" configuration of a part.
Excluding selected parts from processing is an integral part
of the Pre-FBPS operation. Parts are excluded that would be dam-
aged by processing in the FBPS or cnes that, by specification,
cannot be subjected to the FBPS operating temperatures. Excluded
parts include ones with plastics, solder, magnesium, excessive
oil and grease, asbestos, or other materials that would create
environmental or health hazards. Such parts will be identified
in the initial screening process and the FBPS operator trained by
the project manager in their recognition. During the course of
this project additional test parameters regarding pre-processing
of parts will be developed. As the additional parameters are
developed they will be integrated into this test plan.
B-20i
I-
Revision No. 0Section No. IIIPage 3 of 7Date May 5, 1990
B. Fluidized Bed Paint Stripper
Three areas during the FBPS operations require data collec-
tion and allow for variability in the process; the hot bed, the
transition from hot to cooling beds, and parts cooling. For the
hot bed the primary test parameters are temperature and residence
time. The bed temperature is key to the pyrolysis process and
effects the residence time. Bed temperature can also affect the
parts (temper, hardness, etc.). These will be monitored closely
during processing of each part. Secondary hot bed processingparameters are the bed atmosphere (normally compressed air) andfluidizing rate (controlled to manufacturer's recommendations)
these will not be monitored continuously. Because of the hazard-
ous waste minimization nature of this project, the hot bed utili-
ty use (electricity, air, water, sewer) will be monitored.The transition from the hot bed to parts cooling can affect
part metallurgy. As part of the process description of each
parts batch the FBPS operator will record the time to move the
parts from the hot bed to the cooling bed, the movement method,and conditions of the move. This information may prove valuable
in determining optimal processing methods and controlling metal-
lurgical affects on parts.
Real time temperature changes in parts as they are processed
could affect part metallurgy. No plans are included for such
monitoring at this time. However, should the need arise, the
project manager will develop such plans and have the plans in-
cluded in the test plan.
All other monitoring will be done using dial type thermome-ters, stop watches, and system temperature indicators. This in-cludes monitoring of ambient temperatures in the shop area and in
the FBPS enclosure during part movements from the hot to cooling
I bed.
B-21

I
Revision No. 0Section No. IIIPage 4 of 7Date May 5, 1990
Parts cooling is another key area with regards to part met-
allurgy. Three methods of cooling will be tried; fluidized bed,
water quench, and air cooling. The FBPS is initially configured
for fluidizied bed cooling. Plans for air and water cooling will
be developed and added to the test plan. For each method data on
the cooling time and the before and after temperature of the
cooling bed or fluid will be recorded by the FBPS operator. Ad- Iditionally, the Project Manager will collect a complete de-
scription of the operation describing how the specific cooling
method was accomplished. An initial set of processing parameters
has been developed and is shown in Table 1.
C. Post-Fluidized Bed Paint Stripper
Post-processing (less finishing) is divided into five cate-
gories; media blasting (sand, stainless steel, walnut hulls, wa-
ter, steam, etc.), chemical wash (caustic, corrosion inhibitors,
acids, etc.), tumbling, heat treating, and others. For each part
an appro•priate combination of post-FBPS processes will be chosen 3by the project manager and RRAD staff. The choices will be based
on part specifications and how well the part was cleaned in the
FBPS. It is only through experimentation that the appropriate Iprocesses can be determined. As parts are tested and various
post-FBPS processes used, data will be added to this test plan
identifying the specific evaluation criteria and methods for de-
termining process cleaning methods.
D. Parts Evaluation and Control
After parts are processed, they must perform as designed. iNo parts will be placed in service without approval of the pro-
ject manager. Initial testing will be done on scrap parts fol-
lowed by closely controlled tests on actual parts. As actual
parts are processed in the FBPS, they will be meticulouzly tested
before being put into service. The first parts tested will be
B-22I

Revision No. 0Section No. III
Page 5 of 7Date May 5, 1990
TABLE 1. PROCESSING CONDITIONS
HEAVY FERROUS
A. Heavy ferrous parts painted with no oil or greaseHot bed for 80 minutesCooling bed for 80 minutes with media blast
8. Heavy ferrous parts with oil or greaseHot bed for 60 minutes
Cooling bed for 60 minutes with media blast
C. Heavy ferrous parts painted with oil or greaseHot bed for 120 minutes
Cooling bed for 120 minutes with media blast
LIGHT FERROUS
A. Light ferrous parts painted with no oil or greaseHot bed for 50 minutes
Cooling bed for 50 minutes with media blast
8. Light ferrous parts with oil or greaseHot bed for 40 minutes
Cooling bed for 40 minuLes with media blast
C. Light ferrous parts painted with oil or greaseHot bed for 60 minutes
Cooling bed for 60 minutes with media blast
HEAVY ALUMINIM
A. Heavy aluminum parts painted with no oil or greaseHot bed for 40 minutesCooling bed for 40 minutes with media blast
8. Heavy aluminum parts with oil or grease.Hot bed for 30 minutes
Cooling bed for 30 minutes with media blast
C. Heavy alumninui parts painted with oil or grease.Hot bed for 50 minutesCooling bed for 50 minutes with media blast
LIGHT ALUM
A. Light aluminum painted with no oil or grease.Hot bed for 40 minutes
Cooling bed for 40 minutes with media blast
B. Light aluminum with oil or grease.Hot bed for 30 minutes
Cooling bed for 30 minutes with media blast
C. Light alumwiinumn painted with oil or grease.Hot bed for 50 minutesCooling bed for 50 minutes with media blast
B-23

Revision No. 0Section No. IIIPage 6 of 7Date May 5. 1990
uniquely marked. The marking system will be developed in the
field in conjunction with RRAD staff and RRAD managers to track
parts and facilitate evaluation of any unanticipated field prob-lems.i
Mechanical testing will include determining the following,
as appropriate: part dimensions, flatness/warpage, hardness,
tensile strength and stress crack checks. Each of these tests iwill be done as needed on the first parts processed. Need will
be determined based on the part use, part specifications, and
judgment by the Project Manager. Where appropriate, the testing
will be done by RRAD using routine testing techniques such as
magnaflux, dye test, hardness testing, etc. Where additicnal
testing is required, it shall be conducted at the direction of
the Project Manager.
E. Part Finishing Systems pPainted parts will be tested for; paint adhesion to part,
and salt spray/corrosion protection. Typical paints used meet
various military specifications (mil specs). The following are
the mil specs referenced most commonly; Epoxy-polyamide, Mil-C-
22750, Aliphatic Polyurethane Coating, Mill-C-46167, Aliphatic
Polyurethane Coating, Mil-C-53039.
Plated parts (cad, zinc, hard anodized, electroless nickel,
chrome, etc.) will be tested for; plating adhesion to part, cov-
erage, wear, and corrosion. Machined Parts will be tested for;
dimensions bearing surfaces integrity, surface hardness, and
machinability.
Many parts processed are old and painted with older paint
systems such as:
TT-E-485, Enamel;TT-E-529, Enamel;
MIL-P-1757, Zinc chromate;TT-P-636, Red oxide;MIL-C-52128, Forest green; and others.
B-24I

Revision No. 0Section No. III
Page 7 of 7Date May 5, 1990
Evaluation of these systems will be on the basis of how well they
are removed in the FBPS. Removal of these systems in the FBPS
result in special consideration of environmental emissions.
B-25

Revision No. -0Section No. IV
Page 1 Of 14Date ý`ay_5, 1-990
SECTION IV. CATEGORIZE PARTS
Because of the variability of the parts processed a method
of categorizing the parts is necessary. There are several param-
eters important to parts categorization;
Part is free-flowing;Combustibles;Environmental emissions;Size, shape, Lnd coating; and
Structural and/or mechanical integrity of the part.
A decision tree forms the basis of categorizing parts.
Information on a part is collected in response to questions asked
in the decision tree. Depending on the responses, the part is
assigned a rank, as is indicated in the decision trees. The
overall decision process is presented in Figure 1. Blocks 1, 2
and 3 are further expanded in Figures 2, 3, 4, and 5. As ques-
tions asked by each decision tree are answered, a part rank is
ass-Lgned. The rankings are 1 to 4. Rank 1 parts are considered
to have the best chance of successfully being processed. Rank 2
parts may be processable with moderate additional processing.
Rank 3 parts may require extensive additional processing, and
Rank 4 parts are not considered processing candidates. As parts
are tested, their rank can be changed depending on the results of
testing. For example, a Rank 3 part can be changed to a Rank 1
part if it can be successfully processed. Likewise, a Rank I
part can be changed to a Rank 4 if it cannot be successfully re-
used.
The decision trees include two types of ranks: absolute and
adjustnents. An absolute rank is an assigned rank and takes
precedence over the part's current rank. Adjustments are added
or subtracted from the part's current rank.
B-26

Revision No. 0Section No. IVPage .2 of 14Date May 5, 1990
I ncoming Part.
BLOCK 1 NShould The Part Be Not A Suitable Part.
Processed IYes
BLO~CK 2 NWas Part Successiuily 1- Not A Suitable Part.Processed
Yes
BLOCK 3 NoNtASial r.Was The Part Reusable Nuitable Part.
Yes
Successful Proc~ess
Figure 1. Overall decision process.
B-27

Revision No. 0Section No. -IVPage 3 of -14
Date M~ay 5. 1990
[ nmiornig Parts fromDisassernb~y
IPat Fre Fowing and No Small Enough to Fit in the Not a Su~able Pan.I
Smal EnogrA o Fi in ne Pr*I
fsmesl " .~z Lla eCob 'NotaSui~StabeIa
wiHetnMe Pa r ocessdu ng Yeas D O. ~ OCS~l emonstrationoffee~v an Produent Not a Suitable Pean
Yes Unsuccessfuleuls
Noi Yes Ye
is~tr mevse Actoessi: No Unucesu
Corloreons.
Figure 2. Block 1 - decision tree to decide -,fa part should be processed.
B-2~3

Revision No. 0Section No. IVPage 4. of 14Date MaV 5, 199o
OC oaj , Spc:r zýs e
LPaun aria Dewem-r'e fzeMemaJ. I emper.0i Parns a
Snge- Metal. Etc
IN Ye Pal: is ntSile~~ - for Process~( D-i g a ea Praiel RaI
Tef4:'ýc'r. ý-ia'oe-eC. a YQe~Retaned o' Resoreo NO P.ýrocsag.Ip.~T~T rC. alter Pali s ieatec 0o
Ternbei. Etc 6, oOOF
Yes
Does ire Pa'; rna~e T.,-.- Can Warp3ge Do Tolerated in folPo esnsec! zns" P Px:" Pan. 4
'Yes
is t',e,e 0. -ProIs A ardr C'2ae ,J3~$8 Process b
Figure 3. Corit'i ri.tiori cGt Block 1ofproce - ,iSb! tree
LI-29

Revision No. 0Section No. IVPage .5 of 14Date May 5, 1990
From Processes A, B, C.Etc. (Part to be
Processed) 3
Can the Part be Coated Yes Successful a(Painted. Plated, etc.) as Demonstration.it Come: from the FBPS? Rank 11 IIFurther processing and Demonstraition.
then Coated? Rank 1
,Conditions Produce a Part Dmntain
that could be Coated?. / eosRatnk .IFI
Part is not SuitableI
for Proc~essing.Rank 4
I-I _
Figure 4. Block 2 - decision tree to decide ifpart was successfully processed.
B-30
I

Revision No. 0Section No. IVPage 6 of 14Date Mayj 5 1990
Successful
Demonstration
SDoes the Coated Part have No .. =Part is not Suitable
the Required Properties for V for Processing.Reuse? I Rank 4
Yes
Were Steps Required to No =,.Part is not Suitable!
Produce the Coated Part for Processing.Feasible? / Rank 4
Yes
Does the Process used No Part is not Suitable
to Produce the Coated for Processing.Part Provide an Rank 4
Advantage over OtherProcesses?
SYes
Figure 5. Block 3 - successful reuse decision tree.
B-31

IRevision No. 0Section No. IVPage 7 of 14Date May 5, 1990 1
The processing decision is made based on the physical prop-
erties of parts. The ranking process will be revised as the pro- 3ject progresses. The tentative ranking system developed is based
on preliminary information. The following discusses the major Ifactors considered in ranking parts.
A. Part is Free-Flowing 3Effective operation requires that parts placed in and with-
drawn from the FBPS not carry out the aluminum oxide heat trans-
fer medium used in the bed. Also, the parts processed must allow
the aluminum oxide to flow throughout the part to insure that the
part is uniformly heated. The project manager and FBPS operator
shall review, as part of the part categorization, the part geome-
try. The FBPS operator will determine if the part can be placed 3into the bed in such a manner that it will not trap the fluidiz-
ing media. The FBPS operator will help to control the circula- 3tion of the fluidizing media by appropriately stacking/loading
the parts into the fluidized bed. 3B. Minimize Combustibles
The fluidized bed heats parts to temperatures high enough to 3ignite most combustible materials (paint, oils, grease, plastic,
foams, etc.). The syster is designed to operate with an oxygen 3deficient environment and, thus, pyrolize most of the combust;-
bles. The amount of combustibles that the system can burn iLs
limited. Under normal operating conditions the bed is limited to
the equivalent of 35 pounds of oil in a single charge. To mea-
sure the amount of combustibles included with a typical charge is iimpractical. Therefore, combustibles will be controlled by the
FBPS operator by inspection and judgment. This requires that the 3operator have the authority to refuse to process parts if he
believe•, that they contain excessive combustibles, PVC, or halo- 3genated materials.
BI--B-32
Revision No. 0Section No. IVPage 8 of 14Date May 5, 1990
Additional procedures are in place that require review of
which parts are processed in the FBPS. These procedures require
rejection of parts that have excessive combustibles. Sometimes
this will require testing to measure the amount of combustible
material on the part.
Testing will be done gravimetrically. Parts will be weighed
to within 0.1% of the part's weight. The weight of the part will
be recorded and the part cleaned, as appropriate, of all combus-
tible material and the part reweighed. The quantity of the com-
bustible material is then determined by difference. By inspec-
tion and knowledge of the type of material the oil equivalence cf
the combustible material (based on the heat content of the mate-
rial) will be determined and recorded. From this information the
project manager will determine if the part is suitable for pro-
cessing.
C. Environmental Emissions (Cadmium, Zinc. PVC's, Oil & Grease,Etc.)
The FBPS is equipped with an emissions control system to
minimize environmental emissions. The system has two components;
an afterburner to control hydrocarbons and the pyrolysis products
and a wet venturi scrubber to control the particulate emissions.
The afterburner is a natural gas fired combustion chamber that
incinerates all combustible materials and convert them to water
vapor and carbon dioxide.
The air permit for the unit has specific cperating limits
and environmental emissions limits and does not allow processing
of parts that contain PVCs and halogenated materials. Because
the emission control system can control only a limited amount of
the environmental emissions, it imposes limits on the amount and
kind of materials that ;,an be charged into the FBPS. The after-
burner has finite limits on. the quantities of material that it
can incinerate (35 pounds of oil equivalent). The wet venturi
B-33

Revision No. 0 3Section No. IVPage 9 of 14Date May 5, 1990
scrubber has limitations on the kind and quantity of material
that it can effectively control (particulate). Heavy metals are 5of special concern, especially Cadmium and Zinc.
Cadmium and Zinc are common plating metals used on parts
planned for processing in the FBPS. At the bed temperatures
these metals probably will volatilize arid/or oxidize and leave
the bed. In the afterburner any metal vapors will be converted 5to oxides and pass to the venturi scrubber. The scrubber is a
low energy venturi and is expected to have a moderate collection
efficiency on the metal oxide particles found in the process. To
keep emissions of these oxides to acceptable levels the amount of
the metals charged into the FBPS must be controlled. Control of
these materials will be the responsibility of the FBPS operator.
The operator will be responsible for regulating the quantity
of these metals charged into the bed. Basic information from
drawings and knowledge of the parts will define which parts po- -tentially have cadmium or zinc plating. Suspect parts will be
visually inspected to determine if they do or could have plating. 3If the part is suspect it will be treated as if it is plated.
From Table 2 the operator will determine how many of the particu-
lar part can be charged to the FBPS and limit the charge to that
amount. The prcject manager and staff will work with the FBPS
operator to develop specific written instructions for controlling
the amount of cadmium and zinc charged in the FBPS. The instruc-
tions will include a copy of Table 2 that shows the number of 3parts per charge and the weight of plating per unit weight of
charge so the FBPS operator can determine the allowable number of 3parts per charge. The operator will determine the weight of
cadmium and zinc charged and limit the amount of charge to ac-
ceptable limits.
Lead and chrome are used in coatings processed in the FBPS.
The fate of these metals will be determined &urlng the project.
It is theorized that most of the lead and chrome will reiwain with
B-34 UI-

Revision No. -0Section No. IVPage 10 of 14Date My 5, 1990
TABLE 2. PART GEOMETRY AND QUANTITY OF PLATED
Number of partsPart geometry charge per charge
1/4 to 1/2 diameter 2,000and 1 to 2 inch length
1/4 to 1/2 diameter 700and 2 to 6 inch length
1/2 to 1 diameter 1,000and 1 to 2 inch length
1/2 to 1 diameter 350and 2 to 6 inch length
1/2 to 1 diameter and 60greater than 6 inch length
1 to 2 diameter 100and 4 to 10 inch length
1 to 2 diameter 30and greater than 10 inch
For other configurations compute the plated surface area.Each charge is limited to 50 square feet each of cadmium andzinc.
8-35

I
Revision No. 0 3Section No. IVPage 11 of 14Date May 5. 1990 3
the char on the parts; however, this will be verified during the
project. 5D. Size, Shape, and Coating
The parts will be categorized by whether they are thin, 3thick or complex sections. For example, a flat plate like panel
of less than 10 gauge material is considered a thin section where 3a connecting rod, bolt, or casting is a thick section. Complex
sections are typically fabricated parfs, like a support bracket n
or an engine block.
Besides the type of section, parts will be categorized by
the coating system. The coatings are paints, plating, and oils
and greases. Paints are further divided into the CARC (chemTical
agent resisting coating), polyurethanes, and enamels. Plating Iare divided into Cadmium and Zinc and others such as Electroless
nickel and chromium. Oils and greases are categorized as a comr-
bustible material and their input will be controlled. Each of
these categories may effect the way a part is processed. 3E. Structural and/or Mechanical Integrity
As parts are tested, the bed operating temperature could Ralter the structural and/or mechanical irtegrity of parts. Spe-
cific tests will be performed on selected parts to verify what Ieffect processing in the bed has on a part. The tests will be
directed by the project manager based on knowledge of the part's 3metallurgy and how bed temperature would affect that metallurgy.
Work hardening and temper are two of the more important
properties of the parts that will be considered. If the workhardening and/or temper of a part will be changed and could not
be restored after processing in the FBPS or removed without ad- 3versely affecting the part, the part is not a candidate for pro-
cessing. The FBPS will remove all work hardening and temper from 3the aluminum parts.
B-36 m
Revision No. 0Section No. IVPage 12 of 14Date May 5. 1990
1. Ferrous Parts
Ferrous parts tend to be less effected by the bed tempera-
tures. They are less likely to have a special temper or heat
treating that could be damaged by processing in the FBPS. Howev-
er, some ferrous parts can be damaged at bed conditions and each
part must be investigated to determine if the part will be darn-
aged by processing in the FBPS.
2. Non-ferrous Parts
The non-ferrous parts are mostly aluminum. The aluminum
parts represent some unique situations because of work hardening
and temper. For reasons similar to those for the ferrous parts
the non-ferrous parts are categorized by simple thin and thick
sections, complex sections, coating systems and metal treatments.
Additionally the non-ferrous parts are categorized by whether
they have been tempered, work hardened, or surface hardened.
They also are categorized by alloy.
Determination of the temper, alloy, hardening etc. requires
review of the part specifications usually contained on the part
drawings. This review is a part of the total evaluation process
and will be done on a part by part basis. Once determined a part
will be categorized and a decision made by the project managers
on whether the part is a potential processing candidate and its
rank.
Castings and wrought aluminum alloys may require different
processing and are therefore a potential category. This informa-
tion will be determined during the initial evaluations of the
parts by the project managers. The information on the part will
be found with the part specifications and drawings and will be
recorded by the project manager during the evaluation of the
part.
B-37

IRevision No. 0Section t4o. IVPaae 3.3 of 14Date Ma•5. 990
F. Excluded Parts
PVCs will not be allowed in the bed. The incinerator has 5the capacity to incinerate them and the scrubber can control most
of the combustion product. However, the operating permit does Inot allow them in the bed.
Parts that have solder or solder like materials will not be
processed in the bed. The FBPS operator must know which types of -
parts might have solder or solder like materials and make sure
that these parts are not processed in the FBPS.
Parts that contain foams, plastics, paper, cloth, webbing,
etc., will not be allowed in the bed. For example, personnel
carrier seats with webbed belts are not to be processed in the
bed. Once the webbed belts are removed from the seat, the seats mcan be processed. Seat cushions (foam) and plastic part covers
will not be processed. If these can be removed from a part then
the part may be processed. IMagnesium is used as an alloy agent in much of the aluminum
processed by the RRAD. Only a few parts contain enough magnesium 3that they pose a potential hazard. Magnesium could ignite and
cause a violent reaction in the bed, damage the bed, and poten-
tially be a hazard to the personnel in the area. Special precau-
tions will be necessary to prevent magnesium parts from being Iprocessed in the FBPS. These procedures shall parallel the ex-
isting procedures used to identify and control processing of
magnesium parts. 3Currently, the magnesium parts are segregated from the other
parts and cleaned separately. There is no intention to change 3that process. Therefore, these parts should not enter the area
where the FBPC is operating. Still, the operator must be aware 3that magnesium parts will be in the area and trained in the rec-
ognition of those parts. Since there are only a few of the mag- Inesium parts this training is not considered difficult.
B-38 -
U

Revision No. 0Section No. IVPage 14 of 14Date May 5, 1990
Asbestos is present in various gaskets and an ablative coat-ing. At bed conditions, the asbestos would be freed from theorganic matrix holding it together. Once freed, the asbestoscould become airborne, escape from the enclosure during chargingor maintenance, and cause a health hazard to people in the area.
B-39

I
Revision No. 0Section No. VPage 1 of 14Date May 5, 1990 3
SECTION V. PARTS DATA 3Parts data will be collected on two levels; specific, and 3
generic. The part specific data will be collected during testing
of specific parts or groups of like parts. These data include
number of parts being tested, condition of parts (painted, oily,
etc.), test run number, etc. The generic data are collected from
engineering and design data. These data include such things as Ipart heat treatments, type of metal, surface finishes or treat-
ments, etc. The data will be merged as necessary in the data
reduction. This section discusses methods of collecting and
maintaining the parts data and the various data sheets used to 3collect and record the parts data.
A. Uniquely Mark Parts 3Parts being tested initially will require special marking to
insure that they have been properly certified as not having been 3adversely affected by processing in the FBPS. Parts shall have
1/16" thick, 1" round uniquely numbered aluminum tags attached 3with 3/32" diameter soft aluminum wire. The marking numbers as-
signed to parts will be recorded in the project log book. The
log book will be controlled by the project manager and no number
will be assigned without it being immediately recorded in the
project log book. This procedure should prevent duplication of 3part numbers.
Some parts cannot be effectively tagged. These are typical- 3ly the very small, round, slender parts and some castings. For
these parts no identification number will be affixed to the parts
instead the parts will be identified with descriptions and by
controlling position of the containers holding the parts. A spe-
cial system of containers will be used to hold parts being
B-40I

Revision No. 0Section No. VPage 2 of 14Date May 5. 1990
evaluated. These containers will be marked with a stencil iden-
tifying them as test parts and with a bright yellow paint on the
upper edge of the container.
B. Record Part Numbers
Each part type has a unique identification number. Some-
times this number is marked on the part. The number can be part
of the casting, stamped into the part or on a permanently affixed
identification tag. Some parts do not carry a part number.
These unmarked parts are identified by visual inspection and kno-
wledge of the types of paint being processed. For all parts, the
part number is listed on various inventories and in various spec-
ifications documents. The staff will be responsible for locating
and recording the part number by inspection of the part or con-
sulting the various inventories, part drawings, and technical
documents maintained by the project manager. Figure 6 shows the
data sheet that will be used to collect part-specific data. The
part number will be recorded on this data sheet. Figure 7 is a
sample of a completed data sheet.
C. Obtain Part Drawings
Part drawings will be obtained, if possible, for all parts
processed. The part drawings will be clearly identified with the
part number. The drawings will be maintained in a central file
by the project manager. Wnere the drawing references additional
drawings or specifications that information will be collected by
the project manager and reviewed to insure that all necessary
information on the part is available for evaluation.
The part drawings form a key element in the complete evalua-
tion of the parts. The drawings typically contain information on
the part dimensions, tolerances, finishes, heat treating, etc.
They also contain information on the various specifications that
apply to the part.
B-41
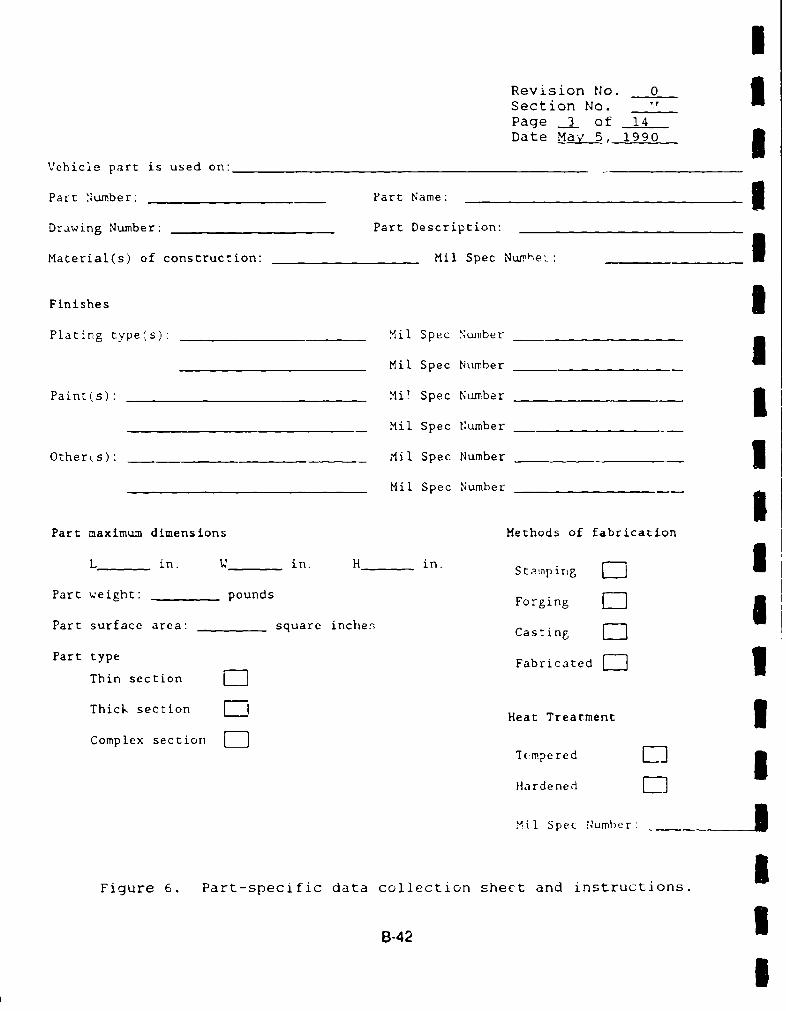
I
Revision No. 0Section No. __
Page _3 of 14Date May_5, 1990 3
Vehicle part is used on:
Part Number: Part Name:
Drawing Number: Part Description:
Material(s) of construction: Mil Spec Nuiber-: I
Finishes IPlating type~s): Mil Spec Number
Mil Spec Number
Pain:(s): Mil Spec Number IMil Spec Number
Otherks): Mui Spec Number IMil Spec Number -
Part maximum dimensions Methods of fabrication
L in. W in. H in. Stamnping -- IPart weight: pounds Forging ID
Part surface area: - square inchen Casting F-
Part type Fabricated El 1Thin section E-7
Thicl section F7 Heat Treatment 3Complex section E7 Ttcmpe red El]
Hardened El
Nil Spec Number:
IFigure 6. Part-specific data collection shect and instructions.
B-42
I

Revision No. 0Section No. VPage 4 of 14Date May 5, 1990
INSTRUCTIONS
Vehicle part is used on: Identify the vehicle family (eg., Brad-ley, 113 etc.)
Part number, drawing number, part description, and material ofconstruction & mil spec number: Transfer these from the drawingor other sources.
Finishes and mil spec: Transfer these from drawings and specifi-cations for part.
Part dimensions: Measure part maximum dimensions.
Part weight: Weight to nearest pound.
Part surface area: Approximate and record in square inches.
Part type, method of fabrication, and heat treatments: Determineby inspection and check the appropriate boxes. Determine the milspec for heat treatment from specifications and record.
Figure 6. (continued)
B-43

IRevision No. 0Section No. VPage 5 of 14Date May 5, 1990 1
Vehicle part is used on: Bradley
Part Number: 012345678 Part Name: Latch, hatch 3Drawing Number: 012345678 Part Description: handle
Material(s) of construction: Cast steel Mil Spec Number: 00-000-000 1Finishes 3Plating type(s): anodized Mil Spec Number 00-000-000
Mil Spec Number IPaint(s): CARC Mil Spec Number 00-000-000
Mil Spec Number
Other(s): Mil Spec Number IMil Spec Number
Part maximum dimensions Methods of fabrication
L 8 in. W 2 in. H 1/4 in. Stamping 3Part weight: 1 pounds Forging DPart surface area: 5 square inches Casting D I
Part type Fabricated El
Thin section D
Thick section Heat Treatment 3Complex section
Tempered I
Hardened 171
Mil Spec Number: 00-000-0"0 J
Figure 7. Completed data sheet.
B-44I

Revision No. 0Section No. VPage 6 of 14Date Ma 5. 1990
D. Record Complete Information on Data Sheets
Keeping track of the operational data for several hundredparts will not be a simple task. The project team will use a
series of data sheets to collect data. The test plan includesinstructions on the preparation of the data sheets. Each part orgroup of like parts processed will have a unique lot number and
data sheet. The data sheet will be used to record all informa-
tion on the processed part(s). Figure 8 is a blank test datasheet and instructions. Figure 9 is an example of a completed
test data sheet. Since this is a research and development pro-
ject data will be extensive. As the project develops the data
sheet may be modified.
How a part is handled can effect the performance of the
part. Tempered aluminum parts, if heated and cooled in a specif-ic manner, will still be tempered after processing. Tempered
aluminum parts, if not processed properly, lose their temper and
become unusable. Also, a steel part that is exposed to moisture
shortly after being processed would develop rust that could make
the part unusable without further processing where, if protected
from moisture after processing, it would be usable without addi-
tional processing.
Figure 10 is a data sheet and instructions designed to col-
lect the pre- and post-processing data on parts. The data sheet
has two modes: specific and generic. The specific mode is when
the pre- and post-data are specific to a unique part and thegeneric mode is used for a class or type of part. Figure 11 is
an example of the form completed for a generic type part and
Figure 12 is an example of the form completed for a specific
part.
B-45

Revision No. 0 jSection No. VPage 7 of 14Date May 5. 1990 3
(AA
"C >
40
EI
.2 .. I I-
0 4i
- CID
. I• . . .- • • _
i.- 410 U-°•
- - C 0|
4,,
7..
.-46 I-
X
00
U, 41Q)
(UA
41
40 4). - - (
".c (A 4ccCT41 ( C . Ch . 1 A
o CL
mA U
B-4

Revision No. 0Section No. VPage 8 of 14Date Ma•_5, 1990
INSTRUCTIONS
Test Number: Assign next number from project log book.
Test start & stop time: Use military time recorded from refer-ence clock areas.
Test date: Enter two digit day number, three letter month abbre-viation, and two digit year.
Basket configuration: Show number marked on basket check appro-priate block if parts are loaded randomly or stacked; describe"other" such as "used fixture to stack parts".
Charge: Record tare weight marked on basket and actual or esti-mated weight of total steel, aluminum, iron, and mixed or othermetals and the total charge weight including basket.
Temperatures: Record indicated temperatures in degree Fahrenheitfrom instruments as indicated.
Time intervals: Record elapsed time to nearest minute from stop-
watch.
Part parameters: Complete for each part type in charge.
Specific part number: Collect and record one for each part typein charge.
Part description: Use part description found on part drawing orother graphics description if part description on drawings is notfound.
Total weight of part: Record to nearest pound.
No. of parts in charge: Record count of parts.
Weight of combustibles: Record estimate of total weight on alllike parts.
Part Color: Describe and record part color.
Comments and observations: Record anything unusual and commenton cleanliness of part or if paint/coating removes easily afterprocessing.
Figure 8. (continued).
B-47

Revision No. 01Section No. VPage 9- of 14Date May 5. 1990
2
2~ V
- C C- C-Ii' oj >--, ben Ito
aC C4 a W
be ~ 0
0, C
Qe Q
00
2 0e
CV 4J .. _ _ _ _ _
be 00
I.. m~. 0 . .0 .0 .0 '
L. 0
I'0 -K IO 0
r- 4,
4110 4, CC In N. U Ibe -0 .0 fn I.r.- -
'A) 'ArGj' rn Isj r
z LiB-48

Revision No. 0Section No. VPage 10 of 14Date May 5. 1990
PRE-PROCESSING DATA POST-PROCESSING DATA
Part number: Describe storage conditions:
Part ID, if applicable:
Date form initiated:
Date form comtpleted:
is part usable? (Y/N): Describe part cleaning:
Describe precteaning done on part:
Describe part heat treatment:
Is part completely disassembled? (Y/N)
If No, describe
components:
Describe part testing: _ _ _ _
FOPS test number associated with
paint:
FOPS test date:Describe part reuse evaluation:
Describe part recoating (painting/pLat-ing):
Figure 10. Pre- and post-processing data sheet and instructions.
B-49

IRevision No. 0 3Section No. VPage 11 of 14Date May 5, 1990
PRE-PROCESSING DATA
Part number: Collect and record from drawing or other source. IPart ID (if applicable): Use only for specially tagged parts(aluminum tag). Record number from tag on part.
Date initiated and completed: Since the part evaluation may takeseveral days, record these as appropriate use in a two digit daynumber, three letter month abbreviation, and two digit year.
Is part usable (Y/N) : Record "N" for no, if part is a salvage,otherwise record "Y" for yes.
Describe precleaning done on part: Record known information or"unknown" if no information on precleaning is available.
Is part completely disassembled (Y/N): Record "Y" for yes or "N"for no. 3If no, describe component: Give verbal description components topart.
FBPS test number associated with part: Indicate required number
FBP3 test date: Record date of FBPS test. 3POST-PROCESSING DATA
For each item, give a verbal description of the requested items. IWhere additional data sheet on information is collected, identifywith part ID or part number and attach to form.
IIUI
Figure 10. (continued). -
B-50
I

Revision No. 0Section No. VPage 12 of 14Date May 5. 1990
PRE-PROCESSING DATA POST-PROCESSING DATA
Part number: 12345689 Describe storage conditions: Part was
Part ID, if applicable: stored inside
Date form initiated: 08 Aug 90
Date form corpleted: 15 Aug 90
Is part usable? (Y/N): Y Describe part cleaning: Part was blast-
Describe precteaning done on part: ed with walnut hulls
Water washed to remove mud
Describe part heat treatment: None
Is part completely disassemblea? (Y/N)
N If No, describe
components: Part is road arm casting
with press fit bearirg Describe part testing: Hardness testing
result was 46C
FBPS test number associated withpaint: 15
FBPS test date: 08 Aug 90Describe part reuse evaluation: Bearing
removed and replaced and part considered
reusable
Describe part recoating (painting/plat-ing): Part masked and prime painted
after aladine wash and finish coated
with CARC
Figure 11. Completed pre-/post-processing data sheet
for a generic type part
B-51
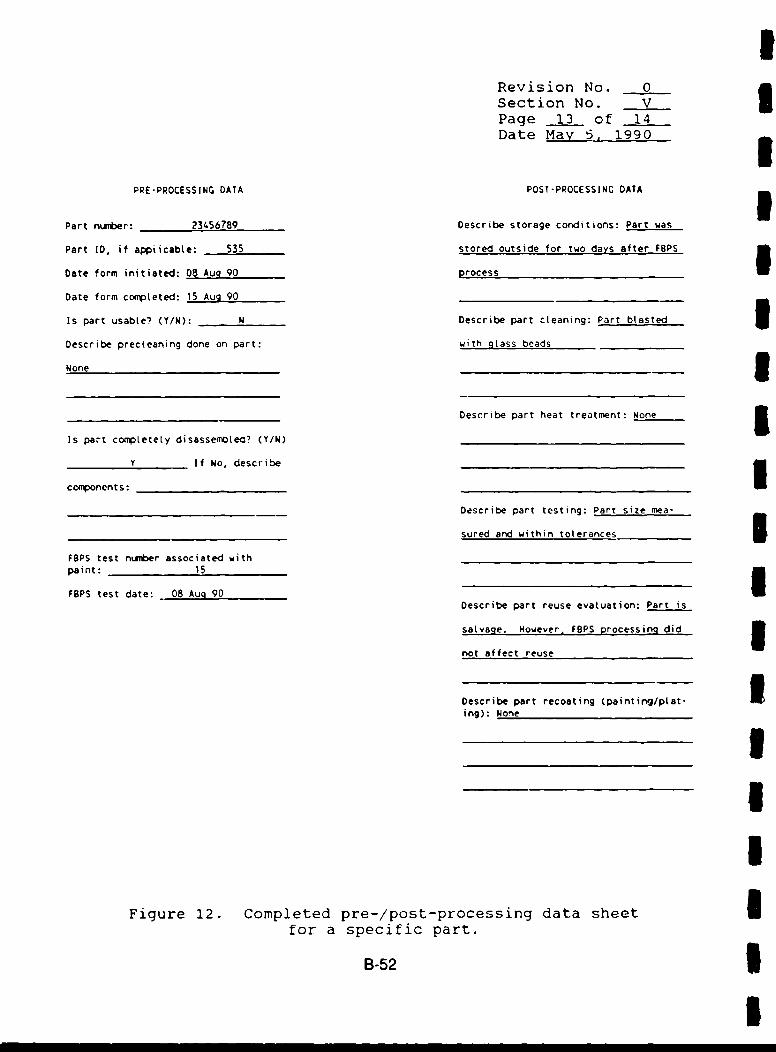
Revision No. 0Section No. VPage 13 of 14Date May 5. 1990
PRE-PROCESSING DATA POST-PROCESSING DATA
Part number: 23456789 Describe storage conditions: Part was
Part ID, if appiicable: 535 stored outside for two days after FBPS
Date form initiated: 08 Aug 90 process
Date form completed: 15 Aug 90
Is part usable? (Y/N): N Describe part cleaning: Part blasted
Describe precteaning done on part: with glass beads
None
Is_______completely__________________ )Describe part heat treatment: None
Is part coup~tetety disassemotea? (Y/N)____________________
Y If No, describe
components: _____________________
Describe part testing: Part size mea-
sured and within tolerances
FBPS test number associated withpaint: 15
FBPS test date: 08 Aug 90Describe part reuse evaluation: Part is
salvage. However, FBPS processing did
not affect reuse
Describe part recoating (painting/pLat-ing): None
Figure 12. Completed pre-/post-processing data sheetfor a specific part.
B-52 I
I

Revision No. 0Section No. VPage 14 of 14Date May 5. 1990
E. Maintain Computerized Data Base of Parts
The data collected on the form will be transferred to a com-
puterized data base for storage and retrieval. The data base
will be maintained by the project manager. The data base man-
agement system will have extensive capabilities regarding sorting
and retrieval of data. As the system is developed, additional
details will be collected and added to the list plan.
B-53

3
Revision No. 0 3Section No. VIPage I of 1Date May 5. 1990 3
SECTION VI. PRE-OPERATIONAL TESTING I
The FBPS equipment is expected to take approximately 40 3weeks from placement of order until completion of installation.
However, the manufacturer has available a smaller demonstration 3FBPS at their facility. Selected parts will be shipped to the
manufacture for testing prior to completion of the RRAD FPBS sys-
tem. These tests will be used to refine the data collection ob-
jectives and provide information used to revise this test plan.
Because of the limited access to the FBPS at the manufacturer
only a few parts can be tested. The exact quantity of parts that
can be tested will be developed as the project progresses. 3The manufacturer's test bed is only 24 inches in diameter
and 30 inches deep. This is smaller than the RRAD FBPS. There- 3fore, the parts that can be tested will be smaller than those
that can be tested at RRAD. The parts selected for testing at
the manufacturer will be selected so that they can fit in the
test bed. The test bed has a fluidized cooling bed; water quench
is possible, depending on part size and material type. The test 3bed will not be used except on an available basis.
BIIII
8-54
I

Revision No. 0Section No. VII_Page 1 of 1Date May 5. 1990
VII. OPERATION DEMONSTRATION
Once the system is installed at RRAD, the manufacturer and
PEI will conduct testing to evaluate the system an," accept the
equipment. To make the most of this testing, parts that are
scheduled for testing will be used for the operational demonstra-
tion. The parts chosen for the operational demonstration will be
parts that have the maximum possibility of successful processing,
are the maximum size and weight, and contain maximum combusti-
bles. These parts will be selected and accumulated by the pro-
ject staff.
The most likely initial test parts are engine parts (blocks,
heads, connecting rods, cylinder sleeves, etc.). These are some
of the simpler parts to evaluate from a metallurgical and refin-
ishing aspect and one of the major components planned for pro-
cessing in the FBPS. Thus, engine parts are ideally suited for
the operational demonstration. Additionally. engine parts are
plentiful, which will be useful should the equipment require
modification and retesting.
B-55

I
Revision No. 0Section No. VIIIPage 1 of 2
Date May 5, 1990 5
VIII. OPERATIONAL TESTS 3The operational tests will be iterative. A best estimate of
how each part can be processed will be made. The part will be
processed on the basis of that initial best estimate. Following
processing the condition of the part will be reviewed by the Iproject staff. Depending on the results of the review the pro-
cessing sequence will be modified. As more information on vari-
ous parts is collected the ability to make generalizations on
processing will be developed. As those generalizations develop 5they will be added to the test plan.
Most parts will not receive a comprehensive evaluation. 3Instead a comprehensive evaluation will be conducted on the most
probable processing candidates. A comprehensive evaluation will
include testing with several pretreatment options, testing with Svarious bed conditions and cooling methods, use of several of the
post treatment options, and finishing the parts in all possible
configurations. Several different parts of the same type will be
used for the comprehensive evaluations. These will include scrap 3parts to minimize cost. Usable parts will be evaluated in the
final phase of the comprehensive evaluations to confirm that the 3best processing sequence produces a useable part.
Following each processing sequence and at each phase the
testing is re-evaluated by the project staff. If the processing
is unsatisfactory or the staff believes better results are possi-
ble the test parameters are nodified and the test repeated. 5As part of the evaluation the project staff will determine
the success of the reuse. Figures 3 and 4 show decision trees
used to demonstrate how the success of processing and reuse is
determined. 3
B-56 II

Revision No. 0Section No. VIIIPage 2 of 2Date May 5. 1990
As time permits, parts of lower priority will be evaluated.
As the testing progresses to the evaluation of lower probability
of processing parts, more innovative processing methods will be
required. This is consistent with the evolution of a research
and development project. Therefore, to leave the most difficult
problems until the last is logical.
B-57

3
Revision No. 012Section No. IXPage 1 of 1Date May 5, 1990 3
IX. DATA EVALUATION 3The data from the testing will be qualitative and quantita- 3
tive. Ease of use, part appearance, processing simplicity, etc.
are qualitative judgments produced from this testing. Evaluation
of such data in mathematical or quantitative terms is not practi-cal. Instead, these will be assigned a pass/fail value and re-
corded in the evaluation. iThe quantitative results (hardness, temper, dimensional sta-
bility, flatness, etc.) are a significant portion of the final 3determination of acceptable FBPS operation and evaluation. Fre-
quently, the quantitative differences will be small. Therefore, 3statistical analysis will be used to determine the parameters
significance. Once determined, the quantitative data will be re-
duced to a pass/fail value and recorded in the evaluation. If
all factors are passing, then the FBPS processing is successful.
If any one determination is a failing value then the FBPS pro- 3cessing is unsuccessful.
iIIUU
8-58 I
Ii I !I I I II IS

Revision No. 0Section No. XPage 1 of 3Date May 5, 1990
SECTION X. REPORT
The report is intended to provide a discussion of what was
done, why, and the testing conclusions. It is also intended tobe a means of submitting the data collected. The report is in-
cluded as a section in the test plan because part of the test
objective is to collect data and report on the findings. There-
fore, an outline of the report is included in the plan to ensurethe testing meets the reporting objective.
The report will be organized in the following chapters:
I. Introduction2. Description of parts tested3. Description of test results4. Discussion of the evaluation criteria5. Recount the operational test parameters6. Present the recommended parts control parameters7. Recommended additional testing8. Conclusions
The following subparagraphs discuss the intent of each of the
report Sections.
A. Introduction
The report introduction will be much like the introduction
to this test plan. It will describe the report objectives and
organization.
B. Description of Parts Tested
Section 2 of the report will document the types of parts
processed at RRAD. The report will include a discussion of both
the parts processed and the parts not processed. The RRAD pro-cesses parts that include lightweight aluminum and aluminum alloy
housings, electrical components, armaments, engine and drive
components, mechanical connections, fixtures, etc. Some of these
are not candidates for processing in a FBPS. The report will
B-59

Revision No. 0Section No. XPage 2 of 3Date May 5. 1990 3
discuss all parts, however, the candidate parts will be discussed
based on the part category and suitability for processing and 5priority.
C. Description of Test Results 3The test results will be presented in both absolute terms
and statistical terms. The description will present a tabulation 3for each part category, the processing time for each coating
system, and the success of the processing sequence reported.
This section will discuss the methods used to categorize and set
the parts priority and introduces the test results. The data
collected during all phases of the testing will be summarized in
this section. The actual test data will be available as a sepa-
rate document.
D. Discussion of the Evaluation Criteria
Section 4 of the report will present the sequence of evalua- itions used to determine the priority of the parts. It will also
present specific categories of parts and test methods and the ibasis of judging if a part was successfully processed.
E. Recount the Operational Test Parameters
Section 5 of the report will summarize the operational test
parameters investigated. It will discuss the various phases of Ithe testing and the data collected. Most of the information in
this section of the report will be extracted from Section V of 3this test plan.
F. Present the Recommended Parts Control Parameters iSection 6 will present a series of recommendations developed
after the test. The discussion includes a determination of parts
that are suitable candidates for FBPS processing and operational
procedures to optimize FBPS use. These will possibly include 3such procedures as:
B-GO
I

Revision No. 0Section No. XPage 3 of 3Date May 5, 1990
o Determining the base metal type and any heat treating,
* If warpage is a potential problem based on the geome-
try, material type, and thickness,
* Type of coatings,
* Presence of combustibles on the part,
• Presence of heavy metals, etc.
G. Recommended Additional Testing
Section 7 will make recommendations for additional tests as
appropriate.
H. Conclusions
The conclusions will be based on the testing. The report
will discuss the usefulness of the FBPS based on how well it
functions as a cleaning device and how effectively it reduces
hazardous waste generation.
"B-61

APPENDIX C
PARTS INCLUDED IN THEFBPS EVALUATION
C-1
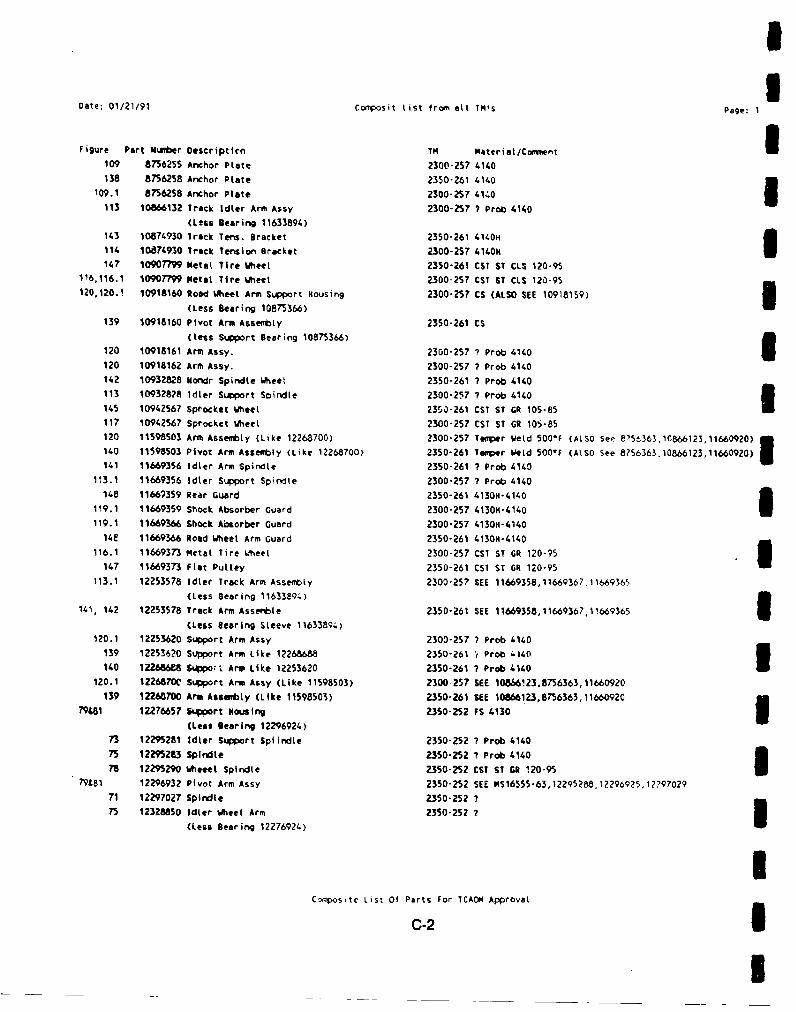
1
Date: 01/21191 Composit list from all TM's Page: 1
Figure Part Numiber Oescriptlen TM Nateriat/Comment I109 8756255 Anchor Plate 2300-2S7 4140138 8756258 Anchor Plate 2350-261 4140
109.1 8756258 Anchor Plate 2300-257 4.140 I113 10866132 Track Idler Arm Assy 2300-257 7 Prob 0140
(Leass Bearing 11633894)
143 10874930 Track Tens. Bracket 2350-261 4140H114 10874930 Track tension Bracket 2300-257 4140H147 10907799 Metal Tire Wheel 2350-261 CST ST CLS 120-95
116,116.1 10907799 Metal Tire Wheet 2300-257 CST ST CLS 120-95120,120.1 10918160 Road Wheel Arm Support Housing 2300"257 CS (ALSO SEE 10918159)
(Less Bearing 10875366) I139 10918160 Pivot Arm Assembly 2350-261 CS
(less Support Bearing 10875366)
120 10918161 Arm Assy. 2300-257 ? Prob 4140 I120 10918162 Arm Assy. 2300-257 7 Prob 0140142 10932828 Nondr Spindle Wheet 2350-261 7 Prop 4140113 10932828 Idler Support Spindle 2300-257 ? Prob 4140
145 10942567 Sprocket Wheel 2350-261 CST ST GR 105-85 I117 10942567 Sprocket Wheel 2300-257 CST ST GR 105-85120 11598503 Arm Assembly (Like 12268700) 2300-257 Tewrper Weld 500"F (ALSO See 8756363,10866123,11660920)140 11598503 Pivot Arm Assembly (Like 12268700) 2350-261 Temper Weld 500*F (ALSO See 8?56363.10&66123,11660920) 5141 11669356 Idler Arm Spindle 2350-261 ? Prob 4140
113.1 11669356 Idler Support Spindle 2300-257 7 Prob 4140
148 11667359 Rear Guard 2350-261 4130N-4140119.1 11669359 Shock Absorber Guard 2300-257 4130H-4140119.1 11669366 Shock Aisorber Guard 2300-257 4130N-4140
14C 11669366 Road Wheel Arm Guard 2350-261 4130H-4140
116.1 11669373 Metal Tire Wheel 2300-257 CS1 ST GR 120-95
147 11669373 Flat Pulley 2350-261 CST ST GR 120-95113.1 12253578 Idler Track Arm Asseftly 2300-257 SEE 11669358,11669367,11669365
(Less Bearing 11633E94)
141, 142 12253578 Track Arm Asse•ble 2350-261 SEE 11669358,11669367,1!669365 I(Less Bearing Sleeve 11633894)
120.1 12253620 Support Arm Assy 2300-257 7 Prob 4140139 12253620 Support Arm Like 1226868. 2350-261 t P-rob 4140
140 122666W6 $uppo5 l Arm Like 12253620 2350-261 7 Prob 4140120.1 1226870C Support Arm Assy (Like 11598503) 2300-257 SEE 10866I23,8756363,11660920
139 12268700 Arm Assaemtly (Like 11598503) 2350-261 SEE 10666123,8756363,11660920
794,81 12276657 Support mousing 2350-252 FS 4130 I(Leas Bearing 12296924)
73 12295281 Idler Support SpiindLe 2350-252 7 Pro-b 4140
75 12295283 Spindle 2350-252 7 Prob 4140
78 12295290 Wheeel Spindle 2350-252 CST ST GR 120-9579&81 12296932 Pivot Arm Assy 2350-252 SEE MS16555-63,12295288,12296925,12?97029
71 12297027 Spindle 2350-252 ?
75 12328850 Idler Wheel Arm 2350-252 7
(Less Bearing 12276924)
Composite List Of Parts For 7CA01 Approval
C-2I
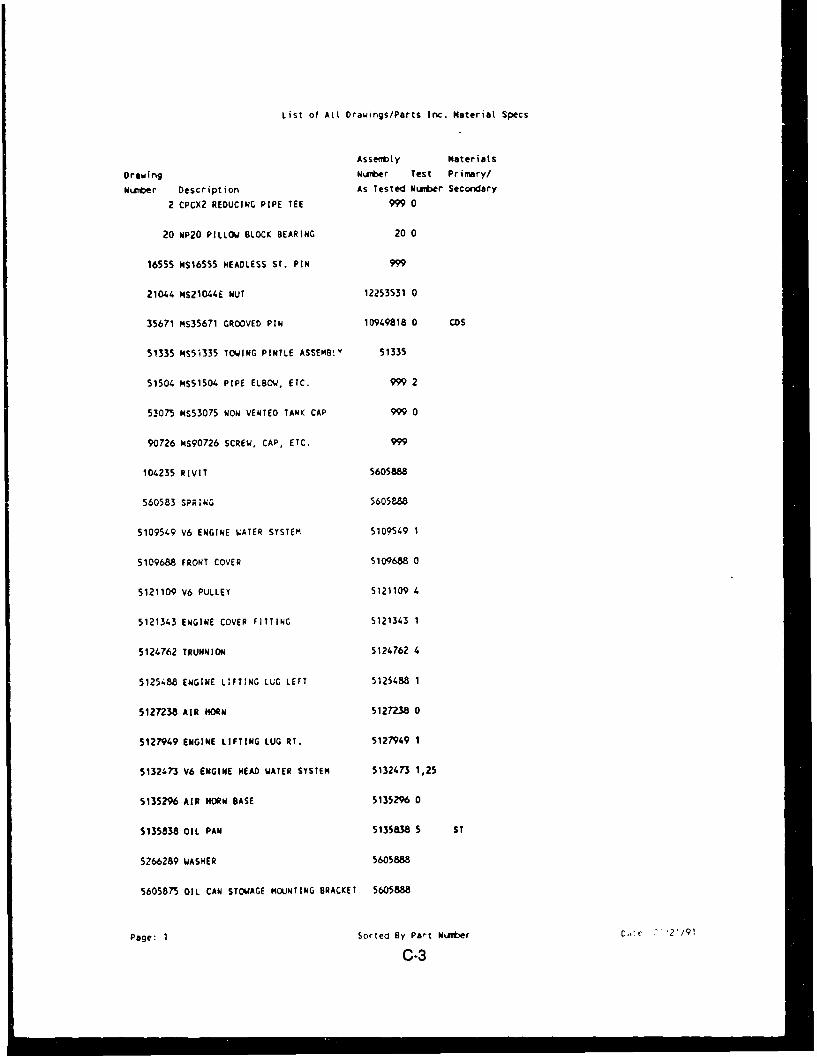
List of At( Drawings/Parts Inc. Material Specs
Assemtly materials
0rawing Nomber Test Primary/
Number Description As Tested Nuzber Secondary
2 CPCX2 REDUCING PIPE TEE 999 0
20 NP20 PILLOW BLOCK BEARING 20 0
16555 MS165S5 HEADLESS ST. PIN 999
21044 MS21O44E NUT 12253531 0
35671 MS35671 GROOVED PIN 10949818 0 COS
51335 MS51335 TOWING PINTLE ASSEMB!v 51335
51504 MS51504 PIPE ELBOW, ETC. 999 2
53075 MS53075 NON VENTED TANK CAP 999 0
90726 NS90726 SCREW, CAP, ETC. 999
104235 RIVIT 5605888
560583 SPRING 5605888
5109549 V6 ENGINE VATER SYSTEM 5109549 1
5109688 FRONT COVER 5109688 0
5121109 V6 PULLEY 5121109 4
5121343 ENGINE COVER FITTING 5121343 1
5124762 TRUNNION 5124762 4
5125488 ENGINE LIFTING LUG LEFT 5125488 1
5127238 AIR HORN 5127238 0
5127949 ENGINE LIFTING LUG R1. 5127949 1
5132473 V6 ENGINE HEAD WATER SYSTEM 5132473 1,25
5135296 AIR HORN BASE 5135296 0
5135838 OIL PAN 5135838 5 ST
5266289 WASHER 5605888
5605875 OIL CAN STOWAGE MOUNTING BRACKET 5605888
Page: 1 Sorled By Part NuLmber Coc 12*/91
C-3

aU
List of All Drawings/Darts Inc. Material Specs
Assembly Materials IDrawing Nurber Test Primary/
Number Description As Tested Nurber Secondary 55605888 OIL CAN STOWAGE MOUNTING BRACKET 5605888
6226763 SPRING 5605888
6774436 Oi Pan 6771436 6 ST
7044253 SPRING 7524312 57355390 PINTLE HOOK 7355390
7359523 SPRING 5605888
7359524 OIL CAN MOUNTING BRACKET ASSY. 5605888 0
7524312 LOCK ASSY. PINTLE 75243121
7524313 LATCH 7524312 I7524314 LOCK 7524312
7528105 FUEL TANK FILLER BAYONET 10861293 I
7954475 AUTOMATIC BREAK CASE 7954475
7954484 GEAR CASE 7954484 2 1
8364016 CHANNEL (RADIO RAIL) 8364016 0
8376495 WEATHERCAP (COMMERCIAL) 8376498 7 18376498 WEATHER CAP (COMMERC!AL) 8376498 7
838197 DUM4MY DRAWING 0I
8447117 RN PIVOT PLATE 8447117 38456497 SPEEDOMETER ADAPTER 8756252
8456618 SLEEVE BEARING 875691S 38463514 STEERING CONTROL LEVER SHAFT 8763512 4
8668636 PLUG 8668636
8668638 GUARD 8668638 2 CAS MIL-A-11356 IPage: 2 Sorted By Part Number Da:e: 01121!91
C-4
I

List of All Drawings/Parts Inc. Material Specs
Assebt y Materials
Drawing Number Test Primary/
Number Description AF Tested Number Secondary
8705203 PERISCOPE QUICK RELEASE ASSY. 8105203
8713396 SLIDE ASSY. 8713396
8756252 FINAL DRIVE OUTPUT SHAFT ASSY. 8756252
8756258 ANCHOR TORSION BAR 8756258 4,24 41414137H,5145H,8640t,8642H,OT BH301-34
1
8756363 SUPPORT ARM 11598503 0 FS414511
4147H,4337H,86B45H,8653HGR 0
8756363 SUPPORT ARM 12268700 16,23 FS4145H
4147H,4337H,86B45H,8653hGR 0
8756377 RIBBED SHOULDER BOLT 12253132
8756378 RIBBED SHOULDER BOLT 12253132
8756478 BEARING AND OIL SEAL RETAINER 8756478
8756491 FINAL DIRVE SPLIENED SHAFT 87W6252
87'56494 FINAL DRIVE SPLINED SHAFT PLUG 8756252
8756497 SPEEDOMETER ADAPTER 8756494
8756552 DIFFERENTIAL STEERING LEVER 8756552
8756586 DIFFERENTIAL UNIVERSAL JOINT YOKE 8756586
8756618 SLEEVE BEARING 0
8756672 DIRVERS HATCH HINGE 8756672
8756711 GROVE PULLEY 8756915
8756850 FILLER CAP COVER 8756850 4 CAS
8756915 GROOVE PULLEY 8656915
8756970 PLAIN SOLID DISK 10907310 0
8756972 HATCH COVER HINGE SEGMENT 87569T2
8763159 PIVOT BREAK HOUSING 11660974
8763251 RIFLE MOUNTING CLIP 8763251
8763257 CLIP BRACKET 8763251
Page: 3 Sorted By Part NuTiber ,. .',,21
C-5
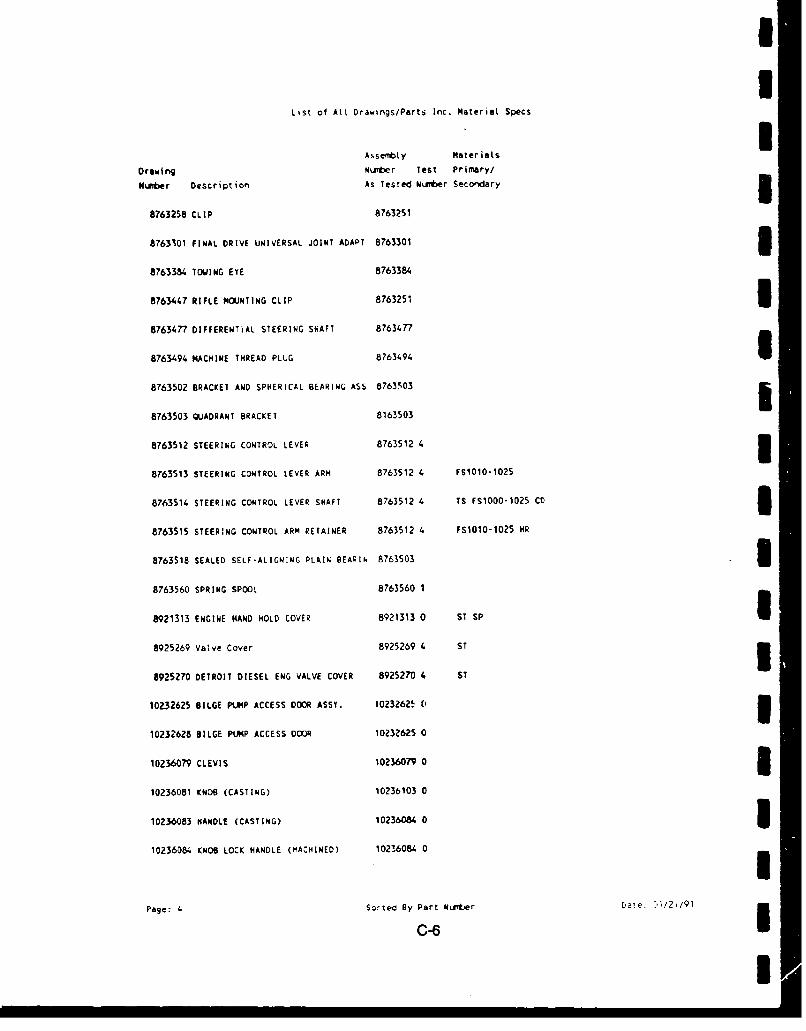
IList of Alt DrawingS/PartS Inc. material Specs
Asseffbty Materials
Drawing Number Test Primary/
Number Description As Tested Nuimber Secondary 38763258 CLIP 8763251
8763301 FINAL DRIVE UNIVERSAL JOINT ADAPT 8763301 38763384 TO•ING EYE 8763384
8763447 RIFLE MOUNTING CLIP 8763251 38763477 DIFFERENTIAL STEERING SHAFT 8763477
8763494 MACHINE THREAD PLUG 8763494
8763502 BRACKET AND SPHERICAL BEARING ASS 8763503 I
8763503 QUADRANT BRACKET 8163503
8763512 STEERING CONTROL LEVER 8763512 4 38763513 STEERING CONTROL LEVER ARM 8763512 4 FS1010-1025
8763514 STEERING CONTROL LEVER SHAFT 8763512 4 TS FS1000-1025 CD 38763515 STEERING CONTROL ARM RETAINER 8763512 4 FSIO1O-1025 HR
8763518 SEALED SELF-ALIGNING PLAIN BEARIN 8763503 38763560 SPRING SPOOL 8763560 1
8921313 ENGINE HAND HOLD COVER 8921313 0 ST SP I8925269 Valve Cover 8925269 4 ST 38925270 DETROIT DIESEL ENG VALVE COVER 8925270 4 ST
10232625 BILGE PIMP ACCESS DOOR ASSY. 1023262ý ( 110232628 BILGE PIMP ACCESS DOOR 10232625 0
10236079 CLEVIS 102360790 310236081 KNOB (CASTING) 10236103 0
10236083 HANDLE (CASTING) 10236084 0 310236084 KNOB LOCK HANDLE (MACHINED) 102!608.4 0
Page: 4 Sorted By Part Nubtier DVae. 6/21/9
C-6

List of Alt Drawings/Parts Inc. Material Specs
Assembly materials
Drawing NLutber Test Primary/
Number Description As Tested Number Secondary
10236085 REMOTE CONTROL LEVER 10236085 0
10236096 HOUSING COVER 10236096 0
10236103 OLT KNOB (MACHINED) 10236103 0
10861293 FUELCELL FILLER NECK 10861293
10861294 NECK FILLER FLANGE 10861293
10861500 DIFFERENTIAL STEERING SHAFT 8763477
10861501 LEVER ARM 8763477
10861503 LEVER ARM 8763477
10861515 DIFFERENTIAL STEERING SHAFT 10861515
10861561 HOOK 10861561
10861607 TOWCABLE HOOK 10661607 7,24 4140H
4142HETC
10861641 ACCELERATOR PEDAL LEVER 10932839 0 CS1009-1025
10861642 ACCELERATOR PEDAL 10932839 0 CS A621 OR A622
10861712 MASTER HYDRAULIC BRAKE CYLINDER 10861712
10861717 VALVE ASSY 10861717
10863439 BEARING SPACER 12253143 0
1086:580 COVER HATCH HINGE SEGMENT 10865584.
10865854 HATCH COVER HINGE SEGMENT 10865854
10865921 PLAIN SOLID DISK 10890649
10865936 EXHAUST HEATER TUBE 10875342 0 1S
10865937 HEATEN EXHAUST ELBOW 10875342 0 CAS CLS2
10865985 SHOCK ABSORBER MOUNT 10865985 7,25 4135H
4137H,4140H,ETC
10866040 VEHICLE LIFTING EYE 10866040 4 4140-4145
C38-C42
10866089 FAN DRIVE SHAFT 10866089 0 C137-CI151 IN SPLINE C32-38
Page: 5 Sorted By Part Number •tc: J''21/91
C-7

II
List o' ALL Drawings/Parts Inc. Material Specs
Assenbly Materials UDrawing N unter Test P imary/
N urbe Description As Tested Number Secondary 510866123 SPINDLE 10866124 St 4140H
4142m, 8640K, 58S6H
10866123 SPINDLE 11598503 0 ST 4140H I0142m, 8640H, 8659H
10866123 SPINDLE 12268700 16,23 4140HS4142 ,8640K, 8650DMI
10866124 SUPPORT ARM 10866124 I10866131 IDLER WHEEL SPINDLE 1225.1'3 0
10866206 STEERING ARM QUADRANT 108662(6 I1087468 CATCH BOLD HANDLE 10874686 7 CST ST CLS 80-50 OR 90 60
1087479ý. HOOK AND DAMPER 10874799
10874930 TRACK " I DJUSTER MOJNTING B 10874930 7,24 4140H,E8C 310875330 FINAL ORIvE UNIVERSAL JOINT SPIDE 10875330 7,24
10875342 HEATER EXHAUST ELBOGJ 10875342 0 TS & CAS WELDED
10875398 BEARING RETAINER 1 2 AL ST 1340
4137-4145,86"0,514510875594 SLEEVE SPACER 10875594 7 AL ST 1340
4130,4135,5130,5135,8630m,8635
10885917 STRAINER SCREEN 10885917 2
10886310 SHAFT 10932839 0 CS 1010-1025 110886/450 LATCH HANDLE 10886450 3
10867"5 AUXILIARY PEDAL 10886715
10888013 SLEEVE BEARING I 310890528 BEARING HOUSING 10890528
10890648 CARGO HATCH TORIUE BRACKET 10890649 0 310890649 CARGO HATCH TOaOUE BRACKET WELDED 10890649 0
10907273 TORSION BAR ANCHOR 10907310 0 310907310 TORSION BAR RETAINER 10907310 0
Im
Page: 6 Sorted By Part Numboer a .21/9
C-8
U

List of Al Orawings/Parts Inc. Material Specs
Asseebty Materiats
Drawing Number Test Primary/
Number Description As Tested Nurler Secondary
10907799 IDLER WHEEL 10907799 3 CS CLS120-9S
10911056 SLEEVE BEARING 8763512 4
10918159 ROAM WHEEL HOUSING SUPPORT 10918160 16 CST GRD115-95OT ASTM A148
10918160 SUPPORT HOUSING 10918160 23
10932290 ELECTRICAL INSTALLATION 10932290
10932551 ADAPTER 10932551 0 1008-1025
10932745 PROPELLER SHAFT 10932745
10932824 (STEERING CONTROL SHAFT) 10932824 4
10932838 DOUBLE ANGLE BRACKET 10932839 0 CS1008-1020
10932839 ACCELERATOR CONTROL PEDAL 10932839 0
10932844 ACCELERATOR CONTROL ARM 10932844
10932916 ENGINE OIL HOSE OIL 10932916
10932988 GASKET 10932968
10942567 SPROCKET CARRIER 10942567 4 CST ST GR1OS-85
CST ST GR120-95 ASTM A148
10942621 ELECTRICAL INSTALLATION 10942621
10943071 BATTERY MOUNTING FRAME 10943071 0
10943072 STEEL CHANNEL 10943071 3 1008-1024
10949503 LOWER TAILGATE LOCK HANOLE 10949503 2
10949528 RIGHT ENGINE MOUNT ADAPTER 10949529
10949605 FUEL TANK ACCESS COVER 10949605 3
10949788 SLIDING WINDOW CVANhIE• 10949818 0 1008-1020
10949792 WINDOW LOCK HANDLE 10949818 0 1008-1020
10949818 WINDOW CHANNEL ASSEMBLY 10949818 0
10950143 OUTER CAB DOOR PANEL 0
Page: 7 Sorted By Part Nirnber L'. '21/•1
C-9

List of A~l. Drawings/Parts Inc. Material Specs
Aseby MaterialsIDrawi ng Nurbter Test Primary/
WNibater Description As Tested Nunbier Secondary5
11010703 SCOOP DISC SUBASSY. (REPLACE PART 0
11069946 BASE PLATE 110699463
11070018 BOX COVER 10170449
11070220 GASKET COVER 110704493
11070350 BUS BAR U1 TO CIRCUIT BREAKER 11070350
11070354 BUS BAR W1 TO E2 110703543
11070449 DISTRIBUTION BOX ASSEMBLY COVER 11070449
11588878 DOOR LATCH 11589281 0I
11589281 TRUNNION ENGINE MOUNT 11589281 0 ND CST CLSS OR 6
CST ST CLS65-35,70-36,80-40U115981005 AIR CLEANER COVER 11598005
11598503 TRACK SUSPENSIOP. PIVOT ARM 11598503 0 TEMPER WELD Q 500 *F3
11612673 SLIDE LATCH PIN 11612676 2
1`1612674 LATCH SLIDE 11612676 23
11612675 SLIDE LATCH BODY 11612676 2
11612676 SLIDE LATCH ASSY 11612676 2
11613007 BALL PLUNGER 11612676 2
11633395 HE.ICAL TORSION SPRING 10949818 0 PWi SPEC QQ-W-470U
11633491 LOOP CLAMP 116334913
11633894 SLEEVE BEARING 12253143 0 01.16
11634072 INSULATED COVER 116340723
116~4D643 UNIVERSAL JOINT 5PIDER 11640643
11660920 TRUNNION 11598503 0 4140H4142K, 41451, 8650m
11660920 TRUNNION 12268700 16,23 4140H
4142H,4145H,8650H3
Page: 8 Scrted By Part wiroer ac '/19
c-10I

List of All Drawings/Parts Inc. Material Specs
Assemfbty Materiats
Drawing Nunmer Test Primary/
NuLaer Description As Tested Number Secondary
11660974 APIVOT SINGLE DISK BRAKE ASSEMBLY 11660974
11669238 PROPELLER SHAFT 11669238
11669358 SUSPENSION ARM 12253578 25 FS4140N-4145H
11669359 GUARD 11669359 3,25 4130N-4140
4340,8630-86"0
11669361 BEARING UNIT HOUSING 11669361 2
11669365 SLEEVE BEARING 12253578 25 0L16
11669366 GUARD 11669366 3,25 4130H-4140
43410,860-8640
11669367 IDLER WHEEL SPINDLE 12253578 25 FS 4142
F145H,86B45H
11669373 IDLER WHEEL 11669373 3 CST ST GR120-95
11678123 SUPPRESSOR MOUNTING PLATE 11678123 9,10
11678177 DIFFERENTIAL UNIVERSAL JOINT YOKE 11678177
11678255 SPROCKET UxEEL 11678255 0 FS 1345H
4340H,4140H4-150,50B44H,50850HOR 134r.-! FIN
11699728 AFT BEAM 11699728
12253130 HUB CAP 12253130 7
12253131 BEARING UNIT HOUSING 12253132
12253132 HUB ASSEMBLY 12253132
12253143 IDLER ARM 12253144 3,18
12253144 CLEVIS 12253143 0
12253106 Match Cover 12253406 4
12253425 FAN PULLEY ACCESS COVER 12253425 9,10,11
12253519 IDLER FLAT PULLEY 12253519 7
12253531 GROOVED PULLEY 12253531 0 CS 1040-1045
12253535 ADJUSTABLE ROD END BRACKET 12253535
12253570 OIL FILTER MOUTI;NG BRACKET 12253570 0
Page: 9 Scrted By Part NuTber Ea:e 1 /21/91
C-11

I
List of All Drawings/Parts Inc. Material Specs
AssMemby materials IDrawing Number Test Primary/
Niaber Description AS Tested NEiter Secondary -
12253578 IDLER ARM 122S3578 2,16,18
12253644 fILLER CAP COVER 12253646 0 AS CLS 2 112265722 INTERCOM BOX ANGLE BRACKET 12265722 0
12268684 GROOVED IDLER PULLEY 12268684 0 1010-1025
12268689 SUSPENSION TORSION BAR 12268689 8
12268692 SHOCK ANSORBER MOUNT 12268692 7 41351I
12268700 ROAD WHEEL ARM ASSEMBLY 12268700 16,23
12268773 PIPE ELBOW 10875342 0 TS I12268994 AIR INLET HOUSING 12268994 312269095 GROOVED PULLEY 12269095 0
12269508 CLIP RETAINER 0 312276657 ROAD WHEEL SUPPORT HOUSIN.G 12276657 16,23 FS ,130
8630
12292439 MOTOR SUPPORT 12292439 1 312292441 MOTOR CLAMP 12292441 1
12294243 VEHICLE LIFTING EYE 12294243 0 FS 4140-4145
12294481 SHIELD 12294481 3
12294777 FORWARDER HOUSING 12294777 0 312294924 WIRE SHIELD 12294924 3
12-95281 IDLER SUPPORT ARM SPINDLE 12295281 4140H-4145H
8640H, 4.340H
12295282 IDLER BEARING UNIT MOUSING 1229522
122•9290 DUAL SUPPORT ROLLER SPINDLE 12295290 CST ST GR120-95
12295542 RIBBED SHOULDER BOLT 0
12296932 TRACK SUSPENSION PIVOT ARM ASSY. 12296932 IPage: 10 Sorted By Part NHilber Dno, C,1/21/91
C-12 I

List of Att Drawings/Parts Inc. Material Specs
AssembLy Materials
Drawing NLarber Test Primary/
Number Description As Tested Number Secondary
12296935 ROAD WHEEL HUB ASSY. 12296935
12297029 TAPERED PIN 12297029 AL ST 4130-4.140
12297362 Come4. CONTROL MOUNTING PLAT 12297362 9,1O,11
12298112 SAFElY HANDLE (NEW PART #12317063 12298112 2
12307265 HATCH HANDLE AND HOOK 12307265 1
123.0770 CONTROL DOOR ANGLE HANDLE 12307270 1 AS 13304130 & 1010-1025
12317158 25 NM AMUNITION ACCESS bLOR 12317158
12328579 SAFETY ANCHOR SHACKLE 12328579
12328805 IDLER WHEEL ARM 12328805
12349903 BILGE PUMP STRAINER 12349903
108990528 Pitlow Block 108990525 3
Page: 11 Sorted By Part Number Date: -1/21/91
C-13

APPENDIX D
ATMOSPHERIC EMISSION TEST REPORT
D-1

SINTERNATIONALTECHNOLOGYCORPORATION
ATMOSPHERIC EMISSION TEST REPORT
FLUIDIZED-BED PAINT REMOVALDEMONSTRATION TESTSRED RIVER ARMY DEPOT,
TEXARKANA, TEXAS
by
IT Air Quality Services11499 Chester Road
Cincinnati, Ohio 45246
Contract No. DAAA15-88-D-0001Task Order No. 0005
JTN 816004-002
Contracting Officer's RepresentativeMs. Carolyn Graham
Project OfficerMr. Ron Jackson
U.S. ARMY TOXIC AND HAZARDOUS MATERIALS AGENCY
ABErIDEEN PROVING GROUND, MARYLAND 21010-5423
April 1991
Regicnal Office
11499 Chester Rd. Cincinnati. Ohio 45246 • 513-782-4700

3UU
CONTENTS I
Figures iiiTables iii
1. Introduction 1-11.1 Background 1-1 31.2 Atmospheric emission tests 1-2
2. Summary of Test Results 2-12.1 Sampling plan 2-12.2 Flue gas data summary 2-12.3 Particulate/multimetals test results 2-52.4 Total hydrocarbon test results 2-72.5 Process sample analytical results 2-9
3. Quality Assurance Procedures and Results 3-13.1 Field sampling quality assurance 3-13.2 Continuous emission monitor - THC 3-1 33.3 Analytical quality assurance 3-5
4. Fluidized-Bed Paint Stripper Operation 4-1
5. Sampling Locations and Test Methods Used 5-15.1 Particulate/metals 5-35.2 Total hydrocarbons 5-4
Appendices IA Computer Printouts and Example Calculations A-1B Field Data Sheets B-iC Laboratory Data Sheets C-1D Sampling and Analytical Procedures D-1IE Calibration Procedures and Results E-1
Iii I
I

FIGURES
Number
5-1 FPBS Unit Showing Sampling Locations 5-2
TABLES
Number Pe
2-1 RRAD Test Plan 2-2
2-2 Summary of Flue Gas Conditions - Afterburner Inlet 2-3
2-3 Summary of Flue Gas Conditions - Venturi Inlet 2-3
2-4 Summary of Flue Gas Conditions - Venturi Outlet 2-4
2-5 Summary of Particulate and Metals Emissions 2-6
2-6 Summary of Hydrocarbon Emissions Data 2-8
2-7 Process Sample Analytical Results 2-9
3-1 Field Equipment Calibration 3-2
3-2 THC Monitor QA/QC Results 3-4
3-3 Filter and Reagent Blank Analysis Data 3-5
3-4 Metals QA/QC Data 3-6
3-5 Methods Detection Limit Data 3-6
4-1 FBPS Operation and Type of Emission Tests 4-1
iii

I.
II
SECTION 1 IINTRODUCTION
1.1 BacIlqground
For tthis task assignment, PEI Associates, Inc. (PEI), under contract to the U.S.
Army Toxicand Hazardous Materials Agency (USATHAMA), has purchased and in-
stalled a PFacedyne Corporation fluidized-bed paint stripper (FBPS) at the Red River
Army Depo .(RRAD) near Texarkana, Texas. The FBPS is a production unit used to
remove paint, oils, and greases from metal parts by immersing the parts in a fluidized
bed of aluminum oxide granules maintained at temperatures high enough to pyrolyze
organic maMtter. Typical temperatures range from 700 to 1000 F, with residence
times in the bed of approximately 1 hour. Usually the bed contains insufficient oxygen
to support (combustion. Therefore, organic matter on the parts and in the coatings
(paints and iprimers) is pyrolyzed in the FBPS to carbon and carbon monoxide. An in-
line gas-firwd incinerator burns the carbon monoxide and fluidizing-bed gases. The
products off combustion are exhausted through a water venturi scrubber to the atmo-
sphere. 3"lhe IFBPS is an alternative to solvent-based paint-stripping systems. Solvent-
based paintt-stripping systems typically use methylene chloride and other chlorinated 3solvents. 1ihe solvents chemically destroy the organic binders in the paint. The re-
maining casting material is removed with washing action or shotblasting prior to re-
coating.
Typically, chemical paint.stripping solvents are toxic and volatile. Methylene 3chloride, the most commonly used solvent, is especially volatile (boiling point 40"C or
104" F). Tlte chemical paint-stripping process generates sludge consisting of stripped
1-11
I

coatings contaminated with paint-stripper solvents. The sludge is listed as a categori-
cal hazardous waste and must be disposed of as such. PEI and USATHAMA believe
that installation of the FBPS will reduce atmospheric releases of stripper compounds
(mostly chlorinated solvents) and reduce the volume of hazardous wastes requiring
disposal. Therefore, the objective of this test program is to demonstrate that the use
of an FBPS will reduce hazardous waste w[IAe satisfactorily removing coatings (or
assisting removal) and enabling reuse of parts at the RRAD.
1.2 Atmospheric Emission Tests
Atmospheric emission tests were conducted on February 26, 27, and 28, 1991.
Testing was performed at the following three locations:
o Afterburner inlet (AI)o Venturi scrubber inlet (VI)o Venturi scrubber outlet (VO)
At each location, a Method 5 sampling train, modified to allow collection and
3nalysis of trace metals [total chromium (Cr), cadmium (Cd), lead (Pb), and zinc (Zn)],
was used to measure particulate and metals concentrations. In addition, a continuous
flame ionization analyzer (FIA) was used to measure total hydrocarbon (THC) concen-
trations at the Al and VI locations.
Messrs. Bob Ressl and David Pomerantz of PEI coordinated FBPS operations
throughout each test period and collected appropriate process samples (scrubber
water-bed sand samples). The following report sections detail the results of the emis-
sion sampling effort.
1-2

I ._
II
SECTION 2 ISUMMARY OF TEST RESULTS 3
This section details the results of the emission test program. No attempt is
made to correlate emissions with FBPS operation, although conclusions relative to
pollutant removal efficiencies are addressed based on the emission data.
2.1 Sampling Plan
Table 2-1 summarizes test times, parameters, and FBPS operation for this test
program. Particulate/multimetals samples were collected simultaneously at the indicat-3
ed locations for Test Series 1 through 5. Test Series 6 through 8 were conducted at
only the Al and VO test locations. Measurements of THC were made primarily at the
Al and Vl test locations.
The initial test series was conducted for about 120 minutes and the remaining 3tests were conducted for 60 minutes each.
2.2 Flue Gas Data Summary 3Tables 2-2 through 2-4 summarize flue gas conditions at each location.
Prior to each test, U.S. EPA Methods 1A and 2C* were used to measure veloci-
ty pressure head and temperatures. These data were then used to set isokinetic sam-
pling rates. Volumetric flow rates are generally expressed in actual cubic feet per
minute (acfm) and dry standard cubic feet per minute (dscfm) at 68" F, 29.92 in.Hg,
and zero percent moisture.
I
*40 CFR 60, Appendix A, July 1990. U2-1 I
I
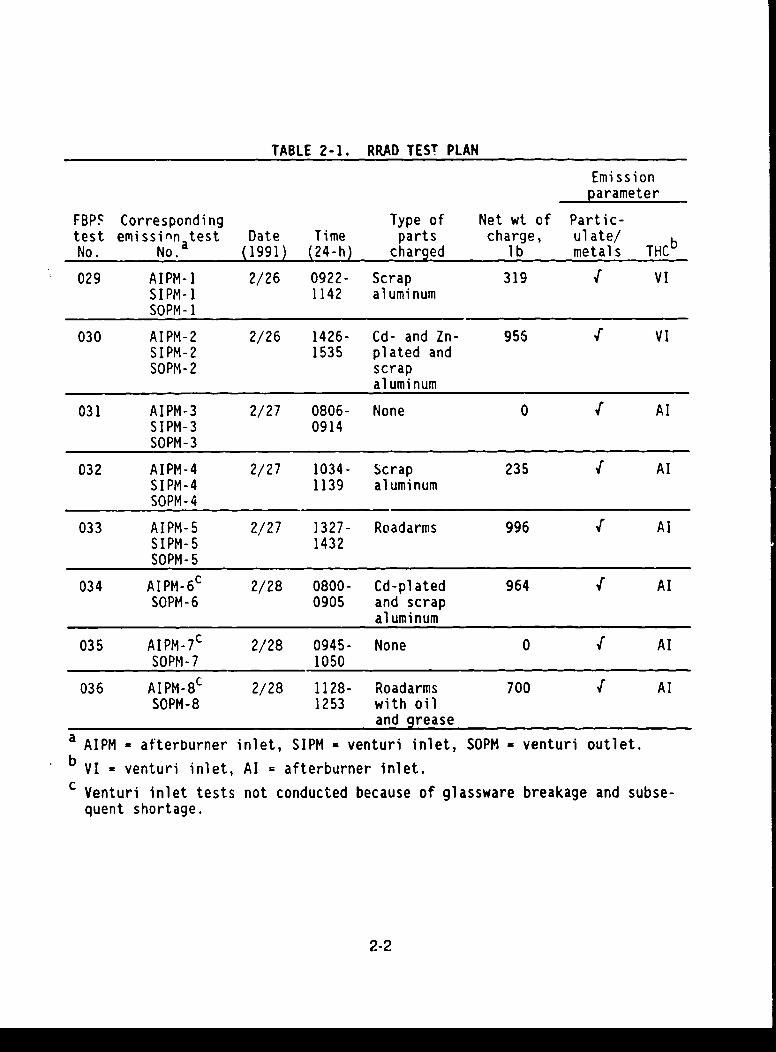
TABLE 2-1. RRAD TEST PLAN
Emissionparameter
FBPF Corresponding Type of Net wt of Partic-test emissinn atest Date Time parts charge, ulate/No. No. (1991) (24-h) charged lb metals THCb
029 AIPM-1 2/26 0922- Scrap 319 1 VISIPM-1 1142 aluminumSOPM-1
030 AIPM-2 2/26 1426- Cd- and Zn- 955 1 VISIPM-2 1535 plated andSOPM-2 scrap
aluminum
031 AIPM-3 2/27 0806- None 0 1 AISIPM-3 0914SOPM-3
032 AIPM-4 2/27 1034- Scrap 235 1 AlSIPM-4 1139 aluminumSOPM-4
033 AIPM-5 2/27 1327- Roadarms 996 1 AlSIPM-5 1432SOPM-5
034 AIPM-6c 2/28 0800- Cd-plated 964 1 AISOPM-6 0905 and scrap
aluminum
035 AIPM-7c 2/28 0945- None 0 1 AISOPM-7 1050
036 AIPM-8c 2/28 1128- Roadarms 700 1 AlSOPM-8 1253 with oil
and greasea AIPM = afterburner inlet, SIPM = venturi inlet, SOPM - venturi outlet.
b VI - venturi inlet, Al -afterburner inlet.
c Venturi inlet tests not conducted because of glassware breakage and subse-
quent shortage.
2-2

III
TABLE 2-2. SUMMARY OF FLUE GAS CONDITIONS - AFTERBURNER INLET
Volumetric Composi-Run Date Time flow rate tion, %
No. (1991) (24-h) acfma dscfmb Tempera- Mois-•ture, "F ture, % 02 CO2
AIPM-1 2/26 0924-1124 521 366 228 7.9 21 0AIPM-2 2/26 1426-1526 524 348 233 12.4 2" 0 0AIPM-3 2/27 0806-0906 531 372 281 0.9 e1 0AIPM-4 2/27 1038-1138 499 392 191 2.3 21 0AIPM-5 2/27 1330-1430 526 341 229 14.6 21 0AIPM-6 2/28 0800-0900 507 412 168 1.5 21 0AIPM-7 2/28 0945-1045 519 404 198 1.0 21 0AIPM-8 2/28 1153-1253 530 395 226 1.4 21 0
a acfm = Actual cubic feet per minute.
b dscfm = Dry standard cubic feet per minute. Standard conditions are 68OF,
29.92 in.Hg, and zero percent moisture.
I
TABLE 2-3. SUMMARY OF FLUE GAS CONDITIONS - VENTURI INLET 3Volumetric Composi-flow rate tion, %
No. (1991) (24-h) acfma dscfmnb Tempera- Mois-ture, OF ture, % 02 CO2
SIPM-1 2/26 0923-1123 1082 892 113 9.6 20 1.0SIPM-2 2/26 1427-1527 1311 1066 116 10.4 20 1.0SIPM-3 2/27 0807-0907 1276 1058 111 9.1 20 1.0SIPM-4 2/27 1037-1137 1230 995 116 10.5 20 1.0SIPM-5 2/27 1329-1429 1280 1002 123 12.5 20 1.0
a acfm = Actual cubic feet per minute.
b dscfm = Dry standard cubic feet per minute. Standard conditions are 68"F,
29.92 in.Hg, and zero percent moisture.
II
2-3 3
I

TABLE 2-4. SUMMARY OF FLUE GAS CONDITIONS - VENTURI OUTLET
Volumetric Composi-flow rate tion, %
Run Date Time acfMa dscfmb Tempera- Mois-No. (1991) (24-h ture, *F ture, % 02 C02
SOPM-1 2/26 0922-1142 915 695 131 15.4 20 1.0SOPM-2 2/26 1430-1535 982 787 126 11.4 20 1.0SOPM-3 2/27 0808-0914 974 788 125 10.5 20 1.0SOPM-4 2/27 1034-1139 920 744 123 11.1 20 1.0SOPM-5 2/27 1327-1432 963 765 127 11.9 20 1.0SOP1i-6 2/28 0800-0905 980 754 129 13.7 20 1.0SOPM-7 2/28 0945-1050 983 770 125 12.8 20 1.0SOPM-8 2/28 1128-1232 961 755 125 12.5 20 1.0
a acfm Actual cubic feet per minute.
b dscfm = Dry standard cubic feet per minute. Standard conditions are 68"F,
29.92 in.Hg, and zero percent moisture.
For tests conducted at the Al, flow rates ranged between 499 and 531 acfm,
with average gas temperatures rarngng between 168 and 281 ° F. Flue gas moisture
content was generally less than 2.5 percent, except in Tests 1, 2, and 5, where mois-
ture contents of 7.9, 12.4, and 14.6 percent, respectively, were measured. Gas com-
position data showed essentially ambient characteristics, with 21 percent oxygen (02)
and 0 percent carbon dioxide (C02). A Fyrite gas analyzer was used to make these
measurements periodically throughout the test program.
Scrubber venturi inlet flow rates ranged between 1082 and 1311 acfm, with an
average temperature of 116 F and a moisture content of 10.4 percent. Gas composi-
tion data showed an average 02 content of 20 percent and a C02 content of 1.0 per-
cent.
Scrubber venturi outlet flow rates ranged between 915 and 983 acfm, with an
average temperature of 126 F. Gas moisture content averaged about 12.4 percent,
with 02 and C02 contents of 20 and 1.0 oercent, respectively. Since the gas stream
appeared saturated and apparently contained water droplets, two moisture determina-
tions were made: the first involved volumetrically determining the amount of water
coilected during each test and the second involved calculating the moisture content by
2-4

I
using the vapor pressure of water at the measured stack temperature and pressure. IThe lower value was reported in each case as specified in U.S. EPA Methcl 4.*
Because the Al and VI test locations did not conform to U.S. EPA sý mpling Ilocation criteria (see SecLion 5 of this report), the measured flow rates are probably
biased high. By comparing scrubber inlet (VI) and outlet (VO) average flow rates, the Imeasurement bias was determined to be about 25 percent. Outlet flow rates mea-
sured at the VO location which meets the U.S. EPA sampling location criteria averaged I757 dscfm for eight tests, compared with a five-test average of 1003 dscfm at the VI
(i.e., about a 25 percent difference). In summary, the outlet flow rates are considered
representative, whereas the gas flow measured at the other two sites is semi-
quantitative at best.
2.3 Particulate/Multimetals Test Results
Particulate concentrations reported in Table 2-5 are expressed in grains per dry
standard cubic foot (gr/dscf', and milligrams per cubic meter (mg/m 3). Metals con- Icentrations are expressed in micrograms per cubic meter (Ag/i 3). Pollutant mass
rates are expressed in pounds per hour (lb/h). The product of volumetric gas flow Irate and concentration yields the mass rate in lb/h.
Test SOPM-1 (scrubber outlet) is considered nonrepresentative because a Uscrubber upset occurred during the first 40 minutes of the test. No major problems,
either process or sample related, were encountered with any of the remaining tests. IAfterburner inlet particulate concentrations ranged between 0.01 and
0.08 gr/dscf (23.3 and 183 mg/m 3) for the eight tests conducted. Maximum concen-
trations were observed in Tests 1, 2, 5, and 6, which correspond to the maximum 1FBPS system loadings (see Table 2-1). Baseline (no parts charged) tests showed
particulate concentrations of 0.01 and 0.026 gr/dscf (23 and 59 mg/m 3).
Particulate concentration at the VI ranged between 0.002 and 0 C0, gr/dscf
(5 and 9.6 mg/m 3). In the five tests in which simultaneous measuremer,•s were made
* 40 CFR 60, Appendix A, July 1990. I2-5
I
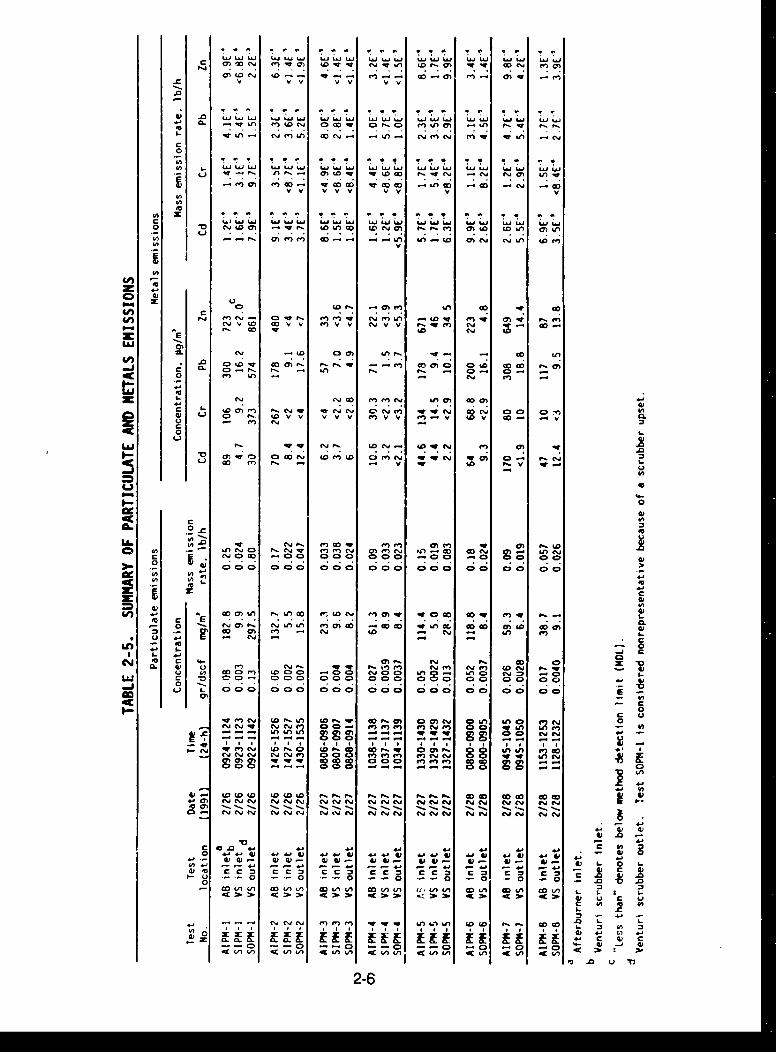
W. W. L.j 1A, W4 W W UJ W. LAJ w w'. w4 (4, (4, (.4 (4, w4 w4 (.4 (4
qr. usu Ln c.4 Ln, coj (4, (4 . . 4,(, (4(, (.4 w' -.S (. 4.A s ~
4. M- en co- .6 . Go. CO. ( fLn( O -~ e'-.. *-t.
v
4Ac ........ *ww w w0 Ir cý r : : I
fi Ok 4 ;((5) S
Z .(.L4 LJ.(J I,.U . L 4 44(4 (. ~ (4. ~~
3c E
o 4)0m rw. -501' cn , c,-I(
e-1 C -c 0 400enc (v 4w . c~-4 -r 4m C %* .0 m5~ v0P. qr to v55 0( 0
0 1
LL. Cv) l r= - o -w P, to0
)P- 4) C 5.-5 C . C oa C Q0 C lC' 4 C. CC )4
03c 4)
(U5
0o 6no 000 Go Ccc ccG cc W cc4
(5n cljff t
.vJ cD SD Q QC
40 Lm cc P) -w ( (0 r -0) - ( (
4, UL 4, JJ
4, (,
La.* so J3 40- 000 *1 0 0 0 0
4110 S.5( 2D-( =0-. 350 .05 , Z =I. (V L) 0 0 0 0)'). (P( . 0 . 4
4x :I - :- .- 4c:- - 2. -- -K-. 4
2-6-

I
at all three locations, particulate concentration was reduced by more than 85 percent Iin a comparison of the Al and VI test results.
Particulate concentrations at the VO ranged between 0.003 and 0.013 gr/dscf
(6.4 and 28.8 mg/m 3). Corresponding mass emission rates were 0.019 and 0.47 lb/h,
respectively. In Tests 2 through 5, VI and VO test results were very similar and, in
some cases, showed higher outlet results (Tests 2 and 5). This is believed to be a
function of scrubber operation in that no mist elimination system is in place. Visual
observation of the system indicated a significant water carryover rate at the outlet test 3location and resulted in entrained particulate (in the water droplets) being collected at
the sampling location.
Emission samples collected at each location were subjected to a metals analy-
sis for Cd, Cr, Pb, and Zn. As reported, all four metals were found in all samples col- -lected at the Al. The highest metals concentrations were observed in Tests 2, 5, 6,
and 7. Tests 2, 5, and 6 correspond to the largest FBPS charge weights, and Test 7
was conducted at a baseline (no-load) condition.
As reported, metals concentrations were reduced across the system in close Iparallel with total particulate reductions.
2.4 Total Hydrocarbon Test Results
Table 2-6 summarizes the THC test results for the test periods indicated. Con-
centrations are reported in parts per million (ppm) as methane on both a wet and dry
basis. The average volumetric flow rates measured at the indicated locations were
used to calculate mass emission rates.
No measurements were made at the VO test location because of the high mois-
ture content of the gas stream. The VI data (February 26) show essentially nondetect-
able THC levels covering Tests 1 and 2. Even though no measurements were made 3at the VO outlet, it is reasonable to assume that the same nondetectable level of THC
would be observed at the VO outlet based on the VI results. After the February 26
tests, the decision was made to monitor exclusively the Al location and no further
measurements were made at the VI or VO locations.
2-7
I

TABLE 2-6. SUMMARY OF HYDROCARBON EMISSIONS DATA
THC concentration, ppmDate Time Average volumetric THC emission
Range (1991) (24-h) Wet Dry flow rate, dscfm rate, lb/h
Venturi inlet
0-500 2/26 1011-1045 7.4a 8.3 1003 0.0210-100 1106-1429 2.5 2.8 1003 0.00700-100 1429-1503 4.4 4.9 1003 0.0120-110 1503-1522 2.5 2.8 1003 0.0070
Afterburner inlet
0-100 2/27 0923-1019 3.8 4.0 379 0.00380-5000 1019-1105 >5000 >5275 379 4.980-500 1105-1135 210 221.5 379 0.210-100 1135-1143 53.8 56.8 379 0.0540-100 1143-1245 31.4 33.1 379 0.0310-100 1245-1255 49.1 51.8 379 0.0490-100 1255-1331 32.6 34.4 379 0.0320-500 1331-1340 >560 >591 379 0.560-5000 1340-1346 >2670 >2816 379 2.660-100 1346-1430 130.3 137.4 379 0.130-100 1430-1445 39.7 41.9 379 0.0400-100 1445-1539 18.5 19.5 379 0.018
0-500 2/28 0805-0837 >2600 >2743 379 2.590-500 0837-0903 71.7 75.6 379 0.0710-500 0903-0920 40.3 42.5 379 0.0400-500 0920-0936 29.8 31.4 379 0.0300-500 0936-1009 19.4 20.5 379 0.0190-500 1009-1041 12.4 13.1 379 0.0120-500 1041-1128 10.6 11.2 379 0.0110-500 1128-1157 >2600 >2743 379 2.590-500 1157-1253 83.9 88.5 379 0.084a 0-500 ppm range (detection limit ±10 ppm).
b 0-100 ppm range (detection limit 12 ppm).
2-8

IThe Al data were relatively consistent, with the exception of large THC spikes
corresponding to Tests 4, 5, 6, and 8. The duration of each spike is indicated by the
corresponding time interval in Table 2-6.
2.5 Process Sample Analytical Results
Table 2-7 summarizes the process sample analytical results. A total of six sand
and four water samples collected during the test program were analyzed for the speci- 5fled metals.
Sand Sample 1 was collected from a randomly selected drum (No. 16864) of i
the virgin sand used to charge the fluidized bed. Samples 2 and 5 are the cold-bed
pre- and post-test samples and Samples 3 and 4 are the hot-bed pre- and post-test
samples. Sample 6 is the dust sample collected from the cyclone between the beds
and the afterburner. 3The water samples were collected as a series of grab samples during the emis-
sions tests. Samples 30 and 34 were taken while cadmium- and zinc-plated parts
were being processed in the FBPS, and Sample 32 was collected while aluminum-
plated parts were being processed. ITABLE 2-7. PROCESS SAMPLE ANALYTICAL RESULTS
Metal concentration, Ag/ga
Sample ID Cadmium Chromium Lead Zinc
Sand - I NDb 9.8 0.7 2.9Sand - 2 1.7 13 19 16Sand - 3 5.5 24 23 34Sand - 4 26.7 14.3 25.9 38.4Sand 5 2.8 15 23 22Sand 6 40.4 35.1 77.5 161
Metal concentration, mg/Lc
Water - 30 0.004 0.083 ND 0.082Water - 31 0.002 0.030 0.0041 0.031Water - 32 ND 0.007 0.0007 0.021Water 34 0.007 0.064 ND 0.20a Mg/g Micrograms per gram. ib ND - Nondetectable.
c mg/L - Milligrams per liter. I
2-9
I

SECTION 3
QUALITY ASSURANCE PROCEDURES AND RESULTS
The procedures described in the Quality Assurance Project P!an were followed
in all field sampling analyses. The following subsections describe the quality assur-
ance (QA) procedures and the results obtained.
3.1 Fleld Sampling Quality Assurance
Routine Reference Method quality control (QC) procedures were followed
throughout the test program. These included, but were not limited to, the following:
0 Calibration of field sampling equipment. Sampling equipment was cali-brated according to the procedures of the "Quali-y AssuranCe Handbookfor Air Pollution Measurement Systems, Volume II," EPA 600/4-72-027B,August 1977. The calibration data are summarized in Table 3-1. Calibra-tion guidelines are described in more detail in Appendix E.
0 Onsite audits of dry gas meters, thermocouples, and digital indicators
(see Appendix B).
o Train configuration and calculation checks.
o Onsite QC checks of the sampling train and leak checks of the pitot tubeand Orsat line.
o Use of designated equipment and reagents.
The sampling equipment and procedures met all the guidelines established in
the reference methods.
3.2 Continuous Emission Monitor - THC
The following QA procedures pertain to the use of the THC continuous emis-
sion monitor (CEM):
3-1

0)(1 Q). Q). 0).
EJ UU vU U~).
LL- LA- ZZ L.. LL- LA- LA-L.
0)
c~ ..
0.EU C)~U IA-3 C C C C, l CA),~d C; V)Cd* C
.C-a)0 I))0 I)0 I) 0 I)0 I ) 0 V)0
a) ,) - c >- -n 0)> . >
" ""*I4 * *4-I *+I 'n14r .+Ic;61C* 0~ 0LnJ e 0
0G' 0 C4% 1 4 %A L
S+ 1 +1 -0-2 +1 4, 4- +1C24
+14, Co - C 14 CD p.# ;40 1 CD W
S.- =. S. -0 U
01) -. 0(4-. 0 4-. 0
s- 2A 0.o; 4- r- 4-ý- r-. 4- 9 C
v* (1) d) 4 U'U 4.J-0 Qto' 0) C.1 a)C) )C.
LL. LA LL " f 0 )(
r_ 0
0) 4-b4-
23-2

V) M 00
Q) W a S
4*- 4-- 4-- P-
00
M0)
c c
39 4 4 ) ) 4 w Li.. 4)A.L. 4)LL CL). LLi. 4)a )( )
U- L-L- L- LA. e'&j LL L ; L 0 00 (% a 0EU ~0+ +++ + + + ++ 00'
+
a) C C
m LC Lr) LL. LA- L- L- L- 0
6U 6 .ý e S- = t
+1 4-
C.0 0 LAEo S C Iw. 4-) .- eU r%-
EU~4 ea0)0'i
o: S- X:. S- CL")U 4- V) +J' 44EU
EU 4c 4) C C LAJ
9.-.~ E . S-) .- . =- 41I-~r 40) ON)0. u
C~I- L.) elf 41 a SJ4I I 4)V) V) r 4.
.A- LL. LA 4L- L- A L w o d '
Za S- CL.S- -4) E" 4) M W 00)) 40 c~j (% C7J E- c-~ 0 S-E
-U lie IV o J~r .- j) S- mj CM*1 r-i mi U- CL 4- >1 U- iv)V N S- 'A0 u
4ii im0)j4- o CD c co 0)
U S..3-3

I
Use of designated sampling equipment and procedures. The CEM m-et Iall performance requirements of U.S. EPA Method 25A. All componentsin the sampling system were either 316 stainless steel (probes) or Teflon(sampling line and pump diaphragms).
System leak checks and integrity checks. Pricr to the start of the firsttest, the entire sampling system from the probe to the analyzer inlet wasleak-checked by plugging the probe inlet and evacuating the system to15 in.Hg. The vacuum was observed for 5 minutes to ensure that thesystem was leak-free.
System integrity and bias were measured by injecting calibration gasesthrough a three-way valve at the probe outlet and comparing the re-sponse obtained with the response obtained when the gas was intro-duced directly to the analyzer. System integrity test results are listed on athe data sheets in Appendix B. System bias in all cases was less than2 percent of scale. I
Pre- and post-test calibrations. At the beginning and end of each testday, the analyzer was ca!ibrated with three standards in the analyticalrange and zero nitrogen. The calibration data were reduced by linear Iregression analysis and the linear equations were used for data reduc-tion. Calibration data are summarized in Table 3-2. Copies of the stripcharts are contained in Appendix B.I
TABLE 3-2. THC MONITOR QA/QC RESULTS t
Calibration a b CorrelationMonitor Date (1991) error, % of span Drift, % of span coefficient m
THC 2/25 0.25 - 0.9999THC 2/26 0.15 0.12 0.9999THC 2/27 0.16 01.20 0.9999 UTHC 2/28 0.16 1.73 0.9999
a Calibration error a (Cal. gas conc.- conc. predicted) X 100.Span value
Calibration error is average value from four calibration gases.b Drift - (Posttest cal. resDonse - initial cal, response) X 100.
Span value
Drift error is average value from four calibration gases.
NOTE: Calibration error and drift checks were all within the Method 25A flimits.
I3-4 1
I

3.3 Analytical Quality Assurance
The laboratory QA procedures outlined in the Quality Assurance Project Plan
were followed for each type of analysis.
The 0C procedures to be used in the sample analyses in this test program
included, but were not limited to, the following:
o Use of designated analytical equipment and experienced laboratory per-sonnel.
o Internal and external audits to ensure accuracy in sampling and analysis.
o Reagent, filter, and field blanks to determine blank levels.
o Sp;ked samples to determine the effect of sample handling and the ma-trix effect.
o Duplicate analysis of selected samples.
Particulate
As a check of the gravimetric analytical procedures, a blank filter and reagent
(acetone) were analyzed in a manner similar to that used for actual field sampling.
Table 3-3 summarizes the particulate b!ank data. The blank corrections were applied
to the particulate data.
TABLE 3-3. FILTER AND REAGENT BLANK ANALYSIS DATAITAS Lab Tare Average-gross Net difference,
Sample type No. weight, mg weight, mg mg
Filter (9070094) X10305509-A 468.2 469.1 0.9
Acetone X10305509-B 107,373.9 107,376.0 2.1 mg(0.0077 mg/g)
Metals
Quality assurance for metals (Cr, Cd, Pb, Zn) included filter reagent blank data,
duplicate analysis (Pb only), and Standard Reference Solution (SRS) analysis. These
data are summarized in Table 3-4. Method Detection Umit (MDL) data for the stack
emission samples are summarized in Table 3-5.
3-5

I
TABLE 3-4. METALS QA/QC DATA I(EMISSION SAMPLES)
SRS data IFilter and HNOV/H2 02 Theoretical Percent recovery
Metal blank data, ,4g value, mg/L (duplicate)
Chromium 9.6 1 85.6, 87.8 mCadmium 2.4 1 86.7, 95.8Lead 2.4 0.75 92.0, 84.4Zinc 58 1 80.4, 82.9
TABLE 3-5. METHOD DETECTION LIMIT DATA !(total 9g)
Afterburner Venturi scrubber Venturi scrubberMetal inlet inlet outlet
Chromium 3 3 3Cadmium 2 2 2Lead 11 0.6 0.6Zinc 5 5 5 1
As indicated, the lead analyses were performeci in duplicate; laboratory report
values (Appendix C) represent the average of the duplicate analysis. IMetals blank corrections were applied to all reported data using the bUank val-
ues summarized in Table 3-4. The reported SRS data are within the guidelines estab- Ilished for each metal analyte. pProcess Samples
Quality assurance for the process samples included SRS analysis and duplicate 3analysis for lead. The percent recovery data for all metals were within the guidelines
specified in the analytical methods. These data are contained in Appendix C. I
II
3-6 m
I

SECTION 4
FLUIDIZED-BED PAINT STRIPPER OPERATION
Table 4-1 summarizes the FBPS operation and type of emission tests conduct-
ed during this test program.
TABLE 4-1. FBPS OPERATION AND TYPE OF EMISSION TESTS
Emission test part
After- VI between wet VOTest Date FBPS burner cap and atmospheric Net wt. ofNo. (1991) test No. inlet scrubber emissions Types of parts charged charge. lb
1 2/26 029 1 1 " Scrap aluminum 319
2 2/26 030 1 " Cd- and Zn-plated and 956scrap aluminum
3 2/27 031 1 I f None 0
4 2/27 032 " 1 " Scrap aluminum 235
5 2/27 033 4 1 4 Roadarms 996
6 2/28 034 1 a " Cd-plated and scrap 964aluminum
7 2/28 035 4 a 4 None 0
8 2/28 036 " a 4 Roadar$ns with oil and 700grease
a Afterburner inlet and scrubber outlet tests only.
On February 26, 1991, the first emission test was conducted with painted alumi-
num parts processed in the FBPS. In the second emissions test, Cd-plated, Zn-
plated, and painted parts were processed in the FBPS. Two painted parts had been
weighed and marked before and after the test to determine the amount of paint re-
moved. A composite wet cap/scrubber water sample was collected during this test.
The plated parts from the second test were sent to be replated.
4-1

I
On February 27, three 1-hour emission tests were run. The first run (Test 3) 1was without any parts loaded in the hot bed. A water sample was collected durir.g
this test. For the second run (Test 4), the unit was loaded with painted aluminumI
parts. water sample was also collected during this test. For the third run (Test 5),
Bradley Roadarms were processed in the FBPS. These parts had a combination of
paint and grease.
On February 28, three additional 1-hour emission test runs were performed.
Test 6 was run with Cd- and Zn-plated parts and painted parts in the FBPS. Three of
the Cd-plated parts had been marked and weighed before and after plating, and after
the test run. Also, five steel plates were included with the test part. The plates had Ibeen sandblasted clean, and their thickness measured, weighed, plated, and mea-
sured again. After the test run, the thickness and weight of each plate were again 3checked. A water sample was collected during the test.
The seventh emission test was conducted with no parts in the hot bed. For the
eighth test, the parts baskets were loaded with painted Ml 13 Roadarms. To these
were added an additional 4.5 ounces of oil and 6.75 ounces of grease, simulating typi- 5cal grease and oil loads. This test run was performed to correlate the hydrocarbon
emissions with the amount of hydrocarbon in the charge. 5Several representative plated parts were measured and weighed to determine
an average area-to-weight ratio for calculating the amount of plating on the miscella- 5neous steel parts. After the eighth test was run, posttest hot-bed and cold-bed sand
samples and a cyclone dust sample were collected. 3
II
4-2 1
I

SECTION 5
SAMPLING LOCATIONS AND TEST METHODS USED
Figure 5-1 depicts the FBPS unit and sampling locv'ions used in this test pro-
gram. At the VO, two sampling ports 90 degrees off-center were located more than
13 duct diameters from both the nearest upstream and downstream disturbances in
the 9-in.-inside-diameter (i.d.) round duct. A total of eight sampling points, four per
port, were used to traverse the cross-sectional area of the duct. U.S. EPA Meth-
ods 1A and 2C were used to measure volumetric gas flow rates at each location.*
Velocity heads and temperature were measured at each point prior to testing. These
data were then used to set isokinetic sampling rates at each point because the pitot
tube and thermocouple are not attached to the sampling probe when small (less than
12-in.-i.d.) ducts are measured. Between-test velocity measurements varied less than
10 percent. The initial test at the VO was 105 minutes in duration. All remaining tests
were 60 minutes in duration (7.5 minutes per point).
At the Vl, only one sampling port was available for use in this study. The geo-
metric configuration of the ductwork and surrounding equipment precluded a multiport
traverse at this location. A total of six sampling points were used to measure volumet-
ric flow rates in the 6-in.-i.d. round duct. This single port was located approximately
5 duct diameters downstream and 3 duct diameters upstream from the nearest flow
disturbances.
These same points were used to traverse the cross-sectional area of the duct.
The initial test was 120 minutes in duration (20 minutes per point) and the remaining
* 40 CFR 60, Appendix A, July 1990.
5-1

tIZ p00 tI .. j A8O03AO~ddV I I A6 jON ONIMVHO I I I 08I375370 YW ENI a 3
2E
II
C
00
0" C:
0 0
C,)
04O U-
x -~ L4
U. Io>0
w 0~LII5-2

tests were 60 minutes in duration (10 minutes per point). Once again, between-test
flow measurements varied less than 10 percent.
The Al test location was similar to that of the VI location in that only one port
was available for access to the gas stream. In addition, because the port coupling ex-
tended from the outside duct wall into the stainless steel round duct, an accurate in-
side diameter measurement was impractical. Therefore, a nominal diameter of 5 in.
(based on design specifications) was used in all flow-rate calculations. Samples from
this location were collected isokinetically at a single point in the duct. The initial test
was conducted for 120 minutes, and the remaining seven tests conducted for 60 min-
utes. Gas compositions (02 and C02) were measured at each location by a Fyrite gas
analyzer.
The following subsections briefly describe the sampling methods used. Detailed
descriptions are contained in Appendix D.
5.1 PartIculate/Metals
The multimetals/particulate procedures follow those in U.S. EPA's "Methodology
for the Determination of Trace Metal Emissions From Stationary Source Combustion
Processes."* The sampling train was a Method 5 train with two impingers containing
5 percent nitric acid (HNO 3)/10 percent hydrogen peroxide (H20 2) solution. The train
uses a quartz fiber filter and a borosilicate glass sampling nozzle to minimize potential
blank contamination. Samples were analyzed first for filterable particulate by U.S. EPA
Method 5** procedures and then for the specified metals (chromium, cadmium,
lead, and zinc) by using both atomic absorption (AA) and inductively coupled argon
spectroscopy (ICAS) analysis techniques.
* Methodology for Determination of Trace Metal Emissions From Stationary Source
Combustion Processes, July 1988.
** 40 CFR 60, Appendix A, July 1990.
5-3
5.2 Total Hydrocarbons IA Beckman Model 402 continuous-flame ionization analyzer was used to mea-
sure THC concentration per Method 25A. The analyzer pump, particulate filter, and
detector are housed in a temperature-controlled oven, which is maintained at 300 FIF
for this test.
The monitor was assembled and calibrated per method specifications. The sys-
tem sampling probe was located at the centroid of each sampling duct, and sampling
was conducted successively at the Al and VI test locations. 5
5!i!U
I
IIIi
5-4 1
I

APPENDIX A
COMPUTER PRINTOUTS AND EXAMPLE CALCULATIONS
A-I

Nomenclature and Dimensions I
An = Cross-sectional area of nozzle, ft2
As = Cross-sectional area of stack, ft2 0
Bws = Proportion by volume of water vapor in the gas stream, dimensionless
Cp = Pitot tube coefficient, dimensionless
CS = Concentration of pollutant in stack gas - grains per dry standard cubic foot,
gr/dscf
%C = Percent of carbon by weight, dry basis 5%CO = Percent of carbon monoxide by volume, dry basis
%C0 2 = Percent of carbon dioxide by volume, dry basis 3Dn = Sampling nozzle diameter, inches
Ds = Stack diameter, inches
F = Factor representing a ratio of the volume of dry flue gases generated to the Icalorific value of the fuel combusted, expressed as dry standard cubic feet per
million Btu of heat input, dscf/10 6 Btu
GCV = Gross calorific value of the fuel combusted on a dry basis, BtWub 5%H = Percent of hydrogen by weight, dry basis
AH = Average pressure drop across the sampling meter flow orifice - inches of water,
in. H2 0
RHV = Higher heating value on an as-received basis, BtuIlb
%ISO = Percent of isokinetic sampling -
La = Maximum acceptable leakage rate for either a pretest leak check of for a leak
check following a component change; equal to 0.020 cubic foot per minute of 4%
of the average sampling rate, whichever is less
Md = Dry molecular weight, Ib/lb-mole
mf -" fuel firing rate (measured coal to boiler), lb of coal per hour
Mn = Total amount of pollutant matter collected - milligrams, mg
Ms = Molecular weight of stack gas (wet basis), lb/lb-mole
%N = Percent of nitrogen by weight, dry basis (continued) iA-2
1

NomenClature knd Dimensioa
%N2 = Percent of nitrogen by volume, dry basis
%O = Percent of oxygen by weight, dry basis
%02 = Percent of oxygen by volume, dry basis
AP = Velocity head of stack gas - inches of water, in.H 2 0
Plmr = Barometric pressure - inches of mercury, in.Hg
PsWat = (also Psi) Static stack gas pressure - inches of water, in.H 2 0
Ps = Absolute stack gas pressure - inches of mercury, in.Hg
Pstd = Gas pressure at standard conditions - 29.92 inches of mercury, in.Hg
pmr = Pollutant matter emission rate - pounds per hour, lb/h
QH = Total heat input - million Btu per hour, 106 Btu/h
Qs = Volumetric flow rate - wet basis at stack conditions - actual cubic feet perminute, acfm
Qgtd = Volumetric flow rate - dry basis at standard conditions - dry standard cubic feetper minute, dscfir.
OR = degrees Rankine = degrees Fahrenheit + 460, OF + 460
%S = Percent of sulfur by weight, dry basis
Tm = Average temperature of dry gas meter, OR
Ts = Average temperature of stack gas, °R
Tatd = Temperature at standard conditions, 528 OR
VIC = Total volume of liquid collected in impingers and silica gel, ml
Vm = Volume of dry gas sampled at meter conditions - cubic feet, ft3
Vnmtd = Volume of dry gas sampled at standard conditions - cubic feet, ft3
Vs = Average stack gas velocity at stack conditions - feet per second, ftW/
Vwgtd = Volume of water vapor at standard conditions - cubic feet, ft3
Y = Dry gas meter calibration correction factor
0 = Total sampling time, minutes
A-3
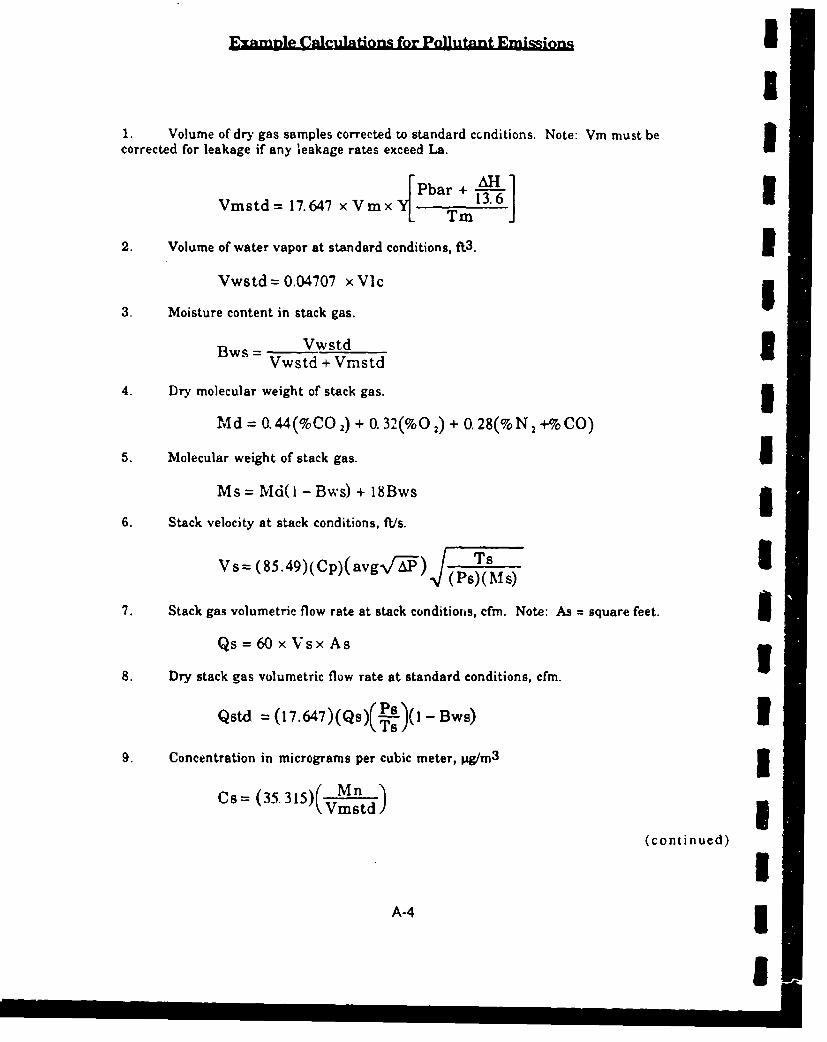
EUUmple Calculations for Pollutant E i.onI -
I1. Volume of dry gas samples corrected to standard cGnditions. Note: Vm must becorrected for leakage if any leakage rates exceed La.
Vmstd= 17.647 xVmx_[ T 13.6]
2. Volume of water vapor at standard conditions, .t3. IVwstd=0.04707 xVlc -
3. Moisture content in stack gas.
Bws = Vwstd 1Vwstd + Vmstd
4. Dry molecular weight of stack gas. 1Md = 0. 44(%CO2) + 0. 32(%02) + 0.28(% N 2 +% CO)
5. Molecular weight of stack gas. iMs= MdO - Bws) + 18Bws 5
6. Stack velocity at stack conditions, fL/s.Vs= (85.49)(Cp)(avgV-A) s P)
TP ST)(MSýI)
7. Stack gas volumetric flow rate at stack conditions, cfm. Note: As = square feet. 5Qs = 60 x Vsx As g
8. Dry stack gas volumetric flow rate at standard conditions, cfm.
Qstd =(17.647) (Qs)(k'-)(1 - Bws)
9. Concentration in micrograms per cubic meter, pg/rm3
Cs= (35.315)( Mn
(continued)
IA-4 I
I

10. Pollutant mass emission rate, lb/h.
pmr =Cs x (6 243 x 10-11) x Qst4 x 60
11. Isokinetic variation, %
(100)(Ts{(0. 0002669 Vic) + (ýL!!ŽýY)(Pbar +(L-]
ISO -(60)(0)(Vs)(Ps)(An)
A-5

Rjamfimpe Cadrc1dations for Pollutn m~in
CORRECO•K FACTORS
117.647 ( T s t dcf= Pstd I
(0.04707 =(a) 100O.44 = molecular weight of C02/100
(0.32 = molecular weight of 02/100 50.28 = molecular weight of N2/100 I18 = molecular weight of water (H20)
_85.49 (lb/lb - mole)(in.Hg) i
().01543 = grains per milligram (gr/mg)(in.H~g.)(ft') I
(0.002669 = (ml)( R)
tIII1
A-I
I

Page I
IT AIR QUALITY SERVICES Validated 3M9i1EMISSION TEST REPORT
FIELD DATA
Plant: R-RA.-D. Texarkana Date: 2/28/91Sampling location: AB Inlet Run number- AIPM-1
Test time (start-stop): 0924-1124
Sample type: PartJMetals Volume correction (cu. It.): 0.000Bar. press. (in. Hg): 30.06 Meter calibration factor: 0.980
Static press. (n. H20): -4.100 Data interval (min.): 20.0Filter number(s): 9070076 Nozzle dis. (in.): 0.194
Stack inside dis. (in.): 5.00 Meter box number. FT-IIPitot tube coeff.: 0.84 Number of traverse points: 6
Total H20 collected (ml): 115.8 % C02 by volume (dry): 0.0% 02 by volume (dry): 21.0 % CO by volume (dry): 0.0
Sample Gas meter Velocity Orifice droptime reading head actual Stack Dry gas meter
(min) (cu. ft.) aP at Temp. temp. (F)0.0 763.179 (in. 1120) (in. 1120) (OF) Inlet outlet
20.0 774.160 0.950 0.98 192 70 7040.0 785.000 0.950 0.94 221 74 7160.0 795.890 0.950 0.9A 250 80 7480.0 805.600 0.950 0.89 269 83 76
100.0 817.360 0.950 0.95 229 85 77120.0 828.631 0.950 0.94 208 85 78120.0 65.452 0.950 0.94 228 80 74
A-7

Page 2 3
IT AIR QUALITY SERVICES Vahdae r191
EMISSION TEST REPORT
FIELD DATA
Plant: R.R.A.D. Texarkana Date: 2/26/91 lSampling location: AB Inlet Run number. AIPM-2
Test time (start-stop): 1426-1526 IISample type: Part/Metals Volume correction (cu. ft.): 0.000
Bar. press. (in. Hg): 30.06 Meter calibration factor: 0.980Static press. (in. 1H20): -4.100 Data interval (min.): 10.0
Filter number(s): 9070092 Nozzle dia. (in.): 0.194 IStack inside dia. (in.): 5.00 Meter box number- FT-11
Pitot tube coeff.: 0.84 Number of traverse points: 6Total H20 colected (ml): 95.A % C02 by volume (dry): 0.0
% 02 by volume (dry): 21.0 % CO by volume (dry): 0.0
Sample Gas meter Velocity Orifice droptime reading head actual Stack Dry gas meter
(min) (cu. ft.) A AI Temp. temp. (VF) U0.0 831.237 (in. HA20) (in. H20) (VF) inlet outlet
10.0 837.010 0.940 0.97 203 77 7620.0 842.900 0.940 0.97 203 78 7730.0 847.810 0.940 0.94 227 80 7840.0 853.640 0.940 0.92 240 82 7850.0 858.800 0.940 0.93 258 84 7960.0 864.124 0.940 0.89 268 85 7960.0 32.887 0.940 0.94 233 81 78
I3
IIII
A-8

Page 3
IT AIR QUALITY SERVICES Validated 3r.SlEMISSION TEST REPORT
FIELD DATA
Plant: RIRA.D. Texarkaxna Date: 2/27/91Sampling location: AB Inlet Run number. AIPM.3
Test time (start-stop): 0806-0906
Sample type: P-tKJMetaIs Volume correction (cu. ft.): 0.000Bar. press. (in. Hg): 29.97 Meter calibration factor: 0.980
Static press. (in. H20): .4.100 Data interval (rmin.): 10.0Filter number(s): 9070052 Nozzle dia. (in.): 0.194
Stack inside dia. (in.): 5.00 Meter box number: FT-I1Pitot tube coefT.: 0.84 Number oftraverse points: 6
Total H20 collected (m]): 5.9 % C02 by volume (dry): 0.0% 02 by volume (dry): 21.0 % CO by volume (dry): 0.0
Sample Gas meter Velocity Orifice droptime reading head actual Stack Dry gas meter
(mrin) (cu. ft.) AP AM Temp. temp. (F)0.0 865.7977 (in. Ff20) (in. 1120) (°F) inlet outlet
10.0 871.000 0.940 0.86 276 72 7120.0 876.080 0.940 0.86 279 72 7230.0 881.207 0.940 0.86 281 74 7240.0 886.480 0.940 0.86 283 78 7350.0 891.740 0.940 0.86 285 80 7460.0 896.902 0.940 0.86 285 82 7560.0 31.105 0.940 O.AS 281 76 73
A-9

Page 4 3IT AIR QUALITY SERVICES vshd,- a?. IEMISSION TEST REPORT
TEST RESULTS fPlant: R.R.A.D.Tezarkaia Test date(s): 2/26/91 2126/91 2/27/91
Ssampling location: AB Inlet Run Number
AIPM-1 AIPM-2 AIPM-3 AVERAGE
0 Net time of test (min) ....... 120.0 60.0 60.0
NTP Net sampling points ....... C 6 6
Y Meter calibration factor ....... 0.980 0.980 0.980 3Dn Sampling nozzle diameter (in) ....... 0.194 0.194 0.194
Cp Pitot tube coeflficient ....... 0.84 0.84 0.84 3%H Average orifice pressure drop (in. 1120) ....... 0.94 0.94 0.86 0.91
Vm Volume of dry gas sampled ....... 65.452 32.887 31.105 43.148at meter conditions (cu. ft.) I
Tm Average gas meter temp•:-ature )....... 76.9 79.4 74.6 77.0
Vmstd Volume of dry gas sampled -.- 63.518 31.767 30.221 41.836 5at standard conditions (aef)
Vie Total H20 collected in impingers ----- 115.E 95.5 5.9 12.4and silica gel (ml)
Vwstd Volume of water vapor at ...... 5.451 4.495 0.278 3.408standard conditions (scf)
[ws Percent moisture by volume, as measured ....... 7.90 12.40 0.91 7.07Percent moisture by volume, at saturation ....... 100.00 100.00 100.00 100.00Percent moisture by volume, used in calculations ....... 7.90 12.40 0.91 7.07
Fred Mole fraction of dry gas ....... 0.92. 0.876 0.991 0.929
1CO2 Percent C02 by volume (dry) ....... 0.0 0.0 0.0 0.0
%02 Percent 02 by volume 'dry) ..... 21.0 21.0 21.0 21.0
%CO Percent CO by volume (dry) - 0.0 0.0 0.0 0.0
%.N2 Percent N2 by volume (dry) -- 79.0 79.0 79.0 79.0
Md Molecular weight. dry stack gas ...... 28.84 28.84 28.84 28.84
MA Molecular weight, stack gas -- 27.98 27.50 28.74 28.07
Pbar Barometric pressure (in. Hg) ....... 30.06 3u.06 29.97 30.03
Ps Static pressure of stack gas (in. H20) --- -4.100 4.100 4.100 -4.100 3Ps Stack pressure - absolute (in. 11g) ....... 29.76 29.76 29.67 29.73
Ts Average stack gita temperature ('F) ....... 228.2 23312 281.3 247.6 3A-0 3
I

Page 5
IT AIR QUALITY SERVICES VaJlidated "lEMISSION TEST REPORT
TEST RESULTS
Plant: R.R.A.D. Texarkana Test datr-.&q: 2/26/91 2/26/91 2127/91Sampling location: AB Inlet
Run NumbersAIPM-1 AIPM-2 AIPM-3 AVERAGE
Vh Average square root of velocity head (in. H20) ....... 0.9747 0.9695 0.9695 0.9713
Vs Average stack gas velocity (fectl.ec.) ....... 63.63 64.08 64.92 64.21
An Stack area (sq. in.) ...... 19.6 19.6 19.6 19.6
Q6 Actual stack flow rate (acfn) ....... 5,1 524 531 52
Qustd Stack flow rate - dry (scfm) ....... 366 348 372 882
ISO Percent isokinetic ....... 96.1 101.1 90.0 95.7
iasa of pollutant = 328.9 118.7 20.0If below detection li" -eplace 0 with 1. 0 0 0
ma Partilculte ma" mg 328.9 118.7 20.0
Co Particulate con, . o n gr/dscf 7.990E-02 5.765E-02 1.021E-02 4.925E.02
Pmr Particulate emission rate lb/h 2.505E-01 i.720E-01 3.253E-02 1.517E-01
Mass of pollutant - 160.0 63.0 5.3If below detection limits, replace 0 with 1. 0 0 0
Mn Cadmium mass lg 160.0 63.0 5.3
Cs Cadmium concentration pg!m3 88.956 70.035 6.193 55.061
Pm.r Cadmium emission rate lb/h 1.219E.04 9.126E.05 8.621E-06 7-.35E-05
Mass of pollutant a 190.0 240.4 3.0If below detection limits, replace 0 with 1. 0 0 1
Mn Chromium mia. Pg 190.0 240.4 43.0
Ca Chromium concentration jIg/m3 105.635 267.245 <3.503 125.462
Pmr Chromium emission rate lb/h 1.447E-04 3.483E.04 <4AJ8E-6 1M41OE-04
A-11
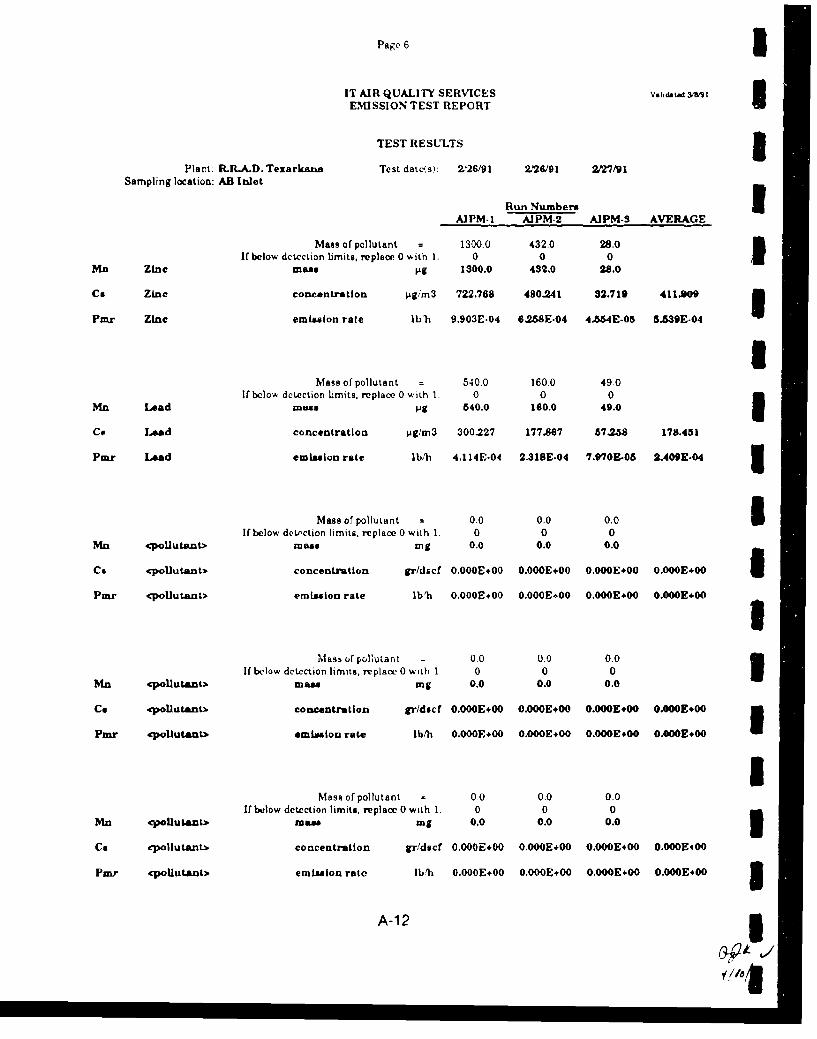
Page 6 3
IT AIR QUALITY SERVICES Va1,hdated W" 1
EMISSION TEST REPORT
TEST RESULTS
Plant: R.R.D.Tezarknna Test dates): 2126/91 2/28/91 2/27/91Sampling location: AB Inlet
Run NumbersAIPM-I AIPM-2 AIPM-3 AVERAGE
Mass of pollutant = 1300.0 432.0 28.0
If below detection limits, replace 0 with 1. 0 0 0n Zicma" ýLg 1300.0 432.0 28.0
Cs Zinc coneentratIon pggim3 722.768 480.241 32.719 411.909 "
Pmr Zinc emission rate lbh 9.903E-04 6.258E-04 4554E-05 5.539E.04
1Mass of pollutant = 540.0 160.0 49.0
If below detection limits, replace 0 with 1. 0 0 0Mn Lead mass ;g 540.0 160.0 49.0 ICo Lead concentration pg/m3 300.227 177.867 57.258 178.451
Pmxr Lomd emission rate lb/h 4.114E-04 2.318E-04 7.970E-05 2.409E.04 3
Mass of pollutant = 0.0 0.0 0.0 £If below detection limits, replace 0 with 1. 0 0 0
Mn <pollutant> mass mg 0.0 0.0 0.0
Cs <pollutant> concentration gr/dscf 0.OOOE+O0 0.OOOE00 O.OOOE*O0 0.OOOE.00 1
Pmnr <pollutant> emission rate lb'h 0O000E+00 0.000E-00 0.000E+00 0.000E*00
Mass of pollutant - 00 0.0 0.0If below detection limits, replace 0 with 1 0 0 0
mn <pollIutA mass mg 0.0 0.0 0.0
Ce <PoUutanto concentration gr/dscf 0.O0E +00 0.000E+00 O.000E+00 O.000E÷00 IIPinr <pollutant>. emialon rate lb/h O.O0013+0 O.OOOE+O0 0OOE.00 0.0OOE*00
IMass of pollutant = 00 0.0 0.0
If below detection limits, replace 0 with 1. 0 0 0Mn .pollutanb. mea mg 0.0 0.0 0.0
Ca .cpollutant-b concentration gr'dscf 0.000E.00 0.OOOE+00 O.OOOE+00 0.000E4-O0
Pmr <poUutLant> emission rate lb/h 0.OOOE00 0.O0OE+00 O.OOOE.00O O.OOE.00 0
A-12 2
2A ./¢

Page 1
IT AIR QUALITY SERVICES va-idatw V71EMISSION TEST REPORT
FIELD DATA
Plant: R.R.AD. Tezarkana Date: 2127/91Sampling location: Afterburner Inlet Run number: AIPM-4
Test time (start-stop): 1038-1138
Sample type: Part/Metais Volume correction (cu. ft.): 0.000Bar. press. (in. Hg): 29.97 Meter calibration factor- 0.980
Static press. (in. H20): -4.100 Data interval (rain.): 10.0Filter number(s): 9070045 Nozzle die. (in.): 0.194
Stack Inside die. (in.): 5.00 Meter box number: FT.11Pitot tube weff.: 0.84 Number of traverse points: 6
Total H20 wollteted (ml): 16.1 % C02 by volume (dry): 0.0% 02 by volume (dry): 21.0 % CO by volume (dry): 0.0
Sample Gas meter Velocity Orifice droptime reading head actual Stack Dry gas meter
(rain) (cu. ft.) AP AH Temp. temp. (VF)0.0 897.928 (in. H'20) (in_ 11[20) (OF) inlet outlet
10.0 903.340 0.940 1.06 146 76 7620.0 908.800 0.940 1.02 168 77 7630.0 914.400 0.940 0.08 192 79 7640.0 919.800 0.940 0.96 210 81 7750.0 925.500 0.940 0.96 214 81 7760.0 931.038 0.940 0.96 216 82 7860.0 33.110 0.940 0.99 191 79 77
A-13

Page 25
IT AIR QUALITY SERVICES v.lie 31/91EMISSION TEST REPORT I
FIELD DATA
Plant: R.RA.D. Tezarkana Date: 2/27/91 3Sampling location: Afterburner Inlet Run number AIPM-5
Test time (start.stop): 1330-1430
Sample type: PartJMeiale Volume correction (cu. ft.): 0.000Bar. press (in. Hg): 29.97 Meter calibration factor. 0480
Static press. (in. H20): -4.100 Data interval (min.): 10.0Filter number(s): 9010412 Nozzle dia. (in.): 0.194 I
Stack inside dia. (in.): 5.00 Meter box number FT-I1PiLot tube coefT.: 0.84 Number of traverse points: 6
Total H20 collected (ml): 114.8 % C02 by volume (dry): 0.0% 02 by volume (dry): 21.0 % CO by volume (dry): 0.0
Sample Gas meter Velocity Orifice droptime reading head actual Stack Dry gas meter
(rain) (cu. ft.) Ap ,! Temp. = temp. (IF)0.0 931.815 1 (in. H20) (in. H20) (OF) Inlet outlet
10.0 937.440 0.940 1.01 176 78 7720.0 942.940 0.940 0.97 205 78 7730.0 948.400 0.940 0.94 228 80 7840.0 953.820 0.940 0.91 246 82 7950.0 959.400 0.940 0.90 256 84 8060.0 964.720 0.940 0.90 262 85 8060.0 32.905 0.940 0.94 229 81 79
AgIiIIIU
A-14I

Page 3
IT AIR QUALITY SERVICES v.,• •7EMISSION TEST REPORT
FIELD DATA
Plant: R.R.AD.Texarkana Date; 2/28/91Sampling location: Afterburner Inlet Run number. Al PM-6
Test time (start-stop): 0800-0900
Sample type: PartJMeta.s Volume correction (cu. ft.): 0.000Bar. press. (in. Hg): 29.75 Meter calibration factor. 0JS0
StatiL press. (in. H20): .5.300 Data interval (rain.): 10.0Filter number(s): 9010487 Nozzle dia. (in.): 0.194
Stack inside dia. (in.): 5.00 Meter box number. iFT.IPitot tube meff: 0.84 Number of traverse points: 6
Total H20 collected (ml): 10.9 % C02 by volume (dry): 0.0% 02 by volume idry): 21.0 % CO by volume (dry): 0.0
Sample Gas meter Velocity Orifice droptime reading head actual Stack Dry gas meter
(min) (cu. ft.) AP Al Temp. temE. (OF)0.0 965.043 (in. R20) (in. 1"20) (F) inlet outlet
10.0 970.760 1.000 1.02 200 73 7220.0 976.700 1-000 1.12 141 73 7230.0 982.370 1.000 1.08 159 74 7240.0 988.420 1.000 1.07 168 79 7360-0 994.000 1.000 1.07 171 79 7460.0 999.855 1.000 1.07 170 81 7560.0 34.812 1.000 1.07 168 77 73
A-15

Page 41
IT AIR QUALITY SERVICES V.a;d&tWd 3,9i1EMISSION TEST REPORT
TEST RESULi S
Plant: R.LA.D. Texarkana Test date(@): 2/27/91 2/27/91 2/28/91Sampling location: Afterburner Inlet
Run Numbers 3AIPM-4 AIPM-5 AIPM-6 AVERAGE
0 Net time of test (moin) - 60.0 60.0 60.0 3NIP Net sampling points ---- 6 6 6
Y Meter calibration factor ..... 0.980 0.980 0.980
Da Sampling nozzle diameter (in) ... 0.194 0.194 0.194
Cp Pitot tube coefficient ....... 0.84 0.84 0.84
a. Average orifice pressure drop (in. H20) ....... 0.99 0.94 1.07 1.00
Vrn Volume of dry gas sampled ....... 33.110 32.905 34.812 33.609at meter conditions (cu. ft.) I
Tin Average gas meter temperature (*F) ....... 78.0 79.8 74.8 77.5
Vmstd Volume of dry gas sampled -- 31.975 31.665 33.582 32.408at standard conditions (acf)
VIc Total H20 collected in impingers ...... 16.1 114.8 10.9 47.3and silica gel (ml)I
Vwotd Volume of water vapor at ...... 0.758 5.404 0.513 2,225standard onditions (set)
Bws Percent moisture by volume, as measured ---- 2.32 14.58 1.50 6.13 iPercent moisture by volume, at saturation ...... 65.38 100.00 39.74 68.37Percent moisture by volume, used in calculations ....... 2.32 14.58 1.50 6.13
Find Mole fraction of dry gas .... 0.977 0.854 0.985 0.939 3'CO2 Percent C02 by volume (dry) ....... 0.0 0.0 0.0 0.0
%02 Percent 02 by volume (dry) .... 21.0 21.0 21.0 21.0 3%(CO Percent CO by volume (dry) - 0.0 0.0 0.0 0.0
%N2 Percent N2 by volume (dry) - 79.0 79.0 79.0 79.0 3Md Molecular weight. dry stack gas - 28.84 28.84 28.84 28A4
Ms Molecular weight- stack gas - 28.59 27.26 28.68 28.18 3Pbar Barometric pressure (in. Hg) ....... 29.97 29.97 29.75 29.90
Pei Static pressure of stauk gas (in. H20) - -4.100 -4.100 -5.300 -4.W00 3Ps Stack pressure - absolute (in. Hg) ...... 29.67 29.67 29.36 29.57
To Average stack gas temperature (°F) ....... 191.0 228.8 168.2 196.0 i
A-16
I

Page 5
IT AIR QUALITY SERVICES Valida-td 317l
EMISSION TEST REPORT
TEST RESULTS
Plant: R.RA.D. Texarkana Test dateLs); 2/27/91 2/27/91 2/28/91Sampling location: Afterburner Inlet
Run Numbers
AIPM.4 AIPM-5 AIPM-6 AVERAGE
Vh Average square root of velocity head (in. H20) ....... 0.9695 0.9695 1.0000 0.9797
Va Average stack gas velocity (feet/sec.) ....... 61.00 64.25 62.03 62.43
As Stack area (sq. in.) ....... 19.6 19.6 19.6 19.6
Q4 Actual stack flow rate (acfm) ....... 499 626 507 511
Qsstd Stackflow rate - dry (scfm) ....... 392 341 412 382
ISO Percent isokinetic ....... 90.3 102.7 90.2 ,4.4
Mass o" pollutant = 55.5 103.2 112.9If below detection limits, replace 0 with 1. 0 0 0
Mn Particulate mass mg 55.5 103.2 112.9
Ce Particulate concentration gr/dect 2.678E.02 5.029E.02 5.187E-02 4.298E-02
Pmnr Particulate emistsion rate lb/h 9.OOOE-02 1.471E.l 1=.833E.01 1.401E-01
Mass of pollutant = 9.6 40.0 61.0If below detection limits, replace 0 with 1. 0 0 0
Mn Cadmium mas 11g 9.6 40.0 61.0
Ca Cadmium concentration 4g/m3 10.603 44.610 64.147 49.78"
Pmr Cadmium emission rate lb/h 1.557E-05 5.702E.05 9.904E.05 6.721E-05
Mass of pollutant = 21.4 120.4 65.4If below detection limits, replace 0 with 1. 0 0 0
Mn Chromium 0ma. &g 27.4 120.4 66.4
Cs Chromium concentration Pg/m3 30262 134.276 6".774 77.770
Pmr Chromium emisalon rate lb/h 4.443E-05 1.716E-04 1.002E-04 1474E-4"
A-17
I~s i I IlI

Page 6
IT AIR QUALITY SERVICES Validated W.9
EMISSION TEST REPORT ITEST RESULTS 3
Plant: R.R.A.D. Texarkana Test daLe(S): 2/27/91 2/27/91 2A28/9ISampling location: Afterburner Inlet
Ruxn Numbers
AIPM-4 AIPM-5 AIPM-6 AVERAGE
Ma-i of pollutant = 20.0 602.0 212.0If below detection lirT its, replace 0 with 1. 0 0 0
Mn Zinc ma PIg 20.0 602.0 212.0
Cs Zinc concentration jpg/m 3 22.089 671.378 222.936 305.467
Pmr Zinc emisslon rate lb/h 3.243E-05 8.382E-04 3.442E-04 4.116E.04
IMass of pollutant = 64.0 160.0 190.0
If below detection limits, replace 0 with 1. 0 0 0Mn Lead mass Pg 64.0 160.0 190.0
Ce Lead concentration lig/m3 70.684 178.439 199.801 149.641
Pmr Lead emission rate lb/h 1.038E-04 2.281E-04 3.085E.04 2.135E.04 3
Mass of pollutant 0.0 0.0 0.0 1If below detection limits, replace 0 with 1. 0 0 0
Mn qpollutant> mass mg 0.0 0.0 0.0
C. qpollutant> concentration gr/dscf 0.001E300 0.O00E+00 .0.OE010 O.OOOE÷O0 IPmr <po~lutant> emission rate lb.h 0.000E+00 0.001E300 O.OOOE00 0.0OOE100
Mass of pollutant 0.0 0.0 0.0If below detection limits, replace 0 with 1. 0 0 0 I
Mn2 <pollutant> ma&e mg 0.0 0.0 0.0
Cs cpoUutant> concentration grldscf 0.O00E.00 0.OOOE+00 O.0OOE÷O0 0.OOOE00
Pmr <pollutant) emission rate lb/h 0.OOOE00 0.OOOE+00 0.OOOE*00 O OE.0 00EI
IMass of pollutant = 0.0 0.0 0.0
If below detection limits, replace 0 with 1. 0 0 0Mn <Pollutant.> ma"l mg 0.0 0.0 0.0
Ce icpollutant> concentration gr/dscf O.OOOE00 O.OOOE+00 O.OOOEi00 O.00E+00
Panr cPo~lutant> emission rate lb/h O.OOOE÷00 0.000E+00 0.OOOE÷00 0.OOOE.00 3A-18

Page 1
IT AIR QUALITY SERVICES Valdat,- 3/7nV1EMISSION TEST REPORT
FIELD DATA
Plant: R.LRA.D. Texarkana Date: ="2l91Sampling location: Afterburner Inlet Run number-. AIPM-7
Test time (start-stop): 0945-1045
Sample type: Partb/Metals Volume correction (cu. ft.): 0.000Bar. press. (in. Hg): 29.75 Meter calibration factor. 0.980
Static press. (in. H20): .-. 300 Data interval (min.): 10.0Filter number(s): 9010533 Nozzle dia. (in.): 0.194
Stack inside dia. (in.): 5.00 Meter box number. FT.IIPitot tube coeff.: 0.84 Number of traverse points: 6
Total H20 collected (ml): 7.3 % C02 by volume (dry): 0.0% 02 by volume (dry): 21.0 % CO by volume (dry): 0.0
Sample Gas meter Velocity Orifice droptime reading head actual Stack Dry gas meter
(min) (cu•. ft.) AP A Temp. temp. (°F)0.0 0. 129 [(in. H120) (in. 1420) (OF) .. inlet outlet
10.0 5.630 1.000 0.95 250 78 77
20.0 11.370 1.000 1.01 210 78 7630.0 17.700 1.000 1.03 200 79 7740.0 23.300 1.000 1.03 190 81 7750.0 28.940 1.000 1.08 169 83 7860.0 34.900 1.000 1.08 168 84 7860.0 34.771 1.000 1.03 198 81 77
A-19

Page 2 3
IT AIR QUALITY SERVICES v 9lid-&1• 3-19
EMISSION TEST REPORT
FIELD DATA
Plant: R.LA.D. Texarkana Date: 2)28/91 3Sampling location: Afterburner Inlet Run number AIPM-8
Test time (start-stop): I IL3-1253
Sample type: Part.JMet&ai Volume correction (cu. ft.): 0.000 1Bar. press. (in. Hg): 29.15 Meter calibration factor. 0.980
Static press. (in. H20): .5.300 Data interval (min.): 10.0Filter number(s): 9010532 Nozzle die. (in.): 0.194
Stack inside die. (in.): 5.00 Meter box number. FT.IIPitot tube coeff.: 0.84 Number of traverse points: 6
Total H20 collected (ml): 10.2 % C02 by volume (dry): 0.0% 02 by volume (dry): 21.0 % CO by volume (dry): 0.0
Sample Gas meter Velocity Orifice droptime reading head actual Stack Dry gas meter
(min) (cu.- ft.) ,A AH Temp. temp. (.F)0.0 46.023 (in. H20) (in. 1120) (°F) inlet outlet
10.0 52.900 1.000 1.27 74 80 7820.0 68.450 1.000 0.96 249 81 7830.0 64.100 1,000 0.95 253 83 78 I40.0 70.250 1.000 0.95 257 85 79
60.0 75-310 1.000 0.95 260 87 8060.0 80.973 1.000 0.95 260 87 8160.0 34.950 1.000 1.01 226 84 79
AIIIIIII
A-20!

Page 4
IT AIR QUALITY SERVICES Val"1"A W1
EMISSION TEST REPORT
TEST RESULTS
Plant: R.R.A.D. Texarkana Test date(s): 2/2,8/1 2/i91 1/1/04
Sampling location: Afterburnfr Inlet
Run NumbersAIPM-7 AIPM-8 0 AVERAGE
0 Net time of test (min) 60.0 60.0 0.0
NP Net sampling points - 6 6 6
Y Meter calibration factor - 0.980 0.980 0.000
Dn Sampling nozzle diameter (in) .... 0.194 0.194 0.000
Cp Pitot tube coerncient ....... 0.84 0.84 0.00
AH Average onfice pressure drop (in. H20) ....... 1.03 1.01 #DIVi01 #DrVM
Vm Volume of dry gas sampled 34.771 34.950 0.000 23-24
at meter conditiojs (cu. ft.)
Tm Average gas meter temperature ('F) ..... 78.8 81.4 #DIV/01 #DeiVM
Vmstd Volume of dry gas sampled - 33.285 33.295 #DIV/01 eDIVMat standard conditions (acf)
SVIc TotAl H20 colected in impingers 7.3 10.2 0.0 S
and silica gel (ml)
Vwstd Volume of water vapor at ....... 0.344 0.480 0.000 S5
standard conditions (scf)
Bws Percent moisture by volume, as measured ....... 1.02 1.42 #DrVi01 ODIVIK
Percent moisture by volume, at saturation ...... 76.33 100.00 #DIV,'0l #DIVM
Percent moisture by volume, used in calculations ... 1.02 1.42 SDIV/01 #DIVM
Fred Mole fraction of dry gas -- 0.990 0.986 #DIV/01 ODIW'
%CO2 Percent C02 by volume (dry) .- 0.0 0.0 0.0
0/602 Percent 02 by volume (dry) ....... 21.0 21.0 0.0 14A
%CO Percent CO by volume (dry) - 0.0 0.0 0.0 *A
%N2 Percent N2 by volume (dry) - 79.0 79.0 100.0 a"
Md Molecular weight - dry stack gas .. 28-84 28.84 28.00 2L&-
Ma Molecular weight- stack gas -. 28.73 28.69 #DIV/01 #DffIVf
Pbar Barometric pressure (in. Hg) ....... 29.75 29.75 0.00 IRM
Psi Static pressure of stack gas (in. H20) - .5.300 -5.300 0.000
Pa Stack pressure - absolute (in. Hg) .-.... 29.36 29.36 0.00 RI*=
To Average stack gas temperature (:F) ....... 197.8 225.5 #DIV/01 #DIVW
A-21

Page 5
IT AIR QUALITY SERVICES Va;,AwdaV,91EMISSION TEST REPORT U
TEST RESULTS
Plant: R.R-.AD. Texarkaxna Test date(s): 2/2&891 2/28/91 1/1104Sampling location: Afterburner Inret
Run Numbers 3AIPM-7 AIPM-8 0 AVERAGE
Vh Average square root of velocity head (in. H20) ....... 1.0000 1.0000 0.0000 0.6007 3Ve Average stack gas velocity (feet/sec.) ....... 63.42 64.79 NDIV/01 #P.rVIO!
As Stack area (sq. in.) ....... 19.6 19.6 19.6 19.6
Q* Actual stack flow rate (acfm) ....... 519 530 #DIV/0i #DIVIO!
Qtd Stack flow rate - dry (scfm) ....... 404 395 #DIV/O! @DIVIO!
ISO Percent isokinetic ....... 9i.1 93.3 #DIV/0O #DIV/O!
IMass of pollutant = 56.0 36.4
If below detection limits, replace 0 with 1. 0 0 0Mn Particulate ma" mg 56.0 36.4 0.0 3Cs Particulate concentration gr/dscf 2,596E.02 1.687E.02 #DIV/0l #DIV/O!
Pmar Particulate emission rate lbh 9,000E.02 5.710E-02 #DIV/0! #DIV/0! 3
M&a.s of pollutant = 160.0 44.0 0.0 5If below detection limits, replace 0 with 1. 0 0 0
Mn Cadmium mes" Pg 160.0 44.0 0.0
Ce Cadmium concentration jig/m3 169.756 46.689 ODIV/0! #DIV/0l 3Pmr Cadmium emission rate lb/h 2.571E-04 6.902E-05 #DIV/o! #DrV/0! I
Mass of pollutant = 75.4 9.4 0.0If below detection limits, replace 0 with 1. 0 0 0
Mn Chromium mass 9g 75.4 9.4 0.0
Ce Chromium concentration i±g/m3 79.997 9.970 #DIV/O! #DIV/O!
Pmr Chromium emiasion rate lb/h 1.212E-04 1.475E-05 #DIV/0! #DIV/0!
I
A-22 "

Page 6
IT AIR QUALITY SERVICES Vid,91EMISSION TEST REPORT
TEST RESULTS
Plant: R.R.A.D. Texarkana Test datces): 2."78&91 2/28/91 1/1/04Sampling location: Afterburner Inlet
Run NumbersAIPM-7 AIPM-8 0 AVERAGE
Mass of pollutant 612.0 82.0 0.0If below detection limits, replace 0 with 1. 0 0 0
Mn Zinc mass Pff 612.0 82.0 0.0
Ce Zinc concentration pg/m3 649.315 86.975 #DIV/N! #DIV/0!
Pmar Zinc emission rate Ibfh 9.836E-04 12"6E-04 #DIV/01 *DrV/O!
Mass of pollutant = 290.0 110.0 0.0If below detection limits. ieplaoc 0 with 1. 0 0 0
Mn Lead mass 9g 290.0 110.0 0.0
Ca Lead concentration pg/m3 307.682 116.673 #DIV/0O #DIV/0!
- Puar Lead emission rate lb/h 4.6611E-04 1.726E-04 #DIV/o! #DIV/O!
Mass of pollutant = 0.0 0.0 0.0If below detcction limits, replac 0 with 1. 0 0 0
Mn -CoPutant> masa mg 0.0 0.0 0.0
Ce <poUutant> concentration pr/dacf 0.000E00 O.OOOE.00 ODIV/0O #DrV/0!
Pmr <pollutant> emission rate lb/h 0.OOOE+O0 0.0OOE+00 #DIV/0l #DIV/0!
Mass of pollutant 0.0 0.0 0.0If below detection limits, replaoc 0 with 1. C 0 0
Mn .PoUutanto ma" mg 0.0 0.0 0.0
Cis Pouutantb concentration grldscf 0.000E.00 O.O00E+00 *DIV/OI #DWV/OI
Pmr <poUutant> emission rate IL/h 0.000E00 O.003E*00 #DIV/O! #DIV/0
Mass of pollutant 0.0 0.0 0.0If below detection limits, rep!ace 0 with 1. 0 0 0
MD qpUutnt> ma" mg 0.0 0.0 0.0
Cs ,poUutant> concentration gr/dscf 0.O000E00 0.OOOE+00 #DIV/O! ODIV/OI
Pmr <pollutant> emission rate lb/h 0.OOOE+00 O.O003.00 *DIV/0O ODIV/0O
A-23
via/-

Page 1 I
IT AIR QUALITY SERVICES Validawd 37.1191
EM]S'ION TEST REPORT UFIELD DATAi
Plant: R.R.A.D. Texarkana Date: 2126/91Sampling location: Venturi Inlet Run number. SIPM-1
Test time (start-stop): 0923-1123
Sample type. PartJMetals Volume correction (cu. ft.): 0.000Bar. press. (in. Hg): 30.06 Meter calibration factor: 0.974
Static press. (in. H20): .-. 90 Data interval (min.): 20.0Fdter number(s): 9)070054 Nozzle dia. (in.): 0.171 I
Stack inside dia. (in-): 6.00 Meter box number: FT-4
Pitot tube cefT.: 0.84 Numbcr of traverse points: 6Total H20 ollected (in]): 388.1 % C02 by volume (dry): 1.0
% 02 by volume kdry): 20.0 % CO by volume (dry): 0.0 ISample Gas meter Velocity Orifice drop
time reading head actual Stack Dry gas meter(ain) (cu. ft.) AP &H Temp. temp. (VF)
0.0 726.931 [(in. H-20) (in. R-20) (CF) inlet outlet
20.0 740.520 1.900 1.64 80 66 6840.0 '52.600 1.500 1.29 84 68 6860.0 766.620 1.900 1.61 100 73 7280.0 780.550 2.300 1.83 138 78 74
100.0 797.900 3.500 2.79 139 80 76120.0 815.669 3.400 '. 72 138 82 77120.0 88.738 2.417 1.98 113 75 73
IIIIIIII
A-24 5
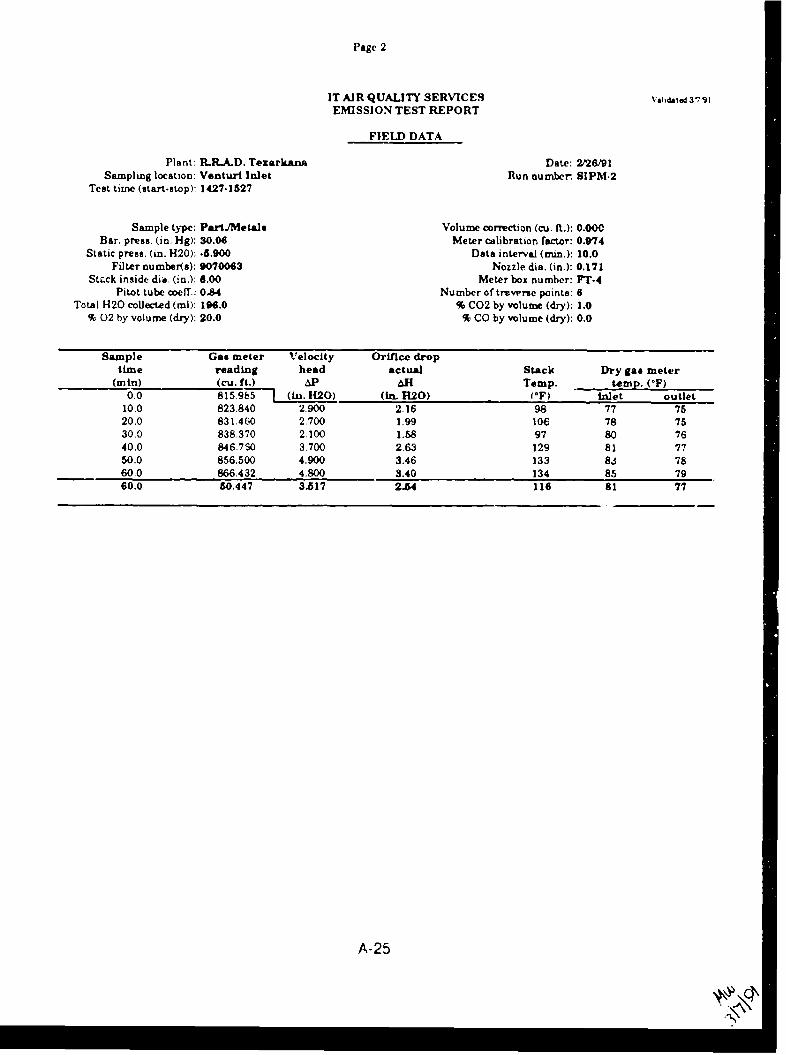
Page 2
IT A] R QUALITY SERVICES Vada,•-• V.71
EMISSION TEST REPORT
FIELD DATA
Plant: R.R.A.D. Texarkana Date: 2/26/91Sampling location: Venturi Inlet Run number. SIPM-2
Test time (start.stop): 1427-1527
Sample type: Part./Metal] Volume correction (cu. ft.): 0.OOCBar. press. (in. Hg): 30.06 Meter calibration factor: 0.974
Static press. (in. H20): .5.900 Data interval (main.): 10.0Filter number(a): 9070063 Nozzle dia. (in.): 0.171
Stc.ck inside dia. (in.): 6.00 Meter box number: T"-4PiLot tube coeff.: 0.84 Number of treverse points: 6
Totsal H20 collected (ml): 196.0 % C02 by volume (dry): 1.0% 02 hy volume (dry): 20.0 % CO by volume (dry): 0.0
Sample Gas meter Velocity Orifice droptime reading head actual Stack Dry gas meter
(m in) (cu. ft.) &P 4 Temp. temp. (VF)0.0 815985 1 (Li. 1120) (in. H20) (IF) inlet outlet
10.0 823.840 2.900 2.16 98 77 7520.0 831.460 2.700 1.99 10O 78 7530.0 838.370 2.100 1.68 97 80 7640.0 846.7S0 3.700 2.63 129 81 7750.0 856.500 4.900 3.46 133 83 7860.0 866.432 4.800 3.40 134 85 7960.0 50.447 3.517 2.54 116 81 77
A-25

Page 3 3
IT AIR QUALITY SERVICES V.ih d &7,11
EMISSION TEST REPORT IFIELD DATA
Plant: R.R.A.D. Texarkana Date: 2f4i91 3Sampling location: Venturi Inlet Run number. SIPM-3
Test time (start.stop). 0807.0907
Sample type. Part/Metals Volume morrection (cu. ft.): 0.000Bar. press. (in. Hg): 29.97 Meter calibration factor 0.,"74
Static press. (in. H20): .6.900 Data interval (min.): 10.0Filter number(s): 9070085 Nozzle dia. (in.): 0.171 I
Stack inside dia. (in.): 0.00 Meter box number: FT-4Pitot tube coeff.: 0.84 Number of traverse points: 6
Total H20 collected (ml): 163.8 % C02 by volume (dry): 1.0% 02 by volume (dry): 20.0 % CO by volume (dry): 0.0 I
Sample Gas meter Velocl*y Orifice droptime reading head actual Stack Dry gas meter
(min, (cu. ft.) AlP AM Temp. temp. (F)0.0 866.588 (in. H20) (in. -1.20) (*F) Inlet outlet
10.0 873.850 2.200 1.6,5 99 75 7320.0 882.150 3.000 2.33 80 76 7230.0 889.500 2.500 1.86 105 78 72 I40.0 897.620 3.400 2.43 128 79 72
50.0 907.200 4.500 3.22 128 80 7460.0 916.809 4.500 3.22 128 82 7660.0 50.221 3.3H0 2.45 111 78 U3
IIIIII-I
A-26!

Page 4
IT AIR QUALITY SERVICES Vgedated W1971
EMISSION TEST REPORT
TEST RESULTS
Plant: R.R.A.D. Texarkana Test date(s): 2/26/91 2/2&'91 2/27/91Sampling location: Venturi Inlet
Run NumbersSIPM-1 SIPM-2 BIPM.3 AVERAGE
0 Net time of test (min) 120.0 60.0 60.0
NP Net sampling points ..... 6 6 6
Y Meter calibration factor ...... 0.974 0.974 0.974
Dni Sampling nozzle diameter (in) ....... 0.171 0.171 0.171
Cp Pitot tube coefficient ....... 0.84 0.84 0.84
Ail Average orifice pressure drop (in. H20) ....... 1.98 2.54 2.45 2.32
Vm Volume of dry gas sampled ...... 88.73S 50.447 50-221 63.135at meter conditions (cu. ft.)
Tmn Average gas meter temperature (*F) ...... 73.5 78.7 76.7 75.9
Vxnatd Volume of dry gar sampled ... 86.356 48.688 48.586 61.210at standard conditions (scf)
VIc Total H20 collected in impingers ....... 385 1 196.0 163.9 248.3and silica gel (ml)
Vwstd Volume of water vapor at ....... 18.127 9.226 7.715 11.689standard conditions (scf)
Bws Percent moisture by volume, as measured ....... 17.35 15.93 13.70 15.66Percent moisture by volume, at saturation ....... 9.59 10.44 9.12 9.72Percent moisture by volume, used in calculations ....... 9.59 10.44 9.12 9.72
Fred Mole fraction of dry gas ... 0.904 0.896 0.909 0.903
C02 Percent C02 by volume (dry) ....... 1.0 1.0 1.0 1.0
O2 Percent 02 by volume (dry) 20.0 20.0 20.0 20.0
%CO Percent CO by volume (dry, )- 0.0 0.0 0.0 0.0
%N2 Percent N2 by volume (dry) - 79.0 79.0 79.0 79.0
Md Molecular weight - dry tack gas -- 28.96 28.96 28.96 28.96
M& Molecular weight - stark gas .... 27.91 27.F2 27.96 27.90
Pbar Barometric pressure (in Hg) .X 3006 30.06 29.97 30.03
Pal Static pressure of stack gas (in. H20) - -5.900 -5.900 -5.900 5.J90
Ps Stack presaur.. • absolute (in. Hg. ....... 29.63 29.63 29.5& 29.10
Ts A%-.ragc stack gas temperature (°, ....... 113.2 116.2 111.3 113.6
A-27
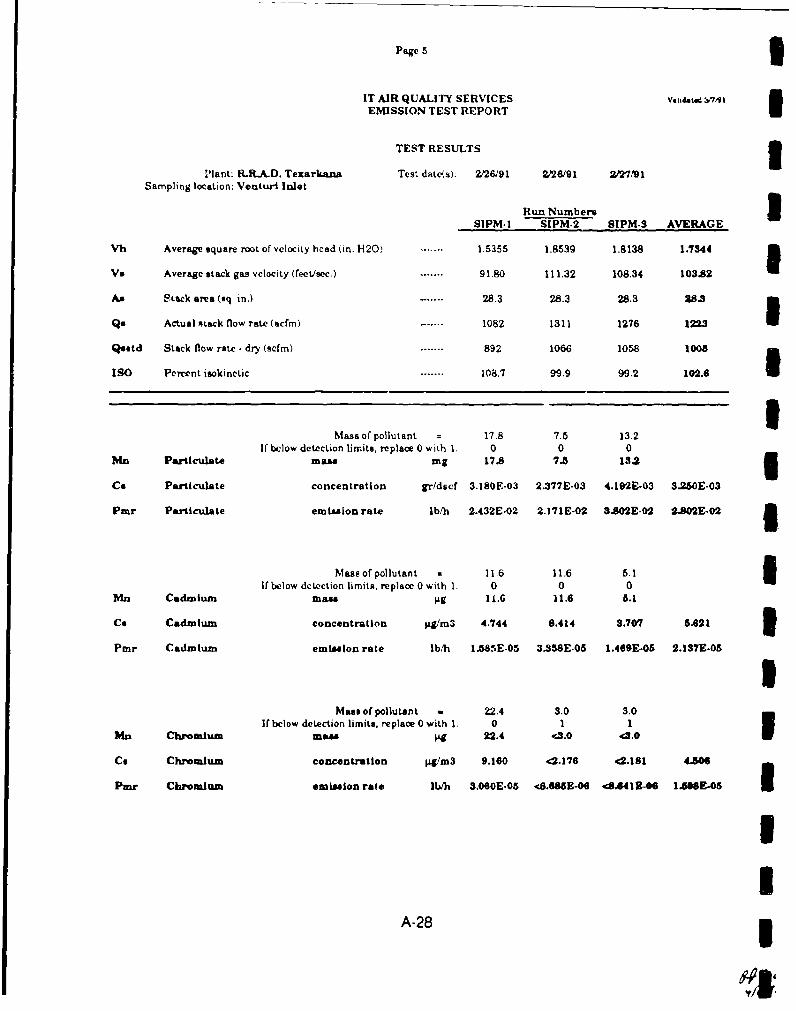
Page S
IT AIR QUALITY SERVICES Vtaldated nWMI
EMISSION TEST REPORT ITEST RESULTS
Plant: R.RJLD. Texarkana Test datveýs): 2d/2691 2/26/91 2/27191Sampling location: Venturi Inlet
Run Numbers 3SIPM-1 SIPM-2 SIPM.S AVERAGE
Vh Average square root of velocity head (in. H20) ...... 1.5355 1.8539 1.8138 1.7344
Vs Average stack gas velocity (feetlsec.) ....... 91.80 111.32 108.34 103.82
Am Stack area (sq. in.) ...... 28.3 28.3 28.3 28.3 IIQs Actual stack flow rate (acfm) ...... 1082 1311 1276 1223
Q*std Stack flow rate . dry (!tfm) ....... 892 1066 1058 1005g
ISO Percent isokinctic ....... 108.7 99.9 99.2 102.6
Mass of pollutant = 17.8 7.5 13.2If below detection limits, replace 0 with 1. 0 0 0
Man Particulate mais mg 17.8 7.5 13.2
Cs Particulate concentration gr/dscf 3.180F-03 2.377E.03 4.192E-03 3.26E-03
Per Particulate emisaion rate lb/h 2.432E-02 2.171E-02 3.802E-02 2A.8021-02 3
Mass of pollutant = 11.6 11.6 5.1If below detection limits, replace 0 with 1. 0 0 0
Mn Cadmium maR" g 11.6 11.6 5.1
Cs Cadmium concentration p&g/m3 4.744 8.414 3.707 6.621 3Pmr Cadmium emisuIon rate lb/h 1.585E.05 3.358E.05 1.469E-05 2.137E.05 I
Mass of pollutant . 22.4 3.0 3.0If below detection limits, replace 0 with 1. 0 1 1
Mn Chromium mae L 22.4 c3.0 43.0 ICs Chromium concentration lt,/m3 9.160 42.176 46.181 4.306
ItPm[r Chromium emL", on rate I"g 3.060E-05 ýcfl.686E-0• 48.41E-OG 1.54E.05
IA-28 5

Page 6
IT AiR QUALITY SER'VICES Vabdaw.d V791EMISSION TEST REPORT
TEST RESULTS
Plant: R.R..AD. Tezarkana Test datc(s): 2/26/91 2126/91 2/27/91Sampling location: Venturi Inlet
Ruu NumbersSIPM-1 SIPM-2 SIPM-3 AVERAGE
Mass of pollutant u 5.0 5.0 5.0If below detection limits, vplace 0 with 1. 1 1 1
?n Zinc mass •g <5.0 <5.0 -5.0
CS Zinc concentration Mg/m3 c2.045 .3.627 43.634 3.102
Piar Zinc emission rate lb/h <6.830E-06 <1.448E-05 <l.440E-05 <I.190E-05
Mass of pollutant = 39.6 12.6 9.6If below detection limits, replace 0 with 1. 0 0 0
Mn Lead mass •g 39.6 12.6 9.6
C. Lead concentration Rg/m3 16.194 9.139 6.978 10.770
Pmr Lead emission rate lb/h 5.410E.05 3.648E-05 2.768E-05 3.941E-05
Mass of pollutant - 0.0 0.0 0.0If below dctection limits, replace 0 with 1. 0 0 0
Mn <poUutant> ma"a mg 0.0 0.0 0.0
C. .cpoUutant> concentration gridscf 0.OOOE,00 0.0000E+0 0.000.E00 0.000E,00
Pmr cr,.lutant> emission rate lb/h O.000.E00 0.0001E+00 O.OOOE*00 0.000.E00
Mass of pollutant 0.0 0.0 0.0If below detection limits, replace 0 with 1. 0 0 0
Mn cpoUuantnb mass mg 0.0 0.0 0.0
Cs <poUutant> concentration lr/dscf 0.OOOE.00 0.000E300 0.0003.00 0.000E.00
Pmr <polilutanta emission rate lb/h 0.O000E00 0.OOOE+0 0 0.0004)0 000A0E*00
Mass nf pullutant = 0.0 0.0 0.0If below detection limits. replaoe 0 with 1. 0 0 0
Mn <poluitant> mass mg 0.0 0.0 0.0
Cs cpoUutant> concenruation gr/dsd 0.000E+00 0.0009.00 0.000E.00 0.0001+00
Pmair poUuLant> emission rate lb/h 0.O00E.00 ZF.010E.00 0.000E+00 O.000.E00
A-29

Page 1 I
IT AIR QUALITY SERVICES vb+ted 17 mEMISSION TEST REPORT 1
FIELD DATA
Plant: ILR.A.D. Texarkana Date: 2/27/91 mSampling locatior.: Venturi Inlet Run number. BIPM-4
Test time (start-stop): 1037-1137 -
Sample type: Part.Mets Volume correction (cu. ft.): 0.000Bar. press. (in. Hg): 29.97 Meter calibration factor. 0.074
Static press. (in. H20): -5.900 Data intervaJ (min.): 10.0Filter number(s): 9070038 Nozzle dia. (in.): 0.171
Stack izside dia. (io.). 6.00 Meter box number: 7T.4
Pitot tube coefT.: 0.84 Number of'trsverse points: 6Total 120 collected (ml): 186.9 % CO2 by volume (dry): 1.0
% 02 by volume (dry): 20.0 % CO by volume (dry): 0.0 ISample Gas meter Velocity Orifice, drop
time reading head actula Stack Dry gas meter(min) (cu. ft.) AP AH Temp. temp. O;F)
0.0 916.9 6 U (n. H20) (Un. R2,O) (°F) inlet outlet
10.0 923-550 2.000 1.50 101 79 7520.0 931.110 2.700 2.07 91 79 7430.0 937.750 2.000 1.45 120 80 7540.0 946.840 3.300 2.37 ,28 81 7650.0 955.000 4.200 3.01 129 81 7760.0 964.394 4.300 3.09 129 82 7880.0 47.4"8 3.083 2.28 1 s 76
II!II
I-
II
A-30 3
N E -I

Page 2
IT AIR QUALITY SERVICES v -sEMISSION TEST REPORT
FIELD DATA
Plant: R.R.A.D. Texarkana Date: 2127/91Sampling location: Venturi Inlet Run number. SIPM.5
Test time (start-stop): 1329-1429
Sample type: PA-tJMetalc Volume correction (cu. ft.): 0.000Bar. press. (in. Hg): 29.97 Meter calibration factor: 0.974
Static press. (in. H20): .5.900 Data interval (min.): 10.0Filter number(s): 9010500 Nozzle dia. (in.): 0.171
Stack inside dia. (in.): 6.00 Meter box number: PTr4Pitot tube ceff: 0.84 , : ,.er of traverse points: 6
Total H20 coUected (ml): 183.7 % C02 by vulume (dry): 1.0% 02 by volume (dry): 20.0 % CO by volume (dry): 0.0
Sample Gas meter Velocity Orifice droptime reading head actual Stack Dry gas meter
(main) (cu. ft.) Alp 4 Temp. temp. (IF)0.0 964.628 1 (in. 1H20) (in.-H20) (IF) inlet outlet
10.0 972.200 2.700 2.05 97 79 7520.0 979.730 2.600 1.92 114 79 7630.0 987.200 2.600 1.88 125 80 7640.0 996.100 3.500 2.50 133 82 7750.0 1004.600 3.900 2.79 133 32 7860.0 1013.803 4.100 2.94 133 84 7960.0 49.175 3.233 2.3U; 123 81 77
A-31

Page 4 3
IT AIR QUALITY SERVICES Vah-td "191EMISSION TEST REPORT U
TEST RESULTS 3Plant: RR.A.D. Texarka-a Test date(s: 2/27/91 2127/91 1/1/04
Sampling location: Venturi Wlet
Run NurabervSIPM-4 SIPM.5 0 AVERAGE
0 Net time of test (min) . 60.0 60.0 0.0 3NP Net sampling points 6 6 6
Y Meter calibration factor .. 0.974 0.974 0.000 5Dn Sampling nozzle diameter (in) - 0.171 0.171 0.000
Cp Pitot tube oweMcient ...... 0.8P4 0.84 0.84 IAH Ave, age orifice pressure drop (in. H20) ....... 2.25 2-35 #DIV/01 *DIV/O!
Vin Volume of dry gas sampled 47.458 49.175 0.000 32.211at meter conditions (cu. ft.)
Tm Average gas meter temperature ('F) ....... 78.1 78.9 #DIV/01 #DIV/0!
Vmstd Volume of dry gas sampled ...- 45.684 47.275 #DIV/0! *DIV/0!at standard conditions (scf) U
Vie Total H20 collected in impingers ....... 155.9 183.7 0.0 113.2and silica gel (ml) 5
Vwstd Volume of water vapor at ....... 7.3,38 8.647 0.000 5.328standard conditions (scf)
Bwo Percent moisture by volume, as measured ....... 13.84 16.46 UDIV/0I #DIV/O!Percent moisture by volume, at saturation ....... 10.52 12.48 #DIV/0! 6DIV/0!Percent moisture by volume, used in calculations ...... 10.52 12-48 SDIV/0l #DIV/0[
Fied Mole fraction of dry gas 0.895 0.875 #DIV/0l ODIV/0! 3%CO2 Percent C02 by volume (dry) ...... 1.0 1.0 0.0 0.7
%02 Perc-nt 02 by volume (dry) ...... 20.0 20.0 0.0 13.3 3%CO Percent CO by volume (dry) - 0.0 0.0 0.0 0.0
%N2 Percent N2 by volume (dry) - 79.0 79.0 100.0 84.0 3Md Molecular weight . dry stack gas o-- 28.96 28.96 28.00 28.64
Ma Molecular weight, stack gas - 27.81 27.59 #DIV/0I #DIV/0I 3Pbar Barometric pressure (in. Hg) 29.97 29.97 0.00 19.98
Pai Static pressure of stack gas (in. H20) - .5.900 -65900 0.000 -. 933 3Ps Stack pressure - absolute (in. Hg) ....... 29.54 29.54 0.00 19.69
To Average stack gas temperature ('F) --.--. 116.3 122.5 #DIV/01 #DIV/OI 3A-32 p
I

Page 5
IT AIR QUALITY SERVICES vmlidait, Sn/lS
EMISSION TEST REPORT
TEST RESULTS
Plant: R.R.A.D. Tezarkana Test date(s). 2/27/91 2/27/91 V1104Sampling location: Venturi Inlet
Run Numbers
SIPM-4 SIPM-5 0 AVERAGE
Vh Average square root of velocity head (in. H20) ..... 1.7352 1.7898 0.0000 1.1750
Vs Average stack gas velocity (fcctsec.) ...... 104.38 108.66 #DIV/0l #DIV/OI
As Stack area (sq. in.) ....... 28.3 28.3 28.3 28.3
Q6 Actual stack flow rate (acfm) ....... 1230 1280 fDIV/01 #DIV/0I
Qxstd Stack flow rate - dry (scfm) ....... 995 1002 *DIVIO! @DIV/0I
ISO Percent isokinetic ....... 97.8 100.2 #DiV/01 #DIV/01
Mass of pollutant = 11.6 6.7If below detection limits, replace 0 with 1. 0 0 0
Mn Particulate mas mg 11.6 6.7 0.0
Ce Particulate concentration gr/dscf 3.918E-03 2.187E.03 *DIV/0! #DIV/O!
Pmr Particulate emLsion rate lb/h 3.342E-02 1.879E-02 #DIV/O! #DIV/0O
Mass of pollutant = 4.2 5.9 0.0If below detection limits, replace 0 with 1. 0 0 0
Mn Cadmium mass •g 4.2 5.9 0.0
C& Cadmium concentration .Lg/m3 3.247 4.407 #DIV/0! #DIV/OI
Pmr Cadmium emision rate lb/h 1.210E-05 1.655E-05 #DIV/0! #DIV/O!
Mass of pollutant - 3.0 19.4 0.0if below detection limits, replace 0 with 1. 1 0 0
Mn Chromium ma sa9 c3.0 19.4 0.0
Ca Chromium concentration jg/m3 42.319 14.492 #DIV/O! #DIV/O!
Pmr Chromium emission rate lb/h <9.643E-06 5.441F,-05 #DIV/0! #DIV/O!
A-33

Page 6 3
IT AIR QUALITY SERVICES Valiatad 3nl91EMISSION TEST REPORT I
TEST RESULTS
Plan,: R.R.AD. Texarkana Test eate(s): 2/27/91 2/27/91 1/11/04Sampling location: Venturi Inlet
Run NumbersSIPM-4 SIPM-5 0 AVERAGE
Mass of pollutant = 5.0 62.0 0.0If below detection limits, replace 0 with 1. 1 0 0
btn Zinc Mas 1A 5.0 62.0 0.0
Ce Zinc concentration lbg/m3 c3.865 46.314 #DIV/01 *DIV/0I
IIpm~r Zinc emission rate Ib/h cl.441E.05 1.739E-04 #D[V/01 #DIV/O01
Mass of pollutant 2.0 12.6 0.0If below detection limits, replace 0 with 1. 0 0 0
Mn Lead mass Pg 2.0 12.6 0.0
Cs Lead concentration gg/mn3 1.546 9.412 *DIV/0I #DIV/0l
Pmr L.ead emission rate Ib/h 5.762E-06 3.34E-05 #DIV/01 #DIV/0!
Mass of pollutant = 0.0 0.0 0.0 iIf below detection limits, replace 0 with 1. 0 0 0
Mn cpoIlutant0 mass mg 0.0 0.0 0.0
Cs <PoIlutant> concentration gr!dscf 0.000E+00 0.000E+00 #DTV/0! *DIV/0I 3Pmr <pollutant> emission rate Ibh O.OOOEO0 O.OOOE.00 #DIVI0I #DIV/0O I
Mass of pollutant 0.0 0.0 0.0If below detection limits, replace 0 with 1. 0 0 0
Mn qpollutanb- mas mg 0.0 0.0 0.0
Ce qpollutanu s concentration gr/dscf O.OOOE+00 0.OOOE+00 *DIV/0I #DIV/0I
Pmr <pollut.atb. emission rate lb/h 0.OOOE.00 0.OOOE.00 *DIV/0l #DIV/O 3
Mass of pollutant = 0.0 0.0 0.0If below detection limits, replace 0 with 1. 0 0 0
Mn q)oUutaat> mass mg 0.0 0.0 0.0 5Cs poqlutarzt> concentration gr/decf 0.000E300 O.OOOE.00 *D[V/0! #DIV/0!
Pmr <pollutantb emission rate lb/h 0.O00E.00 O.OOOE+00 #DIV/0l #DIV/0O i
A-34

Page I
IT AIR QUALIIT SERVICESEMISSION TEST REPORT
FIELD DATA
Plant: R.R.A.D..Txazrkana Date: 2/28/91Sampling location: Venturi Outlet Run number. SOPM.1
Test time (start-stop): 0922-1142
Sample type: Part/Metals Volume correction (cu. ft.): 0.081Bar. press. (in. Hg): 30.06 Meter calibration factor: 0.992
Static press. (in. H20): 0.050 Data interval (min.): 15.0Filter number(s): 90700N9,9070053 Nozzie dia. (in.): 0.252
Stack inside dia. (in.): 9.00 Meter box number: FT-2Pitot tube coefl.: 0.24 Number of traverse points: 7
Total H20 collected (ml): 999.0 % C02 by volume (dry): 1.0% 02 by volume (dry): 20.0 % CO by volume (dry): 0.0
Sample Gas meter Velocity Orifice droptime reading head actual Stack Dry gas meter
(min) (cu. ft.) AP 46H Temp. temp. (OF)0.0 829.154 (in. H20) (in. [120) CF) inlet outlet
15.0 837.170 0.260 0.67 123 73 7330.0 846.596 0.350 0.89 134 78 7445.C 855.740 0.340 0.87 134 78 7760.0 864.735 0.310 0.80 131 84 7775.0 874.390 0.320 0.82 132 82 8090.0 883.010 0.330 0.86 131 87 80
i05.0 892.157 0.340 0.88 131 90 80105.0 63.003 0.321 0.83 131 82 77
A-35

Page 2 3
IT AIR QUALITY SERVICES mEMISSION TEST REPORT
FIELD DATA
Plant: R.R.A..D.-Tezarrkana Date: 2126191Sampling location: Venturi Outlet Run number SOPM-2
Test time (start.stop): 1430-1535n
Sample type: Part./Metalo Volume correction (cu. ft.): 0.000Bar. press. (in Hg): 30.06 Meter calibration factor: 0.992
Static press. (in. H20): 0.050 Data interval (min.): 7.5Filter number(s): 9070086 Nozzle dia. (in.): 0.252
Stack inside dia. (in.): 9.00 Meter box number-. PT.2Pitot tube coelf.: 0.84 Number of traverse points: 8
Total H20 collected (ml): 74.8 % C02 by volume (dry): 1.0% 02 by volume (dry): 20.0 % CO by volume (dry): 0.0
Sample Gas meter Velocity Orifice drop -
time reading head actual Stack Dry gas meter 5(min) (cu. ft.) 4P H Temp. temp. (*F)
0.0 892.532 [ (in H20) (in. H20) (IF) Inlet outlet7.5 895.610 0.400 0.49 121 80 80
15.0 900.300 0.460 0.57 119 82 7922.5 903.650 0.440 0.53 132 85 80
30.0 907.028 0.310 0.38 133 88 8037.5 909.890 0.300 0.37 126 85 8045.0 913.640 0.340 0.42 126 85 80 I52.5 917.210 0.410 0.52 127 89 82600 920.633 0.390 0.47 127 92 8360.0 28.101 0.380 0.47 126 86 81 3
AIIIIII
A-36 3

Page 3
IT AIR QUAUITY SERVICES
EIMISSION TEST REPORT
FIELD DATA
Plant: RR.A.D..Texarkana Date: 227/91Sampling 1rcation: Venturi Outlet Run number SOPM-3
Test time (start-stop). 0808-0914
Sample type: Part./Metals Volume correction (cu. ft.): 0.000Bar. press. (in. Hg): 29.97 Meter calibration factor: 0.992
Static press. (in. H20): 0.050 Data interval (min.): 7.5Filter number(s): 9070093 Nozzle dia. (in.): 0.252
Stack inside dia. (in.): 9.00 Meter box number FT-2Pitot tube moefT.: 0.84 Number of traverse points: 8
Total H20 collected (ml): 93.5 % C02 by volume (dry): 1.0% 02 by volume (dry). 20.0 % CO by volume (dry): 0.0
Sample Gas meter Velocity Orifice droptime reading head actual Stack Dry gas meter
(ra In) (cu. ft.) Alp al Temp. temp. (OF)0.0 920.771 1 (in. H20) (in. H20) (IF) inlet outlet
7.5 925.150 0.330 0.78 130 75 7515.0 929.730 0.350 0.82 134 77 7522.5 934.480 0.370 0.88 131 80 7530.0 938.437 0.400 0.96 123 83 7537.5 944.100 0.350 0.85 121 82 7645.0 948.810 0.360 0.88 121 87 7752.5 953 760 0-400 0.98 120 88 7860.0 959.167 0.430 1.05 120 90 7960.0 38.396 0.374 0.90 125 83 76
A-37
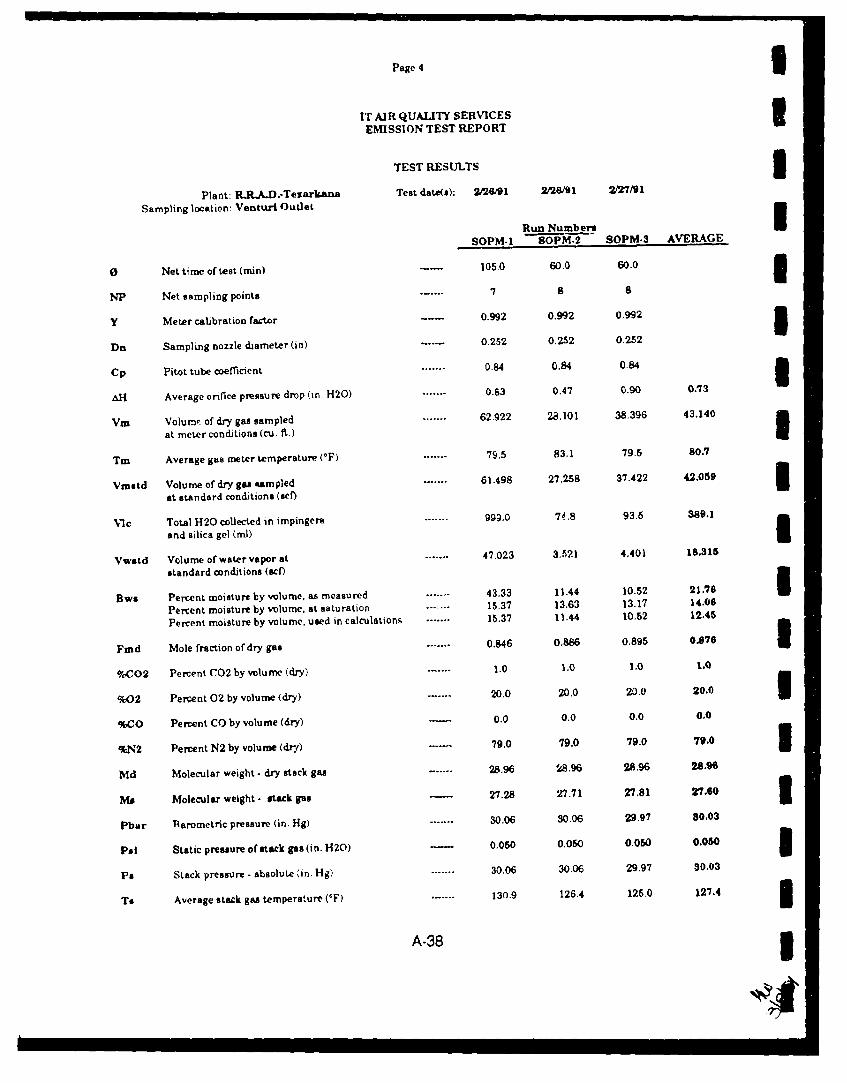
Page 4 1
IT AIR QUALITY SERVICES 3EMISSION TEST REPORT
TEST RESULTS 3Plant: RR A4D.,Tesarkshna Test date(s): ="261 2126191 2(27/91
Sampling location: Venturi Outlet 1
Run Number.
SOPM-1 SOPM-2 SOPM.3 AVERAGE
0 Net time of test (min) . 105.0 60.0 60.0 3NP Net sampling points ...... 7 8 9
Y Meter calibration factor 0.992 0.992 0.992 3Da Sampling nozzle diameter (in) ..... 0.252 0.252 0.252
Cp Pitot tube coefficient ....... 0.84 0.84 0.84 3AM Average orifice pressure drop (in. H20) ....... 0.83 0.47 0.90 0.73
VM Volum•a of dry gas sampled ....... 62.922 28,101 38.396 43.140
at meter conditions (cu. fi..)I
Tm Average gas meter temperature (OF) ....... 79.5 83.1 79.5 80.7
Vinstd Volume of dry gas sampled .... 61.498 271258 37.422 42.059
at standard conditions (sef)
VIC Total H20 collected in impingers ....... 999,0 74.8 93.6 389.1
and silica gel (ml)3
Vwstd Volume of water vapor at ....... 47.023 3.521 4.401 18.315
standard conditions (scf)
Bws Percent moisture by volume, as measured ....... 43.33 11.44 10.52 21.78
Percent moisture by volume, at saturation ....... 15.37 13.63 13.17 14.06
Percent moisture by volume, used in calculations ..... 1. 15.37 11.44 10.52 12.45
Frnd Mole fraction of dry gas ....... 0.846 0.886 0.895 0.976
%C02 Percent C02 by volume (dry) ...... 1.0 1.0 1.0 1.0
%02 Percent 02 by volume (dry) .. 20.0 20.0 20.0 20.0 3%CO Percent CO by volume (dry) - 0.0 0.0 0.0 0.0
%N2 Percent N2 by volume (dry) 79.0 79.0 79.0 79.0 3Md Molecular weight - dry stack gas ...... 28.96 28.96 28.96 28,96
Ms Molecular weight - sack gas - 27.28 27.71 27.81 27.60 3Pbar Rtarometric pressure (in. Hg) ....... 30.06 30.06 29.97 80.03
Psi Static pressure of stack gas (in. H20) - 0.050 0.00 0.050 0.050
Ps Stack pressure - absolute (in. Hg) ....... 30.06 30.06 29.97 30.03
To Average stack gas temperature ('F) -.. 130.9 126.4 126.0 127.4 3A-38 3

Page 5
IT AIR QUALITY SERVICESEMISSION TEST REPORT
TEST RESULTS
Plant: R.R.A.D.-Tezarkans Test datc.s): 2/26/91 2/26/91 2/27/91
Sampling location: Venturi Outlet
Run NumbersSOPM-I SOPM-2 SOPM-$ AVERAGE
Vh Average square root of velocity head (in. H20) ....... 0.5664 0.6148 0.6108 0.5973
Vs Average stack gas velocity (Feet/sec.) ....... 34.53 37.04 36.75 38.11
As Stack area (sq- in.) ....... 63.6 63.6 63.6 63.6
Q6 Actual stack flow rate (acfm) ...... 915 982 974 957
Qsstd Stack flow rate- dry (scfm) ....... 695 787 788 757
ISO Percent isokinetic ....... 160.5 73.7 101.0 111.7
Mass of pollutant = 532.7 12.2 8.6If below detection limits, replace 0 with 1. 0 0 0
Mn Particulate mass mg 532.7 12.2 8.6
Cs Particulate concentration gr/dscf 1.337E-01 6.906E-03 S.546E-03 4804E-02
Pmr Particulate emision rate lb/h 7.967E-01 4.657E-02 2.396E-02 2.SA1E-Ol
Mass of pollutant = 53.0 9.6 6.4
If below detection limits, replace 0 with 1. 0 0 0
Mn Cadmium Mass Jig 53.0 9.6 6.4
Cs Cadmium concentration ;±g/m3 30.435 12.438 6.040 16.304
Pmr Cadmium emilsion rate lb/h 7.926E-05 3.665E-05 1.783E.05 4.4"8E-05
Mass of pollutant a 650.0 3.0 8.0
If below detection limits, replace 0 with 1. 0 1 1
Mn Chromium mASS 1Ag 65.0 <3.0 43.0
C. Chromium concontratlou 1ig/m3 373.257 <3.887 <2.831 126A68U
Pmr Chromium emission rate lb/h 9.721E-04 .0.145E.05 <8.4A. E-06 S80E-04
A-39

Page 6 3
IT AIR QUALITY SERVICESEMISSION TEST REPORT U
TEST RESULTS
Plant: R.R.A.D.-Texarksana Test date.s): 2/26/91 2/26/91 2/27/91Sampling location: Venturi Outlet
Run NumbersSOPM-1 SOPM-2 SOPM.3 AVERAGE
Mas of pollutant = 1500.0 5.0 5.0If below detection limits, replace 0 with 1. 0 1 1
Mn Zinc ma" $g 1300.0 <5.0 0AB.0
C. Zinc concentration IAg/m3 861.362 <6.478 <4.719 290.853
Pmr Zinc emialsion rate lbV 2.243E.03 <1.909E.05 cl.393E-05 7A88E-04
Mass of pollutant = 1000.0 13.6 5.2If below detection limits, replace 0 with 1. 0 0 0
Mn Lead ma". 1g 1000.0 13.6 52
Ca Lead concentration 4rg/m3 574.242 17.620 4.907 1IO.2,3
Pmr Lead emission rate lb/h 1.496E-03 5.192E.05 1.448E.05 5,206E-04 3Mass of pollutant 0.0 0.0 0.0 l
If below detection limits, replace 0 with 1. 0 0 0Mn <poUutant> mass mg 0.0 0.0 0.0
Ca <poUutant> concentration gr,'dscf 0.OOOE+00 0.OOOE.00 0.000E.00 0.0OE.00
Pmr <pollutant> emission rate lb/h 0.OOOE.00 0.000E+00 ..OOOE+00 0.0002+00
Mass of pollutant = 0.0 0.0 0.0If below detection limits, replace 0 with 1. 0 0 0
bin cpoUutan> masI mg 0.0 0.0 0.0 ICs <pouutant) concentration gr/dscf 0.OOOE00 0.000.E00 0.0002.00 O.000E.0
Pmr qpollutant> emission rate lb/h 0.OOOE.00 0.OOOE+00 0.000E200 O.0002.00 3
Mass of pollutant 0.0 0.0 0.0 IIf below detection limits, replace 0 with 1. 0 0 0
Mn <po1Iutazinti ma" mg 0.0 0.0 0.0
Cs "poUutant> concentration g'r/dect 0.OOOE000 0.000E+00 0.000E+00 0.I00E,00
Pmr <pollutant> emission rate lb/h 0.OOOE.00 0.000.E00 0.000.E00 0.000E.00
A-40

Page 1
IT AIR QUALITY SERV1CES v.hidate< 11L90oEMISSION TEST REPORT
FIELD DATA
Plant: R.R.A.D..Tezkrkana Date: 2/27/91Sampling location: Venturi Outlet Run number SOPM-4
Test time (start-stop): 1034-1139
Sample type: PartJMetals Volume correction (cu. ft.): 0.000Bar. press. (in. Hg): 29.97 Meter calibration factor: 0.992
Static press. (in. H20): 0.050 Data interval (min.): 7.5Filter number(s): 9070021 Nozzle dia. (in.): 0.252
Stack inside dia. (in.): 9.00 Meter box number. FT.2Pitot tube coefT.: 0.84 Number of traverse points: 8
Total H20 collected (ml): 88.7 % C02 by volume (dry): 1.0% 02 by volume (dry): 20.0 % CO by volume (dry): 0.0
Sample Gas meter Velocity Orifice droptime reading head actual Stack Dry gas -neter
(ain) .(cu. ft.) F AH Temp. temp. (CF)
0.0 959.294 (In. '20) (in. H20) (VF) inlet outlet7.5 962.750 0.200 0.48 124 80 80
15.0 967.250 0.330 0.80 125 82 7922.5 971.700 0.430 0.76 122 85 7930.0 976.095 0.390 0.77 121 85 8137.5 980.621 0.290 0.71 121 83 8245.0 985.350 0.330 0.80 122 85 8152.5 989.880 0.350 0.80 122 86 8160.0 993.908 0.380 0.78 121 88 6160.0 34.614 0.338 0.74 122 84 81
A-41
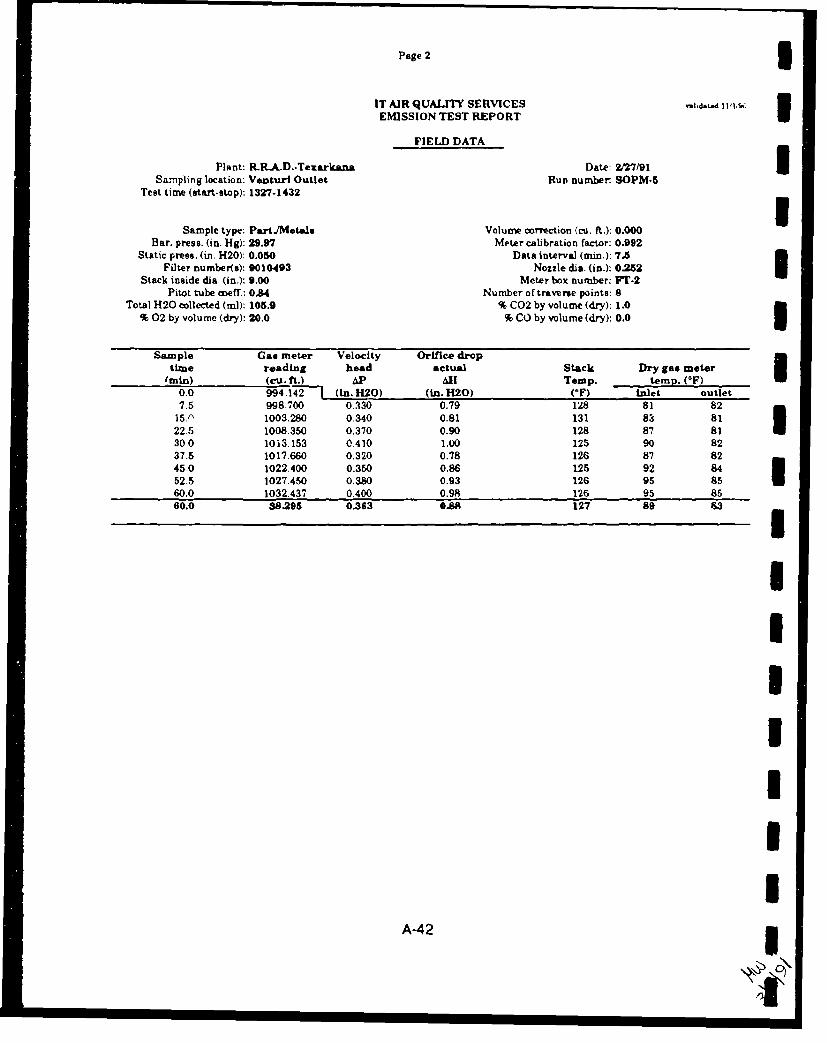
Page 2 3
IT AIR QUALITY SERVICES ýIk d ,LEMISSION TEST REPORT U
FIELD DATA
Plant: R.RA.D.-TexarkanaF Date: 2/27/91 3Sampling location: Venturi Outlet Run number. SOPM.8
Test time (start-stop): 1327.1432
Sample type: PartJMetals Volume correction (cu. ft.): 0.000Bar. press. (in. Hg): 29.97 Meter calibration factor: 0.992
Static press. (in. H20): 0.050 Data interval (mi.): 7.5Filter number(s): 9010493 Nozzle dis. (in.): 0.252 I
Stack inside dia. (in.): 9.00 Meter box number: FT.2
Pitot tube coef.: 0.84 Number of traverse points: 8Total H20 collected (ml): 105.9 % C02 by volume (dry): 1.0
% 02 by volume (dry): 20.0 % CO by volume (dry): 0.0 USample Gas meter Velocity Orifice drop
time reading head actual Stack Dry gas meter,min) (cu . ft.) Al Temp. temp. (OF)
0.0 994.142 I (In.-0) (in. H20) (iF) inlet outlet7.5 998.700 0.330 0.79 128 81 82
15.0 1003.280 0.340 0.81 131 83 8122.5 1008.350 0.370 0.90 128 87 81 a30.0 10i3.153 0.410 1.00 125 90 8237.5 1017.660 0.320 0./8 126 87 8245.0 1022.400 0.350 0.86 125 92 8452.5 1027.450 0.380 0.93 126 95 8560.0 1032.437 0.400 0.98 126 95 8560.0 38.295 0.363 0.88 127 89 63
I
I
= II I
A-42 p
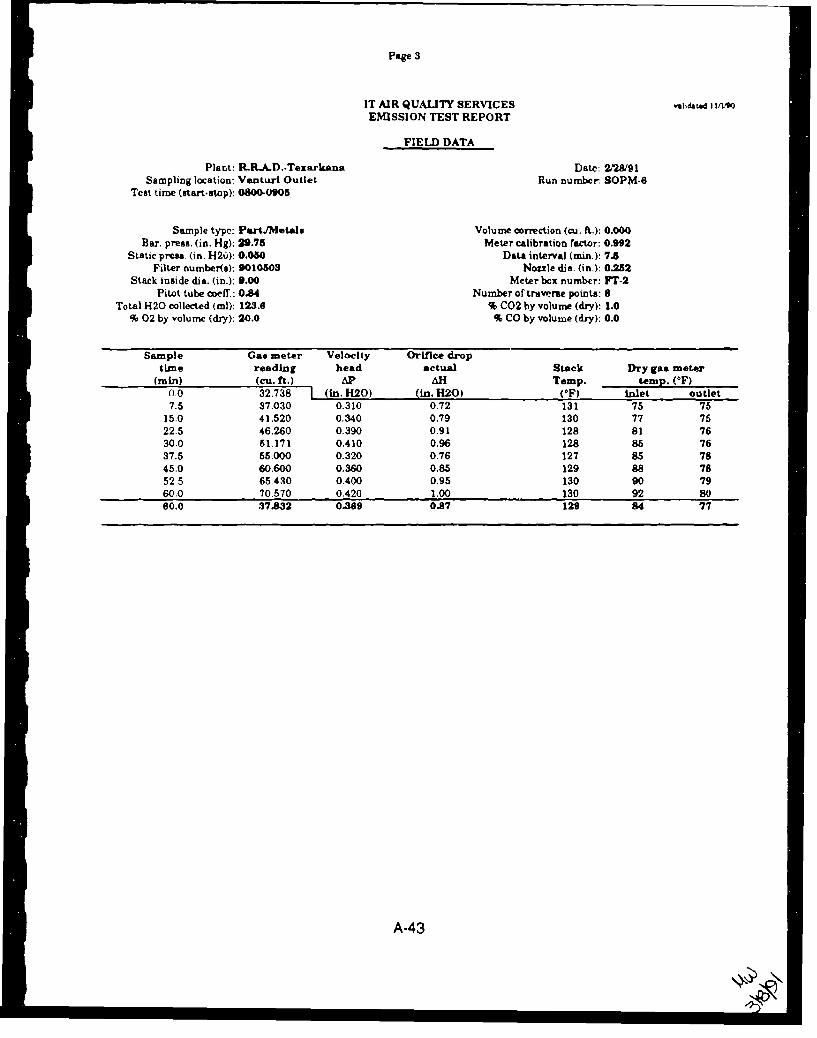
Page 3
IT AIR QUALITY SERVICES , I-at.d 11110
EMISSION TEST REPORT
FIELD DATA
Plant: R.R.A.D..Texarkana Date: 2/28/91Sampling location: Venturi Outlet Run number. SOPM-6
Test time (start.stop): 0800-0905
Sample type: PartJMetals Volume correction (cu. ft.): 0.000Bar. press. (in. Hg): 29.75 Meter calibration factor: 0.992
Static press. (in. 1426): 0.080 Data interval (min.): 7.5Filter number(s): 9010503 Nozzle dia- (in.): 0.252
Stack inside dia. (in.): 9.00 Meter box number: F.-2Pitt tube coeff.: 0.84 Number of trav.rme points: 8
Total H20 oollected (ml): 123.6 % C02 by volume (dry): 1.0% 02 by volume (dry): 20.0 % CO by volume (dry): 0.0
Sample Gas meter Velocity Orifice droptime reading head actual Stack Dry gas meter
(rmin) (cu. ft.) AP - Temp. temp. (°F)S0.0 32.738 [.(in. !-20) (in. H20) (*F) inlet outlet
7.5 37.030 0.310 0.72 131 75 7515.0 41.520 0.340 0.79 130 77 7522.5 46.260 0.390 0.91 128 81 7630.0 51.171 0.410 0.96 128 86 7637.5 55.000 0.320 0.76 127 85 7845.0 60.600 0.360 0.85 129 88 7852.5 65 4,30 0.400 0.95 130 90 7960.0 70.570 0.420 1.00 130 92 8060.0 37.832 0.389 0.87 129 84 77
A-43

Page 43
IT AIR QUALITY SERVICES dld-ted 1 1/1190 IEMISSION TEST REPORT
TEST RESULTS
Plant: R.R.A.D..Texarkana Test date(s): 2127W91 2/27/91 2/28/91Sampling location: Venturi Outlet
Run NumbersSOPM-4 SOPM4 SOPM.6 AVERAGE
0 Net time of test ("n) ..... 60.0 60.0 60.0
NP Net sampling points 8 8 8
Y Meter calibration factor 0.992 0.992 0.992
Dn Sampling nozzle diameter (in) 0.252 0.252 0.252
CP Pitot tube mcfficient --. 0.84 0.84 0.843
311 Average orifice pressure drop (in. H20) .. 0.74 0.88 0.87 0.83
Vm Volume of dry gas sampled 34.614 38.295 37.832 36.914at meter conditions (cu. ft.)
Tm Average gas meter temperature OCF) .... 82.4 85.8 80.6 82.9
Vmstd Volume of dry gas sampled 33.543 36.894 36.523 35.653at standard conditions (Rcr)
VIc Total H20 coUected in impingers 88.7 105.9 123.6 106.1and silica gel (ml)
Vwstd Volume of water vapor at . 4.175 4.985 6.818 4.993standard conditions (scf)
Bws Percent moisture by volume, as measured 11.07 11.90 13.74 12.24Percent moisture by volume, at saturation 12.22 13.86 14.83 13.64Percent moisture by volume, used in calculations . 11.07 11.90 13.74 12.24
Find Mole fraction of dry gas 0.889 0.881 0.863 0.878
"%C02 Percent C02 by volume (dry) 1.0 1.0 1.0 1.0
%02 Percent 02 by volume (dry) .. 20.0 20.0 20.0 20.0
%CO Percent CO by vclume (dry) 0.0 0.0 0.0 0.0
%N2 Percent N2 by volume (dry) 79.0 79.0 79.0 79.0
Md Molecular weight - dry stack gas 28.96 28.96 28.96 28.96
Ms Molecular weight - stack gas 27.78 2i.66 27.45 27.62
Pbar Barometric pressure (in. Hg) 29.97 29.9", 29.75 29.90
Psi Static pressure of stack gas (in. H20) 0.050 0.050 0.050 0.050
Ps Stack pressure, absolute (in. Hg) . 29.97 29.97 29.75 29.90
Ts Average stack gas temperature ('F) 122.3 126.9 129.1 126.1
A-44

Page 5
IT AIR QUALITY SERVICES vaidmwd 114i9
EMISSION TEST REPORT
TEST RESULTS
Plant: R.R.A.D.-Tezarkans Test datcas): 2/27/91 2/27/91 2/28"1Sampling location: Venturi Outlet
Run NumbersSOPM-4 SOPM.5 SOPM-O AVERAGE
Vh Average square root of velocity head (in. 1120) ....... 0.5779 0.6015 0.6064 0.953
Ve Average stack gas velocity (fect./sc.) ....... 34.72 36.35 36.98 84.02
As Stack area (sq. in.) ....... 63.6 63.6 63.6 $3.6
Q6 Actual stack flow rate (acfm) ....... 920 963 980 955
Qsstd Stack flow rate . dry (scfm) ------- 744 765 754 754
ISO Percent isokinctic ....... 95.9 102.5 103.0 100.5
Mass of pollutant = 8.0 30.1 8.7If below detection limits, replace 0 with 1. 0 0 0
Mn Particulate ma" mg 8.0 30.1 8.7
Ce Particulate concentration gr/dscf 3.680E.03 1.259E.02 3.67SE-03 G.6489-0O
Pmr Particulate emission rate Ib/h 2.345E.02 8.255E-02 2.374E-02 4.32-.E-0
Mass of pollutant = 2.0 2.3 9.6If below detection limits, replace 0 with 1. 1 0 0
Mn Cadmium mass Ig 42.0 2.3 9.6
C. Cadmium concentration pg/l3 <2.106 2.202 9.282 41A30
Pmr Cadmium emisslon rate Ib/h 0.864E-06 6.307E-06 2.620E-05 1.279E-0
Mass of pollutant = 3.0 3.0 3.0If below detection limits, replace 0 with 1. 1 1 1
Mn Chromium mass 1g 41.0 4.0 4.0
Ca Chromium concentration gig/m3 <3.158 4.872 4.901 4W977
Pmr Chromium emisslon rate Ib/h c8.795E.06 <8.227K•.06 4.187K-06 .4A03E-CN
A-45
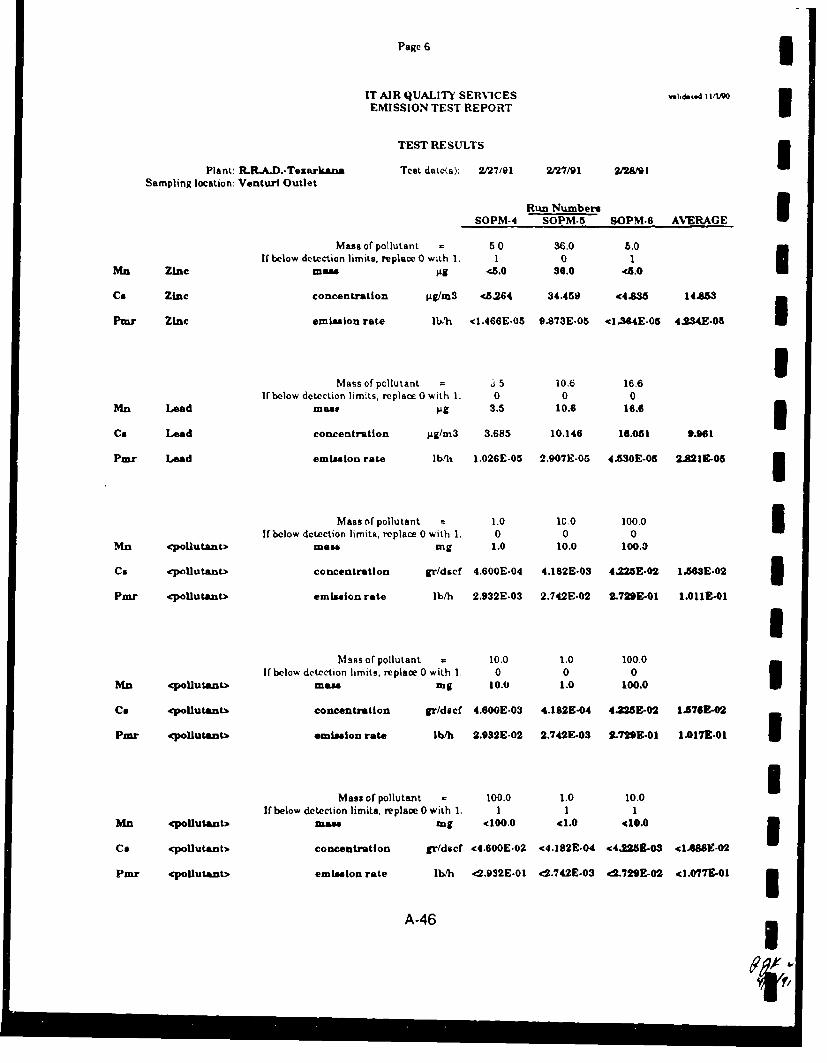
Page 6 3
IT AIR QUALITY SERVICES vshdd 114O
EMISSION TEST REPORT ITEST RESULTS 3
Plant: R.R.A.D.-Tezarklana Test date(s): 2/27/91 2/27/91 2/28/91Sampling location: Venturi Outlet
Run NumbersSOPM-4 SOPM-5 SOPM.6 AVERAGE
Mass of pollutant 5.0 36.0 5.0If below detection limits, replace 0 with 1. 1 0 1
Mn Zinc mR" -. o.0 36.0 <8.0
Cs Zinc concentration jAg/m3S <5.264 34.459 <4J=3 14AM5
Pmur Zinc emission rate lb.h <1.466E-05 9.873E-05 <1.644E-05 4.234E-05
UMass of pollutant =.5 10.6 16.6
If below detection limits, replace 0 with 1. 0 0 0Mn Lead mas1 s19 3.5 10.6 16.6 3Ce Lead concentration gg/m3 3.685 10.146 16.051 9.961
Pmr Lead emission rate lb/h 1.026E-05 2.907E-05 4.MS0E-05 2.821E-05
Mass of pollutant 1.0 1C.0 100.0If below detection limits, replace 0 with 1. 0 0 0
MXn <poUutant> mea mg 1.0 10.0 100.0
Cs coUutant> concentration gr/dscf 4.600E-04 4.182E-03 4.Z25E-02 1.63E.02 3Pair <cpollutant> emission rate lb/h 2.932E-03 2.742E-02 2.72DE-O 1.011E-01 I
Mass oF pollutant = 10.0 1.0 100.0If below detection limits. replace 0 with 1. 0 0 0
Mn <pollutant> mass Mg 10.0 1.0 100.0
Cs cpollutantb concentration gr/dscf 4.600E.03 4.182E-04 4.225E-02 1.576E-02
PMr cpollutant emission rate lb/h 2.932E-02 2.742E-03 2.729E-01 1.017E.01 3
Mass of pollutant = 100.0 1.0 10.0If below detection limits, replace 0 with 1. 1 1 1
Mn <pollutant> maA Ing <100.0 C0 C10.0
Cs <poUutant> concentration gr/dscf c4.600E-02 <4.182E-04 <4.225E-03 <4AB8SE-02
Pair <pollutant> emisslon rate Ib/h <2.9S2E.01 <d.742E.03 c2.729E-02 41.07ME-01 3A-46
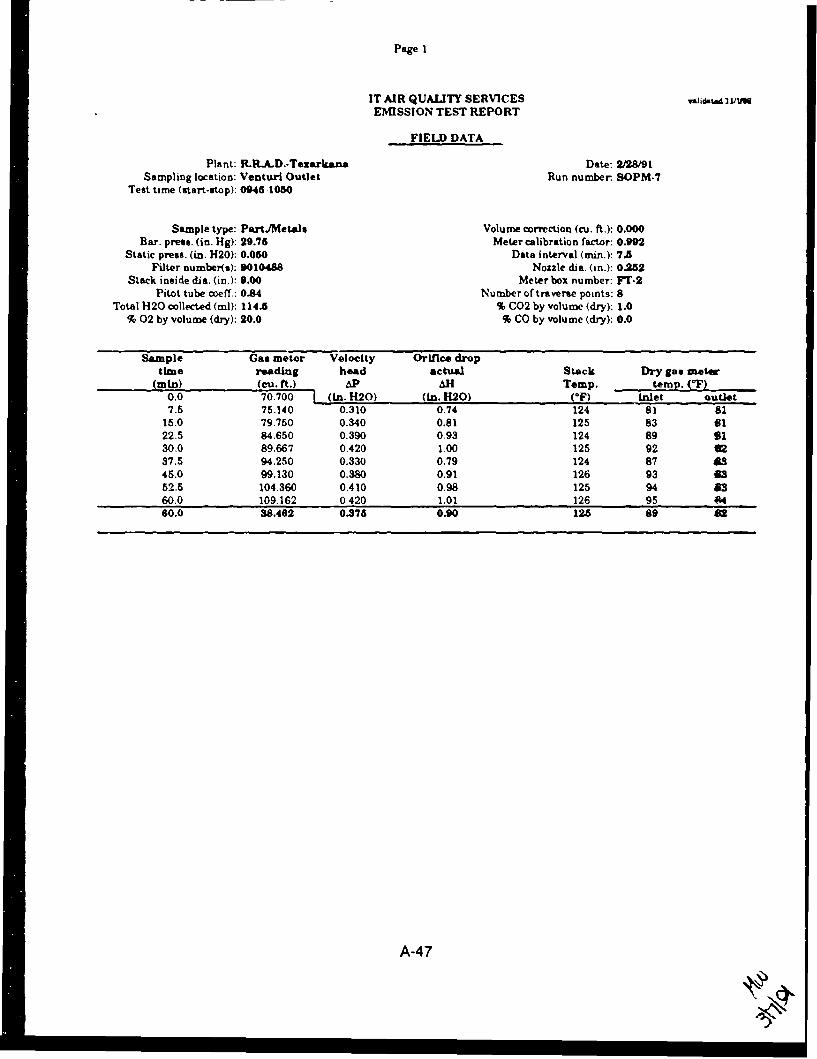
Page 1
IT AIR QUALITY SERVICES wlidsl-, I UWEMISSION TEST REPORT
FIELD DATA
Plant: R.R.A.D.-Texarkana Date: 2/28/91Sampling location: Venturi Outlet Run number. SOPM.7
Test time (start-stop): 0945 1050
Sample type: Part/MetaWl Volume correction (cu. ft.): 0.000Bar. press. (in. Hg): 29.75 Meter calibration factor: 0.992
Static press. (in. H20): 0.050 Data interval (min.): 7.5Filter number(s): 9010488 Nozzle dia. (in.): 0.252
Stack inside dia. (in.): 9.00 Meter box number: FT-2Pitot tube coeff.: 0.84 Number of traverse points: 8
Total H20 collected (m]): 114.5 % C02 by volume (dry): 1.0% 02 by volume (dry): 20.0 % CO by volume (dry): 0.0
Sample Gas meter Velocity Orifice droptime reading head actual Stack Dry gas meter
(min) (cu. ft.) AP Al Temp. temp. (0F)0.0 70.700 1 (in. 20) (in. 20) (-F) inlet Outlet187.5 75.140 0.310 0.74 124 81 81
15.0 79.750 0.340 0.81 125 83 6122.5 84.650 0.390 0.93 124 89 1130.0 89.667 0.420 1.00 125 92 6137.5 94.250 0.330 0.79 124 87 as•46.0 99.130 0.380 0.91 126 93it
52.5 104.360 0.410 0.98 125 94 8360.0 109.162 0.420 1.01 126 9560.0 38.462 0.375 0.90 125 89 as
A-47

Page 2 3
IT AIR QUALITY SERVICES l,,I • 3EMISSION TEST REPORT
FIELD DATAPlant. R..R.A.D.-Texarkana Date: 2/28/91 3mr
Sampling location: Venturi Outlet Run number. SOPM.8Test time (starm.stop): 112&1232
Sample type: P&rtJMetala Volume correction (cu. ft.): 0.000 IBar. press. (in. Hg): 29.75 Meter calibration factor. 0.802
Static press. (in. H20): 0.050 Data interval (main.): 736Filter number(s): 9010633 Nozzle dia. (in.): 0.252
Stack inside dia. (in.): 9.00 Meter box number. FT.2Pitot tube coeff.: 0.84 Number of traverse poirnts: 8
Total H20 collected (ml): 108.5 % C02 by volume (dry): 1.0% 02 by volume (dry): 20.0 % CO by volume (dry): 0.0 3
Sample Gas meter Velocity Orifice droptime reading head actual Stack Dry gas meter
(min) (cu. ft.) &P ai Temp. temp. (IF)0.0 109.330 Qn. H20) (in. H20) (IF) inlet outlet7.5 113.560 0.,•0 0.67 126 84 84
15.0 118.000 0.320 0.76 125 86 8322.5 122.800 0.390 0.93 125 89 83 I30.0 127.885 0.420 1.01 125 91 82
37.5 132.200 0.300 0.71 126 87 8245.0 136.830 0.350 0.84 125 91 8352.5 141.800 0.400 0.97 123 94 8360.0 146.823 0.420 1.01 124 96 8460.0 37.493 0.360 0.8 125 90 83
IIIU
III
A-48

Page 4
IT AIR QUALITY SERVICES valid 1111,oEMISSION TEST REPORT
TEST RESULTS
Plant: R.LA.D..Texarkan- Test date(s). 2/28/91 2?2"8/91 11/04Sampling location: Venturi Outlet
Run NumbersSOPM-7 SOPM-8 0 AVERAGE
0 Net time of test (main) . 600 60.0 0.0
NP Net sampling points ...... 8 8 8
Y Meter calibration factor -.- 0.992 0.992 0.000
Dn Sampling nozzle diameter (in) .... 0.252 0.252 0.000
Cp kPitot tube coefficient ....... 0.84 0.84 0.00
AH Average orifice pressure drop (in. H20) ....... 0.90 0.86 IDIV/01 #DIV/0!
Vm Volume of dry gas sampled .. 38.462 37.493 0.000 25.318at meter conditions (cu, ft.)
Tm Average gas meter temperature (F.. 85.8 86.4 #DIV/01 #DIV/01
Vmstd Volume of dry gas sampled ...... 36.785 35.814 #DIV/01 #DIV/0!at standard conditions (scf)
VIC Total H20 collected in impingers ...... 114.5 108.5 0.0 74.3and silica gel (mcl)
Vwstd Volume of water vapor at ....... 5.390 6.107 0.000 3.499standard conditions (scf)
Bws Percent moisture by volume, as measured ....... 12.78 12.48 *DIV/01 #DIV/0!Percent moisture by volume, at saturation ....... 13.22 13.22 #DIV/01 *DIV/O!Percent moisture by volume, used in calculations ...... 12.78 12.48 *DIV/01 #DIV/0O
Fred Mole fraction of dry gas -.-- 0.872 0.875 #DIV/01 #DIV/0!
vliCO2 Percent C02 by volume (dry) .... 1.0 1.0 0.0 0.7
%02 Percent 02 by volume (dry) ...... 20.0 20.0 0.0 13.3
%CO Percen, CO by volume (dry) - 0.0 0.0 0.0 0.0
9LN2 Percent N2 by volume (dry) - 79.0 79.0 100.0 ".0
Md Molecular weight - dry stack gas - 28.96 28.96 28.00 28.64
Ma Molecular weight - stack gas - 27.56 27.59 DIV/1OI #DIV/O!
Pbar Barometric pressure (in. HZ) .-- 29.76 29.75 0.00 19.83
Ps! Static pressure of stack gas (ij. H20) 0.050 0.050 0.000 0.033
Ps Stock pressure. absolute (in. Hg) .. 29.75 29.75 0.00 19.84
Ts Average stack gas temperature (eF) ...... 124.9 124.9 #DIV/OI #DIV/0O
A-49

Page 5 3IT AIR QUALITY SERvICES Wi 11t'9 I,111i
EMISSION TEST REPORT
TEST RESULTS 3Plant: R.R.A.D..Tezarkana Test date(s): 2/28/91 2/28/91 1/104
Sampling location: Venturi Outlet Run Numbers
SOPM-7 SOPM.8 0 AVERAGE
Vh Average square root of velocity head (in. H20) ....... 0.6115 0.6984 0.0000 0.4033 3Vs Average atack gas velocity (fcetlnec.) ....... 37.08 36.27 SDIV/l1 @DIV/0I
An Stack area (sq. in.) .... 63.6 63.6 63.6 93.6
Qs Actual stack flow rate (acfm) .... 983 961 #DIV/01 #DIV/0O
Qsstd Stack flow rate - dry (scfm) ------- 770 755 #DIV/0O #DIV/0I 3ISO Percent isokinetic ....... 101.6 100.8 NDIV/01 #DIVIO!
IMass of pollutant 6.7 9.2 0.0
If below detection Limits, replace 0 with 1. 0 0 0Mn Particulate mae mg 6.7 9.2 0.0
Cs Particulate concentration grldscfl 2.810E-03 3.964E-03 #DIV/0I #DIV/10
PUnr Pa-ticulate emission rate lb/h 1.854E.02 2.45E-02 #DIV/0I #DIV/Gi1
Mass of pollutant 2.0 12.6 0.0 iIf below dztction limits, replace 0 with 1. 1 0 0
Mn Cadmium mass 1g . <2.0 12.6 0.0
Ca Cadmium cone ntration pg/m3 <1.920 12.424 #DIV/0l #DIVJl 3Pmr Cadmium emission rate Ib/h <5.535E-06 3.515E-05 #DIV/0! #DIV/01 I
Mass of pollutant = 10.4 3.0 0.0If below detection limits, replace 0 with 1. 0 1 0
Mn Chromium mass M~g 10.4 3.0 0.0
Ca Chromium concentration pg/m 3 9.984 .2.958 #DIV/01 #DIV/01l
Pmr Chromium emission rate lb/h 2.878E.05 <.SM9E-06 #DIV/0l #DIV/0l
IIA-50

Page 6
IT AIR QUALITY SERVICES validated tIVIoEMISSION TEST REPORT
TEST RESULTS
Plant: R.-RA.D.-Texarkana Test date(s): 2/28/91 2/28/91 111/04Sampling location: Venturi Outlet
Run Numbers
SOPM-7 SOPM.8 0 AVERAGE
Mass of pollutant = 15.0 14.0 0.0If below detection limits, replace 0 with 1. 0 0 0
Mn Zinc mvae ;Ag 15.0 14.0 0.0
Co Zinc concentration pg/m3 14.401 13.805 #DrV/0I #DIV/0'
Pmr Zinc emission rate lb/h 4.151E.05 3.905E.05 *DIV/0! ODIV/01I_Mass of pollutant = 19.6 9.6 0.0
If below detection limits, xplace 0 with 1. 0 0 0Mn Lead mass Pig 19.6 9.6 0.0
Co Loiad concentration pig/m3 18.817 9.466 *DIV/OI #DIV/0!
Pmr L4ead emission rate lb/h 5.424E-05 2.676E.05 #DIV/0I #DIV/0!
Mass of pollutant 0.0 0.0 0.0If below detection limits, replace 0 with 1. 0 0 0
?Mn <polutant> mam mg 0.0 0.0 0.0
Co cpoliuLant> concentration gr/dscf 0.000E*00 0.000E.00 #DIV/O! #DIV/O!
Pmr qpoUutant> emisslon rate lb/h O.0001E00 O.OOOE00 #DiV/'0l #DIV/OI
Mass of pollutant 0.0 0.0 0.0If below detection limits, replace 0 with 1. 0 0 0
Mn <poUutant> mW&4 mg 0.0 0.0 0.0
Ce qpoUutanb concentration gr/dscf 0.O00E+00 0.OOOE.00 #DIV/01 #DIV/SI
Pmr cpollutant. emislmon rate lb/h 0.000E.00 O.000200 *DIV/O! #DIV/0!
Maas of pollutant = 0.0 0.0 0.0if below detection limits, replace 0 with 1. 0 0 0
Mn cpollutant> mam mg 0.0 0.0 0.0
Co qpoUutantb concentration gr/dacf O.O000E00 0.000E200 #DIV/0! #DIV/0!
Pmr poUut.ant> emission rate lb/h O.O0000 0.000E+00 #DIV/0O #DIV/0I
A-51

iIIIII
APPENDIX B I
FIELD DATA SHEETSi
IIIiIi-IiI
B-i
I

TRAVERSE POINT LOCATION FOR CIRCULAR DUCTS
Plant sZ.•, 4. f i4 Y - - /, .
Date •/ A/Sampling location ___ __.__ __
Inside of far wall to outside of nipple
Inside of near wall to outside of nipple (nipple length):
Stack inside diameter, inches ._-_P___ ,._,-
Distance downstream from flow disturbance (Distance B):
/s Inches / diameter * _ _ d-
Distance upstream from flow disturbance (Distance A): 0L
6-'0 inches / diameler = dd
Calculated by___
SII
ill SCHEMATIC OF WAILEG LOCATIONSA4r
"PCC or UIM, Por LOCATIONPOINT FRlACTION I•OiLU I AND I NIPL FMo OUfYSD, Of RME~.
IImIElf OF ITACK I.C. ITACK I.C. (TO NEORUT 14 me") LENGTH M Of COU11S 41)
B-2

TRAVERSE POINT LOCATION FOR CIRCULAR DUCTSPlantk~/•5 / A7,0,A/ •- " /, /'& /#> I
Date '~$_______
Sampling location IVA-S V '• •:r -
Inside of far wall to outside of nipple --
Inside of near wall to outside of nipple (nipple length): 3Stack Inside diameter, inchesDistance downstream from flow disturbance (Distance B):
_ _ inches / diameter W • dd
Distance upstream from flow disturbance (Distance A):
7-O inches / diameter = , d3 dd
Calculated by_ _ _ _ _
All"*1'- [ 1r4:II~ I
0 •011•ANC, SCHEIMATIC OF SALUG LOCATION
""pOqjCT Of I A TViM POUT LOCATIONPMiNT "ACTION COLUMS l AND NIPPLE numoOUTWO OF NIPPLE
NUMBER Of STACK I.O. STACK I.D. (TO EAREUT 14 OWC) LENGTH SUMa OF COLU11"I & a)
/ 776 ____
_ _- If _ _ 123Id I A-.6
B-3IB-3 I
I

TRAVERSE POINT LOCATION FOR CIRCULAR DUCTS
Plant Z(,S1," • A ,, - R
Date ___2 ._ _ _ _ _
Sampling ilocation ' /,C V/S dr.4,e 0 --/e I-
Inside ofltar wall to outside of nipple /3 7'"
Inside crmear wall to outside of nipple (nipple length):
Stack kisiee diameter, inches "
Distarce lownstream from flow disturbance (Distance B): 1 /
lgoV inches / diameter - I.JVL dd F, A
Distancir wpstream from flow disturbance (Distance A):
C 10 byo .inches / -ameter /8, 3 dd
Calculateb by'
¢lit SCHEMATIC OF SAMPLING LOCATION
S"ACTIO POOU rorVNI PONT LOCATIONP~~~~uN,?CLUN IrATO €1111 AND I NPLENT FrROI OM'OED OF NIPPLE.
mR Of STACK 1.0. STACK i.O. (TO INCAM 14 INCH) LENGTH M OF COUIMIG 4 & PP
8-43 : v #I /t 1/¥ ,,
B-4
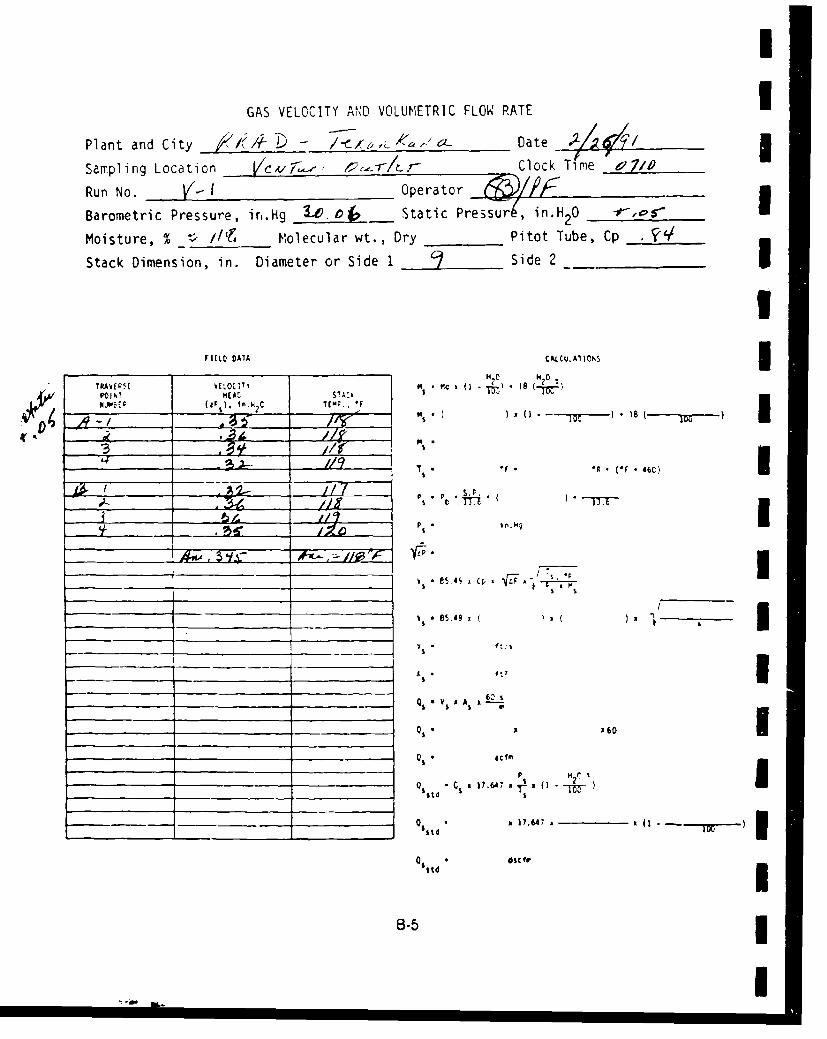
I
GAS VELOCITY AND VOLUMETRIC FLOW RATE 1Plant and City j/// - - Date -)-A
Sampling Location cv'T -'-/c r- Clock Time a71,
Run No. E- I - Operator
Barometric Pressure, ir,.Hg .jý . __ Static Pressur, in.H20 2 -,' 0
Moisture, % _ '> //EP Molecular wt., Dry Pitot Tube, Cp ,_ __
Stack Dimension, in. Diameter or Side 1 • Side 2 5I
FIL•LD DAIA CAzCuA1 IONS I7RTtAO N *
SPOJ I• H(AL•, :,
*j [r (e. .t .•C TE00,. Fr
954 c F 'A~- (* 46
654 a a
_____ __ _--_- __/__ I r R - ,c
S !
'"C a 1764 7 ID (C
Q1
%td *dsCta
6-5•
"a I
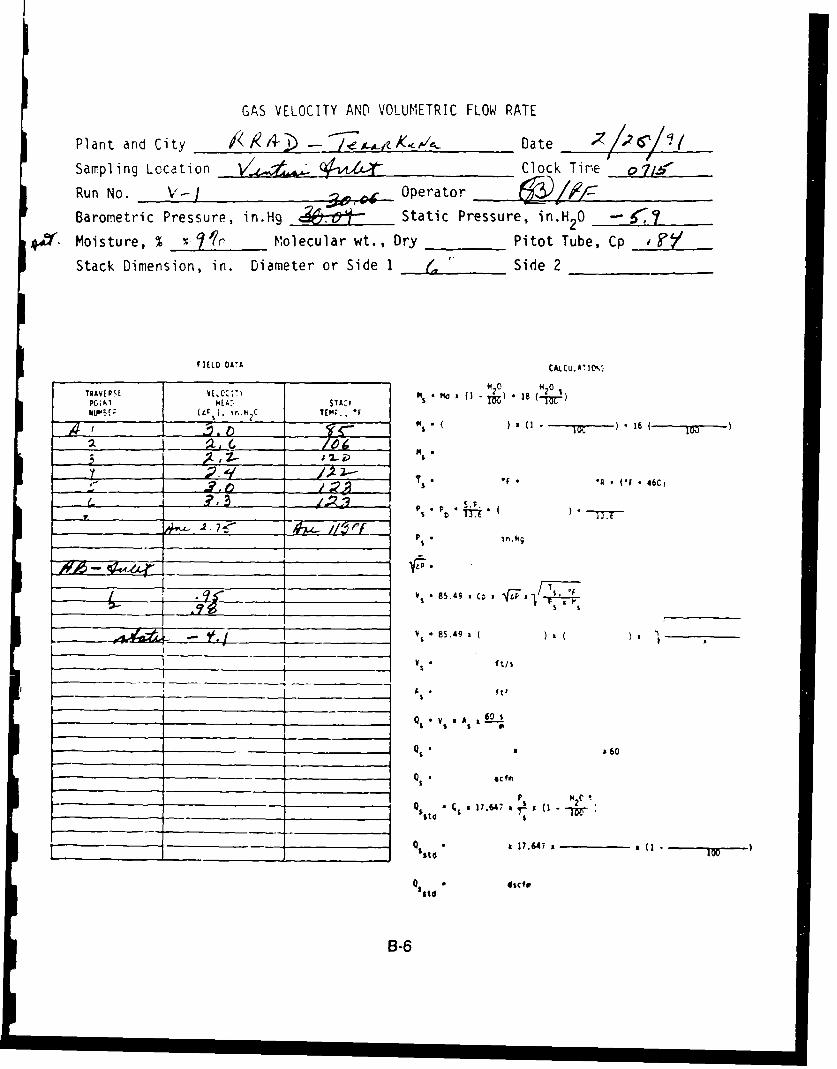
GAS VELOCITY AND VOLUMETRIC FLOW RATE
Plant and City - Date /2 6/ 1
Sampling Location 0'_ __ __-__ __Clock Tie Q7g-Run No. V-4 Operator _!_ _
Barometric Pressure, in.H9 . Static Pressure, in.H2 0 .•
.', Moisture, % - Molecular wt., Dry Pitot Tube, Cp '
Stack Dimension, in. Diameter or Side I j Side 2
rIELD DA7A CALrCu.A j .%S
" TRV V VE ý!i0 20 18 2 0 1)Pokl "A:- STACT
UL (Lt%). ir..h C U ---------- TC . °
- •- P
- • Of 46C)
" " P1 * in.Fi
M
___vs_ 8 5.4 9 C
v * 85.49 ()3(a
I vs •ft/lS
" 7 ftt
0 x6
-- $ t g - s c f r
B-6
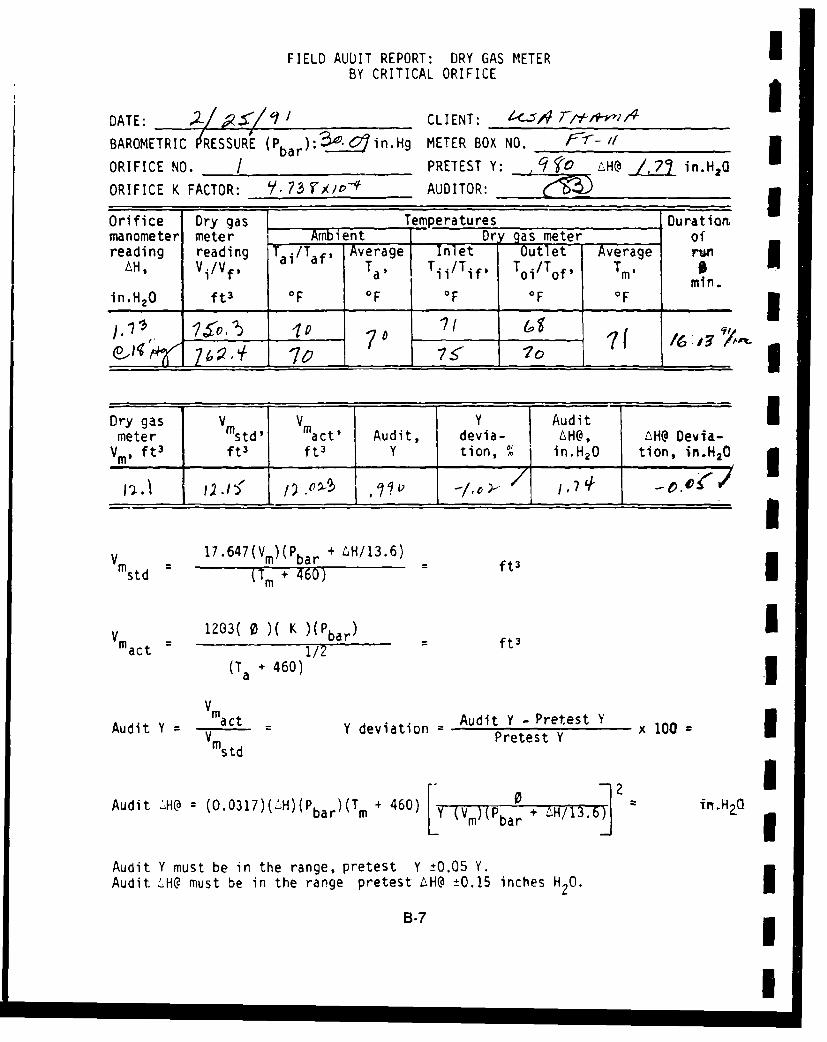
FIELD AUDIT REPORT: DRY GAS METER IBY CRITICAL ORIFICE
DATE: ,2 /2-s / CLIENT: /•/.7i*,-/ 6
BAROMETRIC P'RESSURE (Pbar): in.Hg METER BOX NO. g•- I
ORIFICE NO. I PRETEST Y: __ A LH@ ,3 in.H2Q
ORIFICE K FACTOR: 73 rXio-' AUDITOR: __
Orifice Dry gas Temperatures Durationmanometer meter Ambient Dr gas meter ofreading reading Tai/Taf, Average Inlet Outlet Average run
AH, Vi/Vf, Tas Ti i/Tif. Toi/Tof, Tm, 0 1min.
in.H20 ft 3 OF OF OF OF OF
~7 7 _,____, / 70"
Dry gas V Vm Y Audit -
meter std' act' Audit, devia- L. H@, AH@ Devfa-Vm, ft 3 ft 3 ft 3 Y tion, %0/ . in.H 20 j tion, in.H120
Vm 17. 6 4 7(Vm)(Pbar + ,H/13.6) ft3std (T m + 460)-ftI
Vm 1203( K )( K a Iact/2 ft 3
(Ta + 460) 3V
Audit YV= mact - Y deviation Audit Y -Pretest Y x 100Vmstd Pretest Y
Audit WHO (O.0317)(i;H)(Pbar )(Tm + 460) HT(Vm)(Pa + LH/T1.6 in.H2C
Audit Y must be in the range, pretest Y -O.05 Y.Audit -'H@ must be in the range pretest /AH@ ±0.15 inches H20.
B-7
I

FIELD AUDIT REPORT: DRY GAS METERBY CRITICAL ORIFICE
DATE: .2 /2 •S/V CLIENT: 4<-5_/f 7-,Y _ -__ _
BAROMETRIC PREýSURE'(Pbar): :3,.0? in.Hg METER BOX NO. __ f7-
ORIFICE NO. 7 PRETEST Y: 7 9t ,H@ 2,o3 in.H 20ORIFICE K FACTOR: 5.,_____o 6-6 AUDITOR:
Orifice Dry gas Temperatures Durationmanometer meter Ambient Dr gas meter ofreading reading T ai/Taf Average Inlet Outlet Average runAH, Vi/Vf, Tas Tii/Tif, T oi/Tof, Tm, 0• m in .
in.H 20 ft 3 OF OF OF OF OF
___, / __J'__ 6-7 -71
oDry gas Vm Vm Y Auditmeter std' act' Audit, devia- LH@, AH@ Devia-
. Vm, ft 3 ft3 ft 3 Y tion, % in.H 20 tion, in.H2 0l•qi•,A3" ___.___ ,_____ __,__ / .•' -. __,_____
Vm 17.647(V )(P bar + H/13.6) - 5 ft3
1203( 0 )( K )-Pb/)Vmact /2
(Ta + 460)
Vmac ty.ries
Audit Y = Y deviation = tY Pretest x 100YVm s Pretest Y
Audit ."H@ = (O.031 7 )(L-H)(Pbar )(Tm + 460) (Vm)(Pbar + AH/ 13.6] in.H 20
Audit Y must be in the range, pretest Y ±0.05 Y.
Audit LýH@ must be in the range pretest AH@ ±0.15 inches H2 0.
B-8

FIELD AUDIT REPORT: DRY GAS METER IBY CRITICAL ORIFICE
IBAROMETRIC PRESSURE (Pbar): in.Hg METER BOX NO. F<T-2--
ORIFICE NO. I PRETEST Y: • •- LH@ _I._ in.H 20
ORIFICE K FACTOR: ' 1 W'/t-" AUDITOR: <M2_ l
Orifice Dry gas Temperatures Durationmanometer meter Ambient Dre gas meter ofreading reading Ta /T Average Inlet Outlet Average run I
AH, Vi/Vf, / T af' Ta, Tii/Tif, Toi/Tof, Timl Imin.
in.H20 ft 3 OF OF OF OF °F I
•,1 7./ 1/6 -79 T16 Ir t4 • '.py 17/•
o4 -- -- I 0
Dry gas V V Aut Y Auditv meter std' ct' Audit, devia- AH@, ýH@ Devia-
Vm, ft 3 ft 3 ft 3 Y tion, % in.H 20 tion, in.H 2 0 I
/Iii.#• //3,o ,o'/.lc I, • -. U/V 17. 6 47 (Vm)(Pbar + LH/13.6)mstd (Tm + 460) ft3
Vm 1203( 0 )( K )(P bar) ft 3
act =1/2(Ta + 460) 3
Vmac 9• t•
Audit Y act 7 Y deviation A: 4t Y - P..etest YVm std Pretest Y x 100
Audit .,H@ = (O.0317)('H)(Pbar )(Tm + 460) Y (V)(Pa0 + LH/13.6 in.H 2 0
(O.0317)(.LH)( )T+(mPbar
Audit Y must be in the range, pretest Y -0.05 Y.Audit .H@ must be in the range pretest -,H@ ±0.15 inches HO2 0.
B-9
I

THERMOCOUPLE DIGITAL INDICATORAUDIT DATA SHEET
Date Indicator No. - Orator. ,--- _e ) .I
Equivalent Digital indicatorTest Point Millivolt temperature, temperature reading, Difference,
No. signal* OF* OF %
1 _ _2- -.93
3 ;
4 __,-._ 3•I -,___
Percent difference must be less than or equal to 0.5%.
Percent difference:
(Equivalent temperature OR - Digital Indicator temperature reading OR)(00%)(Equivalent temperature OR)
Where OR - OF + 460°F
These values are to be obtained from the calibrat'in data sheet for thecalibration device.
B-10

,III
THERMOCOUPLE DIGITAL INDICATORAUDIT DATA SHEET 3
Date -/ / Indicator No. ,-iOperator
Equivalent Digital indicatorTest Point Millivolt temperature, temperature reading, Difference,
No. Signal* OF*______ or__________ %_______
2 /1 /_ _ __ _ _ I3 __ _ _ ;2 r4 _ _ _ _ _ _ 4
Percent difference must be less than or equal to 0.5%.
Percent difference:
(Equivalent temperature OR - Digital indicator temperature reading OR)(I00%) 3(Equivalent temperature 7R)
Where OR - OF + 460°F
* These values are to be obtained from the calibration data sheet for the Icalibration device.
IiI
B-il I
I

THERMOCOUPLE DIGITAL INDICATORAUDIT DATA SHEET
Date /.7 V/ Indicator No. __ _-, _ Operator
Equivalent Digital indicatorTest Point Millivolt temperature, temperature reading, Difference,
No. signal* OF* OF %
2 t_____.__
3 CD4 _ _ _ _ _ _ _ _ _ l_ _ _._ _
Percent difference must be less than or equal to 0.5%.
Percent difference:
(Equivalent temperature 0 R - Digital indicator temperature reading *R)(l0O%)(Equivalent temperature 5R' -
Where OR - OF + 460OF
These values are to be obtained from the calibration data sheet for thecalibration device.
B-12

LUU
uj -uI- I
P Ccz Uý
z ~0
C',YIL' u
a:cw
Kai
B-13I

N k'I
MULTIMETALS SAMPLE RECOVERY AND INTEGRITY SHEET
Plant /./' 4.. - - Sample date _____/ ___
Sample location .4 rA, e- -- 7- Recovery date , 191
Run number ,4Jji41- Recovered by ____)__ __
Filter number(s) 0 7 P 0 7 4
MOISTURE
Impingers I 4" 5Final volume (wt) ,..ii•,6g.q •9/.4I ml (g) Final wt _ _ _ _ _ g
Initial volume (Wt) ý'CKI 5f. Y3fý,ml (g) Initial wt _____
Net volume (wt) 6'c.2- 7q.? ml (g) Net wt #,_3.__- - 9Description of impinger water Q0_ % spent
_Totalmoisture .274" 9
RECOVERED SAMPLE
Filter container number(s) /I2O& -A Sealed __
Description of particulate on filter /,iXr 6 x
Sprobe Liquid levelrinse container no. 0 2A-,4 marked
Impinger contents (I+2) Liquid levelcontainer no. /23/b -A marked __
HNV.1f4LO,. blank Liquid level /container no. /1__-/1_ _ _ marked V
Impinger contents (3*.4) Liquid levelcontainer no. "" marked
K<MO4 blank Liquid levelContainer no. marked
Samples stored and locked
Remarks A ef. / i-. -7'/,-p,9?-I
Receirdk b BORATORY CUSTODY DtRemarks
B-14

CC UI
rLA
t v
LLI et
10 6.
C-
4 ; boo
tiX0 U O
zB- 5

MULTIMETALS SAMPLE RECOVERY AND INTEGRITY SHEET
Plant j4DSample date __)Z6)
Sample location ALdwu. ,t Recovery date__ .Z9
Run number A1 e'./n-A Recovered by
Filter number(s) 'e 7eOf
MOISTURE
Impingers 1 3-
Final volume (wt) 6?2,Lý'r g 1 +7.'l (g) Final wt _.2 g
Initial volume (wt)4Lf7,i.'/#c4.jrn (g) Initial wt 767.4, jN~et volume (wt) 6ý. .I' ml (g) N'et wt 2 a-#- g
Description of impinger water e___ % spent
Total moisture 2A • g
RECOVERED SAMPLE
Filter container number(s) //o01--9 Sealed _ /_
Description of particulate on filter
probe Liquid levelrinse container no.. • - marked ___
Impinger contents (i2) Liquid levelcontainer no. //o•i-, marked
HAvo,/H/o, blank ,..lf-,A Liquid levelcontainer no. , marked __ _
Impinger contents (3.4) Liquid levelcontainer no. ---- marked
KMnO,' blank Liquid levelcontainer no. marked
Samples stored and locked - _
Remarks 4i-
TLAB TORY CUSTODY
Received by _ _ _ _ _ Date C• S/
Remarks
B-16

LU.
uJu 9ILI
r% ~ Ifi \
KL N U
LiL
0 C0
\nt. V-,al
tic ---- ----
VA .I4~
-B-1

MULTIMETALS SAMPLE RECOVERY AND INTEGRITY SHEET
Plant ________"_-_-_-__________ Sample date _ ___ ,/ __/
Sample location A -. Z .'rd - Recovery date ,__ _R__h
Run number 9zA-,,• - .-7 Recovered by
Filter number(s) ,?- ---
MOISTURE
Impingers I' 5
Final volume (wt) Sf? 2 i'!Zt_/'.ml (g) Final wt 7_ _-_ 7 4'i g
Initial volume (wt)6dL4 .a W/6 ml (g) Initial wt ?/5.c __40 gNet volume (wt) -Af.3 i17 co- ml (g) Net wt 7.7 _ gDescription of impinger water _ _ % spent
Total moisture , 9
RECOVERED SAMPLE
Filter container number(s) 4,/, ' .°iv Sealed i;
Description of particulate on filter ,_ _ _ _ _ _
____ probe Liquid levelrinse container no. /11C3 -0 9 marked _"
Impinger contents (i+2) Liquid levelcontainer no. iiil •-,i marked
blank Liquid levelcontainer no. / , L marked __
Impinger contents (3÷#) Liquid levelcontainer no. marked
KMnO4 blank Liquid levelcontainer no. marked
Samples stored and locked _
Remarks 4• . /.., -
LABO ~TORY CUSTODY
Received by _ ____, _____, ____ _____. __._._"__Date
Remarks ."•1
B-18

ULJ .
a aL
I-L
~t
zDIPFL
(Irift
wr0 U
B- 191

MULTIMETALS SAMPLE RECOVERY AND INTEGRITY SHEET
Plant ýK/7e- V- r4,Sample date __,..
Sample location _ -. ex .e7 -1ec-r Recovery date R-2-2 -P
Run number grljl - Recovered by /1,F '
Filter number(s) _ _ _ _ _ _ _ _ _ _ _
MOISTURE
Impingers 21 !- qFinal volume (wt) 4C4T OW"I 01tl (9) Final wt
Initial volume (wt) .,' .2 r.Q.n ml (g) Initial wt 7-3-.J_ gNet volume (wt) -i-' I1.1 . I/- 2 ml (g) Net wt /0./ g
Description of impinger water ___% spent
Total moisture /,,( 9
RECOVERED SAMPLE
Filter container number(s) ///.25-/13 Sealed I_
Description of particulate on filter
_. probe Liquid levelrinse container nu. marked
Impinger contents (I-2) Liquid levelcontainer no. ///;6 -A marked __-
H4O1!•, blank Liquid levelcontainer no. /2 / -/ marked
Impinger contents (3.41) Liquid levelcontainer no. marked
K.ImN blank Liquid levelcontainer no. __marked
Samples stored and locked _
Remarks
-W 8WORY CUSTODY
Received by , , / Date -ate
Remarks
B-20

LL- a:TTL,
~ ~r~] 1cr LLJ
0 C- -1--1-t----\Q
--.- U.' L
ax - -
cc Ix T1
LAJ
-i
uV.
ca I-o0
aC4 T-\ -
F f
w- 5
LU U
cr 1
__r > ~ --
B-213

MULTIMETALS SAMPLE RECOVERY AND INTEGRITY SHEET
Filant _______________t __A Sample date ý2~7'
"Sample location 7. -•-e•-r- Recovery date
I*un number 97-O/n ., Recovered by -______- __"_
Filter number(s) _/40/ - (k. a-/-Ž/ L.
MOISTURE
Impingers 4- 5
Winal volume (wt) . ,oii .i1 ?mZl (g) Final wt , gInitial volume (wt)S.Y (g(3 Y•f•.• •l (g) Initial wt 72z2-7 _
lIIet volume (wt) I•.;q I ml (g) Net wt 1Description of impinger water /I____,__.__ % spent
Total moisture I1__. __/
RECOVERED SAMPLE
Filter container number(s) .///1 3 -i/ Sealed __ ,_ _
Description of particulate on filter __ _ . _,_
• probe Liquid levelrinse container no. 1/133-4 marked _
lImpinger contents (i-7) Liquid levelcontainer no. ///3 _-_ marked _- _
blank Liquid levelcontainer no. ! marked
Impinger contents (3.+4) Liquid levelcontainer no. _ marked
K• -O blank Liquid levelcontainer no. marked
Samples stored and locked
Itteceived by________________ Date I/Remrks
B-22

-o Uu
0- z
IC
I-..
4t
U.-
00
wU -C=
0-~ 1C.4
C.-j -
a.~
~ e A
ILLw ~ ~ - - ~ -~
B-23

v-G(-% (9b
PARTICULATE SAMPLE RECOVERY AND INTEGRITY SHEET
Plant Ai?,.A - Sample date ,-?Io9/
Sample location _ .•-•-r- Recovery date --
Run number ,zctn_,- Recovered by 'to/p_ -
Filter number(s) fkrf7
MOISTURE
Impingers / 2- 3 Silica gel
Final volume (,.qt) Y7-3 -I fV* 1n( g Final wt 2393 g
Initial volume g Initial wt _736 gNet volume (wt) .-1' . ml(g) Net wt _. g
Ne voum NO tm11
Description of impinger water .I&_______ % spent
Total moisture 10-1._7 g
RECOVERED SAMPLE
Filter container number(s) /11197-/3 Sealed _
Description of particulate on filter
Probe rinse Liquid levelcontainer no. 1//137 ,-4 marked
blank Liquid levelcontainer no. /,de -A marked
Impinger contents Liquid levelcontainer no, ///-g R marked
blank Liquid levelEcotai'ner no. ------ marked
Samples stored and locked _ _ __ . _.
Remarks . i /.z.I//i4
LAýBORPORY CUSTODY
Received by Dt
Remarks
B-24

Ic-U I
L LJ
00
0 I
UJJ
w -4
U, ;:;..-.:.t - -.--- -
w- a
04
4
a..,
I -2 Ia:E.. ......
~IA. *
ta>
~~cc
cc
B-25

PARTICULATE SAMPLE RECOVERY AND INTEGRITY SHEET
Plant ,e,,j - Sample date .2-2.2- V/
Sample location , _-•.'c--" Recovery date ? -.
Run number 1, .- Recovered by _ ___-/___
Filter number(s) ý/C-? I!
MOISTURE
Impingers / -2 3 Silica gel
Final volume (wt) &2. t •J&.4V#'nl (g) Final wt 266 9 g
Initial volume (wt) ml(g) Initial wt 715-/ 9
Net volume (wt) -ILP 30 mlm(g) Net wt _,-_ _ g
Description of impinger water % spent
Total moisture 7.S g
RECOVERED SAMPLE
Filter container n..nber(s) i/z/z9 -I& Sealed /,t
Description of particulate on filter •40< !rAX
Probe rinse Liquid levelcontainer no. 111_3 4- marked
• 'blank Liquid levelcontainer no. /.22C- 'f marked
Impinger contents Liquid levelcontainer no. ///-vt -•4 marked _
.r blank Liquid levelcontainer no. n/,Z//-o marked
Samples stored and locked
Remarks Off- Z92.- z., . - -4
SK ~~LABOATORY CUSTODY ./ ••
Received by CUSTODY-Date
Remarks /
B-26

a:=
cc cru TI
LLJ
U)Ux ...
- -- --.-
ul wO
U~LU
z 0 C -
z f.-
z LA.-~-- I- s -
U, m
0 CD
00
CC, - . . . . . . . . . .~ . . . . .-
m W44u'j 2u
B-271

./0
PARTICULATE SAMPLE RECOVERY AND INTEGRITY SHEET
Plant ____- Sample date PY
Sample location A'rc-, Q -4 ,•.c,-r Recovery date _ -_-__
Run number - - I Recovered by
Filter number(s) '?aleI5j-2
MOISTURE
Impingers / - 3 Silica gel 77/,
Final volume (wt "A t9-ml(g) Final wt _________
Initial volume (wt)Zwl.o 1. f-?ml(g) Initial wt g...
Net volume (wt) . ml(g) Net wt _.__. g
Description of impinger water -464i k -z % spent
Total moisture /0. g
RECOVERED SAMPLE
Filter container number(s) ///q7 -. Sealed
Description of particulate on filter
Probe rinse Liquid levelcontainer no. /// .-, marked
A.cAI-blank Liquid levelcontainer no. / o7-A marked _
Impinger contents Liquid levelcontainer no. ///____- _ marked
,/,16 blank Liquid levelcontainer no. / 21//1- marked
Samples stored and locked
Remarks <fa::.i• ,4-O ., /• 4 / A -$yt
LýA RATORY CUSTODY
Received by Date
Remarks (/
B-28

IL)2u
0 0.J.
tjI
N Iz %
0- I
a 'U 05
A Cý
00
0 ;yB-29

MULTIMETALS SAMPLE RECOVERY AND INTEGRITY SHEET
Plant _ i. . . - ,/-,•//---v(J4 Sample date 2/1.26 I
Sample locaton Recovery date A_____
Run number _ __1:-_ _ __- _ Recovered by _ _____ _ _ _
Filter number(s) 9 7o0'
MOISTURE
Impingers q 5
Final volume (wt) J'7. I ?'¢fl? J ml (g) Final wt ____ ,__ _
Initial volume (wt)•D9.4 j3cj.t (64"4.ml (g) Initial wt 7S'.9 g
Net volume (wt) -Za2," 177_I t j3 ml (g) Net wt -. Y_ 7 _ g
Description of impinger water d ___ % spent
Total moisture ale -r1 9
RECOVERED SAMPLE
Filter container number(s) /,2,/I -/13 Sealed ___
Description of particulate on filter A_,i, rb'..
probe Liquid levelrinse container no. __ .I_______marked
Impinger contents (i,-) Liquid levelcontainer no. / f• marked _
NNt7114,0O• blank Liquid levelcontainer no. 1.2.7/-A marked __
Impinger contents (3+4) Liquid levelcontainer no. X o marked
KM 4O4 blank Liquid levelcontainer no. 4 marked
Samples stored and locked
Remarks ,,;,Z /•,. .- A
RATORYCUSTODY
Feceived by DateRemarks / '
B-30

U-J
IxI
F;z
0por ',
LU
T,3
11 04 al
fl U
C,%
m B-31

I - ,
MULTIMETALS SAMPLE RECOVERY AND INTEGRITY SHEET
Plant - " Samp le date
Sample location _ . .- Recovery date , / _/
Run number ____.___/_/-.x- Recovered by
Filter number(s) fe 7e,_ S
MO I STURE
Impingers q
Final volume (wt) I.2• •,3.qi•yftml (g) Final wt ?73.4 g9
Initial volume (wt)i,4'.-Y y'4.XJ1'/9ml (g) Initial wt 75/,7 ,AW,9 g
Net volume (wt) 1,W _ ýI- m (g) Net wt -A/-_ g
Description of impinger water eh•i• _ _ _ _ % spent
Total moisture // g
RECOVERED SAMPLE
Filter container number(s) / // 7f¢- &• Sealed _ .. _ _
Description of particulate on filter / - .
probe //,,77-/f Liquid levelrinse container no. • marked __
Impinger contents (i+2) Liquid levelcontainer no. . / ?-X marked _
NNVo blank. Liquid levelcontainer no. /laz'4 -4 marked
Impinger contents (3-+4) Liquid levelcontainer no. Mf' marked
KMnO4 blank Liquid levelcontainer no. /__ _ womarked _ _..
Samples stored and locked
Remarks idA-•e_ -, - /; --
YABOP4TORY CUSTODY
Received by / DateRemarks
B-32

I tI- - I .,. I~-
UZI
- - - - -o- - -
-p -v
cc ~OSN
LUU
0
2B-3

MULTIMETALS SAMPLE RECOVERY AND INTEGRITY SHEET
Plant A •44 Sample date 2Sample location /'. ,"- Recovery date " 9 fzkun number - -, Recovered by ___..._"2-
Filter number(s) q0 ? do U:5"
MOISTURE
Impingers I -q 3 5Final volume (wt) 6V.7 _jt•_A_ 4nl (g) Final wt 7Yo--ee gInitial volume (wt)/dfo (g) Initial wt 2,'C'02 __.
Net volume (wt) i. #7 ry97,9" // qml (g) Net wt 2_,0 _j 1 9
Description of impinger water 74 % spent
Total moisture /$ .3 9
RECOVERED SAMPLE
Filter container number(s) /// A/-/S Sealed __
Description of particulate on filter d/l.7 -
• probe Liquid levelrinse container no. //___l-____ marked _
Impinger contents (1-2) Liquid levelcontainer no. marked _
001qo, blank Liquid levelcontainer no. /112/ 4-• marked
impinger contents (3.+4) Liquid levelcontainer no. marked ___
K 0MrO4 blank - Liquid levelcontainer no. marked
Samples stored and locked
Remarks
LABORATORY CUSTODY
Received by Date 2 •Remarks
B-34

X_ 9 - I,ZIA,IV) \4
tu
tu cma -r
0 I
I-. 005
TI II
wB-3
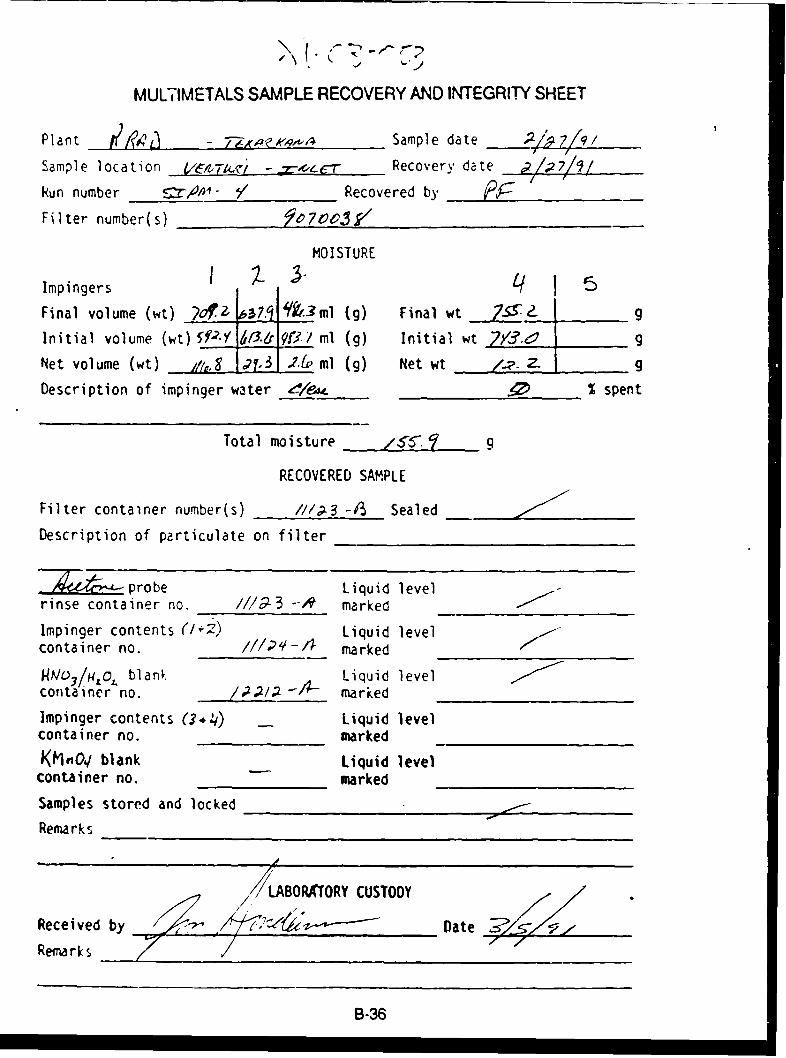
MULTIMETALS SAMPLE RECOVERY AND INTEGRITY SHEET
Plant 64- xe5,, Sample date 24___2_769 _
F I
Sample location ='tT• --- 6-e-r Recovery date ;? 7/9!
Run number !E "- / Recovered by __"
Filter number(s) 70C.3/
MOISTURE
Impingers
Final volume (wt) .521 37. kf3ml (g) Final wt gInitial volume (wt) SP.Y ý3qr?.tl? ml (g) Initial wt 7YS?. _ _ 9
Net volume (wt) _..ll iIi .y3.51-6, ml (g) Net wt .. __._.___ g
Description of impinger water -%el. d % spent
Total moisture S_'6.. 9
RECOVERED SAMPLE
Filter container number(s) ///I • 43 Sealed
Description of particulate on filter
-pr probe Liquid levelrinse container no. ///g 3 -- marked -_
Impinger contents (1r2) Liquid levelcontainer no. ///?4'-/. marked
kN0;/I4,o, blank Liquid levelcontainer no. / marked
Impinger contents (3.4) - Liquid levelcontainer no. Perked
KnO04 blank Liquid levelcontainer no. markedSamples stored and locked ___
Remarks
LBORATORY CUSTODY
Received by Dat --- Date
Remarks
B-36

14 , \_ --- - ----
I 1
.9~- It
w xC ~ Cc
B-37

MULTIMETALS SAMPLE RECOVERY AND INTEGRITY SHEET
Plant ke cm-,f Sample date________
Sample iocation j -A-k /- Recovery date '
Run number rA4' - Recovered by
Filter number(s)
MOISTURE
SImpingers -qFinal volume (wt) % , . . (g) Final wt 7&-g. _
Initial volume (wt• p ,4'•2 ml (g) Initial wt /g"? 3 g
Net volume (wt) / . *. ml (g) Net wt 1."_._)_- g
Description of impinger water e __e % spent
Total moisture /9.7
RECOVERED SAMPLE
Filter container number(s) ///-/• Sealed
Description of particulate on filter
-/ probe Liquid levelrinse container no. _//_ /-.I marked
Impinger contents (/I2) Liquid levelcontainer no. ///13.2-,4 marked
0oy/1H,oL blank Liquid levelContainer no. /#/2 -/- marked
Impinger contents (3.+ ) - Liquid levelcontainer no. markedI<MnO4 blank - Liquid levelcontainer no. marked _
Samples stored and locked _
Remarks
LABOýFORY CUSTODY
Received by 7 Date Z-5• /-ýRemarks __"
B-38

LLL
t. -
Lu ba-LL
TTI
-wi C%lli, 1vrý .6c
0L X
B-3

MULTIMETALS SAMPLE RECOVERY AND INTEGRITY SHEET
Plant A•,41 - Sample date __71,,_4/9/
Sample location Vr..;tr, c-r/c Recovery date 1-/2
Run number S JA - I Recovered by
Filter number(s) v6-7 3 oa 3- f*e?.c'f
MOISTURE
Impingers A " 3- LI5
Final volume (wt) ffit,¶7 _9,eZ, 1'iml (g) Final wt 7..3 AIX g
Initial volume (wt)•,q/.i' &//..•' Y..ml (g) Initial wt 9 . gNet volume (wt) 266-9 " -(,.6,13?8.5 ml (9) Net wt j _gDescription of impinger water 6A_ . _e_-_ % spent
Total moisture I . 0 9
RECOVERED SAMPLE
9,70. e,#3 -/3Fi.lter container number(s) :' 7006 -/3 Sealed VDescription of particulate on filter !--- i
zn probe //e75"- Liquid levelrinse container no. /_c_ _-__ marked -
Impinger contents (1,2) Liquid levelcontainer no. /___ /___,_ marked
HNHo 0O. blank 7dy- 14 Liquid levelcontainer no. 12,2-2:. marked _
Impinger contents (3.+) Liquid levelcontainer no. A) 4 marked -
KMO, blank Liquid levelcontainer no. A1 marked
Samples stored and locked
Remarks $//--. d 7e, A // 90e' 'o*' ['7,$ #-.-- • A•f~ ./:•Z&-.,'/
LA$ORATORY CUSTODY
Received by/' Date .J 5
Remarks
B-40

LU *I
o p C Ib
z It;--4-cc --t
P C
~4 ~f~05*
---- - -
B-41

MULTIMETALS SAMPLE RECOVERY AND INTEGRITY SHEET
Plant I~ASample date ~ 9
Sample locatior 11601,e7, .da 7-Z-/ Recovery date
Run number 2- - Recovered by
Filter number(s) 7 C62&_
MOISTURE
I rpin~ers Iq
Final volume (wt) e 0_f_ Y7.1 M1 (9) Final qs___ gInitial volume (wt)6e• z -• ..' ml (g) Initial wt /17• /49 gNet volume (wt) •fI 11.j /.•ml (g) Net wt T _ __ gDescription of impinger water 1/ % spent
Total moisture __ .___
RECOVERED SAMPLE
F.•Iter container number(s) //1.-/ SealedDescription of particulate on filter _ /•,_-
/A7e#v-- probe 2/67l-,• Liquid levelrinse container no. /--*- -v. marked
Impinger contents (/'2) Liquid levelcontainer no. //o77 -7 marked
H4NV1/WO blank. Liquid levelcontainer no. 4,7211_-/Q marked
Impinger contents (.•,4) Liquid levelcontainer no. A,16, marked
KM,04 blank Liquid levelcontainer no. AI/R_ marked
Samples stored and locked ____
Remarks
7 ,./LABýOTORY CUSTODY
Received by~ Date9Rer•a rk s J
B-42

ILI
wu Ir
1uJ tQ~ -d N. -
o 6,Z 33,4:6 0.
LUULL)
-------------------- c-Lu 6 :-
I~I
B-433

MULTIMETALS SAMPLE RECOVERY AND INTEGRITY SHEET
Plant k~lqfIE-4bs Sample date .2-1p2ASample location &A,7ra?, t a r( t r Recovery date /
Run number Soy-. Recovered by ._ ____'
Filter number(s) ¶s2cC, 93
MOISTURE
Impingers 7 'S- 5Final volume (wt) . /,L J L1/jZ'/ml (g) Final wt_____"_ /W g
Initial volume (wt)Z.6h 0,7.fml (g) Initial wt 99 _ g
Net volume (wt) -/,7 •,& 4.'.u ml (g9 Net wt /3. 9Description of impinger water _/_O % spent
Total moisture _ _ ,__ 9
RECOVERED SAMPLE
Filter container number(s) ////9-j.• Sealed .__,_
Description of particulate on filter r/'6v •,4Y'
probe Liquid levelrinse container no. ///I 4-/4 marked
Impinger contents (02) Liquid levelcontainer no. ////.2 -/-- marked
HU0,1H=O,, blank Liquid levelcontainer no. ./ /_-/,1. markeJ _
Impinger contents (3.#24) Liquid levelcontainer no. - marked0144 blank . Liquid levelcontainer no. _marked
Samples stored and locked
Remarks
,,/ 1OýORY CUSTODY
Received by ~><~ _ _ _ _ _Date •'Remarks Dt
B-44

-44
LL3_ U.
b~ Q LA-- t4
vi W A -
Aq .,x C '
U.
a ---. "I
z cc bol Ud- a IlU
z0 m.o
w'
IrI
-C -
BJ ;Z -4 I
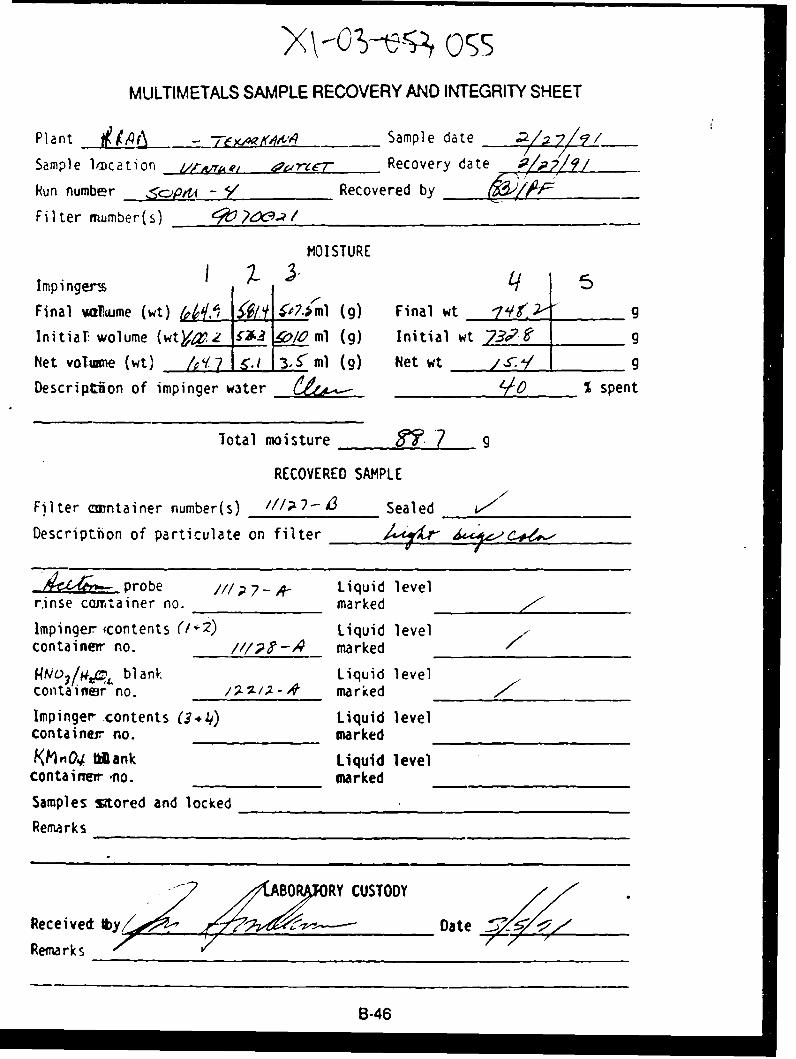
MULTIMETALS SAMPLE RECOVERY AND INTEGRITY SHEET
Plant 1- -A Sample date __2__
Sample 1'izcation a i7- Recovery date R
kun number ýf- y / Recovered by
Filter mumber(s) C ? /
MOISTURE
Impingerm ;L q
Final *dfume (wt) ."47.il (g) Final wt _ _,_____g
Initiat wolume (wtY'Lz A-3 /01V ml (g) Initial wt 73,_7. _ g
Net volwme (wt) Jr12... 1 1 3.,5 ml (g) Net wt 9 J___/__ g
Descriptýion of impinger water ____. ___ % spent
Total moisture .
RECOVERED SAMPLE
Filter cw•ntainer number(s) 7///o- 4 Sealed V__ _
Descriptibon of particulate on filter _ _ _ _____, ___
_ • probe ///?7-,A- Liquid levelr.inse conitainer no. marked __-
Impinger. 'contents (i÷2) Liquid level /container" no. ///yJ -A marked
00/4.0, blank Liquid levelConta |eir no. /;z2././ - marked
Impinger- contents (3*4) Liquid levelcontaineir no. marked
KhmnO•d lank Liquid levelcontainher no. marked
Samples sitored and locked
Remarks
ýý(AO RYCUSTODYU7ORYIReceived , DateI-
Remarks
B-46

ccU
iLi
LIL
,.- CL- -- - -0. t:.
-IL
B-47

MULTIMETALS SAMPLE RECOVERY AND INTEGRITY SHEET
Plant .f•W - -76*-tek-9 Sample date - 0 /
Sample location e/y7.vrsi r,-cc~. Recovery date 7Z/
Run number ...•,,.6 Recovered by ____.
Filter number(s) _ _ _ _ _ _ __ _ _
MOISTURE
Impingers - sFinal volume (wt) £#*' • •.4Sj'.n1 (g) Final wt g g
Initial volume (wt) :ki?,9l m' l (g) Initial wt ______g
Net volume (wt) 12.& 'I.1 j//, ml (g) tet wt /9._g
Description of impinger water 0 ___ % spent
Total moisture Le .- g, 9
RECOVERED SAMPLE
Filter container number(s) l.//__ z _-__3 Sealed
Description of particulate on filter 444 ,-..-i x
A probe Liquid levelrinse container no. I//)-' -,4 marked _
Impinger contents (/+2) Liquid levelcontainer no. . _ I_/_ .-1 marked _
RN O,1 bl ank liquid levelcontainer no. /..2-A' marked _
Impinger contents (3.4) _ Liquid levelcontainer no. marked
IMnOw blank Liquid levelcontainer no. - marked ___
Samples stored and locked __
Remarks
BORATORY CUSTODY
Received byy ~ 2 §- DateRemarks 77"_ _ _ _ _ _
B-48

-IN
0 Ir
SB--

LEAD SAMPLE RECOVERY AND INTEGRITY SHEET
Plant ._i4.t. - v 4 Sample date e/ ,9/•Sample location iq ?-zt--" Recovery date
Run number _ Recovered by ______
Filter number(s) . 3
MOISTURE
Impingers 3 - 5 Silica gel
"Final volume (wt)" X7.• 51?.i.ml (g) Final wt .___/_.0 _ g
Initial volume (wt)S. 4' ,,| 'ml (g) Initial wt 7__ 7._ Z g
Net volume (wt) _ ' 7 o240 -rml (g) Net wt _ _ _ _ g
Description of impinger water & _T7 _% spent
Total moisture Zc3-P
RECOVERED SAMPLE
Filter container number(s) /' 3 r-/A Sealed _
Description of particulate on filter
Acetone probe Liquid levelrinse container no. II11-q marked
Acetone blank Liquid levelcontainer no. / 2->o5--,4 marked
0.1 N HN03 probe A1'4 Liquid levelrinse container no. marked
Impinger contents Liquid levelcontainer no. marked
0.1 N HNO 3 blank Liquid levelcontainer no. marked
Samples stored and locked
Remarks 6.-. 7 '/( - 61cex -4, , rct"'c-.- -
ABO CUSTODY
Received by,• , _ Date
Remarks
B-50

'd IIa- A li
"t- -y-----lVi _ _ _
- ----I ~ jjj~,n1 ~0
4 2 - ~~-51--

X
MULTIMETALS SAMPLE RECOVERY AND INTEGRITY SHEET
Plant 1.- Sample date .7-9?- f/
Sample location 1,/")•.' " Recovery date ..- ZF.. f/Run number 5ZpA4- 7 Recovered by _ oP c.9Filter number(s) F010
MOISTURE
Impingers 1q 5
Final volume (wt) //X.f .{f.l. £.3.oml (g) Final wt ?7f-6F 11 gInitial volume (wt)&Cyj- {g,?j •//ml (g) Initial wt 770.9/ AI'I gNet volume (wt) 2- 1/ i.V ml (g) Net wt _" gDescription of impinger water 6 . __ _ % spent
Total moisture //__.5 _
RECOVERED SAMPLE
Filter container number(s) '// -z Sealed _
Description of particulate on filter 'cy' 6,,y
,-•'- probe Liquid level -/
rinse container no. ,,-,,y/--4 markedImpinger contents Liquid level
container no. marked
blank Liquid levelcontainer no. .. / l-- - r marked __ -
Impinger contents *(q-4) Liquid levelcontainer no. wo/ Z,.4 markedKhtOO0 blank Liquid levelcontainer no. marked
Samples stored and locked
Rem-arks o 9,72P C --- '7'w -1-
b•.ABO ATORY CUSTODY
Received by -- Date _
Remarks
B-52

LUU
__X
U)UICS
tu,
cc 0
<LU 0I
-. - -
B-53

'XL .--0 : -0%s
PARTICULATE SAMPLE RECOVERY AND INTEGRITY SHEET
Plant if.19. __. - "7-___ __ _-__4 Sample date •,.7 9/Sample location . l/pyre-/ oar-n-r Recovery date # --•9- •/
Run number -<0a - Recovered by _____-
Filter number(s) . -/cJSX
MOISTURE
Impingers 3 - - Silica gel
Final volume (wt) 1 wml(g) Final wt 75. 7 g
Initial volume (wt)Sb-3. AS ,$ Wml (g) Initial wt V97.I g
Net volume (wt) •± -1.r-s 1.J ml(g) Net wt _ _ _- g
Description of impinger water . 70 % spent
Total moisture ._______- g
RECOVERrn SAMPLE
Filter container number(s) Y///( - - iSealed
Description of particulate on filter
Probe rinse Liquid levelcontainer no. /-1/3 -A marked
AL&6,rf,,eb 1 an k Liquid levelcontainer no. __ __- _ marked
Impinger contents Liquid levelcontainer no. m/______- __ rarked/I.-l.x blank Liquid level
container no. /___,X_-2_ marked
Samples stored and locked
Remarks 'wW_ /•. .O, &'jz-
Received b Date
Remarks
B-54

INITIAL CEM CALIBRATION AND PERFORMANCE EVALUATION 3Plant k&414Ce &U /r Parameter 3,2 CO,7 02, NOQ(ý aHLocation I Monitor a 2"C 2Date 9-•s--4/ Span value <v r %___ -,__7 __ IOperator f ' /Zr_.e1/d Chart scale 100PN _ __ý _ Pbar, in.Hg 3 5
Chart divisions Concentra-tion pre- Cali- SamplingCal. gas Direct Injection dicted by bration system
Cylinder conc., injection through equation,* error,** bias,*** INo. ppm or % to monitor system Direct System % of span % of span
A~~ eas4; 50V'/ 5-13.J-3 J)/
/<."' o$ 5 , J•,O GI / .U 5 , • .7 i. . sJ• -2. -:.?/
,'A.o._. 6.o ... 6_ 1/ x ,~. / 4•- .0. .• -"•3 -•
Perform linear regression of pretest cal. gas concentration vs. chart adivisions to determine following equation:
y = mx + b x = ppm y chart d'vision 3For data reduction:
SChart division -b) (CD-•';9 7'Pollutant ppn/%. - (
Correlation coef. : 3' f
Calculation concentration predicted by equation using actual chartresponse obtained from each calibration gas response.
(Concentration ef cal. gas,** Calibration error, % span = Ppm - predicted concx.,ppm x 100
Span, ppm
Acceptable limit = ±2% each gas (THC limit is ±5%).
Sampling system bias =
(Direct injection gas conc. - system injection gas conc.) x 100SS-pan value
Acceptable limit <5% of span I
Minimum detectable limit = 2 percent of span or ... 4 •or % (circleone) I
Rise time to 95% of response for high cal. gas injected through system(return to zero after each injection):
c9e s, 69 s, .>6' s Avg. s s
Precision, % scale = difference in chart division response for two repeated
injections of the same gas concentration = - • .3 %(clock time = /J._i )IV
COMMENTS:
B-55

o ~- ~ L1-~ 'ON I
iA
I - -. - 4~* - -
*1~ -. -- l- V
-74
V7 -1 JIW II
I I
4-.Q\-- B -56I

DAILY CEM CALIBRATION AND PERF-UOFANLU tVALU~i IVr
Plant /J________ Parameter Sol, GO2, 0,, NOwlIT
Location 2 ,e#qyQ Monitor AIK,*rw I
Date _ *_ Span value & r_% rU%
Operator )a - Chart scale 100
PN a 2--.2 Pbar, in.Hg _30 _0I
Time, Pretest /if• , Post-test z• Tamb, 'F _ _ _II
Pull No. /I/6vr~z; _~-7ý5I
Concentration Analyzerpredicted by cali-
Cal. gas Chart divisions equation* brationCylinder conc., error,** Drift,***
No. ppm or % Pretest Posttest Pretest Posttest % of span % of span-- - -- - - -- - -- - -- --- - --- - - -- --- -- - -- - - -- -- - - -- - - - -- - ---- --- - -- ----- --.. ..- -- - --- ---i I II I II
/U/ S a- /0/./ /,.o.-5- ,-50I
---- ---- ---- ---- --- --- 0 / - - - -2.. -"-,-
* Perform linear regression of pretest cal. gas concentration vs. chartdivisions to determine followino equation:
y = mx 4 b x = ppm y chart division
For data reduction:
1._(Catdivision -b) - (CO ~~Pollutant ppm/% (Chart - ( - )
Correlation coef. = ,'ff
Analyzer cal. error, % span = (Cal. qas conc. - conc. predicted) x 100" ' ~Span valueI
Acceptable limit = <2% of span (±5% for THC).
*** Drift % span = (Posttest cal. response - initial cal. response) x 100Span valueI
Acceptable limit <3% of span
Minimum detectable limit 2% of span or ?- Ldgpor % (circle one)
Maximum zero drift = __ of span or ppm or % (circle one)
Maximum cal. drift c. % of span or ppm or % (circle one)
COMMENTS: Pretest or posttest (circle one) calibration used to quantitatesamYTe data.' Posttest is used if drift exceeds limits and if post-test yields higher concentrations.
B-57

DAILY CLM LAL Iit MiUI mlu rLR rUr.,-,-,,,L. . .. ...........
Plant lf.,/e• .,A{•io, Parameter Sol, COl, 0-, No., IR
Locatioi Monitor ',e 2
Date _-x __.__'/ Span value djfjýr % 53 'c3
Operator -J rloc / Chart scale 100
PN _ _ _ _ _ _ _ _ __-_ Pbar, in.[Hg _ .__.
Time, Pretest~~c"- Post-test Tamb, *F ?o
Run 1o. o - r.i- . ,,-2
Concentration Analyzerpredicted by cali-.
Cal. gas Chart divisions equation* brationCylinder conc., error,** Drift,***
No. ppm or % Pretest Posttest Pretest Posttest % of span % of span
AZ A <1e S ? se5 qyo ~3 1
*A~t 0 O/00 1r. // .23.C //
* Perform linear regression of pretest cal. gas concentration vs. chartdivisions to determine followino equation:
V = iX 4 b x = ppm y chart division
For data reduction:
Pollutant ppm/% - (Chart division - b) - (CD _$-20)M ( ,/iz, )
Correlation coef. = .______q
Analyzer cal. error, % span = (Cal. gas conc. - conc. predicted) x 100Span value
Acceptable limit = <2% of span (±5% for THC).
** Drift % span = (Posttest cal. response - initial cal. response) x 100Span value
Acceptable limit <3% of span
Minimum detectable limit = 2% of span or /6.b d or % (circle one)
Maximum zero drift = % of span or ppm or % (circle one)
Maximum cal. drift = % of span or ppm or % (circle one)
COMMENTS: Pretest or posttest (circle one) calibration used to quantitatesample data. Posttest is used if driit exceeds limits and if post-test yields higher concentrations.
B-58
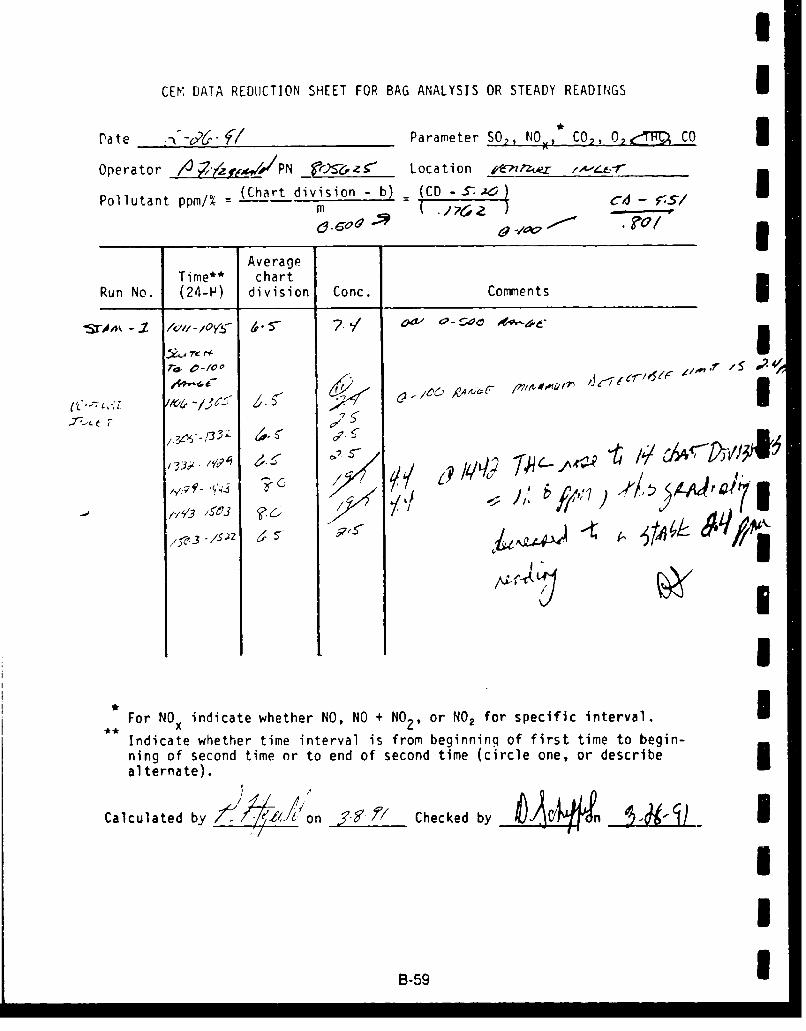
CEV DATA REDUCTION SHEET FOR BAG ANALYSIS OR STEADY READINGS I
Pate I- -2" f(/ Parameter S02, NOM CO2, 0021cý CO 3Operator /0 ,?4¢±/•/PN z.-;' Location k671•n•zZtA ,-_--Lr .L-r
(Chart division - b) _ (CD - S-.-Pollutant ppM/% ' -m-s
AverageTime"* chart
Run No. (24-P) division Conc. Commor ents
57' V#
5I'
For NO x indicate whether NO, NO + NO 2, or NO, for specific interval.
Indicate whether time interval is from beginning of first time to begin-ning of second time or to end of second time (circle one, or describeI
alternate).
Calculated by ' ,/ Checked by ,i"f
IB-59 I

*' ~LISPIP 'ON .LbVH:) NVSIIHO.h~ '8%6VI4 K~lj ).NVcW403O N1'f3H
L 1 _ _ --- -4- .TS- .- --------- - -T
-41 - Iý
-t-
T- T
---
* 4- 4-
A I1W I II~ T Ht
4 Ab-4*-** ___ -z-4
:-' 4 -1- 4 -
I L L-
-~~ -.--1- -L2I I. ___ Br.60

'4WH wueV@ @@03dYH O@NO7@3 A %VdeiD HIV.f
'JVU4Ib ~~V *Oi~ ~i4
A -- -~-..i -
t F ~- .4.,- I7-H I ,f -T.
11 ITII if
I~iH I # '-.---
~L4' L
1- _ L I 1 1 1
- ----- --- -1I ý H7

a It NI 03114.54PP 0M.LV&
I' If I I
I I* I - IRIF I
I '
L I I
i-4- __ :. p4 -.4 £4
- - ~ ~~~- ____7 IL *
- 7+ Il T1
_~ fillI -
I L I
[ ] ;I. I I
- ~ ~ ~ T I I I II,
- * IH- I:
I~0 1I * r.p- - a .. LP

I S n a 1- L.-"'i~ON .ISYi4 NVSINIV4IE 'dO9dH NOLN38 ANYdISO:) NJ.V3H
I~ __
I __ __ .1II I I fil
0 1 II
.LL rl
- I
V IPI
-4-L - I
K rr-
IH I , i f IIf
I I .I II
-1 -1 -1-1-1-L
--F- 1 1 t

w- - w w w w w W w w w 0 w v w 0 0 0 0 0 w 0 0 0 0 0 0 * *DYIHO14~IiW9 NOIN39 ANYPNOD HN133H
_____ IN I I -.- -
I L
I T
II I 'I
Hl.l
I I PIFI1
i t I I t
-I f
II- I I I I
i t I
A I I _
1-1 TI I I-
I f i lL.ILT-I
- - 11.. . I I

VI fiWI O~ildLI-S Y 'ON .LUVY N:Of
-ff
I AI I I
A l I I ILi
Lb I
ii Il !il- - 1 1
IdI
I II I f 1 1 1 f I i fi l I I l
I- It
1 1 1 I,, i f .
I I f 1 1 1 f
.1 .7 t465

DAILY CEM CALIBRATION AND PERFORMANCE EVALUATION
Plant IfA. 6 Parameter SO,, CO,, 0,, NOý,
Location Mo.--' • /- A Wnitor J&'•.• - ylipf 91
Date .2-, 12 I/ Span value dp r % S-&
Operator ,.- j-/0/ Chart scale 100PN 5'G• •i Pbar, in.Hg .
Time, PretestO 'S/ Post-test X Tamb, *F -_ _ _
Run No. Acw.re 7R',, JX2r.-Cr
Concentration Analyzerpredicted by cali-
Cal. gas Chart divisions equation* brationCylinder conc., error,** Drift,***
No. ppm or % Pretest Posttest Pretest Posttest % of span % of span
& 2- S-3 -/&. 3 - - 'S qC;....f3 T . . _12- .. f /
,P '/cf,~ C' /0 /cc' AVc~ -/ V
. ,.lL. ..--- 0 ---------- T ...... 7 -.-----* Perform linear regression of pretest cal. gas concentration. vs. chart
divisions to determine followina equation:
y -rx + b x - ppm y = chart division
For data reduction:
Pollutant ppm/= (Chart division-b)- 1 'J • 4 i"
Correlation coef. .q•/q
** Analyzer cal. error, % span - (Cal. gas conc. - conc. predicted) x 100"Span value
Acceptable limit - <2% of span (±5% for THC).
'* Drift % span - (Posttest cal. response- initial cal. response) x 100Span value -
Acceptable limit 03% of span
Minimum detectable limit - 2% of span or // 2 dIor % (circle one)
Maximum zero drift a/'% of span or __ppm or % (circle one)
Maxim.um cal. drift - Lf % of span or ppm or % (circle one)
COMMENTS: Pretest or posttest (circle one) calibration used to quantitatesample data. Posttest is used if drift exceeds limits and if post-test yieldshf'her concentrations.
"B6 6

CEM DATA REDUCTION SHEET FOR BAG ANALYSIS OR STEADY READINGS I
Pate " /- / Parameter SO,, NOM, CO,, 00 CO IOperator N) V7?S••.e !-1P-•T._'$ Location , -,.-i
Pollutant ppm/% = (Chart division - b) (CD -__ _)
Average k~LL 1 '.!D 5WfzT Tie** chart f ,
Run No. (24-H) division Conc. Cormments
II- ,I
For NOx indicate whether NO, NO + NO2 , or NO2 for specific interval.
Indicate whether time interval is from beginning of first time to begin-ning of second time or to end of second time (circle one, or describealternate).
Calculated by A9 i on fl-.'f" Checked by . ,itLI on ______" __ I
II
B-fi7I

- Iii. 3-4,
til
IT- --T p ~-
--7r It~ I -t-H--
:Qfm I± i<L __ III
I TV I I L
I II
V.
tI
I~ I
I A I I'
I i A-
I ow
9'I -IL L
-Z4-
B-GB
-- w w W W W W W W 0
VIA ~C))w~jLI-sP 'ON 1VIHY NV
-~~~ I--- I 0
7-T I I -I I I ill
I L
-~-A -J
F~ -- I IA-
1~1ZI I ii
r7~~ -- 7
l~~~ii -=---I~-.
-T It II I
7- +. IIj ~ 4
- ---- T?- I-H44
7T. I
41rv -F 'I-'-1- ----..- 7
T,_________ #-- .
- -~ -- - -~+
- - - - _______
-.
T.~ ~ ~ 1

v oil.. I~ Isv r,; t~ ~ ~ N~ C'. ~ NOIN8 ANVdANOD HIV73H
.. ..... .7-- 7- --
1F 7.-- 1.
X+4I II.......I
ALL.
11. 1 Tr
1-44--
- ~~~ -- F 44
44~ zL -1 1 4, -- 7 1* - : 1 4 I ' I . 1 1 1 1 I
-r~ , I7 . . 4
*-~-ffl .1.7 - . *-70'* I

NISN 'O8tJYH NOIN30 ANYcIV%OD HI±Y3N
______ AII II I
1 7 - - -
T~ L -i--
j H - I i II
ITI
*B 7-

vn s ami,
I -- r%
I~ I Ii~ I TX1A]ý 1.77L 717- 1' ---
tv T Z_ _
T11 - - I .
_ * *7
-[ . t
4- _ I
I A --
- B-72

'~~ ON ±MYI4:) NVD)IHDIV4 k!OakvH NOIN39 ANVd40D HIV3H
I i- I L j 4
7,71P
E ± I IF
- - -1
I T I I'
Fl1 L
I.A I
___~~ I LLI*
A I Hý
B-73*
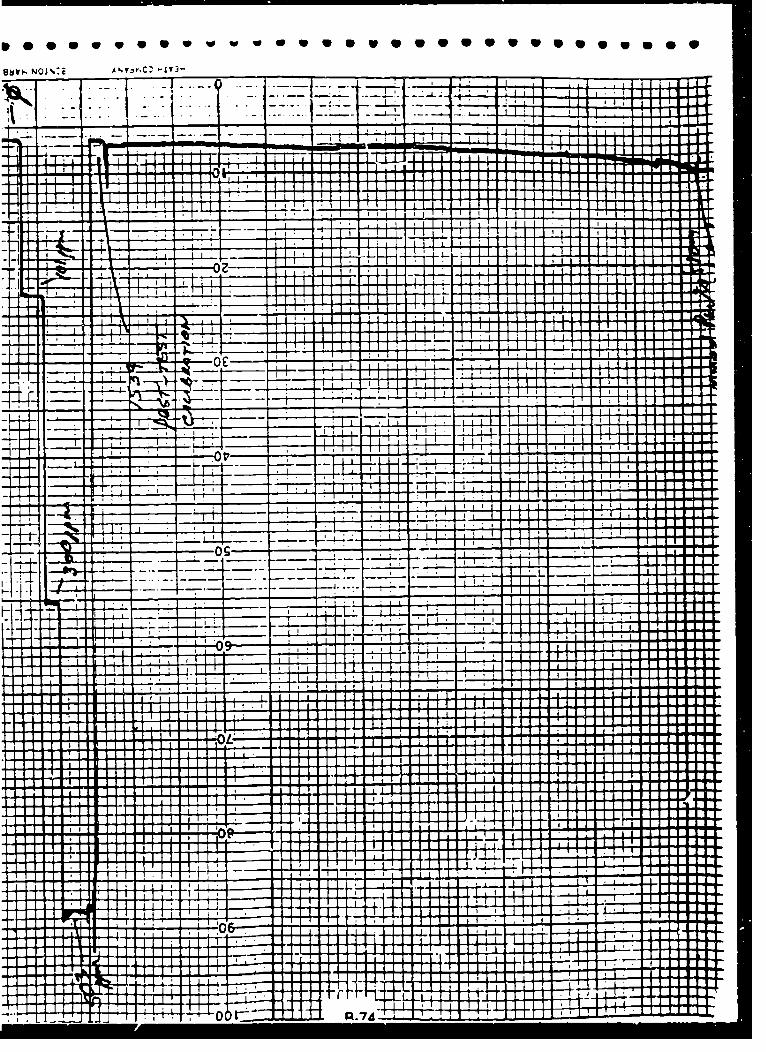
M i l I I I f i l i f - I -__
- -~~ till,, -
t i l I
p447 -- =, a *
--Art- L
----- n, , a - 7
a a a af i l l
J i l J i lJ l l IiII I -
I IIi l
I. I I i l Iilt lt i l l f i l A I t i l l
t i l I I L i I I l i
I t i l l
I I J i l T i l f i l
1 1 1 t i l ,I i l
0- I t il l .. I
I . . a a
I- - .- - I
aI
1IE#[TI or7 .7A EEa

DAILY CEM CALIBRATION AND PERFORVANCE EVALUATION
Plant R. .4. A . Parameter SO2, CO_, 02, NO-I _-
Location - Monitor dfes, 4.. __Date -2-P f/7 Span value ,= r % 7
Operator A ,?A x / Chart scale 100
PN __________r Pbar, ln.Mg V?___f _____1
Time, Pretest 07S Post-test 1330 Tamb, *F _ V_
Run No. Ajo74'a,,nfl -4
Concentration Analyzerpredicted by call-
Cal. gas Chart divisions equation* brationC~t1inder conc., error,** Drift,***
No. ppm or % Pretest Posttest Pretest Posttest % of span I of span
A^Ocs k, ~Z 50 f-3 f~3 _5e16 '/ w .Z-
.,o/0 3 0 T• 111.3 . 3
---- --- -- -- -- -- -- - mtf[. /04 ' - - - - - -* Perform linear regression of pretest cal. gas concentration vs. chart
divisions to determine followina equation:
y a mx 4 b x - ppm y= chart division pFor data reduction:
Pollutant ppm/% ( (Chart division,- b) , (CD"•3F&7inI
Correlation coef. !Y 1I
€ Analyzer cal. error, % span (Cal. gas conc. - conc. predicted) x 100n Span valuI
Acceptable limit - •21 of span (±51 for THC). I
"** Drift I span) - (Posttest cal.. rsoSpan- value inta •a"response)_ x 100I
Acceptable limit '3 of span
Minimum detectable limit - 2% of span or //.O a or % (circle one)
Maximum zero drift a -.__% of span or ppm or % (circle one)
Maximum cal. drift -*/,5_9% of span or _ppm or % (circle ne) ICOtMENTS: Pretest or posttest (circle one) calibration used to quantitate
sample data. Posttest is used if drift exceeds limits and if pst-test yields higher concentrations.
B-75 m

CEM DATA REDUCTION SHEET FOR BAG ANALYSIS OR STEADY READINGS*
Pate ___ -_____,______Parameter SO, NO-, CO,, 02 o
Operator _--PN ?V Location 6?-c,
Pollutant ppm/% = (Chart division b) (CD
AverageTime* chart
Run No. (24-H) division Conc. Comments
.- , fn /
"77 -1"7
For NOx indicate whether NO, NO + NO2 , or NO2 for specific interval.
Indicate whether time interval is from beginning of first time to begin-ning of second time or to end of second time (circle one, or describealternate).
Calculated by .-k./on ,3-'..- fl/-Checked by on

1 1 1 claw 6d LI-SVP 'ON HtI'VN)
TII iI~H--
I 112 1&-
..- ~Id I& II
I~~~ IA--- -.
T i I-~_
ILA H ~
H;t
.4- I4.T IT T I' .J. I I
H~ T_=IH
I Il .4 H I
I --
I~ II
-B-7

ODIH:)A 'ICSMYHI NOIN" v'~ j~ _______
I~~~~- L -A-- ------
I~~ - -
IT - I .i'
II! I FI... -fl 1 7- 1iiz
it I l 1 1111
- ~~ - I I I
.VS
71 -1-1 +J-It
2 4 I I I
*j -7Z
I I -T4 4
L I-
+4 II
F4 I*I-L
I. _
. . .. . Y
FI I,
-T- 14 -- It. I I -
I I -
Hi 1441

CI ~ Ll.v~ 'ON. IYH) hYCIIHýIVb' ostill- N.OiNI AN~dINO~ H1V3I
- ------ -
I I -A 1 4
-- 4-
-~~~~ , .M1 .mmmil m
-7 - -I F Hli I
-- -F1- - -
T I-
.W- --4T- -~+11 -It
-
---
T
-#~*-* -
I -t-- 4-4-
I I I I
- -I*I1 I. TIfI
- I L
I~ L
I~ I T, I- I
I I I
I I v t F I 1 1 I-

* NVlII)lv% 'NOGNVH '-.3 A 4Y~ HC~ $l-.V34
'L I~ A ----- . __
* ~~ A
4b I
IITT
-4- 44-4
1111 AIL
FI
4-'
'Li I
-I-,I
..... ..
+ 4+
444-

n w,4 S LI-IPP 'ON JMlvH:
-. - - - - - - T 4I I I
- i
.- m7I I
II I
- - I77
17 1.
It
. I- I-. I

1IIIi .
IAPPENDIX C I
LABORATORY DATA SHEETS II-£i . .
IIII-II
c-1 I
I

(J InTRNATIONAL ANALYTICALTECHNOLOGYCORPORATION SERVICES
CERTIFICATE OF ANALYSIS
ITAQS Cincinnati Date: April 9, 1991
Attn: Mr. Chuck Eruffey
Job Number 21341 P.O. Number 805625
This is the Certificate of Analysis for the following samples:
Client Project ID: USATHAMA ProjectDate Received: March 5, 1991Work Order: XI-03-031Number of Samples: 11Sample Type: Sand/Water
I. Introduction
Six sand and five water samples arrived at ITAS Cincinnati o•n March 5, 1991. Thesamples were sent for analytical work in support of monitoring work on the USATHAIAProject. The samples are labeled as follows:
Sand 0 1 (1) Sand 1 5 (1) Water 0 31 (1)Sand 0 2 (1) Sand 0 6 Water 1 32 (1)Sand # 3 (1) Water # 30 Water I 33 (1)Sand # 4 Water #34
(1) These samples were placed on hold per client's request.
II. Analytical Results/Methodology
The analytical results for this weport are presented by analytical test. Bach set ofdata will include sample identification information, the analytical results, and theappropriate detection limits.
The &nalyses requested are listed on the following page.
Reviewed and Approved by:
Tim SowardProject Manager103031
,•,er;c n Council ol Independent abotratoriesInienji:-, n, AsszOcizvion ol Environmental iesling Laboratories
A er,:o AssDioio tor Labor-oori Acre•;tation
C-2' - - . 10'" --- U ' 2 EAS'•''• " A! A#%^

IClient: USATHAY'.AWork Order: XI-03-03110303101 IT ANALrrlCaoMM V1c !
CUICUIATI, OH iII. Analytical Results/Methodology (cont.) 3
"* Lead by Graphite Furnace Atomic Absorption;
EPA Method 7421 3" Cadmium, Chromium and Zinc by Inductively
Coupled Plasma Spectroscopy; EPA Method 6010
III. Quality Control
Immediately following the analytical data for the samples can be found the QA/QCinformation that pertains to these samples. The purpose of this information is todemonstrate that the data enclosed is scientifically valid and defensible. ThisQA/QC data is used to aLsess the laboratory's performance during the analysisof the samples it accompanies. All quantitations were performed from within the
calibrated range of the analytical instrument.
II
I
II ,I
I 'C-3 I

Client: USATHAYAWork Orderz XI-03-03210303103 IT ANAL777= MFV=
C 2ICN ATI M
Analytical Results, rng/L
Client Sample ID Water # 30 Water # 34
Lab No. 07 11
hnalyte Ai
Cadmium 0.004 0.007 a-WIChromium 0.083 0.064 4D-M"Lead ND ND CLOTZinc 0.082 0.20 a.•
ND - Not detected above the reported detection limit
Quality ControlStandard Reference Solutions
Theoretical PercentAnalyte Value Recovery
Cadmium 1 95.3, 95.7Chromium 1 99.2, 100Lead 0.075 93.9Zinc 1 97.1, 102
C-4

IClient: USATHAMA
Work Order: X1-03-031 I10303102 ICANAL•flCAJ• on
CINCINNATI, OH
Analytical Results, ug/g I
Client Sample ID Sand # 4 Sand # 6 1Lab No. 04 06 D tio
Analyte L-mi--
Cadmium 26.7 40.4 0.2
Chromium 14.3 35.1 0.3
Lead 25.9 (1) 77.5 2
Zinc 38.4 161 0.53
ND - Not detected above the reported detection limit
(1) The detection limit for lead for this sample is 0.3 ug/9 £U
Quality Control
Standard Reference Solutions
Theoretical Percent
Analyte Value Recovery
Cadmium 1 96.3, 97.0
Chromium 1 99.4, 99.0
Lead 0.075 92.9, 90.1
zinc 1 94.8, 96.0
IaII
0-5 5

INTERNATIONAL ANALYTICALTECHNOLOGYCORPORATION SERVICES
CERTIFICATE OF ANALYSIS
ITAQS Cincinnati Date: April 19, 1991
Attn: Mr. Chuck Bruffey
Job Number 21341 P.O. Number 805625
This is the Certificate of Analysis for the following samples:
Client Project ID: USATHAMA ProjectDate Received: March 5, 1991Work Order: Xl-04-026Number of Samples: 4Sample Type: Sand
I. Introduction
Your @and samples arrived at ITAS Cincinnati on March 5, 1991. The sampleswere sent for analytical work in support of monitoring work on the USATHAMAProject. The samples are labeled as follows:
Sand # 1 Sand# 3Sand # 2 Sand# 5
(1) These samples were taken off hold for additional analysis on April 1, 1991.
1I. Analytical Results/Methodology
The analytical results for this report are presented by analytical test. Bach net ofdata will include sample identification information, the analytical results, and theappropriate detection limits.
The analyses requested are listed on the following page.
Reviewed and Approved by:
Timothy SowrdProject Manager104026
Amrecor. Council of independent Laboratories
Ini, e~niDnol Association of Environmental Testing LaboratoriesAmer o:r. Assocjator for Laboratory Accreditation
C-6rTAnaltcal Services • 11499 Chostor load • CincinntLiOH 45246 * 513-762-4600

IClient: USATHA-MAWork Order: Xl-04--026 1
10402601 Ir .LTTLCAL VIanCINCDINATh, OH I
II. Analytical Reults/Methodology (cont.) 3* Lead by Graphite Furnacc Atomic Absorption;
EPA Method 7421 5* Cadmium, Chromium and Zinc by Inductively
Coupled Plasma Spectroscopy; EPA Method 6010 5III. Quality Corutrol
Immediately follo~.ng the analytical data for the samples can be found the QA/QC
information that pfartains to these samples. The purpose of this information is to
demonstrate that tihe data enclosed is scientifically valid and defensible. This
QA/QC data is used. to assess the laboratory's performance during the analysis
of the samples it -accompanies. All quantitations were performed from within the
calibrated range aif the analytical instrument. I
IIiI
II
C-7 m

Client: USATHAYA
Work Order: Xl-04-026
10402602 IT ANA== SERV=CNCMAM.OH
Analytical Results, ug/9
Client Sample ID Lab No. Cadmium Chromium Lead Zinc---------------- ------- ------- -------- ------ ----
Sand * 1 01 ND 9.8 0.70 2.9
Sand f 2 02 1.7 13 18 16
Sand f 3 03 5.5 24 23 34
Sand 0 5 04 2.8 is 23 22
Detection Limit 0.2 0.3 0.4 0.5
Quality ControlStandard Reference Solutions
Theoretical Percent
Analyte Value Recovery-------- ----------- ---------
Cadmium 1 98.4
Chromium 1 102
Lead 0.07s 1051 losZinc 97.5
C-8
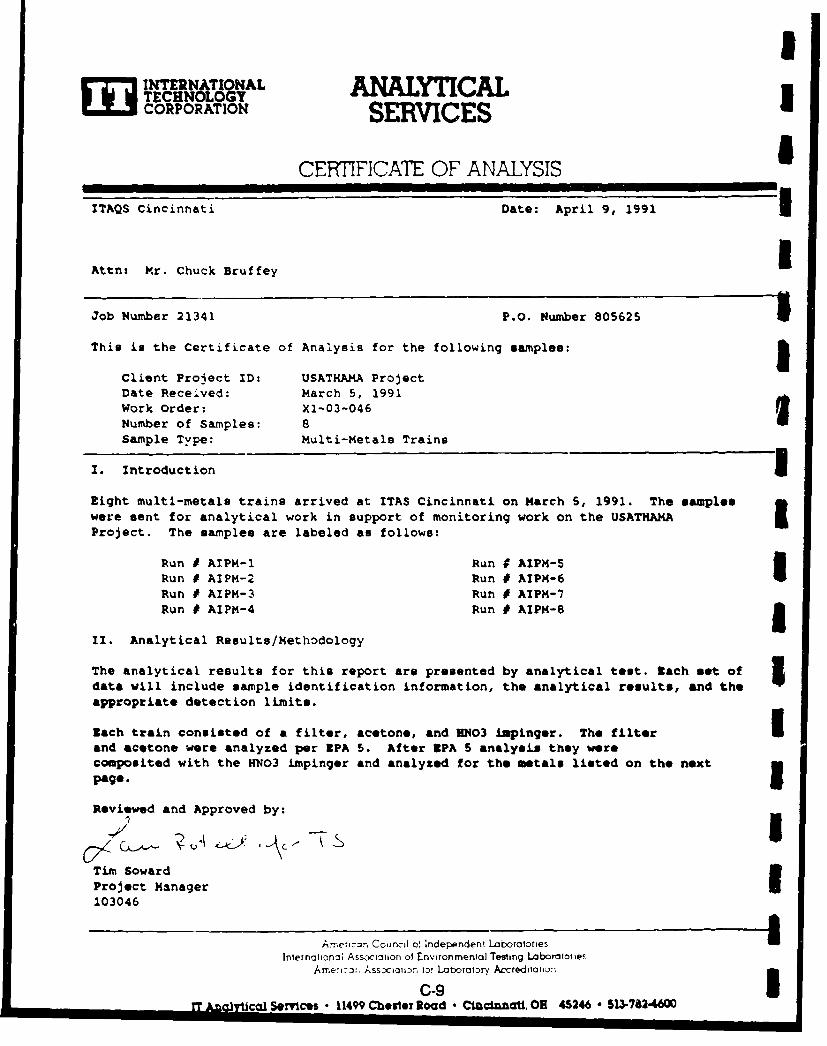
I NERATIONAL ANALYTCALTECHNOLOGY
CORPORATION SERVICES
CERTIFICATE OF ANALYSIS
ITAQS Cincinnati Date: April 9, 1991
Attn: Mr. Chuck BruffeylI
Job Number 21341 P.O. Number 805625
This Is the Certificate of Analysis for the following samples:I
Client Project ID: USATHAMA ProjectDate Received: March 5, 1991Work Order: XI-03-046Number of Samples: 8Sample Type: Multi-Metals Trains
. Introduction
Eight multi-metals trains arrived at ITAS Cincinnati on March 5, 1991. The sampleswere sent for analytical work in support of monitoring work on the USATHAMA £Project. The samples are labeled as follows:
Run I ATPM-1 Run 9 AIPM-5Run * AIPM-2 Run # AIPM-6Run I AIPM-3 Run # AIPM-7Run * AIPM-4 Run # AIP.-8 I
II. Analytical Results/Methodology
The analytical results for this report are presented by analytical test. Each set of 5data will include sample identification information, the analytical results, and theappropriate detection limits.
Each train consisted of a filter, acetone, and HNO3 ilapinger. The filter Iand acetone were analyzed per EPA 5. After EPA 5 analysiA they werecomposited with the HN03 impinger and analyzed for the metals listed on the nextpage.
Reviewed and Approved by:IITim SowardProject ManagerI103046
Amerj=-r, Council o! indepndent Lanborories]niernatmon3; Assc•cotion ol Environmental Tersting Laboratolies
Amenj,'e . AsszxiwiD, i z ! Laboratory Accrepdiatio:--
C-9-IT caCl Services • 114" Chester Road • CIncianati. O 45246 S 13-7824600
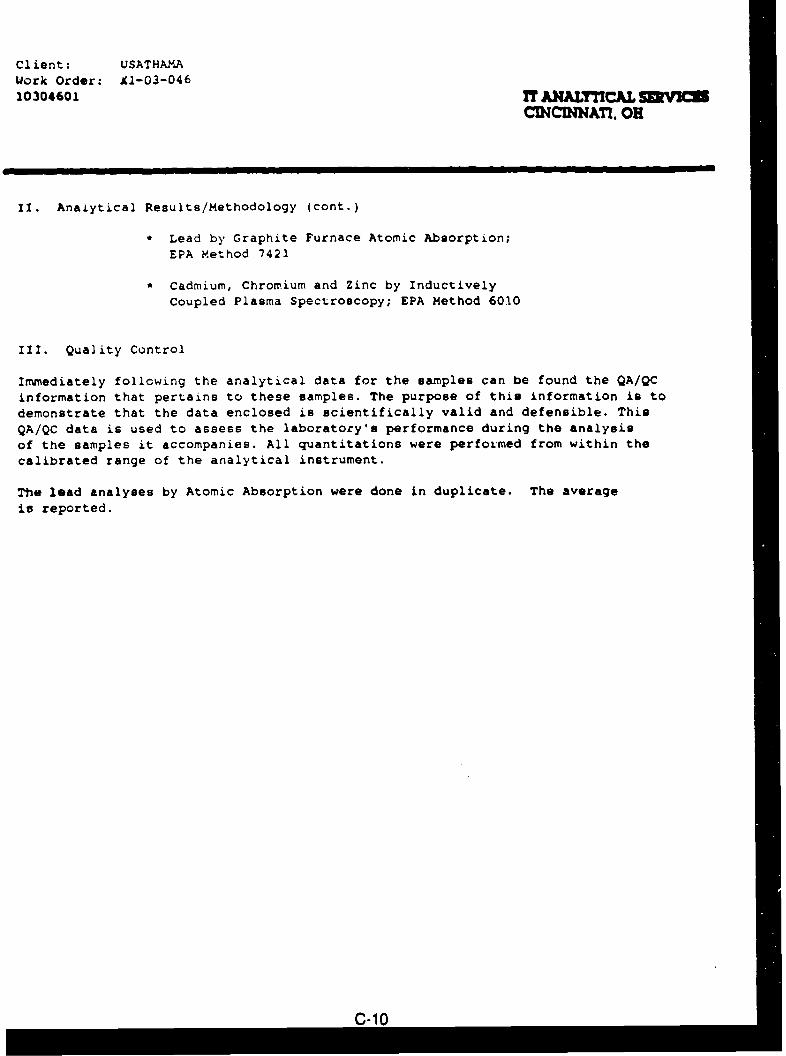
Client: USATHAMAUork Order: Al-03-04610304601 IT AMA=MCA inVIM
CMCMATI, Oi
II. Analytical Results/Methodology (cont.)
"* Lead by Graphite Furnace Atomic Absorption;EPA Method 7421
"* Cadmium, Chromium and Zinc by InductivelyCoupled Plasma Spectroscopy; EPA Method 6010
III. Quality Control
Immediately following the analytical data for the samples can be found the QA/QCinformation that pertains to these samples. The purpose of this information is todemonstrate that the data enclosed is scientifically valid and defensible. ThisQA/QC data is used to assess the laboratory's performance during the analysisof the samples it accompanies. All quantitations were perfor'med from within thecalibrated range of the analytical instrument.
The lead analyses by Atomic Absorption were done in duplicate. The averageis reported.
C-10
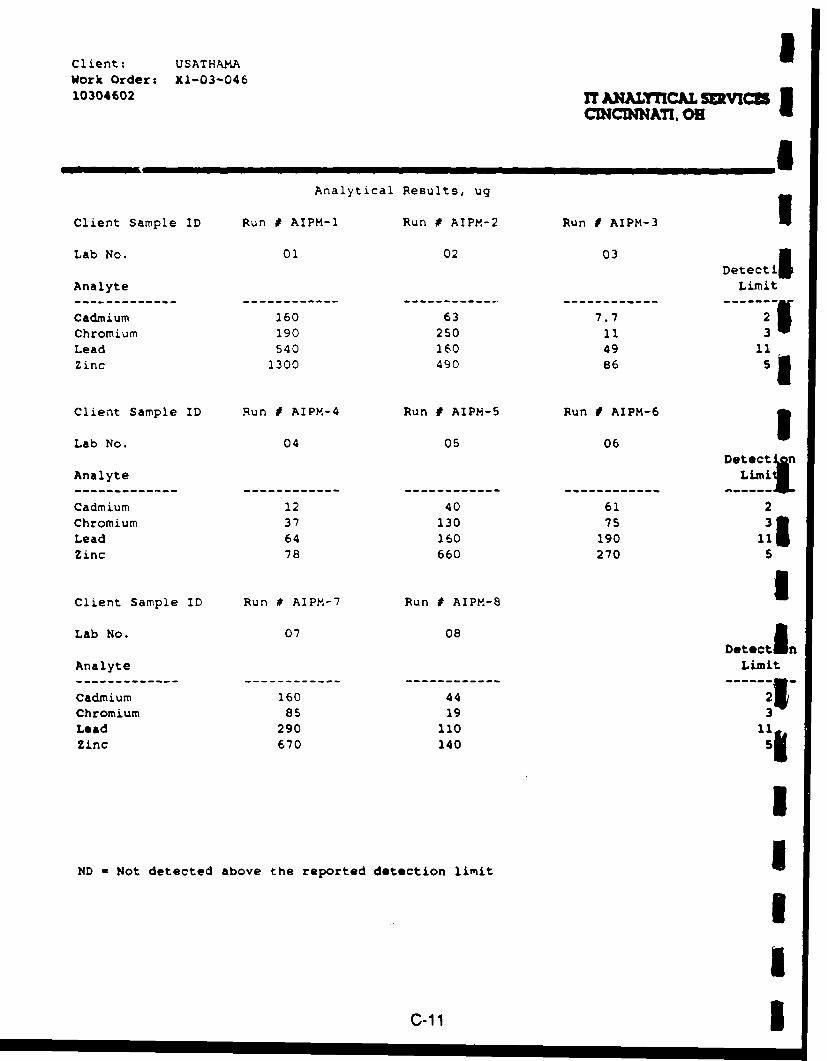
Client: USATHAMA iWork Orderz Xl-03-04610304602 T' ANATrICAir VI• 1
CINCINNATI, OE
Analytical Results, ug
Client Sample ID Run # AIPM-l Run # AIPM-2 Run I AIPM-3 1
Lab No. 01 02 03 1etectif
Analyte Limit
Cadmium 160 63 7.7 2Chromium 190 250 11 3Lead 540 160 49 11Zinc 1300 490 86 5
Client Sample ID Run I AIPM-4 Run # AIPM-5 Run 0 AIPM-6 3Lab No. 04 05 06
Detectý&Analyte ----------------------- Li~mij
Cadmium 12 40 61 2Chromium 37 130 75 3Lead 64 160 190 111Zinc 78 660 270 5
Client Sample ID Run # AIPM-7 Run # AIPM-8
Lab No. 07 08 Detectln
Analyte Limit
Cadmium 160 44 25Chromium 85 19 3Lead 290 110Zinc 670 140
IND a Not detected above the reported detection limit!
IC-ll I

Client: USATHAIMAWork Order: XI-03-04610304603 IT ANA=ITCAL SnVIM
ONCDM ATI. OH
Quality Assurance Data
Quality ControlStandard Reference Solutions
Theoretical PercentAnalyte Value, mg/L Recovery
Cadmium 1 86.7, 95.8
Chromium 1 85.6, 87.8
Lead 0.75 92.0, 84.4
Zinc 1 80.4, 82.9
C-12
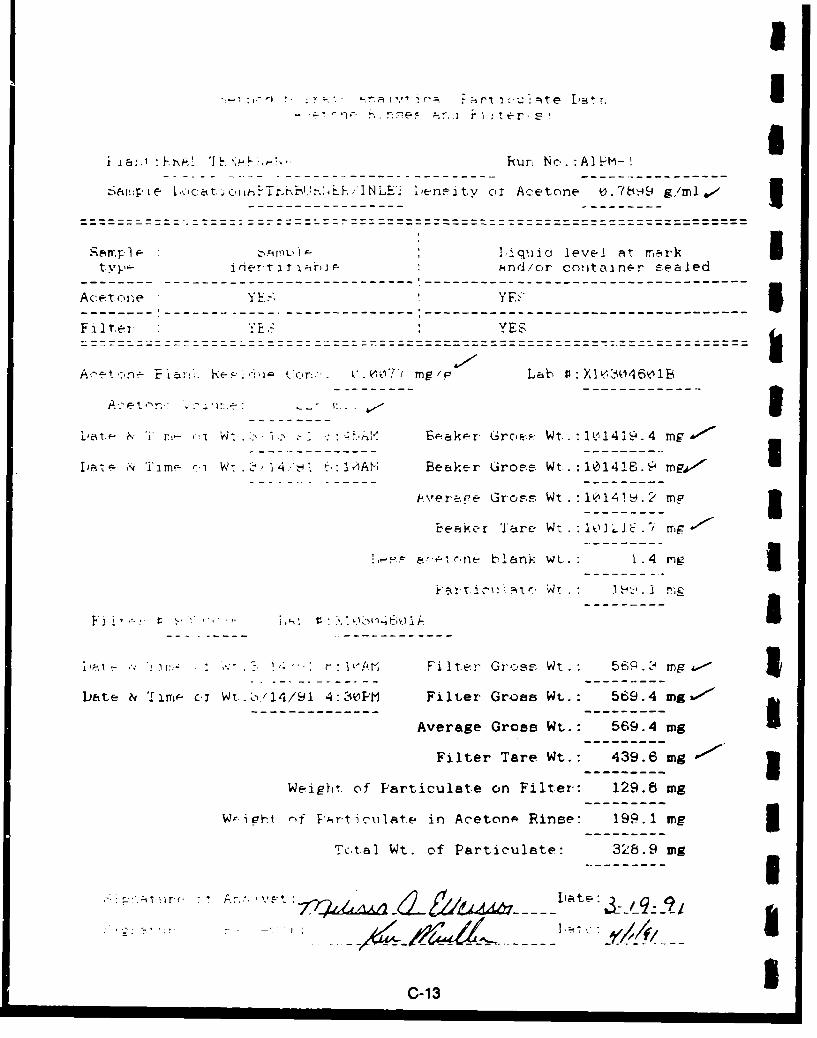
I
- , ., i. J ,enFity c, Acetone U. 78.9 g/ml..
S rr._1 •imL'- ]:iqnid level at rmar5rkt y,- iiT•t arJ •nd,/or coutainE-r sealed
Ac etore YE YEo n e
F i 1 T.re YES
AA e o n P Iat,: . xe-- i cr:.. C - . ,Oo7i mg/.p Lab •:t Xv,3046t1B
Ac~et,. "'~ C'r.e" •-- 1:"'• '. rS.,- <t Wt .r c r1 . .<ak r Cr, - Wt.. :I I1419.4 mg /
-4 'T'am- r.i W,.i, 4.' .'IAM Beaker GroPs Wt..:101418. 4 mgk-*V
P.vertr'e Gross Wt.:10141W .2 mF 3iefker Tare Wt . : I]oIL .J rrg g
:5, . !'. & a c'fle~l blani. wt. 1 .4 m5
Ai. , , ,. ¼" ' Filter Grcoss Wt.: 569.3 mg 5Date 'lrmr- ci Wt.o/14/91 4:3"PM Filter- Gross Wt.: 569.4 mg.
Average Gross Wt.: 569.4 mg
Filter Tare Wt.: 439.6 mg 3Weight of Particulate on Filter: 129.8 mg
Wr-ivhI nf P ~rticulte in Acetonp Rinse: 199.1 mg 5Tctal Wt. of Particulate: 328.9 mg
r3
C-13

-i'-; A!- iNt p-~ -artj..j i mite r~"-, :: br~=. f in-t Pi3ter.q.A
t :..:, :ik.•:,_] .);•k•, ',•Ron No. :All'M-2-
Sei,.ple I~c:_ ~orArTERB;XR.NEF!NLET Deneity of Acetone 0.7899 g/m!l
Liquid level at marktype , itatJa?" and/or container sealed
A'et.oY. YES'
S- - - -- - - - - - - - - -- - - - - - - - - --- - - - - --..- - - - - - - - - - - -. ..
[, . 'V:.:• ,:- £.' . ,:a z k'i•.'M ea r.r. ,.;rcos, Wt . : l028 2 .9 mg 4"
A\,era' Gtroe, Wt.Y: 2803 1 mE
Beaker Tare Wt .: 02""•_z.5
-*• a•.tone b~ank wt.: C9y
Liz, t. r- - FV .t r Gross Wt. : 40 86.3 9 .-
Dat~e & Time oi Wt..3/14/91 4:3OPM Filter Gross Wt. : 486.2 mg 6'
Average Gross Wt.: 486.3 mg
Filter Tare Wt.: 467.3 mg5
Weaght of Farticuiate on Filter: 19.0 mg
•': '.:t -,' brt ac-uJ ate in Acetone Rinse: 99.7 mg
Tt•.b Wt. of Prticulate- 118.7 MEg
.a~~1 aa ct C-~ W tt m
C-14

"-.: -- . -•..•. ytica Pr- iCul I ete a.,_ IrF~esan d F:,1-er' s,
-A t.k. No. :AIPM-. n
Sample LocationAFDERE'URNER!ItLE' Lensity of Acetone 0.7899 g/ml
Samp./- Li.';.]� Liquic. level At mark Itype a l•-" .2 3-e and/or -ontainer ecaled
Acetone YES IFilter YIKS YES
~~- ---------. ---- ------------ - - - - - - - - - - - -
A-~etonE. Plan.Y ]•eadUE L " l l c'rc . ' mg_/g Lab tS: X1O34603B
,.t F- & 'Im• r,: i '1;-/./- " : 4t.A! beaker Gr,:.,s- Wt 9.: 9,7 4 7 mg
Date & Ih. o: c tV, . 1/4 / "@AM Beaker Gross Wt.: 97684.- ing-
Average Gross Wt.. : 97684.5 ,-if 1Beaker Tare Wt.: 97 69.6 mj'*
F, a-7-&•n blan]k wt. : 0.8 mg I
I&rt iu-3:-te W-. 14.1 mgu
A " : v. ... "...1 > . :C .aIAY. 1ii~t .r G~ross Wt.: 426.5 me--'
Date & Time of Wt.3/14/91 4:30PM Filter Gross Wt.: 426.5 mg-" *
Average Gross Wt.: 426.5 mg
Filter Tare Wt.: 420.6 mg 1Weight of Particulate on Filter: 5.9 mg
Weignt cl Particulate in Acetone Rinse: 14.1 mg 3Icot] Wt.. of Particulate: 20.0 Mg
' ~txr : Ar• vr: {/t_. t. , r-A,- . , F,,,. w- 1 Dat1e:
C-15
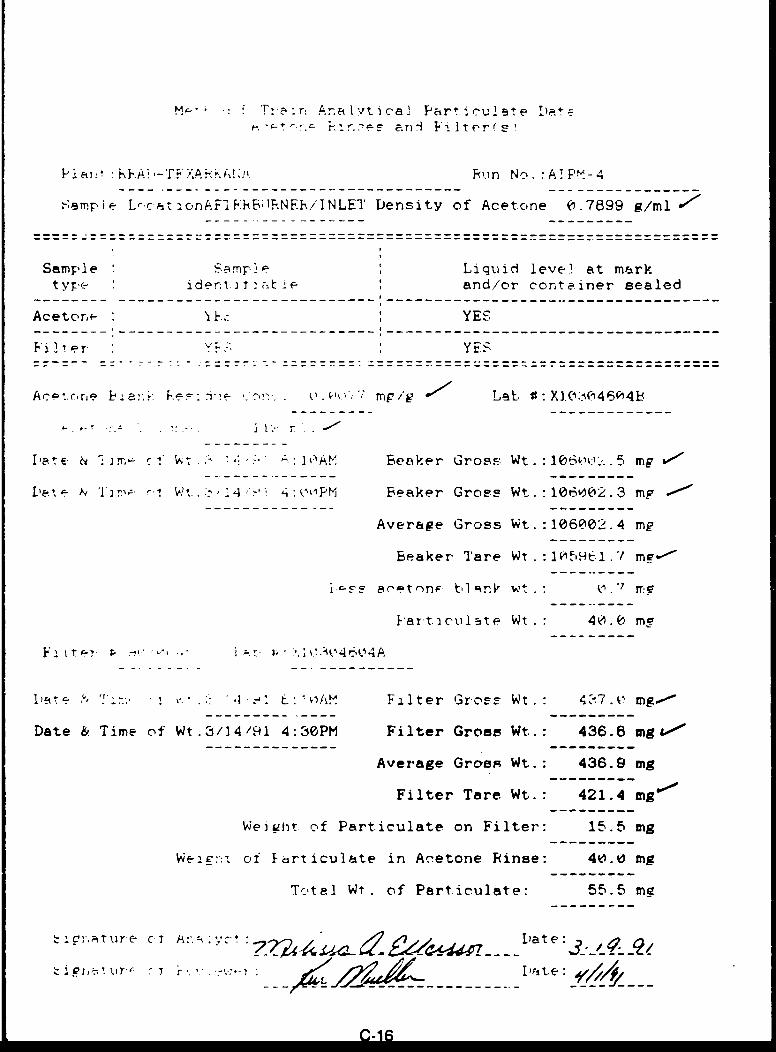
M-- T&:r: Ana vtic'a1 Part irulste l
RIEA:• .- T. ,.A.• ,, Run No. :A! Pý-4
,amrpie L-c FtonAFE Hb;IRNEFiINLEI' Density of Acetone 0.7899 g/ml w
Sampl e p I Liquid level at mark
ty•'e iden~t i; : :and/or container sealed
Acetor,- :.: YES
Fi 2 ter YF., YES
Ac.•trrne bE aa' 1e .: -i'e 0o, .. . mp'g Lab V: X.O.(W'4604b
Dal E & '1 ) M '7 T I A" : Beaker Gross" Wt. :w@63'w1.5 mg
& , 2 r-* Wt :'4 4 :,1PM Beaker Gross Wt. -10602.3 mg
Average Gross Wt. :106002.4 mg
Beaker Tare Wt. I OtH.El .7 mr-"
-Fs* ace!tonn- bl Rnk wt,. o.' In
k-art-t. cu Iet e Wt . : 40.0 mg
}"K L <-r. 1- ,-"4'. ,-, -.>. •" :',.1: 46 4A
1 , nF.. 1 E. .•OA Filter GroEF Wt.: 4`17 . k gA
Date & Time of Wt.3/34/91 4:30PM Filter Gross Wt..: 436.8 mgf-'
Average Gro'ss Wt.: 436.9 mg
Filter Tare Wt.: 421.4 mg
We••it. of Particulate on Filter: 15.5 mg
We -,:- of larticulate in Acetone Rinse: 40.0 mg
Total Wt. of Particulate: 55.5 me
-,%~it urc cC -1 : : at e :3
~~~~~~ý Y114 u' .. -I'itA C-16/

I
.•!-,hd , "ir'uLn Analytica1l Particulate Dat•. I,-.~* cr~&F~~~e nd l- lter( s
.. :..-.- TFX..KAI" Run No :AIPM-5
Sampje Lc, cat~ornAiCEkbU1 ,Ih NLET 'Density of Acetcne 0.7899 g/ml k-Z I
Sam!n1 - ,-Liqujici level at markt yp.• , ident~f ] ~and/or container sealed
Acetore - YE:. 7 YES IlwFilIte r Y YS ES
A:-et.c'r:e- Blenk Oe.iOi' t..7-. 7 me/e Lab #:X10304605B
A,,&rt ,.:ne V.: ;.umr " :, 3Da te &T, Tn• r W- •,•-ý• o--' 8 g/
S..CC . .: 4•., Beaker Gross Wt. : l02 1b.7 t g--
Date & Tim- of Wt.3/14/91 t:,10AM Beaker Gross Wt.:102176.3 mg. ImmAverage Gross W-:.:102176.6 mg 3
Beaker Tare Wt.:1021i.6 mg.Less acetone blank wt.: 0.t mg 3
Particuiate Wt..: 74.4 mg
&'t• 'I "im r , ' .-. 1 . ' ,:-. Filter- Gross Wt. : 359.7 mg
Date & Tihme oi Wt.A3/14./'L 4:3EPM Filter Gross Wt.: 359.9 Mgi&'0
Average Gross Wt.: 359.8 mEg
Filter Tare Wt.: 331.0 mgw" 3Weight of Particulate on Filter: 28.8 mg
W-ight (-f Particulate in Acetone Rinse: 74.4 mg 5Total Wt. of Particulate: 103.2 mg i
S'ign.at.ure co!._ [yw [Date:
- , - - - - -
CnI17

hcet'f.;e- r~FFe and F3 lier, r,
. :i '"vA-?EAFIAN.• Run Nc. :AIPM-6
Samp,!e Locetio:AF'EUR'EiNLET Density o0 Acetone 0.7899 g,,ml
Samy]- S:-nV Liquid levei at mark
t v i!dez ! '. a &Lie and/or container sealed
Acetone Y L- YES
Filter YR-. YES
Acýetc'np Plank oe.odu07 7or,:. . mg/l g Lab 0:X]M304606B
Acei.ur.- v. . r- 3- rp
[,~e?"':-. •Ik. -£.•'.t•' e~ake.r Gr~o~ W.. :1Q.44.;.7.1 mng.-
La•te & T.- ",: W: .;•/141 /,,:I]A.. ~Beaker Gross Wt.:104456.6 rag
Average Gross Wt. :Il.44t,6.9 mg
beaker Tare Wt.:1i441t.7 ig/
L.-,-- a eeone blank wt..: 0.9 mr
Particulate Wt.- 4,0.[ mg -
],•• .• 'I r•;- -• C - -- "- -,O• AM.. ýilter Gross Wt. : 40 t,. E. rag WO
Date & Time of Wt.3/14/91 4:30PM Filter Gross Wt.: 405.9 mg w"
Average Gross Wt.: 405.9 mg
Filter Tare Wt.: 333.3 g
Weight of Particulate on Filter: 72.6 mg
Weics;t 'f Fart L-ulate in Acetone Rinse: 40.3 mg
T(,tal Wt. of Particulate: 112.9 mg
•l :•tr• ,i Ant, yE) ate:
S ] • •.a:.',Z .:%• .•'•'.-]: Dare "
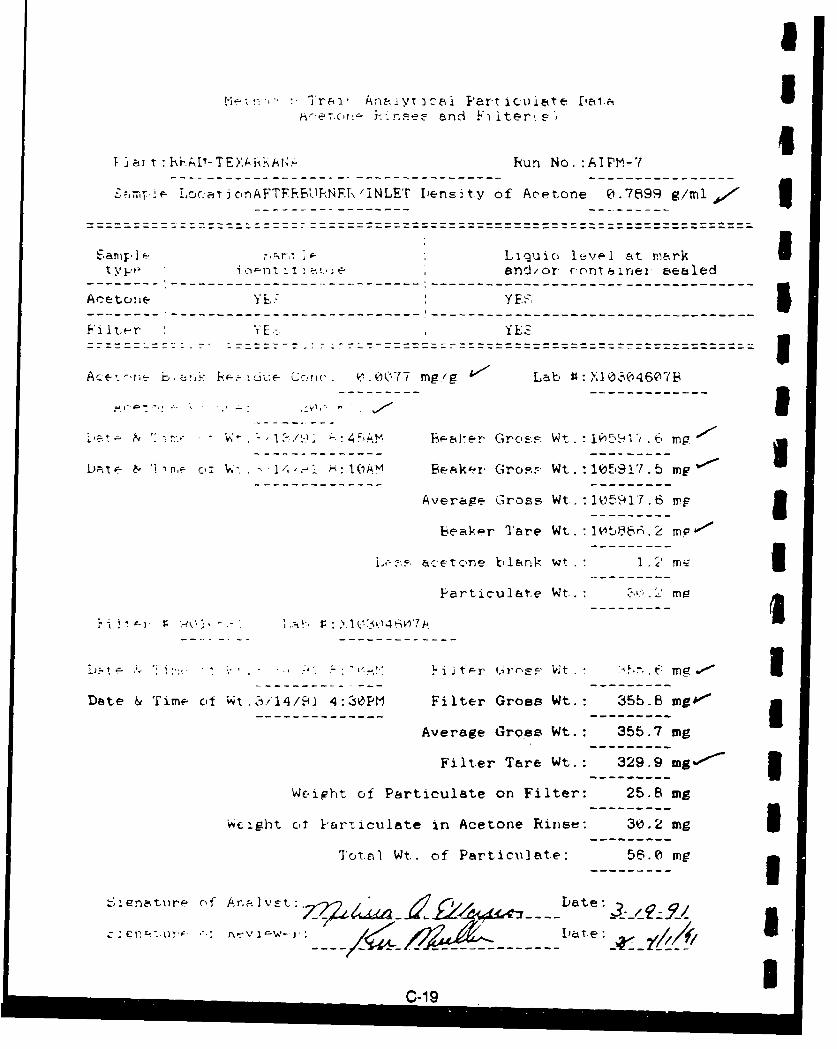
Tr a ~i.iT) a art ico I tte Da i-.A
'I•,•eto:: k n.,eF• and Yi•iter,.s')
I jar t FkuAE¶-TEYAhiAW- hun No. :AIPM-7
= Tm2 £O(: clnAFTFF-1BIRNF.h'INLET Dens.ýty of Ac'etone 0.7899 g/ml 3.ampm I Liquici le\,t1 at merk Ity ,t io r-f nt ;! t and/or- contbinei sealed
Acetoe Y F-
Fi Iter YE.:
Act 1 -.crw. O...k(C77 mg./g Lab #:XIO,0$46@7B
,•t• & ;"*-. •- , ./9 ' •-4 ', B1-l-'er Grc,-'. Wt. i-5YI' . m•
ate •- ~ '½ n, ot W'.. I '4.-1 : IOAM Beaker- Gr-or' Wt. : 1059!7 .5 mp
Average Gross Wt.. : ypI
beakpr Tare Wt. -oabrKl.2 m 'p
i,- ae.etne bi&ank1- wt IParticulate Wt.. L. M 2
--------- --------Date & Time cit Wt.. ,,'14/91 4:30PM Filter Gross Wt.: 355.8 mg0b10
Average Gross Wt..: 355.7 mg
Filter Tare Wt.: 329.9 mg- 5Weipht of Particulate on Filter: 25.8 mg
w ojght ct }'articulate in Acetone Rinse: .2mg5
Total Wt. of Particulate: 56.0 mg
1-'tenature of Ar.ý I ',t:. Date:£I d .3 . ....0" 1 h- at e
1IC-19

t'-,ným '. ' r- - n AnP.y]y• ca I Part. JI %ý*e [,)tia•ne (:1- ,ins•-: and Fj Iter, -
i']_nrt - • -- .,a.AIN i Run No. AIPrj- 8
Sample L.<,-ationrAFT'_" Fý::14EF,]NLE Density ot Ac-etone 0.7899 g/ml ,.
$apeSa'. - Liaid level 6t. mark
type ldEnt&Iat,;e and/or container sealed
Ac.-etouut Yh.-_ YES
F]Iter YES
Acetor- . . . .(,'1.i mg,'g Lab 0:X1?i@4608Br,£ •-' ,- - - - - - -:-,- --- "-]- --'- - - -
- '" > rr,- .;T I.'. t "4 ,AM beaker Gross Wt. : 301966. 9
bat- T'iTT, ct T : , I'];:'AM Beaker Grose Wt. : 101966 9 MRp
Average Gror- Wt.:101966.9 mg
Beaker Tarp Wt.:101943. 2
, '. -. tc-., blank wt.- 0.7 me
Particulate Wt..: 25.0 me
= t--. :r..-- C - > K- . l.4 /"8: .< KP3t.er Gross Wt. : 342.8 mg.
Date & 'limp of Wt.3/14/91 4:30AM Filter Gross Wt.: 342.9 mgv
Average Gross Wt.: 342.9 mg
Filter Tare Wt.: 331.5 m*
Weight of Particulate on Filter: 11.4 mg
Weight ot Particulate in Acetone Rinse: 2b.1 mg
T,,t~al Wt. of Particulate: 36.4 mg
D-ate
S1~nai~r~CI ~-~".'Del. e:
C-20

TECHNLtDGY 1TM3CORPORATION LbrtyDaaCincinnaxti
pm:eDate.. Method Numfber. 6- / 00
Extracted By: vi> [/n ý(/ Chere / 0 l
Yý16 4- 6 rt~s CO-ss 6o
)go Av~ -7-) lq. -1 z&'L3 2_8__310)__ý
r p-C-L I )09//3 /L< tju 7 1 19 9-- 5 ____
Pm L~ I6~?r tdC /-V AI 5 )7
A~m' I\i~5 aC A 0'7e /0: T. '7 . -/
a ITETI_ _ _ _ _ _ _ _ _
Ov* -;w)i -q a
PAI mý (11,I

ERNATIONAL ANALICALTECHNOLOGYCORPORATION SERVICES
CERTIFICATE OF ANALYSIS
ITAQS Cincinnati Date: April 9, 1991
Attnt Mr. Chuck Bruffey
Job Number 21341 P.O. Number 805625
This is the Certificate of Analysis for the following samples:
Client Project ID: USATHAMA ProjectDate Received: March 5, 1991Work Order: Xl-03-053Number of Samples: 5Sample Type: Multi-Metals Trains
I. Introduction
Five multi-metals trains arrived at ITAS Cincinnati on March 5, 1991. The sampleswere sent for analytical work in support of monitoring wozk on the USATHAMAProject. The samples are labeled as follows:
Run # SIPM-1 Run I SIPM-3 Run # SIPM-bRun I SIPM-2 Run I SIPM-4
II. Analytical Results/Methodology
The analytical results for this report are presented by analytical test. Bach set ofdata will include sample identification information, the analytical results, and theappropriate detection limits.
Each train consisted of a filter, acetone, and HN03 impinger. The filterand acetone were analyzed per EPA 5. After EPA 5 analysis they werecomposited with the RNO3 impinger and analyzed for the metals listed on the nextpage.
Reviewed and Approved by:
Tim SowardProject Manager103053
American Council of Independent Laboratorieslniernahonal Association of Environmental Tesling Laboratories
Anerai-or, Association lo. Laboraoii AkcTediltior,
C-22r Ancalyicca Services • 11499 Cheste*34 Cickcnaet, O 45246 * 513-782.46

aClient: USATHAYAWork Order: X1-03-05310305301 I T 'rCAL vcu3
CINCMATI, OM
p
I1. Analytical Results/Methodology (cont.) 3"* Lead by Graphite Furnace Atomic Absorption;
EPA Method 7421 3"* Cadmium, Chromium and Zinc by Inductively
Coupled Plasma Spectroscopy; EPA Method 6010 3III. Quality Control
Immediately following the analytical data for the samples can be found the QA/QC
information that pertains to these samples. The purpose of this information is to
demonstrate that the data enclosed is scientifically valid and defensible. This
QA/QC data is used to assess the laboratory's performance during the analysis
of the samples it accompanies. All quantitations were performed from within the
calibrated range of the analytical instrument.
The lead analyses by Atomic Absorption were done in duplicate. The average
is reported.
CI
III .
II
C-23

Client: USATHAY-AWork Order: Xi-03-05310305302 IT ANALTrAL SERV=
CMqCU4NATI, OH
Analytical Results, ug
Client Sample ID Run # SIPM-1 Run # SIPM-2 Run f SIPM-3
Lab No. 01 02 03Detection
Analyte Limit
Cadmium 14 14 7.5 2Chromium 32 ND ND 3Lead 42 15 12 0.6Zinc 62 ND ND 5
Client Sample ID Run 0 SIPM-4 Run I SIPM-5
Lab No. 04 05DetectLon
Analyte Limit
Cadmium 6.6 8.3 2Ctromium . ND 29 3Lead 4.4 15 0.6Zinc 11 120 5
ND - Not detected above the reported detection limit
C-24

IClient: USATHAMAWork Order: X1-03-053
20305303 IT A)IALTCAL SVi=CMCMATI, OR
III
Quality Assurance Data
Quality Control 3standard Reference Solutions
Theoretical Percent -
Analyte Value, mg/L Recovery
Cadmium 1 86.7, 95.8
Chromium 1 85.6, 87.8 -
Lead 0.75 92.0, 84.4
Zinc 1 80.4, 82.9
I£IIIIIII "-
I0.25 3

A~ec,:e kr~seF- and F-,-It~er ( L
P. na n F.A: -t Fx ,A' FX ., un Nc. : SIM-I
SZ,-- .,e Loct- on .N.i.',.i I'NL.ET Densit.y of Acet.cne 0.789w g/ml 4
Seme . iquid level at marl-
ty, i.nt 17ar a Ee ar,A./cr container sealed
•C~et.o:]e Yk.ZS Y(S.
F1 ter YL YES
A,.e: ::e F:=. -ec~ - .. ,.•,77 Img Ig/ Lab #:X103053@01
L) & Cime ,f .,' .. 4'A!-i Beaker. Gross Wt.. : le4974. 6 mg&
aate & Time eT -. ./14.4,, : ..:210AM Beaker Grose Wt.:104974. 3 msg
Average Gross Wt. :104974.5 mg
Beaker Tare Wt.:104966. 1 ME
L es5 acetone blank wt. : "S mg
,artIL.C.Ijiate WI.: 7 1 m e
"n . " :I 1 'A N Filter Gross Wt.: 47..8 MgE
Date & Time 7f Wt.3/14/9] 4:30PM Filter Gross Wt.: 479.9 mEg
Average Gross Wt.: 479.9 mg
Filter Tare Wt.: 469.2 mgWO
Weight of Particulate on Filter: [email protected] mg
Weight of Particulate in Acetone Rinse: 7.1 mg
Total Wt. of Particulate: 17.8 mE
8igratu,," c.. A..•1v•- . Dat.e:• ,., -. .
S i ngri murt- cf ,D ate•: Y• -1.fe
C-26

aMp.hd 5 Train Anslytical Particulate Data 3
Avetone Einses anH Faiteri s
F'ji&.rw :hRAr,-TEXA.hKANA Run No.:SlPM-2
Sample Loc&tionVFNTiIM INLE'T Density of Acetone 0.7599 g/ml .7 1
San•i:Sai Liquid level at marktype identifi-abie and/or container sealed
Acetone YE E YES 3Fil te C-1, YES
Acetocn- Blank hj-;ch'- ,.:,. . mg/g Lab ,:Xl0305302E
Ace'tocn• '.,:V .n÷ 17 3.iVIte C if, .c..•" 6'4b. Beaker Gross Wt.:1(298,.0 nEgI
D!t) & Ti,. ,i ý./14 /.• b'.IAM Beaker Gross Wt.:[email protected] mg' &0
Average Gross Wt.:l0298f8. mng
Beaker Tare Wt.:l2983.2 mg&w
iL'ss acetone blank w .: 1.1 me
iartaculate Wt.: 4.5 mg
F2 t! ~ ~* ~ X1~3~2A----------I
1at,; , *I. '.-AI Filter Gross Wt. 467.0 mg
Date & Time of Wt.3/14/91 4;30PM Filter Gross Wt.: 467.1 mg
Average Gross Wt.: 467.1 mg IFilter Tare Wt.: 464.1 mg wo
Weight of Particulate on Filter:- 3.0 mg
Wei'nit of I'articulate in Acetone Rinse: 4.5 mg 3Tr,tal Wt. of Particulate: 7.5 mg
S-------------27i' u:~ c: rev ieC-27
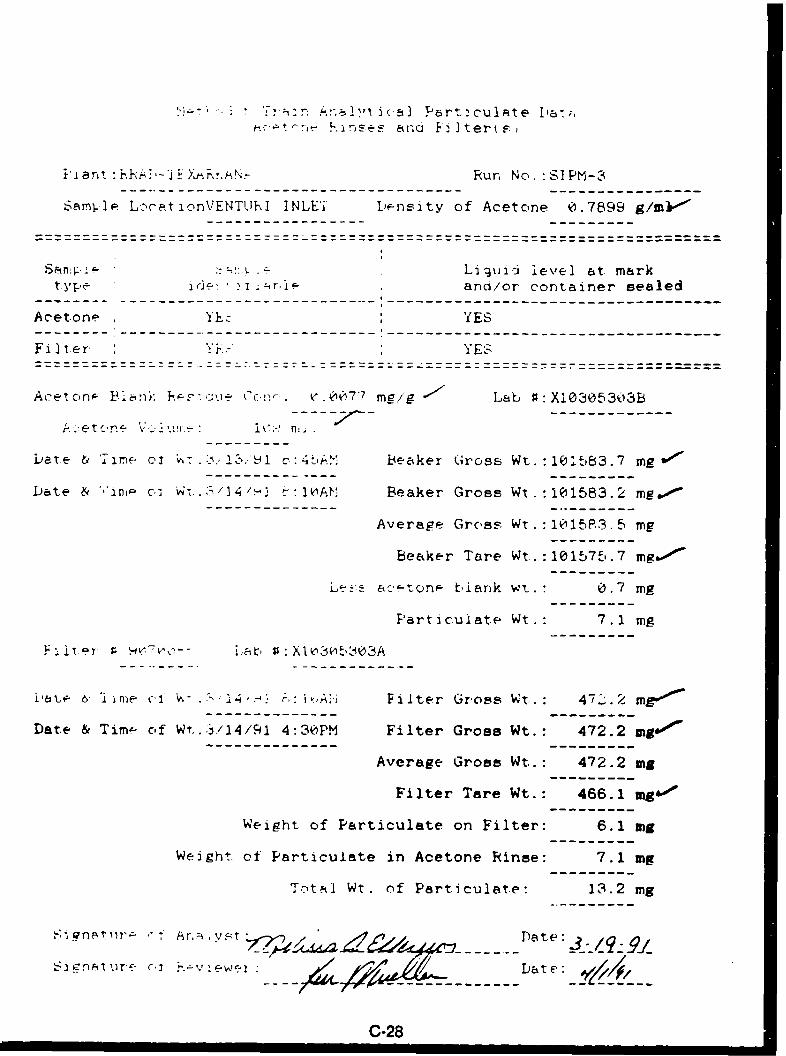
'.i•-":•i ';-, n .J.;a ,, a(B P rt~cu Inte I a-.;,
i jant: :jA ,- 1A.._.i Run No. :SIPM-3
SamnIle Lc'RationVENTUhI INLE'i Density of Acetone 0.7899 g/m]"
Liqui.5 level at. mark
type I iJ: , 2_i r.I f and/or container sealed
Acetone Yk: YES
Fi I t er Y.- YES
Acetn ... _1.n7 mg/g Lab #: Xi0305303b--- -- -- --
Dare & 'irne oT 1 & !-. i c'4,A.• Beaker Gross Wt. :101t,83.7 mg0'
bate ','ini c-, Wt.$/I4'.-• t:10IAN Beaker Gross Wt.:[email protected] mg..O'
Average Gross Wt. :1015.3.5 mg
Beaker Tore Wt.:101575.7 mgw**"'
6----a'..tonr blank w-. : 0.7 mg
Particuiatpe Wt.: 7.1 mg
iiar 33:Xlo: Xi 03A
], & 6. -1n)e C,1 - '1 r:,: i-, A- 1lter Gross Wt.. 472.2 mr
Date & Tim- of Wt.-5/14/9l 4:30PM Filter Gross Wt.: 472.2 mag'
Average Gross Wt..: 472.2 mg
Filter Tare Wt.: 466.1 mg0'
Weight of Particulate on Filter: 6.1 mg
Weight of Particulate in Acetone Rinse: 7.1 mg
Tot~a] Wt. of Particulate: 13.2 mg
i? ~n t 1r-, A r, t Pete:
~ J~M ue c ~---v~wev -- ~ /Dat E:
C-28

I
:•-. .iyt. jc, "E P_,1't.irA•oI at f- Data 5.sk~Twmi ~n s(- s rd P ai ý ýr (s)
1 .•.t 1+A, -TE)'Run No.:SIPM-4 iSamrpl LocationVENTUOR_ INLET Density of Acetone 0.7899 g./ml/ I
sanl.e Liquid level at. mark gtype ient'tiah1l- and/or container sealed
--------------------------------- -----------------------------------
Acetone YESE YES 3Filter YFF YES
-- --- .------------- ------------- 3A.jetc'.... Bia-& 1'ez-d:J•- C:-. •,••,, nig/g / Lab • X1030b$04B~
A:e~tcrie 7". . '
Date & Iinm-- 1. 1 e, : 4'-64hAM 1ieakpr Gross. Wt.:i102961.5 mg/
aDate & Tierr, cf Wt.,'14' -1 •0: AM Beaker Gross Wt.:102961.4 mg,7 3Average Gross Wt. :i@24617.., mg
Beaker Tare Wt. :202954.6 mg'
Les' acetone b1lank wt. :m. e 3Particulate Wti. : 6.5 ML
, , " .... . , " . -1 .4 .1 h A!', Filter Gross Vt.- . rn ' 5Date & Timc. of Wt.3/14/91 4:30PM Filter Gross Wt.: 462.8 mgo#"
Average Gross Wt.: 462.9 mg IFilter Tare Wt.: 457.8 m&,-"'
Weight of Particulate on Filter: 5.1 mg
Weight cf Particulate in Acetone Rinse: 6.5 mg 3Total Wt. of Particulate: 11.6 mg I
c: Date:
C-293

A-.1•a-.:,•E F,.s. ',d :t~er (s ,
i-'.:•n • F •.l -Z EZ..R.• -R• kM n N,-,. : S .PM- 5:
Sarrn.e L-,-'ticnV.NTLU-, INLET Density of Acetone 0.7899 g/ml
• In L~quid level at markt ypeý ,and/cr cr.taiiner sealed
Ac:et.con- Y. YE.,
---------------------------------------- -----------------------------------
It& Thr• oi: W, .•-.']4,~i 4••a:'?FM Beaker Gross Wt.: 9'1IO . m3 -
Average Gross Wt.: 97018.5 mg
Beaker Tare Wt.: 97013.0 mFW-'
LeF.F acetone blank wt..: 0.6 mE
Particulate Wt.: 4.c4 m
Filter _r -ý V?-.. m V- - - - - - - - - - - - - - - -
Date & Tjr. (n W..3 15/91 2:55PM Filter Gross Wt.: 338.2 mg b
Average Gross Wt.: 338.3 mg
Filter Tare Wt.: 336.5 mg-,
Weight of Particulate on Filter: 1.8 mg
o: P'articulate in Acetone Rinse: 4.9 mgTrt.al Wt. of Particulste: 6.7 mg
Si~n.• ,.• - A.-.2..',.,..t: ',% .,3 .:.Date:
.bat C-:
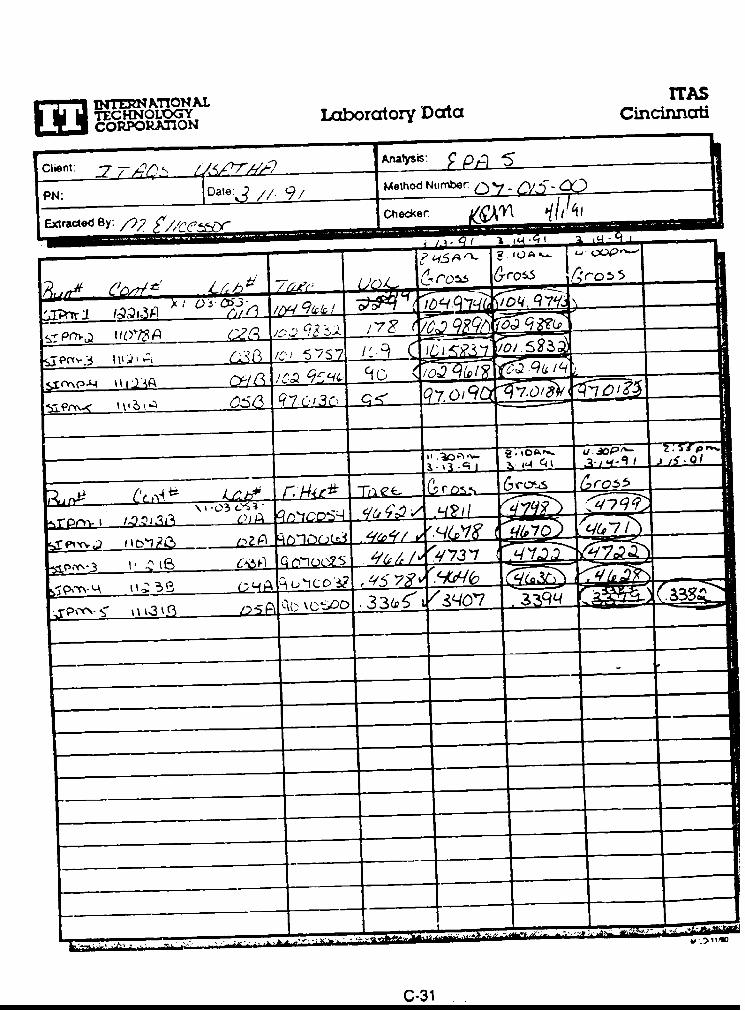
flnTMRAT!ONL LaoriozADtTECHNOLOGY LbrtyDaaCincirmatiLU CORPO3LA=ON
Chn 7 ~ 4Analysi- A
PN: Date:T // i, eh od N2u mnb e r O-
Extracted By. /9ý2 Ohecke~. r q/ . ( I' a
-f - ;r- F I - I_
ro!L5
-~~ ~ i 13 -1 1Q 14 C '," _
~~P(L =,~1 '6 r C____-Pr~- '~~'/ ~ _____
I4~ __0
3~~I 3 (1IO- .
C-31

SINTERNATIONkL ANALYTICALTECHNOLOGYCORPORATION SERVICES
CERTIFICATE OF ANALYSIS
ITAQS Cincinnati Date: April 9, 1991
Attn: Mr. Chuck Bruffey
Job Number 21341 P.O. Number 805625
This is the Certificate of Analysis for the following samples:
Client Project ID: USATHAMA ProjectDate Received: March 5, 1991Work Order: Xl-03-055Number of Samples: 9Sample Type: Multi-Metals Trains
I. Introduction
Eight multi-metals trains and blanks arrived at ITAS Cincinnati on March 5, 1991. The
samples were sent for analytical work in support of monitoring work on the USATHAXAProject. The samples are labeled as follows:
Run # SOPM-1 Run 0 SOPM-6Run I SOPM-2 Run 0 SOPM-7
Run I SOPM-3 Run # SOPM-8Run # SOPM-4 Run # BlankRun # SOPM-5
1I. Analytical Results/Methodology
The analytical results for this report are presented by analytical test. Each set ofdata will include sample identification information, the analytical results, and the
appropriate detection limits.
Each train consisted of a filter, acetone, and 10103 impinger. The filter
and acetone were analyzed per EPA 5. After EPA 5 analysis they were
composited with the MN03 Impinger and analyzed for the mNtals listed on the next
page.
Reviewed and Approved by:
Tim SowardProject Manager103055
Ame:jcan CacjnciJ Ol Innependent UAboratlo;esInternatibnol Association of Environmental Testing Laboratories
Arnei:or. Assacihton for Laboroor- Accreditation
C-32IT Anal cal Services 11499 Cboete • W - CincinnatL ON 45246 • 513-7824600

Client: USATHAYA IWork Order: XI-03-0551030S501 IT AIIA=.fCAL MWnIG a•o~sso 1 • ¢.JL VlCSCINCINATI, OB 3
Ii n n I nI
II. Analytical Results/Methodology (cont.) 3* Lead by Graphite Furnace Atomic Absorption;
EPA Method 7421
Cadmium, Chromium and Zirc by Inductively ICoupled Plasma Spectroscopy; EPA Method 6010 1
I11. Quality Control
Immediately following the analytical data for the samples can be found the QA/QC 5information that pertains to these samples. The purpose of this information is todemonstrate that the data enclosed is scientifically valid and defensible. ThieQA/QC data is used to assess the laboratory's performance during the analysisof the samples it accompanies. All quantitations were performed from within thecalibrated range of the analyt-cal instrument.
The lead analyses by Atomic Absorption were done in duplicate. The average 3is reported.
CIIIIIIIII
0-33 3

Client: USATHAMAWork Orders X1-03-05520305502 ITANALIT!C.I"inV34
CDMCMATI OH
Analytical Results, ug
Client Sample ID Run # SOPM-l Run # SOPM-2 Run # SOPM-3
Lab No. 01 02 03Detection
Analyte Limit
Cadmium 53 12 8.8 2Chromium 650 ND ND 3Lead 1000 (1) 16 7.6 0.6Zinc 1500 5.1 8.9 5
Client Sample ID Run # SOPM-4 Run I SOPM-5 Run I SOPM-6
Lab No. 04 05 06Detoction
Analyte Limit
Cadmium 2.5 4.7 12 2Chromium ND ND 4.5 3Lead 5.9 13 19 0.6Zinc 26 94 53 5
Client Sample ID Run # SOPM-7 Run O SOPM-8 Run # Blank
Lab No. 07 08 09Detectim
Analyte Limit
Cadmium ND 15 ND 2chromium 20 ND 9.6 3Lead 22 12 2.4 0.6Zinc 73 72 58 e
Client Sample ID BlankFilter
Lab No. 10DotectLoi
Anplyte Limit
Cadmium 2.4 2Chromium 3.0 3Lead 4.9 0.6Zinc 83 5
(1) The detection lia.it for lead for this sample - 11 ug
ND - Not detected above the reported detection limit
C-34

Client: USATHAY 3Work Order: XI-03-05510305S03 IT AZIA=F'CAL MMV3
CUiNC kTI. ORN
Quality Assurance Data
Quality ControlStandard Reference Solutions
Theoretical Percent 3Analyte Value, mg/L Recovery
Cadmium 1 86.7, 95.8 1Chromium 1 85.6, 87.8Lead 0.75 92.0, 84.4Zinc 1 80.4, 82.9
CIIIIUII
II

renrFitv oI iA.-P' r:e k. ,o.- e'm.-'Spa)
r.mr e Liquid level at markRlarnk Type 1oe-: i: iaeie and/or- container sealed
Aceton& L'. YES
Filter YES YES
Lab $ M 0 " .. . 5- .-
P,' bealer Grcoas Wt. :107376.1 mg."
ate : '.-. .. : b1,'ii Beaker Gross Wt. :10"375.- rq •.•
Averagee Gros- Wt. :lt'7-37 6 .@ mg..
Beaker 'rare Wt.: 1i7373.9 my.w
---------- heaker Net Wt.. -. 1 mp.(ma)
Acetone Lklank Value: ý,.(!Wi'7 rmg,/p (Ca)
-ltev " , ,'.4 Lab I:XlO3055t9A
Date & Time of Wt..3/14/93 8:10AM Filter Gross Wt.: 469.0 mg
Date & Time Cit W-.3/14/91 4: 3PM Filter Gross Wt..: 469.2 mgo
Average Gross Wt..: 469.1 mg.
Filter Tare Wt.: 468.2 mg"
Difference: 0.9 Mg
C-iniue1: PMnR.iys¶: Date:
C-36

IMet-'c'' •,~an~k Anelyt]c•i I'~eta5
£'en ity ci b,:etc.::e t.7t•.. g..mi (pa8)
Liquid ieve! at mark 3Blank Type. ident fiable and/or container sealed
Acetone ,
Fi iter. YE. YES
Acetcne [-: . ',,r, e- Ik . Lab $3:
Vclurme zf Ar•et.- : r. lVa'
eA r - G.oE- Wt. :M .
Date 1 Lme c-1 Wt. Beaker Gross Wt.: mg. IAverage Gross Wt.. 0. ; ag.
Beaker Tare Wt. : .
Ir. .E P ----- Beaker Net. Wt.: 0.0 mg.(ma)
AMetcre E~Blank VaLue: ERR mp/p (Ca)
Blank V. u!-..--i r •;:,r'ulat.iors: ERR mg/g I
Fiit.er. f: 9 ,ILab #:XI030551A IDate & Time cf Wt..'34,/E1 8":10AM Filter Gross Wt.: 336.7 mg"
Pate & Time cf Wt.3/14/Y1 4:3@PM Filter Gross Wt.: 336.8 Mg
Average Gross Wt.: 336.5 mg 3Filter Tare Wt.: 336.9 me
Difference: -0.1 mng I}•ern rrk .• _3....
Signature ct Analy:. Date:
Date:
C-37

M_-. .- .- . • andvi F! ]teri s
$n, Run Nc. :S(_+M-1
Samrln Locatrý,VEN:L 1 : C,'k]'F'. Density of Acetone 0.7899 g/rr,2 .
, Liquid 1-vel at mark
Teyt- ' I:tit a I ie and/or container sealed
Acetone YES
YES
~ "4 - ,"&r.c'. .•17? me'. q Lab Is:Xlk3.550AP,
bec•C!r t"rc s. WT 1.:3"".:3J .7 m.g-
bate T. ' 01me oi W-..,' I o-i. : Beaker Gross Wt.tl 1:;1 6 mg /
Average Gross Wt. :1032.31 .7 mg
Beaker Tare Wt. -1o3",4_. 3 mg
].--.- cet one b.,an), wt.. : 4 .'1 rr.
kartricuiLte& WT . : i0 mg
wc:,, ri ct,:-uatT e an Acetone R<inse: 17&.7 me
.. -":' _; -05501A
--ate & Time of Wt.3/14,/91 :1AM Filter Gross Wt.: 670.0 -g-
Date & Time of Wt..3/14/91 4:30PM Filter Gross Wt.: 670.0 mg
Average Gross Wt.: 670.0 mg
Filter Tare Wt.: 421.6 mg
Weicht o Particulate on Filter: 246.4 mg
S',J:eture c: Aa-,vE-t: Date:
8Date:
0-38

I
i an : Ru.n-',-L;'.M...-. l<ul, No.: SUOPM-1 I
Filter r. Lat-•',, I
Date 6 1irn of Wt.3/14,91 6:lIOAM Filter Gross Wt.: 527.9 mg 3Ili! I.P N m' I1- OWT.3, W -4": 1-- ?i ter Gross Wt: 528.0 mg
Averag- Gross Wt. : 528.0 mg
Fi It.er aTre Wt., : 422.4 mg/ IS ,i- Prt,• ictlcujite on Filter: 10b.6 me
-~~- -~ -. -I
-- ,:• - -- - - - - ---,----. .•'1 ] ter Grcoss W- T . • mg I• et Thr. r., W' Filter Gross Wr.- m
Ave-rage uross Wt 0.. 1 mg
Filt.-r Tare Wt.: m. 3". " .i a~iC~tC iatef' cri 3 I ter. mg C
Weight ot Particulate in Acetone Rinse: 178.7 mg6
Weight of Particulate on Filters: 354.0 mg
ITotal Particulate: 532.7 mg I
I~.Ii~tur- c~ ,~n2\'~t ~- ----------DeE:,f
-- ) Lr1stf:,3- / UC-39

--.- -" ,- -.- rs e.' •.- P~q t~e[.1•.-
,, '-,, -- hXR.,- Fun Nc. : SOPM-2
Sa_:' ) .- ?•t 3VEW . (,VTLET Density of Acetone 0.7899 g/ml .
Sainp e Liquid level at mark
type I(er)t r and'or container sealed
Acet, Y. YE
Fi I .YE
a-. -,i .. r, . .~<,0 7 mg.g Lab #:Xl(30550i2B
i l lm- ri • .3..;. 4 -1 Beaker Gross' Wt.:l01.-'334.0 mrp.
a te C_ 'fime T- * t.-' .,.1 ', AM beaker Gross Wt. :103734 .4 nip &-o
S. . . . . . . . .. . . .. . .. . .-- - - -
Average Gross Wt. .'73734. 2 fig
beaker 'Tare Wt. :1i3'21.2 mge-
F4-' ac-etone blank wt.. m.
Partac'ulate Wt. 12 2 mE
Date & Time of Wt../14/91 4:30PM Filter Gross Wt.: 419.8 mg
Average Gross Wt.: 419.8 mg
Filter Tare Wt.: 421.5 mg
Weight cf Particulate on Filter: 0.0 Mg
ý:.T Particuiate in Acetone Rinse: 12.2 mg
"Tfta] Wt. of Particulate: 12.2 mg
-4•/

IMt1~-I.-,1 ,. Trin Anatlytical Narticulate Dat; I
- , knse.L: and Filter(s)
S".-.R.-fiKAi-..AkI ~Run No. :SOTM-3 ISample- Loc.at ionVENTUM'\ OUTLE'i Density of Acetone 0.7899 g/mn . 3
S npzrnýLiquid lpvp1 at mark3
type identif a1.ie and/or container sealed
Acet.on- Y :- YES 3Filte- YEC YES
Ac/'CL.bne ka::.X1-030 50,LB
Date N T2me ri Wt. J-. 4.,-/H] 4-1;PH Bfaker Gross Wt.:1@(0566.2 m£w-'/
[Date & 'fTime of W 1t. , o2L . ti lbk.. Beaker Gross Wt. :10@565. 8 me'- IAv-rage Gross Wt. me
Beaker Tare Wt.:[email protected] m_
Les• icetone blank wt.. : v.7mg 3lrarticulate Wt.: iI mg.
F l f",...-.,, Filter Grost' 2 Wt.: 47 r.@ 4? 5 I
Date T 'ime cf Wt.3/14/•]l 4:30PM Filter Gross Wt..: 473.1 nmig
Average Gross Wt.: 473.1 mg
Filter Tare Wt.: 471.6 mg•'
Weight of Particulate on Filter: 1.5 mg
Wei-gt ol P•articulate in Acetone Rinse: 7.1 mg
Total Wt. of Particulate: 8.6 mg
2nýtfliur.- c'i AnJ't~---Date:~~~
C-41
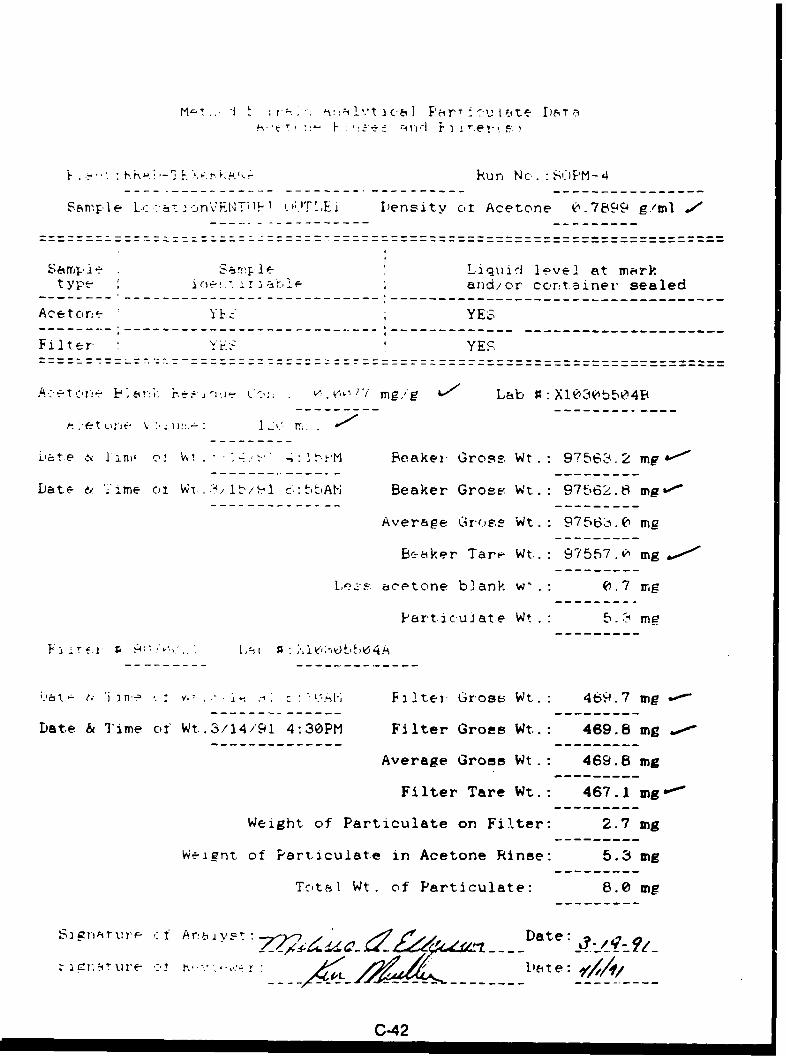
M.!, "iT c.- b.'.e _ PE•T ,' r• r t. te -,.•:.-
.- , .. Run No. :,SJ)PM-4
San;ple L.,.: -.- nVFNlTi1H- ,.;.1TLEi IDensity ct Acetone 0•.7899 g./mI o o
Sai rre p r!p !Liquid level at mark
typt- I ir,÷-. t 3 a and/or con-tainer sealed
Acetcone'- - YES
Filter Y•:s YEq
A.-tn.- •a,.. re:-•l.'_ to:; . . ', mgg Lab ':X1O3Ob5'4B4
,.ate ln, o' • .L -.,, : M Beaker Gross Wt : 97563.2 mp
Date- & ime &o Wi.7b//l c.:5tAH Beaker Grose Wt.: 97562'.8 mn-
Average Gr-,.Ee Wt.: 9756ýi.@ mg
Beaker Tare Wt..: 97557.0 mg
Le-•. acetone blank w".: 0.7 mg
Particueat.e Wt. 5."C me
J " n .: V.. - . c F Filter Gross Wt. : 4 9.7 in "
Date & Time of Wt..3/14/91 4:30PM Filter Gross Wt..: 469.8 mg
Average Gross Wt.: 469.8 mg
Filter Tare Wt.: 467.1 mg-"
Weight of Particulate on Filter: 2.7 mg
Weignt of Particulate in Acetone Rinse: 5.3 mg
Tot;l Wt. of Particulate: 8.0 mg
b-: f : ~Date:
C-42

I
MetL-.Ii i '.'r; n Ana1vt ica] Part iuIate Data I
SF....i'-'fXMA~Al•~ Run No. :SC 'H-5
Samprplo Loc¢.tionVENTURI OUTLET Density of Acetone 0.7899 g/ml,." 1
,••I If! Liquid level at mark
type ider, t 2 fiable and/or container sealed
Ace•t-one. YEY. YES
-- - - - - - ---- -- -------- - - - - - ---- - - - - - - - - - - ---- - ---- - - - ---- - - - - - - - - - - - - - - - - - - - - - - - --== = = = = = = = = = = = =
tin.. :t- !--: , . . . 7 mg' E Lab V:
Date N I•T m,- c,_i W .. ' ,14 1 4: 1"i1-} Beaker Gross Wt..: 0213q.0 m.21---
Date & '1'Tme c', Wt.s/15,HC / '55AM Beaker Gross Wt :102138.8 mg' IAverage Gross Wt. :12136.,i mF 3
Beaker Tare Wt.:102109.3 rng
Less acetone blank wt.: O.t, mg -
Particulate Wt.: 29.1 mg
Dat,- .. 't•n~e c-t Wt.,/i. ',•- ,/1 -A Filter Oross Wt.: 336). mg•'• 3Date & Tz.me of Wt..3/14/91 4:30PM Filter Gross Wt.: 336.1 mg'
Average Gross Wt.: 336.1 mgFilter Tare Wt.: 335.1 mg-'
Weight of Particulate on Filter: 1.0 mg
Weight. of Particulate in Acetone Rinse.: 29.1 mg 3Total Wt. of Particulate: 30.1 mg I
~gnaiC-ur"& f Analyst: Date: !9 z"ii ~~Dat~e:y<
L C-43

-.e; cd 6 • tlra, .1n.:,_yt ical Part ie-ulat~e Data# •-',.r:÷ h.--n'! ý.11 tn< • er~s
.•:' :FhA.-TLK-.. .- un Nr. S ,PM-&
Snam5e Lcc'tacio NTFI iujl LF'I ensity of Acetone 0.7899 g/ml i
6-•lp n- Liquid level at. mark
type iIer.t: 1atr ]e and/or container sealed---------- --------------------------- -----------------------------------
Ace t on- ÷ YES------------------------------------- -----------------------------------
Filter Yr. YES
At'c~e, F5J•i'.i" he.-*- -/7 mr/glgw' Lab 3:X1kh35506B
,a'e •,: 'I r:e ni Wt .:,.14/91 4:15PM beaker Gross Wt.:105402.0 mg
Date •'lime o! W- .* ;115/91 -:55Atl1 Beaker Gross Wt.-105401.9 mg
Average Gross Wt.:105402.0 mg
Beaker Tare Vt.:[email protected]
, n.i.--taetonIe b Fank wt. : 0.9 mg
Iart ciuIate Wt. 7.9 me
Da t,-- . 1 -1 , 1 " A! kilter Gross Wt . : 339.8 mg /
Date & Time of Wt.3/14/91 4:JOPM Filter Gross Wt.: 339.9 mg
Average Gross Wt.: 339.9 mg
Filter Tare Wt.: 339.1 mg
Weight of Particuiate on Filter: 0.8 mg
Weignt ct Particulate in Acetone Rinse: 7.9 mg
T-tl Wt. of Particulate: 8.7 mg
g.-it uure A' A:, rj y s. Date:- 4.. OF/7r22 Z. .ýa 3: 'ý ,
C-44

I
1 • ant RhhA,-TEXi.FKA!Th Fun Nc. "-:SPM-7 ISample L,,caticrnVEN'i-1 OUI'LE• Density of Acetone 0.7899 g/m!. g
Sample Sample Liquid level at marktype identifiable and/or container sealed
Acetone YES YES 3Filter YE' YES,
. i . 3. _ '
Ace ,:r.. B a::.' }o•..:,_: C~n . 10,7 Mg'; / p L.oý Lab 0l:X103055.07BA ,,e t c.-- --- -- --- ------- -----.J /
11ate & S ,m•r-c Wr .'.,',i 4:-i,•. Beaker (rcs : Wt 1:el:.-9 7 mg
Date & Time- -,f W' . 3 ' 2:t•5PM Beaker Gross Wt. : 30,3.6 mns-
Average Gross Wt : 1X2539.7 mg
Beaker Tare Wt." lk<',:I32. e mg• 1
]L-. ;--etonc. blank wt :. l4 mc!
Ya ticuIate Wt .: 6. mgF• I * fl • • 9, *•,'r ]: , : Xl :k• ti7A 3
- .--- - - - - - -
zj Ir. r AFilte C ;I C... Wt k
Date & Time of Wt.3/14/91 4:3@PM Filter Gross Wt.: 335.5 mg
Average Gross Wt.: 335.5 mg
Filter Tare Wt.: 335.1 mgo"
Weight of Particulate on Filter: 0.4 mg IWeiphrt ot Particulate in Acetone Rinse: 6.3 mg 3
Tntal Wt. of Particulate: 6.7 mg
,ign•'ur÷ -?f ArAalyst: Date-:I
,{•:-------------------------------------- Ijat~c"
-------- I
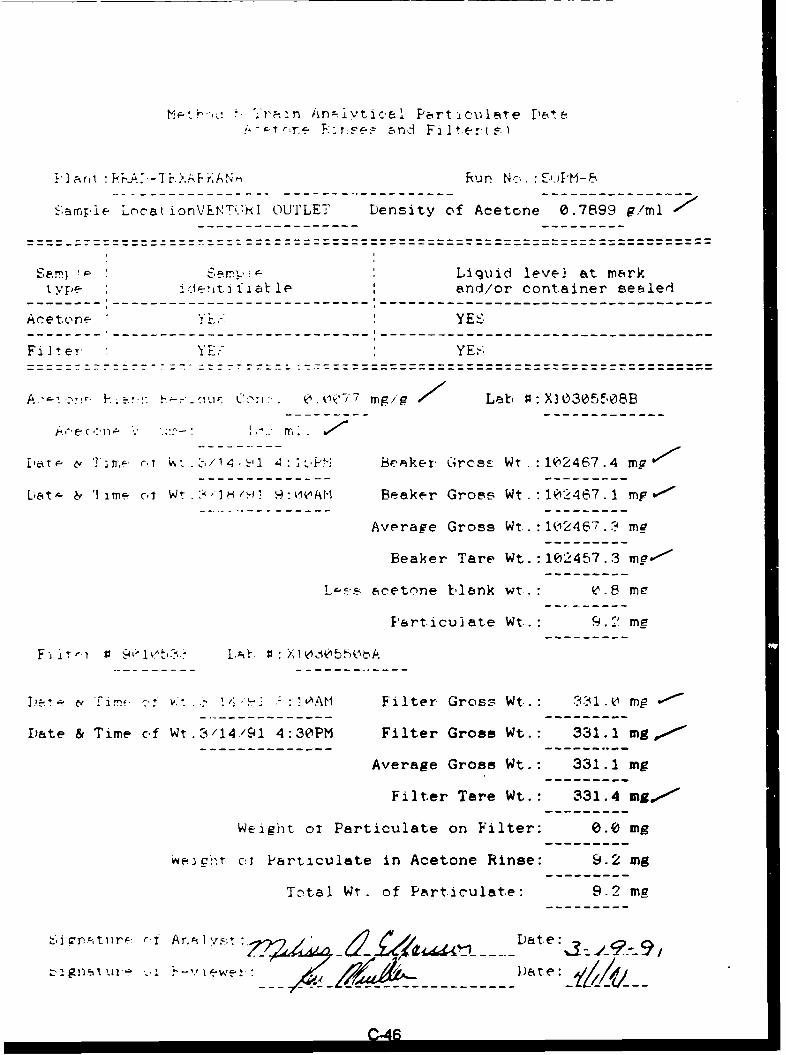
Y.,-<h-, ) '.?pan An-.ivtic~eJ Pert ulate [, 4 e.A -I T e T. F--.e. and Fa It-er-.( F.
'] ar .- Tn.XA- ,, Run Nc.
Campe L ,cat ionVENrTi.Mk OUTLET Density of Acetone 0.7899 g!ml
SamI r- Liquid level at mark
tYpe ,-J-.It i atble and/or container sealed
Acetone Y YES
Fi I t er YE" YE.
A'..-:- I.-~.:*' -." -. .•.u,' C..-': . •. '', mgip - Lab s:'X30305508B
1 'a•# T I'i , • .- , / 1 4.. , ý'-,i- : I S akex. GrcsE Wt . :102467.4 mg w
bat. & 'Iimý. cI Wt H /-•,' •OHA:.tI Beaker Gross Wt. :"12467.i mp&'*
Average Gross Wt. :102467. ma
Beaker Tare Wt. :102457.3 mnp--
L acetnne blank wt. : V.8 me
P&art.icu ate Wt. : 9 2' me
F X 1r fl9V1 1b.- l @5 bA
!)z, - "i o !.: " AM Filter Gross Wt.: a.':.1 mg
Date & Time cof Wt.3/14/c91 4:30PM Filter Gross Wt.: 331.1 mg
Average Gross Wt.: 331.1 mg
Filter Tare Wt.: 331.4 mg*
Weight. ox Particulate on Filter: 0.0 Mg
weigt c•i Particulate in Acetone Rinse: 9.2 mg
Tcotal Wt. of Particulate: 9.2 mg
S j nFti)rt r i ArntI., .*',.+ - ' Date:S.. . .. . . ..
D2L•I•I\I "• '.I .•-M]. .. Da. ...
! ! ! !

ITASKHN ~~~Laboratory Data Cnint
Client: -- Analysis' ý 1,4/1
PN Date: 3 / -Method Number07 /-
P FN: Oate: 07 - 3Checker. &O~
Extfacl' By:A l. ZVI-Q 03 7 ' o 31 ~ ,% _ _
-' 046 ~-~V7 ~7~~975
cC' 17 57 -S - qic7 S7375 /v?56
305,40.43
/07S7~3 /07.) 70o I
E'T -7 ToIA)0 o
Pm -!2 1 i-123 -
03~DI Ii2 9 / -q(C~___ I rý /0 q"
C-471
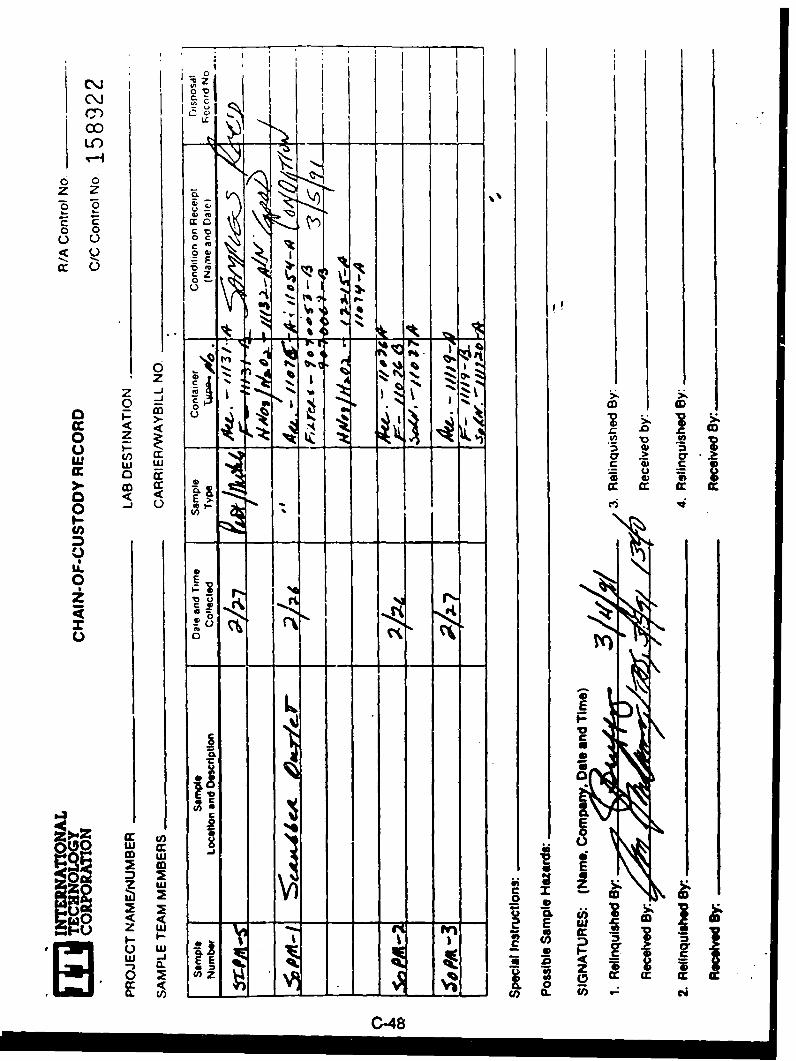
U--o
106
zz
c to ,
= F
z -jj~
0 L 0
oocc 0
0 2
c0
U
LLE
o1
Ea F
000 u0
OD E
V m
S-i i i
I0-48)C-

ar) r: wLI)r
o00
zz
0E aC 0 kWJo 0
cz
'p 3-44 4
0 0 1
o ~z2 CD0
0U U
m c
ZQ
00
z IIogI wi CD3
lau Z I%
U ) -J %-9

C\jI
00
0 0(.)~ 0 c
.0 w C-.- E
cc L)0
b %1
0Ia:
CL a
z cc U
C.) D
00
b c rJcLLLJ I-h E - I
n 00.U
C-50

z _
I II
-m
I- 00 cz M0; w
~ 0 czL)I
Wi
00 C co
LuCE 0
4) 4)0CD
coa: cc m a:m
'/,s
P E E
g~ cc
o 0 1 j
we I-E
ZV) ZW V,)0CL a .0 -
; <

I
jcc
z z ~-
o m0 %1= E:
I- -6
V's
o -l
0 30
C.)C
'oCO CCcc m Cr c<F0.
Da
- Et4~j t~
ga -) 2 :
C-55

0 10
0 0
-c Z
40
cc cc
0
ILI0 2~
00-
0 -J
0 In I
Ir a
0 0
cc <I
a~~ EL coIC5 LF

Ej INTE RNATIONAL ANALYCALTECHNOLOGYCORPORATION SERVICES
CERT::'ICATE OF ANALYSIS
LTAQS Cincinnati Date: April 29, 1991
Attns Mr. Chuck Bruffey
Job Number 21341 P.O. Number 805625
This is the Certificate of Analysis for the following samples:
Client Project ID: USATHAMADate Received: March 5, 1991Work Order: XI-04-146Number of Samples: 2Sample Type: Water
I. Introduction
Two water samples arrived at ITAS Cincinnati on March 5, 1991. The sampleswere sent for analytical work in oupport of monitoring work on the USATHAMAProject. The samples are labeled as follows:
Water # 31Water 0 32
II. Analytical Results/Methodology
The analytical results for this report are presented by analytical test. Each get ofdata will include sample identification information, the analytical results, and theappropriate detection limits.
The analyses requested are listed on the following page.
Reviewed and Approved by:
Timothy SowardProject Manager104146
A erwicar, Council of Indepnaent Laboratones!niencnJicnol Assxciaion of Environmental Tesmng Laborolones
Americ~r, Association for Laboratory keTheditotior,
C-54IT Anl ,.cal Ser. 4e99 1 oeer Road - Clncinwft OH 45246. 513-782-4600
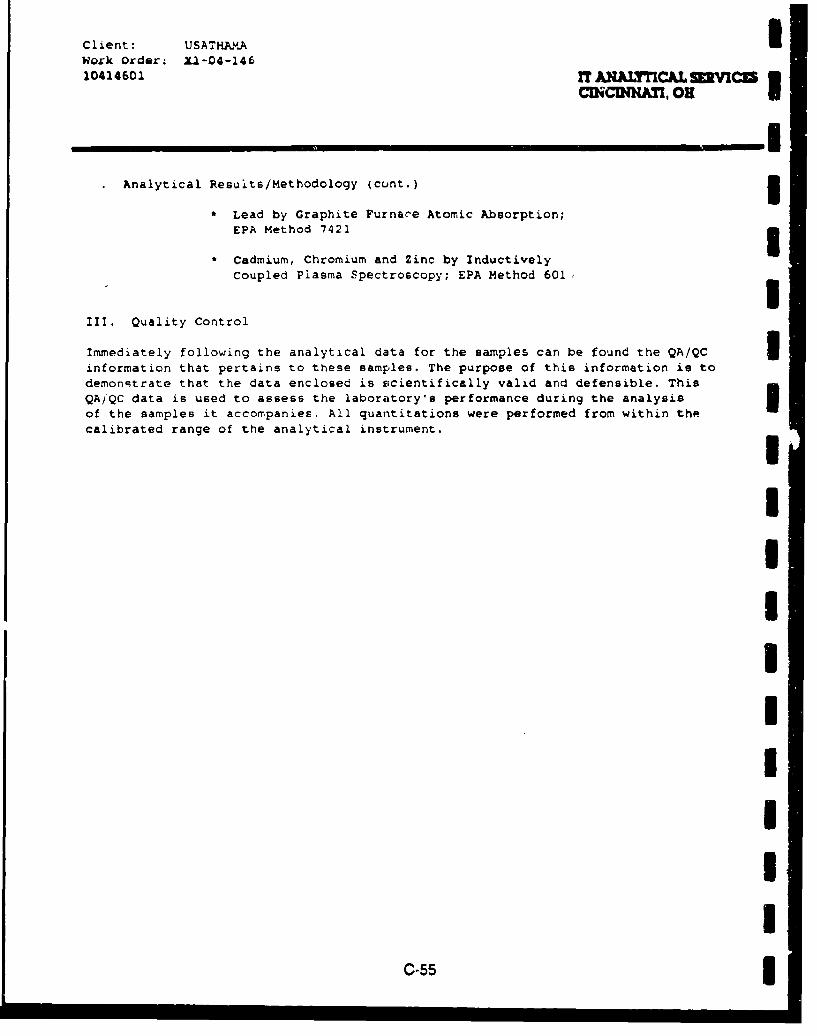
Client: USATHAM•.AWork Order: XI-04-14610414601 IT MA LMUL ,SICCA.L ,OS
MCDWCIATI, 09
Analytical Results/Methodology (cunt.)
"* Lead by Graphite Furnace Atomic Absorption;
EPA Method 7421 3"* Cadmium, Chromium and Zinc by Inductively
Coupled Plasma Spectroscopy; EPA Method 601:
III. Quality Control
Immediately following the analytical data for the samples can be found the QA/QC Uinformation that pertains to these samples. The purpose of this information is todemonstrate that the data enclosed is scientifically valid and defensible. ThisQA/QC data is used to assess the laboratory's performance during the analysisof the samples it accompanies. All quantitations were performed from within thecalibrated range of the analytical instrument.
IUIIUIIII
C-55 3

Client: USATHAYAWork Order. XI-04-14610414603 IT ANALYTM SDVA
CDCMINNATI, Oi
Analytical Results, mg/L
Client Sample ID Water 0 31 Water F 32
Lab No. 08 09Detection
Analyte Limit
Cadmium 0.002 ND 0.002
Chromium 0.03C 0.007 0.006
Lead 0.0041 0.0007 C.0007
Zinc 0.031 0.021 0.008
ND - Not detected above the reported detection limit
Quality Assurance Data
Quality ControlStandard Reference Solutions
Theoretical PercentAnalyte Value Recovery
Cadmium 1 98.8Chromium 1 101Lead 0.075 96.5Zinc 1 99.8
C-56

IIIIII
APPENDIX D 3SAMPLING AND ANALYTICAL PROCEDURESI
I
IIIIUII
D-1 I
I

SAMPLING AND ANALYTICAL PROCEDURES
This Appendix details the sampling and analytical methods used in this test
program. These are generic descriptions with modifications detailed as follows:
Determination of Particulate and Trace Metal Emissions
The method as written is applicable to the measurement of trace metalemissions including mercury. The additional impinger solution (potas-sium permanganate) and recovery and analytical procedures specific tomercury analysis will not be used in this test series, since mercury is nota metal analyte of interest. The potassium permanganate impingers wibe replaced by an empty impinger followed by an Impinger containnsilica gel.
Determination of Total Gaseous Organic Concentration by U.S. EPAMethod 25A
No modifications as written.
D-2

UTitle: 25ADate: -_101164 & _
II
DETERMINATION OF TOTAL GASEOUS ORGANIC CONCENTRATION BY EPA IMETHOD 25A I
Sampling and analysis procedures for determining total gaseous organic emis-
sions are those described in EPA Method 25A." Gas flow rates are determined by 3using EPA Methods 1 and 2 for velocity and temperature, a Fyrite or Orsat analyzer for
oxygen and carbon dioxide content, and wet bulb/dry bulb temperature measure- Iments for moisture content. The following is a detailed description of Method 25A
equipment and procedures. 3Sampling Apparatus
The samp!ing apparatus is shown in Figure 25A-1. The system is set up and
operated in accordance with the guidelines in the operating manual for the total hydro-
carbon monitor. In addition to the hydrocarbon analyzer, the sampling system con-
sists of: 3.articulate Filter - A short piece of 1/2-in.-i.d. pipe packed with glass wool andattached to the end of the sample probe, if needed, or equivalent.
Smple Pr~kg- Stainless steel tubing inserted into the ges stream beingsampled. A three-way ball valve at the outlet of the probe is used to add 3calibration gas.
Sample Lin - 1/4-in.-o.d. heated Teflon line self-limited to maintain a sampletemperature between 250 and 300" F.
Sampling Manifold - One stainless steel three-way valve and 1/44n. stainless 3steel tubing are used to supply calibration standards and sample gas to themonitor. One three-way valve is used to select calibration injections or tosample stack gas. The whole system is wrapped with heat tape.
40 CFR 60, Appendix A, July 1990.
D-3 I
I

GLASS WOOL
HEATABLE FILTER3-WAY VALVE (IF NEEDED)
PROBE STAINLESSFSTE EL PROBEHEATED 1/4-in.
SAMPLING LINE
CALIBRATIONGAS LINE
OPTIONAL 3-WAY VALVE. FOR ALTERNATING 1/4.in. TEFLON
BETW~EEN TWJO SOURCES CALIBRATIONLINE
BECKMAN 402 CHARTSFID RECORDER
(40% H2160% N2)
STAINLESS STEEL TEE,ONE LEG OPEN TO ATMOSPHERE
HIGH MID LOW ZEROGAS
METHANE STANDARDS AND ZERO
Figure 25A-1. Method 25A sampling system.
D-4

I
Calb-ation Gases - Methane standards in air and zero nitrogen (less than 0.1ppmi'THC) are used to calibrate the monitor.
FuJE and Air - A cylinder of 40 percent hydrogen/60 percent nitrogen and acylinider of compressed air to provide fuel and an air supply for the analyzer's&Van- IChal Recorder - A Heath strip-chart recorder or equivalent is used to provide aperanent record of hydrocarbon concentration data.
A Beckman 402 total hydrocarbon analyzer that works on the principle of flame
ionization is used. All critical sample-handling components of the analyzer are con-
tained in a theat-controlled oven. The oven temperature is maintained at 250* F
throughout. the test program. The following analyzer specifications were provided by
the manufaicturer:
Full-scale sensitivity. Adjustable from 5 ppm methane to10,000 ppm (%) methane 3
Response time (0 to 99%): Less than 1 s for oven temperature of 200" FLess than 1.5 s for oven temperature of 400* F
Eled'tricity stability: t 1 percent of full scale per 24 hours, withambient temperature change of less than10 F
Reproducibility: ± 1 percent of full scale for successiveIdentical samples
Output: Selectaole from 10 mV, 100 mV, or IV. 3The magnitude of the analyzer response to carbon atoms depends on the
chemical invironment of this atom In Its molecule. Typical ratios of monitor response Uto methare for carbon atoms in various molecular structures are listed in Table 25A-1.
III
D-5 3
I

TABLE 25A-1. MONITOR RESPONSE FOR VARIOUS MOLECULAR STRUCTURES
Molecular structure Response relative to methane, %
Al iphatic compound 100Aromatic compound 100Olefinic compound 95Acetylenic compound 130Carbonyl radical 0Nitrile radical 30
Monitor Setup and Calibration
The monitor setup and check procedures outlined here are performed prior to
sampling. The monitor is calibrated by introducing zero and high-level calibration
gases to the calibration port of the sampling manifold. The predicted response for
low- and mid-level calibration gases is calculated, assuming that the monitor response
is linear. The low- and mid-level gases are then introduced into the monitor. If actual
responses for the gases differed from the predicted responses by more than 5
percent, the monitoring system is Inspected and repaired before sampling begins.
Once the monitor is calibrated, a system integrity check Is performed. Zero
nitrogen and one of the methane standards are sampled through the sample probes
and lines to make sure that the sampling system Is not diluting or contaminating the
samples. A stainless steel tee with a leg left open to the atmosphere is placed on the
end of the probe during this step so that calibration gases being sent from the
cylinders do not pressurize the sampling system.
Once the sample lines are checked out, a response-time test Is performed.
This test consists of Introducing zero gas to the probes and switching to high-level
calibration gas when the system Is stabilized. The response time is the time from the
concentration change until the measurement system response, and It is equivalent to
95 percent of the response for the high-level calibration gas. The test Is performed
three times, and results are averaged.
D-6

I
Sampling Procedures I
At the start of the test day, the monitor is calibrated and a system integrity
check is performed. Each sample line is also leak-checked by capping the end of the
probe and observing the sample flow rotameter level on the hydrocarbon monitor. If
no flow is indicated by the rotameter, the leak check is considered acceptable.
Daily calibrations for each range are performed with three calibration standards
(low-level, mid-level, and high-level) and zero nitrogen. Each calibration range is
checked by linear regression calculations, which indicate linear responses and are
used to reduce field data.
When sampling is completed, a calibration drift check is performed on the moni-
tor by introducing the zero and mid-level calibration gas to the monitor. If the cali-
bration drifts for the gases do not exceed 2 percent of span, the pretest calibration 3curve is used to report sample results. If the calibration drift for either gas exceeds 2
percent, the monitor is recalibrated and both sets of calibration data are used In Ireporting the results.
IIII
II
I"

Title: PMM
Date: 4/17/91
DETERMINATION OF PARTICULATE AND METAL EMISSIONS
Sampling for filterable particulate matter and total metals (particulate and gase-
ous) emissions was conducted in accordance with the Methodology for the Determina-
tion of Trace Metal Emissions in Exhaust Gases From Stationay Source Combustion
Processes.* This is the same procedure as that in Subsection 3.1 of the Methods
Manual for Compliance with BIF Regulations.** The particulate determination in this
method is consistent with EPA Method 5.***
Sampling Apparatus
The sampling train used in these tests is assembled by ITAQS personnel and
meets all design specifications established by the U.S. EPA. The sampling apparatus
consists of:
Nozzle - Borosilicate glass with an accurately measured round opening.
Probe - Borosilicate glass with a heating system capable of maintaining a mini-mum gas temperature of 250 F at the exit end during sampling.
Pitot Tube - A Type-S pitot tube that meets all geometric standards is used tomeasure gas velocity during each sampling run.
Temperature Gauge - Type-K thermocouple attached to the pitot tube in aninterference-free arrangement with a digital readout to monitor stack gas tem-perature within 5 F.
Filter Holder - Pyrex glass with a heating system capable of maintaining a fittertemperature of 250" * 25" F.
Filter - 87-mm (3-in.)-diameter, Pallflex Type 2500 OAT-UP uhra-pure filter.
* EPA Draft Protocol, July 1988.
** EPA/530-SW-91-010, December 1990.40 CFR 60, Appendix A, July 1990. D-8

Title: PMM IDate: -A4I7I$
IDraft ._Qg - An inclined manometer made by Dwyer with a readability of0.01 in.H 20 in the 0- to 10-in.H 20 range is used. IlmDingers - Five Greenburg-Smith design impingers connectEl in series withglass ball joints. The first, third, and fifth impingers are modified by removingthe tip and extending the tube to within 1.3 cm (0.5 in.) of the bottom of theflask.
Metering System - Vacuum gauge, leak-free pump, thermometers capable ofmeasuring temperature to within 2.8 C (5 F), calibrated dry gas meter, andrelated equipment to maintain an isokinetic sampling rate and to determine Isample to volume. The dry gas meter is made by Rockwell, and the fiber vanepump is made by Gast.
Barometer - Aneroid tube type to measure atmospheric pressures to±2.5 mmHg (±0.1 in.Hg). g
Sampling Procedure
Pallflex filters are desiccated for at least 24 hours and weighed to the nearest I0.1 mg on an analytical balance. One hundred mL of 5 percent nitric acid/10 percent
hydrogen peroxide solution are placed in each of the first two impingers; the third and m
fourth impingers contain 100 mL of acidic potassium permanganate solution; and the
last impinger contains 200 to 400 g of silica gel. IThe train is set up with the probe as shown in Figure PMM-1. The sampling
train is leak-checked at the sampling site prior to each test run by plugging the inlet to
the nozzle and pulling a 15-in.Hg vacuum, and at the conclusion of the test by plug-
ging the inlet to the nozzle and pulling a vacuum equal to the highest vacuum reached
during the test run.
The pitot tube and lines are leak-checked at the test site prior to and at the
conclusion of each test run. This check is made by blowing into the impact opening i
of the pitot tube until 3 or more inches of water is recorded on the manometer and
then capping the impact opening and holding it for 15 seconds to ensure that it is leak 3free. The static-pressure side of the pitot tube is leak-checked by the same proce-
dure, except suction is used to obtain the 3-in.H 20 manometer reading. 5Crushed ice is placed around the impingers to keep the temperature of the gas
leaving the last impinger at 68 F or less. During sampling, stack gas and sampling 3D-9 I

Title: -PMM
LUI--Lu
0>
> ,
r- - ---
I *1I0(
-oox C I -r
pu- LU
I.< 0UJ
LUU
LU 1 0LI ~L U 1 - - I-- -
_SI
0 0 > ,I-LA 2 cc
L D-cc

Title: PMMIDate: 4/17/91
itrain data are recorded at each sampling point. Sampling rates are determined with
the aid of a programmable calculator, and all samp :. data are recorded on the Emis- Ision Testing Field Data Sheet.
Recovery Procedures IUpon completion of each sample run, the sampling train is allowed to cool and 3
is then disassembled into sections. The probe and impinger sections are sealed and
carefully transported to the cleanup area, IThe amount of moisture collected is determined volumetrically using a graduat-
ed cylinder or by weighing each impinger before and after the sample run. After being 3weighed, the silica gel is discarded. Figure PMM-2 is a schematic of the sample re-
covery performed on the different sample fractions. The samples are recovered as
follows:
Container NQ. 1 - The filter is placed into a petri dish, sealed, and labeled. IContainer No. 2 - The fiiter holder, probe, and nozzle are rinsed with acetone torecover particulate. A nylon brush is used to remove particulate. The rinse isrecovered in a glass jar.
Container No. 3 - The nozzle, probe, and filter holder front halves are rinsed Iwith 0.1 N HN0 3 into a leak-free polyethylene container.
The contents of the first two impingers and a 0.1 N HNO 3 rinse of the filter t'old-er backhalf and connecting glassware are placed in the same leak-free polyeth-ylene container. The container is sealed and labeled, and the liquid level ismarked.
Container No. 4 - The contents of the third and fourth impingers and an acidi- 3fled potassium permanganate rinse are placed in an ember glass container.The container is sealed and labeled, and the liquid level is marked.
Blanks of each reagent are taken in the field for preparation and analysis in a
manner identical to that for the samples. For each project, the blanks consist of one 3or more of the following:
1) Field blank - A sampling train is set up, leak-checked, recovered, and Ianalyzed as a sample.
DD-11 I

Title: PMM
Date: 4/17/91
Fi7ter Probe Liner Fitter Holder and Impingers Last
E Nozzle Impingers 1 & 2 1 3&J4 Impinge'
Brush & RinseAcetone
GlassBottle
Remove Filter with Rinse With Measure Implnger Measure Impinger WeighTeflIon Coated 0-1 N HN03 (",cntents Contents Silica Gelo..
Tweezers andPlace in Peto Dish
Recover Contents Recover ContentsAnd Rinse Wrth and Rinse With Discard
0.1 N HNo3 4% KMnlOOH2•• 4
IIContainer # I Container #3 [ otiner ]
Plastic Polyethylene Amber GlassPetri Dish Bottle Sole
Figure PMM-2. Multimetals train recovery procedurpes.
D-12

Title: PMM iDate: 4/17/91
2) Reagent blank - A sample of each reagent used is taken and analyzedeither separately or by combining them in the same proportion as thatiused for samples.
3) Blank spike - A set of blank reagents is taken and combined in the same 3proportion as was used for the samples. Prior to analysis, the blank setis spiked with a known amount, of each metal.
A diagram illustrating sample preparation and analysis procedures for each of
the sample train components is shown in Figure PMM-3. iSample Preparation and Analysis, Particulate
Container No. 1 - The filter and any loose particulate matter from this sampleare placed into a tared weighing dish, desiccated for 24 hours to a constantweight, and weighed to the nearest 0.1 mg. I
Container No. 2 - The acetone washings are transferred to a tared beaker andevaporated to dryness at ambient temperature and pressure, desiccated for 324 hours to a constant weight, and weighed to the nearest 0.1 mg.
Sample Preparation and Analysis, Metals iContainer Nos. 1 and 2 - The filter with its filter catch and the acetone residueare divided into pnrtions containing approximately 0.5 g each and placed into nthe analyst's choice of either individual microwave pressure-relief vessels orParrt Bombs. Six mL of concentrated nitric acid arid 4 mL of concentratedhydrofluoric acid are added to each ves.sel. For microwave heating, the sample Ivessels are microwaved for approximately 12 to 15 minutes (in intervals of 1 to2 minutes) at 600 Watts. For conventional heating, the Parr Bombs are heatedat 140 C (285, F) for 6 hours. The samples are then cooled to room tempera-ture and combined with the acid-digested probe rinse.
Container No. 3 - If necessary, the pH of this sample is lowered to 2 with con- Icentrated nitric acid. After pH adjustment, the sample is rinsed into a beakerwith water, and the beaker is covered with a ribbed waichglass. The samplevolume is reduced to approximately 20 rnL by heating on a hot plate at a temperature just below boiling. The sample is then digested as follows:
a) 30 mL of 50 percent nitric acid is added to the sample, and thesolution is heated for 30 minutes on a hot plate at a temperaturejust below boiling. I
b) 10 mL of 3 percent hydrogen peroxide is added, and the solutionis heated for an additional 10 minutes.
D-13 D-13
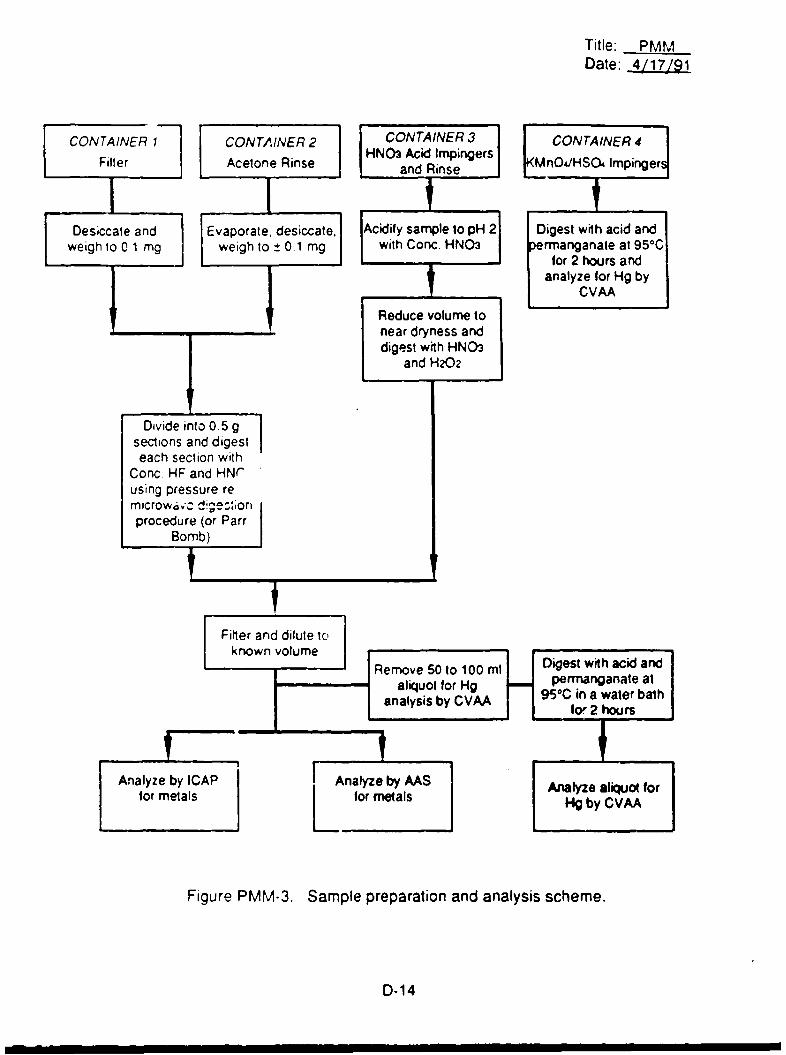
Title: PMMDate: 4/17191
CONTAINER 71 CONTAUNER 2 CONTAINER 3 CONTAINER 4F HNO3 Acid Impingers nO,/HS04 ImpingersFilter Acetone Rinse and Rinse M
T ll
Desiccate and Evaporate, desiccate, Acidify sample to pH 21 Digest with acid andweigh to 0 1 mg weigh to ± 0.1 mg with Conc. HN3I perrnanganate at 950C
I for 2 hours andanayzeforHg by
Reduce volume tonear dryness anddigest with HNO3
and H202
Divide into 0.5 g Isections and digesteach section with
Conc. HF and HN-using pressure remicrowo,,, dg•eszoriprocedure (or Parr
Bomb)
SFilner and dilute to
Analyze by ICAP Analyze by AS Anayz aliquoi forfor metalsvL f
Figure PMM*3. Sample preparation and analysis scheme.
D-14

Title: PMMDate: 4/17/91
Ic) 50 mL of hot water is added, and the solution is heated for an
additional 20 minutes. 1After digestion, the remaining sample is combined with the contents of Con-tainer 1. This combined solution of the acid-digested filter, probe, and proberinse and the impinger contents is filtered by using Whatman 541 filter paper.
The filtered solution is then divided into three fractions. The first fraction is an- 3alyzed by inductively coupled argon plasma emission spectroscopy (ICAP) inaccordance with EPA Method 200.7 (40 CFR 136, Appendix C) which is thesame as Method 6010 from SW 846.* The second fraction is analyzed by 3graphite furnace atomic absorption spectroscopy (AAS). The third fraction isthen digested and analyzed for mercury by cold vapor atomic absorption(GVAA) spectroscopy.3
The following list shows the methods normally used for each metal. The listeddetection limits are shown in micrograms per sample; actual detection limits willvary depending on blank levels, any dilutions made to account for high levels ofmetals, or interferences. The detection limit for mercury includes the permanga-nate fraction.I
Normal procedure Optional alternate procedure
ho-iral detec- Nominal detec- 3MetaL Method No., tion lirrit. -A Method No.* tion limit. 14
Antimony ICAP 60;C 30 AA 7041 2Arsenic MA 70E 0 3 - - -
Car.o- I CA 60IC" 0.5 -Beryllium ICAP 6C,;C 0.7 -
Ca c,,i Ur ICAP 6ciC 1 -
Chror u-n ICAP 6ciCl 3 - -Copper - - [CAP 6010 3Lead AA 7421 0.4 ICAP 6010 60
Nickel I- CAP 6010 10Manganese - [CAP 6010 1Mercury AA 74%C 0.2 - -Seleniium - - A 7740 0.5
Silver AA 7761 0.1 - -
Thallium ICAP 6010 120 AA 7841 0.7 1Zinc - - - [CAP 6010 4
Container No. 4 - A known aliquot of the sample is taken and diluted to approxi-mately 1120 mL with mercury-free water. Approximately 15 mL of 50 percentpotassium permanganate solution, 5 mL of 50 percent nitric acid, 5 mL of con-centrated sulfuric acid, and 9 mL of 5 percent potassium sulfate are added tothe sample. The sample is then heated for 2 hours at 95"C in a convectionoven or water bath. After cooling, 5 mL of hydroxylamine hydrochloride
* Test Methods for Evaluating Solid Waste: Physical/Chemical Methods, SW 846,
Third Edition, September 1988.D-15 I

Title: PMMDate: 4/17/91
solution is added and mixed with the sample. Then 7 mL of stannous chloride
is added and the sample is analyzed for mercury by CVAA spectroscopy.
Normal analytical quality assurance measures include daily full instrument ca&-
bration (ICAP is a zero and standard; AAS is a zero and minimum three standards),
analysis of a method blank, analysis of a laboratory control sample (LCS, a method
blank spiked with a known quantity of each metal), analysis of one sample by ICAP in
duplicate, performance of all AAS analyses in duplicate, and performance of a post-
digestion spike for each metal analyzed by AMS. For specific projects, a matrix spike
may be designated for mercury in the permanganate fraction.
D-16

Title: E-2 IDate: 10/16/90 I
III
APPENDIXE 3CALIBRATION PROCEDURES AND RESULTS
IIIIIII1II
E-oI I
I

CALIBRATION PROCEDURES AND RESULTS
AM of the equipment used is calibrated in accordance with the procedures out-
lined in the Qualit, Assurance Handbook for Air Pollution Measurem••t Systems. Vol-
ume, 1. " The following pages describe these procedures and include the data sheets.
"EPA 600/4-77-027b.
E-2

Nozzle Diameter u
Each nozzle used in these tests is ý,alibrated by making three separate mea- I-surements and calculating the average. If a deviation of more than 0.004 inch is found
ibetween any two measurements, the nozzle is either discarded or reamed out and
cemeasured. A micrometer is used for measuring. These calibration data are shown
in the following Nozzle Calibration data sheet(s). 3
3-IIIIIIIIIIII
E-3
I

NOZZLE CALIBRATION
Date p-& -/ Calibrated by.-J
identification D1 , in. D2 , in. D3, in. AD, in. Vnumber 11 V
1?- .104 12
where:D1 3 = nozzle diameter measured on a different diameter, In.
Tolerance = measure within 0.001 in.
AD = maximum difference in any two measurements, in.Tolerance = 0.004 in.
D avg average of DI, D2 , and D3 .
Nozzle calibration data.
E-4
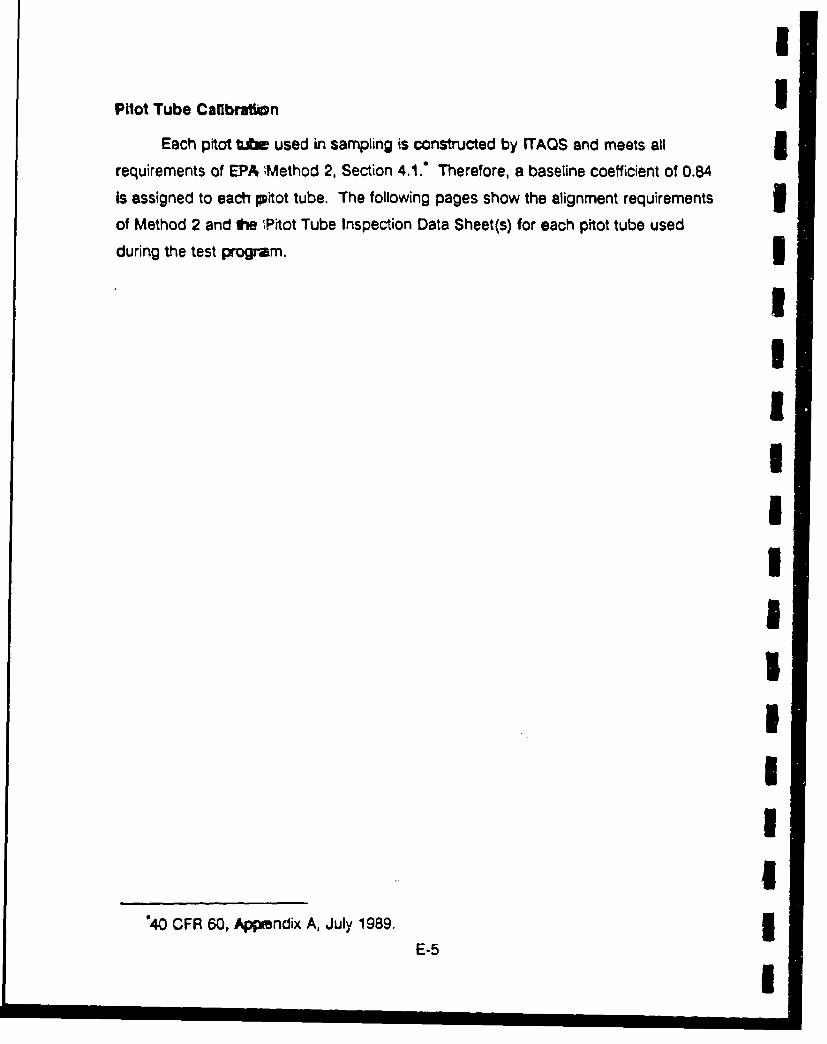
I
Pilot Tube Calbratgon
Each prtot Ut used in sampling is constructed by ITAGS and meets all 5requirements of EPA ,Method 2, Section 4.1. Therefore, a baseline coefficient of 0.84
is assigned to each pitot tube. The following pages show the alignment requirements 3of Method 2 and the !Pitot Tube Inspection Data Sheet(s) for each pitot tube used
during the test program.
IUIUIIIIIII
"40 CFR 60, Appmndix A, July 1989. 3E-5 I

TRANSVERSETUBE AXIS I
I.FACEOPENINGPLANES
(a) ENDVIEW
A-SIDE PLANE
LONGITUDINAL P NOTE:
TUBE AXIS A 1.05 DtsP1 I-SODt
0.48 cm S Dt s 0.95 cm
(3/16 In.) (3/8 In.) B-SIDE PLANE
(b)
-4 -A oTBE(c)
Properly constructed Type S pitot tubes shown in: (a) end view, face openingplanes perpendicular to transverse axis; (b) top view, face opening planes parallel tolongitudinal axis; (c) side view, both legs of equal length and centerlines coincidentwhen viewed from both sides. Baseline coefficient values of 0.84 may be assigned topitot tub s constructed this way.
E-6

,I
TRANSVERSETUBEAXIJ A>.~- 6A I
TUBE AXISTUE AI N -- ."
(ce B17I(d)
- (+ or0
1V" I
A
(g) UTypes of face-opening misalignment that can result from field use or Improper j
construction of Type S pitot tubes. These will not affect Cp as long as a, and a are10", B, and B2 are <5", z is <0.32 (1/8 in.), and w is <0.08 cm (1/32 in.).
E-7
I
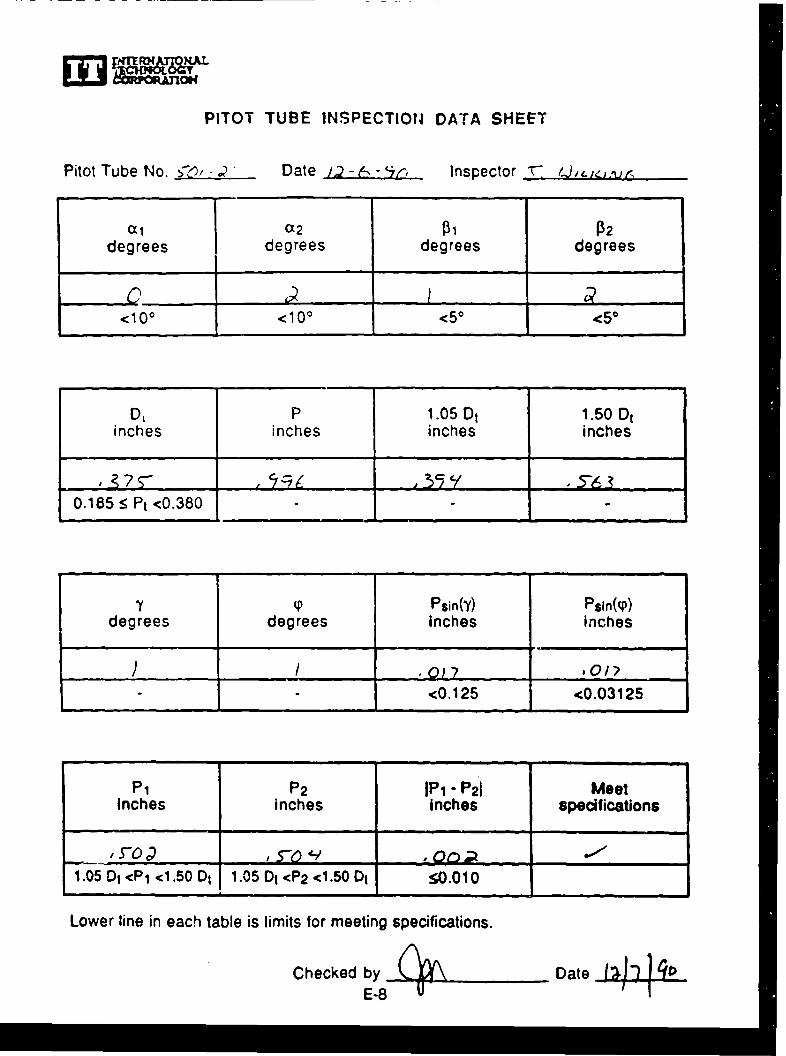
PITOT TUBE INSPECTION DATA SHEET
Pitot Tube No. 57'- Date 2--i Inspector . .
al a2 01 02degrees degrees degrees degrees
<100 <10° <50 <50
D, P 1.05 Dt 1.50 DIinches inches inches inches
0.185 5 Pt -<0.380
y ( Psin(Y) Psin((P)degrees degrees Inches inchtes
). / •0)? 100<0.125 <0.03125
P1 P 2 IPI "P 2 1 Meetinches inches inches specifications
_ _ _, _O _ _ _,__ _ _ _, , .0 4_/ A_ _ _ _ _ I
1.05 D1 <P 1 <1.50 Dt 1.05 Dt <P2 <1.50 DI .0.010
Lower line in each table is limits for meeting specifications.
Checked by Date

Wo" IPITOT TUBE INSPECTION DATA SHEET 3
Pitot Tube No. Jlb Date j 2 q.., Inspector 3 1J,,, 3al a2 01 02 I ..
degrees degrees degrees degrees
<100 <100 <50 <50 II
D, P 1.05 DI 1.50 Dtinches inches inches inches
.3.7.5- , ____ _ .. '.3 ./..__3
0.185•5 Pt <0.380 3
Y Y Psin(Y) Psin(P) Idegrees degrees Inches inches
.0I ,o/? - 0 /,7 1 I
<0.125 <0.03125' ~I.
IP1 P2 IPl - P21 Meet
inches Inches inches specifications
1.05 DI <P 1 <1.50 Di 1.05 DI <P 2 <1.50 DI •:0.010 ILower line in each table is limits for meeting specifications.
Checked by Date l4 a. o
E-9
I

PITOT TUBE INSPECTION DATA SHEET
Pitot Tube No. /iCu7 - Date - Inspector L LA)tLA.-v..
al CL2 031 2degrees degrees degrees degrees
<100 <10 T <50 <50
Dt P 1.05 Dt 1.50 Dtinches inches inches inches
0.185 5 Pt <0.380
I Psin(Y) Psin(W)degrees degrees inches inches
<0.125 <0.03125
P1 P 2 IP1 - P2 1 Meetinches inches inches specifications
1.05 D1<Pj <1.50 Dt 1.05 D1 <P 2 <1.50 D1 .0.010
Lower line in each table is limits for meeting specifications.
Checked by _ _Date DateE-10

Dry Gas Meter and Orifice MeterI
The following page shot i's the Calibration Setup used for the initial and post-teti 3calibration. A wet-test meter with a 2-cubic-feet-per-minute capacity and ± 1 percent
accuracy is used. The pumnp is run, for approximately 15 minutes at an orificemanometer setting of 0.5 in.H 20 to heat up the pump and wet the interior surface ofthe wet-test meter. The information in the following example Calibration Data Sheet is3gathered for the initial calibration; the ratio of accuracy of the wet-test meter to the dry-test meter and the AH@ are then calculsted.3
Post-Test Meter Calibration Check
A post-test meter calibration check is made on each meter box used during the
test to check its accuracy against the last calibration check. This post-test calibration5
must be within ±:5 percent of the initial calibration. The initial calibration is performedas described in APTD-0576. The post-test calibration is performed by the same3meithod. Three calibration runs are made by using the average orifice setting obtained
during each test run and setting the vacuum at the maximum value obtained during3
each test run. The post-test calibration check indicated that all three runs for eachmeter box were within the i 5 percent range allowed by EPA Method 5. 3
The Parliculee Sampling Meter Box Initial Calibration and Post-Test Calibration
data sheets are included in the following pages.3
40 CFR,ý0, App-. -'ýx A, July 19ý%-.LI I1

METER SCY GLASS TUBE
MANOMETER
0
VALVE
Calibration setup.
DATE METER BOX NO__
BA E'TRIC PRE S.4.S.LP. P tr It, RY GAStETERNO
ORFICE GAS VOLUME GAS VC'I.LME DRY GAS METERMANOM4ETER WET TEST DRy GAS WET TEST - -
ETTiG METER MEER MTE.R PLET OUMtT. AVERAGE TIME
frL 2 0 ft 3 1.3 1 q: IF AM*
05S
1 •0 5
15 10
20 103C ¶0
AVERAGE
V, Pbm td 0) SmAWa4m
& MT vd ft TM)fw# 4I0) v .o06S 0034.6
1.0 0.0737
1.6 0Cl0
20 0147
40 024
Y % b11O ofe lfracy o0 wet %at fftlw ID ry owt ffwUv Tiam• * t 0.01
*e O f 0' prmade dofbtwv pal J vv" 0 76 Lf• Of 4w &I I F " • 9 2 b•h OfV'wcu'y. &ý H ) Taiwutm.10 is
Calibration data sheet.
E-12

0 C4. .
ti o t 0.
z rz 3~ .
b. 1
0 :0
CCL 0 4 _
N4m m w0 4 N N codia il
-JD
o 1
~~~~ m Jwm
E-1 3

I I-*I ... *,I;• I"" I ,
. I . .. .
.VIC; I -,.l .'9
I i.,.If --,
I *, 1W , * I ,A,
"- -- -.:,. .. . ' , I '
I.) ' • I I Ii
:,.c . , I -I -- I I-,1' .iiI,•
.- 11 , i, .Vt ' 0 I 60 I, i
cr- I. ~
.-~ --.. e. o Iz. d o'o CL
, Ie l-.I 1• I.... I !'9 "
l:: ••. I I I
~ 7 i ,l iw I4 :t4 l
140W1 4si
W lio jo 4
*I 1::.I .f
45 '~~*~bP~ .1 ~ AII e.v
ii-e ICY 6i
E*w

0o 0 0 C0
& 0 l
0 TO) LL Vi>
U.. Chi ?C-P 0 -
ILI I0 soI
'E 0~ N8 - '!AA- A
at p m I c l!ie L Nej 0 4 0
u too
Cl E' f
ILJ Li
E-151

I I" I ZI I' lI II
- I * a _.a.,
•" I 1H,.."* iT._
1% s-I I I
6'....h... I, .9,
• . "". I.•,m
.• ,,,.lI ll Ii l l tqlI4, O
f S
" 41.'e!C I 11 .
I~I.
M Ii
P- .j*- i44 14-I
100r 4 __0
11, WE * ~mw~LA~ 14,044
II IIIa-~~0 %.-H-]
'I', i'' ' H I#A
U-1 v'illi I
~ ~ ,b
1. 40 46 * 4.0. m
Cd )P- 46 4kI-- 10' $2 I
C;;
FAA mmw

cc aIEI
0. L6Ii%
ON 10 . r. r- pýP ,t. P- P- -r- F r 0
= I- .n en '0 If
IxIimidc1
LN4 4)0R > j n - Ln %3tE 0 l qw%
0p. p. p. p.00 0
E C
p
E-17I

V)-
I!. L I': >~i ~I -
J "-II IiII,.) i
-~S -X-,.4 I I I
*s 40 C*L CL N
6m. 40G 0
~?~~ienr
I~" Io I )4
.II
ull ra 'h l at
~.I* *k
4C.L
w il'a~~~~1 )u3p9II 80I- ~ - *(*4* IOII :4LHH
IPlKI I
O~f~'M'&'~ *t'N1i a 4E.2IA
~pt 4 a ft.N N IN ' ~V. - I)
c 0
rr ~ ' '-LaiJ z''111
I -' '1'~ I 4E3-18
iI
Stack Thermocouples
Each thermocouple is calibrated by comparing it with an ASTM-3F thermometer 3at approximately 32' F, ambient temperature, 100 ,F, and 500 F. The thermocouple
read within 1.5 percent of the reference thermometer throughout the entire range when -
expressed in degrees Rankine. The thermocouples may be checked at ambient
temperature at the test site to verify the calibration. Calibration data are included in 3the following Thermocouple Calibration Data Sheet(s).
EI
I_iiiU
I!
IU
E-19 I
I

ENodTHERMOCOUPLE CALIBRATION DATA SHEET
Date: D/.V-.(1 ,n Thermocouple No: • 7/
Calibrator: T Reference: 4ý5r,,7 -30=
Range: .'
Reference
thermometer ThermocoupleReference temperature temperature Differencepoint no. Source* OF OF
1 2 7Q_ _ _
2 1 3?
33 30
44 . , -
Source: 1) Ice bath2) Ambient3) Water bath4) Oil bath
Percent difference.
Reference temD. OR - thermocouole temp. °R xl10%
(Reference temp. OR)
where OR = OF + 460
Each percent difference must be less than or equal to 1.5%.
Checked by Date
E-20

I
Digital Indicators for Thermocouple Readout UA digital indicator is calibrated by feeding a series of millivolt signals to the input
and comparing the indicator reading with the reading the signal should have gene-
rated. Error did not exceed 0.5 percent when the temperatures were expressed in
degrees Rankine. Calibration data are included in the following Thermocouple Digital
Indicator Calibration Data Sheet(s). 3
IIIU
III 'IIII
E-21 I

lTIUjlr.-9trL( VICI1A'. Itz;I..t.AIUI
CALIEFF&:ICF PATA SHPED
SERIALNO... _. .. .. ... ..... z. _ M..s .. . .
S.......... ............... °........ .... ... ° °... °.. ......... +°.°.o..-... - -°o.. -
; (LLA.E. : DIGITAL iWDICATOE :
T 7ST PCl!; MILLiV'j T t" ¶ A:", : ILk'iTUR[ L.It, DlFfiCE
IASIC L ee. F : dt(. F : s
1 *0.6?2 0.. ... . .. . ...... .. .. -- - - -- - - - ...... •... .... ..... o..... .
2 : 1.52U too10
3 3.e]S 200- *........ ...... ........ ......
t.0 2; : 0O: : M ,3 6 :* + + i + + : * I I:, - 1_-..
o--- . ...- I .... .. . ...... ...... . . ... ----- --------- ---
S: 6.34 o : 7.. ...... .. -. ....... . .. -- - - - - - - •--- ---- --- ---------- • o~
S.......... :.............. : . . ......... , ......... ........... , -,_6 : 10.563 : s+o : o:/ :o
7 2; 2Si 101,c ~............... ....... ..... ......... . -, .. . ... ..
6 : 29.315 1" CA , ?.......................... ............... ....... ...... ...
o .,3..I.6 .J 1e-c.-
*+ I I10' A2.732 3gC%10
ftrtfint d1ifevez:e gsis be less' th~an of equal to *.jSt.i.13
(Equ!vAlhrt !toaarle, deg. a - 91g16l lIdcattr ilesperalyf. del. 1)1001).. d.. ... I .............. ... ..6... .. .............. .... .... .. .
f[1j.Iwalent a :a rd•.II
Whef, e:.dri. II del. F 4 46D

DIGITAL INDICATQR CALIBRATION
DATA S
DATE: - ,21 INDICATOR: FT- -. 3OPERATOR: T ).4)11 K I3J
Equivalent Digital IndicatorTest Point Temperature, 'F Temperature, OF Difference,*
Number .Te . Tdi %
1 0-/I
2 100 i
3 200 !
4 300 i
5 400 I
6 500 17
1000
l
8 1300
9 1600 310 1900 3
__ _ _/__ _ __qZ ,
"PERCENT DIFFERENCE MUST BE LESS THAN OR EQUAL TO 0.5% 1%DIFFERENCE (10.,CR-TdlR)(100) 3
Te',R
Where, OR = OF + 460 IChecked By Date /
E-23 I
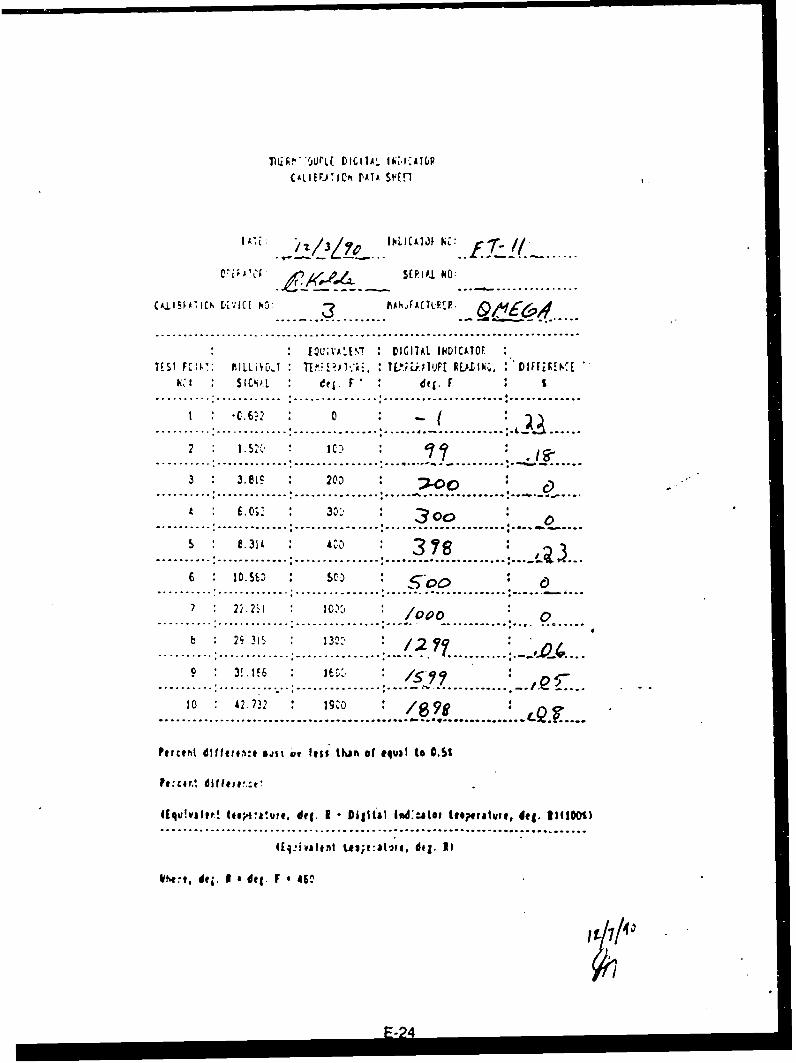
I,~~~~~~ DI III I IC|I I I A' I XI II | A I |P
CALI :F.A:I/Ct, iATA SEI, "
C T :• li3 2 I ;- ý SEP,1101 NO:.. .. ........ ...
(A.LI5iA*'IcF V71.CE so 3 IANJ~ACILRFF..-.. . . ............. -
...... .. . .... ... ....... ...... ... .• .. ,• .... ,i.. .. .. . . . . . . . . . .. o-... . .
* [ Q,;','A 7T : DIGITAL INDICATOF
1 1 Ft. LLiM T T 0r-* T.1-:i .: T ;U TuF[ AU-.(ht, DIF-F(-iW
NI I.52. de.F el1
S.......... ............. ---------------... ; ................... o .............
............ : ............. :......... ..... . . ... . ............ . ......
S.......... o.o.......... . ... --- --- --- --- ........ .... ..... .... oeo .
3 3.81W 20 : X00.... ..... :............ . ........ . . . ..... . ...... ... ...
6.0;2: 335 : ooS.......... :.............. ------- -------.. .. . . ......... . . .
s ~ 37s6 ' . s. : ,: C: )S.......... :............. :... .............. . ....... i................ . ., ,.. .
.......... :............. :............... :.... -- - -- - -........ . .
b 29 Mi /2??S. . . . ............. :............ ... :...... ........... ý . .7 .... ........
YAS~t6 6 *-S.......... :............... ............... :. . . . . . . . .
10 : A2 ., 72 1,..0S.......... :....... .. :.... ................ :...... .............. ._., . .
peictrit dilfitrwe cill Ug lisS than of equal to C.St
1Eju!valur! Its•'lavwg, dug. U " Digitat Isd:auztolesperaluve, deI. 1)1lO01)
f[li2Jvaltnt t:;t:AW tit, d.|. 0I
vtht. dei. I . del. F 4 4560
IE-2/44
Dry Gas Thermocouptes and Impinger Thermocouples iThe dry gas thermocouples are calibrated by comparing them with an ASTM-3F
thermometer at approximately 32 * F, ambient temperature, and a higher temperature
between approximately 100 and 200" F. The thermocouples agreed within 5 " F of the
reference thermometer. The impinger thermocouples are checked in a similar manner
at approximately 32" F and ambient temperature, and they agreed within 2 * F. The 3thermocouples may be checked at ambient temperature prior to the test series to
verity calibration. Calibration data are included in the following Dry Gas Thermometer 3and Impinger Thermocouple Calibration Data Sheet(s).
'1l
IUU
E-25 I

11 V GAIS THEP1l.ICO'JPLECALIBRATION ['AJA SHEET
mee~~'cu. IA~ /r 2-
I JLET
P(,f e:ence FelerenceL'oI nt Source' t h era. o met (-r The rmoco:u plIe
I~.tempe.:ature temperaturfe D'I ff erencedeg. F dec. F deiz. P'
2 3.. .. __ _ _
0'iI TLET
F~txc-I TncE-frefer once.r i 1)t c.ou ICe' thetmoameter Thermocouplelic. tempreratuie temperbturc £'llrerence
oeq. F der. F deg. P'
'Ar L-
t
7 F

CALISF:A71ON ElIATA $SHEET
~~~.F ic f2 ~ F.~e r ~c: r. c:
Nc.tempFerature terh;eyatsir e Difference&g. F dei. F dem. F'P
_ _ _ _ 1 4 _ _ _ __2
Sou1ce t tie 1 mo7te r Ths- mc crtap e.&;e ~r at u: trn~lilur- b'i Tererce
CE~.~ ~ ___ ___ ___ ___ __
1 1 _ _ _ _ _ _
- - ~ 3 _____E-2)7

Efl C7 T C'EA I 'P LE
C L' FI P NIAFLii
~-~~e r --e- rizc
:,i')I zurc~e theruomete-! T!, &r mo ,ziupte
deg. F dec. F deg F''
2 36 -36___
C.-eq. F dej. F dec. P'
E-28
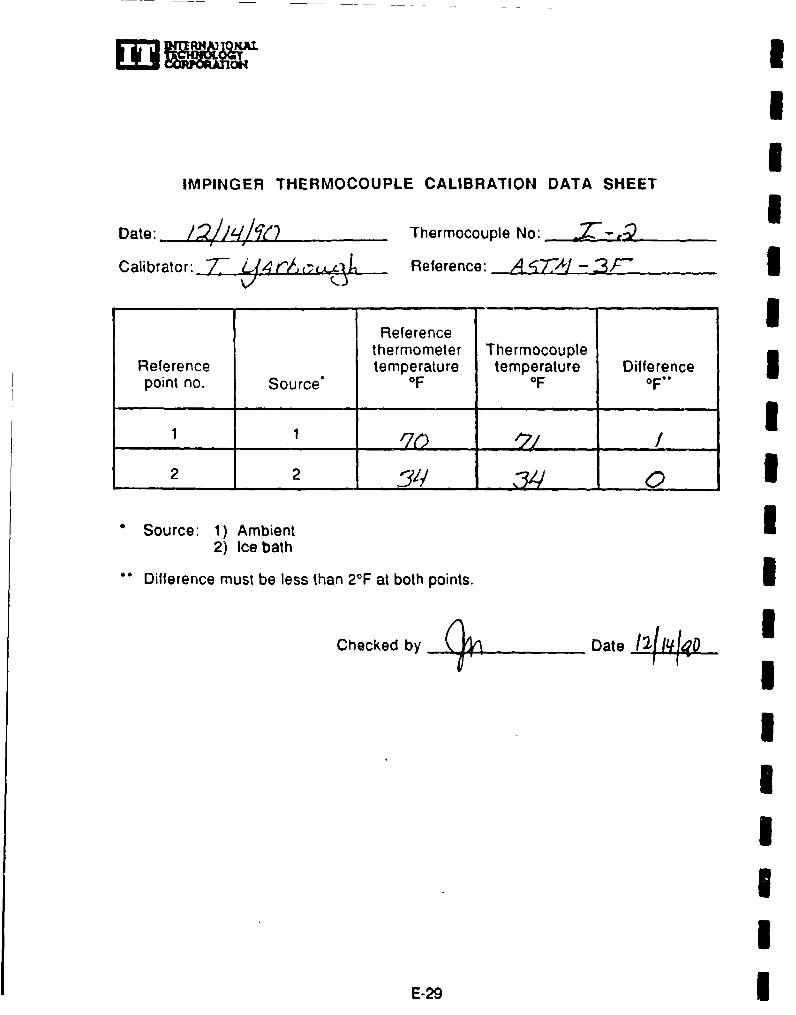
ED Wkl~e I
I
IMPINGER THERMOCOUPLE CALIBRATION DATA SHEET
Date:_________ Thermocouple No: .--
Calibrator: 7 Reference: A4T-*I-3F I
Reference Uthermometer Thermocouple
Reference temperature temperature Differencepoint no. Source' OF OF OF-
2 2 -3
Source: 1) Ambient U2) Ice bath
Difference must be less than 20F at both points. I
Checked by Date 114.
E2
E-29 Ilo

IMPINGER THERMOCOUPLE CALIBRATION DATA SHEET
Date: I__//__I Igo Thermocouple No: .T__5___
Calibrator: L -,, Y __rw,_r_., Reference: A7"A,4- '3I
Referencethermometer Thermocouple
Reference temperature emperature Differencepoint no. Source* OF OF"
1 1 7o 7o 02 2 1_ _ _ 39 _ _ _
Source: 1) Ambient2) Ice bath
Difference must be less than 20F at both points.
Checked by Date Iq44/
E-30

II
IMPINGER THERMOCOUPLE CALIBRATION DATA SHEET
Date:. ____ -_______ Thermocouple No: "- I _.
Calibrator: 77 ,JA-• ./ Reference: 5, T.21 -3
Reference Ithermometer Thermocouple
Reference temperature temperature Differencepoint no. Source' OF OF OF"
1 1 __(_)q___ 0I
2 2 ~
Source: 1) Ambient I2) Ice bath
"Difference must be less than 20F at both points.
Checked by Date I
IIII
E-31 3
Trip Balance
The trip balance is calibrated by comparing It with Class-S standard weights,
and it agreed within 0.5 g. Calibration data are shown in the following Trip Balance
Calibration Data Sheet(s).
E-32
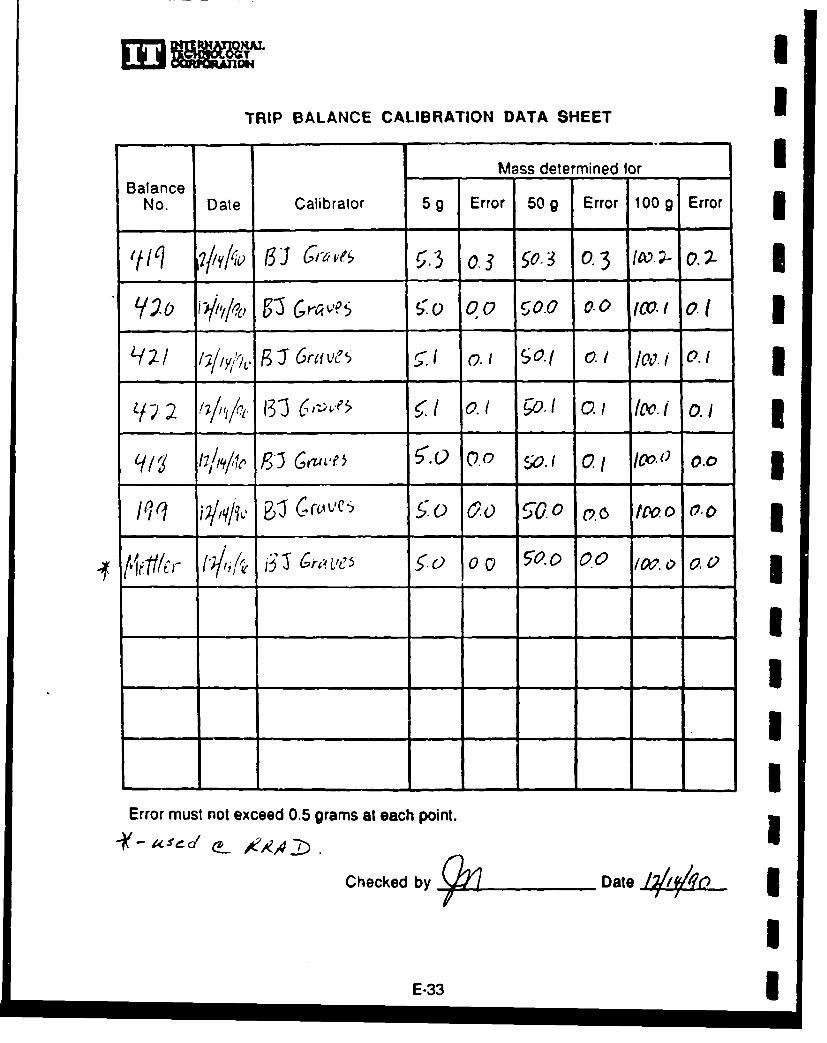
2E1D!WITRIP BALANCE CALIBRATION DATA SHEET I
Balance Mass determined for IBalance i
No. Date Calibrator 5 g Error 50 g Error 100 g Error
'(('1~r 1/v~ 31 ~3 0.3 50-3 0. 3 [W~- #4-
iý120 ( 61/','/ý 5r'0 0C C2 - . 0;.0 [CO. 0a.1
___ _ nI•6r i7 ; .1 0 . (0 i 0.
Error must not exceed 0.5 grams at each point.
oe , ) Checked by __________Date I171W~I
E-33 1

Barometer
The field barometer is calibrated to within 0.1 in.Hg of an NBS-traceable
mercury-in-glass barometer before the test series. It is checked against the reference
barometer after each test series to determine if it reads within 0.2 in.Hg. The barome-
ter read within the allowable limits each time. Calibration data are included in the
following Barometer Calibration Log(s).
E-34
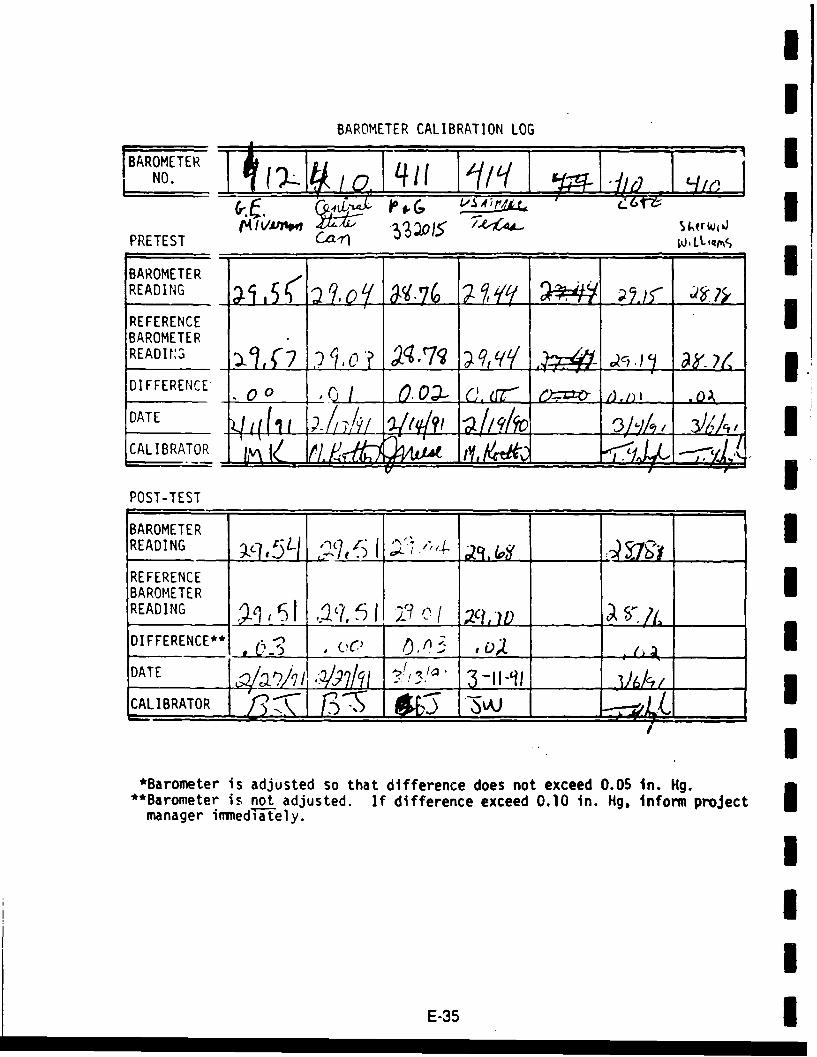
UI
BAROMETER CALIBRATION LOG
IB RMETER _ __ _ _
PRETEST Cail
BAROMETER IREADING p155 i I •A7L , 2 22.• ,REFERENCE UBAROMETERREADVr:S C7 )Qf ~q,ýV
DIFFERENCE .00 ,i o.O•- .
DATE ___l--i. 3k, ,, 3CALIBRATOR
POST-TEST
BAROMETER " IREADING CC'P5 L/ ,gh7 I "' '._
REFERENCEBAROMETERREADING , t%, . - , . , _ '_,__
DIFFERENCE**" Z_ _ IDATE J.A/a.ZJl/ ., . 3-1l-I,
CALIBRATOR B>3- 'S .&•" 1 •$AJ -_.___I
I*Barometer is adjusted so that difference does not exceed 0.05 in. Hg.
"*Barometer is not adjusted. If difference exceed 0.10 in. H-, inform projectmanager immediately.
III
E-35 I

DATE:
5nt97NnJ