Urea induced unfolding of F isomer of human serum albumin: A case study using multiple probes
9
Urea induced unfolding of F isomer of human serum albumin: A case study using multiple probes Basir Ahmad, Ankita, Rizwan Hasan Khan * Interdisciplinary Biotechnology Unit, Aligarh Muslim University, Aligarh 202002, India Received 28 January 2005, and in revised form 10 March 2005 Available online 25 March 2005 Abstract The human serum albumin is known to undergo N F (neutral to fast moving) isomerization between pH 7 and 3.5. The N F isomerization involves unfolding and separation of domain III from rest of the molecule. The urea denaturation of N isomer of HSA shows two step three state transition with accumulation of an intermediate state around 4.8–5.2 M urea concentration. While urea induced unfolding transition of F isomer of HSA does not show the intermediate state observed during unfolding of N isomer. Therefore, it provides direct evidence that the formation of intermediate in the unfolding transition of HSA involves unfolding of domain III. Although urea induced unfolding of F isomer of HSA appears to be an one step process, but no coinci- dence between the equilibrium transitions monitored by tryptophanyl fluorescence, tyrosyl fluorescence, far-UV CD and near-UV CD spectroscopic techniques provides decisive evidence that unfolding of F isomer of HSA is not a two state process. An interme- diate state that retained significant amount of secondary structure but no tertiary structure has been identified (around 4.4 M urea) in the unfolding pathway of F isomer. The emission of Trp-214 (located in domain II) and its mode of quenching by acrylamide and binding of chloroform indicate that unfolding of F isomer start from domain II (from 0.4 M urea). But at higher urea concentration (above 1.6 M) both the domain unfold simultaneously and the protein acquire random coil structure around 8.0 M urea. Further much higher K sv of NATA (17.2) than completely denatured F isomer (5.45) of HSA (8.0 M urea) suggests the existence of residual tertiary contacts within local regions in random coil conformation (probably around lone Trp-214). Ó 2005 Elsevier Inc. All rights reserved. Keywords: N F isomerization; Urea denaturation; Chloroform binding; Multidomain protein; Human serum albumin Over the past four decades, much research has been focused on two central questions: what are the determi- nants of the protein structures, and how does a polypep- tide fold to its unique biologically active state? Folding of a protein in in vitro is likely to differ in many details from that in the cell. However, one feature, which is common in both in vitro and in vivo folding, is the exis- tence of the intermediate conformational state on the folding–unfolding pathway [1,2]. Recent advances in biophysical techniques [3,4] have shown the presence of stable intermediate conformational states in a number of proteins [5–8]. There has been considerable interest in characterizing these partially folded states for gaining an insight into the possible determinants of the protein folds and the mechanism of protein folding [9–14]. The folding process is even more complex in multidomain proteins where each domain may be capable to un- fold/refold independently and interdomain interactions may affect the overall folding topology of the proteins [15–17]. Human serum albumin (HSA) 1 is a monomeric, mul- ti-domain protein of 66.5 kDa. It consists of three 0003-9861/$ - see front matter Ó 2005 Elsevier Inc. All rights reserved. doi:10.1016/j.abb.2005.03.013 * Corresponding author. Fax: +91 571 2721776. E-mail addresses: [email protected], rizwanhkhan1@ yahoo.com (R.H. Khan). 1 Abbreviations used: HSA, human serum albumin; MRE, mean residue ellipticity; I state, intermediate state; Archives of Biochemistry and Biophysics 437 (2005) 159–167 www.elsevier.com/locate/yabbi ABB
-
Upload
independent -
Category
Documents
-
view
1 -
download
0
Transcript of Urea induced unfolding of F isomer of human serum albumin: A case study using multiple probes

Archives of Biochemistry and Biophysics 437 (2005) 159–167
www.elsevier.com/locate/yabbi
ABB
Urea induced unfolding of F isomer of human serum albumin:A case study using multiple probes
Basir Ahmad, Ankita, Rizwan Hasan Khan *
Interdisciplinary Biotechnology Unit, Aligarh Muslim University, Aligarh 202002, India
Received 28 January 2005, and in revised form 10 March 2005Available online 25 March 2005
Abstract
The human serum albumin is known to undergo N � F (neutral to fast moving) isomerization between pH 7 and 3.5. TheN � F isomerization involves unfolding and separation of domain III from rest of the molecule. The urea denaturation of N isomerof HSA shows two step three state transition with accumulation of an intermediate state around 4.8–5.2 M urea concentration.While urea induced unfolding transition of F isomer of HSA does not show the intermediate state observed during unfolding ofN isomer. Therefore, it provides direct evidence that the formation of intermediate in the unfolding transition of HSA involvesunfolding of domain III. Although urea induced unfolding of F isomer of HSA appears to be an one step process, but no coinci-dence between the equilibrium transitions monitored by tryptophanyl fluorescence, tyrosyl fluorescence, far-UV CD and near-UVCD spectroscopic techniques provides decisive evidence that unfolding of F isomer of HSA is not a two state process. An interme-diate state that retained significant amount of secondary structure but no tertiary structure has been identified (around 4.4 M urea)in the unfolding pathway of F isomer. The emission of Trp-214 (located in domain II) and its mode of quenching by acrylamide andbinding of chloroform indicate that unfolding of F isomer start from domain II (from 0.4 M urea). But at higher urea concentration(above 1.6 M) both the domain unfold simultaneously and the protein acquire random coil structure around 8.0 M urea. Furthermuch higher Ksv of NATA (17.2) than completely denatured F isomer (5.45) of HSA (8.0 M urea) suggests the existence of residualtertiary contacts within local regions in random coil conformation (probably around lone Trp-214).� 2005 Elsevier Inc. All rights reserved.
Keywords: N � F isomerization; Urea denaturation; Chloroform binding; Multidomain protein; Human serum albumin
Over the past four decades, much research has beenfocused on two central questions: what are the determi-nants of the protein structures, and how does a polypep-tide fold to its unique biologically active state? Foldingof a protein in in vitro is likely to differ in many detailsfrom that in the cell. However, one feature, which iscommon in both in vitro and in vivo folding, is the exis-tence of the intermediate conformational state on thefolding–unfolding pathway [1,2]. Recent advances inbiophysical techniques [3,4] have shown the presenceof stable intermediate conformational states in a number
0003-9861/$ - see front matter � 2005 Elsevier Inc. All rights reserved.
doi:10.1016/j.abb.2005.03.013
* Corresponding author. Fax: +91 571 2721776.E-mail addresses: [email protected], rizwanhkhan1@
yahoo.com (R.H. Khan).
of proteins [5–8]. There has been considerable interest incharacterizing these partially folded states for gaining aninsight into the possible determinants of the proteinfolds and the mechanism of protein folding [9–14]. Thefolding process is even more complex in multidomainproteins where each domain may be capable to un-fold/refold independently and interdomain interactionsmay affect the overall folding topology of the proteins[15–17].
Human serum albumin (HSA)1 is a monomeric, mul-ti-domain protein of 66.5 kDa. It consists of three
1 Abbreviations used: HSA, human serum albumin; MRE, meanresidue ellipticity; I state, intermediate state;

160 B. Ahmad et al. / Archives of Biochemistry and Biophysics 437 (2005) 159–167
homologous domains encompassing the complete se-quence, each of which displays specific structural andfunctional characteristics [18]. Its overall native threedimensional conformation is stabilized by various intra-and inter-domain forces such as salt bridges, hydropho-bic interactions, and natural boundaries involvinghelical extensions h10 (domain I)–h1 (domain II) andh10 (domain II)–h1 (domain III) existing between threedomains of albumin [18–20]. It is the principal proteinof blood plasma that aids in the transport, metabolism,and distribution of exogenous and endogenousligands[18,19,21].
HSA is known to undergo different pHdependent con-formational transition, the N � F transition betweenpH 5.0 and 3.5, the F � E transition between pH 3.5and 1.2 and N � B transition between pH 7.0 and 9.0[20,21]. Geisow and Beaven [22] proposed that N-F tran-sition involved the unfolding of domain III from the restof themolecule whichwas later verified byKhan et al. [23]using proteolytic fragment serum albumin containing res-idues 377–582. Using three recombinant domains ofHSA, Dockal et al. [20] have provided evidence that theloosening of the HSA structure in the N–F transitiontakes place primarily in domain III.
Urea is known to denature human serum albumin bythree state mechanism with accumulation of an interme-diate state. While formation of intermediate state in theunfolding pathway of HSA has been widely studied [24–27], but there is little understanding about the confor-mational state of different domains at intermediate state[8,26]. As discussed above F isomerisation of HSA dis-plays specific structural characteristic. Unfolding studiesof this protein (F isomer of HSA) will provide powerfulmeans for understanding important structural and func-tional characteristic of the native molecule. In view ofthis, conformational behavior of F isomer of HSA inbuffered urea solution (pH 3.5) was monitored usingfluorescence and CD spectroscopic measurements andthe results were compared with behaviors of nativeHSA molecules in neutral urea solutions.
Materials and methods
Materials
Human serum albumin (HSA) essentially fatty acidfree, lot no. 90K7604; ultra pure urea, lot no. 42K0133were obtained from Sigma Chemical, USA. Chloroformwas purchased from Sisco Research Laboratories, India.
All the other reagents were of analytical grade. HSAwas freed from dimers and highermers by passingthrough Sephacryl-S100 (HR) (76 · 1.8 cm) gel filtrationcolumn.
Protein concentration was determined spectrophoto-metrically using E1%
1cm of 5.30–280 nm [28] on a Hitachi
spectrophotometer, model U- 1500 or alternately bymethod of Lowry et al. [29].
CD measurements
CD measurements were carried out with a Jascospectropolarimeter, model J-720 equipped with a micro-computer. The instrument was calibrated with d-10-camphorsulphonic acid. All the CD measurements weremade at 25 �C with a thermostatically controlled cellholder attached to Neslab�s RTE-110 water bath withan accuracy of ±0.1 �C. Spectra were collected with scanspeed of 20 nm min�1 and response time of 1 s. Eachspectrum was the average of four scans. Far-UV CDand near-UV CD spectra were taken at protein concen-trations of 1.8–2.0 and 20 lM with a 1 mm and 1 cmpath length cell, respectively. The results were expressedas mean residue ellipticity (MRE) in deg cm2 dmol�1
which is defined as MRE = hobs/(10 · n · l · Cp), wherehobs is the CD in millidegree, n is the number of aminoacid residues (585), l is the path length of the cell, andCp is mole fraction. Helical content was calculated fromthe MRE values at 222 nm using the following equationas described by Chen et al. [30]:
%a-helix ¼ ðMRE222nm � 2340=30300Þ � 100. ð1Þ
Fluorescence measurements
Fluorescence measurements were performed on Shi-madzu spectrofluorimeter model RF-540 equipped witha data recorder DR-3. The fluorescence spectra weremeasured at 25 ± 0.1 �C with a 1 cm pathlength cell.The excitation and emission slits were set at 5 and10 nm, respectively. Intrinsic fluorescence was measuredby exciting the protein solution at 280 or 295 nm andemission spectra were recorded in the range of 300–400 nm. A stock solution of ANS was prepared in dis-tilled water and its concentration was determined usingan extinction coefficient of eM = 5000 M�1 cm�1 at350 nm. For ANS fluorescence in the ANS bindingexperiments the excitation was set at 380 nm and theemission spectra were taken in the range of 400–600 nm.
Denaturation/renaturation experiments
Stock protein solutions (for N and F isomers) wereprepared by exhaustive dialysis of HSA monomeragainst 60 mM sodium phosphate buffer of pH 7.0 and10 mM sodium acetate buffer of pH 3.5. To a 0.5 mlstock protein solution (N and/or F isomer), differentvolumes of the desired buffer were added first; followedby the addition of stock urea solutions prepared in theirrespective buffer (10 M) to get a desired concentrationof denaturant. The final solution mixture (3.0 ml) was
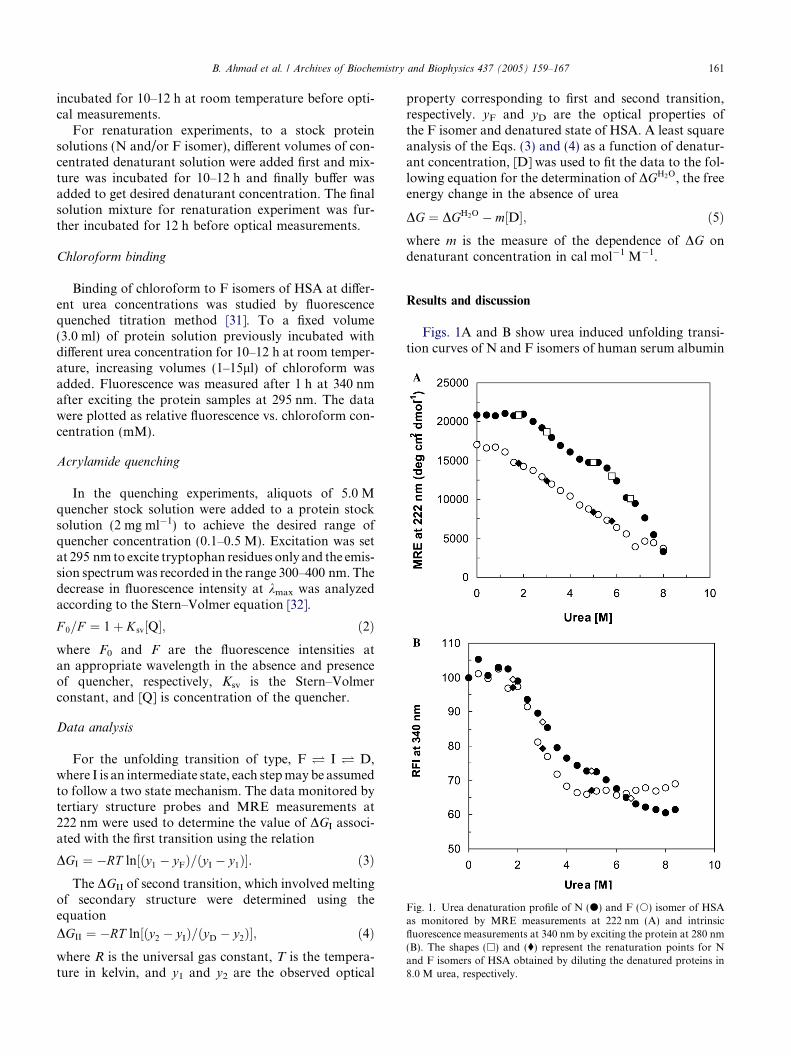
Fig. 1. Urea denaturation profile of N (d) and F (s) isomer of HSAas monitored by MRE measurements at 222 nm (A) and intrinsicfluorescence measurements at 340 nm by exciting the protein at 280 nm(B). The shapes (h) and (�) represent the renaturation points for Nand F isomers of HSA obtained by diluting the denatured proteins in8.0 M urea, respectively.
B. Ahmad et al. / Archives of Biochemistry and Biophysics 437 (2005) 159–167 161
incubated for 10–12 h at room temperature before opti-cal measurements.
For renaturation experiments, to a stock proteinsolutions (N and/or F isomer), different volumes of con-centrated denaturant solution were added first and mix-ture was incubated for 10–12 h and finally buffer wasadded to get desired denaturant concentration. The finalsolution mixture for renaturation experiment was fur-ther incubated for 12 h before optical measurements.
Chloroform binding
Binding of chloroform to F isomers of HSA at differ-ent urea concentrations was studied by fluorescencequenched titration method [31]. To a fixed volume(3.0 ml) of protein solution previously incubated withdifferent urea concentration for 10–12 h at room temper-ature, increasing volumes (1–15ll) of chloroform wasadded. Fluorescence was measured after 1 h at 340 nmafter exciting the protein samples at 295 nm. The datawere plotted as relative fluorescence vs. chloroform con-centration (mM).
Acrylamide quenching
In the quenching experiments, aliquots of 5.0 Mquencher stock solution were added to a protein stocksolution (2 mg ml�1) to achieve the desired range ofquencher concentration (0.1–0.5 M). Excitation was setat 295 nm to excite tryptophan residues only and the emis-sion spectrumwas recorded in the range 300–400 nm. Thedecrease in fluorescence intensity at kmax was analyzedaccording to the Stern–Volmer equation [32].
F 0=F ¼ 1þ Ksv½Q�; ð2Þwhere F0 and F are the fluorescence intensities atan appropriate wavelength in the absence and presenceof quencher, respectively, Ksv is the Stern–Volmerconstant, and [Q] is concentration of the quencher.
Data analysis
For the unfolding transition of type, F � I � D,where I is an intermediate state, each stepmay be assumedto follow a two state mechanism. The data monitored bytertiary structure probes and MRE measurements at222 nm were used to determine the value of DGI associ-ated with the first transition using the relation
DGI ¼ �RT ln½ðy1 � yFÞ=ðyI � y1Þ�. ð3ÞThe DGII of second transition, which involved melting
of secondary structure were determined using theequation
DGII ¼ �RT ln½ðy2 � yIÞ=ðyD � y2Þ�; ð4Þwhere R is the universal gas constant, T is the tempera-ture in kelvin, and y1 and y2 are the observed optical
property corresponding to first and second transition,respectively. yF and yD are the optical properties ofthe F isomer and denatured state of HSA. A least squareanalysis of the Eqs. (3) and (4) as a function of denatur-ant concentration, [D] was used to fit the data to the fol-lowing equation for the determination of DGH2O, the freeenergy change in the absence of urea
DG ¼ DGH2O � m½D�; ð5Þwhere m is the measure of the dependence of DG ondenaturant concentration in cal mol�1 M�1.
Results and discussion
Figs. 1A and B show urea induced unfolding transi-tion curves of N and F isomers of human serum albumin

Fig. 2. Near-UV CD spectra of N isomer (solid line) and F isomer inthe absence (dashed line) and presence of 4.4 (dashed-dotted line) and8.0 M (dotted line) urea (A). Urea denaturation profile of F isomer ofHSA as monitored by MRE measurements at 268 nm (B). The filledcircles (d) in (B) represent the renaturation points obtained by dilutingdenatured F isomers in 8.0 M urea concentration.
162 B. Ahmad et al. / Archives of Biochemistry and Biophysics 437 (2005) 159–167
(HSA) as monitored by the measurements of MRE at222 nm and intrinsic fluorescence intensity at 340 nmafter exciting the protein at 280 nm. Urea inducedunfolding of N isomer (filled circle) of HSA, followeda two-step three state transition with accumulation ofan equilibrium intermediate state (I state) around 4.8–5.2 M urea concentration. The intermediate sate re-tained �40% a-helix compared to 58% found in the Nstate as calculated from MRE value at 222 nm by themethod of Chen et al. [30]. These results are in agree-ment with earlier observation made for a number of pro-teins including HSA and BSA [8,24–27,33–36]. At pH3.5, where HSA exist as F isomer, urea induced unfold-ing transition curve of HSA was lacking intermediatestate (open circle Figs. 1A and B) observed in its N iso-meric form around 4.8–5.2 M urea. As shown in Fig. 1(open circle) urea induced unfolding transition of F iso-mer started at lower urea (1.6 M) concentration and alsocompleted at lower urea (6.4 and 4.4 M as monitored bythe measurements of MRE at 222 nm and intrinsic fluo-rescence intensity at 340 nm, respectively) concentrationcompared to N isomer.
Khan and Salahuddin [37] and Dockal et al. [20],using serum albumin fragment (domain III) and recom-binant domain III, respectively, have provided evidencethat the N � F transition is accompanied by majorconformational changes in domain III without affectingdomain I and II. Moreover, F isomer and I state in theunfolding pathway of N isomer of HSA are found toposses� similar helical contents (�40%). Taken together,absence of I state in the unfolding transition of F iso-mer, equal loss of helical structure during N � F tran-sition and I state formation and unfolding of domain IIIduring N � F isomerization provide direct evidencethat unfolding of domain III is mainly responsible forI state accumulation. The unfolding of F isomer maybe attributed to the unfolding of domain II and I. Thebeginning of unfolding transition of F isomer at lowerurea concentration can be understand in view of unfold-ing of domain III, which may destabilize rest of the mol-ecule as domains are associated by various interdomaininteractions.
To see the unfolding process of rest of the HSA mol-ecule (domain I and II), unfolding transition of F iso-meric form of HSA has been studied in details byusing multiple tertiary structure probes.
Near-UV CD
The CD spectra in the near-UV region were used toprobe the alterations of tertiary structure in more de-tails. Fig. 2A shows the near-UV CD spectra of N iso-mer and F isomer in the absence and presence of 4.4and 8.0 M urea concentration. At pH 7.0 two prominentminima at 262 and 268 nm are observed. By reducingthe pH to 3.5 (F isomerization) there was an increase
in MRE at 262 and 268 nm and a decrease between290 and 300 nm, denoting loss of tertiary structure inthe N–F transition. These observations agree well withresults reported previously [20]. However, at pH 3.5there are still significant amount of CD signal left corre-sponding with spectrum at 8 M urea showing tertiarystructure content of F isomer. Fig. 2B shows the urea-in-duced denaturation of F isomer of HSA as monitoredby the measurements of MRE at 268 nm. The unfoldingtransition from F to U state was found to be a reversiblesingle step process. The unfolding transition which cor-responds to the transformation of F state to U statestarted at 1.6 M urea and completed around 4.4 M ureaconcentration. Since near-UV CD spectra of HSA andits three domains showed common minima at 262 and268 nm [20], changes in MRE at 268 nm may be ascribedto the conformational alteration of whole HSAmolecule.

B. Ahmad et al. / Archives of Biochemistry and Biophysics 437 (2005) 159–167 163
Tyrosyl fluorescence
Since HSA harbors 18 tyrosyl residues distributedamong all the domains of HSA we investigated the tyro-syl fluorescence to get additional insight into the struc-tural features of F isomer. Figs. 3A and B shows thefluorescence spectra of F isomer in the absence and pres-ence of 8.0 M urea obtained after exciting the protein at280 and 295 nm, respectively. The contribution of tyro-sine emission in the denatured form is clear when spectraobtained with wavelength of excitation at 280 and295 nm are compared. A emission peak in the tyrosineemission region (300–320) upon denaturation was ob-served when spectra were obtain with wavelength ofexcitation at 280 nm (Fig. 3A) which is absent in the
Fig. 3. Fluorescence spectra of F isomer of HSA in the absence (1) andpresence (2) of 8 M urea (A) monitored by exciting the protein at280 nm (A) and 295 nm (B). (C) The change in fluorescence intensitymonitored by FI310/350 ratio. The protein (3.5 lM) was excited at280 nm. The filled circles (d) in (C) represent the renaturation pointsobtained by diluting denatured F isomer in 8.0 M urea concentration.
spectra obtain with wavelength of excitation at295 nm. No change in the FI 310/350 ratio was seenover the urea range of 0–1.6 M while an increase inthe ratio from 2 to 4.4 M urea was noted. The increasein the tyrosine emission indicates that tyrosyl residueshave moved away from the lone Trp-214 and energytransfer from tyrosine to tryptophan has vanished.The results are suggestive of unfolding and separationof HSA domains. Similar observation was made in otherproteins during urea denaturation studies [38].
ANS binding
The urea induced unfolding transition was also mon-itored by ANS–protein complex fluorescence at 470nmafter exciting the protein at 380 nm. Exposure of hydro-phobic surface to the solvent could be detected by ANSbinding studies. The urea induced unfolding transitionof F isomer monitored by ANS fluorescence was alsofound to be a single step process (Fig. 4). ANS fluores-cence data showed no apparent intermediate state inurea-induced denaturation, reflecting the absence ofaccumulation of hydrophobic patches. This may beunderstood in view of even exposure of hydrophobicpatches during N � F isomerization.
Urea induced unfolding of F isomer of HSA as fol-lowed by far-UV CD (Fig. 1A open circle) intrinsic fluo-rescence (Fig. 1B open circle), near-UV CD (Fig. 2B),tyrosyl fluorescence (Fig. 3C), and ANS–protein com-plex fluorescence (Fig. 4) was seemed to be cooperativeone step process. This is suggestive of structural integ-rity of F isomer. It is therefore possible that main lossesin a-helical contents and tertiary structure contents dur-ing N � F transition is due to unfolding of domain III
Fig. 4. Urea induced unfolding profile of F isomer of HSA monitoredby ANS fluorescence at 470 nm after exciting the protein at 380 nm.

164 B. Ahmad et al. / Archives of Biochemistry and Biophysics 437 (2005) 159–167
and that tertiary and secondary structural integrity ofdomain I and II is not impaired significantly. Theunfolding transition of F isomer of HSA monitored bymeasurements of MRE at 222 nm, MRE at 268 nm,intrinsic florescence at 340 nm, and FI 310/350 ratiowere compared by converting the data to plots of frac-tion denatured as a function of urea concentration(Fig. 5). As shown in the Fig. 5 Fd analyzed by tertiaryand secondary structure probes are not overlapping,providing evidence that urea induced unfolding is nota simple F � U two state process. Such non-coinciden-tal transitions indicate the probable existence of a inter-mediate in unfolding [39]. It shows that large fraction offar-UV CD in the transition region (�4.0 M urea) doesnot originate from F isomer, but from a species that haslost its tertiary contacts completely. The denaturationwas found to be completely reversible for all the transi-tions studied by different probes. Therefore, urea in-duced unfolding of F isomer of HSA may beapproximated to a three state transition and the mecha-nism for unfolding may be represented as
Fig. 5. Normalized transition curves for urea induced unfolding of Fisomer of HSA as followed by measurements of MRE at 222 nm (d),MRE at 268 nm (m), intrinsic fluorescence at 340 nm (s) after excitingthe protein at 280 nm, FI310/350 ratio (�) and Trp-214 fluorescence at344 nm (n) after exciting the protein at 295 nm.
Table 1Thermodynamic parameters for urea induced unfolding of F isomer of HSA
Probe DGH2OF$MGLI (kcal mol�1) DGMGLMD (kcal mol�1) DGH2O
D
MRE222nm 2.15 1.2 3.35FI340nm 2.74 — —FI310/350 ratio 2.05 — —MRE268nm 2.6 — —
MRE (deg cm2 dmol�1); FI (fluorescence intensity monitored by exciting the
F ��4.4 M urea
MGLINo tertiary contacts �25% a-helices
�D; ð6Þ
where F, MGLI, and D are the native, molten globulelike intermediate, and denatured states of F isomer ofHSA, respectively. To verify the unfolding mechanismpresented in Eq. (6) thermodynamic parameters forF � MGLI and MGLI � D processes were calculatedaccording to procedure described in data analysissection (Materials and methods). The value ofDGF�MGLI, DGMGLI �D, and DGH2O
D and their respec-tive m values are shown in Table 1. Since MGLI is char-acterized by significant amount of helical contents(�25%) with no specific tertiary structure the secondtransition was monitored by measurement of MRE at222 nm and DGMGLI�D was found to 1.2 kcal mol�1.Since DGH2O
D being a thermodynamic property does notdepend on path the total free energy change of unfoldingcan be obtained by summation of free energy change ofindividual steps, i.e., DGF �MGLI and DGMGLI �D. TheDGH2O
D associated with F to MGLI state and finally to Dstate was calculated to be 3.35 kcal mol�1. The values ofDGF �MGLI and mF �MGLI are similar, if not identicalfor the first transition (F � MGLI) whether observedby different tertiary structure probes or helical structureprobe. These further provide evidence that �F� isomercoverts to an intermediate state (so called MGLI) hav-ing significant amount of helical structure without anyspecific tertiary contacts around �4.4 M urea concentra-tion. This state (MGLI) melt to D state above 4.0 Murea concentration. Such intermediate state possessingsignificant amount of secondary structure without ter-tiary structure has been defined as an intermediate of‘‘molten globule’’ type. But the absence of binding ofhydrophobic dye (ANS) to this state might be due topresence of high concentration of urea, which competesdirectly with the interaction between ANS and protein[40] and/or disruption of exposed hydrophobic patchesdue to loss of significant amount of secondary structure.
Conformational transition in domain II
Tryptophanyl fluorescence
HSA contains only one tryptophan residue (Trp-214),which resides in domain II of HSA. To examine the con-
(kcal mol�1) mFMMGLI (cal mol�1 M�1) mMGLIMD (cal mol�1 M�1)
903.7 987964 —805 —1002 —
protein at 280 nm).

Fig. 6. Effect of urea concentrations on lone Trp-214 fluorescence of Fisomer of HSA. The protein (3.5 lM) was excited at 295 nm and the(A) fluorescence intensity at 344 nm (B) maximum wavelength ofemission was measured.
Fig. 7. Chloroform induced tryptophanyl fluorescence quenching of Fisomer of HSA in the absence (d) and presence of 0.4 M (h), 2.0 M(m), 4.4 M (n), and 8.0 M (s) urea concentrations (A). (B) Effect ofincreasing urea concentration on the binding of chloroform (18 mM)to F isomer of HSA. The fluorescence was monitored at 344 nm afterexciting the protein at 295 nm. Each data point was the mean of 3–4independent observations.
B. Ahmad et al. / Archives of Biochemistry and Biophysics 437 (2005) 159–167 165
formational variations around this residue in HSA, pro-tein was excited at 295 nm, which provides no excitationof tyrosine residues and therefore neither emission norenergy transfer to the lone indole side chain. The ureainduced unfolding transitions monitored by measure-ments of fluorescence intensity at 344 nm after excitingthe protein at 295 nm (Fig. 6A) and kmax of emission(Fig. 6B) started at 0.4 M urea and tailed off at 4.4 Murea. The observed decrease in fluorescence intensitywith shift of energy maximum towards longer wave-length together with loss of helical structure from0.4 M urea are suggestive of unfolding of the domain II.
Chloroform binding
Recent, studies have demonstrated that chloroformbinds to the HSA in the close vicinity of tryptophan res-
idue (Trp-214) [31]. Since, the Trp-214 resides in domainII, to get more insight into structural changes aroundenvironment of lone Trp, binding of chloroform to Fisomer of HSA was studied at different urea concentra-tions using tryptophan fluorescence (kex = 295 nm). Fig.7A shows the chloroform-binding isotherm of F isomerof HSA in the absence and presence of different ureaconcentrations. The equilibration of the protein withchloroform caused concentration dependent quenchingof tryptophan fluorescence with no apparent shift inthe emission maximum (344 nm), which is suggestiveof chloroform binding to HSA. As shown in Fig. 7B,a continuous decrease in chloroform induced quenching

166 B. Ahmad et al. / Archives of Biochemistry and Biophysics 437 (2005) 159–167
of tryptophanyl fluorescence was observed in the ureaconcentration range 0.4–4.4 M. The above chloroformbinding studies together with tryptophan fluorescencestudies and far-UV CD studies indicated that unfoldingof domain II of F isomer of HSA started at 0.4 M ureaconcentration.
Acrylamide quenching
The lone tryptophanyl residue (Trp-214) was alsoexamined by fluorescence quenching using neutralquencher, acrylamide [32]. Fig. 8 shows Stern–Volmerplots for fluorescence quenching of F isomer of HSAby acrylamide at different urea concentrations. N isomerof HSA was also included to compare the exposure oftryptophan in both isomers. Values of Stern–Volmerconstant (Ksv) otained from the acrylamide quenchingexperiments are shown in Table 2. Ksv for N isomer(4.46) was found to be higher than that for the F isomer(2.478) and was accompanied by a blue shift in kmax
Fig. 8. Stern–Volmer plots of acrylamide quenching for N isomer (s)and F isomer of HSA in the absence (d) and presence of 4.4 M (m)and 8.0 M (n) urea.
Table 2Acrylamide quenching parameter of HSA
Subject Ksva
HSA (N isomer) 4.46HSA (F isomer) 2.478F isomer in 0.4 M urea 2.78F isomer in 2.2 M urea 3.42F isomer in 4.4 M urea 4.99F isomer in 8.0 M urea 5.45NATA 17.2
a Ksv values were calculated by linear least squares fitting.
from 340 to 334 nm. These result indicate that trypto-phanyl residue of F isomer is less accessible to quench-ing by acrylamide than the N isomer. As can be seenfrom Table 2 Ksv value of F isomer started increasingfrom 0.4 M urea suggesting conformational changes indomain II in the range of 0–4.4 M urea. It must be notedthat in 8.0 M urea concentration wherein protein wasconsidered to exist in a random coil conformation con-tained some local region probably around Trp-214retaining residual structure as evident from the muchhigher Ksv of NATA (17.2) than HSA in 8.0 M urea(5.449, Table 2). This was further supported by Fd value(�0.85) of F isomer monitored by tryptophanyl fluores-cence in 8.0 M urea is less than 1.0. This was in agree-ment with pervious reports suggesting retention ofnative like tertiary structure within local regions in ran-dom coil conformation.
Since HSA contains only one tryptophan (Trp-214)residue which reside in domain II, changes in fluores-cence properties observed after exciting the protein at295 nm, decreased binding of chloroform and quenchingby acrylamide may be ascribed to conformationalchanges in domain II. Thus, it can be inferred thatchanges in domain II of F isomer occurs in the urea con-centration range 0.4–6 M. further changes in fluores-cence intensity observed after exciting the protein at280 nm, MRE at 268 nm, and FI 310/350 ratio, in theurea concentration range 1.6–6.0 may be attributed toconformational changes in domain I and II. Therefore,it appears that domain II begin to unfold before domainI. Taken together earlier results [8] as well as presentinvestigation, it can be concluded that urea inducedunfolding of HSA occurs from C terminal to N terminal.As discussed previously [8], more stability shown by do-main II than domain I in N isomeric form of HSA maybe because of its sandwich position between domains IIIand I.
Acknowledgments
Facilities provided by A.M.U are gratefully acknowl-edged. B.A. and S.K.H. thank Council of Scientific andIndustrial Research, New Delhi and Ankita thanksDepartment of Biotechnology, Govt. of India for finan-cial assistance. The authors are also thankful to DST(FIST) for providing laboratory facilities.
References
[1] M. Arai, K. Kuwajima, Adv. Protein Chem. 53 (2000) 209–271.[2] G. Schartz, Protein Sci. 2 (1993) 141–146.[3] B. Nolting, R. Golbic, A.R. Fersht, Proc. Natl. Acad. Sci. USA
92 (1995) 10668–10672.[4] K.W. Plaxco, C.M. Dobson, Curr. Opin. Struct. Biol. 6 (1996)
630–636.

B. Ahmad et al. / Archives of Biochemistry and Biophysics 437 (2005) 159–167 167
[5] O.B. Ptitsyn, Protein Eng. 7 (1994) 593–596.[6] S.E. Radford, C.M. Dobson, Phil. Trans. R. Soc. Lond. B 348
(1995) 17–25.[7] P.L. Privalov, J. Mol. Biol. 258 (1996) 707–725.[8] B. Ahmad, M.K.A. Khan, S.K. Haq, R.H. Khan, Biochem.
Biophys. Res. Commun. 314 (2004) 166–173.[9] S.K.Haq, S. Rasheedi, R.H.Khan, Eur. J. Biochem. 269 (2002) 47–
52.[10] O.A. Jennings, P.E. Wright, Science 262 (1993) 892–895.[11] H. Feng, N.D. Vu, Y. Bai, J. Mol. Biol. 343 (2004) 1477–1485.[12] J.E. Ollerenshaw, H. Kaya, H.S. Chan, L.E. Kay, Proc. Natl.
Acad. Sci. USA 102 (2004) 14748–14753.[13] D.M. Korzhnev, X. Salvatella, M. Vendruscolo, A.A. Dinardo,
A.R. Davidson, C.M. Dobson, L.E. Kay, Nature 430 (2004) 586–590.
[14] S.K. Haq, S. Rasheedi, P. Sharma, B. Ahmad, R.H. Khan, Int. J.Biochem. Cell Biol. 37 (2005) 361–374.
[15] R. Jaenicke, Oligomeric proteins, in: A.L. Fink, Y. Goto (Eds.),Molecular Chaperon in the Life Cycle of Protein: StructureFunction and Mode of Action, Marcel Dekker Inc., New York,1998, pp. 35–70.
[16] D.B. Wetlaufer, Adv. Protein Chem. 34 (1981) 61–92.[17] P.L. Privalov, Adv. Protein Chem. 35 (1982) 1–104.[18] D.C. Carter, J.X. Ho, Adv. Protein Chem. 45 (1994) 153–204.[19] X.M. He, D.C. Carter, Nature 358 (1992) 209–215.[20] M. Dockal, D.C. Carter, F. Ruker, J. Biol. Chem. 275 (2000)
3042–3050.[21] T. Peters Jr., All About Albumin: Biochemistry, Genetics and
Medical Application, Academic press, New York, 1996.[22] M.J Geisow, G.H. Beaven, Biochem. J. 165 (1977) 477–484.[23] M.Y. Khan, Biochem. J. 236 (1986) 307–310.
[24] M.Y. Khan, S.K. Agarawal, S. Hangloo, J. Biochem. 102 (1987)313–317.
[25] S. Muzammil, Y. Kumar, S. Tayyab, Proteins Struct. Funct.Genet. 40 (2000) 29–38.
[26] S. Tayyab, N. Sharma, M.M. Khan, Biochem. Biophys. Res.Commun. 277 (2000) 83–88.
[27] S. Tayyab, B. Ahmad, Y. Kumar, M.M. Khan, Int. J. Biol.Macromol. 30 (2002) 17–22.
[28] K. Wallevik, J. Biol. Chem. 245 (1973) 2650–2655.[29] O.H. Lowry, N.J. Rosebrough, A.L. Farr, R.J. Randall, J. Biol.
Chem. 193 (1951) 265–275.[30] Y.H. Chen, J.T. Yang, H. Martinez, Biochemistry 11 (1972) 4120–
4131.[31] J.S. Johansson, J. Biol. Chem. 272 (1997) 17961–17965.[32] M.R. Eftink, C.A. Ghiron, Anal. Biochem. 114 (1982) 199–227.[33] J.F. Foster, Some aspects of the structure and conformational
properties of serum albumin, in: V.M. Rosenoer, M.A. Rothschild(Eds.), Albumin Structure Function and Uses, Pergamon, NewYork, 1977, pp. 53–84.
[34] V.N. Uversky, A.S. Karnoup, S. Seshadri, S. Doniach, A.L.Fink, J. Mol. Biol. 278 (1998) 879–894.
[35] A.L. Fink, K.A. Oberg, S. Seshadri, Fold. Des. 3 (1997) 19–25.[36] N.H. Nishizawaand, S.K. unugi, Biochim. Biophys. Acta 1338
(1997) 13–20.[37] M.Y. Khan, A. Salahuddin, Eur. J. Biochem. 141 (1984) 473–
475.[38] M. Manuel, P. Sanchez del, A.R. Fersht, Biochemistry 36 (1997)
5560–5565.[39] M. Matthias, F.X. Schmid, Biochemistry 33 (1994) 12920–12935.[40] T.S.K. Kumar, G. Jayaraman, W.Y. Lin, C. Yu, Biochim.
Biophys. Acta 1294 (1996) 103–105.