Urea Based Dipodal Fluorescence Receptor for Sensing of Fe3+ Ion in Semi-Aqueous Medium
11
SHORT COMMUNICATION Urea Based Dipodal Fluorescence Receptor for Sensing of Fe 3+ Ion in Semi-Aqueous Medium Umesh Fegade & Hemant Sharma & Sanjay Attarde & Narinder Singh & Anil Kuwar Received: 6 July 2013 /Accepted: 2 September 2013 /Published online: 27 September 2013 # Springer Science+Business Media New York 2013 Abstract Urea based fluorescent chemosensor 1 was synthe- sized. Receptor 1 shows unique selectivity for the Fe 3+ ion and no such significant response was noticed with other metal ions (Cr 3+ , Mn 2+ , Co 2+ , Ni 2+ , Cu 2+ , Zn 2+ , Cd 2+ , Hg 2+ , Pb 2+ and Bi 3+ ) in DMSO/H 2 O (50:50,v/v) semi-aqueous solution. The binding features have been established by absorption and fluorescence spectroscopic methods. The binding constant (K) values obtained from Benesi-Hildebrand, Scatchard and Connor plot for receptor 1 is (8.3±0.3) × 10 3 M −1 and has good detection limit 0.7 μ M. The stoichiometry of 1. Fe 3+ complex was confirmed by mass spectroscopy and Job’ s plot. Keywords Dipodal receptors . Semi-aqueous medium . Binding constant Introduction The architecture of noncovalent bonding interactions array in the construction of host molecules for selective complexation with guest molecules is on the verge of getting transferred towards non-cyclic analogues of crown ether, cryptands, cy- clodextrins and spherends because of their solubility problem. Now a day, noncyclic receptors have been made to develop the field of supramolecular chemistry in which the molecular recognition, transport and catalysis phenomena have been deeply studied with the hope of shedding light on enzymatic and more complicated biological processes [1–3]. Over the past few decades, noncyclic compounds also have been utilized as the essential synthetic targets for further applica- tions in host –guest chemistry [ 4–6]. Noncyclic compounds con- taining multiples sites for noncovalent bonding interaction have gained considerable attention because of their ability of complex- ation towards broad range of analytes like ionic and/or neutral/ non-ionic molecules [ 7]. With the plan of synthesis of metallo- supramolecular complexes which can act as sensors and precur- sors, we made an attempt to design the ligands having selective and significant binding abilities towards various metal ions. Among transition metal ions Fe 3+ , Co 2+ and Zn 2+ have con- siderable biological importance and play significant role in many biochemical processes. The human body contains four grams of iron [8]. Most of the iron present in biological systems is tightly associated with enzymes and specialized transport and storage proteins and found in hemoglobin, the red pigment in the eryth- rocytes and rest of stored in ferretin. It plays a vital role in oxygen transfer processes in DNA and RNA synthesis. The deficiency of Fe 3+ causes anaemia, hemochromatosis, liver damage, diabetes, Parkinson’ s disease and cancer. Accumulation of copper and iron leads to over production of H 2 O 2 in tissues; causes oxidative stress and neurodegenerative diseases [9–12]. Herein, we have paid attention towards synthesis and de- signing of fluorescent sensors that utilize photoinduced electron transfer (PET) to translate a cation binding event into a fluores- cence signal. Generally these types of molecules were mostly used as an anion sensor due to the presence of amide groups but in the present work, we have reported a fluorescent sensor 1 designed for selective recognition of iron. Coordination sites in the receptors 1 show that there are two amide groups along with hydroxyl groups (Scheme 1). The binding ability of receptors 1 with Cr 3+ , Mn 2+ , Fe 3+ , Co 2+ , Ni 2+ , Cu 2+ ,Zn 2+ , Cd 2+ , Hg 2+ , U. Fegade : A. Kuwar (*) School of Chemical Sciences, North Maharashtra University, Jalgaon 425001, MS, India e-mail: [email protected] H. Sharma : N. Singh (*) Department of Chemistry, Indian Institute of Technology, Ropar, Rupanagar 140001, Punjab, India e-mail: [email protected] U. Fegade : S. Attarde School of Earth and Environmental Sciences, North Maharashtra University, Jalgaon 425001, MS, India J Fluoresc (2014) 24:27–37 DOI 10.1007/s10895-013-1297-4
Transcript of Urea Based Dipodal Fluorescence Receptor for Sensing of Fe3+ Ion in Semi-Aqueous Medium
SHORT COMMUNICATION
Urea Based Dipodal Fluorescence Receptor for Sensing of Fe3+
Ion in Semi-Aqueous Medium
Umesh Fegade & Hemant Sharma & Sanjay Attarde &
Narinder Singh & Anil Kuwar
Received: 6 July 2013 /Accepted: 2 September 2013 /Published online: 27 September 2013# Springer Science+Business Media New York 2013
Abstract Urea based fluorescent chemosensor 1 was synthe-sized. Receptor 1 shows unique selectivity for the Fe3+ion andno such significant response was noticed with other metal ions(Cr3+, Mn2+, Co2+, Ni2+, Cu2+, Zn2+, Cd2+, Hg2+, Pb2+ andBi3+) in DMSO/H2O (50:50,v/v) semi-aqueous solution. Thebinding features have been established by absorption andfluorescence spectroscopic methods. The binding constant(K) values obtained from Benesi-Hildebrand, Scatchard andConnor plot for receptor 1 is (8.3±0.3) × 103 M−1 and hasgood detection limit 0.7μM. The stoichiometry of 1.Fe3+
complex was confirmed by mass spectroscopy and Job’s plot.
Keywords Dipodal receptors . Semi-aqueousmedium .
Binding constant
Introduction
The architecture of noncovalent bonding interactions array inthe construction of host molecules for selective complexationwith guest molecules is on the verge of getting transferredtowards non-cyclic analogues of crown ether, cryptands, cy-clodextrins and spherends because of their solubility problem.Now a day, noncyclic receptors have been made to develop
the field of supramolecular chemistry in which the molecularrecognition, transport and catalysis phenomena have beendeeply studied with the hope of shedding light on enzymaticand more complicated biological processes [1–3].
Over the past few decades, noncyclic compounds also havebeen utilized as the essential synthetic targets for further applica-tions in host–guest chemistry [4–6]. Noncyclic compounds con-taining multiples sites for noncovalent bonding interaction havegained considerable attention because of their ability of complex-ation towards broad range of analytes like ionic and/or neutral/non-ionic molecules [7]. With the plan of synthesis of metallo-supramolecular complexes which can act as sensors and precur-sors, we made an attempt to design the ligands having selectiveand significant binding abilities towards various metal ions.
Among transition metal ions Fe3+, Co2+ and Zn2+ have con-siderable biological importance and play significant role in manybiochemical processes. The human body contains four grams ofiron [8]. Most of the iron present in biological systems is tightlyassociated with enzymes and specialized transport and storageproteins and found in hemoglobin, the red pigment in the eryth-rocytes and rest of stored in ferretin. It plays a vital role in oxygentransfer processes in DNA andRNA synthesis. The deficiency ofFe3+ causes anaemia, hemochromatosis, liver damage, diabetes,Parkinson’s disease and cancer. Accumulation of copper and ironleads to over production of H2O2 in tissues; causes oxidativestress and neurodegenerative diseases [9–12].
Herein, we have paid attention towards synthesis and de-signing of fluorescent sensors that utilize photoinduced electrontransfer (PET) to translate a cation binding event into a fluores-cence signal. Generally these types of molecules were mostlyused as an anion sensor due to the presence of amide groups butin the present work, we have reported a fluorescent sensor 1designed for selective recognition of iron. Coordination sites inthe receptors 1 show that there are two amide groups alongwithhydroxyl groups (Scheme 1). The binding ability of receptors 1with Cr3+, Mn2+, Fe3+, Co2+, Ni2+, Cu2+,Zn2+, Cd2+, Hg2+,
U. Fegade :A. Kuwar (*)School of Chemical Sciences, North Maharashtra University,Jalgaon 425001, MS, Indiae-mail: [email protected]
H. Sharma :N. Singh (*)Department of Chemistry, Indian Institute of Technology, Ropar,Rupanagar 140001, Punjab, Indiae-mail: [email protected]
U. Fegade : S. AttardeSchool of Earth and Environmental Sciences, North MaharashtraUniversity, Jalgaon 425001, MS, India
J Fluoresc (2014) 24:27–37DOI 10.1007/s10895-013-1297-4
Pb2+ and Bi3+ ions in DMSO/H2O (50:50, v/v) medium wasevaluated and binding constant was computed for 1 .Fe3+ com-plex for which fluorescence intensity was distinctly quenchedwhich lead to recognition of Fe3+ ion. To date, the synthesizedreceptor 1 was not reported for any molecular recognitionstudy.
Experimental
Reagents and Apparatus
All commercial grade chemicals and solvents were purchasedfrom Sigma-Aldrich and used as such.1H and 13C-NMR spec-tra were recorded on a Varian NMR mercury System 300spectrometer operating at 300 & 75 MHz in DMSO-d6 re-spectively. The fluorescence spectra of the receptor 1 withmetal ions (Chloride salts of Cr3+, Mn2+, Fe3+, Co2+, Ni2+,Cu2+, Zn2+ and nitrate salts of Cd2+, Hg2+, Pb2+, Bi3+ wereused) were recorded on Fluoromax-4 spectrofluorometer in
DMSO/H2O (50:50, v/v) solvent system and absorption spec-tra on Schimadzu UV-24500 UV-visible spectrophotometer atroom temperature using 1 cm path length quartz cell.
General Procedure for Synthesis of Receptor 1and its Complexes
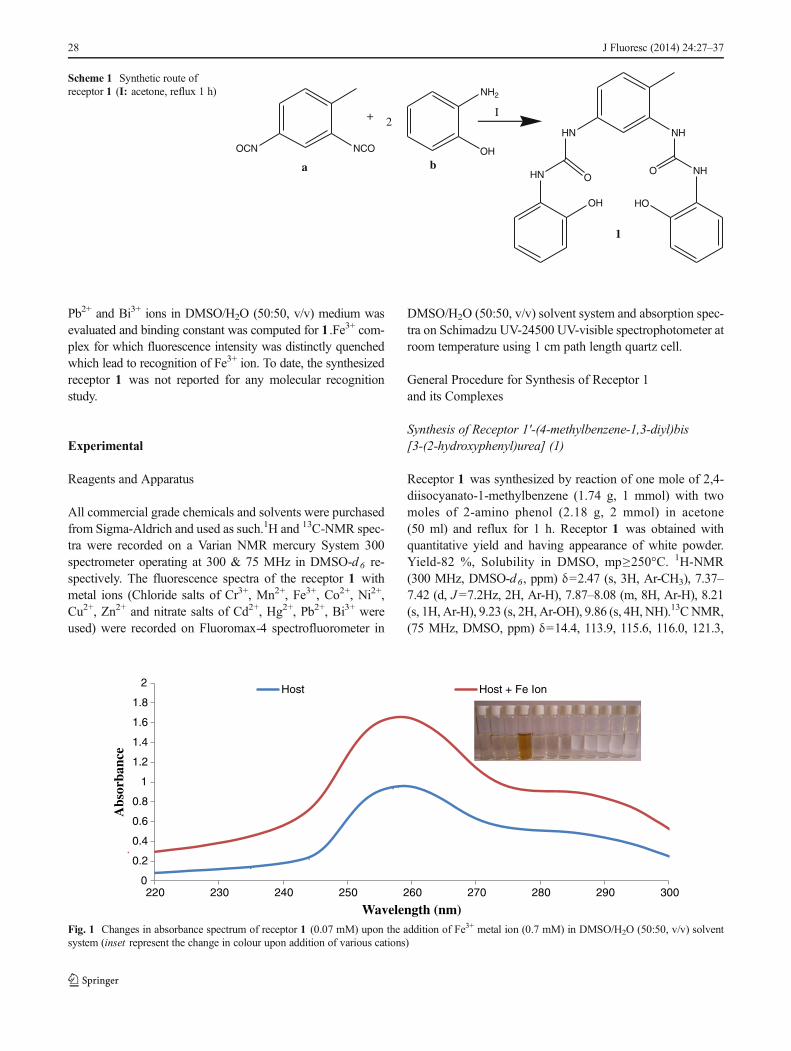
Synthesis of Receptor 1′-(4-methylbenzene-1,3-diyl)bis[3-(2-hydroxyphenyl)urea] (1)
Receptor 1 was synthesized by reaction of one mole of 2,4-diisocyanato-1-methylbenzene (1.74 g, 1 mmol) with twomoles of 2-amino phenol (2.18 g, 2 mmol) in acetone(50 ml) and reflux for 1 h. Receptor 1 was obtained withquantitative yield and having appearance of white powder.Yield-82 %, Solubility in DMSO, mp≥250°C. 1H-NMR(300 MHz, DMSO-d6, ppm) δ=2.47 (s, 3H, Ar-CH3), 7.37–7.42 (d, J =7.2Hz, 2H, Ar-H), 7.87–8.08 (m, 8H, Ar-H), 8.21(s, 1H, Ar-H), 9.23 (s, 2H, Ar-OH), 9.86 (s, 4H, NH).13CNMR,(75 MHz, DMSO, ppm) δ=14.4, 113.9, 115.6, 116.0, 121.3,
NCOOCN
+
NH2
OH
2
a b
HN NH
HN NH
OH HO
OO
1
I
Scheme 1 Synthetic route ofreceptor 1 (I: acetone, reflux 1 h)
0
0.2
0.4
0.6
0.8
1
1.2
1.4
1.6
1.8
2
220 230 240 250 260 270 280 290 300
Abs
orba
nce
Wavelength (nm)
Host Host + Fe Ion
Fig. 1 Changes in absorbance spectrum of receptor 1 (0.07 mM) upon the addition of Fe3+ metal ion (0.7 mM) in DMSO/H2O (50:50, v/v) solventsystem (inset represent the change in colour upon addition of various cations)
28 J Fluoresc (2014) 24:27–37
123.7, 126.0, 129.2, 129.9, 132.9, 135.6, 149.2, 154.6. IR(KBr, cm−1) υ =750, 878, 1,036, 1,538, 1,650, 2,924, 3,268.MS (ESI): m/z required C21H20N4O4:392.43, found 393.00.
Synthesis of Receptor 1.Fe3+ Complex. 1 Fe3+ complex wassynthesized by reaction of one mole of receptor 1 (0.78 g,0.2 mmol) with one moles of FeCl3(0.32 g, 0.2 mmol) in50 ml of DMSO:MeOH (10:90, v/v) reflux with stirring for3 h. The precipitation was collect at room temperatureand dried in vacuum. Further, it was washed with waterthen ethanol followed by petroleum ether. Yield- 72 %,IR (KBr, cm−1) υ=742, 870, 1,030, 1,377, 1,597, 2,853,2,923. MS (ESI): m/z requires C21H18FeN4O4: 446.24,found 446.88.
General UV-Visible and Fluorescence Spectral Measurements
For recognition studies, a stock solution of receptor 1 wasprepared having a concentration of 0.07 mM. Similarly, stock
solutions of metal ions were prepared, concentration of0.7 mM. The metal binding study was performed using 5 mlvolumetric flasks, each contain a stock solution of receptor 1along with particular amount of different transition metal ion.Each solution was placed for 20 min to get rid from non-homogenous error. The titration was performed in 10 mlvolumetric flask with gradual addition of metal ion withconstant interval of time. For whole set of experimentDMSO/H2O (50:50 v/v) choice as solvent system. The selec-tivity of receptor 1 towards Fe3+ in the presence of other metalions was confirmed through interference study. To performthis, a set of solutions were prepared each contain a 1 eq. ofreceptor 1 and 1 eq. of Fe3+ along with 2 eq. of othercompeting ions. The stoichiometry of 1 .Fe3+ complex wasconfirmed through the job’s plot in which total concentrationof host and guest will remain same but molar variations werevaried. The plot between [HG] and [H] /[H] + [G] illustrate thestoichiometry of the complexes formed. The concentration of[HG] was calculated by the equation [HG] = ΔA /Ao x [H].
0
0.2
0.4
0.6
0.8
1
1.2
1.4
1.6
1.8
220 230 240 250 260 270 280 290 300
Abs
orba
nce
Wavelength (nm)
y = 0.417x + 0.543 R² = 0.989
-1.8
-1.6
-1.4
-1.2
-1
-5.5 -5.0 -4.5 -4.0
(Ao -
A)/
Ao-
(Am
ax)
Log G
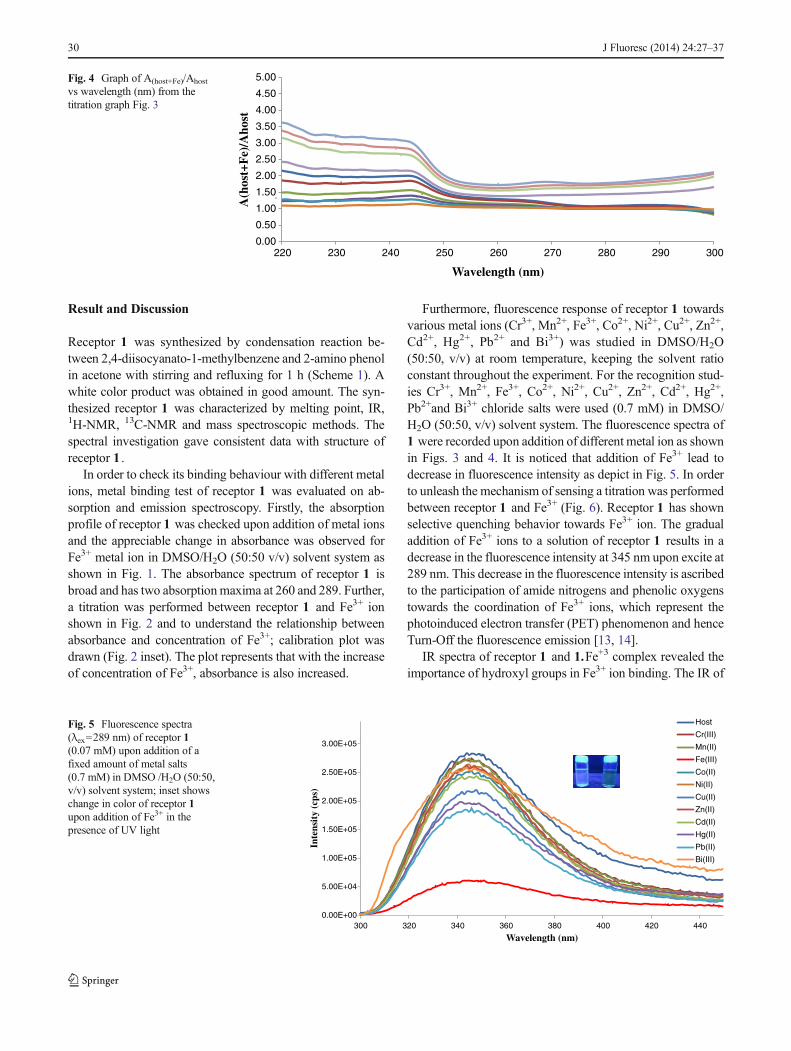
Fig. 3 Changes in absorbance spectrum of receptor 1 (0.07 mM) uponthe gradually addition of Fe3+ metal ion (0.7 mM) in DMSO/H2O (50:50,v/v) solvent system (inset depict the plot between (Ao-A)/(Ao-Amax),
where A0 represents the fluorescence intensity in the absence of guest ion,A represents the fluorescence intensity in presence of guest ion)
0.0
0.5
1.0
1.5
2.0
2.5
3.0
3.5
4.0
220 230 240 250 260 270 280 290 300
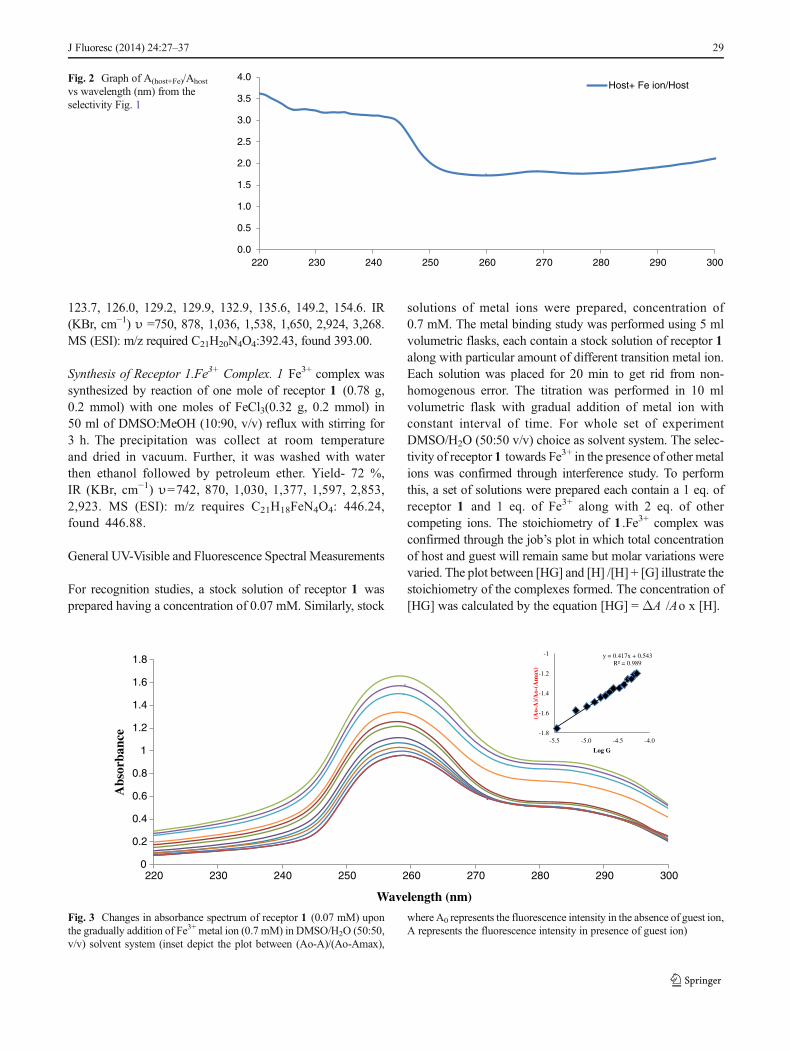
Host+ Fe ion/HostFig. 2 Graph of A(host+Fe)/Ahost
vs wavelength (nm) from theselectivity Fig. 1
J Fluoresc (2014) 24:27–37 29
Result and Discussion
Receptor 1 was synthesized by condensation reaction be-tween 2,4-diisocyanato-1-methylbenzene and 2-amino phenolin acetone with stirring and refluxing for 1 h (Scheme 1). Awhite color product was obtained in good amount. The syn-thesized receptor 1 was characterized by melting point, IR,1H-NMR, 13C-NMR and mass spectroscopic methods. Thespectral investigation gave consistent data with structure ofreceptor 1 .
In order to check its binding behaviour with different metalions, metal binding test of receptor 1 was evaluated on ab-sorption and emission spectroscopy. Firstly, the absorptionprofile of receptor 1 was checked upon addition of metal ionsand the appreciable change in absorbance was observed forFe3+ metal ion in DMSO/H2O (50:50 v/v) solvent system asshown in Fig. 1. The absorbance spectrum of receptor 1 isbroad and has two absorptionmaxima at 260 and 289. Further,a titration was performed between receptor 1 and Fe3+ ionshown in Fig. 2 and to understand the relationship betweenabsorbance and concentration of Fe3+; calibration plot wasdrawn (Fig. 2 inset). The plot represents that with the increaseof concentration of Fe3+, absorbance is also increased.
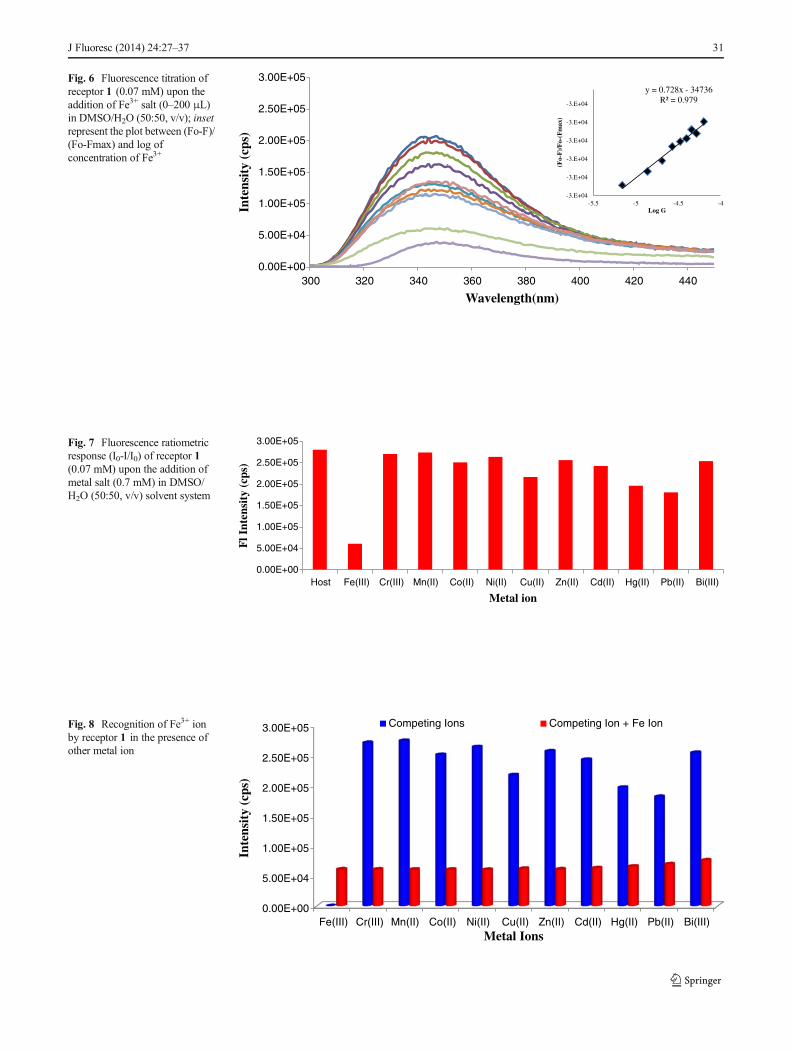
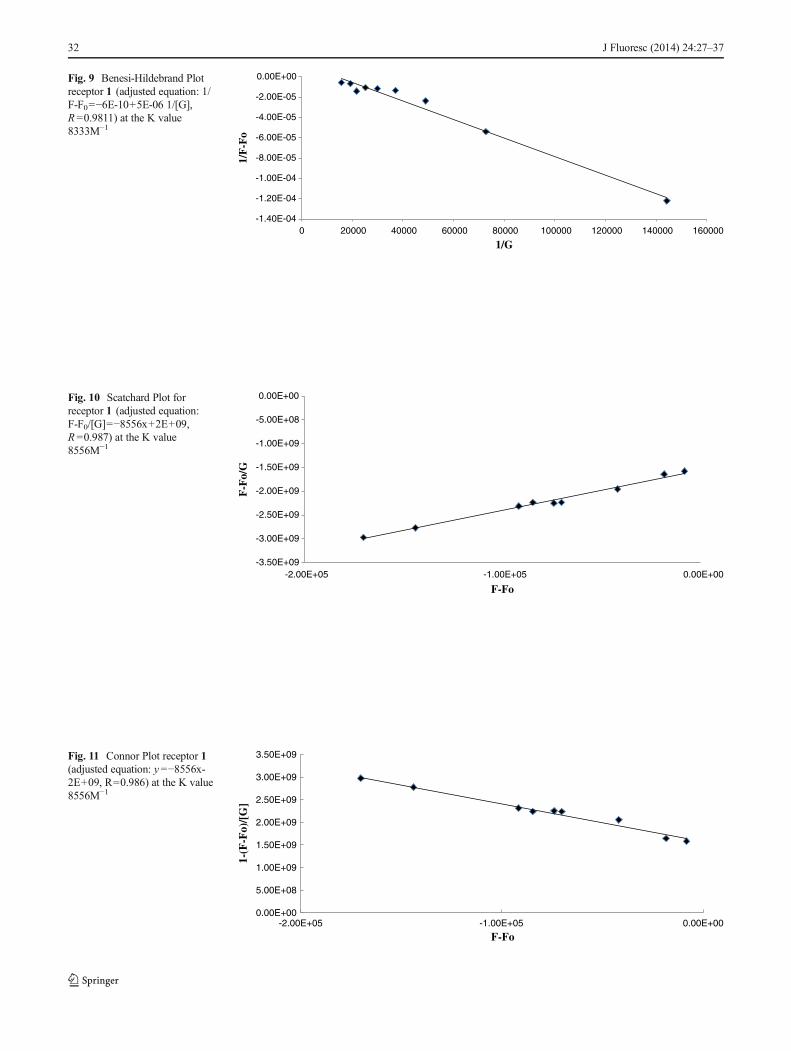
Furthermore, fluorescence response of receptor 1 towardsvarious metal ions (Cr3+, Mn2+, Fe3+, Co2+, Ni2+, Cu2+, Zn2+,Cd2+, Hg2+, Pb2+ and Bi3+) was studied in DMSO/H2O(50:50, v/v) at room temperature, keeping the solvent ratioconstant throughout the experiment. For the recognition stud-ies Cr3+, Mn2+, Fe3+, Co2+, Ni2+, Cu2+, Zn2+, Cd2+, Hg2+,Pb2+and Bi3+ chloride salts were used (0.7 mM) in DMSO/H2O (50:50, v/v) solvent system. The fluorescence spectra of1 were recorded upon addition of different metal ion as shownin Figs. 3 and 4. It is noticed that addition of Fe3+ lead todecrease in fluorescence intensity as depict in Fig. 5. In orderto unleash the mechanism of sensing a titration was performedbetween receptor 1 and Fe3+ (Fig. 6). Receptor 1 has shownselective quenching behavior towards Fe3+ ion. The gradualaddition of Fe3+ ions to a solution of receptor 1 results in adecrease in the fluorescence intensity at 345 nm upon excite at289 nm. This decrease in the fluorescence intensity is ascribedto the participation of amide nitrogens and phenolic oxygenstowards the coordination of Fe3+ ions, which represent thephotoinduced electron transfer (PET) phenomenon and henceTurn-Off the fluorescence emission [13, 14].
IR spectra of receptor 1 and 1.Fe+3 complex revealed theimportance of hydroxyl groups in Fe3+ ion binding. The IR of
0.00E+00
5.00E+04
1.00E+05
1.50E+05
2.00E+05
2.50E+05
3.00E+05
300 320 340 360 380 400 420 440
Inte
nsit
y (c
ps)
Wavelength (nm)
Host
Cr(III)
Mn(II)
Fe(III)
Co(II)
Ni(II)
Cu(II)
Zn(II)
Cd(II)
Hg(II)
Pb(II)
Bi(III)
Fig. 5 Fluorescence spectra(λex=289 nm) of receptor 1(0.07 mM) upon addition of afixed amount of metal salts(0.7 mM) in DMSO /H2O (50:50,v/v) solvent system; inset showschange in color of receptor 1upon addition of Fe3+ in thepresence of UV light
0.00
0.50
1.00
1.50
2.00
2.50
3.00
3.50
4.00
4.50
5.00
220 230 240 250 260 270 280 290 300A
(hos
t+F
e)/A
host
Wavelength (nm)
Fig. 4 Graph of A(host+Fe)/Ahost
vs wavelength (nm) from thetitration graph Fig. 3
30 J Fluoresc (2014) 24:27–37
0.00E+00
5.00E+04
1.00E+05
1.50E+05
2.00E+05
2.50E+05
3.00E+05
300 320 340 360 380 400 420 440
Inte
nsit
y (c
ps)
Wavelength(nm)
y = 0.728x - 34736R² = 0.979
-3.E+04
-3.E+04
-3.E+04
-3.E+04
-3.E+04
-3.E+04
-5.5 -5 -4.5 -4
(Fo -
F)/
Fo -
(Fm
ax)
Log G
Fig. 6 Fluorescence titration ofreceptor 1 (0.07 mM) upon theaddition of Fe3+ salt (0–200 μL)in DMSO/H2O (50:50, v/v); insetrepresent the plot between (Fo-F)/(Fo-Fmax) and log ofconcentration of Fe3+
0.00E+00
5.00E+04
1.00E+05
1.50E+05
2.00E+05
2.50E+05
3.00E+05
Host Fe(III) Cr(III) Mn(II) Co(II) Ni(II) Cu(II) Zn(II) Cd(II) Hg(II) Pb(II) Bi(III)
Fl I
nten
sity
(cp
s)
Metal ion
Fig. 7 Fluorescence ratiometricresponse (I0-I/I0) of receptor 1(0.07 mM) upon the addition ofmetal salt (0.7 mM) in DMSO/H2O (50:50, v/v) solvent system
0.00E+00
5.00E+04
1.00E+05
1.50E+05
2.00E+05
2.50E+05
3.00E+05
Fe(III) Cr(III) Mn(II) Co(II) Ni(II) Cu(II) Zn(II) Cd(II) Hg(II) Pb(II) Bi(III)
Inte
nsit
y (c
ps)
Metal Ions
Competing Ions Competing Ion + Fe IonFig. 8 Recognition of Fe3+ ionby receptor 1 in the presence ofother metal ion
J Fluoresc (2014) 24:27–37 31
-1.40E-04
-1.20E-04
-1.00E-04
-8.00E-05
-6.00E-05
-4.00E-05
-2.00E-05
0.00E+00
0 20000 40000 60000 80000 100000 120000 140000 1600001/
F-F
o 1/G
Fig. 9 Benesi-Hildebrand Plotreceptor 1 (adjusted equation: 1/F-F0=−6E-10+5E-06 1/[G],R=0.9811) at the K value8333M−1
-3.50E+09
-3.00E+09
-2.50E+09
-2.00E+09
-1.50E+09
-1.00E+09
-5.00E+08
0.00E+00
-2.00E+05 -1.00E+05 0.00E+00
F-F
o/G
F-Fo
Fig. 10 Scatchard Plot forreceptor 1 (adjusted equation:F-F0/[G]=−8556x+2E+09,R=0.987) at the K value8556M−1
0.00E+00
5.00E+08
1.00E+09
1.50E+09
2.00E+09
2.50E+09
3.00E+09
3.50E+09
-2.00E+05 -1.00E+05 0.00E+00
1-(F
-Fo)
/[G
]
F-Fo
Fig. 11 Connor Plot receptor 1(adjusted equation: y=−8556x-2E+09, R=0.986) at the K value8556M−1
32 J Fluoresc (2014) 24:27–37
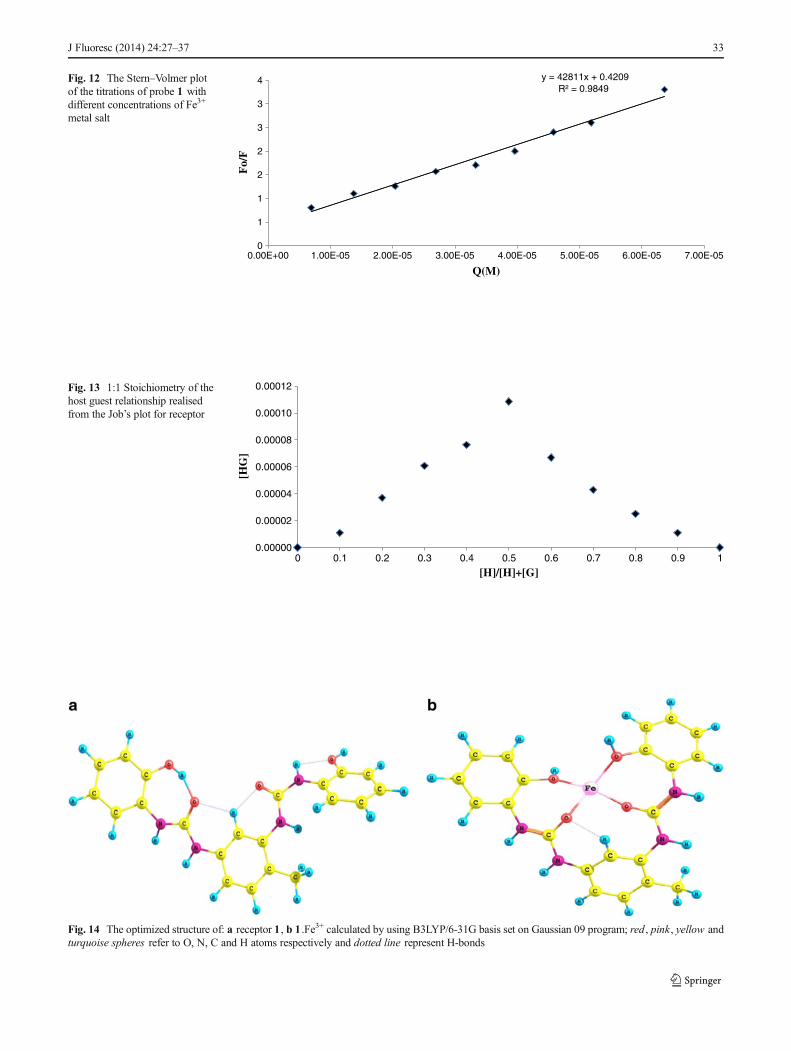
y = 42811x + 0.4209R² = 0.9849
0
1
1
2
2
3
3
4
0.00E+00 1.00E-05 2.00E-05 3.00E-05 4.00E-05 5.00E-05 6.00E-05 7.00E-05F
o/F
Q(M)
Fig. 12 The Stern–Volmer plotof the titrations of probe 1 withdifferent concentrations of Fe3+
metal salt
0.00000
0.00002
0.00004
0.00006
0.00008
0.00010
0.00012
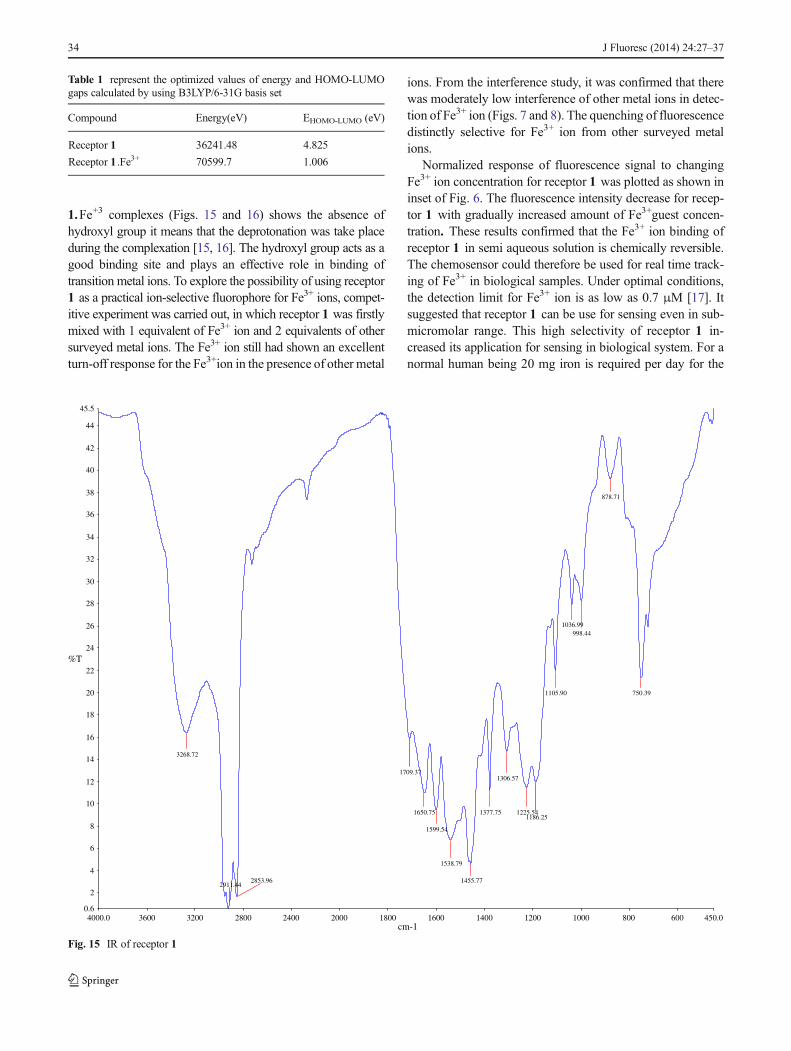
0 0.1 0.2 0.3 0.4 0.5 0.6 0.7 0.8 0.9 1
[HG
]
[H]/[H]+[G]
Fig. 13 1:1 Stoichiometry of thehost guest relationship realisedfrom the Job’s plot for receptor
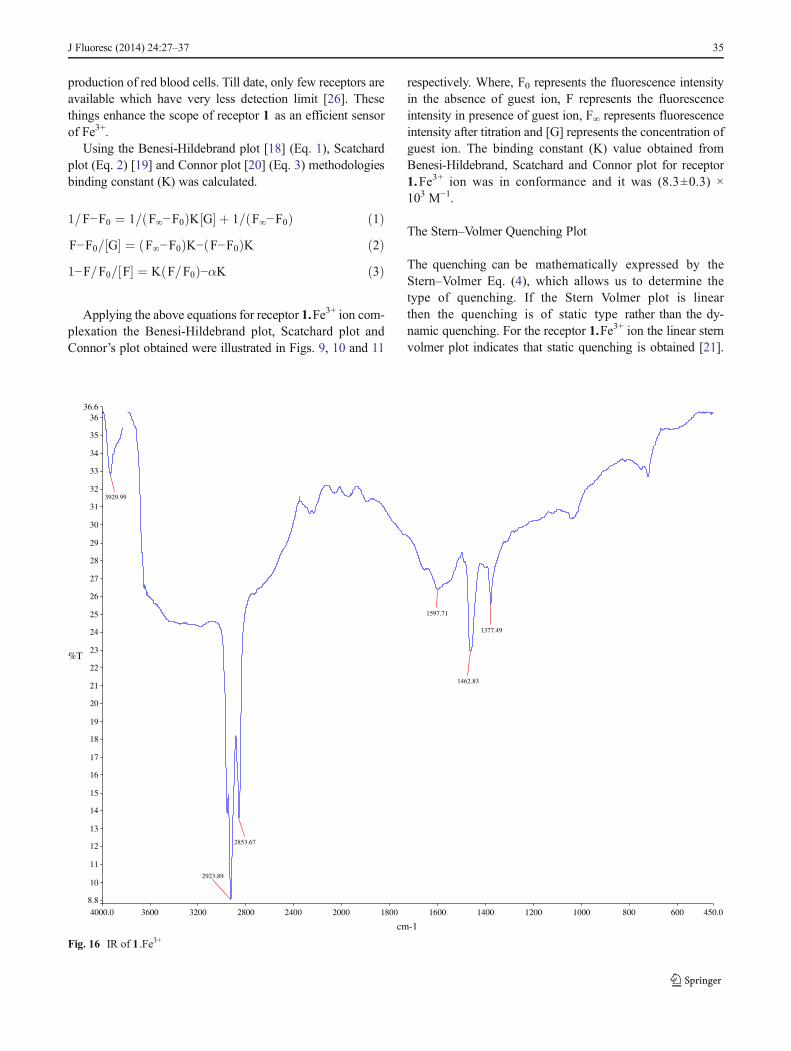
Fig. 14 The optimized structure of: a receptor 1 , b 1 .Fe3+ calculated by using B3LYP/6-31G basis set on Gaussian 09 program; red, pink, yellow andturquoise spheres refer to O, N, C and H atoms respectively and dotted line represent H-bonds
J Fluoresc (2014) 24:27–37 33
1.Fe+3 complexes (Figs. 15 and 16) shows the absence ofhydroxyl group it means that the deprotonation was take placeduring the complexation [15, 16]. The hydroxyl group acts as agood binding site and plays an effective role in binding oftransition metal ions. To explore the possibility of using receptor1 as a practical ion-selective fluorophore for Fe3+ ions, compet-itive experiment was carried out, in which receptor 1 was firstlymixed with 1 equivalent of Fe3+ ion and 2 equivalents of othersurveyed metal ions. The Fe3+ ion still had shown an excellentturn-off response for the Fe3+ion in the presence of other metal
ions. From the interference study, it was confirmed that therewas moderately low interference of other metal ions in detec-tion of Fe3+ ion (Figs. 7 and 8). The quenching of fluorescencedistinctly selective for Fe3+ ion from other surveyed metalions.
Normalized response of fluorescence signal to changingFe3+ ion concentration for receptor 1 was plotted as shown ininset of Fig. 6. The fluorescence intensity decrease for recep-tor 1 with gradually increased amount of Fe3+guest concen-tration. These results confirmed that the Fe3+ ion binding ofreceptor 1 in semi aqueous solution is chemically reversible.The chemosensor could therefore be used for real time track-ing of Fe3+ in biological samples. Under optimal conditions,the detection limit for Fe3+ ion is as low as 0.7 μM [17]. Itsuggested that receptor 1 can be use for sensing even in sub-micromolar range. This high selectivity of receptor 1 in-creased its application for sensing in biological system. For anormal human being 20 mg iron is required per day for the
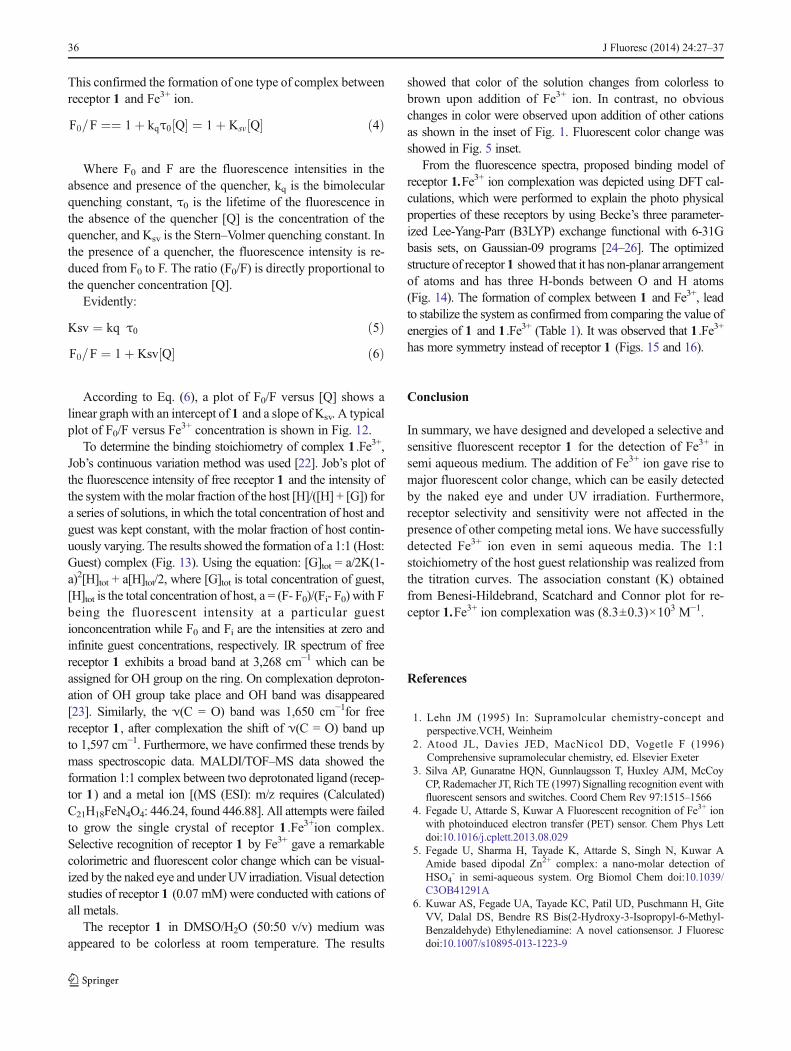
Table 1 represent the optimized values of energy and HOMO-LUMOgaps calculated by using B3LYP/6-31G basis set
Compound Energy(eV) EHOMO-LUMO (eV)
Receptor 1 36241.48 4.825
Receptor 1 .Fe3+ 70599.7 1.006
4000.0 3600 3200 2800 2400 2000 1800 1600 1400 1200 1000 800 600 450.00.6
2
4
6
8
10
12
14
16
18
20
22
24
26
28
30
32
34
36
38
40
42
44
45.5
cm-1
%T
3268.72
2853.96
1650.75
1599.54
1538.79
1455.77
1377.75
1306.57
1225.54
1105.90
1036.99998.44
878.71
750.39
1709.37
2911.44
1186.25
Fig. 15 IR of receptor 1
34 J Fluoresc (2014) 24:27–37
production of red blood cells. Till date, only few receptors areavailable which have very less detection limit [26]. Thesethings enhance the scope of receptor 1 as an efficient sensorof Fe3+.
Using the Benesi-Hildebrand plot [18] (Eq. 1), Scatchardplot (Eq. 2) [19] and Connor plot [20] (Eq. 3) methodologiesbinding constant (K) was calculated.
1=F−F0 ¼ 1= F∞−F0ð ÞK G½ � þ 1= F∞−F0ð Þ ð1ÞF−F0= G½ � ¼ F∞−F0ð ÞK− F−F0ð ÞK ð2Þ1−F=F0= F½ � ¼ K F=F0ð Þ−αK ð3Þ
Applying the above equations for receptor 1.Fe3+ ion com-plexation the Benesi-Hildebrand plot, Scatchard plot andConnor’s plot obtained were illustrated in Figs. 9, 10 and 11
respectively. Where, F0 represents the fluorescence intensityin the absence of guest ion, F represents the fluorescenceintensity in presence of guest ion, F∞ represents fluorescenceintensity after titration and [G] represents the concentration ofguest ion. The binding constant (K) value obtained fromBenesi-Hildebrand, Scatchard and Connor plot for receptor1.Fe3+ ion was in conformance and it was (8.3±0.3) ×103 M−1.
The Stern–Volmer Quenching Plot
The quenching can be mathematically expressed by theStern–Volmer Eq. (4), which allows us to determine thetype of quenching. If the Stern Volmer plot is linearthen the quenching is of static type rather than the dy-namic quenching. For the receptor 1.Fe3+ ion the linear sternvolmer plot indicates that static quenching is obtained [21].
4000.0 3600 3200 2800 2400 2000 1800 1600 1400 1200 1000 800 600 450.0
8.8
10
11
12
13
14
15
16
17
18
19
20
21
22
23
24
25
26
27
28
29
30
31
32
33
34
35
3636.6
cm-1
%T
3929.99
2923.89
2853.67
1597.71
1462.83
1377.49
Fig. 16 IR of 1 .Fe3+
J Fluoresc (2014) 24:27–37 35
This confirmed the formation of one type of complex betweenreceptor 1 and Fe3+ ion.
F0=F ¼¼ 1þ kqτ0 Q½ � ¼ 1þ Ksv Q½ � ð4Þ
Where F0 and F are the fluorescence intensities in theabsence and presence of the quencher, kq is the bimolecularquenching constant, τ0 is the lifetime of the fluorescence inthe absence of the quencher [Q] is the concentration of thequencher, and Ksv is the Stern–Volmer quenching constant. Inthe presence of a quencher, the fluorescence intensity is re-duced from F0 to F. The ratio (F0/F) is directly proportional tothe quencher concentration [Q].
Evidently:
Ksv ¼ kq τ0 ð5ÞF0=F ¼ 1þ Ksv Q½ � ð6Þ
According to Eq. (6), a plot of F0/F versus [Q] shows alinear graph with an intercept of 1 and a slope of Ksv. A typicalplot of F0/F versus Fe3+ concentration is shown in Fig. 12.
To determine the binding stoichiometry of complex 1 .Fe3+,Job’s continuous variation method was used [22]. Job’s plot ofthe fluorescence intensity of free receptor 1 and the intensity ofthe systemwith the molar fraction of the host [H]/([H] + [G]) fora series of solutions, in which the total concentration of host andguest was kept constant, with the molar fraction of host contin-uously varying. The results showed the formation of a 1:1 (Host:Guest) complex (Fig. 13). Using the equation: [G]tot = a/2K(1-a)2[H]tot + a[H]tot/2, where [G]tot is total concentration of guest,[H]tot is the total concentration of host, a = (F- F0)/(Fi- F0) with Fbeing the fluorescent intensity at a particular guestionconcentration while F0 and Fi are the intensities at zero andinfinite guest concentrations, respectively. IR spectrum of freereceptor 1 exhibits a broad band at 3,268 cm−1 which can beassigned for OH group on the ring. On complexation deproton-ation of OH group take place and OH band was disappeared[23]. Similarly, the ν(C = O) band was 1,650 cm−1for freereceptor 1 , after complexation the shift of ν(C = O) band upto 1,597 cm−1. Furthermore, we have confirmed these trends bymass spectroscopic data. MALDI/TOF–MS data showed theformation 1:1 complex between two deprotonated ligand (recep-tor 1) and a metal ion [(MS (ESI): m/z requires (Calculated)C21H18FeN4O4: 446.24, found 446.88]. All attempts were failedto grow the single crystal of receptor 1 .Fe3+ion complex.Selective recognition of receptor 1 by Fe3+ gave a remarkablecolorimetric and fluorescent color change which can be visual-ized by the naked eye and under UVirradiation. Visual detectionstudies of receptor 1 (0.07 mM) were conducted with cations ofall metals.
The receptor 1 in DMSO/H2O (50:50 v/v) medium wasappeared to be colorless at room temperature. The results
showed that color of the solution changes from colorless tobrown upon addition of Fe3+ ion. In contrast, no obviouschanges in color were observed upon addition of other cationsas shown in the inset of Fig. 1. Fluorescent color change wasshowed in Fig. 5 inset.
From the fluorescence spectra, proposed binding model ofreceptor 1.Fe3+ ion complexation was depicted using DFT cal-culations, which were performed to explain the photo physicalproperties of these receptors by using Becke’s three parameter-ized Lee-Yang-Parr (B3LYP) exchange functional with 6-31Gbasis sets, on Gaussian-09 programs [24–26]. The optimizedstructure of receptor 1 showed that it has non-planar arrangementof atoms and has three H-bonds between O and H atoms(Fig. 14). The formation of complex between 1 and Fe3+, leadto stabilize the system as confirmed from comparing the value ofenergies of 1 and 1 .Fe3+ (Table 1). It was observed that 1 .Fe3+
has more symmetry instead of receptor 1 (Figs. 15 and 16).
Conclusion
In summary, we have designed and developed a selective andsensitive fluorescent receptor 1 for the detection of Fe3+ insemi aqueous medium. The addition of Fe3+ ion gave rise tomajor fluorescent color change, which can be easily detectedby the naked eye and under UV irradiation. Furthermore,receptor selectivity and sensitivity were not affected in thepresence of other competing metal ions. We have successfullydetected Fe3+ ion even in semi aqueous media. The 1:1stoichiometry of the host guest relationship was realized fromthe titration curves. The association constant (K) obtainedfrom Benesi-Hildebrand, Scatchard and Connor plot for re-ceptor 1.Fe3+ ion complexation was (8.3±0.3)×103 M−1.
References
1. Lehn JM (1995) In: Supramolcular chemistry-concept andperspective.VCH, Weinheim
2. Atood JL, Davies JED, MacNicol DD, Vogetle F (1996)Comprehensive supramolecular chemistry, ed. Elsevier Exeter
3. Silva AP, Gunaratne HQN, Gunnlaugsson T, Huxley AJM, McCoyCP, Rademacher JT, Rich TE (1997) Signalling recognition event withfluorescent sensors and switches. Coord Chem Rev 97:1515–1566
4. Fegade U, Attarde S, Kuwar A Fluorescent recognition of Fe3+ ionwith photoinduced electron transfer (PET) sensor. Chem Phys Lettdoi:10.1016/j.cplett.2013.08.029
5. Fegade U, Sharma H, Tayade K, Attarde S, Singh N, Kuwar AAmide based dipodal Zn2+ complex: a nano-molar detection ofHSO4
- in semi-aqueous system. Org Biomol Chem doi:10.1039/C3OB41291A
6. Kuwar AS, Fegade UA, Tayade KC, Patil UD, Puschmann H, GiteVV, Dalal DS, Bendre RS Bis(2-Hydroxy-3-Isopropyl-6-Methyl-Benzaldehyde) Ethylenediamine: A novel cationsensor. J Fluorescdoi:10.1007/s10895-013-1223-9
36 J Fluoresc (2014) 24:27–37
7. Kimura E, Aoki S, Kikuta E, Koike T (2003) A macrocyclic zinc (II)fluorophore as a detector of apoptosis. Proc Natl Acad Sci U S A 100:3731–3736
8. Ping X, Cuicui P, Yingjie Z, Xiangxue K, Juanjuan S, Maoyou X,Zhiqiang S (2012) Tunable fluorescent pH sensor based on watersoluble perylenetetracarboxylic acid/Fe3+. Luminescence 27:307–309
9. Chen X, Hong H, Han R, Zhang D, Ye Y, Zhao YF (2012) A Newbis(rhodamine)-based fluorescent chemosensor for Fe3+. J Fluoresc22:789–794
10. Jung H, Singh N, Jang DO (2008) Highly Fe3+ selective ratiometricfluorescent probe based on imine-linked benzimidazole. TetrahedronLett 49:2960–2964
11. Lehninger AL (1976) Biochemistry. Worth Publishers, New York12. Lee JD (2008) Concise of inorganic chemistry. Wiley, India13. Basaric N, Doslicc N, Ivkovic J, Wang YH, Veljkovic J, Majerski
KM, Wan P (2013) Excited state intramolecular proton transfer(ESIPT) from phenol to carbon in selected phenyl naphthols andnaphthyl phenols. J Org Chem 78:1811–1823
14. Zhao J, Ji S, Chen Y, Guo H, Yang P (2012) Excited state intramo-lecular proton transfer (ESIPT): from principal photophysics to thedevelopment of new chromophores and applications in fluorescentmolecular probes and luminescent materials. Phys Chem Chem Phys14:8803–8817
15. Li GK, Xu ZX, Chen CF, Huang ZT (2008) A highly efficient andselective turn-on fluorescent sensor for Cu2+ ion based on calix[4]arene bearing four iminoquinoline subunits on the upper rim. ChemCommun 15:1774–1776
16. Weerasinghe AJ, Schmiesing C, Sinn E (2009) Highly sensitive andselective reversible sensor for the detection of Cr3+. Tetrahedron Lett46:6407–6410
17. Shortreed M, Kopelman R, Kuhn M, Hoyland B (1996) Fluorescentfiber-optic calcium sensor for physiological measurements. AnalChem 68:1414–1418
18. Benesi HA, Hildebrand JH (1949) A spectrophotometric investiga-tion on the interaction of iodine with aromatic hydrocarbons. J AmChem Soc 71:2703–2707
19. Scatchard G (1949) The attractions of proteins for small moleculesand Ions. Ann N YAcad Sci 51:660–672
20. Connors KA (1987) Binding constants: the measurements of molec-ular complex stability. Wiley, New York
21. Stern O, Volmer M (1919) About the decay of the fluorescence. PhysJ 20:183–188
22. Job P (1928) Formation and stability of inorganic complexes insolution. Ann Chim 9:113–203
23. Kuwar AS, Shimpi SR, Mahulikar PP, Bendre RS (2006) Synthesis,characterization and antimicrobial activities of metal complexes of 2formylthymoloxime. J Sci Ind Res 60:665–669
24. Becke AD (1993) Density functional thermo chemistry. III. The roleof exact exchange. J Chem Phys 98:5648–5652
25. Lee C, Yang W, Parr RG (1988) Development of the Colle–Salvetticorrelation of energy formula into a functional of the electrondensity. Phys Rev B 37:785–789
26. Singh N, Kaur N, Mulrooney RC, Callan JF (2008) A ratiometricfluorescent probe for magnesium employing excited state intramo-lecular proton transfer. Tetrahedron Lett 49:6690–6692
J Fluoresc (2014) 24:27–37 37