URBAN TRANSPORT AND LAND USE PLANNING TOWARD THE SUSTAINABLE DEVELOPMENT (CASE STUDY OF BANDUNG...
16
URBAN TRANSPORT AND LAND USE PLANNING TOWARD THE SUSTAINABLE DEVELOPMENT (CASE STUDY OF BANDUNG METROPOLITAN AREA) Harun Al-Rasyid S LUBIS Senior Researcher Transport Research and Development Group, R & D Center for Infrastructure and the Region, Institute of Technology, Bandung Jl. Ganesha No. 10, Bandung – 40132, Indonesia, Telp./Fax.: +62-22-250-2350 e-mail: [email protected] Muhamad ISNAENI Research Associate Transport Research and Development Group, R & D Center for Infrastructure and the Region, Institute of Technology, Bandung Jl. Ganesha No. 10, Bandung – 40132, Indonesia, Telp./Fax.: +62-22-250-2350 e-mail: [email protected] Subagus Dwi NURJAYA Senior Researcher Center for Road Research and Development Ministry of Regional Settlement and Infrastructure, Indonesia Jl. Raya Timur 264 Ujung Berung Bandung – 40294, Indonesia Telp./Fax.: +62-22-250-2350 Abstract: Emphasize to the issues of environment preservation and economic equity become more important in setting the strategy for the future of urban land use and transport system. Hence, for the future of sustainable urban transport planning, the policy objectives should be underlying both of the economic and the environment issues, such as minimizing the transportation cost, emission reduction, and promoting the renewable energy. This paper examines the effectiveness of some urban transport measures in achieving those sustainability objectives. The measures include land use or zoning control, toll road development, light rail transit (LRT) operation, traffic management and vehicle technology alternative. Bandung Metropolitan Area (BMA) in West Java, Indonesia, selected as a case study. Present and future traffic indicators were estimated using standard traffic assignment technique, while emission and energy consumption was then estimated based on link characteristics. Each urban transport measure to some degree performs better than the business as usual case. The LRT alternative performs effectively; as it has the lowest travel time, emission as well as energy consumption, then followed by land use policy and vehicle technology alternatives. Keywords: sustainable urban transport, land use planning, traffic indicators, economic indicators, environment indicators. 1. INTRODUCTION Urban population growth does not only mean that there will be more people that living and working in, but also mean that there will be more loading of passenger and freight travel in the urban transport network. Increase in travel does not only prevail in the quantity of travel, Journal of the Eastern Asia Society for Transportation Studies, Vol.5, October, 2003 1702
-
Upload
independent -
Category
Documents
-
view
6 -
download
0
Transcript of URBAN TRANSPORT AND LAND USE PLANNING TOWARD THE SUSTAINABLE DEVELOPMENT (CASE STUDY OF BANDUNG...

URBAN TRANSPORT AND LAND USE PLANNING TOWARD THE SUSTAINABLE DEVELOPMENT (CASE STUDY OF BANDUNG METROPOLITAN AREA)
Harun Al-Rasyid S LUBIS Senior Researcher Transport Research and Development Group, R & D Center for Infrastructure and the Region, Institute of Technology, Bandung Jl. Ganesha No. 10, Bandung – 40132, Indonesia, Telp./Fax.: +62-22-250-2350 e-mail: [email protected]
Muhamad ISNAENI Research Associate Transport Research and Development Group, R & D Center for Infrastructure and the Region, Institute of Technology, Bandung Jl. Ganesha No. 10, Bandung – 40132, Indonesia, Telp./Fax.: +62-22-250-2350 e-mail: [email protected]
Subagus Dwi NURJAYA Senior Researcher Center for Road Research and Development Ministry of Regional Settlement and Infrastructure, Indonesia Jl. Raya Timur 264 Ujung Berung Bandung – 40294, Indonesia Telp./Fax.: +62-22-250-2350
Abstract: Emphasize to the issues of environment preservation and economic equity become more important in setting the strategy for the future of urban land use and transport system. Hence, for the future of sustainable urban transport planning, the policy objectives should be underlying both of the economic and the environment issues, such as minimizing the transportation cost, emission reduction, and promoting the renewable energy. This paper examines the effectiveness of some urban transport measures in achieving those sustainability objectives. The measures include land use or zoning control, toll road development, light rail transit (LRT) operation, traffic management and vehicle technology alternative. Bandung Metropolitan Area (BMA) in West Java, Indonesia, selected as a case study. Present and future traffic indicators were estimated using standard traffic assignment technique, while emission and energy consumption was then estimated based on link characteristics. Each urban transport measure to some degree performs better than the business as usual case. The LRT alternative performs effectively; as it has the lowest travel time, emission as well as energy consumption, then followed by land use policy and vehicle technology alternatives. Keywords: sustainable urban transport, land use planning, traffic indicators, economic indicators, environment indicators. 1. INTRODUCTION Urban population growth does not only mean that there will be more people that living and working in, but also mean that there will be more loading of passenger and freight travel in the urban transport network. Increase in travel does not only prevail in the quantity of travel,
Journal of the Eastern Asia Society for Transportation Studies, Vol.5, October, 2003
1702

but also in the distance as well as the sprawling growth of urban area. The selected strategy in dealing with urban transport problems will determine the level of impact experienced by the people and their environment. It is widely accepted that well managed urban transport system deeply influences the overall urban economic and prosperity of the community, whereas in-efficient urban transportation will become the prime-suspect of the decreasing of livability, competitiveness, and sustainability of a city. Sayeg et al. (1992) reported that in Bangkok congestion and air pollution have reached a serious level even there were only 72 motor-vehicles/1000 peoples. Midgley (1994) said that in peak-hour the road traffic in Jakarta only moved less than 10 km/h even there were only 142 motor-vehicles/1000 peoples. Barter et al (1994) predict that fast growth cities such as Surabaya and Manila will face similar problem since no sufficient transport policy that could mitigate congestion and air-pollution problem. LPM-ITB (1992) also reported that in Jakarta, Bandung, Surabaya, and Medan, transport sector contributes more than 55.2% to the total air pollution in those four metropolitan cities. The problems turned on by the in-sufficiency of transport capacity; this could be positioned by the lack of transport supply, mismanagement of the utilization of transport facility, sprawling of land use and travel demand pattern, in efficient of vehicle capacity, etc. Urban area in development countries, as Indonesia, specified by unique problems in the urban transport operation, such as non-transport activity on the roadway, un-managed of on-street parking, un-structured of public transport network, and un-controlled of urban development. In fact, as unemployment rate increases in line with financial crisis in Indonesia, the road network capacity contracted because of roadside vendor business penetration to the sidewalk and the roadway, uncoordinated on-street parking, all of which may reduce roadway capacity by 50%. Policies to resolve urban transportation problems in Indonesia seem to follow the predict-and-provide mood with road building spirit in the mainstream agenda. This policy and planning approach has been widely proven fail to solve those problems comprehensively. New road building only can provide temporary solution; because in under-supplied of transport capacity circumstance; the compressed demand will immediately fulfilled this addition of capacity. The most probable policy options that had been widely proven more effective to solve the transport problems and the environment decease in the urban area is the Transport Demand Management (TDM). TDM strategies for sustainable development based on three basic programs; first, optimizing the existing of transport supply, second, managing the demand, and third, use environmental friendly transport mode. Optimization could be conduct by: - Maximize the utilization of road for traffic (e.g. on-street parking restriction, remove
other sources of side friction), - Reduce the number of car in the road network (e.g. traffic restraint, promoting public
transport, car sharing), - Manage the travel demand (e.g. land use restructuring, smart travel behavior), - Use enviromental friendly transport mode (e.g. vehicle combustion enhancement,
alternantive fuel, renewable energy) This paper shows that a combination of some mitigated TDM policies is the most probable solution for sustainable transportation that could mitigate the urban traffic congestion and its impact to the economy, human, and environment.
Journal of the Eastern Asia Society for Transportation Studies, Vol.5, October, 2003
1703

2. APPROACH AND THE METHODOLOGY The modeling approach in this research based on the four stages transport model (trip-based approach) to obtain traffic indicators. Link-based approach using classified traffic count data applied to obtain VMT and VHT by vehicle type. Then by adding the generalized cost model, fuel consumption model, and emission factors could be estimate the economic and environment indicators. Figure 1 shows the general structure of the modeling approach. Trip assignment conducted using SATURN (Van Vliet, 1994). Required input data adjusted to meet the characteristic of road and traffic condition in Indonesian urban area, especially for the time/cost-flow relationship. SATURN’s assignment model only simulate the alternate-user of road network (private and freight car), where road-based public transports treated separately and assumed as a fixed-flow on the each road link in their route.
Figure 1. General Structure of Modeling Approach
Vehicle Hours of Travel (VHT)
Vehicle Miles of Travel (VMT)
Time resource consumption
Aggregated traffic indicators (flow, time, speed)
Trip generation model
Trip Production
Modal split model
Policy alternatives
Land use and economy
Ex: land use planning
Public transport operation
Ex: LRT introduction
Road transport operation
Ex: parking policy
Vehicle technology Alternative
Ex: alternative fuel
Road network supply
Ex: new road
Travel pattern (origin/destination)
Trip distribution model
Mode choice
Trip assignment model
TRIP BASED FOUR STAGES TRANSPORT MODEL
Classified Traffic Count Data
Value of Time (VOT)
Fuel Consumption Model
Fuel Consumption (By fuel types)
Emission Factors
Emission production (by gas types)
Generalized cost model
Total system cost
LINK-BASED-ANALYSIS
Journal of the Eastern Asia Society for Transportation Studies, Vol.5, October, 2003
1704

2.1 The Four Stages Transport Model 2.1.1 Appropriate Model for Each Stages Trip-based four stages transport model employed to deliver the representation of each policy alternatives in the model and, at the end, to obtain traffic indicators. Considering the availability of existing data and calibrated model, especially for Bandung Metropolitan Area (BMA) case, in Table 1 presented the most appropriate trip-based model used in this research.
Table 1. Appropriate Four Stages Transport Model for BMA Case Stage Model Source/Author Note Trip generation Trip Rate Model BMARTS Study (1995) Trip rate based on zone aggregation Trip distribution
(1) Matrix Estimation from Maximum Entropy (ME2)
(2) Furness Model
(1) Willumsen (1982) (2) Furness (1965)
(1) ME2 model in SATURN used to calibrate the base-year 1997 OD matrix
(2) Furness model used to estimate the future OD matrices 2002-2017
Modal split Diversion curve BMARTS Study (1995) The curve shaped by binary logit model represents competition between private and public transport mode
Trip assignment Wardrop-Equilibrium Frank and Wolfe (1956) SATURN used to conduct traffic assignment simulation
2.1.2 Link Speed-Flow Relationship Models to allocate the trip to each origin-destination (in trip distribution stage) and/or to each link in the road network (in trip assignment stage) usually based on the time and distance comparison among alternatives. Estimation of travel distance and travel time in road network derive from speed-flow relationship curve on each road link. SATURN using a universal speed-flow relationship as follows: t = a Vn + to for V < C (1) t = a Cn + to + b (V – C)/C for V >C (2) Where C (pcu/hour) is the link capacity; to (sec.) and t (sec.) respectively represents the travel time at free-flow condition and travel time at traffic volume on this link is V (pcu/hour); and a, b, and n are constants. Logarithmic-manipulation applied on the Indonesian road link speed flow relationship (IHCM, 1997) using several combinations of link data of distance, capacity, and volume; the process resulting the value of n in around of 1.23, and varying a, b values depends on the link characteristics. 2.2 VMT (Vehicle Miles of Travel) and VHT (Vehicle Hours of Travel) Estimation Once the trip assignment (using SATURN) conducted, then we can obtain traffic information on each link in the network. For example: link a with la km length, loaded by traffic in amount of va pcu/hour and running in Va km/hour; then total travel length on link a is va * la pcu.km/hour, and the total travel time is va *(la/Va) pcu.hour/hour. If the value of passenger car equivalent (pce) and link vehicle composition data (v’a
kn = flow of k type of vehicle on link a,
Journal of the Eastern Asia Society for Transportation Studies, Vol.5, October, 2003
1705

where link a included in the k road category) were inserted to the total travel length and total travel time in link a then we could obtain the VMT (vehicle.km/hour) and VHT (vehicle.hour/hour). Figure 2 shows the Methodology to estimate VMT and VHT. In order to meet the operational characteristic of each mode, the link flows were disaggregated in 7 categories, i.e. gasoline-car, diesel-car, motorcycle, public transport minibus, taxi, bus, and truck. The pce using the IHCM 1997 value as follow: 1 for light vehicle (car, jeep, minibus, taxi), 1.2 for heavy vehicle (truck and bus), and 0.25 for motorcycle. Vehicle composition obtained from classified traffic count data that instantly classified in to 9 road categories as the combination of functional classification (arterial, collector, and local road) and the locational classification (city center road, middle-area road, and urbanized-area road).
Figure 2. Estimation process to Obtain VMT and VHT 2.3 Environment Indicators Estimation The environment indicators (total system fuel consumption and emission production) estimated using the methodology as explained in Figure 3. Having done the assignment stage we have link a average speed (Va) and the Ratio of Volume/Capacity (V/Ca); then we could estimate the specific fuel consumption of vehicle type k on link a (FCSa
k) using the PT. Jasa Marga and LAPI-ITB (1996) equation as follow: FCSa
k = bf (1 ± (kk + kl + kr)) (3) Where the bf is the value of basic fuel consumption in litre/1,000 km, kk is correction factor for slope, kl correction factor for traffic condition, and kr is correction factor for roughness.
SAT
UR
N O
utpu
t
Average speed at link a = Va km/hour
Total travel time on link a = va *(λa/Va) pcu.hour/hour
Classified traffic count on link a = v’a = ∑n
1v’a
kn pcu/hour Passenger car equivalent (pce)
Total travel length by vehicle types on link a
VMTa = ∑n
1v’a
kn *λa veh.km/hour
Total travel times by vehicle types on link a
VHTa = ∑n
1v’a
kn *(λa/Va) veh.hour/hour
Surv
ey D
ata
Traffic flow at link a = va pcu/hour
Total travel length on link a = va *λa pcu.km/hour
Sistem’s total travel length by vehicle types
VMT = ∑a
1 ∑n
1v’a
kn *λa veh.km/hour
Sistem’s total travel times by vehicle types
VHT = ∑a
1 ∑n
1v’a
kn *(λa/Va) veh.hour/hour VM
T a
nd V
HT
Est
imat
ion
Journal of the Eastern Asia Society for Transportation Studies, Vol.5, October, 2003
1706
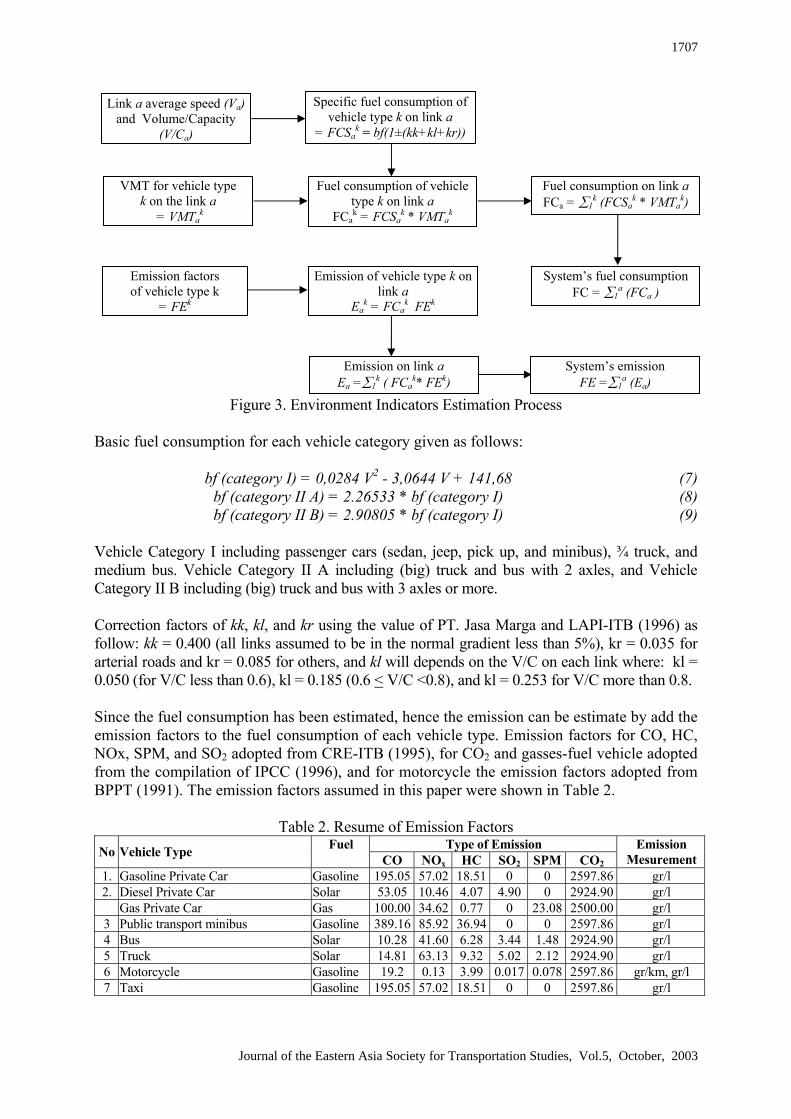
Figure 3. Environment Indicators Estimation Process
Basic fuel consumption for each vehicle category given as follows: bf (category I) = 0,0284 V2 - 3,0644 V + 141,68 (7) bf (category II A) = 2.26533 * bf (category I) (8) bf (category II B) = 2.90805 * bf (category I) (9) Vehicle Category I including passenger cars (sedan, jeep, pick up, and minibus), ¾ truck, and medium bus. Vehicle Category II A including (big) truck and bus with 2 axles, and Vehicle Category II B including (big) truck and bus with 3 axles or more. Correction factors of kk, kl, and kr using the value of PT. Jasa Marga and LAPI-ITB (1996) as follow: kk = 0.400 (all links assumed to be in the normal gradient less than 5%), kr = 0.035 for arterial roads and kr = 0.085 for others, and kl will depends on the V/C on each link where: kl = 0.050 (for V/C less than 0.6), kl = 0.185 (0.6 < V/C <0.8), and kl = 0.253 for V/C more than 0.8. Since the fuel consumption has been estimated, hence the emission can be estimate by add the emission factors to the fuel consumption of each vehicle type. Emission factors for CO, HC, NOx, SPM, and SO2 adopted from CRE-ITB (1995), for CO2 and gasses-fuel vehicle adopted from the compilation of IPCC (1996), and for motorcycle the emission factors adopted from BPPT (1991). The emission factors assumed in this paper were shown in Table 2.
Table 2. Resume of Emission Factors
Type of Emission No Vehicle Type Fuel CO NOx HC SO2 SPM CO2
Emission Mesurement
1. Gasoline Private Car Gasoline 195.05 57.02 18.51 0 0 2597.86 gr/l 2. Diesel Private Car Solar 53.05 10.46 4.07 4.90 0 2924.90 gr/l Gas Private Car Gas 100.00 34.62 0.77 0 23.08 2500.00 gr/l 3 Public transport minibus Gasoline 389.16 85.92 36.94 0 0 2597.86 gr/l 4 Bus Solar 10.28 41.60 6.28 3.44 1.48 2924.90 gr/l 5 Truck Solar 14.81 63.13 9.32 5.02 2.12 2924.90 gr/l 6 Motorcycle Gasoline 19.2 0.13 3.99 0.017 0.078 2597.86 gr/km, gr/l 7 Taxi Gasoline 195.05 57.02 18.51 0 0 2597.86 gr/l
VMT for vehicle type k on the link a
= VMTak
Link a average speed (Va) and Volume/Capacity
(V/Ca)
Emission factors of vehicle type k
= FEk
Emission of vehicle type k on link a
Eak = FCa
k FEk
Specific fuel consumption of vehicle type k on link a
= FCSak = bf(1±(kk+kl+kr))
Fuel consumption of vehicle type k on link a
FCak = FCSa
k * VMTak
Fuel consumption on link a FCa = ∑1
k (FCSak * VMTa
k)
Emission on link a Ea =∑1
k ( FCak* FEk)
System’s fuel consumption FC = ∑1
a (FCa )
System’s emission FE =∑1
a (Ea)
Journal of the Eastern Asia Society for Transportation Studies, Vol.5, October, 2003
1707

2.4 Economic Indicators Estimation Economic indicators presented in this paper are the value of time consumption, fuel cost (for private transport users), and tariff (for public transport users). The process to obtain the economic indicators, in general, is presented in Figure 4. LAPI-ITB (2000) gives the value of time (VOT) for private car users (include for motorcycle and taxi users) in amount of Rp. 6584/hour/vehicle or about Rp. 4389/hour/passenger. For the public transport users (public transport minibus and bus users), the VOT adopted from Purwatmoko and Permadi (1999) that gives the value about Rp. 2032/hour/passenger. Fuel price assumed as follow: Rp. 1810/liter for gasoline and Rp. 1630/liter for solar.
Figure 4. Economic Indicators Estimation Process 3. DESCRIPTION OF STUDY AREA 3.1 BMA Transport Statistics Table 3 shows the recently transportation statistics for study area of Bandung Metropolitan Area (BMA), that compiled from several sources. It can be conclude that the road supply in BMA still far form the ideal condition, where the proportion or road space to the services area only ranging from 2.32% to 3.10%. Public transport services dominated by minibuses covered more than 86% of route and 98% of fleet of road based public transport. 3.2. Vehicle Classification Data As described in Section 2.2, in obtaining VMT and VHT require the classified traffic count data to represent the variability of vehicle composition on the road network. Table 4 presents the representative vehicle composition on each road link classification. Minibus public transport estimated contribute about 15% of BMA traffic, thus cars (gasoline and diesel) take about 65.1% of traffic, motorcycle 12.6%, truck 6.7%, and bus 0.5%.
Vehicle Hours of Travel (VHT) (From Figure 3)
Value of Time (VOT) Value of time consumption
BW = VHT * VOT
Total Cost TB = BW + BB
Vehicle Miles of Travel (VMT)
Fuel Price (FP)
Fuel Consumption Cost BB = FP * FC
Fuel Consumption (FC) (From Figure 3)
Journal of the Eastern Asia Society for Transportation Studies, Vol.5, October, 2003
1708

Table 3. BMA Transportation Statististics (2002) No Data items
1 Demography a. Area (Ha) 16,730 b. Population (people) 2,141,837 c. Population density (people/Ha) 128.02
2 Mobilisation a. Motor-Vehicle Population (Unit) - Passenger car 147,035 - Freight car 40,585 - Bus 3,110 - Motorcycle 412,388 - Special car 333 b. Total vehicle population (Unit) 603,451
c. Motorisation rate (veh/1000 people)
- Include motorcycle 282 - Not include motorcycle 89
4 Road length a. Road length by status (km) - National 40.560 - Province 19.210 - Municipal/Regency 872.931 - Total 932.701
No Data items b. Road length by function (km) - Primary Arterial Road 49.433 - Secondary Arterial Road 26.116 - Primary Collector Road 31.712 - Secondary Collector Road 37.308 - Local Road 788.132 c. Road accessibility (km/km2 area) 5.575 d. Road mobility (km/1000 peoples) 0.435 e. % road space to services area 2.32 - 3.10
5 Traffic Management a. Signalized intersection 154 b. ATCS intersection 134 c. % side walk to the main road 12
6 Road based public transport (unit)
a. City minibus public transport (38 routes) 5,436
b. Urban minibus public transport (36 routes) 5,518
c. City Bus (12 routes) 243 7 Railway Public Transport (train/day)
a. Bandung – Padalarang Route 3 b. Bandung – Cicalengka Route 15 c. Cicalengka – Padalarang Route 9
Table 4. Representative Vehicle Composition by Road Classification for BMA Vehivle composition (%smp) Road location Road Function
Gasoline Car Diesel Car Motorcycle Truck Bus Arterial 69.96% 6.08% 19.02% 3.94% 0.99% Collector 77.19% 6.71% 14.16% 1.28% 0.66%
City Center
Local 78.52% 6.83% 8.64% 5.06% 0.95% Arterial 66.04% 5.74% 20.48% 6.56% 1.17% Collector 72.54% 6.31% 16.33% 4.55% 0.27%
Middle-area city
Local 77.58% 6.75% 11.99% 2.95% 0.74% Arterial 65.91% 5.73% 8.19% 19.80% 0.37% Collector 57.92% 5.04% 25.68% 10.75% 0.61%
Urbanized Area
Local 68.54% 5.96% 8.96% 16.54% 0.00% Note: vehicle composition estimated after the minibus public transport excluded
3.3 Base Year (1997) BMA Road Network Traffic Operation Base year of 1997 road traffic condition in briefly presented in Table 5. However, the travel length, fuel consumption, emission and transport cost at urbanized-area-road still the highest among others, as well as the length of road available and services area coverage. The worst congestion prevails in the middle-area road while the traffic only moves in 20 km/hour. This phenomenon is unique for BMA; while land-use pattern is concentric, then at morning peak the traffic dominated by radial movement from residential areas (along the city boundary) to the business center at CBD, it would result high-loaded of middle area road network.
Journal of the Eastern Asia Society for Transportation Studies, Vol.5, October, 2003
1709

Table 5. Traffic Indicators in The BMA Road Network at Morning Peak Hour Period 1997 Road Location
Indicator Measurement Total BMA City Center Middle-Area Urbanized-Area1. Traffic Indicators a. Total travel time pcu-hour/hour 72857,96 6199,82 41997,89 24660,25 b. Total travel length pcu-km/hour 2242808,1 189838,7 850141,9 1202827,6 c. Average speed km/hour 30,78 30,62 20,24 48,78 d. Average V/C 0,34 0,51 0,73 0,222. Environment Indicators a. Fuel Consumption litre/hour 267.472,0 22.250,4 109.804,1 135.417,4 b. Emission kg/hour 783.063,7 64.204,6 318.914,9 399.944,33. Economic Indicator Rp/hour 931.48 78.88 369.41 483.19
4. DEVELOPMENT OF ALTERNATIVE The alternatives consist of 7 measures, i.e. (1) Do-nothing or business-as-usual, (2) Land use planning, (3) Toll road development, (4) LRT operation, (5) Traffic management, (6) Vehicle technology, and (7) Combination of alternatives (2) to (6). Description of the alternatives presented at Figure 5. The planning Base Year is 1997, and the alternatives begin to present at 2002. Alternative (1) Do-nothing is the base-case scenario as the benchmark to measure the performance of other scenarios. The do-nothing conditions assume there was no intervention to the BMA transport network along the time horizon of 1997-2002; demand growth at the rate of 3.18% in average (actually, each zone has a different growth factor). Alternative (2) Land use Planning adapted the Municipality/Regency of Bandung Land Use Planning Document where in the future development of activity center in BMA would be spread to outside of Bandung city, and developed 5 new activity centers. Alternative (3) Toll Road Development based on the plans of inner toll road study (Seecons and PCI, 1995), that comprises of 5 corridors, 2 corridor East-West at nort and south of Bandung CBD, and 3 corridors North-South, i.e. Pasir Kaliki-Kopo, Kiara Condong, dan Rumah Sakit-Gede Bage. Alternative (4) LRT Operation based on Cegelec Study (1997) that recommend the development of 2 LRT service routes, i.e. (A) ITB-Buahbatu, and (B) Cicaheum-Leuwi Panjang. Alternative (5) Traffic Management based on the parking policy that removing the on-street parking at the CBD roads. Alternative (6) Vehicle Technology promote gas fuel to change the gasoline incrementally from 10% at 2002 to 100% at 2017.
Journal of the Eastern Asia Society for Transportation Studies, Vol.5, October, 2003
1710

Figure 5. Description of Planning Alternatives for BMA Case Study
Σ
µ
Σ
Σ
µ
µ
ΣCicaheum
Kiaracondong
Buah Batu
Andir
Leuwipanjang
St. Hall
Dago/ITB
∃ U
MUNICIPALITY OF BANDUNG
REGENCY OF BANDUNG
LRT Route Plan
Inner Toll Road Plan
CBD ON-Street Parking Restriction Area
New Activity Center
Journal of the Eastern Asia Society for Transportation Studies, Vol.5, October, 2003
1711

5. RESULT AND ANALYSIS 5.1 Traffic Indicators Figures 6, 7, 8, and 9 show the traffic indicators on the BMA road network. Alternative (3) Toll Road Development gives the highest increasing of average travel speed and V/C, and largest travel-times reduction relative to Alternative (1) Do-Nothing. For the travel-length indicator, the most significant reduction performs by Alternative (4) LRT Operation, mostly by reduction 6.6% of road network users that shifted the mode of transport. Alternative (2) Land Use Planning features almost similar performance to the Alternative (4) LRT Operation, except for travel length and average V/C indicators, which seems not high enough.
Figure 6. System Travel Time Figure 7. System Travel Length at Peak Hour Period at Peak Hour Period Figure 8. Average Travel Speed Figure 9. Average Volume/Capacity at Peak Hour Period at Peak Hour Period 5.2 Vehicle Miles of Travel (VMT) and Vehicle Hours of Travel (VHT) Figure 10 and Figure 11, respectively, presented peak hour VMT and HVT in the BMA road transport network. Alternative (4) LRT Operation gives the largest reduction of VMT relative to the Alternative (1) Do-nothing, and for VHT indicators largest reduction featured by Alternative (3) Toll Road Development.
0
50.000
100.000
150.000
200.000
250.000
300.000
350.000
400.000
1997 2002 2007 2012 2017Tahun
Wak
tu p
erja
lana
n si
stem
(sm
p.ja
m/ja
m)
(1) Do-nothing(2) Penataan ruang(3) Pengoperasian jalan tol(4) Pengoperasian LRT(5) Manajemen lalulintas(6) Teknologi kendaraaan(7) Semua alternatif
(1)=(6)(5)
(4)(2)
(3)
(7)
Do- Nothing Land Use Planning Toll Road Development LRT Operation Traffic Management Vehicle Technology All Alternatives
Tra
vel T
imes
(pcu
-hou
r/ho
ur)
Year
2.000.000
2.500.000
3.000.000
3.500.000
4.000.000
4.500.000
5.000.000
1997 2002 2007 2012 2017Tahun
Panj
ang
perj
alan
an s
iste
m(s
mp.
km/ja
m)
(1) Do-nothing(2) Penataan ruang(3) Pengoperasian jalan tol(4) Pengoperasian LRT(5) Manajemen lalulintas(6) Teknologi kendaraaan(7) Semua alternatif
(7)
(3)(4)
(2)
(5)(1)=(6)Do- Nothing Land Use Planning Toll Road Development LRT Operation Traffic Management Vehicle Technology All Alternatives
Year
Tra
vel L
engt
h (p
cu-k
m/h
our)
10
15
20
25
30
35
40
1997 2002 2007 2012 2017Tahun
Kec
epat
an r
ata-
rata
sis
tem
(km
/jam
)
(1) Do-nothing(2) Penataan ruang(3) Pengoperasian jalan tol(4) Pengoperasian LRT(5) Manajemen lalulintas(6) Teknologi kendaraaan(7) Semua alternatif
(7)
(3)
(2)(4)
(1)=(6) (5)
Do- Nothing Land Use Planning Toll Road Development LRT Operation Traffic Management Vehicle Technology All Alternatives
0,3
0,4
0,5
0,6
0,7
1997 2002 2007 2012 2017Tahun
V/C
rat
a-ra
ta s
iste
m
(1) Do-nothing(2) Penataan ruang(3) Pengoperasian jalan tol(4) Pengoperasian LRT(5) Manajemen lalulintas(6) Teknologi kendaraaan(7) Semua alternatif
(7)
(3)
(4)(2)
(5)(1)=(6)Do- Nothing Land Use Planning Toll Road Development LRT Operation Traffic Management Vehicle Technology All Alternatives
Tra
vel S
peed
(km
/hou
r)
Year
Ave
rage
V/C
Year
Journal of the Eastern Asia Society for Transportation Studies, Vol.5, October, 2003
1712
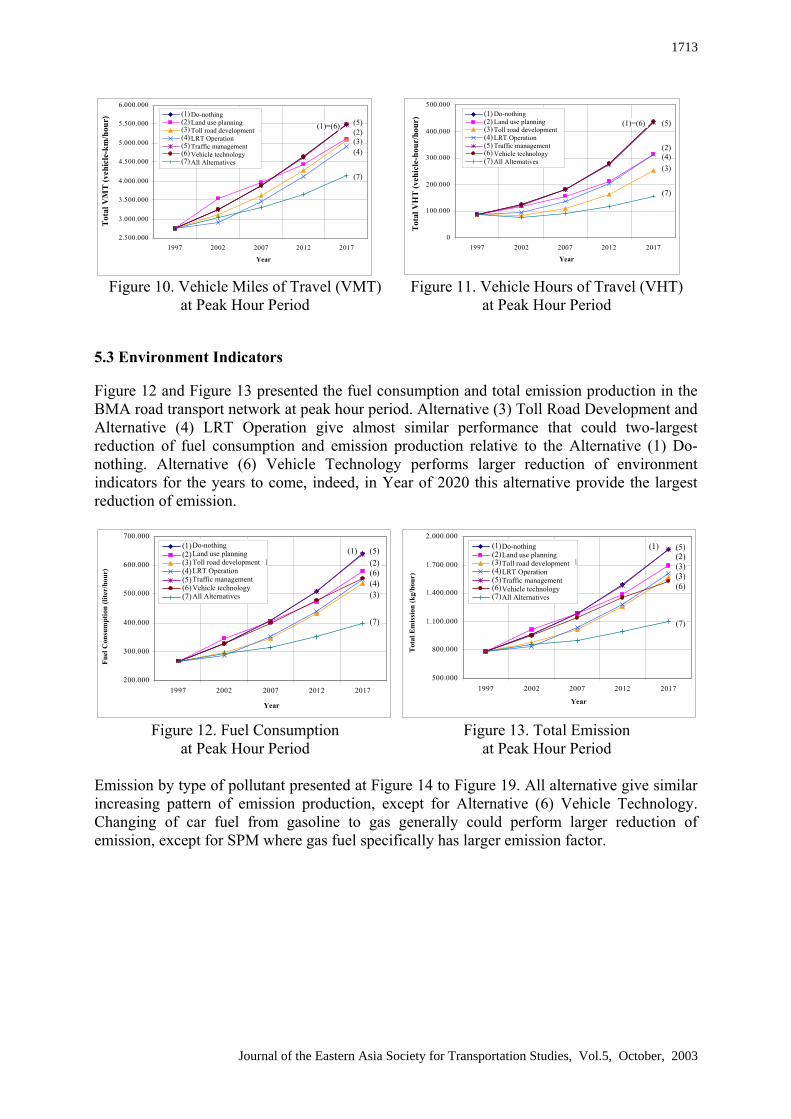
Figure 10. Vehicle Miles of Travel (VMT) Figure 11. Vehicle Hours of Travel (VHT) at Peak Hour Period at Peak Hour Period 5.3 Environment Indicators Figure 12 and Figure 13 presented the fuel consumption and total emission production in the BMA road transport network at peak hour period. Alternative (3) Toll Road Development and Alternative (4) LRT Operation give almost similar performance that could two-largest reduction of fuel consumption and emission production relative to the Alternative (1) Do-nothing. Alternative (6) Vehicle Technology performs larger reduction of environment indicators for the years to come, indeed, in Year of 2020 this alternative provide the largest reduction of emission.
Figure 12. Fuel Consumption Figure 13. Total Emission at Peak Hour Period at Peak Hour Period Emission by type of pollutant presented at Figure 14 to Figure 19. All alternative give similar increasing pattern of emission production, except for Alternative (6) Vehicle Technology. Changing of car fuel from gasoline to gas generally could perform larger reduction of emission, except for SPM where gas fuel specifically has larger emission factor.
200.000
300.000
400.000
500.000
600.000
700.000
1997 2002 2007 2012 2017
Tahun
Kon
sum
si b
ahan
bak
ar s
iste
m
(lit
er/ja
m)
(1) Do-nothing(2) Penataan ruang(3) Pengoperasian jalan tol(4) Pengoperasian LRT(5) Manajemen lalulintas(6) Teknologi kendaraaan(7) Semua alternatif
(7)
(3)(4)(6)(2)(5)(1)
Do-nothing Land use planning Toll road development LRT Operation Traffic management Vehicle technology All Alternatives
Fuel
Con
sum
ptio
n (li
ter/
hour
)
Year
500.000
800.000
1.100.000
1.400.000
1.700.000
2.000.000
1997 2002 2007 2012 2017
Tahun
Emis
i gas
bua
ng si
stem
(kg/
jam
)
(1) Do-nothing(2) Penataan ruang(3) Pengoperasian jalan tol(4) Pengoperasian LRT(5) Manajemen lalulintas(6) Teknologi kendaraaan(7) Semua alternatif
(7)
(3)(6)
(3)(2)(5)(1)Do-nothing
Land use planning Toll road development LRT Operation Traffic management Vehicle technology All Alternatives
Tot
al E
mis
sion
(kg/
hour
)
Year
2.500.000
3.000.000
3.500.000
4.000.000
4.500.000
5.000.000
5.500.000
6.000.000
1997 2002 2007 2012 2017
Tahun
Tota
l VM
T s
iste
m (k
end.
km/ja
m)
(1) Do-nothing(2) Penataan ruang(3) Pengoperasian jalan tol(4) Pengoperasian LRT(5) Manajemen lalulintas(6) Teknologi kendaraaan(7) Semua alternatif
(7)
(3)(2)
(4)
(5)(1)=(6)Do-nothing Land use planning Toll road development LRT Operation Traffic management Vehicle technology All Alternatives
Tot
al V
MT
(veh
.km
/hou
r)
Year
0
100.000
200.000
300.000
400.000
500.000
1997 2002 2007 2012 2017
Tahun
Tota
l VH
T s
iste
m (k
end.
jam
/jam
) (1) Do-nothing(2) Penataan ruang(3) Pengoperasian jalan tol(4) Pengoperasian LRT(5) Manajemen lalulintas(6) Teknologi kendaraaan(7) Semua alternatif
(7)
(3)(4)(2)
(5)(1)=(6) Do-nothing Land use planning Toll road development LRT Operation Traffic management Vehicle technology All Alternatives
Tot
al V
HT
(veh
.hou
r/ho
ur)
Year
Tot
al V
MT
(veh
icle
-km
/hou
r)
Tot
al V
HT
(veh
icle
-hou
r/ho
ur)
Journal of the Eastern Asia Society for Transportation Studies, Vol.5, October, 2003
1713

Figure 14. CO Emission Figure 15. NOx Emission at Peak Hour Period at Peak Hour Period Figure 16. HC Emission Figure 17. SO2 Emission at Peak Hour Period at Peak Hour Period
Figure 18. SPM Emission Figure 19. CO2 Emission at Peak Hour Period at Peak Hour Period 5.4 Economic Indicators Economic indicators represent by the generalize transport cost, test result shown at Figure 20. In general, Alternative (3) Toll Road Development, Alternative (4) LRT Operation, and Alternative (2) Land Use Planning provide almost similar performance in reducing the transport cost. The performance of Alternative (2) Land Use Planning rise for years to come, this result proven the direct interaction of land use and transport operation, where lower transport cost could be provide under a better land use pattern.
40.000
60.000
80.000
100.000
120.000
140.000
1997 2002 2007 2012 2017
Tahun
Emis
i CO
(kg/
jam
)(1) Do-nothing(2) Penataan ruang(3) Pengoperasian jalan tol(4) Pengoperasian LRT(5) Manajemen lalulintas(6) Teknologi kendaraaan(7) Semua alternatif (3)
(7)
(6)
(4) (2) (5) (1) Do-nothing
Land use planning Toll road development LRT Operation Traffic management Vehicle technology All Alternatives
Year
CO
Em
issi
on (k
g/ho
ur)
5.000
7.000
9.000
11.000
13.000
15.000
1997 2002 2007 2012 2017
Tahun
Emis
i NO
x (k
g/ja
m)
(1) Do-nothing(2) Penataan ruang(3) Pengoperasian jalan tol(4) Pengoperasian LRT(5) Manajemen lalulintas(6) Teknologi kendaraaan(7) Semua alternatif
(3)
(7)
(6)
(4) (2) (5) (1)
Do-nothing Land use planning Toll road development LRT Operation Traffic management Vehicle technology All Alternatives
Year
NO
x E
mis
sion
(kg/
hour
)
6.000
8.000
10.000
12.000
14.000
16.000
18.000
1997 2002 2007 2012 2017
Tahun
Emis
i HC
(kg/
jam
)
(1) Do-nothing(2) Penataan ruang(3) Pengoperasian jalan tol(4) Pengoperasian LRT(5) Manajemen lalulintas(6) Teknologi kendaraaan(7) Semua alternatif
(3)
(7)
(6)
(4) (2) (5) (1) Do-nothing
Land use planning Toll road development LRT Operation Traffic management Vehicle technology All Alternatives
Year
HC
Em
issi
on (k
g/ho
ur)
200
300
400
500
600
700
800
1997 2002 2007 2012 2017
Tahun
Emis
i SO
(kg/
jam
)
(1) Do-nothing(2) Penataan ruang(3) Pengoperasian jalan tol(4) Pengoperasian LRT(5) Manajemen lalulintas(6) Teknologi kendaraaan(7) Semua alternatif
(3)
(7)
(6)
(4) (2)
(5) (1) Do-nothing Land use planning Toll road development LRT Operation Traffic management Vehicle technology All Alternatives
Year
SO2 E
mis
sion
(kg/
hour
)
0
1.000
2.000
3.000
4.000
5.000
6.000
7.000
1997 2002 2007 2012 2017
Tahun
Emis
i SPM
(kg/
jam
)
(1) Do-nothing(2) Penataan ruang(3) Pengoperasian jalan tol(4) Pengoperasian LRT(5) Manajemen lalulintas(6) Teknologi kendaraaan(7) Semua alternatif
(3)
(7)
(6)
(4) (2) (5) (1)
Do-nothing Land use planning Toll road development LRT Operation Traffic management Vehicle technology All Alternatives
Year
SPM
Em
issi
on (k
g/ho
ur)
600.000
900.000
1.200.000
1.500.000
1.800.000
1997 2002 2007 2012 2017
Tahun
Emis
i CO
(kg/
jam
)
(1) Do-nothing(2) Penataan ruang(3) Pengoperasian jalan tol(4) Pengoperasian LRT(5) Manajemen lalulintas(6) Teknologi kendaraaan(7) Semua alternatif
(3)
(7)
(6)
(4) (2) (5) (1) Do-nothing
Land use planning Toll road development LRT Operation Traffic management Vehicle technology All Alternatives
Year
CO
2 Em
issi
on (k
g/ho
ur)
Journal of the Eastern Asia Society for Transportation Studies, Vol.5, October, 2003
1714

Figure 20. Transport Cost in BMA at Peak Hour Period
5.5 Discussion Resume of planning alternative performance relative to the Alternative (1) Do-Nothing as an average of performed indicators along the time horizon shown in Table 6. However, the performance provided by Alternative (3) Toll Road Development seems to be the best, even it only slight-difference to the Alternative (4) LRT Operation. Even the Alternative (5) vehicle technology did not reduce the traffic indicators, but this alternative could reduce almost 10% of fuel consumption and emission. The land use policy at Alternative (2) giving a significant reducing of transport cost (22.8%) mostly contributed by travel time saving.
Table 6. Resume of Planning Alternative Performance % Reduction from Alternative (1) Do-nothing
Alternative
Trav
el
Tim
e
Trav
el
Leng
th
Ave
rage
Sp
eed
Ave
rage
V
/C
VM
T
VH
T
Fuel
Con
-su
mpt
ion
Emis
sion
Tran
spor
t co
st
(2) Land use planning 22,9 2,4 -20,7 0,2 1,4 21,4 4,5 4,3 22,8 (3) Toll Road Development 39,8 6,4 -50,9 16,0 6,8 40,0 14,5 14,3 24,8 (4) LRT Operation 26,0 10,5 -18,3 10,8 10,7 26,1 13,7 13,7 23,3 (5) Traffic management 1,4 0,0 -1,1 0,3 0,04 1,3 0,3 0,3 1,4 (6) Vehicle Technology 0,0 0,0 0,0 0,0 0,0 0,0 6,9 9,8 4,0 (7) All Alternative 57,4 18,6 -75,2 24,1 18,1 56,6 28,2 30,2 55,8
It can be said that the most-preferable option to mitigate transport problem for BMA was the toll road development, as shown at Figure 5, however, the plan of inner city toll road of Bandung being the most straightforward solution to mitigate transport congestion. The inner toll road provided a large-scale addition of capacity that also provides a restructuring effect to the road network configuration. Furthermore, the exercise so far has not included the effect of induced and generated traffic from trip maker who will be attracted to travel as road network condition improves, all of which in turn can bring more congestion that may well build up in the toll road network. Considering the scale of alternative (see Figure 5); the LRT operation, let say, only about one a half compared to the scale of inner toll road alternative; but the performance of LRT operation in reduce the energy utilization, emission production, and transport cost only 1%
500
1.000
1.500
2.000
2.500
3.000
3.500
4.000
1997 2002 2007 2012 2017Tahun
Bia
ya P
erja
lana
n Si
stem
(Jut
a R
p/ja
m) (1) Do-nothing
(2) Penataan ruang(3) Pengoperasian jalan tol(4) Pengoperasian LRT(5) Manajemen lalulintas(6) Teknologi kendaraan(7) Semua Alternatif
(3)
(7)
(2)
(6) (5) (1)
(4)
Do-nothing Land use planning Toll road development LRT Operation Traffic management Vehicle technology All Alternatives
Year
Tra
nspo
rt C
ost (
Mill
ion
Rp.
/hou
r)
Journal of the Eastern Asia Society for Transportation Studies, Vol.5, October, 2003
1715

lower than the inner toll road alternatives. So we can conclude, basically, effectiveness of LRT operation almost 2 times higher that the toll road development. Even the land-use planning alternative could not reduce the environment indicators significantly, but this option can reduce transport cost about 22%. However, clustering land utilization could only cutting of the travel times, but not for the length. The most reasonable option is the introduction of a better vehicle technology; the effectiveness showed by the reduction of fuel consumption and gas emission that could reach up to 10% even under the same traffic situation to the do-nothing condition. 6. CONCLUSION 6.1 Recommendation Considering the simulation result presented in the Section 5, it is highly recommended that the most effective strategy to mitigate transport, environment, and economic problems for the future sustainable transport in BMA were the combination strategy of the vehicle technology alternatives with farsighted road development and land-use planning, and promoting the mass transit public transport. 6.2 Suggestion for Further Research In the future, the performance of each alternative may be compared based on multi-criteria analysis that involved stakeholder’s perspectives. Therefore, enhancement also needed for the fuel consumption and emission model that could represent the specific Indonesian characteristics of traffic operation and vehicle combustion type by age and cylinder capacity.
ACKNOWLEDGEMENTS
The authors would like to acknowledge the support from The Ministry of Research and Technology, the Government of Indonesia, under the Riset Unggulan Terpadu research grant.
REFERENCES Barter, P. (1994), The Challenge of South East Asia’s Rapid Motorization: Kuala Lumpur, Jakarta, Surabaya and Manila in an International Perspective. Proceeding of the Asia Studies Association of Australia Biennial Conference 1994. Asia Research Center, Murdoch University, Perth, Western Australia, Australia July 13, p. 21. BPPT (1991) Environmental Impacts of Energy Strategies for Indonesia: Assessment of the Emission Coefficients of the Traffic Sector in Java, BPPT & Forschungszentrum Julich GmbH, Jakarta, Indonesia.
Journal of the Eastern Asia Society for Transportation Studies, Vol.5, October, 2003
1716

Center for Research on Material and Energy ITB (2000) Analyses of Technical Options for Mitigating Environmental Emissions from the Urban Transport System in Selected Asian Countries: Indonesian Case. Second Progress Report, Asian Regional Research Program in Energy, Environment and Climate - Phase II, Bandung, Indonesia. Directorate General of Highway, Ministry of Reginal Settlement and Infrastructure (1997) Indonesian Highway Capacity Manual (IHCM). Frank, M and P. Wolfe (1956) An Algorithm for Quadratic Programming. Naval Research Logistics Quarterly 3 (1-2). pp. 43-53. Furness, K.P. (1965) Time Function Iteration. Traffic Engineering and Control, 7(7), 458-60. LAPI-ITB (1996) Study on Vehicle Operational Cost Estimation, Final Report. Prepared for PT. Jasa Marga. LAPI-ITB (2000) Study on Toll Road User Value of Time Estimation, Final Report. Prepared for PT. Jasa Marga. LPM-ITB (1992) Air Quality Condition in The City of Medan, Jakarta, Bandung, Semarang, and Surabaya, Final Report, prepared for Bapedal. Lubis, H.A.S., Isnaeni, M., Soerawidjaja, T.H (2001) Analysis of Transport Demand Management Strategies for Mitigating Environmental Emission from The Urban Transport System, Journal of EASTS Vol. 4 No. 4, 2001. M + R International and Associate (1995) Urban and Suburban Railway Transport System for The Bandung Metropolitan Area (BMARTS), Phase I-Development Study, Draft Final Report, Bandung, Indonesia, April 1995. Midgley P. (1994) Urban Transportation in Asia: An Operational Agenda for The 1990s, World Bank Technical Paper No. 224, The World Bank, Washington, D.C., p. 15. Purwatmoko, H. and Permadi, E. (1999) Study on the Value of Time Public Transportation Users in Bandung, Final Assignment, Civil Engineering Department, ITB. Sayeg, P. (1992), Assessment of Transportation Growth in Asia and Its Effects on Energy Use, The Environment, and Traffic Congestion: Case Study of Bangkok, Thailand. International Institute for Energy Conservation, Washington, D.C, p. 23. Van Vliet, D (1994) SATURN: A User’s Manual – Universal Version (Date of Last Update 24 July 1994), Leeds, UK. Willumsen (1982). Estimation of Trip Matrices from Volume Counts; Validation of a Model Under Congested Conditions, Proceedings 10th PTRC Summer Annual Meeting, University of Warwick, UK.
Journal of the Eastern Asia Society for Transportation Studies, Vol.5, October, 2003
1717