
Urban form and household activity-travel behaviour
28
Growth and Change Vol. 37 No. 2 (June 2006), pp. 172–199 Urban Form and Household Activity-Travel Behavior RON N. BULIUNG AND PAVLOS S. KANAROGLOU ABSTRACT Cities and metropolitan regions face several challenges including urban sprawl, auto dependence and congestion, and related environmental and human health effects. Examin- ing the spatial characteristics of daily household activity-travel behavior holds important impli- cations for understanding and addressing urban transportation issues. Research of this sort can inform development of urban land use policy that encourages the use of local opportunities, poten- tially leading to reduced motorized travel. This article examines the potential household activity- travel response to a planned metropolitan polycentric hierarchy of activity centers. Behavioral observations have been drawn from an activity-travel survey conducted in the Portland, Oregon, metropolitan area during the mid-1990s. Evidence presented from exploratory analysis indicates an urban/suburban differential, with less daily travel and smaller activity spaces for urban house- holds. Investigation of the travel reduction potential of the proposed land-use strategy suggests that location effects could be offset by adjustments to household sociodemographic and mobility characteristics. Introduction W hile major metropolitan regions across the globe provide a setting for a wide range of human activities, increasing pressures have emerged related to rising urban pop- ulations, the spatial distribution of opportunities within and between cities, and household demand for goods and services. The last quarter century can be characterized as a period of large-scale urbanization coupled with an extraordinary increase in personal affluence and mobility (Lopez and Hynes 2003; OECD 2000). These trends have been associated Ron N. Buliung is an assistant professor in the Department of Geography at the University of Toronto at Mississauga, Mississauga, Ontario, Canada. His e-mail address is ron.buliung@utoronto. ca. Pavlos S. Kanaroglou is a professor in the School of Geography and Earth Sciences at McMas- ter University, Hamilton, Ontario, Canada. His e-mail address is [email protected]. The second author gratefully acknowledges the SSHRC Canada Research Chairs program. An earlier version of this article was presented at the Annual North American Meetings of the Regional Science Associa- tion International, November 11–13, 2004, Seattle, WA. Partial revision of the manuscript took place while the first author held a postdoctoral fellowship at the Joint Program in Transportation, Univer- sity of Toronto. Funding for the fellowship was received from the Natural Science and Engineering Research Council (NSERC) of Canada. The authors also acknowledge the anonymous reviewers for their contributions to the final version of the article. Submitted January 2005; revised July 2005e; accepted August 2005. © 2006 Blackwell Publishing, 350 Main Street, Malden MA 02148 US and 9600 Garsington Road, Oxford OX4, 2DQ, UK.
Transcript of Urban form and household activity-travel behaviour

Growth and ChangeVol. 37 No. 2 (June 2006), pp. 172–199
Urban Form and Household Activity-Travel Behavior
RON N. BULIUNG AND PAVLOS S. KANAROGLOU
ABSTRACT Cities and metropolitan regions face several challenges including urban sprawl,
auto dependence and congestion, and related environmental and human health effects. Examin-
ing the spatial characteristics of daily household activity-travel behavior holds important impli-
cations for understanding and addressing urban transportation issues. Research of this sort can
inform development of urban land use policy that encourages the use of local opportunities, poten-
tially leading to reduced motorized travel. This article examines the potential household activity-
travel response to a planned metropolitan polycentric hierarchy of activity centers. Behavioral
observations have been drawn from an activity-travel survey conducted in the Portland, Oregon,
metropolitan area during the mid-1990s. Evidence presented from exploratory analysis indicates
an urban/suburban differential, with less daily travel and smaller activity spaces for urban house-
holds. Investigation of the travel reduction potential of the proposed land-use strategy suggests
that location effects could be offset by adjustments to household sociodemographic and mobility
characteristics.
Introduction
W hile major metropolitan regions across the globe provide a setting for a wide rangeof human activities, increasing pressures have emerged related to rising urban pop-
ulations, the spatial distribution of opportunities within and between cities, and householddemand for goods and services. The last quarter century can be characterized as a periodof large-scale urbanization coupled with an extraordinary increase in personal affluenceand mobility (Lopez and Hynes 2003; OECD 2000). These trends have been associated
Ron N. Buliung is an assistant professor in the Department of Geography at the University of
Toronto at Mississauga, Mississauga, Ontario, Canada. His e-mail address is ron.buliung@utoronto.
ca. Pavlos S. Kanaroglou is a professor in the School of Geography and Earth Sciences at McMas-
ter University, Hamilton, Ontario, Canada. His e-mail address is [email protected]. The second
author gratefully acknowledges the SSHRC Canada Research Chairs program. An earlier version of
this article was presented at the Annual North American Meetings of the Regional Science Associa-
tion International, November 11–13, 2004, Seattle, WA. Partial revision of the manuscript took place
while the first author held a postdoctoral fellowship at the Joint Program in Transportation, Univer-
sity of Toronto. Funding for the fellowship was received from the Natural Science and Engineering
Research Council (NSERC) of Canada. The authors also acknowledge the anonymous reviewers for
their contributions to the final version of the article.
Submitted January 2005; revised July 2005e; accepted August 2005.© 2006 Blackwell Publishing, 350 Main Street, Malden MA 02148 US and 9600Garsington Road, Oxford OX4, 2DQ, UK.

with rising levels of energy consumption, environmental emissions (e.g., OECD 2000;USDOT BTS 2003), air quality effects, and impacts on human health (e.g., Ewing et al.2003; Künzil et al. 2003; Sturm and Cohen 2004).
An important aspect of addressing the challenges facing urbanized regions involvesunderstanding the spatial characteristics of household activity-travel behavior. Advancesin this research area can inform the development of urban policy that encourages the useof local opportunities, potentially leading to reductions in motorized personal travel. Plan-ning organizations now typically cite the combination of compact and mixed-use devel-opment, concentrated within regional centers, as a land-use strategy for reducing traveland containing urban sprawl (City of Toronto 2002; Metro 1997, 2000). Travel savings areexpected to materialize as households concentrate their activities within and around highlyaccessible mixed-use centers.
In this article, the relationship between weekday household activity-travel behavior andregional urban form in the Portland, Oregon, metropolitan area is examined. Activity-travelmeasures, based on centrographic statistics and computational geometry, are used to characterize the behavior of households drawn from a 1994–1995 cross-sectional activity-travel survey. These measures are initially applied to describe and differentiate the spatialbehavior of households living in the urban and suburban jurisdictions of the study area.Further empirical analysis involves exploring the extent to which household sociodemo-graphics, mobility status, and location within a polycentric hierarchy of regional centersinfluence weekday household activity-travel outcomes.
When compared with similar literature, this study is unique in several ways. First, thehuman-activity perspective (Jones 1979) is applied to the conceptualization of daily activ-ities and travel as sequences of spatially connected events. Second, recognizing the increas-ing importance of discretionary activities (e.g., Handy, DeGarmo, and Clifton 2002;USDOT BTS 2003), the analytic framework has been extended to include weekday dis-cretionary activities of worker and nonworker householders.1 Third, activity-travel patternmeasurement includes approaches drawn from spatial statistics and computational geom-etry. Fourth, the perspective has been adopted that both residential and workplace loca-tions must be jointly considered when exploring activity-travel responses to urban policy.Lastly, while literature of this sort has been dominated by studies performed at the indi-vidual level, this study focuses on the household as the behavioral unit of interest.
The article begins with a review of research where the relationship between travelbehavior and polycentric urban form has been studied. This is followed by a descriptionof the study area, regional urban policy, and the characteristics of a hierarchy of mixed-use centers planned for the study region. The empirical section of the article begins withan exercise designed to logically validate chosen measurement approaches and exploremetropolitan scale variation in household activity-travel behavior. The exploratory analy-sis is followed with a description of the specification of several models designed to examinethe sensitivity of the adopted activity-travel measures to household sociodemographics,auto-based mobility, and residence/workplace locations. Research findings are then dis-cussed and contextualized using similar literature. The article concludes with a summary
URBAN FORM AND HOUSEHOLD ACTIVITY-TRAVEL BEHAVIOR 173

of major findings, a discussion of the broader implications of the results for policy, andthe identification of future research directions.
Polycentric Urban Form and Activity-Travel BehaviorNorth American and European cities and urban regions are now typically described as
polycentric (multicentered), having evolved from monocentric (single-centered) entities inthe presence of enhanced transport and communication technologies, rising affluence, andthe decentralization of activities (Anas, Arnott, and Small 1998; Schwanen, Dieleman, and Dijst 2003). Alongside related concepts such as mixed-use development, densifica-tion, and jobs/housing balance, polycentric metropolitan development has been promotedas a land-use strategy to reduce travel and limit urban sprawl (City of Toronto 2002; Metro1997). An extensive literature has developed over the last quarter century documentingrelationships between travel behavior and patterns of urbanization (e.g., Anderson,Kanaroglou, and Miller 1996; Badoe and Miller 2000; Crane 2000). This review focuseson findings from research that has looked at the relationship between travel behavior andpolycentric urban form.
Two related research themes have emerged in the literature: empirical description oflocal and regional urban spatial structure (e.g., Anas, Arnott, and Small 1998; McMillen2004; Modarres 2003), and investigation of the travel behavior impacts of polycentricurban form. With respect to the second theme, research has looked at the commuting impli-cations of firm and household decentralization, and the relationship between polycentricurban form, mode choice, and travel distance and duration. The literature also includesstudies of individual accessibility to regional employment/activity centers. The studiesexamined in this section have used various indicators to explore the relationship betweenpolycentric urban form and activity-travel behavior.
The co-location hypothesis has been used in the past to describe the potential com-muting implications of firm and household decentralization. Under co-location, efficienttravel is thought to emerge as firms and households follow one another during the courseof employment decentralization (Gordon and Richardson 1997; Gordon, Kumar, andRichardson 1989; Gordon, Richardson, and Jun 1991; Levinson 1998; Levinson andKumar 1994; Schwanen, Dieleman, and Dijst 2004). The co-location literature primarilyaddresses auto-based commuting even though firm decentralization holds additionalimpacts for nonwork activities and travel. Some have argued against such a laissez-faireapproach to urban development and travel reduction, advocating spatial planning tied torelated traditions of new urbanism, neotraditional design, and smart growth (e.g., CNU1998; Crane 2000; Ewing 1997; Newman and Kenworthy 1989; SGN 2003).
Findings with respect to travel mode and polycentricity have been relatively consistent.Research from the San Francisco Bay area suggests that polycentric urban form tends tobe associated with higher levels of auto dependence and solo driving (Cervero and Wu1997, 1998). Moreover, by observing modal shifts over a ten-year period, Cervero and Wu(1998) found that the process of employment decentralization did not lead to an overallreduction in auto use for work. Evidence from Los Angeles County suggests that mode
174 GROWTH AND CHANGE, JUNE 2006

effects could partially be explained by insufficient residence–workplace transit connectiv-ity (Modarres 2003).
Similar mode effects for work have been documented in Europe, with additional evi-dence suggesting auto dominance for discretionary purposes. Studies from the Nether-lands indicate less solo driving with higher residential densities and when householdslocate near employment centers (e.g., Schwanen, Dieleman, and Dijst 2001, 2003, 2004).Looking at several monocentric and polycentric urban agglomerations, Dieleman, Dijst,and Burghouwt (2002) reported greater auto use for residents of suburban or rural com-munities than for residents of medium-sized cities, new towns, and major cities (e.g., Amsterdam, The Hague, Rotterdam). Naess and Sandberg (1996) developed a case studyfor Oslo, Norway, that looked at commuting to a small sample of firm locations. Theyobserved less auto commuting and higher transit use to centrally located firms. They alsofound increased auto travel to be associated with lower work-end urban densities.
Analytic extensions by travel purpose have demonstrated similar effects, with drivingdominating suburban centers for all purposes, and public transit, biking, and walking morecommon in core cities (Schwanen, Dieleman, and Dijst 2001). Variability in tested rela-tionships has also been reported across urban regions differentiated by internal spatialstructure (Schwanen, Dieleman, and Dijst 2001, 2004).
Overall, commuter mode effects reported in the literature suggest that even when co-location can be partially supported empirically, polycentric urban form appears to havehad a negligible impact on auto ownership and use. Greater auto use for work and, to alesser extent, discretionary activities, for residents of peripheral and/or suburban locations,has been reported in North American and European research. These studies also indicatethat relationships between mode choice and urban form are subject to regional variations.The evidence lends support to the development of transport policy that accommodates thetype of spatial interaction that develops within behaviorally distinct urban regions.
Several studies have documented relationships between regional urban form and triplength (e.g., time or distance). With the exception of Dieleman, Dijst, and Burghouwt(2002) and Schwanen, Dieleman, and Dijst (2001), recent studies have focused on thejourney to work. Findings have been relatively inconsistent, with partial evidence fromNorth America and Europe supporting a polycentric approach to development as a travel-reduction strategy. For example, results from two studies in San Francisco suggest thatemployment decentralization and polycentric development may be incompatible with long-term travel-reduction objectives (Cervero and Wu 1997, 1998). While shorter suburbancommutes were reported in the first study, decreasing commute savings over time werereported in the second. Studies for Chicago (Wang 2000) and Columbus (Wang 2001) indi-cate increasing commutes with distance from the central business district (CBD) and sub-centers, with evidence pointing toward the emergence of travel-time inefficiencies in thepresence of a job-relocation strategy.
Conflicting evidence has also been reported in European research. Naess and Sandberg(1996) found evidence of longer average commute distances to central relative to subur-ban or peripheral firm locations in Oslo. In contrast, Owens (1986) reported decreasing
URBAN FORM AND HOUSEHOLD ACTIVITY-TRAVEL BEHAVIOR 175

travel reduction effects for British new towns over time. Studies from the Netherlands alsoprovide only partial support for polycentric urban form with commuters of polycentricagglomerations traveling greater distances and spending more time commuting than theirmonocentric counterparts (Dieleman, Dijst, and Burghouwt 2002; Schwanen, Dieleman,and Dijst 2001, 2003, 2004). Overall, findings from European research seem to indicatethat the emergence of polycentric urban form has not led to systemwide travel efficienciesfor work and other purposes. Moreover, current research suggests that auto ownership anduse have risen concurrently with the evolution of polycentric urban form.
Related to the travel impacts of urban form are questions concerning the accessibilityof opportunities within emerging urban spatial structures. To date, limited attention hasbeen given to the relationship between individual or household accessibility and polycen-tric urban form. Levinson (1998) looked at the effect of home and work-end accessibilityon commute durations in the Washington, DC, metropolitan area. He concluded thatemployment suburbanization contributes to a jobs/housing balance that encourages stablecommute durations. He also reported decreasing employment access with distance to theCBD. Contrasting this second finding, Weber and Kwan (2002) used innovative space-timeaccessibility measures and reported greater accessibility for suburban residents of the Portland metropolitan area. Weber (2003) extended the work to include explanatory models of individual accessibility and found partial evidence to support the existence ofpolycentric urban form in the Portland metropolitan area.
While the Portland studies suggest that polycentricity favors improvements to individ-ual accessibility, the research does not directly address travel reduction. Concentration ofspatial opportunities in and around regional centers could improve “objective” accessibil-ity, but households might not “perceive” an accessibility advantage during activity sched-uling and participation. Insufficient spatial knowledge or an accessibility perception deficitcould give rise to excess travel.
Contrasting findings with respect to travel mode, the literature is not conclusive withrespect to the relationship between measures of travel cost and polycentric urban form.European research suggests that the rise of polycentricity has not been matched with effi-cient commuting. On the other hand, evidence has been presented indicating that poly-centricity has not universally contributed to longer commutes. Looking beyond thecommute, there is arguably insufficient evidence available to draw definitive conclusionsconcerning the relationship between polycentric urban form and nonwork activities andtravel. With respect to mode choice, increased auto-based travel for work and discretionarypurposes has been documented for polycentric urban areas. Even if co-location were tolead to efficient commuting, polycentric urban areas could face an increase in short-distance nonwork auto trips because of rising levels of household auto ownership, avail-ability, and demand for goods and services.
Study Area and Regional Urban PolicyHouseholds used in this research maintain primary residence in the Portland–Vancouver
Metropolitan Area (Figure 1). Central to the study area is the urbanized area managed by the
176 GROWTH AND CHANGE, JUNE 2006

URBAN FORM AND HOUSEHOLD ACTIVITY-TRAVEL BEHAVIOR 177
metropolitan service district (Metro). Established in 1978, Metro is the only elected metro-politan government in the U.S. Operating as the regional metropolitan planning organiza-tion, Metro maintains jurisdiction over federal transport funding, is responsible forestablishing long-term planning objectives, and guides the development and implementa-tion of urban policy within member counties and cities.
The Metro area includes 1.3 million residents, the urbanized portions of three counties(Washington, Clackamas, and Multnomah), and twenty-four cities. In addition to actingas an important commercial and cultural center, the City of Portland remains the largestcity of the jurisdiction with a resident population of approximately 529,121 (2000 U.S.Census). While Metro has divided the region into eight planning districts, this studyfocuses on households living within seven planning districts located within the state ofOregon (Figure 1).
Metro has adopted an integrated transportation and land use policy model that isperhaps best exemplified by the Regional Framework Plan (RFP) introduced in 1997. Com-bining elements of several preexisting policy documents, the RFP jointly addresses landuse and transportation concerns. Two aspects of the RFP that have received attention inacademic research and in the public policy domain are maintenance of the region’s urbangrowth boundary (UGB), and the mixed-use centers program (Metro 1997, 2000). Therehas been considerable debate with respect to the effectiveness of the UGB and its poten-tial impact on the supply and affordability of regional housing opportunities (e.g., Gibsonand Abbott 2002; Phillips and Goodstein 2000).
The mixed-use centers program promotes the evolution of a spatial hierarchy of con-nected urban centers as a key growth management strategy for the Portland–VancouverMetropolitan Area (Figure 1). While some centers already maintain important roles in the
Clark CountyWashington
HillsboroBeaverton
Washington Sq.
I-5
2040 Mixed-use centers Planning districts
Suburban Freeways
MetroUrban
Study bouseholds
Central city(Portland CBD)
Regional centers (RC)
Town centers (TC)
I-84
I-5
217
I-84
Willamette River
Oregon City
Clackamus
Gateway
Clark CountyWashington
Gresham
I-205
I-205
I-20
5
Sunset Hwy.
20
km
10
km
FIGURE 1. STUDY AREA, POLYCENTRIC HIERARCHY OF MIXED-USE CENTERS AND
RESIDENTIAL LOCATIONS OF STUDY HOUSEHOLDS.

regional economy (e.g., Portland CBD, Hillsboro, Gresham), the strategy calls for anincrease in the concentration of employment and nonwork activities at center locationsover time. The approach has been designed to facilitate urban travel reduction through thelocalization of activity participation (Metro 1997). Conceptually, the strategy incorporatesnumerous aspects of what have come to be known as new urbanism and smart growth(CNU 1998; SGN 2003).
Centers included in this study comprise the top three levels of the planned hierarchy(Figure 1). Metro defined center locations according to current and potential influence onregional economic and nonemployment activities. Generic design characteristics includecompact, mixed-use development with a wide array of pedestrian and transit-accessibleretail, cultural, and recreational opportunities (Metro 1997). The geographic locations ofthe centers have been extracted from Metro’s 2040 concept database. Center locations aremodeled as individual points that represent the geographic center of mixed-use center polygons.
Ordered by geographical size and potential influence, the hierarchy includes: (1) thecentral city or Portland CBD, (2) seven regional centers, and (3) thirty town centers (Figure1). The Portland CBD is anticipated to maintain its historical role as the primary com-mercial and cultural center of the region. Serving large market areas, regional centers havebeen designed with high-capacity transit and highway connections to the CBD (Figure 1).Providing a balance of opportunities for employment and shopping within smaller marketareas, town centers are connected to regional centers by lower-capacity roadways andtransit.
Behavioral ObservationsHousehold activity-travel observations have been drawn from Metro’s 1994–1995
Household Activity and Travel Behavior Survey. The survey was conducted in the Port-land six-county region during the spring and autumn of 1994 and the winter of 1995, andwas geographically stratified to capture nonmotorized travel. The original survey contained4,451 households (63 percent of 7,090 recruited), 9,471 individuals, 122,348 activities,and 67,891 trips (Cambridge Systematics 1996). Household activities include the in-homeand out-of-home activities of all household members (e.g., employed, unemployed, stu-dents, retirees). Metro assigned geographic coordinates to activity locations using inter-section or address geocoding methods, the approach depending on the accuracy of reportedlocation data. Geocoded activity locations are accurate to within 200 ft of the actual activ-ity sites (Cambridge Systematics 1996). Activity geocodes are exogenous to the estima-tion of all household activity-travel pattern measures used in this study.
Households recorded activities and travel for two consecutive days. As an approach tomanaging the complexity of modeling with repeat observations, a complete single weekdayactivity record has been randomly chosen for each household. An alternative approach forfuture consideration could involve estimation of measures using the joint distribution ofactivities across survey days. Exclusion of weekend observations was informed by litera-ture documenting differences between weekday and weekend travel (e.g., Bhat and
178 GROWTH AND CHANGE, JUNE 2006

Srinivasan 2004). The final subsample includes 1,609 households from the original survey.Activities recorded for all household members have been included (e.g., students,employed, unemployed, retirees). Households were removed from the analysis if they didnot have complete activity or sociodemographic descriptions, or were missing workplaceand home location geocodes. In the absence of sufficient detail with respect to sociode-mographic characteristics and activity descriptions, households from Clark County, Washington, were also excluded.
Measuring Household Activity-Travel BehaviorThe human activity approach to the study of travel behavior explicitly recognizes travel
dependencies between individuals (Jones 1979). These dependencies can emerge withinhouseholds and within broader social networks that develop from participation in workand nonwork (i.e., social, recreational) activities. For some time, research has shown thatindividual activity-travel outcomes are influenced by household characteristics (e.g., Bhat1996; Bhat and Koppelman 2000; Hanson 1982; Hanson and Hanson 1981; Lu and Pas1999; Sun, Wilmot, and Kasturi 1998; Yee and Niemeier 2000). More recently, empiricalevidence points to the production of activity-travel outcomes through intrahousehold interactions between household members (e.g., Gliebe and Koppelman 2002; Scott andKanaroglou 2002). From a policy perspective, there is increasing recognition that house-hold decisions impact the success of travel demand management strategies (e.g., Bhat1996; Gliebe and Koppelman 2002; Golob 2000; Golob and McNally 1997; Lu and Pas1999; Scott and Kanaroglou 2002).
In this study, the household has been adopted as the primary decision-making unit.Activity scheduling is viewed as a household-level behavioral process that gives rise tothe use of various locations in space for daily activities. It is assumed that both individu-als and households exhibit spatial behavior, revealed through the spatial distribution ofdaily activity locations. The spatial behavior of a household is thought to emerge from thecollective behavior of individual household members. From a spatial perspective, house-hold behavior can be modeled as the joint distribution of activity locations associated withthe activity participation of individual household members.
The geographical dispersion of household activity locations can provide some insightto the behavioral response of households to the spatial organization of cities. When policyencourages adjustments to the spatial organization and accessibility of places, householdsmay choose to respond by modifying their daily activity patterns to reflect the latest dis-tribution of activity locations. Measuring a response of this sort can be achieved usingmethods drawn from spatial statistics and computational geometry (Figure 2). The remain-der of this section elaborates on the conceptualization and measurement of householdactivity-travel behavior.
The spatial statistics literature provides several measures that can be used to describespatial patterns of point events that materialize from individual and household activity-travel decisions. Household activity locations represented as points, geocoded fromaddress information, can be used to characterize the dispersion of activity locations asso-
URBAN FORM AND HOUSEHOLD ACTIVITY-TRAVEL BEHAVIOR 179

180 GROWTH AND CHANGE, JUNE 2006
ciated with daily activity patterns. In this study, the standard distance and standard deviation ellipse (SDE) are used to explore the spatial dispersion of household activitiesconducted during a single weekday. Computational formulae for these measures are well known and available elsewhere (Bachi 1963; Earickson and Harlin 1994; Ebdon 1988; Levine 2002; Yuill 1971).
Both unweighted and weighted (e.g., frequency, duration) measures have been imple-mented within a Geographic Information Systems-based activity analysis toolkit (Buliungand Kanaroglou 2006). In this article, measures of spatial dispersion have been weightedto reflect the recorded frequency with which household members physically contactedactivity locations during a single survey day. The frequency with which a particular loca-tion enters the daily activity pattern can be used to provide some insight to the relativeimportance of a particular activity location to the household’s daily activity schedule.
Standard distance is essentially a bivariate extension to the standard deviation of a univariate distribution. The standard distance of a household’s weekday activity pattern isestimated as the standard deviation of the distance of each activity location from the mean center of the complete daily activity pattern.2 Household activity locations are thoselocations visited by surveyed household members during a specified time interval, in thiscase a single weekday. Interpretation is relatively straightforward with a larger standarddistance indicating greater spatial dispersion of activity locations.
In a manner similar to Levine (2002), the standard distance of the household activitypattern is used to define the radius of a standard distance circle (SDC). The SDC provides
5
Residential locations Daily household kilometers traveled
Household 1 Household 2
Survey households withtwo adults having paidemployment and no youngchildren (age ≤ 12 years).
Metro planning districts
Subruban
Urban
FreewaysHousehold 1Worker 1,
Household 2Worker 1,
Household 2Worker 2,
Household activities
Household activity space
Standard distance circle
Standard deviation ellipse
h1
h1
h2
h2
h1
h2
h2w1,1
w1,1
w1,2
w2,2
w1,2
w2,2
PortlandCBD
km
5
km
2.5
km
FIGURE 2. HOUSEHOLD ACTIVITY-TRAVEL PATTERN MEASURES.

a simple geometry for modeling and visualizing the dispersion of activity events at thehousehold level. Standard distance circles have been constructed for two case study house-holds, one living in the Portland CBD, the other living within an outlying suburb (Figure2). The SDCs for these households illustrate an urban/suburban dichotomy with the sub-urban household having a more dispersed weekday activity pattern. Beyond visualization,the area of the SDC provides a summary dispersion measure that can be used to exploresystematic variation in the scattering of household activities subject to sociodemograph-ics, transport supply, and patterns of land use.
While standard distance provides a useful summary measure of spatial dispersion, ithas certain limitations. First, it cannot accommodate directional bias in the arrangementof point events. Directionally skewed activity patterns could emerge as behavioral agentsrespond to the spatial organization of land uses, the geometry of transportation networks,and the limits to spatial cognition. Second, spatial outliers can lead to overstated estimatesof spatial dispersion (Ebdon 1988; Levine 2002; Yuill 1971), a situation that can arise whenindividuals engage in activities located far from the household’s primary or “regular” activity cluster.
An alternative to standard distance is the SDE. The SDE has the advantage of beingless sensitive to the influence of spatial outliers, while describing the dispersion and ori-entation of point events. Early development of the measure can be traced back to the 1920s(e.g., Furfey 1927; Lefever 1926). In this research, the computational formula reported byLevine (2002) has been used. The SDE is centered on the mean center of a household’sweekday activity pattern. The long axis of the ellipse is oriented in the direction ofmaximum dispersion, while the short axis is oriented in the direction of minimum dis-persion. Ellipses generated for case study households suggest that the suburban householdhas a more dispersed activity pattern than the household living in the Portland CBD (Figure2). Furthermore, the suburban household’s activity pattern appears to be directionallybiased toward the CBD.
While the literature provides several concepts and related geometries for measuring thespace within which individuals conduct daily activities, recent examples have not beenextended to the description of household activity-travel behavior. There exists no de factostandard for depicting household activity patterns using area-based geometries. From thisperspective, it is useful to explore multiple measures. The household activity space (HAS)has been developed as an area-based geometry for describing the geographical extent ofdaily household activity patterns (Buliung and Kanaroglou 2006). The focus on revealedactivity outcomes aligns this measure with attempts in the literature to quantify activityspaces using revealed preference data (e.g., Dijst 1999; Newsome, Walcott, and Smith1998; Schönfelder and Axhausen 2003; Thériault, Claramunt, and Villeneuve 1999).
The HAS is defined as the minimum convex polygon containing activity locationsvisited by a single household, during the course of a single day. Methodologically, theapproach is analogous to convex polygon procedures applied by ecologists to characterizethe home ranges of various species (e.g., Mohr 1947; Worton 1987). The analytical expres-sion for a convex hull has been modified to reflect the HAS concept. For a household, h,
URBAN FORM AND HOUSEHOLD ACTIVITY-TRAVEL BEHAVIOR 181

consider the set of daily activity locations, S = {l1h, l2h . . . lnh}, where lih for i = 1, . . . nrepresents the geocodes for the locations of the n activities of household h. Dropping theindex h from all expressions for brevity, the daily HAS A is the set defined as:
The expression implies that all weights li take on values between 0 and 1, inclusive. A
specific combination of the n weight values provides a point in Euclidean space.
The collection of all such points, for all possible combinations of the weights, providesthe convex hull. Expressing the HAS in this manner provides a basic geometry for visualizing and exploring the spatial characteristics of household activity participation.Activity spaces generated for case study households suggest that the CBD-based household meets its daily activity-travel requirements within a smaller area than the sub-urban household (Figure 2).
As a final measure of household activity-travel behavior, activity locations visited bya household’s individual members are used to generate an estimate of total daily house-hold kilometers traveled (DHKT) (Figure 2). For each householder, the Euclidean distancebetween successive activity locations is calculated. The sum of link distances across anindividual householder’s daily activity pattern, followed by aggregation of individual meas-ures across all householders, provides a measure of total travel for a single weekday ofhousehold activities. The DHKT for a household h can be expressed as:
where Liph is the length of a segment i, joining successive activity locations in the dailyactivity-travel path of person p, from a household h, and n is the number of persons inhousehold h. Summing over k lengths gives the daily path length for person p, whilesumming across all persons p yields an estimate of DHKT for a household, h.
A more elaborate path estimation technique (i.e., network paths using free-flow or con-gested travel times) has not been adopted because this study emphasizes the applicationof geocomputational measures to activity-travel analysis. The DHKT metric has beenincluded to provide some insight to the differences in behavioral conclusions that can bedrawn by applying a “typical” measure of travel demand versus measures drawn fromspatial statistics and computational geometry.
Logical Validation and Dichotomous BehaviorThis section focuses on evaluating the behavioral rigor of the activity-travel measures
introduced earlier in the article. This is achieved by attempting to identify an urban/sub-urban differential in the spatial properties of weekday activity-travel behavior. Suburban
DHKT Lh iphi
k
p
n
===ÂÂ
11
li ii
n
l=Â
1
A l for all i andi i i ii
n
i
n
∫ ≥ =ÏÌÓ
¸˝˛==
ÂÂl l l: ,0 111
182 GROWTH AND CHANGE, JUNE 2006

households are expected to have activity patterns characterized by greater dispersion,larger activity spaces, and more daily kilometers traveled than urban households. A house-hold is labeled as urban or suburban based on the urban/suburban status of its Metro plan-ning district of residence (Figure 1). Using this approach, the subsample includes 937urban, and 672 suburban households. The three urban planning districts include a corezone focused on the Portland CBD.
All activity pattern measures have been estimated for the entire subsample of 1,609households. Parametric independent samples t-tests applied to log transformed (for nor-mality) measures suggest the presence of an urban/suburban differential in activity-travelbehavior (Figure 3). Tests for activity pattern differences using the SDC and SDE meas-ures suggest that urban households have less spatially dispersed weekday activity patternsthan their suburban counterparts (p < 0.001). The same test for the major-axis of the SDEsuggests that the average suburban ellipse is more elongated when compared with theaverage urban ellipse (p < 0.001). This potentially reflects the maximum distance betweenactivity sites for suburban households, and the concentration of activities around highcapacity transport links.
The finding for the HAS also suggests an urban/suburban behavioral dichotomy, withlarger activity spaces for suburban households (p < 0.001). This does not necessarily indi-cate greater travel for suburban households. Higher activity frequencies could give rise tomore daily kilometers for urban households. To investigate this question, a similar test wasconducted for the DHKT measure. Results parallel the area-based finding, with urbanhouseholds traveling fewer daily kilometers (p < 0.001).
Despite certain substantive and methodological variations, complementary findingshave been reported elsewhere. For example, Horton and Reynolds (1971) reported widerregional familiarity for middle-income individuals living further from the CBD, and actionspaces concentrated around the CBD for lower-income, central-city residents. In earlierzone-based studies, Beckmann, Golob, and Zahavi (1983) and Zahavi (1979) found elon-gated and larger ellipses for households located further from the dominant regional center.Schönfelder and Axhausen (2003) reported increasing individual activity spaces with distance between the place of residence and city center. Contrasting these examples,Newsome, Walcott, and Smith (1998) did not find significant differences between ellipti-cal areas for downtown, central city, and suburban residents, but did report differences forother elliptical characteristics (e.g., duration, ratio of axes).
Evidence from this exploratory analysis suggests that centrally located householdstravel less to accommodate participation in activities concentrated over smaller areas thansuburban households. This result supports the conclusion that the adopted measuresprovide reasonable descriptions of the spatial characteristics of household activity-travelbehavior. The exploratory results also complement findings from studies of individualtravel behavior where less commuting and, to a lesser extent, discretionary travel has beenreported for centrally located residents (e.g., Dieleman, Dijst, and Burghouwt 2002;Schwanen, Dieleman, and Dijst 2004, 2003, 2004; Wang 2000, 2001). The presence ofgreater suburban travel and larger activity spaces suggests that travel reduction potential
URBAN FORM AND HOUSEHOLD ACTIVITY-TRAVEL BEHAVIOR 183

184 GROWTH AND CHANGE, JUNE 2006
exists within the region. Evolution of mixed-use activity centers could encourage travelreduction over the long term as households respond to local concentrations of employmentand other opportunities.
Explaining Household Activity-Travel PatternsA multivariate modeling exercise has been carried out to investigate the sensitivity of
daily household activity-travel patterns to residential and workplace locations within theplanned hierarchy of centers. It is expected that the spatial extent of the HAS and DHKTwill systematically vary with household and workplace location within the hierarchy.Households living further from centers are likely to have larger activity spaces and travelgreater distances to meet their daily activity requirements than those living closer to theCBD, regional, or town centers. This hypothesis has been depicted in Figure 4 for a smallsample of households. Town centers have been removed from the figure to improve its legibility. In all but two cases, household location serves as a vertex in the correspond-ing activity space. Similarly, the relative location of householder workplaces within thehierarchy is expected to partially explain observed variation in HASs and daily travel.
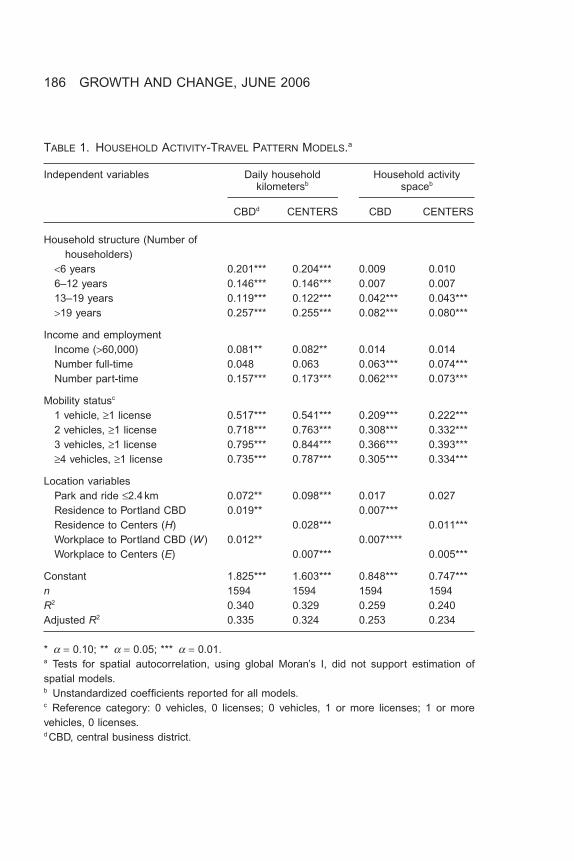
Using a multivariate approach, location effects can be evaluated while controlling forsociodemographic and mobility characteristics. Sociodemographic, mobility, and spatiallocation variables have been regressed against estimates of DHKT and the area of HASsfor the subsample of Metro households (Table 1). Regression diagnostics guided powertransformations of all dependent variables and removal of fifteen households from the finalmodels. Evidence from initial model runs suggested that the omitted households haduncharacteristic values for the specified activity-travel measures given the values of thepredictors used in the models.3 Dependent variable transformations involved taking thenatural logarithm of DHKT, and applying a basic power transformation to the HASmeasure. A Box–Cox likelihood estimation procedure was used to explore the statisticalimplications of using a transformed HAS measure in the models (e.g., Box and Cox 1964;Cook and Weisberg 1999). Experimentation with the Box–Cox procedure indicated that a
0
50
100
150
200
250
Standarddistance circle
Standarddeviation ellipse
Householdactivity space
Measure
Ave
rage
are
a (k
m2 )
Urban Suburban Region
FIGURE 3. URBAN/SUBURBAN HOUSEHOLD ACTIVITY PATTERN DIFFERENTIAL.

URBAN FORM AND HOUSEHOLD ACTIVITY-TRAVEL BEHAVIOR 185
FIGURE 4. HOUSEHOLD ACTIVITY SPACE AND POLYCENTRIC MIXED-USE CENTERS.
basic power transformation of the form, yq, with a transformation parameter of q = 0.15,would sufficiently address the basic assumptions of OLS regression.
Similarly specified with respect to sociodemographic characteristics and householdmobility status, two models have been estimated for each activity-travel measure. Resi-dential and workplace location variables in the CBD models (Table 1) control for locationrelative to the Portland CBD only. In the CENTERS models (Table 1), the focus turnstoward location relative to all of the mixed-use centers that together characterize Metro’spolycentric development strategy (e.g., Portland CBD, regional centers, and town centers).The modeling approach facilitates comparison with research where travel behavior hasbeen studied using the monocentric conceptualization of urban form.
Independent variables have been organized into four classes: household structure,income and employment status, mobility status, and location variables. Only coefficientsfor independent variables that were significant in at least one model have been reported.Several experiments were conducted with alternative specifications for gender, race, andethnicity, and the presence of physically challenged householders. Parameter estimateswere not statistically significant for these types of independent variables. Citing researchthat has influenced model specification, the remainder of this section discusses the ration-ale for including specific independent variables in the regression models.
186 GROWTH AND CHANGE, JUNE 2006
TABLE 1. HOUSEHOLD ACTIVITY-TRAVEL PATTERN MODELS.a
Independent variables Daily household Household activity kilometersb spaceb
CBDd CENTERS CBD CENTERS
Household structure (Number ofhouseholders)
<6 years 0.201*** 0.204*** 0.009 0.0106–12 years 0.146*** 0.146*** 0.007 0.00713–19 years 0.119*** 0.122*** 0.042*** 0.043***>19 years 0.257*** 0.255*** 0.082*** 0.080***
Income and employmentIncome (>60,000) 0.081** 0.082** 0.014 0.014Number full-time 0.048 0.063 0.063*** 0.074***Number part-time 0.157*** 0.173*** 0.062*** 0.073***
Mobility statusc
1 vehicle, ≥1 license 0.517*** 0.541*** 0.209*** 0.222***2 vehicles, ≥1 license 0.718*** 0.763*** 0.308*** 0.332***3 vehicles, ≥1 license 0.795*** 0.844*** 0.366*** 0.393***≥4 vehicles, ≥1 license 0.735*** 0.787*** 0.305*** 0.334***
Location variablesPark and ride ≤2.4 km 0.072** 0.098*** 0.017 0.027Residence to Portland CBD 0.019** 0.007***Residence to Centers (H) 0.028*** 0.011***Workplace to Portland CBD (W ) 0.012** 0.007****Workplace to Centers (E) 0.007*** 0.005***
Constant 1.825*** 1.603*** 0.848*** 0.747***n 1594 1594 1594 1594R2 0.340 0.329 0.259 0.240Adjusted R2 0.335 0.324 0.253 0.234
* a = 0.10; ** a = 0.05; *** a = 0.01.a Tests for spatial autocorrelation, using global Moran’s I, did not support estimation ofspatial models.b Unstandardized coefficients reported for all models.c Reference category: 0 vehicles, 0 licenses; 0 vehicles, 1 or more licenses; 1 or more vehicles, 0 licenses.d CBD, central business district.

Specifications for household structure and employment status are unique within thetravel behavior/polycentric urban form literature. Several approaches to modeling theeffect of household structure on travel behavior have been documented (e.g., Dieleman,Dijst, and Burghouwt 2002; Dijst 1999; Gliebe and Koppelman 2002; Golob 2000; Goloband McNally 1997; Hamed and Easa 1998; Ritsema van Eck, Burghouwt, and Dijst 2005).It is widely known that household size and the presence of children influence activity-travel behavior. To capture these effects, while providing greater insight to the processesof interest, household structure has been modeled as the number of household membersby age category (summation across categories yields household size). This approachreflects an assumption concerning the independent mobility of children and school age,with the degree of independence increasing through the age structure. In general, the pres-ence and number of children of various ages is expected to impact the nonwork activitiesand travel of households.
The effect of individual and household income on activity-travel behavior has also beenwell documented (e.g., Golob 2000; Hanson 1982). To demonstrate the effect of risinghousehold income on activity-travel behavior, the survey’s ordinal income measure hasbeen collapsed to a dummy variable. Theoretically, the discretionary income available tohigh-income households could encourage greater participation in nonobligatory activities,resulting in larger activity spaces and greater cumulative daily travel distance.
Household employment status has often been modeled as the number of householdworkers (e.g., Boarnet and Greenwald 2000; Golob 2000; Naess and Sandberg 1996). Inthis study, householders have been disaggregated by employment tenure based on theexpectation that households with more part-time workers will allocate greater resourcesto discretionary activities and travel because of fewer employment-related time constraints.
With respect to household mobility, on average, households in the subsample ownedessentially two vehicles (M = 1.9), with 69 percent having two or more. To capture theeffect of household auto-based mobility, household mobility bundles have been con-structed that include household vehicles and licensed drivers. Scott and Kanaroglou (2002)found the mobility specification used here to be more effective than the commonlyemployed ratio of vehicles to licenses. In general, improvements to household auto avail-ability are likely to lead to increases in DHKT and larger activity spaces. The automobileprovides households with a level of spatio-temporal flexibility that could give rise to participation in nonwork activities requiring greater travel than what otherwise might be expected.
Several Location Variables have been included to control for the relative location ofhousehold residential and workplace locations within the polycentric hierarchy, and accessto public transit facilities (Table 1). Explicit recognition of work-end accessibility effectsis relatively unique within a literature that has typically focused on the location of the placeof residence. Exploring the relationship between regional activity participation, traveldemand, and the location of Metro’s mixed-use center locations is of interest from a publicpolicy perspective. Since the mid-1990s, Metro has promoted the mixed-use centersprogram as a key strategy to reduce regional motorized travel and contain urban sprawl.
URBAN FORM AND HOUSEHOLD ACTIVITY-TRAVEL BEHAVIOR 187

Public-transit access has been specified as a dummy variable reflecting proximity tothe nearest park-and-ride facility providing access to either bus or light rail from the placeof residence. Park and ride buffer distances have been empirically estimated by taking themean of the distribution of distances to these facilities from residential locations generat-ing park-and-ride trips. On average, these park-and-ride households were located within2.4km of a facility. Experimentation with graduated buffers around this mean distanceconfirmed that the adopted dichotomous specification was the best approach. In the pres-ence of a more detailed transit database, alternative measures for transit access could bedeveloped as has been done elsewhere (e.g., Hess and Ong 2002).
While several household and workplace location measures have been tested, only thoseproviding useful insights to the policy question of interest have been included in thisarticle. Distances used to operationalize the measures are between residential or workplacegeocodes and individual points generated to represent center locations (Portland CBD,regional centers, town centers). A variable common to studies of this sort is distance fromthe place of residence to the CBD (e.g., Cervero and Wu 1998; Naess and Sandberg 1996;Wang 2000, 2001; Weber and Kwan 2002). A similar variable, Residence to Portland CBD(Table 1), has been estimated as the Euclidean distance from residential locations to thePortland CBD. The relative location of household employment activities to the CBD hasbeen specified as the average distance from householder employment locations to the CBD.This quantity, W, can be expressed as:
where dmj is the Euclidean distance to the CBD located at j, from a householder workplacelocation m, and k is the total number of employed householders (Workplace to PortlandCBD in Table 1).
Estimating the relative location measures for the CENTERS models was more complex.Experiments were carried out using several proximity measures (e.g., distance to closestcenter) similar in scope to those reported elsewhere (e.g., Wang 2000; Weber 2003; Weberand Kwan 2002). These types of variables were generally weakly correlated with the house-hold activity-travel behavior measures. In addition, simultaneously controlling for prox-imity to different levels in the centers hierarchy, by including separate variables for distanceto regional centers, town centers, and the Portland CBD, produced severe multicollinear-ity effects.
In response, comprehensive location measures have been estimated using total centeremployment as a proxy measure for the activity attraction potential of these sites. In thefuture, an alternative weighting scheme could be devised to reflect the availability of workand nonwork opportunities at center locations. In the absence of more detailed informa-tion on the distribution of work and nonwork opportunities, traffic analysis zone employ-ment counts have been assigned to spatially coincident centers. The employment countswere recorded in 1994, the same year in which most survey records were completed. Incor-
W d kmjm
k
==
Â1
188 GROWTH AND CHANGE, JUNE 2006

porating distance to centers and the relative size of individual centers reduces the abstrac-tion associated with the residential and workplace location measures. The relative locationof a household within the hierarchy is modeled as the employment weighted mean distance over all the centers (Residence to Centers in Table 1). This quantity, H, can bedefined as:
where ej is the total employment of a center j, and dij is the Euclidean distance from ahousehold residence geocode i to center j.
The final location measure adjusts for the relative location of household employmentactivities within the hierarchy (Workplace to Centers in Table 1). It is a weighted distancemeasure indexed to the workplace locations of employed household members. The quan-tity, E, is estimated for each household, as the weighted mean distance over all the workingmembers of a household k and centers n:
where ej is the total employment of a center j, and dmjl is the Euclidean distance from theworkplace location m, of a householder l, to center j. The spatial extent of the HAS anddaily kilometers traveled are expected to be positively associated with these location variables. In other words, as household residential and workplace locations becomeincreasingly isolated from the hierarchy, requirements for daily travel are expected toincrease, giving rise to larger activity spaces and more DHKT.
Discussion of FindingsThe adopted analytic framework complicates placing the findings of this research
within existing literature. The analysis has been uniquely conducted at the household level,included activities and travel of all householders (employed or otherwise), and extendedactivity types to both work and discretionary episodes. Overall, the DHKT models providebetter fit than the activity space models. With respect to urban form and activity-travelbehavior, subtle differences in the magnitude of coefficients and model-fit are observedacross the CBD and CENTERS models. These, along with other findings, are examinedin greater detail in the remainder of this section.
Coefficients for sociodemographic regressors suggest increases in DHKT with house-hold structure, income, and number of employed householders by job tenure (Table 1).These effects are maintained across both CBD and CENTERS models. The positive coef-ficients for the household structure variables provide evidence that the size of the house-hold has a positive influence on DHKT and the spatial extent of the activity space.4 Largercoefficients for the youngest and oldest household age groups likely reflect links betweenthe activities of young children (e.g., preschoolers) and adults. Households with a large
E e d k ej mjlj
n
l
k
jj
n
=== =
ÂÂ Â11 1
H e d ej ijj
n
jj
n
== =
 Â1 1
URBAN FORM AND HOUSEHOLD ACTIVITY-TRAVEL BEHAVIOR 189

number of preschoolers are likely engaged in serve-passenger activities and a wider arrayof household maintenance activities that could contribute to more daily travel. Specifically,maintenance activity requirements could give rise to more frequent short-distance trips,contributing to greater overall daily travel. As children age, these links become increas-ingly flexible. Households with older children may engage in independent activities morefrequently, with the independent activities of children occurring closer to home.
All else being equal, the DHKT models suggest greater average daily travel distancefor higher income households. The level of discretionary income available to higherincome households may give rise to increased frequency of participation in nonwork activ-ities, or longer distance trips to discretionary activity locations. In addition, a high-incomehousehold that chooses a commute minimizing residential location may exhibit moreDHKT than other households because of the consumption of nonwork activities. Studiesof individual-level commuting provide evidence of similar effects, particularly for autodrivers (e.g., Dieleman, Dijst, and Burghouwt 2002; Schwanen, Dieleman, and Dijst 2003,2004). In an earlier study, Hanson (1982) reported larger worker and nonworker trip fre-quencies, and more work stops for high income households. Results from zone-based commuting time models for Columbus, Ohio, also point to increasing travel with income(Wang 2001).
Other things being equal, daily travel (DHKT) increases with the number of employedhouseholders (particularly part-time employment), an effect repeatedly observed in indi-vidual commuting models (e.g., Naess and Sandberg 1996; Wang 2001). One possibleexplanation for the employment status estimates is that households with a larger part-timeworkforce engage in more discretionary activities and related travel, in the absence of timeconstraints associated with full-time employment. Hazard-based activity studies provideadditional support for this hypothesis, suggesting that work durations structure nonworkactivity participation (e.g., Bhat 1996; Schwanen 2004). In addition, earlier research byHanson (1982) indicates that hours worked tend to reduce social and shopping activity frequency for employed individuals.
Although not reported here, the standardized regression coefficients suggest that themost significant predictors of daily travel relate to household mobility potential. In theCBD model for DHKT, household transition to the highest income class contributes to anaverage increase in weekday travel of approximately 8 percent or 0.5km per day. In com-parison, a change in mobility status that includes moving from a zero to single-vehiclehousehold, yields an average increase in daily travel of approximately 68 percent or 4.2km. The model suggests increasing average DHKT with increasing household autoownership up to three vehicles. Households with four or more vehicles are still, on average, traveling approximately 6.7km more per day than households in the referencecategory. Complementing existing literature, the analytic framework used in this study pro-vides evidence that, beyond the journey to work, households with vehicles and licenseddrivers engage in widely dispersed activities that require more daily travel.
Compared with the daily travel models, income, certain household structure variables,and proximity to park-and-ride facilities are not statistically significant in the activity space
190 GROWTH AND CHANGE, JUNE 2006

models. Alternatively, the employment status relationship becomes stronger as evidencedby the significant coefficient for the number of full-time employees. The relationshipbetween household structure and the HAS is potentially explained by the spatial distribu-tion of out-of-home activities conducted by householders 13 to 14 years of age. These individuals are likely to engage in spatially dispersed out-of-home activities (e.g., extracur-ricular events), independently and jointly with adult householders, giving rise to largeractivity spaces.
Similar to the daily travel models, household mobility has the greatest impact on theHAS. For example, according to the CBD model, one-vehicle households with licenseddrivers have average activity spaces that are four times larger than households in the ref-erence category. Adjusting for multiple centers suggests an increase of approximately sixtimes over the reference category. The average activity space of households with four ormore vehicles is approximately eight times larger than the reference category. This is notunexpected as the mean activity space for zero-vehicle households is approximately 7km2,while households with four or more vehicles have a mean activity space of 101km2. Intuitively, it follows that increasing household auto-based mobility lends itself to dailytravel over a much larger area. From this perspective, the activity space concept appearsto be a useful measure for studying household activity-travel behavior.
Including the location variables improves overall model-fit when compared with basemodels estimated using only sociodemographic and mobility status covariates (DHKT:Adj. R2 = 0.271; HAS: Adj. R2 = 0.186). Park-and-ride coefficients for the DHKT modelssuggest a marginal increase in daily travel with proximity to facilities (0.5km on average).This positive effect is not surprising as regional transit services are quite geographicallyextensive. Transit users have an opportunity to travel considerable distances, potentiallycontributing to higher levels of daily household travel.
With respect to measuring access to public transit in the chosen manner, a similarexample could not be found in the literature dealing with regional urban form and activity-travel behavior. Looking more broadly, findings from new urbanist and neotradi-tional design studies suggest lower levels of auto ownership with improved access totransit, but that effects of this sort are essentially offset by other factors (e.g., Boarnet andGreenwald 2000; Hess and Ong 2002). In contrast, Naess and Sandberg (1996) reportedlonger commuting distances with improved work-end transit access.
The remainder of this discussion focuses on the primary hypothesis of interest con-cerning the relationship between spatial properties of household activity patterns and loca-tion within the hierarchy of centers. As expected, coefficient estimates for the remaininglocation variables suggest a positive effect of both residential location, and the relativelocation of householder workplaces on daily travel distance for all activities and the areaof the HAS. These effects were found to be present in both CBD and CENTERS models.The evidence appears to suggest that, with the exception of the HAS CBD model, resi-dential location measures explain more of the total variation in the activity pattern meas-ures than the household workplace measures. This perhaps indicates that the place ofresidence serves a greater role than the workplace in determining the configuration of daily
URBAN FORM AND HOUSEHOLD ACTIVITY-TRAVEL BEHAVIOR 191

activity patterns. In addition, the findings speak to the inclusion of activities carried outby nonworkers who, in the absence of a workplace, could be more likely to organize dailyexcursions around the place of residence.
The improved fit of the CBD models over the CENTERS models provides evidence ofthe importance of the “centrality” of residences and workplaces within the study area. Thisfinding is consistent with other research where the Portland CBD has been shown to influ-ence individual accessibility (e.g., Weber 2003). This finding does not come as a surprise asPortland retains the largest share of the region’s population and employment. This centralityeffect will likely continue as Metro plans to maintain the Portland CBD’s position within thehierarchy, while directing new growth toward other centers (e.g., Metro 1997, 2000).
Despite the weaker fit of the CENTERS models, the statistical evidence also points tothe influence of the centers hierarchy on regional activity-travel demand.5 As residencesand workplaces become increasingly displaced from the polycentric hierarchy, householdsare required to travel greater distances and carry out their daily activities over larger areas.6
The importance of the centers to the regional economy has been widely recognized (e.g.,Gibson and Abbott 2002; Metro 1997, 2000). Arguing that the CBD’s influence favorsmonocentricity discounts the influence of high-tech employment centers located to the west(e.g., Hillsboro and the Silicon Forest) and east (e.g., Gresham). In addition, past researchhas shown that individuals living closer to Metro’s subcenters experience an accessibilityadvantage (e.g., Webber and Kwan 2002). Collectively, the evidence supports the existenceof an emergent polycentric structure in Metro. This polycentric structure could progres-sively influence regional demand for activities and travel as new development concentratesat regional and town center locations.
While examples exist in the literature where commute distances and times have beenjointly examined (e.g., Schwanen, Dieleman, and Dijst 2004; Wang 2000, 2001), this studyhas focused on explaining daily household travel distance associated with all activities andthe spatial footprint of resulting activity patterns. With this extension beyond commuting,the findings suggest that average weekday household travel, and the area of the corre-sponding activity space, increase with distance from the Portland CBD and other metro-politan centers. In other words, the exogenous distribution of mixed-use centers partiallyexplains observed activity-travel patterns for the subsample of survey households.
With respect to the lack of consensus regarding travel distances and polycentric urbanform, the CENTERS models tend to substantiate findings from research where increases inwork travel distance have been associated with residential distance to regional centers (e.g.,Wang 2000, 2001). Given the discrete time horizon of this study, polycentric urban formappears to have a marginal impact on activity-travel behavior in the Portland metropolitanarea. As has previously been suggested, it is possible that the modeled relationships couldstrengthen over time as economic and activity opportunities develop at the center locations.
It would be somewhat premature to suggest that evidence from this study can be usedto support the co-location hypothesis. The rationale for this position is twofold. First, theco-location hypothesis has not been meaningfully extended to discretionary activities andtravel and has not been framed from an activity perspective. Second, as evidenced by an
192 GROWTH AND CHANGE, JUNE 2006

earlier study by Cervero and Wu (1998), co-location is a temporally dynamic process,potentially generating efficient travel over discrete time periods prior to a “next” phase ofdecentralization. Lacking the necessary data to control for these dynamics, sufficient evi-dence has not been presented to suggest that co-location extends to nonwork activities orthat the process has given rise to efficient suburban travel in the study area.
ConclusionMeasuring the success of urban growth management has primarily focused on land use
outcomes with an emphasis placed on urban densities, land conversion, property values,and urbanized land area (e.g., Caruthers 2002; Caruthers and Ulfarsson 2002; Kline andAlig 1999; Weitz and Moore 1998). As Caruthers (2002) suggests, little is known aboutthe secondary effects of growth management, particularly with respect to urban travel,accessibility, and general quality of life. By looking into the activity-travel implicationsof Metro’s polycentric metropolitan development strategy, this article represents an attemptto understand the potential secondary impacts of growth management.
Unlike past studies of urban form and travel behavior that emphasized the journey towork of employed individuals, this study examined the obligatory and discretionary activity-travel behavior of households. The approach used to describe daily patterns ofbehavior involved the application of measures drawn from spatial statistics and com-putational geometry. These measures were initially used to identify an urban/suburban differential in weekday activity-travel behavior. The remainder of the article focuses onthe relationship between household characteristics, mobility status, and household/workplace location within a planned hierarchy of mixed-use centers. Adjusting for otherfactors, households located further from the Portland CBD and other centers are shown tohave greater daily travel requirements and larger activity spaces. Overall, the resultssuggest that the potential exists to reduce weekday travel by directing growth toward decen-tralized activity centers. In other words, the type of polycentric development strategyendorsed by Metro could achieve desirable activity-travel outcomes.
The transferability of findings for Metro to other urban regions is somewhat question-able given Metro’s unique planning legacy and apparent success with growth management(e.g., Caruthers 2002). Metro’s 2040 concept encourages the co-location of housing, jobs,and nonwork activity opportunities by concentrating development at mixed-use centersdistributed throughout the jurisdiction. Support for decentralized polycentric development,in the absence of the type of urban containment strategy in place for Metro (i.e., the urbangrowth boundary), could encourage sprawl and potentially give rise to greater daily travelrequirements. As opportunities for employment and discretionary activities increasinglydecentralize, households might adjust their residential location preference toward theperiphery, looking to trade travel costs for adequate or desirable housing opportunities.Retail and service firms might then adjust their location preference toward new peripheralmarkets, leading to an overall expansion of the urbanized land area. The activity-travelimplications of this type of unconstrained co-location remain unclear and complex, par-ticularly when the focus turns toward nonwork activities.
URBAN FORM AND HOUSEHOLD ACTIVITY-TRAVEL BEHAVIOR 193

With respect to using land use policy to achieve reductions in motorized travel, regu-lation of urban form merely facilitates spatiotemporal activity-scheduling adjustments thatcould give rise to travel efficiencies. Residential and employment mobility, auto owner-ship and use, alongside the tastes and preferences of households, could limit the effec-tiveness of such an approach (Anderson, Kanaroglou, and Miller 1996; Miller andSoberman 2003; Miller, Kriger, and Hunt 1999). This research has shown that barriers toregional accessibility could potentially be overcome through positive adjustments to thehousehold auto-based mobility bundle. Evidence from this study lends support to the argument that rising personal mobility reduces the significance of the regional distribu-tion of employment as a determinant of travel behavior (Giuliano 1989). In addition, risinglevels of auto ownership in North America and elsewhere (e.g., Cameron, Lyons, and Kenworthy 2004; OECD 2000; Pucher and Renne 2003), coupled with the spatial flexi-bility offered by the automobile, could act to decrease the efficacy of land-use policy asan approach to reducing motorized travel.
With respect to the possible extension of this research, the literature provides severalexamples where quantitative methods have been used to describe metropolitan urban form(e.g., Anas, Arnott, and Small 1998; Modarres 2003). An attempt should be made to ascer-tain the extent to which Metro’s planned center locations coincide with activity centersdetected through other empirical means. Findings from research of this sort could be usedto identify gaps in the planned polycentric hierarchy and enhance understanding of rela-tionships between urban form and personal travel. Lastly, while this study clearly set outto explore the relationship between metropolitan urban form and activity-travel behavior,adjusting the scale of analysis to the neighborhood level represents a potentially usefulfuture endeavor. Research conducted at the neighborhood scale could provide insights to the impact of urban diversity, density, and design (Cervero and Kockelman, 1997) characteristics on the spatial properties of activity-travel behavior.
NOTES1. As a matter of course, the terms “worker” and “employment/employed” are used throughout to
describe paid employment outside of the home.
2. Mean center is the mean of the x and y coordinates associated with the activity locations contained
with a household’s daily activity set.
3. Estimation of all models with and without the fifteen cases resulted in no change to the sign or
statistical significance of the parameter estimates of all models. A marginal improvement to model-
fit occurred when the fifteen cases were removed.
4. Separate models, estimated using a basic household size variable, lend further support to this
conclusion.
5. The simplicity and larger variances of the CBD distance variables provides additional insight to
the marginal improvement in model-fit reported in Table 1.
6. Displacement includes cases where residences and workplaces are located at the periphery or at
the location of potential “gaps” within the hierarchy (i.e., a potential gap can be found north of
the CBD).
194 GROWTH AND CHANGE, JUNE 2006

URBAN FORM AND HOUSEHOLD ACTIVITY-TRAVEL BEHAVIOR 195
REFERENCESAnas, A., R. Arnott, and K.A. Small. 1998. Urban spatial structure. Journal of Economic Literature
36: 1426–1464.
Anderson, W.P., P.S. Kanaroglou, and E.J. Miller. 1996. Urban form, energy and the environment: A
review of issues, evidence and policy. Urban Studies 33: 7–35.
Bachi, R. 1963. Standard distance measures and related methods for spatial analysis. Papers of the
Regional Science Association 10: 83–132.
Badoe, D.A., and E.J. Miller. 2000. Transportation-land use interaction: Empirical findings in North
America, and their implications for modeling. Transportation Research D 5: 235–263.
Beckmann, M.J., T.F. Golob, and Y. Zahavi. 1983. Travel probability fields and urban spatial struc-
ture: 2 Empirical tests. Environment and Planning A 15: 727–738.
Bhat, C.R. 1996. A generalized multiple durations proportional hazard model with an application to
activity behavior during the evening work-to-home commute. Transportation Research B 30:
465–480.
Bhat, C.R., and F.S. Koppelman. 2000. Activity-based travel demand analysis: History, results and
future directions. Paper presented at the 79th Annual meeting of the Transportation Research
Board, Washington, DC., January.
Bhat, C.R., and S. Srinivasan. 2004. A multidimensional mixed ordered-response model for analyz-
ing weekend activity participation. Transportation Research B 39: 255–278.
Boarnet, M.G., and M.J. Greenwald. 2000. Land use, urban design, and nonwork travel: Reproduc-
ing other urban area’s empirical test results in Portland, Oregon. Transportation Research Record
1722: 27–37.
Box, G.E.P., and D.R. Cox. 1964. An analysis of transformations. Journal of the Royal Statistical
Society 26: 211–252.
Buliung, R.N., and P.S. Kanaroglou. 2006. A GIS toolkit for exploring geographies of household
activity/travel behavior. Journal of Transport Geography 14: 35–51.
Cambridge Systematics. 1996. Data collection in the Portland, Oregon metropolitan area: Case study.
Report DOT-T-97-09, U.S. Department of Transportation (USDOT): Washington, DC.
Cameron, I., T.J. Lyons, and J.R. Kenworthy. 2004. Trends in vehicle kilometres of travel in
world cities, 1960–1990: Underlying drivers and policy responses. Transport Policy 11: 287–
298.
Caruthers, J.K. 2002. The impact of state growth management programmes: A comparative analysis.
Urban Studies 39: 1959–1982.
Caruthers, J.K., and G. Ulfarsson. 2002. Fragmentation and sprawl: Evidence from inter-regional
analysis. Growth and Change 33: 312–340.
Cervero, R., and K.M. Kockelman, 1997. Travel demand and the 3 D’s: Density, diversity, and design.
Transportation Research 2: 199–219.
Cervero, R., and K-L. Wu. 1997. Polycentrism, commuting, and residential location in the San
Francisco Bay area. Environment and Planning A 29: 865–886.
———. 1998. Sub-centring and commuting: Evidence from the San Francisco Bay area, 1980–90.
Urban Studies 35: 1059–1076.
City of Toronto. 2002. Toronto official plan. City of Toronto, Toronto Urban Development Services,
Toronto. http://www.toronto.ca/torontoplan/official_plan.htm (accessed April 2006).

196 GROWTH AND CHANGE, JUNE 2006
Congress for New Urbanism (CNU). 1998. Charter of the new urbanism. http://www.cnu.org/
cnu_reports/Charter.pdf (accessed April 2006).
Cook, R.D., and S. Weisberg. 1999. Applied regression including computing and graphics. New York:
Wiley and Sons.
Crane, R. 2000. The influence of urban form on travel: An interpretive review. Journal of Planning
Literature 15: 3–23.
Dieleman, F.M., M. Dijst, and G. Burghouwt. 2002. Urban form and travel behaviour: Micro-level
household attributes and residential context. Urban Studies 39: 507–527.
Dijst, M. 1999. Two-earner families and their action spaces: A case study of two Dutch communities.
Geojournal 48: 195–206.
Earickson, R.J., and J.M. Harlin. 1994. Geographic measurement and quantitative analysis. New York:
Macmillan College.
Ebdon, D. 1988. Statistics in geography 2nd edition. Oxford, UK: Blackwell.
Ewing, R. 1997. Is Los Angeles-style sprawl desirable? Journal of the American Planning Associa-
tion 63: 107–126.
Ewing, R., T. Schmid, R. Killingsworth, A. Zlot, and S. Raudenbush. 2003. Relationship between
urban sprawl and physical activity, obesity, and morbidity. American Journal of Health Promo-
tion 18: 47–57.
Furfey, P.H. 1927. A note on Lefever’s “standard deviational ellipse.” American Journal of Sociology
33: 94–98.
Gibson, K., and C. Abbott. 2002. City profile: Portland Oregon. Cities 19: 425–436.
Giuliano, G. 1989. Research policy and review 27. New directions for understanding transportation
and land use. Environment and Planning A 21: 145–59.
Gliebe, J.P., and F.S. Koppelman. 2002. A model of joint activity participation between household
members. Transportation 29: 49–72.
Golob, T.F. 2000. A simultaneous model of household activity participation and trip chain generation.
Transportation Research B 34: 355–376.
Golob, T.F., and M.G. McNally. 1997. A model of activity participation and travel interactions between
household heads. Transportation Research B 31: 177–194.
Gordon, P., and H.W. Richardson. 1997. Are compact cities a desirable planning goal? Journal of the
American Planning Association 63: 95–106.
Gordon, P., A. Kumar, and H.W. Richardson. 1989. Congestion, changing metropolitan structure and
city size in the United States. International Regional Science Review 12: 45–56.
Gordon, P., H.W. Richardson, and M.J. Jun. 1991. The commuting paradox: Evidence from the top
twenty. Journal of the American Planning Association 57: 416–420.
Hamed, M., and S.M. Easa. 1998. Integrated modeling of urban shopping activities. Journal of Urban
Planning and Development 124: 115–131.
Handy, S.L., A. DeGarmo, and K. Clifton. 2002. Understanding the growth in non-work VMT.
http://swutc.tamu.edu/Reports/167802-1.pdf (accessed April 2006).
Hanson, S. 1982. The determinants of daily travel-activity patterns: Relative location and socio-
demographic factors. Urban Geography 3: 179–202.
Hanson, S., and P. Hanson. 1981. The travel-activity patterns of urban residents: Dimensions and
relationships to sociodemographic characteristics. Economic Geography 57: 332–347.

Hess, D.B., and P.M. Ong. 2002. Traditional neighborhoods and automobile ownership. Transporta-
tion Research Record 1805: 35–44.
Horton, F.E., and D.R. Reynolds. 1971. Effects of urban spatial structure on individual behavior.
Economic Geography 47: 36–48.
Jones, P.M. 1979. New approaches to understanding travel behavior: The human activity approach.
In Behavioural travel modelling, ed. D.A. Hensher and P.R. Stopher, 55–80. London: Redwood
Burn Ltd.
Kline, J., and R. Alig. 1999. Does land use planning slow the conversion of forest and farm lands?
Growth and Change 30: 3–22.
Künzil, N., R. McConnell, D. Bates, T. Bastain, A. Hricko, F. Lurmann, E. Avol, F. Gilliland, and
J. Peters. 2003. Breathless in Los Angeles: The exhausting search for clean air. American
Journal of Public Health 93: 1494–1499.
Lefever, D.W. 1926. Measuring geographic concentration by means of the standard deviational ellipse.
American Journal of Sociology 32: 88–94.
Levine, N. 2002. CrimeStat II: A spatial statistics program for the analysis of crime incident loca-
tions (version 2.0). Houston TX/National Institute of Justice, Washington, DC: Ned Levine &
Associates.
Levinson, D.M. 1998. Accessibility and the journey to work. Journal of Transport Geography 6:
11–21.
Levinson, D.M., and A. Kumar. 1994. The rational locator: Why travel times have remained stable.
Journal of the American Planning Association 60: 319–332.
Lopez, R., and H.P. Hynes. 2003. Sprawl in the 1990s measurement, distribution, and trends. Urban
Affairs Review 38: 325–355.
Lu, X., and E.I. Pas. 1999. Socio-demographics, activity participation and travel behavior. Trans-
portation Research A 33: 1–18.
McMillen, D.P. 2004. Employment densities, spatial autocorrelation, and subcenters in large
metropolitan areas. Journal of Regional Science 44: 225–243.
Metro. 2005. Regional framework plan. Metropolitan Service District, Oregon. www.metro-region.
org/article.cfm?articleid=432 (accessed April 2006).
———. 2000. The nature of 2040. Metropolitan Service District, Oregon. http://www.metro-
region.org/library_docs/land_use/2040history.pdf (accessed April 2006).
Miller, E.J., and D. Soberman. 2003. Travel demand and urban form. NEPTIS Foundation, Toronto.
www.neptis.org/library/show.cfm?id=46&cat_id=19 (accessed April 2006).
Miller, E.J., D.S. Kriger, and J.D. Hunt. 1999. Integrated urban models for simulation of transit and
land-use policies. Transit Cooperative Research Program (TCRP) Report 48. Transportation
Research Board, National Research Council, Washington, DC.
Modarres, A. 2003. Polycentricity and transit service. Transportation Research A 37: 841–864.
Mohr, C.O. 1947. Table of equivalent populations of North American mammals. American Midland
Naturalist 37: 223–249.
Naess, P., and S.L. Sandberg. 1996. Workplace location, modal split and energy use for commuting
trips. Urban Studies 33: 557–580.
Newman, P.W.G., and J.R. Kenworthy. 1989. Gasoline consumption and cities. Journal of the
American Planning Association 55: 24–37.
URBAN FORM AND HOUSEHOLD ACTIVITY-TRAVEL BEHAVIOR 197

Newsome, T.H., W. Walcott, and P.D. Smith. 1998. Urban activity spaces: Illustrations and applica-
tion of a conceptual model for integrating the time and space dimensions. Transportation 25:
357–377.
Organization for Economic Co-operation and Development (OECD). 2000. Synthesis report: Envi-
ronmentally sustainable transport. Vienna: Austrian Federal Ministry for Agriculture, Forestry,
Environment and Water Management, OECD.
Owens, S. 1986. Energy, planning and urban form. London: Pion Ltd.
Phillips, J., and E. Goodstein. 2000. Growth management and housing prices: The case of Portland,
Oregon. Contemporary Economic Policy 18: 334–344.
Pucher, J., and J.L. Renne. 2003. Socioeconomics of urban travel: Evidence from the 2001 NHTS.
Transportation Quarterly 57: 49–77.
Ritsema van Eck, J., G. Burghouwt, and M. Dijst. 2005. Lifestyles, spatial configurations and quality
of life in daily travel: An explorative simulation study. Journal of Transport Geography 13:
123–134.
Schönfelder, S., and K.W. Axhausen. 2003. Activity spaces: Measures of social exclusion? Transport
Policy 10: 273–286.
Schwanen, T. 2004. The determinants of shopping duration on workdays in the Netherlands. Journal
of Transport Geography 12: 35–48.
Schwanen, T., F.M. Dieleman, and M. Dijst. 2001. Travel behaviour in Dutch monocentric and
policentric urban systems. Journal of Transport Geography 9: 173–186.
———. 2003. Car use in Netherlands daily urban systems: Does polycentrism result in lower
commute times? Urban Geography 24: 410–430.
———. 2004. The impact of metropolitan structure on commute behavior in the Netherlands: A
multilevel approach. Growth and Change 35: 304–333.
Scott, D.M., and P.S. Kanaroglou. 2002. An activity-episode generation model that captures interac-
tions between household heads: Development and empirical analysis. Transportation Research B
36: 875–896.
Smart Growth Network (SGN). 2003. Getting to Smart Growth II: 100 More Policies for Implemen-
tation. http://www.epa.gov/smartgrowth/publications.htm (accessed April 2006).
Sturm, R., and D.A. Cohen. 2004. Suburban sprawl and physical and mental health. Public Health
118: 488–496.
Sun, X., C.G. Wilmot, and T. Kasturi. 1998. Household travel, household characteristics, and land
use: An empirical study from the 1994 Portland activity-based travel survey. Transportation
Research Record 1617: 10–17.
Thériault, M., C. Claramunt, and P.Y. Villeneuve. 1999. A spatio-temporal taxonomy for the repre-
sentation of spatial set behaviours. Lecture Notes in Computer Science 1678: 1–18.
USDOT BTS 2003. Transportation statistics annual report 2003. Washington, DC: Department of
Transportation, Bureau of Transportation Statistics.
Wang, F. 2000. Modeling commuting patterns in Chicago in a GIS environment: A job accessibility
perspective. Professional Geographer 52: 120–133.
———. 2001. Explaining intraurban variations of commuting by job proximity and workers’
characteristics. Environment and Planning B: Planning and Design 28: 169–182.
Weber, J. 2003. Individual accessibility and distance from major employment centres: An examina-
tion using space-time measures. Journal of Geographical Systems 5: 51–70.
198 GROWTH AND CHANGE, JUNE 2006

Weber, J., and M.-P. Kwan. 2002. Bringing time back in: A study on the influence of travel time
variations and facility opening hours on individual accessibility. Professional Geographer
54: 226–240.
Weitz, J., and T. Moore. 1998. Development inside urban growth boundaries: Oregon’s empirical evi-
dence of continuous urban form. Journal of the American Planning Association 64: 424–444.
Worton, B.J. 1987. A review of models of home range for animal movement. Ecological Modelling
38: 277–298.
Yee, J.L., and D.A. Niemeier. 2000. Analysis of activity duration using the Puget Sound Transporta-
tion Panel. Transportation Research Part A 34: 607–624.
Yuill, R.S. 1971. The standard deviational ellipse: An updated tool for spatial description. Geografiska
Annaler Series B, Human Geography 53: 28–39.
Zahavi, Y. 1979. The ‘UMOT’ project report. Report DOT-RSPA-DPB-20-79-3. Washington, DC: U.S.
Department of Transportation.
URBAN FORM AND HOUSEHOLD ACTIVITY-TRAVEL BEHAVIOR 199