Inhibition of epidermal xenobiotic metabolism in SENCAR mice by naturally occurring plant phenols
Upload
independentCategory
view
1download
0
BIOENERGY AND BIOFUELS
Upgrading of straw hydrolysate for production of hydrogenand phenols in a microbial electrolysis cell (MEC)
Anders Thygesen & Massimo Marzorati & Nico Boon &
Anne Belinda Thomsen & Willy Verstraete
Received: 29 September 2010 /Revised: 6 December 2010 /Accepted: 6 December 2010 /Published online: 30 December 2010# Springer-Verlag 2010
Abstract In a microbial electrolysis cell (MEC), hydroly-sate produced by hydrothermal treatment of wheat strawwas used for hydrogen production during selective recoveryof phenols. The average H2 production rate was0.61 m3 H2/m
3 MEC·day and equivalent to a rate of0.40 kg COD/m3 MEC·day. The microbial community inthe anode biofilm was adapted by establishment of xylose-degrading bacteria of the Bacteriodetes phylum (16%) andGeobacter sulfurreducens (49%). During the process, 61%of the chemical oxygen demand was removed as hydrogenat 64% yield. The total energy production yield was 78%considering the energy content in the consumed compoundsand the cell voltage of 0.7 V. The highest hydrogenproduction was equivalent to 0.8 kg COD/m3 MEC·dayand was obtained at pH 7–8 and 25°C. Accumulation of53% w/v phenolic compounds in the liquor was obtainedby stepwise addition of the hydrolysate during simulta-neous production of hydrogen from consumption of 95%for the hemicellulose and 100% of the fatty acids. Finalcalculations showed that hydrolysate produced from 1 kg
wheat straw was upgraded by means of the MEC to 22 ghydrogen (266 L), 8 g xylan, and 9 g polyphenolics forpotential utilization in biobased materials.
Keywords Wheat straw . Hydrothermal treatment .
Hemicellulose . Phenolic compounds . Hydrogen
Introduction
Wheat straw is being produced at huge quantities globally(2×10⁹ tons/year; Zhang et al. 2009) and is composed of35–45% cellulose, 20–30% hemicelluloses, and 20% lignin(Thomsen et al. 2008). The cellulose content in the strawcan be used for second-generation bioethanol productionafter a hydrothermal pre-treatment process followed bybaker’s yeast fermentation (Thomsen et al. 2009). Thehemicellulose content that is extracted during this processresults in a carbohydrate-rich hydrolysate. This hydrolysatecan potentially be used for hydrogen production in amicrobial electrolysis cell (MEC) to increase the energyrecovery from the straw and thereby obtain a biorefineryprocess (Rozendal et al. 2006; Ditzig et al. 2007). A MECis a bioelectrochemical system in which bacteria convertchemical energy into electrical energy and allow electrol-ysis of water for hydrogen production (Logan et al. 2006).The integration of a MEC in the straw biorefinery has beenreviewed for production of ethanol and hydrogen by studyof these processes separately (Thygesen et al. 2010). It is,however, needed to test a MEC for hydrogen productionand resulting purification of desirable components from thestraw such as lignin-based phenolic compounds before theprocess can be implemented. Polyphenolics can have apositive effect in biobased materials (Thygesen et al. 2010)
Electronic supplementary material The online version of this article(doi:10.1007/s00253-010-3068-3) contains supplementary material,which is available to authorized users.
A. Thygesen (*) :A. B. ThomsenBiosystems Division, Risø National Laboratory for SustainableEnergy, Technical University of Denmark,P.O. Box 49, 4000 Roskilde, Denmarke-mail: [email protected]
M. Marzorati :N. Boon :W. VerstraeteLaboratory of Microbial Ecology and Technology (LabMET),Ghent University,Coupure Links 653,9000 Ghent, Belgium
Appl Microbiol Biotechnol (2011) 89:855–865DOI 10.1007/s00253-010-3068-3

and remaining hemicellulose can be used in bioplastic(Hansen and Plackett 2008).
Various organic compounds, including simple carbohy-drates (Allen and Bennetto 1993), carboxylic acids (Liu etal. 2005), and amino acids, have been used in microbialfuel cells to produce electricity. Waste products such ashydrolysates produced by hydrothermal treatment of wheatstraw contain a high proportion of these compounds andcan therefore be used as fuel in a microbial fuel cell (MFC)(Thygesen et al. 2009; Zuo et al. 2006; Huang and Logan2008). However, up to now, MECs have mainly been testedwith concentrations of carbon source below 10 g/L(Thygesen et al. 2010). Elevated concentrations of strawhydrolysates can result in toxic effects and must be dilutedbefore a MEC can be implemented. At the hydrothermaltreatment used in this study, 96% of the cellulose remainedin the solid fiber fraction. Thereby, 4% of the cellulose and50% of the hemicellulose were extracted and were found inthe hydrolysate (Thomsen et al. 2008). The completeutilization of the hydrothermal-treated straw hydrolysateimplies the presence of different metabolic processes,including enzymatic hydrolysis of hemicellulose andelectrogenesis on the anode electrode. Hence, the investi-gation of the microbial community is needed for a fullcharacterization of the process. The value of the MECprocess would be further improved if coupled to thedegradation of phenolic compounds since these are morereduced than carbohydrates. Hence, more hydrogen couldbe produced per gram of compound. Alternatively, theprocess could be used to purify the phenolic compounds byselective removal of the sugars and the fatty acids. Thesephenolic compounds can then be used as fuel or as anadditive in biobased materials (Thygesen et al. 2010).
The objective of this study was to use a MEC to upgradestraw hydrolysate through purification of the phenoliccomponents by selective removal of the carbohydrates andthe fatty acids. The process was optimized with respect tohydrogen production by adjustment of cell voltage, tem-perature, pH, and hydrolysate concentration. Chemical andmicrobial analysis was performed to follow the degradationof fatty acids and carbohydrates in the hydrolysate.
Materials and methods
Construction and operation of the microbial electrolysis cell
The MEC reactors were made of two Plexiglas frames (11×8×1.9 cm3 per frame; 334 cm3 MEC) and contained210 cm3 of liquid and 124 cm3 graphite granules. Thereactor has been designed by Clauwaert and Verstraete (2009)and a schematic drawing is shown in Fig. S1. The anodicand cathodic frames were filled with graphite granules of 4±
1 mm in diameter (type 00514; Le Carbone, Belgium).Graphite rods (5 mm diameter; Morgan, Belgium) wereelectrically connected to the graphite granules and theexternal circuit. A cation exchange membrane (CEM; UltrexCMI7000, Membranes International) was inserted betweenthe anode and cathode frames. The anode and cathode had aseparate recirculation vessel (0.5 L) from which the liquidwas pumped through the anode or cathode at a rate of0.35 L/h.
MEC medium and operation
Table S1 shows the operational conditions used in the MECtests (T1–T7). The basic anode medium contained 6 g/LNa2HPO4·2H2O, 3 g/L KH2PO4, 0.08 g/L MgCl2, 0.1 g/LNH4Cl, 0.0146 g/L CaCl2, and 0.5 mL/L trace elementsolution. The trace element solution contained 0.55 g/LFeSO4, 0.070 g/L ZnCl2, 0.064 g/L MnCl2, 0.006 g/LH3BO3, 0.066 g/L CaCl2, 0.0016 g/L CuCl2, 0.013 g/LNiCl2, 0.033 g/L Na2Mo4, and 0.13 g/L CoCl2. Thecathode solution contained 12 g/L Na2HPO4·2H2O and6 g/L KH2PO4 (Rabaey et al. 2005).
The MEC was inoculated with anode liquid from arunning MEC, which itself originally was inoculated withseed material from sludge and sediment bacteria (Clauwaertand Verstraete 2009). Before the experiments were started,a biofilm was developed on the anode granules with acetateas substrate in the MEC at T1 conditions, which required7 days of incubation. When a stable generation ofelectricity was obtained, the tests T1–T7 were conducted.The MEC was fueled with the straw hydrolysate after testsT1 and T2 by replacement of the anode solution. Tests T3–T7 were performed after five cycles with the addition of 6%of hydrolysate in fed-batch mode to obtain a stable currentdensity. The MEC operation temperature was 25°C in testsT1–T6 and 10, 15, and 18°C in T7. The anodic solution hadpH 7 due to adjustment with 2 M NaOH. Acidifiedconditions (pH 4) were obtained in the cathode compart-ment by addition of 2 M HCl to prevent the growth ofhydrogenotrophic microorganisms (Thygesen et al. 2010).The substrate was 2 g/L CH3COONa in T1–T2 and 6% ofthe hydrolysate in T3–T4. T2 and T3 were performed totest the effect of the anodic pH on the hydrogen production2 h after the substrate addition. After T4 (80 h), 20 mL ofthe hydrolysate was added to the processed anode solutionper 100 mL (T5). After T5 (210 h), further 20 mL of thehydrolysate was added per 100 mL (T6). The solutionvolume in the anode compartment was constant at 105 mL.Due to sampling after each step, the total liquid volume inthe anode vessel and anode compartments was 500 mL atT4, 400 mL at T5, and 300 mL at T6 (Table S1). This wasconsidered in the mass balance. The cathode liquid volumewas constant on 500 mL.
856 Appl Microbiol Biotechnol (2011) 89:855–865

Hydrothermal treatment of wheat straw
Wheat straw was hydrothermally treated in a pilot plantreactor with 150 kg straw/h at 180°C for 15 min and at195°C for 3 min resulting in a hydrolysate and a solid fiberfraction. Steam was condensed during the process, and itconstituted the liquid flow, namely the hydrolysate con-taining the extractable and soluble components of the pre-treated wheat straw (10 L hydrolysate/kg straw). Thehydrolysate contained 29 g/L COD, 8.9 g/L xyloseoligomers (10% in monomer form), 1.4 g/L arabinoseoligomers (22% in monomer form), 1.6 g/L glucoseoligomers (10% in monomer form), 0.2 g/L glycolic acid,0.4 g/L formic acid, 1.1 g/L acetic acid, 0.4 g/L lactic acid,2.0 g/L phenolics, and 0.4 g/L 2-furfural (Thomsen et al.2009).
Electrical operation of the MEC and measurements
The cell voltage of the MEC (0.7 V) was added as directcurrent (DC) by usage of a potentiostat as power source(PAR Bi-STAT Potentiostat; Princeton Applied Research,France). The cell voltage, the current production, and thecathode electrode potential in the MEC were recorded oncea minute. Polarization curves were obtained by firstdetermining the open circuit voltage for 15 min and thenby increasing the cell voltage to 0.9 V at a rate of 0.5 mV/s.The polarization curves were used to determine themaximum performance of the MEC with respect to currentproduction. The potential of the cathode electrode wasmonitored with an Ag/AgCl reference electrode with apotential of +0.197 V vs. the standard hydrogen electrode(SHE; model RE-5B, BASi; Clauwaert et al. 2008).
Chemical and enzymatic analysis
The chemical oxygen demand (COD) was measured in theliquid samples at the end of the MEC tests as described byRabaey et al. (2005). The concentrations of glucose, xylose,arabinose, formic acid, acetic acid, and propionic acid weremeasured during the experiments by high-performanceliquid chromatography (HPLC) with refractive indexdetection (Thygesen et al. 2009). The polysaccharides weremeasured after acidic hydrolysis in 4% w/w H2SO4 for10 min at 121°C. The concentration of 2-furfural wasmeasured at the end of the MEC tests by HPLC on a LunaSU C18 250×4.6 mm column (Phenomenex) using a lineareluent gradient of methanol (10–90%) at pH 3 with a flowrate of 0.7 mL/min. UV detection at 280 nm was used withauthentic compounds as calibration standards (Thygesen etal. 2009).
The liquid samples at the end of the MEC tests wereanalyzed for total content of monomeric and polymeric
phenolic compounds based on the reaction betweenaromatic rings and FeCl3. Phosphoric acid was used toterminate the reaction by complex formation with theexcess of Fe3+ resulting in constant color density. Cathecolwas used as phenol standard and the absorbance wasmeasured at 700 nm wavelength (Graham 1992). Themonomeric phenolic compounds were selectively extractedfrom the liquids by solid phase extraction on polystyrenedivenylbenzene polymer columns: IST Isolute ENV+100 mg/L (International Sorbent Technology, UK) asdescribed by Thomsen et al. (2009). Gas chromatography(GC) was performed on a HP 6890 series system withflame ionization detection.
The endoxylanase activity was measured by hydrolysisof 10 g/L xylan with the enzymes produced in the MECusing 5 min of incubation, pH 5.3, and 50°C (Sigma X-0502). Xylose was used as standard and the enzymeactivity was expressed in microkatals (“μkat”; micromolesconverted substrate per second; Thygesen et al. 2003).
Gas analysis
The volume of produced gas in the MEC tests wasmeasured with a gas lock bottle. Gas chromatography wasused for measurement of the concentrations of H2, CH4,and CO2 (Finnigan Trace GC ultra; Thermo FisherScientific) with He as carrier gas and the followingcolumns: Hayesep Q, 80–100 1/8 in. SS; and Molsieve5A, 80–100 2 m×1/8 in. SS. The used detectors were athermal conductivity detector and a flame ionizationdetector with injection of 2.5 mL headspace gas volume.
Microbial community analysis
Liquid and graphite granules from the anodic compartmentwere investigated for the microbial community as describedby Clauwaert et al. (2007a) and Boon et al. (2000) based onthe bacterial 16S rRNA gene using the universal primersp338F and p518R shown in Table S2. The obtained DNAfragments were separated by denaturant gradient gelelectrophoresis (DGGE) with a gradient between 45% and60%, and the similarity between the samples was analyzedwith BioNumerics software v.5.0 (Applied Maths, Sint-Martens Latem, Belgium). The ecological interpretation ofthe obtained DNA fingerprint patterns was provided bymeans of the range-weighted richness (Rr) and thecommunity organization (Co) parameters (Marzorati et al.2008; Wittebolle et al. 2009). Co equals the fraction of thetotal DGGE band intensity that is represented by the 20%most dominant bands (Wittebolle et al. 2008).
We constructed a clone library with the only aim ofproviding a proper phylogenetic affiliation to the DGGEbands. In fact, the sequencing of the DGGE bands could
Appl Microbiol Biotechnol (2011) 89:855–865 857

provide sequences a maximum of only 150 bp. Such alength is not always suitable to discriminate amongcorrelated species. For this reason, we amplified the full16S rRNA gene by means of PCR with the primers p63Fand p1378R. The cloning was performed with a TOPOTA® cloning kit according to the manufacturer’s instruc-tions (Invitrogen). Thirty clones were then sequenced withone primer to identify identical clones, and subsequentlyonly those clones that were different were fully sequenced.As a consequence, we did not sample the library in atraditional way with the aim of covering the total diversityof the samples. The resulting sequences were analyzed inthe database Nucleotide BLAST and submitted to theEMBL Nucleotide Sequence Database (accession numbersfrom FR693789 to FR693799).
Calculations
The Coulombic efficiency CE, the current, and thehydrogen yield were calculated as described by Clauwaertet al. 2007b. The cell voltage Ecell was used for calculationof the energy content W required for generation of currentin joules per gram of COD, which equals the electricalenergy addition:
W ¼ Ecell � nF
MO2
ð1Þ
in which n is the number of electrons exchanged per moleof O2 (4), M is the molar mass of oxygen (32 g/mol), and Fis Faraday’s constant (96,485 C/mol). The reaction energyneeded for the formation of H2 from glucose and water(ΔHθ) as electron donors was calculated in Eq. 2 tocompare the MEC with electrolysis of water. ΔHθ was
calculated to 3.26 kJ/g COD for glucose and to 17.88 kJ/gCOD for H2O:
C6H12O6 sð Þ þ 6H2O lð Þ ! 6CO2 gð Þ þ 12H2 gð Þ
ΔHq ¼ �6 � 394þ 6 � 286þ 1; 274ð ÞkJ=mol
6 � 32 g=mol¼þ3:26kJ=gCOD
H2O lð Þ ! 12O2 gð Þ þ H2 gð Þ
ΔHq ¼ 286kJ=mol
16g=mol¼ þ17:88kJ=gCOD
ð2Þ
Results
MEC processing of the hydrolysate and hydrogen yield
The microbial degradation of the hydrothermal treatedwheat straw hydrolysate in the MEC resulted in theoxidation of organic compounds, which was observed as adecrease in COD content. A COD balance of the experi-ments is presented in Table 1 with a comparison of acetatein T1 and the hydrolysate in T4. The balance is based onthe liquid volume, which was processed in the anodecompartment and included the calculated Coulombicefficiency and the hydrogen yield. The H2 production rateof 0.72 m3/m3·day was obtained with acetate as thesubstrate, which is equivalent to 0.47 kg COD/m3 MEC·day. The acetate was completely consumed withCE of 92% and a yield of H2 of 79%, which is in agreementwith previous observations with a similar MEC (Table 1;Clauwaert and Verstraete 2009). With 6% of the hydroly-sate tested in T4, the H2 production rate was equivalent to0.38 kg COD/m3 MEC·day. Only 61% of the COD content
Test number T1 T4 T5 T6
Prod. rate (H2+CH4) (kg COD/m3 MEC·day) 0.47 0.38 0.30 0.19
CODadded (g/L liq.) 1.40 1.81 4.32 4.82
CODconsum (g/L liq.) 1.40 1.10 3.01 2.67
nH2 (mmol/L liq.) 58 44 91 107
nCH4 (mmol/L liq.) 3.0 0 0 0
Conv. fraction (g/g COD) 1 0.61 0.70 0.56
CE (g/g COD) 0.92 0.45 0.43 0.46
CODgas (g/g COD) 0.79 0.39 0.34 0.36
YH2,Cat (g COD/g COD) 0.86 0.87 0.79 0.78
Glucan T4–T6 (g/L liq.) Added T4, T5, T6=0.60 Final T6=0.07
Hemicellulose T4–T6 (g/L liq.) Added T4, T5, T6=3.79 Final T6=0.14
Phenolics T4–T6 (g/L liq.) Added T4, T5, T6=0.76 Final T6=0.40
Monomeric phenolics T4–T6 (g/L liq.) Added T4, T5, T6=0.03 Final T6=0.00
2-Furfural T4–T6 (g/L liq.) Added T4, T5, T6=0.15 Final T6=0.00
Acetate T4–T6 (g/L liq.) Added T4, T5, T6=0.40 Final T6=0.01
Table 1 Gas production rate,COD balance, and gas yieldsobtained in the MECexperiments
The mass balance is based ongrams COD equivalent andincludes the total additions andfinal concentrations of thecarbohydrates
858 Appl Microbiol Biotechnol (2011) 89:855–865

of the hydrolysate was utilized resulting in a final concentrationof 0.7 g COD/L. The CE was 45%, which means that 74% ofthe converted COD content resulted in current generation. Theyield of H2 was 39%, indicative of the fact that 84% of thecurrent resulted in H2 production (Table 1). Microbialconsumption of H2 can result in production of methane andacetate (Thygesen et al. 2010). This was prevented in thecathode compartment by maintaining acidified conditions(pH 4). To summarize, the H2 production rate and the CEwere each 20% lower with the hydrolysate than with acetate.The H2 yield was 51% lower due to 39% not degradableCOD content and the 20% lower CE.
The electrode potentials for the anode and the cathode arepresented as polarization curves versus current density inFig. 1a. The experiments with different conditions (i.e.,acetate, the hydrolysate, and electrolysis) were compared atpH 7. The cathode electrode potential decreased from −0.6 Vat 0 A/m3 to −1.0 V at 200 A/m3 MEC due to ohmic lossesin the process. The resulting slope was −0.0014 Ω·m3 in the
linear range of 50–200 A/m3. The polarization curvesshowed activation losses up to 0.2 V at currents below20 A/m3 MEC due to the large slope of both the anode andcathode curves in this range (Fig. 1a). This activation loss issimilar to the results reported by Call et al. (2009). Thecathode polarization curves were similar for all theseexperiments since only the anode conditions were varied.The anode electrode potential was also similar for both thehydrolysate and acetate as substrates. The curve whichrepresented the hydrolysate had the maximum at a current of100 A/m3 while it was straight with acetate until 220 A/m3.The resulting slope was 0.0016 Ω·m3 in the linear rangebetween 50 and 200 A/m3. To summarize, the polarizationcurves had similar numeric slopes for the two electrodes andthe two substrates. However, with the hydrolysate, 55% lesscurrent could be obtained than with the acetate.
Figure 1b shows the required energy content forhydrogen production from the substrates calculated fromvoltage and current, respectively. The energy content usedfor the reaction increased with the conversion rate. Theslope on the linear part of the curves was 0.003 Ω·m3=5 kJ/g COD2·L·day and is caused by the ohmic losses in theanode, in the PEM membrane, and in the cathode(Thygesen et al. 2009). The maximum COD removal ratewith acetate of 1.7 kg COD/m3·day was obtained with anenergy input of 10.2 kJ/g COD. For the hydrolysate, thesimilar rate was only 0.7 kg COD/m3·day since it is a morecomplex substrate. However, the conversion energy of 7 kJ/g COD was similar in the two cases when the conversionrate was fixed at 0.5 kg COD/m3·day. The conversionenergy was 23 kJ/g COD with water electrolysis at thesame rate, which is 16 kJ/g COD higher due to the higheranode electrode potential (Fig. 1a). This difference issimilar to the difference in the reaction enthalpy value forthe formation of H2 from H2O (17.88 kJ/g COD) and fromglucose (3.26 kJ/g COD) Eq. 2. Overall, the conversionenergy was similar with the two substrates (6–8 kJ/g COD)while the overall energy loss was in the range 3–5 kJ/gCOD.
Achievement of high concentration of phenolic compounds
The MEC functionality was also tested with a stepwiseaddition of the hydrothermal treated wheat straw hydroly-sate to the MEC processed hydrolysate to decrease thefreshwater consumption and achieve high concentrations ofphenolic compounds (Fig. 2a). The amount of consumedCOD content was 1.10 g, 3.01 g, and 2.67 g per liter ofliquid in steps T4, T5, and T6, respectively, which equals62±7% of the added amount (Table 1). The CODconversion rate calculated from the current was 0.45 kgCOD/m3 MEC·day for 100 h in T5 with 20% freshhydrolysate and 6% processed hydrolysate (Fig. 2a). This
Fig. 1 Electrode potential vs. current density in the MEC operated atvaried pH (a) and the calculated energy input using Eq. 1 vs. the CODconversion rate (b). SHE is the potential of the standard hydrogenelectrode. In (a), the curves with positive slope represent the anode(An) while the curves with negative slope represent the cathode (Ca)
Appl Microbiol Biotechnol (2011) 89:855–865 859

rate was only 0.35 kg COD/m3 MEC·day when 26%processed hydrolysate was in the liquid as in T6. The H2
production rate in the MEC was highest in T4 and T5equivalent to 0.30–0.38 kg COD/m3 MEC·day as comparedwith 0.19 kg COD/m3 MEC·day in T6 due to the lowercurrent. The hydrogen yield from the produced current YH2,Cat was 79±2% as observed by comparison of the curves inFig. 2a. According to Fig. 3c, the conversion rate increasedwith the hydrolysate concentration and was highest (equiv-alent to 1.5 kg COD/m3 MEC·day) at 10–15% fresh and0% processed hydrolysate. The conversion rate decreasedto 1.2 kg COD/m3 MEC·day with 20% of the freshhydrolysate and to 0.9 kg COD/m3 MEC·day with 26% ofthe processed hydrolysate.
Figure 2b provides an explanation of the by-productsformed during the MEC process. The initial process stepwas enzymatic hydrolysis of the hemicellulose contentresulting in release of xylose and glucose. The xylose wasthen utilized 20 h after the hydrolysate addition in the steps
T4 and T5 and after 70 h in step T6. The xylose removalrate was thereby reduced from 0.5 to 0.05 g/L liquid·day bythe increase of the concentration of the processed hydroly-sate from 0% to 26%. Both acetate and propionate wereproduced due to the carbohydrate utilization. Both theglucose and the xylose were completely removed while theacetate and propionate were removed to 91–100% extend(Fig. 2b). The soluble hemicellulose and cellulose(oligomers of xylose, arabinose, and glucose) were degrad-ed at 89–97% extend during the process while 47% w/v ofthe phenolic compounds were removed throughout thethree steps as calculated from Table 1. The contents ofmonomeric phenolics and 2-furfural were completelydegraded. The curve in Fig. 2b thereby shows accumulationof polymeric phenolics in all three steps resulting in 0.4 gphenolic/L. A part of the phenolic compounds wasdegraded (removal of 30–60%) in steps T4 and T5 whileno degradation was observed in T6. This indicates that thedegradation of the phenolic compounds was inhibited at the
Fig. 2 Accumulated hydrogenproduction in the MEC versustime (a). The electrical currentand the hydrogen productionwere calculated as grams COD.b Concentrations of carbohy-drates, fatty acids, and phenoliccompounds vs. time
860 Appl Microbiol Biotechnol (2011) 89:855–865
high concentration of the processed hydrolysate. Theincrease of the hydrolysate concentration to 26% decreasedthe current and the H2 production rate by 23% and 37–50%,respectively, presumably due to decreased consumptionrates of xylose and propionate.
Conversion rate optimization based on pH and temperature
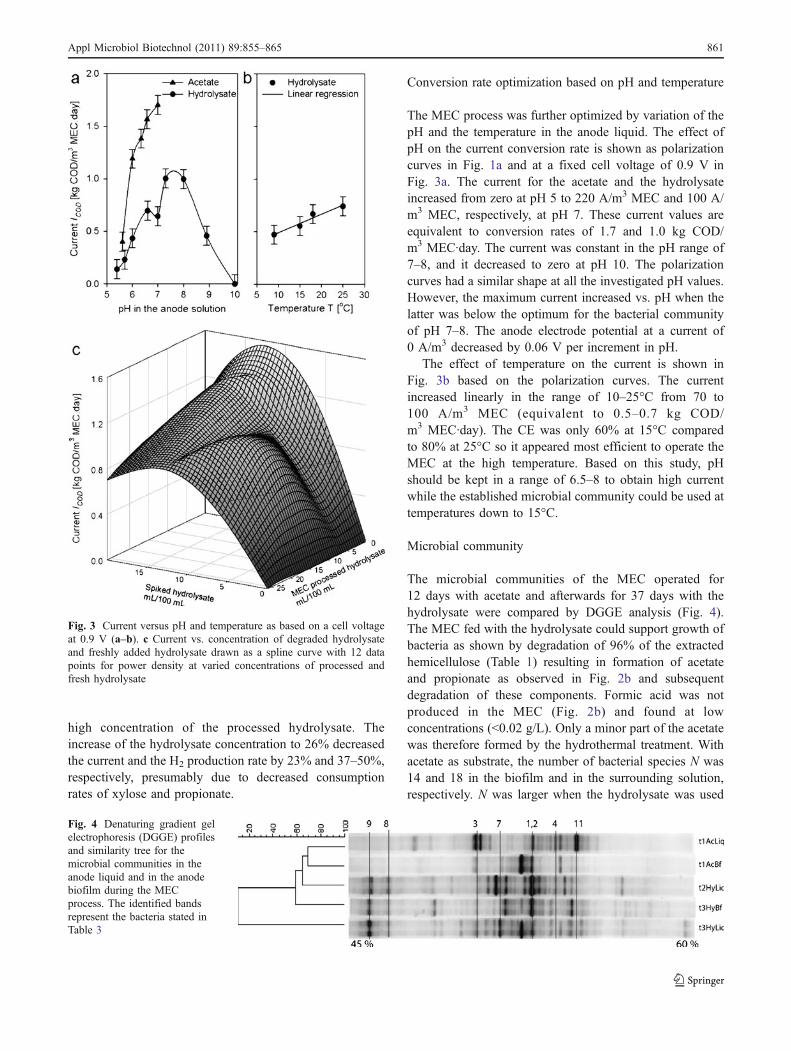
The MEC process was further optimized by variation of thepH and the temperature in the anode liquid. The effect ofpH on the current conversion rate is shown as polarizationcurves in Fig. 1a and at a fixed cell voltage of 0.9 V inFig. 3a. The current for the acetate and the hydrolysateincreased from zero at pH 5 to 220 A/m3 MEC and 100 A/m3 MEC, respectively, at pH 7. These current values areequivalent to conversion rates of 1.7 and 1.0 kg COD/m3 MEC·day. The current was constant in the pH range of7–8, and it decreased to zero at pH 10. The polarizationcurves had a similar shape at all the investigated pH values.However, the maximum current increased vs. pH when thelatter was below the optimum for the bacterial communityof pH 7–8. The anode electrode potential at a current of0 A/m3 decreased by 0.06 V per increment in pH.
The effect of temperature on the current is shown inFig. 3b based on the polarization curves. The currentincreased linearly in the range of 10–25°C from 70 to100 A/m3 MEC (equivalent to 0.5–0.7 kg COD/m3 MEC·day). The CE was only 60% at 15°C comparedto 80% at 25°C so it appeared most efficient to operate theMEC at the high temperature. Based on this study, pHshould be kept in a range of 6.5–8 to obtain high currentwhile the established microbial community could be used attemperatures down to 15°C.
Microbial community
The microbial communities of the MEC operated for12 days with acetate and afterwards for 37 days with thehydrolysate were compared by DGGE analysis (Fig. 4).The MEC fed with the hydrolysate could support growth ofbacteria as shown by degradation of 96% of the extractedhemicellulose (Table 1) resulting in formation of acetateand propionate as observed in Fig. 2b and subsequentdegradation of these components. Formic acid was notproduced in the MEC (Fig. 2b) and found at lowconcentrations (<0.02 g/L). Only a minor part of the acetatewas therefore formed by the hydrothermal treatment. Withacetate as substrate, the number of bacterial species N was14 and 18 in the biofilm and in the surrounding solution,respectively. N was larger when the hydrolysate was used
Fig. 3 Current versus pH and temperature as based on a cell voltageat 0.9 V (a–b). c Current vs. concentration of degraded hydrolysateand freshly added hydrolysate drawn as a spline curve with 12 datapoints for power density at varied concentrations of processed andfresh hydrolysate
Fig. 4 Denaturing gradient gelelectrophoresis (DGGE) profilesand similarity tree for themicrobial communities in theanode liquid and in the anodebiofilm during the MECprocess. The identified bandsrepresent the bacteria stated inTable 3
Appl Microbiol Biotechnol (2011) 89:855–865 861

as substrate with N equal to 17 and 22, respectively(Table 2). Acetate thereby supported a simple biofilmmicrobial community with Rr of 9 (low Rr) and of 26(medium Rr) in the solution. Both values increased whenthe MEC was fed with the hydrolysate: Rr was 40 in thebiofilm and 56 in the solution (Table 2). The changes inrichness were also reflected by the composition of themicrobial community as shown by the clustering in Fig. 4.The microbial communities in the solution and in the biofilmshared 69% similarity when acetate was used as substrate.Addition of the hydrolysate to the MEC induced changes bothin the solution and the biofilm resulting in a similarity of 56%after 34 days. The addition of the hydrolysate induced also adecrease of the Co value (=more even microbial community)both in the liquid phase (40%➔23%) and in the biofilm (61%
➔39%), as expected in consideration of the more complexsubstrate (Table 2).
Table 3 reports the main species identified while Fig. 4shows the position of the sequenced clones in the DGGEgel. The dominant microorganism was for both acetate andthe hydrolysate Geobacter sulfurreducens. Half of theclones from the anode biofilm with the hydrolysate werecorrelated to this species. Microorganisms phylogeneticallycorrelated to Ruminobacillus xylanolyticum, Bacteroidesgraminisolvens, Paludibacter, Cloacibacillus evryensis, andClostridium coccoides were identified only in presence ofthe hydrolysate as a substrate. These species were bothpresent in the biofilm and in the solution. Microorganismswith a 95% similarity to Brooklawnia cerclae were notidentified by DGGE while C. evryensis and C. coccoides
Table 2 Number of distinct bacterial species N, DGGE gradient range Dg, microbial richness Rr, and community organization Co obtained fromthe DGGE profiles as explained by Marzorati et al. (2008)
Samplea Time (day)b Substrate Source N Dg Rr Co
t1AcLiq 12.3 Acetate Solution 18 0.08 26 40
t1AcBf 12.3 Acetate Biofilm 14 0.05 9 61
t2HyLiq 29.2 Hydrolysate Solution 20 0.11 44 25
t3HyLiq 49.0 Hydrolysate Solution 22 0.12 56 23
t3HyBf 49.0 Hydrolysate Biofilm 17 0.14 40 39
a The change of the substrate from acetate to the hydrolysate was performed after 12.3 days of operationb t1/t2/t3 means the sampling time, Ac/Hy means acetate/hydrolysate, and Liq/Sol means anode liquid/anode electrode biofilm
Table 3 DGGE 16S rRNA gene band identifications based on sample “t3HyBf” (Table 2) and the 30 identified colonies
Bacteria, accession no.a Known speciesb Gene bank match Dominancec Characteristics
Deltaproteobacteria, ref. 1, 2
1, FR693789 AE017180.1: 93% Geobacter sulfurreducens Biofilm MEC, electrogenic2, FR693790 AE017180.1: 98%
3, FR693791 AE017180.1: 98%
Actinomycetales
4, FR693792 DQ676995.1: 97% Propionicimonas paludicola Acetate Propionate producer5, FR693793 DQ196625: 95% Brooklawnia cerclae Unknown
Synergistetes, ref. 3 Digests amino acids6, FR693794 GQ258966.1: 99% Cloacibacillus evryensis Hydrolysate
Bacteriodetes, ref. 4, 5
7, FR693795 DQ178248: 96% Ruminobacillus xylanolyticum Hydrolysate Xylanolytic
8, FR693796 AB363973.1: 99% Bacteroides graminisolvens Hydrolysate Xylanolytic
9, FR693797 AB078842: 89% Paludibacter propionicigenes Hydrolysate Propionate prod.
Firmicutes, ref. 6
10, FR693798 EF025906: 99% Clostridium coccoides Hydrolysate Acetogenic
11, FR693799 NR_026111.1: 99% Phascolarctobacterium faecium Acetate Propionate prod.
a The 16S rRNA sequences are archived in the EMBL Nucleotide Sequence Databaseb References: 1, 2Cervantes et al. 2003 and Call et al. 2009; 4 Ueki and Nishiyama (2009); 5 Akasaka et al. (2006); 6 Deldot et al. (1993)c Biofilm means the anode electrode, solution means the anode solution, and hydrolysate means the straw hydrolysate substrate
862 Appl Microbiol Biotechnol (2011) 89:855–865

were identified only in a DGGE gel with a denaturantgradient of 45–65% (data not shown).
Discussion
MEC operation The current generation obtained in theMEC was similar with acetate in this MEC and in a MFCwith the same configuration (270 A/m3 MEC=1.93 kg COD/m3 MEC·day; Aelterman et al. 2006). Thelevel of current was high compared with previous studies ofMECs and MFCs due to the large electrode surface area(1,400 m2/m3) and the small electrode distance (1–2 mm;Thygesen et al. 2010, unpublished data). The previousstudy with the same reactor configuration resulted in alower current density of 160 A/m3 MEC with electricallyisolating cloth instead of a proton exchange membrane(PEM) between the two compartments (Clauwaert andVerstraete 2009). In this study, it was shown that operationwas possible with the PEM as long as the cloth was appliedin the start-up period (Fig. 1a). This is presumably due tothe lower internal resistance in the cloth, which results ineasy formation of the electrode biofilm. The H2 productionrate was lower with the hydrolysate (as compared to theacetate) since this is a complex mix of polysaccharides. Theenzymatic hydrolysis of xylan to xylose was performed inthe MEC by the microbial community since the xylanconcentration decreased by 96%, xylose was produced, anda xylanase enzyme activity of 38–170 μkat/L was detectedin the anode liquid. Even though a complex substrate wasused, a reasonable total energy production yield of 78%was obtained when a cell voltage of 0.7 V was used (Eqs. 1and 2). This is similar to the energy yield obtained withacetate as substrate in a mixed culture MEC (Call et al.2009). Platinum was not needed as catalyst in this MECdue to the usage of a large cathode electrode surface area.This will make it cheaper and more sustainable to constructthe MEC.
pH The current that was produced by the MEC fitted wellwith the Nerst equation for the anode electrode based on thedecrease in electrode potentials vs. pH (Fig. 1a) (Rismani-Yazdi et al. 2008). Furthermore, the anode electrodepotential curves were similar with the substrates acetateand hydrolysate. The activation energy thereby appearedsimilar for the hydrolysate, which is a complex medium,compared to acetate. This indicates that the electrogenicprocess is similar, which can be explained by the fact thatacetate was present in the solution during the entire periodof MEC operation with the hydrolysate (Fig. 2b).
Temperature Considering the moderate decrease in theconversion rate at decreasing temperature, it appeared
possible to operate the system at lower temperatures if theinoculum was previously grown at 25°C. In fact, thesensitivity to temperature was low when the electrogenicbiofilm on the anode was already established. Thisobservation deviates from previous results in which aMFC operated at 15°C resulted in a maximum powergeneration of 2 mW/m2 compared to 70 mW/m2 at 30°C.The temperature is thereby an important factor to start up aMEC which requires the formation of biofilm on the anodeelectrode surface (Min et al. 2008).
Stepwise hydrolysate addition The comparison of theresults of the tests T4, T5, and T6 in terms of the rate ofCOD removal by current generation with fresh andprocessed hydrolysate (Fig. 3c) indicates that it waspossible to recycle effluent from the MEC process and toconcentrate the unconverted COD content. Besides, therewas no large effect of the concentrations of fresh andprocessed hydrolysate on the yields of current andhydrogen. It was thereby possible to concentrate uncon-verted hydrolysate components such as phenolic com-pounds without significant loss of process efficiency(Fig. 2b).
Microbial community The microbial community in a MFCfed with the hydrolysate has already been studied by Zhanget al. (2009). They found a low amount of Geobactermetallireducens and that G. sulfurreducens was not present.The present study deviated in the way that oxygen was notpresent at anytime in the MEC due to lack of oxygendiffusion from the cathode compartment. The dominantbacterium on the electrode surface was G. sulfurreducens,which can transfer electrons to external electron acceptorssuch as Fe(III) and MFC anodes (Cervantes et al. 2003).Call et al. (2009) showed that this microorganism was alsodominant in a MEC but not in a MFC due to the slightpresence of oxygen. The detection of xylanolytic bacteriasuch as R. xylanolyticum and B. graminisolvens can explainthe efficient hydrolysis of xylan (Ueki and Nishiyama2009). Finally, the identification of Propionicimonaspaludicola, B. cerclae, and Paludibacter in the liquid phasecan explain the production of acetate and propionate in thesystem when the hydrolysate was fed (Fig. 2b) (Deldot etal. 1993; Akasaka et al. 2006).
Utilization of the MEC process It was shown that (1) a MECcan be operated successfully at 15 °C when an active biofilm isused; (2) a high total energy yield (about 78%) can be obtainedfrom a mix of complex carbohydrates; (3) the monomeric andparts of the polymeric phenols contribute to the currentproduction; (4) G. sulfurreducens becomes dominant in theMEC (49% of the clones with the biofilm sample obtainedwith the hydrolysate as substrate) due to the anoxic condition;
Appl Microbiol Biotechnol (2011) 89:855–865 863

and (5) from the hydrolysate produced from 1 kg of straw,production of 22 gH2 (0.27 m3) and a solution of 8 ghemicellulose and 9 g polyphenolics could be obtained. Thestraw hydrolysate could thus be processed for energy-efficientproduction of H2 and purification of chemicals, which were noteffectively degraded by the established microbial communitysuch as polymeric phenols and lignin (Table S3).
Competing energy technologies include incineration ofstraw, which has disadvantages such as ash formation in theboilers, a process that results in corrosion. This problem canbe avoided by the hydrothermal treatment due to 95%extraction of the potassium salts (Thygesen et al. 2004).The hydrolysate shall be considered as a waste productfrom bioethanol production so an energy balance shouldinclude the ethanol yield. These issues were considered byThygesen et al. (2010). Finally, despite the advantagesrelated to the use of a MEC, the challenge, which needs tobe addressed, is to perform this approach at pilot scale.
Acknowledgments The Danish Research council is gratefully acknowl-edged for supporting the research project (Microbial fuel cell—used in directconversion of lignocellulosic waste to energy; project number 09-059959).Tomas Fernqvist, Ingelis Larsen, Annette E. Jensen, Peter Clauwaert, TimLacoera, and Siska Maertens are thanked for technical assistance.
References
Aelterman P, Rabaey K, Pham HT, Boon N, Verstraete W (2006)Continuous electricity generation at high voltages and currentsusing stacked microbial fuel cells. Environ Sci Technol 40:3388–3394
Akasaka H, Izawa T, Ueki K, Ueki A (2006) Phylogeny ofnumerically abundant culturable anaerobic bacteria associatedwith degradation of rice plant residue in Japanese paddy fieldsoil. FEMS Microbiol Ecol 43:149–161
Allen RM, Bennetto HP (1993) Microbial fuel-cells—electricityproduction from carbohydrates. Appl Biochem Biotechnol39:27–40
Boon N, Goris J, De Vos P, Verstraete W, Top EM (2000)Bioaugmentation of activated sludge by an indigenous 3-chloroaniline-degrading Comamonas testosteroni strain, I2gfp.Appl Environ Microbiol 66:2906–2913
Call DF, Wagner RC, Logan BE (2009) Hydrogen production byGeobacter species and a mixed consortium in a microbialelectrolysis cell. Appl Environ Microbiol 75:7579–7587
Cervantes FJ, Duong-Dac T, Ivanova AE, Roest K, Akkermans ADL,Lettinga G, Field JA (2003) Selective enrichment of Geobactersulfurreducens from anaerobic granular sludge with quinones asterminal electron acceptors. Biotechnol Lett 25:39–45
Clauwaert P, Verstraete W (2009) Methanogenesis in membranelessmicrobial electrolysis cells. Appl Microbiol Biotechnol 82:829–836
Clauwaert P, Rabaey K, Aelterman P, De Schamphelaire L, Ham TH,Boeckx P, Boon N, Verstraete W (2007a) Biological denitrifica-tion in microbial fuel cells. Environ Sci Technol 41:3354–3360
Clauwaert P, van Der Ha D, Boon N, Verbeken K, Verhaege M,Rabaey K, Verstraete W (2007b) Open air biocathode enables
effective electricity generation with microbial fuel cells. EnvironSci Technol 41:7564–7569
Clauwaert P, Aelterman P, Pham TH, De Schamphelaire L, CarballaM, Rabaey K, Verstraete W (2008) Minimizing losses in bio-electrochemical systems: the road to applications. Appl Micro-biol Biotechnol 79:901–913
Deldot T, Osawa R, Stackebrandt E (1993) Phascolarctobacteriumfaecium gen-nov, spec nov, a novel taxon of the Sporomusagroup of bacteria. Syst Appl Microbiol 16:380–384
Ditzig J, Liu H, Logan BE (2007) Production of hydrogen fromdomestic wastewater using a bioelectrochemically assistedmicrobial reactor (BEAMR). Int J Hydrogen Energ 32:2296–2304
Graham HD (1992) Stabilization of the Prussian blue colour in thedetermination of polyphenols. J Agr Food Chem 40:801–805
Hansen ML, Plackett D (2008) Sustainable films and coatings fromhemicelluloses: a review. Biomacromolecules 9:1493–1505
Huang L, Logan B (2008) Electricity generation and treatment ofpaper recycling wastewater using a microbial fuel cell. ApplMicrobiol Biotechnol 80:349–355
Liu H, Cheng SA, Logan BE (2005) Production of electricity fromacetate or butyrate using a single-chamber microbial fuel cell.Environ Sci Technol 39:658–662
Logan BE, Hamelers B, Rozendal R, Schröder U, Keller J, Freguia S,Aelterman P, Verstraete W, Rabaey K (2006) Microbial fuel cells:methodology and technology. Environ Sci Technol 40:5181–5192
Marzorati M, Wittebolle L, Boon N, Daffonchio D, Verstraete W(2008) How to get more out of molecular fingerprints:practical tools for microbial ecology. Environ Microbiol10:1571–1581
Min B, Román ÓB, Angelidaki I (2008) Importance of temperatureand anodic medium composition on microbial fuel cell (MFC)performance. Biotechnol Lett 30:1213–1218
Rabaey K, Ossieur W, Verhaege M, Verstraete W (2005) Continuousmicrobial fuel cells convert carbohydrates to electricity. WaterSci Technol 52:515–523
Rismani-Yazdi H, Carver SM, Christy AD, Tuovinen OH (2008)Cathodic limitations in microbial fuel cells: an overview. J PowerSources 180:683–694
Rozendal RA, Hamelers HVM, Euverink GJW, Metz SJ, BuismanCJN (2006) Principle and perspectives of hydrogen productionthrough biocatalyzed electrolysis. Int J Hydrogen Energ31:1632–1640
Thomsen MH, Thygesen A, Thomsen AB (2008) Hydrothermaltreatment of wheat straw at pilot plant scale using a three-stepreactor system aiming at high hemicellulose recovery, highcellulose digestibility and low lignin hydrolysis. BioresourTechnol 99:4221–4228
Thomsen MH, Thygesen A, Thomsen AB (2009) Identification andcharacterization of fermentation inhibitors formed during hydro-thermal treatment and following SSF of wheat straw. ApplMicrobiol Biotechnol 83:447–455
Thygesen A, Thomsen AB, Schmidt AS, Jørgensen H, Ahring BK,Olsson L (2003) Production of cellulose and hemicellulose-degrading enzymes by filamentous fungi cultivated on wet-oxidised wheat straw. Enzyme Microb Technol 32:606–615
Thygesen A, Thomsen MH, Jørgensen H, Christensen BH, ThomsenAB (2004) Hydrothermal treatment of wheat straw on pilot plantscale. In: 2nd World Conference and Technology Exhibition onBiomass for Energy, Industry and Climate Protection, Rome,Italy, ISBN 88-89407-03-4
Thygesen A, Poulsen FW, Min B, Angelidaki I, Thomsen AB (2009)The effect of different substrates and humic acid on powergeneration in microbial fuel cell operation. Bioresour Technol100:1186–1191
864 Appl Microbiol Biotechnol (2011) 89:855–865
Thygesen A, Possemiers S, Thomsen AB, Verstraete W (2010)Integration of microbial electrolysis cells (MECs) in thebiorefinery for production of ethanol, H2 and phenolics. WasteBiomass Valor 1:9–20
Ueki A, Nishiyama T (2009) Bacteroides graminisolvens sp. nov., axylanolytic anaerobe isolated from a methanogenic reactortreating cattle waste. Int J Syst Evol Microbiol 59:1901–1907
Wittebolle L, Vervaeren H, Verstraete W, Boon N (2008) Quantifyingcommunity dynamics of nitrifiers in functionally stable reactors.Appl Environ Microbiol 74:286–293
Wittebolle L, Marzorati M, Clement L, Balloi A, Daffonchio D,Heylen K, De Vos P, Verstraete W, Boon N (2009) Initialcommunity evenness favours functionality under selective stress.Nature 458:623–626
Zhang Y, Min B, Huang L, Angelidaki I (2009) Generation ofelectricity and analysis of microbial communities in wheat strawbiomass-powered microbial fuel cells. Appl Environ Microbiol75:3389–3395
Zuo Y, Maness PC, Logan BE (2006) Electricity production fromsteam-exploded corn stover biomass. Energ Fuel 20:1716–1721
Appl Microbiol Biotechnol (2011) 89:855–865 865
Copyright © 2022 FDOKUMEN