Updip sequence development on a wave- and current-dominated, mixed carbonate-siliciclastic...
28
Updip sequence development on a wave- and current-dominated, mixed carbonate-siliciclastic continental shelf: Paleogene, North Carolina, eastern U.S.A. Jenny LaGesse, J. Fred Read * Virginia Polytechnic Institute and State University, United States Received 20 July 2004; received in revised form 30 September 2005; accepted 11 October 2005 Abstract Cores, quarry exposures, and exploratory wells in the Paleogene sediments of the Albemarle Basin, North Carolina, span the transition between the southern carbonate and northern siliciclastic provinces of the eastern U.S. continental shelf succession. This swell-wave- and current-dominated shelf succession differs from the standard carbonate sequence-stratigraphic model because available accommodation is limited by the depth of wave abrasion and scour. The study area is on the thin updip part of the shelf, which includes the relatively positive Cape Fear Arch (Onslow Block) and the slowly subsiding (1.5 cm/ky) Albemarle Block to the north. The Paleogene supersequence set has a basal boundary that is a hardground on Cretaceous shoreface/shallow-shelf mollusc facies. It is overlain by a thin Paleocene sequence of transgressive, deeper offshore, glauconitic fine sands to deep marine silt–shale. Five regionally mappable, vertically stacked Eocene sequences (0–30 m thick), contain coastal sands, shoreface sandy-mollusc rudstone, offshore bryozoan grainstone–packstone and subwave base fine wackestone–packstone and marl. Eocene sequences commonly are bounded by hardgrounds overlain by thin local lowstand shallow-marine sands; they consist of a thin transgressive, shallow-marine unit (commonly absent), overlain by an upward-shallowing highstand marine succession. On the arch, lowstand and transgressive units may be condensed into lags. The lower Oligocene succession on the arch has a single marl to fine foram sand-dominated sequence whereas downdip, two to three siliciclastic-rich sequences are developed, capped by nearshore sandy molluscan facies. The upper Oligocene section is dominated by possibly three sequences composed of basal, thin sands grading up into variably sandy mollusc rudstone. Sequence development was influenced by differential movement of basement blocks (which influenced localization of fines in lows), coupled with increasing third-order eustatic sea-level changes during later Paleogene global cooling. This was coupled with swell-wave and current sweeping of the shelf that effectively decreased available accommodation by 20–30 m and generated the distinctive hardgrounds at sequence boundaries, and variable development of lowstand and transgressive system tracts. The well- developed highstand deposits reflect maximum accommodation allowing deposition of an upward-shallowing succession that terminated at the depth of wave abrasion and current scour on the open shelf. The sequence-stratigraphic development contrasts markedly with that from tropical shelves, which tend to be aggraded to sea level. D 2005 Elsevier B.V. All rights reserved. Keywords: Paleogene; Sequence development; Nontropical wave-dominated; North Carolina 0037-0738/$ - see front matter D 2005 Elsevier B.V. All rights reserved. doi:10.1016/j.sedgeo.2005.10.004 * Corresponding author. E-mail address: [email protected] (J.F. Read). Sedimentary Geology 184 (2006) 155 – 182 www.elsevier.com/locate/sedgeo
Transcript of Updip sequence development on a wave- and current-dominated, mixed carbonate-siliciclastic...
www.elsevier.com/locate/sedgeo
Sedimentary Geology 18
Updip sequence development on a wave- and current-dominated,
mixed carbonate-siliciclastic continental shelf: Paleogene,
North Carolina, eastern U.S.A.
Jenny LaGesse, J. Fred Read *
Virginia Polytechnic Institute and State University, United States
Received 20 July 2004; received in revised form 30 September 2005; accepted 11 October 2005
Abstract
Cores, quarry exposures, and exploratory wells in the Paleogene sediments of the Albemarle Basin, North Carolina, span the
transition between the southern carbonate and northern siliciclastic provinces of the eastern U.S. continental shelf succession. This
swell-wave- and current-dominated shelf succession differs from the standard carbonate sequence-stratigraphic model because
available accommodation is limited by the depth of wave abrasion and scour. The study area is on the thin updip part of the shelf,
which includes the relatively positive Cape Fear Arch (Onslow Block) and the slowly subsiding (1.5 cm/ky) Albemarle Block to
the north.
The Paleogene supersequence set has a basal boundary that is a hardground on Cretaceous shoreface/shallow-shelf mollusc
facies. It is overlain by a thin Paleocene sequence of transgressive, deeper offshore, glauconitic fine sands to deep marine silt–shale.
Five regionally mappable, vertically stacked Eocene sequences (0–30 m thick), contain coastal sands, shoreface sandy-mollusc
rudstone, offshore bryozoan grainstone–packstone and subwave base fine wackestone–packstone and marl. Eocene sequences
commonly are bounded by hardgrounds overlain by thin local lowstand shallow-marine sands; they consist of a thin transgressive,
shallow-marine unit (commonly absent), overlain by an upward-shallowing highstand marine succession. On the arch, lowstand
and transgressive units may be condensed into lags. The lower Oligocene succession on the arch has a single marl to fine foram
sand-dominated sequence whereas downdip, two to three siliciclastic-rich sequences are developed, capped by nearshore sandy
molluscan facies. The upper Oligocene section is dominated by possibly three sequences composed of basal, thin sands grading up
into variably sandy mollusc rudstone.
Sequence development was influenced by differential movement of basement blocks (which influenced localization of fines in
lows), coupled with increasing third-order eustatic sea-level changes during later Paleogene global cooling. This was coupled with
swell-wave and current sweeping of the shelf that effectively decreased available accommodation by 20–30 m and generated the
distinctive hardgrounds at sequence boundaries, and variable development of lowstand and transgressive system tracts. The well-
developed highstand deposits reflect maximum accommodation allowing deposition of an upward-shallowing succession that
terminated at the depth of wave abrasion and current scour on the open shelf. The sequence-stratigraphic development contrasts
markedly with that from tropical shelves, which tend to be aggraded to sea level.
D 2005 Elsevier B.V. All rights reserved.
Keywords: Paleogene; Sequence development; Nontropical wave-dominated; North Carolina
0037-0738/$ - s
doi:10.1016/j.se
* Correspondi
E-mail addr
4 (2006) 155–182
ee front matter D 2005 Elsevier B.V. All rights reserved.
dgeo.2005.10.004
ng author.
ess: [email protected] (J.F. Read).
J. LaGesse, J.F. Read / Sedimentary Geology 184 (2006) 155–182156
1. Introduction
Existing carbonate sequence-stratigraphic models
have mainly been based on tropical ramps and rimmed
shelves. However, more recently, attempts have been
made to define sequence-stratigraphic models for non-
tropical successions (cf. James, 1997). A major differ-
ence between tropical and temperate settings is the lack
of a reefal rim to the shelf, which is open to wave and
boundary current sweeping in these typically swell-
wave-dominated settings. Such open shelves are rarely
aggraded to sea level because of low sedimentation
rates and the depth of wave abrasion, which can extend
down to water depths of 20–60 m or more (Collins,
1988; James, 1997; Pekar and Kominz, 2001). This
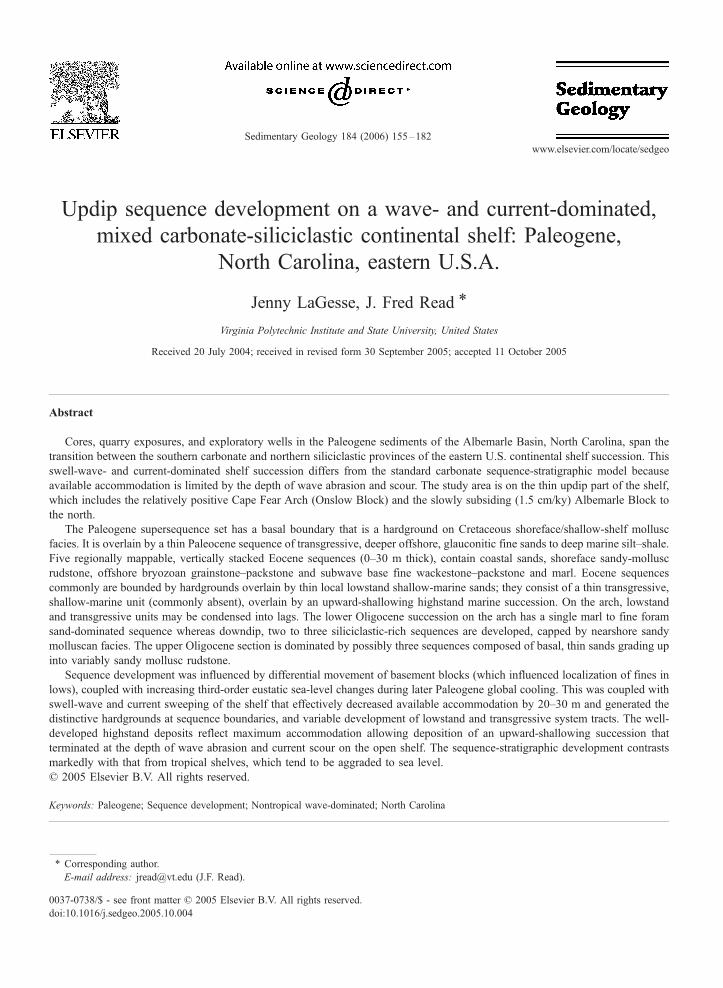
limits available accommodation, which is essentially
the space between the sea floor and the depth of
wave abrasion, rather than sea level (Fig. 1; Osleger,
1991). Once the shelf reaches the wave abrasion zone,
it becomes a bypass surface (Pekar and Kominz, 2001),
which prevents deposition of thick units of shallow-
water facies on the shelf and inhibits shallowing to sea
level.
The Paleogene succession of North Carolina formed
in such a non-tropical open-shelf setting (Coffey and
Read, 2004). In order to understand sequence develop-
ment in this setting, three cores from the relatively thin,
updip part of the Paleogene of North Carolina (Figs. 2
and 3) were logged, and the facies were studied. The
cores were tied into quarry sections and previously
studied wells with sequence picks and age control
(Harris et al., 1986; Coffey and Read, 2004) to provide
high-resolution sequence-stratigraphic cross sections.
The study shows the profound influence that the
open-shelf setting, with its wave sweeping and bound-
ary current scour, had on sequence development, which
Fig. 1. Schematic diagram showing open-shelf wave climate. Accommodatio
30–60 m or more. The wave abrasion zone prevents sediment deposition o
also was influenced by significant third-order glacio-
eustatic sea-level changes from the Paleogene green-
house to icehouse transition, and differential movement
of basement blocks of the basin.
2. Methods
Three cores housed at the North Carolina Geolog-
ical Survey were used in this study, including the
Beaufort County core (BF-C-1-68), the Onslow Coun-
ty core (ON-C-1-94), and the USGS Kure Beach core
drilled during the summer of 2001. The cores were
logged to document colour, quartz grain size, compo-
sition (sand, shale and limestone), Dunham rock
groups, biotic composition, and sedimentary structures.
Representative samples of the lithologies were studied
using plastic-impregnated thin sections stained with
Dickson’s (1965) solution. Cores were incorporated
into regional cross sections based on cores logged by
Harris et al. (2000), published quarry data (Harris et
al., 1986), and in downdip areas, several oil and gas
exploratory wells that had been subjected to thin sec-
tioned cuttings analysis by Coffey (2000), as part of
his regional study. Published biostratigraphic and Sr
isotope data provided age control. Sequence bound-
aries, flooding surfaces, and systems tracts were picked
on the cross sections and traced to generate a regional
high-resolution framework.
3. Structural setting and shelf morphology
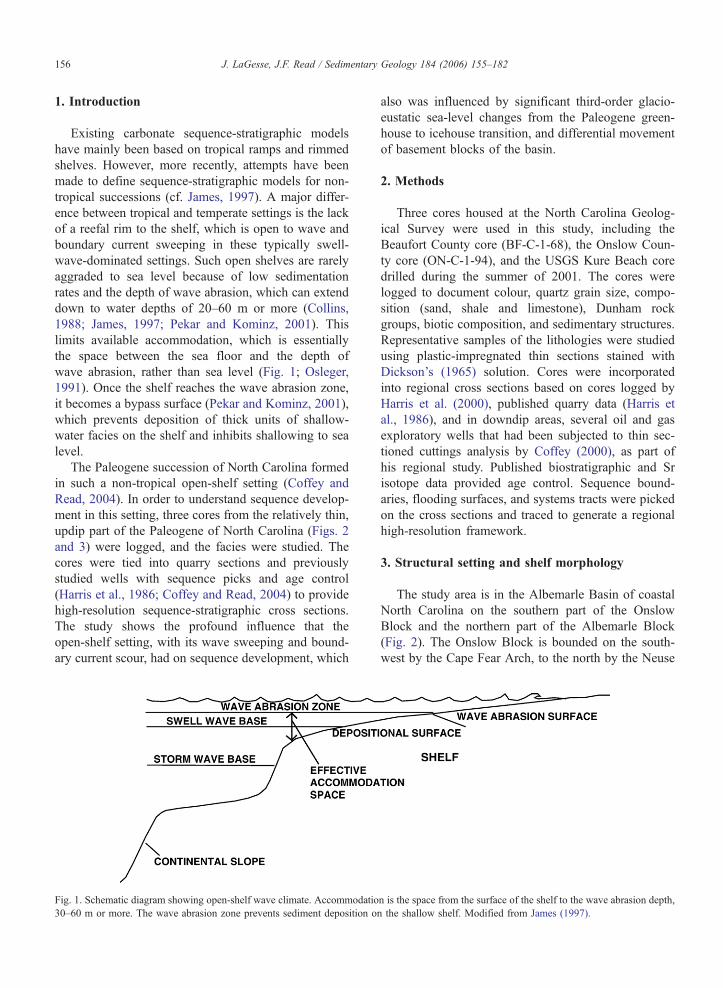
The study area is in the Albemarle Basin of coastal
North Carolina on the southern part of the Onslow
Block and the northern part of the Albemarle Block
(Fig. 2). The Onslow Block is bounded on the south-
west by the Cape Fear Arch, to the north by the Neuse
n is the space from the surface of the shelf to the wave abrasion depth,
n the shallow shelf. Modified from James (1997).
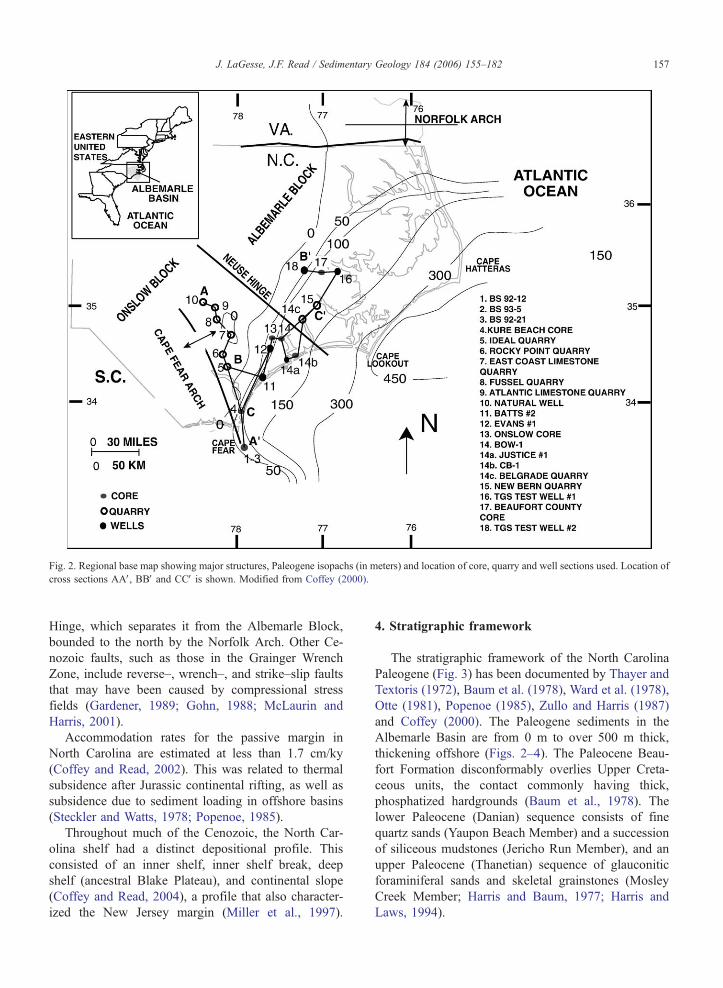
Fig. 2. Regional base map showing major structures, Paleogene isopachs (in meters) and location of core, quarry and well sections used. Location of
cross sections AAV, BBV and CCV is shown. Modified from Coffey (2000).
J. LaGesse, J.F. Read / Sedimentary Geology 184 (2006) 155–182 157
Hinge, which separates it from the Albemarle Block,
bounded to the north by the Norfolk Arch. Other Ce-
nozoic faults, such as those in the Grainger Wrench
Zone, include reverse–, wrench–, and strike–slip faults
that may have been caused by compressional stress
fields (Gardener, 1989; Gohn, 1988; McLaurin and
Harris, 2001).
Accommodation rates for the passive margin in
North Carolina are estimated at less than 1.7 cm/ky
(Coffey and Read, 2002). This was related to thermal
subsidence after Jurassic continental rifting, as well as
subsidence due to sediment loading in offshore basins
(Steckler and Watts, 1978; Popenoe, 1985).
Throughout much of the Cenozoic, the North Car-
olina shelf had a distinct depositional profile. This
consisted of an inner shelf, inner shelf break, deep
shelf (ancestral Blake Plateau), and continental slope
(Coffey and Read, 2004), a profile that also character-
ized the New Jersey margin (Miller et al., 1997).
4. Stratigraphic framework
The stratigraphic framework of the North Carolina
Paleogene (Fig. 3) has been documented by Thayer and
Textoris (1972), Baum et al. (1978), Ward et al. (1978),
Otte (1981), Popenoe (1985), Zullo and Harris (1987)
and Coffey (2000). The Paleogene sediments in the
Albemarle Basin are from 0 m to over 500 m thick,
thickening offshore (Figs. 2–4). The Paleocene Beau-
fort Formation disconformably overlies Upper Creta-
ceous units, the contact commonly having thick,
phosphatized hardgrounds (Baum et al., 1978). The
lower Paleocene (Danian) sequence consists of fine
quartz sands (Yaupon Beach Member) and a succession
of siliceous mudstones (Jericho Run Member), and an
upper Paleocene (Thanetian) sequence of glauconitic
foraminiferal sands and skeletal grainstones (Mosley
Creek Member; Harris and Baum, 1977; Harris and
Laws, 1994).

Fig. 3. Regional stratigraphic framework for the Paleogene of the North Carolina coastal plain (modified from Coffey, 2000). Paleogene global and
regional eustatic curves of Haq et al. (1988) with Oligocene curve of Kominz and Pekar (2001) are included. Biostratigraphic zonations and
radiometric time scale are from Berggren et al. (1995).
J. LaGesse, J.F. Read / Sedimentary Geology 184 (2006) 155–182158
Eocene sediments disconformably overlie Paleo-
cene units or Cretaceous strata (Fig. 4) and are bryo-
zoan-echinoderm limestones (Castle Hayne Limestone;
middle Eocene, Lutetian and Bartonian; Ward et al.,
Fig. 4. Cartoon showing the generalized supersequence stratigraphy of the P
this paper is located in the thin updip portion of the northwest–southeast c
Lowstand wedges shown by stippled pattern at foot of inner shelf break. D
1978; Harris et al., 1993). The overlying mollusc-rich
Eocene unit (mapped as New Bern Formation) is early
late Eocene (Priabonian, Baum et al., 1978) or latest
middle Eocene (Ward et al., 1978). Five Eocene de-
aleogene shelf, North Carolina (scale approximate). The study area for
ross section, as well as away from the cross section along the arch.
rawn from data in Coffey and Read (2004).
Table 1b
Water depths of inner, middle, mid-outer and outer neritic shel
environments are compiled from similar environments of the New
Jersey Oligocene, modern Australian shelf and North Carolina Eocene
Inner
neritic
Middle
neritic
Mid-outer
neritic
Outer
neritic
Jones, 1983 0–15 m 15–50 m – 50–100 m
Browning et al., 1997b 0–30 m 30–100 m – 100–200 m
Boreen et al., 1993 30–130 m 130–180 m
Pekar and
Kominz, 2001
0–40 m 10–110 m 30–130 m 70–145 m
James et al.,
2001
0–50 m 50–120 m – 120–160 m
Collins, 1988 0–60 m 60–100 m – 100–170 m
J. LaGesse, J.F. Read / Sedimentary Geology 184 (2006) 155–182 159
positional sequences were recognized by Zullo and
Harris (1987).
The lower Oligocene succession (Fig. 4) is mapped
as (Rupelian) Lower River Bend Formation and consists
of marl, fine sand, and sandy molluscan limestone. The
upper Oligocene (Chattian), upper River Bend Forma-
tion (Fig. 4) consists of silty–sandy molluscan lime-
stones (Ward et al., 1978; Harris et al., 2000). A single
depositional sequence was recognized in the lower Ol-
igocene succession and three sequences noted in the
upper Oligocene succession (Zullo and Harris, 1987).
The Oligocene units are unconformably overlain by
lower Miocene to Pliocene units (Baum et al., 1978).
Coffey and Read (2004), using thin-sectioned well
cuttings from 23 onshore wells tied into the offshore
seismic, provided a regional supersequence scale
framework (Fig. 4). However, in view of the limited
age control, third-order sequences although evident on
the cross sections were not tied to those defined in the
outcrop belt by Zullo and Harris (1987) and Harris and
Laws (1997).
5. Facies and depositional environments
The Paleogene facies and water depths summarized
in Tables 1a, 1b and 2 are modified from Coffey and
Read (2004) and supplemented by information from the
present study. The schematic facies profile (modified
from Coffey and Read, 2004) is shown in Fig. 5A and
water depths of facies are shown in Fig. 5B. The
estimated water depths of the facies were compiled
from the literature using modern or Tertiary analogues
for which the paleo-bathymetry had been determined.
The terms inner, middle and outer neritic are used here
loosely, because of the wide variation in the published
depth limits of these terms. Inner neritic maximum
depths are as little as 15 m (Jones, 1983) to as much
Table 1a
Estimated water depths for North Carolina Paleogene facies
Facies Location Depthsa Compiled depth
Quartz sand Inner neritic 0–15 m(2), b30 m(8), 10–30 m(1) 0–30 m
Fine glauconitic sand Inner neritic 20–50 m(8), 20–125 m(4), 25–75 m(9) 20–125 m
Sandy mollusk rudstone/grainstone/packstone Inner to middle neritic 30–85 m(9), 30–110 m(5,8), 35–50 m(6) 30–110 m
Silt–shale Middle to outer neritic 45–90 m(8), 60–185 m(4) 45–185 m
Mixed-skeletal grainstone/packstone Middle to outer neritic 30–90 m(5), 80–125(7), 120–200 m(6) 30–200 m
Fine foram sand Middle to outer neritic 30–70 m(8), 120–200 m(6), 145–185 m(1) 30–200 m
Bryozoan–echinoid grainstone/packstone Middle to outer neritic 60–210(7), 80–140 m(5), 90–170 m(3) 60–210 m
Skeletal fragment packstone/wackestone Outer neritic 80–200 m(7), 150–200 m(6), 170–230 m(3) 80–230 m
Marl Outer neritic to slope 200 to N300 m(6), 210 to N300 m(7) 200 to N360 m
Depths are compiled from similar environments of the New Jersey Oligocene and the modern Australian shelf.a From (1)Rao and Amini (1995), (2)Jones (1983), (3)Collins (1988), (4)Browning et al. (1997b), (5)James et al. (1997), (6)James et al. (1999)
(7)James et al. (2001), (8)Pekar and Kominz (2001), and (9)Pekar et al. (2003).
f
as 60 m (Collins, 1988), with an average maximum
depth of 40 m. Middle neritic maximum depths are as
little as 50 m (Jones, 1983) to as much as 130 m
(Boreen et al., 1993), with an average maximum of
120 m. Outer neritic maximum depths are as little as
100–200 m or more, with an average maximum depth
of 180 m. Distribution of the facies in the cross sections
and cores is shown in Figs. 6–10.
6. Sequence stratigraphy
6.1. Regional sequence framework
Five Paleogene supersequences occur in the North
Carolina Albemarle Basin and beneath the adjacent
continental shelf (Harris and Laws, 1997; Coffey and
Read, 2004). Supersequence 1 of Paleocene age is thin
to absent on the updip Onslow Block, but thickens
downdip and offshore to over 100 m. It is dominated
by deep-water marls. Supersequence 2 (early Eocene) is
absent in the study area. Supersequence 3 (middle
Eocene) is the most widespread unit. It is up to 200
m thick downdip and dominated by bryozoan lime-
stone, becoming more quartzose upward. These bryo-
,
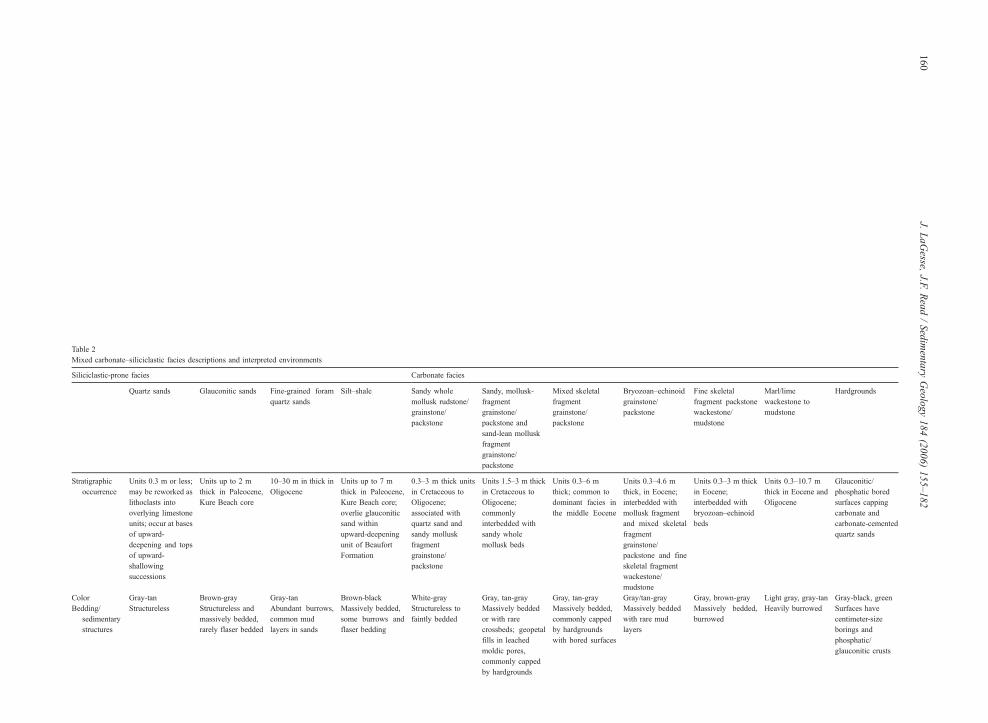
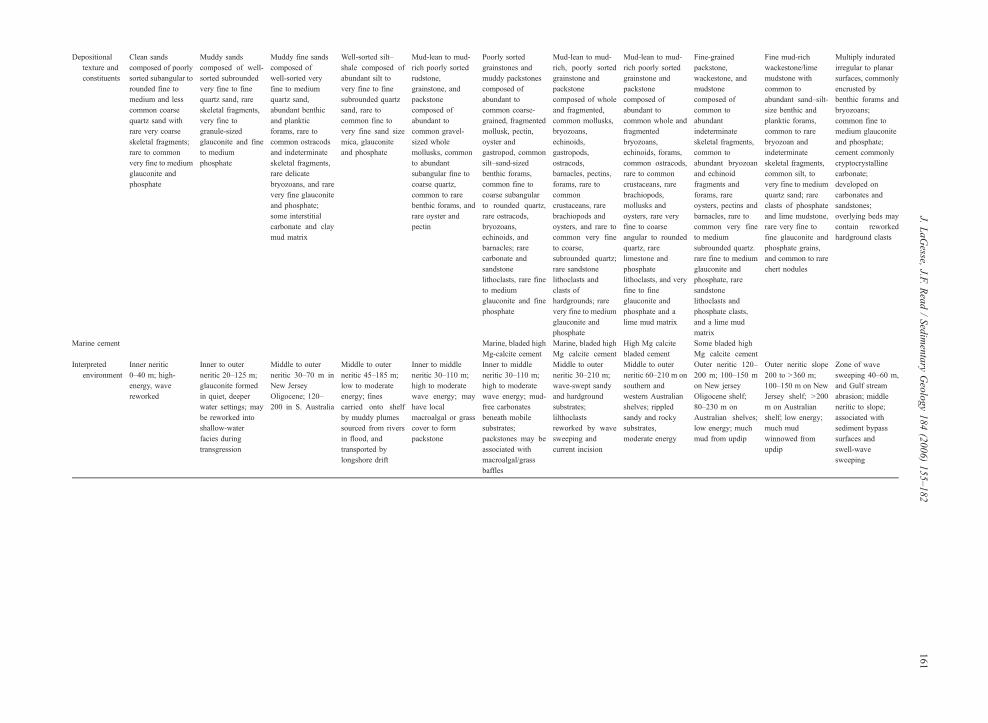
Table 2
Mixed carbonate–siliciclastic facies descriptions and interpreted environments
Siliciclastic-prone facies Carbonate facies
Quartz sands Glauconitic sands Fine-grained foram
quartz sands
Silt–shale Sandy whole
mollusk rudstone/
grainstone/
packstone
Sandy, mollusk-
fragment
grainstone/
packstone and
sand-lean mollusk
fragment
grainstone/
packstone
Mixed skeletal
fragment
grainstone/
packstone
Bryozoan–echinoid
grainstone/
packstone
Fine skeletal
fragment packstone
wackestone/
mudstone
Marl/lime
wackestone to
mudstone
Hardgrounds
Stratigraphic
occurrence
Units 0.3 m or less;
may be reworked as
lithoclasts into
overlying limestone
units; occur at bases
of upward-
deepening and tops
of upward-
shallowing
successions
Units up to 2 m
thick in Paleocene,
Kure Beach core
10–30 m in thick in
Oligocene
Units up to 7 m
thick in Paleocene,
Kure Beach core;
overlie glauconitic
sand within
upward-deepening
unit of Beaufort
Formation
0.3–3 m thick units
in Cretaceous to
Oligocene;
associated with
quartz sand and
sandy mollusk
fragment
grainstone/
packstone
Units 1.5–3 m thick
in Cretaceous to
Oligocene;
commonly
interbedded with
sandy whole
mollusk beds
Units 0.3–6 m
thick; common to
dominant facies in
the middle Eocene
Units 0.3–4.6 m
thick, in Eocene;
interbedded with
mollusk fragment
and mixed skeletal
fragment
grainstone/
packstone and fine
skeletal fragment
wackestone/
mudstone
Units 0.3–3 m thick
in Eocene;
interbedded with
bryozoan–echinoid
beds
Units 0.3–10.7 m
thick in Eocene and
Oligocene
Glauconitic/
phosphatic bored
surfaces capping
carbonate and
carbonate-cemented
quartz sands
Color Gray-tan Brown-gray Gray-tan Brown-black White-gray Gray, tan-gray Gray, tan-gray Gray/tan-gray Gray, brown-gray Light gray, gray-tan Gray-black, green
Bedding/
sedimentary
structures
Structureless Structureless and
massively bedded,
rarely flaser bedded
Abundant burrows,
common mud
layers in sands
Massively bedded,
some burrows and
flaser bedding
Structureless to
faintly bedded
Massively bedded
or with rare
crossbeds; geopetal
fills in leached
moldic pores,
commonly capped
by hardgrounds
Massively bedded,
commonly capped
by hardgrounds
with bored surfaces
Massively bedded
with rare mud
layers
Massively bedded,
burrowed
Heavily burrowed Surfaces have
centimeter-size
borings and
phosphatic/
glauconitic crusts
J.LaGesse,
J.F.Read/Sedimentary
Geology184(2006)155–182
160
Depositional
texture and
constituents
Clean sands
composed of poorly
sorted subangular to
rounded fine to
medium and less
common coarse
quartz sand with
rare very coarse
skeletal fragments;
rare to common
very fine to medium
glauconite and
phosphate
Muddy sands
composed of well-
sorted subrounded
very fine to fine
quartz sand, rare
skeletal fragments,
very fine to
granule-sized
glauconite and fine
to medium
phosphate
Muddy fine sands
composed of
well-sorted very
fine to medium
quartz sand,
abundant benthic
and planktic
forams, rare to
common ostracods
and indeterminate
skeletal fragments,
rare delicate
bryozoans, and rare
very fine glauconite
and phosphate;
some interstitial
carbonate and clay
mud matrix
Well-sorted silt–
shale composed of
abundant silt to
very fine to fine
subrounded quartz
sand, rare to
common fine to
very fine sand size
mica, glauconite
and phosphate
Mud-lean to mud-
rich poorly sorted
rudstone,
grainstone, and
packstone
composed of
abundant to
common gravel-
sized whole
mollusks, common
to abundant
subangular fine to
coarse quartz,
common to rare
benthic forams, and
rare oyster and
pectin
Poorly sorted
grainstones and
muddy packstones
composed of
abundant to
common coarse-
grained, fragmented
mollusk, pectin,
oyster and
gastropod, common
silt–sand-sized
benthic forams,
common fine to
coarse subangular
to rounded quartz,
rare ostracods,
bryozoans,
echinoids, and
barnacles; rare
carbonate and
sandstone
lithoclasts, rare fine
to medium
glauconite and fine
phosphate
Mud-lean to mud-
rich, poorly sorted
grainstone and
packstone
composed of whole
and fragmented,
common mollusks,
bryozoans,
echinoids,
gastropods,
ostracods,
barnacles, pectins,
forams, rare to
common
crustaceans, rare
brachiopods and
oysters, and rare to
common very fine
to coarse,
subrounded quartz;
rare sandstone
lithoclasts and
clasts of
hardgrounds; rare
very fine to medium
glauconite and
phosphate
Mud-lean to mud-
rich poorly sorted
grainstone and
packstone
composed of
abundant to
common whole and
fragmented
bryozoans,
echinoids, forams,
common ostracods,
rare to common
crustaceans, rare
brachiopods,
mollusks and
oysters, rare very
fine to coarse
angular to rounded
quartz, rare
limestone and
phosphate
lithoclasts, and very
fine to fine
glauconite and
phosphate and a
lime mud matrix
Fine-grained
packstone,
wackestone, and
mudstone
composed of
common to
abundant
indeterminate
skeletal fragments,
common to
abundant bryozoan
and echinoid
fragments and
forams, rare
oysters, pectins and
barnacles, rare to
common very fine
to medium
subrounded quartz.
rare fine to medium
glauconite and
phosphate, rare
sandstone
lithoclasts and
phosphate clasts,
and a lime mud
matrix
Fine mud-rich
wackestone/lime
mudstone with
common to
abundant sand–silt-
size benthic and
planktic forams,
common to rare
bryozoan and
indeterminate
skeletal fragments,
common silt, to
very fine to medium
quartz sand; rare
clasts of phosphate
and lime mudstone,
rare very fine to
fine glauconite and
phosphate grains,
and common to rare
chert nodules
Multiply indurated
irregular to planar
surfaces, commonly
encrusted by
benthic forams and
bryozoans;
common fine to
medium glauconite
and phosphate;
cement commonly
cryptocrystalline
carbonate;
developed on
carbonates and
sandstones;
overlying beds may
contain reworked
hardground clasts
Marine cement Marine, bladed high
Mg-calcite cement
Marine, bladed high
Mg calcite cement
High Mg calcite
bladed cement
Some bladed high
Mg calcite cement
Interpreted
environment
Inner neritic
0–40 m; high-
energy, wave
reworked
Inner to outer
neritic 20–125 m;
glauconite formed
in quiet, deeper
water settings; may
be reworked into
shallow-water
facies during
transgression
Middle to outer
neritic 30–70 m in
New Jersey
Oligocene; 120–
200 in S. Australia
Middle to outer
neritic 45–185 m;
low to moderate
energy; fines
carried onto shelf
by muddy plumes
sourced from rivers
in flood, and
transported by
longshore drift
Inner to middle
neritic 30–110 m;
high to moderate
wave energy; may
have local
macroalgal or grass
cover to form
packstone
Inner to middle
neritic 30–110 m;
high to moderate
wave energy; mud-
free carbonates
beneath mobile
substrates;
packstones may be
associated with
macroalgal/grass
baffles
Middle to outer
neritic 30–210 m;
wave-swept sandy
and hardground
substrates;
lilthoclasts
reworked by wave
sweeping and
current incision
Middle to outer
neritic 60–210 m on
southern and
western Australian
shelves; rippled
sandy and rocky
substrates,
moderate energy
Outer neritic 120–
200 m; 100–150 m
on New jersey
Oligocene shelf;
80–230 m on
Australian shelves;
low energy; much
mud from updip
Outer neritic slope
200 to N360 m;
100–150 m on New
Jersey shelf; N200
m on Australian
shelf; low energy;
much mud
winnowed from
updip
Zone of wave
sweeping 40–60 m,
and Gulf stream
abrasion; middle
neritic to slope;
associated with
sediment bypass
surfaces and
swell-wave
sweeping
J.LaGesse,
J.F.Read/Sedimentary
Geology184(2006)155–182
161
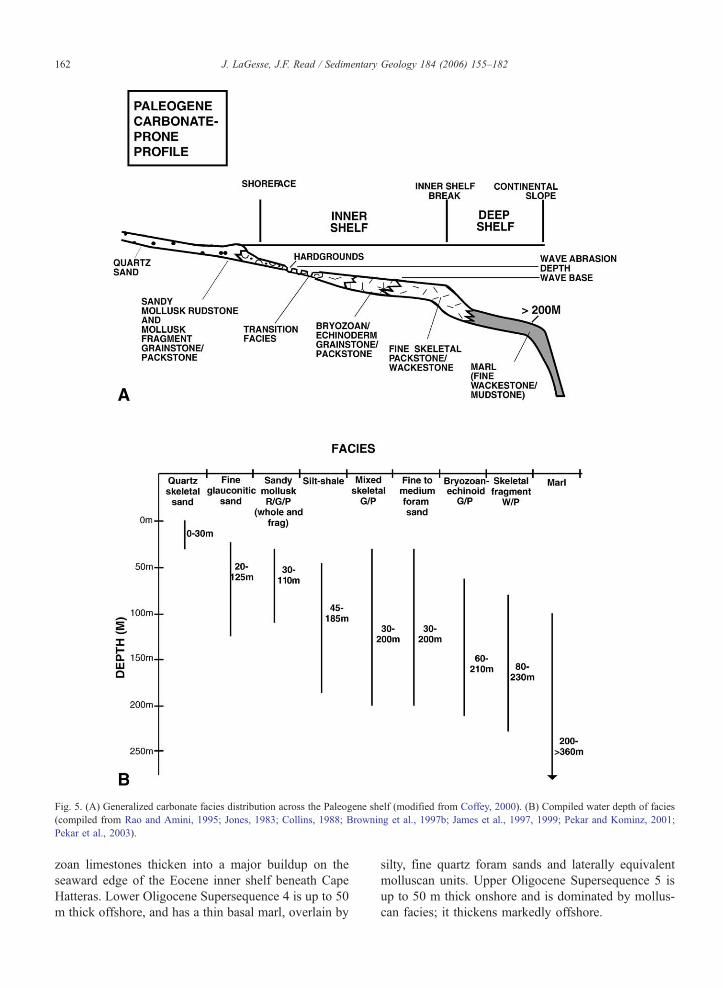
Fig. 5. (A) Generalized carbonate facies distribution across the Paleogene shelf (modified from Coffey, 2000). (B) Compiled water depth of facies
(compiled from Rao and Amini, 1995; Jones, 1983; Collins, 1988; Browning et al., 1997b; James et al., 1997, 1999; Pekar and Kominz, 2001;
Pekar et al., 2003).
J. LaGesse, J.F. Read / Sedimentary Geology 184 (2006) 155–182162
zoan limestones thicken into a major buildup on the
seaward edge of the Eocene inner shelf beneath Cape
Hatteras. Lower Oligocene Supersequence 4 is up to 50
m thick offshore, and has a thin basal marl, overlain by
silty, fine quartz foram sands and laterally equivalent
molluscan units. Upper Oligocene Supersequence 5 is
up to 50 m thick onshore and is dominated by mollus-
can facies; it thickens markedly offshore.
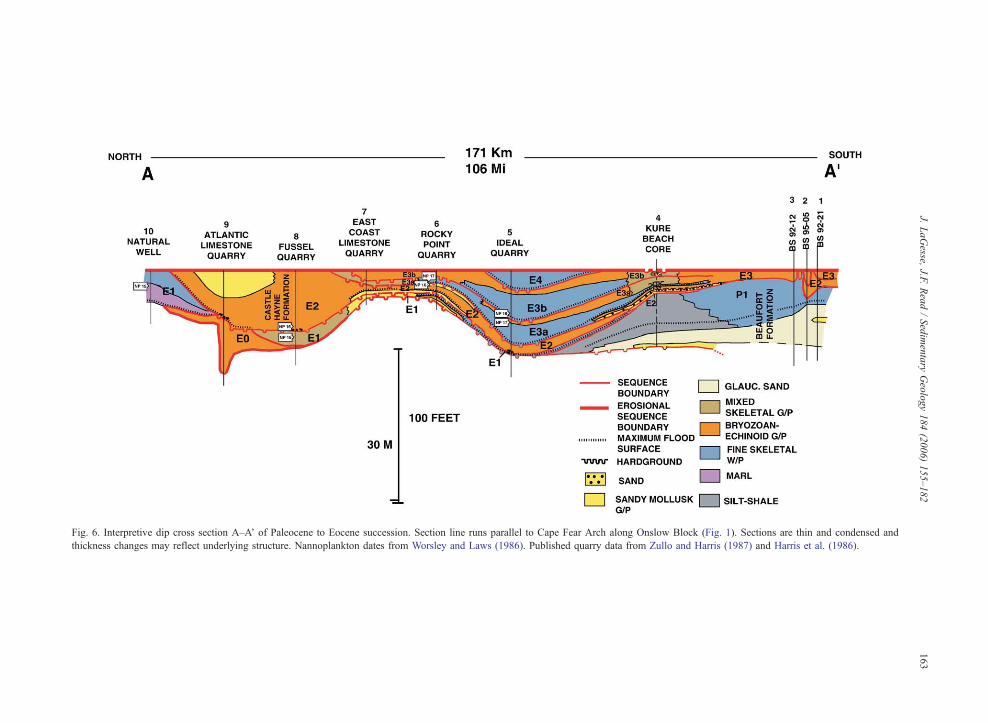
Fig. 6. Interpretive dip cross section A–A’ of Paleocene to Eocene succession. Section line runs parallel to Cape Fear Arch along Onslow Block (Fig. 1). Sections are thin and condensed and
thickness changes may reflect underlying structure. Nannoplankton dates from Worsley and Laws (1986). Published quarry data from Zullo and Harris (1987) and Harris et al. (1986).
J.LaGesse,
J.F.Read/Sedimentary
Geology184(2006)155–182
163
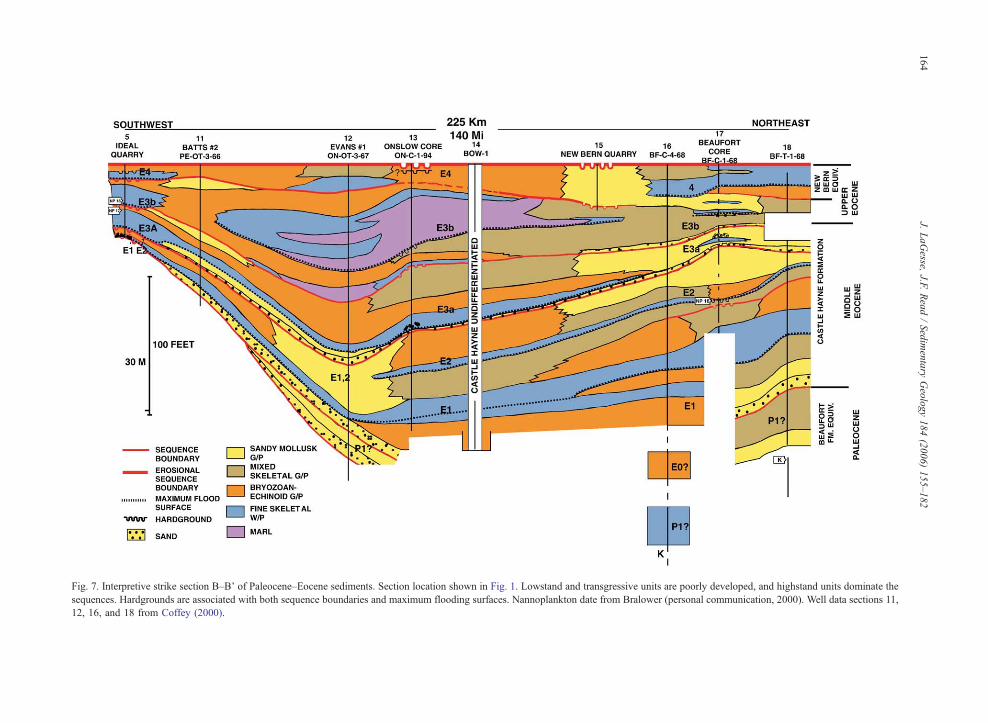
Fig. 7. Interpretive strike section B–B’ of Paleocene–Eocene sediments. Section location shown in Fig. 1. Lowstand and transgressive units are poorly developed, and highstand units dominate the
sequences. Hardgrounds are associated with both sequence boundaries and maximum flooding surfaces. Nannoplankton date from Bralower (personal communication, 2000). Well data sections 11,
12, 16, and 18 from Coffey (2000).
J.LaGesse,
J.F.Read/Sedimentary
Geology184(2006)155–182
164
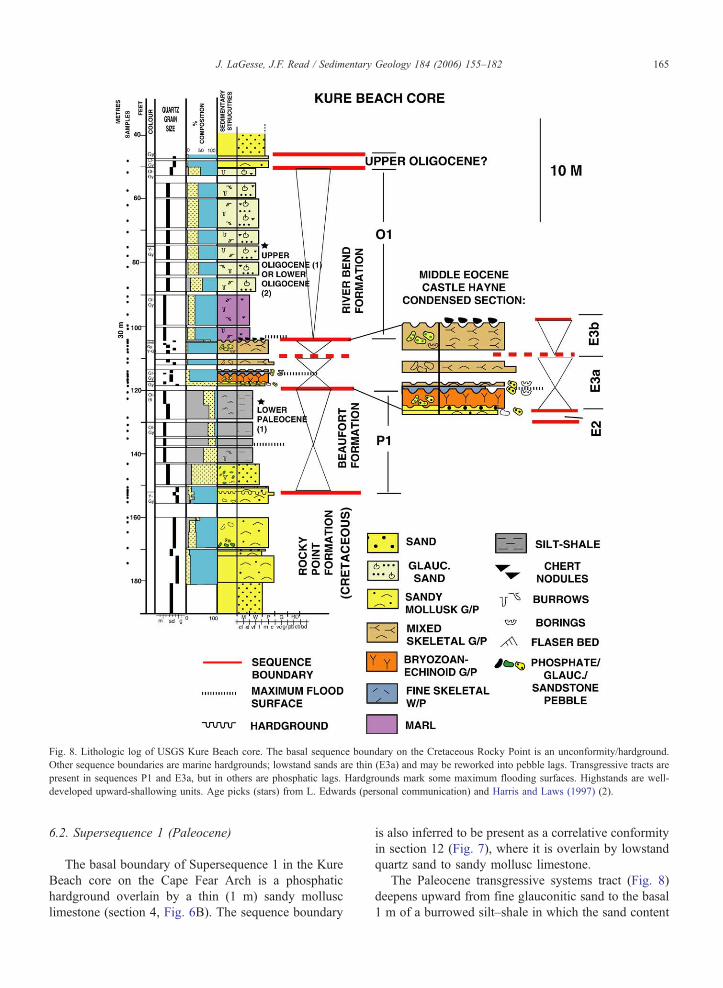
Fig. 8. Lithologic log of USGS Kure Beach core. The basal sequence boundary on the Cretaceous Rocky Point is an unconformity/hardground.
Other sequence boundaries are marine hardgrounds; lowstand sands are thin (E3a) and may be reworked into pebble lags. Transgressive tracts are
present in sequences P1 and E3a, but in others are phosphatic lags. Hardgrounds mark some maximum flooding surfaces. Highstands are well-
developed upward-shallowing units. Age picks (stars) from L. Edwards (personal communication) and Harris and Laws (1997) (2).
J. LaGesse, J.F. Read / Sedimentary Geology 184 (2006) 155–182 165
6.2. Supersequence 1 (Paleocene)
The basal boundary of Supersequence 1 in the Kure
Beach core on the Cape Fear Arch is a phosphatic
hardground overlain by a thin (1 m) sandy mollusc
limestone (section 4, Fig. 6B). The sequence boundary
is also inferred to be present as a correlative conformity
in section 12 (Fig. 7), where it is overlain by lowstand
quartz sand to sandy mollusc limestone.
The Paleocene transgressive systems tract (Fig. 8)
deepens upward from fine glauconitic sand to the basal
1 m of a burrowed silt–shale in which the sand content
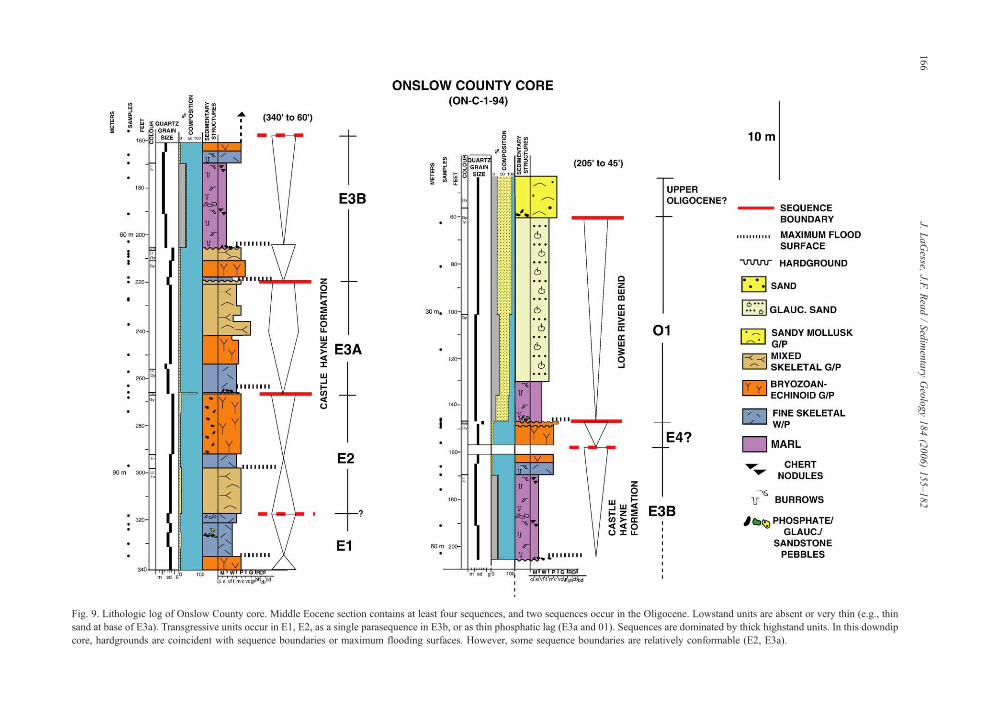
Fig. 9. Lithologic log of Onslow County core. Middle Eocene section contains at least four sequences, and two sequences occur in the Oligocene. Lowstand units are absent or very thin (e.g., thin
sand at base of E3a). Transgressive units occur in E1, E2, as a single parasequence in E3b, or as thin phosphatic lag (E3a and 01). Sequences are dominated by thick highstand units. In this downdip
core, hardgrounds are coincident with sequence boundaries or maximum flooding surfaces. However, some sequence boundaries are relatively conformable (E2, E3a).
J.LaGesse,
J.F.Read/Sedimentary
Geology184(2006)155–182
166
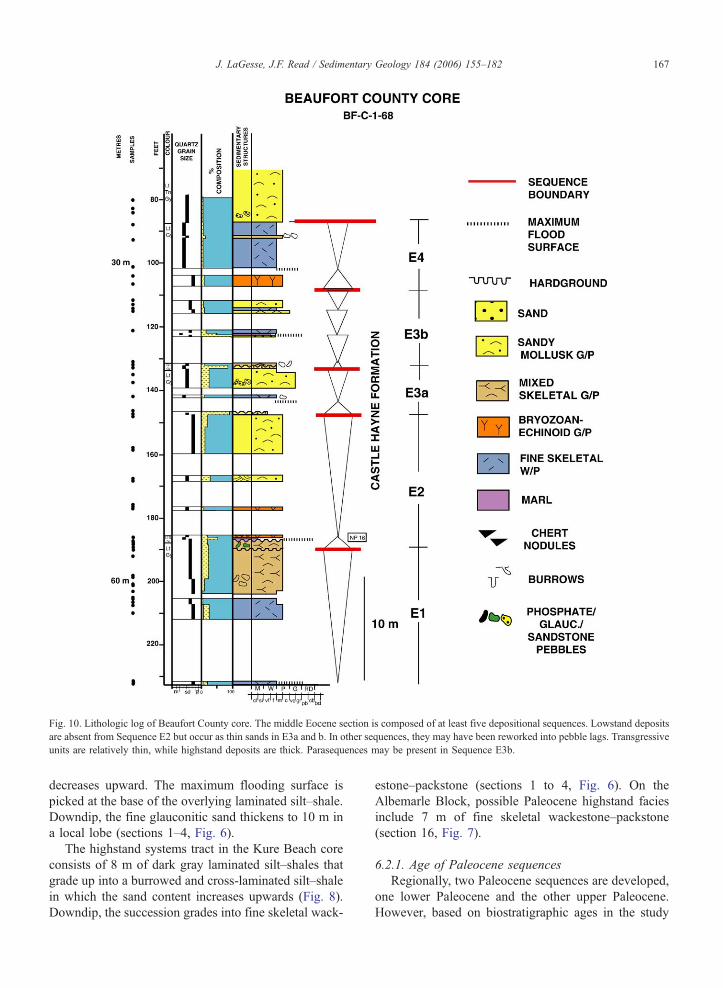
Fig. 10. Lithologic log of Beaufort County core. The middle Eocene section is composed of at least five depositional sequences. Lowstand deposits
are absent from Sequence E2 but occur as thin sands in E3a and b. In other sequences, they may have been reworked into pebble lags. Transgressive
units are relatively thin, while highstand deposits are thick. Parasequences may be present in Sequence E3b.
J. LaGesse, J.F. Read / Sedimentary Geology 184 (2006) 155–182 167
decreases upward. The maximum flooding surface is
picked at the base of the overlying laminated silt–shale.
Downdip, the fine glauconitic sand thickens to 10 m in
a local lobe (sections 1–4, Fig. 6).
The highstand systems tract in the Kure Beach core
consists of 8 m of dark gray laminated silt–shales that
grade up into a burrowed and cross-laminated silt–shale
in which the sand content increases upwards (Fig. 8).
Downdip, the succession grades into fine skeletal wack-
estone–packstone (sections 1 to 4, Fig. 6). On the
Albemarle Block, possible Paleocene highstand facies
include 7 m of fine skeletal wackestone–packstone
(section 16, Fig. 7).
6.2.1. Age of Paleocene sequences
Regionally, two Paleocene sequences are developed,
one lower Paleocene and the other upper Paleocene.
However, based on biostratigraphic ages in the study
J. LaGesse, J.F. Read / Sedimentary Geology 184 (2006) 155–182168
area, only the lower sequence is developed (Lucy
Edwards, personal communication, 2003).
6.3. Supersequence 3 (Eocene)
Supersequence 3 (middle to late Eocene) strata un-
conformably overlie either Paleocene or Upper Creta-
ceous beds. Supersequence 3 contains five major
sequences, labeled Sequences 0, 1, 2, 3 and 4 by
Zullo and Harris (1987) and Harris et al. (1993).
6.3.1. Sequence E0
Sequence E0 has patchy distribution and typically
occurs as isolated, single facies for which no systems
tract can be identified. The basal boundary of Sequence
0 is only observed updip along the arch in quarry
sections 8 and 9, where Sequence 0 units disconform-
ably overlie Cretaceous strata (Fig. 6). No lowstand
systems tract is observed.
Sequence E0 is localized in erosional depressions
along the arch and consists of 14 m of a bryozoan–
echinoid grainstone–packstone that thins rapidly to 0 m
within 8 km (sections 8, 9, Fig. 6). Downdip in well
section 16, Sequence 0 is 6 m of bryozoan–echinoid
grainstone–packstone (Fig. 7). Its systems tracts are not
identified.
6.3.2. Sequence E1
On the Cape Fear Arch (Fig. 6), Sequence 1 is 0–8 m
thick. On the strike line, boundaries between Sequences
E1 and E2 cannot be determined, and together, the
sequences thicken to an aggregate thickness of 37 m
(Fig. 7).
The base of Sequence E1 is a hardground as over the
local high on the arch between sections 5 to 7 (Fig. 6)
or a sharp contact. Downdip in sections 11, 12 and 18,
the sequence boundary is placed beneath a lowstand
quartz sand (Fig. 7).
On the arch (Fig. 6), sequence E1 has a patchy
distribution. The transgressive systems tract consists
of a mixed skeletal grainstone–packstone (section 8)
grading laterally above a local high (sections 7 and 6)
into sandy mollusc grainstone–packstone. These are
overlain by local bryozoan grainstone–packstone (sec-
tion 6). Downdip, the transgressive tract is a bryozoan
grainstone–packstone.
The highstand systems tract for Sequence E1 on the
arch is thin to absent except updip at section 10 (Fig. 6),
where it is a local 6-m succession of marl to fine
skeletal wackestone–packstone with an NP 15 age
pick (Worsley and Laws, 1986). Farther south (sections
5 and 6, Fig. 6), the fine wackestone reappears as a thin
veneer and phosphatic lag deposits. Highstand wack-
estones are traceable as a sheet (a few metres thick)
throughout much of the basin (sections 11 to 18, Fig.
7). These shallow up into late highstand mixed skeletal
grainstone–packstone and bryozoan–echinoid grain-
stone–packstone (sections 11 to 18, Fig. 7). The flood-
ing unit is split at section 16 by a bryozoan limestone
(Fig. 7).
6.3.3. Sequence E2
The Sequence E2 boundary on the arch is a regional
phosphatic hardground (sections 5 to 9, Fig. 6) overlain
on the local high (at sections 6 and 7) by a thin (1 m)
sandy mollusc limestone. Downdip the sequence
boundary is a hardground in the Beaufort core (section
17, Figs. 7 and 10), but is difficult to trace elsewhere.
The Sequence E2 transgressive systems tract on the
arch may be a phosphate pebble lag (sections 9, 8, 5,
Fig. 6). On the strike line (sections 13 to 18, Fig. 7), the
transgressive units of Sequence E2 cannot be defined,
but may be within the 7-m mixed skeletal grainstone–
packstone and bryozoan–echinoid grainstone–pack-
stone units beneath a major flooding unit.
The Sequence E2 highstand systems tract on the arch
is a relatively widespread bryozoan grainstone–pack-
stone that grades up to a sandy mollusc limestone at
section 9 (Fig. 6) and laterally grades into sandy mol-
lusc limestone at section 4 (Figs. 6 and 8). Downdip,
the highstand systems tract contains a shallowing-up-
ward succession consisting of a semi-regional fine
wackestone and local marl, overlain by a complex
facies mosaic of shallower water, bryozoan–echinoid
grainstone–packstone and sandy molluscan limestone
(sections 13 to 18, Figs. 7, 9 and 10).
6.3.4. Sequence E3a
Sequence E3 was mapped by Zullo and Harris
(1987) as a single sequence with a marine flooding
surface in the middle of the section, but Baum (1986)
considered that the hardground surface formed a se-
quence boundary subdividing the sequence into two
smaller sequences. We have subdivided sequence E3
into two minor sequences, E3a and b, because at some
localities, quartz sand and/or sandy limestones appar-
ently occur in the position of the hardground separating
the two units. However, such a subdivision is tentative
and needs better time control for correlation between
sections. Sequence E3 is 0–12 m thick along the Cape
Fear Arch (Fig. 6), thickening to 47 m basinward on the
Albemarle Block (Fig. 7).
Along the Cape Fear Arch, the basal boundary of
Sequence E3a is a hardground on the local high at
J. LaGesse, J.F. Read / Sedimentary Geology 184 (2006) 155–182 169
sections 5 to 7 (Fig. 6). In the Kure Beach core, the
Sequence E3a basal boundary is placed beneath a thin
(less than 1 m), local sand with sandstone rip-up clasts,
capped by a hardground (section 4, Figs. 6 and 8). This
sand above the sequence boundary is traceable downdip
as a thin laterally extensive unit (sections 11 to 18, Fig.
7), as in the Onslow and Beaufort cores (Figs. 9 and
10). In the Beaufort core (Fig. 10), the lowstand sand
also is capped by a hardground.
The transgressive systems tract of Sequence E3a on
the arch is only seen at section 4 (Figs. 6 and 8) where it
is a local, thin (1-m) bryozoan–echinoid grainstone–
packstone unit (with sandstone rip-up clasts), capped by
a hardground. Basinward, transgressive units are only
developed at sections 11 and 12 (Fig. 7) as a 3-m-thick
sandy mollusc limestone and may be present in the
Onslow core (section 13, Figs. 7 and 9) as a very thin
phosphate pebble lag. Elsewhere along strike, the trans-
gressive systems tract cannot be differentiated from the
highstand except in the Beaufort core (section 17, Figs.
7 and 10), where a transgressive sandy mollusc lime-
stone occurs beneath highstand fine skeletal wackes-
tone–packstone.
On the arch, the sequence E3a highstand forms a
shallowing-upward succession at sections 4 and 5 (Fig.
6), consisting of fine skeletal wackestone up into bryo-
zoan and mixed skeletal carbonates. In most sections
downdip (section 11 to 17, Fig. 7), the sequence 3a
highstand also forms a shallowing-upward succession
of fine skeletal wackestone–packstone to bryozoan–
echinoid grainstone–packstone locally capped by
sandy mollusc limestone or mixed skeletal limestone.
6.3.5. Sequence E3b
Along the arch, the Sequence E3b basal boundary is
a hardground at sections 5, 6 and 7 (Fig. 6). In the
highly thinned sections 1 to 3 (Fig. 6), Sequence E3b
cannot be differentiated from Sequence E3a. Downdip
(Fig. 7), the E3b sequence boundary is placed at the top
of upward-shallowing succession of sequence E3a (sec-
tions 5, 11, 12, 13) or beneath thin sands (sections 16
and 17).
On the arch, the transgressive tract is poorly devel-
oped or absent (Fig. 6). Downdip (Fig. 7), the trans-
gressive tract can be recognized at sections 12 and 13,
where it is a shallowing-upward parasequence of fine
skeletal wackestone/marl grading up into bryozoan and
mixed skeletal limestone; a thin sand caps this parase-
quence at section 17. Elsewhere, the transgressive tract
is dominated by a single lithology (sections 11, 16, 17).
The Sequence E3b highstand systems tract along the
arch forms a shallowing-upward succession only at
section 5 (Fig. 6) where it consists of fine skeletal
wackestone–packstone (NP 18 age pick; Worsley and
Laws, 1986) that shallows up to a bryozoan–echinoid
grainstone packstone. The systems tracts are not sepa-
rable in the thin bryozoan limestones in sections 6 and 7
(Fig. 6).
Downdip (Fig. 7), shallowing-upward highstand
units include marl and fine skeletal wackestone–pack-
stone up into bryozoan limestone and sandy mollusc
limestone (sections 5, 12, 13, 17). In the Beaufort core
(section 17, Figs. 7 and 10), the highstand consists of two
shallowing-upward parasequences, the lower one com-
posed of a very thin (less than 1 m) unit of marl to fine
skeletal wackestone–packstone to sandy mollusc lime-
stone and the upper one of very thin fine skeletal wack-
estone–packstone capped by sandy mollusc limestone.
6.3.6. Sequence E4
Sequence E4 has patchy distribution along the Cape
Fear Arch and is locally capped by Oligocene, Pliocene
or Pleistocene units. It commonly is a single facies,
making systems tract identification difficult. The Se-
quence 4 boundary is only evident along the arch at
section 5 (Fig. 6), where it is a hardground.
Downdip, the Sequence E4 boundary is a hard-
ground as in section 15 (Fig. 7). Elsewhere (sections
11 to 18, Fig. 7), the sequence boundary was placed
above shallowing-upward units of the underlying se-
quence E3b. The Sequence E4 transgressive systems
tract was not recognizable along the arch. Downdip
(sections 17, 18, Figs. 7 and 10), the transgressive
tract is a thin locally developed bryozoan–echinoid
grainstone–packstone.
On the arch, the Sequence E4 highstand systems
tract appears to be present only at section 5 (Fig. 6)
as a localized 4-m-thick fine skeletal wackestone–pack-
stone that pinches out laterally. Downdip at sections 12,
16, 17 (Fig. 7), the Sequence E4 highstand is an up-
ward-shallowing succession of fine skeletal wackestone
to bryozoan or mixed skeletal carbonate. Elsewhere, it
consists of a single lithology.
6.3.7. Ages of Eocene sequences
The five Eocene sequences are dated in terms of
nannoplankton (NP) zones (Figs. 3, 6 and 7).
Sequences 0 and 1 are NP 15 age; Sequence 2 is NP
16 age; Sequence 3a spans NP 16 and NP 17; Sequence
3b is NP 18 age; and Sequence 4 spans NP 19 and 20
(Zullo and Harris, 1987; Harris et al., 1993; Harris and
Laws, 1994). This implies that Sequence 3b and 4 are
late Eocene. However, Ward et al. (1978) included all
these sequences in the middle Eocene (Fig. 3).
J. LaGesse, J.F. Read / Sedimentary Geology 184 (2006) 155–182170
6.4. Supersequences 4 and 5 (Oligocene)
Defining third-order sequences in the Oligocene
succession is difficult given the mixed data set of
core, well and quarry exposures, and the poor time
control on individual units.
Supersequence 4 contains up to three sequences (O1
to O3) that are recognizable in offshore seismic profiles
(Snyder et al., 1994) and in cuttings from a few onshore
wells (Coffey, 2000), but in general, they are difficult to
identify onshore. Supersequence 5 contains at least
three sequences (O4 to O6) that can be recognized
from offshore seismic data (Snyder, 1982) and in
some wells (Coffey, 2000).
Supersequence 5 ranges in thickness from 2 m in
the south at section 4 (Fig. 11), slightly thickening to
8 m in section 14, and then undergoes rapid thicken-
ing into the basin (sections 14A, 14B, Fig. 11). It then
thins to a thin veneer updip to the north (sections 14C,
15, Fig. 11).
6.4.1. Sequence O1
Given the 87/86Sr age ranges in section 14 (Harris et
al., 2000; Fig. 11) and the absence of any breaks within
the Kure Beach core (section 4, Fig. 11), the southern
part of the study area is interpreted as a single sequence
informally labeled O1. It is approximately 15 m in the
Kure Beach core to 30 m in section 14 (Fig. 11).
Sequence O1 thins to 13 m in section 14A (Fig. 11),
beyond which it cannot be traced with any confidence.
It may continue updip into sections 14B and 14C, but
there is no age control.
The basal sequence boundary of Sequence O1 is a
hardground in core sections. No lowstand systems tract
or transgressive systems tract can be recognized, and
the maximum flooding surface is coincident with the
sequence boundary. The highstand systems tract con-
sists of a lower unit of marl 5–10 m thick, overlain by
14–30 m of fine foram sand.
6.4.2. Sequence O2a
Given the age control in section 14B and the sand
bodies in section 14A (Fig. 11), it is inferred that
Sequence O1 is overlain by Sequences O2a and O2b
downdip. Updip to the north in section 14C (Fig. 11),
the O2 silty sand may pass into undifferentiated shell
beds given the 87/86Sr age picks in the Belgrade Quarry.
The basal sequence boundary of O2a in section 14A
(Fig. 11) is placed beneath a local lowstand to early
transgressive coarse sand body. The sand unit is over-
lain by 10 m of transgressive/highstand fine foram
sand.
6.4.3. Sequence O2b
The sequence boundary for Sequence O2b in section
14A (Fig. 11) is placed beneath a local lowstand to
early transgressive coarse sandy zone. This sand reap-
pears to the north in section 14C (Fig. 11) and is dated
at 30 Ma (Harris et al., 2000). The highstand systems
tract consists of an upward-shallowing succession of
10–20 m of fine foram sand overlain by 15 m of sandy
mollusc limestone that thins to the northeast to 2 m in
section 14C (Fig. 11). Sequence O2b is preserved only
in the basin, as it appears to pinch out to the southwest
and northeast.
6.4.4. Sequence O3
A third locally preserved sequence tentatively la-
beled O3 is recognized in section 14C (Fig. 11). It is
bracketed by 87/86Sr age dates of 27 Ma above and 29
Ma below (Denison et al., 1993). The O3 sequence
boundary is placed beneath the local lowstand to
early transgressive sand, and the highstand systems
tract consists of 2 m of sandy mollusc limestone (sec-
tion 14C, Fig. 11).
6.4.5. Sequences O4, O5, O6
The Supersequence 5 boundary on the Onslow
Block is placed at the base of either lowstand to early
transgressive local coarse sands (sections 12, 14A, Fig.
11) or where these are absent, at the base of sandy
mollusc limestone units that are locally marked by
phosphatized pebbles (sections 13, 14C, Fig. 11). In
the basin at section 14A (Fig. 11), there is a weak
suggestion that three sequences may be developed
(Sequences O4, O5, O6) based on slight increases in
sand in the well cuttings at the presumed bases of the
sequences. The remainders of the sequences are com-
prised of sandy mollusc limestones. Sequence O4
appears to extend out of the basin to the north into
section 14C and 15 (Fig. 11) based on 87/86Sr ages at
14C (Denison et al., 1993). On the Onslow Block,
although only one sequence appears to be developed,
it is unclear if it is Sequence O4 or O5. The top of
Supersequence 5 is placed above lithified sandy mol-
lusc limestones and beneath unlithified Miocene and
younger sandy beds.
6.4.6. Age of Oligocene sequences
Ages shown in Fig. 11 include 87/86Sr dates (Deni-
son et al., 1993; Harris et al., 2000). Harris et al. (2000)
gave a lower Oligocene (Rupelian) age to the Lower
River Bend units (Sequences O1–O3 of this paper; Fig.
11). The Upper River Bend was considered upper
Oligocene (Chattian) to early Miocene (Aquitanian)
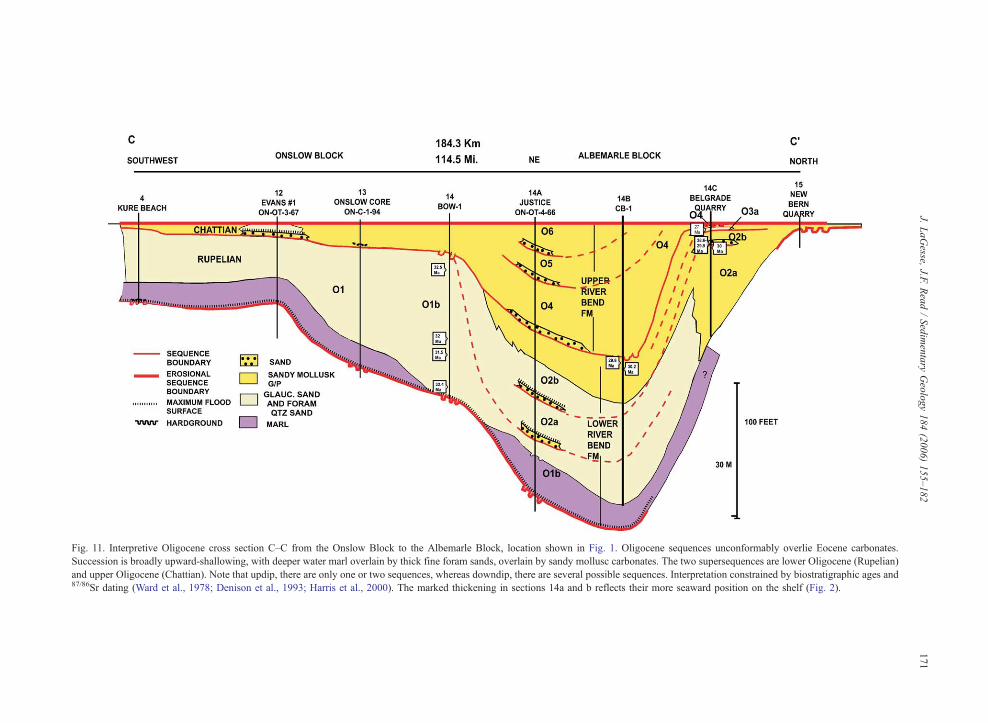
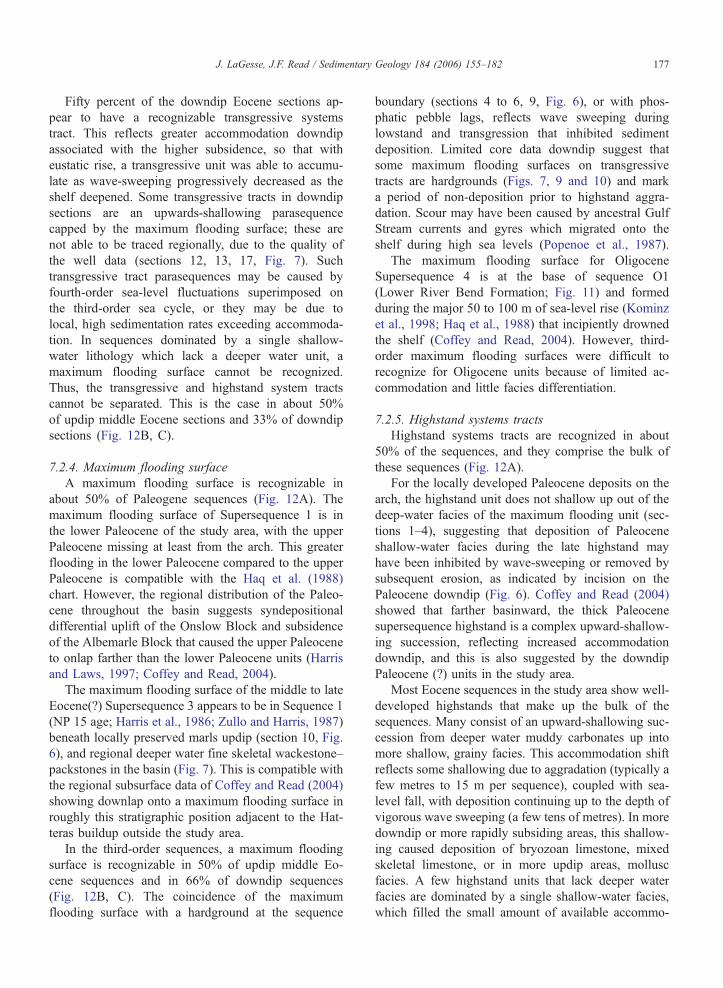
Fig. 11. Interpretive Oligocene cross section C–C from the Onslow Block to the Albemarle Block, location shown in Fig. 1. Oligocene sequences unconformably overlie Eocene carbonates.
Succession is broadly upward-shallowing, with deeper water marl overlain by thick fine foram sands, overlain by sandy mollusc carbonates. The two supersequences are lower Oligocene (Rupelian)
and upper Oligocene (Chattian). Note that updip, there are only one or two sequences, whereas downdip, there are several possible sequences. Interpretation constrained by biostratigraphic ages and87/86Sr dating (Ward et al., 1978; Denison et al., 1993; Harris et al., 2000). The marked thickening in sections 14a and b reflects their more seaward position on the shelf (Fig. 2).
J.LaGesse,
J.F.Read/Sedimentary
Geology184(2006)155–182
171
J. LaGesse, J.F. Read / Sedimentary Geology 184 (2006) 155–182172
(Harris et al., 2000); thus, Sequences O4–O6 of this
paper are late Oligocene.
7. Discussion and interpretation
7.1. Controls
7.1.1. Subsidence rates
Tectonics were extremely important in influencing
thickness, facies and intensity of wave- and current-
scour because of their effect on shelf topography. Sub-
sidence rates for onshore Paleogene units average 1.4
cm/ky (Coffey and Read, 2002), but in the study area,
probably were below 0.5 cm/ky based on preserved
thicknesses. Subsidence rates elsewhere along the east
coast, especially in more offshore areas, were higher
(up to 4 cm/ky) (Steckler and Watts, 1978). Abrupt
changes in sediment thickness in onshore sections
(e.g., Fig. 6) is due to numerous faults evident on
seismic data with localized thickenings, facies changes
and fining into small graben-like depressions (Baum,
1977; McLaurin and Harris, 2001). Areas of low sub-
sidence rates generally were sites of shallow-water
sedimentation and local preservation of thin deeper
water units, while widespread deeper water units were
only preserved in more rapidly subsiding areas. These
tectonically induced lows acted as sediment traps
allowing finer grained facies to accumulate in region-
ally high-energy settings. The Cape Fear Arch resisted
subsidence and thus was the site of deposition of thin
successions. Numerous hardgrounds here attest to
boundary current sweeping as the ancestral Gulf Stream
traversed the arch. Thus, tectonics played an important
role in controlling thickness and facies developed.
7.1.2. Eustasy
Eustatic sea-level changes have been cited as the
major influence on the timing of supersequence and
sequence development in the Paleogene of North Car-
olina and New Jersey (Harris et al., 1993; Harris and
Laws, 1997; Miller et al., 1998). This is indicated by
the correspondence of unconformities and maximum
flooding surfaces in New Jersey and along the Atlantic
margin to the Haq et al. (1988) sea-level record
(Browning et al., 1997a; Miller et al., 1997). Although
we lack sufficient age control to correlate individual
third-order sequences in North Carolina with eustatic
events elsewhere, there is a reasonable correspondence
between most of the sequences of this study and those
defined by Miller et al. (1998) from New Jersey.
Paleocene sea-level rise of at least 100 m, evidenced
by near-shore Upper Cretaceous facies overlain by
deep-water marls, is associated with the transition into
global greenhouse climate following Late Cretaceous
cooling (Coffey and Read, 2004). Delta18O values of
Foraminifers of New Jersey indicate that greenhouse
conditions continued into the early Eocene (Miller et
al., 1987), but show a cooling trend in the middle to late
Eocene into a period of transitional, moderate ampli-
tude eustasy or bdoubthouseQ (Miller et al., 1991) be-
fore passing into the icehouse of the Oligocene. In the
study area, widespread erosion at the Eocene–Oligo-
cene boundary and the transition from Eocene subtrop-
ical bryozoan limestone facies to siliciclastic-dominated
facies deposited in the Oligocene icehouse (Figs. 6, 7
and 11) reflect significant climate cooling and subse-
quent progressively lower relative sea levels (Coffey
and Read, 2004).
7.1.3. Wave climate and ancestral Gulf Stream
The open-shelf environment of the Paleogene Atlan-
tic margin was subject to intense wave sweeping gen-
erated by storms in the broaring forties,Q as it was
positioned north of 308 latitude (Scotese, 1997); swellsalso would have been generated from tropical storms to
the southwest. Swell waves created a zone of abrasion
that caused continuous scouring of the shallow shelf, as
on the present southwestern Australian shelf (Collins,
1988; James et al., 1997; Osleger, 1991). However,
because of the less energetic setting of the Paleogene
Atlantic margin, the inner, middle and outer neritic sub-
environments of the New Jersey to North Carolina
margin (Jones, 1983; Browning et al., 1997a; Pekar
and Kominz, 2001; Pekar et al., 2003; Tables 1a and
1b) likely occurred at shallower depths than their mod-
ern southern Australian counterparts (Collins, 1988;
James et al., 1997, 1999, 2001). This was because the
Paleogene Atlantic Ocean was shallow to the north, and
not as wide as now, limiting the distances that the swell
waves traveled prior to reaching the shelf and subject to
less intense wind and storm systems (Scotese, 1991;
Coffey and Read, 2004). The Albemarle Embayment
also would have been somewhat protected from swell
and storm waves by the bordering Norfolk and Cape
Fear arches, and at least for the Eocene, by the offshore
Hatteras buildup (Coffey and Read, 2004).
The ancestral Gulf Stream current began its circu-
lation across the Blake Plateau at least by the late
Paleocene and the early Eocene, migrating onto the
shelf during highstands of sea level, in depths as
shallow as 200 m (Pinet and Popenoe, 1985, Popenoe
et al., 1987) and perhaps even shallower over the
arches. Gulf Stream erosion produced gullies, pits
and bscour bandsQ in Paleogene strata across the
J. LaGesse, J.F. Read / Sedimentary Geology 184 (2006) 155–182 173
Blake Plateau seaward of the study area (Pinet and
Popenoe, 1985; Popenoe et al., 1987), and possibly
hardground surfaces in outer neritic facies in the study
area. The southwestern coast of Australia experiences
similar effects from the warm Leeuwin Current (James
et al., 1994, 1999). The Gulf Stream within the study
area formed hardgrounds in outer neritic facies (Figs.
9 and 10), and ripped-up, reworked limestone clasts
within middle to outer neritic facies (Fig. 8). This was
especially pronounced where the current passed across
the shallow Cape Fear Arch to form local phosphatic
lag gravels.
7.1.4. Paleocene supersequence 1 controls
Upper Cretaceous sediments probably were exposed
on the arch, perhaps when the latest Cretaceous glaci-
ation (Barrera et al., 1987) lowered sea level. Super-
sequence 1 deposition was initiated when relative sea
level rose over 100 m to flood the shelf in the latest
Maastrichtian (Haq et al., 1988; Frakes et al., 1994).
This caused deposition under a wet–temperate to sub-
tropical climate (Nystrom et al., 1991) of an upward-
deepening succession of lower Paleocene deeper water
clastics grading basinward into carbonates in the down-
dip portion of the arch.
Possible differential uplift of the Onslow Block
along with the smaller late Paleocene sea-level rise
(Haq et al., 1988) prevented accumulation (or preser-
vation) of a subsequent late Paleocene succession in the
study area and may have allowed erosion of any earlier
deposited, updip shallow-water lower Paleocene units
from the region.
The area also appears to have remained above sea
level (or above wave-abrasion depth) throughout the
early Eocene, in part due to regional uplift, during
which Supersequence 2 accumulated in the basin down-
dip from the study area (Harris and Laws, 1997; Coffey
and Read, 2004).
7.1.5. Eocene supersequence 3 controls
Widespread deposition of bryozoan carbonates of
Supersequence 3 was initiated by major sea-level rise
in the middle Eocene, during NP 14 and 15 time, aided
by subsidence of the Onslow and Albemarle Blocks that
shifted the updip depositional limit 175–200 km updip
of the earlier depositional edge (Harris and Laws, 1997).
At least five sea-level cycles in the middle to late Eocene
generated the sequences under warm, marginally sub-
tropical conditions (Harris et al., 1993; Coffey and
Read, 2004). Estimates of sea-level rises (uncorrected
for loading) were made using the minimum water depths
of the shallow-water facies, subtracted from those of the
overlying deeper water facies. These mainly ranged
from 35 to 55 m, but could be as little as 20 m to as
much as 80 m. Maximum rises were in Sequences 3a
and b. Crude estimates of sea-level falls involved in
sequence development (not corrected for unloading)
were made using minimum depths of facies in up-
ward-shallowing sequences, minus shallowing due to
sediment-upbuilding. Estimates of fall magnitudes are
15–40 m, with perhaps up to 70 m of fall associated with
the basal boundary of Sequence 3a. These estimates of
Eocene sea-level changes are not compatible with
greenhouse, ice-free conditions, but suggest limited ice
sheets compatible with the bdoubthouseQ of Miller et al.
(1991) or btransitional eustasyQ of Read (1995), betweengreenhouse and ice-house.
Low subsidence rates over the arch and corres-
ponding low accommodation generated thin sequences
and made these areas susceptible to erosion by marine
currents, leaving Sequences E0 and E1 as erosional
remnants or phosphate lags. The sequences double or
triple in thickness downdip in the study area into the
more rapidly subsiding basin. Late middle Eocene cool-
ing, aridification, and relatively prolonged sea-level fall
(Miller et al., 1987) caused regional sand influx at the
base of Sequence 3. Subsequent flooding possibly as-
sociated with late middle Eocene warming (McGowran
et al., 1997) was followed by a latest middle Eocene
sea-level fall of 20 m (Miller et al., 1998) to 100 m
(Haq et al., 1988), and deposition of the basal sand of
Sequence 3b. If Sequence 3b is late Eocene age (Harris
et al., 1993), and the 3a–3b boundary is indeed a
sequence boundary and not a maximum flooding sur-
face (Zullo and Harris, 1987), then it marks the end–
middle Eocene sea level fall (TA 3.5 of Haq et al.,
1988). Globally, late Eocene eustatic sea-level rises did
not reach as far onto the shelves as in the middle
Eocene (Harris and Laws, 1997).
7.1.6. Oligocene supersequences 4 and 5 controls
The basal boundary of Supersequence 4 formed
during major global cooling in the late Eocene, culmi-
nating in onset of Oligocene icehouse and sea-level
lowstand (Miller et al., 1997; Coffey and Read,
2004). The cooler climate, increased aridity and overall
lower Oligocene sea levels promoted siliciclastic depo-
sition in the area. Sea-level lowstand was followed by
at least 50 m (Miller et al., 1998) to 100 m sea level rise
(Haq et al., 1988) that drowned the shelf, depositing
widespread basal Oligocene marls; these values are
compatible with the facies succession. Accommodation
during drowning was aided by space created by con-
tinued subsidence during prior emergence, coupled
J. LaGesse, J.F. Read / Sedimentary Geology 184 (2006) 155–182174
with subsequent water loading. Oligocene Sequence 1
appears to have filled in much of the accommodation
on the arch with fine foram sands. The remaining
accommodation in the basin was filled by three or
more early Oligocene sequences that ultimately shal-
lowed into sandy shell beds. Sea level changes were in
excess of 50 m (Kominz and Pekar, 2001). However,
low accommodation in the study area allowed only
shallow flooding of the shelf following deposition of
Sequence O1. Sequences O2 and 03 did not extend
onto the arch (Fig. 11), according to the 87/86Sr age
constraints of Harris et al. (2000), due to low accom-
modation here.
Middle Oligocene global cooling and sea-level fall is
marked by a regional hiatus on the arch between lower
Oligocene (Rupelian) and upper Oligocene (Chattian)
units, around 28.5 Ma (Berggren et al., 1995). The
subsequent sea level rises of 50 m or so (Kominz and
Pekar, 2001) flooded the shelf, but there was little
accommodation remaining over the arch where a single,
thin upper Oligocene sequence dominated by mollus-
can limestones was deposited. Downdip, however,
greater subsidence allowed three or more shallow-
water shell bed-dominated sequences to accumulate,
possibly in response to late Oligocene glacio-eustasy
(Kominz and Pekar, 2001). Although these late Oligo-
cene sea-level changes may have been 50–60 m
(Kominz and Pekar, 2001), the slowly subsiding shelf
in the study area remained shallow and probably was
never flooded to more than a few tens of metres,
evidenced by the development of only inner neritic
sand and molluscan limestones (Fig. 11).
7.2. Systems tract development
7.2.1. Sequence boundaries and hardgrounds
In the study area, two-thirds of sequences have
recognizable sequence boundaries, and of these, almost
half are hardgrounds (Fig. 12A). In an individual sec-
tion, it is difficult to separate sequence bounding hard-
grounds from hardgrounds beneath maximum flooding
surfaces. For example, the sequence E3a–3b boundary
was interpreted as a maximum flooding surface (Zullo
and Harris, 1987) or a sequence boundary (Baum,
1986, and this paper). However, regional tracing of
such surfaces allows them to be differentiated. The
sequence boundaries will, at least locally, overlie up-
ward-shallowing highstand deposits and locally have
closely associated sandy facies indicating a major
basinward shift in facies.
The coincidence of sequence boundary and hard-
ground apparently is related to the wave-swept charac-
ter of the shelf surface during low sea level (Fig. 13).
During lowered sea-level phases, unfilled accommoda-
tion from the previous highstand kept the inner shelf
within the zone of abrasion in a few tens of metres of
water (Fig. 13). Continuous wave-sweeping and low
sedimentation rates generated the sequence boundary
and hardgrounds (Collins, 1988; Tucker and Wright,
1990, p. 329; Boreen et al., 1993; Riggs et al., 1998).
As waves abraded the shelf, the sediment stayed near
the sediment-water interface beneath thin, patchy, mi-
grating sediment units, and constant wave and current
agitation provided a continuous source of CaCO3 that
promoted micritic cementation (Tucker and Wright,
1990, p. 325). This formed the indurated, bored and
abraded hardgrounds in core sections. Their phosphatic
and glauconitic composition reflects the low sedimen-
tation rates associated with hardground formation
(McRae, 1972; Moran, 1989).
There is little evidence for exposure of the shelf
during Paleogene sequence boundary development in
the study area, except for the Cretaceous–Tertiary con-
tact, below which there is a negative shift in y13C and
y18O isotope values in the heavily cemented molluscan
limestone (Baum and Vail, 1988). Although Moran
(1989) suggested that hardground formation required
exposure, this is difficult to prove given the relative
scarcity of undoubted subaerial fabrics beneath se-
quence boundaries, and the subsequent marine diage-
netic overprint.
In middle Eocene updip sections, most sequences
have identifiable sequence boundaries that are hard-
grounds (Fig. 12B). By comparison, just over half of
downdip sequences have recognizable sequence bound-
aries and only a few of these are hardgrounds (Fig.
12C). The higher number of recognizable sequence
boundaries and coincident hardgrounds in updip sec-
tions indicate that the further landward sections expe-
rienced intense wave sweeping during lowstand or
transgression, preventing deposition of significant
transgressive deposits. The low number of coincident
sequence boundaries and hardgrounds in downdip sec-
tions may be due to underestimation because of poor
resolution of well cuttings data (the hardgrounds being
best recognized in quarry or core sections).
Although sequences are difficult to trace in the
Oligocene, two-thirds have recognizable sequence
boundaries, and about one-third are also hardgrounds,
the remainder underlie quartz sands (Fig. 12E). As in
the middle Eocene, the number of sequence boundaries
developed as hardgrounds in the Oligocene may have
been underestimated in sections with only well cuttings
data.
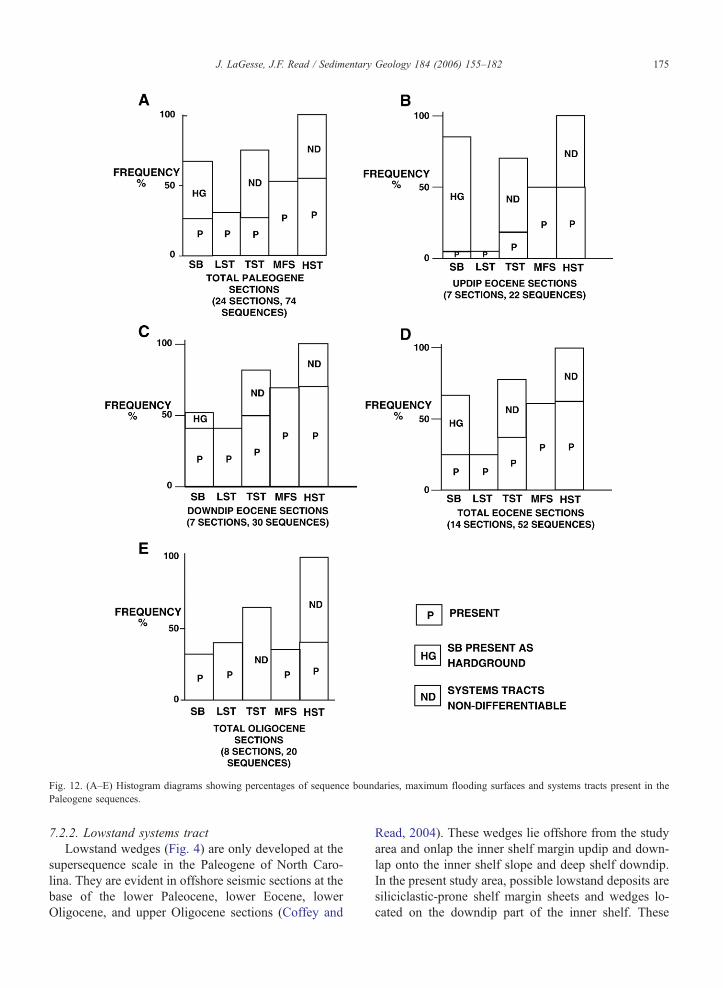
Fig. 12. (A–E) Histogram diagrams showing percentages of sequence boundaries, maximum flooding surfaces and systems tracts present in the
Paleogene sequences.
J. LaGesse, J.F. Read / Sedimentary Geology 184 (2006) 155–182 175
7.2.2. Lowstand systems tract
Lowstand wedges (Fig. 4) are only developed at the
supersequence scale in the Paleogene of North Caro-
lina. They are evident in offshore seismic sections at the
base of the lower Paleocene, lower Eocene, lower
Oligocene, and upper Oligocene sections (Coffey and
Read, 2004). These wedges lie offshore from the study
area and onlap the inner shelf margin updip and down-
lap onto the inner shelf slope and deep shelf downdip.
In the present study area, possible lowstand deposits are
siliciclastic-prone shelf margin sheets and wedges lo-
cated on the downdip part of the inner shelf. These
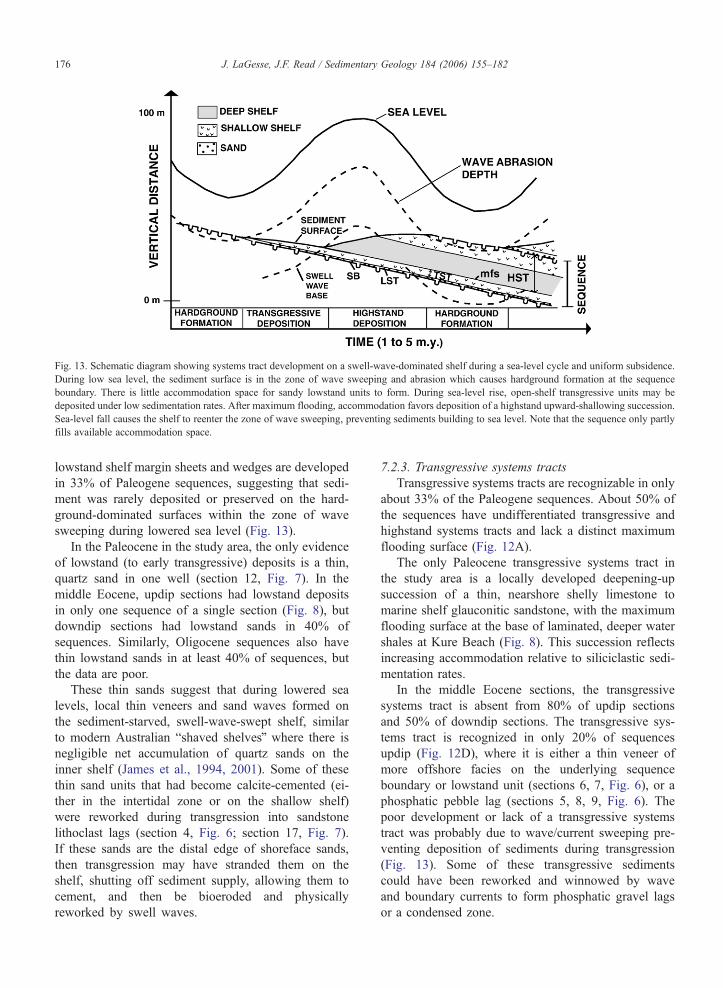
Fig. 13. Schematic diagram showing systems tract development on a swell-wave-dominated shelf during a sea-level cycle and uniform subsidence.
During low sea level, the sediment surface is in the zone of wave sweeping and abrasion which causes hardground formation at the sequence
boundary. There is little accommodation space for sandy lowstand units to form. During sea-level rise, open-shelf transgressive units may be
deposited under low sedimentation rates. After maximum flooding, accommodation favors deposition of a highstand upward-shallowing succession.
Sea-level fall causes the shelf to reenter the zone of wave sweeping, preventing sediments building to sea level. Note that the sequence only partly
fills available accommodation space.
J. LaGesse, J.F. Read / Sedimentary Geology 184 (2006) 155–182176
lowstand shelf margin sheets and wedges are developed
in 33% of Paleogene sequences, suggesting that sedi-
ment was rarely deposited or preserved on the hard-
ground-dominated surfaces within the zone of wave
sweeping during lowered sea level (Fig. 13).
In the Paleocene in the study area, the only evidence
of lowstand (to early transgressive) deposits is a thin,
quartz sand in one well (section 12, Fig. 7). In the
middle Eocene, updip sections had lowstand deposits
in only one sequence of a single section (Fig. 8), but
downdip sections had lowstand sands in 40% of
sequences. Similarly, Oligocene sequences also have
thin lowstand sands in at least 40% of sequences, but
the data are poor.
These thin sands suggest that during lowered sea
levels, local thin veneers and sand waves formed on
the sediment-starved, swell-wave-swept shelf, similar
to modern Australian bshaved shelvesQ where there is
negligible net accumulation of quartz sands on the
inner shelf (James et al., 1994, 2001). Some of these
thin sand units that had become calcite-cemented (ei-
ther in the intertidal zone or on the shallow shelf)
were reworked during transgression into sandstone
lithoclast lags (section 4, Fig. 6; section 17, Fig. 7).
If these sands are the distal edge of shoreface sands,
then transgression may have stranded them on the
shelf, shutting off sediment supply, allowing them to
cement, and then be bioeroded and physically
reworked by swell waves.
7.2.3. Transgressive systems tracts
Transgressive systems tracts are recognizable in only
about 33% of the Paleogene sequences. About 50% of
the sequences have undifferentiated transgressive and
highstand systems tracts and lack a distinct maximum
flooding surface (Fig. 12A).
The only Paleocene transgressive systems tract in
the study area is a locally developed deepening-up
succession of a thin, nearshore shelly limestone to
marine shelf glauconitic sandstone, with the maximum
flooding surface at the base of laminated, deeper water
shales at Kure Beach (Fig. 8). This succession reflects
increasing accommodation relative to siliciclastic sedi-
mentation rates.
In the middle Eocene sections, the transgressive
systems tract is absent from 80% of updip sections
and 50% of downdip sections. The transgressive sys-
tems tract is recognized in only 20% of sequences
updip (Fig. 12D), where it is either a thin veneer of
more offshore facies on the underlying sequence
boundary or lowstand unit (sections 6, 7, Fig. 6), or a
phosphatic pebble lag (sections 5, 8, 9, Fig. 6). The
poor development or lack of a transgressive systems
tract was probably due to wave/current sweeping pre-
venting deposition of sediments during transgression
(Fig. 13). Some of these transgressive sediments
could have been reworked and winnowed by wave
and boundary currents to form phosphatic gravel lags
or a condensed zone.
J. LaGesse, J.F. Read / Sedimentary Geology 184 (2006) 155–182 177
Fifty percent of the downdip Eocene sections ap-
pear to have a recognizable transgressive systems
tract. This reflects greater accommodation downdip
associated with the higher subsidence, so that with
eustatic rise, a transgressive unit was able to accumu-
late as wave-sweeping progressively decreased as the
shelf deepened. Some transgressive tracts in downdip
sections are an upwards-shallowing parasequence
capped by the maximum flooding surface; these are
not able to be traced regionally, due to the quality of
the well data (sections 12, 13, 17, Fig. 7). Such
transgressive tract parasequences may be caused by
fourth-order sea-level fluctuations superimposed on
the third-order sea cycle, or they may be due to
local, high sedimentation rates exceeding accommoda-
tion. In sequences dominated by a single shallow-
water lithology which lack a deeper water unit, a
maximum flooding surface cannot be recognized.
Thus, the transgressive and highstand system tracts
cannot be separated. This is the case in about 50%
of updip middle Eocene sections and 33% of downdip
sections (Fig. 12B, C).
7.2.4. Maximum flooding surface
A maximum flooding surface is recognizable in
about 50% of Paleogene sequences (Fig. 12A). The
maximum flooding surface of Supersequence 1 is in
the lower Paleocene of the study area, with the upper
Paleocene missing at least from the arch. This greater
flooding in the lower Paleocene compared to the upper
Paleocene is compatible with the Haq et al. (1988)
chart. However, the regional distribution of the Paleo-
cene throughout the basin suggests syndepositional
differential uplift of the Onslow Block and subsidence
of the Albemarle Block that caused the upper Paleocene
to onlap farther than the lower Paleocene units (Harris
and Laws, 1997; Coffey and Read, 2004).
The maximum flooding surface of the middle to late
Eocene(?) Supersequence 3 appears to be in Sequence 1
(NP 15 age; Harris et al., 1986; Zullo and Harris, 1987)
beneath locally preserved marls updip (section 10, Fig.
6), and regional deeper water fine skeletal wackestone–
packstones in the basin (Fig. 7). This is compatible with
the regional subsurface data of Coffey and Read (2004)
showing downlap onto a maximum flooding surface in
roughly this stratigraphic position adjacent to the Hat-
teras buildup outside the study area.
In the third-order sequences, a maximum flooding
surface is recognizable in 50% of updip middle Eo-
cene sequences and in 66% of downdip sequences
(Fig. 12B, C). The coincidence of the maximum
flooding surface with a hardground at the sequence
boundary (sections 4 to 6, 9, Fig. 6), or with phos-
phatic pebble lags, reflects wave sweeping during
lowstand and transgression that inhibited sediment
deposition. Limited core data downdip suggest that
some maximum flooding surfaces on transgressive
tracts are hardgrounds (Figs. 7, 9 and 10) and mark
a period of non-deposition prior to highstand aggra-
dation. Scour may have been caused by ancestral Gulf
Stream currents and gyres which migrated onto the
shelf during high sea levels (Popenoe et al., 1987).
The maximum flooding surface for Oligocene
Supersequence 4 is at the base of sequence O1
(Lower River Bend Formation; Fig. 11) and formed
during the major 50 to 100 m of sea-level rise (Kominz
et al., 1998; Haq et al., 1988) that incipiently drowned
the shelf (Coffey and Read, 2004). However, third-
order maximum flooding surfaces were difficult to
recognize for Oligocene units because of limited ac-
commodation and little facies differentiation.
7.2.5. Highstand systems tracts
Highstand systems tracts are recognized in about
50% of the sequences, and they comprise the bulk of
these sequences (Fig. 12A).
For the locally developed Paleocene deposits on the
arch, the highstand unit does not shallow up out of the
deep-water facies of the maximum flooding unit (sec-
tions 1–4), suggesting that deposition of Paleocene
shallow-water facies during the late highstand may
have been inhibited by wave-sweeping or removed by
subsequent erosion, as indicated by incision on the
Paleocene downdip (Fig. 6). Coffey and Read (2004)
showed that farther basinward, the thick Paleocene
supersequence highstand is a complex upward-shallow-
ing succession, reflecting increased accommodation
downdip, and this is also suggested by the downdip
Paleocene (?) units in the study area.
Most Eocene sequences in the study area show well-
developed highstands that make up the bulk of the
sequences. Many consist of an upward-shallowing suc-
cession from deeper water muddy carbonates up into
more shallow, grainy facies. This accommodation shift
reflects some shallowing due to aggradation (typically a
few metres to 15 m per sequence), coupled with sea-
level fall, with deposition continuing up to the depth of
vigorous wave sweeping (a few tens of metres). In more
downdip or more rapidly subsiding areas, this shallow-
ing caused deposition of bryozoan limestone, mixed
skeletal limestone, or in more updip areas, mollusc
facies. A few highstand units that lack deeper water
facies are dominated by a single shallow-water facies,
which filled the small amount of available accommo-
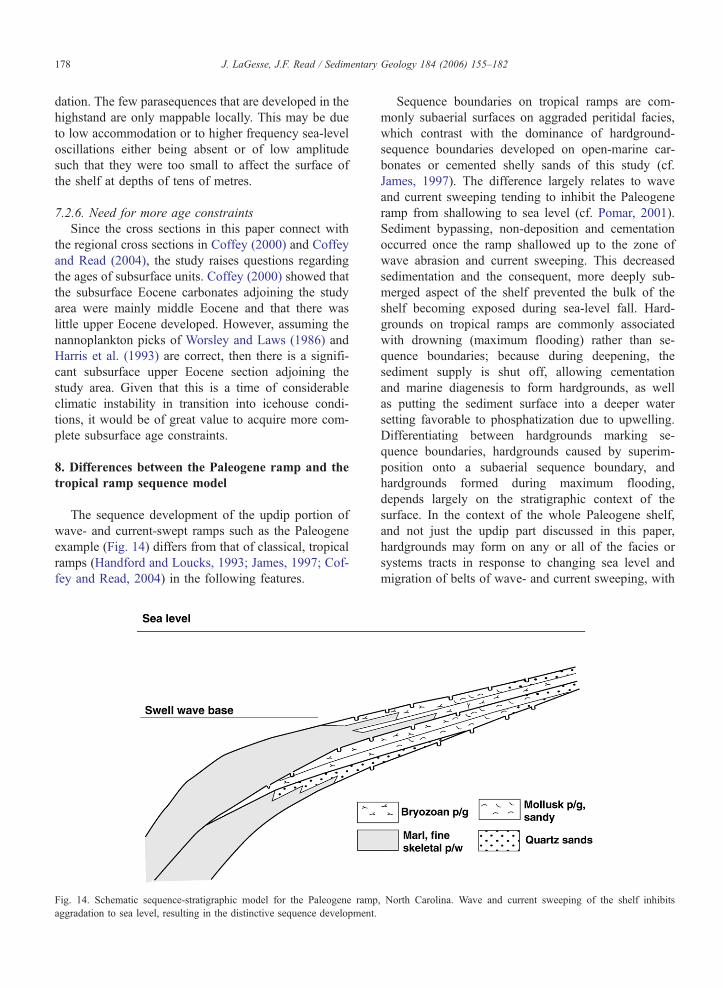
J. LaGesse, J.F. Read / Sedimentary Geology 184 (2006) 155–182178
dation. The few parasequences that are developed in the
highstand are only mappable locally. This may be due
to low accommodation or to higher frequency sea-level
oscillations either being absent or of low amplitude
such that they were too small to affect the surface of
the shelf at depths of tens of metres.
7.2.6. Need for more age constraints
Since the cross sections in this paper connect with
the regional cross sections in Coffey (2000) and Coffey
and Read (2004), the study raises questions regarding
the ages of subsurface units. Coffey (2000) showed that
the subsurface Eocene carbonates adjoining the study
area were mainly middle Eocene and that there was
little upper Eocene developed. However, assuming the
nannoplankton picks of Worsley and Laws (1986) and
Harris et al. (1993) are correct, then there is a signifi-
cant subsurface upper Eocene section adjoining the
study area. Given that this is a time of considerable
climatic instability in transition into icehouse condi-
tions, it would be of great value to acquire more com-
plete subsurface age constraints.
8. Differences between the Paleogene ramp and the
tropical ramp sequence model
The sequence development of the updip portion of
wave- and current-swept ramps such as the Paleogene
example (Fig. 14) differs from that of classical, tropical
ramps (Handford and Loucks, 1993; James, 1997; Cof-
fey and Read, 2004) in the following features.
Fig. 14. Schematic sequence-stratigraphic model for the Paleogene ramp
aggradation to sea level, resulting in the distinctive sequence development.
Sequence boundaries on tropical ramps are com-
monly subaerial surfaces on aggraded peritidal facies,
which contrast with the dominance of hardground-
sequence boundaries developed on open-marine car-
bonates or cemented shelly sands of this study (cf.
James, 1997). The difference largely relates to wave
and current sweeping tending to inhibit the Paleogene
ramp from shallowing to sea level (cf. Pomar, 2001).
Sediment bypassing, non-deposition and cementation
occurred once the ramp shallowed up to the zone of
wave abrasion and current sweeping. This decreased
sedimentation and the consequent, more deeply sub-
merged aspect of the shelf prevented the bulk of the
shelf becoming exposed during sea-level fall. Hard-
grounds on tropical ramps are commonly associated
with drowning (maximum flooding) rather than se-
quence boundaries; because during deepening, the
sediment supply is shut off, allowing cementation
and marine diagenesis to form hardgrounds, as well
as putting the sediment surface into a deeper water
setting favorable to phosphatization due to upwelling.
Differentiating between hardgrounds marking se-
quence boundaries, hardgrounds caused by superim-
position onto a subaerial sequence boundary, and
hardgrounds formed during maximum flooding,
depends largely on the stratigraphic context of the
surface. In the context of the whole Paleogene shelf,
and not just the updip part discussed in this paper,
hardgrounds may form on any or all of the facies or
systems tracts in response to changing sea level and
migration of belts of wave- and current sweeping, with
, North Carolina. Wave and current sweeping of the shelf inhibits
J. LaGesse, J.F. Read / Sedimentary Geology 184 (2006) 155–182 179
preferential preservation of the indurated hardgrounds
(Coffey and Read, 2004).
Transgressive systems tracts are commonly present
on updip parts of tropical ramps. They are much less
common on the Paleogene ramp, where the intense
wave and current sweeping in near-shore areas or on
arches, tended to inhibit deposition until sufficient ac-
commodation had developed during the highstand (cf.
James, 1997).
Grainstones on most tropical ramps are commonly
restricted to a relatively shallow depth range, typically
less than 15 m within fair-weather wave base. Much of
this material is produced by phototrophic organisms
within the well lighted waters. In contrast, grainy
facies may extend over wide areas to water depths of
many tens of metres on the Paleogene ramp. This is
because depth of swell wave reworking generates
grainy sheets over wide areas to many tens of meters
depth, and because many of the grain-producing
organisms belong to heterozoan assemblages of
bryozoans and mollusks that do not require light (cf.
Collins, 1988; James, 1997). Such heterozoan assem-
blages also are not capable of generating shelf edge
reefs, thus leaving the ramp open to wave and current
sweeping.
Few parasequences are developed within sequences
on the Paleogene ramp. In contrast, on tropical ramps
that formed under greenhouse or transitional conditions,
parasequences are more numerous. Again, this likely
reflects the dominance of sediment bypassing due to
wave and current sweeping, tending to inhibit rapid
upward-shallowing to sea level during high-frequency
sea-level changes. Thus, this tends to keep the sediment
surface well below the zone of active sea-level fluctua-
tions, decreasing the likelihood that a small change in
sea level will be preserved as an upward-shallowing
parasequence in the shelf stratigraphy.
9. Conclusions
The Paleogene of southern North Carolina was se-
lected for the study of sequence development of open-
shelf carbonates in a low-accommodation, swell-wave
setting using cores that were then tied into previously
studied quarries (Ward et al., 1978; Harris et al., 1986)
and exploratory wells from the regional study of Coffey
(2000) and Coffey and Read (2004).
A positive arch to the south (Cape Fear Arch) and
a slowly subsiding basinal block to the north (Albe-
marle Block) influenced relative sea-level changes and
accommodation space on the shelf. Local tectonic
depressions allowed fine carbonates to accumulate in
a region of relatively high-energy facies. The Cape
Fear Arch also interacted with the Gulf Stream, result-
ing in phosphatic erosional lags on some sequence
boundaries.
In the study area, Paleocene sequences were domi-
nated by thin, sandy molluscan facies, glauconitic
sands, and offshore silt–shales and marls. Middle Eo-
cene sequences were characterized by molluscan lime-
stone, bryozoan–echinoid grainstone–packstone, and
deep-water fine skeletal wackestone–packstone and
marl. Middle Eocene sequences generally were better
developed downdip than along the updip Cape Fear
Arch. Early Oligocene sequences are dominated by
localized sand units, deep-water foram sands and
marls. Late Oligocene sequences are typically mollus-
can limestones with local sandy units.
Rather than subaerial surfaces, most sequence
boundaries in the Paleogene study area are marine
hardgrounds that formed as sediment-starved wave-
abrasion surfaces during lowered sea levels. Lowstand
sands are thin and patchily developed on the shelf.
Transgressive units also are commonly thin, upward-
deepening and variably developed and are even con-
densed into phosphate lags, due to sediment-starvation,
wave-sweeping, sediment-bypassing, and backstepping
of sediment sources. Rare transgressive units are a
single upward-shallowing parasequence overlain by a
maximum flooding surface. Highstand units make up
the bulk of sequences and consist of a single shallow-
ing-up unit that generally lacks parasequences. Sea
level rise and flooding of the shelf formed relatively
regional, deeper water carbonates above the maximum
flooding surface in areas of regional subsidence. How-
ever, on the arch, these deeper water units commonly
are discontinuous and confined to local areas (gra-
bens?) with higher subsidence. Highstand tracts shal-
lowed up to inner shelf depths, but there is little
evidence that coastal shoreface units ever filled the
remaining accommodation, due to low sedimentation
rates on the shelf, wave sweeping and sediment
bypassing.
The wave- and current-swept shelf setting and
Paleogene transitional global climate with its moder-
ate-amplitude eustasy generated distinctive sequences
in the study area. These are characterized by hard-
ground-dominated sequence boundaries, limited low-
stand and transgressive systems tract development
and dominance of highstands marked by unfilled
accommodation. These contrast markedly with many
tropical shelves with their multiple parasequences,
inboard peritidal cycles and well-developed subaerial
sequence boundaries.
J. LaGesse, J.F. Read / Sedimentary Geology 184 (2006) 155–182180
Acknowledgments
We thank Bill Hoffman, Kathleen Farrell and Laura
DeMoe of the North Carolina Geological Survey, and
Rob Weems, Laurel Bybell, Jean Self-Trail, and Lucy
Edwards of the U.S. Geological Survey for access to
the Kure Beach core, and Bill Harris and Buck Ward for
field discussions. Bill Harris, as well as heading the
North Carolina Earth Sciences Coalition, also provided
many helpful comments on the manuscript as did Brian
Coffey who also gave access to his data sets. Tim
Bralower provided information on ages. Support was
received from the North Carolina Graduate Student
Research Fund. We thank Ellen Mathena for editing
and word processing.
References
Barrera, E., Huber, B.T., Harwood, D.M., Webb, P.N., 1987. Antarctic
marine temperatures: late Campanian through Early Paleocene.
Paleoceanography 2, 21–48.
Baum, G.R., 1977. Stratigraphic framework of the Middle Eocene to
Lower Miocene formations of North Carolina. Ph.D. Thesis,
University of North Carolina–Chapel Hill.
Baum, G.R., 1986. Sequence stratigraphic concepts as applied
to the Eocene carbonates of the Carolinas. In: Textoris,
D.A. (Ed.), SEPM Guidebooks Southeastern U.S., Third Annual
Midyear Meeting, Raleigh, NC, Soc. Econ. Paleontol. Mineral.,
pp. 264–269.
Baum, G.R., Vail, P.R., 1988. Sequence stratigraphic concepts applied
to Paleogene outcrops, Gulf and Atlantic basins. In: Wilgus, C.K,
Hastings, B.S., Ross, C.A, Posamentier, H.W., Van Wagoner, J.K.,
Christopher, G.St.C. (Eds.), Sea-Level Change: An Integrated
Approach, SEPM Special Publication, vol. 42, pp. 309–329.
Baum, G.R., Harris, W.B., Zullo, V.A., 1978. Stratigraphic revision of
the exposed Middle Eocene to Lower Miocene formations of
North Carolina. Southeast. Geol. 1, 1–19.
Berggren, W.A., Kent, D.V., Swisher, I.I.I., Aubry, M.-P., 1995. A
revised Cenozoic geochronology and chronostratigraphy. In:
Berggren, W.A., Kent, D.V., Aubry, M.-P., Hardenbol, J. (Eds.),
Geochronology, Time Scales and Global Stratigraphic Correla-
tion, SEPM Special Publication, vol. 54, pp. 129–212.
Boreen, T., James, N.P., Wilson, C., Heggie, D., 1993. Surficial cool-
water carbonate sediments on the Otway continental margin,
southeastern Australia. Mar. Geol. 112, 35–56.
Browning, J.V., Miller, K.G., Van Fossen, M., Liu, C., Pak, D.K.,
Aubry, M.P., Bybell, L.M., 1997a. Lower to Middle Eocene
sequences of the New Jersey coastal plain and their significance
for global climate change. Proceedings of the ODP, Scientific
Results, pp. 229–242. 150x.
Browning, J.V., Miller, K.G., Bybell, L.M., 1997b. Upper Eocene
sequence stratigraphy and the Absecon Inlet formation, New
Jersey coastal plain. Proceedings of the ODP, Scientific Results,
pp. 243–266. 150x.
Coffey, B.P., 2000. High-resolution sequence stratigraphy of Paleo-
gene, non-tropical, mixed carbonate/siliciclastic shelf sediments,
North Carolina Coastal Plain, U.S.A. Ph.D. Thesis, Virginia Poly-
technic Institute and State University. 196 pp.
Coffey, B.P., Read, J.F., 2002. High resolution sequence stratigraphy
in Tertiary carbonate-rich sections by thin-sectioned well cuttings.
AAPG Bull. 86 (8), 1407–1415.
Coffey, B.P., Read, J.F., 2004. Mixed carbonate-siliciclastic se-
quence stratigraphy of a Paleogene non-tropical continental
shelf succession, southeastern U.S.A. Sediment. Geol. 166,
21–57.
Collins, L.B., 1988. Sediments and history of the Rottnest Shelf,
southwest Australia; swell-dominated, non-tropical carbonate
margin. Sediment. Geol. 60, 15–49.
Denison, R.E., Hetherrington, E.A., Biship, B.A., Dahl, D.A., Koep-
nick, R.B., 1993. The use of Strontium isotopes in stratigraphic
studies: an example from North Carolina. Southeast. Geol. 33,
53–69.
Dickson, J.A.D., 1965. A modified staining technique for carbonates
in thin section. Nature 205 (4971), 587.
Frakes, L.A., Probst, J-L., Ludwig, W., 1994. Latitudinal distribution
of paleotemperature on land and sea from early Cretaceous to
Middle Miocene. Comptes Rendus Academie Science Paris 318
(ser. II), 1209–1218.
Gardener, T.W., 1989. Neotectonism along the Atlantic passive con-
tinental margin: a review. Geomorphology 2, 71–97.
Gohn, G., 1988. Late Mesozoic and Early Cenozoic geology of the
Atlantic Coastal Plain: North Carolina to Florida. In: Sheridan,
R.E., Grow, J.A. (Eds.), The Geology of North America, vol. 102.
U.S. Geological Society of America, The Atlantic Continental
Margin, pp. 107–130.
Handford, C.R., Loucks, R.G., 1993. Carbonate depositional
sequences and systems tracts—responses of carbonate platforms
to relative sea-level changes. In: Loucks, R.G., Sarg, J.F. (Eds.),
Carbonate Sequence Stratigraphy, Recent Developments and
Applications, AAPG Memoir, vol. 57, pp. 3–41.
Harris, W.B., Baum, G.R., 1977. Foraminifera and Rb–Sr glauconite
ages of a paleocene beaufort formation outcrop in North Carolina.
Bull. Geol. Soc. Am. 88, 869–872.
Harris, W.B., Laws, R.A., 1994. Paleogene sediments on the axis of
the Cape Fear Arch, Long Bay, North Carolina. Southeast. Geol.
34 (4), 185–199.
Harris, W.B., Laws, R.A., 1997. Paleogene stratigraphy and sea-level
history of the North Carolina Coastal Plain: global coastal onlap
and tectonics. Sediment. Geol. 108, 91–120.
Harris, W.B., Mendrick, S., Fullagar, P.D., 2000. Correlation of
onshore–offshore Oligocene through lower Miocene strata using87Sr/86Sr isotopic ratios, north flank of Cape Fear Arch, North
Carolina, USA. Sediment. Geol. 134, 49–63.
Harris, W.B., Zullo, V.A., Otte, L.J., 1986. Eocene carbonate facies of
the North Carolina Coastal Plain. In: Textoris, D. (Ed.), SEPM
Field Guidebook, Southeastern United States, Third Annual Mid-
Year Meeting. Raleigh, N.C.
Harris, W.B., Zullo, V.A., Laws, R.A., 1993. Sequence stratigraphy of
the onshore Paleogene, southeastern Atlantic Coastal Plain, USA.
Spec. Publ. Int. Assoc. Sedimentol. 18, 537–561.
Haq, B.U., Hardenbol, J., Vail, P.R., 1988. Mesozoic and
Cenozoic chronostratigraphy and eustatic cycles. In: Wilgus,
C.K., Hastings, B.S., Kendall, C.G.S.C., Posamentier, H.W., Ross,
C.A., Van Wagoner, J.C. (Eds.), Sea-Level Changes: An Inte-
grated Approach, SEPM Special Publication, vol. 42. Tulsa,
OK, pp. 71–108.
James, N.P., 1997. The cool-water carbonate depositional realm. In:
James, N.P., Clarke, A.D., Scholle, P.A. (Eds.), Cool-Water
Carbonates. SEPM Special Publication, vol. 56. Tulsa, Oklahoma,
pp. 1–20.
J. LaGesse, J.F. Read / Sedimentary Geology 184 (2006) 155–182 181
James, N.P., Boreen, T.D., Bone, Y., Feary, D.A., 1994. Holocene
carbonate sedimentation on the west Eucla Shelf, Great Australian
Bight: a shaved shelf. Sediment. Geol. 90, 166–177.
James, N.P., Bone, Y., Hageman, S.J., Feary, D.A., Gostin, V.A.,
1997. Cool-water carbonate sedimentation during the terminal
Quaternary sea-level cycle: Lincoln Shelf, southern Australia,
Cool-Water Carbonates. SEPM Spec. Publ. 56, 53–75.
James, N.P., Collins, L.B., Bone, Y., Hallock, P., 1999. Subtropical
carbonates in a temperate realm: Modern sediments on the south-
west Australian shelf. J. Sediment. Res. 69 (6), 1297–1321.
James, N.P., Bone, Y., Collins, L.B., Kyser, T.K., 2001. Surficial
sediments of the Great Australian Bight: facies dynamics and
oceanography on a vast cool-water carbonate shelf. J. Sediment.
Res. 71 (4), 549–567.
Jones, G.D., 1983. Foraminiferal biostratigraphy and depositional
history of the Middle Eocene rocks of the coastal plain of
North Carolina, Department of Nat. Resources and Community
Development, Division of Land Resources. NCGS Spec. Publ. 8.
80 pp.
Kominz, M.A., Pekar, S.F., 2001. Oligocene eustasy from two-di-
mensional sequence-stratigraphic backstripping. Geol. Soc. Amer.
Bull. 113 (3), 291–304.
Kominz, M.A., Miller, K., Browning, J., 1998. Long-term and
short-term global Cenozoic sea-level estimates. Geology 26,
311–314.
McGowran, B., Li, Q., Moss, G., 1997. The Cenozoic neritic
record in southern Australia. In: James, N.P., Clarke, J.A.D.
(Eds.), Cool Water Carbonates, SEPM Special Publication, vol. 56,
pp. 185–204.
McLaurin, B.T., Harris, W.B., 2001. Paleocene faulting within the
Beaufort Group, Atlantic Coastal Plain, North Carolina. Geol.
Soc. Amer. Bull. 113 (5), 591–603.
McRae, S.G., 1972. Glauconite. Earth-Sci. Rev. 8, 397–440.
Miller, K.G., Fairbanks, R.G., Mountain, G.S., 1987. Tertiary oxygen
isotope synthesis, sea-level history, and continental margin ero-
sion. Paleoceanography 2, 1–19.
Miller, K.G., Wright, J.D., Fairbanks, R.G., 1991. Unlocking the
icehouse: Oligocene–Miocene oxygen isotopes, eustasy, and mar-
gin erosion. J. Geophys. Res. 96, 6829–6848.
Miller, K.G., Browning, J., Pekar, S., Sufarman, P., 1997. Ceno-
zoic evolution of the New Jersey Coastal Plain: changes in sea
level, tectonics, and sediment supply. In: Miller, K., Snyder, S.
(Eds.), Proceedings of the Ocean Drilling Program, Scientific
Results, pp. 361–372.
Miller, K.G., Mountain, G.S., Browning, J.V., Kominz, M., Sufarman,
P.J., Christie-Blick, N., Katz, M.E., Wright, J.D., 1998. Cenozoic
global sea level, sequences, and the New Jersey transect: Results
from coastal plain and continental slope drilling. Rev. Geophys.
36 (4), 569–601.
Moran, L.K., 1989. Petrography of unconformable surfaces and as-
sociated stratigraphic units of the Eocene Castle Hayne Forma-
tion, southeastern North Carolina Coastal Plain. Masters Thesis,
East Carolina University. 337 pp.
Nystrom, P., Willoughby, R., Price, L., 1991. Cretaceous and Tertiary
stratigraphy of the Upper Coastal Plain of South Carolina. In:
Horton, J., Wright, J., Zullo, V. (Eds.), Geology of the Carolinas.
University of Tennessee Press, Knoxville, pp. 221–240.
Osleger, D., 1991. Subtidal carbonate cycles; implications for allo-
cyclic vs. autocyclic controls. Geology 19 (9), 917–920.
Otte, L.J., 1981. Petrology of the exposed Eocene Castle Hayne
Limestone of North Carolina. Ph.D. Thesis, University of North
Carolina. 183 pp.
Pomar, L., 2001. Types of carbonate platforms: a genetic approach.
Basin Res. 13, 313–334.
Pekar, S.F., Kominz, M.A., 2001. Two-dimensional paleoslope mod-
eling: a new method for estimating water depths of benthic
foraminiferal biofacies and paleoshelf margins. J. Sediment.
Res. 71 (4), 608–620.
Pekar, S.F., Christie Blick, N., Miller, K.G., Kominz, M.A., 2003.
Quantitative constraints on the origin of stratigraphic architecture
at passive continental margins: oligocene sedimentation in New
Jersey, U.S.A. J. Sediment. Res. 3 (2), 227–245.
Pinet, P.R., Popenoe, P., 1985. A scenario of Mesozoic–Cenozoic
ocean circulation over the Blake Plateau and its environs. Geol.
Soc. Amer. Bull. 96, 618–626.
Popenoe, P., 1985. Cenozoic depositional and structural history of
the North Carolina margin from seismic–stratigraphic analyses.
In: Poag, C.W. (Ed.), Stratigraphy and Depositional History of
the U.S. Atlantic Margin. Van Nostrand Reinbold Co., New York,
pp. 125–187.
Popenoe, P., Henry, V., Idris, F., 1987. Gulf trough: the Atlantic
connection. Geology 15, 327–332.
Rao, C.P., Amini, Z.Z., 1995. Faunal relationship to grain-size, min-
eralogy and geochemistry in Recent temperate shelf carbonates,
western Tasmania, Australia. Carbon Evap. 10, 114–123.
Read, J.F., 1995. Overview of carbonate platform sequences,
cycle stratigraphy and reservoirs in greenhouse and icehouse
worlds. In: Read, J.F., Kerans, C., Weber, L.J., Sarg, J.F.,
Wright, F.M. (Eds.), Milankovitch Sea-Level Changes,
Cycles and Reservoirs on Carbonate Platforms in Green-
house and Ice-House Worlds, SEPM Short Course, vol. 35,
pp. 1–102.
Riggs, S.R., Ambrose Jr., W.G., Cook, J.W., Snyder, S.W., Snyder,
S.W., 1998. Sediment production on sediment-starved continental
margins; The interrelationship between hardbottoms, sedimento-
logical and benthic community processes, and storm dynamics.
J. Sediment. Res. 68 (1), 155–168.
Scotese, C.R., 1991. Jurassic and Cretaceous plate tectonic recon-
structions: Paleogeography and paleoceanography of Tethys.
Paleogeogr. Paleoclimatol. Paleoecol. 87 (1–4), 493–501.
Scotese, C.R., 1997. Continental Drift Flip Book, 7th Edition. Arling-
ton, Texas. 80 pp.
Snyder, S.W., 1982. Seismic stratigraphy within the Miocene Carolina
Phosphogenic Province: chronostratigraphy, paleotopographic
controls, sea-level cyclicity, Gulf Stream dynamics, and the result-
ing depositional framework. Masters Thesis, University of North
Carolina–Chapel Hill.
Snyder, S.W., Hoffman, C.W., Riggs, S.R., 1994. Seismic strati-
graphic framework of the inner continental shelf: mason Inlet to
New Inlet, North Carolina. North Carolina Geologic Survey
Bull., Dept. Environ. Health, Nat. Resources, vol. 96. Raleigh,
N.C. 59 pp.
Steckler, M.S., Watts, A.B., 1978. Subsidence of the Atlantic-
type continental margin off New York. Earth Planet. Sci. Lett.
41, 1–13.
Thayer, P., Textoris, D., 1972. Petrology and diagenesis of Tertiary
aquifer carbonates, North Carolina. Trans. Gulf Coast Assoc.
Geol. Soc. 22, 257–266.
Tucker, M.E., Wright, P.V., 1990. Carbonate Sedimentology. Black-
well Scientific Publications, Cambridge, MA. 482 pp.
Ward, L.W., Lawrence, D.R., Blackwelder, B.W., 1978. Stratigraphic
revision of the middle Eocene, Oligocene, and lower Miocene–
Atlantic coastal plain of North Carolina. U.S. Geol. Surv. Bull.
1457F, USGS 23 pp.
J. LaGesse, J.F. Read / Sedimentary Geology 184 (2006) 155–182182
Worsley, T.R., Laws, R.A., 1986. Calcareous nannofossil biostratig-
raphy of the Castle Hayne Limestone. In: Textoris, D.A. (Ed.),
SEPM Guidebooks Southeastern United States, Third Annual
Midyear Meeting. SEPM, pp. 289–297.
Zullo, V.A., Harris, W.B., 1987. Sequence stratigraphy, biostratigra-
phy and correlation of Eocene through Lower Miocene strata in
North Carolina. In: Ross, C.A., Haman, D. (Eds.), Timing and
Depositional History of Eustatic Sequences: Constraints on Seis-
mic Stratigraphy, Cushman Foundation for Foraminiferal Re-
search, pp. 197–214.