Comparative paleoecology of Paleogene and Neogene mammalian faunas: body-size structure
22
Abstract Tropl~ic structure and composition are examined in two impo; tmt biotic records, one the Paleogene of Wyanirlg and Mo7:ltana. and the other from the Neogene of Pakistan. The Paleogene sequence spans approximately 10 million years and encompasses four North American Land Manmal Ages (Torrejonian. TifTanian, Clarkt’orkian. and Wasatchian). The Neogene sequence spans approximately 17 my. and includes most of the Miocene and Pliocene with the best documented interval spanning from 16 to 7 Ma. Five’basic trophic categories (primary consun~ers: herbivores, frugivores, omnivores: secondary consumers: insectivores, carnivores) arc recognized for Paleogenc and Neogene n~amnals based on tooth morphology, body size. and mulogy with n~odcrn manmalian groups. The Paleogene nmmalim biota is characterized as one in M hicli both trophic structure and taxonoinic composition cliallge through the history of the record. The Neogcne munnialian biola maintains a relativfaiy consistenl trophic structure tllrougli 1rm1 o1‘ the record, ahhough taxonomic composition changes substantialty tl-rrougl~ time. Based OIJ comparisons 01’ lrophic structure l’rotn the P~ltx~ge~~~ and Ncogc’ne records with that of’ sekctcci modern tnarm~ali~tn fmnas. Paleogene habitats hctuated between closed, humid t‘orcsts and more opm drier woodla~zds. Neogene trophic structure indicates that savanna woodlands were tb typical habitat present through most of the sequence. Only after 7 Ma did these woodlands give way to rnorc Opel grasslands in Pakistan. 1. Introduction Mammalian community structure can be exam- ined in a number of different ways based on characteristics such as taxonomic composition, body-size distribution, species diversity and abun- dance, and food-resource utilization patterns (Damuth et al., 1992). Two importalIt r,ethod- ological steps in such analyses are: first, to develop comparable characteristics that summarize por- tions of community structure; and second, to use these characteristics to compare and contrast com- munity structure of mammalian faunas from a range of ecological settings. Two useful comrnanity characteristics are trophic structure and trophic composition. Trc apllic structure, as used in I!& paper, refers to the relative and absolute frequencies of genera among trophic categories. Trophic composition of the Paleogene and Neogene manlmalian records r&t-s to taxonornic composition. at the generic level, of faunas from discrete horizons or time intervals. Mammalian trophic structure and COW position are expressed at the generic level because the state of taxonomic refinement for many of the Paleogene and Neogene groups currently preci udes species-level comparisons. The goals of the present paper are to examine 0031-0182/95/$9.50 8 1995Elsevier Science B.V. All rights reserved SSnl0031-0182(94)00115-4
-
Upload
independent -
Category
Documents
-
view
0 -
download
0
Transcript of Comparative paleoecology of Paleogene and Neogene mammalian faunas: body-size structure

Abstract
Tropl~ic structure and composition are examined in two impo; tmt biotic records, one the Paleogene of Wyanirlg and Mo7:ltana. and the other from the Neogene of Pakistan. The Paleogene sequence spans approximately 10 million years and encompasses four North American Land Manmal Ages (Torrejonian. TifTanian, Clarkt’orkian. and Wasatchian). The Neogene sequence spans approximately 17 my. and includes most of the Miocene and Pliocene with the best documented interval spanning from 16 to 7 Ma. Five’basic trophic categories (primary consun~ers: herbivores, frugivores, omnivores: secondary consumers: insectivores, carnivores) arc recognized for Paleogenc and Neogene n~amnals based on tooth morphology, body size. and mulogy with n~odcrn manmalian groups. The Paleogene nmmalim biota is characterized as one in M hicli both trophic structure and taxonoinic composition cliallge through the history of the record. The Neogcne munnialian biola maintains a relativfaiy consistenl trophic structure tllrougli 1rm1 o1‘ the record, ahhough taxonomic composition changes substantialty tl-rrougl~ time.
Based OIJ comparisons 01’ lrophic structure l’rotn the P~ltx~ge~~~ and Ncogc’ne records with that of’ sekctcci modern tnarm~ali~tn fmnas. Paleogene habitats hctuated between closed, humid t‘orcsts and more opm drier woodla~zds. Neogene trophic structure indicates that savanna woodlands were tb typical habitat present through most of the sequence. Only after 7 Ma did these woodlands give way to rnorc Opel grasslands in Pakistan.
1. Introduction
Mammalian community structure can be exam- ined in a number of different ways based on characteristics such as taxonomic composition, body-size distribution, species diversity and abun- dance, and food-resource utilization patterns (Damuth et al., 1992). Two importalIt r,ethod- ological steps in such analyses are: first, to develop comparable characteristics that summarize por- tions of community structure; and second, to use these characteristics to compare and contrast com- munity structure of mammalian faunas from a range of ecological settings. Two useful comrnanity
characteristics are trophic structure and trophic composition.
Trc apllic structure, as used in I!& paper, refers to the relative and absolute frequencies of genera among trophic categories. Trophic composition of the Paleogene and Neogene manlmalian records r&t-s to taxonornic composition. at the generic level, of faunas from discrete horizons or time intervals. Mammalian trophic structure and COW position are expressed at the generic level because the state of taxonomic refinement for many of the Paleogene and Neogene groups currently preci udes species-level comparisons.
The goals of the present paper are to examine
0031-0182/95/$9.50 8 1995 Elsevier Science B.V. All rights reserved SSnl0031-0182(94)00115-4

trophic structure and trophic composition within and between two widely separated (qcographidy and temporally) mammalian fossil biotas: the early Paleogene Faunas of *Wyoming and Montana and the Neogene faunas of Pakistan. Each of these records represents a relatively long time span and each preserves large numbers of mammalian fossil remains distributed throughout each sequence (see Badgley et al., 1995, for a review of taphonomic processes and their effects on both cdunal records).
The Paleogene data used in this study are from northwestern Wyoming and south-central Montana. They include mammalian faunas from the northern Bighorn Basin, including the Clarks Fork Basin (Wyoming), and its northern exten- sion, the Crazy Mountains Basin (Montana). The sequence of Paleogene rocks exposed in these basins spans IO million years (approximately 62 -- 52 Ma) and includes the P.:lleocene Fort Union, Bear, Lebo, and Melville formations and the Paleoccne- Eocene Willwood Formation. This stratigraphic series encompasses the Paleocene Torrejonian. Ti0%nian, and Clarkforkian North American Land Mammal Ages and the Eocene Wasatchian Land Mammal Age (SW Simpson, 1937; Rose, 198 I ; Ar*&ibald et aI., 1087: ~in~~::*ich, 1989; Gunnell, I989: Krause and Manly, 1990, Gunnell et al., 1993 t’tdr summaries 0;’ b&tratigraphy and gcochror& ogy). The mammalian f&unas from this region are ~~prcsented by approximately 50,000 specimens in the collections of the University of Michigan (Ann Arbor, Michigan), the State Unlvcrsity of New York (Stony Brook, New York), and the Princeton collection at the Yale University Peabody Museum ( New Haven, Connecticut ).
The Neogenc Siwalik sequence is located on the Potwar Plateau in northern Pakistan. It spans over 17 my. (approximately 18.3-0.6 Ma) and encom- passes the Miocene Murree, Kamliai, Chinji. Nagri, and Dhok Pathan formations. as well as tk Pliocene Soan Formation. This study focuses on the best documented time intervals between 16 and 7 Ma. The mammalian fauna is represented by approximately 45,000 specimens in the coliec- tions of the Geological Survey of Pakistan ( Islamabad 1. the American Museum of Natural History (New York, New York). and the Yale
;Jniversity Peabody Muscum ( New Connecticut ).
aten,
2. Trophic dructure
Differential food utilization among animals is an important component of ecology ( Elton, 1927; Damuth et al., 1992). Trophic structure and guild relationships have been the focus of many ecologi- cal studies (see Lindeman, 1941, 1942; Harrison, 1962: Root, 1967: Fleming, 1973; Karr and James, 1975; Emmons et al., 1983; Grant and Schluter, 1984, ;%nd others). Trophic relationships among fossil mammals have been examined thro@ com- parison with modern mammalian communities (for example, Andrews et al., 1979; Van Couvcring, 1980; Janis, 1984; Van Valkenburgh, 1988, 1989; Andrews, 1992; Gunnell, 1994 ).
General trophic categories c&n:only used for extant and fossil mammaltl i’lclude csrnivore, insectivore, omnivore, and herbivore. Each of these can be further subdivided (Damuth et a!., 1992). Within a general category such as herbivore, more specialized categories could include browser, grazer, mixed fe,:dcr. and frugivore. Trophic cate- gories arc gcncral indicators of food ;mference, as short and long terni climatic variability affects the availability of’ son-x food resource:;, m does wa- sonal production among plants and annmals.
For assessing dietary habits of fossil mammals, the most useful ecomorphological attribute is the dentition ( Rensberger, 1973, 1986; Krause, 1982; Fortelius, 1985; Van Valkenburgh, 1989; Janis, 1990a.b; Collinson and Hooker, 199 1). Mammalian teeth reflect, at least in a general way, the typ<s of foods that are utilized (Kay and Hiiemae, 1974: Kay, 1975; Kay et al., 1978; Lucas, 1979). Teeth play a major ro:e in both initial acquisition and processing of food. As such, the design of the dentition reflects the requirements placed on it by the kinds of foods selected ( Fig. 1).
Mammalian cheek teeth are made up of punctur- ing cusps (points), slicing crests ( lines), and grind- ing surfaces (planes). Depending on dietary specializations, one of these geometric attributes may be emphasized over the other two. Mammals that utilize insects as their major food resource

Fig. 1. Examples of m.>dern mammtilian dentitions :;howing some typical tooth designs (all drawn to same size). A. Carnivore (I!..w.v). Note the reduced number of postcanine teeth (3). the enlarged. blade-like tirst lower molar, the sharply pointed premolars, and the enlarged. sharp canine. B. Insectivore (Blmim). Note the sharply cusped molar teeth and the blunt, procumbent canine. C. Omnivore (Pwc*Jw). Note the low crowned. bluntly cusped molars. the more sharply cusped pren:olars, and the enlarged, laterally angled canine. D. Frugivore (Sq,g~i~~t.s). Note the low crowned, flattened molars, the relatively blunt. rounded premolars, the sharp, projecting canine. and the spatulate. procumbent incisors. E. Herbivore (O~tJtr~tr) in occlusal view (top) and medial view (bottom) showing only the cheek teeth. In occlusal view note the complicated tooth crown pattern with cnamei *~cirt’ounding islands of dcntine (shown in black). In lateral view note relatively high tooth crowns and folded enamel (rolds in black). F. Herbivore (O~~JM%W) in occiusal view (top) and lateral \IW (bottom) showing only the cheek teeth. In occlusal vie\,+* ncvtc sclenodont dental nq~ho;L~g!~ character&d by crcstcd chuck teeth. In I;\teral \%:w note hyysodont ( high-crowned ) cheek tcctl:.
have sharply cusped cheek teeth (Fig. 1 B) that are used to puncture insect exoskeletons. Carni*+Ior3us mammals emphasize tooth crests that form long shearing blades ( Fig. 1 A) useful for slicing meat. Frugivores emphasize planar areas ( Fig. 1 D) that are used to mash and grind fruits. Omnivores tend to have no particular geometric design emphasized ( Fig. 1C ) and instead have generalized teeth that are useful for processing a varit=iy of food items. Some herbivores ( Fig. 1 E-F ) have complex tooth crowns that emphasize crests useful for clipping and shearing vegeiation. Hypsodonty is common in these herbivorous forms as teeth are worn quickly. Other herbivores have more bunodont cheek teeth (suids, some anthropoids) or more lophodont cheek teeth (cercopithecoids, rhinocero-
tids) that are used for grinding or shearing respectively.
The trophic categories recognized for this study are insectivore, carnivore, frugivore, omnivore, and herbivore. These categories reflect the inferred major food resource utilized by the mammals assigned to each. Insectivores utilize insects as their major dietary item, but also may utilize smdll vertebrates and other invertebrates as well. carnivores rely, to a grealer or lesser extent, on flesh, whether it be in the form of freshly killed prey or carrion. Frugivores utilize fruits as their major dietary resource, but also may consume saps, gums, resins, nuts, and leaves. Omnivores utilize a wide variety of foods including nuts, seeds, fruits, eggs, small invertebrates and vertebrates.

Herbivores rely most heavily on leaves, shoots, roots, and other vegetable matter for the bu!k of theE diet, but may eat nuts and fruits as well.
We base our trophic assignments for fossil mam- mals on tooth morphology in combination with estimates of body size. Body size is estimated from tooth size, typical!y area of a lower molar (Ginigerich ci al., 1982: Gingerich and Smith, 1984; Legendre, 1987, 1988; Janis, 1990) or from skeletal proportions such as bone length or cross-sectional area (Gingerich, 1990; Scott, 1990; M. Morgan, unpublished data). The following c as the basis for trophic assignment: Insectivores -- small body size ( less than 500 g ), sharply cusped teeth, shearing crests and grinding surfaces of teeth not welF developed; carnivores -- carnassial teeth with well developed shearing crests, moderate to larger body sizes ( I “- 200 kg). often have several reduced cheek teeth with shearing funcition concen- trated into a single carnassial pair; omnivore-- generalized cheek teeth with more or less equal amounts of puncturing, shearing, and grinding capacity. cheek fecth may be somewhat bunodont, moderate to larger body sizes ( 1 50 kg); frugi- vorc cheek teeth cmphasizc grinding surfxes with some shearing capacity, cheek teeth with low, rounded cusps, mod~rutc body size ( > SO0 g to 30 kg); herbivores check ttxth with slmring capacity emphsizcd, cheek teeth ot’tcn high crowed and lopkodo~~t, bmodont, or selenodont, st~~ull to very large body size ( 500 g to 5000 kg: xc Appendix I for a table of trophic assignments).
3. Paieogene trophic structure and diversity
The P:\leogene mammalian faunas from Wyotning and Montana represent 178 genera from 21 orders. These f;tunas are arranged chronologi- cally into biostratigraphic zones representing approximately 0.5 m-y. (C%igericli. 1983: Gunnel!, 1 WKk Krause and Maas, I O’_)O ). Faunas arc analyti- tally time-averaged within kiostratigraphic zones.
Most Paleogene fossils consist of dentilt remains, with skulls and partially complete skeletom being relatively rare. Nearly all genera arc known from relatively cc,mplete dentilions ‘at least composite dnltitions). bUt noi all trophlc assignments are
completely satispdctory. In many cases. an argu- ment could be made for a different trophic assign- ment based on alternate interpretations of dentcal morphology. For example, The condyiarth t‘amily Hyopsodontidae includes genera that have been assigned to three different trophic categories based on their dentitions and body sizes. Nearly all of these genera could be included in categories other than those assigned to them.
Not all trophic assignments are as problematic as that of hyopsodontids. Many Paleogene groups do have modern analogs such as lemurs, anteaters, opossums, and mustelids. Paleocene mammals are dominated by archaic orders such as “Condylarthra.” Multituberculata. Pantodonta, and Proprimates. As such, modern analogs are often difficult to find for Paleocene mammals, but tooth morphology irnd body size provide strong clues to dietary preference among these mamma- lian groups. Eocene mammals are dominated by modern orders such as Primates, Artiodactyla, and Peris:;odactyla. Modern analogs arc more easily found for these groups and, along with tooth morphology and body size, provided additional evidence for tropliic assigiimcnt.
Fig . 2 sumtnarizes trophic structure throughout the Paleogene. Omnivores represent a substantial portion of the fauna in the Torrejonian and early Titl’anian, fluctuate through the late Tiffanian, and then generally dccljrease in relative frequency and in absolute numbers of genera fhrough the Clatkforkian nhd Wasatchian. Insectivores decline in relative genetic frequency by the end of the Wasatchian compared with the Torrejonian. but remain at moderate relative frequencies through- out the sequence. Carnivores remain relatively constant through the Torrejonian and Tiffanian, but experience a marked increase in relative fre- quency and in absolute numbers of genera begin- ning in tliz Wasatchian. HerbiT:ores incrcdse in relative frequency through the Paieocene, and then

Late PakocenF- Early Eocene
sdcctcd intervals.
uixkrgo 3 slow increase in relative frequency and absolute numbers through the Wasatchiai? after declining in the early Clarkforkian. Frugivores, tllc smallest component of the fauna, fluctuate in rclativc frequency from the Torrejoniaii through the Wasa!chiaii, showing a decrease towards the end of tlal: Tiffanian and then a slow incrcasc in XhtiW I‘rc~~uclIcy through the rest of the scquencc.
The rclativcly high hcquc’nc~y ot’ omnivores in the Torrejonian and Tiffanian iS due mainly to two factors: the generalized nature of most Paleocene mammal dentitions and the dominance of multitu- berculates at most localities. Paleocene mammal dcntitions, for the most part. lack clear specializa- tions towards any particular type of dental func- tion. As such, most are similar to living omnivores in dental design. The most dentally specialized Paleocene mammals, multituberculates, have been recently categorized as omnivorous based on analysis of masticatory function ( Wall and Krause, 1992 ). Remaining generalized in dental design during the initial phase of the radiation and diversi- fication of mammals would allow exploitation of many h;lbitat types. Niche divergence and morpho- logical specialization become more important in later stages of the mammalian radiation, beginning in the Eocene.
Insectivores decrease gradually in relative fre- qucncy through the Paleocene. This pcrceivcd decrease Is partially the result of preservational and collecting biases. Most Paleocene localities used in this analysis consist of quarry sitcs where snn;\ll n~an~n~als (insectivores tend to be very smell ) ;~I’c‘ conccntratcd ( Krmsc and Maas, I YYO: Gunncll. 1904). Late Palcocei3c (Clarklhrkian) Sil~ll~JlCS arc b;lsCd 011 surhce collcctioiis l’ronll geiicrally poorer localities. Surface collecting tends to under-represent smaller mammals ( Winkler, 1983: Krause and Maas, 1990). so that much of the decrease in insectivore frequency is probably due to collecting bias.
There is a noticeable increase in relaiive fre- quency of’ insectivores in Wdsatchian zones w11 through W& Localities ti-0~ these biostrati- graphic intervals, as well as interval Wa6, are much richer in numbers of specimens than 3arkforkian or other Wasa!chian-interval ( Wa% Wa4-5) locali- ties. Perhaps the biases against small mammals are somewhat rcduccd because of the larger numbers of specimens available. Alternatively, there may he a real increase in insectivores during these Wasatchian intervals.
Carnivores experience fluctuating relative Ii-c- quencies through the Paleocene, ranging from a

10~ of 8% in the early TifYanian to a high of 21% in the late Tiffanian. At the beginning of the Wasatchian, carnivores reach higher relative fre- quencies and absolute numbers of genera than at any time during the Paleocene. The increase in carnivores occurs because of the appearance of hyaenodontid creodonts and the diversification of miacid carnivores at the beginning of the early Eocene.
Herbivores experience a general increase in rela- tive frequency through the middle and late P&ocene, reaching their highest levels (3O--35%) by the latter part of the Tiffanian. One exception is a decrease in relative frequency in the middle TiR’anian (zone Ti3). This decrease is likely to be a preservational artifact as the middle Tiffanian sample is based largely on a single locality, Cedar Point Quarry, a taphonomically biased locality from northwestern Wyoming ( Rose, 198 1; Gunnell, 1994). From the early Clarkforkian through the early Wasatchian, herbivores decrease in relative frequency and then increase through the end of Wa6.
Frugivores occur at low relative frequency throughout the sequence, never representing more than about 10% of all genera. Overall, frugivores are represented by higher frequencies in the Wasatchian than at any other time, but this increase Joos nc represent a substantial increase in ~~bs~l~~e numbers of ge~~era. The increase is the result of the appearance and subsequent diversifi- cation of omomyid and, especially adapid, pri- mates in the Wasatchian.
Fig. 3 compares trophic categories in terms of relative frequency of genera and relative frequency of total numbers of specimens (TM) in each category over the whole Paleogene sample. Omnivores, herbivores, and frugivores have higher frequencies bdsed on TNS than on number of genera; carnivores and insectivores have generic frequencies higher than those based on TNS. These patterns probably reflect the lower numbers of individuals as well as collective biomass at higher trophic levels in terrestrial communities ( Eisenberg, 198 i ).
C’hmging patterns of trophic structure* through time are the result of changing tax.monlic composi- t ion wit bin t rophic groups. Omnivores experience
GENERA (N=178)
a TOTAL SPECIMENS (N=24,600)
Insectivore Omnivore Ftugivore Carnivore Herbivore
Trophic Group
‘lg. 3. Comparison of relative frequency of Paieogene trophic groups calculateJ as a percentage of all genera and as a percentage of total number of specimens for all intervals combined.
a relatively consistent decrease from the Torrejonian through the Tiffanian because multitu- berculates decrease in frequency. There is a moder- ate increase in omnivore frequency in the Tiffanian due to the increased presence of arctocyonid ac:j phenacodontid condylarths. Omnivores decrease in frequency in the early Wasatchian and continue that trend through the end of the Wa6, largely due to decreases in condylarths (arctocyonids and phenacodontids) and muhituberculates.
Herbivores represent increasingly higher fre- quencies from the Clarkforkian through the Wasatchian (Fig. 2). The increase in herbivore generic frequencies is due to the appearance of immigrant mammalian groups, including rudznts and tillodonts in the Clarkforkian and artiodactyls and perissodactyls in the Wasatchian.
Ts,1 r ariSg@ilC carnivores include several condyl- arth taxa, creodon ts, and true carnivores. “Condylarthra” (including Mesonychia and some arctocyonids) make up 1%50% of carnivores in the Torrejonian and early Tifinian ( Fig. 4A), while true carnivores make up the remaining per- centage, except in Tiffanian zone Ti3 where oxy- aenid creodonts make their first appearance. Creodonts become an important con;p\bpnent of the carnivore trophic group from the iate Tiffanian onward (ranging from 20 tc 40%). Viverravids

middle Tiffanian when o
sent the dominant carniv Wasatchian, miacids expand, while viverravids fluctuate and stabilize at lower levels. The doubling of total carnivore generic frequency at the begin- ning of the Eocene is due to the appearance of hyaenodontid creodonts. After an initial radiation,
60
inoceratans are present in the late Tiffanian and early Clarkforkian. New herbivore groups appear in the Clarkforkian and Wasatchian and replace or decrease the relative frequency of many of the
,p$I Late Paleocene Early Eocene
ammal Age/Epoch
R Creodonta
Carnivora
ES! Hyaenodontidae Oxyaenidae
Miacidae Viverravidae
Fig. 4. Relative frequency ( % wnera) of Paleogene carnivores at (A) order and (B) family levels. Numbers enclosed in ~~x~~ are absolute numbers of genera fir’ orders and families at selected intervals. Note sudden appearance of ojtyaenids in the Tifrdnian. miacids in the Clarkforkian, and h;/aenodontids in the Wasatchian.

60
Notoungulata
Rodentia
Tillodontia
Dinocerata
Perissodactyla
Artiodactyla
Proprimates
Taeniodonta
Pantodenta
“Condylarthra”
Fig. 5. Relative tiequency (‘%I genera) of Paleo$ene herbivor:, c ??It the ordinal level. Numbers enclosed in bows are absolute nunlbers of genera at selected intcrwls. Note dominance of archaic orders (“Condylarthra”, Pantodonta, TaeGodonta. and Proprimates) in the T~rS+nian and Tiffanian and dominam~ of modern orders (Rodeqtia, Perissodactyla. Artkodactyla) by the end of the wasatchiru1.
archaic orders (Maas et al., 1988). Among the new groups are rodents and tillodonts that first appear in the early Clarkforkian. Rodents remain at low relative frequency through the Clarkforkian and then expand in the Wasatchiun. Members of two other modern orders, Artiodactyla and Perissodnctyla, appear at the beginning of the Wasutchian and make up a substantial portion (~~p~roxin~ately 40% of all genera) of all herbivores by the end of the Wasatchian.
4, Neogene trophic structure and diversity
The Neogene mammalian faunas from the Siwaliks of Pakistan represent 102 general froin I 1 orders. Faunas are chronologically arranged in 0.5 m.y. intervals between 16 and 7 Ma based dn dates derived from the palcomagnetic t;*ye scale (Pilbeam et al., 197’9: Johnson et al.. l%:Z, 1985: Barry et al., 1985; Flynn et al., 1990). As with the Paleogene, faunas are analytically time-averaged by interval.
Most fossils consist of dental remains or isolated skeletal elements. Skulls and partially complete sk tIctons are rare. Nearly all genera are known
from relatively complete dentitions. The most obvi- ous feature of trophic distribution through the Neogene is the preponderance 1of herbivores throughout the sequence, chiefly the result of much higher numbers of 1 odent genera than were present in the Paleogcnc ( Fig. 6). Herbivores account fol 110 less than 63’!/;1 of all genera throughout the Neogene in Pakistan, This contrasts strongly with the Paleogene seque.,ce in North America, where herbivores never account for more than about 3S% of generic diversity in any interval.
Frugivores, insectivores , and omnivores are pre- sent throughout the Miocene sequence at relatively stable, low frequencies. None of these groups ever accounts for more than about 10% of generic diversity. Carnivores begin at low relative fre- quency (likely due to poor sampling, Barry, pers. comm., 1993) in the early portion of the sequence and then gradually increase through the section. Carnivores reach their maximum relative fre- quency ( 20%) between 10 and 9 Ma.
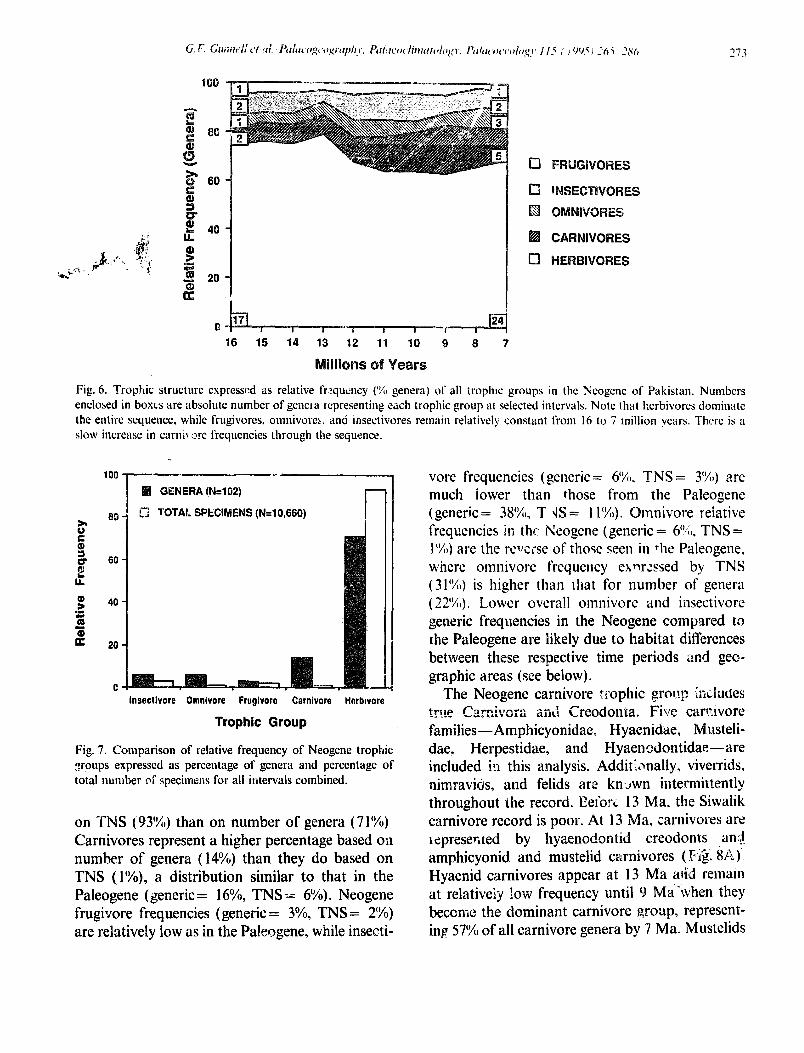
Fig. 7 compares generic frequency versus abun- dance as expressed by total number of specimens (TNS) for each trophic group over the Miocene sequence. As was the case for the Paleogene (Fig. 3), herbivores have higher percentages based
i
16 15 14 13 12 11 10 9 8 7
illio PS Fig. 6. Trophic structure expressed as relative frzqucncy (% genera) of all troplnc groups in the Neogene of Pakistan. Numbers enclosed in boxes are absolute number of genel’a representing each trophic group at selected intervals. Note that herbivores dominate the entire sequence, while frugivores. omnivores, and iilsectivores remain relatively constant from 16 to 7 million years. The is a slow increase in cami\ XC frequencies through the sequence.
--v
GENERA (N=102)
TOTAL SPECIMENS (N=10,660) r
Insectivore Omnivore Frugivore Carnivore Herbtvorr
Trephic Group
B
Fig. 7. Comparison of relative frequency of Neogene trophic groups expressed as percentage of genera and percentage of total number of specimens for all ihervals combined.
on TNS (93%) than on number of genera ( 7 1%) Carnivores represent a higher percentage based on number of genera (14%) than they do based on TNS ( I%), a distribution similar to that in the Paleogene (generic = 16%, TNS = 6%). Neogene frugivore frequencies (generic = 3%, TNS = 2%) are relatively low as in the Paleogene, while insecti-
vore frequencies (generic = 6(1/o, TNS = 3%) are much lower than those from the Paleogene (generic = 38’%, T‘qS = I 1%). Omnivore relative frequencies in thf Neogene (generic = 6%, TNS = 1%) are the r-c!’ 1 Lose of those seen in the Paleogene. where omnivore frequency exnrzssed by TNS (31%) is higher than that for number of genera ( 22%). Lower overall omnivore and insectivore generic frequencies in the Neogene compared to the Paleogene are likely due to habitat diKerences between these respective time periods dnd geo- graphic areas (see below).
The Neogene carnivore trophic group ir&des tsx Carcivora and Creodonta. Five caraxvore families- Amphicyonidae, Hyaenidae, M usteli- dae, Herpestidae, and Hyaenodontidae-are included in this analysis. Addit’.k>nally, viverrids, nimravids, and felids are kn dwn intermittently throughout the record. Eefox 13 Ma, the Siwalik carnivore record is poor. At 13 Ma, carnivores are 1 tipresented by hyaenodontid creodonts an4 amphicyonid and mustelid carnivores ( EYg. &A> Hyaenid carnivores appear at 13 Ma a$d remain at relatively low frequency until 9 Ma “when they become the dominant carnivore group, reyresent- inp 57% of all carnivore genera by 7 Ma. Mustelids

274
a t

rcentage of carnivores ( I I
appearance of hyaenid carnivores, hyaenodontid creodonts decrease in fre ncy until they disap- pear from the record at 8 . Amphicyonlds also decrease in frequency 9 Ma, as hyaenids be=come the dominant carnivore family.
Taxonomic composition of Neogene mammalian herbivores involves four or and nineteen fami- lies ( Fig. 8B--D). Before 15 artiodactyls domi- nate the herbivore fauna, repr’esenting oirer 6004, of all genera ( Fig. 8BL Perissodactyls and probos- cideans each make up about 20% of herbivok e genera. By 14.5 Ma. rodents become more preva.. lent, accounting for 50% of all herbivore genera. Rodents experience a gradual reduction in fre- quency from 14 Ma, representing 30-40% of herbi- vore genera through the rest of the sequence. From 14 Ma, artiodactyls undergo a gradual increase in relative frequency, comprising between 35% and 45% of herbivores through the remainder of the sequence. Perissodactyls and proboscideans remain at relatively low frequencies through the sequence. Perissod.actyls experience a modest increase in fre- quency (up to 20%), beginning at 10.4 Ma with the appearance of hipparionine equids.
Changes in taxonomic composition occur within herbivore orders as well. Between 16 and 14 Ma, tragulids, anthracotheriids, and suids represent nearly equal percentages of artiodactyl herbivores, with bovids present at slightly lower frequencies ( Fig. SC; also see Barry et al., 199 1). Between 14 and 13 Ma, the number of bovid genera increases and giraffids make their first appearance. Traguhds, anthracotheriids, and suids are repre- sented at relatively low frequencies through this period, due to the increase in the number of bovid genera, as the other three families do not decrease in absolute numbers of genera. Anthracotheriids and tragulids remain at relatively low frequencies (8-17%) through the remainder of the sequence. Suids gradually increase in relative frequency from 12 to 9 Ma, while bovids gradually decrease. After 9 Ma, bovids and girafhds experience modest increases in relative frequency, while suids decrease slightly ( 17% by 7 Ma).
represent most of rodent generic diversity (60% to 690/Q. At approximately 12 Ma, cricetids begin to decrease substantially. falling to 12% at 8 Ma. while sciurids and mm-ids undergo gradual increase from 13 to 12 Ma, reaching 38% and 2S/;!, res- pectively, at 8 Ma (due mainly to the decrease in cricetids, since absolute numbers of genera of murids and sciurids increase only slightly). Rhizomyids fluctuate bet .Neen 1 OX and I80$ nuti I:! Ma and then gradually increase in relative frequency, reaching 3 1% by the end o[ the sequence.
5. Tropbis structure and habitat
Western North American Paleogene and Pakistan Neogene mammalian trophic structures differ substantially. These differences likely reflect differing habitats in tire two areas. Comparisons of Paleogene and Neogene trophic patterns ,vith those of modern mamm:niian communities from a range of differing habrt;~s provide insights into how these Cenozcrc habitats differed from one another.
Fig. 9 summer Pizes mammalian trophic structure (excluding bats) from five different modern com- munities (data from Harrison, 1962; Fleming, 5973; Van Couvering, 1 WI; Mares et al., 198 1, 1985; T?a Fonseca and Kierulff, 1988; Badgley, pers. comm., 1993) representing African and South Americaii 1 ainforests (closed, continuous canopy, humid); North American temperate 4roodland and South American thornscrub (patchy., continuous 10 broken canopy, semi-hmmid to dry); and an African savanna woodland (open to broken canopy, arid ).
Herbivores represent between 20% and 30% of relative generic frequency in forested and broken forested zones (raimorest, woodland, thornscrub ). In more open habitats (sav:anna woodland J, herbi-

loo
80
60
40
20
0
100
80
North American Woodland
100
T--- African Savanna Woodland
80
1
100
80
60
40
20
0
--I P-w
merican Thornscrub
Cl Frugivores
Fig. 9. Trophic structure expressed i\s relative Li’txpency of pwrit tbr five modern !n*~mmrrlian faunas: i\n African rainforest (Zaire). a South Amtzrican rainforest ( Brazil ); a North American woodland ( Michigan). a South American thornscrub ( RrP~~l), and an African savanna woodland (Zambia). Note the lac!~ of a dot?,Gnant trophic group in rainforest, woodland, dnd thornscrub distributions and rarity of frugivores from North American woodland habitat (these calculations exclude volant mammals). Note also the dominance of herbivores in more open, drier environments.

vores are represe~~t~~~ at * r&t t ive fi-a_] wrzq
( YYL). Carnivores range ‘i;, to 2V’*;b in guncrjc frequent nlcics in rainfol I&ilails. ivorcs ;i rc more frequent in forested and broken Foreste habitats than in more open habitats. .Frugivores vary significantly across habitats. They are reprc- sented by relatively high frequencies im rainforests (XI-34’%), vary considerably within broken for- ested areas (3-16X), and occur at low frequency (S%) in the savanna woodland. The d?Cferences in frugivore frequencies exhibited between North and So*tth American forzsts are due almost exclusively to the presence of ceboid primates in the equatorral South American E&iidts.
Below, trophic +ttterns from selected Yaleo~ene and Neogene interlrals are compared with those fi*um the five modern habitats. Similarity in general tr+Gc distributions may suggest some similarities in habitats.
Torrejonian trophic distributions, being domi- nated $3~ high frequencies of omnivores and insecti- vores ( Fig. 10 ), do not closely resemble those f’rom any of’ the fibe modern communities. An~c:7ng the modern communities, the South American thornscrub comes the closest in general pattern with relatively high frequencies of omnivores and insectivores, but differs in having a higher percen- tase of herbivores. High insectivore frequency in the Torrejonian is the probable result of tapho- nomic processes that concentrated smaller mam- mals in quarry sites ( Krause and Maas, 1990 ).
The Tiffanian resembles the Torrejonian except for somewhat higher relative frequencies of herbi- vores. The North American woodland and South American thornscrub come closest to matching the Ti@dnian assemblages in trophic structure. Together, the Torrejonian and Tiffanian are not very similar to any of the five modern mammalian communities in trophic structure. The prepon- derance of archaic mammalian groups in the Paleocene may preclude many meaningful campar- isons, although further examination of modern mammalian communities is required before such a conclusion is jus.tified.
t UB‘e soW3Vix~t rgsgm-
n in the Norrh 011 th .4111ericin
omnivores rela- sesent at low to
moderate frequencies. he main difference is in t lie relatively high frequencies of insectivores in the Clarkforkian compared to the modern forests.
Wdsatchian t rophic distributions change through the sequence. In the early Wasatchian, no trophic group clearly dominates, with subequal frequencies of’ herbivores, carnivores, omni\ lres, alId insectivores, uiulc ii*) givores are present in lower frequencies. The trophic distribution in W’asatchian zone:; Wal and Wa3 is similar to that exhibited in the modern South American thornscrub habirat or the African railJorest habi- tat, except tba! the frequencies of carnivores and insectivores are much higher in the Eocene. In Wa.6, the distribution more closely resembles the modern savanna woodland environment with higher frequencies of herbivore\ r\tzd iower, bu: still persistt-lit. f‘requencies of frugivores.
Examining thtx overall patterns of trophic distri- bution for the Paleogcne suggests the following
Ice of habitats. While the Torrejonian and ian are diflicult to intkrrpret, the presence of
frugivores, the low generic frequerGes of herbi- vores, and tlae relativel!~ ,lil;h frequencies of insecti- vores and omnivores wggest forested, relatively humid conditions. Increased relative frequency of herbivores by the end of the Tiffanian through early Clarkforkian sugixsts that the late Paleocene was typified by somewhat more open, drier condi- tions. More forested conditions returned in the late Clarkforkian and early Wasatchian although mammalian trophic structure suggests that the Wasatchian V.S Eess humid than the Torrejonian or early Ti”.“;anian. The end of the Wasatchian was typified tjj relatively more open habitats than was the exlier part of the Wdsatchian.
F-! lbitat conditions suggested by mammalian trophic structure are generally consistent with those described for the Paletrgene of North America based on other lines of evidence, including paieobotanical ( Wolfe and Hopkins, 1967; Wolfe. 1978; Mickey, 1980: Wing et al., 1931: ‘Vving et al., 1995 ); isotopic ( ~uchard t, 1978, Shackk%n, i !kf+,

8 8 e

och et al., 1992;
faunas suggest bri;a:liy similar habitat reconstructions., bas;:d on a wider range of modern analogs ( organ et al., 1995).
5.3. l\ieogene comparisorrs
Fig. 11 summarizes trophic distributions for the Miocetle of Pakistan from 0.5 m.y. intervals at 15. 12, and 8 Ma. The most striking aspect of these distributions is the very high percentage of herbi- vores present. Tile consistent presence of frugivores at low frequel-lcies through the sequence suggests the presence of wooded areas. By analogy with the modern mammalian faunas presented ( Fig. 9 ), nearly all of the Pakistan Neogene may have been similar to African savanna woodland habitats, altiiough even in these habitats, herbivore frequen- cies are not as high as those in the Siwaliks. The vegetation represented by African savanna wood- l,qnd is described by Van Couvering ( 1980, p. 288, her “savanna mosaic”) as, “made up of deciduous irees with an open or continuous, but not interlaced, canopy, with undergrowth of shrubs, herbs, and sparse grasses.” This partially open. woodland setting is generally consistent with paleo- ecological interpretations of the Pakistan latest
urces of evidence rgan et al,. in prep. 1. 5.!32I’,P,tl’i;;‘iiiii Ir;tUilas
suggest a similar habitat reconstrnctisn ( organ et al, 1993).
Taxonomic composition of Neogene herbivores provides further evidence fqr interpreting habitats. Fig. 12A stimmarizes taxonomic composition of herbivores from five modern African faunas (data from Lccendre, 1988). La Maboke and Makokou are humad rainforests Serengeti and Rukwa Valley :tre sub-humid savanna woodlar GS, and Amboseli is a s&-arid savanna. Rodent+> are the dominang herbivores in rainforests, while rodent and non- rodent taxa (includin g cercopithecoid monkeys, hyraxes. proboscidearJs, and ungulates) are about equally divided in savanna woodland habitats. Relatively large ungulates dominate more open, drier savannas in Africa. The distribution of rodent versus non-rodent herbivores is subject to some historical constraint. North American deserts, fol example, lack the large numbers of ungulates present in African semi-arid s:Lvannas and herbi- vores are instead dominated by rodents. The pres- ence of relatively large non-rodent herbivores throughout the Neogene of Pakistan suggest that it is more appropriate to compare this distribution with modern African faunas rather than North All~eric~i~~~ hunas.
15 12 a Millions of Years
HERBIVORES
CARNIVCIWES
OMNIVORES
•j INSECTIVORES
0 FRUGIVORES
Fig. 11. Relative frequency of trophic groups (7;) genera) for selected Neogene time intervals.

x0
80
60
La Makaks Makokou Serengoti
Fauna
Rukwa
12
Milllons of Years
Non-Rodent
m Rodent
Non-Rodent
??Rodent
Htxkivore patterns from the Ncogene at 15 and I2 Ma ( Fig. 12B) resemble those from Serengeti and Rukwu Valley ( Fig. IX), suppor*ting the
intqmtatim of a savann2 woc~dland h;tbitat, At 8 Ma, non-rodent herbivores become more preva- lent, suggesting the onset of more open, perhaps drier conditions. The rodents that are present after 8 Ma are dominated by more hypsodont forms suggesting more grass dominated diets ( Flynn and Jacobs, 1982). Isotopic evidence (Quade et al., 1989: Morgan. 1992; Quads and Cerling. 1995)
suggests that more open grasslands (dominat; cl by C4 plants) bectime prevalent in Pakistan by 7 Ma. The patter!: I of herbivore taxonomic composition is gt‘nt‘rali)’ consistent with this interpretation.
6. Conclusions
The Paleogene record from western North America shows changes in trophic structure and taxonomic composition from the Paleocene

through early by ge~~er~~ in ins
phic groups, while Eoc by genera in
Paleogene sequence, largely as the result of immi- gration events at the beginning of the Clarkforkian and Wasatchian. Archaic groups such as multitu- berculates, condylarths, proprimates. and i;;secti- vores are the coiiin~on elemenrs in Paleocene mammaI faunas. Eocene fhhmas are dominated by modern orders, including perissodactyls, artiodcic- tyls, and primates. Taxonomic changes also OLXXII within orders. The Carnivora is dominated bq viverravids 111 rhe Paleocene, with miacids becon]- ing more conmon in the Eoserw. The Creodonta is dotninka~c~ by o~yacnids in the Palco~32nc. but hyaenodontids become much more common t ban oxyacnids in the early Eocene.
Comparisons with modern mammalian t’,;unas suggest that Paleogene habitats varied through the sequence. Middle and early late Paleoce!ie (Torrejonian and Tiffmian) faunas are dift-;,cult to interpret. but suggest that relatively warm, moist habitats gave waq’ to co&r, drier habitats begin- ning in the. middle TitLnian and Tasting thrmgh the early CParkforkian. The latter portion of the C’larkl’orkian through the c;;rly W;rs;ttchiml may have been characterized by gradual wmming ( Rose, 198 1; Krause and Ma;\s, I990 j. T’hc N_T
Wasatchian appears to have been a time of relatively warm, hut perhaps somewhat drier conditions.
The early part of rhe Paleogene sequence is dominated 1;~ archaic mammalian groups with fairly generalized dental morphology. Insecti- vorous and omnivorous dentitions arc the primi- tive morphological patterns exhibited by late Cretaceous mammals and most early Paleocene mammals have not div~~gcd substantially from these patterns. &y the Eater part of the Paleogene (Eocene), more derived dental designs begin to appear and mammals begin to undeigo niche specialization to exploit changing habitats (Stucky.. 1990). The oe;set of irophic patterns dominated by herbivorous and carnivorous mammals is par- tially the result of such niche specializations.
In the Neogene of Pakistan, trophic structure
iiicrcasc in generic versity begin&g at but this is at least rtially due to poor Sam from earlier intervags. er trophic groups remain at relatively low. coi ent frequencies through the sequence.
% Icrbivor[aF dpd carnivores change in taxonomic composition through the sequence. Th h~rbivor.23 are artiudactyis prio;. to B 5
due to a lack of good wash si Ural would enrich t!lc number of rodcni taxa arry et al., i995: Flynn kft al., 1995). At 14.5 Ma, rodents become :a si,gniticant part of the hcrbivorc fauna and remain so through the late Miocene, but decline in relative frequency towards the end of the sequence (due to m: increase in non-rodent herbivore taxa. not a decrease in rodent taxa). Within orders, taxononlic composition also changes. Bovi4 become the dominant artiodactyl herbivores beginning at I3
Ma. with suids becoming ,lore prominent between 10 a~rd 8 Ma. Within rodents, cricctids dorninatc the CU%~L*- t’;runas, but arc gradually replaced by sciurlds. ;7i:;ri’,i~, imi rl~izomyids through the scq ucl102. C;uG+wtz 1’upcnc*y is dominated ini- t My by hyamodont id crcodonts and amphicycrnici c;miwrc;, 11!, 8 Ma. hyacnc~dmtids hwc diwp- peared. ani hyaenids, mustelids, herpestids, and arnphicyonids make up the carnivores.
Uniikc the Paleogene where mammalian trophic specialization had just begun, Neogene faunas represent the result of appr&rnately 40 million years of community evolution since the early Eocene. Mammalian habitat partitioning was well established by the Miocene. The relatively stable trophic structure seen in the Neogene of Pakistan suggests that global climatic changes exerted lim- ited effects on local vegetation structure. Despite stable trdphic structure, trophic composition fh- tuated and changed through the middle and He RIs,c,nL
Prior to 12 Ma, changes in trophic composition were primarily influenced by immigration events while in the iate Miocene in siN evolution was equally important ( Barry et al., 1991). Local habi-

tat change probabl;d did not begin to become a major cause of change in taxonomic composition, until around 9.5 Ma. After 7 Ma, isotopic evidence from paleoso!s and skeletal elemen@ suggests that grassland habitats and monsoonal climatic pat- terns predominated (Quade et al., 1989; Morgan, 1992; Quade and Cerling, 1995) in the SiwaDik area. The relatively stable trophic structure evident through the Neogene supports the interpretation of relatively stable habitat structure through much of the Siwalik sequence. _ ,
Acknowledgments
The authors thank AK. Behrensmeyrr an2 C. Badgley for the invitation to participate in this symposium. C.M. Janis and an anonymous reviewer read the manuscript and offered many useful suggestions. J.C. Barry, C. Badgley, and D. W. Krause provided unpublished data a insights into Paleogcne and hleogene trophic struc- ture. Bonnie Miljour aided in preparation of figures.
A ppcndix I Tabulation of trophic category assignments for Pakogenc and Neogene mammals based on tooth morphology and body size. Numbers enclose& in brackets arc genera representing each family. Fractions enclosed in brackets represent proportion of genera assigned to trophic category if families contain genera assigned to different trophic categories
Order Family (# of genera) ‘Trophw category Explanation .
\/it erravidae ( 7 ) Carnivore Miacidac ( 4 ) same Oxyaenidae ( 6 ) same Myaenodontidw ( 6 1 same Arctocyonidae ? 1 I2 1 same Mesonychidae ( 4 ) Sillllc‘
Didqmo~onidae ( 1 ) Sillllr:
Omnivore
sanlc
same SiuIIe same same
Eucosmod~ntidae (4) Nuoplapiaulucidu~ ( 5 ) Ptilodontidae ( 3 ) Indeterminate ( I ) Microsyopidae (2 9) Pantolestidae ( 1 4)
same same same same same same
P~~rorn~n’l!,idtrr~ ( ! ) Picrodontidae ( 1) Adapidae ( 2 ) Omomyidoe ( I 4) Eriunceidae ( 8 ) Nyctitheriidue ( 3 ) Dormauliidae (4) Apternodontidae ( I ) Pantolestidac ( 3:4) Apatemyidae ( 5 ) Mixodectidae ( 1)
Frugivorc same si\n1e
Ski Llle
Insectivore sa t11L‘
same same same same same
Carnassial teeth, small to moderate body size same Carnassial teeth, moderate to large body size same same Crushing, blunt kxth, modcrate body size Carnwial teeth. small body size
Sharp prcmolars. gcncralizod molars. small to Il:~r?,:! J(LY Iwdj 4/c same SSltlle
SWE
same Jaw mechanics. small to moderate body size, blade-ii kc P f4 same same same same Generalized molars. moderate body size same
Crushing. flat tencd molars. small body size Specialized premolars, small body size Crushing. fh~ molars. moderate body !+c same Small body size, sharp cusped teeth Siln:p same same same same same

- ‘7 . . h .’
-_ .-__ -- --- -- Palaeoryct idae ( I o ) Fentaeodontidae (3) Leptictidx ( 3 ) Didelphidx ( 3 ) Epoicotherildae ( 2 ) Metacheiror??yidr!c ( I! ! Microsyopidac ( 7 9 t Carpolcstidae ( 3 ) f’lcsiiiditpidilc ( 1 4) Hyopsodon tidx ( 2 7 ) Oiiioniyiclac ( 3 1) P~tlacochirupt~rygicfac ( I )
SiIllW same ski IllC ha tile smx C*l,,,.’ .,.,...C Sillllt’
Sil lllC! SitnlC hiI 1111‘
Sillllc’
Sl lll6
Sllllc‘
‘3 mc
Si111le sa111e smie SiIIllC Simple. peg tec~h. smal: body size Reduced dw,m_m. simi:ie peg teeth Smail bcal’lp, size. sharp teeth Snlitll k,od> ::i>c, blade-like prcmnolars Snw~l size. sllarp. pointed prcmal;rrs F;rliilI size. sharp. pointed prett~~Ai~rs Small size. sharp cusped molars. poinacd prcmohtrs Sm;t II sire. sharp check tctt,h UlllL %I1 ,c‘ I
I xgc sia shearing &nti&ms wnc SillllC Sti’llf2 SitI1lC Voderate to l;im: size. shearing prcmc>litrs .- sLln1t’ s;Lllle Modcmte size. shearing premolars Moderate size. spc&lized incisors. cruAi::g IPV~I’S Spcci:llizcd itntcricjr dcntitions. simpliGcd cheek tWtl1. lilr&JC si7c
SilIllC High crwvncd. bhcuring cheek teeth. nl~~d~ri~~.~ six Large sift. dlCilrinp dciitition Moderate to large size, high crowned shearing cheek teeth same same same Specialized shearing dentition Moderate size. shearing teeth Gnawing incisors. shearing crushing cheek teeth
ralltodollta
su11e
SHllle
smlc
siww
Condylarthra SiI11lC
SiiIIlC
Pr~~teuthcriii Proprimatcs Tiil!~liOdOlltir
same !illtllC Artiodactyla Arctostylopida Dermoptera? Rodentia Neogelrc Carllitora SillllC Xl IlIt’ SiltllC
(; reod on t iI
1 tisect ivora Saaildcntia Pholidota l’ubulidentata
Barylambdid:~e ( Z ) Coryphodontidre ( 1 ) CyriiKOthtT~idiW ( I 1 Panwl,m~bdidx ( 2) Titwoideidae ( I ) Phwacodont idae ( 2 4 1 MelGsco:heriidac ( 1 ) Hyopsodontidae ( 1 7) i’c~ltacodou~idac ( I ) Pksiadapidac ( 3 4 ) Conorvctida~ ( 2 )
Helaletidae ( 1 1 Isectolophidae (2) Dichobunidae ( 2) Arctostylopidae ( I I Playiomenidue ( 1 4) Pat.atl:?.id;,e (8 1
Amphicyonidae ( 3 1 Hyaenidae (4 1 Mustelidae ( i 4) Hcrpestidue ( I ) HyacnodotItidae ( .! 1
Erinaceidae ( I )
Lorisidae ( 1 ) Mustelidac ( 3 4) Adapidae ( 1)
Soricidae i 3 ) _ Tupaiidae (2) Manidae ( I i Orycteropodidae ( 1)
Herbivore same Sillllc’ SillllC Sil llle 53 1llc’ Sit IllC 5;1111c’ SiI IllC Silllli! hil111C
SIllaL
Siltllk
.iiilc
same
same SiitW2 same
same ’ silme same
Carnivore SiiIllc SiilllL‘ same S;llllL’
Omnivore
sallle samt’? f‘rugiwore
!ilseclivore
S;I me
bame
SiIllle
Carnassial teeth, small to large body size SiI IllC same same SiIltflC
Sharp premolars. generalized molars, small to moderate body size same same Crushing flat molarJ, c moderate body size
Sma!! body size. sharp cusped ieeth same Teeth absent. eloqate rostrum same

Perissodactyla
same same Artiodactyla
same same same same Primates Proboscidea SiifllC same same’ Rndentia same same same
Equidae ( 2 I
Chalicotheriidae ( 1) Rhinocerotidae (3) Tragulidae ( 2)
Suidae (8 ) Anthracothcriidae t 3 i CiiraiToidea (4) Bovidae i 16 ) Pongidae ( 1) Deinotheriidae ( 1 1 Ambelodontidae ( 1 f Elephantoidea ( I ) Stcgodontidae ( 1) Sauridae (6) Rhizomyidae (6) Muridae (9) Cricetidae ( 12 )
Herbivore
same same same
same same same same same same same same same same same same same
.+vioderate to large six. h$h crowned shearing cheek teeth same same Moderate to large size, high crowned skearing! crushing cheek teeth SiUIlr: same same same Large size, crushing simring dctl t i t ion Very large size. shearing teeth same same same Gnawing inctsols, shearing crushing cheek teeth same same sar\z
References
Archibald, J-D., Cicmens, W-A., Gingerich, P.D.. Krause, D W., Lindsay, ti.H. and Rose, K,D.. 1987. First North American L,nd Mummal Ages of the Cenozoic Era. In: M,O, Woodburne (Editor), Cenozoic Mammals of North Amoricu: Geochronology and Biostratipruphy. Univ, Calif. Press, Bcrkelcy, pp. 24 76.
Andrews, P., 1992. Community evolution in forest hubitats.
brd, JM mci Ncsbit Evans, ~~~t~r~~s of ec~J~~j~~tJ diversity in fossil and tmxiern
Elial, J. Linn. Sot,, 1 il 177-205. ~ad~~~~~ &\*, Bartels, X, Morgtn, M.E., Behrensmeyer, AK.
and Rnza. SM., 1995. Taphutaomy of vertebrate assemblages from the Faleogene of northwestern W$oming and tm Neogene of northern Pakistan. Pnlaeogeogr. Palaeoclimatol. Palacsecol,, 115: IV- 180.
Barry, J.C., Johnson, N.M., Raza. S.M. and Jacobs, 1I.L.. 19dS, Neogene mammalian fauna! change in southern Asia: Correlations wit11 climatic, tectonic, and eustatic events. Geology, 13: 637 -640.
Barry, J.C.. Morgan, M E., WinAler, A.J , Flynn, L.J., Lindsay, E.H., Jacobs, L.L. and Pilbcam, D.R.. 1991. i-aunal intcrch:uzgc and Miocene* tcrrestria: vertcbratcs of southern Asia, Pale~biology, 17: 23 J-245.
Barry, J.C.. Morgan, M.E., Flynn, L.J., Pilbeatn, D., Jacobs, LL.. Lindsay, E.H., Raza, S.M, and Solounias, N., 1995. Patterns of fauna1 turnover and diversity in tire Neogene Siwaliks of northern Pakistan. Palaeogeogr. Palaeoclimatol. PiIJi~eOeCO!., 1 IS: 209-226.
Brown, J.H. and Bowers. M.A., 1984. Patterns and processes
in three guilds of terr&:strial vertebrates. In: D.R Strong Jr.. D. Simberloff. L.G. Abeie and A.B. Thistle (Editors), Ecological Communities: Conceptual Issues and the Evidence. Princeton Univ. Press, pl:. 282 296.
Buchardt, B., 1978. Oxygen isotope paleotemperatures f'rom the Tertiary period in the North Sea area. Naturr. 27s: 121 1,9.X
Collinson, M.E. and Hnokcr. J.J.. 10~~1. Fossil cvidcncc ol’ intcru:t~ons bctwcen plants and plant-caring mammals. Philc.5. ‘rranh. R. Sot. Lm~don. 231: 107 208.
Damuth, J.D., Jablsnski, D., Harris, J.A., Pot%, R., Stucky, P.K.. Sues, H.-D. tind Weishampel. D& 1992. ‘faxon-free cJmracterizations of auaima! communities. In: A.K. Behrensmeyer, J.D. Damuth, W.A. DeMichele, R. Potts, H.-D. Sues and S.L. Wing (Editors), Terrestrial Ecosystems through Time. Evolutionary Paleoecology of Terrestrial Plants and Animals. Univ. Chicago Press. pp. 182--20X
Eisenberg, J.F., 1981. The Mammalian Radiations---An Analysis of Trends in Evolution, Adaptation, and Behavior. Univ. Chicago Press, 610 pages,
Elton, C., 1927. Animal Ecology. Sidgwick and Jackson. London, 207 pp.
Emtnons. L.H., Gautier-Hion, A. dnd Dubost. G., 1983. Community structure of the frugivorous iol+.zrc~< mam- III~S of Gabon. J. Zool. London, 199: 209-222.
Fleming, T.H., 1973. Numbers of ntantmal species in North and Central American forest communities. Ecology, 44: W-563.
Flynn. L.J. and J ticohs. L.L., 1982. Effects of cttanging environments on Siwalik rodent faunas of northern Pakistan. Palaeogeogr. Palaeoclintatol. Palaeoecol., .jg. 12% E 38.
Flynn, L.J.. Pilbeant, D.. Jacobs, L.L.. Barry, J.C.,

Da Fonseca. G..4.B. und KierulK M.C.M.. 1988. Biz!ogy a11$
rkatur:tl history of Britzilian At!antic forest small mammals. E?l ?. Flu. State Mus. Biol. Sci.. 34: 99 152.
Fortclius. M . . 198s. l_ingula!c :hcck teeth: Dcvclopn:cntal. fm:tional. and evolutionary intcrrclations. Actu Zool. Fem., 180: ! fh.
Ghgcrich. P.D.. 1983. P~~IWCCII~ EOC~‘!IC f;tiltli~l I’i>iics iit1t.l i\ ~*rclinlin;lr~~ ;mlysis oi Litramidc structuritl dcIi)rtl?itttotj in tltc Ciark’s Fork Basin. Wyoming. In: 34th Annu. Field Co16 (;L;i.lebook. Wyo. Cht. Assoc.. 1983. pp. I85 195.
Gingcric h. P.D.. 1989. New carlicst WawiJli:ttl marnwdi~~r~ tiiund i‘mv llic hwcnc ot n~~rtli:~‘~*~ tern Wtorniiig: Composition and diversity in u rarely !mq~ied Hugh- floodplain awmhlape. Univ. Mich. Pap. Palcontol.. 28: I 17.
Gingerich. P.D.. 19QO. Predictior? of body mass ill ltltinlnlalli\tl species from long bow tcngths and diameterx. Contrib. Mus. Paleontol. Univ. Mich., 28: 79 92.
Gingcrich. P.D. and Smith. B.H.. 1984, hll~wetric scaling in tlw dcntition of primates and insectivores. In: W. Jungcrs ( Editor). Six alId ?hling in Primate Biology. Plenum. N~M York. pp. 257 272.
Gingerich. P.D.. Smith. B.H. and Roscnbcrg. K.. l9Q. Alhctric scaling iu the dc’ntition of primates iltld predict ion of body weight ~1 tooth six in fossils. Am. J. Phys. Alltlmrp~l.. 5x: XI IW.
GiIllt. I’. iilld Sclilutcr. D.. “I%!. Intcrspwilic coiiipc‘titicv
inlkrrcd l’rcm pattcrm 01’ guild htwctutc. In: I).li S~rcmg Jr.. 13. SimberloO’, LG. Abele and A.B. Thistk ( EditmsD, Ecologici~l Cn:nn~uaitiex Conceptual issues tind tlic Evidence. Princeton Univ. Press. Primxton. pp. 201 233.
Gunnell, G.F.. 19K9. Evolutionary history of Microsyopoidea ( Manmalia, “Primates) md the relationship between Plcsiadapiformes and Primates. Univ. Mich. Pap. Palcontol., 27: I -- 157.
Gunnell, G.F., 1994. Paleocene mammals and fauna1 analysis of the Chappo Type Locality (Titinian). Green River Basin. Wyoming. J. Vertebr. Paleontol.. 14: 81 104.
Gunnell, G.F.. Bartels, W.S. and Gingerich. P.D.. 1993. Paleocene Eocene boundary in continental North America: biostratigraphy and peochronology. northern Bighorn Basin. Wyoming. N. Mcx. Mus. Nat. Hist. Sci. Bull.. 2: 1.77 144.
Harrison. J.L., 1962. The distribution of feeding habits among
animals in a tropical rain forest. J. Animal Ecol.. 34: 5%%3 Hickey, L.. 1980. Palemme stratignaphy and flora of ‘thy
Clark’s Fork Basitl. in: P.D. , Ginggrich C: E&W). E&y Cenozoic Paleoutology and Stratigraphy of the tiipilorn Basin, Wy*hng. l880- 1980. Univac Mich. Pap. Paleontol.. 24: 33 49.
Jacobs, L.L.. Flynn. L.J.. Downs, W.R. and Barry. J.C.. 1990.
J~IIII~. C’.ILl.. 19%. The USC ~11‘ limil ung~!latc cnlllllluniti~~ ;I>
inciic*aI4m 01’ climte ind ctii iroiimcnt. In: P. 13rcnc!llc\
f Editor). Fossi and Climate. Wiley. New York. pp. 85-l&. Janis. C. M.. 199Oa. Correlgion of cranial and dental variables
with body six ir: ungul~~tes and macropodids. 1~ .J. Damutll and B.J. M:icFddden (Editors). Body Size in ~~~~~~~~~~~~~~~ Paleontology. Crinibridgc LIti. Press. pp. 255-3Oli_
JaIli:;. C.M.. 1990b. The cc:rrelation bett~eera diet ai\d dentill wciir in hcrbi\,orous I~I~~;~!s. and its relatioitship to the dctcrnlinatiotl of diets of cstinci spa&. In: A.J. Boucot ( Edi!:w). Evolutionat-) Palcobiology of Behavior and Coc\xAution. Elscbicr. Arnstcrdarn. pp. 241 39.
.I~~IIIMVL N.M.. Opdykc. N.D.. Johnson, G.D.. Lindsay. E.H. and Tilhirklwli. R.A.K.. 1982. Magnetic polarity stratigraphy and ages of’ Siwalik group rtxks of the Pottvar Plateau.
Pakistan. P;~laeogcogr. P:~l~tcc~ciim,itol. Pi~l;ic~wcoI., 27: 1’: 42.
Jolmw~. N.M., Stix. J., Ccrveny. P.F. and Yahirkhcli. R.A.K.. I’“:;. Paiccmagnetic chronology. fluvial processes. i:tld tL<ronic impliccitions of the Siwalik deposits near Chinji viilagc. Pakistan. J. Geol.. 92: 27 40.
km. J.R. and James. F.C.. 1975. Eco-ill~~~pllolo~ical confipu- ratiolls and convergent c\~olution in species and c~mmmtic~ . III: M.L. Codg and J.M. Diamond ( Editors), Eel *tog> ,111ti Evolution of C’ommunitics. Bclknap Press. Canbridg~. pp. 2% 291
b,aq’. R. t-. l9”5. l‘hc I’unctiorxil ild,.~~t~~tiOllS Ol’ pt~tllatC IllOL~ I
recth. Am. .I, Ply. Anthropol.. 4.:: I95 210 Kay. R.1.. aild Hiiemac. K.M. 1974. I;IW IIIO.LYIIWIII illltf IOOIII
1lU’ i;, UCIII and ii,ssil prirnatcs. Am. J. 1’11~s. Al.thropol.. -to* “7 250. . _-
Kay, R.F.. Sussman, R.W. and ‘l&ersail, I., 1978. Dietary and dental variations in the genus L~JIWP, with conments concerning dietary-dctmtl correlations mong Maiagi;~tiy primates. Am .I. Phys. Anthropol.. 49: 119 128.
Krause, D.W., 1982. Jaw movement, dental function. and diet in the Paleocene rnultituberculate Pfiio&rs. Paleobiology. 8: 265 281.
Krause. D.W. and Maas. MC. 1990. The biogeographic origins of late Paleocene early Eocene nxmnalian inmi- grants to the western interior of North America. In: T.M. Bown and K.D. Rose (Editors), Dawn of the Age of M~~~~mais in the Northern Part cF the Rocky Mountain Interior. North America. Geol. SOC. Am. S~CC. Pap.. 243: 71 105.
Koch, P.L., Zxhos. !.C’. and , Gingcrich. P.D.. i 992. Correlation between isotope records in marine 2nd cmtit’len-
tal carb !cht. xrvoirs near the Paleocene/Eocene ?:-Y:~~I~:~~:,
i\~%ze. 358: 3 l9-322. Kocl~. P.L., Zachos, J.C. and Dettman. D.L.. 1’195. Fcable
isotope stratigraphy and paleoclimtology ot’ the Palewene Bighorn Basin, Wyoming. PaheOgec~~r. Pkdla~OChii~O~.
Palaeoecol.. 115: 6l- 89.

Legendre, S., 1987. Les communautCs de mammif&res fossiles et leur milieu en Europe occidentale de l’Eo&ne supCrieur et Oligockne. Rev. Paliobiol., 6: 191-212.
Legendre, S., 1988. Les communautes de mammifkres du P&og&e ( Eoci’rle sul-$Mec Otigo&rac: d’Exope occi- dentale: structures, milieux et Cvolution. Thesis. U%Y. Montpellier, 265 pp.
Lindeman, R.L., 1941. Seasonal food-cycle dynamics in a senescent lake. Am. Midl. Nat., 26: 636-673.
Lindeman, R.L., 1942. The trophic-dynamic aspect of ecology. Ecology, 23: 399-418.
Lucas, P.W., 1979. The dental-dietary adaptations of ham- mats. N. Jahrb. Geol. Paliiontal. Monatsh., 8: 486-512.
Maas, MC., Krause, D.W. and Strait. S.G., 1988. The decline and extinction of Plesiadapiformes (Mammalia: ?Primates) in North America: displacement or replacement? Paleo- biology, 14: 410-431.
Mans, M.C. and Krause, D.W., in press. Mammalian fauna1 composition anii diversity during the Paleocene of western North America. Hist. Rio! ~6.
Mares. M.A., Willig, M.R. and Lather Jr., T.E., 1985. The Brazilian Caatinga in South American zoogeography: tropi- cal tnammals in a dry region. J. Biogeogr.. 12: 57-69.
Mares, M.A., Willig, M.R., Streilein, K.E. and Lather Jr., T.E., 1981. The mammals of northeastern Brazil: a prelimi- nary assessment. Ann. Carnegie Mus., SO: 81-137.
Morgan, M.E., 1992. Stable carbon isotope analysis of Miocene herbivores from the Siwaliks of northern Pakistan (Abstract ). In: Am. J, Phys. Anthropol. Annu. Meet., 87. pp. 127.
Morgan, M,E., Badglcy, C., Gunnetl, G.F., Gingcrich, P.D., Keppclman, J. and Maas, M,C‘. 1995. Comparative paleo- ecology of Paleogcne and Neogene mammalian faunas: body-size structure, Palacogsogr. Palacoclimatol, Palaeoecol., 115: 287 317.
Pilbcam, D,R., Rchrensmcycr, A.K., Barry, J.C. and lbrahim Shah, S.M. (Editors), 1979. Miocene sediments and faunas of P&k&n. Postitlu, 179: L-45.
Qttttcdc, J. and barring, TL 1995. Stable isotopes in palcosols ttnd the c~prtnsien of C, grasses in the late Miocene of ~orthe~t~ P~akistan. Palaeogeogr, Palacoclimatol. Palaeoecol,, 115: 91 116.
Qu~dcp. 3.. Cerling, T.E. and Bowman, J.R+, 1989. Development of Asian monsoon revealed by marked ecological shift during the latest Miocene in northern Pakistan, Nature, 342: IRS- 166,
Reusborger, J.M., 1973. An occlusion model for mastication and dental wear in herbivorous mammals, J, Paleontol., 47: 515-528.
Rensberger. J-M., 1986. Early chewing mechanisms in mamma- lian herbivores. Paleobiology, 12: 474-494.
Root. R.B., 1967. The niche exploitation pattern of the blue- gray gnatcatcher. Ecol. Monogr., 37: 317 350.
Rose, K.D., 1981. The Clarkforkian Land-Mat,xnal Age and mammalian fauna1 composition across the Paleocene-Eocene boundary. Univ. Mich. Pap. Paleontol , 26: 1-197.
Scott. K.M.. 1990, Postcranial dimensions of ungulates as . pdi~im cd- ?w+ mnss. cn: I ndxUth anti a.:. ;Z”,;cFEQdeil
(Editors). Body Size in Mammalian Paleontology. Cambridge Univ. Press, pp. 301-335.
Shackleton, N.J., 1984. Oxygen isotope evidence for Cenozoic climatic change. In: P.J. Brenchley (Editor), Fossils and Climate. Wiley, Chichester, pp. 27.-34.
Shackleton, NJ., 1986. Paleogene stable isotope events. Palaeogeogr. Palaeoclimatol. Pdlaeoecol., 57: 9 1 - 102.
Simpson, G.G., 1937. The Fort Union of the Crazy Mountain Field, Montana and its mammalian l%unas. U.S. Natl. Mus. Bull., 169: 1-287.
Stucky, R.K.. 1990. Evolution of land mammal diversity in North America during the Cenozoic. In: H.H. Genowtiys ( Editor), Current Mammalogy. Plenum. New York, 2, pp. 375-432.
Van Couvering, J.A.H.. 1980. Community evolution in East Africa during the late Cenozoic. In: A.K. Behrensmeyer and A.P. Hill (Editors), Fossils in the Making, Vertebrate Taphonomy and Paleoecology. Univ. Chicago Press, pp. 272-298.
Van Valkenburgh, B.. 1988. Trophic diversity in past and present guilds ol’ large predatory mammals. Paleobiology, 14: 15s- 173.
Van Valkenburgh, B.. 1989. Carnivore tientdl adaptations and diet: A study of trophic diversity within guilds. In: J.L. Gittleman ( Editor). Carnivore Behavior, Ecology, and Evolution. Comstock, Ithaca, pp. 410--436.
Wall. C.E. and Krause, D.W., 1992. A biomechanical analysis of the masticatory apparatus tit’ P~ihthrs f Multit~1berculata). J. Vertcbr. lJalcontol., 12: 172 187.
Wing, S.L.. Bown, T.M. and Obradovich. J.D.. 1991. Early Eocene biotic and climatic change in intcriol western North ‘Imcricu, Gcrslogq, 19: 1 I89 1192.
Wing, S.L., Hickey, L.J. alid Alroy, J., 1995. Plant and mammal diversity in the Paleocene to early Eocene of the Bighorn Basin, Wyoming. Palaeogeogr. Pnheoclimatol. Palaenecol. 115: 117 - 155.
Winkler, D.A., 1983. Paleoecology of an early Eocene mamma- lian fauna from paleosols in the Clarks Fork Basin, northwestern Wyoming (U.S.A.). Palaeogeogr. Palaeo- climatol. Palaeoecol., 43: 261. 298.
Wolfe, J.A., 1978. A palesbotanical interpretation of Tertiary climates in the northern hemisphere. Am. Sci., 66: 694-703.
Wolfe, J.A. and Hopkins, D.A., 1967. Climatic changes recorded by Tertiary land floras in northwestern North America. In: K. Hatsi (Editor), Tertiary Correlation and Climatic Changes in the Pacific, 1 lth Pac. Sci. Congr., Tokyo. 25, pp. 67 76.