Updating the Australian GTAP database 1996-97
33
Updating the GTAP 1996-97 Australian data base Research Memorandum Cat No: GT-06 Terry Maidment Owen Gabbitas June 2005 This is an Internal Working Document. Research Memoranda do not necessarily reflect the views of the Productivity Commission and are not for quotation without permission
-
Upload
independent -
Category
Documents
-
view
7 -
download
0
Transcript of Updating the Australian GTAP database 1996-97

Updating the GTAP 1996-97
Australian data base
Research Memorandum Cat No: GT-06
Terry Maidment Owen Gabbitas
June 2005
This is an Internal Working Document. Research Memoranda do not necessarily reflect the views of the Productivity Commission and are not for quotation without permission

Inquiries about this research memorandum:
Media and Publications Productivity Commission Locked Bag 2 Collins St East Melbourne VIC 8003 Tel: (03) 9653 2244 Fax: (03) 9653 2303 Email [email protected] General Inquiries: Tel: (03) 9653 2100 or (02) 6240 3200
An appropriate citation for this paper is: Maidment, T and Gabbitas, 0. 2005, Updating the GTAP 1996-97 Australian Data
Base, Productivity Commission Research Memorandum, Canberra, June
Information on the Productivity Commission, its publications and its current work program can be found on the World Wide Web at http://www.pc.gov.au or by contacting Media and Publications on (03) 9653 2244.

I
Contents
Abbreviations III1 Source data 2
2 Processing of the source data 3
2.1 Removal of negative value flows 4
2.2 Reconciling basic price and producer price flows 6
2.3 Re-coding of complementary imports 7
2.4 Removal of re-exports 7
2.5 Reclassification of primary factors of production 7
2.6 Aggregation of investment 8
2.7 Treatment of other taxes less subsidies on production 8
2.8 Converting multi-product industries to single-product industries
8
2.9 Mapping ABS products to their GTAP counterparts 9
2.10 Balancing the data base 9
3 Data base supplied to GTAP 10
4 Comparability with previous GTAP data bases 10
5 Diagnostics 11
Annex 12
References 27

II
FIGURES
1 Process for creating the GTAP version 6 Australian data base 5
TABLES
1 1996-97 input-output data available electronically 12
2 ABS input-output product classification, 1996-97 13
3 GTAP sectoral classification (GSC2) 15
4 Concordance between ABS and GTAP products 16
5 Intermediate use of imported Water transport and Air transport 19
6 Negative cells in the ABS Domestic use table 19
7 Primary factor shares 20
8 Final demand concordance 22
9 Mapping of ABS sectors to more than one GTAP sector 23

III
Abbreviations
ABS Australian Bureau of Statistics
CGE Computable general equilibrium (model)
GDP Gross Domestic Product
GDP(E) Gross Domestic Product (Expenditure)
GDP(I) Gross Domestic Product (Income)
GSC2 GTAP sectoral classification, revision 2
GTAP Global Trade Analysis Project (Purdue University)
GTAP 5 GTAP version 5 database
IO Input output
IOPC Input-output product classification
MF Imports vector (free of duty)
OP Output / Production vector at market prices
SNA68 System of National Accounts, revised 1968
SNA93 System of National Accounts, revised 1993
UF Use matrix, pre-commodity tax
UN United Nations
UP Use matrix, post-commodity tax


1
Updating the GTAP 1996-97 Australian data base
Terry Maidment and Owen Gabbitas Productivity Commission
The Australian component of the GTAP version 6 data base was constructed from key input-output tables supplied by the Australian Bureau of Statistics and some supporting tables estimated from other data sources. The data provided covers the Australian financial year ended 30 June 1997. The data were cleaned and transformed to meet GTAP’s requirements and homogeneity assumptions were used to convert the data from 106 ‘multi-product’ sectors to ‘single-product’ sectors. Finally, the data tables were reclassified and re-balanced to provide the matrices required by GTAP.
This paper describes the construction of the Australian component of the data base for version 6 of the Global Trade Analysis Project (GTAP) model. The provision of the data for Australia was undertaken as part of the Productivity Commission’s commitment as a member of the GTAP consortium.
In line with GTAP requirements, as outlined in Huff, McDougall and Walmsley (2000), the data for Australia were provided in four matrices:
• the supply and use of the 57 GTAP products and three primary factors of production (land, labour and capital) without product taxes (GTAP matrix UF);
• the supply and use of the 57 GTAP products and three primary factors with product taxes (GTAP matrix UP);
• output of the 57 GTAP products (GTAP vector OP); and
• imports of the 57 GTAP products (GTAP vector MF).
Because data definitions and classifications of input-output information available to undertake the update do not match precisely with the requirements of GTAP, a ‘building block’ approach has been adopted. Under this approach, available information was first adjusted or reclassified according to GTAP requirements. When this processing was complete, the individual building blocks so derived were assembled according to the structure of the GTAP data base as defined by the GTAP tables UF, UP, OP and MF.

2
Section 1 describes the key data sources used, while section 2 outlines the processing of source data into a form corresponding to GTAP requirements. Section 3 describes how these data were brought together into the GTAP format. Section 4 notes key conceptual differences and sensitivities between this version and the Australian component of version 5 of the GTAP data base. Section 5 notes key diagnostics tests applied to the data base before its distribution.
1 Source data
The primary data sources used to construct the Australian data base were electronic versions of the 1996-97 input-output (IO) tables made available by the Australian Bureau of Statistics for the Australian financial year ended 30 June 1997.1 The ABS tables contain detailed data on the supply and use of 106 products in Australia and the associated product tax payments (see table 1 for a list of tables of supply, use and derived tables provided in electronic format for the input-output 106 sector Australian product classification).
Two versions of the 1996-97 input-output tables were made available by the ABS. The versions differed with respect to the treatment of transport margin activities.2 The first version recorded such margin service flows differently depending on whether the buyer or seller was invoiced for the cost of transportation and goods traded. This treatment accorded with the recommended treatment of transport margins set out in the System of National Accounts, 1993 edition (Commission of European Communities et al. 1993). The second version recorded transport margin service flows on a common basis — as a cost to the buyer regardless of who was actually invoiced for the transport service (whether the buyer or seller). This treatment of transport services accorded with the treatment set out in the 1968 edition of the System of National Accounts (UN 1968) and the treatment applied in the Australian input-output tables for the financial year 1993-94 — the reference year for the Australian tables submitted for version 5 of the GTAP data base.
The recording of transport margin service flows on a SNA68 basis has significant advantages for economic analysis using input-output tables (Aspen 2001 and
1 ABS (2000) describes the concepts, sources and methods used in compiling the Australian input-
output tables. 2 The ABS defines margin activities to be the difference between the price received by producers
(basic prices) and the price paid by the purchaser of a good or service (purchasers’ prices). Margin activities fall into two broad groups — mark-ups and taxes. Mark-ups primarily increase the value of goods without otherwise transforming them and include wholesale and retail trade margins and transport margins. Tax margins are taxes or subsidies levied on products and include sales taxes, excise taxes, customs duties (tariffs) and, since July 2000, the goods and services tax.

3
Gretton, Bobbin and Horridge 2004). The GTAP secretariat indicated a preference for the data base to be prepared on an SNA68 basis (McDougall, R., GTAP, Purdue University, pers. comm., 9 September 2003). Consequently, the primary data sources used to construct the Australian component of the GTAP version 6 data base was the electronic version of key input-output tables compiled by the ABS according to SNA68.3
A third potential data source was also considered — the 1996-97 MONASH model data base (Horridge 2002). However, this source was derived from the ABS input-output tables that included the SNA93 treatment of transport margin services. Thus, while the MONASH data base provided operational advantages for the compilation of the GTAP data base, it suffered from the same limitations as the ABS tables on which it was based, and accordingly was not used in the current exercise.
Some secondary data sources referenced in this document were used to fill gaps in the primary source data. These gaps arose either because the ABS restricted the release of certain statistics to preserve confidentiality or because some of the supporting tables needed to construct the GTAP data base were not provided by the ABS on an SNA68 basis.4 Any missing SNA68 supporting tables required, such as the duty and commodity tax tables, were estimated from data in the SNA68 tables supplied supplemented with data from the corresponding SNA93 tables.
2 Processing of the source data
The ABS data, although similar to the format of the GTAP data requirements, did not fully satisfy all aspects of the GTAP requirements as set out in Huff, McDougall and Walmsley (2000) without adjustment. The main adjustments applied to the ABS data were:
• the removal of negative value flows;
• the reconciliation of basic price and producer price flows;
• the re-coding of imports, from the generic ABS category of complementary imports to disaggregated GTAP products;
3 The SNA68 Use table supplied by the ABS also contained some revisions. In 60 of the 106 IOPC
commodities, mainly in the mining and manufacturing sectors, SNA68 Total supply (col. T6) was lower than published under SNA93. Most revisions were modest (less than 2 per cent). As a result, Total intermediate usage (row T1) was only 0.7 per cent lower. Australian production (row T2) and Total usage (row T3) were, respectively, also 0.5 per cent and 0.4 per cent lower. Gross domestic product and Gross value added were unchanged.
4 To preserve confidentiality, the ABS restricts the release of statistics where the disclosure of the statistics would enable the identification of data supplied by individuals or firms.

4
• the removal of ‘re-exports’ from imports and exports;
• the re-classification of the ABS primary factor inputs to GTAP input categories;
• the aggregation of the ABS investment categories to the single GTAP investment category;
• the treatment of other taxes less subsidies on production;
• the transformation of industries from a multi-product to a single-product structure;
• the re-classification of flows classified by ABS industry categories to GTAP categories; and
• the final balancing of the data base.
The process for creating the GTAP version 6 data base for Australia is illustrated in figure 1. Details of each process are outlined below.
2.1 Removal of negative value flows
Negative value flows were found to exist for definitional and data reasons.
The main reason for the negative value flows was the recording of imports on a ‘net basis’ in the ABS input-output tables. Under this convention, the net value of imports transportable goods was reported as the value of goods imported less the cost of any Australian transport services incurred in bringing those goods to Australia. To balance the supply and use of relevant flows, the cost of any Australian transport services were deducted from industry and final users’ consumption of relevant transport services. Consequentially, usage of imports of water transport and air transport was set to zero for 88 industries and exports of water transport and air transport services were increased by an identical amounts (see table 5).
In a similar vein, the reported negative of A$135.7 million for household consumption of imported water transport was increased to +$A25.7 million on the basis of benchmark information provided in the 1993-94 input-output tables (ABS 1997).5 Household consumption of domestically produced water transport was reduced by A$161.4 million to offset the adjustment to imports and maintain aggregate household consumption at its initial level. Exports of water transport services were increased to balance supply and use.
5 Household final consumption of imported water transport in 1996-97 was set to 4 per cent of
total intermediate usage, the same share as in the 1993-94 input-output tables (ABS 1997).

5
Figure 1 Process for creating the GTAP version 6 Australian data base
Adjusted 1996-97 input-output tables (SNA68) (106 commodities × 106 industries)
ABS 1996-97 input-output tables (SNA68) (106 commodities × 106 industries)
Single-product input-output tables (SNA68) (106 industries × 106 industries)
Disaggregated input-output tables (SNA68) (118 industries × 118 industries)
Unbalanced GTAP data base (57 industries × 57 industries)
Balanced GTAP input-output tables (57 industries × 57 industries)
Remove negative valuesEstimate SNA68 product
taxes & duty tables
Convert multi-product to single-product industries
ABS Supply table (106 commodities × 106 industries)
Disaggregate industries
Aggregate to GTAP structure
Re-balance total sales and total costs
Concordance between 118 ABS and 57 GTAP industries (summarised in tables 4 & 9)
Disaggregated industry share data (summarised in table 9)

6
Negative value flows also occurred when the estimated use of imports exceeded total use of a product. This statistical relationship implied that input of domestic production by certain users was negative (table 6). These negatives were removed by increasing intermediate usage of domestically produced products to zero and total use by the same amount. To maintain the balance between total costs and sales, imports and exports of these commodities were reduced by 50 per cent of the original negative value.
2.2 Reconciling basic price and producer price flows
GTAP requires that data on usage of products be reported at basic prices (matrix UF) and at producers’ prices (matrix UP) with the difference between the two matrices being taxes on products.
The ABS provided data at basic prices together with a matrix of the impost on users of aggregate taxes on products (ABS IO table 33) and matrices on the components:
• sales tax by commodity and category of use (ABS IO table 34);
• import duty by commodity and category of use (ABS IO table 35);
• other taxes on products by commodity and category of use (ABS IO table 36); and
• (less) subsidies on products by commodity and category of use (ABS IO table 37).
In principle, the table at producers’ prices required by GTAP could have been obtained by simple aggregation of the basic price flows and taxes on these flows. However, revised variants of the relevant tax tables were not available at basic prices with the SNA68 treatment of transport margins service flows (see table 2).
Therefore, to complete the data set, estimates of product taxes had to be imputed. This was done by imputing the ‘ad valorem’ duty, tax or subsidy rate implied by the basic price and product tax tables with the SNA93 treatment of transport services. This ad valorem rate was then applied to the revised use or imports tables at basic prices, as appropriate, to derive revised product tax tables showing (net) product taxes and imports duty. Finally, the results so derived for each industry were scaled to ensure that total product taxes paid by each industry matched comparable totals provided by the relevant benchmark ABS data (ie row P3 in the in the Use table — ABS IO table 2 (SNA68)).

7
2.3 Re-coding of complementary imports
The use and imports tables supplied by the ABS (ABS IO tables 2 and 3, respectively) distinguished between imports of goods produced in Australia (Competing imports, row P6) and those that are not (Complementary imports, row P5). Complementary imports in 1996-97 mostly comprised motor cycles (A$250.8 million) and natural rubber (A$78.8 million) (ABS 2001a, p. 92). Competing imports accounted for 99.7 per cent of Australian imports in 1996-97.
The GTAP data base assigns all imports to specified industry of origin products and makes no provision for complementary imports defined from the perspective of an individual country. In order to conform to GTAP accounting conventions, Complementary imports were allocated to each industry’s use of competing imports.
2.4 Removal of re-exports
The imports table supplied by the ABS (ABS IO table 3) contained information on ‘re-exports’ — goods temporarily brought into Australia that are subsequently exported (row 9909). Re-exports accounted for 2 per cent of Australian imports in 1996-97.
As re-exports are not included in the GTAP data base, re-export flows were identified and subtracted from total exports and imports. Handling and distribution services provided by Australian firms and associated with re-exports were retained and classified as an export of a transport or distribution service in accordance with the convention adopted in source data tables provided by the ABS.
2.5 Reclassification of primary factors of production
The use table supplied by the ABS (ABS IO table 2) provided data on the inputs of two primary factors of production — Compensation of employees (row P1) and Gross operating surplus & mixed income (row P2) — by each industry. These categories overlap with the three primary input categories — land, labour and capital — specified in the GTAP data base.
To complete the GTAP data base, the ABS categories were reclassified to GTAP categories using the primary factor shares adopted in the MONASH model data base (table 7). Horridge (2002) describes the derivation of the primary factor shares from the underlying published input-output tables.

8
2.6 Aggregation of investment
The ABS provided data on commodity sales to each category of final demand —final consumption expenditure disaggregated to private and government; gross fixed capital formation disaggregated to private, public enterprises and general government; changes in inventories; and exports (table 8).
The categorisation is similar to that applied in GTAP, with the exception that the ABS categories of Gross fixed capital formation — Private (column Q3 of ABS IO tables 2 and 3); Gross fixed capital formation — Public enterprises (column Q4); and Gross fixed capital formation — General Government (column Q5) provide a more detailed breakdown than required for GTAP. To complete the GTAP data base, these categories were aggregated to form the GTAP final demand category Investment.
2.7 Treatment of other taxes less subsidies on production
The ABS definition of total sectoral usage (row T2 in ABS IO table 2) includes ‘other taxes less subsidies on production’ whereas the GTAP definition of total usage does not (matrices UF and UP). The estimated total value of these taxes less subsidies was A$22 650 million in 1996-96.6
2.8 Converting multi-product industries to single-product industries
The basic input-output tables provided by the ABS are ‘multi-product’ in nature — that is, each industry produces commodities characteristic of that industry and can also produce commodities characteristic of other industries (eg the ABS Dairy products industry primarily produced Dairy products but also produced some Meat and meat products).
The GTAP model (and hence its data base) on the other hand is ‘single product’ in nature — that is, each ‘industry’ is defined as producing only one ‘commodity’ and each ‘commodity’ is produced by only one ‘industry’.
6 The ABS defines ‘other taxes on production’ as ‘all taxes that enterprises incur as a result of
engaging in production, except taxes on products’ and includes: payroll taxes; recurrent taxes on land, buildings or other structures; some business and professional licences; stamp duties; taxes on pollution; and taxes on international transactions. Likewise, the ABS defines ‘other subsidies on production’ as ‘all subsidies, except subsidies on products, which resident enterprises may receive as a consequence of engaging in production’ and includes employment subsidies (ABS 2000, Australian National Accounts: Concepts, Sources and Methods, Cat. no 5216.0).

9
The multi-product ABS input-output tables were converted to single-product, or symmetric, tables by applying the industry technology assumption, whereby all products produced by an industry were assumed to be produced with the same input-output structure. It also was assumed that an industry supplied each user of products it produced in proportion to its market share for that product. Market share information needed for the application of these assumptions was derived from the supply table provided by the ABS (ABS IO table 1).
The application of these assumptions enables the ‘commodity by industry’ tables supplied by the ABS to be converted to ‘industry by industry’ tables.
2.9 Mapping ABS products to their GTAP counterparts
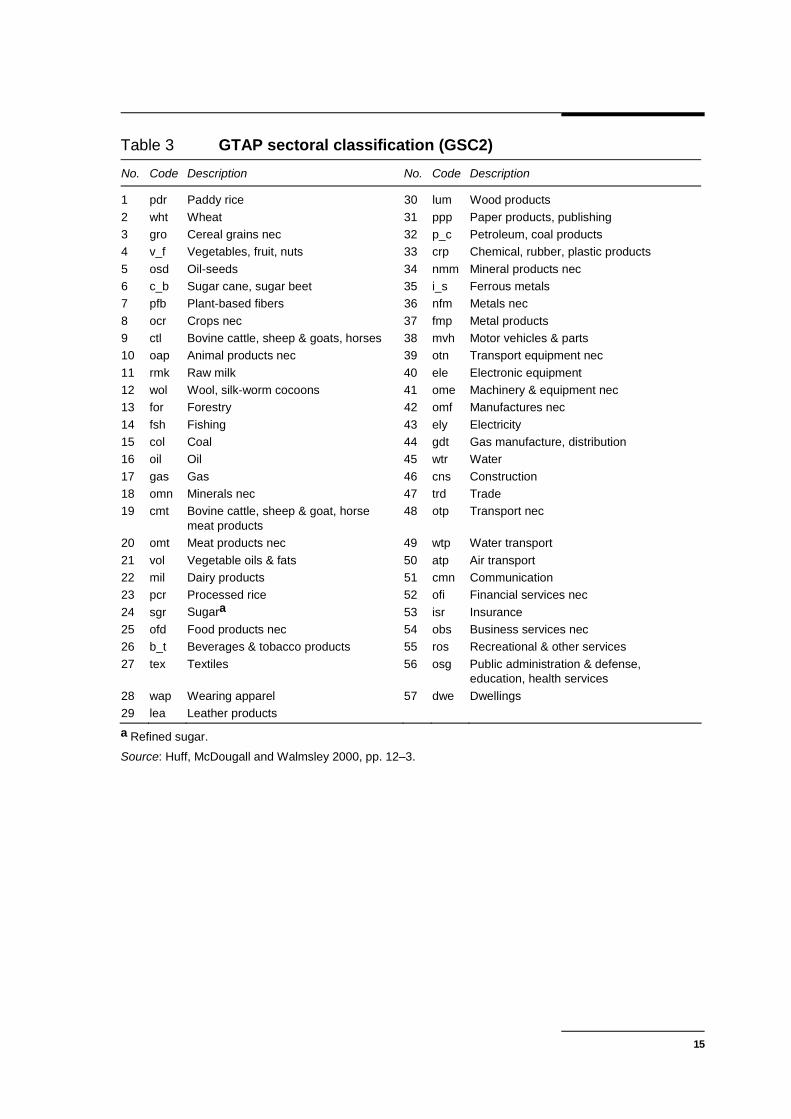
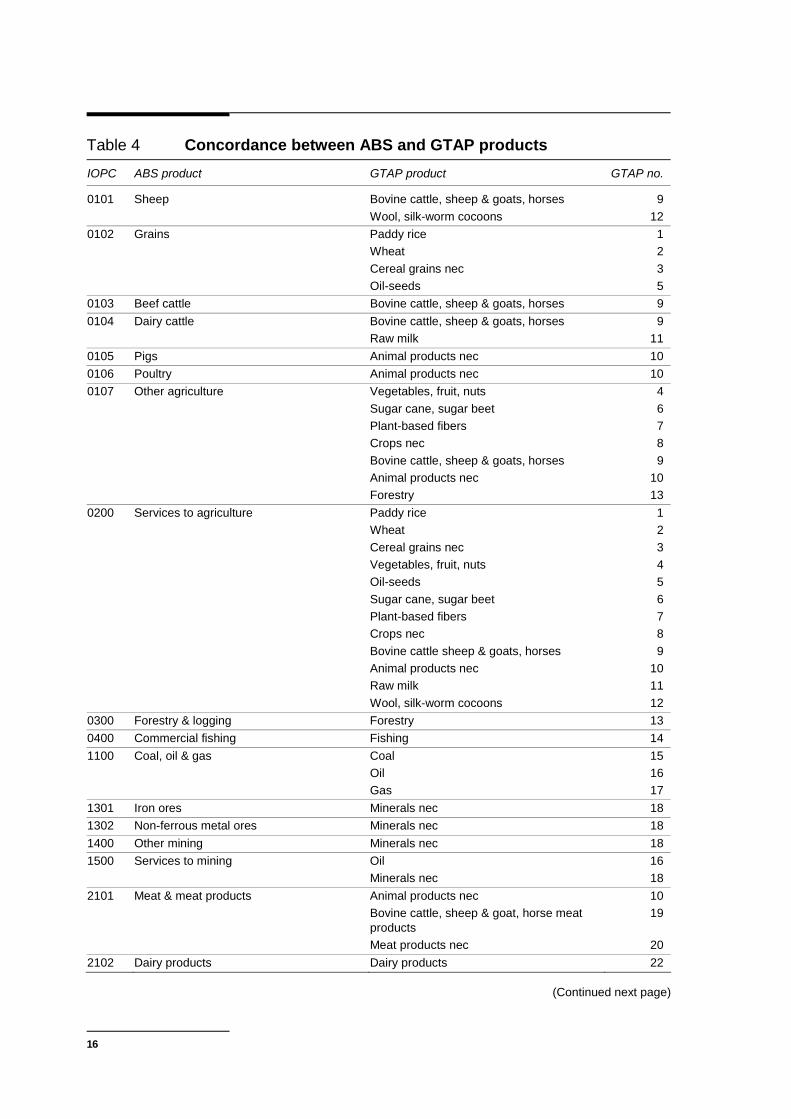
The Australian input-output tables have 106 sectors compared to the 57 in the GTAP version 6 data base (these are listed in tables 2 and 3, respectively). To complete the data base on a 57 sector basis, a concordance was established between the two classifications (table 4) and used to map the input-output data from the 106 ABS sectors to the 57 GTAP sectors.
The concordance shows that 93 ABS sectors can be linked directly to one of the GTAP sectors without adjustment. However, it also shows that 13 ABS sectors were linked to more than one GTAP sector.7 For example, the ABS sector Grains is linked to the GTAP sectors Paddy rice, Wheat, Oil-seeds and Cereal grains.
The process for mapping information on the use of sector outputs (rows) and sector inputs (columns) (and associated product taxes) involved, for each relevant ABS sector, a decomposition of the relevant rows and columns into building block categories that could be linked directly or re-aggregated to a GTAP sector.
Inputs to production and sector outputs were estimated for each building block sector by reference to detailed sector-specific information contained in the MONASH model data base. Where such information was not available (ie where the sectors in MONASH did not correspond to the sectors needed to compile the GTAP data base), the ABS input and output structures were apportioned according to ABS output shares (table 9).
2.10 Balancing the data base Once all adjustments were completed, the GTAP data base was balanced to ensure that total sales aligned with total costs for each sector and that the income and
7 The data used are too detailed to present here in full and is available from the authors on request.

10
expenditure components of GDP aligned with estimates published by the ABS taking into account any adjustments associated with meeting GTAP’s requirements.
3 Data base supplied to GTAP
The above steps provided a series of ‘building block’ tables that met GTAP classificatory and data requirements, but did not conform to the data base structure outlined by Huff, McDougall and Walmsley (2000).
Assembly of the final tables involved:
• for the matrix UF, merging the domestic usage of domestic production, imported supplies and primary inputs by sector and category of final demand, evaluated at basic prices into a single array.
• for the matrix UP, aggregating estimated product taxes (net) by sector and category of use with estimates of usage at basic prices (matrix UF) to provide estimates of usage of domestic production and imported supplies at producer prices.
• for the vector OP, transferring estimated output by sector from the building block tables to a single array. The value of output is estimated at basic prices and, as such, is inclusive of all domestically produced and imported inputs, and product taxes on those inputs (matrix UP) plus other taxes and subsidies on production (such as payroll and land taxes) (not included in matrix UF or UP).
• for the vector MF, transferring the total value of imports by sector (single product industry basis) from the building block tables to a single array.
4 Comparability with previous GTAP data bases
The starting point for the GTAP version 5 data base for Australia was the MONASH model data base for the reference year 1993-94. That data base was benchmarked to ABS input-output tables for that year; however, it had the advantage of commodity and industry disaggregations needed to provide information according to the GTAP sectoral classification.
The starting point for the GTAP version 6 data base was a special version of the input-output tables compiled by the ABS on request from the Productivity Commission. This version differed from the published tables for 1996-97 with respect to the treatment of transport margin services (as outlined above).

11
Although this treatment is aligned to the treatment of transport services in the 1993-94 MONASH data base (and supporting input-output tables), the treatment has not been carried forward to the most recent MONASH data base, at this stage.
More generally, the version 6 data base provided has been compiled according to the statistical standards promulgated in the SNA93, whereas the version 5 data base provided by Mastoris, Travis and Welsh (2002) was based on data compiled according to the statistical standards promulgated in the SNA68. Details of the changes to the Australian national accounts and supporting output tables associated with the new standards are provided in ABS (1997).
5 Diagnostics
The Australian GTAP data base was checked to ensure that:
(a) there were no negative values (other than where appropriate);
(b) the pre- and post disaggregation value of costs and sales balanced;
(c) total sales equalled total costs in total and by sector;
(d) the values for GDP, GDP(I) and GDP(E) were correct;
(e) that the components of GDP(I) and GDP(E) were correct; and
(f) the GTAP entropy input-output cost shares appeared correct.8
8 The entropy input-output cost shares used measure the difference in cost shares for each industry
in the Australian data base compared to a representative GTAP data base and highlight any unusual cost shares (Walmsley and McDougall 2001).

12
Annex
Table 1 1996-97 input-output data available electronically Grouping Table Description
Basic tables 1† Supply table — supply by product group by industry and imports 2†* Use table — input by industry and final use category and supply by product
group 3†* Imports table — input by industry and final use category and supply by
product group 4 Reconciliation of flows at basic prices and at purchasers' prices by product
Industry by industry tables (basic prices, recording intra-industry flows)a 107 Industries Direct allocation of competing imports 5 Flow matrix 6 Direct requirements coefficients from Table 5 7 Total requirements coefficients from Table 6 Indirect allocation of competing imports 8 Flow matrix 9 Direct requirements coefficients from Table 8 10 Total requirements coefficients from Table 9
Primary input tables 17 Primary input content (total requirements) per $100 of final use by industry 18 Primary input content by industry of each category of final use
Other tables 19 Specialisation and coverage ratios by industry 20 Employment by industry 21 Composition of supply of product groups containing margin products 22 Output multipliers, direct allocation of competing imports
Margin matricesb 23 Wholesale trade (4501, part) 24 Retail trade (5101, part) 25 Restaurants, hotels and clubs (5701, part) 26 Road transport (6101, part) 27 Rail transport (6201, part) 28 Pipeline transport (6201, part) 29 Water transport (6301, part) 30 Air transport (6401, part) 31 Port handling (6601, part) 32 Marine insurance (7401, part) 33† Taxes on products (net) 34 Sales tax 35† Duty 36 Other taxes on products 37 Subsidies on products
* Also supplied by the ABS on an SNA68 basis. † used in constructing the GTAP data base. a Similar tables are available at the 35 industry level (ABS IO tables 11 to 16). b Supply of margin by product group to which the margin applies and input of margin by industry and final use category.
Source: ABS 2001a (Input-Output Tables, Australia, 1996-97, Cat. no. 5209.0, p. 93).

13
Table 2 ABS input-output product classification, 1996-97 No. IOPC Description No. IOPC Description
1 0101 Sheep 39 2402 Publishing, recorded media etc 2 0102 Grains 40 2501 Petroleum & coal products 3 0103 Beef cattle 41 2502 Basic chemicals 4 0104 Dairy cattle 42 2503 Paints 5 0105 Pigs 43 2504 Pharmaceuticals 6 0106 Poultry 44 2505 Soap & detergents 7 0107 Other agriculture 45 2506 Cosmetics & toiletries 8 0200 Services to agriculturea 46 2507 Other chemical products 9 0300 Forestry & logging 47 2508 Rubber products 10 0400 Commercial fishing 48 2509 Plastic products 11 1100 Coal, oil & gas 49 2601 Glass & glass products 12 1301 Iron ores 50 2602 Ceramic products 13 1302 Non-ferrous metal ores 51 2603 Cement, lime & concrete slurry 14 1400 Other mining 52 2604 Plaster & other concrete products 15 1500 Services to mining 53 2605 Other non-metallic mineral products 16 2101 Meat & meat products 54 2701 Iron & steel 17 2102 Dairy products 55 2702 Basic non-ferrous metals 18 2103 Fruit & vegetable products 56 2703 Structural metal products 19 2104 Oils & fats 57 2704 Sheet metal products 20 2105 Flour & cereal foods 58 2705 Fabricated metal products 21 2106 Bakery products 59 2801 Motor vehicles & parts etc 22 2107 Confectionery 60 2802 Ships & boats 23 2108 Other food products 61 2803 Railway equipment 24 2109 Soft drinks, cordials & syrups 62 2804 Aircraft 25 2110 Beer & malt 63 2805 Scientific etc equipment 26 2111 Wine & spirits 64 2806 Electronic equipment 27 2112 Tobacco products 65 2807 Household appliances 28 2201 Textile fibres, yarns etc 66 2808 Other electrical equipment 29 2202 Textile products 67 2809 Agricultural, mining etc machinery 30 2203 Knitting mill products 68 2810 Other machinery & equipment 31 2204 Clothing 69 2901 Prefabricated buildings 32 2205 Footwear 70 2902 Furniture 33 2206 Leather & leather products 71 2903 Other manufacturing 34 2301 Sawmill products 72 3601 Electricity supply 35 2302 Other wood products 73 3602 Gas supply 36 2303 Pulp, paper & paperboard 74 3701 Water, sewerage & drainage 37 2304 Paper containers & products 75 4101 Residential building 38 2401 Printing & services to printing 76 4102 Other construction
(Continued next page)

14
Table 2 (continued) No. IOPC Description No. IOPC Description
77 4501 Wholesale trade 92 7701 Ownership of dwellings 78 5101 Retail trade 93 7702 Other property services 79 5401 Mechanical repairs 94 7801 Scientific research etc 80 5402 Other repairs 95 7802 Legal, accounting etc services 81 5701 Accommodation, cafes &
restaurants 96 7803 Other business services
82 6101 Road transport 97 8101 Government administration 83 6201 Rail transportb 98 8201 Defence 84 6301 Water transport 99 8401 Education 85 6401 Air transportc 100 8601 Health services 86 6601 Services to transportd 101 8701 Community services 87 7101 Communication services 102 9101 Motion picture, radio etc 88 7301 Banking 103 9201 Libraries, museums & the arts 89 7302 Non-bank finance 104 9301 Sport, gambling etc 90 7401 Insurance 105 9501 Personal services 91 7501 Services to finance etc 106 9601 Other services
a Services to agriculture, hunting & trapping. b Rail, pipeline & other transport. c Air & space transport. d Services to transport, storage.
Source: ABS 2001a (Input-Output Tables, Australia, 1996-97, Cat. no. 5209.0).
15
Table 3 GTAP sectoral classification (GSC2) No. Code Description No. Code Description
1 pdr Paddy rice 30 lum Wood products 2 wht Wheat 31 ppp Paper products, publishing 3 gro Cereal grains nec 32 p_c Petroleum, coal products 4 v_f Vegetables, fruit, nuts 33 crp Chemical, rubber, plastic products 5 osd Oil-seeds 34 nmm Mineral products nec 6 c_b Sugar cane, sugar beet 35 i_s Ferrous metals 7 pfb Plant-based fibers 36 nfm Metals nec 8 ocr Crops nec 37 fmp Metal products 9 ctl Bovine cattle, sheep & goats, horses 38 mvh Motor vehicles & parts 10 oap Animal products nec 39 otn Transport equipment nec 11 rmk Raw milk 40 ele Electronic equipment 12 wol Wool, silk-worm cocoons 41 ome Machinery & equipment nec 13 for Forestry 42 omf Manufactures nec 14 fsh Fishing 43 ely Electricity 15 col Coal 44 gdt Gas manufacture, distribution 16 oil Oil 45 wtr Water 17 gas Gas 46 cns Construction 18 omn Minerals nec 47 trd Trade 19 cmt Bovine cattle, sheep & goat, horse
meat products 48 otp Transport nec
20 omt Meat products nec 49 wtp Water transport 21 vol Vegetable oils & fats 50 atp Air transport 22 mil Dairy products 51 cmn Communication 23 pcr Processed rice 52 ofi Financial services nec 24 sgr Sugara 53 isr Insurance 25 ofd Food products nec 54 obs Business services nec 26 b_t Beverages & tobacco products 55 ros Recreational & other services 27 tex Textiles 56 osg Public administration & defense,
education, health services 28 wap Wearing apparel 57 dwe Dwellings 29 lea Leather products a Refined sugar.
Source: Huff, McDougall and Walmsley 2000, pp. 12–3.
16
Table 4 Concordance between ABS and GTAP products IOPC ABS product GTAP product GTAP no.
0101 Sheep Bovine cattle, sheep & goats, horses 9 Wool, silk-worm cocoons 12 0102 Grains Paddy rice 1 Wheat 2 Cereal grains nec 3 Oil-seeds 5 0103 Beef cattle Bovine cattle, sheep & goats, horses 9 0104 Dairy cattle Bovine cattle, sheep & goats, horses 9 Raw milk 11 0105 Pigs Animal products nec 10 0106 Poultry Animal products nec 10 0107 Other agriculture Vegetables, fruit, nuts 4 Sugar cane, sugar beet 6 Plant-based fibers 7 Crops nec 8 Bovine cattle, sheep & goats, horses 9 Animal products nec 10 Forestry 13 0200 Services to agriculture Paddy rice 1 Wheat 2 Cereal grains nec 3 Vegetables, fruit, nuts 4 Oil-seeds 5 Sugar cane, sugar beet 6 Plant-based fibers 7 Crops nec 8 Bovine cattle sheep & goats, horses 9 Animal products nec 10 Raw milk 11 Wool, silk-worm cocoons 12 0300 Forestry & logging Forestry 13 0400 Commercial fishing Fishing 14 1100 Coal, oil & gas Coal 15 Oil 16 Gas 17 1301 Iron ores Minerals nec 18 1302 Non-ferrous metal ores Minerals nec 18 1400 Other mining Minerals nec 18 1500 Services to mining Oil 16 Minerals nec 18 2101 Meat & meat products Animal products nec 10 Bovine cattle, sheep & goat, horse meat
products 19
Meat products nec 20 2102 Dairy products Dairy products 22
(Continued next page)

17
Table 4 (continued) IOPC ABS product GTAP product GTAP no.
2103 Fruit & vegetable products Food products nec 25 2104 Oils & fats Vegetable oils & fats 21 2105 Flour & cereal foods Processed rice 23 Food products nec 25 2106 Bakery products Food products nec 25 2107 Confectionery Food products nec 25 2108 Other food products Sugar 24 Food products nec 25 2109 Soft drinks, cordials & syrups Beverages & tobacco products 26 2110 Beer & malt Beverages & tobacco products 26 2111 Wine & spirits Beverages & tobacco products 26 2112 Tobacco products Beverages & tobacco products 26 2201 Textile fibres, yarns etc Textiles 27 2202 Textile products Textiles 27 2203 Knitting mill products Textiles 27 Wearing apparel 28 2204 Clothing Wearing apparel 28 2205 Footwear Leather products 29 2206 Leather & leather products Leather products 29 2301 Sawmill products Wood products 30 2302 Other wood products Wood products 30 2303 Pulp, paper & paperboard Paper products, publishing 31 2304 Paper containers & products Paper products, publishing 31 2401 Printing & services to printing Paper products, publishing 31 2402 Publishing, recorded media etc Paper products, publishing 31 2501 Petroleum & coal products Petroleum, coal products 32 2502 Basic chemicals Chemical, rubber, plastic products 33 2503 Paints Chemical, rubber, plastic products 33 2504 Pharmaceuticals Chemical, rubber, plastic products 33 2505 Soap & detergents Chemical, rubber, plastic products 33 2506 Cosmetics & toiletries Chemical, rubber, plastic products 33 2507 Other chemical products Chemical, rubber, plastic products 33 2508 Rubber products Chemical, rubber, plastic products 33 2509 Plastic products Chemical, rubber, plastic products 33 2601 Glass & glass products Mineral products nec 34 2602 Ceramic products Mineral products nec 34 2603 Cement, lime & concrete slurry Mineral products nec 34 2604 Plaster & other concrete products Mineral products nec 34 2605 Other non-metallic mineral products Mineral products nec 34 2701 Iron & steel Ferrous metals 35 2702 Basic non-ferrous metals Metals nec 36 2703 Structural metal products Metal products 37 2704 Sheet metal products Metal products 37 2705 Fabricated metal products Metal products 37
(Continued next page)

18
Table 4 (continued) IOPC ABS product GTAP product GTAP no.
2801 Motor vehicles & parts etc Motor vehicles & parts 38 2802 Ships & boats Transport equipment nec 39 2803 Railway equipment Transport equipment nec 39 2804 Aircraft Transport equipment nec 39 2805 Scientific etc equipment Machinery & equipment nec 41 2806 Electronic equipment Electronic equipment 40 2807 Household appliances Machinery & equipment nec 41 2808 Other electrical equipment Machinery & equipment nec 41 2809 Agricultural, mining etc machinery Machinery & equipment nec 41 2810 Other machinery & equipment Machinery & equipment nec 41 2901 Prefabricated buildings Manufactures nec 42 2902 Furniture Manufactures nec 42 2903 Other manufacturing Manufactures nec 42 3601 Electricity supply Electricity 43 3602 Gas supply Gas manufacture, distribution 44 3701 Water, sewerage & drainage Water 45 4101 Residential building Construction 46 4102 Other construction Construction 46 4501 Wholesale trade Trade 47 5101 Retail trade Trade 47 5401 Mechanical repairs Trade 47 5402 Other repairs Trade 47 5701 Accommodation, cafes & restaurants Trade 47 6101 Road transport Transport nec 48 6201 Rail transport Transport nec 48 6301 Water transport Water transport 49 6401 Air transport Air transport 50 6601 Services to transport Transport nec 48 Water transport 49 Air transport 50 7101 Communication services Communication 51 7301 Banking Financial services nec 52 7302 Non-bank finance Financial services nec 52 7401 Insurance Insurance 53 7501 Services to finance etc Financial services nec 52 Insurance 53 7701 Ownership of dwellings Dwellings 57 7702 Other property services Business services nec 54 7801 Scientific research etc Business services nec 54 7802 Legal, accounting etc services Business services nec 54 7803 Other business services Business services nec 54 8101 Government administration Public administration & defense, education,
health 56
8201 Defence Public administration & defense, education, health
56
(Continued next page)

19
Table 4 (continued) IOPC ABS product GTAP product GTAP no.
8401 Education Public administration & defense, education, health
56
8601 Health services Public administration & defense, education, health
56
8701 Community services Public administration & defense, education, health
56
9101 Motion picture, radio etc Recreational & other services 55 9201 Libraries, museums & the arts Recreational & other services 55 9301 Sport, gambling etc Recreational & other services 55 9501 Personal services Recreational & other services 55 9601 Other services Public administration & defense, education,
health 56
Source: Estimates based on Huff, McDougall and Walmsley 2000 and ABS 1995 (Central Product Classification).
Table 5 Intermediate use of imported Water transport and Air transport Measure Units Water transport
(6301) Air transport
(6401)
Negative elements No. of cells 83 5 Total value of negative imports A$ million -50.0 -129.8 Total value of imports A$ million 686.8 1497.3 Negatives’ share Per cent 7.3 8.7
Source: ABS 2001a (Input-Output Tables, Australia, 1996-97, Cat. no. 5209.0, SNA68 unpublished).
Table 6 Negative cells in the ABS Domestic use tablea A$ million, 1996-97, Basic prices
Commodity Using industry Value
2806 Electronic equipment 0106 Poultry -0.00050 0104 Dairy cattle 2106 Bakery products -0.00004 0104 Dairy cattle 2108 Other food products -0.00002 0104 Dairy cattle 5701 Accommodation, cafes & restaurants -0.00118 7702 Other property services 7801 Scientific research etc -0.13875 0104 Dairy cattle 8201 Defence -0.00001 2805 Scientific equipment 9501 Personal services -0.16554
Total -0.30604 a Derived by subtracting SNA68 Imports table (ABS IO table 3) from the SNA68 Use table (ABS IO table 2).
Source: ABS 2001a (Input-Output Tables, Australia, 1996-97, Cat. no. 5209.0, SNA68 unpublished).

20
Table 7 Primary factor sharesa Per cent
No. IOPC ABS industry Land Labour Capitalb
1 0101 Sheep 39.7 39.5 20.8 2 0102 Grains 41.5 36.0 22.5 3 0103 Beef cattle 37.6 42.5 19.9 4 0104 Dairy cattle 36.9 49.5 13.6 5 0105 Pigs 32.3 55.4 12.3 6 0106 Poultry 0.0 47.0 53.0 7 0107 Other agriculture 31.4 49.7 18.8 8 0200 Services to agriculture 0.0 85.4 14.6 9 0300 Forestry & logging 0.0 81.6 18.4 10 0400 Commercial fishing 0.0 67.5 32.5 11 1100 Coal, oil & gas 0.0 22.3 77.7 12 1301 Iron ores 0.0 24.7 75.3 13 1302 Non-ferrous metal ores 0.0 29.0 71.0 14 1400 Other mining 0.0 21.4 78.6 15 1500 Services to mining 0.0 53.5 46.5 16 2101 Meat & meat products 0.0 82.4 17.6 17 2102 Dairy products 0.0 45.9 54.1 18 2103 Fruit & vegetable products 0.0 48.1 51.9 19 2104 Oils & fats 0.0 54.6 45.4 20 2105 Flour & cereal foods 0.0 38.2 61.8 21 2106 Bakery products 0.0 66.0 34.0 22 2107 Confectionery 0.0 65.0 35.0 23 2108 Other food products 0.0 57.6 42.4 24 2109 Soft drinks, cordials & syrups 0.0 50.2 49.8 25 2110 Beer & malt 0.0 21.6 78.4 26 2111 Wine & spirits 0.0 26.9 73.1 27 2112 Tobacco products 0.0 25.1 74.9 28 2201 Textile fibres, yarns etc 0.0 71.7 28.3 29 2202 Textile products 0.0 71.9 28.1 30 2203 Knitting mill products 0.0 74.1 25.9 31 2204 Clothing 0.0 81.0 19.0 32 2205 Footwear 0.0 84.5 15.5 33 2206 Leather & leather products 0.0 88.9 11.1 34 2301 Sawmill products 0.0 48.0 52.0 35 2302 Other wood products 0.0 66.7 33.3 36 2303 Pulp, paper & paperboard 0.0 44.3 55.7 37 2304 Paper containers & products 0.0 55.3 44.7 38 2401 Printing & services to printing 0.0 62.3 37.7 39 2402 Publishing, recorded media etc 0.0 54.0 46.0 40 2501 Petroleum & coal products 0.0 23.7 76.3 41 2502 Basic chemicals 0.0 48.3 51.7 42 2503 Paints 0.0 44.0 56.0 43 2504 Pharmaceuticals 0.0 48.8 51.2 44 2505 Soap & detergents 0.0 54.9 45.1 45 2506 Cosmetics & toiletries 0.0 68.4 31.6
(Continued next page)

21
Table 7 (continued) No. IOPC ABS industry Land Labour Capitalb
46 2507 Other chemical products 0.0 50.7 49.3 47 2508 Rubber products 0.0 62.0 38.0 48 2509 Plastic products 0.0 57.5 42.5 49 2601 Glass & glass products 0.0 62.0 38.0 50 2602 Ceramic products 0.0 53.3 46.7 51 2603 Cement, lime & concrete slurry 0.0 42.6 57.4 52 2604 Plaster & other concrete products 0.0 51.1 48.9 53 2605 Other non-metallic mineral products 0.0 59.1 40.9 54 2701 Iron & steel 0.0 55.6 44.4 55 2702 Basic non-ferrous metals 0.0 42.5 57.5 56 2703 Structural metal products 0.0 69.0 31.0 57 2704 Sheet metal products 0.0 65.3 34.7 58 2705 Fabricated metal products 0.0 71.4 28.6 59 2801 Motor vehicles & parts etc 0.0 49.7 50.3 60 2802 Ships & boats 0.0 66.6 33.4 61 2803 Railway equipment 0.0 79.5 20.5 62 2804 Aircraft 0.0 80.1 19.9 63 2805 Scientific etc equipment 0.0 68.9 31.1 64 2806 Electronic equipment 0.0 55.8 44.2 65 2807 Household appliances 0.0 72.8 27.2 66 2808 Other electrical equipment 0.0 70.1 29.9 67 2809 Agricultural, mining etc machinery 0.0 80.4 19.6 68 2810 Other machinery & equipment 0.0 73.6 26.4 69 2901 Prefabricated buildings 0.0 43.1 56.9 70 2902 Furniture 0.0 73.8 26.2 71 2903 Other manufacturing 0.0 58.6 41.4 72 3601 Electricity supply 0.0 26.5 73.5 73 3602 Gas supply 0.0 36.0 64.0 74 3701 Water, sewerage & drainage 0.0 23.7 76.3 75 4101 Residential building 0.0 65.7 34.3 76 4102 Other construction 0.0 86.7 13.3 77 4501 Wholesale trade 0.0 75.5 24.5 78 5101 Retail trade 0.0 92.6 7.4 79 5401 Mechanical repairs 0.0 70.3 29.7 80 5402 Other repairs 0.0 58.9 41.1 81 5701 Accommodation, cafes & restaurants 0.0 63.7 36.3 82 6101 Road transport 0.0 71.8 28.2 83 6201 Rail transport 0.0 79.1 20.9 84 6301 Water transport 0.0 44.6 55.4 85 6401 Air transport 0.0 71.8 28.2 86 6601 Services to transport 0.0 43.6 56.4 87 7101 Communication services 0.0 45.5 54.5 88 7301 Banking 0.0 61.4 38.6 89 7302 Non-bank finance 0.0 47.3 52.7 90 7401 Insurance 0.0 78.7 21.3 91 7501 Services to finance etc 0.0 31.3 68.7
(Continued next page)

22
Table 7 (continued) No. IOPC ABS industry Land Labour Capitalb
92 7701 Ownership of dwellings 0.0 0.0 100.0 93 7702 Other property services 0.0 72.4 27.6 94 7801 Scientific research etc 0.0 71.4 28.6 95 7802 Legal, accounting etc services 0.0 72.7 27.3 96 7803 Other business services 0.0 72.7 27.3 97 8101 Government administration 0.0 85.9 14.1 98 8201 Defence 0.0 90.3 9.7 99 8401 Education 0.0 88.5 11.5 100 8601 Health services 0.0 89.7 10.3 101 8701 Community services 0.0 87.3 12.7 102 9101 Motion picture, radio etc 0.0 54.6 45.4 103 9201 Libraries, museums & the arts 0.0 75.6 24.4 104 9301 Sport, gambling etc 0.0 46.5 53.5 105 9501 Personal services 0.0 49.8 50.2 106 9601 Other services 0.0 84.8 15.2 a Primary factor shares implicit in the 1996-97 MONASH model data base excluding complementary imports. The shares were applied to the total value of Compensation of employees (P1) and Gross operating surplus & mixed income (P2) to map to the GTAP primary factors: land, labour and capital. b Capital and Other costs.
Source: Estimates based on ABS 2001a (Input-Output Tables, Australia, 1996-97, SNA68 unpublished), Horridge 2002 and the 1996-97 MONASH model data base (107 commodities × 107 industries).
Table 8 Final demand concordance Column ABS category GTAP category
Q1 Final consumption expenditure — Households Private household consumption Q2 Final consumption expenditure — Government Government consumption Q3 Gross fixed capital formation — Private Investment Q4 Gross fixed capital formation — Public enterprises Q5 Gross fixed capital formation — General Government Q6 Change in inventories Change in stocks Q7 Exports Exports

23
Tabl
e 9
Map
ping
of A
BS
sect
ors
to m
ore
than
one
GTA
P se
ctor
IO
PC
A
BS
sec
tor (
4 di
git)
AB
S c
ode
AB
S s
ecto
r (8
digi
t) G
TAP
sec
tor
GTA
P n
o.
Dat
a so
urce
use
d
0101
S
heep
01
2400
10
She
ep &
lam
bs
Bov
ine
cattl
e, s
heep
& g
oats
, hor
ses
9
01
2400
20
Woo
l W
ool,
silk
-wor
m c
ocoo
ns
12
MO
NA
SH
199
6-97
dat
a ba
se
(115
com
mod
ities
× 1
13 in
dust
ries)
0102
G
rain
s 01
2100
10
Whe
at
Whe
at
2
0121
0040
R
ice
in th
e hu
sk
Pad
dy ri
ce
1
MO
NA
SH
199
6-97
dat
a ba
se
(144
com
mod
ities
× 1
44 in
dust
ries)
0121
0060
O
ilsee
ds
Oil-
seed
s 5
0102
(nec
) G
rain
s ne
ca
Cer
eal g
rain
s ne
c 3
Tota
l sup
ply
shar
es
(AB
S 2
001b
)
0104
D
airy
cat
tle
0130
0010
W
hole
milk
R
aw m
ilk
11
0130
0015
D
airy
cat
tle
Bov
ine
cattl
e, s
heep
& g
oats
, hor
ses
9 To
tal s
uppl
y sh
ares
(A
BS
200
1b)
0107
O
ther
agr
icul
ture
01
5200
10
0153
0010
H
orse
stu
ds
Dee
r far
min
g B
ovin
e ca
ttle,
she
ep &
goa
ts, h
orse
s 9
0159
0011
01
5900
20
Hon
ey &
bee
swax
Li
ve a
nim
als
nec
Ani
mal
pro
duct
s ne
c 10
0161
0011
01
6100
12
Sug
ar c
ane
for p
lant
ing
Sug
ar c
ane
for c
rush
ing
Sug
ar c
ane,
sug
ar b
eet
6
0162
0010
C
otto
nb
Pla
nt-b
ased
fibe
rs
7
0169
0020
01
6900
30
0169
0040
01
6900
50
Toba
cco
Hop
s G
rass
, luc
erne
& c
love
r see
d H
ay, c
erea
l gra
sses
& fo
dder
Cro
ps n
ec
8
0169
0066
A
gric
ultu
re n
ec
Ani
mal
pro
duct
s ne
c 10
0169
8300
N
atur
al ru
bber
Fo
rest
ry
13
0107
(nec
) O
ther
agr
icul
ture
nec
a V
eget
able
s, fr
uit,
nuts
4
MO
NA
SH
199
6-97
dat
a ba
se
(144
com
mod
ities
× 1
44 in
dust
ries)
(Con
tinue
d ne
xt p
age)

24
Tabl
e 9
(con
tinue
d)
IOP
C
AB
S s
ecto
r (4
digi
t) A
BS
cod
e A
BS
sec
tor (
8 di
git)
GTA
P s
ecto
r G
TAP
no.
D
ata
sour
ce u
sed
0200
S
ervi
ces
to a
gric
ultu
re
0211
0010
02
1100
20
Gin
ned
cotto
n C
otto
n se
ed
Pla
nt-b
ased
fibe
rs
7
0212
0010
S
heep
she
arin
g se
rvic
es
Woo
l, si
lk-w
orm
coc
oons
12
0220
0010
S
kins
A
nim
al p
rodu
cts
nec
10
0200
(nec
) S
ervi
ces
to a
gric
ultu
re n
eca
Pad
dy ri
ce
1
W
heat
2
Cer
eal g
rain
s ne
c 3
Veg
etab
les,
frui
t, nu
ts
4
O
il-se
eds
5
S
ugar
can
e, s
ugar
bee
t 6
Cro
ps n
ec
8
B
ovin
e ca
ttle
shee
p &
goa
ts, h
orse
s 9
Ani
mal
pro
duct
s ne
c 10
R
aw m
ilk
11
Woo
l, si
lk-w
orm
coc
oons
12
Tota
l sup
ply
shar
es
(AB
S 2
001b
)
1100
C
oal;
oil &
gas
11
0100
10
1102
0010
B
lack
coa
l B
row
n co
al
Coa
l 15
1200
0011
C
rude
oil
Oil
16
1200
0023
12
0000
27
1200
0028
Liqu
efie
d na
tura
l gas
N
atur
al g
as
Liqu
efie
d pe
trole
um g
ases
Gas
17
1200
1920
O
ther
inco
me
Coa
l O
il G
as
15
16
17
MO
NA
SH
199
6-97
dat
a ba
se
(144
com
mod
ities
× 1
44 in
dust
ries)
(Con
tinue
d ne
xt p
age)

25
Tabl
e 9
(con
tinue
d)
IOP
C
AB
S s
ecto
r (4
digi
t) A
BS
cod
e A
BS
sec
tor (
8 di
git)
GTA
P s
ecto
r G
TAP
no.
D
ata
sour
ce u
sed
1500
S
ervi
ces
to m
inin
g 15
1100
10
1512
0010
P
etro
leum
exp
lora
tion
(ow
n ac
coun
t) P
etro
leum
exp
lora
tion
serv
ices
nec
O
il 16
1500
(nec
) S
ervi
ces
to m
inin
g ne
ca
Min
eral
s ne
c 18
Tota
l sup
ply
shar
es
(AB
S 2
001b
)
2101
M
eat &
mea
t pro
duct
s 21
1100
11
2111
0070
21
1200
10
Fres
h m
eat
Mea
t for
hum
an c
onsu
mpt
ion
Pou
ltryc
Bov
ine
cattl
e, s
heep
& g
oat,
hors
e m
eat p
rodu
cts
19
2111
0060
R
aw h
ides
A
nim
al p
rodu
cts
nec
10
Tota
l sup
ply
shar
es
(AB
S 2
001b
)
2101
(nec
) M
eat &
mea
t pro
duct
s ne
ca
Mea
t pro
duct
s ne
c 20
M
ON
AS
H 1
996-
97 d
ata
base
(1
44 c
omm
oditi
es ×
144
indu
strie
s)
2105
Fl
our &
cer
eal f
oods
21
5200
41
2152
0042
21
5200
43
2152
0044
Mill
ed ri
ce
Hus
ked
rice
Hul
led
rice
Ric
e br
an
Pro
cess
ed ri
ce
23
2105
(nec
) Fl
our &
cer
eal f
oods
nec
a Fo
od p
rodu
cts
nec
25
Tota
l sup
ply
shar
es &
To
tal i
mpo
rts s
hare
s (A
BS
200
1b)
2108
O
ther
food
pro
duct
s 21
7100
10
2171
0021
21
7100
22
2171
0031
21
7100
32
Raw
sug
ar
Ref
ined
sug
ar
Gol
den
syru
p Ic
ing
suga
r & m
olas
ses
Sug
ar n
ec
Sug
ar
24
2108
(nec
) O
ther
food
pro
duct
s ne
ca
Food
pro
duct
s ne
c 25
MO
NA
SH
199
6-97
dat
a ba
se
(144
com
mod
ities
× 1
44 in
dust
ries)
2203
K
nitti
ng m
ill pr
oduc
ts
2231
0010
22
3200
10
Hos
iery
P
ullo
vers
& ju
mpe
rs
Wea
ring
appa
rel
28
2203
(nec
) K
nitti
ng m
ill pr
oduc
ts n
eca
Text
iles
27
Tota
l sup
ply
shar
es
(AB
S 2
001b
)
(Con
tinue
d ne
xt p
age)

26
Tabl
e 9
(con
tinue
d)
IOP
C
AB
S s
ecto
r (4
digi
t) A
BS
cod
e A
BS
sec
tor (
8 di
git)
GTA
P S
ecto
r G
TAP
no.
Dat
a so
urce
use
d
6601
S
ervi
ces
to tr
ansp
ort
6611
0010
66
1900
10
6642
0010
Par
king
ser
vice
s S
ervi
ces
to ro
ad tr
ansp
ort n
ec
Rai
l fre
ight
forw
ardi
ng
Tran
spor
t nec
48
6620
0010
66
2000
20
6620
0030
Mar
gin
- ser
vice
s to
wat
er tr
ansp
ort
Non
-mar
gin
– st
eved
orin
g &
por
t ha
ndlin
g se
rvic
es
Ser
vice
s to
wat
er tr
ansp
ort n
ec
Wat
er tr
ansp
ort
49
6630
0010
S
ervi
ces
to a
ir tra
nspo
rt A
ir tra
nspo
rt 50
Tota
l sup
ply
shar
es
(AB
S 2
001b
)
6601
(nec
) S
ervi
ces
to tr
ansp
ort n
eca
Tran
spor
t nec
W
ater
tran
spor
t A
ir tra
nspo
rt
48
49
50
7501
S
ervi
ces
to fi
nanc
e et
c 75
2000
10
Ser
vice
s to
insu
ranc
e
Insu
ranc
e
53
7501
(nec
) S
ervi
ces
to fi
nanc
e ne
ca
Fina
nce
serv
ices
nec
52
To
tal s
uppl
y sh
ares
(A
BS
200
1b)
a In
clud
es A
BS
8-d
igit
item
s w
ithin
the
4-di
git p
rodu
ct g
roup
not
spe
cifie
d se
para
tely
abo
ve. b
Exc
lude
s gi
nned
cot
ton.
c P
oultr
y in
clud
ed a
s pa
rt of
Bov
ine
cattl
e, s
heep
& g
oat,
hors
e m
eat p
rodu
cts
on th
e ba
sis
of H
uff,
McD
ouga
ll an
d W
alm
sley
(200
0, p
. 17)
.
Sou
rces
: Est
imat
es b
ased
on
MO
NA
SH
mod
el d
ata
base
s (v
ario
us) a
nd A
BS
200
1b (I
nput
-Out
put T
able
s, P
rodu
ct D
etai
ls, 1
996-
97, C
at. n
o. 5
215.
0).

27
References
ABS (Australian Bureau of Statistics) 1995, Central Product Classification, October.
—— 1997, Input-Output Tables, Australia, 1993-94, Cat. no. 5209.0, June.
—— 2000, Australian National Account: Concepts, Sources and Methodology, Cat. no. 5216.0, November.
—— 2001a, Input-Output Tables, Australia, 1996-97, Cat. no. 5209.0, March.
—— 2001b, Input-Output Tables Product Details, Australian National Accounts, 1996-97, Cat. no. 5215.0, March.
Aspden, C. 2001, The SNA93 definition of basic prices with particular reference to transport margins: is the SNA definition flawed?, National Accounts, Statistics Directorate, Organisation of Economic Co-operation and Development, STD/NA (2011)11, Paris, 17 September.
Commission of European Communities, International Monetary Fund, Organisation of Economic Co-operation and Development, United Nations and World Bank 1993, System of National Accounts 1993 (SNA93), Brussels/Luxembourg, New York, Paris, Washington.
Gretton, P., Bobbin, I. and Horridge, M. 2004, A users perspective on the treatment of transport activities in input-output tables and suggestions for the future, Paper presented at the International Conference on Input-output and General Equilibrium: Data, Modelling and Policy Analysis, Brussels, 2–4 September.
Horridge, M. 2002, Preparation of a CGE data base for the 1996-97 Australian input-output tables, Mimeo, Centre of Policy Studies, Monash University, April.
Huff, K., McDougall, R. and Walmsley, T. 2000, Contributing Input-Output Tables to the GTAP Data Base, GTAP Technical Paper No. 1, Release 4.2, January.
Mastoris, I., Travis, J. and Welsh, A. 2002, ‘Australia’, Chapter 11.B in Dimaranan, B.V. and McDougall, R.A. (eds), Global Trade, Assistance, and Production: The GTAP 5 Data Base, Center for Global Trade Analysis, Purdue University, pp. 11.B.1–11.B.33.
UN (United Nations) 1968, A System of National Accounts (SNA68), Studies in Methods, series F, no. 2, rev. 3, Department of Economic and Social Affairs, Statistical Office of the United Nations, New York.
Walmsley, T. and McDougall, R. 2001, Using entropy to compute shares, mimeo, GTAP, http://www.gtap.agecon.purdue.edu/resources/download/2041.pdf.