Untitled - Dr. Forgó Sándor weblog
623
-
Upload
khangminh22 -
Category
Documents
-
view
0 -
download
0
Transcript of Untitled - Dr. Forgó Sándor weblog

P a g e |1
Preface
It’s an honor to organize for the third
time a very successful scientific event
which constantly grows stronger and
more valuable, one year after another.
The sustainability of such conference
up to the 10th international one is a
proof of its deep-rooted value.
We are looking forward to making ICI10 more distinguished and more
successful. ICI10 also presents a good example of how reciprocal interest
in research and appreciated experiences of close partners would always
lead to success. This event is a result of fruitful co-operation among the
organizers: Delta University for Science and Technology - Egypt,
Esterhazy Karoly - Hungary, Texas A&M Int. Univ. – USA and Open
University - Malaysia.
I'd like to express my deep thanks to all the participants who honored us
from over 16 countries. I would be very much pleased to invite them to
feel at home; that you are here at Delta University is great pleasure to all
of us. Your active participation and attendance tremendously contribute
to the academic strength of the present event. I'm really proud of and

P a g e |2
grateful to all members of Delta University for their industrious and
never-ending efforts to attain success. Special gratitude is due to Prof.
Dr. Abbas El-hefnawy chair of the conference for his constant efforts and
experienced guidance that add up to the success of ICI10.
Moreover, sincere gratitude and appreciation are due to Prof. Dr. Abed
Nasr for his productive and effective efforts as a coordinator of ICI10.
Special tribute should be paid to all those who have visibly or invisibly
contributed to the success of ICI10. I wish you all good luck and a happy
stay on and off Delta University Campus as well as in Egypt.
Dr. Mohammed Rabie Nasser
Host of ICI10 Conference
Head of board of trustees of the university

P a g e |3
Welcome from the Chairman of the conference
I’d like to welcome you all for the third
time in this distinguished and valuable
scientific event (ICI 10) conference. It’s
an honor to gather such noble scientific
pursuits and brilliant academic figures in
one event
I’d like to welcome you all for the third time in this distinguished and
valuable scientific event (ICI 10) conference. It’s an honor to gather such
noble scientific pursuits and brilliant academic figures in one event.
I also would like to warmly appreciate and deeply thank Prof. Dr. Hany
M. Helal Minister of Higher Education and State for scientific Research,
Prof. Dr. Ahmed M. Darwish Minister of State for Administrative
Development, Prof. Dr. Ahmed Z. Badr Minister of education for their
auspices of the conference.
This conference aims to bring together innovations and ideas in software
industry and computer sciences into one common platform. Researchers
and practitioners will have the chance to share findings and experiences
as well as to explore many newly shaped technologies.
P a g e |4
I’d like to welcome our dear guests who came from distant places to
contribute and share their precious scientific experiences in an attempt to
reach a sublime goal of sharing, thinking, contemplating, producing and
analyzing different and new arenas of knowledge.
I am deeply grateful to the conference host Dr. Mohamed Rabie Nasser,
head of board of trustees for his valuable support to give the conference
the best vision. I also thank Prof. Dr. Abed Nasr Conference Coordinator
and members of the organizing committee for their great efforts for the
success of the conference. At the end, I’d like to express my deep
appreciation for our key speakers, university presidents, deans and our
dear guests.
Prof. Dr. Abbas A. El-Hefnawy
Conference Chairman President of the University
P a g e |5
Words from Coordinator of the Conference
ICI10 is the Tenth International
Conference on Information with the
main theme: “Information Technology
Role in Development”. ICI10 discusses
the following main topics:
• Software Industry Quality
• Intelligent Computing and its Role in Developing Decision Support Systems
• Information Technology and its Role in Sustainability Development.
• Cloud Computing: How the Cloud Offers a New Collaborative Learning Environment.
• Software Engineering or Software Testing.
• Bioinformatics.
• Security of Computer systems.
• Other topics of informatics and Computer Science.
These topics were covered by 80 technical papers and distributed over 12
technical sessions. A special session about "e-Health" will be held in the
conference.

P a g e |6
Special gratitude and thanks are due to Dr Mohamed Rabie Nasser, head
of board of trustees of the university for his constant support and moral
and financial backing. I'd be pleased to thank Prof. Dr Abbas El-
Hefnawy, president of the university for his experienced assistance and
guidance and for overcoming all the obstacles that faced us. It is a great
pleasure to express my gratitude to all the members of the organizing
committee and colleagues who spent so much time and exerted great
effort to put our conference in a better form than it would otherwise have
been. I’d seize the chance to thank session's chairpersons for their
unlimited and very remarkable scientific knowledgeable efforts. Last but
not least, special thanks are due to all the participants, especially those
who traveled wide and far and gave us the opportunity to share and
exchange knowledge, ideas and success.
God bless you all
Prof. Dr. Abed Mohamed Nasr
Conference Coordinator
Dean, Faculty of Engineering

P a g e |7
Under Auspices of
Prof. Dr. Hany M. Helal
Minister of Higher Education and State for Scientific Research
Prof. Dr. Ahmed M. Darwish
Minister of State for Administrative Development
Prof. Dr. Ahmed Z. Badr
Minister of Education
General Samir Salaam
Governor of Dakahlia
Conference Host
Dr. Mohamed R. Nasser
Head of board of trustees, Delta University for Science& Technology (DU), Egypt

P a g e |8
Conference Chairpersons
Prof. Dr. Abbas A. El-Hefnawy
President of Delta University for Science& Technology (DU), Egypt
Prof. Dr. Anuwar Ali
President of Open University, Malaysia
Prof. Dr. Dan Jones
President & Chief Executive Officer Texas A&M University‐Commerce, U.S.A
Prof. Dr. Ray Keck
President of Texas A&M International University, U.S.A
Prof. Dr. Zoltan Hauser
Rector of Eszterhazy Karoly College, Hungary

International Scientific Committee Prof. Dr. Fawzy A. Torkey
President of Kafr El‐Sheikh University, Egypt
Prof. Dr. Ferenc Mátyás
Eszterházy Károly College, Eger, Hungary
Prof. Dr. Lajos Kis-Tóth
Vice Rector of Eszterházy Károly College, Eger, Hungary
Prof. Dr Sándor Forgó
Director of the Distance Education Programs at Eszterházy College, Eger, Hungary
P a g e |9
Prof. Dr. Hamdi A. Elmikati
Prof. of Elect. Engineering, Mansoura University, Egypt
Prof. Dr. Hesham Arafat
Head of Computer Engineering Dept., Faculty of Engineering, Mansoura University, Egypt
Prof. Dr. Latifah Abdol Latif
Director of OUM University, Malaysia
Prof. Dr. Mansour Fadzil
Senior Vice President, OUM University, Malaysia
P a g e |10

Prof. Dr. Mohamed A, sheirah
Professor of Computer Controlled Systems, Faculty of Engineering, Ain‐Shams Univ. Cairo, Egypt.
Prof. Dr. Mohamed F. Tolba
Professor of Scientific Computing, Faculty of Computers and Information Sciences, Ain‐Shams Univ. Cairo, Egypt
Prof. Dr. Mohiy M. Hadhoud
Vice President of Menofia university, Egypt
Dr. Péter Antal
Eszterházy Károly College, Eger, Hungary
P a g e |11

Prof. Dr. Ramli Bahroom
General Manager, OUM, Malaysia
Prof. Dr. Samir I. Shahin
Professor of Computer Engineering, Faculty of Engineering, Cairo Univ. Cairo, Egypt.
Prof. Dr. Waiel F. Abd El-Wahed
Vice Dean, Faculty of Computers and Information, Menofia university, Egypt
Prof. Dr. Yehia El-Mashad
Dean of Delta Higher Institute for Computers, Mansoura, Egypt
*Alphabetically ordered
P a g e |12

P a g e |13
Organizing Committee
Prof. Dr. Abed M.Nasr Dean, Faculty of Engineering, DU
Prof. Dr.Yehia EL‐Mashad Dean, Delta Higher Institute for Computers, Mansoura, Egypt.
Prof. Dr. Adel Shebl Dean, Delta Higher Institute for Enineering, Mansoura, Egypt.
Prof. Dr.Farouk Gebril Dean, Delta Higher Institute for Social Works, Mansoura, Egypt.
Prof. Dr. Mirvat El‐Mehallawy Dean, Faculty of Busieness Administration, DU
Mr. Abd El‐Wahab Khalifa General Secretary, DU
*In Alphabetical Order
Dr. Abd El‐Salam Elaasy
Delta Higher Institute for Computers, Mansoura, Egypt.
Dr. Ahmed Refaat Faculty of Engineering, DU
Assoc. Prof. Hamdi Shahin Faculty of Arts, Mansoura University
Dr. Mohamed Abd El‐Hamid Faculty of Engineering, DU
Dr. Nagwa El‐Hamshari Faculty of Engineering, DU
Dr. Ragaa Abd El‐Hakim Faculty of Engineering, DU
Dr. Salma Ali El‐Din Faculty of Busieness Administration, DU
Assoc. Prof. Sherif Sheta Faculty of Engineering, DU
Assoc. Prof. Tharwat Sarhan Faculty of Engineering, DU
Miss. Amira El‐Sherbiny Office Manager of head of Board of Trustees, DU
Mr. Tarek Tantawy Marketing and International Program Manager, DU

P a g e |14
Schedule Overview for ICI10
First Day Schedule Saturday 4th December
Time 10:30 – 11:30 Registration 11:30– 13:00 Opening Session13:00– 13:30 Coffee Break 13:30 – 14:30 Keynote Session #1
14:30 – 16:00 LUNCH / University Tour16:00 – 17:00 Keynote Session #2
20:00 – 22:00 Afternoon Party• Sessions are held in University Conference Hall, Ground Floor, Building of Faculty of
Busieness Administration • Entertainment Party at Delta swimming pool, Mansoura
Second Day Schedule Sunday 5th December
8:30– 9:30 Registration 09:30 – 10:10 Keynote Session #3
10:10 – 11:10 ICI10 Special Session
Intelligent and Assistive Technologies for People with Disabilities 11:10 – 11:40 Coffee Break 11:40 – 12:40 Session#1
Image Processing Session#2
Bioinformatics Session#3
The Role of InformationTechnology in Education
12:40 – 13:10 Coffee Break 13:10 – 14:10 Session#4
Computer and Communications
Networks
Session#5Medical Informatics
Session#6 Intelligent computing
and Multimedia
14:10 – 15:10 LUNCH 15:10– 16:10
Session#7
Security of Computer Systems
Session#8e‐Learning
Session#9 Computer Application
16:10– 17:10 Best Paper Awards, Closing Ceremonies, Conference Recommendations & Group Photo
• Sessions are held in Delta Higher Institute for Computers Conference Halls • Closing Cermony is held in Conference Hall 1, Ground Floor, Building of Delta Higher
Institute for Computers.

P a g e |15
Table of ContentsNo Invited Speakers Page
1 Prof. Dr. Francesco Sicurello President of ITM‐Italian Association of telemedicine and Medical Informatics, Italy.
27
2 Prof. Dr. Halina KwasnickaInstitute of Applied Informatics, Wroclaw University of Technology, Poland
30
3 Prof. Dr. Mohamed Adel YehiaCo‐coordinator of the Egyptian Space Council Program,Cairo, Egypt.
47
4 Prof. Dr. Jie LuDirector of Decision Systems and e‐Service Intillegence Research Lab, University of Technology, Sydney, Australia
49
5 Prof. Dr. Urszula Markowska‐KaczmarInstitute of Informatics, Wroclaw University of Technology, Wroclaw, Poland
57
6 Prof. Dr. Kenneth Revett Harrow School of Computer Science, University of Westminster, London,UK.
70
7 Prof. Dr. Gerald SchaeferDepartment of Computer Science, Loughborough University, U.K.
81
8 Prof. Dr. Bertalan KomencziEszterházy Károly College, Institute of Media Informatics, Department of Informatics, Eger, Eszterházy ,Hungary
87
9 Innovations in Information and Communication Technology: Increasing the Effectiveness of an Open and Distance
95

P a g e |16
Learning InstitutionProfessor Emeritus Anuwar Ali President/Vice‐Chancellor, Open University Malaysia
Intelligent and Assistive Technologies for People with
Disabilities
10 Model Submarine and Web Virtual Reality Help Disabled in the Biology and Ecology Education Tomaz Amon Slovania
113
11 PSDD : Prolog Based System for Dyslexia Diagnosis Adnan G. Abuarafah1, Osama khozium2 1 Faculty of computer and information systems, Umm al‐Qura university, Makkah, SA 2 Faculty of computer and information systems, Umm al‐Qura university, Makkah, SA
119
12 Virtual Reality as an Advanced Visualization Tool for the Diagnosis of Physical Disabilities Ahmed Abdo Ali1, Abdel‐Badeeh M. Salem2 1Aden University (Yemen) 2Faculty of Computer and Information sciences Ain Shams University, Cairo, Egypt
127
13 International Day of Persons with Disabilities: 3 December 2010;Examples of Success Stories and Best Practice . Mohamed Abdalla
137

P a g e |17
World Health Organization, Egypt
Image Processing
14 3D Estimation for Shading Images using Homogenous Polynomials with order n Gamal. F. Elhadi Computer Science Department, Faculty of information and computer science, Manufia University, Manufia 35516, Egypt.
155
15 Clustering With Fuzzy K-Means Applied to Color Image Quantization E. A. ٍ◌ Sallam 1*, W. O. Badr 2. 1 Head of Computer and Automatic Control Engineering Dept, Faculty of Engineering, Tanta University. 2 Electronics and Communication Engineering Department, Delta Higher Institute for Engineering and Technology, Mansoura.
164
16 A Novel Event‐Based Strategy for Tracking Multiple Objects at Real‐Time with Multiple Cameras R.K.Elsadek 1* , A.I.Saleh 2 , M.M.Salem 3 Department of Computer, Faculty of Engineering, Mansoura University, Mansoura, Egypt
172
Bioinformatics
17 Measuring the Entropy of DNA StrandsMohamed Abd elhamid Abbas , Phd Computers and systems Dept., Faculty Eng. Delta Univ. Gamasa City, Egypt
191
18 On the Use of the Electrocardiogram for Biometric Authentication Manal tantawi1, Kenneth Revett 2,Mohamed F. Tolba1 and Abdel‐ Badeeh M. Salem1
200
P a g e |18
1 Faculty of Computer and Information Sciences, Ain Shams University,Cairo, Egypt 2 School of Electronics and Computer Science, University of Westminster, London, England
19 A Survey of Techniques Used in Human Identification Based on Cognitive Biometrics: the Electroencephalogram Wael Khalifa1, Kenneth Revett2 and Abdel‐ Badeeh m. Salem1 1 Faculty of Computer and Information Sciences, Ain Shams University,Cairo, Egypt 2 School of Electronics and Computer Science, University of Westminster, London, England
213
20 A Combination of Genetic Algorithm and Artificial Neural Network for Gene Selection and Tumor Classification R. Ali1, T. El‐Arif 2, Fayed F. M. Ghaleb3 and A. Dakroury1 1Physics Department, Faculty of women for Arts and Science, Ain Shams University, Cairo, Egypt 2Department of Computer Science, Faculty of Computer and Information Sciences, Ain Shams University, Cairo, Egypt. 3Department of math, computer science division, faculty of science, Ain Shams University, Cairo, Egypt
226
The Role of Information Technology in Education
21 Laptop‐Based Classroom InstructionDr. Habil. Lajos Kis‐Toth Eszterházy Károly College, Institute of Mediainformatics, Eger, Hungary
241
22 From the Bibliotheca Alexandriana to the New Library of Alexandria, Basic Mission
252

P a g e |19
Statements of the Libraries in Changing Times Dr. István Monok, CSc Associate Professor, Eszterházy Károly College, Eger, Hungary
23 Effective support for learning with library‐informatics devices CZEGLÉDI László Central Library, Eszterházy Károly College, Eger, Hungary
258
24 Emphasizing the Role of Information Technology In Architectural Education Development Prof. Osama Mohamed Ali Farag1*, Eng. Mai Wahba Mohamed Madkour2. 1Architecture Department, Faculty of Engineering, Masoura University, Egypt 2Architectural Department, Faculty of Engineering, Delta University for Science and Technology, Gamasa, Egypt.
268
Computer and Communications Networks
25 Proposed Architecture for Conventional Computer with Co‐Quantum Processor El‐Mahdy M. Ameen, Aida Osman and H. A. Ali Department of Computers and Systems, Faculty of Engineering, Mansoura University, Egypt
279
26 Proposal for a Novel Cache Portioning Technique for Supporting Cooperation in Mobile Ad‐hoc Networks A. I. Desouky1* A. I. Saleh1* S. H. Ali1 1 Department of Computer Engineering and Systems, Faculty of
290

P a g e |20
Engineering, Mansoura University27 A Novel Strategy for Location Management in
PCS Networks Using Base Areas Scheme Hesham. A. Ali 1, Ahmed I. Saleh 2, Mohammed. H. Ali 3* 1 (Dept. of Computer Eng. & Systems, Faculty of Engineering, Mansoura University, Egypt.) 2 (Dept. of Computer Eng. & Systems, Faculty of Engineering, Mansoura University, Egypt.) 3 (IT Engineer, Sharm El‐Sheik International Airport, South Sinai, Egypt.)
304
28 Comparative Analysis of Quality of Service in Wireless Networks M.badawy and H. A. Ali Dept. of Computers Engineering and Systems, Fac. of Engineering, Mansoura University, Egypt
323
29 Speaker Independent Arabic Speech Recognition Using Neural Networks Shady Y. EL‐Mashed*, Mohammed I. Sharway, Hala H. Zayed Department of Electrical Engineering, Shoubra Faculty of Engineering, Benha University, Cairo, Egypt
336
30 Proposed Framework for Scheduling Grid Workflow Applications Prof. Hesham Arafat Ali., Dr. Ahmed I. Saleh. Ahmed Mohamed A. Ghanem. Dept. of Computer Eng. & Systems, Faculty of Engineering, Mansoura University, Egypt,
346
Medical Informatics
31 A Hybrid Case‐Based Reasoning Approach for the Diagnostics of the Heart Disease.
358

P a g e |21
E. A. M. Abd Rabou 1*, A. B. M. Salem 2 1 Ph.D Candidate, Faculty of Computer and Information Sciences, Ain Shams University, Cairo, Egypt 2 Professor, Faculty of Computer and Information Sciences, Ain Shams Universit, Cairo, Egypt
32 A Study on Artificial Intelligent Techniques of Miycardial SPECT Perfusion Images. Shymaa H. ElRefaie, Haythem El‐Messiry, Abdel‐Badeeh M. Salem Faculty of Computer and Information Sciences, Ain Shams University,Cairo, Egypt
377
33 Computer Based Model of the Circulatory System Mohamed Abd elhamid Abbas , Phd Computers and systems Dept., Faculty Eng. Delta Univ. Gamasa City, Egypt
387
34 Electrocardiogram Classification by using Neural Network Elsayed A. Sallam 1*, Rania M. Abdelghaffar 2. 1 Department of Computer Engineering, Faculty of Engineering, Tanta University. 2 Department of Electronics & Communication Engineering, Delta Higher Institute for Computers, Mansoura.
395
Intelligent Computing and Multimedia
35 The Road from Little Media Via Big Media to Community Media prof. Dr. Sándor Forgó – Dr. Péter Antal – Réka Racskó Institute of Media Informatics, Eszterházy Károly College, Eger
401

P a g e |22
36 Multimedia Innovate for Spatial Thinking Ability Dr. Peter Antal Eszterházy Károly College, Institute of Mediainformatics, Eger, Hungary
407
37 Development of a multimedia education programme for the improvement of communication skills Zsuzsanna Hanák , Magdolna VARGA ESTEFÁN College professor of Eszterházy Károly College (Eger, Hungary)
417
38 Why Cloud Computing is Necessary for Open University Malaysia Dr Ahmad Hashem Open University Malaysia, 50480 Kuala Lumpur, Malaysia
429
39 Interest‐Based Strategy for Service Level Agreements of Web Services Negotiation Afaf Mousa 1, Arabi Keshk 1, Waiel F. Abd El‐Wahed 2. 1 Computer Science, Faculty of computers and information, Shebin El‐Com, Egypt 2 Operation Research & Decision Support, Faculty of computers and information, Shebin El‐Com, Egypt
435
40 Ongoing a Discovery Mechanism for SWS based on Functional and non‐ Functional Properties Tamer A. Farrag1* , A. I. Saleh2 and H. A. Ali2 1 Misr Higher Institute of Engineering and Technology, Mansoura, Egypt 2 Department of Computers and Systems, Faculty of Engineering, Mansoura University, Egypt
447

P a g e |23
Security of Computer Systems
41 A New Model For Web Database Security using Data Security Unique Code (DSUC) Aida O. Abdelgwad 1, Ahmed I. Saleh 2, Eslam M. Hassib 3* 1 (Dept. of Computer Eng. & Systems, Faculty of Engineering, Mansoura University, Egypt) 2 (Dept. of Computer Eng. & Systems, Faculty of Engineering, Mansoura University, Egypt) 3 (IT Engineer, ERG company for electronics, Elmahalah alkobra, Egypt)
457
42 Secure Backup System hosted on a Storage Cloud Sherif S. El‐etriby 1*, Elham Mahmoud 2, Ahmed Daoud 1Faculty of Computers and Information, Menoufia University
475
43 Web Usage Mining Techniques for Web User Profiling W.F. Abdelwahed1*, H.M.AbdelKader2*, W.M.Ead3 1 Faculty of Computers and Information Menoufia University, Shebin El‐Kom, Egypt 2 High Institute for Computer science And Information 6 oct university, Egypt
485
e-Learning
44 e‐learning in TunisiaEttarres Yamna Larodec Laboratory, Universiry of Tunis ISCAE, University of ManoubaTunis, Tunisia
502
45 Distant Learning through Video Conference Ain Shams, Banha, Fayoum Universities Cooperation Mostafa M Aref
514

P a g e |24
Chairman of Computer Science Department, Faculty of Computer and Information Sciences
46 E‐learning Strategy in Ministry of Education in
Kuwait Zakaa Zaki Mohamed Information Center , Kuwait Ministry of Education,Kuwait
518
47 A Web Based Evaluation Tool for Higher Education Quality Assessment Using the Holon Framework E. F. Shoieb1, I. A. F. El‐Khodary1, A. A. Tharwat1 Dept. of Operations Research and Decision Support, Faculty of Computers and Information, Cairo University
523
Computer Applications
48 Information Technology‐Based Approach to Streamline Sustainable Building Design Sherif A. Sheta Associate Professor of Architecture Vice Dean of the Faculty of Engineering Delta University for Science and Technology, Gamasa, Egypt
537
49 Automatic abstract preparationDr. Tünde Molnár Lengyel Associate professor, Eszterházy Károly College, Department of Informatics, Hungary
550
50 Ergonomics Applications in sports fieldMohamed Y. Ghieda Associate Professor at Kinesiology Dept., Faculty of Sport Education, Mansoura University, Egypt
561
51 The Relationship between Knowledge 566

P a g e |25
Management and Corporate Performance: An Applied Study on Public Enterprises Sector for Pharmaceutics Dr. Salma Ali Eldeen Said Doctor of Business Administration, Delta University for Science & Technology
52 Computer Application in Flexible Pavement Overlay Design Dr. Ragaa Abd El‐Hakim1*, Dr. Mustatfa A. K. Abd El‐Ghaffar2, Prof. Dr. Mohamed El‐Shabrawy M. Ali2, Assoc. Prof. Hafez A. Afify3 1 Assistant lecturer, Civil Engineering Department, Faculty of Engineering, Delta University for Science and Technology 2 Assistant lecturer, Public Works Department, Faculty of Engineering, Mansoura University 3 Assoc. Prof., Public Works Department, Faculty of Engineering, Tanta University 4Professor, Public Works Department, Faculty of Engineering, Mansoura University
585
54 The Role of New Technology in Developing some Fields of Mathematics: Integral and Differential Equations A. M. A. El‐Sayed
1 *,, E. A. A. Ziada
2
1 Mathematics Department, Faculty of Science, Alexandria University, Alexandria, Egypt. 2 Faculty of Engineering, Delta University for Science and
Technology, Gamasa, Egypt.
605
55 Digitalisierung des Kulturerbes. Fragen, Anomalien, Möglichkeiten, Überlegungen*
617

P a g e |26
von , Dr. Attila Verók (Károly‐Eszterházy‐Hochschule, Eger)

P a g e |27
Euro Mediterranean Medical Informatics and Telemedicine: e-Health for Mediterranean Countries
Invited Speech
Prof. Francesco Sicurello
IITM - International Institute of Tele-Medicine / @ITIM - Italian Association of Telemedicine and Medical Informatic.
University Technological Centre of Desio University of Milano Bicocca and University of Insubria, Italy
Abstract Medical Informatics is a scientific discipline that studies the application of Information Technology to medicine and health care. The main fields of medical informatics are: computerization of medical record, digital management of data base and data banks in medicine, design and development of Hospital and Health Information Systems (ADT, RIS, LIS, …), Artificial Intelligence in Medicine, standards (HL7, DICOM,…) for interoperability and security of Medical Networks.
Telemedicine is “medicine at distance” and regards the interactive transmission of health data, signals and biomedical images by means of ICT (Information and Communication Technologies), in order to provide better and more rapid support to medical diagnosis and consulting at distance, avoiding hospitalisation and unnecessary treatments.
The diffusion of integrated health/hospitals information systems, of electronic patients' records, health smart cards and services of telemedicine and telecare is becoming a reality. Many projects and applications on e‐health have been developed in the frame of Regional, National and European Health and ICT Programmes

P a g e |28
Diffusion of Internet also in healthcare systems makes it necessary to manage medical records using new tools for database in web environment. Web based systems now provides universal means of research and consultation of clinical data also of multimedia type and web portals represent the future in health care circles, offering a wide range of medical news, clinical guidelines, medical directories, protocols of care and e‐commerce and e‐learning applications.
ICT in health care (e‐Health) could contribute to strength professional cooperation between medical operators (Physicians, Nurses, … ) even in Mediterranean Countries. Connecting together hospitals, health districts, academic and research Centres, it will be possible to exchange experiences and medical knowledge among doctors, health operators and specialists in clinical treatment, in medicine preventive and epidemiology.
So, among Mediterranean Countries, it will be possible to realize an e‐health network or an INTR@MED (Mediterranean Medical Intranet) that permits access to clinical information in particular for teleconsulting and e‐learning in healthcare and even for creating and using large epidemiological databases. Health operators can use the network to retrieve and find information by Internet connections, regardless of regional or national boundaries and constraints.
This virtual network can facilitate accessing to clinical databases, sharing therapeutic/diagnostic protocols and medical guidelines and can allow specialists to discuss and examine difficult clinical cases for better diagnoses and therapies. It permits also teleconsulting and telemonitoring in cardiology/cardiosurgery, oncology, neurology/neurosurgery, orthopaedics, infectious diseases, paediatrics, etc, stimulating cooperative learning/training of physicians.

P a g e |29
Starting since 2001 (during bilateral scientific cooperation on telemedicine between Italy and Egypt) the EMMIT (Euro Mediterranean Medical Informatics and Telemedicine) initiative has been launched. It regards the development of projects, courses and conferences in each Mediterranean Country (from the first EMMIT conference in Genoa 2004, in Alexandria 2006 to Beirut 2009 and Split Croatia‐2010)
ICI 10 - 10TH INTERNATIONAL CONFERENCE ON INFORMATION AT DELTA UNIVERSITY FOR SCIENCE AND TECHNOLOGY
GAMASA, EGYPT, 4 – 6 DECEMBER 2010
1
Intelligent approaches to searching similar images on the basis of visual
content
H. Kwaśnicka 1*
, M. Paradowski1, M. Stanek
1, M. Spytkowski
1, A. Śluzek
2
1 1Institute of Informatics, Wrocław University of Technology, Poland
2 School of Computer Engineering, Nanyang Technological University, Singapore
Abstract
In this paper we propose a method of bridging local and global levels, what should solve the
problem of limited, non-adaptable dictionary when we use automatic annotations in a similar images
retrieving task. In our team we have developed similar images searching tools using global
approaches as well as local approaches to find near similar images. Recently we have started to work
on the method that should join the both approaches. Our faraway goal is to face the difficult problem
with all current approaches to CBIR systems, connected with visual similarity: the semantic gap
between low-level content and higher-level concepts. For this purpose we try to use our experience
from annotation based similar images searching methods and a grouping method which is able to
automatically form visual object. The paper presents some our methods and results, next, the idea of
current research.
Keywords: Images similarity; visual content; image auto-annotation; semantic gap
1. Introduction
The concept of similarity plays a key role in image analysis and, more specific, in image
retrieval. Viable formulation of image similarity allows effectively recognizing and
retrieving images with related content. The general concept of image similarity is vague and
may be defined in multiple different ways. Man is able to determine the mutual similarity of
two images shown to him. Also he is able to find the similar image to a given one, but this
image is similar in his view. So, the term images similarity is not precise, it is very
subjective when is considered by people. Let us see the formal definition of word
‗similarity‘, defined in the American Heritage Dictionary [29]: similarity – is quality or
condition of being similar; resemblance. Following words are the synonyms: likeness,
similarity, similitude, resemblance, analogy, affinity. These words denote agreement or
conformity, the likeness implies close agreement, similarity and similitude suggest
agreement only in some respects or to some degree, while resemblance refers to similarity
in external or superficial details. Analogy means similarity ―as of properties or functions,
Page 30

Intelligent approaches to searching similar images on
the basis of visual content
ICI 10 - 10TH INTERNATIONAL CONFERENCE ON INFORMATION
2
between things that are otherwise not comparable‖. The last word, affinity is a ―likeness
deriving from kinship or from the possession of shared properties or sympathies‖ [29]. What
we want is to design a computer system which will be able to find similar images to a given
one. Taking into account the described meanings, this task is very difficult. One can expect
that such computer system will be imprecise and, possibly, it will require be tuned for
particular users.
Summing the above, different people consider different images as similar and would like to
get different retrieval results. Images may be considered similar if they: have the same
interpretation, share the same object(s), evoke the same emotions, have identical spatial
arrangement, share the same colours or textures, have identical fragments, etc. Some
interpretations of the mentioned similarity concept may be modelled using the object
recognition paradigm, i.e. intelligent techniques. To make the situation even more complex,
we also need to take into account the human perspective and expectations [24]. Thus,
machine learning paradigm seems to be a reasonable solution to the problem of image
similarity measurement.
Application of object recognition paradigm to image retrieval may be successfully
implemented using the similarity of recognized concepts. Instead of low-level, pixel based
queries, the user is able to formulate meaningful, concept based queries [14]. This image
retrieval scheme is sometimes referred to as Annotation Based Image Retrieval [11] in
contrast to classic Content Based Image Retrieval. Despite its multiple advantages,
researchers point out the key disadvantage of such approach: the number of concepts is
predefined and finite [28]. This property makes the object recognition based paradigm
inapplicable when faced with infinite diversity of the surrounding world [7]. Effective
image retrieval may require continuous creation of new concepts which describe the
environment in a precise way.
The paper is a continuation of our research on the mentioned problem. We seek how to
automatically create new concepts without any a‘priori information, purely on a visual
basis [23] and seamlessly integrate them into the notion of image similarity. The presented
idea consists of multiple subcomponents, solving various subproblems, but it may not be yet
considered as complete or functional. Thus, in this paper we do not give clear answers, but
rather we present our most recent ideas. Some methods which are regarded as components
of the proposed idea are developed and studied [1, 17, 27].
Page 31
Intelligent approaches to searching similar images on
the basis of visual content
ICI 10 - 10TH INTERNATIONAL CONFERENCE ON INFORMATION
3
2. Global image analysis
The first component of the presented solution is a global image analysis method where we
are interested in extracting general, holistic image features. Such features are easy to
generalize and efficient for processing by intelligent approaches. We may simply build
image recognition methods based on global features and accompanying labels. These
recognition methods may be image distance based (nearest neighbours recognition
paradigm), which turns to be a quite effective approach. Having a set of labels the image
similarity based retrieval becomes a text based retrieval. However, as mentioned above, we
face the problem of finite, limited and non-adaptable dictionary.
2.1. Global image distances
A set of global features is used in global image analysis. Automatic methods of images
analysis define image similarity as a distance measure between images, which is a sum of
distances between visual features of considered images.
To obtain the similarity or rather dissimilarity between two images, one can measure the
distance between visual vectors in metric space or probabilistic space. Minkowski, Cosine,
Correlation, Mahalanobis or EMD are commonly used measures to calculate distances
between visual features.
The other approaches use divergence between image probabilistic models calculated for the
set of visual features. In that category commonly used measure is Kullback-Leibler
divergence or its symmetric version Jehnsen-Shannon divergence.
Visual features of an image define its certain visual property. Global features capture some
overall characteristics of an image, as colour, texture and shape. An image can be divided
into a number of sub-images; in such approach, the whole image is described by a vector of
features calculated for each sub-image. For example, the average components of red, green
and blue intensities are often calculated as features and a particular dimension of the vector
corresponds to a certain sub-image location. The global approach has one important
advantage: the high speed, both features extraction and similarity measure calculation [6].
However, the global features are usually too rigid to represent an image. The second
approach is extraction of local features, computed for every pixel using its neighbourhood.
Additional step, features summarisation must be performed. Often data set based on a
distribution for each pixel xij (i=1,...,m, j=1,...,n; where m, n are the image width and high,
measured in pixels) is calculated in summarisation step.
Page 32

Intelligent approaches to searching similar images on
the basis of visual content
ICI 10 - 10TH INTERNATIONAL CONFERENCE ON INFORMATION
4
Some features from MPEG-7 standard, as histogram-based descriptors, spatial colour
descriptors and texture descriptors seem to be well suited for natural images retrieval.
Examples of such features are: Fuzzy Color Histogram, JPEG Coefficient Histogram,
General Color Layout, Color and Edge Directivity Descriptor [4], Fuzzy color and texture
histogram [5]. The recent overview of this problem is given in [6].
2.2. Automatic image annotation
Automated Image Annotation (AIA) is a process which describes previously unseen image
Q by a set of concepts {w1, w2, …, wN} from the semantic dictionary D. Word assignment
can be made by finding the correlation between visual features which characterize query
image Q and high-level semantics (concepts). AIA is an integral part of modern CBIR
systems. Text queries are often much more natural than visual queries, e.g. querying by
colour, texture, shape. Image annotations can be seen as a bridge between textual queries
and visual image content.
Machine learning techniques used to solve the AIA problem can be split into classification
based methods and probabilistic modelling methods. Classification methods lie on training
classifiers to recognize if a given word is present within the proper description of the image.
Different classifiers can be used in this approach, good result and speed one can obtain with
decision trees [13, 22].
Probabilistic modelling methods, such as Hierarchical Probabilistic Mixture Model
(HPMM) [10], Translation Model (TM) [8], Supervised Multi-Class Labelling (SML) [3],
Continuous Relevance Model (CRM) [14] and Multiple Bernoulli Relevance Models
(MBRM) [9], try to find the probability density function of visual features associated to
concepts. Parametric or non parametric estimation can be used in this approach.
Results obtained by AIA methods can be further improved by using filter methods which
take into account word co-occurrence models [15], words relations in Word-Net [12] or
proposed by our team GRWCO [13] method which reduces the difference between expected
and resulted word count vectors to reranking the output annotations.
Recently, [19] et. al. have proposed a new method based on the hypothesis that similar
images are likely to share the same annotations. In this approach, an image annotation is a
process of transferring most frequent labels from nearest neighbours. The method does not
solve the fundamental problem of determining the number of annotations that should be
assigned to the target image, it assumes that optimal annotation length is given.
Page 33

Intelligent approaches to searching similar images on
the basis of visual content
ICI 10 - 10TH INTERNATIONAL CONFERENCE ON INFORMATION
5
In our recent research, we have extended this approach. We have proposed PATSI (Photo
Annotation through Similar Images) annotator which introduces transfer function [27] as
well as an optimization algorithm which can be used to find both, the optimal number of
neighbours and the best transfer threshold according to the specified quality measure [17].
PATSI consist of two main phases: preparation and query. In the first phase, for each image
repeat: (1) split the image into a number of regions (sub-images); (2) calculate statistical
visual features for every region (sub-image); (3) create the model of the image. In the query
phase, do: (1) split the query image into regions (sub-images); (2) build a model of the
query image; (3) calculate distances between the query image and all images in the dataset;
(4) Select k most similar images (with the smallest distances); (5) Transfer all words
(annotations) with a weight dependent on a position of a considered image in a similarity
ranking list (how much the image is similar to the query image); (6) Select words with sum
of weight greater than the assumed threshold t. These words are the annotations of the query
image. The more detailed description of the PATSI algorithm one can find in [17] and [27].
2.3. Image retrieval using annotations
In the PATSI (Photo Annotation through Finding Similar Images) approach, concepts from
the most similar images are transferred to the query image using transfer function. Finding
the k most similar images are performed by calculating the distance measure between visual
features of a query image and images in the training set. The resulting annotation consists of
all the words whose transfer values were greater than a specified threshold value t. The
threshold value t influences the resulting annotation length. Optimal threshold value t* and
number of neighbours k must be found using an optimization process [17].
Images retrieval using PATSI is embedded into the method. A query image is an image for
which the similar images should be found. The third task in the query phase is calculation of
distances between the query image and all other images in a dataset. The images from the
dataset are ranked with increasing distances and are presented to a user with this ordering.
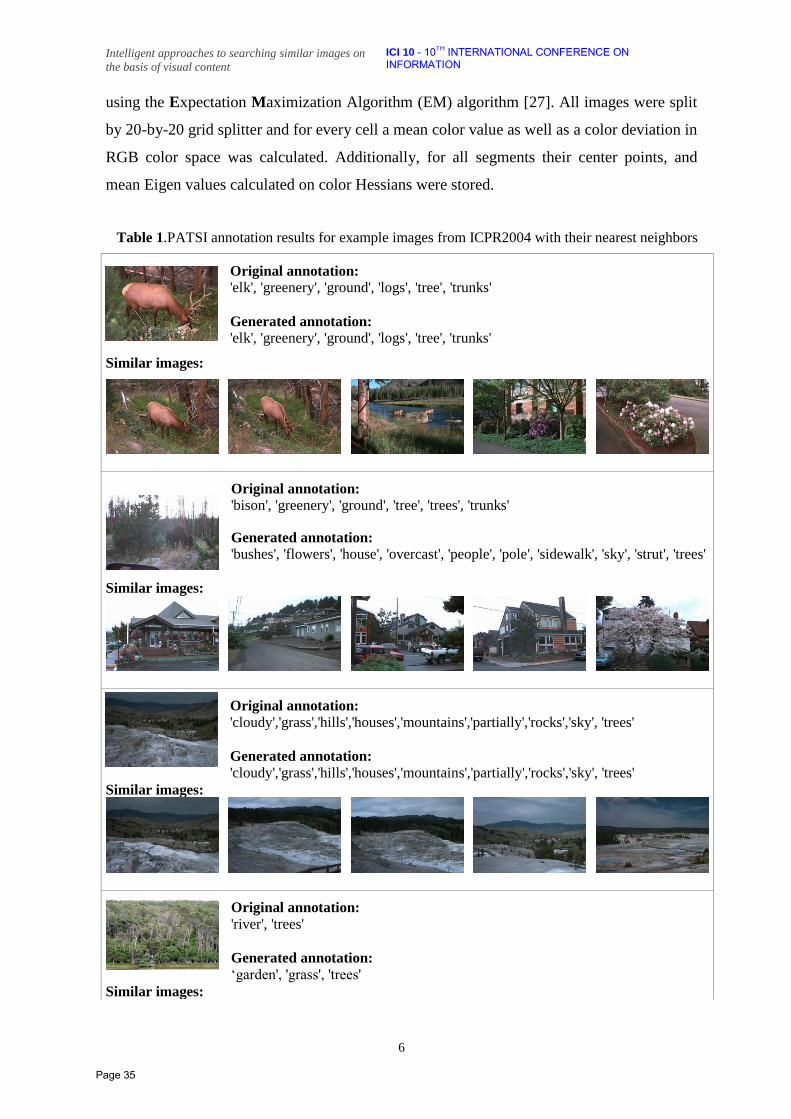
Examples of annotations generated by PATSI for images from ICPR2004 database are
presented in Table. 1. Tables contains also images identified as the most similar images to
the considered one, these images were used in the annotation transfer process. We use
Jehnsen-Shannon divergence to calculate distances between images. Jehnsen-Shannon
divergence was calculated between models of images built onto image visual features.
Visual features were treated as a realization of multivariate random variable described by
multivariate Gaussian distribution. The parameters of that distribution were then calculated
Page 34
Intelligent approaches to searching similar images on
the basis of visual content
ICI 10 - 10TH INTERNATIONAL CONFERENCE ON INFORMATION
6
using the Expectation Maximization Algorithm (EM) algorithm [27]. All images were split
by 20-by-20 grid splitter and for every cell a mean color value as well as a color deviation in
RGB color space was calculated. Additionally, for all segments their center points, and
mean Eigen values calculated on color Hessians were stored.
Table 1.PATSI annotation results for example images from ICPR2004 with their nearest neighbors
Original annotation:
'elk', 'greenery', 'ground', 'logs', 'tree', 'trunks'
Generated annotation:
'elk', 'greenery', 'ground', 'logs', 'tree', 'trunks'
Similar images:
Original annotation:
'bison', 'greenery', 'ground', 'tree', 'trees', 'trunks'
Generated annotation:
'bushes', 'flowers', 'house', 'overcast', 'people', 'pole', 'sidewalk', 'sky', 'strut', 'trees'
Similar images:
Original annotation:
'cloudy','grass','hills','houses','mountains','partially','rocks','sky', 'trees'
Generated annotation:
'cloudy','grass','hills','houses','mountains','partially','rocks','sky', 'trees'
Similar images:
Original annotation:
'river', 'trees'
Generated annotation:
‗garden', 'grass', 'trees'
Similar images:
Page 35
Intelligent approaches to searching similar images on
the basis of visual content
ICI 10 - 10TH INTERNATIONAL CONFERENCE ON INFORMATION
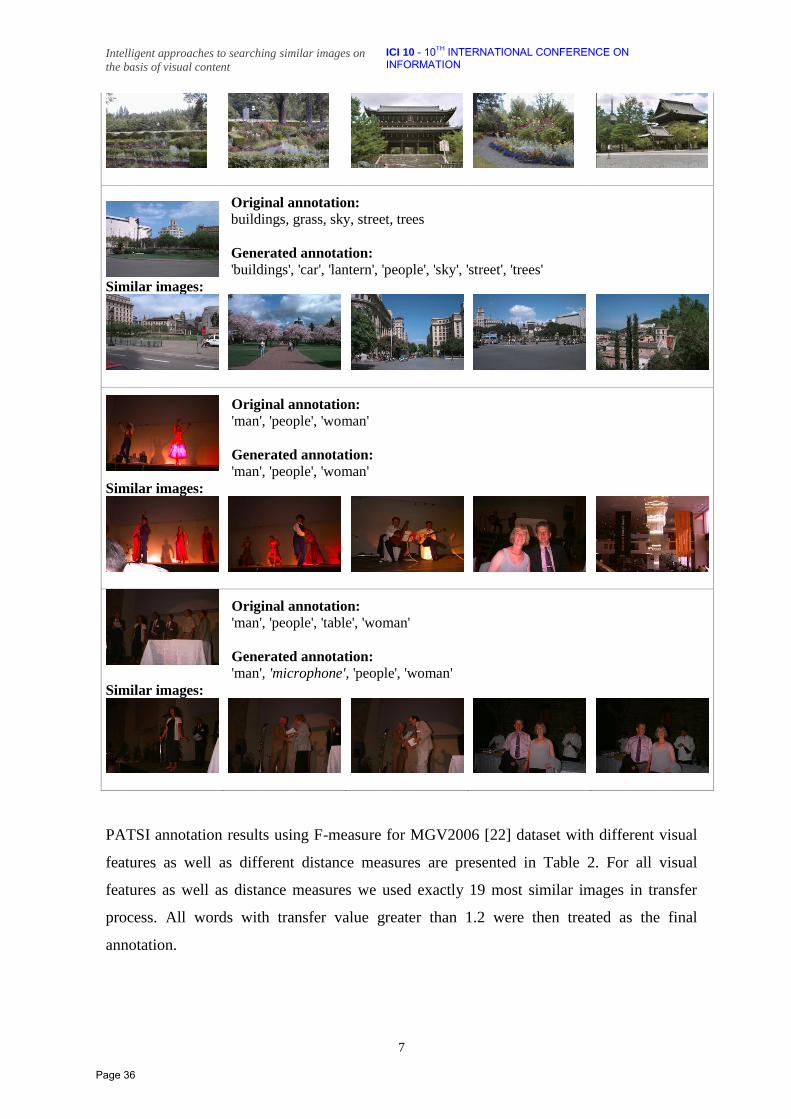
7
Original annotation:
buildings, grass, sky, street, trees
Generated annotation:
'buildings', 'car', 'lantern', 'people', 'sky', 'street', 'trees'
Similar images:
Original annotation:
'man', 'people', 'woman'
Generated annotation:
'man', 'people', 'woman'
Similar images:
Original annotation:
'man', 'people', 'table', 'woman'
Generated annotation:
'man', 'microphone', 'people', 'woman'
Similar images:
PATSI annotation results using F-measure for MGV2006 [22] dataset with different visual
features as well as different distance measures are presented in Table 2. For all visual
features as well as distance measures we used exactly 19 most similar images in transfer
process. All words with transfer value greater than 1.2 were then treated as the final
annotation.
Page 36
Intelligent approaches to searching similar images on
the basis of visual content
ICI 10 - 10TH INTERNATIONAL CONFERENCE ON INFORMATION
8
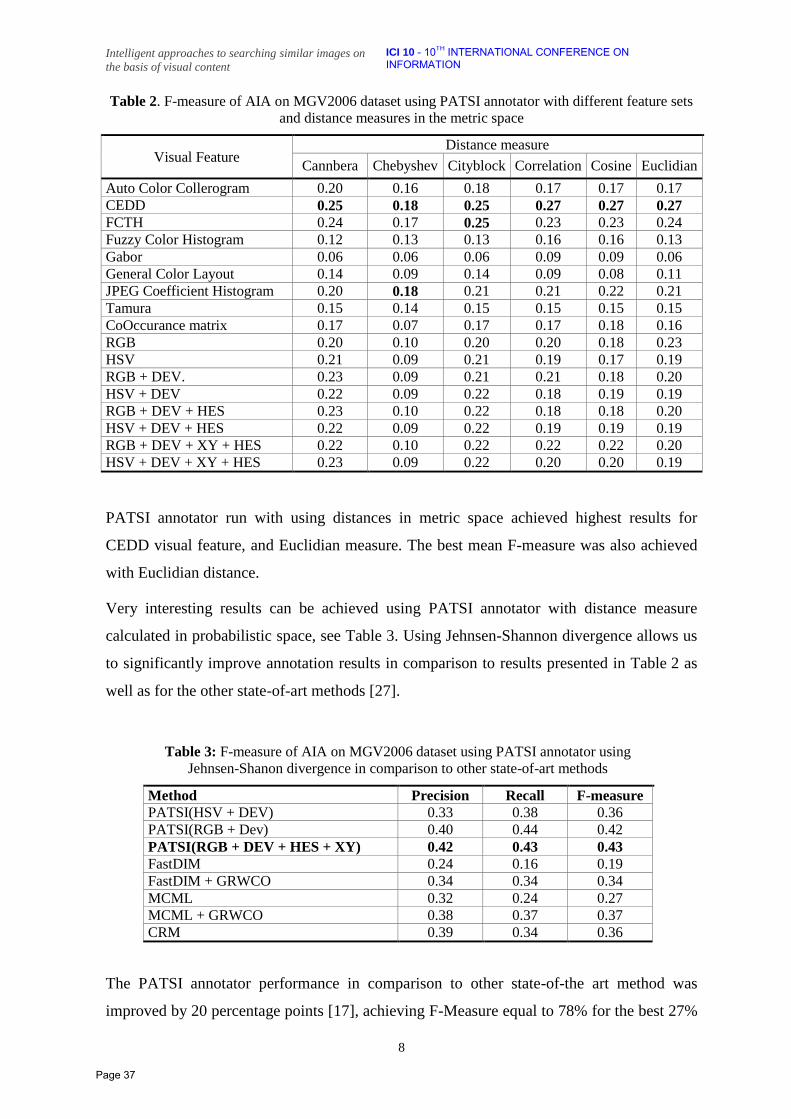
Table 2. F-measure of AIA on MGV2006 dataset using PATSI annotator with different feature sets
and distance measures in the metric space
Visual Feature Distance measure
Cannbera Chebyshev Cityblock Correlation Cosine Euclidian
Auto Color Collerogram 0.20 0.16 0.18 0.17 0.17 0.17
CEDD 0.25 0.18 0.25 0.27 0.27 0.27
FCTH 0.24 0.17 0.25 0.23 0.23 0.24
Fuzzy Color Histogram 0.12 0.13 0.13 0.16 0.16 0.13
Gabor 0.06 0.06 0.06 0.09 0.09 0.06
General Color Layout 0.14 0.09 0.14 0.09 0.08 0.11
JPEG Coefficient Histogram 0.20 0.18 0.21 0.21 0.22 0.21
Tamura 0.15 0.14 0.15 0.15 0.15 0.15
CoOccurance matrix 0.17 0.07 0.17 0.17 0.18 0.16
RGB 0.20 0.10 0.20 0.20 0.18 0.23
HSV 0.21 0.09 0.21 0.19 0.17 0.19
RGB + DEV. 0.23 0.09 0.21 0.21 0.18 0.20
HSV + DEV 0.22 0.09 0.22 0.18 0.19 0.19
RGB + DEV + HES 0.23 0.10 0.22 0.18 0.18 0.20
HSV + DEV + HES 0.22 0.09 0.22 0.19 0.19 0.19
RGB + DEV + XY + HES 0.22 0.10 0.22 0.22 0.22 0.20
HSV + DEV + XY + HES 0.23 0.09 0.22 0.20 0.20 0.19
PATSI annotator run with using distances in metric space achieved highest results for
CEDD visual feature, and Euclidian measure. The best mean F-measure was also achieved
with Euclidian distance.
Very interesting results can be achieved using PATSI annotator with distance measure
calculated in probabilistic space, see Table 3. Using Jehnsen-Shannon divergence allows us
to significantly improve annotation results in comparison to results presented in Table 2 as
well as for the other state-of-art methods [27].
Table 3: F-measure of AIA on MGV2006 dataset using PATSI annotator using
Jehnsen-Shanon divergence in comparison to other state-of-art methods
Method Precision Recall F-measure
PATSI(HSV + DEV) 0.33 0.38 0.36
PATSI(RGB + Dev) 0.40 0.44 0.42
PATSI(RGB + DEV + HES + XY) 0.42 0.43 0.43
FastDIM 0.24 0.16 0.19
FastDIM + GRWCO 0.34 0.34 0.34
MCML 0.32 0.24 0.27
MCML + GRWCO 0.38 0.37 0.37
CRM 0.39 0.34 0.36
The PATSI annotator performance in comparison to other state-of-the art method was
improved by 20 percentage points [17], achieving F-Measure equal to 78% for the best 27%
Page 37
Intelligent approaches to searching similar images on
the basis of visual content
ICI 10 - 10TH INTERNATIONAL CONFERENCE ON INFORMATION
9
percent words in the dictionary of MGV2006 database [22]. The results suggest that for a
small number of concepts AIA can be now treated as the effective image retrieval tool.
During experiments we have spotted that some of the features as well as distance measures
are more suitable to detect some groups of words, while showing a weak performance for
others. By combining them together we can increase overall annotation performance.
Current research is focused on combining many similarity measures and visual features in
one annotation transfer process. We have extended the PATSI algorithm to the multi-PATSI
method which performs annotation transfer process based onto many similarity matrices
calculated using different feature sets and different similarity measures. The results are
combined into the final annotation based on the quality of particular annotators for specific
words.
3. Local image analysis
Local image analysis methods are built on the basis of local features, i.e. features calculated
from very small image regions. Very popular and effective types of local features are
keypoints [18], [20]. Keypoints themselves are much harder to generalize (although such
attempts exist, e.g. [21]) because they are much diversified along single objects. Yet,
keypoints have a very nice property, they are able to capture the notion of sameness.
3.1. Image matching
The goal of image matching is to detect whether two images share visually identical content.
Image matching problem may be divided into many subproblems, such as: sub-image
matching, e.g. [16, 30], image fragment matching, e.g. [23], panorama recognition, e.g. [2],
etc. All these techniques provide high precision results, i.e. if a matching is found, there is a
very low chance it is incorrect.
Sub-image matching methods are able to determine if one image is a fragment of another
image. Such approaches may be very useful for finding identical content in case where both
images share only one common object. The key advantage of sub-image matching is the
applicability of complex (even non-linear) geometrical models for the matching process.
This allows finding objects seen from different viewpoints or even deformed ones. These
methods may be effectively used to capture large objects, such as e.g. monuments,
buildings. However, they are ineffective when faced with a problem of finding multiple
fragments on both images.
Page 38

Intelligent approaches to searching similar images on
the basis of visual content
ICI 10 - 10TH INTERNATIONAL CONFERENCE ON INFORMATION
10
Image fragment matching utilizes simpler geometrical models, but is able to find multiple
identical objects on scenes with cluttered background. The disadvantage of this approach is
the relative simplicity of applied geometry. Deformed or strongly non-planar objects are
harder to capture. These methods may be effectively used to capture small object, such as
e.g. bottles, books, boxes, etc.
Panorama recognition techniques assume that there is only one object of interest. This
object is however captured only partially, i.e. different images contain different fragments of
the object of interest. These methods may be used to capture huge objects, such as e.g.
landscapes, cityscapes.
3.2. Automatic visual object formation
The last, and the most important, fragment of our solution in low level vision refers to the
concept of visual objects [7]. We have proposed a grouping method which is able to
automatically form visual object [24, 25]. It is based on the image matching methods
discussed in Section 3.1. Having a high precision matching routine we may expect that the
created groups are free of errors. The method is able (in a very limited way) to find
meaningful visual objects purely on a visual basis, without any training data or supporting
information. In fact it is an attempt to bridge the semantic gap [6, 26].
The automatic visual object formation method has four major steps: (1) pre-retrieval to
make the process more efficient, (2) image matching to find similarities within the set,
(3) formation of prototypes, which are an intermediate structure [7], and finally,
(4) formation of visual objects. In the first step we measure similarities between all images
in the database. For further processing, we select only the most similar ones. In the second
step we perform image matching for all pairs of similar images within the set. As a result we
get a set of (nearly all) similar image fragments found within the input collection. Because
each image is matched with multiple other images, some image regions on a single image
may have multiple different matches with other images. In the third step we group all these
regions found within a single image. Created groups are called prototypes. In the last step
we group all prototypes according to matching information between images. Resulting
groups are called visual objects and they represent frequently repeating, matched fragments
from the input collection. Exemplary visual objects found in a database containing both
indoor and outdoor scenes are presented in Fig. 1.
Page 39
Intelligent approaches to searching similar images on
the basis of visual content
ICI 10 - 10TH INTERNATIONAL CONFERENCE ON INFORMATION
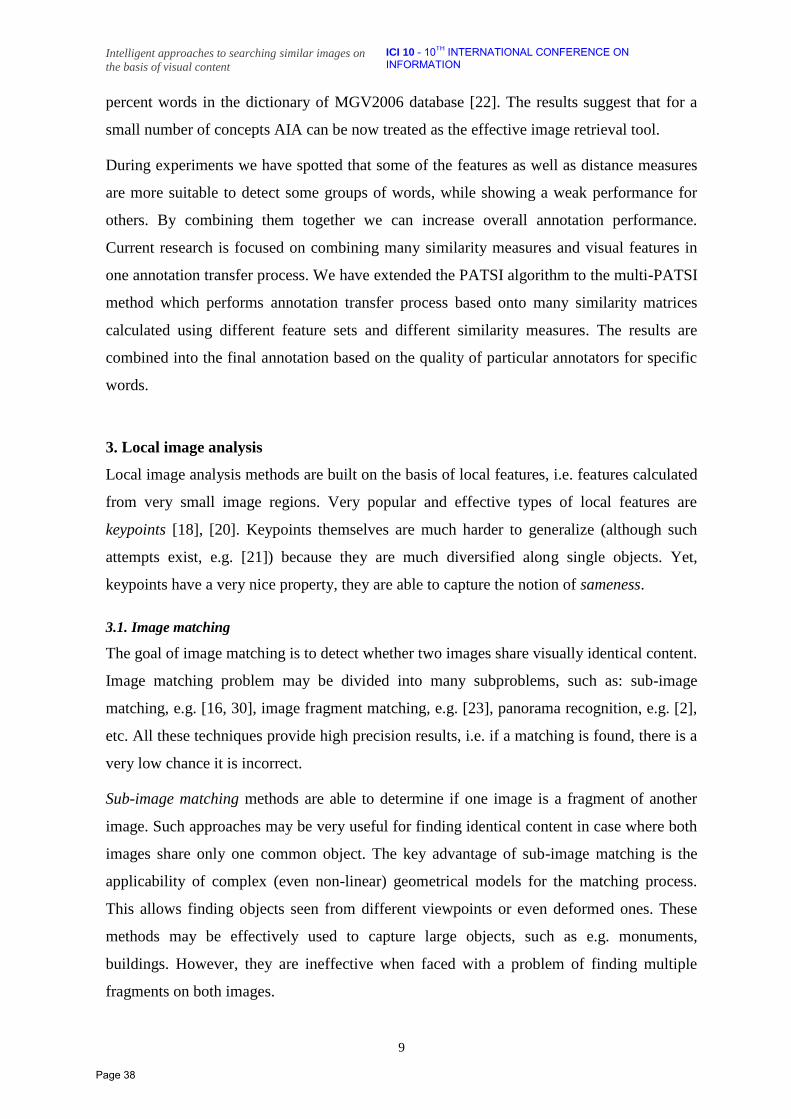
11
Figure 1. Exemplary visual objects are outlined on images from a processed image collection.
Although, each visual object consists of images containing the manifestation of the same
underlying, physical object, this information is very useful. It allows formulating very
specific queries, we may seek for such specific objects as, e.g. a road sign, a flu-remedy
pack, a model of a ship or a car, a monument, a mountain or landscape, etc.
4. Bridging local and global level vision
Having described all necessary components, let us now present the main idea of our current
research. We envision that both, global and local image analysis routines cooperate together.
We would like to utilize global approaches to provide an effective retrieval tool, and we
would like to enforce it by the local approach to solve the problem of limited, non-adaptable
dictionary. Let us assume that the dictionary used in the global image processing is
hierarchical, e.g. it is a fragment of some larger ontology. Some concepts in the hierarchy
may be contradictory and cannot exist together.
Given a small set of hierarchically arranged concepts (e.g. inside, outside, mountain, ship,
building, sky) and a collection of images containing multiple instances of identical objects
(however seen in different scenes and contexts) we would like to make the hierarchy of
concepts more specific and precise. This idea is illustrated in Fig. 2.
First we detect all visual objects using the object formation routine discussed in Section 3.2.
Having all identical objects captured, we would like to link them into our existing hierarchy
of objects. To do this, we employ intelligent, global image analysis techniques, e.g.
classification, automatic image annotation. If needed, we may use a different intelligent
technique (classifier, automatic annotator) on each level of hierarchy. Recognition process
should take into account shapes of regions creating a visual object. We divide the image into
three separate segments, each having a different meaning for the processed visual object.
These three segments are: interior, context and environment, they are illustrated in Fig. 3.
Page 40

Intelligent approaches to searching similar images on
the basis of visual content
ICI 10 - 10TH INTERNATIONAL CONFERENCE ON INFORMATION
12
Figure 2. The concept of bridging local and global level vision.
(a) Interior (b) Context (c) Environment
Figure 3. Three different annotation regions for visual objects
Having recognized objects on all images belonging to a single visual object, we may decide
where to attach it within the concept hierarchy. Usually, various recognition or annotation
Annotation class monument Annotation class ship Annotation class building
Annotation class outside
Visual object
O2 (Sail boat)
Visual object O3
(Container ship) Visual object O4
(Wang church)
Visual object O1
(Obelisk, Beijing)
Glo
bal im
age an
alysis, o
bject reco
gnitio
n, au
tom
atic imag
e
ann
otatio
n, o
nto
log
ies L
ocal im
age an
alysis,
imag
e match
ing
Semantic gap
Page 41

Intelligent approaches to searching similar images on
the basis of visual content
ICI 10 - 10TH INTERNATIONAL CONFERENCE ON INFORMATION
13
methods have one of three possible outputs: precise concept probability values, roughly
estimated concept scores or just a subset of concepts from the dictionary. All those output
types have to be processed in a different way. Three decision rules have been designed for
each type of output. Each decision rule outputs a single support value for each concept w
and each image x containing the visual object.
In weighted decision rule it is assumed that the probability for each concept w within image
x is given directly by the recognition method:
(1)
Output support of this rule is equal to the input probability:
(2)
In binarized decision rule we introduce a threshold t responsible for cutting off a subset of
concepts from the dictionary W:
(3)
(4)
Output support of this rule may contain multiple concepts, thus we have to normalize it:
(5)
(6)
In the last binary decision rule we get the subset of words directly from the recognition
method:
(7)
Output support is averaged in the same way as in the binarized decision rule:
(8)
Final decision regarding of linking the new concept within the hierarchy is made on the
basis of decision rule outputs. An averaged concept support values sw is calculated and
possible contradictions in the hierarchy are solved (function f). Contradictory concepts in
each level of hierarchy are modeled as a set of sets Z (multiple different rules on each level
of hierarchy). Each set Zi contains all contradictory concepts. In case there are two or more
contradictory concepts, the ones with the larger support are chosen by the decision rule dw:
Page 42
Intelligent approaches to searching similar images on
the basis of visual content
ICI 10 - 10TH INTERNATIONAL CONFERENCE ON INFORMATION
14
(9)
(10)
(11)
The decision rule dw introduces a threshold k responsible for the rejection option. In case the
uncertainty is too large (depending on the value of k) the visual object is rejected and not
integrated into the hierarchy. In case the decision rule dw accepts the visual object it is
processed deeper and deeper within the hierarchy.
5. Conclusion
The paper shows briefly the results of our methods concerning similar images retrieval
using PATSI annotation algorithm (now we are testing multi-PATSI method) and the
method of images matching – it detects whether two images share visually identical content.
The important part of our research in low level vision refers to the concept of visual objects.
We have proposed a grouping method which is able to automatically form visual object, this
approach is based on the image matching methods. Our method is able to find meaningful
visual objects purely on a visual basis.
Currently we want to join global and local image analysis routines. Global approaches
should provide efficient retrieval tool, but it can work only on limited dictionary, with all
words well represented in a training set. Such a dictionary can contain words from a given
ontology, i.e., the dictionary consists of hierarchically arranged concepts. Captured in low
level analysis identical objects can be linked into a hierarchy of concepts (objects) by global
image analysis techniques, e.g., automatic image annotation method.
Our future plans concern with the above mentioned problem. Initial set of decision rules are
proposed (Section 4), but we do not have experimental results. Of course, all sub-methods in
the proposed approach should work very well. Having weak one part of the method we are
not able to obtain good final results. So, we plan to improve our global method (e.g., multi-
PATSI method) as well as the automatic visual object formation methods. These two
research topics will be conducted in parallel with studies on the ‗bridge‘ method that should
allow for filling up the semantic gap, perhaps even to a limited extent.
All the presented researches are dedicated to searching similar images, although we still
Page 43
Intelligent approaches to searching similar images on
the basis of visual content
ICI 10 - 10TH INTERNATIONAL CONFERENCE ON INFORMATION
15
have a problem with understanding the concept images similarity. Meaning of similarity of
images still causes problem, however more of us can easily indicate the similar images
within a not large collection of images. It is important that those images are usually similar
in the view of particular user, and therefore the term images similarity is not precise, it is
very subjective when is considered by people. In our group we have developed computer
program, called SIMILARIS, and a set of images used with this program. The main aim of
that research is defining a kind of baseline – measures of images similarity when these
images are evaluated by people. That data can be than used to find the efficient measure of
image similarity. After finishing the testing phase and our preliminary study, the program
SIMILARIS together with used collection of images will be published on the server with
free access to researchers.
Researchers on CBIR systems focus on building systems with the very high precision, but
the fundamental question still remains without answer: is it possible to obtain CBIR systems
with high precision and recall measures? The studies with SIMILARIS should help to find
answer to the above question.
Acknowledgments: This work is partially financed from the Ministry of Science and Higher
Education Republic of Poland resources in 2008–2010 years as a Poland–Singapore joint research
project 65/N-SINGAPORE/2007/0.
References
[1] Broda B., Kwaśnicka H., Paradowski M., Stanek M., ―MAGMA: efficient method for image
annotation in low dimensional feature space based on Multivariate Gaussian Models‖, Proceedings
of the International Multiconference on Computer Science and Information Technology, Ganzha M.,
Paprzycki M. (Eds). Polish Information Processing Society, 2009. p. 131-138, 2009
[2] Brown M., Lowe D. G., ―Recognising panoramas‖, Ninth IEEE International Conference on
Computer Vision (ICCV'03), Vol.2, pp. 1218, 2003
[3] Carneiro, G., Chan, A., Moreno, P., Vasconcelos, N., ―Supervised learning of semantic classes
for image annotation and retrieval‖, IEEE Transactions on Pattern Analysis and Machine
Intelligence 29(3), 394–410, 2007
[4] Chatzichristofis, S., Boutalis, Y., ―Cedd: Color and edge directivity descriptor: A compact
descriptor for image indexing and retrieval‖, Computer Vision Systems 312–322, 2008
[5] Chatzichristofis, S.A., Boutalis, Y.S., ―Fcth: Fuzzy color and texture histogram - a low level
feature for accurate image retrieval‖, Interactive Services, International Workshop on Image
Analysis for Multimedia, p. 191–196, 2008
[6] Datta R., Joshi D., Li J., and Wang J., ―Image retrieval: Ideas, influences, and trends of the new
age‖, ACM Transactions on Computing, Vol. 40, No. 2, 2008
Page 44

Intelligent approaches to searching similar images on
the basis of visual content
ICI 10 - 10TH INTERNATIONAL CONFERENCE ON INFORMATION
16
[7] Dickinson S. J., Leonardis A. and Schiele B., Tarr M. J. (Ed.), ―Object Categorization: Computer
and Human Vision Perspectives‖, Cambridge University Press, 2009
[8] Duygulu, P., Barnard, K., de Freitas, J.F.G., Forsyth, D.A., ―Object recognition as machine
translation: Learning a lexicon for a fixed image vocabulary‖, Proceedings of the 7th European
Conf. on Computer Vision, London, UK, Springer, 2002
[9] Feng, S.L., Manmatha, R., Lavrenko, V., ―Multiple bernoulli relevance models for image and
video annotation.‖, Proceedings of IEEE Computer Society Conference on Computer Vision and
Pattern Recognition 2, 1002–1009, 2004
[10] Hironobu, Y.M., Takahashi, H., Oka, R., ―Image-to-word transformation based on dividing and
vector quantizing images with words. In: in Boltzmann machines‖, Neural Networks, Vol. 4, 1999
[11] Inoue M., ―On the need for annotation-based image retrieval‖, Proceedings of the Information
Retrieval in Context (IRiX), A Workshop at SIGIR 2004, pp. 44–46, 200
[12] Jin, Y., Khan, L., Wang, L., Awad, M., ―Image annotations by combining multiple evidence &
wordnet‖, Proceedings of the 13th annual ACM international conference on Multimedia, 2005
[13] Kwasnicka, H., Paradowski, M., ―Resulted word counts optimization-a new approach for better
automatic image annotation‖, Pattern Recognition 41(12), 2008
[14] Lavrenko V., Manmatha R. and Jeon J., ―A model for learning the semantics of pictures‖,
Proceedings of Neural Information Processing Systems (NIPS), MIT Press, 2003
[15] Llorente, A., Motta, E., Roger, S., ―Image annotation refinement using web-based keyword
correlation‖, Proceedings of the 4th International Conference on Semantic and Digital Media
Technologies, Berlin, 188–191, 2009
[16] Lowe D. G., ―Distinctive image features from scale-invariant keypoints‖, International Journal
of Computer Vision, Vol. 60(2), pp. 91-110, 2004
[17] Maier O., Stanek M., Kwaśnicka H., ―PATSI - photo annotation through similar images with
annotation length optimization‖, Intelligent information systems, Kłopotek M. A. at all (Eds.),
Publishing House of University of Podlasie, 2010. p. 219-232, 2010
[18] Matas J., Chum O., Urban M. and Pajdla T., ―Robust Wide Baseline Stereo from Maximally
Stable Extremal Regions‖, Proceedings of British Machine Vision Conference, pp. 384—393, 2002
[19] Makadia, A., Pavlovic, V., Kumar, S. ―A new baseline for image annotation‖, Proceedings of
the 10th European Conference on Computer Vision, 316–329, 2008
[20] Mikolajczyk K. and Schmid C., ―Scale and Affine Invariant Interest Point Detectors‖,
International Journal of Computer Vision, Vol. 60, pp. 63—86, 2004
[21] Monay F., Quelhas P., Odobez J. M. and Gatica-Perez D., ―Contextual Classification of Image
Patches with Latent Aspect Models‖, EURASIP Journal on Image and Video Processing Vol.2009,
Article ID 602920, 20 pages, doi:10.1155/2009/602920, 2009
[22] Paradowski, M., ―Methods of automatic annotation as an efficient tool for images collections
describing‖ (in Polish: ―Metody automatycznej anotacji jako wydajne narzedzie opisujace kolekcje
obrazow‖), PhD thesis, Wrocław University of Technology, 2008
[23] Paradowski M. and Śluzek A., ―Automatic Visual Object Formation using Image Fragment
Matching‖, Proceedings of 2010 International Multiconference on Computer Science and
Information Technology (IMCSIT), in press, 2010
[24] Russell R. and Sinha P., ―Perceptually-based comparison of image similarity metrics‖,
Technical report, AIM-2001-014, CBCL-201, 2001
[25] Sluzek A., Paradowski M., ―A Vision-based Technique for Assisting Visually Impaired People
and Autonomous Agents‖, Proceedings of 3th International Conference on Human System
Interaction HSI2010, pp. 653-660, 2010
Page 45

Intelligent approaches to searching similar images on
the basis of visual content
ICI 10 - 10TH INTERNATIONAL CONFERENCE ON INFORMATION
17
[26] Smeulders A. W. M. and Gupta A., ―Content-Based Image Retrieval at the End of the Early
Years‖, Transactions on Pattern Analysis and Machine Intelligence, Vol. 22(12), pp. 1349–1380,
2000
[27] Stanek M., Broda B., and Kwasnicka H., ―PATSI — Photo Annotation through Finding Similar
Images with Multivariate Gaussian Models‖, Lecture Notes in Computer Science, Springer, also:
International Conference on Computer Vision and Graphics, Warsaw, 2010
[28] Tadeusiewicz R. and Ogiela M. R., ―The New Concept In Computer Vision: Automatic
Understanding of the Images‖, Proceedings of Artificial Intelligence and Soft Computing, ICAISC
2004, pp. 133-144, 2004
[29] ―The American Heritage® Dictionary of the English Language‖, Fourth Edition copyright
©2000 by Houghton Mifflin Company. Updated in 2009. Published by Houghton Mifflin Company.
http://www.thefreedictionary.com/likeness
[30] Yang D., Sluzek A., ―A low-dimensional local descriptor incorporating TPS warping for image
matching‖, Image and Vision Computing, Vol. doi:10.1016/j.imavis.2009.12.003, 2009.
Page 46

The Role of Information Technology in Egyptian Space Program
(Objectives, Achievements and Future Directions)
Invited Speech
Professor.Mohamed Adel Yehia Chairman of the Egyptian Space Council Program,Cairo, Egypt
Abstract
• In Egypt space technology is viewed as a road to achieve several objectives: - Science and Education:
• Improve our scientific level. • Impact on Education and scientific research.
- Industry and Technology: • Enhance our Industrial base. • Introduce advanced technology.
- National Planning and Imaging: • Satisfy the needs of national agencies of images for planning and development. • Increase the use of Space Imaging as a national planning tool. • Use of Space Technology in Crises management and mitigation
- Raising Technical Awareness: • Raise the level of technological awareness in the country and thus enhance our
entry into advanced technologies Priorities of Space Applications in Response to National Needs • Agriculture: Food Stocks Estimates and Planning. • Water Resource Monitoring and Management. • Urban Planning – The Project of Development Corridor (Farook El Baz). – The project of Transfer of Urban mass to the desert (Rushdi Saeed) • Disaster Monitoring and Management – Establish Risk Zone Atlas of Egypt (Rocks, Floods, Fires) – Fall of Rocks from Mokkattam. • Maritime Movement Monitoring and Control – Control Illegal Immigration – Prevent Human losses at seas ELEMENTS OF THE EGYPTIAN SPACE PROGRAM 1. The Satellites 2. The Stations 3. The Laboratories 4. The Space City 5. The People 6. The Universities 7. The Industry 8. The Technologies 9. The Cooperation Projects The Egyptian Space Program Future Directions
Page 47

Full use of EgyptSat‐1 in development Build network of users and value added Build EgyptSat‐2 in Egypt with 60% Egyptian Component (~5.4 m) Attract Universities‐(Universat‐1) Complete the Infrastructure, build and train the full team Build cooperation with other Arab states towards an Arab Space Program
Page 48
GAMASA, EGYPT, 4 – 6 DECEMBER 2010
Decision Support and Warning Systems for Business Intelligence
Jie Lu, Guangquan Zhang, Ya Gao, Jie Zhang, Vahid Behbood
Decision Systems & E-Service Intelligence Research Laboratory Center for Quantum Computing and Intelligent System
School of Software, Faculty of Engineering and Information Technology University of Technology Sydney, Sydney, Australia
Emails: [email protected], [email protected], [email protected], [email protected], [email protected]
Abstract This paper presents our recent developments in intelligent decision support systems and early warning systems as well as their applications for business intelligence. It reports our research results mainly from three projects: knowledge-based risk prediction method using fuzzy logic and case-based reasoning for avian influenza early warning, intelligent financial warning support system using transferable adaptive inference-based fuzzy neural network, and competitive strategic bidding optimization in electricity markets using bi-level programming and swarm technique.
Keywords: Decision support systems; Fuzzy neural network; Case-based reasoning; Warning systems; knowledge-based systems; Failure prediction; Business intelligence
1. Introduction
Decision making, which is one of the most important activities of human beings, is more
difficult in today's rapidly changing decision environment than ever before. Decision support
systems (DSS) are playing a more and more important role in the decision making of
organizations in every discipline, including health, business, engineering, education and
finance [1-4]. In today, the 21st century’s complex environments, organizational decision
makers have increased requirements for advanced knowledge, previous successful experiences,
and intelligent technical conditions to support and enable better decisions [5]. Knowledge-
based methods and intelligent models have become a necessary component in current advanced
DSS and its applications [6]. With the ever-increasing complexity of decision situations and
related computing systems some new intelligent techniques have been considered today as key
technologies for the development of high quality distributed DSS applications [7-10].
Page 49

Furthermore, the current financial crises and terrorism threats, as well as swine flu in the
world, have sparked an urgent need to build early warning systems (EWS), which can
effectively support decision makers to recognize underlying vulnerabilities and implement
relevant strategies, enabling them to reduce, or eliminate, future problems and the risk of
experiencing a crisis. Powerful predictive ability will ensure that an EWS generates maximal
reliable warnings at the onset of crises. Unlike some natural (e.g. earthquake) and
technological (e.g. mining disaster) phenomena, predictions of a financial attack or an avian flu
social crisis are almost impossible to make by traditional mathematical forecasting models or
physical monitoring, nor is it possible to have a set of threshold values for warnings. Such
predictions are more strongly dependent on domain experts' knowledge and experience of past
similar crises, many of which contain vague, uncertain or dynamic elements and can be only
described in complex, ill-structured forms. For the kind of non-model driven, high uncertainty
involved crisis prediction problems, case-based reasoning (CBR), as the process of solving
new problems based on the solutions of similar past problems [1], neural network, machine
learning, fuzzy logic and other computation intelligence approaches provide a suitable
framework [11-13].
This paper presents our recent developments in intelligent decision support systems and early
warning systems as well as their applications for business intelligence. It reports our research
results mainly from three projects: knowledge-based risk prediction method using fuzzy logic
and CBR for avian influenza early warning, intelligent financial warning support system using
transferable adaptive inference-based fuzzy neural network, and competitive strategic bidding
optimization in electricity markets using bi-level programming and swarm technique.
2. A Knowledge-based Risk Prediction Method Using Fuzzy Logic and CBR for Avian
Influenza Early Warning
The threat of highly pathogenic avian influenza persists with the epidemic size growing in the
world. EWS and various risk analysis methods have been applied to measure and predict the
threat and a number of real EWS have been developed in last two decades. The prerequisites
for an EWS are to provide effective predictions of infectious diseases among which avian
influenza is hard to forecast and has devastating damages in human and other animals for its
virulence. In the meantime, epidemic EWS research has gained considerable attentions. An
epidemic EWS includes four principal components: identification and forecasting of an event;
prediction of the possible health outcomes; an effective and timely response plan; and an
Page 50
ongoing evaluation of the system and its elements [14]. However, there are some difficulties in
developing an epidemic EWS because of the following reasons: (1) the virus is special and
hard to extinct [15]. The virus is varied by the hosts and its origin and has been changing
continuously. Also the virus can cross different species, for example, from birds to mammals,
but it is lucky to believe that it cannot spread among mammals. (2) Poultry farm, bird trade and
wild birds’ migration make it spread through all the possible channels [15-17]. (3) Some other
undiscovered reasons also contribute to these difficulties, such as the unreported and illegal
trade of both wild birds and domestic poultry will shield the truth. These reasons have sparked
a timely need for intelligent or knowledge-based EWS which can effectively monitor and track
new, unknown diseases, produce signals to detect possible crises at an early stage.
Our study proposes a knowledge-based risk prediction method, which can overcome the
predicting difficulties by making full use of previous cases, experiences and knowledge [18].
This proposed knowledge-based method combines CBR techniques with fuzzy logic to make
the prediction more effective and the results more accuracy. A fuzzy logic based risk level
estimation model is also developed which employs SEIR model to simulate the infectious bird
size. Particularly, we developed a seasonal auto-regressive model-based support vector
regression (SARSVR) method which combines the seasonal auto-regressive model with
support vector regression (SVR) together and, in addition, is merged with the latent seasonality
identification method in the forecasting. We collected data from reports on the website:
http://www.oie.int/downld/AVIAN%20INFLUENZA/A_AI-Asia.htm which contains the
verified H7 and H5 infectious animal events from different countries around the world dated
from December 2003 until now. We sum up the time series to total 289 weeks for totally over
6000 cases with about 20 attributes. A set of experiments has been conducted to illustrate the
capabilities and procedures of the proposed method and techniques in avian influenza EWS.
3. Intelligent Financial Warning Support System using Transferable Adaptive Inference-
based Fuzzy Neural Network
Since the advent of various financial crises in the 1990s and 2000s particularly the recent
recession in mid-2008 there have been extensive investments in the construction of accurate
computational systems to predict the probability of financial crises, bankruptcies and Bank
failures. Various data analysis models and prediction systems, called Financial Early Warning
System (FEWS), have been developed. Although these models are useful to managers and
regulators [19-20], some drawbacks make them inapplicable as vital FEWSs for business. Most
Page 51

of the existing approaches, which use statistical methods, have deficiencies such as: ignoring
important sources of uncertainty in classification as an arbitrary definition of failure; data
instability and arbitrary choice of the optimization criteria; and neglecting time dimension of
failure [20]. In addition, almost all existing statistical financial prediction models have been
criticized for their assumptions, which are more likely to be violated in the fields of finance
and economics [21]. Conversely, the growing development of computational intelligence
techniques has led researchers to employ new methods such as Decision Tree [22], Support
Vector Machine [23-26], Case Based Reasoning [27-29], Genetic Algorithm [30] in FEWS.
One of the most popular computational intelligence techniques that have been significantly
applied to the domain of forecasting is Neural Network (NN) [31-35]. Although NN is a well-
known, efficient tool for prediction, it works as a ‘black box’ due to its computational
framework. It learns only the relationship between inputs and outputs, without providing any
knowledge about the relationship between inputs and outputs which is critical for decision
making. Fuzzy systems have been also introduced in this area to tackle the imprecise nature of
financial forecasting and effectively present expert knowledge about the influence of input
variables on financial situation, as output through a fuzzy rule base [36-39]. Its ability to
generate knowledge, and to use expert knowledge to solve prediction problems, makes it very
popular in the financial domain but it is not as accurate as NN. Fuzzy Neural Network (FNN),
which is an embedded model, uses NN and fuzzy systems to create a robust hybrid classifier
and forecaster tool in different fields [40-43]. In recent research, different kinds of FNNs are
used to classify and predict financial failures [21, 44-47]. The main advantages of these models
are their consistent fuzzy rule base gained from fuzzy systems along with their learning ability
and accuracy obtained from NN, to prevent probable future crises.
Although FEWS have proved to be very useful to prevent the reoccurrence of enterprise
bankruptcies and bank failures, ignoring following properties in most researches make them
inapplicable for finance industry. Since FEWS is more than a classical prediction model and
should provide an explanatory analysis to describe the reasons behind the failure, the
explanatory ability of system is as important as its predictive accuracy. In addition, a FEWS
needs to go beyond prediction and provide a prediction-based decision making component to
decide, suggest or recommend solutions for decision makers who have the authority to impede
imminent failure. Furthermore, a flexible and transferable FEWS, which can be modified for
different domains automatically, is so practical in application, easy to install and cheap to
setup. To achieve aforementioned properties in the FEWS, this study develops a system called
Page 52
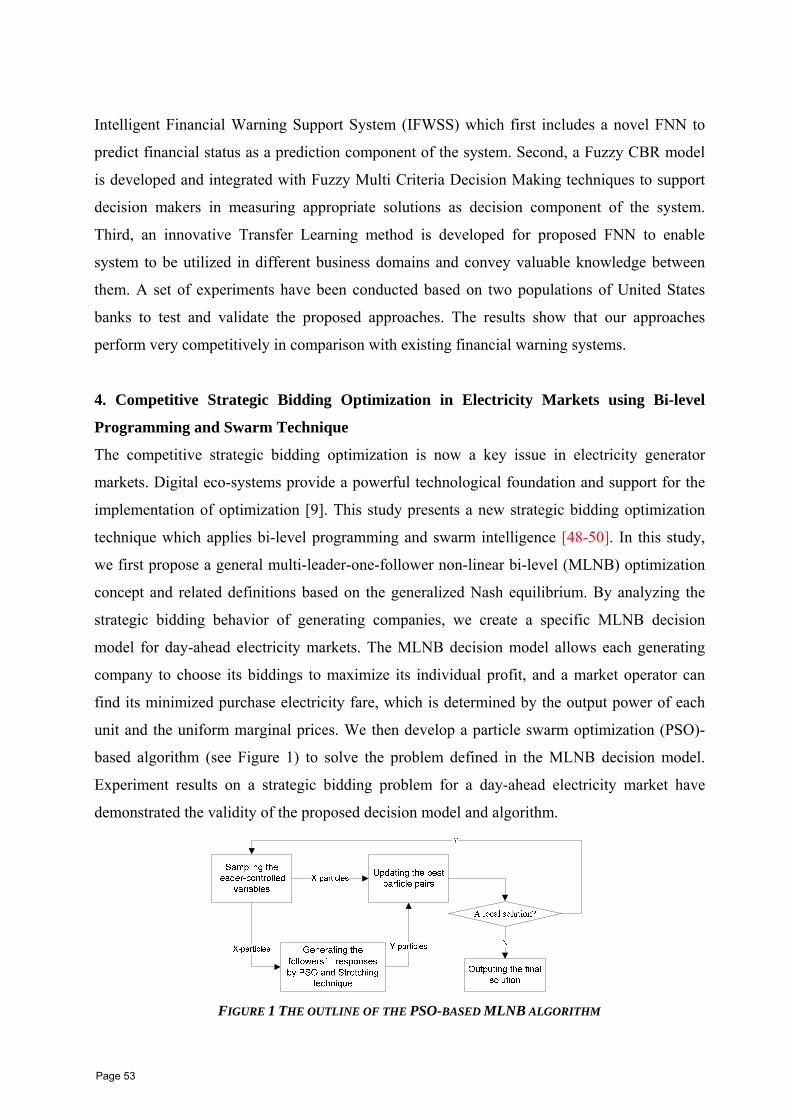
Intelligent Financial Warning Support System (IFWSS) which first includes a novel FNN to
predict financial status as a prediction component of the system. Second, a Fuzzy CBR model
is developed and integrated with Fuzzy Multi Criteria Decision Making techniques to support
decision makers in measuring appropriate solutions as decision component of the system.
Third, an innovative Transfer Learning method is developed for proposed FNN to enable
system to be utilized in different business domains and convey valuable knowledge between
them. A set of experiments have been conducted based on two populations of United States
banks to test and validate the proposed approaches. The results show that our approaches
perform very competitively in comparison with existing financial warning systems.
4. Competitive Strategic Bidding Optimization in Electricity Markets using Bi-level
Programming and Swarm Technique
The competitive strategic bidding optimization is now a key issue in electricity generator
markets. Digital eco-systems provide a powerful technological foundation and support for the
implementation of optimization [9]. This study presents a new strategic bidding optimization
technique which applies bi-level programming and swarm intelligence [48-50]. In this study,
we first propose a general multi-leader-one-follower non-linear bi-level (MLNB) optimization
concept and related definitions based on the generalized Nash equilibrium. By analyzing the
strategic bidding behavior of generating companies, we create a specific MLNB decision
model for day-ahead electricity markets. The MLNB decision model allows each generating
company to choose its biddings to maximize its individual profit, and a market operator can
find its minimized purchase electricity fare, which is determined by the output power of each
unit and the uniform marginal prices. We then develop a particle swarm optimization (PSO)-
based algorithm (see Figure 1) to solve the problem defined in the MLNB decision model.
Experiment results on a strategic bidding problem for a day-ahead electricity market have
demonstrated the validity of the proposed decision model and algorithm.
FIGURE 1 THE OUTLINE OF THE PSO-BASED MLNB ALGORITHM
Page 53

Acknowledgments
The work presented in this paper was supported by Australian Research Council (ARC)
under the discovery projects DP0557154 and DP088739.
References [1] Zhang, G. and Lu, J., “A linguistic intelligent user guide for method selection in multi-objective
decision support systems”, Information Sciences, Vol. 179, No. 14, 2299-2308, (2009). [2] Gao, Y., Zhang, G. and Lu, J., “A decision support system for fuzzy multi-objective bilevel
decision making”, International Journal of Information Technology and Decision Making, Vol. 8, No. 1, 93-108, (2009).
[3] Lu, J., Bai, C. and Zhang, G., “Cost benefit factor analysis in E-services using Bayesian networks”, Expert Systems with Applications, Vol. 36, No. 3, 4617-4625,(2009).
[4] Gao, Y., Zhang, G., Lu, J., Dillon, T. and Zeng, X., “A λ-cut-approximate algorithm for goal-based bilevel risk management systems”, International Journal of Information Technology and Decision Making Vol. 7, No. 4, 589-610, (2008).
[5] Ma, J., Lu, J. and Zhang, G., “Team situation awareness measure using semantic utility functions for supporting dynamic decision-making”, Soft Computing - A Fusion of Foundations, Methodologies and Applications, Vol. 14, No. 12, 1305-1316, (2010).
[6] Lehto, M. R., Papastavrou, J. D., Ranney, T. A. and Simmons, L. A. ,”An experimental comparison of conservative versus optimal collision avoidance warning system thresholds”. Safety Science, Vol. 36, 185-209, (2000).
[7] Ng, G. S., Quek, C. and Jiang, H., “FCMAC-EWS: A bank failure early warning system based on a novel localized pattern learning and semantically associative fuzzy neural network”. Expert Systems with Application, Vol. 34, 989-1003, (2008).
[8] Jie Lu and Guangquan Zhang, “Guest editorial: a special issue on optimization techniques for business intelligence systems”, Journal of Global Optimization, 28 August 2010 online, (2010).
[9] Zhang, G., Lu, J., Montero, J. and Zeng, Y., “Model, Solution concept and the Kth-best algorithm for linear tri-level programming”, Information Sciences Vol. 180, No. 4, 481-492, (2010).
[10] Lu, J., Zhu, Y., Zeng, X., Koehl, L., Ma, J. and Zhang, G., “A linguistic multi-criteria group decision support system for fabric hand evaluation”, Fuzzy Optimization and Decision Making, Vol. 8, No 4, 395-413, (2009).
[11] Jie Lu and Guangquan Zhang, “Guest editorial: a special issue on optimization techniques for business intelligence systems”, Journal of Global Optimization, 28 August 2010 online, (2010).
[12] Lu, J. and Zhang, G., “A special issue on decision intelligence with soft computing”, Soft Computing - A Fusion of Foundations, Methodologies and Applications, Vol. 14, No. 12, 1253-11254, (2010).
[13] Zheng, Z., Lu, J., Zhang, G. and He, Q., “Rule sets based bilevel decision model and algorithm”, Expert Systems With Applications, Vol. 36, No. 1, 18-26, (2009).
[14] Ebi, K. L. and Schmier, J. K., “A stitch in time: improving public health early warning systems for extreme weather events”, Epidemiol Rev, Vol. 27, 115-121, (2005).
[15] Gauthier-Clerc, M., Lebarbenchon, C. and Thomas, F. “Recent expansion of highly pathogenic avian influenza H5N1: a critical review”, Ibis, Vol. 149, 202–214, (2007).
[16] Kilpatrick, A. M., Chmura, A. A., Gibbons, D. W., Fleischer, R. C., Marra, P. P. and Daszak, P., “Predicting the global spread of H5N1 avian influenza”, Proceedings of the National Academy of Sciences (PANS), Vol. 103, 19368–19373, (2006).
Page 54

[17] Weber, T. and Stilianakis, N., “Ecologic immunology of avian influenza (H5N1) in migratory birds”, Emerging Infectious Diseases. Vol. 13, 1139–1143, (2007).
[18] Jie Zhang, Jie Lu and Guangquan Zhang, “A hybrid knowledge-based risk prediction method using fuzzy logic and CBR for avian influenza early warning, Accepted by Journal of Multi-Valued Logic and Soft Computing, (in press) (2010).
[19] B. S. Ahn, S. S. Cho, and C. Y. Kim, "The integrated methodology of rough set theory and artificial neuralnetwork for business failure prediction," Expert Systems with Applications, vol. 18, 65-74, (2000).
[20] S. Balcaen and H. Ooghe, "35 years of studies on business failure: an overview of the classic statistical methodologies and their related problems," The British Accounting Review, vol. 38, 63-93, (2006).
[21] C. Quek, R. W. Zhou, and C. H. Lee, "A novel fuzzy neural approach to data reconstruction and failure prediction," Int. J. Intell. Syst. Account. Financ. Manage., vol. 16, 165-187, (2009).
[22] H. Frydman, E. I. Altman, and D.-L. Kao, "Introducing Recursive Partitioning for Financial Classification: The Case of Financial Distress," The Journal of Finance, vol. 40, 269-291, (1985).
[23] K.-S. Shin, T. S. Lee, and H.-J. Kim, "An application of support vector machines in bankruptcy prediction model," Expert Systems with Applications, vol. 28, 127-135, (2005).
[24] J. H. Min and Y.-C. Lee, "Bankruptcy prediction using support vector machine with optimal choice of kernel function parameters," Expert Systems with Applications, vol. 28, 603-614, (2005).
[25] Z. Hua, Y. Wang, X. Xu, B. Zhang, and L. Liang, "Predicting corporate financial distress based on integration of support vector machine and logistic regression," Expert Systems with Applications, vol. 33, 434-440, (2007).
[26] Y. Ding, X. Song, and Y. Zen, "Forecasting financial condition of Chinese listed companies based on support vector machine," Expert Systems with Applications, vol. 34, 3081-3089, (2008).
[27] C.-S. Park and I. Han, "A case-based reasoning with the feature weights derived by analytic hierarchy process for bankruptcy prediction," Expert Systems with Applications, vol. 23, 255-264, (2002).
[28] S.-T. Li and H.-F. Ho, "Predicting financial activity with evolutionary fuzzy case-based reasoning," Expert Systems with Applications, vol. 36, 411-422, (2009).
[29] H. Li and J. Sun, "Business failure prediction using hybrid2 case-based reasoning (H2CBR)," Computers & Operations Research, vol. 37, 137-151, (2010).
[30] K.-S. Shin and Y.-J. Lee, "A genetic algorithm application in bankruptcy prediction modeling," Expert Systems with Applications, vol. 23, 321-328, (2002).
[31] L. M. Salchenberger, E. M. Cinar, and N. A. Lash, "Neural Networks: A New Tool for Predicting Thrift Failures*," Decision Sciences, vol. 23, 899-916, (1992).
[32] D. Fletcher and E. Goss, "Forecasting with neural networks : an application using bankruptcy data," Information & Management, vol. 24, 159-167, (1993).
[33] R. L. Wilson and R. Sharda, "Bankruptcy prediction using neural networks," Decision Support Systems, vol. 11, 545-557, (1994).
[34] T. Y. Kim, K. J. Oh, I. Sohn, and C. Hwang, "Usefulness of artificial neural networks for early warning system of economic crisis," Expert Systems with Applications, vol. 26, 583-590, (2004).
[35] M. D. Odom and R. Sharda, "A neural network model for bankruptcy prediction," 1990 IJCNN International Joint Conference on Neural Networks, Vol .2, 163-168, (1990).
[36] P. Alam, D. Booth, K. Lee, and T. Thordarson, "The use of fuzzy clustering algorithm and self-organizing neural networks for identifying potentially failing banks: an experimental study," Expert Systems with Applications, vol. 18, 185-199, (2000).
Page 55
Decision Support and Warning Systems for Business Intelligence
ICI 10 - 10TH INTERNATIONAL CONFERENCE ON INFORMATION
8
[37] T.-C. Tang and L.-C. Chi, "Predicting multilateral trade credit risks: comparisons of Logit and Fuzzy Logic models using ROC curve analysis," Expert Systems with Applications, vol. 28, 547-556, (2005).
[38] H. P. Vigier and A. Terceño, "A model for the prediction of "diseases" of firms by means of fuzzy relations," Fuzzy Sets and Systems, vol. 159, 2299-2316, (2008).
[39] J. Lu, G. Zhang, D. Ruan, and F. Wu, "Multi-Objective Group Decision Making: Methods, Software and Applications with Fuzzy Set Techniques," London: Imperial College Press, (2007).
[40] W. L. Tung and C. Quek, "Falcon: neural fuzzy control and decision systems using FKP and PFKP clustering algorithms," IEEE Transactions on Systems, Man, and Cybernetics, Part B, vol. 34, 686-695, (2004).
[41] A. Peymanfar, A. Khoei, and K. Hadidi, "A New ANFIS Based Learning Algorithm for CMOS Neuro-Fuzzy Controllers," 14th IEEE International Conference on Electronics, Circuits and Systems(ICECS 2007), 890-893, (2007).
[42] J. Sim, W. L. Tung, and Q. Chai, "FCMAC-Yager: A Novel Yager-Inference-Scheme-Based Fuzzy CMAC," IEEE Transactions on Neural Networks, vol. 17, 394-1410, (2006).
[43] A. Singh, C. Quek, and S. Y. Cho, "DCT-Yager FNN: A Novel Yager-Based Fuzzy Neural Network With the Discrete Clustering Technique," IEEE Transactions on Neural Networks, vol. 19, 625-644, (2008).
[44] W. L. Tung, C. Quek, and P. Cheng, "GenSo-EWS: a novel neural-fuzzy based early warning system for predicting bank failures," Neural Networks, vol. 17, 567-587, (2004).
[45] G. S. Ng, C. Quek, and H. Jiang, "FCMAC-EWS: A bank failure early warning system based on a novel localized pattern learning and semantically associative fuzzy neural network," Expert Systems with Applications, vol. 34, 989-1003,(2008).
[46] C.-S. Lin, H. A. Khan, R.-Y. Chang, and Y.-C. Wang, "A new approach to modeling early warning systems for currency crises: Can a machine-learning fuzzy expert system predict the currency crises effectively?," Journal of International Money and Finance, vol. 27, 1098-1121, (2008).
[47] H.-J. Chen, S. Y. Huang, and C.-S. Lin, "Alternative diagnosis of corporate bankruptcy: A neuro fuzzy approach," Expert Systems with Applications, vol. 36, 7710-7720, (2009).
[48] Zhang, G.Q., Zhang, G., Gao, Y. and Lu, J., “Competitive strategic bidding optimization in electricity markets using bi-level programming and swarm technique”, Accepted by IEEE Transactions on Industrial Electronics, (2010).
[49] Gao, Y., Zhang, G., Ma, J. and Lu, J., “A λ-cut and goal programming based algorithm for fuzzy linear multiple objective bi-level optimization”, IEEE Transactions on Fuzzy Systems, Vol. 18, No. 1, 1-13, (2010).
[50] Zhang, G. and Lu, J., “Fuzzy bilevel programming with multiple objectives and cooperative multiple followers”, Journal of Global Optimization, Vol. 47, No. 3, 403-419, (2010).
Page 56
ICI 10 - 10TH INTERNATIONAL CONFERENCE ON INFORMATION AT DELTA UNIVERSITY FOR SCIENCE AND TECHNOLOGY
GAMASA, EGYPT, 4 – 6 DECEMBER 2010
1
Where we are in emotional based image retrieval?
U. Markowska-Kaczmar
Institute of Informatics, Wrocław University of Technology, Wroclaw, Poland, [email protected]
Abstract
The paper describes the state of the art in the emotional based image retrieval1. It presents the former research taking into account various aspects of this problem. The paper starts with presentation of different sets of emotions that have been considered in the literature. Then we focus on another challenging task – construction of the visual features responsible for the moods, affections or sensibility evoked in humans by viewing images. A survey of methods applied to find similar images on the basis of their emotional content is presented next. The conclusion presents a list of tasks that have to be solved in future in order to improve the performance of such systems and to enable comparison between different emotional based image retrieval systems.
Keywords: Image Mood Recognition; Emotion Recognition; Emotional-based Image Retrieval
1. Introduction
In the last years rapid development of data storage could be observed. It has resulted in
growing impact of information retrieval problem. Initially research was focused on text
retrieval. After many spectacular successes in this domain now a study is concentrated on text
understanding. In the last 20 years a lot of studies has been also revolved around effective
image retrieval methods. Let us imagine that we show two images a human. He/she is able to
assign mutual similarity between them very quickly. He is also able to indicate the most similar
image to the given one from a collection of images. This result we would like to achieve in
automatic image retrieval. After presentation a query image a system should be able to find
similar images without formulation of similarity criteria.
Subjectivity of human image similarity evaluation is worth of attention. It creates a big
challenge for an automatic method of image retrieval to satisfy user expectation. That is why
automatic method is unprecise in opinion of a user and sometimes it must be adjusted to the
user evaluation in a feedback loop.
1 This work is partially financed from the Ministry of Science and Higher Education Republic of Poland resources in 2008 2010 years as a Poland-Singapore joint research project 65/N–SINGAPORE/ 2007/0.
Page 57

Where we are in emotional based image retrieval? ICI 10 - 10TH INTERNATIONAL CONFERENCE ON INFORMATION
2
In this paper we will concentrate on retrievals of images considering their emotional content.
These systems are called EBIR [17]. An abbreviation is coming from emotional-based image
retrieval. Emotional content can be a difficult feature for the retrieval of visual information
because emotional information relies more on the human assessment to interpret it.
2. Emotions and their classification
The term emotion describes in principle the personal affectedness based on spontaneous
perception e.g. appearing images. Typically, the term mood is used when we concern
publications referring to music, while in the image domain the term emotion is more popular.
Here we use both terms and they are not indiscernible. Sometimes the term affect will be used
instead of them. It is worth mentioning that emotion is very subjective and is strongly tied to
the concept of personality.
Mood classification needs to define what kinds of emotions we will consider. Looking at the
research that has been reported in this field, it becomes obvious that there are two main groups
of mood models. The first group contains models that consist of listings of adjectives or nouns
and the second group contains dimensional models.
The simplest approach, belonging to the first group is presented in the paper [41]. It contains
positive-negative categories. In [27] the basic emotion set is as follows: happiness, sadness,
anger, fear and disgust. In the paper [29] surprise has been added to the set. Authors of the
paper [13] removed disgust from the set, but added neutral emotion and hate.
It seems that the most extended list of the first group is Kate Hevner's Adjective Circle. It
consists of 66 adjectives that can be divided into 8 groups. These eight classes are called:
sublime, sad, touching, easy, light, happy, exciting and grand (going through class 1 to 8).
They are shown in Fig.1. These emotional states were used in music visualization by photos by
Chen and others [5].
Another way of classification of images in some extent referring to its emotional content is
based on adjectives describing more objective attributes of a picture, like a warm-cold, static-
dynamic, heavy-light set, presented in [25]. Authors of the paper [37] developed the concept
and created the following set: exhilarated-depressive, warm-cool, happy-sad, light-heavy, hard-
soft, brilliant-gloomy, lively-tedious, magnificent-modest, vibrant-desolate, showy-elegant,
clear-fuzzy, fanciful-realistic. Some other proposals are: Kobayashi's words (used for example
in the paper [17] and space of valence-arousal-control describing emotions, presented in the
paper [14].
Page 58

Where we are in emotional based image retrieval? ICI 10 - 10TH INTERNATIONAL CONFERENCE ON INFORMATION
3
Figure 2. The Adjective Circle of emotional classes, described in the text
The second group i.e. dimensional mood models consists of one or more dimensions where
each axis represents a special mood characteristic. An example of three-dimensional approach
is given by Mehrhabians [21]. The dimensions are: pleasure/displeasure, arousal/ nonarousal
and dominance/ submissiveness .
Very popular two-dimensional model is proposed by Thayer [32]. It is depicted in Fig. 2. The
model expresses the amount of energy and stress (on axis) contained in composition (musical
or visual). In each quadrant a kind of mood is assigned.
Figure 2. The two dimensional Thayer’s model of emotion classification [32]
Another problem has been presented in [14]. The psychological experiments described in this
paper have shown that only a part of the area of the two-dimensional valence-arousal model
merry 6
joyous
gay
happy
cheerful
bright
hurnorous
playful
whimsical 5
fanciful
quaint
sprightly
delicate
light
gracefullyrical 4
leisurely
serene
tranquil
quiet
soothingdreamy 3
yealding
tender
sentimental
longing
yearning
pleading
plaintitive
pathetic
doleful 2
sad
mournful
tragic
melancholy
frustratic
depresing
gloomy
heavy
dark
spiritual 1
lofty
awe-inspired
dignified
sacred
solemn
sober
serious
vigorous 8
robust
emphatic
martial
ponderous
majesting
exalting
exhilarated
saoaring
triumphant 7
dramatic
passionata
sensational
agitated
exciting
impetuous
restless
stress
depression
exuberance anxious/ frantic
contentment
ener
gy
Page 59

Where we are in emotional based image retrieval? ICI 10 - 10TH INTERNATIONAL CONFERENCE ON INFORMATION
4
generates a human emotion, as it is depicted in Fig. 3. Taking for each quadrants the moods by
the extreme values, the following discrete moods have been chosen: aggressive, melancholic,
euphoric and calm.
Figure 3. Illustration of the 2-D affect space (on the basis of [14])
The presented here a great number of different mood classifications causes many problems in
comparison of results obtained by various authors.
3. Approaches to image retrieval
Generally, there exist two approaches to image retrieval – the first one is based on annotations.
These are the tags assigned to images. They describe image or concepts presented in the image.
So this approach is equivalent to text retrieval. Historically, it was the first approach to similar
image retrieval. Usage an annotations in image retrieval is a consequence of rapid development
of Internet, where images are associated with reach metadata.
However, it is difficult to assume that all images have annotations. Their manual construction
is arduous and with present number of images unfeasible. Well known proverb says: one image
says more than 1000 words. Which of them to use to annotate an image, in which order they
should stand? It is difficult to find an answer.
Further studies were focused on searching images based on the image content like color,
shapes and textures. The systems applying such approach has been called CBIR (Content
Based Image Retrieval).
Initially, the CBIR systems used simple visual features taking into account only one
component like shapes, textures and colors of image (for example only color- [19], [36] and
[39] or only shape), but step by step more complex approaches were introduced, where the
simple features are used to build more sophisticated description of an image. This description
is called visual signature.
pleasant
calm melancholic ar
ou
sal
euphoric agressive
no
n -ar
ou
sal
unpleasant
Page 60
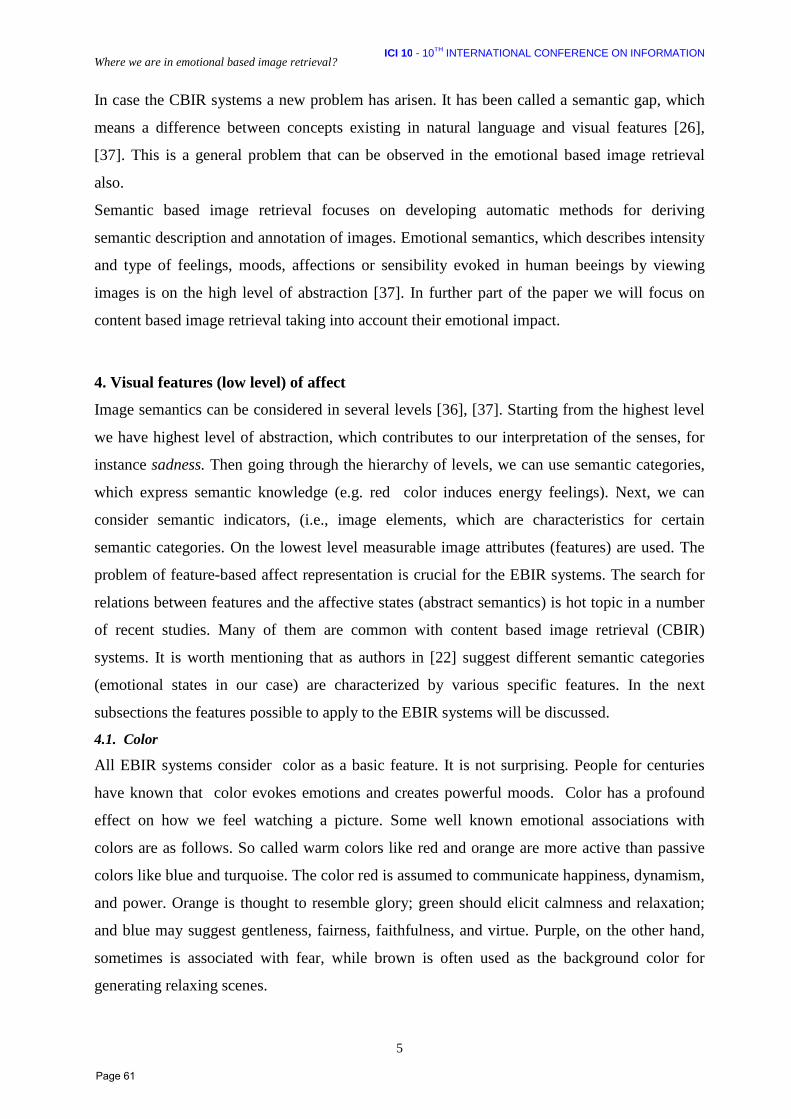
Where we are in emotional based image retrieval? ICI 10 - 10TH INTERNATIONAL CONFERENCE ON INFORMATION
5
In case the CBIR systems a new problem has arisen. It has been called a semantic gap, which
means a difference between concepts existing in natural language and visual features [26],
[37]. This is a general problem that can be observed in the emotional based image retrieval
also.
Semantic based image retrieval focuses on developing automatic methods for deriving
semantic description and annotation of images. Emotional semantics, which describes intensity
and type of feelings, moods, affections or sensibility evoked in human beeings by viewing
images is on the high level of abstraction [37]. In further part of the paper we will focus on
content based image retrieval taking into account their emotional impact.
4. Visual features (low level) of affect
Image semantics can be considered in several levels [36], [37]. Starting from the highest level
we have highest level of abstraction, which contributes to our interpretation of the senses, for
instance sadness. Then going through the hierarchy of levels, we can use semantic categories,
which express semantic knowledge (e.g. red color induces energy feelings). Next, we can
consider semantic indicators, (i.e., image elements, which are characteristics for certain
semantic categories. On the lowest level measurable image attributes (features) are used. The
problem of feature-based affect representation is crucial for the EBIR systems. The search for
relations between features and the affective states (abstract semantics) is hot topic in a number
of recent studies. Many of them are common with content based image retrieval (CBIR)
systems. It is worth mentioning that as authors in [22] suggest different semantic categories
(emotional states in our case) are characterized by various specific features. In the next
subsections the features possible to apply to the EBIR systems will be discussed.
4.1. Color
All EBIR systems consider color as a basic feature. It is not surprising. People for centuries
have known that color evokes emotions and creates powerful moods. Color has a profound
effect on how we feel watching a picture. Some well known emotional associations with
colors are as follows. So called warm colors like red and orange are more active than passive
colors like blue and turquoise. The color red is assumed to communicate happiness, dynamism,
and power. Orange is thought to resemble glory; green should elicit calmness and relaxation;
and blue may suggest gentleness, fairness, faithfulness, and virtue. Purple, on the other hand,
sometimes is associated with fear, while brown is often used as the background color for
generating relaxing scenes.
Page 61
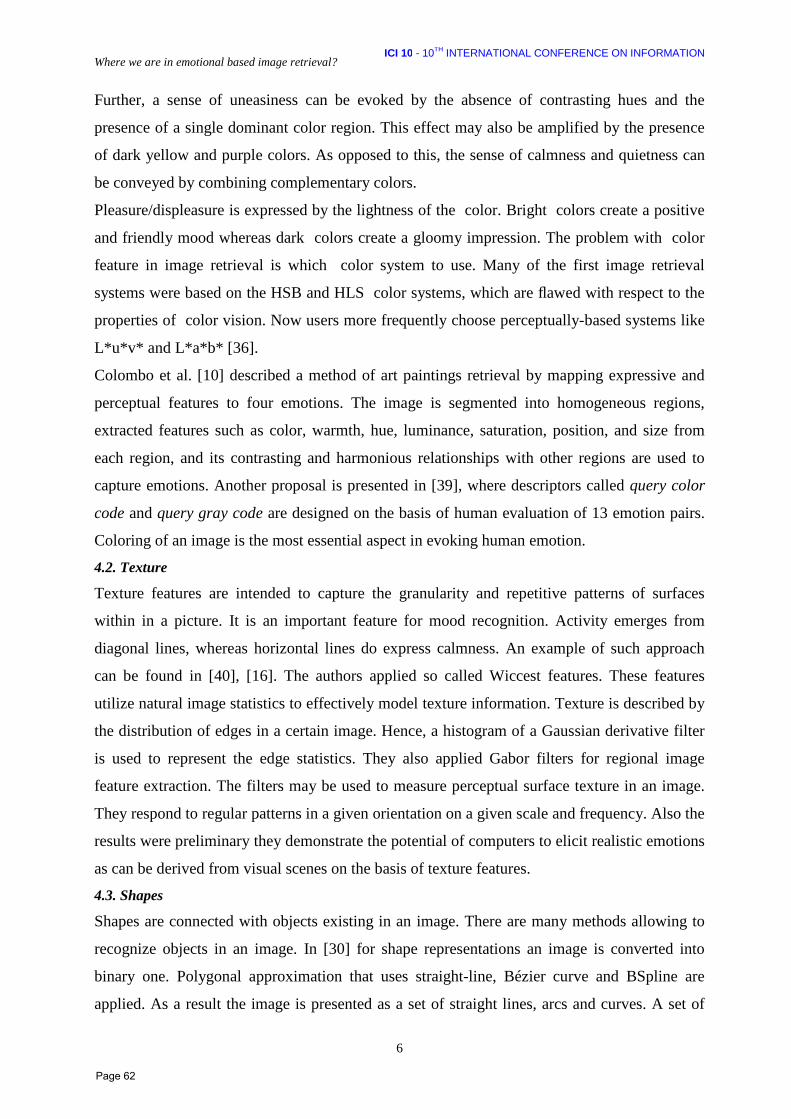
Where we are in emotional based image retrieval? ICI 10 - 10TH INTERNATIONAL CONFERENCE ON INFORMATION
6
Further, a sense of uneasiness can be evoked by the absence of contrasting hues and the
presence of a single dominant color region. This effect may also be amplified by the presence
of dark yellow and purple colors. As opposed to this, the sense of calmness and quietness can
be conveyed by combining complementary colors.
Pleasure/displeasure is expressed by the lightness of the color. Bright colors create a positive
and friendly mood whereas dark colors create a gloomy impression. The problem with color
feature in image retrieval is which color system to use. Many of the first image retrieval
systems were based on the HSB and HLS color systems, which are flawed with respect to the
properties of color vision. Now users more frequently choose perceptually-based systems like
L*u*v* and L*a*b* [36].
Colombo et al. [10] described a method of art paintings retrieval by mapping expressive and
perceptual features to four emotions. The image is segmented into homogeneous regions,
extracted features such as color, warmth, hue, luminance, saturation, position, and size from
each region, and its contrasting and harmonious relationships with other regions are used to
capture emotions. Another proposal is presented in [39], where descriptors called query color
code and query gray code are designed on the basis of human evaluation of 13 emotion pairs.
Coloring of an image is the most essential aspect in evoking human emotion.
4.2. Texture
Texture features are intended to capture the granularity and repetitive patterns of surfaces
within in a picture. It is an important feature for mood recognition. Activity emerges from
diagonal lines, whereas horizontal lines do express calmness. An example of such approach
can be found in [40], [16]. The authors applied so called Wiccest features. These features
utilize natural image statistics to effectively model texture information. Texture is described by
the distribution of edges in a certain image. Hence, a histogram of a Gaussian derivative filter
is used to represent the edge statistics. They also applied Gabor filters for regional image
feature extraction. The filters may be used to measure perceptual surface texture in an image.
They respond to regular patterns in a given orientation on a given scale and frequency. Also the
results were preliminary they demonstrate the potential of computers to elicit realistic emotions
as can be derived from visual scenes on the basis of texture features.
4.3. Shapes
Shapes are connected with objects existing in an image. There are many methods allowing to
recognize objects in an image. In [30] for shape representations an image is converted into
binary one. Polygonal approximation that uses straight-line, Bézier curve and BSpline are
applied. As a result the image is presented as a set of straight lines, arcs and curves. A set of
Page 62

Where we are in emotional based image retrieval? ICI 10 - 10TH INTERNATIONAL CONFERENCE ON INFORMATION
7
typical shapes characterizing the domain specific objects are defined. Fuzzy production rules
are used for calculation similarity between the search shape and given object shape. They are
obtained after image mining.
In some papers shape descriptors are used. When 3D graphical object is displayed [31], a set of
points is used to represent the shape. This set of points is connected by lines to form a
wireframe. This wireframe shows a set of polygons. Once polygons have been created, the
rendering algorithm can shade the individual polygons to produce a solid object.
Another approach to shape recognition is described in [4]. Segment images into primitive
regions are transformed, then some of the primitive regions are combined to generate
meaningful composite shapes, which are used as semantic units of the images during the
similarity assessment process. We should also keep in mind that objects can carry a symbolic
meaning, which can have essential sense for the emotional content retrieval.
4.4. People and faces
Many research has been done in the area of emotional image retrieval concentrated on images
including people. This study has a common roots with robotics for searching a social
interaction with human partner. Studies show that body language [1], [2], [3] is the main means
of communication. Borg in [3] claimed that nonverbal communication is important and creates
up to 93% of communication and that 55% of it consists of body language. Even though the
human species has acquired the powerful capabilities of a verbal language, the role of facial
expressions remains substantial. Look of the face provides significant messages, that is why
knowledge about the posture and facial expression can deliver a lot of information about image
affects.
Many studies are performed in video images recognition where a sequence of postures is
considered to recognize [1]. The authors proposed a multi-modal language where words
contain instances of affective categories that emerge from competitive signals describing the
body posture of a human subject. They show how the emergence of affective categories could
be modeled. They selected five emotional states: happy, sad, angry, tantrum. and scared. For
each state they identified the most important features.
4.5. Social and cultural aspect of emotions
While considering color, symbols and shape features we have to keep in mind culture aspect of
their significance for different nations. For instance, in the Middle East – blue is a protective
color but in China blue is associated with immortality. The problem of individual, social –
cultural aspect of emotions in the context of human- computer interaction is deeply discussed
Page 63

Where we are in emotional based image retrieval? ICI 10 - 10TH INTERNATIONAL CONFERENCE ON INFORMATION
8
in the paper [2]. Some shapes or objects have a specific meaning in different cultures and they
should be treated like a symbols carrying special meaning. 5. Feature extraction
Features extraction methods applied in emotional based image retrieval do not differ much
from those applied in content based image retrieval. Emotional based image retrieval is rather a
problem of a features set choice that discriminates various moods. Generally speaking, all
approaches use a variant of color and gradient information for the image mood classification.
Wang et al. [38] use image brightness, color temperature (warmcool), saturation and contrast
descriptions as features. A non-uniform quantized histogram of the HSV (Hue Saturation
Value) color space is another example of features based on coloring [5]. A color histogram
feature, calculated in the HSV color space is popular approach [12]. It is similar to the MPEG-
7 Scalable Color Descriptor [9]. Its popularity can be explained by a wide spectrum of features
it covers: brightness/darkness, saturation/pastel/pallid and the color tone/hue.
The gradient information is very useful to find texture and shapes. It is estimated by different
features e.g. a Haar Wavelet Transformation [8] or Hough Transformation [13]. Canny Edge
Detectors together with Wavelet Cofficients are also applied [5].
In case of faces included in an image, the feature vector, which expose information about the
characteristics of the current mouth shape and the overall facial expression state, consists of
angles and distances between a series of facial feature points in 2D or in 3D [23]. A feature
vector extraction needs face recognition in an image. Generally, the HSV color model is used
to extract the facial feature points, which is appropriate in order to exploit the behavior of
facial feature areas.
It is worth mentioning the role of ontology in semantic image retrieval, which is more and
more popular in bridging a semantic gap between visual features and semantics. An example
using MPEG- 7 standard is described in [42]. The corresponding relationship between image
low-level features, diversified levels of semantic and emotional semantic features is reflected
by combining Mpeg-7 ontology framework and image semantic description model. Rules
represent rule base for ontology acting on the reasoning machine. Their binding with Reasoner
produces the reasoning results. Ontology can be also helpful to recognize symbols and of
human postures meaning.
6. The techniques applied in emotional image retrieval
Page 64

Where we are in emotional based image retrieval? ICI 10 - 10TH INTERNATIONAL CONFERENCE ON INFORMATION
9
In the next step, on the basis of extracted image descriptors (for machine learning methods
called feature vectors) a similar image is searched.
Two kinds of machine learning methods can be applied: supervised learning (classification)
and unsupervised learning (clustering). The classification scheme is usually based on the
availability of a set of patterns (feature vectors representing images) that have already been
classified by an expert. This set of patterns is called learning set and the resulting learning
strategy is called supervised learning. Learning in unsupervised way, means that the system is
not given an a priori labeling of patterns. It itself establishes the classes based on the
regularities of the patterns.
The challenge in these methods is to construct proper training set with good structure and
enough samples. The training samples usually not enough since data are mostly acquired from
psychological experiments involving subjects. It is worth mentioning that the emotional
semantics are hard to extend after the training had been done.
Typically, the retrieval systems make exhaustive use of machine learning techniques like:
• Regression [11],
• neural networks (NN) [13], [27], [33], [8]
• fuzzy theory (FT) [13], [33],
• interactive genetic algorithm (IGA) [6], [7],
• support vector machine (SVM) [37].
In case when SVM or neural network method are used, after training on a training set the
image in query represented by its feature vector is processed by SVM or neural network and
the class of emotion is found. Similar images are images from the same class of emotions. IGA
provides the images selected, based on the user’s evaluation. In each iteration the user gives an
appropriate fitness to what he or she wants, the system returns the relevant images on this
basis. Also traditional Bayesian approaches naive Bayes [28] or k-NN (k-Nearest Neighbor)
are frequently used or intermixed.
The other method of emotion recognition is an application of hierarchy model or rules with
middle level semantics based on the domain knowledge without training. The knowledge is
available from the color research theory, aesthetics, art theory, design experts and
psychological experiments. Lee [19] extracted rules for emotional evaluation of the color
patterns using rough sets. Wang [37] described a hierarchical model from low level features to
middle level semantics and then to high-level emotional semantics. It used accumulated
knowledge and experience to accomplish image emotional semantic query.
Page 65

Where we are in emotional based image retrieval? ICI 10 - 10TH INTERNATIONAL CONFERENCE ON INFORMATION
10
Another approach is to apply clustering. It allows to group image pixels into regions. For each
region semantic meaning is assigned. In the paper [37], [41] the fuzzy clustering method is
used so as for each cluster colors can be interpreted in semantic way because the only feature
taken into account is color. In [20] the authors applied ant colony algorithm to obtain clusters.
In clustering other methods can be applied for instance SOM (Self Organizing Map) or k-
means [28].
7. Conclusion
Discovering detailed mechanism of emotion deducing on the basis of visual features is still the
challenge. Study in this area is in its infancy, and research on interdisciplinary knowledge
including psychology, sociology, cognition and image processing is needed.
At this place we can ask – how much emotional based image retrieval differs from general
content based retrieval (CBIR)? Certainly, many elements are common and they can be applied
in EBIR systems with success but with regards to the huge opinion subjectivism it seems that
further research should focused on searching for specific features expressing image emotions.
The problem lies in the collection of emotions that are considered, because currently in each
papers this collection contains another set of emotions.
The key problem is to select meaningful visual features that represent human emotions. Some
features (e.g., color, hue, luminance, saturation etc.) have been proposed but their effectiveness
has not yet been evaluated in full extent. Emotional semantics image retrieval is a new and
promising research direction. This semantics refers to the highest level of abstraction, i.e., the
semantics that describes intensity and type of feelings, moods, emotions evoked in humans
when they are viewing images. Emotions expressed in images are subjectively evaluated by
various people and this can cause a great challenge in the machine emotional based image
retrieval.
To fully evaluate existing methods of emotional image retrieval it is necessary to construct a
benchmark image collections. At the moment it is difficult to compare the results obtained by
different research centers because all results are obtained with various image data sets.
Nowadays, only one such collection has been identified [18], applied in 2 papers [40], [41].
Current research trends tend to combine several previously proposed methods, e.g. different
interest point detectors, different features or different matching strategies, which makes it
difficult to judge the overall performance of the individual components, since the interplay and
the fine tuning of the different parts becomes more and more important.
Page 66

Where we are in emotional based image retrieval? ICI 10 - 10TH INTERNATIONAL CONFERENCE ON INFORMATION
11
Emotional image retrieval can be perceived by searching images similar to the query image
taking into account their emotional content only (for instance to find images illustrating a given
story) or it can be one of the existing filters to improve searching similar images. In both cases
its application helps to mimic human search and evaluation in automatic image retrieval and as
stated in [24] it can significantly improve the performance of image retrieval system.
References
[1]. Berthouze N., Fushimi T., Hasegawa M., Kleinsmith A., Takenaka H. “Learning to recognize
affective Body postures”, International Symposium on Computational Intelligence for
Measurement Systems and Applications, 193-198, (2003)
[2]. Boehner K., De Paula R., Dourish P., Sengers P., “How emotion is made and measured”,
International Journal Human-Computer Studies, 65, 275–291, (2007)
[3]. Borg J., “Body Language: 7 Easy Lessons to Master the Silent Language”, Prentice Hall life,
(2008)
[4]. Chang C., Wenyin L., Zhang H. „Image retrieval based on region shape similarity”, Proceedings
of SPIE 4315, 31-38, Storage and retrieval for media databases 2001, Minerva M. Yeung;
Chung-Sheng Li; Rainer W. Lienhart; Eds. (2001)
[5]. Chen C.H., Weng M.F., Jeng S.K., Chuang Y.Y., “Emotion-based music visualization using
photos”, Lecture Notes in Computer Science, 4903, 358-368, (2008)
[6]. Cho S.B., “Emotional image and musical information retrieval with interactive genetic
algorithm”, Proceedings IEEE, 92(4), 702-711, (2004)
[7]. Cho S.-B. and Lee J.-Y., “A human-oriented image retrieval system using interactive genetic
algorithm”, IEEE Transactions on Systems, Man, and Cybernetics Part A: Systems and Humans,
32(3) 452-458, ( 2002)
[8]. Cho S.-B., Chong Y.-G, “Emotional image retrieval using neural network“,
http://flsi.cird.or.jp/iizuka2000/PAPERS/A_4_1.PDF
[9]. Cieplinski L. “MPEG-7 Color Descriptors and Their Applications, Computer Analysis of Images
and Patterns”, Lecture Notes in Computer Science, 2124, (2001)
[10]. Colombo C., Del Bimbo A., Pala P., "Semantics in visual information retrieval," IEEE
Multimedia, 6(3), 38-53, (1999)
[11]. Datta R., Joshi D., Li J., Wang J., “Studying aesthetics in photographic images using a
computational approach,” European Conference on Computer Vision, (3), 288-301, (2006)
[12]. Dunker P., Nowak S., “Content-based mood classification for photos and music. A generic
multi-modal classification framework and evaluation approach”, International Conference on
Multimedia Information Retrieval, ACM MIR’08, (2008)
Page 67

Where we are in emotional based image retrieval? ICI 10 - 10TH INTERNATIONAL CONFERENCE ON INFORMATION
12
[13]. Guo Y., Gao H., “Emotion recognition system in images based on fuzzy neural network and
HMM”. 5th IEEE International Conference on Cognitive Informatics, 1, (2006)
[14]. Hanjalic A., “Extracting moods from pictures and sounds”, IEEE Signal Processing Magazine,
23(2), 90-100, (2006)
[15]. Kim N.Y., Shin Y., Kim Y, Kim E.Y., “Emotion recognition using color and pattern in textile
image”, IEEE Conference on Cybernetics and Intelligent Systems, 1100 – 1105, (2008)
[16]. Kim N.Y., Shin Y., Kim Y, Kim E.Y., “Emotion-based textile indexing using colors and
texture”, Fuzzy Systems and Knowledge Discover , Lecture Notes in Computer Science, vol3613,
1077-1080, (2005)
[17]. Kim Y., Shin Y., Kim Y., Kim E., Shin H., ``Ebir: Emotion-based image retrieval',' Digest of
Technical Papers International Conference on Consumer Electronics, 1—2, (2009)
[18]. Lang, P.J., Bradley, M.M.,Cuthbert, B.N., “International affective picture system (IAPS)”,
Technical Manual and Affective Ratings, NIMH Center for the Study of Emotion and Attention
(1997)
[19]. Lee J., Cheon Y-M.; Kim S.-Y., Park E.-J ., “Emotional evaluation of color patterns based on
rough Sets”, International Conference on Natural Computation, 140-144, (2007)
[20]. Li H., Wen X., Jin H., “The clustering algorithm research of image emotional characteristics
based on ant colony”, International Symposium on Intelligent Information Technology
Application Workshops, 455 - 458 (2008)
[21]. Mehrabian A., “Framework for a comprehensive description and measurement of emotional
states”, Genet Soc Gen Psychol Monogr, 121(3), 339-361, (1995)
[22]. Mojsilovic A., Gomes J., Rogowitz B., “Semantic-friendly indexing and querying of images
based on the extraction of the objective semantic cues”, International Journal of Computer
Vision, 56(1/3), 79-107, (2004)
[23]. Niese R., Al-Hamadi A., Michaelis B., “Analysis of feature space for a 2d/3d vision based
emotion recognition method”, World Academy of Science, Engineering and Technology 59, 321-
326, (2009)
[24]. Olkiewicz K., Markowska-Kaczmar U., “Emotion-based image retrieval - an artificial neural
network approach”, International Multiconference on Computer Science and Information
Technology, (2010)
[25]. Park E.-Y., Lee Y.-W., ``Emotion-based image retrieval using multiple-queries and
consistency feedback,'' 6th IEEE International Conference on Industrial Informatics, (2008)
[26]. Rho S., · Yeo S.-S., “Bridging the semantic gap in multimedia emotion/mood recognition for
ubiquitous computing environment”, J Supercomput, Springer, DOI 10.1007/s11227-010-0447-
6, (2010)
Page 68

Where we are in emotional based image retrieval? ICI 10 - 10TH INTERNATIONAL CONFERENCE ON INFORMATION
13
[27]. Schmidt S., Stock W.G., “Collective indexing of emotions in images. A study in emotional
information retrieval”, Journal of the American Society for Information Science and Technology,
60(5), 863–876 ( 2009)
[28]. Shin Y., Kim Y., Kim E.Y., “Automatic textile image annotation by predicting emotional
concepts from visual features”, Image and Vision Computing, 28 (3), 526-537 (2010)
[29]. Siraj F., Aziz A.A, Sainin, M. S., Hassin M. H., “The Design For Anthropomorphic Sociable
Agent Interaction Through Emotion Detaction”, Seminar ICT Kebangsaan, 59-66 (2003)
[30]. Stanchev P., ”Using image mining for image retrieval”, IASTED Conference on Computer
Science and Technology, 214-218, (2003)
[31]. Suzuki M. T., Kato T., Otsu N., “A similarity retrieval of 3D polygonal models using rotation
invariant shape descriptors”, IEEE International conference on Systems, Man, and Cybernetics,
2946 - 2952 , 4, (2000)
[32]. Thayer R.E., “The biopsychology of mood and arousal”, Oxford University Press, USA, (1989)
[33]. Um J. S., Eum K. B., Lee J. W., “A study of the emotional evaluation models of color patterns
based on the adaptive fuzzy system and the neural network,” Color Research and Application,
27, 208-216, (2002).
[34]. Wang W., He Q. “A survey of emotional, semantic image retrieval”, IEEE International
Conference on Image Processing, 117-120, (2008)
[35]. Wang S., Chen E., Hu J., Wang X., “Kansei-oriented image retrieval”, Lecture Notes in
Computer Science, 2252, 377-388, (2001)
[36]. Wang W.-N., Yu Y.-L., “Image emotional semantic query based on color semantic
description”, Proceedings of the Fourth International Conference on Machine Learning and
Cybernetics, 4571-4576, (2005)
[37]. Wang W.N., Yu Y.L., Jiang S.M., “Image retrieval by emotional semantics: a study of
emotional space and feature extraction. IEEE International Conference on Systems, Man and
Cybernetics, 7, 3534-3539, (2006)
[38]. Wang W.N., Yu Y.L., Zhang J.C. “Image emotional classification: static vs. dynamic. IEEE
International Conference on Systems, Man and Cybernetics, 7, (2004).
[39]. Yoo H.-W., “Visual-based emotional descriptor and feedback mechanism for image retrieval”,
Journal of Information Science and Engineering , 22, 1205-1227 (2006)
[40]. Yanulevskaya V., van Gemert J.C., Roth K., Herbold A.K., Sebe N., Geusebroek J.M.,
Emotional valence categorization using holistic image features, International Conference on
Image Processing, 101-104, (2008)
[41]. Zhang Q., Lee M., “Fuzzy-GIST for emotion recognition in natural scene images,” IEEE 8th
International Conference on Development and Learning, (2009)
[42]. Zhao J.-J., Li J. “The ontology-cored emotional semantic retrieval model”, WASE International
Conference on Information Engineering, 518-521, (2009)
Page 69

Cognitive Biometrics:
A Novel Approach to Person Authentication
Kenneth Revett British University in Egypt
Faculty of Informatics & Computer Science El-Sherouk City, Egypt [email protected]
Introduction:
Cognitive biometrics is a novel approach to user authentication and/or identification that
utilises the response(s) of nervous tissue. The approach relies on the presentation of one or more
stimuli, and the subsequent response(s) are acquired and used for authentication – a typical
stimulus-response paradigm. The stimulus could be the presentation of a familiar photograph,
song, or a Rorschach ink blot, either singly or in various combinations. This feature alone clearly
distinguishes cognitive biometrics from traditional physiological biometrics, which presents a
fingerprint scanner, a fixed and constant input. The purpose of cognitive biometrics is to extract a
unique signature from the user – but one based not on a constant physiological trait such as their iris
or retina – but rather on the cognitive, affective, and conative state of the individual – either alone
or more typically in various combinations. The motivation for this approach is to provide a more
intuitive, user-friendly authentication protocol that is also cost effective. The stimulus presented to
the user is typically in video and/or auditory format – which can be provided by any standard
mobile phone, notebook, or desktop computing device. What is required is the production of the
stimulus and a way to record the response – this can be accomplished through a software only-
mechanism. In addition, this approach may be considered less offensive to the user community
relative to iris or retinal scanners– user acceptability and obtrusiveness is a critical design issue
when developing a biometric. With respect to behavioural biometrics, the state space of possible
input-output relations is limited by the feature space. For instance, in keystroke dynamics, the
features extracted in a typical implementation include the di-graphs, tri-graphs, typing speed, and
total typing time. This is a relatively small feature space – which ultimately may limit the
resolution of such an approach. To circumvent this potential limitation, implementations tend to
rely on narrow thresholds for each feature – which in turn may exacerbate issues such as false
positive and negative measures (FAR/FRR respectively). Cognitive biometrics utilises a much
broader range of features and hence may transcend this inherent limitation. With these
considerations in mind, it is time to explore exactly what the cognitive biometrics approach is all
about.
Cognitive biometrics ultimately relies on the behaviour (very generally construed) of the
subject during the authentication process. Note that cognitive biometrics is completely distinct
from behavioural biometrics. The primary difference is behavioural biometrics such as keystroke
dynamics, signature, and gait still rely on the motoric features of an individual – which are only
peripherally related (or potentially modulated at best) to cognitive state. Furthermore, the purpose
of cognitive biometrics is to utilise an individual‟s perception of a stimulus – which will invoke a
response (non motoric) which engenders the person‟s genetic and experiential background. It is
assumed that genetic variability is large – and experiential backgrounds are extremely varied – their
combination will provide a very large number of possible states that can be used as a means of
person authentication. Behaviour can be considered as a complex interaction between cognition,
affect, and conation. Cognition involves conscious activity and forms the basis of our intellectual
capacities – such as reasoning, memory, and inferential abilities. Affect is a term used to reflect the
Page 70
emotional state of an individual – the mood. Conation refers to drives, desires, and motivations for
action. In very basic terms, all three aspects of behaviour entail the deployment of the central
nervous system – and to some extent the peripheral nervous system. For example, viewing a
familiar photograph generally will elicit memories of the associated context, with concomitant
changes in the affective state of the individual. The responses generated by this stimulus
presentation are not fixed though – the response will be modulated by past (and more recent)
experience, the current state of the individual, and the context in which the stimulus was presented.
One would therefore not expect that all of the responses to the stimulus will be identical across
multiple presentations. The task in this scenario is to identify and hence extract salient features that
persist across multiple stimulus presentations. Certainly, the photograph is not expected to elicit the
same response from another individual – the question is how will the responses differ? If we keep
the stimulus presentation scenario constant, then the differences in the response – if they indeed are
different – must be related to either the current state and/or their experiential histories. Whether
these two aspects actually need to be resolved is an open question. It is difficult to control for the
current state of an individual – this depends on their cognitive, affective, and conative feature set at
the moment of authentication. For now, this issue will remain an open question – to be discussed
somewhat more thoroughly in a later section. The question now at hand is how do we measure the
differential responses from individuals?
Users could be asked to respond verbally to the stimulus – which could be recorded and
analysed. The analysis could occur on several levels – at the speech recognition level and/or at the
semantic level. Clearly speech recognition is a mature science, with a fairly high level of
classification accuracy (typically 80%). Analysing the data at the semantic level is slightly more
complicated – but again there is a large literature on natural language processing that could be
invoked for this process. If we decide not to utilise natural language responses, what features do we
have available to us? The question really boils down to the cardinality of the feature space available
to us when we observe a particular stimulus? Not to be undone by the notion of qualia – we seek to
engage various physiological changes that are both consciously and subconsciously produced when
presented with a response invoking stimulus. The stimulus could be a game, a song, a puzzle, a
photograph as simple examples. The question is does these stimuli produce changes that are
recordable at the physiological level – and if so, what faculties do these changes involve.
Returning back to our cognitive triumvirate, we have cognition, affect, and conation
available to us. How can we ascertain the states of these aspects of behaviour without utilising
natural language? Cognition is a very broad term encompassing a bewildering array of activities
such as memory capacities, planning strategies, reasoning capacities, etc. This array of features is
simply too large to examine exhaustively in real-time, so we must limit the search space (unlike
behavioural biometrics!). Further, the authentication process is generally performed as a solitary
event – so the features must be acquired without human intervention. Further still, we now know
that the mind is responsible for cognition, and that the mind is actually in the head – so that is the
place to start searching for features. One automated method for extracting information about brain
states is by recording the electroencephalogram (EEG). The EEG is a real-time recording of the
electrical potentials that are produced as a result of the firing of concurrently active and spatially
organised neurons. In order to record the EEG, electrodes must be placed on the scalp surface, and
the resulting electrical potentials are measured and stored on a computer system for automated
analysis. The question becomes how is the EEG related to cognition – this is a very interesting
question – central to the field of cognitive electrophysiology. More details on the deployment of
EEG in the context of biometrics will be presented later in the case studies section. At the moment,
it should be noted that the EEG is able to extract data that can be deployed as a neuro-imaging tool
to acquire information about cognition within certain constrained contexts.
Can we gather information concerning the affective state of an individual under the
constraints of a real-time biometric facility? Again, we must rely on the deployment of an
automated mechanism that can acquire features and store them for subsequent analysis (both on-line
and off-line if required). There are several proposed mechanisms for extracting physiological
Page 71

information regarding the affective/emotional state of an individual, of which this paper will focus
on two: the electrocardiogram (ECG) and the epidermal response (EDR). The basic premise behind
this approach is that changes in emotional state produce physiological changes that yield
measurable changes in either cardiovascular function or skin conductance properties. Please note
that no assumption is made here about the mechanism of emotion production. All that is assumed is
that there is a correlation between an emotional state(s) and a recordable signal from one or both of
these devices (EEG/EDR). The feature space of emotional state is potentially large – depending on
the taxonomy one chooses to utilise. In some instances, a basic set of affective states are assumed
and all other emotions are derivable from this base set. Emotions tend to be manifest in a more
stereotyped fashion in contrast to the electrophysiological activity of the brain. Also note that the
time scale for emotion is highly variable – they can last for seconds (a fear response) to years
(love). The stimulus that is presented to the individual should elicit an acute emotional response.
We do not want to permanently alter the individual‟s affective state – otherwise this may alter
subsequent authentication attempts at the very least! The fundamental question is how affective
states manifest themselves in terms of alterations in cardiovascular physiology and skin
conductance properties? This important question will be addressed empirically in the case studies
section.
The conative state of an individual is probably the most difficult to acquire – as the notion of
drive and motivation is typically of variable duration and a more „cerebral‟ attribute. The research
into this aspect of human behaviour is rather limited – virtually non-existent in the biometrics
literature. The difficulty amounts to identifying how changes in conative states maps onto
physiologically measurable changes. The psychology literature presents several possible
approaches to addressing drive and motivation – which may result from peripheral stimulation
through emotional state alterations, producing measurable physiological changes. For instance, the
fight-or-flight response, which results in the immediate sense of fear – will most certainly enhance
the level of arousal – which in turn will have an immediate effect on the conative state of the
individual. Clearly, there will be changes associated with heart rate, respiration, and skin
conductance which could be measured quite accurately. The issue with respect to biometrics is
creating the stimulus necessary to produce a given conative response that is robust in terms of the
number of states thus produced. Fight-or-flight is possibly too limiting a stimulus – reflected in a
stereotypical response. In the context of biometrics, one would like to produce a stimulus-response
result that is unique as possible. Integration of conative states and emotional states may provide a
more robust and richer set of states that could enhance the individuality of the response. This is an
open and interesting area for further research, and will be discussed at a later time.
Thus far, the groundwork for a working definition of cognitive biometrics has been
presented – with an emphasis on the nature of the source of measurable features and the available
technology to record the responses. Essentially, a rational basis for designating the input-output
relationships has been proposed. The inputs must be carefully designed to elicit a response that is
measurable using typical recording methodologies such as the EEG and ECG. One should note that
almost by definition, cognitive biometrics relaxes the constraint that the input-output function is
one-to-one. Unlike fingerprints of retinal scans, the stimulus presented during a cognitive
approach does not have to be unique – any number of photographs may elicit the same response.
Likewise, the same photograph may elicit different responses at different times. This relaxation of
the input-output response is clearly not typical in the biometrics domain – though it may help to
overcome some of the inherent difficulties associated with biometrics generally. The focus in most
biometric research programmes has been to extract a unique and specific feature from an individual
that is invariant over time – which is then utilised for the discrimination task inherent to biometric
authentication. This is why fingerprints and iris scanners (the mainstay of physiological biometrics)
are popular – they are based on the general understanding that these features are absolutely unique.
In terms of behavioural biometrics – the issue of reproducibility and constancy is central to the
success of the authentication mechanism. There is an explicit understanding that we cannot
reproduce our signature exactly every time. The principle reason for this requirement is the lack of
Page 72
a robust feature space – the number of degrees of freedom is small relative to the inherent variance
in the population. To compensate, thresholds for acceptance and rejection are narrowly construed,
resulting in the typical FAR/FRR trade off. That is, when computing the equal error rate (EER),
which is computed by plotting FAR against FRR, for a parametised stringency variable, one
invariably finds that when FAR is reduced, FRR increases and vice versa. The approach adopted in
typical biometrics assumes the classification task (imposter versus legitimate owner) is linearly
separable, and as Minsky and Pappert have pointed out, simple linear discrimination methods do
not work in all cases. The robust and feature rich approach engendered by cognitive biometrics
may provide a way out of this dilemma. This will have to await empirical support before any final
conclusions can be drawn. In the next section, small sample of case studies is presented which
highlight some of the relevant biometric approaches that have been published that fall within the
purview of cognitive biometrics (though possibly unwittingly by the authors!) . Lastly, a conclusion
section will highlight the current state of the art and provide suggestions for further research.
Case Studies:
The sample of case studies presented in this work reflect the use of a biosignal based
approach, whereby the inner mental (cognitive) and emotional states of an individual can be
recorded in a more or less automated fashion. This approach utilises biological based signals such
as the electrocardiogram (ECG), the electroencephalogram (EEG), and the electrodermal response
(EDR) as the inputs to an authentication system, which are recorded using standard equipment in a
non-invasive fashion. Each of these biosignals presents a wealth of information that can be
extracted quite easily using a single recording system, such as the NeXus-4 system
(www.nexus.com), which provides 4 channels for recording a combination of EEG, ECG, or EDR,
using wireless technology for data transport to a server for authentication purposes.
These biosignals are generated by the heart, brain, and the autonomic nervous system
respectively – which are treated essentially as portals which provide real-time information regarding
the on-going dynamics of the nervous system (both central and peripheral). This approach to user
authentication is fairly recent – and the bulk of the research in this domain has focused on
determining which features provide the maximal discriminatory capability. The bulk of the work
published in the literature has thus far focused on discovering unique feature sets that maximise the
resulting classification accuracy. The inputs are treated more or less as a time series – with various
signal processing techniques applied to maximise the cardinality of the feature sets. The results are
quite impressive – with classification accuracies up to 100% for small cohorts. This work really has
laid the groundwork – and has called upon – the signal processing technology which is well
established in other domains. The next stage in the evolution of cognitive biometrics is to
incorporate the biological aspects of behaviour that are manifest in these biosignals. For instance,
there is a considerable literature on the heritability of aspects of the relevant biosignals – which
indicates that on first principle, there is uniqueness contained within these signals that is
independent of the phenotypic expression. This issue needs to be explored more thoroughly – as it
may indicate that the results obtained from small cohorts may extrapolate to the population at large
– clearly a requirement for any serious biometric implementation. Further, the stimulus-response
paradigm should be made central to the authentication scheme – in order to explore the thresholds
required for obtaining satisfactory results. These are issues to keep in mind when reading through
the case studies. These topics will be addressed at the end of the case studies section, where the
focus will be on the future of cognitive biometrics. First, we start with the humble ECG.
Page 73
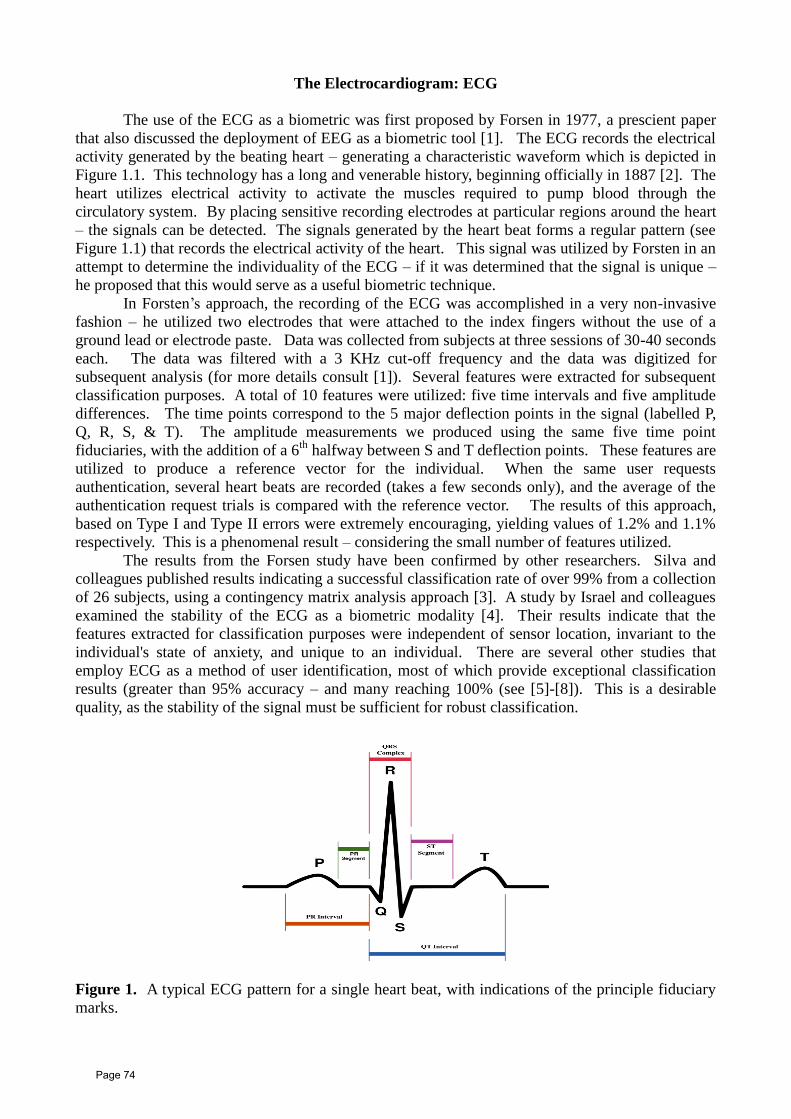
The Electrocardiogram: ECG
The use of the ECG as a biometric was first proposed by Forsen in 1977, a prescient paper
that also discussed the deployment of EEG as a biometric tool [1]. The ECG records the electrical
activity generated by the beating heart – generating a characteristic waveform which is depicted in
Figure 1.1. This technology has a long and venerable history, beginning officially in 1887 [2]. The
heart utilizes electrical activity to activate the muscles required to pump blood through the
circulatory system. By placing sensitive recording electrodes at particular regions around the heart
– the signals can be detected. The signals generated by the heart beat forms a regular pattern (see
Figure 1.1) that records the electrical activity of the heart. This signal was utilized by Forsten in an
attempt to determine the individuality of the ECG – if it was determined that the signal is unique –
he proposed that this would serve as a useful biometric technique.
In Forsten‟s approach, the recording of the ECG was accomplished in a very non-invasive
fashion – he utilized two electrodes that were attached to the index fingers without the use of a
ground lead or electrode paste. Data was collected from subjects at three sessions of 30-40 seconds
each. The data was filtered with a 3 KHz cut-off frequency and the data was digitized for
subsequent analysis (for more details consult [1]). Several features were extracted for subsequent
classification purposes. A total of 10 features were utilized: five time intervals and five amplitude
differences. The time points correspond to the 5 major deflection points in the signal (labelled P,
Q, R, S, & T). The amplitude measurements we produced using the same five time point
fiduciaries, with the addition of a 6th
halfway between S and T deflection points. These features are
utilized to produce a reference vector for the individual. When the same user requests
authentication, several heart beats are recorded (takes a few seconds only), and the average of the
authentication request trials is compared with the reference vector. The results of this approach,
based on Type I and Type II errors were extremely encouraging, yielding values of 1.2% and 1.1%
respectively. This is a phenomenal result – considering the small number of features utilized.
The results from the Forsen study have been confirmed by other researchers. Silva and
colleagues published results indicating a successful classification rate of over 99% from a collection
of 26 subjects, using a contingency matrix analysis approach [3]. A study by Israel and colleagues
examined the stability of the ECG as a biometric modality [4]. Their results indicate that the
features extracted for classification purposes were independent of sensor location, invariant to the
individual's state of anxiety, and unique to an individual. There are several other studies that
employ ECG as a method of user identification, most of which provide exceptional classification
results (greater than 95% accuracy – and many reaching 100% (see [5]-[8]). This is a desirable
quality, as the stability of the signal must be sufficient for robust classification.
Figure 1. A typical ECG pattern for a single heart beat, with indications of the principle fiduciary
marks.
Page 74
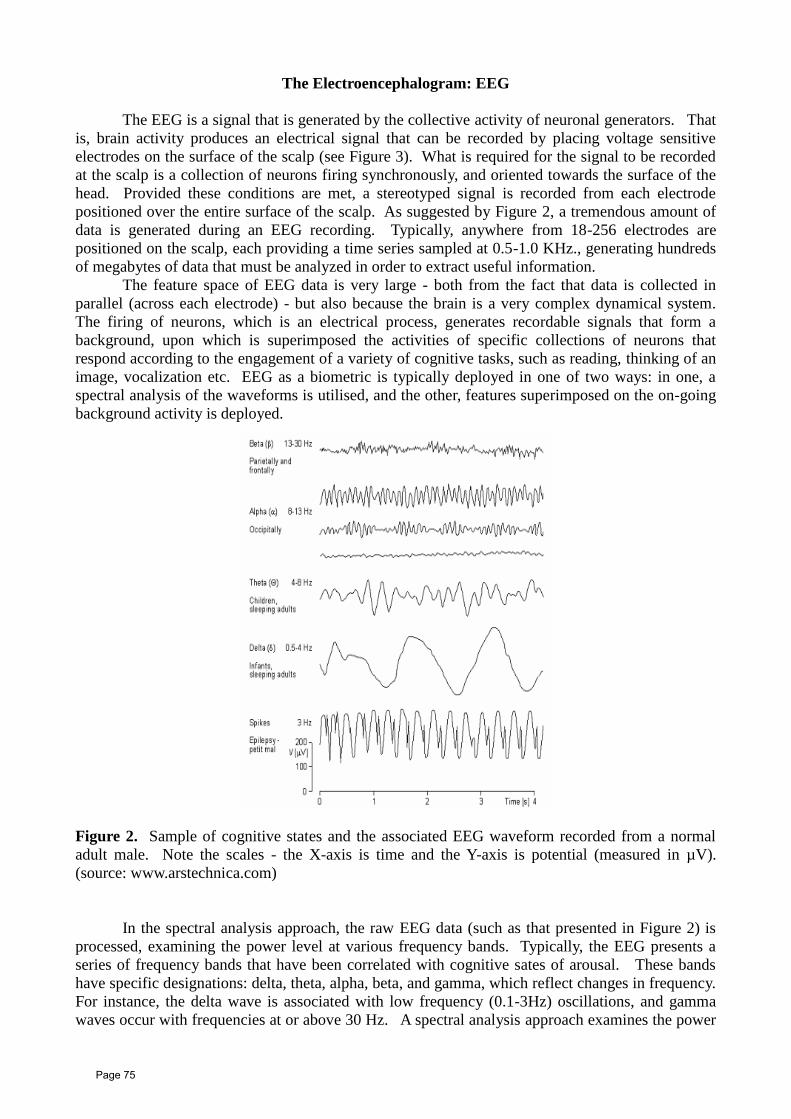
The Electroencephalogram: EEG
The EEG is a signal that is generated by the collective activity of neuronal generators. That
is, brain activity produces an electrical signal that can be recorded by placing voltage sensitive
electrodes on the surface of the scalp (see Figure 3). What is required for the signal to be recorded
at the scalp is a collection of neurons firing synchronously, and oriented towards the surface of the
head. Provided these conditions are met, a stereotyped signal is recorded from each electrode
positioned over the entire surface of the scalp. As suggested by Figure 2, a tremendous amount of
data is generated during an EEG recording. Typically, anywhere from 18-256 electrodes are
positioned on the scalp, each providing a time series sampled at 0.5-1.0 KHz., generating hundreds
of megabytes of data that must be analyzed in order to extract useful information.
The feature space of EEG data is very large - both from the fact that data is collected in
parallel (across each electrode) - but also because the brain is a very complex dynamical system.
The firing of neurons, which is an electrical process, generates recordable signals that form a
background, upon which is superimposed the activities of specific collections of neurons that
respond according to the engagement of a variety of cognitive tasks, such as reading, thinking of an
image, vocalization etc. EEG as a biometric is typically deployed in one of two ways: in one, a
spectral analysis of the waveforms is utilised, and the other, features superimposed on the on-going
background activity is deployed.
Figure 2. Sample of cognitive states and the associated EEG waveform recorded from a normal
adult male. Note the scales - the X-axis is time and the Y-axis is potential (measured in µV).
(source: www.arstechnica.com)
In the spectral analysis approach, the raw EEG data (such as that presented in Figure 2) is
processed, examining the power level at various frequency bands. Typically, the EEG presents a
series of frequency bands that have been correlated with cognitive sates of arousal. These bands
have specific designations: delta, theta, alpha, beta, and gamma, which reflect changes in frequency.
For instance, the delta wave is associated with low frequency (0.1-3Hz) oscillations, and gamma
waves occur with frequencies at or above 30 Hz. A spectral analysis approach examines the power
Page 75
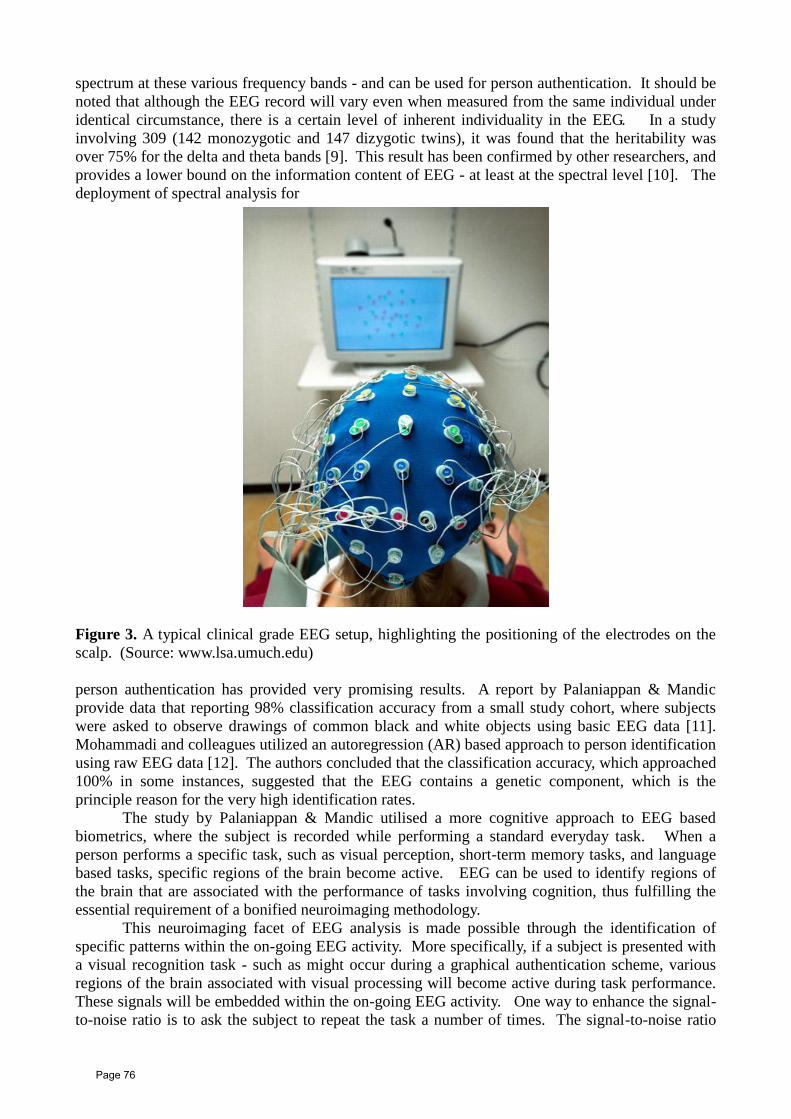
spectrum at these various frequency bands - and can be used for person authentication. It should be
noted that although the EEG record will vary even when measured from the same individual under
identical circumstance, there is a certain level of inherent individuality in the EEG. In a study
involving 309 (142 monozygotic and 147 dizygotic twins), it was found that the heritability was
over 75% for the delta and theta bands [9]. This result has been confirmed by other researchers, and
provides a lower bound on the information content of EEG - at least at the spectral level [10]. The
deployment of spectral analysis for
Figure 3. A typical clinical grade EEG setup, highlighting the positioning of the electrodes on the
scalp. (Source: www.lsa.umuch.edu)
person authentication has provided very promising results. A report by Palaniappan & Mandic
provide data that reporting 98% classification accuracy from a small study cohort, where subjects
were asked to observe drawings of common black and white objects using basic EEG data [11].
Mohammadi and colleagues utilized an autoregression (AR) based approach to person identification
using raw EEG data [12]. The authors concluded that the classification accuracy, which approached
100% in some instances, suggested that the EEG contains a genetic component, which is the
principle reason for the very high identification rates.
The study by Palaniappan & Mandic utilised a more cognitive approach to EEG based
biometrics, where the subject is recorded while performing a standard everyday task. When a
person performs a specific task, such as visual perception, short-term memory tasks, and language
based tasks, specific regions of the brain become active. EEG can be used to identify regions of
the brain that are associated with the performance of tasks involving cognition, thus fulfilling the
essential requirement of a bonified neuroimaging methodology.
This neuroimaging facet of EEG analysis is made possible through the identification of
specific patterns within the on-going EEG activity. More specifically, if a subject is presented with
a visual recognition task - such as might occur during a graphical authentication scheme, various
regions of the brain associated with visual processing will become active during task performance.
These signals will be embedded within the on-going EEG activity. One way to enhance the signal-
to-noise ratio is to ask the subject to repeat the task a number of times. The signal-to-noise ratio
Page 76
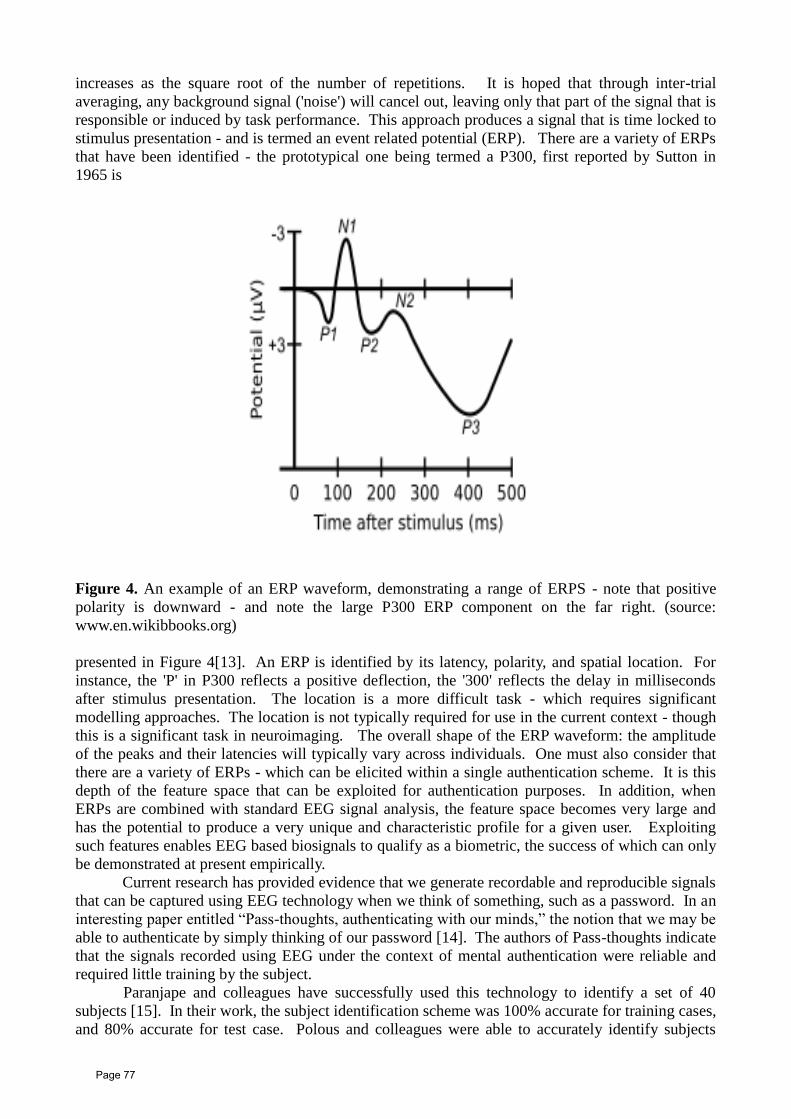
increases as the square root of the number of repetitions. It is hoped that through inter-trial
averaging, any background signal ('noise') will cancel out, leaving only that part of the signal that is
responsible or induced by task performance. This approach produces a signal that is time locked to
stimulus presentation - and is termed an event related potential (ERP). There are a variety of ERPs
that have been identified - the prototypical one being termed a P300, first reported by Sutton in
1965 is
Figure 4. An example of an ERP waveform, demonstrating a range of ERPS - note that positive
polarity is downward - and note the large P300 ERP component on the far right. (source:
www.en.wikibbooks.org)
presented in Figure 4[13]. An ERP is identified by its latency, polarity, and spatial location. For
instance, the 'P' in P300 reflects a positive deflection, the '300' reflects the delay in milliseconds
after stimulus presentation. The location is a more difficult task - which requires significant
modelling approaches. The location is not typically required for use in the current context - though
this is a significant task in neuroimaging. The overall shape of the ERP waveform: the amplitude
of the peaks and their latencies will typically vary across individuals. One must also consider that
there are a variety of ERPs - which can be elicited within a single authentication scheme. It is this
depth of the feature space that can be exploited for authentication purposes. In addition, when
ERPs are combined with standard EEG signal analysis, the feature space becomes very large and
has the potential to produce a very unique and characteristic profile for a given user. Exploiting
such features enables EEG based biosignals to qualify as a biometric, the success of which can only
be demonstrated at present empirically.
Current research has provided evidence that we generate recordable and reproducible signals
that can be captured using EEG technology when we think of something, such as a password. In an
interesting paper entitled “Pass-thoughts, authenticating with our minds,” the notion that we may be
able to authenticate by simply thinking of our password [14]. The authors of Pass-thoughts indicate
that the signals recorded using EEG under the context of mental authentication were reliable and
required little training by the subject.
Paranjape and colleagues have successfully used this technology to identify a set of 40
subjects [15]. In their work, the subject identification scheme was 100% accurate for training cases,
and 80% accurate for test case. Polous and colleagues were able to accurately identify subjects
Page 77
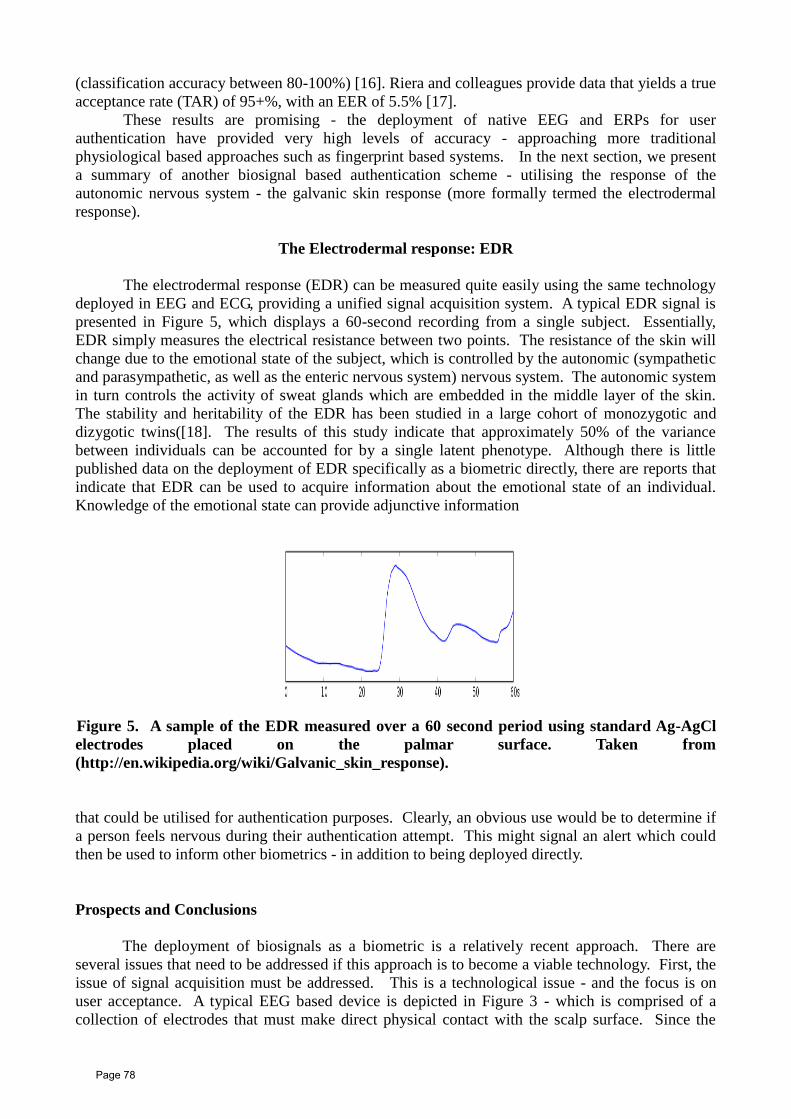
(classification accuracy between 80-100%) [16]. Riera and colleagues provide data that yields a true
acceptance rate (TAR) of 95+%, with an EER of 5.5% [17].
These results are promising - the deployment of native EEG and ERPs for user
authentication have provided very high levels of accuracy - approaching more traditional
physiological based approaches such as fingerprint based systems. In the next section, we present
a summary of another biosignal based authentication scheme - utilising the response of the
autonomic nervous system - the galvanic skin response (more formally termed the electrodermal
response).
The Electrodermal response: EDR
The electrodermal response (EDR) can be measured quite easily using the same technology
deployed in EEG and ECG, providing a unified signal acquisition system. A typical EDR signal is
presented in Figure 5, which displays a 60-second recording from a single subject. Essentially,
EDR simply measures the electrical resistance between two points. The resistance of the skin will
change due to the emotional state of the subject, which is controlled by the autonomic (sympathetic
and parasympathetic, as well as the enteric nervous system) nervous system. The autonomic system
in turn controls the activity of sweat glands which are embedded in the middle layer of the skin.
The stability and heritability of the EDR has been studied in a large cohort of monozygotic and
dizygotic twins([18]. The results of this study indicate that approximately 50% of the variance
between individuals can be accounted for by a single latent phenotype. Although there is little
published data on the deployment of EDR specifically as a biometric directly, there are reports that
indicate that EDR can be used to acquire information about the emotional state of an individual.
Knowledge of the emotional state can provide adjunctive information
Figure 5. A sample of the EDR measured over a 60 second period using standard Ag-AgCl
electrodes placed on the palmar surface. Taken from
(http://en.wikipedia.org/wiki/Galvanic_skin_response).
that could be utilised for authentication purposes. Clearly, an obvious use would be to determine if
a person feels nervous during their authentication attempt. This might signal an alert which could
then be used to inform other biometrics - in addition to being deployed directly.
Prospects and Conclusions
The deployment of biosignals as a biometric is a relatively recent approach. There are
several issues that need to be addressed if this approach is to become a viable technology. First, the
issue of signal acquisition must be addressed. This is a technological issue - and the focus is on
user acceptance. A typical EEG based device is depicted in Figure 3 - which is comprised of a
collection of electrodes that must make direct physical contact with the scalp surface. Since the
Page 78
EEG records the electrical potential (relative to a reference point), it must make physical contact
with the energy source. In addition, the impedance must be within certain limits (less than 5
KOhms) to enhance the SNR, necessitating the use of conductive gels. This combination makes the
use of typical clinical grade EEG systems unrealistic - as the time required to fit the device, the
application of sticky conductive gels makes it very unsuitable from a user acceptance perspective.
There are alternative technologies - that utilise what is termed 'dry' electrodes. These do not require
the use of conductive gels - and are quicker to apply and less cumbersome to the subject. Typically,
these systems are implemented in some form of a helmet - which is placed on the head - and the
electrodes make contact with the scalp directly. In addition, the number of electrodes is kept to a
minimum - typically 4-12 are required. Further, the electrodes are attached to a small footprint
device, which transmits the signals to a receiver (a personal computer) wirelessly - using blue tooth
technology. It is certainly technologically possible to fit the EEG electrodes and related hardware
into a cap like device - which can easily be applied to the head.
Further, all of the biosignals discussed in this paper are obtainable through a single device -
the electrodes used for EEG data acquisition can also be deployed for ECG and EDR recording
simultaneously. The issue of electrode placement can be a cause for concern. The EEG electrodes
can only be placed on the scalp - at locations specific to the type of data one wishes to acquire. with
respect to electrode placement for ECG acquisition - there is also an option to place the electrodes
on the chest or forearms. Forearm placement may be convenient for the subject - but may present
difficulties if the subject must perform a physical task during the authentication process (e.g.
typing). In this scenario, the electrodes would have to be placed on the chest - but note that in a
typical non-clinical ECG application, three electrodes are sufficient (as opposed to the 12-lead
version). Electrode placement for EDR can be positioned more or less anywhere convenient - and
the signal is not affected by muscular activity to the same extent as ECG/EEG signals.
The last issue is reproducibility of the signals. From a theoretical perspective - there does
appear to be a significant genetic factor responsible for the individuality of the EEG and ECG. This
topic engenders the notion of an endophenotype - the bridging between genes and complex
behaviour [19]. That is, the EEG/ECG (a complex behaviour pattern) has a genetic basis - which
can be exploited - and by definition provides a level of individuality , that at the same time is also
reproducible.
Furthermore, by employing a multi-modal biosignal based approach - each with a genetic
basis to some extent - would significantly extend the feature space. This augmented feature space
would clearly provide a robust signature for person authentication - and identification. One could
envision utilising one biosignal to substantiate the other - that is presenting ourselves via the EEG
and then verifying that against an ECG. In addition, biosignals could be used in a larger system that
deploys a behavioural biometric such as keystroke dynamics or signature in conjunction with a
cognitive approach. This approach may provide a more comprehensive and lightweight approach to
user authentication and identification which is acceptable by the user community - a requirement for
any biometric system.
References:
1. Forsen, G., Nelson, M. & Staron, R., Personal attributes authentication techniques, In A.F.B.
Griffin, Ed. Rome Air Development Center report RADC-TR-77-1033, RADC, New York, 1977.
2. Waller AD, A demonstration on man of electromotive changes accompanying the heart's beat. J
Physiol (Lond) 8: 229–34, 1887.
3. Silva,H., Gamboa,H., & Fred,A., Applicability of lead V2 ECG Measurements in Biometrics,
Proceedings of Med-e-Tel 2007, Luxembourg, April 2007
4. Israel, S., Irvine, J., Cheng, A., Wiederhold, M., & Wiederhold, B., ECG to identify individuals,
Pattern Recognition, 38(1), pp. 133-142, 2005.
5. Biel, L., Petterson, O., & Stork, D., ECG analysis: a new approach in human identification, IEE
Transactions on Instrumentation and Measurement, 50(3), pp. 808-812, 2001.
Page 79

6. Kyoso, M. & Uchiyama, A., Development of an ECG identification system, in Proceedings of
the 23rd
Annual International IEEE Conference on Engineering in Medicine and Biology Society,
Instanbul, Turkey, pp. 3721-3723, 2001
7. Kyeong-Seop, K., Tae-Ho, Y., Jeong-Whan, L., Dong-Jun, K., & Heung-Seo, K., A Robust
Human Identification by Normalized Time-Domain Features of Electrocardiogram, IEEE EMBS
27th
Annual International Conference of Engineering in Medicine and Biology (EMBS2005), pp.
1114-1117, 2005.
8. Mehta, S. S. & Lingayat, N. S., Comparative study of QRS detection in single lead and 12-lead
ECG based on entropy and combined entropy criteria using support vector machine, Journal of
Theoretical and Applied Information Technology, pp. 8-18, 2007.
9. Smit, D.J.A., Posthuma, D., Boomsma, D.I., & De Gues, E.J.C., Heritability of background EEG
across the power spectrum, Psychophysiology 42, pp. 691-697, 2005.
10.Zietsch, B.P., Hansen, J.L., ansell, N.K., Geffen, G.M., Martin, N.G., & Wright, M.J., Common
and specific genetic influences on EEG power bands delta, theta, alpha , and beta, Biological
Psychology 75, pp. 154-164, 2007.
11. Palaniappan, R. & Mandic, D.O., EEG based biometric framework for automatic identity
verification, Journal of VLSI Signal processing, 49: pp. 243-250, 2007.
12.Mohammadi, G., Shousttari, P., Ardekani, B.M., & Shamsolhani, M.B., Person identification by
using AR model for EEG signals, Proceedings of WASET, 11: pp. 281-285, 2006.
13. Sutton, S., Braren, M., Zubin, J., & John, E.R., Evoked-potentials correlates of stimulus
uncertainty, Science 150, pp. 1187-8, 1965.
14. Thorpe, J., van Oorschot, P.C., & Somayaji, A., Pass-thoughts: authenticating with our minds,
Proceedings of the 2005 workshop on new security paradigms, pp. 45-56, 2005.
15..Paranjape, R.B., Mahovsky, J., Benedicenti, L., & Kolesapos, Z.,The electroencephalogram as a
biometric, Canadian Conference on Electrical and Computer Engineering, pp.1363 – 1366, 2001.
16.Polous, M., Rangoussi, M., & Alexandris, N, Neural network based person identification using
EEG features, In Proceedings of the IEEE International Conference on Acoustics, Speech, and
Signal processing, 2, pp. 1117-1120, 1999.
17. Riera, A., Soria-Frisch, A., Caparrini, M., Grau, C., & Ruffini, G., Unobtrusive biometric system
based on electroencephalogram analysis, EURASIP Journal on Advances in Signal Processing,
2007.
18.Crider, A., Kremen WS, Xian H, Jacobson KC, Waterman B, Eisen SA, Tsuang MT, Lyons
MJ.,Stability, consistency, and heritability of electrodermal response lability in middle-aged male
twins, Psychophysiology 41(4), pp. 501-509, 2004..
19.Gottesman, H. & Shields, J., Schizophrenia and Genetics: A Twin Study Vantage Point, new
York: Academic Press, 1972.
Page 80

ICI 10 - 10TH INTERNATIONAL CONFERENCE ON INFORMATION AT DELTA UNIVERSITY FOR SCIENCE AND TECHNOLOGY
GAMASA, EGYPT, 4 – 6 DECEMBER 2010
1
Visualisation and browsing of large image repositories (Invited paper)
Gerald Schaefer
Department of Computer Science, Loughborough University, U.K. [email protected]
Abstract Visual information is becoming increasingly important and hence efficient and effective methods for organising, viewing, and retrieving this information are highly sought after. In this paper, we focus on the problem of organising large image repositories and present methods that allow fast intuitive visualisation and browsing of image collections. While several different systems are introduced they have in common that visualisation and navigation is performed on a regular lattice and in a hierarchical manner, that no images are occluded, and that the way images are arranged is based on mutual similarity between them.
Keywords: image databases, image retrieval, image database navigation, image browsing.
1. Introduction
Due to advances in camera technology and the associated drop of equipment costs, many people nowadays own personal image collections of hundreds to thousands of images, while commercial image providers may have image repositories of several million images [1]. Obviously, these collections need to be managed so that the user is able to retrieve certain images at ease. However, as users typically refrain from annotating their image collections with e.g. keywords or descriptions [2], to automate this task is not trivial.
Common tools display images in a one-dimensional linear format where only a limited number of thumbnail images are visible on screen at any one time, thus requiring the user to search back and forth through thumbnail pages to view all images. Obviously, this constitutes a time consuming, impractical and exhaustive way of searching images, especially in larger collections. Furthermore, the order in which the pictures are displayed is based on attributes like file names that often do not reflect the actual image contents and hence cannot be used to speed up the search.
In this paper, we present intuitive approaches to image database visualisation and browsing. Images are organised in a hierarchical manner, which allows for efficient and effective access to large image repositories, while the arrangement of the images is based on their mutual visual similarity placing images that are visually similar close to each other in the visualisation space. Based on these principles, and those of avoiding image overlap and maximising visualisation space usage, image database navigation systems based on a hierarchical MDS grid, a hue sphere visualisation and a hexagonal browsing interface are presented.
Page 81
Visualisation and browsing of large image repositories ICI 10 - 10TH INTERNATIONAL CONFERENCE ON INFORMATION
2
2. General concepts
Our aim is to provide intuitive, effective and efficient interfaces for image database visualisation and navigation, which should allow for fast and intuitive browsing of large image collections. In this section, we describe general concepts that we apply in our approaches, whereas details on several developed systems are given in Section 3. 2.1. Similarity-based visualisation
One of the basic ideas behind our browsing interfaces is similarity-based visualisation, which places images that are visually similar - as established through the calculation of image similarity metrics based on features derived from image content [3] - also close to each other in the visualisation space, a principle that has been shown to decrease the time it takes to localise images [4]. 2.2. Regular tessellation
Image database visualisation approaches typically place image thumbnails at certain co-ordinates so that, in general, images will partially or totally overlap with each other. However, this overlapping has been shown to have a negative impact on the browsing experience [4]. In [4], a user study is reported which compared image visualisation models where images overlap with each other with those that place images on a regular lattice without any overlapping. The results demonstrated that users largely prefer the regular layout as overlap was observed to add to confusion between images. Therefore, visualisations that avoid overlapping will lead to faster retrieval times and more intuitive browsing interfaces. In our approaches, we adopt these findings and constrain images to be placed on a regular tessellation where images do not overlap each other. 2.3. Hierarchical data structure
Classical visualisation approaches will provide only limited usability when being applied to large databases. The reason for this is that due to the limited space on the visualisation plane, images not only overlap each other partially but many images do not appear at all due to occlusion, and hence only a partial view of the database is provided. Zooming in provides only a partial solution, in particular if there are many images with similar image features.
In our approaches, we employ a hierarchical tree structure to address both navigation through large image collections and to eliminate the need for further computation. For this, we make direct use of the mapping to the regular tessellation introduced above to build a hierarchical tree based on clustering images. However, we do not need to employ computationally expensive clustering algorithms. Rather, the tessellation itself directly gives the clusters present at a given level, and the cells directly determine which images fall into which clusters. Assigning images to clusters/cells can hence be performed with simple comparison operations only. A representative image for each cluster to be displayed is typically selected as the image that lies closest to the centre of the cell.
This procedure is adopted at the each level of the tree hierarchy, i.e. first at the root node (the initial global display) and then for each non-empty cell again in a recursive manner, where the images of each child node are again mapped to a tessellated structure, until the complete tree is derived.
The resulting interface provides an intuitive way of browsing to the user, who can, starting from the initial display, successively select a representative image to refine the search. This image cluster is then expanded in the next level of the display where the user can again select an image group to navigate further into the image collection.
Page 82
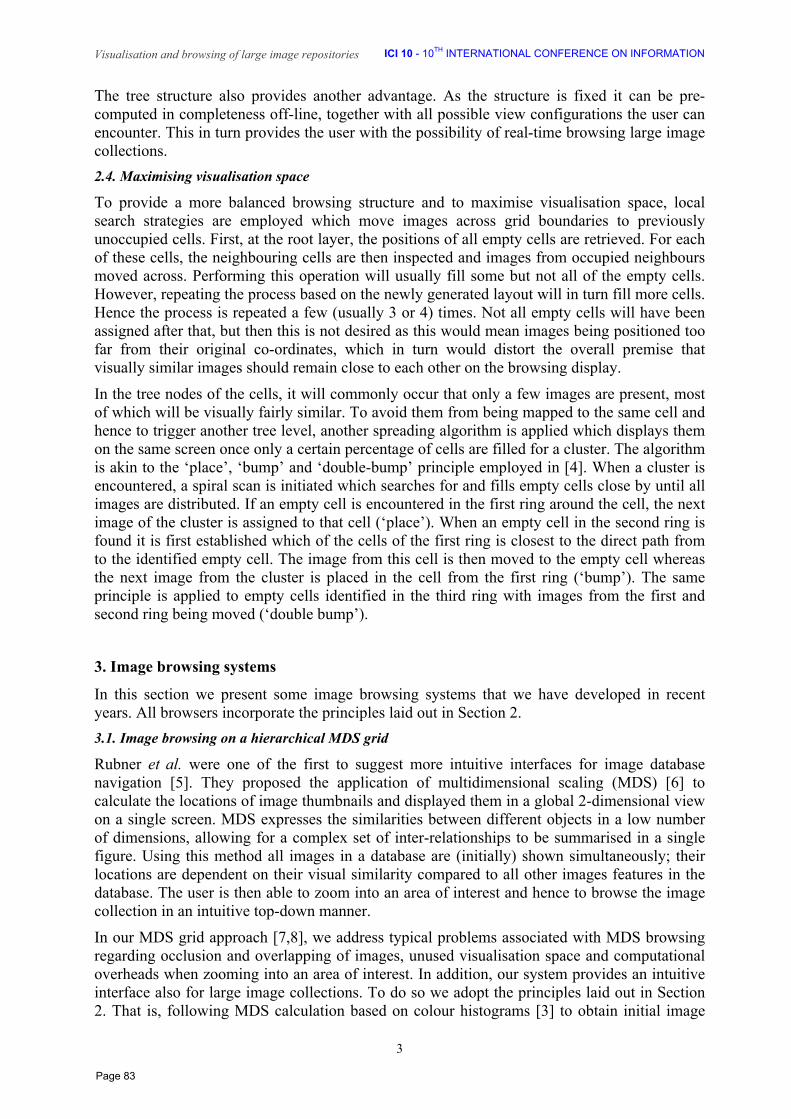
Visualisation and browsing of large image repositories ICI 10 - 10TH INTERNATIONAL CONFERENCE ON INFORMATION
3
The tree structure also provides another advantage. As the structure is fixed it can be pre-computed in completeness off-line, together with all possible view configurations the user can encounter. This in turn provides the user with the possibility of real-time browsing large image collections. 2.4. Maximising visualisation space
To provide a more balanced browsing structure and to maximise visualisation space, local search strategies are employed which move images across grid boundaries to previously unoccupied cells. First, at the root layer, the positions of all empty cells are retrieved. For each of these cells, the neighbouring cells are then inspected and images from occupied neighbours moved across. Performing this operation will usually fill some but not all of the empty cells. However, repeating the process based on the newly generated layout will in turn fill more cells. Hence the process is repeated a few (usually 3 or 4) times. Not all empty cells will have been assigned after that, but then this is not desired as this would mean images being positioned too far from their original co-ordinates, which in turn would distort the overall premise that visually similar images should remain close to each other on the browsing display.
In the tree nodes of the cells, it will commonly occur that only a few images are present, most of which will be visually fairly similar. To avoid them from being mapped to the same cell and hence to trigger another tree level, another spreading algorithm is applied which displays them on the same screen once only a certain percentage of cells are filled for a cluster. The algorithm is akin to the ‘place’, ‘bump’ and ‘double-bump’ principle employed in [4]. When a cluster is encountered, a spiral scan is initiated which searches for and fills empty cells close by until all images are distributed. If an empty cell is encountered in the first ring around the cell, the next image of the cluster is assigned to that cell (‘place’). When an empty cell in the second ring is found it is first established which of the cells of the first ring is closest to the direct path from to the identified empty cell. The image from this cell is then moved to the empty cell whereas the next image from the cluster is placed in the cell from the first ring (‘bump’). The same principle is applied to empty cells identified in the third ring with images from the first and second ring being moved (‘double bump’).
3. Image browsing systems
In this section we present some image browsing systems that we have developed in recent years. All browsers incorporate the principles laid out in Section 2. 3.1. Image browsing on a hierarchical MDS grid
Rubner et al. were one of the first to suggest more intuitive interfaces for image database navigation [5]. They proposed the application of multidimensional scaling (MDS) [6] to calculate the locations of image thumbnails and displayed them in a global 2-dimensional view on a single screen. MDS expresses the similarities between different objects in a low number of dimensions, allowing for a complex set of inter-relationships to be summarised in a single figure. Using this method all images in a database are (initially) shown simultaneously; their locations are dependent on their visual similarity compared to all other images features in the database. The user is then able to zoom into an area of interest and hence to browse the image collection in an intuitive top-down manner.
In our MDS grid approach [7,8], we address typical problems associated with MDS browsing regarding occlusion and overlapping of images, unused visualisation space and computational overheads when zooming into an area of interest. In addition, our system provides an intuitive interface also for large image collections. To do so we adopt the principles laid out in Section 2. That is, following MDS calculation based on colour histograms [3] to obtain initial image
Page 83

Visualisation and browsing of large image repositories ICI 10 - 10TH INTERNATIONAL CONFERENCE ON INFORMATION
4
co-ordinates, we adopt a regular tessellation of the visualisation space, namely a regular grid to which all image thumbnails are mapped. To maximise the use of the visualisation space, i.e. to fill as many grid cells as possible, we incorporate the spreading strategies of Section 2.4. Finally, a hierarchical browsing structure as laid out in Section 2.3 is employed to allow access to large image repositories, and, coupled with the regular quantisation of the visualisation space, to avoid image overlap resulting in an effective and intuitive image browsing environment.
A sample screenshot of the system is shown in Figure 1, which depicts the application after the user has interactively restricted his/her attention to a small subset of images by browsing through the MDS grid structure.
Figure 1. Sample screenshot of the MDS grid browsing system.
3.2. Image browsing on a hue sphere
While the approach presented in Section 3.1 provides an intuitive and effective tool for image browsing, it is still based on MDS which consequently requires considerable (though, due to the tessellation, off-line) computations. Therefore, in another method [8,9] we employ a computationally much more efficient approach as well as a different, more intuitive visualisation space for interaction.
Again we employ colour features to characterise image content, however this time we describe each image by its average (more precisely, median) colour. Rather than employing the standard RGB colour space, we use the HSV space which humans find more intuitive. Of this we take only the hue and value attributes, since the saturation descriptor is deemed less important for describing image content. Value V ranges between 0 and 1 where 0 corresponds to pure black and 1 to pure white. Hue H is the attribute that is usually associated with “colour”, and goes from red to yellow to green to blue back to red, which is also often referred to as the hue circle.
Looking at the two attributes, we almost naturally end up with the body of a sphere, or a spherical globe. The hue circle describes one dimension of the sphere. All colours with high V values are similar, i.e. close to white, and the same holds true for those colours with low V, which similarly become close to black. As black and white by definition don’t have a hue quality, the two points V=0 and V=1 describe the poles of the globe. The use of a globe not only comes naturally with the choice of features, it also has other clear advantages. The concept of a globe will almost certainly be familiar to the average user, as it is a direct analogy of the earth globe. It therefore provides a very intuitive interface to the user, who will have
Page 84
Visualisation and browsing of large image repositories ICI 10 - 10TH INTERNATIONAL CONFERENCE ON INFORMATION
5
experience on how to navigate and find something on its surface. Furthermore it allows us to employ a familiar co-ordinate system based on latitude and longitude. Longitude describes the circumference of the globe (i.e., the east-west co-ordinate) and lies in the interval [0˚,360˚]. Latitude describes the north-south direction from pole to pole and ranges from -90˚ at the south pole to +90˚ at the north pole. Clearly, each point on the surface of the globe can be uniquely described by a pair of longitude/latitude co-ordinates, which in turn correspond to an H/V pair obtained from the average image colour.
Having defined the features and visualisation space, we then again apply the principles of Section 2 and map images to a regular grid on the sphere surface, apply image spreading mechanisms and organise the image collection in a hierarchical structure for browsing. The system starts with an initial view of the database. The controls the user has at his/her disposal for navigation purposes allow rotation of the globe around both the vertical and the horizontal axis, and zooming in and out of a region of interest. In addition, image clusters represented by a grid cell can be expanded to bring up lower levels of the browsing structure.
Examples of the hue sphere system are given in Figure 2, which shows the results of a browsing session where the user first rotated and tilted the sphere to focus on yellow images (left) and then selected one of the representative images on the grid to expand (right).
Figure 2. Examples of the hue sphere browsing system.
3.3. Image browsing on a honeycomb
In our latest image browser, the honeycomb image browser [10], we employ the same image features as in the hue sphere browser, i.e. the median image colour expressed in terms of value V and hue H. Following Section 2, we also organise images on a regular lattice with no image overlap, however, in contrast to our other approaches we do not employ a grid structure but rather utilise a hexagonal lattice. This has the advantage that, when the images are organised in a space-filling arrangement, each row and column of images is visually displaced from its neighbouring rows/columns. This would not be possible using a regular square grid structure as larger visual gaps are needed to delineate images clearly. The space saved as a result of using a hexagonal lattice enables larger or more images to be displayed within the visualisation. In addition, on a hexagonal lattice, the six neighbours of a hexagon are equidistant from the middle cell while on a square architecture, the neighbours at the diagonal are further away than the horizontal and vertical neighbouring cells.
Image spreading and hierarchical data organisation are adopted akin to our previous work and following the principles of Section 2. Navigation in the honeycomb browser is performed, as in the other approaches, either horizontally (i.e., on the same layer of the browsing structure) or vertically (i.e., moving from one layer to another). Horizontal browsing operations include pan
Page 85
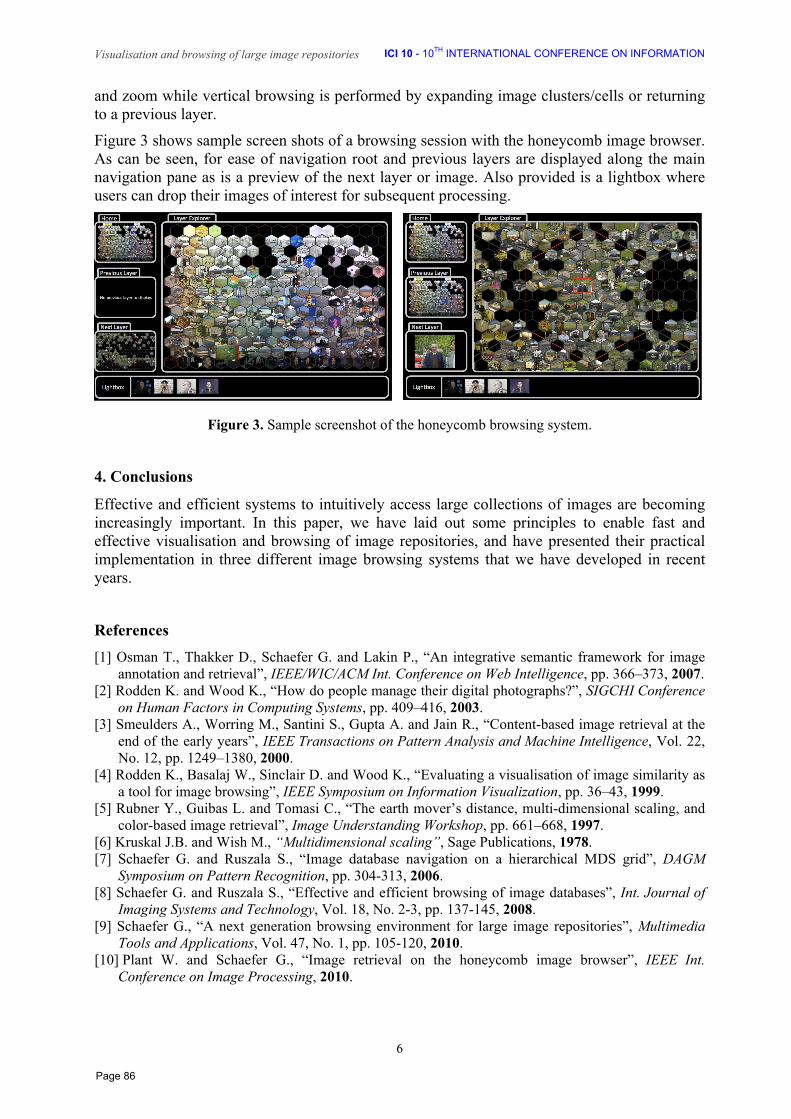
Visualisation and browsing of large image repositories ICI 10 - 10TH INTERNATIONAL CONFERENCE ON INFORMATION
6
and zoom while vertical browsing is performed by expanding image clusters/cells or returning to a previous layer.
Figure 3 shows sample screen shots of a browsing session with the honeycomb image browser. As can be seen, for ease of navigation root and previous layers are displayed along the main navigation pane as is a preview of the next layer or image. Also provided is a lightbox where users can drop their images of interest for subsequent processing.
Figure 3. Sample screenshot of the honeycomb browsing system.
4. Conclusions
Effective and efficient systems to intuitively access large collections of images are becoming increasingly important. In this paper, we have laid out some principles to enable fast and effective visualisation and browsing of image repositories, and have presented their practical implementation in three different image browsing systems that we have developed in recent years.
References [1] Osman T., Thakker D., Schaefer G. and Lakin P., “An integrative semantic framework for image
annotation and retrieval”, IEEE/WIC/ACM Int. Conference on Web Intelligence, pp. 366–373, 2007. [2] Rodden K. and Wood K., “How do people manage their digital photographs?”, SIGCHI Conference
on Human Factors in Computing Systems, pp. 409–416, 2003. [3] Smeulders A., Worring M., Santini S., Gupta A. and Jain R., “Content-based image retrieval at the
end of the early years”, IEEE Transactions on Pattern Analysis and Machine Intelligence, Vol. 22, No. 12, pp. 1249–1380, 2000.
[4] Rodden K., Basalaj W., Sinclair D. and Wood K., “Evaluating a visualisation of image similarity as a tool for image browsing”, IEEE Symposium on Information Visualization, pp. 36–43, 1999.
[5] Rubner Y., Guibas L. and Tomasi C., “The earth mover’s distance, multi-dimensional scaling, and color-based image retrieval”, Image Understanding Workshop, pp. 661–668, 1997.
[6] Kruskal J.B. and Wish M., “Multidimensional scaling”, Sage Publications, 1978. [7] Schaefer G. and Ruszala S., “Image database navigation on a hierarchical MDS grid”, DAGM
Symposium on Pattern Recognition, pp. 304-313, 2006. [8] Schaefer G. and Ruszala S., “Effective and efficient browsing of image databases”, Int. Journal of
Imaging Systems and Technology, Vol. 18, No. 2-3, pp. 137-145, 2008. [9] Schaefer G., “A next generation browsing environment for large image repositories”, Multimedia
Tools and Applications, Vol. 47, No. 1, pp. 105-120, 2010. [10] Plant W. and Schaefer G., “Image retrieval on the honeycomb image browser”, IEEE Int.
Conference on Image Processing, 2010.
Page 86
Learning Environment at the Beginning of the 21st Century
Prof. habil. Bertalan Komenczi PhD director of the Information Society Research Group Esterházy Károly College Institute of Media Informatics Eszterházy tér 1., 3301 Eger, Hungary +36 20 9718219 E-mail: [email protected]
Abstract
While electronic learning environments have become a reality and an indispensable aspect of contemporary educational philosophies, the respective pedagogical reflection and evaluation efforts tend to be stranded at the revolutionary pre-paradigm forming stage. The present paper makes an attempt to describe and present the option system and the resulting challenge exerted by information and communication technology devices on the theory and practice of instruction and learning. Having provided an overview and survey of the latest developments and analyzed the respective processes we strove for the exploration of more profound and generally applicable trends, impact systems, and correlations beneath the dynamically changing surface phenomena. Our analytical effort was primarily motivated by a desire to understand the innovative capacity and novelty value of the vigorously proliferating new technologies, in addition to assessing the nature and extent of their impact on the centuries old systems and methods of traditional education and that of the various learning schemes.The author offer a definition of the concept of electronic learning environments and present an interdisciplinary approach regarding the learning environment in the 21-th century. The presentation display a theory on the essential technological dimension of the “new cognitive habitus” along with providing a system- oriented definition of the e-learning concept. It focuses on the main conceptual framework and the crucial components of the electronic learning environments. Furthermore it outline a possible interpretations of the role of science and technology in the educational process and delineate the interrelations between pedagogy and brain development in the cultural evolution.
The cognitive habitus of today’s society is an extremely complex interactive symbol system, which clearly leaves its mark on the learning environments. If we want successfully respond to the challenges of the information society, we should reconsider and revise our knowledge concerning the learning environments. Electronic learning environments are the newest form of the cognitive habitus and the recent everyday environments for teaching and learning. One possible system-oriented approach to the electronic learning environments is the application of the author’s mesoworld model. The mesoworld model is a holistic construct. The model highlights the fact, that the dominant information input arrives from the whole area of the “hyperworld” and schools – and the society as well - are not able to screen and control that information flow. Consequently, the erstwhile dominant school impact system is only secondary, complementary, or at best correctional concerning the development of the learner’s personality. Furthermore, the mesoworld model demonstrates that the school is only an imbedded system between a vertical and horizontal information universe.
Today’s modern mind is a hybrid structure: the integration of different representational and communication systems. The externalization of memory has altered how human use their biologically given resources. Both mimetic and linguistic internal representation can now be externally driven, formatted, recombined and retrieved. The whole hierarchy of biologically given cognitive mechanisms has been wired into a fast moving external memory environment, with results that are difficult to predict. Any reasoning on education and learning environment we have to take this into consideration.
Key words:
Electronic learning environment, cognitive habitus, cultural evolution, e-learning, mesoworld model, hyperworld, microworlds, evolutional psychology, cognitive science, external symbolic storage
Page 87
Introduction
In the field of education we are witnessing a comprehensive paradigm change. While electronic learning environments have become a reality and an indispensable aspect of contemporary educational philosophies, the respective pedagogical reflection and evaluation efforts tend to be stranded at the revolutionary pre-paradigm forming stage. Consequently, the present paper and the respective presentation should be regarded only to an experimental attempt at the interpretation of the respective phenomena along with the systematization of the attained experiences. Furthermore, it hopes to facilitate a better understanding of electronic learning environments by the elaboration of new perspectives and professional aspects while encouraging the posing of new questions. It affords both a freeze frame and cross section view reflecting the contemporary directions, trends, and innovative patterns of the impact system formed between the applied technology and didactic approaches.
One of the focal points of the present paper is the interpretation of the concept of electronic learning environments and the description of the respective features. We attempted to identify such conceptual models and thematic approaches which in addition to being integrated into a system can be suitable for the presentation of the options and possibilities provided by electronic learning environments. Furthermore, the scope of our research included the impact of electronic information and communication tools on traditional learning environments, along with the respective correlation between electronic and traditional learning environments. Our analysis raises several questions as well: What characteristics are changed, which components tend to resist change? Should all forthcoming, scheduled, or pending modifications be considered equally necessary and positive? Can we fully substantiate the positive perspective and the associated demands for radical change promoted by proponents of a full scale, unqualified, comprehensive application of information technology devices in the education process? In what way our expectations are modified as a result of the application of said apparatus in the instruction and learning process? Is it possible to interpret or view certain pedagogical phenomena in a non-traditional manner? Is it possible or even necessary to incorporate new elements into pedagogical concepts and approaches? Is it feasible to develop a differing, more comprehensive approach examining the teaching and learning process in the evolutionary or historical context in addition to the traditional social sciences oriented pedagogical theory and pedagogical history perspective?
The present paper aims to fulfil several objectives. On the one hand it provides a summary of the results and related experiences of a comprehensive, broad-scoped research and development effort launched several years ago. It also attempts to perform a critical analysis whose validity is primarily assured by its internal consistency, the logical coherence of the identified inherent correlations, and the harmony with existing scholarly knowledge. On the other hand it also functions as a systematized exploration of experiences, results, and scholarly insights gained during the investigation of the respective subject. While due to the dynamically changing aspects of the field of information and communication technology we could not guarantee the applicability of our recommendation on the long run, we are convinced that the goals of the present work exploring an area fraught with misconceptions are warranted and necessary. It is beyond doubt that instructors, management of higher education institutions, professional experts involved in the arrangement and research of education efforts along with educational policy makers should be as informed as possible regarding the developments of this field. We hope that our effort will not only facilitate a better understanding of newly developed electronic learning environments but promotes the prevalence of a pedagogically rational approach in the arrangement and realization of the goals of the teaching and learning process.
Page 88

I. The Definition of the Concept of Electronic Learning Environments
1. The concept of electronic learning environment (ELE) is a general term used to refer to such learning environments in which electronic information and communication technology play a definitive role as a basic toolkit in the development, functioning and management of the learning environment (LE).
2. Electronic learning environments always have a virtual dimension. This virtual dimension is a unique interactive interface for web-based communication and information retrieval. The term is often used – as a synonym – to refer to the electronic learning environments. Virtual learning environment (VLE) - in a narrower sense – is a software system designed to help teachers managing the learning activity their students.
3. Electronic learning environments are sometimes called digital learning environments due to the fact that the processing, storing, modification, and transmission of information is primarily done via digital technology. Educational material in digital form are called digital learning material and hence the use of the term digital learning environments, which is – like the term “virtual learning environment” - an other synonym for electronic learning environment.
4. Due to the virtual dimension, the resources of the electronic learning environment are partly delocalized. These distributed resources can be accessed from anywhere at any time by hyperlinks and other communication channels. This gives the learner in an electronic learning environment an immense freedom and flexibility, but - at the same time – a disturbing information overload too.
5. Electronic learning environments – in principle – always offer the learners the needed help by providing communication channels to tutorial help in the learning process. Electronic learning environments are especially favourable spaces for collaborative or cooperative learning.
6. Electronic learning environments are not the alternatives to traditional learning environments. Our argumentation is based on a conviction that as compared to traditional schools electronic learning environments cannot be considered a suddenly emerging “edenic structure” carrying the promise of the “brave new electronic world..” We believe that such sites of knowledge acquisition symbolize a unique cognitive habitus or ontogenetic cultural niche organically connected to preceding forms resulting from the cognitive evolution of human beings rising from primate level.
II. The Technological Dimensions of Electronic Learning Environments
1. The Metamorphosis of the External Symbolic Storage
Our relevant experiences and scholarly analysis leads us to conclude, that the emblematic screen-surface of the electronic learning environments is the result of a unique metamorphosis of the Donaldian1 external symbolic storage, a transformation occurring in several well identifiable steps. We believe that the promotion of a greater awareness of this conversion or transformation facilitates a better understanding of the options provided by the respective and available electronic learning environments. The main steps of the respective conversion or evolution process are as follows:
1 Merlin Donald is a Canadian Psychologist who coined the term “external symbolic storage” in his famous book: The Origin of the Human Mind, (1991).
Page 89
1.1. The defining development was the recognition of the possibility of machine-made computing and the elaboration of the respective complex equipments. Consequently, the external symbolic storage was transformed into an operation performing/information processing machine. The crucial step was to put out the symbols in such a way, that the operations happen automatically, without a human mind.
1.2. The next step was to transform the external symbolic storage into a screen: the results of the given operation were communicated to the user via a display. The screen played a decisive role facilitating the further phases of the metamorphosis process. Present day screens with unique multiple windows systems provide us wholly new insight into real and virtual worlds.
1.3. Then the external symbolic storage system emerged as a virtual control panel through which - via icons and pull down menus – instructions can be given to the machine. The invention of the graphical user interface (GUI) triggered an iconic turn in the way how to command computers and generally in manipulating symbols.
1.4. The external symbolic storage as an iconic driven control panel provides access to a theoretically unlimited information universe. The components of this continuously expanding information galaxy can be retrieved at the user’s discretion. In addition, the user can present and organize the symbols in varied patterns.
1.5. The external symbolic storage functions as an input and output surface of communication channels. The various synchronous and asynchronous systems of audio-visual communication operate through this communication platform on a planetary scale.
2. A new definition of the concept of e-learning
Electronic learning environments (the everyday learning environments in the new cognitive habitus) provide two sets of means (toolkits) for managing and facilitating learning.
2.1 The first set of means is presented by the key-characteristics of the multimedia computer: data storage, data processing, interactivity, hypertext, multimedia, animation, simulation, virtual reality.
2.2. The second set of means includes the characteristic features of the networked computer: open information resources, network communication, and augmented reality. These are the “virtual dimensions” of the ELE. We can virtually step out of the concrete learning environments. In this case new dimensions include the data base networks, the diverse options of electronic telecommunication, and the components of the augmented reality. Augmented reality creates a fully new relationship between the individual and his environment. To implement an action we always need prior knowledge. Augmented reality means, that the respective knowledge is neither present in the biological internal mental representation, nor it is obtained from the external symbolic storage. The supplementary information - what we need for effective action - arrives from external sources via the network and it is superimposed directly on the environment. This provides a new dimension for the interaction between the individual and his or her actual environment.
In our view the strategic significance of this definition of e-learning rests on its system integration perspective and logical coherence. The definition presents new aspects for the system-oriented analysis, design, conversion, and development of learning environments via exploring and interpreting the relationship between electronics-based and traditional instruction in an integrative and complementary manner. Consequently, this conceptual model in addition to providing important guidelines for the evaluation of e-learning programs and educational materials along with facilitating the development of learning tools can be applied for the analysis of the learner component criteria of the e-learning process as well.
Page 90

III. A System-oriented Approach to Electronic Learning Environments We have introduced two quasi system-models, which can facilitate a more effective comprehension and interpretation of the main characteristics of the electronic learning environments. The respective mesoworld and communication-centred models are constructed in a holistic fashion and emphasize that in case of public school students the dominant information inputs are derived by extension from the full cognitive habitus, more specifically the media sphere. Consequently, the impact system received within the schools’ organizational and academic structure is secondary or at best a correctional mechanism. While the previously elaborated system models for the teaching and learning process did not exceed the traditional school and curriculum-centred framework structure, the mesoworld and communication-centred models take the delocalization of the learning environment and the multidirectional extension of the learning process into account.
The main elements of the mesoworld model are as follows:
1. In this interpretation the microworlds designate the internal subjective mindsets of the students, which are preconditions in the learning process.
2. The „Hyperworld” include the full domain of global representations. Hyperworld consist of all the information, explicit knowledge and arts produced and accumulated in the human cultural evolution. The main components of the hyper world are the Gutenberg Galaxy, the Marconi Constellation, and the Neumann Universe. Today the most ubiquitous manifestation of the hyper world is the World Wide Web. For most people it is the Media Sphere that presents the hyper world as a daily symbol environment.
4. The mesoworld of traditional schools generally means a closed learning environment in a dual sense. It is closed in relation to the external world beyond the school environment, and from a pedagogical point of view it is closed as far as the information base and respective content knowledge of the students are concerned. The traditional mesoworld is not especially concerned with the prior knowledge of students.
5. The ideal educational mesoworld is an open learning environment creating a unique connection between the micro worlds and the hyper world. This mesoworld integrates the real world into the learning environment and prepares the students for navigation in the hyper media system of the World Wide Web.
6. The mesoworld model is also a holistic construct. The model highlights the fact, that the dominant information input arrives from the whole area of the hyper world and schools – and the society as well - are not able to screen and control that information flow. Consequently, the erstwhile dominant school impact system is only secondary, complementary, or at best correctional concerning the development of the learner’s personality. Furthermore, the mesoworld model demonstrates that the school is only an imbedded system between a vertical and horizontal information universe
IV. The Role of Science and Technology in the Teaching Process In an OECD publication you can read the following sentence: „Unlike architecture or medicine, education is still in a primitive stage of development. It is an art, not a science.” 2
We think, this statement is – at least - questionable. One problem with this quote is that Pedagogy cannot be compared either to Medicine or to Architecture. Medical profession and Pedagogy are totally different endeavors. Medicine focus on fixed structures which develop in
2 In: Understanding the Brain – Towards a New Learning Science. OECD, 2002.
Page 91
prescribed sequences closed, completed during the ontogenesis and the result is a closed, predetermined structure. Medical practice aims to preserve, maintain and restore the original and optimal state of this closed, predetermined structure that means: the human body. Pedagogy however is a discipline preoccupied with an open, non-determined system. The developmental processes, which pedagogy deal with are basically open and stochastic. The difference between the two can be best expressed by Bernd Jensch’s aphorism: the process of becoming human is a long effort; we have already succeeded up to the shoulder, now we only have to work on the head.3 Well, the area under the shoulder is the focus of medicine, but the one above belong to Pedagogy.
The essence of teaching is the promotion and facilitation of the unique, peculiar, and creative development of the human mind. Consequently, despite the science-like components of teaching, it cannot be fully treated as a scientific discipline. As H. Aebli points out: Teaching is truly a great art, in which Psychology can provide certain amount of help, the decisive factor, however, is in the teacher’s practical knowledge in what to do in concrete situations”4 As Seymour Papert pointed out in his statement: „…technology can support mega change in education as far reaching, as what we have seen in medicine, but it will do it through a process directly opposite to what has driven change in modern medicine. Medicine has changed by becoming more and more technical in its nature; in education, change will come by using technical means to shuck off the technical nature of school learning.”
Having analyzed the correlation between the instructor, the respective technology, and traditional and on-line instruction, we attempted to overcome the technophile-technophobe duality. High level and high quality teaching efforts have always been considered an interpersonal activity, which so far have successfully resisted standardisation and probably will never have the capability of being expressed in algorithms. This, however, does not mean that quality teaching efforts have nothing to do with technology. One of the basic functions of electronic info-communicational technology implies the transmission of an increasingly abstract symbol flow to the teacher. The instructor absorbs the given information, interprets it, integrates it into a given system and uses it during his lectures, class room-based and virtual seminars, and in interpersonal connections. Technology is able to decide the optimal time for directing the symbol flow to the learner without the involvement of the teacher. Consequently, certain teaching activities can be expressed in algorithms or can be automated, while certain ones escape such categorisation. Teaching is - above all – a performance art which unfolds in real time. Teaching is the act of constructing knowledge in a dialogic social environment - face to face or electronically mediated. The basically vertical aspect of culture transmission needs personal touch and interpersonal context.
V. Electronic Learning Environments, Pedagogy and the Cultural Evolution
Electronic learning environments are the natural result of the human cognitive evolution. They do not constitute a radically new, revolutionary option to the traditional schools. Pedagogy - in evolutionary context - is a special genetically coded human adaptation, a kind of social learning mechanism. That means: pedagogy is an integral part of the human nature. Humans are preadapted to transfer knowledge to, and receive knowledge from conspecifics by teaching and learning. The joint attention scenes of the human ontogenesis present the 3 „Die Menschenwerdung ist ein langwieriger Prozess. Bis zu den Schultern ist schon geglükt. Nur der Kopf ist heikel…..” 4 „Unterricht ist „eine Hohe Kunst, in der psychologische Erkentnisse einige Hilfe leisten können, das Entscheidende aber vom Erzieher in der konkreten Situation eh und je erspürt werden muss” In: Aebli, H.: Grundlagen des Lehrens. Stuttgart, Klett-Cotta, 1987. S. 57.
Page 92

archetypes of class room attention and they constitute the natural basis of dialogic knowledge construction. We believe that the acquisition and application of the conceptual apparatus and the vocabulary of the evolutional psychology and cognitive science can enhance didactic thinking and thereby positively impact the discipline of pedagogy and within it: didactical thinking and reasoning.
The basically vertical aspect of cultural transmission entails the personal touch and the interpersonal context. Vertical transmission is performed by master figures ranging from the kindergarten teacher and elementary school teacher to PhD thesis directors and acclaimed practitioners of a given profession. The establishment of the personal connection and the conditions for direct interpersonal communication are achieved in harmony with the basic biological determination of humans. Consequently the need and ability to learn is one of the general, genetically coded features of human nature.
Conclusion
We have examined the learning environments and the process of teaching and learning according to a general anthropological, human ethological and evolutional framework, in which the biological, social, and technological factors outline a uniform continuum. Following this approach the conclusion can be drawn that the electronic learning environments do not constitute a suddenly emerging, radically new revolutionary option, offering the potential of the “brave new world” in comparison to the traditional schools. An electronic learning environment is the new ontogenetic cultural niche for teaching and learning.
One possible system-oriented approach to the electronic learning environments is the application of the mesoworld model, as a holistic construct. The model highlights the fact, that the dominant information input arrives from the media environment, and schools are no more the main information provider for students. Consequently, the erstwhile dominant school impact system is only secondary, complementary, or at best correctional concerning the development of the learner’s personality.
Many people might think that ICT devices have a substantial transformation potential promoting profound changes in the organisational culture of the schools in addition to introducing new perspectives and practices of learning. Moreover, information and communication technology is expected to provoke internal changes in the rigid, conservative structure of the schools. However, research results prove that the mere installation of information and communication technology devices and equipment into the learning environment is not sufficient by itself. There is a great demand for carefully considered pedagogical innovation supported by management committed to the respective changes along with teachers capable of and willing to apply the particular innovations.
Having examined the connection of information technology and pedagogical methodology we refrained from radical predictions. Since the respective correlation and mutual impact is rather asymmetric the applied teaching and learning methodology has a much greater role in the efficiency of learning than the respective technology. However, as relevant examples illustrate excessive appreciation of technology or technological determinism tends to be prevalent. In our view the work of two theoreticians, Marshall McLuhan and Ivan Ilich could be most interesting for us then we are contemplating on the future mission and possibilities of education. These theories discussed in detail in the book help us comprehend and understand the two keystone aspects of learning environments, the multi and hypermedial symbol world along with that of the creative potential of network-based communication and the recognition and identification of respective inherent pedagogical options. Both conceptual universes
Page 93

integrally contain a demand for returning to the more social and natural forms of learning. At the time when these perspectives and philosophies were elaborated neither a socially receptive atmosphere, nor the technological background was available for the realization of the respective radical recommendations. Today, however, in the developed world pedagogical innovation efforts are primarily driven and motivated by the ideas originally generated by McLuhan and Ilich. The dominant technological feature of such aspirations is the development of electronic learning environments.
Pedagogy, as a peculiar genetically coded human adaptation is an integral part of human nature containing the promise of predestination for teaching and learning. The shared attention scenes of the human ontogenesis present the archetypes of class room attention and dialogic knowledge construction Acquisition and application of the conceptual apparatus of the cultural evolution can enhance didactic thinking and thereby positively impact the discipline of Pedagogy.
As a result of the human cognitive evolution - surpassing the level of primates – we have a unique, peculiar cognitive mindset. Today’s modern mind is a hybrid structure: the integration of different representational and communication systems. The externalization of memory has altered how human use their biologically given resources. Both mimetic and linguistic internal representation can now be externally driven, formatted, recombined and retrieved by means of new external memory media. The whole hierarchy of biologically given cognitive mechanisms has been wired into a fast moving external memory environment, with results that are difficult to predict. Any reasoning on education and learning environment we have to take this into consideration.
References
1. Aebli, H. (1987). Grundlagen des Lehrens. Klett-Cotta, Stuttgart.
2. Donald, M. (1991). Origins of the Modern Mind: Three Stages in the Evolution of Culture and Cognition Cambridge, MA: Harvard University Press.
3. Donald, M. (2001). A mind so rare. The evolution of human consciousness. New York-London: W.W. Norton & Company
4. Donald, M. (2007). Evolutionary Origins of the Social Brain. Social Brain Matters-Stances on the Neurobiology of Social Cognition. Ed: Villarroya, O. & Argimon, F., Amsterdam-New York .
5. Gergely, G. & Csibra, G. (2006). Social Learning and Social Cognition: The Case for Pedagogy. Munakata, Yuko – Johnson, Mark (eds.): Processes of Change in Brain and Cognitive Development. Attention and Performance. Oxford University Press, Oxford,
6. Komenczi, B. (2009). Elektronikus tanulási környezetek. Gondolat Könyvkiadó, Budapest.
7. Pléh, Cs. (2001). A kognitív architektúra módosulásai és a mai információtechnológia. Mobil információs társadalom. Szerk: Nyíri Kristóf. Budapest : MTA Filozófiai Kutatóintézete
8. Tomasello et al (2005). Understanding and sharing intentions: The origins of cultural cognition. Behavioral and Brain Sciences (2005) 28, 675–735
9. Tomasello, M.(1999). The Cultural Origins of Human Cognition. Harvard University Press, Cambridge, M.
10. OECD (2002) Understanding the Brain – Towards a New Learning Science. OECD Publication Service, Paris
Page 94

The 10th International Conference on Information (ICI10) 4-6 December 2010
Gamasa, Egypt
Innovations in Information and Communication Technology:
Increasing the Effectiveness of an Open and Distance Learning Institution
Professor Emeritus Anuwar Ali President/Vice-Chancellor Open University Malaysia
Page 95

INNOVATIONS IN INFORMATION AND COMMUNICATION TECHNOLOGY: INCREASING THE EFFECTIVENESS OF AN
OPEN AND DISTANCE LEARNING INSTITUTION
Professor Emeritus Anuwar Ali President/Vice-Chancellor Open University Malaysia
Abstract
In the digital world of today, information and communication technology (ICT) influences everything from the way we work to the way we communicate, and are a mainstay for many businesses. Higher education has also been impacted by ICT, as many of the latest teaching and learning innovations are built on the internet and web-based technologies; and this is perhaps most pronounced in open and distance learning (ODL). A well-equipped ICT infrastructure is essential for ODL institutions as it provides the resources needed to complement the university’s pedagogy and delivery system, and they are important enablers for driving new innovations in teaching and learning and for revitalising higher education as a whole. For Open University Malaysia (OUM), Malaysia’s premier ODL institution, ICTs are a fundamental component and represent the vital link between what is necessary and what is innovative. It is through technologies that OUM has been able to continuously develop and enhance its delivery system as well as its support services to learners, both within and outside the country. This is in line with OUM’s vision to be a leading provider of flexible learning and to promote the democratisation of education. This paper will illustrate the leverage of new innovations in ICT as exemplified by OUM. A university’s ICT infrastructure must be continuously expanded in order to develop best practices and maximise technologies to benefit all of the university’s stakeholders. This paper will also explore how newer developments in ICT can be adopted and utilised to enhance effectiveness in ODL as well as higher education at large. The use of ICTs can certainly be considered a critical component in realising OUM’s learner-centred approach.
Page 96
INNOVATIONS IN INFORMATION AND COMMUNICATION TECHNOLOGY: INCREASING THE EFFECTIVENESS OF AN
OPEN AND DISTANCE LEARNING INSTITUTION
1. INTRODUCTION
In today’s world, information and communication technology (ICT) is a pervasive force
that has impacted virtually everything, from doing business to the way we teach, learn
and even entertain ourselves. ICTs have created a new dimension in higher education
as well; culminating into new ways of teaching and learning that have transformed the
traditional classroom into a limitless environment where pedagogies, materials and
resources can be combined and utilised outside regular notions of time and space.
Learners have also evolved with the many exciting developments that have taken place
in the educational sphere. Today’s learners, known as “digital natives” (The Economist,
2008; Magaña & Frenkel, 2009), live in an era where technologies are ubiquitous and
indispensable. Where previous generations would have come to class with books and
pens, today’s learners are armed with mobile and smart telephones, laptop computers
and portable media players like iPods. Particularly for open and distance learning
(ODL) institutions, this trend has opened the door for numerous opportunities. ICTs
have enabled ODL to gain a firm foothold in the global higher education scene, and with
newer technologies, ODL institutions have the luxury of exploring new modes of
teaching, transforming curricula, inventing media-rich forms of content that can suit
different learning styles and even leveraging on technologies as platforms for
collaboration. ODL is indeed no longer a novelty in higher education, be it in an elite
and competitive environment such as in the United Kingdom, or in a less developed
setting like Asia or Africa. In ODL, it is clear that ICT innovations hold the key to further
advancements in how we teach, learn and acquire knowledge.
Many higher education institutions today, not merely those operating in ODL have, in
varying degrees, adopted different technologies in their day-to-day operations. The
pervasiveness ICT in higher education means that technologies can impact every
aspect of a learner’s educational experience; from the moment he/she registers to the
Page 97

moment of graduation. Adopting ICT innovations is not a one-step process; for ODL
institutions, it is also an imperative to search for ways to adopt these innovations in a
smart, economical and effective manner. An effective ODL delivery using the right
technologies in the right way is part and parcel of maintaining a respectable level of
quality, especially in the eyes of ODL stakeholders. Quality education via effective
utilisation of ICTs will extend to a rewarding teaching and learning experience to
learners and faculty members as well as improve efficiency and order for the entire
organisation.
For an ODL institution like Open University Malaysia (OUM), ICTs have been the
mainstay of our educational provision. In the past nine years of operations, OUM has
cumulatively enrolled over 95,000 learners in academic programmes delivered through
a blended pedagogy designed using various technologies to complement teaching,
learning and campus administration as well. As at June 2010, over 20,000 learners
have successfully graduated; a testimony not only to the viability of ODL, but also to the
effectiveness of technologies in a higher education environment.
This paper will explore how ICT innovations can shape the effectiveness of an ODL
institution like OUM. By leveraging on technologies to improve teaching and learning,
OUM has had significant accomplishments in Malaysian ODL within the last decade.
The use of ICTs has become integrated into the university’s learner-centred approach.
However, we believe that there is always room for improvement, both in the kind of
technologies institutions can choose to adopt as well as how to maximise their use in
higher education. With this in mind, this paper will also discuss how higher education
can learn to cope with the challenges in implementing ICT innovations in ODL.
2. ICT IMPACT IN OPEN AND DISTANCE LEARNING
The notion that ICT has had profound impact in higher education is especially accurate
for ODL institutions. The open, flexible and dynamic nature of ODL has naturally
benefited from the smart adoption of appropriate ICTs. In recent years, this can be
seen in such developments as learning and content management systems, multimedia-
rich course materials, virtual libraries and the use of collaborative tools like the Wiki.
Page 98

These innovations have had enormous implications on the ODL delivery system, by
facilitating different learning styles, fostering creativity and encouraging co-operation
between academics, learners and their peers. Day-to-day administrative processes
have also benefited from ICT – many ODL institutions now leverage on technological
applications to administer assessment, monitor learner activity, manage queries,
complaints and et cetera.
In ODL, access, flexibility and independence are the cornerstones in its delivery
system. Oftentimes, ODL learners study in their own time, attending classes or
interacting with their tutors and lecturers only on an occasional basis. Because many of
them are working adults who juggle multiple responsibilities, these learners must catch
up on reading material and assignments, do quizzes or prepare for examinations on
their own and in their own time. ICT, particularly web-based innovations, have become
an important component that allows these learners easy access to their study materials,
tutors and the university at all times without constantly having to be on campus. This is
certainly where ICT has been such an advantage, through which ODL has been able to
innovate and progress in such diverse ways.
The idea that ICT can enhance the effectiveness of an ODL operation is something that
responds very well to the Iron Triangle of higher education. Sir John Daniel, the
President and Chief Executive Officer of the Commonwealth of Learning (COL), has
often spoken of this Iron Triangle as an illustration for the three main challenges facing
higher education. These are access, quality and cost (Figure 1). Any higher education
system must provide access that is as wide as possible, quality that is as high as
possible and cost that is as low as possible (Daniel, 2010). I believe that the
coalescence of ODL and ICT is certainly one of the means to truly break free from these
challenges and pave the way towards a democratised provision of higher education. As
Sir John himself asserted, technology is what allows for this triangle to be flexible;
allowing for wider access, higher quality and lower cost to be achieved all at the same
time.
Page 99

Figure 1: The Iron Triangle of Higher Education
One enabling factor in using technology to transform this triangle will be the
advancement of internet and broadband penetration – a challenge that is much more
obvious for developing countries. Currently, Asia and Africa still lag behind compared
to the more developed regions, with an internet penetration rates that stand at only 21.5
per cent and 10.9 per cent, respectively (Internet World Stats, 2010). However, in
Malaysia, we are fortunate in that internet access has been a focal point in the nation’s
technological development. The recent unveiling of Malaysia’s national budget for 2011
revealed that the Government will continue to encourage broadband service providers
and even maintain duty and tax exemptions on broadband equipment until 2012 (Mohd
Najib, 2010).
The National Broadband Initiative, launched in 2007, targeted a 50 per cent household
broadband penetration by the end of this year (Malaysian Communications and
Multimedia Commission (MCMC), n.d.). Malaysia has progressed quite positively – by
the end of 2009, household broadband penetration has climbed to 31.7 per cent and
the average fixed line coverage in most populated areas has already reached 90 per
cent (MCMC, ibid.). Achieving good internet penetration will likely be inevitable if ODL
is to progress even further in creating the access for tertiary education while ultimately
keeping costs affordable for everyone.
Page 100

Several salient features in an effective ODL programme are materials and resources
that are easily accessible and usable; stable networks and infrastructure to facilitate
asynchronous communication (e.g. e-mail service, online forums); as well as creative
applications and relevant curricula that can support different learning styles, foster
reflective thinking, allow for self and peer evaluation and create a platform for
interactive and attractive teaching techniques. The ICT tools that are available today
are an advantage for ODL and represent the resources for those required features.
Using ICT effectively can ensure that these programmes can be delivered in a cost-
effective and accessible manner, without compromising the quality of the learning
experience.
In an environment like ODL, ICT is inherently linked to a novel academic approach
whereby tutors must assume a more facilitative, rather than instructive, role – they must
help learners to construct their own thoughts and opinions from the information
provided. In essence, the learner becomes the centre of the educational process and
in this sense, ICT has a major role to play, seeing as it is acknowledged to have a direct
impact on the main processes involved in teaching and learning, i.e. what is learned;
when and where learning takes place; how learning occurs; who teaches and who
learns (Oliver, 2002).
This learner-centred approach is, in fact, also a central concept in ODL. It resonates
with the entire ODL philosophy – from delivery to teaching, learning and the
technologies that make all of them possible. The idea of quality education with a
learner-centred approach means prioritising learner needs by creating learner-friendly
programme design, learning materials and support services. All of these aspects
encompass the efforts to ensure a rewarding teaching and learning experience for
everyone involved. For any ODL operation to succeed and be sustainable, it is thus
essential to use ICT in ways that can enhance every single level of university
operations.
Page 101

3. ICT USAGE IN OPEN UNIVERSITY MALAYSIA: ENHANCING THE EFFECTIVENESS IN OPEN AND DISTANCE LEARNING
Technological innovations are at the very centre of ODL. By utilising state-of-the-art
technologies, ODL has been able to deliver academic programmes with higher impact
and efficiency, in a cost-effective manner. The convergence of pedagogies and digital
technologies is evident in the ODL mode of delivery, blending face-to-face interaction
with virtual interfaces, combining stand-alone multimedia applications with networked
environments, Web 2.0 applications like Wikis, blogs, online social networking, open
educational resources (OER) and even mobile learning. At OUM, we try to adopt these
ICT innovations into the appropriate channels to create an educational environment that
can benefit learners, faculty members and support staff too.
OUM was established in August 2000 as a response to the Government’s call for the
democratisation of education. It is thus the mission of the university to make higher
education accessible, affordable and available for anyone who seeks it. Although having
been set up under a consortium of 11 public universities, OUM operates as a private
university that leverages on other public institutions and the industry to lend their
expertise in managing and delivering OUM’s programmes.
Almost a decade on, OUM’s cumulative intake has reached over 95,000 while the
number of graduates has surpassed 25,000. Over 8,500 individuals from public and
private educational institutions are appointed as tutors, and they conduct face-to-face
tutorial sessions on a fortnightly basis at 61 learning centres situated in major locations
nationwide. In its mission to educate the masses, OUM relies on ICT to deliver its
programmes as well as provide the necessary support system. With flexible entry
requirements that acknowledge learning experiences outside formal or traditional
educational pathways, a learner-friendly academic system and a blended learning
pedagogy, OUM focuses on lifelong learning opportunities for working adults who may
have missed out on the chance to pursue higher education earlier in their lives. The
blended learning pedagogy combines self-managed learning using print modules and
other learning materials with face-to-face sessions and the all-important e-learning
component. e-Learning remains the core of OUM’s delivery method, but the university
has also had to focus on its accompanying elements as well – many of which are
Page 102

achieved or developed through ICT and certainly deemed important to provide a
comprehensive and enriching educational experience for the learners.
ICT has been fundamental in achieving the necessary targets in OUM’s delivery
processes, while at the same time, the university must remain mindful of the main
objective to create an enriching teaching and learning environment through the
university’s learner-centred approach. For OUM, the foray into ICT innovations as an
educational complement began with the development of an in-house learning
management system (LMS) and today includes various other innovations that are
designed to make teaching and learning more effective. OUM continuously seeks to
ensure that all administrative processes are also given due consideration in its ICT
development initiative.
To a large extent, the leverage on ICTs has also helped OUM spread its wings
internationally. Over the past five years or so, OUM has forged partnerships with
numerous foreign educational institutions. Four of our most prominent partners are:
• Arab Open University (AOU) in Manama, Bahrain;
• University of Science and Technology (USTY), Yemen in Sana’a, Yemen;
• Villa College in Malé, the Maldives; and
• Accra Institute of Technology (AIT), Ghana.
With the exception of Villa College, OUM’s partnerships with AOU, USTY and AIT all
involve the offering of postgraduate programmes in Business Administration and
Information Technology. OUM is also currently in the midst of forging another
partnership with the Eszterházy Károly College in Eger, Hungary. Through this
partnership, OUM hopes to establish a learning centre in Hungary and begin by offering
the Master of Business Administration (MBA) and Master of Instructional Design and
Technology (MIDT) programme.
The following are descriptions of ICT innovations that have been adopted at OUM.
3.1 The e-Learning Model
The e-learning model employed by OUM encompasses one of the three components of
the blended pedagogy. The most important element in this model is the university’s
Page 103

LMS, today known as myVLE (my Virtual Learning Environment). Because learners do
most of their studying independently, the e-learning model must be able to provide the
necessary support and guidance to help make this process an interesting, engaging and
enriching experience.
All of OUM’s courses are complemented with rich, web-based content, including
downloadable modules (in PDF), topic-specific forums, frequently-asked questions and
resources such as learning objects and links to collections in the digital library. Modules
are also available in Hyper Text Markup Language (HTML) format; allowing learners to
have actual interaction with the module content. There are also other useful resources,
e.g. YouTube videos, audio files and web links. A designated e-tutor is also appointed
to facilitate each forum, with whom all registered learners in a particular course can
interact within a virtual environment. All assignments are submitted online via myVLE as
well; and they are automatically run through a Similarity Checker System to ensure
originality and tested for plagiarism.
3.2 My Virtual Learning Environment (myVLE)
The most vital element in OUM’s e-learning model is myVLE. First developed to support
online discussion forums and provide a link to the university’s digital library collection as
well as other learning resources, myVLE has transformed into a system that allows
learners and tutors to access multimedia learning materials, interact with one another,
try out quizzes and even check on their own profiles, schedules and payments. All of
these services, including the digital library, can be accessed as long as the learner or
tutor is connected to the Internet.
3.3 Learning Materials
The learning materials that have been developed and are accessible through myVLE
include: CD-based multimedia courseware, iBooks, iTutorials, iLectures, iRadio learning
segments, audiobooks as well as digital modules in PDF and HTML formats. The HTML
modules are the latest development to be incorporated into the myVLE. By leveraging
on web-based technologies, OUM has been able to transform print modules into
interactive web pages that incorporate useful links, hover-boxes to reveal definitions of
specific terminology and even self-assessed quizzes for learners to try out.
Page 104

3.4 OUM’s Internet Radio (iRadio)
One of OUM’s proudest ICT tools is university’s internet radio (known as iRadio), which
broadcasts infotainment academic segments that are based on print modules and even
accompanied by occasional live interviews with subject-matter-experts. iRadio also
produces audio learning materials for visually impaired learners. With features such as
podcasts via the iCast website, these segments can all be downloaded into any
computer or handheld media player. Learners can opt to be automatically informed on
the availability of latest content by subscribing to the iCast Really Simple Syndication
(RSS) feed. Even Web 2.0 applications like social networking tools, e.g. Facebook and
Twitter, have also been incorporated into iRadio.
OUM has also collaborated with the Ministry of Education, the Maldives, to bring iRadio
Maldives on air. With support from the Commonwealth Educational Media Centre for
Asia (CEMCA), OUM has been able to provide knowledge and technical support to the
Maldivian team, including training their members on the necessary know-how’s in
broadcasting technologies, applications and software; as well as developing
programmes, segments and scripts for the implementation of their version of the internet
radio. iRadio Maldives was successfully launched in December 2009.
The Central Institute of Educational Technology (CIET) in New Delhi, also with support
from CEMCA and COL, became the latest institution to launch its own version of iRadio
known as “Umang on www”. “Umang” is the collective name for audio programmes
broadcasted by CIET and through this venture, all of these programmes will now be
available over the Internet. Similar to the iRadio Maldives project, the OUM team also
provided knowledge, expertise and technological support to CIET. “Umang on www”
was successfully launched on 4 June 2010.
3.5 Mobile Learning
Mobile learning is also one of the newer technologies that have been included in OUM’s
educational framework. The m-learning initiative was piloted in May 2009 for one of
OUM’s core courses, i.e. “Learning Skills for Open and Distance Learners”. There were
about 2,000 learners enrolled for that particular semester. Mobile learning was
integrated to provide more learning opportunities and to benefit from the proliferation of
mobile telephones amongst its learners (Anuwar Ali, 2009). Each learner with a
Page 105

registered telephone number received two to three short text messages per week during
the entire semester. The messages were usually in the form of small ‘chunks’ of
content, reminders and motivational phrases. Learners appeared very receptive to this
new technology, and by the end of 2009, OUM also began implementing m-learning for
two more courses i.e. “Company Law” and “Renal Nursing”.
3.6 Mathematics Resource Centre (MRC) and Electronic Gateway to English
Resources (e-GATE)
In an effort to help learners deal with the complexities of Mathematics, OUM also
launched the Mathematics Resource Centre (MRC) in September 2009. The MRC
serves as an online centre that provides a variety of resources, including supplemental
notes, practice problems, interactive tutorials and links to other Mathematics sites. It
also provides a round-the-clock free online tutoring service. The MRC is the first of its
kind for OUM; and has garnered over 100,000 page views since its launch. It has been
able to simultaneously engage learners, tutors and faculty members who are on the
lookout for useful resources for teaching Mathematics and has become part of the
university’s retention initiative.
Early in 2010, a similar website was developed for the English language. Known as the
Electronic Gateway to English Resources (e-GATE), it provides various useful links for
learners in search of help in grammar, reading, speaking, listening and writing. As a
means of promoting the website to more visitors, not only the OUM community, e-GATE
also has complementary Facebook and Twitter pages as well.
3.7 Open Educational Resources (OER)
The OUM OER project was initiated with the aim of sharing some of OUM’s learning
resources with the general public. The OER, available via http://oer.oum.edu.my/, is still
in its early phase and will generally cover the following areas:
• Mathematics;
• English;
• Learning Skills for Open and Distance Learners;
• Business;
• Information Technology;
• Social Sciences;
Page 106
• Nursing Science; and
• Education.
OUM’s OER are licensed under Creative Commons, but are openly accessible online.
Currently, the website includes learning materials for “Learning Skills for Open and
Distance Learners” and Basic Mathematics. In due time, more content will be developed
and added to the website.
3.8 e-Customer Relationship Management (e-CRM) System
e-CRM was introduced as a one-stop mechanism to facilitate learner enquiries. As a
system that has been built into myVLE, e-CRM allows learners to channel their
complaints, questions, compliments and suggestions directly to the personnel in charge
and track the progress of their posts at their own convenience, without having to come to
the university or to even make a single telephone call. Every enquiry is automatically
forwarded to the relevant individual, and the turnaround time is between three to seven
days. Since it was introduced in 2009, e-CRM has become an important component in
OUM’s learner retention efforts.
3.9 ICT in Administration and Management
The use of technologies at OUM extends beyond teaching and learning. For OUM to be
a truly effective ODL institution, it is important to ensure that administrative processes
can fulfil the needs of the staff and complement the developments in educational
technologies that are utilised at the university. As an ODL institution with many learning
centres dispersed throughout the country, the need to consolidate university
management through technologies is perhaps even more pronounced. To smoothen
these administrative processes, OUM has invested extensively in ICT infrastructure to
mediate various areas in university operations, e.g. learner admission and records,
examinations and transcripts, databases for finance, accounting and human resources
as well as a management information system.
The management information system, for instance, keeps detailed records and statistics
of learners and tutors throughout Malaysia and is updated on a daily basis. Learners’
documents are kept in digital format and can be accessed without having to obtain hard-
copies from the relevant offices. OUM has even migrated to the GMail™ e-mailing
Page 107

system – a first for any university in Malaysia – in its effort to encourage greater
efficiency throughout the institution. While many of the ICT innovations were adopted to
support learners, they have also facilitated administration and management at OUM,
making it more efficient and easy for the support staff to play their respective roles as
members of the campus community.
4. THE WAY FORWARD: SOME CHALLENGES AND PROSPECTS FOR ICT IN ODL The three challenges that constitute the Iron Triangle of higher education, i.e. access,
quality and cost, can also relate to the context of ICT. The same connotations apply to
the challenges that affect how technological innovations can be harnessed in an ODL
setting. Loing (2005) contends that integrating ICT within a university environment
comes with external and internal challenges; involving faculty and staff members,
decision makers, academics, teaching staff as well as instructors. However, the
presence and role of ICT are both recurring and unavoidable – higher education
institutions must learn to deal with it one way or another (Loing, ibid.).
Access to technology is an important challenge for ODL. Local ICT capacity, with
regards to national network infrastructures, availability of Internet or broadband
connections, ICT awareness and use of personal computers, along with the institution’s
very own ICT approach are fundamental elements in this challenge. For learners, the
concern is whether or not they are comfortable with this approach and what sort of
equipment is required. For the university, creating greater access requires proper
investment strategies and delving into issues of cost and quality as well. On a larger
scale, countries must also look for ways to improve systems and technologies, look into
new energy supplies, bridge the digital divide (especially for remote areas and rural
communities) and explore what financial mechanisms can support this endeavour.
The question of quality in ICT and education has to do with the kinds of tools and
applications, how they are used and what impact they can make on educational
paradigms, curricula and approaches to teaching and learning. This is a significant and
admittedly, a considerable challenge for many ODL institutions. The definitive end for
ICT integration should be universal in that every institution should seek to provide quality
Page 108
education and an enriching learning experience. In this sense, one of the main avenues
for higher education institutions to integrate ICT is content.
With the various innovations that are available today, there is great potential for ODL
programmes to incorporate more web-based technologies to complement available
learning materials. For instance, there is vast creative potential in platforms like
YouTube and Wikipedia. The University of California Berkeley broke new ground when,
in 2006, it introduced its own YouTube channel; streaming hundreds of videotaped
lectures in over 300 hours of free education via the World Wide Web. There are also
other cases of educational web-based technologies, e.g. Wikimedia Foundations
Wikibooks – which are digital alternatives to traditional textbooks (accessible via
http://www.wikibooks.org/); and Wikiversity (http://en.wikiversity.org/) – which is a project
that collects learning resources, projects and research across all levels of education.
OER is a very current trend in the concept of open educational access. Some prominent
OER initiatives include the Open University’s Open Learn (accessible at
http://openlearn.open.ac.uk/), the Massachusetts Institute of Technology’s MIT
OpenCourseWare (at http://ocw.mit.edu/) and University of Southern Queensland’s
OpenCourseWare (at http://ocw.usq.edu.au/). OUM is still quite new to the open source
movement, but we believe that this can be an important technological tool for Malaysian
ODL to expand even further.
The problem of cost is also persistent for higher education and ODL. Implementing ICTs
requires the development of network infrastructures, procurement of hardware and
software, capacity building for faculty members, tutors, support staff and learners, as
well as forging collaboration with other institutions and relevant private partners. Each
entails very substantial investment on the part of the institution. Ultimately, the institution
will want to achieve economies of scale and cost-effectiveness, while at the same time,
enhance the quality of its delivery. This can indeed be very challenging – investing in
the most sophisticated technology may not necessarily produce positive outcomes, and
learners may even prefer low-cost media that they consider to be more accessible. This
is where ODL institutions need to strike a balance between investment and outcome;
and provide a comprehensive and conducive environment where ICT innovations can be
fully adopted and yield maximum benefits. In fact, OUM’s experimentation in mobile
Page 109
learning is a demonstration of how low-cost technology can boost ODL delivery – today,
OUM learners in remote locations in Malaysia are able to receive learning materials as
text messages through their mobile telephones.
Trucano (2010) suggests that some other low-cost innovations that are useful in
education are handheld devices like MP3 players and digital cameras. In the future, it is
likely that sophisticated equipments such as tablet computers can be obtained
affordably; making the pedagogical possibilities even more exciting for e-learning
proponents. Of course, at this moment when many countries and institutions are still
struggling with the digital divide, the idea of open sharing remains the most profound in
establishing an effective ODL delivery. I believe that OER and other openly available
web-based collaborative tools are the best representations of the ODL philosophy. They
can certainly prove to be the best kind of ICT to impart the access, quality and cost
needed for effectiveness, efficiency and excellence in ODL.
From an institutional perspective, investing in ICTs involves financial allocation for
infrastructure and capacity enhancement of staff competencies. All ICT staff and other
personnel in the university need to be given proper training in order to make full use of
the university’s available infrastructure. This is where a university can benchmark
against the best practices of other ODL institutions. National standards are also useful –
for Malaysian colleges and universities, codes of practice provided by the Malaysian
Qualifications Agency are both a necessity and a valuable guide to evaluating
institutional capacities, from the infrastructural viewpoint to that of the actual use of
technologies in a teaching and learning environment. Today, such best practices are
ubiquitous and many are even freely accessible online; making the benchmarking
process a more practicable procedure. This will certainly go a long way in assessing
ICT adoption in ODL, as well as assuring the quality of the ODL provision itself.
Page 110

5. CONCLUDING REMARKS In today’s technology-driven world, higher education will be reinvented in the light of ICT
tools and applications; a phenomenon that is perhaps most true in an ODL environment.
OUM has proven that it is possible for an ODL institution to leverage on ICT for the
advantage of the university, its learners and its support staff as well. For OUM,
continuous ICT development is to be an important agendum as the university strives to
enhance its learner-centred approach and as we move towards greater advances in
ODL in Malaysia. The different ICT innovations described in this paper are but a glance
into what technologies can truly offer, both for academic enrichment and for institutional
effectiveness.
It will be important for all ODL institutions to remain in control of their ICT adoption
strategies – ICTs should complement, enrich and enhance the educational process, but
should not be the ultimate driving force per se. Institutions need also be mindful of the
financial costs and investment required in using ICTs in an ODL setting. These
encompass everything from the technologies themselves to the know-how required to
put them to use. Quality assurance has become a norm in ODL and higher education at
large; and this presents a way for ODL institutions to benchmark against the
technological practices of others.
Having said that, the potential for creativity and innovation is indeed great – particularly
for higher education institutions that are willing to openly share and collaborate. The
next step in educational technology certainly appears to point in this direction. Moving
forward will be vital – in terms of what innovations we explore, how we use them to
enrich educational experiences, as well as improve administration and management for
the good of the entire ODL community. Ultimately, these ICT innovations are but the
means for all of us to provide quality education to a democratised learning audience.
Page 111

17
REFERENCES: Anuwar Ali (2009). Challenges in Online and m-Learning Practice in Malaysia: the
Experience of Open University Malaysia. Keynote Paper presented at the 2nd International Conference on e-Learning. Shah Alam, Selangor Darul Ehsan, 1-2 December 2009.
Daniel, J. (2010). Technology in Education: Much Ado about Nothing? Presented at the
Tin Ka Ping Distinguished Lecture Series. Hong Kong, China, 28 September 2010.
Internet World Stats (2010, June). Internet and Population Statistics. Accessed October
25, 2010 from http://www.internetworldstats.com/ Loing, B. (2005). ICT and Higher Education. Presented at the 9th UNESCO/NGO
Collective Consultation on Higher Education. Paris, France, 6-8 April 2005. Magaña, S., & Frenkel, P. (2009, February). Transforming Teaching and Learning for
the 21st Century. Accessed July 8, 2010, from http://www.prometheanworld. com/upload/pdf/Transforming_Teaching_and_Learning_for_the_21st_Century_V6.pdf
Malalaysian Communications and Multimedia Commission (n.d.). National Broadband
Initiative. Accessed October 25, 2010, from http://www.skmm.gov.my/ index.php?c=public&v=art_view&art_id=36
Mohd Najib Tun Abdul Razak (2010, October). Introducing the Supply Bill (2011):
Transformation towards a Developed and High-Income Nation. Presented at the Malaysian Parliament. Kuala Lumpur, Malaysia, 15 October 2010.
Oliver, R. (2002). The Role of ICT in Higher Education for the 21st Century: ICT as a
Change Agent for Education. Accessed July 12, 2010, from http://elrond.scam.ecu.edu.au/oliver/2002/he21.pdf
The Economist (2008). The Future of Higher Education: How Technology Will Shape
Learning. Accessed February 24, 2010, from www.nmc.org/pdf/Future-of-Higher-Ed-(NMC).pdf
Trucano, M. (2010, September). Cataloguing Low Cost ICT Devices Used in Education.
Accessed October 13, 2010, from http://blogs.worldbank.org/edutech/ cataloguing-low-cost-ict
Page 112

Model submarine and web virtual reality help disabled in the biology and ecology education.
Tomaz Amon
[email protected] www.bioanim.com
Abstract Excursions into the nature and exploring the biodiversity there might prove difficult for the disabled, especially in the case of water biotopes. We tested a new tool to help disabled and other students in science education - a model remote controlled submarine (70cm long and commercially available, though relatively inexpensive) to gather data from beneath the water. Using this device has proved to be an exciting experience and great fun. Gathered data are later analysed and incorporated into the virtual reality projects that we have created. New software (like modules developed in the TErenCe project) and hardware tools that combine art, education and science can be of great help here.
Getting rich data in an exciting way by the help of the model submarine Water ecosystems are very important in today’s world of changing climate and searching new ways of food and energy production. For example, algae are considered as one of the key organisms in the process of modern food and biofuel production. Therefore the education about organisms living in water needs to be as rich and attractive as possible. We have already created the web virtual reality educational game about the lake ecology and now we proceed to the next step – exploring the ponds and lakes with a miniature remote controlled submarine containing a video camera. The video footage obtained this way can be used as educational material and becomes part of the lake edutainment game. We obtained a remote controlled model submarine (Neptune from thundertiger.com). We inserted a miniature video camcorder inside. So during the underwater exploration the camera is recording what goes on in front of the submarine, but it is not possible to see the picture in real time (fig.1.). After the diving session the camera is removed the recording is monitored. As the submarine is typically not more than ten meters away from us it is possible to see and partly control the footage by directing the nose of the submarine to the desired place and direction. There is also an option to use a video camera on the cable thus controlling the video picture in real time, but we preferred totally wireless connection to the submarine model. There is also planned in future to establish a wireless video transmition from the submarine to the observer. When we made the first trial sessions the model submarine became a favorite “toy” and anyone hardly could wait to see the recorded footage. Because the model submarine is small (about 70 cm long and 25 cm tall), it can float and submerge also in shallow ponds or streams. Animals are not afraid of it and one gets easily the astounding pictures of underwater life like fish curiously expecting the strange underwater object. The main danger is that the submarine gets entangled into the water plants and needs to be pulled
Page 113
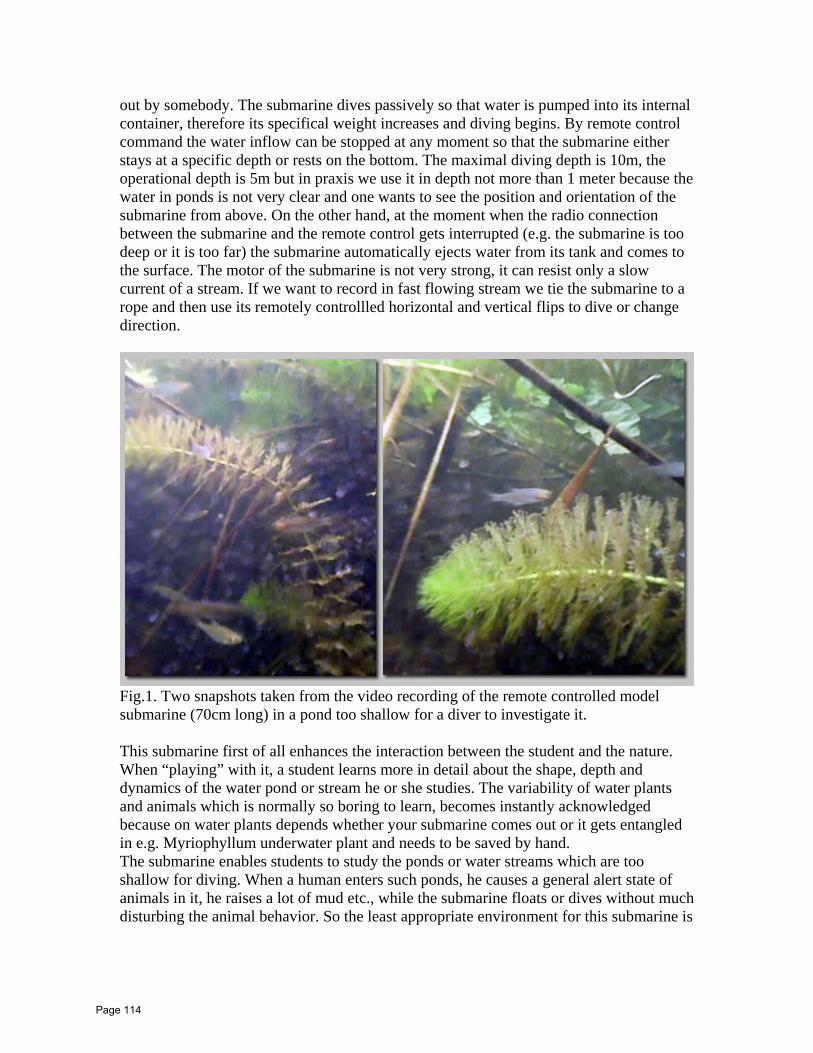
out by somebody. The submarine dives passively so that water is pumped into its internal container, therefore its specifical weight increases and diving begins. By remote control command the water inflow can be stopped at any moment so that the submarine either stays at a specific depth or rests on the bottom. The maximal diving depth is 10m, the operational depth is 5m but in praxis we use it in depth not more than 1 meter because the water in ponds is not very clear and one wants to see the position and orientation of the submarine from above. On the other hand, at the moment when the radio connection between the submarine and the remote control gets interrupted (e.g. the submarine is too deep or it is too far) the submarine automatically ejects water from its tank and comes to the surface. The motor of the submarine is not very strong, it can resist only a slow current of a stream. If we want to record in fast flowing stream we tie the submarine to a rope and then use its remotely controllled horizontal and vertical flips to dive or change direction.
Fig.1. Two snapshots taken from the video recording of the remote controlled model submarine (70cm long) in a pond too shallow for a diver to investigate it. This submarine first of all enhances the interaction between the student and the nature. When “playing” with it, a student learns more in detail about the shape, depth and dynamics of the water pond or stream he or she studies. The variability of water plants and animals which is normally so boring to learn, becomes instantly acknowledged because on water plants depends whether your submarine comes out or it gets entangled in e.g. Myriophyllum underwater plant and needs to be saved by hand. The submarine enables students to study the ponds or water streams which are too shallow for diving. When a human enters such ponds, he causes a general alert state of animals in it, he raises a lot of mud etc., while the submarine floats or dives without much disturbing the animal behavior. So the least appropriate environment for this submarine is
Page 114
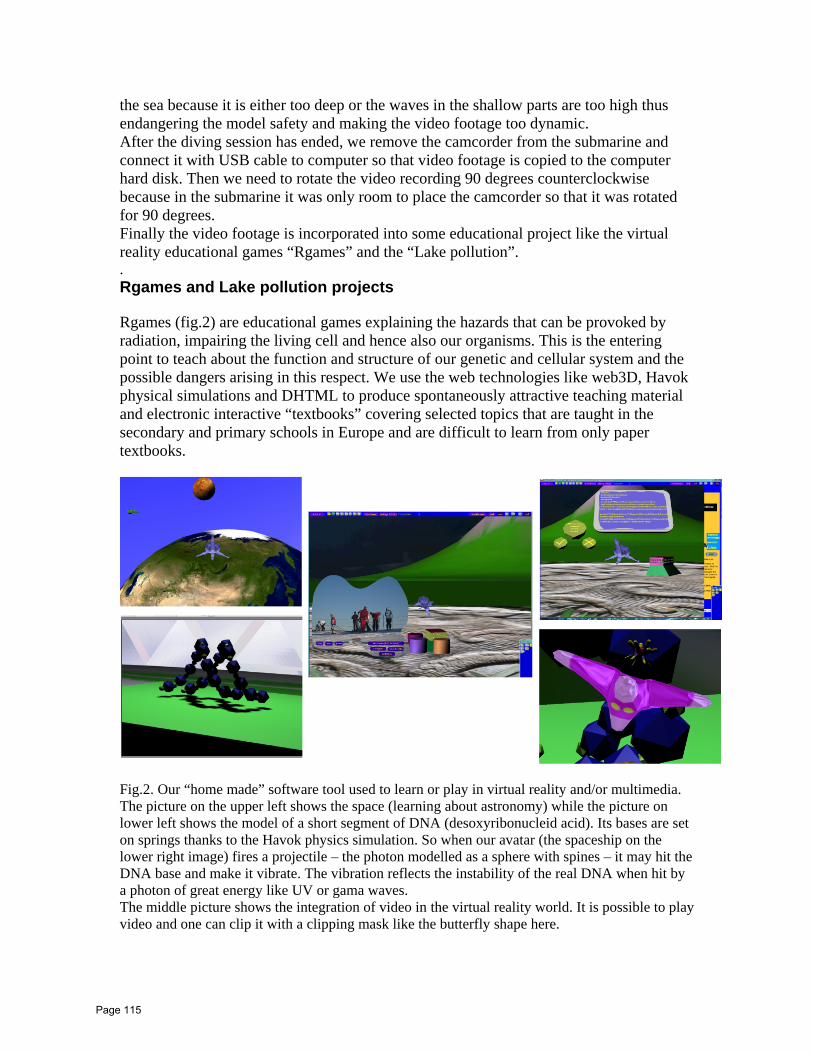
the sea because it is either too deep or the waves in the shallow parts are too high thus endangering the model safety and making the video footage too dynamic. After the diving session has ended, we remove the camcorder from the submarine and connect it with USB cable to computer so that video footage is copied to the computer hard disk. Then we need to rotate the video recording 90 degrees counterclockwise because in the submarine it was only room to place the camcorder so that it was rotated for 90 degrees. Finally the video footage is incorporated into some educational project like the virtual reality educational games “Rgames” and the “Lake pollution”. . Rgames and Lake pollution projects Rgames (fig.2) are educational games explaining the hazards that can be provoked by radiation, impairing the living cell and hence also our organisms. This is the entering point to teach about the function and structure of our genetic and cellular system and the possible dangers arising in this respect. We use the web technologies like web3D, Havok physical simulations and DHTML to produce spontaneously attractive teaching material and electronic interactive “textbooks” covering selected topics that are taught in the secondary and primary schools in Europe and are difficult to learn from only paper textbooks.
Fig.2. Our “home made” software tool used to learn or play in virtual reality and/or multimedia. The picture on the upper left shows the space (learning about astronomy) while the picture on lower left shows the model of a short segment of DNA (desoxyribonucleid acid). Its bases are set on springs thanks to the Havok physics simulation. So when our avatar (the spaceship on the lower right image) fires a projectile – the photon modelled as a sphere with spines – it may hit the DNA base and make it vibrate. The vibration reflects the instability of the real DNA when hit by a photon of great energy like UV or gama waves. The middle picture shows the integration of video in the virtual reality world. It is possible to play video and one can clip it with a clipping mask like the butterfly shape here.
Page 115

We created a web portal explaining some of the themes that are now much discussed by young people and difficult to teach only with written or spoken explanation. We concentrated on the themes connected with the living cell and its genetics like radiation – from natural (visible or invisible) sunlight to other radiation sources (radioactivity). The living organisms face radiation from the early times of the evolution of life on Earth. Radiation has harms as well as benefits for the living beings. It is also an excellent starting point to play, explore and learn in the virtual reality environment. We made the experiments’ designs according to the suggestions of experts in physics and biology and we accepted the pedagogical theories of expansive learning and constructivism, where student learns as he constructs things. First we made our models with Z-Brush modeler, then added animations in Discreet Plasma and finally ported the functional models into the Adobe Director, where the final product was assembled and further programmed. In Director we programmed the code related to the virtual reality world, while the educational game engine itself was done in Macromedia Flash and then ported to Director. So it was possible to produce in addition to the virtual reality Director world also a “planar” Flash version of our game that is running well also on older computers that children or some schools sometimes still have. This Flash – Director combination enhances also the collaboration between pupils. They can write their Flash code – a simple game for example. After playing it in Flash planar environment they can plug it into our Director code (with models and 3D world already available there) and instantly they get a real virtual reality game. So their motivation for learning natural sciences gets enhanced. In the virtual simulation/play about the lake pollution the user can experiment how to manage and clean the polluted lake without previous knowledge of biology and ecology. However, if you want to be successful in playing the game, you need to gain knowledge about the biology and ecology of clean and polluted lakes. The virtual environment is represented by the model of the lake which has inflow of fresh water, outflow of lake water and the lake depth is divided into three levels: shallow, medium and deep. Plants can only grow in the shallow part of the lake, deeper there is no light for them even in the unpolluted lake. The deep part of the lake contains cold water which almost never mixes and is vulnerable to accumulation of toxic agents of pollution as well as potentially toxic sediments. The border around the lake contains a virtual farmland (the source of organic pollution), a factory (the source of chemical pollution) and a cleaning plant. The user can use several vehicles (avatars) to travel in the virtual reality world. The vehicles take forms of animals (e.g. a tadpole for swimming in water), or a dragonfly for flying in the air. The parts of the vehicles can be animated (the tadpole moves its tail in order to show swimming and the dragonfly flaps its wings to simulate flying). The user controls the flying or swimming of a vehicle with the keyboard keys. The whole world contains Havok physics simulation and is collision sensitive where desired (for example the avatar always collides but its whiskers never collide). There is possible to “fire missiles” from any vehicle. When the missile hits a relevant target, some action is evoked as the result. For example, when underwater, a water plant starts to grow there in order to help to make cleaner water. But if the user fired the missile too deep, where there is no light, then also no plants can grow and so firing the missile was ineffective. The objects – sources of pollution like the farmland or the factory – produce pollution. Pollution is modelled as quantum spheres of “pollution units” which are produced by the polluting agent and enter the lake. If heavy enough they might fall on the bottom and increase the degree of pollution. On the other hand, the water cleaning plant produces “cleaning spheres” that destroy the pollution spheres when colliding with them. So everybody sees the degree of pollution or cleaning at a glance.
Page 116
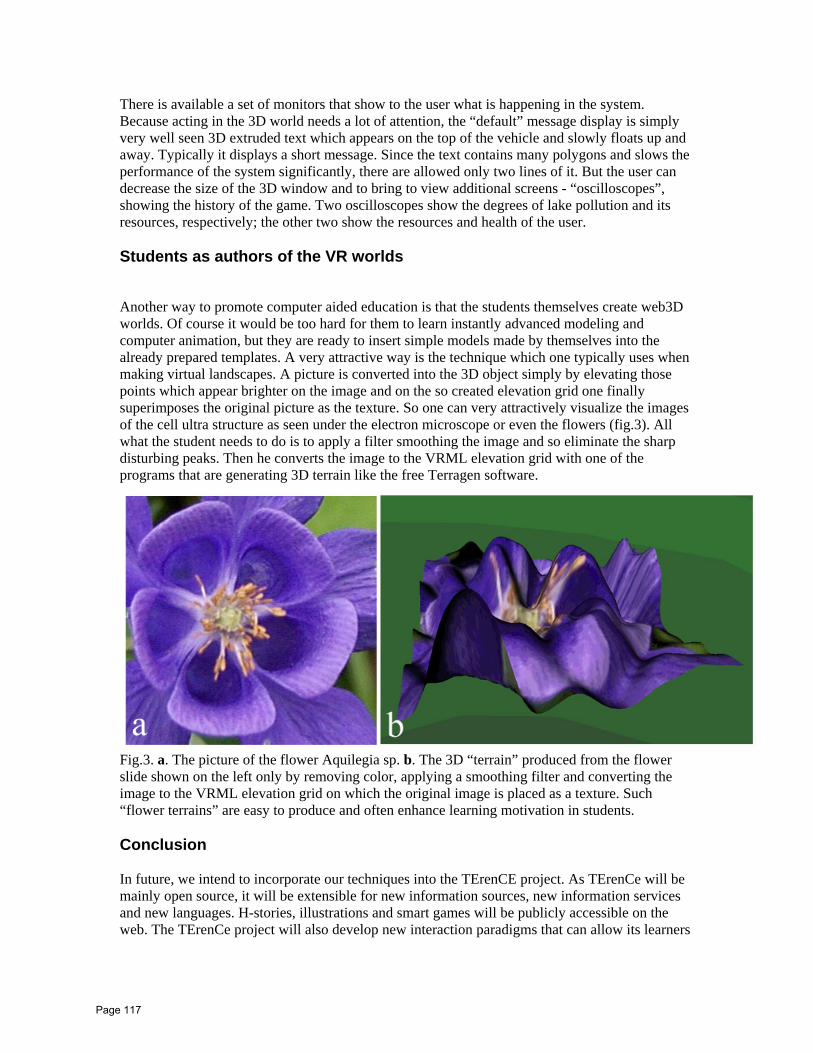
There is available a set of monitors that show to the user what is happening in the system. Because acting in the 3D world needs a lot of attention, the “default” message display is simply very well seen 3D extruded text which appears on the top of the vehicle and slowly floats up and away. Typically it displays a short message. Since the text contains many polygons and slows the performance of the system significantly, there are allowed only two lines of it. But the user can decrease the size of the 3D window and to bring to view additional screens - “oscilloscopes”, showing the history of the game. Two oscilloscopes show the degrees of lake pollution and its resources, respectively; the other two show the resources and health of the user. Students as authors of the VR worlds
Another way to promote computer aided education is that the students themselves create web3D worlds. Of course it would be too hard for them to learn instantly advanced modeling and computer animation, but they are ready to insert simple models made by themselves into the already prepared templates. A very attractive way is the technique which one typically uses when making virtual landscapes. A picture is converted into the 3D object simply by elevating those points which appear brighter on the image and on the so created elevation grid one finally superimposes the original picture as the texture. So one can very attractively visualize the images of the cell ultra structure as seen under the electron microscope or even the flowers (fig.3). All what the student needs to do is to apply a filter smoothing the image and so eliminate the sharp disturbing peaks. Then he converts the image to the VRML elevation grid with one of the programs that are generating 3D terrain like the free Terragen software.
Fig.3. a. The picture of the flower Aquilegia sp. b. The 3D “terrain” produced from the flower slide shown on the left only by removing color, applying a smoothing filter and converting the image to the VRML elevation grid on which the original image is placed as a texture. Such “flower terrains” are easy to produce and often enhance learning motivation in students. Conclusion In future, we intend to incorporate our techniques into the TErenCE project. As TErenCe will be mainly open source, it will be extensible for new information sources, new information services and new languages. H-stories, illustrations and smart games will be publicly accessible on the web. The TErenCe project will also develop new interaction paradigms that can allow its learners
Page 117

to friendly interact with the system. TErenCe will also contribute to the evaluation of its learners’ performances by the development of evaluation methodologies that are centred on them. In brief, TErenCe aims at offering a customisable suite of e-tools (1) that allow educators to automatically construct smart reasoning games framed around h-stories, and (2) that stimulate learners to read as well as play with h-stories through the educators’ smart games. How to enter the world where you intend to learn or to play? We all know the classical access to the web. You open the site you want or search with some searching engine. Ok with this, and what then? Typically you “land” in some web portal which is informative, nicely designed but not much different from a paper book with the exception of some animations. Just the right design for those who want to find information the same way as if they went to a classical library. On the other hand, if we want to creatively learn in an intuitive way, we can also try some other interface. Probably instead of text links why not to put interesting sounds or colors? Or colored pseudo - random patterns? Fractal landscapes, always different where we decide where to land and to continue our journey from that part on. So we are not guided by our logical thinking when surfing the web, but instead by our intuition. Where does us then lead such an intuition? How to establish a web site that receives the input from our intuition and then brings us to the web page that our intuition asked for? One of the way is to apply the psychological studies and produce an intelligent model, but the other is to ask the users themselves to help create the model. Simply by giving them a number of links (a link palette) at each time. The links can also be the pseudo-random patterns like abstract paintings, that can be of course animated and accompanied by sound. The way many users go is tracked by the server and so later on it is possible to statistically evaluate the users’ responses in order to find out if there exist some rules which can drive some model. It were quite interesting to see if all this is just a noise or if there exist some rules, maybe also different in different cultural surroundings? Acknowledgements Our projects were supported by the European Union and Ministry of Education in Slovenia (IST-2001-34204, Minerva 100152-CP-1-2002-1-EE-MINERVA-M, 116947-CP-1-2004-1-SI-MINERVA-M, FP6-511114), TErenCE (FP7-ICT-2009-5, project number: 257410). References Bioanim http://www.bioanim.com. Pixologic http://www.pixologic.com. VRML http://www.web3d.org . Macromedia- Adobe://www.macromedia.com Discreet http://www.discreet.com Autodesk http://www.autodesk.com NIH Image http://rsb.info.nih.gov/nih-image/ Terragen http://www.planetside.co.uk TErenCe—An Adaptive Learning System for Reasoning about Stories with Poor Comprehenders and their Educators. Collaborative project. FP7-ICT-2009-5, project number: 257410 Neptune SB-1 Submarine SC http://www.thundertiger.com/product/5220-F.html
Page 118

AT DELTA UNIVERSITY FOR SCIENCE AND TECHNOLOGY
GAMASA, EGYPT, 4 – 6 DECEMBER 2010
PSDD : Prolog-based System for Dyslexia Diagnosis
Dr. Adnan G. Abuarafah1, Dr. Osama khozium2*
1 Faculty of computer and information systems, Umm al-Qura university, Makkah, SA, [email protected]
2 Faculty of computer and information systems, Umm al-Qura university, Makkah, SA, [email protected]
Abstract
This paper reviews dyslexia and the effect it has on the lives of children and adults. In the paper we present a diagnosis system for dyslexia using prolog approach which called PSDD : prolog based system for dyslexia diagnosis. We explain the motivation, general idea and initial results in the term of user requirements and system architecture. Besides, teachers maintain significant level of information pertaining learning disabilities, thus reduce amount of human errors.
Keywords : Dyslexia; logic programming; diagnosis; user requirements.
1. Introduction
Dyslexia is a disorder affecting up to 17% of the population.[1],[2],[3],[4],[7] People with dyslexia
often think in different ways. Dyslexia particularly affects the handling of symbolic information
especially written language.
The British Psychological Society’s Division of Education and Child Psychology drew together
widespread research showing that dyslexia has multiple causes and the appropriate intervention
consists of frequently delivered and highly structured phonic learning, word reading and spelling
skills programs.
Their definition of dyslexia is as follows:
“Dyslexia is evident when accurate and fluent word reading and/or spelling develops very
incompletely or with great difficulty. This focuses on literacy learning at ‘word level’ and implies
the problem is severe and persistent, despite appropriate learning opportunities.”[1]
An independent report, dated June, 2009, from Sir Jim Rose to the Secretary of State for Children,
Schools and Families refers to dyslexia as….
Page 119

2
‘Dyslexia is a learning difficulty that primarily affects the skills involved in accurate and fluent
word reading and spelling.’[2].
Children have this problem when they struggle to acquire word reading and/or spelling skills and
knowledge despite appropriate intervention.
Dyslexia can cause frustration and negative feelings about competencies for some children and in
turn this might cause behavior problems. History is full of examples of great people who have
overcome dyslexia to achieve enormous success – Albert Einstein being probably the most famous.
However, Dyslexia is worrying for both parents and educators.[1], [6], [8], [9].
The main objective of this paper is to present PSDD system which can :
- Helps new teachers to know what type and degree of disability that each of their students may
have.
- Helps educators to categorize the students into a suitable curriculum activity based on students
disability.
- Helps parents and educators to monitor the performance and progress of a dyslexic user and his
current emotional / physical states. In addition PSDD supports them with recommendations to
enhance dyslexics, raise their level and awareness in treating with this disorder.
The rest of the paper is organized as follows. The next section provides overview on dyslexia
causes and treatment. Section three describes the main architecture of the proposed system (PSDD).
In section four we highlight the usage of prolog as an approach for the diagnosis module, some
examples of rules and facts are provided, while section five concludes the paper.
2. Overview on dyslexia
Dyslexia is identified through good record keeping of children’s spelling and word reading progress
over time which includes monitoring the child’s responses to the application of well-founded
intervention.
Individual focused intervention can dramatically improve many children’s reading and spelling
performance. Research shows that on average, good intervention makes a positive difference of two
months per month to reading and spelling age.
2.1. What causes dyslexia?
The causes of dyslexia fall into two broad categories:- [1], [6].
neurological e.g. genetic inheritance, forms of damage to the brain during or post birth;
Page 120

environmental e.g. lack of exposure to reading, reduced motivation and self-esteem in relation to
reading and spelling, unvaried methods of teaching word reading and spelling, for example total use
of synthetic phonics approaches will disadvantage children who are more successful at being able to
recognize whole words but struggle to split words into sound patterns or build sounds into words.
The problem for the investigator trying to pinpoint a cause is that factors within these two broad
categories interrelate and neurological problems can cause environmental ones and vice versa.
Measuring and observing a child’s reading and spelling abilities and their progress in relation to
well-founded support programs, is the most robust way of telling whether a child has dyslexia.
Parents and educators involved in teaching a child to read and spell are well placed to identify
struggling readers and spellers. Teachers can then provide effective interventions to meet the child’s
individual needs that accelerates the learning process.
3. The main architecture of the proposed system
The architecture of the proposed system consists of four main components. Figure 1 shows the
main architecture of the proposed system and the data flow.
3
Progressing Report
PSDD Educators
Parents
Feed back KB
Module
Dyslexic profile
Report Module Feed back
Progressing Report
Figure 1. The main architecture of the proposed system
Page 121

4
3.1. The components of the system
3.1.1 PSDD component
Which includes mainly two modules, knowledge base module and report generator module.
Next section will cover this component in detail, also some examples for prolog facts and
rules will be highlighted.
3.1.2 Dyslexic's profile component
3.1.3 Educator component
Which includes teachers and educators experts of dyslexia.
3.1.4 Parent component
Which includes parents of the dyslexic
3.2 Data flow
3.2.1 System inputs
a - Test and state of the dyslexic through PSDD to define the initial diagnosis
b- Report of the case by the educators through PSDD.
c- Report of the case by the parents through PSDD.
3.2.2 System output
a- Progressing report provided by the PSDD each period of time, this period will be
defined by the educators due to the progressing rate, normally this period around two
to three months.
b- The progressing report will include some recommendations to the educators and the
parents to guide them through the treatment of the case. 4. Usage of prolog in PSDD
Prolog as a logic programming language provides many possibilities to realize
a task. [11], [12]. It is considered to be difficult to be implemented because of the simple syntax
and the concept of recursive programming. In addition, the domain of logic programming is
infinite. For a given programming task, there is no single solution, but many strategies to design
Page 122

a solution. In PSDD system we are interested in diagnosis domain using simple syntax through
Arabic questions to get simply clear answers from the dyslexics, recursive concept to generate
periodic reports for the evaluations considerations and using the constraint-based modeling
(CBM) concept to define the level of the dyslexics in percentage in order to monitor the
progressing rate.[10], [12].
4.1 Aspects of questions through PSDD. Figure 2. Arabic questions examples
Questions about vision, reading and spelling.
Questions about behavior, health, development and personality spelling.
Questions about disorientation.
Questions about writing and motor skills.
Questions about math and time management.
Questions about memory and cognition.
Figure 2 shows example of Arabic questions.
5
Page 123

4.2. Example of Facts in PSDD
• Fact1: “Complains of dizziness, headaches or stomach ache while reading”. • Fact2: “Confused by letters, numbers, words, sequences, or verbal explanations”.
4.3. Example of rules in PSDD
The main rule in PSDD is to calculate the result of each aspect as an individual by itself and evaluate its percentage , every aspects has two counters so if the answer is yes it adds 1 to the x counter and if maybe then it will add 1 to the s counter. Figure 3
Figure 3. Shows some calculations of the results using CBM in prolog
After calculating each aspect alone, the average of all aspects will be given in percentage as shown in figure 3.
PSDD gives some explanations and definitions for the aforementioned aspects to facilitate and explain the meaning for the nonprofessional persons. For example figure 4. Explain what does it mean by disorientation and what is the symptom for this disorder.
6
Page 124
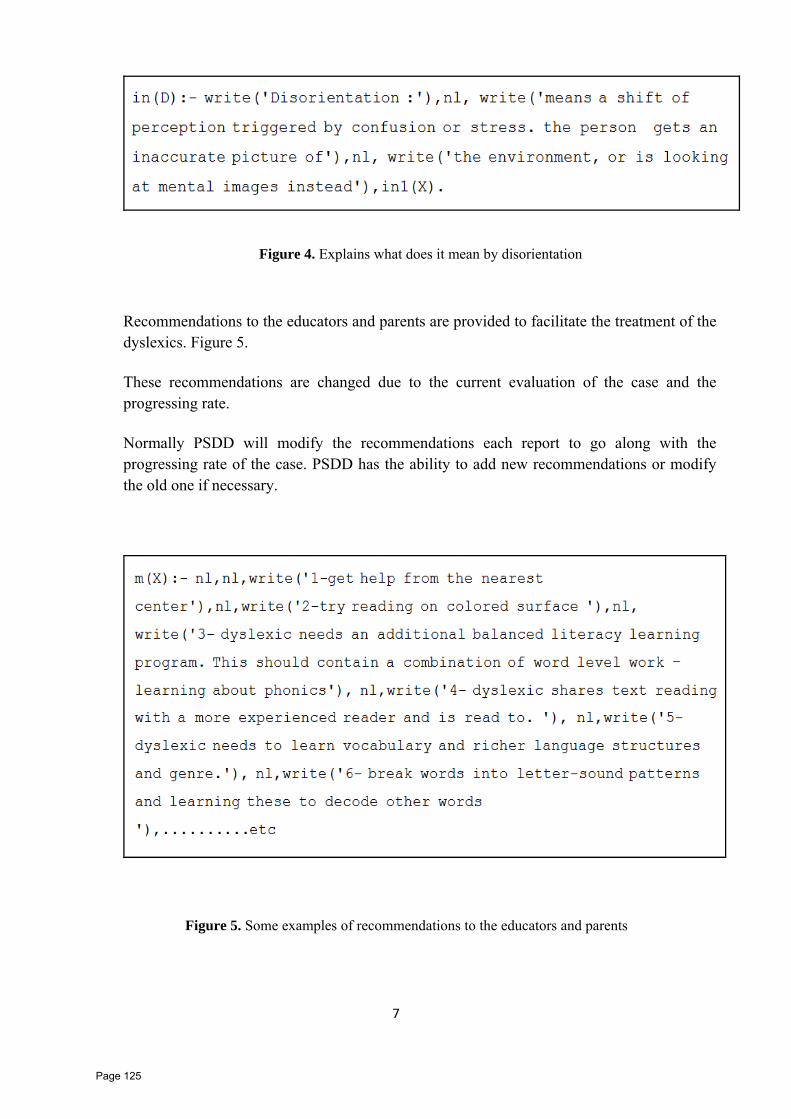
Figure 4. Explains what does it mean by disorientation
Recommendations to the educators and parents are provided to facilitate the treatment of the dyslexics. Figure 5.
These recommendations are changed due to the current evaluation of the case and the progressing rate.
Normally PSDD will modify the recommendations each report to go along with the progressing rate of the case. PSDD has the ability to add new recommendations or modify the old one if necessary.
Figure 5. Some examples of recommendations to the educators and parents
7
Page 125

PSDD : Prolog-based System for Dyslexia Diagnosis ICI 10 - 10TH INTERNATIONAL CONFERENCE ON INFORMATION
8
5. Conclusions and future work
This paper discusses PSDD which diagnoses dyslexia cases in Arabic and simple way. PSDD generates periodic reports which reflect the change and enhancement of the case according to the recommendations provided to the educators and the parents. These recommendations will help them to support the dyslexics to overcome this disorder.
As for future work we would like to include a sound recorder to read test questions, and to modify the fonts so it can be readable by dyslexic people, and try to include oral tests in it, such as written text and the person enters the answers as the meaning of the text...etc.
References
[1] DECP, the British psychological society's division of education and child psychology "Dyslexia research",
DECP, 1996.
[2] Sir Jim Rose, " Identifying and teaching children and young people with dyslexia and literacy
difficulties", June 2009.
[3] Arlenc Waddell, "Identifying dyslexia" , DCSF publications, 2008.
[4] Stanovich KE, “Explaining the differences between the dyslexic and the garden-variety poor reader: the
phonological-core variable-difference model.” Journal of Learning Disabilities 21 (10): 590–604, 1988.
[5] Warnke, Andreas " Reading and spelling disorders: Clinical features and causes " Journal European
Child & Adolescent Psychiatry 8 (3): S2–S12, 1999. http://www.springerlink.com/content/m3
1740417111l8w3/?p=e21d91f12abf440186aa325a73b0c59dπ=1. Retrieved 2010-07-11.
[6] McCandliss BD, Noble KG., " The development of reading impairment: a cognitive neuroscience model ",
Ment Retard Dev Disabil Res Rev 9 (3): 196–204,2003.
[7] Czepita D, Lodygowska E, " Role of the organ of vision in the course of developmental dyslexia ", Klin
Oczna 108 (1–3): 110–3,2006.
[8] Birsh, Judith R., " Research and reading disability ", Paul H. Brookes Publishing., 2005.
[9] NLM MeSH Browser., " Learning Disorders: MeSH Result ", http://www.ncbi.nlm.nih.gov/mesh/
68004410?ordinalpos=1&itool=EntrezSystem2.PEntrez.Mesh.Mesh_ResultsPanel.Mesh_RVFull. Retrieved
2009-11-06.
[10] Chris Stork, "Unification & Prolog" , http://www.ics.uci.edu, 2004.
[11] Berna,p,et al. "programming techniques for prolog. learning to build and comprehended complex information
structures : prolog as a case study", Albex, 1999.
[12] Berna,P., " Prolog programming, a first course ", Albex, 1990.
Page 126

Virtual Reality as an Advanced Visualization Tool for the
Diagnosis of Physical Disabilities
Ahmed Abdo Ali* and Abdel-Badeeh M. Salem**
* Aden University ,Yemen. [email protected]
**Faculty of Computer and Information science Ain Shams University, Cairo,Egypt
[email protected] [email protected]
Abstract Virtual Reality (VR) can be considered as the leading edge of a general evolution of present communication interfaces involving the television, computer and telephone. Main characteristic of this evolution is the full immersion of the human sensor motor channels into a vivid and global communication experience. The potential of virtual reality (VR) technologies to assist and improve rehabilitation techniques and procedures is unlimited. This research demonstrates how physically disabled people can benefit from the innovative Virtual Reality techniques. Several specific examples show the applicability of Virtual Reality to therapy and rehabilitation of various disabilities. In addition, the research follows how physicians can use Virtual Reality as an advanced visualization tool for the diagnosis of physical disabilities. Finally, the technical aspects of virtual reality are briefly discussed.
Keywords Virtual Reality, Human Activity Rehabilitation, Disabled Individual, Haptics, Assistive Technology, Speech disabilities , Advanced Visualization
1. Introduction Virtual Reality (VR), a technology that began in military and university laboratories more than 20 years ago, may be called Artificial Reality, Cyberspace, or Synthetic Reality. VR is a computer-created sensory experience that allows a participant to believe and barely distinguish a "virtual" experience from a real one. VR uses computer graphics, sounds, and images to reproduce electronic versions of real-life situations. Virtual Reality is not a computer, but a technology that uses computerized clothing to synthesize reality. Most current VR systems provide only visual experiences created by computer-assisted design
Page 127

(CAD) or other graphics/animation systems, but researchers are working on interface devices that add sound and touch. Eventually, VR may be delivered through direct computer-to-brain connections. A breakthrough in Virtual Reality came with the development of a head-mounted display with two tiny stereoscopic screens positioned just a few inches in front of the eyes. The most popular VR system ,EyePhone),is one designed by field pioneer, Jaron Lanier (1989). The system features a head-mounted display called the EyePhone. Users also wear a DataGlove that generates movement and interaction in the virtual environment. Movement in Cyberspace is simulated by shifting the optics in the field of vision in direct response to movement of certain body parts, such as the head or hand. The sensation is like being inside an artificial world the computer has created. The user moves while the virtual world is standing still. DataGloves is a group at NASA developed a system of helmet, glove, and a monochrome three-dimensional reality. The Data Glove, a key interface device, uses position tracking sensors and fiber optic strands running down each finger, allowing the user to manipulate objects that exist only within the computer simulated environment. When the computer "senses" that the user's hand is touching a virtual object, the user "feels" the virtual object. The user can pick up an object and do things with it just as he would do with a real object. The DataGlove’s most obvious application will be in robotics, particularly in the handling of hazardous materials, or by astronauts to control robot repairers from the safety of a spaceship,or from a space station, or even from Earth.
Recently there is a great increase and attention directed toward uses of VRT for applications other than commercial video-games and similar forms of self-entertainment. Among the more
promising are applications to the fields of medical technology, architectural design, telecommunications and, significantly, products and services designed to help and improve
the quality of life for the severely disabled. As examples of the latter, the use of VR as a tool for training new users to safely and efficiently operate wheelchairs while others have
focused on the problems and difficulties facing the disabled in poorly designed homes and other buildings. VRT has been successfully implemented in training and assessment environments. Current interfaces for virtual environments include monitors (flat and CAVE),head mounted displays (HMDs), sensors, force feedback mechanisms (haptics), and real time tracking devices. These devices allow the user the capability to interact with his/her virtual environment VE and provide feedback recordings in real time. This coordinated action of sensors and user inputs defines the virtual world. The feedback recordings are taken through multiple sensory modalities such as motion (visual) and force (touch) feedback. Virtual environments have the ability to track body movements, provide kinematic data, and adapt the user’s environment based on individual feedback and therapist input. virtual environments can be specifically designed to aid in the rehabilitation of a large number of disabilities resulting from disease and injury. Through the understanding of the changing needs of disabled individuals and the path or progression of a person’s rehabilitation process, the ultimate VRR system will be created. This initial VRR system will be created as a high end, multidimensional system suitable for comprehensive laboratories or research studies. It will eventually be scaled down after the necessary factors for immersion are determined and only those factors that optimize the immersive properties are included in order to develop a canonical system.
Page 128
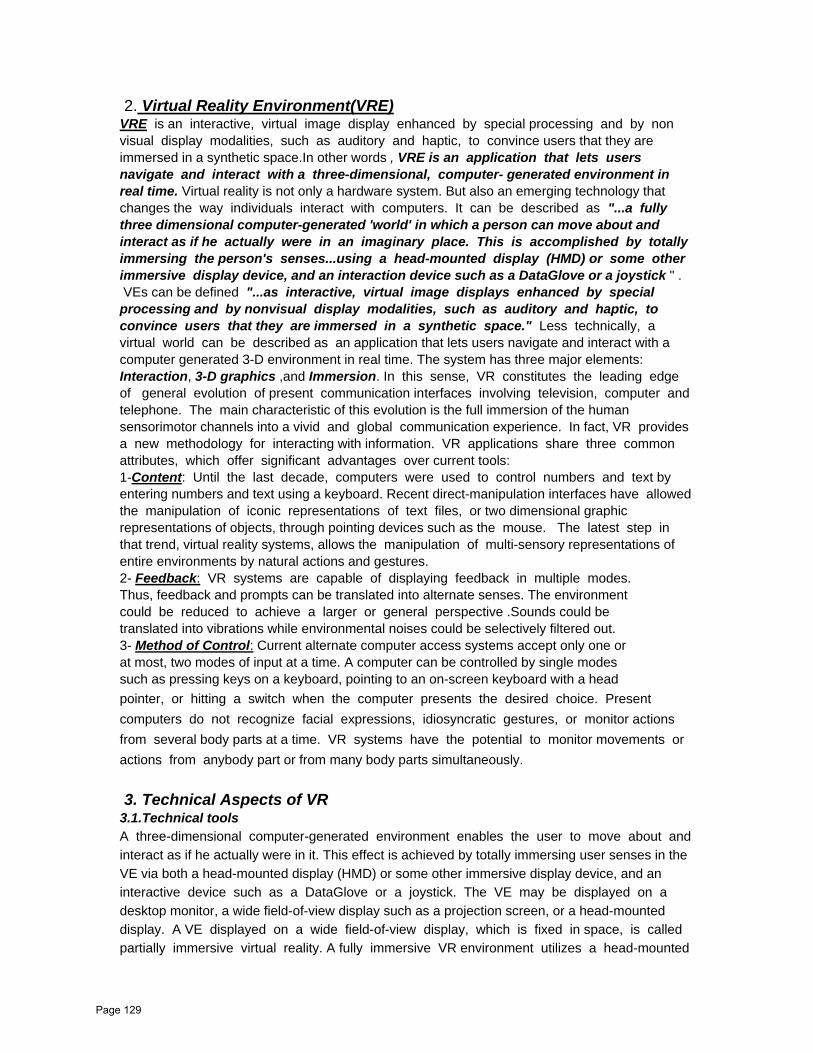
2. Virtual Reality Environment(VRE) VRE is an interactive, virtual image display enhanced by special processing and by non visual display modalities, such as auditory and haptic, to convince users that they are immersed in a synthetic space.In other words , VRE is an application that lets users navigate and interact with a three-dimensional, computer- generated environment in real time. Virtual reality is not only a hardware system. But also an emerging technology that changes the way individuals interact with computers. It can be described as "...a fully three dimensional computer-generated 'world' in which a person can move about and interact as if he actually were in an imaginary place. This is accomplished by totally immersing the person's senses...using a head-mounted display (HMD) or some other immersive display device, and an interaction device such as a DataGlove or a joystick " . VEs can be defined "...as interactive, virtual image displays enhanced by special processing and by nonvisual display modalities, such as auditory and haptic, to convince users that they are immersed in a synthetic space." Less technically, a virtual world can be described as an application that lets users navigate and interact with a computer generated 3-D environment in real time. The system has three major elements: Interaction, 3-D graphics ,and Immersion. In this sense, VR constitutes the leading edge of general evolution of present communication interfaces involving television, computer and telephone. The main characteristic of this evolution is the full immersion of the human sensorimotor channels into a vivid and global communication experience. In fact, VR provides a new methodology for interacting with information. VR applications share three common attributes, which offer significant advantages over current tools: 1-Content: Until the last decade, computers were used to control numbers and text by entering numbers and text using a keyboard. Recent direct-manipulation interfaces have allowed the manipulation of iconic representations of text files, or two dimensional graphic representations of objects, through pointing devices such as the mouse. The latest step in that trend, virtual reality systems, allows the manipulation of multi-sensory representations of entire environments by natural actions and gestures. 2- Feedback: VR systems are capable of displaying feedback in multiple modes. Thus, feedback and prompts can be translated into alternate senses. The environment could be reduced to achieve a larger or general perspective .Sounds could be translated into vibrations while environmental noises could be selectively filtered out. 3- Method of Control: Current alternate computer access systems accept only one or at most, two modes of input at a time. A computer can be controlled by single modes such as pressing keys on a keyboard, pointing to an on-screen keyboard with a head pointer, or hitting a switch when the computer presents the desired choice. Present computers do not recognize facial expressions, idiosyncratic gestures, or monitor actions from several body parts at a time. VR systems have the potential to monitor movements or actions from anybody part or from many body parts simultaneously. 3. Technical Aspects of VR 3.1.Technical tools A three-dimensional computer-generated environment enables the user to move about and interact as if he actually were in it. This effect is achieved by totally immersing user senses in the VE via both a head-mounted display (HMD) or some other immersive display device, and an interactive device such as a DataGlove or a joystick. The VE may be displayed on a desktop monitor, a wide field-of-view display such as a projection screen, or a head-mounted display. A VE displayed on a wide field-of-view display, which is fixed in space, is called partially immersive virtual reality. A fully immersive VR environment utilizes a head-mounted
Page 129

display, with a head position sensor to control the displayed images so that they appear to remain stable in space when turning the head or moving through the VE.. A see-through head-mounted display and head position sensor may be used to augment the user’s experience of the real world by superimposing space-stabilized computer-generated images of virtual objects on the user’s view of the outside world. 3.2 Low cost VR Due, in large part, to the significant advances in PC hardware that have been made over the last years, low cost VR systems are approaching reality. While the cost of a basic desktop VR system has not changed much, the functionality has improved dramatically, both in terms of graphics processing power and VR hardware such as head-mounted displays (HMDs). The availability of powerful PC engines and the emergence of reasonably priced 3D accelerator cards allow high-end PCs to process and display 3D simulations in real time. Presently, input devices for desktop VR are largely mouse- and joystick-based. Although these devices are not suitable for all applications, they can keep costs down and avoid the ergonomic issues of some of the up-to-date I/O devices such as 3D mouse and gloves. Also, software has been greatly improved over the last years. It now allows users to create or import 3D objects, to apply behavioral attributes such as weight and gravity to the objects, and to program the objects to respond to the user via visual and/or audio events. Ranging in price from free to $6,000, the toolkits are the most functional among the available VR software choices. While some toolkits rely exclusively on C or C++ programming to build a virtual world, others offer simpler point and- click operations for simulation. 3.3 Data structures and modeling For huge scenes containing millions of polygons, the challenge is to identify the relevant (potentially visible) portion of the model, load data into memory and render it at interactive frame-rates. In many cases it may still happen that the number of polygons of all visible objects dramatically exceeds rendering capabilities. Therefore the other important aspect of the data structure construction is level-of-detail (LOD) definition. Due to the perspective projection distant objects appear smaller on the screen that the close ones. In the extreme case they may cover as little as one pixel! In this situation it does not make sense to render them with the highest possible geometric resolution, because the user will not notice it. Nevertheless, when the same objects are closer to the user they must be rendered with a high resolution in order to let him/her see all the details. To achieve the best image quality at interactive frame rates, several approaches may be used: • hierarchical scene database – the scene is represented as a set of objects. Each object of the scene is described with multiple LODs that represent different accuracy of object representation (and contain different numbers of polygons). In extreme case objects can be represented by one textured polygon. The visibility analysis is performed on such a prepared model in two phases: the preprocessing phase (determination of cell-to-cell and cell-to-object visibility) and during the walkthrough phase (determination of eye-to-cell and eye-to-object visibility). To improve the performance of this process the splitting planes are chosen along the major obscuring elements e.g., walls, floors, ceilings or door frames. • memory management – if the whole scene cannot be loaded into the main memory, special algorithms for swapping in the relevant parts must be used. The loading of objects from the disk can take relatively much time, so prediction of objects that might be potentially visible in the near future has to be done and loading should start in advance (prefetching), in order to avoid waiting in the rendering phase. • constant frame-rate rendering – after all the potentially visible objects were determined in
Page 130
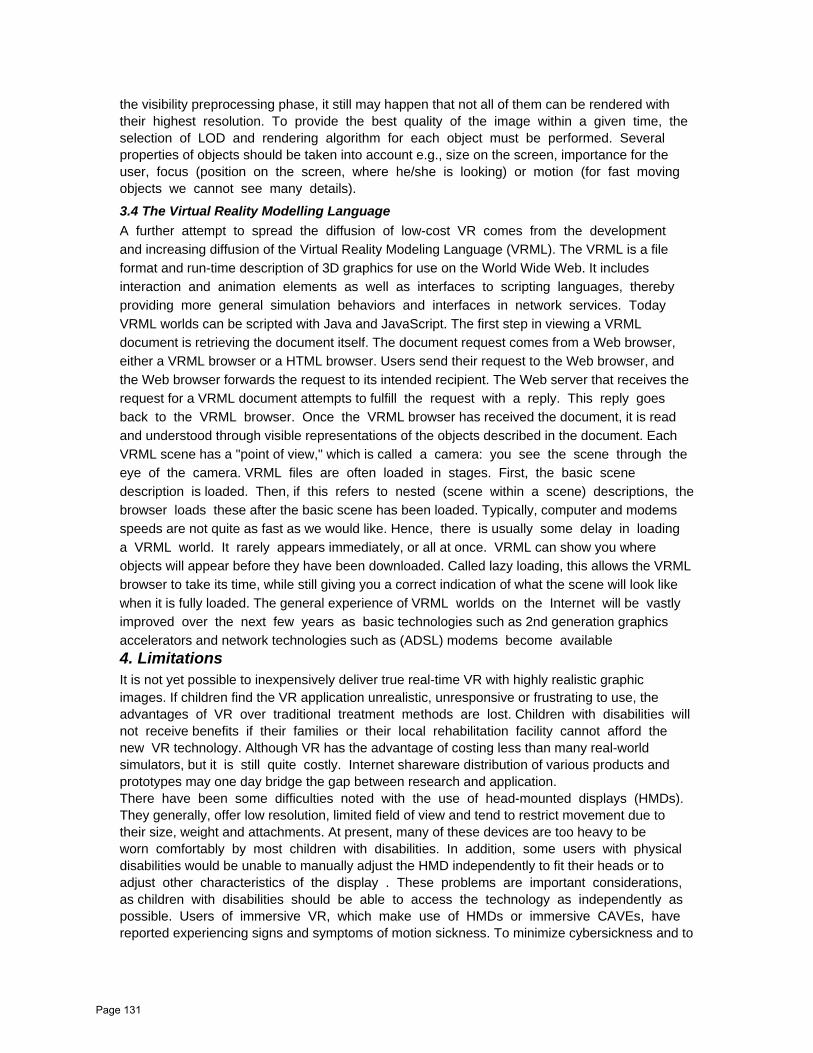
the visibility preprocessing phase, it still may happen that not all of them can be rendered with their highest resolution. To provide the best quality of the image within a given time, the selection of LOD and rendering algorithm for each object must be performed. Several properties of objects should be taken into account e.g., size on the screen, importance for the user, focus (position on the screen, where he/she is looking) or motion (for fast moving objects we cannot see many details).
3.4 The Virtual Reality Modelling Language A further attempt to spread the diffusion of low-cost VR comes from the development and increasing diffusion of the Virtual Reality Modeling Language (VRML). The VRML is a file format and run-time description of 3D graphics for use on the World Wide Web. It includes interaction and animation elements as well as interfaces to scripting languages, thereby providing more general simulation behaviors and interfaces in network services. Today VRML worlds can be scripted with Java and JavaScript. The first step in viewing a VRML document is retrieving the document itself. The document request comes from a Web browser, either a VRML browser or a HTML browser. Users send their request to the Web browser, and the Web browser forwards the request to its intended recipient. The Web server that receives the request for a VRML document attempts to fulfill the request with a reply. This reply goes back to the VRML browser. Once the VRML browser has received the document, it is read and understood through visible representations of the objects described in the document. Each VRML scene has a "point of view," which is called a camera: you see the scene through the eye of the camera. VRML files are often loaded in stages. First, the basic scene description is loaded. Then, if this refers to nested (scene within a scene) descriptions, the browser loads these after the basic scene has been loaded. Typically, computer and modems speeds are not quite as fast as we would like. Hence, there is usually some delay in loading a VRML world. It rarely appears immediately, or all at once. VRML can show you where objects will appear before they have been downloaded. Called lazy loading, this allows the VRML browser to take its time, while still giving you a correct indication of what the scene will look like when it is fully loaded. The general experience of VRML worlds on the Internet will be vastly improved over the next few years as basic technologies such as 2nd generation graphics accelerators and network technologies such as (ADSL) modems become available 4. Limitations It is not yet possible to inexpensively deliver true real-time VR with highly realistic graphic images. If children find the VR application unrealistic, unresponsive or frustrating to use, the advantages of VR over traditional treatment methods are lost. Children with disabilities will not receive benefits if their families or their local rehabilitation facility cannot afford the new VR technology. Although VR has the advantage of costing less than many real-world simulators, but it is still quite costly. Internet shareware distribution of various products and prototypes may one day bridge the gap between research and application. There have been some difficulties noted with the use of head-mounted displays (HMDs). They generally, offer low resolution, limited field of view and tend to restrict movement due to their size, weight and attachments. At present, many of these devices are too heavy to be worn comfortably by most children with disabilities. In addition, some users with physical disabilities would be unable to manually adjust the HMD independently to fit their heads or to adjust other characteristics of the display . These problems are important considerations, as children with disabilities should be able to access the technology as independently as possible. Users of immersive VR, which make use of HMDs or immersive CAVEs, have reported experiencing signs and symptoms of motion sickness. To minimize cybersickness and to
Page 131

better simulate real-world interaction, it's suggested that users should not be allowed to defy the laws of physics by being allowed to fly or to go through walls or floors. However, for a hospitalized child or a child who uses a wheelchair, such a fantasy experience may provide a sense of freedom. Due to these current limitations, many researchers have opted for the less immersive desk-top VR. Speakers may also be used to provide 3D sound. The major limitation of desk-top VR is that users have a diminished sense of immersion, however, its advantages include cost-efficiency and absence of cybersickness. 5. The Disabled and Virtual Reality Virtual reality (VR) is of special interest for patients showing dysfunction or complete loss of specific ‘output functions’ such as motion or speech. it has the potential for improving their lives. Applications have been developed which could minimize the effects of a disability, improve quality of life, enhance social participation, and improve life skills, mobility and cognitive abilities, while providing a motivating and interesting experience for people with disabilities. Virtual environments (VE) can be built to accommodate the needs of people with varying literacy, physical, language and cognitive levels. Even people with severe disabilities can explore or create new environments or manipulate objects without being limited by their disability, provided the correct interface is chosen or designed. The freedom of movement allowed by VR empowers people by giving them a sense of control over their environment. In fact, unlike many real world environments, VEs can be custom-designed to enhance the strengths of an individual rather than allow a disability to limit their interactive capabilities. With VR, children with disabilities can actively participate, focus on their abilities, and realize a sense of control and mastery. 5.1. Benefits of VR for people with disabilities Benefits of VR have been reported for training and skills enhancement of people with Disabilities , such benefits can be briefed as follows :
1- Learn and practice new skills , such as crossing streets, or going shopping without the worry of potential injury or fear.
2- VEs can also be designed to meet the specific training needs of each person. For example, the number of stimuli presented to a child who has autism )التوحد( can be controlled, or virtual wheelchair training for children with severe physical disabilities can be moderated.
3- Benefits by using of VR in rehabilitation, such as for applications for cognitive assessment , physical assessment , and training in motor cognitive functioning .
4- Social benefits for people with disabilities , like the sense of self-control and mastery, also VR has allowed people to communicate with other people sharing similar disabilities or diseases. Alternatively, through the use of an avatar (a persona that the user chooses to adopt in a virtual world), VR may also offer a new perspective for children and the opportunity to experience different points of view or assume different identities. The anonymity associated with communicating with other networked users within a VE puts the child on an equal footing and provides a social outlet for children who might otherwise be isolated from their peers. However, VEs may in fact cause the user to withdraw from real-life social situations, a result of quasi-addiction to this artificial reality. 5.2. Proposed areas of VR for some specific disabilities
Page 132

In the following, the possible areas of use of VR for some specific disabilities will be shown: (1)Virtual Environments for visual impaired or blind children Dysfunctions of the visual system, especially strabism, are worked upon at San Jose State University. They propose to use the ‘BioMuse’ input system in order to determine the degree of misalignment of the eye axes. In a second step, the information gained in this way can be used for training and exercising eye muscles by keeping objects in a virtual environment aligned. Another virtual environment, Audio Math was developed not only for, but by blind children. This unique feature allowed its test by its very developers during and after implementation. The results provide evidence that sound can be a powerful interface to develop and enhance memory and the learning of mathematics in blind children. Sanchez conducted another study with sound-based virtual environments which looked at the development of abstract memory through spatial reference. Audio Battleship, as this application is called, showed that this was process was very useful in forming mental images of space, haptic perception, abstract memory, and spatial abstraction. (2)Virtual Environments for physical disabilities Patients suffering from motor disturbances like pareses can benefit from Virtual Reality techniques in various ways. Here, VR can be applied for rehabilitation of specific disorders by training exactly those functions that are disturbed. This can be done by creating virtual scenarios, in which series of motor tasks are generated. VR based tests can be accurately graded, realizing a smooth transition from simple, low-dimensional to more complex motor tasks. An additional motivating effect for patients arises from the precise feedback of their success in real time. In projects at Rutgers University, Loma Linda University and Greenleaf Medical Systems, USA, VR datagloves are already used successfully for rehabilitation purposes. A very popular concept is that of Biofeedback, where patients are trained to control activation of single muscles, measured by EMG. Some investigations hint, however, that progress in abstract biofeedback paradigms not necessarily enhances daily practical performance: ‘To learn, one has to act on the world’. To avoid these problems even for severe handicapped patients, VR seems to be especially suitable. An apraxic patient has lost the capability to spatially and/or temporally organize and coordinate movement sequences. Apraxias can arise from lesions of human cortex, often accompanied by elementary motor disturbances. A system is developed where Virtual scenarios are created in which apraxic patients have to perform specific tasks, e.g. grasping an object. Providing different input technologies (3D tracking devices, spaceball, computer mouse) to control complex movements, A new VE was developed to train children with physical disabilities (Spatial problems) . It consisted of a simulated “maze” comprising four rooms linked by runways to be explored by the participants. Then in a test they had to take shortcuts between target room locations. The experimental group consisted of 7 physically disabled children, 6 boys and one girl took part in this project, with a mean age of 12.3 years. A simulation system for powered wheelchairs was developed in France. Its aim was to help to find the wheelchair that matches the locomotive disability of any given user. The system has a fixed base platform and a simulator. (3)Virtual Environments for hearing and speech impaired children Patients with speech disorders or disabilities can benefit from a ‘redirecting’ of output channels. Several groups are developing systems where VR datagloves are used to record gestures for translation from sign language into written text or even spoken words (created using a speech synthesizer )At the Institute of Technical Computer Science in Aachen a system is developed replacing the dataglove by video camera. Currently, arm and hand still have to be prepared, e.g. using white gloves with colored markers, in order to get sufficient contrast for the video recording . The participants were 44 hearing-impaired children of 8-11 with a hearing loss in the better ear ranged from 50 dB to 120 dB, and also a handful of
Page 133

hearing children. Three groups were formed: the hearing impaired was divided into an experimental and a control group, while the hearing children formed a second control group. Each subject in the experimental group was given 15 minutes once a week over a period of three months to play unguided a VR 3D Tetris game, involving the rotation of objects in space. Children in the hearing-impaired control group played with a regular non-virtual 2D Tetris game involving rotation for the same period of time. The subjects of the normal hearing control group were given no rotation tasks. The VR hardware used in this research was a virtual reality interactive game, with software that is able to create a three-dimensional environment. The software included three games (Tetris, Puzzle and Center-Fill).Their results indicate that the hearing-impaired improved in structural inductive processes and flexible-thinking ability. In addition to this finding, the research showed that the structural induction and the ability to think in a flexible way skills had improved to the point where hearing-impaired children reached the levels of normal hearing ones. A multilingual, multimodal speech teaching and training system was developed for 5-10 year old children with speech problems in a SPECO Project. This system exposed the patients to both speech pictures and sounds of the reference speech, thus using both visual and auditory elements. The efficiency of the system was shown not only by collected opinions of therapists who had used it for a considerable period, but also by an objective experiment. A common treatment for verbal apraxia is repetition accompanied by slow speech, that can be produced by time-scaling speech of normal speed, so long as it is of a very high quality. (4)Collaborative Environment and social skills Almeida and Ramos described reference architecture for a multi-user virtual communication platform to help the rehabilitation and social integration of Down’s syndrome children. It connects children with Down’s syndrome all over the world through a virtual platform of communication and shared construction processes. The AS Interactive project has focused on supporting the teaching of social skills for people with autistic spectrum disorders (ASDs) through developing a series of (VEs), which contain places and situations with various levels of social difficulty, for example a bus or a café where the user must find an appropriate seat. Observations led to describe a definite need for a close connection between the designers and the ‘experts’ in the field under study (teachers, training practitioners, etc.). During the months of data collection the teachers became familiar with the technology and able to give more precise directions to the designers. A further step remotely supervised therapies is the use of the internet. In terms of treatments for motor disorders, the range of motion, its dynamism, flexibility and strength can be accessed via a remote force feedback device. Some problems arise from the time delay between response and feedback leading to a possible borderline instability. However, using wave variable encoding for velocity and force information, this problem can be dealt with. Under wave variable control, a system of robots 500 miles apart suffers from little time delay: packet loss was less than 1% at transfer rates of 100 Hz with UDP transmission. (5)Virtual Class to test ADHD and fear of public speaking The first effort of Rizzo’s research group included the creation of a VE imitating an ordinary class room. They investigated children’s attention performance while exposed to typical distracter factors, i.e. they assessed Attention Deficit Hyperactivity Disorder ADHD. The environment took the form of a rectangular class room with its ‘typical residents’: a male or female teacher and the group of pupils. The room also had typical furniture and fittings: a table on the front wall, a large window looking toward a crowded street on one of the side walls and a pair of doorways on the other. The user sits at a real desk while immersed the environment with the use of a HMD. Typical classroom distracters (ambient classroom noise, pupil motions, outside events on the street, etc.) were systematically controlled and
Page 134

manipulated in the VE. On-task attention can be measured via performance (reaction time) using a variety of adjustable attention challenges. These can vary from a simpler focused or selective attention task, such as pressing a button upon hearing the name of a specific color, to a more complex task of alternating or divided attention, such as responding when the target color is mentioned but only if another item e.g. an animal, is present. Sustained attention can also be gauged by changing the time demands. (6)Virtual Environments for autistic children Autism is a pervasive developmental disorder altering both verbal and non-verbal communicative abilities. Targeting primarily the visual perception a “Returning Home” scenario was developed in Greece for autistic children. In the form of simulated environment it helps the educator to create a coherent organization of certain important everyday activities. The AURORA project discussed the problems of creating interactive robotic systems for therapeutic purposes in teaching of children with autism. It is hoped that such virtual learning environments will aid the rehabilitation process, and through refinement for each individual patient provide an enjoyable ‘toy’ and increase quality of life. Moore and his co-workers used a collaborative virtual environment (CVE) to analyze the ability of children with autism to understand basic emotions represented by a humanoid avatar. They carried out two empirical studies, whose results suggest that children with autism may be able to accurately recognize emotions in virtual representations. This strengthens the position of CVE as an effective tool of rehabilitation of autism. 6. Conclusion Virtual Reality techniques can be applied in the field of physical disabilities. Two major questions for the discipline are: What are the research challenges that informatics faces today? How can the discipline be strengthened and positioned to maximize its success in addressing those challenges? Progress toward research challenges formulated more than ten years ago has been changed. While many new technologies have become available for research, and education, many fundamental problems remain to be addressed by informatics research. Computer graphics are better now and the 3D rendering techniques are becoming more mature, thus contributing to the reality of the simulated environments. The review of current VR applications shows that VR can be considered a useful tool for education and rehabilitation. However there are also some critical questions. What is the situation with the youngest children? Is VR really dangerous for them? Where is the limit to the use of VR? Are there any ethical standards? These questions are still under future study. References [1] Maurissa D’Angelo, S. Narayanan (2007) A Virtual Reality Environment to Assist Disabled Individuals, Virtual Rehabilitation 2007 Conference [2] Robert W. Gundersen et al. (1996) Applications of virtual reality technology to wheelchair remote steering systems [3] Cecília Sik Lányi(2006) Virtual Reality in Special Needs Early Education, The International Journal of Virtual Reality [4] Tomasz Mazuryk (2001)Virtual Reality History, Applications, Technology and Future, http://www.cg.tuwien.ac.at/ [5] T. KUHLEN (2005) VIRTUAL REALITY FOR PHYSICALLY DISABLED PEOPLE [6] Albert A.Rizzo (2001) The Application of Virtual Reality Technology in Rehabilitation ,EPF
Page 135

[7] JOAN MCCOMAS(1998),CURRENT USES OF VIRTUAL REALITY FOR CHILDREN WITH DISABILITIES, Virtual Environments in Clinical Psychology and Neuroscience [8] Giuseppe RIVA(2001) Virtual Reality in telemedicine, IOS Press: AmsterdDon [9] Brutzman(1998) The Virtual Reality Modeling Language and Java , Communications of the ACM
Page 136

International Day of Persons with Disabilities-3 December 2010; Examples of Success Stories and Best Practice.
Gamasa, Egypt
By: Abdalla, Mohamed
Vice President EMMIT@ Consultant for ICT Humanitarian Services
Ex. Senior Advisor ITU/UN
Page 137

Mohamed Abdalla Consultant for ICT Humanitarian Services
2
Table of Contents
1. International Day of Persons with Disabilities - 3 December 2010 .....................3 1.1 Background.......................................................................................................................................3 1.2 Keeping the promise for disability-inclusive MDGs ................................................................3 1.3 How the Day may be observed......................................................................................................4
2. Events at UN headquarters and around the world to commemorate IDPD 2010 ...................................................................................................................................................4
2.1 Event at UN headquarters to commemorate IDPD 2010 ............................................4 2.2 Event around the world to commemorate IDPD 2010.................................................5
3. Cairo Declaration on Supporting Access to Information and Communication Technology Services for Persons with Disabilities, November 2007...........................5 4. Definition and examples of applications on Assistive Technology.......................6 5. Example of Success Stories from the USA;Kids Together, Inc. History and lessons learnt. .................................................................................................................................7 5.1 Company mission and definition.............................................................................................7 5.2 History of Kids Together ...............................................................................................................7
6 Success story from UAE, Supporting Families to empower people with Disabilities. ......................................................................................................................................9 7 Success Story from Italy; remote assistance health care project in reggio Emilia. ............................................................................................................................................. 11
7.1 Project concept .............................................................................................................................. 11 7.2 Objectives...................................................................................................................................... 11 7.3 Operational Center..................................................................................................................... 11 7.4 Teleservices.................................................................................................................................. 12 7.5 Possible experiments ................................................................................................................ 12
8 Examples of New Projects on SPwD from the UK and other European Countries. ...................................................................................................................................... 13
8.1 About FAST ................................................................................................................................... 13 8.2 Activities........................................................................................................................................ 13 8.3 New projects................................................................................................................................. 14
9 Success story from Egypt; special Olympics-Egypt. .................................................. 15 10 Example of Upcoming International relevant Conferences and events. ......... 16 11 Conclusion & Recommendations. ................................................................................. 17 12 Bibliography ........................................................................................................................ 18
Page 138

Mohamed Abdalla Consultant for ICT Humanitarian Services
3
1. International Day of Persons with Disabilities -‐ 3 December 20101 1.1 Background The annual observance of the International Day of Persons with Disabilities on 3 December was
established by the International Year for Disabled Persons (1981). The Day aims to promote a better
understanding of disability issues with a focus on the rights of persons with disabilities and gains to be
derived from the integration of persons with disabilities in every aspect of the political, social, economic and
cultural life of their communities.
The goal of full and effective participation of persons with disabilities in society and development was
established by the World Programme of Action concerning Disabled Persons, adopted by the United
Nations General Assembly in 1982.
Through the World Programme of Action concerning
Disabled Persons (1982) and the Standard Rules on
Equalization of Opportunities for Persons with Disabilities
(1993), the United Nations promotes the rights and well-
being of persons with disabilities. The Organization’s
commitment to the full and effective participation of all
human rights by persons with disabilities is deeply rooted
in the quest for social justice and equity in all aspects of
societal development.
These commitments provide an international policy framework, which has been further strengthened by the
newly adopted Convention on the Rights of Persons with Disabilities, adopted in 2006. The Convention
provides an impetus and unique platform for advancement of the international disability rights agenda in
development from which to engage the wider global development community. Work within this community is
framed by the Millennium Development Goals (MDGs) and other internationally agreed development goals.
1.2 Keeping the promise for disability-inclusive MDGs Although many commitments have been made by the international development community to include
persons with disability in all aspects of development,
the gap between policy and practice continues. While
the MDGs cannot be fully achieved without the
inclusion of persons with disabilities, the current track
toward the achievement of the MDGs may further
increase their marginalization. Furthermore, the
persistent and cumulative impact of the multiple global
crises threatens the progress made toward the
achievement of the MDGs that has a disproportionate
and negative impact on persons with disabilities.
1 www.un.org/disabilities/default.asp?id=1540
Page 139

Mohamed Abdalla Consultant for ICT Humanitarian Services
4
Persons with disabilities represent key target groups in all the MDGs, yet disability and the concerns of
persons with disabilities still remains to be included in MDG processes and mechanisms. Their lack of
representation could negatively impact on progress in the achievement of the MDGs.
Although, Governments, global leaders, policy-makers and other stakeholders acknowledge the need for
disability-inclusive development, they must be supported in their efforts and be reminded to keep their
promises. The International Day of Persons with Disabilities – 3 December 2010 – can be used for this
purpose to further ensure the full and effective participation of persons with disability in all aspects of
societal life and development.
1.3 How the Day may be observed Include: Observance of the Day provides opportunities for participation by all stakeholders –
Governments, UN system organizations, civil society and organizations of persons with disabilities – to
focus on issues related to the inclusion of persons with disabilities in the MDGs.
Organize: Hold forums, public discussions and information campaigns in support of the Day focusing
on disability issues and development, finding innovative ways and means by which persons with disabilities
and their families can be further integrated into the development agenda.
Celebrate: Plan and organize performances everywhere to showcase - and celebrate - the
contributions by persons with disabilities to the communities in which they live as agents of development
and change.
Take Action: A major focus of the Day is practical action to mainstream disability in all aspects of
development, as well as to further their participation in social life and development on the basis of equality.
Take action to highlight progress and obstacles in implementing disability-sensitive policies, as well as
promote public awareness of the contributions by persons with disabilities to the development of their
communities.
2. Events at UN headquarters and around the world to commemorate IDPD 2010
2.1 Event at UN headquarters to commemorate IDPD 2010 The Secretary General Message on the IDPD 3 Dec.2010
For more details: www.un.org/disabilities/default.asp?id=1540
Friday, 3 December 2010
• Interactive Panel Discussion on Community-based inclusive development: The role of CBR in the
realization of the MDGs for persons with disabilities
• DESA Disability Film Festival
• Seminar and Workshop on CBR Guidelines
Thursday, 2 December
• AIDS and Disability: An emerging developmental concern
• Panel Discussion on Ageing and Disability
• Education and the MDGs
Page 140

Mohamed Abdalla Consultant for ICT Humanitarian Services
5
2.2 Event around the world to commemorate IDPD 2010
Forthcoming.
For temorarly information: www.un.org
3. Cairo Declaration on Supporting Access to Information and Communication Technology Services for Persons with Disabilities, November 2007
Issued by the First Arab Regional Conference on Sharing Experience on Best Practices in ICT Services for Persons with Disabilities Cairo-Egypt, 13–15 November 2007
The First Arab Regional Conference on Sharing Experience with
Best Practices in Information and Communication Technology
(ICT) Services for Persons with Disabilities was attended by 280
participant representing 14 Arab countries,* namely Bahrain,
Egypt, Iraq, Jordan, Kuwait, Lebanon, Libyan Arab Jamahiriya,
Mauritania, Oman, Qatar, Saudi Arabia, Sudan, Syrian Arab
Republic and Tunisia, in addition to several non-Arab countries,
namely Colombia, Denmark, Italy, Japan, Kenya, Malaysia and
Mali, and experts from the International Telecommunication Union
(ITU), World Health Organization (WHO) and the Arab League.
The Conference was held with a view to discussing 48 work papers that focus on the following points.
- The use of information and communication technology applications as assistive technologies to provide
services to people with disabilities, and the roles of governmental entities, nongovernmental organizations,
research centres, universities, civil society and the private sector in providing such services;
-Review of the experiences and success stories of participating countries; - The United Nations Convention
on the Rights of Persons with Disabilities, adopted in 2006, and the responsibilities of the signatory
countries, United Nations specialized agencies and other concerned parties with respect to the entry into
force and
implementation of the Convention.
this conference could be seen as one of the first successful stories in the Arab region in the field of the
accessibility of ICT Services to PwD, for more information and details please review the declaration site, the
declaration is available also on Arabic and French in addition to English languages 2
2 www.emro.who.int
Page 141
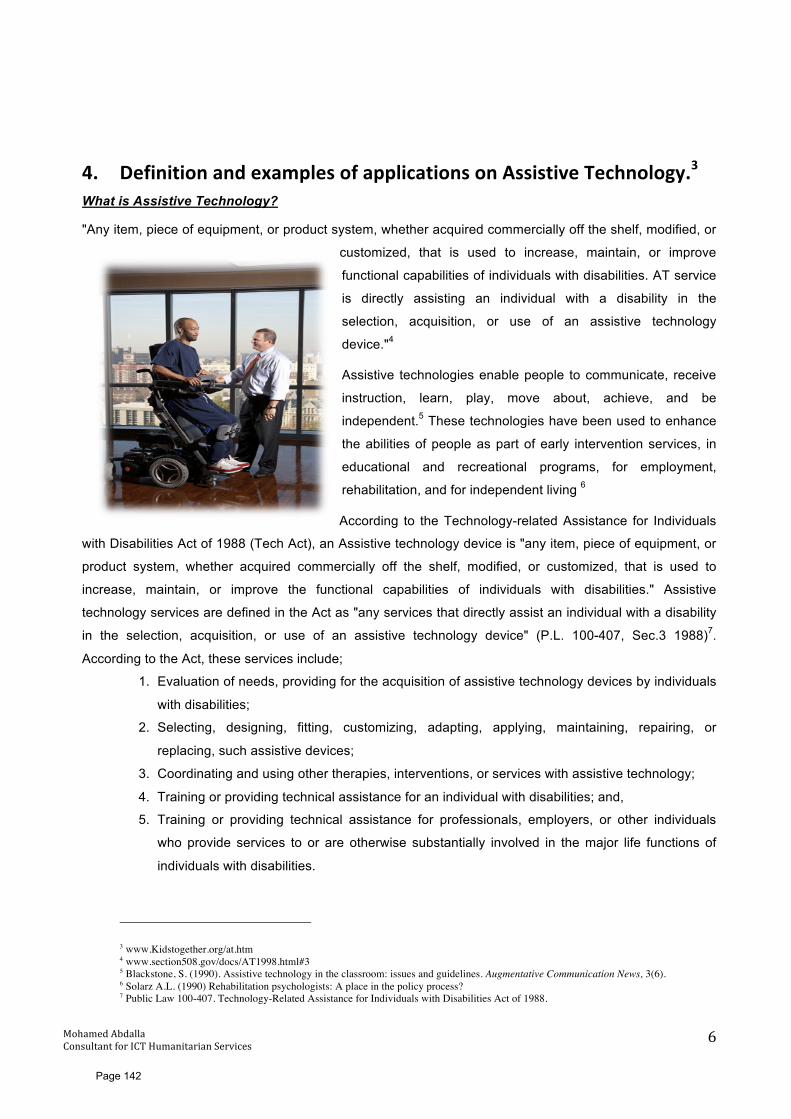
Mohamed Abdalla Consultant for ICT Humanitarian Services
6
4. Definition and examples of applications on Assistive Technology.3 What is Assistive Technology?
"Any item, piece of equipment, or product system, whether acquired commercially off the shelf, modified, or
customized, that is used to increase, maintain, or improve
functional capabilities of individuals with disabilities. AT service
is directly assisting an individual with a disability in the
selection, acquisition, or use of an assistive technology
device."4
Assistive technologies enable people to communicate, receive
instruction, learn, play, move about, achieve, and be
independent.5 These technologies have been used to enhance
the abilities of people as part of early intervention services, in
educational and recreational programs, for employment,
rehabilitation, and for independent living 6
According to the Technology-related Assistance for Individuals
with Disabilities Act of 1988 (Tech Act), an Assistive technology device is "any item, piece of equipment, or
product system, whether acquired commercially off the shelf, modified, or customized, that is used to
increase, maintain, or improve the functional capabilities of individuals with disabilities." Assistive
technology services are defined in the Act as "any services that directly assist an individual with a disability
in the selection, acquisition, or use of an assistive technology device" (P.L. 100-407, Sec.3 1988)7.
According to the Act, these services include;
1. Evaluation of needs, providing for the acquisition of assistive technology devices by individuals
with disabilities;
2. Selecting, designing, fitting, customizing, adapting, applying, maintaining, repairing, or
replacing, such assistive devices;
3. Coordinating and using other therapies, interventions, or services with assistive technology;
4. Training or providing technical assistance for an individual with disabilities; and,
5. Training or providing technical assistance for professionals, employers, or other individuals
who provide services to or are otherwise substantially involved in the major life functions of
individuals with disabilities.
3 www.Kidstogether.org/at.htm 4 www.section508.gov/docs/AT1998.html#3 5 Blackstone, S. (1990). Assistive technology in the classroom: issues and guidelines. Augmentative Communication News, 3(6). 6 Solarz A.L. (1990) Rehabilitation psychologists: A place in the policy process? 7 Public Law 100-407. Technology-Related Assistance for Individuals with Disabilities Act of 1988.
Page 142

Mohamed Abdalla Consultant for ICT Humanitarian Services
7
5. Example of Success Stories from the USA;Kids Together, Inc. History and lessons learnt.8
5.1 Company mission and definition Mission Statement
"To promote inclusive communities where all people belong"
The Goals of Kids Together, Inc. Include a desire to remove barriers that exclude people with disabilities.
We support the belief that children with disabilities, like all children, have the need to be welcomed,
cherished and embraced in our communities.
Listed below is the history, how to support Kids Together and our goals. With your help we can make this
website an even greater resource to support and improve the quality of life for people with disabilities, both
children and adults. As volunteers submit useful information that has helped themselves, their families or
others, it will be added so that the next person doesn't have to try and re-invent the wheel. The information
is intended to be helpful to families, professionals, educators, advocates, self-advocates and the
community!
Don't miss out on the awesome nationwide listserv dedicated solely to creating inclusion in schools and
communities, and our email newsletter! All free!
5.2 History of Kids Together
Kids Together, Inc began in early 1995 as a large children's festival
attracting over 5,000 people to Quakertown, PA. It was organized by
volunteer parents of young children with disabilities. Our goal was to
promote children with disabilities being a part of what every other child was,
and just be kids. We wanted other people to understand that having a
disability was but one small part of our children, and that they are more
similar to all children then they are different.
The theme of that first year's event was "celebrating children with
disabilities as equals in the community". The festival continued to
grow. Up to 7,000 attended and enjoyed the free entertainment,
activities, exhibits and information for the next four years. The festival
and the informative program were supported by many local
businesses. The entire event was made accessible to people of all
8 www.kidstogether.org/kidstogether.htm
Page 143

Mohamed Abdalla Consultant for ICT Humanitarian Services
8
abilities, promoted a positive image of people with disabilities, and used only people first language in all
materials. All material such as the program, flyers, handouts, t-shirts and all entertainment promoted
inclusion of people with disabilities. Oh.... and EVERYONE had fun, TOGETHER!
While the festival was a huge success and helped to educate many
about acceptance of people with disabilities and inclusion in school,
recreation, employment and the community, in the year 2000, Kids
Together changed its focus to sharing information and resources
through other means such as the website, listserv, email newsletter
nationwide, and presenting, participating and providing input to state
agencies and statewide coalitions.
“Together we can make a difference Together we are better”
Page 144

Mohamed Abdalla Consultant for ICT Humanitarian Services
9
6 Success story from UAE, Supporting Families to empower people with Disabilities.9
Success story from the UAE, During its annual distinguished
event in 2009, Zayed Higher Organization for Humanitarian
Care, Special Needs & Minor Affairs will gather together the
key stakeholders in the field of special and inclusive
education once again as yet another stepping stone towards
the improvement of lives of people with special needs and
their families in the region.
It is believed that all people, regardless of disability, should
have the right to a permanent and stable relationship within
the family structure and their local community. To
accomplish this, families should receive the supports necessary to maintain their unity, integrity, and
competence. Therefore, this year the focus of the conference is on family support.
This included practical advice for family to support members with special needs and disabilities, such as
engaging and using multi-professional networks to enable them to be more effective within the family unit
and the local community.
The following topics on innovations in the field of family support for inclusive education purposes and social
interaction for people with special needs and disabilities, including but not limited to the following topics:
1. Family support, mainstreaming, multi agency support for empowering people with special
needs and disabilities;
2. Role of families in driving the implementation of inclusive education and best practices from
round the world in the following areas:
1- Role of families in adopting, training and using new technologies and
devices for inclusive education;
2- Training for families for educational and health purposes;
3- Role of families as members of support groups and advocacy agencies;
4- Role of families in overcoming challenges and barriers
3. Success stories related to families of people with disabilities;
4. Sport and recreational activities to empower people with disabilities;
5. Mental health and disability issues from a family support perspectives
6. Families, culture, inclusive education and advocacy;
7. Innovative ideas and project in the area of voluntary work for empowering people with
disabilities purposes;
8. Support in areas such as respite care, specialized day care, adaptive equipment,
modifications to make the home safer or more accessible, transportation, future panning,
9 www.buid.ac.ae/accessAD2009/
Page 145

Mohamed Abdalla Consultant for ICT Humanitarian Services
10
home health care, specialized clothing and diets, recreational activities and equipment,
therapies, dental care, and medical care.
9. Bridging the gap between theory and practice in supporting families of people with
disabilities;
10. Policy issues and family support;
11. Research findings related to evaluation of family support in the field of disability;
12. Attitudes, social issues and implications of social inclusion of people with disabilities;
13. International positions and philosophies towards the role of families and family support in
securing rights for people with disabilities; inclusive education;
14. The role of families in assessment and planning interventions;
15. Family members as teaching assistants and support for learning team members in inclusive
setting.
Page 146

Mohamed Abdalla Consultant for ICT Humanitarian Services
11
7 Success Story from Italy; remote assistance health care project in reggio Emilia.
7.1 Project concept Remote assistance home care project, The assumptions for the implementation in this project represent
an excerpt of the application more general project of "remote assistance home care, produced by the
'Municipal Administration Reggio Emilia in the course of 2006/2007, 's agreement with the Technical
Committee.bearing in mind the today's demographic changes and changes in the structure socio-economic
fabric of our society, understood as a relationship between global market considered and the system of
social and health services, emerging evidence from which this project proposal starts.
7.2 Objectives The main Objective is to give support and frail people to safety by the Operative Station / Contact
Center of Teleservices managing emergencies and bookings.
Housing for vulnerable people through a call center / contact center which manages
emergencies, providing information and give the opportunity to book 'tele'.
The project will be a stimulus from the Municipality of Reggio Emilia in 'Emilia to a' development of
Develop services to home services in 'perspective of home care and more direct responsiveness to
need for guidance for those groups of citizens in distress.
The Contact / Center as well as performing functions that are currently the manager in charge of
rescue and emergency service will, by virtue of 'innovative technology infrastructure, social services
to optimize time and resources in providing a range of services to citizens through networking.
7.3 Operational Center The Operations Centre is the heart of the Service, is the place where all calls Output from home terminals
converge and the land can be a very important resource for the following 2 reasons:
The evolution of the classic telephone assistance / rescue and emergency services to a
variety of Teleservices forming a single point of connection with the territory, a strong
reference point for citizenship;
The relationship of users with an operator to relocate and who knows social structure, local
culture and related services can be a stimulus for the further development of the service in
terms of quantity and quality, infusing more confidence in people;
Page 147

Mohamed Abdalla Consultant for ICT Humanitarian Services
12
7.4 Teleservices In this context, means for teleservices (telebooking of services): is the possibility of or book at home,
through contact with the Central Office, the following services:
Delivery of meals or booking in the same dining
arrangement;
Delivery of revenue or reservation of the same points
in the initiative;
Delivery of drugs;
Reservations for supporting minor maintenance;
Reservation of transportation services for persons with
disabilities.
7.5 Possible experiments A further phase of the project, to be taken into account in preparing the Operational Center concerns or the
testing of home automation solutions (automation of certain domestic functions remote-controlled by the
Operations Centre) in relation to heritage building public and private; or testing experience related to the
types of telemedicine Telemonitoring of vital parameters with transmission of data to specialized centers.
Page 148
Mohamed Abdalla Consultant for ICT Humanitarian Services
13
8 Examples of New Projects on SPwD from the UK and other European Countries.10
8.1 About FAST The Foundation for Assistive Technology was founded in 1998 to tackle the inadequate design of assistive
technology products and services. The failure to develop a thriving market in equipment that meets the real
needs of disabled and older people is a major barrier to independent living. With limited resources, FAST’s
strategy for achieving maximum impact is to work at a national, strategic level to highlight the complex
causes of this failed market and to bring the sector together to find innovative ways of working, in
partnership with disabled and older people.
8.2 Activities Working directly with academic researchers,
industry, service providers, policy makers and
voluntary sector organisations to raise
awareness of the crucial importance of
equipment to achieve independence
Documenting all of the current UK activity to
research and design assistive technology, to
reduce duplication and to highlight innovative
and relevant product development
Working with the sector on national level
projects to focus efforts on producing
commercial products that are appealing and
useful to disabled and older people
Providing expert analysis of research and development trends and service provision
challenges
Providing a central hub for the sector to review and provide action plans on promoting good
practice and to address cross-sector barriers to delivering good services
Working with the research and design community to enable end users to play a full role in the
design of assistive technologies
10 www.fastuk.org/research/currentebulletin.php
Page 149
Mohamed Abdalla Consultant for ICT Humanitarian Services
14
8.3 New projects The Health Design and Technology Institute
(HDTI) at Coventry University is leading on work to
develop a telehealth services code of practice for
Europe. Project TeleSCoPE is bringing
together thirteen partners from six countries:
Belgium, Bulgaria, Hungary, Italy, Ireland and
Slovenia. Academic, user-facing, user and supply
sector partners will all take part, and include Malcolm
Fisk, chair of the Telecare Services Association and
managing director of Insight Social Research Ltd. The project will address a wide range of user groups in
community settings, including people with long term conditions and people with learning or physical
disabilities and sensory impairments, as well as frail older people. It will consider a range of technologies,
including social alarms, fall detectors, seizure detectors, vital signs monitors, and pill dispensers.
Researchers will deliver some key parameters for services and will help to establish good practice
benchmarks for the ways in which people's choices and needs can be met. The code will be designed for
adoption in all 27 EU member states.
• Brain-computer interfaces (BCIs) offer a way for people with severe motor disabilities to operate
computers and environmental controls by using brain waves. Abilitynet is part of a consortium made up of
Spanish and Austrian university research centres, which is looking at both direct and indirect interaction
with computers. The ultimate aim of Brainable: Autonomy and social inclusion through mixed reality Brain-
Computer Interfaces: Connecting the disabled to their physical and social world, which is funded under the
EU's FP7 programme, is to develop an intelligent virtual reality-based user interface with avatars and
scenarios that will help disabled people to move around on their wheelchairs, interact with all sort of
devices, express themselves using music, pictures and text, communicate online and offline with other
people, play games to counteract cognitive decline, and get trained in new functionalities and tasks.
User interfaces of consumer products are becoming increasingly complex, which can cause very real
problems for disabled and older people because their specific needs are poorly understood and often not
reflected in the design process. The Royal National Institute for Deaf people (RNID) is part of a consortium
developing VICON: Virtual User Concept for Supporting Inclusive Design of Consumer Products and User
Interfaces. The aim of this project, which is funded by the EU FP7 programme, is to develop a library of
virtual users, who have varying degrees of impairment in vision, hearing and manual dexterity, which can be
used to test product designs for accessibility and usability issues at an early stage so that the final product
is more inclusive. Other partners are based in Germany, Turkey and Sweden
Page 150

Mohamed Abdalla Consultant for ICT Humanitarian Services
15
9 Success story from Egypt; special Olympics-‐Egypt. Special Olympics is a global organization that serves more than 3.4 million athletes with intellectual
disabilities working with hundreds of thousands of
volunteers and coaches each year. Since the
establishment of Special Olympics in 1968, the
number of people with and without intellectual
disabilities who are involved with the organization
has been growing, but the unmet need to reach more
people with intellectual disabilities is staggering.
It’s at the local level--right here--where interested
volunteers meet the athletes. That’s where the
perceptions start to change and where the miracle of
transformation takes place.
Many people know that Special Olympics provides year-round sports training and athletic competition in a
variety of Olympic-type sports for children and adults with intellectual disabilities. Those activities give them
continuing opportunities to develop physical fitness, demonstrate courage, experience joy and participate in
a sharing of gifts, skills and friendship.
What’s not as widely known is that Special Olympics sporting events occur frequently throughout the year.
In 2009, for example, there were more than 44,000 competitions around the world, an average of 121 a
day.
Hundreds of thousands of coaches, educators and volunteers worldwide offer their time to train athletes,
organize those competitions and plan those events. When you see the seriousness and sense of purpose
evident in each Special Olympics athletic event, a window of understanding opens.11
11 www.specialolympics.org
Page 151

Mohamed Abdalla Consultant for ICT Humanitarian Services
16
10 Example of Upcoming International relevant Conferences and events. RAATE conference12
The programme is now available for RAATE 2010, the only UK
conference focused on the latest innovations and developments
in assistive technology. This year's conference is being held at
the University of Warwick conference centre on 29th November
2010. The keynote speaker is Professor Martin Ferguson-Pell,
Dean of the Faculty of Rehabilitation Medicine at the University
of Alberta, which is the only free standing faculty of rehabilitation
medicine in Canada. Professor Ferguson-Pell trained in biomedical engineering at the University of
Strathclyde and has held senior positions at University College London and the Royal National Orthopaedic
Hospital.
The conference programme features sessions on technology support for dementia and for stroke, user-
centred design, access, ambient assisted living and telecare. Researchers will present findings from a
range of projects, including work to develop a narrative support tool to enable children with complex
communication needs to discuss their day at school; new devices for incontinence; how to make exam
papers accessible to pupils with disabilities; assistive technology for people with locked-in syndrome; and a
progress update on the government’s Whole System Demonstrator telecare pilots.
The conference is organised by Coventry University’s Health Design and Technology Institute (HDTI), with
sponsorship from Toby Churchill, the Foundation for Assistive Technology and the Posture and Mobility
Group.
12 www.fastuk.org/research/currentebulletin.php
Page 152
Mohamed Abdalla Consultant for ICT Humanitarian Services
17
11 Conclusion & Recommendations. On conclusion, Disability as a global severs fact, is a mixed problem between the human presence in terms
of technology and global cooperation and also infinite scientific researches of the causes and the
elimination methods of such health and inability problem.
Accordingly, and from all the previous mentioned UN efforts and success stories in this paper from around
the globe, we are able to give some concluding remarks and recommendations, which I believe could be at
a place of significant positive change to the life of PwD.
Keeping the observance of the International day of Persons
with Disabilities PwD on the 3rd of December in every year by
renewing celebrations and actions.
Following up the different UN activities for supporting the PwD
through specialized sites such as www.un.org/disabilities/,
[email protected] or any other relevant sites.
To support the implementation of Cairo Declaration on
Supporting Access to Information and Communication
Technology Services for PwD, November 2007 in cooperation
with WHO, ITU and national authorities and entities.
To promote inclusive communities where all people belong and put Kids together.
To share information, success stories and best practice with others (countries, entities,
organizations, and individuals).
To do all possible efforts for supporting families to empower PwD.
To participate in and encourage the Special Olympics games and activities everywhere.
To follow up the latest innovations and development in assistive technology (AT) and
encourage its applications at low cost in developing countries.
To attend as much as possible the relevant conferences and events worldwide and to get the
maximum benefits of it.
Making Communications and Information Technology work for all.
Page 153

Mohamed Abdalla Consultant for ICT Humanitarian Services
18
12 Bibliography
Solarz A.L. (1990) Rehabilitation psychologists: A place in the policy process?
Public Law 100-407. Technology-Related Assistance for Individuals with Disabilities Act of 1988.
www.un.org/disabilities/default.asp?id=1540
www.emro.who.int
www.Kidstogether.org/at.htm
www.section508.gov/docs/AT1998.html#3
Blackstone, S. (1990). Assistive technology in the classroom: issues and guidelines. Augmentative Communication News, 3(6).
www.kidstogether.org/kidstogether.htm
www.buid.ac.ae/accessAD2009/
www.fastuk.org/research/currentebulletin.php
www.specialolympics.org
www.fastuk.org/research/currentebulletin.php
Page 154
5D Estimation for SI using HP with order n ICI 10 - 10TH INTERNATIONAL CONFERENCE ON INFORMATION
3D Estimation for Shading Images using Homogenous Polynomials with order n
Gamal. F. Elhadi
Computer Science Department, Faculty of information and computer science, Manufia University, Manufia 35516, Egypt.
[email protected] , [email protected] Abstract
Recently there are a several development techniques for reconstruction surface from shading images information. This paper presents a new approach for estimating the shape of three dimension 3-D object from its two dimension 2-D shade image in terms of a approximating the height map by a second order of homogenous polynomial. The proposed approach satisfies the integrability condition and does not need any boundary condition assumptions, we have designed a stand-alone, flexible Matlab implementation that enables to evaluation the proposed approach. The experiments on real images show the approaches ability to reconstruction the surface from similarity .
Keywords: Computer Vision, Shading Image, Homogenous Polynomial, Integrability Condition.
1 Introduction Shape-from-Shading (SFS) uses the pattern of lights and shades in an image to infer the shape of the surfaces in view. Shape recovery is a classic problem in computer vision. The goal is to derive a 3-D scene description from one or more 2-D images. The recovered shape can be expressed in several ways: depth , surface normal , surface gradient , and surface slant, ),( yxZ ),,( zyx nnn ),( qp φ , and tilt, θ . The depth can be considered either as the relative distance from camera to surface points, or the relative surface height above the x-y plane. The surface normal is the orientation of a vector perpendicular to the tangent plane on the object surface. The surface gradient, ),(),(
yz
xzqp
∂∂
∂∂
= is
the rate of change of depth in the x and y directions. The surface slant,φ , and tilt,θ , are related to the surface normal as )cos,sinsin,sincos(),,( φφθφθ lllnnn zyx = , where l is the magnitude of the surface normal. SFS is a fundamental problem in Computer Vision. The common way to obtain shape information is to solve the image irradiance equation, which relates the reflectance map to image intensity. As this task is nontrivial, most of the works in the field employ simplifying assumptions, and in particular the assumption that projection of scene points during a photographic process is orthographic [5,17,1,13,16,21]. This resulted in low stability of reconstruction algorithms. The SFS problem consists of computing the three-dimensional shape of a surface from the brightness variations in a black and white image of that surface. Pioneered by Horn [6], this problem has been central in the field of computer vision since the early days, because of several reasons, the interest in this problem has slightly decreased at the end of the 90s. First, due to the difficulty of the problem, progress in SFS research is very slow. Second, until recently, the results obtained on real images have been very disappointing. For example, in [21], Zhang et al. acknowledge failure. Third, the various constraints imposed by the existing solutions to the SFS problem limit its applications.
The SFS problem consists of recovering the shape of a scene from a single grey-level image, by means of the analysis of the shading. The craze for SFS in the past seems to have subsided, probably because of rather disappointing results on real images [21]. Nevertheless, several recent
1Page 155

5D Estimation for SI using HP with order n ICI 10 - 10TH INTERNATIONAL CONFERENCE ON INFORMATION
works [2,3,9,10,11] have (independently) attempted to modelize SFS in a more realistic way, in particular by considering perspective projection.
The present work fits into this scheme; we outline a new modeling of the SFS problem and validate it through a practical application. Our final purpose is to design a system that “unwarps” the image, taken by a digital camera and we attempt to change this situation completely and hope to revive the interest of the community for this old problem and its applications.
This article is organized as follows. We first review the reflectance map in section 2, and the problem formulation is given in section 3. Our Homogenous polynomial algorithm is presented in section 4. Section 5 presents our results and discussions. Finally, the paper summarizes and the future directions in section 6. 2 The Reflectance Map
Let Z(x,y) be the unknown surface height of the 3-D object above the (x,y) plane, E(x,y) is defined as the brightness distribution of the shading image of that surface and the brightness values are defined by the properties of the surface such as orientation, reflectively, illumination and reflectance map R(Zx,Zy,B,h,ρ). The relationship between the brightness E(x,y) and the reflectance map R(Zx,Zy,B,h,ρ) can be expressed in the following form [6]:
),,),,(),,((),,,,(),( ρρ hByxQyxPRhBZZRyxE yx == (1)
where
YyxZyxQZ
xyxZyxPZ yx ∂
∂==
∂∂
==),(),(),(),(
are the surface orientation with respect to x and y axis, B is the illumination direction vector, h is the vector form the surface to the camera, and ρ is the albedo or intrinsic reflectivity of the materials composing the surface, the normal to the surface is denoted as N=(-P,-Q,1) and the unit normal to the surface N defined as [18]:
1
)1,,(22 ++
−−=
QPQPN (2)
The unit vector in light source direction L can be written as [18]:
222zyx bbb
BL++
= (3)
where , denotes the illumination direction vector ),,( zyx bbbB = . In the case of the so called lambertian or diffused light source, the reflection property E(x, y) is
proportional to the )(θCOS where θ is the angle between the surface normal N and the direction of the light source L . The imaging geometry is illustrated in fig.1
2Page 156

5D Estimation for SI using HP with order n ICI 10 - 10TH INTERNATIONAL CONFERENCE ON INFORMATION
The relation between the illumination angle θ , surface normal and illumination vectors is: NLCOS .)( =θ (4) and the reflectance map of eq (1) can be rewritten as : )(),( θρCOSyxE = (5) By substitute from eqs (2)-(4) in eq (5), we obtain the reflectance map as:
1
),(22222 ++++
++=
QPbbb
bQbPbyxE
zyx
zyxρ (6)
Eq (6) is a first order nonlinear partial differential equation in x and y. It has been observed [6] that shape from shading can be expressed as a problem of solving a first-order nonlinear partial differential equation in x and y. In deriving iterative solutions to eq (6) by the calculus of variations, it appears to be much more straightforward to solve for surface orientation than to solve directly for Z, the question of consistency between P(x,y) and Q(x,y) arises [19] and leads us to search for an integrable solution. The integrability is defined as :
x
yxQy
yxPZZ yxxy ∂∂
=∂
∂⇒=
),(),( (7)
A nonintegerable solution will give rise to an infinite number for solutions for the problem of shape from shading.
An iterative solution for eq.(6), seek P(x,y) and Q(x,y) values that minimize the mean square error (MSE), , between the original gray scale image E(x,y) and the computed gray scale image resulted from substituting P(x, y) and Q(x,y) in the reflectance map R(P(x, y), Q(x, y),). The requirement of smooth P(x, y) and Q(x,y) can be achieved in terms of the second partial derivatives [18].
2)),(),(( yxRyxE −
2222 ,,, yyxx QPQP
Z
Fig.1. Image geometry.
X
Y
Nsource
L
θ
h
camera
3Page 157

5D Estimation for SI using HP with order n ICI 10 - 10TH INTERNATIONAL CONFERENCE ON INFORMATION
Brooks, Horn and Ikeuchi developed an iterative algorithm that minimizes the cost function [6,12]. Although the algorithm converges to a solution for the surface orientation P(x,y) and Q(x,y), the solution does not satisfy integrability condition [19,20].
Robert T. Frankot and Ramma Chellappa, [19], overcome the integrability problem by using Fourier transform as a transition stage to satisfy the integrability condition by projecting the nonintegerable solution into its nearest integrable solution in the Fourier domain. Although they achieved their aim of integrable solution, the algorithm reflects high computational complexity since they need to use Fourier transform at every iteration to satisfy the integrability in Fourier domain then come back to time domain using inverse Fourier transform.
Following the work reported in [19], we can take the following assumptions:- 1- At any point the reflectance map R is a function of the surface orientation and albedo only.
),( 00 yx
2- R(P,Q) is spatially invariant. 3-The albedo ρ and the illumination vector are known over the entire image.
Omar E. Vega Hong and Yang [15], introduces a new method for estimating shape from shading, consists of three algorithms, although they get a good results their has complexity computation, and needs integration process.
In this paper, however, a fast Homogenous Polynomial (HP) approach for estimating the depth and satisfies integrability condition without resorting to a additional Fourier Transform (FT) stages is provided.
3 Problem Formulation
The problem of finding integrable solution in the SFS problem can be simplified if the unknown surface height is represented in a form that satisfies the integrability condition. The unknown surface height Z(x,y) can be expanded on a complete set of basis function ),( yxijΦ multiplied by a set of expansion coefficients such that: ija
∑∑= =
Φ=n
iijij
n
iyxayxZ
0 0),(),( (8)
The surface orientation P(x, y) and Q(x, y) can be written as:
∑∑= = ∂
Φ∂=
n
i
ijij
n
i xyx
ayxP0 0
),(),( (9)
∑∑= = ∂
Φ∂=
n
i
ijij
n
i yyx
ayxQ0 0
),(),( (10)
The proposed method depends on estimating the values of that minimize the cost function (U) based on MSE criterion such that:-
ija
dxdyQPP
aRyxEyxU
yyx
ij
))2(
))(),((((),(222
2
+++
+−= ∫∫λ
(11)
where the first term represented the square of the difference between the image brightness and the resultant brightness using the reflectance map R(p(x, y),q(x, y)), the second term represents the smoothness, where Px(x, y), Qx(x, y), Py(x, y), and Qy(x ,y) represents the derivatives of the surface and λ is constant. The estimation process is based on MSE minimization procedure.
4Page 158
5D Estimation for SI using HP with order n ICI 10 - 10TH INTERNATIONAL CONFERENCE ON INFORMATION
4 Algorithm for Homogenous Polynomial (HP) We suppose that the function take the form: ),( yxijΦ
∑∑= =
=Φn
i
jin
iij YXyx
0 0)(),( (12)
then the surface of height map Z(x, y) can be written as:-
∑∑= =
=n
i
jin
iij YXayxZ
0 0)(),( (13)
and the surface orientation P(x, y) and Q(x, y) can be denoted as:
∑∑=
−
=
=n
i
jin
iij YiXayxP
0
1
0)(),( (14)
∑∑=
−
=
=n
i
jin
iij YjXayxQ
0
1
0)(),( (15)
where the surface second derivatives , satisfy the integrability condition
such that: yyxx QPQP ,,,
WyxQyxP xy == ),(),(
∑∑=
−−
=
=n
i
jin
iij YijXayxW
0
11
0)(),( (16)
The coefficient are estimated using the following recursive relation [19]: ija
IJAkijij RyxRyxEaa )),(),(( −+= λ (17)
where λ is constant, (k) denotes the iteration number, and ij
ijA a
aRR
IJ ∂
∂=
)(
The coefficient can be smoothed using the following relation [19,14]: ija
][201
][51
1,11,11,11,1
,1,11,1,
−−−++−−−
−+−+
++++
++++=
jijijiji
jijijijiij
aaaa
aaaaa (18)
Horn [6,7] used the idea of gradient space and characteristic strip developed by Marckworth [4] to solve the problem of SFS. The characteristic strip method has several disadvantages [8]. The proposed approach procedure satisfies the integerability condition and provides 3-D shape estimation with low computational complexity compared to conventional FT based methods, the FTP algorithm can be summarized as following code:
5
1- Input shading image with light source direction , ro=0.05, and lamda=2000. )1,8.0,6.1(),,( =zyx bbb
2- Start with initial random values for ija3- Estimate a new value of using Eq (17) ija4- Smooth the previous values using Eq (18) ija5- Compute the cost function Eq (11). 6- Repeat the previous step (3) until the cost function step (5) stop decreasing or become sufficiently small.
Fig.2. The code of the FTP algorithm.
Page 159
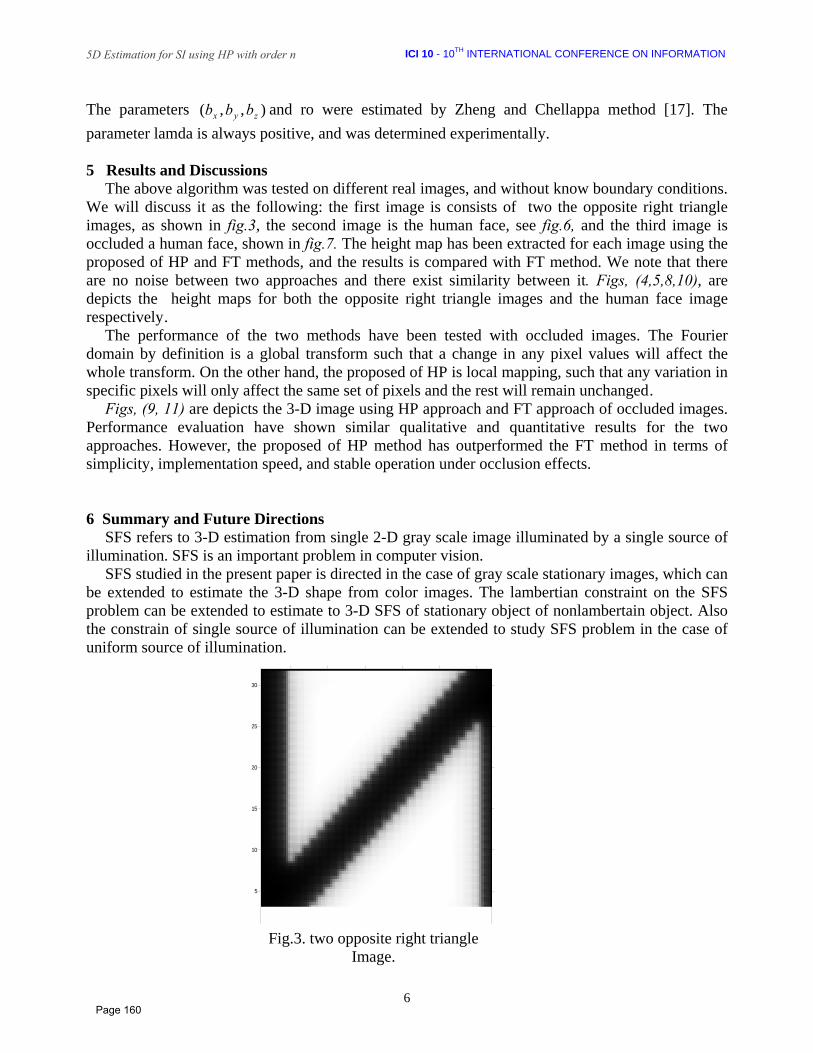
5D Estimation for SI using HP with order n ICI 10 - 10TH INTERNATIONAL CONFERENCE ON INFORMATION
The parameters and ro were estimated by Zheng and Chellappa method [17]. The parameter lamda is always positive, and was determined experimentally.
),,( zyx bbb
5 Results and Discussions
The above algorithm was tested on different real images, and without know boundary conditions. We will discuss it as the following: the first image is consists of two the opposite right triangle images, as shown in fig.3, the second image is the human face, see fig.6, and the third image is occluded a human face, shown in fig.7. The height map has been extracted for each image using the proposed of HP and FT methods, and the results is compared with FT method. We note that there are no noise between two approaches and there exist similarity between it. Figs, (4,5,8,10), are depicts the height maps for both the opposite right triangle images and the human face image respectively.
The performance of the two methods have been tested with occluded images. The Fourier domain by definition is a global transform such that a change in any pixel values will affect the whole transform. On the other hand, the proposed of HP is local mapping, such that any variation in specific pixels will only affect the same set of pixels and the rest will remain unchanged.
Figs, (9, 11) are depicts the 3-D image using HP approach and FT approach of occluded images. Performance evaluation have shown similar qualitative and quantitative results for the two approaches. However, the proposed of HP method has outperformed the FT method in terms of simplicity, implementation speed, and stable operation under occlusion effects.
6 Summary and Future Directions
SFS refers to 3-D estimation from single 2-D gray scale image illuminated by a single source of illumination. SFS is an important problem in computer vision.
SFS studied in the present paper is directed in the case of gray scale stationary images, which can be extended to estimate the 3-D shape from color images. The lambertian constraint on the SFS problem can be extended to estimate to 3-D SFS of stationary object of nonlambertain object. Also the constrain of single source of illumination can be extended to study SFS problem in the case of uniform source of illumination.
5
10
15
20
25
30
Fig.3. two opposite right triangle Image.
6Page 160
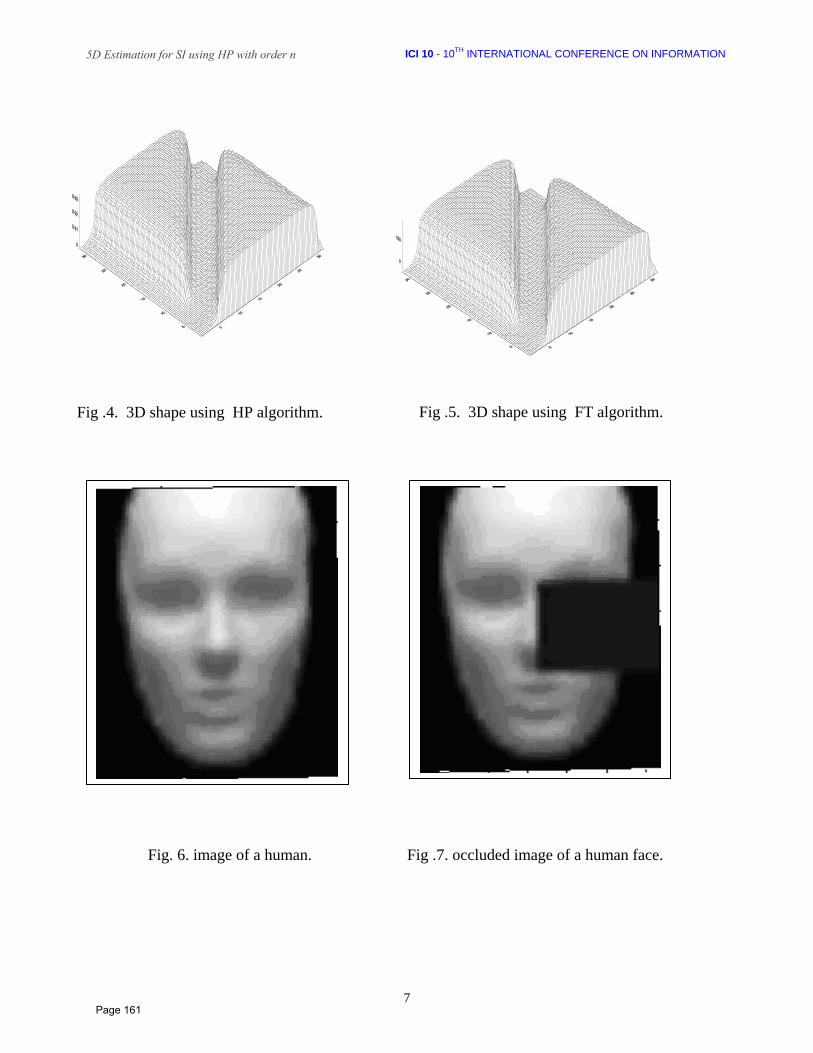
5D Estimation for SI using HP with order n ICI 10 - 10TH INTERNATIONAL CONFERENCE ON INFORMATION
Fig .4. 3D shape using HP algorithm. Fig .5. 3D shape using FT algorithm.
Fig. 6. image of a human. Fig .7. occluded image of a human face.
7Page 161

5D Estimation for SI using HP with order n ICI 10 - 10TH INTERNATIONAL CONFERENCE ON INFORMATION
Fig. 9. 3D shape using FT algorithm
Fig. 8. 3D shape using FT algorithm.
Fig. 11. 3D shape using HP algorithm. Fig. 10. 3D shape using HP algorithm.
References [1] A. Robles-Kelly and E. R. Hancock. Model acquisition using Shape from Shading. In F. J. Perales and E. R. Hancock, editors, Intl. Workshop on Articulated Motion and Deformable Objects, pages 43–55, Palma de Mallorca, Nov. 2002. [2] A. Tankus, N. Sochen, and Y. Yeshurun. A New Perspective [on] Shape-from-Shading. In Proceedings of the 9 th IEEE International Conference on Computer Vision, Volume (11), pages 862–869, Nice, France, Oct.2006.
8Page 162

5D Estimation for SI using HP with order n ICI 10 - 10TH INTERNATIONAL CONFERENCE ON INFORMATION
[3] A. Tankus, N. Sochen, and Y. Yeshurun. Perspective Shape from Shading by Fast Marching. In Proceedings of the IEEE Computer Society Conference on Computer Vision and Pattern Recognition, Washington, DC, Jun.–Jul. 2009. [4] A. K. Makworth, “Interpreting picture of polyhedral scenes”, Artificial Intelligence, 4, 1973. [5] B. K. P. Horn. Image intensity understanding. Artificial Intelligence, 8(2):201–231, Apr. 1977. [6] B. K. P. Horn ''Obtaining shape from shading information'' in the psychology of Machine Vision, P. H. Winston. Ed. New York, McGraw-Hill, 1975, pp. 115-155 . [7] B. K. P. Horn, "Shape from shading: a method for obtaining the shape of smooth opaque object from one view", Ph. D. dissertation (Massaschusetts Institute of Technology), Cambridge, Mass. 1970. [8] C. H. Lee and A. Rosenfeld. “Improved method of estimating shape from shading using light source coordinate system” in B. K. P. Horn and M.J. Brooks, Eds.,“Shape from shading” Cambridge, MA: MIT Press, pp 323-569, 1989. [9] E. Prados, F. Camilli, and O. Faugeras. A viscosity method for Shape from Shading without boudary data. Technical report, INRIA, To appear in 2004. [10] E. Prados and O. Faugeras. A mathematical and algorithmic study of the lambertian SFS problem for orthographic and pinhole cameras. Technical Report RR-5005, INRIA, November 2008. [11] E. Prados and O. Faugeras. Perspective Shape from Shading and Viscosity Solutions. In International Conference on Computer Vision, 2005, pages 826–831. [12] K. Ikeuchi and B. P. Horn, ''Numerical shape and occluding boundaries'' Artificial Intelligence., C A, Aug. 1985 pp 932-936. [13] M. Bichsel and A. P. Pentland. A simple algorithm for Shape from Shading. In Computer Vision and Pattern Recognition, pages 459– 465, 1992. [14] M. J. Brooks and B. K. P. Horn, '' Shape from shading'', in Proc. Int. Joint Conf. Artificial Intelligence., Los Angeles, CA, AUG 1985, PP. 932-936. [15] Omar E. Vega Hong andYang ''Shading Logic: A Herurisistic Approach to Recover Shape from shading'' IEEE Transaction on Pattern Analysis and Machine Intelligence, Vol. 15, No. 6 J une 1999. [16] P.S. Tsai and M. Shah. Shape from Shading using linear approximation. Image and Vision Computing, 12 (8):487–498, Oct. 1994. [17] Q. Zheng and R. Chellappa. Estimation of illuminant direction, albedo, and shape from shading. Trans. on Pattern Analysis and Machine Intelligence, 13 (7):680–702, 1991. [18] R. Jain, R. Kasturi and B.g. schunck, "Machine Vision'', first edition, Mc Graw- Hill 1995 [19] R. T. Frankot and R. Chellppa. ''A Method of inforcing Integerability in shape from shading'' IEEE Trans. on pattern analysis and Machine. Intelligence. Vol. 10, No 4, July 1989. [20] R. T. Frankot and Chellappa, ''An improved algorithm for the shape from shading problem'', in Proc. Indian Inst. Sci. Conf Syst Signal Procecss Bangalore, India, Dec. 11-13, 1986. [21] R. Zhang, P.-S. Tsai, J.-E. Cryer, and M. Shah. Shape from Shading: A survey. IEEE Transactions on Pattern Analysis and Machine Intelligence, 21(8):690–706, August 1999.
9Page 163
GAMASA, EGYPT, 4 – 6 DECEMBER 2010
Clustering With Fuzzy K-Means Applied to Color Image Quantization
E. A. ٍ◌ Sallam 1*, W. O. Badr 2.
1 Head of Computer and Automatic Control Engineering Dept, Faculty of Engineering, Tanta University, Email: [email protected]. 2 Electronics and Communication Engineering Department, Delta Higher Institute for Engineering and Technology, Mansoura, Email: [email protected].
Abstract
The main goal of color image quantization methods is a color reduction with minimum color error between the original image and quantized one. In this paper, there was investigated fuzzy c-means technique .The comparison presented was based on testing of six color images for quantization into 16, 32 and 64 color. In evaluation process, the mean squared error is used for comparison. The results of the simulation proved the efficiency of fuzzy c-means for color image quantization.
Keywords : Color image quantization; K-means; Fuzzy c-means; Clustering .
1 .Introduction
Color has been recognized as an important visual cue for image and scene analysis .Much work
in color analysis has focused on color image formation, color quantization, human visual
perception, image segmentation, color-based object recognition, and image retrieval [1].
Color image quantization is a common image processing technique that allows the representing
of true color images using only a small number of colors and is useful for displaying images on
limited hardware such as mobile devices, for image compression, and for other applications
mentioned above [1]. True color images typically uses 24 bits per pixel, each byte for red, green
and blue components .As a result, more than16 million colors. Generally, 512 × 512 pixels
digital images in an uncompressed true color (24 bits/pixel) format (such as . bmp forma) have a
768-Kbyte file size .However, with a good color quantization algorithm and some lossy
compression algorithms (such as ones used by .jpg formats), the same image quality (at least
visually) can mostly be restored from a much smaller file. If the image is quantized to 256
colors, the file size will be reduced to one-third of the original size [2]. The color image
Page 164

quantization can reduce not only storage requirement but also the transfer time of the image.
These reductions are quite important for multimedia applications in the Interne. More ever, the
color image quantization can be implemented as a preprocessing step for many applications such
as image compression algorithm, image segmentation [2]. Generally speaking, color image
quantization is divided into four phases [3]:
1. Sampling the original image for color statistics.
2. Choosing a color map based on the color statistics.
3. Mapping original colors to their nearest neighbors in the color map.
4. Quantizing and rendering the original image .
Many color quantization methods are proposed in the past. Notable examples include the
median-cut algorithm, the uniform algorithm, genetic algorithm [4], the octree algorithm, the
center-cut algorithm and clustering-based algorithms such as k-means.
This paper is organized as follows. In section 2, fuzzy c-means clustering algorithm was
proposed in the problem of color image quantization. The experimental results were described in
section 3. And finally, in section 4 conclusion of the paper.
2 .Experimental
Clustering is the process of partitioning a set of objects into subsets of similar objects called
clusters and the task is how to identify those clusters that best represent the colors in an image
[5]. clustering algorithms based on two techniques: hierarchical or partitional (iterative)
technique, it may be found that the hierarchical methods are faster than the iterative methods but
they have larger quantization errors. One of the most popular iterative methods of clustering is
k-means (KM), but it depends on initial conditions so it converges to suboptimal solutions. It is
frequently used as a post processing module to refine a roughly chosen representative data set
[6]. So we propose fuzzy c-means clustering algorithm for the problem of color image
quantization and compare it with KM.
Page 165

2.1 . Fuzzy c -means
Fuzzy c-means (FCM) is based on the idea of finding clusters centers by iteratively adjusting
their position and evaluation of an objective function similar to k-means [6]. For color image
quantization, the objective function follows the following equation [7, 8]:
obj ji cx2C
1j
N
1i
kij −∑ ∑
= =
= μ (1)
where is the fuzzy membership of pixel kijμ ix and the center of cluster is , and k is a
constant that defines the fuzziness of the resulting partitions. Obj can reach the global minimum
when pixels nearby the centroid of corresponding cluster.
jc
The membership functions and the cluster centers are updated by
cx
cx
1kij C
1m mj)1k(
2ij∑
= ⎟⎟⎟
⎠
⎞
⎜⎜⎜
⎝
⎛
−
−=
−
μ (2)
And
xN
i jkj∑ μ
cN
1j
1j
kij
i
∑=
==
μ
(3)
The steps involved in fuzzy c-means clustering are [1]:
1. Initialize the cluster ic and let t=0.
2. Initialize the fuzzy partition memberships function ijμ according to equation (2).
3. Let t=t+1 and compute new cluster ic using equation (3).
4. Repeat steps 2 to 3 until convergence.
Page 166

An initial setting for each cluster center is required and FCM converges to local minimum, the
efficiency of FCM has been investigated
3. Results
In order to evaluate the proposed method for color quantization, a set of six images have been
taken (Lena, baboon, kod23, house, parrot, and peppers see Fig.1) from the internet.
During tests the images were quantized into (16, 32 and 64) colors, comparing the results with
the k-means clustering algorithm, this algorithm assigns a data point to the nearest cluster center
of k disjoint clusters such that the following clustering criterion A(C) is minimized[1,6]
ji
n
1i 1....kj
cx minA(C) 2
−∑== ∈
. (4)
The results are listed in Tables 1-3 expressed in terms of MSE (mean square error) defined as
[1,6]:
( ) ( ) ([ ]∑∑= =
−+−+−=n
1i
m
1j
*jij
2*jj
2*jij
2bibgig iirr
MN1MSE ) . (5)
where M and N are the image dimensions in pixels, , , are color components of the
pixel of location (i ,j) in original image and , , are color components of the pixel in
quantized image. The smaller the MSE value, the better is the quantized image.
ijr
*ij b
ijg
*ij
ijb
*ijr g
Tables 1-3 show the results of comparison of different dimensions of palette (16, 32, and 64)
with respect to MSE measure of quantization error for both KM and FCM algorithms.
Page 167
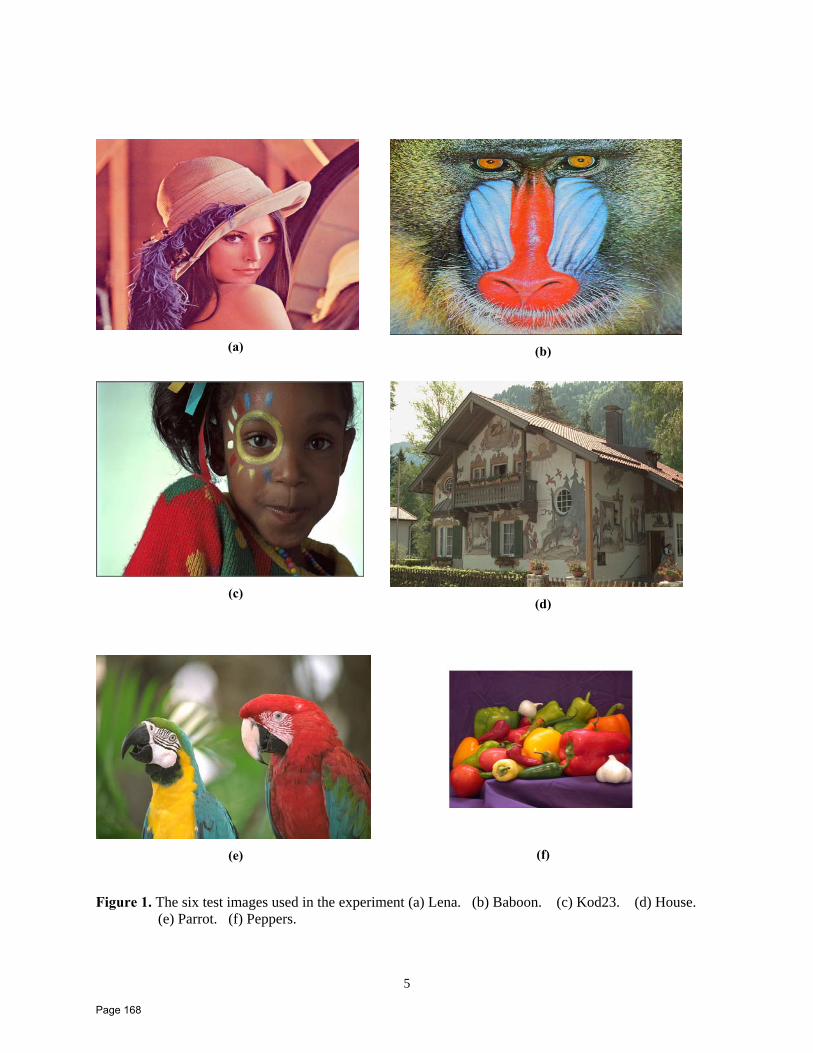
5
(a)
(b)
(c)
(d)
(e)
(f)
Figure 1. The six test images used in the experiment (a) Lena. (b) Baboon. (c) Kod23. (d) House. (e) Parrot. (f) Peppers.
Page 168
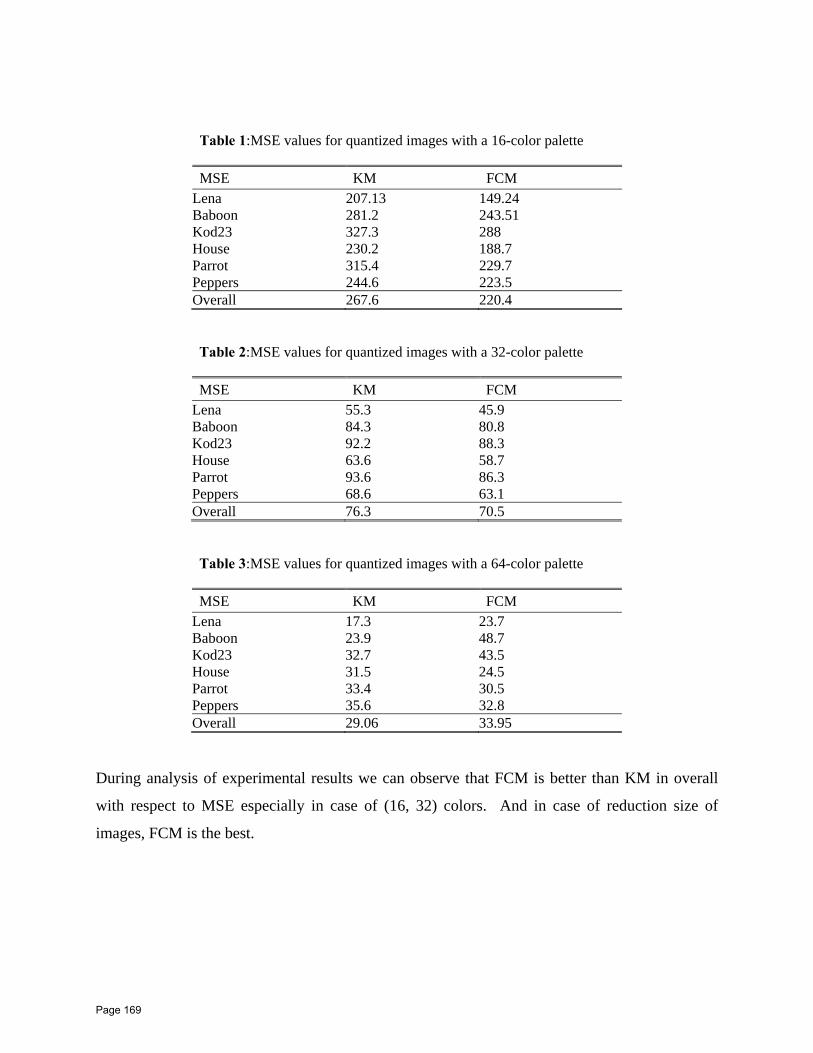
Table 1:MSE values for quantized images with a 16-color palette
MSE KM FCM Lena 207.13 149.24 Baboon 281.2 243.51 Kod23 327.3 288 House 230.2 188.7 Parrot 315.4 229.7 Peppers 244.6 223.5 Overall 267.6 220.4
Table 2:MSE values for quantized images with a 32-color palette
MSE KM FCM Lena 55.3 45.9 Baboon 84.3 80.8 Kod23 92.2 88.3 House 63.6 58.7 Parrot 93.6 86.3 Peppers 68.6 63.1 Overall 76.3 70.5
Table 3:MSE values for quantized images with a 64-color palette
MSE KM FCM Lena 17.3 23.7 Baboon 23.9 48.7 Kod23 32.7 43.5 House 31.5 24.5 Parrot 33.4 30.5 Peppers 35.6 32.8 Overall 29.06 33.95
During analysis of experimental results we can observe that FCM is better than KM in overall
with respect to MSE especially in case of (16, 32) colors. And in case of reduction size of
images, FCM is the best.
Page 169

4 .Conclusion
In this work we have investigated the performance of fuzzy c-means clustering approaches for
color quantization, and compare results of it with k-means algorithm. Comparison shows the
efficiency of the proposed algorithm with respect to MSE. Even though it is better than the hard
k-means algorithm at avoiding local minima, FCM can still converge to local minima of the
squared error criterion but with longer execution time.
References
[1] Frackiewicz M. and Palus H., “Clustering with K-harmonic means applied to color image quantization.” , IEEE international symposium on signal processing and information technology, 52-57, Dec 2008.
[2] Sirisathitkul Y., Auwatanamongkol S. and Uyyanonvara B., “Color image quantization using distances between adjacent colors along the color axis with highest color variance.” , Patt. Rec., Letters 25, 1025-1043, 2004.
[3] Chang Y., Hong Y. and Archibald J., “A robust color image quantization algorithm based on knowledge reuse of K-Means clustering ensemble.”, journal of multimedia, vol. 3, no. 2, 20-27, 2008.
[4] Scheunders P., “ A comparison of clustering algorithms applied to color image quantization.”, Patt .Rec., Letters, vol .18, 1379-1384, 1997.
[5] Jain A., Murty M. ,“Data clustering:A review.”,ACM computer surveys, vol. 31, no. 3,1999.
[6] Verevka O., “Color image quantization in window system with local k -means algorithm.”, Proc .Western Computer Graphics Symposium, 74-79, 1995.
[7] Schaefer G., Zhou H., “Fuzzy clustering for color reduction in images.”, Telecommunication Systems, Springer Netherlands, vol. 40,no. 1-2 ,17-25,2009.
[8] Eschrich S.,Ke J. and Hall L.,“Fast accurate fuzzy clustering through data reduction.”, IEEE Trans.Fuzzy systems, vol. 11,262-270,2003.
.
Page 170

Clustering with Fuzzy K-Means Applied to Color Image Quantization
ICI 10 - 10TH INTERNATIONAL CONFERENCE ON INFORMATION
8
Page 171

ICI 10 - 10TH INTERNATIONAL CONFERENCE ON INFORMATION AT DELTA UNIVERSITY FOR SCIENCE AND TECHNOLOGY
GAMASA, EGYPT, 4 – 6 DECEMBER 2010
A novel event-based strategy for tracking multiple objects at real-time with multiple cameras
R.K.Elsadek 1* , A.I.Saleh 2 , M.M.Salem 3
1 Department of Computer, Faculty of Engineering, Mansoura University, Mansoura, Egypt, [email protected].
2 Department of Computer, Faculty of Engineering, Mansoura University, Mansoura, Egypt, [email protected].
3 Department of Computer, Faculty of Engineering, Mansoura University, Mansoura, Egypt, [email protected].
Abstract Recently, due to the dramatic development of computer vision and surveillance systems, object
tracking has become an appealing research area. A considerable amount of work has been devoted to tackling the problem of object tracking using multiple camera system. Unfortunately, the majority of works still face many problems that strongly harm not only the accuracy of object positioning but also the continuity of tracking. The main contribution of this paper is to introduce a novel strategy for multiple objects using multiple camera system. The proposed strategy based on a flexible number of video cameras, each of them is attached to a workstation that analyzes its stream. These workstations are connected to the tracking server, which harmonizes the system, collects data, and creates the output spatial-tempo database. The novelty of the proposed strategy comes over two lines. The first is the methodology proposed for transforming of object coordinates to its real coordinates. The second is a new event-driven tracking methodology. Moreover, the proposed strategy introduces a cheap, easy installation, and robust tracking system. The phases of system installation and tracking are presented in details through the paper. Over a CAD of soccer game, the proposed tracking strategy has been tested. Experimental results have shown that robust tracking is available by taking the advantage of the proposed strategy.
Keywords : Object tracking; Multiple-sensors; Perspective projection; Background subtraction; Kalman filter; Tracking events.
1. Introduction Object tracking is the essential part in surveillance systems. Tracking an object is to get
spatial-tempo information of such moving object, which helps to study and predict its future
behaviors. For example, the rockets in a military defense system, customers in a market, players
in a sport game, cars in a street etc. Tracking these objects helps in military defense, goods
arranging, sport strategies, and traffic controlling.
Tracking can be done by one or multiple types of sensors [1]. Radar, sonar, infrared, laser-
radar, and video cameras are the common sensors used in tracking. According to the resolution
Page 172
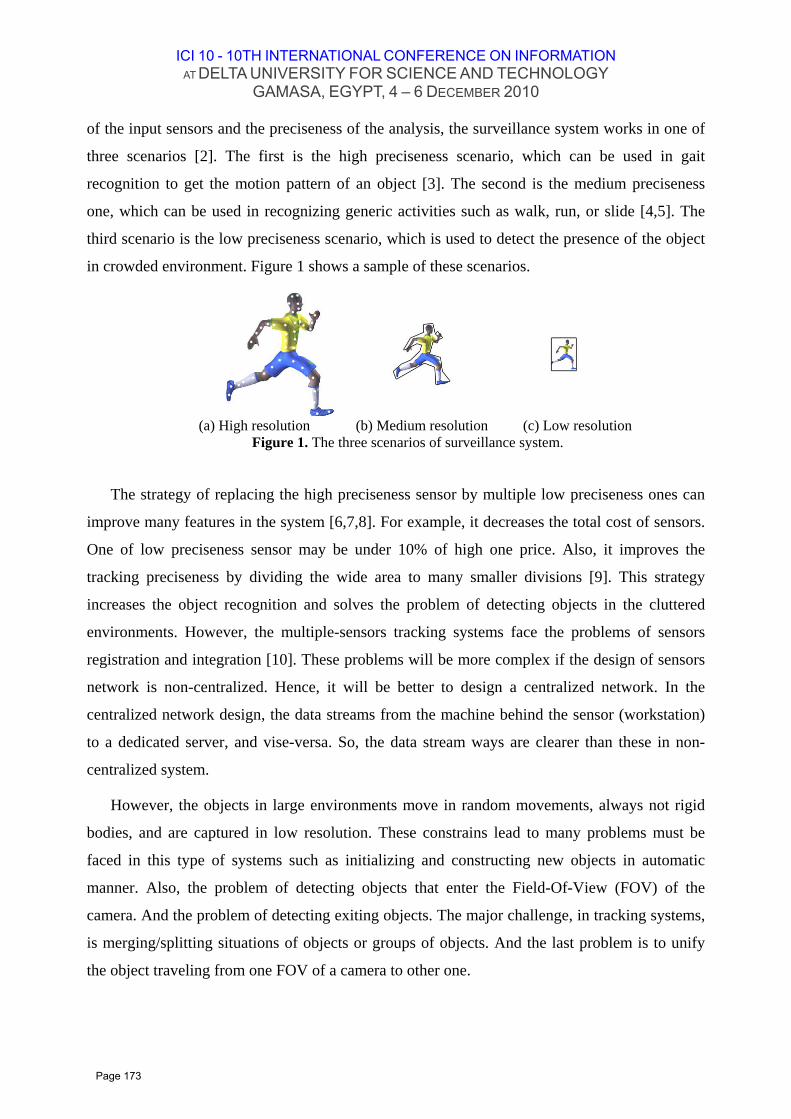
ICI 10 - 10TH INTERNATIONAL CONFERENCE ON INFORMATION AT DELTA UNIVERSITY FOR SCIENCE AND TECHNOLOGY
GAMASA, EGYPT, 4 – 6 DECEMBER 2010
of the input sensors and the preciseness of the analysis, the surveillance system works in one of
three scenarios [2]. The first is the high preciseness scenario, which can be used in gait
recognition to get the motion pattern of an object [3]. The second is the medium preciseness
one, which can be used in recognizing generic activities such as walk, run, or slide [4,5]. The
third scenario is the low preciseness scenario, which is used to detect the presence of the object
in crowded environment. Figure 1 shows a sample of these scenarios.
(a) High resolution (b) Medium resolution (c) Low resolution
Figure 1. The three scenarios of surveillance system.
The strategy of replacing the high preciseness sensor by multiple low preciseness ones can
improve many features in the system [6,7,8]. For example, it decreases the total cost of sensors.
One of low preciseness sensor may be under 10% of high one price. Also, it improves the
tracking preciseness by dividing the wide area to many smaller divisions [9]. This strategy
increases the object recognition and solves the problem of detecting objects in the cluttered
environments. However, the multiple-sensors tracking systems face the problems of sensors
registration and integration [10]. These problems will be more complex if the design of sensors
network is non-centralized. Hence, it will be better to design a centralized network. In the
centralized network design, the data streams from the machine behind the sensor (workstation)
to a dedicated server, and vise-versa. So, the data stream ways are clearer than these in non-
centralized system.
However, the objects in large environments move in random movements, always not rigid
bodies, and are captured in low resolution. These constrains lead to many problems must be
faced in this type of systems such as initializing and constructing new objects in automatic
manner. Also, the problem of detecting objects that enter the Field-Of-View (FOV) of the
camera. And the problem of detecting exiting objects. The major challenge, in tracking systems,
is merging/splitting situations of objects or groups of objects. And the last problem is to unify
the object traveling from one FOV of a camera to other one.
Page 173
ICI 10 - 10TH INTERNATIONAL CONFERENCE ON INFORMATION AT DELTA UNIVERSITY FOR SCIENCE AND TECHNOLOGY
GAMASA, EGYPT, 4 – 6 DECEMBER 2010
The main goal of this paper is to introduce a real-time system for tracking multiple objects
using multiple cameras system. The easy installation, ability to be a portable system, and the
low cost are taken as the main goals [11]. The system uses multi-sensors, which are constructed
over a centralized network to track many objects. This strategy has many benefits such as
increases the accuracy of object tracking, decreases the processing time under the real time,
decreases the ambiguity in objects occlusion, increases the system installation flexibility,
increases the capability of event-recognition and video-parsing, and can be extended to other
domains [12,13,14].
The novelty of our strategy comes in three main edges: (i) the image-to-world coordinates
transformation, which effects directly in system setup phase, tracking phase, and moving objects
between cameras FOVs, (ii) the concept of considering the object as a group of objects, which
solves and correcting a lot of tracking problems, and (iii) the tracking events algorithm, which
leads to a clear tracking in the environment of multiple objects and multiple cameras tracking
system.
2. Previous efforts Many systems for tracking objects in wide environment have been developed in recent
years. The architecture of them differs because of their purpose, the type of used sensors, and
also the economic reasons.
The famous architecture that depends on a type camera sensor can be count in three types.
The first architecture consists of a number of workstations covers the tracked environment with
static cameras. An instance of this type was proposed by J.Kang [15] who used multiple
stationary cameras that provide a good coverage of a soccer field. The registration of cameras
viewport is performed using a homography. The system can integrate 3D motion tracking
component without explicit recovery of 3D information. These types of systems still have
several issues to be addressed such as reducing the complexity and the delay generated by the
propagation of uncertain hypothesis. Another instance was introduced by Ming Xu [12,16] who
uses eight digital video cameras statically positioned around the stadium, and calibrated to a
common ground-plane coordinate system using Tsai's algorithm. Tracking is done on two-stage.
First stage is the extraction tracked objects information from each camera stream. Second stage,
central module collects the data from each camera to update the estimated states of each player.
There are several difficulties and opportunities to improve the reliability and accuracy, such as
Page 174
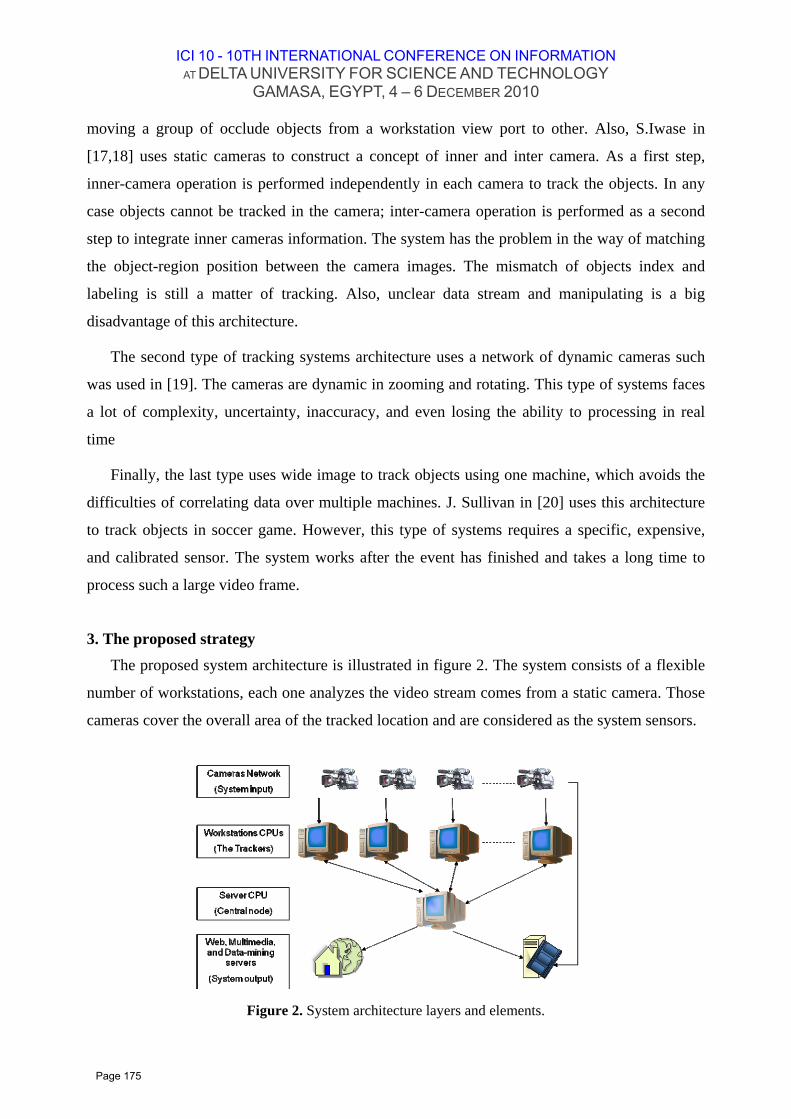
ICI 10 - 10TH INTERNATIONAL CONFERENCE ON INFORMATION AT DELTA UNIVERSITY FOR SCIENCE AND TECHNOLOGY
GAMASA, EGYPT, 4 – 6 DECEMBER 2010
moving a group of occlude objects from a workstation view port to other. Also, S.Iwase in
[17,18] uses static cameras to construct a concept of inner and inter camera. As a first step,
inner-camera operation is performed independently in each camera to track the objects. In any
case objects cannot be tracked in the camera; inter-camera operation is performed as a second
step to integrate inner cameras information. The system has the problem in the way of matching
the object-region position between the camera images. The mismatch of objects index and
labeling is still a matter of tracking. Also, unclear data stream and manipulating is a big
disadvantage of this architecture.
The second type of tracking systems architecture uses a network of dynamic cameras such
was used in [19]. The cameras are dynamic in zooming and rotating. This type of systems faces
a lot of complexity, uncertainty, inaccuracy, and even losing the ability to processing in real
time
Finally, the last type uses wide image to track objects using one machine, which avoids the
difficulties of correlating data over multiple machines. J. Sullivan in [20] uses this architecture
to track objects in soccer game. However, this type of systems requires a specific, expensive,
and calibrated sensor. The system works after the event has finished and takes a long time to
process such a large video frame.
3. The proposed strategy
The proposed system architecture is illustrated in figure 2. The system consists of a flexible
number of workstations, each one analyzes the video stream comes from a static camera. Those
cameras cover the overall area of the tracked location and are considered as the system sensors.
Figure 2. System architecture layers and elements.
Page 175
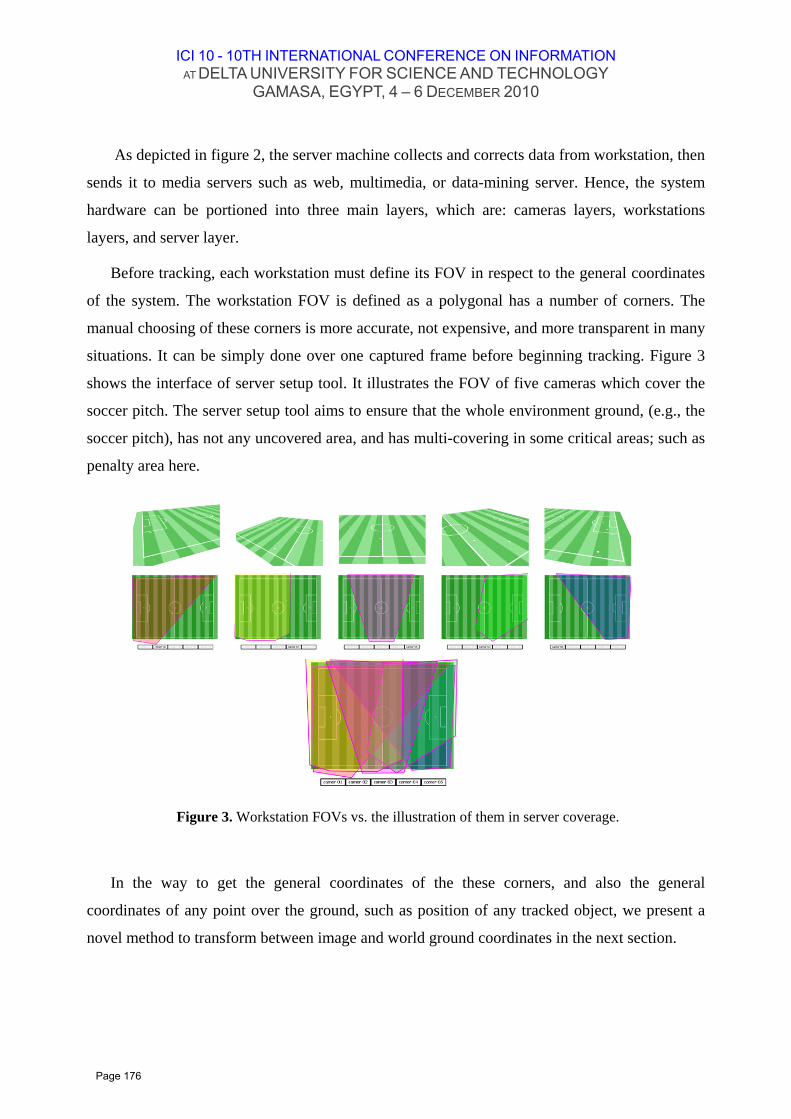
ICI 10 - 10TH INTERNATIONAL CONFERENCE ON INFORMATION AT DELTA UNIVERSITY FOR SCIENCE AND TECHNOLOGY
GAMASA, EGYPT, 4 – 6 DECEMBER 2010
As depicted in figure 2, the server machine collects and corrects data from workstation, then
sends it to media servers such as web, multimedia, or data-mining server. Hence, the system
hardware can be portioned into three main layers, which are: cameras layers, workstations
layers, and server layer.
Before tracking, each workstation must define its FOV in respect to the general coordinates
of the system. The workstation FOV is defined as a polygonal has a number of corners. The
manual choosing of these corners is more accurate, not expensive, and more transparent in many
situations. It can be simply done over one captured frame before beginning tracking. Figure 3
shows the interface of server setup tool. It illustrates the FOV of five cameras which cover the
soccer pitch. The server setup tool aims to ensure that the whole environment ground, (e.g., the
soccer pitch), has not any uncovered area, and has multi-covering in some critical areas; such as
penalty area here.
In the way to get the general coordinates of the these corners, and also the general
coordinates of any point over the ground, such as position of any tracked object, we present a
novel method to transform between image and world ground coordinates in the next section.
Figure 3. Workstation FOVs vs. the illustration of them in server coverage.
Page 176
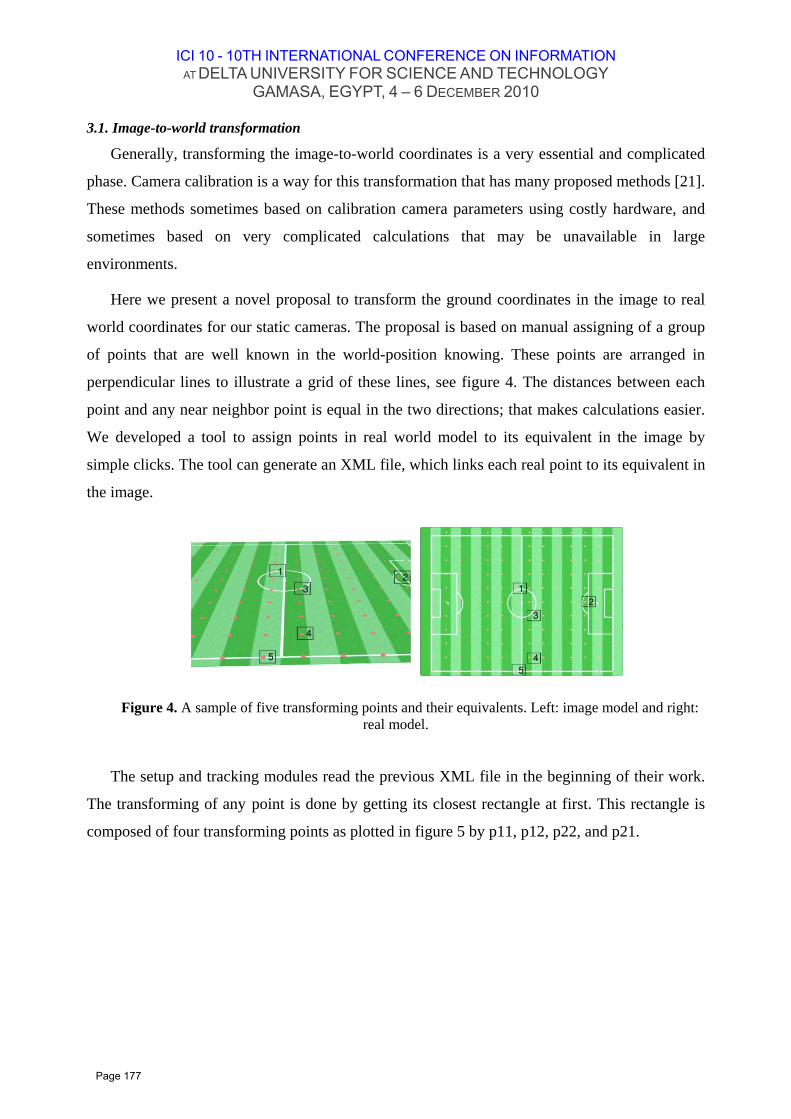
ICI 10 - 10TH INTERNATIONAL CONFERENCE ON INFORMATION AT DELTA UNIVERSITY FOR SCIENCE AND TECHNOLOGY
GAMASA, EGYPT, 4 – 6 DECEMBER 2010
3.1. Image-to-world transformation
Generally, transforming the image-to-world coordinates is a very essential and complicated
phase. Camera calibration is a way for this transformation that has many proposed methods [21].
These methods sometimes based on calibration camera parameters using costly hardware, and
sometimes based on very complicated calculations that may be unavailable in large
environments.
Here we present a novel proposal to transform the ground coordinates in the image to real
world coordinates for our static cameras. The proposal is based on manual assigning of a group
of points that are well known in the world-position knowing. These points are arranged in
perpendicular lines to illustrate a grid of these lines, see figure 4. The distances between each
point and any near neighbor point is equal in the two directions; that makes calculations easier.
We developed a tool to assign points in real world model to its equivalent in the image by
simple clicks. The tool can generate an XML file, which links each real point to its equivalent in
the image.
Figure 4. A sample of five transforming points and their equivalents. Left: image model and right: real model.
The setup and tracking modules read the previous XML file in the beginning of their work.
The transforming of any point is done by getting its closest rectangle at first. This rectangle is
composed of four transforming points as plotted in figure 5 by p11, p12, p22, and p21.
Page 177

ICI 10 - 10TH INTERNATIONAL CONFERENCE ON INFORMATION AT DELTA UNIVERSITY FOR SCIENCE AND TECHNOLOGY
GAMASA, EGYPT, 4 – 6 DECEMBER 2010
Next, the transformation is based on the following proof. Referring to figure 5, if a point P is
found in this rectangle, it is also laying over a line that is parallel to two edges and perpendicular
the other two edges. We depend on the fact that cross-ratios remain invariant under perspective
projection [19], but we use an approximation in this ratio.
Referring to figure 5:
P11 Px1 : P11 P12 = P21 Px2 : P21 P22 = R
For R equal this ratio in the world model, and also in the image model, we take the same
ratio to deduce this pair of approximated equations
R = P11 Px1 : P11 P12 , and R = P21 Px2 : P21 P22
Using the previous pair of equation, a module iterates the ratio R until reaching the
threshold. This threshold is a small perpendicular distance from point P to the line Px1Px2.
(a) Image model (b) Real model
Figure 5. Image verse real model for perspective projection.
Page 178

ICI 10 - 10TH INTERNATIONAL CONFERENCE ON INFORMATION AT DELTA UNIVERSITY FOR SCIENCE AND TECHNOLOGY
GAMASA, EGYPT, 4 – 6 DECEMBER 2010
The first step in the tracking or setup model, is searching for the equivalent polygonal, in the
image, that the point laying in it. And if the point is not found in any complete polygonal, as in
the image boarders, the model uses the nearest polygonal. Figure 6 illustrates the transformation
algorithm by a simple flow chart.
3.2. The proposed framework for object tracking
The main goal in any tracking system is solving the problem of discontinuity of objects
tracks. This problem is caused by many reasons such as disappearing object in a blind area,
disappearing partially or completely by a static object, or exiting and reentering. However, those
reasons are ignored in our work, because our environment is totally covered by many cameras,
the ground is visible with no cutting by any static objects, and completely closed.
In this work, we face the problem of discontinuity of objects tracks in the ways of
initializing new objects, merging/splitting situations, and entering/exiting FOV of workstations.
Our tracking steps are beginning with extracting the foreground pixel, which was done by
background subtraction method [22]. A filter such as Laplacian of Gradient (LoG) is applied to
reduce noise [23]. The Otsu's method clusters the foreground pixels in the form of blobs.
Finally, the object dimensions and position is represented with a bounded rectangle around its
blobs. Figure 7 illustrates these steps in a simple example.
Figure 6. Image-to-world transformation algorithm.
Start No
Yes Get Point position in image
coordinates Found?
Searching the surround polygon
Searching the nearest polygon
Iterate to get Ratio in X-direction
Iterate to get Ratio in Y-direction
Calculate the real X-position
Calculate the real Y-position End
Page 179
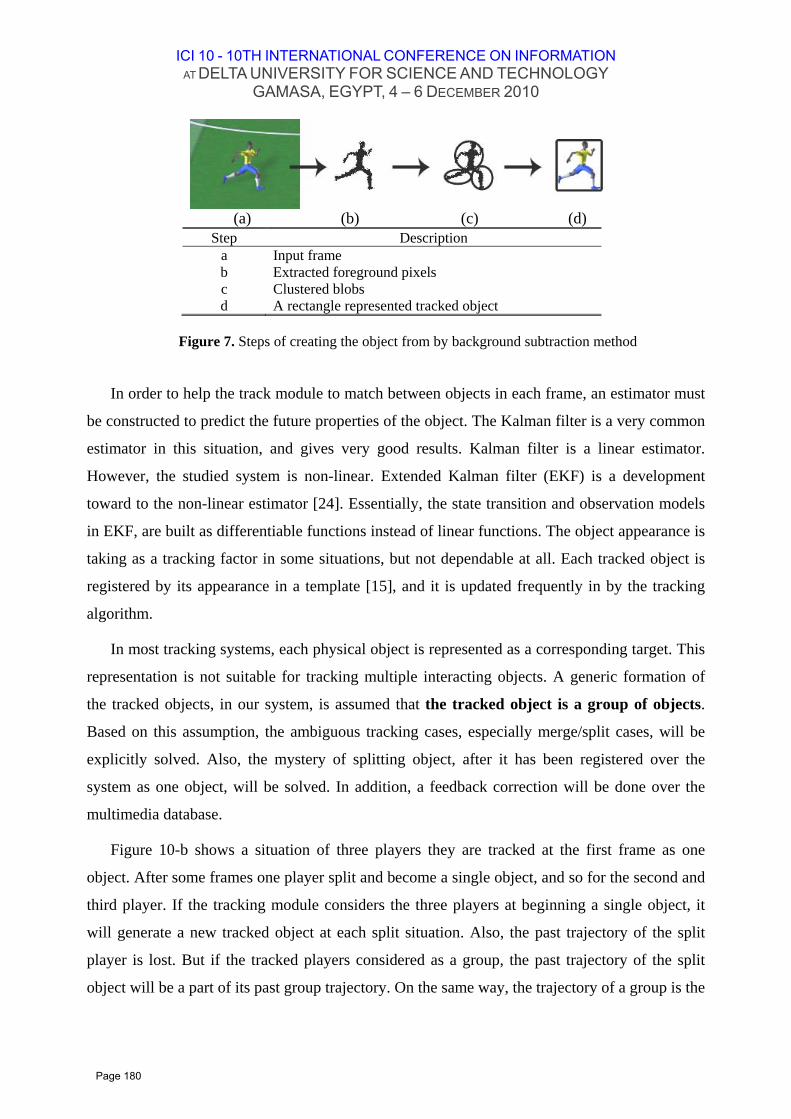
ICI 10 - 10TH INTERNATIONAL CONFERENCE ON INFORMATION AT DELTA UNIVERSITY FOR SCIENCE AND TECHNOLOGY
GAMASA, EGYPT, 4 – 6 DECEMBER 2010
(a) (b) (c) (d)
Step Description a Input frame b Extracted foreground pixels c Clustered blobs d A rectangle represented tracked object
Figure 7. Steps of creating the object from by background subtraction method
In order to help the track module to match between objects in each frame, an estimator must
be constructed to predict the future properties of the object. The Kalman filter is a very common
estimator in this situation, and gives very good results. Kalman filter is a linear estimator.
However, the studied system is non-linear. Extended Kalman filter (EKF) is a development
toward to the non-linear estimator [24]. Essentially, the state transition and observation models
in EKF, are built as differentiable functions instead of linear functions. The object appearance is
taking as a tracking factor in some situations, but not dependable at all. Each tracked object is
registered by its appearance in a template [15], and it is updated frequently in by the tracking
algorithm.
In most tracking systems, each physical object is represented as a corresponding target. This
representation is not suitable for tracking multiple interacting objects. A generic formation of
the tracked objects, in our system, is assumed that the tracked object is a group of objects.
Based on this assumption, the ambiguous tracking cases, especially merge/split cases, will be
explicitly solved. Also, the mystery of splitting object, after it has been registered over the
system as one object, will be solved. In addition, a feedback correction will be done over the
multimedia database.
Figure 10-b shows a situation of three players they are tracked at the first frame as one
object. After some frames one player split and become a single object, and so for the second and
third player. If the tracking module considers the three players at beginning a single object, it
will generate a new tracked object at each split situation. Also, the past trajectory of the split
player is lost. But if the tracked players considered as a group, the past trajectory of the split
object will be a part of its past group trajectory. On the same way, the trajectory of a group is the
Page 180

ICI 10 - 10TH INTERNATIONAL CONFERENCE ON INFORMATION AT DELTA UNIVERSITY FOR SCIENCE AND TECHNOLOGY
GAMASA, EGYPT, 4 – 6 DECEMBER 2010
future trajectory of its merged objects or groups. So the assumption is useful in merge and split
situation.
3.3. Building tracking events and their responses
In traditional tracking systems, the system is divided into segmentation and objects creating
stage, creating objects paths stage, and server feedback correction stage. We break the linearity
of cascading the classic tracking stages by taking the decision of tracking from events done in
these stages. An early version of this strategy is introduced in [25] and [26] which used it with
an enhancement in tracked object template. The strategy of tracking-events enhances the
automotive of tracking systems over many levels. The first is enhancing the automatic object
creation as well as avoiding the manual scenarios. Using tracking events also maximizes the
stability of traveling objects between system workstations. Also, it enhances the continuity of
object tracking in several scenarios such as merging and splitting.
This paper focuses on a limited number of events. These events are shown in table 1 by their
abbreviation names and meaning.
Table 1. Tracking events used, their meanings, and their responses
Event description Corresponding Response E1 Creating a new target R1 E2 Target entering the FOV of workstation R2 E3 Target split from a group of targets R3 E4 Target exiting the FOV of workstation R4 E5 Target merged with other one R5 E6 Target is tracked in stable manner R6
Each event, we built, is triggered by a collection of conditions, that are generated by simple
operations, calculation, and conditions. For example, changing size of target bounded box Rseg ,
that is generated by segmentation. Also, changing of size and position of the target bounded box
that is generated by Kalman filter Rkal. The objects used in the algorithm are briefly mentioned
in the following table.
Table 2. Objects used in the tracking algorithm Object description
Riseg Rectangle bounded target i
Rikal Rectangle generated by Kalman filter around target i
Ti Appearance template of target i Gk Group has k ID over a workstation
Gkg-pos Group k global position
Gk-global Group k-global ID over the Server
Page 181

ICI 10 - 10TH INTERNATIONAL CONFERENCE ON INFORMATION AT DELTA UNIVERSITY FOR SCIENCE AND TECHNOLOGY
GAMASA, EGYPT, 4 – 6 DECEMBER 2010
The proposed algorithm is not only defining the events and their response, but also arranging
them in order of their priority. The priority of events means; which is tested earlier than other, so
the events are arranged from highest to lowest priority. Hence, if one event for the target is
success, other events are not tested.
The Algorithm
Inputs data: SSB: Set of N targets Segmented Bounded Boxes SSB = { R1
seg , R2seg , … , RN
seg } KBB: Set of M targets Kalman filter Bounded Boxes KBB = { R1
kal , R2kal , … , RM
kal } AT: Set of M Appearance Templates AT = { T1 , T2 , … , TM } Algorithm Defining Events: For each Rx
seg Є SBB test E1, E2, E3 in order E1 :
if Rxseg != any Ri
kal Є KBB AND Distance between ( Rx
seg , FOV boundaries ) >= Tuned threshold Then
Trigger R1 go to OUT1
E2 : if Rx
seg != any Rikal Є KBB AND
Distance between ( Rxseg , FOV boundaries ) < Tuned threshold
Then Trigger R2 go to OUT1
E3 : if size ( Rx
seg ) << matched size ( Rikal )
Then Trigger R3 go to OUT1
OUT1 : For next Rx
seg Є SBB test E1, E2, E3 in order
For each Rxkal Є KBB test E4, E5, E6 in order
E4 : if Rx
kal Outside(FOV) Then
Trigger R4
Page 182

ICI 10 - 10TH INTERNATIONAL CONFERENCE ON INFORMATION AT DELTA UNIVERSITY FOR SCIENCE AND TECHNOLOGY
GAMASA, EGYPT, 4 – 6 DECEMBER 2010
go to OUT2 E5 :
if size ( Rxkal ) << matched size ( Ri
seg ) AND Rx
kal.intersected_with ( any Rykal in previous frame )
Then Trigger R5 go to OUT2
E6 : if Rx
kal.totally_matched ( Rxseg )
Then Trigger R6 go to OUT2
OUT2 : For next Rx
kal Є KBB test E4, E5, E6 in order
Events Responses: Responses are done over: SRM ( Server Response Module ) and WRM ( Workstation Response Module ) R1 :
new WRM.register ( Gk ) WMR.create_target_template (Gk ) WRM.send_to_SRM ( Gk
g-pos ) SRM.associate ( Garrary [ ] ) get Gk-global [ ] SRM.announce_each_WRM ( Gk-global [ ] )
R2 : new WRM.register ( Gk ) WRM.send_to_SRM ( Gk
g-pos ) SRM.associate ( Garrary [ ] ) get Gk-global [ ] SRM.announce_WRM ( Gk-global [ ] )
R3 : WRM.search_has_not_kalman ( Gk [ ] ) get Gnkal [ ] WRM.search_near_split_group (Gnkal [ ] ) get Gs [ ] WRM.associate_to_previous_target ( Gs [ ] , Tx [ ] ) , get Gs1 [ ] , Gs2 [ ] // Gs1 is an array of previous known targets, Gs2 is an array of unknown targets WMR.targets_back_correction ( Gs2 [ ] ) WMR.trigger_new_response ( Gs2 [ ] )
R4 : WRM.stop_tracking ( Gk )
R5 : WRM.register_group ( Gk ) = Gv + Gw WRM.announce_to_SRM ( Gk
g-pos ) SRM.associate ( Garrary [ ] ) get Gk-global [ ] SRM.announce_WRM ( Gk-global [ ] ) if WRM.search( Gk-global [ ], Gv , Gw ) = = True then
WRM.split ( Gk ) ; WRM.delete_kalman ( Gv , Gw ) else
WRM.give_kalman_position ( Gv , Gw ) R6 :
WRM.track ( Gk ); WRM.update_kalman ( Gk ); WRM.update_template ( Tx )
Page 183
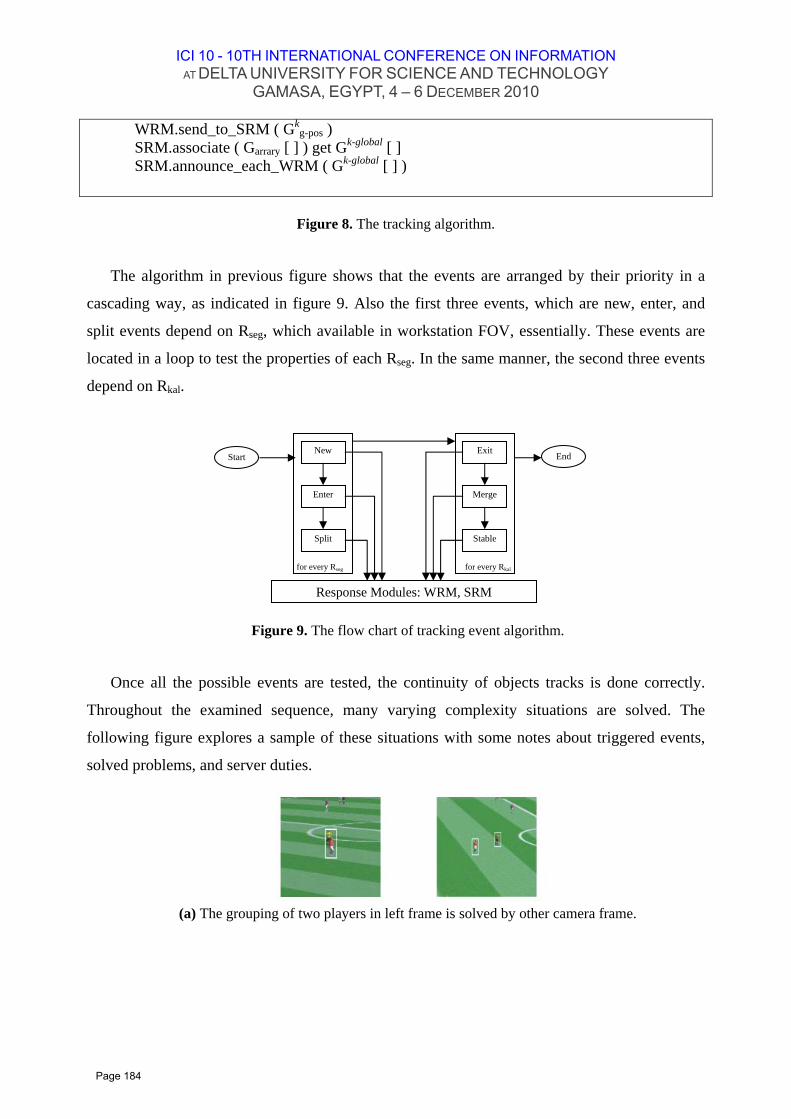
ICI 10 - 10TH INTERNATIONAL CONFERENCE ON INFORMATION AT DELTA UNIVERSITY FOR SCIENCE AND TECHNOLOGY
GAMASA, EGYPT, 4 – 6 DECEMBER 2010
WRM.send_to_SRM ( Gkg-pos )
SRM.associate ( Garrary [ ] ) get Gk-global [ ] SRM.announce_each_WRM ( Gk-global [ ] )
Figure 8. The tracking algorithm.
The algorithm in previous figure shows that the events are arranged by their priority in a
cascading way, as indicated in figure 9. Also the first three events, which are new, enter, and
split events depend on Rseg, which available in workstation FOV, essentially. These events are
located in a loop to test the properties of each Rseg. In the same manner, the second three events
depend on Rkal.
Figure 9. The flow chart of tracking event algorithm.
Once all the possible events are tested, the continuity of objects tracks is done correctly.
Throughout the examined sequence, many varying complexity situations are solved. The
following figure explores a sample of these situations with some notes about triggered events,
solved problems, and server duties.
(a) The grouping of two players in left frame is solved by other camera frame.
Response Modules: WRM, SRM
New
Enter
Split
Exit
Merge
Stable
for every Rseg for every Rkal
Start End
Page 184
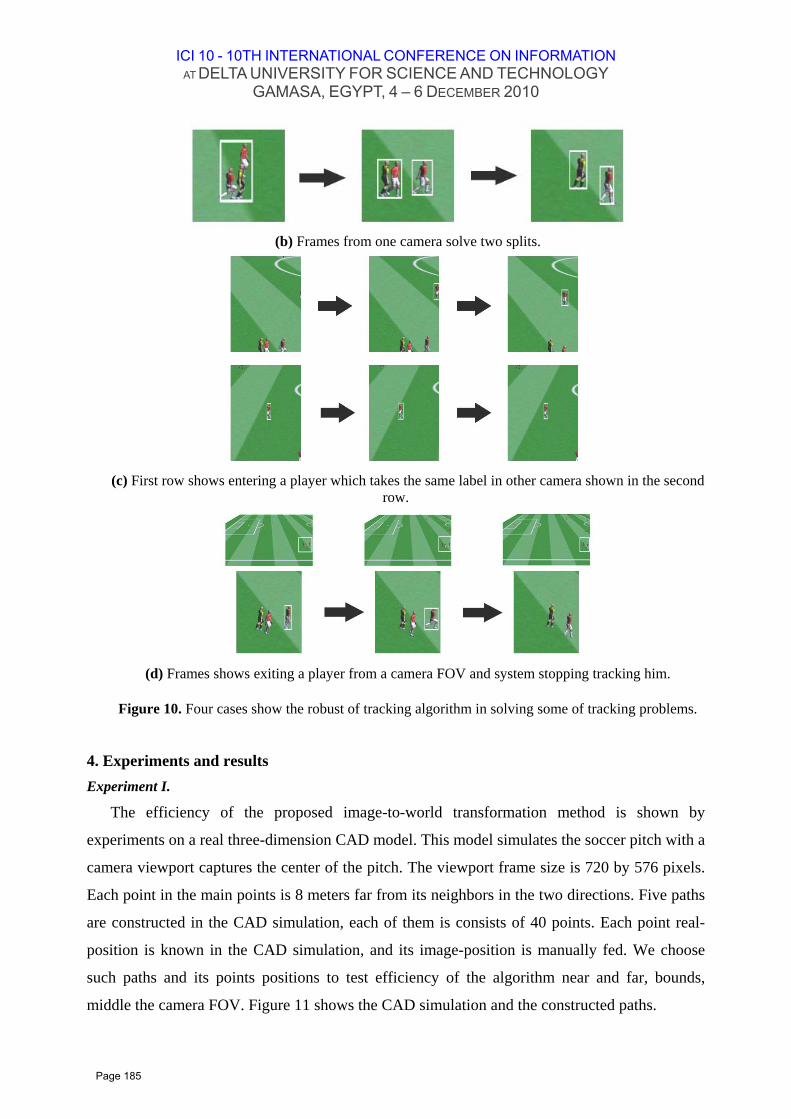
ICI 10 - 10TH INTERNATIONAL CONFERENCE ON INFORMATION AT DELTA UNIVERSITY FOR SCIENCE AND TECHNOLOGY
GAMASA, EGYPT, 4 – 6 DECEMBER 2010
(b) Frames from one camera solve two splits.
(c) First row shows entering a player which takes the same label in other camera shown in the second
row.
(d) Frames shows exiting a player from a camera FOV and system stopping tracking him.
Figure 10. Four cases show the robust of tracking algorithm in solving some of tracking problems.
4. Experiments and results Experiment I.
The efficiency of the proposed image-to-world transformation method is shown by
experiments on a real three-dimension CAD model. This model simulates the soccer pitch with a
camera viewport captures the center of the pitch. The viewport frame size is 720 by 576 pixels.
Each point in the main points is 8 meters far from its neighbors in the two directions. Five paths
are constructed in the CAD simulation, each of them is consists of 40 points. Each point real-
position is known in the CAD simulation, and its image-position is manually fed. We choose
such paths and its points positions to test efficiency of the algorithm near and far, bounds,
middle the camera FOV. Figure 11 shows the CAD simulation and the constructed paths.
Page 185
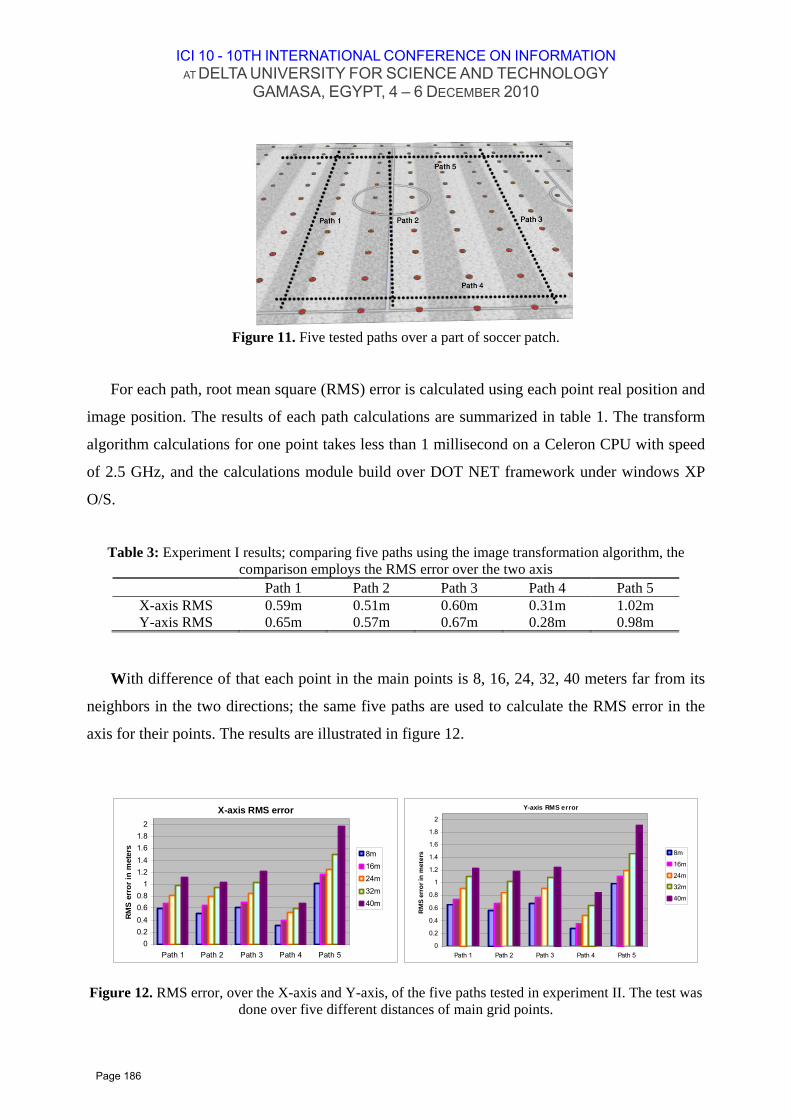
ICI 10 - 10TH INTERNATIONAL CONFERENCE ON INFORMATION AT DELTA UNIVERSITY FOR SCIENCE AND TECHNOLOGY
GAMASA, EGYPT, 4 – 6 DECEMBER 2010
Figure 11. Five tested paths over a part of soccer patch.
For each path, root mean square (RMS) error is calculated using each point real position and
image position. The results of each path calculations are summarized in table 1. The transform
algorithm calculations for one point takes less than 1 millisecond on a Celeron CPU with speed
of 2.5 GHz, and the calculations module build over DOT NET framework under windows XP
O/S.
Table 3: Experiment I results; comparing five paths using the image transformation algorithm, the
comparison employs the RMS error over the two axis Path 1 Path 2 Path 3 Path 4 Path 5
X-axis RMS 0.59m 0.51m 0.60m 0.31m 1.02m Y-axis RMS 0.65m 0.57m 0.67m 0.28m 0.98m
With difference of that each point in the main points is 8, 16, 24, 32, 40 meters far from its
neighbors in the two directions; the same five paths are used to calculate the RMS error in the
axis for their points. The results are illustrated in figure 12.
X-axis RMS error
00.20.40.60.8
11.21.41.61.8
2
Path 1 Path 2 Path 3 Path 4 Path 5
RM
S e
rro
r in
mete
rs 8m16m24m32m40m
Y-axis RMS error
0
0.2
0.4
0.6
0.8
1
1.2
1.4
1.6
1.8
2
Path 1 Path 2 Path 3 Path 4 Path 5
RM
S e
rro
r in
mete
rs 8m
16m
24m
32m
40m
Figure 12. RMS error, over the X-axis and Y-axis, of the five paths tested in experiment II. The test was done over five different distances of main grid points.
Page 186

ICI 10 - 10TH INTERNATIONAL CONFERENCE ON INFORMATION AT DELTA UNIVERSITY FOR SCIENCE AND TECHNOLOGY
GAMASA, EGYPT, 4 – 6 DECEMBER 2010
Experiment II.
The proposed tracking algorithm is tested over a three-dimension CAD simulation. The
environment of this experiment is the soccer pitch with a network of five cameras as shown in
figure 13. The simulation is 2 minutes length, 25 frames-per-second, MPEG format, and with
768 by 576 pixels in frame size. However, each workstation tries to process 3000 frames, the
dropped frames over the five workstations was less than 20%. In the fact of satisfying of 5
processed frames-per-second, which means the dropped frames can be up to 80%. Each of
workstations and the server are in the same specifications in the previous experiment. The
events, we constructed in the algorithm, are successfully triggered in most cases. The algorithm
works in good manner toward continuity of objects tracking. Also, the labeling of most objects
worked successfully.
Figure 13. Workstation FOVs of the five static cameras.
Observing the workstation and the server work to record the events manually, and then
compare them with the events triggered by the system, it’s the evaluation method we use. This
evaluation is detailed in table 2.
Table 4. Experiment II results; the system evaluation
observing Manual and CAD
System succession Evaluation
New target register event 25 22 88% Target-enter event 31 30 97% Target-split event 34 27 79% Target-exit event 26 26 100% Targets-merged event 32 30 94% Objects trajectory correlation 1.0 0.81 81%
The plotting of an object path clearly shows the continuity of the object tracking over the
system. A sample of path plotting of two objects over the patch is showed in the next figure.
Page 187

ICI 10 - 10TH INTERNATIONAL CONFERENCE ON INFORMATION AT DELTA UNIVERSITY FOR SCIENCE AND TECHNOLOGY
GAMASA, EGYPT, 4 – 6 DECEMBER 2010
Figure 14. Comparing real and system path of two players. The events new (N), merging (G), and
splitting (S) are shown on the path.
5. Conclusions In this paper, a novel strategy was presented for constructing a tracking system in a crowded
environment. The novelty of this strategy is appeared in flexibility of system architecture,
clearly solving image transformation and system setup problem, exploring a new model of the
tracked objects, and finally presents the event-response algorithm for tracking objects over a
network of sensors. The experiments show that the proposed algorithms and strategy is very
dependable. The future work will be concentrated over extending the event-response algorithm
to cover other events, and testing the system in other environments.
6. References [1] C.Chia, W.Chan, and S.Chien. "Cooperative Surveillance System with Fixed Camera Object
Localization and Mobile Robot Target Tracking," PSIVT 2009, LNCS 5414, pp. 886–897, 2009.
[2] W.Niu, L.Jiao, D.Han, and Y.Wang "Real-Time Multi-Person Tracking in Video Surveillance,"
Proceedings of the Pacific Rim Multimedia Conference, pp. 2C1 1-5, Singapore, 2003.
[3] M.Tandl, T.Stark. "An object-oriented approach to simulating human gait motion based on motion
tracking," Int. J. Appl. Math. Comput. Sci., vol. 19, no. 3, pp.469–483, 2009.
[4] D.Lai, Y.Chang, Z.Zhong. "Active Contour Tracking of Moving Objects Using Edge Flows and Ant
Colony Optimization in Video Sequences," PSIVT, LNCS 5414, pp. 1104–1116, 2009.
[5] B.Sugandi, H.Kim. "A moving object tracking based on color information employing a particle filter
algorithm," The 14th International Symposium on Artificial Life and Robotics, Oita, Japan, 2009.
[6] M.Mozerov, A.Amato, X.Roca, J. González. "Solving the Multi Object Occlusion Problem in a
Multiple Camera Tracking System," ISSN 1054-6618, Pattern Recognition and Image Analysis, 2009,
vol. 19, no. 1, pp. 165–171. © Pleiades Publishing, Ltd., 2009.
[7] A.Ercan, A.Elgamal, L.J.Guibas. "Object Tracking in the Presence of Occlusions via a Camera
Network," IPSN'07, April 25-27, 2007.
Page 188

ICI 10 - 10TH INTERNATIONAL CONFERENCE ON INFORMATION AT DELTA UNIVERSITY FOR SCIENCE AND TECHNOLOGY
GAMASA, EGYPT, 4 – 6 DECEMBER 2010
[8] R.Reulke, F.Meysel, S.Bauer. "Situation Analysis and Atypical Event Detection with Multiple
Cameras and Multi-Object Tracking," RobVis 2008, LNCS 4931, pp. 234–247, 2008.
[9] T. Ellis, D. Makris, J. Black, "Learning a Multi-camera Topology," Joint IEEE International
Workshop on Visual Surveillance and Performance Evaluation of Tracking and Surveillance, October,
Nice, France, pp. 165-171. 2003.
[10] N.D.Doulamis. "Coupled multi-object tracking and labeling for vehicle trajectory estimation and
matching," © Springer Science + Business Media, LLC 2009.
[11] D.Setterwall. "Computerized video analysis of football - technical and commercial possibilities for
football coaching," Master’s thesis ISSN 1403-0721, Department of Numerical Analysis and Computer
Science, KTH, Stockholm, Sweden, 2004.
[12] M.Xu, J.Orwell, L.Lowey, and D.Thirde. "Architecture and algorithms for tracking football players
with multiple cameras," IEE Proceedings, Vision, Image & Signal Processing, vol. 152, no. 2, pp. 232-
241, 2005.
[13] R.T.Collins, A.J.Lipton, H.Fujiyoshi, and T.Kanade, "Algorithms for Cooperative Multisensor
Surveillance," In Proc. of the IEEE, vol 89(10), pp. 1456-1477, Oct, 2001.
[14] C.J.Needham, and R.D.Boyle. "Performance evaluation metrics and statistics for positional tracker
evaluation," In M.Petrou J.Kittler and M.Nixon, editors, International Conference on Vision Systems
ICVS03, Graz, Austria, pp 278-289, 2003.
[15] J.Kang, I.Cohen, and G.Medioni. "Soccer player tracking across uncalibrated camera streams,"
IEEE International Workshop on Visual Surveillance and Performance Evaluation of Tracking and
Surveillance (PETS 03), October, 2003.
[16] M.Xu, J.Orwell, G.Jones, "Tracking football players with multiple cameras," In IEEE International
Conference on Image Processing. 2004.
[17] S.Iwase, H.Saito, "Tracking soccer players based on homography among multiple views," pp. 283-
292, Proc. SPIE 2003.
[18] S.Iwase and H.Saito, "Tracking soccer player using multiple views," InIAPR workshop on machine
vision applications, 2002.
[19] J.Hayet and J.H.Piater and J.G.Verly, "Fast 2D model-to-image registration using vanishing points
for sports video analysis," ICIP(3), pp. 417-420, 2005.
[20] J.Sullivan and S.Carlsson, "Tracking and labeling of interacting multiple targets," in ECCV, vol. 3,
pp. 619–632, 2006.
[21] D.Farin, S.Krabbe, "Robust camera calibration for sport videos using court models," Proc. SPIE
Storage and Retrieval Methods and Applications for Multimedia 2004, vol. 5307, pp.80–91, Jan. 2004.
[22] S.Cheung and C.Kamath, "Robust Techniques for Background Subtraction in Urban Traffic Video,"
Video Communications and Image Processing, SPIE Electronic Imaging, San Jose, January 2004.
Page 189

ICI 10 - 10TH INTERNATIONAL CONFERENCE ON INFORMATION AT DELTA UNIVERSITY FOR SCIENCE AND TECHNOLOGY
GAMASA, EGYPT, 4 – 6 DECEMBER 2010
[23] A. Prati, I. Mikic, M.M. Trivedi, and R. Cucchiara, "Detecting Moving Shadows: Algorithms and
Evaluation IEEE Trans. Pattern Analysis and Machine Intelligence", vol.25, no. 7, pp. 918-923, July
2003.
[24] R.Rosales and S.Sclaroff, "Improved Tracking of Multiple Humans with Trajectory Prediction and
Occlusion Modeling," In Proc. of CVPR, Santa Barbara, CA, 1998.
[25] O.Javed, and M.Shah, "Tracking and Object Classification for Automated Surveillance," The
seventh European Conference on Computer Vision, Copenhagen, May 2002.
[26] L.J.Latecki and R.Miezianko, "Object tracking with dynamic template update and occlusion
detection," in Proc. IEEE Int’l. Conf. Pattern Recog., (Hong Kong, China), vol.1, pp. 556–560, Aug. 20-
24, 2006.
Page 190
GAMASA, EGYPT, 4 – 6 DECEMBER 2010
Measuring DNA Strands Entropy Mohamed A. Abbas
Dept. of Comp. and Communications Faculty of Engineering
Delta University for Science and Technology [email protected]
Abstract Measuring entropy is important during the analysis of gene stability on the DNA. Stable genes on the DNA maximize the total enthalpy. The entropy of the DNA is the defects. These are higher energy states, such as indecent hydrogen bonding. In light of these defects or higher energy, the DNA needs to figure out how to use this energy impending to reach a state of better enthalpy, using the free energy within the defect. The main contribution of this paper is to suggest a new approach to measure the entropy and enthalpy of the DNA. This approach takes into account the simplicity and the accuracy in measurement process. Some cases of gene stability are presented for human and results are compared. The results depict that the proposed approach is able to measure both the thermodynamic entropy and information entropy of DNA strands easily and accurately.
Keywords: Entropy estimation, Grammar Based Codes, Suffix tree, prefix tree, gradient
1. Introduction
With the complete DNA sequences of many organisms already known, the problem of
recognizing and characterizing the different regions of DNA and their different functions
becomes a great challenge. Information theoretic entropy is one tool that can be used to help
solve this problem. The monomer units of DNA are nucleotides, and the polymer is known as a
"polynucleotide." Each nucleotide consists of a 5-carbon sugar (deoxyribose), a nitrogen
containing base attached to the sugar, and a phosphate group. There are four different types of
nucleotides found in DNA, differing only in the nitrogenous base. The four nucleotides are
given one letter abbreviations as shorthand for the four bases : A is for adenine , G is for
guanine , C is for cytosine and T is for thymine. Adenine and guanine are purines. Purines are
the larger of the two types of bases found in DNA. The 9 atoms that make up the fused rings (5
carbon, 4 nitrogen). All ring atoms lie in the same plane. Cytosine and thymine are pyrimidines
consist of 6 atoms (4 carbon, 2 nitrogen). Like purines, all pyrimidine ring atoms lie in the
same plane. Structures of purines and pyrimidine are depicted in figure1. In order to synthesize
protein, the cell creates a transient copy of a portion of DNA, called mRNA. The sequence of
mRNA is read, three symbols at a time, and this triplet specifies a single component of the
protein called an amino acid. The components are strung together in the order their code
appears in the mRNA sequence. Although made as a linear structure, many types of protein
can fold up on themselves and become active structures that control or influence a chemical
reaction in the cell. No all of the sequence information that gets copied from the DNA ends up
Page 191

specifying a protein. In higher eukaryotes, such as plants and animals, much of the mRNA is
cut out before the cell translates it into protein. The portions that are translated are called exons
and the portions that are removed are called introns. Random changes in a sequence are
thought to be more deleterious if they take place in an exon rather than in an intron so these
two regions should have different information theoretic entropy [1-10].
The Information Theoretic version of entropy was first proposed in its modern form by
C. E. Shannon [13] in a statistical form and by Kolmogorov in an algorithmic theoretic
view [8]. The Shannon Entropy of a data sequence is a highly used figure to describe the
complexity, compressibility [4], amount of information, weight of noise component,
effectiveness of random data generators, and many other properties of the analysed data.
Various applications exist for the estimation of entropy in quite distant fields as Biology [7],
and Medicine [5] [12]. A good collection of various applications is presented in [15].
The amount of information per symbol extracted from a data source (i.e., entropy) was
prior to Shannon considered to be log2(|S|) bits of information where S is the alphabet
from which the data source selects its output. Shannon introduced the effect of statistical
properties of the source on its entropy level [20-31].
figure1: Structures of purines and pyrimidine 2 Previous Work There have been several previous attempts to characterize the entropy of DNA. This section
focuses on these attempts. One approach is to compress the sequence in order to determine an
Page 192

upper bound on the entropy. Such a method has been used by Grumbach and Tahi with their
two algorithms Biocompress and Biocompress-2. Biocompress-2 is actually a combination of
three approaches: 1) Literal encoding, where each symbol is coded as a two bit number; 2)
Arithmetic encoding, where a substring of symbols is encoded using second order arithmetic
encoding; 3) Lempel_Ziv style encoding, where a substring is encoded as a pair of integers,
one representing the length of the match_ and the second representing the position of the match
somewhere to the left of the current position.
Farach et a developed a novel algorithm to estimate the entropy of DNA sequences called a
match length entropy estimator. Letting Li represent the match length at the ith character in a
sequence, the value of Li is the length of the longest substring that occurs in two places: 1)
starting at position i+1 and 2) a sliding window consisting of the previous Nw characters.This
algorithm was used to test the differences between the entropy of introns and exons, and
contrary to what was expected, they found that the average entropy of exons was larger 73% of
the time and that the variability of introns was larger 80% of the time.
CDNA Loewenstern and Yianilos developed CDNA, a program that estimates the entropy of
DNA sequences. The motivation for CDNA comes from the observation that naturally
occurring DNA sequences contain many more near repeats then would be expected by chance.
Two parameters that CDNA uses to capture the inexact matches are w, which represents the
substring size, and h, which represents the Hamming distance [32].
The recent approach is Grammar Transform Analysis and Compression (or GTAC) entropy
estimator, uses a novel data structure to repeatedly solve the longest non-overlapping pattern
problem in linear time. It is an example of a Grammar Based Code. The core of GTAC is to
repeatedly solve the longest non-overlapping pattern (LNP) problem. The LNP problem is as
follows: Given a set of strings, ρ, and the longest substring β such that β occurs in at least two
no overlapping positions somewhere in ρ. The LNP problems can appear in the context of
grammar when we let ρ be the set of all right hand sides of the production rules
P. And we add the additional constraint that the length of β is at least two. GTAC’s goal is to
repeatedly find the LNP and reduce it, creating a new rule. If an LNP β appears in the
following form :
Rewrite the previous rule as two rules.
Page 193

If an LNP β appears in different rules
Then rewrite the previous rules and introduce a new one, as follows.
GTAC can optionally recognize reverse complements. In DNA sequences, the symbols a and t
are the complement of each other, and the symbols g and c are the complement each other [32].
3. DNA Entropy Estimator based on Purines and Pyrimidine Structures Previous attempts impose a stationary probability model and define complexity to be
information entropy. This condition transforms complexity into a property of the source and
the problem becomes estimation. This section presents a proposed algorithm for an entropy
estimator based on the structure of purines and pyrimidine or (EPPS). The measured entropy
are both information and thermodynamic entropy. The proposed algorithm for measuring the
proposed thermal entropy depends on the knowledge of a specific heat capacity of carbons ,
nitrogens ; the basic building blocks of purines and pyrimidine. This algorithm is a new trend
toward measuring the total heat capacity of DNA strands, genes and mRNA direct a new focus
on mutations and protein to protein interactions.
Entropy is a measure of the disorder present in a system and it is disorder or randomness. Heat
capacity, Entropy, is a thermodynamic quantity, its value is equal to the amount of heat
absorbed or emitted divided by the thermodynamic temperature (the absolute temperature, in
Kelvin). The units of entropy are joules per Kelvin per mole. In an isothermal process, the
change in entropy (delta-S) is the change in heat (Q) divided by the absolute temperature (T):
delta-S = Q/T. In any reversible thermodynamic process, it can be represented in calculus as
the integral from a processes initial state to final state of dQ/T. The SI units of entropy are J/K
(joules/degrees Kelvin). Specific heat capacity of Carbon: (25 °C) ranges from 6.155 to 8.517
J·mol−1·K−1; We can deal with the maximum value considering the worst case. In addition
the specific heat capacity of Nitrogen (25 °C) (N2) 29.124 J·mol−1·K−1. The 9 atoms of
purines that make up the fused rings are 5 carbon and 4 nitrogen, so we can estimate the total
Page 194

heat capacity of purines is calculated using the following formula 5*8.517 + 4* 29.124 =
1356.74 J·mol−1·K−1. Whereas pyrimidines consist of 6 atoms 4 carbon and 2 nitrogen. Then
the total heat capacity of pyrimidines is calculated using the following formula 4*8.517 + 2*
29.124 = 1050.44 J·mol−1·K−1. Then the total heat capacity, entropy, could be measured
approximately if the sequence of bases are known. The following is the proposed algorithm to
measure the entropy for the sequence of DNA strands based on Purines and Pyrimidine
Structures. Note that Chargaff's rule states that: A + G = T + C. Where A = Adenine, G =
Guanine, C = Cytosine, and T = Thymine Also, G = C and A = T . Some people discuss the G
+ C content of DNA. This refers to the amount of G + C relative to A + T. If G + C is equal to
A + T then the ration is 1. If there is a higher G + C content of the species, it will be greater
than 1. If there is a lower G + C content of the species, it will be less than 1.
The proposed algorithm for measuring the information entropy is based on the fact of existing
4 bases in DNA strands. The probability of finding one of those, for example Adenine, at a
particular position is 25%, or 1/4. If you are looking for an Adenine next to a Guanine, then the
probability is 1/4 for each position, or (1/4)x(1/4)=1/16. If you are looking for the string of
bases AGC, the probability is (1/4)3, or 1/64. This means that every 64 bases, you would
expect to find the string AGC. Many, but by no means all, Restriction Enzymes recognize
exact sequences of bases 6 nucleotides long.(1/4)6 = 1/4096, or about once every 4,100 base
pairs Just like most things in the world of statistics, these are only probabilities. Figure 2
depicts the proposed algorithm for measuring both thermal and information entropy. Figure2
depicts the proposed algorithm EPPS for measuring information and thermal entropy
EPPS(x) begin for each base b of sequence s do
if (b is "A" or "G") increasing the counter of Purines (Pu);
if (b is "C" or "T") increasing the counter of Pyrimidine(Py); end for;
thermal entropy= Pu* 1050.44 + Py*1356.74 measure thermal entropy based on Purines and Pyrimidine Structures; for each base b of sequence s do p=p*(0.25)
end for; measure information entropy based on Purines and Pyrimidine Structures;
end alg;
Figure2: Proposed algorithm EPPS for measuring information and thermal entropy
Page 195
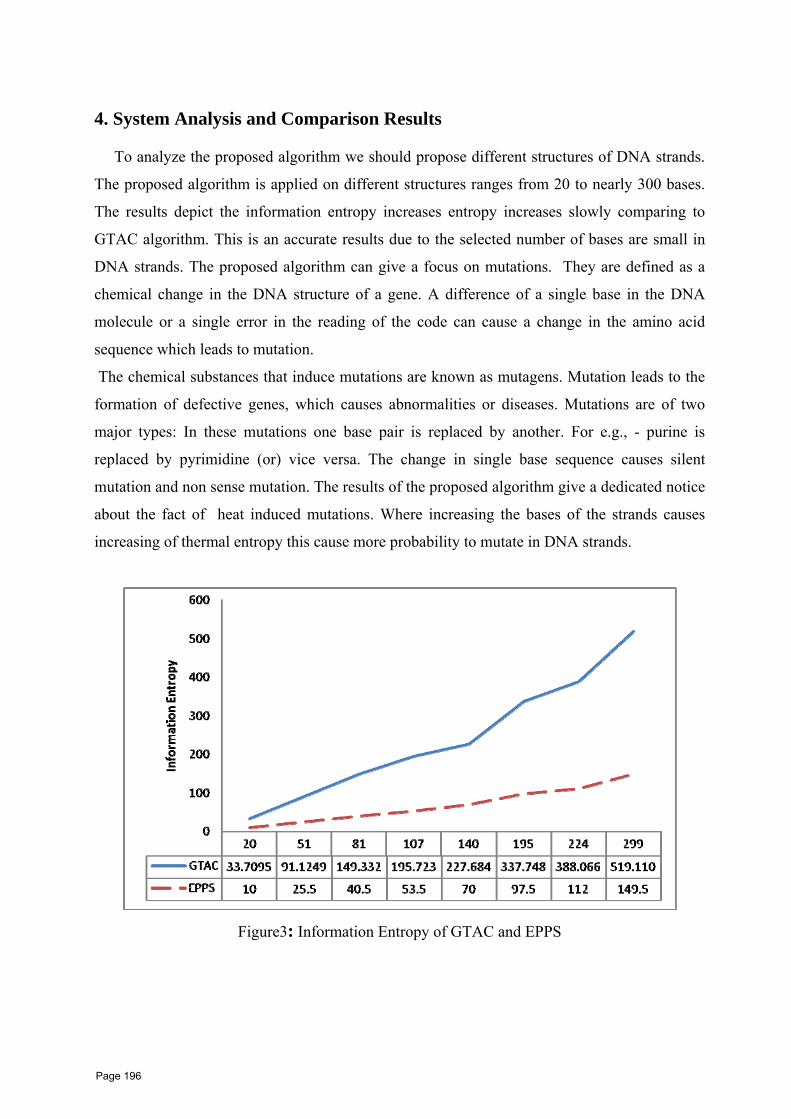
4. System Analysis and Comparison Results
To analyze the proposed algorithm we should propose different structures of DNA strands.
The proposed algorithm is applied on different structures ranges from 20 to nearly 300 bases.
The results depict the information entropy increases entropy increases slowly comparing to
GTAC algorithm. This is an accurate results due to the selected number of bases are small in
DNA strands. The proposed algorithm can give a focus on mutations. They are defined as a
chemical change in the DNA structure of a gene. A difference of a single base in the DNA
molecule or a single error in the reading of the code can cause a change in the amino acid
sequence which leads to mutation.
The chemical substances that induce mutations are known as mutagens. Mutation leads to the
formation of defective genes, which causes abnormalities or diseases. Mutations are of two
major types: In these mutations one base pair is replaced by another. For e.g., - purine is
replaced by pyrimidine (or) vice versa. The change in single base sequence causes silent
mutation and non sense mutation. The results of the proposed algorithm give a dedicated notice
about the fact of heat induced mutations. Where increasing the bases of the strands causes
increasing of thermal entropy this cause more probability to mutate in DNA strands.
Figure3: Information Entropy of GTAC and EPPS
Page 196
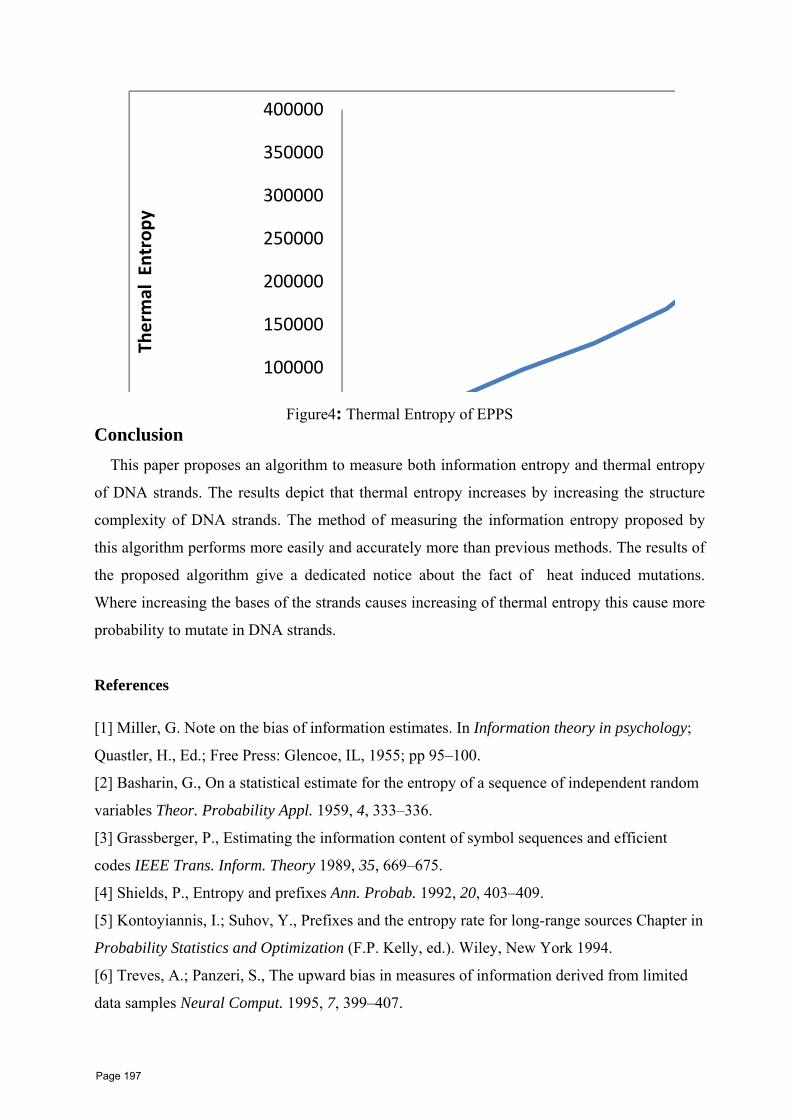
100000
150000
200000
250000
300000
350000
400000
Thermal Entropy
Figure4: Thermal Entropy of EPPS Conclusion This paper proposes an algorithm to measure both information entropy and thermal entropy
of DNA strands. The results depict that thermal entropy increases by increasing the structure
complexity of DNA strands. The method of measuring the information entropy proposed by
this algorithm performs more easily and accurately more than previous methods. The results of
the proposed algorithm give a dedicated notice about the fact of heat induced mutations.
Where increasing the bases of the strands causes increasing of thermal entropy this cause more
probability to mutate in DNA strands.
References [1] Miller, G. Note on the bias of information estimates. In Information theory in psychology;
Quastler, H., Ed.; Free Press: Glencoe, IL, 1955; pp 95–100.
[2] Basharin, G., On a statistical estimate for the entropy of a sequence of independent random
variables Theor. Probability Appl. 1959, 4, 333–336.
[3] Grassberger, P., Estimating the information content of symbol sequences and efficient
codes IEEE Trans. Inform. Theory 1989, 35, 669–675.
[4] Shields, P., Entropy and prefixes Ann. Probab. 1992, 20, 403–409.
[5] Kontoyiannis, I.; Suhov, Y., Prefixes and the entropy rate for long-range sources Chapter in
Probability Statistics and Optimization (F.P. Kelly, ed.). Wiley, New York 1994.
[6] Treves, A.; Panzeri, S., The upward bias in measures of information derived from limited
data samples Neural Comput. 1995, 7, 399–407.
Page 197

[7] Sch¨urmann, T.; Grassberger, P., Entropy estimation of symbol sequences Chaos 1996, 6,
414–427.
[8] Kontoyiannis, I. The complexity and entropy of literary styles; NSF Technical Report no.
97, 1996, [Available from pages.cs.aueb.gr/users/yiannisk/ ].
[9] Kontoyiannis, I.; Algoet, P.; Suhov, Y.; Wyner, A., Nonparametric entropy estimation for
stationary
processes and random fields, with applications to English text IEEE Trans. Inform. Theory
1998, 44, 1319–1327.
[10] Darbellay, G.; Vajda, I., Estimation of the information by an adaptive partitioning of the
observation
space IEEE Trans. Inform. Theory 1999, 45, 1315–1321.
[11] Victor, J., Asymptotic Bias in Information Estimates and the Exponential (Bell)
Polynomials Neural Comput. 2000, 12, 2797–2804.
[12] Antos, A.; Kontoyiannis, I., Convergence properties of functional estimates for discrete
distributions Random Structures & Algorithms 2001, 19, 163–193.
[13] Paninski, L., Estimation of entropy and mutual information Neural Comput. 2003, 15,
1191–1253.
[14] Cai, H.; Kulkarni, S.; Verd´u, S., Universal entropy estimation via block sorting IEEE
Trans. Inform. Theory 2004, 50, 1551–1561, Erratum, ibid., vol. 50, no. 9, p. 2204.
[15] Brown, P.; Della Pietra, S.; Della Pietra, V.; Lai, J.; Mercer, R., An estimate of an upper
bound for the Entropy of English Computational Linguistics 1992, 18, 31–40.
[16] Chen, S.; Reif, J. Using difficulty of prediction to decrease computation: Fast sort, priority
queue and convex hull on entropy bounded inputs. 34th Symposium on Foundations of
Computer Science, Los Alamitos, California, 1993; pp 104–112.
[17] et al., M. F. On the entropy of DNA: Algorithms and measurements based on memory and
rapid convergence. Proceedings of the 1995 Sympos. on Discrete Algorithms, 1995.
[18] Stevens, C.; Zador, A. Information through a Spiking Neuron. NIPS, 1995; pp 75–81.
[19] Teahan, W.; Cleary, J. The entropy of English using PPM-based models. Proc. Data
Compression Conf. – DCC 96, Los Alamitos, California, 1996; pp 53–62.
[20] Strong, S. P.; Koberle, R.; de Ruyter van Steveninck, R.; Bialek, W., Entropy and
Information in Neural Spike Trains Phys. Rev. Lett. 1998, 80, 197–200.
[21] Suzuki, R.; Buck, J.; Tyack, P., Information entropy of humpback whale song The Journal
of the Acoustical Society of America 1999, 105, 1048–1048.
Page 198

Measuring DNA Strands Entropy ICI 10 - 10TH INTERNATIONAL CONFERENCE ON INFORMATION
9
[22] Loewenstern, D.; Yianilos, P., Significantly Lower Entropy Estimates for Natural DNA
Sequences Journal of Computational Biology 1999, 6, 125–142.
[23] Levene, M.; Loizou, G., Computing the entropy of user navigation in the web
International Journal of Information Technology and Decision Making 2000, 2, 459–476.
[24] Reinagel, P., Information theory in the brain Current Biology 2000, 10, 542–544.
[25] London, M., The information efficacy of a synapse Nature Neurosci. 2002, 5, 332–340.
[26] Bhumbra, G.; Dyball, R., Measuring spike coding in the rat supraoptic nucleus The
Journal of Physiology 2004, 555, 281–296.
[27] Nemenman, W.; Bialek, W.; de Ruyter van Steveninck, R., Entropy and information in
neural spike trains: Progress on the sampling problem Physical Review E 2004, 056111.
[28] Warland, D.; Reinagel, P.; Meister, M., Decoding visual infomation from a population of
retinal ganglion cells J. of Neurophysiology 1997, 78, 2336–2350.
[29] Kennel, M.; Mees, A., Context-tree modeling of observed symbolic dynamics Physical
Review E 2002, 66, .
[30] Amigo’, J.M.; Szczepan’ski, J.M.; Wajnryb, E.M.; Sanchez-vives, M.V., Estimating the
entropy rate of spike trains via Lempel-Ziv complexity Neural Computation 2004, 16, 717–736
[31] Shlens, J.; Kennel, M.; Abarbanel, H.; Chichilnisky, E., Estimating information rates with
confidence intervals in neural spike trains Neural Comput. 2007, 19, 1683–1719.
[32] J. Kevin Lanctot; Estimating DNA Sequence Entropy; SODA '00 Proceedings of the
eleventh annual ACM-SIAM symposium on Discrete algorithms 2000, ISBN:0-89871-453-2
Page 199
GAMASA, EGYPT, 4 – 6 DECEMBER 2010
On the Use of the Electrocardiogram for Biometric Authentication
Manal Tantawi1, Kenneth Revett2, Abdel Badeeh Salem1, Mohamed Fahmy Tolba1
1 Faculty of Computer and Information Sciences, Ain Shams University, Cairo, Egypt
2 British University in Egypt, Egypt.
Abstract This paper provides a comprehensive survey of the deployment of the electrocardiogram (ECG) as a biometric authentication system. The paper begins with an overview of the ECG, some of the features that have been extracted for use in biometric authentication, followed by a series of case studies. The conclusion reached in this survey indicates that the ECG is a very effective and efficient mode of user authentication. Classification accuracies of over 95% are routinely obtained, rivalling more traditional anthropometric based approaches such as fingerprint and face recognition based approaches. Some caveats of the ECG based approach are also discussed -these include accounting for disease states, emotional states, and the general caveat that many of the published studies are performed on a small cohort.
Keywords: Biometrics; Cognitive Biometrics; Electrocardiogram (ECG); User Authentication
1. Introduction
The term electrocardiogram (ECG) was introduced by Willem Einthoven in 1893 at a meeting
of the Dutch Medical Society. In 1924, Einthoven received the Nobel Prize for his life's work in
ECG development [1]. The ECG is recorded by placing electrodes (up to 12 electrodes) at
various strategic body points such as chest, neck, arms, and legs. The ECG machine records
the electrical activity (electrical impulses) of the heart in exquisite detail that results when the
heart muscle cells in the atria and ventricles contract. The results of the impulses are
displayed on a computer monitor and then printed onto graph paper. For each heartbeat, the
ECG traces three complex waves: P, QRS and T waves (figure 1).the various table text styles are
provided. The formatter will need to create these components, incorporating the applicable
criteria that follow.
The Atria contractions (both right and left) shows up as the P wave; while the ventricular
contractions (both right and left) show as a series of 3 waves, Q-R-S, known as the QRS
complex; finally, the third and last common wave in an ECG is the T wave. This reflects the
electrical activity produced when the ventricles are recharging for the next contraction
(repolarizing). The letters P, Q, R, S, and T are not abbreviations for any actual words but
Page 200
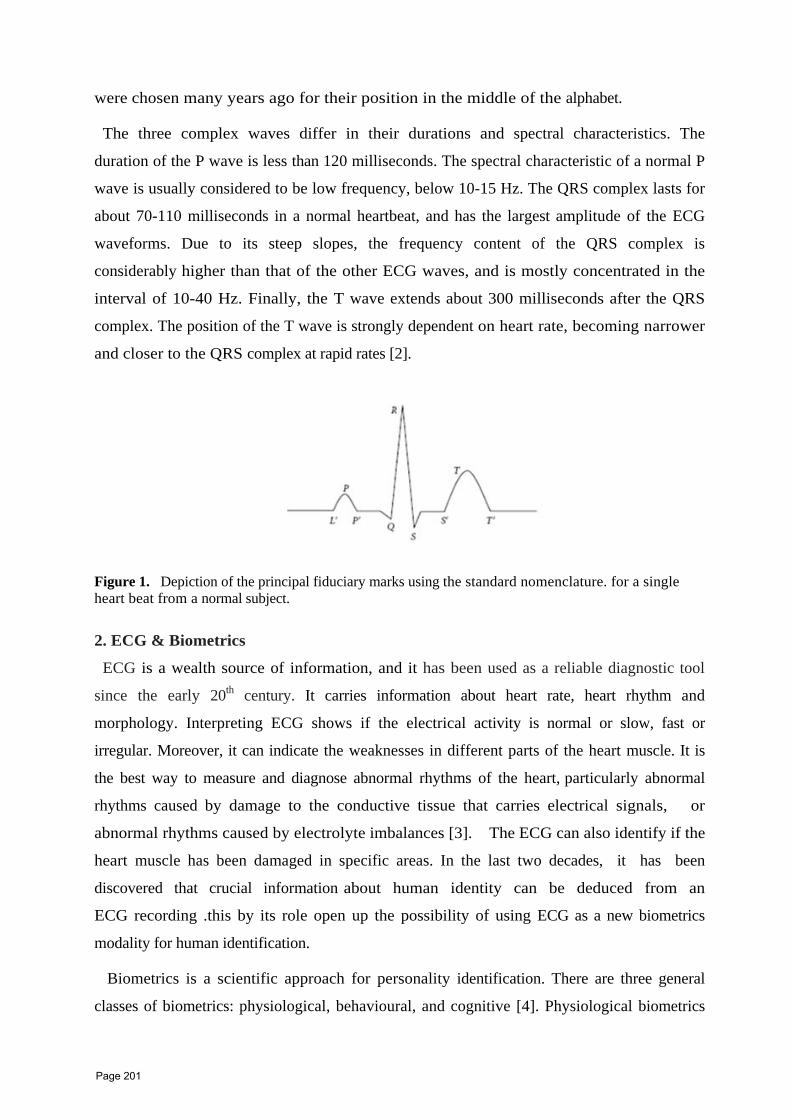
were chosen many years ago for their position in the middle of the alphabet.
The three complex waves differ in their durations and spectral characteristics. The
duration of the P wave is less than 120 milliseconds. The spectral characteristic of a normal P
wave is usually considered to be low frequency, below 10-15 Hz. The QRS complex lasts for
about 70-110 milliseconds in a normal heartbeat, and has the largest amplitude of the ECG
waveforms. Due to its steep slopes, the frequency content of the QRS complex is
considerably higher than that of the other ECG waves, and is mostly concentrated in the
interval of 10-40 Hz. Finally, the T wave extends about 300 milliseconds after the QRS
complex. The position of the T wave is strongly dependent on heart rate, becoming narrower
and closer to the QRS complex at rapid rates [2].
Figure 1. Depiction of the principal fiduciary marks using the standard nomenclature. for a single heart beat from a normal subject.
2. ECG & Biometrics
ECG is a wealth source of information, and it has been used as a reliable diagnostic tool
since the early 20th century. It carries information about heart rate, heart rhythm and
morphology. Interpreting ECG shows if the electrical activity is normal or slow, fast or
irregular. Moreover, it can indicate the weaknesses in different parts of the heart muscle. It is
the best way to measure and diagnose abnormal rhythms of the heart, particularly abnormal
rhythms caused by damage to the conductive tissue that carries electrical signals, or
abnormal rhythms caused by electrolyte imbalances [3]. The ECG can also identify if the
heart muscle has been damaged in specific areas. In the last two decades, it has been
discovered that crucial information about human identity can be deduced from an
ECG recording .this by its role open up the possibility of using ECG as a new biometrics
modality for human identification.
Biometrics is a scientific approach for personality identification. There are three general
classes of biometrics: physiological, behavioural, and cognitive [4]. Physiological biometrics
Page 201
deals with anatomical traits that are unique to an individual such as: face, fingerprint and iris.
Behavioural biometrics deals with functional traits such as: signature, gait and keystroke.
Cognitive biometrics relies on the outputs of the central and peripheral nervous systems, such
as the electroencephalogram, electrocardiogram, and sudation patterns. Although
physiological biometrics has recorded lower error rates than behavioural biometric,
physiological biometrics requires dedicated and expensive hardware. Cognitive biometrics -
such as the ECG is a relatively recent approach - relying on the modulation of the biosignals
such as the ECG by the cognitive and emotional state of the individual. The validity of using
ECG for biometric recognition is supported by the fact that the physiological and
geometrical differences of the heart in different individuals display certain uniqueness in
their ECG signals. Human individuals present different patterns in their ECG regarding wave
shape, amplitude, PT interval, due to the difference in the physical conditions of the heart.
Moreover, collecting the ECG for someone only needs few electrodes or even one electrode is
enough for identification process [5], [6]. Finally, ECG signals can not be falsified as other
biometric traits (ex: fingerprint and iris), which recently can be falsified by the aid of new
technology.
A typical ECG identification (verification) system usually consists of three crucial stages:
1) pre-processing stage where the signal is filtered for noise and baseline removal then
segmentation process takes place to detect individual heartbeats from the signal; 2) feature
extraction where a set of features that represent the distinctive characteristic of an
individual is extracted from each heartbeat, Most of the existing approaches rely on
extracting a set of analytical features which represents the amplitude of the signal fiducial
points: P, Q, R, S and T and also the durations between them. Moreover, features are
usually normalized (divided by duration of a full heartbeat) to avoid the effect of heart rate
variability; 3) classification, the extracted features are fed into a classifier to be classified.
For human identification, (one to many) classification is considered; features are classified
to one of the enrolled individuals in the system. While for human verification, (one to one)
classification occurs, the input features are checked if they match the features of a specific
individual enrolled in the system or not.
Dealing with ECG is a very challenging problem. First of all, raw ECG data contain
noise and artifact components that alter the expression of the ECG trace from the ideal
structure and render any interpretation inaccurate and misleading. Most of the existing
systems utilize a simple Butterworth filter with cut-off frequencies of 1-40Hz (ECG spectra)
as a pre-processing stop for removing noise. However, not all frequencies of noise are below 1
Page 202

or more than 40 Hz, some of them overlap with the spectra of the ECG signal. Moreover, any
rapid change in the heart rate usually shifts the ECG spectrum from the predefined
frequency band dictated by the fix cut-off frequencies of the Butterworth filter [7]. Therefore, it
is important to become acquainted with the common types of noise and artifacts contained
in the ECG and describe a method which can compensate for their presence before
proceeding to the feature extraction stage.
In addition to noise problem, there is another challenging issue in dealing with ECG
signals fiducial points detection, which is very essential for feature extraction. Since
most of the existing works utilize feature vectors that are measured from different parts of
the ECG signal. These features are either time duration, or amplitude differences between
fiducial points. However, accurate fiducial detection is a difficult task due to the
high sensitivity of ECG signals. Also, current fiducial detection machines are built solely for
the medical field, where only the approximate locations of fiducial points are required for
diagnostic purposes. Even if these detectors are accurate in identifying exact fiducial
locations validated by cardiologists, there is no universally acknowledged rule for
defining exactly where the wave boundaries lie [8]. These reasons encourage the
researchers recently to utilize appearance feature extraction methods where only R peak
detection is needed and sometimes without fiducial points detection at all as in [9, 10,
11]. Appearance features represent holistic patterns in ECG signals, instead of amplitude
and duration between fiducial points.
3. Related Work
Biel et al. [12] were among the first to examine the applicability of analyzing ECGs for
human identification. A set of 30 temporal and amplitude features from heart beats that are
normally used in clinical diagnosis is extracted. The features are obtained directly from
SIEMENS ECG equipment. A feature selection algorithm based on simple analysis of the
correlation matrix is utilized to reduce the dimension of features. Further selection of
feature set is based on experiments. The experiments involved 20 subjects of varying ages.
A 100% human identification rate was achieved. However, using a specific apparatus for
feature extraction causes a lack of automatic recognition which is considered as a major
drawback in this method.
Kyoso and Uchiyama [13] proposed detecting the locations of the fiducial points of the ECG
signal using the second derivative waveform. Only 4 duration features are extracted from
each heartbeat, which are P wave duration, PQ interval, QRS interval and QT interval. Every
Page 203
possible two feature combination from the four extracted features is used with
Discriminant analysis for classification, Mahalanobis' generalized distance has been
applied as a criterion for discrimination. Experiments were carried out to show the system
performance for every possible pair of feature parameters with heartbeats of 9 subjects. It is
obvious that there is a large variation in the achievable accuracy with the different
combinations. The highest accuracy was achieved using the combination of QRS interval and
QT interval features and also the combination of QRS interval and PQ interval features
provided accurate results. These results encourage the authors to suggest the use of a
combination of these three features for better accuracy.
Shen et al. [5] proposed a two-step scheme for identity verification from one-lead ECG.
A template matching method is first used to compute the correlation coefficient for
comparison of two QRS complexes. A decision-based neural network (DBNN) approach is
then applied to complete the verification from the possible candidates selected with template
matching. The inputs to the DBNN are seven temporal and amplitude features extracted from
QRST wave. The experimental results from 20 subjects showed that the correct verification
rate was 95% for template matching, 80% for the DBNN, and 100% for combining the two
methods. Shen et al. [6] extended the proposed methods in a larger database that contains 168
normal healthy subjects. Template matching and mean square error (MSE) methods
were compared for prescreening, and distance classification and DBNN compared
for second-level classification. The features employed for the second-level classification
are seventeen temporal and amplitude features. The best identification rate for 168 subjects is
95.3% using template matching and distance classification.
Palaniappan and Krishnan [14] proposed an approach that utilizes features extracted from
QRS segment of ECG signals. Six features are extracted: R-R interval, R amplitude, QRS
interval, QR amplitude, RS amplitude and finally a form factor of the QRS segment is
introduced. The Form factor is a measure of the complexity of the QR signal. The
performance of Multilayer Perceptron and Simplified Fuzzy ARTMAP (SFA) neural
network classifiers was compared. Experiments were carried out on 2000 heartbeats from 10
subjects (200 per each). The dataset is partitioned into two halves, one for training and the
other for testing. 97.6% was the best identification accuracy achieved by the MLP classifier,
while 84.5% was the best result achieved by SFA. The MLP outperforms the SFA classifier.
However, the SFA has the advantage of incremental learning ability, no need to be retrained
if new subject is added. The drawback of this approach is that it ignores the effective
features that can be taken from the P and T waves and can help in improving the performance.
Page 204
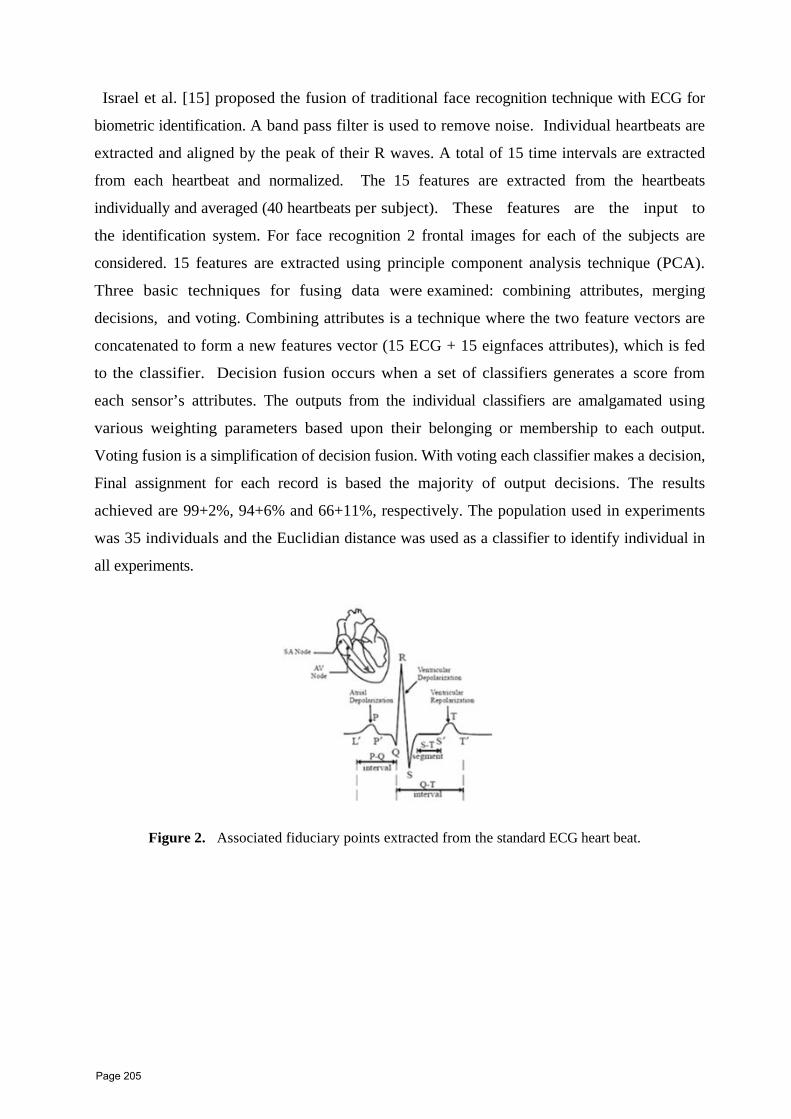
Israel et al. [15] proposed the fusion of traditional face recognition technique with ECG for
biometric identification. A band pass filter is used to remove noise. Individual heartbeats are
extracted and aligned by the peak of their R waves. A total of 15 time intervals are extracted
from each heartbeat and normalized. The 15 features are extracted from the heartbeats
individually and averaged (40 heartbeats per subject). These features are the input to
the identification system. For face recognition 2 frontal images for each of the subjects are
considered. 15 features are extracted using principle component analysis technique (PCA).
Three basic techniques for fusing data were examined: combining attributes, merging
decisions, and voting. Combining attributes is a technique where the two feature vectors are
concatenated to form a new features vector (15 ECG + 15 eignfaces attributes), which is fed
to the classifier. Decision fusion occurs when a set of classifiers generates a score from
each sensor’s attributes. The outputs from the individual classifiers are amalgamated using
various weighting parameters based upon their belonging or membership to each output.
Voting fusion is a simplification of decision fusion. With voting each classifier makes a decision,
Final assignment for each record is based the majority of output decisions. The results
achieved are 99+2%, 94+6% and 66+11%, respectively. The population used in experiments
was 35 individuals and the Euclidian distance was used as a classifier to identify individual in
all experiments.
Figure 2. Associated fiduciary points extracted from the standard ECG heart beat.
Page 205

Figure 3. The set of features used by Israel and collegues for their ECG based user authentication scheme (see Fig 2 for their physiological source and reference [15] for full details).
In later work, Israel et al. [16] Proposed a more extensive set of descriptors to characterize
ECG trace. Input ECG signals are filtered using frequency band pass filter between 2KHZ
and 60 KHZ in order to remove noise. Filtered ECG signals are traced to locate fiducial
positions in each heartbeat. 8 points (4 peaks and 4 base points, see figure 2) are detected in
time domain in 2 stages. The peaks have been located by finding the local maximum in a
region surrounding each of the P, R, and Complexes. The base positions have been
determined by tracking downhill and finding the location of the minimum radius of
curvature.15 distance features are then extracted from distances between fiducial points
(figure 3). Since The distances between the fiducial points and the R position varies with heart
rate. Distances are normalized by dividing them by the L’T’distance. A Wilk's Lambda method
is applied for reduction of feature number to 12 features. Classification is performed on
heartbeats using standard linear discriminant analysis. The system was tested on dataset of 29
subjects, and a 100% human identification accuracy was achieved, while the heartbeat
identification rate was 81%. Moreover, the effect of varying ECG lead placement was
tested and no significant differences were observed in the results. Finally, the invariance of
the normalized extracted features to individual's anxiety states (i.e. reading aloud,
mathematical manipulation and driving) was tested and validated.
Plataniotis et al. [9] proposed a new approach for human identification using ECG
signals based on utilizing the coefficients from the Discrete Cosine Transform (DCT) of the
Autocorrelation (AC) sequence of ECG data segments. The main advantage of this approach, it
doesn’t require any waveform detections (fiducial locations) or even extracting of individual
ECG pulses (heartbeats). The ECG records are first filtered, for DC and noise reduction. The
normalized autocorrelation function of each record is estimated over a considered window of
arbitrary length N, origin and M autocorrelation lags. The DCT of the windowed
autocorrelation is calculated and the first C number of significant coefficients is selected.
Normalized Euclidean distance and Gaussian log likelihood are considered for
classification. By experiments, the values of M and C were empirically selected and it was
Page 206

found that the length N is related to the sampling rate of the used database. The system was
tested on 14 healthy subjects from PTB database, and 100% subject recognition rate was
achieved.
Wang et al. [8] proposed an approach that integrates both analytical and appearance features
in a hierarchical scheme. After the ECG records are filtered for noise reduction, they are
segmented into individual heartbeats based on the localization of R wave peaks. Fiducial
points Q, S, P and T are located by finding local minima and maxima separately, while
minimum radius curvature is used to locate the onset and end of P and T. A total of 21
analytical features (15 distance and 6 amplitude features) are extracted and a Wilk's Lambda
method is applied for reduction of feature number (the same approach done by Israel et al.
[15]). Appearance features are extracted by using Principle Component Analysis (PCA)
and Linear Discriminant Analysis (LDA) for comparison. Nearest center, K-nearest
neighbors (K-NN) and again Linear Discriminant Analysis (LDA) are utilized for classification.
Experiments on 13 healthy subjects (records for same subject are taken few years apart)
showed that an identification rate of 84.61% and a heartbeat identification rate of 74.45%
were achieved using only analytical features and LDA for classification. Using the appearance
PCA features increase the recognition rates to 100% and 95.55% respectively using K-NN.
Furthermore, a simple fusion of both kinds of features improves the performance by around 1%
using LDA classifier. Finally, a hierarchical scheme is proposed, at the first step, only analytic
features are used for provides us the potential classes that the entry might belongs to. If all
the heartbeats are classified as one subject, decision module output this result directly. If the
heartbeats are classified as a few different subjects, a new PCA based
classification module which is dedicated to classify these confused subjects is then applied.
100% correct human identification rate and 98.90% accuracy for heartbeat identification
were achieved. In later work, Wang et al [8] utilized the significant coefficients of the discrete
cosine transform (DCT) of the autocorrelated heartbeat signals. This system was tested on PTB
and MIT-BIH public databases. A human identification rate of 100% for both datasets was
achieved, and heartbeat identification accuracy of 94.47% for PTB and 97.8% for MIT-BIH.
Singh and Gupta [17] developed a method in a series of steps: 1) a preprocessing step that
includes correction of signal from noise artifacts. 2) an existing QRS and new P and T
delineators (developed by the authors) are utilized to detect QRS, P and T waves,
respectively from the ECG records; 3) 19 stable features related to interval, amplitude and
angle are computed from each heartbeat; 4) finally the extracted features are
Page 207
classified using template matching and adaptive thresholding. The accuracy achieved by
the system was 99% on the data set of 125 recordings prepared from 25 healthy individual
ECG from QT database; records for same subject are taken few years apart.
Chan et al. [18] introduced a novel distance measure based on the wavelet transform for
identifying PQRST waveforms (heartbeats). PQRST waveforms are detected automatically
using the multiplication of backward differences algorithm and temporally aligned using a
cross-correlation measurement, and the signal-to-noise ratio was improved by ensemble
averaging. Three different quantitative measures: percent residual difference,
correlation coefficient, and a novel distance measure based on the wavelet transform were used
and compared for classification. The system was tested on a dataset of 50 healthy subjects,
3 records per subject, one used as enrollment data and the others for testing. A
classification accuracy of 95% was achieved by the wavelet distance measure,
outperforming the other methods by over than 10%. Later, Chan et al. [19] proposed the
combination of the methodologies the correlation coefficient CCORR and a wavelet distance
WDIST measure. This approach was tested on a dataset of 60 healthy subjects (data include 50
subjects previously reported by [18] and the system accuracy was improved at all rank levels.
Wan and Yao [20] proposed an artificial neural network (ANN) based approach for
identifying ECGs. After removing noise from ECG signals, 40 heartbeats are extracted for
each subject. The 40 heartbeats were reduced to a dataset of 10 heartbeats by averaging every 4
heartbeats to one heartbeat, to reduce the effects of signal variation effects to identification
performance. Each of the 10 heartbeat in a dataset is decomposed into 256 wavelet
coefficients. These coefficients are used as input vectors to a 3 layer feedforward neural
network. The network input layer accepts 2 heartbeats wavelet coefficients (512-element
vector) as the input vector. The output of the neural network generates the discrimination results
which indicate whether the two heartbeats in the input vector come from the same or two
different individuals. If the two wavelet coefficient structures in the input vector belong to the
same individual, the network output is +1; otherwise -1. Finally the network is tested by new
datasets of 15 subjects and all of them are successfully identified. The main advantage of using
ANN is that it gives the system the ability to identify those subjects with poor ECG
signals.
Irvine and Israel [21] proposed a new methodology for identity verification that quantifies the
minimum number of heartbeats required to authenticate an enrolled individual. The approach is
Page 208

based on the statistical theory of sequential procedures. The procedure extracts fiducial
features from each heartbeat to compute the test statistics in a fashion similar to Israel et al.
[16].Sampling of heartbeats continues until a decision is reached—either verifying that
the acquired ECG matches the stored credentials of the individual (H0) or that the ECG
clearly does not match the stored credentials for the declared identity (H1). The system was
first tested on a dataset of 29 persons, and the approach arrives at the correct decision in
fifteen heartbeats or fewer in all but one instance and in most cases the decision is reached with
half as many heartbeats. Later on, the dataset was extended to include 104 subjects and the
system achieved the same results. Moreover, the invariance of the system to ECG electrode
placement and individual’s state of anxiety was tested and proved.
A new wavelet based framework is introduced and evaluated by Fatemian and
Hatzinakos [7]. The proposed system utilized a robust preprocessing stage that is directly
applied on the raw ECG signal for noise handling. Furthermore, one of the novelties of this
system is the design of personalized heartbeat template so that the gallery set consists of only
one heartbeat per subject. A dyadic wavelet transform (DWT) is applied to the raw ECG
signals, and then the signals are reconstructed at the third scale where most of the signal
energy is retained. Further smoothing via moving average is applied. By utilizing the
computed wavelet coefficients the deflected heartbeats are removed. The remaining
heartbeats are then resampled, normalized and using the median of the aligned heartbeats, the
heartbeat template for each subject is constructed. Finally, classification is
accomplished based on the correlation among templates. The system was evaluated over 2
common databases: MIT-BIH (13 subjects) and the PTB (14 subjects), and an accuracy of
99.6% was achieved.
Page 209

Table 1: shows the consideration of the stability issues of ECG by the existing systems
[12] [13] [5,6] [14] [15] [16] [9] [8] [17] [18, 19]
[20] [21] [7]
Automatically extracted features
Utilization of analytical features
Utilization of appearance
features
Consideration of heart rate variability
Scalability Dealing with
unhealthy subjects
Individual's anxiety states
are considered
ECG records for same
subject are few years
apart (effect of age)
Consideration of heart beat recognition
accuracy
5. Conclusion
The ECG has been used as a clinical tool for over a century - and is extremely well
characterized. This large knowledge base provides a range of analytical tools that can be
harnessed for its deployment as a biometric. The feature space of the ECG is quite rich - with
many studies producing 30 or more features. Many of these features are based on pure
fiduciary marks - such as the R-R interval, and are dependent on accurate location of
fiduciary marks in the recorded time series. Typically, 8-10 features can be obtained in this
way. In addition, spectral analysis can yield a large number of features - typically 20 or so
have been utilized, either alone or in conjunction with typical landmark (fiducial) feature
sets. This is a large feature space significantly facilitates the classification task.
Consider signature and gait analysis, which typically only utilize six or so features - this is a
real luxury. The time required for the data collection is fairly minimal - subjects are
Page 210

typically required to sit for 10-30 seconds - this will produce approximately 10-30 heart beat
samples- which are typically more than enough to construct a model of the subject and
perform the actual authentication task. The equipment used is becoming more user
friendly. The standard 12-lead ECG setup used in clinical practice is not required - in our
laboratory we routinely use a 3-lead system, which can be attached to the forearms if there is no
typing involved in the authentication process. Otherwise, the leads should be placed on the
torso. Therefore, with respect to ease of use - and hence acceptability, the ECG is a very
viable biometric approach. What is also extremely important is the effectiveness of the ECG based approach.
The case studies presented in this survey indicate that accuracies well above 95% can be
readily obtained - comparable to values associated with fingerprint based scenarios. These
classification rates are derived from both user authentication (a 1:1 task) and user
identification (a 1:N task), though the data on the identification task is still wanting. One
issue with the data on user authentication is that the cohorts in most studies are fairly small -
typically 20 or so subjects are deployed in published studies. There is no a priori reason why the
approach will not scale to larger cohorts - but it would be very useful to deploy studies with
100+ subjects on a routine basis - though this is typically practically very difficult. There
are a number of studies that utilize ECG databases - such as the MIT-BIH database, which
contains very large records of subjects. The issue with utilizing static datasets is that there
is no way to change the conditions of the experiment - something that might be very
useful to do. Nevertheless, such data repositories provide a testing ground for
algorithm development.
Lastly, there are issues of the stability of the ECG which are still very challenging (see table 1) -
for instance how does the emotional state of a user affect their ECG - can we develop
emotion invariant algorithms for classification purposes? Another interesting question to
address is how disease alters the ECG? A subject may become ill over time which may
affect their coronary status - this in turn would be detected by the ECG - can we devise methods
tat can cope with changes in coronary function? Typically, we would require the user to
re-enroll periodically, and any change may be incorporated into a new enrollment record that
would include any physiological changes. Exactly how this is handled is a serious matter - not
only for ECG, but more generally across all biometric based approaches to authentication.
Clearly there is still a lot of research needed in this domain - and we strongly encourage the
research community to address these issues and present their findings.
Page 211

References [1] http://en.wikipedia.org/wiki/Willem_Einthoven (accessed 20 July, 2010)
[2] Y.Wang, F. Agrafioti, D. Hatzinakos, and K. Plataniotis, “Analysis of human electrocardiogram for
biometric recognition,” EURASIP Journal on Advances in Signal Processing, vol. 2008, Article ID
148658, 11 pages,2008.
[3] A.J. John & L.A. Fleisher, Electrocardiography: the ECG, Clin Anaesthesiology, 24, pp. 697-
715, 2006.
[4] Revett, K., Behavioral Biometrics: A Remote Access Approach, John Wiley & Sons, ISBN: 978-0-
470-51883-0, 2008.
[5] T. W. Shen, W. J. Tompkins, and Y. H. Hu, “One-lead ECG for identity verification,” in
Proceedings of the 2nd Joint Engineering in Medicine and Biology, 24th Annual Conference and the
Annual Fall Meeting of the Biomedical Engineering Society (EMBS/BMES ’02), vol. 1, pp. 62-63,
Houston, Tex, USA, October 2002.
[6] T. W. Shen, “Biometric identity verification based on electrocardiogram (ECG),” Ph.D.
dissertation, University of Wisconsin, Madison,Wis, USA, 2005.
[7] S.Fatemian and D.Hatzinakos," A new ECG feature extractor for biometric recognition",
Proceedings of the 16th international conference on Digital Signal Processing, pp. 323-328 , IEEE
Press Piscataway, NJ, USA ,2009.
[8] Y.Wang, F. Agrafioti, D. Hatzinakos, and K. Plataniotis, “Analysis of human electrocardiogram for
biometric recognition,” EURASIP Journal on Advances in Signal Processing, vol. 2008, Article ID
148658, 11 pages, 2008.
[9] K. N. Plataniotis, D. Hatzinakos, and J. K. M. Lee, “ECG biometric recognition without fiducial
detection,” in Proceedings of Biometrics Symposiums (BSYM ’06), Baltimore, Md, USA, September
2006.
[10] Y. Wang, K. N. Plataniotis, and D. Hatzinakos, “Integrating analytic and appearance attributes
for human identification from ECG signal,” in Proceedings of Biometrics Symposiums (BSYM
’06), Baltimore, Md, USA, September 2006.
[11] S.Fatemian and D.Hatzinakos," A new ECG feature extractor for biometric recognition",
Proceedings of the 16th international conference on Digital Signal Processing, pp. 323-328 , IEEE
Press Piscataway, NJ, USA ,2009.
[12] L. Biel,O. Pettersson, L. Philipson, and P.Wide, “ECG analysis: a new approach in human
identification,” IEEE Transactions on Instrumentation and Measurement, vol. 50, no. 3, pp. 808-812,
2001.
[13] M. Kyoso and A.Uchiyama, “Development of an ECG identification system,” in Proceedings of the
23rd Annual International Conference of the IEEE Engineering in Medicine and Biology Society
(EMBS ’01), vol. 4, pp. 3721-3723, Istanbul, Turkey, October 2001.
[14] R. Palaniappan and S. M. Krishnan, “Identifying individuals using ECG beats,” in Proceedings
Page 212

On the Use of the Electrocardiogram for Biometric Authentication
ICI 10 - 10TH INTERNATIONAL CONFERENCE ON INFORMATION
14
of the International Conference on Signal Processing and Communications (SPCOM ’04), pp. 569-
572, Bangalore, India, December 2004.
[15] S. A. Israel, W. T. Scruggs, W. J. Worek, and J.M. Irvine, “Fusing face and ECG for personal
identification,” in Proceedings of the 32nd Applied Imagery Pattern Recognition Workshop (AIPR’03),
pp. 226–231, Washington, DC, USA, October 2003.
[16] S. A. Israel, J. M. Irvine, A. Cheng, M. D. Wiederhold, and B. K. Wiederhold, “ECG to identify
individuals,” Pattern Recognition, vol. 38, no. 1, pp. 133-142, 2005.
[17] Y. N. Singh and P. Gupta, " ECG to Individual Identification", Prabhu Goel Security Center of IIT,
Kanpur, 2006.
[18] A. D. C. Chan, M. H. Hamdy, A. Badre, V. Badee, “Wavelet distance measure for person
identification using electrocardiograms,” submitted to IEEE Trans Instrum Meas, 2005.
[19] A.D.C. Chan, M. H. Hamdy, A. Badre, V. Badee, "person identification using
electrocardiograms", IEEE Transactions on Instrumentation and. Measurement, Vol. 57, No. 2,
pp.248-253. February 2008.
[20] Y. Wan and J. Yao, "A Neural Network to Identify Human Subjects with Electrocardiogram
Signals", Proceedings of the World Congress on Engineering and Computer Science 2008, WCECS
2008, October 22 - 24, 2008, San Francisco, USA.
[21] J. M. Irvine and S. A. Israel, " A Sequential Procedure for Individual Identity Verification Using
ECG", Hindawi Publishing Corporation EURASIP Journal on Advances in Signal Processing Volume
2009, Article ID 243215, 13 pages,2009.
Page 213
GAMASA, EGYPT, 4 – 6 DECEMBER 2010
A Survey of Techniques Used in Human Identification Based on Cognitive Biometrics: the Electroencephalogram
Wael H. Khalifa1, Abdel Badeeh Salem1, Kenneth Revett2, Mohamed Roushdy1
1 Faculty of Computer and Information Sciences, Ain Shams University, Cairo, Egypt
2 British University in Egypt, Egypt.
Abstract An Electroencephalogram (EEG) is the recording of electrical activity recorded from the surface of the skull that records the synchronized electrical activity of neurons within the brain. There is a significant heritability of brain wave patterns, especially in the alpha and beta bands, which indicates that there is a significant amount of individuality in the EEG within these frequency bands. That there is a genetic component of the EEG provides support to its applicability for person authentication and/or identification - as a biometric. This survey presents the common steps for developing a human identification systems based on EEG signals, along with a sample of results obtained from their use derived from a random selection of case studies.
Keywords: Artificial Intelligence; Cognitive Biometrics; Electroencephalogram; Signal Processing; User Identification
1. Introduction
Biometrics is the process of uniquely identifying individuals based on one or more physical,
behavioral, or cognitive characteristics. Physiological biometrics is related to the physical
characteristics of one or more body parts such as the fingerprint, face, or hand geometry.
Behavioral biometrics utilizes information derived from a person’s behavior, such as typing
rhythm, gait and signature. Cognitive biometrics relies on the outputs of the central and
peripheral nervous systems, such as the electroencephalogram, electrocardiogram, and sudation
patterns.
Therefore, the deployment of the EEG falls within the realm of cognitive biometrics.
Cognitive biometrics is a relatively new approach to user authentication - relying on signals
produced by cognitive and emotional responses mediated by nervous tissue. Many of the
responses are stereotypical - such as sudation (sweating) when an individual is placed under
duress or stressful scenarios. In addition, people tend to respond in characteristic ways that
seems to be genetically determined. If these responses can be measured accurately under
authentication scenarios, one may be able to produce an authentication system that is robust,
Page 214

Electroencephalogram theft proof, and stable, and acceptable by the majority of users. This paper presents to the
general reader some background information on the EEG, along with several case studies
where the EEG has been successfully applied as a cognitive biometric.
There are several techniques of recording brain activities such as magneto encephalography
(MEG) and functional magnetic resonance imaging (fMRI), and electroencephalography
(EEG). In this survey, the focus will be on the deployment of the EEG as a biometric. The
reason for this is simply one of ease of use. An fMRI requires that a person is housed within
the bore of a large magnet - a very large and expensive piece of equipment. It is simply not
feasible to have one in every office!
EEG signals are brain activities recorded from electrodes positioned on the scalp via a cap
which is very similar to that used by swimmers. The electrodes are placed within the cap,
which is easily placed over a person’s head. The electrodes emanate from the cap - which may
be attached to a recording device which may then transmit the signals wirelessly to a computer
for storage and analysis purposes. The EEG is the most practical capturing method that can be
used in biometrics due to the advances in its hardware devices; there are some a EEG signal
capturing device that are equal in size to a mobile phone or computer headset. Data can be
acquired continuously, typically sampled at 0.5-1KHz, and filtered as appropriate to remove
artifacts such as line noise. After the EEG signals have been collected, they can be analyzed
using a variety of signal processing approaches. Lastly, a wide range of machine learning
algorithms have been applied to perform the classification process - with the goal of
determining if a given EEG recording belongs to a particular individual requesting
authentication - much like matching a password to a login ID. The viability of this approach
will be examined in this paper through a series of published case studies.
Typically, biometrics is deployed to gain access to a trusted computer system. For instance, a
password is typically used and forms the basis of C2 level security. A difficulty with a
password is that they can be lost, stolen, guessed, or forgotten. Alternative approaches to user
authentication have been suggested - such as fingerprints, retinal patterns, hand geometry,
keystroke dynamics, etc (see [1] for a review). It is generally agreed by the relevant research
community and industry that for a system to be deployable as a biometric, it should meet the
following requirements:
a) Changeability: If the user’s authentication information is compromised, we must be
able to replace this information (and revoke any old password or access credential).
Page 215

Electroencephalogram
b) Shoulder-surfing resistance: The scheme must not be vulnerable to shoulder-surfing,
particularly in the presence of ubiquitous visual recording devices.
c) Theft protection: This includes physical theft and the computational infeasibility of
guessing attacks. If we must rely on the entropy of an authentication scheme for
protection against off-line dictionary attack, we require an authentication method whose
entropy can scale with processor speeds
d) Protection from user non-compliance: To discourage unintended transfer to other
parties, the user should not be able to write down (in a manner useful to an attacker) or
share their authentication information “too easily”.
e) Stable over time: the period of stability should be kept at realistic limits - typically a
password is changed every 2 weeks - depending on the security requirements. A
fingerprint on the other hand should last a lifetime - but may be altered through
physical damage. A person's EEG should be stable for their lifetime - though there may
be subtle changes at the extremes of age - infants versus the elderly. But typically, the
feature used must be stable over the expected period over which it would normally be
changed.
f) Easy to deploy: we want a fast and simple means to authenticate ourselves. This is
probably why fingerprints are considered a popular method - as it is very quick and
non-invasive. Being placed into an MRI scanner is probably not a viable solution, but
recording an EEG is typically fast and with the deployment of dry electrodes, obviates
the need for a cap and conductive gels - making it a feasible approach.
The discovery of electrical currents in the brain was discovered in the latter half of the 19th
century, but understanding the meaning of such currents advanced in the past years more
rapidly as the technology improved allowing researchers to capture more data accurately.
Moreover, the advancement in the signal processing and data classification techniques helped
researches to use the data captured in disease diagnosis, brain computer interface and finally
user identification. Several classifiers were experimented for the use of EEG signals in user
identification such as neural networks, fisher’s classifier and linear classifier. In Each
experiment the subjects were asked to do one or more mental tasks such as solving a
mathematical problem, mental visual counting, composing a letter or even just resting.
Depending on the tasks and the classifiers used several experiments were conducted that
Page 216
Electroencephalogram showed very promising results in the use of this characteristic as a behavioral biometric
feature.
The need of a new behavioral biometric is derived from the need of securing important
facilities and important information. Most of the market available secure systems can be
penetrated by hacking or by a mistake of one the authorized personnel. The good thing about
using EEG is that it covers all the above mentioned requirements unlike other techniques.
Users can change their password by selecting different mental tasks, its prone to shoulder
surfing no one can view your thoughts, Users have to do the authentication their selves, they
can’t give a copy of the password and they have to be alive. One of the most commonly used
authentication techniques is finger print recognition; if the user fingerprint is captured by an
intruder, when the system administrators discover this breach the user and the intruder will be
prevented from entering the system, The benefits of EEG based authentication system is
enormous, it has all the principle benefits of more traditional authentication methods.
In this paper we investigate the various techniques and experiments that were developed for
using EEG signals as a user identification characteristic. In the next section we present a brief
summary on the medical aspects of the EEG signals in section three we describe the methods
of capturing EEG signals and user identification methodology. In section four we discuss the
techniques used to identify the users. Finally, we present a brief discussion.
2. Medical Aspects of EEG
The electrical currents in the brain were discovered in 1875 by an English physician Richard
Caton. He observed the EEG from the exposed brains of rabbits and monkeys. In 1924 Hans
Berger, a German neurologist, used his ordinary radio equipment to amplify the brain's
electrical activity measured on the human scalp [2]. He announced that weak electric currents
generated in the brain can be recorded without opening the skull, and depicted graphically on a
strip of paper. The activity that he observed changed according to the functional status of the
brain, such as in sleep, anesthesia, and lack of oxygen and in certain neural diseases, such as in
epilepsy. [3]
EEG signals are generated from activities in the neurons. When the neurons are activated, local
current flows are produced. EEG measures mostly the currents that flow during synaptic
excitations of the dendrites of many pyramidal neurons in the cerebral cortex. Differences of
electrical potentials are caused by summed postsynaptic graded potentials from pyramidal cells
Page 217
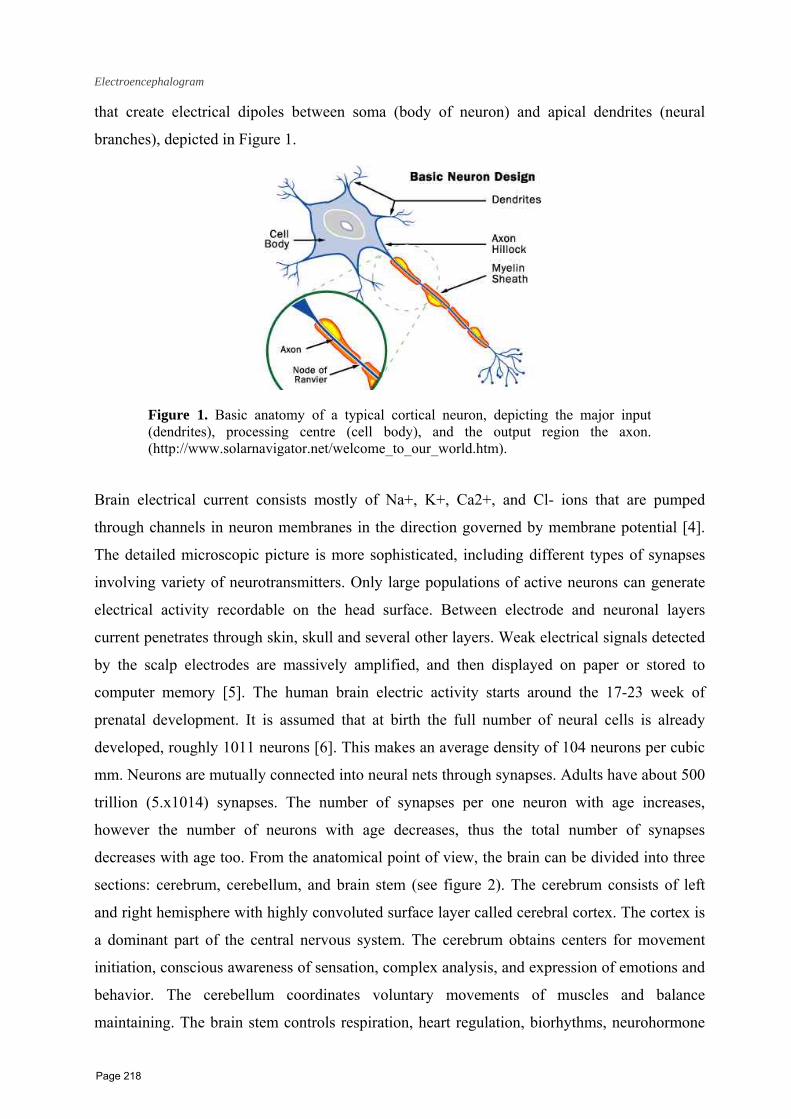
Electroencephalogram that create electrical dipoles between soma (body of neuron) and apical dendrites (neural
branches), depicted in Figure 1.
Figure 1. Basic anatomy of a typical cortical neuron, depicting the major input (dendrites), processing centre (cell body), and the output region the axon.(http://www.solarnavigator.net/welcome_to_our_world.htm).
Brain electrical current consists mostly of Na+, K+, Ca2+, and Cl- ions that are pumped
through channels in neuron membranes in the direction governed by membrane potential [4].
The detailed microscopic picture is more sophisticated, including different types of synapses
involving variety of neurotransmitters. Only large populations of active neurons can generate
electrical activity recordable on the head surface. Between electrode and neuronal layers
current penetrates through skin, skull and several other layers. Weak electrical signals detected
by the scalp electrodes are massively amplified, and then displayed on paper or stored to
computer memory [5]. The human brain electric activity starts around the 17-23 week of
prenatal development. It is assumed that at birth the full number of neural cells is already
developed, roughly 1011 neurons [6]. This makes an average density of 104 neurons per cubic
mm. Neurons are mutually connected into neural nets through synapses. Adults have about 500
trillion (5.x1014) synapses. The number of synapses per one neuron with age increases,
however the number of neurons with age decreases, thus the total number of synapses
decreases with age too. From the anatomical point of view, the brain can be divided into three
sections: cerebrum, cerebellum, and brain stem (see figure 2). The cerebrum consists of left
and right hemisphere with highly convoluted surface layer called cerebral cortex. The cortex is
a dominant part of the central nervous system. The cerebrum obtains centers for movement
initiation, conscious awareness of sensation, complex analysis, and expression of emotions and
behavior. The cerebellum coordinates voluntary movements of muscles and balance
maintaining. The brain stem controls respiration, heart regulation, biorhythms, neurohormone
Page 218

Electroencephalogram and hormone secretion, etc [5]. The highest influence to EEG comes from the electrical activity
of cerebral cortex due to its surface position and the synchronicity of pyramidal neurons that
are aligned perpendicular to the cortical surface.
Figure 2. Regions (lobes) of the human brain, along with other major anatomical landmarks (Source: (http://msnowe.files.wordpress.com/2009/06/brain_witelson1.jpg).
EEG signals are sinusoidal waves, their amplitude is normally between 0.5 and 100 μV. After
applying a Fourier transform to the row signals and the power spectrum is generated, we have
four groups of waves [7] see figure 3:
• Delta 0.5-4, usually happens during deep sleep
• Theta 4-7.5 Hz, theta waves in adults while awake is abnormal, they are generated by
access to unconscious material, deep inspiration and meditation
• Alpha 8-13 Hz, appears during relaxation without attention and concentration.
• Beta 14-26 Hz Usual working rhythm
• Gamma 30+ Hz associated with memory consolidation
Figure 3. Representative time series of the classical frequency bands containedwithin EEG recordings - typically called 'Brain waves’.
Page 219

Electroencephalogram
3. Experiment Aspects
3.1. Task Definition
Each part of the brain is responsible for a certain mental or physical activity. The identification
technique will require that the user perform a certain mental task. Accordingly this task will
trigger neurons in a certain parts of the brain that is responsible for handling such task.
Different tasks have been used; the most used task was just letting the user stay still in a quite
environment and relax; then capture the signal for a period of time to identify the user. Several
tasks were later introduced; R. Palaniappan used the following five different tasks in his
experiment [8]:
• Baseline task. The subjects were asked to relax and think of nothing in particular. This
task was used as a control and as a baseline measure of the EEG signals.
• Geometric figure rotation task. The subjects were given 30s to study a particular three-
dimensional block object, after which the drawing was removed and the subjects were
asked to visualize the object being rotated about an axis. The EEG signals were
recorded during the mental rotation period.
• Math task. The subjects were given nontrivial multiplication problems, such as 79 times
56 and were asked to solve them without vocalizing or making any other physical
movements. The tasks were non-repeating and designed so that an immediate answer
was not apparent. The subjects verified at the end of the task whether or not he/she
arrived at the solution and no subject completed the task before the end of the 10s
recording session.
• Mental letter composing task. The subjects were asked to mentally compose a letter to a
friend or a relative without vocalizing. Since the task was repeated for several times the
subjects were told to continue with the letter from where they left off.
• Visual counting task. The subjects were asked to imagine a blackboard and to visualize
numbers being written on the board sequentially, with the previous number being
erased before the next number was written. The subjects were instructed not to
verbalize the numbers but to visualize them. They were also told to resume counting
from the previous task rather than starting over each time.
Page 220
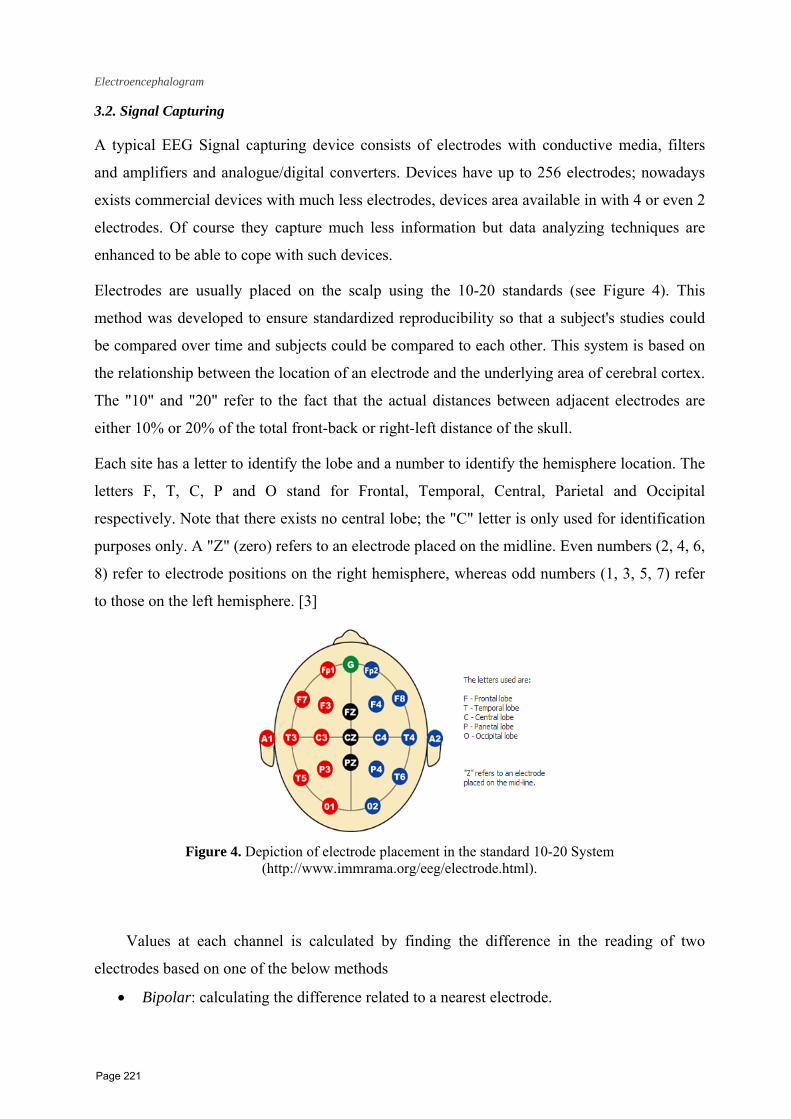
Electroencephalogram 3.2. Signal Capturing
A typical EEG Signal capturing device consists of electrodes with conductive media, filters
and amplifiers and analogue/digital converters. Devices have up to 256 electrodes; nowadays
exists commercial devices with much less electrodes, devices area available in with 4 or even 2
electrodes. Of course they capture much less information but data analyzing techniques are
enhanced to be able to cope with such devices.
Electrodes are usually placed on the scalp using the 10-20 standards (see Figure 4). This
method was developed to ensure standardized reproducibility so that a subject's studies could
be compared over time and subjects could be compared to each other. This system is based on
the relationship between the location of an electrode and the underlying area of cerebral cortex.
The "10" and "20" refer to the fact that the actual distances between adjacent electrodes are
either 10% or 20% of the total front-back or right-left distance of the skull.
Each site has a letter to identify the lobe and a number to identify the hemisphere location. The
letters F, T, C, P and O stand for Frontal, Temporal, Central, Parietal and Occipital
respectively. Note that there exists no central lobe; the "C" letter is only used for identification
purposes only. A "Z" (zero) refers to an electrode placed on the midline. Even numbers (2, 4, 6,
8) refer to electrode positions on the right hemisphere, whereas odd numbers (1, 3, 5, 7) refer
to those on the left hemisphere. [3]
Figure 4. Depiction of electrode placement in the standard 10-20 System
(http://www.immrama.org/eeg/electrode.html).
Values at each channel is calculated by finding the difference in the reading of two
electrodes based on one of the below methods
• Bipolar: calculating the difference related to a nearest electrode.
Page 221

Electroencephalogram
• Referential: calculating the difference with reference to the ear lobe so nodes at the
right side of the head use reference of the right ear, and the left with the left ear.
• Common reference, calculating the difference to a single electrode reference for all
electrodes.
Based on the mental tasks that the user will perform, activities should be expected at certain
channels which reflect the part of the brain responsible for this activity.
4. Processing Techniques In this section we will discuss various techniques used in human identification based on EEG Signals
4.1. Fisher’s Discriminant Analysis
Riera and colleagues have developed a multimodal authentication algorithm based on EEG and
ECG signals [9]. They conducted the test on 40 healthy subjects. Each subject was required to
sit in a comfortable armchair, to relax, be quiet and close their eyes. Then three 3 minute takes
are recorded to 32 subjects and four 3 minutes takes are recorded to the 8 subjects. The 32
subject set are used as reference subject in the classification stage and the 8 subjects are the
ones that are enrolled into the systems. Then several 1 minute takes are recorded afterwards to
these enrolled subjects, in order to use them as authentication tests. Two electrodes were used
to capture the EEG signals and 2 for the ECG. The data was divided to four seconds epochs.
Two types of Features were extracted from the four seconds epochs, one channel features
(Auto regression, Fourier Transform) and Synchronicity features. Three features were selected
from the Synchronicity features namely; Mutual information (measures the dependency degree
between two random variables given in bits, when logarithms of base 2 are used in its
computation), Coherence (quantizes the correlation between two time series at different
frequencies), Correlation measures (measure of the similarity of two signals,). The classifier
used in the authentication process is the classical Fisher’s Discriminant Analysis, Four
different discriminant functions were used (Linear, Diagonal Linear, quadratic, diagonal
quadratic). The five best classifiers from the original 28 classifiers generated for each subject
are selected during the enrollment and authentication of each subject.
The False Acceptance Rate (FAR) is computed taking into account both the intruder and the
impostor cases (21.8%). The True Acceptance Rate (TAR) only takes into account the legal
cases. (71.9%) After combining the 2 signals (EEG and ECG) the TAR is 97.9% and the FAR
is 0.82%.
Page 222
Electroencephalogram 4.2. Linear Discriminant Classifier
R Palaniappan[8] proposed a multiple mental thought identification modal. The
experiment was conducted on four subjects; the subjects were seated in an Industrial Acoustics
Company sound controlled booth with dim lighting and noise-less fan (for ventilation). An
Electro-Cap elastic electrode cap was used to record EEG signals from positions C3, C4, P3,
P4, O1 and O2 defined by the 10-20 system of electrode placement. Each subject was
requested to do up to five mental tasks. Signals were recorded for 10 seconds during each task
and each task was repeated 10 times. Each recording was segmented into 20 segments, each
0.5s length. The five mental tasks performed by the subjects are baseline task (relaxed state),
geometric figure rotation, math task (2 digits, 2 number multiplication), mental letter
composing task, and visual mental counting. The captured data features were extracted using
AR modeling. Six AR coefficients were obtained for each channel, giving a total of 36 feature
vector for each EEG segment for a mental thought. When two mental thoughts were used, the
size of the feature vector was 72 and so forth when more mental thoughts were used.
Linear Discriminant Classifier was used to classify the EEG feature vectors, LDC is a linear
classification method that is computationally attractive as compared to other classifiers like
artificial neural network. Various results were presented showing the error rate using 1,2…5
five combination of the mental tasks. Using 1 task an average of error rate is 2.6%, while using
the 5 mental tasks, the error rate was 0.1%.
4.3. LVQ Neural Net
Cempírek et al. [10], proposed neural network classification technique for user identification.
The algorithm was conducted on a datasets of 8 subjects. The subject was sat is a dim and
silent room, eyes kept closed. Then the EEG recordings were segmented (segment length 180
sec, step 22.5 sec); the single segments were centered. Linear magnitude spectra of the single
segments were computed by Fast Fourier transform (Hamming window was used).
The LVQ neural network is a self–organizing neural network, with added second layer for
vectors classification intended to be used with unlabelled training data. The first network layer
detects subclasses. The second layer combines these subclasses into one single class. Actually,
the first layer computes distance between input and stored patterns; the winning neuron is the
one with minimum distance. Hence LVQ network is a kind of nearest-neighbour classifier; it
does not make clusters, but the algorithm search through the weights of connections between
Page 223
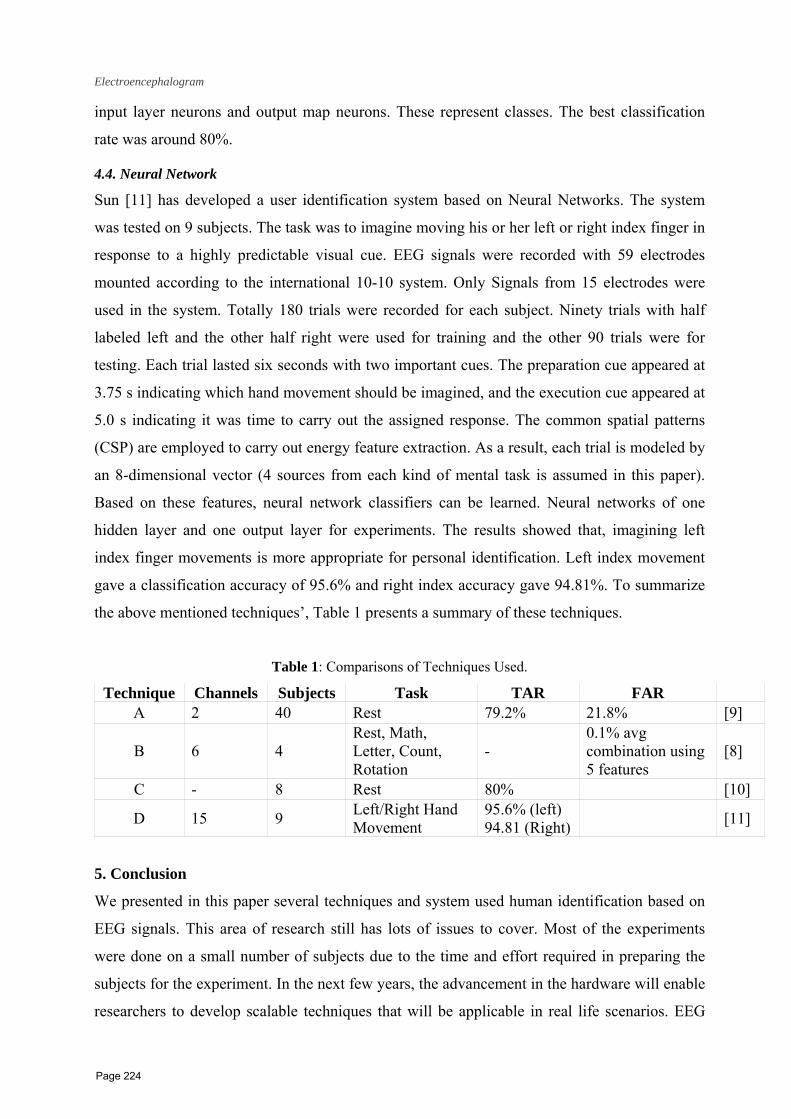
Electroencephalogram input layer neurons and output map neurons. These represent classes. The best classification
rate was around 80%.
4.4. Neural Network
Sun [11] has developed a user identification system based on Neural Networks. The system
was tested on 9 subjects. The task was to imagine moving his or her left or right index finger in
response to a highly predictable visual cue. EEG signals were recorded with 59 electrodes
mounted according to the international 10-10 system. Only Signals from 15 electrodes were
used in the system. Totally 180 trials were recorded for each subject. Ninety trials with half
labeled left and the other half right were used for training and the other 90 trials were for
testing. Each trial lasted six seconds with two important cues. The preparation cue appeared at
3.75 s indicating which hand movement should be imagined, and the execution cue appeared at
5.0 s indicating it was time to carry out the assigned response. The common spatial patterns
(CSP) are employed to carry out energy feature extraction. As a result, each trial is modeled by
an 8-dimensional vector (4 sources from each kind of mental task is assumed in this paper).
Based on these features, neural network classifiers can be learned. Neural networks of one
hidden layer and one output layer for experiments. The results showed that, imagining left
index finger movements is more appropriate for personal identification. Left index movement
gave a classification accuracy of 95.6% and right index accuracy gave 94.81%. To summarize
the above mentioned techniques’, Table 1 presents a summary of these techniques.
Table 1: Comparisons of Techniques Used.
Technique Channels Subjects Task TAR FAR A 2 40 Rest 79.2% 21.8% [9]
B 6 4 Rest, Math, Letter, Count, Rotation
- 0.1% avg combination using 5 features
[8]
C - 8 Rest 80% [10]
D 15 9 Left/Right Hand Movement
95.6% (left) 94.81 (Right) [11]
5. Conclusion
We presented in this paper several techniques and system used human identification based on
EEG signals. This area of research still has lots of issues to cover. Most of the experiments
were done on a small number of subjects due to the time and effort required in preparing the
subjects for the experiment. In the next few years, the advancement in the hardware will enable
researchers to develop scalable techniques that will be applicable in real life scenarios. EEG
Page 224

A Survey of Techniques Used in Human Identification Based on Cognitive Biometrics: the Electroencephalogram
ICI 10 - 10TH INTERNATIONAL CONFERENCE ON INFORMATION
12
signal as discussed is one of the strong and safest characteristics of an individual, as soon as
the technology enables large system development; EEG based authentication will be
implemented in different places.
References
[1] Revett, K., Behavioral Biometrics: A Remote Access Approach, John Wiley & Sons, ISBN: 978-0-
470-51883-0, 2008.
[2] Berger, H., Ueber das Elektroenkephalogramm des Menschen, Archiv für Psychiatrie und
Nervenkrankheiten, 1929, Berlin, 87: 527-570.
[3] Teplan, M, “Fundamentals of EEG Measurement,” in Measurement Science Review, vol. 2, pp. 1–
11, 2002.
[4] H. L. Atwood, W. A. MacKay., “Essentials of neurophysiology,” B.C. Decker, Hamilton, Canada,
1989.
[5] F. S. Tyner, J. R.Knott., “Fundamentals of EEG technology Volume 1: Basic concepts
andmethods,”, Raven press, New York., 1989.
[6] Y P. L. Nunez., “Neocortical Dynamics and Human EEG Rhythms,” Oxford University Press, New
York,1995.
[7] http://emedicine.medscape.com/article/1139332-overview [20100712].
[8] Ramaswamy Palaniappan,“Multiple Mental Thought Parametric Classification: A New Approach
for Individual Identification”, Proceeding of International Journal of Signal Processing, Volume 2, PP
222-226, 2006.
[9] Alejandro Riera, Aureli Soria-Frisch, Marco Caparrini, Ivan Cester, and Giulio Ruffini,
“Multimodal Physiological Biometrics Authentication”, Biometrics: Theory, Methods, and
Applications, Wiley Press, 2010.
[10] Cempírek, M. - Šťastný, J. “The optimization of the EEG-based biometric classification.” Applied
Electronics., pp. 25-28. 2007.
[11] Shiliang Sun. “Multitask Learning for EEG-Based Biometrics”, Proceeding of International
Conference on Pattern Recognition, PP 51-55, 2008
Page 225
A COMBINATION OF GENETIC ALGORITHM AND ARTIFICIAL NEURAL NETWORK FOR GENE SELECTION AND TUMOR CLASSIFICATION
R. Ali1*, T. El-Arif 2, Fayed F. M. Ghaleb3 and A. Dakroury1
1Physics Department, Faculty of women for Arts and Science, Ain Shams University, Cairo, Egypt
2Department of Computer Science, Faculty of Computer and Information Sciences, Ain Shams University, Cairo, Egypt. 3Department of math, computer science division, faculty of science, Ain Shams University, Cairo, Egypt
Email: [email protected] Abstract: - A recent progress in DNA microarray technology allows to measure the simultaneous gene expression of thousands of genes under multiple experimental conditions .This technology has a significant impact on genomic and post-genomic studies. Disease diagnosis and drug discovery studies benefits from the microarray technology. In the analysis of gene expression profiles, the number of tissue samples with gene expression levels available is usually small compared to the number of genes. This can lead either to a possible overfitting or even to a complete failure in the analysis of microarray data. The selection of genes that are really indicative of the tissue classification concerned is becoming one of the key steps in microarray studies. The main goal of this study is to expand the previous researches in gene selection to other possible directions by using a hybrid technique involving genetic algorithm (GA) and artificial neural network (ANN) for cancer classification. The genetic algorithm is applied to select genes, while the artificial neural network is used as the classifier or evaluator. The proposed approach was tested with microarray data of leukemia and colon tumors. Experimental results show that the proposed method is a useful tool for gene selection and classification. Keyword: Genetic algorithm (GA); artificial neural network (ANN); gene selection. 1. Introduction DNA microarray technology has advanced so much that we can simultaneously measure the expression levels of thousand of genes under particular experimental environments and conditions. This enables us to generate massive gene expression data. However, it has also led to many statistical and analytical challenges (due to the large number of genes but relatively few samples). We can analyze gene information rapidly and precisely by managing all this information at one time using several statistical methods and machine learning [13]. DNA microarray experiments primarily consist of either monitoring each gene multiple times under many condition, or alternatively evaluating each gene in single environment but in different types of tissues, especially cancerous tissues [2, 4, 9, 16, 27, 28, 29, 30]. The first type has allowed for the identification of functionally related genes due to common expression patterns [11, 17, 19, 22, 23, 30], while the latter experiments have shown an important result in the classification of tissue types (diagnosis) and in the identification of genes whose expression is a good diagnostic indicator. This because in the analysis of gene expression profiles, the number of tissue samples with genes expression levels available is usually small compared to the number of genes. This can lead either to a possible overfitting and dimensional curse or even to a complete failure in the analysis of microarray data. Most of the genes monitored in microarray may not be relevant to classification and these genes may potentially degrade the prediction performance of data analysis by masking the contribution of the relevant genes. * Corresponding author
Page 226

The selection of genes that are really indicative of the tissue classification concerned is becoming one of the key steps in microarray studies. The benefit gained from gene selection in microarray data analysis is not only the stability of the analysis model, but also the biological interpretability of relationship between the genes and a complex biological phenomenon. A large number of features also increase computational complexity and cost. Therefore, reducing the dimensionality of the gene expression information is a key step in developing a successful gene expression-based data analysis system. In order to extract information from gene expression measurements, different methods have been employed to analyze this data including that one in the work of [24]. In this paper, we attempt to use a hybrid system that integrates genetic algorithm (GA) and artificial neural network (ANN) for genes expression analysis and prediction of their functionality for cancer classification. The genetic algorithm is used for the feature selection operation which boosts the classification operation created by ANN. We test the proposed method with two benchmark cancer datasets: leukemia and colon. The experimental result shows that GA/ANN is a useful tool for gene selection and mining high-dimensional data. The rest of the paper is organized as follows. In Section 2, we provide background information on DNA microarray data analysis and discuss some related works. In Section 3, we present the GA/ANN in details. In Section 4, we describe the group of the DNA cancer datasets which used in our search. Section 5, we examine the performance of the proposed method and compare it with the results of different state-of-the-art methods from the literature. Finally, in section 6 we conclude with some final remarks and suggest future research directions.
2. DNA Microarray Uncovering broad patterns of genetic activity, providing a new understanding of gene functions and generating unexpected insights into biological mechanisms are the goals of microarray-based studies [14]. With the development and application of DNA microarrays, the expression of almost all human genes can now be systematically examined in human malignancies. DNA sequences are initially transcribed into mRNA sequences. These mRNA sequences are translated into the amino acid sequences of the proteins that perform various functions. Measuring mRNA levels can provide a detailed molecular view of the genes. Measuring gene expression levels under different conditions is important for expanding our knowledge of gene functions. Gene expression data can help provide a better understanding of cancer. It can also allow for the classification of individual tumors by their gene expression patterns, which may also describe and predict therapeutic resistance and sensitivity patterns [25]. DNA arrays consist of a large number of DNA molecules spotted in a systemic order on a solid substrate. Depending on the size of each DNA spot on the array, DNA arrays can be categorized as microarrays when the diameter of the DNA spot is less than 250 mm, and macroarrays when the diameter is bigger than 300 mm. The arrays with small solid substrates are also referred to as DNA chips. Gene information can be investigated in a short time, because so many genes can be put on the DNA microarray to be analyzed. There are two representative DNA microarray technologies: cDNA microarray technology and oligonucleotide microarray technology. cDNA microarrays are composed of thousands of individual DNA sequences printed in a high-density array on a glass microscope slide using a robotic arrayed. High-density oligonucleotide microarrays are made using spatially patterned, light-directed combinatorial chemical synthesis and contain hundreds of thousands of different oligonucleotides on a small glass surface. DNA microarrays are composed of thousands of individual DNA sequences printed in a high-density array on a glass microscope slide using a robotic arrayer, as
Page 227
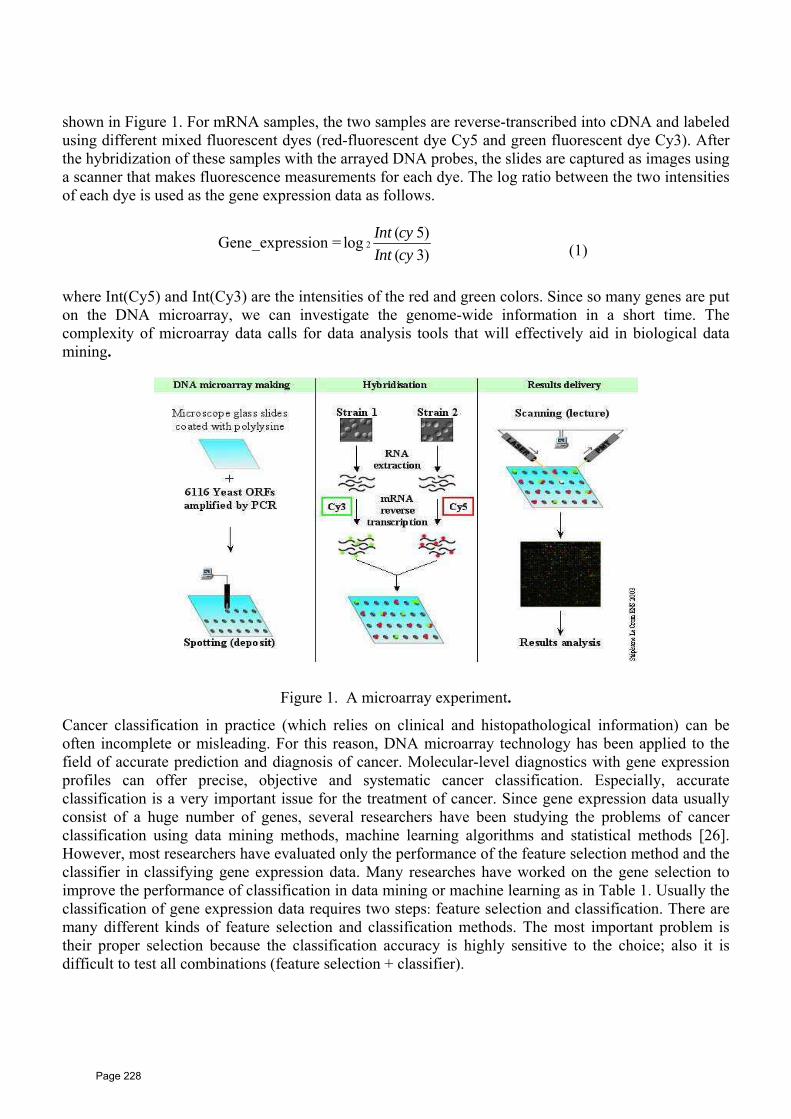
shown in Figure 1. For mRNA samples, the two samples are reverse-transcribed into cDNA and labeled using different mixed fluorescent dyes (red-fluorescent dye Cy5 and green fluorescent dye Cy3). After the hybridization of these samples with the arrayed DNA probes, the slides are captured as images using a scanner that makes fluorescence measurements for each dye. The log ratio between the two intensities of each dye is used as the gene expression data as follows.
Gene_expression = 2( 5)log( 3)
(1) Int cyInt cy
where Int(Cy5) and Int(Cy3) are the intensities of the red and green colors. Since so many genes are put on the DNA microarray, we can investigate the genome-wide information in a short time. The complexity of microarray data calls for data analysis tools that will effectively aid in biological data mining.
Figure 1. A microarray experiment.
Cancer classification in practice (which relies on clinical and histopathological information) can be often incomplete or misleading. For this reason, DNA microarray technology has been applied to the field of accurate prediction and diagnosis of cancer. Molecular-level diagnostics with gene expression profiles can offer precise, objective and systematic cancer classification. Especially, accurate classification is a very important issue for the treatment of cancer. Since gene expression data usually consist of a huge number of genes, several researchers have been studying the problems of cancer classification using data mining methods, machine learning algorithms and statistical methods [26]. However, most researchers have evaluated only the performance of the feature selection method and the classifier in classifying gene expression data. Many researches have worked on the gene selection to improve the performance of classification in data mining or machine learning as in Table 1. Usually the classification of gene expression data requires two steps: feature selection and classification. There are many different kinds of feature selection and classification methods. The most important problem is their proper selection because the classification accuracy is highly sensitive to the choice; also it is difficult to test all combinations (feature selection + classifier).
Page 228

Table 1. Related works for the classification of DNA microarray data
Researcher
Feature selection
Classification
Data
Gloub [28] Neighborhood analysis Weighted votes Leukemia
BenDor A. et al. [3] TNOM score Nearest neighbor
SVM with quadratic kernel
Adaboost
Leukemia Colon
Furey T. S. et al. [29]
Signal-to-noise ratio SVM Leukemia Colon
Li W. et al. [32] Model selection with Akiake information and Bayesian information criterion with logistic
regression
Leukemia
Li L. et al. [15] Genetic Algorithm KNN Lymphoma Colon
Nguyen D. V. et al. [6]
PLS, PCA Discriminate analysis
Ovrain Leukemia
Colon Lymphoma
NCI60 Cho S. J. et al. [26] Pearson correlation
coefficients MLP Leukemia
Cho J. et al. [8] KFDA ( Kernel machine and kernel fisher discriminate analysis)
Leukemia Colon Breast
Kim K. and Cho S. [14]
Correlations analysis MLP, KNN, SVM and (SA-SOM)
Leukemia Colon
Lymphoma
Shen Q. et al. [24] Modified discrete particle swarm optimization
SVM Colon
Dessi N. & Pes B. [18]
Genetic algorithm SVM Leukemia
Huynh H. T. et al. [7]
SVD Neural network Leukemia Colon
3. Methods 3.1. Genetic Algorithm In the 1970,s Holland invented the specific evolutionary optimization technique, which is known as the genetic algorithm (GA). In GA, the potential solutions to the given problem are encoded as
Page 229

chromosomes; the chromosome consists of a set of genes, which represent the characteristics of that solution. The GA operates on a number of chromosomes, collectively termed a “population”. In order to assess each solution’s potential for reproduction, it is necessary to gauge the fitness of each solution. This is a measure of the ability of that solution to satisfy the objective problem. Those solutions with a higher fitness have a greater chance of selection for reproduction. The reproduction process creates new chromosomes with the combined characteristics of the parent chromosome. Hence, the properties of higher fitness chromosomes are propagated throughout the population. Successive application of the reproduction process creates a whole population of solutions, termed the “next generation”. This generation contains a higher population of the characteristics possessed by the fitter solutions of the previous generation. The mechanism of selection and reproduction facilitates help in the exploration of the solution space [5, 12]. Successive generations of the GA explore a variety of solutions throughout the solution space. If the GA is successful, it will converge to an optimal region of the solution space, producing an optimal or near optimal solution to the objective function. The simple genetic algorithm (SGA) contains only copying chromosomes (selection), swapping (crossover), and mutating (mutation) these chromosomes [21]. The basic cycle of the SGA is shown in Figure 2.
Initial population
Evaluation of the chromosome fitness
Optimality
Selection
Crossover?
Mutation ?
Mutation ?
O/P The best solution
Yes
Stop
Yes
No
Yes
No
Crossover
No
Figure 2. Basic structure of the (SGA).
3.2. Artificial Neural Network ANNs are a supervised classification technique, originally designed to mimic the parallel functioning of the human brain. ANNs are mathematical information processing models composed of many units,
Page 230
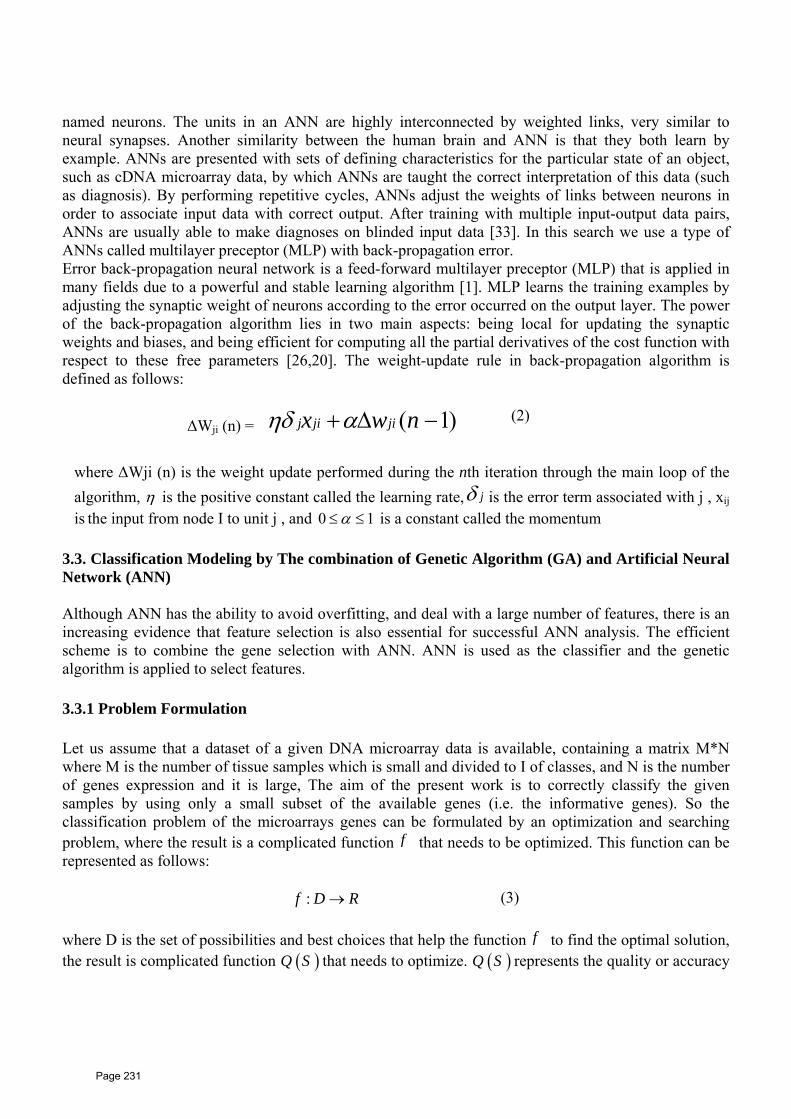
named neurons. The units in an ANN are highly interconnected by weighted links, very similar to neural synapses. Another similarity between the human brain and ANN is that they both learn by example. ANNs are presented with sets of defining characteristics for the particular state of an object, such as cDNA microarray data, by which ANNs are taught the correct interpretation of this data (such as diagnosis). By performing repetitive cycles, ANNs adjust the weights of links between neurons in order to associate input data with correct output. After training with multiple input-output data pairs, ANNs are usually able to make diagnoses on blinded input data [33]. In this search we use a type of
e parameters [26,20]. The weight-update rule in back-propagation algorithm is defined as follows:
( 1)j ji jix w n
ANNs called multilayer preceptor (MLP) with back-propagation error. Error back-propagation neural network is a feed-forward multilayer preceptor (MLP) that is applied in many fields due to a powerful and stable learning algorithm [1]. MLP learns the training examples by adjusting the synaptic weight of neurons according to the error occurred on the output layer. The power of the back-propagation algorithm lies in two main aspects: being local for updating the synaptic weights and biases, and being efficient for computing all the partial derivatives of the cost function with respect to these fre
ηδ α+ΔWji (n) = Δ − (2)
i th
where ΔWj (n) is the weight update performed during the n iteration through the main loop of the algorithm, η is the positive constant called the learning rate, jδ is the error term associated with j , xij s the input from node I to unit j , and i 0 1α≤ ≤ is a constant called the momentum
Modeling by The combination of Genetic Algorithm (GA) and Artificial Neural etwork (ANN)
on with ANN. ANN is used as the classifier and the genetic lgorithm is applied to select features.
.3.1 Problem Formulation
lt is a complicated function
3.3. ClassificationN Although ANN has the ability to avoid overfitting, and deal with a large number of features, there is an increasing evidence that feature selection is also essential for successful ANN analysis. The efficient scheme is to combine the gene selectia 3 Let us assume that a dataset of a given DNA microarray data is available, containing a matrix M*N where M is the number of tissue samples which is small and divided to I of classes, and N is the number of genes expression and it is large, The aim of the present work is to correctly classify the given samples by using only a small subset of the available genes (i.e. the informative genes). So the classification problem of the microarrays genes can be formulated by an optimization and searching problem, where the resu f that needs to be optimized. This function can be
presented as follows:
(3)
nd best choices that help the functi
re
RDf →: where D is the set of possibilities a on f to find the optimal solution, the result is complicated function that needs to optimize. ( )Q S ( )Q S represents the quality or accuracy
Page 231
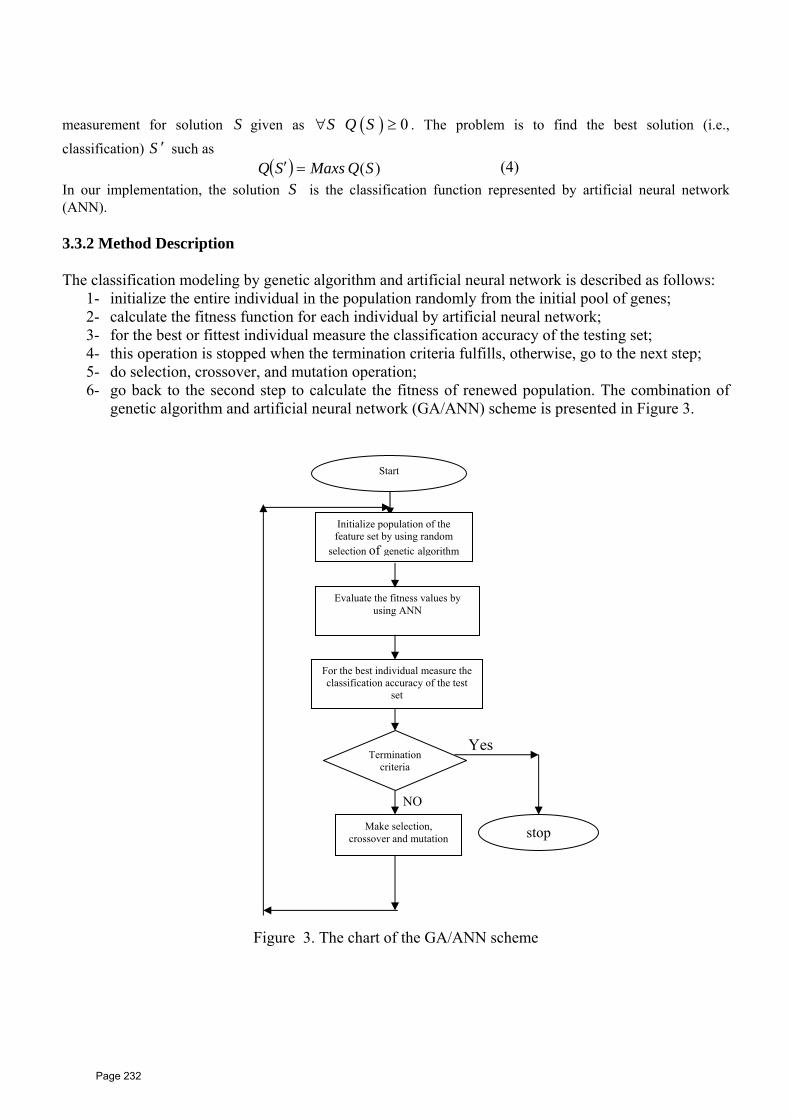
measurement for solution S given as ( ) 0S Q S∀
)( SQMaxs
≥ . The problem is to find the best solution (i.e., classification) S such as ′
( )SQ =′ (4) In our implementation, the solution S is the classification function represented by artificial neural network (ANN). 3.3.2 Method Description The classification modeling by genetic algorithm and artificial neural network is described as follows:
1- initialize the entire individual in the population randomly from the initial pool of genes; 2- calculate the fitness function for each individual by artificial neural network; 3- for the best or fittest individual measure the classification accuracy of the testing set; 4- this operation is stopped when the termination criteria fulfills, otherwise, go to the next step; 5- do selection, crossover, and mutation operation; 6- go back to the second step to calculate the fitness of renewed population. The combination of
genetic algorithm and artificial neural network (GA/ANN) scheme is presented in Figure 3.
Yes
NO
Start
Initialize population of the feature set by using random
selection of genetic algorithm
Figure 3. The chart of the GA/ANN scheme
Evaluate the fitness values by using ANN
Make selection, crossover and mutation
For the best individual measure the classification accuracy of the test
set
Termination criteria
stop
Page 232
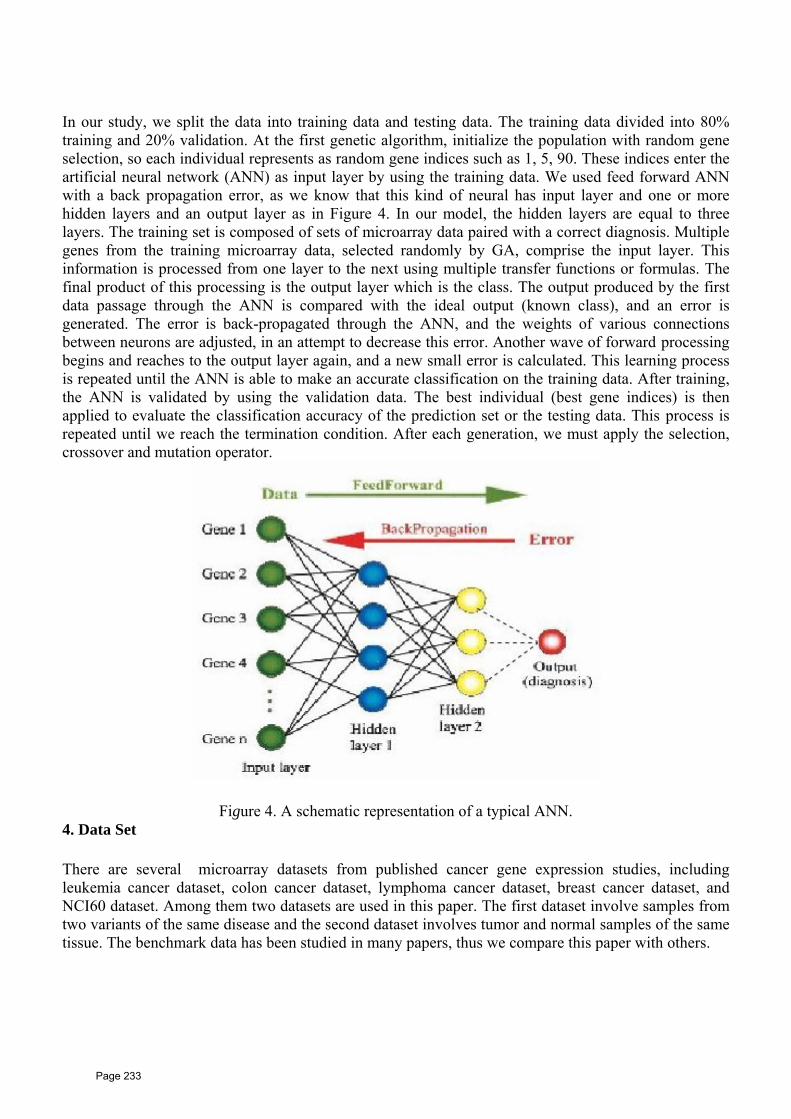
In our study, we split the data into training data and testing data. The training data divided into 80% training and 20% validation. At the first genetic algorithm, initialize the population with random gene selection, so each individual represents as random gene indices such as 1, 5, 90. These indices enter the artificial neural network (ANN) as input layer by using the training data. We used feed forward ANN with a back propagation error, as we know that this kind of neural has input layer and one or more hidden layers and an output layer as in Figure 4. In our model, the hidden layers are equal to three layers. The training set is composed of sets of microarray data paired with a correct diagnosis. Multiple genes from the training microarray data, selected randomly by GA, comprise the input layer. This information is processed from one layer to the next using multiple transfer functions or formulas. The final product of this processing is the output layer which is the class. The output produced by the first data passage through the ANN is compared with the ideal output (known class), and an error is generated. The error is back-propagated through the ANN, and the weights of various connections between neurons are adjusted, in an attempt to decrease this error. Another wave of forward processing begins and reaches to the output layer again, and a new small error is calculated. This learning process is repeated until the ANN is able to make an accurate classification on the training data. After training, the ANN is validated by using the validation data. The best individual (best gene indices) is then applied to evaluate the classification accuracy of the prediction set or the testing data. This process is repeated until we reach the termination condition. After each generation, we must apply the selection, crossover and mutation operator.
Figure 4. A schematic representation of a typical ANN. 4. Data Set There are several microarray datasets from published cancer gene expression studies, including leukemia cancer dataset, colon cancer dataset, lymphoma cancer dataset, breast cancer dataset, and NCI60 dataset. Among them two datasets are used in this paper. The first dataset involve samples from two variants of the same disease and the second dataset involves tumor and normal samples of the same tissue. The benchmark data has been studied in many papers, thus we compare this paper with others.
Page 233

4.1 Leukemia Cancer Dataset Leukemia cancer dataset developed by Gloub et al. [28], was obtained from a patient having two types of leukemia, acute lymphoblastic leukemia (ALL), and acute myeloid leukemia (AML). The data here was taken from bones marrow samples and the samples were of different cell types, for example B or T cells and different patient genders. Each sample was analyzed using an Affymetrix microarray containing expression levels of 7129 genes. The data contained 72 samples divided into 38 for training and 34 for test. The training samples contain 27 samples corresponding to acute lymphoblastic leukemia (ALL) and 11 samples corresponding to acute myeloid leukemia (AML), and the testing samples contain 20 samples corresponding to acute lymphoblastic leukemia (ALL) and 14 samples corresponding to acute myeloid leukemia (AML). The data was available on http://www.broad.mit.edu/cgi-bin/cancer/datasets.cgi. 4.1 Colon Cancer Dataset Colon data was developed by Alon et al. [30] and consisted of 62 samples of colon epithelial cells taken from colon cancer patients. Each sample contains 2000 gene expression levels. Although original data consists of 6000 gene expression levels, 4000 out of 6000 were removed based on the confidence in the measured expression levels. 40 of 62 samples are colon cancer samples and the remaining are normal samples. Each sample was taken from tumors and normal healthy parts of the colons of the same patients and measured using high density oligonucleotide arrays. In this study, we split the data to 46 samples for training and 16 for testing. The data was available on http://www.microarray.princeton.edu/oncology/. 5. Results and Discussion At the beginning, ANN classifier was carried out for colon cancer data by using all initial genes (2000 gene), the accuracy rates of classification for training set and testing set were 90% and 71%, respectively, and when it was carried out for leukaemia cancer data with all initial genes (7129 gene), the accuracy rates of classification were 91% for training data and 80% for testing data.
Using all initial genes dose not offer a good predictive ability and there is an obvious symptom of over-fitting. Inclusion of excess of the gene variables in the modeling process will degrade the performance of the ANN analysis. This might arise from the sensitivity of ANN to irrelevant variables that do not contribute to classification and prediction. So the genetic algorithm is employed to select the genes strongly contributing to classification for ANN modeling. In the present work, the population size of GA is selected as 50 individuals, the number of generation is 50, the selection is created by roulette wheel, the crossover operator = 0.8 and mutation operator = 0.01. Firstly, the program started with 100 random genes for each individual, which were chosen randomly from the initial pool (2000 gene for colon, 7129 for leukemia). After 50 generations, the program got the fittest individual and then generates another 50 individuals from this fittest. But in this case each individual contained only 50 genes, and then the program started again to run another 50 generations. After the second 50 generations, the program tested if the classification accuracy of 100 genes ≤ the classification accuracy of 50 genes; then we decrease the number of genes to 25 from the best individual
Page 234
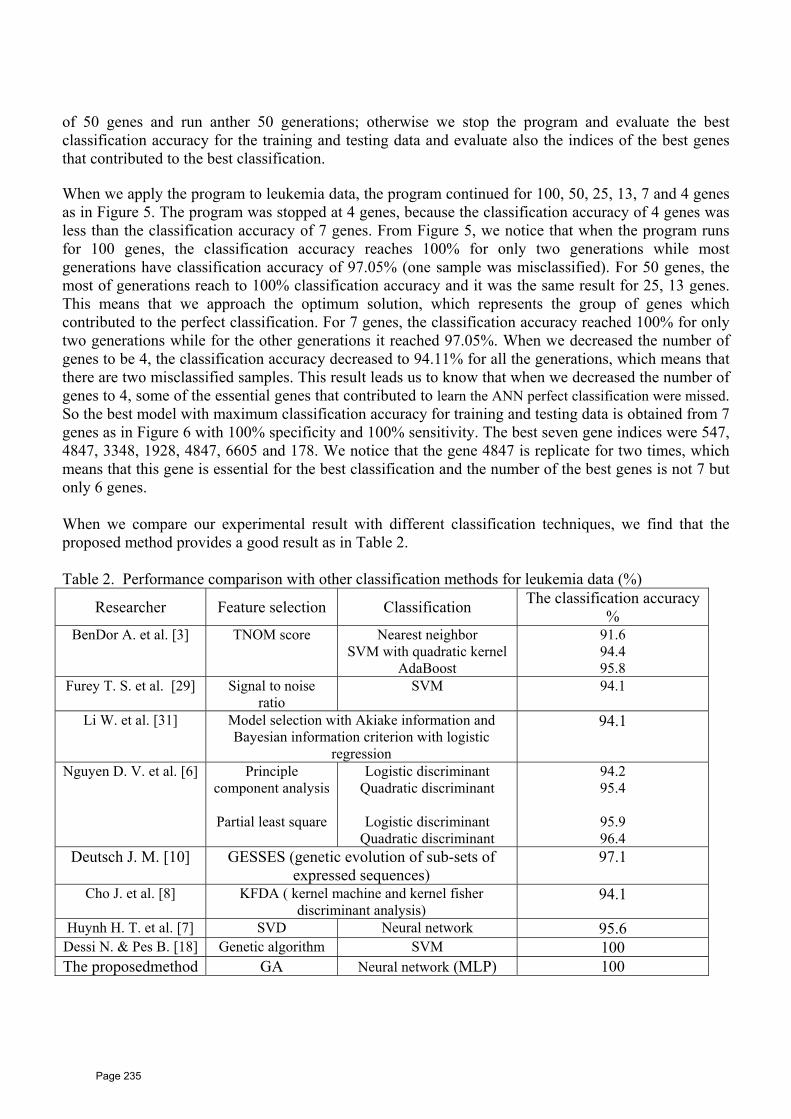
of 50 genes and run anther 50 generations; otherwise we stop the program and evaluate the best classification accuracy for the training and testing data and evaluate also the indices of the best genes that contributed to the best classification.
When we apply the program to leukemia data, the program continued for 100, 50, 25, 13, 7 and 4 genes as in Figure 5. The program was stopped at 4 genes, because the classification accuracy of 4 genes was less than the classification accuracy of 7 genes. From Figure 5, we notice that when the program runs for 100 genes, the classification accuracy reaches 100% for only two generations while most generations have classification accuracy of 97.05% (one sample was misclassified). For 50 genes, the most of generations reach to 100% classification accuracy and it was the same result for 25, 13 genes. This means that we approach the optimum solution, which represents the group of genes which contributed to the perfect classification. For 7 genes, the classification accuracy reached 100% for only two generations while for the other generations it reached 97.05%. When we decreased the number of genes to be 4, the classification accuracy decreased to 94.11% for all the generations, which means that there are two misclassified samples. This result leads us to know that when we decreased the number of genes to 4, some of the essential genes that contributed to learn the ANN perfect classification were missed. So the best model with maximum classification accuracy for training and testing data is obtained from 7 genes as in Figure 6 with 100% specificity and 100% sensitivity. The best seven gene indices were 547, 4847, 3348, 1928, 4847, 6605 and 178. We notice that the gene 4847 is replicate for two times, which means that this gene is essential for the best classification and the number of the best genes is not 7 but only 6 genes. When we compare our experimental result with different classification techniques, we find that the proposed method provides a good result as in Table 2. Table 2. Performance comparison with other classification methods for leukemia data (%)
Researcher Feature selection Classification The classification accuracy %
BenDor A. et al. [3] TNOM score Nearest neighbor SVM with quadratic kernel
AdaBoost
91.6 94.4 95.8
Furey T. S. et al. [29] Signal to noise ratio
SVM 94.1
Li W. et al. [31] Model selection with Akiake information and Bayesian information criterion with logistic
regression
94.1
Nguyen D. V. et al. [6] Principle component analysis
Partial least square
Logistic discriminant Quadratic discriminant
Logistic discriminant
Quadratic discriminant
94.2 95.4
95.9 96.4
Deutsch J. M. [10] GESSES (genetic evolution of sub-sets of expressed sequences)
97.1
Cho J. et al. [8] KFDA ( kernel machine and kernel fisher discriminant analysis)
94.1
Huynh H. T. et al. [7] SVD Neural network 95.6 Dessi N. & Pes B. [18] Genetic algorithm SVM 100 The proposedmethod GA Neural network (MLP) 100
Page 235
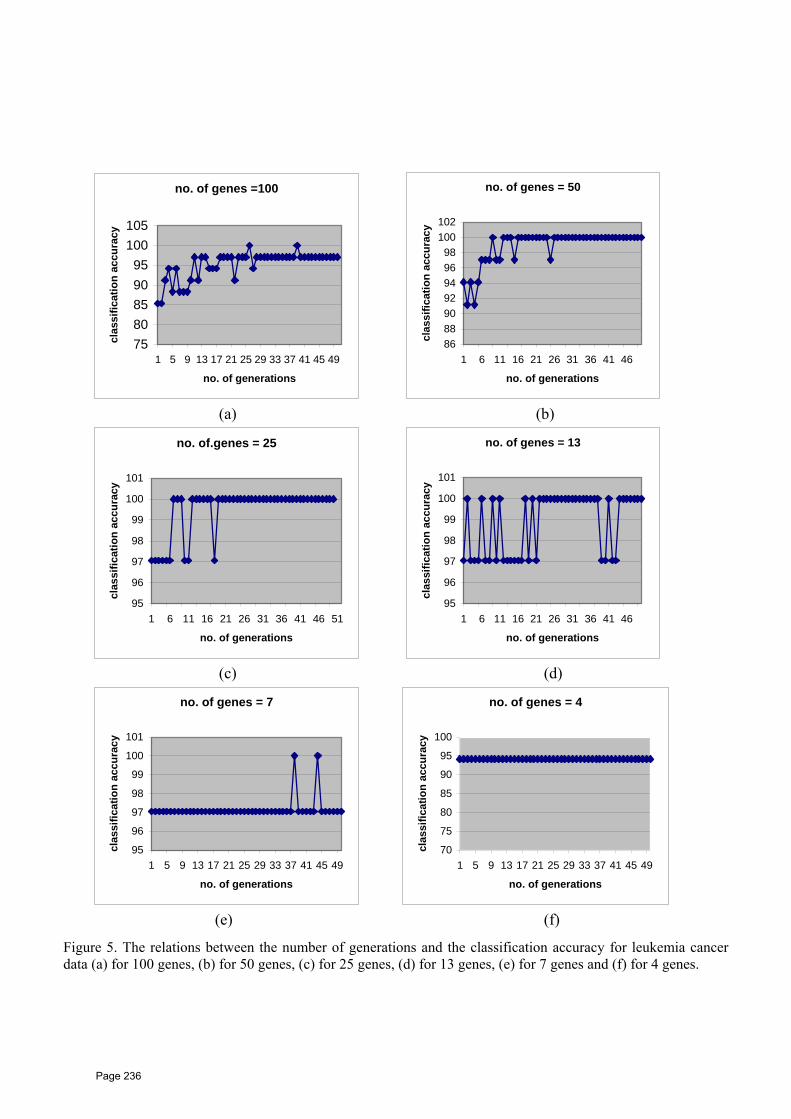
no. of genes =100
7580859095
100105
1 5 9 13 17 21 25 29 33 37 41 45 49
no. of generations
clas
sific
atio
n ac
cura
cy
no. of genes = 50
86889092949698
100102
1 6 11 16 21 26 31 36 41 46
no. of generations
clas
sific
atio
n ac
cura
cy
(a) (b)
no. of.genes = 25
95
96
97
98
99
100
101
1 6 11 16 21 26 31 36 41 46 51
no. of generations
clas
sific
atio
n ac
cura
cy
no. of genes = 13
95
96
97
98
99
100
101
1 6 11 16 21 26 31 36 41 46
no. of generations
clas
sific
atio
n ac
cura
cy
(c) (d)
no. of genes = 7
95
96
97
98
99
100
101
1 5 9 13 17 21 25 29 33 37 41 45 49
no. of generations
clas
sific
atio
n ac
cura
cy
no. of genes = 4
70
75
80
85
90
95
100
1 5 9 13 17 21 25 29 33 37 41 45 49
no. of generations
clas
sific
atio
n ac
cura
cy
(e) (f)
Figure 5. The relations between the number of generations and the classification accuracy for leukemia cancer data (a) for 100 genes, (b) for 50 genes, (c) for 25 genes, (d) for 13 genes, (e) for 7 genes and (f) for 4 genes.
Page 236
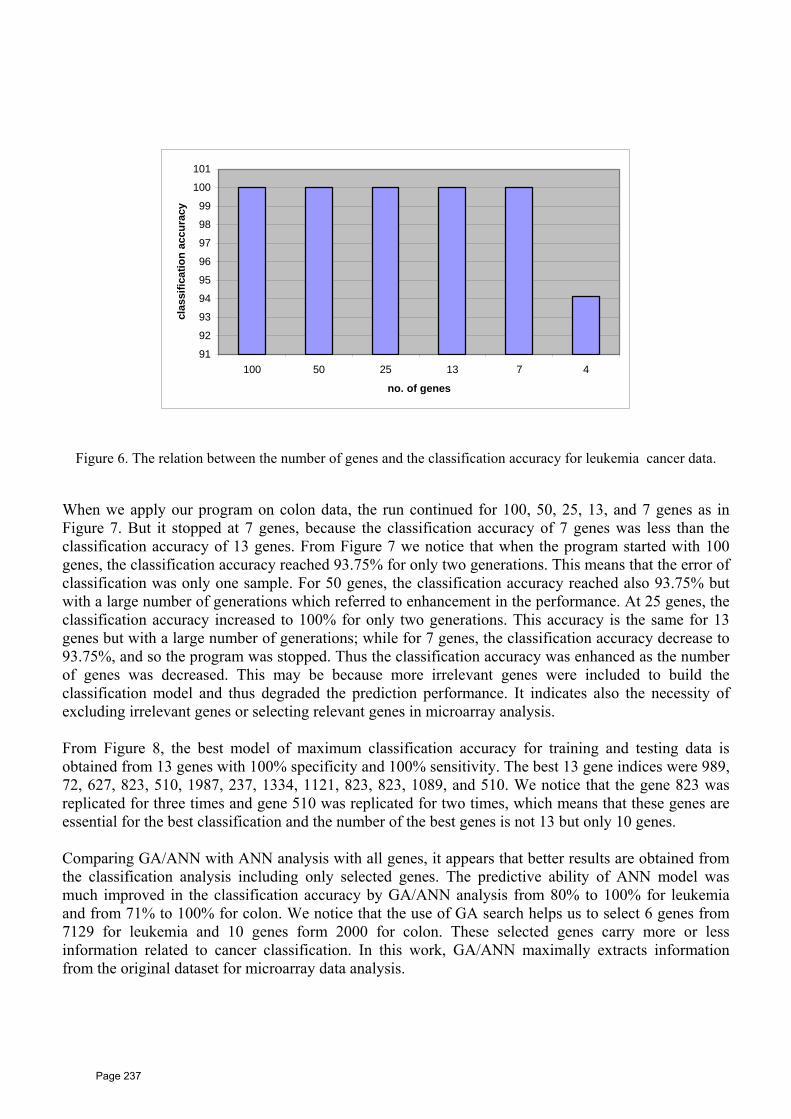
91
92
93
94
95
96
97
98
99
100
101
100 50 25 13 7
no. of genes
clas
sific
atio
n ac
cura
cy
4
Figure 6. The relation between the number of genes and the classification accuracy for leukemia cancer data.
When we apply our program on colon data, the run continued for 100, 50, 25, 13, and 7 genes as in Figure 7. But it stopped at 7 genes, because the classification accuracy of 7 genes was less than the classification accuracy of 13 genes. From Figure 7 we notice that when the program started with 100 genes, the classification accuracy reached 93.75% for only two generations. This means that the error of classification was only one sample. For 50 genes, the classification accuracy reached also 93.75% but with a large number of generations which referred to enhancement in the performance. At 25 genes, the classification accuracy increased to 100% for only two generations. This accuracy is the same for 13 genes but with a large number of generations; while for 7 genes, the classification accuracy decrease to 93.75%, and so the program was stopped. Thus the classification accuracy was enhanced as the number of genes was decreased. This may be because more irrelevant genes were included to build the classification model and thus degraded the prediction performance. It indicates also the necessity of excluding irrelevant genes or selecting relevant genes in microarray analysis. From Figure 8, the best model of maximum classification accuracy for training and testing data is obtained from 13 genes with 100% specificity and 100% sensitivity. The best 13 gene indices were 989, 72, 627, 823, 510, 1987, 237, 1334, 1121, 823, 823, 1089, and 510. We notice that the gene 823 was replicated for three times and gene 510 was replicated for two times, which means that these genes are essential for the best classification and the number of the best genes is not 13 but only 10 genes. Comparing GA/ANN with ANN analysis with all genes, it appears that better results are obtained from the classification analysis including only selected genes. The predictive ability of ANN model was much improved in the classification accuracy by GA/ANN analysis from 80% to 100% for leukemia and from 71% to 100% for colon. We notice that the use of GA search helps us to select 6 genes from 7129 for leukemia and 10 genes form 2000 for colon. These selected genes carry more or less information related to cancer classification. In this work, GA/ANN maximally extracts information from the original dataset for microarray data analysis.
Page 237
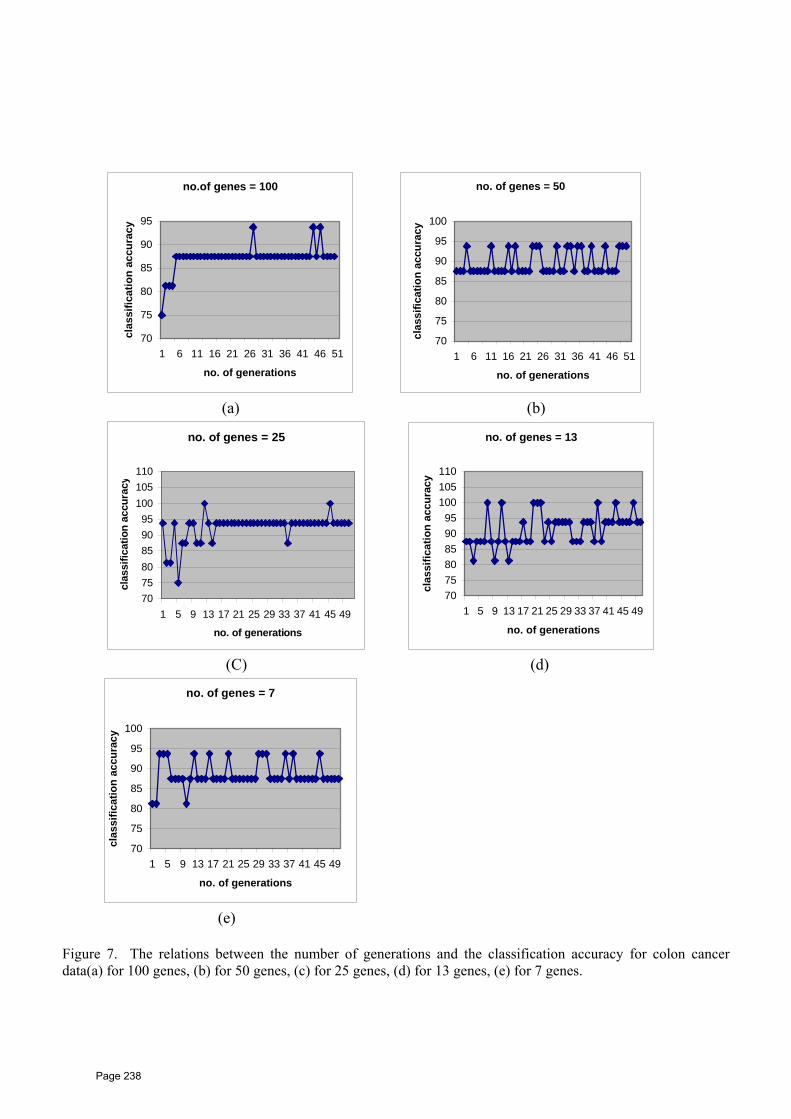
no.of genes = 100
70
75
80
85
90
95
1 6 11 16 21 26 31 36 41 46
no. of generations
clas
sific
atio
n ac
cura
cy
51
no. of genes = 50
70
75
80
85
90
95
100
1 6 11 16 21 26 31 36 41 46 51
no. of generations
clas
sific
atio
n ac
cura
cy
(a) (b)
no. of genes = 25
707580859095
100105110
1 5 9 13 17 21 25 29 33 37 41 45 49
no. of generations
clas
sific
atio
n ac
cura
cy
no. of genes = 13
707580859095
100105110
1 5 9 13 17 21 25 29 33 37 41 45 49
no. of generations
clas
sific
atio
n ac
cura
cy
(C) (d)
no. of genes = 7
70
75
80
85
90
95
100
1 5 9 13 17 21 25 29 33 37 41 45 49
no. of generations
clas
sific
atio
n ac
cura
cy
(e) Figure 7. The relations between the number of generations and the classification accuracy for colon cancer data(a) for 100 genes, (b) for 50 genes, (c) for 25 genes, (d) for 13 genes, (e) for 7 genes.
Page 238
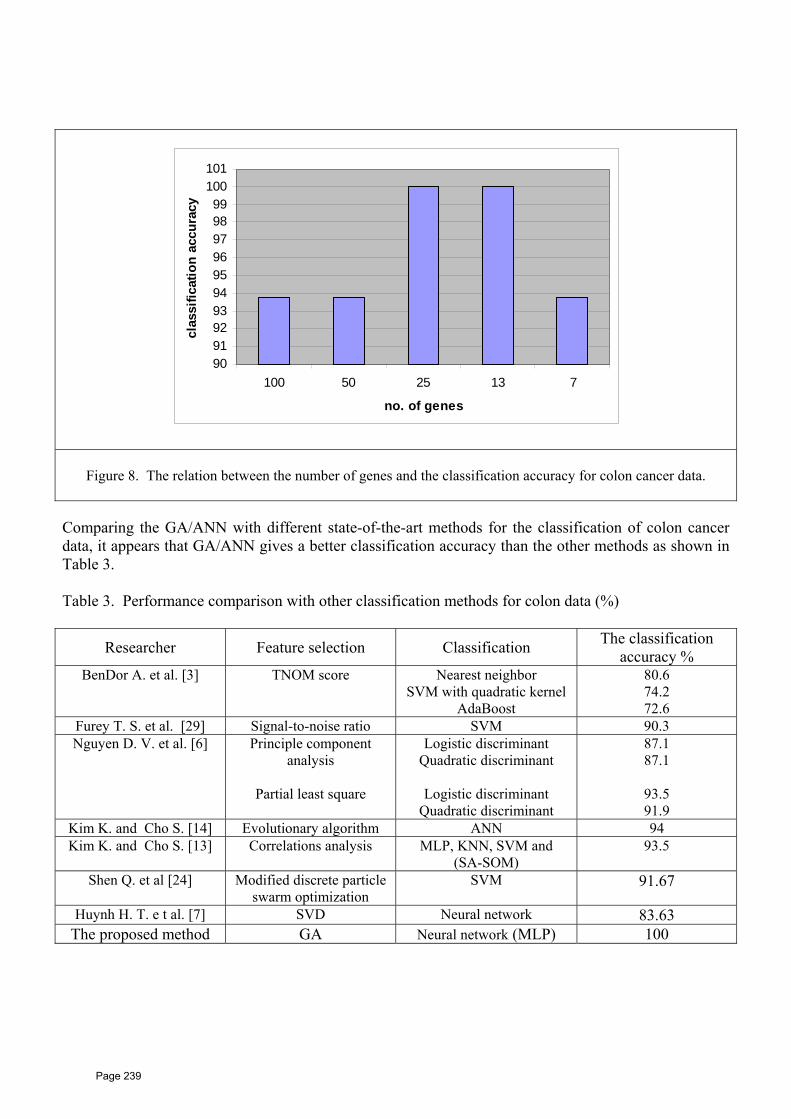
Figure 8. The relation between the number of genes and the classification accuracy for colon cancer data.
90919293949596979899
100101
100 50 25 13 7
no. of genes
clas
sific
atio
n ac
cura
cy
Comparing the GA/ANN with different state-of-the-art methods for the classification of colon cancer data, it appears that GA/ANN gives a better classification accuracy than the other methods as shown in Table 3. Table 3. Performance comparison with other classification methods for colon data (%)
Researcher Feature selection Classification The classification accuracy %
BenDor A. et al. [3] TNOM score Nearest neighbor SVM with quadratic kernel
AdaBoost
80.6 74.2 72.6
Furey T. S. et al. [29] Signal-to-noise ratio SVM 90.3 Nguyen D. V. et al. [6] Principle component
analysis
Partial least square
Logistic discriminant Quadratic discriminant
Logistic discriminant
Quadratic discriminant
87.1 87.1
93.5 91.9
Kim K. and Cho S. [14] Evolutionary algorithm ANN 94 Kim K. and Cho S. [13] Correlations analysis MLP, KNN, SVM and
(SA-SOM) 93.5
Shen Q. et al [24] Modified discrete particle swarm optimization
SVM 91.67
Huynh H. T. e t al. [7] SVD Neural network 83.63 The proposed method GA Neural network (MLP) 100
Page 239

4. Conclusion The selection of genes that are really indicative of the tissue classification concerned is a key step in developing a successful gene expression-based data analysis system. In this paper, the GA was applied to select genes and ANN was used as the classifier. A new objective function was formulated to determine the appropriate number of genes. Leukemia and colon datasets were used by the proposed GA/ANN algorithm. The results have demonstrated that the proposed method is useful for gene selection and classification. As for future work, we will apply the proposed method to a variety of datasets and study the feature selection for it. Reference
1. A. Abraham, “Artificial neural networks”, Handbook of measuring system design, John Wiley
& Sons, Ltd. ISBN: 0-470-01243-8, 2005. 2. A. Alizadeh, M. Eisen, R. Davis, C. Ma, I. Lossos, A. Rosenwald, J. Boldrick, H. Sabet, T. Trant
and X. Yu, “Distinct types of diffuse large B-cell Lymphoma identified by gene expression profiling”, Nature, Vol. 403, pp. 503-511, 2000.
3. A. Ben-Dor, L. Bruhn, N. Friedman, I. Naachman, M. Schummer and N. Yakhini, “Tissue classification with gene expression profiles”, J. Comput. Bio1., Vol. 7, pp. 559-584, 2000.
4. C. Perou, S. Jeffrey, M. Vande Rijn, C. Rees, M. Eisen, D. Ross, A. Pergamenschikov., C. Williams, S. Zhu and J. Lee, “Distinctive gene expression patterns in human mammary epithelial cells and breast cancer”, Proc. Natl. Acad. Of Sci. USA, Vol. 96, pp. 9212-9217, 1999.
5. D. M. Mukhopadhyoy, M. O. Bulitanas, A. Farkhod, S. Jeon and D. Bhattacharyya, “Genetic algorithm: a tutorial review”, International journal of grid and distributed computing, Vol. 2, No. 3, pp., 2009.
6. D. V. Nguyen and D. M. Rock, “Tumor classification by partial least squares using microarray gene expression data“, Bioinformatics, Vol 18, no.1, pp. 39-50, 2002.
7. H. T. Huynh, J. Kim and Y. Won, “Classification study on DNA microarray with feed forward neural network trained by singular value decomposition”, International journal of Bio-science and Bio-technology. Vol. 1, no. 1, pp. 17-24, 2009.
8. J. Cho, D. Lee, J. Park and I. Lee, “Gene selection and classification from microarray data using Kernel machine”, FEBS, Vol. 571, pp. 93-98, 2004.
9. J. Khan, J. S. Wei, M. Ringner, L. Saal, M. Ladanyi., F. Westermann, F. Berthold, M. Schwab, C. R. Antonescu, C. Peterson and P. Meltzer, “Classification and diagnostic prediction of cancers using expression profiling and artificial neural networks”, Nat. Med., Vol. 7, pp. 673-679, 2001.
10. J. M. Deutsch, “Evolutionary algorithms for finding optimal gene sets in microarray prediction “, Bioinformatics, Vol. 19, no. 1, pp. 45-52, 2003.
11. J. Newton, “analysis of microarray gene expression data using machine learning techniques”, University of Alberta, CANADA, 2001.
12. K. F. Man, K. S. Tang and S. Kwong, “Genetic Algorithms”, Springer-Verlag, London, 1999. 13. K. J. Kim and S. Cho, "Prediction of colon using an evolutionary neural network",
Neurocomputing, Vol. 61, pp. 361-379, 2004. 14. K. J. Kim and S. Cho, “Ensemble classification based on correlation analysis for DNA microarray
classification”, Neuro Computing, vol. 70, pp. 187-199, June 2006.
Page 240

16
15. L. Li, C. R. Weinberg, T. A. Darden and L. G. Pedersen, “Gene selection for sample classification based on gene expression data: study of sensitivity to choice of parameters of the GA/KNN method”, Bioinformatics, Vol. 17, no. 12, pp. 1131-1142, 2001.
16. M. Dettling, “Bagboosting for tumor classification with gene expression data”, Bioinformatics, Vol. 20, no. 18, pp. 3583-3593, 2004.
17. M. P. S. Brown, W. N. Grandy, D. Lin, N. Cristianini, C. Sugnet, M. Ares and D. Haussler, “Support vector machine classification of microarray gene expression data”, UCSC_CRL_99-09, 1999.
18. N. Dessi and B. Pes, “An evolutionary method for combining different feature selection criteria in microarray data classification”, Journal of Artificial Evolution and Application, 2009.
19. P. H. Sydenham and R. Thorn, “Handbook of measuring system design”, John Wiley & Sons, Ltd. ISBN: 0-470-02143-8, PP. 901- 902, 2005.
20. P. Mazunder and M. E. Rudnick “Genetic Algorithms for VLSI Design, Layout& Test Automation”, Prentice Hall PTR, upper saddle River, 2000.
21. P. Pavlidis, C. Tang and W. S. Noble, “Classification of Genes Using Probabilistic Model of Microarray Expression Profiles”, Work Shop on Data Mining in Bioinformatics, pp. 1-7, 2002.
22. P. R. Walker, B. Smith, Q. Y. Liu, A. F. Famili, J. J. Valdes, Z. Liu and B. Lach, “Data mining of gene expression changes in Alzheimer brain”, Artificial Intelligence in Medicine, vol. 31, pp. 137-154, 2004.
23. Q. Shen, W. Shi, W. Kong and B. Ye, “A combination of modified swarm optimization algorithm and support vector machine for gene selection and tumor classification”, Talanta, Vol. 7, pp. 1679-1683, 2007.
24. S. B. Cho and. H. H. Won, “Data mining for gene expression profiles from DNA microarray”, Knowledge Eng., Vol. 31, no.16, pp. 593-608, 2003.
25. S. Cho and H. Won, “Machine learning in DNA microarray analysis for cancer classification“, Conferences in Research and Practice in Information Technology. Vol. 19, 2003.
26. S. L. Pomeroy, P. Tamayo, M. Gassenbeek, M. S. Lisa, M. Angelo, M. E. Melaughlin and J. Y. Kim, “Prediction of central nervous system embryonal tumor outcome based on gene expression”, Nature, Vol. 415, pp.436-442, 2002.
27. T. R. Gloub, D. K. Slonim, P. Tamayo, C. Haurd, M. Gasenbeek, J. Mesirov, H. Collor, M. Loh, J. Downing, M. Caligiuri, F. C. Bloom and E. Lander, “Molecular classification of cancer: class discovery and class prediction by gene expression monitoring”, Science, Vol. 286, pp. 531-537, 1999.
28. T. S. Furey, N. Cristianini, N. Duffy, D.W. Bednarski, M. Schummer and D. Haussler, “Support vector machine classification and validation of cancer tissue sample using microarray expression data”, Bioinformatics, Vol 16, no. 10, pp. 906-914, 2000.
29. U. Alon, N. Barkai, D. Notterman, K. Gish, S. Ybarra, D. Mack and A. Levine, “Broad patterns of gene expression revealed by clustering analysis of tumor and normal tissues probed by oligonucleotide arrays”, Proc. Natl. Acad. Of Sci. USA, Vol. 96, pp. 6745-6750, 1999.
30. W. Li and Y. Yang, “How many genes are needed for discriminant microarray data analysis”, Critical Assessment of Techniques for Microarray Data Mining Workshop, 2000.
31. W. Li and Y. Yang, “ZIPF’s law in important of genes for cancer classification using microarray data”, Center for Genomic and Human Genetics, New York, USA, 2002.
32. Y. Xu, F. M. Selaru, J. Yin, T. Zou, V. Shustova, Y. Mori, F. Sato, T.C. Liu, A Olaru etal., , “Artificial neural networks and gene filtering distinguish between global gene expression profiles of Barrett's Esophagus and Esophageal cancer“, Cancer Research, Vol. 62, pp. 3493-3497, 2005.
Page 241
GAMASA, EGYPT, 4 – 6 DECEMBER 2010
LAPTOP-BASED CLASSROOM INSTRUCTION
Dr. Habil. Lajos Kis-Toth PhD
Eszterházy Károly College, Institute of Mediainformatics, Eger, Hungary email: [email protected]
Abstract The Institute of Media Informatics of the Eszterházy Károly College of Eger, Hungary joined by the
College's Demonstration Elementary School will launch a pedagogical and methodological experiment in the 2009/2010 academic year.
As a result of this new and exciting venture aiming to promote efficient and productive digital literacy all fifth grade students of the Demonstration School can start their studies in an electronic and interactive learning environment comprised of projectors, interactive boards and such IP cameras, which facilitate the synchronous broadcast and archiving of lessons and presentations on-line. Furthermore, the traditional work stations will be superseded by Classmate PC machines in the respective classrooms.
In addition to elaborating electronic learning environments for students, the technical and professional support efforts included instructors as well.
Consequently, in 2008 all instructors were provided with notebook computers. Moreover, professional training programs familiarised interested instructors with the foundations of
electronic educational material development, and with the use of the MOODLE LMS framework and the Mahara electronic portfolio.
In the summer of 2009 teachers of the Demonstration School of college were provided professional training. Accordingly, fifth grade teachers were familiarised with the technological foundations and the methodology of the efficient use of such equipment and devices as the CMPC, the Interactive Board and e-presentations.
In our presentation we would like to describe our experience of this project and a short analysis of positive impacts and the drawbacks.
Keywords: multimedia, information age, lifelong learning, digital competence, learning
methods, educational material development
1. Introduction
1.1 Theoretical background
Manuel Castells’ gives an apt description of the 21st century or the century of information in his seminal work, The Information Age: “In the last quarter of our waning 20th century the information-centred technological revolution transformed our ways of thinking, production, consumption, trade, in addition to how we arrange our activities, how we communicate, and finally how we live and die […].”[1]
Information has a comprehensive impact on human life including the teaching and learning process. Simultaneously with modernization and the attendant technological and economic changes an overall need for new competences emerged leading to a greater appreciation of informatics skills, digital literacy, and information search and retrieval capabilities.
Marshall McLuhan’s original concept of the typographical man obtaining printed books and acquiring information from a wide range of printed materials is being used in the context of audio-visual and digital communication, and by now the term “typographical or post-typographical man” has been superseded by the electronic man “for whom knowledge is not based on the possession of information, but on the ability to find his or her way in the limitless flow of electronically accessible information.” [2]
Page 242
The new challenges posed by the information-based society and the respective changing social demands led to educational reforms emphasizing the acquisition of such skills and aptitudes as effective access to and application of information, the realization of respective research objectives, and the formulation of knowledge responding to the needs of the the 21st century. Consequently, the education process must provide a flexible response to the aforementioned changes. The list of key competences established by the European Union calls for the acquisition of skills and aptitudes promoting economic success, social advancement, obtaining and renewing knowledge, meeting the requirements of life long learning, general educational needs and self-actualization. The list contains the following eight competences: effective communication in one’s native language, foreign language proficiency, sufficient knowledge of mathematics and natural sciences, digital, learning, social, entrerpreneurial, and cultural expression skills.
These key competences are also emphasized by the National Core Curriculum introduced in Hungary in 1998 calling for the acquisition of skills and aptitudes indispensable to all learning efforts within the lifelong learning perspective during the years of mandatory schooling. [3] Digital competence criteria entails a self-confident and critical application of electronic media in work, leisure time, and during communication. The resulting media competence is related to logical and critical thinking, high standard information processing, and developed communication abilities. At a basic, beginning level information and communication technology application skills include the capability to search, evaluate, store, formulate, present, and transmit information based upon multimedia technology along with taking part in Internet-based communication and taking advantage of the respective network-provided options.
While the Classmate PC, a portable computer equipped with Internet connection is a crucial component of educational efforts aiming to facilitate the acquisition of digital competence, only a small percentage of school teachers take advantage of the new alternatives and the rate of the use of information and communication technology devices during the isntruction of the respective subjects is even smaller. The resulting digital gap between teacher and student, and amid various generations was demonstrated by the 2006 National Informatics Survey and by the treatise of István Herendi. Consequently, the survey showed that “the use of computers by teachers during classroom instruction” is a field where significant improvement is needed. Although, due to numerous successful grant application projects ”[…]virtually all schools are equipped with an appropriate technological background including portable computers, projectors, and screens, these are usually kept locked in a safe place and teachers are not encouraged to use these devices as school management tends to save them for special days.” [4]
János Ollé reaches a similar conclusion: “most teachers are compelled to cope with such a paradoxical situation according to which their school age child is an everyday user of computers, while the instructors can hardly take advantage of the information and digital literacy of the respective student population in order to increase the efficiency of the instruction process.” [5]
The unequal access to and use of digital technology characterising the larger society is reproduced in the schools as well since the limited computerized resources are utilized only during the instruction of the most talented students, or those displaying the highest socio-economic status. Consequently, Péter Fehér’s [6] research confirms that the rise of Prensky’s net-generation in Hungary has not been completed as students have not obtained the respective knowledge and competence. Consequently, there are several areas in need of development.
Research results also suggest that the abovementioned goals have not been completely realised due to logistical, administrative, and pedagogical obstacles preventing the efficient shared use of computers.
Page 243

Aiming to find solution for these problems and to achieve a more efficient integration of information and communication technology into the educational process laptop programs have been adopted by an increasing number of schools. Consequently, all students studying in the given class or school are provided with a laptop computer for in school and in most cases home use as well. Laptop programs promote a more natural and trouble-free incorporation of technology into the educational process by the elimination of several obstacles including problems resulting from sharing and scheduling use time, the movement of students to and from computer laboratories, along with unequal access to computing devices.
1.2 The international background
The first Classmate PC (CMPC) projects were carried out within the 2006 Intel World Ahead program. Accordingly, the target audience of low price laptops equipped with Intel processors but not produced by the factories of Intel were users in developing countries. The program bore a certain resemblance to the OLPC, or One Laptop per Child project. As the international results suggest the Classmate PC is expected to produce revolutionary changes in school instruction.
In Chile in the Atenea School for Girls the Classmate PC (CMPC) is used at least once a week int he third, sixth, and seventh grades for the development of writing and reading skills and during Mathematics lessons, while eight graders employ such equipment in the solution of tasks requiring collaboration. While the school was ranked among the most sucessful educational institutions of the country last year, the extension of the use of CMPC through the third and eight grades is planned.
Two months after the introduction of CMPCs in the Abel. T. Motshoane Secondary School of Mabopane, South Africa school attendance increased from 40% to 90%. Students coping with a limited availability of computers while attending an Egyptian school built in an economically disadvantaged community were granted their wish of studying from the same materials as their wealthier counterparts after the introduction of CMPCs. After they developed a capability of exploring the Internet in a safe and secure way learning itself became happier and more attractive as well. Teachers in Beijing, China observed that as a result of the introduction of CMPCs students became more motivated and even devoted recess time to work on laptops, while pupils capable of learning at a faster pace used the portable computer to find additional information concerning topics discussed during class. A teacher of the Acueducto School of Guadalajara noted that in an all-girl class students not only become more motivated and improved their attention span following the launching of the CMPC program, but their attitude to in-class work changed as well. Accordingly, previously silent pupils are posing questions and work on potential answers. It is believed that the laptops enable students to test new options with a minimized risk thereby helping them to cope with potential failures and problems better than in a traditional educational context.
The laptop program achieved a resounding success in Macedonia as well. After educational policy makers in Venezuela became familiar with the laptop initiative in April 2008 the
Page 244
adoption of the respective goals was confirmed in writing. Subsequently, almost 100,000 teachers were enrolled in training programs and by the end of the year 500,000 Classmate PC machines were ordered for elementary schools throughout the country. Moreover, substantial infrastructural investments facilitated the introduction of broad bandwidth Internet access in schools, along with launching the local manufacturing of computers and assigning local firms the duty of the operation, maintenance, and software development of school systems. Furthermore, notable results were achieved in foreign commerce as 1 million CMPC sets produced in Portugal have been sold abroad.
Three age groups participated in the experiment in England as kindergarten age (3-4 years), pre-school (4-7 years), and primary or lower division elementary school (7-11 years) students have become familiar with laptop technology. Consequently, in all sixteen Wi-Fi equipped classrooms interactive boards replaced traditional blackboards and altogether 140 CMPCs were provided for in class and home use. Furthermore, promising pilot programs concerning the integration of CMPCs in the education process are presently being conducted in Romania, Bulgaria, Serbia, and the Czech Republic.
2. Methods
2.1 Preceding developments in Hungary
The Hungarian government was the first in the Central European Region to sign a declaration of intent in the autumn of 2007 concerning the introduction of various educational projects of the Intel World Ahead Program in elementary and secondary education. Accordingly, three components of the program were involved. The Intel Teach teacher training project assists instructors to recognise when, how, and where they can use the technological equipment in the classroom, the Intel Classmate PC program provides a computer specifically developed for meeting the requirements and needs of students, and the Intel School Learning and Teaching supplies an on-line educational power resource. According to Intel the Classmate PC and the related services could be integral components of Hungarian reform aspirations since higher education and especially teacher training can be easily and quickly involved in the program, the support of parents and local governments can be obtained, the standards of education efforts can be visibly improved, and last but not least the ubiquitous complaints concerning the lack of technological experts could be remedied via a methodological change concerning the instruction of natural science subjects.
The respective instrument apparatus including the Classmate PC was developed for meeting the demands of competence-based education. Consequently, it supports project-based instruction methods, group work, and mobile education options. Designers took children’s needs into consideration as the computer is small, light-weight, and sturdy. The programs installed on the Classmate PC enable teachers to administer tests instantly, show films and presentations, in addition to monitoring the students’ work and internet use via their own machines. In Hungary the Classmate PC was introduced at first in two schools in Budapest, but later a large scale pilot project was launched in Eger with the inclusion of fifth grade students using and striving to realize modern educational methods and objectives respectively.
3. The elaboration of electronic learning environments in Eger - the professional background of the research project
Inspired by domestic research results the Institute of Media Informatics of the Eszterházy Károly College and the Demonstration Elementary School of the Eszterházy Károly College launched an unprecedented pedagogical and methodological experiment in the 2009/2010 academic year. Accordingly, all fifth grade classes started the school year in an interactive teaching and learning environment as the respective classrooms were equipped with the latest instruction technology apparatus including interactive boards, Wi-Fi end points and IP cameras.
Page 245
The respective strategy also called for teachers to participate in a thirty hour professional training program facilitating the acquisition of skills for the productive use of the respective devices and target software along with obtaining the necessary methodological foundations. The pedagogical research focused on three fifth grade classes involving 29 teachers and 120 students. In the first week of September 2009 the pupils’ information and communication technology proficiency was assessed via a questionnaire-based survey. In addition to the acquisition of the relevant equipment a newly developed application enabled the recording and Internet-based viewing of the respective teaching activities and class-room presentations.
Moreover, the project assigned priority to competence-based education requirements specified by the National Development Strategy. Accordingly, special attention was paid to such criteria as the acquisition of knowledge usable and utilizable in everyday life while promoting the improvement of subject knowledge via “knowledge and information-imbedded skill and aptitude development.” Consequently, these pupils can learn in an educational environment meeting world standards.
The project also included the exploration of the options, advantages, and disadvantages of the device system and the interactive learning environment. Following the collection and evaluation of data all respective methodological and practice-related conclusions will be publicized and disseminated.
During the beginning phase of the research project the basic criteria was established including the preparation of methodological documents in the form of lesson plans and the arrangement of two open classes accessible by parents via Internet demonstrating the active use of ICT devices, of the CMPC, and of the interactive board.
The teachers participated in a special course including a workshop held at the same time every week. The further training program lasted for seven days during which the participants fulfilled various assignments and gained hands-on experience in 8-10 hour per day sessions. The respective criteria can be read at the official web-page of the project. Accordingly, the project designers called for ICT use in approximately 30% of each lesson throughout a whole semester in cases of all subjects where the devices of electronic learning environments can be integrated into the educational process.
3.1 Preliminary measuring of ICT competence via a questionnaire-based survey
Students’ questionnaires Almost all (99%) of fifth grade students surveyed responded in an affirmative manner
concerning computer access at home. As far as owning a computer is concerned there is a greater distribution among the answers as almost half of the 11-12 age group (40,4%) reported about owning a computer, and in case of the larger section of the sample (56,7%) the parents for various reasons did not approve of their child having his or her own computer. Almost more than half of those surveyed (61%) use the Internet on a daily basis (see Chart 1) and the high level informatics literacy of the students is demonstrated by the fact that 72,3% use network-provided options in solving school assignments and the proportion of those who do not use these possibilities or do not have a computer is almost identical 12, 9% and 14,9% respectively (see Chart 2). More than half of the students responding to the survey (62,4%) consider the computer an indispensable tool both for work and school, and the rate of those who do not deem the computer necessary or is not interested in this activity is almost identical 20,8% and 16.8% respectively (see Chart 3).
Teachers’ questionnaires The average time of professional experience of teachers responding to the survey was 23,6
years. The participant with the greatest seniority has worked as a teacher for 34 years, and the
Page 246
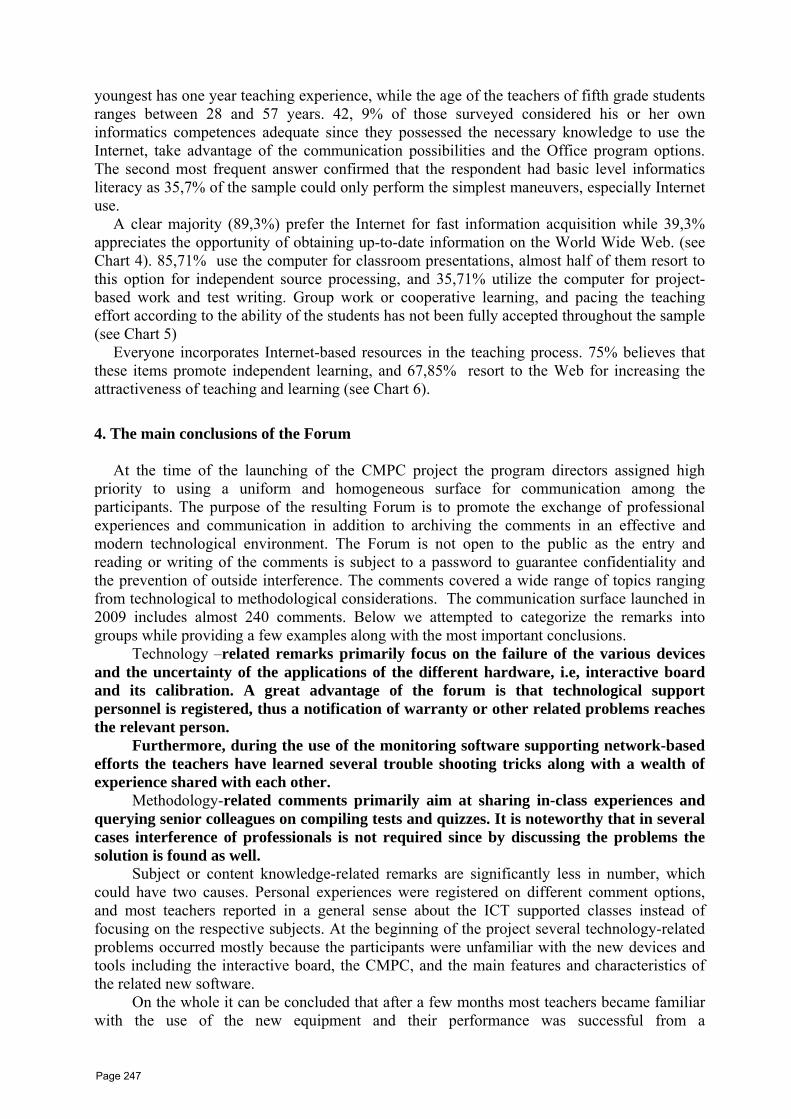
youngest has one year teaching experience, while the age of the teachers of fifth grade students ranges between 28 and 57 years. 42, 9% of those surveyed considered his or her own informatics competences adequate since they possessed the necessary knowledge to use the Internet, take advantage of the communication possibilities and the Office program options. The second most frequent answer confirmed that the respondent had basic level informatics literacy as 35,7% of the sample could only perform the simplest maneuvers, especially Internet use.
A clear majority (89,3%) prefer the Internet for fast information acquisition while 39,3% appreciates the opportunity of obtaining up-to-date information on the World Wide Web. (see Chart 4). 85,71% use the computer for classroom presentations, almost half of them resort to this option for independent source processing, and 35,71% utilize the computer for project-based work and test writing. Group work or cooperative learning, and pacing the teaching effort according to the ability of the students has not been fully accepted throughout the sample (see Chart 5)
Everyone incorporates Internet-based resources in the teaching process. 75% believes that these items promote independent learning, and 67,85% resort to the Web for increasing the attractiveness of teaching and learning (see Chart 6).
4. The main conclusions of the Forum
At the time of the launching of the CMPC project the program directors assigned high priority to using a uniform and homogeneous surface for communication among the participants. The purpose of the resulting Forum is to promote the exchange of professional experiences and communication in addition to archiving the comments in an effective and modern technological environment. The Forum is not open to the public as the entry and reading or writing of the comments is subject to a password to guarantee confidentiality and the prevention of outside interference. The comments covered a wide range of topics ranging from technological to methodological considerations. The communication surface launched in 2009 includes almost 240 comments. Below we attempted to categorize the remarks into groups while providing a few examples along with the most important conclusions.
Technology –related remarks primarily focus on the failure of the various devices and the uncertainty of the applications of the different hardware, i.e, interactive board and its calibration. A great advantage of the forum is that technological support personnel is registered, thus a notification of warranty or other related problems reaches the relevant person.
Furthermore, during the use of the monitoring software supporting network-based efforts the teachers have learned several trouble shooting tricks along with a wealth of experience shared with each other.
Methodology-related comments primarily aim at sharing in-class experiences and querying senior colleagues on compiling tests and quizzes. It is noteworthy that in several cases interference of professionals is not required since by discussing the problems the solution is found as well.
Subject or content knowledge-related remarks are significantly less in number, which could have two causes. Personal experiences were registered on different comment options, and most teachers reported in a general sense about the ICT supported classes instead of focusing on the respective subjects. At the beginning of the project several technology-related problems occurred mostly because the participants were unfamiliar with the new devices and tools including the interactive board, the CMPC, and the main features and characteristics of the related new software.
On the whole it can be concluded that after a few months most teachers became familiar with the use of the new equipment and their performance was successful from a
Page 247
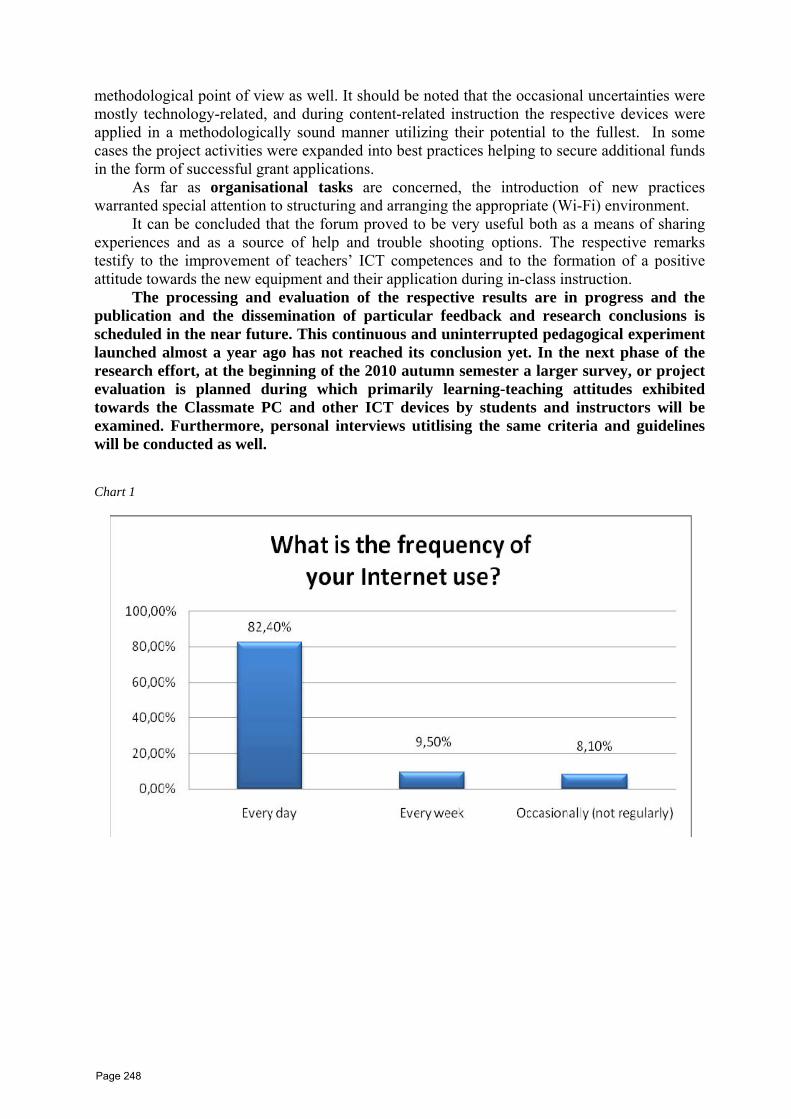
methodological point of view as well. It should be noted that the occasional uncertainties were mostly technology-related, and during content-related instruction the respective devices were applied in a methodologically sound manner utilizing their potential to the fullest. In some cases the project activities were expanded into best practices helping to secure additional funds in the form of successful grant applications.
As far as organisational tasks are concerned, the introduction of new practices warranted special attention to structuring and arranging the appropriate (Wi-Fi) environment.
It can be concluded that the forum proved to be very useful both as a means of sharing experiences and as a source of help and trouble shooting options. The respective remarks testify to the improvement of teachers’ ICT competences and to the formation of a positive attitude towards the new equipment and their application during in-class instruction.
The processing and evaluation of the respective results are in progress and the publication and the dissemination of particular feedback and research conclusions is scheduled in the near future. This continuous and uninterrupted pedagogical experiment launched almost a year ago has not reached its conclusion yet. In the next phase of the research effort, at the beginning of the 2010 autumn semester a larger survey, or project evaluation is planned during which primarily learning-teaching attitudes exhibited towards the Classmate PC and other ICT devices by students and instructors will be examined. Furthermore, personal interviews utitlising the same criteria and guidelines will be conducted as well.
Chart 1
Page 248

Chart 2
Chart 3
Page 249
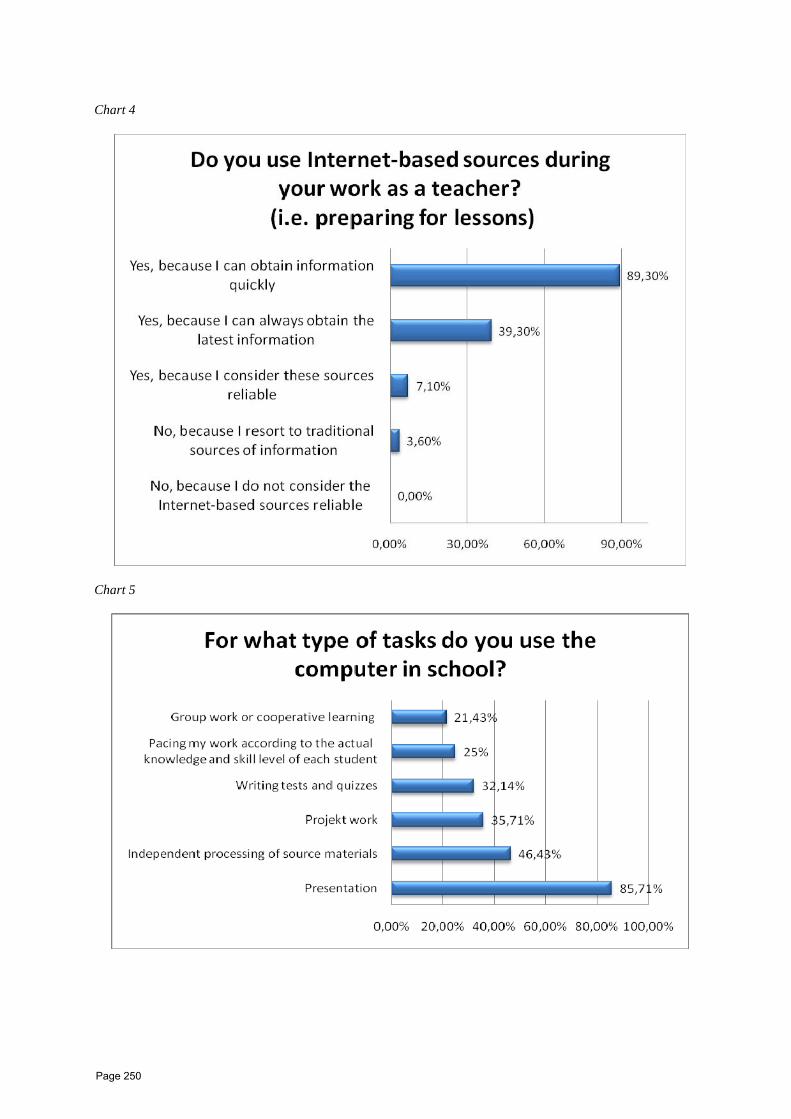
Chart 4
Chart 5
Page 250
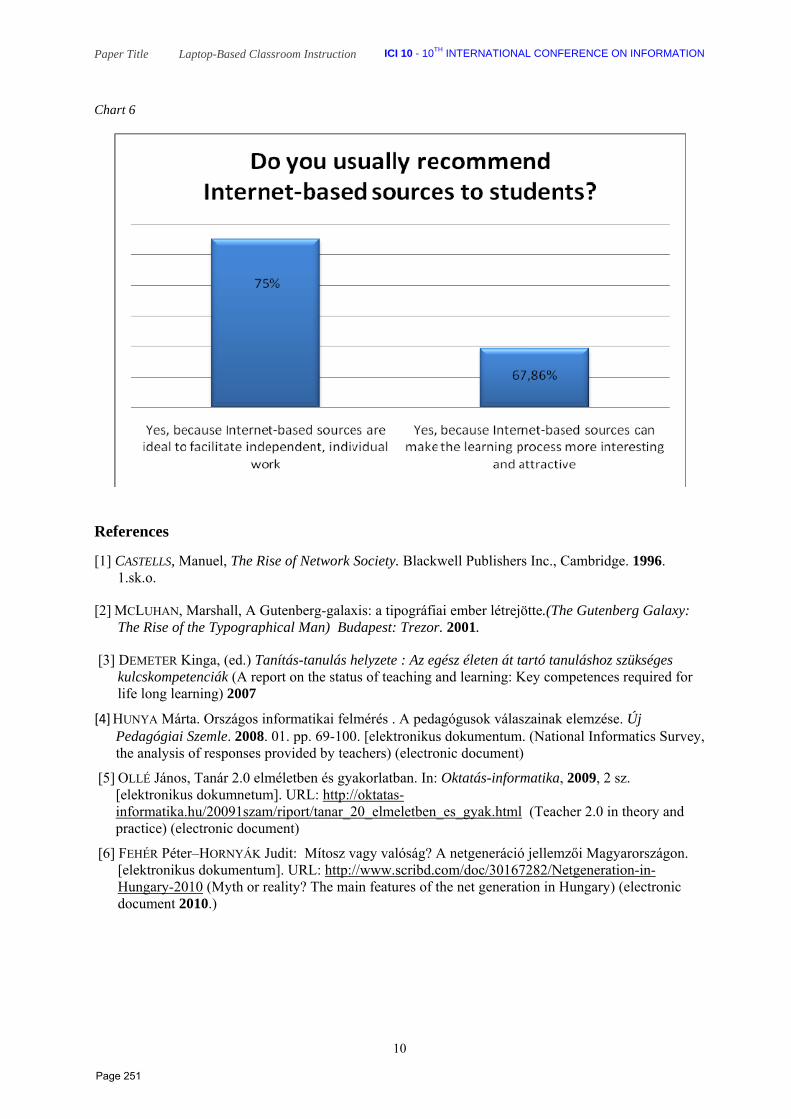
THPaper Title Laptop-Based Classroom Instruction ICI 10 - 10 INTERNATIONAL CONFERENCE ON INFORMATION
10
Chart 6
References
[1] CASTELLS, Manuel, The Rise of Network Society. Blackwell Publishers Inc., Cambridge. 1996. 1.sk.o.
[2] MCLUHAN, Marshall, A Gutenberg-galaxis: a tipográfiai ember létrejötte.(The Gutenberg Galaxy: The Rise of the Typographical Man) Budapest: Trezor. 2001.
[3] DEMETER Kinga, (ed.) Tanítás-tanulás helyzete : Az egész életen át tartó tanuláshoz szükséges kulcskompetenciák (A report on the status of teaching and learning: Key competences required for life long learning) 2007
[4] HUNYA Márta. Országos informatikai felmérés . A pedagógusok válaszainak elemzése. Új Pedagógiai Szemle. 2008. 01. pp. 69-100. [elektronikus dokumentum. (National Informatics Survey, the analysis of responses provided by teachers) (electronic document)
[5] OLLÉ János, Tanár 2.0 elméletben és gyakorlatban. In: Oktatás-informatika, 2009, 2 sz. [elektronikus dokumnetum]. URL: http://oktatas-informatika.hu/20091szam/riport/tanar_20_elmeletben_es_gyak.html (Teacher 2.0 in theory and practice) (electronic document)
[6] FEHÉR Péter–HORNYÁK Judit: Mítosz vagy valóság? A netgeneráció jellemzői Magyarországon. [elektronikus dokumentum]. URL: http://www.scribd.com/doc/30167282/Netgeneration-in-Hungary-2010 (Myth or reality? The main features of the net generation in Hungary) (electronic document 2010.)
Page 251

From the Bibliotheca Alexandriana to the New Library of Alexandria
Basic Mission Statements of the Libraries in Changing Times
István Monok
Abstract Education needed writing and books from the very beginning and the place of orientation in accumulated knowledge became the library. Kings and emperors who were fond of science liked to possess the entire tradition in their libraries. The first universal, all inclusive library in Alexandria came into being with this very purpose. The question, however, is whether it was the only purpose the founders had in mind. With the re-establishment of the Library of Alexandria in 2002 another question rises: what was the purpose of its founders? How did they manage to realize their goal? Is there a difference between the two acts of foundation? Is there a difference in purpose and intention between the Library of Alexandria and national libraries? The discussions turned around four major issues: what is the purpose of the establishment (to found), what will the library be like as a building, workplace and what the process of work will there be like (to integrate), how should the library take care of the preservation of documents (to preserve), and how should the collection of tradition be used (to create). Keywords:
Cultural heritage; Library history; National libraries; Librarianship
Stat rosa pristina nomine, nomina nuda tenemus (Bernard de Morval †1140)
The motto of my lecture is from Bernard de Morval of his De contemptu mundi (I,952). The meaning of this quotation is complex and can be interpreted in different ways. I think it sums up the meaning of all libraries and, in a wider sense, that of all public collections. The same idea led Umberto Eco to choose the very same motto as the title – „The Name of the Rose” – of his book on the library and of the librarian. I would like to believe that my lecture will shed light on the meaning of this quotation.
Reading and writing have a double root. On one hand, they allowed individuals and the society to satisfy their desire to pass down their memories to the next generations while on the other hand, agreements (laws) regulating the life of society could be formulated and made public. Libraries as institutions came to life not only to preserve the ever growing number of written documents. Along with the institutionalisation of the keeping of legal and economic documents the collection of pieces of our written cultural heritage also began. These collections were named by expressions which are translated today as „archives” or „libraries”. These two institutions separated when profit-making legal activities were added to the archival jobs (the preservation of documents). From this moment on libraries became independent and little by little other objects such as studiolo or curiosity chambers were added to books. When these latter ones became independent the first museums were founded. Later on these museums will have their own libraries as well.
Education needed writing and books from the very beginning and the place of orientation in accumulated knowledge became the library. Kings and emperors who were fond of science liked to possess the entire tradition in their libraries. The first universal, all inclusive library in Alexandia came into being with this very purpose. The question, however, is whether it was
Page 252

the only purpose the founders had in mind. With the re-establishment of the Library of Alexandria in 2002 another question rises: what was the purpose of its founders? How did they manage to realize their goal? Is there a difference between the two acts of foundation? Is there a difference in purpose and intention between the Library of Alexandria and national libraries?
The strategic planning of this new collection was not made by one single library or the librarians of one single nation. Taking a look at the discussions on the establishment of the new Library of Alexandria we can have a clear picture of what librarians, politicians and representatives of the intelligentsia think of the role of libraries at the turn of the third millenium. Let me state right away that the activity of a library in these discussions is, by no means, confined to the mere technical role of an information centre. The discussions turned around four major issues: what is the purpose of the establishment (to found), what will the library be like as a building, workplace and what the process of work ill there be like (to integrate), how should the library take care of the preservation of documents (to preserve), and how should the collection of tradition be used (to create).
To Found Alexandria in Ancient Times realized the idea of an ambitious emperor and the scholars around him. They collected all written documents of the world known then in one library so that they could be used by the few scholars there. One should not, however, forget about the representational role the library played to display royal power. Now the new Library of Alexandria has a wider scope and is includes more in space and naturally in time. It collects the Hebrew Scriptures and Christian Bible, the Vedas, as well as the written pieces of our cultural heritage from the antiquities, the classics of the Confucians and the Koran. The new Library of Alexandria documents the history of these pieces of our cultural heritage, the inner structure of these texts, the process of their canonization, the history of their influence in religion, society and politics as well as in the history of ideas. The founding collection of 4 million items is therefore encyclopedic by nature (it is not the national library of Egypt). The act of foundation carries an important political message: it aims to present a universal and integral tradition where pieces build on one another in opposition to the growing differences in political views of the countries belonging to the different cultural traditions.
Those who read the international secondary literature of the history of libraries are not be surprised by the fact that there is no one single book which carries the title: „the History of Libraries”. On the other hand, there are innumerable books such as „The History of Books”, or „The History of Book Printing”, or „The History of Selling Books”, or „The History of Reading”. Although the individual histories of libraries do share common elements but their foundation, their role in society and their use carry individual characteristics different in each society. The foundation of national libraries took place in many ways and there are different interpretations even of the same national library. This latter aspect is especially important nowadays when we are celebrating the anniversaries of their foundations and when the issue – what is a national library? – is raised again in several ways. The fact that this question is more than timely could be seen in a very special way at the „foundation”of the German National Library in 2006 when the „Deutsche Bibliothek” of Frankfurt became the „Deutsche Nationalbibliothek” by a new law. Before this law was passed there had been a heated discussion in the German Parliament around questions whether there had been a national library at all in Germany politically united since Bismark, or do Germans need a national library at all. Everybody knows that with early Christianisation the first libraries were soon founded in German territories and that each German Elector founded his own library on his land (in German generally called Landesbibliothek, however in Bayern and Prussia Staatsbibliothek). Without interrupting the topic outlined in the introduction I must mention
Page 253

here that it is not by chance that there were so many pieces in the discussion connecting the rise of national pride experienced during the Football World Cup of 2006 with the issue of the German national library. It is also not by accident that in the integrating Europe the notion of „nation” is to be reconsidered at the celebration of each national library’s anniversary. To finish this detour I would like to state that I find the public discussion of this issue very positive since it contributes to preserving the cultural diversity of Europe.
Returning to our subject which is the history of the foundations of national libraries we should touch on the question expressed so well by the title of the conference to be held in Paris on Mathias Hunyadi in 2008: Mathias Corvin et les bibliothèques princières à l’origine de l’État moderne. The libraries of dukes in quattrocento and cinquecento, besides being means of representation of power, show the tendency described by political science as the appearance of the modern state. Let me mention a few examples here to briefly touch on the different historical traditions. In Italy a number of aristocratic libraries were founded in the 15th and 16th centuries (Sforza, Medici, Este, Aragon, etc.) which, in their collections, were all suitable to serve as a base for the national library of the unified Italy but were too much connected to familial and territorial traditions. This is why two new – national collections (of modern approach based on legal deposit) were established, one in Rome and the other one in Florence. The idea of a legal deposit, besides being a means of the representation of power, is a sign of the appearance of or more precisely the intention of establishing the modern nation state. It not by accident that this idea came up first in France and England (Frances 1er, Henry VIII) where the royal libraries served later as a basis for the national libraries. The unification of the Iberian kingdoms and the expulsion of the Arabs of the Iberian Peninsula took place when an ambitious royal dynasty, the Hapsburgs, unified large territories of Europe under their rule. In the central (if I may put it this way) Hapsburg countries such as Spain and Austria the royal (emperor’s) library could not become the national library of all the peoples united under their rule. The royal collection of the Netherlands (Orange-Nassau dynasty) which gained independence early got scattered, thus could not form the basis of the national library of the Netherlands so it had to be founded (1798). The national library of Belgium is called „Royal Library” even today named after their first national king (Bibliothèque Royale Albert 1er) in spite of the fact that it was Mary of Hapsburg, the widow of Louis I, king of Croatia and Hungary, being the stateholder (stadhouder) in the Low Countries, who created the library which later served as a basis of the national library by integrating the library of Mechelen of Margaret of Hapsburg into her collections gathered in Brussels from her different castles. The history of the national libraries of the nations in Central-Europe and the Baltiques is almost entirely unrelated to royal collections of books. The smaller school, university or society libraries which typically gained national character in the 19th century and served later as basis of national libraries of newly independent states, were all formed under Swedish, German, Hapsburg, Russian or Hungarian rule. This is why the title of the conference held in Budapest in 2002 on this subject was formulated as „Les bibliothèques centrales et la construction des identités collectives”. There are countries where the invader supported the establishment of the first collections. A good example of this is the history of the Finnish National Library. In the Thirty-Year War the army of the Swedish king Gustaf Adolf took the library of the Strahov Prémontré monastery in Prague to Turku where a university based on this collection was also founded in 1640. Although this library burned down along with the city itself in 1827 and the library was newly founded in Helsinki in the centre of the Russian Grand Duchy with substantial help from the tsar, the year of foundation of the Finnish National Library is yet celebrated as 1640, the year when the University of Turku was established.
Page 254

I would also like to speak of the national libraries of the Carpathian Basin. Mathias Hunyadi established one of the biggest libraries of Europe at the end of the 15th century. At the end of his life his ambition to become an emperor led him to take Vienna where he played a role in the establishment of the royal library – this view is shared even by some Austrian historians. The Bibliotheca Corvina of Buda, however, could not serve as the basis of any of the peoples living in the Carpathian Basin and interestingly enough even today no nation is interested in connecting the foundation of their national libraries with the Corvina.
Ferenc Széchényi when offering his own library along with his collection of museum pieces for the benefit of the national culture in 1802 clearly formulated its purpose which has defined the fundamental job for our library ever since then: the collection of hand written or printed documents of Hungarian connection. The foundation itself carried a political message which was clearly understood not only by the historians of the 20th century but by his contemporaries as well.
The nobility of Hungary (and not just the nobles of Hungarian origin) of the 18th century were both faced with the Habsburg’s government policy to centralize and unify each branch of the state administration and with the tendency to achieve German dominance. The protestant aristocracy took up as their main job the support of their church institutions. Both in Transylvania (the Telekis, the Bethlens, etc.) and in Hungary (the Rédeys, the Radvánszkys, etc.) this support was always connected with the development of libraries. The bibliophile aristocracy and church leadership of the 18th century knew very well that their libraries were not only means of accumulating wealth or places of scholarship or centres for cultural management but were also the storehouses of the written documents of our cultural heritage which preserve sometimes the only existing original or its copy testifying of our ancestors’ thoughts. The year 1802 could very well be considered as a mile stone in the history of library in the Carpathian Basin since during the preceding two centuries the aristocratic courts and the historical churches served to supplement the missing cultural management of the royal court and created the basis for the modern central (national) as well as the public library network. The idea of the establishment of Hungarian national library rose along with the idea of the foundation of the national scholarly society, the national academy of science. Since there was no national ruler this role was naturally played by the Hungarian aristocracy. Some founded institutions of higher education (the Festetich family), some like Klimó established libraries while others like Teleki founded libraries for the academy.
The „document of Hungarian interest” („Hungaricum”) meant for Széchényi and his contemporaries manuscript or printed sources related to the historical territory of Hungary. Széchényi did not establish a „Bibliotheca nationalis” but a „Bibliotheca Regnicolaris” that is the library of the peoples of Hungary. This is why the Széchényi National Library became a central collection of the peoples of the Carpathian Basin. This is true even if in the first half of the 19th century the ethnic minorities of Hungary founded their own central collections (museums and libraries) one after the other as background institutions to their national cultural identities which have served this purpose in the past one and a half or two centuries. The Romanians of Transylvania established their collections in Balázsfalva, the Saxons in Nagyszeben (Bruckenthal Museum), the Serbs in Újvidék, the Croatian in Zagreb and the Slovaks in Túrócszentmárton. These latter collections have very interesting histories themselves which is at some places interpreted today as precedents to their national libraries, an example to this is, among others, the Croatian National Library.
To integrate The building of the Library of Alexandria in antiquity is known from epic sources to be the place of scholarly work where scholars and their disciples lived together. The building of the
Page 255

present day Library of Alexandria (80,000 square metres) and its facilities were designed and built in a way that the library can really be the place of work for librarians and researchers where doctoral schools can flourish (in the history of books and in information technology). Electronic catalogues, bibliographies and electronically designed expert systems serve as means of orientation. It is the belief of the new founders that the library works with the help of the texts on the texts for the sake of reading. The library is a workshop for making people read in a wider sense (copying, publishing, microfilms and digitalisation). The core is untouched. What changes with years is the quantity and the technology. The newly established Library of Alexandria is a proof that we have reached the point in the history of libraries in terms of being public when internet is what provides access for the public while the library itself as a building and as place of work is becoming the museum of books, scholarly training and research centre. The library is the place to preserve tradition and is the symbol of family, dynastic, institutional and cultural continuity. Alexandria itself is the symbol of universal cultural continuity.
The European national libraries are the places and symbols of the preservation of each country’s national cultural continuity. The public access and the scholarly use of their collections are organic parts of the process through which public library systems have been formed in each country. The European model can be summed up by mentioning three elements: the initiatives of the Humanists, the educational and cultural program of the Reformation movement, and, on the part of some of the monarchs, responsible aristocrats and church leaders, the promotion of national culture. It was not until the end of the 18th century and the first part of the 19th century that reading circles and public libraries were formed.
Each national library should have, as a goal, wider cooperation with institutions of higher education and of the academy of sciences as well as aiming to become a centre of research in the history of books and library science in the spirit declared by the new Library of Alexandria.
To Preserve The cultural heritage of societies based on written culture is more or less continuous. Scriptors (printers and publishers), authors, the interpreters of their work as well as librarians are key figures in this process. Let me go back to the motto of my lecture at this point. The role of the librarian in providing cultural continuity is important primarily because they preserve documents trusted on to them „under their names” and without interpreting them. A librarian does not interpret the contents of the text, does not try to decipher their enigmatic meaning, does not enter into polemy with its contents from scientific, political or moral aspects.
In the history of libraries it was the time when the introduction of legal deposits took place that preservation without selection became possible. The documents themselves and their „names or entries” are to be preserved. Preservation, however, is a more complex job. Physical conservation itself requires serious knowledge, continuously developing technologies and funds. The preservation of the „name” is one of the classic jobs of a librarian that is the continues preparation of catalogues and bibliographies. However, passing down tradition is also part of the process of preservation. This latter has lost some of its importance due to the great number of documents but in the past a significant number of texts were preserved this way. Defining the „name” of the document or creating an entry is not always easy and requires scholarship in itself.
To Create Copying was an important part of the activities in the Library of Alexandria in ancient times while a lot of new texts were created in the library the copying of which had to be arranged as
Page 256
6
well. The Library of Alexandria of the 21st century wants to present itself as a centre for scholarly research and carries out publishing in the subjects mentioned before.
Public collections are not only the venues of basic research in history. The scientific processing of public collections is done on the entirety of the collection without being evaluative („nomina nuda tenemus”). The result of this process can, therefore, be used by others, by anybody in fact. Research at public collections should, in principle, be valued more today when the possibilities of research in humanities and social sciences are changing fast with the development of new technologies. Possibilities provided by new technology cannot even be tried out without contents. Basic research and providing contents, therefore, are tightly connected areas. Their unity can be guaranteed by public collections because they are to present the entirety of the contents and because they are technically equipped to do so.
Referring back to the previous train of thoughts („to preserve”) let me mention here the newest chapter in palimpsest research. Now there is a digital technology which allows us to reconstruct erased texts up to three layers. Many of the texts from late antiquity and the early Middle Ages can now be discovered but this work can only be done in libraries through the scientific processing of the collection.
Each type of public collection created its discipline which has a well-organized network of institutions (museology, archival science, library science). To do research in the field of theses disciplines is also one of the scientific activities carried out in public collections.
To end this lecture let me refer to the name of the rose again: „Stat rosa pristina nomine, nomina nuda tenemus”. Libraries can carry out their mission unchanged from the times of their foundation only if they undertake the preservation of the entirety of the documents they have been entrusted with without bias and by taking part in the process of passing cultural heritage down in a wider sense. Librarians can accomplish their jobs if they do not want to become writers, polemic philosophers or politicians. Instead they strive to pass down cultural heritage at the place assigned to them in the division of this work. If they make the information (the name of the rose) publically available without selection using modern technology and if they do research (naming) of the highest scientific standard.
National libraries, however, are called for something more. By the fact that the written heritage of a society sharing the same cultural heritage is concentrated into and is presented as a collection the unity of the collection can and has to be interpreted in itself, and, in fact, has already been interpreted by the members of the society. Public collections preserve and present the members of the society with a common ground, a base where they belong. This common ground or base does not, however, belong to one ethnic community only. The histories of the national libraries from their foundation have illustrated the diversity of different communities belonging together. The modern Library of Alexandria will need a long time to become the national library of the world. The European Library will also have to step over the stage and the concept of being a shared surface of the catalogues of all the European National Libraries. This stage is overpassed if the individual national libraries in Europe will survive and if they effectively manage to preserve their cultural diversity stressed so much in political slogans. If it is reached then Europe itself will have a firmer foundation in opposition to the present political and economic alliance based on globally defined foundations. The preservation of cultural diversity, in fact, requires independence of each nation. Independence is based on an integrated system of institutions which allow the society to preserve and get to know their past. National libraries are such institutions.
Page 257
GAMASA, EGYPT, 4 – 6 DECEMBER 2010
Effective support for learning with library-informatics devices
L. Czeglédi
Central Library, Eszterházy Károly College, Eger, Hungary, [email protected]
Abstract There are various possibilities for interaction between library systems and e-learning systems. The majority of current solutions result from of a connection of the two systems, their linkage along different aspects and requirements. E-learning-based library interactions do not yet have a long tradition, which is due to the low level of development, or even the absence of methodological and structural elements. While digitalisation and the establishment of digital libraries have been in the centre of professional research for years, recently more emphasis has been placed on the structure and elaboration of digital libraries and on the analysis of the respective services. This trend is best illustrated by the increasing professional interest paid to the question of library portals based upon a well-structured digital repository holding appropriate quality content and providing an optimal background for the support of e-learning learner management systems. The delivery and provision of electronic educational materials and resources pose a serious challenge for higher education institutions and their libraries compelling them to meet such requirements as content preparation, archiving, and the legal regulation of the use of digital materials. Our research aims to develop a theoretical and a practical model of knowledge portals and educational material delivery in addition to examining their interaction.
Keywords: Library portals; Education; E-learning; Digital library; Digital repository; Knowledge portals
1. Introduction
One of the most crucial issues emerging as a result of research and development concerning
digitalisation supported education is the integration of various content knowledge into a
broad scale of information systems. The present study relying on and utilizing current
research results attempts to incorporate the present options into a system along with
providing an overview of the most important professional achievements complemented by
the author’s recommendations. The treatise’s overall aim is the introduction of the
theoretical background of the EKLEKTIKA project in addition to describing pertaining
plans for the future.
Page 258

Due to copy right and intellectual property issues along with technological difficulties the
conversion of a traditional library model utilizing physically tangible data carriers into a
digital environment cannot be achieved in a problem free manner. Furthermore, questions
related to on-line accessibility are not solely limited to legal and technological issues. Users
also need options facilitating content search along with relevant features helping the
processing of the acquired data.
The recent joining of the efforts of research and education institutions has resulted in a
broad scale cooperation characterized by a distribution of the respective services. Moreover,
the need for access to information on user demand provided a significant reinforcement for
the application of e-Learning schemes in higher education. While the evolving e-
Universities express a natural need for libraries, these facilities have not been able to match
the selection and services provided by their regular counterparts. It is unlikely that a digital
version compatible with the quality and professional depth of the established scholarly
libraries will be developed in the near future, thus the feasibility of educational programs
exclusively based on digital information sources is questionable [1]. Consequently, during
the elaboration of multifunctional library portals the options for the incorporation of Virtual
Learning Environments (VLE) and e-Learning training management systems should be
taken into consideration. [2]
2. Library portals + Digital repositories + e-Learning = Knowledge portals
The library portal is the apex of the digital library integration process. In order to guarantee
its success cooperation between intra-library information services, content providers, and
those of responsible for the maintenance of libraries is essential. The final result of this
integration effort will meet user needs in an integrated network-based environment.
First, however, one must define the concept of the library portal. The answer is somewhat
hard to come by as any definition depends on the given library environment, ranging from
static library homepages until the more sophisticated portal images of the established and
larger libraries. Thus a portal can be a simple homepage equipped with hyperlinks to library
content and services, but it can also take the form of a complex web-page offering a variety
of carefully integrated services in addition to an integrated service accessibility package
reachable from several points of the network. Library professionals distinguish between
simple, well-integrated, and well-rounded portals [3]. Let’s take a look at each item by Dahl,
Banerjee and Spalti!
Page 259
2.1. The simple portal
At its most basic level the library portal appears in the form of an appropriately elaborated
home-page facilitating connections to the respective library sources including the on-line
catalogue, catalogues of other libraries, shared catalogues, network data bases, and full text
sources. Thus integration is achieved primarily via the aforementioned links to these and
other services as well. While the library catalogues, the interlibrary loan system, and the
relevant electronics-based services are independent and separately accessible, these options
can be integrated into the same web page or graphic surface too.
2.2. The well-integrated portal
The most important features and functions of the portal environment can be realized and
implemented through an appropriate web design, dynamically operating web pages,
authorial devices, and content processing systems along with any type of commercial and
local developmental efforts. A more advanced and sophisticated portal development
endeavour however, offers not only greater integration, but supplies increased capacity tools
for information search as well.
The well-integrated library portal entails a comprehensive user interface incorporating a
variety of applications into one personalized user service thereby uniting such scattered
services provided by digital repositories as integrated searching tools, the (Single Sign-On –
SSO) option, and the cooperation with institution level systems.
2.3. The well-rounded portal
The well-rounded portals are part of a general strategy aiming to match user needs in a
network environment. Modularity facilitating the separation of the respective library
services along with the differentiation of content from form is one of the indispensable
requirements of well-rounded portals. Furthermore, the elaboration of a well-rounded portal
is not exclusively within the scope of libraries as the cooperation and shared design with
other organizational units is often a pre-condition for wider scale integration.
Library portals operating in a higher education context are inseparable from knowledge
management portals and display all basic features of portals thereby offering “such
technology, which from a definite point of entry facilitates the search of information
fulfilling personalized needs in heterogeneous, local, and distant sources, web-pages and
indexes”. [4] Thus, as it has been demonstrated earlier a reliable library portal assures
access to all sources available in and via the given library along with facilitating their use
through a single personalized user interface upon one entry. Any user interface design must
Page 260
include the integration of learning management systems into the array of services provided
by the portal in addition to assuring access to the relevant services from the surfaces of the
learning management systems. Consequently, a wide variety of e-Learning tools and
technologies should be applied. These devices and technologies can be divided into three
main groups: virtual communication tools (e-mail, mailing lists, news groups,
announcement boards), integrated learning environments (knowledge portals, virtual
learning environments), and Web-based educational materials. [5]
While knowledge portals usually include the learning management systems and the Web-
based educational texts, electronic course collections cannot always take the place of regular
textbooks as in most cases they complement the latter with digital materials. [6]
Consequently, modern technological solutions must facilitate the identification of shared
points and developmental perspectives of library portals and e-Learning training
management systems while fulfilling learning and research support functions.
The elaboration of digital repository based e-Learning library systems and library portals
assuring the strongest possible support to instruction and research efforts is one of the
crucial aspects of this endeavour. Research programs must aim at the establishment of the
respective professional background entailing a comprehensive development of knowledge
portals supporting the learning process.
3. The main objectives and theoretical foundations of the project
Any development of library portals and digital repositories must be based upon the view of
the library as a source centre whose functions and services should be converted into a virtual
form to a greatest possible extent. Virtual libraries are inseparable from the Internet and
network environments. One of the main goals of the establishment of virtual libraries is the
facilitation of interlibrary connections and the creation of library portals while taking
advantage of a wide variety of sources available on the World Wide Web. Before
undertaking the design effort, however, several issues must be clarified. At first, the
developers must justify the need for digitalization, or the provision of digital services
followed by a decision concerning the extent of their use. Namely, should these services
substitute for a portion of traditional options, or these features would operate in a parallel
fashion, perhaps in a task division format?
Page 261
The aforementioned objectives can be primarily considered the general aims of the
digitalization process. Based upon these goals we established the following complementary
objectives in the EKLEKTIKA project while taking the feasibility of special learning
support tasks into consideration:
• It is essential that all institutional sources should be accessible via one standard
surface after performing a single entry or sign on manoeuvre;
• Traditional, and e-Learning-based education along with scholarly research
should be supported by a separate and independent knowledge data base;
− the long term preservation and archiving of intellectual property and
material objects of local character and the provision of accessibility;
− the establishment of a required digital repository via the use of the
latest and most cost-effective means and methods of digital technology;
• facilitation of access to other knowledge bases in an organised and systemised
manner;
• promotion of accessibility to information with creative, interactive, and
personalized services;
• promotion of multilinguality and the elimination of obstacles in the virtual space.
The realization of these special objectives enables users to formulate an information-
learning-teaching-research environment designed to meet their own needs thereby
maximising the potentials offered by the library portal and the digital repository supporting
the latter.
Consequently, the main aim of the EKLEKTIKA project is the creation of an e-Learning
library competence centre incorporating the infrastructure and technological background of
digitalization along with the components of electronic services provided by the library and
the means of the modernization of library operation. Other objectives include the oversight
of the necessary elements of the physical environment, the overview of the methodology
facilitating the respective applications, and the management of standardization tasks along
with the design and development of a technological background required for operation.
4. Digital library vs. digital repository
Prior to the elaboration of a strategy related to the implementation of the above goals certain
conceptual or theoretical issues should be clarified. A thorough investigation has to be
Page 262
performed before the establishment of digital repositories as the difference between digital
libraries and digital repositories is not always clear. Consequently, one should take a look at
dissimilarities related to the nature and application of the two concepts.
Most professional sources tend to share the view that the term “digital library” refers to such
a collection of digitalized documents in which the very process alludes to the storing of data
in the form of binary signs intelligible for the computer. Digital documents include textual,
image-based, audio-visual, and web-based materials in addition to multimedia, motion
picture, animation, and 3D type documents.
Furthermore, there is no agreement in professional circles concerning the equation of digital
repositories with digital libraries and the resulting overlapping applications and despite the
temporary prevalence of either term a slight distinction in meaning is justified. Therefore,
although libraries store a wide variety of information sources, the inclusion of a given
document is at the discretion of the respective librarian, meanwhile repositories encourage
users to add sources or perhaps contribute to the production of the respective documents.
Thus the term repository refers to a capability of adding information-based objects or items
in addition to storing and sharing the sources of information and learning within a given
community. While the metadata indications of digital repositories cannot match the
scholarly rigour of bibliographical descriptions provided by digital libraries, the conceptual
system of libraries is not only similar to that of the repositories, but yields excellent
application options as well. [7]
5. The function of digital repositories
In addition to clarifying terminological and typological issues, the function of digital
repositories has to be determined as well. Consequently, the basic tasks of digital
repositories is the inclusion and grouping of all relevant sources of learning into logical and
continuously refined and enhanced categories along with possessing such features as a
systemized entries, thesaurus, index system, and search engines [8].
Furthermore, a digital repository might include the digitalised version of the components of
analogue collections along with documents originally prepared in a digital form. Thus
similarly to traditional libraries the digital repository has a dual function of service provision
and document preservation. Such duality implied by the aforementioned objectives is
converted into its mission as well.
Page 263
The primary task of the service provision component is assuring on line accessibility in a
diverse, creative, and interactive manner. On line access entails not only the settlement of
copyright or intellectual property issues, but focuses on such concerns as the search,
retrieval, and practical use of digital content along with the full scale of the respective
support services. The main function of the Central Digital Repository scheduled to be
established within the EKLEKTIKA project includes three additional objectives:
guaranteeing the efficiency of instruction, learning, and research via the integration of the
components of the digital repository and other portal components, providing support to
teaching and learning with the integration of the bulk of traditional library services into an
electronic environment, and giving electronic service support to public libraries while
assuring access to information for the general public. Another important requirement that
should be kept in mind during the design of the respective services is the elaboration of
personalized or individualized learning environments both in virtual and traditional contexts
according to disciplines or topics. The traditional library background is connected to the
library portal and the e-Learning training systems via the integrated library system.
Physically tangible learning spaces include such work stations, which are suitable for the
preparation of examination pieces or documents and multimedia products in addition to the
development of texts required for the fulfilment of academic and professional tasks.
While the preservation function includes long time conservation primarily in the form of
storage, after a certain time physical objects become subject to amortization. In case of
digital materials, this decay is primarily manifested in the respective formats becoming
obsolete, a problem potentially solved by continual format migration. [9] Moreover, this
phenomenon also applies to hardware as hardware migration promotes long term
preservation goals.
Although international research results highlight that utility or use-oriented preservation
methods can be an appropriate vehicle for the realization of long time conservation
objectives, the potential later applicability of digitalised materials, presently out of use due
to legal restrictions or a lack of an appropriate technological background, is rather
questionable. Whereas the respective legal and technological contexts can change, after a
while these documents usually become forgotten or turn out to be obsolete. Consequently,
one of the main aims of the use or utility-oriented preservation effort is the identification of
dynamic, flexible, and relevant conservation options while supporting pertinent search and
retrieval capability and the provision of support services.
Page 264
Although safe storing of master files and meta data on two separate data carriers i.e.
magnetic tape and DVD, is a crucial requirement, DVDs cannot fulfil long terms storage
functions effectively as the data has to be saved again after two or three years. Consequently,
the expected growth of data quantity not only poses a significant additional burden on the
respective institutions, but raises data security and safety concerns as well. Therefore, a
degree of uncertainty can be discerned and a generic or overall solution meeting specific
technological and cost-effectiveness requirements of large scale digitalization efforts has not
been developed yet.
6. Knowledge portals: the virtual environment of the education process
Until now the most important criteria of providing virtual library services in support of
instruction and research were discussed in addition to exploring issues related to designing
digital repositories. The key to progress is the development of virtual learning environments
(VLE) consisting of e-Learning libraries and the library portals as well. Consequently, these
components have to be integrated into the instruction and library system in addition to a
pedagogical evaluation of the objectives to be realised via the application of the virtual
learning environment.
Although the ever increasing demand for the educational application of information sources
accessible on-line could hardly be refuted, such aspirations are often frustrated by a lack of
conscious planning concerning the integration of the respective resources into the particular
network-based context. Despite the comfort and effectiveness provided by technology, the
latter’s capability of information transmission is proportionate to the integration of the main
components of the education process (students, instructors, and library staff) into the
respective virtual learning environment. Furthermore, the acquisition of information
management skills, the enhancement of connections and collaboration within the learning
environments, along with the respective technological improvements are crucial
requirements for the success of e-Learning efforts. [10]
These demands and previously mentioned infrastructural changes influence the future of the
libraries maintained by higher education institutions. In the near future improvements and
changes are expected in the following areas: integrated library systems, the amount of
available information, accessibility of information, learning spaces, instruction concerning
the use of information, the printing of the respective information, organisational forms,
Page 265
orientation, access to computers, material resources, the establishment of consortia
(especially in case of electronic documents). [11]
The primary objective of the EKLEKTIKA project is the formulation of this virtual
environment through the use of devices and options provided by information and
communication technology, libraries, informatics, and the educational process.
7. Conclusion The design and development of digital repositories and library portals are complex tasks requiring
the application of technological, information and communication technology, library science, and
library informatics skills and methods. These activities should be based on thoroughly planned
pedagogical approaches taking into consideration the advantages and limits of a wide variety of
educational theories within a virtual context. One of the most important features of library portals is
personalization assuring a space and user-friendly environment for technology-supported learning
efforts. Yet, a well-structured, effective, and successful library portal cannot be imagined without a
digital repository regularly uploaded and enhanced with pertinent and easily retrievable information.
Accordingly, the digital repository scheduled to be established within the EKLEKTIKA project has
to fulfil three basic functions: providing a state of the art support for library services and information
accessibility, long term conservation guaranteeing the preservation of unprocessed raw materials
necessary for new documents, and finally these two roles join in servicing e-Learning training
management systems via the appropriate interface. [12] The services provided by the knowledge
portal are based on a philosophy of enabling the user to formulate his or her own information and
research environment via the implementation of the special objectives and the options provided by
Web 2.0 technology. Consequently, erstwhile passive users can become active contributors in
shaping the electronic collection to their individual needs giving rise to active and passive
professional information provision based on the unlimited accessibility and effective application of
appropriate quantity and quality of information stored in a digital format.
References [1] Johnston, P., “After the Big Bang: the forces of change and e-learning”, Ariadne, 27 (2001).
URL: http://www.ariadne.ac.uk/issue27/johnston/ (Download: 10. 07. 2010.)
[2] Compare: Thomas, A. and Rothery, A., “Online repositories for learning materials: the user
perspective”, Ariadne, 45 (2005). URL: http://www.ariadne.ac.uk/issue45/thomas-rothery/
(Download: 10. 07. 2010.)
Page 266

Paper Title ICI 10 - 10TH INTERNATIONAL CONFERENCE ON INFORMATION
10
[3] Dahl, M., Banerjee, K. and Spalti, M., “Digital libraries: integrating content and systems”, 1st
Ed., Chandos Publishing, (2006)
[4] Horváth Z., “Könyvtári portálok – a webhasználók visszahódítása (Library portals)”,
Tudományos és műszaki tájékoztatás, 52 9, 399-409 (2005)
[5] Allan, B., “E-learning and teaching in library and information services”, 1st Ed., Facet
Publishing, (2002)
[6] Driscoll, L., “Electronic reserve: a manual and guide for library staff members”, Journal of
interlibrary loan, document delivery & information supply, 14 1, 35-52 (2003)
[7] Duncan, C., “Digital repositories: e-learning for everyone”, eLearnInternational, Edinburgh
(2003). URL:
http://www.intrallect.com/index.php/intrallect/content/download/412/1733/file/Digital_Repositories
_E-Learning_for_Everyone.pdf (Download: 10. 07. 2010.)
[8] Wang, M., “The strategic role of digital libraries: issues in e-learning environments”, Library
review, 52 3, 111-116 (2003)
[9] Hitchcock, S., Brody, T., Hey, J., and Carr, L., “Digital preservation service provider models for
institutional repositories”, D-lib magazine, 13 5/6, (2007).
URL: http://www.dlib.org/dlib/may07/hitchcock/05hitchcock.html (Download: 10. 07. 2010.)
[10] Markland, M., “Embedding online information resources in Virtual Learning Environments:
some implications for lecturers and librarians of the move towards delivering teaching in the online
environment”, Information research, 8 8, (2003). URL: http://informationr.net/ir/8-4/paper158.html
(Download: 10. 07. 2010.)
[11] Marcum, J. W., “Visions: the academic library in 2012”, D-lib magazine, 9 5,
(2003).URL: http://www.dlib.org/dlib/may03/marcum/05marcum.html (Download: 10. 07. 2010.)
[12] Compare: Czeglédi L., “EKLEKTIKA projekt: tartalomszolgáltatás és tudásmenedzsment
(EKLEKTIKA Project: Content Providing and Knowledge Management)”, Networkshop,
Dunaújváros, Hungary (2008). URL: https://nws.niif.hu/ncd2008/docs/0nj/nj48.htm
Page 267

GAMASA, EGYPT, 4 – 6 DECEMBER 2010
The Role of Information Technology
In Architectural Education Development in Egypt
Professor. Dr. Osama Mohamed Ali Farag1*, Assistant lecturer: Mai Wahba Mohamed Madkour 2.
1 Affiliation (Architecture Department, Faculty of Engineering, Masoura University, Egypt, [email protected]).
2 Affiliation (Architectural Department, Faculty of Engineering, Delta University for Science and Technology, Gamasa, Egypt [email protected])
Abstract
Purpose:
High Technology creates new challenges and priorities in architectural education and practice, the matter that should be addressed by architects of Egypt.
This paper searches in the nature of art and architecture creativity in digital media settings with particular respect to architectural education. It tests the effect of using software technique to increase the creative capabilities of students in the architectural education disciplines. In addition attempts to explore the role of new potentials of information technology applications in the future of architectural education.
Methodology:
To obtain these goals the study undertakes a number of sequential methodical steps by analyzing innovative techniques in architectural education such as collaborative design, multi- and trans- disciplinary (e.g. Rivet Architecture) and sustainable education.
These technical options are scanned and tackled whether they coexist in a meaningful way in today’s Egyptian and international university structures to determine the gab between them.
Findings:
This paper seeks answers to a bunch of essential questions:
• Does sustainable education development require its own protection incubating environment to traditional curriculum and traditional disciplines?
• How can the technical option be made for courageous students to make educational paths different from traditional tracks?
ts?
?
• What can we learn from comparative analysis of universities in different nations and environmen
• How widely and efficiently modern digital media is adopted and used in Egyptian architectural faculties?
• In what ways is information technology utilised in architectural education?
• What kind of digital tools and media are used in architectural education
• Are there defined strategies to use digital tools and media in architectural education?
Page 268
edia is used in architectural education in general – not only CAAD
media intact has caused to architectural working and educational environments?
• How digital mcurriculum?
• What kind of changes the digital
Keywords: Architectural Educational; Information Technology Applications; Collaborative esign, Digital Media; Sustainable Education.
1. In
gy, developed and continues to
evolve a discipline which aims to integrate three core areas [1].
the design. Perhaps it is best left unanswered.
Creativity takes place, ceasing at detail design.
as detailers and information providers, spanning the boundaries of design
and production.
abler", rather than that of a "provider", and where the profession
can meet new challenges [2].
D
troduction:
Architecture and technology have a very special relationship, since without the
technologies to realize the built form architectural design would exist only on paper. In
education technology is usually taught as a separate subject to architectural design, coming
together in the realization of the design project. Yet technology is so completely tied up with
architecture that in practice the designer is constantly juggling with the design concept, the
technology to realize it and the management of that process, so much so that towards the end of
the 20th century a new discipline, that of architectural technolo
One question which is difficult, if not impossible, to answer is whether the design
generates the detail or the technologies dictate
Technologists are the production workers, converting design intent into meaningful
information that can be conveyed to the builder; as such they occupy an important and often
unrecognized role
We, the architects, believe that architecture involves everything that influences the way in
which the built environment is planned, designed, made, used, furnished, landscaped and
maintained. We feel responsible for the improvement of the education and training of future
architects to enable them to meet the expectations of 21st Century societies worldwide for
sustainable human settlements in every cultural heritage. Still greater diversity is therefore
needed in professional practice and, as a consequence, in architectural education and training.
This is particularly true for those who are working in a developing context, where the architects
could accept the role of an "en
Page 269

Modern information technology and digital tools have been adopted to the architectural
discipline and architectural profession during the 1990’s:CAD has been adopted into
architecture, it has become the major working environment. CAD and digital media has also
been adopted by the majority of the European architectural schools. Architectural CAD
(CAAD) is teached as separate courses or larger CAAD-curriculums. Even if CAAD –
currently better understood as information and communication technology (ICT) – has a major
role in managing design information, the role of the digital media has probably not yet
understood nor adopted to be an essential part of current architectural education. The digital
tools nor methods using them are perhaps not as widely used in education, as they are used in
the practise or in architectural offices – this suspicious doubt has been an important motivation
to this study [3], [4]. The content of the CAAD-education given in the design education and
Curricula, Traditional and E-education Areas [5].
2. Methods:
There is no doubt that the architect's capacity to solve problems, can greatly contribute to
tasks such as community development, self-help programmes, educational facilities, etc., for
the creation of a global network of architectural education within which individual
achievements can be shared by all and that it will enhance the understanding that architectural
education constitutes some of the most significant environmental and professional challenges
of the contemporary world.
We therefore declare: 2.1. General considerations:
1- That the educators must prepare architects to formulate new solutions for the present
and the future as the new era will bring with it grave and complex challenges with
respect to social and functional degradation of many human settlements. These
challenges may include global urbanisation and the consequent depletion of existing
environments, a severe shortage of housing, urban services and social infrastructure,
and the increasing exclusion of architects from built environment projects.
2- That architecture, the quality of buildings and the way they relate to their surroundings,
respect for the natural and built environment as well as the collective and individual
cultural heritage are matters of public concern.
3- That it is in the public interest to ensure that architects are able to understand regional
characteristics and to give practical expression to the needs, expectations and
Page 270

.
.
improvement to the quality of life of individuals, social groups, communities and
human settlements.
4- Methods of education and training for architects are varied in order to develop a
cultural richness (including methods of project delivery) of the client, the users, the
construction industry and the architectural profession, whilst being aware of the
political and financial motivations behind such changes.
5- That, subject to recognition of the importance of regional and cultural customs and
practices and the need for differences in curriculum to accommodate these variations, a
common ground exists within the pedagogical methods used, and by establishing
capabilities, this will enable countries, architecture schools and professional
organizations to evaluate and improve the education given to future architects.
6- That the increasing mobility of architects between different countries calls for mutual
recognition or validation of individual degrees, diplomas, certificates and other
evidence of formal qualification.
7- That the mutual recognition of degrees, diplomas, certificates or other evidence of
formal qualification to practise in the field of architecture has to be based on objective
criteria, guaranteeing that holders of such qualifications have received and continue to
maintain the kind of education and training called for in this Paper.
8- That the vision of the future world, cultivated in architecture schools, should include
the following goals :
• A decent quality of life for all the inhabitants of human settlements
• A technological application which respects the social, cultural and aesthetic needs of
people and is aware of the appropriate use of materials in architecture and their initial
and future maintenance costs.
• An ecologically balanced and sustainable development of the built and natural
environment including the rational utilisation of available resources.
• An architecture which is valued as the property and responsibility of everyone
9- Issues related to architecture and the environment should be introduced as part of the
general education at primary and secondary schools, because an early awareness of the
built environment is important to both future architects and users of buildings [6].
10- That systems for continuing professional development should be set up for architects
as architectural education should never be considered a closed process but one in which
life-long learning occurs.
Page 271

2.2. Objectives of Architectural Education:
1- That architectural education develops the capacity in students to be able to
conceptualize, design, understand and realize the act of building within a context of the
practice of architecture which balances the tensions between emotion, reason and
intuition, and which gives physical form to the needs of society and the individual.
2- That architecture is a discipline which draws knowledge from the humanities, the social
and the physical sciences, technology, environmental sciences, the creative arts and the
liberal arts.
3- That education leading to formal qualifications and permitting professionals to practice
in the field of architecture has to be guaranteed to be at university/tertiary level with the
discipline of architecture as the main subject and be available at universities,
polytechnics and academies.
4- That architectural education includes the following points:
• An ability to create architectural designs that satisfy both aesthetic and technical
requirements.
• An adequate knowledge of the history and theories of architecture and the
related arts, technologies and human sciences.
• Knowledge of the fine arts as an influence on the quality of architectural design.
• An adequate knowledge of urban design, planning and the skills involved in the
planning process.
• An understanding of the relationship between people and buildings, and
between buildings and their environment, and of the need to relate buildings and
the spaces between them to human needs and scale.
• An understanding of the profession of architecture and the role of the architect
in society, in particular in preparing briefs that take account of social factors.
• An understanding of the methods of investigation and preparation of the brief
for a design project.
• An understanding of the structural design, construction and engineering
problems associated with building design.
Page 272

• An adequate knowledge of physical problems and technologies and of the
function of buildings so as to provide them with internal conditions of comfort
and protection against the climate.
• The design skills necessary to meet building users' requirements within the
constraints imposed by cost factors and building regulations.
• An adequate knowledge of the industries, organisations, regulations and
procedures involved in translating design concepts into buildings and
integrating plans into overall planning.
5- That the following special points be considered in the development of the curriculum:
• Awareness of responsibilities toward human, social, cultural, urban, architectural,
and environmental values, as well as architectural heritage.
• Adequate knowledge of the means of achieving ecologically sustainable design and
environmental conservation and rehabilitation.
• Development of a creative competence in building techniques, founded on a
comprehensive understanding of the disciplines and construction methods related
to architecture.
• Adequate knowledge of project financing, project management, cost control and
methods of project delivery.
• Training in research techniques as an inherent part of architectural learning, for
both students and teachers.
6- That architectural education involves the acquisition of the following capabilities:
6. A. DESIGN
• Ability to engage imagination thinks creatively, innovate and provide design
leadership.
• Ability to gather information, define problems, apply analysis and critical
judgement and formulate strategies for action. Ability to think three-dimensionally
in the exploration of design.
• Ability to reconcile divergent factors, integrate knowledge and apply skills in the
creation of a design solution [7].
6. B. KNOWLEDGE
1- Cultural and Artistic Studies
• Ability to act with knowledge of historical and cultural precedents in local and
world architecture.
Page 273

• Ability to act with knowledge of the fine arts as an influence on the quality of
architectural design.
• Understanding of heritage issues in the built environment.
• Awareness of the links between architecture and other creative disciplines.
2- Social Studies
• Ability to act with knowledge of society, and to work with clients and users that
represent society’s needs.
• Ability to develop a project brief through definition of the needs of society users
and clients, and to research and define contextual and functional requirements for
different types of built environments.
• An understanding of the social context in which built environments are procured,
of ergonomic and space requirements and issues of equity and access.
• An awareness of the relevant codes, regulations and standards for planning, design,
construction, health, safety and use of built environments.
3- Environmental Studies
• Ability to act with knowledge of natural systems and built environments.
• Understanding of conservation and waste management issues.
• Understanding of the life cycle of materials, issues of ecological sustainability,
environmental impact, design for reduced use of energy, as well as passive systems
and their management. Awareness of the history and practice of landscape
architecture, urban design, as well as territorial and national planning and their
relationship to local and global demography and resources.
• Awareness of the management of natural systems taking into account natural
disaster risks.
4- Technical Studies
• Technical knowledge of structure, materials, and construction.
• Ability to act with innovative technical competence in the use of building
techniques and the understanding of their evolution.
• Understanding of the processes of technical design and the integration of structure,
construction technologies and services systems into a functionally effective whole.
• Understanding of services systems as well as systems of transportation,
communication, maintenance and safety.
Page 274

• Awareness of the role of technical documentation and specifications in design
realisation, and of the processes of construction, cost, planning and control.
5- Design Studies
• Knowledge of design theory and methods.
• Understanding of design procedures and processes.
• Knowledge of design precedents and architectural criticism.
6- Professional Studies
• Ability to act with knowledge of professional, business, financial and legal
contexts.
• Ability to understand different forms of procurement of architectural services.
• Awareness of the workings of the construction and development industries,
financial dynamics, real estate investment, and facilities management.
• Awareness of the potential roles of architects in conventional and new areas of
activity and in an international context.
• Understanding of business principles and their application to the development of
built environments, project management and the functioning of a professional
consultancy.
• Understanding of professional ethics and codes of conduct as they apply to the
practice of architecture and of the architects’ legal responsibilities where
registration, practice and building contracts are concerned.
6 .C. SKILL
• Ability to act and to communicate ideas through collaboration, speaking,
numeracy, writing, drawing, modelling and evaluation.
• Ability to utilise manual, electronic, graphic and model making capabilities to
explore, develop, define and communicate a design proposal.
• Understanding of systems of evaluation, that uses manual and/or electronic means
for performance assessments of built environments.
7- That the balanced acquisition of subjects and capabilities cited in Sections II.3, II.4 and
II. 5 requires a period of not less than five years of full-time studies in a university or an
equivalent institution, plus in order to be registered/licensed/certified not less than two
years internship in a suitable practice setting, of which one year may be obtained prior
to the conclusion of academic studies [3].
Page 275

3. Results:
In order to achieve the above mentioned Objectives, the following conditions and
requirements should be taken into account:
1- Adequate studios, laboratories, facilities for research, advanced studies, libraries,
information and data exchanges for new technologies should be provided at the
departments of architecture.
2- In order to promote a common understanding and to raise the level of architectural
education, the creation of a network, on a worldwide basis for the exchange of
information, teachers and senior students is as necessary as a regional network to
promote an understanding of diverse climate, materials, vernacular practices and
culture. The use of external examiners is a recognised method of achieving and
maintaining comparable national and global standards.
3- Each teaching institution must adjust the number of students according to its teaching
capacity and the selection of students shall be in relation to the aptitudes required for a
successful education in architecture, and this will be applied by means of an appropriate
selection process at the point of entry into each academic programme.
4- Teacher/student numbers must reflect the design studio teaching methodology required
to obtain the above capabilities as studio teaching should be a major part of the learning
process.
5- Individual project work with direct teacher/student dialogue should form the basis of
the learning period, continuous interaction between the practice and teaching of
architecture must be encouraged and protected and design project work must be a
synthesis of acquired knowledge and accompanying skills.
6- The development of conventional drawing skills is still a requirement of the
educational programme and modern personalised computer technology and the
development of specialised software makes it imperative to teach the use of computers
in all aspects of architectural education.
7- Research and publication should be regarded as an inherent activity of architectural
educators and may encompass applied methods and experiences in architectural
practice, project work and construction methods, as well as academic disciplines.
8- Education establishments should create systems for self-evaluation and peer review
conducted at regular intervals including in the review panel, appropriately experienced
educators from other departments of architecture or other countries and practising
architects, or participate in the approved UNESCO-UIA Validation System.
Page 276
9- Education should be formalised by an individual’s demonstration of capabilities by the
end of the programme of studies, the principal part being a presentation of an
architectural project demonstrating the acquired knowledge and concomitant skills. For
this purpose, juries should constitute an interdisciplinary team, including examiners
external to the department of architecture who may be practitioners or academics from
other schools or countries but who must have experience and expertise in the
assessment process at that level.
10- In order to benefit from the wide variety of teaching methods, including distance
learning, exchange programmes for teachers, and students at advanced levels are
desirable. Final projects could be shared among different architecture departments as a
means of facilitating comparison between results and self-evaluation of teaching
establishments, through a system of international awards, exhibitions and publications
on the internet web site [8].
4. Conclusion:
The research constitutes a framework providing orientation and guidance to students and
teachers involved in education and training in architecture and planning. It is conceived as a
"dynamic" document which will be regularly revised, thus taking into consideration new
trends, needs and developments in professional practice, as well as in education systems.
Beyond all aesthetic, technical and financial aspects of the professional responsibilities,
the major concerns, expressed by the Charter, are the social commitment of the profession, i.e.
the awareness of the role and responsibility of the architect in his or her respective society, as
well as the improvement of the quality of life through sustainable human settlements.
References
[1] http://www.araburban.net/news/624html, Research, By: Ahmed Mosaad El-Tayeby, Architectural
Department, Faculty of Arts, Alexandria University, Last accessed in March 2010.
[2] http://www.arkit.net, Paper By: PENTTILÄ Hannu, “Architectural-IT and Educational Curriculums
a European Overview”, Last accessed in February 2010.
[3] Stephen Emmitt, “Technology”, Metropolitan University, UNESCO/UIA Charter for Architecture
Education, Revised version 2005.
Page 277

The Role of Information Technology In Architectural Education Development in Egypt
ICI 10 - 10TH INTERNATIONAL CONFERENCE ON INFORMATION
11
[4] http://www.araburban.net/news/595.html, Research, By: Ahmed Moawwad Awad Ibrahim,
Architecture Engineering Department, Faculty of Engineering, Helwan University, Last accessed in
March 2010.
[5] http://mmaatouk.kau.edu.sa/Show_Res.aspx?Site_ID=0053034&LNG=AR&RN=22203, Paper, By:
Mohamed M.H. Maatouk, “Art Creativity in Digital Media Settings as a Guide for Developing the
Architectural Education and Practice in the Future”, Paper, submitted to The 10th Yearly National- 2nd
Arabic Conference of University, Education Development Center, University of Arabian Countries in
the Future, Ain Shams University, Cairo, Egypt, published 2003, Last accessed in February 2010.
[6] http://www.mittaviiva.fi/hannu/studies/ecaad2002_penttila, Last accessed in March 2010.s
[7] http://www.ijee.dit.ie/articles/999986/article.htm, Article By: Erik De Graaff & Rob Cowdroy,
“Theory and Practice of Educational Innovation Introduction of Problem-Based Learning in
Architecture: Two Case Studies”, Last accessed in March 2010.
[8] Graham Corneya and Alan Reidb, “Student teachers’ learning about subject matter and pedagogy in
education for sustainable development”, Environmental Education Research”, Vol. 13, No. 1,
Department of Educational Studies, Oxford, UK; Department of Education, University of Bath, UK
February 2007, pp. 33–54.
Page 278
GAMASA, EGYPT, 4 – 6 DECEMBER 2010
Proposed Architecture for Conventional Computer with Co-Quantum Processor
El-Mahdy M. Ameen, Aida Osman and H. A. Ali
Department of Computers and Systems, Faculty of Engineering, Mansoura University, Egypt ABSTRACT: This paper presents a proposed architecture for constructing a conventional-quantum computing machines from the hardware point of view. The proposed architecture will help in improving the performance of the conventional computer by building a new processor; such processor combines both a classical processor in conjunction with a Co-quantum processor. The proposed architecture classifies the operations of the whole central processing unit into two categories; the first for Co-quantum processor to execute the complicated quantum computations. The second, for the classical processor which plays the role of performing conventional tasks such as network communication process, storing data tasks and the main task of controlling all system operations. Discussion and analysis of the proposed architecture, which is based on quantum parallelism in computations, shows that; the proposed architecture improves classical computer performance. In addition; the proposed architecture is capable of performing any arbitrary quantum computation as well as conventional computations Keywords: architecture, conventional processor, quantum processor, central processing unit.
1. INTRODUCTION
Today computer hardware technology is based on high performance technological trend in
the semiconductor industry continue to tolerate by Moore's Law, in contrast continually
shrinking size of circuitry packed onto silicon chips would eventually reach a point where
individual elements would be no larger than a few atoms and eventually the conventional
wisdom of transistor cramming for progress must be abandoned. So as we are getting close to
the end of this roadmap, the idea to utilize quantum physics for solving difficult computational
tasks has a lot of interest among both physicists and computer scientists. Once such a quantum
processor is successfully built, it could carry out factoring large numbers, searching databases,
and simulating physical systems exponentially faster than any computer used today. All the
aspects of quantum computing are currently under intensive research and, as a result, the first
quantum algorithms appeared before the actual fabrication of the first quantum gate. Using
solid-state devices as the basic building blocks in the design of a quantum processor is
particularly interesting, since these devices can be fabricated with a technology already
prevalent in current computer chip fabrication [1-6].
This paper is organized as follow: in the next section we will discuss the concept of
quantum information and quantum computations, in section 3 we will explore the important
Page 279
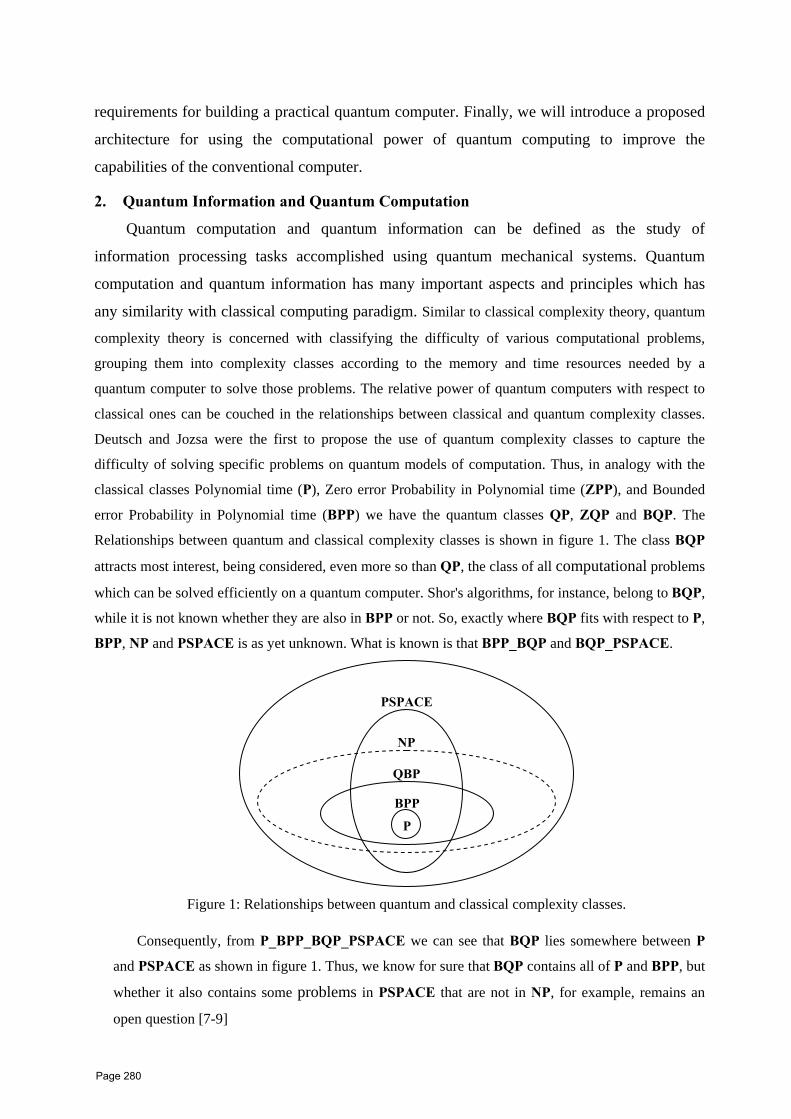
requirements for building a practical quantum computer. Finally, we will introduce a proposed
architecture for using the computational power of quantum computing to improve the
capabilities of the conventional computer.
2. Quantum Information and Quantum Computation
Quantum computation and quantum information can be defined as the study of
information processing tasks accomplished using quantum mechanical systems. Quantum
computation and quantum information has many important aspects and principles which has
any similarity with classical computing paradigm. Similar to classical complexity theory, quantum
complexity theory is concerned with classifying the difficulty of various computational problems,
grouping them into complexity classes according to the memory and time resources needed by a
quantum computer to solve those problems. The relative power of quantum computers with respect to
classical ones can be couched in the relationships between classical and quantum complexity classes.
Deutsch and Jozsa were the first to propose the use of quantum complexity classes to capture the
difficulty of solving specific problems on quantum models of computation. Thus, in analogy with the
classical classes Polynomial time (P), Zero error Probability in Polynomial time (ZPP), and Bounded
error Probability in Polynomial time (BPP) we have the quantum classes QP, ZQP and BQP. The
Relationships between quantum and classical complexity classes is shown in figure 1. The class BQP
attracts most interest, being considered, even more so than QP, the class of all computational problems
which can be solved efficiently on a quantum computer. Shor's algorithms, for instance, belong to BQP,
while it is not known whether they are also in BPP or not. So, exactly where BQP fits with respect to P,
BPP, NP and PSPACE is as yet unknown. What is known is that BPP_BQP and BQP_PSPACE.
PSPACE
NP
QBP
BPP
P
Figure 1: Relationships between quantum and classical complexity classes.
Consequently, from P_BPP_BQP_PSPACE we can see that BQP lies somewhere between P
and PSPACE as shown in figure 1. Thus, we know for sure that BQP contains all of P and BPP, but
whether it also contains some problems in PSPACE that are not in NP, for example, remains an
open question [7-9]
Page 280

3. Requirements for Quantum Architectures
To build a quantum processor of practical computational value, we must be capable of storing and
processing a system of tens of millions qubits. While the work in physics and device development has
made significant progress, such quantum processor main requirements are five criteria [10-13]:
1. Quantum bits (qubit): finite Hilbert space quantum systems which can be composed in direct
product form. A qubit is a unit vector in a two dimensional state space, for which a particular
orthonormal basis, denoted by { | 0 >, | 1 >} has been fixed. An arbitrary qubit | Ψ > can be
written as a linear combination of the computational basis as follow:
Where α and β are complex numbers such that | α |2 + | β |2 = 1. The qubit | Ψ > in
equation (1) is in a superposition of | 0 > and | 1 >, a state in which it is not possible to say
that the qubit is definitely in the state | 0 >, or definitely in the state |1 >. In general, an n-
qubit quantum system may represent 2n bit strings distinguished by 2n complex-valued
coefficients:
Where each xi represents the ith bit string from 0 to 2n−1 in equation (2) [10,14].
2. Long coherence: high isolation of the system from the environment, such that quantum
superposition states have long lifetimes because they are the heart of any quantum algorithm.
3. Universal control: ability to subject the quantum system to a controllable sequence of unitary
transforms which can approximate an arbitrary operator.
4. Initialization: ability to prepare the quantum systems in a fiducially input state that used to
evaluate a function f(x) for exponentially many different values of x in the time it takes a classical
computer to evaluate the function for just one value. This is possible by loading the memory
register with a superposition of all possible input values x in the initialization process [5, 16, 17].
5. Measurement: the capability to measure the final quantum state. The amount of information that
can be stored in a qubit and, respectively, retrieved from a qubit can be extracted using any point
on the Bloch sphere. When measuring a qubit, the only possible results of a measurement are the
eigenvalues of the unitary operator describing this measurement [4-6, 9, 16]. According to this,
when we measure a qubit with respect to the standard basis for
quantum computation | 0 > and | 1 > we get either the result 0 with probability | α |2 or the
Page 281

result 1 with probability | β |2. Furthermore, measurement alters the state of a qubit, collapsing it
from its superposition of | 0 > and |1 > to the specific state consistent with the measurement
result [18, 19].
In the previous section we give a general overview of the important requirements for building a
practical quantum computer. Next we will give a description to the proposed architecture
4. Proposed Architecture for Conventional Computer with Co-quantum Processor
In this paper, the high parallelism of quantum computer forces us to design an architecture aimed
at improving the performance of the conventional computer by building an enhanced processor; this
processor combines both a classical processor in conjunction with a co-quantum processor. Our
proposed architecture classify the operation of the whole system into two categories; the first for
co-quantum processor to execute the complicated quantum computations. The second category for the
classical processor which plays the role of the coordinator to all system operations also it performs the
other network communication and data manipulation tasks. We believe that our proposed architecture
has the following contributions:
• Improve classical computer performance using the quantum parallelism in computations.
• It will be a good start towards a non homogeneous networks of conventional and quantum
computers in the near future.
This architecture is capable of performing any arbitrary quantum computation as well as
conventional computations. A schematic of the conventional-quantum architecture is shown in
figure 2.
Page 282

Conventional Co-Quantum processor
Classical processor
Figure 2: A schematic of the conventional-quantum architecture
The architecture consists of a classical microprocessor with a co-quantum processor
connected together with a memory unit through a common bus managed by a bus controller.
All units are controlled from classical front-end software that determines the program to be run
and the instructions to be executed by each processor. The following subsection gives an
overview of the system components and their functions.
Quantum Co-Processor
Operation
Result
QA
LU
Q-algo.2Q-algo.1
Q-algo. NQ-algo.3
Inte
rfac
e
un
it
Qubit Initialization & State preparation
Measurement Unit
Telepo
rtation Ch
anne
l CALU QRR
CIB
Con
trol
U
nit
QIB
Q-cache
Classical System Bus
Bus
C
ontr
olle
r
QMEM.
Con
trol
U
nit
Memory
CRAM QRAM
Page 283
4.1. Conventional processor
As shown in the figure 2 it consists of mainly the classical arithmetic and logic unit
(CALU)[20], which is responsible for executing the instructions in the execution phase
delivered by the control unit through conventional instruction buffer (CIB). Additionally,
the control unit which is the brain of our architecture and its great mission of orchestrating
all parts of this architecture starting from fetching the instruction from the memory,
decoding it, preparing and fetching the operands, delivering it to the CIB to be queued until
execution in the CALU and finally collects all results from the system. In this processor the
quantum result registers (QRR) will be used to hold the obtained results from the quantum
processor, but if the QRR is full or the quantum results are large it will be buffered in the
quantum results cache (QR-cache).
4.2. Co-Quantum processor
First of all, these arrived quantum instructions to the co-quantum processor must be
queued in the quantum instruction buffer (QIB) to be initialized in a quantum state. The
qubit initialization and state preparation unit is the first physical quantum unit of the co-
quantum processor that receives the decoded instruction from the QIB, and then prepares
the operands in a quantum initial state to be processed by a specified processing unit
according to the decoded quantum unitary operation. When new instruction received the
qubit initialization and state preparation unit searches for operands in the quantum memory
(QMEM), if cache hit occurs then it will deliver them immediately to the specific processing
unit, but if cache miss occurs, it will prepare the qubits and push them to the specified
processing unit. The co-quantum processor has quantum arithmetic and logic unit (QALU)
which is composed of number of processing units, each of them composed of a number of
quantum circuits. The overall function of the sequence of operations in an entire n-qubit quantum
circuit divided into K time steps and the collective action of the sequence is the product of all
individual operators for each time step. In each time step, a single gate in a quantum circuit with one
or more input qubits in the initial state | Ψ > transforms the state to a different state | Ψ'> by
changing all probability amplitudes that describe the state vector [c0, c1, . . . , cn−1]T. Finally, the
result from any quantum processing unit will be obtained by measurement [13, 18, 21-23].
Measurement collapses all obtained superposition states to only one output state that can be
treated classically once again in the classical processor to finish the PREPARE-EVOLVE-
MEASURE instruction execution cycle in the co-quantum processor.
All co-quantum processor units are connected together through the teleportation channel
that constructs the transportation means inside the co-quantum processor.
Page 284

4.3. Bus controller and memory
Memory space is partitioned into two spaces, one for the conventional program
requirements from storing the compiled program code till results be obtained. The second
space for intermediate quantum results obtained through the execution cycle of the program.
In fact the bus controller part of the system is an extension to the control unit functions; it
controls the access to the memory spaces in the read and write operations.
After the previous outlines of the system components and their functions the following
explanation will explore our proposed scenario of interactions between system components.
5. Interactions between Conventional-Quantum Architecture Components
A computer system cannot be designed without an understanding of its target workload and
expected performance. Above, we suggested the goals of the architecture and now we will get
a brief description of the work flow of this architecture. The proposed architecture consists
mainly of two processors, as previously stated the co-quantum processor composed of a
number of quantum processing units that communicates through teleportation but the only way
of communication between the classical and quantum hardware is through measurement unit.
The communication and synchronization of the two processors is handled by the control unit
according to a pre-compiled program with the help of specific communication and
synchronization protocol. The following subsections will illustrate the suggested methodology
used in the proposed communication and synchronization protocol.
5.1. Execution cycle and Communication protocol scenario
In the proposed architecture quantum instructions are architected as an extension to the
existing instructions set through the use of a special opcode which indicates that the rest of
the instruction should be treated as quantum instruction. Also to guaranteed high
performance, the proposed protocol must preserve the pipelining execution technique for the
instructions execution, as a result a special instruction pre-fetch buffer will be used in both
processors; one for the classical processor and called CIB and the other is called QIB as
previously stated in section 4.1. This allows instruction to be fetched simultaneously while
another instruction is being executed.
Achieving high degree of concurrent instruction execution could be facilitated by the
compiler, which should have the freedom to fully classify instructions and computation in
order to optimize the usage of quantum data and make much parallelism between the units
as possible. In this system the proposed communication protocol characteristics depends on
the following factors:
Page 285
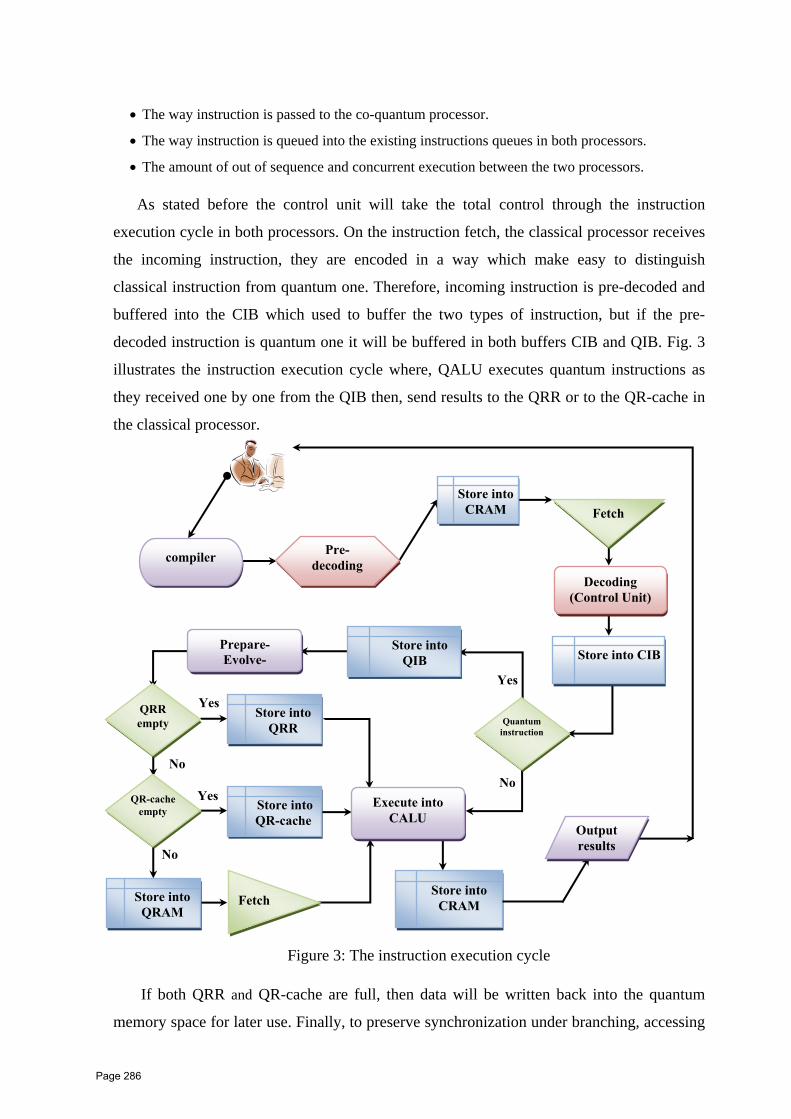
• The way instruction is passed to the co-quantum processor.
• The way instruction is queued into the existing instructions queues in both processors.
• The amount of out of sequence and concurrent execution between the two processors.
As stated before the control unit will take the total control through the instruction
execution cycle in both processors. On the instruction fetch, the classical processor receives
the incoming instruction, they are encoded in a way which make easy to distinguish
classical instruction from quantum one. Therefore, incoming instruction is pre-decoded and
buffered into the CIB which used to buffer the two types of instruction, but if the pre-
decoded instruction is quantum one it will be buffered in both buffers CIB and QIB. Fig. 3
illustrates the instruction execution cycle where, QALU executes quantum instructions as
they received one by one from the QIB then, send results to the QRR or to the QR-cache in
the classical processor.
Figure 3: The instruction execution cycle
If both QRR and QR-cache are full, then data will be written back into the quantum
memory space for later use. Finally, to preserve synchronization under branching, accessing
Yes
Yes
Store intoCRAM Fetch
Pre-decoding compiler
Decoding (Control Unit)
Prepare-Evolve-
Store into QIB Store into CIB
QRR empty
Store into QRR Quantum
instruction
QR-cache empty
Execute into CALU
Store into QR-cache
No
No No
Yes
Output results
Store into CRAM
Store into QRAM
Fetch
Page 286

memory and interrupt call all current execution information should be saved to help pointing
to the exact point in the program where the exception occurred. The next subsection will
give explanation of how the proposed communication protocol will preserve high
synchronization between the two processors as well as high data manipulation rates.
5.2. Synchronization and out of sequence execution
Synchronization here means that the two processors must be at the same point in the
program flow. Ideally both processors will be running concurrently executing their
instructions in parallel, additionally they will execute their instructions as they arrive from
the instruction queues therefore allowing out of sequence execution. Under these
circumstances the maximal throughput would be achieved, and the overall system
performance is determined by the individual performance of the processors as well as the
performance of instructions mix. But branches in program and data dependencies between
classical and quantum processes do not make these circumstances possible all the time. So,
to assure consistency of the operations, the two processors must be synchronized under the
following conditions:
• Branches in the program (conditional and unconditional).
• Exchange of data (either through the memory or exchange of register contents).
• Interrupts and procedure calls.
Branches in the program causes the processor to suddenly changing the order of
instructions execution, so the QIB contents must be changed to hold the new instructions set
for the new address of the branch instruction. When the branch instruction is decoded the
classical processor must waits until QIB complete signal arrived from quantum processor.
At this point both processors are synchronized and branch can take place.
Any memory access is a reason for synchronization. If data is to be written to memory it
must be assured that the data at the location to be overwritten is not longer needed by the
other processor (classical or quantum). Similarly if there is an access to memory location
and data in this location is a result of an instruction currently executed by the other
processor, then this instruction must be completed. Also if the data is already available, the
other processor should not be allowed to proceed beyond this point if there is possibility that
execution of the next instruction might alter the data. When interrupts and procedure calls
are presents the processors must achieve synchronization before the status of the calling
process is saved. In all cases, when an exception is detected the status of the processors
Page 287
must be saved in the way that makes it possible to restart the process to this saved point in
the program.
6. CONCLUSION
In this paper we proposed an architecture for constructing a conventional-quantum
computing machines from the hardware point of view. Discussion and analysis emphasis that
our proposed architecture will improve the performance of the conventional computer by
building a new processor; this processor combines both a classical processor in conjunction
with a Co-quantum processor.
Complete information of this hybrid machine will be presented in our next work; we will
give the system structure in more details.
REFERENCES
[1] Douglas J. Matzke," Is Quantum Computing A Solution For Semiconductor Scaling", Dallas IEEE
Computer Society Meeting, Jan 19, 2007.
[2] Technical Report 2005, School of Computing, Queen's University, Kingston, Ontario, " On The
Importance Of Parallelism For Quantum Computation And The Concept Of A Universal
Computer", May 2005.
[3] D. Kielpinski, Chris Monroe, and David J. Wineland, “Architecture for a large-scale ion-trap
quantum computer", Nature, 417:709, June 13, 2002.
[4] Marius Nagy and Selim G. Akl," Quantum Computation And Quantum Information", Technical
Report No. 496 School of Computing Queen's University Kingston, Canada, 2005.
[5] Sofge, D.A., " Survey of Quantum Programming Languages: History, Methods, and Tools ",
Quantum, Nano and Micro Technologies, IEEE Second International Conference on 2008.
[6] Hassan, S., Humaira, Asghar, M.,“Limitation of Silicon Based Computation and Future Prospects”,
Communication Software and Networks, ICCSN '10, Second International Conference on 2010.
[7] Mohamed, T., Badawy, W., Jullien, G ,“On using FPGAS to accelerate the emulation of quantum
computing”, Electrical and Computer Engineering, CCECE '09. Canadian Conference on 2009.
[8] M. Oskin, F. Chong, and I. Chuang, “A Practical Architecture for Reliable Quantum Computers,”
IEEE Comput., Vol. 35, No. 1, p. 79–87, January 2002.
[9] M. Nielsen, “Optical quantum computation using cluster states,” Phys. Rev. Lett, Vol. 93
(040503), 2004
[10] D. P. DiVincenzo, “The physical implementation of quantum computation,”Fortschr.Phys., Vol.
48, pp. 771–783, 2000.
[11] Lieven Vandersypen, Isaac Chuangy," NMR Quantum Computing - Lessons For The Future",
submitted to Rinton on March 28, 2001.
Page 288

Proposed Architecture for Conventional Computer With Co-Quantum Processor
ICI 10 - 10TH INTERNATIONAL CONFERENCE ON INFORMATION
11
[12] A. Ekert et al., “Practical quantum cryptography based on two-photon interferometry”, Phys. Rev.
Lett., Vol. 69, pp. 1293–1295, 1992.
[13] Bokor, J., Nadai, L., Rudas, I.J.,” Controllability of Quantum Bits from the von Neumann
Architecture to Quantum Computing”, Computational Intelligence and Intelligent Informatics,
ISCIII '07. International Symposium on 2007.
[14] M.A.Nielsen, I.L.Chuang, “Quantum Computation and Quantum Information”, Cambridge Univ.,
Press, New York, NY, 2000.
[15] L. M. Vandersypen et al., “Experimental realization of Shor’s quantum factoring algorithm using
nuclear magnetic resonance,” Nature, Vol. 414, p. 883, 2001.
[16] E. Farhi, J. Goldstone, S. Gutmann, and M. Sipser, “Quantum Computation by Adiabatic
Evolution,” 2000, quant-ph/0001106.
[17] H. J. Briegel and R. Raussendorf, “Persistent entanglement in arrays of interacting particles,” Phys.
Rev. Lett, Vol. 86, pp. 910–913, 2001.
[18] T. S. Metodi, D. D. Thaker, A. W. Cross, F. T. Chong, and I. L. Chuang, “A quantum logic array
microarchitecture: scalable quantum data movement and computation,” In Proc. 38th International
Symposium on Microarchitecture, MICRO-38, 2005.
[19] J. I. Cirac and P. Zoller, “Quantum computations with cold trapped ions,” Phys. Rev. Lett, Vol. 74,
pp. 4091–4094, 1995.
[20] Xunying Zhang, Xubang Shen, "A Power-Efficient Floating-point Co-processor Design",
International Conference on Computer Science and Software Engineering , IEEE,2008 .
[21] M. Oskin, F. T. Chong, J. Kubiatowicz, and I. L. Chuang, “Building quantum wires: the long and
the short of it,” in ISCA-30, San Diego, CA, 2003.
[22] Sofge, D.A ,“Toward a Framework for Quantum Evolutionary Computation “,IEEE Conference
Cybernetics and Intelligent Systems, 2006.
[23] Boncalo, O., Amaricai, A., "Reliability Analysis of Qubit Data Movement for Distributed
Quantum Computation”, Digital System Design, Architectures, Methods and Tools, 12th
Euromicro Conference on 2009.
Page 289
Proposal for a Novel Cache Portioning Technique for Supporting Cooperation in Mobile Ad-hoc Networks
1S. H. Ali *1A. I. Saleh *1A. I. Desouky
Abstract Mobile Ad-hoc networks (MANETs) have been widely researched for many years. MANET is simply a collection of two or more devices equipped with wireless communications and networking capability. These devices can communicate with other nodes that immediately within their radio range or those that are outside their radio rang. MANETs have a wide range of applications from military networks to emergency preparedness telecommunications. Most of the previous researches in ad hoc networks focus on routing protocols that adapt to the dynamic network topologies, and no much work has been done on data accessing. Caching of frequently accessed data in multi-hop ad hoc environment is a potential technique that can improve both the data access performance and availability. Cooperative caching, which allows the sharing and coordination of cached data among clients, can further explore the potential of the caching techniques. In this paper, we propose A Novel Cache Portioning Technique for Supporting Cooperation in Mobile Ad-hoc Networks. The proposed cache portioning technique is the first, to the best of our knowledge, to divide the cache space into several functional parts. This may have a significant impact in improving the caching efficiency as it can minimize the cost as well as improving the hit rate.
Keywords: Wireless communication; Mobile ad hoc networks; Caching; Cooperative cache.
1. Introduction:
With the recent advances in wireless communication, the functionality of mobile information
services of have been noticeably improved. Moreover, many mobile computing applications
have become a reality. Users are enabled to access information and services through wireless
connections on the move[1-2]. Mobile wireless environments can be classified as either
infrastructure based or ad hoc based. As shown in Figure(1a), the infrastructure based uses a
fixed network device such as a Mobile Support Station(MSS) which forwards messages that
mobile hosts send or receive. The MSS is similar to the server in a traditional client-server
distributed system in that all source data is deployed on it. Other mobile hosts retrieve data
from the MSS and can cache a copy by themselves. In contrast, ad hoc networks, like that
shown in Figure(1b), do not store data on the MSS but use it only as the access point to the
Internet. Ad hoc networks disperse all data items for searching and querying across the
mobile hosts[3]. Mobile ad hoc networks (MANETs) are a collection of mobile nodes
forming temporary networks without the support of any static infrastructures or centralized
network backbones. It is an autonomous system in which mobile hosts connected by wireless
links are free to move randomly and often act as routers at the same time. Communications 1 Department of Computer Engineering and Systems, Faculty of Engineering, Mansoura University [email protected]
Page 290

between one node and another normally require multiple hops as the transmission range of a
mobile node is limited. Intermediate nodes that lie in the communication paths act as routers
and forward packets towards the hosts[4].
The general features of mobile ad-hoc networks summarized as follows [4] : (i) Autonomous
terminal, each mobile terminal is an autonomous node, which may function as both a host
and a router. (ii) Dynamic network topology, since the nodes are mobile, the network
topology may change rapidly and unpredictably and the connectivity among the terminals
may vary with time. (iii) Distributed operation, since there is no infrastructure for the central
control of the network operations, the control and management of the network are distributed
among the terminals. The nodes involved in a MANET should collaborate among themselves
in which each node acts as a relay, to implement several functions such as security and
routing. (iv) Light-weight terminals, in most cases, the MANET nodes are mobile devices
with limited CPU processing capability, small memory size, and low power storage.
(a) Single-hope Client-server model
(b) Multihop Mobile peer-to-peer model
Figure 1. Wireless mobile environments. (a) In infrastructure-based single-hop network (b) Ad hoc multi-hop networks
MH: Mobile Host
MH6
MH3
MH4MH5
Peer-to-peer channel
MSS
MH2 MH1
MH1
MH3
MH5
MH7MH6
MH2
MSS
MH4
Page 291
With the increase of portable devices as well as the progress in wireless communication, ad
hoc networking is gaining importance with the increasing number of common applications.
Typical applications include[5]; (i) Military battlefield, ad hoc networking would allow the
military to take advantage of network technology to maintain an information between the
soldiers, vehicles, and military information head stations.(ii) Local level, ad hoc networks can
link independently both an immediate and momentary multimedia network using notebook
computers or palmtop computers to spread and share information among participants at
conference or classroom. (iii) Commercial area, ad hoc can be used in emergency operations
for disaster relief efforts(e.g. in fire, flood, or earthquake). Emergency rescue operations must
take place where non-existing or damaged communications infrastructure and rapid use of a
communication network is needed. Information is relayed from one rescue team member to
another over a small handheld.
Most of the previous researches in MANETs focus on the development of dynamic routing
protocols that can improve the connectivity among mobile hosts which are connected to each
other by one-hop/multi-hop links[6-10]. Although routing is an important issue in ad hoc
networks, the issue of data access is also vital since one of the critical goals of a MANET is
to provide data access service to mobile clients[4-5].
MANETs are mobile and constrained by limited energy, bandwidth, and computation power.
As the mobile devices always retrieve data from the data center, it may result in a large
amount of traffic in the MANET. Therefore, this will consumes both wireless bandwidth and
the power of mobile devices. Moreover , a mobile host suffers from high access latency if it
is distant from the data center, and packet loss probability for long distance data access is
high. These problems are more definite when the network size is large, which results in poor
system scalability. The above observations encourage researchers to investigate data caching
techniques for MANETs. With data cached in mobile nodes, a data request may be satisfied
by a nearby caching site, instead of being serviced by the data center[11-14].
As mobile nodes in a MANET share common interests. Therefore, sharing cache contents
between mobile nodes offers significant benefits. Cache sharing allows geographically
neighboring mobile nodes to access each other’s cache contents. Hence, the number of long-
distance data accesses to the data center can be reduced (i.e., reduce the bandwidth and power
consumption).
Page 292
In this paper, we proposed A Novel Cache Portioning Technique for Supporting Cooperation
in Mobile Ad-hoc Networks. Where, the cache is subdivided into three main parts, which are;
(i) Frequent Data part(FD), and, (ii) Cooperative Data part(CD), and, (iii) Difficult Data to be
achieved part(DD). The first part stores the frequently used data for the entire host. The data
stored in this part is chosen carefully to minimize the cache miss as possible. The second part
supports the cooperation between the local node and those nodes inside its zone. Hence,
frequent data used by the host neighboring nodes are stored inside this part. On the other
hand, the last part stores the data that are difficult to be achieved. This data is simply needs
high cost to be retrieved as it is not found in the surrounding zone.
2. Related Work
Over the last several years, there has been a large amount of work done in the area of
cooperative caching in MANETs. In [ ١٥-١٦ ], Cooperative Caching (CoCa) protocol for
mobile computing environments has been proposed. In CoCa, mobile nodes share their cache
contents with each others to reduce both the number of server requests and the number of
access misses. A more advanced scheme has been proposed in [١٧], which is called a Group-
based Cooperative Caching scheme (GroCoCa). It considers both the node mobility and the
data access pattern to adopt a centralized incremental clustering algorithm. GroCoCa
improves system performance at the expense of extra power consumption. In the Seven
Degrees of Separation (7DS) architecture introduced in [١٨], users cache data and share them
with their neighbors when experiencing intermittent connectivity to the Internet. However, in
spite of their effectiveness, the pre-mentioned caching techniques assume a single-hop
wireless communication environment, rather than the multi-hop ad hoc networks. Caching
techniques used in one-hop mobile environment may not be applicable to multi-hop mobile
environments since the requested data may need to go through multiple hops to be available.
Generally, in multi-hop MANET environment, discovering an available copy of the requested
data item is the core of caching scheme. Several existing protocols [1٢٠-٩] employing a
flooding mechanism to place the requested data item. Although flooding may reduce the
response time for the requested data, it unfortunately, introduces the broadcast storm problem
[21]. Moreover, it may also lead to an excessive communication overhead. To go around
those hurdles, flooding of a data request packet is restricted to nodes within k hops from the
node who request the data item, where k is the number of hops between the requesting node
Page 293

According to [22] a cooperative caching scheme to reduce the communication and energy
costs associated with fetching a web object has been proposed. When a node N wants to
access a web data W that is not cached locally, N requests W through the base station only if
the base station is in its zone. Otherwise, N will broadcast a request for W in its zone. If W is
not cached by any node in the zone, a peer-to-peer communication is performed with the
mobile nodes that are known to share interests with N and are at a distance that is less than
the one between N and the nearest base station. The communication is based on the notion of
terminal profile. However, if data correlation between mobile terminals is small, the effect of
terminal profile will be lost. In [23] , a Zone Cooperative (ZC) protocol, which tries to
discover a data item along the path to the data source has been proposed. Each node searches
for the item in its zone before forwarding a request packet to the next node on the path.
Consequently, the protocol may suffer from high access latency.
In [24-25], the authors presented three cache resolution schemes: CacheData, CachePath,
and HybridCache. In CacheData, forwarding nodes check the passing-by data requests. If a
data item is found to be frequently requested, forwarding nodes cache the data, so that the
next request for the same data can be answered by forwarding nodes instead of travelling
further to the data server. A problem for this scheme is that the data could take a lot of
caching space in forwarding nodes. To overcome this problem the authors present another
cache resolution scheme CachePath. In CachePath, forwarding nodes caches the information
of a path to the request originator and uses this information to redirect future requests to the
nearby caching site. This scheme saves caching spaces compared to CacheData, but since the
caching node is dynamic, the recorded path could become obsolete and this scheme could
introduce extra processing overhead. To avoid the weaknesses of those two schemes the
authors proposed HybridCache. In HybridCache, when a mobile node forwards a data item, it
caches the data or the path based on some criteria. These criteria include the data item size
and the Time-To-Live (TTL) of the item. The main disadvantage of these schemes is that the
Page 294
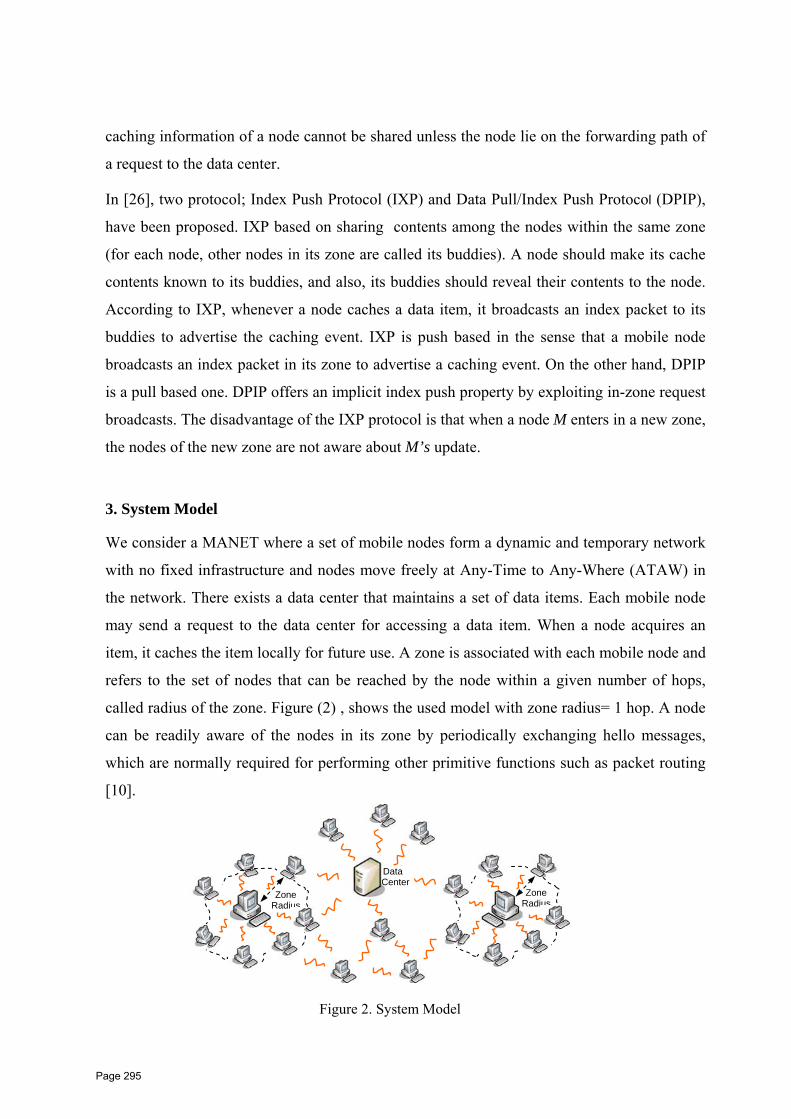
caching information of a node cannot be shared unless the node lie on the forwarding path of
a request to the data center.
In [26], two protocol; Index Push Protocol (IXP) and Data Pull/Index Push Protocol (DPIP),
have been proposed. IXP based on sharing contents among the nodes within the same zone
(for each node, other nodes in its zone are called its buddies). A node should make its cache
contents known to its buddies, and also, its buddies should reveal their contents to the node.
According to IXP, whenever a node caches a data item, it broadcasts an index packet to its
buddies to advertise the caching event. IXP is push based in the sense that a mobile node
broadcasts an index packet in its zone to advertise a caching event. On the other hand, DPIP
is a pull based one. DPIP offers an implicit index push property by exploiting in-zone request
broadcasts. The disadvantage of the IXP protocol is that when a node M enters in a new zone,
the nodes of the new zone are not aware about M’s update.
3. System Model We consider a MANET where a set of mobile nodes form a dynamic and temporary network
with no fixed infrastructure and nodes move freely at Any-Time to Any-Where (ATAW) in
the network. There exists a data center that maintains a set of data items. Each mobile node
may send a request to the data center for accessing a data item. When a node acquires an
item, it caches the item locally for future use. A zone is associated with each mobile node and
refers to the set of nodes that can be reached by the node within a given number of hops,
called radius of the zone. Figure (2) , shows the used model with zone radius= 1 hop. A node
can be readily aware of the nodes in its zone by periodically exchanging hello messages,
which are normally required for performing other primitive functions such as packet routing
[10].
Zone Radius
Data Center
Zone Radius
Figure 2. System Model
Page 295

4. Proposal
The basic idea of the proposed caching scheme is to portioning the cache into a set of n
functional portions in which each portion maintains a set of data items to satisfy a particular
request. This cache portioning scheme is the first, to the best of our knowledge to be
introduced. The philosophy standing behind this idea is that; the cache is a sharing media that
should maintain not only the needs of its hosting node but also the needs of those nodes lying
inside the node zone (buddies). Hence, the future needs of those buddies should be taken into
consideration.
On the other hand, to be more flexible and to particularly support the nodes co-operation, the
local cache should also maintain those data that are difficult to achieve (those data items that
are distant from the node as well as its zone). Hence, according to the work in this paper,
each node is concerning of triple types of data items, which are; (i) the data that will be used
frequently for its personal needs, (ii) data items that may be needed frequently by the
neighboring nodes (node buddies) to support the buddies co-operation, and (iii) those data
items that are difficult to be achieved to improve the caching flexibility.
Therefore, for each node in the zone, the cache is split into three parts: Frequent Data part
(FD), Cooperative Data part (CD) and Difficult Data to be achieved part (DD) as illustrated
in figure(3),
Data difficult to be
achieved N %
Cooperative data
X% Fr d equent use
data M%
Figure3. Node's Cache
Page 296
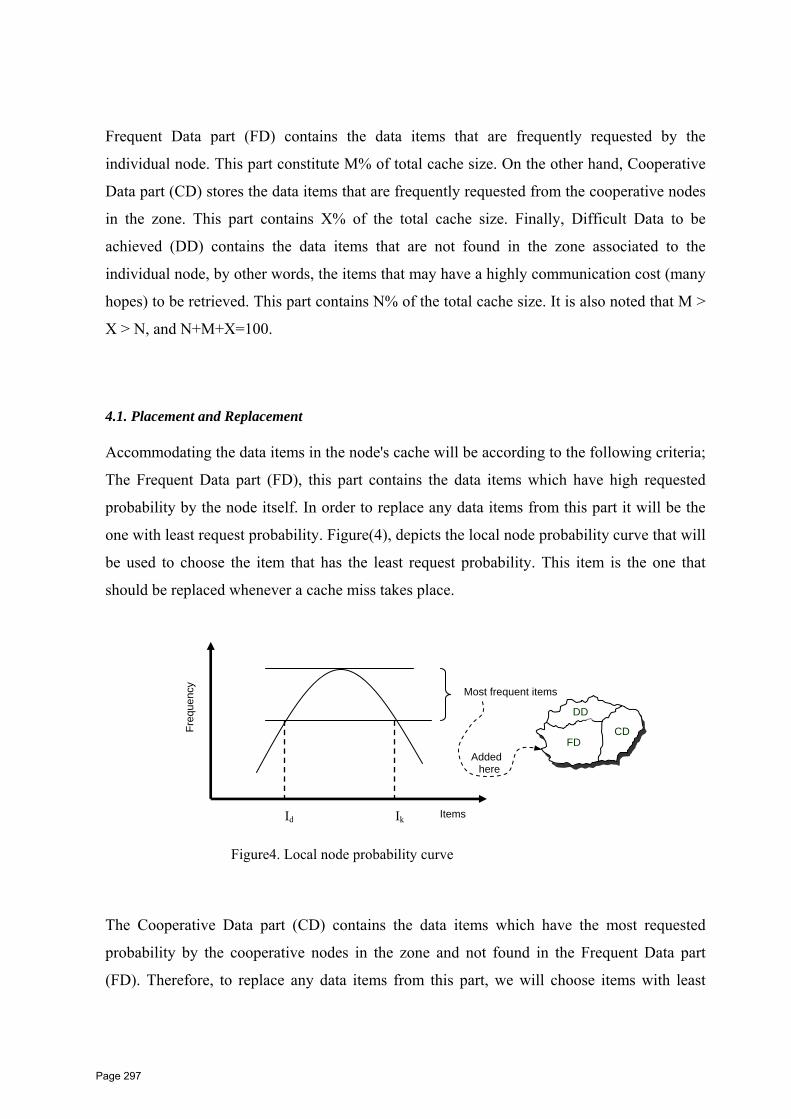
Frequent Data part (FD) contains the data items that are frequently requested by the
individual node. This part constitute M% of total cache size. On the other hand, Cooperative
Data part (CD) stores the data items that are frequently requested from the cooperative nodes
in the zone. This part contains X% of the total cache size. Finally, Difficult Data to be
achieved (DD) contains the data items that are not found in the zone associated to the
individual node, by other words, the items that may have a highly communication cost (many
hopes) to be retrieved. This part contains N% of the total cache size. It is also noted that M >
X > N, and N+M+X=100.
4.1. Placement and Replacement Accommodating the data items in the node's cache will be according to the following criteria;
The Frequent Data part (FD), this part contains the data items which have high requested
probability by the node itself. In order to replace any data items from this part it will be the
one with least request probability. Figure(4), depicts the local node probability curve that will
be used to choose the item that has the least request probability. This item is the one that
should be replaced whenever a cache miss takes place.
Freq
uenc
y
Most frequent items
DD
CD FD
Added here
I
The Cooperative Data part (CD) contains the data items which have the most requested
probability by the cooperative nodes in the zone and not found in the Frequent Data part
(FD). Therefore, to replace any data items from this part, we will choose items with least
d Items Ik
Figure4. Local node probability curve
Page 297
requested probability from the cooperative nodes in the zone. Figure (5), depicts the
cooperative nodes probability curve.
Finally, the Difficult Data to be achieved (DD) part contains the data items with the highest
communication cost probability (i.e. number of hops), which are not found in the zone, and
need to be achieved outside the zone using several number of a hops until it reach the data
source (server).On the other hand, in order to replace any data items from this part , we will
choose the items with least communication cost probability. Figure(6), depicts the
communication cost probability curve.
Freq
uenc
y
Most frequent
DD
CDFD
Id Items Ik
Figure5 . Cooperative nodes probability curve
Com
mun
icat
ion
Cos
t (no
. of
hops
)
Data difficult to be achieved
DD
CD FD
Id Items Ik
Figure6. Communication Cost probability curve
Page 298

4.2. Node mobility
There are two cases for the node mobility: (i) Entering in a new zone: When a node enters a
new zone, it should broadcast its cache contents to all its neighbors of the new zone, so it
sends the information about all Data items within its local cache. This will improve the data
availability in the zone. (ii) Leaving a current zone: Figure(7), depicts the proposed node exit
algorithm. When a node leaves its current zone, it should notify its neighbors to take the
suitable action. So, the neighbors will decide whether the data held by the leaving node can
cached by them. First, the leaving node must check the Cooperative Data (CD) items, if any
data item is found in the zone and at the same time has a fresh update copy then, this item
must be removed from the Cooperative part of the leaving node. Otherwise, if the
Cooperative Data item does not found in the zone or has stale update copy, then this item
should be cached in the zone. Therefore , we should search for a node has a free space in the
zone to cache this data item. If we found, store this data item at the zone node then remove
this item from the Cooperative part of the leaving node. Then notify all other zone nodes to
update their local cache. On the other hand, if we did not find a free space, the zone nodes
must eliminate a victim data item, to make a space for the newly cached ones, then clear it
from the Cooperative Data part of the leaving node. Then notify all other zone nodes to
update their local cache. The selection of a victim element based on the following criteria: (a)
has a low demand probability. And (b) has as many copy as possible.
5 - Conclusion MANETs is a collection of cooperative mobile nodes that communicate with each other
without the intervention of centralized access points. Cooperative caching in MANET
improves system performance because it allows sharing and coordination of cached data
among multiple mobile users in the network. In this paper A Novel Cache Portioning
Technique for Supporting Cooperation in Mobile Ad-hoc Networks is proposed, which divide
the cache space into several functional parts. This may have a significant impact in
improving the caching efficiency as it can minimize the cost as well as improving the hit rate.
Page 299

Start Node decide to exit zone
Figure 7. Node Exit Algorithm
fresh
Clear item from local
cache
Check its Cooperative Data(CD)
CD
finished
Sto p
yes
Pick next item in CD
No
Item exist at
zone
yes
Node has
free space
Ask zone nodes for victim item
Replace victim with local item
No
Check
update
No
Not fresh
Store item at
remote node
yes
Notify all other zone nodes to update
their local cache
Page 300

References
[1] Jing J. , Abdelsalam H. and Ahmed E., “Client-server computing in mobile environments”, ACM Computing Surveys, Vol.31,No.2, pp.117 – 157, (1999).
[2] Rene M., "Communication paradigms for mobile computing", ACM SIGMOBILE Mobile Computing and Communication Review, New York, Vol.6, No. 4, pp.56-58, Oct. (2002).
[3] Chi Y. C., Hong V. L. and Alvin T. S. C., "Distributed group-based cooperative caching in a mobile broadcast environment", Proc. of the 6th international conference on Mobile data management , pp. 97 – 106, (2005).
[4] Aravindhan V., Venkatesh S., Thomas F. P. and Raj A., "A mobility-prediction-based relay deployment framework for conserving power in manets", IEEE Transaction on Mobile Computing , Vol.8, No.6, pp.750 – 765, Jun.(2009).
[5] Mario B., Giuseppe D. M. , Orazio T. and Lorenzo V. , "P2P over manet : a comparison of cross-layer approaches", Proc. of 18th International Conference on Database and Expert Systems Applications (DEXA 2007), Germany, pp.814-818, Sep. (2007) .
[6] Magnus F., Per J. and Peter. L., "Wireless ad hoc networking – the art of networking without a network", Ericsson Review ,Vol.77 , no.4 , pp.248–263 , (2000).
[7] Samir R.D., Cliarles E. P. and Elizabeth M. R., "Performance comparison of two on-demand routing protocols for ad hoc networks", IEEE INFOCOM, pp.3–12, (2000).
[8] David B. J. and David A. M., "Dynamic source routing in ad hoc wireless networks", IEEE Transaction on Mobile Computing , pp.158–181, (1996).
[9] Charles P. and Pravin B. , "Highly dynamic destination-sequenced distance-vector routing (DSDV) for mobile computers", ACM SIGCOMM ,vol.24, no.4, pp.234–244, (1994).
[10] Charles P. and Elizabeth M. R., "Ad hoc on-demand distance vector routing", IEEE Workshop on Mobile Computing Systems and Applications , pp.90–100, (1999).
[11] Narttom C., Ramesh C. J. and Manoj M., "Broadcast based cache invalidation and prefetching in mobile environment", International Conference on High Performance Computing (HiPC), Springer-Verlag LNCS, 3296 , pp.410–419, (2004) .
[12] Narttom C., Ramesh C. J. and Manoj M., "Energy efficient cache invalidation in a disconnected wireless mobile environment", International Journal of Ad Hoc and Ubiquitous Computing (IJAHUC), vol.1,no.3, pp.184–192, (2005) .
Page 301

[13] Guohong C., "On improving the performance of cache invalidation in mobile environments", ACM/Kluwer Mobile Networks and Applications, vol.7, no.4 , pp.291–303 , (2002) .
[14] Guohong C., "A scalable low-latency cache invalidation strategy for mobile environments", IEEE Transactions on Knowledge and Data Engineering, vol.15, no.5, pp.1251–126, (2003) .
[١٥] Chin Y., Hong V. L. and Alvin C., “Peer-to-peer cooperative caching in mobile environments”, Proc. 24th Int’l Conf. Distributed Computing Systems Workshops (ICDCSW ’04), pp. 528-533,(2004).
[١٦] Chin Y., Hong V. L. and Alvin C., “Cache signatures for peer-to-peer cooperative caching in mobile environments”, Proc.18th Int’l Conf. Advanced Information Networking and Applications (AINA ’04), pp. 96-101,(2004).
[١٧] Chin Y., Hong V. L. and Alvin T.S.C, “Group-based cooperative cache management for mobile clients in mobile environment”, Proc. 33rd Int’l Conf. Parallel Processing (ICPP ’04), vol.1, pp. 83-90, (2004).
[١٨] Maria P. and Henning S., “Effects of power conservation, wireless coverage and cooperation on data dissemination among mobile devices”, Proc. ACM MobiHoc’01, USA, pp. 117-127, Oct. (2001).
[19] William H. O. L., Mohan K. and Svetha V., “A cooperative cache architecture in supporting caching multimedia objects in manets”, Proc. Fifth Int’l Workshop Wireless Mobile Multimedia (WOWMOM ’02), USA, pp. 56-63, (2002).
[20] Takaaki M. and Aida T., “Cache data access system in ad hoc networks” , Proc. Vehicular Technology Conf. (VTC ’03), Japan , vol. 2, pp. 1228-1232, Apr. (2003).
[21] Sze Y. N. , Yu C. T., Yuh S. C. and Jang P. S. , “The broadcast storm problem in a mobile ad hoc network” , Proc. of the 5th annual ACM/IEEE international conference on Mobile computing and networking, USA, pp. 151-162, Aug. (1999).
[22] Francoise S. and Valerie I., “Energy-aware web caching for mobile terminals” , Proc. 22nd Int’l Conf. Distributed Computing Systems Workshops (ICDCSW ’02), pp. 820-825, July (2002).
[23] Narttam C. , Ramesh C. J. and Manoj M., “Cooperative caching in mobile ad hoc networks based on data utility”, International Journal of Mobile Information System, vol. 3, no. 1, pp. 19-37, (2007).
[24] Liangzhong Y. and Guohong C., “Supporting cooperative caching in ad hoc networks” , Proc. IEEE INFOCOM ’04, pp. 2537-2547,(2004).
Page 302

Proposal for a Novel Cache Portioning Technique for Supporting Cooperation in Mobile Ad-hoc Networks
ICI 10 - 10TH INTERNATIONAL CONFERENCE ON INFORMATION
[25] Liangzhong Y. and Guohong C., “Supporting cooperative caching in ad hoc networks”, IEEE Trans. Mobile Computing, vol. 5, no. 1, pp. 77-89, Jan. (2006).
[26] Ge M. C. and Cheng R. Y. , "Exploiting in- zone broadcasts for cache sharing in mobile ad hoc networks", IEEE Transaction on Mobile Computing, vol.8, no.3, MARCH (2009).
Page 303
ICI 10 - 10TH INTERNATIONAL CONFERENCE ON INFORMATION AT DELTA UNIVERSITY FOR SCIENCE AND TECHNOLOGY
GAMASA, EGYPT, 4 – 6 DECEMBER 2010
1
A Novel Strategy for Location Management in PCS Networks Using Base
Areas Scheme
Hesham. A. Ali 1, Ahmed I. Saleh 2, Mohammed. H. Ali
3*
1 (Dept. of Computer Eng. & Systems, Faculty of Engineering, Mansoura University, Egypt,
[email protected]) 2 (Dept. of Computer Eng. & Systems, Faculty of Engineering, Mansoura University, Egypt,
[email protected]) 3 (IT Engineer, Sharm El-Sheik International Airport, South Sinai, Egypt,
Abstract
The main objective of PCS networks is to provide "anytime-anywhere" cellular services.
Accordingly, the existence of lost calls as well as the network slow response have become the major
problems that hardly degrade the reliability of such networks. However, those problems can be
overcome by perfectly manage the locations of PCS network users. Hence, network users can be
identified both perfectly and rabidly, which in turn minimizes network overheads and provide better
cellular services. In the existing location management scheme, Location Area (LA) is considered as
the smallest unit to make location registration. The Mobile Terminal (MT) must register itself when
passing through the boundary of its hosing LA to the one of the neighboring ones. Also, MT must
pass its new location to its master Home Location Register (HLR) even though MT is currently
managed by another HLR, which increases communication costs. Existing location management
scheme suffers from two major hurdles, namely; (i) excessive location registrations by MTs located
around LA boundaries (Ping-Pong) and (ii) requiring the network to poll all LA cells to locate the
MT. In this paper, a novel location management scheme for PCS network is introduced by
restructuring LAs of PCS networks into small areas called Base Area (BA), which in turn minimizes
the paging cost. Moreover, registration is done through the current HLR instead of the master HLR,
which improves not only the network response but also the network quality of service. The proposed
scheme also uses caching to reduce unwanted location updates (registrations). An analytical model is
developed to study the performance of the proposed framework. Experimental results have shown
that the proposed scheme introduces a distinct improvement in network response and tracing
process.
Keywords: PCS Networks, HLR, VLR, MT, BA, LA, SA, DB Cache.
1. INTRODUCTION
One of the most human aims over the past few years is to provide a transparent
cellular communication services all over the world. Such services are the ones that
guarantee a reliable exchange of information in any form (voice, data, video, images, etc.)
with no worry about the real-time distribution of mobile users. Hence, they should be
Page 304
Ragaa
Cross-Out
Ragaa
Replacement Text
9
A Novel Strategy for Location Management in PCS
Networks Using Base Areas Scheme
ICI 10 - 10TH INTERNATIONAL CONFERENCE ON INFORMATION
2
independent of service time, user's location or underlying network access arrangement. This
aim is continuously promoted by the tremendous growth in wireless communications, the
great improvement and innovation of personal communications service (PCS) networks and
the exponential expanding rate of PCS network subscribers which also predicted to continue
increasing in the near future [1], [2], [3].
A personal Communication Service (PCS) network is the integration of cellular
(Wireless) and conventional (wired) networks. It provides wireless communication services
that enable Mobile Terminals [MTs] to communicate and exchange any form of information
on the move "anytime-anywhere". To efficiently fire any service of the PCS network, the
location of the MT should be clearly identified [4], [5], [6]. Consequently, an MT must
register itself in the system when moving to new location. So we study Location
management Schemes to choose the best.
There are two basic operations in location management: Location Registration
(Update) and Call Delivery. Location registration is the process through which system
tracks the continuously changed locations (up-to-date) of MTs. When an incoming call
arrives, the system searches for the called MT. This process is referred to as call delivery
[7], [8], [9].
To the best of our knowledge, two standard schemes are currently exist for PCS
location management, which are; Interim Standard 41 (IS-41) for North America Digital
Cellular system and Global System for Mobile (GSM) for Pan-European Digital Cellular
system. Both schemes use a two-tier infrastructure of Home Location Register (HLR) and
Visitor Location Register (VLR) databases.
The HLR is a global database that maintains Mobile terminal identity information
including the permanent data (e.g., service subscribed, billing information, directory
number, profile information, current location, roaming-limits, VLR-address, MSC-address,
and validation period) of the MTs whose primary subscription is within the area.
The VLR contains temporary records for all MTs currently active within its serviced
area, Billing and accounting information and Location Area Identity (LAI). It retrieves
information for handling calls to or from a visiting MT [10], which are modified and
queried frequently for location tracking and call delivery.
Page 305
A Novel Strategy for Location Management in PCS
Networks Using Base Areas Scheme
ICI 10 - 10TH INTERNATIONAL CONFERENCE ON INFORMATION
3
In the existing location management schemes, MT must pass its new location to its
master HLR even though it is currently managed by another HLR, which increases
communication costs.
Some related works have been conducted for location management in PCS networks
(e.g., [5], [6], [12], [13]). In [10] a dynamic HLR location management scheme for PCS
Networks introduced to reduce the signaling cost for location registration and call delivery.
The scheme provided a dynamic copy of MT location information in nearest HLR. MT can
always access the location data in its nearest HLR for performing location registration and
call delivery. Using GTT (Global Title Translation) table to lookup the current HLR.
Dynamic hierarchical database architecture for location management in PCS
networks [11] is introduced. A new tier of databases called directory registers is added to
the PCS networks which increase the systems cost and also causes difficulties to the design
and implementation of the systems. Each directory register should determine the location
information distribution strategies for its associated MTs and set up the location pointers at
the selected remote directory registers for each MT periodically which increases the
network bandwidth and computational overheads.
A per-user location caching strategy [14] is introduced to reduce the communication
cost for call delivery by reusing the cached data about a called MTs location from a last call.
The performance of this scheme depends on the probability that the cached data still valid.
A user profile replication scheme [15] is proposed, where user's profile is replicated
at preselected locations to reduce the call delivery delay. The replication is made by a center
point which collects the mobility and calling parameters of the whole user population time
by time. To generate and distribute the replication decision for a large user population is a
computationally intensive and time-consuming process which may incur significant amount
of network bandwidth.
In this paper, a novel strategy for location management in PCS networks is
introduced by restructuring the location areas (LAs) of PCS into small areas called Base
Areas (BAs) which in turn minimizes the paging cost. Moreover, registration is done
through the current HLR instead of the master HLR, which improves not only the network
response but also the network quality of service. The proposed scheme also uses caching to
reduce unwanted location updates, read/write from databases and reduce the signaling costs.
Page 306
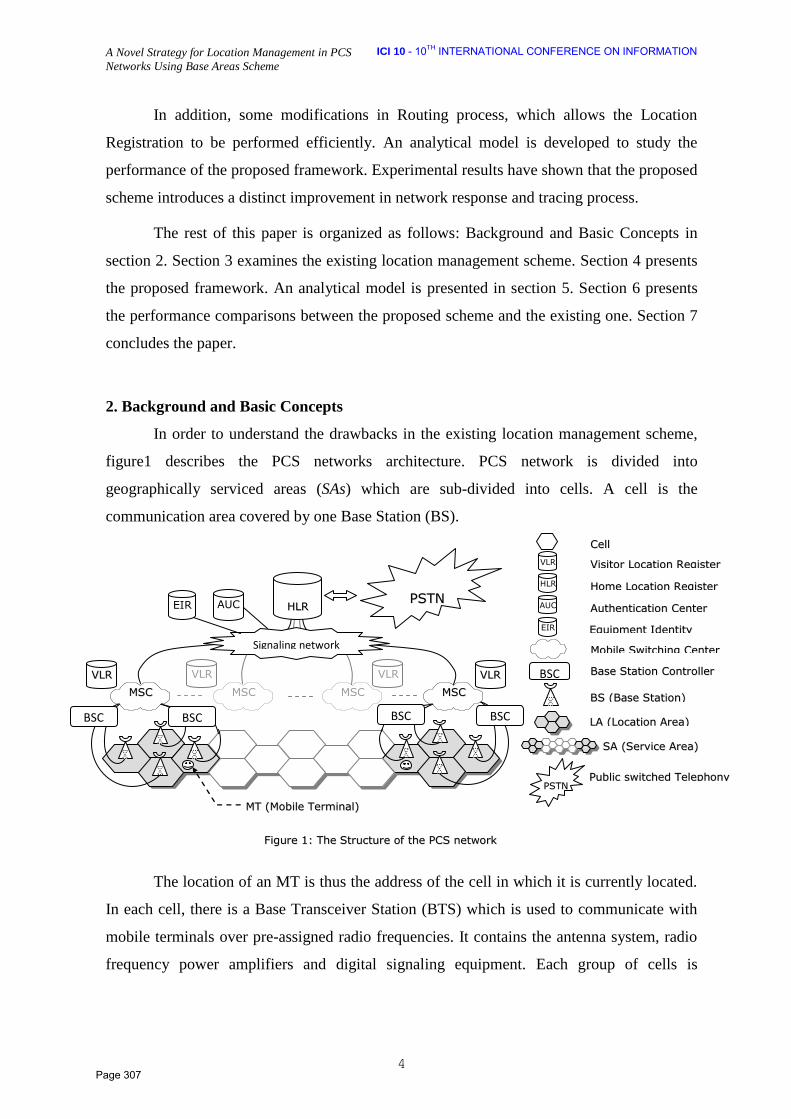
A Novel Strategy for Location Management in PCS
Networks Using Base Areas Scheme
ICI 10 - 10TH INTERNATIONAL CONFERENCE ON INFORMATION
4
In addition, some modifications in Routing process, which allows the Location
Registration to be performed efficiently. An analytical model is developed to study the
performance of the proposed framework. Experimental results have shown that the proposed
scheme introduces a distinct improvement in network response and tracing process.
The rest of this paper is organized as follows: Background and Basic Concepts in
section 2. Section 3 examines the existing location management scheme. Section 4 presents
the proposed framework. An analytical model is presented in section 5. Section 6 presents
the performance comparisons between the proposed scheme and the existing one. Section 7
concludes the paper.
2. Background and Basic Concepts
In order to understand the drawbacks in the existing location management scheme,
figure1 describes the PCS networks architecture. PCS network is divided into
geographically serviced areas (SAs) which are sub-divided into cells. A cell is the
communication area covered by one Base Station (BS).
The location of an MT is thus the address of the cell in which it is currently located.
In each cell, there is a Base Transceiver Station (BTS) which is used to communicate with
mobile terminals over pre-assigned radio frequencies. It contains the antenna system, radio
frequency power amplifiers and digital signaling equipment. Each group of cells is
CCeellll
HLR HHoommee LLooccaattiioonn RReeggiisstteerr
EIR EEqquuiippmmeenntt IIddeennttiittyy
RReeggiisstteerr
BSC BBaassee SSttaattiioonn CCoonnttrroolllleerr VVLLRR
MMSSCC MMSSCC MSC
VLR VVLLRR
MSC
VLR
MSC
VLR
AUC
MMTT ((MMoobbiillee TTeerrmmiinnaall))
PPSSTTNN
HHLLRR
PPSSTTNN
FFiigguurree 11:: TThhee SSttrruuccttuurree ooff tthhee PPCCSS nneettwwoorrkk
VViissiittoorr LLooccaattiioonn RReeggiisstteerr
AAuutthheennttiiccaattiioonn CCeenntteerr
LLAA ((LLooccaattiioonn AArreeaa))
BBSS ((BBaassee SSttaattiioonn))
MMoobbiillee SSwwiittcchhiinngg CCeenntteerr
SSAA ((SSeerrvviiccee AArreeaa))
PPuubblliicc sswwiittcchheedd TTeelleepphhoonnyy
BSC BSC BSC BSC
Signaling network
AUC EIR
Page 307
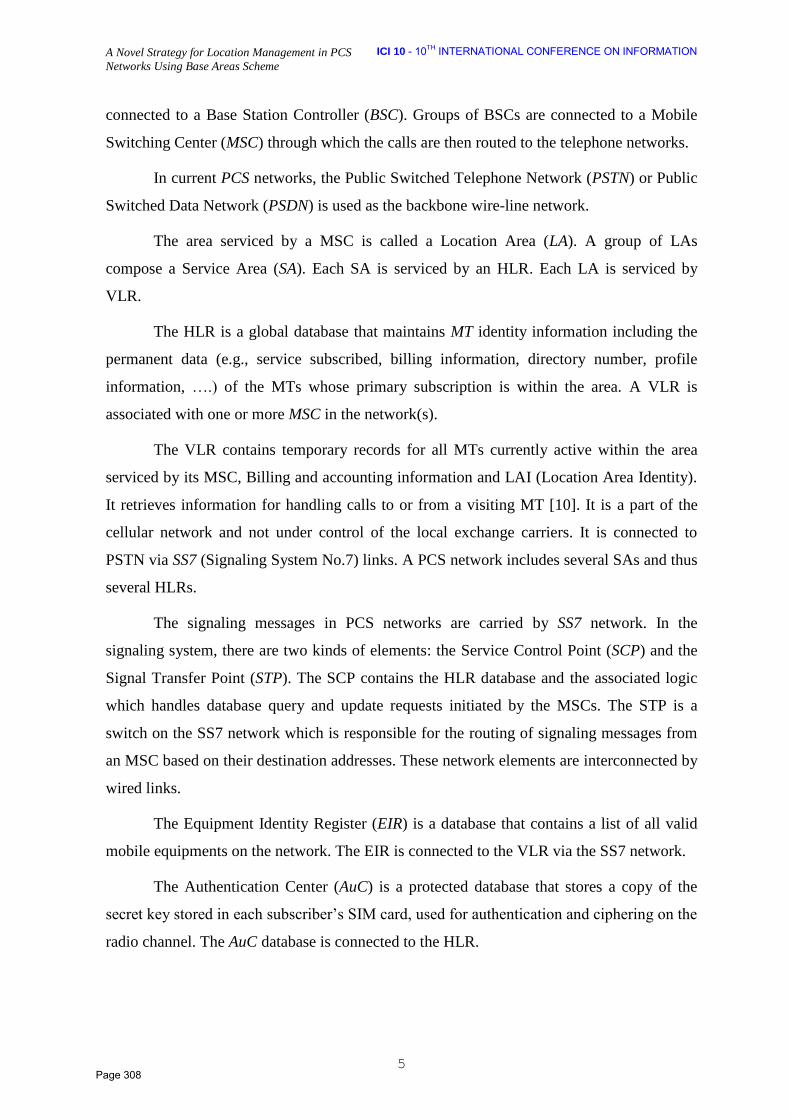
A Novel Strategy for Location Management in PCS
Networks Using Base Areas Scheme
ICI 10 - 10TH INTERNATIONAL CONFERENCE ON INFORMATION
5
connected to a Base Station Controller (BSC). Groups of BSCs are connected to a Mobile
Switching Center (MSC) through which the calls are then routed to the telephone networks.
In current PCS networks, the Public Switched Telephone Network (PSTN) or Public
Switched Data Network (PSDN) is used as the backbone wire-line network.
The area serviced by a MSC is called a Location Area (LA). A group of LAs
compose a Service Area (SA). Each SA is serviced by an HLR. Each LA is serviced by
VLR.
The HLR is a global database that maintains MT identity information including the
permanent data (e.g., service subscribed, billing information, directory number, profile
information, ….) of the MTs whose primary subscription is within the area. A VLR is
associated with one or more MSC in the network(s).
The VLR contains temporary records for all MTs currently active within the area
serviced by its MSC, Billing and accounting information and LAI (Location Area Identity).
It retrieves information for handling calls to or from a visiting MT [10]. It is a part of the
cellular network and not under control of the local exchange carriers. It is connected to
PSTN via SS7 (Signaling System No.7) links. A PCS network includes several SAs and thus
several HLRs.
The signaling messages in PCS networks are carried by SS7 network. In the
signaling system, there are two kinds of elements: the Service Control Point (SCP) and the
Signal Transfer Point (STP). The SCP contains the HLR database and the associated logic
which handles database query and update requests initiated by the MSCs. The STP is a
switch on the SS7 network which is responsible for the routing of signaling messages from
an MSC based on their destination addresses. These network elements are interconnected by
wired links.
The Equipment Identity Register (EIR) is a database that contains a list of all valid
mobile equipments on the network. The EIR is connected to the VLR via the SS7 network.
The Authentication Center (AuC) is a protected database that stores a copy of the
secret key stored in each subscriber’s SIM card, used for authentication and ciphering on the
radio channel. The AuC database is connected to the HLR.
Page 308
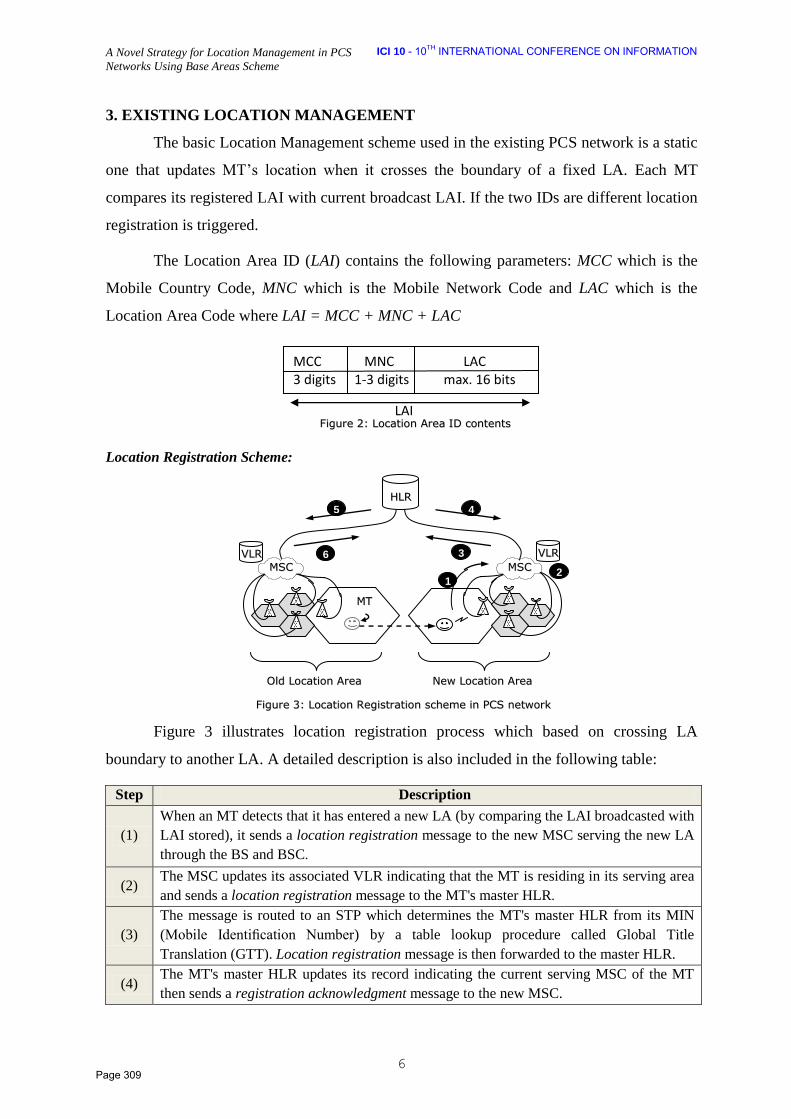
A Novel Strategy for Location Management in PCS
Networks Using Base Areas Scheme
ICI 10 - 10TH INTERNATIONAL CONFERENCE ON INFORMATION
6
OOlldd LLooccaattiioonn AArreeaa
VVLLRR
MMSSCC MMSSCC VVLLRR
HHLLRR
FFiigguurree 33:: LLooccaattiioonn RReeggiissttrraattiioonn sscchheemmee iinn PPCCSS nneettwwoorrkk
NNeeww LLooccaattiioonn AArreeaa
1 2
3
4
MMTT
SSttaattiioonn
5
6
3. EXISTING LOCATION MANAGEMENT
The basic Location Management scheme used in the existing PCS network is a static
one that updates MT’s location when it crosses the boundary of a fixed LA. Each MT
compares its registered LAI with current broadcast LAI. If the two IDs are different location
registration is triggered.
The Location Area ID (LAI) contains the following parameters: MCC which is the
Mobile Country Code, MNC which is the Mobile Network Code and LAC which is the
Location Area Code where LAI = MCC + MNC + LAC
Location Registration Scheme:
Figure 3 illustrates location registration process which based on crossing LA
boundary to another LA. A detailed description is also included in the following table:
Step Description
(1)
When an MT detects that it has entered a new LA (by comparing the LAI broadcasted with
LAI stored), it sends a location registration message to the new MSC serving the new LA
through the BS and BSC.
(2) The MSC updates its associated VLR indicating that the MT is residing in its serving area
and sends a location registration message to the MT's master HLR.
(3)
The message is routed to an STP which determines the MT's master HLR from its MIN
(Mobile Identification Number) by a table lookup procedure called Global Title
Translation (GTT). Location registration message is then forwarded to the master HLR.
(4) The MT's master HLR updates its record indicating the current serving MSC of the MT
then sends a registration acknowledgment message to the new MSC.
MCC MNC LAC 3 digits 1-3 digits max. 16 bits
LAI FFiigguurree 22:: LLooccaattiioonn AArreeaa IIDD ccoonntteennttss
Page 309

A Novel Strategy for Location Management in PCS
Networks Using Base Areas Scheme
ICI 10 - 10TH INTERNATIONAL CONFERENCE ON INFORMATION
7
(5) The master HLR sends a registration cancellation message to the old MSC to delete the
MT's record from its associated VLR.
(6) The old MSC deletes the record of the MT from its associated VLR and sends a
cancellation acknowledgment message to the master HLR.
4. PROPOSED FRAMEWORK
The existing location management scheme suffers from two major hurdles, namely;
(i) excessive location registrations by MTs located around LA boundaries which making
frequent movements back and forth between two LAs (Ping-Pong) and (ii) requiring the
network to poll all LA cells to locate the MT each time a call arrives which may result in
excessive volume of wireless broadcast traffic. As seen PCS networks are divided into
Areas serviced by HLR called Service Areas (SAs). Each SA is sub-divided into Location
Areas (LAs) associated with MSC and VLR.
A novel location management scheme for PCS network is proposed by restructuring
LAs into small areas composed of group of cells called Base Area (BA) to make the MT
location more specific, which in turn minimizes the paging cost. Number of cells in BA
depending on the network performance. Moreover, registration is done through the current
HLR instead of the master HLR, which improves not only the network response but also the
network quality of service. Also caching used to reduce unwanted location updates
(registrations) and reduce read/write from databases (accessing databases).
In addition, some modifications in registration process and in Routing process which
allows the Location Registration to be performed efficiently which will be introduced in the
framework.
The LAI contains the following parameters: MCC which is the Mobile Country
Code, MNC which is the Mobile Network Code, LAC which is the Location Area Code and
BAC which is the Base Area Code.
Where LAI = MCC + MNC + LAC + BAC
LAI
MCC MNC LAC BAC 3 digits 1-3 digits max. 16 bits N bits
FFiigguurree 44:: TThhee nneeww llooccaattiioonn AArreeaa IIDD ccoonntteennttss
Page 310
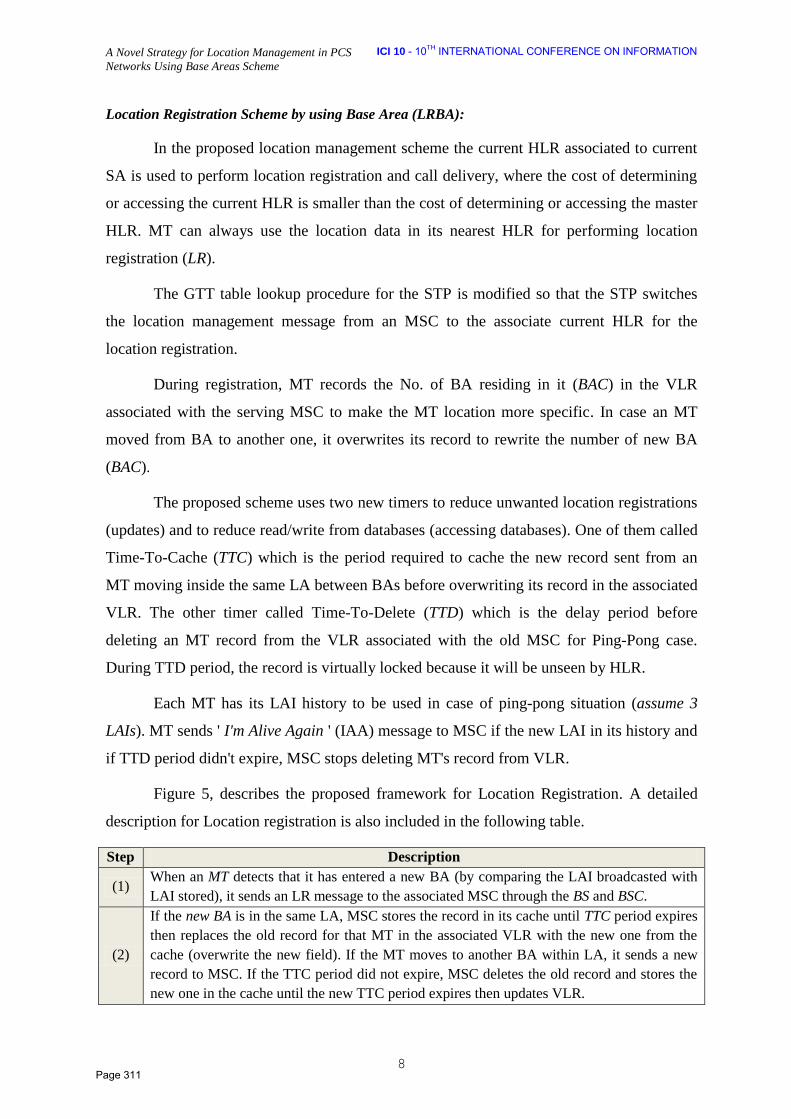
A Novel Strategy for Location Management in PCS
Networks Using Base Areas Scheme
ICI 10 - 10TH INTERNATIONAL CONFERENCE ON INFORMATION
8
Location Registration Scheme by using Base Area (LRBA):
In the proposed location management scheme the current HLR associated to current
SA is used to perform location registration and call delivery, where the cost of determining
or accessing the current HLR is smaller than the cost of determining or accessing the master
HLR. MT can always use the location data in its nearest HLR for performing location
registration (LR).
The GTT table lookup procedure for the STP is modified so that the STP switches
the location management message from an MSC to the associate current HLR for the
location registration.
During registration, MT records the No. of BA residing in it (BAC) in the VLR
associated with the serving MSC to make the MT location more specific. In case an MT
moved from BA to another one, it overwrites its record to rewrite the number of new BA
(BAC).
The proposed scheme uses two new timers to reduce unwanted location registrations
(updates) and to reduce read/write from databases (accessing databases). One of them called
Time-To-Cache (TTC) which is the period required to cache the new record sent from an
MT moving inside the same LA between BAs before overwriting its record in the associated
VLR. The other timer called Time-To-Delete (TTD) which is the delay period before
deleting an MT record from the VLR associated with the old MSC for Ping-Pong case.
During TTD period, the record is virtually locked because it will be unseen by HLR.
Each MT has its LAI history to be used in case of ping-pong situation (assume 3
LAIs). MT sends ' I'm Alive Again ' (IAA) message to MSC if the new LAI in its history and
if TTD period didn't expire, MSC stops deleting MT's record from VLR.
Figure 5, describes the proposed framework for Location Registration. A detailed
description for Location registration is also included in the following table.
Step Description
(1) When an MT detects that it has entered a new BA (by comparing the LAI broadcasted with
LAI stored), it sends an LR message to the associated MSC through the BS and BSC.
(2)
If the new BA is in the same LA, MSC stores the record in its cache until TTC period expires
then replaces the old record for that MT in the associated VLR with the new one from the
cache (overwrite the new field). If the MT moves to another BA within LA, it sends a new
record to MSC. If the TTC period did not expire, MSC deletes the old record and stores the
new one in the cache until the new TTC period expires then updates VLR.
Page 311
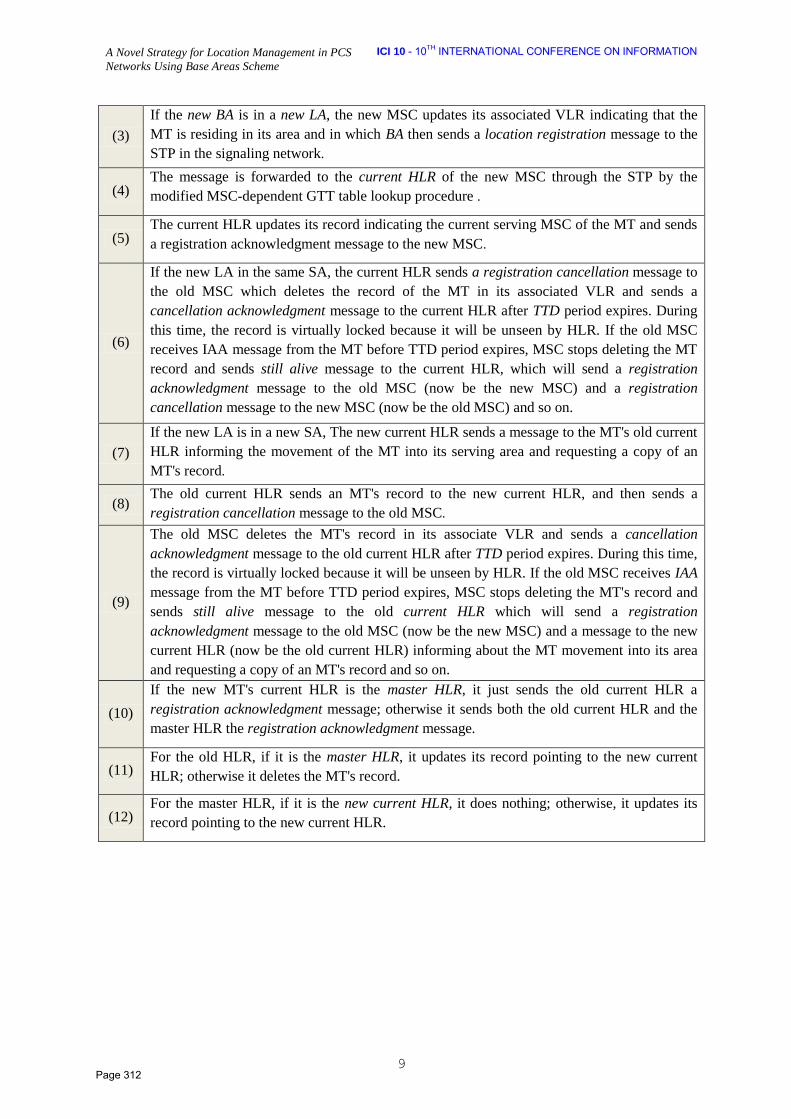
A Novel Strategy for Location Management in PCS
Networks Using Base Areas Scheme
ICI 10 - 10TH INTERNATIONAL CONFERENCE ON INFORMATION
9
(3)
If the new BA is in a new LA, the new MSC updates its associated VLR indicating that the
MT is residing in its area and in which BA then sends a location registration message to the
STP in the signaling network.
(4) The message is forwarded to the current HLR of the new MSC through the STP by the
modified MSC-dependent GTT table lookup procedure .
(5) The current HLR updates its record indicating the current serving MSC of the MT and sends
a registration acknowledgment message to the new MSC.
(6)
If the new LA in the same SA, the current HLR sends a registration cancellation message to
the old MSC which deletes the record of the MT in its associated VLR and sends a
cancellation acknowledgment message to the current HLR after TTD period expires. During
this time, the record is virtually locked because it will be unseen by HLR. If the old MSC
receives IAA message from the MT before TTD period expires, MSC stops deleting the MT
record and sends still alive message to the current HLR, which will send a registration
acknowledgment message to the old MSC (now be the new MSC) and a registration
cancellation message to the new MSC (now be the old MSC) and so on.
(7)
If the new LA is in a new SA, The new current HLR sends a message to the MT's old current
HLR informing the movement of the MT into its serving area and requesting a copy of an
MT's record.
(8) The old current HLR sends an MT's record to the new current HLR, and then sends a
registration cancellation message to the old MSC.
(9)
The old MSC deletes the MT's record in its associate VLR and sends a cancellation
acknowledgment message to the old current HLR after TTD period expires. During this time,
the record is virtually locked because it will be unseen by HLR. If the old MSC receives IAA
message from the MT before TTD period expires, MSC stops deleting the MT's record and
sends still alive message to the old current HLR which will send a registration
acknowledgment message to the old MSC (now be the new MSC) and a message to the new
current HLR (now be the old current HLR) informing about the MT movement into its area
and requesting a copy of an MT's record and so on.
(10)
If the new MT's current HLR is the master HLR, it just sends the old current HLR a
registration acknowledgment message; otherwise it sends both the old current HLR and the
master HLR the registration acknowledgment message.
(11) For the old HLR, if it is the master HLR, it updates its record pointing to the new current
HLR; otherwise it deletes the MT's record.
(12) For the master HLR, if it is the new current HLR, it does nothing; otherwise, it updates its
record pointing to the new current HLR.
Page 312

A Novel Strategy for Location Management in PCS
Networks Using Base Areas Scheme
ICI 10 - 10TH INTERNATIONAL CONFERENCE ON INFORMATION
10
Expired
FFiigguurree 55:: PPrrooppoosseedd LLooccaattiioonn RReeggiissttrraattiioonn sscchheemmee iinn PPCCSS nneettwwoorrkk
Cancellation
message
Req. copy of MT
information
Old MSC
Not expired Expired
MT return to the Old LA,
send IAA to MSC
IAA MSC Send (still alive) message to old current HLR
Req. updates from new current HLR
TTD
Delete record from VLR
Send Ack. to old current HLR
Stop
Send ack. to old HLR
Copy
New current HLR is the master
Old current HLR is the master Neither old nor new current HLR is the master
Old current HLR (deletes MT record) after
rec. Cancel. Ack. from old MSC
Send Ack. to master HLR to update its record to point to the new current
HLR
Old current HLR delete MT record
after receiving cancellation ack.
from old MSC
Stop
Update its record
Old current HLR
New current HLR
Not expired
New LA
STP/GTT
New SA SA
Same SA
Same LA Moved to new BA
MSC – put a new record in cache New MSC-Update VLR
TTC
Update VLR MT moved to another BA, send
new record to MSC
Delete old record in cache Stop
Update new current HLR
New MSC
Ack
.
Cancellation message
Not expired
Old MSC
Expired TTD
Delete record from VLR
Send Ack. to current HLR
Stop
Cancellation message
MT return to the Old LA, send IAA (I am
Alive Again) to MSC
MSC Send (still alive) message to current HLR
New MSC
MT
LA
Page 313

A Novel Strategy for Location Management in PCS
Networks Using Base Areas Scheme
ICI 10 - 10TH INTERNATIONAL CONFERENCE ON INFORMATION
11
5. Analytical Model
To study the performance of the proposed location management scheme and
compare it with the existing one, we establish the following analytical model.
For an MT, We define µ be the mobility rate for LA (number of movements per unit
time) and µB to be the mobility rate for BA. Mobility rate = 𝜇𝑈𝑖𝑗𝑖=1
𝑇𝑖𝑚𝑒 , where µUi is the
number of movements for user i, j is the number of users and Time is the unit time used
(assume it measured in minutes). Denote the average LA residence time and the average BA
residence time by TL =1/ µ and TB = 1/ µB, respectively. In this analysis, we assume the
database access and the signaling costs are measured by the delays required to complete the
database update/query and signal transmission, respectively. These delay values can be
obtained by on-line measurements, if such measurement functions are available in the
particular network, or by a table lookup process. Note that cost for accessing HLRs and
VLRs including the communication cost (wired and wireless). We assume that the cost for a
DB update is equal to the cost for a DB query. This assumption is reasonable since the cost
for DB update or query is much smaller than the communication cost. Denote costs for
updating or querying the HLR and VLR by Ch and Cv, respectively. Let Cg be the cost for
performing Global Title Translation (GTT) to determine the master HLR or current HLR.
To perform location registration, there are signaling costs over communication lines
among the same SA or between two different SAs. Let CS1 and CS2 be the signaling costs for
the communication links in the same SA and between two different SAs, respectively.
Without loss of generality, we assume that there are N SAs, d cells in LA and K cells in
every BA. For convenience, we give the list of notation used in the performance analysis:
Parameters Description
N Number of SAs in the PCS network.
d Number of cells in LA.
K Number of cells in BA.
µ The LA mobility rate per unit time.
µB The BA mobility rate per unit time.
TL The average LA residence time.
TB The average BA residence time.
Ch Cost for updating or querying the HLR.
Cv Cost for updating or querying the VLR.
Cg Cost for performing Global Title Translation (GTT) to determine the master or
current HLR.
CS1 and CS2 Signaling costs for the communication links in the same SA and between two SAs.
Page 314

A Novel Strategy for Location Management in PCS
Networks Using Base Areas Scheme
ICI 10 - 10TH INTERNATIONAL CONFERENCE ON INFORMATION
12
tc Cache access time.
TTC Time To Cache = α
TTD Time To Delete = β
The proposed scheme will be compared with the existing one through the costs for
Location Registration to investigate how much we can gain. The costs will be divided into
signaling cost and computational cost. Signaling cost from MT to MSC through BS and
BSC will be neglected because it approximately fixed value in most cases.
Location Registration Cost:
In this part the location registration cost for the existing scheme and the new
proposed one will be analyzed to allow us to compare between them to investigate how
much we can gain or loss.
5.1. Existing Location Registration Scheme:
When an MT moves between two LAs inside or outside its master SA there are fixed
computational costs. Two CV, one when informing the new MSC that it's serving the moved
MT and updating its associated VLR and one when sending cancellation message to the old
MSC to delete that MT record from its associated VLR. One Ch when updating the master
HLR for that MT and one Cg for performing Global Title Translation (GTT) to determine
the master HLR. The signaling cost differs according to different cases. The costs will be
multiplied in mobility rate to calculate the total cost for every case. The costs for existing
Scheme can be calculated from the following cases according to the scheme in figure 3:
Case 1: Movement inside the same LA
There is no change in LAI, so there is no need to location registration process.
CLR = 0 CS = 0
Case 2: Movement inside Same SA between LAs (inside its master SA)
There are signaling costs for communication link, two between the new MSC and
the master HLR and two between the old MSC and master HLR.
CLR = µ [2Cv + Ch + Cg]
CS = µ . 4 Cs1
Case 3: Movement inside Same SA between LAs (outside its master SA)
There are signaling costs for communication link with the master HLR that is inside
another SA, 2 between the new MSC and the master HLR and 2 between the old MSC and
master HLR.
Page 315
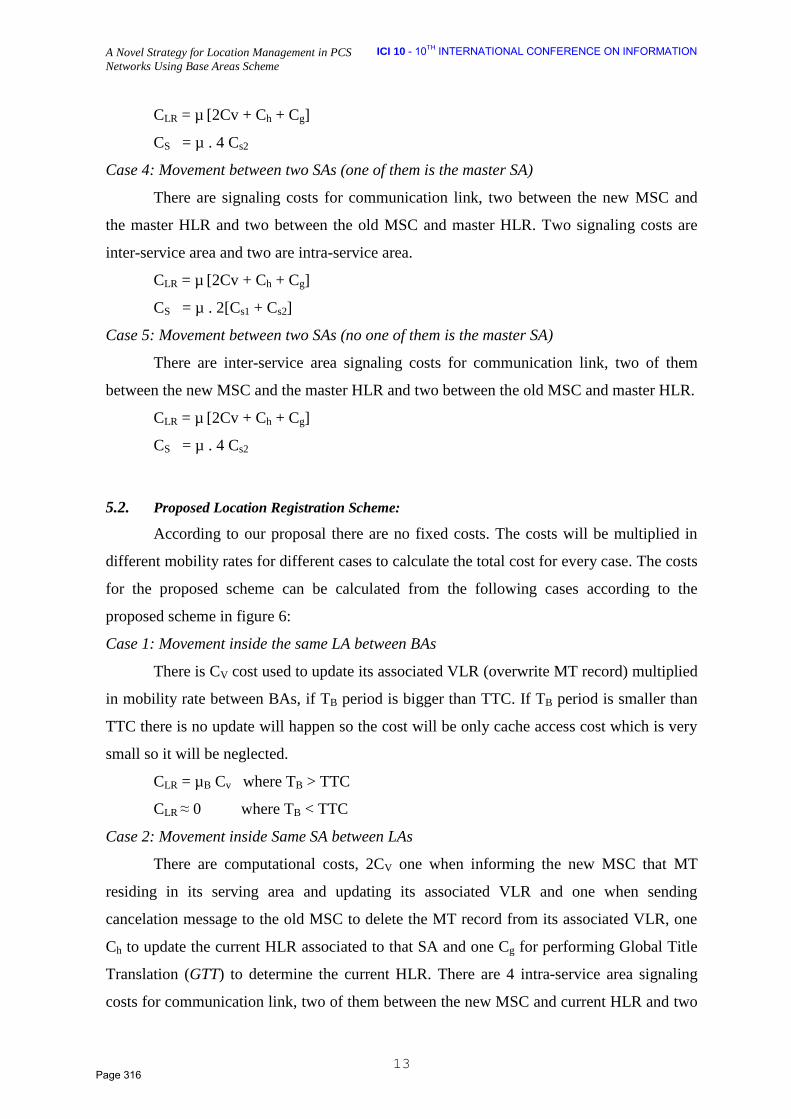
A Novel Strategy for Location Management in PCS
Networks Using Base Areas Scheme
ICI 10 - 10TH INTERNATIONAL CONFERENCE ON INFORMATION
13
CLR = µ [2Cv + Ch + Cg]
CS = µ . 4 Cs2
Case 4: Movement between two SAs (one of them is the master SA)
There are signaling costs for communication link, two between the new MSC and
the master HLR and two between the old MSC and master HLR. Two signaling costs are
inter-service area and two are intra-service area.
CLR = µ [2Cv + Ch + Cg]
CS = µ . 2[Cs1 + Cs2]
Case 5: Movement between two SAs (no one of them is the master SA)
There are inter-service area signaling costs for communication link, two of them
between the new MSC and the master HLR and two between the old MSC and master HLR.
CLR = µ [2Cv + Ch + Cg]
CS = µ . 4 Cs2
5.2. Proposed Location Registration Scheme:
According to our proposal there are no fixed costs. The costs will be multiplied in
different mobility rates for different cases to calculate the total cost for every case. The costs
for the proposed scheme can be calculated from the following cases according to the
proposed scheme in figure 6:
Case 1: Movement inside the same LA between BAs
There is CV cost used to update its associated VLR (overwrite MT record) multiplied
in mobility rate between BAs, if TB period is bigger than TTC. If TB period is smaller than
TTC there is no update will happen so the cost will be only cache access cost which is very
small so it will be neglected.
CLR = µB Cv where TB > TTC
CLR ≈ 0 where TB < TTC
Case 2: Movement inside Same SA between LAs
There are computational costs, 2CV one when informing the new MSC that MT
residing in its serving area and updating its associated VLR and one when sending
cancelation message to the old MSC to delete the MT record from its associated VLR, one
Ch to update the current HLR associated to that SA and one Cg for performing Global Title
Translation (GTT) to determine the current HLR. There are 4 intra-service area signaling
costs for communication link, two of them between the new MSC and current HLR and two
Page 316
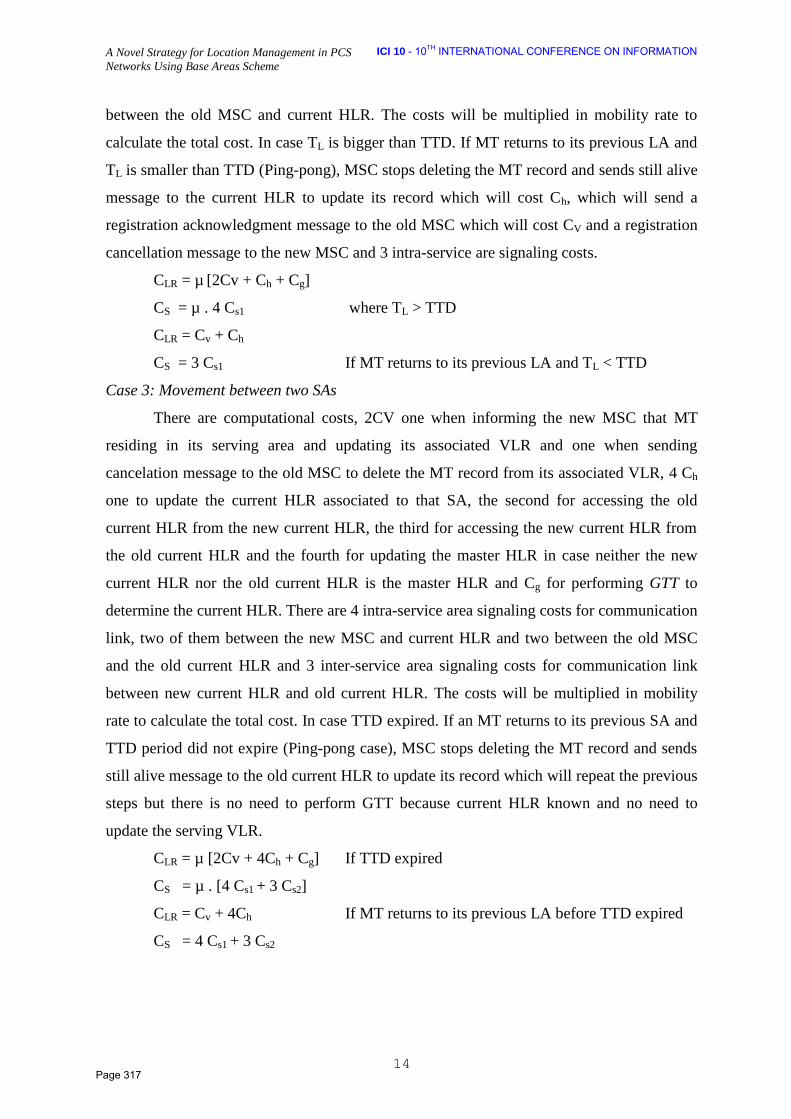
A Novel Strategy for Location Management in PCS
Networks Using Base Areas Scheme
ICI 10 - 10TH INTERNATIONAL CONFERENCE ON INFORMATION
14
between the old MSC and current HLR. The costs will be multiplied in mobility rate to
calculate the total cost. In case TL is bigger than TTD. If MT returns to its previous LA and
TL is smaller than TTD (Ping-pong), MSC stops deleting the MT record and sends still alive
message to the current HLR to update its record which will cost Ch, which will send a
registration acknowledgment message to the old MSC which will cost CV and a registration
cancellation message to the new MSC and 3 intra-service are signaling costs.
CLR = µ [2Cv + Ch + Cg]
CS = µ . 4 Cs1 where TL > TTD
CLR = Cv + Ch
CS = 3 Cs1 If MT returns to its previous LA and TL < TTD
Case 3: Movement between two SAs
There are computational costs, 2CV one when informing the new MSC that MT
residing in its serving area and updating its associated VLR and one when sending
cancelation message to the old MSC to delete the MT record from its associated VLR, 4 Ch
one to update the current HLR associated to that SA, the second for accessing the old
current HLR from the new current HLR, the third for accessing the new current HLR from
the old current HLR and the fourth for updating the master HLR in case neither the new
current HLR nor the old current HLR is the master HLR and Cg for performing GTT to
determine the current HLR. There are 4 intra-service area signaling costs for communication
link, two of them between the new MSC and current HLR and two between the old MSC
and the old current HLR and 3 inter-service area signaling costs for communication link
between new current HLR and old current HLR. The costs will be multiplied in mobility
rate to calculate the total cost. In case TTD expired. If an MT returns to its previous SA and
TTD period did not expire (Ping-pong case), MSC stops deleting the MT record and sends
still alive message to the old current HLR to update its record which will repeat the previous
steps but there is no need to perform GTT because current HLR known and no need to
update the serving VLR.
CLR = µ [2Cv + 4Ch + Cg] If TTD expired
CS = µ . [4 Cs1 + 3 Cs2]
CLR = Cv + 4Ch If MT returns to its previous LA before TTD expired
CS = 4 Cs1 + 3 Cs2
Page 317

A Novel Strategy for Location Management in PCS
Networks Using Base Areas Scheme
ICI 10 - 10TH INTERNATIONAL CONFERENCE ON INFORMATION
15
6. PERFORMANCE COMPARISONS
In this part a system model will be introduce to simulate the existing PCS networks
to allow us to study the effect of an MT movements.
SYSTEM MODEL:
According to the difficulty of applying this proposal in the real life and the need to
verify it in a realistic way. An application developed to simulate PCS network using Visual
Basic given 3SAs ( SA1, SA2, SA3 ), each SA contains 3 LAs ( LA11, LA12, LA13,LA21,
……… ) and each LA contains N-BAs (BA111, BA112, …., BA121, ……………)
according to the number of cells in BA from the total number of cells in LA. Assuming 10
MTs moving among SAs, LAs or BAs randomly. Every BA has d cells. With the possibility
of changing Mobility Rate and Inter-SA Signaling Cost.
From the application, the total computation cost and total signaling cost for location
registration can be taken based on the existing Scheme and the proposed scheme. For
comparison, we define the total cost of the proposed location management scheme and the
total cost of the existing one per unit time as C', C for computational cost and S', S for
signaling cost, compared with mobility rate which changed from 0.1 to 10. The signaling
costs are normalized to CS1 such that CS1 =1. To study the effect of varying the cost
parameters CS2, we consider the cases that CS2 =2 and 4 CS1 according to SA location and if
there is direct connection between 2 SAs or via indirect connection.
The following figures show the costs for computational cost and signaling cost with
respect to the mobility rate in different cases for location registration.
HLR
HLR HLR
Page 318

A Novel Strategy for Location Management in PCS
Networks Using Base Areas Scheme
ICI 10 - 10TH INTERNATIONAL CONFERENCE ON INFORMATION
16
02000400060008000
10000120001400016000180002000022000240002600028000300003200034000
0.1 0.5 1 5 10
Tota
l Co
st
Mobility Rate
S
S' [5 Cells]
S' [1 Cell]
S' [2 Cells]
0300060009000
120001500018000210002400027000300003300036000390004200045000480005100054000
0.1 0.5 1 5 10
Tota
l Co
st
Mobility Rate
S
S' [5 Cells]
S' [1 Cell]
S' [2 Cells]
Figure 6: Location Registration Cost with CS2 = 2 CS1
Figure 7: Location Registration Cost with CS2 = 4 CS1
From the previous figures, we observe that the computational costs and signaling
costs in proposed scheme are better than them for existing scheme in low mobility rate and
equal in medium mobility rate but in high rate grows rapidly. In general there is saving in
total computational cost about 10% and about 22% in total signaling cost in very low
mobility rate (in most cases). Although the increasing of location registration costs in high
mobility rates but most of users stay for a period in their work or home (very low mobility
rate).
0200400600800
100012001400160018002000220024002600280030003200340036003800400042004400
0.1 0.5 1 5 10
Tota
l Co
st
Mobility Rate
C
C' [5Cells]
C' [1 Cells]
C' [2 Cells]
0200400600800
10001200140016001800200022002400260028003000320034003600380040004200
0.1 0.5 1 5 10
Tota
l Co
st
Mobility Rate
C
C' [5 Cells]
C' [1 Cell]
C' [2 Cells]
Page 319

A Novel Strategy for Location Management in PCS
Networks Using Base Areas Scheme
ICI 10 - 10TH INTERNATIONAL CONFERENCE ON INFORMATION
17
7. CONCLUSIONS
A novel strategy for location management in PCS networks is presented. The idea of
the proposed method is simple and effective. It provides restructuring the location areas of
PCS networks into small areas called Base Areas (BAs) for group of cells connected to BSC
to makes the MT location more specific and reduces paging cost. Using the current HLR
instead of the master HLR to improve network response, location registration and paging
cost. Using Caching to reduce unwanted location registrations, signaling costs, read/write
from databases (accessing databases), and enhance the system performance.
In addition, some modifications in registration process and routing process, which
allows the Location Registration to be performed efficiently. The architecture and the
functions of existing network elements, such as the HLRs, and the VLRs remain unchanged.
An analytical model and a simulator application are developed to study the performance of
the proposed framework in a realistic way, which show distinct improvement in system
performance and tracing process. The performance study shows that the proposed scheme
can reduce the total costs of location registration comparing to the existing location
management scheme significantly from about 10% to even 22% in very low mobility rates
which most of users reside in.
REFERENCES
[1] T.X. Brown, S. Mohan, “Mobility management for personal communications systems”. IEEE
Trans .Vehicular Technology, vol.46, no.2, pp. 269-278, May 1997.
[2] Y.Fang, Chlamtac and Y.Lin, “Portable movement modeling for PCS Networks”. IEEE
Transactions on Vehicular Technology, vol.49, no.4, pp.1356-1363, July 2000.
[3] Y.Fang, Chlamtac and H.Fei, “Analytical results for optimal choice of location update interval
for mobility database failure restoration in PCS networks”. IEEE Transactions on Parallel and
Distributed Systems, vol.11, no.6, pp.615-624, June 2000.
[4] The Mobile Communications Handbook, J.D .Gibson (Editor in Chief), CRC Press & IEEE
Press, 1996.
[5] W .Wong and V .Leung, “Location management for next generation personal communication
networks”. IEEE Network, pp. 8-14, Sep/Oct .2000.
[6] J .Zhang, “Location management in cellular networks.”, in Handbook of Wireless Networks and
Mobile Computing, IvanStojmenovic (Editor), John Wiley & Sons, pp .27-49, 2002.
[7] J .Li, H .Kameda, and K .Li, “Optimal dynamic mobility management for PCS networks.”,
IEEE/ACM Trans .on Networking, vol .8, no .3, pp .319 -327, 2000
Page 320
A Novel Strategy for Location Management in PCS
Networks Using Base Areas Scheme
ICI 10 - 10TH INTERNATIONAL CONFERENCE ON INFORMATION
18
[8] C.Lo, R.Wollf, and R.Bernhardt, “Expected network database transaction volume to support
personal communications services”, Proc.1st Int. Conf. Universal Personal Communications, pp.
1-6, Sept.1992.
[9] K .Meier-Hellstern and E .Alonso, “The use of SS7 and GSM to support high density personal
communications.”, Proc .IEEEICC, pp .1698-1720, 1992.
[10] Jie Li, Yi Pan and Yang Xiao, “A Dynamic HLR Location Management Scheme for PCS
Networks”, IEEE INFOCOM 2004.
[11] J .Ho and I, Akyildiz, “Dynamic hierarchical database architecture for location management in
PCS networks”, IEEE/ACMTrans .Networking, Vol.5, no .5, pp. 646-660, Oct .1997.
[12] Y.Lin, “Reducing location update cost in a PCS network”, IEEE/ACM Trans. Networking,
Vol.5, no.1, pp.25-33, Feb.1997.
[13] W .Ma and Y .Fang, “Two-level pointer forwarding strategy for location management in PCS
networks", IEEE Transactions on Mobile Computing, vol.1, no .1, pp. 32-45, Jan-.Mar .2002.
[14] R. Jain, Y .Lin, and S .Mohan, “A caching strategy to reduce network impacts on PCS”, IEEE J.
Select .Areas Comm., Vol. 12, no .8, pp.1434-1445, 1994.
[15] N .Shivakumar and J .Widom, “User profile replication for faster location lookup in mobile
environments”, Proc .ACMMOBICOM’95, pp.161-169, Nov .1995.
[16] Y. Xiao, “A dynamic anchor-cell assisted paging with an optimal timer for PCS networks”,
IEEE Communications Letters, Vol. 7, no.6, Jun.2003.
[17] C.K.Ng and H.W. Chan, “Enhanced Distance-Based Location Management of Mobile
Communication Systems Using a Cell Coordinates Approach “, IEEE TRANSACTIONS ON
MOBILE COMPUTING, VOL .4, NO .1, JANUARY/FEBRUARY 2005.
[18] Yi-hua Zhu, Senior Member, IEEE, and Victor C .M .Leung, Fellow, IEEE , “Optimization of
Distance-Based Location Management for PCS Networks“, IEEE TRANSACTIONS ON
WIRELESS COMMUNICATIONS, VOL .7, NO .9, SEPTEMBER 2008 .
[19] Daniel Morris, Student Member, IEEE, and A. Hamid Aghvami, Fellow, IEEE , “A Novel
Location Management Scheme for Cellular Overlay Networks“, IEEE TRANSACTIONS ON
BROADCASTING, VOL. 52, NO.1, 2008.
Hesham Arafat Ali Computers engineering and systems Department head, Faculty of
Engineering, Mansoura University, Mansoura, Egypt. P.O.Box 35516, Fax (work): +20-
(0)50-2244426
Tel: +2- 0102417939
E-mail: [email protected]
Research Interests
Mobile computing, Grid Scheduling, Database, Web caching, Mobile Agents.
Page 321

A Novel Strategy for Location Management in PCS
Networks Using Base Areas Scheme
ICI 10 - 10TH INTERNATIONAL CONFERENCE ON INFORMATION
19
Ahmed Ibrahim Saleh Computer and systems Department, Faculty of Engineering,
Mansoura University, Mansoura, Egypt. P.O.Box 35516, Fax (work): +2-(0)50- 2244690
Tel: +2- 0111098298
E-mail: [email protected]
Research Interests
Mobile computing, Grid Scheduling, Web caching, Mobile Agents
Mohammed Helmy Ali Sharara IT Engineer, Sharm El-Sheik International Airport, South
Sinai
Tel: +2-0181932505
E-mail: [email protected]
Research Interests
Mobile computing, Networking, Security, Parallel Processing, Database, Mobile
Agents
:ملخص البحث
Page 322

GAMASA, EGYPT, 4 – 6 DECEMBER 2010
Comparative Analysis of Quality of Service in Wireless Networks M.badawy and H. A. Ali
Dept. of Computers Engineering and Systems, Fac. of Engineering, Mansoura University, Egypt
ABSTRACT: Next-Generation Internet applications involve accessing large volume of multimedia information from remote servers and databases. The objective of the network support is to guarantee the quality-of-presentation (QoP) required by the multimedia client(s) at the destination(s). Over the years, in order to meet the requirements of diverse applications on network quality –of- service (QoS), significant effort has been made to provide end-to-end QoS support using various algorithms and mechanisms at different network protocol layers. This paper describes the major features of Wireless Networks that challenge QoS provisioning (Resource Constraints، Platform Heterogeneity, Dynamic Network Topology, and Mixed Traffic) will be introduced. Also the different QoS Parameters of (application, Systems, and network) will be analyzed. Finally, the state of the art in provisioning of QoS over wireless network and the several open research topics of interest (Service-Oriented Architecture, QoS-Aware Communication Protocols, and Resource Self-Management; QoS-Aware Power Management) also, will be introduced. Keywords: Computer network, QoS, Multimedia, Resource Constraints 1. Introduction
Nowadays most applications require a specific level of assurance from the network
such as assured database access to retrieve information. tele-medicine, financial operations
(purchase and delivery), tele-learning and applications for emergencies and security. All the
applications that require a specific level of assurance from the network need QoS. The
importance of QoS is parallel with the recent evolution of telecommunication networks.
The QoS meaning changes, depending on the application field and on the scientific scope.
According to ISO 8402, quality is defined as “the totality of characteristics of an entity that
bear on its ability to satisfy stated and implied needs”. ISO 9000 defines quality as the degree
to which a set of inherent characteristics fulfils requirements. ITU-T defines QoS as “the
collective effect of service performance which determines the degree of satisfaction of a user of
the service”. IETF considers QoS as the ability to segment traffic or differentiate between
traffic types in order for the network to treat certain traffic flows differently from others [1].
QoS is defined in several ways, and the combination of all of these definitions is really the
best definition of all. A technical definition is that QoS is a set of techniques to manage
bandwidth, delay, jitter, and packets loss for flows in a network. The purpose of every QoS
mechanism is to influence at least one of these four characteristics and, in some cases, all of
them. For example, a required bit rate, delay, jitter, packet dropping probability and/or bit error
rate may be guaranteed. Quality of service guarantees are important if the network capacity is
insufficient, especially for real-time streaming multimedia applications such as voice over
Page 323

IP(VOIP
studies,
impact o
QoS par
wireless
The
concept
wireless
open res
2. Rela
2
There ar
(1) Intri
objectiv
influenc
perceive
the “ave
paramet
service
some no
commun
using a
level of
perform
decrease
with th
particul
perceive
ive Analysis of
P), online g
questions
on the perfo
radigms? W
s QoS? The
rest of this
t, section 3
s network is
search issue
ated Basic
.1. Types of
re different
insic Qos is
ve paramete
ce the intri
ed by the u
erage opinio
ters may n
is provided
ontechnical
nity’s expe
specific se
f assistance
mance decre
e will raise
e assessed
ar service o
ed QoS. Th
f Quality of Se
games and
to answer a
ormance if
What are the
ese question
paper is or
demonstrat
s introduced
es.
and concep
f QoS
types of Qo
s directly p
ers as, for in
insic QoS
users; it hea
on” of the u
ot be suffi
d. The QoS
parameters
ctations and
ervice. It is
of the prov
ease may b
e criticism i
QoS. An a
offered, toge
is is the dut
ervice in Wirele
IP-TV. So,
are as follo
information
e challenges
ns and others
rganized as
tes Wireless
d in section
pts
oS. Referen
provided by
nstance, los
rating, (2)
avily depend
users. [3].It
cient to sa
S offered by
s that are m
d (3) Asses
related to
ider and oth
be surely to
f the user i
appropriate
ether with m
ty of the ser
ess ICI 10 - 10TH0 INTERNATIIONAL CONFERRENCE ON INFFORMATION
, even if th
ows: Does h
n traverses d
s that face w
s are the cor
he QoS is th
heterogenei
different ne
wireless QoS
re of this pa
he object o
ity influenc
etwork porti
S? What are
aper,
of a great n
ce QoS? Wh
ions that us
e the recent
number of
hat is the
e specific
t trends in
flow: Next
s Networks
4.Section 5
section wil
Quality of
5 and 6 surv
ll introduce
f Service, ch
veys previo
the related
hallenges fo
ous effort an
basic and
or QoS in
nd related
nce [2] identtifies three ttypes of QooS as followw:
2
the networ
ss and delay
Perceived
ds on the n
follows tha
tisfy custom
y a provider
meaningful t
ssed QoS is
P-QoS and
her marketin
olerated by
is paying fo
e use of the
market analy
rvice provid
rk itself and
y. User per
QoS (P-Q
network per
at just ensur
mers who
r must refle
to the custo
s referred to
d also depe
ng and com
a user if a
or it. Neithe
e intrinsic
ysis, are nec
der.
d may be d
rception of
QoS) is def
formance b
ring particul
are not con
ect the intri
mer and rel
o the will o
nds on the
mmercial asp
a service is
er ITU nor
QoS capab
cessary to e
described in
the service
fined as th
but it is mea
lar service (
ncerned wi
insic QoS a
levant to a
of a user to
pricing me
pects. For ex
s free, but
ETSI nor I
bilities adju
ensure a hig
n terms of
e does not
he quality
asured by
(network)
th how a
as well as
particular
o keep on
echanism,
xample, a
the same
IETF deal
usted to a
gh level of
Page 324
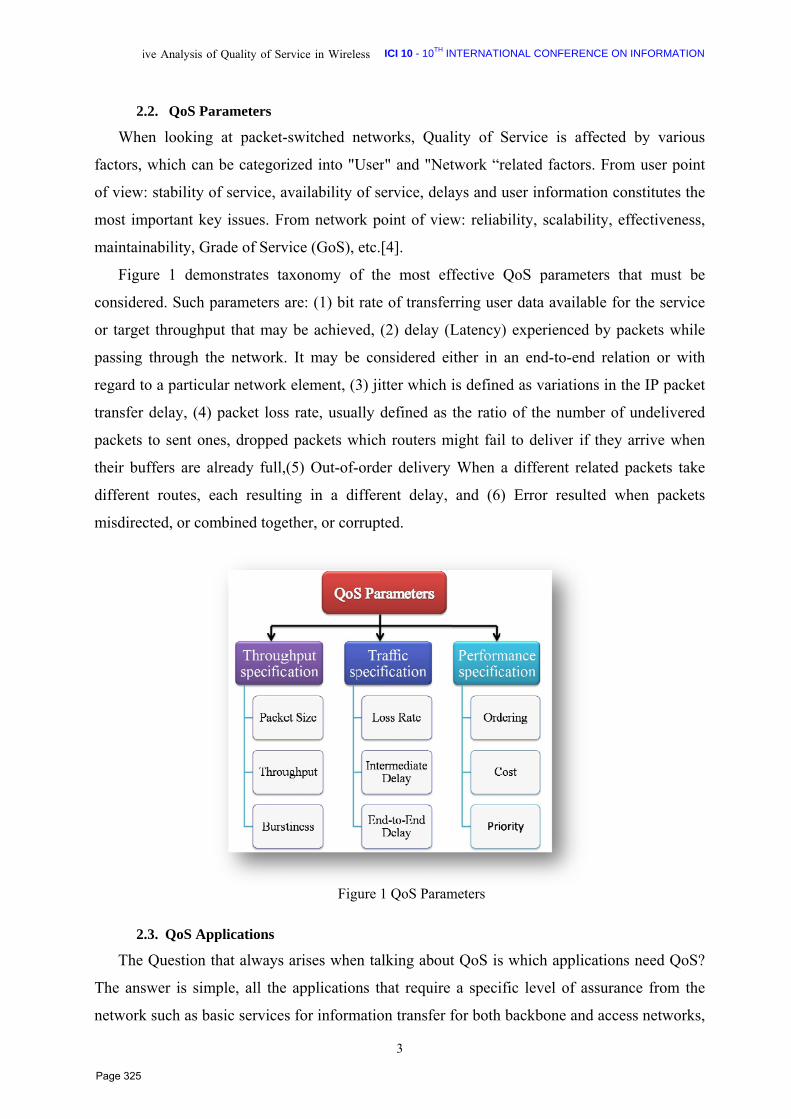
2
Whe
factors,
of view
most im
maintain
Figu
conside
or targe
passing
regard t
transfer
packets
their bu
differen
misdirec
2
The
The ans
network
ive Analysis of
.2. QoS Pa
en looking
which can
w: stability o
mportant key
nability, Gr
ure 1 demo
red. Such p
et throughpu
through th
to a particul
r delay, (4)
to sent one
uffers are al
nt routes, e
cted, or com
.3. QoS App
Question t
swer is sim
k such as ba
f Quality of Se
arameters
at packet-
be categor
of service, a
y issues. Fr
rade of Serv
onstrates ta
parameters a
ut that may
he network.
lar network
packet loss
es, dropped
lready full,
each resulti
mbined toge
plications
that always
mple, all the
asic services
ervice in Wirele
-switched n
rized into "U
availability o
rom networ
vice (GoS),
axonomy o
are: (1) bit
y be achieve
. It may be
k element, (3
s rate, usua
d packets w
(5) Out-of-
ng in a di
ether, or cor
Figu
arises when
e application
s for inform
ess ICI 10 - 10TH0 INTERNATIIONAL CONFERRENCE ON INFFORMATION
networks, Q
User" and "
of service, d
rk point of
etc.[4].
Quality of
"Network “r
delays and
view: reliab
Service is
related fact
user inform
bility, scala
affected by
ors. From u
mation const
ability, effec
y various
user point
titutes the
ctiveness,
f the most
rate of tran
ed, (2) dela
e considered
3) jitter whi
ally defined
which router
-order deliv
ifferent del
rrupted.
t effective
nsferring us
ay (Latency
d either in
ich is define
as the ratio
rs might fai
very When
ay, and (6
QoS param
er data avai
y) experienc
an end-to-
ed as variat
o of the nu
il to deliver
a different
) Error res
meters that
ilable for th
ced by pack
end relation
tions in the
umber of un
r if they arr
related pac
sulted when
must be
he service
kets while
n or with
IP packet
ndelivered
rive when
ckets take
n packets
3
ure 1 QoS P
n talking ab
ns that requ
mation transf
arameters
bout QoS is
uire a speci
fer for both
s which app
ific level of
h backbone a
plications ne
f assurance
and access n
eed QoS?
from the
networks,
Page 325
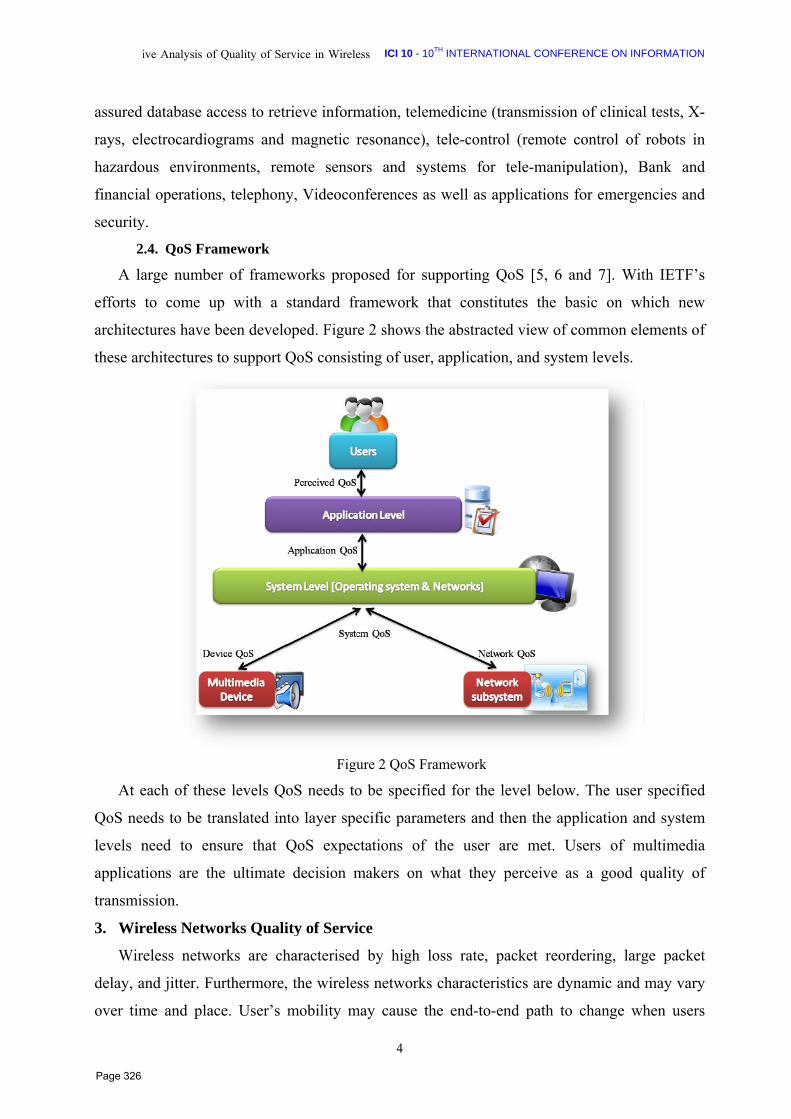
assured
rays, el
hazardo
financia
security
2
A la
efforts
architec
these ar
At e
QoS ne
levels n
applicat
transmi
3. Wir
Wir
delay, a
over tim
ive Analysis of
database ac
lectrocardio
ous environ
al operation
y.
.4. QoS Fra
arge numbe
to come u
ctures have
rchitectures
each of thes
eds to be tr
need to en
tions are th
ssion.
reless Netw
eless netwo
and jitter. Fu
me and plac
f Quality of Se
ccess to retr
ograms and
nments, rem
ns, telephony
amework
er of frame
up with a
been develo
to support Q
se levels Q
ranslated in
nsure that
he ultimate
works Quali
orks are ch
urthermore,
ce. User’s
ervice in Wirele
rieve inform
magnetic r
mote senso
y, Videocon
works prop
standard fr
oped. Figur
QoS consist
Figu
oS needs to
nto layer spe
QoS expec
decision m
ity of Servi
haracterised
, the wirele
mobility m
ess ICI 10 - 10TH0 INTERNATIIONAL CONFERRENCE ON INFFORMATION
mation, telem
resonance),
ors and sy
nferences a
medicine (t
tele-contro
ystems for
as well as ap
transmission
ol (remote
tele-manip
pplications
n of clinical
control of
pulation), B
for emerge
l tests, X-
robots in
Bank and
encies and
posed for su
ramework t
e 2 shows t
ting of user
upporting Q
that constit
the abstracte
r, applicatio
QoS [5, 6 a
tutes the b
ed view of c
n, and syste
and 7]. Wit
basic on wh
common ele
em levels.
th IETF’s
hich new
ements of
4
ure 2 QoS Fr
o be specifi
ecific param
ctations of
makers on
ice d by high l
ss networks
may cause th
ramework
ied for the
meters and t
the user a
what they
loss rate, p
s characteri
he end-to-e
level below
then the app
are met. U
perceive a
w. The user
plication an
Users of m
as a good q
specified
nd system
multimedia
quality of
packet reord
stics are dy
end path to
dering, larg
ynamic and
o change wh
ge packet
may vary
hen users
Page 326

roam, and further, users will expect to receive the same QoS as they change from one AP to
another.
3.1. How QoS Differs in Wireless and Wired networks?
Wireless networks have fundamental differences relative to wired networks; such
differences constitute more challenges in wireless environment and increase the complexity of
QoS mechanisms in wireless networks. Figure 3 elaborates the main differences between both
of them.
Figure 3 Wireless Networks Constraints
Consequently, the main objective of wireless QoS is to achieve effective resource usage
and satisfy applications requirements by providing mechanisms for controlling access to, and
use of, the wireless medium, based on application characteristics of the application.
In wireless environment the key QoS parameters can be categorized into: (1) network based
which involves are Packet Loss (Reliability), Efficiency, and (2) user based which relate to the
cost the user is willing to accept and involves Energy Consumption, and Network Lifetime.
These points are elaborated below.
The most effective QoS parameters in wireless network research are delay and packet loss
which are defined previously. Efficiency, which can be defined as the utilization of the network
resources which are scarce, is important to improve.
Energy consumption is a very important QoS parameter, due to the limitation of battery
lifetime of terminals. Energy consumption is actually related to the lifetime of the node, since
the lifetime of the node depends on the node's available energy. Network Lifetime can be
defined as the time after which at least one node will lose all of its power. Loss of a node has a
great impact on the whole network and seriously degrades the quality of service available in
the network [8].
3.2. Wireless QoS Characteristics
QoS in wireless environment can be categorized into: parameterized or prioritized QoS
[9, 10]. Parameterized QoS is expressed in terms of quantitative values, such as data rate, delay
bound, and jitter bound. In a prioritized QoS scheme, the values of QoS parameters such as
Page 327
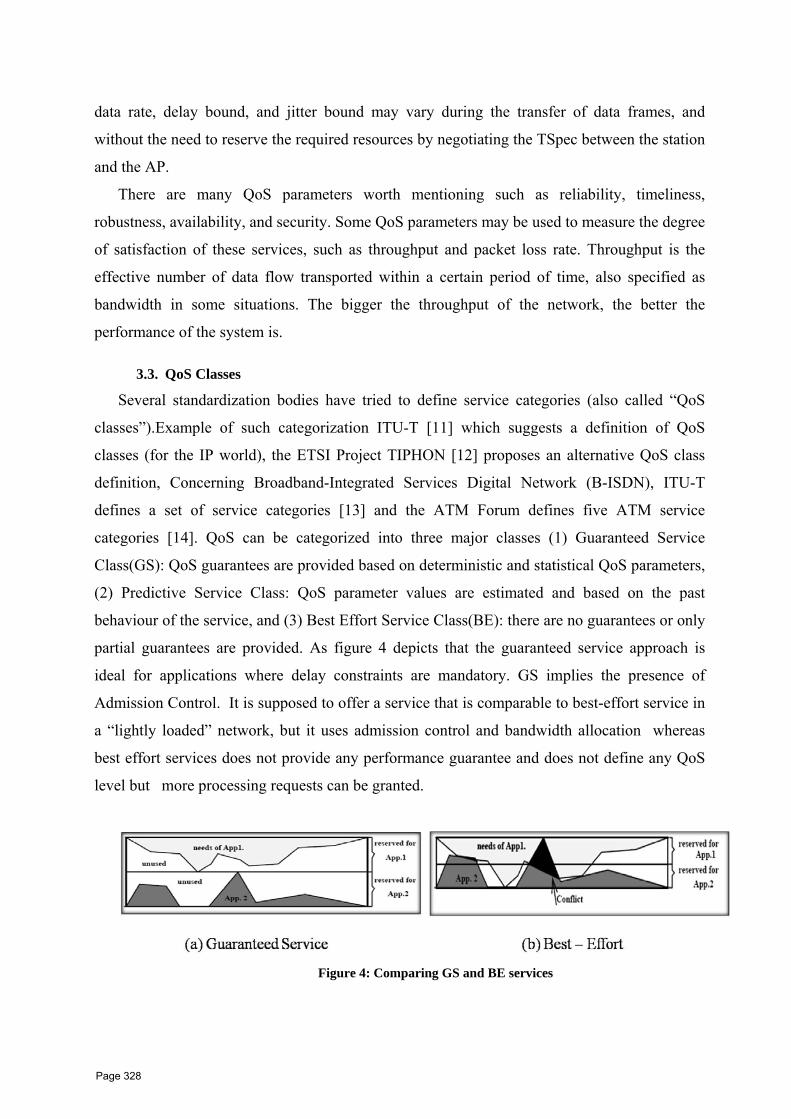
data rate, delay bound, and jitter bound may vary during the transfer of data frames, and
without the need to reserve the required resources by negotiating the TSpec between the station
and the AP.
There are many QoS parameters worth mentioning such as reliability, timeliness,
robustness, availability, and security. Some QoS parameters may be used to measure the degree
of satisfaction of these services, such as throughput and packet loss rate. Throughput is the
effective number of data flow transported within a certain period of time, also specified as
bandwidth in some situations. The bigger the throughput of the network, the better the
performance of the system is.
3.3. QoS Classes
Several standardization bodies have tried to define service categories (also called “QoS
classes”).Example of such categorization ITU-T [11] which suggests a definition of QoS
classes (for the IP world), the ETSI Project TIPHON [12] proposes an alternative QoS class
definition, Concerning Broadband-Integrated Services Digital Network (B-ISDN), ITU-T
defines a set of service categories [13] and the ATM Forum defines five ATM service
categories [14]. QoS can be categorized into three major classes (1) Guaranteed Service
Class(GS): QoS guarantees are provided based on deterministic and statistical QoS parameters,
(2) Predictive Service Class: QoS parameter values are estimated and based on the past
behaviour of the service, and (3) Best Effort Service Class(BE): there are no guarantees or only
partial guarantees are provided. As figure 4 depicts that the guaranteed service approach is
ideal for applications where delay constraints are mandatory. GS implies the presence of
Admission Control. It is supposed to offer a service that is comparable to best-effort service in
a “lightly loaded” network, but it uses admission control and bandwidth allocation whereas
best effort services does not provide any performance guarantee and does not define any QoS
level but more processing requests can be granted.
Figure 4: Comparing GS and BE services
Page 328

3
As d
definitio
expense
enter in
guarante
perform
prioritiz
allocatio
reserved
Reserva
phases.
paramet
Applica
resource
4. Ch
Rese
the lifet
with iss
of resea
guarante
ive Analysis of
.4. Relation
discussed b
ons, rather
e of mechan
nto a contra
ees for
mance/throug
zing traffic.
on is strictl
d at each ste
ation Protoc
Operations
ters done b
ation QoS –
e reservatio
allenges fo
earch in Qu
time of the
sues of conn
arch in prov
ees for traff
f Quality of Se
n between Q
before QoS
than referr
nisms to pro
actual agree
the ab
ghput/latenc
. The term
ly related w
ep on the ne
col. As figur
s on QoS in
bidirectiona
– system Q
on to guaran
r QoS Supp
uality of Se
network (in
nections bet
viding reliab
fic flows in
ervice in Wirele
QoS and Reso
is sometim
ring to the
ovide QoS i
ement term
bility of
cy bounds
m “resource”
with Call A
etwork for t
re 5 depicts
n Phase 1
al [see figu
QoS and Sy
ntee that traf
Figure
port in Wir
ervice issue
n terms of p
tween heter
ble transpor
wireless N
ess ICI 10 - 10TH0 INTERNATIIONAL CONFERRENCE ON INFFORMATION
ources
mes used as
ability to
is justified,
med a servic
a net
based on
” means, in
Admission C
the call as i
s the resourc
(Translation
ure 2 also],
ystem QoS
ffic flows re
a quality m
reserve res
network cu
ce level agr
twork/proto
n mutually
n this cont
Control (CA
it is set up. A
ce reservatio
ns) in whic
, Human (
– network
eceive the c
measure, w
sources. In
ustomers an
reement (SL
ocol to
agreed me
text, bandw
AC) mechan
An example
on phases w
ch Layered
user QoS)
k QoS. In P
orrect servi
with many a
advance: W
d providers
LA) which
give gu
easures, us
width and b
nisms. Reso
e is RSVP,
which consi
Translation
– applicat
Phase 2 an
ice is done [
alternative
When the
s typically
specifies
uaranteed
sually by
buffer. Its
ources are
Resource
sts of two
n of QoS
tion QoS,
n accurate
[15, 16].
5 QoS and RResources
reless Netw
s in wireles
power), fair
rogeneous n
rt services,
Networks. In
work ss network
rness of acc
nodes. This
and the lac
n this section
is mostly o
cess to the n
paper will
ck of resear
n, some of t
oriented to e
network, an
also discus
ch in provi
the major fe
extending
nd dealing
s the lack
ding QoS
features of
7
Page 329
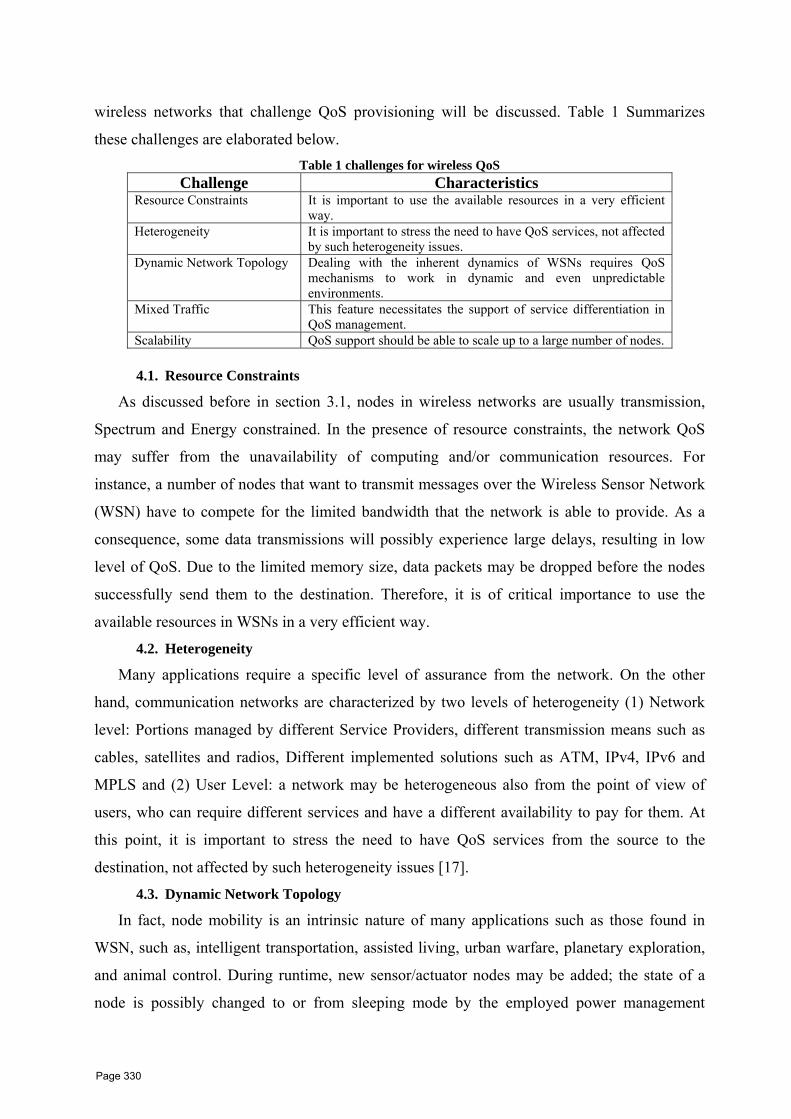
wireless networks that challenge QoS provisioning will be discussed. Table 1 Summarizes
these challenges are elaborated below. Table 1 challenges for wireless QoS
Challenge Characteristics Resource Constraints It is important to use the available resources in a very efficient
way. Heterogeneity It is important to stress the need to have QoS services, not affected
by such heterogeneity issues. Dynamic Network Topology Dealing with the inherent dynamics of WSNs requires QoS
mechanisms to work in dynamic and even unpredictable environments.
Mixed Traffic This feature necessitates the support of service differentiation in QoS management.
Scalability QoS support should be able to scale up to a large number of nodes.
4.1. Resource Constraints
As discussed before in section 3.1, nodes in wireless networks are usually transmission,
Spectrum and Energy constrained. In the presence of resource constraints, the network QoS
may suffer from the unavailability of computing and/or communication resources. For
instance, a number of nodes that want to transmit messages over the Wireless Sensor Network
(WSN) have to compete for the limited bandwidth that the network is able to provide. As a
consequence, some data transmissions will possibly experience large delays, resulting in low
level of QoS. Due to the limited memory size, data packets may be dropped before the nodes
successfully send them to the destination. Therefore, it is of critical importance to use the
available resources in WSNs in a very efficient way.
4.2. Heterogeneity Many applications require a specific level of assurance from the network. On the other
hand, communication networks are characterized by two levels of heterogeneity (1) Network
level: Portions managed by different Service Providers, different transmission means such as
cables, satellites and radios, Different implemented solutions such as ATM, IPv4, IPv6 and
MPLS and (2) User Level: a network may be heterogeneous also from the point of view of
users, who can require different services and have a different availability to pay for them. At
this point, it is important to stress the need to have QoS services from the source to the
destination, not affected by such heterogeneity issues [17].
4.3. Dynamic Network Topology
In fact, node mobility is an intrinsic nature of many applications such as those found in
WSN, such as, intelligent transportation, assisted living, urban warfare, planetary exploration,
and animal control. During runtime, new sensor/actuator nodes may be added; the state of a
node is possibly changed to or from sleeping mode by the employed power management
Page 330
mechanism; some nodes may even die due to exhausted battery energy. All of these factors
may potentially cause the network topologies of WSANs to change dynamically.
Dealing with the inherent dynamics of WSNs requires QoS mechanisms to work in
dynamic and even unpredictable environments. In this context, QoS adaptation becomes
necessary; that is, WSNs must be adaptive and flexible at runtime with respect to changes in
available resources. For example, when an intermediate node dies, the network should still be
able to guarantee real-time and reliable communication by exploiting appropriate protocols and
algorithms.
4.4. Mixed Traffic
Diverse applications may need to share the same wireless network .This feature will
become increasingly evident as the scale of network grows. There is no immediately clear way
to identify the amount of resources (buffer space and bandwidth) required by a flow to
guarantee performance requirements, except for peak bandwidth assignment. This has given
rise to many investigations on the bandwidth allocation problem. An important notion is
represented by the concept of equivalent bandwidth, which is defined as the minimum rate
allocation necessary to guarantee a specific QoS to a single statistically homogeneous flow. If
flows are not homogeneous, either from the QoS requirements or from the traffic sources
viewpoint, equivalent bandwidth techniques are hardly applicable and new solutions are
necessary. This feature necessitates the support of service differentiation in QoS management.
4.5. Scalability
A generic network is envisioned as consisting of hundreds or thousands of nodes densely
distributed. Therefore, QoS support should be able to scale up to a large number of nodes, i.e.,
QoS support should not degrade quickly when the number of nodes or their density increases.
5. Previous Effort and related research Wireless sensor networks become a fertile area of research in wireless networks. A wireless
sensor network (WSN) consists of spatially distributed autonomous sensors to cooperatively
monitor physical or environmental conditions, such as temperature, sound, vibration, pressure,
motion or pollutants[18]. Today this field is widely supported by an increasing number of
dedicated journals such as ACM Trans. on Sensor Networks and Int. J. of Distributed Sensor
Networks and conferences such as SENSYS (ACM Conf. on Embedded Networked Sensor
Systems). Service-oriented approaches have been used in building WSNs. Table 2 surveys
such approaches. This need for actuation heralds the emergence of wireless sensor/actuator
networks (WSANs) [19], a substantial extension of sensor networks that feature coexistence of
sensors and actuators.
Page 331

Table 2 Previous Efforts in WSN Approach characteristics
a service-oriented sensor
platform [19]
Explored the potential of service-oriented architecture in building open, efficient, interoperable, scalable, and application aware WSANs. A prototype service-oriented WSAN was developed on top of TinyOS.
OASiS [20] Develop a programming framework called OASiS that provides abstractions
for object-centric, ambient-aware and service-oriented sensor network
applications.
Service Oriented Sensor Web
Approach [21]
Present a reusable, scalable, extensible, and interoperable service-oriented
sensor web architecture. The architecture conforms to the sensor web
enablement standard defined by the OpenGIS consortium (OGC), integrates
sensor web with grid computing, and provides middleware support for sensor
webs.
A Real-Time Communication
Framework [22]
Design a real-time communication framework that supports event detection,
reporting, and actuator coordination.
Real-Time Coordination and
Routing Approach [23].
Propose a real-time coordination and routing framework that addresses the
coordination of sensors and actuators and respects the delay bound for routing
in a distributed manner.
Communication and
Coordination Approach [24]
Present a distributed protocol for sensor-actor coordination that includes an
adaptive mechanism to trade off energy consumption for delay when the data
transmission is subject to real-time constraints.
An Adaptive Sampling
Approach [25, 26].
Adaptive sampling approaches have been exploited for dynamic management
of resources in WSNs. However, these approaches don’t take into account the
co-existence of sensors and actuators. Few solutions have been devised for
resource self-management that facilitates QoS-enabled autonomic WSAN
Low energy, adaptive and
distributed MAC protocol [27]
Develop a data transport protocol that reduces the energy consumption
associated with data transmission while meeting the QoS requirements in
timeliness domain.
6. OPEN RESEARCH ISSUES
Due to the many distinctive characteristics of WSANs, however, existing QoS mechanisms
may not be applicable to WSANs. To achieve QoS support in WSAN, the above challenges
have to be addressed. In this section, several open research topics of interest will be identified.
6.1. Service-Oriented Architecture
The concept of SOA [19] is by no means new and has been widely used in for example the
web services domain. However, many of its elegant potentials have not ever been explored in
WSANs, though SOA will undoubtedly have a major impact in many branches of technology.
SOA enables rapid, cost-effective composition of interoperable, scalable systems. This is
Page 332

particularly useful for QoS provisioning in WSANs that are integrated into large-scale cyber-
physical systems in which multiple applications run on diverse technologies and platforms.
6.2. QoS-Aware Communication Protocols
In order to efficiently support QoS in WSANs, communication protocols need to be
designed with in mind the platform heterogeneity, specifically the heterogeneity between
sensors and actuators that are involved in the communication. For this reason, state-of-the-art
QoS-aware MAC, routing, and transport protocols devoted to WSNs may not be suitable for
WSANs.
6.3. Resource Self-Management
Resource management is of paramount importance for QoS provisioning because the
corresponding resource budgets need to be guaranteed in order to achieve certain QoS levels.
This is particularly true for WSANs where computing, communication and energy resources
are inherently limited. Generally speaking, a higher level of QoS corresponds to a need of more
resources, e.g. CPU time, memory size, bandwidth and/or energy. Resource management in
WSANs is challenging, because of the ever increasing complexity of WSANs, highly dynamic
feature of WSANs, and changing and unpredictable environments in which WSANs operate.
6.4. QoS-Aware Power Management
Energy conservation is a major concern in both WSNs and WSANs. The lifetime of
sensor/actuator nodes is tightly restricted by the available battery energy. Since wireless
communication is much more energy-expensive than sensing and computation, the
transmission power of nodes has to be properly managed in a way that the energy consumption
is minimized in order to prolong the lifetime of the whole network.
Depending on the network topology and the QoS requirements, the power management
mechanisms for actuator nodes may be different from those used in sensor nodes. Thus the
QoS can be maximized through exploiting the different capabilities of sensors and actuators. In
like manner, different transmission power levels may be assigned to the same node with
respect to different types of traffic. In-network computation can be exploited to reduce the
energy consumption of both sensor and actuator nodes since it reduces traffic load at the cost of
slightly increased computation in each involved node. Still, the inherently non-deterministic
and open nature of wireless channels poses great challenges for QoS-aware power
management.
6.5. Supporting Tools The fundamental role of WSAN is to connect the cyber space and the physical world.
Cyberspaces are by nature discrete-time systems, whereas the physical world is composed of
Page 333
continuous-time systems. This hybrid feature of the integrated system challenges the
development of simulation and design tools that can be used to evaluate the performance of
QoS mechanisms for WSANs. An interesting question is whether or not it is technically
feasible to develop such a tool based on a service-oriented architecture. If so, programming
technologies for implementing various services need to be developed. In addition, benchmark
testbeds and prototypes also deserve extensive research and development effort. Using these
supporting tools, guidelines can be further developed that help implement new protocols,
mechanisms, and algorithms for QoS management in practice.
7. Conclusion WSAN is an area still in its infancy, despite some recent progress. It is anticipated that
WSANs will evolve rapidly and become pervasive in the near future, much in the same way as
the Internet came to the desktop before. Lessons should be taken from Internet that WSANs
have to be designed with QoS support in mind. This paper has discussed the requirements and
challenges for supporting QoS in WSANs. Some interesting open research topics have been
identified, though the spectrum of research in this field can be much broader. The challenges
are formidable and extensive research from multiple disciplines is needed before QoS-enabled
WSANs become reality.
REFERENCES [1] J. Gozdecki, A. Jajszczyk, R. Stankiewicz, “Quality of Service Terminology in IP Networks”,
IEEE Comm. Mag., vol. 41, no. 3, March 2003, pp. 153–159. [2] D. Adami, M. Marchese, L. S. Ronga, “TCP/IP based Multimedia Applications and Services over
Satellite Links: Experience of an ASI/CNIT Project”, IEEE Pers. Comm., vol. 8, no. 3, June 2001, pp. 20–27.
[3] D. Adami, M. Marchese, L. S. Ronga, “An Applied Research Study for the Provision of a QoS-Oriented Environment for Voice and Video Services over Satellite Networks”, Com. Comm. Journal, Special Issue on Advances in Performance Evaluation of Computer and Telecommunication Networking, vol. 25, no. 11–12, July 2002, pp. 1113–1124.
[4] Peuhkuri M., IP Quality of Service, Helsinki University of Technology, Laboratory of Telecommunications Technology, 1999.
[5] Klara Nahrstedt and Jonathan M. Smith. The QoS Broker. Technical Report MS-CIS-94-13, University of Pennsylvania, March 1994.
[6] K. Lakshman. AQUA: An Adaptive Quality of Service Architecture for Distributed Multimedia Applications. PhD thesis, Computer Science Department, University of Kentucky, Lexington, Kentucky, January 1996.
[7] M. Fry, V. Witana, P. Ray, and A. Senevirante. Managing QoS in multimedia services. Journal of Network and Systems Management, 5(3), September 1997.
[8] Vishal Sharma and Abhay Karandikar, “Quality of Service in Wireless Networks”, chapter in book Technical, Commercial and Regulatory Challenges of QoS: An Internet Service Model Perspective, Morgan Kaufman, 2008.
Page 334

Comparative Analysis of Quality of Service in Wireless Networks
ICI 10 - 10TH INTERNATIONAL CONFERENCE ON INFORMATION
13
[9] Ni, Q., Romdhani, L., Turletti, T., and Aad, I. 2002. QoS issues and enhancements for IEEE802.11 wireless LAN. Sophis-AntipolisFrance: INRIA (Institut National de researche en Informatique Automatique).
[10] Ho, J. M. 2002. Some comments on 802.11e draft 2.0. IEEE 802.11e Working Document 80211-02/005r0.
[11] ITU-T Recommendation. Network Performance Objectives for IP-Based Services. ITU-T Recommendation Y.1541, February 2003.
[12] ETSI. Satellite Earth Stations and Systems (SES). Broadband Satellite Multimedia IP. IP Interworking over Satellite; Performance, Availability and Quality of Service. ETSI Technical Report, TR 102 157 V1.0.0, March 2003.
[13] R. Onvural, Asynchronous Transfer Mode Networks Performance Issues, Artech House, Boston, USA, 1994.
[14] D. McDysan, D. Spohn, ATM, McGraw-Hill, New York, USA, 1999. [15] R. Braden, L. Zhang, S. Berson, S. Herzog, S. Jamin, “Resource ReserVation Protocol (RSVP) –
Version 1 Functional Specification”, IETF RFC 2205, September 1997. [16] J. Wroclawski, “The Use of the Resource Reservation Protocol with the Integrated Service”, IETF
RFC 2210, September 1997. [17] Shantidev Mohanty “ Performance analysis of a novel architecture to integrate heterogeneous
wireless systems” Computer Networks , Volume 51, Issue 4, 14 March 2007, Pages 1095-1105 [18] Rezgui, A.; Eltoweissy, M. Service-Oriented Sensor-Actuator Networks. IEEE Communications
Magazine 2007, 45(12), 92-100. [19] King, J.; Bose, R.; Yang, H.; Pickles, S.; Helal, A. Atlas: a service-oriented sensor platform. In
Proc. of 31st IEEE Conf. on Local Computer Networks, Nov 2006; pp. 630-638. [20] Kushwaha, M.; Amundson, I.; Koutsoukos, X.; Neema, S.; Sztipanovits, J. OASiS: A
Programming Framework for Service-Oriented Sensor Networks. In Proc. 2nd Int. Conf. on Communication Systems Software and Middleware, Bangalore, India, Jan. 2007; pp.1-8. .
[21] Chu, X.; Buyya, R. Service Oriented Sensor Web. In: Mahalik, N. P. (ed), Sensor Network and Configuration: Fundamentals, Standards, Platforms, and Applications. Springer-Verlag, ISBN: 978-3-540-37364-3, Germany, Jan. 2007; pp.51-74.
[22] Ngai, E. C.H.; Lyu, M.R.; Liu, J. A Real-Time Communication Framework for Wireless Sensor-Actuator Networks. In Proc. IEEE Aerospace Conf., Big Sky, Montana, U.S.A., March 2006
[23] Shah, G.A.; Bozyigit, M.; Akan, O.B.; Baykal, B. Real-Time Coordination and Routing in Wireless Sensor and Actor Networks. In Proc. 6th Int. Conf. on Next Generation Teletraffic and Wired/Wireless Advanced Networking (NEW2AN), Lecture Notes in Computer Science, 2006; Vol. 4003, pp. 365-383.
[24] Melodia, T.; Pompili, D.; Gungor, V. C.; Akyildiz, I. F. Communication and Coordination in Wireless Sensor and Actor Networks. IEEE Transactions on Mobile Computing 2007, 6(10), 1116-1129.
[25] Gedik, B.; Liu, L.; Yu, P.S. ASAP: An Adaptive Sampling Approach to Data Collection in Sensor Networks. IEEE Transactions on Parallel and Distributed Systems 2007, 18(12), 1766-1783.
[26] Liu, X.; Wang, Q.; He, W.; Caccamo, M.; Sha, L. Optimal Real-Time Sampling Rate Assignment for Wireless Sensor Networks. ACM Transactions on Sensor Networks 2006, 2(2), 263-295.
[27] Munir, M.F.; Filali, F. Low energy, adaptive and distributed MAC protocol for wireless sensor-actuator networks. In Proc. of 18th IEEE Annual Int. Symposium on Personal Indoor and Mobile Radio Communications, Athens, Greece, Sept. 2007.
Page 335
GAMASA, EGYPT, 4 – 6 DECEMBER 2010
Speaker Independent Arabic Speech Recognition Using Neural Networks
Shady Y. EL-Mashed*,
Mohammed I. Sharway, Hala H. Zayed
Department of Electrical Engineering, Shoubra Faculty of Engineering, Benha University, Cairo, Egypt
[email protected] [email protected] [email protected]
Abstract Though Arabic language is a widely spoken language, research done in the area of Arabic Speech Recognition (ASR) is limited when compared to other similar languages. Also while the accuracy of speaker dependent speech recognizers has nearly reached to 100%, the accuracy of speaker independent speech recognition system is still relatively poor. This paper concerns with the recognition of speaker independent continuous Arabic digits (number) using recurrent Neural Networks. Automatic recognition of spoken digits is one of the challenging tasks in the field of computer speech recognition. A spoken digit recognition process is needed in many applications that use numbers as input such as telephone dialing using speech, addresses, airline reservation, and automatic directory to retrieve or send information. This has been realized by first building a corpus consisting of 1000 numbers composing 10000 digits recorded by 20 speakers different in gender, age, physical conditions…, in a noisy environment. Secondly, each recorded number has been digitized into 10 separate digits. Finally these digits have been used to extract their features which are taken as input data to the Neural Networks for the training and the testing phases.
Keywords: Automatic Speech Recognition; Arabic Digits; Neural Networks
1. Introduction Automatic Speech Recognition (ASR) is the process of converting captured speech signals into the corresponding sequence of words in text. It can be used, for example, in a car environment to voice control non critical operations, such as dialing a phone number or on-board navigation by GPS, presenting the driving route to the driver. It can also be used to facilitate for people with functional disability. With their voice they could operate their PC's, operate the light switch, turn off/on the coffee machine or operate some other domestic appliances. It is used also in so many applications such as learning foreign language, learning the correct reading of the holly Quraan, speech interfaces (increasingly on mobile devices) and indexing of audio/video databases for search. Human machine interaction is switching from buttons and screens to speech. Speech recognition is an important element in this interaction [1].
Page 336
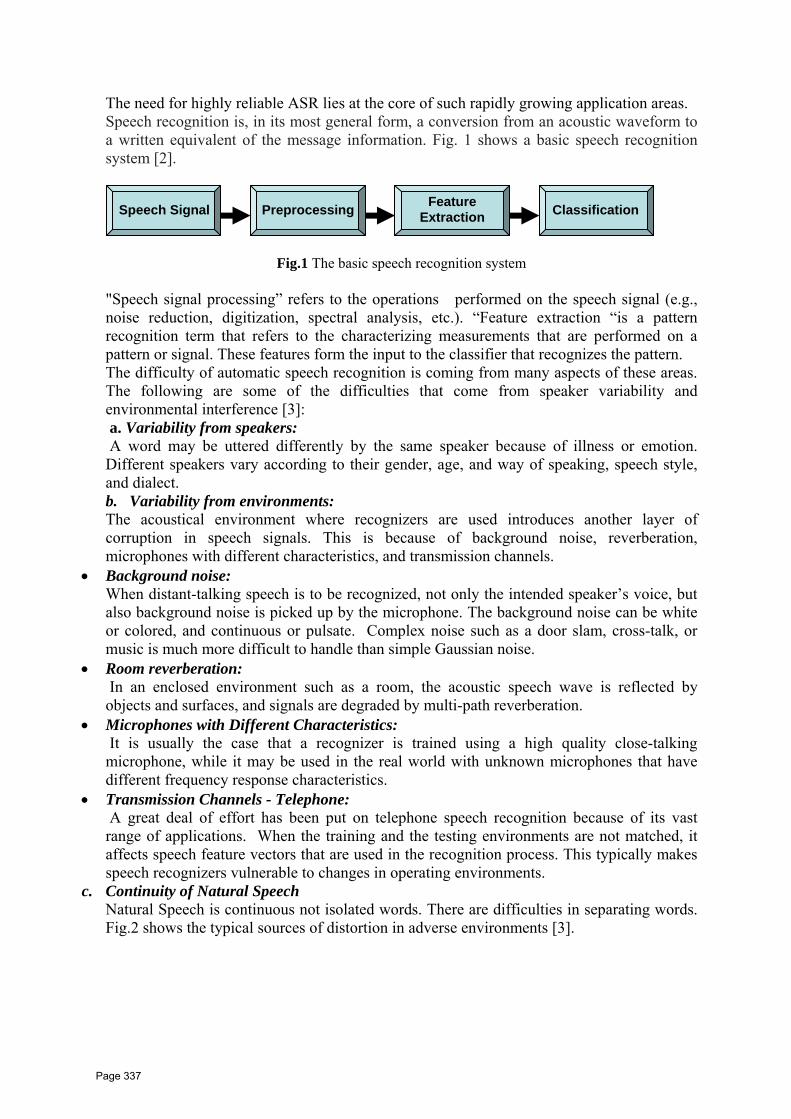
The need for highly reliable ASR lies at the core of such rapidly growing application areas. Speech recognition is, in its most general form, a conversion from an acoustic waveform to a written equivalent of the message information. Fig. 1 shows a basic speech recognition system [2].
Fig.1 The basic speech recognition system "Speech signal processing” refers to the operations performed on the speech signal (e.g., noise reduction, digitization, spectral analysis, etc.). “Feature extraction “is a pattern recognition term that refers to the characterizing measurements that are performed on a pattern or signal. These features form the input to the classifier that recognizes the pattern. The difficulty of automatic speech recognition is coming from many aspects of these areas. The following are some of the difficulties that come from speaker variability and environmental interference [3]: a. Variability from speakers: A word may be uttered differently by the same speaker because of illness or emotion. Different speakers vary according to their gender, age, and way of speaking, speech style, and dialect. b. Variability from environments: The acoustical environment where recognizers are used introduces another layer of corruption in speech signals. This is because of background noise, reverberation, microphones with different characteristics, and transmission channels.
• Background noise: When distant-talking speech is to be recognized, not only the intended speaker’s voice, but also background noise is picked up by the microphone. The background noise can be white or colored, and continuous or pulsate. Complex noise such as a door slam, cross-talk, or music is much more difficult to handle than simple Gaussian noise.
• Room reverberation: In an enclosed environment such as a room, the acoustic speech wave is reflected by objects and surfaces, and signals are degraded by multi-path reverberation.
• Microphones with Different Characteristics: It is usually the case that a recognizer is trained using a high quality close-talking microphone, while it may be used in the real world with unknown microphones that have different frequency response characteristics.
• Transmission Channels - Telephone: A great deal of effort has been put on telephone speech recognition because of its vast range of applications. When the training and the testing environments are not matched, it affects speech feature vectors that are used in the recognition process. This typically makes speech recognizers vulnerable to changes in operating environments.
c. Continuity of Natural Speech Natural Speech is continuous not isolated words. There are difficulties in separating words. Fig.2 shows the typical sources of distortion in adverse environments [3].
Feature Extraction Speech Signal Preprocessing Classification
Page 337
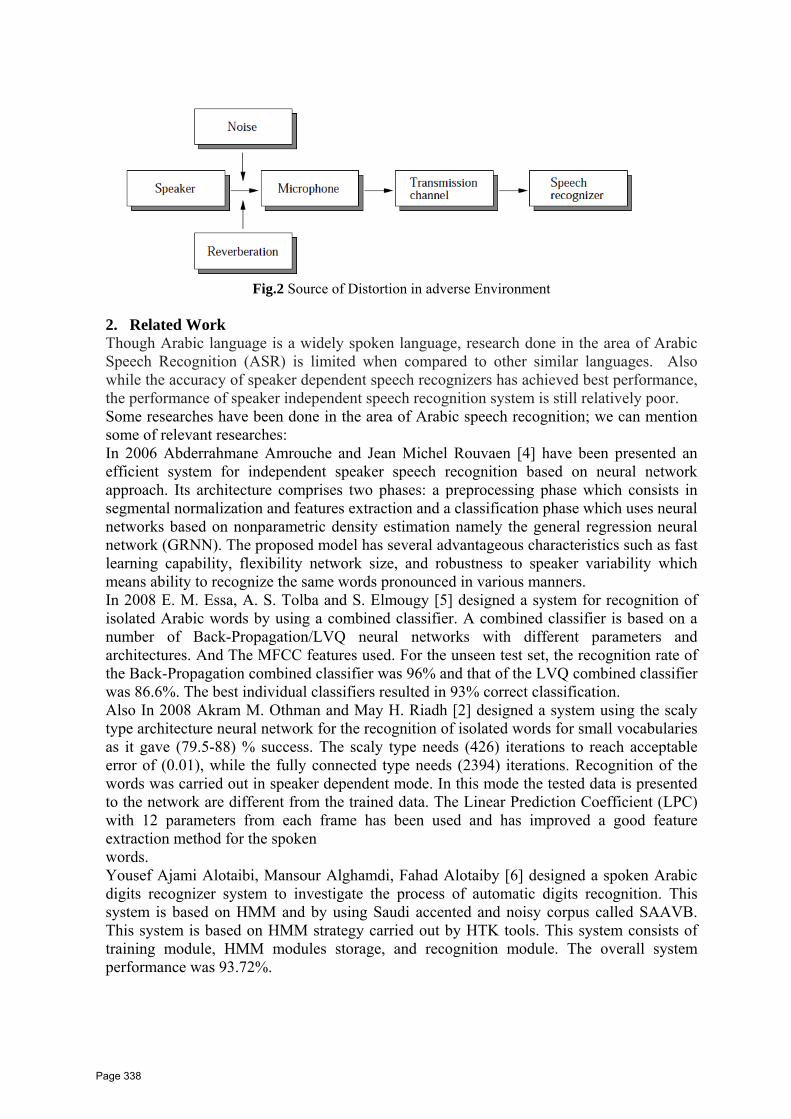
Fig.2 Source of Distortion in adverse Environment
2. Related Work Though Arabic language is a widely spoken language, research done in the area of Arabic Speech Recognition (ASR) is limited when compared to other similar languages. Also while the accuracy of speaker dependent speech recognizers has achieved best performance, the performance of speaker independent speech recognition system is still relatively poor. Some researches have been done in the area of Arabic speech recognition; we can mention some of relevant researches: In 2006 Abderrahmane Amrouche and Jean Michel Rouvaen [4] have been presented an efficient system for independent speaker speech recognition based on neural network approach. Its architecture comprises two phases: a preprocessing phase which consists in segmental normalization and features extraction and a classification phase which uses neural networks based on nonparametric density estimation namely the general regression neural network (GRNN). The proposed model has several advantageous characteristics such as fast learning capability, flexibility network size, and robustness to speaker variability which means ability to recognize the same words pronounced in various manners. In 2008 E. M. Essa, A. S. Tolba and S. Elmougy [5] designed a system for recognition of isolated Arabic words by using a combined classifier. A combined classifier is based on a number of Back-Propagation/LVQ neural networks with different parameters and architectures. And The MFCC features used. For the unseen test set, the recognition rate of the Back-Propagation combined classifier was 96% and that of the LVQ combined classifier was 86.6%. The best individual classifiers resulted in 93% correct classification. Also In 2008 Akram M. Othman and May H. Riadh [2] designed a system using the scaly type architecture neural network for the recognition of isolated words for small vocabularies as it gave (79.5-88) % success. The scaly type needs (426) iterations to reach acceptable error of (0.01), while the fully connected type needs (2394) iterations. Recognition of the words was carried out in speaker dependent mode. In this mode the tested data is presented to the network are different from the trained data. The Linear Prediction Coefficient (LPC) with 12 parameters from each frame has been used and has improved a good feature extraction method for the spoken words. Yousef Ajami Alotaibi, Mansour Alghamdi, Fahad Alotaiby [6] designed a spoken Arabic digits recognizer system to investigate the process of automatic digits recognition. This system is based on HMM and by using Saudi accented and noisy corpus called SAAVB. This system is based on HMM strategy carried out by HTK tools. This system consists of training module, HMM modules storage, and recognition module. The overall system performance was 93.72%.
Page 338
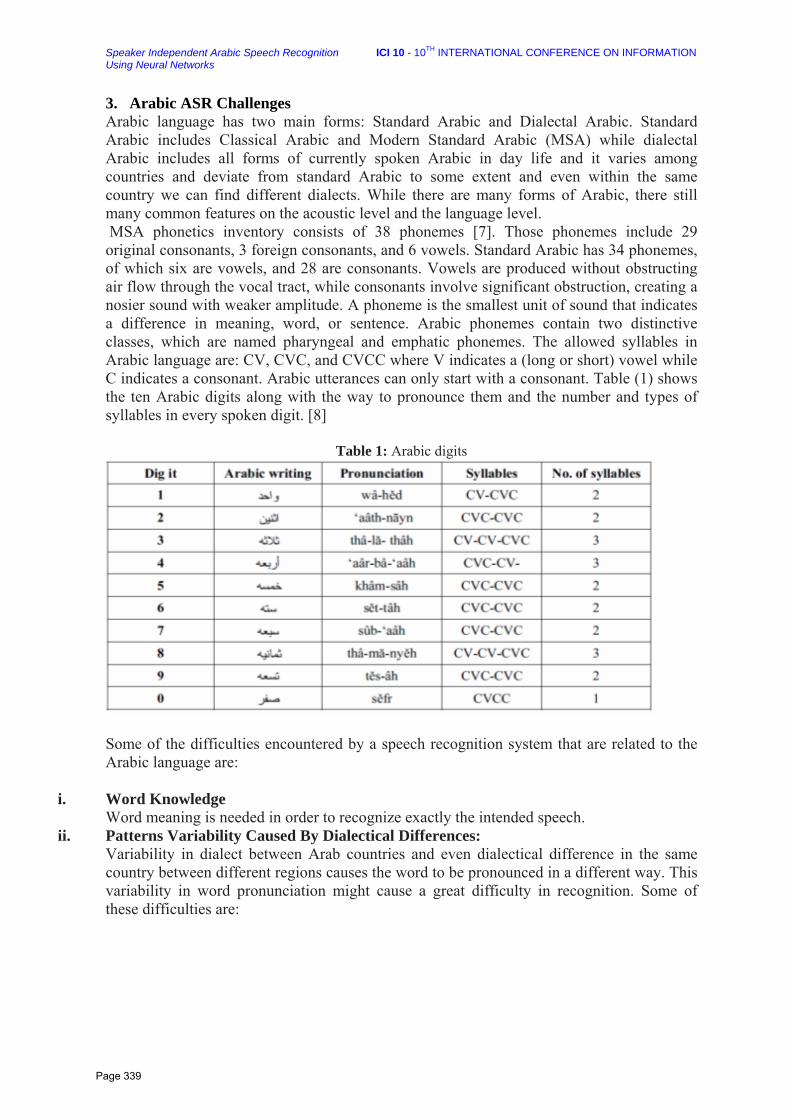
THSpeaker Independent Arabic Speech Recognition Using Neural Networks
ICI 10 - 10 INTERNATIONAL CONFERENCE ON INFORMATION
3. Arabic ASR Challenges Arabic language has two main forms: Standard Arabic and Dialectal Arabic. Standard Arabic includes Classical Arabic and Modern Standard Arabic (MSA) while dialectal Arabic includes all forms of currently spoken Arabic in day life and it varies among countries and deviate from standard Arabic to some extent and even within the same country we can find different dialects. While there are many forms of Arabic, there still many common features on the acoustic level and the language level. MSA phonetics inventory consists of 38 phonemes [7]. Those phonemes include 29 original consonants, 3 foreign consonants, and 6 vowels. Standard Arabic has 34 phonemes, of which six are vowels, and 28 are consonants. Vowels are produced without obstructing air flow through the vocal tract, while consonants involve significant obstruction, creating a nosier sound with weaker amplitude. A phoneme is the smallest unit of sound that indicates a difference in meaning, word, or sentence. Arabic phonemes contain two distinctive classes, which are named pharyngeal and emphatic phonemes. The allowed syllables in Arabic language are: CV, CVC, and CVCC where V indicates a (long or short) vowel while C indicates a consonant. Arabic utterances can only start with a consonant. Table (1) shows the ten Arabic digits along with the way to pronounce them and the number and types of syllables in every spoken digit. [8]
Table 1: Arabic digits
Some of the difficulties encountered by a speech recognition system that are related to the Arabic language are:
i. Word Knowledge Word meaning is needed in order to recognize exactly the intended speech.
ii. Patterns Variability Caused By Dialectical Differences: Variability in dialect between Arab countries and even dialectical difference in the same country between different regions causes the word to be pronounced in a different way. This variability in word pronunciation might cause a great difficulty in recognition. Some of these difficulties are:
Page 339

iii. Co articulation effects:
The acoustic realization of a phoneme may heavily depend on the acoustic context in which it occurs. This effect is usually called Co articulation. Thus, the acoustic feature of a phoneme is affected by the neighboring phonemes, the position of a phoneme in a word and the position of this word in a sentence. Such acoustic features are very different from those of isolated phonemes, since the articulatory organs do not move as much in continuous speech as in isolated utterances.
iv. Diacritization: Diacritics play an important part in written Arabic material. The absence of diacritics in most Arabic texts causes many ambiguities in the pronunciation of words [9], [10], [11], [12].
4. The Proposed System 4.1 System Overview First is the digital signal processing phase, whose functions are speech acquisition through a microphone, filtering, and sampling. The system starts by transforming the speech signal into a processable form, using a microphone, by converting it into an electrical signal. This electrical signal, which is an analog signal, is then changed into digital form. Digitization is done using the audio sound card. A sampling rate of 8 kHz with a sampling precision of a 16-bit are chosen. That means, for every second the sound card returns 8,000 samples or numbers, each number is a double byte integer. Endpoint detection method was, also, used to separate speech from silent portions of the signal. 4.1.1 Recording System
Fig.3 The recording system
The Recording System used consists of two tabs as shown in Fig.3: (1) Admin tab: (a) Audio Settings Audio Settings tab is used to adjust the parameters used in the digitization process as shown in Table (2). (b) Data Settings Data Settings tab contains the volunteer's names to select from them when recording, and the data which is 100 mobile numbers, each one consisting of 10 continuous digits. (2) Volunteer tab: allows choosing a volunteer name from the stored list and starting recording the displayed number then we stop recording when the speaker finished, after that
Page 340
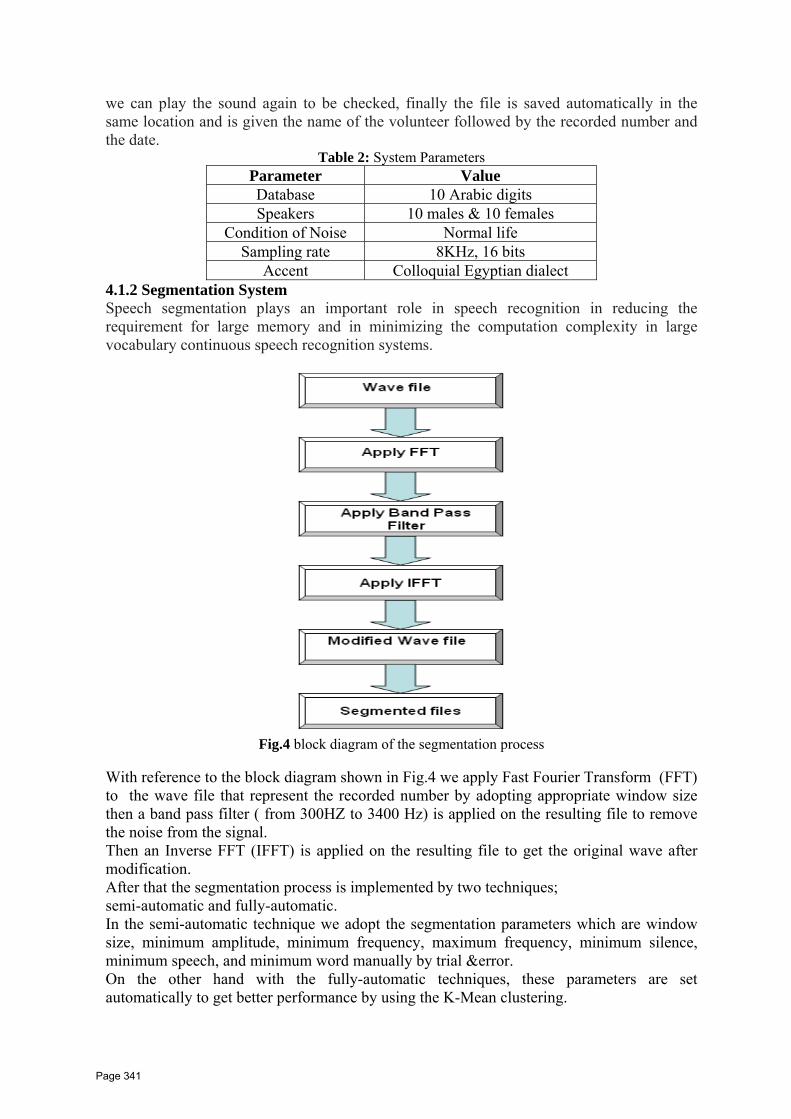
we can play the sound again to be checked, finally the file is saved automatically in the same location and is given the name of the volunteer followed by the recorded number and the date.
Table 2: System Parameters Parameter Value Database 10 Arabic digits Speakers 10 males & 10 females
Condition of Noise Normal life Sampling rate 8KHz, 16 bits
Accent Colloquial Egyptian dialect 4.1.2 Segmentation System Speech segmentation plays an important role in speech recognition in reducing the requirement for large memory and in minimizing the computation complexity in large vocabulary continuous speech recognition systems.
Fig.4 block diagram of the segmentation process
With reference to the block diagram shown in Fig.4 we apply Fast Fourier Transform (FFT) to the wave file that represent the recorded number by adopting appropriate window size then a band pass filter ( from 300HZ to 3400 Hz) is applied on the resulting file to remove the noise from the signal. Then an Inverse FFT (IFFT) is applied on the resulting file to get the original wave after modification. After that the segmentation process is implemented by two techniques; semi-automatic and fully-automatic. In the semi-automatic technique we adopt the segmentation parameters which are window size, minimum amplitude, minimum frequency, maximum frequency, minimum silence, minimum speech, and minimum word manually by trial &error. On the other hand with the fully-automatic techniques, these parameters are set automatically to get better performance by using the K-Mean clustering.
Page 341
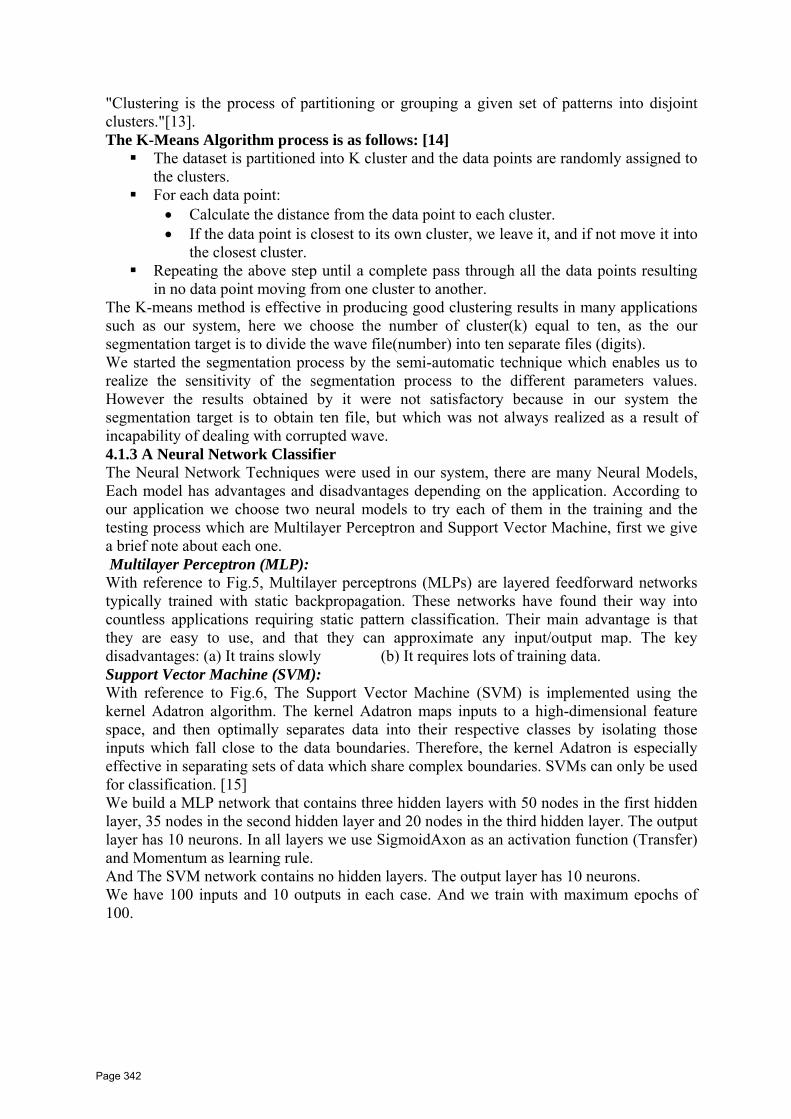
"Clustering is the process of partitioning or grouping a given set of patterns into disjoint clusters."[13]. The K-Means Algorithm process is as follows: [14]
The dataset is partitioned into K cluster and the data points are randomly assigned to the clusters.
For each data point: • Calculate the distance from the data point to each cluster. • If the data point is closest to its own cluster, we leave it, and if not move it into
the closest cluster. Repeating the above step until a complete pass through all the data points resulting
in no data point moving from one cluster to another. The K-means method is effective in producing good clustering results in many applications such as our system, here we choose the number of cluster(k) equal to ten, as the our segmentation target is to divide the wave file(number) into ten separate files (digits). We started the segmentation process by the semi-automatic technique which enables us to realize the sensitivity of the segmentation process to the different parameters values. However the results obtained by it were not satisfactory because in our system the segmentation target is to obtain ten file, but which was not always realized as a result of incapability of dealing with corrupted wave. 4.1.3 A Neural Network Classifier The Neural Network Techniques were used in our system, there are many Neural Models, Each model has advantages and disadvantages depending on the application. According to our application we choose two neural models to try each of them in the training and the testing process which are Multilayer Perceptron and Support Vector Machine, first we give a brief note about each one. Multilayer Perceptron (MLP): With reference to Fig.5, Multilayer perceptrons (MLPs) are layered feedforward networks typically trained with static backpropagation. These networks have found their way into countless applications requiring static pattern classification. Their main advantage is that they are easy to use, and that they can approximate any input/output map. The key disadvantages: (a) It trains slowly (b) It requires lots of training data. Support Vector Machine (SVM): With reference to Fig.6, The Support Vector Machine (SVM) is implemented using the kernel Adatron algorithm. The kernel Adatron maps inputs to a high-dimensional feature space, and then optimally separates data into their respective classes by isolating those inputs which fall close to the data boundaries. Therefore, the kernel Adatron is especially effective in separating sets of data which share complex boundaries. SVMs can only be used for classification. [15] We build a MLP network that contains three hidden layers with 50 nodes in the first hidden layer, 35 nodes in the second hidden layer and 20 nodes in the third hidden layer. The output layer has 10 neurons. In all layers we use SigmoidAxon as an activation function (Transfer) and Momentum as learning rule. And The SVM network contains no hidden layers. The output layer has 10 neurons. We have 100 inputs and 10 outputs in each case. And we train with maximum epochs of 100.
Page 342
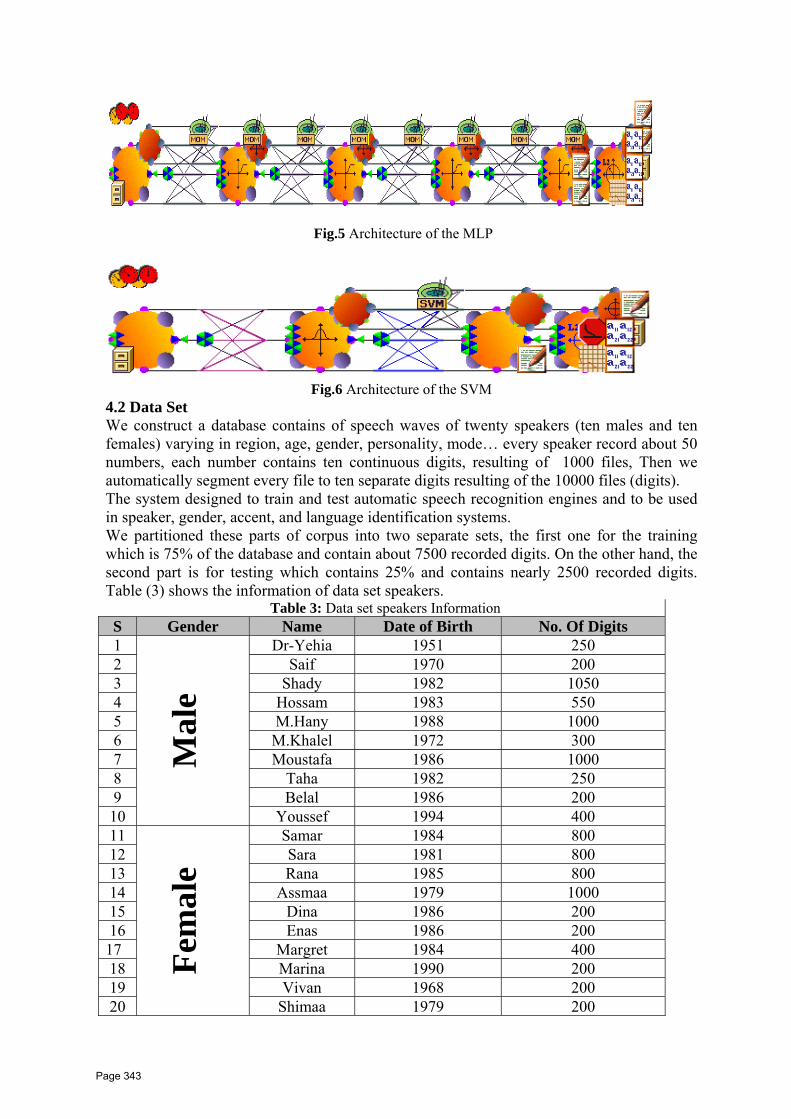
Fig.5 Architecture of the MLP
Fig.6 Architecture of the SVM
4.2 Data Set We construct a database contains of speech waves of twenty speakers (ten males and ten females) varying in region, age, gender, personality, mode… every speaker record about 50 numbers, each number contains ten continuous digits, resulting of 1000 files, Then we automatically segment every file to ten separate digits resulting of the 10000 files (digits). The system designed to train and test automatic speech recognition engines and to be used in speaker, gender, accent, and language identification systems. We partitioned these parts of corpus into two separate sets, the first one for the training which is 75% of the database and contain about 7500 recorded digits. On the other hand, the second part is for testing which contains 25% and contains nearly 2500 recorded digits. Table (3) shows the information of data set speakers.
Table 3: Data set speakers Information S Gender Name Date of Birth No. Of Digits 1
Mal
e
Dr-Yehia 1951 250 2 Saif 1970 200 3 Shady 1982 1050 4 Hossam 1983 550 5 M.Hany 1988 1000 6 M.Khalel 1972 300 7 Moustafa 1986 1000 8 Taha 1982 250 9 Belal 1986 200 10 Youssef 1994 400 11
Fem
ale
Samar 1984 800 12 Sara 1981 800 13 Rana 1985 800 14 Assmaa 1979 1000 15 Dina 1986 200 16 Enas 1986 200 17 Margret 1984 400 18 Marina 1990 200 19 Vivan 1968 200 20 Shimaa 1979 200
Page 343

5. Results and Conclusions A confusion matrix is a simple methodology for displaying the classification results of a network. The confusion matrix is defined by labeling the desired classification on the rows and the predicted classifications on the columns. Since we want the predicted classification to be the same as the desired classification, the ideal situation is to have all the exemplars end up on the diagonal cells of the matrix (the diagonal that connects the upper-left corner to the lower right). Tables (4) and (5) shows the Active Confusion Matrix of MLP and SVM respectively
Table 4: Active Confusion Matrix of MLP Col101 Col102 Col103 Col104 Col105 Col106 Col107 Col108 Col109 Col110
Col101 79 8.10 0.00 1.60 3.30 1.60 1.60 ١.٦٠ ١.٦٠ ١.٦٠ 0.00 0.00 Col102 8.20 91.8 0.00 0.00 0.00 0.00 ٠.٠٠ ١.٦٠ 0.00 0.00 Col103 16.70 0.00 83.30 0.00 0.00 0.00 0٠.٠٠ ٠.٠
Col104 0.00 0.00 0.00 76.90 15.40 0.00 7.70 0.00 0.00 0.00Col105 0.00 0.00 0.00 0.00 97.40 0.00 2.60 0.00 0.00 0.00Col106 6.30 12.50 0.00 0.00 6.20 75.00 ٠.٠٠ 0.00 0.00 0.00Col107 4.20 4.20 0.00 4.20 4.16 0.00 79.07 ٤.١٧ 0.00 0.00Col108 15.00 5.00 0.00 0.00 0.00 5.00 0.00 75.00 0.00 0.00Col109 21.10 0.00 0.00 15.8 5.20 0.00 ٥.٣٠ ٠.٠٠ 52.60 0.00Col110 5.30 0.00 0.00 0.00 0.00 0.00 0.00 94.70 ٠.٠٠ ٠.٠٠
Table 5: Active Confusion Matrix of SVM
Col101 Col102 Col103 Col104 Col105 Col106 Col107 Col108 Col109 Col110 Col101 99.86 0.14 0.00 0.00 0.00 0.00 0.00 0.00 0.00 0.00Col102 0.00 100.00 0.00 0.00 0.00 0.00 0.00 0.00 0.00 0.00Col103 0.16 0.00 99.84 0.00 0.00 0.00 0.00 0.00 0.00 0.00Col104 0.00 0.00 0.00 100.00 0.00 0.00 0.00 0.00 0.00 0.00Col105 0.00 0.13 0.00 0.00 99.87 0.00 0.00 0.00 0.00 0.00Col106 0.00 0.00 0.00 0.00 0.00 100.00 0.00 0.00 0.00 0.00 Col107 0.24 0.00 0.00 0.00 0.00 0.00 99.76 0.00 0.00 0.00Col108 0.00 0.00 0.00 0.00 0.00 0.00 0.00 100.00 0.00 0.00 Col109 0.20 0.00 0.00 0.00 0.00 0.00 0.00 0.00 99.80 0.00 Col110 0.00 0.26 0.00 0.00 0.00 0.00 0.00 0.00 0.00 99.74
Fig.7 Active performance of SVM Fig.8 Active performance of MLP
Page 344

Speaker Independent Arabic Speech Recognition Using Neural Networks
ICI 10 - 10TH INTERNATIONAL CONFERENCE ON INFORMATION
We can jump to the conclusion that, a spoken Arabic digits recognizer is designed to investigate the process of automatic digits recognition. This system is based on a NN and by using Colloquial Egyptian dialect within a noisy environment. This system is based on NN and carried out by neuro solution tools. The performance of the system is 91% when we used (MLP) and the performance increased to 96% when we use (SVM).This result is our first step and the work will continue in the subject concerned to achieve better performance.
References [1]H. Satori, M. Harti, and N. Chenfour, "Introduction to Arabic Speech Recognition Using CMUSphix System", http://arxiv.org/abs/0704.2083 [2] Akram M. Othman, and May H. Riadh, "Speech Recognition Using Scaly Neural Networks", World Academy of Science, Engineering and Technology 38, 2008. [3] Dongsuk Yuk, "Robust Speech Recognition Using Neural Networks And Hidden Markov Models- Adaptations Using Non-Linear Transformations", Ph. D, Graduate School—New Brunswick Rutgers, The State University of New Jersey, October 1999. [4] Abderrahmane Amorite, and Jean Michel Rouvaen, "Efficient System for Speech Recognition using General Regression Neural Network", International Journal of Intelligent Systems and Technologies 1;2 © www.waset.org Spring 2006. [5] E. M. Essa, A. S. Tolba and S. Elmougy, "Combined Classifier Based Arabic Speech Recognition", INFOS2008, March 27-29, 2008 Cairo-Egypt [6] Yousef Ajami Alotaibi, Mansour Alghamdi and Fahad Alotaiby, "Speech Recognition System of Arabic Digits based on A Telephony Arabic Corpus", http://www.mghamdi.com/IPCV08.pdf [7] Yousef Ajami Alotaibi1, Mansour Alghamdi, Fahad Alotaiby "Speech Recognition System of Arabic Digits based on A Telephony Arabic Corpus" http://www.mghamdi.com/IPCV08.pdf
t.pdf
[8] Yousef Ajami Alotaibi, "A Simple Time Alignment Algorithm for Spoken Arabic Digit Recognition", JKAU: Eng. Sci., Vol. 20 No.1, pp: 29-43 (2009 A.D. / 1430 A.H.) [9] Moustafa Elshafei, Husni Al-Muhtaseb, and Mansour Al-Ghamdi, "SPEAKER-INDEPENDENT NATURAL ARABIC SPEECH RECOGNITION SYSTEM", http://www.mghamdi.com/ICIS2008.pdf [10] N.Uma Maheswari, A.P.Kabilan, R.Venkatesh, "SPEAKER INDEPENDENT SPEECH RECOGNITION SYSTEM USING NEURAL NETWORKS", Received July 4, 2009, http://jre.cplire.ru/mac/jul09/1/tex [11] Mohamad Adnan Al-Alaoui, Lina Al-Kanj, Jimmy Azar1 and Elias Yaacoub, "Speech Recognition using Artificial Neural Networks and Hidden Markov Models", The 3rd International Conference on Mobile and Computer Aided Learning, IMCL2008, www.imcl-conference.org. [12] Khalid Saeed, Mohammad K. Nammous, "A New Step in Arabic Speech Identification Spoken Digit Recognition", http://aragorn.pb.bialystok.pl/~zspinfo/arts/KSaeedSpringer.pdf [13] Khaled Alsabti, Sanjay Ranka, Vineet Singh, "An Efficient K-Means Clustering Algorithm",http://citeseerx.ist.psu.edu/viewdoc/download?doi=10.1.1.110.903&rep=rep1&type=pdf [14]http://www.improvedoutcomes.com/docs/WebSiteDocs/Clustering/K-Means_Clustering_Overview.htm [15] http://www.neurosolutions.com
Page 345
Proposed Framework for Scheduling Grid Workflow Applications
Ahmed Mohamed A. Ghanem, Dr. Ahmed I. Saleh, and Prof. Hesham Arafat Ali
Computers and Systems Engineering Dept., Faculty of Engineering, Mansoura University, Egypt ABSTRACT: The Grid Workflow scheduling is one of the most important issues in Workflow management because of its impact on the performance. Due to its importance, many scheduling approaches are proposed including static, dynamic and adaptive ones. Static approaches performance in Grid environment is questioned due to the continuous environment changes. The main objective of this paper is to introduce an adaptive scheduling approach in which the new Grid changes can be taken into consideration in order to achieve high performance and minimized makespan. The experimental results show that the proposed adaptive approach outperforms the static approaches in Grid environment. Keywords: Grid Workflow, Workflow Scheduling, DAG, Adaptive Scheduling, makespan.
1. INTRODUCTION
Science has greatly developed the last two decades in a way that there is a need for high
performance resources to execute big and complex problems. Grids are one of the solutions to
this problem as Grids integrate large-scale distributed heterogeneous resources to enable users
to access remote resources through secure and scalable networks. Many scientific fields such
as high-energy physics, gravitational-wave physics, geophysics, astronomy, and bioinformatics
are utilizing Grids to manage, and process large data sets. Workflow applications [1]
incorporate multiple dependent tasks to be executed in a predefined order and may entail the
transfer and storage of a huge amount of data. The very important issue in executing a
scientific workflow in Grids is how to map and schedule workflow tasks onto multiple
distributed resources and handle task dependencies in a timely manner to deliver users’
expected performance. Workflow can be represented as a direct acyclic graph (DAG), in which
nodes are the tasks and the edges are the inter-task dependencies. Each node label shows the
task computation cost and each edge label shows the communication cost between tasks. The
makespan is the total execution time of a workflow application, which is used to measure the
performance of workflow applications.
Workflow scheduling is one of the key functions in the workflow management system [3].
A scheduling is a process that maps and manages the execution of inter-dependent tasks on the
distributed resources. It allocates suitable resources to workflow tasks in order to achieve high
performance. Proper scheduling can have significant impact on the performance of the system.
According to [16] there are three types of workflow scheduling: full-plan-ahead, Just-in-time
Page 346

scheduling and adaptive scheduling. The first approach is a static one in which the whole
workflow tasks are scheduled prior to the execution phase. In contrast of the second one which
is completely dynamic as it postpones the scheduling decision for a workflow task, as long as
possible, and performed when the task is ready to be executed. The third approach is a hybrid
one that combines the two former approaches i.e., hybrid. Nearly all the systems fall in the first
category. Full-plan-ahead is represented in GridFlow [4] and Vienna Grid Environment [5].
DAGMan [6] and Taverna [7] support dynamic scheduling, and Pegasus [8] supports both. The
static scheduling is the best approach when the meta-data about the Grid resources is known in
advance. This meta-data includes the performance of task execution and data communication
which is supposed to be accurate which is not true for the Grid. Furthermore, static approaches
are proven to perform better than dynamic ones even with inaccurate meta-data.
However, due to the nature of the Grid environment, static scheduling may perform poorly
because of the continuous change in the Grid environment and the fact that the Grid resources
are not dedicated but they are shared between many users and all of them compete for using
them. Many challenges may face the static scheduling of workflow application including
events like: resources join or leave at any time; the resource performance may vary over time
due to internal or external factors. We claim that the performance of the static scheduling can
be improved by combining them with adaptive strategy which reschedules the remaining of the
workflow tasks when the Grid changes (i.e. when some resources appear or disappear). We
have selected one of the static scheduling heuristic practically HEFT and modified it to fit in
the hybrid scheduling approaches category. In static scheduling, the planning phase is a one-
time process which does not consider the future change in the Grid after the execution has
started. With the new approach, the Monitor will notify the planner if any run-time event which
interests the planner (i.e., the former events). Rescheduling may be needed and the schedule
may change to make use of the new resources and resubmitting the tasks that were scheduled to
leaving resources to other ones in order to reduce the makespan. This requires the planning
phase to be an event-driven process. The experiments results show the improvement by the
new adaptive approach.
The main contributions of this paper are: (1) propose an adaptive rescheduling approach.
(2) evaluate the performance of the adaptive approach. (3) study how the adaptive approach
performs better than static approach when a resource change happens.
The remainder of this paper is organized as follows. The next section presents related work
is. Problem definition is demonstrated in section 3. Then we describe the proposed scheduling
approach in section 4. Section 5 indicates the experiments results and the evaluation of the
Page 347
proposed scheduling approach performance. Summary and Future work is given in section 6 of
this paper.
2. Related Work
In general, the problem of mapping workflow tasks on distributed resources belongs to a
class of problems known as NP-hard problems [8], and because of its importance on
performance it has been extensively studied and many heuristics were proposed in the
literature. Heterogeneous Earliest Finish Time (HEFT) [8] is one of the most popular
heuristics. It is implanted in ASKALON on WIEN2K application. Other heuristics such as
Min-min, Critical-Path-on-a-processor (CPOP) and Levelized Min Time (LMT) are studied
exhibiting the same strengths and weaknesses differing by few percent. HEFT is selected in
this paper to implement the adaptive scheduling algorithm.
Static approaches used in Grid workflow applications have some challenges that are
discussed in [15]. Few researches address the adaptive scheduling approaches. The hybrid
approach proposed in [10] combines the just-in time scheduling and the full-ahead planning by
partitioning the workflow into sub-workflows and by performing full-graph scheduling of the
individual sub-workflows in a just-in-time manner. Another hybrid approach presented in [12]
achieves the same goal by triggering rescheduling when the state of the Grid changes (i.e.,
when some resources appear or disappear). Rescheduling of applications is the most widely
used method to make full-ahead planning more dynamic. To trigger rescheduling of an
application, certain acceptance criteria defined for the application execution are needed, as well
as a monitoring system which can control the fulfillment of these criteria. Another rescheduling
policy is proposed in [13], which considers rescheduling at a few, carefully selected points
during the execution. The research tackles one of the shortcomings that static scheduling
always assumes accurate prediction of job performance. After the initial schedule is made, it
selectively reschedules some jobs if the run time performance variance exceeds predefined
threshold. However, this approach deals with only the inaccurate estimation and does not
consider the change of resource pool. Paper [17] describes how adaptive workflow execution
can be expressed as an optimization problem where the objective of the adaptation is to
maximize some property expressed as a utility function. It evaluates using an adaptive
approach for alternative utility measures based on response time and profit.
We will focus on how the planner will adapt to the change in the Grid resources and if the
new resources can be utilized to achieve higher performance.
Page 348
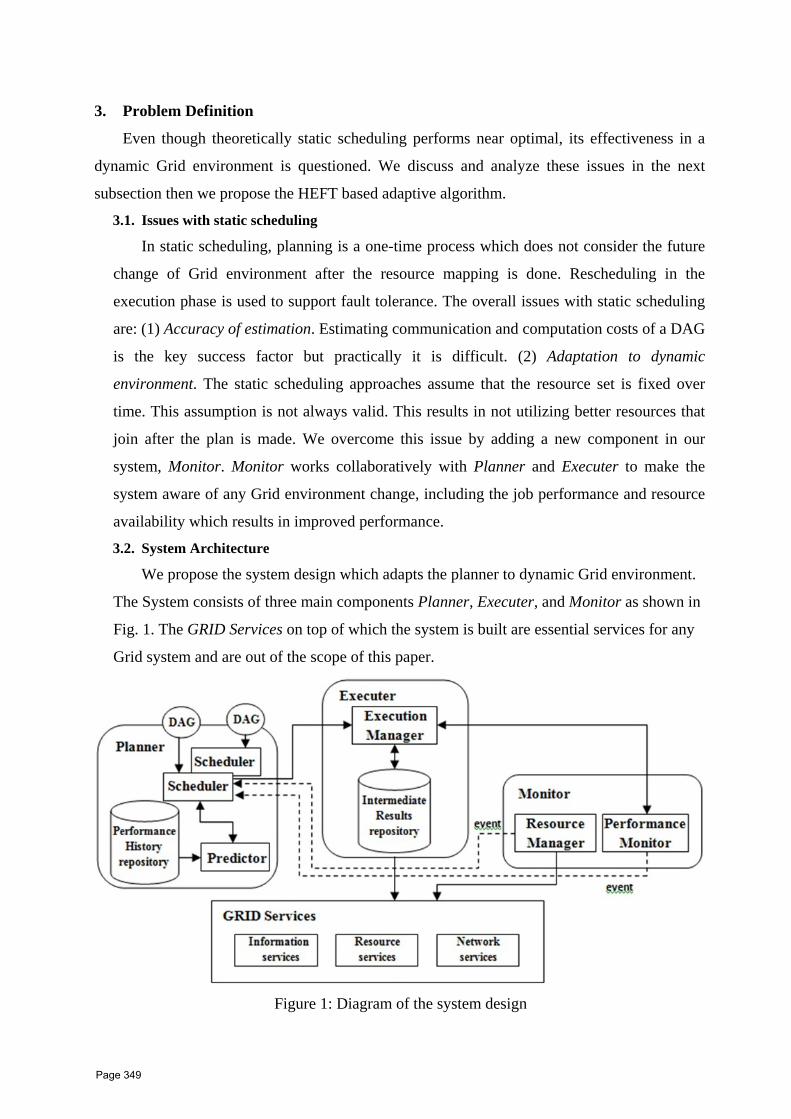
3. Problem Definition
Even though theoretically static scheduling performs near optimal, its effectiveness in a
dynamic Grid environment is questioned. We discuss and analyze these issues in the next
subsection then we propose the HEFT based adaptive algorithm.
3.1. Issues with static scheduling
In static scheduling, planning is a one-time process which does not consider the future
change of Grid environment after the resource mapping is done. Rescheduling in the
execution phase is used to support fault tolerance. The overall issues with static scheduling
are: (1) Accuracy of estimation. Estimating communication and computation costs of a DAG
is the key success factor but practically it is difficult. (2) Adaptation to dynamic
environment. The static scheduling approaches assume that the resource set is fixed over
time. This assumption is not always valid. This results in not utilizing better resources that
join after the plan is made. We overcome this issue by adding a new component in our
system, Monitor. Monitor works collaboratively with Planner and Executer to make the
system aware of any Grid environment change, including the job performance and resource
availability which results in improved performance.
3.2. System Architecture
We propose the system design which adapts the planner to dynamic Grid environment.
The System consists of three main components Planner, Executer, and Monitor as shown in
Fig. 1. The GRID Services on top of which the system is built are essential services for any
Grid system and are out of the scope of this paper.
Figure 1: Diagram of the system design
Page 349

The role of each system component is defined as follows:
Planner. The Planner has a set of subcomponents including Scheduler, Performance
History Repository and Predictor. For each workflow application represented as a DAG, the
Planner instantiates a Scheduler instance. The Scheduler inquires the Predictor to estimate
the computation and the communication cost with the given resource set based on the
performance history. It then decides an initial resource mapping in order to achieve the
optimal performance of the entire workflow and submits the schedule to the Executer.
During the execution phase, the Monitor notifies the Scheduler with events of interest.
Scheduler may decide a new schedule to make use of the new available resources if it
minimizes the makespan of the workflow.
Executer. The Executer is an enactment environment for workflow applications. It
consists of Execution Manger and Intermediate Results Repository. Execution Manager
receives a DAG and executes it as scheduled. It is also responsible for storing the output of
each executed job to the Intermediate Results Repository to be ready for executing the child
tasks on the mapped resource. If the schedule is a result of reschedule, it stores the progress
and intermediate results of the running job that will be scheduled to a new resource such
that the job can start executing from the end point it had reached before the reschedule is
made.
Monitor. The Monitor consists of two main components Resource Manager and
Performance Monitor. We have separated the Monitor from the executer to decrease the
system complexity. The role of Manager and Performance Monitor is to update the
Scheduler with the events such as:
• Resource Pool Change. If new resources are discovered after the initial schedule,
rescheduling may reduce the makespan of the workflow. In case of resource failure,
fault tolerance mechanism is triggered and it is taken care of by Execution Manager.
If the failure is predictable, Execution Manager tries to store the intermediate results
of the running task which was scheduled on that resource and updates the
Performance Monitor which notifies the Scheduler in turn. This mechanism can
decrease the impact of resource failure on the performance.
• Resource Performance Variance. The performance estimation accuracy is largely
dependent on history data, and inaccurate estimation leads to a bad schedule. If the
run time Performance Monitor can notify the Planner of any significant performance
variance, the Planner will evaluate its impact and reschedule if necessary. In the
Page 350

T- set of jobs in the DAG R - set of all available resources H - Heuristic employed by scheduler S - Schedule 1. set initial schedule S0 = schedule (T, R, H) 2. while (there is any event) # R is updated via communication with Resource Manager 3. update the resource set R # randomly choose nk as one of the running jobs 4. if (nk.EFT1 < nk.EFT0) 5. store the intermediate results of the chosen job and schedule the remaining to the
new resource # new schedule is made for the not started jobs only 6. S1 = schedule (T, R, H) 7. end if 8. end while
meantime, the Performance History Repository is updated to improve the estimation
accuracy in the subsequent planning.
4. HEFT-based Adaptive scheduling MAHEFT
The adaptive scheduling algorithm is described in Fig. 2. For a given DAG, an initial
schedule is made. When there is a new resource available, first, the resource set is updated and
the Planner tries to schedule the remaining of one of the running tasks to the new resource. If
there are more than one running jobs, the chosen job will be selected randomly. It will not be
scheduled on the new resource unless its earliest finish time according to Equation (5) is less
than the earliest finish time of the initial schedule. When scheduled to the new resource, the
Executer will save the intermediate results to the Intermediate Results Repository and sends
them to the new resource. Then, the Planner schedules the remaining jobs of the DAG. The
Planner will continuously listen to an event from the Monitor to adapt to the Grid environment
changes.
Figure 2: Adaptive scheduling algorithm
Next we define our scheduling strategy, which is HEFT-based scheduling algorithm,
referred to as Modified Adaptive Heterogeneous Earliest Finish Time (MAHEFT). We use
HEFT to implement the schedule (T, R, H) method in the scheduling algorithm in Fig. 2. We
directly use the scheduling system model defined in paper [15] with revision and extension.
The input for a workflow scheduling algorithm is an abstract workflow which is a workflow
tasks without allocating them to specific resources. A Workflow application is represented by a
Directed Acyclic Graph (DAG), G = (V, E), where V is the set of ν jobs (nodes) and E is the set
of e edges. Each edge (i, j) ∈ E represents precedence constraint such that job ni should
Page 351

complete its execution before job nj starts (i.e., ni is the parent of nj and nj is the child of ni). In
any given task graph, a job without any parent is called an entry job and a job without any
child is called an exit job. data is a υ × υ matrix of communication data, where datai,k is the
amount of data required to be transmitted from job ni to nk. R is a set of r heterogeneous
resources which represent computation units connected in a fully connected topology in which
all inter-processor communication are assumed to be performed without contention.
Table 1: Definition of symbols in MAHEFT
We define the symbols used by MAHEFT in Table 1, and explain how they are calculated
according to the following equations. For the entry job:
0),( =jentry rnEST (1)
For the other jobs in the graph, the EST and EFT are computed recursively, as shown in
Equation (2) and (3) respectively. In order to compute the EFT of a job ni, all immediate
predecessor jobs of ni must have been scheduled.
)}),((max],[max{),( ,)( immnprednji cnAFTjavailrnESTim∈
= (2)
),(),( , jijiji rnESTwrnEFT += (3)
The inner max block in the Equation (2) returns the ready time, i.e., the time when all the
data needed by ni has arrived at resource rj. After a job nm is scheduled on a resource rj, the
earliest finish time of nm on resource rj, is equal to the actual finish time, AFT (nm). After all
jobs in a graph are scheduled, the schedule length (i,e., makespan) will be the actual finish time
of the exit job nexit as defined in Equation (4).
)}(max{ exitnAFTmakespan = (4)
Symbol Definition EST (ni, rj) the earliest start time for not-started job ni on resource rj EFT (ni, rj) the earliest finish time for not- started job ni on resource rj AFT (ni) the actual finish time of job ni avail[j] the earliest time when resource rj is ready for executing new jobs wi,j the computation cost of job ni on resource rj ci,j the communication cost for data dependence of job nj on ni
ic the average communication cost of ni pred(ni) the set of immediate predecessor jobs of job ni remi,j the remaining time for job ni on resource rj
Page 352

T- set of the jobs of sate not started in the DAG R - set of all available resources H - HEFT heuristic employed by scheduler 1. compute ranku for all jobs by traversing graph upward, starting from the exit job 2. sort the jobs in a scheduling list by nonincreasing order of ranku 3. while there are unscheduled jobs in the list do 4. select the first job ni from the scheduling list 5. for each resource rk in R do 6. compute EFT(ni, rk) 7. assign job ni to the resource that minimizes EFT of job ni 8. end while
The objective function of the workflow scheduling problem is to determine the assignment
of jobs of a given application to resources such that its makespan is minimized.
ω+×−+×
= iji
ji
ji
kijiki c
wrem
wwrem
rnEFT )1(),(,
,
,
,,1 (5)
It is obvious that MAHEFT is identical to HEFT when it is the initial schedule, see Fig. 3.
Jobs are ordered in the schedule (T, R, H) by their priorities based on upward rank of a job ni is
recursively defined by
))((max)( ),()( jujinsuccniiu nrankcwnrankij
++=∈
(6)
where succ(ni) is the immediate successors of job ni, ),( jic is the average communication cost of
edge (i, j) Since the rank is computed recursively by traversing the task graph upward, starting
from the exit job, it is called upward rank. For the exit job, the upward rank is equal to
exitexitu wnrank =)( (7)
Figure 3: procedure schedule (T, R, H) of MAHEFT
As illustration, we use a sample DAG and resource set, shown in Fig. 4, to compare
schedule performance of traditional HEFT, AHEFT [12] and MAHEFT. Fig. 5 shows the
schedule obtained from HEFT, AHEFT and MAHEFT respectively. Resources r1, r2 and r3 are
available from the beginning while r4 emerges at 13. HEFT produces the schedule with
makespan as 83 without considering the addition of resource r4 at later time. For AHEFT and
MAHEFT, the initial schedule made at time point 0 is identical as the one by HEFT.
However, when resource r4 is added, AHEFT schedule reduces the makespan to 78 and
MAHEFT reduces the makespan to 75.
Page 353
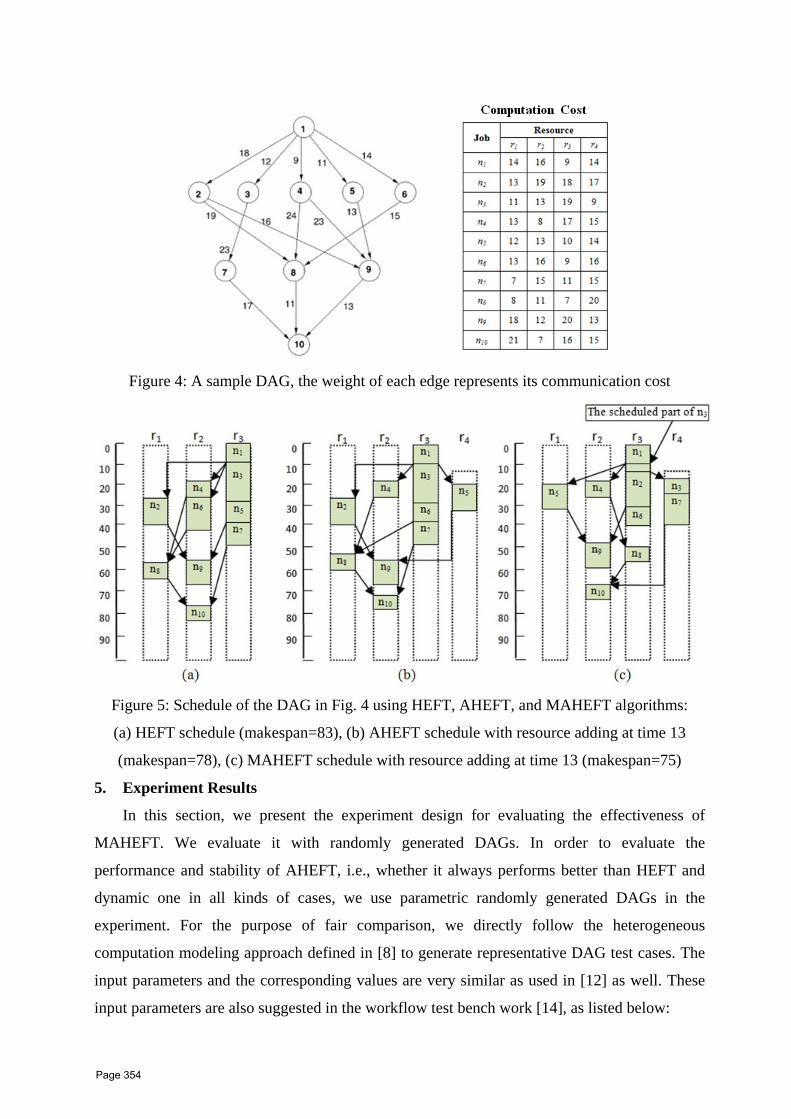
Figure 4: A sample DAG, the weight of each edge represents its communication cost
Figure 5: Schedule of the DAG in Fig. 4 using HEFT, AHEFT, and MAHEFT algorithms:
(a) HEFT schedule (makespan=83), (b) AHEFT schedule with resource adding at time 13
(makespan=78), (c) MAHEFT schedule with resource adding at time 13 (makespan=75)
5. Experiment Results
In this section, we present the experiment design for evaluating the effectiveness of
MAHEFT. We evaluate it with randomly generated DAGs. In order to evaluate the
performance and stability of AHEFT, i.e., whether it always performs better than HEFT and
dynamic one in all kinds of cases, we use parametric randomly generated DAGs in the
experiment. For the purpose of fair comparison, we directly follow the heterogeneous
computation modeling approach defined in [8] to generate representative DAG test cases. The
input parameters and the corresponding values are very similar as used in [12] as well. These
input parameters are also suggested in the workflow test bench work [14], as listed below:
Page 354

• The number of jobs in the graph (υ).
• Communication to computation ratio (CCR). A data-intensive application has a higher
CCR, while a computing-intensive one has a lower value.
• The resource heterogeneous factor, β. A higher value of β suggests the bigger difference
of resource capability. The resources are homogeneous when β is 0. The average
computation cost of all jobs in a DAG is DAGw , then the average of each job ni in the
graph, represented as iw , is selected randomly from a uniform distribution with range
[0, 2 × DAGw ]. Then, the computation cost of each job ni on each resource rj in the
system, i.e., wi,j , is randomly selected from the following range:
)2
1()2
1( ,ββ
+×≤≤−× ijii www .
To model the dynamic change of resources, we introduce three additional parameters as
following: (1) Initial resource pool size, R; (2) Interval of resource change, ω. The higher value
of ω indicates the lower frequency of resource change; and (3) Percentage of resource change,
Δ, to measure the resource change percentage each time compared with the initial resource
pool. The value set for each parameter is listed in Table 2.
Table 2: Parameter values of random generated DAGs
Fig. 6 presents the results of HEFT, AHEFT and MAHEFT for Randomized generated
DAGs. It worth noting that, our MAHEFT algorithm performs better than the other two
algorithms. The improvement rate may vary according to the DAG type generated. In Fig. 6
(a), the makespan increases with total number of jobs and it is obvious because more jobs
means more computation and communication cost needed. In Fig. 6 (e), the makespan of the
three algorithms tends to be the same with larger values of resource change interval because
the higher the resource change interval the more static become the Grid environment and this
leads to no change in it. Fig. 6 (f) shows the effectiveness of our algorithm more clear when the
Parameter Value υ 20, 40, 60, 80,100 CCR 0.1, 0.5, 1.0, 5.0, 10.0 β 0.1, 0.25, 0.5, 0.75, 1.0 R 10, 20, 30, 40, 50 Δ 0.1, 0.15, 0.2, 0.25 ω 50, 100, 200, 400
Page 355
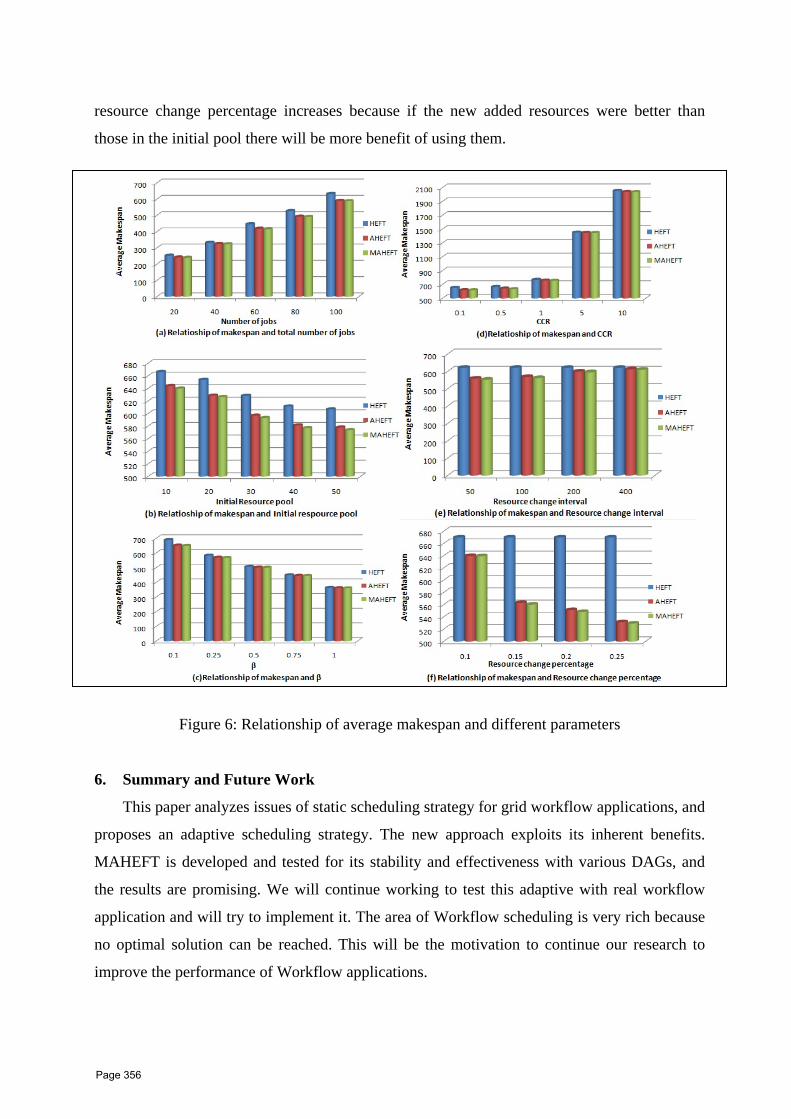
resource change percentage increases because if the new added resources were better than
those in the initial pool there will be more benefit of using them.
Figure 6: Relationship of average makespan and different parameters
6. Summary and Future Work
This paper analyzes issues of static scheduling strategy for grid workflow applications, and
proposes an adaptive scheduling strategy. The new approach exploits its inherent benefits.
MAHEFT is developed and tested for its stability and effectiveness with various DAGs, and
the results are promising. We will continue working to test this adaptive with real workflow
application and will try to implement it. The area of Workflow scheduling is very rich because
no optimal solution can be reached. This will be the motivation to continue our research to
improve the performance of Workflow applications.
Page 356

REFERENCES
[1] I. J. Taylor, E. Deelman, D. B. Gannon, and M. Shields, Workflows for e-Science: Scientific
Workflows for Grids. Springer, 2006, ch. 1.
[2] I. Foster and C. Kesselman, “Computational Grids,” in The Grid: Blueprint for a New Computing
Infrastructure. Springer, 1999, ch. 2.
[3] J. Yu and R. Buyya, “A Taxonomy of Workflow Management Systems for Grid Computing”,
Journal of Grid Computing, Springer, 3(3-4): 171-200, Spring Science + Business Media B.V.,
Sept. 2005.
[4] J. Cao, S. A. Jarvis, S. Saini, and G. R. Nudd. Gridflow: Workflow management for grid
computing. In Proceeding of CCGrid ’03.
[5] I. Brandic, S. Pllana, and S. Benkner. Amadeus: A Holistic Service-oriented Environment for Grid
Workflows. gccw, 0:259–266, 2006.
[6] J. Frey and et al., Condor-g: A computation management agent for multi-institutional grids. Cluster
Computing, 5(3):237–246, 2002.
[7] T. Oinn and et al., Taverna: A tool for the composition and enactment of bioinformatics
workflows. Bioinfomatics, 20(17):3045–3054, 2004.
[8] H. Topcuouglu, S. Hariri, and M.-Y. Wu. Performance effective and low-complexity task
scheduling for heterogeneous computing. IEEE Transactions on Parallel and Distribution Systems,
13(3):260–274, 2002.
[9] E. Deelman, G. Singh, M.-H. Su, J. Blythe, Y. Gil, C. Kesselman, et al. Pegasus: a Framework for
Mapping Complex Scientific Workflows onto Distributed Systems. Scientific Programming
Journal, 13(2), Nov. 2005.
[10] Z. Yu and W. Shi. An Adaptive Rescheduling Strategy for Grid Workflow Applications. In
Proceedings of the 21st IPDPS 2007, Mar 26 -30 2007. IEEE Computer Society Press.
[11] R. Sakellariou and H. Zhao. A low-cost rescheduling policy for efficient mapping of workflows on
grid systems. Scientific Programming, 12(4):253–262, 2004.
[12] U. H¨onig and W. Schiffmann. A comprehensive test bench for the evaluation of scheduling
heuristics. In roc. of PDCS 2004.
[13] E. Deelman, J. Blythe, Y. Gil, and C. Kesselman. Workflow Management in GriPhyN. Grid
Resource Management, State of the Art and Future Trends. pages 99–116, 2004.
[14] M. Wieczorek, R. Prodan, A. Hoheisel, M. Wieczorek , R. Prodan, A. Hoheisel. Taxonomies of
the Multi-criteria Grid Workflow Scheduling Problem. Grid Middleware and Services Book. p
237-264. Springer US, 2008.
[15] K. Lee, N. W. Paton, R. Sakellariou, A. Fernandes. Utility Driven Adaptive Workflow Execution.
In the Proceedings of the 2009 9th IEEE/ACM International Symposium on Cluster Computing
and the Grid, p 220-227, 2009.
Page 357
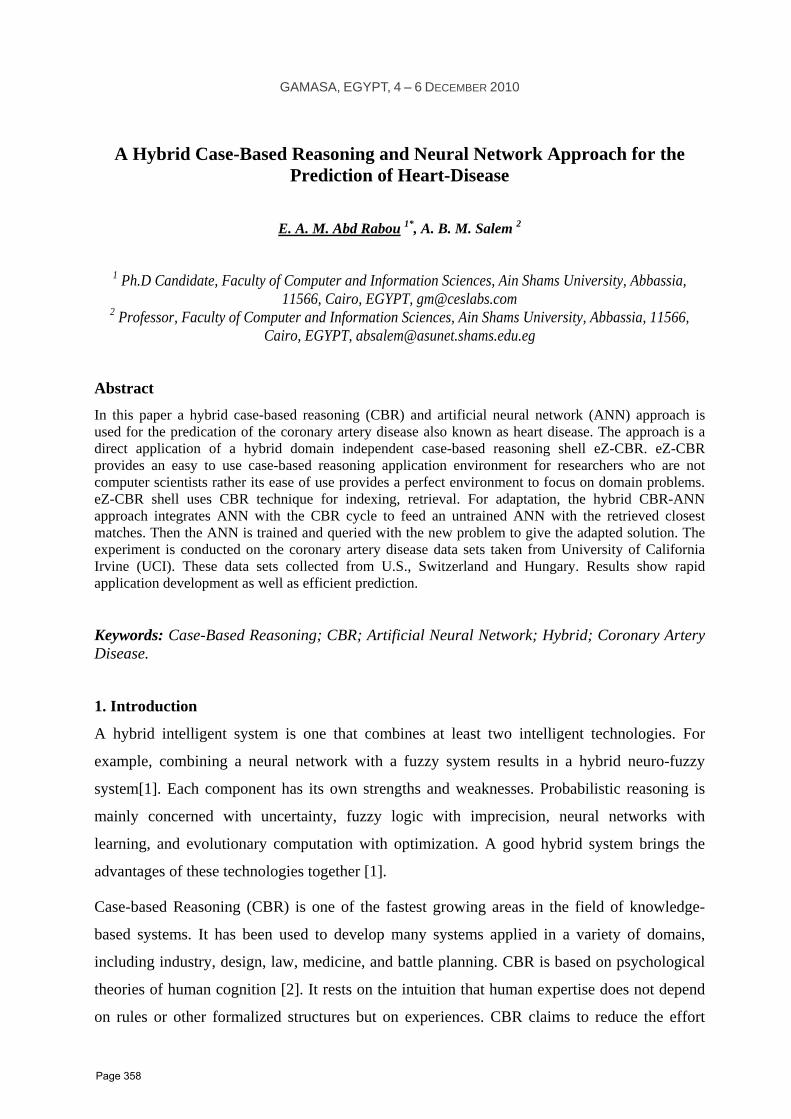
GAMASA, EGYPT, 4 – 6 DECEMBER 2010
A Hybrid Case-Based Reasoning and Neural Network Approach for the Prediction of Heart-Disease
E. A. M. Abd Rabou 1*, A. B. M. Salem 2
1 Ph.D Candidate, Faculty of Computer and Information Sciences, Ain Shams University, Abbassia,
11566, Cairo, EGYPT, [email protected] 2 Professor, Faculty of Computer and Information Sciences, Ain Shams University, Abbassia, 11566,
Cairo, EGYPT, [email protected]
Abstract
In this paper a hybrid case-based reasoning (CBR) and artificial neural network (ANN) approach is used for the predication of the coronary artery disease also known as heart disease. The approach is a direct application of a hybrid domain independent case-based reasoning shell eZ-CBR. eZ-CBR provides an easy to use case-based reasoning application environment for researchers who are not computer scientists rather its ease of use provides a perfect environment to focus on domain problems. eZ-CBR shell uses CBR technique for indexing, retrieval. For adaptation, the hybrid CBR-ANN approach integrates ANN with the CBR cycle to feed an untrained ANN with the retrieved closest matches. Then the ANN is trained and queried with the new problem to give the adapted solution. The experiment is conducted on the coronary artery disease data sets taken from University of California Irvine (UCI). These data sets collected from U.S., Switzerland and Hungary. Results show rapid application development as well as efficient prediction.
Keywords: Case-Based Reasoning; CBR; Artificial Neural Network; Hybrid; Coronary Artery Disease.
1. Introduction
A hybrid intelligent system is one that combines at least two intelligent technologies. For
example, combining a neural network with a fuzzy system results in a hybrid neuro-fuzzy
system [1]. Each component has its own strengths and weaknesses. Probabilistic reasoning is
mainly concerned with uncertainty, fuzzy logic with imprecision, neural networks with
learning, and evolutionary computation with optimization. A good hybrid system brings the
advantages of these technologies together [1].
Case-based Reasoning (CBR) is one of the fastest growing areas in the field of knowledge-
based systems. It has been used to develop many systems applied in a variety of domains,
including industry, design, law, medicine, and battle planning. CBR is based on psychological
theories of human cognition [2]. It rests on the intuition that human expertise does not depend
on rules or other formalized structures but on experiences. CBR claims to reduce the effort
Page 358
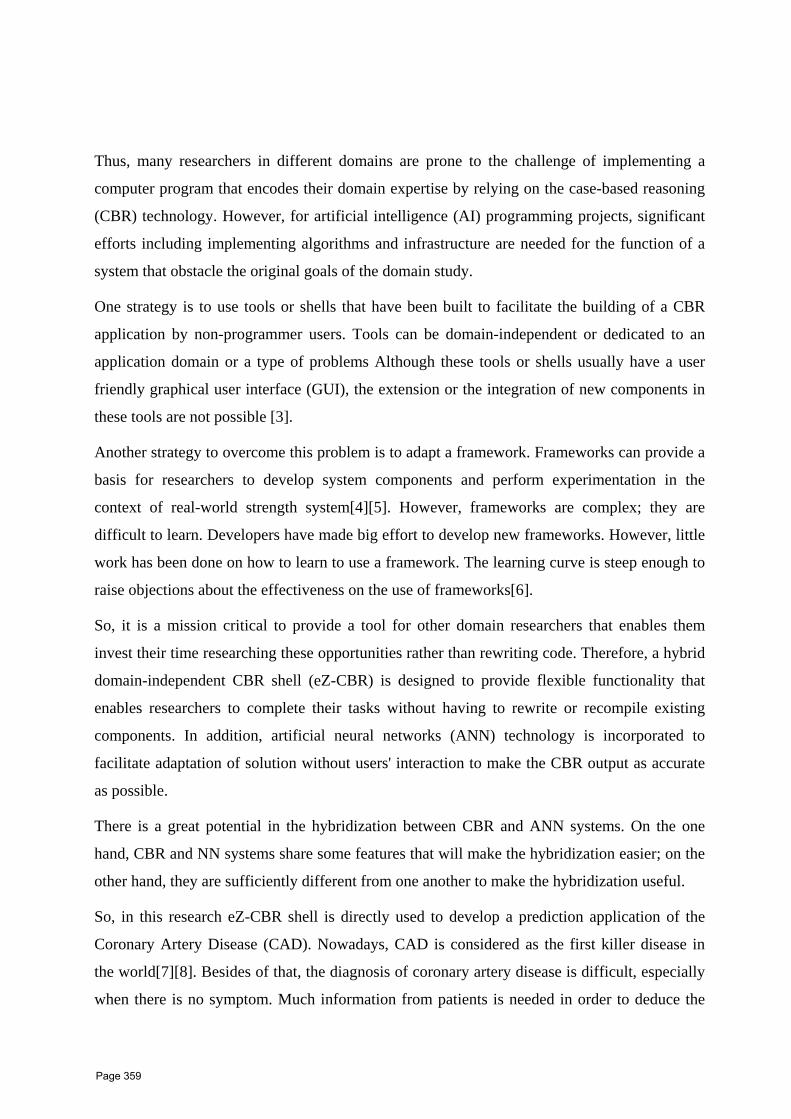
Thus, many researchers in different domains are prone to the challenge of implementing a
computer program that encodes their domain expertise by relying on the case-based reasoning
(CBR) technology. However, for artificial intelligence (AI) programming projects, significant
efforts including implementing algorithms and infrastructure are needed for the function of a
system that obstacle the original goals of the domain study.
One strategy is to use tools or shells that have been built to facilitate the building of a CBR
application by non-programmer users. Tools can be domain-independent or dedicated to an
application domain or a type of problems Although these tools or shells usually have a user
friendly graphical user interface (GUI), the extension or the integration of new components in
these tools are not possible [3].
Another strategy to overcome this problem is to adapt a framework. Frameworks can provide a
basis for researchers to develop system components and perform experimentation in the
context of real-world strength system [4] [5]. However, frameworks are complex; they are
difficult to learn. Developers have made big effort to develop new frameworks. However, little
work has been done on how to learn to use a framework. The learning curve is steep enough to
raise objections about the effectiveness on the use of frameworks [6].
So, it is a mission critical to provide a tool for other domain researchers that enables them
invest their time researching these opportunities rather than rewriting code. Therefore, a hybrid
domain-independent CBR shell (eZ-CBR) is designed to provide flexible functionality that
enables researchers to complete their tasks without having to rewrite or recompile existing
components. In addition, artificial neural networks (ANN) technology is incorporated to
facilitate adaptation of solution without users' interaction to make the CBR output as accurate
as possible.
There is a great potential in the hybridization between CBR and ANN systems. On the one
hand, CBR and NN systems share some features that will make the hybridization easier; on the
other hand, they are sufficiently different from one another to make the hybridization useful.
So, in this research eZ-CBR shell is directly used to develop a prediction application of the
Coronary Artery Disease (CAD). Nowadays, CAD is considered as the first killer disease in
the world [7] [8]. Besides of that, the diagnosis of coronary artery disease is difficult, especially
when there is no symptom. Much information from patients is needed in order to deduce the
Page 359

This paper is organized in five sections. First section is this introduction. Section 2 gives a
theoretical background on Coronary Artery Disease, CBR and ANN. Section 3 illustrates the
architecture, design and implementation of the eZ-CBR shell. Section 4 discusses the
prediction system of CAD. Finally, section 5 concludes the work.
2. Theoretical Background
2.1. Coronary Artery Disease
Coronary heart disease, also called coronary artery disease (CAD), affects about 14 million
men and women in the United States [9].
Disease develops when a combination of fatty material, calcium, and scar tissue (plaque) builds
up in the arteries that supply the heart with blood. Through these arteries, called the coronary
arteries, the heart muscle (myocardium) gets the oxygen and other nutrients it needs to pump
blood [9].
• The plaque often narrows the artery so that the heart does not get enough blood;
• This slowing of blood flow causes chest pain, or angina;
• If plaque completely blocks blood flow, it may cause a heart attack (myocardial
infarction) or a fatal rhythm disturbance (sudden cardiac arrest);
• A major cause of death and disability, coronary heart disease claims more lives in the
United States than other causes of death combined.
Figure 1 shows signs of (CAD). CAD occurs when sticky plaque builds up inside the coronary
arteries. This narrows the arteries, making it more difficult for blood to flow through.
Figure 1. Signs of Coronary Heart Disease [9].
Page 360
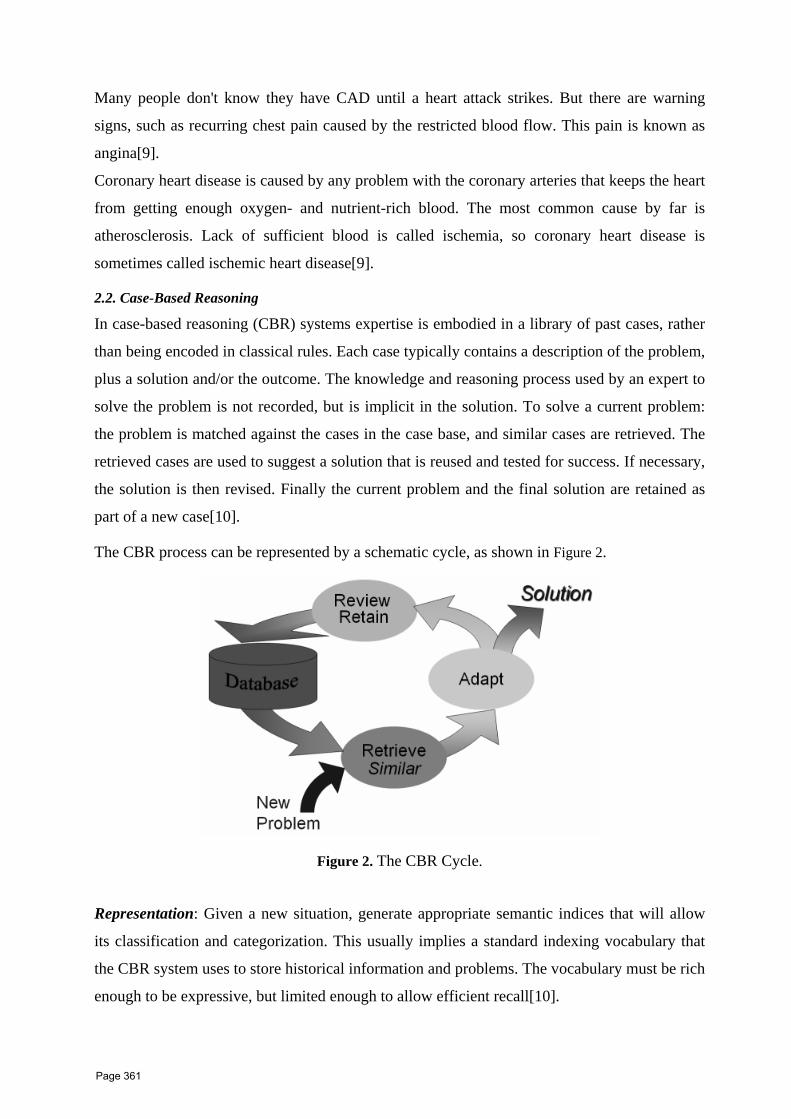
Many people don't know they have CAD until a heart attack strikes. But there are warning
signs, such as recurring chest pain caused by the restricted blood flow. This pain is known as
angina [9].
Coronary heart disease is caused by any problem with the coronary arteries that keeps the heart
from getting enough oxygen- and nutrient-rich blood. The most common cause by far is
atherosclerosis. Lack of sufficient blood is called ischemia, so coronary heart disease is
sometimes called ischemic heart disease [9].
2.2. Case-Based Reasoning
In case-based reasoning (CBR) systems expertise is embodied in a library of past cases, rather
than being encoded in classical rules. Each case typically contains a description of the problem,
plus a solution and/or the outcome. The knowledge and reasoning process used by an expert to
solve the problem is not recorded, but is implicit in the solution. To solve a current problem:
the problem is matched against the cases in the case base, and similar cases are retrieved. The
retrieved cases are used to suggest a solution that is reused and tested for success. If necessary,
the solution is then revised. Finally the current problem and the final solution are retained as
part of a new case [10].
The CBR process can be represented by a schematic cycle, as shown in Figure 2.
Figure 2. The CBR Cycle.
Representation: Given a new situation, generate appropriate semantic indices that will allow
its classification and categorization. This usually implies a standard indexing vocabulary that
the CBR system uses to store historical information and problems. The vocabulary must be rich
enough to be expressive, but limited enough to allow efficient recall [10].
Page 361

Retrieval: Given a new, indexed problem, retrieve the best past cases from memory. This
requires answering three questions: What constitute an appropriate case? What are the criteria
of closeness or similarity between cases? How should cases be indexed? Part of the index must
be a description of the problem that the case solved, at some level of abstraction. Part of the
case, though, is also the knowledge gained from solving the problem represented by the case.
In other words, cases should also be indexed by some elements of their solution [12].
Adaptation: Modify the old solutions to confirm to the new situation, resulting in a proposed
solution. With the exception of trivial situations, the solution recalled will not immediately
apply to the new problem, usually because the old and the new problem are slightly different.
CBR researchers have developed and used various adaptation techniques [12].
Validation: After the system checks a solution, it must evaluate the results of this check. If the
solution is acceptable, based on some domain criteria, the CBR system is done with reasoning.
Otherwise, the case must be modified again, and this time the modifications will be guided by
the results of the solution's evaluation [12].
Update: If the solution fails, explain the failure and learn it, to avoid repeating it. If the solution
succeeds and warrants retention, incorporate it into the case memory as a successful solution
and stop. The CBR system must decide if a successful new solution is sufficiently different
from already-known solutions to warrant storage. If it does warrant storage, the system must
decide how the new case will be indexed, on which level of abstraction it will be saved, and
where it will be put in the case-base organization [12].
Retaining the case is the process of incorporating whatever is useful from the new case into the
case library. This involves deciding what information to retain and in what form to retain it;
how to index the case for future retrieval; and integrating the new case into the case library.
2.3. Artificial Neural Network
Artificial Neural Network (ANN) is an information processing paradigm that is inspired by the
way biological nervous systems, such as the brain, process information. It is composed of
massively parallel computing systems consisting of an extremely large number of simple
processors with many interconnections. ANN models attempt to use some organizational
principles believed to be used in the human [13]. This research is focusing on multi-layer feed-
forward back-propagation artificial neural network [14] which is described in the following.
The back-propagation algorithm has emerged as the workhorse for the design of a special class
of layered feed-forward networks known as multilayer perceptrons (MLP). As shown in Figure
Page 362

where is the desired response and is the actual output produced in response to the
.
• . During this second phase, the error signal is propagated through
ented in one of two basic ways:
3, a multilayer perceptron has an input layer of source nodes and an output layer of neurons
(i.e., computation nodes); these two layers connect the network to the outside world. In
addition to these two layers, the multilayer perceptron usually has one or more layers of hidden
neurons, which are so called because these neurons are not directly accessible. The hidden
neurons extract important features contained in the input data.
Figure 3. A Typical Feed-Forward Neural Network.
The training of an MLP is usually accomplished by using a backpropagation (BP) algorithm
that involves two phases [14]:
• Forward Phase. During this phase the free parameters of the network are fixed, and the
input signal is propagated through the network layer by layer. The forward phase
finishes with the computation of an error signal
input
Backward Phase
the network in the backward direction, hence the name of the algorithm. During this
phase adjustments are applied to the free parameters of the network so as to minimize
the error in a statistical sense.
Back-propagation learning may be implem
Page 363

In this mode of BP
the free parameters
utationally efficient
s with antisymmetric activation functions (e.g., hyperbolic tangent function)
• poch involves
data;
rate. This
network design whenever it is available.
a b Figure 4. Activation Function Types (a) Antisymmetric Activation Function (
Sequential mode: (also referred to as the on-line mode or stochastic mode):
learning, adjustments are made to the free parameters of the network on an example-by
example basis. The sequential mode is best suited for pattern classification.
Batch mode: In this second mode of BP learning, adjustments are made to
of the network on an epoch by- epoch basis, where each epoch consists of the entire set of
training examples. The batch mode is best suited for nonlinear regression.
The back-propagation learning algorithm is simple to implement and comp
in that its complexity is linear in the synaptic weights of the network. However, a major
limitation of the algorithm is that it does not always converge and can be excruciatingly slow,
particularly when it has to deal with a difficult learning task that requires the use of a large
network. To make back-propagation learning perform better, the following list of heuristics
may be followed:
• Use neuron
in preference to nonsymmetric activation functions (e.g., logistic function). Figure 4a
and Figure 4b show examples of these two forms of activation functions;
Shuffle the training examples after the presentation of each epoch; an e
the presentation of the entire set of training examples to the network;
• Preprocess the input data so as to remove the mean and decorrelate the
• Arrange for the neurons in the different layers to learn at essentially the same
may be attained by assigning a learning rate parameter to neurons in the last layers that
is smaller than those at the front end;
• Incorporate prior information into the
b) Nonsymmetric Activation Function.
Page 364

One other heuristic that deserves to be mentioned relates to the size of the training set, N, for a
pattern classification task. Given a multilayer perceptron with a total number of synaptic
weights including bias levels, denoted by W, a rule of thumb for selecting N is
where denotes “the order of,” and denotes the fraction of classification errors permitted on
ed with the back-propagation
examples is split into two parts:
erformance
les and then tested
3. eZ-CBR Shell
designed using object-oriented paradigm. So the entire shell is consisted of
test data. For example, with an error of 10% the number of training examples needed should be
about 10 times the number of synaptic weights in the network.
Supposing that a multilayer perceptron has chosen to be train
algorithm, how to determine when it is “best” to stop the training session? How the size of
individual hidden layers of the MLP can be selected? The answers to these important questions
may be gotten though the use of a statistical technique known as cross-validation, which
proceeds as follows [15].
• The set of training
o Estimation subset used for training of the model
o Validation subset used for evaluating the model p
• The network is finally tuned by using the entire set of training examp
on test data not seen before.
3.1. Architecture
eZ-CBR shell is
interacting objects which can be seen grouped into three main parts the input part, the
processing part which will deal with the CBR process, and the output part. The input part deals
with domain definition and loading different files required for building a CBR application. The
CBR process part has all the necessary classes and functions required to complete the CBR
process. The output part is responsible for writing the output. The eZ-CBR shell architecture is
shown in Figure 5.
Page 365
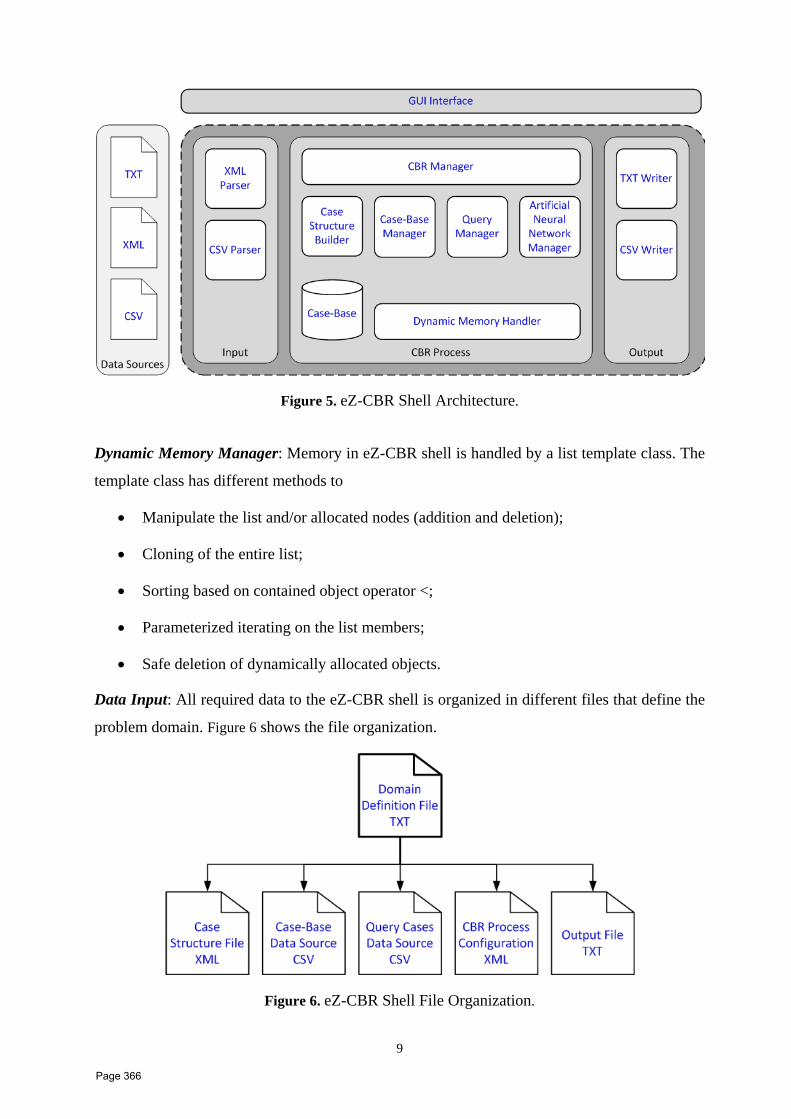
9
Figure 5. eZ-CBR Shell Architecture.
Dynamic Memory Manager: Memory in eZ-CBR shell is handled by a list template class. The
template class has different methods to
• Manipulate the list and/or allocated nodes (addition and deletion);
• Cloning of the entire list;
• Sorting based on contained object operator <;
• Parameterized iterating on the list members;
• Safe deletion of dynamically allocated objects.
Data Input: All required data to the eZ-CBR shell is organized in different files that define the
problem domain. Figure 6 shows the file organization.
Figure 6. eZ-CBR Shell File Organization.
Page 366

Data Files Parsing: Two types of files that need some effort to be parsed into the appropriate
memory objects are presented in the eZ-CBR shell. They are "XML" and "CSV" files. CSV,
comma separated values, files are commonly used to transport large amounts of tabular data.
The files are easily editable using common spreadsheet applications. A CSV parser engine is
added to the eZ-CBR shell to enable of importing both case-base data sources as well as query
cases data sources. The second parsing effort is the "XML" parser. eZ-CBR shell uses
"CMarkup" that is adopted from http://www.firstobject.com/dn_markup.htm.
Case Representation: eZ-CBR shell applies object-oriented techniques for representing
cases [16]. Such representations are particularly suitable for complex domains in which cases
with different structures occur. The case in eZ-CBR shell is represented by a list of attributes.
The list is dynamically allocated so the case can be represented with any number of attributes.
The attribute type is lately bound to its actual type using polymorphism. The case itself can be
one of the attributes in the attribute list. The following are a list of the possible feature types:
• Boolean- the value can be either true or false
• Numeric- can be integer or double type (ranges can be set)
• Symbolic- the feature value must be one of an enumerated list of possible values
• String- the value can be any string
• Taxonomy- similar to symbolic type except that the possible values are represented
with a tree structure
Figure 7 shows the case structure class diagram along with different classes that constitute the
case class.
Similarity: Similarity is used for comparing two (or more) objects. The first object is under
actual consideration and is called the problem object. The second object is already known and
stored; often it is called a prototype or a case [17]. Similarity is always used for describing
something like "closely related".
Similarity measures for such object-oriented representations are often defined by the general
scheme: The goal is to determine the similarity between two objects, i.e., one object
representing the case (or a part of it) and one object representing the query (or a part of it). This
similarity is called object similarity (or global similarity). The object similarity is determined
recursively in a bottom up fashion, i.e., for each simple attribute, a local similarity measure
determines the similarity between the two attribute values, and for each relational slot an object
Page 367

, ∑ , ∑ 1
where is the feature relevance weight and is the local similarity measure (i.e. feature
agram that illustrates the recursive bottom-up calculation of the
l with K-Nearest Neighbor
Figure 7. Case Structure Class Diagram.
The similarity between a query, I and a case, J of a class C is defined as the sum of the
similarities of its constituent features multiplied by their relevance weights
specific similarity measure).
Figure 8 gives a schematic di
global similarity of a certain instance of a case with complex composition of different sub-
instances of other classes using global similarity decomposition.
Case Retrieval: eZ-CBR shell uses similarity based retrieva
algorithm. The following is the retrieval steps employed by the process
Page 368

12
Figure 8. Recursive Calculation of Global Similarity.
• Given a query case instance
en the query-instance and all the case-base bases using the
inimum distance
st neighbors as the prediction value of the
ell employs feed-forward back-propagation artificial neural network to
similar cases from the retrieval process
feed them as input for an
• Calculate the distance betwe
similarity measures as described before
• Sort the distance and determine nearest neighbors based on the m
• Determine parameter K = number of nearest neighbors
• Gather the category of the nearest neighbors
• Use simple majority of the category of neare
query instance.
Adaptation: eZ-CBR sh
adapt the retrieved cases to the solution. The following is a list of steps during the adaptation
process that are required to be conducted for each query case.
• For each query case
o Get the most
o Prepare the attributes of the most similar cases to
initialized feed-forward back-propagation neural network
Page 369

o Configure the neural network by determining the number of hidden layers and
number of neurons in each layer
o For every pattern of in the training set
o Feed pattern through NN
o Check errors and calculate error gradients
o Update weights according to error gradients (back propagation)
o When converging is done, query the network with the query case
The neural network output is the adapted solution for the selected query
• Repeat for other queries
Configuration of the neural network is done through the CBR process parameters file Figure 6
which defines the number of hidden layers and number of neurons in each layer in addition to
the training parameters such as learning rate, momentum, maximum number of epochs and the
desired accuracy. The number of the hidden layers and the number of neurons in each layer are
set to an arbitrary value at the beginning, then a good method to find out how many hidden
neurons are required would be to: train the network several times and check what the average
accuracy is at the end and then use this accuracy as a measure to compare different
architectures.
The training of the network is done through the following steps
• For every piece of data (pattern) in the training set the following occurs:
o Feed pattern through NN
o Check errors and calculate error gradients
o Update weights according to error gradients (back propagation)
Once all the patterns in the training data set have been processed, the process begins again
from the start. Each run through of all the patterns in the training set constitutes an epoch. The
training stops when the maximum number of epochs or the desired accuracy is reached.
The entire CBR process inside the eZ-CBR shell can be summarized in Figure 9.
Page 370
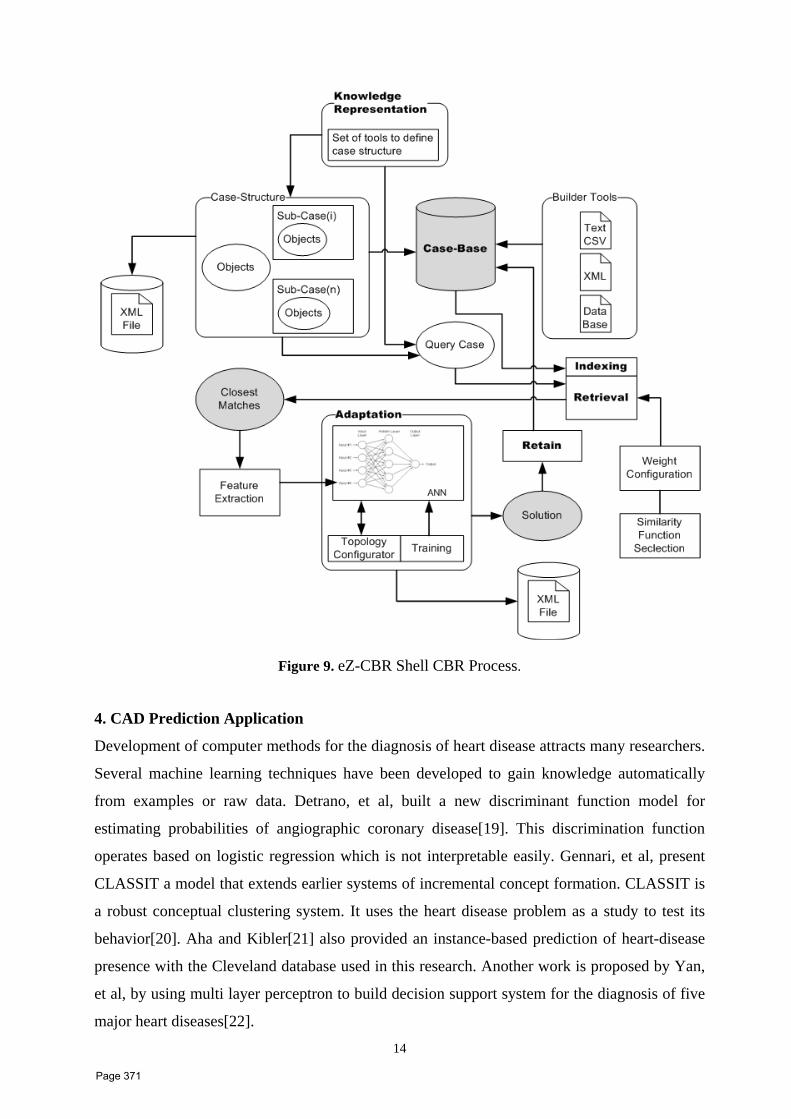
14
Figure 9. eZ-CBR Shell CBR Process.
4. CAD Prediction Application
Development of computer methods for the diagnosis of heart disease attracts many researchers.
Several machine learning techniques have been developed to gain knowledge automatically
from examples or raw data. Detrano, et al, built a new discriminant function model for
estimating probabilities of angiographic coronary disease [19]. This discrimination function
operates based on logistic regression which is not interpretable easily. Gennari, et al, present
CLASSIT a model that extends earlier systems of incremental concept formation. CLASSIT is
a robust conceptual clustering system. It uses the heart disease problem as a study to test its
behavior [20]. Aha and Kibler [21] also provided an instance-based prediction of heart-disease
presence with the Cleveland database used in this research. Another work is proposed by Yan,
et al, by using multi layer perceptron to build decision support system for the diagnosis of five
major heart diseases [22].
Page 371

The CAD dataset is acquired from the Machine Learning Repository [23] provided by the
University of California, Irvine (UCI).
The data sets are collected from
• Cleveland Clinic Foundation (303 cases)
• Hungarian Institute of Cardiology, Budapest (294 cases)
• V.A. Medical Center, Long Beach, CA (200 cases)
• University Hospital, Zurich, Switzerland (123 cases)
The Cleveland data set is used as the case-base for the application with total of 303 cases. 128
cases from the Long Beach data set are used for testing the application.
Table 1: CAD Dataset Attributes. No. Attribute Data Type Description 1 age continuous age in years 2 sex boolean (male, 1; female, 0)
3 cp symbolic
chest pain type • typical angina, 1 • atypical angina, 2 • non-anginal pain, 3 • asymptomatic, 4
4 trestbps continuous resting blood pressure 5 chol continuous serum cholestoral in mg/dl 6 fbs boolean fasting blood sugar > 120 mg/dl)
7 restecg symbolic
resting electrocardiographic results • normal, 0 • ST-T wave abnormality, 1 • showing probable left
ventricular hypertrophy by Estes' criteria, 2
8 thalach continuous maximum heart rate achieved 9 exang boolean exercise induced angina
10 oldpeak continuous ST depression induced by exercise relative to rest
11 slope symbolic
the slope of the peak exercise • normal, 0 • upsloping, 1 • flat, 2 • downsloping, 3
12 ca integer number of major vessels (0-3) colored by flourosopy
13 thal symbolic • normal, 3 • fixed defect, 6 • reversable defect, 7
14 Class boolean diagnosis of heart disease (angiographic disease status) 0 is healthy, 1 is sick
Page 372

The attributes of these data sets are relating to physical examination, diagnostic laboratory and
stress tests. The database contains 76 attributes, but all published experiments refer to using a
subset of 14 of them as shown in Table 1.
To build the prediction application data sets of 303 selected patients from Cleveland is used.
There are some missing data in three input attributes which are slope, ca and thal. Missing data
are imputed using the substitution of missing data by the mode (most frequently occurring
value) [24].
Different files required for eZ-CBR shell are prepared; Figure 10 shows a sample of the case-
base file.
Figure 10. A Sample of CAD Case-Base.
The retrieval and adaptation are configured to the following parameters
• K parameter for K-Nearest Neighbour algorithm is set to 100 as an arbitrary number
• Neural network parameters are set to
o One hidden layer with 11 nodes
o Learning rate = 0.9
o Momentum = 0.9
o Maximum number of epochs = 3000
o Mean square error = 0.001
Page 373
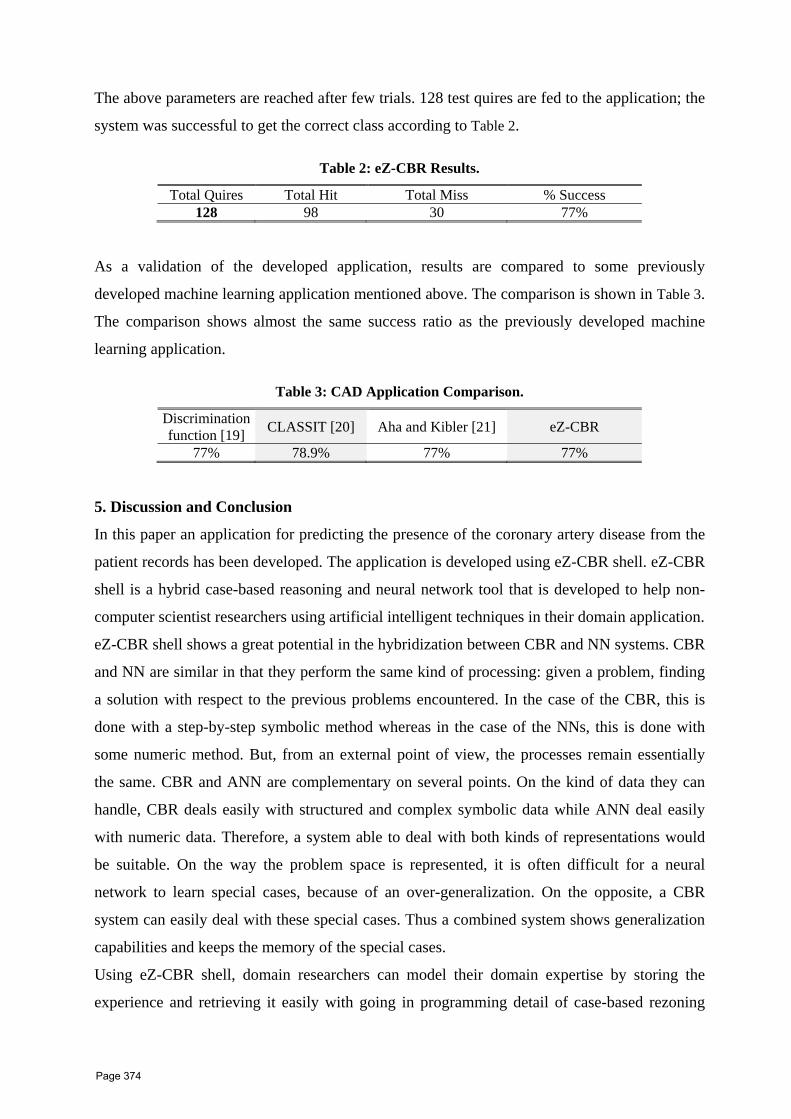
The above parameters are reached after few trials. 128 test quires are fed to the application; the
system was successful to get the correct class according to Table 2.
Table 2: eZ-CBR Results.
Total Quires Total Hit Total Miss % Success 128 98 30 77%
As a validation of the developed application, results are compared to some previously
developed machine learning application mentioned above. The comparison is shown in Table 3.
The comparison shows almost the same success ratio as the previously developed machine
learning application.
Table 3: CAD Application Comparison.
Discrimination function [19]
CLASSIT [20] Aha and Kibler [21] eZ-CBR
77% 78.9% 77% 77%
5. Discussion and Conclusion
In this paper an application for predicting the presence of the coronary artery disease from the
patient records has been developed. The application is developed using eZ-CBR shell. eZ-CBR
shell is a hybrid case-based reasoning and neural network tool that is developed to help non-
computer scientist researchers using artificial intelligent techniques in their domain application.
eZ-CBR shell shows a great potential in the hybridization between CBR and NN systems. CBR
and NN are similar in that they perform the same kind of processing: given a problem, finding
a solution with respect to the previous problems encountered. In the case of the CBR, this is
done with a step-by-step symbolic method whereas in the case of the NNs, this is done with
some numeric method. But, from an external point of view, the processes remain essentially
the same. CBR and ANN are complementary on several points. On the kind of data they can
handle, CBR deals easily with structured and complex symbolic data while ANN deal easily
with numeric data. Therefore, a system able to deal with both kinds of representations would
be suitable. On the way the problem space is represented, it is often difficult for a neural
network to learn special cases, because of an over-generalization. On the opposite, a CBR
system can easily deal with these special cases. Thus a combined system shows generalization
capabilities and keeps the memory of the special cases.
Using eZ-CBR shell, domain researchers can model their domain expertise by storing the
experience and retrieving it easily with going in programming detail of case-based rezoning
Page 374

cycle. Users are not only be able to retrieve the required experience, but they will also be able
to adapt the most similar cases without going in the complication details of the adaptation
process. All they need is to setup some parameters and eZ-CBR shell will do the rest for them
until getting the results.
In addition to the rapidness and ease of use of the eZ-CBR shell in the development of human-
like expert systems, the results of the developed systems show very good prediction regarding
the previously developed domain specific applications. The system is able to learn from the
data sets and then discover the knowledge in the form of a final decision. This shows that eZ-
CBR is successful domain independent hybrid tool able to rapidly develop human-like expert
systems that gives same results like domain specific machine learning application.
References
[1] Negnevitsky M., “Artificial intelligence: a guide to intelligent systems,” 2nd Ed. Addison-Wesley,
pp. 259-299, 2005.
[2] Watson I., “Applying Case-Based Reasoning: Techniques for Enterprise Systems,” Morgan
Kaufmann Publishers, California, 1997.
[3] Jaczynski M. and Trousse B., “An Object-Oriented Framework for the Design and the
Implementation of Case-Based Reasoners,” Proc. of the 6th German Workshop on Case-Based
Reasoning, Berlin, 1998.
[4] Bogaerts S. and Leake D., “A Framework for Rapid and Modular Case-Based Reasoning System
Development,” Technical Report, TR 617, Computer Science Department, Indiana University,
Bloomington, IN, 2005.
[5] Althoff K-D., Auriol E., Barletta R., and Manago M., “A Review of Industrial Case-Based
Reasoning Tools,” in Goodall A., “An AI Perspectives Report Oxford: AI Intelligence,” 1995.
[6] Abdrabou E., and Salem A., “Application of Case-Based Reasoning Frameworks in a Medical
Classifier,” Proc. of ICICIS-04, 2009.
[7] "Coronary heart disease statistics fact sheets 2008/2009," British Heart Foundation, London 2008.
[8] Zaret B. L., Moser M., and Cohen L. S., “Yale university school of medicine heart book,” New
York: Hearst Books, 1992.
[9] eMedicineHealth.com, http://www.emedicinehealth.com/coronary_heart_disease/article_em.htm.
[10] Aamodt A. and Plaza E., “Case-Based Reasoning: Foundational Issues, Methodological Variation
and System Approaches,” AICOM, Vol. 7, No. 1, pp. 39-58, 1994.
[11] Bello-Tomas J. J., Gonzlaez-Calero J. A. and Dïaz-Agudo B., “JCOLIBRI: An Object-Oriented
Framework for Building CBR Systems,'' Advances in Case-Based Reasoning, Lecture Notes in
Computer Science, Springer Berlin/ Heidelberg, Vol. 3155, pp. 32-46, 2004.
[12] Kolodner J. L., “Case-Based Reasoning,” Morgan Kaufmann Publishers, California, 1993.
Page 375

A Hybrid Case-Based Reasoning and Neural Network Approach for the Prediction of Heart-Disease
ICI 10 - 10TH INTERNATIONAL CONFERENCE ON INFORMATION
19
[13] Jain A. K., Mao J., and Mohiuddin K. M., “Artificial neural networks: a tutorial,” Computer, IEEE
Computer Society Press Los Alamitos, CA, Vol. 29(3), pp. 31-44, 1996.
[14] Bishop C. M., “Neural Networks for Pattern Recognition,” Oxford University Press, New York,
1995.
[15] Haykin S., “Neural Networks: A Comprehensive Foundation,” 2nd Ed, Englewood Cliffs, NJ:
Prentice-Hall., 1999.
[16] Manago M., Bergmann R., Conruyt N., Traph ner R., Pasley J., Le Renard J., Maurer F., Wes S.,
Althoff K. D., and Dumont S., “CASUEL: a common case representation language,'' ESPRIT
project 6322,Task 1.1, Deliverable D1, 1994.
[17] Richter M., “Foundations of Similarity and Utility,'' In D. Wilson, and G. Sutcliffe, Proc. of The
Twentieth International Florida Artificial Intelligence Research Society Conference FLAIRS-07,
AAAI Press, Menlo Park, California, pp. 30-37, 2007.
[18] Bergmann R., and Stahl A., “Similarity measures for object-oriented case representations,''
Advances in Case-Based Reasoning, No. 1488, Springer-Verlag London, UK, pp. 37-44, 1998.
[19] Detrano R., Janosi A., Steinbrunn W., Pfisterer M., Schmid J.-J., Sandhu S., Guppy K. H., Lee S.,
and Froelicher V., “International application of a new probability algorithm for the diagnosis of
coronary artery disease,'' The American Journal of Cardiology, Vol. 64, pp. 304-310, 1989.
[20] Gennari J.H., Langley P., and Fisher D., “Models of incremental concept formation,” Journal of
Artificial Intelligence, Vol. 40, pp. 11-61, 1989.
[21] W. David Aha and Dennis Kibler, “Instance-based prediction of heart disease presence with the
Cleveland database”.
[22] Yan H., Jiang Y., Zheng J., Peng C., and Li Q., “A multilayer perceptron-based medical decision
support system for heart disease diagnosis,” Expert Systems with Applications, Vol. 30, pp. 272,
2006.
[23] Frank A., Asuncion A., “UCI Machine Learning Repository” http://archive.ics.uci.edu/ml Irvine,
CA: University of California, School of Information and Computer Science, 2010.
[24] Diamantaopoulis, Schlegelmilch B., “Taking the Fear Out of Data Analysis,” Thomson, London,
2002.
Page 376
GAMASA, EGYPT, 4 – 6 DECEMBER 2010
A Study on Artificial Intelligent Techniques of
Myocardial SPECT perfusion Images Shymaa H. ElRefaie, Haythem El‐Messiery and Abdel‐Badeeh M. Salem
Faculty of Computer and Information Sciences, Ain Shams University, Cairo, Egypt [email protected], [email protected], [email protected]
Abstract
Single Photon Emission Computed Tomography (SPECT) scintigraphy is a non noninvasive diagnostic method for the assessment of presence and severity of coronary artery disease (CAD). Artificial intelligence techniques have been utilized to develop automated diagnostic systems with the aim to support human readers and improve the diagnostic accuracy. These methods use the individual diagnostic information of both normal and abnormal images of a case library and thus can potentially offer better diagnostic accuracy. This study presents different artificial intelligence approaches in diagnosis of myocardial SPECT perfusion and a comparative analysis between these approaches.
Keywords- Nuclear Medicine; SPECT; Artificial Intelligence; Case Based Reasoning; Myocardial Perfusion.
1. Introduction
Myocardial perfusion SPECT imaging is an established noninvasive method for the functional assessment of coronary artery disease. Visual interpretation of perfusion scintigrams requires experienced readers and is associated with interobserver variability. Thus, computer based methods have been developed that support decisions with quantitative image analysis [1].
In recent years, methods of artificial intelligence such as expert system, neural networks and case-based reasoning have improved the diagnostic accuracy of automated interpretation of myocardial perfusion images. These methods use the individual diagnostic information of both normal and abnormal images of a case library and thus can potentially offer better diagnostic accuracy than does polar map analysis using a database of reference limits that have been derived by statistical analysis. In the artificial neural network approach, the concept is to try to emulate how human neurons perform pattern recognition tasks. Repeated recognition trials are run using sample perfusion data as input and using corresponding coronary angiography results as output to modify the strength between the input and output nodes. In this manner, the network is trained and the input data eventually predict the output. In the case-based reasoning approach, the algorithm searches a library of patient cases to find the ones that best match those of the patient study being
Page 377
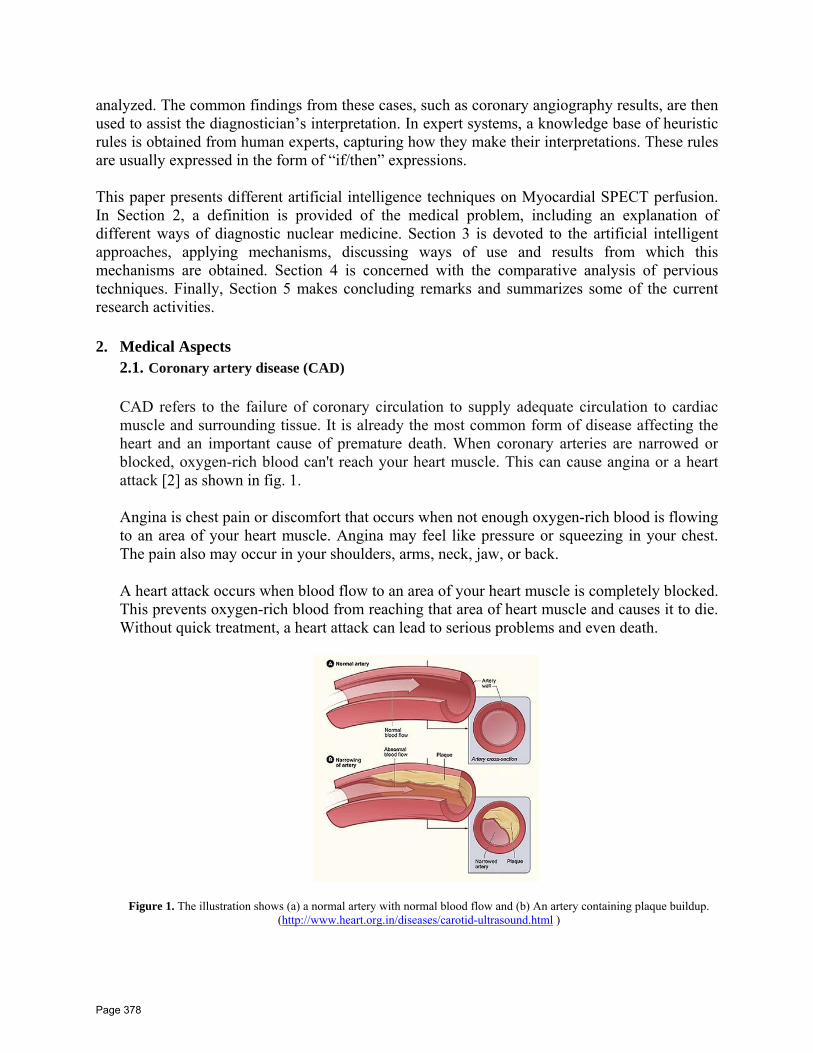
analyzed. The common findings from these cases, such as coronary angiography results, are then used to assist the diagnostician’s interpretation. In expert systems, a knowledge base of heuristic rules is obtained from human experts, capturing how they make their interpretations. These rules are usually expressed in the form of “if/then” expressions.
This paper presents different artificial intelligence techniques on Myocardial SPECT perfusion. In Section 2, a definition is provided of the medical problem, including an explanation of different ways of diagnostic nuclear medicine. Section 3 is devoted to the artificial intelligent approaches, applying mechanisms, discussing ways of use and results from which this mechanisms are obtained. Section 4 is concerned with the comparative analysis of pervious techniques. Finally, Section 5 makes concluding remarks and summarizes some of the current research activities.
2. Medical Aspects
2.1. Coronary artery disease (CAD)
CAD refers to the failure of coronary circulation to supply adequate circulation to cardiac muscle and surrounding tissue. It is already the most common form of disease affecting the heart and an important cause of premature death. When coronary arteries are narrowed or blocked, oxygen-rich blood can't reach your heart muscle. This can cause angina or a heart attack [2] as shown in fig. 1.
Angina is chest pain or discomfort that occurs when not enough oxygen-rich blood is flowing to an area of your heart muscle. Angina may feel like pressure or squeezing in your chest. The pain also may occur in your shoulders, arms, neck, jaw, or back.
A heart attack occurs when blood flow to an area of your heart muscle is completely blocked. This prevents oxygen-rich blood from reaching that area of heart muscle and causes it to die. Without quick treatment, a heart attack can lead to serious problems and even death.
Figure 1. The illustration shows (a) a normal artery with normal blood flow and (b) An artery containing plaque buildup. (http://www.heart.org.in/diseases/carotid-ultrasound.html )
Page 378

Myocardial perfusion imaging (MPI) is a form of functional cardiac imaging, used for the diagnosis of ischemic heart disease. The underlying principle is that under conditions of stress, diseased myocardium receives less blood flow than normal myocardium. MPI is one of several types of cardiac stress test [3].
2.2. Diagnosis of CAD
Nuclear medicine is a branch or specialty of medicine and medical imaging that uses radionuclides and relies on the process of radioactive decay in the diagnosis and treatment of disease. In nuclear medicine procedures, radionuclides are combined with other chemical compounds or pharmaceuticals to form radiopharmaceuticals. These radiopharmaceuticals, once administered to the patient, can localize to specific organs or cellular receptors. This property of radiopharmaceuticals allows nuclear medicine the ability to image the extent of a disease-process in the body, based on the cellular function and physiology, rather than relying on physical changes in the tissue anatomy. In some diseases nuclear medicine studies can identify medical problems at an earlier stage than other diagnostic tests.
There are several techniques [4] of diagnostic nuclear medicine:
• Scintigraphy is a form of diagnostic test, wherein radiopharmaceuticals are taken internally, and the emitted radiation is captured by external detectors (gamma cameras) to form two-dimensional (2D) images.
• Positron emission tomography (PET) is a nuclear medicine imaging technique which produces a three-dimensional image or picture of functional processes in the body. The system detects pairs of gamma rays emitted indirectly by a positron-emitting radionuclide (tracer), which is introduced into the body on a biologically active molecule.
• Single Photon Emission Computer Tomography (SPECT) is a nuclear medicine tomographic imaging technique using gamma rays. It is very similar to conventional nuclear medicine planar imaging using a gamma camera. However, it is able to provide three dimensional (3D) information. This information is typically presented as cross-sectional slices through the patient, but can be freely reformatted or manipulated as required.
Page 379
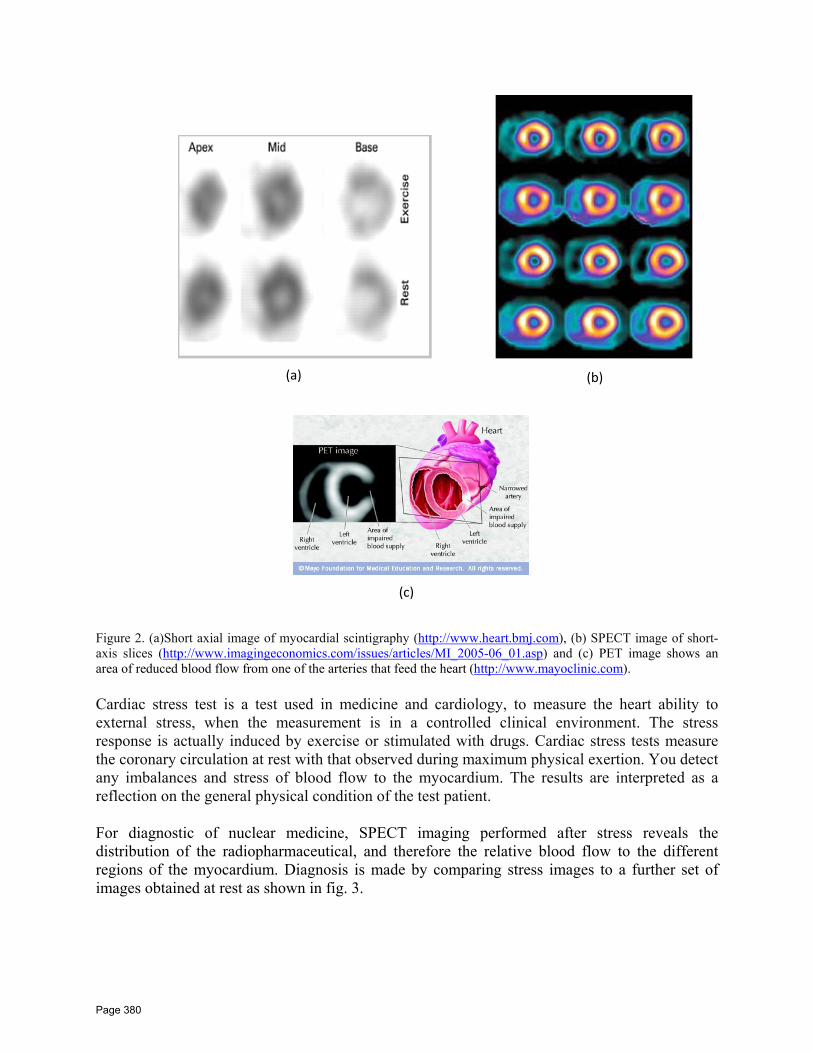
(a) (b)
(c)
Figure 2. (a)Short axial image of myocardial scintigraphy (http://www.heart.bmj.com), (b) SPECT image of short-axis slices (http://www.imagingeconomics.com/issues/articles/MI_2005-06_01.asp) and (c) PET image shows an area of reduced blood flow from one of the arteries that feed the heart (http://www.mayoclinic.com).
Cardiac stress test is a test used in medicine and cardiology, to measure the heart ability to external stress, when the measurement is in a controlled clinical environment. The stress response is actually induced by exercise or stimulated with drugs. Cardiac stress tests measure the coronary circulation at rest with that observed during maximum physical exertion. You detect any imbalances and stress of blood flow to the myocardium. The results are interpreted as a reflection on the general physical condition of the test patient.
For diagnostic of nuclear medicine, SPECT imaging performed after stress reveals the distribution of the radiopharmaceutical, and therefore the relative blood flow to the different regions of the myocardium. Diagnosis is made by comparing stress images to a further set of images obtained at rest as shown in fig. 3.
Page 380
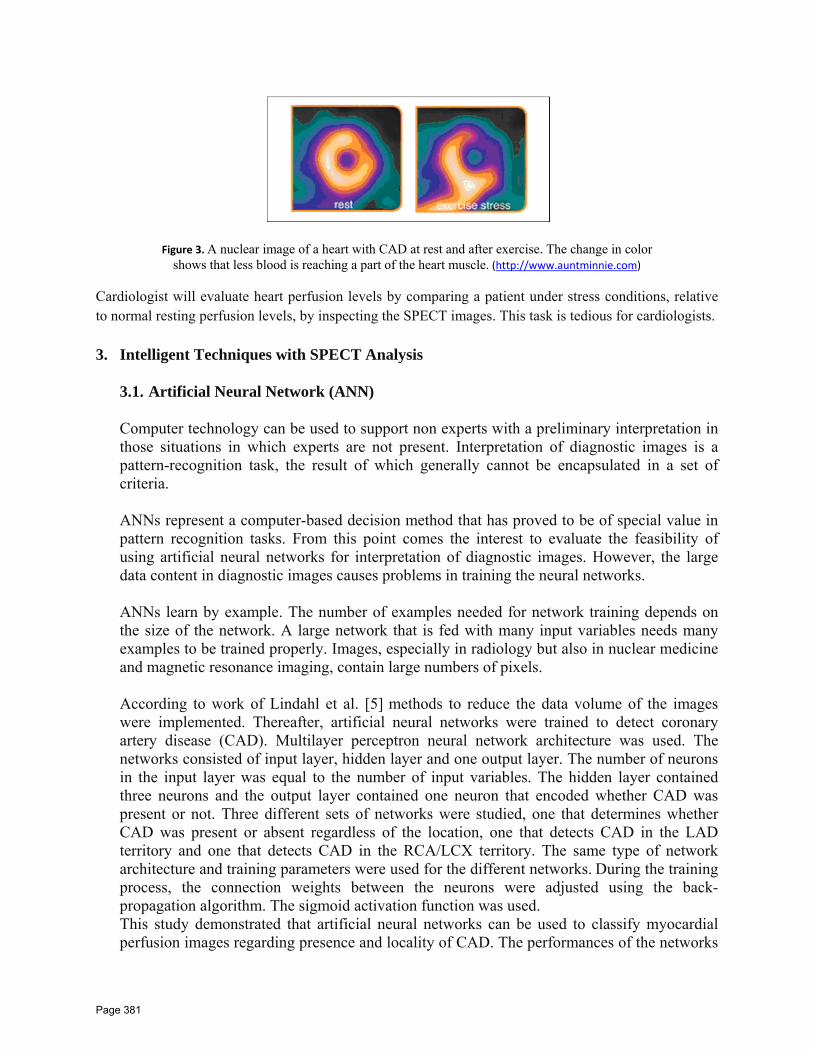
Figure 3. A nuclear image of a heart with CAD at rest and after exercise. The change in color shows that less blood is reaching a part of the heart muscle. (http://www.auntminnie.com)
Cardiologist will evaluate heart perfusion levels by comparing a patient under stress conditions, relative to normal resting perfusion levels, by inspecting the SPECT images. This task is tedious for cardiologists.
3. Intelligent Techniques with SPECT Analysis
3.1. Artificial Neural Network (ANN)
Computer technology can be used to support non experts with a preliminary interpretation in those situations in which experts are not present. Interpretation of diagnostic images is a pattern-recognition task, the result of which generally cannot be encapsulated in a set of criteria. ANNs represent a computer-based decision method that has proved to be of special value in pattern recognition tasks. From this point comes the interest to evaluate the feasibility of using artificial neural networks for interpretation of diagnostic images. However, the large data content in diagnostic images causes problems in training the neural networks.
ANNs learn by example. The number of examples needed for network training depends on the size of the network. A large network that is fed with many input variables needs many examples to be trained properly. Images, especially in radiology but also in nuclear medicine and magnetic resonance imaging, contain large numbers of pixels. According to work of Lindahl et al. [5] methods to reduce the data volume of the images were implemented. Thereafter, artificial neural networks were trained to detect coronary artery disease (CAD). Multilayer perceptron neural network architecture was used. The networks consisted of input layer, hidden layer and one output layer. The number of neurons in the input layer was equal to the number of input variables. The hidden layer contained three neurons and the output layer contained one neuron that encoded whether CAD was present or not. Three different sets of networks were studied, one that determines whether CAD was present or absent regardless of the location, one that detects CAD in the LAD territory and one that detects CAD in the RCA/LCX territory. The same type of network architecture and training parameters were used for the different networks. During the training process, the connection weights between the neurons were adjusted using the back-propagation algorithm. The sigmoid activation function was used. This study demonstrated that artificial neural networks can be used to classify myocardial perfusion images regarding presence and locality of CAD. The performances of the networks
Page 381
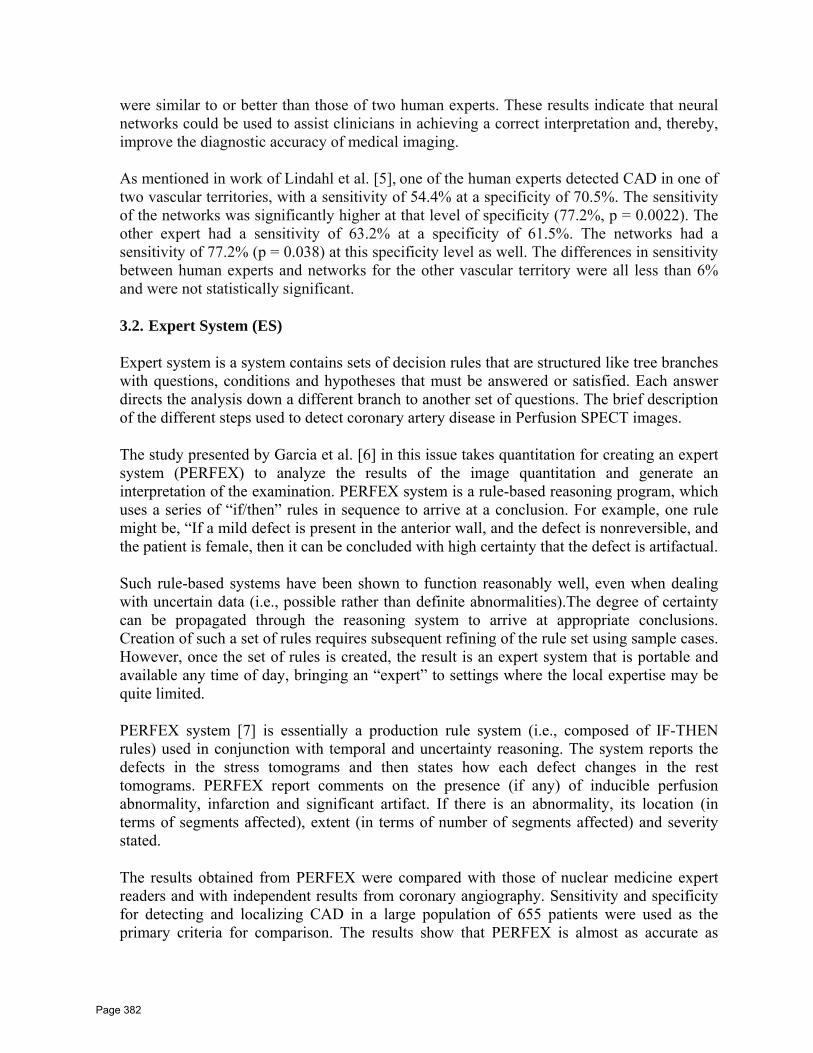
were similar to or better than those of two human experts. These results indicate that neural networks could be used to assist clinicians in achieving a correct interpretation and, thereby, improve the diagnostic accuracy of medical imaging. As mentioned in work of Lindahl et al. [5], one of the human experts detected CAD in one of two vascular territories, with a sensitivity of 54.4% at a specificity of 70.5%. The sensitivity of the networks was significantly higher at that level of specificity (77.2%, p = 0.0022). The other expert had a sensitivity of 63.2% at a specificity of 61.5%. The networks had a sensitivity of 77.2% (p = 0.038) at this specificity level as well. The differences in sensitivity between human experts and networks for the other vascular territory were all less than 6% and were not statistically significant.
3.2. Expert System (ES)
Expert system is a system contains sets of decision rules that are structured like tree branches with questions, conditions and hypotheses that must be answered or satisfied. Each answer directs the analysis down a different branch to another set of questions. The brief description of the different steps used to detect coronary artery disease in Perfusion SPECT images.
The study presented by Garcia et al. [6] in this issue takes quantitation for creating an expert system (PERFEX) to analyze the results of the image quantitation and generate an interpretation of the examination. PERFEX system is a rule-based reasoning program, which uses a series of “if/then” rules in sequence to arrive at a conclusion. For example, one rule might be, “If a mild defect is present in the anterior wall, and the defect is nonreversible, and the patient is female, then it can be concluded with high certainty that the defect is artifactual.
Such rule-based systems have been shown to function reasonably well, even when dealing with uncertain data (i.e., possible rather than definite abnormalities).The degree of certainty can be propagated through the reasoning system to arrive at appropriate conclusions. Creation of such a set of rules requires subsequent refining of the rule set using sample cases. However, once the set of rules is created, the result is an expert system that is portable and available any time of day, bringing an “expert” to settings where the local expertise may be quite limited.
PERFEX system [7] is essentially a production rule system (i.e., composed of IF-THEN rules) used in conjunction with temporal and uncertainty reasoning. The system reports the defects in the stress tomograms and then states how each defect changes in the rest tomograms. PERFEX report comments on the presence (if any) of inducible perfusion abnormality, infarction and significant artifact. If there is an abnormality, its location (in terms of segments affected), extent (in terms of number of segments affected) and severity stated.
The results obtained from PERFEX were compared with those of nuclear medicine expert readers and with independent results from coronary angiography. Sensitivity and specificity for detecting and localizing CAD in a large population of 655 patients were used as the primary criteria for comparison. The results show that PERFEX is almost as accurate as
Page 382
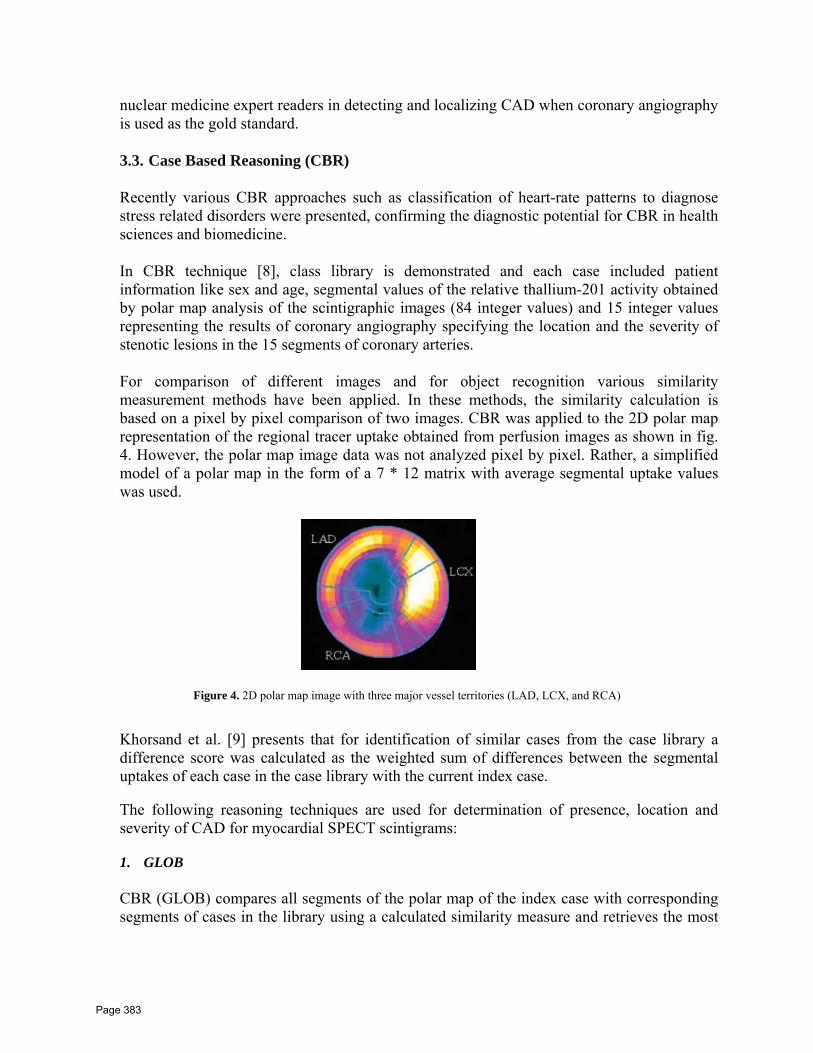
nuclear medicine expert readers in detecting and localizing CAD when coronary angiography is used as the gold standard.
3.3. Case Based Reasoning (CBR)
Recently various CBR approaches such as classification of heart-rate patterns to diagnose stress related disorders were presented, confirming the diagnostic potential for CBR in health sciences and biomedicine.
In CBR technique [8], class library is demonstrated and each case included patient information like sex and age, segmental values of the relative thallium-201 activity obtained by polar map analysis of the scintigraphic images (84 integer values) and 15 integer values representing the results of coronary angiography specifying the location and the severity of stenotic lesions in the 15 segments of coronary arteries.
For comparison of different images and for object recognition various similarity measurement methods have been applied. In these methods, the similarity calculation is based on a pixel by pixel comparison of two images. CBR was applied to the 2D polar map representation of the regional tracer uptake obtained from perfusion images as shown in fig. 4. However, the polar map image data was not analyzed pixel by pixel. Rather, a simplified model of a polar map in the form of a 7 * 12 matrix with average segmental uptake values was used.
Figure 4. 2D polar map image with three major vessel territories (LAD, LCX, and RCA)
Khorsand et al. [9] presents that for identification of similar cases from the case library a difference score was calculated as the weighted sum of differences between the segmental uptakes of each case in the case library with the current index case.
The following reasoning techniques are used for determination of presence, location and severity of CAD for myocardial SPECT scintigrams:
1. GLOB CBR (GLOB) compares all segments of the polar map of the index case with corresponding segments of cases in the library using a calculated similarity measure and retrieves the most
Page 383

similar case (best-match) or a set of similar cases (best-list) to derive the diagnosis for the case.
2. Territorial (TER) CBR (TER) compares single case which was divided into three separate territories corresponding to the anatomic distribution of the three major coronary arteries and each major vessel territory was treated as an independent case. Each vessel territory (LAD/ LCX/RCA) on the polar map was considered as a separate case, which was compared to corresponding territories of cases in the case library. For calculation of the similarity measure the quantitative polar map was divided into three corresponding territories and retrieves three best-match cases (or three best-lists) for each territory of the LAD, LCX, and RCA to derive the angiographic diagnosis for the corresponding territory.
3. GROUP CBR (GROUP) technique divides the case library into partitions with similar cases to optimize the accuracy and efficiency of a system. In this method, the case library was divided in eight case groups corresponding to the extent of coronary artery disease in the three major coronary vessels using the angiography data of each case. Eight case groups were compiled as follows:
• Group 1: normal cases or cases with only minor lumen • Groups 2 4ــ: cases with single vessel disease (LAD, LCX, or RCA). • Groups 5 7ــ: cases with two vessel disease (LAD-LCX, LAD-RCA, or LCX-
RCA). • Group 8: cases with three vessel disease (LAD, LCX and RCA).
In this method, the new case was compared with all cases in the eight subgroups separately and a group difference score was calculated as an average of the difference score of cases in the corresponding group. The most similar group (best-match) or a list of groups (best-list) was then used to derive the diagnosis for the presented case.
In the previous CBR techniques, Two retrieval approaches where used: 1. Best-match Approach:
A case (for GLOB and TER method) or a group (for GROUP method) with the highest degree of similarity (lowest difference score) was retrieved from the library as the result.
2. Best-list Approach (Adaptation approach): A set of cases or groups with the highest degree of similarity (lowest difference score) were retrieved from the case library and were then adapted to resemble more closely the index case.
For overall detection of significant CAD, According to work of Khorsand et al. [9], fig 5 shows that the best-match approach of both TER and GROUP retrieval methods showed a higher diagnostic accuracy than the GLOB.
Page 384
Figure 5. Accuracy, sensitivity, and specificity for the overall detection of significant coronary artery disease by best-match results of global (GLOB-BM), territorial (TERBM), and group retrieve (GROUP-BM) approaches of case based reasoning.
4. Comparative Analysis of pervious techniques
Neural networks differ from AI expert systems since they do not require complicated programs for formation of rules based on capturing the knowledge of one or more experts. Neural network systems are able to form those rules by a learning procedure using pairs of training input data and desired output data. However, understanding how to effectively execute this "learning" is the key point for the neural network system; in general, one has to collect enough patterns to train the network [10]. On the other hand, an expert system might be a better approach in the event of difficulty in preparing enough patterns to train it. Therefore, the process of learning or training can be an advantage of the neural network approach as well as a disadvantage. Moreover, hybrid systems, called "expert networks," which include both neural networks and expert systems, may be useful for further complicated applications. A potential disadvantage of neural networks is that once they are created, their method of function is difficult to describe in a way that can be comprehended by humans, making it impossible for the user to figure out how the program arrived at a given conclusion. Case-based reasoning programs are similar to neural networks in that they use a large set of examples with known diagnoses to arrive at a conclusion. However, they omit the neural network “training” step and instead give a diagnosis by finding the most similar case in database of known examples [11, 12]. 5. Conclusion
In this study we present different approaches of artificial intelligence for the assessment of coronary artery disease based on analysis of myocardial SPECT perfusion scintigrams. We stated some results of different algorithms according to mechanisms and approaches obtained. The final comparative analysis shows the advantage and disadvantages for each method. This concludes that using of artificial intelligence techniques can offer better diagnostic accuracy than visual interpretation of myocardial SPECT perfusion scintigrams which sure can help cardiologists in their work.
Page 385

ICI 10 - 10TH INTERNATIONAL CONFERENCE ON INFORMATION
10
References
[1] Wanda Acampa, Wei He, Carmine di Nuzzo and Alberto Cuocolo, “Quantification of myocardial perfusion imaging”, Journal of Nuclear Cardiolog, Vol. 9, No. 3 (2002) [2] Wim van den Broek, Alberto Cuocolo and Adriana Ghilardi, “Myocardial Perfusion Imaging”, European Association of Nuclear Medicine Technologist Committee Education Sub-Committee (2004)
[3] Kenneth Revett, Abd-badeeh M. Salem and Florin Gorunescu, "A Rule-based Approach to Processing SPECT Imaging for the diagnosis of Heart Disease", In the fifth International Conference of Euro-Mediterranean Medical Informatics and Telemedicine (2009)
[4] Felipe Massicano, Adriana V. F. Massicano, Natanael Gomes da Silva, Felipe Belonsi Cintra, Rodrigo Müller de Carvalho and Hélio Yoriyaz, “ANALYSIS OF CT AND PET/SPECT IMAGES FOR DOSIMETRY CALCULATION”, International Nuclear Atlantic Conference (2009) [5] Dan Lindahl, John Palmer, Mattias Ohlsson, Carsten Peterson, Anders Lundin and Lars Edenbrandt, “Automated Interpretation of Myocardial SPECT Perfusion Images Using Artificial Neural Networks”, The Journal of Nuclear Medicine Vol. 38, No. 12 (1997) [6] Ernest V. Garcia, C. David Cooke, Russell D. Folks, Cesar A. Santana, Elzbieta G. Krawczynska, Levien De Braal, and Norberto F. Ezquerra, “Diagnostic Performance of an Expert System for the Interpretation of Myocardial Perfusion SPECT Studies”, The Journal of Nuclear Medicine Vol. 42, No. 8 (2001) [7] Rashid Jalal Qureshi and Syed Afaq Husain, “Design of an Expert System for Diagnosis of Coronary Artery Disease Using Myocardial Perfusion Imaging”, National Conference on Emerging Technologies (2004) [8] Aliasghar Khorsand, Mojgan Haddad, Senta Graf, Deddo Moertl, Heinz Sochor, and Gerold Porenta, “Automated Assessment of Dipyridamole 201Tl Myocardial SPECT Perfusion Scintigraphy by Case-Based Reasoning”, The Journal of Nuclear Medicine Vol. 42, No. 2 (2001)
[9] Aliasghar Khorsand , Senta Graf , Heinz Sochor ,Ernst Schuster , Gerold Porenta , “Automated assessment of myocardial SPECT perfusion scintigraphy: A comparison of different approaches of case-based reasoning”, Artificial Intelligence in Medicine (2007)
[10] Hiroshi Fujita, Tetsuro Katafuchi, Toshiisa Uehara, and Tsunehiko Nishimura, “Application of Artificial Neural Network to Computer-Aided Diagnosis of Coronary Artery Disease in Myocardial SPECT Bull's eyeImages”, The Journal of Nuclear Medicine Vol 33,No. 2 (1992) [11] Jerold W. Wallis, “Use of Artificial Intelligence in Cardiac Imaging”, The Journal of Nuclear Medicine, Vol. 42, No. 8 (2001) [12] Russell D. Folks, “Interpretation and Reporting of Myocardial Perfusion SPECT: A Summary for Technologists”, The Journal of Nuclear Medicine, Vol. 30, No. 4 (2002)
Page 386
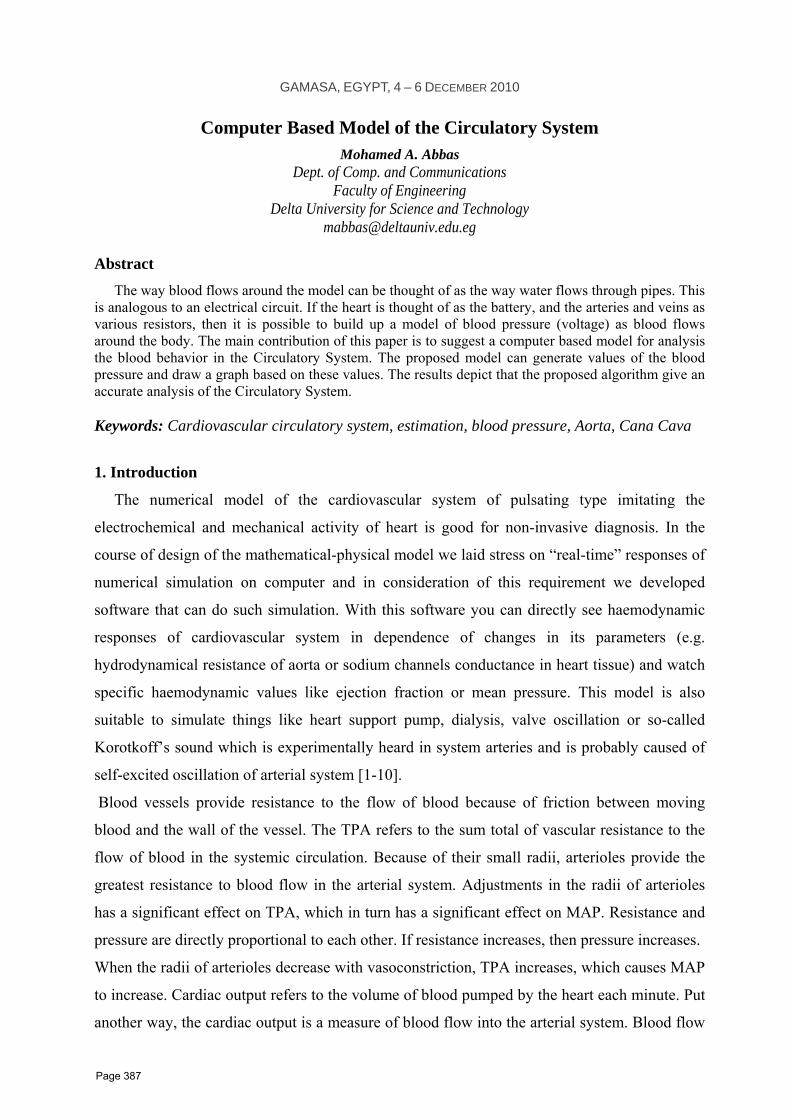
GAMASA, EGYPT, 4 – 6 DECEMBER 2010
Computer Based Model of the Circulatory System Mohamed A. Abbas
Dept. of Comp. and Communications Faculty of Engineering
Delta University for Science and Technology [email protected]
Abstract The way blood flows around the model can be thought of as the way water flows through pipes. This is analogous to an electrical circuit. If the heart is thought of as the battery, and the arteries and veins as various resistors, then it is possible to build up a model of blood pressure (voltage) as blood flows around the body. The main contribution of this paper is to suggest a computer based model for analysis the blood behavior in the Circulatory System. The proposed model can generate values of the blood pressure and draw a graph based on these values. The results depict that the proposed algorithm give an accurate analysis of the Circulatory System. Keywords: Cardiovascular circulatory system, estimation, blood pressure, Aorta, Cana Cava
1. Introduction
The numerical model of the cardiovascular system of pulsating type imitating the
electrochemical and mechanical activity of heart is good for non-invasive diagnosis. In the
course of design of the mathematical-physical model we laid stress on “real-time” responses of
numerical simulation on computer and in consideration of this requirement we developed
software that can do such simulation. With this software you can directly see haemodynamic
responses of cardiovascular system in dependence of changes in its parameters (e.g.
hydrodynamical resistance of aorta or sodium channels conductance in heart tissue) and watch
specific haemodynamic values like ejection fraction or mean pressure. This model is also
suitable to simulate things like heart support pump, dialysis, valve oscillation or so-called
Korotkoff’s sound which is experimentally heard in system arteries and is probably caused of
self-excited oscillation of arterial system [1-10].
Blood vessels provide resistance to the flow of blood because of friction between moving
blood and the wall of the vessel. The TPA refers to the sum total of vascular resistance to the
flow of blood in the systemic circulation. Because of their small radii, arterioles provide the
greatest resistance to blood flow in the arterial system. Adjustments in the radii of arterioles
has a significant effect on TPA, which in turn has a significant effect on MAP. Resistance and
pressure are directly proportional to each other. If resistance increases, then pressure increases.
When the radii of arterioles decrease with vasoconstriction, TPA increases, which causes MAP
to increase. Cardiac output refers to the volume of blood pumped by the heart each minute. Put
another way, the cardiac output is a measure of blood flow into the arterial system. Blood flow
Page 387

is directly proportional to pressure (Flow = pressure/resistance), therefore an increase in flow
(cardiac output) will cause an increase in pressure (MAP). Blood volume is directly related to
blood pressure. If the blood volume is increased, then venous return of blood to the heart will
increase. An increase in venous return will, by Starling's Law, cause stroke volume to increase.
As stroke volume goes up the cardiac output goes up and the blood pressure rises. Thus one
way to control blood pressure over the long term is to control blood volume.The main
objective of this paper is to simulate the main functions of circulatory system using the basic
terms related to it. This objective can lead to more understand of the blood behavior in the
circulatory system. Figure1 depicts Fluid Exchange between Capillaries and Tissues [11-15].
Figure1: Fluid Exchange between Capillaries and Tissues
2 Previous Work The way blood flows around the model can be thought of as the way water flows through
pipes. This is analogous to an electrical circuit. If the heart is thought of as the battery, and the
arteries and veins as various resistors, then it is possible to build up a model of blood pressure
(voltage) as blood flows around the body. The model will generate values of the blood pressure
and draw a graph based on these values. The parameters that affect the blood are:
- Heart rate : The number of times the heart beats, pumps blood per minute.
- Stroke volume : The volume of blood pumped out by the heart per beat. This is multiplied by
the heart rate to give the cardiac output.
- Viscosity : The viscosity of the blood will affect the flow through the body.
The parameters that affect the blood carrying vessels are:
- Length : The longer the vessel, the more resistance there is to flow. This is similar to the
length of wires.
- Radius : This defines how narrow or wide the vessel is. Narrow vessels will be more resistant
to the flow of blood, much the same way that thin wires increase electrical resistively.
Page 388

- Number : The number of vessels in this section of the route. A greater number of vessels will
decrease the resistance to flow, similar to the effect of placing resistors in parallel.
The types of blood carrying vessels in the model are:
- Aorta : The major vessel carrying blood out of the heart.
- Large artery : The next biggest artey to the aorta, this is when the blood begins to branch out.
- Medium artery : Smaller but greater in number as the blood is split further.
- Arteriol : Small but there are millions in the body.
- Capillary : The smallest of all the blood carrying vessels. They are very narrow but there a
billions in the body.
- Venule : The vein equivalent of an ateroil.
- Medium vein : The same as the artery.
- Large vein : The same as the artrey.
- Vena cava : The major vessel carrying blood back to the heart [16-28]. 2-1 Haemodynamic Performance of Cardiovascular System
Zdeněk Brož et al in [1] introduced the following equations describes pressure changes in
the pulmonary artery and aorta
i
iiii
i Cdt
tdVVUtV
tP)
)()((
)(η+−
=
i=2,8 (1)
For other segments in pulmonary and systemic circuit we can omit the last item in the equation
and use it in following form :
i
iii C
VUtVtP
))(()(
−=
i=3,4,5,9,10,11,12,13,14,15 (2)
where C[m3/Pa] denotes the compliance, VU[m3] is the residual volume and η[1] represents
the wall viscosity. Pressure in dialysis pump is described by following equation :
(10)
Blood flow between compartments is determined by the balance of momentum in the following
differential and ordinary equations :
3
• between ventricles and output arteries, and between dialysis pump and systemic veins:
TttT
Pt ampl ,0;)(sin)( 216 ∈=
πP
⎟⎟⎠
⎞⎜⎜⎝
⎛−−−= 2
2,
2
,,,
)()(
2)()()(1)(
tAtF
tFRtptpLdt
tdF
j
kjkjkjkj
j
kj ρξ
Page 389

j=1,7,16; k=2,8,11 (3)
• in flow that comes from pulmonary artery or aorta we can omit the last item that
represents blood inertia :
j=2,8,8; k=3,9,12 (4) ( ))()()(1)(,,
, tFRtptpLdt
tdFkjkjkj
j
kj −−=
• flow between other segments are described in following form :
( ) 2
2
,,
)(.)()(1)(
i
ikj
kjkj VU
tVtptp
RtF −=
j=3,4,9,9,9,9,10,13,14,15;
k=4,5,10,14,15,16,11,11,11,11 (5)
• or
( ))()(1)(
,, tptp
RtF kj
kjkj −= j=0,5,6,11,12 ; k=1,6,7,0,13 (6)
where L[Pa.s2/m3] characterizes the blood inertia, R[Pa.s/m3] is the hydrodynamical
resistance, ξ[1] is the coefficient of blood inertia and A[m2] is the flow area. The volume
changes in all segments of the cardiovascular system are determined by the balance of mass
[29].
i, j, k=0,1,2,…,16 (7) )()()( ,, tFtFtVdtd
kjjij −=
3. A Simulator of the Circulatory System In this section a simulator of circulatory system is introduced based on derived equations
form the conservation of average blood volume and the systematic arterial pressure introduced
in [29] by Athanasios Tsanas et al .
Ca Pa = -(Pa-Pv)/Rc + H (Clv Ppv) (8)
Cv Pv = (Pa-Pv)/Rc – (Pv/ Rv)
[Ca/dt + AVstate/Rav +1/Ra] = [Ca Pa (t-dt)/dt+ Pv/ Ra] ( 9)
Where Pa the mean arterial pressure, Pv the mean venous pressure, Cv the compliance of the
venous system, Rc the resistance to flow through the arterial system, Rv the resistance to flow
through the venous system, Ca the compliance of the arterial system, dv the stroke volume and
H is the heart rate. On other hand the systematic arterial pressure by way of of the swan ganz
is measured from the following equation:
Pa(systematic arterial pressure) = CO(cardiac output)*SVR(systemic vascular resistance)
Equations 8 and 9 leads to the following equation
Page 390

Rc Ca Pa = -Pa+Pv+RcH Clv Ppv (10)
Equations 2 and 3 leads to the following derived equation:
Ra dt AVstate + Rc H Clv Ppv dt Rav = Ra Ca Rav (Pa-1)+(dt Rav)(Rc Ca Pa-1)+Pa dt Rav
From the following equation we can deduce the values of Aortic valve states from the
following equation:
AVstate = (Ra Ca Rav (Pa-1)+(dt Rav)(Rc Ca Pa-1)+Pa dt Rav-Rc H Clv Ppv dt Rav) / (Ra dt)
Above derived equations is a trend toward a clear view of the circulatory system in different
states. Next section analyzes the proposed simulator where two parameters of analysis is used:
the drop in pressure and the total resistance in aorta and vana cava.
4. System Analysis and Results This section measures the performance of the proposed simulator from two points of view.
Figure 2 depicts that pressure drop increases rapidly if the radius of aorta decreases. This is a
logical view where decreasing the radius of aorta refers two more fats on its wall that causes
more effects on drop the pressure. Figure 3 simulated the pressure drop related the increasing
of Vena Cava length where drop increases rapidly but in small steps comparing with the case
of aorta. Figure 4 study the total resistance at different values of Cana Cava radius ;it is clear
that the total resistance increases in linear steps by increasing the length of vena cava. Figure 5
depicts the effect of drop in pressure related to the arterial system blood pressure. The figure depicts
that the arterial system blood pressure varies in approximatly linear steps causes many drops in blood
pressure. The above results explains the circle and varitaions in circulatory system.
Page 391
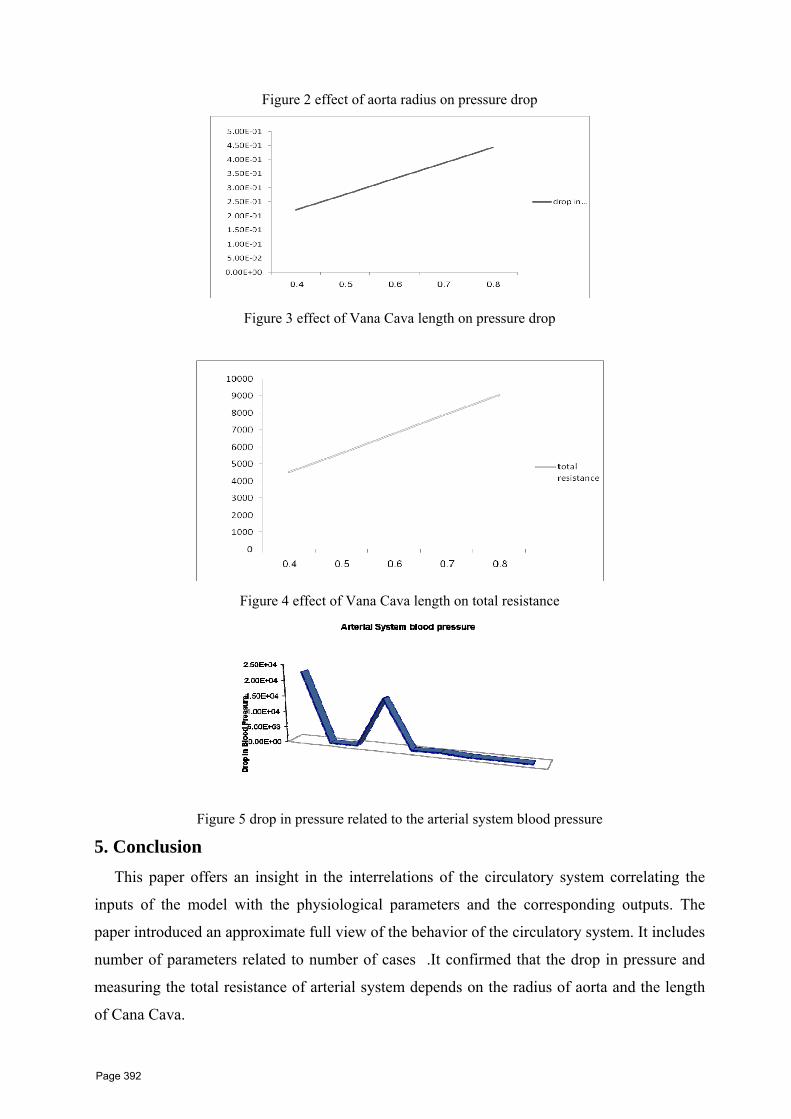
Figure 2 effect of aorta radius on pressure drop
Figure 3 effect of Vana Cava length on pressure drop
Figure 4 effect of Vana Cava length on total resistance
Figure 5 drop in pressure related to the arterial system blood pressure
5. Conclusion This paper offers an insight in the interrelations of the circulatory system correlating the
inputs of the model with the physiological parameters and the corresponding outputs. The
paper introduced an approximate full view of the behavior of the circulatory system. It includes
number of parameters related to number of cases .It confirmed that the drop in pressure and
measuring the total resistance of arterial system depends on the radius of aorta and the length
of Cana Cava.
Page 392

References [1] Zdeněk Brož et al ,Mathematical modeling of Cardiovascular System,2005.
[2] E. B. Shim, J. Y. Sah, C. H. Youn, Mathematical modeling of cardiovascular system dynamics using a lumped
parameter method. Jpn J Physiol, Vol. 54, No. 6. (December 2004), pp. 545-553.
[3] Převorovská S., Maršík F., Musil J. Human cardiovascular system with heart failure under
baroreflex control (numerical model), Acta of Bioengineering and Biomechanics Vol. 3, No. 1, 2001
[4] Brož. Z Diploma Thesis, Faculty of Nuclear Sciences and Physical Engineering, CVUT, 2001
[5] M. O’Rourke: Accurate measurement of arterial pressure, Journal of Human Hypertension, Vol. 17,
No. 7, 445-447, 2003.
[6] J. Melbin and A. Noordergraaf: Pressure Gradient Related to Energy Conversion in the Aorta, Circ.
Res.,52; 143-150, 1983.
[7] A. Quarteroni: Modeling the Cardiovascular System: A mathematical challenge: 961:970,
Mathematics Unlimited – 2001 and Beyond, B. Engquist and W. Schmid, eds., Springer Verlag, Berlin,
2000.
[8] P. Molino, C. Cerutti, C. Julien et al: Beat-to-beat estimation of Windkessel model parameters in c
[9] S. Cani_c, Blood flow through compliant vessels after endovascular repair: Wall deformation
induced by the discontinuous wall properties, submitted to Comput. Visual. Sci., 2001.
[10] L. Formaggia, J.-F. Gerbeau, F. Nobile, and A. Quarteroni, On the coupling of 3D and ID Navier–
Stokes equations for flow problems in compliant vessels, Comp. Meth. Appl. Mech. Eng., to appear,
2001.
[11] L. Formaggia, F. Nobile, A. Quarteroni, and A. Veneziani, Multiscale modelling of the circulatory
system: A preliminary analysis, Comput. Visual. Sci., 2 (1999), 75–83.
[12] I.V. Haljasmaa, A.M. Robertson, and G.P. Galdi, On the effect of apex geometry on wall shear
stress and pressure in two-dimensional models of arterial bifurcations, to appear, Math. Models Meth.
Appl. Sci., 2001.
[13] R. Wulandana and A.M. Robertson, Use of a multi-mechanism constitutive model for inflation of
cerebral arteries, Proceedings of First Joint BMES/EMBS Conference, Atlanta, Georgia, October 13–16,
1999.onscious rats, Am. J. Physiol., 274: H171-H177, 1998.
[14] Choi S, Antaki JF, Boston JR, Thomas D: A Sensorless Approach to Control of A Turbodynamic
Left Ventricular Assist System, IEEE Trans CST 9(3), 473-482, 2001.
[15] Giridharan GA, Skliar M, Olsen DB, Pantalos GM: Modeling and Control of a Brushless DC Axial
Flow Ventricular Assist Device, ASAIO J 48: 272-289, 2002.
[16] Boston JR, Simaan MA, Antaki JF, Yu Y: Control Issue in Rotary Heart Assist Devices,
Proceedings of The American Control Conference: 3473-3477, June 2000.
[17] Liu Y, Allaire PE, Wood HG, Olsen DB: Design and initial testing of a mock human circulatory
loop for left ventricular assist device performance testing, Artifical Organs 29(4):341-5,
April 2005.
Page 393

Computer Based Model of the Circulatory System ICI 10 - 10TH INTERNATIONAL CONFERENCE ON INFORMATION
8
[18] Oshikawa M, Araki K, Endo G, Anai H, Sato M: Sensorless Controlling Method for A Continuous
Flow Left Ventricular Assist Device, Artificial Organs 24(8): 600-605, 2000.
[19] Ohuchi K, Kikugawa D, et al: Control Strategy for Rotary Blood Pumps, Artificial Organs 25(5):
366-370, 2001.
[20] Baloa LA, Liu D, Boston JR, Simaan MA, Antaki JF: Control of Rotary Heart Assist Devices,
Proceedings of The American Control Conference, 2982-2986, 2000.
[21] Iijima T, Inamoto T, Nogawa M, Takatani S: Control of Centrifugal Pump Based on the Motor
Current, Artificial Organs 21 (7): 665-660, 1997.
[22] Amin DV, Antaki JF, Litwak p: Controller for an Axial-flow Blood Pump, Biomedical
Instrumentation & Technology 31: 483-487, 1997.
[23] Vollkron M, Schima H, Huber L, Benkowski R, Morello G, Wieselthaler G: Development of a
suction detection system for axial blood pumps: Artif Organs 28(8):709-16 2004.
[24] Hoshi H, Katakoa K, Ohuchi K, Asama J, Shinshi T, Shimokohbe A, Takatani S: Magnetically
suspended centrifugal blood pump with a radial magnetic driver, ASAIO J.51(1):60-4, 2005.
[25] Untaroiu A, Throckmorton AL, Patel SM, Wood HG, Allaire PE, Olsen DBNumerical and
experimental analysis of an axial flow left ventricular assist device: the influence of the diffuser
on overall pump performance. Artificial Organs 29(7):581-91 2005.
[26] Song X, Throckmorton AL, Wood HG, Allaire PE, Olsen DB: Transient and quasi-steady
computational fluid dynamics study of a left ventricular assist device, ASAIO J 50(5):410-7, 2004.
[27] Hoshi H, Katakoa K, Ohuchi K, Asama J, Shinshi T, Shimokohbe A, Takatani S: Magnetically
suspended centrifugal blood pump with a radial magnetic driver, ASAIO J. 51(1):60-4, 2005.
[28] Goldowsky M: Magnevad–the world’s smallest magneticbearing turbo pump, Artificial Organs
28(10): 945-52, 2004.
[29] Athanasios Tsanas et al, "Modeling the Circulatory System: evaluating the Cardiac Output and the
Arterial Pressure",2004
Page 394

GAMASA, EGYPT, 4 – 6 DECEMBER 2010
Electrocardiogram Classification by using Neural Network
Elsayed A. Sallam 1*, Rania M. Abdelghaffar 2.
1 Department of Computer Engineering, Faculty of Engineering, Tanta University, Email: [email protected].
2 Department of Electronics & Communication Engineering, Delta Higher Institute for Computers, Mansoura, Email:[email protected].
Abstract
Electrocardiography (ECG) is one of the most important physiological signals, whose changes can reflect the changes in emotional states in some degree. In this study, the ECG signals obtained from the AHA database were used to classify the five heartbeat classes. Feature extraction from the ECG signals for classification of ECG beats was performed by using discrete wavelet transform (DWT). The neural network was then presented for the classification of the ECG signals. Eight types of ECG beats were classified with a success of 95.33%.
Keywords: Electrocardiogram; ECG; Wavelet Transform; DWT; Artificial Neural Network; ANN; Classification; Feature Extraction.
1. Introduction
An electrocardiogram (ECG) is a graphic produced by an electrocardiograph, which records
the electrical activity of the heart over time. The signal is constructed by measuring electrical
potentials between various points of the body using a galvanometer. Understanding the various
waves and normal vectors of depolarization and repolarization is very important to obtain
useful diagnostic information. ECG signals have a wide array of applications throughout the
medical field in determining whether the heart is functioning properly or suffering from any
abnormalities.
The ECG feature can be extracted in time domain or in frequency domain. Some of the features
extraction methods implemented in previous research includes Discrete Wavelet Transform
[1], Karhunen-Loeve Transform [2], Hermitian Basis and other methods [3].
All of the ECG waveforms pattern and variability must be determine accurately to get the
better diagnostic result that will shown the correct heart disease of the patient. Fig.1 shows an
example of a normal ECG trace, which consists of a P wave, a QRS complex and a T wave.
The small U wave may also be sometimes visible, but is neglected in this work for its
inconsistency. The P wave is the electrical signature of the current that causes atrial
Page 395

contraction; the QRS complex corresponds to the current that causes contraction of the left and
right ventricles; the T wave represents the repolarization of the ventricles.
Fig.1 An example of normal ECG trace.
This research is mainly aimed to extract important parameters from the ECG signal through the
DWT technique. By applying this signal analysis technique, the most important parameter of
the ECG signal can be taken as the analysis data. Then, the data will be used as an input to the
classifier to identify the heart disease.
The most difficult problem faced by an automatic ECG analysis is the large variation in the
morphologies of ECG waveforms, it happens not only for different patients or patient groups
but also within the same patient. This project is useful for the medical application enhancement
such as in hospital, clinic which can automatically help to increase the patient health care. The
block diagram of the general model ECG beat classification is shown in Fig. 2; it is divided
into four steps: (1) Data acquisition, (2) Pre-processing beat detection (filter and QRS
detection), (3) calculation of features by wavelet transform, and (4) classification by neural
networks, which are described, separately, as follows.
Raw ECG signal
Signal pre-processing
QRS detection
Feature Extraction
ANN signal Classification
Fig. 2 General System for ECG Classification A. Data acquisition The Database in the American Heart Association (AHA) [4] ECG Database being used as a
data of ECG input signal for features extraction part processing.
B. Pre-processing The first step of signal pre processing is filtering the ECG signal because as any other
measured signal, ECG is also contaminated with high frequency noise. The unwanted noise of
the heart signal must be removing. The ECG is sampled at 250 Hz then filtered using a
Page 396

bandpass filter between 0.5HZ - 40Hz to eliminate the motion artifact, baseline wander and
50Hz notch filter to eliminate power line noise. The QRS complexes are detected and a
representative beat identified. A data window containing the P-QRS-T complex is isolated
using ECG samples in the range 200ms before the R-wave maximum point to 400ms after R-
wave maximum. The isopotential value is subtracted, and the data window multiplied with
Hanning window to ensure the end points are zero and thus eliminating possible edge effects.
Each sample is preprocessed by firstly removing the mean value to eliminate the offset effect,
and then dividing with standard deviation. This process results in normalized signals with zero
mean and unity standard deviation, which aims to reduce the possible false decisions due to
signal amplitude biases resulting from instrumental and human differences.
C. Features Extraction using DWT The Wavelet Transform (WT) is designed to address the problem of non-stationary ECG
signals. It derived from a single generating function called the mother wavelet by translation
and dilation operations. The main advantage of the WT is that it has a varying window size,
being broad at low frequencies and narrow at high frequencies, thus leading to an optimal time-
frequency resolution in all frequency ranges. The WT of a signal is the decomposition of the
signal over a set of functions obtained after dilation and translation of an analyzing wavelet [5].
The ECG signals which consisting of many data points, can be compressed into a few features
by performing spectral analysis of the signals with the WT. These features characterize the
behaviour of the ECG signals. Using a smaller number of features to represent the ECG signals
is particularly important for recognition and diagnostic purposes. The ECG signals were
decomposed into time-frequency representations using Discrete Wavelet Transform (DWT).
The DWT technique has been widely used in signal processing tasks in recent years. The major
advantage of the DWT is that it provides good time resolution. Good resolution at high
frequency and good frequency resolution at low frequency. Because of its great time and
frequency localization ability, the DWT can reveal the local characteristics of the input signal.
The DWT represents a 1-Decompodition signal s(t) in terms of shifted versions of a low pass
scaling function φ(t) and shifted and dilated versions of a prototype bandpass wavelet function
ψ(t).
)2(2)( )2/(, ktt jjkj −=Ψ −− ψ (1)
)2(2)( )(, ktt jjkj −= −− ϕϕ (2)
where: j : controls the dilation or translation, : denotes the position of the wavelet function k
Page 397
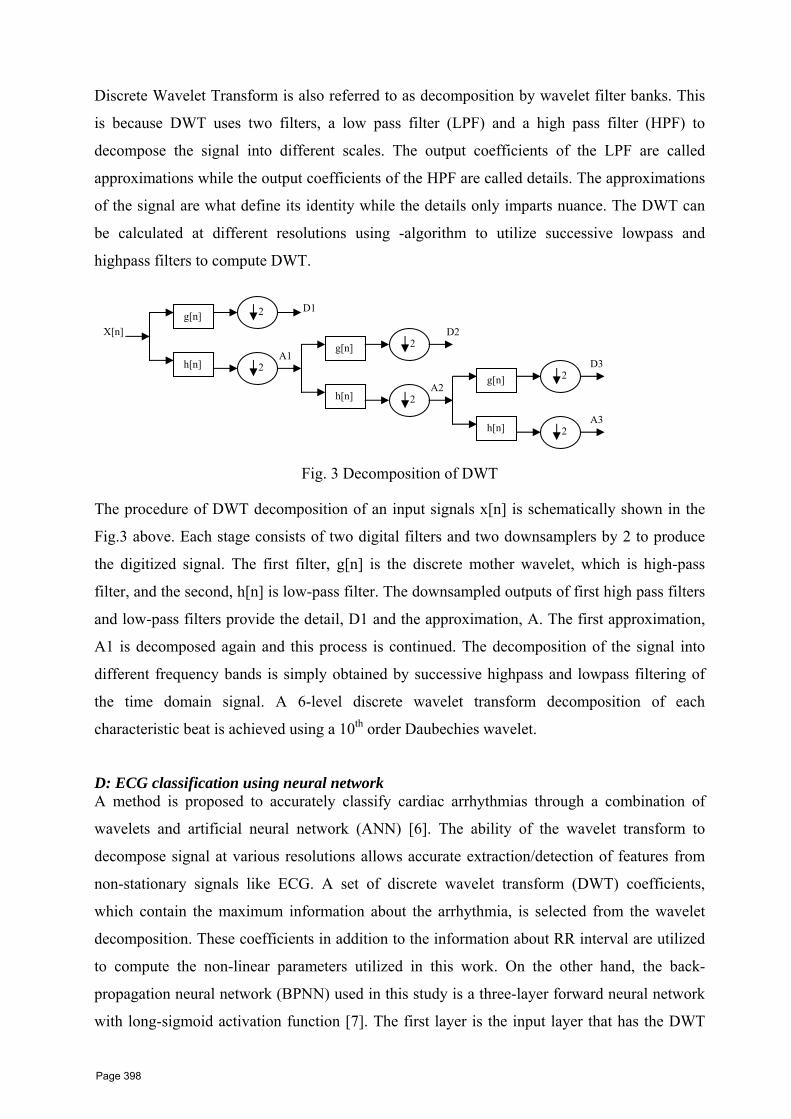
Discrete Wavelet Transform is also referred to as decomposition by wavelet filter banks. This
is because DWT uses two filters, a low pass filter (LPF) and a high pass filter (HPF) to
decompose the signal into different scales. The output coefficients of the LPF are called
approximations while the output coefficients of the HPF are called details. The approximations
of the signal are what define its identity while the details only imparts nuance. The DWT can
be calculated at different resolutions using -algorithm to utilize successive lowpass and
highpass filters to compute DWT.
2
Fig. 3 Decomposition of DWT
The procedure of DWT decomposition of an input signals x[n] is schematically shown in the
Fig.3 above. Each stage consists of two digital filters and two downsamplers by 2 to produce
the digitized signal. The first filter, g[n] is the discrete mother wavelet, which is high-pass
filter, and the second, h[n] is low-pass filter. The downsampled outputs of first high pass filters
and low-pass filters provide the detail, D1 and the approximation, A. The first approximation,
A1 is decomposed again and this process is continued. The decomposition of the signal into
different frequency bands is simply obtained by successive highpass and lowpass filtering of
the time domain signal. A 6-level discrete wavelet transform decomposition of each
characteristic beat is achieved using a 10th order Daubechies wavelet.
D: ECG classification using neural network A method is proposed to accurately classify cardiac arrhythmias through a combination of
wavelets and artificial neural network (ANN) [6]. The ability of the wavelet transform to
decompose signal at various resolutions allows accurate extraction/detection of features from
non-stationary signals like ECG. A set of discrete wavelet transform (DWT) coefficients,
which contain the maximum information about the arrhythmia, is selected from the wavelet
decomposition. These coefficients in addition to the information about RR interval are utilized
to compute the non-linear parameters utilized in this work. On the other hand, the back-
propagation neural network (BPNN) used in this study is a three-layer forward neural network
with long-sigmoid activation function [7]. The first layer is the input layer that has the DWT
g[n]
2
h[n] 2
g[n]
2
h[n] 2
g[n]
h[n] 2
X[n]
D1
A1
A2
D2
D3
A3
Page 398

features and the RR interval as inputs. The second layer, also called the hidden layer, has 40
neurons and the output layer has eight neurons, which is equal to the number of ECG beat
types to be classified, the eight beat types employed in the study were Normal beat (NORM),
Left bundle branch block (LBBB), Pre-ventricular contraction (PVR), Atrial fibrillation (AF),
Ventricular fibrillation (VF), Complete heart block (CHB), Ischemic dilated cardiomyopathy
(ISCH), and Sick sinus syndrome (SSS). A criterion of 0.001 in mean square error is
empirically determined to terminate the iteration in the training phase of the classifier. The
output (target) vector is defined with a combination of 1 and 0s to represent each of the classes
being recognized. As three neurons are chosen for the output layer combination of outputs are
available (23=8), the output as 000 to 111. The non-linear parameters are used as inputs to
ANN and the classification is done. The output of the classifier is a graphical representation. A
few of them are shown in results. The classification results are tabulated in Table 1.
Table 1: Classification of cardiac arrhythmia using ANN.
Cardiac signal
condition
Data sets
testing
Correctly
classification
Sets
misclassified% accuracy
NORM 30 29 1 96.66
LBBB 14 13 1 92.85
PVC 25 24 1 96
AF 20 19 1 95
VF 47 45 2 93.62
CHB 21 20 1 95.24
ISCH 18 17 1 94.44
SSS 18 17 1 94.44
TOTAL 193 184 9 95.33
3. Results and conclusion:
A dynamical analysis of heart rate behaviour derived from non-linear mathematics can reveal
abnormal pattern of RR interval dynamics which cannot detect by commonly employed
moment statistics of heart rat variability. ANN model is most suitable for those tasks to which
there is least or limited knowledge about input variables and rules. The ANN classifier can be a
diagnostic tool to aid the physician in the analysis of heart diseases. The results show that the
Page 399

Electrocardiogram Classification by using Neural Network ICI 10 - 10TH INTERNATIONAL CONFERENCE ON INFORMATION
6
proposed method is effective for classification of cardiac arrhythmia with an overall accuracy
of 95.33% (Table-1). The results conclude that it is possible to classify the cardiac arrhythmia
with the help of multilayered network. The advantage of ANN classifier is its simplicity and
ease of implementation.
References
[1] Cuiwei Li, Chongxun Zheng, Changfeng Tai, “Detection of ECG Characteristic Points
Using Wavelet Transforms”, IEEE Transactions on Biomedical Engineering, Vol. 42, No. 1,
January 1995.
[2] Franc Jager, “Feature Extraction and Shape Representation of Ambulatory
Electrocardiogram Using the Karhunen-Lo`eve Transform” Electrotechnical Review,
Ljubljana, Slovenija, 2002.
[3] David Cuesta-Frau, Juan C, Perez-Cortes, Gabriela Andrea Garcia, Daniel Navak, “Feature
Extraction Methods Applied to the Clustering of Electrocardiographic Signals. A Comparative
Stucy”, Czech Technical University In IEEE Proceeding, 2002.
[4] ECRI, http://www.healthcare.ecri.org.
[5] I. Daubechies, “The Wavelet Transform, Time-Frequency Localization and Signal
Analysis”, IEEE Trans. Inform. Theory, 961–1005, 1990.
[6]Yegnanarayana B. “Artificial Neural Networks”, Prentice Hall, India, 2007.
[7] Sung-Nien Yu, & Kuan-To Chou, “Integration of independent component analysis and
neural networks for ECG beat classification”, ELSEVIER, Expert System with Application 34,
2841- 2846, 2008.
Page 400

GAMASA, EGYPT, 4 – 6 DECEMBER 2010
THE ROAD FROM LITTLE MEDIA VIA BIG MEDIA TO COMMUNITY MEDIA
prof. Dr. Sándor Forgó – Dr. Péter Antal – Réka Racskó
Institute of Media Informatics, Eszterházy Károly College, Eger [email protected], [email protected] [email protected]
Abstract The primary objective of our empirical research project was the assessment of the
efficiency of the heretofore delivered courses in light of the new learning options. Presently the respective research results are being processed and following a more sophisticated statistical analysis the information will be used as starting points for other scholarly inquiries. Our long term goals also include a comparison of the respective research results with similar scholarly programs performed in Hungary and in other countries as well.
Finally, we can conclude that the integration of the new methods into the methodological components of teacher training programs is expected to obtain a strategic significance. The Eszterházy Károly College adopting such initiatives has proven to be a pioneer in this field as teaching programs supported by network-based learning are being continually offered and delivered in order to assure the highest possible standards and potential perfection of the respective teaching efforts.
Keywords: multimedia, distance and blended learning, WEB 2.0, competence, learning methods, educational technology
1. Introduction
1.1 From Distance Learning to Networtk based Learning (e-Learning) The distance learning perspective was introduced in Hungary in the 1990s. While
augmenting oral learning and instruction, distance learning entailing media-supported instruction has always provided an alternative to traditional teaching/ learning locations and times. Such efforts included the correspondence-based educational method of I. Pitman, printed and paper-based educational materials, instruction of the physically disabled via telephone in America, educational programs broadcast via radio and television, mailing video cassettes with educational content, the instructional use of various telecommunication devices (fax machine, telephone) along with other communication forms.[1]
Distance learning, however, as a fully unique instructional arrangement surpasses educational efforts designed merely to overcome physical distance. The common denominator between such learning schemes is the nature of distance learning as a guided didactic conversation effectively carried on by various media. Consequently, adequate motivation and appropriate learner empowerment methods can promote efficient knowledge acquisition through the use of specially elaborated professional texts or educational materials. After the emergence of programmed instruction schemes media incorporated into various instructional packages became not only an important supplement or auxiliary to independent learning, but acquired a learning management function as well.
Page 401
Furthermore, it is worth mentioning that during this period (the first half of the 1990s) traditional instructional packages1, considered as an antecedent of blended learning schemes were already complemented by CD-based texts. [2]
As TOMPA asserts:
“simultaneously with the instruction package concept it was incorporated into pedagogical and instructional technology parlance in the mid 1970s […] At that time it meant an assortment of information transmission devices, (slides, film, video, tape, exercise book, models, scale models, plotting board, or student experimental set) integrated separately into the instructional package” [3]
Basically, the traditional paper or electronics-based instructional packages developed in
the earlier stages of distance learning closely reflected the criteria of the first three generations of the Schramm categories.
In blended learning schemes supported by the e-learning approach the spatial and temporal boundaries are recreated via digital (off-line, on-line) technology. These devices including the CD-ROM, DVD, and Internet at first fulfilled a complementary function, while today they tend to present an alternative to e-learning schemes.
According to András BENEDEK:
“The technological background is a significant aspect of the e-learning concept.[…]While Hungary can no way be considered to be outside the international mainstream, the practical and theoretical background of e-learning has not yet yielded a coherent strategy here.” [4]
Due to electronic learning’s principal function facilitating independent learning, self-
guided and self-paced knowledge acquisition becomes essential. Consequently, teachers are required to design learning materials capable of enabling students to autonomous learning in extracurricular settings. At the same time however, in addition to enabling the students to acquire knowledge, attention should be paid to such learning support options as personalised help, tutoring, guiding the learning process, and providing feedback concerning the appropriate level of knowledge-acquisition. Personal communication between student and teacher is facilitated by such well-known aspects of instant message sending services as the MSN and Skype in addition to other IP-based telephoning options.
E-learning development efforts in Hungary at first relied on project results reflecting the trends and standards accepted by the international informatics community and later methodological experts of distance and traditional education became more significant. The history of e-Learning forums2 in Hungary functions as apt demonstration of the evolution of e-Learning from a training tool primarily preferred by the business sector into an increasingly popular teaching approach in public, higher, and adult education.
At first e-learning methods were designed to supersede correspondence and part-time education schemes. The original, top to bottom regular arrangement of the learning process including curriculum development, course management and shared communication gradually gave way to complementary blended learning solutions often deployed in full time programs as well.
1 As Klára Tompa argues ”it is a system of various educational materials (audio-visual, printed, electronic,
multimedia) facilitating the realisation of exactly defined learning objectives via a specific curriculum based upon a structured thematic lay-out while guaranteeing options for performance appraisal and self-evaluation.”
2 The most important annual professionial event of the Hungarian e-learning community http://elearning.sztaki.hu/archivum
Page 402
The Eszterházy Károly College of Eger, however, was an exception. In 2002 the information management undergraduate degree program. was approved by the Hungarian Higher Education Accreditation Commission. The program launched in (internal network supported on-line ) e-Learning format determined the respective institutional developmental trends for electronics-based open learning schemes. The training scheme provided a comprehensive Learning Management System including such features as administration capability, curriculum, tests, learning instructions, communication features (forum, e-mail, communicational and group work functions) along with diverse electronic learning services. Furthermore, the on-line electronic curricula including learning guides, self-tests, and various exercises were complemented by the printed version of the respective texts as well.
The increasing popularity and the subsequent wide-spread availability of Internet-based, or web-surface provided services (Web 1.0) not only shaped the business and communication sphere, but resulted in the expansion of learning tools and approaches. Despite the provision of educational materials in a textual, image-based, or multimedia format true interactivity has not been achieved as learners restricted to downloading the respective information were relegated into a passive receiver role. The emergence of learning facilitation programs, such as the Learning Management Systems not only promoted content transmission and administration options, but by establishing a framework for the learning process highlighted the increasing importance of the learner as well.
The rise of Web 2.0 -based electronic communities not only promotes greater participation via the respective open systems, but upgrades the user from a mere receiver of information into a producer and editor of the given text eventually bringing about the e-Learning 2.0, learner-centred web environments.
This learning format regarding users as a knowledge development community utilises tools connecting network-provided content on a simple web surface. The theoretical background of e-learning Web 2.0 approaches and that of the principal learning theory of the digital era is provided by connectivism.
Today the electronic communities created by Web 2.0 services providing content elaborated, uploaded, shared, and reviewed by the users themselves have significantly impacted e-Learning schemes as well. Digitalization at first revolutionizing content processing and communication via localized media has facilitated the development of user centred web-based learning environments.
E-Learning 2.0 is a learner-centred irregularly arranged learning format in which the resulting learner autonomy and spontaneous knowledge exchange results not in a hierarchical scheme, but brings about a multi-directional, decentralized, multi-channeled approach promoting the creativity of the learner via collaborative knowledge acquisition.
Today we experience the convergence of various media types. It is not out of the ordinary to listen to the radio or watch the television via the Internet, while we can provide or share content with other users. Modern mass communication devices can optimize the most important channels of direct human communication with an ever-increasing efficiency.
These types of media, however, have always maintained a productive connection with the issues of teaching and learning. Having examined the union (media convergence) and independent proliferation (diversification) of various communication channels both pedagogy and andragogy have to meet the challenge of providing efficient support for the teaching and learning process.
This objective, however, has to be jointly realised by the Hungarian teacher, instructor, and researcher community as the availability of more and at the same time diversely applicable media systems in the field of education and in distance learning as well is a shared concern.
Page 403
2. Methods
2.1 The preceding background and scientific objectives of the empirical research effort The steady proliferation of networks has exerted a significant impact on the primary
source of knowledge acquisition thereby demanding an increasingly dominant role for network facilitated learning in the education process. The higher education and scholarly community of the United States has already recognised that meeting the challenges of today’s academic world cannot be imagined without the integration of Web-based devices and tools into the teaching and learning process. Consequently, teachers should be equipped with the appropriate ICT competences, and must obtain an optimal level of digital literacy along with an appropriate content-based knowledge in addition to displaying adequate motivation.
A paradigm shift promoting the incorporation of connectivist learning methods and the application of Web 2.0-based tools into the methodological preparation of prospective teachers have not fully been accepted by the Hungarian teacher training community as not all prospective teachers have become familiar with the main features of this method
Nevertheless, in the Hungarian higher education sphere several efforts have been launched to assess the extent of motivation towards these new approaches Furthermore, in addition to creating a greater public interest attempts have been made to promote a change of perspective resulting in the integration of new Web-based services and options in the curricula.
3. Development and results Inspired by contemporary international trends the Department of Instruction and
Communication Technology of the Eszterházy Károly College has recognised this new dimension of higher education and in the previous semester launched a course supported by Web-based instructional devices.
During the course the students applied Web 2.0 options while taking advantage of the motivational capacity of learning by discovery along with knowledge acquisition embedded into other activities. The course utilized the following tools: blogs, community bookmarks (link sharing), content or presentation sharing, shared documents, Wikipedia, cognitive maps, and video-based annotation. In order to promote collaborative efforts students were provided continuous feedback on the submitted assignments mostly in the form of comments, an option made available by most service providers.
The course was completed with a questionnaire-based survey3 focusing among others on the respondents’ socio-economic status, access to computers, familiarity with the Internet, network-based value orientation, and previous knowledge concerning network facilitated learning.
The survey containing open and closed questions, Likert scale, and answer matrix was administered on line to a sample group of 100. In the next phase of the research project interviews will be prepared in order to reveal more profound correlations.
. While the introduction of research results within the abovementioned framework is not
our primary aim, we would like to forward some crucial observations and conclusions. Almost half of the sample population (45%) is between age 19-24, while the proportion of the 23-30, 31-40, and 41-50 participant age groups is virtually equal with 18%, 19%, and 17% respectively. Moreover, the rate of full-time and part-time students (47%, 53%) is
3 The questionnaire was compiled by Dr. Sándor Forgó and the respective answers were evaluated by Réka Racskó.
Page 404

virtually equal as well. It is vitally important that in case of the part-time students, 98% of those surveyed were enrolled in teacher training programs primarily at the M.A. level.
Learning by discovery primarily for more experienced teachers, but for young ones as well appears to be an ideal means of becoming familiar with and utilizing the options provided by the new services. Consequently, our previous hypothesis holding that in case of a large majority of those surveyed knowledge is primarily obtained via learning by discovery (browsing on the Internet) and via peer groups was substantiated.
Another basic premise of the research asserted that at least half of the students can be significantly motivated by educational methods incorporating network-based learning. The submitted assignments proved that one of the most popular content-sharing services was the Slideshare as 62% of those surveyed used and became familiar with the presentation sharing option while completing their task. The second most popular option was the community bookmark or the Delicious link sharing service followed by the Wikipedia, and blog preparation.
Although the results of the research project have not been fully processed, in light of the available data some conclusions can be made. Consequently, while students can significantly be motivated by the new services and applications, a competence level required for confident use has not always been achieved. The subsequent narrowing and eventual elimination of the digital gap requires additional remedial efforts. The provision of new ideas concerning the application of the Web and the Web 2.0 devices in learning and teaching to students participating in educational programs incorporating network-based learning led to two benefits. Consequently, the answers given to the questionnaires revealed that students participating in M.A. level teacher training programs can obtain crucial skills for the teaching profession along with developing a more confident and secure attitude towards the use of said devices and options based upon a more profound technological prowess.
The primary objective of our empirical research project was the assessment of the efficiency of the heretofore delivered courses in light of the new learning options. Presently the respective research results are being processed and following a more sophisticated statistical analysis the information will be used as starting points for other scholarly inquiries. Our long term goals also include a comparison of the respective research results with similar scholarly programs performed in Hungary and in other countries as well.
4. Conclusion Finally, we can conclude that the integration of the new methods into the methodological
components of teacher training programs is expected to obtain a strategic significance. The Eszterházy Károly College adopting such initiatives has proven to be a pioneer in this field as teaching programs supported by network-based learning are being continually offered and delivered in order to assure the highest possible standards and potential perfection of the respective teaching efforts
Page 405

Multimedia innovate for spatial thinking ability ICI 10 - 10TH INTERNATIONAL CONFERENCE ON INFORMATION
6
References [1] Learning Efforts and the New Media. Az új média és az elektronikus tanulás - In: ÚPSZ Új
Pedagógiai Szemle, 2009/8–9. 91-97 [2] TOMPA, Integration options provided by electronic media 2006
URL: http://human.kando.hu/pedlex/lexicon/O2.xml/oktatocsomag.html [3] TOMPA Integration options provided by electronic media. 2006 URL: http://www.oki.hu/oldal.php?tipus=cikk&kod=testveri-Tompa-mediumok [4] BENEDEK E-learning strategies. In: The role of e-Learning in adult education and training
schemes (L. HARANGI. – Gitta KELNER. Budapest, Magyar Pedagógiai Társaság Felnőttnevelési Szakosztály. 2003. p. 6-7. (Hungarian Pedagogical Association, Adult Education Section)
Page 406

GAMASA, EGYPT, 4 – 6 DECEMBER 2010
MULTIMEDIA INNOVATE FOR SPATIAL THINKING ABILITY
Dr. Peter Antal
Eszterházy Károly College, Institute of Mediainformatics, Eger, Hungary email: [email protected]
Abstract The issue treated by the present dissertation is given a special currency by the fact that the ever-
increasing prevalence of new learning approaches including multimedia use and the compilation and implementation of a complete distance learning program requires a fundamentally different thought process from instructional technology teacher/designer and user alike Consequently the traditionally linear learning process is superseded by a three-dimensional matrix-based spatial framework facilitating the comprehension and design of the vertical, horizontal, and deep structure of the respective educational materials. This also requires educational material developers especially, to acquire a ground-breaking cognition-space based competence.
Consequently the present treatise strives for the realisation of a multiple objective including the elaboration and implementation of a multimedia program promoting spatial thinking, in addition to the testing and impact analysis of said program while aiming to provide learner support during the practical application of the respective acquired skills.
The instructional technology approach and the respective computer program presented have proven to be an ideal yet practical tool for the promotion of spatial thinking as it enabled the author to determine learning styles according to the original site (right or left hemisphere of the brain) of the cognitive process.
By charting new directions for Instructional Technology via the incorporation of the author’s own research the present treatise not only contributes to the further development of the theoretical foundations of the discipline but the related tangible and material output including text, learning guide, along with CD and Web-based instructional program enriches the learning process as well.
Keywords: multimedia, spatial thinking, cognition, competence, learning methods, educational technology
1. Introduction
As a result of the dynamic development of the education profession in the past decades new instruction apparatus systems, learning methods, and knowledge acquisition competence criteria emerged while innovative demands and expectations confronted the learner. The novel instructional approaches promoted the change of the learning environments as well. Furthermore, it became obvious that no matter how comprehensive a learning strategy claims to be it cannot be applied to each individual student. Since all learning groups consists of different individuals with diverse thinking and learning styles interpreting and processing the respective information in a variety of ways, only a kind of “whole-brained” learning approach utilising the full scale of cognitive processes can stake a claim for efficiency.
Page 407
2. Methods
2.1 The role of thinking in various didactic trends Different didactic trends assign varying significance to thinking as teaching strategies
significantly impact the means and quality of knowledge acquisition. The deductive perspective considers learner creativity dysfunctional as it is primarily based on explanations provided by teachers while the inductive instructional approach holds that acquired learning experiences and the subsequent abstraction efforts yield the appropriate conclusions. Constructivist learning philosophies view learning and thinking a primarily active process whose definitive feature is the interpretation and processing of information by the help of knowledge organised into the currently operational cognitive systems of the learner. Consequently a conceptual shift or modification takes place in the thought process of the learner thereby facilitating the formation of a higher level cognitive system. Nahalka [1]
2.2 The main features of spatial thinking Spatial cognition can be improved by specialized pedagogical methods both in an
intentional and spontaneous manner either medially via a symbolically coded written or spoken language or empirically.
The pace of the development of spatial thinking corresponds to the respective intellectual progress level along with environmental stimulation, intellectual abilities, and age having an impact as well. Spatial cognition is based on the formation of spatial perspective via associative learning. The human thinking process is primarily built on associative maneuvres as Roger Sperry demonstrated that the two hemispheres of the brain fulfil divergent functions and operate in a dissimilar fashion. Sperry [2]
Learning methodology experts had already showed that engraving or the commitment of the learned material to memory is more effective if the text is connected to the learner’s own thoughts. Tony Buzan’s cognitive or thought map method provides an apt example. Accordingly, the student re-conceptualizes the given educational material in his or her own mind. Buzan [3]
If the information is positioned in the individual’s logical channels, registered according to personal associations and incorporated into the respective system, inscription or the engraving of information tends to be very effective. This unique approach simultaneously facilitates associative or correlative thinking, spatial stimulation, the grouping and holistic treatment of information. Consequently, if we elaborate the visual elements, an active and individual participation in learning, or individualized learning is realised. Furthermore, cognitive or thought process maps facilitate the placement of a higher emphasis on certain logical elements. The cognitive or thought process map provided especially good results in improving the school performance of students coping with learning difficulties. Therefore, effective learning utilizes or maximizes “whole brain capacity,” or the full scale of mental processes. Gyarmathy, [4]
Thus the determination of the content, design, and the goals of the learning process has to become a “full-brained” effort in order to harmonize learning with the thinking practices and learning styles of students.
2.3 Reasons for the development of spatial cognition Ninety percent of information stored by the human brain is related to space or spatiality.
The majority of school subjects including the respective correlations and procedures require
Page 408

some capability of dealing with spatial problems. Educational materials categorized according to and meeting the requirements of the Schramm taxonomy are effective means of promoting spatial thinking. Schramm [5]
Various types of educational materials influence information processing indirectly or directly along with exerting either an abstract or tangible impact.
2.4 Learning styles Learning styles refer to those procedures and approaches, which students apply during
the learning process in the context of the respective orientation, motivation, and hereditary features. Forgó, Hauser, Kis-Toth [6]
Since students during learning tend to prefer sensory organ modality, according to the favoured means of perception we can discern auditory, visual, and kinetic learners. Frontal or teacher centred arrangements provide an optimal learning environment for auditory learners acquiring knowledge faster and easier via hearing. Many of these students taking advantage of oral presentations, explanations, and auditory devices achieve considerable academic success.
Visual learners follow either text-based or spatial styles. The former can learn fastest with the help of reading and writing, while the latter type favours graphic explanations and the application of audiovisual materials over the written text.
Current social conditions are the least conducive to kinetic learning styles requiring motion and tactility or touching. Students with kinetic learning styles displaying right hemisphere-dominated thinking have a high demand for physical activity and movement along with an ability to identify the essential information and correlations. Bohony [7] [8]
2.5 Learning environments The quality and effectiveness of the learning process not only depend on teacher
competences and the efficiency of the respective instructional technology and methodology, but are influenced by the quality of the learning environment.
Learning environment is defined as the aggregate of all environmental factors impacting the learning or knowledge acquisition process.
The learning environment of traditional education requires mostly a system transmission approach, while the constructive learning model is based on system formation or situation-specific perspectives. The new information and communication technologies provide a variety of opportunities for the shaping and enhancement of learning environments. Komenczy [9]
In case of traditional, teacher-directed, or linear sequenced learning it is the instructor who determines the respective logical route optimal for the acquisition of a concept, phenomenon, or process along with establishing the logical structure of the processing of the educational materials. The rise of electronic learning environments (multimedia, e-learning) utilizing spatial or matrix-type methods promotes alternative means of learning.
Matrix-based text processing provides numerous alternatives for knowledge acquisition depending on previous qualifications and intelligence level in addition to the impact of the structure of the learning process determined by the teacher and the creativity of the respective student. Antal [10]
The structure or matrix elaborated during the development phase is a spatial and tangible logical unit facilitating successful knowledge acquisition by utilizing the structural features of electronic educational materials either according to a predetermined principle or via an independent and separate thought process.
Page 409
The composition of electronic educational materials as compared to that of their traditional counterparts requires heretofore unprecedented spatial abstraction. both from instructor and student as well. The increasing proliferation of independently and individually processed educational materials requires painstaking design along with the acquisition of the competence of structured spatial thinking. Antal [11]
3. The elaboration of educational materials
3.1 Introducing the basic research problem, outlining the respective research objectives In the past few years it became obvious that despite the broad scope of learning
strategies, no learning strategy generically applicable to all students can be identified. Since the respective learning and student groups interpreting and processing information in differing ways consists of students with a variety of thinking and learning styles, only learning approaches utilizing “full brain capacity “can be effective.
The subsequent emergence of new forms of learning including multimedia use and the composition and design of a full distance learning program requires a different thinking structure both from the designer, that is, the instruction technology teacher and the respective user as well.
Recommendation: the learning effort should be supported with an educational tool (multimedia) specifically designed for the purpose of facilitating spatial thinking
The main objective of the present research is the elaboration of an instruction technology procedure and the respective instrument or device system facilitating the effective promotion of spatial thinking.
Main tasks: the exploration of the theoretical foundations of the development of spatial thinking, the elaboration of the details, concept, and methodology of the respective instruction technology procedure, the submission of a proposal for the creation of the required educational materials with optimal effect in addition to forwarding methodological guidelines for the subsequent impact analyses.
The preparation, application, testing and impact analysis of a multimedia-based instruction program promoting the development of information and communication technology aptitudes, the examination of the options of the analysis of spatial information along with the exploration of its new pedagogical and methodological features is required for the achievement of said objectives.
3.2 Introducing the main aspects of the research process
• Assessment of students’ previously existing knowledge concerning spatial thinking,
the justification of the scholarly need for the given treatise (preliminary test)
• The elaboration of the respective educational material and the introduction of the
main features and conditions of the preparation process
• Efficiency analysis:
The compilation and introduction of the examination sample Input test The main features of the realization of the research and experimental
objectives Output test The evaluation and presentation of results
Page 410
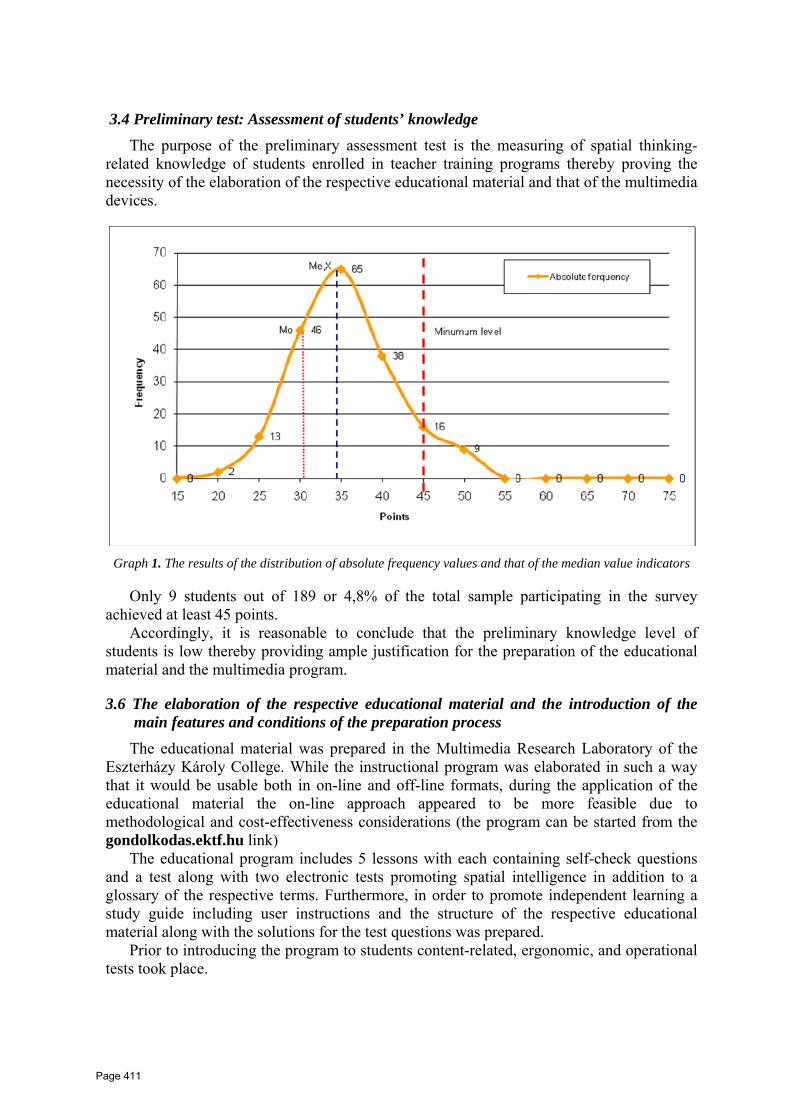
3.4 Preliminary test: Assessment of students’ knowledge The purpose of the preliminary assessment test is the measuring of spatial thinking-
related knowledge of students enrolled in teacher training programs thereby proving the necessity of the elaboration of the respective educational material and that of the multimedia devices.
Graph 1. The results of the distribution of absolute frequency values and that of the median value indicators
Only 9 students out of 189 or 4,8% of the total sample participating in the survey achieved at least 45 points.
Accordingly, it is reasonable to conclude that the preliminary knowledge level of students is low thereby providing ample justification for the preparation of the educational material and the multimedia program.
3.6 The elaboration of the respective educational material and the introduction of the main features and conditions of the preparation process
The educational material was prepared in the Multimedia Research Laboratory of the Eszterházy Károly College. While the instructional program was elaborated in such a way that it would be usable both in on-line and off-line formats, during the application of the educational material the on-line approach appeared to be more feasible due to methodological and cost-effectiveness considerations (the program can be started from the gondolkodas.ektf.hu link)
The educational program includes 5 lessons with each containing self-check questions and a test along with two electronic tests promoting spatial intelligence in addition to a glossary of the respective terms. Furthermore, in order to promote independent learning a study guide including user instructions and the structure of the respective educational material along with the solutions for the test questions was prepared.
Prior to introducing the program to students content-related, ergonomic, and operational tests took place.
Page 411
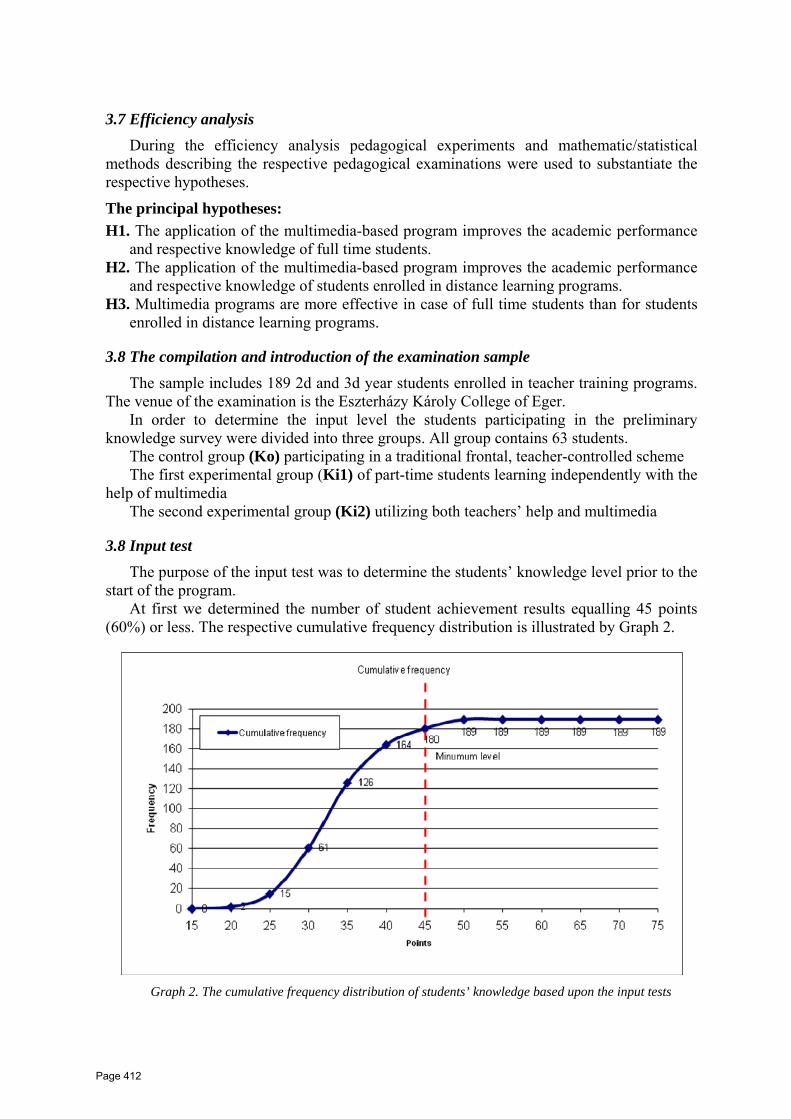
3.7 Efficiency analysis During the efficiency analysis pedagogical experiments and mathematic/statistical
methods describing the respective pedagogical examinations were used to substantiate the respective hypotheses.
The principal hypotheses: H1. The application of the multimedia-based program improves the academic performance
and respective knowledge of full time students. H2. The application of the multimedia-based program improves the academic performance
and respective knowledge of students enrolled in distance learning programs. H3. Multimedia programs are more effective in case of full time students than for students
enrolled in distance learning programs.
3.8 The compilation and introduction of the examination sample The sample includes 189 2d and 3d year students enrolled in teacher training programs.
The venue of the examination is the Eszterházy Károly College of Eger. In order to determine the input level the students participating in the preliminary
knowledge survey were divided into three groups. All group contains 63 students. The control group (Ko) participating in a traditional frontal, teacher-controlled scheme The first experimental group (Ki1) of part-time students learning independently with the
help of multimedia The second experimental group (Ki2) utilizing both teachers’ help and multimedia
3.8 Input test The purpose of the input test was to determine the students’ knowledge level prior to the
start of the program. At first we determined the number of student achievement results equalling 45 points
(60%) or less. The respective cumulative frequency distribution is illustrated by Graph 2.
Graph 2. The cumulative frequency distribution of students’ knowledge based upon the input tests
Page 412

95,76% of the total sample participating in the survey achieved less than 45 points on the test. Accordingly, we could conclude that the students’ preliminary knowledge level was low.
The main features of the realisation of the objectives of the pedagogical experiment. Based upon the results of the preliminary survey the low level of respective student knowledge was ascertained. The multimedia-based educational materials were integrated into the Instruction Technology subject mandatory for students enrolled in teacher training programs. The duration of the experimental course (5 weeks) was identical both in case of full and independently learning part time students. After the completion of the course the knowledge of students was tested again. The purpose of the survey was to assess the extent of potential changes in students’ knowledge due to the application of a variety of methods.
Method of examination: the repetition of the knowledge test and the evaluation of the respective results. Processing of results: calculating absolute and cumulative frequency, two sample t-test
3.9 Output test Table 1 contains the grouped frequency results of students’ knowledge demonstrated at
the output test. Table 1.
Upper point levels
Absolute frequency Cumulative fequency Ko group
fi Ki1 group
fi Ki2 group
fi Ko group
cfi Ki1 group
cfi Ki2 group
cfi 15 0 0 0 0 0 0 20 0 0 0 0 0 0 25 0 0 0 0 0 0 30 0 0 0 0 0 0 35 3 0 0 3 0 0 40 10 0 1 13 0 1 45 16 5 1 29 5 2 50 21 11 4 50 16 6 55 6 16 11 56 32 17 60 7 21 16 63 53 33 65 0 9 20 63 62 53 70 0 1 6 63 63 59 75 0 0 4 63 63 63
The purpose of the frequency examination was the identification of student achievement
equalling or less than 45 points or 60% in the three groups. Chart 2 illustrates the respective cumulative frequency distribution.
Page 413
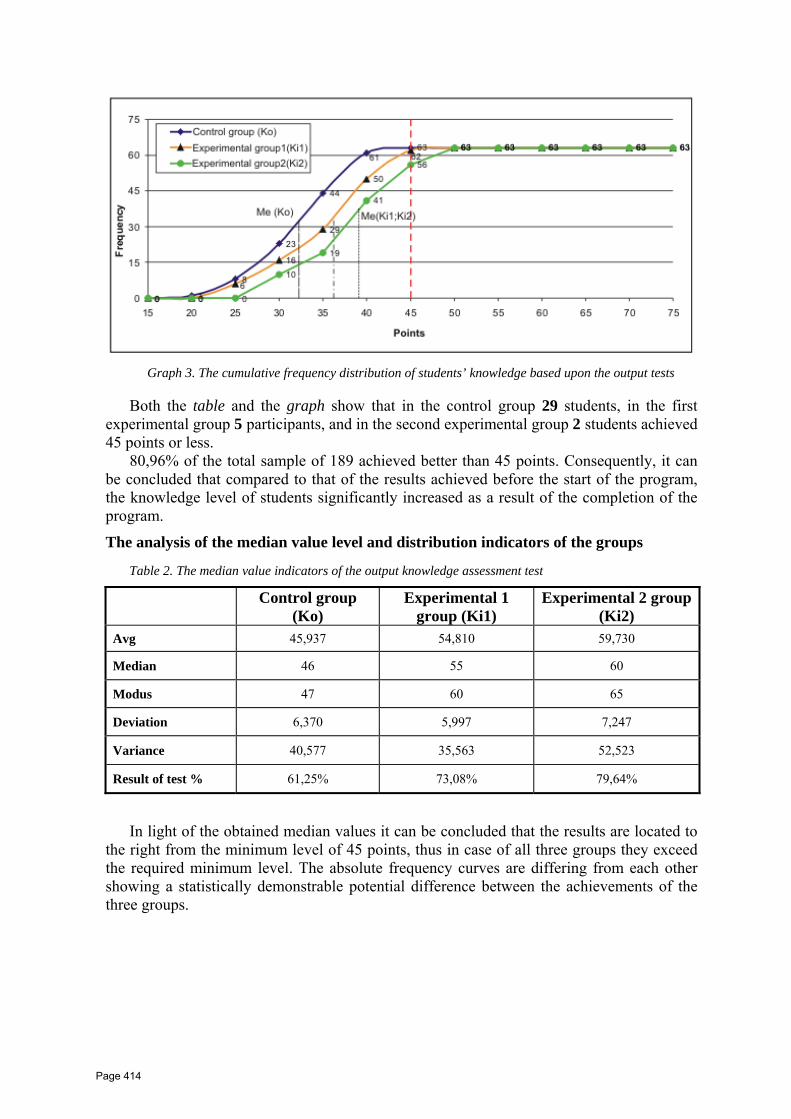
Graph 3. The cumulative frequency distribution of students’ knowledge based upon the output tests
Both the table and the graph show that in the control group 29 students, in the first experimental group 5 participants, and in the second experimental group 2 students achieved 45 points or less.
80,96% of the total sample of 189 achieved better than 45 points. Consequently, it can be concluded that compared to that of the results achieved before the start of the program, the knowledge level of students significantly increased as a result of the completion of the program.
The analysis of the median value level and distribution indicators of the groups
Table 2. The median value indicators of the output knowledge assessment test
Control group (Ko)
Experimental 1 group (Ki1)
Experimental 2 group (Ki2)
Avg 45,937 54,810 59,730
Median 46 55 60
Modus 47 60 65
Deviation 6,370 5,997 7,247
Variance 40,577 35,563 52,523
Result of test % 61,25% 73,08% 79,64%
In light of the obtained median values it can be concluded that the results are located to the right from the minimum level of 45 points, thus in case of all three groups they exceed the required minimum level. The absolute frequency curves are differing from each other showing a statistically demonstrable potential difference between the achievements of the three groups.
Page 414
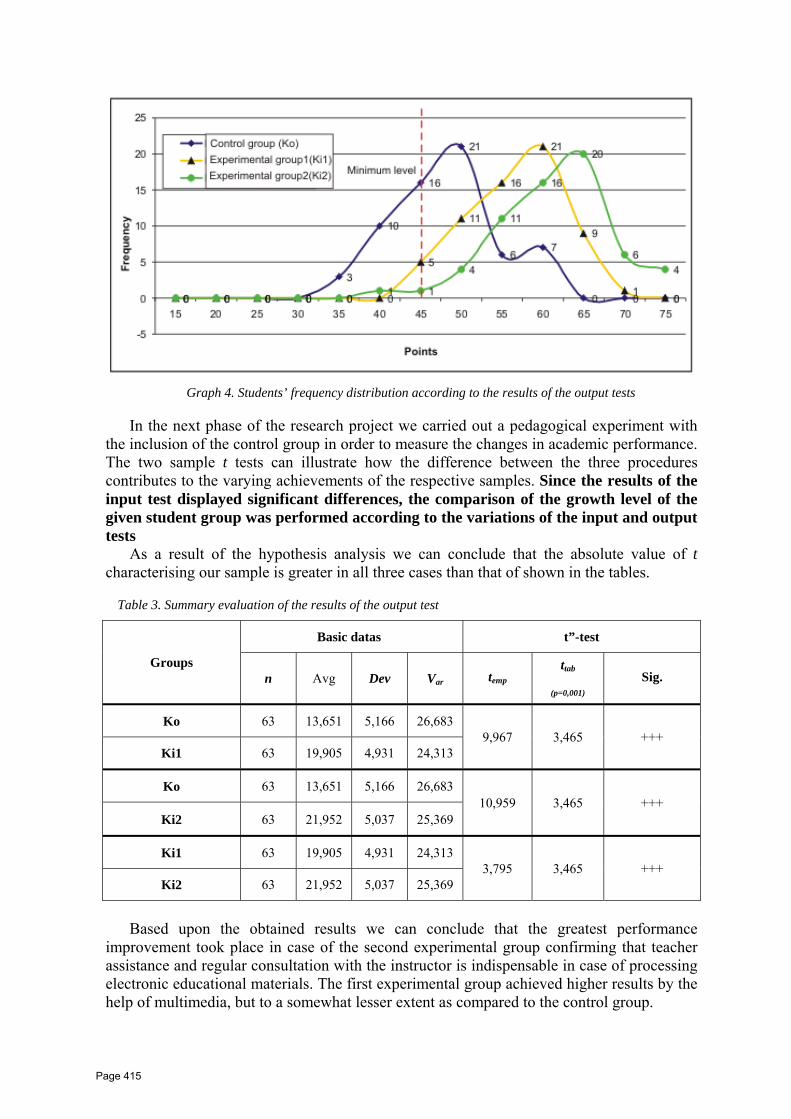
Graph 4. Students’ frequency distribution according to the results of the output tests
In the next phase of the research project we carried out a pedagogical experiment with the inclusion of the control group in order to measure the changes in academic performance. The two sample t tests can illustrate how the difference between the three procedures contributes to the varying achievements of the respective samples. Since the results of the input test displayed significant differences, the comparison of the growth level of the given student group was performed according to the variations of the input and output tests
As a result of the hypothesis analysis we can conclude that the absolute value of t characterising our sample is greater in all three cases than that of shown in the tables.
Table 3. Summary evaluation of the results of the output test
Groups
Basic datas t”-test
n Avg Dev Var temp ttab
(p=0,001) Sig.
Ko 63 13,651 5,166 26,683 9,967 3,465 +++
Ki1 63 19,905 4,931 24,313
Ko 63 13,651 5,166 26,683 10,959 3,465 +++
Ki2 63 21,952 5,037 25,369
Ki1 63 19,905 4,931 24,313 3,795 3,465 +++
Ki2 63 21,952 5,037 25,369
Based upon the obtained results we can conclude that the greatest performance
improvement took place in case of the second experimental group confirming that teacher assistance and regular consultation with the instructor is indispensable in case of processing electronic educational materials. The first experimental group achieved higher results by the help of multimedia, but to a somewhat lesser extent as compared to the control group.
Page 415
Multimedia innovate for spatial thinking ability ICI 10 - 10TH INTERNATIONAL CONFERENCE ON INFORMATION
10
4. Conclusions
4.1 The comparison of the research results with the hypotheses H1 Substantiated in case of the second experimental group of full time students as
compared to the control group. a highly significant performance improvement took place in the content knowledge of the respective students.
H2. Substantiated in case of the first experimental group of distance learning students as compared to the control group. a highly significant performance improvement took place in the content knowledge of the respective students
H3. Substantiated in case of the first experimental group of distance learning students as compared to the experimental group of full time students a highly significant performance improvement took place in the content knowledge of the full time students.
References [1] NAHALKA, I., Konstruktív pedagógia – egy új paradigma a láthatáron. In: Iskolakultúra,
1997/2.
[2] SPERRY, R.W., Brain bisection and consciousness. In: How the Self Controls Its Brain, / edit:
J.C. Eccles Springer-Verlag, New York, 1966. ISBN 3540562907
[3] BUZAN, T., Make the Most of Your Mind. Linden Press, NY, 1984. ISBN- 0671495194
[4] GYARMATHY, É. (2001) Gondolatok térképe. In: TaníTani, 18-19. 2001,. pp.108-115.
[5] SCHRAMM, W., Az új tanítási eszközök az Amerikai Egyesült Államokban. In: Nouvelles
méthodes et techniques d’education. Études et Documents d’Education No. 48. 1963, Paris
UNESCO. 1. fej. Ford.: Kiss Árpád. OPKM – dokumentum.
[6] FORGÓ S., HAUSER, Z., KIS-TÓTH, L., Médiainformatika, Eger: Líceum kiadó, 2005.
[7] BOHONY, P., Oktatástechnológusok és tanárjelöltek néhány tanulási jellemzői In: Agria Media
2006. CD-ROM / edit: Tompa K. 2007. ISBN 963 9417 09 2
[8] BOHONY, P.,-BOHONY, M., Egyetemi hallgatók tanulási stílusai. In: Agria Media 2004. I.
kötet / edit: Tompa K. 2004. II. kötet pp. 589-595. ISBN 963 9417 09 2
[9] KOMENCZI, B., Elektronikus tanulási környezetek Habilitációs értekezés Debrecen, 2007.
[10] ANTAL, P., Visual Design of Distance Learning teaching Materials In: XIV. Didmattech 2003,
Votobia Praha
[11] ANTAL, P., Application of E-learning Materials in Higher Education In: Information
&Communication Technology in Natural Science Education 2007. pp:129-135. NSERC, Siauliai
Unversity, 2007. Siauliai, Lithuania ISBN: 978-9986-38-823-4
Page 416
ICI 10 - 10TH INTERNATIONAL CONFERENCE ON INFORMATION AT DELTA UNIVERSITY FOR SCIENCE AND TECHNOLOGY
GAMASA, EGYPT, 4 – 6 DECEMBER 2010
Development of a multimedia education programme for the improvement of communication skills
Zsuzsanna Hanák1 , Magdolna VARGA ESTEFÁN2
1College professor of Eszterházy Károly College (Eger, Hungary)[email protected] 2College professor of Eszterházy Károly College (Eger, Hungary)[email protected]
Abstract
The aim of the dissertation is to develop the pedagogical knowledge with the preparation, testing and efficiency-test of a teaching program supported by a CD-ROM. The aim is to prepare a program and aids.
The aim of our research is to produce, test and to introduce into the teachers’ training a multimedia teaching program which alleviates the preparation of students in their work to enlarge and develop the communicative knowledge and ability of elementary school pupils. The learning efficiency of students can be improved in the future with the help of the multimedia CD-ROM as it renders the interaction. It makes possible for the students to sit at a computer and according to his own learning rhythm to study the difficult parts of the material with the help of specially selected units, which otherwise is not possible in small groups and one-to-one work.
Keywords:
Multimedia teaching programme communication improvement training
Page 417

1.INTRODUCTION
The aim of the thesis is to report about the results of a project involving research and development. Aims of the project were to design, accomplish and test a multimedia teaching programme that supports the preparation of future teachers by helping them to provide knowledge of communication for primary and secondary school students and to improve their communication skills. Further aim was to integrate this programme into teachers training. The development of the programme was based on a comprehensive international and Hungarian special literature, and its efficiency was controlled by thorough analysis.
Our first task was to develop a playful, but effective communication improvement training for primary school and secondary school children.
Our second task was to teach this training programme as a method to future teacher students. This task proved to be complex, because we had to work out communication improvement of the students based on their own experiences then provide them with necessary knowledge about the theory of communication and small group leadership. Only after these could come the acquirement of the programme as a teaching method, with supervision.
Our hypotheses were as follows:
H1: In our view, the programme will affect personality characteristics and communication style of students, but not their intelligence.
H2: We assume that the multimedia education program will transfer knowledge regarding the topic in an understandable form.
H3: We think that this teaching programme will improve the efficiency of the subject, students will get better marks.
H4: In our opinion, the programme will be most effective for the students having visual or auditory learning style.
H5: We presume that the teaching programme will provide interactivity, and so will give an opportunity for the students to get information individually, at their own rate.
H6: We expect that the multimedia education programme will motivate the students to finish their studies.
2.METHODS 2.1 Methods used for the examination of students:
– Personality tests
We used Eysenck's EPQ to explore the students' personality along the dimensions of extroversion-introversion, neuroticism, psychoticism and filling social requirements.
Page 418

– Examination of communication style
We used the questionnaire of Rudas to examine the characteristics of communication of students regarding kindliness, making long-lasting impression, relaxedness, arguing, observantness, preciseness, live-expressiveness, dramatic effect, openness and domination.
– Measurement of intelligence
We used the Raven test to measure IQ.
- Subject-related basic knowledge
We analysed results of subject tests.
2.2 Methods used for measuring the efficiency of the multimedia education programme:
– Measurement of subject-related scholastic records
Document analysis. Analysis of final term-grades.
– Analysis of learning styles
We used the questionnaire of Szitók developed to reveal learning styles of students.
- Analysis of motivating value, interactivity and clearness of content
We used Likert-type questionnaires to measure various dimensions of the efficiency of the programme.
- Dimensions regarding motivating effect of the programme
* maintaining interest
* maintaining attention
* motivation to learn
- Dimensions regarding interactivity
* individual learning
* individual tempo
* feedback
* object-orientation
* distribution
- Dimensions regarding content
* multimedial elaboration of the topic
* importance and actuality of the topic
* content and clearness of the text
Page 419
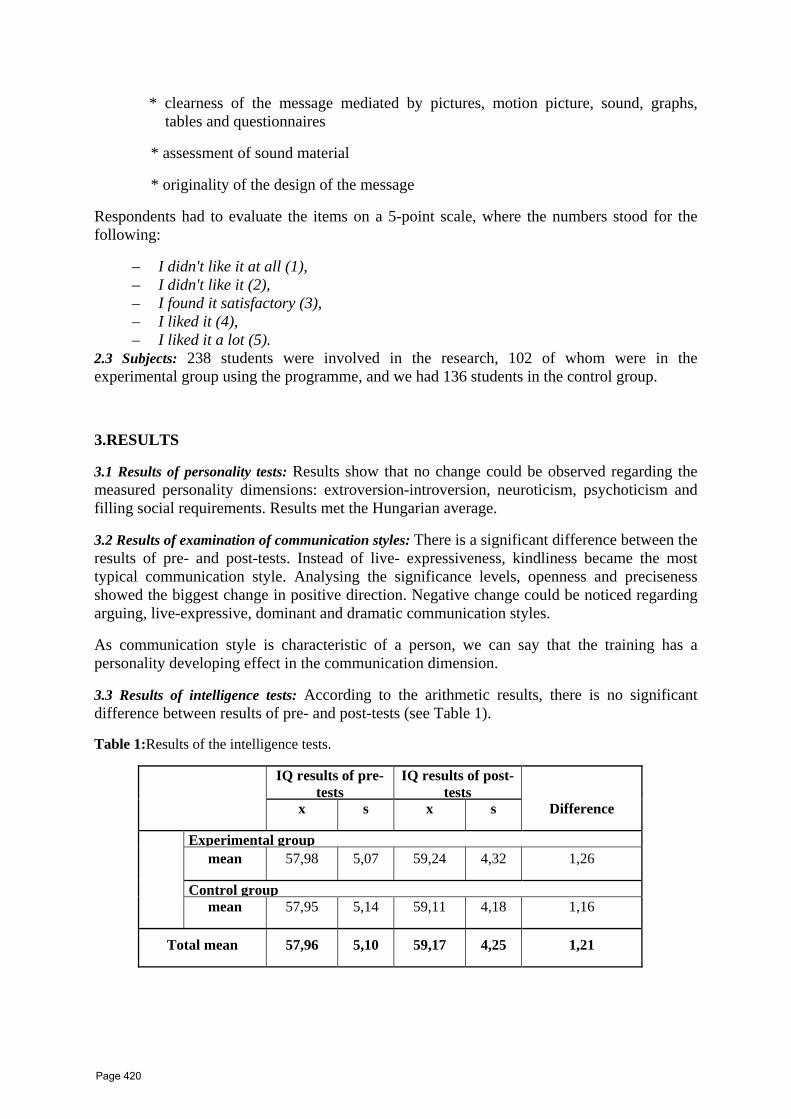
* clearness of the message mediated by pictures, motion picture, sound, graphs, tables and questionnaires
* assessment of sound material
* originality of the design of the message
Respondents had to evaluate the items on a 5-point scale, where the numbers stood for the following:
– I didn't like it at all (1), – I didn't like it (2), – I found it satisfactory (3), – I liked it (4), – I liked it a lot (5).
2.3 Subjects: 238 students were involved in the research, 102 of whom were in the experimental group using the programme, and we had 136 students in the control group.
3.RESULTS
3.1 Results of personality tests: Results show that no change could be observed regarding the measured personality dimensions: extroversion-introversion, neuroticism, psychoticism and filling social requirements. Results met the Hungarian average.
3.2 Results of examination of communication styles: There is a significant difference between the results of pre- and post-tests. Instead of live- expressiveness, kindliness became the most typical communication style. Analysing the significance levels, openness and preciseness showed the biggest change in positive direction. Negative change could be noticed regarding arguing, live-expressive, dominant and dramatic communication styles.
As communication style is characteristic of a person, we can say that the training has a personality developing effect in the communication dimension.
3.3 Results of intelligence tests: According to the arithmetic results, there is no significant difference between results of pre- and post-tests (see Table 1).
Table 1:Results of the intelligence tests.
IQ results of pre-tests
IQ results of post-tests
Difference
x s x s
Experimental group mean 57,98 5,07 59,24 4,32 1,26
Control group mean 57,95 5,14 59,11 4,18 1,16
Total mean 57,96 5,10 59,17 4,25 1,21
Page 420

3.4 Results of efficiency tests of the multimedia education program:
Clearness of content: 58,14% of the students liked it
30,49% of the students liked it very much
11,37% of the students found it satisfactory.
content and clearness of the text
* clearness of the message mediated by pictures, motion picture, sound, graphs, tables and questionnaires
* assessment of sound material
* originality of the design of the message
– Multimedial elaboration of the topic: 24,5% of the students liked the multimedial elaboration of the topic, 75,5% of the students liked it very much. Mean of qualifications: 4,75, which is the highest rate of the ten aspects, so this got to the first place in the ranking.
– Importance and actuality of the topic: 81,37% of the students liked the actuality of the topic, 18,63% of the students liked it very much. This aspect got to the fifth place in the ranking with the mean of 4,19.
– Content and clearness of the text: 59,8% of the students liked the content and clearness of the text, 40,2% of the students liked it very much. Mean of qualifications of this aspect: 4,40, that means fourth place in the ranking of qualifications.
– Clearness of the message mediated by pictures: 80,39% of the students liked the quality of the pictures, 19,61% of the students liked it very much. Mean of the qualifications: 4,2, ranking place: sixth.
– Clearness of the message mediated by motion picture: 55,88% of the students liked the information mediated by motion picture, 44,12% of the students liked it very much. Mean of qualifications of this aspect: 4,44, that meant third place in the ranking.
– Clearness of the message mediated by graphs: 26,47% of the qualifications were satisfactory, 63,73% were good and 9,8% were excellent. The mean is 3,83, this means the ninth place in the ranking.
– Clearness of the message mediated by tables: 84,31% of the students liked the usefulness of the tables, and 15,69% of the students liked it very much. The mean of qualifications is: 4,16, that is eighth ranking place.
– Usefulness of the questionnaires: Qualifications were good in 82,35%, and excellent in 17,65%. The mean is 4,18, that means seventh place in the ranking.
– Assessment of sound material: The qualifications for the sound material were satisfactory in 87,25%, good in 7,84%, and excellent in 4,91%. Mean of this aspect: 3,18, that is tenth ranking place.
– Originality of the design of the message: This aspect was liked by 41, 18% of the students, and 58,83% liked it very much. Mean of qualifications: 4,59, that means second place in the ranking.
Summarizing the qualifications for clearness of content of the multimedia education programme, the total mean of the students was 4,19 (they liked it). Though, modifications were needed for the final version of the programme, according to the following ranking:
Page 421

1. Clearness of sound material
2. Quality of graphs
3. Usefulness of tables
4. Usefulness of questionnaires
5. Information mediated by pictures
6. Clearness of content of texts
7. Information mediated by motion picture
Qualifications regarding motivating effect of the programme
The motivating effect of the programme was liked in 63,73%, and 36,27% of the subjects liked it a lot.
– 79,41% of the students thought that the education programme is good in maintaining interest (they liked it), and 20,59% found it very good (thy liked it a lot). The mean of qualifications is 4,21, that means fourth ranking place for this aspect.
– The education programme's motivating effect to learn was liked in 54,9%, and very much liked in 45,10%. The mean of qualifications is 4,45, that means second place in the ranking.
– 83,33% of the students liked the attention maintaining effect of the programme, 16,37% liked it a lot. The mean is 4,17, that is the fifth place in the ranking.
– 77,45% of the students found good the education programme's effect to enhance subject efficiency, and 22,55% of the students evaluated this aspect with the highest score. Mean of the qualifications: 4,23, this means the third place in the ranking.
– 23,53% of the students liked the programme's help in the preparation for practical work, and 76,47% of the students liked it a lot. The mean of the qualifications is 4,76, this meant the first ranking place.
To summarize these results: subjects liked the motivating effect of the education programme (mean: 4,36). When working out the final version, practically, we had to make corrections along the following ranking:
1. Increasing the programme's effect to maintain attention.
2. Increasing the programme's effect to maintain interest.
3. Increasing the programme's effect to enhance subject efficiency.
4. Increasing the programme's effect to motivate learning.
5. Help the practical work.
Qualifications of the multimedia education programme's interactivity
Interactivity was found very good in 71,76%, and 28,24% of the students found it good. − 76,47% of the students liked the possibility of individual learning very much, and 23,53%
of the students liked it. Mean of the qualifications is 4,76, that gives the third ranking place to this aspect.
Page 422

− 82,35% of the students found the possibility of learning at individual rate excellent, and 17,65% found it good. Mean of qualifications: 4,82, that means the first ranking place for this aspect of qualification.
− The feedback of the learnt material was liked by 52,94% of the students and was liked very much by 47,06% of them. Mean of qualifications: 4,47, that means fifth place in the ranking.
− Subjects liked the object-orientation of the lessons very much in 75,49%, and liked it in 24,51%. The mean of qualifications is 4,75, that means the fourth ranking place.
− 77,45 % of the students liked the distribution of the lessons very much, and 22,55% of them liked it. Mean of qualifications: 4,77, this is the second place of the ranking.
To summarize the results: interactivity of the education programme were rated excellent (4,71). When working out the final version of the multimedia education programme, we took special care of improving the following aspects:
1. Feedback
2. Object-orientation of the lessons
3. Possibility of individual learning
4. Distribution of the lessons
5. Helping learning at individual rate
Subject efficiency of the students using the education program
Students using the education program attained the following term marks:
excellent 20,7 %,
good 36,3 %,
satisfactory 27,4 %,
pass 15,6 %,
there were no fails.
According to the percentages, subject efficiency of the students can be demonstrated by the following ranking:
1. good (36,3%)
2. satisfactory (27,4%)
3. excellent (20,7%)
4. pass (15,6%)
5. fail (0%)
Page 423

Research results regarding learning styles of students using the education program (experimental group)
Results show that 25,5% of students use ”silence” learning style. This means that they are distracted by any noise around them when they are learning. They can only learn in complete silence, they are distracted by speaking, radio or cassette/CD player.
”Auditory” and ”visual” learning styles got to the second ranking place with 24,5%. Characteristics of students with auditory learning style: they don’t like silent reading, they read aloud when preparing, they usually repeat the prep loud, and they like teacher’s explanations. Students with visual learning style find graphs and tables useful, like demonstrations at the lessons. They usually make drafts and graphs when learning, and they don’t like verbal instructions.
”Kinesthetic” learning style got to the fourth ranking place, with 10,8%. Students with kinesthetic learning style are willing to write during learning, they prefer activity; they don’t like to sit by their desk. They usually like to make graphs, they prefer ”tangible” tasks and practical work, they can easily memorize movements.
At the fifth and sixth ranking place, there are ”mechanical” and ”social” learning styles, both with 5,9%. Students with ”mechanical” learning style don’t like tasks requiring complex thinking, they learn everything word by word. Those with ”social” learning style don’t like to learn alone, they willingly learn together with their mates, and make others hear their lesson.
”Impulsive” learning style is at the seventh ranking place with its percentage of 2,9. Characteristic of this learning style that students have difficulty with learning, they prefer activities. They tend to respond without thinking, it is difficult for them to proceed step by step when solving a task.
3.5 Interpretation of research results, revealing correlations 3.5.1 Effects of the education programme on subject efficiency: Comparing the test results of experimental and control group, it is clear that regarding the written test, the experimental group was more effective (mean of marks: 3,62) than the control group (mean of marks: 3,3).
As to excellent marks (5), there is not a great difference (0,1 regarding percental distribution) for the experimental group.
Analysing good marks (4), we can see that this difference for the benefit of the experimental group is much bigger (14,3).
Regarding satisfactory marks (3), the experimental group is better again (difference: 0,9).
As to pass marks (2), the results spectacularly show that students in the control group achieved poorer (10,9).
Fail marks were given only to members of the control group.
Thus, with more or less difference, the test results of students in the experimental group were better regarding every marks.
Ranking the assessments, we can make the following observations:
Page 424

- The greatest difference was found regarding good mark (4) for the benefit of the experimental group (14,3). - The second biggest difference was regarding pass mark (2) for the control group (10,9). - The third difference was found by fail mark (1), for the control group (4,4). - Regarding the extent of differences, satisfactory mark (3) is at the fourth ranking place, where members of the experimental group were found in bigger percentage (0,9). - The least difference could be observed between the percentages regarding excellent mark (5) for the benefit of the experimental group (0,1). Thus, we can ascertain that the multimedia education programme enhances subject efficiency. The reliability testing was done by means of t-test. Reliability: 88%.
3.5.2 Correlations between learning styles and subject efficiency of students using the education programme The following results were found concerning students using the multimedia education programme:
– Students with kinetic learning style had the best achievement (3,74). – Then followed the results of students with visual learning style (3,68). – The marks of students learning with mechanical style was third (3,67). – The fourth ranking place of subject efficiency belongs to students with auditory
learning style (3,64). – The average of marks in the fifth ranking place is 3,58, that is by silence learning
style – Those with social learning style took only the sixth ranking place of average marks
(3,5). – The worst achievement (3,00) was found by impulsive learning style.
Thus, we can ascertain, that the multimedia education programme is most effective by kinetic learning style.
3.5.3 Revealing correlations between learning style and qualifications of the multimedia education programme
– Students learning by silence learning style found interactivity the best aspect of the multimedia education programme (4,63). Then came the motivating effect of the education programme (4,42), followed by attributes of content (4,26).
– According to qualifications of students with auditory learning style, interactivity of the education programme stands first (4,72), attributes of content took the second (4,09), and motivating effect (4,04) took the third place.
– Interactivity is first by visual learning style (4,71), motivating effect was placed second (4,56), and attributes of content was placed third (4,24).
– The ranking of students with kinetic learning style was similar: interactivity stands first (4,76), then comes motivating effect (4,36) and finally attributes of content (4,19).
– Regarding qualifications of students with mechanical learning style, interactivity is in the first place (4,76), motivating effect is second (4,66), then attributes of content (4,00).
– Interactivity was qualified best (4,76) by students with social learning style, too. Motivating effect took the second place (4,5), and attributes of content the third (4,45).
– By impulsive learning style, interactivity took the first place (4,61), attributes of content and motivating effect were second and third (with the same qualifications of 4,00).
Page 425
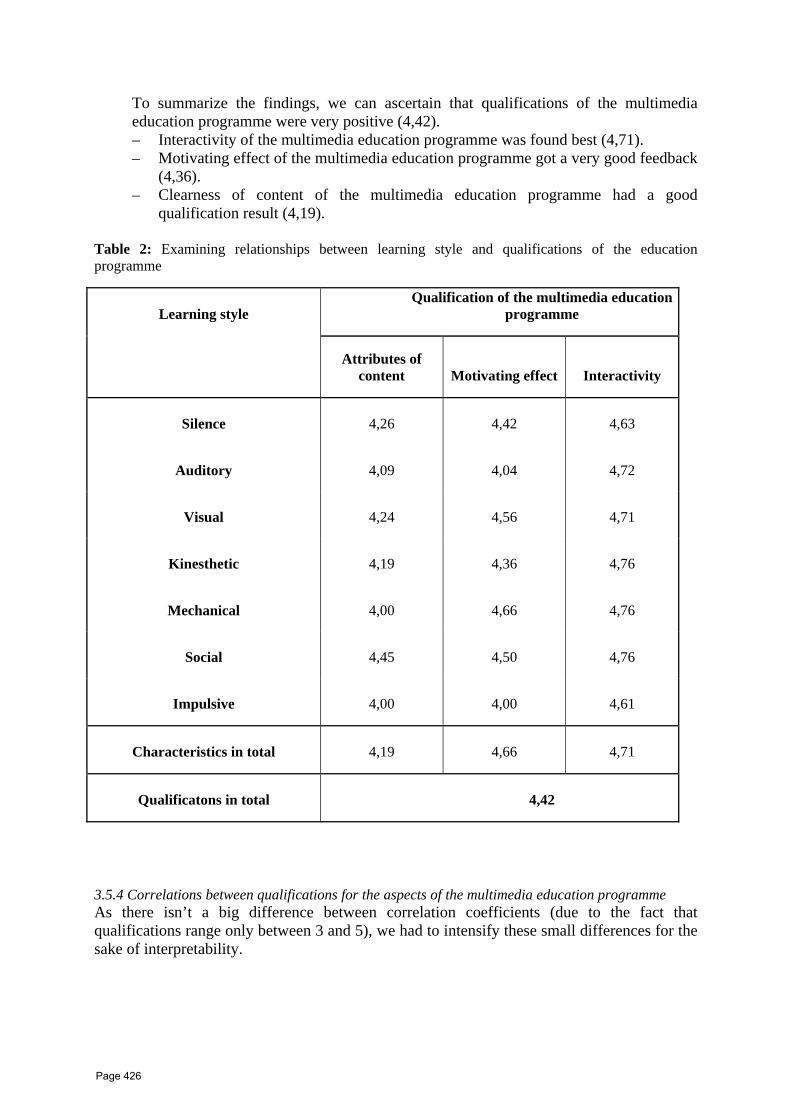
To summarize the findings, we can ascertain that qualifications of the multimedia education programme were very positive (4,42). – Interactivity of the multimedia education programme was found best (4,71). – Motivating effect of the multimedia education programme got a very good feedback
(4,36). – Clearness of content of the multimedia education programme had a good
qualification result (4,19).
Table 2: Examining relationships between learning style and qualifications of the education programme
Learning style Qualification of the multimedia education
programme
Attributes of
content
Motivating effect Interactivity
Silence 4,26 4,42 4,63
Auditory 4,09 4,04 4,72
Visual 4,24 4,56 4,71
Kinesthetic 4,19 4,36 4,76
Mechanical 4,00 4,66 4,76
Social 4,45 4,50 4,76
Impulsive 4,00 4,00 4,61
Characteristics in total 4,19 4,66 4,71
Qualificatons in total 4,42
3.5.4 Correlations between qualifications for the aspects of the multimedia education programme As there isn’t a big difference between correlation coefficients (due to the fact that qualifications range only between 3 and 5), we had to intensify these small differences for the sake of interpretability.
Page 426
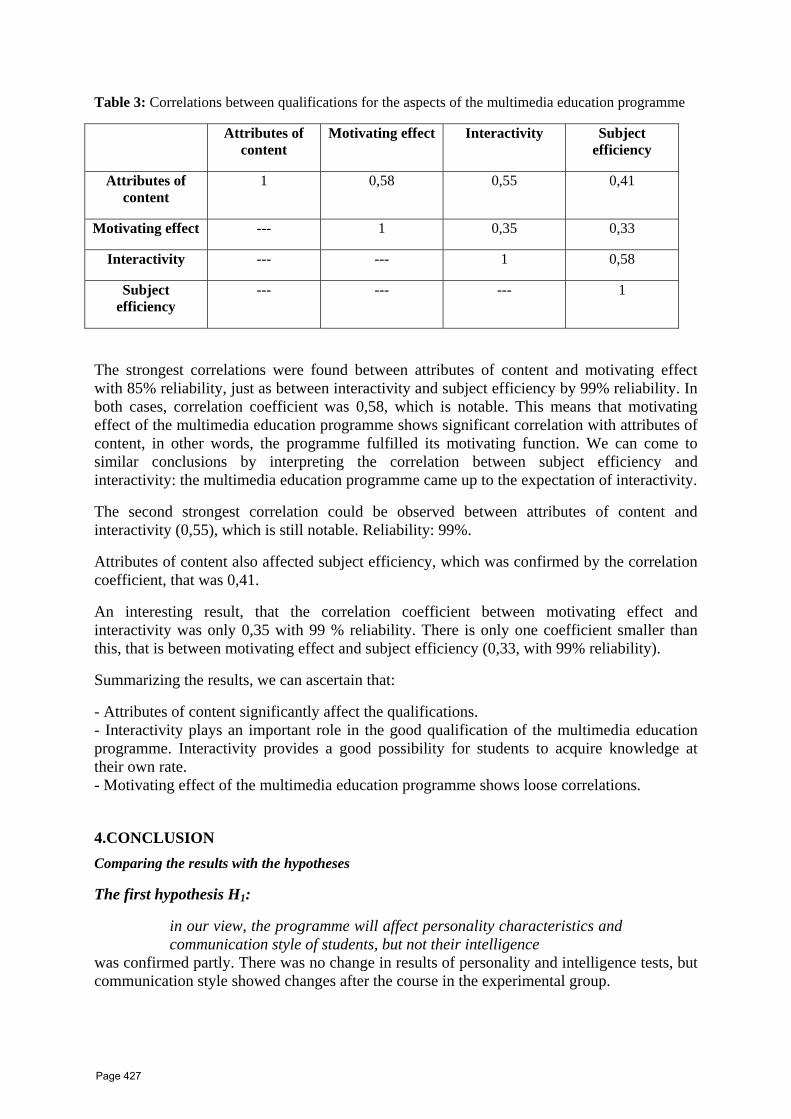
Table 3: Correlations between qualifications for the aspects of the multimedia education programme
Attributes of content
Motivating effect Interactivity Subject efficiency
Attributes of content
1 0,58 0,55 0,41
Motivating effect --- 1 0,35 0,33
Interactivity --- --- 1 0,58
Subject efficiency
--- --- --- 1
The strongest correlations were found between attributes of content and motivating effect with 85% reliability, just as between interactivity and subject efficiency by 99% reliability. In both cases, correlation coefficient was 0,58, which is notable. This means that motivating effect of the multimedia education programme shows significant correlation with attributes of content, in other words, the programme fulfilled its motivating function. We can come to similar conclusions by interpreting the correlation between subject efficiency and interactivity: the multimedia education programme came up to the expectation of interactivity.
The second strongest correlation could be observed between attributes of content and interactivity (0,55), which is still notable. Reliability: 99%.
Attributes of content also affected subject efficiency, which was confirmed by the correlation coefficient, that was 0,41.
An interesting result, that the correlation coefficient between motivating effect and interactivity was only 0,35 with 99 % reliability. There is only one coefficient smaller than this, that is between motivating effect and subject efficiency (0,33, with 99% reliability).
Summarizing the results, we can ascertain that:
- Attributes of content significantly affect the qualifications. - Interactivity plays an important role in the good qualification of the multimedia education programme. Interactivity provides a good possibility for students to acquire knowledge at their own rate. - Motivating effect of the multimedia education programme shows loose correlations.
4.CONCLUSION Comparing the results with the hypotheses
The first hypothesis H1:
in our view, the programme will affect personality characteristics and communication style of students, but not their intelligence
was confirmed partly. There was no change in results of personality and intelligence tests, but communication style showed changes after the course in the experimental group.
Page 427

The second hypothesis H2:
we assume that the multimedia education program will transfer knowledge regarding the topic in an understandable form
was verified. According to the feedbacks, 58,14% of students liked the clearness of content, and 30,49% liked it very much. The mean of qualifications is 4,19, which means a good qualification. The third hypothesis H3:
we think that this teaching programme will improve the efficiency of the subject, students will get better marks
was verified. The mean of exam marks of students using the multimedia education programme was better (3,62) than that of the control group. The fourth hypothesis H4:
in our opinion, the programme will be most effective for the students having visual or auditory learning style
was not confirmed. Students with kinesthetic learning style achieved the best marks (3,74) using the multimedia education programme. The fifth hypothesis H5:
we presume that the teaching programme will provide interactivity, and so will give an opportunity for the students to get information individually, at their own rate
was confirmed. The qualification of interactivity was very good (71,76%), and good (28,24%), the mean of qualifications is 4,71. This means a very good qualification. The sixth hypothesis H6:
we expect that the multimedia education programme will motivate the students to finish their studies
was verified. Motivating effect of the programme was found good in 63,73%, and very good in 36,27%. The mean of qualifications id 4,36, which means a good qualification.
There is a balance between the developmental effect of interpersonal relations and development transmitted by technology. The developing effect of interpersonal relations is best in a small group personality development training, based on personal experience. The developing effect transmitted by technology is most efficient in the cognitive sphere. So, theoretical principles of didactics can be enriched with educational-psychological integrated knowledge like development of communication skills, small group leadership and learning styles.
Empirical studies revealed statistically significant correlations.
The following facts can be described:
The multimedia education programme is most efficient in case of kinetic learning style. Only high level of content may result in high level of motivation and interactivity, a multimedia education programme only with high professional content can increase subject efficiency.
That is why it is desirable to emphasize the complex approach of the disciplines of education, psychology and education technology in teachers training.
Page 428

Why Cloud Computing is Necessary for Open University Malaysia
Dr Ahmad Hashem Open University Malaysia
50480 Kuala Lumpur Malaysia
Abstract
Open University Malaysia (OUM) practices flexible learning so that learners and staff can access learning and conduct other transactions online at any time convenient to them. This flexibility means that the online services provided by OUM must be available all the time and must be accessible from any place that has Internet connection. Providing this kind of service requires special ICT infrastructure that is designed to be highly reliable. There must be sufficient redundancy built in to ensure that single points of failure are eliminated. Services must continue to be available even if some devices in the infrastructure fail. Also, there must always be a team of dedicated technical personnel on duty to ensure regular maintenance are carried out and can quickly diagnose and repair faults that occur. OUM continue to invest heavily in infrastructure and technical manpower to ensure its ICT services meet the expectations of the flexible learning environment. However, OUM is now embarking on new e-learning delivery approaches that require substantial increase in infrastructure investment. The capacity of servers, storage and bandwidth will need to be increased drastically to meet the new requirements. To cater to the new requirements the existing model of ICT infrastructure provisioning is no longer viable and a new approach is required. The ICT department of OUM has been experimenting with using “hosting infrastructure within the cloud” services for some time. We now understand the landscape better and are now embarking on using cloud services for hosting services. Some of the advantages to be gained through using cloud computing services for OUM include cost savings because of pay for use model, capacity can be increased without the need to increase own internal maintenance personnel and very high availability because of distributed hosting architecture. This paper will discuss several reasons why OUM must seriously look at cloud computing as a viable way of consuming ICT infrastructure and some of the initial steps that it has taken towards this. Introduction The Ministry of Education Malaysia invited Multimedia Technology Enhancement Operations Sdn. Bhd. (METEOR), a consortium of the first 11 public universities in the country, to set up an open university in August 1999 in order to expand education to the masses that cannot be accommodated by conventional universities,. This in turn resulted in the establishment of Open University Malaysia (OUM) as the seventh private university in August 2000.
The motto for OUM is "University for All" to reflect its role in the democratization of education. Education will now be more accessible to all, regardless of time, place, age and socio-economic background. The OUM was positioned as an alternative channel to quality tertiary education that is available to the masses. To ensure tertiary education is opened up to a wider spectrum of the population, the OUM was allowed some flexibility in its entry requirements. Since its first intake
Page 429
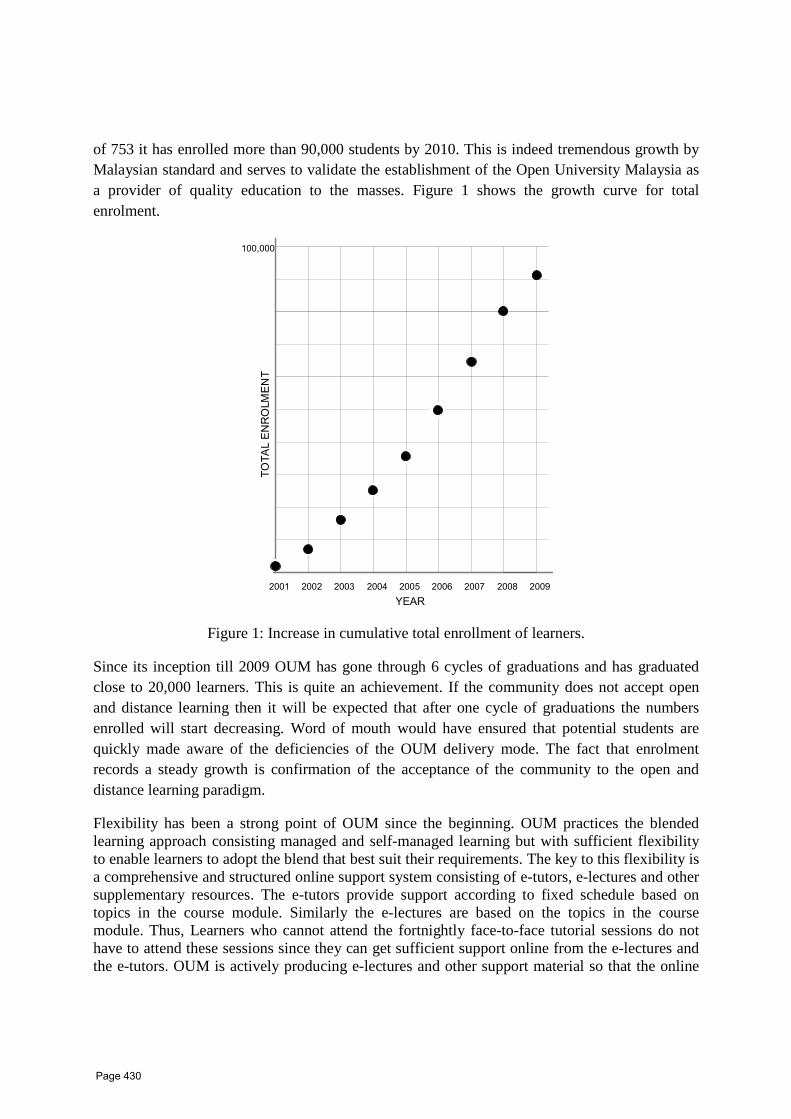
of 753 it has enrolled more than 90,000 students by 2010. This is indeed tremendous growth by Malaysian standard and serves to validate the establishment of the Open University Malaysia as a provider of quality education to the masses. Figure 1 shows the growth curve for total enrolment.
2001 2002 2003 2004 2005 2006 2007 2008 2009
100,000
TOTALENROLMENT
YEAR
Figure 1: Increase in cumulative total enrollment of learners.
Since its inception till 2009 OUM has gone through 6 cycles of graduations and has graduated close to 20,000 learners. This is quite an achievement. If the community does not accept open and distance learning then it will be expected that after one cycle of graduations the numbers enrolled will start decreasing. Word of mouth would have ensured that potential students are quickly made aware of the deficiencies of the OUM delivery mode. The fact that enrolment records a steady growth is confirmation of the acceptance of the community to the open and distance learning paradigm.
Flexibility has been a strong point of OUM since the beginning. OUM practices the blended learning approach consisting managed and self-managed learning but with sufficient flexibility to enable learners to adopt the blend that best suit their requirements. The key to this flexibility is a comprehensive and structured online support system consisting of e-tutors, e-lectures and other supplementary resources. The e-tutors provide support according to fixed schedule based on topics in the course module. Similarly the e-lectures are based on the topics in the course module. Thus, Learners who cannot attend the fortnightly face-to-face tutorial sessions do not have to attend these sessions since they can get sufficient support online from the e-lectures and the e-tutors. OUM is actively producing e-lectures and other support material so that the online
Page 430
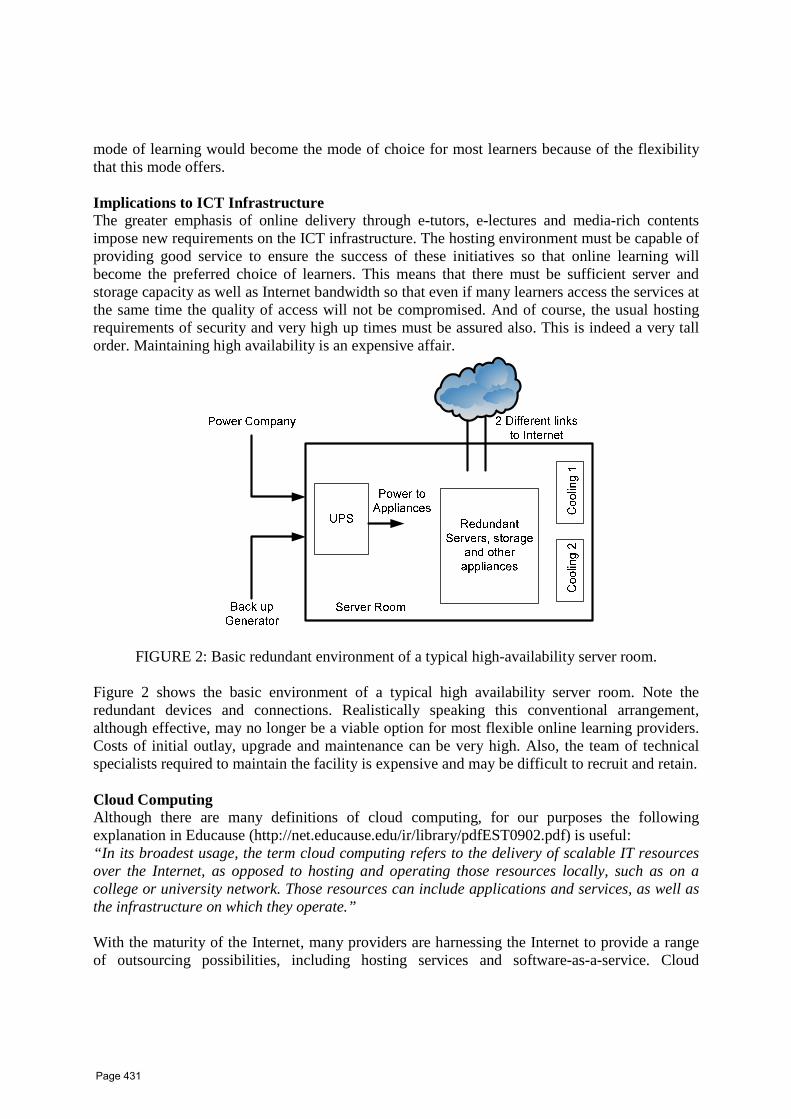
mode of learning would become the mode of choice for most learners because of the flexibility that this mode offers. Implications to ICT Infrastructure The greater emphasis of online delivery through e-tutors, e-lectures and media-rich contents impose new requirements on the ICT infrastructure. The hosting environment must be capable of providing good service to ensure the success of these initiatives so that online learning will become the preferred choice of learners. This means that there must be sufficient server and storage capacity as well as Internet bandwidth so that even if many learners access the services at the same time the quality of access will not be compromised. And of course, the usual hosting requirements of security and very high up times must be assured also. This is indeed a very tall order. Maintaining high availability is an expensive affair.
FIGURE 2: Basic redundant environment of a typical high-availability server room. Figure 2 shows the basic environment of a typical high availability server room. Note the redundant devices and connections. Realistically speaking this conventional arrangement, although effective, may no longer be a viable option for most flexible online learning providers. Costs of initial outlay, upgrade and maintenance can be very high. Also, the team of technical specialists required to maintain the facility is expensive and may be difficult to recruit and retain. Cloud Computing Although there are many definitions of cloud computing, for our purposes the following explanation in Educause (http://net.educause.edu/ir/library/pdfEST0902.pdf) is useful: “In its broadest usage, the term cloud computing refers to the delivery of scalable IT resources over the Internet, as opposed to hosting and operating those resources locally, such as on a college or university network. Those resources can include applications and services, as well as the infrastructure on which they operate.” With the maturity of the Internet, many providers are harnessing the Internet to provide a range of outsourcing possibilities, including hosting services and software-as-a-service. Cloud
Page 431

computing is still relatively new so there are still issues of standardization, assurance of quality of service, cost etc. However, from our limited experience with the services many are good enough already to be worthy of consideration as a possible substitute for in-house provision. Why OUM is considering cloud computing The OUM ICT services must be able to cater to a total population of more than 95,000 (learners, alumni and staff) and growing. Also, being a provider of flexible education means that all the services must be available at anytime and from anywhere with ease. Thus, the ICT infrastructure must have very high up time and must be easily accessible. Provisioning infrastructure to support these demands require large and continuous financial and human resources investments. The quality of the service provision is also being compared constantly to user experience of other, usually free, services that is available over the Internet. For example, most users have free email accounts from Google, Yahoo or Microsoft. Google’s Gmail for example give users more than 7 Gigabytes (GB) of storage space for absolutely free. If OUM were to provide this capacity for more than 95,000 users means that it would need to have basic storage capacity of at least 665 Terabytes. With backup and redundancy storage requirements the actual capacity required will be huge. With the present population growth trend it will not be possible for OUM to provide the level of service that can meet user expectations. However, since learners pay for the OUM services they expect the OUM services to be at par if not better than the free services that they are currently enjoying. Starting in 2010 OUM is embarking on several new initiatives to make learning much more flexible by providing innovative online support and media-rich resources. One of the initiatives is the online e-tutor, a structured tutorial support service that is available at scheduled times to all students. Tutorial sessions are based on learning topics in the print module of each subject. Each session is supported by web-based video lectures and media-rich content. To cater to this rapid growth in “Internet-heavy” content the ICT infrastructure must also grow to cope. One particular area that must be enhanced is the bandwidth to the Internet. With many users using the Internet to access media-rich content and to carry out many other transactions the present bandwidth of 20 Megabits per second (Mbps) is barely adequate. Ideally, to cope with the new requirements OUM will need to have at least 155 Mbps. But bandwidth is still a very expensive commodity in Malaysia. As Table 1 shows, Malaysia is the most expensive country in the Asia-Pacific region for leased-line bandwidth.
Annual Rental Cost (USD) 45 Mbps 155 Mbps Australia 36,000 66,000 China 34,800 72,000 Hong Kong 21,600 36,000 India 22,800 60,000 Indonesia 144,000 162,000 Japan 45,600 69,600 Malaysia 122,400 216,000 New Zealand Not Available Not Available Philippines 60,000 96,000
Page 432

Singapore 36,000 74,400 South Korea 45,600 105,600 Taiwan 24,000 38,400 Thailand 70,800 129,600 Vietnam 218,400 Not Available
Table 1: Annual cost of leased-line rental in Asia-Pacific countries for 45 Mbps and 155 Mbps Extracted and adapted from Access Price Benchmarking for APCC 2009 – A Study Produced for the Asia Pacific Carriers’ Coalition (APCC) http://www.asiapacificcarriers.org/sp/user/attach/2010-06 13_APCC%20Final%20Report%202010.pdf In the OUM operations as with most universities there are instances where the demand for ICT resources far exceeds the available capacity. At the OUM these occur during registration and re-registration period where learners wait until the last minute to register. Thus, thousands of learners go online suddenly to access the registry web services. The same phenomenon occurs for online essay submission. Learners usually submit their essays as late as possible even if a decent period for submission was scheduled. It is not viable to provision resources to cope with these short-term spikes in demand since for most of the time there will be huge excess capacity laying idle. Some cloud computing initiatives Email is of vital importance to the operations of OUM. It is the primary means of communication within OUM and between OUM and the outside world. In the beginning our proprietary email that was hosted and managed internally was sufficient. As the number of users grow various problems start to surface. The proliferation of spam mails made the situation worse. To alleviate the problems OUM have to invest in a better email system and hardware including new firewall and spam filter, or we could look at outsourcing this vital service. After much deliberation we chose the later route – we chose Google’s Gmail as the email for OUM (http://www.google.com/a/help/intl/en/edu/case_studies/oum.html). Since 2008, staff and learners of OUM have been using Gmail as the OUM email. As at middle of 2010 every user gets 7501 MB. The service availability has been very high, almost 100%. Also, the incidence of spam has been reduced drastically. And all these benefits for absolutely free! We are also experimenting with hosting the LMS and the media-rich content in the cloud on a pay-per-use model. Thus, we only pay for the resources that we use, be it servers, storage or bandwidth. Thus, the hosting infrastructure can grow and shrink with demand and payment is based on usage. From our experiments it appears that hosting the LMS and the media-rich content on the cloud offer similar user experience to internal hosting. Also, the large increase in bandwidth that is required because of the increase in media-rich content is now handled by the service provider and not OUM. Thus, the OUM bandwidth does not have to be increased to cope with the new demands. We also found that the pay-per-use model to be very cost effective. Things are not all rosy. There are still many uncertainties with cloud hosting. How long can the service provider continue to provide service? If the provider cannot continue its business can our
Page 433

data be recovered? By outsourcing most of the hosting services OUM may not have internal expertise to meet technical challenges that may arise. There are many other concerns but we are hoping many of these will be resolved as we understand the services better and as the services become more mature. Conclusion The provisioning of modern, web-based flexible education requires continuous investments in ICT infrastructure. These investments can be quite substantial. Financial constraints may impose limit on growth of infrastructure and hence quality of service offering. Cloud hosting, with its pay-per-use model can provide an attractive alternative to internal hosting. However, the technology is still relatively new and there are still many uncertainties.
Page 434

GAMASA, EGYPT, 4 – 6 DECEMBER 2010
Interest-Based Strategy for Service Level Agreements of Web Services
Negotiation
Afaf Mousa 1, Arabi Keshk 1, Waiel F. Abd El-Wahed 2.
1 Computer Science, Faculty of computers and information, Shebin El-Com, Egypt {afafmousa,
arabikeshk}@yahoo.com. 2 Operation Research & Decision Support, Faculty of computers and information, Shebin El-Com, Egypt,
Abstract
The non functional requirements of web services such as quality of service (QoS) should be negotiated by the service consumer and provider during service invocation for producing a contract. Efficient negotiation of the service level agreements (SLAs) is essential to manage service provisioning and monitor the actual fulfillment of negotiated SLAs. Argumentation-based negotiation (ABN) has been accepted as a promising alternative for game-theoretic or heuristic based negotiation. This paper is concerned with a particular style of ABN that namely interest-based negotiation (IBN) for presenting a new strategy. We propose a model that demonstrates (through simulation) that our new IBN strategy reduces the execution time and communication overhead of the negotiation process so, producing SLAs faster.
Keywords: Interest-Based Negotiation; Reframing; SLA; Web Service.
1. Introduction
Web services technology has evolved as a very important area of research because of its great
potential for replacing Enterprise Application Integration (EAI) software with dynamic
Business-to-Business (B2B) or Business-to-Consumer (B2C) integration over the Internet. The
versatility of Web services comes at the cost of the complexity in managing Web services and
service-based composite processes.
The term Quality of Service (QoS) is commonly used to express the non-functional service
attributes that define the expected quality of a Web service such as reliability, response time,
throughput and availability [1] [2]. The service provider and consumer can negotiate the
expected QoS and lay out the terms of compensation when the required QoS is not provided in
the form of a contract, which is called the Service Level Agreements (SLAs) [4] [3]. A service
Page 435

Web Services Negotiation
consumer may use a single service or compose a chain of services to create a business process,
which commonly called a composite process [5], and therefore efficient negotiation of the
SLAs is essential.
Negotiation has been an interesting area of research since 1960s [6]. Negotiation is the search
for agreement on the exchange of scarce resources among parties. Researchers have applied
combinations of different models and technologies from different problem domains such as
game theory [7] and heuristic. They are referred to as proposal-based approaches. The
proposed agreements –in the form of bids or offers– are exchanged and when proposed deals
are not accepted, and the possible response is either a counter-proposal or withdrawal.
Argumentation-based negotiation (ABN) approaches enable additional meta-information to be
exchanged during negotiation. ABN is a promising alternative to proposal-based approaches
[8]. This paper is concerned with a particular style of argument-based negotiation, namely
interest-based negotiation (IBN).
IBN originally developed for human negotiation and firstly introduced in [9]. It has been
adapted and applied to multi-Agent systems negotiation dialogues [8]. It is subclass of ABN
where the agents are arguing for negotiation related issues such as beliefs, goals or social
aspects. IBN rests on the idea that the agents can explicit the goals underlying the negotiation
and discusses alternative ways to achieve these. The proposed negotiation model consists of a
negotiation strategy, a negotiation protocol and the information state of agents.
The rest of the paper is organized as follows. Section 2 presents related research work in SLAs
negotiation and IBN negotiation. Section 3 presents the proposed model and an example.
Section 4 shows the evaluation dimensions and experimental results. Section 5 concludes the
paper.
2. Related work
Approaches to automated negotiation have been classified in three categories [13]: (1) game
theoretic (2) heuristic and (3) argumentation based. Methods for automated SLAs negotiation
include only proposal-based approaches such as game-theoretic or heuristic based negotiation.
Argumentation-based negotiation has been accepted as a promising alternative to game-
theoretic or heuristic based negotiation. This paper is concerned with a particular style and
namely interest-based negotiation for SLAs Negotiation.
Page 436
Web Services Negotiation
2.1. SLAs Negotiation
A mathematical model for the negotiation process based on game theory models is developed
in [15]. The idea is a trial to capture the bargaining process that occurs when client's
counteroffer does not meet the service provider objectives. Game theory to define their
negotiation approach is applied in [7]. The game theory assumes the full rationality of the
agents and completes knowledge of circumstances. These assumptions are quite unrealistic and
therefore the application of game theory for practical negotiations is limited. The agents are
bounded information and computational power and may be compensated by the ability of
argumentation.
To address some of the limitations of game-theoretic approaches, a number of heuristic
approaches have emerged. An example of heuristic approaches is the concept of decision
function introduced by [11]. The heuristic approaches have a number of disadvantages as
discussed in [12].
A multilayered approach to negotiation of SLAs for Web service compositions by three
decision making steps is described in [10]. The approach uses regression analysis for learning
opponent’s behavior. It is very difficult to predict precisely how the system and the constituent
agents will behave. Consequently, the models need extensive evaluation through simulations
and empirical analysis.
A learning model to predict the opponent’s strategy during negotiation is proposed in [14]. The
authors apply Bayesian learning to generate counter-offer that produces maximum utility value
payoff to reach optimal solution. Learning approaches require prior knowledge obtained before
entering the negotiation and such knowledge may be sometimes difficult to obtain.
A scheme for negotiation of e-services under uncertainty using existing records of similar
negotiations is proposed in [16]. In their scheme, a participant who is negotiating in
uncertainty obtains assistance in the form of negotiation alternatives and offers made, from
other reputable participants who have negotiated the same issue. In [17] a negotiation
knowledgebase in the negotiation broker is implemented to accommodate this aspect in the
future. To overcome these limitations, ABN often process acquiring information and resolving
uncertainties to take place in the negotiation process itself.
Although game theoretic and heuristic based approaches are highly suitable for a wide range of
applications, they share some further limitations. In most game-theoretic and heuristic models,
agents exchange proposals. They are not allowed to exchange any additional information rather
Page 437

Web Services Negotiation
than what is expressed in the proposal itself. This can be problematic in situations where agents
have limited information about the environment. They also assume that agents’ utilities or
preferences are fixed. One agent cannot directly influence another agent’s preference model, or
any of its internal mental attitudes (e.g., beliefs, desires, goals, etc.) that generate its preference
model. A rational agent would only modify its preferences upon receipt of new information,
and they do not facilitate the exchange of this information.
In [8], ABN attempts to overcome the above limitations by allowing agents to exchange
additional information about their beliefs and other mental attitudes during the negotiation
process. Thus, in addition for accepting or rejecting a proposal, an agent can offer a critique of
it. This can help to make negotiations more efficient.
2.2. Interest-Based Negotiation
Reframing is a sub-type of interest-based negotiation strategy that enhances bargaining by
allowing the negotiators to ask for the underlying goal of the negotiation and propose
alternative plan(s) which may entail a deal on alternative issues [21]. Reframing overcomes the
limitations of positional approaches. Reframing, as a strategy, rests on the hypothetic existence
of alternative plan(s) to achieve the underlying goal of the initiator involving different
resources for which bargaining will be more advantageous for both parties.
In [20] define an appropriate protocol that allows both bargaining and reframing to enable
agents to use reframing. They break the protocol into two parts, (1) the bargaining protocol and
(2) the reframing one.
2.2.1. Bargaining: Protocol and Strategy
Figure 1 describes a bargaining protocol (on the left) as discussed in [20]. It is a classical
alternated offers protocol.
• The initiator makes a request.
• The partner chooses between the following options:
1. Refuse the request.
2. Make a counter proposal.
• Then the protocol allows alternated counter proposals from both parties with possible
refusal or acceptance at each stage.
The work in [20] adds to this protocol the possibility to embed a reframing dialog instead of
making a proposal (or counter proposal).
Page 438
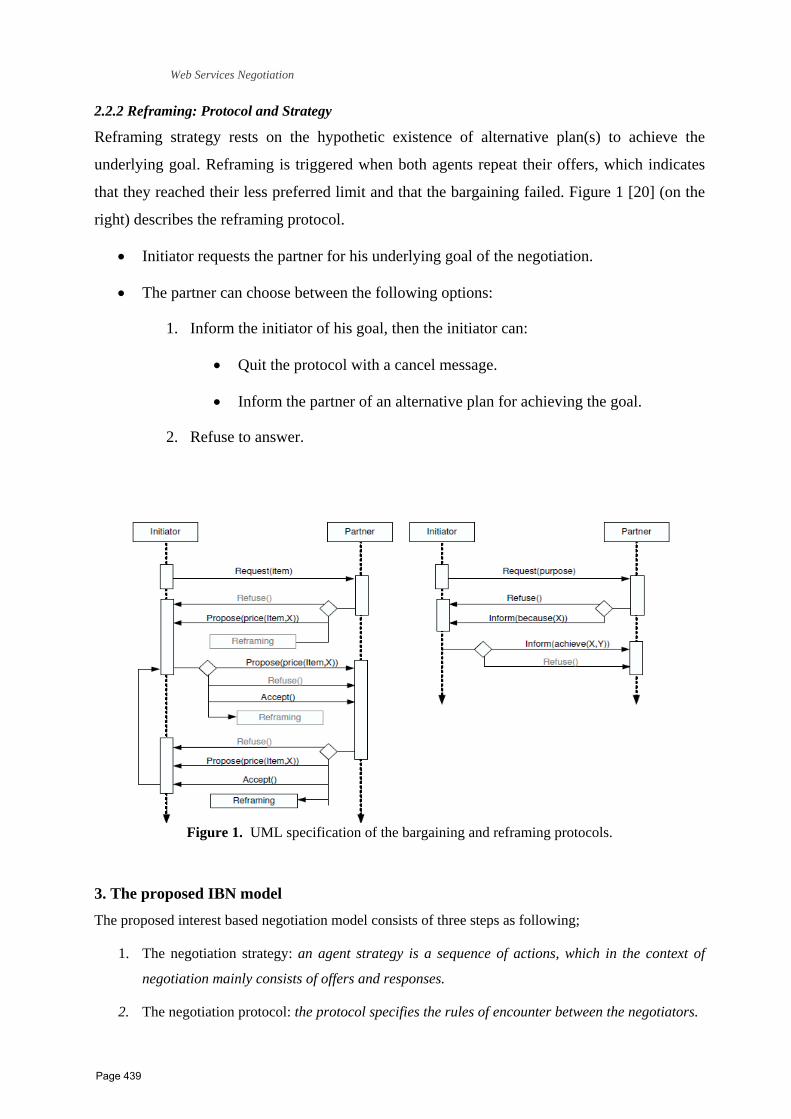
Web Services Negotiation
Figure 1. UML specification of th reframing protocols.
2.2.2 Reframing: Protocol and Strategy
Reframing strategy rests on the hypothetic existence of alternative plan(s) to achieve the
underlying goal. Reframing is triggered when both agents repeat their offers, which indicates
that they reached their less preferred limit and that the bargaining failed. Figure 1 [20] (on the
right) describes the reframing protocol.
• Initiator requests the partner for his underlying goal of the negotiation.
• The partner can choose between the following options:
1. Inform the initiator of his goal, then the initiator can:
• Quit the protocol with a cancel message.
• Inform the partner of an alternative plan for achieving the goal.
2. Refuse to answer.
e bargaining and
3. The proposed IBN model The proposed interest based negotiation model consists of three steps as following;
1. The negotiation strategy: an agent strategy is a sequence of actions, which in the context of
negotiation mainly consists of offers and responses.
2. The negotiation protocol: the protocol specifies the rules of encounter between the negotiators.
Page 439

Web Services Negotiation
3. The information state of agents: the agents' models reify the negotiation strategy and the
negotiation protocol.
3.1 Best Alternative to a Negotiated Agreement (BATNA) strategy
It is triggered before bargaining, so agents are aware with all available solution. As a process, parties
should
1. Analyze the problem.
2. Search for alternative solutions.
3. Order preferences.
4. Select the solution.
3.2 The Negotiation Protocol
Figure 2 presents UML specification of the proposed protocol, which we break into two parts, (1) the
bargaining protocol (on the left) and (2) the BATNA one (on the right).
3.2.1 Bargaining Protocol
We use the same one described in section 3.1 but instead of reframing dialog we employee BATNA one
to enable initiator to collect all available solutions before bargaining.
The bargaining function used by the agent to compute their next offers is simple but standard one.
Starting with initial offers that are their most preferred options, the agents will use the mean ((X+Y) /2)
of the participating agents current offers (X and Y) as long as it falls within the preferences boundaries.
3.2.2 BATNA Protocol
• The initiator informs the partner of the underlying goal of the negotiation and current available
solution.
• The partner can choose between the following:
1. Inform the initiator of alternative cheapest solutions.
2. Refuse to answer.
On the reception of the information that there is an alternative plan for achieving a goal from partner
that is evaluated by initiator to be cheaper than the one selected by partner, partner will update his
valuation function over the resources not owned according to this new information.
Page 440
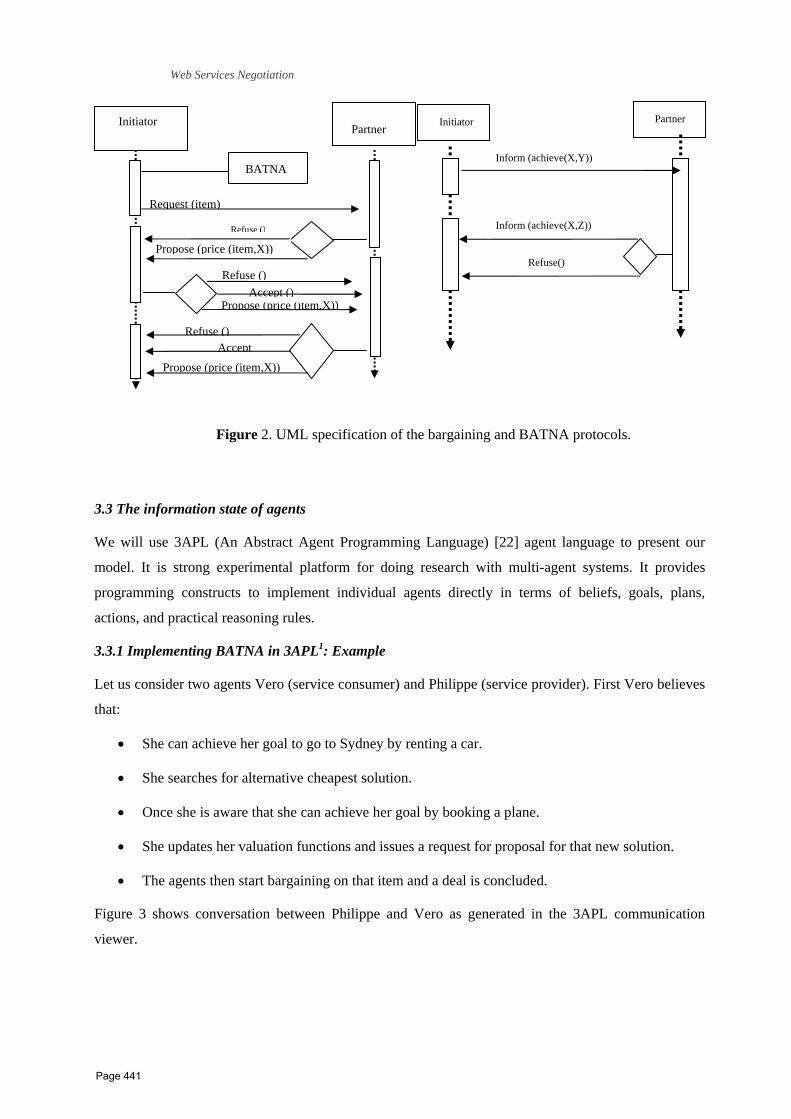
Web Services Negotiation
Propose (price (item,X))
Accept Refuse ()
Propose (price (item,X))Accept ()
Refuse ()
Initiator Partner
BATNA
Request (item)
Refuse ()
Propose (price (item,X))
Partner
Refuse()
Inform (achieve(X,Z))
Inform (achieve(X,Y))
Initiator
Figure 2. UML specification of the bargaining and BATNA protocols.
3.3 The information state of agents
We will use 3APL (An Abstract Agent Programming Language) [22] agent language to present our
model. It is strong experimental platform for doing research with multi-agent systems. It provides
programming constructs to implement individual agents directly in terms of beliefs, goals, plans,
actions, and practical reasoning rules.
3.3.1 Implementing BATNA in 3APL1: Example
Let us consider two agents Vero (service consumer) and Philippe (service provider). First Vero believes
that:
• She can achieve her goal to go to Sydney by renting a car.
• She searches for alternative cheapest solution.
• Once she is aware that she can achieve her goal by booking a plane.
• She updates her valuation functions and issues a request for proposal for that new solution.
• The agents then start bargaining on that item and a deal is concluded.
Figure 3 shows conversation between Philippe and Vero as generated in the 3APL communication
viewer.
Page 441

Web Services Negotiation
Figure 3. The conversation between Philippe and Vero (BATNA strategy)
Figure 4 [20] shows conversation between Philippe and Vero as generated in the 3APL communication
viewer for reframing strategy, where
• Vero believes that, she can achieve her goal to go to Sydney by renting a car.
• She requests for a proposal about the rent of a car from Philippe, one of the sellers she knows.
• The agents bargain until it fails, then Philippe asks for the underlying purpose of the initial
request.
• Vero informs him that her goal is to go to Sydney.
• Philippe then informs her of an alternative way to achieve that goal, namely by taking a plane.
• The agents then start bargaining on that item and a deal is concluded.
Figure 4. The conversation between Philippe and Vero (Reframing strategy)
Page 442

Web Services Negotiation
4. Experimental results
The main aim is to evaluate the differences among the reframing strategy and BATNA strategy by
studying the simulation outcomes.
4.1 Evaluation dimensions
In this section, we illustrate the factors used to compare the performance of these strategies.
4.1.1 Qualitative dimensions
• Goal Benefit
The first qualitative dimension of a negotiation is whether a deal is reached or not. In our case, it is
interesting to see which strategy allows agents to achieve their goals more often (by reaching deals
when bargaining only strategy is unsuccessful).
• Number of Updates
Another qualitative dimension is the number of updates of the agents valuation functions conducted in
the negotiation process.
4.1.2 Quantitative dimensions
• Plan Benefit
In cases where both strategies lead to the same results in terms of goal achievement, quantitative
dimensions of the quality of the deals are used such as the benefit in terms of the cost of the plans.
• Execution time
The time needed for the negotiation process to end, whether a deal is reached or not.
• Number of Messages
The number of communication messages between the two agents in the negotiation process, in order to
measure the communication overhead.
4.2 Experimental results
Table 1 summarizes the results obtained from the simulation application. It presents the ordering of the
strategies in respect of the performance dimensions.
Page 443
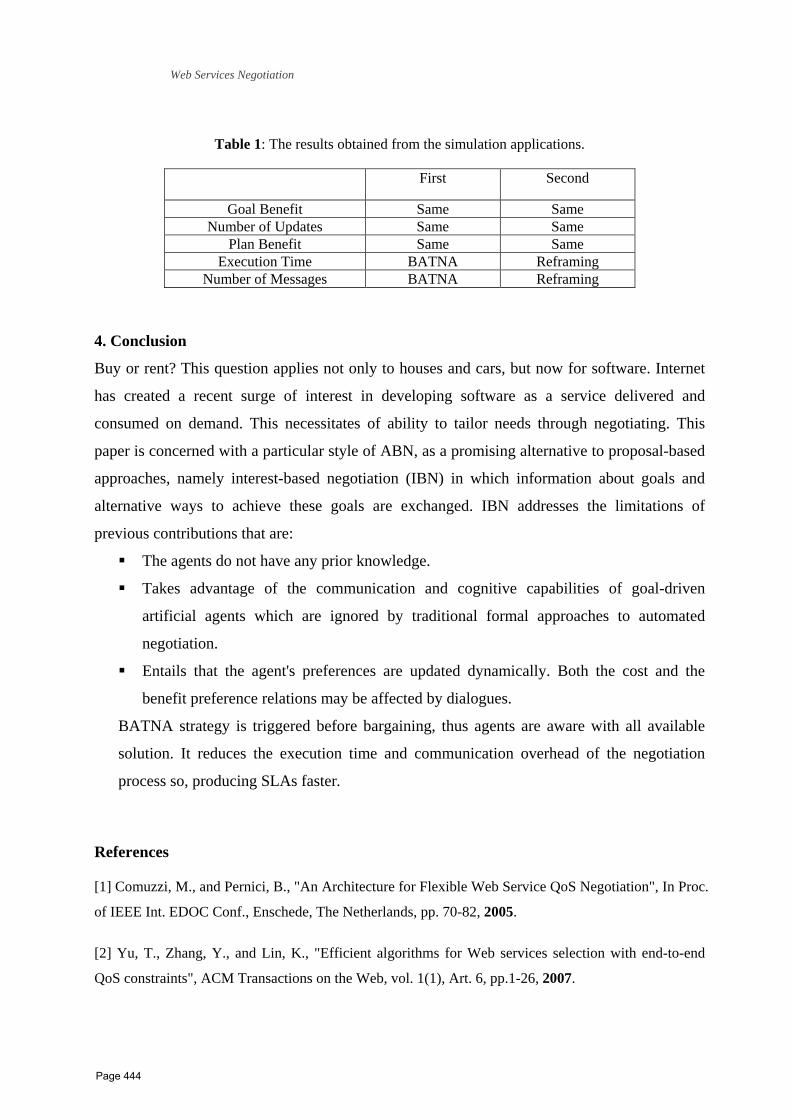
Web Services Negotiation
Table 1: The results obtained from the simulation applications.
First Second
Goal Benefit Same Same Number of Updates Same Same
Plan Benefit Same Same Execution Time BATNA Reframing
Number of Messages BATNA Reframing
4. Conclusion
Buy or rent? This question applies not only to houses and cars, but now for software. Internet
has created a recent surge of interest in developing software as a service delivered and
consumed on demand. This necessitates of ability to tailor needs through negotiating. This
paper is concerned with a particular style of ABN, as a promising alternative to proposal-based
approaches, namely interest-based negotiation (IBN) in which information about goals and
alternative ways to achieve these goals are exchanged. IBN addresses the limitations of
previous contributions that are:
The agents do not have any prior knowledge.
Takes advantage of the communication and cognitive capabilities of goal-driven
artificial agents which are ignored by traditional formal approaches to automated
negotiation.
Entails that the agent's preferences are updated dynamically. Both the cost and the
benefit preference relations may be affected by dialogues.
BATNA strategy is triggered before bargaining, thus agents are aware with all available
solution. It reduces the execution time and communication overhead of the negotiation
process so, producing SLAs faster.
References
[1] Comuzzi, M., and Pernici, B., "An Architecture for Flexible Web Service QoS Negotiation", In Proc.
of IEEE Int. EDOC Conf., Enschede, The Netherlands, pp. 70-82, 2005.
[2] Yu, T., Zhang, Y., and Lin, K., "Efficient algorithms for Web services selection with end-to-end
QoS constraints", ACM Transactions on the Web, vol. 1(1), Art. 6, pp.1-26, 2007.
Page 444

Web Services Negotiation
[3] Yan, J., Zhang, J., Lin, J., Chhetri, M., Goh, S., and Kowalczyk, R., "Towards Autonomous Service
Level Agreement Negotiation for Adaptive Service Composition", InProc. of the 10th Int. Conf. on
Computer Supported Cooperative Work in Design, Nanjing,China, pp.1-6, , 2006.
[4] Cappiello, C., Comuzzi, M., and Plebani, P., "On Automated Generation of Web Service Level
Agreements", In Proc. of IEEE Int. Conf. on Advanced Information Systems Engineering (CAiSE’07),
Trondheim, Norway, pp. 264-278, 2007.
[5] Dahlem, D. Nickel, L., Sacha, J., Biskupski, B., Dowling, J., and Meier, R., "Towards Improving
the Availability of Service Compositions", In Proc. of the IEEE Int. Conf. on Digital Ecosystems and
Technologies (DEST), Cairns, Australia, IEEE CS Press, pp. 67-70, 2007.
[6] Aggarwal, R., Verma, K., Miller, J., and Milnor, W., "Constraint Driven Web Service Composition
in METEOR-S", In Proc. of the IEEE Conf. on Services Computing (SCC’04), Washington, DC, IEEE
CS Press, pp. 23-30, 2004.
[7] Fatima, S. S., Wooldridge, M., and Jennings, N. R., "A Comparative Study of Game Theoretic and
Evolutionary Models of Bargaining for Software Agents", Artificial Intelligence Review. vol. 23(2),
pp.187-205, 2005.
[8] I. Rahwan, S. D. Ramchurn, N. R. Jennings, P. McBurney, S. Parsons, and L. Sonenberg,
Argumentation based negotiation. Knowledge Engineering Review, 18(4):343–375, 2003.
[9] I. Rahwan, L. Sonenberg, and F. Dignum. Towards interest-based negotiation. In J. Rosenschein, T.
Sandholm, M. J. Wooldridge, and M. Yokoo, editors, Proceedings of the 2nd International Joint
Conference on Autonomous Agents and Multiagent Systems (AAMAS 2003), pp. 773–780. ACM Press,
2003.
[10] Brzostowski, J. and Kowalczyk, R., "Predicting partner's behavior agent negotiation", In Proc. of
Int. Joint Conf. on Autonomous Agents and Multiagent Systems,(AAMAS '06), Hakodate, Japan. ACM,
NY, pp. 355-361, 2006.
[11] Faratin, P. Sierra, C., and Jennings, N. R., "Negotiation among groups of autonomous
computational agents", University of London, 1998.
[12] Jennings, N. R., Faratin, P., Lomuscio, A. R., Parsons, S., Sierra, C. & Wooldridge, M.,
"Automated negotiation: prospects, methods and challenges", International Journal of Group Decision
and Negotiation 10(2), 199–215, 2001.
Page 445

Interest-Based Strategy for Service Level Agreements of
Web Services Negotiation
ICI 10 - 10TH INTERNATIONAL CONFERENCE ON INFORMATION
12
[13] P. Pasquier, F. Dignum, I. Rahwan, and L. Sonenberg, "A Formal Analysis of Interest-based
Negotiation", 2009.
[14] Narayanan, V. and Jennings, N., "Learning to negotiate optimally in non-stationary environments",
In Proc. of ACM Int. Workshop on Cooperative Information Agents (CIA), Edinburgh, UK and LNCS,
Springer, vol. 4149, pp.288-300, 2006.
[15] Cristian F., Nicolas F., Alejandro J., Akhil S., Yuan Ch., and Subu I., "A Game Theoretic
Framework for SLA Negotiation", HP Laboratories Palo Alto, 2008.
[16] Yee, G., and Korba, L., "Bilateral E-Services Negotiation under Uncertainty", In Proc. of the Intl.
Symposium on Applications and the Internet (SAINT ’03), Orlando, Florida, and National Research
Council Canada, 2003.
[17] Zulkernine, F., Martin, P., Craddock, C., and Wilson, K., “A Policy-based Middleware for Web
Services SLA Negotiation”, In Proc. of the IEEE Int. Conf. on Web Services (ICWS’08), Beijing,
China, IEEE CS Press, 2008.
[18] I. Rahwan, "Interest-based negotiation in multi-agent systems", PhD thesis, Department of
Information Systems, University of Melbourne, Melbourne, Australia, 2004.
[19] R. Fisher and W. Ury, "Getting to Yes: Negotiating Agreement Without Giving", In New York:
Penguin Books, 1983.
[20] P. Pasquier, F. Dignum, I. Rahwan, and L. Sonenberg, "Interest-based negotiation as an extension
of monotonic bargaining in 3APL", In Proceedings of the Ninth Pacific Rim International Workshop on
Multi-Agents (PRIMA 2006, volume 4088 of Lecture Notes in Artificial Intelligence (LNAI), pp. 569-
580, Guilin, China, 2006.
[21] P. Pasquier, L. Sonenberg, I. Rahwan, F. Dignum, R. Hollands, "An empirical study of interest-
based negotiation", In Proceedings of the 9th International Conference on Electronic Commerce
(ICEC2007), ACM Press, USA, 2007.
[22] M. Dastani, M. B. van Riemsdijk, and J.-J. Meyer, "Multi-Agent Programming: Languages,
Platforms and Applications", chapter programming multi-agent systems in 3APL, pp. 10-45. Springer-
Verlag, 2005.
Page 446
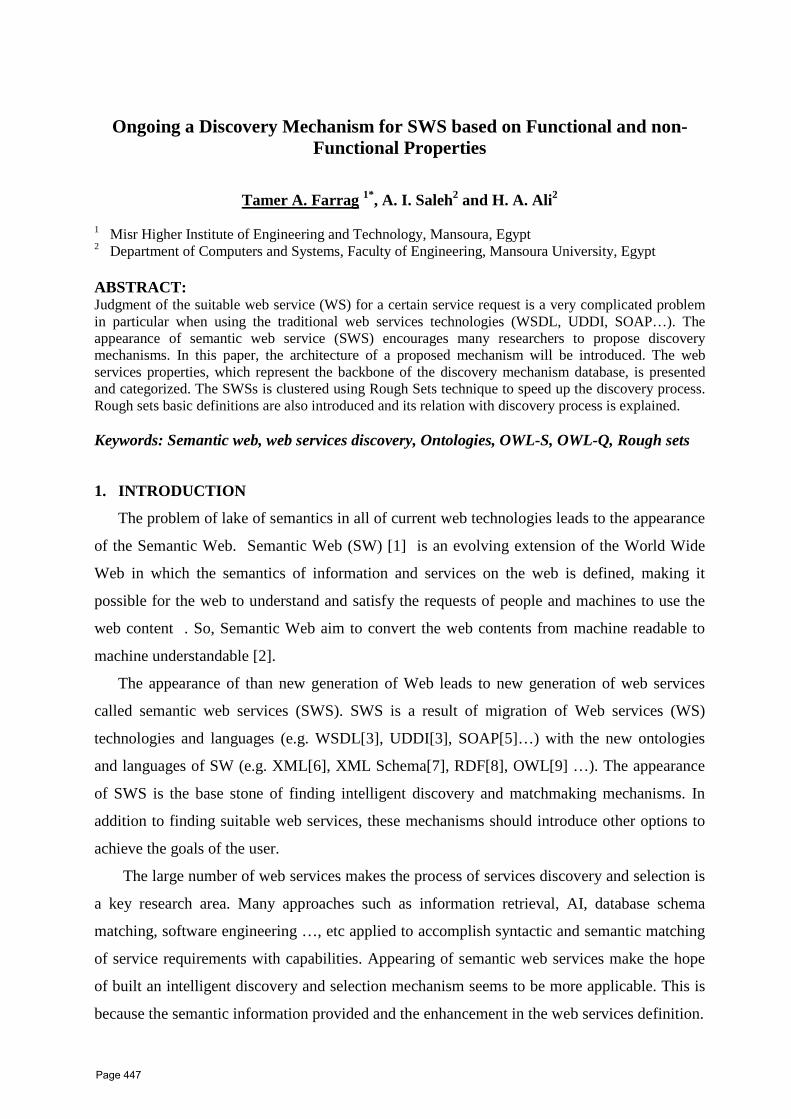
Ongoing a Discovery Mechanism for SWS based on Functional and non-Functional Properties
UTamer A. Farrag U P
1*P, A. I. SalehP
2P and H. A. AliP
2
P
1P Misr Higher Institute of Engineering and Technology, Mansoura, Egypt
P
2P Department of Computers and Systems, Faculty of Engineering, Mansoura University, Egypt
ABSTRACT: Judgment of the suitable web service (WS) for a certain service request is a very complicated problem in particular when using the traditional web services technologies (WSDL, UDDI, SOAP…). The appearance of semantic web service (SWS) encourages many researchers to propose discovery mechanisms. In this paper, the architecture of a proposed mechanism will be introduced. The web services properties, which represent the backbone of the discovery mechanism database, is presented and categorized. The SWSs is clustered using Rough Sets technique to speed up the discovery process. Rough sets basic definitions are also introduced and its relation with discovery process is explained. Keywords: Semantic web, web services discovery, Ontologies, OWL-S, OWL-Q, Rough sets 1. INTRODUCTION
The problem of lake of semantics in all of current web technologies leads to the appearance
of the Semantic Web. Semantic Web (SW) [1] is an evolving extension of the World Wide
Web in which the semantics of information and services on the web is defined, making it
possible for the web to understand and satisfy the requests of people and machines to use the
web content . So, Semantic Web aim to convert the web contents from machine readable to
machine understandable [2].
The appearance of than new generation of Web leads to new generation of web services
called semantic web services (SWS). SWS is a result of migration of Web services (WS)
technologies and languages (e.g. WSDL [3], UDDI [3], SOAP [5]…) with the new ontologies
and languages of SW (e.g. XML [6], XML Schema [7], RDF [8], OWL [9] …). The appearance
of SWS is the base stone of finding intelligent discovery and matchmaking mechanisms. In
addition to finding suitable web services, these mechanisms should introduce other options to
achieve the goals of the user.
The large number of web services makes the process of services discovery and selection is
a key research area. Many approaches such as information retrieval, AI, database schema
matching, software engineering …, etc applied to accomplish syntactic and semantic matching
of service requirements with capabilities. Appearing of semantic web services make the hope
of built an intelligent discovery and selection mechanism seems to be more applicable. This is
because the semantic information provided and the enhancement in the web services definition.
Page 447
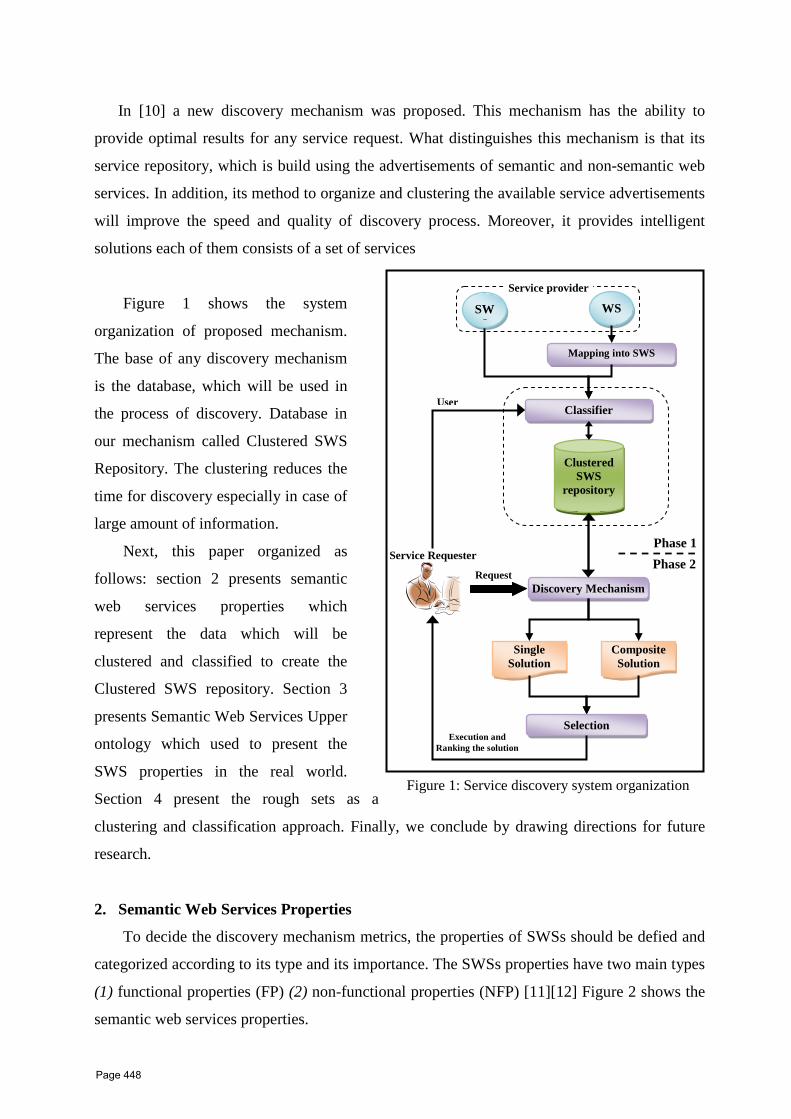
In [10] a new discovery mechanism was proposed. This mechanism has the ability to
provide optimal results for any service request. What distinguishes this mechanism is that its
service repository, which is build using the advertisements of semantic and non-semantic web
services. In addition, its method to organize and clustering the available service advertisements
will improve the speed and quality of discovery process. Moreover, it provides intelligent
solutions each of them consists of a set of services
Figure 1 shows the system
organization of proposed mechanism.
The base of any discovery mechanism
is the database, which will be used in
the process of discovery. Database in
our mechanism called Clustered SWS
Repository. The clustering reduces the
time for discovery especially in case of
large amount of information.
Next, this paper organized as
follows: section 2 presents semantic
web services properties which
represent the data which will be
clustered and classified to create the
Clustered SWS repository. Section 3
presents Semantic Web Services Upper
ontology which used to present the
SWS properties in the real world.
Section 4 present the rough sets as a
clustering and classification approach. Finally, we conclude by drawing directions for future
research.
2. Semantic Web Services Properties
To decide the discovery mechanism metrics, the properties of SWSs should be defied and
categorized according to its type and its importance. The SWSs properties have two main types
(1) functional properties (FP) (2) non-functional properties (NFP) [11] [12] Figure 2 shows the
semantic web services properties.
Figure 1: Service discovery system organization
WS
Mapping into SWS
Classifier
Discovery Mechanism
Single Solution
Composite Solution
Clustered SWS
repository
Execution and Ranking the solution
User
Request
Selection
Service provider
Service Requester
SWS
Phase 1 Phase 2
Page 448

Figure 2 semantic web services properties
The functional properties descript the way to use the SWS; they include the input, output,
precondition, and effects (hereafter IOPEs). Inputs and outputs specify the data transformation
produced by the services. Inputs specify the information that the service requires for its
execution. They are similar, in most respects, to arguments of functions in programming
languages. The result of the execution of the service is the generation of a set of outputs.
Preconditions specify conditions that should be satisfied for a process to execute correctly.
Effects the changes of the state of the world resulted by the service execution. For example, to
complete the sale, a book-selling service requires as input a credit card number and expiration
date, but also the precondition that the credit card is valid and is not overdrawn. The result of
the sale is the output of a receipt that confirms the proper execution of the transaction, and as
an effect the transfer of ownership and the physical transfer of the book from the warehouse of
the seller to the address of the buyer and the amount of money in the credit card account have
been reduced.
Non-functional properties has many taxonomies and contain a large number of metrics
but after making a survey , a shortlist of the most important properties is will presented. They
can be divided into either QoS-related or context-related properties. QoS-related properties
represent a very important aspect of non-functional characteristics for a Web service. QoS may
be further divided into two main categories:
Semantic web services Properties
Functional
Inputs
Outputs
Preconditions
Effects
Non-Functional
QoS properties
Execution
Response time
Accessibility
Throuput
Availability
Accuracy
Security
Encryption
Authentication
Access control
Context properties
Cost
Organization arrangement
Monitoring
Payment method
Reputation
Location
Page 449
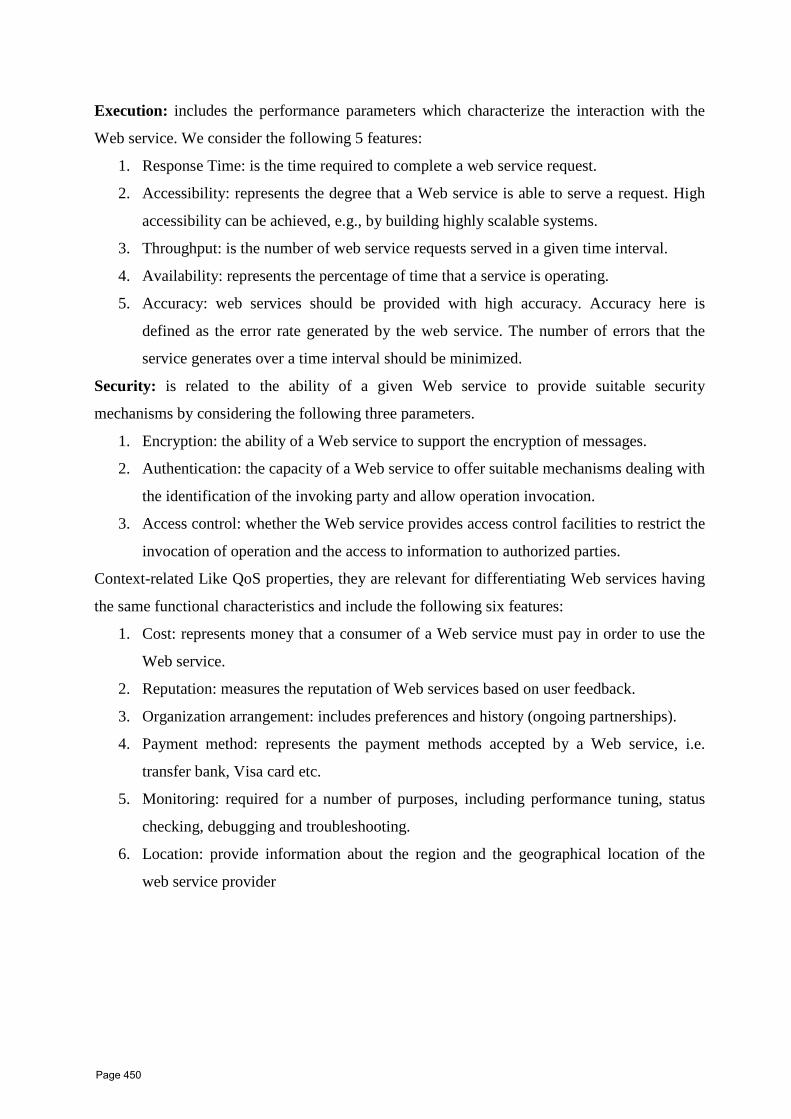
Execution: includes the performance parameters which characterize the interaction with the
Web service. We consider the following 5 features:
1. Response Time: is the time required to complete a web service request.
2. Accessibility: represents the degree that a Web service is able to serve a request. High
accessibility can be achieved, e.g., by building highly scalable systems.
3. Throughput: is the number of web service requests served in a given time interval.
4. Availability: represents the percentage of time that a service is operating.
5. Accuracy: web services should be provided with high accuracy. Accuracy here is
defined as the error rate generated by the web service. The number of errors that the
service generates over a time interval should be minimized.
Security: is related to the ability of a given Web service to provide suitable security
mechanisms by considering the following three parameters.
1. Encryption: the ability of a Web service to support the encryption of messages.
2. Authentication: the capacity of a Web service to offer suitable mechanisms dealing with
the identification of the invoking party and allow operation invocation.
3. Access control: whether the Web service provides access control facilities to restrict the
invocation of operation and the access to information to authorized parties.
Context-related Like QoS properties, they are relevant for differentiating Web services having
the same functional characteristics and include the following six features:
1. Cost: represents money that a consumer of a Web service must pay in order to use the
Web service.
2. Reputation: measures the reputation of Web services based on user feedback.
3. Organization arrangement: includes preferences and history (ongoing partnerships).
4. Payment method: represents the payment methods accepted by a Web service, i.e.
transfer bank, Visa card etc.
5. Monitoring: required for a number of purposes, including performance tuning, status
checking, debugging and troubleshooting.
6. Location: provide information about the region and the geographical location of the
web service provider
Page 450
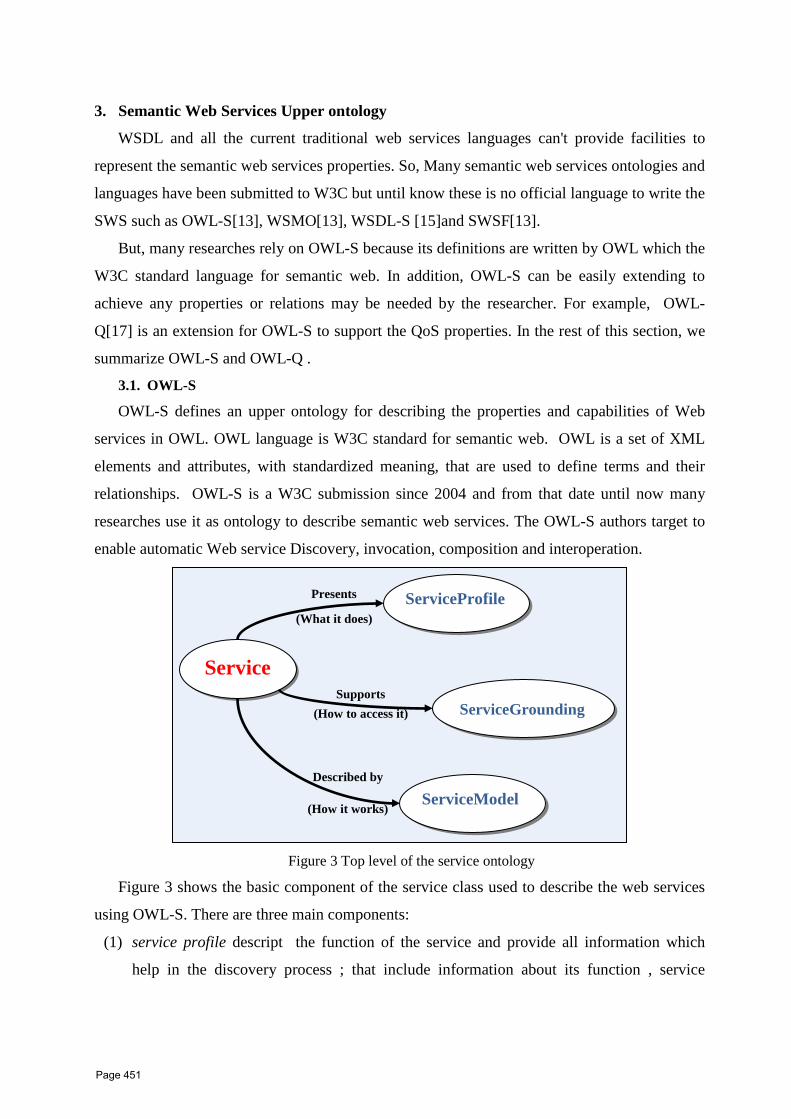
3. Semantic Web Services Upper ontology
WSDL and all the current traditional web services languages can't provide facilities to
represent the semantic web services properties. So, Many semantic web services ontologies and
languages have been submitted to W3C but until know these is no official language to write the
SWS such as OWL-S [13], WSMO [13], WSDL-S [15]and SWSF [13].
But, many researches rely on OWL-S because its definitions are written by OWL which the
W3C standard language for semantic web. In addition, OWL-S can be easily extending to
achieve any properties or relations may be needed by the researcher. For example, OWL-
Q [17] is an extension for OWL-S to support the QoS properties. In the rest of this section, we
summarize OWL-S and OWL-Q .
3.1. OWL-S
OWL-S defines an upper ontology for describing the properties and capabilities of Web
services in OWL. OWL language is W3C standard for semantic web. OWL is a set of XML
elements and attributes, with standardized meaning, that are used to define terms and their
relationships. OWL-S is a W3C submission since 2004 and from that date until now many
researches use it as ontology to describe semantic web services. The OWL-S authors target to
enable automatic Web service Discovery, invocation, composition and interoperation.
Figure 3 Top level of the service ontology
Figure 3 shows the basic component of the service class used to describe the web services
using OWL-S. There are three main components:
(1) service profile descript the function of the service and provide all information which
help in the discovery process ; that include information about its function , service
Service
ServiceProfile
ServiceGrounding
ServiceModel
Presents
(What it does)
Supports
(How to access it)
Described by
(How it works)
Page 451
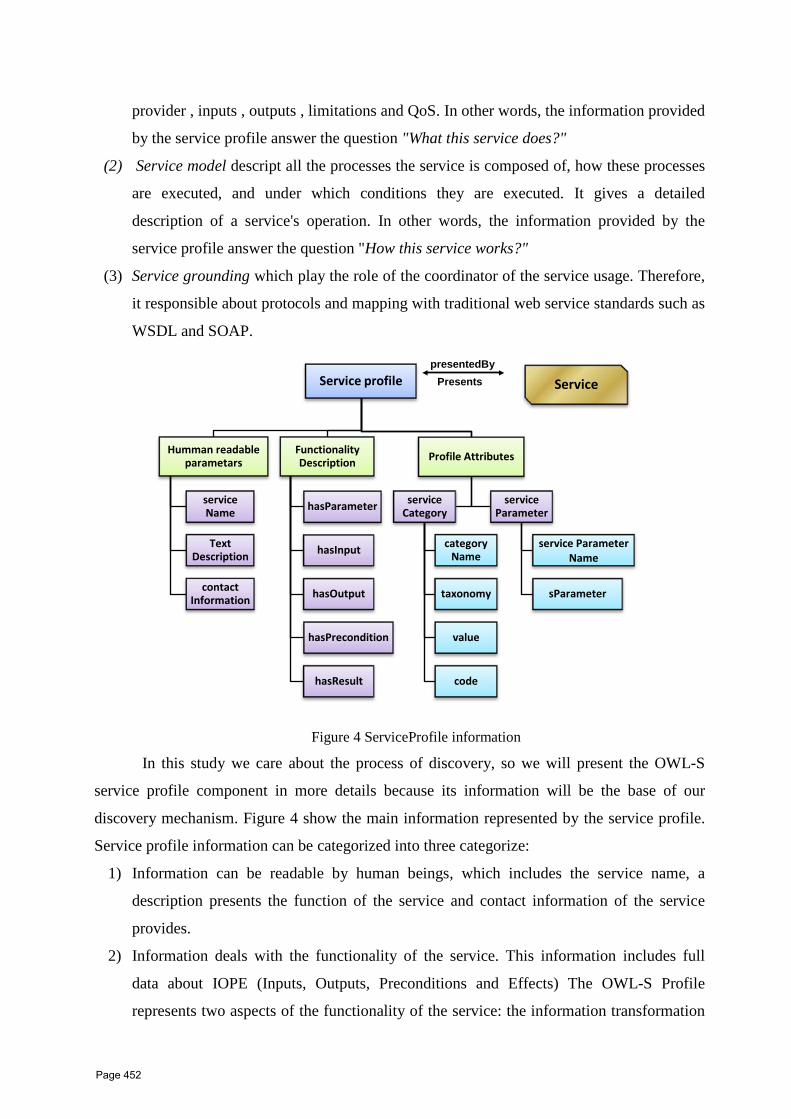
provider , inputs , outputs , limitations and QoS. In other words, the information provided
by the service profile answer the question "What this service does?"
(2) Service model descript all the processes the service is composed of, how these processes
are executed, and under which conditions they are executed. It gives a detailed
description of a service's operation. In other words, the information provided by the
service profile answer the question "How this service works?"
(3) Service grounding which play the role of the coordinator of the service usage. Therefore,
it responsible about protocols and mapping with traditional web service standards such as
WSDL and SOAP.
Figure 4 ServiceProfile information
In this study we care about the process of discovery, so we will present the OWL-S
service profile component in more details because its information will be the base of our
discovery mechanism. Figure 4 show the main information represented by the service profile.
Service profile information can be categorized into three categorize:
1) Information can be readable by human beings, which includes the service name, a
description presents the function of the service and contact information of the service
provides.
2) Information deals with the functionality of the service. This information includes full
data about IOPE (Inputs, Outputs, Preconditions and Effects) The OWL-S Profile
represents two aspects of the functionality of the service: the information transformation
Service profile
Humman readable parametars
service Name
Text Description
contact Information
Functionality Description
hasParameter
hasInput
hasOutput
hasPrecondition
hasResult
Profile Attributes
service Category
category Name
taxonomy
value
code
service Parameter
service ParameterName
sParameter
ServicepresentedBy
Presents
Page 452

(represented by inputs and outputs) and the state change produced by the execution of the
service (represented by preconditions and effects).
3) Information includes the quality guarantees that are provided by the service, possible
classification of the service, and additional parameters that the service may want to
specify.
There are two famous classification of services: NAICS (North American Industry
Classification System) and UNSPSC United Nations Standard Products and Services Code. For
Example, The UNSPSC is a hierarchical classification with five levels. These levels allow
analysis by drilling down or rolling up to analyze expenditures. Each level in the hierarchy has
its own unique number. All UNSPSC entities are further identified with an 8-digit structured
numeric code, which both indicates its location in the taxonomy and uniquely classifies it. An
additional 2-digit suffix indicates the business function identifier.
As noticed the OWL-S concentrates on description of functional properties of the SWS.
But, it can't be used to descript the QoS and other non-functional properties. In [17], OWL-Q is
presented as an extension to OWL-S which will help the service provider to descript the non-
functional properties of his service.
3.2. OWL-Q
The most prominent QoS-based Web service discovery algorithms fail to produce accurate
results because they rely either on syntactic descriptions of QoS metrics or on semantically
poor QoS metric descriptions. Many researches try to support QoS by extend UUDI to support
web service QoS description or OWL-S by adding new tags to its ServiceProfile to achieve the
same goal. The key drawback of these approaches is there is no respectable model to define the
QoS metric. QoS of a WS is a set of non-functional attributes that may impact the quality of
the service offered by the WS. Each QoS attribute is measured by one or more QoS metrics,
which specify the measurement method, schedule, unit, value range and other measurement
details.
OWL-Q has been developed as a rich, extensible and modular ontology language that
complements the WS functional description language OWL-S. OWL-Q is actually an upper
ontology comprised of many sub-ontologies/facets, each of which can be extended
independently of the others (syntactical separation and refinement of QoS specifications). Each
facet concentrates on a particular part of QoS WS description. OWL-Q has eleven facets:
OWL-Q (main), Measurement Directive, Time, Goal, Function, Measurement, Metric, Scale,
QoSSpec, Unit and ValueType [17].
Page 453

4. Rough Sets
Rough sets theory is a mathematic tool for knowledge discovery in any datasets or
information system. It was first developed by Zdzisław I. Pawlak in 1980’s [18]. It can be
consider the extension of classical sets theory, which called "crisp sets". In crisp sets, either an
element belongs to the set or it does not. On contrary, rough sets, descript the crisp sets by two
sub sets called lower and upper approximation sets. Rough sets have many applications in
Knowledge discovery in databases (KDD) among them, feature selection, data reduction, and
discretization. Next, a background about rough sets basic definition and its relation to our
research will be illustrated.
Let T = (U, A,C,D) be a decision system data, where "U" is a non-empty finite set called
the universe, "A" is a set of features, "C" and "D" are subsets of A, named the conditional and
decisional attributes subsets respectively. Here, "U" is the set of available SWSs which
registered in our repository. "A" is represented by the SWSs functional and non-functional
properties. "C" is represented by the requirements of the service requester. "D" is represented
by service requester preferences and service provider constrains
Definition 1. Let R ⊆ C and X ⊆U, the R-lower approximation set of X, is the set of all
elements of U which can be with certainty classified as elements of X.
RX = ∪{Y ∈U / R: Y ⊆ X}
According to this definition, we can see that R-Lower approximation is a subset of X, thus
RX ⊆ X .
Definition 2.
XR
The R-upper approximation set of X is the set of all element of U, which can
belong possibly to the subset of interest X.
= ∪{Y ∈U / R: Y ∩ X ≠φ}
Note that X is a subset of the R-upper approximation set, thus X ⊆ XR .
In our research RX is the set of SWSs that achieve the service requester requirements
exactly. XR is the set of SWSs may achieve these requirements.
Definition 3.
XRXR −
The Boundary region of a set X is the collection of elementary sets defined by
BN(X)= . These sets are included in R-Upper but not in R-Lower approximations.
Definition 4.
XR
A subset defined through its lower and upper approximations is called a Rough
set. That is, when the boundary region is a non-empty set
( ≠ RX).
Page 454

Definition 5.
Where, card denotes cardinality of a set. The dependency coefficient expresses the
proportion of the objects correctly classified with respect the total, considering the set of
conditional features.
Let T = (U, A,C,D) be a decision table, the Dependency Coefficient between the
conditional attribute C, and the decision attribute D is given by
Definition 6.
RcardRcardXR =)(α
Rough sets provide a metric to measure the classification accuracy
.
In [19] usage of Rough sets and other techniques are compared in fields of feature
selection, data reduction, and discretization. The results are lead to the following conclusions:
Rough set is a good option to data preprocessing tasks in the KDD process.
Discretization based on Rough sets theory compares well with other discretization
methods.
Feature Selection using Rough sets theory is a way to identify relevant features. Only
features having a large dependency with the decisional attribute are considered relevant.
Instance selection using Rough sets concepts shows good results.
5. CONCLUSION
Towards an Intelligent discovery mechanism, the properties of semantic web services is
presented and categorized. The values of these propertied represent the data of the discovery
process. These properties mainly categorized into functional and non-Functional properties.
The functional properties help to know is the web service can be considered as discovery result
or not?. On the other hand, the non-functional properties can be used as a base of the results
ranking process. To speed up the discover process, the data is clustered and classified by using
Rough sets technique as a new trend.
In the future, we aim to work on our system structure in more details. Then we will
implement it and prepare a test collection to verify our proposal.
REFERENCES [1] Berners-Lee, Tim; James Hendler and Ora Lassila (May 17, 2001). "The Semantic Web".
Scientific American Magazine. Retrieved on 2008-03-26 http://www.sciam.com/article.cfm?id=thesemanticweb&print=true.
Page 455

[2] Lei Li and Ian Horrocks , "A Software Framework For Matchmaking Based on Semantic Web Technology" , International Journal of Electronic Commerce archive ,Volume 8 , Issue 4 Pages 39-60 , 2004 ,ISSN:1086-4415
[3] WSDL 1.1 , http://www.w3.org/TR/wsdl ,2001 [4] UDDI, www.oasis-open.org/committees/uddi-spec, 2005. [5] SOAP, http://www.w3.org/TR/soap/ ,2007 [6] XML , http://www.w3.org/XML/ [7] XML Schema, http://www.w3.org/XML/Schema [8] RDF , http://www.w3.org/RDF/ [9] OWL, http://www.w3.org/2004/OWL/, 2004. [10] Tamer A. Farrag, and H. A. Ali , " A Cluster-Based Semantic Web Services Discovery and
Classification " , In Proceedings of the 2nd International conference on Advanced Computer Theory and Engineering , Cairo , Egypt 2009 , P.P 1825 -1834.
[11] Youakim Badr, Ajith Abraham, Frédérique Biennier and Crina Grosan ,"Enhancing Web Service Selection by User Preferences of Non-Functional Features" , Fourth International Conference on Next Generation Web Services Practices (NWeSP 2008), IEEE Computer Society Press, ISBN 978-0-7695-3455-8, pp. 60-65, 2008.
[12] K Lee, J Jeon, W Lee, S Jeong, and S Park, "QoS for Web Services: Requirements and Possible Approaches "World Wide Web Consortium (W3C) note, Nov. 2003, Available online at: www.w3c.or.kr/kr-office/TR/2003/ws-qos/, Last retrieved 1/2/2010
[13] OWL-S, http://www.w3.org/Submission/OWL-S/ ,2004 [14] WSMO, http://www.wsmo.org/. [15] WSDL-S, http://www.w3.org/Submission/WSDL-S/, 2005. [16] SWSF , http://www.w3.org/Submission/SWSF/, 2005 [17] Kyriakos Kritikos and Dimitris Plexousakis ," OWL-Q for Semantic QoS-based Web Service
Description and Discovery" , in Proceedings of the SMRR 2007. [18] Zdzislaw Pawlak, S.K.M. Wong and Wojciech Ziarko , "Rough sets: probabilistic versus
deterministic approach ", International Journal of Man-Machine Studies Volume 29, Issue 1, 1988, Pages 81-95.
[19] Frida Coaquira and Edgar Acuña ," Applications of Rough Sets Theory in Data Preprocessing for Knowledge Discovery" , Proceedings of the World Congress on Engineering and Computer Science 2007 WCECS 2007, October 24-26, 2007, San Francisco, USA
[20] F. Lecue and N. Mehandjiev , "Towards Scalability of Quality Driven Semantic Web Service" , In Proceedings of the 7th IEEE International Conference on Web Services (ICWS'09), July 6-10, 2009, Los Angeles, CA, USA
[21] Jiangang Ma , Yanchun Zhang , Jing He, "Efficiently finding web services using a clustering semantic approach", CSSSIA /IEEE 2008 conference , p.1-8, April 22, 2008, Beijing, China
[22] Jorge Cardoso ,"Semantic Web Services: Theory, Tools, and Applications" , Book 2007 ,ISBN 978-1-59904-045-5
[23] Maozhen Li, Member, IEEE, Bin Yu, Omer Rana, and Zidong Wang, Senior Member, IEEE ," Grid Service Discovery with Rough Sets" , IEEE TRANSACTIONS ON KNOWLEDGE AND DATA ENGINEERING, VOL. 20, NO. 6, JUNE 2008
[24] Stefan Dietze, Alessio Gugliotta, John Domingue ,"Exploiting Metrics for Similarity-based
Semantic Web Service Discovery", In Proceedings of the 7th IEEE International Conference on
Web Services (ICWS'09), July 6-10, 2009, Los Angeles, CA, USA.
Page 456
AT DELTA UNIVERSITY FOR SCIENCE AND TECHNOLOGY GAMASA, EGYPT, 4 – 6 DECEMBER 2010
A New Model For Web Database Security using Data Security Unique Code (DSUC)
Aida O. Abdelgwad 1, Ahmed I. Saleh 2, Eslam M. Hassib 3*
1 (Dept. of Computer Eng. & Systems, Faculty of Engineering, Mansoura University, Egypt,
[email protected]) 2 (Dept. of Computer Eng. & Systems, Faculty of Engineering, Mansoura University, Egypt,
[email protected]) 3 (IT Engineer, ERG company for electronics, Elmahalah alkobra, Egypt,
ABSTRACT:
The most important issue that should be taken into consideration when designing and building business based web applications is web database security. Those applications usually include critical processes such as electronic-commerce web applications that include money transfer via visa or master cards. Security is a critical issue in other web based application such as sites for military weapons companies and national security of countries. In this paper we introduce a new web database security model that includes a combination of triple system ; (i) Host Identity protocol(HIP) in a new authentication method called DSUC (Data Security Unique Code), (ii) a strong filtering rules that detects intruders with high accuracy, and (iii) a real time monitoring system that employs the Uncertainty Degree Model (UDM) using fuzzy sets theory. We expect that by combining these three powerful security systems we can get a very strong security model. Finally, the proposed web database security model has the ability to detect and provide a real time prevention of intruders access with high precision.
Keywords: intrusion detection, intrusion prevention, web database, security, HIP. 1.Introduction: Nowadays, due to the development of network paradigms and Internet technologies, web database security has become a very important issue. It was reported by Computer Security Institute (CSI) and the FBI that; 70% of computer users reported that their networks were attacked over the last year [1]. Moreover, Denial of Service attacks increased 33% over the same period. The wonderful issue is that all of these took place across networks, where firewalls had been installed in 90 percent of instances. It is apparent that firewalls are not always effective against many intrusion attempts. Firewalls are also typically employed only at the network perimeter. However, many attacks are usually launched from within an organization [2]. For illustration, Virtual private networks (VPNs) provide access to the internal network that often bypasses the firewall. From another point of view, the wide evolution and popularity of wireless networks have changed the way that organizations work as well as offering new availabilities; however, they also introduce new security threats. While an intruder needs a physical infrastructure to access a wired network in order to launch his attack, a wireless network allows anyone within its range to passively monitor the traffic or even start an attack [3].
Page 457
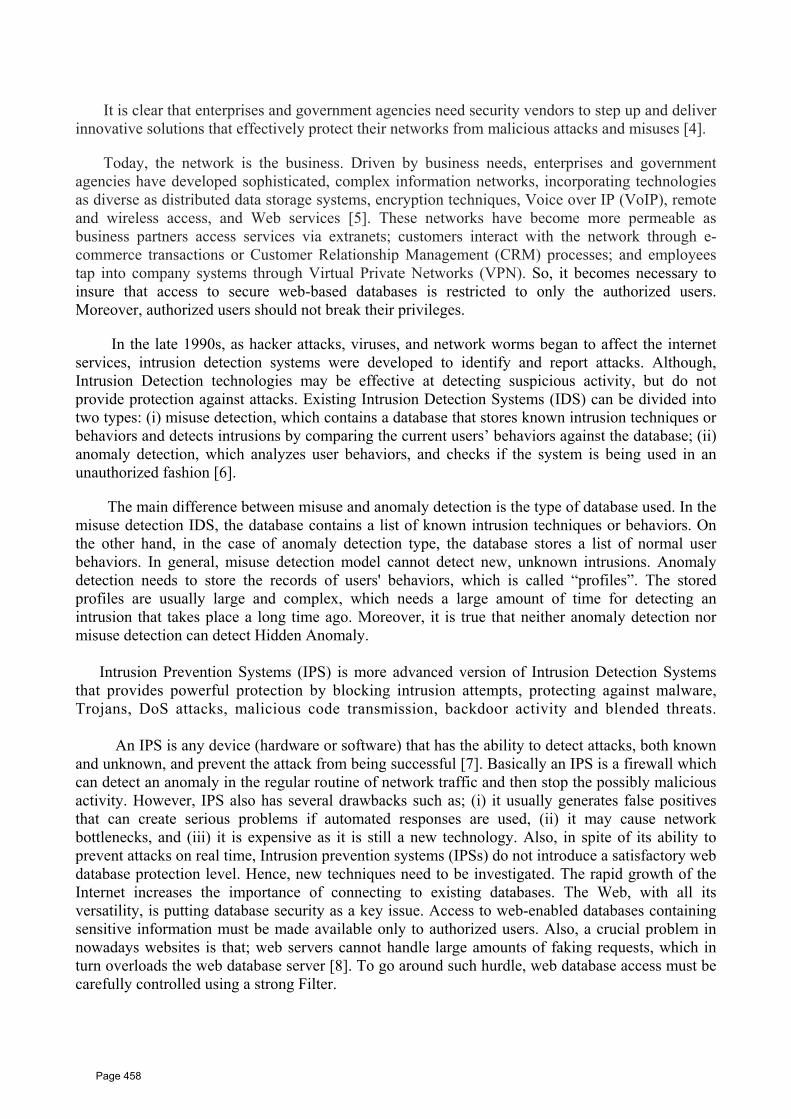
It is clear that enterprises and government agencies need security vendors to step up and deliver
innovative solutions that effectively protect their networks from malicious attacks and misuses [4].
Today, the network is the business. Driven by business needs, enterprises and government agencies have developed sophisticated, complex information networks, incorporating technologies as diverse as distributed data storage systems, encryption techniques, Voice over IP (VoIP), remote and wireless access, and Web services [5]. These networks have become more permeable as business partners access services via extranets; customers interact with the network through e-commerce transactions or Customer Relationship Management (CRM) processes; and employees tap into company systems through Virtual Private Networks (VPN). So, it becomes necessary to insure that access to secure web-based databases is restricted to only the authorized users. Moreover, authorized users should not break their privileges.
In the late 1990s, as hacker attacks, viruses, and network worms began to affect the internet services, intrusion detection systems were developed to identify and report attacks. Although, Intrusion Detection technologies may be effective at detecting suspicious activity, but do not provide protection against attacks. Existing Intrusion Detection Systems (IDS) can be divided into two types: (i) misuse detection, which contains a database that stores known intrusion techniques or behaviors and detects intrusions by comparing the current users’ behaviors against the database; (ii) anomaly detection, which analyzes user behaviors, and checks if the system is being used in an unauthorized fashion [6].
The main difference between misuse and anomaly detection is the type of database used. In the misuse detection IDS, the database contains a list of known intrusion techniques or behaviors. On the other hand, in the case of anomaly detection type, the database stores a list of normal user behaviors. In general, misuse detection model cannot detect new, unknown intrusions. Anomaly detection needs to store the records of users' behaviors, which is called “profiles”. The stored profiles are usually large and complex, which needs a large amount of time for detecting an intrusion that takes place a long time ago. Moreover, it is true that neither anomaly detection nor misuse detection can detect Hidden Anomaly.
Intrusion Prevention Systems (IPS) is more advanced version of Intrusion Detection Systems that provides powerful protection by blocking intrusion attempts, protecting against malware, Trojans, DoS attacks, malicious code transmission, backdoor activity and blended threats.
An IPS is any device (hardware or software) that has the ability to detect attacks, both known
and unknown, and prevent the attack from being successful [7]. Basically an IPS is a firewall which can detect an anomaly in the regular routine of network traffic and then stop the possibly malicious activity. However, IPS also has several drawbacks such as; (i) it usually generates false positives that can create serious problems if automated responses are used, (ii) it may cause network bottlenecks, and (iii) it is expensive as it is still a new technology. Also, in spite of its ability to prevent attacks on real time, Intrusion prevention systems (IPSs) do not introduce a satisfactory web database protection level. Hence, new techniques need to be investigated. The rapid growth of the Internet increases the importance of connecting to existing databases. The Web, with all its versatility, is putting database security as a key issue. Access to web-enabled databases containing sensitive information must be made available only to authorized users. Also, a crucial problem in nowadays websites is that; web servers cannot handle large amounts of faking requests, which in turn overloads the web database server [8]. To go around such hurdle, web database access must be carefully controlled using a strong Filter.
Page 458

Finally, with the increased use of mobility devices, techniques that require the validity of a host
and/or a user discarding the change in IP address is strongly required. Another ill news is that; the most attacks are usually made by "authorized'' users of the system. To the best of our knowledge, implementing an efficient web database security model has not been addressed yet. Accordingly, web database security is still more complex than the proposed solutions. Many hurdles stand in the way of achieving the maximum protection of web databases. Accordingly, this issue is still an elusive problem that attracts the interests of many researchers [9].
The focus of this paper is to shed some light on how databases can be used in a secure manner
when connecting to the World Wide Web. To accomplish such aim, the paper introduces a novel web database security model that including a new authentication method called DSUC (Data Security Unique Code) which is a hardware component like USB flash memory contain a unique MAC code like LAN adapter ,this MAC address must be attached to the user host to pass the security check by using HIP(Host Identity protocol) with a strong filtering server and finally a real time monitoring system by using fuzzy set theory called UDM (Uncertainty degree model) for monitoring users operations in real time.
2.Background and basic concepts:
In this section, a simple view for the Host Identity Protocol (HIP) is illustrated. Then, Fuzzy logic is explained in details.
2.1. Host Identity Protocol:
Currently, communications through computer networks are usually described with the
ISO/OSI reference model, which contains seven layers illustrated in Figure 1. In such model, each layer; (i) uses functions from lower layers, (ii) provides new functionalities to upper layers, and (iii) has its own protocols to communicate with its peers located at the other network computers. The network and transport layers, as illustrated in figure 2, play an important role in Internet communications. Network layer is usually managed by the Internet Protocol (IP), while the transport layer is included to handle the data segments transmitted in IP packets. Common protocols for the transport layer are; (i) Transmission Control Protocol (TCP), or (ii) User Datagram Protocol (UDP).
Internet protocol defines one of the two main namespaces currently used in the Internet, the
namespace composed of IP addresses. The second main namespace is composed of Domain Name System (DNS) names [11]. While DNS names are used as identifiers on application level, IP addresses are most important and are used in the ISO/OSI network model from the network layer to the application layer.
Page 459
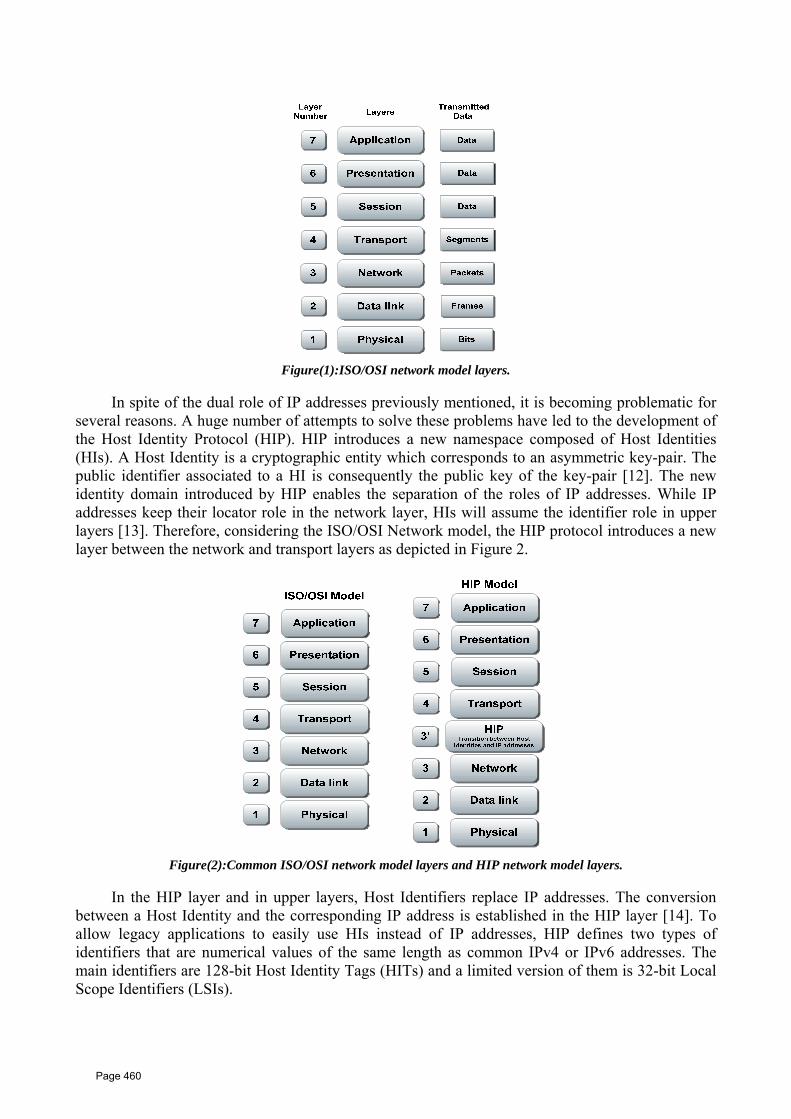
Figure(1):ISO/OSI network model layers.
In spite of the dual role of IP addresses previously mentioned, it is becoming problematic for
several reasons. A huge number of attempts to solve these problems have led to the development of the Host Identity Protocol (HIP). HIP introduces a new namespace composed of Host Identities (HIs). A Host Identity is a cryptographic entity which corresponds to an asymmetric key-pair. The public identifier associated to a HI is consequently the public key of the key-pair [12]. The new identity domain introduced by HIP enables the separation of the roles of IP addresses. While IP addresses keep their locator role in the network layer, HIs will assume the identifier role in upper layers [13]. Therefore, considering the ISO/OSI Network model, the HIP protocol introduces a new layer between the network and transport layers as depicted in Figure 2.
Figure(2):Common ISO/OSI network model layers and HIP network model layers.
In the HIP layer and in upper layers, Host Identifiers replace IP addresses. The conversion
between a Host Identity and the corresponding IP address is established in the HIP layer [14]. To allow legacy applications to easily use HIs instead of IP addresses, HIP defines two types of identifiers that are numerical values of the same length as common IPv4 or IPv6 addresses. The main identifiers are 128-bit Host Identity Tags (HITs) and a limited version of them is 32-bit Local Scope Identifiers (LSIs).
Page 460

The introduction of a new namespace and the use of the new HIP protocol imply a new way to
establish communications between two hosts. HIP communications are divided in two main phases: the HIP Base Exchange and the secured data transfer [15]. The HIP Base Exchange uses specific HIP packets to establish a connection between two end hosts, represented by their Host Identities. The resulting communication is therefore based on a pair of HITs or LSIs. The Base Exchange also allows the exchange and negotiation of parameters and cryptographic keys for the communication. After the Base Exchange is completed, the end-hosts can establish secured communications, based on HIs, and exchange data in a secured way. The data transfer relies on an existing end-to end security protocol, which is typically but not necessarily the IPsec ESP protocol [16].
Accordingly, the HIP Operation sequence can be expressed in the following steps, which are also illustrated in figure 3; (i) the Responder must register its Host Identity, and registered its domain namespace in the DNS Server in advance, (ii) the Initiator must register its Host Identity, and registered its domain namespace in the DNS Server in advance, (iii) the client (Initiator) sends packet I1 to the RVS starting the HIP authentication. After validating it, the RVS forwards I1 to the Responder (in the Web server). (iv) After checking the packet I1, if I1 has a (UI&HI( binding flag added by RVS, the Responder (in the Web server) directly sends packet R1 to the Initiator, The R1 contains a challenge puzzle to HI and UI, that is, a cryptographic challenge that the Initiator must solve before continuing the exchange.
In addition, it contains the initial Diffie-Hellman parameters and a signature. (v)In the packet
I2, the Initiator (client) must display the solution to the received challenge puzzle .Without a correct solution, the Responder (in the Web server) discards the I2 message. The I2 also contains a Diffie-Hellman parameter that carries needed information for the Responder. (vi)The packet R2 finalizes the 4-way handshake, containing the SPI (Security Parameters Index) value of the Responder [17].
Figure (3): HIP Base Exchange operations sequence. 2.2. Fuzzy :
The fuzzy logic was specifically designed to mathematically represent uncertainty. However, the story of fuzzy logic started much more earlier . . . To devise a brief theory of logic, and later mathematics, Aristotle posited the so-called”Laws of Thought” [18]. One of these, the “Law of the Excluded Middle,” states that every proposition must either be True (T) or False (F). Even when Parmenides proposed the first version of this law (around 400 Before Christ) there were strong and immediate objections: for example, Heraclitus proposed that things could be simultaneously True and not True.
Page 461

It should be noted that Knuth also proposed a three valued logic similar to Lukasiewicz’s, from which he predicted that mathematics would become even more fashionable than in traditional bi-valued logic. The notion of an infinite-valued logic was introduced in Zadeh’s seminal work ”Fuzzy Sets” where he described the mathematics of fuzzy set theory, and by extension fuzzy logic[19]. This theory proposed making the membership function (or the values F and T) operate over the range of real numbers [0, 1]. New operations for the calculus of logic were proposed, and showed to be in principle at least a generalization of classic logic. Fuzzy logic provides an inference morphology that enables approximate human reasoning capabilities to be applied to knowledge-based systems. The theory of fuzzy logic provides a mathematical strength to capture the uncertainties associated with human cognitive processes, such as thinking and reasoning [20]. The conventional approaches to knowledge representation lack the means for representing the meaning of fuzzy concepts. For example, uses a fuzzy Adaptive Resonance Theory (ART) and neural network to detect anomaly intrusion of database operations, by monitoring the connection activities to a database. As a result, we have a motivation of integrating fuzzy set theory and intrusion detection technique to deal with Hidden Anomaly in databases precisely in real time. The advantage of using fuzzy logic because it can be used to calculate the intermediate numbers like a probability between (0,1). In our research that is a very important point because we want to calculate the uncertainty degree which is a fraction of integer 1.We will use a fuzzy membership function called (triangular fuzzy number) to achieve this goal and that what we will illustrate in the next sections[21]. 2.3. Previous Efforts:
There is relatively little prior work in the field of evaluating intrusion detection systems. The
work of Puketza and others at the University of California at Davis is the only reported work that clearly predates the Lincoln effort [22]. These papers describe a methodology and software platform for the purpose of testing intrusion detection systems. The methodology consists of using scripts to generate both background traffic and intrusions with provisions for multiple interleaved streams of activity [23].
These provide a (more or less) repeatable environment in which real-time tests of an intrusion
detection system can be performed. Only a single IDS, the network security monitor (NSM), seems to have been tested, and the tests reported could not be seen as any sort of a systematic evaluation. The earlier work, dating from 1993, reports the ability of NSM to detect several simple intrusions, both in isolation and in the presence of stresses [24]. One form of stress is induced by system loading. Load is measured in terms of the number of concurrent jobs running on the host supporting NSM and NSM is reported to drop packets under high load averages (42% byte stream loss at a load average of about 14.5).
Other forms of stress include background noise (non intrusive network activity), session
volume (the number of commands issued during an intrusive session), and intensity (number of concurrent sessions on the link being monitored). No experimental results are given for these forms of stress. In their later paper, the Davis group concentrates on the ability of the test facility to support factoring of sequential attacks into a number of concurrent or overlapping sessions [25].
They report that NSM assigns lower scores to some attacks that have been factored, noting
that NSM’s independent evaluation of individual network connections may allow attacks to be hidden in this way. In 1998, while the Lincoln group was developing and carrying out its test
Page 462
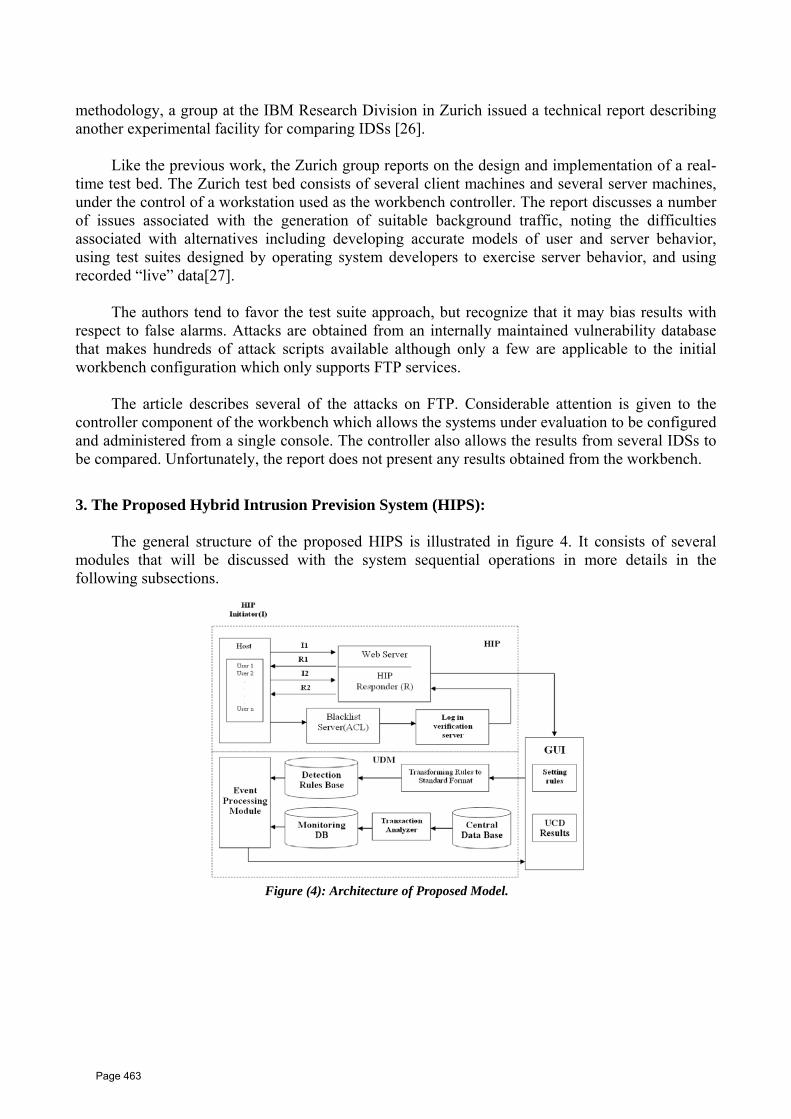
methodology, a group at the IBM Research Division in Zurich issued a technical report describing another experimental facility for comparing IDSs [26].
Like the previous work, the Zurich group reports on the design and implementation of a real-
time test bed. The Zurich test bed consists of several client machines and several server machines, under the control of a workstation used as the workbench controller. The report discusses a number of issues associated with the generation of suitable background traffic, noting the difficulties associated with alternatives including developing accurate models of user and server behavior, using test suites designed by operating system developers to exercise server behavior, and using recorded “live” data[27].
The authors tend to favor the test suite approach, but recognize that it may bias results with
respect to false alarms. Attacks are obtained from an internally maintained vulnerability database that makes hundreds of attack scripts available although only a few are applicable to the initial workbench configuration which only supports FTP services.
The article describes several of the attacks on FTP. Considerable attention is given to the
controller component of the workbench which allows the systems under evaluation to be configured and administered from a single console. The controller also allows the results from several IDSs to be compared. Unfortunately, the report does not present any results obtained from the workbench.
3. The Proposed Hybrid Intrusion Prevision System (HIPS):
The general structure of the proposed HIPS is illustrated in figure 4. It consists of several
modules that will be discussed with the system sequential operations in more details in the following subsections.
Figure (4): Architecture of Proposed Model.
Page 463

3.1. Host Identity Protocol (HIP):
As illustrated in Figure 5, the HIP Responder is in the Web server while the clients (host and
user) accessing the web database represent the HIP Initiator. The HIP authenticating method is located in the Web server of database system. Also, The BS (blacklist server) cooperates with the Web server to authenticate both the User Identity and Host Identity.
We have considered the host identity in a DSUC (Data Security Unique Code) which is a hardware component like flash memory that contains specific code for each user that the user must have it attached to his host to pass the security check in order to be able to access the database. So, if there is a user in Egypt wants to access the company database in Syria so, he must have his own DSUC attached in the pc that he want to use it to access the database in France and provide a true user name and true password along with true DSUC. 3.1.1: DSUC Packet structure:
Next Header
Header Length
0 Packet Type
Version Res. 0
Checksum controls
Sender’s Host Identity Tag(HIT)
(User’s DSUC)
receiver’s Host Identity Tag(HIT)
(Web Server DB Identifier)
HIP Parameters
Figure (5): DSUC Packet structure. The DSUC packet structure is the same as HIP packet structure as illustrated in figure (5) consists of the following fields: The HIP header is logically an IPv6 extension header. The Header Length field contains the length of the HIP Header and HIP parameters. The HIP Version field contains the used version, currently 1. The following three "Res." bits are reserved for future use. The two zero bits in the first line of the header are reserved for potential compatibility. The Checksum field is an ordinary checksum for the whole message. The Controls field conveys information about the structure of the packet and capabilities of the host. A sending host can set the HIP message exchange to anonymous; The receiving host of an anonymous HI may choose to refuse it. where the sender's HIT represent the DSUC of each user and the receiver's HIT represent the company web DB code. The HIP Parameters field contains the various HIP options and extensions. 3.2. Filtering System (Blacklist database): It's a server that contain (black list) of banned user identities and MAC addresses, if the user has entered true user ID and password without or with wrong DSUC he will be banned for 24 hours, if the user has entered wrong user ID or password with true DSUC we will give him wrong 5 attempts then he will be banned for 24 hours.
Page 464

3.3.Uncertaininty degree model(UDM): Given a vector of a random variable X and n observations X1,…,Xn, the goal of the statistical sub-model of X is to determine whether a new observation Xn+1is abnormal with respect to the previous observations. The mean avg and the standard deviation stdev of 1X,…,Xn are defined as:
A new observation Xn +1is defined to be abnormal if it falls outside a confidence interval that is standard deviations from the mean, which is denoted by CI:
CI = avg± dev
Where dev= d × stdev with d as a parameter. Therefore, it would apply for the case of Hidden Anomaly. Membership functions are used to “measure” the uncertainty degrees for each transaction. For each transaction, a value of variable X can be observed. It can be mapped into the interval [0,1] by a membership function. We define 0 means completely acceptable, and 1 implies anomaly or completely unacceptable. The values between 0 and 1 are called uncertainty degree. In this way, the dubiety of transactions can be denoted in a unified form. We will use (triangular fuzzy membership function) as illustrated in figure (6) which is defined as A fuzzy set A is called triangular fuzzy number with peak (or center) a, left width α > 0 and right width β > 0 if its membership function has the following form:
Xmax= Xavg= Xmin=
Figure (6): Triangular Fuzzy membership function.
Page 465
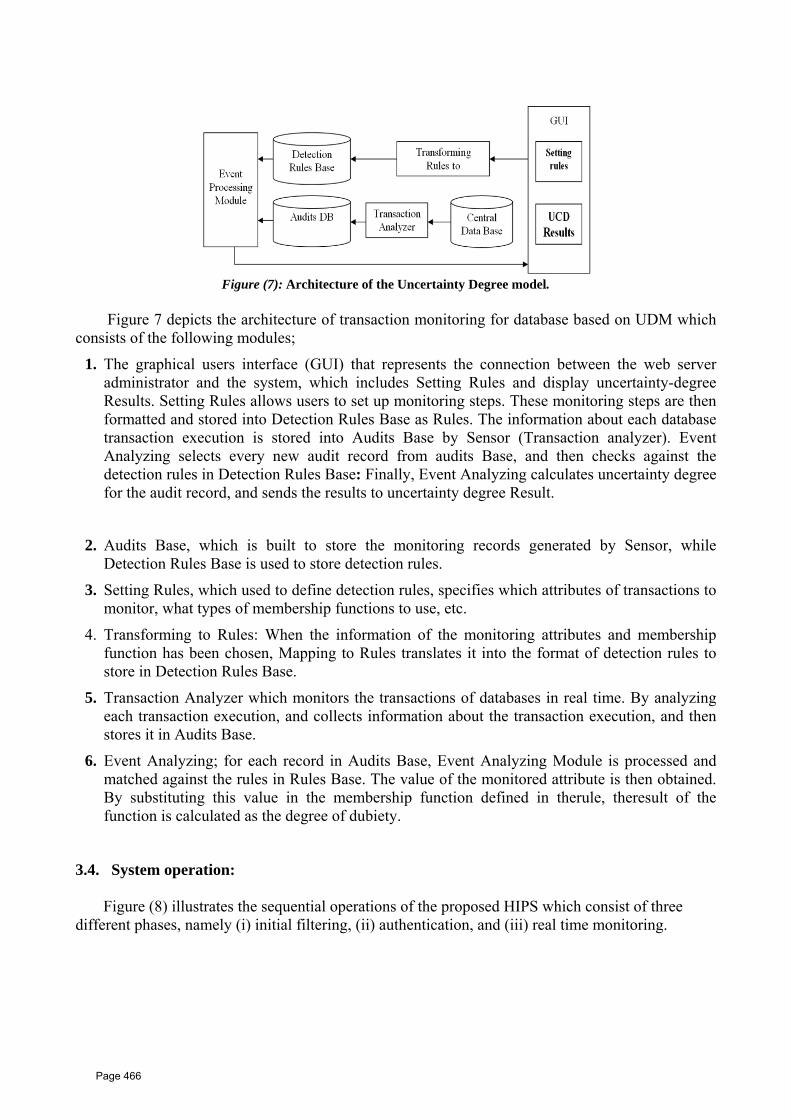
Figure (7): Architecture of the Uncertainty Degree model. Figure 7 depicts the architecture of transaction monitoring for database based on UDM which consists of the following modules;
1. The graphical users interface (GUI) that represents the connection between the web server administrator and the system, which includes Setting Rules and display uncertainty-degree Results. Setting Rules allows users to set up monitoring steps. These monitoring steps are then formatted and stored into Detection Rules Base as Rules. The information about each database transaction execution is stored into Audits Base by Sensor (Transaction analyzer). Event Analyzing selects every new audit record from audits Base, and then checks against the detection rules in Detection Rules Base: Finally, Event Analyzing calculates uncertainty degree for the audit record, and sends the results to uncertainty degree Result.
2. Audits Base, which is built to store the monitoring records generated by Sensor, while
Detection Rules Base is used to store detection rules.
3. Setting Rules, which used to define detection rules, specifies which attributes of transactions to monitor, what types of membership functions to use, etc.
4. Transforming to Rules: When the information of the monitoring attributes and membership function has been chosen, Mapping to Rules translates it into the format of detection rules to store in Detection Rules Base.
5. Transaction Analyzer which monitors the transactions of databases in real time. By analyzing each transaction execution, and collects information about the transaction execution, and then stores it in Audits Base.
6. Event Analyzing; for each record in Audits Base, Event Analyzing Module is processed and matched against the rules in Rules Base. The value of the monitored attribute is then obtained. By substituting this value in the membership function defined in therule, theresult of the function is calculated as the degree of dubiety.
3.4. System operation:
Figure (8) illustrates the sequential operations of the proposed HIPS which consist of three different phases, namely (i) initial filtering, (ii) authentication, and (iii) real time monitoring.
Page 466
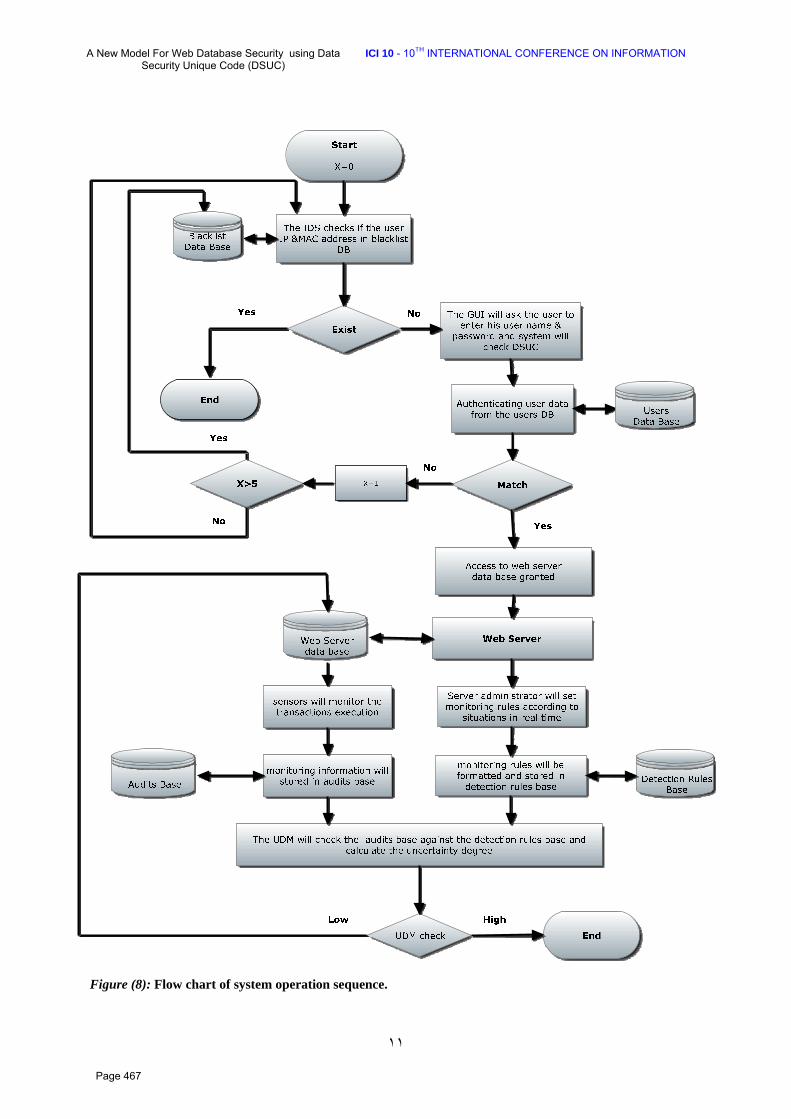
THA New Model For Web Database Security using Data Security Unique Code (DSUC)
ICI 10 - 10 INTERNATIONAL CONFERENCE ON INFORMATION
١١
Figure (8): Flow chart of system operation sequence.
Page 467

Phase 1: Filtering System check: • When a new user enters the GUI of the system the system will automatically get its IP address and MAC address from the network hash table and checks them in the blacklist database if its IP address or MAC address exist the system will cancel his request silently.
Phase 2: Host Identity Protocol check: • The system will ask the user to enter his user identity (user name & password) then the system
will check for the DSUC and checks them in the users database if there is any change in the three fields (user name, password, DSUC) the system will give him five attempts to enter the user identity correctly then he will be blocked from the system and his IP and Mac addresses will be added in the blacklist database.
• The blacklist database is cleared every 24 hours. • If the entered data is correct the user will be allowed to enter the web server database and gets the desired data under certain constrains. • Now the system will work in two phases in real time, the system administrator will set the
monitoring rules of the fuzzy membership function that will be transformed and stored in detection rules base, and the system will monitor the transactions execution and store it in the Analyzer base and monitoring.
Phase 3: Uncertainty Degree Model check: • The system will uses the fuzzy membership function to calculate the degree of uncertainty
• If the Uncertainty degree is high (close to 1) the system will automatically block the user from accessing server database. 4.Experimental Results: Initially, we need to define two terms in our system, which are (i) Analyzer Record, and (ii) Detection Rule. Analyzer Record is used for recording the information about each database operation. This data structure is 6-tuple recording information of each database transaction: <AID, UID, SQLText, Time, Data1, Data2> as illustrated in table 1. To make it clearer, from now on in this paper, we will use the term Analyzer Record instead of transaction.
Term Meaning AID Is the identifier for each Analyzer Record. UID records the user name of the transaction
SQLTEXT Records the content of the SQL statement of the transaction.
Data1 Is the first data field that the transaction relates to, for example; the data value before update.
Data2 Is the second data field that the transaction relates to, for example; the data value after an update.
Time
Specifies a number of hours as a time range. The audit records occurred in that time range before the currently being tested will be seen by the rule.
Table (1): Analyzer Record structure.
Page 468
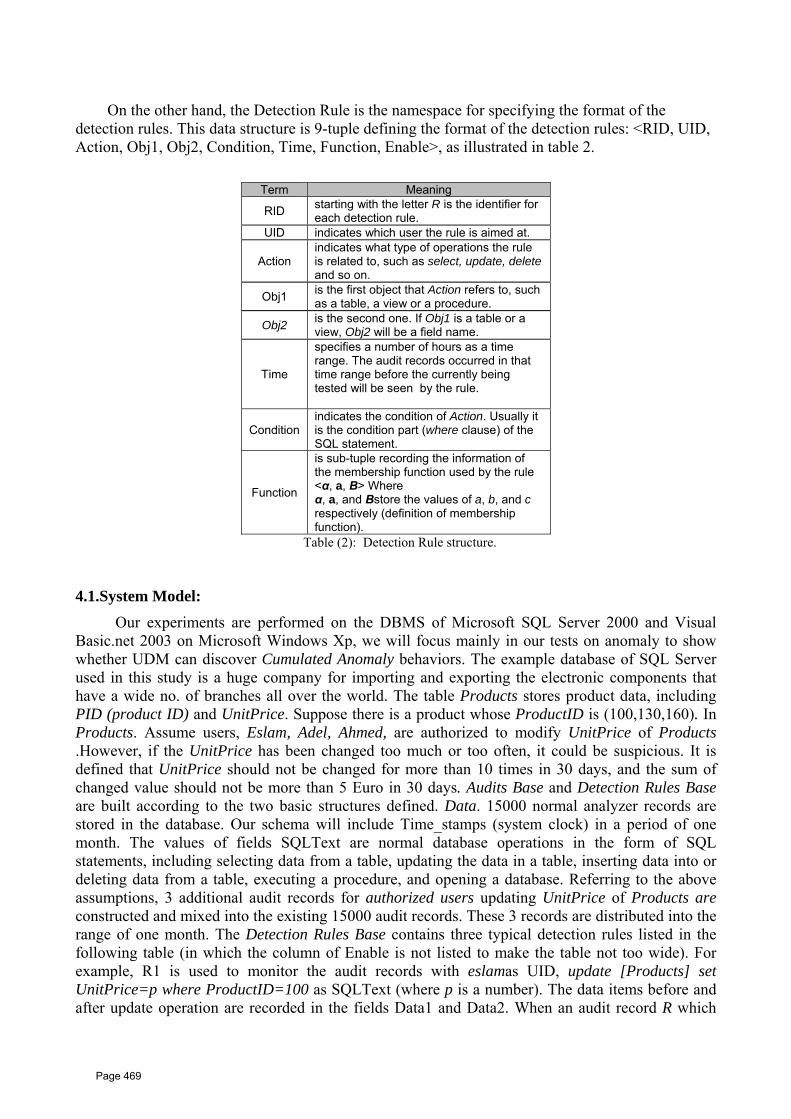
On the other hand, the Detection Rule is the namespace for specifying the format of the detection rules. This data structure is 9-tuple defining the format of the detection rules: <RID, UID, Action, Obj1, Obj2, Condition, Time, Function, Enable>, as illustrated in table 2.
Term Meaning
RID starting with the letter R is the identifier for each detection rule.
UID indicates which user the rule is aimed at.
Action indicates what type of operations the rule is related to, such as select, update, delete and so on.
Obj1 is the first object that Action refers to, such as a table, a view or a procedure.
Obj2 is the second one. If Obj1 is a table or a view, Obj2 will be a field name.
Time
specifies a number of hours as a time range. The audit records occurred in that time range before the currently being tested will be seen by the rule.
Condition indicates the condition of Action. Usually it is the condition part (where clause) of the SQL statement.
Function
is sub-tuple recording the information of the membership function used by the rule <α, a, B> Where α, a, and Bstore the values of a, b, and c respectively (definition of membership function).
Table (2): Detection Rule structure.
4.1.System Model: Our experiments are performed on the DBMS of Microsoft SQL Server 2000 and Visual Basic.net 2003 on Microsoft Windows Xp, we will focus mainly in our tests on anomaly to show whether UDM can discover Cumulated Anomaly behaviors. The example database of SQL Server used in this study is a huge company for importing and exporting the electronic components that have a wide no. of branches all over the world. The table Products stores product data, including PID (product ID) and UnitPrice. Suppose there is a product whose ProductID is (100,130,160). In Products. Assume users, Eslam, Adel, Ahmed, are authorized to modify UnitPrice of Products .However, if the UnitPrice has been changed too much or too often, it could be suspicious. It is defined that UnitPrice should not be changed for more than 10 times in 30 days, and the sum of changed value should not be more than 5 Euro in 30 days. Audits Base and Detection Rules Base are built according to the two basic structures defined. Data. 15000 normal analyzer records are stored in the database. Our schema will include Time_stamps (system clock) in a period of one month. The values of fields SQLText are normal database operations in the form of SQL statements, including selecting data from a table, updating the data in a table, inserting data into or deleting data from a table, executing a procedure, and opening a database. Referring to the above assumptions, 3 additional audit records for authorized users updating UnitPrice of Products are constructed and mixed into the existing 15000 audit records. These 3 records are distributed into the range of one month. The Detection Rules Base contains three typical detection rules listed in the following table (in which the column of Enable is not listed to make the table not too wide). For example, R1 is used to monitor the audit records with eslamas UID, update [Products] set UnitPrice=p where ProductID=100 as SQLText (where p is a number). The data items before and after update operation are recorded in the fields Data1 and Data2. When an audit record R which
Page 469

meets the demand of R2 occurs, the algorithm seeks the audit records meeting the demand of R2 which have occurred 720 hours before R, and sums up the margins between each pair of Data1 and Data2 in each of them. Then, the summation is substituted into Fx defined in R2. Finally, a result value of the function is calculated as the dubiety degree of that audit record. As this is a real-time process; an audit record will be examined as soon as it arrives.
4.2.The Experiment Detection Rules Table: As illustrated in table 3, it is noted that each user has one rule. Hence, one test could be applied for each user (one test per rule). Also, The column time shows the period that the rule will be valid in hours, for illustration, R1 has time 480 hours to convert it into days (480/24=20 days).
Table (3): User’s Detection Rules Table. 4.3.Different users tests: In the following subsections, the different tests for each user using rules illustrated in table 3 will be introduced in more details.
User No.1:
Figure (9): Eslam Price change chart.
Figure (9) shows us the audit record of operations for a user whose name is Eslam in 30 days. As we can see from the above figure that the summation of all changes are (58-52=6) > the max no. of changes allowed (5), so he did break the rule.
٥٠٥١٥٢٥٣٥٤٥٥٥٦٥٧٥٨٥٩٦٠
٠ ١٢٠٣ ١٨٢٦ ٢٧٣٣ ٣٧١٥
Prod
uct p
rice
AID
Eslam Price change chart(R1)
Page 470

Figure (10): Eslam Uncertainty Degree chart.
The test applied with rules R1, we can see as illustrated in Figure (10) that the user behavior causes anomaly because he did break the rule of 5 euro change, and he made a change of 6 Euro. So, we can notice that the curve has reached the max value (1) which means completely Unacceptable. So, we can see that Eslam behavior causes anomaly. User No.2:
Figure (11): Adel Price change chart.
Figure (11) shows us the audit record of operations for a user whose name is Adel in 30 days. As we can see as illustrated in Figure (12) that the summation of all changes are (55-51=4) <= the max no. of changes allowed (5), so he didn't break the rule.
٠٠.١٠.٢٠.٣٠.٤٠.٥٠.٦٠.٧٠.٨٠.٩١
٠ ٧٢٧ ١٢٠٣ ١٥٣٣ ١٨٢٦ ٢٤٧٠ ٢٧٣٣ ٣٤٦٤ ٣٧١٥ ٤٣٦٧
Unc
erta
inty
Deg
ree
AID
Eslam Test (R1)
٥٠٥١٥٢٥٣٥٤٥٥٥٦٥٧٥٨٥٩٦٠
٠ ٨٧٩ ١٦٩٨ ٢٣٤٥ ٣٢٥٦
Prod
uct p
rice
AID
Adel Price change chart(R2)
Page 471

Figure (12): Adel Uncertainty Degree chart.
The test applied with rules R2. we can see as illustrated in Figure (12) that the user behavior doesn’t cause anomaly because he made a change of 4 Euro .So ,he didn’t break the rule of 5 Euro change so, we can notice that the curve reach the value(.6) which means acceptable. So, we can see that Adel behavior doesn't cause anomaly. User No.3:
Figure (13): Ahmed Price change chart.
Figure (13) shows us the audit record of operations for a user whose name is Ahmed in 10 days. As we can see as illustrated in Figure (14) that the summation of all changes are (59-52=7) > the max no. of changes allowed (5), so he did break the rule, so the user behavior causes anomaly.
٠٠.١٠.٢٠.٣٠.٤٠.٥٠.٦٠.٧٠.٨٠.٩١
٠ ٣٧٢ ٨٧٩ ١٣٨٧ ١٦٩٨ ١٩٥٨ ٢٣٤٥ ٢٨٩٦ ٣٢٥٦ ٣٧٤٥
Unc
erta
inty
Deg
ree
AID
Adel Test (R2)
٥٠٥١٥٢٥٣٥٤٥٥٥٦٥٧٥٨٥٩٦٠
٠ ٣٩٦ ١٠٨٩ ١٧٥٣ ٢٤٦٩
Prod
uct p
rice
AID
Ahmed Price change chart(R3)
Page 472

Figure (14): Ahmed Uncertainty Degree chart.
The test applied with rules R3. We can see as illustrated in Figure (14) that the user behavior cause anomaly because he did break the rule of 5 euro change, and he made a change of 7 Euro. So, we can notice that the curve has reached the max value (1) which means completely Unacceptable. So, we can see that Ahmed behavior causes anomaly.
5. Conclusion: We have proposed a new model for web database security using Ultra Hybrid security system based on DSUC and Uncertainty Degree Model. Our tests and experimental results shows that our system is efficient and capable for blocking intruders from hacking into our system and discover suspicious behaviors of internal and authorized system users. We can guarantee triple security layers, and test shows that our system can block 93% of attackers on high load.
6.References: [1] Darren Muts, Fredrik Valeur, Giovanni Vigna.Anomalous system call detection. ACM Transactions onInformation and system Seurity, Vol. 12, No. 1, February2009, 61-93. [2] Wellington, B., "Secure Domain Name System (DNS) Dynamic Update", 2008. 11. [3] PengNing, SushilJajodia, “Intrusion detection SystemsBasics”, Handbook of Information Security, JohnWiley & sons, H. Bidgoli (Editor), Vol. 3, page 695,2006. [4] P. Jokela, R. Moskowitz, et al. “Using ESP transport format with HIP”, (draft-04), 2007.10 [5] B. Meyer, Object Oriented Software Construction, Prentice Hall, Upper Saddle River, NJ, USA,
2nd edition, 2005. [6] Vixie, P., Thomson, S., Rekhter, Y. and J. Bound, "Dynamic Updates in the Domain Name
System (DNS UPDATE)", RFC 2136, 2007.04. [7] Tian-Qing Zhu, Ping Xiong. Optimization of membership functions in anomaly detection based
on fuzzy data mining. Proceedings of 2005 International Conference on Machine Learning and Cybernetics (IEEE Cat. No. 05EX1059. Vol. 14, 2005.
[8] Francesco M. Malvestuto, Mauro Mezzini, MarinaMoscarini. Auditing sum-queries to make a statisticaldatabase secure. ACM Transactions on Information andsystem Security, Vol. 12, No. 1, February 2009. [9] WaiLup Low, Joseph Lee, Peter Teoh. DIDAFIT: Detecting intrusions in databases through
fingerprinting transactions. ICEIS 2002.
٠٠.١٠.٢٠.٣٠.٤٠.٥٠.٦٠.٧٠.٨٠.٩١
٠ ٣٩٦ ١٠٨٩ ١٧٥٣ ٢٤٦٩
Unc
erta
inty
Deg
ree
AID
Ahmed Test (R3)
Page 473

THA New Model For Web Database Security using Data Security Unique Code (DSUC)
ICI 10 - 10 INTERNATIONAL CONFERENCE ON INFORMATION
18
[10] R. Moskowitz, “Host Identity Protocol.” InternetDraft, July 2006. [11] R. Moskowitz, “Host Identity Protocol Architecture.”RFC 4423 (Proposed Standard), may 2006. [12] T. Okagawa et al., “Ip packet routing mechanism based on mobility management in a ip basednetwork,” 14th International Conference on Intelligencein NGN, 2009. [13] PedryczWitold, Gomide Fernando. An Introduction to Fuzzy Sets: Analysis and Design.
Cambridge, Mass. MIT Press, 2008. [14] P. Nikander, Host Identity Protocol (HIP) Domain NameSystem(DNS)Extensions, 2006.09. [15] A. Matos, J. Santos, J. Girao, M. Liebsch, andR. Aguiar, “Host Identity Protocol Location PrivacyExtensions.” Internet Draft (Work in Progress),March 2009. [16] P. Nikander, “End-Host Mobility and Multi-Homing with Host Identity Protocol”, 2006.06. [17] Madson, C. and R. Glenn, "The Use of HMAC-SHA -1-96 within ESP and AH", RFC 2404,
2008 [18] S. Kent, “IP Encapsulating Security Payload (ESP)”, (RFC 4303), 2005.12. [19] Sin Yeung Lee, WaiLup Low, Pei Yuen Wong. Learning fingerprints for a database intrusion
detection system. ESORICS 2002. [20] K. Ilgun, R. A. Kemmerer, and P. A. Porras, “State transition analysis: A rule-based intrusion detection approach,” Transactions on SoftwareEngineering, 2005. [21] Chung C Y,Gertz M, Levitt K. DEMIDS: A Misuse Detection System for Database Systems.
In:The Third Annual IFIP 11.5 Working Conf. on Integrity and Internal Control in Information Systems, 2009
[22] Chan Man Kuok, Ada Fu, Man Hon Wong. Mining fuzzy association rules in databases. SIGMOD Record, 2008, 27(1).
[23] Darren Muts, Fredrik Valeur, Giovanni Vigna. Anomalous system call detection. ACM Transactions on Information and system Seurity, Vol. 9, No. 1, February 2006.
[24] Francesco M. Malvestuto, Mauro Mezzini, Marina Moscarini. Auditing sum-queries to make a statistical database secure. ACM Transactions on Information and system Security, Vol. 9, No. 1, February 2006, 31-60.
[25] Ingrian Networks, Inc. Encrypting Critical Data in Databases with Ingrian Networks, 2004.12. [26] Ingrian Networks, Inc. Ensuring Compliance with Credit Card Security Policies, 2005.12. [27] Rung Ching Chen, Cheng Chia Hsieh. An anomaly intrusion detection on database operation by fuzzy ART neural network. Proceedings of ICS 2003. 839-844.
Page 474
ICI 10 - 10TH INTERNATIONAL CONFERENCE ON INFORMATION AT DELTA UNIVERSITY FOR SCIENCE AND TECHNOLOGY
GAMASA, EGYPT, 4 – 6 DECEMBER 2010
1
Secure Backup System hosted on a Storage Cloud
Sherif S. El-etriby 1*, Elham Mahmoud 2, Ahmed Daoud
1Faculty of Computers and Information,
Menoufia University, P.O.Box: 32511,Shebin El-kom, Egypt,
E-mail: [email protected]
Abstract Cloud has become a new vehicle for delivering such as computing and storage to customers demand in order to reduce the cost of using information technology resources. Many of companies and individuals are suffer some problem in backup system of their data, for instance; data loss and corruption, huge amount of data requires more space and rapidly change in storage hardware and theft of confidential data during transfer or storage. Furthermore, customary-user can not dealing with cloud storage because cloud requires programming skills to be use the Application Programming Interface (API), which is one of the key technical facilitators of cloud computing (not accessible for end users). As well as the One of the biggest challenges for cloud backup service providers is reducing the cost of storing older and/or various types of data in the most cost-effective manner possible. For these explanation, our paper develop a cloud based file sharing and backup system in which files are kept on secure, reliable and efficient storage clouds. Storage clouds will be responsible for holding all the users data which will be transferred encrypted using high encryption techniques such as the Advanced Encryption Standard (AES). Our suggested system will be divided into a number of phases which starts from developing the storage cloud connection classes to the end user applications and services website. The approach is able to backup various types of devices such as (servers, personal computers and mobile phones); also the software design aims to be portable as possible to run on all platforms. The system main parts are (Storage cloud – connection classes – file classes – user interface). The system is able to backup any PC and store the backup on the storage cloud, user Interface is optimized to be easy, and the system is 90% secure against security attacks.
Keywords: Cloud computing; Cloud storage; Virtualization; Security.
1. Introduction
Cloud computing is a term used to describe both a platform and type of application. A cloud
computing platform dynamically provisions, configures, reconfigures, and deprovisions servers
as needed. Servers in the cloud can be physical machines or virtual machines. Advanced clouds
typically include other computing resources such as storage area networks (SANs), network
equipment, firewall and other security devices. Generally, Cloud computing is a modern term
in computer science used specifically to refer to advances in client-server technology that have
occurred in the last decade. It is a general term for anything that involves delivering hosted
Page 475

Secure Backup System hosted on a Storage Cloud ICI 10 - 10TH INTERNATIONAL CONFERENCE ON INFORMATION
2
services over the Internet. These services are broadly divided into three categories:
Infrastructure-as-a-Service (IaaS), Platform-as-a-Service (PaaS) and Software-as-a-Service
(SaaS). Therefore, it can be the ability to rent a virtual server, load software on it. It can be
storing and securing immense amounts of data that is accessible only by authorized
applications and users.
There are lots of definitions and metaphors of cloud computing. From our points of view, cloud
computing is a kind of computing technique where IT services are provided by massive low-
cost computing units by IP networks. There are five major technical characteristics of cloud
computing: large scale computing resources, high scalability and elastic, shared resource pool
(virtualized and physical resource), dynamic resource scheduling, and general purpose [1-2].
Several technology issues have stymied past efforts at providing IT as a Service, including
virtualization, manageability, security, and billing and chargeback. Most cloud computing
infrastructure consists of services delivered through common centers and built on servers.
Clouds often appear as single points of access for all consumers' computing needs. Commercial
offerings are generally expected to meet quality of service (QoS) requirements of customers,
and typically include SLAs. The major cloud-only service providers include Salesforce,
Amazon and Google.
Cloud storage delivers virtualized storage on demand, over a network based on a request for a
given quality of service (QoS). There is no need to purchase storage or in some cases even
provision it before storing data. You only pay for the amount of storage your data is actually
consuming. Cloud storage is used in many different ways. For example: local data (such as on
a laptop) can be backed up to cloud storage; a virtual disk can be “synched” to the cloud and
distributed to other computers; and the cloud can be used as an archive to retain (under policy)
data for regulatory or other purposes.
A cloud storage installation is dedicated to access, protection and serving data, the key
component is hard disk space. Being able to pay for the space that meets your specific needs at
a given time has significant advantages over a traditional solution like building out a storage
area network in your local office. Your storage can be available to all of your satellite office.
The terms cloud computing and cloud storage have been gaining popularity over the past year,
becoming the new winners in the marketing buzzword wars. However, obtaining mindshare
and headlines is only the first hurdle in becoming a sustainable long-term trend that delivers
value. Cloud storage is storage accessed over a network (internal or external) via Web Services
APIs [3-5]. Since the appearance of cloud computing and it’s fast development, many fields of
Page 476
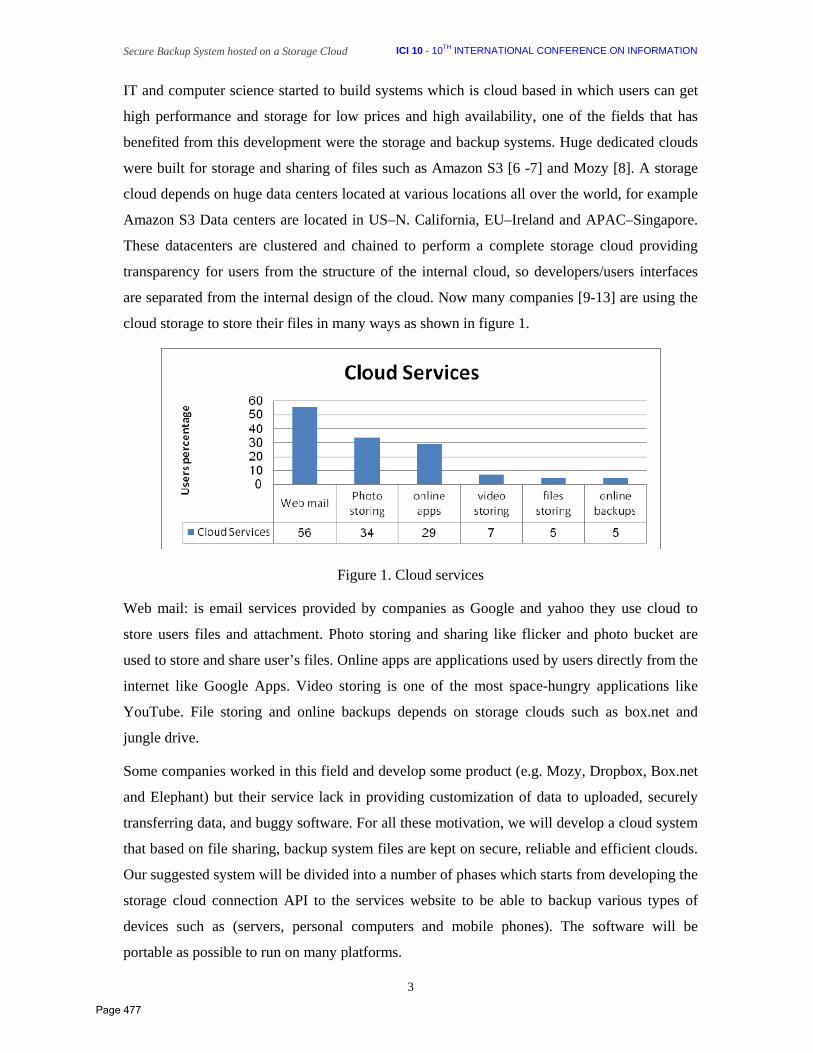
Secure Backup System hosted on a Storage Cloud ICI 10 - 10TH INTERNATIONAL CONFERENCE ON INFORMATION
3
IT and computer science started to build systems which is cloud based in which users can get
high performance and storage for low prices and high availability, one of the fields that has
benefited from this development were the storage and backup systems. Huge dedicated clouds
were built for storage and sharing of files such as Amazon S3 [6 -7] and Mozy [8]. A storage
cloud depends on huge data centers located at various locations all over the world, for example
Amazon S3 Data centers are located in US–N. California, EU–Ireland and APAC–Singapore.
These datacenters are clustered and chained to perform a complete storage cloud providing
transparency for users from the structure of the internal cloud, so developers/users interfaces
are separated from the internal design of the cloud. Now many companies [9-13] are using the
cloud storage to store their files in many ways as shown in figure 1.
Figure 1. Cloud services
Web mail: is email services provided by companies as Google and yahoo they use cloud to
store users files and attachment. Photo storing and sharing like flicker and photo bucket are
used to store and share user’s files. Online apps are applications used by users directly from the
internet like Google Apps. Video storing is one of the most space-hungry applications like
YouTube. File storing and online backups depends on storage clouds such as box.net and
jungle drive.
Some companies worked in this field and develop some product (e.g. Mozy, Dropbox, Box.net
and Elephant) but their service lack in providing customization of data to uploaded, securely
transferring data, and buggy software. For all these motivation, we will develop a cloud system
that based on file sharing, backup system files are kept on secure, reliable and efficient clouds.
Our suggested system will be divided into a number of phases which starts from developing the
storage cloud connection API to the services website to be able to backup various types of
devices such as (servers, personal computers and mobile phones). The software will be
portable as possible to run on many platforms.
Page 477

Secure Backup System hosted on a Storage Cloud ICI 10 - 10TH INTERNATIONAL CONFERENCE ON INFORMATION
4
Our suggested System Works as follows:
1. The user downloads the client from the site then executes it and select desired options
of backup. (Mobile, PC, Server).
2. Client connects to the UAPI classes and uses them to connect to the cloud (see Fig. 2).
3. After establishing the connection with the cloud file transfer starts and its info is
recorded in the database, as shown in Fig. 3.
4. When the client OS crashes or lost his data then by just running the client it will restore
all of his data and repair the system.
5. Users can also use the file sharing feature available in the website to share their files
with others in similar way to sites such (rapidshare.com).
So, the goal of the proposed system is providing secure data transfers, 24-H/7-D working
available backup service hosted on the cloud conditional on Amazon S3, easy user interface.
2. Related work
By studying available cloud storage services on the market we can get these outcome:
Box.net: [14] has been around for quite a while, Thanks to its integration with numerous
online services, including Gmail, Zoho, picnick, and Scribd, box.net can not only store all your
documents, but can also function as the hub of your virtual office. [3].One other nice feature of
box.net is that you can share your files and folders with ‘collaborators,’ which makes it a good
service to exchange files within a small business or among friends. You can see Box.net
feature as illustrated in table 1.
Table 1: Box.net.
Advantages Disadvantages • Easy to use and integrated
with many other services. • Provides suitable packages for
various types of users. • Collaborators can use and edit
the same folders.
• Only online not suitable for hugeand complicated backups.
• Not oriented for backups so nosuitable interface for rapidbackups (must be done manually).
Dropbox.com: [15] is a files backup system which provides the user with a 2GB of free
storage. The upside of this service is that its software has a very small footprint and available
for Windows, Linux, and Mac.
Page 478

Secure Backup System hosted on a Storage Cloud ICI 10 - 10TH INTERNATIONAL CONFERENCE ON INFORMATION
5
Table 2: Dropbox.net. Advantages Disadvantages
• Free 2GB of storage suitable for users.
• Have two interfaces (Desktop application and web interface).
• Works with windows, Mac and Linux.
• Integrates with the system desktop.
• Desktop application mustdownload all the files in the sharedfolder when started.
• Not oriented for backups so nosuitable interface for rapidbackups (must be done manually).
Elephant Drive: [16] is a cloud backup system used to only backup systems using a java
desktop system.
Table 3: Elephant Drive. Advantages Disadvantages
• Automatic backup interface which brings all important files together the upload.
• Easy to use. • Works on Windows, Mac and
Linux.
• Heavy when loading, andconsumes system resources.
• Service is not available most oftime.
• System has a lot of bugs.
Mozy.com: [14] Founded in 2005, Mozy is an online backup service for consumers and small
businesses with more than 1 million customers and 50,000 business customers backing up 25+
petabytes of information to multiple data centers around the globe.
Table 4: Mozy service. Advantages Disadvantages
• Easy and efficient backup system.
• 2GB of free space for free user. • Automatic backup system with
automated scheduled backups • Secure data transfer and
encryption. • 1-RClick folder restore services
• Does not support Linux • Doesn’t use cloud services as they
use their data centers.
3. Methodology
First steps were research and analysis where we collected data about backup and storage
techniques, we organized these data as comparisons and technical reports in which we wrote
what we collected about competitors and about new technologies ex: cloud computing.
After that we started the analysis phase in which we analyzed the system and classified it’s
parts , draw the flow diagrams and determined the best algorithms to be applied for building an
efficient backup system based on cloud storage. These studies led us to a simple design of the
Page 479
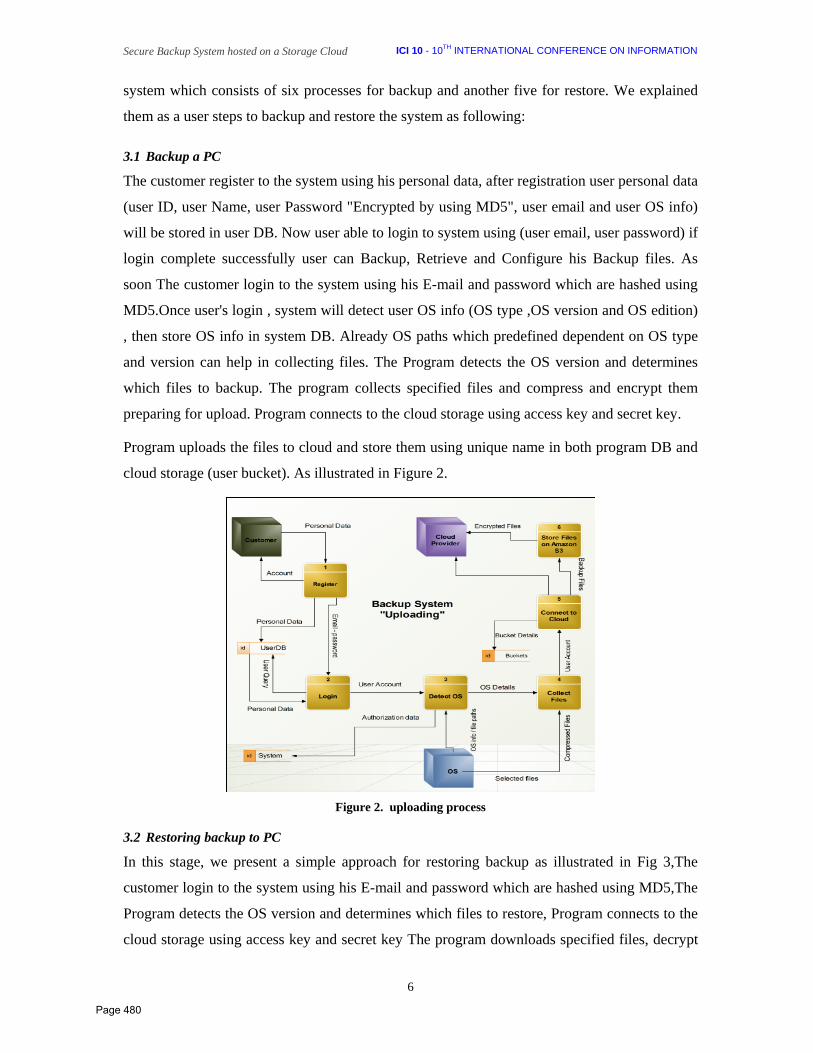
Secure Backup System hosted on a Storage Cloud ICI 10 - 10TH INTERNATIONAL CONFERENCE ON INFORMATION
6
system which consists of six processes for backup and another five for restore. We explained
them as a user steps to backup and restore the system as following:
3.1 Backup a PC
The customer register to the system using his personal data, after registration user personal data
(user ID, user Name, user Password "Encrypted by using MD5", user email and user OS info)
will be stored in user DB. Now user able to login to system using (user email, user password) if
login complete successfully user can Backup, Retrieve and Configure his Backup files. As
soon The customer login to the system using his E-mail and password which are hashed using
MD5.Once user's login , system will detect user OS info (OS type ,OS version and OS edition)
, then store OS info in system DB. Already OS paths which predefined dependent on OS type
and version can help in collecting files. The Program detects the OS version and determines
which files to backup. The program collects specified files and compress and encrypt them
preparing for upload. Program connects to the cloud storage using access key and secret key.
Program uploads the files to cloud and store them using unique name in both program DB and
cloud storage (user bucket). As illustrated in Figure 2.
Figure 2. uploading process
3.2 Restoring backup to PC
In this stage, we present a simple approach for restoring backup as illustrated in Fig 3,The
customer login to the system using his E-mail and password which are hashed using MD5,The
Program detects the OS version and determines which files to restore, Program connects to the
cloud storage using access key and secret key The program downloads specified files, decrypt
Page 480

Secure Backup System hosted on a Storage Cloud ICI 10 - 10TH INTERNATIONAL CONFERENCE ON INFORMATION
7
and decompress them preparing for restore, Program restores the files to their original locations
and indicates user that operation had been finished. Our method has been implemented using
java Technology More processing steps are still required as a future work will be illustrated
later in figures 4,5,6,and 7.
Figure 3. Download Process
Then we started the implementation phase by building system components using Java and built
a database on MySQL Server that will host all users’ data. In implementation phase we focused
on security and portability so system were designed to be very secure by applying very strong
Encryption techniques such as AES-256 so files are kept safe while transferring and while
storing on cloud datacenters, taking about portability the system is built in Java which is
portable and can be used on most known operating systems. After that we started the testing
the system against failures and security holes.
4. Experimental Results
As we focused the Backup System process on two main tasks. The first is to get the best
method to store backups as illustrated in figure 2. The second task is to perform the restoring
operation as illustrated in figure 3. After the research and implementation of our methodology
we got the following results.
• System is able to backup any PC and store the backup on the storage cloud.
• System transfers files encrypted using Advanced Encryption Techniques.
Page 481
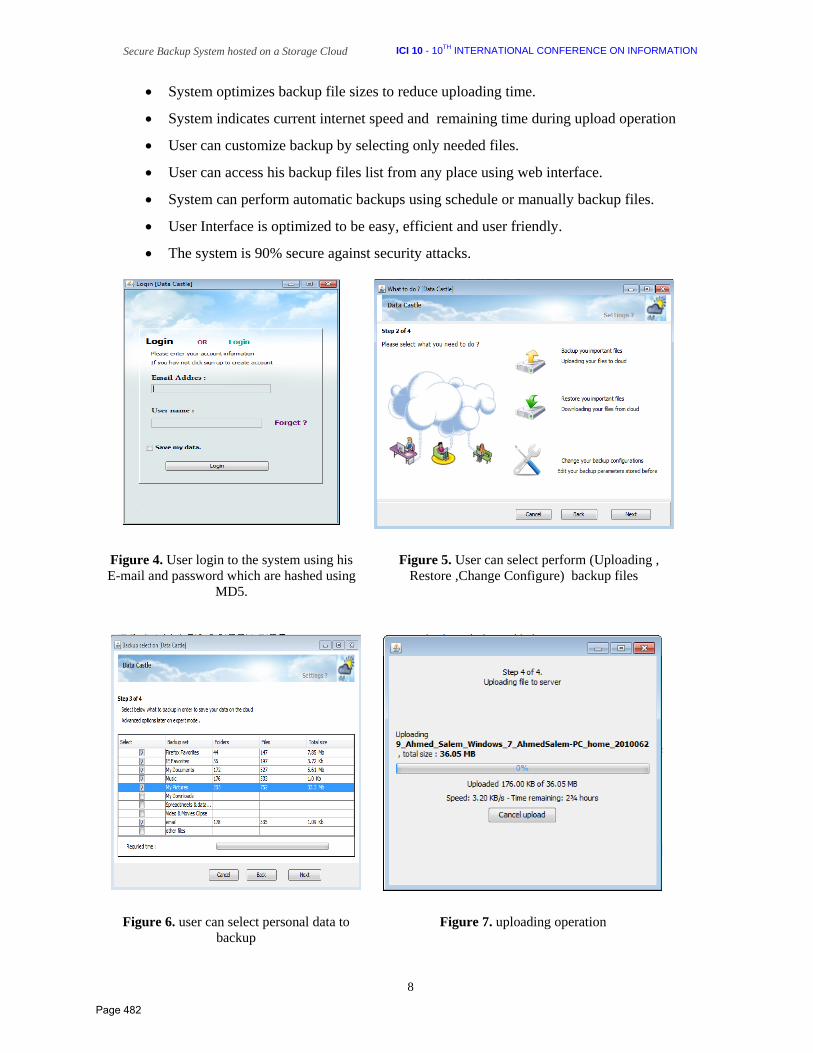
Secure Backup System hosted on a Storage Cloud ICI 10 - 10TH INTERNATIONAL CONFERENCE ON INFORMATION
8
• System optimizes backup file sizes to reduce uploading time.
• System indicates current internet speed and remaining time during upload operation
• User can customize backup by selecting only needed files.
• User can access his backup files list from any place using web interface.
• System can perform automatic backups using schedule or manually backup files.
• User Interface is optimized to be easy, efficient and user friendly.
• The system is 90% secure against security attacks.
Figure 4. User login to the system using his E-mail and password which are hashed using
MD5.
Figure 5. User can select perform (Uploading , Restore ,Change Configure) backup files
Figure 6. user can select personal data to backup
Figure 7. uploading operation
Page 482

Secure Backup System hosted on a Storage Cloud ICI 10 - 10TH INTERNATIONAL CONFERENCE ON INFORMATION
9
5. Conclusion
In this project we accomplished the most complex tasks, starting from, detecting OS and
collecting most important files to encrypting files with advanced encryption techniques (AES)
[2-3], then compressing these files and Upload Backup files to Cloud Storage [4], then to
retrieve, decrypt and reallocate these files on specific paths which are predefined by the
Operating System. More tasks are still required as a future work; we will port the previous
application to mobile phones which will provide mobile users the ability to use cloud storage.
Then a web Application will be developed to enable users to access the system from anywhere
using web browsers, this can help in case of retrieving an important files while systems are
totally down.
References
[1] M.G. Jaatun, zhao, and C.Rong , “Cloud computing”, LNCS 5931, pp. 626-631, Springer-Verlag
Berlin Heidelberg, 2009
[2] Ling Qian, Zhiguo Luo, Yujian Du, and Leitao Guo, “Cloud computing: An overview”, 2009
[3] G. Boss, P. Malladi, D. Quan, L. Legregni “Cloud Computing”, HiPODS, www.ibm.com/
developerworks/ websphere/zones/hipods/, October 2007
[4] Cloud Computing from Wikipedia, encyclopedia, http://en.wikipedia.org/wiki/Cloudcomputing
[5] J. Daemen, V. Rijmen, "The Design of Rijndael: AES - The Advanced Encryption Standard"
Springer. ISBN 3-540-42580-2, 2002.
[6] ChristofPaar, Jan Pelzl, "The Advanced Encryption Standard", Chapter 4 of "Understanding
Cryptography, Textbook for Students and Practitioners". Springer, 2009.
[7] Cloud Storage Strategy, http://cloudstoragestrategy.com/2009/03/defining-cloud-storage.html
[8] Storage Explained: Cloud storage defined By Carol Sliwa, Features Writer
[9] http://searchstorage.techtarget.com/news/article/0, 289142,sid5_gci1347466,00.html,10 Feb 2009,
[10] "Amazon S3 Developer Guide", http://docs.amazonwebservices.com/ AmazonS3/ 2006 -03-01/.
[11] "RightScale Ruby library to access Amazon CloudFront, EC2, S3, SQS, and SDB", 2007-10-27.
http://developer.amazonwebservices.com/connect/entry.jspa?externalID=1014.
[12] Hruska, Joel. "Online backup solutions: a review". Ars Technica.
http://arstechnica.com/reviews/other/online-backup-solutions-a-review.ars. Retrieved 2008-03-03.
[13] Cloud Computing Statistics Published by Frank, http://computinginthecloud.wordpress.com/
2008/09/21/some-interesting-cloud-computing-statistics/
[14] "Box.net lets you store, share, work in the computing cloud" Silicon Valley / San Jose Business
Journal, 2009-12-04. Retrieved on 2010-02-01
Page 483

Secure Backup System hosted on a Storage Cloud ICI 10 - 10TH INTERNATIONAL CONFERENCE ON INFORMATION
10
[15] Purdy, Kevin (2008-10-17). "Free Online Storage Feature-by-Feature Comparison Chart".
Lifehacker. http://lifehacker.com/5064688/free-online-storage-feature+by+feature-comparison-
chart. Retrieved 2010-04-26
[16] Kirkpatrick, Marshall. "Amazon releases early info on S3 storage use". TechCrunch.
http://www.techcrunch.com/2006/07/12/amazon-releases-early-info-on-s3-storage-use/
[17] Hans Dobbertin, Cryptanalysis of MD5 compress. Announcement on Internet, May 1996
http://eprint.iacr.org/2004/264
Page 484
Web Usage Mining Techniques for Web User Profiling
W.F. Abdelwahed1*, H.M.AbdelKader2*, W.M.Ead3
1 Faculty of Computers and Information Menoufia University,
Shebin El-Kom, Egypt // [email protected]//[email protected] 2 High Institute for Computer science And Information 6 oct university, Egypt
Abstract Web usage mining has become a popular research area, as a huge amount of data is available online. These data can be used for several purposes, such as web personalization, web structure enhancement, web navigation prediction etc. However, the raw data in log files are not directly usable; they have to be preprocessed in order to transform them into a suitable format for different data mining tasks. One of the key issues in the preprocessing phase is to identify web users. Thus, several data management solutions such as clustering have been proposed web users based on their navigation pattern. In this paper we examine and compare two type of clustering techniques: namely, k-mean algorithm and two-step algorithm. Also become necessary to predict the needs of users are very important especially for those who provide Internet connectivity services to custom their server for each category of web users according to navigation patterns. Association rule algorithms have also proposed for that purpose. In contradiction to clustering techniques, association rule algorithms is very useful especially in online mining since clustering techniques used in offline mining.
Key-Words: - Web mining, Prediction, Clustering, Log file, Personalization.
1. Introduction
The last years have been characterized by an exponential growth both of the number of online available
Web applications and of the number of their users. This growth has generated huge quantities of data
related to user interactions with the Web sites, stored by the servers in user access log files. Analyzing user
interactions with the Web sites can enhance web site design content, navigational plan and in a good
manner as an interactive way for such users. All these are the aspects of web mining.
As mentioned above web mining can be categorized as:
• Web Content Mining: which focuses on the information available in the web pages;
Page 485
• Web Structure Mining: which searches the information resources in the structure of web sites;
• Web Usage Mining: which deals with the knowledge extraction from server log files in order to
derive useful patterns of user access which we are interest in.
Web usage mining is a heavily researched area in the field of data mining. The expansion of the World
Wide Web (Web for short) has resulted in a large amount of data that are collected on the servers of the
web sites. From these data various types of information can be derived, such as information about
frequently visited pages or page sets, user navigational patterns, behavior of different user groups etc. For
this reason data mining techniques are adapted to the data originated from the internet as well, and new
difficulties are raised that have to be solved in an efficient way. The information obtained form web log
data can be used for various purposes. For example information about association rules obtained from web
log data , Renáta Iváncsy and Sándor Juhász [1], can help detecting pages which are visited together even if
they are not directly connected, thus revealing associations between groups of users sharing a specific
interest , Eirinaki .M and Vazirgiannis .M [2]. This information can be used when restructuring Web sites
by adding links between those pages that are visited together. Another web mining technique is web user
clustering to identifying the categories of them purpose of discovering user profiles.
Data that are needed for web usage mining which are collected from www in a log file which is
discussed in next section.
The rest of paper is arranged as follows: Sections 2 describes the log file. Section 3, related previous
work. Section 4 discusses web mining process. Section 5, discusses clustering algorithms. Section 6,
discusses association rule algorithms. Section 7 discusses navigation pattern mining. Sections 8, discusses
the experimental results followed by conclusion and future works.
2. Related work
Several Web usage Mining projects have been proposed for mining user navigation behavior. In
the following we review some of the most significant navigation pattern mining systems and
algorithms in web usage mining area that.
Cadez et al. [3] in the Web CANVAS tool proposed a partitioning clustering method, which
visualizes user navigation paths in each cluster.
Jalali et al. [4],[5] proposed a recommender system for navigation pattern mining through Web
usage mining to predict user future movements. The approach is based on the graph partitioning
clustering algorithm to model user navigation patterns for the navigation patterns mining phase.
Page 486

Others proposed clustering techniques which is based on knowing the clustering number but in
most cases we don't know this number, this what we implemented in the two-step algorithm, also
as the same correlation between navigated pages which help in the improvement of the
navigational plan which lead to the adaptive web sites.
3. Experimental data
We have used in this work the log file which automatically created by the server which stores all
events that is being done by the user on WWW. These events may be his/her usage to the web,
errors generated by server to user actions, and cookies ...etc.
We are particularly interested in user navigations to web sites. Moreover when users visit a
Web site, the Web server stores the information about their accesses in a log file. Each record of a
log file represents a page request executed from a Web user. In particular, it typically contains the
following information : user’s IP address, date and time of the access, URL of the requested page,
request protocol, a code indicating the status of the request, size of the page (if the request is
successful) for example table1:
Table 1: sample of records in a log file
190.144.44.36 - 2009-08-26:00:06:34 "GET
/logs///administrator/components/com_virtuemart/export.php?mosConfig_absolute_path=http://filtry.in.ua//
components/com_virtuemart/id1.txt? HTTP/1.1" 404 255
"1.109.250.29",,,2009-08-26 10:22:06,"GET
/show_news.php?cutepath=http://filtry.in.ua//components/com_virtuemart/id1.txt?
HTTP/1.1",404,211,,"Mozilla/5.0"
"1.109.250.29",,,2009-08-26 10:22:06,"GET
/logs/show_news.php?cutepath=http://filtry.in.ua//components/com_virtuemart/id1.txt?
HTTP/1.1",404,216,,"Mozilla/5.0"
"4.163.51.76",,,2009-08-26 10:22:07,"GET /images/cat_collapse.gif HTTP/1.1",200,76," http://filtry.in.ua
/CGI-BIN/LANSAWEB?WEBEVENT+L0170944C6656F6002C7502K+M37+ENG","Mozilla/4.0
(compatible; MSIE 7.0; Windows NT 5.1; FBSMTWB; GTB6; .NET CLR 1.0.3705; .NET CLR 1.1.4322;
.NET CLR 2.0.50727; .NET CLR 3.0.4506.2152; .NET CLR 3.5.30729)"
"10.98.146.166",,,2009-08-26 10:22:09,"GET
/components/com_colorlab/admin.color.php?mosConfig_live_site= http://filtry.in.ua /skin/id1.txt??
HTTP/1.1",404,237,,"Mozilla/5.0"
Page 487

Table 2: interpreting a record in a log file
Attribute value IP 190.144.44.36
Date and time 2009-08-26:00:06:34 URL(referrer) http://filtry.in.ua
Requested page /logs///administrator/components/com_virtuemart/export.php?mosConfig //components/com_virtuemart/id1.txt?
Request protocol GET Status code 404 Size of page 255
Table 2: interpreting a record in our log file, moreover to that there are many code indicates status
for user requests as in table 3:
Table 3: status code description Status Code Description
200 Ok 302 Found 304 Not modified 404 Not found
There are many log file formats such as: NCSA Common Log File Format., NCSA Extended Log File Format
and W3SVC IIS Log File Format.
The black box of user access to www cannot be used in any decision making or even prediction of
user needs which are the aim of web mining.
4. Web mining process
Web usage mining is the task of discovering the activities of the users while they are browsing and
navigating through the Web. The aim of understanding the navigation preferences of the visitors is
to enhance the quality of electronic commerce services (e commerce), to personalize the Web
portals or to improve the Web structure and Web server performance. Being essentially a web
mining process it consists of the basic stages as in Pabarskaite .Z and Raudys .A [6]
• Data Collection. During this stage, data are collected either from Web servers or from
clients that visit a Web site.
• Data Preprocessing. In this stage, primarily data cleaning, user identification and user
session identification take place.
Page 488
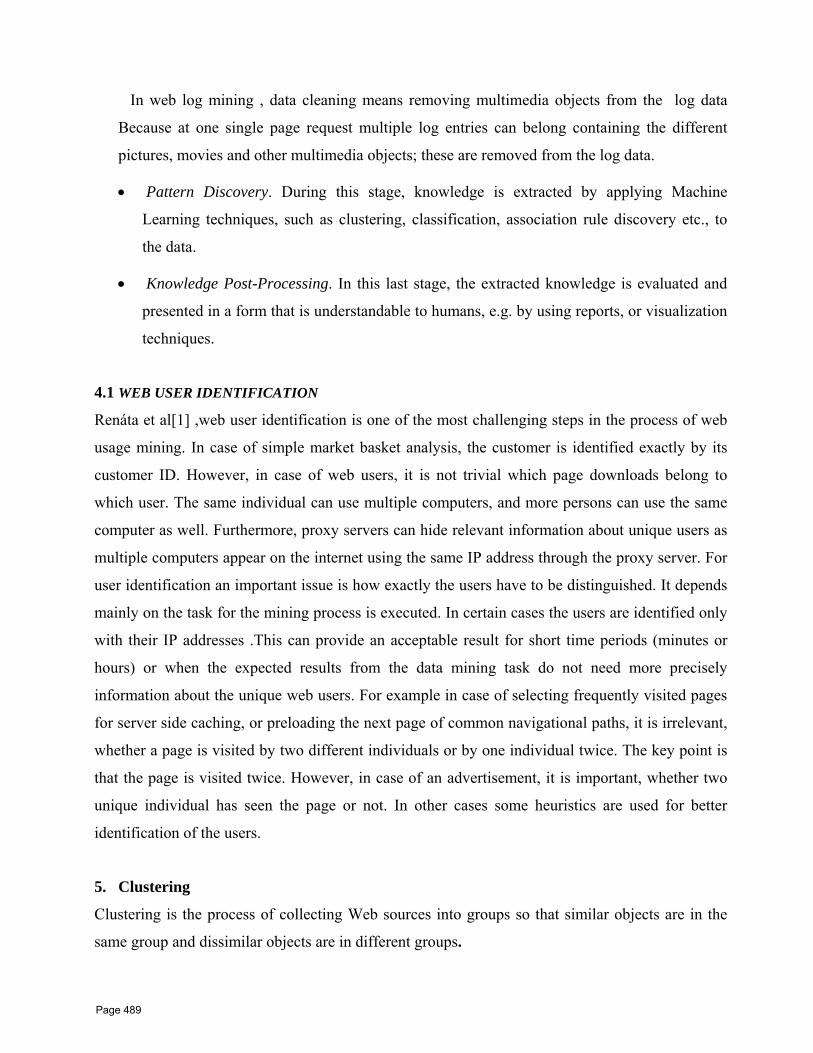
In web log mining , data cleaning means removing multimedia objects from the log data
Because at one single page request multiple log entries can belong containing the different
pictures, movies and other multimedia objects; these are removed from the log data.
• Pattern Discovery. During this stage, knowledge is extracted by applying Machine
Learning techniques, such as clustering, classification, association rule discovery etc., to
the data.
• Knowledge Post-Processing. In this last stage, the extracted knowledge is evaluated and
presented in a form that is understandable to humans, e.g. by using reports, or visualization
techniques.
4.1 WEB USER IDENTIFICATION
Renáta et al[1] ,web user identification is one of the most challenging steps in the process of web
usage mining. In case of simple market basket analysis, the customer is identified exactly by its
customer ID. However, in case of web users, it is not trivial which page downloads belong to
which user. The same individual can use multiple computers, and more persons can use the same
computer as well. Furthermore, proxy servers can hide relevant information about unique users as
multiple computers appear on the internet using the same IP address through the proxy server. For
user identification an important issue is how exactly the users have to be distinguished. It depends
mainly on the task for the mining process is executed. In certain cases the users are identified only
with their IP addresses .This can provide an acceptable result for short time periods (minutes or
hours) or when the expected results from the data mining task do not need more precisely
information about the unique web users. For example in case of selecting frequently visited pages
for server side caching, or preloading the next page of common navigational paths, it is irrelevant,
whether a page is visited by two different individuals or by one individual twice. The key point is
that the page is visited twice. However, in case of an advertisement, it is important, whether two
unique individual has seen the page or not. In other cases some heuristics are used for better
identification of the users.
5. Clustering
Clustering is the process of collecting Web sources into groups so that similar objects are in the
same group and dissimilar objects are in different groups.
Page 489
Clustering on the Web can be one of the following types, Vakali, Pallis and Angelis [7]:
1. Web User Clustering: The establishment of groups of users exhibiting similar browsing
patterns. (By decreasing the lengths in Web navigation pathways).
2. Web Document Clustering: The grouping of documents with related content.
Moreover, clustering has some benefits as listed in Baldi .P, Frasconi .P, and Smyth .P [8]:
• The improvement of the Web searching process: Clustering Web content allows efficient
query processing over the large amount of documents stored on Web servers.
• The interaction with information retrieval systems: Query clustering helps in discovering
frequently asked questions or the most popular topics on a search engine.
• The construction and maintenance of more intelligent Web servers: Intelligent servers that
are able to dynamically adapt their designs to satisfy future user needs, providing clues
about improvements in site design, might be useful, our target in this paper.
• The improvement of caching and perfecting schemes: This will help to deliver the
appropriate content (products) to the interested users in a timely, scalable, and cost-
effective manner, one benefits of our work.
• The adaptation of e-commerce sites to customers’ needs: Understanding Web users’
navigation behavior through e-commerce Web sites can provide valuable insights into
customer behavior, and can help end users, for example, by recommending new products to
Web site visitors based on their browsing behavior.
5.1 K-means clustering
The K-means clustering, or Hard C-means clustering, is an algorithm based on finding data
clusters in a data set such that a cost function (or an objection function) of dissimilarity (or
distance) measure is minimized, Bezdek .J. C [9]. In most cases this dissimilarity measure is chosen
as the Euclidean distance
A set of n vectors xj , j =1,…, n , are to be partitioned into c groups Gi , i= 1 …. c . The cost
function, based on the Euclidean distance between a vector xk in group j and the corresponding
cluster center ci, can be defined by:
Page 490

J= =∑=
c
iiJ
1∑ ∑= ∈
⎟⎟⎠
⎞⎜⎜⎝
⎛−
c
i Gxkik
ik
cX1
2
,
(1)
Where ∑ ∈−=
ik Gkk iki cXJ,
2 is the cost function within group i. The partitioned groups are
defined by a c x n binary membership matrix U, where the element uij is 1 if the jth data point xj
belongs to group i, and 0 otherwise. Once the cluster centers i c are fixed, the minimizing uij for
Equation (1) can be derived as follows:
1 if 2
ij cX − ≤2
kj cX − , for each k ≠ i ,
uij =
0 otherwise. (2)
which means that xj belongs to group i if ci is the closest center among all centers. On the other
hand, if the membership matrix is fixed, i.e. if uij is fixed, then the optimal center ci that minimize
Equation (1) is the mean of all vectors in group i:
∑∈
=ik Gxk
ki
i XG
c,
1 (3)
Where iG is the size of Gi, or iG =∑=
n
i iju1
.
The algorithm is presented with a data set x i, i =1,...., n; it then determines the cluster centers ci and the membership matrix U iteratively using the following steps:
Step 1: Initialize the cluster center c i, i =1…..c. This is typically done by randomly selecting c
points from among all of the data points.
Step 2: Determine the membership matrix U by Equation (2).
Step 3: Compute the cost function according to Equation (1). Stop if either it is below a certain
tolerance value or its improvement over previous iteration is below a certain threshold.
Step 4: Update the cluster centers according to Equation (3). Go to step 2.
The performance of the K-means algorithm depends on the initial positions of the cluster
centers, thus it is advisable to run the algorithm several times, each with a different set of initial
cluster centers.
Page 491

5.2 Two-step clustering The two-step clustering is a scalable cluster analysis algorithm designed to handle very large data
sets. It can handle both continuous and categorical attributes. It requires only one data pass. It has
two steps, SPSS Inc [10]:
1) pre-cluster records into many small sub-clusters;
2) Cluster the sub-clusters resulting from pre-cluster step into the desired number of clusters.
It can also automatically select the number of clusters.
It uses a log-likelihood distance measure, to accommodate both symbolic and range fields. It is a
probability-based distance. The distance between two clusters is related to the decrease in log-
likelihood as they are combined into one cluster. In calculating log-likelihood, normal distributions
for range fields and multinomial distributions for symbolic fields are assumed. It is also assumes
that the fields are independent of each other, and so are the records. The distance between clusters
i and j is defined as:
( )jijijid ,),( ξξξ −+= (4)
where
⎟⎟⎠
⎞⎜⎜⎝
⎛Ε++−= ∑∑
==
BA K
kvkvkk
K
Kvv N
1
22
1)log(
21 σσξ (5)
and
∑=
−=ΕkL
i v
vki
v
vkivk N
NNN
1log (6)
where
KA is the number of range type input fields,
KB is the number of symbolic type input fields,
Lk is the number of categories for the kth symbolic field,
Nv is the number of records in cluster v, Nvki is the number of records in cluster v which belongs to the lth category of the kth symbolic field, is the estimated variance of the kth continuous variable for all records, 2
kσ
Page 492

is the estimated variance of the kth continuous variable for records in the vth cluster, and 2
vkσ
< i, j > is an index representing the cluster formed by combining clusters i and j.
In contrast, a k-means algorithm would need to run multiple times (one for each specified
number of clusters) in order to generate the sequence. But to determine the number of clusters
automatically, Two-Step uses a two-stage procedure that works well with the hierarchical
clustering method.
6. Association Rules As mentioned above, Adaptation of any e-commerce site to customer needs requires understanding
web user's navigation behavior through e-commerce web sites can provide valuable insights into
customer behavior, and can help end users. For example, by recommending new products to Web
site visitors based on their browsing behavior, also finding correlation of user navigation can
improve the site navigation plan, all of previously mentioned are the goals of the association rules
mining technique.
6.1 CARMA Algorithm
The continuous association rule mining algorithm (Carma) is an alternative to Apriori that
reduces I/O costs, time, and space requirements, Hidber .C [11]. It uses only two data passes and
delivers results for much lower support levels than Apriori. In addition, it allows changes in the
support level during execution. Carma deals with items and itemsets that make up transactions.
Items are flag-type conditions that indicate the presence or absence of a particular thing in a
specific transaction. An itemset is a group of items which may or may not tend to co-occur within
transactions.
Carma proceeds in two stages. First it identifies frequent itemsets in the data, and then it
generates rules from the lattice of frequent itemsets, more in Hidber .C [11].
7. Navigation Patterns Mining
Mining of navigation patterns is the main task and objective of this work. A user navigation
pattern is common browsing characteristics among a group of users. Since many users may have
common interests up to a point during their navigation, navigation patterns should capture the
overlapping interests or the information needs of these users. In addition, navigation patterns
Page 493

should also be capable to distinguish among web pages based on their different significance to
each pattern.
In the WUM systems, the large majority of methods that have been used for navigation
pattern mining from Web data are clustering methods. Clustering aims to divide a data set into
groups that are very different from each other and whose members are very similar to each other.
Data gathered in the log file cannot be used in direct way so it must be preprocessed to be
in an appropriate format suitable for mining tasks as mentioned in section 4.
Table 4: show the content of log file used
Number of records Number of users Number of sessions 21412 730 2465
In this study, data converting to this data set are done as showing in tables 5 to table 7
applying mining algorithms.
There are around 184 URLs in this dataset. Assigning each URL address in the session to
sequential numeric values is the first step.
Table 5: URLs address assign to numeric value Index URLs Address
0 /administrator/components/com_jjgallery/admin_jjgallery_p1 /catalog/ 2 /components/ 3 /images/items/
…. ….
Table 6: URLs assigning for clustering Session URLs Number appear in the sessions
1 2 3 4
….
0 0 0 0 ..
4 0 0 1
….
8 0 2 2 ..
0 0 0 5 ..
58 0 32 53 …
0 0 0 1
…..
…. …. …. …. ….
Page 494
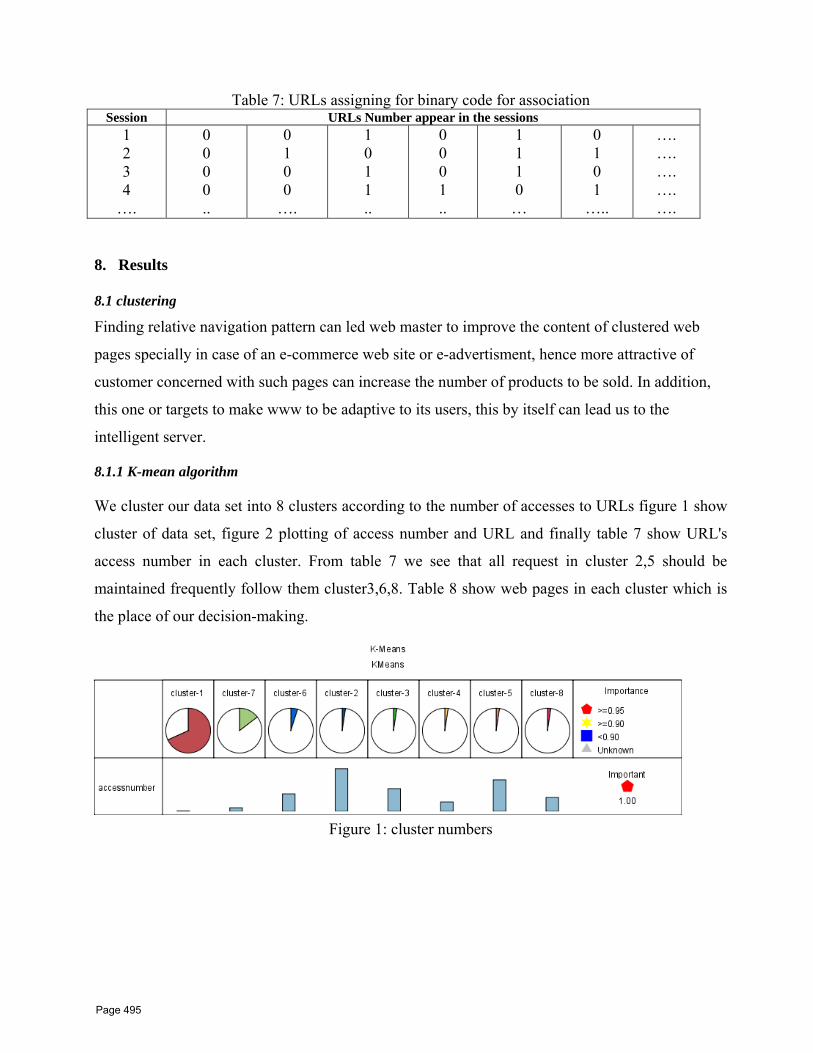
Table 7: URLs assigning for binary code for association
Session URLs Number appear in the sessions1 2 3 4
….
0 0 0 0 ..
0 1 0 0
….
1 0 1 1 ..
0 0 0 1 ..
1 1 1 0 …
0 1 0 1
…..
…. …. …. …. ….
8. Results 8.1 clustering
Finding relative navigation pattern can led web master to improve the content of clustered web
pages specially in case of an e-commerce web site or e-advertisment, hence more attractive of
customer concerned with such pages can increase the number of products to be sold. In addition,
this one or targets to make www to be adaptive to its users, this by itself can lead us to the
intelligent server.
8.1.1 K-mean algorithm We cluster our data set into 8 clusters according to the number of accesses to URLs figure 1 show
cluster of data set, figure 2 plotting of access number and URL and finally table 7 show URL's
access number in each cluster. From table 7 we see that all request in cluster 2,5 should be
maintained frequently follow them cluster3,6,8. Table 8 show web pages in each cluster which is
the place of our decision-making.
Figure 1: cluster numbers
Page 495
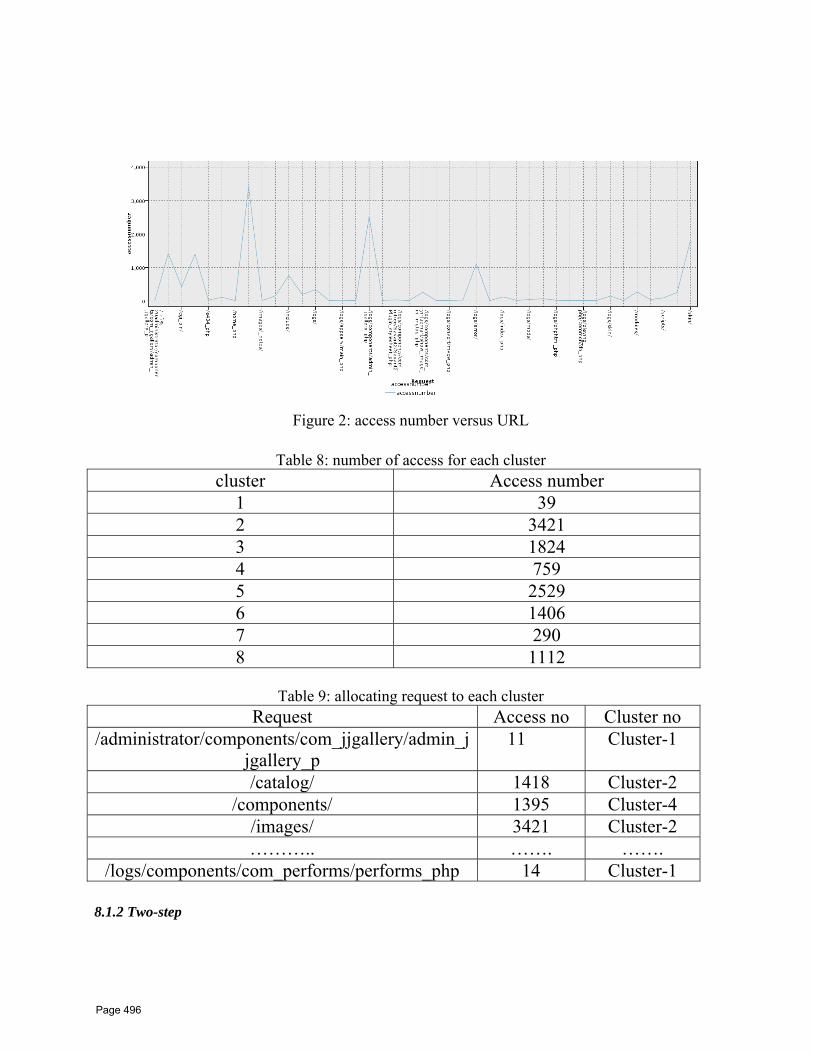
Figure 2: access number versus URL
Table 8: number of access for eaccluster Access mber
h cluster
nu1 39 2 3421 3 1824 4 759 5 2529 6 1406 7 290 8 1112
: allocating request to eac
ATable 9 h cluster
Request ccess no Cluster no /administrator/comp _jjgallery/admin_j
jgallery_p 11 Cluster-1 onents/com
/catalog/ 1418 Cluster-2 /co / 1395 mponents Cluster-4
/images/ 3421 Cluster-2 ……….. … . … …….
/logs/components/com_performs/performs_php 14 Cluster-1 8.1.2 Two-step
Page 496

the domain expertise since we don't know the desired number of
clusters. We start with in
deviation of two techniques. Table 10: devia n two step and k-mean
As mentioned above, It has two steps 1) pre-cluster records into many small sub-clusters. 2)
cluster the sub-clusters resulting from pre-cluster step into the desired number of clusters. Defining
number of cluster depends on
itial cluster number and auto cluster to that in k-mean. Table 9; show the
t eion betweStandard deviation Cluster no K-m an T e wo-step
Cluster -1 43.312 2.167 Cluster -2 0 0 Cluster -3 0 7.411 Cluster -4 170 1.708 Cluster -5 0 43.908 Cluster -6 0 79.726 Cluster -7 0 80.323 Cluster -8 79.726 30.901
Two-step cluster, since hierarchical and k-means clustering do not scale efficiently in large data
umber of
an lead to increase the income of the e-commerce, also may make apart of
ome programming facilities on
d
h content to each to each related navigational pattern.
he following figure showing the correlated pages which help us in finding association rules by
CARMA.
sets.
8.2 association rule
As user research on web site he/she wants to reach to it target in more quickly time. Finding
correlation between user navigation paths can improve the navigations plan of requests of www.
In addition, this become powerful way in case we want user to see as possible as large n
available product this c
an advertisment and the rest in the correlated page this can give more view about more
advertisment to users.
Finally, after implementing this mining on the server site this can help us to make our server to be
intelligent to predict future customer needs, we also can provide s
server to help in the adaptation of the web site by the improving the navigational plan, design, an
even thoug
T
Page 497

Figure 3: correlated requests
There are three types of strong, medium, and weak linkage between pages as in the
following tables from figure 4 to figure 6.
Figure 4: strong links between requests
Page 498

Figure 5: medium links between requests
Figure 6: weak links between requests
In our experiment we start support and confidence in low percent and increase until
sa tion occur this may depend on domain expertise.
Figure 7; show the correlated request with support and confidence
confidence. This table can lead us to display more ads in the strong
tisfac
degree sorted by
correlated pages, also may be
useful in improving web catalogs f
Figure 7: correlated requests
or e-commerce sites.
Page 499
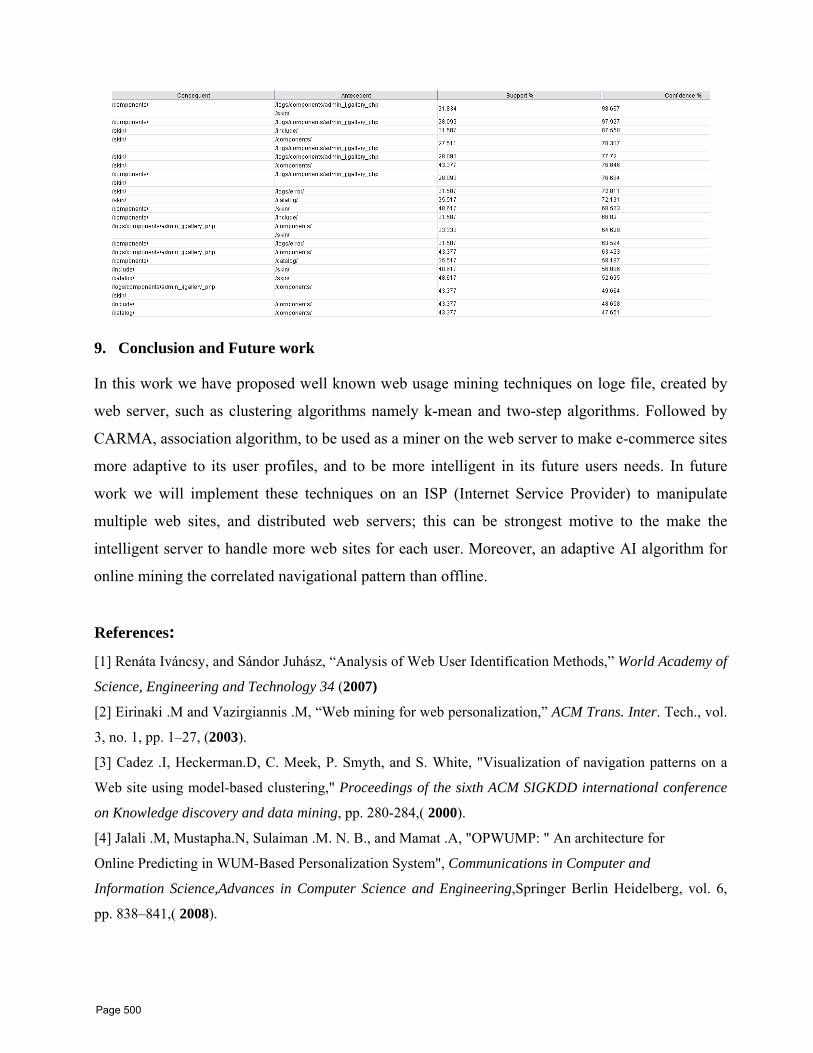
9. Conclusion and Future work
e have proposed well known web usage mining techniques on loge file, created by
a miner on the web server to make e-commerce sites
t these techniques on an ISP (Internet Service Provider) to manipulate
oreover, an adaptive AI algorithm for
d Sándor Juhász, “Analysis of Web User Identification Methods,” World Academy of
ational conference
ng,Springer Berlin Heidelberg, vol. 6,
In this work w
web server, such as clustering algorithms namely k-mean and two-step algorithms. Followed by
CARMA, association algorithm, to be used as
more adaptive to its user profiles, and to be more intelligent in its future users needs. In future
work we will implemen
multiple web sites, and distributed web servers; this can be strongest motive to the make the
intelligent server to handle more web sites for each user. M
online mining the correlated navigational pattern than offline.
References: [1] Renáta Iváncsy, an
Science, Engineering and Technology 34 (2007)
[2] Eirinaki .M and Vazirgiannis .M, “Web mining for web personalization,” ACM Trans. Inter. Tech., vol.
3, no. 1, pp. 1–27, (2003).
[3] Cadez .I, Heckerman.D, C. Meek, P. Smyth, and S. White, "Visualization of navigation patterns on a
Web site using model-based clustering," Proceedings of the sixth ACM SIGKDD intern
on Knowledge discovery and data mining, pp. 280-284,( 2000).
[4] Jalali .M, Mustapha.N, Sulaiman .M. N. B., and Mamat .A, "OPWUMP: " An architecture for
Online Predicting in WUM-Based Personalization System", Communications in Computer and
Information Science,Advances in Computer Science and Engineeri
pp. 838–841,( 2008).
Page 500

Web Usage Mining Techniques for Web User Profiling ICI 10 - 10TH INTERNATIONAL CONFERENCE ON INFORMATION
[5] Jalali .M, Mustapha .N, Sulaiman N. B, and Mamat A, "A Web Usage Mining Approach Based on LCS
Algorithm in Online Predicting Recommendation Systems," in 12th International on Information
Visualisation,IV'08, London, UK, pp. 302-307,( 2008).
[6] Pabarskaite .Z and Raudys .A, "A process of knowledge discovery from web log data: Systematization
and critical review", Journal of Intelligent Information Systems, Vol. 28. No. 1. (2007).
[7] Vakali, Pallis and Angelis, "Clustering Web Information Sources", Idea Group Inc,( 2007)
[8] Baldi .P, Frasconi .P and Smyth .P, "Modeling the Internet and the Web". New York:Wiley, (2003).
[9] Bezdek .J. C, "Pattern Recognition with Fuzzy Objective Function Algorithms". Plenum Press,( 1981).
[10] SPSS Inc. "SPSS Two-Step Cluster", Technical report ( 2005).
[11] Hidber .C, "Online Association Rule Mining". In: Proceedings of the ACM SIGMOD International
Conference on Management of Data, New York: ACM Press, 145–156,(1999).
Page 501
ICI 10 - 10TH INTERNATIONAL CONFERENCE ON INFORMATION AT DELTA UNIVERSITY FOR SCIENCE AND TECHNOLOGY
GAMASA, EGYPT, 4 – 6 DECEMBER 2010
1
e-learning in Tunisia
Ettarres Yamna 1*
1 Larodec Laboratory, University of Tunis, ISCAE/HIABA, University of Manouba, Tunis, Tunisia,
[email protected], [email protected]
Abstract
In this work, we are going to present the situation of e-learning in Tunisia and the role of the Virtual University of Tunis 1 (VUT). The VUT provides Tunisian universities with equipments, online platforms, training of trainers and teachers, technical and pedagogical support. Different experiences and national projects to support e-learning are presented. We note that, an e-learning project has numerous dimensions and there are always multiple difficulties to implement these projects. At the end of the paper, we suggest some recommendations to improve and to develop e-learning in Tunisia. These recommendations will be valid for any e-learning project on the basis of the Tunisian experience.
Keywords: e-learning; e-learning project; Virtual University of Tunis.
1. Introduction
e-learning represents an effective approach to improve knowledge, skills and qualifications. It
helps promote employability, reduce shortage of Information and Communication
Technologies (ICT) skills and improve social inclusion [1]. According to The European
Commission, the e-learning is defined as "the use of new multimedia technologies and the
Internet to improve the quality of learning by facilitating access to resources and services as
well as remote exchanges and collaboration" [1].
In a globalization and continuous competition, with a main aim to provide quality learning,
development of skills is in the core of strategic concerns of each country, university or college.
However, as mentioned by the European Commission, "effectiveness of education systems
depends entirely on the effectiveness of the approaches to teaching and learning. In order to be
effective, the introduction of ICT will have to be accompanied by a far-reaching reorganization
of learning structures" [1]. For this reason, it is important to adapt curricula and strategies with
the aim of integrating new learning methods based on ICT.
1 http://www.uvt.rnu.tn/
Page 502
e-learning in Tunisia ICI 10 - 10TH
INTERNATIONAL CONFERENCE ON INFORMATION
2
However, implementation of any e-learning project should take a strategic dimension [2],
requiring investment in infrastructures, logistics, contents, services and training of trainers and
teachers. Deployment of an e-learning project is difficult and requires a realistic and a well-
founded conception, for operative means and strategies to be implemented.
In Tunisia, the Virtual University of Tunis (VUT) was created. It plays an important role in the
development of e-learning. The VUT provides the necessary support for Tunisian universities
and colleges in the use of technologies and online pedagogic resources. In fact, access centers
to Internet, positioning and e-learning Moodle platforms are provided. The VUT’s aim is to
reinforce the production of innovating and quality pedagogic contents and services while
making them available to a wide range of teachers and students.
In this work, we start by presenting the e-learning projects and the difficulties related to their
implementation. Afterwards, the situation of e-learning in Tunisia and the role of the VUT,
some experiences, accomplishments and recommendations are going to be introduced.
2. e-learning projects
2.1. Dimensions of an e-learning project
e-learning projects have numerous dimensions: pedagogical, social, cultural, technological,
economic, legal and organizational. The pedagogical dimension deals with the choice of
appropriate pedagogical methods, programs and contents. Social dimension implies the impact
on actors, for instance involvement, motivation, mobilization, availability, communication,
cooperation and collaboration at the different levels. In the cultural dimension, hostilities to
changes have to be managed. Adopted technological means and tools, e-learning platforms,
norms and standards concern the technological dimension. Estimation of costs related to
quality contents’ production and update, development and/or deployment of platforms,
infrastructure and training of trainers and teachers are to be studied in the economic dimension.
Concerning the legal dimension, legislation texts dealing with organizational approaches,
remuneration and responsibilities of each actor have to be clearly defined. In the organizational
dimension, strategies, process management, resources’ allocation and work organization must
be established in accordance with the context. It is represented by the autonomy, profile,
number and level of equipment of learners. We note that learners groups may be heterogeneous
where cultural and social differences must be taken under consideration. Context concern also
equipment and available human resources in colleges.
Page 503
e-learning in Tunisia ICI 10 - 10TH
INTERNATIONAL CONFERENCE ON INFORMATION
3
2.2. Key measures for a successful e-learning project
Implementation of e-learning projects is not an easy task and needs a deep conception and a
mature reflection. Establishment of conditions conducive to the management of change and
organization of educational systems to new training approaches are essential [3].
At first, a feasibility study, taking into account the context and different dimensions and
constraints, is to be accomplished. Goals, strategies, methods and tools have to be clearly
defined. According to Lebrun, "a device is a coherent package of resources, strategies, methods,
tools and actors interacting in a given context to achieve a goal" [Lebrun, 2006]. The quality of
online learning depends on the quality of the system in place: its relevance to the needs and
goals of internal and external actors, consistency, robustness, flexibility, etc.
In the pedagogical dimension, quality programs and contents and their relevance to learners’
needs and goals have to be developed in addition to adequate training of trainers and teachers.
Trainings include adapted sessions not only for mastering technology but also for the use of
technology in education and management of change [1]. Certification programs have to be
implemented. We note that, adopted teaching methods are dictated by the context and available
tools. Moreover, learners’ assessment must be also well studied.
In the social dimension, communication plans and effective awareness (before, during and after
the project) have to be planned. The constitution of the piloting team of the project is the next
step. Motivation, psychological and financial support to this team is also important. More than
training organized with well defined objectives, informal trainings between peers should be
encouraged in a context of collaboration and sharing of expertise. These approaches can form
well trained teams to avoid centralization of know-how by main actors. Close and active
collaboration between actors with the definition of their roles and key factors for their
motivation are important.
In the cultural dimension, actors at different levels should be conscious of the need of changes
and the interests of ICT in education through a promotion of digital literacy. The online
learning should not be considered as a "computerization" of the teaching face-to-face mode,
but enrichment and an initiative for solving problems in a face-face teaching approach. The
worth of working with aware actors and highly engaged leaderships is very noticeable.
Organization of meetings, awareness and training days are important.
In the technological dimension, study of different existing experiences and strategies [3], in
addition to establishment of cooperation with recognized e-learning organisms may help in the
choice of adequate technological means and standards. The creation of training and digital
Page 504
e-learning in Tunisia ICI 10 - 10TH
INTERNATIONAL CONFERENCE ON INFORMATION
4
production centers is a primordial operation to be carried out at each university or college. For
more details about technological aspects, see [5].
In the economic dimension, a reallocation and a coherent use of existing financial resources
may fix a lot of problems. Financial loans for the improvement of education quality may be
necessary.
In the legal dimension, new legal texts must be established in order to generalize the
application of different adopted approaches.
In the organizational dimension, rigorous, realistic and well founded design to accompany the
change is to be fulfilled in accordance with the context. For instance, introduction of real
measures to encourage teachers making effective use of technology in their courses and
providing them appropriate conditions for the development of contents and relevant e-learning
environments are necessary.
3. National strategy of Tunisia
3.1. Virtual University of Tunis VUT
In Tunisia, there are 12 universities and the General Directorate of Technological Studies
affiliated to the Ministry of Higher Education and Scientific Research. Each one of them
manages numerous colleges which can be geographically distant. With the goal to develop an
e-learning national strategy uniformly applied in different universities, the VUT was created. It
is a public institution created in January 2002 (Decree number 112-02 of January 28, 2002).
In the pedagogical dimension, more than 400 interactive multimedia digital teaching modules
with auto evaluation were developed by the VUT in collaboration with teachers in different
universities. Each one is evaluated by two experts and provided for a free access to all students
and teachers through an access from the digital working environment (http://ent.uvt.rnu.tn/).
An access to multiple partners’ resources, such as Massachusetts Institute of Technology
(MIT), is allowed. The goal of the VUT is to offer quality online training using teaching
methods pedagogically well adapted to the new technologies and to online learning. The VUT
provides convenient training for pedagogic teams such as, starting with ICT, design,
development and use of an online course, introduction to the use of Moodle platform, tutoring,
etc. Trainers are foreign and Tunisian experts.
In the social dimension, technical and pedagogic assistance is given to pedagogic teams in
order to help them mastering ICT use in education. The VUT support trainers and teachers by
Page 505
e-learning in Tunisia ICI 10 - 10TH
INTERNATIONAL CONFERENCE ON INFORMATION
5
enabling collaboration through multiple dedicated platforms. Trainers and tutors working with
the VUT are given a convenient remuneration.
In the cultural dimension, communication plans are organized. Computer Science and Internet
Certificate (C2i2) national and international seminaries, e-learning conferences, awareness,
production and working days about different e-learning issues are organized by the VUT.
In the technological dimension, online platforms are provided, hosted and managed by the
VUT. Access centers to Internet, teleconferencing centers and laboratories for digital
production are provided to some universities and colleges. Cooperation with international
universities is accomplished to exchange experiences, best practices, experts, contents, etc. An
e-learning Information System (ELIS) is developed to manage teachers training sessions.
In the legal dimension, development of e-learning is a national strategy in Tunisia. That is why;
several means are available to citizens and especially to students to obtain needed equipments
and to democratize the use of ICT. The aim is to narrow the digital divide between regions. As
a result, different legal texts are created to organize e-learning procedures.
In the organizational dimension, the VUT collaborate with other universities in order to
develop e-learning projects. Moreover, for a better collaboration and coordination with the
VUT, Departments of Virtual Education (DVE) are created in each university.
3.2. National C2i teaching strategy
Since the reform of higher education in Tunisia, licenses’ pads include a module named
Preparation to Computer Science and Internet Certificate PC2i in the license’s first year. This
module is a cross-cutting one. C2i level 1 referential contains two parts. The first part recovers
the evolution and the ethical aspects of the Internet use and the second one refers to specific
and instrumental domains of competences. PC2i is created to develop, reinforce, validate,
master ICT and help students’ skills to evolve in accordance with technological developments,
which enable them to integrate in professional life. The VUT accomplishes also the C2i
certification of C2i correspondents, pedagogic teams and students.
The VUT provides the necessary support for Tunisian universities to develop an online
teaching of PC2i. The national strategy is to develop online courses. Different approaches and
strategies are developed in Tunisia. A quality charter is developed to uniform PC2i teaching
approaches.
2 http://c2i.uvt.rnu.tn/
Page 506

e-learning in Tunisia ICI 10 - 10TH
INTERNATIONAL CONFERENCE ON INFORMATION
6
3.3. Objectives of the C2i quality charter
The first objective of the C2i quality charter is the establishment of a uniform training module
PC2i in all colleges and the second one is to provide high quality training to prepare students to
certification exams. The training will focus on learning and interaction. Quality courses spaces
being customizable and adaptable must be implemented and used in several scenarios with
context-dependent quality learning activities and assessments. Activities and Multiple Choice
Question (MCQ) banks validated by expert groups will be implemented and shared. But, the
third objective deals with the creation of an e-learning culture in Tunisia and to take
advantages of its benefits in teaching PC2i. A strategy with one-to-one and not one-size-fits-
all, generally adopted in the case of a large number of learners, will improve obviously the
learning quality. The fourth goal is a reflection on the improvement of working procedures and
their automation. This approach ensures better work organization and optimization of time
allocated to the enrolment of students. A part of data interchange between online platforms and
tools of the educational system is accomplished.
4. An e-learning project- Case of PC2i in the Higher Institute of Computer Science and
Management- Kairouan (HICSM-K)
4.1. Online teaching strategy in HICSM-K
During the academic year 2007-2008, the infrastructure of HICSM-K had been improved
considerably, allowing the teaching of PC2i in different modes: face-to-face, mixed or online
mode. The number of students is over 1000. Work’s organization had followed a hierarchical
model allowing sharing of tasks, with respect to a charter developed and adopted by the
pedagogic team. In this organization, there was the creation of licenses coordinators allowing
link between the tutors and the C2i correspondent. This team was responsible for creating
learning activities and enrichment of the online e-learning platform. The training provided is a
tutored self-training. This mode of instruction is a mixed one between face-to-face and distant
learning dictated by pedagogic choices [6]. The strategy’s objectives are to have direct and
weekly relationships with learners, while limiting the effect of isolation with a gradual
introduction of an e-learning culture. Training sessions to the platform Moodle had been
organized for the C2i teaching team. Information and awareness days are also organized at the
beginning and during the academic years for students and teachers. During PC2i sessions,
students assisted by their tutors are invited to conduct various online activities. Successful
PC2i online training is a result of a strong involvement of all the project team which is
Page 507
e-learning in Tunisia ICI 10 - 10TH
INTERNATIONAL CONFERENCE ON INFORMATION
7
composed of the C2i correspondent, licenses coordinators, tutors, HICSM-K, DVE, the
Kairouan University and the VUT.
4.2. Learning process
The main objective of the learning process of PC2i is to allow the maximum number of
students to obtain the C2i certificate. For a better learning and organization of the platform,
each PC2i chapter is represented by 5 themes: Objectives / Plan of the chapter, Resources,
Communication, Activities and Evaluation. Lebrun defines five components of the learning
process resulting from the analysis of the literature [4], [7], followed by our model:
Information (access to contents), Motivation (nature and usefulness of PC2i), Activity
(activities on the platform), Interaction (communication between tutors and learners or between
learners) and Production (accomplishment of projects).
4.3. Strategy’s evaluation
PC2i exams were done online. The organization of the online survey "C2i Online Exams" is a
part of a quality approach. Main objectives were the evaluation of learners’ satisfaction and
improving conditions of online exams. 56.13% of learners felt that the decision to have an
online exam was good, very good or excellent. 35.85% of them found it ordinary. In the future,
64.62% of students would have an online exam against 21.7% who were against. 13.68% had
no preferences.
5. Evaluation of an online use e-learning platform [8]
In our previous work [8]; we suggested a comparative analysis of teaching experience based on
the use of the Moodle platform in numerous Tunisian colleges (HICSM-K, the International
University of Tunis (IUT), the VUT, and the Institute of the High Commercial Studies
(IHCS)). The sample was heterogeneous. It was composed of students having different
profiles, managers (VUT and IUT) and computer science students (IHCS and HICSM-K).
Learners belonging to the VUT had a 100% online course in microeconomics. Students at the
IUT had a PC2i course in a tutored self-training mode. Learners in IHCS were divided into two
groups: the first one had a C Programming course and the second one was composed of
learners in master having a course entitled "e-learning tools". The training offered in IHCS was
face-to-face with the use of an e-learning platform. Learners of HICSM-K were in master and
had a course in "Development and Integration of Web Applications", with a blended learning
mode.
Page 508
e-learning in Tunisia ICI 10 - 10TH
INTERNATIONAL CONFERENCE ON INFORMATION
8
Data for this analysis were collected through the establishment of an online survey during the
academic year 2009-2010. Several aspects have been addressed, namely satisfaction about the
quality of pedagogical content, the quality of online tutoring, the easiness of using the e-
learning platform, the quality of content available online and the role of the platform. It should
be noted that the same survey was conducted during the academic year 2008-2009. It revealed
that computer science students were satisfied with the e-learning approach used based on the
use of the Moodle platform [9]. The new survey [8] revealed that the majority of learners were
equipped with the necessary means to be connected to the Internet. 44.54% of learners
exercised a professional activity with their studies. At a technical level, learners mastered the
technology. The majority of learners ensured that courses meet their objectives. The online
contents were considered as having a good quality by the majority of learners who were also
satisfied with the quality of online support. The majority found that the use of the platform was
simple or very simple and did not require prior training. More than 76% of learners felt that the
use of an e-learning platform had facilitated their access to training, reducing the isolation’s
problem. In terms of future training modes, 30% of students believed they are capable to
acquire 100% online training. For the choice of the learning mode, most students opted for
blended learning. 80.23% of learners recommended the use of the platform to their peers and
78.20% recommended it to other teachers.
6. Higher Education Quality Support Program (HEQSP)
Tunisia has developed a program of reforms of higher education for 2006-2011, which aims to
improve knowledge, skills and qualifications of students, and to contribute to a more
diversified economy based on knowledge. The project has three components. The first one is
dedicated to the improvement of the capacity of public higher education, the second one deals
with the modernization of the system of higher education by strengthening quality insurance
mechanisms, institutional autonomy and financial viability. The last one is a competitive
program which allocates subventions to improve, according a bottom-up approach, the
Academic Quality (AQ) and the institutional performance. The financed projects are directly
proposed by faculty members and universities; therefore, many of them are innovative and deal
with e-learning, pedagogic approaches using ICT and information systems' implementation.
For instance, the VUT’s project is entitled: "Project for improvement of the management of
virtual education" 3 . The HICSM-K’s project is entitled: "A portal solution for computer
3 http://www.uvt.rnu.tn/paq/
Page 509

e-learning in Tunisia ICI 10 - 10TH
INTERNATIONAL CONFERENCE ON INFORMATION
9
supported collaborative education and learning systems". The project of the Higher Institute of
Accountancy and Business Administration (HIABA) is entitled: "Pedagogic renovation and
employability of graduates".
In the HEQSP-AQ, the component hardware upgrade and didactics is present in 54% of the
financed projects. The component Online Courses/Distance Education/Information Systems is
present in 31% of projects.
7. RECOMMENDATIONS
These recommendations are drawn from the previous reviewed experiences. They can be
considered as good practices to be followed in the development of any e-learning project. They
will remain valid, not only in the case of Tunisia, but also for any country wishing to
implement e-learning projects at different scales.
7.1. Pedagogical dimension
• Facilitate the organization of training of trainers and teachers’ sessions through the
creation of well equipped training spaces in each university and/or college.
• Provide weekly an adequate training based on a schedule established under the
constraint of the number of teachers and their different profiles.
• Organize numerical-pedagogic trainings for new teachers.
• Generalize and encourage the use of Moodle platforms in different disciplines.
7.2. Cultural and social dimensions
• Organize information and awareness days among e-learning actors in each university
and college.
• Encourage and monitor the use of already developed online courses by teachers.
• Encourage teachers to digitize their courses according to a well developed and up to
date competence’s referential.
• Identify and generalize best practices.
• Improve existent approaches through a rigorous study and construction of innovative
approaches.
Page 510

e-learning in Tunisia ICI 10 - 10TH
INTERNATIONAL CONFERENCE ON INFORMATION
10
7.3. Technological and research dimensions
• Develop tools for decision aid problems and specify qualitative and quantities e-
learning indicators to evaluate approaches’ performance and to control progress.
• Integrate intelligent components in the platforms for more interactivity and adaptability.
For instance, Intelligent Tutoring Systems (ITS), automatic evaluation of contents and
their impact on students outcomes, automatic classification of students in certification
exams, adaptive e-learning strategies, tests and evaluations, automatic assessments, etc.
7.4. Legal dimension
• Clarify different roles of different e-learning actors and their remuneration especially
for the tutor [10] as it is accomplished by the VUT.
• Generalize the adopted VUT approach of tutors’ remuneration to tutors in colleges.
• Create a new status for tutor having to be certified.
7.5. Organizational dimension
• Create a coordinator of the virtual education in each college, working in collaboration
with the DVE. He can be the C2i correspondent (well-formed, C2i certified and active).
• Create adequate spaces for students with free Internet access in their colleges.
• Equip all colleges with WIFI connections and enable controlled access to students.
• Organize more C2i certification sessions for teachers and students in their colleges.
• Encourage development of HEQSPs, based on the initiative of the teachers and
involved actors in e-learning, in order to obtain more relevant programs.
8. Conclusion
Information, awareness, training and motivation of actors and allocation of resources are the
keys factors for successful e-learning projects. The deployment of an e-learning project must
be an iterative and incremental subject to assessments and periodic evaluation. A collection of
different actors’ opinions, their point of views and assessments will better involve and motivate
them while providing improved educational process. It should be noted that with changes,
resistances are to be managed. Procedures for evaluation and compensation of the tutors’ work
constitute an important factor for the adoption, integration and development of e-learning.
Page 511

e-learning in Tunisia ICI 10 - 10TH
INTERNATIONAL CONFERENCE ON INFORMATION
11
Our experience has shown that students are motivated for this mode of teaching which
eliminates the distance between teacher and learner. The senses of autonomy, competence,
participation, with a good relationship climate are the key concept of motivation developed by
e-learning [4].
As prospects, the development of quality space courses and creation of C2i certification,
production and training centers in colleges and universities is obviously necessary to certify
and to train the maximum number of students and teachers.
Even if technology opens several directions for progress and innovation; it is unable to change
radically learning mechanisms. It is not the teacher who brings knowledge to the learner, but
the later creates his own learning from his experience, failures and successes. [11].
References
[1] Commission of The European Communities, “The eLearning Action Plan: Designing tomorrow's education”, 2001.
[2] Ledru M., “Le e-learning, projet d'entreprise”. Editions Liaisons, Collection Entreprises et carrières, 2002.
[3] Duderstadt J., Atkins D., Van Houweling D., “Higher education in the digital age: technology
issues and strategies for American colleges and universities”, American Council on Education/Praeger Series on Higher Education, Greenwood Publishing, 2002.
[4] Lebrun M., “eLearning pour enseigner et apprendre - Allier pédagogie et technologie”. Editions Academia-Bruylant, 2006.
[5] Bates T., “Technology, e-learning and distance education”, Routledge Studies in Distance Education, 2005.
[6] Bellier S., “Le e-learning”, Editions Liaisons, Collection Entreprises et carrières, 2001.
[7] Lebrun M., “Théories et méthodes pédagogiques pour enseigner et apprendre - Quelle place pour
les TIC dans l’éducation?”, Editions De Boeck, Collection Perspectives en éducation et formation, 2ème édition, 2007.
[8] Ettarres Y. and Nahali M. A., “Evaluation de l’utilisation d’une plateforme d’enseignement en ligne
dans le cadre de différentes formations : Une étude comparative”, Conference of e-Learning For All LEAFA2010, Tunisia, 2010.
[9] Ettarres Y., “Evaluation de l’utilisation d’une plateforme d’enseignement à distance dans le cadre
d’un cours de développement et intégration d’applications Web”, 5ème Symposium International en EAD : Technologies pédagogiques, Web et Réseaux, Mahdia. 105-111, 2009.
[10] Anderson T., “The theory and practice of online learning”, second edition, Athabasca University, 2008.
Page 512

e-learning in Tunisia ICI 10 - 10TH
INTERNATIONAL CONFERENCE ON INFORMATION
12
[11] De Gromard S., Ducreux J-M. and Roy H., “La formation dans tous ses états, le e-learning pour
développer les compétences”, Éditions d’Organisation, 2002.
Page 513

GAMASA, EGYPT, 4 – 6 DECEMBER 2010
Distant Learning through Video Conference Ain Shams, Banha, Fayoum Universities Cooperation
Mostafa M. Aref
Computer Science Department, Faculty of Computer Science and Information Sciences,
Ain Shams University, Abbassia, Cairo, Egypt
Abstract This paper presents the cooperation between Computer faculties in Ain Shams, Banha and Fayoum in teaching computer science courses. Students are from Banha and fayoum Universities. Faculty staffs are from Ain Shams University. Video conference is a media for communication. The talk presents the current time table. Advantages and disadvantages of this cooperation are discussed.
Keywords: Distance learning, E-learning, video conference
1. Introduction
Distant Learning is a concept derived from the use of information and communication
technologies (ICTs) to revise and transform traditional teaching and learning models and
practices has evolved in the past decade. This evolution has resulted from the emergence of the
information society and has greatly impacted on the global economic and socio-cultural
development [1]. Using video distance learning allows large areas of the classroom to be
captured at a resolution approaching human visual acuity. This allows instructors and students
to interact with significantly less constraints then the classic television based distance learning
design. Organizations find themselves increasingly spread across multiple cities, countries, and
continents. Even small organizations find that their partners, customers, clients and other
business collaborations extend beyond the range of easy face-to-face interaction [2]. It comes
as no surprise that education is becoming increasingly vital in the knowledge society, resulting
in new ideas within the area of learning and teaching [3]. Furthermore, general developments
in higher education, resulting from societal demands as well as an increased need for students
to become autonomous, have increased the need for academics to understand the learning
process [4].
Page 514

2. The Current Cooperation
Table 1 shows the current cooperation between Ain Shams University and both of Banha
University and Fayoum University. In this table, there are courses that offered by Ain Shams
University to only one University (either Banha or Fayoum). These courses are Computational
Linguistics, Automata and Software Engineering. The instructor is communicated with the
students through video conference. Some materials (power point presentation or handouts) are
sent to the students. During the lecture, these materials may be presented to the students. The
instructor gives his/her lecture. Discussions may be carried on during the lecture. There is a
complete communication between instructor and students. Either them may ask questions and
the other party answer them. For the instructor, the video screen shows the whole students
body. For the students, the video screen shows the instructor, and the course material.
Table 1: Cooperation between Ain Shams, Banha and Fayoum Universities
Day of the week Subject Cooperated Universities
Sunday Compiler theory Banha and Fayoum Computational Linguistics Fayoum
Monday Automata Banha Image Processing Banha and Fayoum
Wednesday Software Engineering Banha Logic Programming Banha and Fayoum
In the same time, there are courses that offered by Ain Shams University to both of Banha and
Fayoum University. These courses are Compiler theory, Image Processing and Logic
Programming. The only difference in this case, the video screen is showing the students body
for both of the universities. The instructor may receive questions from the students of both of
the universities.
3. Issues within the higher education context
Despite the advancement of distant learning tools, several emerging issues that have impact on
successful distant learning implementations in higher education have been cited. These
include:
3.1 Identifying teaching process underlying online courses
Successful implementation of distant learning necessitates a two-tier training approach. The
‘learning’ which refers to teaching process aspects, through which individuals learn, acquire
and retain skills and information to facilitate knowledge development. The distant refers to
Page 515
technologies which communicate information to be learnt. This implies that the use of
technology in itself does not cause or improve the quality of learning. To this effect,
3.2 Improving ICT skills
The level of ICT skills for both teachers and students affects the effective use of technology to
support online instruction. For instance, [5] a point out that confidence and comfort in using
ICT reduces barriers to social interaction, administration, learner motivation, and time.
Therefore, the lack of relevant skills interferes with the learning process and often causes
problems for both teachers and students.
3.3 Technology use
The arguments against online learning often focus on what is viewed as negative impacts from
not having face-to-face contacts and anxiety caused by the nature and quantity of information
transmitted through technology [6]. In this regard, reluctance of teachers in adopting e-
Learning relates to their being too traditional in their teaching style, unwillingness to adopt
change, or perceived increased teacher work load [7].
3.4 Management support
Furthermore, distant Learning initiatives require full commitment and support from
management for their operationalisation and sustainability. Successful transitions to more
flexible modes of delivery require significant buy-in from senior management and a long-term
commitment to support, foster, and monitor strategic change. The need to improve
organisational processes associated with distant Learning. University structures are rigid and
unproven, regarding the incorporation of technological advancements [1].
4. Conclusion
There is a strong need for identifying suitable strategies for effective e-Learning
implementation and we have here provided a general overview of various theories for learning
processes and methods. We have analysed some quite recent e-Learning implementation trends
and discussed e-Learning implementation aspects. More specifically, we have discussed e-
Learning state of art, eliciting different implementation strategies indicating the continual
evolution of e-Learning. We have also taken a look at e-Learning within a higher education
context and emerging issues that have impact on its implementation. We, as many others, have
noted that e-Learning implementations are serious commitments in a variety of ways, involving
Page 516

Paper Title ICI 10 - 10TH INTERNATIONAL CONFERENCE ON INFORMATION
4
encompassing change processes which consider strategic, didactic, organisational, economic,
and cultural dimensions for all stakeholders. From the emerging issues of e-Learning
implementation within the higher education context, two problems emanate: 1) the limited
uptake of technology as an instruction delivery method; and 2) the ineffective use of
technology to support learning. In respect to this, future research should therefore seek to
further investigate these aspects and to explore suitable approaches for effective
implementation of e-Learning to support learning. Not the least in higher education contexts.
References [1] E. Kahiigi, L. Ekenberg, H. Hansson, F. Tusubira and M. Danielson, “Exploring the e-Learning
State of Art”, Proceedings of the 6th European Conference on e-Learning, Copenhagen, Denmark on 4-
5 October 2007.
[2] R. Abler, S. Brennan, J. Jackson, “High Definition Video Support for Natural Interaction through
Distance Learning”, Frontiers in Education Conference, 38th Annual, Saratoga Springs, NY, 2008.
[3] U. Bleimann, “A New Pedagogical Approach Beyond e-Learning”, Campus-Wide Information
Systems, Emerald, Bradford, S, Vol. 21 No. 5. pp191-195, 2004.
[4] R. Webster, and F. Sudweeks, “Teaching for e-Learning in the Knowledge Society: Promoting
Conceptual Change in Academics’ Approaches to Teaching”, Current Developments in Technology-
Assisted Education. [online] http://www.formatex.org/micte2006/pdf/631-635.pdf [accessed 15th
November 2010]
[5] L. Muilenburg, and Z. Berge, “Student Barriers to Online Learning: A factor analytic study”,
Distance Education Vol. 26, No.1, pp29-48, 2005.
[6] P.Miller, J. Walker, and J. Aayla, “Technology integration as a transformative catalyst and tool”,
International Journal of Learning Vol.10: pp2461–2480, 2003.
[7] D. Watson, “Pedagogy before technology: Re-thinking the relationship between ICT and teaching”,
Education and Information Technologies, Vol.6, No.4, pp251–266, 2001.
Page 517

E-learning Strategy in Ministry of Education in Kuwait
Zakaa Zaki Mohammed
Information Center , Kuwait Ministry of Education,Kuwait [email protected]
Abstract:. The leap of development in information technology, especially of the educational; process, software development, educational means of electronic. The aim of such technologies to serve the teacher and student together in terms of the evolution of hardware, peripherals, networks needed to connect these devices to the global network and the Internet. The benefits of e-learning is to bypass the constraints of space and time in the educational process, where students can access educational content anytime, anywhere, and taking into account individual differences among learners, enabling them to complete the processes of educational attainment in different environments. Moreover, to create an environment that interacts instantly between learners and teachers, through the means and tools for electronic communication. This paper presents a strategy towards e-learning in Kuwaiti Ministry of Education. The investigation was conducted at the Information Center in the Ministry of Education. A study carried out the plan of the Ministry of Education to introduce the latest applications in the field of information technology in schools and curricula of various educational levels, consistent with the overall strategy for education in the country, The primarily aim was to improve education and create a generation of self learns and be able to keep pace with global developments.
Keywords: IT education, e-learning projects in Kuwait, e-Learning infrastructure.
1. Introduction E-learning in the developed countries is a popular phrase, as Anderson (2005)
pointed out that if we search for the phrase e-learning in one of the internet search engines, we would receive more than three million hits. E-learning has been defined in a variety of ways in the literature. The most common definition states that e-learning or electronic learning in higher education is a technique to enhance learning and teaching experiences. It is used to educate students with or without their instructors through any type of digital media (Christie et al2004) and/or utilizing many ICT information and communication technologies (Laurillard 2004). In recent years the Higher Education sectors are concentrating on the online context of e-learning by using the Internet to enhance education (Arabasz et al 2003).
Information Technology (IT) has emerged as an important component of society. Many private higher education institutions around the world are using e-learning in
Page 518

their education curriculum to compete with others and survive financially. Also many higher education institutions are changing to new technology in education to enhance student learning experiences and to produce better learning outcomes and competencies. Traditional universities should have a flexible organizational structure to incorporate technology such as e-learning approaches into their education curriculum to improve student learning experience (Singh, O'Donoghue, and Worton 2003, Laurillard 2004).
There are some important factors for the success of e-learning during implementation in Higher Education institutions. Poor preparation can affect the use of e-learning facilities. Poor instructor awareness and training in using e-learning facilities will lead to poor outcomes. The availability of connections to e-learning websites combined with slow downloads discourages students from using e-learning.
With the various facilities of Information and Communication Technology (ICT) and
the rapid growth of e-learning, computers are now used by students in many education processes and are valuable tools in learning in higher education. Accessing online learning resources has become flexible and fast without any geographical barriers (Sivapalan and Cregan 2005, Concannon and Campbell 2005). The aim of this paper is to investigate the statey towards Information and Communication technology ICT in Ministry of Education in Kuwait.
2-The Objectives of E-learning in Ministry of Education in Kuwait The objectives of e-learning in the Ministry of Education in Kuwait is to provide a model for remarkable education in Kuwait to be a pioneer in the region, as well as improving teaching and learning through the dissemination of technical scientific excellence appropriate to support educational programs in Kuwait. In addition to spread the culture of self-learning to the learner, create a learning environment technology and adopt the latest technology in the field of learning and teaching tools. The national strategy for the use of information technology and communications, to the importance of creating an environment to interact instantly between learners on the one hand, and the teacher on the other hand through the means and electronic tools. The work take into account individual differences among learners and enable them to complete the learning process in appropriate environments, emphasizing the need to transform the role of the teacher to be a leader and directed the educational process away from indoctrination. To overcome the constraints of space and time in the educational process, where students can access educational content at any time and place, and a culture of learning and self training in the student community in Kuwait. Using the methods of a variety of different more accurate and fair in evaluating the performance of learners. It enables the student to receive the scientific material in the way that fits with their capabilities by the way video, audio or printed. We build a database of renewed scientific materials and accessories, which contributes in the development and increase the effectiveness of teaching, and to avoid the emergence of new generations who suffer technological literacy ». It confirms the participation in the responsibility for achieving the goals of educating young people between the school, the family and society. It helps to overcome the constraints of space and time in the educational process.
Page 519

3-The Strategic Vision for E-Learning in Kuwait The strategic vision for e-learning launched within the framework of reference include the strategy of public education in the State of Kuwait from 2005 until 2025. The document the general goals (Education 1976), and strategic information and communications technology in Kuwait, and the project, Sheikh Sabah al-Ahmad al-Sabah, the national e-learning (2001 ), in addition to the educational indicators in Kuwait (2007), and the approach to the development of education in Kuwait, Major Programme V (UNESCO: Communication and information). Out of interest of the Ministry of Education and its desire to keep abreast of developments in the field of information technology and effectively utilized to serve the educational process, the Ministry has launched several strategic projects in the field of information technology, which supports the following topics:
FIRST: Linking public schools place the President of the Ministry of Education through a private network and the Ministry of Education offers the following features:
The possibility of exchanging information and access to sources of information easily.
The ability to service and multimedia applications and e-training with high efficiency.
Flexibility and the ability to accommodate additional devices in the application of the latest information technology.
Security, confidentiality, and steadiness. Frequency compatibility with the applicable terms of the Ministry of
Transportation. SECOND: the provision of network information in the public schools to observe the growth of the absorptive capacity to allow for adding additional hardware. THIRD: the provision of learning resource centers and provision of interactive whiteboards in schools to be converted into smart classrooms. FOURTH: Provide national educational portal world-class standard through electronic content management and the provision of educational resources for students, information and administrative services. FIFTH: to create the infrastructure for the Ministry of Education and to link schools and the Ministry of Education to support the application of e-learning system in the ministry. SIXTH: Training and transfer of knowledge and develop the skills of teachers. Project to develop e-content The deployment of electronic content to the curriculum of the State of Kuwait within the educational electronic portal one of the vital elements that give the project e-learning real value towards e-learning. If not about distance education so keen the Ministry of Education to follow all the criteria, which aims to establish and develop the electronic content in accordance with standards universal.
Page 520

4-infrastructure projects: Data Center : The beginning of infrastructure projects such as data center Data Center development is designed according to the latest techniques and is the largest in the Middle East . The testimony of international companies, in addition to the project for linking all schools in Kuwait, the ministry network through fiber optic network in cooperation with the Central Agency for Technology and the Ministry of Transportation.
Wireless (WIRELESS & ACCESS POINT)
This project allows the student access to sources of knowledge and knowledge of educational portal and e-content within the school without having the need to provide links and nodes of the network throughout the school and in all seasons and through the provision of a wireless network covering the school
Large-scale WAN Ministry of Education schools network linking large-scale WAN
The project aims to link schools with the Office of the ministry in high-speed network to ensure continuous updating of student data, the online portal continuing on a daily basis, ensuring accuracy and validity of the data. It can be an effective exchange of information and experiences between the different categories of schools.
Kuwait educational portal Stopped commentators as well as at the gate of Kuwait educational considered the primary interface for education projects-mail, which will meet the teacher, the student, administration and parents. She works on the management of learning activities and education in terms of tutorials, drills, exercises, and is considered one of the most important e-learning solutions.
Electronic content
It is one of the most important elements of e-learning system where they are providing interactive scientific material in a full explanation from the internet. They are easily accessed at any time and any place, pointing out that the approach based e-conversion the traditional approach to interactive that includes (text, voice, image and movement), through a series of educational units Learning Object that reflect the concepts of specific scientific. International standards based allows the learner the possibility of active interaction with this content with the teacher and with peers, whether simultaneously or not simultaneously . Schools, and smart classrooms, provide means of better education and teaching methods more advanced, and develop the skills and thinking of students through searching for information and retrieved, using information and communication technology and the Internet in any field or educational material, and the possibility of studies and new activities, and so for all levels Education, which represents a rich of source of educational facility, and improve the performance and skills of the teacher as well as methods of explanation to make lessons more effective and commensurate with the exciting possibilities for understanding and creativity of the students.
Page 521

Technological tools On the technological tools that make up the schools and smart classes «We have interactive whiteboard, which consists of projectors E (Data Show) PC board and a wireless network within the school, the electronic library and laptop for each student and teacher». 5-Conclusion:
At the end the ministry of education emphasize on the importance of the awareness of education, which seeks to build awareness among students and the community as a whole. Developments in education to educate the Kuwaiti society, the importance of e-learning, the use of visual media print, the use of public relations activities to build awareness among the public of developments of educational e-learning projects and the implantation of culture among the public. And this project is training faculty on new technologies to raise the efficiency of performance and raise the educational level, and raise administrative performance and keep pace with technological development.
6 References: [1] Al-Doub E. and Goodwin R. (2007). Issues in E-learning in Kuwait. Submitted to
a conference. [2] Anderson J. (2005). IT, e-learning, and teacher development. International
Education Journal ERC2004 Special Issue 2005, 5(5), 1-14. ISSN 1443-1475, 2005 Shannon Research
Press. [3] Arabasz P. and Baker M. (2003) Evolving Campus Support Models for E-Learning
Courses. ECAR Educause Center for Applied Research. http://www.educause.edu, Accessed [24/8/2006]
[4] Christie M. and Ferdos F. (2004). The Mutual Impact of Education technology: Building a Pedagogy of E-learning. Journal of Information Impact Vol.4 No.1 pp15-26, 2004 http://www.jiti.com/v04/v4n1.015-026.html. Accessed 7 Jun 2006.
[5] Concannon F. and Campbell M. (2005). What campus-based students think about the quality and benefits of e-learning. British Journal of Education Technology Vol 36 No 3 2005 P501-512.
[6] Laurillard D. (2004). E-Learning in Higher Education. http://www.bacs.uq.edu.au/CurriculumReview/DianaLaurillard.pdf. Accessed 13 Jul 2006.
[8] Singh, G., O'Donoghue, J. and Worton, H. (2003). A Study Into The Effects Of e-learning On Higher Education. Journal of University Leaching and Learning Practice http utlp.uow.edu.au/2005_v02_i01/pdf/odonoghue_003.pd://j f. Accessed 7 JUn 2006.
Page 522
GAMASA, EGYPT, 4 – 6 DECEMBER 2010
A Web Based Evaluation Tool for Higher Education Quality Assessment Using the Holon Framework
I. A. F. El-Khodary 1, E. F. Shoieb 1*, A. A. Tharwat 1
1 Dept. of Operations Research and Decision Support, Faculty of Computers and
Information, Cairo University, Cairo, Egypt, [email protected], [email protected], [email protected]
Abstract In a globalized world where knowledge creation is essential and competition becomes critical, Higher Education Institutions are put under pressure to formulate, discuss and communicate clear priorities and focus on efficient management, planning and resource processes to achieve excellence and ensure continuous performance improvement. Higher Education management and Quality Assurance occurs within a complex system involving several nominally independent stakeholders coupled with informational and resource flows and behaviour which makes the process of management, decision making and quality assessment very hard. Therefore, these institutions need a tool that guides them toward informed decision making; a tool that evaluates and assesses the current state and support their decisions towards quality assurance and vision achievement.
In this research we are aiming to build a web based Decision Support system for quality assessment in higher education using the Holon Framework to improve the quality of education in a faculty. The Holon Framework is an interdisciplinary approach derived from the Systems Movement and Software Engineering. The framework combines elements of both soft and hard systems thinking. From its origins in software project management, the framework has evolved into an approach that can be used to explore complex and messy managerial situations and has benefited from being applied in a number of case studies.
The Holon approach attempts to gain an understanding of specific problems that leads to informed process improvement and decision making. It aims to empower academics and administrators through resolving relevant problems, metricating them, generating a pragmatic vision and moving towards it.
In our research, we focused on the soft part of the Holon Framework for quality assessment to identify the main problems ‘the what’ that afflicts the achievement of the faculty vision. We use the web to minimize the decision makers’ time and effort.
Keywords: Web Based Decision Support System; Higher Education Management; Quality Assessment; Holon Framework.
1. Introduction
Changes that have occurred in the environment external to Higher Education (HE) like
geopolitical order changes, globalization in the societal domain, and changes in the
Page 523

scientific and technological development which increased demands for improved efficiency
and better quality, have led to changes in Higher Education decision making process and
Higher Education management techniques.
Too many decisions about higher education rely heavily on reputation and rankings. To
meet the challenges of the 21st century, higher education must change to a system based on
performance, which addresses the need for developing approaches to more valid, rigorous,
reliable, and useful assessment of higher education institutions. Historically, assessments
have been based largely on reputation, resources, facilities, quality of inputs (faculty,
students), and the richness of opportunities provided. The advocated shift is to greater focus
on establishing clear and measurable goals, developing systematic methods for assessing
performance, value-added, outcomes, impact and the benefits derived by students from
these resources, facilities, and opportunities. Also, using external comparisons and
outcomes information to document and encourage progress.
So, the challenge for us as researchers is to extend our assessment models to include a
greater emphasis on performance, results, outcomes and impact, and to link assessment
activities to planning and improvement. We argue that there is a need for a holistic approach
to Higher Education Quality Assessment in order to improve quality and increase
productivity. The quality assessment occurs within a complex system involving several
nominally independent stakeholders coupled with informational and resource flows and
behaviour which make hard system methodologies not suitable to deal with our objective.
Therefore, soft system methodologies which deal with the institutions’ socio processes seem
more suitable. Nevertheless, the lack of using metrics is a significant limitation, thus
addressing the need for a multi-methodological holistic approach that combines both soft
system thinking with hard system thinking.
We are aiming to build a web based Decision Support System for quality assessment in
higher education using the Holon Framework to provide recommendations in order to
improve the education processes in a faculty. The Holon Framework is an interdisciplinary
approach derived from the Systems Movement and Software; a multi-methodology that
merges aspects of Soft Systems Methodology (SSM) [1] and the Goal/Question/Metric
(GQM) Paradigm [2]. It was defined by the IMMaGe Group at South Bank University [3],
[4], and [5] to higher education planning and control. The general approach guiding the
development of the Holon Framework has been to view processes involving people as
socio-processes and to explore problem situations by formulating an abstract representation
Page 524
based on systems ideas. Enquiry into the problem domain is facilitated by open dialogue,
and Holons are employed as a means of structuring initial thinking and focusing debate. The
Holon Framework combines elements of both soft and hard systems thinking.
The paper starts in section 2 by providing a survey regarding different techniques, including
the Holon framework, used for HE quality assessment. In Section 3, we will describe the
web based DSS developed and illustrate how the Holon Framework is incorporated within
the system for HE quality assessment. Conclusions will be provided in Section 4.
2. Literature Survey
A lot of research work has been done in the field of Higher Education management and
quality assessment. In this section we will discuss the some of the issues regarding the main
methods used in the assessment of Higher Education quality.
2.1. Performance Indicators
Performance indicators (PIs) measure, either qualitatively or quantitatively, an object, unit
or process in order to appraise it in terms of defined objectives. The vast majority of cases,
discussion of performance indicators are restricted to the assessment of the efficiency and
effectiveness of institutional management. In a few cases (such as staff student ratios) a link
with teaching and learning is suggested but as yet no detailed research on this has been
found. A few authors such as [6] have drawn tenuous links between performance indicators
and their possible use in teaching quality assessment, but others comment that PIs are not
applicable to teaching quality assessment [7]; examples include the Staff-Student Ratio
(SSR), where a low SSR could be considered a positive aspect (more face to face contact
between students and staff) or negative (inefficient use of resources). This issue needs
further investigation because links between performance indicators and “product” or
“service” quality are often a significant feature of other industries. It may be that education
is so specialized that this is more difficult or that the appropriate tools have not (until now)
been available.
Also PIs have significant limitations as a management tool, since PIs usually measure inputs
or outputs to the organization and ignore the actual things that management can directly
influence which are called “levers”. PIs cannot explore the links between “levers” and
“outcomes”.
Page 525

2.2. League Tables
A set of PIs can be combined and presented in the form of “league tables”. A range of PIs
and weights are selected to produce a single value. Institutions are then ranked according to
this value. This process has been even more controversial than “straight” PIs. One of the
opinions about league tables [8], is “What counts cannot always be tabulated. League tables
are also unfair, open to manipulation and do not measure vital aspects of university
education such as inspiration, friendship and intellectual challenge, and weighting used also
contains a bias.”
2.3 Institutional Planning Approach
Galbraith [9] identifies the dominant HE planning approach that is associated with soft
institutional managerializm [10]. The four key parts of the approach are: strategic plan;
performance indicators; mathematical models; and artificial structures. A strategic plan
usually entails a vision statement and related strategic aims. These strategic aims are treated
separately and expressed in terms of goals, which are assessed through the use of PIs.
Furthermore, regression models, spreadsheets and databases can make use of the collected
data for forecasting and budgeting purposes.
The problem that the strategic aims can’t be assumed independent of each other; the HE
processes are interrelated and affect each other. Ackhoff in [11] contends that managers are
not confronted with problems that are independent of each other, but with situations that
consist of dynamic, transient and complex problems that interact with each other. He calls
such a situation messes. Furthermore, he states:
“Messes are systems of problems; the sum of the optimal solutions to each
component problem taken separately is not an optimal solution to the mess.
The behaviour of a mess depends more on how the solutions to its parts interact
than on how they act independently of each other.”
2.4 System Dynamics
Systems Dynamics (SD) models are an excellent way of exploring the links between
“levers” and “outcomes”. To summarize the current SD contributions to Higher Education
[12] presented an extended taxonomy of SD investigations in higher education management.
The completed investigations were classified into nine specific areas of concern (Corporate
governance, Planning, Resourcing and budgeting, Teaching quality, Teaching practice,
Micro worlds, Enrolment demand, External forces / legislation and Human resource
Page 526
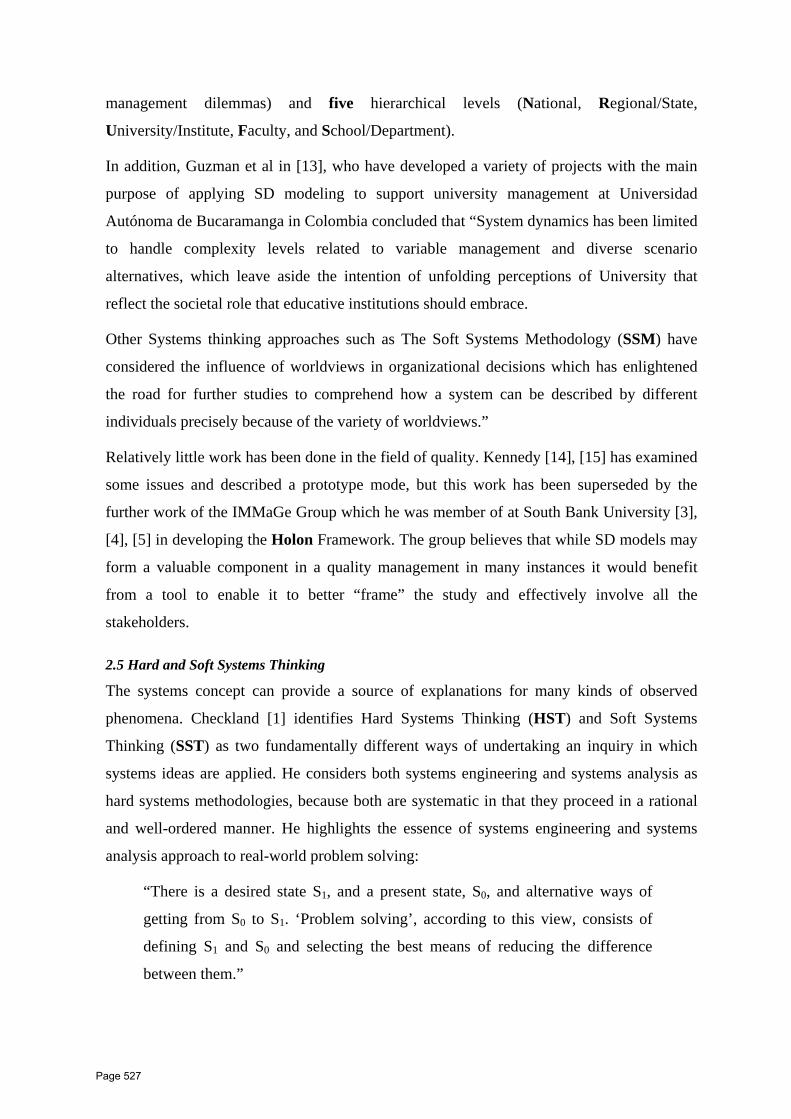
management dilemmas) and five hierarchical levels (National, Regional/State,
University/Institute, Faculty, and School/Department).
In addition, Guzman et al in [13], who have developed a variety of projects with the main
purpose of applying SD modeling to support university management at Universidad
Autónoma de Bucaramanga in Colombia concluded that “System dynamics has been limited
to handle complexity levels related to variable management and diverse scenario
alternatives, which leave aside the intention of unfolding perceptions of University that
reflect the societal role that educative institutions should embrace.
Other Systems thinking approaches such as The Soft Systems Methodology (SSM) have
considered the influence of worldviews in organizational decisions which has enlightened
the road for further studies to comprehend how a system can be described by different
individuals precisely because of the variety of worldviews.”
Relatively little work has been done in the field of quality. Kennedy [14], [15] has examined
some issues and described a prototype mode, but this work has been superseded by the
further work of the IMMaGe Group which he was member of at South Bank University [3],
[4], [5] in developing the Holon Framework. The group believes that while SD models may
form a valuable component in a quality management in many instances it would benefit
from a tool to enable it to better “frame” the study and effectively involve all the
stakeholders.
2.5 Hard and Soft Systems Thinking
The systems concept can provide a source of explanations for many kinds of observed
phenomena. Checkland [1] identifies Hard Systems Thinking (HST) and Soft Systems
Thinking (SST) as two fundamentally different ways of undertaking an inquiry in which
systems ideas are applied. He considers both systems engineering and systems analysis as
hard systems methodologies, because both are systematic in that they proceed in a rational
and well-ordered manner. He highlights the essence of systems engineering and systems
analysis approach to real-world problem solving:
“There is a desired state S1, and a present state, S0, and alternative ways of
getting from S0 to S1. ‘Problem solving’, according to this view, consists of
defining S1 and S0 and selecting the best means of reducing the difference
between them.”
Page 527

Checkland contends that the distinguishing characteristic of all HST is the belief that real-
world problems can be investigated in this way. It is argued that most hard methodologies
are goal-centered or goal orientated in that they assume the problem, i.e. ‘the what’, is given
for the goal state S1, and the usual objective is to find the best way to achieve the goal , i.e.
‘the how’.
Mathematical techniques such as regression analysis can investigate alternative ways to
achieve state S1. It is assumed that there is clarity in the definitions of S1 and S0. We believe
that the identification of the problem, i.e. ‘the what’, is a significant weakness of HST, and
agree with [8] that there is a need to combine mathematical techniques with a soft
methodology.
When investigating social situations, systems theorists realized that the problem, i.e., ‘the
what’, could not be assumed as a given. Stakeholders may have different views of what are
the most important problems to be solved in order to improve the situation. Soft
methodologies have emerged with the aim of attempting to assist in understanding the
perspective of the stakeholder, leading to relevant improvements in the area of concern and
to make sense of a situation. The frame of reference of the modeler changes from ‘observer’
to ‘facilitator’ in order to understand stakeholders’ points of view. Most soft methodologies
can be associated with SST. [8] argue that the main aim of the soft systems thinker is to
identify state S0 problems, i.e. ‘the what’, relevant in a social situation, which require
solving or controlling in order to produce a desired state S1.
Soft Systems Methodology (SSM) [1] emerged from systems engineering. It is a systems-
based general learning methodology for investigating, learning about and improving a
problem situation. There are many accounts of successful applications of SSM in a variety
of organizations. However, there are weaknesses in the approach, and one of these concerns
the way in which system change is controlled. [8] found that the lack of use of metrics
within SSM is a significant methodological limitation. However, they explain that the
identification of relevant problems and their metrication will lead to more informed
decision-making; this had led to thinking of the Holon Framework.
2.6 The Holon Framework
The Holon Framework [3] combines elements of both soft and hard systems thinking. From
its origins in software project management, the framework has evolved into an approach
Page 528
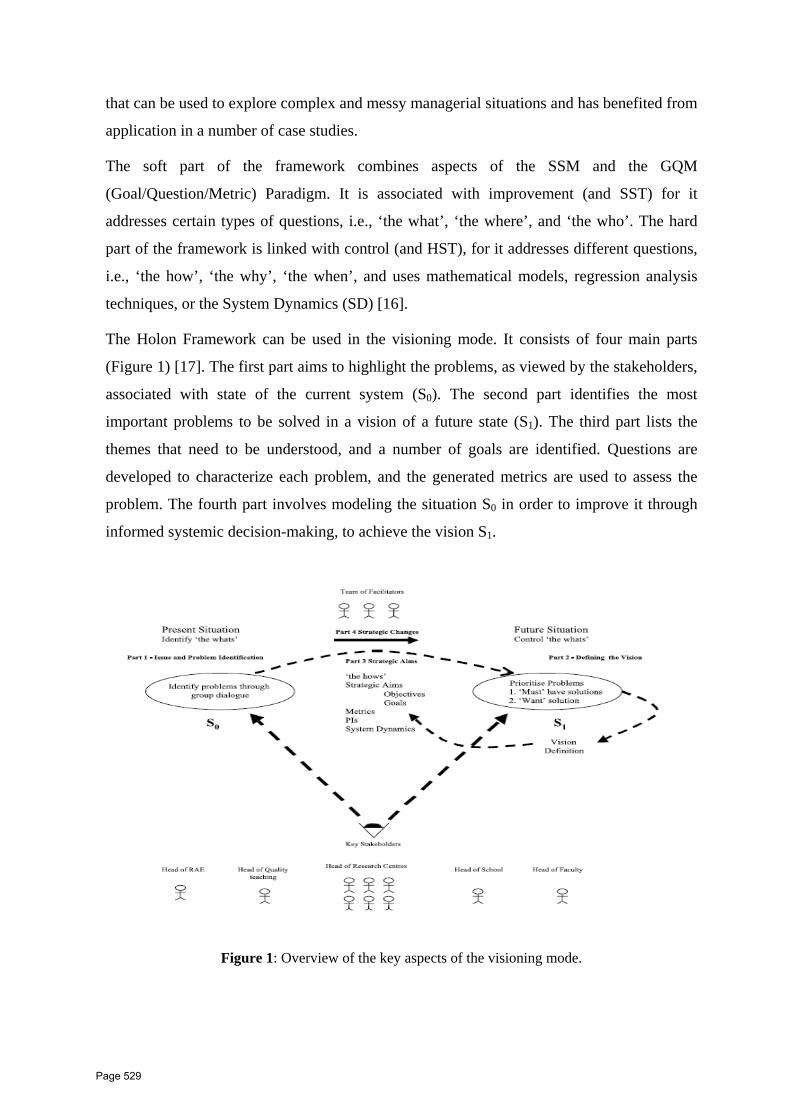
that can be used to explore complex and messy managerial situations and has benefited from
application in a number of case studies.
The soft part of the framework combines aspects of the SSM and the GQM
(Goal/Question/Metric) Paradigm. It is associated with improvement (and SST) for it
addresses certain types of questions, i.e., ‘the what’, ‘the where’, and ‘the who’. The hard
part of the framework is linked with control (and HST), for it addresses different questions,
i.e., ‘the how’, ‘the why’, ‘the when’, and uses mathematical models, regression analysis
techniques, or the System Dynamics (SD) [16].
The Holon Framework can be used in the visioning mode. It consists of four main parts
(Figure 1) [17]. The first part aims to highlight the problems, as viewed by the stakeholders,
associated with state of the current system (S0). The second part identifies the most
important problems to be solved in a vision of a future state (S1). The third part lists the
themes that need to be understood, and a number of goals are identified. Questions are
developed to characterize each problem, and the generated metrics are used to assess the
problem. The fourth part involves modeling the situation S0 in order to improve it through
informed systemic decision-making, to achieve the vision S1.
Figure 1: Overview of the key aspects of the visioning mode.
Page 529

The Holon’s Framework consists of six stages:
1. The Framing Stage: This stage has a number of objectives, among which are that
the stakeholders are identified and that the investigators gain a broad understanding
of the situation, together identifying and labeling the Framing Holon, environment
Holon, and all relevant sub-holons.
2. The Enquiry Stage: This stage aims to identify the problems as perceived by the
stakeholders.
3. The Formulation Stage: This stage attempts to collate various problems into
themes to be addressed. These can be linked with a sub-holon hierarchical level.
4. The Metrication Stage: This stage analyzes the themes and links the emergent
problems with the appropriate hierarchical level. Metrics are generated to
characterize specific problems.
5. Mathematical Modeling Stage: This stage aims to further examine the data through
the use of Microsoft Excel spreadsheets or regression models. Moreover, an SD
model can be constructed to explain the socio-process of concern.
6. Action Stage: This stage aims to facilitate change through understanding of and
dialogue around the area of concern.
In next section we propose our web based quality assessment tool using the Holon
Framework.
3. Developed Web-Based Quality Assessment Tool
We developed a web based Decision Support system for quality assessment in higher
education using the Holon Framework to improve the Higher Education processes in a
faculty within a university in Egypt. Having such a system on the web facilitates easier
dealing with the stakeholders throughout the different stages of the assessment and
minimizing the decision makers’ time and effort.
The developed system makes use of the quality evaluation questionnaire provided by the
National Authority for Quality Assurance and Accreditation of Education (NAQAAE) in
Egypt to identify the holons and collect data from stakeholders to finally arrive at the most
important themes and problems. NAQAAE [18] has formulated sixteen criteria covering the
effectiveness and capability of an educational organization in performing its functions and
Page 530

its efficiency in teaching. For each of these criteria a number of questions have been put
forward to aid evaluators in assessing the quality of education in this HE institution, and
accordingly accreditation could be granted.
The system is organized so that is follows the six stages of the Holon Framework which are
described in the following paragraphs.
3.1 The Framing Stage
At the start, it is necessary to define a basic structure for the investigation in terms of ‘the
who’, i.e. the key stakeholders within the faculty (the dean, head of departments, head of
research centers, head of quality management,……), and the holons to be used to capture
the issues.
The Framing Holon (Figure 2) was the faculty itself and within this there were holons for
research, post graduate studies, courses and programmes (curriculum), students and
graduates, academic standards, financial resources, academic staff, quality management,
administration, management, ethics, leadership, resources, strategic planning, and society
participation (resembling the subjects of the sixteen criteria put forward by NAQAAE). The
Framing Holon itself was within wider holons representing the University, government and
industry.
3.2 The Enquiry Stage
The objective of this stage is to explore the perceptions of the academics and administrators
in order to identify and confirm the problems that characterize the faculty. Instead of asking
the stakeholders about the problems they thought existed and what are the issues that must
be solved and what is want to be solved, we resorted to the questionnaire put forward by
NAQAAE to collect their assessment of the current situation and automatically generate
reports of the most critical problems and the positive themes existing in the faculty using
simple statistics. In addition, through this online questionnaire, we can determine the
strengths of the faculty for decision makers to make use of them to enhance the quality of
their organization.
During the use of the online questionnaire with the stakeholders, information is placed in the
relevant holons through answering the questionnaire. The outputs of this stage are:
1. Problem Statistical report (Table 1) indicating the result of the questionnaire, which
is the academics and administrators perspective about the faculty.
Page 531
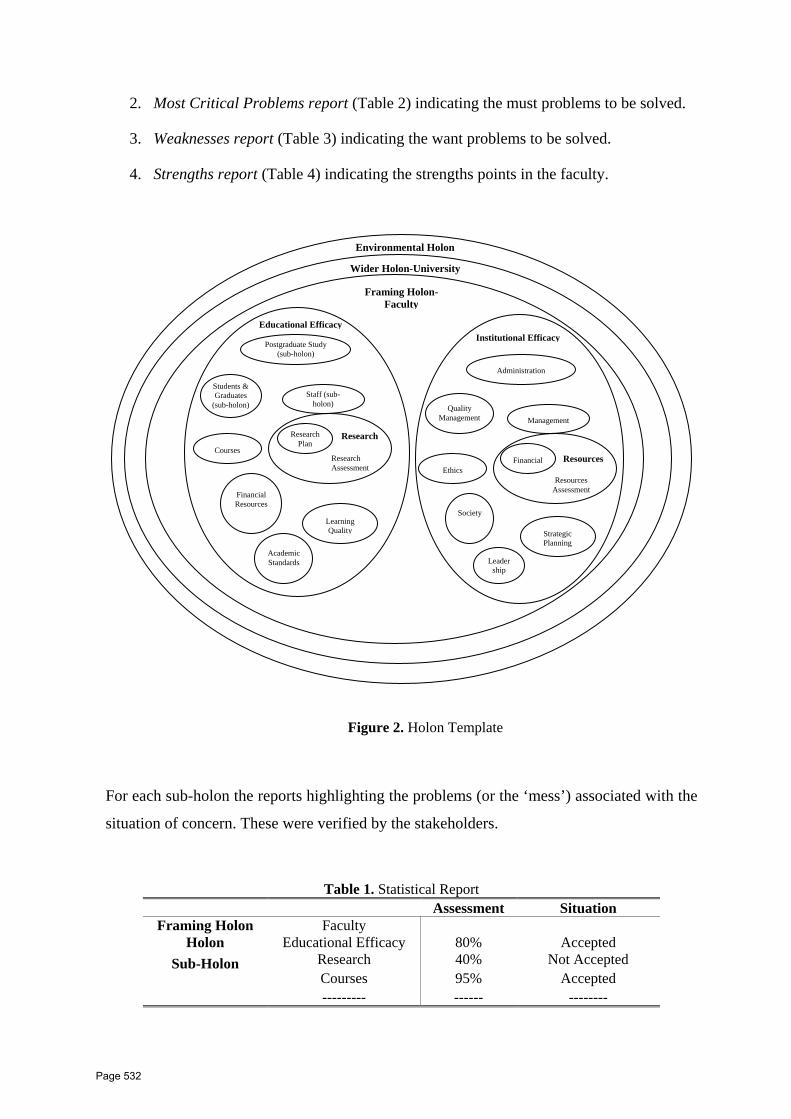
2. Most Critical Problems report (Table 2) indicating the must problems to be solved.
3. Weaknesses report (Table 3) indicating the want problems to be solved.
4. Strengths report (Table 4) indicating the strengths points in the faculty.
Figure 2. Holon Template
Environmental Holon
Wider Holon-University
Framing Holon- Faculty
Educational EfficacyInstitutional Efficacy
Postgraduate Study (sub-holon)
Administration
For each sub-holon the reports highlighting the problems (or the ‘mess’) associated with the
situation of concern. These were verified by the stakeholders.
Table 1. Statistical Report Assessment Situation
Framing Holon Faculty Holon Educational Efficacy 80% Accepted
Sub-Holon
Research 40% Not Accepted Courses 95% Accepted --------- ------ --------
Management
Ethics
Quality Management
Strategic Planning
Society
Leadership
Resources
Resources Assessment
Financial
Staff (sub-holon)
Students & Graduates
(sub-holon)
Research Plan
Research Assessment
Research Courses
Financial Resources
Learning Quality
Academic Standards
Page 532

Table 2. Critical Problems Report
Critical Source Framing Holon Faculty
Holon Educational Efficacy Sub-Holon Research Ratio of researches to number of staff last 5
years
Table 3. Weaknesses Report
Weakness Source Framing Holon Faculty Holon Educational Efficacy Sub-Holon
Research
Database for researches Market benefits from research
Table 4. Strengths Report
Strength Source Framing Holon Faculty Holon Educational Efficacy Sub-Holon
Courses
Courses fit the market need Modernization and development of courses
3.3 The Formulation Stage
Once we identified the various problems which are related to the themes linking to the sub-
holon hierarchical level, an online meeting with the stakeholders within the faculty will be
held to identify potential solutions, they will be asked via open dialogues to suggest
solutions they think will help in resolving the problems identified in the previous stage. The
output of this stage will be a list of potential solutions.
3.4 The Metrication Stage
Metrics tables (Table 5) are generated which highlight the theme (‘what’), the appropriate
holon (‘where’), the metrics that should be collected, and the relevant stakeholders (‘who’).
The relevant performance indicators are identified with its hierarchal level. The GQM
methodology is used to generate these metrics, as the stakeholders asked to identify the goal
for every theme and choose from a prepared list of metrics the ones they need to monitor to
achieve this goal. The metric tables are generated to improve quantitative visibility and to
put a hand on the relevant performance indicators.
Page 533

Table 5. Example of A Metrics Table Where What Metric Who Framing Holon Faculty Holon Educational
Efficacy
Sub-Holon Research Ratio of researches to
number of staff
(no of researches/ no of staff)
administration and staff
3.5 The Mathematical Modeling Stage
The data can be further examined using electronic spread sheets or an SD model can be
constructed after we have framed the study and identified the relation between holons using
also the performance indicators (metrics) collected and the hierarchal levels identified.
The SD model will explain the socio processes of concern after incorporating the academics
and administrations perception. There are three main steps involved in the development of
the SD model: first have good understandings of the main attributes affecting the university
(which is done using the holon framework) and influence diagrams are used to explain the
main influences; second to build a prototype model using information obtained from the
influence diagram.; and third the collection of data required to finish the model (can be
obtained from the metrication stage.
In our study, we will use the Analytic Hierarchy process technique, stakeholders will be
asked to compare the importance of every pair of problems, and using AHP a list of
prioritized problems is generated. A relations matrix between problems and potential
solutions will be formed to designate the priorities of the solutions.
3.6 The Action Stage
As a result of the analysis undertaken in previous stages, issues are identified where action
is felt to be necessary and a list of prioritized recommended actions is ready in order to
initiate informed change and generate movement towards the desired state, S1.
4. Conclusion
In this paper we argue that there is a need within HE management to take a systemic view of
the socio processes at work within the institutional and educational activities. We developed
a decision support system for HE management and quality assessment using the Holon
Framework which will enable quality improvement. We believe that the management
Page 534

cannot move towards the vision unless there is a clear understanding of the current situation,
assess it and understand the themes and problems associated, and this what the Holon
Framework provides.
There is a lot of research that has to be done especially in the mathematical modelling stage.
In our case, we simply resorted to the AHP to provide a prioritization of the recommended
actions.
Once the model has been built and actions have been established and implemented it will
lead movement towards the faculty vision.
5. References
[1] Checkland, P.B., Systems thinking, systems practice. Chichester, UK, John Wiley and Sons, (1981).
[2] Boehm, B.W., Rombach, H.D., and Zelkowitz, M.V., Foundations of empirical software engineering: the legacy of Victor R Basili. Berlin & Heidelberg, Germany, Springer, (2005).
[3] Bell, G.A., Cooper, M.A. and Jenkins, J.O., Software Cost Estimation: Where Next? Proceedings of the United Kingdom Academy for Information Systems (UKAIS ‘99), UK: York University, pp. 575–587, (1999).
[4] Warwick, J., Bell, G.A., Cooper, M.A., and Kennedy, M., Higher Education Planning Using the Holon Planning and Costing Framework: From Framing to Metrication, South Bank University Technical Report SBU-CISM-00-05, London UK, (2000).
[5] Bell, G. A., Cooper, M. A., Warwick, J., and Kennedy, M., The development of the Holon and Costing Framework for higher education management, Paper Presented at the 18th International Systems Dynamics Conference, Bergen, Norway, (2000).
[6] Cave, M., Hanney, S., Henkel, M., and Kogan, M., The use of performance indicators in higher education: the challenge of the quality movement, London, Kingsley, (1997).
[7] Barnetson, B., and Cutright, M., Performance indicators as conceptual technologies. Higher Education, 40(3), Netherlands, Kluwer, (2000).
[8] Bell, G.A., Warwick, J., Cooper, M.A., and Kennedy, M., Towards a general holistic framework for improving and controlling human activity systems. In B. Lehaney, S. Clarke and M. Nicholls (eds) Mixed mode modelling: mixing methodologies for intervention. Utrecht, Netherlands, Kluwer Academic Publisher, (2001).
[9] Galbraith, P.L., When strategic plans are not enough: challenges in university management, System Dynamics: An International Journal of Policy Modelling, X (1 and 2), 55–84, (1998).
[10] Trow, M., Managerialism and the academic profession: the case of England, Higher Education Policy, 7(2), 11–18, (1994).
[11] Ackoff, R.L., The future of operational research is past. Journal of Operational Research Society, 30(2), 93–104, (1979).
Page 535

A Web Based Evaluation Tool for Higher Education Quality Assessment Using the Holon Framework
ICI 10 - 10TH INTERNATIONAL CONFERENCE ON INFORMATION
14
[12] Kennedy, M., An Extended Taxonomy of System Dynamics Models of Higher Education, Proceedings of the Twentieth International System Dynamics Conference, Palermo, Italy, (2002).
[13] Guzman, M., Gutierrez, R., Pinto, L., and Cruz, J., Understanding University Management Using System Dynamics Simulations, a Review Based on Research Experiences Estados Unidos. Proceedings Of Annual Meeting The International Society For The Systems Sciences, 1(1), 1–5, (2008).
[14] Kennedy, M., A Pilot System Dynamics Model to Capture and Monitor Quality Issues in Higher Education Institutions Experiences Gained. Proceedings of the 16th System Dynamics Conference, Quebec City, Canada, (1998a).
[15] Kennedy, M., Some Issues in System Dynamics Model Building to Support Quality Monitoring in Higher Education, Proceedings of the 16th System Dynamics Conference, Quebec City, Canada, (1998b).
[16] Forrester, J.W., Industrial dynamics. Portland, Oregon, USA, Productivity Press, (1961).
[17] Bell, G., Warwick, J., and Kennedy, M., Enabling process improvement and control in higher education management, Perspectives: Policy and Practice in Higher Education, 13: 4, 104 — 117, (2009).
[18] National Authority for Quality Assurance and Accreditation of Education (NAQAAE), Accreditation of Higher Education Institutions Manual, 2nd Edition, Egypt, (2009).
Page 536
ICI 10 - 10TH INTERNATIONAL CONFERENCE ON INFORMATION AT DELTA UNIVERSITY FOR SCIENCE AND TECHNOLOGY
GAMASA, EGYPT, 4 – 6 DECEMBER 2010
1
Information Technology-based Approach to Streamline Sustainable
Building Design
Sherif A. Sheta
Associate Professor of Architecture
Department of Architectural Engineering
Faculty of Engineering, Mansoura University, Egypt
Email: [email protected]
Abstract
Intelligence in architectural engineering has been initiated as an interest in the state of the art integrated
systems within a single building or an entire complex, so that systems can communicate and exchange
information simultaneously. Efficient communication among these systems allows the right responses
and decisions to operate buildings in a productive, economical and efficient way. On the other hand,
efficiency in information technology sharing prevents decisions from interfering with other systems’
responses or operation. Systems’ decisions and responses form the responsive architecture that is
represented by systems outputs. These sectors span existing and well-known technologies in buildings
such as insulation and efficient air conditioning, all the way through to the new nanotechnologies which
would evolve efficiency in broad new ways. In this sense, a summary of the current use of IT in the
home building process is provided. The use of advanced materials is highlighted for their competitive
potential advantage in sustainable architecture. This study ties together important findings and inputs on
improved building systems and new materials, as wireless micro sensors, energy-efficient panelized
construction systems, advanced window systems and advanced daylighting systems. It puts these pieces
together to allow innovations in these areas to be more fully utilized.
Keywords: Information technology; Sustainable building design.
1. Introduction
A key area of mitigating technology in architectural engineering revolves around efficiency
and smart materials. Efficiency is an ideal economical means of managing energy and
significantly reducing the overall burden of its growing demand. Architects necessarily edit
reality when developing drawings that fully represent the prospected condition of building
projects. Were they to include all of the database needed for decision makers to be entirely
informed, they would have to present their full scale proposals, technologies of representation,
then, necessarily edit out of the picture some information so as to emphasize other information
deemed more salient by the architect. In addition to dealing with a multiplicity of practitioners
Page 537
Information Technology-based Approach to Streamline
Sustainable Building Design
ICI 10 - 10TH INTERNATIONAL CONFERENCE ON INFORMATION
2
in sustainable building processes, the architect must coordinate a building design and its later
modifications, materials lists, delivery schedules, commissioning, and inspector schedules.
1.1. Problem
Although information technology would appear to be the ultimate solution for architects
managing this complex process worldwide, many still use appropriate technology only
occasionally, while others who do take advantage of available technologies use them for only a
few of the steps in the management process.
1.2. Aim
As such, three overarching goals have been established in this study that all bear on the
following attributes: (1) to determine the need for improved building technology development
and provide relevant strategic services; (2) to develop and update new building technologies;
and (3) to disseminate new and existing technological information.
1.3. Methodology
Intelligence in architectural engineering has been initiated as an interest in the state of the art
integrated systems within a single building or an entire complex, so that systems can
communicate and exchange information simultaneously. Efficient communication among these
systems allows the right responses and decisions to operate buildings in a productive,
economical and efficient way. On the other hand, efficiency in information technology sharing
prevents decisions from interfering with other systems’ responses or operation. Systems’
decisions and responses form the responsive architecture that is represented by systems
outputs. These sectors span existing and well-known technologies in buildings such as
insulation and efficient air conditioning, all the way through to the new nanotechnologies
which would evolve efficiency in broad new ways. In this sense, a summary of the current use
of IT in the home building process is provided.
1.4. Research limitations
This paper approaches a roadmap for the development of future Integrated Building Design
Systems (IBDS) with a potential for end user participation. The problem examined here is
primarily found in the relationships between sustainable building design, information
technology, and the society they serve.
In addition to the characteristics of integration, standardization and networking, there is a very important
characteristic of IBDS: intelligent, that is, using KBS (knowledge-based system) to organize and guide the
architectural design process simulation software using the entire process, so that in order to play correctly
computing tools.
Page 538
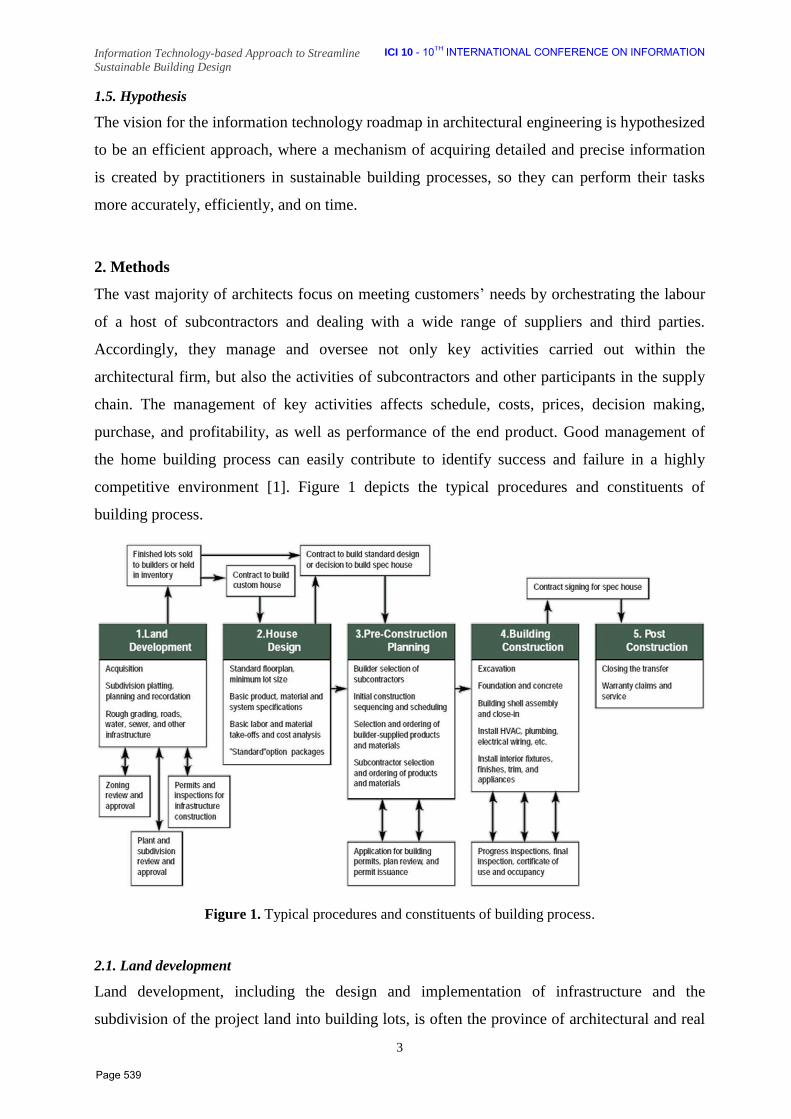
Information Technology-based Approach to Streamline
Sustainable Building Design
ICI 10 - 10TH INTERNATIONAL CONFERENCE ON INFORMATION
3
1.5. Hypothesis
The vision for the information technology roadmap in architectural engineering is hypothesized
to be an efficient approach, where a mechanism of acquiring detailed and precise information
is created by practitioners in sustainable building processes, so they can perform their tasks
more accurately, efficiently, and on time.
2. Methods
The vast majority of architects focus on meeting customers’ needs by orchestrating the labour
of a host of subcontractors and dealing with a wide range of suppliers and third parties.
Accordingly, they manage and oversee not only key activities carried out within the
architectural firm, but also the activities of subcontractors and other participants in the supply
chain. The management of key activities affects schedule, costs, prices, decision making,
purchase, and profitability, as well as performance of the end product. Good management of
the home building process can easily contribute to identify success and failure in a highly
competitive environment [1]. Figure 1 depicts the typical procedures and constituents of
building process.
Figure 1. Typical procedures and constituents of building process.
2.1. Land development
Land development, including the design and implementation of infrastructure and the
subdivision of the project land into building lots, is often the province of architectural and real
Page 539
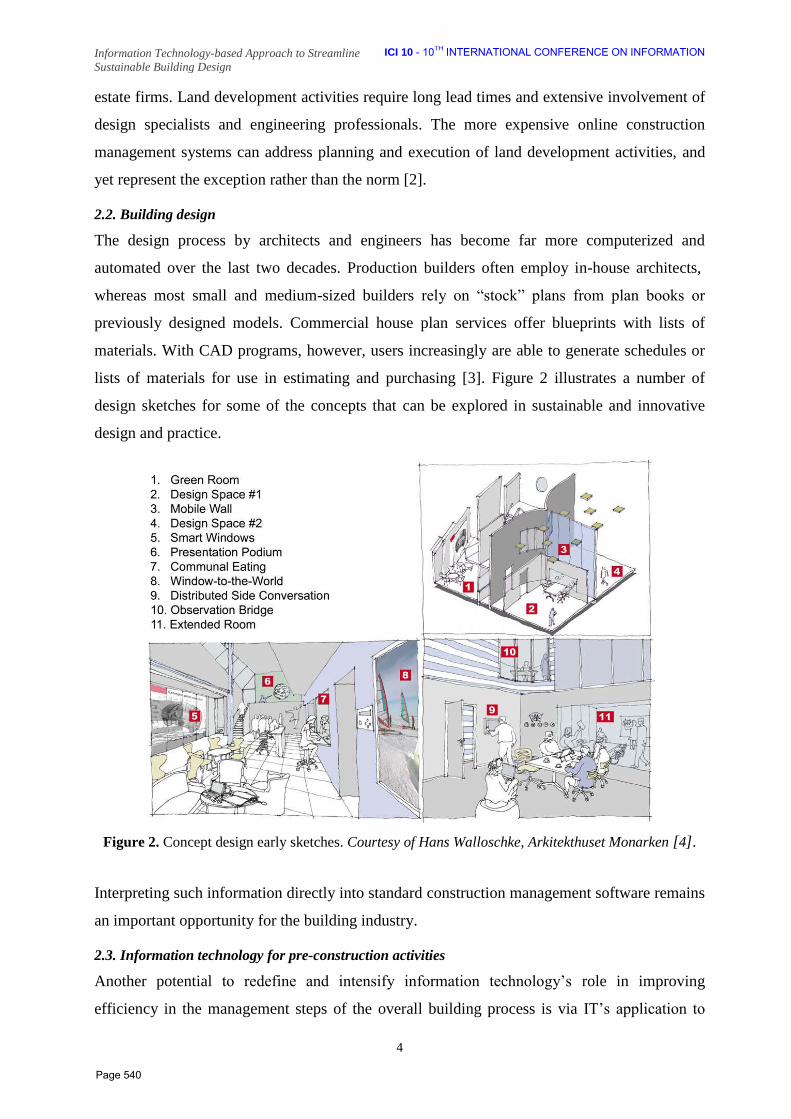
Information Technology-based Approach to Streamline
Sustainable Building Design
ICI 10 - 10TH INTERNATIONAL CONFERENCE ON INFORMATION
4
estate firms. Land development activities require long lead times and extensive involvement of
design specialists and engineering professionals. The more expensive online construction
management systems can address planning and execution of land development activities, and
yet represent the exception rather than the norm [2].
2.2. Building design
The design process by architects and engineers has become far more computerized and
automated over the last two decades. Production builders often employ in-house architects,
whereas most small and medium-sized builders rely on “stock” plans from plan books or
previously designed models. Commercial house plan services offer blueprints with lists of
materials. With CAD programs, however, users increasingly are able to generate schedules or
lists of materials for use in estimating and purchasing [3]. Figure 2 illustrates a number of
design sketches for some of the concepts that can be explored in sustainable and innovative
design and practice.
Figure 2. Concept design early sketches. Courtesy of Hans Walloschke, Arkitekthuset Monarken [4].
Interpreting such information directly into standard construction management software remains
an important opportunity for the building industry.
2.3. Information technology for pre-construction activities
Another potential to redefine and intensify information technology’s role in improving
efficiency in the management steps of the overall building process is via IT’s application to
Page 540

Information Technology-based Approach to Streamline
Sustainable Building Design
ICI 10 - 10TH INTERNATIONAL CONFERENCE ON INFORMATION
5
“pre-construction” activities and processes [5]. A comprehensive approach for expanding the
use of IT in these activities will help simplify, expedite, and improve efficiency in the land
development process. According to [6], steps to achieve these goals may include but not
limited to:
1. Posting of codes on Internet.
2. Electronic process of plans and permits.
3. Automated plan checking.
4. Utilising new technologies for remote or virtual site inspection.
5. Providing public information portal to educate designers, builders and customers on
sustainable construction practices.
2.4. Sustainable building construction activities
Sustainable construction can be seen as providing a contribution to poverty alleviation, creating
a healthy and safe working environment, equitably distributing social costs and benefits of
construction, facilitating employment creation, developing human resources, acquiring
financial benefits and uplift for the community, figure 3. In addition, Information and
Communication Technology (ICT) is expected to be a powerful technological driving force
providing customised and integrated information technology throughout the construction
process [7].
Figure 3. The expansion of key management principles in sustainable construction [7].
The ways in which built structures are procured and erected, used and operated, maintained and
repaired, modernised and rehabilitated, and finally dismantled and reused or demolished and
recycled, constitute the complete cycle of sustainable construction activities. Building products
should, as far as possible, be reusable and materials recyclable. Design for long service life and
durability is superior to design for reusability [8]. Reusability is superior to recycling, and
Page 541
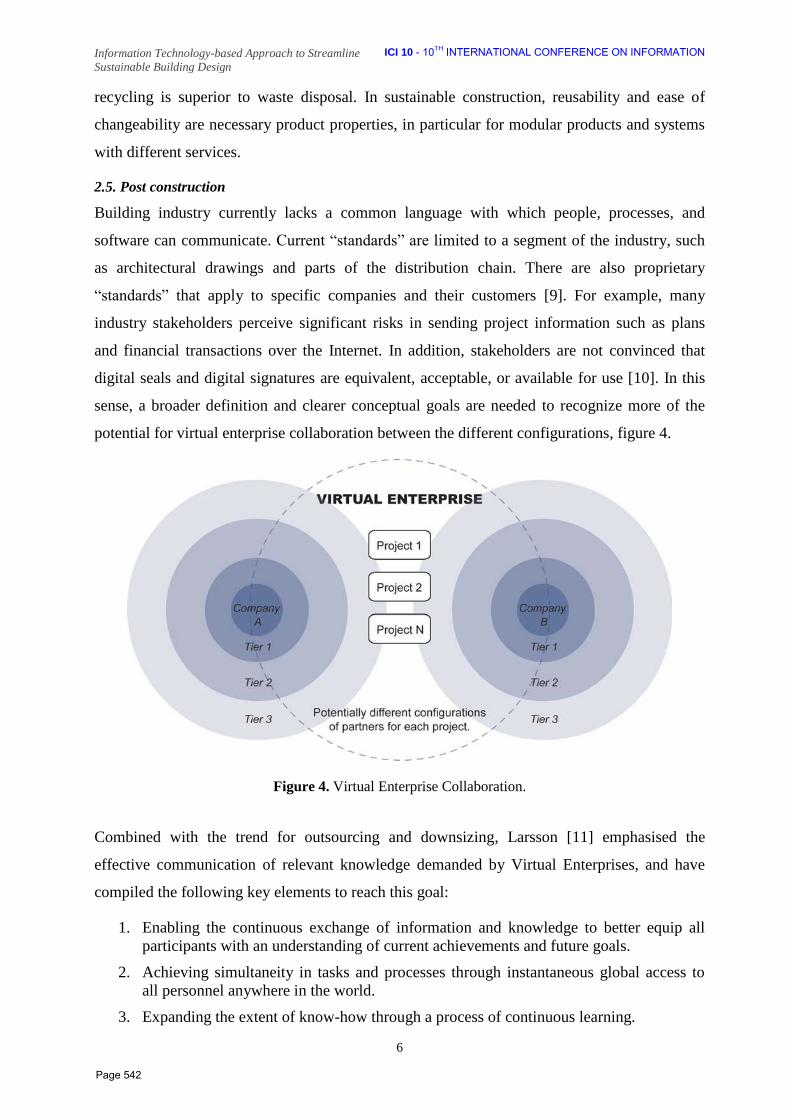
Information Technology-based Approach to Streamline
Sustainable Building Design
ICI 10 - 10TH INTERNATIONAL CONFERENCE ON INFORMATION
6
recycling is superior to waste disposal. In sustainable construction, reusability and ease of
changeability are necessary product properties, in particular for modular products and systems
with different services.
2.5. Post construction
Building industry currently lacks a common language with which people, processes, and
software can communicate. Current “standards” are limited to a segment of the industry, such
as architectural drawings and parts of the distribution chain. There are also proprietary
“standards” that apply to specific companies and their customers [9]. For example, many
industry stakeholders perceive significant risks in sending project information such as plans
and financial transactions over the Internet. In addition, stakeholders are not convinced that
digital seals and digital signatures are equivalent, acceptable, or available for use [10]. In this
sense, a broader definition and clearer conceptual goals are needed to recognize more of the
potential for virtual enterprise collaboration between the different configurations, figure 4.
Figure 4. Virtual Enterprise Collaboration.
Combined with the trend for outsourcing and downsizing, Larsson [11] emphasised the
effective communication of relevant knowledge demanded by Virtual Enterprises, and have
compiled the following key elements to reach this goal:
1. Enabling the continuous exchange of information and knowledge to better equip all
participants with an understanding of current achievements and future goals.
2. Achieving simultaneity in tasks and processes through instantaneous global access to
all personnel anywhere in the world.
3. Expanding the extent of know-how through a process of continuous learning.
Page 542
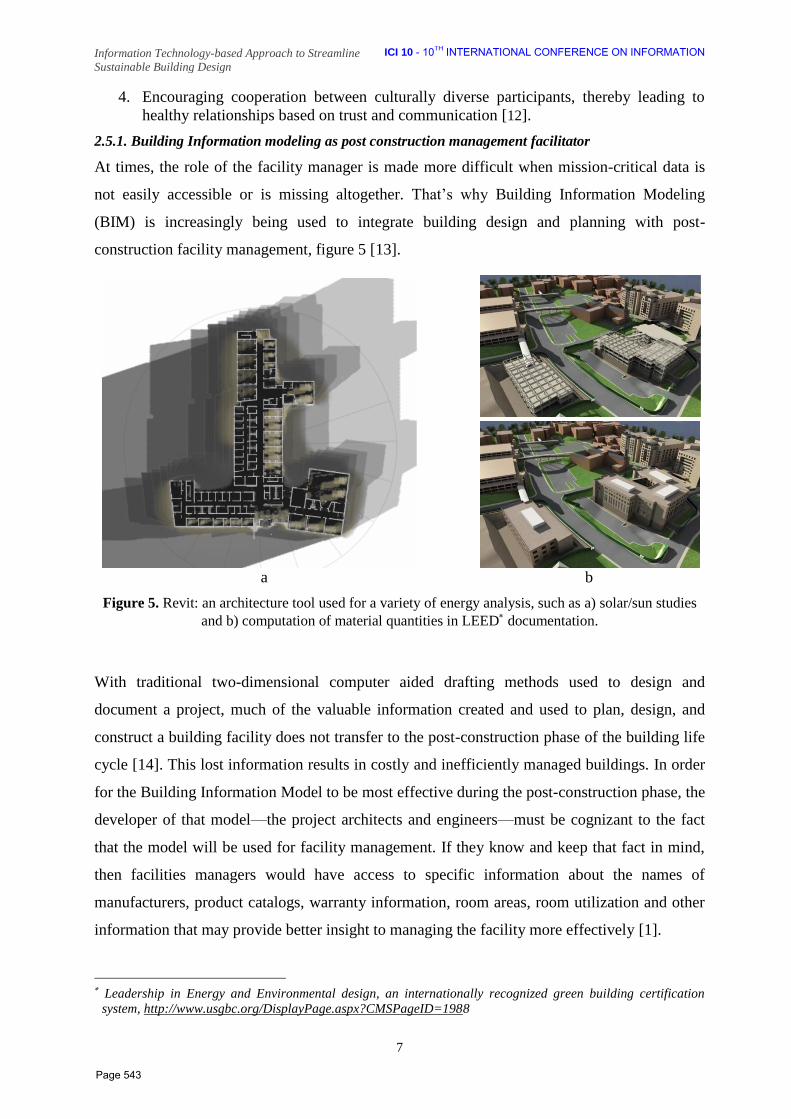
Information Technology-based Approach to Streamline
Sustainable Building Design
ICI 10 - 10TH INTERNATIONAL CONFERENCE ON INFORMATION
7
4. Encouraging cooperation between culturally diverse participants, thereby leading to
healthy relationships based on trust and communication [12].
2.5.1. Building Information modeling as post construction management facilitator
At times, the role of the facility manager is made more difficult when mission-critical data is
not easily accessible or is missing altogether. That’s why Building Information Modeling
(BIM) is increasingly being used to integrate building design and planning with post-
construction facility management, figure 5 [13].
a b
Figure 5. Revit: an architecture tool used for a variety of energy analysis, such as a) solar/sun studies
and b) computation of material quantities in LEED documentation.
With traditional two-dimensional computer aided drafting methods used to design and
document a project, much of the valuable information created and used to plan, design, and
construct a building facility does not transfer to the post-construction phase of the building life
cycle [14]. This lost information results in costly and inefficiently managed buildings. In order
for the Building Information Model to be most effective during the post-construction phase, the
developer of that model—the project architects and engineers—must be cognizant to the fact
that the model will be used for facility management. If they know and keep that fact in mind,
then facilities managers would have access to specific information about the names of
manufacturers, product catalogs, warranty information, room areas, room utilization and other
information that may provide better insight to managing the facility more effectively [1].
Leadership in Energy and Environmental design, an internationally recognized green building certification
system, http://www.usgbc.org/DisplayPage.aspx?CMSPageID=1988
Page 543
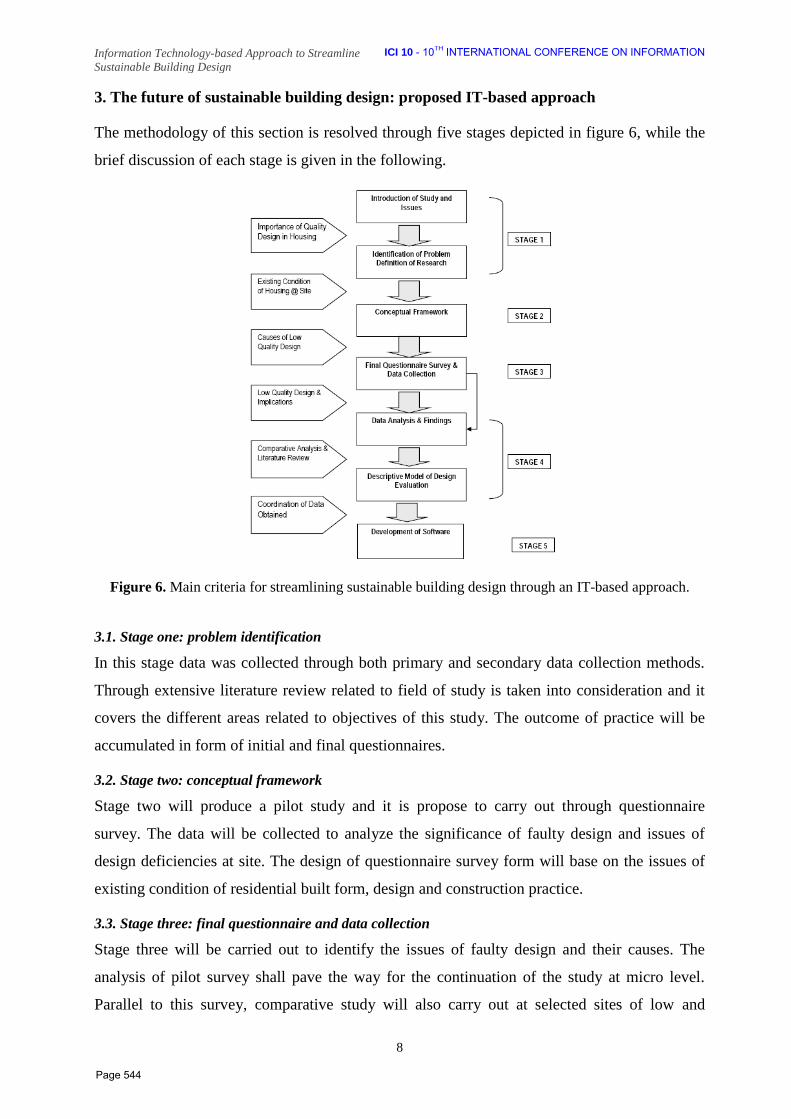
Information Technology-based Approach to Streamline
Sustainable Building Design
ICI 10 - 10TH INTERNATIONAL CONFERENCE ON INFORMATION
8
3. The future of sustainable building design: proposed IT-based approach
The methodology of this section is resolved through five stages depicted in figure 6, while the
brief discussion of each stage is given in the following.
Figure 6. Main criteria for streamlining sustainable building design through an IT-based approach.
3.1. Stage one: problem identification
In this stage data was collected through both primary and secondary data collection methods.
Through extensive literature review related to field of study is taken into consideration and it
covers the different areas related to objectives of this study. The outcome of practice will be
accumulated in form of initial and final questionnaires.
3.2. Stage two: conceptual framework
Stage two will produce a pilot study and it is propose to carry out through questionnaire
survey. The data will be collected to analyze the significance of faulty design and issues of
design deficiencies at site. The design of questionnaire survey form will base on the issues of
existing condition of residential built form, design and construction practice.
3.3. Stage three: final questionnaire and data collection
Stage three will be carried out to identify the issues of faulty design and their causes. The
analysis of pilot survey shall pave the way for the continuation of the study at micro level.
Parallel to this survey, comparative study will also carry out at selected sites of low and
Page 544
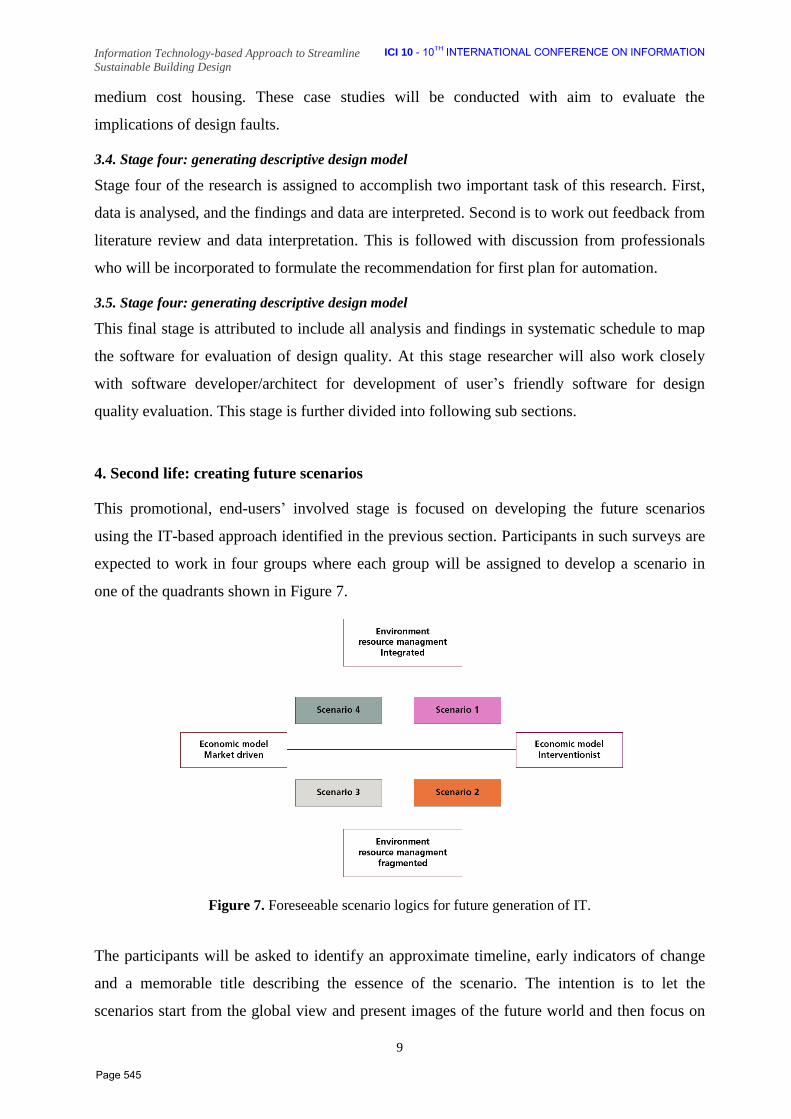
Information Technology-based Approach to Streamline
Sustainable Building Design
ICI 10 - 10TH INTERNATIONAL CONFERENCE ON INFORMATION
9
medium cost housing. These case studies will be conducted with aim to evaluate the
implications of design faults.
3.4. Stage four: generating descriptive design model
Stage four of the research is assigned to accomplish two important task of this research. First,
data is analysed, and the findings and data are interpreted. Second is to work out feedback from
literature review and data interpretation. This is followed with discussion from professionals
who will be incorporated to formulate the recommendation for first plan for automation.
3.5. Stage four: generating descriptive design model
This final stage is attributed to include all analysis and findings in systematic schedule to map
the software for evaluation of design quality. At this stage researcher will also work closely
with software developer/architect for development of user’s friendly software for design
quality evaluation. This stage is further divided into following sub sections.
4. Second life: creating future scenarios
This promotional, end-users’ involved stage is focused on developing the future scenarios
using the IT-based approach identified in the previous section. Participants in such surveys are
expected to work in four groups where each group will be assigned to develop a scenario in
one of the quadrants shown in Figure 7.
Figure 7. Foreseeable scenario logics for future generation of IT.
The participants will be asked to identify an approximate timeline, early indicators of change
and a memorable title describing the essence of the scenario. The intention is to let the
scenarios start from the global view and present images of the future world and then focus on
Page 545
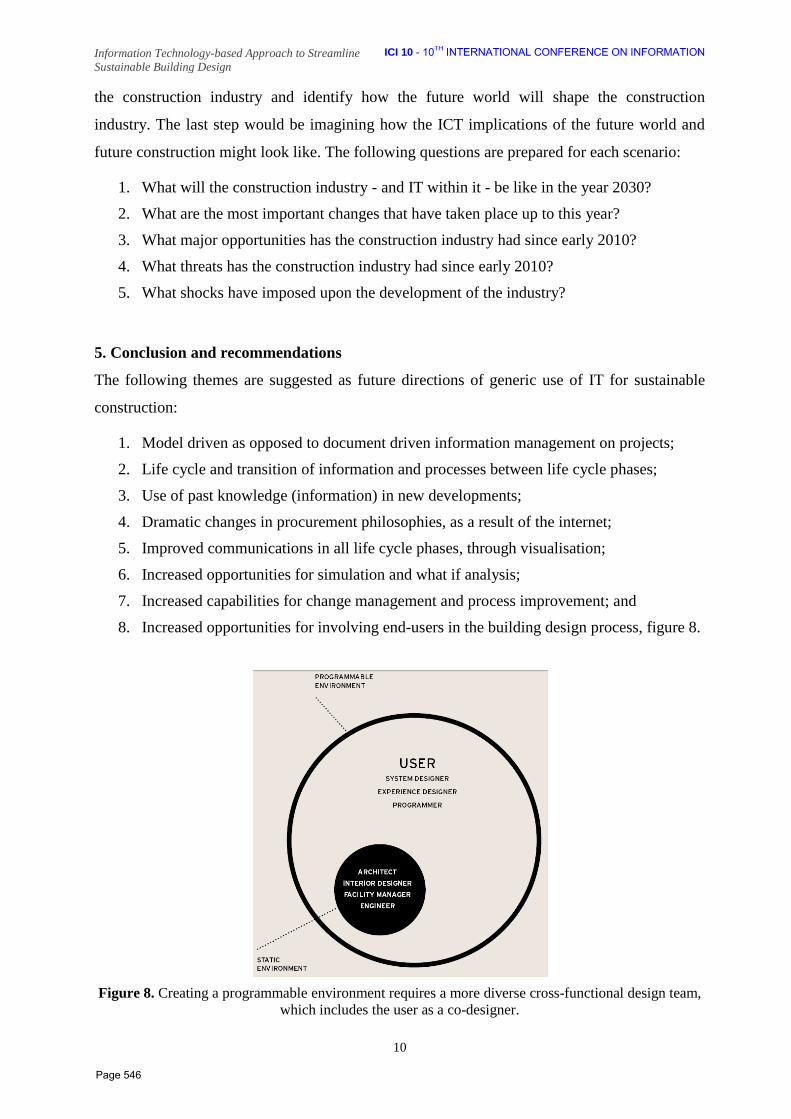
Information Technology-based Approach to Streamline
Sustainable Building Design
ICI 10 - 10TH INTERNATIONAL CONFERENCE ON INFORMATION
10
the construction industry and identify how the future world will shape the construction
industry. The last step would be imagining how the ICT implications of the future world and
future construction might look like. The following questions are prepared for each scenario:
1. What will the construction industry - and IT within it - be like in the year 2030?
2. What are the most important changes that have taken place up to this year?
3. What major opportunities has the construction industry had since early 2010?
4. What threats has the construction industry had since early 2010?
5. What shocks have imposed upon the development of the industry?
5. Conclusion and recommendations
The following themes are suggested as future directions of generic use of IT for sustainable
construction:
1. Model driven as opposed to document driven information management on projects;
2. Life cycle and transition of information and processes between life cycle phases;
3. Use of past knowledge (information) in new developments;
4. Dramatic changes in procurement philosophies, as a result of the internet;
5. Improved communications in all life cycle phases, through visualisation;
6. Increased opportunities for simulation and what if analysis;
7. Increased capabilities for change management and process improvement; and
8. Increased opportunities for involving end-users in the building design process, figure 8.
Figure 8. Creating a programmable environment requires a more diverse cross-functional design team,
which includes the user as a co-designer.
Page 546
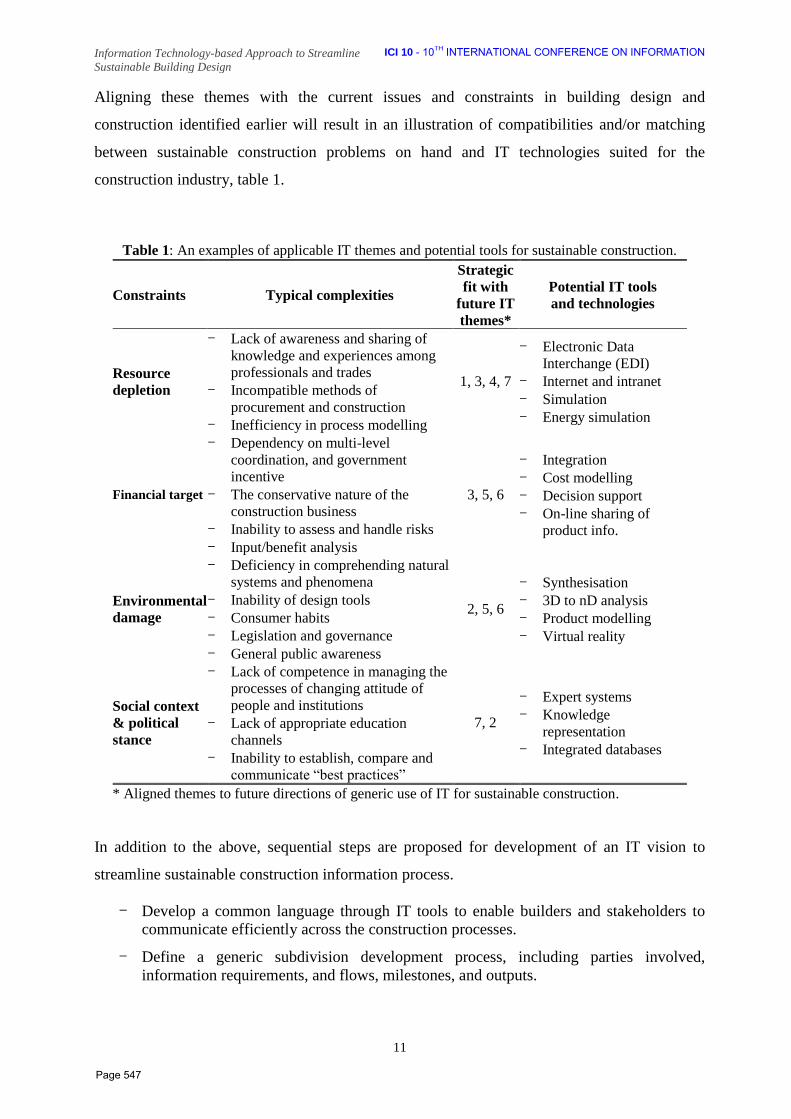
Information Technology-based Approach to Streamline
Sustainable Building Design
ICI 10 - 10TH INTERNATIONAL CONFERENCE ON INFORMATION
11
Aligning these themes with the current issues and constraints in building design and
construction identified earlier will result in an illustration of compatibilities and/or matching
between sustainable construction problems on hand and IT technologies suited for the
construction industry, table 1.
Table 1: An examples of applicable IT themes and potential tools for sustainable construction.
Constraints Typical complexities
Strategic
fit with
future IT
themes*
Potential IT tools
and technologies
Resource
depletion
- Lack of awareness and sharing of
knowledge and experiences among
professionals and trades
- Incompatible methods of
procurement and construction
- Inefficiency in process modelling
1, 3, 4, 7
- Electronic Data
Interchange (EDI)
- Internet and intranet
- Simulation
- Energy simulation
Financial target
- Dependency on multi-level
coordination, and government
incentive
- The conservative nature of the
construction business
- Inability to assess and handle risks
- Input/benefit analysis
3, 5, 6
- Integration
- Cost modelling
- Decision support
- On-line sharing of
product info.
Environmental
damage
- Deficiency in comprehending natural
systems and phenomena
- Inability of design tools
- Consumer habits
- Legislation and governance
- General public awareness
2, 5, 6
- Synthesisation
- 3D to nD analysis
- Product modelling
- Virtual reality
Social context
& political
stance
- Lack of competence in managing the
processes of changing attitude of
people and institutions
- Lack of appropriate education
channels
- Inability to establish, compare and
communicate “best practices”
7, 2
- Expert systems
- Knowledge
representation
- Integrated databases
* Aligned themes to future directions of generic use of IT for sustainable construction.
In addition to the above, sequential steps are proposed for development of an IT vision to
streamline sustainable construction information process.
- Develop a common language through IT tools to enable builders and stakeholders to
communicate efficiently across the construction processes.
- Define a generic subdivision development process, including parties involved,
information requirements, and flows, milestones, and outputs.
Page 547
Information Technology-based Approach to Streamline
Sustainable Building Design
ICI 10 - 10TH INTERNATIONAL CONFERENCE ON INFORMATION
12
- Review current software tools for land developers. The generic subdivision
development process will serve as the template for development of next generation
software tools.
- Use existing software tools as a starting point. Implement key steps of the process,
including community layout, plan submission, takeoffs for material and labor to build
infrastructure, cost estimating, and master scheduling.
- Demonstrate application of the system and evaluate its accuracy and utility compared to
existing approaches.
- Work with land developers on actual projects, running the system side-by-side with
whatever other approaches to design and planning are in use.
- Study the ease or complexity of use of the system and the accuracy of its outputs.
- Assess in quantitative terms the potential for improved efficiency (time savings, cost
savings, ease of revisions) and any drawbacks to this approach.
- Identify additional outputs or utility for incorporation into the system.
- Refine the system based on what is learned through the demonstration process and re-
evaluate or make the system available on a larger scale.
- Publicize the results and encourage broader implementation.
References
[1] Per Christiansson, Kjeld Svidt, and Kristian Birch Sørensen, Future Integrated Design
Environments. In “Journal of Information Technology in Construction (ITcon),” Kazi A.S, Aouad
G, and Baldwin A. (Eds.) ITcon Vol. 14, August (2009), pp. 445:60.
[2] Ralf Seppelt, Computer-Based Environmental Management. Weinheim: Wiley-VCH Verlag
GmbH & Co., KGaA, (2003).
[3] Christoph Morbitzer, Paul Strachan, Jim Webster, Brian Spires, and David Cafferty, Integration of
Building Simulation into the Design Process of an Architecture Practice. Proceedings of “Seventh
International IBPSA Conference, Rio de Janeiro, Brazil, August 13-15, (2001).
[4] Gabriela Goldschmidt, Design representation: private process, public image. In “Design
representation,” Gabriela Goldschmidt and William L. Porter (Eds.) London: Springer-Verlag
London Limited, (2004).
[5] Inger Andresen, Integrated building concepts. In “Integrating Environmentally Responsive
Elements in Buildings,” Øyvind Aschehoug and Inger Andresen (Eds.) Denmark, Aalborg
University, IEA-ECBCS Annex 44, (2008).
[6] Ali Hemmati and Ali Kheyroddin, Sustainable development in construction. In “World Academy
of Science, Engineering and Technology (WASET),” UK: Emerald Group Publishing Limited,
Issue 59, (2009), p. 19.
[7] Tan Yigitcanlar, Planning for Smart Urban Ecosystems: Information Technology Applications for
Capacity Building in Environmental Decision Making. In “Theoretical and Empirical Researches
in Urban Management,” Number 3(12), August (2009).
[8] Harish Chandra, Planning, Design and Construction of the Central Library Building as Dynamic
Engine and Multi-Functional Complex facilitating the Sharing, Interaction and Exchange of
Learning, Research Experiences, Knowledge and Information to achieve Academic Excellence: A
Case Study of Indian Institute of Technology Madras (IIT Madras). Proceedings of “World Library
and Information Congress: 72nd
IFLA General Conference and Council,” Seoul, Korea, August 20-
24, (2006).
Page 548

Information Technology-based Approach to Streamline
Sustainable Building Design
ICI 10 - 10TH INTERNATIONAL CONFERENCE ON INFORMATION
13
[9] Martin Woolley, The thoughtful mark maker – representational design skills in the post-
information age. In “Design representation,” Gabriela Goldschmidt and William L. Porter (Eds.)
London: Springer-Verlag London Limited, (2004).
[10] Irish Council for Science, Technology and Innovation (ICSTI), Investing in Research, Technology
and Innovation (RTI) in the Period 2000 to 2006. Statement of the Irish Council for Science,
Technology, and Innovation, (1999).
[11] Andreas Larsson, Engineering know-who: why social connectedness matters to global design
teams. Division of Computer Aided Design, Department of Applied Physics and Mechanical
Engineering, Lulea, Sweden: Lulea University of Technology, May (2005).
[12] Patricia Search, Digital storytelling for cross-cultural communication in global networking. In
“Selected Readings on Information Design communication, technology, history and education,”
Carla G. Spinillo, Petrônio Bendito & Stephania Padovani (Eds.) Curitiba, SBDI: Brazilian
Society of Information Design, (2009).
[13] Karen M. Kensek, BIM+: exploring the potentials of building information modelling for achieving
sustainable design. Proceedings of “The Value of Design,” 97th ACSA Annual Meeting, Portland,
Oregon, March 26-28, (2009).
[14] Mike Hobbs, Elaine Brown, and Marie Gordon, Learning and assessment with virtual worlds. In
“E-learning technologies and evidence-based assessment approaches,” Christine Spratt and Paul
Lajbcygier (Eds.) NY: Information Science Reference, (2009).
Page 549
GAMASA, EGYPT, 4 – 6 DECEMBER 2010
Automatic abstract preparation
Dr. Tünde Molnár Lengyel
Associate professor, Eszterházy Károly College, Department of Informatics, Hungary email: [email protected]
Abstract (Abstract Text; 11 pt Times New Roman, Maximum 200 words, justified, single spaced lines)
As the rapidly multiplying scientific information condemns any researcher’s effort to keep up with the latest development in his or her own field to futility the automatization of content exploration gains increasing significance. Consequently, any research or project helping to attract attention to or pointing out the essential information of a given scholarly text becomes indispensable. While in part due to the respective intricate linguistic structures the automatization of this task has not been fully achieved in Hungary, the urgency of the implementation of such project is not diminished.
Presently several programs facilitate the distinction of essential information in English language texts via the utilization of quantitative or qualitative principles in addition to the available help provided for researchers of German, French, Greek, Spanish, Italian, and Chinese texts. Consequently, my research project aiming to develop an automatized Hungarian language text extraction program attempts to remedy the abovementioned situation.
In my presentation I would like to examine the possibilities and limitations of the automation of research abstract preparation in addition to surveying the procedures and technological implementations facilitating the compilation of research abstracts in the Hungarian language.
Keywords: Automatic abstract preparation; content analysis, quantitative programme, qualitative programme
1. Introduction
As a result of an ever-increasing availability of new information the automation of
documentary content exploration is steadily gaining importance. Since the virtually
unprocessable amount of information makes keeping up with the latest professional
developments even in our field, library science and information management, rather difficult,
research projects aiming at promoting the selection and identification of appropriate
information assume a vital significance. One possible solution to the above quandary,
Page 550
automation can yield several benefits including improved efficiency of information search and
retrieval systems, newly developed Internet search engines, in addition to the Internet-based
news monitoring systems. While information retrieval appears to be crucial, issues concerning
information processing have to be addressed as well. Such potential questions have to be
answered as what should be done after identifying the respective information, can after
entering a given web-page or obtaining the electronic version of a needed article or book the
user be left on his or her own, or be offered assistance? The thorough reading of the given text
is rather time-consuming and if we consider the ever-increasing number of publications we can
see that an instructor or researcher aiming to keep up with the latest developments in his or her
field will be compelled to spend much more time reading these materials than it is practically
feasible. The requirements of one’s profession or the expectations of society also lead to an
increase in the number of articles as the evaluation and potential advancement of a college
instructor or academic researcher in any discipline are based upon the number of articles
published and lectures held at scholarly conferences. Consequently, simultaneously with the
growing number of publications the articles’ novelty content declines and redundancies along
with overlaps also increase. This problem is not discipline-specific as the ever-growing number
of professional publications leads to the decline of novelty or new information capacity and
increases the potential of overlaps and redundancies.
2. Methods (Experimental / Theoretical) (12pt Times New Roman, Bold)
Therefore, the role of research abstracts becomes more and more significant as by the help of
the former the reader uses the tenth of the time in obtaining relevant, or (theoretically) the most
important information compared to the full reading of the given text. Furthermore, the
compilation of research abstracts also helps in the elimination of redundancies.
While in my opinion, the significance and importance of research abstracts are beyond any
dispute, no one can be expected to read through all the periodicals containing research abstracts
and each respective excerpt However, research abstracts allow one to gain more information
relevant to his or her field and another important benefit is that the reading of these abstracts
helps one to decide whether the full reading of the given article is necessary. or not
So far we have examined the importance of research abstracts from a user’s point of view and
even after a brief glance we can safely conclude that the overview of the latter poses a
significant challenge in most disciplines. When we look at the other side of the coin, the
compilation of research abstracts, we have to contend with difficulties in that respect as well.
Page 551

The ever proliferating publications make the work of abstract and documentation compilers
more and more arduous as traditional methods cannot yield a comprehensive or approximate
reproduction of the given materials in the respective fields. A greater reliance on the computer
in the work of the documentalist appears to be the only solution, as more and more procedures
should be elaborated to facilitate the presentation of the most important elements of articles, or
possibly books.
While nowadays leading scientific publications require authors to provide abstracts or
summaries to their submitted articles, only a very few articles are published in this format, and
the abstract preparation potential of documentation experts is limited due to other professional
commitments. Consequently, any research or project helping to attract attention to or pointing
out the essential information of a given scholarly text becomes indispensable. While in part due
to the respective intricate linguistic structures the automatization of this task has not been fully
achieved in Hungary, the urgency of the implementation of such project is not diminished. ”In
light of the wide-spread applicability and popularity of abstracts, the need to automatize this
process is all the more justified”. Due to the usability and popularity of text extracts the
automatization of the respective representational process appears to be natural.”[1]
Presently several programs facilitate the distinction of essential information in English
language texts via the utilization of quantitative or qualitative principles (Supplement 1) in
addition to the available help provided for researchers of German(1), French(2), Greek(3),
Spanish(4), Italian(5), and Chinese(6) texts. Consequently, my research project aiming to
develop an automatized Hungarian language text extraction program attempts to remedy the
abovementioned situation.
In the following section I would like to examine the possibilities and limitations of the
automation of research abstract preparation in addition to surveying the procedures and
technological implementations facilitating the compilation of research abstracts in the
Hungarian language.
Content analysis
While several theoretical approaches have been put forth for content analysis purposes
including the manual process developed in 1963[2], despite the call of the 2001 edition of the
Librarians’ Reference Book[3], for the elaboration of automatic Hungarian language extract
programs this goal has not yet been fully realized
Look at the some options for the automatization of extract preparation! Content extraction
software is usually grouped according to its ability to facilitate quantitative or qualitative
Page 552

content analysis. However, no clear distinction can be made between the two approaches. All
software capable of performing qualitative content analysis provide quantity-based reports and
the qualitative approach is primarily indicated by provision of memoranda and annotations..My
research leads me to conclude that most programs do not go beyond statistical reporting, which
on the one hand, helps researchers to make conclusions or perform analyses, but on the other,
very few applications facilitate content extraction. While my research effort can be grouped
into the category of quantity-based content analysis, in addition to focusing on statistical data I
aim to discern the essential components of particular texts.
The first step for the automation of abstract preparation is ascertaining how many times do
certain words (treated as separate units) appear in the text Then the given set of data is
organized according to frequency and thus the statistical verbal rendering of the text is
obtained.
Frequency analysis
It was Zipf who discovered a certain regularity in the distribution of the words and structures
of the text. He examined Joyce’s Ulysses, and having arranged the words of the novel
according to occurrence, he asserted ’’that the product of the cumulative occurrence figures
and the inclusive frequency values is constant.’’[4]
In order to perform a frequency analysis in the text, the roots of the words of the text (type)
along with the different forms of occurrence (sign) have to be identified and the occurrence
will be ranked according to frequency.
Whereas the identification of roots is a painstakingly long effort calling for the inclusion of the
computer in the work process, in case of Hungarian texts this is the most difficult task. One
possible solution could be computer-assisted linguistics, which in Hungary started in 1960 with
the introduction of mechanized translations. This period was primarily characterized by the
elaboration of the foundations of the mechanized translation algorithm from Russian to
Hungarian language. The second era (1967-71) is defined by the work of documentary
linguistics experts elaborating a syntactic analysis method of their own. The third lexicologic
phase (1972-78) responding to the needs of literary critics or philologists included the
development of software for language teaching and the compilation of quantitative-analysis
based frequency dictionaries focusing on colloquial and literary Hungarian. However, these
research results were so closely associated with certain scholars that the disbanding of the
Documentation Group in 1972 in Budapest all but eliminated linguistics research efforts. With
1979 the fourth stage begins, experiencing an attempt made to make up for the loss of research
Page 553
experience in the 1970’s. As a result of a dynamic development of language processing
systems throughout Europe, Hungarian researchers elaborate the MI language culminating in
the arrival of a Hungarian morphological analysis application method.
The appearance of personal software in the 1990’s lead to rapid developments. The elaboration
of a spelling and grammar check system taking into consideration of the characteristics of the
Hungarian language was a significant achievement of this period. In this system the
composition of words, that is the connection between the root and the suffix, was described by
an algorithm. Morphologic, the firm responsible for its development, became one of the
leading companies in the computerized linguistics field after Microsoft purchased their
program. The newer versions of this software examines the context and can eliminate the
irrelevant interpretations.[5] Today more and more Hungarian institutions achieve world wide
reputation due to their computerized linguistics efforts. For example, the ILP, or Inductive
Logic Programming developed in the Artificial Intelligence Research Laboratory of the
Hungarian Academy of Science and of Szeged University played a pioneering role in the
introduction of experimental linguistic applications.
While the abovementioned results help in the identification of roots of words in the Hungarian
language, they have not yet been applied in the field of library science.
Following the identification of roots, the counting of the words contained by the given text is
necessary for the frequency analyses, a task which can be carried out via simple programming
commands.
In order to perform a frequency analysis or prepare an abstract or excerpt, the significant
expressions contained by the given text have to be identified.
Methods
Consequently I propose two solution methods. The definition of significant words can be
achieved by the use of Luhn’s principle.[6] ”While the textual statistics approach utilizing the
Luhn method has provided the most reliable results until now,” the definition of the significant
words can be done by the vocabulary or dictionary method as well.
1. Following Zipf’s laws, significant expressions constitute the given domain of the
frequency list which is dependent upon the respective discipline. However, it is true
in all disciplines that these expression do not constitute the beginning or the end of
the given list. The list of significant words is obtained when the Gauss curve
Page 554
defined according to the empirical method characteristic of the given discipline is
projected on to the frequency distribution function.[7]
As far as Hungarian texts are concerned few disciplines elaborated a frequency
dictionary facilitating the construction of the Gauss curve. Although word
frequency dictionaries have been developed in Hungary,[8] these are not discipline-
specific. Nevertheless, computerized linguistics research and dictionary compilation
efforts[9], can promise solutions for the future.
2. Luhn theorem is non-forbidden words occurring more than three times are
considered significant. According to Luhn’s notion, elaborated in 1951, the multiple
occurrence of certain doublets or triple word constructs can be helpful in computer-
assisted identification of terms carrying relevant information.. Having omitted
trivial expressions, the weighting of adjacent words and triple word constructs help
to identify relevant sections of the text. Consequently non-trivial expressions
containing two or more units get a higher weighting value than their counterparts
appearing only once in the text. Having established the weighting process, one has
to define which units he or she wants to retrieve as relevant location, either in the
form of a sentence or a paragraph Subsequently, the automation process starts
during which a numerical value is assigned to the chosen unit based upon the
weighting process and the sentences and paragraphs reflecting the highest numerical
value are retrieved as a result.
In my view the combination of both approaches appears to be the best answer. Accordingly, in
case of texts covering an area in which word frequency dictionaries are available those
dictionary compilations should be used for that purpose, and in lieu of the word frequency
dictionary Luhn’s method should be applied. The latter method identifies and defines the
significant expressions via the analysis of the frequency of the words in the given text. It is
vital to determine the structure or components of the resulting extract. While I recommend the
preservation of the most important sentences, this method raises several problems as well:
• The references in the particular sentences have to be eliminated in order to
guarantee the intelligibility of the independent extracts. (if necessary linguistic
approaches should be used);
• it is important to focus on the intratextual position of the sentence,
• attention should be paid to the potential introductory expressions[10] with which the
author aimed to stress the given sentence (the collection and compilation of
expressions into a dictionary is feasible if the examination of manual text extraction
Page 555

substantiates this hypothesis, that is why in my view the examination of the main
features of manual extraction by assessing the features and exploring the principal
dynamics of manual extraction, and use up the results on the autimatization.)
From the very beginning of the research process I was compelled to search for an answer to
one of the most intriguing quandaries, the possibility of establishing rules and guidelines for
human or non-automated abstract preparation. In order to answer this question I tested the
summary preparation capability of students majoring in information management or library
science informatics programs at various higher education institutions, of informatics experts
and of students majoring in Hungarian language and literature. The participants of this survey
were asked to prepare the abstracts of professional articles focusing on various topics. On the
basis of result is worthy research this topic.
I chose scientific articles focusing on different topics as a subject of the survey. One treatise
followed a more interdisciplinary approach while the other treatise exclusively focused on
library science. Moreover, for the purpose of analysing the correlation between the subject of
the article and the knowledge of the sample group, participants not possessing an informatics
background were also involved in the survey. Having examined the abstracts of the article
focusing on library science I expect to discern a greater divergence between the outputs of
professional and lay sample groups, than in that of the case of the interdisciplinary treatise.
The group of people with non-informatics background contains students majoring in Hungarian
language and literature enabling me to examine which plays a more important role in abstract
preparation, professional knowledge or procedural skills.
In order to examine whether the different skills and professional levels of sample groups lead
to varying outputs in the abstract preparation process, not only students, but experts
represented the Information Science-Library Science field in the survey.
In order to examine whether the type of higher education institution in which the student is
enrolled impacts the abstract preparation process I analysed the composition of the student
sample groups.
3. Results (12 pt Times New Roman, Bold)
My results is as follows:
In case of both articles a strong correlation can be established between the abstracts prepared
by the student sample groups, while compared to the professionally prepared abstracts this
correlation is lower, but in case of articles on different subjects the results are similar as well.
Page 556

A significant difference supporting the correlation between the subject of the given article and
the proficiency of the sample group could not be discerned.
Content knowledge and non content-specific procedural proficiency in text condensation and
the identification of the essence of texts does not result in significant differences in case of the
student sample group.
According to the results of the analysis we can conclude that significant differences can be
discerned concerning the abstracts prepared by students and that of professional experts further
proving the hypothesis that the level of content knowledge impacts the final results of the
abstract preparation process. In case of students the content-specific knowledge does not lead
to major differences as the abstracts of both articles prepared by the three student groups show
a great similarity to each other but at the same time a major difference can be observed in
relation to abstracts prepared by professional experts.
Students tend to prefer sentences located in the beginning of the texts while the professional
experts tend to form the sentences of the abstracts from the total textual domain. Moreover, the
student markings are more homogeneous than that of the rankings prepared by experts
representing varying proficiency levels and differing professional backgrounds.
The identification of the crucial sentences of the text does not depend on the proficiency level
of the student groups. The abstracts prepared by student groups majoring in library science and
informatics programs at colleges and universities show no significant divergence. The close
positive connection is indicated by a higher than 0.9 correlation value of the weighed numbers
of the given sentences in the respective abstracts.
As one of my priorities was the examination of the efficiency of the abstract preparation
program. Consequently, I had to develop clear guidelines concerning the appropriate output
and I hoped that the several similar results would provide me with a term of reference and
comparison. But I get of the result, that there are no two people who would prepare the same
abstract.
4. Conclusion (12 pt Times New Roman, Bold)
In conclusion I would point out that automatization procedure, which was presentation in my
article, can only be used in case of discursive texts during which the author concentrates on one
topic and uses objective statements with a consistent vocabulary, form, and structure instead of
writing in a literary language. Generally, we can conclude that the Luhn method is more
Page 557
effective in case of scientific statements, publications and reports, than it would be in case of a
sophisticated literary work. Whereas automated abstract preparation systems have not yet been
implemented in Hungary, the demand for such apparatus appears to increase, well it can be
utilised in numerous areas:
• Researchers and instructors can increase their familiarity of the respective
professional texts. The search engines of the various web-pages are continously
improved as finding the right information is crucial. But what happens after locating
the respective information, or when a user reaches a certain web-page and gains
access to a downloadable article or book? At this point the user is left to his or her
own devices and is compelled to perform the time consuming activity of reading
through the given material. If we take into consideration the continuously increasing
number of published scholarly articles and texts it becomes obvious that a
researcher, instructor, or expert is forced to allocate more time to keeping up with
the latest results of his or her discipline than humanly possible.This is, however, not
a discipline specific problem as the ever-increasing number of publications leads to
a declining novelty value along with more frequent overlaps and redundance. My
program can provide much needed help enabling the researcher to peruse the
content of the given article before making a decision to perform a thorough reading.
Furthermore, the program helps in the identification of overlapping information as
well.
• While most integrated library systems store and provide extracts of the given
documents, the limited capacity of library staff does not allow a full utilization of
this feature. Consequently, the program can be potentially used in preserving senior
theses and dissertations in an electronic format, along with expanding the
applicability and processability options of the latter.
• Although more and more journals accessible on-line furnish extracts of the
respective articles, there are still several publications which do not go beyond
offering a table of contents from wich the full text of the article can be reached. My
program can significantly contribute to the improvement of this situation.
• Another potential use of the program concerns the publication activity of
researchers and instructors who are often required to prepare extracts or summaries
of their own work. This, however, raises a significant theoretical dilemma as there
are several conflicting views regarding the propriety of an author preparing the
summary or extract of his own work. The self-prepared extracts usually do not meet
Page 558

the criteria of the genre as the authors rather explain than summarize their own
works.Consequently, if authors prepared a separate extract of their work by the help
of the program and formed and improved it subsequently, they not only would save
time, but could go a long way in eliminating the errors of bias.
• Furthermore, due to the increasing popularity and availability of digitalization
projects more and more documents become available in electronic format which is
not only encouraging, but appears to justify the need for the elaboration of an
extracting program.
References (12 pt Times New Roman, Bold) [1] Horváth T., Papp I., „Könyvtárosok kézikönyve 2”,„Librarians’ Reference Book 2” Budapest,
Osiris, (2001) pp.146.
[2] Szalai Sándor, „Gépi kivonatkészítés.” „Mechanized extract preparation” Budapest, Országos
Műszaki Könyvtár és Dokumentációs Központ, (1963) pp.25-42.
[3] Horváth T., Papp I., „Könyvtárosok kézikönyve 2”,„Librarians’ Reference Book 2” Budapest,
Osiris, (2001) pp.146-147.
[4] Horváth T., Papp I., „Könyvtárosok kézikönyve 1”,„Librarians’ Reference Book 1” Budapest,
Osiris, (1999) p.107.
[5] Prószéki G., “Számítógépes nyelvészet.” “Computer Linguistics” Budapest, (1989). p. 489-492.
[6] Horváth T., Papp I., „Könyvtárosok kézikönyve 2”,„Librarians’ Reference Book 2” Budapest,
Osiris, (2001) p.146.
[7] Horváth T., Papp I., „Könyvtárosok kézikönyve 1”,„Librarians’ Reference Book 1” Budapest,
Osiris, (1999) p.56.
[8] Lengyelné Molnár Tünde, “Gyakorisági szótárak. Magyarországi helyzetkép.” “An assessment of
the availabilty of word frequency dictionaries in Hungary”, Könyvtári Figyelő, vol 52. n. 1. p. 45-58.
(2006.)
[9] Magyar Nemzeti Szövegtár; Szószablya szótár; Magyar Értelmező Kéziszótár gyakorisági adatai
Hungarian National Text Collection. Word Sabre Dictionary. Frequency data acquired from the
Hungarian Dictionary of Definitions
[10] Pl. „Összefoglalva”; „A lényeg”; „Ne feledjük” i.e. Such words are: ”in sum, the essence is,, let us
not forget”
Multimedia Data: (12 pt Times New Roman) 1) TACT software, http://www.chass.utoronto.ca/tact/index.html
2) TACT software, http://www.chass.utoronto.ca/tact/index.html, T-LAB software, http://www.tlab.it>
3) TACT software, http://www.chass.utoronto.ca/tact/index.html>
Page 559

Paper Title ICI 10 - 10TH INTERNATIONAL CONFERENCE ON INFORMATION
11
4) TEXTPACK homepage, http://www.gesis.org/en/software/textpack/index.htm>, T-LAB
homepage, http://www.tlab.it
5) T-LAB homepage, http://www.tlab.it>
6) CONCORDANCE homepage, http://www.concordancesoftware.co.uk/
Page 560

GAMASA, EGYPT, 4 – 6 DECEMBER 2010
1
Eg eg
Ergonomics Applications in sports field Mohamed Y. Ghieda
Associate Professor at Kinesiology Dept., Faculty of Sport Education, Mansoura University, ypt, [email protected].
Abstract Why we need ergonomics? Ergonomics or human engineering is one of the engineering sciences, which draws its information from studding the human movement, which seeks to identify the human capacity to improve the efficiency and use this information to design the space and tools and materials which used in sport activities separately, through the sport movements performance by less effort and best achievement in the light of the player potential physical and physical characteristic. Based on the above it is clear to us now, how important the application of this science in sport activities, leaving us with an important question: What are the obstacles to the application of ergonomics in sports field?
Keywords: (Ergonomics; Sport; Human Engineering; Players; Achievement; Performance)
1. Introduction
Most people have heard of ergonomics and think it is something to do with seating or with the design of car controls and instruments. It is, but it is much more. Ergonomics is the application of scientific information concerning humans to the design of objects, systems and environment for human use. Ergonomics comes into everything which involves people such as: Sports, work systems, leisure, defence, transport, agriculture, healthcare, education, construction, consumer goods and safety should all embody ergonomics principles if well designed. And we can say ergonomics fit between people and the things they do to achieve it quickly, easily, fewer mistakes and more comfortable. Ergonomics is the field of study that seeks to fit the job or the skill to the person or the player, rather than the person to the job. This is achieved through the evaluation and design of workplaces, environments, job tasks, sport equipments, and processes in relationship to human capabilities and interactions in the workplace. Ergonomics can be defined simply as the study of work. More specifically, ergonomics is the science of designing the job to fit the player, rather than physically forcing the player’s body to fit the skill, related Musculoskeletal Disorders (MSDs). Ergonomics draws on a number of scientific disciplines, including Physiology, Biomechanics, Psychology, Anthropometry, Industrial hygiene, and Kinesiology. Anytime there is a change in the workplace (new job, new tool, new tactics, new skill …), new ergonomic solutions are required. It is important that all sport equipments (bows, arrows, balls, shoes, chairs, desks …) and other accessories are adjustable in order to meet individual player's needs, for no two people are alike. Ergonomics covers the entire work area and the courts, including issues regarding the lighting, workstation, tools, and clothes too.
Effective use of ergonomic practices will assist in maintaining high levels of player productivity, avoiding Painful and costly player's injuries and increasing player satisfaction. By designing the job around the players will have a decreased risk of injury and an improved perception of their "employee-cantered" rules at play?
Page 561

2
2. Definitions
Ergonomics the term ergonomics is derived from the Greek words ergon (work) and nomos (natural laws), ergonnomos (ergonomics) is a science concerned with the physical and psychological relationship between machines and people who use them.
Ergonomist works in teams which may involve a variety of other professions: design engineers, sport coaches, production engineers, industrial designers, computer specialists, industrial physicians, health and safety practitioners, and specialists in human resources. The overall aim is to assesses these interactions and attempts to improve efficiency and reduce strain and discomfort.
Biomechanics a scientific and engineering field that explains the characteristics of biological system -the human body- in mechanical terms. Musculoskeletal disorders injuries and disorders of the soft tissues (muscles, tendons, ligaments, joints, and cartilage) and nervous system. Anthropometry the study of human body dimension measurements, used in developing design standards and requirements for manufactured products to ensure they are suitable for the intended audience. Industrial hygiene the science of anticipating, recognizing, evaluating, and controlling workplace conditions that may cause worker injuries and illnesses. Kinesiology study of the principles of mechanics and anatomy in relation to human movement. MSDs or musculoskeletal disorders are injuries and disorders of the soft tissues (muscles, tendons, ligaments, joints, and cartilage) and nervous system.
3. Results
A. The components of ergonomics Ergonomics deals with the interaction of technological and work situations with the human being. The basic human sciences involved are: Anatomy, Physiology, Psychology, Anthropometry, Biomechanics, and Kinesiology.
B. Ergonomics and player MSDs MSDs can affect nearly all the player body tissues, including the nerves and tendon sheaths, and most frequently involve the arms and back. Occupational safety and health professionals have called these disorders a variety of names, including cumulative trauma disorders, repeated trauma, repetitive stress injuries, and occupational overexertion syndrome. These painful and often disabling injuries generally develop gradually over weeks, months, and years. MSDs usually result from parts of the body affected by MSDs (Arms, Back, Hands, Wrists, Fingers, Legs, Neck, and Shoulders) C. To prevent back disorders
Coaches should teach players to avoid long reaches, maintain neutral postures, and use proper lifting techniques. Using correct posture is important whether a player is sitting,
Page 562

3
standing, pulling, pushing, lifting, or using tools or equipment. Training players in general lifting techniques also can help reduce the strain leading to back disorders. For example, players should use their leg muscles and bend their knees to pick up and lower heavy loads. Providing appropriate equipment, such as weight lifting can also reduce load weight, minimizing incorrect lifting and potential injury.
D. Type of training and education program we need Training and education program ensure that coaches sufficiently inform players about ergonomic risk factors at their sport so they are better able to participate actively in their own protection. It can be very helpful in designing improved workplaces to reduce MSD hazards. A good ergonomics training program will teach players how to properly use equipment, tools, and machine controls as well as the correct way to perform sport tasks. For example, coaches should encourage work methods that allow players to keep their joints in a neutral position (wrists straight and elbows bent at a right angle) while using tools requiring manual force to prevent excessive force on joints and tendons. Coaches also should tell players to avoid all side-to-side twisting and quick motions of their wrists and to keep their hands in line with their fore-arms while using tools or operating their sport equipments. E. The situation of Ergonomics in Egypt It is slightly different from the other countries, although the teaching material for students of engineering, medicine and applied arts for long time. And from a few years ago at some Faculties of Sport Education for graduation students only. The data of Egyptian consumers are still largely unknown as there are shortcomings in teaching due to a lack of available information and the inefficiency of teaching aids and lack of laboratories to perform the experiments efficiently. 4. Conclusion
Why ergonomics is important in sports field? New rolls of all sport require higher production rates and advances in technology to remain competitive and stay in top. As a result, sport today can involve: 1. Frequent lifting, carrying, and pushing or pulling loads without help from other players or devices, 2. Increasing specialization that requires the player to perform only one function or skill movement for a long period of time or day after day, 3. Training more than 8 hours a day, 4. Training at a quicker pace of work, such as faster assembly line speeds, and 5. having Tighter Grips when using sport tools. 6. Monitoring of individual capabilities is achieved by means of regular physical fitness testing. 7. Matching between task demands and individual capabilities. 8. Simulations (such as biomechanical modelling of performance) or protective sport equipment. 9. Selection of top players. 10. Exercise prescription.
Page 563

4
11. Choice of sport. 12. Designing sport equipments and systems, so that they are easier to use and less errors especially in high stress. 13. Designing tasks and jobs such as rest breaks. 14. Design of training arrangements to cover all significant aspects. 15. Designing working environments, including lighting and heating, to suit the needs of the players and the task performed. 16. Design of players protective equipments. 17. To employ sport techniques such as simulation-simulation and virtual reality VR to deepen and expand the influence of this science. These factors especially if coupled with Poor machine design, sport tools, and workplace design or the uses of improper tools, create physical stress on players’ bodies, which can lead to sport injury.
Who needs to read this Essay? You need to know about ergonomics if you are player, trainer, teacher or a coach in any sport field and you work activities and skill conditions include: 1. repeating the same Motion throughout your workday, 2. Training in awkward or stationary positions, 3. Lifting heavy or awkward items, 4. Using excessive force to perform tasks, and 5. Being exposed to excessive vibration or extreme temperatures.
What are the obstacles to the application of ergonomics in sports field? 1. The inferences that can be made from discrete studies and the influence of individual differences
on the results. In sport especially, the child is not simply an adult in miniature but requires specific study and understanding.
2. Similarly disabled athletes, whether chronically or temporarily affected, represent heterogeneous population exemplified by both the multiple events organised for them and the growing status of the Paralympic Games.
3. The need to study effects specific to age, gender, and sport. 4. Lack of specialists for its application in the sports field. 5. Need to modern technologies and massive financial capabilities. 6. The lack of scientific references and sources of how to benefit from applications of this science in
the sports field. 7. There is no suitable encourage for the researchers to research and experimentation in this area. 8. The concept of "information overload" between designers, engineers, sport coaches and different
sport competition rules.
References [1] Celine Mckeown, Michael Twiss, “Workplace ergonomics: a practical guide”, 2nd edition, IOSH, 2000.
[2] Ellis, Seth R, “Towards the design ergonomic: the evolution of the designer as functional interface with marketing and engineering”, Design Management Institute Review, Vole .5, No .3, Summer 1994.
[3] Liu, Tsai Lu and Hannum, Victoria, “What function form follows?” Proceeding of 2005 International Conference on Planning and Design, 37 -44, 2005.
Page 564

5
[4] Neville S., Alan H., Karel B., Eduardo S., Hal H., “Human factors ergonomics methods”, Taylor& Francis, 2002.
[5] Rothstein, Paul, “Rethinking design education in a time of change :risks and rewards”, Innovation, 23-25, Spring 2005.
[6] Steve Bayer, “Sports ergonomics”, lboro academy, London, UK, 2003. [7] Tomas Reilly, “Ergonomics in sport and physical activity :enhancing performance and improving safety”, Human Kinetics, 2010. [8] Zaki M. H., Nasar S. N., “Ergonomics in sport field”, Alexandria Library, Alex, Egypt, 2004.
Multimedia Data:
1) Ergonomic
information, http://www.nohsc.gov.au/OHSInformation/Databases/OHSSolutions/solutionslistres.asp?S
ort=Industry
2) Cornell University, http://ergo.human.cornell.edu
3) Ergo Solutions, http://www.ergosolutionsmag.com
4) Ergo Web, http://www.ergoweb.com/resources/casestudies
5) Human Factors/Ergonomics Society (HFES), http://www.hfes.org
ww.iea.cc6) International Ergonomics Association (IEA), http://w
rgo7) UC Berkeley/SF, http://www.me.berkeley.edu/e
8) UC Davis Ag-Ergo, http://ag-ergo.ucdavis.edu
9) Ergonomic basics, http://ergonomics.about.com/od/ergonomicbasics/a/ergo101.htm
f Industrial Design Education 10) National Instructive Committee o
China, http//:edu.dolcn.com/schoollist.html
11) Basic Ergonomics, http://en.wikipedia.org/wiki/Ergonomics
12) Ergonomics in sport& leisure, http://www.ergonomics.org.uk/sig
Page 565
GAMASA, EGYPT, 4 – 6 DECEMBER 2010
The relationship between Knowledge Management and Corporate Performance: An Applied Study on Public Enterprises Sector for
Pharmaceutics
Dr. Salma Ali Eldeen Said
Doctor of Business Administration Delta University for Science & Technology
Email: [email protected]
Abstract Knowledge is considered as one of the most important economic resources, it is
essential for the competitive strategy of any organization. It has become the representative of the future value of the corporation. Because knowledge is intangible, it cannot be measured, but such activities or outcomes associated with applying knowledge can be measured. Managing knowledge effectively can improve corporate performance continuously.
Generally, the purpose of this research is to analyze the relationship between knowledge management and the performance of Public Enterprises Sector for Pharmaceutics by approaching innovative Structural Equation Modelling analysis with Balanced Scorecard (BSC), that contains four perspectives which are; learning & growth; internal processes; customers; and financial performance.
The research found that there is a positive relationship and indirect effects of knowledge on Public Enterprises Sector for Pharmaceutical from the perspective of learning and growth, a positive relationship and direct effect from the perspective of internal processes, and a negative relationship from the customer perspective. However, there is no relationship from the financial performance perspective. The research recommends that the Public Enterprises Sector for Pharmaceutical is entrusted to professional management firms, providing the efficiencies of human resources, and providing necessary finance for sustainable development and industrial modernization.
1. Introduction Public sector medication business is one of the most important strategic sectors in
the Egyptian economy. It links up with providing individuals with the medications, which consider one side of the square of the life, as Food, clothing, housing and ……etc.
The knowledge represents one of requirements of developing, growth and
continuation the pharmaceutical industry, also requirements of the local and international competition. This becomes important especially after (TRIPS) or intellectual property agreement .This agreement becomes a great challenging to the pharmaceutical industry, due to the non-permission of purchasing the raw material, only the original producer can do that or you need permission from the patent owner. It may lead to a bad effect on the productivity cost of pharmaceutical industry particularly and on the Egyptian economy in
Page 566
general. Thus, this requires doing necessary researches to know the relationship between Knowledge management and the performance of the Public Enterprises Sector for Pharmaceutics.
2. Literature Review and Conceptual framework of the research
2.1. Literature Review
Prior researches have examined the relationships of Knowledge management and the performance, for example, Chen & Cheng (2008) proposed an approach of measuring a technology university's knowledge management (KM) performance from competitive perspective. The approach integrates analytical network process (ANP), which is a theory of multiple criteria decision-making and is good at dealing with tangible and intangible information, with Balanced Scorecard (BSC) that contains four perspectives, including customer perspective, internal business perspective, innovation and learning perspective, and financial perspective, being adopted as the indicators of KM performance measurement (KMPM).
This paper makes three important contributions: (1) it propose a methodology of comparing an organization's knowledge management per-formance with its major rivals to offer effective information for improving KM. increasing decision making quality, and obtaining clear effort direction of attaining competitive advantage; (2) it explores the case involving a lot of findings that present the positions of the case organization against its major rivals and imply that the technology university has to reinforce knowledge creation and accumulation to catch up with its competitive rivals; and (3) it is generic in nature and applicable to benefit an organization. The results prove the proposed method can act as a measurement tool for the entire KM of an organization.
Wen (2009) developed a model for the measurement of the effectiveness of knowledge management in Taiwanese high-tech enterprises. Following a survey of the relevant literature on the subject, the study describes the construction of the model - including the opinions of specialists, scholars, and practitioners of knowledge management practice among Taiwan's high-tech firms, the use of focus groups, the application of analytic hierarchy process (AHP), and a questionnaire analysis of qualitative and quantitative methods. The study summarizes the experts' opinions, selects the measurement indicators, and calculates the weightings of dimensions and items. An empirical study is then conducted to test the validity and reliability of the model, and its suitability for improving the measurement of knowledge management effectiveness in high-tech firms.
Kalling (2003) argued that current research into knowledge management fails to
recognize and offer a detailed understanding about the role of knowledge in improving firm performance. Instead of focusing, exclusively, on the nature and attributes of knowledge & management of learning, research should also direct attention to the factors that enable knowledge to contribute to performance. To aid in this, his paper suggests that the concept of knowledge management is divided into three instances; development, utilization and capitalization, based on the assumption that knowledge is not always utilized, and that utilized knowledge does not always result in improved performance. The paper also identifies challenges and solutions in relation to each of the instances. Empirical findings
Page 567

are based on empirical study of three knowledge ventures within a European manufacturing MNC.
Zack.. et al (2009) examined the relationships of Knowledge management and the
performance, A search of the literature revealed 12 KM practices whose performance impact was assessed via a survey of business organizations. Findings - KM practices were found to be directly related to organizational performance which, in turn was directly related to financial performance. There was no direct relationship found between KM practices and financial performance. A different set of KM practices was associated with each value discipline (i.e. customer intimacy, product development and operational excellence) A gap exists between the KM practices that firms believe to be important and those that were directly related to organizational performance.
Lee & Chol (2008) investigated knowledge management factors such as enablers
processes, and performance. However, most current empirical research has explored the relationships between these factors in isolation. To fill this gap, this paper develops a research model that interconnects knowledge management factors. The model includes seven enablers: collaboration, trust, learning, centralization, formalization, T-shaped skills, and information technology support. The emphasis is on knowledge creation processes such as socialization, externalization, combination, and internalization. To establish credibility between knowledge creation and performance, organizational creativity is incorporated into the model. Surveys collected from 58 firms were analyzed to test the model. The results confirmed the impact of trust on knowledge creation. The information technology support had a positive impact on knowledge combination only. Organizational creativity was found to be critical for improving performance; neglecting ideas can undermine a business. The results may be used as a stepping stone for further empirical research and can help formulate robust strategies that involve tradeoffs between knowledge management enablers.
Gooijer (2000) argued that measuring the business benefits of knowledge
management is difficult. Even more so for public sector agencies whose outcomes are social benefits, rather than simple profit. In addition, it describes an approach for measuring the performance of knowledge management strategies for a public sector agency in Victoria, Australia. Knowledge management is defined as those actions which support collaboration and integration. Two models are presented, for measuring knowledge management performance and knowledge management behaviours: a performance framework based on the balanced scorecard approach, and a behaviour framework that identifies levels of practice demonstrated by individuals. The Knowledge Management Performance Scorecard maps the objectives for knowledge management across the balanced scorecard's key result areas, while Knowledge Management Behaviour Framework identifies seven levels of knowledge management skills for demonstrating collaborative behaviour. The framework also outlines what might be typical behaviours of managers and the roles they would assume in relation to individuals at each level.
2.1.1. The scientific contribution of the research: The previous studies indicate that there is a default in the traditional system of
measuring the performance Norton (2001) Brigham et al (2005), that‘s because it depends on the financial measurements only. So Healy et al (82) offered the Economic value added theory (EVA), to express the true profits of the companies and to reflect the concept of the economical profit under the concept of value creation.
Page 568

However, this didn’t give here any validity. Kaplan & Norton (2001) developed Balanced Scorecard which relies on the current research of measuring the knowledge management performance. It based on translation the whole view of performance companies, according to a balanced set of financial and non-financial performance. It’s distributed to four basic perspectives which cover the different dimensions of the general performance, according to a set of variables which start with learning and growth, then the internal processes, then the customer and finally the financial perspective, according to the Causal and Effect relation. They indicate the manner of value creation and starting with the vision and the strategy of the company.
Some of the previous studies depended on the traditional statically methods, like descent analysis and the connection to study the relation between the knowledge performance and the performance of the companies. The other studies depend on questionnaire lists to realize a sample of respondents according to Kalling (2003) measurement. This study reaches to contradictory results, because it divided the whole image of performance and ignores the direct and indirect medium variables. Thus, the current financial depended on statistically packed program AMOS 5; it is a specialized program of data analysis with the use of Structural Equation Modelling.
This informs the significant relations between each perspective of the Balanced
Scorecard and the significant relations. They express each perspective and indicate the direct and indirect effects of Structural Equation Modelling. Variables in which appear as a dependent variable in a relation and independent variable in another relation. This helps to reach a more accurate statistically implication Lee& Choi (2007). The Egyptian research is rare in the field of studying the relations between the knowledge management and the performance of companies under the Balanced Scorecard with the use of Structural Equation Modelling.
2.2. Conceptual framework of the research: Knowledge refers to an observer's distinction of "objects" through which brings forth
from the background of experience a coherent and self-consistent set of coordinated actions (Zeleny, 1987). Through the process of distinction, individual pieces of data and information become connected with one another in a network of relations. Knowledge then is contained in the overall organizational pattern of the network and not in any of the components.
Knowledge is more than information. Information is data organized into meaningful patterns. Information is transformed into knowledge when a person reads, understands, interprets, and applies the information to a specific work function. Knowledge becomes visible when experienced persons put into practice lessons learned over time.
A common definition of KM is: "The collection of processes that govern the creation, dissemination and leveraging of knowledge to fulfil organizational objectives ". KM is an emerging set of organizational design and operational principles, processes, organizational structures, applications and technologies that helps knowledge workers dramatically leverage their creativity and ability to deliver business value. In fact, KM is
Page 569
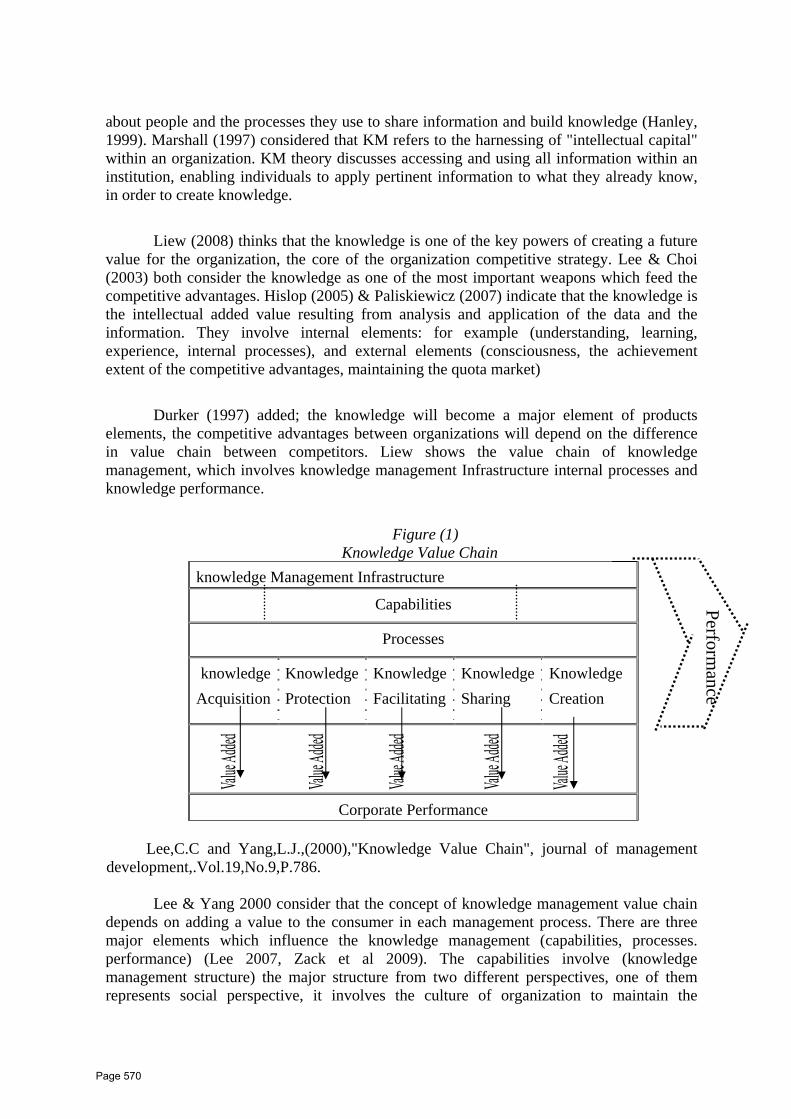
about people and the processes they use to share information and build knowledge (Hanley, 1999). Marshall (1997) considered that KM refers to the harnessing of "intellectual capital" within an organization. KM theory discusses accessing and using all information within an institution, enabling individuals to apply pertinent information to what they already know, in order to create knowledge.
Liew (2008) thinks that the knowledge is one of the key powers of creating a future value for the organization, the core of the organization competitive strategy. Lee & Choi (2003) both consider the knowledge as one of the most important weapons which feed the competitive advantages. Hislop (2005) & Paliskiewicz (2007) indicate that the knowledge is the intellectual added value resulting from analysis and application of the data and the information. They involve internal elements: for example (understanding, learning, experience, internal processes), and external elements (consciousness, the achievement extent of the competitive advantages, maintaining the quota market)
Durker (1997) added; the knowledge will become a major element of products elements, the competitive advantages between organizations will depend on the difference in value chain between competitors. Liew shows the value chain of knowledge management, which involves knowledge management Infrastructure internal processes and knowledge performance.
Figure (1) Knowledge Value Chain
knowledge Management Infrastructure
Capabilities
Processes
Knowledge Creation
KnowledgeSharing
KnowledgeFacilitating
KnowledgeProtection
knowledge Acquisition
Corporate Performance
Performance
Lee,C.C and Yang,L.J.,(2000),"Knowledge Value Chain", journal of management development,.Vol.19,No.9,P.786.
Lee & Yang 2000 consider that the concept of knowledge management value chain
depends on adding a value to the consumer in each management process. There are three major elements which influence the knowledge management (capabilities, processes. performance) (Lee 2007, Zack et al 2009). The capabilities involve (knowledge management structure) the major structure from two different perspectives, one of them represents social perspective, it involves the culture of organization to maintain the
Page 570

knowledge that provides creative advantages, the culture of individuals to create and divide the knowledge, the culture of managers to how manage the knowledge.
The other perspective represents the technical perspective (Information
Technology). The processes of knowledge management involve (Creation, Acquisition, Facilitating, Sharing, and Protection). Alavi & Leidner (2001) divided the processes of knowledge into (Creation, Storage, Sharing, and Protection) but Ruggles (1998) focus only on four processes for knowledge management (knowledge generation, facilities of growing knowledge, knowledge application, and knowledge transfer). The core of knowledge management is improving the performance of organizations (Lee (2007) - Zack et al. (2009).
2.2.1. Measuring knowledge management performance
Many study tended to measure knowledge management by the manner of its effectiveness in improving the performance, because knowledge is concrete and it’s difficult to be measured, performance measurements included financial measurements and non-financial measurements. The literatures of the study show that there are eight different methods to measure performance of knowledge management. This can be represented in the following table:
Table (1) A review of KM performance evaluation perspectives.
Category Sub-category Researchers
Qualitative analysis
Questionnaire
Expert interviews
Critical success
Changchit et al. (2001 )
Longbottom ans Chourides (2001)
Chourides et al. (2003 )
Quantitative analysis
Financial indicator
analysis
return on investment
Net present value Tobin's q
Laitamaki and Kordupleski ( 1997 )
Stein et al. ( 2001 )
Lev ( 2001 )
Hall et al. ( 2000 )
Non-financial Indicator
analysis
Communities of practice
Individual , context , content
and process knowledge
assessment
Smits and Moor ( 2004 )
Holt et al . ( 2004
Internal performance
analysis
Balanced scorecard
Activity based evaluation
Kaplan and Norton ( 1996 )
Martinsons et al . (1999)
Hassan and Gould (2001)
External performance Benchmarking Marr ( 2004 )
Page 571

analysis
Best practices
Pemberton et al . ( 2001 )
Asoh et al . ( 2002)
Project orientated
analysis
social patterns
KM project management
model
Bresnena et al . ( 2003 )
Kasvi et al . ( 2003 )
Organizational
orientated analysis Intellectual capital
Edvinsson ( 1997 )
Svelby ( 1998 )
Table 1 shows that:
- The approach of performance measurements of knowledge management varies from quantitative and non-quantitative analysis, from financial and non-financial analysis to internal and external analysis, then to basic analysis for projects and organizations. Methods of measurement differs from approach to another and from study to another, also the scale differs from study to another.
- The study of Yen & Yen (2005) present the growth in research which addressed
performance measurements of knowledge management from 2000-2005 with 50 %, while the period from 1995 to 2000 included 20% from quantitative analysis of performance measurements.
- Most researches which relies only on financial performance in performance
measurements of knowledge management resulted in indirect and weak effect of knowledge management on performance, that’s because it doesn’t reflect the intangible benefits of knowledge management, in addition its impact is not clear, but it took place on the long-term.
- The most previous researches in performance measurements of knowledge
management through internal performance and basic analysis for organization depend on Balanced Scorecard (BSC) in accordance to four basic perspectives, which included (Learning and growth, Internal Process, customer, and financial performance) this can be represented in the following table.
Table 2
Balanced Scorecard (BSC) Measures Perspectives Possible measures
Customer Customer satisfaction, retention, acquisition profitability, market share, customer referrals cross – selling price relative to competition, brand recognition.
Internal Process Operation
Management
Quality lead-time, inventory, productivity, efficiency, non-value adding activities, risk minimization, alternative distribution channels.
Customer Management Innovation
Customer products per customer, segmentation Number of new products, R&D, patents, new opportunities, and product & service diversification.
Page 572
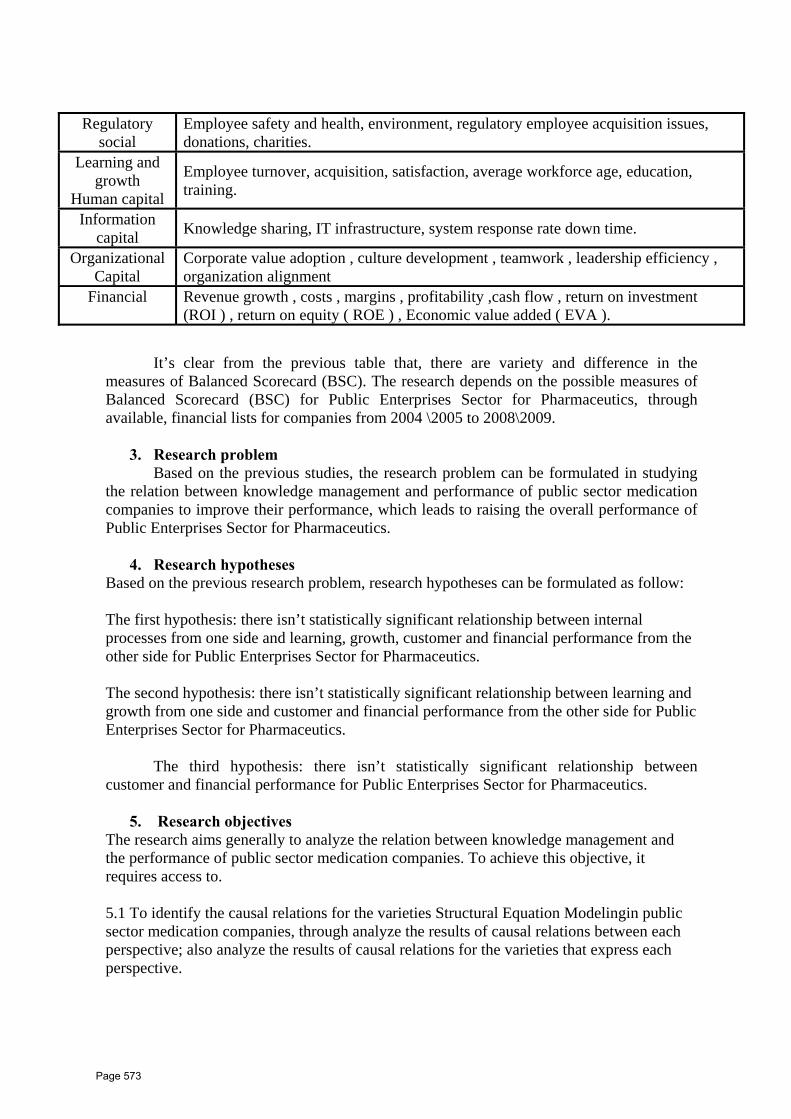
Regulatory social
Employee safety and health, environment, regulatory employee acquisition issues, donations, charities.
Learning and growth
Human capital
Employee turnover, acquisition, satisfaction, average workforce age, education, training.
Information capital Knowledge sharing, IT infrastructure, system response rate down time.
Organizational Capital
Corporate value adoption , culture development , teamwork , leadership efficiency , organization alignment
Financial Revenue growth , costs , margins , profitability ,cash flow , return on investment (ROI ) , return on equity ( ROE ) , Economic value added ( EVA ).
It’s clear from the previous table that, there are variety and difference in the measures of Balanced Scorecard (BSC). The research depends on the possible measures of Balanced Scorecard (BSC) for Public Enterprises Sector for Pharmaceutics, through available, financial lists for companies from 2004 \2005 to 2008\2009.
3. Research problem
Based on the previous studies, the research problem can be formulated in studying the relation between knowledge management and performance of public sector medication companies to improve their performance, which leads to raising the overall performance of Public Enterprises Sector for Pharmaceutics.
4. Research hypotheses Based on the previous research problem, research hypotheses can be formulated as follow: The first hypothesis: there isn’t statistically significant relationship between internal processes from one side and learning, growth, customer and financial performance from the other side for Public Enterprises Sector for Pharmaceutics. The second hypothesis: there isn’t statistically significant relationship between learning and growth from one side and customer and financial performance from the other side for Public Enterprises Sector for Pharmaceutics.
The third hypothesis: there isn’t statistically significant relationship between customer and financial performance for Public Enterprises Sector for Pharmaceutics.
5. Research objectives
The research aims generally to analyze the relation between knowledge management and the performance of public sector medication companies. To achieve this objective, it requires access to.
5.1 To identify the causal relations for the varieties Structural Equation Modelingin public sector medication companies, through analyze the results of causal relations between each perspective; also analyze the results of causal relations for the varieties that express each perspective.
Page 573
5.2 To identify the direct and indirect effects of varieties Structural Equation Modelling in Public Enterprises Sector for Pharmaceutics.
6. The importance of the research
The importance of the research related to some aspects:
6.1 If there was any relation between knowledge management and the performance of Public Enterprises Sector for Pharmaceutics, it would lead to improving the performance of these companies and achieve competitive advantages locally and internationally.
6.2 The importance of the strategic role which Public Enterprises Sector for Pharmaceutics plays in pharmaceutical industry. It requires researches, development and creation that affect the raise of Egyptian economy performance. It also keeps pace with global developments towards the weapon of knowledge, especially after applying the intellectual property agreement (TRIPS).
6.3 The importance of the role which the knowledge management plays to improve
the performance of companies. This becomes one of the most important competitive advantages and the main source of the economic resources in the companies.
7. The research methodology
The survey is under conceptual framework of the research and depending on analyzing the financial lists of public sector medication companies in a period of five years from 2004\2005 to 2008\2009 aims at knowing the effect of knowledge management on the performance of Public Enterprises Sector for Pharmaceutics.
7.1. Society and the sample of the research
The population of the research is represented by all the public sector medication companies which included eleven companies in 2009, excluding two companies for trading and distribution, and the company of bottles industry and medicinal requirements, because of the non-identical activity. Thus, the sample of the research consists of eight Public enterprises Sector firms for Pharmaceutics, three companies follow Public Enterprises Sector for Pharmaceutics medicinal requirements with a property of 100%, and five companies follow Public Enterprises Sector for Pharmaceutics with a property of 60%. The reason of choosing the Public Enterprises Sector for Pharmaceutics is related to the importance of this industry in the Egyptian economy which certify a big competitive in the local markets and the international markets, especially after the (TRIPS) 2005 and intellectual property agreement, so that the knowledge became the major method of these companies to achieve competitive advantages locally and internationally.
7.2. Statistical analysis method Analysis of Structural Equation Modelling which serves the research objective is used to identify the relation between knowledge management and the performance of Public Enterprises Sector for Pharmaceutics, the following figure show research modelling:
Page 574
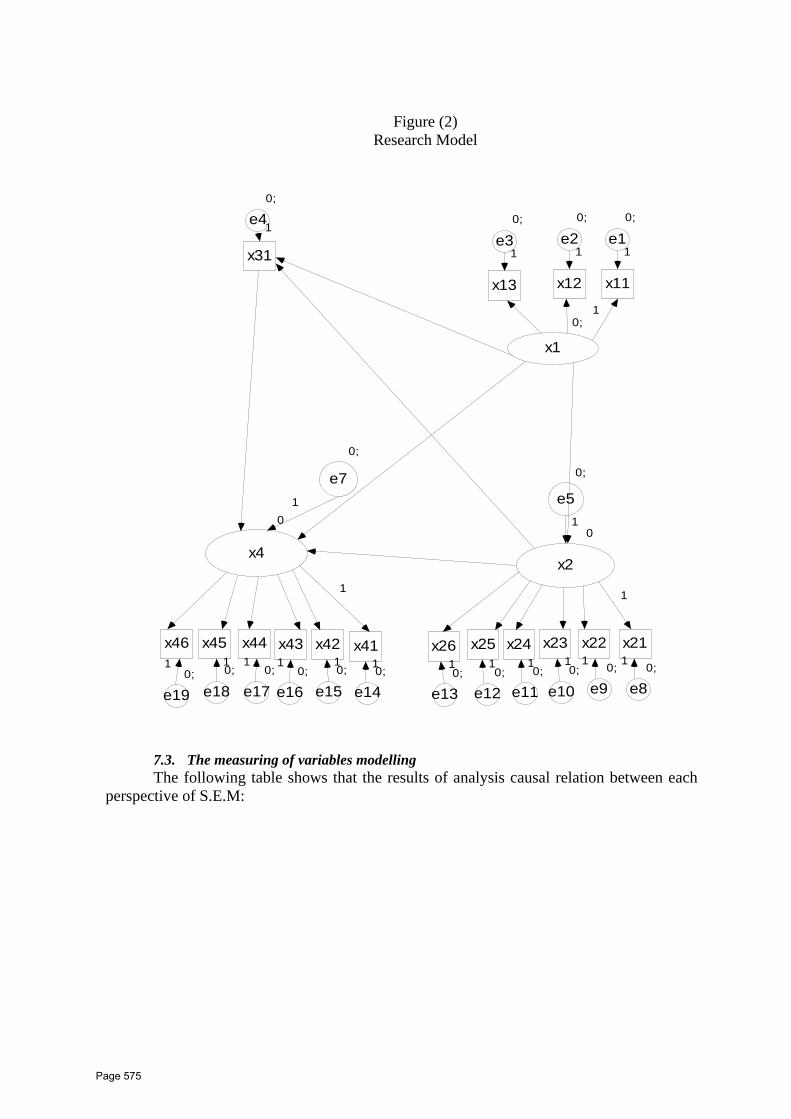
Figure (2) Research Model
0;
x1
0
x2
0
x4
x11x12x13
x21x22x23x24x25x41x42x43x44x45x46
1
0;
e11
0;
e21
0;
e31
0;
e80;
e90;
e100;
e110;
e120;
e140;
e150;
e160;
e170;
e180;
e19
x31
0;
e41
1 1 1 1 1 1 1 1 1 1
0;
e71
x26
0;
e13
11
1 1
0;
e51
7.3. The measuring of variables modelling The following table shows that the results of analysis causal relation between each
perspective of S.E.M:
Page 575
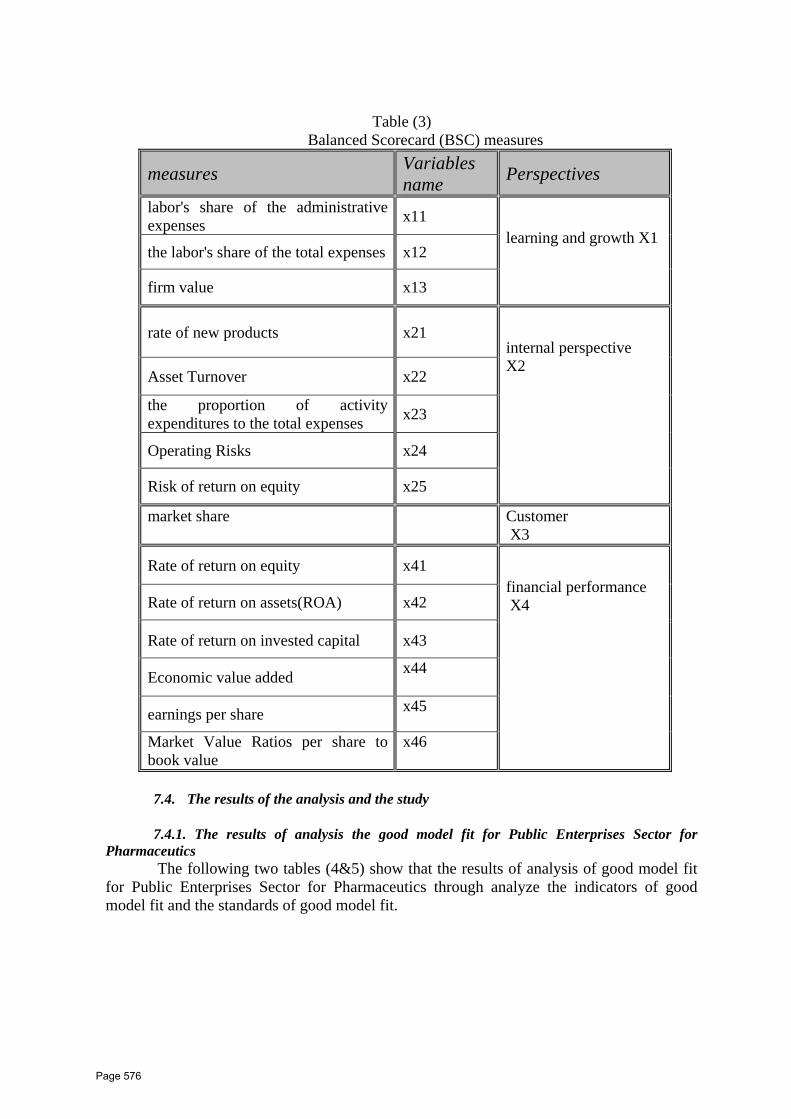
Table (3) Balanced Scorecard (BSC) measures
Perspectives Variables name measures
learning and growth X1
x11 labor's share of the administrative expenses
x12 the labor's share of the total expenses
x13 firm value
internal perspective X2
x21 rate of new products
x22 Asset Turnover
x2the proportion of activity expenditures to the total expenses 3
x24 Operating Risks
x25 Risk of return on equity
Customer X3
market share
financial performance X4
x41 Rate of return on equity
x42 Rate of return on assets(ROA)
x43 Rate of return on invested capital
x44 Economic value added
x45 earnings per share
x46 Market Value Ratios per share to book value
7.4. The results of the analysis and the study 7.4.1. The results of analysis the good model fit for Public Enterprises Sector for
Pharmaceutics The following two tables (4&5) show that the results of analysis of good model fit
for Public Enterprises Sector for Pharmaceutics through analyze the indicators of good model fit and the standards of good model fit.
Page 576

From this table, it can be concluded that: - There is a statistically significant positive relationship between the learning and
growth perspective(x1) and the internal process perspective (x2) and the financial performance perspective(x4) with degrees of confidence from 90% to 99.9%.
- In addition, there is a positive relationship between learning and growth
perspective(x1) and customer perspective (x3), but it isn’t significant. - There is a statistically significant positive relationship between internal process
perspective (x2) and learning and growth perspective(x1), customer perspective (x3) and financial performance perspective(x4) with degrees of confidence from 90% to 99.9%.
- On the other hand the results show a statistically significant negative relationship
between customer perspective (x3) and learning and growth perspective (x1), customer perspective (x3) and financial performance perspective(x4) with a degree of confidence 99.9%.
7.4.2. The results of analysis the causal relations of S.E.M variables 7.4.2.2. Results of analysis the causal relations of variables which express each
perspective in S.E.M Table (7)
the causal relations of S.E.M variables All Paths Estimate S.E C.R p
x12 x1 1,04 0,17 6,05 ***
x13 x1 1,02 0,18 5,78 ***
x42 x4 1,07 0,15 7,00 ***
x43 x4 0,88 0,18 5,00 ***
x44 x4 1,08 0,13 8,07 ***
x45 x4 1,11 0,15 7,50 ***
0,65 0,17 3,80 *** x46 x4
x22 x2 0,99 0,12 7,98 ***
x23 x2 0,99 0,13 7,78 ***
x24 x2 0,53 0,16 3,38 ***
Page 577

THThe relationship between Knowledge Management and Corporate Performance: An Applied Study on Public Enterprises Sector for Pharmaceutics
ICI 10 - 10 INTERNATIONAL CONFERENCE ON INFORMATION
x25 x2 0,53 0,10 5,10 ***
x26 x2 0,56 0,11 4,93 ***
*** S.E 100,
This table indicates that: - There is a statistically significant substantial relationship between and learning and
growth perspective(x1) and the variables which express it, participate in forming it and represented in the labor's share of the administrative expenses, the labor's share of the total expenses, firm value (x13) , with a degree of confidence 99.9%.
- There is statistically significant substantial relationship between the internal
perspective (x2) and the variables which express it, participate in forming it and represented in the rate of new products (x21), Asset Turnover (x22), the proportion of activity expenditures to the total expenses (x23), Operating Risks (x24), Risk of return on equity (x25), the proportion of researches and development (x26), with a degree of confidence 99.9%.
- There is statistically significant substantial relationship between the customer
perspective (x3) and the variables which express it, participate in forming it and represented in the market share ( x31) ,with a degree of confidence 99.9%.
- There is statistically significant substantial relationship between the financial
performance perspective (x4) and the variables which express it, participate in forming it and represented in the rate of the return on equity (x41), Rate of return on assets (ROA) (x42), Rate of return on invested capital(x 43), Economic value added (x44), earnings per share (x45), the percentage of Market Value Ratios per share to book value (x46) with a degree of confidence 99.9%
7.4.3. The results of analysis the direct and indirect effects of S.E.M variables The Following table (8) shows the results of analysis the direct and indirect effects
of S.E.M variables in Public Enterprises Sector for Pharmaceutics.
Page 578
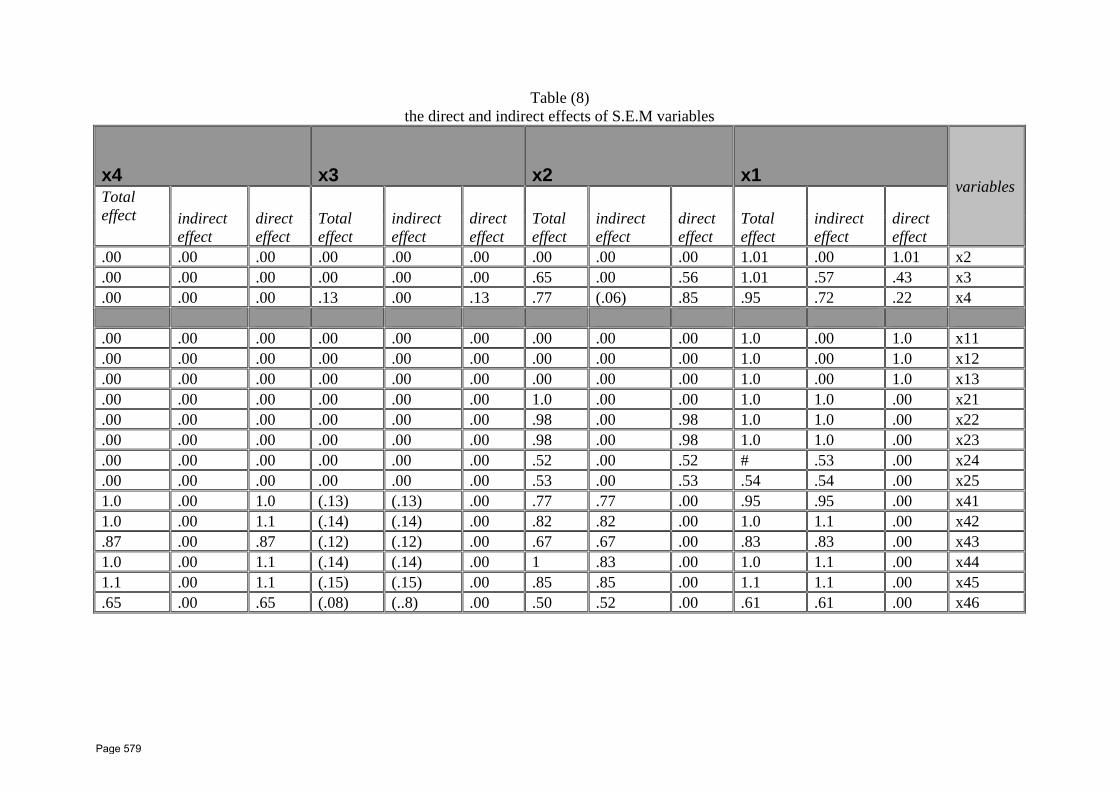
Table (8) the direct and indirect effects of S.E.M variables
variables x1 x2 x3 x4
direct effect
indirect effect
Total effect
direct effect
indirect effect
Total effect
direct effect
indirect effect
Total effect
direct effect
indirect effect
Total effect
x2 1.01 .00 1.01 .00 .00 .00 .00 .00 .00 .00 .00 .00 x3 .43 .57 1.01 .56 .00 .65 .00 .00 .00 .00 .00 .00 x4 .22 .72 .95 .85 (.06) .77 .13 .00 .13 .00 .00 .00 x11 1.0 .00 1.0 .00 .00 .00 .00 .00 .00 .00 .00 .00 x12 1.0 .00 1.0 .00 .00 .00 .00 .00 .00 .00 .00 .00 x13 1.0 .00 1.0 .00 .00 .00 .00 .00 .00 .00 .00 .00 x21 .00 1.0 1.0 .00 .00 1.0 .00 .00 .00 .00 .00 .00 x22 .00 1.0 1.0 .98 .00 .98 .00 .00 .00 .00 .00 .00 x23 .00 1.0 1.0 .98 .00 .98 .00 .00 .00 .00 .00 .00 x24 .00 .53 # .52 .00 .52 .00 .00 .00 .00 .00 .00 x25 .00 .54 .54 .53 .00 .53 .00 .00 .00 .00 .00 .00 x41 .00 .95 .95 .00 .77 .77 .00 (.13) (.13) 1.0 .00 1.0 x42 .00 1.1 1.0 .00 .82 .82 .00 (.14) (.14) 1.1 .00 1.0 x43 .00 .83 .83 .00 .67 .67 .00 (.12) (.12) .87 .00 .87 x44 .00 1.1 1.0 .00 .83 1 .00 (.14) (.14) 1.1 .00 1.0 x45 .00 1.1 1.1 .00 .85 .85 .00 (.15) (.15) 1.1 .00 1.1 x46 .00 .61 .61 .00 .52 .50 .00 (..8) (.08) .65 .00 .65
Page 579
pharmaceutics
This Table Indicates that: - There is a positive and indirect effect of the learning and growth perspective (x1) on
each internal processes (x2), which represented in (Operating Risks (x24), risks of the return on the right of ownership (x25), the customer (x3) that represented in the quota market, and on the financial performance (x4) that represented in (the rate of the return on the right of ownership (x41), Rate of return on assets (ROA) (x42), Rate of return on invested capital (x 43), Economic value added (x44), earnings per share (x45), the percentage of Market Value Ratios per share to book value (x46).
- There is a positive and direct effect of internal processes perspective (x2) on learning
and growth perspective (x1), the customer (x3) which represented in the quota market, however it appeared a positive effect , but it’s indirect and weak of the internal processes perspective (x2) on the financial performance (x4) which represented in (the rate of the return on the right of ownership (x41), Rate of return on assets (ROA) (x42), Rate of return on invested capital (x43), Economic value added (x44), earnings per share (x45).
- On the other side the results show that there is a negative effect ,but it‘s indirect and
weak of the customer (x3) which represented in the quota market on the financial performance (x4) which represented in ((the rate of the return on the right of ownership (x41), Rate of return on assets (ROA) (x42), Rate of return on invested capital (x 43), Economic value added (x44), ), earnings per share (x45), the percentage of Market Value Ratios per share to book value (x46)). There is an effect of customer perspective on each of learning and growth perspective (x1), and the internal processes perspective (x2).
7.5. Final results.
From the previous explanation of results which related to the quality of documentation form, the particularly results of analysis, the causal relation of S.E.M variables, the particularly results of analysis, the direct and indirect effects of S.E.M variables for Public Enterprises Sector for Pharmaceutics. The following results can be introduced:
7.5.1. The particularly results of the first hypothesis validity There is a positive and indirect effect of the learning and growth perspective (x1) on
each internal process (x2), customer (x3) and financial performance (x4), with a statistically significant positive relationship between learning and growth perspective (x1) and each of internal process perspective (x2) and financial performance (x4) with degrees of confidence from 90% to 99.9%. That means there is a positive and direct effect of knowledge management from the learning and growth perspective on the performance of Public Enterprises Sector for Pharmaceutics. This result indicates the rejection of the first hypothesis. It matches the study of Lee 2007, Lee &Choi 2003.
7.5.2. The particularly results of the second hypothesis validity - There is a positive and indirect effect of internal processes (x2) on the learning and
growth perspective (x1) and the customer (x3) which represented in the quota market, there isn’t effect of internal processes on the financial performance (x4), with a statistically significant positive relation between internal processes (x2) from one side and the customer (x3) and financial performance (x4) from the other side , with degrees of confidence from 90% to 99.9%. That means there is a positive and direct effect of knowledge management from the internal processes perspective on the performance of public sector medication companies from learning and growth perspective. Also there isn’t any effect of knowledge management on
Page 580
pharmaceutics financial performance. This may be due to the knowledge management effect from the learning and growth perspective on financial performance isn’t clear, but in the long-term.
- This result indicates the rejection of the second hypothesis. It matches the study of
Lee & Choi 2003, Lee & Lee2007- Rhodes et al. (2008).
7.5.3. The particularly results of the third hypothesis validity - on the other hand the results show that there is negative effect but it’s indirect and
weak from customer perspective (x3),which represented in quota market, on learning and growth perspective (x1), internal process perspective (x2) and the financial performance (x4), with a statistically significant negative relation between customer perspective (x3) internal processes and learning and growth perspective (x1), internal process and financial performance with a degree of confidence 99.9%. That means there is a negative and indirect effect of knowledge management from the customer perspective on the performance of Public Enterprises Sector for Pharmaceutics.
- This result indicates the rejection of the third hypothesis. It matches the study of Zack et al. (2009).
7.6 Research Recommendations.
Based on the final results, there is a positive and indirect relationship between knowledge management and the performance of Public Enterprises Sector for Pharmaceutics. From the learning and growth perspective, also there is positive and direct relation from the internal processes perspective. However, the relation came negative from the customer perspective, and the relation is disappeared from financial performance perspective.
From this regards, the research recommends:
7.6.1 Assign the public sector companies to professional management companies which work efficiently. 7.6.2 Take advantage from pharmaceutical elements found in the Egyptian desert. 7.6.3 Produce pharmaceutical chemicals, which ended the period of protection. 7.6.4 Try to keep the existence of effective substance instead of import it. 7.6.5 Availability of funding to improve and renew the Production Lines in public sector companies. 7.6.6 Attention is given to more research which related to the performance in the framework of a balanced approach to Balanced Scorecard. 7.6.7 Providing a certain proportion from each company sales to fund the researches and the development.
Page 581
pharmaceutics 7.6.8 Providing the qualified people with special and distinguished contracts in these companies and the financial treatment will be similar to wages in the same activity in the private sector. 7.6.9 Carrying out a lot of researches to support or reject the results of this research on different companies or in different periods of time. 7.6.10 The Egyptian companies build the framework of Balanced Scorecard as a strategic system to manage and measure the knowledge performance inside these companies. Reference
- Brigham, EF. And M.C. Ehrhardt,(2005), Financial Management. Theory and Practice, Thomson. South- Western.
- Lev, B., (2001)", Intangibles: management Measurement and reporting", Washington, Dc, Brookings Institution press.
- Wheelen. T, and David Hunger.(2002).Strategic Management and Business Policy. Eighth Edition, Upper saddle River. New Jersey.
- Abran.A. & Buglione, L.,(2003)," Multidimensional performance model for
consolidating balanced scorecards Advances in Engineering software, No.34,P. 339-416. - Asoh, D., Belardo, S., & Neilson, R.,(2002)."Knowledge management: Issues, challenges
and opportunities for government in the new economy", in Sprague, (ed), Proceedings of the 35 th Hawaii international conference on system sciences p.129, IEEE press.
- Braam, J. M., &Nijssen, E., J., (2004)", Performance effects of using the balanced scorecard”: A note on the Dutch experience, long range planning, 37, P.335-349.
- Chen, M. Y., &Chen, A., P., (2005)," Knowledge management performance evaluation: A decade Review from 1995 to 2004", Journal of Information Science, Vol.32 No.1, P.15-36.
- Davis, S.,& Albright, T.,(2004)," An investigation of the effect of balanced scorecard implementation of financial performance" .Management Accounting Research, Vol.,15, P.135-153.
- Gooijer, T.,(2000),"Designing a Knowledge management performance framework," Journal of Knowledge management,Vol.4, No.1, P.303-310.
- Hertzum, M.,(2002)",The importance of trust in software engineers assessment and choice if information sources," Information and Organization ,Vol.,12, P.1-18.
- Holt, D. T., Bartczak, S., E., Clark, S., W., & Trent, M., R., (2004)," The development of an instrument to measure readiness for Knowledge management In R. Sprague (Ed)", Proceedings of the 35 th Hawaii international conference on system sciences. (80238b), IEEE presses.
- Kaplan, R., & Norton, D., (1992)", the balanced scorecard: Measures that drive performance ", Harvard Business Review, Vol., 70, P.71-79.
- Kaplan, R., & Norton ,D.,(1996)," Using the balanced scorecard as a strategic management system", Harvard Business Review, Vol.,74 ,P.75-85
- Lee, K., C., & Lee,Kang, I. W., (2005),"KMPI: Measuring Knowledge management performance ", Information and management ,Vol.42, P.469-482.
- Lee, K., C., & Lee,Kang, I. W., (2007)",Capabilities, processes, and performance : A structural Approach", Human factors and Ergonomics in mamufacturing,Vol.17,No1,P.21-41.
Page 582

The relation between knowledge management and corporate performance: An applied study on public enterprises sector for
pharmaceutics
ICI 10 - 10TH INTERNATIONAL CONFERENCE ON INFORMATION
19
- Lee, K., C., & Choi, B., (2003), "Knowledge management enablers, processes, and Organization performance: An integrative view and empirical examination", Journal of management Information system, vol.20, No.1, P.179-228.
- Papalexand,A.,Ioannou, G., and Soderquist, K. E.,(2005)," An integrated methodology for putting the balanced scorecard into action", European Management Journal, Vol.(23),No.(2),P.217.
- Rhodes,J, Hung , R.,Lok, P., Lien, Y., &Wu,C.,(2008)",Factors influencing Organization Knowledge transfer: implication for corporate performance", Journal of Knowledge management,Vol.12,No.3, P.84-100.
- Ruggles.R., (1998),"The state of notion: Knowledge management in practice", California management Review ,Vol.40, P.80-89.
- Smits,M.,& Moor,A.,d., (2004)," Measuring Knowledge management effectiveness in communities on practice,In R. Sprague(ed) )", Proceedings of the 35 th Hawaii international conference on system sciences.(80238b), IEEE .
- Zack,M., McKeen &Singh S., (2009)," Knowledge management and Organization performance: an exploratory analysis," Journal of Knowledge management,Vol.13, No.3, P.392-409.
Page 583
ICI 10 - 10TH INTERNATIONAL CONFERENCE ON INFORMATION AT DELTA UNIVERSITY FOR SCIENCE AND TECHNOLOGY
GAMASA, EGYPT, 4 – 6 DECEMBER 2010
Computer Application in Flexible Pavement Overlay Design
Dr. Ragaa Abd El-Hakim1*
, Dr. Mustatfa A. K. Abd El-Ghaffar2, Prof. Dr. Mohamed El-
Shabrawy M. Ali2, Assoc. Prof. Hafez A. Afify
3
1 Civil Engineering Department, Faculty of Engineering, DeltaUniversity for Science and Technolog,
Email:[email protected]
2 Public Works Department, Faculty of Engineering, Mansoura University
3 Public Works Department, Faculty of Engineering, DeltaUniversity for Science and Technology
Abstract
At present time, all pavement design methods are directed towards reducing the empiricism
in the design procedure and making full use of the analytical modeling. The mechanistic
response parameters of pavements are required for damage prediction models of a
pavement. These parameters include the vertical strain at the top of subgrade, the tensile
strain at the bottom of the surface layer. The present study uses the ANSYS computer code
to predict the stress-strain distribution within the different layers of a pavement. The vertical
strain at the top of subgrade was also obtained through the analysis by ANSYS as it was
taken as a damage prediction model to develop a design procedure for overlays in flexible
pavements. The design procedure was deveveloped by determining the Effective Structural
Number SN eff and comparing it with the Required Structural Number SNreq, Then
calculating the thickness of new overlay layer using the difference between SN eff and SNreq
Keywords: FEA, Ansys, Overlay, Structural Number, Esg, SNeff ,SNreq
1. Introduction
Layered elastic theory is the simplest and most widely used in pavement analysis. Therefore,
many approaches have emerged based on this theory. As the finite element technique has
become a popular analytical tool, it has made possible the analysis of a layered pavement
system in a more realistic manner. At the same time, it is possible to consider different
boundary conditions and variations in the material properties of the pavement layers and
their thicknesses. Since the basic objective of the present study is to evolve a more scientific
approach that sees maintenance and construction as interacting strategies over time, a
1 Page 584
Ansys Software Computer Application in Flexible
Pavement Overlay Design
ICI 10 - 10TH INTERNATIONAL CONFERENCE ON INFORMATION
2
parametric study was conducted to evaluate the performance of pavement structure using the
finite element analysis.
2. Concept of Finite Element Method
The basic concept of the finite element method (FEM) when applied to any problem of the
structural analysis is that a continuum can be modeled analytically by dividing into sub
regions or domains called elements. In each of these elements the behavior is described by a
separate set of assumed functions representing the stresses and displacements in that region.
Theses sets of functions are often chosen in a form that ensures continuity of the described
behavior throughout the complete continuum. Many authors have described the finite
element method [Desai and Abel, 1972; Bathe, 1982; Zienkiewicz and Taylor, 1989, 1991]
and according to them, the finite element solution for any continuum can be obtained
through eight basic steps:
i. Discretization of the continuum.
ii. Selection of approximation model.
iii. Definition of strain –displacement and stress-strain relations.
iv. Deriving the element stiffness matrix.
v. Assembling the element stiffness matrix and imposing boundary conditions and
external forces.
vi. Solution of primary unknowns (displacements).
vii. Computation of secondary unknowns (stresses and strains).
viii. Interpretation of results.
2.1 Application of FEM in Pavement Analysis
The mechanistic response parameters of pavements are required for damage prediction
models of a pavement. These parameters include the vertical strain at the top of subgrade,
the tensile strain at the bottom of the surface layer, the surface vertical deflection and the
tensile stresses in a concrete pavement. The finite element technique provides an almost
ideal approach to the problem of calculating these parameters in complex pavement
structures. The flexibility of the method allows variation of structural properties both with
area and depth to be introduced into any of the layers without significantly increasing the
complexity of the solution. Further, it can handle any combination of traffic loading and
climatic conditions. A lot of research on the use of finite element technique in the pavement
analysis has been conducted so far.
Page 585

Ansys Software Computer Application in Flexible
Pavement Overlay Design
ICI 10 - 10TH INTERNATIONAL CONFERENCE ON INFORMATION
3
[Rabab’ah and Liang, 2007], used an axisymmetric finite element analysis to solve the stress
distribution in a semi-finite elastic solid subjected to a concentrated load at the surface.
Their results were in close agreement with the Boussinesq’s equation. [Hyunwook Kim,
2007], justified the use of finite element analysis in solving axisymmetric loading of the
pavement system with anisotropic layers. [Zhao, 2009] have provided solutions by finite
element technique for cases where pavement materials possess simple visco-elastic
behavior. [Steven, 2007] used the prismatic solid program for determining the stresses in the
pavements with cement treated bases. [Sheng Hu, 2008] used the triangular element to study
the stresses and deflections in two and three layered pavement systems. [Jain, 1987] used
the isoparametric axisymmetric element incorporating non-linearity in the solution of
flexible pavement.
On the other hand, some researchers have used nonlinear elastic material properties in the
finite element analysis. [Harichandran et al., 1989] has successfully used the general-
purpose finite element program ABAQUS, to simulate traditional flexible pavements.
[Helwany et al., 1998] illustrated the usefulness of finite element technique in the analysis
of three layer pavement systems subjected to different types of loadings. They found that
finite element modeling of pavements once validated could be extremely useful. It can be
used directly to estimate the parameters of damage prediction models of pavements without
resorting to field experiments, which may be costly.
[Kim et al., 2000, 2005] developed the pavement condition assessment procedure and
synthetic pavement responses were computed using a finite element program for the
dynamic analysis of full depth and aggregate base pavements.. They used the measured
FWD multi-load level deflections; distress survey results, temperatures, and lab testing
results were used to validate the condition assessment procedure. [Nishiyama et al., 2005]
conducted the extensive field evaluation, laboratory testing, and computer modeling of thin
concrete overlay to characterize the bond condition between the concrete overlay and the
existing pavements and its impact on the future performance of the thin bonded concrete
overlay.
The present study uses the ANSYS computer code to predict the stress-strain distribution
within the different layers of a pavement. The vertical strain at the top of subgrade was also
obtained through the analysis by ANSYS as it was taken as a damage prediction model to
develop a design procedure for overlays in flexible pavements.
Page 586

Ansys Software Computer Application in Flexible
Pavement Overlay Design
ICI 10 - 10TH INTERNATIONAL CONFERENCE ON INFORMATION
4
The element type, boundary conditions and model dimensions are explained later in the
main model used in this study. Figure 1 shows the finite element configuration of the
verification problem.
2.2 Features of the Computer Code (Ansys)
ANSYS is one of the numerous finite element softwares, which perform finite element
analysis of a complicated geometry in an easy way. It is a general- purpose program and
more flexible since it has options to perform analysis in the fields like structural, Thermal,
Fluid Mechanics and Electro-magnetics. The program has the following features:
i. Different types of analysis such as Static, Modal, Spectrum, Transient and Harmonic.
ii. Two and three-dimensional analysis (plane stress, plane strain and axisymmetric).
400 m
m (
Com
pacte
d
Su
bgra
de)
500 m
m (
Un
com
pacte
d
Su
bgra
de)
900 mm
Axis of Symmetry
a
Load 5 kN
Pressure = 70.73 kPa
Radius of Contact Area (a) = 150 mm
Figure 1. Finite Element Discretization of the Verification Problem
Page 587
Ansys Software Computer Application in Flexible
Pavement Overlay Design
ICI 10 - 10TH INTERNATIONAL CONFERENCE ON INFORMATION
5
iii. Linear and nonlinear analyses, with different material properties like, isotropic,
orthotropic, anisotropic, constant temperature or temperature gradient depending on the
application.
iv. Provision for different types of elements, the ANSYS element library contains more
than 100 different element types.
v. Various constitutive models such as elastic, hyperbolic, elasto-plastic and visco-elastic.
2.3 Nonlinear Elastic Analysis
The matrix techniques, employed in finite element analysis have been extended to solve the
problems of nonlinear structures. The nonlinear problems can be divided into three
categories. These categories are problems involving material nonlinearity alone, problems
involving geometrical nonlinearity alone and problems involving both material as well as
geometric nonlinearities.
Material nonlinearity includes problems in which the stresses are not linearly proportional to
the strains, but in which only small displacements and small strains are considered. In the
present study the nonlinearity in finite element analysis is due to the changes in values of
elastic modulii with stress levels. To deal with nonlinearity, it is not necessary to
reformulate the complete problem. If a solution to a nonlinear problem can be driven from
some iterative processes in which, at final stage the material constants are so adjusted that
the appropriate constitutive law is satisfied, then the realistic solution can be achieved.
2.3.1 Nonlinear Solution Techniques.
One of the three basic techniques, viz. incremental or stepwise procedure, iterative or
Newton methods and step iterative or mixed procedure is usually attempted for the solution
of nonlinear problem by the FEM. The basis of the incremental procedure is the sub-
division of load into many small partial loads or increments. Usually these load increments
are of equal magnitude, but in general they need not be so. The load is applied one
increment at a time, and during the application of each increment, the equations are assumed
to be linear. These load increments are accumulated to give the total load at any state of
loading, and the incremental process is repeated until the total load has been reached.
Essentially, the incremental procedure approximates the nonlinear problem as a series of
linear problems, that is, nonlinearity is treated as piece wise linear.
2.3.2 Adoption of nonlinearity
Page 588

Ansys Software Computer Application in Flexible
Pavement Overlay Design
ICI 10 - 10TH INTERNATIONAL CONFERENCE ON INFORMATION
6
In the present study, where in the strength modulli of elements vary with stress conditions,
when minor principal stresses are either compressive or tensile in nature, the iterative
technique is considered to be appropriate and employed in finite element analysis. Since
modulli values depend on stress conditions and the stresses in turn depend on the modulli
values, it is necessary to make repeated analysis to ensure that the modulli values and stress
conditions correspond to each other in the finite element model.
2.4 The FE Model Used in the Analytical Analysis
The input data to the program requires description of the pavement geometry, material
properties of elements, coordinates of nodal points, the associating loading data and
prescribed displacements at the boundary nodes. The output is in terms of stresses and
strains at nodal points.
2.4.1 Description of the Problem
A four-layer flexible pavement system as shown in Figure 2 was considered and analyzed in
this study. A pressure “ρ” is assumed to be applied at surface and distributed over a circular
area with radius of contact equal to “a”. The following assumptions were made in the
analysis:
i. All layers are of finite thicknesses except the bottom layer (subgrade), which is of
infinite thickness.
ii. All layers are of infinite extent in the lateral direction.
iii. All pavement materials including soil exhibit a multi-linear mechanical response.
iv. All pavement materials have isotropic elastic behavior.
v. Poisson’s ratio was taken as 0.4 for all layers as suggested by Ceylan et al., 2006.
vi. The pavement system is assumed to be axisymmetric about the axis of loading as
suggested by Sackman, 1961 and Vesic, 1962. The problem of stress distribution in
axisymmetric bodies subjected to axisymmetric loads is reduced to a two dimensional
analysis because of the displacement field describing the state of strains in any plane
section of the body, can be completely defined by two displacement components in
two directions; along the axis of symmetry and in radial direction, [Safa, 1994].
The 8-noded structural solid element (PLANE-82) in ANSYS program was used in the
modeling. The element is defined by eight nodes having two-degree of freedoms at each
node: translations in the nodal x and y directions. It provides more accurate results for
mixed quadrilateral-triangular meshes.
Page 589

Ansys Software Computer Application in Flexible
Pavement Overlay Design
ICI 10 - 10TH INTERNATIONAL CONFERENCE ON INFORMATION
7
2.4.2 Boundary Conditions and their Size
For application of FEM in pavement analysis, the layered system of infinite extent is
reduced to an appropriate size with finite dimensions. This requires some approximations in
the analysis. These approximations will, however have little influence on the stress
distributions in the FE model and the support conditions at its boundaries are appropriately
selected, [Desai and Abel, 1972]. The boundaries of the FE continuum may be kept fixed or
free. [Clough and Rashid, 1965] applied it to solve the Boussinesq’s problem of stress
distribution by assuming fixed supports at the bottom and right hand sides. [Chiyyarath and
Lymon, 1968] assumed roller supports for an elastic half space.
Figure 3 shows the two-dimensional view of the half axisymmetric solid on which the FE
analysis was performed in this study. Line (I) represents the axis of loading and the roller
supports were kept there to achieve the condition that shear stresses and radial
displacements are each equal to zero. Simultaneously, line (III) should be sufficiently away
Figure 2. Layout of a Four Layer Flexible Pavement System
Z
2a
r
E4& υ μ 4
E3& μ 3
E2& μ 2
E1& μ 1
h4
(in
fin
it e
h2
h
1
h3
Interface-I
Interface-II
Interface-III
Overlay
Surface Course
Base Course
Subgrade
P
ρ
P = Normal Load
ρ = Contact Pressure
a = Radius of Contact Area
h = Layer Thickness
E = Modulus of Elasticity
μ = Poisson’s Ratio Axis of Symmetry
Page 590
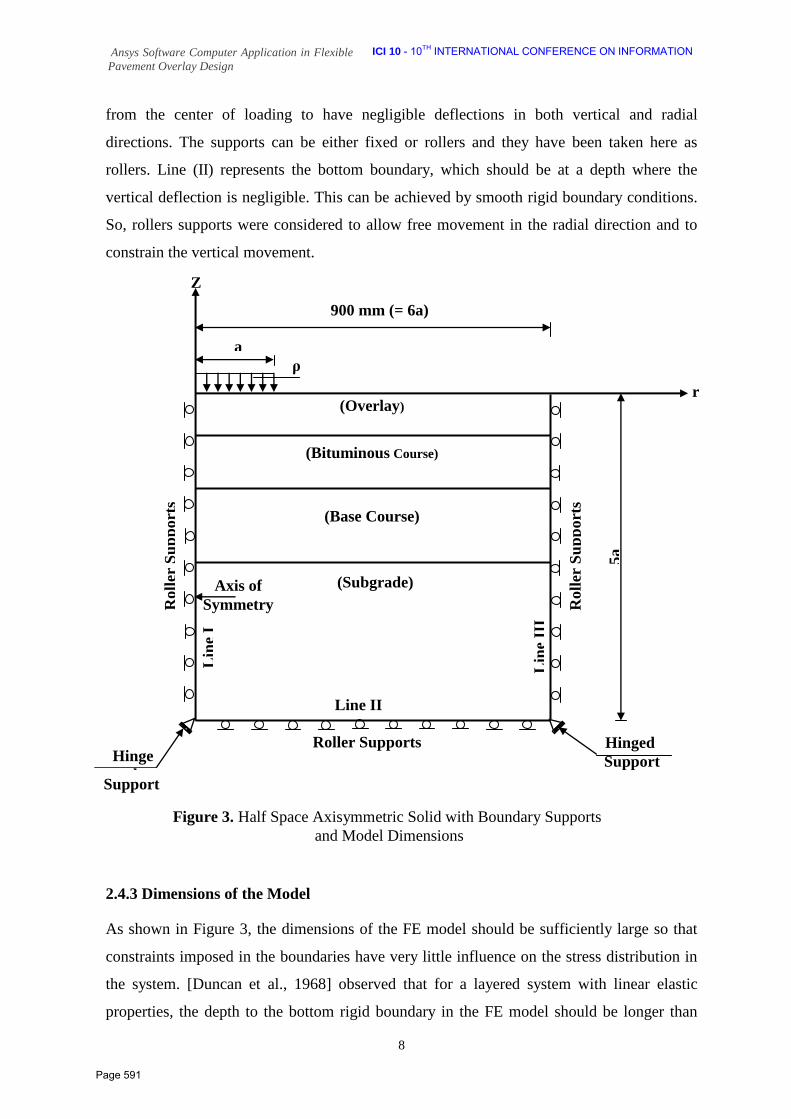
Ansys Software Computer Application in Flexible
Pavement Overlay Design
ICI 10 - 10TH INTERNATIONAL CONFERENCE ON INFORMATION
8
from the center of loading to have negligible deflections in both vertical and radial
directions. The supports can be either fixed or rollers and they have been taken here as
rollers. Line (II) represents the bottom boundary, which should be at a depth where the
vertical deflection is negligible. This can be achieved by smooth rigid boundary conditions.
So, rollers supports were considered to allow free movement in the radial direction and to
constrain the vertical movement.
2.4.3 Dimensions of the Model
As shown in Figure 3, the dimensions of the FE model should be sufficiently large so that
constraints imposed in the boundaries have very little influence on the stress distribution in
the system. [Duncan et al., 1968] observed that for a layered system with linear elastic
properties, the depth to the bottom rigid boundary in the FE model should be longer than
Figure 3. Half Space Axisymmetric Solid with Boundary Supports
and Model Dimensions
a
900 mm (= 6a)
Roll
er S
up
port
s
Roll
er S
up
port
s
Roller Supports
(Overlay)
(Bituminous Course)
(Base Course)
(Subgrade)
Axis of
Symmetry
ρ
Lin
e II
I
Lin
e I
Line II
5a
Z
r
Hinged
Support Hinge
d Support
Page 591

Table (4) Indicators of good model fit
Sig. level Degrees of freedom Chi-square 0.000
٩٩
From the table 4. It’s obvious that the analysis model of simultaneous structural
equations tracks is good model fit at a significant less than, 0001 7.4.1.1. The indicators of good model fit for Public Enterprises Sector for Pharmaceutics
Table (5) Standards of good model fit.
CFI (Comparative
fit index)
TLI (Tucker Lewis
IFI (Incremental
fit index)
RFI (Relativefit index)
NFI (Nor
med fit index)
Model
0.66 0.59 0.67 0.52 0.60
From this table It’s obvious that the analysis model of simultaneous structural
equations tracks is good model fit at a significant less than ,0001
7.4.1.2. The standards the good model fit for Public Enterprises Sector for Pharmaceutics The following two tables (6&7) show the results of analysis the causal relations of
S.E.M Variables in Public Enterprises Sector for Pharmaceutics through analyze the causal relations between each perspective, and analyze the results of causal relations for variables which express each perspective.
Tables (6) The causal relations between each perspective
All Paths Estimate S.E C.R p
x2 x1 1,02 0,21 4,94 ***
x31 x1 0,44 0,38 1,14 0,25
x31 x2 0,57 0,33 1,72 0,09
x4 x1 0,23 0,12 1,85 0,06
x4 x2 0,85 0,16 5,18 ***
x4 x31 -0,14 0,05 -2,58 0,01
390,093
Page 592

Ansys Software Computer Application in Flexible
Pavement Overlay Design
ICI 10 - 10TH INTERNATIONAL CONFERENCE ON INFORMATION
9
that required for a single layer system. [Chiyyarath and Lymon, 1968] adopted fixed right
hand boundary at a distance “4a” from the axis of symmetry and the bottom rigid boundary
at a depth of “5a” where “a” is the radius of loaded area. In the present study, the minimum
depth to the rigid boundary is taken “5a” and it increases with the change in the layers’
thicknesses. However, the radial distance from the axis of loading is taken (900 mm) for all
trials, which equals “6a” for a 300 mm diameter plate used in the present analysis.
2.4.4 Input Material Properties of Elements
It must be recognized that the performance of a pavement is dependant on the properties of
its components. The chosen materials must have certain properties to withstand the stresses
imposed both at and within the road surface and sub-surface layers. The resulting
performance of the constituent materials is dependant upon the manner in which they are
bound together and the conditions under which they operate. Their assessment is carried out
in a laboratory where a range of test methods is used to predict subsequent in-service
performance.
The most widely used basic or fundamental material properties required as inputs for elastic
or visco-elastic layer analysis of pavement structure are: modulus of each layer material and
the subgrade (for bituminous bound layers, the variation of modulus with temperature and
rate of loading should be known), Poisson's ratio of each layer material, creep compliance
and related properties for visco-elastic analysis.
2.4.5 Loading of the Model
For cyclically symmetric loading, ANSYS software support is available for linear static and
large-deflection nonlinear static solution options. (Cyclically symmetric loading implies any
load applied on the cyclic sector representing a loading pattern that is repetitive at sector
angle increments around the 360° structure.)
The program was fed with a cyclic line pressure represents the wheel loading on the
pavement section and the procedure was developed to simulate the repetitions of standard
axle loads on the roadway section.
2.5 Parametric Study
Over the years, finite element method has been proven to be the most effective technique to
conduct complex numerical analysis of many geotechnical problems. The main objective of
this section is to conduct a finite element parametric study to investigate the influence of
various factors on the vertical compressive strain on top of the subgrade soil and horizontal
Page 593

Ansys Software Computer Application in Flexible
Pavement Overlay Design
ICI 10 - 10TH INTERNATIONAL CONFERENCE ON INFORMATION
10
tensile strain under the bottom of asphalt concrete layer. Also, to develop a procedure that
can readily be employed in overlay design. The parameters being studied included the
effective depth of new overly, depth of asphalt concrete layer, type of subgrade soil,
thickness of the base layer, and condition of the existing pavement.
2.5.1 Relationship between Strain and Pavement Distresses
Most fatigue cracks initiate at the bottom of the HMA layer and propagate upward to the
surface of the pavement under repeated load applications. This fatigue cracking is a result of
the repeated bending of the HMA layer under traffic. Basically, the pavement and HMA
layer deflects under wheel load that result in tensile strains and stresses at the bottom of the
layer. With continued bending, the tensile stresses and strains cause cracks to initiate at the
bottom of the layer and propagate to the surface. This mechanism is illustrated in Figure 4
Figure 4. Bottom Up Fatigue Cracking
So, if the tensile strain at the bottom of the HMA layer is determined, fatigue cracking for
different parameters can be studied which must be different from one pavement to another.
Similarly, rutting which is a surface depression in the wheel paths is caused by inelastic or
plastic deformations in any or all of the pavement layers and subgrade. These plastic
deformations are typically the result of the following:
1) Densification or one-dimensional compression and consolidation
2) Lateral movements or plastic flow of materials (HMA, aggregate base, and subgrade
soils) from wheel loads as illustrated in Figure 5
Therefore, studying the vertical compressive strains on top of the subgrade, can relate the
rutting to different parameters of the pavement.
Page 594

Ansys Software Computer Application in Flexible
Pavement Overlay Design
ICI 10 - 10TH INTERNATIONAL CONFERENCE ON INFORMATION
11
Figure 5. Types and Mechanisms of Rutting in flexible Pavements
2.5 .2 Variables Considered in the Parametric Study
Through the present study, the parametric study is adopted to develop a different tool for
performance analysis of pavements. For this concern, variable conditions related to the
pavement system are investigated. Four types of subgrade soil were investigated through the
experimental program to determine their Subgrade Modulus, poisson ratio. These soils were
classified as sandy soil, clayey soil, sandy clay soil, and silty clay soil. They are looking to
be with variable strength. Furthermore, four conditions of asphalt concrete were assumed
namely as, new asphalt concrete pavement, good asphalt pavement condition, fair asphalt
pavement condition, and poor asphalt pavement condition. Furthermore, various thicknesses
of asphalt concrete are assumed viz., 5cms, 10 cms, and 15 cms. The most important
parameter that should be investigated is the overlay thickness, so five different thicknesses
viz., 2.5 cms, 5cms, 7.5 cms, 10cms, and 15 cms. In addition, two different base thicknesses
were adopted during analysis, 20cms and 35 cms.
The parametric study was performed using finite element analysis with the help of ANSYS
program. A total number of 480 problem were solved using the program changing the above
parameters and the horizontal tensile strain (fatigue strain) besides the vertical compressive
strain (rutting strain) were computed accurately
All parametric study results were plotted on graphs, an illustrative example of the typical
plot of graphs is shown in Figure 6.
Page 595
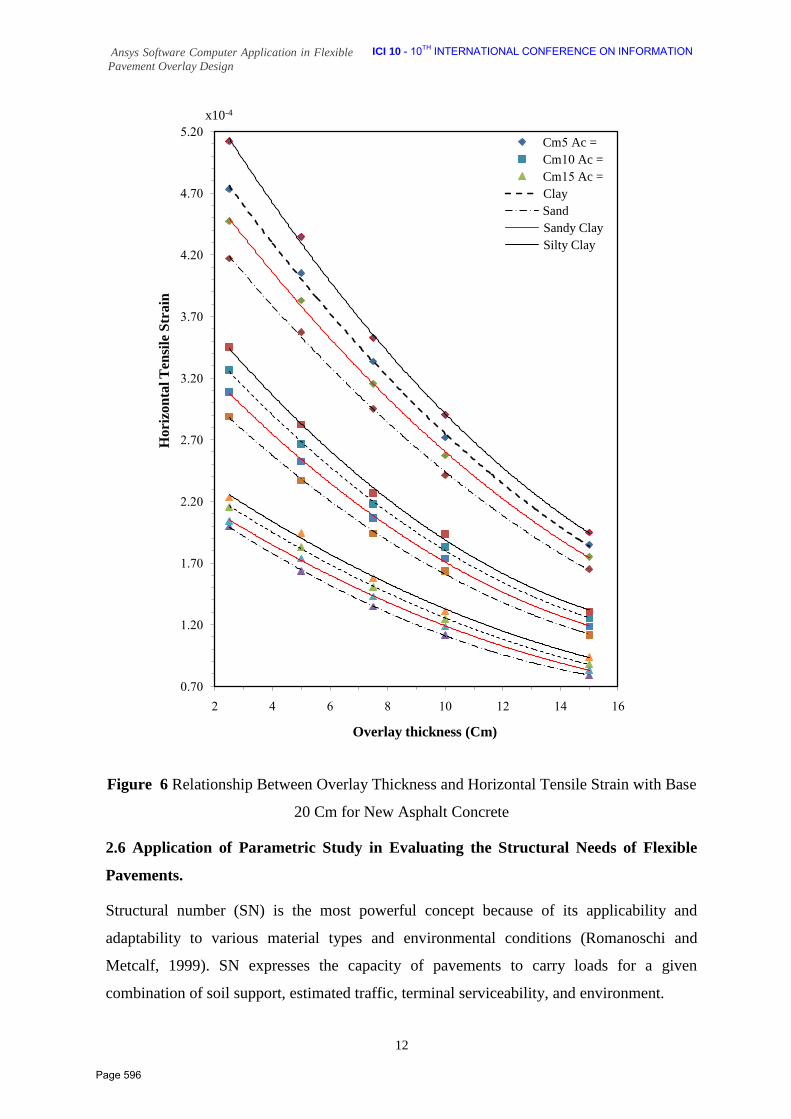
Ansys Software Computer Application in Flexible
Pavement Overlay Design
ICI 10 - 10TH INTERNATIONAL CONFERENCE ON INFORMATION
12
Figure 6 Relationship Between Overlay Thickness and Horizontal Tensile Strain with Base
20 Cm for New Asphalt Concrete
2.6 Application of Parametric Study in Evaluating the Structural Needs of Flexible
Pavements.
Structural number (SN) is the most powerful concept because of its applicability and
adaptability to various material types and environmental conditions (Romanoschi and
Metcalf, 1999). SN expresses the capacity of pavements to carry loads for a given
combination of soil support, estimated traffic, terminal serviceability, and environment.
x10-4
0.70
1.20
1.70
2.20
2.70
3.20
3.70
4.20
4.70
5.20
2 4 6 8 10 12 14 16
Hori
zon
tal T
ensi
le S
train
Overlay thickness (Cm)
Ac = 5Cm
Ac = 10Cm
Ac = 15Cm
Clay
Sand
Sandy Clay
Silty Clay
Page 596
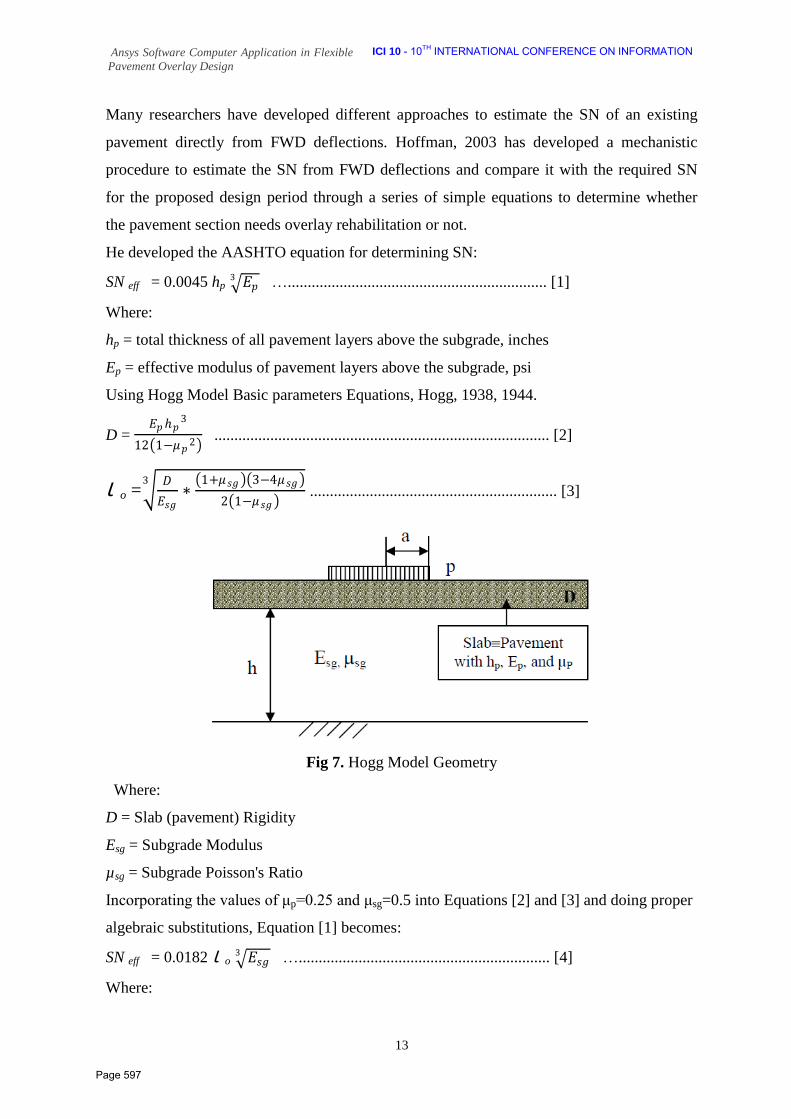
Ansys Software Computer Application in Flexible
Pavement Overlay Design
ICI 10 - 10TH INTERNATIONAL CONFERENCE ON INFORMATION
13
Many researchers have developed different approaches to estimate the SN of an existing
pavement directly from FWD deflections. Hoffman, 2003 has developed a mechanistic
procedure to estimate the SN from FWD deflections and compare it with the required SN
for the proposed design period through a series of simple equations to determine whether
the pavement section needs overlay rehabilitation or not.
He developed the AASHTO equation for determining SN:
SN eff = 0.0045 hp 𝐸𝑝3 …................................................................. [1]
Where:
hp = total thickness of all pavement layers above the subgrade, inches
Ep = effective modulus of pavement layers above the subgrade, psi
Using Hogg Model Basic parameters Equations, Hogg, 1938, 1944.
D = 𝐸𝑝𝑝
3
12 1−𝜇𝑝2
.................................................................................... [2]
Ɩ o = 𝐷
𝐸𝑠𝑔∗
1+𝜇𝑠𝑔 3−4𝜇𝑠𝑔
2 1−𝜇𝑠𝑔
3 .............................................................. [3]
Fig 7. Hogg Model Geometry
Where:
D = Slab (pavement) Rigidity
Esg = Subgrade Modulus
µsg = Subgrade Poisson's Ratio
Incorporating the values of μp=0.25 and μsg=0.5 into Equations [2] and [3] and doing proper
algebraic substitutions, Equation [1] becomes:
SN eff = 0.0182 Ɩ o 𝐸𝑠𝑔3 …............................................................... [4]
Where:
Page 597
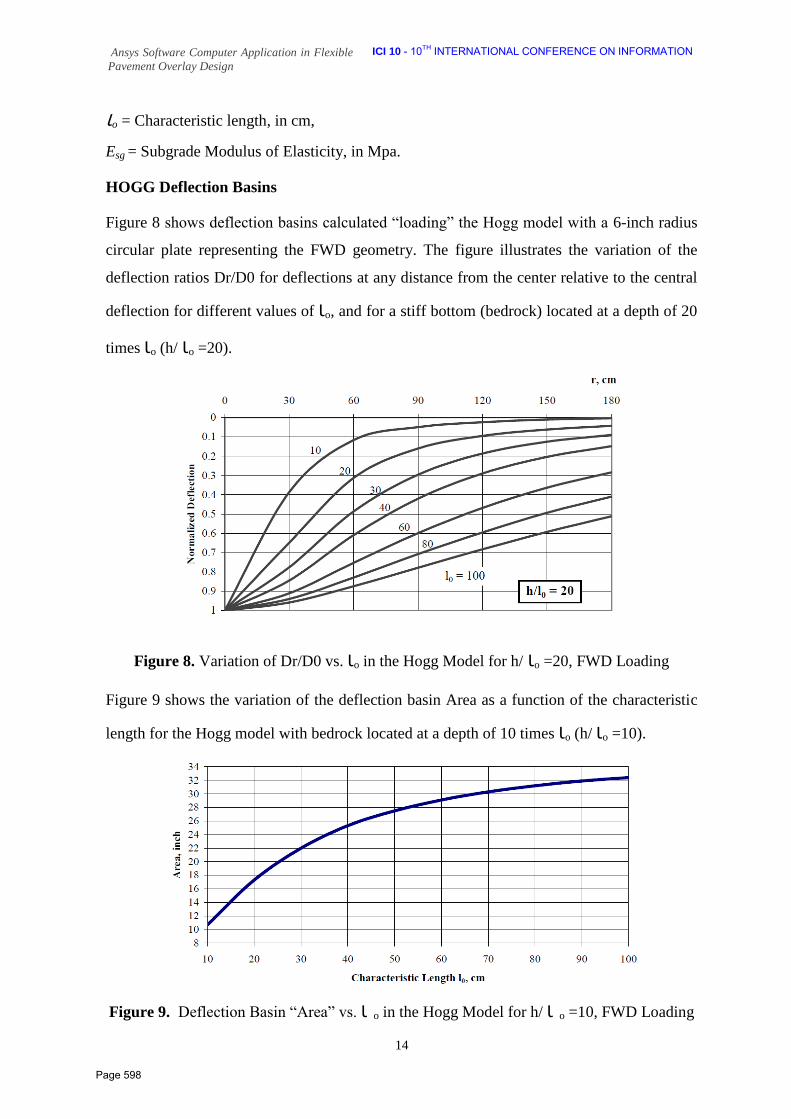
Ansys Software Computer Application in Flexible
Pavement Overlay Design
ICI 10 - 10TH INTERNATIONAL CONFERENCE ON INFORMATION
14
Ɩo = Characteristic length, in cm,
Esg = Subgrade Modulus of Elasticity, in Mpa.
HOGG Deflection Basins
Figure 8 shows deflection basins calculated “loading” the Hogg model with a 6-inch radius
circular plate representing the FWD geometry. The figure illustrates the variation of the
deflection ratios Dr/D0 for deflections at any distance from the center relative to the central
deflection for different values of Ɩo, and for a stiff bottom (bedrock) located at a depth of 20
times Ɩo (h/ Ɩo =20).
Figure 8. Variation of Dr/D0 vs. Ɩo in the Hogg Model for h/ Ɩo =20, FWD Loading
Figure 9 shows the variation of the deflection basin Area as a function of the characteristic
length for the Hogg model with bedrock located at a depth of 10 times Ɩo (h/ Ɩo =10).
Figure 9. Deflection Basin “Area” vs. Ɩ o in the Hogg Model for h/ Ɩ o =10, FWD Loading
Page 598

Ansys Software Computer Application in Flexible
Pavement Overlay Design
ICI 10 - 10TH INTERNATIONAL CONFERENCE ON INFORMATION
15
The deflection basin Area is calculated from the following expression (Wiseman et al,
1997):
Area = 6 1 + 2𝐷30
𝐷0+ 2
𝐷60
𝐷0+
𝐷90
𝐷0 ........................................................... [5]
Where:
Area = Deflection basin Area, in inches,
D0, D30, D60, D90= FWD deflections at r=0, 30, 60 and 90 cm respectively.
During his researsh, Hoffman, derived a method using simple curve fitting techniques to
express the relationship between the characteristic length and the deflection basin Area
using an expression of the form:
Ɩ o =𝐴 ∗ 𝑒𝐵∗𝐴𝑟𝑒𝑎 ..................................................................................... [6]
Where:
Ɩo = Characteristic length in cm,
Area = Deflection Basin Area, in inches,
A, B = Curve fitting coefficients as described in Table 1
Table 1: Curve Fitting Coefficients for the Calculation of Ɩo
Range of Area
Values, inch
h/ Ɩo A B
Area ≥23.0 5 3.275 0.1039
21.0 ≤Area<23.0 10 3.691 0.0948
19.0 ≤Area<21.0 20 2.800 0.1044
Area <19.0 40 2.371 0.1096
In a similar way, he fit exponential curves for the determination of Esg using an expression
of the form:
Esg = 𝑚 ∗𝑝
𝐷0∗ Ɩ 0
𝑛 .................................................................................. [7]
Where:
Esg = Subgrade Modulus of Elasticity, in Mpa.
p = pressure on FWD testing plate, in kpa.
D0 = FWD Deflection under loading plate, in µm.
m, n = curve fitting coefficients as shown in Table 2
Page 599
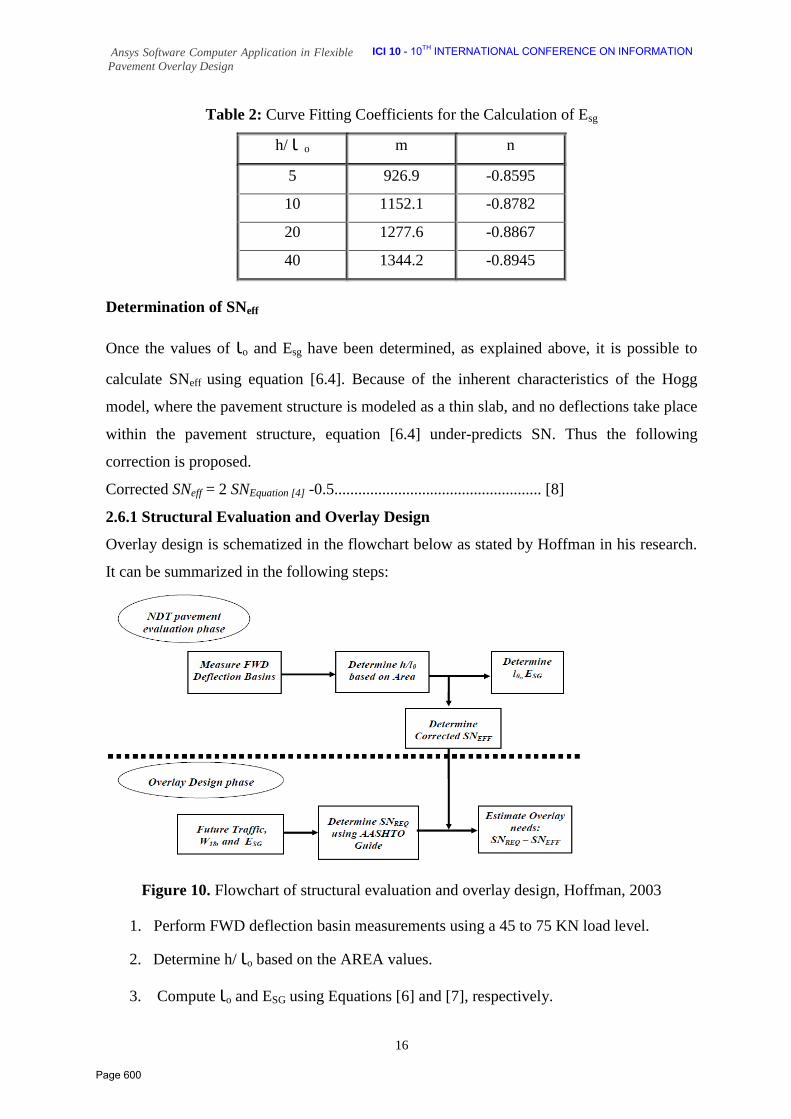
Ansys Software Computer Application in Flexible
Pavement Overlay Design
ICI 10 - 10TH INTERNATIONAL CONFERENCE ON INFORMATION
16
Table 2: Curve Fitting Coefficients for the Calculation of Esg
h/ Ɩ o m n
5 926.9 -0.8595
10 1152.1 -0.8782
20 1277.6 -0.8867
40 1344.2 -0.8945
Determination of SNeff
Once the values of Ɩo and Esg have been determined, as explained above, it is possible to
calculate SNeff using equation [6.4]. Because of the inherent characteristics of the Hogg
model, where the pavement structure is modeled as a thin slab, and no deflections take place
within the pavement structure, equation [6.4] under-predicts SN. Thus the following
correction is proposed.
Corrected SNeff = 2 SNEquation [4] -0.5.................................................... [8]
2.6.1 Structural Evaluation and Overlay Design
Overlay design is schematized in the flowchart below as stated by Hoffman in his research.
It can be summarized in the following steps:
Figure 10. Flowchart of structural evaluation and overlay design, Hoffman, 2003
1. Perform FWD deflection basin measurements using a 45 to 75 KN load level.
2. Determine h/ Ɩo based on the AREA values.
3. Compute Ɩo and ESG using Equations [6] and [7], respectively.
Page 600

Ansys Software Computer Application in Flexible
Pavement Overlay Design
ICI 10 - 10TH INTERNATIONAL CONFERENCE ON INFORMATION
17
4. Calculate the "uncorrected" SNeff using Equation [4]. Correct the value of SNeff
using Equation [8].
5. Determine "design" values. Use a 30th percentile for ESG, and a 10th to 30th
percentile for corrected SNeff. The recommended percentiles for SNeff depend on
the importance of the road analyzed. Use the lower percentiles for the major and
most important roads and arteries.
The structural adequacy or the overlay needs can be determined using the following scheme:
1. Estimate future traffic demand in terms of 8.2 ton (18 kips) ESAL during the design
period (10 to 20 years depending on budget or rehabilitation strategies).
2. Using the ESG evaluated with Hoffman's equationsvand the future traffic demand;
determine the required SN based on the 1993 AASHTO Guide.
3. Compare the required SN with the evaluated corrected SNeff to establish structural
adequacy or strengthening needs. If the corrected SNeff is higher than the required
SN, there is no structural deficit in the pavement. If the corrected SNeff is lower than
the required SN, it is possible to express the required strengthening in terms of AC
overlay thickness using the following expression:
hAC = 𝑆𝑁𝑟𝑒𝑞 − 𝑆𝑁𝑒𝑓𝑓 𝛼 ......................................................................[9]
Where:
hAC = Thickness of AC overlay, inches
α = AC layer coefficient (use 0.44 as in AASHTO guide or other values)
2.6.2 Implementation of Structural Evaluation and Overlay Design in the Present
Study
During the field studies, and due to the unpresence of the Falling Weight Deflectometer test
equipment, the researcher used the Benkelman beam for measuring the characteristic
deflection. In the measurements of Benkelman deflections, the researcher determined the
central deflections D0 and the deflection basin was not determined. To overcome this
problem and use the Hoffman's procedure, one can use the recommended exponential curve
by Ali (1992), for deflection profile of laboratory model of flexible pavement. The form of
the curve is:
Dx = D0∗ 𝑒−𝐵∗𝑥 ................................................................................. [10]
Where:
D0 = Deflection Under Load (mm),
Page 601
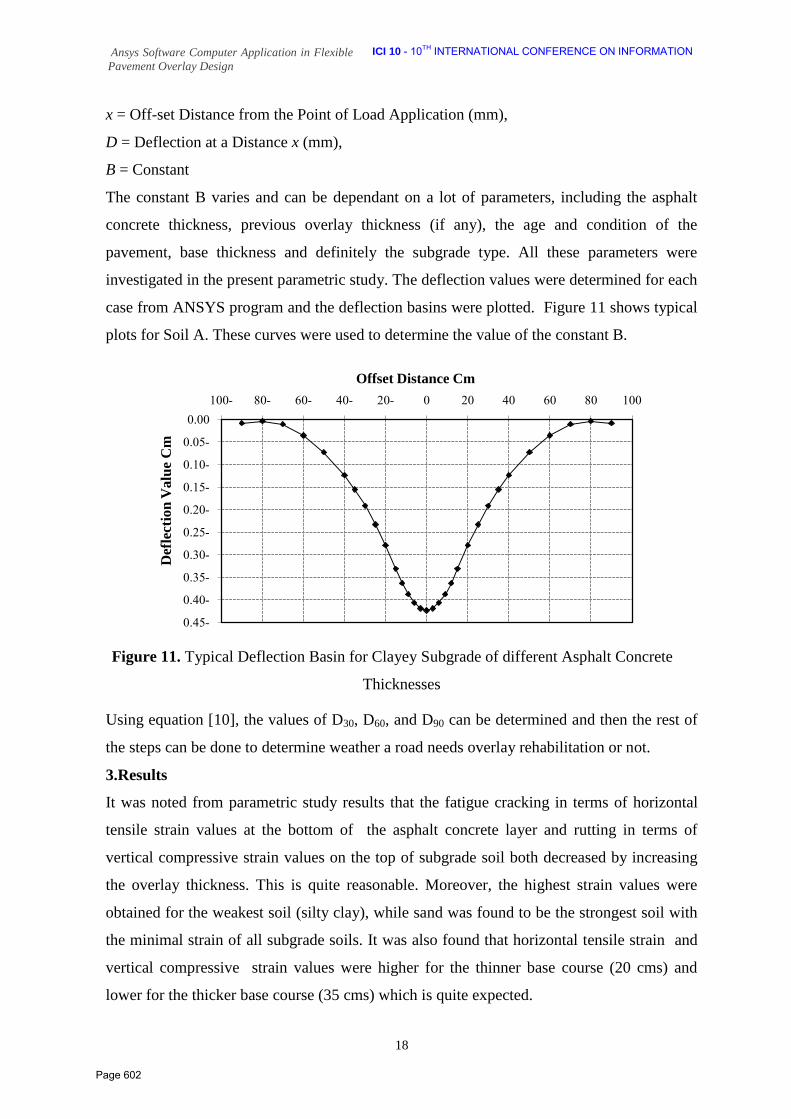
Ansys Software Computer Application in Flexible
Pavement Overlay Design
ICI 10 - 10TH INTERNATIONAL CONFERENCE ON INFORMATION
18
x = Off-set Distance from the Point of Load Application (mm),
D = Deflection at a Distance x (mm),
B = Constant
The constant B varies and can be dependant on a lot of parameters, including the asphalt
concrete thickness, previous overlay thickness (if any), the age and condition of the
pavement, base thickness and definitely the subgrade type. All these parameters were
investigated in the present parametric study. The deflection values were determined for each
case from ANSYS program and the deflection basins were plotted. Figure 11 shows typical
plots for Soil A. These curves were used to determine the value of the constant B.
Figure 11. Typical Deflection Basin for Clayey Subgrade of different Asphalt Concrete
Thicknesses
Using equation [10], the values of D30, D60, and D90 can be determined and then the rest of
the steps can be done to determine weather a road needs overlay rehabilitation or not.
3.Results
It was noted from parametric study results that the fatigue cracking in terms of horizontal
tensile strain values at the bottom of the asphalt concrete layer and rutting in terms of
vertical compressive strain values on the top of subgrade soil both decreased by increasing
the overlay thickness. This is quite reasonable. Moreover, the highest strain values were
obtained for the weakest soil (silty clay), while sand was found to be the strongest soil with
the minimal strain of all subgrade soils. It was also found that horizontal tensile strain and
vertical compressive strain values were higher for the thinner base course (20 cms) and
lower for the thicker base course (35 cms) which is quite expected.
-0.45
-0.40
-0.35
-0.30
-0.25
-0.20
-0.15
-0.10
-0.05
0.00
-100 -80 -60 -40 -20 0 20 40 60 80 100
Def
lect
ion
Valu
e C
m
Offset Distance Cm
Page 602

Ansys Software Computer Application in Flexible
Pavement Overlay Design
ICI 10 - 10TH INTERNATIONAL CONFERENCE ON INFORMATION
19
Plot graphs of relationship between overlay thickness and horizontal tensile strain and
vertical compressive strain revealed that the horizontal tensile strain values at the bottom of
the asphalt concrete layer and the vertical compressive strain values on the top of subgrade
have increased due to the increase of the asphalt concrete age and getting poorer in
condition. The highest strain value was obtained for the weakest soil (silty clay), while sand
was found to be the strongest soil with the minimal strain of all subgrade soils. It was also
found that horizontal tensile strain values were higher for the thinner base course (20 cms)
and lower for the thicker base course (35 cms)
4. Conclusions
Based on this study, the following conclusions can be made:
1. Rutting accumulation can be resisted through thicker overlays, thicker pavement layers
and good subgrade conditions.
2. Fatigue cracking is a result of thinner overlays, thinner pavement layers and weak
subgrade soils.
3. Finite element technique is an applicable tool for pavement analysis and design as it
makes analysis of a multi layered pavement system in a more realistic manner as well as
considering different boundary conditions and variations in the material properties of the
pavement layers and their thicknesses as a simple task.
4. The deflection basins can be translated in structural number effective values and
subgrade modulli in the field to monitor structural behavior with time.
5. The overlay thickness can be estimated through determination of the effective structure
number (SNeff) which in turn can be considered a useful tool to quantify and budget
overlay need at the network level.
References
[1] Desai, C. S. and Abel J. F. (1972), “Introduction to the Finite Element Method”, Van Nostrand
Reinhold Co., New York, USA.
[2] Bathe, K. J. (1982), “Finite Element Procedures in Engineering Analysis”, Englewood Cliffs,
New Jersey, USA.
[3] Zienkiewicz, O. C. and Taylor, R. T. (1989), “The Finite Element Method”, International
Edition, Vol. I, McGraw Hill Book Co. Ltd., London, UK.
[4] Zienkiewicz, O. C. and Taylor, R. T. (1991), “The Finite Element Method”, International
Edition, Vol. II, McGraw Hill Book Co. Ltd., London, UK.
Page 603

Ansys Software Computer Application in Flexible
Pavement Overlay Design
ICI 10 - 10TH INTERNATIONAL CONFERENCE ON INFORMATION
20
[5] Rabab’ah S. and R. Y. Liang, 2007, "Finite Element Modeling of Field Performance of Different
Permeable Base under Asphalt Pavement" TRB 86th Annual Meeting 2007, Journal of
Transportation Research Board
[6] Hyunwook Kim, Katie F. Chou, William G. Buttlar, 2007, " Finite Element Fracture Analysis of
Airport Overlay System" TRB 86th Annual Meeting 2007
[7] Zhao Y., L. Zhou, Fujian Ni, Xingyu Gu, 2009, "Reflective Cracking Viscoelastic Analysis for
HMA Pavement Using Finite Element Approach" Submitted to 88th TRB Annual Meeting 2009
[8] Steven B., Alabaster D., J. de Pont, 2007, "The Elastic Non-Linear Finite Element Analysis of a
Flexible Pavement Subjected to Varying FWD Loads" TRB 86th Annual Meeting 2006
[9] Sheng Hu, Xiaodi Hu, Fujie Zhou, and L. F. Walubita,"A New Finite Element Analysis Tool for
Pavement Crack Propagation" Submitted to 87th TRB Annual Meeting , 2008, Washington, D.C.
[10] Jain, S. S., (1987), “Analysis, Design and Evaluation of Flexible Pavements for Indian
Environment”, Ph. D. Thesis, University of Roorkee, Roorkee, India.
[11] Harichandran, R. S., Baladi, G. Y. and Yeh, M. S. (1989) “Development of a Computer
Program for Design of Pavement Systems Consisting of Layers of Bound and Unbound Materials”,
Final Report, Report No. FHWA-MI-RD-89-02. Michigan Department of Transportation, Lansing,
USA.
[12] Kim, Y. R., S. R. Ranjithan, J. D. Troxler, and B. Xu. (2000). “Assessing Pavement Layer
Condition Using Deflection Data.” NCHRP Report 10-48, TRB
[13] Nishiyama T., H. D. Lee and M. Asghar Bhatti (2005). “Investigation of Bonding Condition in
Concrete Overlay by Laboratory Testing, Finite Element Modeling and Field Evaluation” TRB 05-
2009 Transportation Research Board 84th Annual Meeting in Washington, D.C.
[14] Safa, Ebrahim, (1994), “Performance Analysis of Overlays for Flexible Pavements”, Ph. D.
Thesis, University of Roorkee, Roorkee, India
[15] Chiyyarath, V. G. and Lymon, C. R. (1968), “Finite Element Method for Problems in Soil
Mechanics”, Journal of Soil Mechanics and Foundation Division, ASCE, Vol. 94, SM2
[16] Romanoschi, S. and J. B. Metcalf (1999). "Simple Approach to Estimation of Pavement
Structural Capacity". In Transportation Research Record 1652
[17] Hoffman M. S. (2003), "A Direct Method for Evaluating the Structural Needs of Flexible
Pavements Based on FWD Deflections"
[18] Wiseman, G., Uzan, J., Hoffman, M. S., Ishai, I., and Livneh, M., (1997). "Simple Elastic
Models for Pavement Evaluation Using Measured Deflection Bowls", Proceedings, Fourth
International Conference – Structural Design of Asphalt Pavements, Volume II, Ann Arbor,
Michigan.
[19] Ali, G. A., (1992),"A Laboratory Investigation of the Application of Transfer Function to
Flexible Pavements", Ph.D Thesis, Purdue University, U.S.A
Page 604

GAMASA, EGYPT, 4 – 6 DECEMBER 2010
The Role of New Technology in Developing some Fields of Mathematics:
Integral and Differential Equations
A. M. A. El-Sayed 1 *, , E. A. A. Ziada 2 1 Mathematics Department, Faculty of Science, Alexandria University,
Alexandria, Egypt. Email: [email protected]
2 Faculty of Engineering, Delta University for Science and Technology, Gamasa, Egypt.
Email: [email protected]
Abstract New technology tools play very important role in developing all fields of mathematics. We are concerned here with two of these fields; integral and differential equations. The great effect of using programming languages will be appeared when different methods will be used to solve these type of equations such as Adomian decomposition method (ADM) and numerical methods. Keywords: Technology tools; Integral equation; Differential equations; Programming languages; MatLab; Mathematica; Adomian method; Numerical methods. 1. Introduction Integral equations (IEs) and differential equations (DEs) appeared in many fields of science and engineering, including fluid flow, electrical networks, fractals theory, control theory, electromagnetic theory, probability, statistics, optics, potential theory, biology, chemistry, diffusion, and viscoelasticity [7,14-19,22,25-27]. There are different methods for solving IEs and DEs. In this paper, we use ADM [2-6,9,23,24,28] to solve these equations. This method has many advantages, it is efficiently works with different types of linear and nonlinear equations in deterministic or stochastic fields and gives an analytic solution for all these types of equations without linearization or discretization [1,8]. New technology tools such as computer programming languages (Mathematica, MatLab, ... and so on) play very important role in developing all fields of mathematics especially in IEs and DEs. These computer programming languages are used to evaluate the calculations appear in the methods of solution. By this way, we save our time and efforts. This paper is organized as follow: • In section 2, we solve the nonlinear IEs and we followed that by the solution of nonlinear quadratic integral equations in section 3. • In section 4, we solve the nonlinear DEs and we followed that by the solution of nonlinear fractional differential equations in section 5. 2. Solution of Nonlinear Integral Equations
2.1. The solution algorithm Consider the nonlinear integral equation,
( ) ( ) ( ) ( )( )0
tx t p t k t s f t x s ds= + , ,∫ , (1)
The solution algorithm of equation (1) using ADM is, ( ) ( )0x t p t= , (2)
Page 605

( ) ( ) ( ) ( )10
t
i ix t k t s A s d− s= ,∫ , (3)
where are Adomian polynomials of the nonlinear term iA ( )f t x, , which take the form
0 0
1 ik
i kik
dA f xi d
λ
λλ
⎡ ⎤∞⎛ ⎞⎢ ⎥⎜ ⎟⎢ ⎥⎜ ⎟⎢ ⎥⎜ ⎟
=⎢ ⎥⎝ ⎠⎣ ⎦ =
=! ∑
Finally, the solution will be,
0
( ) ( )ii
x t x∞
=
= ∑ t (4)
2.2. Numerical examples Example 1 Consider the following linear integral equation,
4
2
0
7 1( ) ( ) ( )48 4
ttx t t t s x s ds⎛ ⎞
= − + +⎜ ⎟⎝ ⎠
∫ , (5)
and has the exact solution ( ) 2x t t= . Applying ADM to equation (5), we get
42
0
10
7( )48
1( ) ( ) ( ) 14
t
i i
tx t t
x t t s x s ds i−
⎛ ⎞= − ,⎜ ⎟
⎝ ⎠
= + ,∫ ≥ .
and the solution will be,
0
( ) ( )q
ii
x t x=
= ∑ t
The first four terms of the series solution are
6 2 86
211 224 15 11 360 1977( )
5760 184320 4423680t t ttx t t
⎛ ⎞ ⎛⎜ ⎟ ⎜⎝ ⎠ ⎝
− − += − + −
2t ⎞⎟⎠ .
Table 1 shows the absolute error of ADM series solution (when 5q = ). Table 2 shows a caparison between the time of ADM solution by using computer and by hand.
Table1 Absolute:t
Error
Exact ADMx x−
0.1 7.6306× 2210−
0 2. 1710− 1.25057× 0 3. 1510− 3.65079× 0 4. 1310− 2.04894× 0 5. 1210− 4.65875× 0 6. 1110− 5.98145× 0 7. 1010− 5.1768× 0 8. 910− 3.35698× 0 9. 810− 1.74616× 1 810− 7.63289×
Table 2 : Time used
Error of ADM Computer Time Hand Time
0.312 sec 15 min
Page 606

2 Consider the following nonlinear integral equation,Example
( )93 140 5 0
( ) ( ) ( )t
t 2x t t ts x s d= − + ∫ s , (6)
and has the exact solution x ( ) 3t t= . Applying ADM to equation (6), we get
93
0
10
( )40
1( ) ( ) ( ) 15
t
i i
tx t t
x t ts A s ds i−
⎛ ⎞= − ,⎜ ⎟
⎝ ⎠
= , ≥∫ .
where are Adomian polynomials of the nonlinear term iA 2x and the solution will be,
0
( ) ( )q
ii
x t x=
= ∑ t
The first three terms of the series solution are
9 6 12 15 6 12 189
328000 800 7 33280000 1248000 17280 91
( )40 1120000 46592000000
t t t t t ttx t t⎛ ⎞ ⎛⎜ ⎟ ⎜⎝ ⎠ ⎝
− + − + −= − + −
t ⎞⎟⎠ .
Table 3 shows the absolute error of ADM series solution (when 5q = ). Table 4 shows a caparison between the time of ADM solution by using computer and by hand.
Table 3 Absolu: te Errort
Exact ADMx x−
0 1. 2710− 2.04637× 0 2. 2510− 9.17759× 0 3. 2310− 4.1317× 0 4. 2210− 5.33563× 0 5. 2110− 6.97983× 0 6. 1810− 1.07355× 0 7. 1610− 4.4191× 0 8. 1410− 8.02184× 0 9. 1210− 7.83087× 1 1010− 4.66567×
Table 4 : Time used
Error of ADM Computer Time Hand Time
0.422 sec 30 min
We see that in this type of equation, we can make the calculation by hand but it takes a lot of time and effort than if we use computer programming languages. But in the following type of equations it is very difficult to make the calculations by hand, so we do it by using computer programming languages (Mathematica).
3. Solution of Nonlinear Quadratic Integral Equations
3.1. The Solution Algorithm Consider the nonlinear quadratic integral equation (QIE),
( ) ( ) ( )( ) ( ) ( )0
( )t
x t p t f t x t k t s g s x s ds= + , , ,∫ , (7)
The solution algorithm of equation (7) using ADM is, ( ) ( )0x t p t= , (8)
Page 607

( ) ( ) ( ) ( ) ( ) ( )1 10
t
i i ix t A t k t s B s ds− −= ,∫ . (9)
where and iA iB are Adomian polynomials of the nonlinear terms ( )f t x, and ( )g s x, respectively The solution will be, .
0
( ) ( )ii
x t x∞
=
= ∑ t (10)
3.2. Numerical examples Example 3 Consider the following nonlinear QIE,
12
3
0
1( ) ( ) ( ) ( )40 5
tt 2x t t x t ts x s ds⎛ ⎞
= − +⎜ ⎟⎝ ⎠
∫ , (11)
and has the exact solution ( ) 3x t t= . Applying ADM to equation (11), we get
123
0
1 10
( )40
1( ) ( ) ( ) ( ) 15
t
i i i
tx t t
x t x t ts A s ds i− −
⎛ ⎞= − ,⎜ ⎟
⎝ ⎠
= ,∫ ≥ .
where are Adomian polynomials of the nonlinear term iA 2x and the solution will be,
0
( ) ( )q
ii
x t x=
= ∑ t
Table 5 shows a caparison between the absolute error of ADM solution and repeated trapezoidal (RT) solution. Table 5 Absolute Error:
t Error of ADM ( ) 5q =
Error of RT ( 0 01h = . )
0 1. 1.21323 2410−× 1.16096 1510−× 0 2. 2.54434 1810−× 1.19317 1210−× 0 3. 1.26909 1410−× 6.88523 1110−× 0 4. 5.33583 1210−× 1.22297 910−× 0 5. 5.78484 1010−× 1.13921 810−× 0 6. 2.66071 810−× 7.05709 810−× 0 7. 6.76878 710−× 3.30211 710−× 0 8. 0.000011148 1.26135 610−× 0 9. 0.000131325 4.15054 610−× 1 0.0011805 0.0000122957
4 Consider the following nonlinear QIE ,Example
( )132 3 21420 10 0
( ) ( ) ( ) ( )t
tx t t x t s t s x s ds= − + −∫ , (12)
andhastheexactsolution x ( ) Applying ADM to equation (12), we get 2t t= .
Page 608

( )
( )
132
0
1 10
4201 ( ) ( ) ( ) 1
10t
i i i
tx t t
x t A t s t s B s ds i− −
⎛ ⎞= − ,⎜ ⎟
⎝ ⎠
= −∫ , ≥ .
where and iA iB are Adomian polynomials of the nonlinear terms 3x and 2x respectively. Table 6 shows a caparison between the absolute error of ADM solution and RT solution. Table 6 Absolute Error:
t Error of ADM ( 5m = )
Error of RT ( 0 01h = . )
0 1. 1.84889 2910−× 6.93889 1810−× 0 2. 3.11434 2210−× 1.70211 1410−× 0 3. 5.24273 1810−× 1.47457 1210−× 0 4. 5.22501 1510−× 3.49307 1110−× 0 5. 1.10644 1210−× 4.0674 1010−× 0 6. 8.79574 1110−× 3.02256 910−× 0 7. 3.55608 910−× 1.6477 810−× 0 8. 8.76355 810−× 7.16206 810−× 0 9. 1.47912 610−× 2.62132 710−× 1 0.0000184998 8.39942 710−×
4. Solution of Nonlinear ODEs
4.1. The solution algorithm Let us consider the n -th order nonlinear ODE, ( ) ( ) ( )Ly t f y x t+ = , (13) where, ( )f y is the nonlinear term expanded in terms of Adomian polynomials,
0
( ) nn
f y A∞
=
= ,∑ (14)
which take the form:
0 0
1 ni
n ni
dA fn d
λ
λλ
⎡ ⎤∞⎛ ⎞⎢ ⎜ ⎟⎢ ⎜ ⎟⎢ ⎜ ⎟
=⎢ ⎥⎝ ⎠⎣ ⎦iy ⎥
⎥⎥
=
⎛ ⎞= ⎜ ⎟!⎝ ⎠∑ (15)
and L L R= + , (16)
1
0and ( )
n kn
knk
d dL R adt dt
−
=
= , = ∑ kt .
),
(17)
Substitute from (14) and (16) into (13) we get,
(18) 0
( ) ( ) (nn
L R y t A x t∞
=
+ + =∑
Page 609

0
( ) ( ) ( ) nn
Ly t x t Ry t A∞
=
= − − ,∑ (19)
Applying to both sides of equation (19) we have, 1L−
1 1 1
0
( ) ( ) ( ) ( ) nn
y t p t L x t L Ry t L A∞⎛ ⎞
⎜− − −⎜⎜
=⎝ ⎠
= + − − ∑ ⎟⎟⎟, (20)
where,
1
0 0fold
t tL n dt− …dt= − ,∫ ∫L L
and ( )p t is the solution of , and satisfy the given initial conditions. ( ) 0Ly t =
Decompose 0
( ) ( )nn
y t y∞
=
= ∑ t and substitute in equation (20), we get the following recursive
relations, 1
0 ( ) ( ) ( )y t p t L x t−= + ,1
1n
(21) 1
1( ) ( )n ny t L Ry t L A− −− −= − − . (22)
Finally, the solution of (13) is 0
( ) ( )nn
y t y∞
=
= ∑ t .
4.2. Numerical examples Example 5 The relaxation-oscillation equation ( ) ( ) ( ) 0mD y t Ay t f t t+ = , > ,
m (23)
( ) (0) 0 ( 0 1 1)ky k …= , = , , , − . will be solved using ADM in two cases when 1m = and 2m = . Case 1 ( ): 1m =In this case this problem is called the relaxation differential equation. If we take 1A = ,
( ) ( )f t H t= , and the equation (23) will be, (0) 0y = ,
( ) ( ) (0) 0dy y t H t ydt
+ = , = , (24)
where is the unit-step function, and it has the exact solution ( )H t ( ) 1 ty t e −= − . Using ADM we get, 0 0
( ) ( )t
y t H dτ τ= ,∫ (25)
10( ) ( ) 1
t
n ny t y d nτ τ−= − ,∫ ≥ . (26)
from equations (25) and (26) we have,
2 3 4 5
0 1 2 3 42 6 24 120t t t ty t y y y y …= , = − , = , = − , = ,
hence,
0 1 2 3 40
( ) nn
y t y y y y y y∞
=
= = + + + + +∑ L
2 3 4 5
2 6 24 1201 t
t t t tt
e −
= − + − + −
≈ − .
L
Page 610

Figure 1. shows ADM and exact solutions (when 40n = ). Case 2 ( ): 2m =In this case this problem is called the oscillation differential equation. If we take 1A = ,
( ) ( )f t H t= , and the equation (23) will be, (0) 0y = , (0) 0y ′ = ,
2
2 ( ) ( ) (0) 0 (0) 0d y y t H t y ydt
′+ = , = , = . (27)
which has the exact solution ( ) 1 cos( )y t t= − . Using ADM we get,
0 0 0( ) ( )
t ty t H d dτ τ τ= ,∫ ∫
(28) 10 0( ) ( ) 1
t t
n ny t y d d nτ τ τ−= − , ≥ .∫ ∫from equation (28) we have,
2 4 6 8 10
0 1 2 3 42 24 720 40320 3628800t t t t ty y y y y= , = − , = , = − , = ,…
hence,
0 1 2 3 40
2 4 6 8 10
( )
2 24 720 40320 36288001 cos( )
nn
y t y y y y y y
t t t t t
t
∞
=
= = + + + + +
= − + − + −
≈ − .
∑ L
L
Figure 2. shows ADM and exact solutions (when 35n = ).
Page 611

Example 6 Consider the initial value problem,
2
22 4 4d y dy 2y t
dt dt+ − = − , (29)
(0) 0 (0) 1y y′
= , = .
1
which has the exact solution . ( )y t t=Applying ADM to the problem (29) we have,
( ) ( )
20 0 0
1 10 0 0
4
4 ( ) ( )
t t
t t t
n n n
y t t d d
y y d A d d n
τ τ
τ τ τ τ τ
⎛ ⎞⎜ ⎟⎝ ⎠
− −
= + − ,
= − + , ≥ .
∫ ∫∫ ∫ ∫
The first three terms of the series solution will be
4 6 7 8 9 10 1
12 13 14 16
8 22 104 11 31 871 61( )3 45 315 630 1134 151200 89100
291 37 5983160 7076160 8255520 18662400
t t t t t t ty t t
t t t t
= + − − + + + −
− + + − .
1
Table 7 shows the absolute error of ADM series solution (when 10n = ). Table 8 shows a caparison between the time of ADM solution by using computer and by hand.
Table 7 Absolute: Error t
Exact ADMx x−
0 1. 1510− 7.73135× 0 2. 1110− 1.87377× 0 3. 1010− 3.09455× 0 4. 710− 1.20702× 0 5. 610− 3.48215× 0 6. 0.0000443862 0 7. 0.000331685 0 8. 0.00161217 0 9. 0.00504559 1 0.00710138
Table 8 : Time used
Error of ADM Computer Time Hand Time
21.327 sec 90 min
Also, we see that in this type of equation, we can make the calculation by hand but it takes a lot of time and effort than if we use computer programming languages. But in the following type of equations it is very difficult to make the calculations by hand, so we do it by using computer programming languages (Mathematica).
5. Solution of Nonlinear Fractional DEs
5.1. The solution algorithm
Let ( ] 1 21 1 0k k k k … n n kα α α∈ − , , = , , , < < < < < , ,L m mα and are any positive integer numbers. Consider the nonlinear FDE,
n
( )1 2 mnD x f t x D x D x … D xα α α= , , , , , , (30)
( ) (0) 0 1 1jjx c j … n= , = , , , − . (31)
Page 612

where ( ) ( )[0 ]d
dtD x x t t J T T R x C J+= , = , ∈ = , , ∈ , ∈ and the fractional derivatives are considered in the Caputo sense which defined as,
( ) ( ) ( ) ( )1
0
11
r r
t
D x I D x r r
I x t t x d
α α
αα
α
τ τ τα
−
−
= , − < ≤ ,
= − .Γ ∫
Let
1
0
jn
jj
tx c Xj
−
=
= + ,!∑
equations (30) and (31) will be
1 2
1
0
m
jnn
jj
tD X f t c X D X D X … D Xj
α α α−
=
⎛ ⎞= , + , , , ,⎜ ⎟!⎝ ⎠
∑ ,
n
(32)
( ) (0) 0 0 1 1jX j …= , = , , , − .
n
(33) Let nD X y X I y= ⇒ = . (34) and from equation (34), we get i in nD X I D Xα α−=
( )in n nI D I yα−=
1 2inI y i … mα−= , = , , , . (35) Substitute from equations (34) and (35) into equation (32) we get,
1
1
0
m
jnn nn
jj
ty f t c I y I y … I yj
α α−
− −
=
⎛ ⎞= , + , , ,⎜ ⎟!⎝ ⎠
∑ (36)
The solution algorithm of equation (36) using ADM is, ( ) ( )0y t a t= , (37)
( ) ( )1 1j jy t A t j−= , ≥ . (38) where is the all terms of (36) that not contain ( )a t y and its derivatives and are Adomian
polynomials of the nonlinear term
jA1
0
jm
nnnt
j jj
f t c … I yα−
−!
=
⎛ ⎞, + , ,⎜ ⎟
⎝ ⎠∑ I y which take the form,
1
0 0 0 0
1m
j jnni n i
j j ijj i i
d tA f t c I y … I yj d j
α
λ
λ λλ
⎡ ⎤⎛ ⎞− ∞ ∞⎢ ⎥⎜ ⎟−⎢ ⎥⎜ ⎟⎢ ⎥⎜ ⎟⎜ ⎟⎢ ⎥= = =⎝ ⎠⎣ ⎦ =
= , + , ,! !∑ ∑ ∑ i
and the solution of equation (36) will be,
0
( ) ( )ii
y t y∞
=
= ∑ t (39)
Finally, the solution of problem (30)-(31) will be,
( ) ( )1
0
jn
jj
tx t c Xj
−
=
= +!∑ t
Page 613

1
0
( )jn
nj
j
tc I yj
−
=
= +!∑ t (40)
5.2. Numerical examples Example 7 Consider the following nonlinear FDE [21], ( )2 12 ( ) ( ) ( ) ( )aD x t bD x t cD x t ex t f tα α+ + + =3 , (41)
( ) ( )
2 13 3 9
2 1
2 2( ) 24 4 2bt ct et
7f t at
α α
α α
− −
= + + + ,Γ − Γ −
1 2(0) (0) 0 0 1x x α α′= = , < < ≤ ,
which has the exact solution 3
3( ) tx t = . Using equations (32)-(34), we get
( )( )2 132 2 21 ( )y bI y cI y e I y f t
aα α− −−
= + + − , (42)
Applying ADM to equation (42), we have
01( ) ( )y t f ta
= , (43)
2 12 21 1 1
1( ) 1i i i iy t bI y cI y eA ia
α α− −⎛⎜ − − −⎝
−= + + ,⎞
⎟⎠
≥ . (44)
where are Adomian polynomials of the nonlinear term iA ( )32I y . From equations (43) and (44), the first three terms of the series solution of the problem (42) when
1( 1 2 1 2 1 0 00196c ea b α= , , = / , = , = . ,= 2 0 07621)α = . is,
2
09
10 9238 10 998 3
34 92379 4 99804 11
( ) ( )
2 0 00081098 0 000169158 0 33333327
0 0379418 0 00836124 0 0003367
ii
y t y t
tt t t
t t t
=
. . ⎛⎜⎝
. . ⎞⎟⎠
=
= + − . − . − .
++ . + . + .
∑
L
t
t−
and the solution of the problem (41) is,
2
3 18 4 92379 6 84758
6 92183 6 99608 20 11
( ) ( )0 333333 5 74652 10 0 002154810 000928711 0 0000999932 3 94255 10
x t I y tt t t
t t
− . .
. .
=
= . − . × − .− . + . + . × +L
while the first two terms of the series solution to the problem (42) when 5 2
1 25 2( 1 0 1 0 2 0 3 )a b c e α α= , = . , = . , = . , = , = is,
1
0
3 58579 3 84568 4 10557
9 10 2929 10 5528
( ) ( )
2 0 00152492 0 00419432 0 002839830 0111111 0 0000555717 0 0000597022
ii
y t y t
t t tt t t
=
. .
. .
=
= − . − . − .+ . − . − . +
∑
L
t .
t .
and the solution of the problem (41) is,
2
3 5 58579 5 84568 6 10557
20 11 6 12 2929 6 12 5528
( ) ( )0 333333 0 0000595317 0 000148072 0 00009110061 97128 10 4 22628 10 5 25031 10
x t I y tt t t
t t t
. .
− − . − .
=
= . − . − . − .+ . × − . × − . × +L
Page 614

1 21 2 1 2 1 0 00196 0 07621).c e
Table 9 shows a comparison between a proposed numerical method solution (PNM) illustrated in [19] and ADM solution (when a b α α= , = , = / , = , = . , = .
( )Table 9 Absolute Error at 1t: =
Error of PNM Error of ADM h Error Computer
Time Hand Time
n Error Computer Time
Hand Time
0.1 0.0664736 0.265 sec 10 min 2 0.00330097 15.156 sec 60 min 0.01 0.00784993 0.375 sec 30 min 0.001 0.000797757 95.063 sec 60 min 3 0.000150218 478.577 sec 80 min 0.0005 0.000399235 894.999 sec 80 min
Table 10 shows a comparison between PNM solution and ADM solution (when
1 25 21 0.1 0.2 0.3 ).
5 2a b c e α α= , = , = , = , = , =
( )Table10 Absolute Error at 1t: =
Error of PNM Error of ADM h Error Computer
Time Hand Time
n Error Computer Time
Hand Time
0.1 0.0830668 0.282 sec 10 min 2 0.00030847 36.859 sec 50 min 0.01 0.00938608 1.078 sec 40 min 0.001 0.000868269 106.392 sec 70 min 3 5.7435 610−× 506.954 sec 90 min 0.0005 0.000388881 952.907 sec 100 min
References [1] K. Abbaoui and Y. Cherruault, "Convergence of Adomian’s method applied to differential equations", Computers Math. Applic., 28, 103-109 (1994). [2] G. Adomian, "Stochastic System", Academic press, (1983). [3] G. Adomian, "Nonlinear Stochastic Operator Equations", Academic press, San Diego, (1986). [4] G. Adomian, "Nonlinear Stochastic Systems: Theory and Applications to Physics", Kluwer, (1989). [5] G. Adomian, R. Rach and R. Mayer, "Modified decomposition", J. Appl. Math. Comput., 23, 17-23 (1992). [6] G. Adomian, "Solving Frontier Problems of Physics: The Decomposition Method", Kluwer, (1995). [7] A. Carpinteri and F. Mainardi, "Fractals and fractional calculus in continuum mechanics", Springer Verlag, 223-276 (1997). [8] Y. Cherruault, G. Adomian, K. Abbaoui and R. Rach, "Further remarks on convergence of decomposition method", International J. of Bio-Medical Computing., 38, 89-93 (1995). [9] V. Daftarder-Gejji and A. Babakhani, "Analysis of a system of fractional differential equations", J. Math. Anal. Appl., 293, 511-522 (2004). [10] K. Diethelm and N. J. Ford, "Numerical solution of the Bagley–Torvik equation", BIT, 42, 490–507 (2002). [11] K. Diethelm and N. J. Ford, "Multi-order fractional differential equations and their numerical solution", Appl. Math. Comput., 154, 621-640 (2004). [12] K. Diethelm and Y. Luchko, "Numerical solution of linear multi-term initial value problems of fractional order", J. Comput. Anal. Appl., 243-263 (2004). [13] K. Diethelm, "Multi-term fractional differential equations multi-order fractional differential systems and their numerical solution", J. Europ. Syst. Autom., 42, 665-676 (2008). [14] I. L. El-Kalla and E. A. A. Ziada, "Solution of multidimensional nonlinear differential equations of arbitrary orders by Adomian method", Math. Sci. Res. J., (2009), accepted. [15] A. M. A. El-Sayed, E. M. El-Mesiry and H. A. A. El-Saka, "Numerical solution for multi-term fractional (arbitrary) orders differential equations", Comput. Appl. Math., 23, 33–54 (2004).
Page 615

The Role of New Technology in Developing some Fields of Mathematics: Integral and Differential Equations
ICI 10 - 10TH INTERNATIONAL CONFERENCE ON INFORMATION
12
[16] A. M. A. El-Sayed, M. M. Saleh and E. A. A. Ziada, "Analytical and numerical solution of multi-term nonlinear differential equations of arbitrary orders", J. Appl. Math. Computing, (2009), accepted. [17] A. M. A. El-Sayed, I. L. El-Kalla and E. A. A. Ziada, "Adomian solution of multidimensional nonlinear differential equations of arbitrary orders", International Journal of Applied Mathematics and Mechanics, (2009), accepted. [18] A. M. A. El-Sayed, M. M. Saleh and E. A. A. Ziada, "Numerical and analytic solution for nonlinear quadratic integral equations", Math. Sci. Res. J., 183-191 (2008). [19] A. M. A. El-Sayed, I. L. El-Kalla and E. A. A. Ziada, "Analytical and numerical solutions of multi-term nonlinear fractional orders differential equations", Applied Numerical Mathematics, (2010), accepted. [20] I. L. El-kalla, "Error analysis of Adomian series solution to a class of nonlinear differential equations", Applied Mathematics E-Notes, 7, 214-221 (2007). [21] E. A. M. El-Mesiry, A. M. A. El-Sayed and H. A. A. El-Saka, "Numerical methods for multi-term fractional (arbitrary) orders differential equations", Appl. Math. Comp., 160, 683–699 (2005). [22] A. A. Kilbas, H. M. Srivastava and J. J. Trujillo, "Theory and Applications of Fractional Differential Equations", Elsevier, New York, (2006). [23] C. P Li and Y.H. Wang, "Numerical algorithm based on Adomian decomposition for fractional differential equations", Comput Math Appl, 57 (10), 1672-1681 (2009). [24] C.P. Li and C.X. Tao, "On the fractional Adams method", Comput Math Appl, 58 (8), 1573-1588 (2009). [25] K. S. Miller and B. Ross, "An Introduction to the Fractional Calculus and Fractional Differential Equations", Wiley-Interscience, New York, (1993). [26] I. Podlubny and A. M. A. El-Sayed, "On two definitions of fractional calculus", Solvak Academy of science-institute of experimental phys, (1996). [27] I. Podlubny, "Fractional Differential Equations", Academic Press, New York, (1999). [28] N. T. Shawaghfeh, "Analytical approximate solution for nonlinear fractional differential equations", J. Appl. Math. Comput., 131, 517-529 (2002).
Page 616

Digitalisierung des Kulturerbes.
Fragen, Anomalien, Möglichkeiten, Überlegungen* von
Dr. Attila Verók
(Károly-Eszterházy-Hochschule, Eger)
Fragen und Anomalien
Die Frage der Digitalisierung des Kulturerbes stellt heutzutage ein immer beliebteres
Phänomen sowohl in der Europäischen Union als auch weltweit dar. Damit die Urheberrechte
im ganzen Bibliothekswesen – das ich jetzt in meinem Text unter die Lupe nehme – nicht im
Spiel sein können, wurden in der letzten Zeit die Aktivitäten im Bereich Dienstleistungen mit
Bezug auf alte Bücher und alte Dokumente aus der Zeitspanne vor 1850 wie beispielsweise
Holz- und Kupferschnitte, Landkarten, Porträts, Musikschriften, Manuskripten, Abschriften
von Druckwerken usw. lebhafter. Dabei kann man unter anderen an die Auktionen, die
Buchhandelstätigkeit, Projekte zur Restaurierung oder Neuveröffentlichung alter Drucke bzw.
die Klärung der Rechtslage denken.
Seit der Französischen Revolution am Ende des 18. Jahrhunderts sichern die
Bibliotheken für alle Menschen den Zugang zum Kulturerbe ohne Unterscheidung in
juristischem Sinne. Deshalb kann seit dieser Zeit von der Öffentlichkeit der bürgerlichen
Kultur geredet werden, also wurden mit den Monopolien und Privilegien der einzelnen
Gesellschaftsschichten und Institutionen aufgeräumt. Diese Situation galt bis zur jüngsten
Vergangenheit und funktionierte ziemlich reibungslos im Leben der (bürgerlichen)
Gesellschaft. Seit einiger Zeit findet man aber konträre Interesse in diesem Segment der
Gesellschaft: Die Wirtschaft und die Politik mischen sich in die kulturbezogenen
Angelegenheiten des Sektors ein, was zu ständig zunehmenderen Spannungen führt. Die
Wirtschaft will heutzutage auch von diesem Gebiet leben bzw. bedeutenderweise profitieren,
und riss damit den Bibliotheken die Möglichkeit aus der Hand. Wurden früher zum Beispiel
die neu entwickelten oder ausgebauten Datenbanken durch die Bibliotheken ausprobiert, wird
es heute schon fast ohne Ausnahme in der Wirtschaftssphäre getan und damit wird der
Anspruch auf die Technologie vor den Anspruch von der Seite der Benutzer gestellt. Das war
aber von Anfang an bis jetzt gar keine typische Erscheinung, sondern gerade ein umgekehrter * Die Erstellung dieser Studie wurde durch die Unterstützung des János-Bolyai-Forschungsstipendiums der Ungarischen Akademie der Wissenschaften ermöglicht.
Page 617

Vorgang kennzeichnete die Funktion und Wirksamkeit des ganzen Systems. Es ergibt sich
daraus, dass es heute – aus Mangel an Geld, Arbeitskräften und Zeit, da die Bibliotheken
nicht zu schnell auf die Änderungen der technologischen Branche reagieren können – leere
Makette, Schablonen im Bibliothekswesen existieren, wobei kein richtiger Inhalt im
Hintergrund zu finden ist, weil es nicht im Interesse des Wirtschaftssektors steht. Das ist
selbstverständlich in gewisser Hinsicht eine reine Vereinfachung oder übertriebene
Formuliereung, im Grunde genommen gilt sie doch.
Als gutes, aber leider seltenes Gegenbeispiel kann ich die Europäische Digitale
Bibliothek (EDL = European Digital Library Project oder Europeana, früher TEL)1
hervorheben, die zur Zeit entsprechend zu funtionieren scheint,2 weil sie nicht direkt von der
Europäischen Union, sondern von den Mitgliedsbibliotheken des Systems, also von einigen
Dutzenden Nationalbibliotheken und Forschungs- bzw. wissenschaftlichen Bibliotheken
aufrechterhalten wird. Auf der anderen Seite verlangt aber der technologische Sektor, alle
Entwicklungsphasen der Digitalisierungstechnologie selbst zu machen, woraus
bedauerlicherweise folgt, dass heute in der EU kein Geld für die Digitalisierung des
Kulturerbes anzuschaffen ist, weil es schon anderen als den Bibliotheken zur Verfügung steht.
Dieser Mechanismus geht dann so weiter, entsteht ein selbsterregender Vorgang, der am Ende
zur Falle für die Bibliothen wird: Die technologische Entwicklung schreitet kontinuierlich
fort, so bekommt der wirtschaftliche und nicht der Bibliothekssektor das Geld und hat der
letztere keine Chance, die neuen Errungenschaften auszunutzen und beispielsweise die sich
immer notwendiger erweisenden Datenbanken wie digitale oder virtuelle Bibliotheken usw.
durch inhaltreiche Angaben aufzufüllen. Das Bibliothekswesen kann daher den Schritt nicht
halten und hat enorm große Rückstände in der Entwicklung, was in absehbarer Zeit – wenn
der oben geschilderte Vorgang nach wie vor bestehen wird – eine total chaotische,
unübersehbare und unbehandelbare Situation schafft, die entweder zum Zusammenbruch des
elektronisch aufgebauten Bibliothekswesens oder zu erzwungenen revolutionären Schritten
von der Seite der Bibliotheken führt. Im schlimmsten Fall kann auch ein enervierter Zustand
im Bibliotheksbereich zustande kommen. Für alle drei aufgezählten Möglichkeiten könnten
schon Beispiele aus aller Welt erwähnt werden. Hier möchte ich aber nur einige erfreuliche
Lösungen ans Tageslicht bringen und damit ein wenig zur optimistischen Anschauung auf
diesem Gebiet beitragen. 1 Siehe dazu die Homepages: http://www.theeuropeanlibrary.org/portal/organisation/cooperation/archive/edlproject/index.php und http://www.europeana.eu 2 Vgl. dazu die ganze Flut von Nachrichten der letzten Zeit in der internationalen Presse seit Ende 2008.
Page 618

Noch kurz zurück zur EDL oder Europeana. Das Ziel dieses Vorhabens war
ursprünglich, mit Hilfe von Texten hinter den Katalogtiteln auch über Texte zu verfügen, aber
nicht nur im bibliothekarischen Bereich. Sie sollte ein oder das einzige Internetportal werden,
wo die Andenken des europäischen Kulturerbes an einem virtuellen Platz gesammelt werden.
Natürlich nicht nur Druckwerke, sondern auch Musikalien, Gemälde, Fotos, Filme oder
Archivmaterialien. Hauptziel ist die Aufbewahrungsabsicht und die Möglichkeit der
Besichtigung. Schöne Vorstellung, aber wegen der oben skizzierten Lage könnte die
technologische Industrie das ganze aus der Bahn schleudern. Um das Problemkomplex auch
statistisch zu zeigen, erwähne ich nur einen viel sagenden Zahlenwert: Der Gesamtbestand der
größten Bibliotheken in Europa liegt über 2,5 Milliarden Stück Druckwerke, aber davon ist
heute nur ungefähr 1 % in digitaler Form zugänglich! Ich glaube, das Verhältnis zeigt die
riesengroße Anomalie und Deformation sehr wohl, von der die Rede ist.
Möglichkeiten
Da die Kultur in Europa sozusagen „frei” vorliegt – das heißt, vorwiegend auf der
Ebene des Unterrichtswesens geregelt bzw. organisiert wird – und vom wirtschaftlichen bzw.
politisch-bürokratischen Sektor streng kontrolliert und ausgesaugt wird, können dafür Gelder
nur auf verborgene Weise erworben werden (z. B. im Unterrichts- oder Bauwesen). Die
Formel scheint ziemlich simpel zu sein: Gelder von der Europäischen Union können für
Kultur nicht ausgegeben werden. Es gibt aber einige Möglichkeiten in der Hand der
Bibliotheken und Hochschulinstitutionen wie beispielsweise verschiedene Forschungsprojekte
oder Entwicklung von Lehrstoffmaterialien.
Im Rahmen von Forschungsprojekten kann viel vom europäischen oder nationalen
Kulturerbe gerettet werden. Die Bibliotheken können zum Beispiel den Zugang zu den
einzelnen Rekords in vielerlei Sprachen gewährleisten (vgl. das MAX-Programm). An den
Hochschulinstitutionen könnten demgegenüber die Transmissionstechniken geforscht werden,
das heißt, wie das kulturelle Material im Allgemeinen oder konkret von Generation zu
Generation überliefert wird, und dazu methodologisch-theoretische Schemata ausgearbeitet
werden. Was also wünschenswert wäre: eine ausschließliche Finanzierung der gemeinsamen
Aktivität und der Theorie!
Was die Theorie und Praxis der Entwicklung von Lehrstoffmaterialien anbelangt, kann
festgestellt werden, dass hier auch viele wertvolle Sachen vom Kulturerbe zu retten wären,
aber dieses Gebiet ist noch kaum davon berührt. Dieser Sektor hat noch viele Möglichkeiten
Page 619

in der Hand, wie die Digitalisierung des kulturellen Materials in diesen Bereich
einzuschmuggeln wäre. Es gibt schon Versuche in Europa und auch bei uns in Ungarn, wovon
die Neuerungsschritte an der Károly-Eszterházy-Hochschule zu Eger hervorzuheben sind.3
Probleme in der Digitalisierungspraxis
Heute gilt die Digitalisierung von Materialien unterschiedlichster Art für eine einfache
Tätigkeit, aber es gibt auch Probleme auf diesem Gebiet. Als Erstes kann das Fehlen an
Metadaten erwähnt werden. Eine Generation sollte nämlich gezwungen werden, sämtliche
Angaben, die während zahlreicher Jahrhunderte verfertigt worden sind, zu bearbeiten. Da
dabei die automatischen Anlagen eine sehr schwache Leistung aufweisen, kann das nur mit
Hilfe von menschlichen Arbeitskräften verwirklicht werden. Die massenhafte Bearbeitung
können die Maschinen mehr oder weniger ohne Hindernis vollziehen, aber die
Einzelbearbeitung der aufzunehmenden Dokumente braucht unbedingt die Anwesenheit und
effektive Arbeit von Menschen. Hier möchte ich die Wichtigkeit der Bildung kompetenter
Fachleute betonen!
Zweitens muss man über die Probleme der sicheren Aufbewahrung von Materialien in
digitaler Form sprechen. Da bedeutet die ständige Veränderung von Formaten für die
Fachleute eine fortlaufende Herausforderung. Es hört sich stetig, dass die Zuständigen vor
dem großen Dilemma stehen, was sie eigentlich tun sollten: emanieren, simulieren, das schon
vorhandene Material immer auf neuere Datenträger überspielen oder die veraltende
Hardwareumgebung aufbewahren und ständig in funktionsfähigem Zustand halten? Meines
Wissens weiß noch niemand eine beruhigende Antwort auf diesen Problemkreis. Hier sollte
der Augenmerk wieder auf die Bildung von zukünftigen Informatikern bzw. Bibliothekaren
mit zuverlässigen EDV-Kenntnissen gerichtet werden, damit sie immer auf dem Laufenden
gehalten und von ihnen möglicherweise eine der besten langfristigen Lösungen
herausgefunden und angewendet werden können.
Überlegungen, Erwägungen
3 Siehe dazu die Bekanntmachung und Beschreibung der laufenden TÁMOP-Projekte auf der Homepage der Károly-Eszterházy-Hochschule: http://www.ektf.hu.
Page 620

Zum Schluss habe ich vor, die Priorität der praxisorientierten Bildung von Fachleuten
für Kultur im Allgemeinen zu betonen – das kann man nicht oft genug tun! – und einige
hoffentlich adekvate Überlegungen zum Thema zu formulieren.
Ohne gut gebildete Fachleute ist die ganze Digitalisierungsgeschichte eindeutig
unvorstellbar! Diese Leute müssen unbedingt über komplexen Kompetenzen verfügen, weil
sie mit keinen homogenen Beständen umgehen sollen. Die Archiv-, Bibliotheks- und
museologischen Matrialien trennen sich voneinander nicht stark ab, alle drei
Sammlungsformen mischen sich ineinander, weil sie teilweise gemeinsame
Sammlungsgegenstände haben. Daher ist es notwendig, sie immer zusammen zu behandeln.
In der Bildung von Fachleuten auf kulturellem Gebiet würde es sich lohnen, die vorher
gesagten vor Auge zu halten, denn bis jetzt war es nur manchmal der Fall. Es müsste eine
absolut praxisorientierte Bildung verwirklicht werden! Dabei braucht man ein
weitverzweigtes, aber gründliches Konzept, das sich aus den folgenden Bereichen
zusammensetzt:
• theoretische Grundlegung (klassische filosofische bzw. geisteswissenschaftliche
Kenntnisse)
• technische Kenntnisse (EDV, Programmierung usw.)
• praktische Kenntnisse (z. B. Ethnografie, Archeologie, Archivpraxis, Restaurierung
usw.)
• grundlegende Kenntnisse auf dem Gebiet der Nachbarwissenschaften (juristische
Studien, Kenntnisse im Managementbereich, Vorbereitung auf Organisierung von
Auktionen usw.)
Unter Erwägung dieser Aspekte hat die Leitung der Károly-Eszterházy-Hochschule
die Entscheidung getroffen, die Fachrichtung Bearbeitung von alten Drucken im Rahmen des
Faches Bibliothekar mit erweiterten EDV-Kenntnissen (MA)4 und das nagelneue Fach Studien
zum Kulturerbe (MA)5 mit zwei Fachrichtungen wie Sammlungsreferent für Museologie und
Kulturerbe bzw. Weinkultur ins Leben zu rufen.
Das Ziel unserer Institution ist klar und eindeutig. Wir möchten gut gebildete und
gründlich vorbereitete Fachleute in kleiner Anzahl heranbilden, die sich verpflichtet sind oder
sich gebunden fühlen, entweder im Forschungs- und Unterrichtsbereich oder auf dem Gebiet
des Kulturmanagements oder der Technologie oder wo immer sie angestellt werden, das
Kulturerbe unter allen Umständen zu retten und es zu überliefern. Darüber hinaus wollen wir 4 Läuft seit dem Studienjahr 2007/2008. 5 Das Studium der Kandidaten beginnt erst im September des Studienjahres 2010/2011.
Page 621

im Unterrichtssektor zur digitalen Bewahrung des Kulturerbes im höchsten Maße beitragen.
Und all das in Hoffnung, dass wir uns damit dem Trend in Europa und in der Welt schließen
und auf dem im vorliegenden Text geschilderten Gebiet etwas Dauerhaftes oder
Unvergängliches hinterlassen können.
Page 622