UNIVERSITY OF SAO PAULO FACULTY OF ECONOMICS ...
234
UNIVERSITY OF SAO PAULO FACULTY OF ECONOMICS, BUSINESS, AND ACCOUNTING ACCOUNTING AND ACTUARIAL SCIENCES DEPARTMENT CONTROLLERSHIP AND ACCOUNTING GRADUATING PROGRAM UNIVERSITY OF ANTWERP FACULTY OF APPLIED ECONOMICS GRADUATING PROGRAM MANAGEMENT CONTROL MECHANISMS AND STEWARDSHIP IN FAMILY FIRMS: AN ANALYSIS OF ANTECEDENTS AND CONSEQUENCES MECANISMOS DE CONTROLE GERENCIAL E STEWARDSHIP EM EMPRESAS FAMILIARES: UMA ANÁLISE DE ANTECEDENTES E CONSEQUÊNCIAS BEHEERSCONTROLEMECHANISMEN EN STEWARDSHIP IN FAMILIE BEDRIJVEN: EEN ANALYSE VAN ANTECEDENTEN EN GEVOLGEN Daniel Magalhães Mucci Promotors: Prof. Dr. Fábio Frezatti and Prof. Dr. Ann Jorissen SÃO PAULO 2018
-
Upload
khangminh22 -
Category
Documents
-
view
3 -
download
0
Transcript of UNIVERSITY OF SAO PAULO FACULTY OF ECONOMICS ...

UNIVERSITY OF SAO PAULO
FACULTY OF ECONOMICS, BUSINESS, AND ACCOUNTING
ACCOUNTING AND ACTUARIAL SCIENCES DEPARTMENT
CONTROLLERSHIP AND ACCOUNTING GRADUATING PROGRAM
UNIVERSITY OF ANTWERP
FACULTY OF APPLIED ECONOMICS GRADUATING PROGRAM
MANAGEMENT CONTROL MECHANISMS AND STEWARDSHIP IN FAMILY
FIRMS: AN ANALYSIS OF ANTECEDENTS AND CONSEQUENCES
MECANISMOS DE CONTROLE GERENCIAL E STEWARDSHIP EM EMPRESAS
FAMILIARES: UMA ANÁLISE DE ANTECEDENTES E CONSEQUÊNCIAS
BEHEERSCONTROLEMECHANISMEN EN STEWARDSHIP IN FAMILIE
BEDRIJVEN: EEN ANALYSE VAN ANTECEDENTEN EN GEVOLGEN
Daniel Magalhães Mucci
Promotors: Prof. Dr. Fábio Frezatti and Prof. Dr. Ann Jorissen
SÃO PAULO
2018

Prof. Dr. Vahan Agopyan Rector of the University of São Paulo
Prof. Dr. Adalberto Américo Fischmann
Dean of the Faculty of Economics, Administration, and Accounting
Prof. Dr. Ariovaldo dos Santos Head of the Accounting and Actuarial Department
Prof. Dr. Lucas Ayres Barreira de Campos Barros
Coordinator of the Post-Graduate Program in Controllership and Accounting
DANIEL MAGALHÃES MUCCI
MANAGEMENT CONTROL MECHANISMS AND STEWARDSHIP IN FAMILY
FIRMS: AN ANALYSIS OF ANTECEDENTS AND CONSEQUENCES
Reviewed Version
Ph.D. Dissertation presented to the Graduate Program in Controllership and Accounting at the Faculty of Economics, Business, and Accounting, University of Sao Paulo, Brazil and to the Faculty of Applied Economics, University of Antwerp, Belgium, to obtain the joint doctoral degree: at the University of Sao Paulo: Ph.D. in Science - Concentration area: Controllership and Accounting at the University of Antwerp: Ph.D. in Applied Economics Promotors: Prof. Dr. Fábio Frezatti (University of Sao Paulo) and Prof Dr. Ann Jorissen (University of Antwerp)
(Reviewed Version)
SÃO PAULO
2018

I authorize the reproduction and partial or total disclosure of this Ph.D. dissertation, by any
conventional or electronic means, for study and research purposes, as long as the source is
mentioned.
Cataloging in Publication
Library and Documentation Service
Faculty of Economics, Business, and Accounting
University of Sao Paulo
FICHA CATALOGRÁFICA Elaborada pela Seção de Processamento Técnico do SBD/FEA/USP
Mucci, Daniel Magalhães Management control mechanisms and stewardship in family firms: an analysis of antecedents and consequences / Daniel Magalhães Mucci. -- São Paulo, 2018. 234 p. Tese(Doutorado) – Universidade de São Paulo, 2018. Orientador: Fábio Frezatti. Co-orientador: Ann Jorissen
1. Empresas familiares 2. Teoria do stewardship 3. Mecanismos de controle gerencial 4. Riqueza sócio-emocional 5. Justiça processual 6. Desempenho da empresa familiar I. Universidade de São Paulo. Fa- culdade de Economia, Administração e Contabilidade. II. Título. CDD – 658.041

To my parents Paulo and Berenice, Marcela and my family.

ACKNOWLEDGEMENTS This Ph.D. dissertation is a result of hard work, dedication and effort on my part as well as
many other people, in special the two promotors of this Ph.D. study.
First, I would like to thank God for enlightening me and everyone around me including my
family, professors and colleagues. I dedicate this Ph.D. dissertation to my grandparents,
Joaquim and Adélia, who, although they are not present in life, certainly, are very happy and
proud of this achievement. And to Grandma Maria, who despite the long distance during this
years that I have been living in Sao Paulo, I believe she is very happy to have a grandson
reaching this academic degree and who will follow a teaching career.
I also dedicate this Ph.D. to my parents, Paulo and Berenice, for providing me with values to
which I mirror my attitudes, for guiding me and for unconditionally supporting my decisions
and to my brother Gustavo, for being a symbol of dedication to me. I dedicate this Ph.D. to
Marcela, for sharing all the moments with me during all these many years and for encouraging
and motivating me in every step that I take. To her family for supporting us in the pursuit of
our goals. My gratitude also goes to Aunt Consola and Uncle Júlio, for giving me the
opportunity to be with them more intensely in these last years, providing me with care and
advise that I carry for life. To my uncles and cousins, and my family for all their support.
Particularly, I would like to thank my promotors for their support to develop this Ph.D.
dissertation. Prof. Fábio Frezatti, who in the last almost six years has been sharing his
knowledge and experience with me, providing me with advices that I carry in my career and
life. Prof. Ann Jorissen, who accepted to guide my Ph.D. project and provided me with unique
insights and with the opportunity to develop the doctoral thesis jointly between USP and the
University of Antwerp. I feel privileged to have two promotors with numerous professional,
academic and personal qualities, and for being involved in the development of this Ph.D.
dissertation.
I also would like to thank all those directly and indirectly involved in the implementation of the
joint Ph.D. agreement in USP and in UAntwerpen, specially Cida, Ana Paula, and Adriana from
USP and Esmeralda Aerts from UAntwerpen. This experience and interaction were very
important for my training and for the quality of this Ph.D. dissertation.

Many thanks to my colleagues from FEA/USP, for sharing knowledge and experiences during
the courses and activities. In particular, to Bianca, Samantha, Franciele and Daiana for
supporting me during the courses and in this Ph.D. dissertation. To the professors of the
Accounting and Actuarial Department at the FEA/USP for providing me with knowledge and
expertise in accounting topics.
I also appreciate my colleagues and professors from the University of Antwerp for welcoming
me into their Department. Especially my thanks to Poppy, Veronique, Robin, Oveis, Gertjan,
Sabine, Caroline and all the colleagues and professors with whom I had the opportunity to learn
during the time I lived in Antwerp.
My thank also goes to the Department of Accounting and Actuarial Science at FEA/USP and
to FIPECAFI, in the figures of Prof. Ariovaldo dos Santos and Prof. Lucas Ayres, for the
support throughout the course. And to the Accounting Department of the Faculty of Applied
Economics of the University of Antwerp, in the figure of Prof. Eddy Laveren and Prof. Marc
Deloof for making the agreement viable and for receiving me as their home Ph.D. student since
my first stay.
I also thank the members of the doctoral committee Professor Ilse Maria Beuren, Professor
Carlos Eduardo Facin Lavarda and Professor Ana Carolina de Aguiar Rodrigues for following
the development of this dissertation since its beginning and for making critical questions,
comments and recommendations to improve the quality and relevance of this research.
To the Brazilian Government, in particular, CAPES (Coordination for the Improvement of
Higher Education Personnel) for the financial support that allowed me to develop the Ph.D.
research.
Finally, I particularly would like to thank the people and businesses who were involved and
participated in the survey for their attention and contribution to this Ph.D. research.
Anyway, many thanks to all of you involved in this Ph.D. trajectory.

ABSTRACT Mucci, D. M. (2018). MANAGEMENT CONTROL MECHANISMS AND STEWARDSHIP IN FAMILY FIRMS: AN ANALYSIS OF ANTECEDENTS AND CONSEQUENCES. Doctoral Dissertation, Faculty of Economics, Business and Accounting, University of Sao Paulo and Faculty of Applied Economics, University of Antwerp. This dissertation aims to enhance the understanding of stewardship in family firms by studying its antecedents related to the controlling family’s ability and willingness to influence the firm, management control mechanisms design and procedural justice and its consequences regarding its moderating effect on the relationship between family involvement and performance. First, we explore the heterogeneity among family businesses, by considering the influence of a family’s ability and willingness on the design of formal and participative management control mechanisms. We define ability as the level of family involvement in ownership and in management. Willingness is based on the socioemotional wealth (SEW) literature, which refers to the controlling family’s affect-related value invested in the firm. We focus on the following SEW sub-dimensions (1) family control and influence (2) and renewal of family bonds. Second, we investigate whether management control mechanisms such as goal setting and performance evaluation often installed to curb manager’s opportunistic behavior, stimulate stewardship in family firms. We focus on the degree of participation and formality applied to these management control mechanisms, which elements are studied in the procedural justice literature. Therefore, we discuss how management control mechanisms’ design and procedural justice are associated with stewardship. Stewardship implies a collective-serving and pro-organizational attitudes and behaviors and constitutes a distinctive characteristic of family firms. Third, we examine whether a stewardship-oriented culture moderates the association between family involvement and family firm performance, whereby family involvement is a sub-item of the familiness construct, which focuses on the interaction between family members and its business. To test these relationships in an empirical way, we developed a survey and selected data from medium and large Brazilian family firms. We applied Structural Equation Modeling (SmartPLS) as the main data analysis method to test our hypotheses. The contributions of this study are multiple to the literature. First, more insights are provided in the adoption of participative and formal management control mechanisms in family firms and how a family’s willingness to influence the firm creates different adoption patterns. We also demonstrate that different SEW intentions must be treated separately since each sub-dimension influences the design of management control mechanisms in the family business in a different way. Second, the results show how formal and participative goal setting and performance evaluation stimulate stewardship identification and stewardship-oriented culture in the family firm. This study provides evidence to practitioners that goal setting and performance evaluation, usually studied as agency mechanisms can foster stewardship in the family firm if they are designed based on the fairness principles. Third, the study reveals that the relationship between familiness and family firm performance is moderated by a stewardship-oriented culture, indicating patterns that lead to a higher financial performance. Keywords: Family businesses; Stewardship theory; Management control mechanisms; Socioemotional Wealth; Procedural justice; Family firm performance.

RESUMO Mucci, D. M. (2018). MECANISMOS DE CONTROLE GERENCIAL E STEWARDSHIP EM EMPRESAS FAMILIARES: UMA ANÁLISE DE ANTECEDENTES E CONSEQUÊNCIAS. Tese de Doutorado, Faculdade de Economia, Administração e Contabilidade, Universidade de São Paulo e Faculdade de Economia Aplicada, Universidade da Antuérpia. Esta tese visa aprimorar a compreensão sobre stewardship nas empresas familiares, estudando seus antecedentes relacionados à capacidade e às intenções da família controladora de influenciar a empresa, o desenho dos mecanismos de controle gerencial e a justiça processual, e suas consequências ao moderar a relação entre envolvimento da família e desempenho. Primeiro, exploramos a heterogeneidade entre as empresas familiares, considerando a influência da habilidade e da intenção da família sobre o desenho de mecanismos de controle gerencial formais e participativos. Definimos habilidade como o nível de envolvimento familiar na propriedade e na gestão. As intenções são baseadas na literatura da riqueza sócio-emocional (SEW), que se refere ao valor do afeto da família controladora investido na empresa. Estudamos as seguintes sub-dimensões da SEW (1) controle e influência familiar (2) e renovação dos laços familiares. Em segundo lugar, investigamos se os mecanismos de controle gerencial, como a definição de objetivos e a avaliação de desempenho, geralmente estabelecidos para reduzir o comportamento oportunista do gestor, estimulam o stewardship nas empresas familiares. Focamos no grau de participação e formalidade aplicados a esses mecanismos de controle gerencial, cujos elementos são estudados na literatura de justiça processual. Portanto, discutimos como o desenho dos mecanismos de controle gerencial e a justiça processual estão associados ao stewardship. Stewardship implica em atitudes e comportamentos coletivos e pró-organizacionais e constitui em uma característica distintiva das empresas familiares. Em terceiro lugar, examinamos se uma cultura orientada para o stewardship modera a associação entre envolvimento da família e desempenho da empresa familiar, onde o envolvimento da família é um subitem do construto familiness que por sua vez foca na interação entre os membros da família e o negócio. Para testar essas relações de forma empírica, desenvolvemos uma pesquisa e obtivemos dados de empresas familiares brasileiras de médio e grande porte. Aplicamos a Modelagem de Equações Estruturais (SmartPLS) como o principal método de análise de dados para testar nossas hipóteses. As contribuições deste estudo são múltiplas para a literatura. Em primeiro lugar, são fornecidas mais ideias sobre o desenho de mecanismos de controle gerencial participativos e formais nas empresas familiares e como a intenção da família de influenciar a empresa cria diferentes padrões de adoção. Também demonstramos que as diferentes intenções da SEW devem ser tratadas separadamente, uma vez que cada sub-dimensão influencia o desenho dos mecanismos de governança na empresa familiar de uma maneira diferente. Em segundo lugar, os resultados mostram como a definição de objetivos e a avaliação do desempenho formais e participativos estimulam a identificação cultura orientada para o stewardship na empresa familiar. Este estudo fornece evidências aos profissionais de que a definição de objetivos e a avaliação do desempenho, geralmente estudados como mecanismos de agência podem promover o stewardship na empresa familiar, se forem delineados com base nos princípios da justiça. Em terceiro lugar, o estudo revela que a relação entre envolvimento da família e desempenho da empresa familiar é moderada pela cultura orientada para o stewardship, indicando padrões que levam a um maior desempenho financeiro. Palavras-chave: Empresas familiares; Teoria do stewardship; Mecanismos de controle gerencial; Riqueza sócio-emocional; Justiça processual; Desempenho da empresa familiar.

ABSTRACT Mucci, D. M. (2018). BEHEERSCONTROLEMECHANISMEN EN STEWARDSHIP IN FAMILIE BEDRIJVEN: EEN ANALYSE VAN ANTECEDENTEN EN GEVOLGEN. Doctoraal Proefschrift, Faculteit Economie, Bedrijfskunde en Accounting, Universiteit van Sao Paulo en Faculteit Toegepaste Economische Wetenschappen, Universiteit Antwerpen. Dit proefschrift bestudeert de invloed van stewardship in familiebedrijven door enerzijds mogelijke antecedenten te onderzoeken zoals het vermogen en de bereidheid van de controlerende familie om het bedrijf te beïnvloeden en de aanwezige beheerscontrolemechanismen in de onderneming. Anderzijds wordt ook onderzocht of stewardship de relatie tussen familie-invloed en bedrijfsprestaties modereert. Eerst bekijken we in welke mate diverse vormen van familiale invloed geassocieerd zijn met de aanwezige beheerscontrolemechanismen in de familie-onderneming. De familiale invloed wordt op tweeërlei wijze benaderd. Ten eerste wordt de mogelijkheid die de familie heeft om de onderneming te controleren bekeken aan de hand van het aandelenkapitaal en de deelname door familieleden aan het top management van de onderneming. Ten tweede wordt de bereidheid van de familie om de onderneming te beïnvloeden in kaart gebracht. Hiervoor wordt een beroep gedaan op het concept van Socio-Emotional Wealth (SEW). We bekijken hierbij de volgende twee SEW sub-dimensies (1) familiecontrole en invloed en (2) het overdragen van de familie-onderneming naar toekomstige generaties. Ten tweede onderzoeken we of beheersmechanismen zoals planning en prestatie-meting, die vaak geïnstalleerd worden in bedrijven om het opportunistische gedrag van managers te beperken, stewardship- gedrag en stewardship-cultuur in familiebedrijven versterken. Bij de controlemechanismen planning en prestatiemeting hebben we vooral aandacht naar de mate waarin het hele management participeert in de planning en de prestatie-evaluatie, alsook naar de mate van formaliteit van deze twee controlemechanismen. Bij het bestuderen van de relatie tussen die beheerscontrolemechanismen en stewardship-cultuur en - gedrag in de onderneming, betrekken we de modererende rol van de perceptie die managers hebben ivm de rechtvaardigheid van deze controlemechanismen. Ten derde onderzoeken we of een stewardship-georiënteerde cultuur de relatie tussen familiale invloed op het bedrijf en de prestaties van het familiebedrijf versterkt. Om deze relaties empirisch te testen, gebruiken we gegevens die werden verkregen uit een enquête die werd ontwikkeld op basis van de literatuur en verstuurd naar middelgrote en grote Braziliaanse familiebedrijven. Om de vooropgestelde relaties en hypothesen te toetsen werd gebruik gemaakt van de techniek van Structural Equation Modeling (SmartPLS). De resultaten van deze studie vullen de literatuur op diverse punten aan. Ten eerste stellen we vast dat vooral de bereidheid van een familie om het bedrijf te beïnvloeden mede de vorm (mate van participatie en formaliteit) bepaalt van de aanwezige controlemechanismen eerder dan de mogelijkheid van een familie om de onderneming te beïnvloeden. We tonen ook aan dat verschillende SEW-voornemens beter afzonderlijk bestudeerd worden, daar elke subdimensie op een andere manier het ontwerp van de beheersmechanismen in het familiebedrijf beïnvloedt. Ten tweede tonen de resultaten aan hoe deze controlemechanismen bijdragen tot een stimulering van stewardship gedrag en een stewardship-georiënteerde cultuur in het familiebedrijf. De resultaten tonen verder aan dat controlemechanismen die traditioneel bekeken worden als agentschapsmechanismen (‘agency control mechanisms’) toch stewardship kunnen versterken als ze gepercipieerd worden als rechtvaardig. Ten derde blijkt uit de studie dat de relatie tussen familiale invloed op het bedrijf en familieprestatie gemodereerd wordt door een stewardship-georiënteerde cultuur. Trefwoorden: Familiebedrijf; Stewardship theorie; Beheerscontrolemechanismen; Socio-gemotiveerde rijkdom; Procedurele rechtvaardigheid; prestaties van de familie-bedrijven.
LIST OF FIGURES
Figure 1. Dissertation’s theoretical portrait ............................................................................ 23 Figure 2. Summary of the papers and literature review issues ............................................... 31 Figure 3. Papers, samples and subsamples information .......................................................... 56 Figure 4. Constructs measures – after language changes in the questionnaire – Part I .......... 62 Figure 5. Control Variables ..................................................................................................... 64 Figure 6. Theoretical research model – paper 1 ...................................................................... 82 Figure 7. Theoretical research model and hypotheses – paper 1 ............................................ 91 Figure 8. Structural model – Model 1 ................................................................................... 113 Figure 9. Structural model (Interaction pfamilyTMT and FamilyCEO) – Model 2 ............. 113 Figure 10. Theoretical research model – paper 2 .................................................................. 124 Figure 11. Theoretical research model and hypotheses – paper 2 ........................................ 132 Figure 12. Theoretical model – Paper 3 ................................................................................ 169 Figure 13. Theoretical model and hypotheses – Paper 3 ...................................................... 175 Figure 14. Quadratic effect pfamilyTMT – dependent variable industry-adjusted ROA (orthogonal approach) ............................................................................................................ 184 Figure 15. Quadratic effect pfamilyTMT – dependent variable industry-adjusted ROS (orthogonal approach) ............................................................................................................ 184 Figure 16. Moderating effect of stewardship – orthogonal approach – dependent variable industry-adjusted ROA .......................................................................................................... 186 Figure 17. Moderating effect of stewardship – orthogonal approach – dependent variable industry-adjusted ROS ........................................................................................................... 186 Figure 18. Theoretical portrait and empirical results…………………………………….…194

LIST OF TABLES
Table 1. Summarizing agency and stewardship theories ......................................................... 32 Table 2. Family affiliation: agency and stewardship assumptions .......................................... 35 Table 3. Family firm’s constructs ............................................................................................ 38 Table 4. Summary of papers and constructs from our bibliographical survey in Brazilian journals ..................................................................................................................................... 48 Table 5. Overview of publication Topics (Id) and year ........................................................... 48 Table 6. Overview of publication Topics (Id) and Journal Articles ........................................ 50 Table 7. Comparison of respondents versus EMIS database – Total Operating Revenue (BRL in 2015) ..................................................................................................................................... 58 Table 8. Comparison of respondents versus EMIS database – States Federation ................... 59 Table 9. Comparison of respondents versus EMIS database – Industry ................................. 60 Table 10. Sample Size for a Statistical Power of 0.80 ............................................................. 67 Table 11. Family businesses’ descriptive information – Sample 152 ..................................... 69 Table 12. Family businesses’ descriptive information – Sample 120 ..................................... 71 Table 13. Family businesses’ descriptive information – Sample 59 ....................................... 73 Table 14. Respondents’ descriptive information ..................................................................... 76 Table 15. Items descriptive statistics (n=120) - Paper 1 .......................................................... 93 Table 16. Items descriptive statistics (n=152) - Paper 1 .......................................................... 94 Table 17. Family firms’ characteristics and management control mechanisms design (n=120) .................................................................................................................................................. 96 Table 18. Family firms’ characteristics and management control mechanisms design (n=152) .................................................................................................................................................. 97 Table 19. Cross loadings between the items and the construct (n=152) ................................ 100 Table 20. Cross loadings between the items and the construct (n=120) ................................ 101 Table 21. First-Order Latent Variable Correlations (n=152) ................................................. 102 Table 22. First-Order Latent Variable Correlations (n=120) ................................................. 102 Table 23. Structural model (Model 1) ................................................................................... 109 Table 24. Structural model (Model 2) – Interaction FIM and FamilyCEO ........................... 111 Table 25. Items’ descriptive statistics (n=152) - Paper 2 ...................................................... 135 Table 26. Items’ descriptive statistics (n=120) - Paper 2 ...................................................... 136 Table 27. Items’ descriptive statistics (nonfamily managers, n=99) ..................................... 137 Table 28. Items’ descriptive statistics (founders and family managers, n=53) ..................... 138 Table 29. Items’ descriptive statistics (family managers, n=36) ........................................... 139 Table 30. Respondents’ characteristics and stewardship (n=120 and n=152) ....................... 141 Table 31. Family firms’ characteristics and stewardship (n=120 and n=152) ....................... 142 Table 32. First-Order Latent Variable Correlations (n=152) ................................................. 145 Table 33. First-Order Latent Variable Correlations (n=120) ................................................. 145 Table 34. Cross loadings between the items and the construct (n=152) ................................ 146 Table 35. Cross loadings between the items and the construct (n=120) ................................ 147 Table 36. Structural Model .................................................................................................... 153

Table 37. Structural Model – Comparison about the subsamples of managers’ family affiliation ................................................................................................................................ 158 Table 38. Indirect effects - Models presented in Table 36 .................................................... 159 Table 39. Summary of the results .......................................................................................... 159 Table 40. Sample descriptive statistics .................................................................................. 176 Table 41. First-Order Latent Variable Correlations (n=59) .................................................. 178 Table 42. Crossloadings between the items and the constructs (n=59)................................. 178 Table 43. Structural model – Dependent variable industry-adjusted Return on Assets (ROA) ................................................................................................................................................ 180 Table 44. Structural model – Dependent variable industry-adjusted Return on Equity (ROE) ................................................................................................................................................ 181 Table 45. Structural model – Dependent variable industry-adjusted Return on Sales (ROS) ................................................................................................................................................ 182

LIST OF ABBREVIATIONS
AVE – Average Variance Extracted
CEO – Chief Executive Officer
CFA – Confirmatory Factor Analyses
CR – Composite Reliability
FCI – Family control and influence
FIM – Family Involvement in Management
FIO – Family Involvement in Ownership
FRFB – Renewal of family bonds through dynastic succession
GS – Goal setting
HTMT – Heterotrait-Monotrait Ratio of Correlations
MCS – Management Control Systems
MLMV – Measured Latent Marked Variable
PE – Performance Evaluation
PLS – Partial Least Squares
PMS – Performance Measurement Systems
SEM – Structural Equation Modeling
SEW – Socioemotional Wealth
TMT – Top Management Team
US – United States of America
VIF – Variance Inflation Factor


SUMMARY
1. INTRODUCTION .......................................................................................................... 21
1.1. Ph.D. dissertation’s theoretical portrait ....................................................................... 21
1.2. Empirical studies ............................................................................................................ 22
1.2.1. Study 1: Controlling family’s ability and willingness, and the design of management control mechanisms in family firms ........................................................... 24
1.2.2. Study 2: Management control mechanisms’ fair design and procedural justice as antecedents of stewardship in family firms .................................................................. 26
1.2.3. Study 3: Family involvement in management and family firm’s performance: the moderating role of stewardship-oriented culture ...................................................... 28
1.3. Ph.D. dissertation’s structure ........................................................................................ 29
2. LITERATURE REVIEW AND DISSERTATION’S CONSTRUCTS ..................... 31
2.1. Agency and stewardship theories .................................................................................. 31
2.2. Constructs in the family firm literature ....................................................................... 36
2.2.1. Controlling family’s influence: ability and willingness .................................... 37
2.2.2. Socioemotional Wealth ........................................................................................ 39
2.2.3. Familiness .............................................................................................................. 43
2.3. Management control mechanisms design characteristics and Procedural Justice .. 44
2.4. A review of family firms’ literature in Brazilian journals .......................................... 47
2.4.1. Management control mechanisms in family firms ............................................ 50
2.4.2. Stewardship in family firms ................................................................................ 52
2.4.3. Socioemotional wealth.......................................................................................... 52
2.4.4. Familiness .............................................................................................................. 52
2.4.5. Procedural justice ................................................................................................. 53
2.4.6. Summary of the findings from the review of the literature in Brazil .............. 53
3. METHODOLOGY ......................................................................................................... 55
3.1. Sample Selection ............................................................................................................. 55
3.2. Data Collection Method ................................................................................................. 57
3.3. Descriptive analyses about respondents ....................................................................... 58
3.4. Measurement of Constructs and Instruments ............................................................. 60
3.5. Data Analyses Methods .................................................................................................. 66
3.6. Family firms’ and respondents’ descriptive statistics ................................................. 67

4. STUDY 1: CONTROLLING FAMILY’S ABILITY AND WILLINGNESS AND THE DESIGN OF MANAGEMENT CONTROL MECHANISMS IN FAMILY FIRMS .......................................................................................................................................... 77
4.1. Introduction .................................................................................................................... 77
4.2. Theoretical model and hypotheses................................................................................ 81
4.2.1. The relationship between family involvement in ownership and a family’s willingness to influence the firm........................................................................................ 83
4.2.2. The relationship between family control and influence intention SEW and family involvement in management .................................................................................. 84
4.2.3. The relationship between family involvement in management and management control mechanisms design ......................................................................... 85
4.2.4. The relationship between family control and influence SEW intention and management control mechanisms design ......................................................................... 87
4.2.5. The relationship between the renewal of family bonds through dynastic succession SEW intention and management control mechanism design ...................... 89
4.3. Data analyses .................................................................................................................. 91
4.3.1. Descriptive Statistics ............................................................................................ 91
4.3.2. Structural Equation Modeling ............................................................................ 98
4.3.2.1. Measurement model assessment ................................................................. 98
4.3.2.2. Structural model analyses.......................................................................... 103
4.3.2.3. The relationship between family involvement in ownership and a family’s willingness to influence the firm ................................................................................. 104
4.3.2.4. The relationship between family control and influence SEW intention and family involvement in management .................................................................... 105
4.3.2.5. The relationship between family involvement in management and management control mechanisms design ................................................................... 105
4.3.2.6. The relationship between family control and influence SEW intention and management control mechanisms design ........................................................... 106
4.3.2.7. The relationship between the renewal of family bonds through dynastic succession SEW intention and management control mechanism design ................ 107
4.3.2.8. Control variables ........................................................................................ 107
4.4. Conclusions ................................................................................................................... 114
5. STUDY 2: MANAGEMENT CONTROL MECHANISMS’ FAIR DESIGN AND PROCEDURAL JUSTICE AS ANTECEDENTS OF STEWARDSHIP IN FAMILY FIRMS ................................................................................................................................... 119
5.1. Introduction .................................................................................................................. 119
5.2. Theoretical model and hypotheses.............................................................................. 124

5.2.1. Management control mechanisms’ fair design and procedural justice perceptions ......................................................................................................................... 126
5.2.2. Management control mechanisms’ fair design and stewardship ................... 128
5.2.3. Procedural justice perceptions and stewardship ............................................. 131
5.2.4. Mediation hypothesis ......................................................................................... 132
5.3. Data analyses ................................................................................................................. 133
5.3.1. Descriptive Statistics .......................................................................................... 133
5.3.2. Measurement model assessment ....................................................................... 143
5.3.3. Structural Equation Modeling .......................................................................... 148
5.3.4. Results and discussion - full samples ................................................................ 150
5.3.4.1. Management control mechanisms’ fair design and procedural justice . 150
5.3.4.2. Management control mechanisms’ fair design and stewardship ........... 151
5.3.4.3. Procedural justice and stewardship .......................................................... 152
5.3.5. Results and discussion - subsamples ................................................................. 155
5.3.5.1. Management control mechanisms’ fair design and procedural justice . 155
5.3.5.2. Management control mechanisms’ fair design and stewardship ........... 156
5.3.5.3. Procedural justice and stewardship .......................................................... 156
5.3.6. Mediation results ................................................................................................ 157
5.4. Conclusions ................................................................................................................... 160
6. STUDY 3: FAMILY INVOLVEMENT IN MANAGEMENT AND FAMILY FIRM’S PERFORMANCE: THE MODERATING ROLE OF STEWARDSHIP-ORIENTED CULTURE ...................................................................................................... 165
6.1. Introduction .................................................................................................................. 165
6.2. Theoretical model and hypotheses .............................................................................. 169
6.2.1. The relationship between family CEO and firm performance ...................... 170
6.2.2. The relationship between the ratio of family managers in the TMT and firm performance ...................................................................................................................... 171
6.2.3. Moderation of stewardship-oriented culture ................................................... 173
6.3. Data analyses ................................................................................................................. 175
6.3.1. Descriptive Statistics .......................................................................................... 175
6.3.2. Structural Equation Modeling .......................................................................... 177
6.3.2.1. Measurement model assessment ................................................................ 177
6.3.2.2. Structural model analyses .......................................................................... 179
6.3.2.3. The relationship between family CEO and firm performance ............... 183
6.3.2.4. The relationship between the ratio of family managers in the TMT and firm performance .......................................................................................................... 183

6.3.2.5. Moderation of stewardship-oriented culture ........................................... 185
6.4. Discussion and conclusions .......................................................................................... 187
7. FINAL REMARKS ...................................................................................................... 191
7.1. Ph.D. dissertation’s theoretical portrait and results ................................................. 191
7.2. Summary of the results ................................................................................................ 196
7.3. Implications for the literature ..................................................................................... 198
7.4. Implications for practitioners ..................................................................................... 201
REFERENCES....................................................................................................................... 205
APPENDIX – Section 2 ......................................................................................................... 224
Appendix 1. Overview of publication Topics (Id) and objective – Part I .............................. 224
Appendix 2. Overview of publication Topics (Id) and Methodology description – Part I .... 227
Appendix 3. First Letter (Portuguese).................................................................................... 229
APPENDIX – Section 5 ......................................................................................................... 230
Appendix 4. Measurement model evaluation for subsamples of family and nonfamily managers ................................................................................................................................ 230
APPENDIX – Section 6 ......................................................................................................... 233
Appendix 5. Sample versus industry information .................................................................. 233

21
1. INTRODUCTION
In this introduction, we present the Ph.D. dissertation’s theoretical portrait, the elements,
and rationales that we consider in each of the three empirical studies and the structure of the
dissertation.
1.1. Ph.D. dissertation’s theoretical portrait
This dissertation aims to enhance the understanding of stewardship in family firms by
investigating its antecedents related to the controlling family’s ability and willingness to
influence the firm, management control mechanisms design and procedural justice and the
consequences of stewardship with respect to its moderating effect on the relationship between
family involvement and family firm performance. We are interested in studying the foundations
and the constructs of the stewardship literature in the context of family businesses, regarding,
particularly, management control mechanisms and manager’s attitudes and behaviors in family
businesses.
Our exclusive focus on family firms is necessary since family firms have unique
characteristics, that result from the controlling family’s ability and willingness to influence the
firm’s processes and decisions, the diversity of goals that the family firm pursue, and managers’
attitudes and behaviors (Chrisman, Chua, Pearson, & Barnett, 2012; Dawson & Mussolino,
2014). Family firms are expected to pursue multiple noneconomic and family-centric goals
which are have been recently studied in the Socioemotional Wealth (SEW) theoretical
perspective (Berrone, Cruz, & Gomez-Mejia, 2012; Gomez-Mejia, Cruz, Berrone, & De Castro,
2011). In addition, prior literature indicates that managers’ family affiliation might be a relevant
attribute of managers’ attitudes and behaviors in these organizations, which should be
considered by researchers (Davis, Allen, & Hayes, 2010; James, Jennings, & Jennings, 2017;
Verbeke & Kano, 2012). Hence, the family firm’s heterogeneity and distinctiveness might have
influence on management practices and organizational behaviors that require in-depth
investigations (Chrisman, Chua, & Sharma, 2005; Gagné, Sharma, & De Massis, 2014; Helsen,
Lybaert, Steijvers, Orens, & Dekker, 2017; Songini, Gnan, & Malmi, 2013).
Due to the complexity of this subject, we developed, in this Ph.D. dissertation, three
empirical studies to shed more light and generate additional insights on the association between
(i) the controlling family’s ability and willingness to influence the family firm and the design
of management control mechanisms, (ii) management control mechanisms’ fairness design,

22
procedural justice and stewardship, (iii) and familiness and family firm’s financial performance
moderated by stewardship. We summarize in Figure 1 this Ph.D. dissertation’s theoretical
portrait and indicate the studies, the constructs, the associations and the boundaries among those
studies.
The rationale of this Ph.D. dissertation starts by looking at how a controlling family’s
ability and willingness influence the level of participation and formality in goal setting and
performance evaluation (Helsen et al., 2017; Songini & Gnan, 2015; Speckbacher & Wentges,
2012). Thereafter, we study how the design of these management control mechanisms foster
stewardship attitudes and behaviors in family firms, among family and nonfamily managers
(Davis, Schoorman, & Donaldson, 1997; Neubaum, Thomas, Dibrell, & Craig, 2017), taking
into consideration the procedural justice literature (Langevin & Mendoza, 2013). Particularly,
this discussion is aligned with the underlying situational mechanisms that constitute
organizational level antecedents of stewardship (Davis et al., 2010, 1997; Madison, Holt,
Kellermanns, & Ranft, 2016; Neubaum et al., 2017). Finally, we investigate how a stewardship-
oriented culture (Zahra, Hayton, Neubaum, Dibrell, & Craig, 2008) is associated with the
familiness construct in the family firm, and specifically, how it enhances the benefits of a family
involvement in the business on a family firm’s performance (Garcia-Castro & Aguilera, 2014;
Kim & Gao, 2013; Minichilli, Corbetta, & MacMillan, 2010; Sciascia & Mazzola, 2008).
1.2. Empirical studies
In the sequence, we briefly present the three empirical studies conducted in this
dissertation (Figure 1) and introduce the research questions and the theoretical bases of each
paper, which we explore with more substance in the further sections of this Ph.D. dissertation.
So, the theoretical discussion, hypotheses, findings, and contributions will be presented
individually in each of the three studies.

23
Figure 1. Dissertation’s theoretical portrait Source: Authors Study 1: Controlling family’s ability and willingness, and the design of management control mechanisms in family firms (Green); Study 2: Management control mechanisms’ fair design and procedural justice as antecedents of stewardship in family firms (Purple) Study 3: Family involvement in management and family firm’s performance: the moderating role of stewardship-oriented culture (Brown)
Family control and influence
Renewal of family bonds
through dynastic succession
Family involvement in
ownership
Formality- Goal setting;- Performance
evaluation
Participation- Goal setting;- Performance
evaluation
Management control mechanisms design
characteristics
Family involvement in management
Family’s ability
Family’s willingness: Socioemotional wealth
intentions
Procedural justice
- Goal setting;- Performance
evaluation
Stewardship-oriented culture
Stewardship identification
Stewardship
Family firm’sperformance

24
The theoretical motivation and underpinnings of these three studies are mainly
supported by the stewardship theory, which is grounded on a sociological and psychological
perspective with respect to manager’s behaviors and the role of management control
mechanisms in these organizations (Davis et al., 1997; Madison et al., 2016; Neubaum et al.,
2017). As we employ a broader perspective about both the antecedents and the consequences
of stewardship in family firms, we also found strong support on the family firm literature
regarding its constructs and on the management accounting literature.
1.2.1. Study 1: Controlling family’s ability and willingness, and the design of
management control mechanisms in family firms
The basic idea of the first study is that the controlling family’s influence in the business
impacts how management control mechanisms are designed in those firms (Helsen, Lybaert,
Steijvers, Orens, & Dekker, 2017; Speckbacher & Wentges, 2012). Recent studies have been
linking this association to contingency theory (Chenhall, 2003) and naming these family firm
factors as family contingencies (Helsen et al., 2017; Songini, Vola, & Gnan, 2017). The
research question that guides the first study is: how the controlling family’s ability and
willingness are associated with the design of management control mechanisms in family firms?
A controlling family’s influence in the business is being attributed to two
complementary elements that are (1) a controlling family’s ability and (2) a controlling family’s
willingness (Chrisman, Chua, Pearson, & Barnett, 2012; De Massis, Kotlar, Chua, & Chrisman,
2014). With respect to the determinants of management control mechanisms design, we
consider in this study these two elements. We follow previous empirical research and study the
controlling family’s ability in terms of family involvement in ownership and family
involvement in management (Chrisman et al., 2012).
In addition, we study a controlling family’s willingness based on the Socioemotional
Wealth (SEW) construct (Berrone et al., 2012; Gomez-Mejia et al., 2011). The socioemotional
wealth (SEW) consists in one of the main paradigms from the family business literature
(Berrone et al., 2012; Gomez-Mejia et al., 2011). SEW intentions conceives in the “preservation
of socioemotional” and “affective endowments” that may be seen as the core goal of the family
firm (Gomez-Mejia et al., 2011). As SEW construct covers multiple controlling family’s
intentions as reference points for decision-making, for our purposes we delimit two sub-

25
dimensions that are (1) family control and influence, and (2) renewal of family bonds through
dynastic succession (Berrone et al., 2012).
Our focus on both ability and willingness has the following main reasons. First, only the
controlling family’s ability has so far been discussed in prior studies that investigate the
association between family contingencies and Management Control Systems design
characteristics (Songini & Gnan et al., 2013; Helsen et al., 2017; Hiebl, Duller, Feldbauer‐
Durstmüller, & Ulrich, 2015; Michiels, Voordeckers, Lybaert, & Steijvers, 2013; Speckbacher
& Wentges, 2012). These studies mainly relied on the agency theory arguments that family
firms do not need agency mechanisms because they do not face typical agency problems
(Madison, Holt, Kellermanns, & Ranft, 2016). Second, a controlling family’s willingness has
not yet attracted much empirical attention in this field. Therefore, although prior literature
indicates associations between a controlling family’s ability (Michiels et al., 2013; Songini &
Gnan, 2015; Speckbacher & Wentges, 2012), our central argument is that a family’s willingness
drives the design of management control mechanisms and depending on the controlling
family’s focus will be differently associated with management control mechanisms’ design.
With respect to management control mechanisms, we investigate goal setting and
performance evaluation mechanisms that are focused on top managers of family firms. These
mechanisms are used to assist the strategic and management processes (Ferreira & Otley, 2009).
We focus on two design characteristics of these mechanisms that are formality and participation
(Hartmann & Slapničar, 2009, 2012). Our argument is that, beyond the agency monitoring
perspective of controls, formal and participative mechanisms can foster transparency in the
firms’ processes and knowledge sharing among managers in the firm.
Formality has been linked to the family firm’s level of professionalization and
hypothesized based on the agency perspective, which has been partially addressed by prior
literature (Chua, Chrisman, & Bergiel, 2009; Dekker, Lybaert, Steijvers, Depaire, & Mercken,
2013; Songini & Gnan, 2015; Speckbacher & Wentges, 2012; Stewart & Hitt, 2012). However,
participation design characteristic might also be a relevant element to be studied in family firms
due to the complexity of its relationships, among family and nonfamily managers, that exists in
family firms (Dawson & Mussolino, 2014; Songini, Gnan, & Malmi, 2013). Dekker et al.
(2013) investigates participation in terms of decentralization of authority, which they consider
one of the elements of a family firm’s professionalization.
Finally, these characteristics are also relevant since they have been treated in the
management accounting and procedural justice literature as determinants of pro-organizational

26
attitudes and behaviors in the firm (Hartmann & Slapničar, 2009, 2012; Langevin & Mendoza,
2013; Voußem, Kramer, & Schäffer, 2016), which discussion we explore in the second study
of this Ph.D. dissertation.
1.2.2. Study 2: Management control mechanisms’ fair design and procedural
justice as antecedents of stewardship in family firms
The second study focus on the antecedents of stewardship (Hernandez, 2012) in family
firms (Davis, Allen, & Hayes, 2010; Neubaum, Thomas, Dibrell, & Craig, 2017), considering
management control mechanisms design and procedural justice. Stewardship has been
hypothesized as an important construct in the family firm literature (Davis et al., 2010; Davis,
Schoorman, & Donaldson, 1997; Madison et al., 2016; Neubaum et al., 2017) to which it is
credited the distinctiveness (Simon, Marquès, Bikfalvi, & Dolors Muñoz, 2012) and
competitive advantage of family firms (Corbetta & Salvato, 2004; Zahra et al., 2008).
Stewardship is argued to reflect a competing paradigm to the agency theory, in which managers
are expected to act pro-organizationally and support the long-term wealth of the company and
its principals (Davis et al., 1997; Donaldson & Davis, 1991). The stewardship theory provides
a counterpoint to the agency theory regarding managers’ behavioral assumptions and the need
for governance and management control mechanisms (Davis et al., 1997; Donaldson, 2008).
The stewardship literature determines that when individuals behave as stewards, there
is no need to implement traditional agency mechanisms such as monitoring and incentive
systems. Monitoring and incentive systems are used to curb agent’s opportunistic behavior in
the agency theory paradigm (Eisenhardt, 1989; Madison et al., 2016). Conversely, informal and
social controls might better suit the stewardship perspective, since there is no need for aligning
stewards’ behaviors with the principals’ interests (Davis et al., 2010, 1997; Neubaum et al.,
2017). James et al. (2017) theoretically explain that should be an appropriate fit between
management control mechanisms and managers’ behaviors in family firms, based on the agency
theory or stewardship theory lenses.
Based on the relevance of the stewardship construct on the family firm field, we study
in the second paper the following research question: Are management control mechanisms’ fair
design and procedural justice perceptions associated with manager’s stewardship identification
and with a stewardship-oriented culture in family firms? Therefore, we address this question
and examine the relationship between the level of participation and formality in goal setting

27
and performance evaluation and manager’s perceptions about stewardship, whereby this
relationship is mediated by procedural justice (Hartmann & Slapničar, 2009, 2012; Sieger,
Bernhard, & Frey, 2011). Due to the complexity of the stewardship construct, we consider both
at the individual level and at the organizational level, respectively stewardship identification
and stewardship-oriented culture.
The reasoning for the hypotheses is supported by the stewardship literature particularly
related to situational mechanisms (Davis et al., 1997; Donaldson & Davis, 1991), on the recent
empirical evidence that investigates whether agency and stewardship mechanisms relate to
family and nonfamily manager’s attitudes and behaviors in the family firm (e.g., James et al.,
2017; Madison et al., 2016; Neubaum et al., 2017) and on the procedural justice literature (e.g.,
Langevin & Mendoza, 2013). The basic argument in the second study is that management
control mechanisms that are designed based on the fairness principles and that enhance
procedural justice perceptions are expected to foster pro-organizational attitudes and behaviors
in the firm such as identification, trust and affective commitment (Cugueró-Escofet & Rosanas,
2013; Hartmann & Slapničar, 2009; Langevin & Mendoza, 2013).
Based on this idea, we propose that management control mechanisms that have been
widely investigated in the agency theory literature (Anthony, Govindarajan, Hartmann, Kraus,
& Nilsson, 2014; Eisenhardt, 1989; Merchant & Van der Stede, 2007), such as goal setting and
performance evaluation, can also be considered as stewardship situational mechanisms,
depending on how they are designed (Hernandez, 2012). Among the design characteristics of
stewardship situational mechanisms are the use of power, collectivism orientation, involvement
orientation, and level of power distance (Davis et al., 2010, 1997; Madison et al., 2016;
Neubaum et al., 2017).
Particularly, traditional agency management control mechanisms that are discussed in
the Performance Measurement Systems framework (Ferreira & Otley, 2009) and Management
Control Systems (Malmi & Brown, 2008) can also be used to improve communication,
transparency, coordination, and knowledge in organizations. In the stewardship lens, when
these mechanisms are installed to serve these purposes, they may foster, for example, managers’
motivation, identification, and trust in the organization. Therefore, depending on their design,
traditional agency mechanisms, such as goal setting and performance evaluation, can be seen
as instruments that encourage communication, trust, empowerment, and transparency toward
the firm (Langevin & Mendoza, 2013; Van der Heyden, Blondel, & Carlock, 2005) and in this

28
sense, are aligned with the stewardship situational mechanisms construct (Davis et al., 1997;
Neubaum et al., 2017).
1.2.3. Study 3: Family involvement in management and family firm’s
performance: the moderating role of stewardship-oriented culture
In the third study, we are motivated by the stewardship theoretical perspective in family
firms, with respect to the stewardship implications over family firm’s performance since prior
literature conceptually suggests that stewardship would lead to a family firm’s competitive
advantage (Corbetta & Salvato, 2004; Davis et al., 2010; Zahra et al., 2008). Therefore, we link
the stewardship literature to the familiness framework, which provides a particular perspective
on the firm’s internal resources and their relationship with competitive advantage (Dawson &
Mussolino, 2014; Habbershon & Williams, 1999). By combining both familiness and
stewardship literature, the third study aims to address the gap that exists in the literature
regarding inconclusive findings of prior empirical studies (Garcia-Castro & Aguilera, 2014;
Rutherford, Kuratko, & Holt, 2008).
The basic idea of the third study is that a stewardship-oriented culture enhances the
positive association between familiness, measured through family involvement, and a family
firm performance. We rely on the familiness construct and on the consequences of a
stewardship-oriented culture to investigate how those constructs are associated with a family
firm’s performance. The research question that guides the third study is: does a stewardship-
oriented culture moderate the association between the level of family involvement in
management and a family firm’s performance?
Our arguments rest on the familiness and on the stewardship literature. Based on
familiness construct, we discuss the relationship between a family involvement in management
and family firm’s financial performance (Garcia-Castro & Aguilera, 2014; Minichilli et al.,
2010; Rutherford et al., 2008). In the context of family firms, the familiness construct has
mostly been applied as an antecedent of family firm’s performance, which concept is grounded
on the resource-based view (Chrisman, Chua, & Sharma, 2005; Dawson & Mussolino, 2014;
Habbershon, Williams, & MacMillan, 2003). Familiness has been hypothesized as originating
from the interaction between the family and family firm systems, which creates idiosyncratic
firm-level resources and capabilities that drive a family firm’s competitive advantage
(Habbershon et al., 2003; Irava & Moores, 2010).

29
We follow Minichilli et al. (2010) and capture familiness by family involvement in
management and study its relationship with family firm performance. We treat family
involvement in management as the presence of a family Chief Executive Officer (CEO) and as
the percentage of family managers in the Top Management Team (TMT) as fostering a family
firm’s performance. Particularly, we hypothesize two contradicting hypotheses related to the
association between the ratio of family managers in the TMT and performance, since prior
literature has also suggested nonlinear effect (De Massis, Kotlar, Campopiano, & Cassia, 2015;
González-Cruz & Cruz-Ros, 2016; Mazzola, Sciascia, & Kellermanns, 2013; Minichilli et al.,
2010; Sciascia & Mazzola, 2008). However, these studies that treat the association between
family involvement and performance lead to inconclusive findings, which might be explained
by the complexity of familiness construct and relationships (Anderson & Reeb, 2003; Garcia-
Castro & Aguilera, 2014; Minichilli et al., 2010; Rutherford et al., 2008).
Therefore, we extend previous discussions about familiness, by exploring the
stewardship organizational-level construct (stewardship-oriented culture), which is seen as a
“secret sauce” of family firms (Davis et al., 2010) in fostering the positive association between
familiness and family firm’s performance (Corbetta & Salvato, 2004; Simon, Marquès,
Bikfalvi, & Dolors Muñoz, 2012; Zahra et al., 2008). A stewardship-oriented culture indicates
the extent to which a collective, supportive, and caring environment exists in the firm (Zahra et
al., 2008). Our central argument in the third study is that as family managers are expected to
behave as stewards in the family firm (e.g., Davis et al., 2010), a stewardship-oriented culture
might foster the positive influence that a family involvement in management has on the firm’s
performance.
1.3. Ph.D. dissertation’s structure
This dissertation is divided into seven sections. First, in this introductory section, we
presented the theoretical portrait and the three empirical studies. It is important to mention that
each of the three papers has a particular problematization and research question to address a
specific issue. Therefore, in this first section, we provide a broad picture of how the three
empirical studies are, at the same time, independent and complementary from each other.
In the second section, we present previous research and the concepts of the underlying
constructs, where we discuss the following elements: Stewardship and Agency theories,
Controlling family influence (ability and willingness), Management control mechanisms design
characteristics and procedural justice. This review is mainly based on the international literature

30
considering papers published in highly ranked journals in family firms, management
accounting, and general management. We also add a subsection in the Literature Review
section, to discuss previous research about these issues, especially about management control
mechanisms and family firms, developed in Brazil. This is important to provide a big picture
about this Ph.D. dissertation’s contribution to the Brazilian research community. In general, the
literature review gives an understanding of the current discussion in the literature and the
constructs that we investigated in the three papers.
In the third section, we present the methodology and describe the sample, data
collection, the respondents’ characteristics, the measurement of constructs and data analyses
methods. We indicate in the methodology section that the three papers derive from one survey
developed with Brazilian family firms, however, due to the objective and constructs of each
paper, we work in each paper with a different number of respondents to the survey.
In the fourth, fifth and sixth sections, we present the three papers of this dissertation.
These papers are each divided in the following subsections: (i) introduction, (ii) theoretical
model and hypotheses, (iii) data analyses (iv) and conclusions. In the first paper, we address
the relationship between a family’s ability and willingness and the design of management
control mechanisms regarding the level of participation and formality concerning goal setting
and performance evaluation. The second paper, presented in section five, studies the
relationship between the design of management control mechanisms and stewardship in family
firms, which is mediated by procedural justice. In the third paper, presented in section six, we
focus on the familiness construct, stewardship-oriented culture, and firm financial performance.
Finally, we present the final remarks in the seventh section, indicating this Ph.D. dissertation’s
contributions to the academic community and to practitioners.

31
2. LITERATURE REVIEW AND DISSERTATION’S CONSTRUCTS
In this literature review, we present previous research that provides more information
on these dissertation’s constructs, which is vital for the interpretation of the Ph.D. dissertation
portrait. We present in Figure 2 below the title of the papers, the literature review subsections
and the constructs used in the research design of the three papers. Although each paper is based
on different constructs, the stewardship theoretical lens is the propellant engine throughout this
dissertation.
Paper title Literature review subsections Constructs Paper 1: Controlling family’s ability and willingness and the design of management control mechanisms in family firms
Constructs in the family firm literature and Management control mechanisms design characteristics literature
Controlling family’s ability, controlling family’s willingness (Socioemotional wealth), participation and formality in management control mechanisms
Paper 2: Management control mechanisms’ fair design and procedural justice as antecedents of stewardship in family firms
Management control mechanisms design characteristics literature, procedural justice literature and Stewardship literature
Participation and formality in management control mechanisms, procedural justice, stewardship-oriented culture and stewardship identification
Paper 3: Family involvement in management and family firm’s performance: the moderating role of stewardship-oriented culture
Constructs in the family firm literature and Stewardship literature
Familiness (Family involvement in management), performance and stewardship-oriented culture
Figure 2. Summary of the papers and literature review issues
In the sequence, we present the literature about agency and stewardship theories,
focusing on both conceptual background and family firm’s studies that used stewardship as
their theoretical lens. We additionally present the constructs related to the controlling family’s
ability and willingness to influence the family firm. Then we present the literature about
management control mechanisms (control systems and mechanisms used by organizations),
which concept is aligned to the agency and stewardship lens. We discuss those management
control mechanisms design based on the procedural justice theoretical background. Finally, we
present a review of papers published in Brazilian journals that explore the constructs used in
the three papers of this dissertation.
2.1. Agency and stewardship theories
Agency theory and stewardship theory are both concerned with managers’ behavior and
their roles in achieving the organization’s goals (Donaldson & Davis, 1991; Tosi, Brownlee,

32
Silva, & Katz, 2003; Wasserman, 2006). The tenets of agency and stewardship theories include
individual-level attitudes and behaviors, and firm-level management control mechanisms
(Davis et al., 1997; Madison et al., 2016). Based on a recent literature review developed by
Madison et al. (2016, p. 67), we present in Table 1 the basic principles of agency and
stewardship theories that can be applied to any organizational form (for example family firms).
The basic difference between agency and stewardship theories underlies the ‘model of
man’ (Davis et al., 1997; Donaldson & Davis, 1991). For agency theory, managers are
economically rational and self-interested, and for the stewardship theory, they are pro-social.
Agency theory is grounded on the economic model of man where individuals seek to maximize
their own utility. Agency theory suggests a relationship between two parties, the principal
(owner) and the agent (manager) where it is expected that the later will behave in a self-
interested manner that conflicts with the principal’s interests (Chrisman, Chua, Kellermanns, &
Chang, 2007; Jensen & Meckling, 1976).
Table 1
Summarizing agency and stewardship theories
Agency theory Stewardship theory Foundational work Jensen and Meckling (1976) Davis et al. (1997) Relationship Based on the principal-manager
relationship: describes the individual-level agent behaviours and the firm-level agency governance mechanisms that are implemented in response
Based on the principal-manager relationship: Describes the individual-level steward behaviours and the firm-level stewardship governance mechanisms that are implemented in response
Assumption of Economic model of man Humanistic model of man Behaviour Opportunistic: Individual/self-serving Pro-organizational: Collective/other-
serving Governance Monitoring and incentive systems:
mechanisms to curb opportunistic behaviour by aligning the interests of the manager with those of the principal
Trust systems: Mechanisms to encourage cooperation and involvement to facilitate the natural alignment of interests between the manager and principal
Outcome Pro-organizational outcomes; Firm performance by way of cost minimization
Pro-organizational outcomes; Firm performance by way of wealth maximization
Source: Madison et al. (2016, p. 67)
Alternatively to the agency perspective, the stewardship approach determines that
individuals are trustworthy, collectivists, and pro-organizational so it provides an opposite
perspective to the agency anti-management view (Donaldson, 2008). The stewardship theory is
based on the humanistic model of man, which has its roots in sociology and psychology (Davis

33
et al., 1997; Donaldson & Davis, 1991). Stewardship may be defined in terms of human caring,
generosity, loyalty, and devotion to a social group or institution (Donaldson, 1990).
Stewardship theory is about the relationship between two parties, the principal (owner)
and the steward (manager). A steward aims to protect and maximizes shareholders’ wealth
because in this situation the steward’s utility function is maximized. The steward’s motivations
are directed to organizational rather than personal objectives, so it prescribes that the interests
of the managers are aligned with the principals’ interests (Davis et al., 1997). This
conceptualization is consistent with Hernandez’ (2008, p. 122) definition of stewardship as “the
attitudes and behaviors that place the long-term best interest of a group ahead of personal
goals that serve an individual’s self-interests”.
In addition to the individual-level tenets, the agency and stewardship theories also
discuss the firm-level governance mechanisms that are appropriate to the managers’ behavioral
assumptions. The agency theory proposes a control-oriented management philosophy (Davis et
al., 1997; Jensen & Meckling, 1976), which leads to monitoring and incentive mechanisms
being installed to curb opportunistic behavior, and to align manager’s and principal’s interests
(Madison et al., 2016). In contrast, the stewardship theory suggests an involvement-oriented
management philosophy and that mechanisms are put in place to encourage managers’
cooperation and involvement (Davis et al., 1997; Madison et al., 2016; Neubaum et al., 2017).
In this sense, the stewardship theory proponents indicate that stewardship is different from the
agency theoretical lens in terms of management philosophy and cultural dimension (situational
mechanisms), and individual psychological mechanisms such as motivation, social comparison,
identification and power (Davis et al., 1997; Donaldson & Davis, 1991).
Recently, Neubaum et al. (2017) developed an empirical study about the above-
mentioned elements. They named these elements the stewardship climate, which they define as
“the extent to which individuals perceive that their firm’s policies, practices, and procedures
foster stewardship behaviors and stewardship values, which are widely shared across the
organization” (Neubaum et al., 2017, p. 38). Therefore, these authors widen the discussion of
stewardship by proposing this second-order construct, which consists of the following
dimensions (i) intrinsic motivation, (ii) organizational identification, (iii) use of personal forms
of power, (iv) collectivism, (v) low power distance, (vi) and involvement orientation.
According to the literature, the family business context and relationships are consistent
with the assumptions of these stewardship-like behaviors (Neubaum et al., 2017). Family firms
are considered organizations whose members are bound by social ties, organizational
34
identification, emotional attachment, and other affective endowments appointed by the
socioemotional wealth perspective (Davis et al., 2010; Gómez-Mejía, Haynes, Núñez-Nickel,
Jacobson, & Moyano-Fuentes, 2007; Le Breton-Miller, Miller, & Lester, 2011). Stewardship
was conceptualized as a ‘secret sauce’ of family firms, which can lead to competitive advantage
(Davis et al., 2010; Dibrell & Moeller, 2011; Eddleston, Kellermanns, & Sarathy, 2007; Zahra
et al., 2008).
In this dissertation, we investigate stewardship in family firms considering the firm-
level management control mechanisms that we study in the umbrella of Management Control
Systems (e.g., Malmi & Brown, 2008) and Performance Measurement Systems (Ferreira &
Otley, 2009). We consider management control mechanisms as explicit and implicit practices
of the organization, which assist the strategic and management processes with respect to
“managing performance, and for supporting and facilitating organizational learning and
change” (Ferreira & Otley, 2009, p. 264). Specifically, we operationally interpret stewardship
in the context of family businesses and considered management control mechanisms fairness
design and procedural justice regarding goal setting and performance evaluation. We provide
more information about this construct on the management control mechanism’s literature
review subsection.
Following prior literature (e.g., Zahra et al., 2008), we investigate the association
between management control mechanisms design and stewardship attitudes and behaviors in
the family firm. We considered stewardship both at an individual level attitude and at an
organizational level, as a ‘collective phenomenon’, according to Neubaum et al. (2017).
The construct ‘stewardship-oriented culture’ (Dibrell & Moeller, 2011; Zahra et al.,
2008) is defined as “the degree to which a stewardship culture exists within the family firm”
(Zahra et al., 2008, p. 1042). Following Zahra et al. (2008, p. 1043) a stewardship-oriented
culture indicates the “extent to which the family firm developed a collective, supportive, and
caring environment for their employees, and provided opportunities for them to reach their
potential”. We study the stewardship-oriented culture as an outcome that is influenced by the
exchanges that occur in the business social setting and management practices (Hernandez,
2012).
In addition, we also focus on an individual-level stewardship attitude. Some studies
focused on stewardship motivation (Eddleston, 2008; Zahra et al., 2008) while others on the
stewardship identification (Craig, Dibrell, & Neubaum, 2011; James et al., 2017; Vallejo,
2009). In this dissertation, we study stewardship identification, which refers to the extent of

35
manager’s identification with the firm by “accepting the organization’s mission, vision, and
objectives” (Davis et al., 1997, p. 29). This element was previously conceptualized as one of
the key features of stewardship (Davis et al., 1997; Neubaum et al., 2017).
We investigate both organizational-level and individual-level stewardship since
complex interactions exist in the context of family firms between family and nonfamily
managers. A manager’s family affiliation is a characteristic that determines different behaviors
in the family firm (Davis et al., 2010; James et al., 2017; Verbeke & Kano, 2012), which adds
more complexity to the interpretation of stewardship in the family business setting (Madison et
al., 2016).
For Corbetta and Salvato (2004), the stewardship behavior is presumably expected just
for family managers that are members of the owning family but are not themselves the principal
owner. In this sense, family managers are supposed to subordinate personal goals to family
goals and pursue relational contracts that govern family firm behavior and which are immersed
in emotions and sentiments. We summarize these assumptions in Table 2, adapted from James
et al. (2017).
Table 2
Family affiliation: agency and stewardship assumptions
Assumptions Nonfamily managers Family managers Divergent tendencies of nonfamily vs. family managers
The majority of nonfamily managers will think and act like agents
The majority of family managers will think and act like stewards
Bifurcated enactment of governance approaches
Nonfamily managers are more likely to be governed by an agency than a stewardship approach
Family managers are more likely to be governed by a stewardship than an agency approach
Source: Adapted from James et al. (2017, p. 264)
When Corbetta and Salvato (2004) mention that a steward behavior is expected just for
family managers, they are consistent with the concept of bifurcation bias introduced by Verbeke
and Kano (2012). The bifurcation bias is related to an asymmetric treatment whereby “family
employees are treated by default as highly valuable, firm-specific assets, being ‘on the inside
for the long run’ and as loyal stewards with a long-term commitment to the firm” (Verbeke &
Kano, 2012, p. 1189). And, in contrast, “nonfamily managers are dealt with as easily
substitutable, commodity-like, short-term assets, and as self-serving agents who ultimately
remain ‘outsiders’ even if used/internalized temporarily by the firm” (Verbeke & Kano, 2012,
p. 1189).

36
Stewardship behavior is expected by default for family managers and agency behavior
for nonfamily managers (see Table 2). However, previous research has challenged these
behavioral family affiliation assumptions and has shown that family managers can also behave
as agents while nonfamily managers can also behave as stewards (James et al., 2017; Madison
et al., 2016). James et al. (2017) empirically demonstrate a different perspective to the
assumption that nonfamily managers might be governed by agency mechanisms while family
managers may be governed by stewardship mechanisms. These authors show that stewardship-
type mechanisms are positively associated with stewardship attitudes and behaviors
independently of managers’ presence of a family affiliation (James et al., 2017). These authors
did not consider a specific management practice, and portrayed these mechanisms in terms of
the sense of autonomy, belonging and competence that the owning family provides to managers
in family firms. On the other hand, for the agency-type mechanisms, James et al. (2017)
investigated the existence of incentive-based compensation and monitoring by family
managers.
Therefore, Madison et al. (2016) suggest that stewards’ behaviors can also be stimulated
in nonfamily managers. We argue that the fairness perception on the management control
mechanisms in place in the family firm may play a role on that. This is consistent with Verbeke
and Kano (2012), who claim that mechanisms that signals the values of fairness and equality to
family outsiders might mitigate the bifurcation bias effect (Verbeke & Kano, 2012).
2.2. Constructs in the family firm literature
Previous literature in family firms has applied a large range of constructs to capture
family firm heterogeneity and distinctiveness (Dawson & Mussolino, 2014). These constructs
evolve from more objective perspectives (Astrachan, Klein, & Smyrnios, 2002) to more
subjective perspectives (Gómez-Mejía, Haynes, Núñez-Nickel, Jacobson, & Moyano-Fuentes,
2007). Following Dawson and Mussolino (2014) and Chrisman, Kellermanns, Chan, and Liano
(2010), there are three main theoretical lenses to investigate family firms’ heterogeneity.
First, the Socioemotional Wealth (SEW) construct proposes an analysis of the
controlling family’s noneconomic goals in family firms, which drive decision-making
processes and management control mechanisms (Berrone, Cruz, & Gomez-Mejia, 2012;
Gómez-Mejía et al., 2007). Second, the literature beyond the components of family involvement
in the business, known as the essence of family business approach, looks at elements that

37
characterize family firms in terms of a configurational approach (Chrisman, Chua, & Sharma,
2005; Chrisman, Chua, & Steier, 2003; Chua, Chrisman, & Sharma, 1999; Dawson &
Mussolino, 2014). The essence of family firms relates to the vision held by the dominant family
coalition and their intention to sustain such vision across generations (Chua et al., 1999;
Dawson & Mussolino, 2014). Third, the familiness perspective highlights the distinctiveness of
family business based on the family businesses resources in comparison to nonfamily firms
(Habbershon & Williams, 1999; Sirmon & Hitt, 2003).
In sum, these three main theoretical frameworks provide diverse and complementary
understanding about family firms, regarding definition, dimensions, level of analyses, and
theoretical background (Dawson & Mussolino, 2014). We present a summary of these
constructs definition, dimensions and theoretical basis in Table 3, adapted from Dawson and
Mussolino (2014, pp. 175–176).
2.2.1. Controlling family’s influence: ability and willingness
De Massis et al. (2014), following to a large extent these theoretical constructs, provide
a critical discussion of the sufficient and necessary conditions for family involvement to
produce particularistic family-centric behaviors. They claim that the previous empirical
literature about family firms has not recognized this distinctive behavior to influence the firm,
which can result in theoretical limitations of previous research.
For De Massis et al. (2014) it is important to consider both ability and willingness as
key drivers of family firm’s distinctiveness. Ability is the “discretion of the family to direct
allocate, add to or dispose of a firms’ resources” (De Massis et al., 2014, p. 346), which relates
to the family power and legitimacy (Chrisman, Chua, De Massis, Frattini, & Wright, 2015).
Family ability takes an objective perspective and uses the family involvement constructs such
as family involvement in management and family involvement in ownership (Carney, 2005;
Chrisman, Chua, Pearson, & Barnett, 2012; De Massis et al., 2014).

38
Table 3
Family firm’s constructs
Construct Socioemotional wealth (SEW) The essence of family business Familiness Definition Family’s stock of affect-related value
invested in the family firms (Berrone, Cruz, Gomez-Mejia, & Larraza-Kintana, 2010)
Noneconomic utilities or affective endowments (Berrone et al., 2010)
The array of non-financial benefits specifically associated with the well-being and affective needs of family members that are derived from operating a business enterprise (Debicki, Kellermanns, Chrisman, Pearson, & Spencer, 2016, p. 48)
The vision of the dominant family coalition and the intention of that dominant condition to sustain such vision across generations (Chua et al., 1999)
A core essence statement encapsulates the values that serve as the foundation for the vision and mission (Craig & Moores, 2010)
A unique bundle of resources resulting from the interaction of the family and business systems (Habbershon & Williams, 1999; Habbershon, Williams, & MacMillan, 2003)
It is represented via the bundle of decision premises that expresses the influence of the business family on its business (Frank, Kessler, Rusch, Suess-Reyes, & Weismeier-Sammer, 2016, p. 5)
Dimensions Family control and influence Family members’ identification with the
firm Binding social ties Emotional attachment Renewal of family bonds to the firm
through dynastic succession (Berrone et al., 2012)
Family prominence Family continuity Family enrichment (Debicki et al., 2016)
Vision (Chua et al., 1999) Transgenerational intention (Chrisman et al.,
2005; Chua et al., 1999) The following have also been put forward in
the literature: Familiness (Chrisman, Chua, & Litz, 2003;
Chrisman et al., 2005) Commitment (Chrisman et al., 2012) Family’s influence over the strategic direction
of the family firm and family firm behaviour (Chrisman et al., 2005)
Human resources (reputation and experience), organizational resources (decision making and learning), and process resources (relationships and networks) (Irava & Moores, 2010)
Structural (social interactions and networks), cognitive (shared vision and purpose, as well as unique language, stories, and culture), and relational (trust, norms, obligations, and identity) dimensions (Pearson, Carr, & Shaw, 2008)
Involvement, essence, and organizational identity (Zellweger, Eddleston, & Kellermanns, 2010)
Decision premises such as ownership, management and control; proficiency level of active family members; sharing of information between active family members; transgenerational orientation; family–employee bond; family business identity (Frank et al., 2016, p. 5)
Theoretical basis
Behavioral theory; Agency theory; Prospect theory
Various (e.g., configurative approach; Behavioural and stakeholder theories)
Resource-based view; systems theory, New Systems theory
Source: Adapted from Dawson and Mussolino (2014, pp. 175–176)

39
In addition, willingness is defined as the “favorable disposition of the involved family
to engage in distinctive behavior” (De Massis et al., 2014, p. 347), which relates to the
controlling family goals and intentions toward the family business. In this Ph.D. dissertation,
we use socioemotional wealth preservation as construct to capture a family’s willingness to
influence the business decisions (De Massis et al., 2014). This approach is also supported by
Veider and Matzler (2016), who argue that SEW consists in reference points for decision-
making in family firms. Socioemotional wealth elements can vary considerably across family
firms (Berrone et al., 2012), which theoretical foundations we explore in the following
subsection.
2.2.2. Socioemotional Wealth
Socioemotional wealth is a construct that captures the stock and flows of affective
endowments of the dominant coalition in the business (Berrone et al., 2012; Chua, Chrisman,
& De Massis, 2015; Gomez-Mejia, Cruz, Berrone, & De Castro, 2011). SEW or affective
endowments comprise “... the stock of affect-related value that a family derives from its
controlling position in a particular firm” (Berrone et al., 2012, p. 259). For Debicki et al. (2016,
p. 48), SEW is “the array of nonfinancial benefits specifically associated with the well-being
and affective needs of family members that are derived from operating a business enterprise”.
SEW is founded on behavioral agency theory which proposes that the maximization of
financial results is just one of the objectives of a family firm but not always the most important
one (Wiseman & Gomez-Mejia, 1998). Additionally, the behavioral agency theory suggests
that family firms are loss-averse with respect to SEW (Gomez-Mejia et al., 2011). Particularly
in family firms, it is expected that the behaviors and decision-making processes are directed by
a major objective that is to preserve or increase socioemotional endowments (Berrone et al.,
2012; Gomez-Mejia et al., 2011).
The study from Berrone et al. (2012) is considered to be the seminal paper to distinguish
different sub-dimensions of Socioemotional Wealth. Berrone et al. (2012) proposed five sub-
dimensions of SEW, which they named the FIBER model, including (i) family direct and
indirect control and influence over strategic business decisions; (ii) identification of family
members with the firm where the firm is seen as an extension of the family for both internal
and external stakeholders; (iii) binding social ties related to family firms’ social relationships;

40
(iv) emotional attachment of family members that is a source of emotions in the family
business context; (v) and renewal of family bonds to the firm through dynastic succession.
Recently, researchers have tried to validate this theoretical model proposed by Berrone
et al. (2012) and delved deeper into the sub-dimensions of socioemotional wealth (Chua et al.,
2015; Debicki et al., 2016; Hauck, Suess-Reyes, Beck, Prügl, & Frank, 2016; Schulze &
Kellermanns, 2015). Hauck et al. (2016) developed a survey aiming to validate the dimensions
and items proposed by Berrone et al. (2012). Hauck et al. (2016) validated three of the five
dimensions of the FIBER model which they named REI scale: Renewal of family bonds through
dynastic succession; Emotional attachment of family members; Identification of family
members with the firm. Furthermore, Debicki et al. (2016), proposed an investigation of the
SEW intentions, which they grouped along the following three dimensions: (i) prominence of
the family image, (ii) continuity and succession, and (iii) providing happiness and harmony to
the family. The SEW construct is an emergent topic of research in the family firm domain and
it offers many possibilities to researchers (e.g., Berrone et al., 2012; Debicki et al., 2016)
including in management accounting domain (Songini, Gnan, & Malmi, 2013).
Considering the multidimensional nature of SEW (Berrone et al., 2012) and the
heterogeneity in terms of antecedents and outcomes of each of the SEW sub-dimensions
(Berrone et al., 2012; Chua, Chrisman, & De Massis, 2015; Dawson & Mussolino, 2014;
Debicki et al., 2016), previous studies have limited their research design to one or some of these
SEW dimensions, in alignment with the focus of each study. For example, Gómez-Mejía, Cruz,
and Imperatore (2014) focused on family control and influence and identification dimensions,
since they argue that they are the most salient dimensions of SEW for the gambling process in
earnings management and voluntary disclosure.
Taking this rationale (Gómez Mejía et al., 2014) and the lack of consensus in the
literature about the SEW dimensions (Chua, Chrisman, & De Massis, 2015; Schulze &
Kellermanns, 2015), we focus on two dimensions of FIBER model (Berrone, Cruz, & Gomez-
Mejia, 2012), which have been considered by recent studies (Chua et al., 2015; Debicki,
Kellermanns, Chrisman, Pearson, & Spencer, 2016). These are (i) family control and influence
and (ii) renewal of family bonds through dynastic succession. These two dimensions are present
in the main theoretical frameworks described on the family firm literature (Chrisman,
Kellermanns, Chan, & Liano, 2010; Dawson & Mussolino, 2014). For example, in the essence
approach (Chrisman, Chua, & Sharma, 2005; Chrisman, Chua, & Steier, 2003; Chua, Chrisman,
& Sharma, 1999) family control and influence have been treated as a family’s ability to

41
influence related to family’s involvement in management control, management, and ownership,
however in the SEW it is treated as a controlling family’s willingness.
Additionally, in the essence approach, the renewal of family bonds is consistent with
the construct of family transgenerational control intention. This element has been explored by
Chrisman et al. (2003) as the transgenerational perspective of vision set by the dominant family
coalition. In the definition of family firms reported by Chua et al. (1999, p. 25), this concept is
recognized as “potentially sustainable across generations of the family or families”.
Moreover, these elements are also present in the familiness literature (Frank, Kessler,
Rusch, Suess-Reyes, & Weismeier-Sammer, 2016; Habbershon & Williams, 1999; Sirmon &
Hitt, 2003). For example, Frank et al. (2016) use the New Systems Theory Perspective
(Luhmann, 2013) to redefine the familiness construct, which they call decision premises.
Among the elements of familiness, they discuss ownership, management and control, and
transgenerational control orientation, that are related respectively to family control and
influence and renewal of family bonds SEW intentions.
Therefore, we develop our hypotheses, in the first empirical study, based on the SEW
framework (Berrone et al., 2012; Gómez-Mejía, Haynes, Núñez-Nickel, Jacobson, & Moyano-
Fuentes, 2007) because we use two SEW reference points to capture a controlling family’s
willingness. There is still lack of evidence about how a family’s willingness is associated with
management accounting practices in family firms (Helsen, Lybaert, Steijvers, Orens, & Dekker,
2017; Prencipe, Bar-Yosef, & Dekker, 2014; Songini, Gnan, & Malmi, 2013). We hypothesize
that family control and influence and the renewal of family bonds through dynastic succession
intentions may be differently associated with management control mechanisms’ design.
Family control and influence is related to the intention to keep the power in the hands
of the controlling family (founder or a dominance coalition) and exert influence over business
decisions. This influence can be exerted directly by the roles that the family owners assume in
the company or indirectly by the delegation of power to nonfamily managers (Berrone et al.,
2012). Additionally, there are other ways by which the controlling family can achieve control
over the business (Berrone et al., 2012), for example by the founder reputation and status in the
firm, which are considered informal mechanisms. In sum, control and influence SEW intentions
are usually highly desired elements for family members (Berrone et al., 2012; Zellweger,
Eddleston, & Kellermanns, 2010).
The renewal of family bonds through dynastic succession points to the family’s
intention to maintain the company for future generations – also recognized in the literature as
42
transgenerational sustainability or transgenerational orientation (Berrone et al., 2012;
Chrisman, Chua, Pearson, & Barnett, 2012; Suess-Reyes, 2016; Zellweger & Dehlen, 2012). In
this sense, the enterprise is seen as a family’s heritage and tradition (Berrone et al., 2012;
Casson, 1999), and it indicates that the firm is not just an asset held by the family. We argue in
the hypotheses of Paper 1 that this element has important implications on the time horizons of
plans and decisions in the business. Finally, the renewal of family bonds SEW intentions
indicate that “family members view the firm as a long-term family investment to be bequeathed
to descendants” (Berrone et al., 2012, p. 264). This concept is tied to the transgenerational
orientation element that has been widely studied in the family business research (Chrisman et
al., 2012). Suess-Reyes (2016, p. 1) defines transgenerational control orientation as “a decision
premise to maintain the family’s control over the business across generations”.
Transgenerational orientation is a central point in the main frameworks of family distinctive
characteristics and intentions (Suess-Reyes, 2016), such as familiness, essence, and
socioemotional wealth.
We treated empirically these two SEW dimensions based on Frank et al. (2016). First,
we show that the elements of SEW that we have chosen in this study, are consistent with the
other main theoretical lenses in the family firm literature. Second, the instrument of Frank et al.
(2016) is argued to capture decision premises in the organizational level, which is consistent
with the willingness concept (De Massis, Kotlar, Chua, & Chrisman, 2014) and also with the
reference point concept from the SEW perspective (Berrone et al., 2012; Debicki et al., 2016;
Gomez-Mejia, Cruz, Berrone, & De Castro, 2011). Frank et al. (2016) have developed the
concept of familiness on decision premises based on the New Systems Theory (NST)
Perspective. Frank et al. (2016, p. 712) “define a family business as a communication system
incorporating the decision premises shaped by a family […] to enable business-related
communication”. For these authors, decision premises (Simon, 2012) are “communicatively
constructed realities that frame the decision-making processes in organizations” (Frank et al.,
2016, p. 713). Despite the differences around SEW and familiness (in the NST perspective)
approaches, the concept around decision premises is similar to the discussion of reference points
of decision in the SEW theoretical framework.
In this sense, we argue that the measures of Frank et al. (2016) are more consistent with
the willingness and reference point concepts than the other measures, such as those of Berrone
et al. (2012). Hence, despite the fact that we treat empirically the SEW intentions based on the
Frank et al. (2016), we argue that they are consistent with the SEW literature. In the first

43
empirical sutdy, we develop the research hypotheses based on both the familly’s ability and
willingness to influence the firm, which explanations were presented previously.
2.2.3. Familiness
With regard to the third empirical study, we adopt the theoretical lens provided by the
familiness framework since it proposes an organizational-level construct which is
conceptualized in the resource-based view. Familiness is studied as the unique bundle of
resources that emerge from the interaction of family and business systems which leads to
competitive advantage (Dawson & Mussolino, 2014; Habbershon & Williams, 1999;
Habbershon, Williams, & MacMillan, 2003).
In the resource-based view perspective, resources can be considered as human resources
(reputation and experience), organizational resources (decision making and learning) and
process resources (relationships and networks). The dimensions of familiness represent the
interactions between these resources. Chrisman et al. (2003) proposes four aspects for
familiness that are the: “(i) intention to maintain family control of the dominant coalition; (ii)
unique, inseparable, and synergistic resources and capabilities arising from family involvement
interactions; (iii) a vision set by the family controlled dominant coalition and intended for
transgenerational pursuance; (iv) and pursuance of such vision” (Chrisman, Chua, & Litz,
2003, pp. 470–471).
Other studies have also explored familiness dimensions. Irava and Moores (2010), for
example, suggests familiness comprise the following dimensions (i) human (reputation and
experience), (ii) organizational (decision making and learning) and (iii) process resources
(relationships and networks). Moreover, Pearson et al. (2008) indicate the structural dimension
(social interactions and networks), cognitive dimension (shared vision and language) and
relational dimension (trust, norms, obligations, and identification), which leads to a competitive
advantage.
Hence, we follow previous studies that have treated familiness as the family
involvement in the business since it captures the family firm’s resources and capabilities
derived from the family and business interactions, which are expected to be positively
associated to family firms’ performance. Motivated by the controversial findings in the current
literature (Anderson & Reeb, 2003; Garcia-Castro & Aguilera, 2014; Minichilli, Corbetta, &
MacMillan, 2010; Rutherford, Kuratko, & Holt, 2008), we explore the stewardship

44
organizational-level construct (stewardship-oriented culture), as a positive moderator for the
association between family involvement in management and family firm performance (Dibrell
& Moeller, 2011; Eddleston, Kellermanns, & Sarathy, 2007; Zahra, Hayton, Neubaum, Dibrell,
& Craig, 2008). Finally, we apply the familiness framework in the third study to discuss that
the association between family involvement in management and family firm financial
performance will be stronger for higher levels of stewardship-oriented culture.
2.3. Management control mechanisms design characteristics and Procedural Justice
We investigate management control mechanisms based on the Performance
Measurement Systems (PMS) and procedural justice literature. First, we present the purposes
of management control mechanisms in organizations in the agency and stewardship
perspective, and then we introduce the procedural justice lens regarding those mechanisms’
design characteristics. Finally, we present the constructs that will be explored in this Ph.D.
dissertation in terms of management control mechanisms’ design characteristics.
Conceptually, we use the term management control mechanisms to refer to “the explicit
and implicit control systems or mechanisms of the organizations” (Madison, Holt, Kellermanns,
& Ranft, 2016, p. 68). Management control mechanisms can be considered a broad concept, in
which umbrella we can place, for example, management accounting practices and control
mechanisms such as monitoring and trust systems (Davis, Schoorman, & Donaldson, 1997;
Madison et al., 2016), which might include both formal and informal mechanisms studied in
the Management Control Systems’ literature (Malmi & Brown, 2008) and in the Performance
Measurement Systems’ literature (Ferreira & Otley, 2009; Otley, 1999).
Management control mechanisms have been traditionally treated as agency control
mechanisms, which purpose is to align managers and principals’ interests in the organization.
They exist to limit actions, direct attention and constrain managers’ discretion over business
decisions, curbing opportunistic behaviors (Eisenhardt, 1989). Most of the definitions of
management mechanisms in the management accounting domain meets this theoretical
background. For example, Anthony et al. (2014, p. 4) indicate that management control is a
“systematic process by which the organization’s higher-level managers influence the
organization’s lower-level managers to implement the organization’s strategies”.
However, management control mechanisms can also foster trust, preserve managers’
autonomy, authority, and discretion, and create transparency in organizations, which are related
45
to the stewardship literature (Ahrens & Chapman, 2004; Madison et al., 2016; Simons, 2013).
These management control mechanisms can be depicted in terms of many organizational
processes, ranging from setting goals, evaluating performance and rewarding, depending on the
purpose of those management control mechanisms.
Ferreira and Otley (2009) provide an insightful definition and framework about those
mechanisms, which they named as Performance Measurement Systems (PMS). For Ferreira
and Otley (2009, p. 264), PMS are:
[…] the evolving formal and informal mechanisms, processes, systems, and networks used by organizations for conveying the key objectives and goals elicited by management, for assisting the strategic process and ongoing management through analysis, planning, measurement, control, rewarding, and broadly managing performance, and for supporting and facilitating organizational learning and change. (2009, p. 264)
From this definition and based on the procedural justice lens, we focus on goal setting
and performance evaluation mechanisms since they are considered to play a vital role in
performance evaluation systems (Otley, 1999). In this sense, we combine, in this study, goal
setting and performance evaluation management control mechanisms that are studied in the
Management Control Systems’ literature (Malmi & Brown, 2008) as a planning and a
cybernetic mechanism (usually for a 12-month period). Those mechanisms have been partially
discussed in the family business literature (Helsen et al., 2017; Songini et al., 2013) and some
evidence can be found in the stewardship literature (e.g., Hernandez, 2012).
Therefore, while the agency paradigm follows the economic perspective, the
stewardship paradigm is supported by the psychological and the sociological views.
Subsequently, we introduce the procedural justice framework to discuss the design
characteristics of management control mechanisms in fostering stewardship in family firms.
Previous literature has suggested that procedural justice is a key mediating variable that links
management control mechanisms design and managers’ attitudes and behaviors (Beuren, Klein,
Lara, & Almeida, 2016; Hartmann & Slapničar, 2009; Langevin & Mendoza, 2013; Voußem,
Kramer, & Schäffer, 2016).
Prior literature has suggested that those management control mechanisms (e.g. goal
setting, performance evaluation and rewarding) might be considered as procedures in the
procedural justice theoretical framework (Hartmann & Slapničar, 2012; Kim & Mauborgne,
1993; Langevin & Mendoza, 2013; Voußem, Kramer, & Schäffer, 2016), which are expected
to generate procedural justice feelings toward managers (Langevin & Mendoza, 2013; Libby,
1999). Before discussing procedural justice in the management accounting domain, we present

46
some elements to characterize procedural justice supported by traditional scholars in this field
(e.g., Leventhal, Karuza, & Fry, 1980).
Procedural justice is one of the approaches under the organizational justice umbrella
(Fortin, 2008) that has been first discussed by two social scientists from judicial processes
perspective (Thibaut & Walker, 1975). Procedural justice (Colquitt, Conlon, Wesson, Porter,
& Ng, 2001; Leventhal et al., 1980) is related to the perception of managers on the procedures
that determine the allocation of organizational resources and decisions. Lind and Tyler (1988,
p. 1) define procedural justice as the “judgments that procedures and social processes are just
and fair”. The literature points that fair decisions should be accurate, free from information
bias, consistently through people and over time, and should have mechanisms to correct flaws
of opinions from affected groups and follow the prevailing personal ethical standards
(Leventhal et al., 1980). These are considered the normative rules of procedural justice
(Leventhal et al., 1980).
In the organizational setting and management accounting domain, Lau and Oger (2012,
p. 324) suggest that procedural fairness “refers to judgments on how fair are the means or the
rules and processes people use to make decisions”. Lau and Oger (2012) state that since the
mid-1990, management accounting researchers have been interested in this subject. One of the
reasons for this growing attention to procedural justice can be found in Anthony and
Govindarajan (1995, p.556), who point out that “objectives, goals, and standards are likely to
provide strong incentives only if the manager perceives them as fair”. Therefore, management
accounting scholars should understand the fairness elements in management accounting
practices, since fairness may potentially support the alignment of behaviors in the organization
(Malmi & Brown, 2008; Merchant & Van der Stede, 2007; Otley, 1999).
Langevin and Mendoza (2013) highlight that, in previous empirical and theoretical
research, Management Control Systems’ fairness characteristics relate to: (i) participation in
target-setting (Lau & Tan, 2005; Libby, 1999); (ii) level of formality and quality of feedback
(Hartmann & Slapničar, 2009); (iii) use of multiple nonfinancial measures in performance
evaluation (Bellavance, Landry, & Schiehll, 2013; Burney, Henle, & Widener, 2009; Lau &
Moser, 2008). These characteristics point to the whole management process, from goal setting
and ending up with performance evaluation process (Langevin & Mendoza, 2013).
In this dissertation, we focus on two fairness characteristics of management control
mechanisms design, which are participation and formality, specifically with respect to goal
setting and performance evaluation processes. First, participation can be understood as an

47
expression of voice in the management context (Langevin & Mendoza, 2013). Hartmann and
Slapničar (2012, p. 21) argue that “voice is a central process variable” because it “establishes
a feeling of being valued as an equal organizational member”. Following Anthony and
Govindarajan (2007, p. 10) participation points to the “involvement of employees in and their
influence over” the family business decisions.
Second, formality means to have explicit, objective and quantitative targets and
measures respectively for goal setting and performance evaluation (Hartmann & Slapničar,
2009, 2012). It is different from informal performance evaluation systems that are designed
with implicit and qualitative criteria and which are characterized by a high level of subjectivity
(Hartmann & Slapničar, 2009).
In the context of family business, Lansberg (1989) was one of the first authors to bring
the discussion of justice to the family business field (Van der Heyden, Blondel, & Carlock,
2005). These authors recognized the concept of justice as a messy and complicated subject
especially in family firms due to the existence of many systems (family, business, and
ownership). These issues may be more complex, due to the characteristics of the family
business, the business system and the family system, which certainly tends to influence a firm’s
processes.
We explore this discussion of management control mechanisms fairness design in
papers 1 and 2. In paper 1, we study the controlling family’s ability and willingness influence
on the design of those management control mechanisms. In paper 2, we combine the
management control mechanisms’ fair design and procedural justice in family firms with the
stewardship theoretical lens. In this sense, we propose that those design characteristics in goal
setting and performance evaluation, mediated by procedural justice perceptions, can be
interpreted as stewardship situational mechanisms in family firms.
2.4. A review of family firms’ literature in Brazilian journals
We developed a bibliographic survey to identify previous research that has been settled
in the context of family firms in Brazil, which has discussed one of the following keywords: (i)
governance mechanisms and management control systems, (ii) stewardship, (iii)
socioemotional wealth, (iv) procedural justice, (v) and performance or familiness. We focus on
the Brazilian journals that are listed in the SPELL (Scientific Periodicals Electronic Library)
Brazilian database. Our goal is to provide a big picture about our contribution to the Brazilian
research community since our theoretical models, hypotheses and discussions are supported

48
mainly by international publications in family business and management accounting top
journals.
We searched the SPELL database for journal articles published in Portuguese between
January 2007 to the end of December 2016 (10-year period) using the following search
expressions in abstract or keywords (“family business*”) AND one of those presented in Table
4. We target journals from the general business and accounting literature.
Table 4 shows that 144 papers were published within the ‘family firm’ expression during
this 10-year period of which 20 (twenty) contain the terms related to management control
mechanisms, 3 (three) to stewardship, 1 (one) to Socioemotional wealth and 8 (eight) to
familiness. Looking at the terms in the general management literature, we identified 2 (two)
studies that discussed stewardship, 7 (seven) for procedural justice and 1 (one) for familiness.
Some of these studies were also identified in the family firm literature. In total, we present the
results of 39 papers from which 3 were classified in more than one topic.
Table 4
Summary of papers and constructs from our bibliographical survey in Brazilian journals
Id Keywords (English) Keywords (Portuguese) Papers published
1 Family firm or family firms Empresa familiar ou Empresas familiares ou Controle familiar ou Indústrias familiares ou Gestão familiar ou Organização familiar
144
2
(1) AND governance mechanisms or management control systems or management control or management accounting
Mecanismos de gestão ou Mecanismos de governança ou Sistemas de controle gerencial ou Controle gerencial ou Contabilidade gerencial ou Práticas gerenciais ou Práticas de gestão ou Controladoria
20
3 (1) AND stewardship Stewardship* ou teoria da agência ou problemas de agência ou custos de agência
3
4 (1) AND socioemotional wealth Riqueza socioemocional ou SEW ou socioemotional wealth
1
5 (1) AND procedural justice or procedural fairness
Justiça processual ou justiça organizacional 0
6 (1) AND performance or familiness
Desempenho ou Familiness* ou Visão baseada em recursos ou RBV
8
7 Stewardship Stewardship* 2
8 Procedural justice or procedural fairness
Justiça processual 7
9 Performance or familiness Familiness* 1
* No translation to Portuguese.
The number of papers published is similar in each year. Table 5 shows that in 2009,
2010, and 2011 there is a prevalence of studies about management control mechanisms in
family firms. In addition, in 2015 and 2016 there is a concentration of studies about procedural
justice in organizations in general.
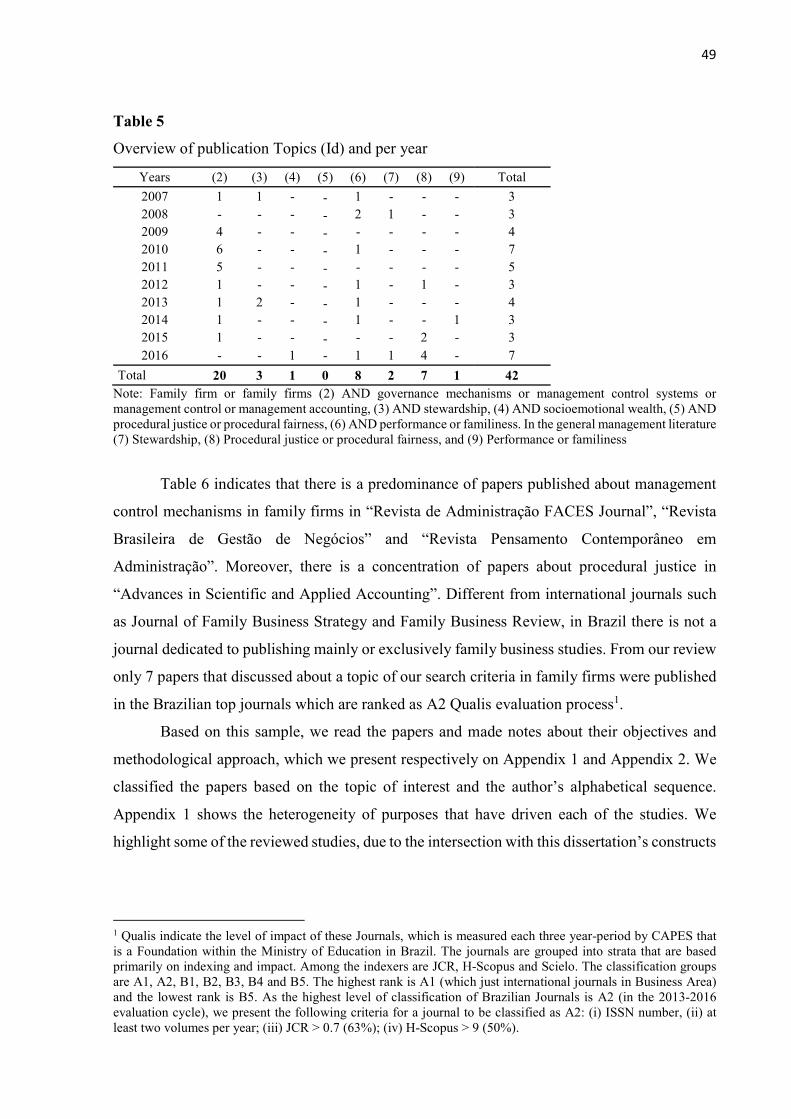
49
Table 5
Overview of publication Topics (Id) and per year
Years (2) (3) (4) (5) (6) (7) (8) (9) Total
2007 1 1 - - 1 - - - 3 2008 - - - - 2 1 - - 3 2009 4 - - - - - - - 4 2010 6 - - - 1 - - - 7 2011 5 - - - - - - - 5 2012 1 - - - 1 - 1 - 3 2013 1 2 - - 1 - - - 4 2014 1 - - - 1 - - 1 3 2015 1 - - - - - 2 - 3 2016 - - 1 - 1 1 4 - 7
Total 20 3 1 0 8 2 7 1 42 Note: Family firm or family firms (2) AND governance mechanisms or management control systems or management control or management accounting, (3) AND stewardship, (4) AND socioemotional wealth, (5) AND procedural justice or procedural fairness, (6) AND performance or familiness. In the general management literature (7) Stewardship, (8) Procedural justice or procedural fairness, and (9) Performance or familiness
Table 6 indicates that there is a predominance of papers published about management
control mechanisms in family firms in “Revista de Administração FACES Journal”, “Revista
Brasileira de Gestão de Negócios” and “Revista Pensamento Contemporâneo em
Administração”. Moreover, there is a concentration of papers about procedural justice in
“Advances in Scientific and Applied Accounting”. Different from international journals such
as Journal of Family Business Strategy and Family Business Review, in Brazil there is not a
journal dedicated to publishing mainly or exclusively family business studies. From our review
only 7 papers that discussed about a topic of our search criteria in family firms were published
in the Brazilian top journals which are ranked as A2 Qualis evaluation process1.
Based on this sample, we read the papers and made notes about their objectives and
methodological approach, which we present respectively on Appendix 1 and Appendix 2. We
classified the papers based on the topic of interest and the author’s alphabetical sequence.
Appendix 1 shows the heterogeneity of purposes that have driven each of the studies. We
highlight some of the reviewed studies, due to the intersection with this dissertation’s constructs
1 Qualis indicate the level of impact of these Journals, which is measured each three year-period by CAPES that is a Foundation within the Ministry of Education in Brazil. The journals are grouped into strata that are based primarily on indexing and impact. Among the indexers are JCR, H-Scopus and Scielo. The classification groups are A1, A2, B1, B2, B3, B4 and B5. The highest rank is A1 (which just international journals in Business Area) and the lowest rank is B5. As the highest level of classification of Brazilian Journals is A2 (in the 2013-2016 evaluation cycle), we present the following criteria for a journal to be classified as A2: (i) ISSN number, (ii) at least two volumes per year; (iii) JCR > 0.7 (63%); (iv) H-Scopus > 9 (50%).

50
and associations. We also present some considerations about the methodological approaches
applied by the reviewed studies on each topic.
Table 6
Overview of publication Topics (Id) and Journal Articles
Journals Qualis (2) (3) (4) (5) (6) (7) (8) (9) Total Revista Brasileira de Gestão de Negócios A2 2 - - - 1 - - - 3 Advances in Scientific and Applied Accounting A2 - - - - - - 2 - 2 Organizações & Sociedade A2 1 - - - 1 - - - 2 Revista de Administração A2 - - 1 - - 1 - - 2 Revista de Administração Contemporânea A2 - 1 - - - - 1 - 2 Revista de Contabilidade e Organizações A2 - - - - 1 - 1 - 2 Revista Contemporânea de Contabilidade A2 1 - - - - - - - 1 Contabilidade, Gestão e Governança B1 1 - - - 1 - - - 2 Revista de Negócios B1 1 1 - - - - - - 2 BASE - Revista de Administração e Contabilidade da UNISINOS
B1 1 - - - - - - - 1
Contextus - Revista Contemporânea de Economia e Gestão
B1 1 - - - - - - - 1
Enfoque Reflexão Contábil B1 - - - - - - 1 - 1 REAd. Revista Eletrônica de Administração B1 - - - - - - 1 - 1 Revista de Ciências da Administração B1 - 1 - - - - - - 1 Revista de Administração FACES Journal B2 3 - - - - 1 - - 4 Revista Pensamento Contemporâneo em Administração B2 1 - - - 1 - - 1 3 Gestão & Regionalidade B2 1 - - - - - - - 1 Revista Alcance B2 1 - - - - - - - 1 Revista Ciências Administrativas B2 1 - - - - - - - 1 Revista de Administração da Unimep B2 1 - - - - - - - 1 Revista da Micro e Pequena Empresa B2 1 - - - - - - - 1 Revista Eletrônica de Estratégia & Negócios B2 - - - - 1 - - - 1 Revista Gestão & Planejamento B2 1 - - - - - - - 1 Revista Gestão & Tecnologia B2 - - - - 1 - - - 1 Revista Organizações em Contexto B2 1 - - - - - - - 1 Revista Capital Científico - Eletrônica B3 - - - - - - 1 - 1 Revista de Estudos de Administração - 1 - - - 1 - - - 2 Total Geral 20 3 1 0 8 2 7 1 42
Note 1: Family firm or family firms (2) AND management control mechanisms or management control systems or management control or management accounting, (3) AND stewardship, (4) AND socioemotional wealth, (5) AND procedural justice or procedural fairness, (6) AND performance or familiness. In the general management literature (7) Stewardship, (8) Procedural justice or procedural fairness, and (9) Performance or familiness. Note 2. Qualis indicate the level of impact of these Journals, which is measured each three year-period by CAPES that is a Foundation within the Ministry of Education in Brazil.
2.4.1. Management control mechanisms in family firms
We selected five papers that discussed the role of formal mechanisms in family firms,
especially in the succession process. Müler and Beuren (2010) developed a survey with 12
(twelve) large Brazilian businesses and propose that the controllership practices exist in those
family firms, which are related to the beliefs and values of the controlling family. Mizumoto

51
and Machado Filho (2007) indicates that the adoption of corporate governance practices
allowed the studied firm to improve monitoring and management, which support the pursuance
of the organization’s strategies. Additionally, these authors show that those management
control mechanisms avoided adverse effects related to the controlling family’s influence in the
firm, such as entrenchment.
Leal and Botinha (2013) suggest the importance of the controller to the succession
process regarding information flows and strategy formulation. These authors developed a case
study with a large Brazilian firm and interviewed family and nonfamily managers. In addition,
Oliveira, Albuquerque, and Pereira (2012) investigated a long-running family firm that is
public-listed on the Brazilian Stock Exchange (Bovespa). Oliveira et al. (2012) discuss the
implications of adopting a formal governance structure while entering in Level 1 corporate
governance index of BM&F Bovespa2 had for the firm, for better defining the agent’s and
principal’s roles as well as defining clear succession rules. Finally, Oliveira, Álvares, Pinheiro,
and Pimentel (2011), based on a case study in a large Brazilian family firm, suggest that the
complexity of the family dimension and the controlling family’s influence on the business can
be diminished by the implementation of formal governance mechanisms and succession
policies. In sum, these studies agree that formal governance practices support a family firm to
be sustainable in the long-term.
From the studies that investigated governance and management mechanisms in family
firms (topic 2), 15 applied a qualitative approach (mainly case studies) while 4 applied a survey
design. From the studies that applied a survey, the sample size ranged from 12 to 13 firms
focusing on a heterogeneous sample of small, medium and large firms (Beuren, Fachini, &
Nascimento, 2010; Theodoro & Beuren, 2010) and on a sample of large firms (Beuren &
Muller, 2010; Muller & Beuren, 2010). These studies target managers from accounting area as
the study informants and developed descriptive analyses. By the other hand, the qualitative
studies about governance and management mechanisms in family firms focused mainly on large
businesses, conducted interviews with top managers and developed discourse or content
analysis as the main analytical approach.
2 São Paulo Stock, Mercantile & Futures Exchange (BM&F Bovespa). Recently, after a merger between BM&F BOVESPA and Cetip, it is named B3 (http://www.bmfbovespa.com.br/en_us/about/about-bm-fbovespa/who-we-are/).
52
2.4.2. Stewardship in family firms
With regards to topic 3 (stewardship), we highlight two studies. Pinto and Leal (2013)
investigated the association between ownership concentration and manager’s compensation, by
developing a quantitative approach based on archival data with a sample of 315 large firms.
Machado, Grzybovski, Teixeira, and Silva (2013) studied the role of governance structure in
avoiding agency problems in a small family firm. Machado et al. (2013) propose that the
governance model emphasized by the literature (especially for large firms) is different from
those applied to small family firms. In small businesses, there is more informal governance
regarding information sharing and less formal mechanisms.
2.4.3. Socioemotional wealth
We identified just one study that discusses socioemotional wealth (topic 4), which
reviews the literature and proposes avenues for future research (Kalm & Gomez-Mejia, 2016).
Kalm and Gomez-Mejia (2016) present the Socioemotional wealth theoretical background and
points to its influence on strategic decisions and organizational governance in family firms,
which are in line with Gomez-Mejia et al. (2011).
2.4.4. Familiness
We highlight three studies from the eight studies that were classified in the familiness
topic. From the three studies, two of them indicate the resource-based view as their theoretical
lens (Filardi, Freitas, Pinto, & Silveira, 2012; Nóbrega & Hoffman, 2014). Filardi et al. (2012),
based on a case study developed with a medium family firm that operates as a distributor of
veterinary products, argues that by investing in resources and capabilities the firm achieved
superior performance among its competitors. Nóbrega and Hoffmann (2014) discuss the
relationship between the family firm’s internal resources and entrepreneurial orientation based
on a case study developed with a small family firm. The other studies that employ a qualitative
methodological approach did not discuss the familiness construct.
Finally, Peixoto and Buttini (2013) used a longitudinal archival data from a sample of
246 large and public-listed Brazilian firms (family and nonfamily firms). They concentrated on
the association of family involvement in ownership and firm’s value and performance, and they
show that higher the level of ownership concentration, lower was the firms’ performance.

53
2.4.5. Procedural justice
Finally, we identified studies in the general management literature that investigates
procedural justice. All the seven studies identified employed a survey design and focused on
managers mainly from large firms, which sample range from 26 to 119 respondents. This larger
sample was obtained with an individual organization consisting of a single entity survey.
From these studies, we highlight Beuren et al. (2016) that shows the association between
Management Control Systems fairness dimensions, such as controllability and the use of
multiple performance indicators, and manager’s fairness perceptions regarding distributive and
procedural justice. These authors also indicate that procedural justice and interactional justice
are positively associated with manager’s commitment. Beuren et al. (2016) developed a survey
with managers from large firms in Brazil.
2.4.6. Summary of the findings from the review of the literature in Brazil
Based on this review, we suggest that there is a lack of studies that employ a quantitative
perspective in Brazil, regarding the discussion of the association between the controlling
family’s influence and the design of management control mechanisms in family firms.
Additionally, we show that stewardship and socioemotional wealth frameworks have not been
widely studied in Brazil. Particularly, we argue that stewardship theoretical lens and its
constructs have not been studied in the context of Brazilian family firms. In addition, we show
that socioemotional wealth has not received an empirical treatment by prior Brazilian family
firm literature.
Despite of familiness being the second most researched term from our review, we
highlight that the studies have not addressed the association of family’s influence on the firms’
performance except for Peixoto and Buttini (2013) that focused on family and nonfamily
public-listed firms. Based on the procedural justice literature we argue that the studies did not
yet discuss about formal and participative management control mechanisms’ fairness
dimensions and did not focused exclusively in manager’s perceptions in the family firm setting.
Therefore, by looking at the consequences of procedural justice, prior literature in Brazil has
not addressed yet the association between procedural justice and stewardship.

54

55
3. METHODOLOGY
3.1. Sample Selection
To achieve the objectives of this study, we administered a survey mailed to Brazilian
family firms. This method has been applied previously by family businesses researchers, as
suggested for example by Hair and Sarstedt (2014) and Wilson et al. (2014). We employed a
survey in this study in order to collect information about the constructs. Additionally,
specifically for paper 3, we combine the survey results with archival data on family firm’s
financial performance.
We use an ex-ante criterion based on the firm’s legal form and industry, from which we
eliminate NGO (Non-governmental organizations) and financial institutions. However, we did
not use proxies to target family firms for our survey because our database did not have reliable
information about family ownership or family involvement in the top management team, which
are usually considered operational definitions commonly applied in the family firms’ field. Our
focus was on medium and large-sized privately held family businesses observed in the database
named EMIS® (Emerging Market)3. In Brazil, depending on the reference used, the firm size
classification includes total operating revenue or the number of employees. As we did not have
the updated information about the number of employees’ before starting the survey, we limited
our population based on the total operating revenue information. In the current database, we
had 2,953 firms that could be potentially considered as Brazilian family businesses. Those firms
also have at least one available email address.
In sum, to get to this population of 2,953 firms, we have kept in the database firms that:
(1) were privately held, (2) had a total operating revenue superior than 20 million BRL4
(Brazilian Currency) in 2015, (3) had an operational status, (4) and had Limited Liability
Company and Public Limited Company Legal Forms. We additionally excluded publicly
companies, banks, cooperatives, associations, and partly state-owned companies.
Furthermore, we added email contacts from those firms that participated in the previous
surveys that were developed by a research group at the University of Sao Paulo (Brazil), which
firms were mostly in the IS EMIS® database, totalizing approximately additional 250 contacts.
3 EMIS database website (https://www.emis.com/who-we-are). EMIS operates in and reports on countries where high reward goes hand-in-hand with high risk. We bring you time-sensitive, hard-to-get, relevant news, research and analytical data, peer comparisons and more for over 125 countries emerging markets. 4 In 16th September 2017, US$ 1 was equivalent to BRL 3.125.

56
However, when we sent the emails, we realized that some of these contacts were not updated
and did not get to the potential respondent's mailbox.
In total, we sent 2,279 emails of which we obtained 152 valid questionnaires (response
rate of 6.67%). In these questionnaires, the respondents filled out practically all the questions,
with exception to one or other assertive. For those cases, we applied the mean replacement
procedure in our analyses, which consists of replacing the missing for the mean score of the
specific variable (Parwoll & Wagner, 2012).
Due to the specific purposes of each paper and the limitations of data availability, we used
different samples and subsamples of the population of responding firms to the survey in the
analyses of Papers 1, 2 and 3. We summarize the papers’ information, samples, and subsamples
in Figure 3.
Paper title Samples Subsamples Paper 1: Family’s influence and the design of management control mechanisms in family firms
n=152 (complete sample) n=120 (after excluding listed firms, firms with less than 50 employees and family ownership lower than 50%)
-
Paper 2: Management control mechanisms’ fair design and procedural justice as antecedents of stewardship in family firms
n=152 (complete sample) n=120 (after excluding listed firms, firms with less than 50 employees and family ownership lower than 50%)
n= 99 (nonfamily managers) n= 53 (family managers and founders) n= 36 (family managers)
Paper 3: Family involvement in management and family firm’s performance: the moderating role of stewardship-oriented culture
n=59 (after keeping firms with financial information in 2016 and excluding firms with negative equity in 2016 and extreme values of Return on Sales and total assets)
-
Figure 3. Papers, samples and subsamples information
In paper 1, we discuss the relationship between the controlling family’s ability and
willingness and the design of management control mechanisms. We conducted the analyses
with the full sample of 152 respondents and with a sample of 120 respondents, after excluding
firms that were listed firms (5 firms), that had less than 50 employees (18 firms), and had family
ownership lower than 50% (11 firms). It is important to mention that two public listed firms
had family ownership lower than 50%.
In paper 2, we investigate the association between management control mechanisms’ fair
design, procedural justice and stewardship (both organizational and individual levels). First, we
developed the analyses for a sample of 152 and for a sample of 120 respondents (as commented
in paper 1). Thereafter, we focused on the analyses about the respondents’ family affiliation
based on the subsamples of (i) nonfamily managers (n=99), (ii) family managers and founders

57
(n=53) (iii) and family managers (n=36). These subsamples were selected out of the 152
respondents’ sample.
In paper 3, we explore familiness and stewardship in family firms and their association
with family firm performance. Due to confidentiality issues, some of the respondents did not
characterize the firm’s name. In addition, other firms did not have available financial
information in 2016. We could identify in EMIS® database 66 firms with financial information
in 2016. From those, we excluded firms that have negative equity (4 firms) and had an extreme
value of Return on Sales (2 firms) and total assets (1 firm). Therefore, we conducted the
analyses in paper 3, based on a sample of 59 family firms.
3.2. Data Collection Method
The data collection procedure follows the recommendations of the research method
design established in Dillman (2007). First, we applied a pre-test with two nonfamily managers,
one founder, and one heir from medium and large family businesses and one pre-test with a
Ph.D. student that investigate management control systems in family firms. As a result of the
pre-test, we made minor changes by adding labels to firm characterization questions such as
firm’s size. However, we did not change any of the constructs’ items after the pre-test. As a
validity procedure for the constructs, the questionnaire was translated into Portuguese and
adapted to a five-point Likert scale. Then we translated the questionnaire back into English and
compared it to the English original version to check for face validity of the items and constructs.
After the validation of the questionnaire, we sent the first email to invite the respondents
to participate, followed up by four reminders between September/2016 and February/2017. The
time between reminders varied from one week to two weeks or/and to one month. The emails
were not submitted for all contacts at the same time but divided in parcels during all this period.
To optimize the response rate, we used two websites for data collection that were
SurveyMonkey® and Qualtrics®. After the data collection, we tabulated the responses obtained
in Qualtrics® to the SurveyMonkey® website and downloaded the full database from
SurveyMonkey®.

58
3.3. Descriptive analyses about respondents
We present the comparison of our respondents and the population (EMIS database) in
Table 7, Table 8 and Table 9. By comparing the firm size, we can see that our sample comprises
a higher proportion of larger firms in terms of total operating revenue. If we look at the industry,
we will see that our sample includes a higher proportion of manufacturing firms and a lower
proportion of Professional, Scientific, and Technical Services while the other industries are
quite similar. Comparing the nationwide, we will see that, similar to the EMIS® database, the
concentration of firms are in the Southeast and South regions in Brazil especially in São Paulo,
Minas Gerais, Rio Grande do Sul, Santa Catarina and Paraná. We did not have a response from
firms situated in thirteen of the 27 Brazilian Federation Units. We also report below the
statistical significance of the representativeness of our sample in relation to the population
based on the z-statistic (between two proportions), which results lower than 1.96 indicate that
there is no statistical differences in the proportion of the sample and the population (EMIS®
database).
According to the z-statistics, our sample of respondents has, in relation to the
characteristics of the total population, a higher representation of large-sized companies, a higher
representation of family firms from Sao Paulo and Minas Gerais States, and also of
Manufacturing firms.
Table 7
Comparison of respondents versus EMIS database – Total Operating Revenue (BRL in 2015)
Total Operating Revenue Respondents Respondents Respondents
EMIS database (n=152) (n=120) (n=59)
(Brazilian currency - BRL, 2015) n % z-statistic n % n % n %
Up to 20 million 23 15.13% - 5 4.17% - - - -
Between 21 and 50 million 16 10.53% -5.51 15 12.50% 1 1.69% 934 31.63%
Between 51 and 100 million 11 7.24% -5.03 8 6.67% 4 6.78% 743 25.16%
Between 101 and 300 million 32 21.05% -2.51 28 23.33% 11 18.64% 905 30.65%
Between 301 and 500 million 25 16.45% 6.07 23 19.17% 14 23.73% 146 4.94%
Between 501 million and 1 billion 26 17.11% 7.24 24 20.00% 18 30.51% 124 4.20%
More than 1 billion 19 12.50% 5.66 17 14.17% 11 18.64% 101 3.42%
Total 152 120 59 2,953 Note 1: Z-statistic (values lower than 1.96 indicate that there is no statistical difference in the proportion of the sample and the population - EMIS database).

59
Table 8
Comparison of respondents versus EMIS database – States Federation
State Federation
Respondents Respondents Respondents EMIS database
(n=152) (n=120) (n=59)
n % z-statistic n % n % n %
Sao Paulo 40 26.32% -2.38 34 28.33% 18 30.51% 1057 35.79%
Minas Gerais 27 17.76% 3.25 19 15.83% 6 10.17% 284 9.62%
Rio Grande do Sul 19 12.50% 1.98 15 12.50% 11 18.64% 235 7.96%
Santa Catarina 15 9.87% 1.84 13 10.83% 7 11.86% 181 6.13%
Parana 13 8.55% 0.29 9 7.50% 4 6.78% 233 7.89%
Rio de Janeiro 8 5.26% -1.97 7 5.83% 4 6.78% 301 10.19%
Distrito Federal 8 5.26% 3.79 5 4.17% 3 5.08% 40 1.35%
Espirito Santo 4 2.63% -0.64 4 3.33% 3 5.08% 107 3.62%
Pernambuco 3 1.97% -0.61 3 2.50% 0 0.00% 83 2.81%
Mato Grosso do Sul 3 1.97% 2.2 3 2.50% 0 0.00% 16 0.54%
Ceara 2 1.32% -0.79 2 1.67% 2 3.39% 68 2.30%
Goias 2 1.32% -0.52 2 1.67% 0 0.00% 56 1.90%
Paraiba 1 0.66% -0.32 1 0.83% 0 0.00% 27 0.91%
Amazonas 1 0.66% - 0 0.00% 0 0.00% 35 1.19%
Bahia 0 0.00% - 0 0.00% 0 0.00% 80 2.71%
Mato Grosso 0 0.00% - 0 0.00% 0 0.00% 31 1.05%
Para 0 0.00% - 0 0.00% 0 0.00% 28 0.95%
Alagoas 0 0.00% - 0 0.00% 0 0.00% 23 0.78%
Maranhao 0 0.00% - 0 0.00% 0 0.00% 17 0.58%
Rio Grande do Norte 0 0.00% - 0 0.00% 0 0.00% 16 0.54%
Piaui 0 0.00% - 0 0.00% 0 0.00% 11 0.37%
Sergipe 0 0.00% - 0 0.00% 0 0.00% 10 0.34%
Tocantins 0 0.00% - 0 0.00% 0 0.00% 7 0.24%
Rondônia 0 0.00% - 0 0.00% 0 0.00% 6 0.20%
Amapa 0 0.00% - 0 0.00% 0 0.00% 1 0.03%
Roraima 0 0.00% - 0 0.00% 0 0.00% 0 0.00%
Acre 0 0.00% - 0 0.00% 0 0.00% 0 0.00%
Missing 6 3.95% - 3 2.50% 1 1.69% 0 0.00%
Total 152 120 59 2,953
Note 1: Z-statistic (values lower than 1.96 indicate that there is no statistical difference in the proportion of the sample and the population - EMIS database).

60
Table 9
Comparison of respondents versus EMIS database – Industry
Industry Respondents Respondents Respondents
EMIS database (n=152) (n=120) (n=59)
n % z-statistic n % n % n % Manufacturing 89 58.60% 4.01 78 65.00% 37 62.70% 1241 42.00% Retail Trade 17 11.20% 1.13 10 8.30% 6 10.20% 252 8.50% Wholesale Trade 10 6.60% -1.99 10 8.30% 4 6.80% 351 11.90% Transportation and Warehousing
7 4.60% -2.08 6 5.00% 2 3.40% 292 9.90%
Information 6 3.90% -2.15 5 4.20% 4 6.80% 141 4.80% Professional, Scientific, and Technical Services
9 5.90% -0.47 3 2.50% 0 0.00% 335 11.30%
Agriculture, Forestry, Fishing and Hunting
3 2.00% -1.66 2 1.70% 2 3.40% 145 4.90%
Others 11 7.20% 0.75 6 5.00% 4 6.80% 196 5.70% Total 152 120 59 2,953
Note 1: Some respondents did not identify the name of the firm, so we could not classify directly based on EMIS database. Therefore, we took in account their answer in the questionnaire about the firms’ industry, and we classified these firms based on the authors’ interpretation on that information. Note 2: Z-statistic (values lower than 1.96 indicate that there is no statistical difference in the proportion of the sample and the population - EMIS database).
3.4. Measurement of Constructs and Instruments
The questionnaire contains validated scales that were used in studies published in high-
quality journals in the family firm and management accounting literature. The instruments are
mainly based on a five-point Likert scale, which were partially adapted to fit this study’s
purposes and the Brazilian context.
We present the operationalization of the constructs in Figure 4. First, we apply objective
instruments for the controlling family ability to influence the family firm, which were used by
many previous researchers (Astrachan, Klein, & Smyrnios, 2002; Chrisman et al., 2012; Hauck,
Suess-Reyes, Beck, Prügl, & Frank, 2016; Vandekerkhof, Steijvers, Hendriks, & Voordeckers,
2015). We used two indicators for family involvement in management, one as the percentage
of family managers in the Top Management Team (pfamilyTMT) and the other being a dummy
variable measuring if a family member is the CEO of the family firm (familyCEO). We also
used a measure of family involvement in ownership (FIO) which was transformed as a dummy
variable indicating if the controlling family holds 100% of the family business shares or quotas.
We transformed the FIO items in a dummy variable due to the high ownership concentration in
our sample.
To capture the controlling family’s SEW intentions (Berrone et al., 2012), we use Frank
et al. (2016) instruments for Family Control and Influence (FCI) and Renewal of family bonds
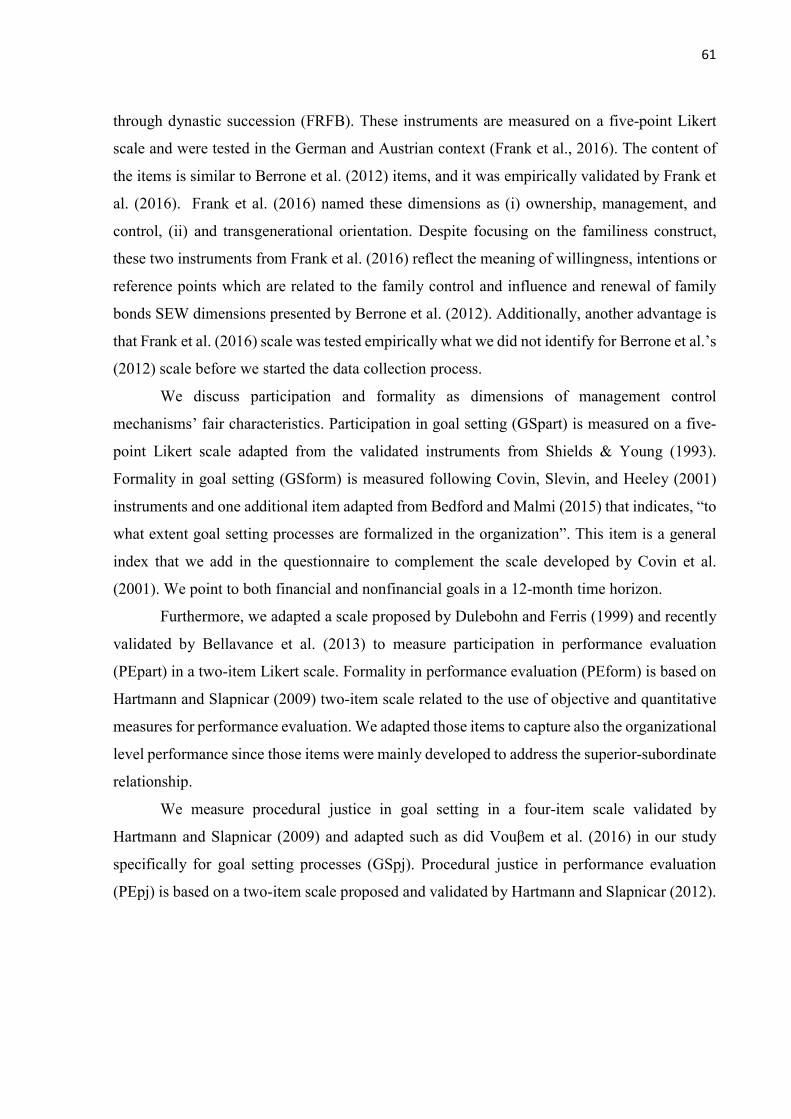
61
through dynastic succession (FRFB). These instruments are measured on a five-point Likert
scale and were tested in the German and Austrian context (Frank et al., 2016). The content of
the items is similar to Berrone et al. (2012) items, and it was empirically validated by Frank et
al. (2016). Frank et al. (2016) named these dimensions as (i) ownership, management, and
control, (ii) and transgenerational orientation. Despite focusing on the familiness construct,
these two instruments from Frank et al. (2016) reflect the meaning of willingness, intentions or
reference points which are related to the family control and influence and renewal of family
bonds SEW dimensions presented by Berrone et al. (2012). Additionally, another advantage is
that Frank et al. (2016) scale was tested empirically what we did not identify for Berrone et al.’s
(2012) scale before we started the data collection process.
We discuss participation and formality as dimensions of management control
mechanisms’ fair characteristics. Participation in goal setting (GSpart) is measured on a five-
point Likert scale adapted from the validated instruments from Shields & Young (1993).
Formality in goal setting (GSform) is measured following Covin, Slevin, and Heeley (2001)
instruments and one additional item adapted from Bedford and Malmi (2015) that indicates, “to
what extent goal setting processes are formalized in the organization”. This item is a general
index that we add in the questionnaire to complement the scale developed by Covin et al.
(2001). We point to both financial and nonfinancial goals in a 12-month time horizon.
Furthermore, we adapted a scale proposed by Dulebohn and Ferris (1999) and recently
validated by Bellavance et al. (2013) to measure participation in performance evaluation
(PEpart) in a two-item Likert scale. Formality in performance evaluation (PEform) is based on
Hartmann and Slapnicar (2009) two-item scale related to the use of objective and quantitative
measures for performance evaluation. We adapted those items to capture also the organizational
level performance since those items were mainly developed to address the superior-subordinate
relationship.
We measure procedural justice in goal setting in a four-item scale validated by
Hartmann and Slapnicar (2009) and adapted such as did Vouβem et al. (2016) in our study
specifically for goal setting processes (GSpj). Procedural justice in performance evaluation
(PEpj) is based on a two-item scale proposed and validated by Hartmann and Slapnicar (2012).

62
Family involvement in ownership (Chrisman, Chua, Pearson, & Barnett, 2012; Hauck, Suess-Reyes, Beck, Prügl, & Frank, 2016) FIO. Dummy variable 1 if the controlling family holds 100% of the business shares/quotas. Family involvement in management (Chrisman et al., 2012; Hauck et al., 2016) pfamilyTMT. Family involvement in management is measured as the percentage of family managers in the Top Management Team. FamilyCEO. Is the CEO from the controlling family? (dummy variable Yes=1 and No=0)
Family control and influence SEW intentions – Based on the scale of ownership, management and control developed and validated by Frank et al. (2016) Indicate the degree to which you personally agree or disagree with the following statements. Level of agreement with the statements (1 = I completely disagree and 5 = I completely agree): FCI_1. In the family business, great care is taken that only family members own the firm. FCI_2. In the family business, great care is taken that the firm’s management consists exclusively of family members. FCI_3. In the family business, great care is taken that several family members are involved in the firm’s management. FCI_4. In the family business, great care is taken that family control and independence are maintained. Renewall of family bonds through dynastic succession SEW intentions – Based on the scale of transgenerational orientation developed and validated by Frank et al. (2016) Indicate the degree to which you personally agree or disagree with the following statements. Level of agreement with the statements (1 = I completely disagree and 5 = I completely agree): FRFB_1. In the family business, great care is taken to think in generations. FRFB_2. In the family business, great care is taken to avoid selling the company to nonfamily members. FRFB_3. In the family business, great care is taken that the company can be passed on to the next generation. Management control mechanisms fairness characteristics Indicate the degree to which you personally agree or disagree with the following statements. Level of agreement with the statements (1 = I completely disagree and 5 = I completely agree): Participation (goal setting) - Adapted from Shields & Young (1993) GSpart_1. Manager's contribution is important to goal setting of the company. GSpart_2. In the company, it is important that goal setting includes changes that were suggested by managers. GSpart_3. In the company, managers are influential in goal setting. GSpart_4. Top management often initiates discussions about goals with managers. Formality (goal setting) - Adapted from Covin et al. (2001) GSform_1. Our goal setting nearly always result from extensive quantitative analysis of data. GSform_2. Our goal setting is nearly always detailed in formal written reports. GSform_3. We rely principally on experienced-based intuition (rather than quantitative analysis) when setting major goals. * GSform_4. To what extent are goal setting processes formalized in the organization? ** Participation (performance evaluation) - Dulebohn and Ferris (1999) applied by Bellavance et al. (2013) PEpart_1. The superior gives you the opportunity to ask questions about performance evaluation. PEpart_2. The superior considers your views when discussing performance evaluation. Formality (performance evaluation) - Adapted from Hartmann & Slapnicar (2009) PEform_1. When judging performance, my superior bases on objective information previously established. PEform_2. When judging performance, my superior expresses it in quantitative terms (evaluates performance based on quantitative criteria).
Figure 4. Constructs measures – after language changes in the questionnaire – Part I * Reverse coded item. ** This item was added to the model based on Bedford & Malmi (2015).

63
Procedural justice Indicate the degree to which you personally agree or disagree with the following statements. Level of agreement with the statements (1 = I completely disagree and 5 = I completely agree): Goal Setting - Developed and validated by Hartmann & Slapnicar (2009). Adapted from Voußem el al. (2016) GSpj_1. I think that the way in which goals were set is fair. GSpj_2. I have full confidence in the system with which goals were set. GSpj_3. I think that the criteria that were used to set goals are fair. GSpj_4. I am very satisfied with the way in which goals were set. Performance Evaluation - Adapted from Hartmann & Slapnicar (2012) PEpj_1. I think the way performance is evaluated is fair. PEpj_2. I have full confidence in the performance evaluation system. Stewardship-oriented culture (Developed and validated by Zahra et al. (2008) Indicate the degree to which you personally agree or disagree with the following statements. Level of agreement with the statements (1 = I completely disagree and 5 = I completely agree): STEW_1. Your company allows managers to reach their full potential contributing to the company. STEW_2. Your company promotes a professionally orientated workplace. STEW_3. Your company inspires managers' care and loyalty to the company STEW_4. Your company encourages a collectivist culture focused on business group rather than an individualistic culture. Stewardship Identification (Craig, Dibrell, & Neubaum, 2011) Indicate the extent to which this happens in your organization (1= Not at all; 5= Very high extent): STEWid_1. To what extent do you see yourself believing in the company's goals? STEWid_2. To what extent do you see yourself as an integral part of the company? STEWid_3. To what extent do you see yourself accepting company's goals?
Figure 4. Constructs measures – after language changes in the questionnaire – Part II * Reverse coded item.
Moreover, we capture stewardship-oriented culture (STEW) based on a 4-item
multidimensional scale from Zahra et al. (2008). This scale indicates “the degree to which a
stewardship culture exists within the family firm” (Zahra et al., 2008, p. 1042). These items
reflect the “extent to which the family firm developed a collective, supportive, and caring
environment for their employees, and provided opportunities for them to reach their potential”
(Zahra et al., 2008, p. 1043). We also capture the managers’ stewardship identification
(STEWid) that is an individual level measure based on a three-item scale developed and tested
by Craig et al. (2011) that refers to what extent managers identify with the firm by “accepting
the organization’s mission, vision, and objectives” (Davis, Schoorman, & Donaldson, 1997, p.
29).
Finally, for firm financial performance we used three indicators that were widely used
in the family firm literature for the familiness-performance relationship that are (Garcia-Castro
& Aguilera, 2014; Minichilli, Corbetta, & MacMillan, 2010; Rutherford et al., 2008): (i) Return
on Assets (ROA); (ii) Return on Equity (ROE); (iii) Return on Sales (ROS). All these indicators
were obtained from the EMIS® database, which were measured as a percentage for 2016.
Return on Assets is measured as the ratio between the net operating income and total assets.
Return on Equity is measured as the ratio between the net operating income and equity. Return
on Sales is measured as the ratio between the net operating income and total sales. We
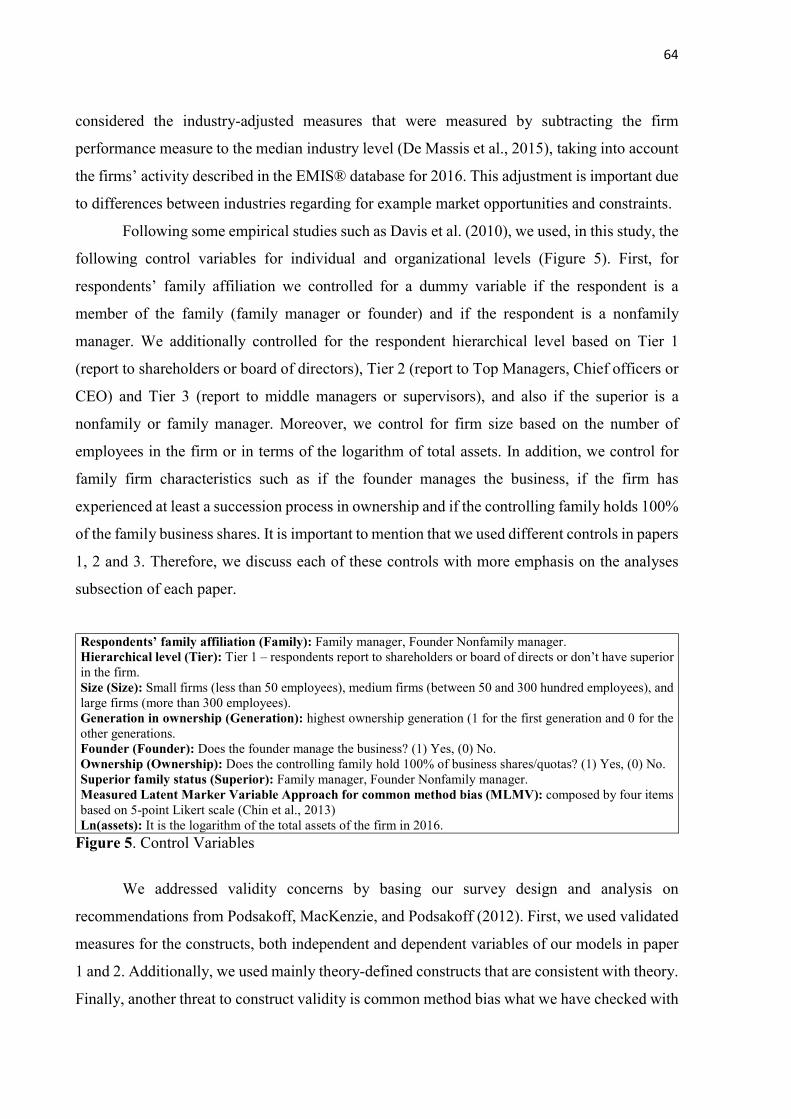
64
considered the industry-adjusted measures that were measured by subtracting the firm
performance measure to the median industry level (De Massis et al., 2015), taking into account
the firms’ activity described in the EMIS® database for 2016. This adjustment is important due
to differences between industries regarding for example market opportunities and constraints.
Following some empirical studies such as Davis et al. (2010), we used, in this study, the
following control variables for individual and organizational levels (Figure 5). First, for
respondents’ family affiliation we controlled for a dummy variable if the respondent is a
member of the family (family manager or founder) and if the respondent is a nonfamily
manager. We additionally controlled for the respondent hierarchical level based on Tier 1
(report to shareholders or board of directors), Tier 2 (report to Top Managers, Chief officers or
CEO) and Tier 3 (report to middle managers or supervisors), and also if the superior is a
nonfamily or family manager. Moreover, we control for firm size based on the number of
employees in the firm or in terms of the logarithm of total assets. In addition, we control for
family firm characteristics such as if the founder manages the business, if the firm has
experienced at least a succession process in ownership and if the controlling family holds 100%
of the family business shares. It is important to mention that we used different controls in papers
1, 2 and 3. Therefore, we discuss each of these controls with more emphasis on the analyses
subsection of each paper.
Respondents’ family affiliation (Family): Family manager, Founder Nonfamily manager. Hierarchical level (Tier): Tier 1 – respondents report to shareholders or board of directs or don’t have superior in the firm. Size (Size): Small firms (less than 50 employees), medium firms (between 50 and 300 hundred employees), and large firms (more than 300 employees). Generation in ownership (Generation): highest ownership generation (1 for the first generation and 0 for the other generations. Founder (Founder): Does the founder manage the business? (1) Yes, (0) No. Ownership (Ownership): Does the controlling family hold 100% of business shares/quotas? (1) Yes, (0) No. Superior family status (Superior): Family manager, Founder Nonfamily manager. Measured Latent Marker Variable Approach for common method bias (MLMV): composed by four items based on 5-point Likert scale (Chin et al., 2013) Ln(assets): It is the logarithm of the total assets of the firm in 2016.
Figure 5. Control Variables
We addressed validity concerns by basing our survey design and analysis on
recommendations from Podsakoff, MacKenzie, and Podsakoff (2012). First, we used validated
measures for the constructs, both independent and dependent variables of our models in paper
1 and 2. Additionally, we used mainly theory-defined constructs that are consistent with theory.
Finally, another threat to construct validity is common method bias what we have checked with

65
Harman test. We also address this concern by applying a procedure called “the measured latent
marker variable approach” (Chin et al., 2013) where we add a control variable that doesn’t
relate to the items in the proposed model (Chin et al., 2013; Mahama & Cheng, 2013; Nitzl,
2016).
We first conducted Harman’s single factor test to address for common method bias
(Podsakoff, MacKenzie, et al., 2012) for the 152 respondents’ sample. In paper 1, we obtained
five factors with an eigenvalue higher than one, which the first factor accounts for 25.87% of
the variance. The results for the sample of 120 respondents are quite similar, in which six factors
are extracted and the first factor accounts for 26.02% of the total variance. Based on these
results, it seems that common method bias might not be a concern in paper 1.
In paper 2, we obtained five factors with an eigenvalue higher than one, accounting for
77.99% of the variance. The first factor accounts for 50.95% of the items variance. The results
for the sample of 120 respondents indicate to the extraction of five factors with eigenvalues
higher than one, which the first represents 52.17% of the items variance. The results for paper
2 indicate that our results might suffer from common method bias, since the first factor accounts
for more than 50% of the items’ variance. We attribute this result to the subjective measures
that were used in paper 2, such as for procedural justice and stewardship identification. To
address potential common method bias problem, we adopted the latent marker variable
approach (Chin et al., 2013), which we explain in the sequence.
Therefore, we controlled the dependent variables for the latent marker variable approach
(Chin et al., 2013). This latent variable is expected to be not correlated to our constructs. We
used four items based on Likert scale that is: (i) The businesses controlled by families represent
a significant part of the Brazilian economy; (ii) The businesses controlled by families cannot
afford the most advanced technologies; (iii) The activities of the businesses controlled by
families can be as globalized as the other types of firms; (iv) The hiring process of businesses
controlled by families involves greater risk than businesses that are not controlled by families.
To validate the MLMV measure, we run correlation analyses that demonstrate that the MLMV
items are not significantly correlated to the indicators that we use to measure our dependent
variables (Chin et al., 2013; Mahama & Cheng, 2013; Nitzl, 2016), which results are presented
in the measurement model subsection of papers 1 and 2.
We did not apply the Harman test or the latent marker variable approach (Chin et al.,
2013) for the third paper, since we use the cross-sectional survey information as independent
variables, and the financial performance data as dependent variable, which was obtained from

66
an archival source. Therefore, as we combine the survey and archival data we expect that
common method bias may not be a concern for paper 3. In addition, we rely on return indexes
available in EMIS® database, which are based on the financial information published by those
firms, to mitigate possible measurement errors that might be present on other sources.
3.5. Data Analyses Methods
In each of the individual studies further in this dissertation, we provide descriptive
statistics and apply the multivariate technique of Structural Equation Modeling (SEM-
SmartPLS) to test the theoretical model. This technique is appropriate regarding the complexity
of the constructs, relationships and the number of questionnaires we have obtained (Sarstedt,
Ringle, Smith, Reams, & Hair, 2014). The SEM technique has been used extensively in social
sciences, and in management accounting research (e.g., Hartmann & Slapničar, 2009; Nitzl,
2016).
We used the variance-based Structural Equation Modeling technique in SmartPLS
software because it has a number of advantages (Hair Jr., Hult, Ringle, & Sarstedt, 2013; Hair
Jr., Sarstedt, Ringle, & Gudergan, 2017; Nitzl, 2016): (i) it allows researchers to analyze
constructs that are both independent and dependent at the same time as FCI and FRFB in the
first paper and procedural justice in the second paper; (ii) it is possible to estimate reliably
complex models with fewer observations in comparison to regression analysis for example; (iii)
and does not impose the data distribution assumptions as in regression analysis and in our model
some items have a nonnormal distribution such as procedural justice and stewardship-oriented
culture (in paper 2).
We checked the post-hoc results in GPower 3.1.9.2 software5 to evaluate the application
of SmartPLS with our sample size as suggested by Nitzl (2016). We obtained a statistical power
higher than 0.8 (less than 20% type II error) for a minimum sample of 109 respondents, based
on the following parameters (Nitzl, 2016): (i) 5% significance level (type I error); (ii) detection
of medium relative effect (f2 higher than 0.15); (iii) and having 8 predictors in our model.
Specifically for paper 3, as we developed the analyses with a smaller sample size, we
obtained a statistical power higher than 0.8 (less than 20% type II error) for a minimum sample
of 52 respondents, based on the following parameters (Nitzl, 2016): (i) 5% significance level
5 http://www.gpower.hhu.de

67
(type I error); (ii) detection of strong relative effect (f2 higher than 0.35); (iii) and having 8
predictors in our model.
A more detailed information about the sample size and the parameters that we
mentioned before are presented in Table 10, based on Nitzl (2016, p. 26).
Table 10
Sample Size for a Statistical Power of 0.80
Number of predictors
Effect size
0.15 (medium) 0.35 (strong)
Significance level Significance level
0.01 0.05 0.10 0.01 0.05 0.10
1 82 55 43 37 25 20
2 98 65 54 45 31 25
3 109 77 62 51 36 29
4 114 85 69 55 40 32
5 127 92 75 59 43 35
6 135 98 80 63 46 38
7 142 103 85 67 49 41
8 148 109 90 70 52 43
9 154 114 94 73 54 45
10 160 118 98 76 57 47 Source: Adapted from Nitzl (2016, p. 26).
3.6. Family firms’ and respondents’ descriptive statistics
Table 11, Table 12 and Table 13 report the firms’ characteristics and Table 14 reports the
respondents’ descriptive information. We highlight in the sequence the statistics for the sample
of 152 respondents, but we also present the results of the 120 and 59 respondents’ samples.
First, the sample is composed mainly of large firms (about 63% have more than 300
employees)6 and of firms with higher family ownership. In about 71.7% of the firms, the
controlling family owns 100% of business shares or quotas. Additionally, we see a large
presence of family members as Chief Executive Officers or occupying a similar position (in
6 If we look at the European Commission criteria firms that have more than 250 employees are considered large firms (http://ec.europa.eu/growth/smes/business-friendly-environment/sme-definition_pt) The Brazilian firm size criteria is usually based on the revenue metrics from the Brazilian Investment Bank named as BNDES (“Banco Nacional de Desenvolvimento Econômico e Social”). This bank considers medium-sized firms those that have a revenue between 3.6 to 300 million reais per year and large firms those with a turnover of more than 300 million reais per year. Reais is the Brazilian currency.

68
78.3% of the firms) in the family business. Moreover, 53.9% of the firms from our sample still
have the founder managing the day-to-day business.
We provide evidence of a diversified composition of the Top Management Team ranging
from 100% composed of family managers to 0% of family managers present. Finally, a higher
proportion of family firms is owned by the first and second generation of the family. We can
see that about 50% of the firms do not have the first generation as owners of the family business
anymore, so these businesses have experienced at least one ownership succession process since
their foundation. In addition, looking at the firms’ age, we can see that just 13.8% are young
family businesses, which were founded less than 20 years ago.
Furthermore, we present some comparisons in relation to the family’s ability to control
the firm, regarding the percentage of family managers in the TMT, regarding family
involvement in ownership and family CEO. Additionally, in relation to family’s willingness we
discuss family control and influence and renewal of family bonds SEW sub-dimensions. We
ran Confirmatory Factor Analyses for the constructs of willingness in SmartPLS software, and
we present the results of the mean of standardized scores (for each of the samples) in Table 11,
Table 12 and Table 13. The interpretation of the associations in the samples is similar. Larger
firms seem to present lower levels of family involvement in the TMT, and proportionally more
dispersed ownership and less presence of a family manager as the CEO. If we look at
willingness, larger firms present less FCI and FRFB intentions, except for firms that have
between 500 and 1000 employees.
Additionally, family firms with 100% ownership in the controlling family’s hands, with
the founder managing the business and with a family manager as the CEO present higher levels
of family involvement in the TMT and family’s willingness. Finally, the results indicate that
when family managers are present in the TMT, the family involvement in ownership seems to
be higher, as well as the presence of family CEO and the family’s willingness to control the
firm. These results indicate that the dimensions of family ability and willingness seem to be
associated.

69
Table 11
Family businesses’ descriptive information – Sample 152 – Part I
Mean % FIM
Ownership FamilyCEO Mean FCI
Mean FRFB n % <100% 100% N Y
Panel A: Size (number of employees)
Less than 50 employees 18 11.8% 69.0% 3 15 2 16 0.331 0.100
Between 51 and 100 employees 9 5.9% 64.9% 1 8 0 9 0.243 0.022
Between 101 and 300 employees 29 19.1% 56.3% 5 24 3 26 0.070 0.003
Between 301 and 500 employees 18 11.8% 42.9% 4 14 3 15 -0.167 -0.062
Between 501 and 1000 employees 21 13.8% 37.8% 8 13 4 17 0.085 -0.211
More than 1000 employees 57 37.5% 32.3% 21 35 21 36 -0.150 0.065
Panel B: Controlling family ownership
Family owns up to 25% of the shares 6 3.9% 19.9% - - 3 3 -1.348 -1.571
Family owns more than 25% but up to 50% of the shares
4 2.6% 22.5% - - 2 2 -0.490 -0.511
Family owns more than 50% but less than 100% of the shares
32 21.1% 30.4% - - 9 23 -0.224 -0.070
Family owns 100% of the shares 109 71.7% 51.9% - - 18 91 0.164 0.117
Missing 1 0.7%
Panel C: Percentage of family members in the TMT
No family members 29 19.1% - 14 14 20 9 -0.502 -0.277
More than 0% and up to 25% 30 19.7% - 7 23 7 23 -0.390 -0.299
More than 25% and up to 50% 36 23.7% - 14 22 2 34 -0.022 -0.006
More than 50% but less than 100% 22 14.5% - 6 16 3 19 0.248 0.332
100,00% 29 19.1% - 1 28 0 29 0.636 0.264
Missing 6 3.9%
Panel D: Is the CEO from the controlling family?
Yes 119 78.3% 54.0% 28 91 - - 0.164 0.117
No 33 21.7% 11.8% 14 18 - - -0.410 -0.327
Panel E: Does(Do) the founder(s) manage(s) the business?
Yes 82 53.9% 53.1% 20 62 8 74 0.332 0.134
No 68 44.7% 36.0% 22 45 24 44 -0.362 -0.107
Missing 2 1.3% Note 1: FCI and FRFB are respectively family control and influence SEW intention and renewal of family bonds SEW intention. These values are the means that were obtained by applying the Confirmatory Factor Analyses for each construct. These scores are standardized having the mean 0 and standard deviation of 1.

70
Table 11
Family businesses’ descriptive information – Sample 152 – Part II
Mean % FIM
Ownership FamilyCEO Mean FCI
Mean FRFB n % <100% 100% N Y
Panel F: Family Generations - Ownership
First generation 43 28.3% 47.3% 15 28 7 36 -0.050 -0.314
First and Second generations 34 22.4% 45.5% 7 27 4 30 0.346 0.374
First, Second and Third generations 2 1.3% 40.0% 1 1 0 2 0.295 0.365
Second generation 31 20.4% 46.3% 8 23 8 23 -0.230 -0.186
Second and third generations 19 12.5% 36.8% 5 14 7 12 -0.235 -0.074
Third generation 15 9.9% 35.5% 3 11 6 9 0.102 0.390
Third and fourth generations 4 2.6% 56.3% 1 3 0 4 -0.442 -0.211
Fourth generation 3 2.0% 56.1% 2 1 1 2 0.370 0.510
Later than fourth generation 1 0.7% 66.7% 1 1 0.878 0.932
Panel G: Firm age
Between 0 and 20 years 21 13.8% 10.0% 5 15 4 17 0.387 -0.044
Between 21 and 40 years 37 24.3% 25.7% 9 28 9 28 0.035 0.019
Between 41 and 60 years 32 21.1% 34.4% 9 23 5 27 -0.130 -0.044
More than 61 years 49 32.2% 25.0% 16 33 14 35 -0.104 0.076
Missing 13 8.6% Note 1: FCI and FRFB are respectively family control and influence SEW intention and renewal of family bonds SEW intention. These values are the means that were obtained by applying the Confirmatory Factor Analyses for each construct. These scores are standardized having the mean 0 and standard deviation of 1.

71
Table 12
Family businesses’ descriptive information – Sample 120 – Part I
Mean % FIM
Ownership FamilyCEO Mean FCI
Mean FRFB n % <100% 100% N Y
Panel A: Size (number of employees)
Between 51 and 100 employees 8 6.7% 100.0% 0 8 0 8 0.234 0.037
Between 101 and 300 employees 25 20.8% 90.0% 1 24 1 24 0.284 0.240
Between 301 and 500 employees 16 13.3% 28.6% 2 14 3 13 -0.044 -0.085
Between 501 and 1000 employees 20 16.7% 25.0% 7 13 3 17 0.178 -0.155
More than 1000 employees 51 42.5% 37.5% 16 35 17 34 -0.232 -0.036
Panel B: Controlling family ownership
Family owns more than 50% but less than 100% of the shares
26 21.7% 11.1% - - 6 20 -0.211 -0.112
Family owns 100% of the shares 94 78.3% 58.8% - - 18 76 0.058 0.031
Panel C: Percentage of family members in the TMT
No family members 22 18.3% - 8 14 13 9 -0.371 -0.169
More than 0% and up to 25% 28 23.3% - 6 22 7 21 -0.444 -0.331
More than 25% and up to 50% 26 21.7% - 6 20 1 25 0.029 0.060
More than 50% but less than 100% 19 15.8% - 5 14 2 17 0.293 0.340
100,00% 21 17.5% - 1 20 0 21 0.592 0.096
Panel D: Is the CEO from the controlling family?
Yes 96 80.0% 70.0% 20 76 - - 0.172 0.085
No 24 20.0% 0.0% 6 18 - - -0.689 -0.339
Panel E: Does(Do) the founder(s) manage(s) the business?
Yes 58 48.3% 69.2% 10 48 4 54 0.391 0.190
No 60 50.0% 41.4% 16 44 19 41 -0.336 -0.121
Panel F: Family Generations - Ownership
First generation 28 23.3% 43.5% 8 20 4 24 0.069 -0.253
First and Second generations 28 23.3% 44.6% 4 24 3 25 0.354 0.353
First, Second and Third generations 2 1.7% 40.0% 1 1 0 2 0.391 0.352
Second generation 27 22.5% 44.0% 7 20 8 19 -0.416 -0.276
Second and third generations 16 13.3% 41.9% 2 14 4 12 0.025 -0.014
Third generation 14 11.7% 38.2% 3 11 5 9 0.129 0.298
Third and fourth generations 4 3.3% 56.3% 1 3 0 4 -0.524 -0.259
Fourth generation 1 0.8% 75.0% 0 1 0 1 -1.503 1.032 Note 1: FCI and FRFB are respectively family control and influence SEW intention and renewal of family bonds SEW intention. These values are the means that were obtained by applying the Confirmatory Factor Analyses for each construct. These scores are standardized having the mean 0 and standard deviation of 1.

72
Table 12
Family businesses’ descriptive information – Sample 120 – Part II
Mean % FIM
Ownership FamilyCEO Mean FCI
Mean FRFB n % <100% 100% N Y
Panel G: Firm age
Between 0 and 20 years 11 9.2% 36.7% 3 8 2 9 0.402 -0.170
Between 21 and 40 years 27 22.5% 43.5% 4 23 6 21 0.042 -0.037
Between 41 and 60 years 29 24.2% 47.6% 6 23 4 25 -0.086 0.021
More than 61 years 44 36.7% 37.1% 11 33 11 33 -0.133 0.005 Note 1: FCI and FRFB are respectively family control and influence SEW intention and renewal of family bonds SEW intention. These values are the means that were obtained by applying the Confirmatory Factor Analyses for each construct. These scores are standardized having the mean 0 and standard deviation of 1.

73
Table 13
Family businesses’ descriptive information – Sample 59 – Part I
Mean % FIM
Ownership FamilyCEO Mean FCI
Mean FRFB n % <100% 100% N Y
Panel A: Size (number of employees)
Between 101 and 300 employees 7 11.9% 71.4% 2 5 0 7 0.35 -0.68 Between 301 and 500 employees 9 15.3% 27.8% 2 7 2 7 -0.49 -0.12 Between 501 and 1000 employees 8 13.6% 40.0% 2 6 2 6 0.24 0.03 More than 1000 employees 35 59.3% 35.9% 13 21 9 26 0.00 0.16
Panel B: Controlling family ownership Family owns up to 25% of the shares 2 3.4% 47.2% - - 0 2 -0.15 -0.52 Family owns more than 25% but less than 50% of the shares
0 0.0% - - - - - - -
Family owns more than 50% but less than 100% of the shares
17 28.8% 31.1% - - 4 13 -0.08 0.08
Family owns 100% of the shares 39 66.1% 43.8% - - 8 31 0.05 -0.04
Missing 1 1.7% 0.0% - - 1 0 -0.30 1.18
Panel C: Percentage of family members in the TMT
No family members 11 18.6% - 3 7 8 3 -0.52 0.04 More than 0% and up to 25% 12 20.3% - 5 7 2 10 -0.50 -0.25 More than 25% and up to 50% 19 32.2% - 7 12 19 0.02 -0.06 More than 50% but less than 100% 9 15.2% - 4 5 2 7 0.70 0.29 100,00% 7 11.9% - 0 7 7 0.64 0.03 Missing 1 1.7% - 0 1 1 0 0.48 0.83
Panel D: Is the CEO from the controlling family? Yes 46 78.0% 46.6% 15 31 - - 0.13 -0.03 No 13 22.0% 12.1% 4 8 - - -0.47 0.11
Panel E: Does(Do) the founder(s) manage(s) the business? Yes 21 35.6% 48.7% 7 14 2 19 0.50 0.10 No 37 62.7% 34.6% 12 24 11 26 -0.24 0.01
Missing 1 1.7% 33.3% 0 1 0 1 -1.69 -2.52
Panel F: Family Generations - Ownership First generation 7 11.9% 41.6% 3 4 0 7 0.34 0.02 First and Second generations 10 17.0% 38.0% 4 6 1 9 -0.42 0.00 First, Second and Third generations 2 3.4% 40.0% 1 1 0 2 0.67 0.26 Second generation 15 25.4% 38.2% 7 8 3 12 -0.23 -0.45 Second and third generations 13 22.0% 38.2% 3 10 4 9 0.08 -0.04 Third generation 9 15.4% 35.7% 0 8 4 5 0.28 0.60 Third and fourth generations 2 3.4% 62.5% 0 2 0 2 -0.41 0.03
Fourth generation 1 1.7% 60.0% 1 0 1 0 1.24 1.18 Note 1: FCI and FRFB are respectively family control and influence SEW intention and renewal of family bonds SEW intention. These values are the means that were obtained by applying the Confirmatory Factor Analyses for each construct. These scores are standardized having the mean 0 and standard deviation of 1.
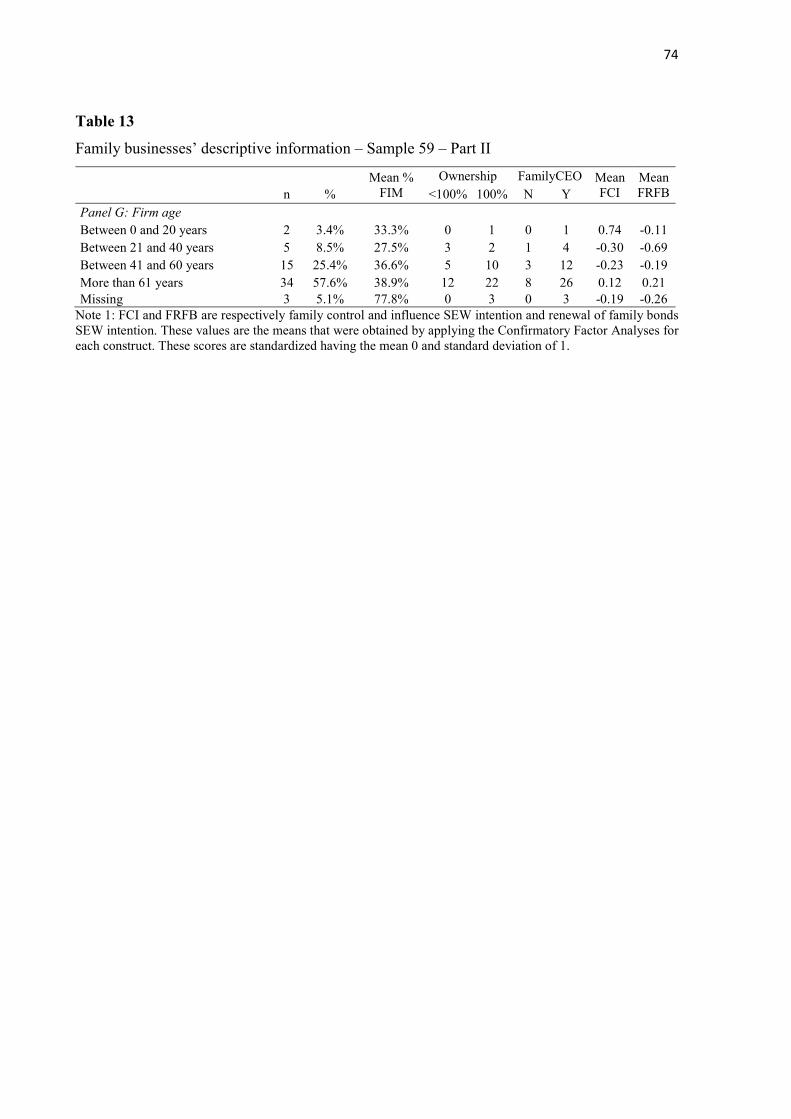
74
Table 13
Family businesses’ descriptive information – Sample 59 – Part II
Mean % FIM
Ownership FamilyCEO Mean FCI
Mean FRFB n % <100% 100% N Y
Panel G: Firm age Between 0 and 20 years 2 3.4% 33.3% 0 1 0 1 0.74 -0.11 Between 21 and 40 years 5 8.5% 27.5% 3 2 1 4 -0.30 -0.69 Between 41 and 60 years 15 25.4% 36.6% 5 10 3 12 -0.23 -0.19 More than 61 years 34 57.6% 38.9% 12 22 8 26 0.12 0.21 Missing 3 5.1% 77.8% 0 3 0 3 -0.19 -0.26
Note 1: FCI and FRFB are respectively family control and influence SEW intention and renewal of family bonds SEW intention. These values are the means that were obtained by applying the Confirmatory Factor Analyses for each construct. These scores are standardized having the mean 0 and standard deviation of 1.

75
We present the results of the respondent’s descriptive statistics in Table 14. We develop
the analyses based on the 152 respondents’ sample, but we report the results for the sample of
120 and 59 respondents in Table 14. Among the respondents, 65.1% are nonfamily managers,
23.7% family managers, and 11.2% founders. Moreover, the respondents are mainly from the
business, finance and accounting areas (46.1%), operations and engineering areas (16.5%), and
commercial and marketing areas (17.8%). It is relevant to mention that 15.1% of the
respondents are considered Chief Executive Officers.
From our respondents 49.3% report directly to shareholders and board of directors (Tier
1) and 47.4% report directly to the CEO or top managers (Tier 2). In sum, the respondents are
mostly nonfamily managers that occupy important positions in the firm hierarchy. Additionally,
54.0% of the respondents have been working for the family business for more than ten years.
Finally, 65.1% of the respondents report directly to a family manager while 34.9% report to a
nonfamily manager. Therefore, we argue that our respondents are experienced to answer the
questions in an organizational level perspective and about the controlling family ability and
willingness to influence the firm, independently of their family affiliation.
We additionally develop some analyses about the respondents’ descriptive statistics. The
respondents of our sample usually report directly to the founder or another family manager.
About 50% of nonfamily managers in our sample report to a family manager or the founder and
the other 50% to another nonfamily manager. Table 14 also shows that about 64 from 75
managers that are in Tier 1 report to a family manager while 35 from 72 managers that are in
Tier 2 report to a family manager, which demonstrates the large presence of family managers
in the hierarchical structure of these family firms.

76
Table 14
Respondents’ descriptive information
Sample 152 Sample 120 Sample 59
n % Report to
n % Report to
n % Report to
1 2 1 2 1 2 Panel A: Respondent’s family status Nonfamily manager 99 65.10% 51 48 83 69.20% 44 39 48 81.4% 23 25 Family manager 36 23.70% 2 34 27 22.50% 2 35 10 16.9% 0 10 Founder 17 11.20% 0 17 10 8.30% 0 10 1 1.7% 0 1
Panel B: Respondent’s business area Business, Finance, and Accounting
70 46.10% 30 40 53 44.20% 24 29 33 55.9% 15 18
Operations and engineering 25 16.50% 10 15 23 19.20% 10 13 6 10.2% 3 3
Commercial and Marketing 27 17.80% 8 19 22 18.30% 8 14 10 16.9% 4 6
Chief Executive Officer 23 15.10% 4 19 16 13.30% 3 13 7 11.9% 1 6 Others 5 3.30% 1 4 5 4.20% 1 4 3 5.1% 3 Missing 2 1.30% 0 2 1 0.80% 0 1
Panel C: Respondent’s hierarchical level Tier 1 75 49.30% 11 64 56 46.70% 10 46 28 47.5% 6 22 Tier 2 72 47.40% 37 35 59 49.20% 31 28 29 49.2% 16 13 Tier 3 5 3.30% 5 0 5 4.20% 5 0 2 3.4% 1 1
Panel D: Respondent’s Tenure Between 1 and 2 years 5 3.30% 3 2 3 2.50% 2 1 1 1.7% 1 0 Between 3 and 5 years 25 16.50% 12 13 21 17.50% 9 12 9 15.3% 5 4 Between 6 and 10 years 39 25.70% 17 22 26 19.20% 16 10 12 20.3% 5 7 More than 10 years 82 54.00% 21 61 70 57.50% 19 51 37 62.7% 12 25 Missing 1 0.70% 0 1 0
Panel E: Respondent's superior family status Nonfamily manager 53 34.90% - - 46 38.30% - - 23 39.0% - - Family manager or founder 99 65.10% - - 74 61.70% - - 36 61.0% - -
Note 1: Tier 1 (report to shareholders or board of directors), Tier 2 (report to Top Managers, Chief Officers or CEO) and Tier 3 (report to middle managers or supervisors). Note 2: Report to nonfamily manager (1), and report to a family manager (2)

77
4. STUDY 1: CONTROLLING FAMILY’S ABILITY AND WILLINGNESS AND THE
DESIGN OF MANAGEMENT CONTROL MECHANISMS IN FAMILY FIRMS
4.1. Introduction
It has frequently been observed by many researchers who investigate management
accounting topics in family businesses, that despite the importance of this issue for family firms
(Songini, Gnan, & Malmi, 2013) and the recent efforts made by management accounting
scholars, it is still an under developed field of research (Helsen, Lybaert, Steijvers, Orens, &
Dekker, 2017; Prencipe, Bar-Yosef, & Dekker, 2014; Songini et al., 2013).
Among the traditional studies about Management Control Systems (MCS), there is a
stream of research that investigates the determinants of the design and use of MCS. The
prevalent theories that have been widely used by management accounting researchers are the
agency theory (Jensen & Meckling, 1976), contingency theory (Burns & Stalker, 1961;
Chenhall, 2003), upper echelons theory (Hambrick & Mason, 1984), and organizational life-
cycle theory (Miller & Friesen, 1984). Those theories have also been applied in the family
business context, combined to family firms’ specific constructs (Moores & Mula, 2000; Songini
& Gnan, 2015; Songini et al., 2013).
Previous family firm literature has been investigating the implications of the distinctive
characteristics of family firms (Dawson & Mussolino, 2014), which arise typically by the
involvement of the controlling family in the firm, on management mechanisms design and use
(Songini et al., 2013), and on organizational behavior (Gagné, Sharma, & De Massis, 2014).
Family firm’s characteristics have been conceptually and empirically treated as contingency
factors that explain the design and use of management control mechanisms in family firms
(Chenhall, 2003; Helsen et al., 2017), which Songini, Vola, and Gnan (2017) named as family
contingencies.
There are different theoretical lenses to study a family’s influence on the firm that can
be combined with the theories used to discuss the determinants of MCS (Salvato & Moores,
2010; Senftlechner & Hiebl, 2015; Songini et al., 2017). Dawson and Mussolino (2014) present
three main theoretical frameworks for treating the family firm distinctiveness that are the
essence-approach (Astrachan, Klein, & Smyrnios, 2002; Chua, Chrisman, & Sharma, 1999),
the socioemotional wealth construct (Berrone et al., 2012; Debicki, Kellermanns, Chrisman,
Pearson, & Spencer, 2016; Gómez-Mejía, Haynes, Núñez-Nickel, Jacobson, & Moyano-

78
Fuentes, 2007) and familiness construct (Frank et al., 2016; Habbershon, Williams, &
MacMillan, 2003; Tagiuri & Davis, 1996).
Each of these approaches looks through a different lens at the family firm, regarding its
definitions, its dimensions, and level of analyses (Chrisman, Kellermanns, Chan, & Liano,
2010; Dawson & Mussolino, 2014). For example, the socioemotional wealth (SEW) literature
points that decisions in family firms are usually based on family’s noneconomic reference
points and affective endowments (Berrone et al., 2012; Gomez-Mejia, Cruz, Berrone, & De
Castro, 2011) while familiness looks at the family firm’s resources and capabilities, which are
expected to create competitive advantage (Chrisman, Chua, & Litz, 2003; Habbershon et al.,
2003).
Helsen et al. (2017) list a set of determinants used as proxies for family distinctive
characteristics that are expected to influence the choice of MCS in those firms such as: family
involvement in management and governance (Songini & Gnan, 2015; Speckbacher & Wentges,
2012), generational stage (Michiels, Voordeckers, Lybaert, & Steijvers, 2013), CEO family
status (Michiels et al., 2013), family manager status (Chua, Chrisman, & Bergiel, 2009), and
ownership dispersion (Michiels et al., 2013). These proxies all focus on a family’s ability to
influence the firm (De Massis, Kotlar, Chua, & Chrisman, 2014). Despite the family ability
being considered a necessary condition to capture the family influence on the business, it might
not be sufficient to capture family firm’s distinctiveness (Chua, Chrisman, & De Massis, 2015;
De Massis et al., 2014). In this sense, we argue that the relationship between the controlling
family influence and management accounting mechanisms might be more complex than
addressed in these previous studies.
Based on this reasoning, we propose in line with De Massis et al. (2014) and Chrisman
et al. (2015) that the controlling family willingness is a complementary element that should be
addressed by researchers. It refers to the controlling family’s intentions and goals towards the
family firm, which also influences how management control mechanisms are designed and used
(Berrone et al., 2012; De Massis et al., 2014; Gomez-Mejia et al., 2011). Previous literature
suggests that the socioemotional wealth framework (Berrone et al., 2012; Gomez-Mejia et al.,
2011) might constitute an important lens to capture the controlling family’s willingness in
family businesses (Chrisman et al., 2015; De Massis et al., 2014; Veider & Matzler, 2016).
Therefore, based on the ability and willingness literature (Chrisman et al., 2015; De
Massis et al., 2014), we combine (1) traditional agency theory insights that have been linked to
the controlling family’s ability, with (2) the controlling family’s willingness, which can be
linked to SEW, to discuss the influence of the controlling family’s ability and willingness on

79
the design of management control mechanisms. We propose the following research question:
How the controlling family’s ability and willingness are associated with the design of
management control mechanisms in family firms?
We investigated corporate management control mechanisms such as goal setting and
performance evaluation, which are focused on top managers. This study wants to make the
following contributions to the family firm and management accounting literature. First, prior
studies that have examined the family influence on management control mechanisms have been
grounded on the agency theory regarding the role of these mechanisms in organizations (Helsen
et al., 2017; Songini & Gnan, 2015; Speckbacher & Wentges, 2012). The underlying agency
assumption is that a family owned and family managed firm does not need agency mechanisms
related to monitoring and incentive systems since they do not face typical agency problems
(Jensen & Meckling, 1976; Madison, Holt, Kellermanns, & Ranft, 2016). However,
Management Control Systems (MCS) might not serve exclusively to monitoring and incentive
purposes. For instance, MCS can be adopted to balance the firm’s effectiveness and innovation
(Ahrens & Chapman, 2004; Kruis, Speklé, & Widener, 2016; Simons, 1995), discussed as the
duality of controls, which we highlight, for example, the enabling-coercive framework (Adler
& Borys, 1996; Ahrens & Chapman, 2004; Jordan & Messner, 2012). Those mechanisms are
used “for assisting the strategic process and ongoing management through analysis, planning,
measurement, control, rewarding, and broadly managing performance” (Ferreira & Otley,
2009, p. 264).
Hence, family firms can also use management control mechanisms to create a
professional environment (Dekker, Lybaert, Steijvers, Depaire, & Mercken, 2013; Dyer, 1989;
Stewart & Hitt, 2012). In addition, based on the family agency problems that family firms incur,
management control mechanisms might mitigate typical family firm agency problems (e.g.,
nepotism, entrenchment) and potential conflicts among family and nonfamily managers.
Formal management control mechanisms are also related to an increase of transparency and
knowledge sharing toward the organizational structure (Giovannoni, Maraghini, & Riccaboni,
2011; Zahra, Neubaum, & Larrañeta, 2007). The current literature in family firms that focused
on the family’s ability to influence management control mechanisms and on the agency
perspective might not provide explanations when we consider these additional roles of
management control mechanisms.
Therefore, we argue that the controlling family’s willingness might play a relevant role
in determining how management control mechanisms are designed in the firm (Berrone, Cruz,
& Gomez-Mejia, 2012; Songini, Gnan, & Malmi, 2013). The family willingness is a subjective

80
concept related to the controlling family’s intentions to influence the family business. These
intentions are seen by Gomez-Mejia et al. (2011) as reference points and decision premises for
decision-making, which impact the design of management practices (Berrone et al., 2012;
Helsen, Lybaert, Steijvers, Orens, & Dekker, 2017; Songini et al., 2013). We include a family’s
intentions in order to shed more light on the underlying drivers that shape the design of
management control mechanisms.
Second, we expand the discussion about the socioemotional wealth construct by treating
two independent controlling family’s intentions that are (1) family control and influence and
(2) renewal of family bonds through dynastic succession (Berrone et al., 2012). The SEW
framework is a recent development in the family firm literature and has been attracting more
interest of researchers since it has implications over many organizational topics (Berrone et al.,
2012; Songini et al., 2013). Additionally, considering the multidimensional nature of SEW
construct (Berrone et al., 2012; Chua, Chrisman, & De Massis, 2015; Debicki, Kellermanns,
Chrisman, Pearson, & Spencer, 2016; Gómez Mejía, Cruz, & Imperatore, 2014; Schulze &
Kellermanns, 2015), we discuss that the different SEW sub-dimensions have different
implications for management control mechanisms design.
Third, we discuss formality and participation design characteristics in the firm’s goal
setting and performance evaluation processes. Therefore, this study provides insights about the
adoption of participative and formal management control mechanisms, such as goal setting and
performance evaluation, in a family firm’s context (Dekker et al., 2013; Giovannoni et al., 2011;
Helsen et al., 2017; Songini & Gnan, 2015; Speckbacher & Wentges, 2012). Particularly, we
argue that family involvement in ownership influences management control mechanisms design
through (1) family control and influence and (2) dynastic succession intentions (Chrisman,
Chua, Pearson, & Barnett, 2012). It is relevant to investigate the design of management control
mechanisms in family firms since previous research indicates that differences in design and use
of management control mechanisms have a direct impact on managers' attitudes and behaviors
as well as on a family firm’s performance (González-Cruz & Cruz-Ros, 2016; Sciascia &
Mazzola, 2008).
Our results suggest that the level of family involvement in ownership is positively
related to the degree of a family’s intentions to control and influence the firm and to the renewal
of family bonds through dynastic succession. Additionally, we show that the controlling
family’s ability to influence the firm, captured by the family involvement in management and
the occupation of the CEO position was not validated empirically as a determinant of formal
and participative goal setting and performance evaluation, contradicting previous evidence in

81
the literature (e.g., Songini & Gnan, 2015; Speckbacher & Wentges, 2012). In contrast, we do
find that the elements related to a controlling family’s willingness to influence the family firm
are significantly associated with the design of these management control mechanisms.
Particularly, our results demonstrate that different dimensions of a family’s intentions
must be considered separately in research design as they each has a different influence on
management control mechanisms design in the family business (Chua et al., 2015; Gómez
Mejía et al., 2014). On one side, we find that higher family control and influence intention is
negatively associated with the level of formality and the level of participation in the goal setting
process, which implies a higher level of centralization of decisions made in the firm and less
transparency concerning the family firm’s goals. On the other side, our results provide evidence
that a family’s dynastic succession intentions are positively associated with more formal and
more participative goal setting and performance evaluation processes (Giovannoni et al., 2011;
Songini et al., 2013; Suess-Reyes, 2016; Zahra et al., 2007). These findings are also consistent
with the discussion of a restrictive and an extended SEW perspective (see Miller & Le Breton-
Miller, 2014), which has implications for priorities and outcomes in the family firm, such as
time horizons, strategic behaviours, management control and management arrangements,
among others (Kellermanns, Eddleston, & Zellweger, 2012; Miller & Le Breton-Miller, 2014).
The remainder of the paper is organized as follows. In Section 2 we present the
conceptual model and the hypotheses. In Section 3 we present the results and data analyses
regarding descriptive statistics and Structural Equation Modeling. In Section 4 we develop the
conclusions and highlight the limitations of this study.
4.2. Theoretical model and hypotheses
Our theoretical model addresses the claims of prior research (De Massis, Kotlar, Chua,
& Chrisman, 2014; Helsen et al., 2017; Songini et al., 2013) to consider both elements of ability
and willingness to explain family firm behavior and management processes. As is presented in
Figure 6 this paper examines the following relationships, based on six constructs.
The starting point of our model is that a family’s involvement in ownership is
considered a key measure that determines the controlling family’s ability to influence the family
business (Chrisman et al., 2012; De Massis et al., 2014). We examine ability regarding family
involvement in ownership and management while willingness is studied based on the SEW
intentions framework (Berrone et al., 2012; De Massis et al., 2014). We base our discussions
on two SEW reference points for decision-making (Chua et al., 2015) being family control and

82
influence over business decisions and renewal of family bonds through dynastic succession that
are present in the main theoretical frameworks (Berrone et al., 2012; Dawson & Mussolino,
2014; Frank, Kessler, Rusch, Suess-Reyes, & Weismeier-Sammer, 2016). We study both the
ability and willingness constructs since previous research has indicated that they both shape
family firm behavior and family firm processes (Chrisman et al., 2012; De Massis et al., 2014).
Figure 6. Theoretical research model – paper 1 Note 1: FIO (Family Involvement in Ownership), FCI (Family Control and Influence), FRFB (Renewal of Family Bonds), FIM (Family Involvement in Management). FIM is measured as (i) the percentage of family managers in the Top Management Team (pfamilyTMT) (ii) and if a family manager is the CEO of the firm (familyCEO). Note 2: The controlling family’s ability and willingness refer respectively to the family involvement constructs and the socioemotional wealth intentions.
Chua et al. (2015) suggest that the dimensions of socioemotional wealth can also be
treated independently (Berrone et al., 2012; Chua et al., 2015; Gomez-Mejia et al., 2011) since
each of these intentions should constitute a part of the socioemotional wealth construct. We
follow these arguments in our model.
Moreover, we discuss management control mechanisms design considering formality
and participation in both goal setting and performance evaluation. Previous management
accounting literature has highlighted the relevance of those mechanisms for the organization’s
Performance Measurement Systems (PMS) regarding planning and evaluating mechanisms
(Ferreira & Otley, 2009; Malmi & Brown, 2008; Merchant & Van der Stede, 2007; Otley,
1999). We define goal setting as the process by which managers define financial and
Family control and influence
Renewal of family bonds
through dynastic succession
Family involvement in
ownership
Formality- Goal setting;- Performance
evaluation
Participation- Goal setting;- Performance
evaluation
Management control mechanisms design
characteristics
Family involvement in management
Family’s willingness: Socioemotional wealth
intentions
Family’s ability
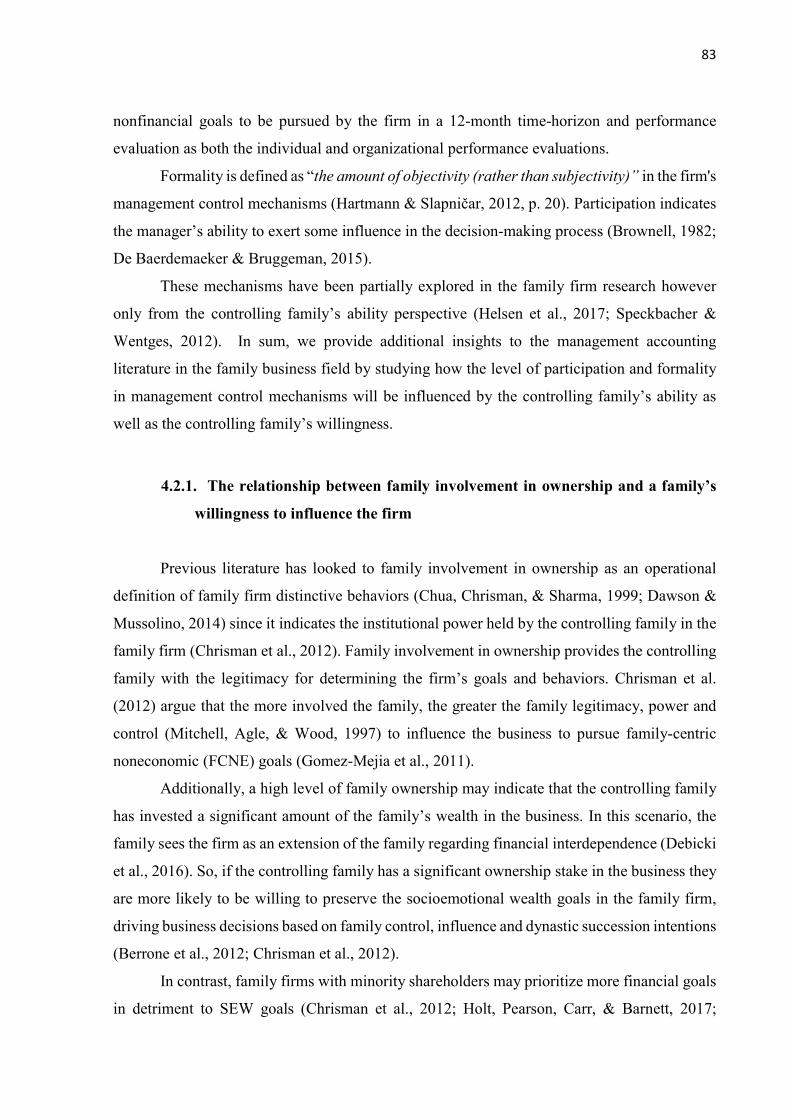
83
nonfinancial goals to be pursued by the firm in a 12-month time-horizon and performance
evaluation as both the individual and organizational performance evaluations.
Formality is defined as “the amount of objectivity (rather than subjectivity)” in the firm's
management control mechanisms (Hartmann & Slapničar, 2012, p. 20). Participation indicates
the manager’s ability to exert some influence in the decision-making process (Brownell, 1982;
De Baerdemaeker & Bruggeman, 2015).
These mechanisms have been partially explored in the family firm research however
only from the controlling family’s ability perspective (Helsen et al., 2017; Speckbacher &
Wentges, 2012). In sum, we provide additional insights to the management accounting
literature in the family business field by studying how the level of participation and formality
in management control mechanisms will be influenced by the controlling family’s ability as
well as the controlling family’s willingness.
4.2.1. The relationship between family involvement in ownership and a family’s
willingness to influence the firm
Previous literature has looked to family involvement in ownership as an operational
definition of family firm distinctive behaviors (Chua, Chrisman, & Sharma, 1999; Dawson &
Mussolino, 2014) since it indicates the institutional power held by the controlling family in the
family firm (Chrisman et al., 2012). Family involvement in ownership provides the controlling
family with the legitimacy for determining the firm’s goals and behaviors. Chrisman et al.
(2012) argue that the more involved the family, the greater the family legitimacy, power and
control (Mitchell, Agle, & Wood, 1997) to influence the business to pursue family-centric
noneconomic (FCNE) goals (Gomez-Mejia et al., 2011).
Additionally, a high level of family ownership may indicate that the controlling family
has invested a significant amount of the family’s wealth in the business. In this scenario, the
family sees the firm as an extension of the family regarding financial interdependence (Debicki
et al., 2016). So, if the controlling family has a significant ownership stake in the business they
are more likely to be willing to preserve the socioemotional wealth goals in the family firm,
driving business decisions based on family control, influence and dynastic succession intentions
(Berrone et al., 2012; Chrisman et al., 2012).
In contrast, family firms with minority shareholders may prioritize more financial goals
in detriment to SEW goals (Chrisman et al., 2012; Holt, Pearson, Carr, & Barnett, 2017;

84
Zellweger & Astrachan, 2008). Chrisman et al. (2012, p. 271) argue that “although minority
owners cannot necessarily block the goals desired by the dominant coalition, negotiation and
compromise will become more necessary, preventing the family with dominant ownership from
having absolute power to pursue FCNE goals”.
Therefore, we argue that family involvement in ownership provide family managers
with authority, power, and legitimacy that support their willingness to keep the family’s
autonomy and independence to establish the firm’s vision, strategies, and goals (Berrone et al.,
2012; Chrisman et al., 2012; De Massis et al., 2014). Hence, we hypothesize that:
H1: Family involvement in ownership is positively associated with family control and
influence SEW intention.
Additionally, a high level of family ownership might also be positively related to the
controlling family's intention to transfer the firm to the next generations. A high family
ownership has been related to family members’ psychological attachment to the firm (Chrisman
et al., 2012; Zellweger & Astrachan, 2008) and to the perception that the family firm is seen as
an extension of the family (Miller & Le Breton-Miller, 2014; Sundaramurthy & Kreiner, 2008).
The family’s and the firm’s financial and psychological interdependence (Chrisman et al., 2012;
Debicki et al., 2016; Gómez-Mejía, Haynes, Núñez-Nickel, Jacobson, & Moyano-Fuentes,
2007) might enhance the controlling family’s intention to pass the organization to future family
generations as a way to preserve the family’s heritage and to safeguard the family’s wealth
(Berrone et al., 2012; Jorissen, Laveren, Maneemai, & Voordeckers, 2016; Suess-Reyes, 2016).
Therefore, we propose that:
H2: Family involvement in ownership is positively associated with renewal of family
bonds through dynastic succession SEW intention.
4.2.2. The relationship between family control and influence intention SEW and
family involvement in management
We expect that when the family’s willingness to control and influence (FCI) the firm’s
decisions is high, the controlling family will be more likely to nominate family members to
occupy strategic management positions in the firm. We argue that in this scenario, family
managers will be appointed to occupy positions in the Top Management Team as well as the
CEO (Chief Executive Officer) position (Chrisman et al., 2012; Vandekerkhof, Steijvers,
Hendriks, & Voordeckers, 2015).

85
By keeping these positions in the family hands, they assure the controlling family’s
autonomy and power to control the family business goals and strategies (Berrone et al., 2012;
Mitchell et al., 1997). Specifically, the nomination of a family CEO is a central decision made
by the controlling family that prioritizes their control and autonomy in business decisions.
Therefore, by having multiple family managers in the TMT and also a family member as the
most powerful actor in the organization’s management structure, the family can mitigate the
risks associated with the loss of SEW (Hall & Nordqvist, 2008; Hambrick & Mason, 1984;
Kammerlander & Ganter, 2015; Vandekerkhof et al., 2015; Zellweger, Nason, Nordqvist, &
Brush, 2013).
In contrast, the presence of nonfamily managers in the Top Management Team as well
as a nonfamily CEO could be a threat to family members intentions to keep their authority and
dominance over business decisions (Gómez-Mejía et al., 2007; Songini et al., 2013;
Speckbacher & Wentges, 2012). Although in this scenario the controlling family could still
exert control by the board of directors and by indicating a nonfamily CEO aligned with their
interests, however, their autonomy and power over business decisions would become weaker
(Lardon, Deloof, & Jorissen, 2017). In fact, the controlling family would appoint outside CEO’s
when “they have reached a stage in which the family owners have become more tolerant
towards risk-taking” (Lardon et al., 2017, p. 30) that can be also seen in terms of socioemotional
wealth. Hence, we hypothesize that:
H3: Family control and influence SEW intention is positively associated with family
involvement in management.
4.2.3. The relationship between family involvement in management and
management control mechanisms design
The upper echelon literature studies the role that the powerful actors (e.g., managers in
the Top Management Teams) play in the organization about management practices and firm
behavior (Hambrick & Mason, 1984). In family firms, the TMT composition is an important
issue (Vandekerkhof et al., 2015) since managers behavioral assumptions have been grounded
on manager’s family affiliation (James, Jennings, & Jennings, 2017), which have implications
for the adoption of management control mechanisms in these firms (James et al., 2017;
Madison, Holt, Kellermanns, & Ranft, 2016; Madison, Kellermanns, & Munyon, 2017).
Prior literature indicates that there is no need to adopt agency mechanisms in family-
owned and family-managed firms (Cruz, Gomez-Mejia, & Becerra, 2010; Fama & Jensen,

86
1983; Jensen & Meckling, 1976; Madison et al., 2016). Principals’ concerns about agent
opportunism would be minimal, and the controlling family would be reluctant to incur in
unnecessary agency costs such as formal management control mechanisms, which are costly
mechanisms for organizations. The presence of family members in the TMT makes stronger
the family ties and control over the business which they exercise by informal communication
and social controls (Dekker et al., 2013; Hiebl, Duller, Feldbauer-Durstmüller, & Ulrich, 2015;
Moores & Mula, 2000; Speckbacher & Wentges, 2012). Speckbacher and Wentges (2012)
provide empirical evidence that family managed firms are more likely to seek informal
performance evaluation processes.
In contrast, we propose that the lesser the family involvement in management, the higher
will be the use of formalized mechanisms, such as goal setting and performance evaluation
(Hiebl et al., 2015; Speckbacher & Wentges, 2012). The presence of nonfamily managers in
the TMT can be seen as an incentive to adopt formal practices since nonfamily managers have
been expected to behave as agents (James et al., 2017; Madison et al., 2016, 2017; Verbeke &
Kano, 2012). This argument is aligned with the traditional agency perspective indicating that
the presence of nonfamily managers leads to type I agency problems where management control
mechanisms play a role in curbing opportunistic behaviors and limiting the agent’s discretion
(James et al., 2017; Madison et al., 2016). Therefore, in a scenario of low involvement of family
managers in the TMT, the controlling family will employ formal management control
mechanisms (e.g., goal setting and performance evaluation) as agency mechanisms to exert
monitoring of nonfamily managers behavior in the organization. Based on these arguments, we
hypothesize that:
H4a: Family involvement in management is negatively associated with formality in
management control mechanisms.
For the classical agency perspective, centralization may decrease information
assymetry, and conflicts in the organization since the controlling family (such as both principal
and agent) usually determine the priorities (economic or noneconomic goals) to be pursued in
the family firm (Barnett & Kellermanns, 2006; Gomez-Mejia et al., 2011).
A high family involvement in management leads to a high concentration of power in the
hands of the family owners and family managers that occupy the TMT or/and the CEO position
in the firm. Family firms with high family involvement in management are expected to lead to
an autocratic family firm perspective where the controlling family exert full control on the
organization's management processes (Barnett & Kellermanns, 2006; Dekker et al., 2013; Dyer,

87
1989; Sorenson, 2000), leaving no space for nonfamily managers’ participation. This scenario
is illustrated in parts by the autocracy family firm cluster discussed by Dekker et al. (2013).
Therefore, family managers in TMT (Berrone et al., 2012) and the family CEO
(Kammerlander & Ganter, 2015; Lardon et al., 2017) are usually invested with a high level of
autonomy over management control mechanisms to guarantee the pursuance of both financial
and family-centric noneconomic goals of the controlling family (Berrone et al., 2012; Holt et
al., 2017). In this sense, family managers are expected to avoid delegating responsibilities
related to planning and evaluating performance to nonfamily managers. Actually, family
managers might participate in decision-making probably through family relational mechanisms
in detriment of corporate management control mechanisms (Madison et al., 2016; Mustakallio,
Autio, & Zahra, 2002). In fact, in a scenario of high family involvement in management, the
controlling family would not have incentives to offer the opportunity to nonfamily managers to
participate in corporate management control mechanisms.
On contrary, if the TMT is mainly composed by nonfamily managers, these executives
would not have legitimacy and power, as family managers have, to centralize goal setting and
performance evaluation in their hands. This scenario of nonfamily managers predominance in
the TMT is characterized by a homogeneous distribution of power than when there is a presence
of family managers, which might lead to a higher level of participation in management control
mechanisms. Therefore, we hypothesize that:
H4b: Family involvement in management is negatively associated with manager’s
participation in management control mechanisms.
4.2.4. The relationship between family control and influence SEW intention and
management control mechanisms design
Family control and influence SEW intention is considered a decision premise in the
family firm, which consists in the family’s willingness to maintain the controlling family’s
autonomy and independence in the firm’s decision-making processes (Berrone et al., 2012;
Frank et al., 2016). We argue that when the family coalition is willing to retain family control
and influence in the business, they will be reluctant to adopt formal management control
mechanisms (Barnett & Kellermanns, 2006; Dekker et al., 2013; Gomez-Mejia et al., 2011;
Jorissen et al., 2016), since formal mechanisms create transparency. Family firms are
considered to be more secretive and less open.

88
Owner-managers are averse to mechanisms that have the potential to reduce their
control (Chen, Huang, & Chen, 2009; Senftlechner & Hiebl, 2015). More formalized
management practices increase transparency and visibility allowing others to have more
information about the firm. More formalized management control mechanisms could be a threat
to family members intentions of authority and dominance because they would need to share
information with nonfamily managers (Gómez-Mejía et al., 2007; Miller & Le Breton-Miller,
2014; Songini et al., 2013; Speckbacher & Wentges, 2012).
Therefore, the controlling family would prefer to transfer insights and to share the
family’s vision, personally and not explicitly in written plans or reports. Family managers may
prioritize informal family and corporate management control mechanisms as a strategy to avoid
transparency and visibility about family affairs and about family-centric noneconomic goals in
the family firm (Chen et al., 2009; Senftlechner & Hiebl, 2015). Informal practices “can be
more arbitrary and thus more flexible, but also more controllable when desired by leaders”
(Morgan & Gomez-Mejia, 2014, p. 282) that are usually the controlling family.
Finally, formal management control mechanisms may be risky to family members
because they put them in the same position as nonfamily managers, which may open
opportunity for nonfamily managers to perceived unfair treatment and to challenge the family
autonomy over business decisions (Barnett & Kellermanns, 2006; Gomez-Mejia et al., 2011).
This literature provides support for the following hypothesis:
H5a: Family control and influence SEW intention is negatively associated with
formality in management control mechanisms.
Additionally, we argue that if the controlling family is willing to maintain a family’s
control and influence in the firm they will avoid delegating strategic responsibilities and giving
voice to nonfamily managers, which will be related to a low level of participation in
management control mechanisms (Barnett & Kellermanns, 2006; Eddleston & Kellermanns,
2007; Gomez-Mejia et al., 2011; Miller & Le Breton-Miller, 2014; Songini et al., 2013).
In this sense, if the controlling family delegates responsibilities related to goal setting
and performance evaluation to nonfamily managers, they could increase information
asymmetries and also make conflicts, related to goal alignment between owners and nonfamily
managers (based on the economic versus nonfinancial priorities), more evident. A central
argument is that by giving managers opportunity to participate in management control
mechanisms the family firm would naturally be decreasing the controlling family’s power and
autonomy (Barnett & Kellermanns, 2006; Gomez-Mejia et al., 2011), which is in conflict with
89
their willingness to preserve their control and influence over the family firm’s decisions
(Berrone et al., 2012; Debicki et al., 2016). Thus, we propose that:
H5b: Family control and influence SEW intention is negatively associated with
manager’s participation in management control mechanisms.
4.2.5. The relationship between the renewal of family bonds through dynastic
succession SEW intention and management control mechanism design
The controlling family’s dynastic succession intention is expected to lead to a long-term
orientation of strategy and decision making in family firms (Berrone et al., 2012). Different
from the control and influence SEW intention, we argue that this long-term orientation and
sustainability drive the use of formal and participative management control mechanisms
(Berrone et al., 2012).
Hoffmann et al. (2016) suggest that family involvement is insufficient to foster a bright
side of family influence in the firm. The bright side of family influence can be stimulated by
the controlling family’s long-term orientation of decisions (Kellermanns et al., 2012; Naldi,
Cennamo, Corbetta, & Gomez-Mejia, 2013). One first evidence is that transgenerational
orientation is related to the “willingness to safeguard the survival of the business across
generations” (Suess-Reyes, 2016, p. 2). It is expected that the controlling family will adopt
formal management control mechanisms (Gomez-Mejia et al., 2011; Songini et al., 2013) to
sustain the long-term success of the firm. Formal management control mechanisms may
improve the firms’ chances of success in the long-term (Dekker et al., 2013; Giovannoni et al.,
2011) since they stimulate a structured management process to deal with uncertainties and
identify opportunities (Anthony, Govindarajan, Hartmann, Kraus, & Nilsson, 2014).
Formal management control mechanisms help to maintain cohesiveness between the
controlling family and family business, which is positive in a long-term orientation perspective
toward the firm (Suess-Reyes, 2016). Additionally, formal management accounting practices
can support the knowledge transfer across generations and between the controlling family by
reinforcing the founder’s vision and values (El Masri, Tekathen, Magnan, & Boulianne, 2017;
Giovannoni et al., 2011). The renewal of family bonds intention fosters the controlling family
to design formal management control mechanisms to avoid risks and surprises (Jorissen et al.,
2016), and to promote the sharing of knowledge in the firm (Zahra et al., 2007).
Therefore, if the controlling family is willing to renew family bonds through dynastic
succession, they will adopt formal structures and mechanisms to support transparency and trust

90
among family and nonfamily managers (Sundaramurthy & Kreiner, 2008). These formal
mechanisms would avoid conflicts in the organization which could challenge the firm’s long-
term survival (Giovannoni et al., 2011; Songini et al., 2013; Suess-Reyes, 2016). This
discussion supports the following hypothesis:
H6a: Renewal of family bonds through dynastic succession SEW intention is positively
associated with formality in management control mechanisms.
Furthermore, managers’ participation in management control mechanisms is expected
to broaden the scope and bring more diverse discussions to the TMT in family businesses.
Manager’s participation might improve business decisions by fostering information sharing
between top managers and middle managers (Dekker et al., 2013; Locke & Latham, 1990;
Magner, Welker, & Campbell, 1996). In addition, a high level of manager’s participation in
goal setting and performance evaluation lead to a higher transparency of goals and strategies,
what makes management control mechanisms more effective in the firm (De Baerdemaeker &
Bruggeman, 2015).
Im sum, following Giovannoni et al. (2011, p. 131) “management accounting practices
are capable of as carriers of knowledge (through time and space), by providing the managers
participating in these practices with shared language of socially constructed meanings with
which to make sense of organizational reality and cope with uncertainty associated with periods
of transition”. We refer to dynastic succession as the one of most important transitions that
family firms experience (Berrone et al., 2012; Giovannoni et al., 2011; Suess-Reyes, 2016).
Therefore, participation makes the firm more adaptable and flexible to face the
environmental uncertainties and to pursue oportunities that might emerge (De Baerdemaeker &
Bruggeman, 2015). We expect that, by allowing manager’s participate in management control
mechanisms, the family firm would enhance knowledge transfer and flexibility by stimulating
interaction among managers. We also argue that manager’s participation might foster the
effectiveness of decision-making by combining different experiences and expertises, what
could support a dynastic succession process (Berrone et al., 2012; Giovannoni et al., 2011;
Suess-Reyes, 2016) and assure the family business’ continuity in the long-term (Gómez-Mejía
et al., 2007; Songini et al., 2013). Hence, we propose that:
H6b: Renewal of family bonds through dynastic succession SEW intention is positively
associated with manager’s participation in management control mechanisms.

91
The theoretical model and hypotheses are presented in Figure 7.
Figure 7. Theoretical research model and hypotheses – paper 1 Note 1: FIO (Family Involvement in Ownership), FCI (Family Control and Influence), FRFB (Renewal of Family Bonds), FIM (Family Involvement in Management). FIM is measured as (i) the percentage of family managers in the Top Management Team (pfamilyTMT) (ii) and if a family manager is the CEO of the firm (familyCEO). Note 2: The controlling family ability and willingness refer respectively to the family involvement constructs and the socioemotional wealth intentions. Note 3: We used the following control variables in the model. Family indicates that if the respondent is a founder, family manager or nonfamily manager (family affiliation). Tier relates to the hierarchical level (Tier 1 are those managers that report directly to shareholders, CEO or does not have superior in the firm). Founder indicates if the founder manages the firm. Generation indicates if the organization has experienced at least a transfer of shares from the first generation to the next. Size indicates if the organization is a large (more than 300 employees) or medium firm (between 50 and 300 employees). MLMV is the variable used to control for common method bias.
4.3. Data analyses
4.3.1. Descriptive Statistics
We report in Table 15 and Table 16 the descriptive statistics of the items of family
involvement, family control and influence intention, renewal of family bonds through dynastic
succession intention, participation and formality in both goal setting and performance
evaluation. We comment the results based on the 120 respondents’ sample, but we also report
the results of the 152 sample. The sample of 152 is composed of all respondents, and the sample
of 120 respondents is composed of private medium and large family firms with family
ownership higher than 50% (more information about sample composition is presented in the
Family control and influence
Renewal of family bonds
through dynastic succession
Family involvement in
ownership
Family involvement in management
Family’s willingness: Socioemotional wealth
intentions
H1(+) H3(+)
H5a,b(-)
H6a,b(+)
H4a,b(-)
H2(+)
Family’s ability
Formality- Goal setting;- Performance
evaluation
Participation- Goal setting;- Performance
evaluation
Management control mechanisms design
characteristics

92
methodology section). We argue that both samples present similar results for the descriptive
statistics.
If we look at the family control and influence intention, the respondents presented a
level of agreement of 3.69 and 3.73 respectively related to keeping the firm ownership
exclusively in the family hands and maintaining the control and autonomy to make decisions
related to the firm. About the intentions related to the management team composition, the
respondents demonstrated an average score of 2.45. Moreover, the dynastic succession
intention items present a similar average score emphasizing the controlling family intention to
pass the firm to the next generation (3.80), to think in generations (3.40), and to avoid selling
the company to nonfamily members (3.67).
Additionally, respondents seem to agree more with participation dimension than with
formality in goal setting process. If we analyze the means of the items of these constructs,
respondents present an average score of 4.33 about the importance of manager's contribution to
goal setting of the company and 4.23 that the firms accept changes suggested by managers.
About formality in the goal setting process, respondents seem to slightly disagree that they rely
principally on experienced-based intuition (rather than quantitative analysis) when setting
major goals (2.78). As this item was reversed coded (should indicate informal goal setting) it
was consistent, but it was further excluded in the measurement model evaluation because of the
lack of convergent and discriminant validity.
About participation in performance evaluation, respondents indicate that the superiors
give opportunity to ask questions (3.74) and consider their opinion when discussing the
performance evaluation (3.75). About formality, respondents present an average score of 3.62
and 3.51 respectively related to judging performance based on objective information and
expressing it in quantitative terms.
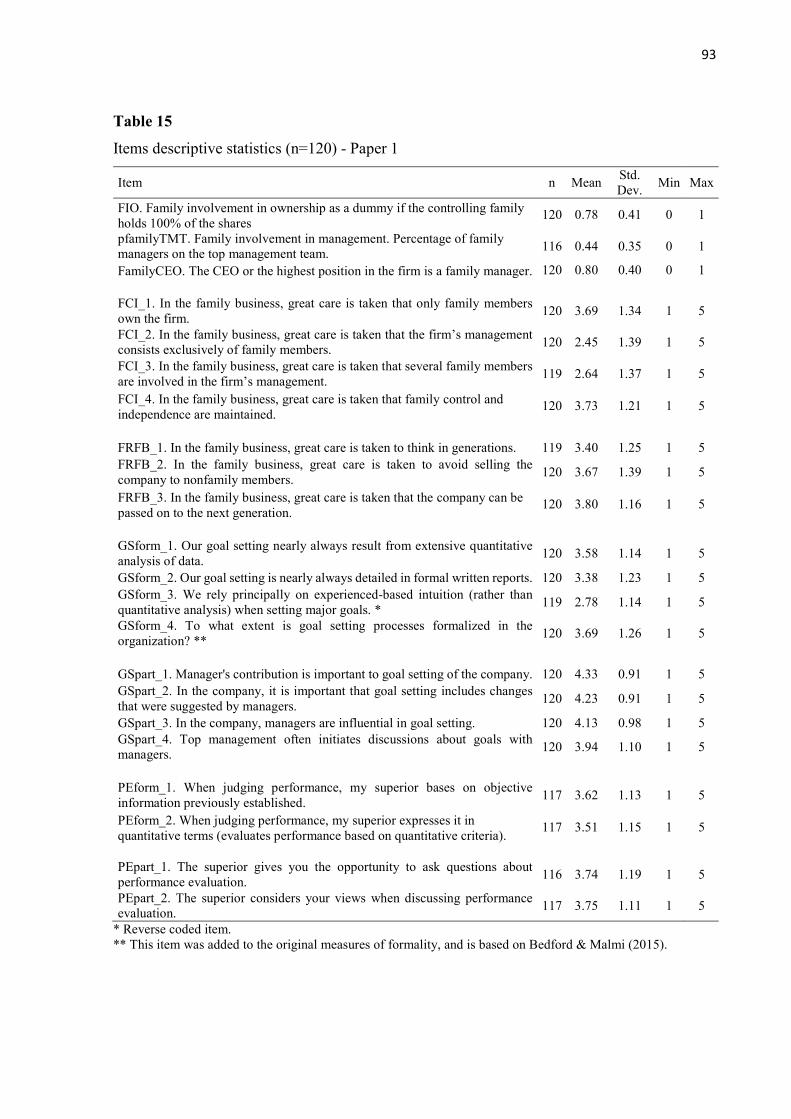
93
Table 15
Items descriptive statistics (n=120) - Paper 1
Item n Mean Std. Dev.
Min Max
FIO. Family involvement in ownership as a dummy if the controlling family holds 100% of the shares
120 0.78 0.41 0 1
pfamilyTMT. Family involvement in management. Percentage of family managers on the top management team.
116 0.44 0.35 0 1
FamilyCEO. The CEO or the highest position in the firm is a family manager. 120 0.80 0.40 0 1 FCI_1. In the family business, great care is taken that only family members own the firm.
120 3.69 1.34 1 5
FCI_2. In the family business, great care is taken that the firm’s management consists exclusively of family members.
120 2.45 1.39 1 5
FCI_3. In the family business, great care is taken that several family members are involved in the firm’s management.
119 2.64 1.37 1 5
FCI_4. In the family business, great care is taken that family control and independence are maintained.
120 3.73 1.21 1 5
FRFB_1. In the family business, great care is taken to think in generations. 119 3.40 1.25 1 5 FRFB_2. In the family business, great care is taken to avoid selling the company to nonfamily members.
120 3.67 1.39 1 5
FRFB_3. In the family business, great care is taken that the company can be passed on to the next generation.
120 3.80 1.16 1 5
GSform_1. Our goal setting nearly always result from extensive quantitative analysis of data.
120 3.58 1.14 1 5
GSform_2. Our goal setting is nearly always detailed in formal written reports. 120 3.38 1.23 1 5 GSform_3. We rely principally on experienced-based intuition (rather than quantitative analysis) when setting major goals. *
119 2.78 1.14 1 5
GSform_4. To what extent is goal setting processes formalized in the organization? **
120 3.69 1.26 1 5
GSpart_1. Manager's contribution is important to goal setting of the company. 120 4.33 0.91 1 5 GSpart_2. In the company, it is important that goal setting includes changes that were suggested by managers.
120 4.23 0.91 1 5
GSpart_3. In the company, managers are influential in goal setting. 120 4.13 0.98 1 5 GSpart_4. Top management often initiates discussions about goals with managers.
120 3.94 1.10 1 5
PEform_1. When judging performance, my superior bases on objective information previously established.
117 3.62 1.13 1 5
PEform_2. When judging performance, my superior expresses it in quantitative terms (evaluates performance based on quantitative criteria).
117 3.51 1.15 1 5
PEpart_1. The superior gives you the opportunity to ask questions about performance evaluation.
116 3.74 1.19 1 5
PEpart_2. The superior considers your views when discussing performance evaluation.
117 3.75 1.11 1 5
* Reverse coded item. ** This item was added to the original measures of formality, and is based on Bedford & Malmi (2015).
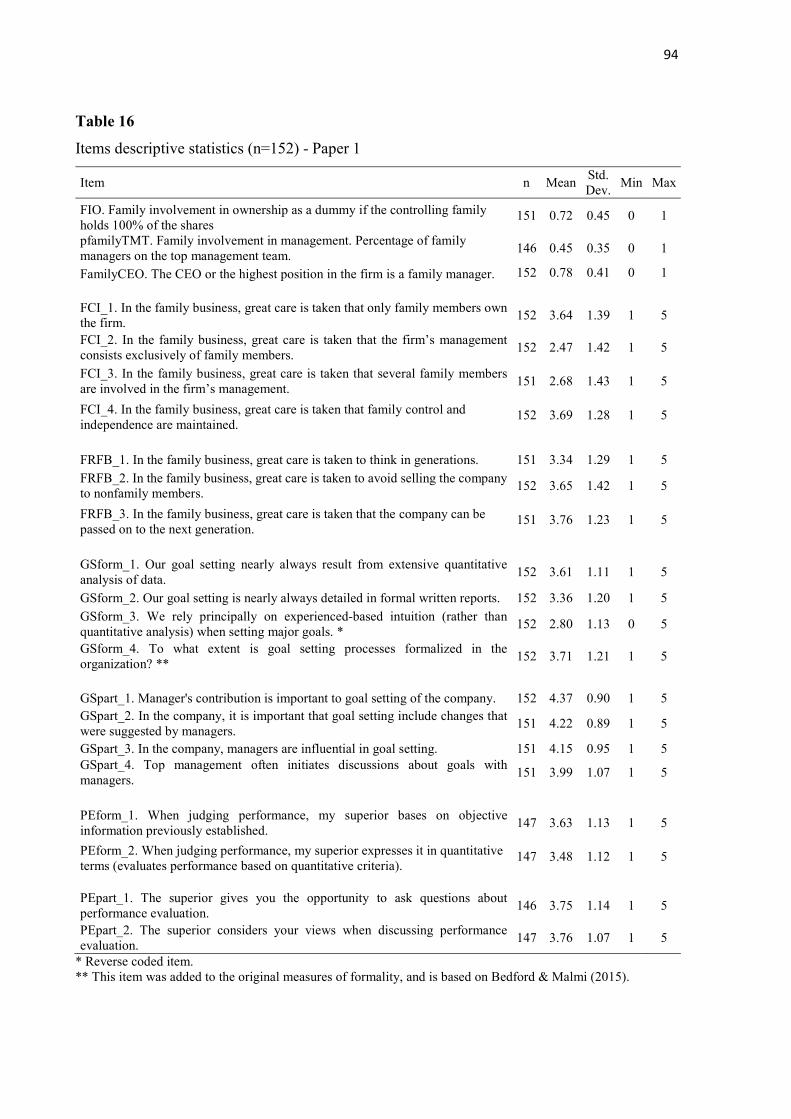
94
Table 16
Items descriptive statistics (n=152) - Paper 1
Item n Mean Std. Dev.
Min Max
FIO. Family involvement in ownership as a dummy if the controlling family holds 100% of the shares
151 0.72 0.45 0 1
pfamilyTMT. Family involvement in management. Percentage of family managers on the top management team.
146 0.45 0.35 0 1
FamilyCEO. The CEO or the highest position in the firm is a family manager. 152 0.78 0.41 0 1
FCI_1. In the family business, great care is taken that only family members own the firm.
152 3.64 1.39 1 5
FCI_2. In the family business, great care is taken that the firm’s management consists exclusively of family members.
152 2.47 1.42 1 5
FCI_3. In the family business, great care is taken that several family members are involved in the firm’s management.
151 2.68 1.43 1 5
FCI_4. In the family business, great care is taken that family control and independence are maintained.
152 3.69 1.28 1 5
FRFB_1. In the family business, great care is taken to think in generations. 151 3.34 1.29 1 5
FRFB_2. In the family business, great care is taken to avoid selling the company to nonfamily members.
152 3.65 1.42 1 5
FRFB_3. In the family business, great care is taken that the company can be passed on to the next generation.
151 3.76 1.23 1 5
GSform_1. Our goal setting nearly always result from extensive quantitative analysis of data.
152 3.61 1.11 1 5
GSform_2. Our goal setting is nearly always detailed in formal written reports. 152 3.36 1.20 1 5
GSform_3. We rely principally on experienced-based intuition (rather than quantitative analysis) when setting major goals. *
152 2.80 1.13 0 5
GSform_4. To what extent is goal setting processes formalized in the organization? **
152 3.71 1.21 1 5
GSpart_1. Manager's contribution is important to goal setting of the company. 152 4.37 0.90 1 5 GSpart_2. In the company, it is important that goal setting include changes that were suggested by managers.
151 4.22 0.89 1 5
GSpart_3. In the company, managers are influential in goal setting. 151 4.15 0.95 1 5 GSpart_4. Top management often initiates discussions about goals with managers.
151 3.99 1.07 1 5
PEform_1. When judging performance, my superior bases on objective information previously established.
147 3.63 1.13 1 5
PEform_2. When judging performance, my superior expresses it in quantitative terms (evaluates performance based on quantitative criteria).
147 3.48 1.12 1 5
PEpart_1. The superior gives you the opportunity to ask questions about performance evaluation.
146 3.75 1.14 1 5
PEpart_2. The superior considers your views when discussing performance evaluation.
147 3.76 1.07 1 5
* Reverse coded item. ** This item was added to the original measures of formality, and is based on Bedford & Malmi (2015).

95
We present in Table 17 and in Table 18 comparisons related to the family ability (family
involvement in ownership and family involvement in management) and management control
mechanisms design (participation and formality of goal setting and performance evaluation).
For the results of participation and formality in goal setting and performance evaluation
processes, we ran Confirmatory Factor Analyses and report the mean of the standardized scores
(for both samples of 152 and 120 respondents). The interpretation of the means in the two
samples is similar.
First, larger firms seem to have higher levels of formality and participation concerning
goal setting and performance evaluation processes. Additionally, family firms with 100%
controlling family ownership, with the founder in the business and with a family manager as
the CEO present lower level of formality and participation in goal setting and performance
evaluation processes. The results also indicate that when family managers are less involved in
the TMT, the higher the level of formality and participation in goal setting and performance
evaluation, except for those firms which the TMT is composed exclusively of family managers.
Finally, looking at the ownership generation of the family firm, we can see that the results about
the levels of participation and formality in management control mechanisms do not present a
descriptive pattern.

96
Table 17
Family firms’ characteristics and management control mechanisms design (n=120)
Formality Participation n % GS PE GS PE
Panel A: Size (number of employees) Between 51 and 100 employees 8 6.7% -0.175 -0.066 -0.631 -0.179 Between 101 and 300 employees 25 20.8% -0.258 -0.174 0.120 -0.065 Between 301 and 500 employees 16 13.3% -0.293 0.174 0.007 0.157 Between 501 and 1000 employees 20 16.7% -0.193 -0.113 -0.227 -0.284 More than 1000 employees 51 42.5% 0.321 0.085 0.127 0.123
Panel B: Controlling family ownership Family owns more than 50% but less than 100% of the shares
26 21.7% 0.015 0.067 0.093 0.068
Family owns 100% of the shares 94 78.3% -0.053 -0.244 -0.336 -0.246
Panel C: Percentage of family members in the TMT No family members 22 18.3% 0.169 0.369 0.204 0.275 More than 0% and up to 25% 28 23.3% 0.237 0.022 -0.046 0.146 More than 25% and up to 50% 26 21.7% -0.099 -0.139 -0.174 -0.260 More than 50% but less than 100% 19 15.8% -0.063 -0.687 -0.204 -0.309 100,00% 21 17.5% -0.306 0.232 0.156 -0.062
Panel D: Is the CEO from the controlling family? Yes 96 80.0% -0.085 -0.014 -0.061 -0.053 No 24 20.0% 0.339 0.057 0.242 0.213
Panel E: Does(Do) the founder(s) manage(s) the business? Yes 58 48.3% -0.211 -0.162 -0.178 -0.186 No 60 50.0% 0.232 0.158 0.174 0.156
Panel F: Family Generations (ownership) First generation 28 23.3% -0.135 -0.334 -0.315 -0.398 First and Second generations 28 23.3% -0.059 0.225 0.193 0.317 First, Second and Third generations 2 1.7% -0.381 -1.016 -0.632 -1.193 Second generation 27 22.5% -0.031 -0.081 -0.116 -0.072 Second and third generations 16 13.3% -0.214 -0.154 -0.033 -0.181 Third generation 14 11.7% 0.527 0.683 0.426 0.688 Third and fourth generations 4 3.3% 0.662 0.051 0.474 0.025 Fourth generation 1 0.8% 0.428 -0.059 0.466 -0.214
Panel G: Firm age
Between 0 and 20 years 11 9.2% 0.027 0.236 -0.149 0.147
Between 21 and 40 years 27 22.5% 0.015 -0.342 -0.175 -0.118
Between 41 and 60 years 29 24.2% -0.078 0.099 0.049 0.110
More than 61 years 44 36.7% 0.088 0.120 0.189 0.061
Note 1: GS and PE are respectively goal setting and performance evaluation processes. These values are the means that were obtained by applying the Confirmatory Factor Analyses for each construct. The results of the CFA are standardized scores (mean is zero and standard deviation one).

97
Table 18
Family firms’ characteristics and management control mechanisms design (n=152) – Part I
Formality Participation
n % GS PE GS PE
Panel A: Size (number of employees)
Less than 50 employees 18 11.8% -0.197 -0.157 0.071 0.119
Between 51 and 100 employees 9 5.9% -0.122 -0.004 -0.672 -0.144
Between 101 and 300 employees 29 19.1% -0.328 -0.193 -0.152 -0.251
Between 301 and 500 employees 18 11.8% -0.230 0.162 -0.061 0.164
Between 501 and 1000 employees 21 13.8% -0.200 -0.103 -0.287 -0.275
More than 1000 employees 57 37.5% 0.395 0.149 0.039 0.162
Panel B: Controlling family ownership Family owns up to 25% of the shares
6 3.9% -0.344 -0.313 -0.657 -0.824
Family owns more than 25% but up to 50% of the shares
4 2.6% 0.693 0.313 0.266 0.489
Family owns more than 50% but less than 100% of the shares
32 21.1% 0.047 -0.158 -0.304 -0.243
Family owns 100% of the shares 109 71.7% -0.028 0.046 -0.019 0.087
Missing 1 0.7%
Panel C: Percentage of family members in the TMT
No family members 29 19.1% 0.178 0.289 0.036 0.132
More than 0% and up to 25% 30 19.7% 0.227 -0.022 -0.175 0.117
More than 25% and up to 50% 36 23.7% 0.043 -0.017 -0.167 -0.179
More than 50% but less than 100% 22 14.5% -0.113 -0.750 -0.258 -0.350
100,00% 29 19.1% -0.291 0.312 0.066 0.083
Missing 6 3.9%
Panel D: Is the CEO from the controlling family?
Yes 119 78.3% -0.028 0.046 -0.019 0.087
No 33 21.7% 0.053 -0.135 -0.300 -0.256
Panel E: Does(Do) the founder(s) manage(s) the business?
Yes 82 53.9% -0.166 -0.109 -0.208 -0.121
No 68 44.7% 0.226 0.145 0.047 0.125
Missing 2 1.3%
Note 1: GS and PE are respectively goal setting and performance evaluation processes. These values are the means that were obtained by applying the Confirmatory Factor Analyses for each construct. The results of the CFA are standardized scores (mean is zero and standard deviation one).
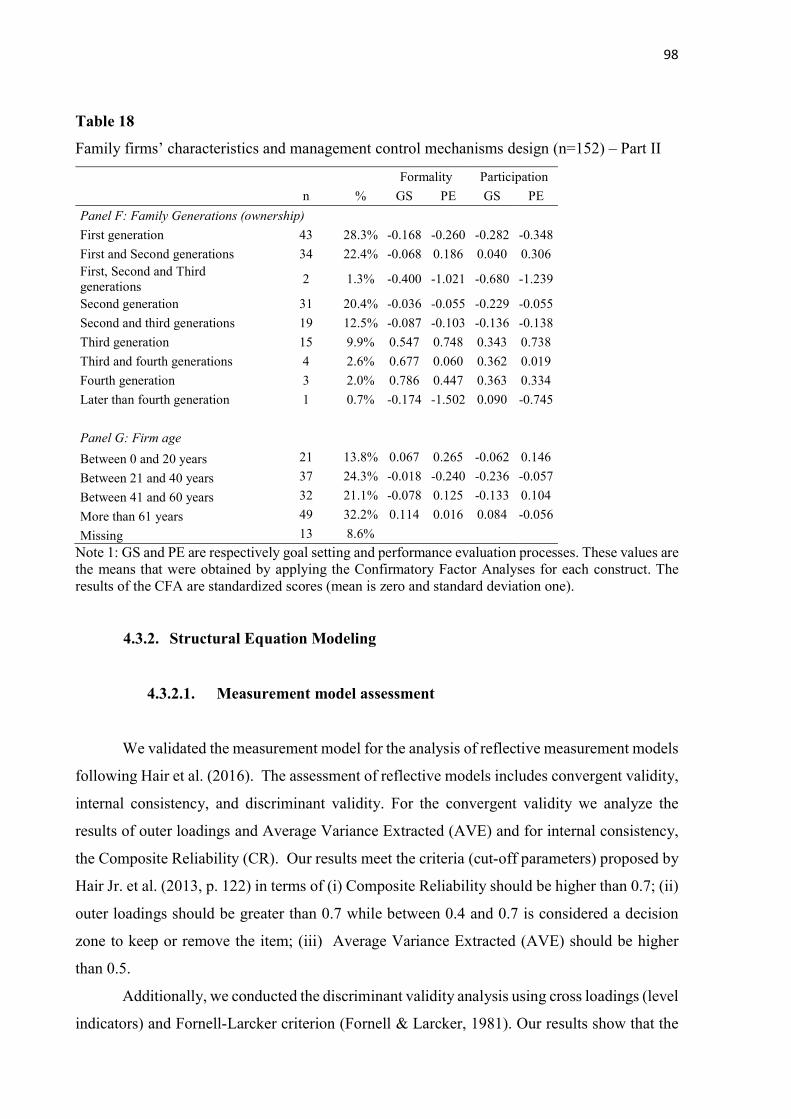
98
Table 18
Family firms’ characteristics and management control mechanisms design (n=152) – Part II
Formality Participation
n % GS PE GS PE
Panel F: Family Generations (ownership)
First generation 43 28.3% -0.168 -0.260 -0.282 -0.348
First and Second generations 34 22.4% -0.068 0.186 0.040 0.306 First, Second and Third generations
2 1.3% -0.400 -1.021 -0.680 -1.239
Second generation 31 20.4% -0.036 -0.055 -0.229 -0.055
Second and third generations 19 12.5% -0.087 -0.103 -0.136 -0.138
Third generation 15 9.9% 0.547 0.748 0.343 0.738
Third and fourth generations 4 2.6% 0.677 0.060 0.362 0.019
Fourth generation 3 2.0% 0.786 0.447 0.363 0.334
Later than fourth generation 1 0.7% -0.174 -1.502 0.090 -0.745
Panel G: Firm age
Between 0 and 20 years 21 13.8% 0.067 0.265 -0.062 0.146
Between 21 and 40 years 37 24.3% -0.018 -0.240 -0.236 -0.057
Between 41 and 60 years 32 21.1% -0.078 0.125 -0.133 0.104
More than 61 years 49 32.2% 0.114 0.016 0.084 -0.056
Missing 13 8.6%
Note 1: GS and PE are respectively goal setting and performance evaluation processes. These values are the means that were obtained by applying the Confirmatory Factor Analyses for each construct. The results of the CFA are standardized scores (mean is zero and standard deviation one).
4.3.2. Structural Equation Modeling
4.3.2.1. Measurement model assessment
We validated the measurement model for the analysis of reflective measurement models
following Hair et al. (2016). The assessment of reflective models includes convergent validity,
internal consistency, and discriminant validity. For the convergent validity we analyze the
results of outer loadings and Average Variance Extracted (AVE) and for internal consistency,
the Composite Reliability (CR). Our results meet the criteria (cut-off parameters) proposed by
Hair Jr. et al. (2013, p. 122) in terms of (i) Composite Reliability should be higher than 0.7; (ii)
outer loadings should be greater than 0.7 while between 0.4 and 0.7 is considered a decision
zone to keep or remove the item; (iii) Average Variance Extracted (AVE) should be higher
than 0.5.
Additionally, we conducted the discriminant validity analysis using cross loadings (level
indicators) and Fornell-Larcker criterion (Fornell & Larcker, 1981). Our results show that the
99
cross loadings are considered low compared to the outer loadings. Additionally, the square root
of AVE of each latent variable is found to be greater than the highest correlations between the
latent variables (Hair Jr. et al., 2013). We also analyzed the HTMT criterion to assess
discriminant validity, which we found values lower than 0.85 (Henseler, Ringle, & Sarstedt,
2014) that are consistent with Fornell-Larcker criterion. In sum, our measurement model was
validated after excluding GSform_3 item that lack of convergent and discriminant validity by
presenting a lower outer loading and higher cross loadings. The results are shown in Table 19,
Table 20, Table 21 and Table 22.
The correlation coefficients presented in Table 21 and Table 22 indicate preliminary
associations between the family involvement in management and the family control and
influence intentions. Additionally, we can see that the intentions of family control and influence
(FCI) and renewal of family bonds (FRFB) are positively and statistically significant correlated.
The family involvement in ownership (FIO), family involvement in management (percentage
of family managers in the TMT and family CEO) seems to be positively and statistically
significant correlated.
We can also observe a medium correlation between management control mechanisms
design characteristics in goal setting and performance evaluation. We have found negative
correlations between FCI and goal setting formality and participation which are not statistically
significant. Conversely, we have found positive correlations between FRFB and management
control mechanisms design characteristics, which was statistically significant for goal setting
and performance evaluation formality as well as participation in performance evaluation.

100
Table 19
Cross loadings between the items and the construct (n=152)
FIO FCI FRFB pfamily TMT
family CEO
GS_ form
GS_ part
PE_ form
PE_ part
d_ownership100% 1.000 0.254 0.197 0.304 0.182 -0.038 0.141 0.089 0.154
FCI_1 0.285 0.763 0.399 0.311 0.314 0.010 -0.039 0.160 0.061
FCI_2 0.180 0.850 0.288 0.550 0.401 -0.194 -0.168 0.029 -0.074
FCI_3 0.142 0.799 0.464 0.322 0.165 -0.018 -0.067 0.146 0.026
FCI_4 0.204 0.740 0.626 0.234 0.311 -0.024 0.013 0.028 0.130
FRFB_1 0.149 0.526 0.876 0.218 0.204 0.245 0.118 0.131 0.161
FRFB_2 0.167 0.497 0.824 0.184 0.119 0.144 0.094 0.186 0.184
FRFB_3 0.201 0.410 0.937 0.189 0.133 0.315 0.140 0.249 0.249
pfamilyTMT 0.304 0.476 0.223 1.000 0.489 -0.184 0.034 -0.035 -0.042
d_familyCEO 0.182 0.393 0.172 0.489 1.000 -0.167 -0.088 -0.019 -0.046
GSform_1 0.004 -0.021 0.299 -0.120 -0.116 0.841 0.395 0.307 0.371
GSform_2 -0.098 -0.109 0.183 -0.170 -0.160 0.890 0.442 0.300 0.317
GSform_4 -0.006 -0.109 0.223 -0.183 -0.153 0.829 0.478 0.438 0.387
GSpartic_1 0.120 -0.073 0.109 0.030 -0.051 0.393 0.868 0.369 0.448
GSpartic_2 0.095 -0.109 0.127 0.004 -0.108 0.464 0.872 0.328 0.378
GSpartic_3 0.156 -0.140 0.084 -0.004 -0.137 0.452 0.911 0.348 0.458
GSpartic_4 0.113 -0.015 0.153 0.088 -0.006 0.465 0.813 0.331 0.423
PEform_1 0.057 0.122 0.199 0.013 0.000 0.395 0.394 0.946 0.594
PEform_2 0.113 0.074 0.212 -0.081 -0.037 0.373 0.352 0.938 0.628
PEpart_1 0.142 0.090 0.206 -0.060 -0.037 0.367 0.436 0.612 0.919
PEpart_2 0.146 -0.022 0.221 -0.023 -0.048 0.416 0.484 0.605 0.953
Controls
Tier 1 0.025 0.114 0.014 0.145 0.169 0.014 0.234 0.037 0.028
rfamily_status 0.104 0.162 0.072 0.179 0.218 -0.099 0.055 -0.023 -0.031
rfounder_status 0.174 0.116 0.097 0.226 0.136 0.087 0.188 0.133 0.162
d_founder 0.093 0.368 0.124 0.236 0.306 -0.196 -0.131 -0.130 -0.117
o_generation1 -0.076 -0.023 -0.198 0.045 0.076 -0.084 -0.093 -0.140 -0.198
largefirms -0.201 -0.163 -0.031 -0.347 -0.237 0.196 0.058 0.126 0.089
mediumfirms 0.156 0.078 0.002 0.214 0.194 -0.164 -0.111 -0.098 -0.132
MLMV_1 -0.030 0.079 0.077 0.109 0.072 0.149 0.098 -0.067 0.014
MLMV_2 0.028 0.047 0.074 0.088 -0.046 0.281 0.258 0.367 0.303
MLMV_3 -0.138 -0.008 -0.054 0.002 0.118 -0.157 -0.193 -0.141 -0.182
MLMV_4 -0.042 0.086 0.032 -0.060 0.004 0.135 0.088 0.090 0.020
Note 1: We excluded the GSform_3 indicator because it lacks discriminant validity. The construct of GSform was more correlated with other items than this specific indicator, so we excluded from the model. Note 2. Size, Tier, Family affiliation, Founder, Generation and MLMV are control variables in our model. Size, Tier and Family are dummy variables and MLMV is a 4-item formative latent variable that is connected to all endogenous variables in our model (Chin et al., 2013; Nitzl, 2016).

101
Table 20
Cross loadings between the items and the construct (n=120)
FIO FCI FRFB pfamily TMT
family CEO
GS_ form
GS_ part
PE_ form
PE_ part
d_ownership100% 1.000 0.111 0.061 0.219 0.041 0.026 0.177 0.126 0.130
FCI_1 0.212 0.662 0.320 0.225 0.228 -0.019 -0.107 0.120 -0.007
FCI_2 0.069 0.875 0.227 0.543 0.373 -0.228 -0.207 -0.030 -0.182
FCI_3 0.044 0.742 0.404 0.256 0.133 -0.063 -0.140 0.047 -0.098
FCI_4 0.051 0.701 0.518 0.149 0.303 -0.080 -0.048 -0.054 0.022
FRFB_1 0.008 0.450 0.874 0.164 0.213 0.246 0.073 0.074 0.074
FRFB_2 0.063 0.426 0.761 0.137 0.105 0.102 0.048 0.145 0.110
FRFB_3 0.084 0.308 0.931 0.125 0.112 0.310 0.102 0.220 0.189
pfamilyTMT 0.219 0.447 0.162 1.000 0.442 -0.178 -0.006 -0.087 -0.120
d_familyCEO 0.041 0.370 0.167 0.442 1.000 -0.168 -0.124 -0.029 -0.108
GSform_1 0.039 -0.107 0.302 -0.142 -0.128 0.848 0.322 0.254 0.355
GSform_2 -0.034 -0.111 0.230 -0.122 -0.150 0.906 0.443 0.281 0.362
GSform_4 0.064 -0.214 0.169 -0.198 -0.157 0.823 0.476 0.388 0.356
GSpartic_1 0.149 -0.129 0.096 -0.014 -0.069 0.361 0.878 0.360 0.448
GSpartic_2 0.130 -0.182 0.062 -0.003 -0.129 0.409 0.880 0.287 0.366
GSpartic_3 0.191 -0.204 0.073 -0.026 -0.191 0.445 0.920 0.326 0.449
GSpartic_4 0.138 -0.113 0.088 0.025 -0.027 0.431 0.787 0.244 0.380
PEform_1 0.084 0.038 0.155 -0.060 -0.031 0.343 0.332 0.948 0.552
PEform_2 0.158 -0.026 0.175 -0.107 -0.022 0.322 0.328 0.933 0.639
PEpart_1 0.114 -0.024 0.118 -0.136 -0.089 0.353 0.416 0.595 0.901
PEpart_2 0.127 -0.168 0.155 -0.095 -0.109 0.413 0.462 0.583 0.955
Controls
Tier 1 0.005 0.088 -0.046 0.060 0.092 0.011 0.262 0.046 0.022
rfamily_status 0.041 0.091 -0.061 0.187 0.220 -0.077 0.081 0.033 -0.057
rfounder_status 0.159 0.077 0.089 0.095 0.075 0.104 0.141 0.096 0.123
d_founder 0.113 0.380 0.153 0.185 0.307 -0.226 -0.175 -0.161 -0.161
o_generation1 -0.056 0.033 -0.129 -0.007 0.070 -0.048 -0.132 -0.138 -0.193
largefirms -0.279 -0.181 -0.111 -0.330 -0.261 0.153 0.040 0.092 0.061
MLMV_1 -0.062 0.029 0.033 0.035 0.027 0.134 0.053 -0.162 -0.071
MLMV_2 0.012 -0.041 0.070 0.017 -0.113 0.285 0.260 0.372 0.353
MLMV_3 -0.166 0.033 0.011 -0.070 0.079 -0.151 -0.230 -0.128 -0.164
MLMV_4 -0.124 0.044 0.024 -0.104 -0.068 0.149 0.073 0.097 0.018
Note 1: We excluded the GSform_3 indicator because it lacks discriminant validity. The construct of GSform was more correlated with other items than this specific indicator, so we excluded from the model. Note 2. Size, Tier, Family affiliation, Founder, Generation and MLMV are control variables in our model. Size, Tier and Family are dummy variables and MLMV is a 4-item formative latent variable that is connected to all endogenous variables in our model (Chin et al., 2013; Nitzl, 2016).

102
Table 21
First-Order Latent Variable Correlations (n=152)
FIO FCI FRFB pfamilyTMT familyCEO GS_form GS_part PE_form PE_part FIO - FCI 0.254 0.789
FRFB 0.197 0.532 0.880 pfamilyTMT 0.304 0.476 0.223 - familyCEO 0.182 0.393 0.172 0.489 - GS_form -0.038 -0.092 0.277 -0.184 -0.167 0.854 GS_part 0.141 -0.098 0.136 0.034 -0.088 0.513 0.867 PE_form 0.089 0.105 0.218 -0.035 -0.019 0.408 0.396 0.942 PE_part 0.154 0.028 0.228 -0.042 -0.046 0.420 0.494 0.648 0.936
CR - 0.868 0.911 - - 0.890 0.923 0.941 0.934
AVE - 0.623 0.775 - - 0.729 0.751 0.888 0.877 Note 1. Correlations greater than or equal to | 0.159 | are significant at 5% and correlations higher than or equal to | 0.208 | are significant at 1%. Note 2. The values on the diagonal are the square roots of the average variances extracted; because these values are higher than the correlations between the latent variables (values outside the diagonal), there is discriminant validity (Hair Jr., Hult, Ringle, & Sarstedt, 2013). Note 3. Grey cells indicate correlations between dimensions of the same theoretical constructs. Note 4: Composite Reliability (CR) and Average Variance Extracted (AVE)
Table 22
First-Order Latent Variable Correlations (n=120)
FIO FCI FRFB pfamilyTMT familyCEO GS_form GS_part PE_form PE_part FIO - FCI 0.111 0.749
FRFB 0.061 0.440 0.858 pfamilyTMT 0.219 0.447 0.162 - familyCEO 0.041 0.370 0.167 0.442 - GS_form 0.026 -0.165 0.276 -0.178 -0.168 0.860 GS_part 0.177 -0.183 0.091 -0.006 -0.124 0.477 0.868 PE_form 0.126 0.008 0.175 -0.087 -0.029 0.354 0.351 0.940 PE_part 0.130 -0.117 0.150 -0.120 -0.108 0.416 0.475 0.630 0.929
CR - 0.835 0.893 - - 0.895 0.924 0.939 0.926
AVE - 0.562 0.736 - - 0.739 0.753 0.884 0.862 Note 1. Correlations greater than or equal to | 0.179 | are significant at 5% and correlations higher than or equal to | 0.234 | are significant at 1% Note 2. The values on the diagonal are the square roots of the average variances extracted; because these values are higher than the correlations between the latent variables (values outside the diagonal), there is discriminant validity (Hair Jr. et al., 2013). Note 3. Grey cells indicate correlations between dimensions of the same theoretical constructs. Note 4: Composite Reliability (CR) and Average Variance Extracted (AVE)
103
4.3.2.2. Structural model analyses
Once the validation of the measurement model has been completed, we conducted the
analyses of the structural model (Hair Jr. et al., 2013). In the first step, we analyzed the
incidence of multicollinearity based on Variance Inflation Factor (VIF), which is expected to
be lower than 5 (and tolerance values below 0.2). Second, we analyzed the structural path
coefficients regarding size and statistical significance of effects. We run the bootstrapping
analyses based on 1,000 subsamples, bias corrected confidence level and two-tailed tests. We
show results of the direct effects in Table 23, Table 24, Figure 8 and Figure 9.
Additionally, we assess the determination of R², which indicates the percentage of a
dependent variable variance that is explained by the independent variables. To avoid bias in a
complex model, we present the results for the adjusted coefficient of determination (Radj²) as
suggested by Hair Jr. et al. (2013), which is used to compare models with a different number of
variables or sample size. The fourth step is the effect size coefficient (f²), which indicates the
extent to which the independent variable has a substantial impact on the dependent variable.
We used the classification suggested for the social sciences by Cohen (1988) to interpret our
results such as: small effect (f² = 0.02); medium effect (f² = 0.15); and large effect (f² = 0.35).
Hair Jr. et al. (2013) mention that f² lower than 0.02 indicates no relationship between variables.
We present in Table 23 the path coefficients (β) of structural equation model (Model 1).
We additionally propose a second model (Model 2) to analyze the consistency of the results
based on an independent variable that combines the percentage of family managers in the TMT
and if the CEO is from the controlling family, which results are reported in Table 24. As the
results are consistent in both structural models, we will comment the coefficients and statistics
presented in Table 23 (Model 1).
First, we suggest that VIF indicators determine that multicollinearity is not a concern
because all values are below two while Hair Jr. et al. (2013) points to values lower than five.
Additionally looking at the interpretation of the models and the control variables we can see
that besides some controls are statistically significant (and have large size effects), they do not
alter the conclusions of effect sizes and statistical significance of our hypotheses, which
indicates that our results are robust.
Although model’s fit indexes are not highly recommended in variance based SEM such
as is usually discussed for covariance-based SEM (Hair Jr., Sarstedt, Ringle, & Gudergan,

104
2017)7, we present these results. We used the parameter for model fit based on SRMR criteria,
which scores should be lower than 0.08 (Hair Jr. et al., 2013, 2017). Our results for SRMR
(Saturated Model) ranged from 0.69 to 0.74 which parameters meet the criteria suggested by
Hair Jr. et al. (2013), indicating a good fit for our models.
In the sequence, we discuss the results about the hypotheses. We particularly describe
the statistical results for the 152 respondents’ sample.
4.3.2.3. The relationship between family involvement in ownership and a
family’s willingness to influence the firm
Our result shows that family involvement in ownership (FIO) is positively and
statistically significant associated with family control and influence (FCI) SEW intentions (=
0.197, p < 0.05). The effect size (f2) of family involvement in ownership is considered small
(f2=0.046). We did not find statistically significant results for the sample of just private medium
and large firms (n=120) maybe due to the characteristics of our sample in which about 80% of
the firms are totally owned by the controlling family. These results confirm our hypothesis H1
that indicates that by holding totally of the firm’s shares, the controlling family is expected to
have financial and emotional dependence toward the firm, which therefore might foster their
willingness to maintain their autonomy and independence to make decisions in the firm
(Berrone, Cruz, & Gomez-Mejia, 2012; Chrisman, Chua, Pearson, & Barnett, 2012; Gomez-
Mejia, Cruz, Berrone, & De Castro, 2011).
Additionally, the association between family involvement in ownership (FIO) and
renewal of family bonds through dynastic succession (FRFB) was statiscally significant at 10%
(= 0.158, p < 0.10), having a small effect size (0.026). This result support hypothesis H2 at
10% significance level which proposes that a high ownership might create financial and
psychological interdependence between the family and the firm, that enhances the controlling
family willingness to pass the firm to future generations (Berrone et al., 2012; Jorissen, Laveren,
Maneemai, & Voordeckers, 2016; Suess-Reyes, 2016; Zellweger & Astrachan, 2008).
By analyzing the control variables, we can see that variables such as the presence of the
founder or the family generation of the family business might be significantly associated to a
family’s willingness.
7 https://www.smartpls.com/documentation/functionalities/model-fit.

105
4.3.2.4. The relationship between family control and influence SEW
intention and family involvement in management
Table 23 also shows that the controlling family willingness to control and influence the
firm’s decision (FCI) is positively and statistically significant associated with the percentage of
family managers in the Top Management Team (pfamilyTMT) presenting a high path
coefficient (= 0.431, p < 0.001, f2=0.22). With respect to the association between FCI and the
presence of a family manager as the CEO (familyCEO) in the firm, we have found a positive
and statistically significant result (= 0.317, p < 0.001, f2=0.11) which has a smaller effect size
than for the percentage of family managers in the TMT.
Therefore, these results support hypotheses H3 that as higher the family’s willingness
to control and influence the decisions of the family firm, the controlling family will be more
likely to nominate more family managers to occupy positions in the Top Management Team
(Chrisman et al., 2012; Vandekerkhof, Steijvers, Hendriks, & Voordeckers, 2015) as well as
will keep a family member as the CEO of the family firm (Chrisman et al., 2012; Gomez-Mejia
et al., 2011; Lardon, Deloof, & Jorissen, 2017).
4.3.2.5. The relationship between family involvement in management and
management control mechanisms design
With respect to the hypotheses H4a and H4b, our results are contradictory to prior
literature (e.g., Helsen, Lybaert, Steijvers, Orens, & Dekker, 2017; Speckbacher & Wentges,
2012), in the sense that Family Involvement in Management (FIM) seems not to be associated
with the level of formality and participation in management control mechanisms. Particularly,
we did not find statistically significant associations between FIM and formality in both goal
setting and performance evaluation process (H4a) as well as for managers’ participation in those
management control mechanisms (H4b).
In model 2 (presented in Table 24), when we analyse the interaction between the
percentage of family managers in the TMT and the Family CEO (FIM_familyCEO), we find a
statisticaly significant negative association between family involvement in management and
the level of formality in goal setting process (= -0.138, p < 0.10), although based on an effect
size (f2= 0.018) considered irrelevant by Hair Jr. et al. (2013). Therefore, this result contradicts
the agency perspective and the empirical results of previous research (Songini & Gnan, 2015;

106
Speckbacher & Wentges, 2012). However, our results are in alignment with the arguments of
De Massis et al. (2014) who claim that a family’s ability may be not a sufficient condition to
capture the family’s influence over management control mechanisms and organizational
behaviour (Chrisman, Chua, De Massis, Frattini, & Wright, 2015; Veider & Matzler, 2016).
Therefore, we explore the role of a family’s willingness (family control and influence and
dynastic succession intentions) on the design of management control mechanisms in family
firms.
4.3.2.6. The relationship between family control and influence SEW
intention and management control mechanisms design
Although family involvement in management is not associated with management
control mechanisms design, which contradicts previous literature (e.g., Hiebl, Duller,
Feldbauer‐Durstmüller, & Ulrich, 2015; Speckbacher & Wentges, 2012), we provide evidence
that both elements of willingness (family control and influence and dynastic succession
intentions) present a significant association with the design of management control
mechanisms.
First, family control and influence SEW intention (FCI) is significantly negatively
associated with the design characteristics of goal setting processes. We have found small
significant effect (= -0.243, p < 0.05, f2=0.047) of FCI on goal setting for formality. FCI is
also negatively associated to goal setting participation, which we also found a small size
negative significant effect (= -0.295, p < 0.01, f2=0.063). However, we did not find a
statistically significant association between FCI with participation and formality in
performance evaluation. Our results allow us to partially confirm the hypotheses H5a and H5b
(Barnett & Kellermanns, 2006; Dekker, Lybaert, Steijvers, Depaire, & Mercken, 2013; Gomez-
Mejia, Cruz, Berrone, & De Castro, 2011; Senftlechner & Hiebl, 2015; Speckbacher &
Wentges, 2012). So higher family control intentions lead to less participation in goal setting as
well as less formality applied in that goal setting process.
Therefore, when a controlling family’s willingness to retain family autonomy and
independence in the firm’s decision-making process is high, they will resist adopting formal
and participative goal setting processes in the family firm. This result is in line with prior
literature (Gomez-Mejia et al., 2011; Jorissen, Laveren, Maneemai, & Voordeckers, 2016;
Miller & Le Breton-Miller, 2014). These results are robust if we compare to the sample of

107
medium and large private family firms with controlling family ownership higher than 50%
(n=120).
4.3.2.7. The relationship between the renewal of family bonds through
dynastic succession SEW intention and management control mechanism
design
The renewal of family bonds through dynastic succession intention (FRFB) presents a
stronger and significantly positive association with both the formality as well as managers’
participation in management control mechanisms if we compare to FCI intention.
First, FRFB has a medium effect on goal setting formality (= 0.414, p < 0.01,
f2=0.172), and a small effect on performance evaluation formality (= 0.188, p < 0.05,
f2=0.031), whereby both results are statistically significant. These results suggest that a higher
level of formality might (i) reinforce the family’s vision and values in the firm, (ii) support the
knowledge transfer between different family generations, as well as between family managers
and nonfamily managers, (iii) and support the transparency of firm’s goals and performance,
which enhance the family firm chances to be sustainable in the long-term, from generation to
generation (Berrone, Cruz, & Gomez-Mejia, 2012; Giovannoni, Maraghini, & Riccaboni, 2011;
Gomez-Mejia et al., 2011; Suess-Reyes, 2016).
Second, the results indicate a statistically significant small effect of FRFB on manager’s
participation in goal setting (= 0.248 p < 0.01, f2=0.056) and performance evaluation (=
0.262, p < 0.01, f2=0.059). We argue that by providing managers the opportunity to participate
in goal setting and performance evaluation, the controlling family creates a sense of shared
knowledge and language in the firm and enhances the decisions made by the firm (Giovannoni
et al., 2011; Suess-Reyes, 2016), what is supported by the fact that the controlling family is
willing to transfer the firm to the next generations.
These conclusions are also supported with the 120 respondents’ sample and in model 2,
which confirm statistically the hypotheses H6a and H6b.
4.3.2.8. Control variables
Looking at the control variables in the theoretical model, we argue that family managers
might have a different perception of FCI and FRFB, and a higher perception of participation in
108
goal setting and performance evaluation processes, if compared to nonfamily managers. Family
managers might be involved in goal setting through family management control mechanisms
such as in relational mechanisms (Mustakallio, Autio, & Zahra, 2002). Additionally, we expect
that top managers (Tier 1) perceive a higher level of participation in goal setting and
performance evaluation because of their hierarchical level. Moreover, larger firms may have
higher levels of formality in goal setting and performance evaluation processes if compared to
medium sized family firms (Chenhall, 2003; Speckbacher & Wentges, 2012). Finally, we add
two controls for a family ability that are the presence of the founder in the business and the
family ownership generation (Chrisman, Chua, Pearson, & Barnett, 2012), in order to include
additional drivers of family heterogeneity in the model.
First, it seems coherent that hierarchical level control variable (Tier) has a positive sign
and is statisticaly significant associated with goal setting participation. Additionally, both size
and respondent's family status control variables were not statistically significant and brought
low changes in the structural coefficients, and no changes in the statistical significance
conclusions. We would expect size specially to be significantly correlated to formality which
in our model did not occur. Maybe because we focus just on medium and large firms that have
a high family ownership concentration, and where family distinctive characteristics may play a
more important role in determining the design of goal setting and performance evaluation in
the firm. The presence of the founder is positively related to the family intentions, and the first
generation ownership is negatively related to FCI and FRFB.
We introduce the MLMV variable to control for common method bias, which results
suggest that besides having a large effect size they do not alter as we have mentioned, the
interpretation of the results. In this sense, common method bias may not be a serious concern
in our models (Chin et al., 2013; Mahama & Cheng, 2013; Nitzl, 2016).

109
Table 23
Structural model (Model 1) – Part I
Just controls (n=152) (n=120) (n=152) β P Values f2 R2adj β P Values f2 R2adj β P Values f2 R2adj VIF FIO -> FCI H1(+) 0.044 0.596 0.002 0.123 0.197 0.011 0.046 0.175 1.07 founder -> FCI 0.392 0.000 0.157 0.146 0.367 0.000 0.143 0.374 0.000 0.149 1.18 generation -> FCI -0.158 0.060 0.027 -0.049 0.608 0.003 -0.126 0.117 0.018 1.13 size -> FCI -0.085 0.364 0.008 -0.088 0.325 0.008 -0.046 0.606 0.002 1.16 MLMV -> FCI 0.067 0.489 0.005 -0.042 0.670 0.002 0.055 0.545 0.004 1.01
FIO -> FRFB H2(+) 0.010 0.920 0.000 0.018 0.158 0.064 0.026 0.077 1.07 founder -> FRFB 0.204 0.009 0.039 0.066 0.176 0.043 0.029 0.180 0.020 0.031 1.18 generation -> FRFB -0.265 0.003 0.069 -0.166 0.101 0.028 -0.236 0.006 0.055 1.13 size -> FRFB -0.032 0.716 0.001 -0.067 0.466 0.004 0.003 0.977 0.000 1.16 MLMV -> FRFB 0.091 0.335 0.009 0.050 0.614 0.003 0.078 0.385 0.007 1.01
FCI -> pfamilyTMT H3(+) 0.410 0.000 0.192 0.239 0.431 0.000 0.224 0.284 1.19 founder -> pfamilyTMT 0.162 0.054 0.026 0.130 -0.025 0.774 0.001 -0.007 0.936 0.000 1.36 generation -> pfamilyTMT -0.063 0.447 0.004 -0.010 0.904 0.000 0.004 0.951 0.000 1.14 size -> pfamilyTMT -0.317 0.006 0.106 -0.261 0.001 0.087 -0.281 0.012 0.101 1.12
FCI -> familyCEO H3(+) 0.277 0.001 0.081 0.171 0.317 0.000 0.106 0.180 1.19 founder -> familyCEO 0.270 0.002 0.070 0.099 0.157 0.067 0.024 0.146 0.096 0.020 1.36 generation -> familyCEO -0.035 0.646 0.001 0.028 0.716 0.001 0.015 0.833 0.000 1.14 size -> familyCEO -0.160 0.049 0.026 -0.178 0.002 0.037 -0.134 0.112 0.020 1.12
pfamilyTMT -> GS_form H4a(-) -0.078 0.379 0.006 0.243 -0.134 0.134 0.016 0.264 1.64 familyCEO -> GS_form H4a(-) -0.035 0.655 0.001 -0.031 0.669 0.001 1.41 FCI -> GS_form H5a(-) -0.265 0.014 0.062 -0.243 0.017 0.047 1.79 FRFB -> GS_form H6a(+) 0.408 0.000 0.184 0.414 0.000 0.172 1.41 size -> GS_form 0.177 0.053 0.037 0.135 0.113 0.233 0.015 0.095 0.283 0.011 1.16 MLMV -> GS_form 0.331 0.008 0.128 0.279 0.051 0.104 0.319 0.004 0.139 1.04

110
Table 23
Structural model (Model 1) – Part II
Just controls (n=152) (n=120) (n=152) β P Values f2 R2adj β P Values f2 R2adj β P Values f2 R2adj VIF pfamilyTMT -> PE_form H4a(-) -0.124 0.233 0.013 0.149 -0.098 0.325 0.007 0.147 1.64 familyCEO -> PE_form H4a(-) 0.076 0.410 0.005 0.033 0.692 0.001 1.41 FCI -> PE_form H5a(-) -0.012 0.910 0.000 0.030 0.760 0.001 1.79 FRFB -> PE_form H6a(+) 0.176 0.058 0.030 0.188 0.034 0.031 1.41 size -> PE_form 0.108 0.211 0.014 0.130 0.085 0.386 0.008 0.093 0.343 0.009 1.16 MLMV -> PE_form 0.355 0.013 0.146 0.382 0.059 0.174 0.343 0.009 0.138 1.04
pfamilyTMT -> GS_part H4b(-) 0.108 0.266 0.011 0.209 0.088 0.332 0.006 0.196 1.57 familyCEO -> GS_part H4b(-) -0.088 0.320 0.008 -0.092 0.251 0.008 1.42 FCI -> GS_part H5b(-) -0.317 0.002 0.085 -0.295 0.003 0.063 1.80 FRFB -> GS_part H6b(+) 0.223 0.031 0.053 0.248 0.007 0.056 1.42 family -> GS_part 0.090 0.190 0.008 0.143 0.054 0.506 0.003 0.089 0.192 0.008 1.29 tier -> GS_part 0.190 0.007 0.036 0.278 0.000 0.088 0.221 0.002 0.053 1.20 MLMV -> GS_part 0.299 0.028 0.104 0.268 0.097 0.092 0.279 0.020 0.096 1.06
pfamilyTMT -> PE_part H4b(-) -0.099 0.328 0.009 0.141 -0.106 0.245 0.009 0.134 1.57 familyCEO -> PE_part H4b(-) -0.008 0.927 0.000 -0.002 0.981 0.000 1.42 FCI -> PE_part H5b(-) -0.162 0.146 0.021 -0.101 0.319 0.007 1.80 FRFB -> PE_part H6b(+) 0.217 0.031 0.046 0.262 0.004 0.059 1.42 family -> PE_part 0.119 0.164 0.013 0.098 0.077 0.494 0.006 0.128 0.132 0.015 1.29 tier -> PE_part -0.032 0.698 0.001 0.020 0.827 0.000 -0.009 0.910 0.000 1.20 MLMV -> PE_part 0.305 0.023 0.103 0.332 0.072 0.130 0.290 0.017 0.097 1.06
Note 1: Classification of Cohen (1988): small effect (f² = 0.02), medium effect (f² = 0.15) and large effect (f² = 0.35). Note 2: FIO (Family Involvement in Ownership), FCI (Family Control and Influence), FRFB (Renewal of family bonds), Family Involvement in Management (FIM), which is treated as pfamilyTMT (the percentage of family managers in the Top Management Team) and as familyCEO (that indicates if a family manager is the CEO of the firm). Management control mechanisms design variables are participation in goal setting (GS_part), participation in performance evaluation (PE_part), formality in goal setting (GS_form) and formality in performance evaluation (PE_form). Note 3: We used the following control variables in the model. Family indicates that if the respondent is a founder, family manager or nonfamily manager (family affiliation). Tier relates to the hierarchical level (Tier 1 are those managers that report directly to shareholders, CEO or does not have superior in the firm). Founder indicates if the founder manages the firm. Generation indicates if the organization has experienced at least a transfer of shares from the first generation to the next. Size indicates if the organization is a large (more than 300 employees) or medium firm (between 50 and 300 employees). MLMV is the variable used to control for common method bias.

111
Table 24
Structural model (Model 2) – Interaction FIM and FamilyCEO – Part I
(n= 120) (n= 152) β P Values f2 R2adj β P Values f2 R2adj VIF FIO -> FCI H1(+) 0.045 0.591 0.002 0.12 0.194 0.013 0.044 0.17 1.07 founder -> FCI 0.366 0.000 0.142 0.374 0.000 0.148 1.18 generation -> FCI -0.046 0.612 0.002 -0.123 0.13 0.017 1.13 size -> FCI -0.081 0.391 0.007 -0.047 0.59 0.002 1.16 MLMV -> FCI -0.042 0.67 0.002 0.055 0.52 0.004 1.01
FIO -> FRFB H2(+) 0.01 0.917 0.000 0.02 0.157 0.063 0.026 0.08 1.07 founder -> FRFB 0.176 0.048 0.029 0.179 0.022 0.031 1.18 generation -> FRFB -0.166 0.102 0.028 -0.236 0.007 0.055 1.13 size -> FRFB -0.067 0.441 0.004 -0.001 0.993 0.000 1.16 MLMV -> FRFB 0.05 0.608 0.003 0.078 0.392 0.007 1.01
FCI -> FIM_familyCEO H3(+) 0.453 0.000 0.248 0.28 0.446 0.000 0.246 0.30 1.19 founder -> FIM_familyCEO -0.009 0.922 0.000 0.018 0.819 0.000 1.35 generation -> FIM_familyCEO -0.023 0.756 0.001 0.002 0.983 0.000 1.14 size -> FIM_familyCEO -0.247 0.002 0.082 -0.27 0.012 0.096 1.12
FIM_familyCEO -> GS_form H4a(-) -0.086 0.358 0.007 -0.138 0.098 0.018 1.48 FCI -> GS_form H5a(-) -0.266 0.016 0.061 0.25 -0.245 0.014 0.048 0.27 1.78 FRFB -> GS_form H6a(+) 0.402 0.000 0.180 0.407 0.000 0.166 1.4 size -> GS_form 0.121 0.180 0.018 0.098 0.268 0.012 1.15 MLMV -> GS_form 0.279 0.061 0.107 0.318 0.005 0.141 1.02
Note 1: Classification of Cohen (1988): small effect (f² = 0.02), medium effect (f² = 0.15) and large effect (f² = 0.35). Note 2: FIO (Family Involvement in Ownership), FCI (Family Control and Influence), FRFB (Renewal of family bonds), FIM_familyCEO (interaction between the percentage of family managers in the Top Management Team and Family CEO variable). Management control mechanisms design variables are participation in goal setting (GS_part), participation in performance evaluation (PE_part), formality in goal setting (GS_form) and formality in performance evaluation (PE_form). Note 3: We used the following control variables in the model. Family indicates that if the respondent is a founder, family manager or nonfamily manager (family affiliation). Tier relates to the hierarchical level (Tier 1 are those managers that report directly to shareholders, CEO or does not have superior in the firm). Founder indicates if the founder manages the firm. Generation indicates if the organization has experienced at least a transfer of shares from the first generation to the next. Size indicates if the organization is a large (more than 300 employees) or medium firm (between 50 and 300 employees). MLMV is the variable used to control for common method bias.

112
Table 24
Structural model (Model 2) – Interaction FIM and FamilyCEO – Part II
(n= 120) (n= 152)
β P Values f2 R2adj β P Values f2 R2adj VIF
FIM_familyCEO -> PE_form H4a(-) -0.041 0.692 0.001 0.15 -0.029 0.747 0.001 0.15 1.48 FCI -> PE_form H5a(-) -0.015 0.892 0.000 0.018 0.845 0.000 1.78 FRFB -> PE_form H6a(+) 0.178 0.058 0.031 0.185 0.036 0.03 1.40 size -> PE_form 0.093 0.339 0.009 0.107 0.272 0.012 1.15 MLMV -> PE_form 0.368 0.074 0.164 0.335 0.015 0.134 1.02
FIM_familyCEO -> GS_part H4b(-) 0.112 0.173 0.013 0.22 0.082 0.302 0.006 0.20 1.42 FCI -> GS_part H5b(-) -0.354 0.001 0.104 -0.332 0.001 0.080 1.79 FRFB -> GS_part H6b(+) 0.221 0.021 0.052 0.253 0.010 0.059 1.41 family -> GS_part 0.042 0.607 0.002 0.078 0.244 0.006 1.29 tier -> GS_part 0.278 0.000 0.088 0.215 0.001 0.050 1.19 MLMV -> GS_part 0.286 0.091 0.108 0.293 0.026 0.108 1.03
FIM_familyCEO -> PE_part H4b(-) -0.069 0.457 0.004 0.15 -0.078 0.358 0.005 0.14 1.42 FCI -> PE_part H5b(-) -0.180 0.123 0.025 -0.114 0.281 0.009 1.79 FRFB -> PE_part H6b(+) 0.217 0.023 0.046 0.262 0.003 0.059 1.41 family -> PE_part 0.074 0.521 0.006 0.123 0.14 0.014 1.29 tier -> PE_part 0.018 0.850 0.000 -0.011 0.890 0.000 1.19 MLMV -> PE_part 0.330 0.080 0.131 0.289 0.022 0.097 1.03
Note: Classification of Cohen (1988): small effect (f² = 0.02), medium effect (f² = 0.15) and large effect (f² = 0.35). Note 2: FIO (Family Involvement in Ownership), FCI (Family Control and Influence), FRFB (Renewal of family bonds), FIM_familyCEO (indicates the interaction between percentage of family managers in the Top Management Team and Family CEO variable). Management control mechanisms design variables are participation in goal setting (GS_part), participation in performance evaluation (PE_part), formality in goal setting (GS_form) and formality in performance evaluation (PE_form). Note 3: We used the following control variables in the model. Family indicates that if the respondent is a founder, family manager or nonfamily manager (family affiliation). Tier relates to the hierarchical level (Tier 1 are those managers that report directly to shareholders, CEO or does not have superior in the firm). Founder indicates if the founder manages the firm. Generation indicates if the organization has experienced at least a transfer of shares from the first generation to the next. Size indicates if the organization is a large (more than 300 employees) or medium firm (between 50 and 300 employees). MLMV is the variable used to control for common method bias.

113
Figure 8. Structural model – Model 1 Note: These results are based on the 152 respondents’ sample.
Figure 9. Structural model (Interaction pfamilyTMT and FamilyCEO) – Model 2 Note: These results are based on the 152 respondents’ sample.
Family control and influence
Renewal of family bonds
through dynastic succession
Family involvement in ownership
Formality- Goal setting;- Performance
evaluation
Participation- Goal setting;- Performance
evaluation
Management control mechanisms design
characteristics
Percentage family TMT
Family’s willingness: Socioemotional wealth
intentions
Family’s ability
p< 0.01***p<0,05**p<0.10*N= 152
------- No significant relationship
0.197**
0.158*
0.414***-> GS_form0.188**-> PE_form0.248***-> GS_part0.262***-> PE_part
-0.243***-> GS_form-0.295***-> GS_part
Family CEO
0.317***0.431***
Family control and influence
Renewal of family bonds
through dynastic succession
Family involvement in
ownership
Formality- Goal setting;- Performance
evaluation
Participation- Goal setting;- Performance
evaluation
Management control mechanisms design
characteristics
FIM_ FamilyCEO
Family’s willingness: Socioemotional wealth
intentions
Family’s ability
p< 0.01***p<0,05**p<0.10*N= 152
------- No significant relationship
0.194**
0.157*
0.407***-> GS_form0.185**-> PE_form0.253***-> GS_part0.262***-> PE_part
-0.245***-> GS_form-0.332***-> GS_part
-0.138*-> GS_form
0.446***

114
4.4. Conclusions
This study discusses the association of a controlling family’s ability and willingness to
influence the firm (Chrisman et al., 2015; De Massis et al., 2014; Veider & Matzler, 2016) with
the design of management control mechanisms (Helsen, Lybaert, Steijvers, Orens, & Dekker,
2017; Songini & Gnan, 2015; Speckbacher & Wentges, 2012). Different from previous
literature, we have considered both elements of a controlling family’s influence in the family
firm which are family ability and willingness.
Despite previous literature has been proposing that family ability variables are
associated with management control mechanisms design (e.g., Speckbacher & Wentges, 2012),
this paper provides insights about how the controlling family’s willingness to maintain their
autonomy over the firm’s decisions and the controlling family intention to transfer the firm to
the next generations are significantly associated with management control mechanisms design
(Berrone et al., 2012; Gomez-Mejia et al., 2011) and have more explanatory power than the
family ability elements. These results suggest that the dimensions of socioemotional wealth that
are related to a controlling family firm’s willingness, are independent and differently related to
management control mechanisms design. These issues were addressed regarding earnings
management and voluntary disclosure (Gómez Mejía, Cruz, & Imperatore, 2014) and in our
study for management control mechanisms design. In this sense, we propose that the SEW sub
dimensions, being the intention to control and the intention to transfer the firm to the next
generation, should be treated separated as each has an opposite association with formality and
participation in management control mechanisms in the family businesses.
Particularly, our results indicate a significant association between the controlling
family’s involvement in ownership and a family willingness dimensions. Consistent with our
hypotheses we point that the higher the family ownership, the more emphasis the controlling
family puts on power and legitimacy to pursue family centric noneconomic (FCNE) goals being
to maintain the family autonomy in the firm’s decision-making and to transfer the firm to the
next generations (Chrisman et al., 2012; Gomez-Mejia et al., 2011; Sundaramurthy & Kreiner,
2008). Additionally, we show that the nomination of family members to occupy Top
Management Team positions or the CEO position are driven by a high family willingness
intention to maintain their autonomy and independence over the firm’s decisions (Berrone et
al., 2012; Vandekerkhof, Steijvers, Hendriks, & Voordeckers, 2015).
Furthermore, we have not found a statisticaly significant association between family
involvement in management and management control mechanisms design. This result shows

115
that family involvement in management may not play a direct role in the design of management
control systems which was frequently suggested by previous empirical research, usually based
on the agency insights (Helsen et al., 2017; Hiebl et al., 2015; Speckbacher & Wentges, 2012)
and only including family ability variables in the research design. These results point to the fact
that a controlling family’s influence on the level of formality and manager’s participation in
management control mechanisms might be more complex than captured by the family’s ability
(De Massis et al., 2014).
Therefore, our results indicate that management control mechanisms might have wider
purposes in organizations, beyond the traditional agency theory monitoring and incentive
functions. Management control mechanisms, in the umbrella of MCS and PMS, can also be
adopted to balance effectiveness and innovation in the firm, by fostering transparency,
flexibility, knowledge transfer among other outcomes related to a firm’s capabilities (Ahrens
& Chapman, 2004; Kruis, Speklé, & Widener, 2016; Simons, 1995).
The traditional agency perspective of controls has been sufficient to explain how a
family’s ability is associated to the design of controls in family firms. However, we argue that
this reasoning isn’t sufficient when we look at the willingness construct, where the other roles
of management control mechanisms might offer lens to interpret how a controlling family’s
willigness is associated with management control mechanisms. In fact, we argue that a
controlling family’s willingness, as their disposition to engage in distinctive behavior (De
Massis et al., 2014), might explain better how management control mechanisms are designed
in family firms, which we investigate based on the ability and willingness lens.
On one side, our results indicate that the family control and influence intention may be
related to a restrictive socioemotional wealth (Kellermanns, Eddleston, & Zellweger, 2012;
Miller & Le Breton-Miller, 2014) where a negative valence leads to a less formal and
participative goal setting process. FCI intention, consistent with our hypothesis, is related to
lower participation of managers in goal setting and also limits the adoption of formalized goal
setting because this is seen as threat to family members authority and dominance over business
decisions (Barnett & Kellermanns, 2006; Gomez-Mejia et al., 2011; Miller & Le Breton-Miller,
2014).
On the other side, our results suggest that the renewal of family bonds through dynastic
succession intention might a relevant determinant of management control mechanisms’ design
in family firms. A high intention to transfer the firm to the next generation lead to a higher
participation and formality in both goal setting and performance evaluation processes. These
results are consistent with previous studies that indicate that formal and participative

116
management control mechanisms reinforce the family’s values in the firm, support the
knowledge transfer and transparency which is preferred if the controlling family is willing to
transfer the firm to the next generations (Giovannoni et al., 2011; Gomez-Mejia et al., 2011;
Suess-Reyes, 2016).
Despite these findings, this study has some limitations. This study was developed based
on a cross-sectional survey design in which common method variance is an usual concern
(Podsakoff, MacKenzie, Lee, & Podsakoff, 2003; Podsakoff, MacKenzie, & Podsakoff, 2012).
We adopted many recommendations from Podsakoff et al. (2012) and Dillman (2007) to
minimize this concern, for example, we: (i) assured the confidentiality to respondents, (ii)
analysed the wording of our measures and developed a pre-test with a founder, a heir and
managers that were our target respondents in the firms, (iii) adopted measures that were
previous validated in studies from the family firm and management accounting field, (iv)
diagnosed common method bias by applying Harman test (Podsakoff, MacKenzie, et al., 2012),
(v) and added a common method variance control variable in the model (Chin et al., 2013; Nitzl,
2016). Moreover, a traditional limitation in cross-sectional design is the difficulty in making
causal interpretations of the results (Ittner, 2014; Van der Stede, 2014). With regards to the
sample, our sample is considered sufficient for Structural Equation Modeling in SmartPLS (see
methodology section – Nitzl, 2016). Our sample comprises many Brazilian regions, family
firms sizes, and industries, but especially firms from the most developed Brazilian Federation
States regarding Gross Domestic Product (GDP) such as Southeast and South regions. Our
sample also has a predominance of manufacturing firms.
Finally, we highlight some suggestions for future studies. First, we suggest that while
investigating distinctive behavior and management control mechanisms in family firms,
researchers should integrate both ability and willingness dimensions such as argued by De
Massis et al. (2014). We also consider that the socioemotional wealth theoretical lens is fruitful
and offers many possibilities to researchers (Berrone et al., 2012; Gomez-Mejia et al., 2011)
especially in management accounting research (Songini et al., 2013; Helsen et al., 2017). There
are specific SEW dimensions that could offer a different perspective to understand how
management control mechanisms are designed and used in family firms (Berrone et al., 2012;
Chua, Chrisman, & De Massis, 2015; Debicki, Kellermanns, Chrisman, Pearson, & Spencer,
2016; Hauck, Suess-Reyes, Beck, Prügl, & Frank, 2016; Schulze & Kellermanns, 2015). We
have adopted two sub dimensions discussed by Berrone’s et al. (2012) FIBER model, which
are in line with the willingness lens on family firms since each decision premise hold a high
level of complexity that should be treated separated (Chua et al., 2015). We suggest that

117
socioemotional wealth has many facets that should be debated with due caution regarding their
association with management control mechanisms design or organizational behavior.
Second, we have looked at goal setting and performance evaluation processes that are
considered relevant mechanisms of the firm Performance Measurement Systems (PMS)
regarding planning and evaluating mechanisms (Ferreira & Otley, 2009; Malmi & Brown,
2008; Merchant & Van der Stede, 2007). Future studies could look at other mechanisms such
as rewarding or budgeting (Bedford & Malmi, 2015; Sponem & Lambert, 2016), or employ a
more complex perspective suggested by Malmi and Brown (2008) investiganting Management
Control Systems as a package (Grabner & Moers, 2013).
Future studies could adopt a qualitative methodology to investigate these associations
with greater depth and detail (e.g., Giovannoni et al., 2011). It seems that a controlling family’s
willingness to preserve the firm toward generations influences organizational behaviour and
management control mechanisms in family firms which deserves further in depth investigation.

118

119
5. STUDY 2: MANAGEMENT CONTROL MECHANISMS’ FAIR DESIGN AND
PROCEDURAL JUSTICE AS ANTECEDENTS OF STEWARDSHIP IN FAMILY
FIRMS
5.1. Introduction
Agency theory and stewardship theory have opposing views about the role of
governance mechanisms in organizations (Davis, Schoorman, & Donaldson, 1997; Donaldson
& Davis, 1991). The reason for this distinction arises from the underlying assumptions related
to the model of man. While for agency theory, managers are economically rational and self-
interested, for stewardship theory, they are pro-social and intrinsically motivated to support the
principals’ interests (Davis et al., 1997; Donaldson & Davis, 1991). Stewards are motivated by
intrinsic rewards such as reciprocity while agents are by extrinsic rewards such as financial
incentives.
These basic assumptions for agents and stewards lead to different individual’s and
firm’s characteristics (Davis et al., 1997), which can be explained by psychological mechanisms
(motivation, power, identification, and social comparison) and situational mechanisms
(management philosophy and cultural differences). Psychological are individual level
characteristics, and situational mechanisms are related to the governance mechanisms of the
organization (Davis et al., 1997; Neubaum, Thomas, Dibrell, & Craig, 2017).
Agency theory has focused on the role of control and monitoring mechanisms in
aligning agents and principals’ behaviors in a firm (Eisenhardt, 1989; Holt, Madison, &
Kellermanns, 2016; Jensen & Meckling, 1976). However, according to the stewardship theory,
traditional agency mechanisms should be replaced by informal and social controls, since there
is no need to align principals and agents’ interests (Davis, Allen, & Hayes, 2010; Davis et al.,
1997; Hernandez, 2012; Neubaum et al., 2017). In this sense, the stewardship theory offers a
competing paradigm to the agency theory (Davis et al., 1997; Donaldson & Davis, 1991), by
providing an alternative lens to the agency theory’s “anti-management view” to explain human
behavior (Donaldson, 2008).
Both theories have also been studied in the field of family firms (Corbetta & Salvato,
2004; James, Jennings, & Jennings, 2017; Madison, Holt, Kellermanns, & Ranft, 2016;
Madison, Kellermanns, & Munyon, 2017; Neubaum et al., 2017). According to the family
business literature, stewardship is considered to be a distinctive feature of family firms that may
lead to a competitive advantage to the family firm in comparison to nonfamily firms (Corbetta

120
& Salvato, 2004; Eddleston & Kellermanns, 2007; Simon, Marquès, Bikfalvi, & Dolors Muñoz,
2012; Zahra, Hayton, Neubaum, Dibrell, & Craig, 2008).
One reason is that family firms are family owned and family managed whereby
principal-agent problems are avoided (Jensen & Meckling, 1976). According to Jensen and
Meckling (1976), owner-managed firms do not incur in traditional agency costs. Second, family
members are bounded by social ties, organizational identification, and emotional attachment
(Berrone, Cruz, & Gomez-Mejia, 2012; Davis et al., 2010; Gómez-Mejía, Haynes, Núñez-
Nickel, Jacobson, & Moyano-Fuentes, 2007; Le Breton-Miller, Miller, & Lester, 2011). In these
firms, the values of altruism, collectivism, and trust, may be more present than in nonfamily
firms (Corbetta & Salvato, 2004; Simon et al., 2012) which foster manager’s efforts to achieve
a better performance in the organization.
Particularly, previous studies have also considered that a manager’s family affiliation is
a relevant attribute to determine manager’s behavior, in which family managers are argued to
act as stewards and nonfamily managers as agents (Chrisman, Chua, Kellermanns, & Chang,
2007; James et al., 2017; Verbeke & Kano, 2012). Family managers are expected to present
more loyalty, devotion (Donaldson, 1990), trust and pro-organizational behavior towards the
family firm than nonfamily managers (Corbetta & Salvato, 2004; Davis, et al., 2010; Verbeke
& Kano, 2012). Although these assumptions and previous empirical evidence, researchers
claim that it is still an open debate in the field ( Hiebl, 2015; James et al., 2017; Madison et al.,
2016).
Neubaum et al. (2017) point that the antecedents of stewardship in the family firm
context are largely conjecture, which indicates that more empirical evidence is needed to
address this issue. Therefore, consistent with Davis et al. (1997), we argue that the
organizational structure and management control mechanisms applied in the family firms
influence managers’ attitudes and behaviors. We argue that management control practices and
managers’ perceptions of these practices might stimulate stewardship attitudes and behaviors if
aligned with procedural justice principles (Lubatkin, Ling, & Schulze, 2007). This is consistent
with the understanding that stewardship behavior also stems from the social context of the
organization (Davis et al., 2010; Davis et al., 1997; Simon et al., 2012), as well as management
practices (Henssen, Voordeckers, Lambrechts, & Koiranen, 2014; Hernandez, 2012; James et
al., 2017; Simon et al., 2012).
The traditional theorists of stewardship claim that social and trust controls may be more
suitable to maximize stewardship since there is no need for aligning managers’ behaviors
(Davis et al., 2010, 1997; Madison et al., 2016). Monitoring systems and financial controls are

121
effective for aligning behaviors between principals and agents (Davis et al., 2010; Madison et
al., 2016; Tosi, Brownlee, Silva, & Katz, 2003), however, are not necessary for aligning
stewards and principal’s interests. Hence, these authors also emphasize that conventional
agency governance mechanisms may be detrimental to the benefits of stewardship (James et
al., 2017; Madison et al., 2016).
However, we study whether typical agency mechanisms, such as goal setting and
performance evaluation, can also be considered as situational mechanisms to stimulate
stewardship identification and a stewardship-oriented culture in the family firm, depending on
how these mechanisms are designed. We rely hereby on the concept of fairness, which is
investigated in the management accounting literature in relation to management control’s
design (Hartmann & Slapničar, 2009, 2012; Langevin & Mendoza, 2013). Therefore, in contrast
to the traditional scholars from the stewardship literature, we propose that management control
mechanisms can foster stewardship identification and culture in the family firm, when managers
perceive them as fair (Lubatkin et al., 2007), regardless manager’s family affiliation (James et
al., 2017).
There are some theoretical arguments that procedural justice and stewardship are
positively associated (Neubaum et al., 2017; Pieper, 2010), but the relationship still lacks
empirical evidence. We consider, in line with Davis et al. (1997), management control
mechanisms design and how a manager perceives these management control mechanisms as
situational mechanisms influencing stewardship in the family firm. As management control
mechanisms, we interpret those practices previously discussed in the Management Control
Systems (Malmi & Brown, 2008) and Performance Measurement Systems (Ferreira & Otley,
2009), such as goal setting and performance evaluation.
With respect to stewardship, we look at both organizational and individual levels of
stewardship, which the literature named respectively, stewardship-oriented culture (Zahra et al.,
2008) and stewardship identification (Craig, Dibrell, & Neubaum, 2011; Neubaum et al., 2017).
Stewardship-oriented culture reflects the organizational and cultural conditions within the
organization and stewardship identification indicates the manager’s sense of membership on
the family firm despite his or her family affiliation (Neubaum et al., 2017; Zahra et al., 2008).
We examine whether management control mechanisms design in the context of family
firms are related to stewardship through procedural justice perceptions. Therefore, we propose
the following research question: Are management control mechanisms’ fair design and
procedural justice perceptions associated with manager’s stewardship identification and
with a stewardship-oriented culture in family firms?

122
First, our study contributes to the literature by providing a discussion about stewardship
situational mechanisms, which has received scarce attention in the management literature
(Hernandez, 2012) and in the family firm literature so far (Davis et al., 2010; James et al., 2017;
Madison et al., 2016; Madison et al., 2017; Neubaum et al., 2017). Particularly, Hernandez
(2012, p. 173) argue that researchers should examine the “antecedents that facilitate and
explain the emergence of stewardship behaviors” in which are included organizational-level
mechanisms, such as management control mechanisms. Our study also shows empirical
evidence that management control mechanisms’ fairness characteristics and procedural justice
can be considered antecedents of stewardship, which has not been discussed previously in the
literature, except from a theoretical perspective (Neubaum et al., 2017; Pieper, 2010).
Recently, James et al. (2017) provide empirical evidence that stewardship-type
management control mechanisms are positively associated with pro-organizational behaviors
and attitudes such as job performance and organizational identification, regardless managers’
family affiliation. James et al. (2017) did not consider a specific steward-type management
control mechanism, but rested their discussion in terms of the sense of autonomy, belonging
and competence that the controlling family provides to managers in the family firm. These
authors also found that agency management control mechanisms (performance-based pay, share
ownership, and monitoring by family managers) were not strongly associated with pro-
organizational attitudes and behaviors. In the present study we show that traditional agency
mechanisms such as goal setting and performance evaluation are positively associated with
stewardship-oriented culture and identification when they are perceived as fair. Therefore, we
refer to the discussion on the procedural justice literature (Hartmann & Slapničar, 2012;
Langevin & Mendoza, 2013; Leventhal, Karuza, & Fry, 1980; Lubatkin et al., 2007).
In this sense, we address a gap in the literature on procedural justice in family firms, by
also focusing on family and nonfamily managers’ perceptions and attitudes (Sieger, Bernhard,
& Frey, 2011). Procedural justice is considered a topic of interest in management accounting,
with much research potential (Hartmann & Slapničar, 2012; Langevin & Mendoza, 2013),
particularly in the family firms literature (Barnett & Kellermanns, 2006; Lubatkin et al., 2007;
Pieper, 2010; Van der Heyden, Blondel, & Carlock, 2005). Family firms experience complex
relationships related to the multiple subsystems that influence decisions in the firm, which have
implications over manager’s perceptions about management controls fairness (Sieger et al.,
2011; Van der Heyden et al., 2005).
Particularly, our results show that higher levels of participation and and higher levels of
formality of goal setting and performance evaluation are positively related to procedural justice,
123
which is consistent with prior studies in the management accounting literature (Bellavance,
Landry, & Schiehll, 2013; Hartmann & Slapničar, 2009, 2012; Langevin & Mendoza, 2013).
Additionally, formality and participation in goal setting are positively associated with a
stewardship-oriented culture. With respect to the relationship between performance evaluation
design characteristics and stewardship-oriented culture, no significant association was found.
In addition, the results show that procedural justice in goal setting is positively
associated with both individual and organizational level constructs of stewardship. When we
analyze the stewardship attitude of the individual, our findings indicate a positive association
between participation in both goal setting and performance evaluation with stewardship
identification (De Baerdemaeker & Bruggeman, 2015; Henssen et al., 2014; Hernandez, 2012).
Therefore, our findings support that management control mechanisms, particularly the goal
setting process, when it is designed based on the fairness design characteristics, is a relevant
antecedent for stewardship in family firms (Hernandez, 2012).
These results are distinct when we analyze the subsamples of family and nonfamily
managers. While for nonfamily managers, formality influences stewardship-oriented culture,
for family managers it is the participation in goal setting, which influences a stewardship-
oriented culture. As hypothesized by James et al. (2017) a family affiliation might be an
important attribute that differentiates manager’s perceptions about management control
mechanisms (Corbetta & Salvato, 2004; Davis et al., 2010; Verbeke & Kano, 2012). Since
family affiliation seems to be an important factor that differentiates managers’ level of
agreement with procedural justice and stewardship identification indicators, we focused in this
study on differences between the two groups. However, we could not discuss about the
differences between the relationship’s coefficients in the multigroup analyses, to the analysis
parameters and sample size.
Finally, our study shows practitioners that traditional agency mechanisms can foster
stewardship in family firms depending on how they are designed, highlighting on which design
characteristics they should focus to develop and support a stewardship-oriented culture and
stewardship identification in their organization (Davis et al., 2010; James et al., 2017; Madison
et al., 2016). Our study strengthens the debate that the procedural justice lens may provide a
complementary theoretical background to interpret stewardship management control
mechanisms in family firms (Lubatkin et al., 2007; Madison et al., 2016, 2017; Neubaum et al.,
2017).

124
5.2. Theoretical model and hypotheses
Our theoretical model focuses on situational mechanisms that might influence
stewardship in family firms and investigates whether traditional agency mechanisms, often
installed to align nonfamily manager’s behavior with the objectives of the family owners in
family firms, also create a stewardship-like attitude and culture. Specifically, we study how
design characteristics of management control mechanisms with respect to the level of
participation and the level of formality in goal setting and performance evaluation foster
stewardship identification and stewardship-oriented culture, and whether this relationship is
mediated by procedural justice perceptions. We adopt the following research model to test these
relationships (Figure 10).
Figure 10. Theoretical research model – paper 2
Our model considers two design characteristics of management control mechanisms that
are said to influence human’s perceptions and behavior. Previous literature in management
accounting provides insights that participation and formality are antecedents of procedural
justice (Cugueró-Escofet & Rosanas, 2013; Hartmann & Slapničar, 2009, 2012; Langevin &
Mendoza, 2013; Libby, 1999). There is evidence in the family business literature that those
management control mechanisms design characteristics (being participation and formality in
goal setting and performance evaluation) might also be associated with stewardship (Davis et
al. 1997; Henssen et al., 2014; Hernandez, 2012; Madison et al., 2016; Neubaum et al., 2017;
Pearson & Marler, 2010; Simon et al., 2012).
Participation indicates the “involvement of employees in and their influence over” the
firm’s decisions (Anthony & Govindarajan, 2007, p. 10) which in our study relates to manager’s
Participation- Goal setting;- Performance
evaluation
Formality- Goal setting;- Performance
evaluation
Management control mechanisms fairness
design
Procedural justice- Goal setting;- Performance
evaluation
Stewardship-oriented culture
Stewardship identification
Stewardship

125
ability to exert some influence in the goal setting and performance evaluation process
(Brownell, 1982; De Baerdemaeker & Bruggeman, 2015). In the procedural justice literature,
the concept of participation is broader and is interpreted as the expression of voice, indicating
if the “manager believes his/her views have been given consideration” (Langevin & Mendoza,
2013, p. 213). Hartmann and Slapnicar (2012, p. 20), following Moers (2005) define formality
as “the amount of objectivity (rather than subjectivity)” in the firm's management processes,
such as applied in goal setting and performance evaluation.
In addition, we consider management processes that have been explored previously in
the stewardship literature (Hernandez, 2012). We define goal setting as the financial and
nonfinancial goals to be pursued by the firm in a 12-month time-horizon and performance
evaluation as both the individual or/and organizational performance evaluation. These
processes play a vital role in the firm’s Performance Measurement Systems (PMS) regarding
planning and evaluating mechanisms (Ferreira & Otley, 2009; Malmi & Brown, 2008; Otley,
1999).
Additionally, we discuss procedural justice as a mediating variable, segregating these
perceptions specifically to each management process, such as modeled by previous studies
(Hartmann & Slapničar, 2009; Voußem, Kramer, & Schäffer, 2016). This is justified since
procedural justice normative criteria might not be straightforward for all management control
mechanisms and firm’s contexts (Hartmann & Slapničar, 2012). Procedural justice is defined
as “an individual’s perception of the fairness of procedural components of the social system”
(Leventhal, Karuza, & Fry, 1980, p. 35).
Finally, our dependent variables cover both the organizational and the individual level
constructs of stewardship, respectively named as stewardship-oriented culture and stewardship
identification (Craig et al., 2011; James et al., 2017; Neubaum et al., 2017; Zahra et al., 2008).
Following Zahra et al. (2008) stewardship-oriented culture is defined as “the degree to which a
stewardship culture exists within the family firm” (Zahra et al., 2008, p. 1042). The stewardship-
oriented culture concept explores the notions of autonomy, belonging and competence of
managers (James et al., 2017). Stewardship identification is an individual level construct,
which according to Davis et al. (1997, p. 29), is defined as managers seeing themselves
members of an organization, “by accepting the organization’s mission, vision, and objectives.”
Stewardship identification was previously conceptualized as one of the key elements of
stewardship (Davis et al., 1997; Neubaum et al., 2017). Recently, Madison et al. (2017)
operationalized stewardship behavior as manager’s identification and commitment.

126
In the next subsections, we discuss the underlying hypotheses of this model, which are
supported by the literature. The overall model includes four main hypotheses and an additional
hypothesis for the mediating role of procedural justice.
5.2.1. Management control mechanisms’ fair design and procedural justice
perceptions
Langevin and Mendoza (2013, p. 213) argue that “MCS undoubtedly have a major
impact on managers’ perception of justice (or injustice)” since it includes procedures such as
goal setting and performance evaluation that are expected to influence managers’ attitudes and
behaviors toward the organization (Anthony & Govindarajan, 2007; Merchant & Van der Stede,
2007). Colquitt and Jackson (2006) proposed that fairness characteristics should embrace all
decision-making process since they are related to pro-organizational outcomes.
We discuss participation and formality as process characteristics that are associated
positively with procedural justice (Hartmann & Slapničar, 2009, 2012). These features have
been seen as consistent with procedural justice norms (Colquitt, Conlon, Wesson, Porter, & Ng,
2001; Hartmann & Slapničar, 2009; Langevin & Mendoza, 2013; Leventhal et al., 1980; Van
der Heyden, Blondel, & Carlock, 2005).
Participation is likely to increase procedural justice perceptions since participation
relates to the traditional components of procedural justice (normative rules) such as accuracy,
correctability, representativeness, and ethicality (Folger & Greenberg, 1985; Leventhal et al.,
1980; Thibaut & Walker, 1975). Following Langevin and Mendoza (2013, p. 214) participation:
(i) serves as a means of communication, improving the exchange of information between
managers and superiors (accuracy); (ii) enables managers to express their complaints and to
correct actions and plans (correctability); (iii) allows managers to express their concerns and
values (representativeness); (iv) is consistent with moral values as individuals engage in
organizational activities (ethicality).
Therefore, participation is in line with the components of procedural justice, such as
accuracy, correctability, representativeness and ethicality (Langevin & Mendoza, 2013;
Leventhal et al., 1980) which we hypothesize that it leads to a higher procedural justice
perception. Specifically, about representativeness, participation might represent that managers
are valued members of the group’s decision-making process which support manager’s
procedural justice perceptions (Langevin & Mendoza, 2013; Lind & Tyler, 1988). In the family

127
businesses literature, Van der Heyden et al. (2005) propose that voice in the management
processes, which is an elementary aspect of participation, is consistent with fairness principles.
Previous studies that applied an experimental research design found that letting
managers participate in the management control processes has positively influenced their sense
of procedural justice (e.g., Libby, 1999). Additionally, studies applying survey research design
also found a positive association between participation and procedural justice (Hartmann &
Slapničar, 2009; Lau & Tan, 2005). Therefore, we hypothesize that:
H1a: Manager’s participation in management control mechanisms is positively
associated with procedural justice.
Formality, being another fairness characteristic considered in this paper, has been
characterized with conflictual evidence in the literature investigating the relationship between
formal performance evaluation systems and procedural justice (Langevin & Mendoza, 2013).
While formal performance evaluation systems enable more consistency of judgments and
decisions (Lau & Buckland, 2001), they restrict to a certain extent correctability (Lau & Moser,
2008), that is other rule of procedural justice (Leventhal et al., 1980). So, research on formality
particularly concerning performance evaluation processes has led to conflicting evidence since
researchers consider the firm’s context as a crucial element (Hartmann & Slapničar, 2012).
Nevertheless, in this study, we consider formality as a fair characteristic of goal setting
and performance evaluation processes, which is associated positively to procedural justice
(Hartmann & Slapničar, 2009). Formal goal setting process might provide information clarity
about the firm’s goals and strategies to managers, which migh foster their procedural justice
perceptions. Therefore, in formalized performance evaluation, superiors “will be able to deliver
more consistent, more accurate and less biased performance evaluations” (Hartmann &
Slapničar, 2009, p. 725). Consistency indicates that performance evaluation is developed by
clear rules and metrics that provide managers information about the criteria used for evaluating
the firm’s and manager’s performance (Cugueró-Escofet & Rosanas, 2013; Van den Bos,
Vermunt, & Wilke, 1997). Previous empirical evidence has suggested that a formal
performance evaluation system is positively related to procedural justice (Hartmann &
Slapničar, 2009; Lau & Sholihin, 2005).
In the family business context, Van der Heyden et al. (2005) list two characteristics
related to fairness that are linked to formality. First, the formality of goal setting and
performance evaluation can foster clarity of information, processes, and expectations in the
organization. Second, formality can guarantee that procedures are implemented with

128
consistency across people, over time, and by the firms’ values and norms (Van der Heyden et
al., 2005). According to this literature, we state the following hypothesis:
H1b: Formality in management control mechanisms is positively associated with
procedural justice.
5.2.2. Management control mechanisms’ fair design and stewardship
Previous literature has suggested that participative management control is positively
related to stewardship attitudes and behaviors in the family firm (Eddleston & Kellermanns,
2007; Eddleston, Kellermanns, & Zellweger, 2012; Zahra et al., 2008). When managers have a
high level of participation in management control mechanisms they may better internalize the
firm’s goals and safeguard that these goals are achieved (De Baerdemaeker & Bruggeman,
2015). Participation foster the sense of trust, psychological ownership and commitment toward
the organization (De Baerdemaeker & Bruggeman, 2015; Eddleston & Kellermanns, 2007).
Empowering managers to use their skills to act with autonomy in the organization
maximizes the individual's motivations in the firm (Donaldson, 2008). Therefore, management
control mechanisms that provide managers with autonomy, flexibility and responsibility in
decision-making (Donaldson, 2008; Henssen et al., 2014; Hernandez, 2012) are expected to
enhance stewardship attitudes through manager’s cognitive processes (Hernandez, 2012).
Furthermore, Davis et al. (2010) propose that “if a nonfamily employee is involved in
determining the strategic direction of the firm and works closely with family members, they may
perceive stewardship differently from a nonfamily member who has no decision-making
authority and simply provides labor for the organization” (Davis et al., 2010, p. 1112). So
managers that are involved in the determination of the business goals and performance
evaluation are more likely to develop a sense of membership on the family firm by accepting
the firm’s vision, and goals, which indicates that participation might be a determinant factor for
stewardship identification. Therefore, we hypothesize that:
H2a: Manager’s participation in management control mechanisms is positively
associated with manager’s stewardship identification.
Neubaum et al. (2017) and Zahra et al. (2008) discuss stewardship at the organizational
level, which they respectively named as stewardship climate and stewardship-oriented culture.
Neubaum et al. (2017) explore the following dimensions of stewardship climate: intrinsic
motivation; organizational identification, use of personal forms of power, collectivism, low

129
power distance, and involvement orientation (Davis, Frankforter, Vollrath, & Hill, 2007; Davis
et al., 1997; Hernandez, 2012; Neubaum et al., 2017). Zahra et al. (2008) explore stewardship-
oriented culture regarding managers’ sense of autonomy, belonging and competence which was
recently empirically explored by James et al. (2017).
Therefore, these authors consider that a stewardship-oriented culture might be fostered
by management control mechanisms that are designed as follows (1) an involvement-oriented
rather than control-oriented practice; (2) grounded on a collectivist rather than an individualist
culture; (3) characterized by a low-power distance and more authority and discretion on the
decision-making process of the firm (Davis et al., 1997; Donaldson & Davis, 1991; Neubaum
et al., 2017; Zahra et al., 2008). Participation might enhance the level of information sharing
(horizontal and vertical flows) in the firm and provides integration of the manager's capabilities,
creating a sense of shared effort (De Baerdemaeker & Bruggeman, 2015), which relates to a
collectivist and low power distance culture (Davis et al., 1997).
Hence, we argue that participative management control mechanisms are related to an
involvement-oriented management philosophy and a collectivist culture in the family firm,
which characterize a stewardship-oriented culture (Neubaum et al., 2017; Zahra et al., 2008).
Therefore, we state that:
H2b: Manager’s participation in management control mechanisms is positively
associated with stewardship-oriented culture.
In addition, formality indicates that goal setting and performance evaluation processes
are explicitly to managers since they are written in reports and quantified. We argue that
formality provides transparency and objectivity to the management process.
Pearson and Marler (2010) propose that owners can foster steward-like attitudes and
behaviors in the firm by designing procedures that communicate openly and transparently the
goals and rules of the organization. For these authors, encouraging and giving managers access
to information is crucial to creating reciprocal stewardship in the family firm, supporting their
argument on the leader-member exchange (LMX) background (Pearson & Marler, 2010).
Formality may prevent the controlling family members to make biased decisions in
relation to opportunism, nepotism8 (Jaskiewicz, Uhlenbruck, Balkin, & Reay, 2013),
8 “Nepotism is a common hiring mechanism in (family) firms where families use their control to hire family members” (Jaskiewicz, Uhlenbruck, Balkin, & Reay, 2013, p. 121) regardless qualifications (Miller & Le Breton-Miller, 2014).

130
managerial entrenchment9 (Chrisman, Chua, & Sharma, 2005) and by asymmetric altruism
(Cherchem, 2017) that could lead to conflicts in the family firm. Lubatkin et al. (2007) point
that formality may mitigate inaccurate and biased performance evaluation leading to an equal
treatment of family and nonfamily managers. Hence, formality may foster manager’s sense of
identification with the firm, regardless of their family affiliation.
H3a: Formality in management control mechanisms is positively associated with
manager’s stewardship identification.
Furthermore, Simon et al. (2012) suggest that formality might enforce stewardship
values such as identification, involvement, motivation, and loyalty. Formal management
control mechanisms are designed to determine managers’ responsibilities toward the firm goals
as well as accountability for results, independent of their family affiliation. Formality has been
traditionally linked to agency monitoring and incentive mechanisms, however the role of
management control mechanisms in organizations is wider than the notion of control (e.g.,
Ahrens & Chapman, 2004; Kruis, Speklé, & Widener, 2016). Formal management control
mechanisms can be used to foster transparency, flexibility, knowledge transfer among other
purposes (Giovannoni, Maraghini, & Riccaboni, 2011; Zahra, Neubaum, & Larrañeta, 2007),
creating a professional environment (Dekker, Lybaert, Steijvers, Depaire, & Mercken, 2013;
Stewart & Hitt, 2012).
Formal management control mechanisms provide transparency about the firm’s goals,
decisions, structure, and rules stimulating trust and strengthening manager’s pro-organizational
behavior (Cherchem, 2017; Suess, 2014). Formality can be related to the situational
mechanisms of stewardship such as collectivism and lower power distance where managers are
able to share information and act in the principals’ interests to achieve the firm's goals (Davis
et al., 1997). So, we propose that:
H3b: Formality in management control mechanisms is positively associated with
stewardship-oriented culture.
9 “Increased managerial ownership reduces the efficacy of the corporate management control mechanisms.” (Morck & Yeung, 2003, p. 371). Managerial entrenchment indicates that “family executives are protected from performance accountability” (Gomez-Mejia, Cruz, Berrone, & De Castro, 2011, p. 675)

131
5.2.3. Procedural justice perceptions and stewardship
At the individual level, procedural justice is supposed to satisfy the need for control and
the need for esteem and belonging (Greenberg & Colquitt, 2013; Lau & Oger, 2012). Folger
and Cropanzano (1998, preface), focusing on HRM systems, argue that “Fair treatment, by
contrast, breeds commitment intentions to remain on the job and helpful citizenship behavior
that go beyond the call of formal duties”. Kim and Mauborgne (2003, p. 1) argue that “When
people feel a decision affecting them was made fairly, they trust and cooperate with managers.
They share ideas and willingly go beyond the call of duty.” Procedural fairness has been shown
to enhance trust (Cropanzano, Prehar, & Chen, 2002) and organizational commitment
(Cropanzano, Bowen, & Gilliland, 2007). On contrary, unfair perceptions with respect to
management control mechanisms are supposed to weaken manager’s sense of identification
with the firm and cooperative behaviors (Langevin & Mendoza, 2013; Lubatkin et al., 2007).
Based on a literature review on the use of psychology theories in family firms field,
Pieper (2010) argues that organizational justice is one of the factors that can affect the
development of intrinsic motivation among employees. Lubatkin et al. (2007) indicate that
justice violations lead to opportunistic behaviors while fairness can efficiently restrain it.
Therefore, fairness can incentivize managers goal alignment in the organization (Cugueró-
Escofet & Rosanas, 2013).
In the family business literature, Van der Heyden et al. (2005, p. 7) point that fair process
is “an essential part of establishing trust, commitment, and harmony in family firms”. Justice
perceptions have also been linked to organizational identification in the context of the family
firm (Carmon, Miller, Raile, & Roers, 2010). Therefore, we state that:
H4a: Procedural justice in management control mechanisms is positively associated
with manager’s stewardship identification
Additionally, procedural justice principles are aligned with the situational mechanisms
of a stewardship-oriented culture such as collectivism, involvement, low power distance,
organizational identification and an involvement management orientation (Davis et al., 1997;
Neubaum et al., 2017). Empirical evidence is available that the perception of procedural justice
has been empirically proved to influence people’s attitudes and behaviors as supporting
legitimacy of organizational authorities, discouraging forms of disruptive behavior, promoting
the acceptance of organizational change, enhancing the perception of trustworthiness, reducing
fears of exploitation, and encouraging cooperation among employees (Colquitt, Conlon,

132
Wesson, Porter, & Ng, 2001; Langevin & Mendoza, 2013; Pieper, 2010; Sieger, Bernhard, &
Frey, 2011). Therefore, procedural justice perceptions can foster a stewardship-oriented culture
in the firm regarding a collective, supportive and caring environment (Zahra et al., 2008).
Fairness principles can eliminate or mitigate the adverse trade-offs between the family
and the business systems because they stimulate pro-organizational behavior (Van der Heyden
et al., 2005). These tradeoffs include choices between emotions and economic performance, for
example. These fair processes can improve the satisfaction and commitment of both family and
nonfamily managers involved in the family business (Van der Heyden et al., 2005). Therefore,
the literature provides support for the following hypothesis:
H4b: Procedural justice in management control mechanisms is positively associated
with stewardship-oriented culture.
The theoretical model and hypotheses are presented in Figure 11.
Figure 11. Theoretical research model and hypotheses – paper 2 Note 1. We add the following control variables in the theoretical model. Ownership indicates if the controlling family holds 100% of business shares/quotas. Family indicates that if the respondent is a founder, family manager or nonfamily manager (family affiliation). Superior indicates if the respondents’ superior in the firm is a nonfamily or a family manager. MLMV is the variable used to control for common method bias. Tier relates to the hierarchical level (Tier 1 are those managers that report directly to shareholders, CEO or does not have superior in the firm). Founder indicates if the founder manages the firm. Note 2. The mediating hypothesis (H5) indicates the indirect association between management control mechanisms’ fairness design and stewardship (identification and culture).
5.2.4. Mediation hypothesis
The characteristics of collaboration, autonomy, and responsibility of control systems
have also an indirect association with stewardship (Hernandez, 2012). In this sense, we propose
Participation- Goal setting;- Performance
evaluation
Formality- Goal setting;- Performance
evaluation
Management control mechanisms fairness
design
Procedural justice- Goal setting;- Performance
evaluation
Stewardship-oriented culture
Stewardship identification
Stewardship
H1a(+)
H1b(+)
H2a, H2b (+)
H3a, H3b (+)
H4a, H4b (+)

133
a partially mediated relationship between management control mechanisms’ fairness design
characteristics and stewardship, through procedural justice.
Since management control mechanisms’ fair design is expected to be positively related
to the stewardship identification (Davis et al., 2010; Henssen et al., 2014; Hernandez, 2012)
and stewardship-oriented culture (Hernandez, 2012; Neubaum et al., 2017; Simon et al., 2012),
and these dimensions of management control mechanisms are associated positively with
procedural justice (Hartmann & Slapničar, 2009; Langevin & Mendoza, 2013), we argue that
procedural justice partially mediates the relationship between management control
mechanisms’ fair design and stewardship. Therefore, we hypothesize that:
H5: Procedural justice mediates the relationship between management control
mechanisms’ fair design characteristics and stewardship.
5.3. Data analyses
5.3.1. Descriptive Statistics
We present in Table 25 the descriptive statistics of the indicators in our model that are:
participation and formality in both goal setting and performance evaluation; procedural justice
in goal setting and performance evaluation; stewardship-oriented culture and stewardship
identification. We conducted the analyses below based on the 152 sample, but we also present
the results of the sample of 120 respondents in Table 26, which is composed exclusively of
medium and large family firms with high ownership concentration (for more explanation see
the Methodology section). In Table 27, Table 28 and Table 29 we present the descriptive
statistics for the subsamples of nonfamily managers (n= 99), family managers and founders (n=
53) and family managers (n= 36)
First, about participation, respondents present a mean score of 4.37 about the importance
of manager's contribution to the goal setting process in the company and 4.22 that the firm
include changes suggested by managers. Additionally, respondents indicate a mean score of
4.15 and 3.99 respectively about managers being influential in goal setting and in the top
management initiatives.
Moreover, respondents seem to agree on a lower level with formality in goal setting
indicators if compared to manager’s participation. Respondents present a mean score of 2.82 if
the firm relies principally on experienced-based intuition (rather than quantitative analysis)
when setting major goals. As this item was reversed coded (should indicate informal goal

134
setting), it was consistent with the construct, but it was further excluded in the measurement
model evaluation of SEM analyses because it did not meet the criteria for convergent and
discriminant validity. Managers also indicate that the firm’s goal setting nearly always result
from extensive quantitative analysis of data (3.61) and are detailed in formal written reports
(3.36). Respondents also point a mean score of 3.71 about the extent that the goal setting process
is formalized in the organization.
The items of procedural justice in goal setting present a similar mean score ranging from
3.70 to 3.89 about the respondent's sense of fairness with the way in which goals were set. The
elements captured in the procedural justice construct are manager’s perceptions about the way
which goals were set (3.89), his or her confidence in the system (3.79) and in the criteria to set
goals (3.78), and his or her satisfaction (3.70).
About formality in performance evaluation, respondents indicate that superiors give the
opportunity to ask questions (3.75) and consider their views when discussing performance
evaluation (3.76). Additionally, respondents present a mean score of 3.63 and 3.48 respectively
related to judging performance based on objective information and expressing it in quantitative
terms. The items of procedural justice in performance evaluation present a similar mean about
the respondents’ sense of fairness with the way in which performance is evaluated (3.54) and
confidence in the performance evaluation system (3.41), but a higher standard deviation than
procedural justice in goal setting.
Finally, stewardship identification presents a higher mean score than stewardship-
oriented culture if we compare the means as well as a lower variance. Concerning stewardship
identification, the respondents seem to believe (4.13) and accept (4.14) the firms’ goals and see
themselves as an integral part of the firm (4.28). About stewardship culture, respondents
indicate that the firm inspires managers' care and loyalty (4.06), encourages a collectivist
culture (3.78), allows managers to reach their full potential (3.70) and promotes a professionally
orientated workplace (3.59).
Looking at the descriptive statistics in the subsamples, the mean scores of our research
seem to be higher for family managers and founders if compared to nonfamily managers, except
for formality.

135
Table 25
Items’ descriptive statistics (n=152) - Paper 2
Item n Mean Std. Dev.
Min Max
GSpart_1. Manager's contribution is important to goal setting of the company. 152 4.37 0.90 1 5
GSpart_2. In the company, it is important that goal setting includes changes that were suggested by managers.
151 4.22 0.89 1 5
GSpart_3. In the company, managers are influential in goal setting. 151 4.15 0.95 1 5 GSpart_4. Top management often initiates discussions about goals with managers.
151 3.99 1.07 1 5
GSform_1. Our goal setting nearly always result from extensive quantitative analysis of data.
152 3.61 1.11 1 5
GSform_2. Our goal setting is nearly always detailed in formal written reports. 152 3.36 1.20 1 5
GSform_3. We rely principally on experienced-based intuition (rather than quantitative analysis) when setting major goals. *
151 2.82 1.11 1 5
GSform_4. To what extent is goal setting processes formalized in the organization? **
152 3.71 1.21 1 5
GSpj_1. I think that the way in which goals were set is fair. 152 3.89 0.96 1 5 GSpj_2. I have full confidence in the system with which goals were set. 152 3.79 1.01 1 5 GSpj_3. I think that the criteria that were used to set goals are fair. 152 3.78 1.05 1 5 GSpj_4. I am very satisfied with the way in which goals were set. 152 3.70 1.04 1 5
PEpart_1. The superior gives you the opportunity to ask questions about performance evaluation.
146 3.75 1.14 1 5
PEpart_2. The superior considers your views when discussing performance evaluation.
147 3.76 1.07 1 5
PEform_1. When judging performance, my superior bases on objective information previously established.
147 3.63 1.13 1 5
PEform_2. When judging performance, my superior expresses it in quantitative terms (evaluates performance based on quantitative criteria).
147 3.48 1.12 1 5
PEpj_1. I think the way performance is evaluated is fair. 148 3.54 1.15 1 5
PEpj_2. I have full confidence in the performance evaluation system. 148 3.41 1.24 1 5
STEW_1. Your company allows managers to reach their full potential contributing to the company.
152 3.70 1.04 1 5
STEW_2. Your company promotes a professionally orientated workplace. 152 3.59 1.18 1 5 STEW_3. Your company inspires managers' care and loyalty to the company 152 4.06 1.00 1 5
STEW_4. Your company encourages a collectivist culture focused on business group rather than an individualistic culture.
152 3.78 1.16 1 5
STEWid_1. To what extent do you see yourself believing in the company's goals?
151 4.13 0.91 1 5
STEWid_2. To what extent do you see yourself as an integral part of the company?
151 4.28 0.95 1 5
STEWid_3. To what extent do you see yourself accepting company's goals? 150 4.14 0.92 1 5 * Reverse coded item. ** This item was added to the original measures of formality, and is based on Bedford & Malmi (2015).
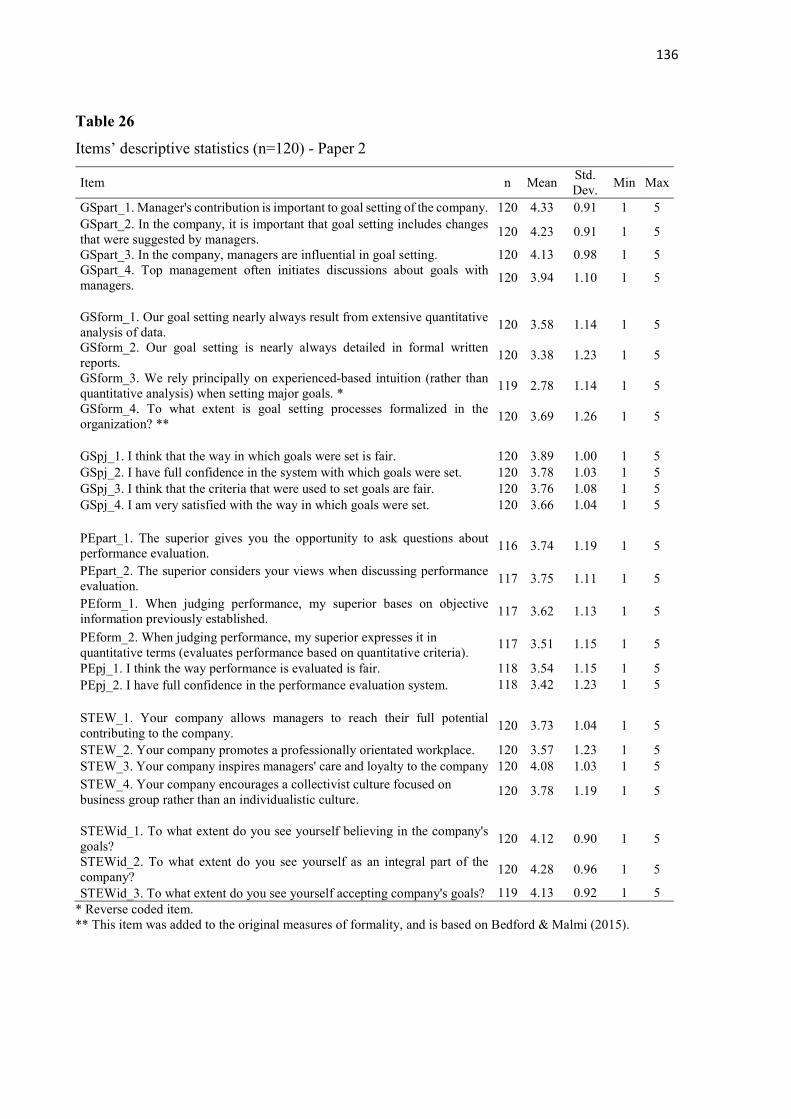
136
Table 26
Items’ descriptive statistics (n=120) - Paper 2
Item n Mean Std. Dev.
Min Max
GSpart_1. Manager's contribution is important to goal setting of the company. 120 4.33 0.91 1 5 GSpart_2. In the company, it is important that goal setting includes changes that were suggested by managers.
120 4.23 0.91 1 5
GSpart_3. In the company, managers are influential in goal setting. 120 4.13 0.98 1 5 GSpart_4. Top management often initiates discussions about goals with managers.
120 3.94 1.10 1 5
GSform_1. Our goal setting nearly always result from extensive quantitative analysis of data.
120 3.58 1.14 1 5
GSform_2. Our goal setting is nearly always detailed in formal written reports.
120 3.38 1.23 1 5
GSform_3. We rely principally on experienced-based intuition (rather than quantitative analysis) when setting major goals. *
119 2.78 1.14 1 5
GSform_4. To what extent is goal setting processes formalized in the organization? **
120 3.69 1.26 1 5
GSpj_1. I think that the way in which goals were set is fair. 120 3.89 1.00 1 5 GSpj_2. I have full confidence in the system with which goals were set. 120 3.78 1.03 1 5 GSpj_3. I think that the criteria that were used to set goals are fair. 120 3.76 1.08 1 5 GSpj_4. I am very satisfied with the way in which goals were set. 120 3.66 1.04 1 5
PEpart_1. The superior gives you the opportunity to ask questions about performance evaluation.
116 3.74 1.19 1 5
PEpart_2. The superior considers your views when discussing performance evaluation.
117 3.75 1.11 1 5
PEform_1. When judging performance, my superior bases on objective information previously established.
117 3.62 1.13 1 5
PEform_2. When judging performance, my superior expresses it in quantitative terms (evaluates performance based on quantitative criteria).
117 3.51 1.15 1 5
PEpj_1. I think the way performance is evaluated is fair. 118 3.54 1.15 1 5 PEpj_2. I have full confidence in the performance evaluation system. 118 3.42 1.23 1 5
STEW_1. Your company allows managers to reach their full potential contributing to the company.
120 3.73 1.04 1 5
STEW_2. Your company promotes a professionally orientated workplace. 120 3.57 1.23 1 5 STEW_3. Your company inspires managers' care and loyalty to the company 120 4.08 1.03 1 5 STEW_4. Your company encourages a collectivist culture focused on business group rather than an individualistic culture.
120 3.78 1.19 1 5
STEWid_1. To what extent do you see yourself believing in the company's goals?
120 4.12 0.90 1 5
STEWid_2. To what extent do you see yourself as an integral part of the company?
120 4.28 0.96 1 5
STEWid_3. To what extent do you see yourself accepting company's goals? 119 4.13 0.92 1 5 * Reverse coded item. ** This item was added to the original measures of formality, and is based on Bedford & Malmi (2015).

137
Table 27
Items’ descriptive statistics (nonfamily managers, n=99)
Item n Mean Std. Dev.
Min Max
GSpart_1. Manager's contribution is important to goal setting of the company. 99 4.29 0.96 1 5 GSpart_2. In the company, it is important that goal setting includes changes that were suggested by managers.
98 4.15 0.96 1 5
GSpart_3. In the company, managers are influential in goal setting. 98 4.04 1.00 1 5 GSpart_4. Top management often initiates discussions about goals with managers.
98 3.82 1.12 1 5
GSform_1. Our goal setting nearly always result from extensive quantitative analysis of data.
99 3.62 1.16 1 5
GSform_2. Our goal setting is nearly always detailed in formal written reports. 99 3.45 1.21 1 5 GSform_3. We rely principally on experienced-based intuition (rather than quantitative analysis) when setting major goals. *
98 2.71 1.13 1 5
GSform_4. To what extent is goal setting processes formalized in the organization? **
99 3.68 1.26 1 5
GSpj_1. I think that the way in which goals were set is fair. 99 3.78 1.04 1 5 GSpj_2. I have full confidence in the system with which goals were set. 99 3.67 1.06 1 5 GSpj_3. I think that the criteria that were used to set goals are fair. 99 3.68 1.12 1 5 GSpj_4. I am very satisfied with the way in which goals were set. 99 3.57 1.12 1 5
PEpart_1. The superior gives you the opportunity to ask questions about performance evaluation.
95 3.71 1.14 1 5
PEpart_2. The superior considers your views when discussing performance evaluation.
96 3.69 1.07 1 5
PEform_1. When judging performance, my superior bases on objective information previously established.
96 3.56 1.15 1 5
PEform_2. When judging performance, my superior expresses it in quantitative terms (evaluates performance based on quantitative criteria).
96 3.45 1.11 1 5
PEpj_1. I think the way performance is evaluated is fair. 97 3.51 1.16 1 5 PEpj_2. I have full confidence in the performance evaluation system. 97 3.32 1.24 1 5
STEW_1. Your company allows managers to reach their full potential contributing to the company.
99 3.58 1.13 1 5
STEW_2. Your company promotes a professionally orientated workplace. 99 3.47 1.26 1 5 STEW_3. Your company inspires managers' care and loyalty to the company 99 3.92 1.08 1 5
STEW_4. Your company encourages a collectivist culture focused on business group rather than an individualistic culture.
99 3.62 1.22 1 5
STEWid_1. To what extent do you see yourself believing in the company's goals?
99 3.94 0.97 1 5
STEWid_2. To what extent do you see yourself as an integral part of the company?
99 4.10 1.01 1 5
STEWid_3. To what extent do you see yourself accepting company's goals? 98 3.97 0.98 1 5 * Reverse coded item. ** This item was added to the original measures of formality, and is based on Bedford & Malmi (2015).

138
Table 28
Items’ descriptive statistics (founders and family managers, n=53)
Item n Mean Std. Dev.
Min Max
GSpart_1. Manager's contribution is important to goal setting of the company. 53 4.51 0.75 2 5 GSpart_2. In the company, it is important that goal setting includes changes that were suggested by managers.
53 4.34 0.76 3 5
GSpart_3. In the company, managers are influential in goal setting. 53 4.36 0.81 2 5 GSpart_4. Top management often initiates discussions about goals with managers.
53 4.30 0.91 2 5
GSform_1. Our goal setting nearly always result from extensive quantitative analysis of data.
53 3.58 1.03 1 5
GSform_2. Our goal setting is nearly always detailed in formal written reports. 53 3.19 1.19 1 5
GSform_3. We rely principally on experienced-based intuition (rather than quantitative analysis) when setting major goals. *
53 3.02 1.07 1 5
GSform_4. To what extent is goal setting processes formalized in the organization? **
53 3.77 1.12 1 5
GSpj_1. I think that the way in which goals were set is fair. 53 4.11 0.78 2 5 GSpj_2. I have full confidence in the system with which goals were set. 53 4.02 0.89 2 5 GSpj_3. I think that the criteria that were used to set goals are fair. 53 3.98 0.89 1 5 GSpj_4. I am very satisfied with the way in which goals were set. 53 3.94 0.82 2 5
PEpart_1. The superior gives you the opportunity to ask questions about performance evaluation.
51 3.82 1.16 1 5
PEpart_2. The superior considers your views when discussing performance evaluation.
51 3.90 1.06 1 5
PEform_1. When judging performance, my superior bases on objective information previously established.
51 3.76 1.09 1 5
PEform_2. When judging performance, my superior expresses it in quantitative terms (evaluates performance based on quantitative criteria).
51 3.55 1.14 1 5
PEpj_1. I think the way performance is evaluated is fair. 51 3.61 1.13 1 5 PEpj_2. I have full confidence in the performance evaluation system. 51 3.57 1.24 1 5
STEW_1. Your company allows managers to reach their full potential contributing to the company.
53 3.94 0.79 2 5
STEW_2. Your company promotes a professionally orientated workplace. 53 3.79 1.01 1 5 STEW_3. Your company inspires managers' care and loyalty to the company 53 4.32 0.80 2 5 STEW_4. Your company encourages a collectivist culture focused on business group rather than an individualistic culture.
53 4.09 0.99 1 5
STEWid_1. To what extent do you see yourself believing in the company's goals?
52 4.50 0.64 3 5
STEWid_2. To what extent do you see yourself as an integral part of the company?
52 4.63 0.74 2 5
STEWid_3. To what extent do you see yourself accepting company's goals? 52 4.46 0.70 2 5 * Reverse coded item. ** This item was added to the original measures of formality, and is based on Bedford & Malmi (2015).

139
Table 29
Items’ descriptive statistics (family managers, n=36)
Item n Mean Std. Dev.
Min Max
GSpart_1. Manager's contribution is important to goal setting of the company. 36 4.36 0.80 2 5 GSpart_2. In the company, it is important that goal setting includes changes that were suggested by managers.
36 4.31 0.75 3 5
GSpart_3. In the company, managers are influential in goal setting. 36 4.22 0.83 2 5 GSpart_4. Top management often initiates discussions about goals with managers.
36 4.17 1.00 2 5
GSform_1. Our goal setting nearly always result from extensive quantitative analysis of data.
36 3.47 1.03 1 5
GSform_2. Our goal setting is nearly always detailed in formal written reports. 36 3.00 1.22 1 5 GSform_3. We rely principally on experienced-based intuition (rather than quantitative analysis) when setting major goals. *
36 3.17 1.03 1 5
GSform_4. To what extent is goal setting processes formalized in the organization? **
36 3.67 1.22 1 5
GSpj_1. I think that the way in which goals were set is fair. 36 4.08 0.84 2 5 GSpj_2. I have full confidence in the system with which goals were set. 36 4.00 0.96 2 5 GSpj_3. I think that the criteria that were used to set goals are fair. 36 3.92 0.97 1 5 GSpj_4. I am very satisfied with the way in which goals were set. 36 3.86 0.87 2 5
PEpart_1. The superior gives you the opportunity to ask questions about performance evaluation.
36 3.67 1.24 1 5
PEpart_2. The superior considers your views when discussing performance evaluation.
36 3.72 1.16 1 5
PEform_1. When judging performance, my superior bases on objective information previously established.
36 3.64 1.10 1 5
PEform_2. When judging performance, my superior expresses it in quantitative terms (evaluates performance based on quantitative criteria).
36 3.39 1.20 1 5
PEpj_1. I think the way performance is evaluated is fair. 36 3.42 1.20 1 5 PEpj_2. I have full confidence in the performance evaluation system. 36 3.36 1.33 1 5
STEW_1. Your company allows managers to reach their full potential contributing to the company.
36 3.75 0.81 2 5
STEW_2. Your company promotes a professionally orientated workplace. 36 3.56 1.03 1 5 STEW_3. Your company inspires managers' care and loyalty to the company 36 4.14 0.83 2 5 STEW_4. Your company encourages a collectivist culture focused on business group rather than an individualistic culture.
36 3.97 1.11 1 5
STEWid_1. To what extent do you see yourself believing in the company's goals?
35 4.40 0.69 3 5
STEWid_2. To what extent do you see yourself as an integral part of the company?
35 4.49 0.85 2 5
STEWid_3. To what extent do you see yourself accepting company's goals? 35 4.40 0.77 2 5 * Reverse coded item. ** This item was added to the original measures of formality, and is based on Bedford & Malmi (2015).

140
Furthermore, we present comparisons related to the respondents’ and family firms’
characteristics with stewardship constructs. To estimate the factors of stewardship-oriented
culture and stewardship identification constructs, we ran Confirmatory Factor Analyses in
SmartPLS and present in Table 30 the mean of the standardized scores (for both samples of 152
and 120 respondents). The interpretation of the associations is consistent between the two
samples.
First, family managers report higher mean scores of stewardship-oriented culture and
stewardship identification than nonfamily managers, but lower mean scores if we compare to
founders (Panel A). Additionally, respondents that are Chief Executive Officers and from the
Commercial and Marketing areas present higher average score especially for the stewardship
identification and culture (Panel B), which can be related to the respondents hierarchical level
or family manager status (Panel C). Moreover, as we expected, respondents from higher
hierarchical levels and that report to a family manager (Panel E) have rated in average a higher
score of both stewardship constructs. Finally, increasing tenure in the organization seems to be
linked to a higher level of stewardship (Panel D). These analyses are consistent with previous
literature (Corbetta & Salvato, 2004; Davis et al., 2010, 1997).
Moreover, by analyzing the family firm characteristics in Table 31, we can see that firms
with more than 1,000 employees (Panel A) seem to present a higher score for stewardship
identification and for a stewardship-oriented culture which results are similar to firms with less
than 50 employees. Panel B indicates that firms with a lower concentration of shares seem to
present lower scores for stewardship identification and stewardship-oriented culture than those
firms with 100% of the shares in the controlling family’s hands. The exception is firms with a
controlling family stake between 25% and 50% of the shares.
Additionally, if we analyze the family involvement in management (Panel C), family
firms with lower than 25% of family managers in the TMT seem to present higher mean scores
of stewardship identification and stewardship-oriented culture especially in the sample of
medium and large firms (n= 120). However, these results are not conclusive which we also
found for the CEO family affiliation.
The presence of the founder in the firm seems to be related to a lower score of
stewardship identification and stewardship-oriented culture. Table 31 also shows that firms that
are owned by later generations present a higher mean score for both stewardship identification
and culture. These descriptive results about firm characteristics and stewardship seem to be
contradictory to the literature, which argues that small firms with the presence of the founder

141
are likely to foster stewardship, due to the predominance of values such as altruism,
collectivism, and trust.
Table 30
Respondents’ characteristics and stewardship (n=120 and n=152)
Sample 120 Sample 152 STEW Identification STEW Culture
n % n % 120 152 120 152
Panel A: Family status Nonfamily manager 83 69.17% 99 65.13% -0.193 -0.212 -0.124 -0.143 Family manager 27 22.50% 36 23.68% 0.370 0.285 0.126 0.073 Founder 10 8.33% 17 11.18% 0.606 0.650 0.688 0.680
Panel B: Business area Business, Finance, and Accounting 53 44.17% 70 46.05% -0.111 -0.081 0.003 -0.005 Operations and engineering 23 19.17% 25 16.45% -0.038 0.033 -0.104 -0.055 Commercial and Marketing 22 18.33% 27 17.76% 0.253 0.216 0.070 0.103 Chief Executive Officer 16 13.33% 23 15.13% 0.347 0.186 0.204 0.104 Others 5 4.17% 5 3.29% -0.904 -0.914 -0.664 -0.671 Missing 1 0.83% 2 1.32% 0.164 -0.399 0.739 -0.036
Panel C: Hierarchical level Tier 1 56 46.67% 75 49.34% 0.277 0.277 0.234 0.213 Tier 2 59 49.17% 72 47.37% -0.192 -0.226 -0.130 -0.146 Tier 3 5 4.17% 5 3.29% -0.835 -0.845 -1.076 -1.090
Panel D: Tenure Between 1 and 2 years 3 2.50% 5 3.29% -1.247 -1.188 -1.184 -1.109 Between 3 and 5 years 21 17.50% 25 16.45% -0.449 -0.497 -0.342 -0.397 Between 6 and 10 years 23 19.17% 39 25.66% 0.078 0.122 0.063 0.095 More than 10 years 69 57.50% 82 53.95% 0.159 0.167 0.130 0.180 Missing 0 1 0.66% -0.956 -0.838
Panel E: Superior family status Nonfamily manager 46 38.33% 53 34.9% -0.140 -0.203 -0.148 -0.181 Family manager or founder 74 61.67% 99 65.1% 0.087 0.110 0.092 0.097
Note 1. Tier 1 (report to shareholders or board of directors), Tier 2 (report to Top Managers, Chief Officers or CEO) and Tier 3 (report to middle managers or supervisors). Note 2. STEWidentification and STEWculture are the constructs of stewardship, respectively the individual and organizational levels. These values are the means measured based on the latent scores that were obtained in the Confirmatory Factor Analyses in SmartPLS. Note 3. We refer to both sample sizes of 120 and 152 respondents.

142
Table 31
Family firms’ characteristics and stewardship (n=120 and n=152) – Part I
Sample 120 Sample 152 STEWIdentification STEWCulture
n % n % 120 152 120 152
Panel A: Size (number of employees)
Less than 50 employees 0 0.0% 18 11.8% - 0.197 - 0.192
Between 51 and 100 employees 8 6.7% 9 5.9% -0.317 -0.306 -0.267 -0.271
Between 101 and 300 employees 25 20.8% 29 19.1% -0.077 -0.244 -0.121 -0.298
Between 301 and 500 employees 16 13.3% 18 11.8% -0.259 -0.211 -0.021 -0.021
Between 501 and 1000 employees 20 16.7% 21 13.8% -0.060 -0.088 -0.151 -0.159
More than 1000 employees 51 42.5% 57 37.5% 0.171 0.206 0.176 0.199
Panel B: Controlling family ownership Family owns up to 25% of the shares 0 0.0% 6 3.9% - -0.669 - -0.639
Family owns more than 25% but up to 50% of the shares
0 0.0% 4 2.6% - -0.128 - 0.152
Family owns more than 50% but less than 100% of the shares
26 21.7% 32 21.1% -0.111 -0.114 -0.109 -0.195
Family owns 100% of the shares 94 78.3% 109 71.7% 0.019 0.069 0.035 0.075
Missing 1 0.7% 0.553 1.272
Panel C: Percentage of family members in the TMT
No family member 22 18.3% 29 19.1% 0.100 -0.098 0.231 0.084
More than 0% and up to 25% 28 23.3% 30 19.7% 0.325 0.289 0.161 0.155
More than 25% and up to 50% 26 21.7% 36 23.7% -0.201 -0.115 -0.240 -0.219
More than 50% but less than 100% 19 15.8% 22 14.5% -0.238 -0.128 -0.296 -0.250
100,00% 21 17.5% 29 19.1% -0.198 0.052 0.099 0.234
Missing 4 3.3% 6 3.9% 0.376 -0.082 0.171 -0.076
Panel D: Is the CEO from the controlling family?
Yes 96 80.0% 119 78.3% -0.038 0.031 -0.001 0.027
No 24 20.0% 33 21.7% 0.105 -0.112 0.022 -0.099
Panel E: Does(Do) the founder(s) manage(s) the business?
Yes 58 48.3% 82 53.9% -0.323 -0.226 -0.244 -0.158
No 60 50.0% 68 44.7% 0.263 0.248 0.230 0.179
Missing 2 1.7% 2 1.3% 0.953 0.953 0.403 0.403 Note 1. STEWidentification and STEWculture are the constructs of stewardship, respectively the individual and organizational levels. These values are the means measured based on the latent scores that were obtained in the Confirmatory Factor Analyses in SmartPLS. Note 2. We refer to both sample sizes of 120 and 152 respondents.

143
Table 31
Family firms’ characteristics and stewardship (n=120 and n=152) – Part II
Sample 120 Sample 152 STEWIdentification STEWCulture
n % n % 120 152 120 152
Panel F: Family Generations
First generation 28 23.3% 43 28.3% -0.174 -0.180 -0.225 -0.166
First and Second generations 28 23.3% 34 22.4% 0.201 0.244 0.084 0.100
First, Second and Third generations 2 1.7% 2 1.3% -0.214 -0.214 -0.024 -0.024 Second generation 27 22.5% 31 20.4% -0.116 -0.104 -0.013 -0.016
Second and third generations 16 13.3% 19 12.5% -0.198 -0.201 -0.230 -0.203
Third generation 14 11.7% 15 9.9% 0.177 0.202 0.383 0.442
Third and fourth generations 4 3.3% 4 2.6% 0.369 0.369 0.797 0.797
Fourth generation 1 0.8% 3 2.0% 0.953 0.564 -0.032 -0.295
Later than the fourth generation 1 0.7% 0.953 -0.838
Panel G: Firm age
Between 01 and 20 years 11 9.2% 21 13.8% 0.138 0.099 -0.042 0.049
Between 21 and 40 years 27 22.5% 37 24.3% -0.019 -0.020 -0.041 0.023
Between 41 and 60 years 29 24.2% 32 21.1% -0.157 -0.139 0.074 0.047
More than 61 years 44 36.7% 49 32.2% 0.179 0.130 0.077 -0.016
Missing 9 7.5% 13 8.6% -0.459 -0.242 -0.303 -0.200 Note 1. STEWidentification and STEWculture are the constructs of stewardship, respectively the individual and organizational levels. These values are the means measured based on the latent scores that were obtained in the Confirmatory Factor Analyses in SmartPLS. Note 2. We refer to both sample sizes of 120 and 152 respondents.
5.3.2. Measurement model assessment
We follow Hair et al.’s (2013) steps to proceed with the validation of the measurement
model based on reflective model evaluation for the two samples (n=152 and n=120). We present
the tables of the two samples (n=152 and n=120). More details about the difference between
those two samples can be found in the Methodology section of this dissertation. The results of
the measurement model assessment are consistent between these two samples. We also
analyzed the measurement model for the subsamples of (i) nonfamily managers (n=99), (ii)
family managers and founders (n=53), (iii) and family managers (n=36), which results are
complementary. These results about the measurement model assessment for the subsamples are
presented in Appendix 4.
First, for the convergent validity, we analyze the outer loadings and Average Variance
Extracted (AVE). We also analyze the Composite Reliability (CR) as an internal consistency
parameter. The AVE and CR of the latent variables in the model are respectively higher than
0.5 and higher than 0.7 (Table 32 and Table 33). The outer loadings are also higher than 0.7
(Table 34 and Table 35).

144
Additionally, we conducted the discriminant validity analysis based on the cross
loadings (level indicators) and Fornell-Larcker criterion (Fornell & Larcker, 1981). First, the
square roots of AVE were greater than the correlations between the latent variables (Hair Jr.,
Hult, Ringle, & Sarstedt, 2013), which we present in Table 32 and Table 33. The results also
show that the cross loadings are considered high in some cross-correlations which were
expected since we used subjective constructs such as procedural justice and stewardship. In a
reflective latent variable, items are expected to be correlated, which does not consist in a
statistical concern for the model. We address these issues of multicollinearity in the inner model
evaluation based on the VIF parameter, where in advance no indicative of multicollinearity was
found. In sum, following Hair et al. (2013) recommendations, our measurement model was
validated after excluding GSform_3 item, which did not pass in the convergent and discriminant
validity criteria, since this item presented a low level of outer loadings and high level of cross
loadings. We finally analyze the Heterotrait-Monotrait criterion (HTMT) to assess discriminant
validity (values lower than 0.85), where we have found results consistent with Fornell-Larcker
criterion.
Furthermore, the correlation coefficients presented in Table 32 and Table 33 indicate
preliminary strong positive associations between the constructs. First, management control
mechanisms’ fair design characteristics are positively and statistically significantly correlated.
Additionally, the management control mechanisms’ fair characteristics are highly correlated
with procedural justice, for example, participation and formality in goal setting are strongly and
higher correlated with procedural justice in goal setting than in performance evaluation.
Procedural justice in goal setting and goal setting fairness characteristics seem to be higher
correlated to stewardship identification and stewardship culture than the performance
evaluation constructs. Finally, the individual and organizational level constructs of stewardship
are highly and statistically significant correlated, which is also consistent with the cross
loadings results.

145
Table 32
First-Order Latent Variable Correlations (n=152)
1 2 3 4 5 6 7 8
1. GS_form 0.85
2. GS_part 0.51 0.87
3. GS_pj 0.56 0.63 0.95
4. PE_form 0.41 0.40 0.46 0.94
5. PE_part 0.42 0.49 0.53 0.65 0.94
6. PE_pj 0.52 0.49 0.58 0.72 0.72 0.97
7. STEW_cult 0.59 0.62 0.68 0.51 0.57 0.59 0.87
8. STEW_iden 0.48 0.63 0.70 0.40 0.55 0.52 0.78 0.93
Composite Reliability (CR) 0.89 0.92 0.97 0.94 0.94 0.97 0.93 0.95
Average Variance Extracted (AVE) 0.73 0.75 0.90 0.89 0.88 0.94 0.76 0.87 Note 1. Correlations greater than or equal to | 0.159 | are significant at 5% and correlations higher than or equal to | 0.208 | are significant at 1% for a sample of 152 respondents. Note 2. The values on the diagonal are the square roots of the average variances extracted; because these values are higher than the correlations between the latent variables (values outside the diagonal), there is discriminant validity (Hair Jr. et al., 2013). Note 3. Grey cells indicate correlations between dimensions of the same theoretical constructs.
Table 33
First-Order Latent Variable Correlations (n=120)
1 2 3 4 5 6 7 8
1. GS_form 0.86
2. GS_part 0.48 0.87
3. GS_pj 0.58 0.63 0.95
4. PE_form 0.36 0.35 0.42 0.94
5. PE_part 0.41 0.47 0.52 0.63 0.93
6. PE_pj 0.52 0.46 0.56 0.71 0.71 0.97
7. STEW_cult 0.63 0.63 0.71 0.52 0.54 0.61 0.87
8. STEW_iden 0.53 0.64 0.71 0.41 0.55 0.52 0.78 0.93
Composite Reliability (CR) 0.89 0.92 0.97 0.94 0.93 0.97 0.93 0.95
Average Variance Extracted (AVE) 0.74 0.75 0.90 0.88 0.87 0.94 0.76 0.87 Note 1. Correlations greater than or equal to | 0.179 | are significant at 5% and correlations higher than or equal to | 0.234 | are significant at 1% for a sample of 120 respondents. Note 2. The values on the diagonal are the square roots of the average variances extracted; because these values are higher than the correlations between the latent variables (values outside the diagonal), there is discriminant validity (Hair Jr. et al., 2013). Note 3. Grey cells indicate correlations between dimensions of the same theoretical constructs.

146
Table 34
Cross loadings between the items and the construct (n=152)
GS_form GS_part GS_pj PE_form PE_part PE_pj STEW_cult STEW_iden
GSform_1 0.84 0.40 0.48 0.31 0.37 0.44 0.51 0.44
GSform_2 0.88 0.44 0.41 0.30 0.31 0.40 0.44 0.39
GSform_4 0.84 0.48 0.53 0.44 0.39 0.49 0.54 0.40
GSpartic_1 0.39 0.87 0.49 0.37 0.45 0.44 0.50 0.57 GSpartic_2 0.47 0.86 0.45 0.33 0.38 0.38 0.45 0.43 GSpartic_3 0.45 0.91 0.57 0.35 0.46 0.42 0.59 0.58
GSpartic_4 0.47 0.83 0.63 0.33 0.42 0.44 0.60 0.60
GSpj_1 0.48 0.60 0.93 0.40 0.48 0.50 0.63 0.66
GSpj_2 0.57 0.58 0.95 0.45 0.49 0.56 0.64 0.65 GSpj_3 0.51 0.63 0.96 0.42 0.52 0.55 0.64 0.67
GSpj_4 0.55 0.57 0.95 0.48 0.52 0.58 0.66 0.67
PEform_1 0.40 0.40 0.46 0.95 0.59 0.71 0.53 0.42
PEform_2 0.38 0.35 0.40 0.93 0.63 0.64 0.43 0.33
PEpart_1 0.37 0.44 0.48 0.61 0.93 0.67 0.48 0.47
PEpart_2 0.42 0.49 0.51 0.60 0.94 0.67 0.58 0.56
PEpj_1 0.50 0.48 0.55 0.69 0.68 0.97 0.54 0.48
PEpj_2 0.51 0.47 0.57 0.70 0.70 0.97 0.61 0.53
STEWcult_1 0.44 0.52 0.58 0.48 0.51 0.54 0.87 0.66 STEWcult_2 0.57 0.54 0.60 0.49 0.51 0.55 0.88 0.64 STEWcult_3 0.51 0.57 0.58 0.47 0.54 0.54 0.88 0.73 STEWcult_4 0.52 0.54 0.61 0.34 0.41 0.43 0.86 0.68
STEWident_1 0.47 0.57 0.65 0.38 0.51 0.49 0.76 0.94 STEWident_2 0.45 0.64 0.60 0.33 0.53 0.49 0.69 0.92 STEWident_3 0.44 0.56 0.70 0.42 0.50 0.49 0.73 0.93
Controls Tier 1 0.01 0.24 0.15 0.04 0.03 0.12 0.21 0.27
d_founder -0.20 -0.13 -0.26 -0.13 -0.12 -0.13 -0.17 -0.23
d_ownership100% -0.04 0.14 0.16 0.09 0.15 0.06 0.13 0.12 rfamily_status -0.09 0.06 0.10 -0.02 -0.03 -0.04 0.04 0.15
rfounder_status 0.09 0.19 0.12 0.13 0.16 0.16 0.24 0.23
rsuperiorfamily_status -0.06 0.12 0.12 0.04 0.00 0.06 0.13 0.15 MLMV_1 0.15 0.10 0.22 -0.07 0.01 0.06 0.09 0.14 MLMV_2 0.28 0.26 0.36 0.37 0.30 0.39 0.32 0.36 MLMV_3 -0.16 -0.19 -0.29 -0.14 -0.18 -0.12 -0.25 -0.23 MLMV_4 0.13 0.09 0.15 0.09 0.02 0.17 0.10 0.14
Note 1. We excluded the GSform_3 indicator because it lacks on convergent and discriminant validity. This item was more correlated with other latent variables than with formality in goal setting, so we excluded from the model. Note 2. Hierarchical level, Founder, Ownership, Superior family status, Family status and MLMV are the control variables in our model. Tier, d_founder, d_ownership100% and rsuperiorfamily_status are dummy variables. Tier 1 indicates managers that report to shareholders or board of directors; d_founder indicates if the founder manages the firm; d_ownership100% points to a controlling family ownership of 100% of the shares. Additionally, rfounder_status and rfamily_status compose the family affiliation control variable. Finally, MLMV is a 4-item formative latent variable that is connected to all endogenous variables in our model as an approach to control for common method bias (Chin et al., 2013; Nitzl, 2016).
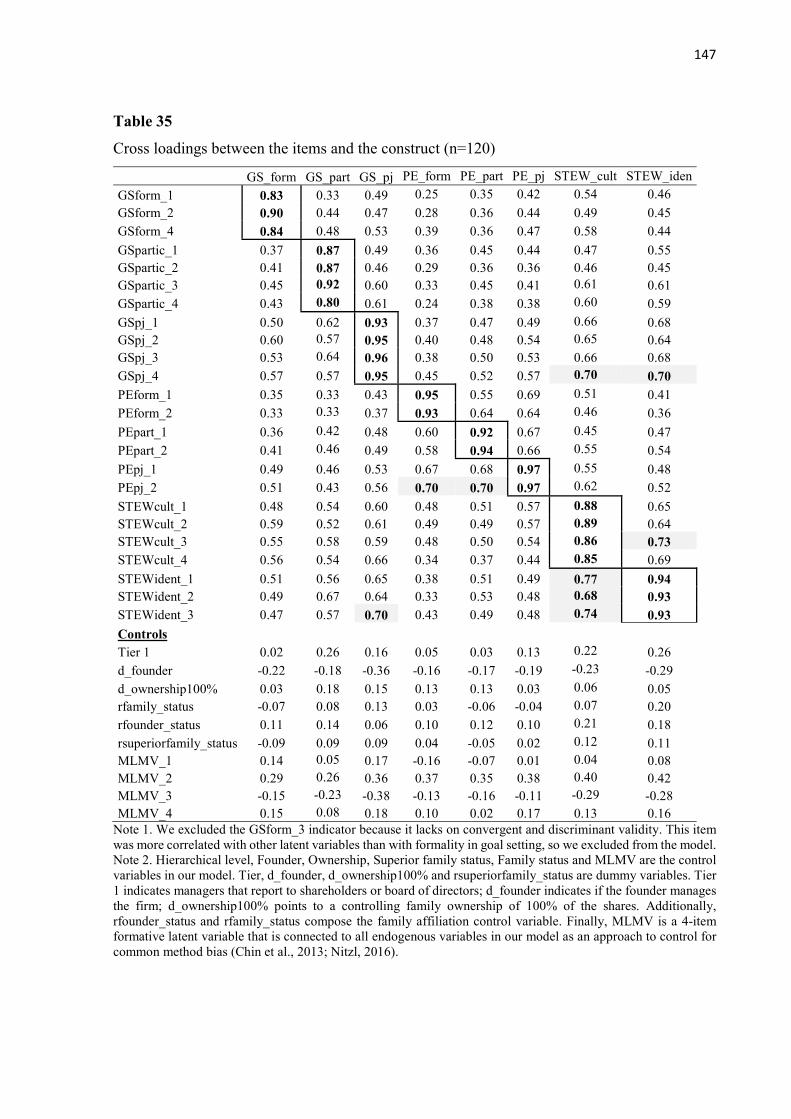
147
Table 35
Cross loadings between the items and the construct (n=120)
GS_form GS_part GS_pj PE_form PE_part PE_pj STEW_cult STEW_iden
GSform_1 0.83 0.33 0.49 0.25 0.35 0.42 0.54 0.46
GSform_2 0.90 0.44 0.47 0.28 0.36 0.44 0.49 0.45
GSform_4 0.84 0.48 0.53 0.39 0.36 0.47 0.58 0.44
GSpartic_1 0.37 0.87 0.49 0.36 0.45 0.44 0.47 0.55 GSpartic_2 0.41 0.87 0.46 0.29 0.36 0.36 0.46 0.45 GSpartic_3 0.45 0.92 0.60 0.33 0.45 0.41 0.61 0.61
GSpartic_4 0.43 0.80 0.61 0.24 0.38 0.38 0.60 0.59
GSpj_1 0.50 0.62 0.93 0.37 0.47 0.49 0.66 0.68 GSpj_2 0.60 0.57 0.95 0.40 0.48 0.54 0.65 0.64 GSpj_3 0.53 0.64 0.96 0.38 0.50 0.53 0.66 0.68
GSpj_4 0.57 0.57 0.95 0.45 0.52 0.57 0.70 0.70
PEform_1 0.35 0.33 0.43 0.95 0.55 0.69 0.51 0.41
PEform_2 0.33 0.33 0.37 0.93 0.64 0.64 0.46 0.36
PEpart_1 0.36 0.42 0.48 0.60 0.92 0.67 0.45 0.47
PEpart_2 0.41 0.46 0.49 0.58 0.94 0.66 0.55 0.54
PEpj_1 0.49 0.46 0.53 0.67 0.68 0.97 0.55 0.48
PEpj_2 0.51 0.43 0.56 0.70 0.70 0.97 0.62 0.52
STEWcult_1 0.48 0.54 0.60 0.48 0.51 0.57 0.88 0.65 STEWcult_2 0.59 0.52 0.61 0.49 0.49 0.57 0.89 0.64 STEWcult_3 0.55 0.58 0.59 0.48 0.50 0.54 0.86 0.73 STEWcult_4 0.56 0.54 0.66 0.34 0.37 0.44 0.85 0.69
STEWident_1 0.51 0.56 0.65 0.38 0.51 0.49 0.77 0.94 STEWident_2 0.49 0.67 0.64 0.33 0.53 0.48 0.68 0.93 STEWident_3 0.47 0.57 0.70 0.43 0.49 0.48 0.74 0.93
Controls Tier 1 0.02 0.26 0.16 0.05 0.03 0.13 0.22 0.26
d_founder -0.22 -0.18 -0.36 -0.16 -0.17 -0.19 -0.23 -0.29
d_ownership100% 0.03 0.18 0.15 0.13 0.13 0.03 0.06 0.05 rfamily_status -0.07 0.08 0.13 0.03 -0.06 -0.04 0.07 0.20
rfounder_status 0.11 0.14 0.06 0.10 0.12 0.10 0.21 0.18
rsuperiorfamily_status -0.09 0.09 0.09 0.04 -0.05 0.02 0.12 0.11 MLMV_1 0.14 0.05 0.17 -0.16 -0.07 0.01 0.04 0.08 MLMV_2 0.29 0.26 0.36 0.37 0.35 0.38 0.40 0.42 MLMV_3 -0.15 -0.23 -0.38 -0.13 -0.16 -0.11 -0.29 -0.28 MLMV_4 0.15 0.08 0.18 0.10 0.02 0.17 0.13 0.16
Note 1. We excluded the GSform_3 indicator because it lacks on convergent and discriminant validity. This item was more correlated with other latent variables than with formality in goal setting, so we excluded from the model. Note 2. Hierarchical level, Founder, Ownership, Superior family status, Family status and MLMV are the control variables in our model. Tier, d_founder, d_ownership100% and rsuperiorfamily_status are dummy variables. Tier 1 indicates managers that report to shareholders or board of directors; d_founder indicates if the founder manages the firm; d_ownership100% points to a controlling family ownership of 100% of the shares. Additionally, rfounder_status and rfamily_status compose the family affiliation control variable. Finally, MLMV is a 4-item formative latent variable that is connected to all endogenous variables in our model as an approach to control for common method bias (Chin et al., 2013; Nitzl, 2016).

148
5.3.3. Structural Equation Modeling
After completing the validation of the measurement model, we present the structural
model assessment. Hair et al. (2013) suggest some steps to follow which we discuss below.
First, we analyzed multicollinearity between the constructs based on Variance Inflation Factor
(VIF). Based on the VIF parameters, measures should be lower than five indicating that
multicollinearity may not be a concern for the structural model. Then, we analyzed the path
coefficients based on the size and statistical significance after applying the bootstrapping
procedure with 1,000 repetitions and a two-tailed test (Hair Jr. et al., 2013).
Third the coefficient of determination of R-square, which indicates the percentage of a
dependent variable variance that is explained by the independent variables. We used the
adjusted coefficient of determination (R2adj), which is usually used to compare different
models with a different number of variables or also different samples or subsamples, as in our
study. Moreover, the effect size coefficient (f2), which indicates the impact of an independent
variable on the dependent variable, based on the omitted variable procedure. To evaluate these
parameters we used the classification suggested by Cohen (1988) that is usually applied in the
social sciences. Cohen (1988) recommends the following parameters: small effect (f2=0.02);
medium effect (f2=0.15); large effect (f2=0.35). As suggested by Hair et al. (2013), f2 lower
than 0.02 indicate that an independent and dependent variable are not statistically related.
In this section, we present the results for different samples (Table 36) and subsamples
(Table 37). We run the analyses for 152 and 120 respondents, and subsamples of respondents’
family affiliation based on the 152 respondents’ sample divided into (i) nonfamily managers
(99 respondents), (ii) family managers and founders (53 respondents), (iii) and family managers
(36 respondents). It is important to state that we run the analyses of the subsample of family
managers (n=36) as an exploratory analysis, since this subsample size is insufficient for
Structural Equation Modeling analysis.
We also conducted robustness analyses based on the family affiliation subsamples, since
previous literature point that family and nonfamily managers can have different perceptions
about stewardship, but also different perceptions about the determinants of stewardship in the
family firms (Corbetta & Salvato, 2004; Davis et al., 2010; James et al., 2017; Madison et al.,
2016; Verbeke & Kano, 2012). To address this goal, we developed the multi-group analyses in
SmartPLS taking the family affiliation as our moderator variable. Following Hair Jr., Sarstedt,
Ringle and Gudergan (2017), we first tested for measurement invariance (MICOM) in
SmartPLS that is the first test applied in the multi-group analyses. However, the measurement

149
model was different between our subsamples of nonfamily and family managers regarding the
mean of stewardship and procedural justice, which shows that the model presents variance in
the measurement models between the subsamples.
Therefore, we were not able to proceed with multi-group analyses in SmartPLS to test
for the statistically significant difference between the coefficients of these subsamples (Hair Jr.
et al., 2017). In this case, Hair et al. (2017) suggest researchers to run the structural model for
each of the subsamples for exploratory purposes. Although we cannot argue about the
statistically significant difference between the coefficients in the subsamples (what would be
discussed in multi-group analyses – MGA), our results suggest that these associations might be
different. Therefore, not just the perceptions of nonfamily managers and family managers about
stewardship might be different, but also the antecedents of stewardship attitude and culture
(James et al., 2017).
We consider that a sample of 53 and 36 respondents would be insufficient to analyze a
model with too many predictors (as we present in Table 37). Hence, we run the subsamples
results without control variables (except for the common method bias control variable -
MLMV) to decrease the number of predictors and, consequently, the need for a larger sample
(Hair Jr. et al., 2017; Nitzl, 2016). Hence, we present the results for the samples including
family manager affiliation as a control variable and the results for the subsamples of family and
nonfamily managers. We are aware that the subsample analyses have limitations regarding
sample size, but they offer interesting insights about the effect-sizes of the antecedents of
stewardship for family and nonfamily managers.
Despite model’s fit indexes are not widely recommended in variance based SEM such
as is usually applied for covariance-based SEM (Hair Jr. et al., 2017)10, we present these results
for our full sample models. As you can see in Table 36 the results for the samples of 152 and
120 respondents meet the parameter for model fit based on SRMR criteria, which scores should
be lower than 0.08 (Hair Jr. et al., 2013; Hair Jr. et al., 2017).
Furthermore, we included individual and firm level control variables in our model. First,
we propose that family managers and founders would perceive higher stewardship culture and
identification if compared to nonfamily managers (James et al., 2017; Verbeke & Kano, 2012),
which is aligned to the discussion that “Is blood thicker than water” highlighted by Davis et al.
(2010). We also control for the respondents’ superior family affiliation, following Davis et al.
(2010), since they may perceive stewardship differently if they work closely with family
10 https://www.smartpls.com/documentation/functionalities/model-fit.
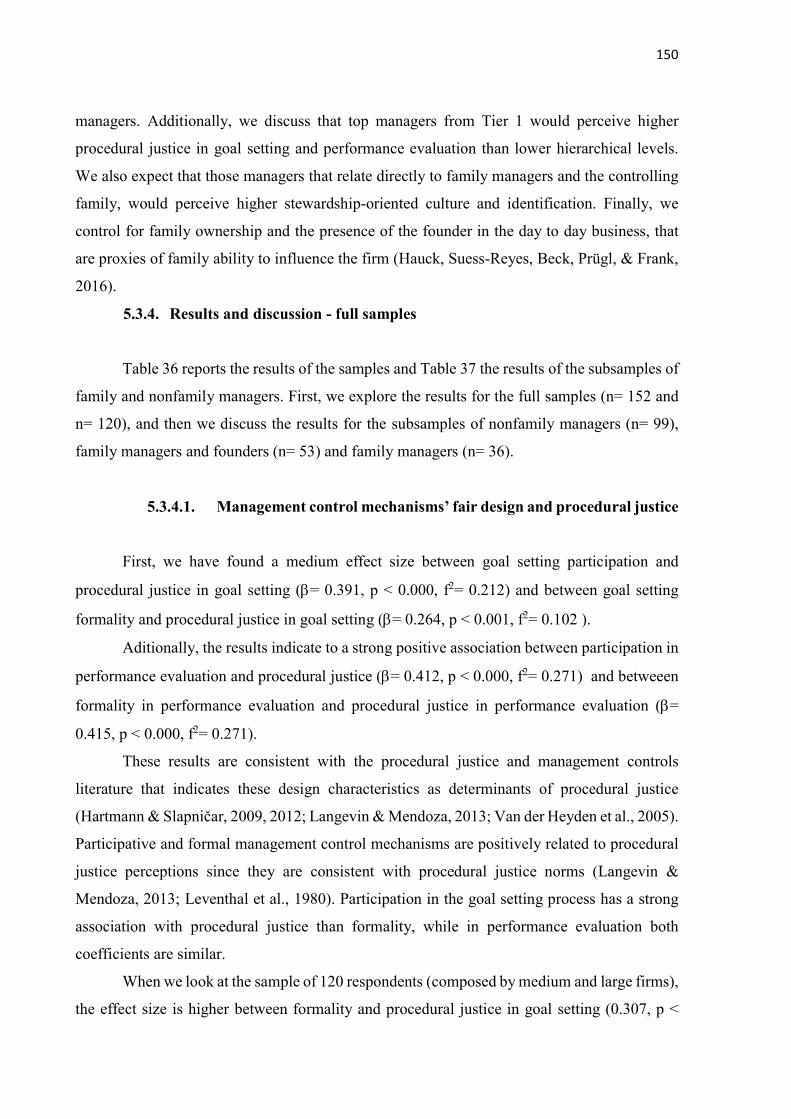
150
managers. Additionally, we discuss that top managers from Tier 1 would perceive higher
procedural justice in goal setting and performance evaluation than lower hierarchical levels.
We also expect that those managers that relate directly to family managers and the controlling
family, would perceive higher stewardship-oriented culture and identification. Finally, we
control for family ownership and the presence of the founder in the day to day business, that
are proxies of family ability to influence the firm (Hauck, Suess-Reyes, Beck, Prügl, & Frank,
2016).
5.3.4. Results and discussion - full samples
Table 36 reports the results of the samples and Table 37 the results of the subsamples of
family and nonfamily managers. First, we explore the results for the full samples (n= 152 and
n= 120), and then we discuss the results for the subsamples of nonfamily managers (n= 99),
family managers and founders (n= 53) and family managers (n= 36).
5.3.4.1. Management control mechanisms’ fair design and procedural justice
First, we have found a medium effect size between goal setting participation and
procedural justice in goal setting (= 0.391, p < 0.000, f2= 0.212) and between goal setting
formality and procedural justice in goal setting (= 0.264, p < 0.001, f2= 0.102 ).
Aditionally, the results indicate to a strong positive association between participation in
performance evaluation and procedural justice (= 0.412, p < 0.000, f2= 0.271) and betweeen
formality in performance evaluation and procedural justice in performance evaluation (=
0.415, p < 0.000, f2= 0.271).
These results are consistent with the procedural justice and management controls
literature that indicates these design characteristics as determinants of procedural justice
(Hartmann & Slapničar, 2009, 2012; Langevin & Mendoza, 2013; Van der Heyden et al., 2005).
Participative and formal management control mechanisms are positively related to procedural
justice perceptions since they are consistent with procedural justice norms (Langevin &
Mendoza, 2013; Leventhal et al., 1980). Participation in the goal setting process has a strong
association with procedural justice than formality, while in performance evaluation both
coefficients are similar.
When we look at the sample of 120 respondents (composed by medium and large firms),
the effect size is higher between formality and procedural justice in goal setting (0.307, p <
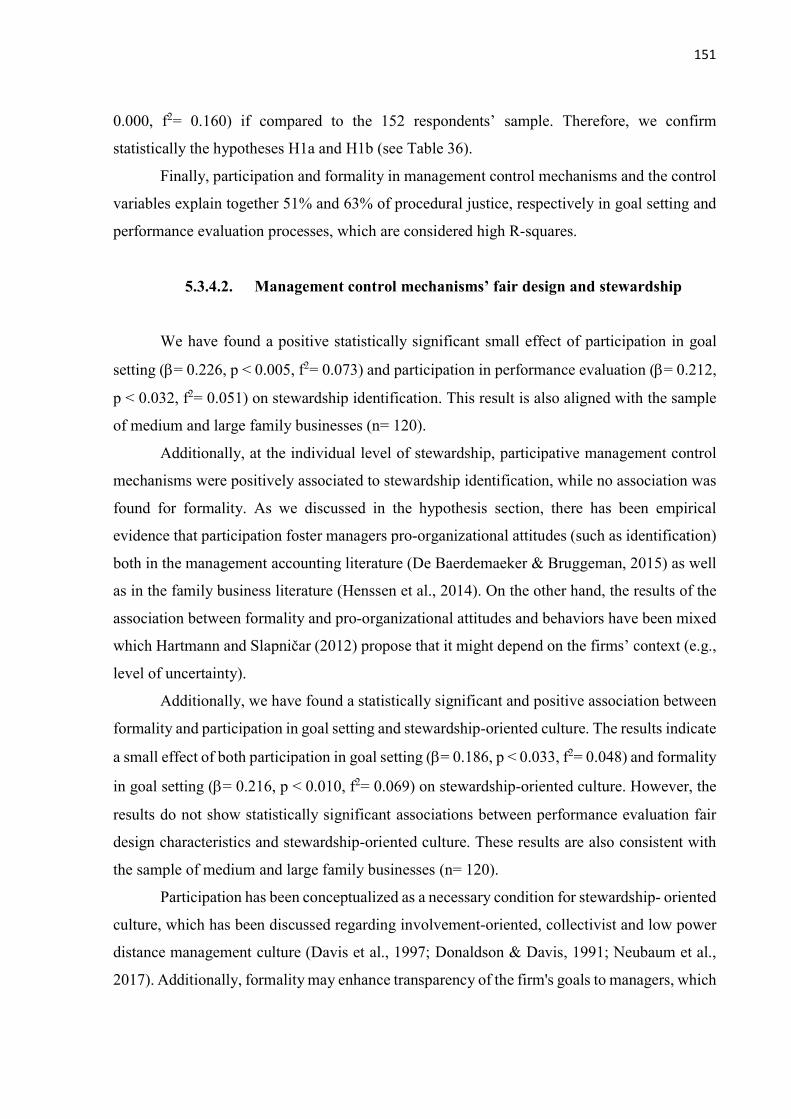
151
0.000, f2= 0.160) if compared to the 152 respondents’ sample. Therefore, we confirm
statistically the hypotheses H1a and H1b (see Table 36).
Finally, participation and formality in management control mechanisms and the control
variables explain together 51% and 63% of procedural justice, respectively in goal setting and
performance evaluation processes, which are considered high R-squares.
5.3.4.2. Management control mechanisms’ fair design and stewardship
We have found a positive statistically significant small effect of participation in goal
setting (= 0.226, p < 0.005, f2= 0.073) and participation in performance evaluation (= 0.212,
p < 0.032, f2= 0.051) on stewardship identification. This result is also aligned with the sample
of medium and large family businesses (n= 120).
Additionally, at the individual level of stewardship, participative management control
mechanisms were positively associated to stewardship identification, while no association was
found for formality. As we discussed in the hypothesis section, there has been empirical
evidence that participation foster managers pro-organizational attitudes (such as identification)
both in the management accounting literature (De Baerdemaeker & Bruggeman, 2015) as well
as in the family business literature (Henssen et al., 2014). On the other hand, the results of the
association between formality and pro-organizational attitudes and behaviors have been mixed
which Hartmann and Slapničar (2012) propose that it might depend on the firms’ context (e.g.,
level of uncertainty).
Additionally, we have found a statistically significant and positive association between
formality and participation in goal setting and stewardship-oriented culture. The results indicate
a small effect of both participation in goal setting (= 0.186, p < 0.033, f2= 0.048) and formality
in goal setting (= 0.216, p < 0.010, f2= 0.069) on stewardship-oriented culture. However, the
results do not show statistically significant associations between performance evaluation fair
design characteristics and stewardship-oriented culture. These results are also consistent with
the sample of medium and large family businesses (n= 120).
Participation has been conceptualized as a necessary condition for stewardship- oriented
culture, which has been discussed regarding involvement-oriented, collectivist and low power
distance management culture (Davis et al., 1997; Donaldson & Davis, 1991; Neubaum et al.,
2017). Additionally, formality may enhance transparency of the firm's goals to managers, which

152
is considered relevant to a stewardship culture (Simon et al., 2012). Therefore, we partially
confirm statistically the following hypotheses H2a, H2b, H3a, and H3b (see Table 36).
5.3.4.3. Procedural justice and stewardship
Moreover, the results indicate that managers’ perceptions of procedural justice in goal
setting is positively associated with stewardship-oriented culture ( = 0.243, p < 0.009,
f2=0.060) and stewardship identification ( = 0.301, p < 0.01, f2=0.098). In contrast, procedural
justice in performance evaluation is not statistically significant associated with stewardship in
both individual and organizational levels. In the sample of medium and large firms (n= 120)
the coefficients of association between goal setting procedural justice and stewardship lose
statistical significant at 5% significance level. These results are also consistent with the findings
of the association between participation and formality with stewardship.
Therefore, we partially confirm statistically hypothesis H4a and H4b by showing that
fair management control mechanisms enhance manager’s stewardship identification (Lubatkin
et al., 2007; Pieper, 2010) and a collective, professional and supportive environment in the
family firm (Van der Heyden et al., 2005; Zahra et al., 2008). Goal setting process seems to be
crucial management mechanisms in family firms since it relates to pro-organizational and
collectivist attitudes and culture (Van der Heyden et al., 2005; Zahra et al., 2008). These
findings indicate that is important to segregate manager’s perceptions about procedural justice
related to different mechanisms (Hartmann & Slapničar, 2012) since we show they have
different associations to managers attitudes and also to the family firm’s culture.
Management control mechanisms’ fairness design, managers procedural justice
perceptions and the control variables explain together 59% of the variance of the stewardship-
oriented culture and 61% of the variance in stewardship identification, which are considered
high R-squares.

153
Table 36
Structural Model – Part I
Controls Sample 152 Sample 120 Sample 99 (nonfamily managers)
β P Values f2 R2ad β P Values f2 R2ad VIF β P Values f2 R2ad β P Values f2 R2ad
GS_part -> GS_pj H1a 0.391 0.000 0.212 0.513 1.54 0.371 0.000 0.214 0.553 0.335 0.000 0.174 0.569
GS_form -> GS_pj H1b 0.264 0.001 0.102 1.45 0.307 0.000 0.160 0.367 0.000 0.218
Family -> GS_pj 0.06 0.43 0.00 0.24 0.026 0.729 0.001 1.26 0.025 0.750 0.001
Tier -> GS_pj 0.11 0.15 0.01 0.031 0.613 0.002 1.27 0.045 0.532 0.004 0.076 0.237 0.014
MLMV -> GS_pj 0.48 0.00 0.30 0.264 0.000 0.124 1.19 0.289 0.003 0.166 0.261 0.012 0.139
PE_part -> PE_pj H1a 0.412 0.000 0.271 0.633 1.76 0.425 0.000 0.292 0.624 0.445 0.000 0.413 0.716
PE_form -> PE_pj H1b 0.415 0.000 0.271 1.79 0.412 0.000 0.272 0.456 0.000 0.411
Family -> PE_pj 0.05 0.53 0.00 0.15 -0.025 0.629 0.001 1.26 -0.080 0.217 0.014
Tier -> PE_pj 0.08 0.32 0.01 0.093 0.095 0.020 1.22 0.135 0.027 0.041 0.096 0.111 0.033
MLMV -> PE_pj 0.38 0.00 0.17 0.111 0.059 0.029 1.17 0.084 0.185 0.017 0.067 0.294 0.014
GS_part -> STEW_iden H2a 0.226 0.005 0.073 0.605 1.894 0.238 0.007 0.093 0.639 0.248 0.010 0.089 0.613
PE_part -> STEW_iden H2a 0.212 0.032 0.051 2.402 0.196 0.056 0.048 0.392 0.003 0.148
GS_form -> STEW_iden H3a 0.060 0.491 0.006 1.735 0.114 0.233 0.022 0.161 0.141 0.038
PE_form -> STEW_iden H3a -0.092 0.353 0.010 2.282 -0.056 0.585 0.004 0.035 0.793 0.001
GS_pj -> STEW_iden H4a 0.301 0.001 0.098 2.518 0.223 0.075 0.051 0.162 0.133 0.027
PE_pj -> STEW_iden H4a 0.025 0.804 0.001 3.075 0.015 0.883 0.000 -0.109 0.436 0.009
Family -> STEW_iden 0.31 0.00 0.11 0.34 0.190 0.001 0.073 1.345 0.216 0.002 0.106
Founder -> STEW_iden -0.35 0.00 0.17 -0.168 0.002 0.058 1.324 -0.165 0.009 0.060 -0.073 0.302 0.011
r_superior -> STEW_iden 0.12 0.13 0.02 0.060 0.300 0.007 1.323 0.034 0.572 0.003 0.049 0.452 0.006
MLMV -> STEW_iden 0.38 0.00 0.22 0.118 0.068 0.027 1.391 0.181 0.018 0.067 0.083 0.334 0.014
Note 1. Classification of Cohen (1988): small effect (f² = 0.02), medium effect (f² = 0.15) and large effect (f² = 0.35) Note 2. Sample n=152 is composed of all respondents. Sample 120 consists of private medium and large family firms with family ownership higher than 50%. Note 3. The parameters that were estimated to evaluate model fit were: (i) sample 152 (SRMR - Saturated Model= 0.053, SRMR - Estimated Model = 0.070); (ii) sample 120 (SRMR - Saturated Model= 0.058, SRMR - Estimated Model= 0.073).
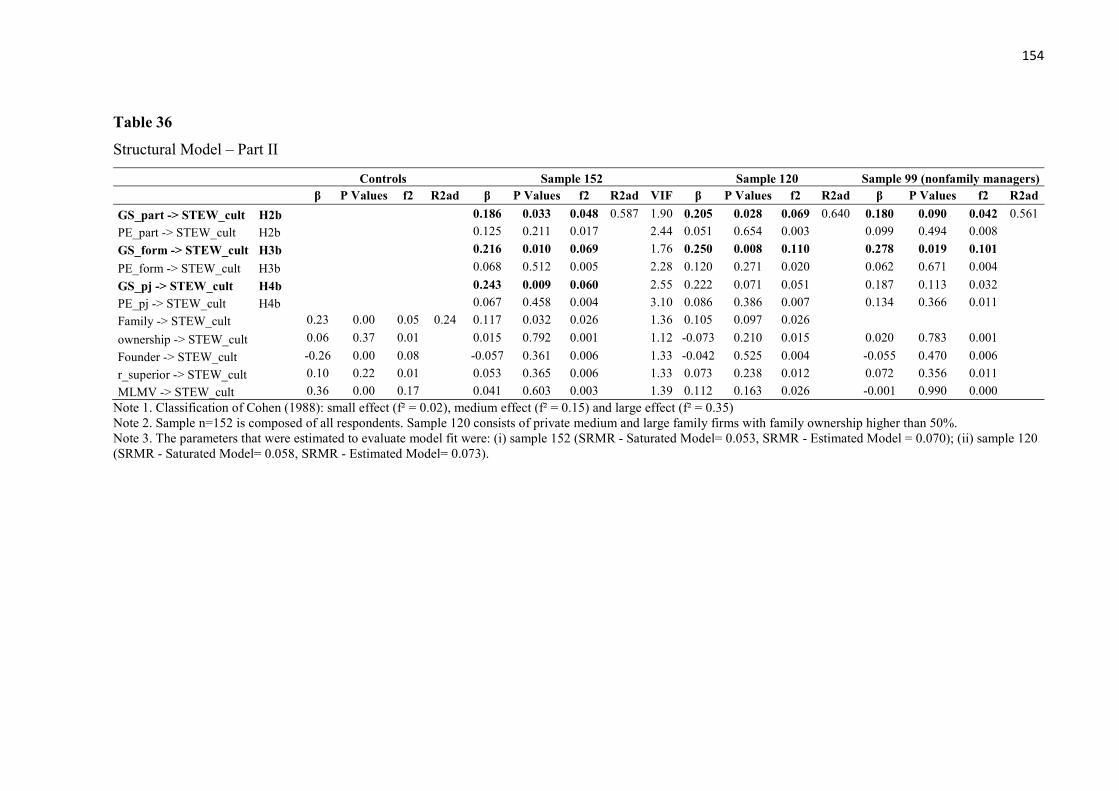
154
Table 36
Structural Model – Part II
Controls Sample 152 Sample 120 Sample 99 (nonfamily managers) β P Values f2 R2ad β P Values f2 R2ad VIF β P Values f2 R2ad β P Values f2 R2ad
GS_part -> STEW_cult H2b 0.186 0.033 0.048 0.587 1.90 0.205 0.028 0.069 0.640 0.180 0.090 0.042 0.561
PE_part -> STEW_cult H2b 0.125 0.211 0.017 2.44 0.051 0.654 0.003 0.099 0.494 0.008
GS_form -> STEW_cult H3b 0.216 0.010 0.069 1.76 0.250 0.008 0.110 0.278 0.019 0.101
PE_form -> STEW_cult H3b 0.068 0.512 0.005 2.28 0.120 0.271 0.020 0.062 0.671 0.004
GS_pj -> STEW_cult H4b 0.243 0.009 0.060 2.55 0.222 0.071 0.051 0.187 0.113 0.032
PE_pj -> STEW_cult H4b 0.067 0.458 0.004 3.10 0.086 0.386 0.007 0.134 0.366 0.011
Family -> STEW_cult 0.23 0.00 0.05 0.24 0.117 0.032 0.026 1.36 0.105 0.097 0.026
ownership -> STEW_cult 0.06 0.37 0.01 0.015 0.792 0.001 1.12 -0.073 0.210 0.015 0.020 0.783 0.001
Founder -> STEW_cult -0.26 0.00 0.08 -0.057 0.361 0.006 1.33 -0.042 0.525 0.004 -0.055 0.470 0.006
r_superior -> STEW_cult 0.10 0.22 0.01 0.053 0.365 0.006 1.33 0.073 0.238 0.012 0.072 0.356 0.011
MLMV -> STEW_cult 0.36 0.00 0.17 0.041 0.603 0.003 1.39 0.112 0.163 0.026 -0.001 0.990 0.000 Note 1. Classification of Cohen (1988): small effect (f² = 0.02), medium effect (f² = 0.15) and large effect (f² = 0.35) Note 2. Sample n=152 is composed of all respondents. Sample 120 consists of private medium and large family firms with family ownership higher than 50%. Note 3. The parameters that were estimated to evaluate model fit were: (i) sample 152 (SRMR - Saturated Model= 0.053, SRMR - Estimated Model = 0.070); (ii) sample 120 (SRMR - Saturated Model= 0.058, SRMR - Estimated Model= 0.073).

155
5.3.5. Results and discussion - subsamples
In this following subsections we explore the results for the subsamples, which are
presented in Table 37.
5.3.5.1. Management control mechanisms’ fair design and procedural justice
The conclusions for the full samples can be also extended to nonfamily managers
subsample. We have found a statistically significant positive association between participation
( = 0.354, p < 0.000, f2=0.201) and formality in goal setting ( = 0.358, p < 0.000, f2=0.207)
with procedural justice in goal setting. And also between participation ( = 0.463, p < 0.000,
f2=0.445) and formality in performance evaluation ( = 0.442, p < 0.000, f2=0.378) with
procedural justice in performance evaluation. Therefore, for nonfamily managers both
participation and formality are considered determinants for procedural justice perceptions
(Langevin & Mendoza, 2013; Leventhal et al., 1980).
In contrast, if we analyze family managers and founders, the results point to a
nonsignificant association between formality in goal setting and participation in performance
evaluation, respectively with procedural justice in goal setting and procedural justice in
performance evaluation. However, a positive and significant association was found between
participation in goal setting and procedural justice in goal setting ( = 0.439, p < 0.000,
f2=0.276) and between formality in performance evaluation and procedural justice in
performance evaluation ( = 0.373, p < 0.008, f2=0.157).
These results partially support the management accounting literature conceptualization
(Hartmann & Slapničar, 2009, 2012; Langevin & Mendoza, 2013) and family firm’s empirical
evidence (Van der Heyden et al., 2005). Family managers may put more emphasis in
participating in the definition of the firms’ goals and measuring performance based on objective
and quantitative metrics. They might not emphasize formality in goal setting and participation
in performance evaluation as a fair design characteristic because this could put in risk the family
authority and autonomy in the firm (Barnett & Kellermanns, 2006; Kellermanns, Eddleston, &
Zellweger, 2012; Miller & Le Breton-Miller, 2014). Actually, family managers might
participate in goal setting probably through family management control mechanisms such as
relational mechanisms (Mustakallio, Autio, & Zahra, 2002), and not through formal corporate
management control mechanisms.

156
5.3.5.2. Management control mechanisms’ fair design and stewardship
Furthermore, the relationship between management control mechanisms’ fair
characteristics and stewardship are different if we analyze the subsamples of nonfamily and
family managers (Table 37). For nonfamily managers, participation in goal setting (= 0.247,
p < 0.011, f2= 0.088) and participation in performance evaluation (= 0.398, p < 0.003, f2=
0.156) are positively and statistically significant associated to stewardship identification, which
evidence is aligned with previous literature (Henssen et al., 2014; Heyden et al., 2005). Hence,
for nonfamily managers, participation and formality can foster their sense of membership in the
firm.
For family managers, we have found that formality in performance evaluation (= -
0.389, p < 0.041, f2= 0.243) is negatively and statistically significantly associated with
stewardship identification. Family managers’ stewardship identification may have other
antecedents related to the family member emotional attachment in the firm and altruistic
relationships fostered by the owning family (Davis et al., 2010; James et al., 2017; Verbeke &
Kano, 2012).
Additionally, for nonfamily managers, formality in goal setting is positively associated
to stewardship-oriented culture (= 0.265, p < 0.029, f2= 0.094). This indicates that the
controlling family stimulates a professional, collectivist and long-term culture in the family
firm (Barnett & Kellermanns, 2006; Neubaum et al., 2017). Professional values might be
considered significant for nonfamily managers perceptions about stewardship (Simon et al.,
2012). For family managers and founders, it is the participation design characteristic (= 0.363,
p < 0.010, f2= 0.194). These results for family managers can be due to the limitation of
subsample size, but also indicate that family managers may place more value in trust and
informal management control mechanisms (James et al., 2017; Madison et al., 2016) by which
they foster a stewardship-oriented culture in the firm.
5.3.5.3. Procedural justice and stewardship
When we analyze the subsamples, procedural justice does not seem to be an antecedent
of stewardship for nonfamily managers, both on the individual and organizational level at a 5%
significance level. In contrast, family managers indicate a high effect size for this relationship
specifically related to procedural justice in goal setting and stewardship identification (=

157
0.641, p < 0.000, f2= 0.615). This might be an evidence of multicollinearity between the items
of procedural justice in goal setting and stewardship identification for family managers and
founders sample. In this sense, despite management mechanisms’ fair characteristics were
significantly positively associated, procedural justice perception may not be considered an
antecedent of stewardship in the subsample of family and nonfamily managers.
5.3.6. Mediation results
Hypothesis H5 indicates the indirect effect of management control mechanisms’ fair
design on stewardship through procedural justice perceptions, following previous literature
conceptualizations (Hartmann & Slapničar, 2009, 2012; Sieger, Bernhard, & Frey, 2011). We
present these results in Table 38.
Our results show that participation in goal setting has a significant indirect association
with stewardship-oriented culture (= 0.095, p < 0.05) and stewardship identification (= 0.118,
p < 0.01), through procedural justice. In addition, formality of goal setting has an indirect
significant effect on stewardship identification (= 0.080, p < 0.05). Therefore, these results
indicate that procedural justice in goal setting acts as a mediator between goal setting fair design
characteristics and stewardship, while no association was found for performance evaluation
mechanism.
Table 39 presents the summary of the research hypotheses and empirical evidence for
the samples of family firms and subsamples of respondents divided regarding their family
affiliation.

158
Table 37
Structural Model – Comparison about the subsamples of managers’ family affiliation
Sample (n=152) Nonfamily managers (n=99) Family managers and founders (n=53) Family managers (n=36) β P Values f2 R2ad P Values f2 R2 R2ad β P Values f2 R2ad β P Values f2 R2ad
GS_part -> GS_pj H1a 0.407 0.000 0.249 0.518 0.354 0.000 0.201 0.568 0.440 0.000 0.276 0.425 0.496 0.000 0.478 0.527
GS_form -> GS_pj H1b 0.257 0.001 0.098 0.358 0.000 0.207 0.069 0.573 0.007 0.188 0.220 0.057
MLMV -> GS_pj 0.266 0.000 0.127 0.255 0.011 0.132 0.356 0.126 0.200 0.304 0.307 0.169
PE_part -> PE_pj H1a 0.411 0.000 0.266 0.631 0.463 0.000 0.445 0.710 0.301 0.169 0.097 0.476 0.253 0.302 0.068 0.415
PE_form -> PE_pj H1b 0.417 0.000 0.268 0.442 0.000 0.378 0.373 0.008 0.157 0.441 0.006 0.198
MLMV -> PE_pj 0.110 0.052 0.029 0.064 0.336 0.012 0.200 0.189 0.070 0.096 0.574 0.014
GS_part -> STEW_iden H2a 0.263 0.003 0.091 0.568 0.247 0.011 0.088 0.615 0.194 0.197 0.055 0.607 0.114 0.494 0.025 0.691
PE_part -> STEW_iden H2a 0.201 0.052 0.042 0.398 0.003 0.156 -0.083 0.584 0.010 -0.113 0.539 0.026
GS_form -> STEW_iden H3a 0.034 0.687 0.002 0.158 0.152 0.037 -0.008 0.950 0.000 -0.177 0.256 0.068
PE_form -> STEW_iden H3a -0.077 0.471 0.006 0.038 0.763 0.002 -0.254 0.111 0.086 -0.389 0.041 0.243
GS_pj -> STEW_iden H4a 0.377 0.000 0.150 0.191 0.071 0.039 0.641 0.000 0.615 0.790 0.000 0.965
PE_pj -> STEW_iden H4a 0.028 0.767 0.001 -0.108 0.442 0.009 0.107 0.518 0.013 0.195 0.319 0.053
MLMV -> STEW_iden 0.108 0.111 0.021 0.076 0.356 0.011 0.183 0.253 0.068 0.302 0.260 0.229
GS_part -> STEW_cult H2b 0.216 0.013 0.063 0.580 0.184 0.092 0.043 0.570 0.363 0.010 0.194 0.610 0.133 0.468 0.030 0.643
PE_part -> STEW_cult H2b 0.119 0.216 0.015 0.101 0.466 0.009 0.173 0.262 0.042 0.112 0.579 0.022
GS_form -> STEW_cult H3b 0.188 0.021 0.053 0.265 0.029 0.094 0.122 0.280 0.029 -0.038 0.801 0.003
PE_form -> STEW_cult H3b 0.076 0.459 0.006 0.064 0.643 0.004 0.060 0.678 0.005 0.039 0.840 0.002
GS_pj -> STEW_cult H4b 0.279 0.002 0.085 0.215 0.083 0.044 0.264 0.104 0.105 0.609 0.001 0.497
PE_pj -> STEW_cult H4b 0.072 0.390 0.004 0.138 0.325 0.013 -0.092 0.524 0.009 -0.023 0.913 0.001
MLMV -> STEW_cult 0.041 0.582 0.003 -0.004 0.963 0.000 0.206 0.261 0.087 0.163 0.447 0.058 Note 1. Classification of Cohen (1988): small effect (f² = 0.02), medium effect (f² = 0.15) and large effect (f² = 0.35) Note 2. Sample n=152 is composed of all respondents. Sample 120 consists of private medium and large family firms with family ownership higher than 50%. Note 3. Grey cells may indicate a multicollinearity problem between the latent variables supposed to occur in the family managers’ subsample. We present the results of family manager’s subsample as an exploratory analysis, since this sample size is insufficient for SEM analysis.

159
Table 38
Indirect effects - Models presented in Table 36
Sample 152 Sample 120 Sample 99
β P Values β P Values β P Values
GS_part -> STEW_cult 0.095 0.020 0.082 0.097 0.063 0.166
GS_part -> STEW_iden 0.118 0.003 0.083 0.094 0.054 0.139
PE_part -> STEW_cult 0.028 0.485 0.036 0.446 0.060 0.395
PE_part -> STEW_iden 0.010 0.799 0.006 0.888 -0.048 0.447
GS_form -> STEW_cult 0.064 0.062 0.068 0.131 0.069 0.211
GS_form -> STEW_iden 0.080 0.035 0.068 0.131 0.059 0.216
PE_form -> STEW_cult 0.028 0.456 0.035 0.388 0.061 0.374
PE_form -> STEW_iden 0.010 0.798 0.006 0.885 -0.050 0.465 Note 1. Sample n=152 is composed of all respondents. Sample 120 consists of private medium and large family firms with family ownership higher than 50%. Sample 99 contains just nonfamily managers.
Table 39
Summary of the results
Hypotheses
Full Model Subsamples model
n=152 n=120 Nonfamily managers
(n=99)
Nonfamily managers
(n=99)
Founders and Family
Managers (n=53)
Family Managers
(n=36)
Procedural Justice H1a: GS_part -> GS_pj (+)*** (+)*** (+)*** (+)*** (+)*** (+)*** H1a: PE_part -> PE_pj (+)*** (+)*** (+)*** (+)*** No No H1b: GS_form -> GS_pj (+)*** (+)*** (+)*** (+)*** No No H1b: PE_form -> PE_pj (+)*** (+)*** (+)*** (+)*** (+)*** (+)*** Stewardship identification H2a: GS_part -> STEW_iden (+)*** (+)*** (+)*** (+)*** No No H2a: PE_part -> STEW_iden (+)** (+)* (+)*** (+)*** No No H3a: GS_form -> STEW_iden No No No No No No H3a: PE_form -> STEW_iden No No No No No (-)** H4a: GS_pj -> STEW_iden (+)*** No No No (+)*** (+)*** H4a: PE_pj -> STEW_iden No No No No No No Stewardship-oriented culture H2b: GS_part -> STEW_cult (+)** (+)** (+)* (+)* (+)*** No H2b: PE_part -> STEW_cult No No No No No No H3b: GS_form -> STEW_cult (+)** (+)** (+)** (+)** No No H3b: PE_form -> STEW_cult No No No No No No H4b: GS_pj -> STEW_cult (+)** (+)* No (+)* (+)* (+)*** H4b: PE_pj -> STEW_cult No No No No No No
Note 1. Statistical significance (Yes/No and p<0.01***, p<0.05** and p<0.10*) Note 2. In the full model, we add all the control variables (Table 5.10) while in the subsamples model we add just the MLMV control variable (Table 5.11).

160
5.4. Conclusions
This study discussed management control mechanisms’ design and procedural justice
as situational mechanisms of stewardship in family firms (Davis et al., 1997; Neubaum et al.,
2017). We argue that traditional agency mechanisms, such as goal setting and performance
evaluation, might stimulate stewardship if they are aligned with procedural justice values
(Lubatkin et al., 2007), regarding participation and formality fair design characteristics
(Langevin & Mendoza, 2013).
Despite previous literature has been proposing that trust and social mechanisms
maximizes the benefits of stewardship in organizations (Davis et al., 1997; Madison et al.,
2016), this paper provides insights on how typical agency mechanisms are associated with
stewardship in the family business context, by considering the procedural justice lens (Lubatkin
et al., 2007). We support this understanding in the management accounting literature, due to
the vast empirical evidence that shows that procedural justice is an antecedent of many pro-
organizational attitudes and behaviors in organizations such as trust, identification, and
commitment (Cugueró-Escofet & Rosanas, 2013; Hartmann & Slapničar, 2009; Langevin &
Mendoza, 2013).
In this sense, we address the claim raised by Neubaum et al. (2017) that the antecedents
of stewardship are still a conjecture, complementing empirical studies that have been developed
recently in the context of family businesses (James et al., 2017; Madison et al., 2016; Madison
et al., 2017). Aiming to expand the scope of these discussions, we considered both individual
and organizational levels of stewardship, which were respectively named as manager’s
stewardship identification (Craig et al., 2011; James et al., 2017; Madison et al., 2017) and
stewardship-oriented culture (Zahra et al., 2008).
Particularly, we show that participation and formality characteristics of goal setting as
well as manager’s procedural justice perceptions about goal setting are positively associated
with stewardship-oriented culture (Hernandez, 2012; Neubaum et al., 2017; Simon, Marquès,
Bikfalvi, & Muñoz, 2012; Zahra et al., 2008). Participative and formal goal setting mechanism
seem to foster stewardship-oriented culture, what we did not find for performance evaluation
mechanism (Ferreira & Otley, 2009; Malmi & Brown, 2008; Otley, 1999).
About manager’s stewardship identification, our results indicate the relevance of
participation in goal setting and in performance evaluation enhancing this attitude of managers
in the family firm. Therefore, our results reveal the positive association between participative
management control mechanisms and stewardship identification, which was also supported by

161
prior studies (Henssen et al., 2014; Hernandez, 2012; Madison et al., 2016). However, we find
that formality in management control mechanisms can not be considered an antecedent of
manager’s stewardship identification. We also indicate that manager’s perceptions about
procedural justice are an important antecedent of stewardship identification and stewardship-
oriented culture in family firms (Neubaum et al., 2017; Vallejo, 2009; Van der Heyden et al.,
2005).
Furthermore, we have also explored the results based on the manager’s family
affiliation, since previous literature has revealed that it is a relevant characteristic to determine
manager’s attitudes and behaviours in family firms (Corbetta & Salvato, 2004; Davis et al.,
2010; Verbeke & Kano, 2012), despite recent empirical evidence that questioned these
assumptions (Hiebl, 2015; James et al., 2017; Madison et al., 2016). By analysing the
subsamples, we suggest that family and nonfamily managers perceive the antecedents of
stewardship differently in relation to stewardship identification and stewardship-oriented
culture, while prior literature indicates that they can both behave as stewards in the family firm
(Henssen et al., 2014; James et al., 2017). For nonfamily managers, formality in goal setting is
a significant antecedent for stewardship-oriented culture while for family managers it is the
level of manager’s participation in this process. Additionally, we show that for nonfamily
managers, participation in both goal setting and performance evaluation is positively associated
with stewardship identification, while for family managers and founders we did not find
statistically significant results.
Despite these contributions, this study has a series of limitations that should be
highlighted. Our paper relied on a single respondent survey design which implicates in the
possibility of response bias especially with regards to subjective measures such as procedural
justice and stewardship identification (Podsakoff, MacKenzie, Lee, & Podsakoff, 2003;
Podsakoff, Mackenzie, & Podsakoff, 2012). The respondent’s bias can also be extended to the
organizational level constructs such as stewardship-oriented culture (Podsakoff et al., 2003;
2012). Additionally, this study comprises a cross-sectional design which also limits causal
interpretations (Ittner, 2014; Van der Stede, 2014). We diagnosed common method bias by
applying Harman test (Podsakoff et al., 2003; 2012) and treated this concern statistically by
adding a common method variance control variable in the model (Chin et al., 2013; Nitzl, 2016).
We also used validated instruments in the family business and management accounting
literature and used a set of control variables in the model, related to the family firm and
respondents characteristics.

162
Moreover, our sample is composed of small, medium and large Brazilian family firms.
We addressed some differences by excluding small-sized firms, public listed firms and those
firms with high dispersion in ownership (in a sample composed by 120 respondents), and the
results of these analyses do not show significant differences from the whole sample (152
respondents). Our sample comprises most of the Brazilian regions, but regarding
representativeness, it captured just the firms in EMIS database. Since Brazil is a large and
heterogeneous country which implicates a population of more than 12 million small and
medium firms we consider that these results may not generalize for all Brazilian family
businesses, but mainly to medium and large family firms from manufacturing industry that are
installed in the Southeast and South regions.
Finally, we highlight further avenues of research. First, participation has been treated as
a conceptual dimension of stewardship in family firms (Davis et al., 1997; Hernandez, 2012;
Neubaum et al., 2017), but future research could also address manager’s participation in
different management control mechanisms such as strategic planning and budgeting systems.
For example, each management control mechanism has different time horizons, serves to
different purposes in the Management Control Systems (Malmi & Brown, 2008), which might
have a different influence over managers’ attitudes and behaviors.
Second, we suggest that formality might be an important fair dimension of management
control mechanisms, which influence stewardship. Different from the agency perspective of
monitoring mechanism attributed to formal management practices, we suggest that formality
has other dimensions that are needed to develop a collective and professional culture in family
firms (Simon et al., 2012). For example, previous literature in management accounting has
pointed that formal management control mechanisms can also enhance transparency, learning
and innovation in organizations (Adler & Borys, 1996; Ahrens & Chapman, 2004; Chapman &
Kihn, 2009; Simons, 1995), which might foster pro-organizational attitudes and behaviors in
the family firm (Davis et al., 1997; Hernandez, 2012; Neubaum et al., 2017).
Third, as procedural justice perceptions might not be straightforward in terms of
dimensions and management practices, we suggest future studies to treat these perceptions for
different management control mechanisms such as goal setting, performance evaluation and
rewarding (Hartmann & Slapničar, 2009, 2012; Voußem, Kramer, & Schäffer, 2016).
Additionally, as we have suggested, procedural justice might be one of the antecedents of
stewardship, whether more empirical evidence is still needed in the family firm field (Neubaum
et al., 2017; Van der Heyden et al., 2005). We propose that future studies take into account
manager’s family affiliation characteristic as a critical dimensions that differentiate how

163
managers perceive fairness design characteristics and procedural justice in management control
mechanisms, as well as their attitudes and behaviours in the family firm (James et al., 2017;
Madison et al., 2016; Verbeke & Kano, 2012).
Fourth, with regards to stewardship, although some developments have been made in
the field, there is opportunity for research about the antecedents and the consequences of
stewardship in family firms (James et al., 2017; Madison et al., 2017; Neubaum et al., 2017).
We suggest future scholars to investigate how management control mechanisms are associated
with stewardship attitudes and behaviours (James et al., 2017; Madison et al., 2016; Neubaum
et al., 2017) and whether stewardship influence firms competitive advantage in family firms
(Eddleston & Kellermanns, 2007; Madison et al., 2017; Zahra et al., 2008).

164
165
6. STUDY 3: FAMILY INVOLVEMENT IN MANAGEMENT AND FAMILY FIRM’S
PERFORMANCE: THE MODERATING ROLE OF STEWARDSHIP-ORIENTED
CULTURE
6.1. Introduction
In the family business literature there are two opposing views on family firm
performance depending on whether a family involvement can be considered as an advantage or
as a disadvantage to the firm (Chirico & Bau’, 2014; Miller & Le Breton-Miller, 2006;
Rutherford, Kuratko, & Holt, 2008). One view considers that family firms outperform
nonfamily firms because of the distinctive characteristics that derive from the controlling family
involvement in the family firm, for example, regarding absent or limited agency costs
(Anderson & Reeb, 2003; Rutherford et al., 2008). The second stream looks at the adverse
effects that controlling family involvement brings to the firm such as nepotism, entrenchment
and unprofessional management (Lubatkin, Schulze, Ling, & Dino, 2005; Rutherford et al.,
2008), which negatively affects the family firms’ performance.
Garcia-Castro and Aguilera (2014) present a summary of studies that suggest both
positive and negative relationships between a family involvement in the business and family
firm performance, and further argue that empirical evidence are still inconclusive (Garcia-
Castro & Aguilera, 2014; González-Cruz & Cruz-Ros, 2016). Prior studies have used several
elements for a family involvement in the business (Garcia-Castro & Aguilera, 2014) such as
ownership (e.g., the percentage of family ownership), management control (e.g., board of
directors composition), management (e.g., family CEO and Top Management Team
composition), and experience (e.g., generations involved in the firm).
Therefore, despite the existence of a whole stream of literature on family firm
performance, previous studies have used different samples, different definitions of family firms
(Miller, Minichilli, & Corbetta, 2013; Sciascia & Mazzola, 2008), and especially insufficient
attention to mediating and moderating variables, which can explain the mixed findings of the
literature (Chirico & Bau’, 2014; González-Cruz & Cruz-Ros, 2016; Kim & Gao, 2013). In
fact, researchers propose that the association between family involvement in business and
performance might be indirect rather than direct (Chrisman, Steier, & Chua, 2008) or that may
be moderated by other family firm’s capabilities (Dibrell & Moeller, 2011; Garcia-Castro &
Aguilera, 2014; Kim & Gao, 2013).

166
The familiness framework has contributed to this discussion about firm’s performance
since it provides a broader perspective on the internal resources of the organization and their
relationship with the firm’s competitive advantage (Dawson & Mussolino, 2014; Habbershon
& Williams, 1999). In prior studies, familiness has been conceptualized as a factor driving the
family firm’s performance (Rutherford et al., 2008; Sciascia & Mazzola, 2008). Familiness is
considered a “fuzzy” concept (Irava & Moores, 2010; Moores, 2009) which is traditionally
grounded on the resource-based view (RBV) theory.
In the family business literature, RBV offers a lens to discuss firm characteristics and
distinctiveness (Irava & Moores, 2010) in which familiness is considered a central concept.
Familiness is defined as the “idiosyncratic firm-level bundle of resources and capabilities a
particular firm has because of the systematic interaction between family, its individual members
and the business” (Irava & Moores, 2010, p. 131). The level of family involvement in the group
of top executives might reflect the level of familiness (Minichilli, Corbetta, & MacMillan,
2010). Following Minichilli et al. (2010) we focus on two components included in this
involvement, they are (i) whether the CEO is a family manager and (ii) the proportion of family
managers in the Top Management Team (Ensley & Pearson, 2005; Minichilli et al., 2010).
However, familiness construct might be more complex than captured by family
involvement in business proxies (Irava & Moores, 2010; Pearson, Carr, & Shaw, 2008). Prior
literature suggests numerous sources of family firm’s competitive advantage which has been
addressed by the familiness studies (Dawson & Mussolino, 2014; Irava & Moores, 2010;
Pearson et al., 2008).
Therefore, in this study, we also rely on the stewardship literature (e.g., Davis et al.,
1997), specifically on the stewardship-oriented culture construct (Zahra et al., 2008). The
stewardship theory portrays that managers develop a pro-organizational behavior (Davis et al.,
1997) fostering motivation, care, and loyalty among individuals (Ward, 1988). In the family
business context, stewardship is linked to reciprocal altruism, trust and collectivism (Davis et
al., 2010, 1997; Eddleston, Kellermanns, & Sarathy, 2007).
Stewardship has been considered as a capability for family firm’s dynamics by multiple
studies (Dibrell & Moeller, 2011; Eddleston & Kellermanns, 2007; Zahra et al., 2008). There
is evidence in the literture that a stewardship-oriented culture influences the family firm’s
capacity to react to strategic contingencies (Eddleston et al., 2007; Zahra et al., 2008).
Eddleston, Kellermanns, and Zellweger (2012, pp. 349–350) argue that “when stewardship is
present in family firms, a competitive advantage may arise due to organizational members’
collectivistic attitudes, psychological commitment, and trustworthy behaviors”. Hence, the

167
stewardship theory can expand the understanding about how a family involvement influence
the family firm performance.
A stewardship-oriented culture might assist a family firm to deploy the familiness
resources, related to the family involvement in the business. In this sense, we propose that a
stewardship-oriented culture might enhance the association between family involvement in
management and firm’s performance, supporting the bright side of family involvement in the
firm (Lubatkin et al., 2005; Minichilli et al., 2010; Villalonga & Amit, 2006). Based on the
assumptions about the attitudes and behaviors of family managers in terms of stewardship
(James et al., 2017), a stewardship-oriented culture might maximize the benefits of the presence
of a family CEO and family managers in the Top Management Team (TMT) and lead into a
higher level of firm’s performance (Miller & Le Breton-Miller, 2006).
We use this previous conceptualization and consider stewardship-oriented culture as a
capability that moderates the association between a family involvement in management and a
family firm’s financial performance (Corbetta & Salvato, 2004; Eddleston, Kellermanns, &
Sarathy, 2007; Miller & Le Breton-Miller, 2006). Hence, based on the previous discussion
grounded on the familiness construct (Dawson & Mussolino, 2014; Irava & Moores, 2010;
Pearson, Carr, & Shaw, 2008) and on the stewardship literature (Dibrell & Moeller, 2011;
Eddleston & Kellermanns, 2007; Miller & Le Breton-Miller, 2006; Zahra, Hayton, Neubaum,
Dibrell, & Craig, 2008), we propose the following research question: Does a stewardship-
oriented culture moderates the association between the level of family involvement in
management and a family firm’s performance?
This study contributes to the familiness and stewardship literature in multiple ways.
First, prior empirical literature has focused on comparing family firms’ versus nonfamily firms’
performance, however so much is still to be uncovered regarding the investigation of the drivers
of family firms’ performance with inconclusive empirical evidence (e.g., Garcia-Castro &
Aguilera, 2014). The reason could be the use of different samples, performance measures, or
modeling strategies (Chrisman, Chua, & Sharma, 2005; Garcia-Castro & Aguilera, 2014;
Rutherford et al., 2008; Sciascia & Mazzola, 2008).
Additionally, we use a sample of medium and large family firms from an emerging
economy (Kim & Gao, 2013) and consider different performance measures for a family firm’s
performance (Garcia-Castro & Aguilera, 2014). These issues are important since previous
studies focused mainly on family businesses from Europe and United States, which might have
diferent institutional and cultural characteristics that influence family firms behaviors and were
based in self-reported performance measures.

168
Furthermore, consistent with previous studies, we discuss a nonlinear association
between the ratio of family managers in the TMT and firms’ performance (Minichilli et al.,
2010; Sciascia & Mazzola, 2008). Particularly, we extend the discussion of familiness by
introducing the stewardship-oriented culture construct that has been conceptualized to be
associated with firm’s competitive advantage (Corbetta & Salvato, 2004; Dibrell & Moeller,
2011; Eddleston et al., 2007; Zahra et al., 2008). Previous literature that focused on the
resource-based view in the family firm field investigated the influence of stewardship
orientation on strategic flexibility (Zahra et al., 2008), innovativeness (Dibrell & Moeller,
2011), and entrepreneurial orientation (Eddleston et al., 2012). Only a few studies have
investigated how stewardship is associated with family firm’s performance (Alves, Gama, &
Augusto, 2017; Eddleston et al., 2007).
Our results suggest that a stewardship-oriented culture moderates the association
between family involvement in management regarding the presence of a family CEO and family
firm’s financial performance. However, differently from what we hypothesized (Dibrell &
Moeller, 2011; Eddleston et al., 2007; Miller & Le Breton-Miller, 2006), a low level of
stewardship-oriented culture, combined with the presence of a family CEO, is associated with
a higher level of family firm’s performance. Particularly, based on the analysis of the
moderation effect, the slope of a low level of stewardship-oriented culture is sharp while a high
level of stewardship-oriented culture is flat through the presence of a family or a nonfamily
CEO. This indicates that for a low level of stewardship the presence of a family CEO leads to
a high level of firm performance while in a high level of stewardship this influence is weaker
in which the presence of a family CEO might not lead to competitive advantage. However, we
did not find a statistically significant moderation effect for the relationship between the ratio of
family managers in the TMT and family firm’s performance.
Additionally, we analyzed the two components of family involvement that are (i) the
presence of a family CEO and (ii) the ratio of family managers in the TMT (Ensley & Pearson,
2005; Minichilli et al., 2010). First, we show that the presence of a family CEO is positively
associated with the firm’s performance, which result is consistent with all three profitability
measures (ROA, ROE, and ROS). This result is aligned to previous empirical evidence that a
family leadership in the family firm drives a higher level of performance (González-Cruz &
Cruz-Ros, 2016; Minichilli et al., 2010).
Second, the association between the ratio of family managers in the TMT and firm’s
performance has shown conflicting evidence. Different from what we have hypothesized, we
have found a nonlinear U-shape association between the ratio of family managers in the TMT

169
and firm’s performance. This finding indicates that the mix of family and nonfamily managers
in the TMT drive a low level of performance, due to the tensions and conflicts that may occur
between these two groups, which discussion is related to the ‘faultlines’ concept (Minichilli et
al., 2010).
This paper is organized in four sections including this introduction (Section 1). In
Section 2, we present the conceptual model and research hypotheses. In Section 3, we show the
results of both descriptive statistics and Structural Equation Modeling. In Section 4, we present
the discussions, conclusions and highlight the limitations of this study.
6.2. Theoretical model and hypotheses
Our theoretical model is based on the familiness construct, particularly on the family’s
involvement in management and on the stewardship-oriented culture. We investigate whether
a stewardship-oriented culture moderates the relationship between family involvement in
management and a family firm’s financial performance. We present the research model in
Figure 12.
Figure 12. Theoretical model – Paper 3
As indicated by the resource-based view (RBV), firms can have unique resources that
enable them to develop a competitive advantage, which is expected to influence their
performance positively (Barney, 1991; Habbershon, Williams, & MacMillan, 2003). These
firm-particular resources can be both tangible and intangible, and therefore they are not
accessible to all organizations (Amit & Schoemaker, 1993). Amit and Schoemaker (1993)
Performance
Stewardship-oriented culture
Family CEO
Ratio of family managers in the
TMT
Quadratic effect of the ratio of
family managersin the TMT
Family involvement in management

170
divided the previous called resources (Barney, 1991) in resources and capabilities, which can
be approached from different angles. These authors define resources as “stocks of available
factors that are owned or controlled by the firm” and capabilities as their “capacity to deploy
these resources” (Amit & Schoemaker, 1993, p. 35). We discuss family involvement in
management as a resource and stewardship-oriented culture as a capability in the umbrella of
familiness construct (Dibrell & Moeller, 2011; Habbershon, Williams, & MacMillan, 2003;
Irava & Moores, 2010).
Family involvement in management is divided into two components. There is the family
affiliation of the CEO and the ratio of family managers in the TMT (Ensley & Pearson, 2005;
Minichilli et al., 2010). Following previous literature (González-Cruz & Cruz-Ros, 2016;
Sciascia & Mazzola, 2008), we also consider whether the relationship between the presence of
family managers in the family firm’s TMT is linear or nonlinear.
A stewardship-oriented culture reflects the extent to which the family firm “had adopted
stewardship-oriented practices, like encouraging collectivism, or providing an environment of
care and concern for employees” (Zahra et al., 2008, p. 1048) what is expected to enhance the
positive association between family involvement in management and performance, considering
a moderating effect and not a mediating or direct effect such as addressed by previous studies
(Alves et al., 2017; Eddleston, Kellermanns, & Sarathy, 2007).
A firm’s financial performance is a highly complex construct. In this study, we discuss
three accounting performance measures that are ROA, ROE, and ROS available in the EMIS®
database11, which were adjusted based on the median of the industry (De Massis, Kotlar,
Campopiano, & Cassia, 2015; Garcia-Castro & Aguilera, 2014). They are more desirable than
perceptual measures (e.g., Eddleston & Kellermanns, 2007) since they represent real financial
performance (Eddleston, Kellermanns, & Sarathy, 2007). In the next subsections, we present
the underlying hypotheses of this model, which are supported by the previous literature. The
overall model includes three main hypotheses and two moderator hypotheses.
6.2.1. The relationship between family CEO and firm performance
Chief Executive Officers (CEO) are leaders of the Top Management Team and are
considered the most powerful actors in the organization (Finkelstein & Hambrick, 1996;
11 EMIS database website (https://www.emis.com/who-we-are). EMIS operates in and reports on countries where high reward goes hand-in-hand with high risk. We bring you time-sensitive, hard-to-get, relevant news, research and analytical data, peer comparisons and more for over 125 countries emerging markets.

171
Finkelstein, Hambrick, & Cannella, 2008). They have the greatest power to influence the family
firms’ performance (González-Cruz & Cruz-Ros, 2016; Minichilli et al., 2010) because they
dominate all the firm’s decision processes, such as the delegation of responsibilities in the
firm’s governance structure. The power and dominance of a family CEO is expected to be
higher than nonfamily CEO’s, what can be reflected on the speed in which complex decisions
related to acquisitions and long term investments, for example, are made (Miller & Le Breton-
Miller, 2006), which can be beneficial to the family firm performance.
We argue that a family CEO increases a family firm’s performance since they are
expected to behave altruistically in the firm (Chrisman, Chua, & Sharma, 2005; Schulze,
Lubatkin, & Dino, 2003) and add a long-term view to the decision-making process (Miller &
Le Breton-Miller, 2006). Family CEO’s usually have lengthy job tenures and long-term
investment horizons which engender superior performance (Miller & Le Breton-Miller, 2006).
Additionally, a family CEO could reduce conflicts with respect to aligning managers’
and principals’ goals in the firm and reducing agency costs (Jensen & Meckling, 1976;
Madison, Holt, Kellermanns, & Ranft, 2016). A family CEO is expected to behave as a steward
in the firm, presenting a high level of loyalty, commitment and identification (Davis, Allen, &
Hayes, 2010; Henssen, Voordeckers, Lambrechts, & Koiranen, 2014) which has been
conceptualized as positively related to performance (Miller & Le Breton-Miller, 2006).
Minichili et al. (2010) consider the presence of a family CEO as the bright side of family
involvement.
We suggest that the presence of a family CEO is positively associated with a family
firm’s financial performance (Anderson & Reeb, 2003; González-Cruz & Cruz-Ros, 2016;
Minichilli et al., 2010; Villalonga & Amit, 2006). Based on previous literature, we hypothesize
that:
H1: There is a positive association between the presence of a family CEO and family
firm’s financial performance
6.2.2. The relationship between the ratio of family managers in the TMT and firm
performance
Previous empirical literature has suggested that family involvement in management,
captured by the number of family managers present in the Top Management Team has been
positively associated with family firm performance (Rutherford et al., 2008; Sciascia, Mazzola,

172
& Chirico, 2013). These studies indicate that the benefits of a high level of family involvement
in management is related to reduced agency problems, lower agency costs and reduced
information asymmetry (Chrisman, Chua, & Litz, 2004; Miller & Le Breton-Miller, 2006).
With respect to manager’s behavioral assumptions, family managers are expected to
behave as stewards generating an individual sense of identification, loyalty, commitment, trust,
among other pro-organizational attitudes and behaviors (Davis et al., 2010, 1997; Neubaum,
Thomas, Dibrell, & Craig, 2017), which are expected to be positively related to higher family
firm’s performance. Therefore, we hypothesize that:
H2a: There is a positive association between the ratio of family managers in the TMT
and family firm’s financial performance.
However, recent studies have suggested conflicting evidence about the linear
association of family involvement in management, regarding the presence of family managers
in the Top Management Team, and firm’s performance (Garcia-Castro & Aguilera, 2014;
González-Cruz & Cruz-Ros, 2016; Rutherford et al., 2008). These conflicting findings
motivated researchers to discuss nonlinear relationships of family involvement in management
and a firm’s performance (De Massis, Kotlar, Campopiano, & Cassia, 2015; González-Cruz &
Cruz-Ros, 2016; Mazzola, Sciascia, & Kellermanns, 2013; Minichilli et al., 2010; Sciascia &
Mazzola, 2008).
These studies reveal that the benefits of the family ratio in the TMT on firm’s
performance are significant just after a certain level of family manager’s participation in the
TMT (Sciascia & Mazzola, 2008). However, when the family involvement in management
achieves a high degree, it brings negative effects on performance.
These negative effects are related to typical family agency costs (Madison, Holt,
Kellermanns, & Ranft, 2016; Villalonga & Amit, 2006) such as nepotism (Jaskiewicz,
Uhlenbruck, Balkin, & Reay, 2013), managerial entrenchment (Chrisman, Chua, & Sharma,
2005) and asymmetric altruism (Cherchem, 2017) that could lead to conflicts in the family firm.
We argue that in extreme levels of family involvement in management the within-family agency
costs resulting from family managers’ conflicts and emotional involvement to the firm, exceeds
the benefits of reduced traditional principal-agent costs (Chirico & Bau’, 2014; Chrisman,
Chua, & Litz, 2004; Lubatkin, Schulze, Ling, & Dino, 2005).
Moreover, a high level of family managers in the TMT leads to a lower diversity of
expertise in the TMT (Patel & Cooper, 2014; Vandekerkhof, Steijvers, Hendriks, &
Voordeckers, 2015), which might also negatively influence a firm’s performance. The presence

173
of nonfamily managers could bring diverse perceptions and expertise to the TMT that are
complimentary to those from family managers, what might improve the family firm’s decision-
making process (Chrisman, Memili, & Misra, 2014; De Massis et al., 2015; Vandekerkhof et
al., 2015) such as formal strategic and financial planning (Filbeck & Lee, 2000; Speckbacher
& Wentges, 2012). In sum, as family managers are constrained by the lack of professional
competencies (Dyer, 1989), a high level of family managers in the TMT might negatively
influence the firm’s performance.
Moreover, family managers may attribute more value to nonmonetary (e.g., emotions,
status) in detriment to monetary returns what could have an impact on the firm’s financial
performance. Therefore, in a high level of family managers in the TMT, the controlling family
will determine decision-making based on the preservation of their socioemotional wealth in
detriment of financial goals (Chrisman, Chua, Pearson, & Barnett, 2012; Gomez-Mejia, Cruz,
Berrone, & De Castro, 2011; Kellermanns, Eddleston, & Zellweger, 2012; Miller & Le Breton-
Miller, 2014).
In sum, Sciascia and Mazzola (2008, p. 337) argue that:
the benefits of FIM induced by lower agency costs, the stewardship effect, and lower compensation are not so evident until a certain level of FIM is reached, while, on the other hand, the negative effects deriving from conflict between family managers, nonmonetary goal orientation, reduced professional competencies, and less social capital are more likely to manifest themselves once the FIM percentage approaches 100. (Sciascia & Mazzola, 2008, p. 337)
Complementarily, González-Cruz & Cruz-Ros (2016, p. 1453) propose that “an equal
mix of family and non-family managers bring all the benefits of low agency cost, high and
healthy stewardship behavior, and managerial competences”. Therefore, we hypothesize that:
H2b: There is an inverted-U-shaped association between the ratio of family managers
in the TMT and family firm’s financial performance.
6.2.3. Moderation of stewardship-oriented culture
Stewardship theory is considered relevant for understanding the performance of family
firms (Corbetta & Salvato, 2004; Zahra et al., 2008). There are several arguments to consider
the stewardship-oriented culture as a capability of the family firm (Dibrell & Moeller, 2011;
Eddleston & Kellermanns, 2007). Looking at the resource-based view, a firm’s culture cannot
be easily copied by the firm’s competitors in the sense that is a complex issue. Moreover, the
stewardship-oriented culture positively relates to the level of communication and cohesion

174
among managers, as well as pro-organizational behaviors which all create sustainable and
inimitable competitive advantage to the firm (Miller & Le Breton-Miller, 2006; Zahra et al.,
2008).
The sources of competitive advantage of family firms arise from the differential
relational advantages of family-managed firms that are related to the stewardship lens (Dibrell
& Moeller, 2011; Eddleston & Kellermanns, 2007; Eddleston, Kellermanns, & Sarathy, 2007;
Zahra et al., 2008). Additionally, the prevalence of altruism, collectivism, and trust in the
relationships among family firm’s managers (Corbetta & Salvato, 2004) may foster their efforts
to achieve a better performance in the firm. Finally, the benefits of stewardship rely on a long-
term investment perspective (Davis et al., 1997; Eddleston et al., 2012), which can lead a
superior performance. For instance, Kim and Gao (2013) shows how a firm’s family-longevity
goals moderate the relationship between family involvement in management and performance.
Prior literature has conceptualized that a stewardship-oriented culture leads to higher
strategic flexibility (Zahra et al., 2008), entrepreneurial orientation (Eddleston et al., 2012),
however little support about how it is related to performance. Based on the stewardship
literature (Davis et al., 2010; James et al., 2017; Madison et al., 2016), we argue that
stewardship-oriented culture might enhance the bright side of family involvement’s influence
in performance. A stewardship-oriented culture will support the positive influence of family
managers’ stewardship-like behaviors on the firm’s performance. Therefore, the degree to
which a stewardship-oriented culture exists in the firm might influence the relationship between
FIM and performance.
Family managers are expected to behave as stewards in the family firm, presenting a
high level of commitment, identification, among others pro-organizational attitudes (Corbetta
& Salvato, 2004; Davis et al., 2010). James et al. (2017, p. 264) discuss that stewardship
mechanisms “will empower pro-organizational attitudes and behaviors amongst the majority
of steward-like family managers” while agency mechanisms will dampen their motivation. A
stewardship governance is aligned to a culture that fulfills manager’s needs for autonomy,
belonging and competence (James et al., 2017; Zahra et al., 2008).
Particularly, we propose that a stewardship-oriented culture maximizes the benefits of
a presence of a family CEO and of a high ratio of family managers in the TMT, enhancing the
positive effect of familiness on the family firm’s financial performance. This is aligned with
Miller & Le Breton-Miller (2006, p. 74), which suggests that stewardship “can engender far-
sighted contributions that feed distinctive capabilities and produce superior performance”.

175
Therefore, we hypothesize that:
H3: The positive association between the presence of a family CEO and family firm’s
financial performance will be stronger for higher levels of stewardship-oriented culture than
for lower levels of stewardship-oriented culture.
H4: The positive association between the ratio of family managers in the TMT and
family firm’s financial performance will be stronger for higher levels of stewardship-oriented
culture than for lower levels of stewardship-oriented culture.
We present the theoretical model and hypothesis in Figure 13.
Figure 13. Theoretical model and hypotheses – Paper 3
6.3. Data analyses
First, we report the descriptive statistics of the variables and then discuss the Structural
Equation Modeling results.
6.3.1. Descriptive Statistics
We present the descriptive statistics in Table 40. We show the firm’s financial
information in 2016 in terms of Total Operating Revenue, Total Assets, and Total Equity. The
firm’s Total Assets ranges between 13.91 million Brazilian reais (BRL12) to 7.38 billion reais.
We use the logarithm of Total assets as one of our control variables.
12 In 16th September 2017, US$ 1 BRL was equivalent to BRL 3.125 dollars.
Firm size
Control variables
Performance
Stewardship-oriented culture
Family CEO
Ratio of family managers in the
TMT
Quadratic effect of the ratio of
family managersin the TMT
H1
H2a
H2b
H3
H4

176
Table 40
Sample descriptive statistics
Variable n Mean Std. Dev. Min Max TOpRev_16 (million BRL) 59 592.93 748.48 2.38 4228.95 Tassets_16 (million BRL) 59 667.84 1083.77 13.91 7385.26 Tequity_16 (million BRL) 59 304.17 420.88 3.93 2648.36
ROA_16 (%) 59 5.42 12.12 -27.05 71.27 ROE_16 (%) 59 5.19 51.41 -263.76 187.03 ROS_16 (%) 59 4.85 9.69 -28.20 37.55
familyCEO 59 0.78 - 0 1 pfamilyTMT 58 0.39 0.32 0 1 size_TMT 58 6.21 3.55 2 20 d_ownersship_100% 58 0.66 - 0 1
STEWcult_1. Your company allows managers to reach their full potential contributing to the company.
59 3.83 1.04 1 5
STEWcult_2. Your company promotes a professionally orientated workplace.
59 3.71 1.09 1 5
STEWcult_3. Your company inspires managers' care and loyalty to the company.
59 4.25 0.77 2 5
STEWcult_4. Your company encourages a collectivist culture focused on business group rather than an individualistic culture.
59 3.93 1.06 1 5
Note 1: TOpRev_16 (Total Operating Revenue in 2016), Tassets_16 (Total Assets in 2016) , Tequity_16 (Total Equity in 2016), ROA_2016 (Return on Assets in 2016), ROE_16 (Return on Equity in 2016), ROS_16 (Return on Sales in 2016), familyCEO (it is a dummy variable that indicates 1 if a family manager is the CEO and 0 otherwise), pfamilyTMT (it is the ratio of family manager in the Top Management Team), size_TMT (size of the Top Management Team), d_ownersship_100% (it is a dummy variable that indicates 1 if the controlling family holds 100% of the shares/quotas and 0 otherwise), and STEWcult_1 to STEWcult_4 are stewardship-oriented culture indicators. Note 2. From the 59 family firms, the ISI Emerging Markets database (EMIS) indicates that the financial information of 35 of the firms were audited and 24 were not audited in 2016. Note 3. In 16th September 2017, US$ 1 was equivalent to BRL 3.125.
Additionally, we present the statistics of the performance measures that are ROA
(Return on Assets), ROE (Return on Equity) and ROS (Return on Sales). The average scores
for those variables are respectively 5.42%, 5.19%, and 4.85%. The highest standard deviation
and range can be seen in ROE measure. It is important to mention that in our analyses we used
the adjusted-industry performance measure, which was estimated by subtracting the firm’s
performance from the median in the industry. We present additional information about the
industries and firms financial information in Appendix 5.
Table 40 also shows the level of family involvement in management regarding the
presence of a family CEO (familyCEO) and percentage of family managers in the TMT
(pfamilyTMT). In about 78% of the firms in our sample, the family firm is managed by a family
CEO, and in average 39% of the TMT is composed of family managers. We also present

177
information about the family involvement in ownership, which in 66% of the firms in our
sample the controlling family owns 100% of the shares/quotas.
With respect to stewardship-oriented culture, respondents indicate the highest score that
for the firm inspires managers' care and loyalty to the company (4.25) and the lowest score for
the assertive related to the promotion of a professionally orientated workplace (3.75).
6.3.2. Structural Equation Modeling
We tested the theoretical path model using Partial Least Squares (PLS) which is a
technique of structural equation modeling that is recommended for small-size samples and
complex models. We present the results of the measurement model followed by the results of
the structural model.
6.3.2.1. Measurement model assessment
We validated the measurement model for the analysis of reflective measurement models
following Hair et al. (2013). The evaluation of reflective models includes convergent validity,
internal consistency, and discriminant validity which we conducted exclusively for a
stewardship-oriented culture latent variable since the other variables are single-item constructs
in which the latent variable is the indicator itself. For the convergent validity we analyze the
outer loadings and Average Variance Extracted (AVE) and for internal consistency, the
Composite Reliability (CR). We analyzed the discriminant validity using Fornell-Larcker
criterion (Fornell & Larcker, 1981) and cross-loadings (level indicators), respectively in Table
41 and Table 42. Our results meet the criteria suggested by Hair et al. (2013) about the
validation of the measurement model.
The correlation coefficients presented in Table 41 indicate preliminary associations
between the quadratic variable of the percentage of family managers in the top management
team and stewardship-oriented culture. Table 41 also shows a negative correlation between
stewardship and financial performance (Return on Assets), which is statistically significant at
5% significance level. This result contradicts previous literature that stewardship is positively
correlated to family firm’s performance (Chrisman, Chua, & Litz, 2004).
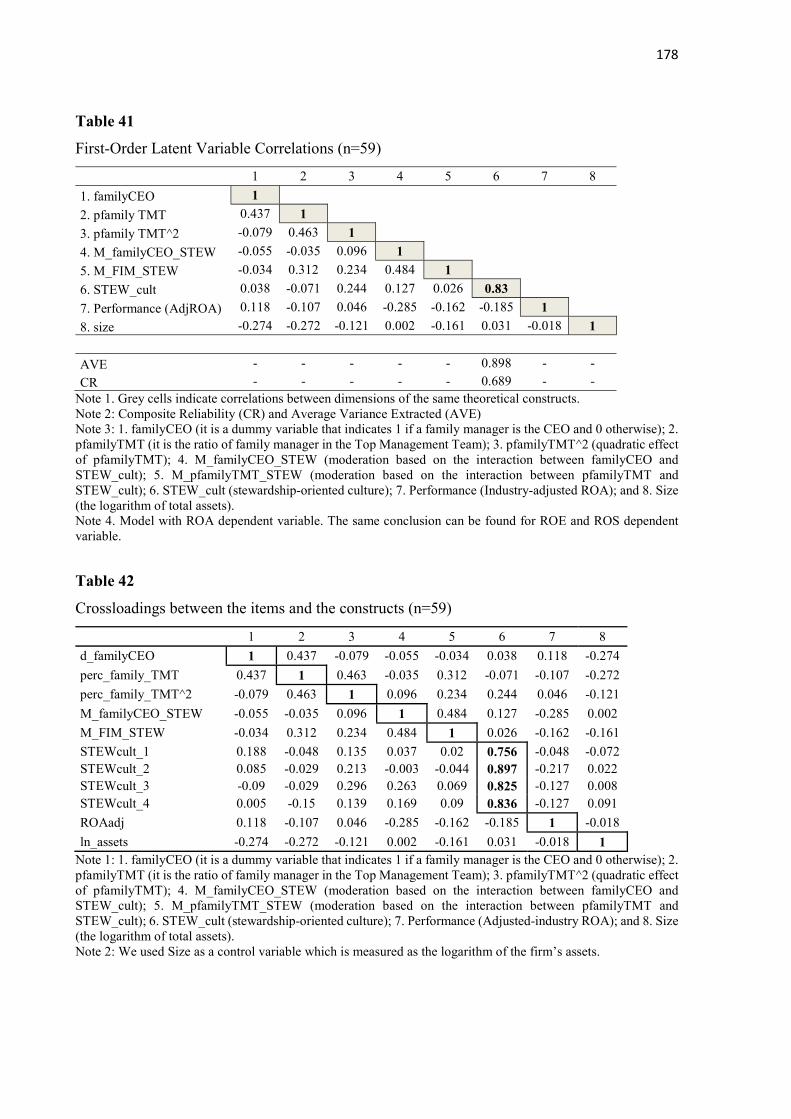
178
Table 41
First-Order Latent Variable Correlations (n=59)
1 2 3 4 5 6 7 8
1. familyCEO 1
2. pfamily TMT 0.437 1
3. pfamily TMT^2 -0.079 0.463 1
4. M_familyCEO_STEW -0.055 -0.035 0.096 1
5. M_FIM_STEW -0.034 0.312 0.234 0.484 1
6. STEW_cult 0.038 -0.071 0.244 0.127 0.026 0.83
7. Performance (AdjROA) 0.118 -0.107 0.046 -0.285 -0.162 -0.185 1
8. size -0.274 -0.272 -0.121 0.002 -0.161 0.031 -0.018 1
AVE - - - - - 0.898 - -
CR - - - - - 0.689 - - Note 1. Grey cells indicate correlations between dimensions of the same theoretical constructs. Note 2: Composite Reliability (CR) and Average Variance Extracted (AVE) Note 3: 1. familyCEO (it is a dummy variable that indicates 1 if a family manager is the CEO and 0 otherwise); 2. pfamilyTMT (it is the ratio of family manager in the Top Management Team); 3. pfamilyTMT^2 (quadratic effect of pfamilyTMT); 4. M_familyCEO_STEW (moderation based on the interaction between familyCEO and STEW_cult); 5. M_pfamilyTMT_STEW (moderation based on the interaction between pfamilyTMT and STEW_cult); 6. STEW_cult (stewardship-oriented culture); 7. Performance (Industry-adjusted ROA); and 8. Size (the logarithm of total assets). Note 4. Model with ROA dependent variable. The same conclusion can be found for ROE and ROS dependent variable.
Table 42
Crossloadings between the items and the constructs (n=59)
1 2 3 4 5 6 7 8
d_familyCEO 1 0.437 -0.079 -0.055 -0.034 0.038 0.118 -0.274
perc_family_TMT 0.437 1 0.463 -0.035 0.312 -0.071 -0.107 -0.272
perc_family_TMT^2 -0.079 0.463 1 0.096 0.234 0.244 0.046 -0.121
M_familyCEO_STEW -0.055 -0.035 0.096 1 0.484 0.127 -0.285 0.002
M_FIM_STEW -0.034 0.312 0.234 0.484 1 0.026 -0.162 -0.161
STEWcult_1 0.188 -0.048 0.135 0.037 0.02 0.756 -0.048 -0.072 STEWcult_2 0.085 -0.029 0.213 -0.003 -0.044 0.897 -0.217 0.022 STEWcult_3 -0.09 -0.029 0.296 0.263 0.069 0.825 -0.127 0.008 STEWcult_4 0.005 -0.15 0.139 0.169 0.09 0.836 -0.127 0.091
ROAadj 0.118 -0.107 0.046 -0.285 -0.162 -0.185 1 -0.018
ln_assets -0.274 -0.272 -0.121 0.002 -0.161 0.031 -0.018 1 Note 1: 1. familyCEO (it is a dummy variable that indicates 1 if a family manager is the CEO and 0 otherwise); 2. pfamilyTMT (it is the ratio of family manager in the Top Management Team); 3. pfamilyTMT^2 (quadratic effect of pfamilyTMT); 4. M_familyCEO_STEW (moderation based on the interaction between familyCEO and STEW_cult); 5. M_pfamilyTMT_STEW (moderation based on the interaction between pfamilyTMT and STEW_cult); 6. STEW_cult (stewardship-oriented culture); 7. Performance (Adjusted-industry ROA); and 8. Size (the logarithm of total assets). Note 2: We used Size as a control variable which is measured as the logarithm of the firm’s assets.

179
6.3.2.2. Structural model analyses
Once the validation of the measurement model has been completed, we conducted the
analysis of the structural model (Hair Jr. et al., 2013). In the first step, we analyzed
multicollinearity based on Variance Inflation Factor (VIF), which is expected to be lower than
five. Second, we analyzed the structural path coefficients statistical significance of effects by
running the bootstrapping procedure (1,000 subsamples, bias-corrected confidence level and
two-tailed tests). Additionally, the determination of R², which indicates the percentage of a
dependent variable variance that is explained by the independent variables and moderators in
the model. We present the results for the adjusted coefficient of determination (Radj²) as
suggested by Hair et al. (2013). The fourth parameter is the effect size coefficient (f²), which
indicates the extent to which the independent variable has a substantial impact on the dependent
variable. We follow the criteria suggested by Cohen (1988): small effect (f² = 0.02); medium
effect (f² = 0.15); and large effect (f² = 0.35). Hair et al. (2016) mention that f² lower than 0.02
indicates no relationship. To test for the moderation, Hair et al. (2013) suggest the following
parameters, based Kenny (2016): small effect (f² = 0.005); medium effect (f² = 0.01); and large
effect (f² = 0.025).
Our model has a quadratic effect of the ratio of family managers in the TMT
(pfamilyTMT^2) and a moderator variable that is stewardship-oriented culture. Hair et al.
(2013) indicate three different procedures for moderator and quadratic effects. The three
procedures are the product indicator approach, the two-step approach, and the orthogonal
approach. Hair et al. (2013) explain that the two-step approach can be used to reveal the
significance of the moderating effect while the orthogonal approach is recommended to
minimize estimation bias and maximize prediction. Due to the objectives of this study, we run
the analyses based on the orthogonal and on the two-step approaches. The orthogonalization
approach uses standard residuals as indicators for the interaction term while the two-stage
approach uses the product of the latent scores of the moderator and the independent variable as
the indicator of the interaction term (Hair Jr. et al., 2013).
Additionally, we run three different models based on three different financial industry-
adjusted performance measures (e.g., De Massis, Kotlar, Campopiano, & Cassia, 2015) that are
(i) Return on Assets (ROA), (ii) Return on Equity (ROE) and (iii) Return on Sales (ROS). The
difference in the models are based on the significance of the associations, but they provide
consistency when we analyze the signs, independent of statistical significance. We present the
results in Table 43, Table 44 and Table 45.

180
Table 43
Structural model – Dependent variable industry-adjusted Return on Assets (ROA)
QUADRATIC MODERATOR
Hypotheses β P Values f2 R2adj β P Values f2 R2adj
MODERATOR: TWO_STAGE APPROACH
familyCEO -> PerformanceROA H1 0.280 0.122 0.058 0.011 0.370 0.031 0.113 0.145
pfamilyTMT -> PerformanceROA H2a -0.334 0.118 0.067 -0.504 0.003 0.150
pfamilyTMT^2 -> PerformanceROA H2b 0.185 0.333 0.037 0.328 0.012 0.121
M_familyCEO_STEW -> PerformanceROA H3 -0.352 0.065 0.098
M_pfamilyTMT_STEW -> PerformanceROA H4 0.087 0.627 0.006
STEW_cult -> PerformanceROA -0.293 0.207 0.097
size -> PerformanceROA -0.005 0.950 0.000 0.017 0.873 0.000
MODERATOR: ORTHOGONAL APPROACH
familyCEO -> PerformanceROA H1 0.280 0.120 0.058 0.011 0.377 0.019 0.120 0.187
pfamilyTMT -> PerformanceROA H2a -0.231 0.093 0.044 -0.293 0.017 0.089
pfamilyTMT^2 -> PerformanceROA H2b 0.185 0.352 0.037 0.305 0.014 0.111
M_familyCEO_STEW -> PerformanceROA H3 -0.377 0.017 0.131
M_pfamilyTMT_STEW -> PerformanceROA H4 0.049 0.793 0.002
STEW_cult -> PerformanceROA -0.322 0.196 0.124
size -> PerformanceROA -0.005 0.952 0.000 0.023 0.820 0.001 Note 1: Classification of Cohen (1988): small effect (f² = 0.02), medium effect (f² = 0.15) and large effect (f² = 0.35). Note 2: familyCEO (it is a dummy variable that indicates 1 if a family manager is the CEO and 0 otherwise); pfamilyTMT (it is the ratio of family manager in the Top Management Team); pfamilyTMT^2 (quadratic effect of pfamilyTMT); M_familyCEO_STEW (moderation based on the interaction between familyCEO and STEW_cult); M_pfamilyTMT_STEW (moderation based on the interaction between pfamilyTMT and STEW_cult); STEW_cult (stewardship-oriented culture); PerformanceROA (Industry- Adjusted ROA); and 8. Size (the logarithm of total assets). Note 3: We used Size as a control variable which is measured as the logarithm of the firm’s assets.

181
Table 44
Structural model – Dependent variable industry-adjusted Return on Equity (ROE)
QUADRATIC MODERATOR
Hypotheses β P Values f2 R2adj β P Values f2 R2adj
MODERATOR: TWO_STAGE APPROACH
familyCEO -> PerformanceROE H1 0.421 0.016 0.139 0.062 0.427 0.016 0.144 0.140 pfamilyTMT -> PerformanceROE H2a -0.154 0.502 0.015 -0.099 0.677 0.006 pfamilyTMT^2 -> PerformanceROE H2b 0.068 0.678 0.005 0.071 0.641 0.006 M_familyCEO_STEW -> PerformanceROE H3 0.179 0.538 0.039 M_pfamilyTMT_STEW -> PerformanceROE H4 -0.296 0.106 0.045 STEW_cult -> PerformanceROE -0.250 0.437 0.060 size -> PerformanceROE 0.064 0.546 0.004 0.062 0.547 0.005 MODERATOR: ORTHOGONAL APPROACH
familyCEO -> PerformanceROE H1 0.421 0.018 0.139 0.062 0.515 0.001 0.267 0.314 pfamilyTMT -> PerformanceROE H2a -0.116 0.456 0.012 -0.141 0.327 0.025 pfamilyTMT^2 -> PerformanceROE H2b 0.068 0.676 0.005 0.119 0.377 0.023 M_familyCEO_STEW -> PerformanceROE H3 -0.510 0.015 0.274 M_pfamilyTMT_STEW -> PerformanceROE H4 0.073 0.671 0.004 STEW_cult -> PerformanceROE -0.287 0.357 0.130 size -> PerformanceROE 0.064 0.545 0.004 0.081 0.407 0.010
Note 1: Classification of Cohen (1988): small effect (f² = 0.02), medium effect (f² = 0.15) and large effect (f² = 0.35). Note 2: familyCEO (it is a dummy variable that indicates 1 if a family manager is the CEO and 0 otherwise); pfamilyTMT (it is the ratio of family manager in the Top Management Team); pfamilyTMT^2 (quadratic effect of pfamilyTMT); M_familyCEO_STEW (moderation based on the interaction between familyCEO and STEW_cult); M_pfamilyTMT_STEW (moderation based on the interaction between pfamilyTMT and STEW_cult); STEW_cult (stewardship-oriented culture); PerformanceROE (Industry- Adjusted ROE); and 8. Size (the logarithm of total assets). Note 3: We used Size as a control variable which is measured as the logarithm of the firm’s assets.

182
Table 45
Structural model – Dependent variable industry-adjusted Return on Sales (ROS)
QUADRATIC MODERATOR
Hypotheses β P Values f2 R2adj β P Values f2 R2adj
MODERATOR: TWO_STAGE APPROACH
familyCEO -> PerformanceROS H1 0.415 0.033 0.145 0.128 0.554 0.010 0.316 0.316 pfamilyTMT -> PerformanceROS H2a -0.525 0.005 0.188 -0.760 0.000 0.427 pfamilyTMT^2 -> PerformanceROS H2b 0.219 0.142 0.058 0.389 0.002 0.211 M_familyCEO_STEW -> PerformanceROS H3 -0.455 0.067 0.182 M_pfamilyTMT_STEW -> PerformanceROS H4 0.224 0.252 0.043 STEW_cult -> PerformanceROS -0.294 0.188 0.122 size -> PerformanceROS -0.077 0.662 0.006 -0.045 0.755 0.003 MODERATOR: ORTHOGONAL APPROACH
familyCEO -> PerformanceROS H1 0.415 0.027 0.145 0.128 0.522 0.004 0.303 0.366 pfamilyTMT -> PerformanceROS H2a -0.404 0.001 0.154 -0.465 0.000 0.290 pfamilyTMT^2 -> PerformanceROS H2b 0.219 0.133 0.058 0.351 0.003 0.189 M_familyCEO_STEW -> PerformanceROS H3 -0.478 0.002 0.268 M_pfamilyTMT_STEW -> PerformanceROS H4 0.209 0.254 0.039 STEW_cult -> PerformanceROS -0.345 0.171 0.185 size -> PerformanceROS -0.077 0.667 0.006 -0.031 0.830 0.001
Note 1: Classification of Cohen (1988): small effect (f² = 0.02), medium effect (f² = 0.15) and large effect (f² = 0.35). Note 2: familyCEO (it is a dummy variable that indicates 1 if a family manager is the CEO and 0 otherwise); pfamilyTMT (it is the ratio of family manager in the Top Management Team); pfamilyTMT^2 (quadratic effect of pfamilyTMT); M_familyCEO_STEW (moderation based on the interaction between familyCEO and STEW_cult); M_pfamilyTMT_STEW (moderation based on the interaction between pfamilyTMT and STEW_cult); STEW_cult (stewardship-oriented culture); PerformanceROS (Industry- Adjusted ROS); and 8. Size (the logarithm of total assets). Note 3: We used Size as a control variable which is measured as the logarithm of the firm’s assets.
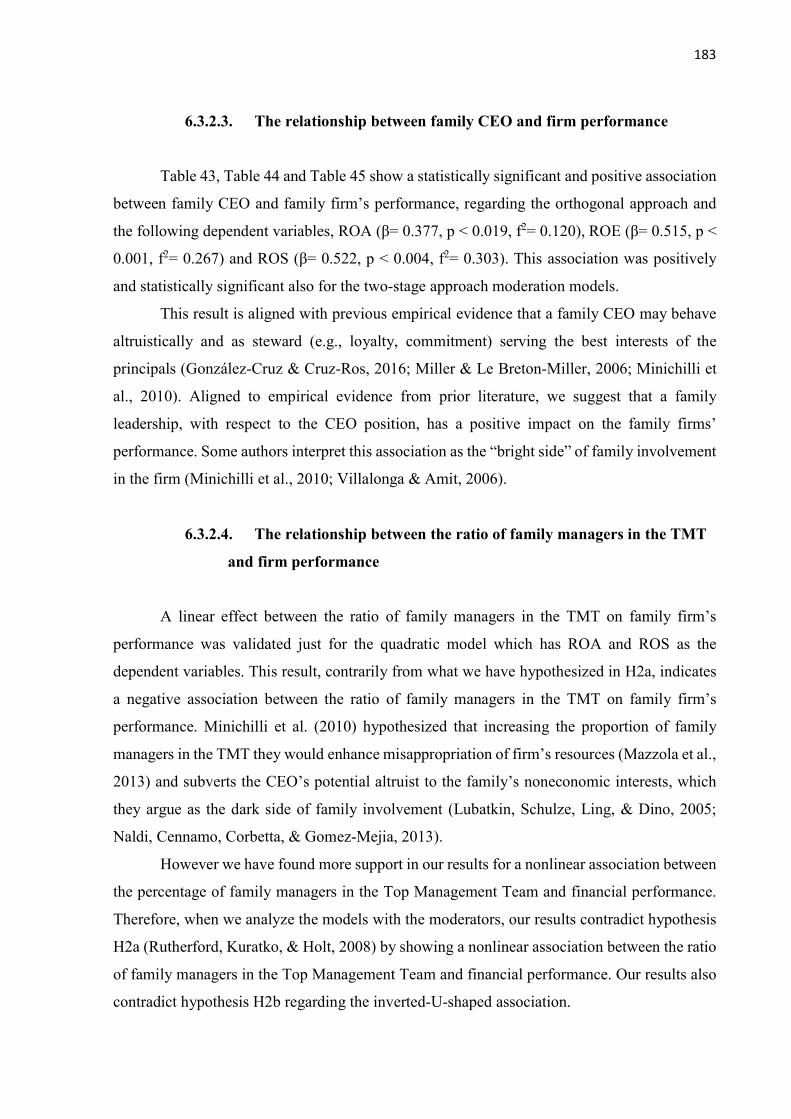
183
6.3.2.3. The relationship between family CEO and firm performance
Table 43, Table 44 and Table 45 show a statistically significant and positive association
between family CEO and family firm’s performance, regarding the orthogonal approach and
the following dependent variables, ROA (β= 0.377, p < 0.019, f2= 0.120), ROE (β= 0.515, p <
0.001, f2= 0.267) and ROS (β= 0.522, p < 0.004, f2= 0.303). This association was positively
and statistically significant also for the two-stage approach moderation models.
This result is aligned with previous empirical evidence that a family CEO may behave
altruistically and as steward (e.g., loyalty, commitment) serving the best interests of the
principals (González-Cruz & Cruz-Ros, 2016; Miller & Le Breton-Miller, 2006; Minichilli et
al., 2010). Aligned to empirical evidence from prior literature, we suggest that a family
leadership, with respect to the CEO position, has a positive impact on the family firms’
performance. Some authors interpret this association as the “bright side” of family involvement
in the firm (Minichilli et al., 2010; Villalonga & Amit, 2006).
6.3.2.4. The relationship between the ratio of family managers in the TMT
and firm performance
A linear effect between the ratio of family managers in the TMT on family firm’s
performance was validated just for the quadratic model which has ROA and ROS as the
dependent variables. This result, contrarily from what we have hypothesized in H2a, indicates
a negative association between the ratio of family managers in the TMT on family firm’s
performance. Minichilli et al. (2010) hypothesized that increasing the proportion of family
managers in the TMT they would enhance misappropriation of firm’s resources (Mazzola et al.,
2013) and subverts the CEO’s potential altruist to the family’s noneconomic interests, which
they argue as the dark side of family involvement (Lubatkin, Schulze, Ling, & Dino, 2005;
Naldi, Cennamo, Corbetta, & Gomez-Mejia, 2013).
However we have found more support in our results for a nonlinear association between
the percentage of family managers in the Top Management Team and financial performance.
Therefore, when we analyze the models with the moderators, our results contradict hypothesis
H2a (Rutherford, Kuratko, & Holt, 2008) by showing a nonlinear association between the ratio
of family managers in the Top Management Team and financial performance. Our results also
contradict hypothesis H2b regarding the inverted-U-shaped association.

184
In Figure 14 and Figure 15, we demonstrate that a predominance of one subgroup, being
family managers or nonfamily managers in the TMT, is related to a higher level of Return on
Assets and Return on Sales. On the other hand, when the TMT mix both family and nonfamily
managers, the graphs show a lower level of performance regarding ROA and ROS. These
results contradict the hypothesis about an inverted-U-shaped association and support a U-
shaped relationship, such as suggested by previous literature (González-Cruz & Cruz-Ros,
2016; Minichilli et al., 2010; Sciascia & Mazzola, 2008). Actually, a TMT composed
exclusively by nonfamily managers present the highest level of performance (see Figure 14 and
Figure 15).
Figure 14. Quadratic effect pfamilyTMT – dependent variable industry-adjusted ROA (orthogonal approach)
Figure 15. Quadratic effect pfamilyTMT – dependent variable industry-adjusted ROS (orthogonal approach)
-0.2
0
0.2
0.4
0.6
0.8
1
1.2
1.4
Low pfamilyTMT High pfamilyTMT
Adj
ust
ed P
erfo
rman
ce R
OA
-0.4
-0.2
0
0.2
0.4
0.6
0.8
1
1.2
1.4
1.6
Low pfamilyTMT High pfamilyTMT
Ad
just
ed P
erfo
rman
ce R
OS

185
However, this finding is also consistent with Minichilli et al. (2010) that indicates that
the association between the percentage of family managers in the TMT and performance has a
U-shape format in a sample of Italian small and medium family firms, and not an inverted-U-
shape as we have hypothesized (Chirico & Bau’, 2014; Sciascia & Mazzola, 2008). Minichilli
et al. (2010, p. 217) claim that “tensions and conflicts emerge when both ‘principal’ (owners
and family members) and ‘agents’ (non-family managers) coexist in the same decision-making
arena”.
In family firms, there are two basic subgroups that are family and nonfamily managers.
While family managers share common values related to their relatives and emotional
attachment to the firm, nonfamily managers share professional values and the feeling that they
are outsiders from the family clan (Davis et al., 2010; Lubatkin et al., 2005; Verbeke & Kano,
2012). This argument is aligned to the ‘faultlines’ concept suggested by Minichilli et al. (2010),
which determines that faultlines occur in a Top Management Team that is composed by both
family and nonfamily managers. These ‘faultlines’ rely on the ‘schisms’ due to the presence of
both family and nonfamily managers, which has been discussed in the TMT heterogeneity
literature (Certo, Lester, Dalton, & Dalton, 2006; Lau & Murnighan, 1998). These ‘schisms’
can motivate conflicts between the subgroups of family and nonfamily managers, what would
negatively impact their tasks’ effectiveness and by consequence a family firm’s performance.
6.3.2.5. Moderation of stewardship-oriented culture
The moderation effect was significant for the association between the presence of a
family CEO and firm performance (H3) in the orthogonal approach models, regarding Return
on Assets (β= -0.377, p < 0.017, f2= 0.131), Return on Equity (β= -0.510, p < 0.015, f2= 0.274),
and Return on Sales (β= -0.478, p < 0.002, f2= 0.268) dependent performance variables. These
results are similar to the results from the two-step approach model.
In Figure 16 and Figure 17 we show that firms without a family CEO that have a higher
stewardship-oriented culture perform slightly better than those firms with a lower stewardship-
oriented culture, concerning ROA and ROS. The difference is much representative with the
presence of a family CEO, however different from what we have hypothesized. Therefore, a
family firm that has a family CEO and a low level of stewardship-oriented culture perform
much better than those that have a family CEO and a high level of stewardship-oriented culture.

186
Figure 16. Moderating effect of stewardship – orthogonal approach – dependent variable industry-adjusted ROA
Figure 17. Moderating effect of stewardship – orthogonal approach – dependent variable industry-adjusted ROS
Additionally, the slope in the graphs are much representative in a scenario of a low level
of stewardship-oriented culture than a high level. Hence, having or not a family CEO might be
more important in a low level of stewardship-oriented culture, in terms of family firm’s
financial performance. This finding contradicts previous literature that suggests that
stewardship governance and culture improve the financial performance of family managed
firms, since stewardship-oriented culture enhances the benefits of family manager’s
stewardship behaviors (James et al., 2017; Madison et al., 2016; Madison et al., 2017). In this
-0.6
-0.4
-0.2
0
0.2
0.4
0.6
0.8
1
1.2
Low familyCEO High familyCEOAd
just
ed P
erfo
rman
ce R
OA
Low Stewardship
High Stewardship
-1
-0.5
0
0.5
1
1.5
Low familyCEO High familyCEO
Ad
just
ed P
erfo
rman
ce R
OS
Low Stewardship
High Stewardship

187
sense, we would expect that a family CEO that behaves as a steward would increasingly
influence performance in a scenario of a high level of stewardship-oriented culture, which was
not supported by our results.
Finally, the stewardship-oriented culture moderating effect on the association between
the ratio of family managers in the TMT and family firm’s performance was not statistically
significant at 10% significance level, which result does not support hypothesis H4.
6.4. Discussion and conclusions
This study discusses the association between family involvement in management and
family firm’s financial performance (González-Cruz & Cruz-Ros, 2016; Minichilli et al., 2010;
Rutherford et al., 2008; Sciascia & Mazzola, 2008) considering stewardship-oriented culture as
a moderator of this relationship (Dibrell & Moeller, 2011). This paper combines insights from
the stewardship literature with insights from the literature on family firm performance grounded
in the familiness concept. Different from previous literature, we considered the moderation
effect of stewardship-oriented culture in this relationship.
We found that family involvement in management is associated with family firm’s
performance, in particular for the presence of a family CEO that shows positive influence on
the firm’s financial performance, in the three performance measures used in this study (ROA,
ROE, and ROS). This result is consistent with previous literature (González-Cruz & Cruz-Ros,
2016; Minichilli et al., 2010).
Additionally, the results for the association between the ratio of family managers in the
TMT and family firms’ performance suggest a nonlinear relationship. We showed a statistically
significant association for ROA and ROS performance measures, specifically a U-shape
relationship. Therefore, different from what we have hypothesized, but also consistent with
prior empirical evidence (Minichilli et al., 2010) we indicate that the presence of just nonfamily
managers or family managers in the TMT is positively associated to family firms’ performance.
We propose that conflicts and tensions between these subgroups of family and nonfamily
managers might be avoided (Lubatkin et al., 2005; Minichilli et al., 2010). This is consistent
with the discussion about ‘fautlines’, which main argument is that differences inside groups can
motivate conflicts that damage a family firm’s performance (Minichilli et al., 2010).
Finally, this study provides evidence that stewardship-oriented culture moderates the
association between the presence of a family CEO and firm’s performance. However, different

188
from our hypothesis (Eddleston et al., 2007; Miller & Le Breton-Miller, 2006), the results
indicate that a low level of stewardship-oriented culture combined with the presence of a family
CEO produces a higher level of performance (ROA, ROE and ROS). Particularly, for a lower
level of stewardship-oriented culture, the presence of a family CEO is associated with higher
firm’s performance.
In a high level of stewardship, the presence of a family CEO might not bring a
representative difference in the family firm’s performance. We could argue that in a low level
of stewardship-oriented culture, having a family CEO, which is expected to behave as a
steward, might lead to competitive advantage since we show that it is related to a higher level
of performance. However, we did not find support for the moderating effect of stewardship-
oriented culture on the relationship between the ratio of family managers in the TMT and
performance. This study provides elements to the discussion about managers’ behaviors and
management control mechanisms fit in family firms (James et al., 2017; Madison et al., 2016)
and its influence on the firm’s performance (Madison et al., 2017), which needs further
investigation.
Despite the contributions that this paper provides, our findings are subject to some
limitations. First, this study is developed based on cross-sectional data which combine survey
data (family involvement in management and stewardship) with archival data (financial
information). Due to this design, we are not concerned about common method variance
(Podsakoff, MacKenzie, Lee, & Podsakoff, 2003; Podsakoff, MacKenzie, & Podsakoff, 2012).
However, as we focus on cross-sectional data, our causal conclusions might have some
limitations related to the timing that we developed the survey and the year that we considered
the financial profitability measures (ROA, ROE, and ROS). We have no assurance that the
family firm maintained the family involvement in management stable during the full 2016 year,
regarding family CEO and the ratio of family managers in the TMT. However the tenure of top
managers in family firms is expected to be higher than it is in nonfamily firms.
Also, our sample can be considered small and exclusively composed by Brazilian firms,
which has limitation concerning generalization. Although we develop analyses with a small
sample size (n=59), it is sufficient for Structural Equation Modeling in SmartPLS (see
methodology section - Nitzl, 2016). Due to the complexity of information and the availability
of archival data, we consider the sample relevant to the purposes of this study. Despite these
considerations, the results show statistical significance aligned to previous literature. In
addition, we work with financial information and indexes from which 35 from 59 family firms
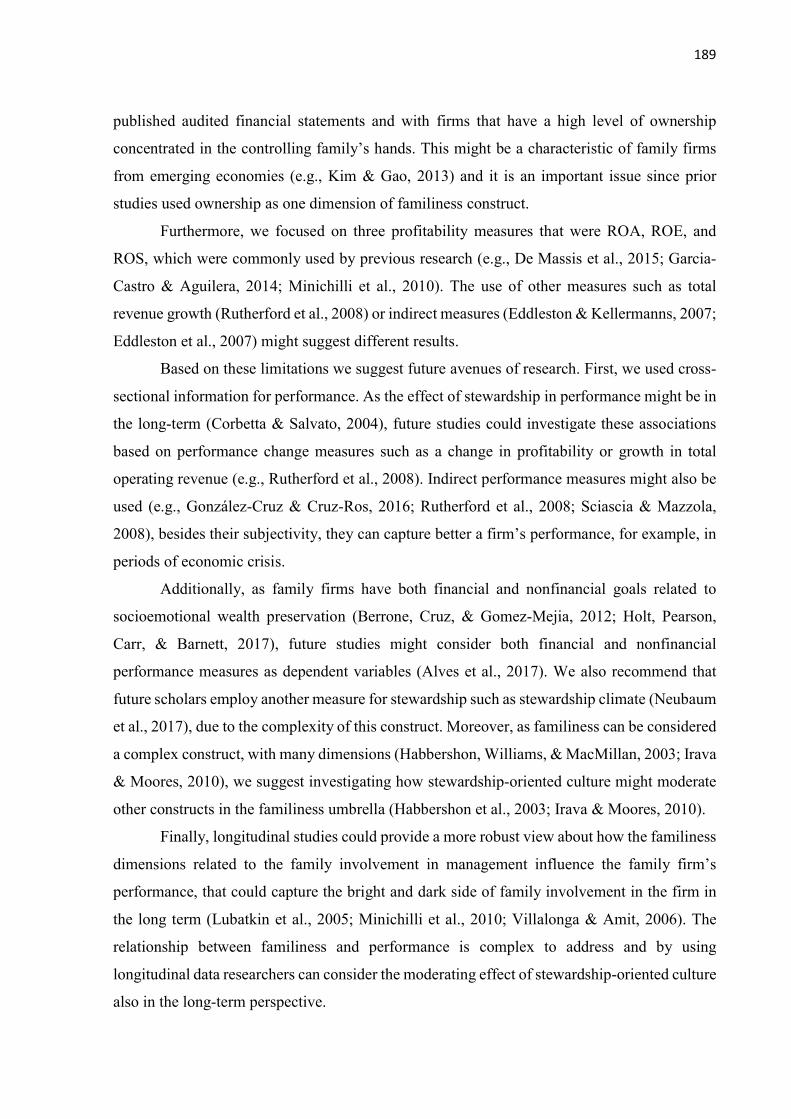
189
published audited financial statements and with firms that have a high level of ownership
concentrated in the controlling family’s hands. This might be a characteristic of family firms
from emerging economies (e.g., Kim & Gao, 2013) and it is an important issue since prior
studies used ownership as one dimension of familiness construct.
Furthermore, we focused on three profitability measures that were ROA, ROE, and
ROS, which were commonly used by previous research (e.g., De Massis et al., 2015; Garcia-
Castro & Aguilera, 2014; Minichilli et al., 2010). The use of other measures such as total
revenue growth (Rutherford et al., 2008) or indirect measures (Eddleston & Kellermanns, 2007;
Eddleston et al., 2007) might suggest different results.
Based on these limitations we suggest future avenues of research. First, we used cross-
sectional information for performance. As the effect of stewardship in performance might be in
the long-term (Corbetta & Salvato, 2004), future studies could investigate these associations
based on performance change measures such as a change in profitability or growth in total
operating revenue (e.g., Rutherford et al., 2008). Indirect performance measures might also be
used (e.g., González-Cruz & Cruz-Ros, 2016; Rutherford et al., 2008; Sciascia & Mazzola,
2008), besides their subjectivity, they can capture better a firm’s performance, for example, in
periods of economic crisis.
Additionally, as family firms have both financial and nonfinancial goals related to
socioemotional wealth preservation (Berrone, Cruz, & Gomez-Mejia, 2012; Holt, Pearson,
Carr, & Barnett, 2017), future studies might consider both financial and nonfinancial
performance measures as dependent variables (Alves et al., 2017). We also recommend that
future scholars employ another measure for stewardship such as stewardship climate (Neubaum
et al., 2017), due to the complexity of this construct. Moreover, as familiness can be considered
a complex construct, with many dimensions (Habbershon, Williams, & MacMillan, 2003; Irava
& Moores, 2010), we suggest investigating how stewardship-oriented culture might moderate
other constructs in the familiness umbrella (Habbershon et al., 2003; Irava & Moores, 2010).
Finally, longitudinal studies could provide a more robust view about how the familiness
dimensions related to the family involvement in management influence the family firm’s
performance, that could capture the bright and dark side of family involvement in the firm in
the long term (Lubatkin et al., 2005; Minichilli et al., 2010; Villalonga & Amit, 2006). The
relationship between familiness and performance is complex to address and by using
longitudinal data researchers can consider the moderating effect of stewardship-oriented culture
also in the long-term perspective.

190

191
7. FINAL REMARKS
7.1. Ph.D. dissertation’s story
We present, in Figure 18, the summary of the story presented in the three studies of the
Ph.D. Despite they were presented in different sections, the three empirical studies can be
structured as a chain with respect to the antecedents and consequences of management control
mechanisms and stewardship in family firms. Our contribution to the management accounting
area rests on the understanding that management control mechanisms are designed and used by
family firms, which are affected by the controlling family’s influence on the firm, and which
also influence stewardship attitudes and behaviors of both family and nonfamily managers in
the family firm. As a final consequence we show how these elements are associated with a
family firm’s performance.
Our story begins by looking at the distinctive characteristics of family firms. We follow
the framework presented by De Massis et al. (2014) and divided a controlling family’s influence
in two dimensions that are a controlling family’s ability and a controlling family’s willingness.
We treat ability as the level of family involvement in ownership and in management.
Willingness refers to SEW sub-dimensions (1) family control and influence intentions (2) and
renewal of family bonds intentions. Therefore, we first discussed how a family’s ability and
willingness are associated. Our results suggest that a family involvement in ownership is
positively associated with both controlling family’s SEW intentions. Then, we show that a
controlling family’s willingness to control and influence the firm is positively associated with
the level of family involvement in management. In that sense, we suggest that what determines
the number of family managers in the TMT is the family’s intentions to keep their autonomy
and legitimacy in the decision making process.
After analyzing the association among a controlling family’s ability and willingness, we
discussed how these distinctive characteristics of family firms, named by prior studies as family
contingencies (Songini et al., 2017), are associated with management control mechanisms
design such as the level of formality and participation in goal setting and performance
evaluation. Prior studies have shown strong empirical evidence that a family involvement in
management is related to the design of management control mechanisms, which literature is
rested on the agency theorizations. However, our results indicate to a different direction with
respect to the strong association of a controlling family’s willingness and the design of

192
management mechanisms, regardless the family's ability dimension. Our findings provide
evidence that the dimensions of a controlling family’s willingness to influence the firm, which
was treated as control intentions and renewal of family bonds intentions, are associated with
management control mechanisms design. On one hand, the intention to control and influence
the firm is negatively associated with formal and participative goal setting. On the other hand,
the intention to transfer the family bonds to the next generation is positively associated with
formal and participative goal setting and performance evaluation.
Thereafter, we focus on the consequences of these management control mechanisms
design to manager’s attitudes and behaviors in family firms. Based on the procedural justice
and stewardship theoretical rationales, we study how formal and participative management
control mechanisms foster stewardship attitudes and stewardship behaviors in family firms.
Management control mechanisms might be seen as organizational procedures in the procedural
justice literature, which characteristics drive procedural justice perceptions, and pro-
organizational attitudes and behaviors. Particularly, the level of formality and participation of
a procedure are seen as determinants for procedural justice perceptions. Therefore, we
investigate how these mechanisms’ design and procedural justice perceptions, which are
aligned with the underlying situational mechanisms that constitute organizational level
antecedents of stewardship, influence manager’s stewardship identification and a stewardship-
oriented culture in family firms. Our results show that participative and formal management
control mechanisms are positively associated with procedural justice. These design
characteristics were also positively associated with stewardship identification and stewardship-
oriented culture. Participative goal setting and performance evaluation are seen as antecedents
for manager’s stewardship identification. Moreover, participative and formal goal setting is
positively associated to a stewardship-oriented culture. We also indicate that procedural justice
perceptions in goal setting is positively associated with both stewardship identification and
stewardship-oriented culture. We also discussed the differences that might exist among family
and nonfamily managers with respect to their stewardship attitudes towards the firm, which
might also be influenced by differences in management control mechanism’s design.
After discussing the antecedents of stewardship in family businesses, an issue that still
come up was whether stewardship is actually a driver of family firm’s competitive advantage,
such as suggested by prior literature. Hence, we relied on the familiness background about
family firm’s resources and capabilities and on the stewardship literature, to investigate how a
stewardship-oriented culture enhances the benefits of a family involvement in the business on

193
a family firm’s performance. We first explore the association of family involvement and family
firm’s performance. We show a positive association between the presence of a family member
as the CEO of the organization with a family firm’s performance. With respect to the ratio of
family managers in the Top Management Team, our findings suggest a U-shape association
with performance, which result is aligned with the ‘fautlines’ concept discussed by Minichilli
et al. (2010). Looking at stewardship as a competitive advantage, our results indicate that
stewardship-oriented culture moderates the association between the presence of a family
member as the Chief Executive Officer and family firm’s performance. Particularly, based on
the analysis of the moderation effect, we suggest that a low level of stewardship enhances the
association between the presence of a family CEO and performance. In a high level of
stewardship, there is an inexpressive difference for the presence or not of a family CEO and a
family firm’s performance, which finding contradicts prior literature insights. Our results do
not support the moderation effect for the relationship between the ratio of family managers in
the TMT and family firm’s performance.
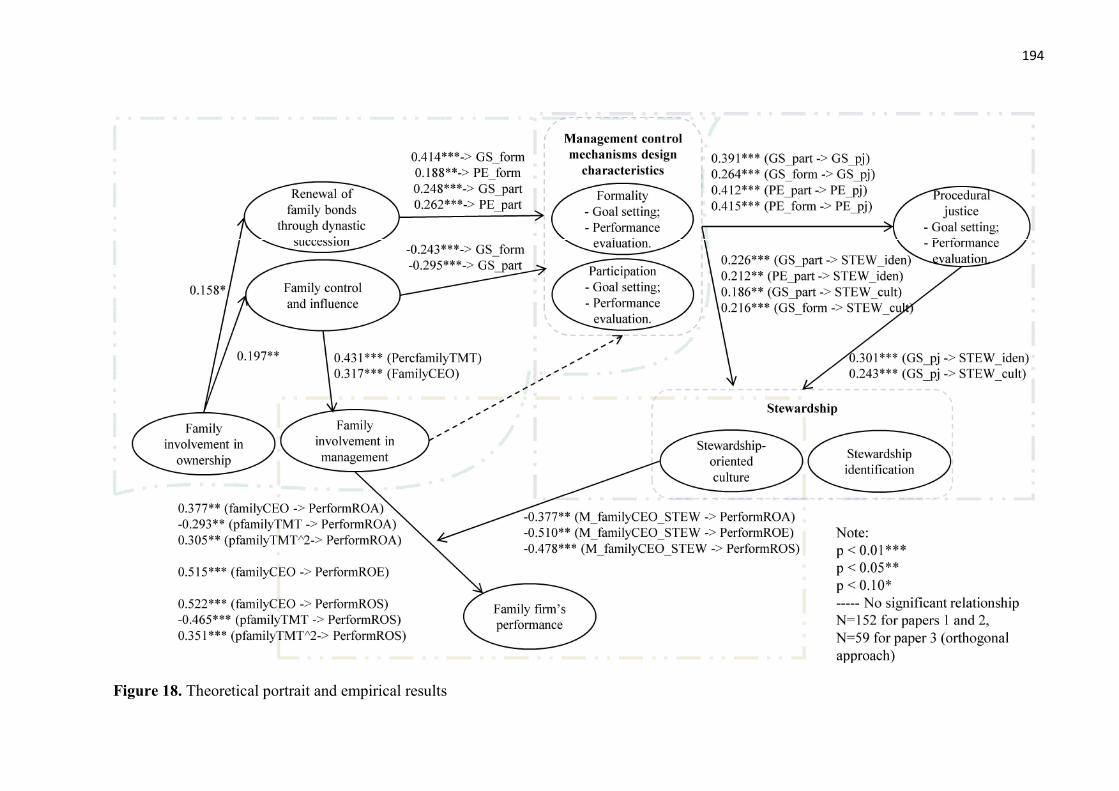
194
Figure 18. Theoretical portrait and empirical results
Family control and influence
Renewal of family bonds
through dynastic succession
Family involvement in
ownership
Formality- Goal setting;- Performance
evaluation.
Participation- Goal setting;- Performance
evaluation.
Management control mechanisms design
characteristics
Family involvement in management
Procedural justice
- Goal setting;- Performance
evaluation.
Stewardship-oriented culture
Stewardship identification
Stewardship
Family firm’sperformance
0.197**
0.158*
Note:p < 0.01***p < 0.05**p < 0.10*----- No significant relationshipN=152 for papers 1 and 2, N=59 for paper 3 (orthogonal approach)
0.431*** (PercfamilyTMT)0.317*** (FamilyCEO)
0.414***-> GS_form0.188**-> PE_form0.248***-> GS_part0.262***-> PE_part
-0.243***-> GS_form-0.295***-> GS_part
0.391*** (GS_part -> GS_pj)0.264*** (GS_form -> GS_pj)0.412*** (PE_part -> PE_pj)0.415*** (PE_form -> PE_pj)
0.301*** (GS_pj -> STEW_iden)0.243*** (GS_pj -> STEW_cult)
0.226*** (GS_part -> STEW_iden)0.212** (PE_part -> STEW_iden) 0.186** (GS_part -> STEW_cult)0.216*** (GS_form -> STEW_cult)
0.377** (familyCEO -> PerformROA)-0.293** (pfamilyTMT -> PerformROA)0.305** (pfamilyTMT^2-> PerformROA)
0.515*** (familyCEO -> PerformROE)
0.522*** (familyCEO -> PerformROS)-0.465*** (pfamilyTMT -> PerformROS)0.351*** (pfamilyTMT^2-> PerformROS)
-0.377** (M_familyCEO_STEW -> PerformROA)-0.510** (M_familyCEO_STEW -> PerformROE)-0.478*** (M_familyCEO_STEW -> PerformROS)

195
7.2. The three empirical studies theoretical background
In this Ph.D. dissertation, we have developed three empirical studies that aimed to
enhance the comprehension about the stewardship theoretical perspective in family firms with
respect to its antecedents and consequences. We have investigated the antecedents of
stewardship related to the controlling family’s ability and willingness to influence the firm,
management control mechanisms design and procedural justice and the consequences of
stewardship regarding its moderating effect on the relationship between family influence and
performance.
As we have discussed during this dissertation, the stewardship theory has different
conceptualizations from the agency paradigm and has not been widely discussed by prior
management accounting literature. Stewardship holds itself in the sociological and
psychological perspective regarding manager’s behaviors and the role of management control
mechanisms in organizations (Davis, Schoorman, & Donaldson, 1997).
The family firms’ field has been conceptualized as promising for the stewardship
foundations, since family firms have distinctive characteristics basically originated from the
family involvement in the business, and which makes stewardship a particular phenomenon in
family firms (Davis et al., 2010; Madison et al., 2016). Therefore, family firms are complex
organizations with respect to their distinctive characteristics that have implications over
management practices and organizational behaviors.
Particularly, we have investigated a controlling family’s ability (e.g., family
involvement in the business) and willingness (socioemotional wealth) to influence the family
firm regarding management control’s design. We also examined the familiness construct with
respect to a family’s involvement association with firm performance. All these constructs
(family involvement, Socioemotional Wealth and familiness) have been explored in the family
firm literature.
In addition, we have discussed management control mechanisms design and procedural
justice which constructs and discussions were supported in the management accounting
literature, procedural justice literature and in the general management literature. These studies
about the design and use of Management Control Systems are vast in management journals,
however the fairness dimensions of those mechanisms have been not deeply studied.
Throughout the empirical studies, we have brought elements mainly from the
stewardship literature but also foundations from other fields such as management accounting,

196
procedural justice and family firms. As you could see, the stewardship theorizations were
present in diverse degrees in the three empirical studies of this Ph.D. dissertation. The
stewardship lens has been a promising perspective to the family firm field, contradicting and
complementing the agency theory assumptions for those firms, in terms of managers’ behaviors
and the role of governance mechanisms in family firms (Madison et al., 2016; Davis et al.,
1997).
Therefore, the results of each of the three studies have important contributions to the
academic literature and also provide elements that can be explored by practitioners such as
founders, heirs, family managers, nonfamily managers, and consultants that are interested in
family businesses. In this final section, we summarize the main findings of the three empirical
studies of this Ph.D. dissertation and indicate their implications for the literature and for
practitioners.
7.3. Summary of the results
In the first study of this Ph.D. dissertation (Section 4), we explored how the controlling
family’s ability and willingness to influence the family firm is associated with formality and
participation on goal setting and performance evaluation, based on a sample of 152 Brazilian
family firms. In contrast to prior empirical evidence, our results reveal that rather than the
controlling family’s ability, it is their willingness that influences how management control
mechanisms are designed in those firms. Particularly, we show that a family’s intention to
maintain their autonomy and independence in the decision-making process is negatively
associated to formality and participation in the goal setting process. On the other hand, a
family’s intention to transfer the firm to the next generations is positively related to formality
and participation in both goal setting and performance evaluation processes.
Hence, a family’s emphasis on the maintenance of family control and autonomy, leads
to higher centralization and less transparency of decision making in the family firm, while a
family’s succession intention is associated to formal and participative goal setting and
performance evaluation processes, strong communication, knowledge transfer and
transparency. We additionally show that a family’s ability and willingness are strongly and
positively associated to each other. These results are consistent for the two dimensions that we
analyzed for the controlling family involvement in management, that were family involvement

197
in ownership and family involvement in management (the presence of a family CEO and the
ratio of family managers in the TMT).
In the second study of this Ph.D. dissertation (Section 5), we examined the influence of
the design of goal setting and performance evaluation on stewardship identification and
stewardship-oriented culture, through procedural justice. Our results complement the literature
about stewardship by addressing its situational mechanisms (Davis et al., 1997; Neubaum,
Thomas, Dibrell, & Craig, 2017). Based on a sample with 152 family firms, we indicate that
management control mechanisms’ fair design characteristics are positively associated with
stewardship identification and stewardship-oriented culture. The results point to the relevance
in terms of significance and effect size of procedural justice in both goal setting and
performance evaluation in fostering a pro-organizational and collective culture in the family
firm. These results in the organizational level of the stewardship construct is also aligned with
the individual level, named stewardship identification.
Further, we explored how these relationships might differ when we consider the
respondents’ family affiliation. Therefore, we analyzed subsamples of nonfamily and family
managers, which results suggest different significant associations between management control
mechanisms design and procedural justice with stewardship. Particularly, for nonfamily
managers, formality in goal setting is a significant antecedent for stewardship-oriented culture
and participation in both goal setting and performance evaluation is positively associated with
stewardship identification. In contrast, for family managers we have just found that
participation in goal setting is associated with stewardship-oriented culture. These results
suggest that family and nonfamily managers might perceive differently the determinants of
stewardship.
In the third paper of this Ph.D. dissertation (Section 6), we investigated the moderating
effect of a stewardship-oriented culture on the family involvement-performance relationship
framed in the familiness framework. Based on a sample of 59 medium and large Brazilian
family firms, we reveal, consistent with prior literature, that the presence of a family CEO is
positively related to a family firm’s performance and also show a nonlinear U-shape association
between the ratio of family managers in the TMT and family firm’s performance. These results
are significant for different dependent variables, such as industry-adjusted ROA and ROS.
In addition to the traditional familiness-performance literature (González-Cruz & Cruz-
Ros, 2016; Minichilli et al., 2010; Sciascia & Mazzola, 2008), our results indicate that a
stewardship-oriented culture has a significant moderating effect on the association between the

198
presence of a family CEO and performance. Based on the analysis of the moderation effect, we
suggest that for a low level of stewardship the presence of a family CEO is associated with a
high level of performance while in a high level of stewardship the presence of a family CEO
might not foster a high level of performance, which result contradicted our theoretical
arguments.
7.4. Implications for the literature
Our findings, based on the three empirical studies developed in this Ph.D. dissertation,
provide developments in the following areas of family firm’s research (1) stewardship
theoretical perspective, (2) antecedents of stewardship, (3) family contingencies of
management control mechanisms design and (4) consequences of stewardship. In this
subsection, we provide a broader view about this dissertation’s contributions to the literature,
which we also outline, in some extent, in the empirical studies sections.
First, as we have presented, the stewardship perspective is different from traditional
agency theory, and offers a different perspective on organizations (Davis et al., 1997;
Donaldson & Davis, 1991; Hernandez, 2012) that is still unexplored by empirical studies in the
management literature. The agency paradigm and its branches have been attracting the majority
if not totally of the research attention in the management field in the last decades. However,
despite this scenario, we argued that the stewardship paradigm might offer relevant insights that
require in-depth investigations especially for different organizational forms, such as family
firms. Recent efforts have been made in the family firm’s field to analyze both agency and
stewardship paradigms, which studies lead to inconclusive findings. Due to the complexity of
the stewardship construct (Neubaum et al., 2017; Zahra, Hayton, Neubaum, Dibrell, & Craig,
2008), we address this discussion based on both the individual level and the organizational level
which are respectively conceptualized as stewardship identification (Craig, Dibrell, &
Neubaum, 2011; James et al., 2017; Madison et al., 2017) and stewardship-oriented culture
(Zahra et al., 2008).
Second, one of the streams that needs further investigation is the analyses of the
antecedents of stewardship (Davis et al., 1997; Neubaum et al., 2017), which we partially
addressed in this dissertation. Neubaum et al. (2017) claim that the antecedents of stewardship
are still a conjecture and propose a multidimensional construct named stewardship climate to
capture this complex phenomena in family firms. Other recent studies have addressed this issue

199
by looking at the fit between governance mechanisms and behavioral assumptions in the context
of family firms (James et al., 2017; Madison et al., 2016, 2017). Therefore, we address the lack
of studies in the literature about organizational-level factors (Hernandez, 2012) such as
management control mechanisms’ design and procedural justice, which influence stewardship.
The traditional studies have treated these organizational level factors as situational mechanisms
for stewardship (Davis et al., 1997). In particular, with respect to the stewardship assumptions
in family firms, prior literature indicates the importance of considering the family affiliation as
an attribute of stewardship behaviors. This discussion has been rested in the bifurcation bias
perspective about managers’ behaviors in family firms (Verbeke & Kano, 2012). Due to the
complexity of behaviors in the family firm, we also consider the manager’s family affiliation
in our analyses such as explored by recent empirical studies (James et al., 2017; Madison et al.,
2017; Davis et al., 2010).
Regarding the antecedents of stewardship, this Ph.D. dissertation also contributes to the
area of Management Control Systems fairness and procedural justice (Hartmann & Slapničar,
2012; Langevin & Mendoza, 2013; Libby, 1999), which is usually discussed in context of
agency theoretical perspective. By considering the stewardship lens in the family business field,
we show that procedural justice is an important antecedent of stewardship. We address the claim
from prior literature about the different perceptions of justice that might exist among family
and nonfamily managers (Barnett & Kellermanns, 2006; Carmon, Miller, Raile, & Roers, 2010;
Sieger, Bernhard, & Frey, 2011; Van der Heyden, Blondel, & Carlock, 2005). In this sense, the
overlap of family and business boundaries might drive how procedural justice is perceived in
the family firm. For instance, nonfamily managers’ justice perceptions have received little
attention by researchers, and the effect of family influence on these perceptions is argued to be
largely unknown (Barnett & Kellermanns, 2006; Carmon et al., 2010; Pieper, 2010). Procedural
justice has attracted the interests in Human Resource (HR) practices (e.g., Barnett &
Kellermanns, 2006), but we suggest that management accounting scholars might also
investigate the fairness discussions on the MCS umbrella, and how can drive pro-organizational
behaviors (Langevin & Mendoza, 2013; Voußem et al., 2016).
Procedural justice has been conceptualized as a driver to various positive attitudinal and
behavioral organizational outcomes (Folger & Bies, 1989; Kim & Mauborgne, 2003; Kim &
Mauborgne, 1993; Libby, 1999) which indicates the importance of this construct for
organizations. In this sense, Langevin and Mendoza (2013, p. 218) state that “managers must
fully appreciate the importance of fairness and be willing to involve themselves, knowing that

200
fairness is a key dimension of their role”. In sum, this Ph.D. dissertation strengthens the
discussion that the procedural justice might provide insights to the existing theoretical
background of stewardship regarding stewardship governance mechanisms in family firms
(Lubatkin, Ling, & Schulze, 2007; Madison et al., 2016, 2017; Neubaum et al., 2017).
Particularly, we suggest that the goal setting process might be seen as a key management
mechanisms for both family and nonfamily managers, which is associated to managers pro-
organizational attitudes and behaviors, which is in line with the goal setting theory arguments
(Locke & Latham, 1990).
Third, we provide insights on the antecedents of management control mechanisms
adopted in family firms, considering both a family’s ability and a family’s willingness to
influence the firm (De Massis, Kotlar, Chua, & Chrisman, 2014; Helsen, Lybaert, Steijvers,
Orens, & Dekker, 2017). In this regard, Chrisman et al. (2015) indicate that researchers should
address the paradoxes engendered by the association and interaction of a family’s ability and
willingness to influence the family firm. This stream of discussion has not been widely
investigated by prior literature since they have concentrated in the ability dimension, which is
mainly supported by the agency theoretical arguments about agency problems in family firms,
and its relationship with management mechanisms design (Songini & Gnan, 2015; Speckbacher
& Wentges, 2012).
Recently, studies have been suggesting many opportunities in this field of research
(Helsen et al., 2017; Songini, Gnan, & Malmi, 2013; Songini, Vola, & Gnan, 2017) with respect
to how family elements named family contingencies impact management control mechanisms
design and use. We also contribute to this literature by examining exclusively family firms,
since previous studies have focused on the comparison among family and nonfamily firms,
ignoring the heterogeneity that exists among family firms (Chua et al., 2012).
In particular, we address the lack of studies that investigated the family contingencies
and management controls design and use in family firms that study a controlling family’s
willingness. Therefore, we expand prior literature by addressing willingness and by also
considering Socioemotional Wealth as the lens to interpret the controlling family’s willingness.
Actually, we show that the controlling family’s reference points for decision making, which are
explored in the SEW theoretical lens, have different implications over management
mechanisms and organizational behaviors (Gomez et al., 2011; Berrone et al., 2012). We
additionally contribute to the literature in SEW by showing that SEW is a complex construct
which dimensions should be explored independently (Chua et al., 2015).

201
Fourth, with respect to the consequences of stewardship, we explored the combination
of stewardship insights and familiness construct, bringing the stewardship-oriented culture
construct, which has not yet been far discussed by prior literature. For example, Kim and Gao
(2013) discuss the moderating effect of long-term orientation on familiness, and other authors
investigate the association of stewardship to different organizational behaviors such as strategic
flexibility (Zahra et al., 2008), innovativeness (Dibrell & Moeller, 2011), and entrepreneurial
orientation (Eddleston, Kellermanns, & Zellweger, 2012). Particularly, this stream of research
about mediating and moderating models to discuss the familiness-performance relationship
(Chirico & Bau’, 2014; González-Cruz & Cruz-Ros, 2016; Kim & Gao, 2013) is important due
to the existence of multiple inconclusive findings by prior literature (Garcia-Castro & Aguilera,
2014; Rutherford, Kuratko, & Holt, 2008). With this respect, an additional contribution of this
Ph.D. is providing empirical evidence on family firms from an emerging economy such as
Brazil, which enriches the literature that is mainly focused on the US and European family
firms. Brazil carries institutional characteristics of an emerging economy and cultural
characteristics (Xu & Meyer, 2013) which might bring differences to family firm’s
organizational behaviors (Kim & Gao, 2013).
7.5. Implications for practitioners
This Ph.D. dissertation also bring relevant contributions to practitioners. The first
implication regards the growing interest of family and nonfamily managers about the
professionalization of family firms. A family firm professionalization has been treated by
empirical research based on multiple dimensions (Dekker, Lybaert, Steijvers, Depaire, &
Mercken, 2013; Stewart & Hitt, 2012) such as adopting management practices, as having
diluted governance and ownership structure, or pursuing financial in detriment to nonfinancial
goals.
The professionalization topic has been treated widely based on the life-cycle
perspective, which indicates that a family firm professionalization occurs naturally with the
development and growth of family firms (Gersick et al., 1997; Giovannoni, Maraghini, &
Riccaboni, 2011). However, this broad assumption might not explain why, for example, young
firms with a high level of participation of the owing family are considered professionalized
firms while large and traditional firms with a similar involvement of family members are not.
We address the discussion of professionalization by looking at two elements of a family firm
professionalization, (i) the adoption of formal management and (ii) the participation of
202
managers in the decision-making process, with respect to goal setting and performance
evaluation.
Particularly, we address this issue and provide evidence that a family firm
professionalization is driven by the controlling family’s intentions that is reflected in the
decision-making processes, and not by the presence of a high level of family managers in the
TMT or of a family CEO. Our study contradicted prior evidence and show that the presence of
family managers in the TMT does not drive the design of management mechanisms (formality
and participation), but rather the controlling family’s willingness, which, in turn, is translated
into multiple family-centric noneconomic goals. Hence, a controlling family that is willing to
maintain its autonomy and legitimacy in strategic decisions will be less likely to adopt formal
and participative management control mechanisms such as goal setting and performance
evaluation.
On opposite, a family firm that envisages a long-term perspective toward a succession
process will be expected to adopt formal and participative management control mechanisms.
Therefore, we show practitioners that the succession intention is relevant for the family firm
because it drives the firm’s actions to the long-term perspective, which makes the family firm’s
leaders to implement formal and participative mechanisms, to increase transparency and
knowledge transfer to sustain the firm’s longevity.
In addition to the insights provided by prior literature based on agency problems
conceptualization of management controls, our results show practitioners that in family firms
there are subjective and intangible forces (which we explored as SEW reference points) that
determine how management control mechanisms are designed in those firms. Our findings are
helpful to nonfamily managers who aim to work for a family firm. Based on this study they can
understand that the decisions related to the design and use of professional mechanisms in family
firms might rest in a subjective zone of a controlling family’s SEW intentions and not because,
for example, contingency factors such as size and uncertainty.
These findings are also important for family members (e.g., founders and heirs) to reflect
about how their willingness can inhibit or enhance the adoption of participative and formal
mechanisms. Family managers can better manage their influence over the firm. We suggest that
family firms can implement professional practices by managing their noneconomic SEW
intentions and not necessarily by hiring nonfamily managers to the firm. It might exist a
counterbalance between the different controlling family’s willingness that impact the design of
mechanisms in the family firm.

203
The second implication relates to the comprehension that stewardship has been seen as
a vantage point for family firms that has been linked to their competitive advantage. There are
many arguments in the literature that stewardship is a relevant issue for family firms, which we
also address in this study. Therefore, practitioners should understand the implications that the
stewardship behavioral assumptions have for the governance mechanisms and how that leads
to a higher level of performance in the family firm. Family firm’s leaders might understand that
not all the governance and management mechanisms that benefit a nonfamily firms, will
naturally be positive if implemented in family firms. There is evidence that stewardship
assumptions might better fit to the family firm context, and in that case, monitoring and
incentive systems might produce negative effects to a family firm’s performance. On the other
side, an involvement-oriented mechanism might bring more benefits in a context where
stewardship is prevalent, which is used to be the case of family firms.
In this study, we provide evidence that a stewardship-oriented culture has a moderator
effect on the familiness-performance relationship. Specifically, when there is a nonfamily CEO,
a high level of stewardship-oriented culture might drive a slightly higher level of performance.
On the other hand, when there is a family CEO, a low level of stewardship-oriented culture
drive a higher level of performance. This result offer insights to family owners when it is
beneficial to keep a family member as the CEO of the firm, and when the nomination of a
nonfamily manager might produce a higher level of performance.
Regarding the antecedents of stewardship, we reveal that goal setting and performance
evaluation, usually studied as agency mechanisms can foster stewardship in the family firm, if
they are designed based on the fairness principles. Family firm’s leaders should take into
account both the controlling family’s willingness and the fairness of goal setting and
performance evaluation processes, as situational mechanisms to foster stewardship
identification and culture in their family firms. We reveal that stewardship culture is fostered
by the design of formal and participative management mechanism, in which transparency of
decisions and involvement of nonfamily managers in the decision-making circle might benefit
the firm in the long-term, what should be considered by founders and family managers. These
issues are relevant for attracting nonfamily managers for the family firm and to enhance the
exchanges that occur between family and nonfamily managers in the decision-making process.
Finally, our third implication to practitioners relates to the results that we found by
analyzing the relationship between family involvement in management and performance. First,
we indicate a positive and strong association between the presence of a family CEO and

204
performance, which might indicate the benefits of maintaining a family member as the leader
of the firm. Additionally, we reveal a U-shape relation between the ratio of family managers in
the TMT and performance, what might suggest that ‘faultlines’ might occur when you have
different sub-groups in the TMT (Minichilli, Corbetta, & MacMillan, 2010). Therefore, by
having a TMT composed by both family and nonfamily managers, a family firm might occur
in conflicts that in our study had driven to a low level of performance. Actually, a homogeneous
TMT formed completely by nonfamily managers has been linked to a higher level of
performance. Therefore, due to the contradictory findings of our study and in prior literature,
we suggest that the mix of family and nonfamily managers in the TMT, which discussion has
been studied in the professionalization umbrella, is a complex issue for family firms with
empirical evidence for both bright and dark sides of family involvement.

205
REFERENCES Adler, P. S., & Borys, B. (1996). Two Types of Bureaucracy: Enabling and Coercive.
Administrative Science Quarterly, 41(1), 61. http://doi.org/10.2307/2393986
Ahrens, T., & Chapman, C. S. (2004). Accounting for Flexibility and Efficiency: A Field Study of Management Control Systems in a Restaurant Chain. Contemporary Accounting Research, 21(2), 271–302. http://doi.org/10.1506/VJR6-RP75-7GUX-XH0X
Alves, C. A., Gama, A. P. M., & Augusto, M. (2017). The role of Family influence in firms’ performance: a stewardship theory perspective. In 13th Workshop on Family Firm Management Research. Bilbao, Spain.
Amit, R., & Schoemaker, P. J. H. (1993). Strategic assets and organizational rent. Strategic Management Journal, 14(1), 33–46. http://doi.org/10.1002/smj.4250140105
Anderson, R. C., & Reeb, D. M. (2003). Founding-Family Ownership and Firm Performance: Evidence from the S&P 500. The Journal of Finance, 58(3), 1301–1328. http://doi.org/10.1111/1540-6261.00567
Anthony, R. N., & Govindarajan, V. (2007). Management Control Systems (12th ed.). Boston, Massachusetts.: McGraw-Hill.
Anthony, R. N., & Govindarajan, V. (1995). Management Control Systems. New York: McGraw-Hill Inc.
Anthony, R. N., Govindarajan, V., Hartmann, F. G. H., Kraus, K., & Nilsson, G. (2014). Management Control Systems: European Edition. McGraw-Hill.
Astrachan, J. H., Klein, S. B., & Smyrnios, K. X. (2002). The F-PEC Scale of Family Influence: A Proposal for Solving the Family Business Definition Problem. Family Business Review, 15(1), 45–58. http://doi.org/10.1111/j.1741-6248.2002.00045.x
Barnett, T., & Kellermanns, F. W. (2006). Are We Family and Are We Treated as Family? Nonfamily Employees’ Perceptions of Justice in the Family Firm. Entrepreneurship Theory and Practice, 30(6), 837–854. http://doi.org/10.1111/j.1540-6520.2006.00155.x
Barney, J. (1991). Firm Resources and Sustained Competitive Advantage. Journal of Management, 17(1), 99–120. http://doi.org/10.1177/014920639101700108
Bedford, D. S., & Malmi, T. (2015). Configurations of control: An exploratory analysis. Management Accounting Research, 27, 2–26. http://doi.org/10.1016/j.mar.2015.04.002
Bellavance, F., Landry, S., & Schiehll, E. (2013). Procedural justice in managerial performance evaluation: Effects of subjectivity, relationship quality, and voice opportunity. The British Accounting Review, 45(3), 149–166. http://doi.org/10.1016/j.bar.2013.06.013
Berrone, P., Cruz, C., & Gomez-Mejia, L. R. (2012). Socioemotional Wealth in Family Firms. Family Business Review, 25(3), 258–279. http://doi.org/10.1177/0894486511435355
Berrone, P., Cruz, C., Gomez-Mejia, L. R., & Larraza-Kintana, M. (2010). Socioemotional Wealth and Corporate Responses to Institutional Pressures: Do Family-Controlled Firms Pollute Less? Administrative Science Quarterly, 55(1), 82–113. http://doi.org/10.2189/asqu.2010.55.1.82

206
Beuren, I. M., Klein, L., Lara, F. L., & Almeida, L. B. de. (2016). Percepção de Justiça nos Sistemas de Controle Gerencial Aumenta Comprometimento e Confiança dos Gestores? Revista de Administração Contemporânea, 20(2), 216–237. http://doi.org/10.1590/1982-7849rac2016140083
Brownell, P. (1982). The Role of Accounting Data in Performance Evaluation, Budgetary Participation, and Organizational Effectiveness. Journal of Accounting Research, 20(1), 12. http://doi.org/10.2307/2490760
Burney, L. L., Henle, C. A., & Widener, S. K. (2009). A path model examining the relations among strategic performance measurement system characteristics, organizational justice, and extra- and in-role performance. Accounting, Organizations and Society, 34(3–4), 305–321. http://doi.org/10.1016/j.aos.2008.11.002
Burns, T., & Stalker, G. M. (1961). The Management of Innovation. Tavistock, London.
Carmon, A. F., Miller, A. N., Raile, A. N. W., & Roers, M. M. (2010). Fusing family and firm: Employee perceptions of perceived homophily, organizational justice, organizational identification, and organizational commitment in family businesses. Journal of Family Business Strategy, 1(4), 210–223. http://doi.org/10.1016/j.jfbs.2010.10.003
Carney, M. (2005). Corporate Governance and Competitive Advantage in Family- Controlled Firms. Entrepreneurship & Regional Development, 249–265. http://doi.org/10.1111/j.1540-6520.2005.00081.x
Casson, M. (1999). The economics of the family firm. Scandinavian Economic History Review, 47(1), 10–23. http://doi.org/10.1080/03585522.1999.10419802
Certo, S. T., Lester, R. H., Dalton, C. M., & Dalton, D. R. (2006). Top Management Teams, Strategy and Financial Performance: A Meta-Analytic Examination. Journal of Management Studies, 43(4), 813–839. http://doi.org/10.1111/j.1467-6486.2006.00612.x
Chapman, C. S., & Kihn, L.-A. (2009). Information system integration, enabling control and performance. Accounting, Organizations and Society, 34(2), 151–169. http://doi.org/10.1016/j.aos.2008.07.003
Chen, Y.-R., Huang, Y.-L., & Chen, C.-N. (2009). Financing Constraints, Ownership Control, and Cross-Border M&As: Evidence from Nine East Asian Economies. Corporate Governance: An International Review, 17(6), 665–680. http://doi.org/10.1111/j.1467-8683.2009.00770.x
Chenhall, R. H. (2003). Management control systems design within its organizational context: findings from contingency-based research and directions for the future. Accounting, Organizations and Society, 28(2–3), 127–168. http://doi.org/10.1016/S0361-3682(01)00027-7
Cherchem, N. (2017). The relationship between organizational culture and entrepreneurial orientation in family firms: Does generational involvement matter? Journal of Family Business Strategy, 8(2), 87–98. http://doi.org/10.1016/j.jfbs.2017.04.001
Chin, W. W., Thatcher, J. B., Wright, R. T., Steel, D., Chin, W. W., Thatcher, J. B., … Abdi, H. (2013). New Perspectives in Partial Least Squares and Related Methods. (H. Abdi, W. W. Chin, V. Esposito Vinzi, G. Russolillo, & L. Trinchera, Eds.)New Perspectives in Partial Least Squares and Related Methods (Vol. 56). New York, NY: Springer New York. http://doi.org/10.1007/978-1-4614-8283-3

207
Chirico, F., & Bau’, M. (2014). Is the Family an “Asset” or “Liability” for Firm Performance? The Moderating Role of Environmental Dynamism. Journal of Small Business Management, 52(2), 210–225. http://doi.org/10.1111/jsbm.12095
Chrisman, J. J., Chua, J. H., De Massis, A., Frattini, F., & Wright, M. (2015). The Ability and Willingness Paradox in Family Firm Innovation. Journal of Product Innovation Management, 32(3), 310–318. http://doi.org/10.1111/jpim.12207
Chrisman, J. J., Chua, J. H., Kellermanns, F. W., & Chang, E. P. C. (2007). Are family managers agents or stewards? An exploratory study in privately held family firms. Journal of Business Research, 60(10), 1030–1038. http://doi.org/10.1016/j.jbusres.2006.12.011
Chrisman, J. J., Chua, J. H., & Litz, R. (2003). A unified systems perspective of family firm performance: an extension and integration. Journal of Business Venturing, 18(4), 467–472. http://doi.org/10.1016/S0883-9026(03)00055-7
Chrisman, J. J., Chua, J. H., & Litz, R. A. (2004). Comparing the Agency Costs of Family and Non-Family Firms: Conceptual Issues and Exploratory Evidence. Entrepreneurship Theory and Practice, 28(4), 335–354. http://doi.org/10.1111/j.1540-6520.2004.00049.x
Chrisman, J. J., Chua, J. H., Pearson, A. W., & Barnett, T. (2012). Family Involvement, Family Influence, and Family-Centered Non-Economic Goals in Small Firms. Entrepreneurship Theory and Practice, 36(2), 267–293. http://doi.org/10.1111/j.1540-6520.2010.00407.x
Chrisman, J. J., Chua, J. H., & Sharma, P. (2005). Trends and Directions in the Development of a Strategic Management Theory of the Family Firm. Entrepreneurship Theory and Practice, 29(5), 555–576. http://doi.org/10.1111/j.1540-6520.2005.00098.x
Chrisman, J. J., Chua, J. H., & Steier, L. P. (2003). An introduction to theories of family business. Journal of Business Venturing, 18(4), 441–448. http://doi.org/10.1016/S0883-9026(03)00052-1
Chrisman, J. J., Kellermanns, F. W., Chan, K. C., & Liano, K. (2010). Intellectual Foundations of Current Research in Family Business: An Identification and Review of 25 Influential Articles. Family Business Review, 23(1), 9–26. http://doi.org/10.1177/0894486509357920
Chrisman, J. J., Memili, E., & Misra, K. (2014). Nonfamily Managers, Family Firms, and the Winner’s Curse: The Influence of Noneconomic Goals and Bounded Rationality. Entrepreneurship: Theory and Practice, 38(5), 1103–1127. http://doi.org/10.1111/etap.12014
Chrisman, J. J., Steier, L. P., & Chua, J. H. (2008). Toward a theoretical basis for understanding the dynamics of strategic performance in family firms. Entrepreneurship: Theory and Practice, 32(6 SPEC. ISS.), 935–947. http://doi.org/10.1111/j.1540-6520.2008.00264.x
Chua, J. H., Chrisman, J. J., & Bergiel, E. B. (2009). An Agency Theoretic Analysis of the Professionalized Family Firm. Entrepreneurship Theory and Practice, 33(2), 355–372. http://doi.org/10.1111/j.1540-6520.2009.00294.x
Chua, J. H., Chrisman, J. J., & De Massis, A. (2015). A Closer Look at Socioemotional Wealth: Its Flows, Stocks, and Prospects for Moving Forward. Entrepreneurship Theory and Practice, 1(403), n/a-n/a. http://doi.org/10.1111/etap.12155
Chua, J. H., Chrisman, J. J., & Sharma, P. (1999). Defining the family business by behavior. Entrepreneurship Theory and Practice, 19–39. Retrieved from http://faculty.utep.edu/Portals/167/11 Defining the family Business by behavior.pdf
208
Chua, J. H., Chrisman, J. J., Steier, L. P., & Rau, S. B. (2012). Sources of heterogeneity in family firms: An introduction. Entrepreneurship Theory and Practice, 36(6), 1103-1113. DOI: 10.1111/j.1540-6520.2012.00540.x
Cohen, J. (1988). Statistical Power Analysis for the Behavioral Sciences (2nd editio). Routledge.
Colquitt, J. A., Conlon, D. E., Wesson, M. J., Porter, C. O. L. H., & Ng, Y. K. (2001). Justice at the Millennium: A Meta-Analyic Review of 25 Years of Organizational Justice Research. Journal of Applied Psychology, 86(3), 425–445.
Colquitt, J. A., & Jackson, C. L. (2006). Justice in Teams: The Context Sensitivity of Justice Rules Across Individual and Team Contexts1. Journal of Applied Social Psychology, 36(4), 868–899. http://doi.org/10.1111/j.0021-9029.2006.00047.x
Corbetta, G., & Salvato, C. (2004). Self-Serving or Self-Actualizing? Models of Man and Agency Costs in Different Types of Family Firms: A Commentary on “Comparing the Agency Costs of Family and Non-family Firms: Conceptual Issues and Exploratory Evidence.” Entrepreneurship Theory and Practice, 28(4), 355–362. http://doi.org/10.1111/j.1540-6520.2004.00050.x
Covin, J. G., Slevin, D. P., & Heeley, M. B. (2001). Strategic decision making in an intuitive vs. technocratic mode: structural and environmental considerations. Journal of Business Research, 52(1), 51–67. http://doi.org/10.1016/S0148-2963(99)00080-6
Craig, J. B., Dibrell, C., & Neubaum, D. O. (2011). Stewardship Behaviour as Management control in Family Businesses. Contemporary Issues in Corporate Management Control, 277–296.
Craig, J. B., & Moores, K. (2010). Strategically aligning family and business systems using the Balanced Scorecard. Journal of Family Business Strategy, 1(2), 78–87. http://doi.org/10.1016/j.jfbs.2010.04.003
Cropanzano, R., Bowen, D. E., & Gilliland, S. W. (2007). The Management of Organizational Justice. Academy of Management Perspectives, 21(4), 34–48. http://doi.org/10.5465/AMP.2007.27895338
Cropanzano, R., Prehar, C. a., & Chen, P. Y. (2002). Using Social Exchange Theory to Distinguish Procedural from Interactional Justice. Group & Organization Management, 27(3), 324–351. http://doi.org/10.1177/1059601102027003002
Cruz, C. C., Gomez-Mejia, L. R., & Becerra, M. (2010). Perceptions of Benevolence and the Design of Agency Contracts: CEO-TMT Relationships in Family Firms. Academy of Management Journal, 53(1), 69–89. http://doi.org/10.5465/AMJ.2010.48036975
Cugueró-Escofet, N., & Rosanas, J. M. (2013). The just design and use of management control systems as requirements for goal congruence. Management Accounting Research, 24(1), 23–40. http://doi.org/10.1016/j.mar.2012.11.001
Davis, J. H., Allen, M. R., & Hayes, H. D. (2010). Is Blood Thicker Than Water? A Study of Stewardship Perceptions in Family Business. Entrepreneurship Theory and Practice, 34(6), 1093–1116. http://doi.org/10.1111/j.1540-6520.2010.00415.x
Davis, J. H., Frankforter, S., Vollrath, D., & Hill, V. (2007). An Empirical Test of Stewardship Theory. Journal of Business and Leadership: Research, Practice, and Teaching, 3(1), 40–50.
Davis, J. H., Schoorman, F. D., & Donaldson, L. (1997). Toward a stewardship theory of

209
management. Academy of Management Review, 22(1), 20–47. http://doi.org/10.5465/AMR.1997.9707180258
Dawson, A., & Mussolino, D. (2014). Exploring what makes family firms different: Discrete or overlapping constructs in the literature? Journal of Family Business Strategy, 5(2), 169–183. http://doi.org/10.1016/j.jfbs.2013.11.004
De Baerdemaeker, J., & Bruggeman, W. (2015). The impact of participation in strategic planning on managers’ creation of budgetary slack: The mediating role of autonomous motivation and affective organisational commitment. Management Accounting Research, 29, 1–12. http://doi.org/10.1016/j.mar.2015.06.002
De Massis, A., Kotlar, J., Campopiano, G., & Cassia, L. (2015). The Impact of Family Involvement on SMEs’ Performance: Theory and Evidence. Journal of Small Business Management, 53(4), 924–948. http://doi.org/10.1111/jsbm.12093
De Massis, A., Kotlar, J., Chua, J. H., & Chrisman, J. J. (2014). Ability and Willingness as Sufficiency Conditions for Family-Oriented Particularistic Behavior: Implications for Theory and Empirical Studies. Journal of Small Business Management, 52(2), 344–364. http://doi.org/10.1111/jsbm.12102
Debicki, B. J., Kellermanns, F. W., Chrisman, J. J., Pearson, A. W., & Spencer, B. A. (2016). Development of a socioemotional wealth importance (SEWi) scale for family firm research. Journal of Family Business Strategy, 7, 47–57. http://doi.org/10.1016/j.jfbs.2016.01.002
Dekker, J. C., Lybaert, N., Steijvers, T., Depaire, B., & Mercken, R. (2013). Family Firm Types Based on the Professionalization Construct. Family Business Review, 26(1), 81–99. http://doi.org/10.1177/0894486512445614
Dibrell, C., & Moeller, M. (2011). The impact of a service-dominant focus strategy and stewardship culture on organizational innovativeness in family-owned businesses. Journal of Family Business Strategy, 2(1), 43–51. http://doi.org/10.1016/j.jfbs.2011.01.004
Dillman, D. A. (2007). Mail and Internet Surveys: The Tailored Design Method (2nd editio). Wiley.
Donaldson, L. (1990). CEO governance and shareholder returns: Agency theory or stewardship theory. University of New South Wales.
Donaldson, L. (2008). Ethics Problems and Problems with Ethics: Toward a Pro-Management Theory. Journal of Business Ethics, 78(3), 299–311. http://doi.org/10.1007/s10551-006-9336-6
Donaldson, L., & Davis, J. H. (1991). Stewardship Theory or Agency Theory: CEO Governance and Shareholder Returns. Australian Journal of Management, 16(1), 49–64. http://doi.org/10.1177/031289629101600103
Dulebohn, J. H., & Ferris, G. R. (1999). The Role of Influence Tactics in Perceptions of Performance Evaluations’ Fairness. Source: The Academy of Management Journal, 42(3), 288–303. Retrieved from http://www.jstor.org/stable/pdf/256920.pdf?refreqid=excelsior:8aace0052f36682980496f0422a91582
Dyer, W. G. (1989). Integrating Professional Management into a Family Owned Business. Family Business Review, 2(3), 221–235. http://doi.org/10.1111/j.1741-6248.1989.00221.x

210
Eddleston, K. A. (2008). Commentary: The Prequel to Family Firm Culture and Stewardship: The Leadership Perspective of the Founder. Entrepreneurship Theory and Practice, 32(6), 1055–1061. http://doi.org/10.1111/j.1540-6520.2008.00272.x
Eddleston, K. A., & Kellermanns, F. W. (2007). Destructive and productive family relationships: A stewardship theory perspective. Journal of Business Venturing, 22(4), 545–565. http://doi.org/10.1016/j.jbusvent.2006.06.004
Eddleston, K. A., Kellermanns, F. W., & Sarathy, R. (2007). Resource Configuration in Family Firms: Linking Resources, Strategic Planning and Technological Opportunities to Performance. Journal of Management Studies, 45(1), 070703070820002–??? http://doi.org/10.1111/j.1467-6486.2007.00717.x
Eddleston, K. A., Kellermanns, F. W., & Zellweger, T. M. (2012). Exploring the Entrepreneurial Behavior of Family Firms: Does the Stewardship Perspective Explain Differences? Entrepreneurship Theory and Practice, 36(2), 347–367. http://doi.org/10.1111/j.1540-6520.2010.00402.x
Eisenhardt, K. M. (1989). Agency Theory: An Assessment and Review. The Academy of Management Review, 14(1), 57. http://doi.org/10.2307/258191
El Masri, T., Tekathen, M., Magnan, M., & Boulianne, E. (2017). Calibrating management control technologies and the dual identity of family firms. Qualitative Research in Accounting & Management, 14(2), 157–188. http://doi.org/10.1108/QRAM-05-2016-0038
Ensley, M. D., & Pearson, A. W. (2005). Ensley_et_al-2005-Entrepreneurship_Theory_and_Practice, (December 2003), 267–284.
Fama, E. F., & Jensen, M. C. (1983). The Booth School of Business , University of Chicago Separation of Ownership and Control Author ( s ): Eugene F . Fama and Michael C . Jensen Source : The Journal of Law & Economics , Vol . 26 , No . 2 , Corporations and Private Property : A Conference Sp. The Journal of Law & Economics, 26(2), 301–325.
Ferreira, A., & Otley, D. (2009). The design and use of performance management systems: An extended framework for analysis. Management Accounting Research, 20(4), 263–282. http://doi.org/10.1016/j.mar.2009.07.003
Filbeck, G., & Lee, S. (2000). Financial Management Techniques in Family Businesses. Family Business Review, 13(3), 201–216. http://doi.org/10.1111/j.1741-6248.2000.00201.x
Finkelstein, S., & Hambrick, D. C. (1996). Strategic Leadership: Top Executives and Their Effects on Organizations. South-Western College Pub.
Finkelstein, S., Hambrick, D. C., & Cannella, B. (2008). Strategic Leadership: Theory and Research on Executives, Top Management Teams, and Boards. Oxford University Press.
Folger, R., & Bies, R. J. (1989). Managerial responsibilities and procedural justice. Employee Responsibilities and Rights Journal, 2(2), 79–90. http://doi.org/10.1007/BF01384939
Folger, R., & Cropanzano, R. (1998). Organizational Justice and Human Resource Management. SAGE.
Folger, R., & Greenberg, J. (1985). Procedural justice. An inter- pretive analysis of personnel systems. In K. R. & G. Ferris (Ed.), Research in personnel and human resources management (pp. 141–183). Greenwich, CT: JAI Press.
Fornell, C., & Larcker, D. F. (1981). Structural Equation Models with Unobservable Variables

211
and Measurement Error: Algebra and Statistics. Journal of Marketing Research, 18(3), 382. http://doi.org/10.2307/3150980
Fortin, M. (2008). Perspectives on organizational justice: Concept clarification, social context integration, time and links with morality. International Journal of Management Reviews, 10(2), 93–126. http://doi.org/10.1111/j.1468-2370.2008.00231.x
Frank, H., Kessler, A., Rusch, T., Suess-Reyes, J., & Weismeier-Sammer, D. (2016). Capturing the Familiness of Family Businesses: Development of the Family Influence Familiness Scale (FIFS). Entrepreneurship: Theory and Practice, 1–34. http://doi.org/10.1111/etap.12229
Gagné, M., Sharma, P., & De Massis, A. (2014). The study of organizational behaviour in family business. European Journal of Work and Organizational Psychology, 23(5), 643–656. http://doi.org/10.1080/1359432X.2014.906403
Garcia-Castro, R., & Aguilera, R. V. (2014). Family involvement in business and financial performance: A set-theoretic cross-national inquiry. Journal of Family Business Strategy, 5(1), 85–96. http://doi.org/10.1016/j.jfbs.2014.01.006
Gersick, K. E., Davis, J. A., Hampton, M. M., & Lansberg, I. (1997). De geração para geração: ciclos de vida das empresas familiares. São Paulo: Negócio.
Giovannoni, E., Maraghini, M. P., & Riccaboni, a. (2011). Transmitting Knowledge Across Generations: The Role of Management Accounting Practices. Family Business Review, 24, 126–150. http://doi.org/10.1177/0894486511406722
Gnan, L., Vergata, T., Songini, L., Bocconi, P. D., Malmi, T., & Aalto, P. D. (2011). Special Issue: The role and impact of accounting in family business. Journal of Family Business Strategy, 2(1), 52–53. http://doi.org/10.1016/j.jfbs.2010.11.002
Gomez-Mejia, L. R., Cruz, C., Berrone, P., & De Castro, J. (2011). The Bind that Ties: Socioemotional Wealth Preservation in Family Firms. The Academy of Management Annals, 5(1), 653–707. http://doi.org/10.1080/19416520.2011.593320
Gómez-Mejía, L. R., Haynes, K. T., Núñez-Nickel, M., Jacobson, K. J. L., & Moyano-Fuentes, J. (2007). Socioemotional Wealth and Business Risks in Family-controlled Firms: Evidence from Spanish Olive Oil Mills. Administrative Science Quarterly, 52(1), 106–137. http://doi.org/10.2189/asqu.52.1.106
Gómez Mejía, L., Cruz, C., & Imperatore, C. (2014). Financial Reporting and the Protection of Socioemotional Wealth in Family-Controlled Firms. European Accounting Review, 23(3), 387–402. http://doi.org/10.1080/09638180.2014.944420
González-Cruz, T. F., & Cruz-Ros, S. (2016). When does family involvement produce superior performance in SME family business? Journal of Business Research, 69(4), 1452–1457. http://doi.org/10.1016/j.jbusres.2015.10.124
Grabner, I., & Moers, F. (2013). Management control as a system or a package? Conceptual and empirical issues. Accounting, Organizations and Society, 38(6–7), 407–419. http://doi.org/10.1016/j.aos.2013.09.002
Greenberg, J., & Colquitt, J. A. (2013). Handbook of Organizational Justice. Psychology Press.
Habbershon, T. G., & Williams, M. L. (1999). A resource-based framework for assesing the strategic advantages of famiy firms. Family Business Review, 12(1), 1–22. http://doi.org/10.1111/j.1741-6248.1999.00001.x

212
Habbershon, T. G., Williams, M., & MacMillan, I. C. (2003). A unified systems perspective of family firm performance. Journal of Business Venturing, 18(4), 451–465. http://doi.org/10.1016/S0883-9026(03)00053-3
Hair, J. F., & Sarstedt, M. (2014). Innovative and established research methods in family business: Description, illustration and application guidelines. Journal of Family Business Strategy, 5, 1–3. http://doi.org/10.1016/j.jfbs.2014.01.010
Hair Jr., J. F., Hult, T. M., Ringle, C. M., & Sarstedt, M. (2013). A Primer on Partial Least Squares Structural Equation Modeling (PLS-SEM). Sage Publications (CA).
Hair Jr., J. F., Sarstedt, M., Ringle, C. M., & Gudergan, S. P. (2017). Advanced Issues in Partial Least Squares Structural Equation Modeling. SAGE Publications, Inc.
Hall, A., & Nordqvist, M. (2008). Professional Management in Family Businesses: Toward an Extended Understanding. Family Business Review, 21(1), 51–69. http://doi.org/10.1111/j.1741-6248.2007.00109.x
Hambrick, D. C., & Mason, P. a. (1984). Upper Echelons: The Organization as a Reflection of Its Top Managers. The Academy of Management Review, 9(2), 193. http://doi.org/10.2307/258434
Hartmann, F., & Slapničar, S. (2009). How formal performance evaluation affects trust between superior and subordinate managers. Accounting, Organizations and Society, 34(6–7), 722–737. http://doi.org/10.1016/j.aos.2008.11.004
Hartmann, F., & Slapničar, S. (2012). The perceived fairness of performance evaluation: The role of uncertainty. Management Accounting Research, 23(1), 17–33. http://doi.org/10.1016/j.mar.2011.10.004
Hauck, J., Suess-Reyes, J., Beck, S., Prügl, R., & Frank, H. (2016). Measuring socioemotional wealth in family-owned and -managed firms: A validation and short form of the FIBER Scale. Journal of Family Business Strategy, 7(3), 133–148. http://doi.org/10.1016/j.jfbs.2016.08.001
Helsen, Z., Lybaert, N., Steijvers, T., Orens, R., & Dekker, J. (2017). Management Control Systems in family firms: A review of the literature and directions for the future. Journal of Economic Surveys, 31(2), 410–435. http://doi.org/10.1111/joes.12154
Henseler, J., Ringle, C. M., & Sarstedt, M. (2014). A new criterion for assessing discriminant validity in variance-based structural equation modeling. Journal of the Academy of Marketing Science, 115–135. http://doi.org/10.1007/s11747-014-0403-8
Henssen, B., Voordeckers, W., Lambrechts, F., & Koiranen, M. (2014). The CEO autonomy–stewardship behavior relationship in family firms: The mediating role of psychological ownership. Journal of Family Business Strategy, 5(3), 312–322. http://doi.org/10.1016/j.jfbs.2014.01.012
Hernandez, M. (2008). Promoting Stewardship Behavior in Organizations : A Leadership Model, 345–352. http://doi.org/10.1007/s10551-007-9440-2
Hernandez, M. (2012). Toward an Understanding of the Psychology of Stewardship. Academy of Management Review, 37(2), 172–193. http://doi.org/10.5465/amr.2010.0363
Hiebl, M. (2015). Agency and stewardship attitudes of chief financial officers in private companies. Qualitative Research in Financial Markets, 7(1), 4–23. http://doi.org/10.1108/QRFM-12-2012-0032

213
Hiebl, M. R. W., Duller, C., Feldbauer‐Durstmüller, B., & Ulrich, P. (2015). Family influence and management accounting usage – findings from Germany and Austria. Family Influence and Management Accounting, 17(3), 336–348. Retrieved from http://ssrn.com/abstract=2668735
Hoffmann, C., Wulf, T., & Stubner, S. (2016). Understanding the performance consequences of family involvement in the top management team: The role of long-term orientation. International Small Business Journal, 34(3), 345–368. http://doi.org/10.1177/0266242614550500
Holt, D. T., Madison, K., & Kellermanns, F. W. (2016). Variance in Family Members Assessments: The Importance of Dispersion Modeling in Family Firm Research. Family Business Review, 894486516673700. http://doi.org/10.1177/0894486516673700
Holt, D. T., Pearson, A. W., Carr, J. C., & Barnett, T. (2017). Family Firm(s) Outcomes Model: Structuring Financial and Nonfinancial Outcomes Across the Family and Firm. Family Business Review, 30(2), 182–202. http://doi.org/10.1177/0894486516680930
Irava, W. J., & Moores, K. (2010). Clarifying the strategic advantage of familiness: Unbundling its dimensions and highlighting its paradoxes. Journal of Family Business Strategy, 1(3), 131–144. http://doi.org/10.1016/j.jfbs.2010.08.002
Ittner, C. D. (2014). Strengthening causal inferences in positivist field studies. Accounting, Organizations and Society, 39(7), 545–549. http://doi.org/10.1016/j.aos.2013.10.003
James, A. E., Jennings, J. E., & Jennings, P. D. (2017). Is It Better to Govern Managers via Agency or Stewardship? Examining Asymmetries by Family Versus Nonfamily Affiliation. Family Business Review. http://doi.org/10.1177/0894486517717532
Jaskiewicz, P., Uhlenbruck, K., Balkin, D. B., & Reay, T. (2013). Is Nepotism Good or Bad? Types of Nepotism and Implications for Knowledge Management. Family Business Review, 26(2), 121–139. http://doi.org/10.1177/0894486512470841
Jensen, M. C., & Meckling, W. H. (1976). Theory of the firm: Managerial behavior, agency costs and ownership structure. Journal of Financial Economics, 3(4), 305–360. http://doi.org/10.1016/0304-405X(76)90026-X
Jordan, S., & Messner, M. (2012). Enabling control and the problem of incomplete performance indicators. Accounting, Organizations and Society, 37(8), 544–564. http://doi.org/10.1016/j.aos.2012.08.002
Jorissen, A., Laveren, E., Maneemai, P., & Voordeckers, W. (2016). THE DESIGN AND USE OF CONTROLS IN FAMILY SMES: A MULTI-THEORY PERSPECTIVE. In 39th European Accounting Association Annual Congress. Maastricht. Retrieved from http://eaa2016.eaacongress.org/r/default.asp
Kammerlander, N., & Ganter, M. (2015). An Attention-Based View of Family Firm Adaptation to Discontinuous Technological Change: Exploring the Role of Family CEOs’ Noneconomic Goals. Journal of Product Innovation Management, 32(3), 361–383. http://doi.org/10.1111/jpim.12205
Kellermanns, F. W., Eddleston, K. a., & Zellweger, T. M. (2012). Extending the Socioemotional Wealth Perspective: A Look at the Dark Side. Entrepreneurship Theory and Practice, 36(6), 1175–1182. http://doi.org/10.1111/j.1540-6520.2012.00544.x
Kenny, D. A. (2016). Moderation. Retrieved from http://davidakenny.net/cm/moderation.htm

214
Kim, C., & Mauborgne, R. (2003). Tipping Point Leadership. Harvard Business Review, (April).
Kim, W. C., & Mauborgne, R. A. (1993). Procedural justice, attitudes, and subsidiary top management compliance with multinationals’ corporate strategic decisions. Academy of Management Journal, 36(3), 502–526. http://doi.org/10.2307/256590
Kim, Y., & Gao, F. Y. (2013). Does family involvement increase business performance? Family-longevity goals’ moderating role in Chinese family firms. Journal of Business Research, 66(2), 265–274. http://doi.org/10.1016/j.jbusres.2012.08.018
Kruis, A. M., Speklé, R. F., & Widener, S. K. (2016). The Levers of Control Framework: An exploratory analysis of balance. Management Accounting Research, 32, 27–44. http://doi.org/10.1016/j.mar.2015.12.002
Langevin, P., & Mendoza, C. (2013). How can management control system fairness reduce managers’ unethical behaviours? European Management Journal, 31(3), 209–222. http://doi.org/10.1016/j.emj.2012.12.001
Lansberg, I. (1989). A framework for understanding issues of justice in family businesses. In Family Firm Institute Conference Proceedings.
Lardon, A., Deloof, M., & Jorissen, A. (2017). Outside CEOs, board control and the financing policy of small privately held family firms. Journal of Family Business Strategy, 8(1), 29–41. http://doi.org/10.1016/j.jfbs.2017.01.002
Lau, C. M., & Buckland, C. (2001). Budgeting-the Role of Trust and Participation: A Research Note. Abacus, 37(3), 369–388. http://doi.org/10.1111/1467-6281.00092
Lau, C. M., & Moser, A. (2008). Behavioral Effects of Nonfinancial Performance Measures: The Role of Procedural Fairness. Behavioral Research in Accounting, 20(2), 55–71. http://doi.org/10.2308/bria.2008.20.2.55
Lau, C. M., & Oger, B. (2012). Behavioral effects of fairness in performance measurement and evaluation systems: Empirical evidence from France. Advances in Accounting, 28(2), 323–332. http://doi.org/10.1016/j.adiac.2012.09.009
Lau, C. M., & Sholihin, M. (2005). Financial and nonfinancial performance measures: How do they affect job satisfaction? The British Accounting Review, 37(4), 389–413. http://doi.org/10.1016/j.bar.2005.06.002
Lau, C. M., & Tan, S. L. C. (2005). The Importance of Procedural Fairness in Budgeting. Advances in Accounting, 21, 333–356. http://doi.org/10.1016/S0882-6110(05)21014-3
Lau, D. C., & Murnighan, J. K. (1998). Demographic diversity and faultlines: the compositional dynamics of organizational groups. Academy of Management Review, 23(2), 325–340. http://doi.org/10.5465/AMR.1998.533229
Le Breton-Miller, I., Miller, D., & Lester, R. H. (2011). Stewardship or Agency? A Social Embeddedness Reconciliation of Conduct and Performance in Public Family Businesses. Organization Science, 22(3), 704–721. http://doi.org/10.1287/orsc.1100.0541
Leventhal, G. S., Karuza, J., & Fry, W. (1980). Beyond fairness: a theory of allocation preferences. In Mikula (Ed.), Justice and social interaction (pp. 167–218). New York: Springer-Verlag.

215
Libby, T. (1999). The influence of voice and explanation on performance in a participative budgeting setting. Accounting, Organizations and Society, 24(2), 125–137. http://doi.org/10.1016/S0361-3682(98)00043-9
Lind, E. A., & Tyler, T. R. (1988). The social psychology of procedural justice. New York: Plenum.
Locke, E. A., & Latham, G. P. (1990). A Theory of Goal Setting & Task Performance. Pearson College Div.
Lubatkin, M. H., Ling, Y., & Schulze, W. S. (2007). An organizational justice-based view of self-control and agency costs in family firms. Journal of Management Studies, 44(6), 955–971. http://doi.org/10.1111/j.1467-6486.2006.00673.x
Lubatkin, M. H., Schulze, W. S., Ling, Y., & Dino, R. N. (2005). The effects of parental altruism on the governance of family-managed firms. Journal of Organizational Behavior, 26(3), 313–330. http://doi.org/10.1002/job.307
Luhmann, N. (2013). A systems theory of religion. Stanford University Press.
Madison, K., Holt, D. T., Kellermanns, F. W., & Ranft, A. L. (2016). Viewing Family Firm Behavior and Governance Through the Lens of Agency and Stewardship Theories. Family Business Review, 29(1), 65–93. http://doi.org/10.1177/0894486515594292
Madison, K., Kellermanns, F. W., & Munyon, T. P. (2017). Coexisting Agency and Stewardship Governance in Family Firms: An Empirical Investigation of Individual-Level and Firm-Level Effects. Family Business Review, 89448651772742. http://doi.org/10.1177/0894486517727422
Magner, N., Welker, R. B., & Campbell, T. L. (1996). Testing a Model of Cognitive Budgetary Participation Processes in a Latent Variable Structural Equations Framework. Accounting and Business Research, 27(1), 41–50. http://doi.org/10.1080/00014788.1996.9729530
Mahama, H., & Cheng, M. M. (2013). The Effect of Managers’ Enabling Perceptions on Costing System Use, Psychological Empowerment, and Task Performance. Behavioral Research in Accounting, 25(1), 89–114. http://doi.org/10.2308/bria-50333
Malmi, T., & Brown, D. a. (2008). Management control systems as a package—Opportunities, challenges and research directions. Management Accounting Research, 19(4), 287–300. http://doi.org/10.1016/j.mar.2008.09.003
Mazzola, P., Sciascia, S., & Kellermanns, F. W. (2013). Non-linear effects of family sources of power on performance. Journal of Business Research, 66(4), 568–574. http://doi.org/10.1016/j.jbusres.2012.01.005
Merchant, K. A., & Van der Stede, W. A. (2007). Management Control Systems: Performance Measurement, Evaluation and Incentives (2nd editio).
Michiels, A., Voordeckers, W., Lybaert, N., & Steijvers, T. (2013). CEO Compensation in Private Family Firms. Family Business Review, 26(2), 140–160. http://doi.org/10.1177/0894486512454731
Miller, D., & Friesen, P. H. (1984). A Longitudinal Study of the Corporate Life Cycle. Management Science, 30(10), 1161–1183. Retrieved from http://www.jstor.org/stable/2631384?seq=1&cid=pdf-reference#references_tab_contents

216
Miller, D., & Le Breton-Miller, I. (2006). Family Governance and Firm Performance: Agency, Stewardship, and Capabilities. Family Business Review, 19(1), 73–87. http://doi.org/10.1111/j.1741-6248.2006.00063.x
Miller, D., & Le Breton-Miller, I. (2014). Deconstructing socioemotional wealth. Entrepreneurship: Theory and Practice, 38(4), 713–720. http://doi.org/10.1111/etap.12111
Miller, D., Minichilli, A., & Corbetta, G. (2013). Is family leadership always beneficial? Strategic Management Journal, 34(5), 553–571. http://doi.org/10.1002/smj.2024
Minichilli, A., Corbetta, G., & MacMillan, I. C. (2010). Top management teams in family-controlled companies: “Familiness”, “faultlines”, and their impact on financial performance. Journal of Management Studies, 47(2), 205–222. http://doi.org/10.1111/j.1467-6486.2009.00888.x
Mitchell, R. K., Agle, B. R., & Wood, D. J. (1997). Toward a theory of stakeholder identification and salience: defining the principle of who and what really counts. Academy of Management Review, 22(4), 853–886. http://doi.org/10.5465/AMR.1997.9711022105
Moers, F. (2005). Discretion and bias in performance evaluation: the impact of diversity and subjectivity. Accounting, Organizations and Society, 30(1), 67–80. http://doi.org/10.1016/j.aos.2003.11.001
Moores, K. (2009). Paradigms and Theory Building in the Domain of Business Families. Family Business Review, 22(2), 167–180. http://doi.org/10.1177/0894486509333372
Moores, K., & Mula, J. (2000). The Salience of Market, Bureaucratic, and Clan Controls in the Management of Family Firm Transitions: Some Tentative Australian Evidence. Family Business Review, 13(2), 91–106. http://doi.org/10.1111/j.1741-6248.2000.00091.x
Morck, R., & Yeung, B. (2003). Agency Problems in Large Family Business Groups. Entrepreneurship Theory and Practice, 27(4), 367–382. http://doi.org/10.1111/1540-8520.t01-1-00015
Morgan, T. J., & Gomez-Mejia, L. R. (2014). Hooked on a feeling: The affective component of socioemotional wealth in family firms. Journal of Family Business Strategy, 5(3), 280–288. http://doi.org/10.1016/j.jfbs.2014.07.001
Mustakallio, M., Autio, E., & Zahra, S. A. (2002). Relational and Contractual Governance in Family Firms: Effects on Strategic Decision Making. Family Business Review, 15(3), 205–222. http://doi.org/10.1111/j.1741-6248.2002.00205.x
Naldi, L., Cennamo, C., Corbetta, G., & Gomez-Mejia, L. (2013). Preserving Socioemotional Wealth in Family Firms: Asset or Liability? The Moderating Role of Business Context. Entrepreneurship Theory and Practice, 37(6), 1341–1360. http://doi.org/10.1111/etap.12069
Neubaum, D. O., Thomas, C. H., Dibrell, C., & Craig, J. B. (2017). Stewardship Climate Scale. Family Business Review, 30(1), 37–60. http://doi.org/10.1177/0894486516673701
Nitzl, C. (2016). The use of partial least squares structural equation modeling (PLS-SEM) in management accounting research: Directions for future theory development. Journal of Accounting Literature, 37(July), 19–35. http://doi.org/10.1016/j.acclit.2016.09.003
Otley, D. (1999). Performance management : a framework for management control systems research. Management Accounting Research, 10(November 1998), 363–382.

217
Parwoll, M., & Wagner, R. (2012). The impac of missing values on PLS model fit. In Challenges at the interface of data analysis, computer science, and optimization (pp. 537–544). Berlin, Heidelberg: Springer.
Patel, P. C., & Cooper, D. (2014). Structural Power Equality between Family and Non-Family TMT Members and the Performance of Family Firms. Academy of Management Journal, 57(6), 1624–1649. http://doi.org/10.5465/amj.2012.0681
Pearson, A. W., Carr, J. C., & Shaw, J. C. (2008). Toward a Theory of Familiness: A Social Capital Perspective. Entrepreneurship Theory and Practice, 32(6), 949–969. http://doi.org/10.1111/j.1540-6520.2008.00265.x
Pearson, A. W., & Marler, L. E. (2010). A Leadership Perspective of Reciprocal Stewardship in Family Firms. Entrepreneurship Theory and Practice, 34(6), 1117–1124. http://doi.org/10.1111/j.1540-6520.2010.00416.x
Pieper, T. M. (2010). Non solus: Toward a psychology of family business. Journal of Family Business Strategy, 1(1), 26–39. http://doi.org/10.1016/j.jfbs.2010.02.003
Podsakoff, P. M., MacKenzie, S. B., Lee, J.-Y., & Podsakoff, N. P. (2003). Common method biases in behavioral research: a critical review of the literature and recommended remedies. The Journal of Applied Psychology, 88(5), 879–903. http://doi.org/10.1037/0021-9010.88.5.879
Podsakoff, P. M., MacKenzie, S. B., & Podsakoff, N. P. (2012). Sources of Method Bias in Social Science Research and Recommendations on How to Control It. Annual Review of Psychology, 63(1), 539–569. http://doi.org/10.1146/annurev-psych-120710-100452
Prencipe, A., Bar-Yosef, S., & Dekker, H. C. (2014). Accounting Research in Family Firms: Theoretical and Empirical Challenges. European Accounting Review, (March 2015), 1–25. http://doi.org/10.1080/09638180.2014.895621
Rutherford, M. W., Kuratko, D. F., & Holt, D. T. (2008). Examining the Link Between “Familiness” and Performance: Can the F-PEC Untangle the Family Business Theory Jungle? Entrepreneurship Theory and Practice, 32(6), 1089–1109. http://doi.org/10.1111/j.1540-6520.2008.00275.x
Salvato, C., & Moores, K. (2010). Research on Accounting in Family Firms: Past Accomplishments and Future Challenges. Family Business Review, 23(3), 193–215. http://doi.org/10.1177/0894486510375069
Sarstedt, M., Ringle, C. M., Smith, D., Reams, R., & Hair, J. F. (2014). Partial least squares structural equation modeling (PLS-SEM): A useful tool for family business researchers. Journal of Family Business Strategy, 5(1), 105–115. http://doi.org/10.1016/j.jfbs.2014.01.002
Schulze, W. S., & Kellermanns, F. W. (2015). Reifying socioemotional wealth. Entrepreneurship: Theory and Practice, 39(3), 447–459. http://doi.org/10.1111/etap.12159
Schulze, W. S., Lubatkin, M. H., & Dino, R. N. (2003). Exploring the agency consequences of ownership dispersion among the directors of private family firms. Academy of Management Journal, 46(2), 179–194. http://doi.org/10.2307/30040613
Sciascia, S., & Mazzola, P. (2008). Family Involvement in Ownership and Management: Exploring Nonlinear Effects on Performance. Family Business Review, 21(4), 331–345. http://doi.org/10.1111/j.1741-6248.2008.00133.x

218
Sciascia, S., Mazzola, P., & Chirico, F. (2013). Generational Involvement in the Top Management Team of Family Firms: Exploring Nonlinear Effects on Entrepreneurial Orientation. Entrepreneurship: Theory and Practice, 37(1), 69–85. http://doi.org/10.1111/j.1540-6520.2012.00528.x
Senftlechner, D., & Hiebl, M. R. W. (2015). Management accounting and management control in family businesses: past accomplishments and future opportunities. Journal of Accounting & Organizational Change, 11(4), 573–606. http://doi.org/10.1108/JAOC-08-2013-0068
Shields, M. D., & Young, S. M. (1993). Antecedents and Consequences of Participative Budgeting: Evidence on the Effects of Asymmetrical Information. Journal of Management Accounting Research, 5(August), 265–280. Retrieved from http://ezaccess.library.uitm.edu.my/login?url=http://search.ebscohost.com/login.aspx?direct=true&db=bth&AN=9701211563&site=ehost-live&scope=site
Sieger, P., Bernhard, F., & Frey, U. (2011). Affective commitment and job satisfaction among non-family employees: Investigating the roles of justice perceptions and psychological ownership. Journal of Family Business Strategy, 2(2), 78–89. http://doi.org/10.1016/j.jfbs.2011.03.003
Simon, A., Marquès, P., Bikfalvi, A., & Muñoz, M. (2012). Exploring value differences across family firms: The influence of choosing and managing complexity. Journal of Family Business Strategy, 3(3), 132–146. http://doi.org/10.1016/j.jfbs.2012.05.003
Simons, R. (1995). Levers of Control: How Managers Use Innovative Control Systems to Drive Strategic Renewal (1 edition). Harvard Business Review Press.
Simons, R. (2013). Performance Measurement and Control Systems for Implementing Strategy Text and Cases: Pearson New International Edition. Pearson Education Limited.
Sirmon, D. G., & Hitt, M. A. (2003). Managing Resources: Linking Unique Resources, Management, and Wealth Creation in Family Firms. Entrepreneurship Theory and Practice, 27(4), 339–358. http://doi.org/10.1111/1540-8520.t01-1-00013
Songini, L., & Gnan, L. (2015). Family Involvement and Agency Cost Control Mechanisms in Family Small and Medium-Sized Enterprises. Journal of Small Business Management, 53(3), 748–779. http://doi.org/10.1111/jsbm.12085
Songini, L., Gnan, L., & Malmi, T. (2013). The role and impact of accounting in family business. Journal of Family Business Strategy, 4(2), 71–83. http://doi.org/10.1016/j.jfbs.2013.04.002
Songini, L., Vola, P., & Gnan, L. (2017). Management Business and Management Control Systems Package: paths and determinants. In 13th Workshop on Family Firm Management Research. Bilbao.
Sorenson, R. L. (2000). The Contribution of Leadership Style and Practices to Family and Business Success. Family Business Review, 13(3), 183–200. http://doi.org/10.1111/j.1741-6248.2000.00183.x
Speckbacher, G., & Wentges, P. (2012). The impact of family control on the use of performance measures in strategic target setting and incentive compensation: A research note. Management Accounting Research, 23(1), 34–46. http://doi.org/10.1016/j.mar.2011.06.002

219
Sponem, S., & Lambert, C. (2016). Exploring differences in budget characteristics, roles and satisfaction: A configurational approach. Management Accounting Research, 30, 47–61. http://doi.org/10.1016/j.mar.2015.11.003
Stewart, A., & Hitt, M. A. (2012). Why Can’t a Family Business Be More Like a Nonfamily Business? Family Business Review, 25(1), 58–86. http://doi.org/10.1177/0894486511421665
Suess-Reyes, J. (2016). Understanding the transgenerational orientation of family businesses: the role of family governance and business family identity. Journal of Business Economics, 1–29. http://doi.org/10.1007/s11573-016-0835-3
Suess, J. (2014). Family governance - Literature review and the development of a conceptual model. Journal of Family Business Strategy, 5(2), 138–155. http://doi.org/10.1016/j.jfbs.2014.02.001
Sundaramurthy, C., & Kreiner, G. E. (2008). Governing by Managing Identity Boundaries: The Case of Family Businesses. Entrepreneurship Theory and Practice, 32(3), 415–436. http://doi.org/10.1111/j.1540-6520.2008.00234.x
Tagiuri, R., & Davis, J. (1996). Bivalent attributes of the family firm. Family Business Review, 9(2), 199–208.
Thibaut, J. W., & Walker, L. (1975). Procedural justice: A psychological analysis (Erlbaum As). Hillsdale, NJ.
Tosi, H. L., Brownlee, A. L., Silva, P., & Katz, J. P. (2003). An Empirical Exploration of Decision-making Under Agency Controls and Stewardship Structure. Journal of Management Studies, 40(8), 2053–2071. http://doi.org/10.1046/j.1467-6486.2003.00411.x
Vallejo, M. C. (2009). The Effects of Commitment of Non-Family Employees of Family Firms from the Perspective of Stewardship Theory. Journal of Business Ethics, 87(3), 379–390. http://doi.org/10.1007/s10551-008-9926-6
Van den Bos, K., Vermunt, R., & Wilke, H. a. M. (1997). Procedural and distributive justice: What is fair depends more on what comes first than on what comes next. Journal of Personality and Social Psychology, 72(1), 95–104. http://doi.org/10.1037/0022-3514.72.1.95
Van der Heyden, L., Blondel, C., & Carlock, R. S. (2005). Fair Process: Striving for Justice in Family Business. Family Business Review, 18(1), 1–21. http://doi.org/10.1111/j.1741-6248.2005.00027.x
Van der Stede, W. A. (2014). A manipulationist view of causality in cross-sectional survey research. Accounting, Organizations and Society, 39(7), 567–574. http://doi.org/10.1016/j.aos.2013.12.001
Vandekerkhof, P., Steijvers, T., Hendriks, W., & Voordeckers, W. (2015). The Effect of Organizational Characteristics on the Appointment of Nonfamily Managers in Private Family Firms. Family Business Review, 28(2), 104–122. http://doi.org/10.1177/0894486513514274
Veider, V., & Matzler, K. (2016). The ability and willingness of family-controlled firms to arrive at organizational ambidexterity. Journal of Family Business Strategy, 7(2), 105–116. http://doi.org/10.1016/j.jfbs.2015.10.001

220
Verbeke, A., & Kano, L. (2012). The Transaction Cost Economics Theory of the Family Firm: Family-Based Human Asset Specificity and the Bifurcation Bias. Entrepreneurship Theory and Practice, 36(6), 1183–1205. http://doi.org/10.1111/j.1540-6520.2012.00545.x
Villalonga, B., & Amit, R. (2006). How do family ownership, control and management affect firm value? Journal of Financial Economics, 80(2), 385–417. http://doi.org/10.1016/j.jfineco.2004.12.005
Voußem, L., Kramer, S., & Schäffer, U. (2016). Fairness perceptions of annual bonus payments: The effects of subjective performance measures and the achievement of bonus targets. Management Accounting Research, 30, 32–46. http://doi.org/10.1016/j.mar.2015.10.001
Ward, J. L. (1988). The special role of strategic planning for family businesses. Family Business Review, 1(2), 105-117.
Wasserman, N. (2006). Stewards, agents, and the founder discount: executive compensation in new ventures. Academy of Management Journal, 49(5), 960–976. http://doi.org/10.5465/AMJ.2006.22798177
Wilson, S. R., Whitmoyer, J. G., Pieper, T. M., Astrachan, J. H., Hair, J. F., & Sarstedt, M. (2014). Method trends and method needs: Examining methods needed for accelerating the field. Journal of Family Business Strategy, 5, 4–14. http://doi.org/10.1016/j.jfbs.2014.01.011
Wiseman, R. M., & Gomez-Mejia, L. R. (1998). a Behavioral Agency Model of Managerial Risk Taking. Academy of Management Review, 23(1), 133–153. http://doi.org/10.5465/AMR.1998.192967
Xu, D., & Meyer, K. E. (2013). Linking theory and context:‘Strategy research in emerging economies’ after Wright et al.(2005). Journal of Management Studies, 50(7), 1322-1346. http://doi.org/10.1111/j.1467-6486.2012.01051.x
Zahra, S. A., Hayton, J. C., Neubaum, D. O., Dibrell, C., & Craig, J. (2008). Culture of Family Commitment and Strategic Flexibility: The Moderating Effect of Stewardship. Entrepreneurship Theory and Practice, 32(6), 1035–1054. http://doi.org/10.1111/j.1540-6520.2008.00271.x
Zahra, S. A., Neubaum, D. O., & Larrañeta, B. (2007). Knowledge sharing and technological capabilities: The moderating role of family involvement. Journal of Business Research, 60(10), 1070–1079. http://doi.org/10.1016/j.jbusres.2006.12.014
Zellweger, T. M., & Astrachan, J. H. (2008). On the Emotional Value of Owning a Firm. Family Business Review, 21(4), 347–363. http://doi.org/10.1177/08944865080210040106
Zellweger, T. M., & Dehlen, T. (2012). Value Is in the Eye of the Owner. Family Business Review, 25(3), 280–297. http://doi.org/10.1177/0894486511416648
Zellweger, T. M., Eddleston, K. A., & Kellermanns, F. W. (2010). Exploring the concept of familiness: Introducing family firm identity. Journal of Family Business Strategy, 1(1), 54–63. http://doi.org/10.1016/j.jfbs.2009.12.003
Zellweger, T. M., Nason, R. S., Nordqvist, M., & Brush, C. G. (2013). Why Do Family Firms Strive for Nonfinancial Goals? An Organizational Identity Perspective. Entrepreneurship Theory and Practice, 37(2), 229–248. http://doi.org/10.1111/j.1540-6520.2011.00466.x

221
References of studies that were included in the review of Brazilian journals.
Amboni, N., Andrade, R. O., & Lima, A. J. (2011). Práticas de gestão no Grupo Cecrisa SA. Revista de Administração da UNIMEP, 9(3).
Barcia, F.; & Grzybovski, D..(2008). Empresa familiar: resolução de conflitos familiares em função dos negócios. Revista de Estudos de Administração, v. 8, n. 16.
Bertucci, J., Silva, E., Pimentel, T., & Pereira, R. D. (2009). Mecanismos de Governança e Processos de Sucessão: um estudo sobre a influência dos elementos da governança corporativa na orientação do processo sucessório em uma empresa familiar. Revista Brasileira de Gestão de Negócios, 11(31).
Beuren, I. M., dos Santos, V., & dos Santos, A. F. (2010). Tipologia de cultura organizacional dominante em empresas familiares do ramo têxtil: um estudo multicasos na área de controladoria. Revista da Micro e Pequena Empresa, 4(3), 53-72.
Beuren, I. M., & dos Santos, V. (2012). Percepção de justiça organizacional na avaliação de desempenho de controllers. Enfoque: Reflexão Contábil, 31(3).
Beuren, I. M., & Müler, E. T. (2010). Evidências de institucionalização da controladoria em empresas familiares. Revista de Administração FACES Journal, 9(2).
Beuren, I. M., Althoff, N., & Stédile, R. M. (2010). Práxis da controladoria em empresas familiares brasileiras. Revista Ciências Administrativas, 16(2).
Beuren, I. M., Amaro, H. D., & da Silva, P. Y. C. D. (2015). Percepção dos gestores em relação ao princípio da controlabilidade para o alcance da justiça organizacional. REAd. Revista Eletrônica de Administração (Porto Alegre), 21(2), 378-405.
Beuren, I. M., Barros, C. M., & Dal Vesco, D. (2016). Percepção de justiça organizacional dos gestores no uso do balanced scorecard para a mensuração do desempenho estratégico. Revista de Contabilidade e Organizações, 10(27).
Beuren, I. M., Fachini, G. J., & Nascimento, S. (2009). Evidências de isomorfismo nas funções da controladoria das empresas familiares têxteis de Santa Catarina. In Anais do Congresso Brasileiro de Custos-ABC.
Beuren, I. M., Fachini, G. J., & Nascimento, S. (2009). Evidências de isomorfismo nas funções da controladoria das empresas familiares têxteis de Santa Catarina. In Anais do Congresso Brasileiro de Custos-ABC.
Beuren, I. M., Klein, L., Lara, F. L., & de Almeida, L. (2016). Percepção de Justiça nos Sistemas de Controle Gerencial Aumenta Comprometimento e Confiança dos Gestores?. RAC-Revista de Administração Contemporânea, 20(2).
Beuren, I. M., Kreuzberg, F., & Franz, L. (2016). Percepção de justiça processual na avaliação de desempenho: uma análise à luz da incerteza e da tolerância à ambiguidade. Advances in Scientific and Applied Accounting, 9(1), 003-021.
dos Santos, E. A., de Oliveira, R. M., & Konopka, R. (2016). Justiça organizacional e clima ético: percepção dos efeitos no estresse relacionado com o trabalho. Revista Capital Científico-Eletrônica (RCCҽ)-ISSN 2177-4153, 14(3), 69-83.
dos Santos, V., Beuren, I. M., & Hein, N. (2015). Relação da percepção de justiça na avaliação de desempenho com folga organizacional dos controllers. Advances in Scientific and Applied Accounting, 8(1), 063-087.

222
Eccel, C. S., Cavedon, N. R., & Craide, A. (2007). A empresa familiar cachorro quente do Rosário: entre a Antropologia e a Administração. Organizações & Sociedade, 14(42), 49-66.
Ésther, A. B. (2014). A construção da cultura e da identidade organizacionais na empresa familiar de pequeno porte: o papel do empreendedor fundador. Revista Organizações em Contexto-online, 10(20), 205-242.
Filardi, F., Freitas, A., Pinto, N., & Silveira, F. (2012). Avaliação do desempenho de empresas familiares: a estratégia de uma distribuidora de produtos veterinários frente a seus concorrentes sob o enfoque da Resource-Based View. Revista Eletrônica de Estratégia & Negócios, 5(1), 167-199.
Fontes Filho, J. R., Ventura, E., & Oliveira, M. J. D. (2008). Governança e participação no contexto das cooperativas de crédito. Revista de Administração FACES Journal, 7(3).
Grande, J. F., & BEUREN, I. (2011c). Mudanças de práticas de contabilidade gerencial: aplicação da análise de discurso crítica no relatório da administração de empresa familiar. Revista Base (Administração e Contabilidade) da UNISINOS, 8(2).
Grande, J. F., & Beuren, I. M. (2011a). Mudanças de práticas de contabilidade gerencial identificadas nos relatórios da administração de empresas familiares. Contabilidade, Gestão e Governança, 14(3).
Grande, J., & Beuren, I. M. (2011b). Mudanças nas práticas de contabilidade gerencial de empresas. Revista de Administração FACES Journal, 10(3).
Jacinto, N. M. F., & Vieira, A. (2010). O desenvolvimento de competências para inovação tecnológica e organizacional. Revista Gestão & Tecnologia, 8(2), 1-18.
Kalm, M., & Gomez-Mejia, L. R. (2016). Socioemotional wealth preservation in family firms. Revista de Administração (São Paulo), 51(4), 409-411.
Leal, E. A., & Botinha, C. T. (2013). Análise das atribuições e da participação do controller no processo sucessório em uma empresa familiar. Contextus, 11(2).
Lissoni, J., Pereira, M. F., Almeida, M. I. R., & Serra, F. R. (2010). Family Business: how family and ownership shapes business professionalization/Empresas Familiares: como a família ea propriedade modelam a profissionalização do negócio/Empresas Familiares: cómo la familia y la propiedad modelan la profesionalización del negocio. Revista Brasileira de Gestao de Negócios, 12(37), 464.
Machado, R., Grzybovski, D., Teixeira, E., & da Silva, M. (2013). Governança de pequenas empresas familiares brasileiras: aspectos a considerar no modelo adotado. Revista de Ciências da Administração, 15(37).
Maia, T. (2009). Gestão de pessoas: particularidades de empresas familiares. Revista Pensamento Contemporâneo em Administração, 3(2).
Mizumoto, F. M., & Machado Filho, C. P. (2007). Práticas de governança corporativa em empresa familiar de capital fechado: um estudo de caso. Revista de Negócios, 12(2), 3-17.
Müler, E. T., & Beuren, I. M. (2010). Estrutura formal e práticas da controladoria em empresas familiares brasileiras. Gestão & Regionalidade, 26(76).

223
Nelson, R. E., & Pimentel, T. D. (2015). Uma Perspectiva Weberiana para a Governança de Empresas Familiares: Notas a Partir de um Estudo com Empresas Longevas. Organizações & Sociedade, 22(75), 539-560.
Nepomuceno, L. H., & dos Santos, A. C. (2009). As competências gerenciais em uma empresa familiar: uma abordagem crítica. Revista Alcance, 16(1).
Nóbrega, G. J., & Hoffmann, V. E. (2014). Family businesses and the creation of entrepreneurship through their internal resources. Revista Pensamento Contemporâneo em Administração, 8(2), 92.
Oliveira, J., Albuquerque, A. L., & Pereira, R. D. (2012). Governança, sucessão e profissionalização em uma empresa familiar:(re) arranjando o lugar da família multigeracional. Revista Brasileira de Gestão de Negócios, 14(43).
Oliveira, J., Álvares, E., Pinheiro, A., & Pimentel, T. (2011). A Governança corporativa como elemento mediador na empresa familiar. Revista de Administração FACES Journal, 10(3).
Peixoto, F., & Buccini, A. R. (2013). Separação entre propriedade e controle e sua relação com desempenho e valor de empresas brasileiras: onde estamos?. Revista de Contabilidade e Organizações, 7(18).
Pinto, M. B., & Leal, R. P. C. (2013). Ownership concentration, top management and board compensation. Revista de Administração Contemporânea, 17(3), 304-324.
Teixeira, E. B.; Toso, V. C.; & Grzybovski, D. (2009). Práticas de gestão em Micro e Pequenas Empresas de base familiar: um estudo das empresas industriais assistidas pelo Programa de Extensão Empresarial em Ijuí/RS. Revista de Estudos de Administração, v. 9, n. 18.
Theodoro, A. J., & Beuren, I. M. (2011). SUPORTE DE INFORMAÇÕES DA CONTROLADORIA NA GESTÃO DE EMPRESAS CENTENÁRIAS DO ESTADO DO RIO GRANDE DO SUL-BRASIL. Gestão & Planejamento-G&P, 11(2).
Tomei, P. A., & Riche, L. (2016). Estilo de Liderança e Desempenho organizacional: Uma Descrição Comparativa entre duas empresas. Contabilidade, Gestão e Governança, 19(1), 108-125.
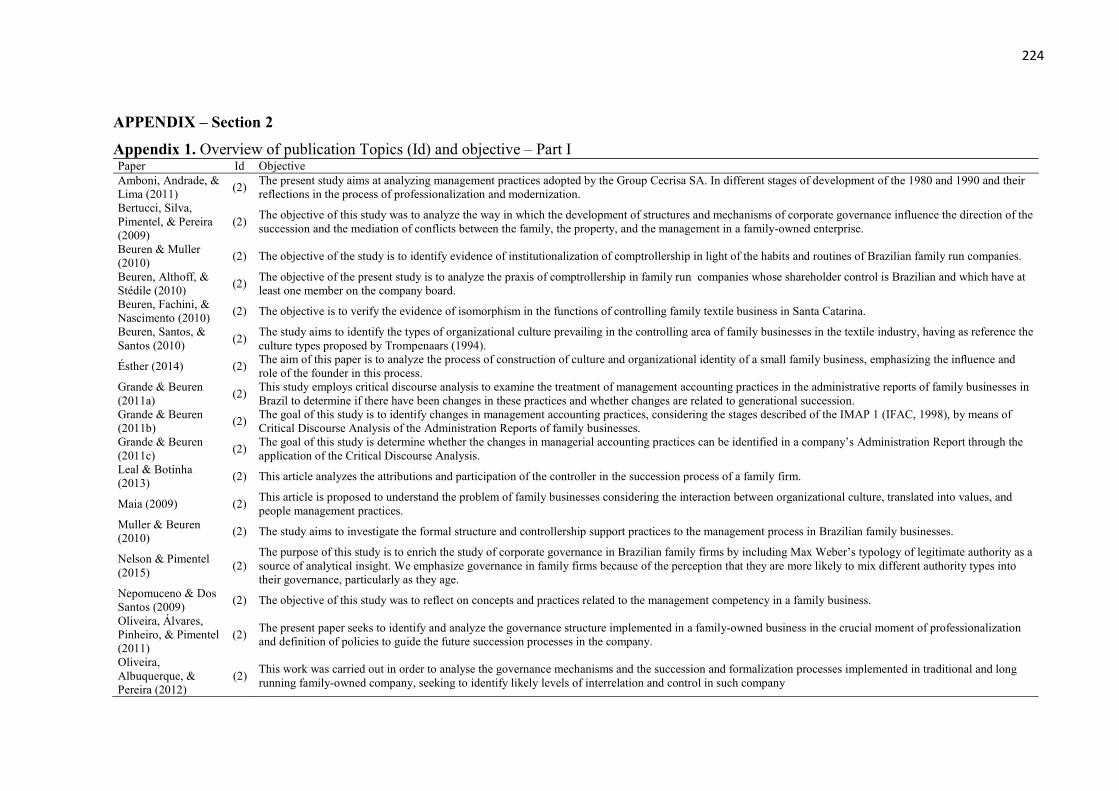
224
APPENDIX – Section 2
Appendix 1. Overview of publication Topics (Id) and objective – Part I Paper Id Objective Amboni, Andrade, & Lima (2011)
(2) The present study aims at analyzing management practices adopted by the Group Cecrisa SA. In different stages of development of the 1980 and 1990 and their reflections in the process of professionalization and modernization.
Bertucci, Silva, Pimentel, & Pereira (2009)
(2) The objective of this study was to analyze the way in which the development of structures and mechanisms of corporate governance influence the direction of the succession and the mediation of conflicts between the family, the property, and the management in a family-owned enterprise.
Beuren & Muller (2010)
(2) The objective of the study is to identify evidence of institutionalization of comptrollership in light of the habits and routines of Brazilian family run companies.
Beuren, Althoff, & Stédile (2010)
(2) The objective of the present study is to analyze the praxis of comptrollership in family run companies whose shareholder control is Brazilian and which have at least one member on the company board.
Beuren, Fachini, & Nascimento (2010)
(2) The objective is to verify the evidence of isomorphism in the functions of controlling family textile business in Santa Catarina.
Beuren, Santos, & Santos (2010)
(2) The study aims to identify the types of organizational culture prevailing in the controlling area of family businesses in the textile industry, having as reference the culture types proposed by Trompenaars (1994).
Ésther (2014) (2) The aim of this paper is to analyze the process of construction of culture and organizational identity of a small family business, emphasizing the influence and role of the founder in this process.
Grande & Beuren (2011a)
(2) This study employs critical discourse analysis to examine the treatment of management accounting practices in the administrative reports of family businesses in Brazil to determine if there have been changes in these practices and whether changes are related to generational succession.
Grande & Beuren (2011b)
(2) The goal of this study is to identify changes in management accounting practices, considering the stages described of the IMAP 1 (IFAC, 1998), by means of Critical Discourse Analysis of the Administration Reports of family businesses.
Grande & Beuren (2011c)
(2) The goal of this study is determine whether the changes in managerial accounting practices can be identified in a company’s Administration Report through the application of the Critical Discourse Analysis.
Leal & Botinha (2013)
(2) This article analyzes the attributions and participation of the controller in the succession process of a family firm.
Maia (2009) (2) This article is proposed to understand the problem of family businesses considering the interaction between organizational culture, translated into values, and people management practices.
Muller & Beuren (2010)
(2) The study aims to investigate the formal structure and controllership support practices to the management process in Brazilian family businesses.
Nelson & Pimentel (2015)
(2) The purpose of this study is to enrich the study of corporate governance in Brazilian family firms by including Max Weber’s typology of legitimate authority as a source of analytical insight. We emphasize governance in family firms because of the perception that they are more likely to mix different authority types into their governance, particularly as they age.
Nepomuceno & Dos Santos (2009)
(2) The objective of this study was to reflect on concepts and practices related to the management competency in a family business.
Oliveira, Álvares, Pinheiro, & Pimentel (2011)
(2) The present paper seeks to identify and analyze the governance structure implemented in a family-owned business in the crucial moment of professionalization and definition of policies to guide the future succession processes in the company.
Oliveira, Albuquerque, & Pereira (2012)
(2) This work was carried out in order to analyse the governance mechanisms and the succession and formalization processes implemented in traditional and long running family-owned company, seeking to identify likely levels of interrelation and control in such company
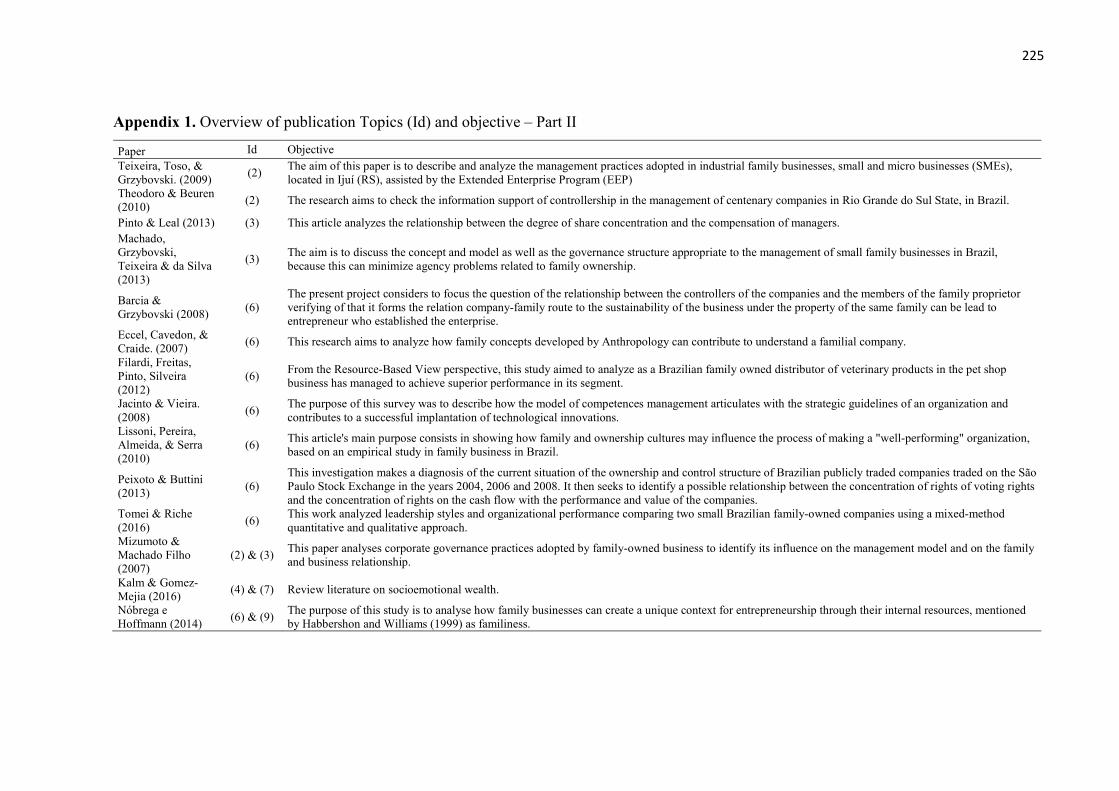
225
Appendix 1. Overview of publication Topics (Id) and objective – Part II
Paper Id Objective Teixeira, Toso, & Grzybovski. (2009)
(2) The aim of this paper is to describe and analyze the management practices adopted in industrial family businesses, small and micro businesses (SMEs), located in Ijuí (RS), assisted by the Extended Enterprise Program (EEP)
Theodoro & Beuren (2010)
(2) The research aims to check the information support of controllership in the management of centenary companies in Rio Grande do Sul State, in Brazil.
Pinto & Leal (2013) (3) This article analyzes the relationship between the degree of share concentration and the compensation of managers. Machado, Grzybovski, Teixeira & da Silva (2013)
(3) The aim is to discuss the concept and model as well as the governance structure appropriate to the management of small family businesses in Brazil, because this can minimize agency problems related to family ownership.
Barcia & Grzybovski (2008)
(6) The present project considers to focus the question of the relationship between the controllers of the companies and the members of the family proprietor verifying of that it forms the relation company-family route to the sustainability of the business under the property of the same family can be lead to entrepreneur who established the enterprise.
Eccel, Cavedon, & Craide. (2007)
(6) This research aims to analyze how family concepts developed by Anthropology can contribute to understand a familial company.
Filardi, Freitas, Pinto, Silveira (2012)
(6) From the Resource-Based View perspective, this study aimed to analyze as a Brazilian family owned distributor of veterinary products in the pet shop business has managed to achieve superior performance in its segment.
Jacinto & Vieira. (2008)
(6) The purpose of this survey was to describe how the model of competences management articulates with the strategic guidelines of an organization and contributes to a successful implantation of technological innovations.
Lissoni, Pereira, Almeida, & Serra (2010)
(6) This article's main purpose consists in showing how family and ownership cultures may influence the process of making a "well-performing" organization, based on an empirical study in family business in Brazil.
Peixoto & Buttini (2013)
(6) This investigation makes a diagnosis of the current situation of the ownership and control structure of Brazilian publicly traded companies traded on the São Paulo Stock Exchange in the years 2004, 2006 and 2008. It then seeks to identify a possible relationship between the concentration of rights of voting rights and the concentration of rights on the cash flow with the performance and value of the companies.
Tomei & Riche (2016)
(6) This work analyzed leadership styles and organizational performance comparing two small Brazilian family-owned companies using a mixed-method quantitative and qualitative approach.
Mizumoto & Machado Filho (2007)
(2) & (3) This paper analyses corporate governance practices adopted by family-owned business to identify its influence on the management model and on the family and business relationship.
Kalm & Gomez-Mejia (2016)
(4) & (7) Review literature on socioemotional wealth.
Nóbrega e Hoffmann (2014)
(6) & (9) The purpose of this study is to analyse how family businesses can create a unique context for entrepreneurship through their internal resources, mentioned by Habbershon and Williams (1999) as familiness.

226
Appendix 1. Overview of publication Topics (Id) and objective – Part III
Paper Id Objective Fontes Filho, Ventura, & Oliveira (2008)
(7) This article explores the references of the agency theory and the stewardship theory, characterized by different assumptions about human nature and motivation of the managers, in order to investigate the contribution of these theories in the formulation of models of governance to credit cooperatives.
Beuren & dos Santos (2012)
(8) The goal of this study is to verify the perception of organizational justice in controllers performance evaluation of companies adopting variable compensation systems.
Beuren, Amaro, & da Silva (2015)
(8) The goal of this study is to investigate the perception of managers regarding the principle of controllability to the achievement of organizational justice.
Beuren, Barros, & Dal Vesco (2016)
(8) This study examines the perception of Organizational Justice of managers in the use of the balanced scorecard to measure the strategic performance of a manufacturing company.
Beuren, Klein, Lara, & de Almeida (2016)
(8) The goal of this is study is to determine whether the perception of fairness regarding the dimensions of the Management Control Systems increases managers’ commitment and confidence.
Beuren, Kreuzberg, & Franz (2016)
(8) The goal of this study is to investigate the relationship between performance evaluation measures and the perception of procedural fairness in light of uncertainty and tolerance to ambiguity
dos Santos, Beuren, & Hein (2015)
(8) The study aims to verify the relationship between the perception of organizational justice in performance evaluation and the level of controllers’ organizational slack in the form of financial and human resources, of the easiness in reaching the budgetary and power targets.
dos Santos, de Oliveira, & Konopka (2016)
(8) This study aims to understand the effects of organizational justice and ethical climate in the workplace and its relationship with stress

227
Appendix 2. Overview of publication Topics (Id) and Methodology description – Part I
Paper Id Methodology
and data collection
Time-frame Sample size Firm size Informants Analytical approach
Amboni, Andrade, & Lima (2011) (2) Case study Cross-sectional NI Large Top executives interpretive (historical) Bertucci, Silva, Pimentel, & Pereira (2009)
(2) Case study Cross-sectional 5 interviews Medium Top executives NI
Beuren & Muller (2010) (2) Survey Cross-sectional 12 firms Large Managers (accounting area) descriptive Beuren, Althoff, & Stédile (2010) (2) Multi-case Cross-sectional 4 firms Large Managers (accounting area) descriptive Beuren, Fachini, & Nascimento (2010)
(2) Survey Cross-sectional 13 firms Small, medium and large
Managers (accounting area) descriptive
Beuren, Santos, & Santos (2010) (2) Multi-case Cross-sectional 3 firms Large Managers (accounting area) Ésther (2014) (2) Case study Longitudinal 6 interviews Small Top executives and employees content analysis Grande & Beuren (2011a) (2) Archival Longitudinal 9 firms Large - discourse analysis Grande & Beuren (2011b) (2) Archival Longitudinal 9 firms Large - discourse analysis Grande & Beuren (2011c) (2) Archival Longitudinal 1 firm Large - discourse analysis
Leal & Botinha (2013) (2) Case study Cross-sectional 8 interviews Large Top executives and Managers (accounting area)
content analysis
Maia (2009) (2) Multi-case Cross-sectional 13 interviews (3 firms)
Small and Medium Top executives content analysis
Muller & Beuren (2010) (2) Survey Cross-sectional 12 firms Large Managers (accounting area) descriptive
Nelson & Pimentel (2015) (2) Interviews Cross-sectional 17 interviews
Large Top executives discourse analysis
Nepomuceno & Dos Santos (2009) (2) Case study Cross-sectional NI Medium Top executives discourse analysis Oliveira, Álvares, Pinheiro, & Pimentel (2011)
(2) Case study Cross-sectional NI Large NI content analysis
Oliveira, Albuquerque, & Pereira (2012)
(2) Case study Cross-sectional 8 interviews Large Top executives content analysis
Teixeira, Toso, & Grzybovski. (2009)
(2) Interviews Cross-sectional 11 industries
Small Top executives discourse analysis
Theodoro & Beuren (2010) (2) Survey Cross-sectional 13 firms Small, medium and large
NI descriptive
Pinto & Leal (2013) (3) Archival Cross-sectional 315 firms Large - descriptive and multiple regression
Machado, Grzybovski, Teixeira & da Silva (2013)
(3) Case study Cross-sectional 5 interviews Small Top executives and Managers content analysis

228
Appendix 2. Overview of publication Topics (Id) and Methodology description – Part II
Paper Id Methodology and
data collection Time-frame Sample size Firm size Informants Analytical approach
Barcia & Grzybovski (2008)
(6) Bibliographic - - - - -
Eccel, Cavedon, & Craide. (2007)
(6) Case study Longitudinal NI Small NI ethnographic
Filardi, Freitas, Pinto, Silveira (2012)
(6) Case study Cross-sectional 7 interviews Medium Top executives content analysis
Jacinto & Vieira. (2008) (6) Case study Cross-sectional 10 interviews Medium Top executives, managers and employees
content analysis
Lissoni, Pereira, Almeida, & Serra (2010)
(6) Case study Longitudinal 9 interviews Large Top executives analytic description
Peixoto & Buttini (2013) (6) Archival Longitudinal 246 firms Large - descriptive and panel data
Tomei & Riche (2016) (6) Mixed methods Cross-sectional 28 respondents (16 from firm A and 12 from B)
Small Top executives and employees
descriptive and content analysis
Mizumoto & Machado Filho (2007)
(2) & (3) Case study - NI Large Top executives/consultants content analysis
Kalm & Gomez-Mejia (2016)
(4) & (7) Theoretical - - - - -
Nóbrega e Hoffmann (2014)
(6) & (9) Case study Cross-sectional NI Small Top executives and employees
NI
Fontes Filho, Ventura, & Oliveira (2008)
(7) Interviews Cross-sectional 4 credit cooperatives - Top executives NI
Beuren & dos Santos (2012)
(8) Survey Cross-sectional 26 respondents Large Managers (accounting area) descriptive and correlation
Beuren, Amaro, & da Silva (2015)
(8) Survey Cross-sectional 63 respondents Large Managers (accounting area) descriptive and structural equation modeling
Beuren, Barros, & Dal Vesco (2016)
(8) Survey Cross-sectional 47 managers (1 firm) Large Managers (accounting area) descriptive and structural equation modeling
Beuren, Klein, Lara, & de Almeida (2016)
(8) Survey Cross-sectional 67 respondents Large Managers (accounting area) descriptive and structural equation modeling
Beuren, Kreuzberg, & Franz (2016)
(8) Survey Cross-sectional 119 employees (1 firm) Large Employees descriptive and structural equation modeling
dos Santos, Beuren, & Hein (2015)
(8) Survey Cross-sectional 26 respondents Large Managers (accounting area) descriptive and correlation
dos Santos, de Oliveira, & Konopka (2016)
(8) Survey Cross-sectional 82 respondents (22 accounting offices)
Small Managers (accounting area) descriptive, correlation and multiple regression

229
Appendix 3. First Letter (Portuguese)
ASSUNTO: Pesquisa Acadêmica FEA-USP - Mecanismos de gestão nas empresas brasileiras controladas por famílias
Caro(a) Sr.(a) Bom dia!
Meu nome é Daniel Magalhães Mucci, aluno de doutorado em Controladoria e Contabilidade na Universidade de São Paulo. Participo da realização de pesquisas na área de contabilidade e controle gerencial, mais especificamente, discuto o efeito de mecanismos de gestão nas empresas controladas por famílias e sua influência sobre as percepções dos gestores. O Professor Fabio Frezatti (USP - Brasil) e a Professora Ann Jorissen (UAntwerpen - Bélgica) são os orientadores dessa pesquisa de doutorado.
Convido o(a) Sr.(a) a participar dessa pesquisa, cujas discussões o permitirão refletir sobre diferentes aspectos do seu trabalho e que deverá proporcionar importantes conhecimentos sobre como os sistemas de controle gerencial impactam a percepção dos gestores nas empresas. Os resultados deste estudo podem ajudar as organizações a melhorar seus sistemas de gestão, o que será benéfico para os gestores e também para a organização. O tema abordado pela pesquisa é inédito no Brasil e presente em pesquisas desenvolvidas recentemente na Europa.
A população de empresas do estudo é formada por empresas de médio e grande porte, que apresentam a característica de serem controladas por grupos familiares, independentemente do nível de profissionalização, e se a família atua ou não na gestão do dia-a-dia do negócio. Os respondentes indicados são profissionais que ocupam cargos de gestão na empresa, podendo ser da família controladora ou não. As respostas individuais serão direcionadas ao nosso banco de dados e os dados serão tratados de modo agregado.
Como agradecimento, vamos lhe enviar um sumário executivo dos resultados do nosso estudo, adicionado a um relatório individual através do qual vai ser possível comparar a sua organização com as outras empresas da amostra. Por isso, pedimos para deixar o seu e-mail ao final da pesquisa.
Sua participação neste estudo é voluntária e todas as suas respostas serão mantidas em sigilo. A pesquisa deve levar entre 10 e 15 minutos para ser concluída. Pela metodologia só podemos considerar para análise os questionários completos.
Caso aceite participar, por favor, clique no link abaixo "Iniciar questionário" para acessar o site da pesquisa.
Caso esteja interessado(a) nas nossas pesquisas anteriores, acesse o site do nosso Laboratório de Pesquisas sobre Práticas Gerenciais da FEA/USP (www.lppgfea.com). Lá vai encontrar relatórios de pesquisas e links para alguns dos nossos trabalhos acadêmicos publicados.
Sou muito grato pelo seu tempo. Somente com a sua ajuda é que seremos capazes de entender melhor esse segmento tão importante e pouco pesquisado no Brasil. Como consequência poderemos fornecer às organizações sugestões importantes sobre a forma como os seus processos de gestão são desenvolvidos.
Mais uma vez, muito obrigado!

230
APPENDIX – Section 5 Appendix 4. Measurement model evaluation for subsamples of family and nonfamily managers
First-Order Latent Variable Correlations for nonfamily managers subsample (n=99)
GS_form
GS_part
GS_pj
PE_form
PE_part
PE_pj
STEW_cult
STEW_iden
GS_form 0.868 GS_part 0.548 0.877 GS_pj 0.637 0.639 0.955 PE_form 0.433 0.346 0.482 0.943 PE_part 0.458 0.535 0.571 0.642 0.932 PE_pj 0.517 0.448 0.585 0.765 0.768 0.965 STEW_cult 0.647 0.603 0.668 0.514 0.589 0.608 0.873 STEW_iden 0.583 0.660 0.670 0.488 0.678 0.561 0.789 0.931
CR 0.902 0.930 0.977 0.941 0.929 0.964 0.928 0.951 AVE 0.754 0.769 0.912 0.889 0.868 0.931 0.763 0.867
Cross loadings between the items and the constructs for nonfamily managers subsample (n=99)
GS_form GS_part GS_pj PE_form PE_part PE_pj STEW_cult STEW_iden MLMV GSform_1 0.851 0.429 0.514 0.383 0.421 0.468 0.553 0.480 0.259
GSform_2 0.892 0.505 0.516 0.308 0.389 0.425 0.518 0.531 0.292
GSform_4 0.861 0.492 0.622 0.431 0.386 0.454 0.608 0.507 0.312
GSpartic_1 0.412 0.861 0.490 0.336 0.480 0.390 0.470 0.594 0.265
GSpartic_2 0.497 0.909 0.536 0.316 0.438 0.400 0.502 0.521 0.307
GSpartic_3 0.503 0.916 0.588 0.307 0.500 0.384 0.564 0.602 0.319
GSpartic_4 0.502 0.818 0.612 0.257 0.453 0.395 0.565 0.589 0.317
GSpj_1 0.564 0.607 0.936 0.426 0.541 0.504 0.604 0.624 0.478
GSpj_2 0.655 0.611 0.959 0.487 0.541 0.582 0.670 0.638 0.496
GSpj_3 0.590 0.640 0.969 0.444 0.556 0.561 0.630 0.658 0.489
GSpj_4 0.623 0.584 0.957 0.485 0.543 0.584 0.647 0.639 0.436
PEform_1 0.442 0.341 0.490 0.952 0.612 0.758 0.539 0.500 0.419
PEform_2 0.370 0.309 0.414 0.934 0.600 0.680 0.423 0.414 0.332
PEpart_1 0.383 0.440 0.508 0.544 0.923 0.689 0.482 0.603 0.252
PEpart_2 0.467 0.551 0.553 0.647 0.940 0.740 0.608 0.658 0.344
PEpj_1 0.498 0.467 0.563 0.730 0.746 0.963 0.553 0.528 0.362
PEpj_2 0.500 0.399 0.566 0.746 0.736 0.966 0.618 0.553 0.392
STEWcult_1 0.458 0.508 0.580 0.458 0.518 0.555 0.871 0.672 0.330
STEWcult_2 0.597 0.488 0.596 0.501 0.522 0.564 0.888 0.657 0.341
STEWcult_3 0.640 0.565 0.558 0.487 0.579 0.576 0.873 0.748 0.326
STEWcult_4 0.553 0.543 0.603 0.342 0.431 0.420 0.860 0.674 0.280
STEWident_1 0.562 0.599 0.637 0.465 0.624 0.526 0.783 0.940 0.397
STEWident_2 0.523 0.644 0.554 0.354 0.637 0.502 0.666 0.918 0.384
STEWident_3 0.545 0.602 0.678 0.541 0.633 0.538 0.754 0.934 0.366
MLMV_1 0.151 0.123 0.233 -0.049 0.049 0.095 0.105 0.145 0.357
MLMV_2 0.287 0.281 0.332 0.356 0.259 0.348 0.278 0.347 0.777
MLMV_3 -0.167 -0.185 -0.326 -0.271 -0.245 -0.179 -0.236 -0.206 -0.573
MLMV_4 0.097 0.140 0.197 0.110 0.030 0.182 0.127 0.163 0.402

231
First-Order Latent Variable Correlations for family managers and founder (n=53)
GS_form
GS_part
GS_pj
PE_form
PE_part
PE_pj
STEW_cult
STEW_iden
GS_form 0.820
GS_part 0.459 0.820
GS_pj 0.397 0.571 0.920
PE_form 0.342 0.529 0.404 0.941
PE_part 0.349 0.409 0.437 0.662 0.948
PE_pj 0.531 0.610 0.573 0.631 0.621 0.976
STEW_cult 0.499 0.674 0.671 0.518 0.538 0.578 0.850
STEW_iden 0.342 0.504 0.763 0.172 0.239 0.453 0.687 0.908
CR 0.859 0.890 0.957 0.939 0.946 0.976 0.912 0.934
AVE 0.672 0.673 0.847 0.885 0.898 0.952 0.722 0.825
Cross loadings between the items and the constructs for family managers and founder
subsample (n=53)
GS_form GS_part GS_pj PE_form PE_part PE_pj STEW_cult STEW_iden MLMV GSform_1 0.848 0.340 0.424 0.151 0.267 0.382 0.445 0.436 0.388 GSform_2 0.873 0.384 0.239 0.319 0.215 0.405 0.395 0.196 0.268
GSform_4 0.732 0.432 0.265 0.452 0.399 0.564 0.372 0.125 0.163
GSpartic_1 0.345 0.899 0.451 0.439 0.369 0.572 0.548 0.445 0.252 GSpartic_2 0.384 0.647 0.144 0.349 0.237 0.327 0.273 0.052 0.066 GSpartic_3 0.366 0.868 0.453 0.436 0.362 0.492 0.609 0.421 0.245
GSpartic_4 0.444 0.843 0.629 0.492 0.345 0.545 0.640 0.522 0.262
GSpj_1 0.288 0.540 0.901 0.331 0.328 0.482 0.670 0.732 0.383 GSpj_2 0.423 0.449 0.904 0.350 0.378 0.516 0.523 0.648 0.495 GSpj_3 0.345 0.613 0.949 0.352 0.424 0.510 0.623 0.704 0.407
GSpj_4 0.413 0.492 0.927 0.451 0.476 0.598 0.643 0.718 0.568
PEform_1 0.291 0.520 0.378 0.946 0.563 0.621 0.499 0.188 0.265
PEform_2 0.355 0.473 0.383 0.935 0.688 0.563 0.475 0.133 0.291
PEpart_1 0.333 0.447 0.425 0.735 0.950 0.645 0.510 0.152 0.338
PEpart_2 0.329 0.325 0.402 0.514 0.945 0.528 0.509 0.304 0.354
PEpj_1 0.487 0.549 0.536 0.613 0.564 0.974 0.529 0.398 0.425
PEpj_2 0.547 0.637 0.580 0.618 0.643 0.978 0.595 0.482 0.396
STEWcult_1 0.456 0.534 0.544 0.551 0.524 0.522 0.819 0.542 0.419 STEWcult_2 0.519 0.662 0.567 0.455 0.484 0.525 0.869 0.557 0.559 STEWcult_3 0.221 0.564 0.578 0.436 0.453 0.458 0.880 0.615 0.456
STEWcult_4 0.487 0.515 0.595 0.307 0.357 0.451 0.830 0.632 0.331
STEWident_1 0.343 0.386 0.634 0.132 0.218 0.416 0.588 0.899 0.500 STEWident_2 0.351 0.594 0.700 0.262 0.285 0.460 0.707 0.907 0.431
STEWident_3 0.244 0.392 0.739 0.076 0.152 0.362 0.577 0.919 0.425
MLMV_1 0.164 -0.052 0.111 -0.133 -0.095 -0.042 -0.022 0.007 0.031 MLMV_2 0.283 0.234 0.445 0.383 0.379 0.463 0.445 0.410 0.899 MLMV_3 -0.187 -0.150 -0.185 0.117 -0.045 0.014 -0.266 -0.271 -0.380 MLMV_4 0.202 0.005 0.068 0.056 0.004 0.161 0.054 0.135 0.207

232
First-Order Latent Variable Correlations for family managers subsample (n=36)
GS_form
GS_part
GS_pj
PE_form
PE_part
PE_pj
STEW_cult
STEW_iden
GS_form 0.822
GS_part 0.396 0.823
GS_pj 0.523 0.639 0.917
PE_form 0.289 0.507 0.511 0.955
PE_part 0.357 0.349 0.521 0.651 0.950
PE_pj 0.590 0.595 0.639 0.645 0.575 0.979
STEW_cult 0.445 0.589 0.820 0.531 0.534 0.572 0.829
STEW_iden 0.381 0.496 0.788 0.195 0.243 0.458 0.737 0.932
CR 0.861 0.892 0.955 0.954 0.949 0.979 0.898 0.952
AVE 0.675 0.677 0.840 0.911 0.903 0.959 0.688 0.868
Cross loadings between the items and the constructs for family managers subsample (n=36)
GS_form GS_part GS_pj PE_form PE_part PE_pj STEW_cult STEW_iden MLMV GSform_1 0.857 0.245 0.532 0.078 0.273 0.423 0.426 0.488 0.530 GSform_2 0.869 0.352 0.316 0.296 0.246 0.472 0.309 0.196 0.327
GSform_4 0.731 0.438 0.376 0.448 0.376 0.607 0.327 0.141 0.170
GSpartic_1 0.291 0.922 0.491 0.499 0.359 0.575 0.448 0.400 0.201 GSpartic_2 0.332 0.678 0.219 0.341 0.129 0.314 0.142 0.079 0.012 GSpartic_3 0.261 0.852 0.499 0.339 0.269 0.440 0.541 0.423 0.211
GSpartic_4 0.426 0.820 0.688 0.468 0.309 0.544 0.586 0.513 0.210
GSpj_1 0.405 0.604 0.882 0.417 0.384 0.529 0.820 0.763 0.341 GSpj_2 0.540 0.505 0.896 0.449 0.471 0.590 0.661 0.670 0.521 GSpj_3 0.461 0.688 0.952 0.416 0.507 0.575 0.738 0.725 0.403
GSpj_4 0.517 0.538 0.935 0.588 0.548 0.649 0.777 0.727 0.580
PEform_1 0.204 0.488 0.488 0.956 0.512 0.618 0.514 0.220 0.347
PEform_2 0.350 0.479 0.487 0.953 0.734 0.614 0.500 0.152 0.425
PEpart_1 0.326 0.417 0.507 0.740 0.953 0.605 0.512 0.160 0.336
PEpart_2 0.353 0.241 0.482 0.489 0.947 0.483 0.501 0.306 0.349
PEpj_1 0.556 0.532 0.559 0.635 0.511 0.976 0.518 0.385 0.348
PEpj_2 0.596 0.627 0.685 0.629 0.609 0.982 0.598 0.504 0.367
STEWcult_1 0.388 0.420 0.705 0.570 0.551 0.556 0.786 0.569 0.442 STEWcult_2 0.502 0.629 0.670 0.460 0.466 0.487 0.842 0.588 0.516 STEWcult_3 0.120 0.447 0.662 0.450 0.406 0.402 0.860 0.633 0.430
STEWcult_4 0.462 0.448 0.679 0.260 0.332 0.444 0.828 0.661 0.356
STEWident_1 0.430 0.368 0.674 0.196 0.256 0.484 0.642 0.924 0.539 STEWident_2 0.351 0.564 0.771 0.250 0.249 0.430 0.709 0.918 0.423
STEWident_3 0.294 0.448 0.754 0.107 0.180 0.374 0.707 0.952 0.486
MLMV_1 0.203 -0.173 -0.025 -0.231 -0.184 -0.110 -0.126 -0.047 -0.154 MLMV_2 0.394 0.232 0.443 0.497 0.394 0.447 0.479 0.381 0.897 MLMV_3 -0.220 -0.027 -0.205 0.139 0.020 0.090 -0.197 -0.390 -0.403 MLMV_4 0.233 0.022 0.058 -0.070 -0.065 0.202 0.069 0.224 0.273

233
APPENDIX – Section 6
Appendix 5. Sample versus industry information
Part I
Activity Sample Industry
n TOp Rev
Tassets
ROA ROE ROS n TOp Rev
Tassets ROA_ median
ROE_ median
ROS_ median
Animal Slaughtering and Processing (3116) 1 928 706 -0.8 -1.8 -0.6 19 283 267 1.86 6.64 0.61 Apparel Manufacturing (315) 1 593 907 5.2 7.1 7.9 16 289 221 0.56 0.65 0.32 Biomass Electric Power Generation (221117) 1 2423 7385 2.6 7.3 8.3 5 2306 5293 -1.50 10.57 -1.39 Broadcasting (except Internet) (515) 1 1012 836 0.8 2.2 0.7 1 1012 836 0.80 2.17 0.66 Building Material and Garden Equipment and Supplies Dealers (444)
1 2434 2341 3.2 6.1 3.1 17 392 467 -4.55 -6.87 -4.67
Business Support Services (5614) 1 452 295 -0.2 -0.7 -0.1 4 165 128 0.75 4.13 0.77
Chemical Manufacturing (325) 1 366 593 7.1 21.1 11.6 122
509 679 5.99 10.34 5.61
Fabricated Metal Product Manufacturing (332) 1 458 569 7.8 20.9 9.7 66 98 90 1.75 4.78 1.99 Flour Milling and Malt Manufacturing (31121) 3 331 315 7.5 32.8 7.2 14 155 360 4.70 8.04 2.35
Food Manufacturing (311) 4 638 400 15.8 28.0 9.2 115
835 468 4.82 13.71 3.75
Footwear Manufacturing (3162) 1 228 172 -6.1 -15.3 -4.6 10 641 322 5.17 14.89 7.36 Furniture and Home Furnishings Stores (442) 2 648 558 5.6 8.8 4.9 11 387 296 3.30 10.42 1.93 Furniture and Related Product Manufacturing (337) 1 231 371 -4.5 -10.4 -7.2 20 41 39 0.57 1.35 0.78 General Merchandise Stores (452) 1 325 179 13.5 17.9 7.4 11 383 348 8.47 5.59 2.74 Grain and Oilseed Milling (3112) 1 211 60 17.6 42.9 5.0 8 920 2168 5.89 9.20 3.18 Grocery and Related Product Merchant Wholesalers (4224) 1 1997 1015 17.2 24.6 8.7 48 360 352 5.57 14.95 2.82 Grocery Stores (4451) 1 314 132 13.0 19.9 5.5 7 633 2073 8.10 19.94 2.10 Management of Companies and Enterprises (55) 1 2 14 6.4 9.3 37.6 44 1106 1802 4.74 9.46 7.55 Management of Companies and Enterprises (551) 1 366 628 0.9 2.1 1.5 44 1106 1802 3.32 6.65 2.83
Merchant Wholesalers, Durable Goods (421) 1 365 503 6.5 7.4 8.9 138
268 223 2.35 6.24 1.28
Merchant Wholesalers, Nondurable Goods (422) 2 371 255 8.1 12.7 6.1 80 379 290 4.37 13.66 3.38 Note. TOpRev and Tassets are in million BRL and ROA, ROE and ROS are in percent. The sample values are the average, when there is more than 1 firm.

234
Part II
Activity Sample Industry
n TOp Rev
Tassets
ROA ROE ROS n TOp Rev
Tassets ROA_ median
ROE_ median
ROS_ median
Miscellaneous Manufacturing (339) 1 114 171 1.6 2.9 2.5 45 1447 775 4.21 6.88 3.62 Motor Vehicle and Motor Vehicle Parts and Supplies Merchant Wholesalers (4211)
1 95 52 -0.3 -0.5 -0.2 42 881 461 0.05 0.67 0.02
Motor Vehicle and Parts Dealers (441) 2 207 136 1.0 1.8 0.4 41 112 135 -0.61 -1.14 -0.32 Motor Vehicle Parts Manufacturing (3363) 1 431 136 -0.2 -0.5 -0.1 33 65 72 -0.22 0.11 -0.19 Navigational, Measuring, Electromedical, and Control Instruments Manufacturing (33451)
1 302 731 5.0 7.6 12.1 7 49 48 -2.35 7.55 -2.87
Newspaper, Periodical, Book, and Directory Publishers (5111)
2 500 503 -12.5 -143.6 -10.7 7 4863 2066 -11.48 -23.49 -9.56
Nonmetallic Mineral Mining and Quarrying (2123) 1 133 760 0.2 0.2 1.0 2 15 20 13.37 14.14 29.91 Other Food Manufacturing (3119) 2 2195 1922 5.5 12.6 3.9 30 268 258 4.91 9.64 2.76 Paper Manufacturing (322) 1 353 505 -0.7 -2.6 -1.0 83 196 397 1.07 4.63 1.77 Pharmaceutical and Medicine Manufacturing (3254) 2 1966 1604 11.0 25.2 9.2 37 607 603 6.68 15.16 7.84 Primary Metal Manufacturing (331) 1 686 754 2.0 4.5 2.2 23 347 436 -0.41 0.34 -0.37 Printing and Related Support Activities (323) 1 460 220 71.3 187.0 34.1 14 2373 985 1.97 5.56 2.15 Professional, Scientific, and Technical Services (541) 2 248 521 -1.6 -7.0 -4.0 81 211 410 -0.56 -4.70 -0.52 Publishing Industries (except Internet) (511) 1 86 94 3.8 18.5 4.1 1 32312 12733 3.79 18.47 4.12 Real Estate (531) 1 420 350 5.9 10.6 4.9 16 37 50 -0.13 5.00 -4.67 Repair and Maintenance (811) 1 280 263 -9.0 -28.3 -8.5 43 95 95 1.17 3.83 0.69 Soap, Cleaning Compound, and Toilet Preparation Manufacturing (3256)
2 249 287 8.2 11.5 8.5 18 106 126 2.74 6.68 4.46
Soft Drink and Ice Manufacturing (31211) 1 678 357 14.2 25.8 7.5 16 588 557 5.21 6.94 3.93 Sugar and Confectionery Product Manufacturing (3113) 1 76 357 0.6 2.6 2.9 25 946 558 1.33 19.98 3.25 Sugarcane Farming (11193) 1 524 1996 6.3 16.0 24.1 30 335 621 3.12 5.93 8.81 Textile Mills (313) 2 367 433 -13.0 -90.8 -13.3 51 44 61 0.32 2.74 0.25 Textile Product Mills (314) 1 237 254 7.8 12.7 8.3 8 380 387 4.69 8.04 3.14 Transit and Ground Passenger Transportation (485) 1 272 585 3.2 4.9 6.9 1 237 254 3.21 4.94 6.91 Water Transportation (483) 1 79 133 8.3 12.0 14.1 1 17244 30219 8.32 12.00 14.10
Note. TOpRev and Tassets are in million BRL and ROA, ROE and ROS are in percent. The sample values are the average, when there is more than 1 firm.