UNIVERSITY OF NOVA GORICA FACULTY FOR ENVIRONMENTAL ...
50
UNIVERSITY OF NOVA GORICA FACULTY FOR ENVIRONMENTAL SCIENCE SOIL MONITORING IN VICINITY OF INDUSTRIAL ZONES: CASE STUDY IN ROMANIA DIPLOMA THESIS Alenka BLATNIK Mentors: prof. dr. Camelia Draghici doc.dr. Gregor Muri Nova Gorica, 2012
-
Upload
khangminh22 -
Category
Documents
-
view
3 -
download
0
Transcript of UNIVERSITY OF NOVA GORICA FACULTY FOR ENVIRONMENTAL ...

UNIVERSITY OF NOVA GORICA FACULTY FOR ENVIRONMENTAL SCIENCE
SOIL MONITORING IN VICINITY OF INDUSTRIAL ZONES: CASE STUDY IN ROMANIA
DIPLOMA THESIS
Alenka BLATNIK
Mentors: prof. dr. Camelia Draghici doc.dr. Gregor Muri
Nova Gorica, 2012

,

I
STATEMENT I am stating, that this diploma thesis is a result of my own research work. Results, which occured in it as a part of common research with others, or other researches (experts) contributed them, are showen explicitily and/or listed (quoted) in thesis. Alenka Blatnik
II
ACKNOWLEDGEMENT I wish to thank mostly my mentor prof. dr. Camelia Draghici, who despite her busy shedule always found time to help me, guide me and advise me. I also want to thank my other mentor doc. dr. Gregor Muri, who was also there for me, helping me out the best way he could. I wish to thank all workers at the APM Brasov agency who were there working with me, helping me and guiding me through the whole procedure, so I could also learn how to do it by myself. They were always nice and there to help me if I needed it. They are: Magdalena Gibicz, Mihaela Antonescu, Ioana Benga, Maria Rat, Bianca Cismas and Ionut Chirita. I specialy wish to thank to the faculties’ secretary Marina Artico. Through all the years of my studies she helped me a lot and made my studying much easier. In the end, I wish to thank all other persons who were there for me, helping me and supporting me on my path, wheather they know it or not!

III
ABSTRACT Some Romanian regions, mostly depend on industrial and agricultural production. Most agricultural areas are near industries, where many polluted sites can occure. If industrial emissions are not properly controlled, the quantity of hazardous substances in soil in the vicinity of industries may quickly exceed accepted limit values. Therefore, we decided to do a research of such areas. The areas which soil we have examned, are: Hoghiz, Fagaras and Victoria; for background information we took samples from Valea Bogatii (forest ground). For research we used monitoring technique, which included soil sampling in different areas, laboratory analysis and data processing. The parameters of interest for our study were pH, electrical conductivity and heavy metals (copper, chromium, lead, nickel and zinc). pH and electrical conductivity were analysed electrometrically pH-meters and for analyses of heavy metals we used Flame Atomic Absorption Spectrometer (FAAS). Based on the results that we gathered, we can conclude that the researched areas in vicinity of studied industrial zones are adequate for agricultural use, since none of the heavy metals are exceeding limit values, and pH and electrical conductiviy have acceptable concentrations. Key words: soil quality, industry, monitoring, laboratory work, data analys POVZETEK Nekatere romunske regije so večinoma odvisne od kmetijske in industrijske proizvodnje. Večina kmetijskih površin se nahaja v bližini industrij, kjer lahko pride do onesnaženja. Če emisije iz industrije niso pravilno nadzorovane, lahko količina nevarnih substanc v tleh v okolici industrij zelo hitro presega sprejemljive mejne vrednosti. Zato smo se odločili, da bomo raziskali takšne vrste področij. Regije, v katerih smo raziskovali tla, so: Hoghiz, Fagaras in Victoria; za stanje ozadja smo jemali vzorce iz Valea Bogatii (gozdna tla). Za raziskavo smo uporabili monitoring, ki zajema vzorčevanje na različnih lokacijah, laboratorijsko delo in analizo podatkov. Parametri, ki smo jih merili, so: pH, električna prevodnost in težke kovine (baker, krom, svinec, nikelj in cink). pH in električno prevodnost smo analizirali elektrometrično. Za analizo težkih kovin pa smo uporabili Plamenski Atomski Absorpcijski Spektrometer (FAAS). Na osnovi končnih rezultatatov, ki smo jih dobili, lahko zaključimo, da je raziskovano področje v okolici industrijskih con primerno za kmetijsko uporabo, glede na to, da nobena težka kovina ne presega mejnih vrednosti ter pH in električna prevodnost dosegajo sprejemljive vrednosti. Ključne besede: kvaliteta tal, industrija, monitoring, laboratorijsko delo, analiza podatkov

IV
TABLE OF CONTENTS
1. INTRODUCTION ....................................................................................... 1
2. THEORETICAL ASPECTS ....................................................................... 2
2.1. International and national monitoring systems ............................................ 2
2.2. Specific legislation for soil monitoring .......................................................... 2 2.2.1. European legislation for soil monitoring .......................................................................... 3 2.2.2. Slovenian legislation for soil monitoring.......................................................................... 3 2.2.3. Romanian legislation for soil monitoring ......................................................................... 4
2.3. Parameters for soil quality monitoring ......................................................... 6 2.3.1. Hydrogen potential of the soil ......................................................................................... 6 2.3.2. Soil electrical conductivity ............................................................................................... 6 2.3.3. Heavy metals in soil and their toxicity ............................................................................. 7
2.3.3.1. Chromium in soil and its’ toxicity ................................................................................ 7 2.3.3.2. Copper in soil and its’ toxicity ..................................................................................... 8 2.3.3.3. Lead in soil and its’ toxicity ......................................................................................... 8 2.3.3.4. Nickel in soil and its’ toxicity ....................................................................................... 9 2.3.3.5. Zinc in soil and its’ toxicity ........................................................................................ 10
2.4. Standards for sampling and analytical methods for soil quality parameters determination ........................................................................................... 10
3. EXPERIMENTAL PART .......................................................................... 12
3.1. Soil quality monitoring program in Fagaras, Hoghiz and Victoria areas from Romania .................................................................................................... 12
3.1.1. Valea Bogatii reference sampling area .......................................................................... 13 3.1.2. Fagaras industrial area ................................................................................................... 13 3.1.3. Hoghiz industrial area .................................................................................................... 15 3.1.4. Victoria industrial area ................................................................................................... 16
3.2. Equipment and reagents ............................................................................ 19 3.2.1. Equipment and procedure for sampling ........................................................................ 20 3.2.2. Equipment and procedure for sample preparation ....................................................... 21 3.2.3. Equipment and procedure for soil quality parameters’ determination ........................ 21
3.2.3.1. Analytical balance METTLER TOLEDO Models ML .................................................... 22 3.2.3.2. pH-meter MP225 General Purpose GLP pH/mV/°C Meter ....................................... 22 3.2.3.3. MC226 Basic Conductivity / °C Meter ....................................................................... 23 3.2.3.4. Speedwave MWS-3
+ microwave system ................................................................... 24
3.2.3.5. Flame Atomic Absorption Spectrometry................................................................... 25 3.2.4. Determination of the hydrogen potential of the soil..................................................... 26 3.2.5. Determination of the soil electrical conductivity ........................................................... 26 3.2.6. Determination of the heavy metals in soil ..................................................................... 27
4. RESULTS .................................................................................................... 30
4.1. Hydrogen potential of the monitored soils ................................................. 30
4.2. Electrical conductivity (EC) of the monitored soils....................................... 31
4.3. Copper (Cu2+) of the monitored soils .......................................................... 32
4.4. Chromium (Cr) of the monitored soils ........................................................ 31

V
4.5. Lead (Pb2+) of the monitored soils .............................................................. 32
4.6. Nickel (Ni2+) of the monitored soils ............................................................. 34
4.7. Zinc (Zn2+) of the monitored soils ............................................................... 35
5. CONCLUSIONS ......................................................................................... 37
6. REFERENCES ........................................................................................... 38

VI
LIST OF TABLES
Table 1: Limit and critical imission values of substances in soil in Romania (Ordin nr.
756/1997) .......................................................................................................................... 5
Table 2: International/National standards in EU, Slovenia and Romania ..................... 11
Table 3: Minimum number of sampling points on a potentially polluted area (APM
Brasov, 2009) ................................................................................................................. 20
Table 4: Technical data for METTLER TOLEDO balances (METTLER TOLEDO
manual) ........................................................................................................................... 22
Table 5: Description of pressure vessel (BERGHOF Products & Instruments GmbH,
2005) ............................................................................................................................... 25
Table 6: Program 17 which includes 5 steps of operation (APM Brasov, 2009) .......... 28
Table 7: Conditions of the methods for measurements by FAAS (APM Brasov, 2009)
........................................................................................................................................ 29

VII
LIST OF FIGURES
Figure 1: Scale of hydrogen potential (pH)(Factorsaffecting, 2011) .............................. 6 Figure 2: Locations of sampling points (Google maps, 2012) ...................................... 13
Figure 3: sampling locations in Fagaras area (Google maps, 2012) ............................. 14 Figure 4: Sampling locations in Hoghiz area (Google maps, 2012) ............................. 16 Figure 5: Sampling point on the exit of Victoria village and entering Ucea beside
electric station (Ionut Chirita, 2011)............................................................................... 17 Figure 6: Sampling locations in Victoria area (Google maps, 2012) ............................ 17
Figure 7: View towards Purolite industry from sampling location (Ionut Chirita, 2011)
........................................................................................................................................ 18 Figure 8: Sampling location near Viromet industry (Ionut Chirita, 2011) .................... 19 Figure 9: Sampling with probe, wooden stick, plastic bag and gloves (Ionut Chirita,
2011) ............................................................................................................................... 21 Figure 10: METTLER TOLEDO balance (METTLER TOLEDO manual) ................. 22 Figure 11: General Purpose pH-meter model MP225 (Mettler Toledo, SKAFTE
MedLab) ......................................................................................................................... 23
Figure 12: pH-meter MC226 Basic Conductivity / °C Meter (Mettler Toledo, SKAFTE
MedLab) ......................................................................................................................... 23 Figure 13: Speedwave MWS-3
+ microwave system (Berghof) ..................................... 24
Figure 14: pH at all locations during the period of research, 0-20 cm of depth (APM
Brasov) .......................................................................................................................... 30 Figure 15: Electrical conductivity at all locations during the period of research, 0-20 cm
of depth (APM Brasov) ................................................................................................ 31 Figure 16: Chromium content at all locations during the period of research, 0-20 cm of
depth (APM Brasov) ................................................................................................... 322
Figure 17: Copper contents at all locations during the period of research, 0-20 cm of
depth (APM Brasov) ................................................................................................... 333
Figure 18: Lead content at all locations during the period of research, 0-20 cm of depth
(APM Brasov) ............................................................................................................. 344
Figure 19: Nickel content at all locations during the period of research, 0-20 cm of
depth (APM Brasov) ..................................................................................................... 35
Figure 20: Zinc content at all locations during the period of research, 0-20 cm of depth
(APM Brasov) ............................................................................................................... 36

1. INTRODUCTION Soil is the weathered and fragmented outer layer of the Earths' solid surface, initially formed from the original rocks and then transformed by growth and decay of plants and organisms. Soil can also move, carried by wind, water flow, and construction equipment. Moving soil, like moving water, transports the contaminants it carries (Wiener, 2000). It is essentially a non-renewable resource and a very dynamic system, which performs many functions and delivers services vital to human activities and ecosystems survival. Any damage to its structure also damages other environmental media and ecosystem. Soil is one of the fundamental systems for agricultural food production, life and the environment, and therefore its functions and quality must be maintained in a sustainable conditions. Soil degradation is driven or exacerbated by human activity such as inadequate agricultural and forestry practices, industrial activities, tourism, urban and industrial sprawl and construction works. Several countries have established soil protection policies which include legislation, guidance documents, monitoring systems, identification of risk areas, inventories, remediation programmes and funding mechanisms for contaminated sites for which no responsible party can be found. Such policies ensure a comparable level of soil protection to the approach endorsed by a strategy. The goal of this diploma thesis was to establish the quality of agricultural areas in vicinity of industrial zones. That goal was devised by Romanian goverment through APM Brasov agency for which I was working this research project. This project needs to be done as a part of obligations towards the European Union requirements. Agency needs to monitor soils quality in order to verify that the land is adequate for agricultural use. The researched areas also need to meet the adequate level of quality, based on the EU regulations. For the purpose of getting proper informaton, I studied different legislations and standards, which define what kind of procedure is the most appropriate and how to use it. In that case, I established that monitoring is the most appropriate method, and that evaluating hydrogen potential, electrical conductivity and heavy metals (copper, chromium, lead, nickel and zinc) in soil are appropriate parameters to have a good overview of the situation. Therefore I used the monitoring method which includes going onto field and taking samples from the areas, measuring parameters from samples, and analysing gained data. During the thesis I also compared Romanian information and procedure with their Slovenian and European equivalents. The hypotesis is that selected areas in vicinity of industries are contaminated and not adequate for agricultural use, since in the past, those industries were one of the biggest contaminators in the area.

2
2. THEORETICAL ASPECTS Theoretical information is necessary for any kind of work if we want the work to have a good quality. In every work theoretical aspects need to be researched, which in my case are information about monitoring. I discovered what monitoring actually is, if goverment has any kind of rules for monitoring and what they are (in my case legislations and standards), and some extra information about researched parameters.
2.1. International and national monitoring systems Monitoring is the regular observation and recording of activities taking place in a project or programme. It is a process of routinely gathering information on all aspects of the project. To monitor is to check on how project activities are progressing. It is an observation – systematic and purposeful observation (Bartle, 2007). Environment monitoring is a complex activity of achieving data about the environment quality, based on systematic measurements and on long term trend of different parameters and indicators, covering a specific area and period of time, in order to ensure the possibility of pollution control. National environmental monitoring is done in regime of national boundaries according to their legislations. Many countries have their own legislation, policies or guidelines to prevent or ameliorate soils degradation. Some countries have only one central government responsible for laws, whereas in others regional governments also have the power to make binding legislation on soil and environment. International environmental monitoring is carried at international level, which is characterized by contradictory context areas such as long run strategies versus short run expectations, social stability versus economic flexibility, competition versus cooperation, growing change dynamics versus uncertainty, work intensification versus staff reduction or innovative ability versus increasing cost pressure. Since I was using environmental monitoring method for my study, I found out that there are different legislations defining why and how to monitor site of interest. Slovenia and Romania are now part of European Union (EU), so they did take guidlines for legislations from EU, but they also established a few legislations of their own in order to adjust to their situation of soil characteristics.
2.2. Specific legislation for soil monitoring Legislation is law or other regulation which has been enacted by a legislative or other governing body (Parlament, Congress, State Legislature or City Council). Before an item of legislation becomes a law it may be known as a bill and may be broadly referred to as “legislation” while it remains under consideration to distinguish it from other business. Legislation can have many purposes: to regulate, to authorize, to proscribe, to provide (funds), to sanction, to grant, to declare or to restrict. European legislations provides a guidline for legislations for other countries that are part of EU. Since Slovenia and Romania are part of EU, I will first present EU legislation related to soil quality and monitoring, to explain why and how monitoring

3
should be used, and then I will explained about Slovenian and Romanian regulations which were used as a guidline not only in these countries by their institutions authorised for soil monitoring, but also in my diploma thesis.
2.2.1. European legislation for soil monitoring Many people are using sewage sludge in agriculture for better crop production, but it could have toxic heavy metals above accepted limits and therefore have toxic influence on plants and on man, through their presence in crops. To regulate the use of sewage sludge in such a way as to prevent harmful effects on soil, vegetation, animals and man, while encouraging its correct use and not to impair the quality of the soil and of agricultural products, the European Council established Directive 86/278/EEC designed to insure the proper use of sewage sludge by limiting its use, respectively by limiting the amount of heavy metals added to cultivated soil. This Directive was later amended with Directive 91/692/EC and EC Regulation 807/2003. Since I was using monitoring method, the European Environmental Agencies’ Proposal for European soil monitoring and assessment framework (Huber et al., 2001) was of great help for my study. It contains an initial list of policy-relevant indicators on soil quality to support soil protection policies across the environmental spectrum and outlines a minimum set of soil data that needs to be considered for monitoring at the European level in order to feed these indicators. Concidering that some areas are changing their use and some aren’t under monitoring control, environmental liability in those areas is questionable. That is why European Parlament and Council have adopted Directive 2004/35/CE, the purpose of which is to establish a framework of environmental liability based on the »polluter-pays« principle, to prevent and remediate environmental damages. In order to protect soil and established sustainable use of soil, action is required at different levels – local, national and European. For this resons, European parlament and Council established a Thematic strategy for soil protection [SEC(2006)620], [SEC(2006)1165]. Commission shall develop specific regimes and actions to ensure integration of soil protection and that the actions and initiatives taken from different sites are mutually supportive, consistent and complementary.
2.2.2. Slovenian legislation for soil monitoring Before Slovenia became part of EU, its goverment adopted a regulation: Regulations about operational monitoring at import of dangerous substances and floral nutrients into soil (Ur.l. RS, št. 55-2869/1997). Operational monitoring is conducted with following steps: taking samples of soil, sludge of wastewater treatment plant (WTP), compost or sludge; preparing the samples; measuring the parameters (basic and extra parameters); evaluating emissions and annual amounts of hazardous materials and floral nutrients; and presenting reports on performed measurements. Considering that the Republic of Slovenia is now part of EU, its legislations must be adopted according to EU legislation. Regulations about operational monitoring at import of dangerous substances and floral nutrients into soil (Ur.l. RS, št. 55-2869/1997) have been kept, and new regulations were also established in order to

4
achive the criteria emposed by EU policies. Some of those new regulations are : Regulation on the limit, warning and critical levels of dangerous substances into soil (Ur.l. RS, št. 68/1996); Regulation on limit values of the release of hazardous substances and fertilizers into soil (Ur.l. RS, št. 84/2005); Regulation on the criteria for assessing the likelihood of significant impacts of implementation of the plan, program, outline or other general act and its amendments on the environment in the process of a comprehensive environment impact assessment (Ur.l. RS, št. 9/2009); and Regulation of the content of the report on the impact of the planned activity on the environment and the mode of its preparation (Ur.l. RS, št. 36/2009).
2.2.3. Romanian legislation for soil monitoring My study was part of the APM Brasov monitoring program, where specific legislations defined by EU policies are also used. Those legislations are based on EU legislations and are established by the Romanian Government or by its Ministries. In order to regulate soil quality, Romanian Ministry of Waters, Forests and Environmental Protection established the Order (Ordin nr. 756/1997), which defines some concepts and sets out the thresholds of alert and action levels for pollutants in air, water and soil. These regulations on soil pollution are presented in Table 1.: - Imission of substances in soil is defined as a abundance of individual dangerous substance in soil and is expressed in milligrams or micrograms per kilogram of mass of dry soil (mg/kg, μg/kg); - Normal imission value is defined as a density of individual dangerous substance in soil, which has such burden on soil, that life circumstances are ensured for plants and animals, and because of which quality of ground water and soil fertility aren’t decreasing. At this level, the influences and impacts on human health are still acceptable; - Warning imission value is defined as a density of individual dangerous substance in soil, which in certain way of land use has likelihood of harmful influences and impacts on human health and environment; - Critical imission value is defined as a density of individual dangerous substance in soil, at which, because of harmful effects or influences on a person and environment, polluted soil isn’t appropriate for production of plants for human or animal nutrition, and for retention or filtering of water. - Sensitive land use is the use of land for residential and recreational purposes, agricultural areas as protected areas or sanitary restrictions regime and land areas provided for such future use; - Less sensitive land use includes all existing commercial and industrial uses and land areas provided for such future use; - Where there are uncertainties about the classification of land uses, considered concentrations of alert and intervention thresholds for sensitive land uses will be used.

5
Table 1: Limit and critical imission values of substances in soil in Romania (Ordin nr. 756/1997)
Limit and critical imission values of substances in soil in
Romania
Hazardous substance Normal value
(mg/kg dry soil)
Warning value (mg/kg dry soil)
Critical value (mg/kg dry soil)
Sensitive Less
sensitive Sensitive
Less sensitive
Cu and its compounds 20 100 250 200 500
Ni and its compounds 20 75 200 150 500
Pb and its compounds 20 50 250 100 1.000
Zn and its compounds 100 300 700 600 1.500
Cr and its compounds
Total 30 100 300 300 600
(VI) 1 4 10 10 20
In Table 1, the colomn I marked with bold gives the values that I used in my research. They represent the minimum amount of dangerous substances that could have harmfull influences on human health and environment. In year 2004, the Ministry of Agriculture issued Order (Ordin nr. 49/2004) of technical standards for environmental protection and especially the soil, when sewage sludge is used in agriculture. This Order is the transposition of the European Council Directive 86/278/EEC and it gives the adapted values of heavy metals’ content in sludge or soil, and also some limits for organic pollutants. In year 2005, new Orders were issued by Ministry of Environment and Water Management (Ordin nr. 242/2005), and Ministry of Agriculture, Forest and Rural development (Ordin nr. 197/2005) for the organisations’ national system of integrated soil monitoring, surveillance, control and decisions to reduce contribution of pollutants from agriculture sources and managing organic wastes from livestock in areas potentially vulnerable to nitrate pollution. In order to evaluate damage on soil and subsoil, the Goverment of Romania established the Decision (Hotărâre nr. 1408/2007), which regulates the procedure for investigation and assessment of soil and subsoil for environmental remediation and geological settings. I also used information from this Govermental Decision in order to clarify the nature and intensity of identified pollution. The Romanian Ministry of Water, Forests and Environmental Protection also established The Procedure for Environmental Audit in order to achieve environmental balance in the environment (Ordin nr. 184/1997). In our case we used Environmental Balance of level II, which is on a site investigation conducted in an environmental assessment to quantify the size of pollution by sampling and analysis of physical, chemical or biological factors. It also includes risk assessment, meaning the probability and severity analysis of main components of an environmental impact.

6
2.3. Parameters for soil quality monitoring The parameters I used in this study are hydrogen potential (pH), electrical conductivity (EC) and heavy metals (chromium, copper, lead, nickel and zinc). I chose these parameters in order to have a proper overview into quality of studied soils.
2.3.1. Hydrogen potential of the soil Hydrogen potential (pH) is the decimal logarithm of the reciprocal of hydrogen-ion activity, expressed in mol per litre (Pankratz, 2001). pH provides a measure of the acidity or alkalinity of a solution, on a scale from 0 to 14, where 7 is neutral, greater than 7 is more basic and less than 7 is more acidic (Figure 1). Decreasing pH values indicates increasing hydrogen ion concentration (acidity) while increasing pH values indicates decreasing hydrogen ion concentration (alkalinity) (Loconto, 2001). Figure 1 gives an example of different pH values of some usual products.
Neutralizing acids or bases is best controlled electrometrically with a pH-meter, which indicates the neutral point more precisely than any other method. The pH-meter is especially useful in colored solutions, where color indicator is of no use. The pH of soil in agriculture is important since plants grow better within a rather narrow pH range. The optimum pH varies with each type of plant. Plant nutrients form insoluble compounds if soils’ pH is too high. Toxic amounts of some metals become available if pH is too low. The pH of acid type of fertilizers is controlled in order to prevent waste of acid, and to insure a more uniform product.
2.3.2. Soil electrical conductivity Electrical conductivity (EC) is the ability of a material to transmit (conduct) an electrical current and is commonly expressed in units of MiliSiemens per meter (mS/m) or MicroSiemens per centimeter (μS/cm). A measurement correlates with soil properties that affect crop productivity, including soil texture, cation exchange capacity (CEC), drainage conditions, organic matter level, salinity and subsoil characteristics (Grisso et al., 2009). Electric conductors such as metal, have high conductivity, while insulators like glass or a vacuum have low conductivity. A semiconductor has a conductivity that varies widely under different conditions. The EC of soil varies depending on the amount of moisture held by soil particles. Sand has a low conductivity, silt has a medium conductivity and clay has a high conductivity. Consequently, EC strongly correlates to soil particle size, texture and composition (Grisso et al., 2009). In addition to EC values separating variations in soil texture, EC has been shown to relate closely to other soil properties used to determine a field’s productivity: water-
Figure 1: Scale of hydrogen potential (pH) of some usual products (Stevens, 2011)

7
holding capacity/drainage, cation exchange capacity, depth to claypan or rock outcropping, porosity, salinity and temperature.
2.3.3. Heavy metals in soil and their toxicity Heavy metals are chemical elements that are commonly found in environment and therefore we are daily exposed to them. Some of them, in trace concentration, are even essential for our existence and good health. They can damage the health of plants and animals at low concentrations and tend to accumulate in different tissues and bioacumulate in the food chain (Loconto, 2001). Heavy metals are toxic in their chemically combined forms and some, notably mercury, are toxic in the elemental form. In that case, human metabolism cannot digest or excrete them and so they accumulate in organs and tissues. They enter the human body through food, water, air or absorption through the skin. Most common route for adults is by industrial exposure (Ngan, 2005). A number of heavy metals are used or produced as a by-product in many agricultural, manufacturing and pharmaceutical processes. The most common route of exposure to heavy metals of children is through accidental ingestion (normal hand-to-mouth activity). E.g. when they are playing in contaminated soils or eat/chew on objects that are not food (e.g. bark chips, dirt or painted objects) (Ngan, 2005).
2.3.3.1. Chromium in soil and its’ toxicity Chromium (Cr) naturally can be found in rocks, animals, plants, volcanic dust and gases (Habeck, 2012). The pure metallic form rarely occurs in nature, it rather occurs in combination with other elements as chromium salts, some of which are soluble in water (Argonne National Laboratory, 2005). Chromium is abudant in earth's crust. Both Cr6+ and the more predominant Cr3+ form are readily found in nature. Chromate is the most important Cr-containing ore and is used for production of ferrochromium by direct reduction (Lippmann, 2000). Cr6+ is rapidly reduced to Cr3+ (is much less toxic then Cr6+) in soil, by reaction with organic matter or other reducing agents in soils. This reduction occurs more rapidly in acidic soils. These reactions reduce its presence in the soil solution and reduce plant uptake. Equilibrated Cr3+ in soils is essentially inert under the conditions of pH, chelaton and redox found in nearly all soil materials. If Cr3+ is only sparingly soluble in the soil solution, the oxidation reaction does not proceed. This inert nature is an important source of environmental protection against adverse effects of Cr3+ applied to soil by biosolids or other organic amendments (Epstein, 2003). Exposure to Cr occurs primarly within the industrial setting or from contact with industrial effluents released into the general environment. Symptoms of acute toxicity include allergic reactions and many internal human injuries like incidences of lung and different types of cancer. The toxicity and carcinogenicity of Cr are largely related to exposure to the metal in its hexavalent state (Lippmann, 2000). The most likely risk of occupational exposure is through inhalation of Cr-bearing aerosols. Although trivalent chromium Cr3+ is required in trace amounts for sugar and lipid metabolism, few cases have been reported where its complete removal from the diet has caused Cr deficiency.

8
2.3.3.2. Copper in soil and its’ toxicity
Copper (Cu2+
) naturally occurs in low concentrations as sulfides, oxides, and
carbonates.
Cu2+
ions are water–soluble, where they function at low concentration as bacteriostatic
substances, fungicides and wood preservatives. In sufficient amounts, they are poisonous to higher organisms; at lower concentrations it is an essential trace micronutrient to all higher plant and animal life. Cu has been used for decades as an algecide and fungicide. Bordeaux (a mixture of copper sulfate and lime) has been used as a spray in vineyards and vegetable crops. Copper has also been added as diet additive to swine and poultry and thus excreted in the manure. Cu is also often added to agricultural crops grown on sandy soils (Epstein, 2003). A low soil pH increases Cu solubility and availability to plants. Organic soils such as peats and mucks generally have low available Cu or the Cu is complexed, resulting in crop deficiencies. Industrial pollution also added Cu to soils. One of the biggest environmental pollutants is the dilution form of Cu in which it now occurs, for example, in the U.S. 150–175 tons of inert material (not counting overburden removed in strip mining) must be processed and discarded to produce a ton of Cu metal (Manahan, 2001). The second problem is the occurrence of Cu as the sulfide, so that in the production of Cu large amounts of sulfur must be recovered as a by-product or, unfortunately in some less developed countries, released into the atmosphere as pollutant SO2, contributing to the acidic rains. Toxic levels of Cu rarely occur naturaly in soils. However, Cu toxicity or defficiency may cause many problems to human body. Some of these are: hair loss, certain types of anaemia, stubborn weight problems, liver degeneration, arthritic symptoms, depression, gastric ulcers and cancer, thrush, fibroids, ovarian cysts, gall bladder and migraines.
2.3.3.3. Lead in soil and its toxicity
Major source of lead (Pb2+
) is galena, PbS. Somewhat more than half of the Pb
processed by humans comes from the geosphere, mostly as Pb mined for the metal, and with a very small fraction contained in coal that is burned (Manahan, 2001). Pb is considered to have a stable oxidation state (Pb2+) that furnishes a divalent ion. Pb2+ has a remarkable tendency to form well-characterized and often highly crystalline basic salts of both anhydrous and hydrated types, for example, white Pb, a pigment formerly of great commercial importance. Pb can also form salts with organic acids, which is the basis of certain chelating agents used in Pb treatment. Under certain physical, chemical and biological conditions, it is possible for a given metal to assume more than one form, which can permit new pathways of chemical reactivity. It is this same reactive potential that has made certain metals a toxic threat to the environment and to living systems that can concentrate them. Inorganic compounds of lead to which humans are likely to be exposed include the halides and oxides, the sulfate and sulfides, carbonate, and chromate.

9
Some of the Pb in soils is from natural geological sources whereas other soils have become polluted and contaminated with Pb from leaded gasoline, paints and emission sources. The past use of organic Pb additives to gasoline is the major source of Pb contamination of surface soils. Numerous studies have shown that it remains on or near the soil surface (lead solubility in soil decreases as the soil pH increases). Pb in surface soils stems primarily from the use of Pb additives to gasoline and atmospheric deposition from industrial sources (Epstein, 2003). The prime medium for Pb transport is air, because fine particulates, generated especially by antropogenic high-temperature sources, may travel long distance before settling out via wet, dry, or cold deposition. Pb has been widely distributed as metallic, inorganic compounds, and organo-metallic compounds. It has a number of toxic effects, including inhibition of the synthesis of hemoglobin where it causes blood disorders in mammals and is potent neurotoxin that accumulates both in soft tissues and the bones. There it adversely affects the central and peripheral nervous system, the kidney and causes brain disorders.
2.3.3.4. Nickel in soil and its toxicity
Nickel (Ni2+
) is widely distributed in nature, constituting about 0.008 % of the earths’
crust and 8.5 % of the earth's core. The most abundant ores are the oxides and sulfides of Ni; these minerals also contain other metals such as Co, Cu, Au, Hg and Pt. A natural source of atmospheric Ni are windblown dusts containing particles from the natural weathering of rocks and soils, and from volcanic emissions; high levels of Ni are readily found in ingenous rocks. High concentrations (200 ng/g Ni) have been measured in water from areas within the vicinity of active mining. A wide range of Ni concentrations has been found in soils depending on the overall mineral content of the top soil (Lippmann, 2000). The chemical composition of the ores dictates their respective smelting and refining process, although a widely used procedure involves either roasting to form the oxide (NiO) or conversion to volatile nickel carbonyl (Ni(CO)4), which produces Ni metal by reduction (Lippmann, 2000). Soil can be contaminated with nickel from superphosphate, automobile exhausts, industrial smokestacks, smelting and biosolids (Epstein, 2003). Release of Ni particles into the atmosphere is mainly as a pollutant from industrial processes and through the combustion of fossil fuels. Exposure to Ni is primarily in the industrial setting involved with refining of Ni ores and processing of the metal into Ni alloys. The release of Ni into air may also occur as a result of the incineration of solid waste containing nickel-cadmium batteries. Ni is proven to be a skin allergen for some people. Ni metal and most of its derivates (except Ni(CO)4) have little overt toxicity. The greatest concern in biosolids relates to potential phytotoxicity. Application of phosphorus fertilizers, coal, fly ash and biosolids can increase soil Ni and result in an increase in plant uptake. Factors such as cation exchange capacity, organic matter, chelation, pH, solubility and precipitation are important in determining the availability of Ni to plants.

10
2.3.3.5. Zinc in soil and its toxicity
Zinc (Zn2+
) is 24th most abundant element in the Earth’s crust (found in many ore
minerals) and has five stable isotopes. The primary natural source of Zn in soils is from weathering of the ferromagnesian minerals and sphalerite. Soil clays, organic matter and hydrous oxides play a major role in the retention and adsorption of Zn (Epstein, 2003). Although a number of Zn compounds are synthesized and used, by far the most important of them is zinc oxide, ZnO. Formerly widely used as a paint pigment, this white substance is now employed as an accelerating and activating agent for hardening rubber products, particularly tires. Tire wear is a major vector for the transfer of Zn to the environment and, since it occurs with Zn, toxic cadmium is also dissipated to the environment by tire wear. The other two major compounds of Zn employed commercially are Zn chloride used in dry cells, as a disinfectant, and to vulcanize rubber, and zinc sulfide, used in Zn electroplating baths and to manufacture zinc-containing insecticides, particularly Zineb. Zn is introduced to agricultural soils from phosphate fertilizers as well as atmospheric deposition. Although it is not very toxic to animals, Zn is phytotoxic (toxic to plants) and soil can be “poisoned” by exposure to Zn from Zn smelting or from application of zinc-rich sewage sludge. Recycling of Zn is complicated by its dispersal as plating on other metals. However, means do exist to reclaim significant fractions of such Zn, such as from electric arc furnaces. Zinc is relatively abundant and not particularly toxic, so its industrial ecology is of less concern than that of toxic Pb or scarce chromium. As with other metals, the mining and processing of Zn can pose some environmental concerns. Zn occurs as ZnS (a mineral called sphalerite), and the sulfur must be reclaimed in the smelting of zinc. Zn minerals often contain significant fractions of Pb and Cu, as well as significant amounts of toxic arsenic and cadmium.
2.4. Standards for sampling and analytical methods for soil quality
parameters determination Standards on international, European and national levels are defined, since all EU countries need guidance for better monitoring. Those standards describe different procedures needed to obtain required quality. I used specific standards, which helped me to perform sampling, prepare thesamples and do required measurements of pH, EC and heavy metals content in considered samples. The standards I used are shown in Table 2.

11
Table 2: International/National standards in EU, Slovenia and Romania
International / National
EU Romanian Slovenian
Monitoring EN ISO 16133:2004 SR ISO 16133: 2011 SIST ISO
16133:2006
Pa
ram
ete
rs
pH EN ISO 10390:2005 SR ISO 10390:1994 SIST ISO
10390:2005
Electrical conductivity
(EC)
EN ISO 11265:1994/Cor
1:1996
SR ISO 11265+A1:1996
SIST ISO 11265:1996/Cor
1:2005
Heavy metals (Cu, Zn, Cr, Ni, Cd and
Pb)
EN ISO 11466:1995 SR ISO 11466:2009 SIST ISO
11466:1996
EN ISO 11047:1998 SR ISO 11047:1998 SIST ISO
11047:1998
Description of standards mentioned in Table 2: o ISO 16133 – Soil quality - Guidance on the establishment and maintenance of monitoring programmes o ISO 10390 – Soil quality - Determination of pH o ISO 11265 – Soil quality -- Determination of the specific electrical conductivity o ISO 11466 – Soil quality – Extraction of trace elements soluble in aqua regia o ISO 11047 – Soil quality - Determination of cadmium, chromium, cobalt, copper, lead, manganese, nickel and zinc -- Flame and electrothermal atomic absorption spectrometric methods We can see that standards for specific parameters are the same in EU, Slovenia and Romania. This is because Slovenia and Romania have to follow the exact procedure defined by EU standards. For this purpose, Slovenian and Romanian goverments translated EU standards into their own languages. The only difference is the year when the governments took those standards into action.

12
3. EXPERIMENTAL PART My practical work consisted of getting some background information about industries developed in the areas of interest, taking samples from that areas, measuring the soil parameters and analysing gained information. I researched legal documents about those industrial activities and I found the environmental permits that were issued to them. I took samples together with the representatives from the Environmental Protection Agency Brasov (APM), and also with their help I did paramteres’ measurements in laboratory. Finally, I formulated the conclusion about the situation in the studied areas from the registered data.
3.1. Soil quality monitoring program in Fagaras, Hoghiz and Victoria areas
from Romania Since we were making measurements in 3 different areas (Fagaras, Hoghiz and Victoria) and one in Valea Bogatii, I needed to get some background information about those regions and factories that are located there. All the following companies received The Integrated Environmental Permit, which contains monitoring requirements, appropriate discharge of pollutants that occur, specific measurement methodology and frequency, evaluation procedure and the obligation to provide data requested by the competent authority to verify compliance with the permit. The Integrated Environmental Permit also includes conditions necessary to ensure that: - Appropriate preventive measures are taken against pollution, in particular for the application of best available techniques (BAT); - No significant pollution is caused; - Waste generation is avoided, where waste is produced, it is recovered; - Measures are taken to prevent accidents and limit their consequences; - Significant environmental impact is minimized produced by different conditions of normal operation; - Necessary measures are taken upon definitive cessation of activities so as to avoid any risk of pollution, and to restore the site to its original state for use in business; - Appropriate measures are taken to use energy efficiently; - They are using the principles of BAT. From year 2006 until year 2011, on four different locations, about 3-5 samples per location per month were taken (Figure 2). Those samples were taken from different types of field (agricultural and non-agricultural). Choices were made based on the options and adequacy of presented areas.

13
Figure 2: Locations of sampling points (Google maps, 2012) In Figure 2, locations from where we took samples are circled with red and Brasov city is marked with blue, in order to have a sense of locations of sampling points and their distance from Brasov.
3.1.1. Valea Bogatii reference sampling area Until the year 2009, samples for background were taken from an unused field. With year 2009 APM started taking samples from Valea Bogatii (forest). Valea Bogatii has negligible antropogenic impact and it has characteristics of natural environment of that region, therefore is more apropriate for background measurements. We took 4-5 random samples from this area.
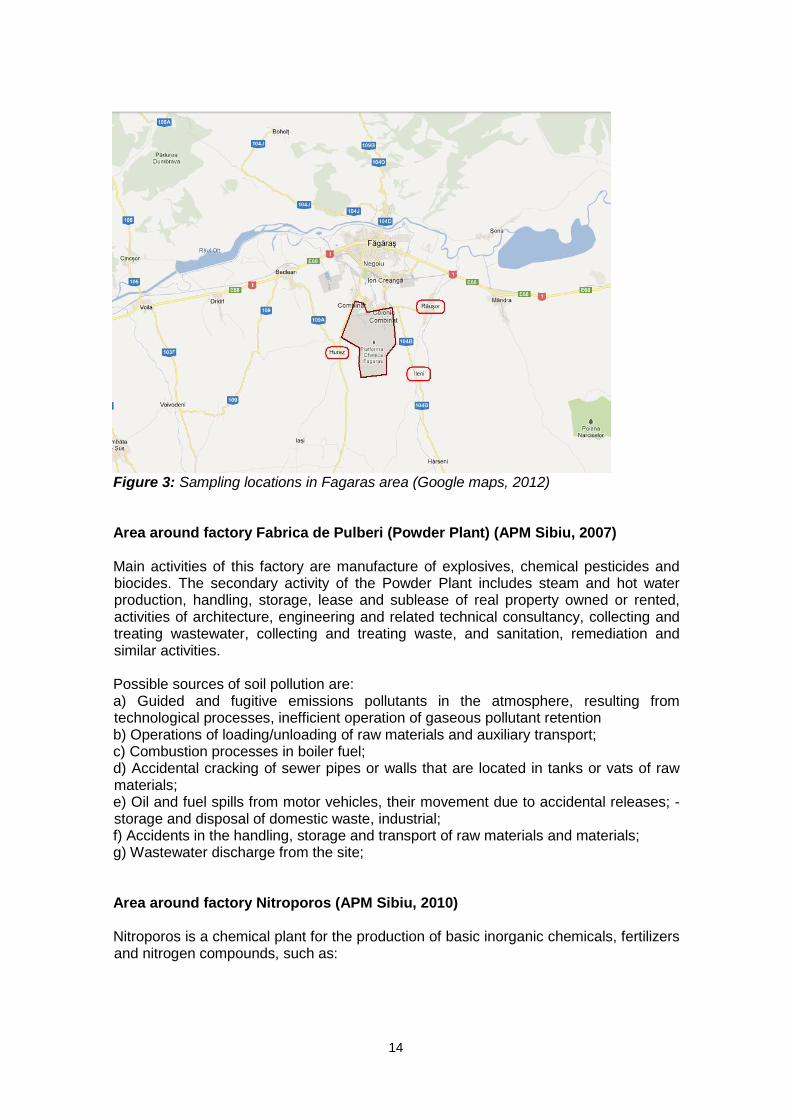
3.1.2. Fagaras industrial area The city is situated on a relatively low terrace, on the left bank of the river Olt. The inhabitants live mostly on the left tributaries of the Olt, because the great river caused harm by flooding of valleys of the Olt meadow. Climate in Fagaras city is influenced by the presence of the mountains and is characterized by frequent temperature inversions, especially in winter. In late winter and early spring, snow suddenly melts. We took ~5 random samples from three regions that are located around city Fagaras: Hurez, Ileni and Rausor (Figure 3). All samples were taken from agricultural fields that are still in use. In Figure 3 cities from where we took samples are circled with red, and the industries that might have influence on the surroundings are circled with brown
14
Figure 3: Sampling locations in Fagaras area (Google maps, 2012) Area around factory Fabrica de Pulberi (Powder Plant) (APM Sibiu, 2007) Main activities of this factory are manufacture of explosives, chemical pesticides and biocides. The secondary activity of the Powder Plant includes steam and hot water production, handling, storage, lease and sublease of real property owned or rented, activities of architecture, engineering and related technical consultancy, collecting and treating wastewater, collecting and treating waste, and sanitation, remediation and similar activities. Possible sources of soil pollution are: a) Guided and fugitive emissions pollutants in the atmosphere, resulting from technological processes, inefficient operation of gaseous pollutant retention b) Operations of loading/unloading of raw materials and auxiliary transport; c) Combustion processes in boiler fuel; d) Accidental cracking of sewer pipes or walls that are located in tanks or vats of raw materials; e) Oil and fuel spills from motor vehicles, their movement due to accidental releases; - storage and disposal of domestic waste, industrial; f) Accidents in the handling, storage and transport of raw materials and materials; g) Wastewater discharge from the site; Area around factory Nitroporos (APM Sibiu, 2010) Nitroporos is a chemical plant for the production of basic inorganic chemicals, fertilizers and nitrogen compounds, such as:

15
a) Gases such as ammonia, chlorine or hydrogen chloride, fluorine or hydrogen fluoride, carbon oxides, sulfur compounds, nitrogen oxides, hydrogen, sulfur dioxide, carbonyl chloride; b) Acids, such as chromic acid, hydrofluoric acid, phosphoric acid, nitric acid, hydrochloric acid, sulfuric acid, oleum, sulfur acids; c) Bases, such as: ammonium hydroxide, potassium hydroxide, sodium hydroxide; d) Salts, such as: ammonium nitrate porous/technical and ammonium nitrate solution. Other activities (under certificate of findings) are: manufacture of other inorganic basic chemicals, supply of steam and air conditioning, production, transmission, distribution, marketing of power, collection and treatment of wastewater , collection, purification and distribution, wholesale of chemical products, storage, transport by pipeline, railway transport, road transport of goods and general mechanical engineering. Possible sources of soil pollution (the main causes that can lead to the presence of pollutants in soil and subsoil) are: a) Negligent handling of raw materials and finished products; b) Poorly maintained pipelines with liquids inside; c) Loss of products due to technological equipment and technical accidents and mechanical tanks; d) Spills from storage tanks of liquid (liquid fertilizers, oil, etc.). Leaks can occur due to corrosion or cracking of shell bottom tanks, corrosion, cracking, leakage tanks (pumps, pipes, valves, fittings) and handling errors in the control and supervision tanks (spills, incorrect handling), the CF Auto ramps or loading/unloading of goods from local stations, pre-treatment facilities and wastewater; e) Release of gases into the air and dust coming from the processes of manufacture site. Soil pollution sources are mainly uncontrolled release of ammonia through equipment leaks, air emissions of ammonia, nitrates that can come from the decomposition of ammonium nitrate in air emissions, and improper storage of heavy metals from waste or sludge catalysts for the plant.
3.1.3. Hoghiz industrial area Hoghiz area is also located near the river Olt, but receives smaller influence from mountains, since it is located further away from them. We took ~5 random samples from three villages: Cuciulata, Fantana and Hoghiz (Figure 4). In village Fantana we took random samples from one agricultural location, and from villages Cuciulata and Hoghiz we took random samples at beginning and at the end of the village. Villages from which we took samples are in Figure 4 circled with red and industry of interest is marked with the brown line.

16
Figure 4: Sampling locations in Hoghiz area (Google maps, 2012) Area around factory Lafarge ciment (APM Sibiu, 2010) The main activities are crushing and grinding of raw materials, clinker production, cement grinding, transport and storage of their associated activities, quality control, packaging, storage, marketing of cement, insurance maintenance, transportation, laboratory, manufacturing heating water, wastewater treatment and work related to the technological IPPC. The types of secondary activities are manufacture of cement, recovery of waste and scrap metal recycling, industrial waste utilization as raw material substitutes and alternative fuels for incineration in cement, collection, purification and distribution of wastewater treatment, technical testing and analysis activities, distribution and trade of electricity, agents involved in the trade of timber and construction, wholesale of wood and construction, and wholesale of waste and scrap, handling, warehousing and storage, advertising, collection and treatment of sewage, collection and treatment of other waste (collection and treatment of hazardous waste), sanitation, remediation and similar activities (other cleaning activities). Possible sources of soil pollution are routed and fugitive emissions, operations of loading/unloading of raw materials, auxiliary transport, emissions from motor vehicles, and soil pollution caused by accidental spills.
3.1.4. Victoria industrial area As it can be seen from Figure 2, Victoria city is located at the foot of a mountain. Because of that, mountain type climate has a big influence on the climate and the quality of the soil.

17
In this area we took ~3 random samples from 6 different locations around the city of Victoria: vicinity of industry Purolite, crossroads of plastic waste and Viromet industry, garden of firefighters, woodworking railway station, the exit of Victoria village and entrance to Ucea next to an electric station (Figure 5) and in the neighbourhood of the polyclinic.
Figure 6: Sampling locations in the Victoria area (Google maps, 2012) In Figure 6 I marked the villages that were included in sampling proces with red. With brown I marked industries that might have impact on soil quality in its surroundings.
Figure 5: Sampling point at the exit of Victoria village and entrance to Ucea next to an electric station (Ionut Chirita, 2011)

18
Area around factory Purolite (APM Sibiu, 2009)
Purolite is a chemical plant (Figure 7) with chemical installations for production of organic chemicals, such as basic plastic materials (polymers, synthetic fibers and cellulose-based fibers), and it manufactures plastics in primary forms. The subject of integrated environmental permit is the primary task of styrene-divinylbenzen copolymers production, cation production, cation production of weak acids, obtaining of anions, transporting and storage of raw materials, auxiliary materials, intermediate products and finished products, quality control activities
associated, packaging, storage, marketing, providing maintenance, transportation, laboratory, heat production, industrial wastewater pre-treatment. Directly related technical activities are reception and storage of raw materials (liquid and solid storage materials), obtaining styrene copolymers, obtaining cations, obtaining anions, dehydration and packing of ion exchange resins, purification and/or conditioning of certain kinds of ion exchange resins, obtaining mixture of cations and anions (called mixed bed), and drying and milling of ion exchange resins. Possible sources of soil pollution on the site are directed and fugitive emissions of pollutants in the atmosphere arising from the technological operations of loading/ unloading of raw materials and auxiliary transport, accidental cracking sewer pipes or walls that are located in tanks or vats of raw materials, operations of loading/unloading of raw materials and auxiliary transport, oil and fuel spills from motor vehicle emissions, traffic accidents due to their improper storage and disposal of waste, accidents, handling of raw materials, leaks in the piping system and the basin of wastewater collection. Area around factory Sparomex (APM Sibiu, 2008) Sparomex produces chemical installations for the manufacture of explosives. Area networks and transport routes are fully concreted. Non-concrete surface consists partly of green space. Location PC operating company is entirely concrete. Possible sources of soil pollution due to the production process could be accidental cracking sewer pipes, oil and fuel spills from motor vehicle emissions due to their movements, and hazardous substances stored in appropriate tanks. Tanks themselves are stored in special places.
Figure 7: View towards Purolite industry from sampling location (Ionut Chirita, 2011)

19
Area around factory Viromet (APM Sibiu, 2007) Main activities of this industry (Figure 8) are production of electricity, electricity transmission, production and distribution of heat and hot water, chemical installations for the production of basic organic chemicals, such as oxygen-containing hydrocarbons (alcohols, aldehydes, ketones, carboxylic acids, esters, acetates, ethers, peroxides, epoxy resins), manufacture of other organic basic chemicals, manufacture of plastics in primary forms, manufacture of glues, gelatins and manufacture of other chemicals, chemical installations for the production of basic inorganic chemicals, such as base-ammonium hydroxide (ammonia water), manufacture of other inorganic basic chemicals, and landfills by excluding landfills of inert waste, waste processing and storage. Secondary activities are manufacture of industrial gases, manufacture of plastic plates, sheets, tubes and plastic profiles, manufacture of plastic packaging, manufacture of plastic products for construction (general mechanical engineering and manufacture of valves), maintenance and repair of motor vehicles, storage and warehousing, wholesale of chemical products, collection and wastewater, collection and treatment of other waste, and collection, treatment and supply (abstractions in Brasov). Possible sources of soil pollution are guided and fugitive emission pollutants in the atmosphere, resulting from technological processes, operation of loading/unloading of raw materials and auxiliary transport, handling negligence of raw materials and finished products, poorly maintained pipelines with liquids inside, loss of products due to technological installations and technical accidents and mechanical tanks, processes of fuel combustion in the boiler, accidental cracking of sewer pipes or walls that are located on tanks or vats of raw materials, oil and fuel spills from motor vehicles, their movement due to accidental releases, storage and disposal of domestic waste, industrial (slurry of calcium sulfate, pyrite ash, spent catalysts, ion exchange exhausted, oils), on-site sewage disposal and handling, storage and transport of the sludge drying beds.
3.2. Equipment and reagents In next chapters I describe what I have done in order to collect needed data. I describe where and how I took samples, how they were processed, which equipment and reagents we used in order to get the needed data and how I analysed the gathered data, in order to establish a conclusion.
Figure 8: Sampling location near Viromet industry (Ionut Chirita, 2011)
20
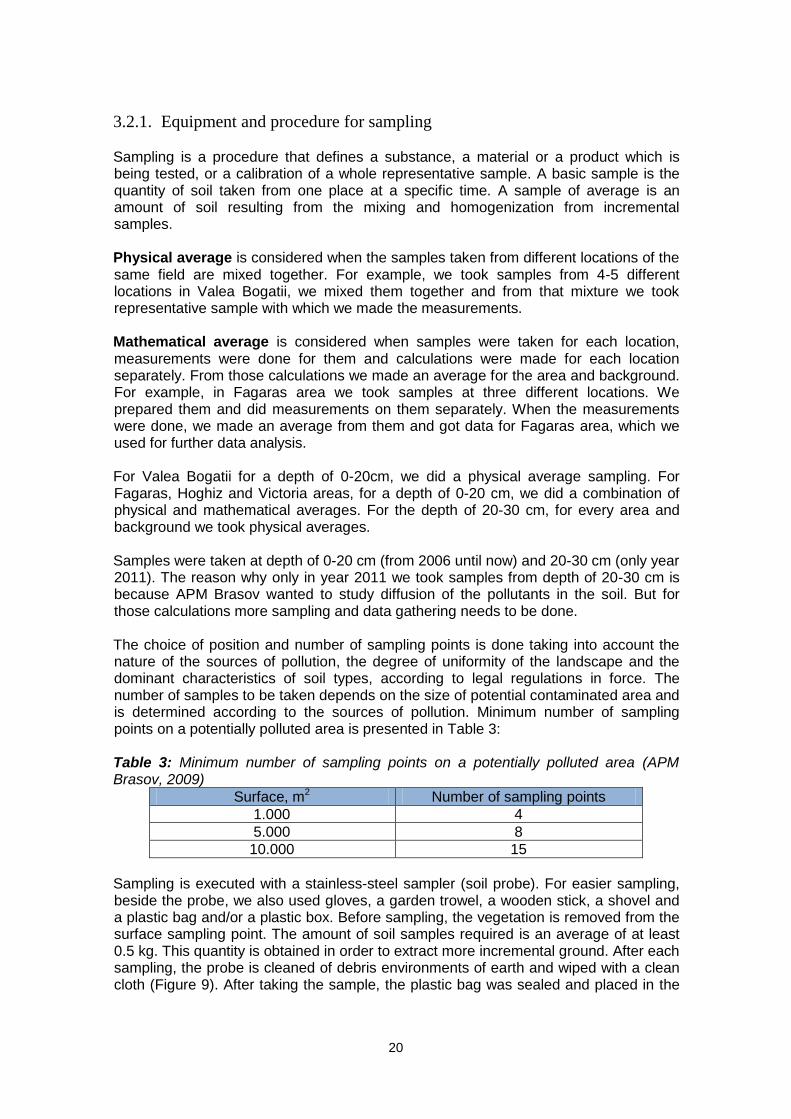
3.2.1. Equipment and procedure for sampling Sampling is a procedure that defines a substance, a material or a product which is being tested, or a calibration of a whole representative sample. A basic sample is the quantity of soil taken from one place at a specific time. A sample of average is an amount of soil resulting from the mixing and homogenization from incremental samples. Physical average is considered when the samples taken from different locations of the same field are mixed together. For example, we took samples from 4-5 different locations in Valea Bogatii, we mixed them together and from that mixture we took representative sample with which we made the measurements. Mathematical average is considered when samples were taken for each location, measurements were done for them and calculations were made for each location separately. From those calculations we made an average for the area and background. For example, in Fagaras area we took samples at three different locations. We prepared them and did measurements on them separately. When the measurements were done, we made an average from them and got data for Fagaras area, which we used for further data analysis. For Valea Bogatii for a depth of 0-20cm, we did a physical average sampling. For Fagaras, Hoghiz and Victoria areas, for a depth of 0-20 cm, we did a combination of physical and mathematical averages. For the depth of 20-30 cm, for every area and background we took physical averages. Samples were taken at depth of 0-20 cm (from 2006 until now) and 20-30 cm (only year 2011). The reason why only in year 2011 we took samples from depth of 20-30 cm is because APM Brasov wanted to study diffusion of the pollutants in the soil. But for those calculations more sampling and data gathering needs to be done. The choice of position and number of sampling points is done taking into account the nature of the sources of pollution, the degree of uniformity of the landscape and the dominant characteristics of soil types, according to legal regulations in force. The number of samples to be taken depends on the size of potential contaminated area and is determined according to the sources of pollution. Minimum number of sampling points on a potentially polluted area is presented in Table 3: Table 3: Minimum number of sampling points on a potentially polluted area (APM Brasov, 2009)
Surface, m2 Number of sampling points
1.000 4
5.000 8
10.000 15
Sampling is executed with a stainless-steel sampler (soil probe). For easier sampling, beside the probe, we also used gloves, a garden trowel, a wooden stick, a shovel and a plastic bag and/or a plastic box. Before sampling, the vegetation is removed from the surface sampling point. The amount of soil samples required is an average of at least 0.5 kg. This quantity is obtained in order to extract more incremental ground. After each sampling, the probe is cleaned of debris environments of earth and wiped with a clean cloth (Figure 9). After taking the sample, the plastic bag was sealed and placed in the

21
plastic box with a lid. The box is identified by the inscription of the name of the sampling point and/or the identification number of sampling points in sketch/description of the sampling report. Boxes with samples are transported in crates or cartons.
3.2.2. Equipment and procedure for sample preparation For the preparation of samples, we were following the Romanian legislation PG-17.2, and for the preparation of samples for the measurement of heavy metals, we were following Romanian legislation Cod: PL-S-01. Samples are recorded in the "Register. Front samples”. Laboratory evidence handling is done carefully to avoid sample contamination by air or dust, the air in the laboratory or other samples. The soil samples were put in drying trays in the laboratory, marked with labels, on which there is a sample code, and covered with paper. Samples were spread around the tray so that the layer did not get thicker then 15mm. During drying, we crushed bigger pieces of soil by hand or pestle and mortar, so that the drying process would be quicker. Drying process lasted at least 24h (on room temperature), depending on the soil humidity. All equipment used for homogenisation were cleaned to minimize the potential of cross-contamination. After the drying process, samples of soil were crushed using porcelain pestle and mortar. With a 2 mm sieve we separated particles we were going to use for measuring pH and electrical conductivity of soil. With a 0,15 mm sieve we separated particles for measuring heavy metals. By continued exchange of use of pestle and mortar, and sieve, we got enough samples for all necessary measurements.
3.2.3. Equipment and procedure for soil quality parameters determination The technical equipment we used for parameters determination are two different models of METTLER TOLEDO balances, a pH-meter for measurement of pH, a conductometer for measurement of electrical conductivity, a Speedwave MWS-3+
microwave system and a Flame Atomic Absorption Sprectrometer (FAAS) for measurements of heavy metals. They are all described in order as mentioned.
Figure 9: Sampling with probe, wooden stick, plastic bag and gloves (Ionut Chirita, 2011)

22
3.2.3.1. Analytical balance METTLER TOLEDO Models ML a. Model ML 1502E (Table 4) has readability of 0,01g, with a round weighing pan – we used this model for weighing soil samples for pH and EC measurements. b. Model ML 204 (Table 4) has readability of 0,0001g, with a draft shield (235 mm) – we used this model for weighing soil samples for heavy metal measurements. Table 4: Technical data for METTLER TOLEDO balances (METTLER TOLEDO manual)
Model ML 1502E (a.) ML 204 (b.)
Maximum load 1520g 220 g
Readability 0.01g 0.1 mg
Sensitivity temperature drift (10...30°C)
3 ppm/°C 1.5g ppm/°C
Internal adjustment No Yes
Adjustment range with external weights
100...1520g 100...220g
Setting time, typ. 1.5s 3s
Weighting technology Strain gauge MonoBloc
Usable height of draft shield [mm] / 235
Net weight [kg] 2.2 4.1
Both balances look the same from the outside (Figure 10). Both are protected against dust and water, and are useable only in dry interior rooms. Ambient temperature range should be between 10 and 30°C and relative air humidity should be 10% to 80% at 31°C, linearly decreasing to 50% at 40°C, non-condensing. In order to measure requested weight, we used a piece of paper, a beaker and a spoon. The paper was placed inside the balance on the round weighing pan and with the spoon we loaded the paper with the soil sample. When the requested weight was reached, we closed the door of the balance so we would be sure that any outside parameters did not influence the weight. After the weight was measured, we took the paper out, transfered soil sample into the beaker and cleaned the balance round weighing pan of possible debris.
3.2.3.2. pH-meter MP225 General Purpose GLP pH/mV/°C Meter In order to measure a pH value, we used a combination electrode, housing both measuring and reference elements (Figure 11). In combination electrode the glass electrode is concentrically surrounded by the reference electrolyte. Next to the reference and glass electrode, a temperature sensor is added. By housing the temperature sensor in the same body as the pH and reference elements, temperature compensated readings can easily be made with a single probe. The response time and accuracy of an electrode is dependent upon a number of factors, which is why we need to be sure of a proper calibration of electrode.
Figure 10: METTLER TOLEDO balance (METTLER TOLEDO manual)

23
Before we started measuring the pH of a soil sample solution, and in order to get results without any possible influences, we first needed to stabilize the pH-meter, which was done by putting the pH electrode in clean water for 15 min. After that, we cleaned the electrode with a dry paper towel and put the electrode in a soil sample solution. We stired the suspension vigorously before we put the electrode into the sample and
measured the pH. We waited for a few minutes for the measurement to stabilize,. When it did, the instrument beeped and then we wrote down the pH and temperature values. I wrote down the values of temperature for the reason of verification because the temperature of soil suspension should not differ by more than 1°C. Before every measurement of a soil sample solution, we did the same process of stabilization of the electrode with distilled water and cleaned the electrode with a dry paper towel before we put the electrode into a new sample solution. The values are designated for two decimal places. Reading is considered stable if in a time of 5 s values do not vary more than 0,02 pH units. The usual speed of achieving equilibrium is 1 min, but may depend on the inter alia. All gained measurements were here presented with Figure 14 and Figure 15.
3.2.3.3. MC226 Basic Conductivity / °C Meter The MC226 (Figure 12) measures in two modes: conductivity or total dissolved solids. Technology implemented in this type of sensor conductivity measurement technique is combined with automatic temperature compensation technique to facilitate easy and accurate measurements. Automatic temperature compensation is provided by incorporating a thermistor in the electrode body. Before making any measurements we needed to stabilize the conductometer. We did that with distilled water, in which we put the electrode for 15 minutes so the electrode would neutralize. After we heard a beep, we took the electrode out of the water and cleaned it with a dry paper towel. The electrode was then ready for measurements, so it was put into the soil sample solution until an equilibrium was reached. When the machine beeped, we wrote down the values of electrical conductivity and temperature (for verification purposes). Before we took measurements of another soil sample solution, we calibrated the electrode with distilled water and cleaned it with a dry paper towel. All gained information about electrical conductivity is presented here with Figure 16 and Figure 17.
Figure 11: General Purpose pH-meter model MP225 (Mettler Toledo, SKAFTE MedLab)
Figure 12: MC226 Basic Conductivity / °C Meter (Mettler Toledo, SKAFTE MedLab)

24
3.2.3.4. Speedwave MWS-3+
microwave system This system is designed for pressure digestion at temperatures up to 230°C in continuous use (short term 260°C) and, depending on the type of vessels employed, pressures up to a max. of 100 bar. It is made of stainless steel and equipped with a swivelling safety lid, an electromechanical locking mechanism and a circular sample chamber for uniform microwave distribution. Three over-temperature switches and three micro-switches guarantee the necessary operating safety. The chamber is permanently ventilated by a special fan (Figure 13).
The speedwave MWS-3+ is equipped with a temperature monitoring system. This system determines the temperature inside the pressure vessels by measuring the infrared radiation emitted by the sample. This information is forwarded to the power control module, which uses the highest measured temperature and the number of inserted vessels to regulate the oven power. Continuous adjustment of the magnetron output allows the temperature to be regulated on the basis of all vessel contents. Radiation components emitted by the vessel walls and, in particular, the exterior of the vessel, are
completely filtered out. The target and actual temperatures of all samples are displayed on the screen in real time and saved to memory. For safety reasons, the microwave automatically switches itself off in case the magnetron, the microwave oven or the high voltage transformer overheats. All vessels are equipped with a rupture disc, which produces a spontaneous pressure release upwards through the screw-on tube connections in case of excessive vessel pressure. In some cases, such a spontaneous pressure release may occur after the vessel has been removed from the microwave oven. Acid vapours that escape when the rapture disc activates are guided to a sealed collection system integrated in the rotor. That gas collection system must be connected to an exhaust system via a PFA (perfuoroalkoxy) vent tube. The PFA tube is connected to the screw-on connection located in the centre of the top of the microwave. Any hot acid vapours released when the rupture disc activates are safely removed through this PFA vent tube. Thereby the vapours are vented or suctioned off through the PFA tube connected to the swivelling lid. The electronic swivelling lid-locking mechanism can only be opened by means of the software control. In addition, 3 interlock switches are installed, which shut the microwave off if the lid is opened by force during microwave operation. The type of vessels that we used in our procedure are DAK-100 vessels. These vessels are made of a TMF-pressure vessel with a cap. Additionally, this vessel
Figure 13: Speedwave MWS-3+ microwave system (Berghof)

25
consists of a ceramic pressure jacket and a TMF-insert. It is assembled from 8 pressure vessels made of TMF (thermo-mechanical fatigue), a rotor and a gas collection system. Characteristics of this vessel type are writen in Table 5. Table 5: Description of the pressure vessel (BERGHOF Products & Instruments GmbH, 2005)
Volume
(mL) Max
pressure Max
temperature
Max sample weight –
organic (mg)
Min fill volume – acid (mL)
DAK-100 100 100 bar 230°C < 1000 > 5
After a preparation of soil sample solutions, we put those into marked vessels which we then insert into a Speedwave MWS-3+ mictowave system and waited for about an hour for process to finished.
3.2.3.5. Flame Atomic Absorption Spectrometry Instruments for flame atomic absorption spectrometry (FAAS) are a light source (hollow-catode lamp), a flame, a monochromator, a detector and a sample holder. The sample holder in atomic absorption instruments is the atomizer cell that contains the gaseous atomized sample. In a flame atomizer, a solution of the sample is nebulized by a flow of a gaseous oxidant, mixed with a gaseous fuel, and carried into a flame, where atomization occures (Skoog, 1998). First is desolvation, in which the solvent is evaporated to produce a finely divided solid molecular aerosol. Dissociation of most of these molecules then leads to an atomic gas. Some of the atoms so formed ionize to give cations and electrons, while also some other molecules and atoms are produced in the flame as a result of interactions. Fractions of the molecules, atoms and ions are also exited by the heat of the flame. thus giving atomic, ionic and molecular emission spectra. The sample solution is aspirated into a flame and the sample element is converted to atomic vapor. The flame then contains atoms of that element. Some are thermally excited by the flame, but most remain in the ground state. These ground-state atoms can absorb radiation of a particular wavelength that is produced by a special source made from that element (Christian, 2004). The wavelength of radiation given off by the source are the same as those absorbed by the atoms in the flame. Absorbance is directly proportional to the pathlength in the flame and to the concentration of atomic vapor in the flame. Both of these variables are difficult to determine, but the pathlength can be held constant and the concentration of atomic vapor is directly proportional to the concentration of the analyte in the solution being aspirated. The major disadvantage of making measurements by atomic absorption is that a different source (lamp) is required for each element (Christian, 2004). If the gas flow rate does not exceed the burning velocity, the flame propagates itself back into the burner, giving flashback. As the flow rate increases, the flame rises until it reaches a point above the burner where the flow velocity and the burning velocity are equal. At higher flow rates, the flame rises and eventually reaches a point where it blows off of the burner. This flow rate is highly dependent upon the kind of fuel and oxidant being used. (Skoog, 1998)

26
3.2.4. Determination of the hydrogen potential of the soil For measurement of pH we were following the method 9045D (EPA, 2004). We needed 6 beakers (50 mL), 6 stirring rods, an analytical balance capable of weighting 0.01 g, pH-meter MP225 Mettler Toledo equipped with the system of control and adjustment of the temperature, 0.1 M KCl and distilled water. Each month, for each sample (3 samples for Fagaras, 3 for Hoghiz, 6 for Victoria and 1 for Valea Bogatii as reference), we first made a suspension. In order to do that, we crushed the soil samples with a cheramic pestle and a mortar. Then we weighed 10 g of sample with the analytical balance and put them in a glass beaker. We added 50 mL of 0,1 M KCl with a cylinder into the glass beaker with the sample and stirred the mixture with a glass stirring rod for 15 min. After stirring, we left samples for 2 h so the samples could stabilize, but not more than 24 h. As equilibrium was reached after 2 h, we were able to make measurements after that time. When we gained the information from measurements, we made calculations of pH. Within calculations for pH we used the mathematical average: Formulas we used for calculations are given in the equations 1 – 5: pH1 = -log (C1) C1 = 10-pH (1) pH2 = -log (C2) C2 = 10-pH (2) pH3 = -log (C3) C3 = 10-pH (3) ...
C = (4)
pH = -log (C) (5) Where pH1, pH2 and pH3 are values measured by the pH-meter; C, C1, C2 and C3 are intermediate values used for calculation of the equation (5); x is a number of measurements done by pH-meter; pH is the final value we used for analys and is presented in graphs. Final amounts of pH in soil samples for 0-20 cm of depth are presented here with graph, shown with Figure 14. For the depth of 20-30 cm, final amounts are only described.
3.2.5. Determination of the soil electrical conductivity To measure the EC we needed an analytical balance capable of weighting 0.01 g, distilled water, a 250 mL cylinder, 12 glass Erlenmeyer flasks, 6 filtering funnels, 6 pieces of filter paper with a small content of ashes and a high retaining power, 6 beakers (50 mL) and an electrical conductivity meter MC226 Metter Toledo. In order to calculate EC, we first weighed 50 g of each sample with the laboratory balance into separate glass Erlenmeyer flasks, where we added 250 mL of distilled water at 20°C±1°C. Samples were manually stirred for 15 min and then they were left to rest for 2h, so the suspended soil can settle out from the suspension. After that we
27
filtered half of the solution by using filter paper and a filtering funnel. In the end we used the filtered solution in which we measured electrical conductivity. We expressed it in units of µS/cm. We made the same procedure for determination of a blank test and for samples. When we obtained information from EC measurements, we calculated the mathematical average of gained values in order to get the results, which we used for analys. They are presemted in graph with Figure 15 for depth of 0-20 cm, and for 20-30 cm of depth they are described.
3.2.6. Determination of heavy metals in soil For the preparation for measurement of heavy metals we were following method 3050b (EPA, 1996). This method was writen for two separate digestion procedures FAAS or ICP-AES and GFAA or ICP-MS, if the quatities of heavy metals in soil is low. In our case, we were following digestion procedure for FAAS. For measuring the heavy metals content in soil samples, we needed an analytical balance capable of weighting 0,0001 g, a 10 mL pipet, 6 vessel tubes for filtering, a Speedwave MWS-3+ microwave system, 6 volumetric flasks (100 mL), 6 funnels, 6 pieces of filter paper (No. 41 or equivalent), 6 caps, a fume hood, an appliance for temperature heating controle and a Flame Atomic Absorption Spectrometer (FAAS). Additionally to the equipment, reagents that were used in this procedure are distilled water, concentrated nitric acid, concentrated hydrochloric acid and hydrogen peroxide (30%). Blank solutions were prepaired simultanoiusly with the samples. We weighted a 0,5 ± 0,0001 g of each sample separately, put them in vessels and covered them with 10 mL of 65% HNO3. Digestion vessels were burned in ascending order from 1-8. In the workbook we noted the sample code and serial number for each vessel. Vessels had to rest for 1h to allow gas to be released, eliminating the risk posed by rapid heating of mixture reaction obtained by the microwave, before we put them into the microwave oven system for 1 h. After predigesting, we placed digestion vessels into the microwave rotor as symmetrically as possible and connected them to the receptacle, enclosing the inner cover with lid and disc rupture. Any unused positions on the collection vessel should be sealed with the supplied blind stoppers or with lock screws in order to ensure the proper operation of the gas removal. By turning the swivelling lid until the lock engaged, the microwave was locked. In the same time, we had to make sure that the rapture disc was properly seated in the lid, that is, that its edge sat uniformly in the lid groove. Then we screwed the vent tube to the top of the microwave oven to make sure that it was properly connected to the exhaust system. Once we selected or created an appropriate application for the desired number of vessels that has been placed in the oven, we started the program. The program could be cancelled at any time by pressing the “Stop” key. Program that was used for this situation was number 17 and includes 5 steps (shown in Table 6), which means that they are following ISO 11466 standard for soil.

28
Table 6: Program 17, which includes 5 steps of operation (ISO 11466)
Temperature
(°C) Pressure
(bar) Duration
(min) Inclination
(min) Power (%)
Step 1. 145 30 5 2 80
Step 2. 170 30 10 2 80
Step 3. 190 30 15 2 80
Step 4. 100 0 10 1 0
Step 5. 100 0 10 1 0
When the program finished, by selecting “Finish”, all the data was saved to the memory and it went back to the main window. After the microwave digestion system reached the end of the program, we left the vessels inside and waited for approximately 2h for samples to cool down. After this time, we disconnected the vent tube first and loosened the screw on the gas collector, all vessels were removed and placed under a vent hood for further cooling. Acid vapours can leak out of the vessels during the cooling phase, which generally, does not result in any sample loss or contamination. The vessels may only be opened after an adequate cooling period. The length of the cooling period depends on the heating time and the digestion temperature. The total cooling time before the vessels are opened should be at least half the digestion time and, if possible, somewhat more than this. In our case we left the vessels in the fume hood to cool for appox. 30 min. We opened the outlet tube, making sure the vessels were not directed toward the operator. If the cover opposed to ceiling a slite resistance, we would have to leave it for extra 10 min. The inner containers were carefully removed and left to cool for extra approx. 15 min in the fume hood, before we opened the covers. The contents of the containers were transfered quantitatively by filtration qualitative Whatman No. 41 filter paper in 100 mL flasks. The containers were rinsed with distilled water at least three times. We also washed residue on the filter paper with water, then filled the flask mix with water up to the sign. The samples thusly treated are put in plastic bottles with the lid tightly closed and labeled with a sample indentification card. When the procedure with the microwave oven was finished, the samples were stored for a few days, where they waited for the final measurement with the FAAS. The method is based on the measurement by the FAAS in the concentration of an element in an extract of the water region sample. We put the FAAS into operation, according to the manufacturer's instructions to the appropriate wavelength specified for each element, using the recommended conditions and background correction system (Table 7). Then we aspirated the calibration solution and optimized suction conditions, burner height and flame conditions. We adjusted the instrument response at zero while absorbing water it sucked. After measuring at least 10 samples of each heavy metal solution, reading the absorbance at least two times and if the values were within acceptable range, we calculated mathematical average of results. If the values were not within accepted area, we had to make new measurements all over again, until we got the measurements that were within accepted area. Absorbance is <1, and preferably not greater than 0.7.

29
Table 7: Conditions of the methods for measurements by FAAS (Cod: PL-S-01, 2009)
Metal Wavelength
(nm) Flame type
Main interference
Background correction
Chromium 357.9 Air/acetylene or acetylene/N2O
reducing Fe, Al Halogen
Copper 324.8 Air/acetylene,
oxidising - Deuterium
Lead 217.0 Air/acetylene,
oxidising - Deuterium
Nickel 232.0 Air/acetylene,
oxidising Fe Deuterium
Zinc 231.9 Air/acetylene,
oxidising - Deuterium
When we obtained the measurements by the FAAS, we processed them in order to get the final data for the analysis. The process of analysis included the calculation of the amount of element in the sample, for which we used equation .
Vfm
w M
)( 01
)(
(6)
w(M) – amount of element M in the sample, in mg/kg ρ1 – content ot element corresponding to absorbance of the sample, mg/l ρ0 – content of element corresponding to blank absorbance of the solution, mg/l f – dillution factor, where the sample was diluted V – volume of sample taken for analysis, l (0,1 l) m – sample mass in kg, adjusted to water content In the end, out of the gained information of calculations of heavy metals, for better overview, I made graphs which I present here with Figures 16-20 for 0-20 cm of depth. And for 20-30 cm of depth, I only describe them.

30
4. RESULTS We took samples from different areas from 0-20 cm and 20-30 cm depth. After preparation of samples in laboratory and their analysis, data were registered. This information was processed with some calculations and the results are presented with graphs. For 0-20 cm of depth, each parameter is shown with its own graph. For 20-30 cm of depth I just descibe them. On each graph, there are information of parameter from the beginning of sampling in April 2006 until Jun 2011 (when I did samplling). Samplings from different locations are shown on one graph for each parameter.
4.1. Hydrogen potential of the monitored soils Figure 14 shows pH data of sampled soil we took at depth of 0-20 cm from all sampled locations. Information of pH in Hoghiz area shows values around 7, which means that they are in neutral zone. Values from Fagaras are around 5, which means that they are somewhat acidic. Values from Victoria are between 4 and 5, which is even more acidic then from Fagaras. In year 2009, APM started taking samples from Valea Bogatii for background. That is why the data, before year 2009, is missing on the graph. The data we have taken shows that the values for Valea Bogatii are changing between 4 and 5, which means that the pH is somewhat acidic. On all locations, pH is not changing too much, but it slightly varies.
Figure 14: pH at all locations during the period of research, 0-20 cm of depth (APM Brasov) For pH at depth of 20-30 cm from all sampled locations data was taken only during a 3 months period. Values have more or less horizontal line. Hoghiz area has neutral values (around 7), while Valea Bogatii, Fagaras and Victoria area are showing somewhat acidic values (between 4 and 5). In order to have a better overview of the situation at depth of 20-30 cm, more data is needed.

31
We can conclude that the pH values from 0-20 cm and 20-30 cm, compared at every location separately from the same period, are not much different.
4.2. Electrical conductivity (EC) of the monitored soils Figure 15 shows values of EC between years 2006 and 2011, on all sampled locations. Samples were taken from 0-20 cm of depth. We can see that Valea Bogatii has the highest EC from all sampled areas, especially around the period between June and August during all sampled years. Lower values then Valea Bogatii has Hoghiz, then Fagaras (also has highest values around June) and the lowest EC has Victoria area. The common thing in all areas is that EC values are slowely declining during the sampled years. It is not jet sure why, but that is the question to be resolved in the future.
Figure 15: Electrical conductivity at all locations during the period of research, 0-20 cm of depth (APM Brasov) Values of samples taken from 20-30 cm of depth from all sampled locations include only three values, but we can see some changes in EC from different areas. They are mostly decreasing (from 90 to 40 µS/cm in Valea Bogatii, and in other areas they are between 40 and 10 µS/cm), but in order to have a better overview, we need more data from all locations. We can conclude that the values of EC, comparing them at every location, in depth of 0-20 cm are not much different then the one from depth of 20-30 cm.
4.3. Chromium (Cr) of the monitored soils The warning value in soil for chromium is 100 mg/kg of dry soil. Figure 16 represent the quantity of chromium in the sampled soil taken from all locations at 0-20 cm of depth. Since APM started making measurements in year 2009, the data before that year are not available.

32
We can see in Figure 16 that the concentrations at different areas do not exceed the warning value. The concentrations of chromium are not at minimum amount, but are in an acceptable area. In that matter, Fagaras has the biggest amount of chromium in the soil, Hoghiz has less chromium in the soil than Fagaras and the Victoria has even less amount of chromium in the soil. As expected, Valea Bogatii has the least amount of chromium in the soil. In all situations, concentrations are changing during the year and they are varving around specific amounts, but they are not exceeding the limit value.
Figure 16: Chromium content at all locations during the period of research, 0-20 cm of depth (APM Brasov) Since concentration of chromium at depth of 20-30 cm include only two measurements, we cannot see bigger changes. Until we get data for a longer period, we cannot say whether the concentration of chromiumm exceed the permissible limits or not. Nevertheless, we can see that the concentrations are for now in acceptable range of limit (between 20 and 60 mg/kg dry soil). We can see that the quantities of chromium in depth of 0-20 cm is similair to the quantities of chromium in depth of 20-30 cm. In that comparisment, amounts from every location were compared seperately for the same period.
4.4. Copper (Cu2+
) of the monitored soils Warning value of copper in the soil is 100 mg/kg of dry soil. Data shown in Figure 17 represents the quantity of copper in the area of interest at 0-20 cm of depth. We can see that in most areas concentrations are reaching the limit, but none of them are crossing it. Valea Bogatii has the minimum concentration of copper, other areas have an high amount. We can also see that the concentration of copper in all locations during the year 2006 is rapidly changing each month. During the years 2007 and 2008 the amount of copper is still changing in all locations, but not as rapidly. From the year 2009 onward the amount of copper is rapidly declining, consequently reaching almost minimum amounts in years 2010 and 2011. At this time it is not jet sure why.

33
Figure 17: Copper contents at all locations during the period of research, 0-20 cm of depth (APM Brasov) Since concentration of copper from samples taken from 20 – 30 cm of depth include only 2 measurements, we cannot see the changes that are occuring, but we can see that all areas have acceptable amounts of copper compared to the allowed limit (Valea Bogatii has amounts between 0 and 10 mg/kg of dry soil, while other areas have amount between 20 and 40 mg/kg of dry soil). For a better overview of the situation at that depth we would need more data. . Quantities of copper in depth of 20-30 cm are similair to the quantities of copper in depth of 0-20 cm after 2009. I compared quantities from every location seperately for the same period.
4.5. Lead (Pb2+
) of the monitored soils The warning value of lead in the soil is 50 mg/kg of dry soil. Figure 18 represent concentrations of lead taken from all sampled locations at 0-20 cm of depth. We can see that concentrations from all areas are reaching limit value, but they are not exceeding it. Valea Bogatii has a minimum amount of lead, but in year 2011 the amount started to rise. Victoria has the biggest amount of lead, it is not declining and it is changing rapidly through all the years. We can also see that the concentrations in Fagaras are changing through months and years. If we look at the annual changes of Fagaras concentrations, they are sometimes low and sometimes high: In year 2006 the concentrations were high, then they declined in year 2007, went up a little in 2008 and stayed there through year 2009 (though the changes were small during the year). The quantities then declined rapidly in year 2010 and in year 2011 slowly started to rise. In Hoghiz area the quantities were in the beginning very high, but after some period they were declining. If we look closer, we can see that, though the quantities in Hoghiz are higher then the ones in Fagaras, the way that the quantities are changing through the years is very similar to the changing of quantities from Fagaras.

34
Figure 18: Lead content at all locations during the period of research, 0-20 cm of depth (APM Brasov) None of the measurements of samples taken from 20-30 cm of depth from all locations exceed the limit value. We can see little changes, but we can not get a better conclusion until we have measurements from a longer period. We can see declining in Valea Bogatii (from approximately 15 to 10 mg/kg of dry soil), and rising in Victoria, Fagaras and Hoghiz area (all from approximately 40 to 60 mg/kg of dry soil). It is difficult to compare quantaties of lead in the depth of 0-20 cm and the depth of 20-30 cm, because quantities in depth of 0-20 cm are changing rapidly. But if I compare only the quantities from both depths during the April and May 2011, we can see that there is no big difference in quantities between the two depths.
4.6. Nickel (Ni2+
) of the monitored soils The limit value of nickel in the soil is 75 mg/kg of dry soil. Figure 19 represent concentrations of nickel taken from the soil from all sampled locations at 0-20 cm of depth. We can see changes occuring, but none of the concentrations exceed the limit, which means that all locations have an acceptable amount of nickel. All locations in the beggining had a high amount of nickel in the soil, but in the middle of the year 2006 the amount of nickel at every location rapidly declined. Since then, there were some similair changes at all locations. During the year 2007, concentrations were mostly constant. With year 2008 concentrations slowly started to grow. Through the years 2009, 2010 and 2011 concentrations increased with monthly changes. Fagaras region had and still has the biggest amount of nickel in the soil, and through the years that amount through monthly changes has been rising. Hoghiz region, in the beginning, had a mostly constant concentration of nickel in the soil, but this amount increased, as well. In Victoria region, monthly and annual changes of nickel concentrations in the soil are similair to the changes in Fagaras and Hoghiz regions,

35
but the amount of nickel in the soil is the lowest compared to those regions. And, as expected, concentrations of nickel in Valea Bogatii region are the lowest of them all, though the monthly and annual changes of concentrations in Valea Bogatii are similair to other sampled regions.
Figure 19: Nickel content at all locations during the period of research, 0-20 cm of depth (APM Brasov) Concentrations of nickel in the sampled soil taken from 20-30 cm of depth from all sampled locations are increasing, but until we get data from a longer period, we cannot conclude anything for sure. Except that they are acceptable for now, since none of the concentrations exceed the limit value. Fagaras has amounts between 60-65 mg/kg of dry soil, while other locations have amounts between 30-50 mg/kg of dry soil. It is very difficult to determine wheater there is a difference between the layers or not, because the quantity of nickel in the depth of 0-20 cm is changing rapidly. If we compare only the quantities during the April and May in 2011, we can see that the quantaties of nickel in the depth of 20-30 cm is higher than the one in the depth of 0-20 cm, accept for the location of Victoria where the quantities are opposite – Victoria has higher quantities of nickel in the depth of 0-20 cm comparing to the depth of 20-30 cm.
4.7. Zinc (Zn2+
) of the monitored soils The limit value of zinc in the soil is 300 mg/kg of dry soil. Figure 20 represent concentrations of zinc from samples taken from all the sampled locations at 0-20 cm of depth. We can see that in the beginning, concentrations were reaching limit value, but they did not exceed it. After year 2009 concentrations were declining and closely coming to the minimum amount. Valea Bogatii, as usual, has the smallest amount, since it represents the background. Regions of Fagaras and Hoghiz have similair monthly and annual changes. In the beggining they are high, but with year 2007 they rapidly decreased. In year 2008 concentrations slowely increased, but with the year 2009 they decreased and stayed there untill the end (year 2011). In Victoria region, concentrations impulsively rised

36
slightly and declined, until the year 2009, where they concilate a little and until year 2011 they dropped down to almost minimum point.
Figure 20: Zinc content at all locations during the period of research, 0-20 cm of depth (APM Brasov) Concentrations of zinc samples taken from 20-30 cm of depth are below the limit value and they are somewhat constant (all locations have concentration of zinc between 30-100 mg/kg of dry soil), but until we get data from a longer period we cannot have a quality overview. Concentrations of zinc in the 20-30 cm of depth have similair concentrations to the one in the 0-20 cm of depth, except in case of Victoria. The amounts in Victoria in the 0-20 cm of depth are higher then the one in 20-30 cm of depth, which is opposite from the other locations.

37
5. CONCLUSIONS The goal of this diploma thesis was to establish the quality of agricultural areas in vicinity of industrial zones. For that matter, I studied some legal documents that apply to my topic, I took samples from questioned areas, made measurements of parameters from them in laboratory and analysed gathered data which I presented with graphs (Figure 14 – Figure 20). Samples were taken from different points at the same location, so I could get the best homogeneous sample possible. We were also in different locations from the same area, so we could get the best possible overview of the situation of the questioned area. From those samples, we made measurements and calculated the concentrations of pH, EC and heavy metals, since those are the parameters that could give us good overview if the soil is proper for agricultural use or the soil has substances with hazardous influences. Gained results were presented as graphs with monthly concentrations in annual outline. In that way we have a good overview of what was happening in the questioned areas and from that way we can make some conclusion much more easier. In all cases we can see that imissions are under the limit of warning values for sensible use: o Upper layer of soil (0 – 20 cm) – all parameters (pH, EC and heavy metals) are reaching limit value, but they do not exceed it. In most situations concentrations are decreasing or they are staying at low level, or at least below limit level; o Lower layer of soil (20 – 30 cm) – we had a small amount of measurements that can poorly tell us the real situation of the questioned area at that depth. For that matter, we need data from a longer period, in order to have a better overview and get better concusions. o For the start I can say that, based on the gathered information, some parameters have different concentrations at different depths (Ni, Zn), while some have similair concentrations at both depths (pH, EC, Cr, Cu, Pb). Nickel has bigger amount in the 20-30 cm of depth then in the 0-20 cm of depth, accept in Victoria where the concentrations are opposite. And in the case of zinc, only in Victoria the concentrations are higher in 0-20 cm of depth then in 20-30 cm of depth. All the other locations have similair amount of zinc at the both depths. Based on the gathered data I can conclude that my hypothesis (that selected areas in the vicinity of industries are contaminated and are not adequate for agricultural use) was wrong! In the past, those areas were contaminated, but since all industries are working according to EU legislations and standards, their pollution decreased. All the parameters that could harm environment are in acceptable range. In the future: APM Brasov is interested in studying the heavy metals' diffusion in deeper layers, so they could see how and how quickly substances are traveling through layers of soil. That is the reason why we have started with measurements from 20-30 cm of depth.

38
6. REFERENCES Agentia Regionala pentru Protectia Mediului Sibiu. 2007. Autorizatie integrata de Mediu, nr. SB 87/2007: S.C. Fabrica de Pulberi S.A. Ministerul Mediukui şi Dezvoltarii Durabile, Agenitia Nationala pentru Protectia Mediului. Nr. 5057/30.11.2007.: 52 Agentia Regionala pentru Protectia Mediului Sibiu. 2010. Autorizatie integrata de Mediu, nr. SB 3/2010: S.C. Lafarge Ciment (Romania) S.A. Ministerul Mediukui şi Dezvoltarii Durabile, Agenitia Nationala pentru Protectia Mediului. Nr. 5152/05.02.2010: 52 Agentia Regionala pentru Protectia Mediului Sibiu. 2010. Autorizatie integrata de Mediu, nr. SB 108/2010: S.C. Nitroporos S.R.L. Ministerul Mediukui şi Dezvoltarii Durabile, Agenitia Nationala pentru Protectia Mediului. Nr. 3081/ACC/05.02.2010: 84 Agentia Regionala pentru Protectia Mediului Sibiu. 2009. Autorizatie integrata de Mediu, nr. SB 37/2006/2009: S.C. Purolite S.R.L. Ministerul Mediukui şi Dezvoltarii Durabile, Agenitia Nationala pentru Protectia Mediului. Nr. 358/16.06.2009: 67 Agentia Regionala pentru Protectia Mediului Sibiu. 2008. Autorizatie integrata de Mediu, nr. SB 92/2008: S.C. Sparomex S.R.L. Ministerul Mediukui şi Dezvoltarii Durabile, Agenitia Nationala pentru Protectia Mediului. Nr. 4233/20.08.2008: 41 Agentia Regionala pentru Protectia Mediului Sibiu. 2007. Autorizatie integrata de Mediu, nr. SB 50/2006/2007: S.C. Viromet S.A. Ministerul Mediukui şi Dezvoltarii Durabile, Agenitia Nationala pentru Protectia Mediului. Nr. 2370/21.11.2007: 96 Bartle P. 2007. The nature of monitoring and evaluation: Definition and purpose. Community Empowerment Collective (CEC) (30.09.2011.). http://cec.vcn.bc.ca/cmp/modules/mon-wht.htm (2011) BERGHOF Products + Instruments GmbH. 2005. Speedwave™ MWS-3+ (Controller version) – Microwave Digestion System with Built-in, Non-Contact Temperature and Pressure Measurement. Eningen: 95 pages (User manual V2.2.) Christian G. D. 2004. Analytical chemistry.6th Edition. USA. John Wiley & Sons, Inc.: 838 Chromium. 2005. Argonne National Laboratory, EVS. Human health fact sheet: 2 http://www.ead.anl.gov/pub/doc/chromium.pdf (30.06.2012) Commission of the European Communities. 2006. Communication from the Commission to the Council, the European Parlament, the European Economic and Social Committee and the Committee of the region: Thematic strategy for soil protection [SEC(2006)620], [SEC (2006) 1165]. Commission of the European Communities: 12 Commission of the European Communities. 2006. Proposal for a Directive of European Parlament and of the Council: Establishing a framework for the protection of soil and amending Directive 2004/35/CE. Commission of the European Communities: 30

39
Council Regulation (EC) No. 807/2003. 2003. Adapting to Decision 1999/468/EC the provision relating to committees which assist the Commission in the exercise of its implementing powers laid down in Council instruments adopted in accordance with the consultation procedure (unanimity). Official Journal of the European Union: 27 Determinarea cadmiului, cromului, cuprului, plumbului, nichelului şi zincului din sol (Cod: PL-S-01). 2009. Agenţia pentru Protecţia Mediului Braşov: 12. (Test procedure) Directive 2004/35/CE of the European Parlament and of the Council. 2004. On environmental liability with regard to the prevention and remedying of environmental damage. Official Journal of the European Union: 20 Environmental Protection Agency: Method 3050b – Acid digestion of sediments, sludges and soil. 1996. Revision 2. Environmental Express: 12 Environmental Protection Agency: Method 9045D – Soil and waste pH. 2004. Revision 4. ALS Environmental: 5 Epstein E. 2003. Land application of sewage sludge and biosolids. 1st Edition. Boca Raton, Florida, USA. Lewis publishers, CRC Press LLC: 201 Eşantionarea, prelevarea, manipularea şi pregătirea obiectelor de încercat – sol (PG-17.2.). 2009. Agenţia pentru Protecţia Mediului Braşov: 10. (General procedure) European Council Directive 86/278/EEC. 1986. On the protection of the environment, and in particular of the soil, when sewage sludge is used in agriculture. Official Journal of the European Communities: 7 European Council Directive 91/692/EEC. 1991. Standardising and rationalizing reports on the implementation of certain Directives relating to the environment. Official Journal of the European Communities: 11 Grisso R., Alley M., Holshouser D., Thomason W. 2009. Precision farming tools: Soil electrical conductivity. Virginia State University, Publication 442-508: 6 Guvernul. 2007. Hotărâre nr. 1408 privind modalităţile de investigare şi evaluare a poluării solului şi subsolului. Monitorul Oficial nr. 802/2007: 6 Habeck M. 2012. Toxicological Profile for Chromium. Agency for Toxic Substances and disease Registry, USA Public Health Service. (http://www.eco-usa.net/toxics/chemicals/chromium.shtml) Huber S., Syed B., Freudenschuβ A., Ernstsen V., Loveland P. 2001. Proposal for a European soil monitoring and assessment framework. Copenhagen, European Environment Agency: 58 (Technical report 61) ISO 10390. Soil quality – Determination of pH. 1999: 10 ISO 11047. Soil quality – Determination of cadmium, chromium, cobalt, copper, lead, manganese, nickel and zinc in aqua regia extracts of soil – Flame and electrothermal atomic absorption spectrometric methods. 1998: 24 ISO 11265. Soil quality – Determination of the specific electrical conductivity. 1998: 8

40
ISO 11466. Soil quality – Extraction of trace elements soluble in aqua regia. 1995. ISO 16133. Soil quality – Guidance on the establishment and maintenance of monitoring programmes. 2004. Lippmann M. 2000. Environmental toxicants: human exposure and their health effects. 2nd Edition. New York. USA. John Wiley & Sons, Inc.: 1007 Loconto P. R. 2001. Trace Environmental Quantitative Analysis: Principles, techniques and applications. 1st Edition. New York, USA. Marcel Dekker, Inc.: 630 Manahan S.E. 2001. Fundamentals of environmental chemistry. 2nd Edition. Boca Raton, Florida, USA. CRC Press LLC: 969 METTLER TOLEDO. A guide to pH measurement – The theory and practice of laboratory pH applications. (Manual for pH-meter) METTLER TOLEDO. pH Meters: Innovations in Conductivity Measurement. Skafte Medlab. (http://www.skafte.se/products/mettler/product_mc226.htm) (2011) Ministerul Agriculturii. 2004. Ordin nr. 49/2004 pentru aprobarea Normelor tehnice privind protectia mediului si in special a solurilor, cand se utilizeaza namoluri de epurare in agricultura. Monitorul Oficial nr. 66/2004: 6 Ministerul Apelor, Pădurilor şi Protecţiei Mediului. 1997. Ordin nr. 184/1997 pentru aprobarea Procedurii de realizare a bilanţurilor de mediu. Monitorul Oficial nr. 303/1997: 43 Ministerul Apelor, Pădurilor şi Protecţiei Mediului. 1997. Ordin nr. 756/1997 pentru aprobarea Reglementării privind evaluarea poluarii mediului. Monitorul Oficial nr. 303/1997: 11 Ministerul Mediului şi Gospodăririi apelor, şi Ministerul Agriculturii, Pădurilor şi Dezvoltării Rurale. 2005. Ordin nr. 242/2005 şi Ordin nr. 197/2005 pentru aprobarea organizării Sistemului naţional de monitoring integrat al solului, de supraveghere, control şi decizii pentru reducerea aportului de poluanţi proveniţi din surse agricole şi de management al reziduurilor organice provenite din zootehnie în zone vulnerabile şi potenţial vulnerabile la poluarea cu nitraţi şi pentru aprobarea Programului de organizare a Sistemului naţional de monitoring integrat al solului, de supraveghere, control şi decizii pentru reducerea aportului de poluanţi proveniţi din surse agricole şi de management al reziduurilor organice provenite din zootehnie în zone vulnerabile şi potenţial vulnerabile la poluarea cu nitraţi. Monitorul Oficial al României, Partea I: 28 Ngan V. 2005. Heavy metal toxicity. DermNet NZ. (http://dermnetnz.org/reactions/heavy-metal.html) (05. July 2010) Pankratz T.M. 2001. Environmental engineering dictionary and directory. 1st Edition. Boca Raton, Florida, USA. Lewis Publishers, CRC Press LLC: 337 Pravilnik o obratovalnem monitoringu pri vnosu nevarnih snovi in rastlinskih hranil v tla, Ur.l. RS, št. 55-2869/1997

41
Skoog D. A., Holler F. J., Nieman T. A. 1998. Principles of Instrumental Analysis. 5th Edition. USA. Thomson Learning, Inc.: 955 Stevens E. pH values for common substances. 2010. The Encyclopedia of Earth. (http://www.eoearth.org/article/PH) (2011) Uredba o mejnih, opozorilnih in kritičnih vrednostih nevarnih snovi v tleh, Ur.l. RS, št. 68/1996 Uredba o mejnih vrednostih vnosa nevarnih snovi in gnojil v tla, Ur.l. RS, št. 84/2005 Uredba o merilih za ocenjevanje verjetnosti pomembnejših vplivov izvedbe plana, programa, načrta ali drugega splošnega akta in njegovih sprememb na okolje v postopku celovite presoje vplivov na okolje, Ur.l. RS, št. 9/2009 Uredba o vsebini poročila o vplivih nameravanega posega na okolje in načinu njegove priprave, Ur.l. RS, št. 36/2009 Weiner E. R. 2000. Applications of environmental chemistry: A practical guide for environmental professionals. 1st Edition. Boca Raton, Florida, USA. Lewis Publishers, CRC Press LLC: 271