Università degli Studi di Cagliari - CORE
126
Università degli Studi di Cagliari DOTTORATO DI RICERCA in Scienze e Tecnologie Chimiche e Farmaceutiche Ciclo XXIII Smart nanostructured drug delivery systems based on non-ionic surfactants Settore/i scientifico disciplinari di afferenza CHIM-02 Chimicha Fisica Presentata da: Pradip Hiwale Coordinatore Dottorato: Prof. Mariano Casu Tutor: Prof.ssa. Maura Monduzzi Dr. Sergio Murgia Dr. Andrea Salis Esame finale anno accademico 2009 – 2010 brought to you by CORE View metadata, citation and similar papers at core.ac.uk provided by UniCA Eprints
-
Upload
khangminh22 -
Category
Documents
-
view
1 -
download
0
Transcript of Università degli Studi di Cagliari - CORE

Università degli Studi di Cagliari
DOTTORATO DI RICERCA
in
Scienze e Tecnologie Chimiche e Farmaceutiche
Ciclo XXIII
Smart nanostructured drug delivery systems based on non-ionic surfactants
Settore/i scientifico disciplinari di afferenza
CHIM-02 Chimicha Fisica
Presentata da: Pradip Hiwale
Coordinatore Dottorato: Prof. Mariano Casu
Tutor: Prof.ssa. Maura Monduzzi
Dr. Sergio Murgia
Dr. Andrea Salis
Esame finale anno accademico 2009 – 2010
brought to you by COREView metadata, citation and similar papers at core.ac.uk
provided by UniCA Eprints

SMART NANOSTRUCTURED DRUG DELIVERY
SYSTEMS BASED ON NON-IONIC SURFACTANTS
Pradip Hiwale
PhD in Chemical Sciences and Pharmaceutical Technology
A dissertation
submitted to
University of Cagliari
in partial fulfillment of the requirements
for the degree of
Doctor of philosophy
Department of Chemical Sciences University of Cagliari SS 554 Bivio Sestu
09042 Monserrato (CA) ITALY
XXIII Cycle
2008-2010


Dedicated to my beloved parents & my loving grandmother


Acknowledgement
Pursuing a Ph.D. project is a unique experience full of
everyday happenings. To reach at this stage of highest academic
accomplishment, was possible only because of support of many
people who always stood beside me whenever I required their
guidance, help or assistance.
First of all, I’d like to give my sincere thanks to my
respectable supervisor, Prof Maura Monduzzi, who accepted me as
her Ph.D. student. She has always offered me ideas and suggestions
which were foundations to my research. Every time I met her for
discussions, she has motivated and encouraged me. Without her
help I could not have finished my dissertation successfully.
I must give special thanks to Dr Sergio Murgia. He is the one
whom I met first, when I arrived in Cagliari and from that day he
has always helped me in every possible way. His encouragement
and help made me feel confident to realize my desire of completing
doctorate degree.
I also appreciate very much to Dr Andrea Salis. Our
brainstorming discussions and conversations have boosted my
knowledge and vision. I’d like to give my sincere thanks to him for
his support and supervision.
Thanks are due to Gabriele Conti, Marco Piludu and Prof
Alessandro Riva for the precious collaborations in the
Electron Microscopy measurements, and to Prof Anna Maria
Fadda and Carla Caddeo for rheological measurements.
My thanks to my colleagues Sandrina Lampis, Maura
Carboni, Mariana Mamusa, Daniela Steri, Luca Medda and

Francesca Cugia. I will always remember the good time spent with
them in last three years.
I would like to thank MIUR for providing me ‘Young
Indian Researcher Fellowship’ for years 2008 and 2009.
Thanks are due to Projects MIUR DM28142 of the Sardinian
Biomedicine District, MIUR Prin 2008, grant number
2006030935, for financial support. Sardegna Ricerche Polaris
is thanked for free access to the instruments belonging to the
Nanobiotechnology laboratories. In addition thanks are due to
CSGI and CNBS for general expertise support.
I need to mention my sincere thanks to Prof. Arvind K.
Bansal, who has recommended me to pursue PhD in University of
Cagliari. His teachings will always remain fundamental for me.
I give my heartfelt thanks to all my friends and well-wishers.
However, this list is not complete; I would like to mention some
names: Prof. Sanjay Kasture, Amit Khairnar, Ajita, Shaji,
Manishankar, Brajesh, Amita, Amit Kumar, Shailendra, Saumya,
Yogesh, Pallab, Amit Phatale, Abhijeet and Amol.
I am very much grateful to my parents. Their
understanding and affection encouraged me to work sincerely
and to continue pursuing Ph.D. abroad.
Last but not the least, I would like to express thanks to
my wife Kavita, who lived apart from me, even after the
marriage. Her love and support has enabled me to work hard.
-Pradip Hiwale
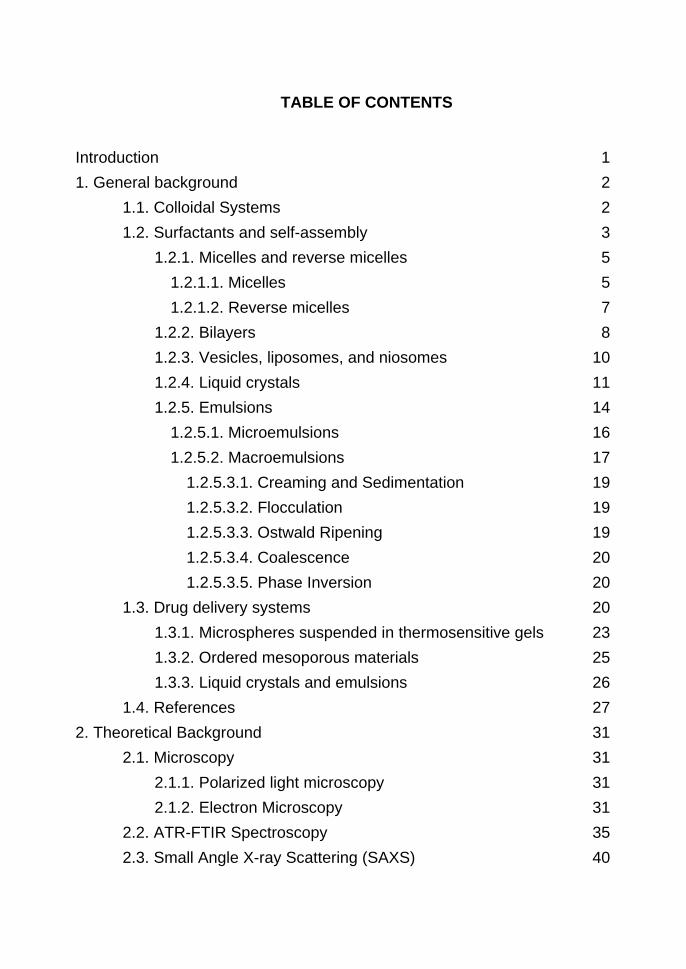
TABLE OF CONTENTS
Introduction 1
1. General background 2
1.1. Colloidal Systems 2
1.2. Surfactants and self-assembly 3
1.2.1. Micelles and reverse micelles 5
1.2.1.1. Micelles 5
1.2.1.2. Reverse micelles 7
1.2.2. Bilayers 8
1.2.3. Vesicles, liposomes, and niosomes 10
1.2.4. Liquid crystals 11
1.2.5. Emulsions 14
1.2.5.1. Microemulsions 16
1.2.5.2. Macroemulsions 17
1.2.5.3.1. Creaming and Sedimentation 19
1.2.5.3.2. Flocculation 19
1.2.5.3.3. Ostwald Ripening 19
1.2.5.3.4. Coalescence 20
1.2.5.3.5. Phase Inversion 20
1.3. Drug delivery systems 20
1.3.1. Microspheres suspended in thermosensitive gels 23
1.3.2. Ordered mesoporous materials 25
1.3.3. Liquid crystals and emulsions 26
1.4. References 27
2. Theoretical Background 31
2.1. Microscopy 31
2.1.1. Polarized light microscopy 31
2.1.2. Electron Microscopy 31
2.2. ATR-FTIR Spectroscopy 35
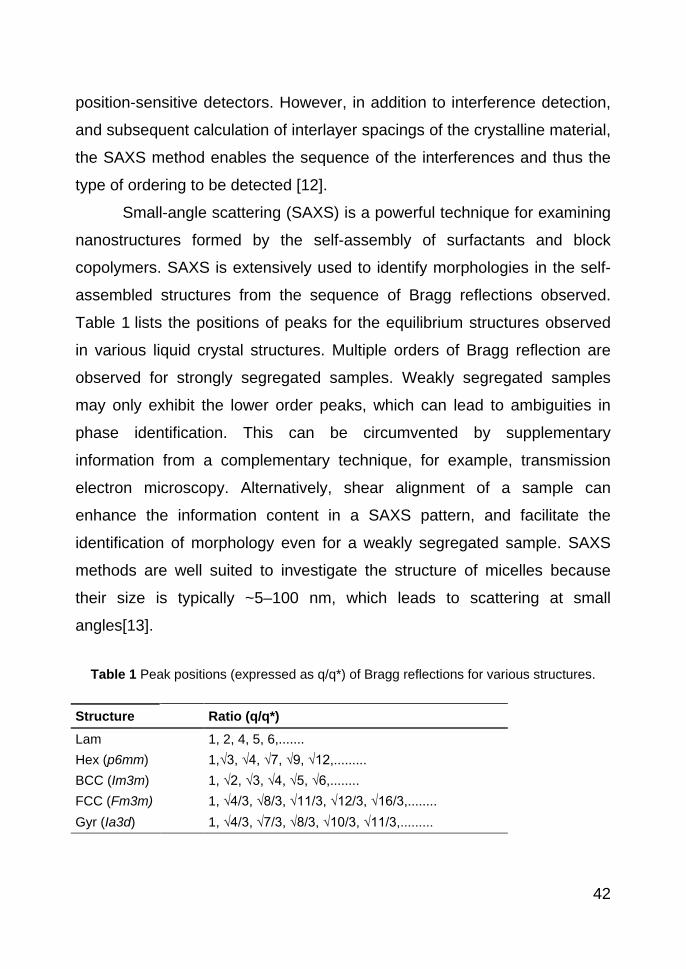
2.3. Small Angle X-ray Scattering (SAXS) 40

2.4. Rheology of gels 43
2.5. References 46
3. Microspheres suspended in Pluronic F127 gel 48
3.1. Introduction 48
3.2. Materials and methods 50
3.2.1. Materials 50
3.2.2. Preparation of gelatin microspheres 50
3.2.3. Lysozyme activity 51
3.2.4. Drug loading and encapsulation ratio of microspheres 52
3.2.5. Preparation of gel and microsphere/gel suspension 52
3.2.6. Microscopy 53
3.2.7. ATR-FTIR studies 53
3.2.8. Rheology 53
3.2.9. SAXS experiments 53
3.2.10. In vitro release studies 54
3.3. Results and discussion 55
3.3.1. Preparation of gelatin microspheres 55
3.3.2. Microscopy 57
3.3.3. ATR-FTIR studies 60
3.3.4. Rheological characterization 61
3.3.5. SAXS 63
3.3.6. In vitro release studies 65
3.4. Conclusions 67
3.5. References 68
4. Ordered mesoporous materials 72
4.1. Introduction 72
4.2. Materials and methods 74
4.2.1. Materials 74
4.2.2. Characterization of OMMs and lysozyme 74
4.2.3. Loading of lysozyme. 75
4.2.4. In vitro lysozyme release studies 76
4.3. Results and discussion 77
4.3.1. OMMs and protein characterization 77
4.3.1.1. OMMs characterization 77
4.3.1.2. Protein characterization 81
4.3.2. Adsorption of lysozyme on OMMs 83
4.3.3. Release of lysozyme 85
4.3.4. OMMs stability in the release medium 88
4.4. Conclusions 89
4.5. References 90
5. Monoolein based formulations for caffeine 95
5.1. Introduction 95
5.2. Materials and methods 97
5.2.1. Materials 97
5.2.1. Preparation of formulations 97
5.2.2. Polarized light microscopy (PLM) 98
5.2.3. Nuclear Magnetic Resonance (NMR) 99
5.2.3. SAXS experiments 100
5.2.4. In vitro release studies 101
5.3. Results and discussion 101
5.3.1. Phase behaviour 101
5.3.2. Polarized light microscopy 102
5.3.2 2H NMR 103
5.3.3. SAXS 105
5.3.4. In vitro release of caffeine 107
5.4. Conclusions 109
5.5. References 109
Concluding Remarks 113


1
INTRODUCTION
Smart nanostructured materials refer to the materials that can
respond to external stimuli or to their environment, and owing to their small
size and very large interfacial area; they possess specific properties and
functions. These materials are useful for biomedical applications, for
instance, site-specific drug delivery and tissue engineering. The
mechanisms used to achieve novel drug delivery systems typically
incorporate one or more of the following materials: biologics, polymers
and/or silica based materials.
The aim of this PhD work was to modify existing nanostructured
materials by altering specific parameters. Three different types of non-ionic
surfactants were utilized in this work to obtain diverse nanostructured drug
delivery systems. Triblock copolymers of polyoxyethylene and
polyoxypropylene viz. Pluronic F127 and Pluronic P123 were used to
prepare thermoreversible gels and templates for the synthesis of
mesoporous silica materials, respectively. A sorbitan alkyl ester - span 80
was used in the preparation of gelatin microspheres. The monoglyceride
surfactant monoolein was used to formulate different liquid crystalline
structures and W/O emulsions stabilized by liquid crystalline phases.
The model protein lysozyme and the small hydrophilic drug caffeine
were used to evaluate loading and release performances. Three different
types of formulations, mainly obtained using non-ionic surfactants, were
characterized by techniques such as polarized light microscopy (PLM),
scanning- and transmission electron microscopy (SEM and TEM), infrared
(IR) spectroscopy, potentiometry, rheology, small angle X-ray scattering
(SAXS), nuclear magnetic resonance (NMR) spectroscopy and N2
adsorption/desorption. Structural features were then correlated with the in
vitro release properties to study the effect of different variables.

2
1. GENERAL BACKGROUND
1.1. Colloidal Systems The term colloid applies broadly to systems containing at least two
components, in any state of matter, one dispersed in the other, where the
dispersed component consists of large molecules or small particles [1].
Thus, they consist of a dispersed phase (or discontinuous phase)
distributed uniformly in a finely divided state in a dispersing medium (or
continuous phase). Colloids are broadly classified into three major classes
viz. simple colloids, network colloids and multiple colloids. In case of simple
colloids, for example emulsions and colloidal suspensions, a clear
distinction between the dispersed phase and dispersing medium can be
made. Another important example is association colloids, where molecules
of surface active agents come together to form small aggregates (micelles)
in water. The nanostructures formed by surfactant molecules can adopt an
ordered structure to form liquid crystals. In case of network colloids, such
as certain gels, it is hardly possible to distinguish the two phases as they
consist of interpenetrating networks, the elements of each being of colloidal
dimension. Multiple colloids involve co-existence of three phases of which
two (and sometimes three) phases are finely divided. For example, multiple
emulsions where water in oil emulsion is dispersed in water or oil in water
emulsion is dispersed in oil [2].
The colloidal dispersed phase normally, but not necessarily, in all
cases lie between 10-10000 nm [3]. It is not obligatory for all three
dimensions to lie in these limits, since colloidal behavior is observed in
some systems containing fibers in which only one dimension is in colloidal
range. An alternative classification of colloids is based upon the type of
dispersing medium i.e. lyophobic (or hydrophobic when dispersing medium
is water) and lyophilic i.e. lyophilic (or hydrophilic when dispersing medium
3
is water) colloids, depending on whether particles can be described in the
former case as ‘solvent hating’ or in the latter case as ‘solvent loving’ [2].
1.2. Surfactants and self-assembly
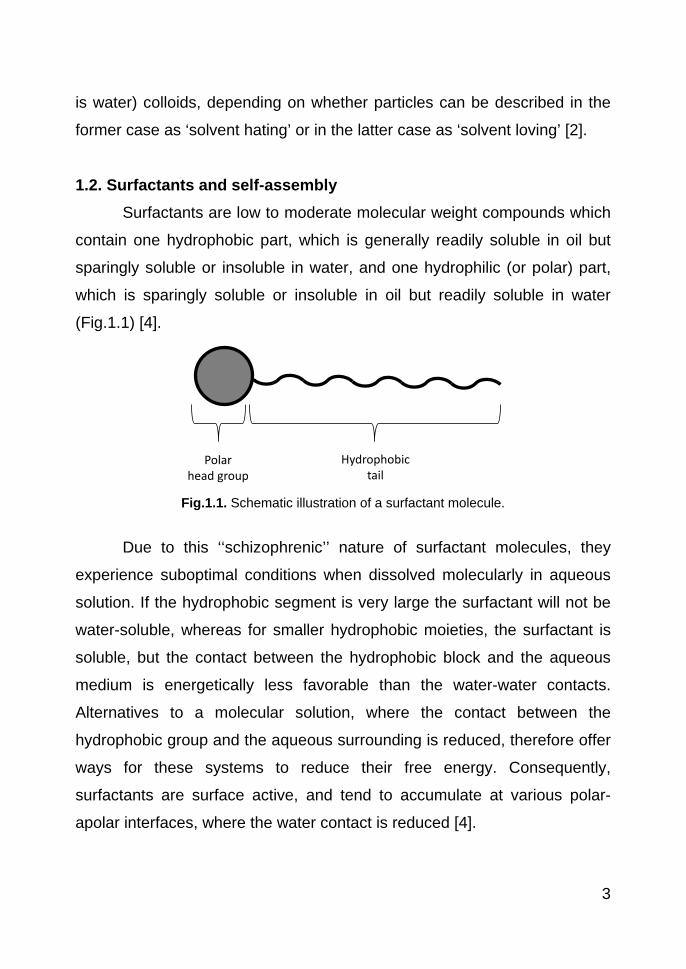
Surfactants are low to moderate molecular weight compounds which
contain one hydrophobic part, which is generally readily soluble in oil but
sparingly soluble or insoluble in water, and one hydrophilic (or polar) part,
which is sparingly soluble or insoluble in oil but readily soluble in water
(Fig.1.1) [4].
Fig.1.1. Schematic illustration of a surfactant molecule.
Due to this ‘‘schizophrenic’’ nature of surfactant molecules, they
experience suboptimal conditions when dissolved molecularly in aqueous
solution. If the hydrophobic segment is very large the surfactant will not be
water-soluble, whereas for smaller hydrophobic moieties, the surfactant is
soluble, but the contact between the hydrophobic block and the aqueous
medium is energetically less favorable than the water-water contacts.
Alternatives to a molecular solution, where the contact between the
hydrophobic group and the aqueous surrounding is reduced, therefore offer
ways for these systems to reduce their free energy. Consequently,
surfactants are surface active, and tend to accumulate at various polar-
apolar interfaces, where the water contact is reduced [4].
Polarhead group
Hydrophobic tail

4
Another way to reduce the oil-water contact is self-assembly, through
which the hydrophobic domains of the surfactant molecules can associate
to form various structures, which allow a reduced oil-water contact. Various
structures can be formed, including micelles, microemulsions, and a range
of liquid crystalline phases (Fig.1.2). The type of structures formed depends
on a range of parameters, such as the size of the hydrophobic tail, the
nature and size of the polar head group, temperature, salt concentration,
pH, etc. Through varying these parameters, one structure may also turn
into another, which offers interesting opportunities in triggered drug delivery
[4].
The primary mechanism for surfactants to reduce the energy in most
cases will be adsorption at the available interfaces. However, when all
interfaces begin to be saturated, the overall energy reduction may continue
through other mechanisms as illustrated in Fig.1.2 [3].
Fig.1.2. Modes of surfactant action for reduction of surface and interfacial energies.
Micelle formation
Liquid crystal formation
Adsorption at L/L interface
Adsorption at S/L interfaceor
Bilayer and vesicle formation
Crystalization
Adsorption at L/V interface
Monomer

5
Micelles and liquid crystals formation is a process of thermodynamic
random self-assembly whereas the formation of emulsions often involves a
tricky, kinetically driven process.
In the following sections these self-assembly structures are
discussed individually in order of the complexity of the structures.
1.2.1. Micelles and reverse micelles 1.2.1.1. Micelles
A micelle is a colloidal-size object that is formed by spontaneous
association of surfactant molecules. When dissolved in aqueous medium
part of the initially added surfactant molecules are adsorbed onto the air–
liquid interface and form an adsorbed monolayer. Since the space for the
monolayer formation is limited at the surface, the rest of the molecules
remain in the solution as a free form of molecules (monomers). In general,
the main attractive driving force for the micellization (micelle formation) is
the hydrophobic interaction (Fig.1.3).
Fig.1.3. Micelle formation: micellization.
As the concentration of surfactant increases, the monomers come
close together because of this interaction. This also brings closely together
the head groups, which can be either ionic (for ionic surfactants) or
hydrated (for nonionic surfactants). Thus, the repulsive force between the
head groups begins to arise on the surface of the self-assembled aggregate
cmc
hydrophilic head
hydrophobic tail
monomer 2-20 nmmicelle
6
(micelle). The transition of monomers into this self-assembled aggregate
form occurs when these two opposite forces are balanced. The micelle is at
equilibrium with monomers. For most of the surfactants, the initially formed
micelle has spherical or near-spherical shape (close to ellipsoidal in the
case of longer chain length). The monomer concentration where the first
micelle begins to appear is defined as critical micelle concentration or cmc.
Since pre-micellar aggregates are formed in many cases, this point for the
cmc is not always clear cut. Thus, the cmc is often determined by the
empirical average of the narrow ranges of concentration. Typical cmc
ranges are from 10−5 to 10−2 mole/liter for most of the single-chain
surfactants and the amphiphilic polymers, such as the Pluronic series. The
aggregation number is the number of surfactant or polymer molecules
within a micelle. It ranges 50-10,000. No micelle has a clear-cut
aggregation number. It always shows a Gaussian-type distribution. Thus,
the aggregation numbers from the references are the average number.
Naturally, this is quite dependent on the measurement method and
calculation process. So is the cmc. Studies using various techniques show
that the state of the micelle core region is close to that of the bulk
hydrocarbon. The microviscosity of the micelle core of typical surfactants
ranges ∼10 - ∼50 cP at room temperature.
Ninham et al. has proposed the concept of the surfactant (or micelle)
packing parameter [5-7].
𝑃𝑃 =𝑣𝑣𝑎𝑎0 𝑙𝑙
(1)
where v is the volume of the hydrocarbon chain of the surfactant
monomer in the micelle, ao is the area occupied by the head group on the
micelle surface, and l is the apparent length of the hydrocarbon chain of the
surfactant monomer in the micelle. All these are the simple molecular
7
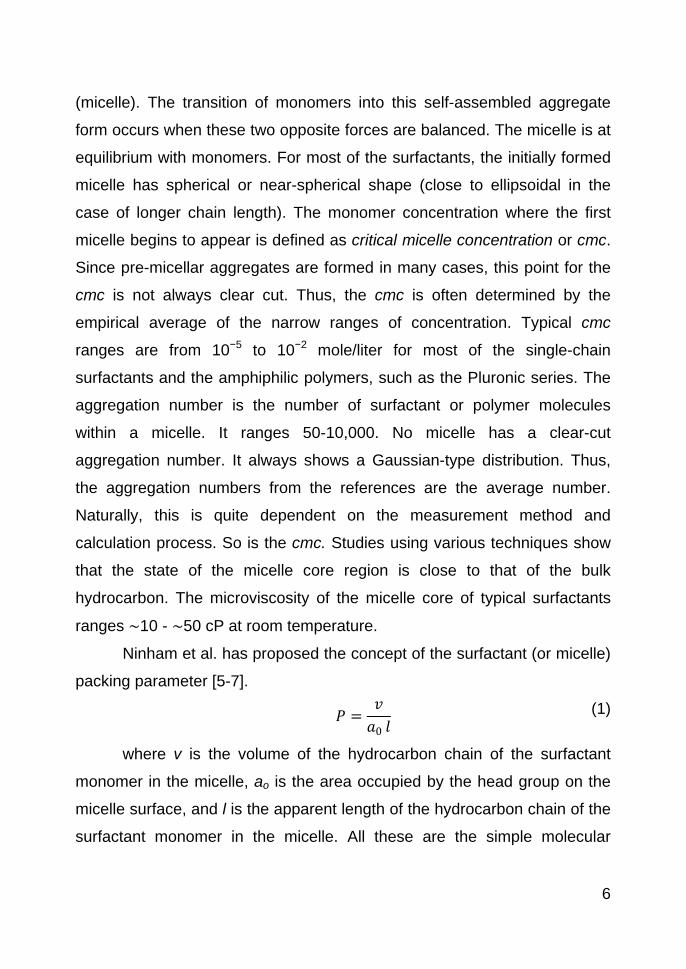
parameters of surfactant. The term aol has the dimension of volume; thus, P
becomes a dimensionless parameter.
Fig.1.4. Surfactant packing parameter (P).
Once the three sub-parameters v, ao and l are estimated, it is
possible to predict the most favored nanostructure using the surfactant
packing parameter (Fig.1.4). For example, when the P-value is close to 1/3,
one can predict the formation of a spherical micelle by the simple
geometrical consideration of packing of cone-type monomer into three -
dimensional self-assembled aggregate. Similarly, when the P-value is close
to 1/2, one can predict that rod-like micelles will be formed. When the P-
value is close to 1, the unit packing shape becomes the cylinder type; thus
a bilayer-type nanostructure is the most likely structure to be assembled. P
> 1 results in reverse nanostructures (micelle).
1.2.1.2. Reverse micelles The ideal reverse micelle should be composed of the surfactant
molecules that are positioned in reverse compared with those of normal
ao
ao
lv
l (length)
v (volume)
(area)
micelle cross-section
P = 1/3Spherical micelle
P = 1/2Rodlike micelle
P = 1Bilayer
P > 1Reverse micelle
8
micelles (Fig.1.12). To have thermodynamically stable reverse micelles that
can be counterparts of normal micelles, there should be at least a minimum
number of hydrated water molecules that can balance the repulsive force
with the attractive hydrophobic force. When the content of water molecules
increases, the core region of reverse micelles can hold additional water
molecules that are not needed for the hydration of the polar head groups.
This water droplet thus can be named as confined or nanoscale medium.
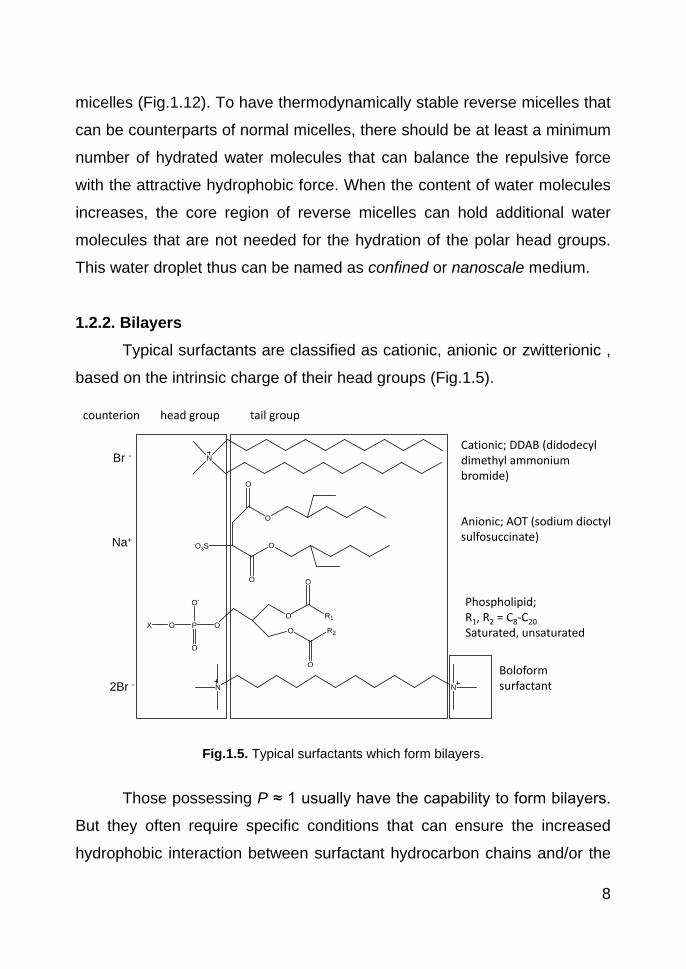
1.2.2. Bilayers
Typical surfactants are classified as cationic, anionic or zwitterionic ,
based on the intrinsic charge of their head groups (Fig.1.5).
Fig.1.5. Typical surfactants which form bilayers.
Those possessing P ≈ 1 usually have the capability to form bilayers.
But they often require specific conditions that can ensure the increased
hydrophobic interaction between surfactant hydrocarbon chains and/or the
O
O
O
O
-O3S
OO
OP
R1
R2
O
O
O-
O
OX
N
N N
counterion head group tail group
Br -
Na+
2Br -
Cationic; DDAB (didodecyldimethyl ammonium bromide)
Anionic; AOT (sodium dioctyl sulfosuccinate)
Phospholipid;R1, R2 = C8-C20Saturated, unsaturated
Boloformsurfactant
9
decreased repulsive interaction between head groups. Thus, typical binary-
phase diagrams of such surfactants with water at these conditions show a
wide range of micelle region (spherical, rodlike, wormlike, etc.) that is
followed by a liquid crystal region at higher concentration [8].
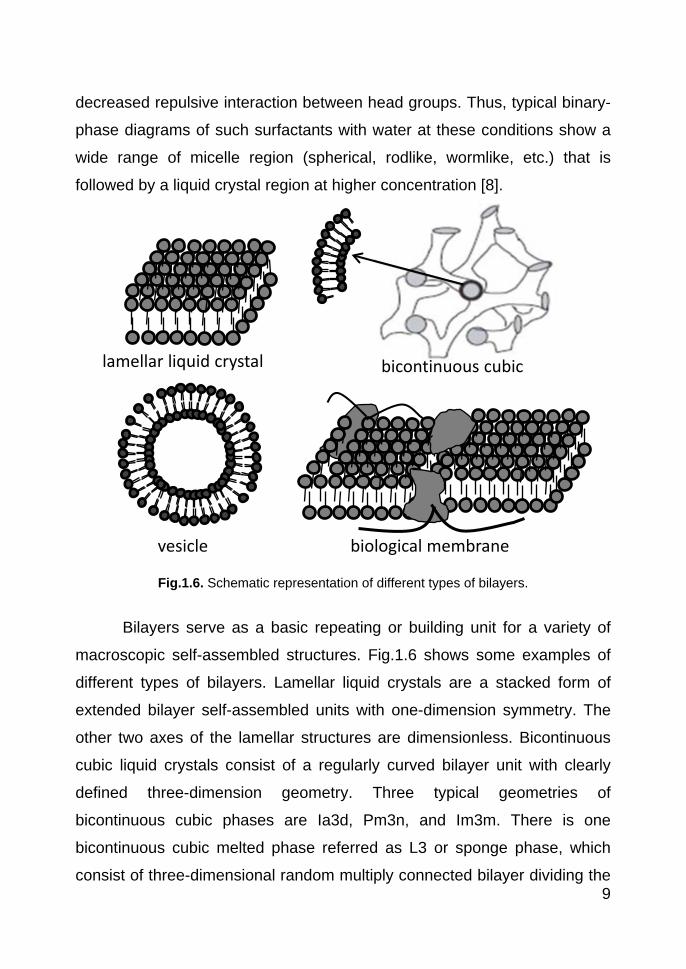
Fig.1.6. Schematic representation of different types of bilayers.
Bilayers serve as a basic repeating or building unit for a variety of
macroscopic self-assembled structures. Fig.1.6 shows some examples of
different types of bilayers. Lamellar liquid crystals are a stacked form of
extended bilayer self-assembled units with one-dimension symmetry. The
other two axes of the lamellar structures are dimensionless. Bicontinuous
cubic liquid crystals consist of a regularly curved bilayer unit with clearly
defined three-dimension geometry. Three typical geometries of
bicontinuous cubic phases are Ia3d, Pm3n, and Im3m. There is one
bicontinuous cubic melted phase referred as L3 or sponge phase, which
consist of three-dimensional random multiply connected bilayer dividing the
lamellar liquid crystal bicontinuous cubic
vesicle biological membrane
10
solvent into two sub-volumes [9]. Some gels (hydrogel and organogel) are
also stabilized by the action of the bilayer unit. A vesicle is a metastable
suspension of spherical (globular) enclosed bilayers. A basic structure of
biological membranes is a bilayer of various lipids with embedded proteins.
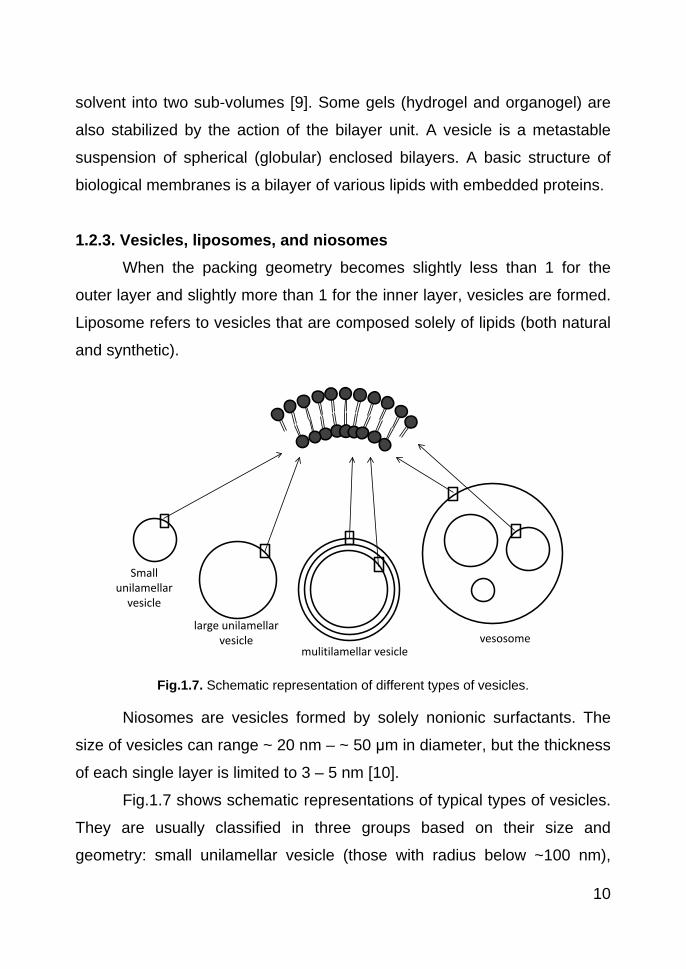
1.2.3. Vesicles, liposomes, and niosomes
When the packing geometry becomes slightly less than 1 for the
outer layer and slightly more than 1 for the inner layer, vesicles are formed.
Liposome refers to vesicles that are composed solely of lipids (both natural
and synthetic).
Fig.1.7. Schematic representation of different types of vesicles.
Niosomes are vesicles formed by solely nonionic surfactants. The
size of vesicles can range ~ 20 nm – ~ 50 μm in diameter, but the thickness
of each single layer is limited to 3 – 5 nm [10].
Fig.1.7 shows schematic representations of typical types of vesicles.
They are usually classified in three groups based on their size and
geometry: small unilamellar vesicle (those with radius below ~100 nm),
Small unilamellar
vesicle
large unilamellar vesicle
mulitilamellar vesiclevesosome
11
large unilamellar vesicle (those with radius above ~ 100 nm), and
multilamellar vesicle [11]. A large unilamellar vesicle with different sizes of
smaller unilamellar vesicles inside is named a vesosome.
Vesicles, in most cases, are thermodynamically unstable but
kinetically stable self-assembled aggregates. A vesicle “solution” is a
dispersion of those aggregates. Thus, a variety of physicochemical
properties of vesicles depend on preparation and post-preparation
techniques such as sonication, filtration, extrusion, and so forth. These
treatments in turn provide useful means to control size and shape of
vesicles for given applications.
1.2.4. Liquid crystals Liquid crystals show both crystalline solid and isotropic liquid
characteristics at ambient temperature and pressure. They display some
degree of geometrical ordering but with some degree of molecular mobility.
Liquid crystals are thermodynamically stable and their phases are referred
as mesophases. No strong bonds as those are involved in the solid state
are responsible for the liquid crystalline state. Weak intermolecular forces
are the only interactions responsible of this state. Their macroscopic
appearance often looks like a gellish solid but with some degree of fluidity,
and some of them show crystalline solid-like properties such as optical
anisotropy. Based on the origin of intermolecular interactions that induce
the ordering, liquid crystals are classified as thermotropic and lyotropic
liquid crystals. Thermotropic liquid crystals are induced by temperature
changes, while lyotropic liquid crystals are formed by the change of
concentrations in the presence of a solvent.
Surfactant liquid crystals have more variety of structural diversity
than thermotropic liquid crystals and usually exist in equilibrium with
monomers. They are often in equilibrium with other self-assembled
12
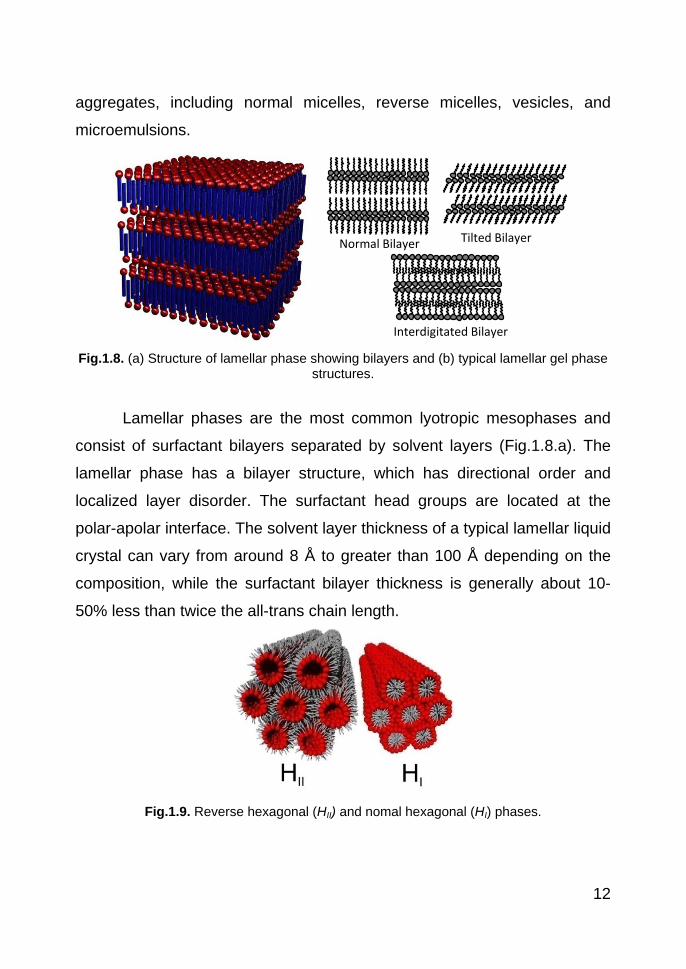
aggregates, including normal micelles, reverse micelles, vesicles, and
microemulsions.
Fig.1.8. (a) Structure of lamellar phase showing bilayers and (b) typical lamellar gel phase
structures.
Lamellar phases are the most common lyotropic mesophases and
consist of surfactant bilayers separated by solvent layers (Fig.1.8.a). The
lamellar phase has a bilayer structure, which has directional order and
localized layer disorder. The surfactant head groups are located at the
polar-apolar interface. The solvent layer thickness of a typical lamellar liquid
crystal can vary from around 8 Å to greater than 100 Å depending on the
composition, while the surfactant bilayer thickness is generally about 10-
50% less than twice the all-trans chain length.
Fig.1.9. Reverse hexagonal (HII) and nomal hexagonal (HI) phases.
Normal Bilayer Tilted Bilayer
Interdigitated Bilayer
13
In many systems, at temperatures below that at which the lamellar
phase forms, a gel phase (Lβ) exists. Such phases consist of similar bilayer
structures to those in lamellar phases: however, the alkyl chains are frozen
in an all-trans configuration (Fig.1.8.b) [12].
Lyotropic hexagonal mesophases consist of infinite liquid cylinders
organized on a hexagonal lattice with surfactant polar heads located at the
interface of the cylinders. For packing parameter P < 1, (hydrophilic
surfactants), oil in water self-assembly structured (normal hexagonal or HI)
phases are formed. Lipophilic surfactants (P > 1) form reverse self-
assembly structures (water in oil) commonly referred as the reverse
hexagonal structure (HII) (Fig.1.9).
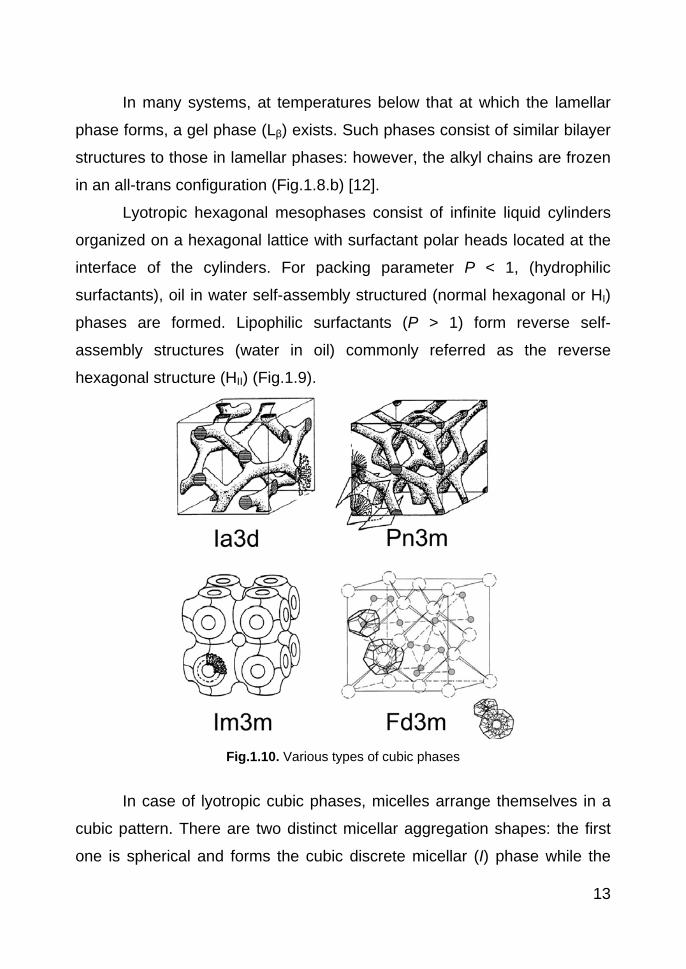
Fig.1.10. Various types of cubic phases
In case of lyotropic cubic phases, micelles arrange themselves in a
cubic pattern. There are two distinct micellar aggregation shapes: the first
one is spherical and forms the cubic discrete micellar (I) phase while the
14
second one is rod-like, interconnected in a three dimensional scheme and
form the bicontinuous cubic (V) phase. The three common structures of
bicontinuous cubic phases include double diamond (Pn3m), gyroid (Ia3d)
and primitive (Im3m), whereas the common example of discrete cubic
micellar phase is face centered cubic (fcc) or Fd3m (Fig.1.10). From an
optical point of view, all types of cubic phases present no texture, since
they are isotropic and can be distinguished from the isotropic micellar
solutions only by their high viscosity. The cubic phases I and V can be
correctly identified one from another by their precise location among other
phases. In the hypothesis of increasing progressively the surfactant
concentration, the I phase location is between the isotropic micellar solution
and the hexagonal one, while the V phase location is between the
hexagonal phase and the lamellar one. However, only small angle X-ray
scattering (SAXS) technique can assign the type of cubic liquid crystalline
structure univocally.
1.2.5. Emulsions
A surfactant can be used to stabilize the mixture of two immiscible
liquids (such as oil and water). The surfactants are self-assembled into
protective layers at the interface between the two liquids, and dramatically
decrease the interfacial tension between the two liquids, which stabilizes
the water or oil droplets. The head group of the surfactant is toward water
side, while the tail group is toward the oil phase. These systems are
referred as emulsions. Two types of emulsion are possible, based on the
ratio of water to oil phase. When the water is the disperse phase while oil
forms the droplets, it is defined as oil-in-water emulsion (O/W). Water-in-oil
(W/O) is the reverse situation, with water droplets in the oil-disperse phase.
Emulsions are also classified as microemulsions and macroemulsions,
depending on the size of the droplets and the thermodynamic properties.
15
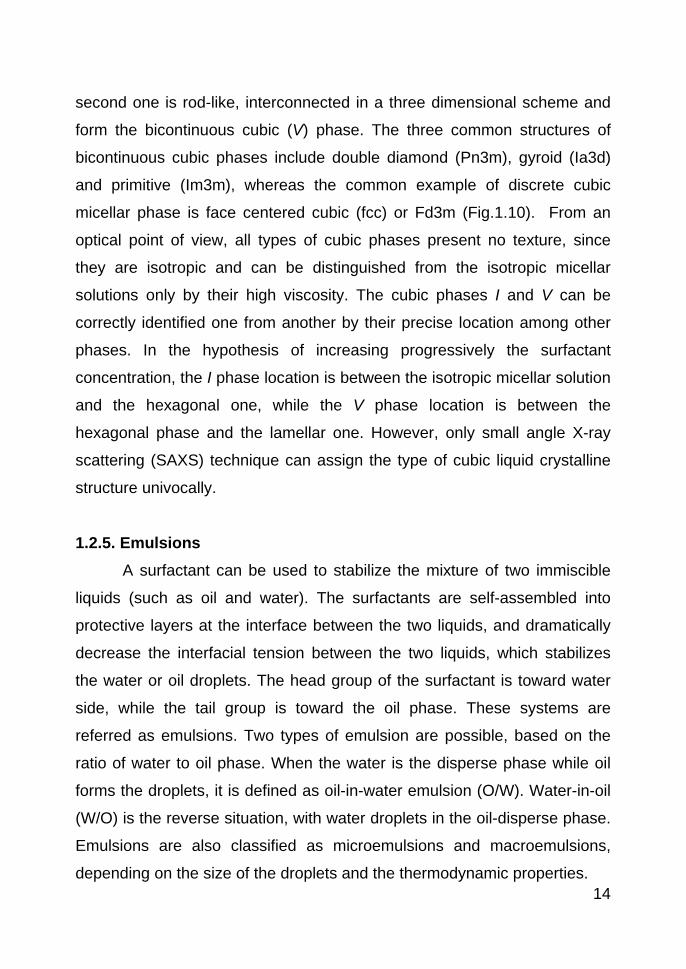
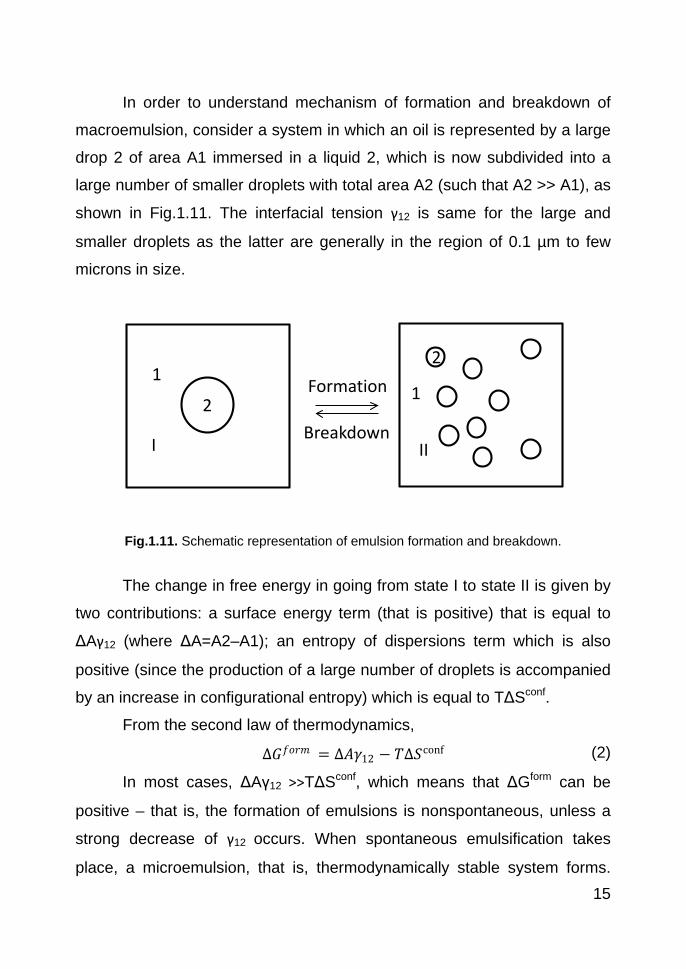
In order to understand mechanism of formation and breakdown of
macroemulsion, consider a system in which an oil is represented by a large
drop 2 of area A1 immersed in a liquid 2, which is now subdivided into a
large number of smaller droplets with total area A2 (such that A2 >> A1), as
shown in Fig.1.11. The interfacial tension γ12 is same for the large and
smaller droplets as the latter are generally in the region of 0.1 µm to few
microns in size.
Fig.1.11. Schematic representation of emulsion formation and breakdown.
The change in free energy in going from state I to state II is given by
two contributions: a surface energy term (that is positive) that is equal to
ΔAγ12 (where ΔA=A2–A1); an entropy of dispersions term which is also
positive (since the production of a large number of droplets is accompanied
by an increase in configurational entropy) which is equal to TΔSconf.
From the second law of thermodynamics,
∆𝐺𝐺𝑓𝑓𝑓𝑓𝑓𝑓𝑓𝑓 = ∆𝐴𝐴𝛾𝛾12 − 𝑇𝑇∆𝑆𝑆conf (2)
In most cases, ΔAγ12 >>TΔSconf, which means that ΔGform can be
positive – that is, the formation of emulsions is nonspontaneous, unless a
strong decrease of γ12 occurs. When spontaneous emulsification takes
place, a microemulsion, that is, thermodynamically stable system forms.
2
1
I
Formation
Breakdown
2
II
1
16
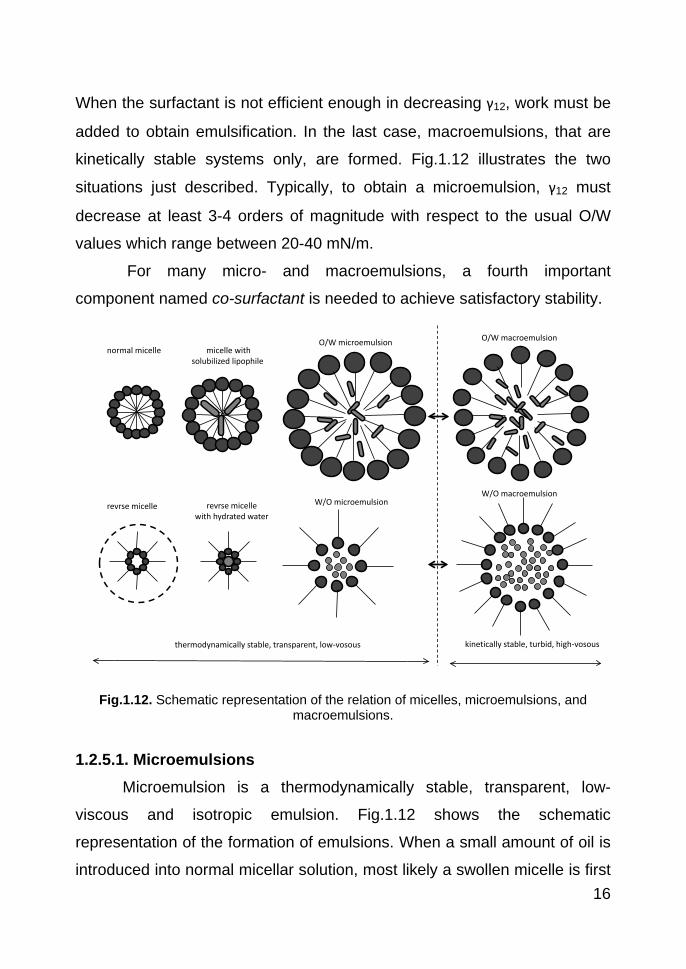
When the surfactant is not efficient enough in decreasing γ12, work must be
added to obtain emulsification. In the last case, macroemulsions, that are
kinetically stable systems only, are formed. Fig.1.12 illustrates the two
situations just described. Typically, to obtain a microemulsion, γ12 must
decrease at least 3-4 orders of magnitude with respect to the usual O/W
values which range between 20-40 mN/m.
For many micro- and macroemulsions, a fourth important
component named co-surfactant is needed to achieve satisfactory stability.
Fig.1.12. Schematic representation of the relation of micelles, microemulsions, and
macroemulsions.
1.2.5.1. Microemulsions Microemulsion is a thermodynamically stable, transparent, low-
viscous and isotropic emulsion. Fig.1.12 shows the schematic
representation of the formation of emulsions. When a small amount of oil is
introduced into normal micellar solution, most likely a swollen micelle is first
normal micelle micelle with solubilized lipophile
O/W microemulsion O/W macroemulsion
revrse micelle revrse micellewith hydrated water
W/O microemulsionW/O macroemulsion
thermodynamically stable, transparent, low-vosous kinetically stable, turbid, high-vosous
17
formed as the oil (or hydrophobic molecule) is solubilized inside the normal
micelle. This is a typical micellar solubilization. As more oil is solubilized,
the micelle swells further, and oil droplets begin to be formed inside the
micelle. This oil droplet stays in almost a pure oil phase, but not as the
mixture of oil and hydrocarbon chain of surfactant. This ideal state thus can
be regarded as the oil droplets emulsified (or stabilized) by surfactant layers
in the water phase. This is the O/W microemulsion. In case of these
thermodynamically stable systems also bicontinuous nanostructures, as in
the case of cubic liquid crystals, have been reported.
1.2.5.2. Macroemulsions Macroemulsion may be defined as an opaque, heterogeneous
system of two immiscible liquid phases (oil and water) where one of the
phases is dispersed in the other as drops of microscopic or colloidal size
(typically around 1 µm). There are two kinds of simple macroemulsions viz.
oil-in-water (O/W) and water-in-oil (W/O), depending on which phase
comprise the drops. Macroemulsions made by the agitation of the pure
immiscible liquids are very unstable and break rapidly to the bulk phases.
They may be stabilized by the addition of surfactants, which protect the
newly formed droplets from coalescence [13].
In the absence of any stabilization mechanism, the emulsion will
break by flocculation, coalescence, Ostwald ripening, or a combination of
all these processes.
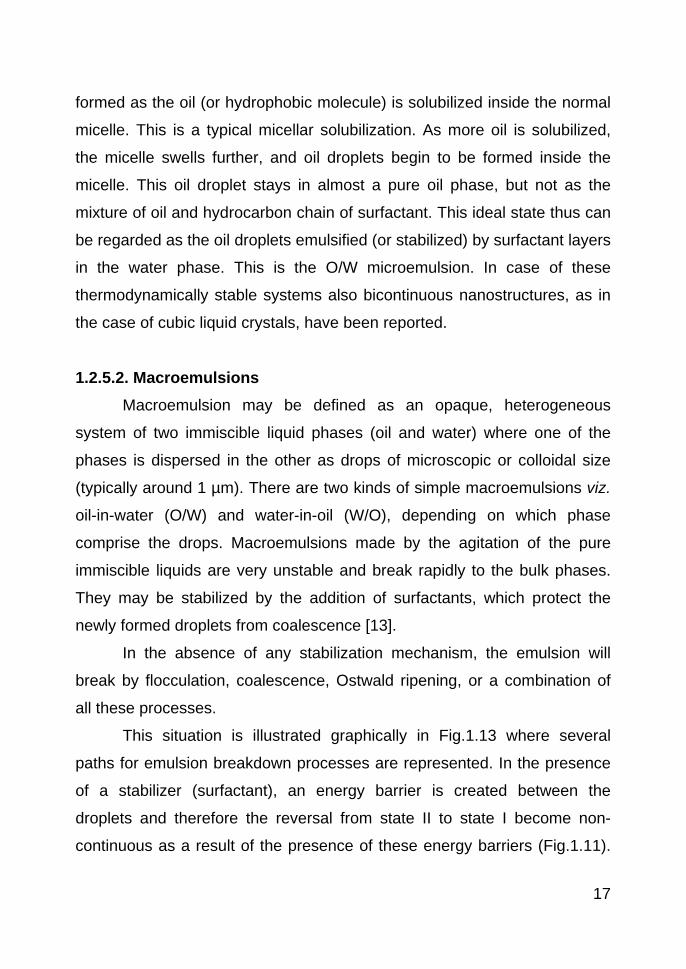
This situation is illustrated graphically in Fig.1.13 where several
paths for emulsion breakdown processes are represented. In the presence
of a stabilizer (surfactant), an energy barrier is created between the
droplets and therefore the reversal from state II to state I become non-
continuous as a result of the presence of these energy barriers (Fig.1.11).
18
Thus, in the presence of the energy barriers, the system becomes
kinetically stable.
Fig.1.13. Schematic representation of the various breakdown processes in emulsions.
The physical phenomena involved in each breakdown process are
not simple, and requires an analysis of the various surface forces involved.
In addition, these processes may take place simultaneously rather than
consecutively, which in turn complicates the analysis. Model
macroemulsions, with monodisperse droplets, cannot be easily produced
and hence any theoretical treatment must take into account the effect of
polydispersity. In addition, the measurement of surfactant adsorption in
macroemulsion is not simple, and such information must be extracted from
measurements made at a planar interface [14].
A summary of each of the breakdown processes is provided in the
following sections, together with details of each process.
Sedimentation
Coalescence
19
1.2.5.3.1. Creaming and Sedimentation Creaming is the process by which buoyant macroemulsion droplets
tend to rise to the top of a container. It is the same process as
sedimentation, but in the opposite direction [15]. This process results from
external forces, usually gravitational or centrifugal. When such forces
exceed the thermal motion of the droplets (Brownian motion), a
concentration gradient builds up in the system such that the larger droplets
move more rapidly either to the top (if their density is less than that of the
medium) or to the bottom (if their density is greater than that of the medium)
of the container. In the limiting cases, the droplets may form a close-packed
(random or ordered) array at the top or bottom of the system, with the
remainder of the volume occupied by the continuous liquid phase.
1.2.5.3.2. Flocculation This process refers to aggregation of the droplets (without any
change in primary droplet size) into larger units. It is the result of the van
der Waals attractions which are universal with all disperse systems.
Flocculation occurs when there is not sufficient repulsion to keep the
droplets apart at distances where the van der Waals attraction is weak.
Flocculation may be either strong or weak, depending on the magnitude of
the attractive energy involved.
1.2.5.3.3. Ostwald Ripening Ostwald ripening in macroemulsions is the growth of one droplet at
the expense of a smaller one due to the difference in chemical potential of
the continuous phase between different droplets arising from their different
radii of curvature. This chemical potential increases with decreasing radius
and consequently the solubility of the material comprising the droplet phase
increases. The smaller droplets thus tend to dissolve and their material
20
diffuses through the bulk phase and re-deposits onto a larger droplet,
resulting in an overall increase in the average radius of the macroemulsion.
Ostwald ripening generally proceeds with the cube of the average radius
varying linearly with time. As the radius of the emulsion droplets increases,
the rate of change in droplet radius falls rapidly since dr/dt = (1/r2)dr3/dt;
thus, for a given rate of ripening, the rate of change in radius falls as r-2 [16].
1.2.5.3.4. Coalescence This refers to the process of thinning and disruption of the liquid film
between the droplets, with the result that fusion of two or more droplets
occurs to form larger droplets. The limiting case for coalescence is the
complete separation of the emulsion into two distinct liquid phases. The
driving force for coalescence is the surface or film fluctuations; this results
in a close approach of the droplets whereby the van der Waals forces are
strong and prevent their separation.
1.2.5.3.5. Phase Inversion Phase inversion refers to the phenomenon when an O/W
macroemulsion, quite suddenly changes its morphology and becomes a
W/O macroemulsion [17]. In many cases, phase inversion passes through a
transition state whereby multiple emulsions are produced.
1.3. Drug delivery systems Successful drug delivery requires consideration of numerous
aspects. Depending on the route of administration, the disease or disorder,
the properties of the drug, and many other aspects, various strategies have
to be developed. Without doubt the most generically important aspects of
any therapy are its efficacy and safety [4]. First and foremost, the drug
concentration should be sufficiently high at the site of action in order to

21
have a therapeutic effect, but at the same time it should not be too high,
since this may result in detrimental side effects. For a safe and efficient
therapy, the drug concentration should preferably lie essentially constant
within ‘‘therapeutic window’’ over the time of action (Fig.1.14).
Fig.1.14. Schematic illustration of the drug level for an ideal sustained release formulation (solid line) and of a more typical situation demanding repeated administration (dotted line).
The goal of a constant drug concentration within the therapeutic
window at the site of action over a suitable therapeutic time puts
requirements not only on the drug but also on the drug formulation. The
drug delivery system should preferably be designed so that a preferential
accumulation of the drug is reached at the site of action, whereas the drug
concentration elsewhere in the body should be as low as possible. The
reason for this need of ‘‘targeting’’ is that a high concentration of the drug in
tissues or cells other than those being targeted may cause problems
related to side effects. A typical example of the latter is cancer therapy,
where accumulation of chemotherapeutic agents in areas other than the
tumor frequently causes severe side effects, some of which may be dose
limiting, thereby limiting also the efficacy of the treatment [18]. Furthermore,
the drug should be stable against degradation during storage and
Drug
con
cent
ratio
n
Time
A
B BB
A = first administration
B = following administration Toxic
level
Minimum therapeutic level
Therapeutic range

22
administration, and the formulation designed so that drug degradation is
minimized. Once the drug has performed its action, however, it should
either be straightforwardly excreted or metabolized to harmless
compounds. There are also many other aspects to a drug delivery system,
e.g., in relation to the route of administration. Naturally, the preferred
situation is that the drug is straightforwardly administrable by the patient
himself/herself, without unpleasant sensations. However, depending on a
number of different aspects also other routes may be chosen. The complete
therapeutic strategy therefore involves choice not only of the drug but also
of the drug delivery system and the administration route. Different routes of
administration put different requirements on the drug delivery system, and
consequently different drug delivery systems tend to have their primary
application within a given route of administration, and within a certain type
of indication. For example, in oral drug delivery, the drug and the drug
carrier have to pass through the stomach, with its quite low pH, which tends
to affect drug stability and drug solubility, as well as the properties of the
drug carrier system. Also, the uptake in the intestine puts some rather
demanding requirements on the drug and the drug formulation, not the least
for hydrophobic drugs and/or large molecules (e.g., protein and peptide
drugs). In topical administration the penetration over the stratum corneum
poses a severe limitation in the therapy efficacy, which puts special
demands on the drug delivery system. In intravenous drug delivery, the
uptake of the drug and the drug carrier in the reticuloendothelial system
frequently reduces the drug bioavailability and results in dose-limiting side
effects.
For this thesis work, three different drug delivery systems mainly
based upon non-ionic surfactants were studied and are briefly described in
following sections.

23
1.3.1. Microspheres suspended in thermosensitive gels
Microspheres are usually solid, approximately spherical particles
containing dispersed drug in either solution or microcrystalline form.
Incorporation of drugs can be achieved by entrapment during production
(polymerization, gelation, or encapsulation techniques, such as
coacervation and phase separation) and by covalent and ionic attachment.
Microspheres may be prepared from natural polymers such as gelatin and
albumin [19-20] and from synthetic polymers such as polylactic and
polyglycolic acid [21-22]. The drug is either totally encapsulated within a
distinct capsule wall or is dispersed throughout the microsphere. Drug
release is controlled by dissolution and diffusion of the drug through the
microsphere matrix or the microcapsule wall, or by polymer degradation.
Microspheres range in size between approximately 1 and 1000 µm.
Consequently, these systems are outside the conventional colloidal size
range. In the pharmaceutical literature, however, microcapsules with sizes
up to approximately 15 µm are considered as colloidal-delivery systems
[23].
Chemical or physical crosslinking of some polymers leads to
hydrogel formation which absorbs a considerable amount of water while
maintaining their shape. Injectable hydrogels are of great interest as
potential materials for protein delivery [24]. Especially, thermo-sensitive and
sol–gel transition water soluble polymers can provide in-situ forming
hydrogels for delivery of therapeutic molecules upon injection into the body
without an invasive surgical procedure [25]. Physically crosslinked
hydrogels self-assembled as a result of intermolecular ionic interactions,
hydrogen bonding, and hydrophobic interactions are advantageous for
macromolecular delivery systems, since they provide a more benign
environment for encapsulation of proteins, compared to chemically
24
crosslinked hydrogels. Various synthetic thermo-sensitive polymers such as
poly(N-isopropylacrylamide) [26], polyphosphazenes[27], poly(ethylene
oxide) (PEO)/poly(propylene oxide) (PPO) tri-block copolymers [28], and
PEO/poly(d,l-lactide-co-glycolide) (PLGA) tri-block copolymers [29] have
been extensively studied for use as injectable sol–gel transition hydrogel
systems for pharmaceutical and biomedical applications. Among these, a
series of PEO–PPO–PEO tri-block copolymers (or Pluronics) has been
widely exploited as in-situ forming drug delivery carriers because they
exhibit unique sol–gel transition behaviors in response to temperature
variations in aqueous solution. These tri-block copolymers form spherical
micelles in aqueous solution by hydrophobic interaction between the middle
PPO segments [30]. Above a critical gelation temperature and
concentration, the self-assembled micelles are closely packed to produce a
physically crosslinked gel structure. This consists of discrete cubic micellar
phase, as described in section 1.2.4. However, the Pluronic hydrogels are
very soft and easily disintegrated and dissolved out upon contact with
excess amount of buffer solution. This is due to the fact that the
concentration of Pluronic copolymers is immediately diluted to below the
critical gelation concentration, resulting in the dis-assembling of the micellar
structure. Thus, when a highly concentrated aqueous solution of Pluronic
copolymer is injected into the body tissue as a sol state, the in-situ formed
gel structure cannot be maintained for the desired period to achieve
sustained release of encapsulated drugs.
A combination of microspheres and hydrogel has been attempted by
many researchers for various reasons. The examples include 5-Fluorouracil
in chitosan microspheres and Pluronic F127 (PF127) gel [31], insulin in
calcium-alginate microspheres and PF127 gel [32], Baclofen in poly(lactide-
co-glycolide) (PLGA) microspheres dispersed in chitosan and PF127 gels

25
[33], timolol maleate in Poly(adipic anhydride) microspheres and gelrite gel
[34], oxybenzone in gelatin microspheres and aloe vera gel [35].
1.3.2. Ordered mesoporous materials The porosity of a ceramic matrix can be ordered or disordered. It is
clear that a well-ordered pore distribution in a ceramic matrix favors the
homogeneity of the adsorption and release stages [36]. Ordered silica
mesoporous materials are potentially excellent candidates in the field of
controlled drug delivery systems for pharmaceutical drugs, proteins and
other biogenic molecules. Since the discovery of ordered mesoporous silica
materials in 1990s, synthesis and applications of mesoporous solids have
received intensive attention due to their highly ordered structures, larger
pore size, and high surface area [37].
Table 1 Porous structures of mesoporous materials.
Mesoporous solid Space group
Pore diameter (nm) Structure
MCM-41 P6mm 2-5 Hexagonal 1D channel MCM-48 Ia3d 2-5 Bicontinuous 3D SBA-15 P6mm 5-10 Hexagonal 1D channel
SBA-16 Im3m Min 1-6; max 4-9 Body centre arrangement of cages SBA-1 Pm3m 2-4 Cubic 3D SBA-3 P6mm 2-4 2D hexagonal MSU P6mm 2-5 2D hexagonal HMS P6mm 2-5 Hexagonal
Table 1 presents the porous structure of some mesoporous
materials, which have been employed for drug delivery [37]. Vallet-Regi et
al. in 2000 has reported the application of MCM-41 as a new drug delivery
system [38]. This has stimulated many researchers to develop different
types of mesoporous materials with varying porous structure and
functionality for sustained drug released and stimuli-responsive release.
MCM-41 shows hexagonal arrays of cylindrical mesopores. The structure of
26
the wall of the pores consists of a disordered network of siloxane bridges
and free silanol groups that could act as reacting nuclei against appropriate
guest chemical species, behaving as a matrix for controlled adsorption and
liberation of organic molecules. The pore morphology and clearance
determine the type of molecules that can fit into these materials and,
therefore, those that are eligible for the adsorption process; however, the
maximum amount accepted depends on the pore volume, which is
generally described in terms of cm3g-1 of material. In systems that only
contain mesopores, the total pore volume is evidently equal to the
mesopore total volume, but this is not generally the case. Frequently, there
are also micropores or even macropores (pores with diameter larger than
50 nm); this last type of pore is usually associated to interparticle porosity,
and its contribution to the total pore volume increases with decreasing
particle size in the material. Undoubtedly, the specific surface is a
parameter that influences the adsorption properties of the material, since it
is a surface phenomenon itself. The concept of surface encompasses not
only the outer surface of the material, but also the inner surface of its
cavities and channels, provided that the nitrogen-based molecules used in
these measurements can pass freely through these inner areas [39].
1.3.3. Liquid crystals and emulsions The description about various liquid crystals has been given in
section 1.2.4. The stabilization of emulsions by lamellar liquid crystals has
been reported by Friberg et al. [40]. In order to further stabilize emulsions,
crystallization of lamellar liquid crystalline phases located at the water/oil
interface resulting in the formation of a so-called gel phase has been
reported [41-43]. It has been demonstrated by Engels et al. that changes in
the type and concentration of the co-emulsifier caused the formation of a
lamellar gel phase surrounding the oil droplets inside an oil-in-water (O/W)
27
emulsion which increased the stability of the emulsion from 5 days to more
than 1 month [43]. It was found that the physico-chemical properties of the
system remained unaffected by the change of the co-surfactant. It was
proved that the presence of the lamellar liquid crystalline phase causes the
observed increase in emulsion stability. The viscous lamellar film
surrounding the emulsion droplets may be several layers thick and reduces
the attraction potential between the droplets. As a result, the lamellar layer
acts as a barrier against coalescence [44].
Emulsions containing a third phase or multimolecular layers of
lyotropic liquid crystals are often found in cosmetic products and are
therefore widely used by the cosmetics industry to adjust or optimize
specific properties of the product such as viscosity or consistency, storage
stability or application convenience [45].
Recently, it has been reported that the long-term stable
W/O emulsions can be obtained by dispersing water in the lamellar and
reverse hexagonal phases formed by monoolein-based systems [46-47].
Skin permeation experiments demonstrated that emulsions containing liquid
crystalline phases compared to an emulsion without liquid crystals, showed
enhanced skin penetration of the hydroquinone and octadecenedioic acid.
The increase in skin penetration was attributed to an increased partitioning
of the drugs into the skin. In the case of salicylic acid, no effect of liquid
crystalline phases in emulsion on penetration was observed. This effect
was suggested to be due to different interaction of drug and surfactants
forming liquid crystalline phases in emulsions [48].
1.4. References [1] J. Swarbrick, Encyclopedia of pharmaceutical technology, CRC Pr I Llc, 2007. [2] D.H. Everett, Basic Principles of Colloid Science, Royal Society of Chemistry Paperbacks, London.

28
[3] D. Myers, D. Meyers, Surfaces, interfaces, and colloids: principles and applications, Wiley-VCH Weinheim, Germany, 1999. [4] M. Malmsten, Surfactants and polymers in drug delivery, Informa HealthCare, 2002. [5] J.N. Israelachvili, D.J. Mitchell, B.W. Ninham, Theory of self-assembly of hydrocarbon amphiphiles into micelles and bilayers., J Chem Suc Faraday Trans 2, 57 (1976) 1525. [6] J. Israelachvili, Intermolecular and Surface Forces, Second Edition: With Applications to Colloidal and Biological Systems (Colloid Science), {Academic Press}, 1992. [7] D.J. Mitchell, B.W. Ninham, Micelles, vesicles and microemulsions, J Chem Soc Faraday Trans 2 Mol Chem Phys, 77 (1981) 601-629. [8] G. Burducea, Lyotropic liquid crystals II: Structural Polymorphism, Rom Rep Phys, 56 (2004) 87-100. [9] H.F. Mahjoub, K.M. McGrath, M. Kléman, Phase Transition Induced by Shearing of a Sponge Phase, Langmuir, 12 (1996) 3131-3138. [10] I.F. Uchegbu, S.P. Vyas, Non-ionic surfactant based vesicles (niosomes) in drug delivery, Int J Pharm, 172 (1998) 33-70. [11] J.H. Van Zanten, Characterization of vesicles and vesicular dispersions via scattering techniques, in: M. Rosoff (Ed.) Vesicles, Marcel Dekker, New York, 1996, pp. 239–294. [12] S. Fuller, Y. Li, G.J.T. Tiddy, E. Wyn-Jones, R.D. Arnell, Formulation of Lyotropic Lamellar Phases of Surfactants as Novel Lubricants, Langmuir, 11 (1995) 1980-1983. [13] B. Binks, Emulsions—Recent Advances in Understanding, Modern Aspects of Emulsion Science; Binks, BP, Ed.; The Royal Society of Chemistry: Cambridge, England, (1998). [14] T. Tadros, Emulsion Science and Technology: A General Introduction, Emulsion Science and Technology, (2009) 1. [15] M.M. Robins, Emulsions -- creaming phenomena, Curr Opin Colloid Interface Sci, 5 (2000) 265-272. [16] P. Taylor, Ostwald ripening in emulsions, Colloids Surf A Physicochem Eng Asp, 99 (1995) 175-185. [17] F. Groeneweg, W.G.M. Agterof, P. Jaeger, J.J.M. Janssen, J.A. Wieringa, J.K. Klahn, On the Mechanism of the Inversion of Emulsions, Chem Eng Res Des, 76 (1998) 55-63. [18] M. Ferrari, Cancer nanotechnology: opportunities and challenges, Nat Rev Cancer, 5 (2005) 161-171. [19] K. Ulubayram, I. Eroglu, N. Hasirci, Gelatin Microspheres and Sponges for Delivery of Macromolecules, Journal of Biomaterials Applications, 16 (2002) 227-241. [20] R. Arshady, Albumin microspheres and microcapsules: Methodology of manufacturing techniques, J Control Release, 14 (1990) 111-131.

29
[21] I. Soriano, M. Llabres, C. Evora, Release control of albumin from polylactic acid microspheres, Int J Pharm, 125 (1995) 223-230. [22] S. Hunter, M. Andracki, S.K. Hunter, Nasal or IM administration of streptococcal surface protein, C5A peptidase, encapsulated within biodegradable polyglycolic acid microspheres induces strong antibody response in mice: a potential new GBS vaccine, Am J Obstet Gynecol, 189 (2003) S100-S100. [23] D. Burgess, A. Hickey, Microsphere technology and applications, Encyclopedia of Pharmaceutical Technology. New York, NY: Marcel Dekker, (1994) 1-29. [24] A.S. Hoffman, Hydrogels for biomedical applications, Adv Drug Deliv Rev, 54 (2002) 3-12. [25] H.J. Chung, Y. Lee, T.G. Park, Thermo-sensitive and biodegradable hydrogels based on stereocomplexed Pluronic multi-block copolymers for controlled protein delivery, J Control Release, 127 (2008) 22-30. [26] T.G. Park, A.S. Hoffman, Deswelling characteristics of poly(N-isopropylacrylamide) hydrogel, J Appl Polym Sci, 52 (1994) 85-89. [27] L. Qiu, Novel degradable polyphosphazene hydrogel beads for drug controlled release, J Appl Polym Sci, 87 (2003) 986-992. [28] J.G.W. Wenzel, K.S.S. Balaji, K. Koushik, C. Navarre, S.H. Duran, C.H. Rahe, U.B. Kompella, Pluronic® F127 gel formulations of Deslorelin and GnRH reduce drug degradation and sustain drug release and effect in cattle, J Control Release, 85 (2002) 51-59. [29] B. Jeong, Y.H. Bae, D.S. Lee, S.W. Kim, Biodegradable block copolymers as injectable drug-delivery systems, Nature, 388 (1997) 860-862. [30] P. Alexandridis, T. Alan Hatton, Poly(ethylene oxide)-poly(propylene oxide)-poly(ethylene oxide) block copolymer surfactants in aqueous solutions and at interfaces: thermodynamics, structure, dynamics, and modeling, Colloids Surf A Physicochem Eng Asp, 96 (1995) 1-46. [31] A.P. Rokhade, N.B. Shelke, S.A. Patil, T.M. Aminabhavi, Novel hydrogel microspheres of chitosan and pluronic F-127 for controlled release of 5-fluorouracil, J Microencapsulation, 24 (2007) 274-288. [32] Y. Wang, J.-Q. Gao, F. Li, S.-H. Ri, W.-Q. Liang, Triblock copolymer Pluronic®F127 sustains insulin release and reduces initial burst of microspheres—in vitro and in vivo study, Colloid Polym Sci, 285 (2006) 233-238. [33] F. Lagarce, N. Faisant, J.-C. Desfontis, L. Marescaux, F. Gautier, J. Richard, P. Menei, J.-P. Benoit, Baclofen-loaded microspheres in gel suspensions for intrathecal drug delivery: In vitro and in vivo evaluation, Eur J Pharm Biopharm, 61 (2005) 171-180.

30
[34] A.-C. Albertsson, J. Carlfors, C. Sturesson, Preparation and characterisation of poly(adipic anhydride) microspheres for ocular drug delivery, J Appl Polym Sci, 62 (1996) 695-705. [35] M. Patel, S.K. Jain, A.K. Yadav, D. Gogna, G.P. Agrawal, Preparation and Characterization of Oxybenzone-Loaded Gelatin Microspheres for Enhancement of Sunscreening Efficacy, Drug Deliv, 13 (2006) 323 - 330. [36] U. Ciesla, F. Schüth, Ordered mesoporous materials, Microporous Mesoporous Mater, 27 (1999) 131-149. [37] S. Wang, Ordered mesoporous materials for drug delivery, Microporous Mesoporous Mater, 117 (2009) 1-9. [38] M. Vallet-Regi, A. Rámila, R.P. del Real, J. Pérez-Pariente, A New Property of MCM-41: Drug Delivery System, Chemistry of Materials, 13 (2000) 308-311. [39] M. Vallet-Regí, Ordered mesoporous materials in the context of drug delivery systems and bone tissue engineering, Chem Eur J, 12 (2006) 5934-5943. [40] S. Friberg, L. Mandell, M. Larsson, Mesomorphous phases, a factor of importance for the properties of emulsions, J Colloid Interface Sci, 29 (1969) 155-156. [41] K. Larsson, Stability of emulsions formed by polar lipids, Prog Chem Fats Other Lipids, 16 (1978) 163-169. [42] K. Shinoda, S. Friberg, Emulsions and solubilization, Wiley New York et al., 1986. [43] T. Engels, T. Förster, W. von Rybinski, The influence of coemulsifier type on the stability of oil-in-water emulsions, Colloids Surf A Physicochem Eng Asp, 99 (1995) 141-149. [44] S. Friberg, Liquid crystalline phases in emulsions, J Colloid Interface Sci, 37 (1971) 291-295. [45] T. Engels, W. Rybinski, Liquid crystalline surfactant phases in chemical applications, J Mater Chem, 8 (1998) 1313-1320. [46] S. Mele, S. Murgia, M. Monduzzi, Monoolein based liquid crystals to form long-term stable emulsions, Colloids Surf A Physicochem Eng Asp, 228 (2003) 57-63. [47] S. Mele, S. Murgia, F. Caboi, M. Monduzzi, Biocompatible Lipidic Formulations: Phase Behavior and Microstructure, Langmuir, 20 (2004) 5241-5246. [48] A. Otto, J. Wiechers, C. Kelly, J. Dederen, J. Hadgraft, J. du Plessis, Effect of Emulsifiers and Their Liquid Crystalline Structures in Emulsions on Dermal and Transdermal Delivery of Hydroquinone, Salicylic Acid and Octadecenedioic Acid, Skin Pharmacology and Physiology, 23 (2010) 273-282.

31
2. THEORETICAL BACKGROUND
2.1. Microscopy 2.1.1. Polarized light microscopy
Polarized light microscopy (PLM) is one of the important techniques
for identification of lyotropic liquid crystals (except cubic mesophases)
because anisotropic liquid crystals show birefringence similar to crystalline
solids. Each liquid crystal shows typical black and white textures. In the
case of an additional λ-plate with strong birefringent properties, color effects
of the textures can also be observed [1]. Hexagonal mesophases can be
recognized by their typical fan shape texture (Fig.2.1.a) [2]. Lamellar
mesophases typically show oily streaks with inserted maltese crosses
(Fig.2.1.b). The latter result from defect structures, called confocal domains
that arise from concentric rearrangement of plane layers [3]. In some
lamellar mesophases these defects prevail. Hence no oily streaks occur but
mosaic pattern can be observed (Fig. 2.1.c). A drawback of PLM is that it is
restricted to particle dimensions in the micron or submicron range whereas
colloidal dimensions of liquid crystals are only resolved by transmission
electron microscopy (TEM).
Fig.2.1. Characteristic pattern of liquid crystalline phases (a) hexagonal fan-like structure,
(b) lamellar maltese crosses and (c) lamellar mosaic pattern. 2.1.2. Electron Microscopy
There are two types of electron microscopes – the scanning electron
microscope (SEM) and the transmission electron microscope (TEM). These
(a) (b) (c)

32
devices require measurements to be undertaken in a vacuum, except for
the environmental SEM. Also, the samples must be conducting (in order to
accelerate the electrons onto the sample) and, hence, a sample must have
a metal layer deposited on its surface if it is to be investigated by SEM or
TEM. In the TEM, the sample is a very thin specimen and contrast within
the image is due to the spatial variations in intensity of the transmitted
electron beam through the specimen, as the beam is raster scanned over
the specimen. In the SEM, the image may be produced in a number of
ways – from variations in the intensity of secondary electrons back-
scattered from the specimen through to X-ray emission produced by
inelastic collisions of the primary beam with bound electrons in the
specimen. The idea that gave rise to the electron microscope is that, just as
light is refracted and focused by an optical lens, the electron, due to its
charge, will have its path deviated by either a magnetic field or an electric
field. Therefore, with careful design of appropriate electric and magnetic
fields within the instrument, an electron beam may be focused like an
optical beam [4].
In case of TEM microscope, the electrons are emitted by an
incandescent cathode source, and accelerated towards more positive grids
through either electrostatic or magnetic field lens onto an object. The
specimen is supported on a very thin film to minimize the scattering of the
electrons as they pass through the sample. Depending on the thickness
and composition of the object, the electron beam experiences different
attenuation as a function of position. The beam travels through two more
lenses before being imaged onto a fluorescent screen (in original models)
or photographic plate or directly onto a scintillator placed on the face of a
photomultiplier tube or a CCD device. (A scintillator is a semi-transparent
material, which emits a flash of light when a charged particle traverses it.)
33
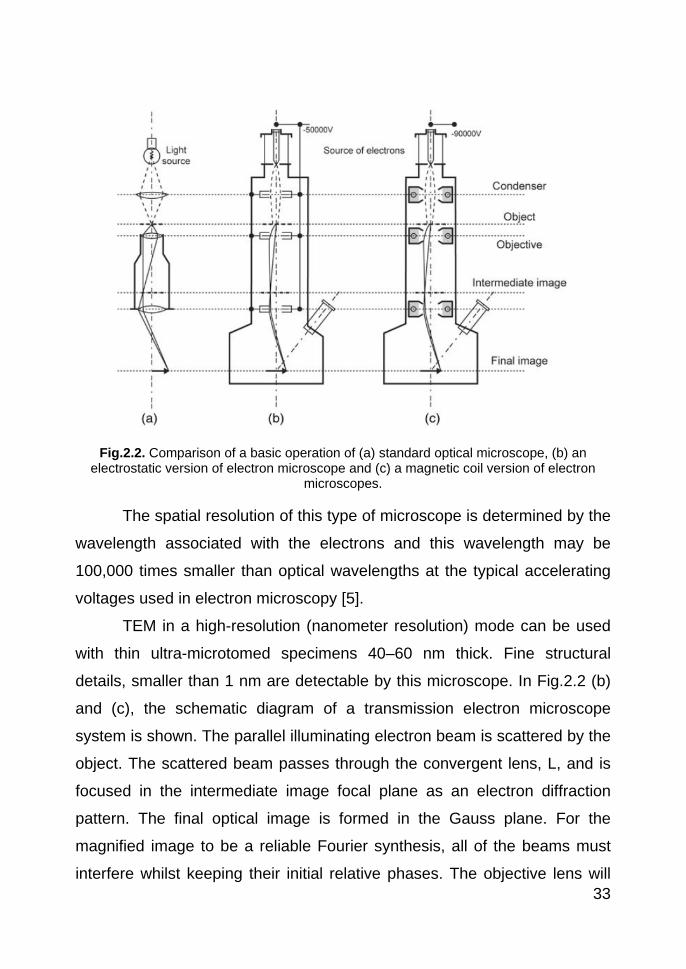
Fig.2.2. Comparison of a basic operation of (a) standard optical microscope, (b) an
electrostatic version of electron microscope and (c) a magnetic coil version of electron microscopes.
The spatial resolution of this type of microscope is determined by the
wavelength associated with the electrons and this wavelength may be
100,000 times smaller than optical wavelengths at the typical accelerating
voltages used in electron microscopy [5].
TEM in a high-resolution (nanometer resolution) mode can be used
with thin ultra-microtomed specimens 40–60 nm thick. Fine structural
details, smaller than 1 nm are detectable by this microscope. In Fig.2.2 (b)
and (c), the schematic diagram of a transmission electron microscope
system is shown. The parallel illuminating electron beam is scattered by the
object. The scattered beam passes through the convergent lens, L, and is
focused in the intermediate image focal plane as an electron diffraction
pattern. The final optical image is formed in the Gauss plane. For the
magnified image to be a reliable Fourier synthesis, all of the beams must
interfere whilst keeping their initial relative phases. The objective lens will
34
introduce additional phase shifts. These phase shifts vary as a function of
the spherical aberration Cs of the lens, the diffraction angle, 2θ, of the
beams relative to the optic axis and the defocus distance, Δf . The transfer
function of the electron beam lens, K, has been shown to
𝐾𝐾(𝑢𝑢) = 𝐷𝐷(𝜆𝜆𝑓𝑓𝑢𝑢)𝑒𝑒−𝑖𝑖𝑖𝑖 (𝑢𝑢) (1)
where χ(u) = π(1/2Csλ3u4−λΔfu4) and D is the characteristic function
of the objective aperture, χ(u) is the aberration function, u is the spatial
frequency (u=2θ/λ), f is the focal image distance and λ is the wavelength.
The objective acts like a filter for spatial frequencies, selecting and
modifying the phase of planar waves that can interfere in the image plane
[6].
Typical acceleration voltages are V=120 kV, which gives the electron
an energy, E = 120 keV (where 1 electronVolt, eV is equivalent to an
energy of 1.6 × 10⁻¹⁹ Joules) and the representative wavelength, λ, for
these electrons is 3.35 × 10⁻³ nm, computed from the non-relativistic De
Broglie expression
𝜆𝜆 =
ℎ�2𝐸𝐸𝑓𝑓𝑒𝑒
(2)
where me is the electronic mass. Hence, the electron microscope
has potentially, one of the highest spatial resolutions of all of the
microscope techniques.
The electron microscope (like any other microscope) can be
considered as an information channel that carries information from object to
observer. The overall model for the electron microscope contains
parameters, e.g. atomic coordinates which are unknown and which must be
determined by experiment. Structure determination can be achieved by
fitting the model to the experimental data in an iterative procedure in which
the model parameters are systematically refined. By implication, details
beyond the Rayleigh point resolution (and even beyond the information limit

35
of the microscope) may be extracted because, in the absence of noise (and
assuming that the model is correct), the fitting procedure would be perfect
and exact values of the model parameters would be obtained! In practice,
however, results will always be limited by some noise component, e.g. the
Poisson noise due to the counting statistics (quantum or shot noise) which
is determined by the number of electrons in the illuminating beam. In
scanning electron microscopes, low energy secondary electrons (Ee < 50
eV) are detected using a scintillator/pm tube detector. At these low
energies, the secondary electrons can only escape, and be detected, from
within a few nanometers of the surface of the specimen [7].
2.2. ATR-FTIR Spectroscopy
Infrared spectroscopy is a technique based on the vibrations of the
atoms of a molecule. An infrared spectrum is commonly obtained by
passing infrared radiation through a sample and determining what fraction
of the incident radiation is absorbed at a particular energy. The energy at
which any peak in an absorption spectrum appears corresponds to the
frequency of a vibration of a part of a sample molecule.
Processes of change, including those of vibration and rotation
associated with infrared spectroscopy, can be represented in terms of
quantized discrete energy levels E0, E1, E2, etc., as shown in Fig.2.3.
Fig.2.3. Illustration of quantized discrete energy levels.

36
Each atom or molecule in a system must exist in one or other of
these levels. In a large assembly of molecules, there will be a distribution of
all atoms or molecules among these various energy levels. The latter are a
function of an integer (the quantum number) and a parameter associated
with the particular atomic or molecular process associated with that state.
Whenever a molecule interacts with radiation, a quantum of energy (or
photon) is either emitted or absorbed. In each case, the energy of the
quantum of radiation must exactly fit the energy gap E1 − E0 or E2 − E1, etc.
The energy of the quantum is related to the frequency by the following:
Δ𝐸𝐸 = ℎ𝜈𝜈 (3)
Hence, the frequency of emission or absorption of radiation for a
transition between the energy states E0 and E1 is given by:
𝜈𝜈 = (𝐸𝐸1 − 𝐸𝐸0)/ℎ (4)
Associated with the uptake of energy of quantized absorption is
some deactivation mechanism whereby the atom or molecule returns to its
original state. Associated with the loss of energy by emission of a quantum
of energy or photon is some prior excitation mechanism. Both of these
associated mechanisms are represented by the dotted lines in Fig.2.3.
The interactions of infrared radiation with matter may be understood
in terms of changes in molecular dipoles associated with vibrations and
rotations. The frequency of vibrational modes depends upon the stiffness of
the bond and the masses of the atoms at each end of the bond. The
stiffness of the bond can be characterized by a proportionality constant
termed the force constant, k (derived from Hooke’s law). The reduced
mass, μ, provides a useful way of simplifying calculations by combining the
individual atomic masses, and may be expressed as follows:
�1 𝜇𝜇� � = �1 𝑓𝑓1� � + �1 𝑓𝑓2� � (5)

37
where m1 and m2 are the masses of the atoms at the ends of the
bond. A practical alternative way of expressing the reduced mass is:
𝜇𝜇 = 𝑓𝑓1𝑓𝑓2/(𝑓𝑓1 + 𝑓𝑓2) (6)
The equation relating the force constant, the reduced mass and the
frequency of absorption is:
𝑣𝑣 = (1/2𝜋𝜋)√(𝑘𝑘 ⁄ 𝜇𝜇) (7)
This equation may be modified so that direct use of the wavenumber
values for bond vibrational frequencies can be made, namely:
�̅�𝑣 = (1/2𝜋𝜋𝜋𝜋)√(𝑘𝑘 ⁄ 𝜇𝜇) (8)
where c is the speed of light.
A molecule can only absorb radiation when the incoming infrared
radiation is of the same frequency as one of the fundamental modes of
vibration of the molecule. This means that the vibrational motion of a small
part of the molecule is increased while the rest of the molecule is left
unaffected.
Vibrations can involve either a change in bond length (stretching) or
bond angle (bending). Some bonds can stretch in-phase (symmetrical
stretching) or out-of-phase (asymmetric stretching). If a molecule has
different terminal atoms such as HCN, ClCN or ONCl, then the two
stretching modes are no longer symmetric and asymmetric vibrations of
similar bonds, but will have varying proportions of the stretching motion of
each group. In other words, the amount of coupling will vary.
Bending vibrations also contribute to infrared spectra and these are
summarized in Fig.2.4.
Fig.2.4. Different types of bending vibrations.

38
It is best to consider the molecule being cut by a plane through the
hydrogen atoms and the carbon atom. The hydrogens can move in the
same direction or in opposite directions in this plane, here the plane of the
page. For more complex molecules, the analysis becomes simpler since
hydrogen atoms may be considered in isolation because they are usually
attached to more massive, and therefore, more rigid parts of the molecule
[8]. This results in in-plane and out-of-plane bending vibrations, as
illustrated in Fig.2.5.
Fig.2.5. Out-of-plane and in-plane bending vibrations.
Fourier-transform infrared (FTIR) spectroscopy is based on the idea
of the interference of radiation between two beams to yield an
interferogram. The latter is a signal produced as a function of the change of
pathlength between the two beams. The two domains of distance and
frequency are interconvertible by the mathematical method of Fourier-
transformation [9].
The essential equations for a Fourier-transformation relating the
intensity falling on the detector, I(δ), to the spectral power density at a
particular wavenumber, ν, given by B(.ν), are as follows:
𝐼𝐼(𝛿𝛿) = � 𝐵𝐵(�̅�𝜈
+∞
−∞) cos(2𝜋𝜋�̅�𝜈𝛿𝛿)𝑑𝑑�̅�𝜈
(9)
which is one half of a cosine Fourier-transform pair, with the other
being:

39
𝐵𝐵(�̅�𝜈) = � 𝐼𝐼(𝛿𝛿
+∞
−∞) cos(2𝜋𝜋�̅�𝜈𝛿𝛿)𝑑𝑑𝛿𝛿
(10)
These two equations are interconvertible and are known as a
Fourier-transform pair. The first shows the variation in power density as a
function of the difference in pathlength, which is an interference pattern.
The second shows the variation in intensity as a function of wavenumber.
Each can be converted into the other by the mathematical method of
Fourier-transformation.
Attenuated total reflectance (ATR) spectroscopy utilizes the
phenomenon of total internal reflection (Fig.2.6).
Fig.2.6. Schematic of a typical attenuated total reflectance cell.
A beam of radiation entering a crystal will undergo total internal
reflection when the angle of incidence at the interface between the sample
and crystal is greater than the critical angle, where the latter is a function of
the refractive indices of the two surfaces. The beam penetrates a fraction of
a wavelength beyond the reflecting surface and when a material that
selectively absorbs radiation is in close contact with the reflecting surface,
the beam loses energy at the wavelength where the material absorbs. The
resultant attenuated radiation is measured and plotted as a function of
wavelength by the spectrometer and gives rise to the absorption spectral
40
characteristics of the sample [10]. The depth of penetration in ATR
spectroscopy is a function of the wavelength, λ, the refractive index of the
crystal, n2, and the angle of incident radiation, θ. The depth of penetration,
dp, for a non-absorbing medium is given by the following:
𝑑𝑑𝑝𝑝 = (𝜆𝜆/𝑛𝑛1)/{2𝜋𝜋[𝑠𝑠𝑖𝑖𝑛𝑛𝑠𝑠 − (𝑛𝑛1/𝑛𝑛2)2]} (11)
where n1 is the refractive index of the sample.
The crystals used in ATR cells are made from materials that have
low solubility in water and are of a very high refractive index. Such
materials include zinc selenide (ZnSe), germanium (Ge) and thallium–
iodide (KRS-5). Different designs of ATR cells allow both liquid and solid
samples to be examined [10].
2.3. Small Angle X-ray Scattering (SAXS)
Small angle X-ray scattering (SAXS) is a small angle scattering
technique where the elastic scattering of X-rays by a sample which has
structure in the nanometer-range, is recorded at very low angles (0.1 - 10°).
This angular range contains information about the shape and size
of macromolecules, pore sizes, unit cell distances of liquid crystalline
phases etc.
In a SAXS instrument a monochromatic beam of X-rays is brought to
a sample from which some of the X-rays scatter, while most go through the
sample without interacting with it. The scattered X-rays form a scattering
pattern which is then detected at a detector which is typically a 2-
dimensional flat X-ray detector situated behind the sample perpendicular to
the direction of the primary beam that initially hit the sample. The scattering
pattern contains the information on the structure of the sample.
Elastic interactions are characterized by zero energy transfers, such
that the final wave vector kf is equal in modulus to ki. The relevant
41
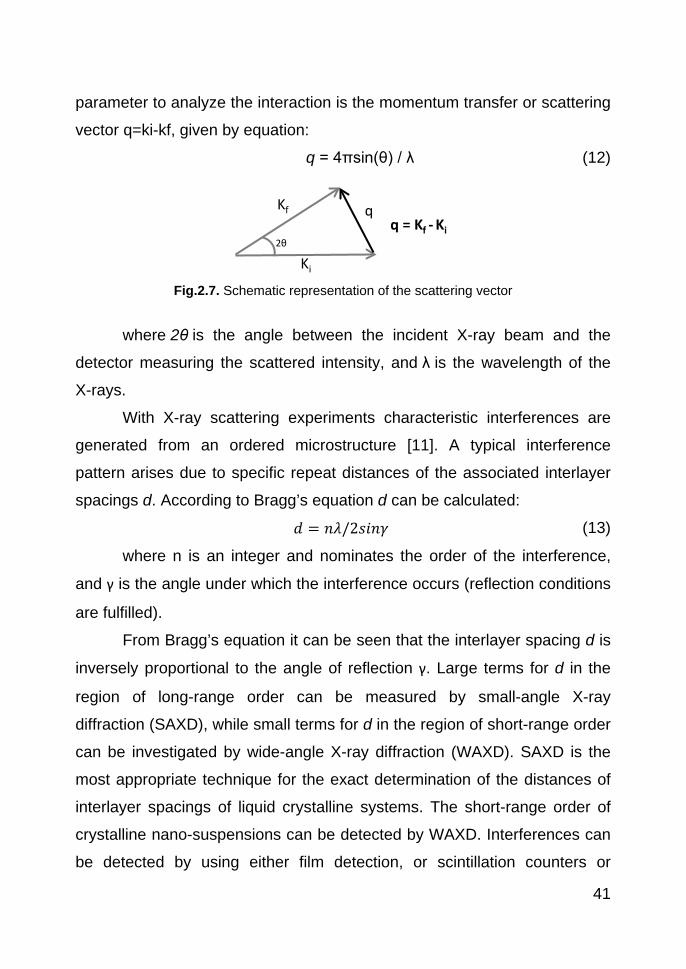
parameter to analyze the interaction is the momentum transfer or scattering
vector q=ki-kf, given by equation:
q = 4πsin(θ) / λ (12)
Fig.2.7. Schematic representation of the scattering vector
where 2θ is the angle between the incident X-ray beam and the
detector measuring the scattered intensity, and λ is the wavelength of the
X-rays.
With X-ray scattering experiments characteristic interferences are
generated from an ordered microstructure [11]. A typical interference
pattern arises due to specific repeat distances of the associated interlayer
spacings d. According to Bragg’s equation d can be calculated:
𝑑𝑑 = 𝑛𝑛𝜆𝜆/2𝑠𝑠𝑖𝑖𝑛𝑛𝛾𝛾 (13)
where n is an integer and nominates the order of the interference,
and γ is the angle under which the interference occurs (reflection conditions
are fulfilled).
From Bragg’s equation it can be seen that the interlayer spacing d is
inversely proportional to the angle of reflection γ. Large terms for d in the
region of long-range order can be measured by small-angle X-ray
diffraction (SAXD), while small terms for d in the region of short-range order
can be investigated by wide-angle X-ray diffraction (WAXD). SAXD is the
most appropriate technique for the exact determination of the distances of
interlayer spacings of liquid crystalline systems. The short-range order of
crystalline nano-suspensions can be detected by WAXD. Interferences can
be detected by using either film detection, or scintillation counters or
Kf
Ki
q
2θ
q = Kf - Ki
42
position-sensitive detectors. However, in addition to interference detection,
and subsequent calculation of interlayer spacings of the crystalline material,
the SAXS method enables the sequence of the interferences and thus the
type of ordering to be detected [12].
Small-angle scattering (SAXS) is a powerful technique for examining
nanostructures formed by the self-assembly of surfactants and block
copolymers. SAXS is extensively used to identify morphologies in the self-
assembled structures from the sequence of Bragg reflections observed.
Table 1 lists the positions of peaks for the equilibrium structures observed
in various liquid crystal structures. Multiple orders of Bragg reflection are
observed for strongly segregated samples. Weakly segregated samples
may only exhibit the lower order peaks, which can lead to ambiguities in
phase identification. This can be circumvented by supplementary
information from a complementary technique, for example, transmission
electron microscopy. Alternatively, shear alignment of a sample can
enhance the information content in a SAXS pattern, and facilitate the
identification of morphology even for a weakly segregated sample. SAXS
methods are well suited to investigate the structure of micelles because
their size is typically ~5–100 nm, which leads to scattering at small
angles[13].
Table 1 Peak positions (expressed as q/q*) of Bragg reflections for various structures.
Structure Ratio (q/q*) Lam 1, 2, 4, 5, 6,....... Hex (p6mm) 1,√3, √4, √7, √9, √12,......... BCC (Im3m) 1, √2, √3, √4, √5, √6,........ FCC (Fm3m) 1, √4/3, √8/3, √11/3, √12/3, √16/3,........ Gyr (Ia3d) 1, √4/3, √7/3, √8/3, √10/3, √11/3,.........
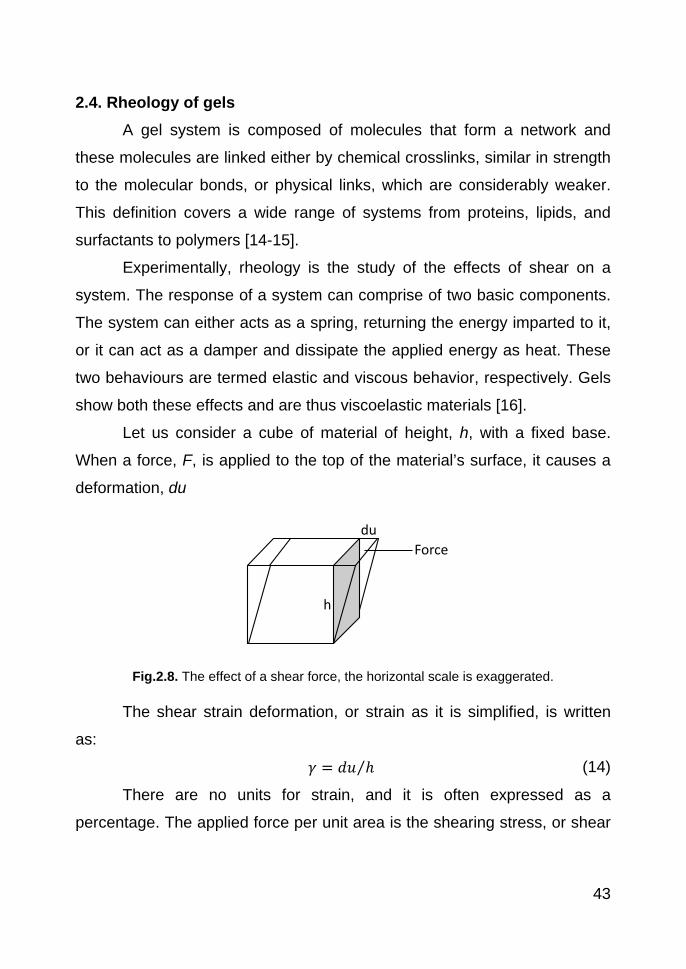
43
2.4. Rheology of gels A gel system is composed of molecules that form a network and
these molecules are linked either by chemical crosslinks, similar in strength
to the molecular bonds, or physical links, which are considerably weaker.
This definition covers a wide range of systems from proteins, lipids, and
surfactants to polymers [14-15].
Experimentally, rheology is the study of the effects of shear on a
system. The response of a system can comprise of two basic components.
The system can either acts as a spring, returning the energy imparted to it,
or it can act as a damper and dissipate the applied energy as heat. These
two behaviours are termed elastic and viscous behavior, respectively. Gels
show both these effects and are thus viscoelastic materials [16].
Let us consider a cube of material of height, h, with a fixed base.
When a force, F, is applied to the top of the material’s surface, it causes a
deformation, du
Fig.2.8. The effect of a shear force, the horizontal scale is exaggerated.
The shear strain deformation, or strain as it is simplified, is written
as:
𝛾𝛾 = 𝑑𝑑𝑢𝑢 ℎ⁄ (14)
There are no units for strain, and it is often expressed as a
percentage. The applied force per unit area is the shearing stress, or shear
du
h
Force
44
stress, measured in Pascals. The shear modulus, G, can be defined as the
ratio of the shearing force to the shearing strain amplitude:
𝐺𝐺 = 𝜎𝜎/𝛾𝛾 (15)
In general G is a complex quantity. If the cube is a viscous liquid,
when we apply a force we now get a constant flow rather than just a
deformation. This can be described as a strain changing as a function of
time. The rate of change of strain is known as the shear rate, and generally
has units of reciprocal seconds.
The viscosity is defined as:
𝜂𝜂 = 𝑆𝑆ℎ𝑒𝑒𝑎𝑎𝑓𝑓 𝑓𝑓𝑎𝑎𝑟𝑟𝑒𝑒 𝑆𝑆ℎ𝑒𝑒𝑎𝑎𝑓𝑓 𝑠𝑠𝑟𝑟𝑓𝑓𝑒𝑒𝑠𝑠𝑠𝑠⁄ (16)
The combination of hydrophobic blocks and hydrophilic blocks
causes the systems to associate intermolecularly to form transient
networks. A transient network allows for the hydrophobic end groups to
detach from the micelles. Once detached, a chain is free to move
independent of the rest of the network. Motion of the chains is governed by
Rouse dynamics with a characteristic time, τR.
So, relaxation time = detachment time +Rouse time.
𝜏𝜏 = 𝛽𝛽0−1 + 𝜏𝜏𝑅𝑅 (17)
The relaxation time when the stress and elongation have reached
equilibrium is equal to η/G, where G is the modulus.
𝛾𝛾𝑟𝑟𝑓𝑓𝑟𝑟𝑎𝑎𝑙𝑙 = 𝑆𝑆𝑒𝑒𝑙𝑙𝑎𝑎𝑠𝑠𝑟𝑟𝑖𝑖𝜋𝜋 + 𝛾𝛾𝑣𝑣𝑖𝑖𝑠𝑠𝜋𝜋𝑓𝑓𝑢𝑢𝑠𝑠 (18)
This can be expressed as
𝑑𝑑𝛾𝛾 𝑑𝑑𝑟𝑟⁄ = 𝑆𝑆 𝜂𝜂⁄ + 𝑑𝑑𝑆𝑆 𝑑𝑑𝑟𝑟 ∙ 1 𝐺𝐺⁄ ⁄ (19)
i.e. Rate of strain is equal to zero under conditions of constant
stress. So,
𝑆𝑆/𝜂𝜂 + 𝑑𝑑𝑆𝑆/𝑑𝑑𝑟𝑟. 1/𝐺𝐺 = 0 (20)
Assuming S=S0 at time zero
𝑆𝑆 = 𝑆𝑆0 ∙ 𝑒𝑒−𝑟𝑟 𝜏𝜏⁄ (21)

45
So, according to the Maxwell model, under conditions of constant
strain, the stress will decrease exponentially with time and at the relaxation
time will be equal to 1/e, of its original value.
In the Maxwell model the viscoelastic moduli are given by:
𝐺𝐺′(𝜔𝜔) = (𝐺𝐺∞𝜔𝜔2𝜏𝜏2)(1 + 𝜔𝜔2𝜏𝜏2)(Storage modulus) (22)
𝐺𝐺′′ (𝜔𝜔) = (𝐺𝐺∞𝜔𝜔𝜏𝜏)(1 + 𝜔𝜔2𝜏𝜏2)(Loss modulus) (23)
ω – Angular frequency (rad s-1)
τ – Stress relaxation time.
tan 𝛿𝛿 = 𝐺𝐺′′ /𝐺𝐺′ (24)
This ratio is loss tangent, and is a measure of the energy loss per
cycle.
In general G is both a complex quantity, comprising of storage (real)
(G') and loss (imaginary) (G'') components and frequency dependent,
showing vastly different behavior at low shear rates and high shear rate
[17].
As concentration is increased, the ‘‘symmetric’’ diblocks such as
PEO-PPO-PEO copolymers, which have a roughly equal number of
hydrophobic and hydrophilic groups show a progression in the following
order [18]:
Isotropic micellar cubic micellar hexagonal lamellar structure
This is analogous to the phase behavior seen in surfactant solutions.
The phase behavior of PEO-containing copolymers corresponds to
fascinating rheological properties; the most notable is formation of a cubic
gel from low viscosity solutions as the temperature is increased.
Rheological ‘phase boundaries’ can be measured for several copolymers
which show transitions between sols, ‘soft gels,’ and ‘hard gels’. The sol–
hard gel transition corresponds to the formation of a close-packed

46
micellar gel, described above. The soft gels, on the other hand, show a
fractal structure consistent with the idea of a percolated network of micelles
[19]. The soft gel transition has also been ascribed to a spherical-to-
cylindrical micelle transition [20-21] or the occurrence of defects in
the cubic phase [22-23].
2.5. References
[1] W. Haase, D. Demus und L. Richter: Textures of Liquid Crystals. Verlag Chemie, Weinheim, New York 1978. 228 Seiten, Preis: DM 185, Berichte der Bunsengesellschaft für physikalische Chemie, 84 (1980) 1271-1271.
[2] M. Wlodzimierz Sulek, A. Bak, The Effect of Liquid Crystalline Structures on Antiseizure Properties of Aqueous Solutions of Ethoxylated Alcohols, Int J Mol Sci, 11 (2010) 189-205.
[3] S. Radhika, B.K. Sadashiva, V.A. Raghunathan, Occurrence of transition between lamellar antiferroelectric and columnar ferroelectric phases in achiral seven-ring bent-core compounds derived from 5-methoxyisophthalic acid, Ferroelectr, 364 (2008) 20-32.
[4] C.W. Oatley, W.C. Nixon, R.F.W. Pease, Scanning Electron Microscopy, in: L. Marton (Ed.) Advances in Electronics and Electron Physics, Academic Press, 1966, pp. 181-247.
[5] P. Goodhew, F. Humphreys, R. Beanland, Electron microscopy and analysis, Taylor & Francis Group, 2001.
[6] M. Hajibagheri, Electron microscopy methods and protocols, Humana Pr Inc, 1999.
[7] J. Bozzola, L. Russell, Electron microscopy: principles and techniques for biologists, Jones & Bartlett Pub, 1999.
[8] B. Stuart, Infrared spectroscopy: fundamentals and applications, Wiley, 2004.
[9] P. Griffiths, J. De Haseth, Fourier transform infrared spectrometry, Wiley-Interscience, 2007.
[10] K.A. Oberg, A.L. Fink, A New Attenuated Total Reflectance Fourier Transform Infrared Spectroscopy Method for the Study of Proteins in Solution, Anal Biochem, 256 (1998) 92-106.
[11] K. Fontell, Liquid crystallinity in lipid-water systems, Molecular Crystals and Liquid Crystals, 63 (1981) 59-82.
[12] A. Bradley, C. Hardacre, J. Holbrey, S. Johnston, S. McMath, M. Nieuwenhuyzen, Small-angle X-ray scattering studies of liquid crystalline 1-alkyl-3-methylimidazolium salts, Chem Mater, 14 (2002) 629-635.
47
[13] C. Müller-Goymann, Physicochemical characterization of colloidal drug delivery systems such as reverse micelles, vesicles, liquid crystals and nanoparticles for topical administration, Eur J Pharm Biopharm, 58 (2004) 343-356.
[14] J. Fairclough, A. Norman, 7 Structure and rheology of aqueous gels, Annual Reports Section" C"(Physical Chemistry), 99 (2003) 243-276.
[15] Y. Osada, K. Kajiwara, H. Ishida, Gels handbook, Academic Press London, 2001.
[16] C. Macosko, R. Larson, Rheology: principles, measurements, and applications, Wiley-Vch New York, 1994.
[17] C. Daniel, I.W. Hamley, M. Wilhelm, W. Mingvanish, Non-linear rheology of a face-centred cubic phase in a diblock copolymer gel, Rheologica Acta, 40 (2001) 39-48.
[18] I.W. Hamley, Amphiphilic diblock copolymer gels: the relationship between structure and rheology, Philos Transact A Math Phys Eng Sci, 359 (2001) 1017-1044.
[19] H. Li, G.-E. Yu, C. Price, C. Booth, E. Hecht, H. Hoffmann, Concentrated Aqueous Micellar Solutions of Diblock Copoly(oxyethylene/oxybutylene) E41B8: A Study of Phase Behavior, Macromolecules, 30 (1997) 1347-1354.
[20] S. Hvidt, E.B. Joergensen, W. Brown, K. Schillen, Micellization and Gelation of Aqueous Solutions of a Triblock Copolymer Studied by Rheological Techniques and Scanning Calorimetry, J Phys Chem, 98 (1994) 12320-12328.
[21] E.B. Jørgensen, S. Hvidt, W. Brown, K. Schillén, Effects of salts on the micellization and gelation of a triblock copolymer studied by rheology and light scattering, Macromolecules, 30 (1997) 2355-2364.
[22] J.A. Pople, I.W. Hamley, J.P.A. Fairclough, A.J. Ryan, B.U. Komanschek, A.J. Gleeson, G.E. Yu, C. Booth, Ordered phases in aqueous solutions of diblock oxyethylene/oxybutylene copolymers investigated by simultaneous small-angle X-ray scattering and rheology, Macromolecules, 30 (1997) 5721-5728.
[23] L. Derici, S. Ledger, S.M. Mai, C. Booth, I.W. Hamley, J.S. Pedersen, Micelles and gels of oxyethylene-oxybutylene diblock copolymers in aqueous solution: The effect of oxyethylene-block length, Phys Chem Chem Phys, 1 (1999) 2773-2785.

48
3. MICROSPHERES SUSPENDED IN PLURONIC F127 GEL
3.1. Introduction Among the different types of drug delivery systems being proposed
recently, microspheres composed of biodegradable polymers for controlled
release applications are extensively studied [1]. Gelatin is one of the
common natural polymers used in the fabrication of particulate drug
delivery systems such as microspheres [2-4]. It is a well known natural
polymer derived from collagen which possesses good biodegradability and
biocompatibility [2, 5-6]. Moreover, it has been extensively used in various
contemporary pharmaceutical dosage forms, and it is included on the FDA
list of inactive ingredients [7]. Gelatin exhibits polyion complexation
properties which can be utilized in the formulation of the sustained release
of numerous charged pharmacologically active molecules including proteins
[5-6]. Different cross-linking methods have been reported for gelatin
microspheres (GMs) in order to alter the toxicity associated with cross-
linking agents [8].
In this context, it should be remarked that GMs, due to their
biodegradability, are not expected to fulfill all requirements of an effective
controlled release, in terms of pharmacokinetic protocols. Burst release
cannot be avoided unless a protection that slows down the degradation
process is adopted. To obtain sustained release drug delivery systems,
combinations of microspheres and gel systems have been attempted
previously by several authors. Examples include 5-Fluorouracil in chitosan
microspheres and PF127 gel [9], insulin in calcium-alginate microspheres
and PF127 gel [10], Baclofen in Poly(lactide-co-glycolide) (PLGA)
microspheres dispersed in chitosan and PF127 gels [11], timolol maleate in
Poly(adipic anhydride) microspheres and gelrite gel [12], oxybenzone in
gelatin microspheres and aloe vera gel [13].
49
The present work focuses on GMs dispersed in the thermosensitive
Pluronic F127 (PF127) gel matrix. The concentrated aqueous solutions (20-
40 % w/v) of Pluronic F127 (PF127), a synthetic triblock copolymer, show
thermoreversible properties due to interactions between different segments
of the copolymer along with hydration strength. Above the Krafft
temperature, that was found to be approximately 12 ºC [14-15], PF127
molecules (concentration around, 20 % w/v) form O/W micelles. The
micelle structure consists of almost spherical arrangement of copolymer
with a dehydrated polypropylene oxide core and an outer shell of hydrated
swollen polyethylene oxide chains. With increasing temperature ordered
packing of micelles leads to gelation of aqueous solution of PF127 [16].
PF127 gels can be useful to enhance the stability and the protection of
proteins. They do not show any inherent myotoxicity with single or multiple
injections [17]. This polymer has been reported in literature for delivery of
various protein/peptide drugs such as insulin [18], urease [19], interleukin-2
[20], epidermal growth factor [21], bone morphogenic protein (BMP) [22],
and basic fibroblast growth factor (bFGF) [23]. Most release profiles show
sustained release kinetics over several hours.
The aim of the present work was to investigate the effect on
morphology and release performance of two different crosslinking methods
in the preparation of GMs loaded with lysozyme chosen as a model protein.
To the best of our knowledge, the combination of GMs and PF127 gel has
never been reported. Lysozyme is a small antibacterial protein with
molecular weight of 14.4 kD useful for the treatment of prosthetic valve
endocarditis [24-25]. Another important aim of this work was to investigate
the release performance modifications produced by suspending the
lysozyme loaded GMs in PF127 gel, and to ascertain that lysozyme does
not lose its activity due to the preparation conditions of the formulation or
during the release. Scanning Electron Microscopy (SEM), ATR-Fourier

50
Transform Infrared (FTIR) Spectroscopy and Small-Angle X-Ray Scattering
(SAXS) techniques along with rheological measurements were used to
characterize morphology and physico-chemical properties of the
formulations. The quantification of lysozyme loading and release was
performed through lysozyme activity assay using Micrococcus lysodeikticus
bacterial suspension [26].
3.2. Materials and methods 3.2.1. Materials
Hen egg white lysozyme (isoelctric point ~11), gelatin B (isoelectric
point 4.7-5.2), D-glucose, Span 80, acetone, Pluronic F127, potassium
dihydrogen orthophosphate and dipotassium hydrogen phosphate were
purchased from Sigma aldrich. Millipore filtered and distilled water was
used wherever required.
3.2.2. Preparation of gelatin microspheres Glucose cross-linked gelatin microspheres (GluGM) and
glutaraldehyde cross-linked gelatin microspheres (GAGM) were prepared
with and without lysozyme loading. Both types of GMs were prepared by
thermal gelation method as first described by Tabata and Ikada and later
modified by several authors [2, 27-28]. For GluGM, 400 mg of D-glucose
was dispersed in 20 ml of an aqueous gelatin B solution (20 %, w/v,
preheated at 40 ⁰C) and the dispersion was added drop wise to mixture of
soya oil and Span 80 (1 % v/v) while stirring the mixture at 1000 rpm at 80
⁰C for 10 min. This gave water in oil (W/O) emulsion. Stirring was continued
for further 10 min while decreasing the temperature to 15 ⁰C. Then 150 ml
of acetone was added to dehydrate and flocculate the microspheres. After
10 min of stirring microspheres were then filtered through sintered glass

51
filter and washed with 250 ml of acetone to remove residual oil. GluGMs
were dried under vacuum to remove acetone. For preparing, lysozyme
loaded GluGM (LGluGM), 100 mg of lysozyme was dissolved in gelatin and
glucose-D solution. In case of GAGM, first gelatin microspheres without
cross-linking were obtained through the same procedure as that of GluGM
without the addition of sugar. These GMs were then mixed with 0.22 M
glutaraldehyde prepared in aqueous ethanol solution (90 % v/v) with stirring
for 45 min and then with 99.8 % ethanol for 4 hours to remove excess of
glutaraldehyde. GAGMs were vacuum dried to evaporate residual ethanol.
For preparing lysozyme loaded GAGMs (LGAGM), GAGMs were
suspended in 10 mg/ml of lysozyme prepared in phosphate buffer pH 7.4
for 24 hours. The resulting LGAGMs were separated from the lysozyme
solution and freeze dried. All the microspheres were stored in closely
packed glass vial.
3.2.3. Lysozyme activity Lysozyme activity was measured by a method reported in literature
[26]. Micrococcus lysodeikticus (Sigma) bacterial cell suspension was used
to quantitatively determine the bioactivity of the enzyme. Lysozyme is
known to digest the cell wall of bacteria. The bacterial cells were dispersed
in potassium phosphate buffer (66 mM, pH 6.24) in the concentration of
0.015% w/v. It was further diluted with the same buffer so that initial
absorbance was approximately 1.50 at 450 nm. An appropriately diluted
lysozyme solution (0.1 ml) was added into 2.5 ml of bacterial suspension
and the absorbance at 450 nm was recorded every 15 s during a total
incubation period of 5 min at 25 °C. The bioactive lysozyme concentration
was determined by the following equation

52
𝑈𝑈𝑛𝑛𝑖𝑖𝑟𝑟𝑠𝑠/ 𝑓𝑓𝑙𝑙 𝑙𝑙𝑙𝑙𝑠𝑠𝑓𝑓𝑙𝑙𝑙𝑙𝑓𝑓𝑒𝑒
= (∆𝐸𝐸450𝑛𝑛𝑓𝑓 / min𝑇𝑇𝑒𝑒𝑠𝑠𝑟𝑟 − ∆𝐸𝐸450𝑛𝑛𝑓𝑓 / min𝐵𝐵𝑙𝑙𝑎𝑎𝑛𝑛𝑘𝑘)(𝑑𝑑𝑓𝑓)
(0.001)(0.1) (1)
where ∆E450nm/min is the reduction in the absorbance at 450 nm per
minute, df is the dilution factor, 0.001 is the change in absorbance at 450
nm as per the unit definition of lysozyme activity, 0.1 is volume (in ml) of
lysozyme used for the assay.
3.2.4. Drug loading and encapsulation ratio of microspheres Both types of lysozyme loaded gelatin microspheres (5 mg) were
dispersed in 10 ml distilled water with the help of magnetic stirrer. The
concentration of bioactive lysozyme was monitored till it becomes constant
by the method described in section 3.2.3. The drug loading (LD) and
encapsulation ratio (ED) were determined by using following equations:
𝐿𝐿𝐷𝐷= 𝐴𝐴𝜋𝜋𝑟𝑟𝑢𝑢𝑎𝑎𝑙𝑙 𝑙𝑙𝑓𝑓𝑎𝑎𝑑𝑑𝑒𝑒𝑑𝑑 𝑎𝑎𝑓𝑓𝑓𝑓𝑢𝑢𝑛𝑛𝑟𝑟 𝑓𝑓𝑓𝑓 𝑙𝑙𝑙𝑙𝑠𝑠𝑓𝑓𝑙𝑙𝑙𝑙𝑓𝑓𝑒𝑒 𝑓𝑓𝑜𝑜𝑟𝑟𝑎𝑎𝑖𝑖𝑛𝑛𝑒𝑒𝑑𝑑 𝑜𝑜𝑙𝑙 𝑒𝑒𝑒𝑒𝑟𝑟𝑓𝑓𝑎𝑎𝜋𝜋𝑟𝑟𝑖𝑖𝑓𝑓𝑛𝑛 × 100
𝐴𝐴𝑓𝑓𝑓𝑓𝑢𝑢𝑛𝑛𝑟𝑟 𝑓𝑓𝑓𝑓 𝑓𝑓𝑖𝑖𝜋𝜋𝑓𝑓𝑓𝑓𝑠𝑠𝑝𝑝ℎ𝑒𝑒𝑓𝑓𝑒𝑒𝑠𝑠 (2)
𝐸𝐸𝐷𝐷= 𝐴𝐴𝜋𝜋𝑟𝑟𝑢𝑢𝑎𝑎𝑙𝑙 𝑙𝑙𝑓𝑓𝑎𝑎𝑑𝑑𝑒𝑒𝑑𝑑 𝑎𝑎𝑓𝑓𝑓𝑓𝑢𝑢𝑛𝑛𝑟𝑟 𝑓𝑓𝑓𝑓 𝑙𝑙𝑙𝑙𝑠𝑠𝑓𝑓𝑙𝑙𝑙𝑙𝑓𝑓𝑒𝑒 𝑓𝑓𝑜𝑜𝑟𝑟𝑎𝑎𝑖𝑖𝑛𝑛𝑒𝑒𝑑𝑑 𝑜𝑜𝑙𝑙 𝑒𝑒𝑒𝑒𝑟𝑟𝑓𝑓𝑎𝑎𝜋𝜋𝑟𝑟𝑖𝑖𝑓𝑓𝑛𝑛 × 100
𝐴𝐴𝑓𝑓𝑓𝑓𝑢𝑢𝑛𝑛𝑟𝑟 𝑓𝑓𝑓𝑓 𝑙𝑙𝑙𝑙𝑠𝑠𝑓𝑓𝑙𝑙𝑙𝑙𝑓𝑓𝑒𝑒 𝑎𝑎𝑑𝑑𝑑𝑑𝑒𝑒𝑑𝑑 𝑟𝑟𝑓𝑓 𝑟𝑟ℎ𝑒𝑒 𝑝𝑝𝑓𝑓𝑒𝑒𝑝𝑝𝑎𝑎𝑓𝑓𝑎𝑎𝑟𝑟𝑖𝑖𝑓𝑓𝑛𝑛
(3)
3.2.5. Preparation of gel and microsphere/gel suspension
PF127 gel was prepared by dissolving 20 % w/v of PF127 powder in
distilled water for 12 to 24 hours at 4 ⁰C in refrigerator. This method of
preparation is called as ‘cold method’ [29]. The lysozyme was dissolved in
distilled water for preparing lysozyme loaded PF127 gel. Lysozyme loaded
gelatin microspheres were added to PF127 gel to form gelatin microsphere
in PF127 gel formulation just before the experiment.
53
3.2.6. Microscopy The prepared gelatin microspheres were observed under scanning
electron microscope to study shape and surface properties. The gelatin
microspheres were sprinkled onto a double adhesive tape fixed on
aluminium stage. Fixed microspheres were spattered with platinum film.
Examination of microspheres was performed with a scanning electron
microscope FE Hitachi S4000 operating at 15–20 KV.
3.2.7. ATR-FTIR studies ATR-FTIR studies were conducted with a Bruker Tensor 27
spectrophotometer equipped diamond ATR accessory and DTGS
(deuteriotriglycine sulphate) detector. Each spectrum was an average of
128 scans at resolution of 4 cm-1 from wavenumber 4000 to 400 cm-1. The
Opus spectroscopic software was used for data handling.
3.2.8. Rheology Rheological measurements were performed with rheometer (Malvern
Kinexus, Worcestershire, UK) using cone-plate geometry CP4/40 and a 200
µm gap operating in the oscillation mode. The frequency and shear stress
was set as 0.1 Hz and 0.5 Pa. The temperature ramp was performed from
5-40 ⁰C at 1 ⁰C/min rate. The sampling interval was set 5 seconds. The
oscillatory measurements gave the information about the rheological
parameters such as elastic or storage modulus (G') and the loss or viscous
modulus (G''). Sol-gel transition temperature was determined for all the gel
samples.
3.2.9. SAXS experiments Small-angle X-ray diffraction was recorded with a S3-MICRO
SWAXS camera system (HECUS X-ray Systems, Graz, Austria). Cu Kα

54
radiation of wavelength 1.542 Å was provided by a GeniX X-ray generator,
operating at 50 kV and 1 mA. A 1D-PSD-50 M system (HECUS X-ray
Systems, Graz, Austria) containing 1024 channels of width 54.0 μm was
used for detection of scattered X-rays in the small-angle region. The
working q-range (Å−1) was 0.003 ≤ q ≤ 0.6, where q = 4π sin (θ) λ−1 is the
modulus of the scattering wave vector. The distance between the sample
and detector was 235 mm. Solutions were usually taken from storage under
refrigerator, heated to the required temperature and allowed 15 min to
equilibrate. A few milligrams of the sample were enclosed in a stainless
steel sample holder using a polymeric sheet (Bratfolie, Kalle) window. The
diffraction patterns were recorded at 37 °C for 3 hours. To minimize
scattering from air, the camera volume was kept under vacuum during the
measurements. Silver behenate (CH3-(CH2)20-COOAg) with a d spacing
value of 58.38 Å was used as a standard to calibrate the angular scale of
the measured intensity. The lattice parameters (a) were determined for the
cubic phases from the linear fits of the reciprocal spacing (1/dhkl) of the
various reflections versus the sum of the Miller indexes (h2 + k2 +l2)1/2. For a
correct assignment the plot passes through the origin, and the slope is 1/a,
where ‘a’ is the lattice parameter.
3.2.10. In vitro release studies For gelatin microspheres alone, 5 mg weighed amount lysozyme
loaded GM was put in test tube along with 5 ml of release media. Aliquot of
2 ml sample of the supernatant solution after a brief centrifugation was
withdrawn at predetermined time-points and replaced with 2 ml fresh
phosphate buffer.
Membrane-less diffusion system was used for studying the release
of lysozyme from LGAGM and LGluGM suspended in PF127 gel [30].
Accurately weighed 1 g sample of each type was put in a flat-bottomed vial

55
(internal diameter about 18 mm) followed by gently adding 1 ml of
phosphate buffer (pH 7.4) on the surface of gels, and then the vial was
shaken in a thermostatic shaker under 37 °C at 100 rpm. Complete
supernatant solution was withdrawn at predetermined time-points and
replaced with equal amount of fresh phosphate buffer. The concentration of
bioactive lysozyme in the supernatant solution was determined using the
method described in section 3.2.3. In order to estimate the lysozyme
release from lysozyme loaded gelatin microspheres, unloaded
microspheres were subjected to same release conditions to obtain the
actual release.
3.3. Results and discussion 3.3.1. Preparation of gelatin microspheres
Gelatin microspheres are normally prepared by the simple method of
thermal gelation, also referred as emulsification-solvent-extraction method.
In order to reduce the immediate quick dissolution of gelatin, and hence a
burst release of the drug encapsulated within the microspheres, several
cross-linking methods have been proposed. Chemical cross-linking of
gelatin is frequently adopted by many researchers to decrease the solubility
of GMs and consequently to decrease the rate of release of drugs from the
microspheres. Di- or polyaldehydes used as cross-linking agents are known
to give excellent microspheres for controlling release properties of
encapsulated drug. However, these cross-linking agents lead to several
undesirable toxic side effects, if traces of them remain after crosslinking
and/ or if they form toxic products after reaction with the encapsulated drug.
To overcome this problem several ‘natural’ cross-linking agents, for
example sugars or sugar-derived compounds have been attempted for the
preparation of microspheres with modified release profiles of the
encapsulated drugs. The two representative compounds of chemical cross-
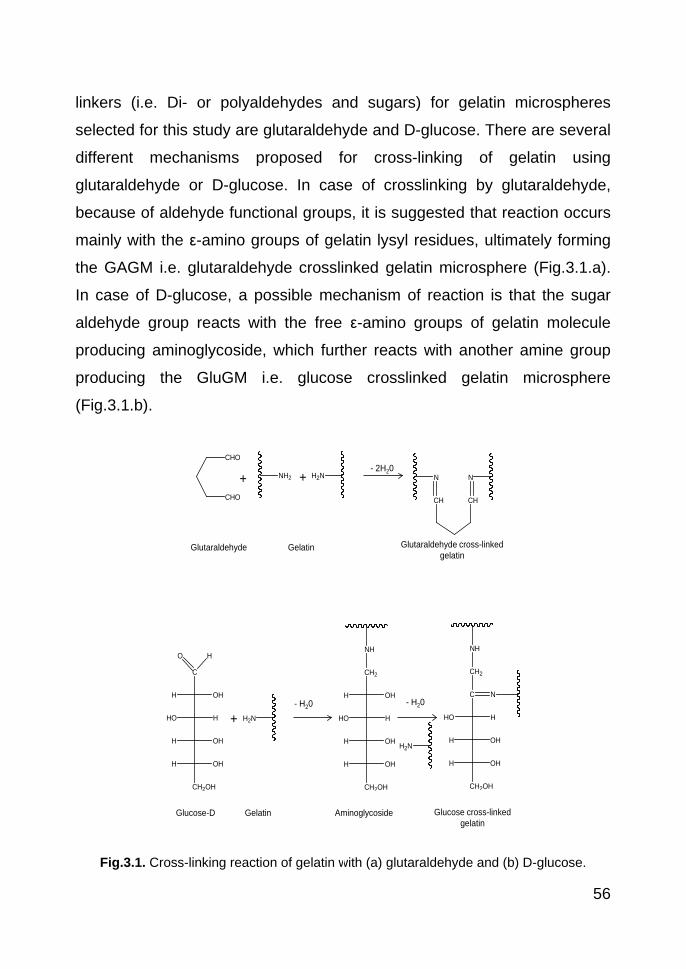
56
linkers (i.e. Di- or polyaldehydes and sugars) for gelatin microspheres
selected for this study are glutaraldehyde and D-glucose. There are several
different mechanisms proposed for cross-linking of gelatin using
glutaraldehyde or D-glucose. In case of crosslinking by glutaraldehyde,
because of aldehyde functional groups, it is suggested that reaction occurs
mainly with the ε-amino groups of gelatin lysyl residues, ultimately forming
the GAGM i.e. glutaraldehyde crosslinked gelatin microsphere (Fig.3.1.a).
In case of D-glucose, a possible mechanism of reaction is that the sugar
aldehyde group reacts with the free ε-amino groups of gelatin molecule
producing aminoglycoside, which further reacts with another amine group
producing the GluGM i.e. glucose crosslinked gelatin microsphere
(Fig.3.1.b).
Fig.3.1. Cross-linking reaction of gelatin with (a) glutaraldehyde and (b) D-glucose.
CHO
CHO
+ +NH2 H2N N
CH CH
N- 2H20
Glutaraldehyde Gelatin Glutaraldehyde cross-linked gelatin
Glucose-D Gelatin Aminoglycoside Glucose cross-linked gelatin
H2N
C
OHH
HHO
OHH
OHH
CH2OH
HO
+
H2N
- H20 - H20
CH2
OHH
HHO
OHH
OHH
CH2OH
NH
CH2
C N
HHO
OHH
OHH
CH2OH
NH
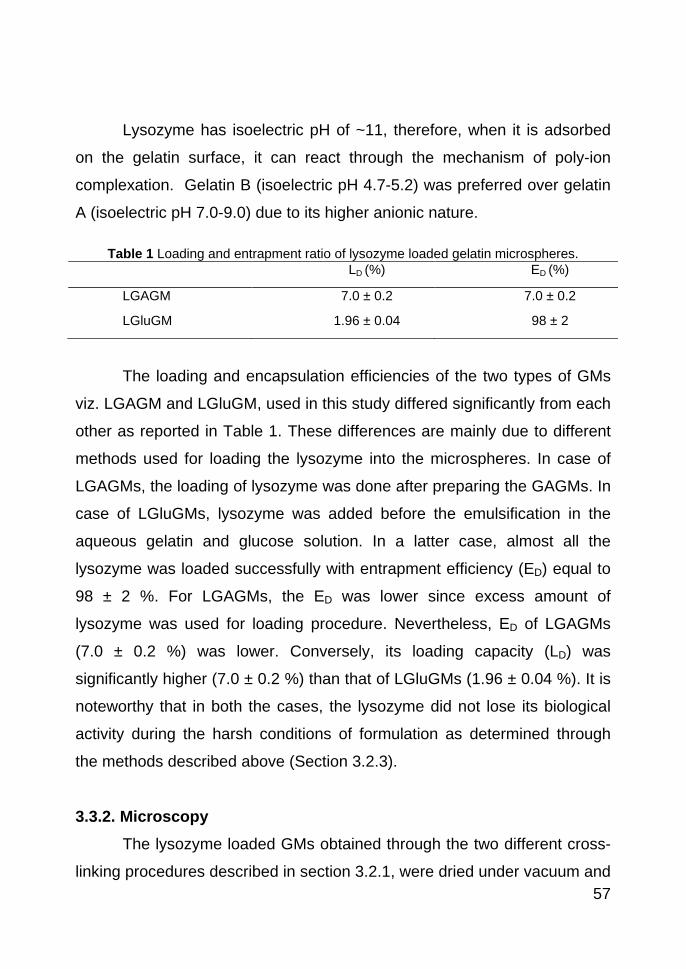
57
Lysozyme has isoelectric pH of ~11, therefore, when it is adsorbed
on the gelatin surface, it can react through the mechanism of poly-ion
complexation. Gelatin B (isoelectric pH 4.7-5.2) was preferred over gelatin
A (isoelectric pH 7.0-9.0) due to its higher anionic nature.
Table 1 Loading and entrapment ratio of lysozyme loaded gelatin microspheres. LD (%) ED (%)
LGAGM 7.0 ± 0.2 7.0 ± 0.2
LGluGM 1.96 ± 0.04 98 ± 2
The loading and encapsulation efficiencies of the two types of GMs
viz. LGAGM and LGluGM, used in this study differed significantly from each
other as reported in Table 1. These differences are mainly due to different
methods used for loading the lysozyme into the microspheres. In case of
LGAGMs, the loading of lysozyme was done after preparing the GAGMs. In
case of LGluGMs, lysozyme was added before the emulsification in the
aqueous gelatin and glucose solution. In a latter case, almost all the
lysozyme was loaded successfully with entrapment efficiency (ED) equal to
98 ± 2 %. For LGAGMs, the ED was lower since excess amount of
lysozyme was used for loading procedure. Nevertheless, ED of LGAGMs
(7.0 ± 0.2 %) was lower. Conversely, its loading capacity (LD) was
significantly higher (7.0 ± 0.2 %) than that of LGluGMs (1.96 ± 0.04 %). It is
noteworthy that in both the cases, the lysozyme did not lose its biological
activity during the harsh conditions of formulation as determined through
the methods described above (Section 3.2.3).
3.3.2. Microscopy The lysozyme loaded GMs obtained through the two different cross-
linking procedures described in section 3.2.1, were dried under vacuum and
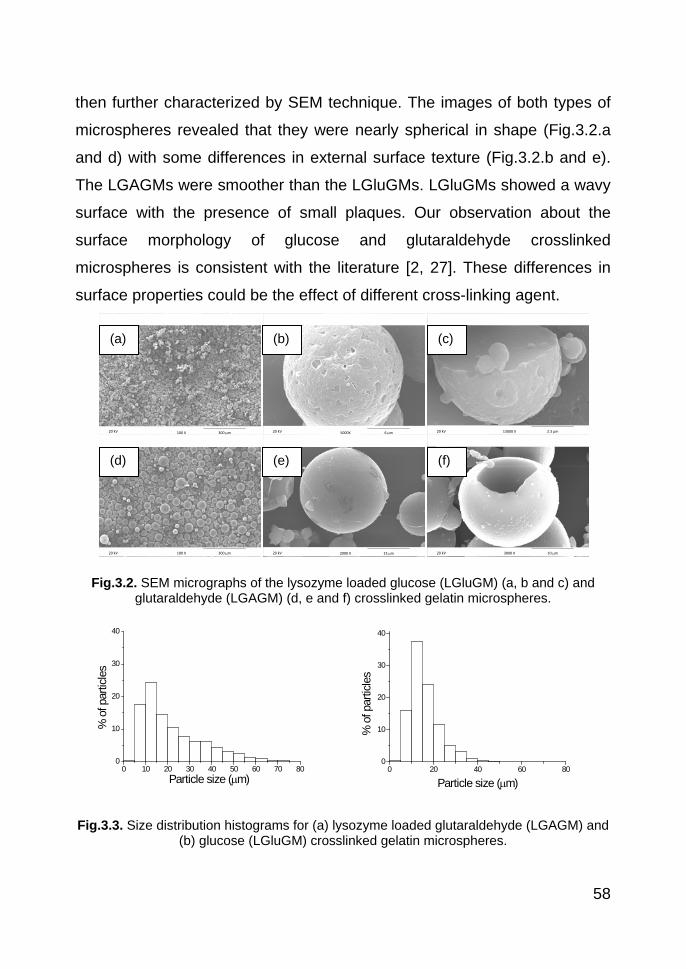
58
then further characterized by SEM technique. The images of both types of
microspheres revealed that they were nearly spherical in shape (Fig.3.2.a
and d) with some differences in external surface texture (Fig.3.2.b and e).
The LGAGMs were smoother than the LGluGMs. LGluGMs showed a wavy
surface with the presence of small plaques. Our observation about the
surface morphology of glucose and glutaraldehyde crosslinked
microspheres is consistent with the literature [2, 27]. These differences in
surface properties could be the effect of different cross-linking agent.
Fig.3.2. SEM micrographs of the lysozyme loaded glucose (LGluGM) (a, b and c) and glutaraldehyde (LGAGM) (d, e and f) crosslinked gelatin microspheres.
Fig.3.3. Size distribution histograms for (a) lysozyme loaded glutaraldehyde (LGAGM) and
(b) glucose (LGluGM) crosslinked gelatin microspheres.
300 µm100 X20 kV 6 µm5000X20 kV 2.3 µm13000 X20 kV
300 µm100 X20 kV 15 µm2000 X20 kV 10 µm3000 X20 kV
0 10 20 30 40 50 60 70 800
10
20
30
40
% o
f par
ticle
s
Particle size (µm)0 20 40 60 80
0
10
20
30
40
% o
f par
ticle
s
Particle size (µm)
(a)
(f) (e) (d)
(c) (b)

59
The formulation parameters which can significantly affect the particle
size, surface morphology, and dispersion of gelatin microspheres are the
concentration of gelatin solution, the concentration of the emulsifier, the
W/O ratio, the emulsifying time, and the stirring speed [31]. Therefore,
concentration of gelatin solution as 20 % w/v, concentration of emulsifier
(Span 80) as 1 % v/v, W/O ratio as 0.05, emulsifying time 10 min and
stirring speed 1000 rpm were kept constant in order to study the effect of
the two different crosslinking agents on the release properties.
The image analysis of SEM micrographs leads to obtain size
distribution and other interesting features induced by the different cross-
linkers. Fig.3.3.a and b shows size distribution histograms for LGAGM and
LGluGM, respectively. It is clear from the size distribution histograms that
the particle size distribution of LGAGM and LGluGM were different. Both
types of gelatin microspheres showed log-normal size distribution.
Table 2 Size distribution parameters for LGluGM and LGAGM.
Parameter LGluGM (µm) LGAGM (µm)
Mean 15.91 22.06
Standard Deviation 6.63 13.68
Minimum 4.80 2.72
Median 14.50 17.39
Maximum 48.02 70.49
D90* 25.23 42.65
* 90 % of particles are of size less than (µm)
Table 2 summarizes the various size distribution parameters for the
two types of GMs investigated. For LGAGM and LGluGM, mean particle
size was approximately 22 µm and 16 µm, respectively. In case of LGAGM
D90 (90% of microspheres are smaller than that) was about 43 µm whereas
in case of LGluGM it was about 25 µm. This clearly shows that the
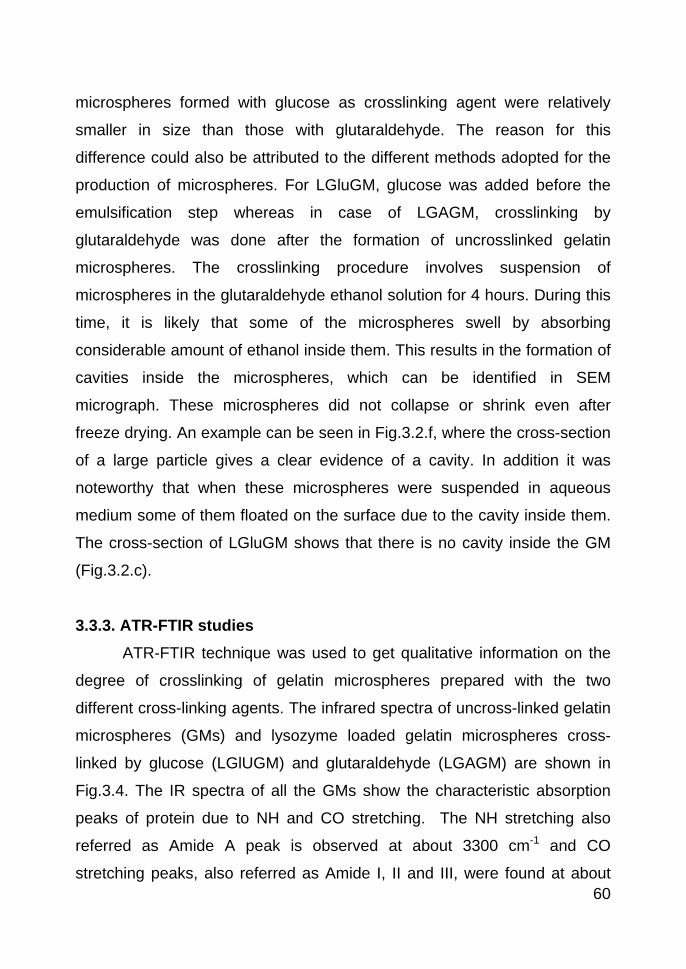
60
microspheres formed with glucose as crosslinking agent were relatively
smaller in size than those with glutaraldehyde. The reason for this
difference could also be attributed to the different methods adopted for the
production of microspheres. For LGluGM, glucose was added before the
emulsification step whereas in case of LGAGM, crosslinking by
glutaraldehyde was done after the formation of uncrosslinked gelatin
microspheres. The crosslinking procedure involves suspension of
microspheres in the glutaraldehyde ethanol solution for 4 hours. During this
time, it is likely that some of the microspheres swell by absorbing
considerable amount of ethanol inside them. This results in the formation of
cavities inside the microspheres, which can be identified in SEM
micrograph. These microspheres did not collapse or shrink even after
freeze drying. An example can be seen in Fig.3.2.f, where the cross-section
of a large particle gives a clear evidence of a cavity. In addition it was
noteworthy that when these microspheres were suspended in aqueous
medium some of them floated on the surface due to the cavity inside them.
The cross-section of LGluGM shows that there is no cavity inside the GM
(Fig.3.2.c).
3.3.3. ATR-FTIR studies ATR-FTIR technique was used to get qualitative information on the
degree of crosslinking of gelatin microspheres prepared with the two
different cross-linking agents. The infrared spectra of uncross-linked gelatin
microspheres (GMs) and lysozyme loaded gelatin microspheres cross-
linked by glucose (LGlUGM) and glutaraldehyde (LGAGM) are shown in
Fig.3.4. The IR spectra of all the GMs show the characteristic absorption
peaks of protein due to NH and CO stretching. The NH stretching also
referred as Amide A peak is observed at about 3300 cm-1 and CO
stretching peaks, also referred as Amide I, II and III, were found at about
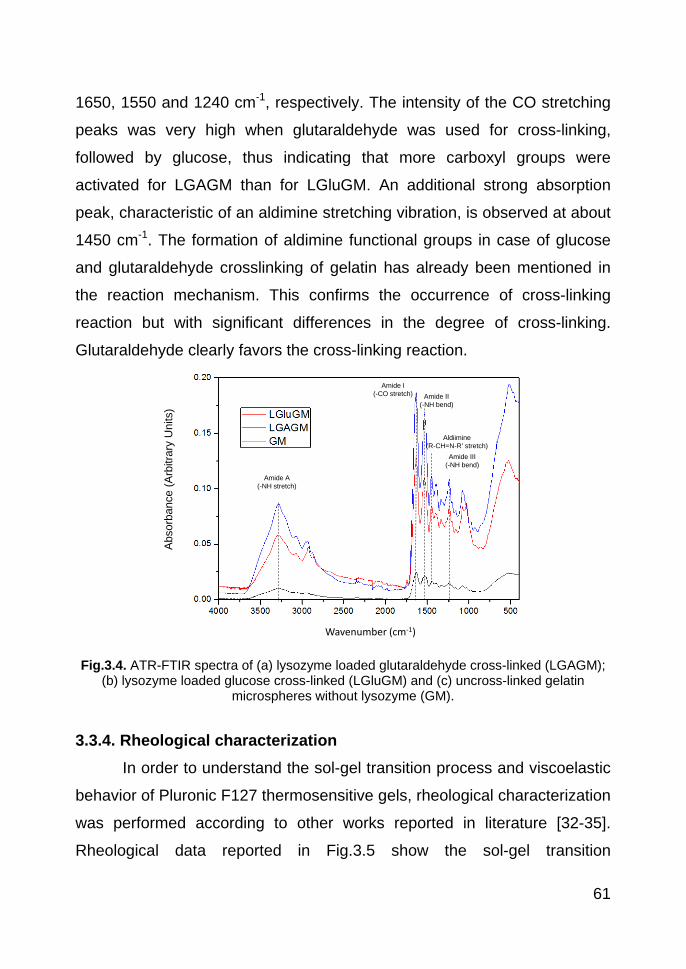
61
1650, 1550 and 1240 cm-1, respectively. The intensity of the CO stretching
peaks was very high when glutaraldehyde was used for cross-linking,
followed by glucose, thus indicating that more carboxyl groups were
activated for LGAGM than for LGluGM. An additional strong absorption
peak, characteristic of an aldimine stretching vibration, is observed at about
1450 cm-1. The formation of aldimine functional groups in case of glucose
and glutaraldehyde crosslinking of gelatin has already been mentioned in
the reaction mechanism. This confirms the occurrence of cross-linking
reaction but with significant differences in the degree of cross-linking.
Glutaraldehyde clearly favors the cross-linking reaction.
Fig.3.4. ATR-FTIR spectra of (a) lysozyme loaded glutaraldehyde cross-linked (LGAGM);
(b) lysozyme loaded glucose cross-linked (LGluGM) and (c) uncross-linked gelatin microspheres without lysozyme (GM).
3.3.4. Rheological characterization In order to understand the sol-gel transition process and viscoelastic
behavior of Pluronic F127 thermosensitive gels, rheological characterization
was performed according to other works reported in literature [32-35].
Rheological data reported in Fig.3.5 show the sol-gel transition
Abs
orba
nce
(Arb
itrar
y U
nits
)
Wavenumber (cm-1)
Amide A (-NH stretch)
Amide I (-CO stretch) Amide II
(-NH bend)
Amide III (-NH bend)
Aldiimine(R-CH=N-R’ stretch)
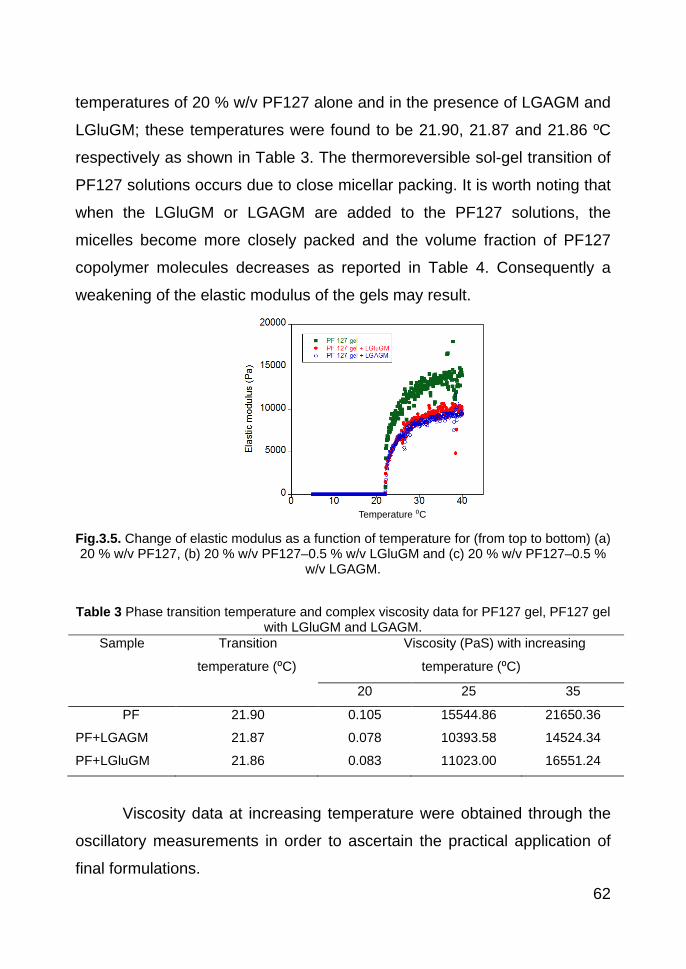
62
temperatures of 20 % w/v PF127 alone and in the presence of LGAGM and
LGluGM; these temperatures were found to be 21.90, 21.87 and 21.86 ºC
respectively as shown in Table 3. The thermoreversible sol-gel transition of
PF127 solutions occurs due to close micellar packing. It is worth noting that
when the LGluGM or LGAGM are added to the PF127 solutions, the
micelles become more closely packed and the volume fraction of PF127
copolymer molecules decreases as reported in Table 4. Consequently a
weakening of the elastic modulus of the gels may result.
Fig.3.5. Change of elastic modulus as a function of temperature for (from top to bottom) (a) 20 % w/v PF127, (b) 20 % w/v PF127–0.5 % w/v LGluGM and (c) 20 % w/v PF127–0.5 %
w/v LGAGM.
Table 3 Phase transition temperature and complex viscosity data for PF127 gel, PF127 gel with LGluGM and LGAGM.
Sample Transition
temperature (⁰C)
Viscosity (PaS) with increasing
temperature (⁰C)
20 25 35
PF 21.90 0.105 15544.86 21650.36
PF+LGAGM 21.87 0.078 10393.58 14524.34
PF+LGluGM 21.86 0.083 11023.00 16551.24
Viscosity data at increasing temperature were obtained through the
oscillatory measurements in order to ascertain the practical application of
final formulations.
Temperature ⁰C
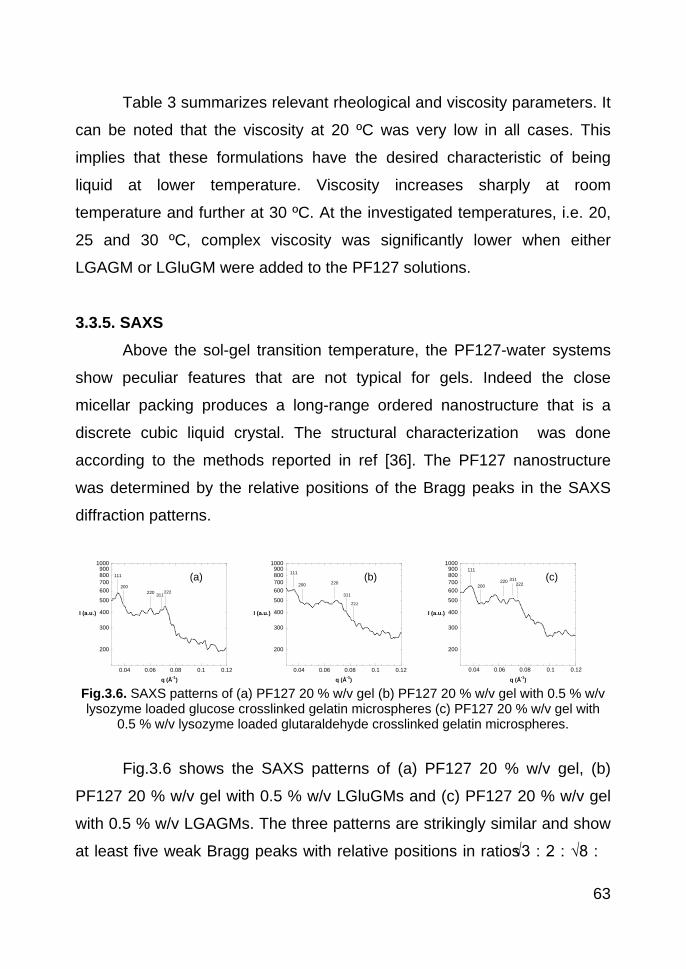
63
Table 3 summarizes relevant rheological and viscosity parameters. It
can be noted that the viscosity at 20 ºC was very low in all cases. This
implies that these formulations have the desired characteristic of being
liquid at lower temperature. Viscosity increases sharply at room
temperature and further at 30 ºC. At the investigated temperatures, i.e. 20,
25 and 30 ºC, complex viscosity was significantly lower when either
LGAGM or LGluGM were added to the PF127 solutions.
3.3.5. SAXS Above the sol-gel transition temperature, the PF127-water systems
show peculiar features that are not typical for gels. Indeed the close
micellar packing produces a long-range ordered nanostructure that is a
discrete cubic liquid crystal. The structural characterization was done
according to the methods reported in ref [36]. The PF127 nanostructure
was determined by the relative positions of the Bragg peaks in the SAXS
diffraction patterns.
Fig.3.6. SAXS patterns of (a) PF127 20 % w/v gel (b) PF127 20 % w/v gel with 0.5 % w/v lysozyme loaded glucose crosslinked gelatin microspheres (c) PF127 20 % w/v gel with
0.5 % w/v lysozyme loaded glutaraldehyde crosslinked gelatin microspheres.
Fig.3.6 shows the SAXS patterns of (a) PF127 20 % w/v gel, (b)
PF127 20 % w/v gel with 0.5 % w/v LGluGMs and (c) PF127 20 % w/v gel
with 0.5 % w/v LGAGMs. The three patterns are strikingly similar and show
at least five weak Bragg peaks with relative positions in ratios √3 : 2 : √8 :
200
300
400
500
600700800900
1000
0.04 0.06 0.08 0.1 0.12
I (a.u.)
q (Å-1)
111
200220 311222
200
300
400
500
600700800900
1000
0.04 0.06 0.08 0.1 0.12
I (a.u.)
q (Å-1)
111
200 220
311
222
200
300
400
500
600700800900
1000
0.04 0.06 0.08 0.1 0.12
q (Å-1)
I (a.u.)
111
200220 311
222
(a) (b) (c)
64
√11 : √12... which can be indexed as hkl = 111, 200, 220, 311, 222
reflections of a face centered cubic phase of Fm3m space group (Q225).
Although the SAXS pattern is essentially dominated by a Fm3m structure,
several weak non-indexable peaks are visible.
Two parameters are characteristic of the nanostructure of the liquid
crystalline phases: the lattice parameter a, and the interfacial area per PEO
block, ap. In the normal micellar cubic structure the interfacial area per PEO
block can be calculated from:
𝑎𝑎𝑝𝑝 = (36𝜋𝜋𝑛𝑛𝑢𝑢𝑓𝑓2)1/3 𝑣𝑣𝑝𝑝2Φp a
(4)
where nu is the number of spherical micelles in the cubic cell, f is the
apolar volume fraction, υp is the volume of one PF127 molecule, Φp is the
copolymer volume fraction in the system and a is the lattice parameter. The
apolar volume fraction f, is given by:
𝑓𝑓 = 0.34Φp (5)
where 0.34 is the volume fraction of the PPO block in the PF127
molecule (PPO weight fraction = 0.30). To convert the weight fractions of
the components into volume fractions, the bulk densities of the copolymer
(1.05 g/cm3), water and additives are used. The volume of one molecule is
20000 Å3. The aggregation number of the micelles, Nagg, defined as the
number of P127 molecules per micelle can be determined using:
𝑁𝑁𝑎𝑎𝑎𝑎𝑎𝑎 =
Φ𝑝𝑝 𝑎𝑎3
𝑛𝑛𝑢𝑢𝑣𝑣𝑝𝑝
(6)
In these equations nu = 4 for the unit cell of the face-centered lattice
consisting of four micelles.
Mortensen et al have shown that 20 % w/v PF127 gel may have face
centered cubic (fcc) or body centered cubic (bcc) ordering depending on
the proportion of diblock copolymer in the commercial triblock copolymer,
with as-received samples forming fcc structured gels and purified samples
65
forming bcc gels [37]. Recently, Chaibundit et al found that with as-received
PF 127, fcc structure is formed and with the addition of 10-30% ethanol, it
changes to bcc structure [38]. Our results are in agreement with the
reported findings; since all samples used in this study were prepared with
the as-received PF127, a fcc structure was found. No significant variations
in the nanostructure of PF127 gel were found after inclusion of GMs; indeed
small differences in lattice parameter are within 5 % of error (Table 4).
Table 4 PF127 volume fraction (Φp), apolar volume fraction (f), lattice parameter (a),
interfacial area (ap) and aggregation number (Nagg) obtained from SAXS data for PF127 gel, PF127 gel with LGAGM and LGluGM.
Sample name PF127/W/GM Ratio Φp f
Space group a (Å) ap(Å2) Nagg
PF 20/80/0 0.192 0.065 Fm3m 294 ± 9 238 56
PF+LGAGM 19.9/79.6/0.5 0.183 0.062 Fm3m 281 ± 12 244 45
PF+LGluGM 19.9/79.6/0.5 0.183 0.062 Fm3m 281 ± 2 235 50
This result implies that lysozyme, if any diffused from GMs and/or
GMs themselves is/are not affecting significantly the discrete cubic LC
structure of PF127 gel.
3.3.6. In vitro release studies In vitro release studies performed on gelatin microspheres showed
that both types of cross-linked microspheres showed burst release. About
51 % and 89 % of lysozyme was released in the first hour of release
experiment in case of LGAGM and LGluGM, respectively. This difference in
burst release of lysozyme from LGAGM and LGluGM could be attributed to
the differences in degree of cross-linking of gelatin microspheres. Gelatin
microspheres are known to swell in aqueous medium due to hydration.
Glutaraldehyde and glucose forms bridges in polymeric chains of gelatin.
Therefore, the extent of swelling process depends upon the degree of

66
cross-linking. If the degree of cross-linking is higher, more bridges are
formed and microspheres swell less. Swelling of microspheres can cause
increased mobility of encapsulated lysozyme, and hence diffusion from the
microspheres into the release medium, occurs. Since glutaraldehyde has
shown higher cross-linking density than glucose, lysozyme was released at
higher rate in case of glucose crosslinked microspheres compared to
glutaraldehyde crosslinked microspheres.
Fig.3.7. In vitro release of lysozyme from (a) lysozyme loaded gelatin microspheres crosslinked by glutaraldehyde (LGAGM) and glucose (LGluGM); and (b) PF127 20 % w/v with lysozyme (PF), lysozyme loaded glutaraldehyde (PF + LGAGM) and glucose (PF +
LGluGM) cross-linked gelatin microspheres
The release of lysozyme from LGluGM and LGAGM suspended in
PF127 gel was slower, in comparison also to lysozyme dissolved in PF127
gel (Fig.3.7.b). PF127 gel released almost all the lysozyme in 5 hours,
whereas the GMs suspended in PF127 gel could extend the release for
another 1 hour. The reason for the slower release of lysozyme from the
GMs suspended in PF127 gel could be the increased path required for
lysozyme to pass through the micellar gel matrix before releasing into the
buffer medium. It can be noted in Fig.3.7.b that during the initial 2 hours of
release experiment, LGluGM suspended in PF127 gel released significantly
more lysozyme (33 ± 0.34 %) in comparison to LGAGM suspended in
0 50 100 150 200 250 300 350 400 450 5000
102030405060708090
100110120
% C
umul
ative
lyso
zym
e re
leas
ed
Time (min)
LGluGM LGAGM
0 50 100 150 200 250 300 350 400 450 5000
102030405060708090
100110120
% C
umul
ative
lyso
zym
e re
leas
ed
Time (min)
PF+LGluGM PF+LGAGM PF
)
(a) (b)
67
PF127 gel (approximately 26 ± 4 %). This effect could be related to burst
release of lysozyme from LGluGM (Fig.3.7.a). It is worth mentioning that
after this initial burst release from LGluGM suspended in PF127 gel, the
lysozyme was slowly released from both the GMs.
Burst release of encapsulated drugs from microspheres is an
unwanted phenomenon. To limit the burst release, some authors has
suggested use of higher concentration of cross-linking agents. But, this has
its inherent disadvantages, as cross-linking agents at high concentration
will give rise higher toxicity or interact with the encapsulated drugs.
3.4. Conclusions
The results of this study allow to point out that the cross-linking of
gelatin with glutaraldehyde and D-glucose produced two different cross-
linked structures. Although, the shape of microspheres was spherical in
both the cases, the surface texture and size distribution was clearly distinct.
The infrared spectroscopy analysis showed that the degree of cross-linking
density was significantly different for the two types of microspheres
obtained. Lysozyme, without losing its biological activity, was successfully
loaded, although loading and encapsulation was significantly different for
the two types of microspheres. The nanostructure of 20 % w/v PF127 gel
was found to be a Fm3m type cubic discrete liquid crystal; that was not
significantly modified upon gelatin microspheres addition. PF127 gel has
higher elastic modulus and complex viscosity than the microspheres in gel
formulations. The suspension of GMs in PF127 gel allowed for a more
sustained release of lysozyme. Finally, it should be remarked that the
combination of these two different formulation systems into one can give
more options to control the drug release.

68
3.5. References [1] M.-L. Manca, S. Mourtas, V. Dracopoulos, A.M. Fadda, S.G.
Antimisiaris, PLGA, chitosan or chitosan-coated PLGA microparticles for alveolar delivery?: A comparative study of particle stability during nebulization, Colloids and Surfaces B: Biointerfaces, 62 (2008) 220-231.
[2] R. Dinarvand, S. Mahmoodi, E. Farboud, M. Salehi, F. Atyabi, Preparation of gelatin microspheres containing lactic acid--effect of cross-linking on drug release, Acta Pharm, 55 (2005) 57-67.
[3] K. Ulubayram, I. Eroglu, N. Hasirci, Gelatin microspheres and sponges for delivery of macromolecules, J Biomater Appl, 16 (2002) 227-241.
[4] Z.S. Patel, M. Yamamoto, H. Ueda, Y. Tabata, A.G. Mikos, Biodegradable gelatin microparticles as delivery systems for the controlled release of bone morphogenetic protein-2, Acta Biomaterialia, 4 (2008) 1126-1138.
[5] S. Young, M. Wong, Y. Tabata, A.G. Mikos, Gelatin as a delivery vehicle for the controlled release of bioactive molecules, J. Controlled Release, 109 (2005) 256-274.
[6] K. Mladenovska, E.F. Kumbaradzi, G.M. Dodov, L. Makraduli, K. Goracinova, Biodegradation and drug release studies of BSA loaded gelatin microspheres, Int. J. Pharm., 242 (2002) 247-249.
[7] S. Singh, K.V. Rama Rao, K. Venugopal, R. Manikandan, Alteration in dissolution characteristics of gelatin-containing formulations, Pharm. Tech., (2002) 36-58.
[8] M.A. Vandelli, M. Romagnoli, A. Monti, M. Gozzi, P. Guerra, F. Rivasi, F. Forni, Microwave-treated gelatin microspheres as drug delivery system, J. Controlled Release, 96 (2004) 67-84.
[9] A.P. Rokhade, N.B. Shelke, S.A. Patil, T.M. Aminabhavi, Novel hydrogel microspheres of chitosan and pluronic F-127 for controlled release of 5-fluorouracil, J. Microencapsulation, 24 (2007) 274-288.
[10] Y. Wang, J.-Q. Gao, F. Li, S.-H. Ri, W.-Q. Liang, Triblock copolymer Pluronic®F127 sustains insulin release and reduces initial burst of microspheres—in vitro and in vivo study, Colloid Poly. Sci., 285 (2006) 233-238.
[11] F. Lagarce, N. Faisant, J.-C. Desfontis, L. Marescaux, F. Gautier, J. Richard, P. Menei, J.-P. Benoit, Baclofen-loaded microspheres in gel suspensions for intrathecal drug delivery: In vitro and in vivo evaluation, Eur. J. Pharm. Biopharm., 61 (2005) 171-180.
[12] A.-C. Albertsson, J. Carlfors, C. Sturesson, Preparation and characterisation of poly(adipic anhydride) microspheres for ocular drug delivery, J. Appl. Poly. Sci., 62 (1996) 695-705.
69
[13] M. Patel, S.K. Jain, A.K. Yadav, D. Gogna, G.P. Agrawal, Preparation and Characterization of Oxybenzone-Loaded Gelatin Microspheres for Enhancement of Sunscreening Efficacy, Drug Delivery, 13 (2006) 323 - 330.
[14] M.J. Song, D.S. Lee, J.H. Ahn, D.J. Kim, S.C. Kim, Dielectric behavior during sol-gel transition of PEO-PPO-PEO triblock copolymer aqueous solution, Polymer Bulletin, 43 (2000) 497-504.
[15] G. Wanka, H. Hoffmann, W. Ulbricht, Phase Diagrams and Aggregation Behavior of Poly(oxyethylene)-Poly(oxypropylene)-Poly(oxyethylene) Triblock Copolymers in Aqueous Solutions, Macromolecules, 27 (1994) 4145-4159.
[16] G. Dumortier, J. Grossiord, F. Agnely, J. Chaumeil, A Review of Poloxamer 407 Pharmaceutical and Pharmacological Characteristics, Pharm. Res., 23 (2006) 2709-2728.
[17] Y. Liu, W.-L. Lu, J.-C. Wang, X. Zhang, H. Zhang, X.-Q. Wang, T.-Y. Zhou, Q. Zhang, Controlled delivery of recombinant hirudin based on thermo-sensitive Pluronic® F127 hydrogel for subcutaneous administration: In vitro and in vivo characterization, J. Controlled Release, 117 (2007) 387-395.
[18] M. Morishita, J.M. Barichello, K. Takayama, Y. Chiba, S. Tokiwa, T. Nagai, Pluronic® F-127 gels incorporating highly purified unsaturated fatty acids for buccal delivery of insulin, International Journal of Pharmaceutics, 212 (2001) 289-293.
[19] E.A. Pec, Z.G. Wout, T.P. Johnston, Biological activity of urease formulated in poloxamer 407 after intraperitoneal injection in the rat, Journal of Pharmaceutical Sciences, 81 (1992) 626-630.
[20] T.P. Johnston, M.A. Punjabi, C.J. Froelich, Sustained Delivery of Interleukin-2 from a Poloxamer 407 Gel Matrix Following Intraperitoneal Injection in Mice, Pharmaceutical Research, 9 (1992) 425-434.
[21] M.D. Dibiase, C.T. Rhodes, Formulation and Evaluation of Epidermal Growth Factor in Pluronic F-127 Gel, Drug Development and Industrial Pharmacy, 22 (1996) 823-831.
[22] J.H. Jeon, D.A. Puleo, Alternating release of different bioactive molecules from a complexation polymer system, Biomaterials, 29 (2008) 3591-3598.
[23] J.J. Yoon, H.J. Chung, T.G. Park, Photo-crosslinkable and biodegradable Pluronic/heparin hydrogels for local and sustained delivery of angiogenic growth factor, Journal of Biomedical Materials Research Part A, 83A (2007) 597-605.
[24] A.J. Kuijpers, G.H.M. Engbers, P.B. van Wachem, J. Krijgsveld, S.A.J. Zaat, J. Dankert, J. Feijen, Controlled delivery of antibacterial proteins from biodegradable matrices, J. Controlled Release, 53 (1998) 235-247.
70
[25] M.S. Bhattacharyya, P. Hiwale, M. Piras, L. Medda, D. Steri, M. Piludu, A. Salis, M. Monduzzi, Lysozyme Adsorption and Release from Ordered Mesoporous Materials, J. Phys. Chem. C, 114 (2010) 19928-19934.
[26] Y. Lin, J. Sun, G. Jiang, J. Zan, F. Ding, In vitro Evaluation of Lysozyme-loaded Microspheres in Thermosensitive Methylcellulose-based Hydrogel, Chin. J. Chem. Eng., 15 (2007) 566-572.
[27] R. Cortesi, C. Nastruzzi, S.S. Davis, Sugar cross-linked gelatin for controlled release: microspheres and disks, Biomaterials, 19 (1998) 1641-1649.
[28] Y. Tabata, Y. Ikada, Synthesis of Gelatin Microspheres Containing Interferon, Pharm. Res., 6 (1989) 422-427.
[29] I.R. Schmolka, Artificial skin I. Preparation and properties of pluronic F-127 gels for treatment of burns, J. Biomed. Mater. Res., 6 (1972) 571-582.
[30] Y. Yang, J. Wang, X. Zhang, W. Lu, Q. Zhang, A novel mixed micelle gel with thermo-sensitive property for the local delivery of docetaxel, J. Controlled Release, 135 (2009) 175-182.
[31] R. Sun, J. Shi, Y. Guo, L. Chen, Studies on the particle size control of gelatin microspheres, Front. Chem. Chin., 4 (2009) 222-228.
[32] J. Yun Chang, Y.-K. Oh, H. Soo Kong, E. Jung Kim, D. Deuk Jang, K. Taek Nam, C.-K. Kim, Prolonged antifungal effects of clotrimazole-containing mucoadhesive thermosensitive gels on vaginitis, J. Controlled Release, 82 (2002) 39-50.
[33] J.Y. Chang, Y.-K. Oh, H.-g. Choi, Y.B. Kim, C.-K. Kim, Rheological evaluation of thermosensitive and mucoadhesive vaginal gels in physiological conditions, Int. J. Pharm., 241 (2002) 155-163.
[34] G. Grassi, A. Crevatin, R. Farra, G. Guarnieri, A. Pascotto, B. Rehimers, R. Lapasin, M. Grassi, Rheological properties of aqueous Pluronic-alginate systems containing liposomes, J. Colloid Interface Sci, 301 (2006) 282-290.
[35] Y. Liu, Y.-y. Zhu, G. Wei, W.-y. Lu, Effect of carrageenan on poloxamer-based in situ gel for vaginal use: Improved in vitro and in vivo sustained-release properties, Eur. J. Pharm. Biopharm., 37 (2009) 306-312.
[36] R. Ivanova, B. Lindman, P. Alexandridis, Evolution in Structural Polymorphism of Pluronic F127 Poly(ethylene oxide)−Poly(propylene oxide) Block Copolymer in Ternary Systems with Water and Pharmaceutically Acceptable Organic Solvents: From “Glycols” to “Oils”†, Langmuir, 16 (2000) 9058-9069.
[37] K. Mortensen, W. Batsberg, S. Hvidt, Effects of PEO−PPO Diblock Impurities on the Cubic Structure of Aqueous PEO−PPO−PEO Pluronics Micelles: fcc and bcc Ordered Structures in F127, Macromolecules, 41 (2008) 1720-1727.

71
[38] C. Chaibundit, N.M.P.S. Ricardo, N.M.P.S. Ricardo, C.A. Muryn, M.-B. Madec, S.G. Yeates, C. Booth, Effect of ethanol on the gelation of aqueous solutions of Pluronic F127, Journal of Colloid and Interface Science, 351 (2010) 190-196.
72
4. ORDERED MESOPOROUS MATERIALS
4.1. Introduction Ordered mesoporous materials (OMMs) have outstanding textural
and structural features [1] that make them suitable hosts for bioactive
molecules [2]. They have high surface area (about 1000 m2/g) a highly
ordered, and hence a highly reproducible structure, with uniform pore size
(2 – 50 nm) which is comparable with the diameter of many bio-
macromolecules. Most of previous works concerning the use of OMMs as
sorbents for bio-macromolecules were aimed to stably immobilize an
enzyme into the pores to obtain a stable and active biocatalyst [3-4] for
potential industrial,[5-6] environmental,[7] or biosensing applications [8].
Innovative emerging applications are the use of OMMs in different
nanomedicine topics, namely, carriers for the release of drugs and bioactive
agents [9] and tissue engineering [10]. A drug delivery system is capable of
releasing a carried bioactive agent in a specific location at a specific rate.
The use of OMMs for biocatalysis or controlled release depends on
the fact that the interaction between the macromolecule and the sorbent
surface is strong or weak, respectively. Consequently, given a bioactive
agent, the chemical surface of the sorbent material has an important effect
on the strength of the interaction, and hence on the possible application [5].
In addition, it is relevant that OMMs surface can be easily modified by a
wide number of suitable functionalizing agents[11-12] that allow for tailoring
the sorbent surface to get the desired, weak or strong, interaction with the
adsorbing molecule [13]. Moreover, the surface interaction can be
modulated by the suitable choice of the pH,[3, 14] the ionic strength [14]
and also the type of salt [15-16] of the adsorbing solution.
SBA-15 and similar materials have been studied as delivery systems
for different locations. Most researchers focused the attention in the oral
73
therapy, studying the controlled release of ibuprofen,[17] nimodipine,[18]
itraconazole,[19] and many poorly soluble drugs [20]. Vallet-Regì and
coworkers - taking advantage of the bioactive behavior of mesoporous
silica, that can be covered by a layer of hydroxyapatyte[21-22] and thus
used as bioceramics for bone tissue regeneration - deeply studied the local
release of drugs for bones disease [12, 23-26]. Lopez et al. used ordered
mesoporous silica for the storage and release of valproic acid and sodic
phenytoin in the brain of rats [27].
An important issue for the use of OMMs as drug delivery systems
concerns their toxicity and biocompatibility. Hudson et al. found that
subcutaneous injection of some OMMs in rats resulted in a general good
biocompatibility as determined through histological investigations. In
contrast, intra-peritoneal and intra-venous injections in mice caused death
[28].
Another key point for the application of OMMs in drug delivery
systems is the stability of the matrix in the releasing medium. Very recently
Izquierdo-Barba et al. investigated the stability of SBA-15 like materials in
selected aqueous media mimicking body fluids. They found that, although
the mesoporous structure of SBA-15 was partially lost after 60 days in all
tested media, organically modified SBA-15 samples exhibited a higher
resistance to lixiviation [29].
Here we report the characterization through TEM, SAXS, N2-
adsorption/desorption isotherms, ATR-FTIR, and potentiometric titrations of
two different OMMs, namely: SBA-15 and MSE, and their use for the
adsorption and the in vitro controlled release of a model protein - hen egg
white lysozyme (Lyz) - in physiological conditions (pH = 7.4, t = 37°C). The
effect of the different chemical surface and the adsorbing pH is
investigated. Besides the structural features, it will be shown that the
different material surface can affect both the loading amount and the
74
kinetics of the release. Finally, a comparison of the stability of the two
matrices towards the lixiviation effect of the release medium is presented.
4.2. Materials and methods 4.2.1. Materials
Chemicals for the synthesis and modification of OMMs,
tetraethylorthosilicate (TEOS, 98%), pluronic copolymer 123
(EO20PO70EO20), 1,2-bis(trimethoxysilyl)ethane (BTMSE) (96%) and
buffer components, sodium hydrogencarbonate (99%), Na2HPO4 (99%),
and NaH2PO4 (99%), were purchased from Sigma-Aldrich. Lysozyme from
hen egg white (92717 U/mg) was purchased from Fluka.
4.2.2. Characterization of OMMs and lysozyme SBA-15 mesoporous silica and MSE mesoporous organosilica were
synthesized according to the methods reported in refs [30] and [31],
respectively. SBA-15 and MSE were characterized with the following
techniques. SAXS patterns were recorded (1200 s) with a S3-MICRO
SWAXS camera system (HECUS X-ray Systems, Graz, Austria). Cu Kα
radiation of wavelength 1.542 Å was provided by a GeniX X-ray generator,
operating at 50 kV and 1 mA. A 1D-PSD-50 M system (HECUS X-ray
Systems, Graz, Austria) containing 1024 channels of width 54.0 µm was
used for detection of scattered X-rays in the small-angle region.
Transmission electron microscopy (TEM) images were obtained on a JEOL
100S microscope. Finely ground samples were placed directly onto
formvar-coated electron microscopy nichel grids. Textural analysis was
carried out on a Thermoquest-Sorptomatic 1990, by determining the N2
adsorption/desorption isotherms at 77 K. Before analysis the sample was
out-gassed overnight at 40 °C. The specific surface area, the total pore
volume and the pore size distribution were assessed by the BET [32] and
75
BJH [33] methods respectively. ATR-FTIR studies were conducted with a
Bruker Tensor 27 spectrophotometer equipped diamond-ATR accessory
and DTGS (deuteriotriglycine sulphate) detector. A number of 128 scans at
resolution of 4 cm-1 were averaged from wavenumber 4000 to 400 cm-1.
The Opus spectroscopic software was used for data handling. Surface
charge densities of SBA-15 and MSE were determined through
potentiometric titrations according to the procedure reported in ref [15]. The
theoretical titration curve of lysozyme and the corresponding theoretical pI
were obtained through PROPKA 2.0 software [34-35]. Lysozyme images in
Fig.4.5.a-d were made with VMD software support. VMD is developed with
NIH support by the Theoretical and Computational Biophysics group at the
Beckman Institute, University of Illinois at Urbana-Champaign.
4.2.3. Loading of lysozyme.
To load lysozyme on SBA-15 and MSE, 0.2 g of the mesoporous
sample were suspended in 10 mL of aqueous solution of lysozyme (10
mg/mL) prepared in 10 mM phosphate buffer pH 7.0 or 10 mM sodium
hydrogen carbonate buffer at pH 9.6, and soaked for 96 hours with shaking
at 100 rpm and 37°C. The concentration of lysozyme was measured by UV
spectrophotometer at a wavelength of 280 nm. The amount of lysozyme
loaded onto the samples was determined according to the change of
concentration before and after soaking. After loading, the powders were
quickly and thoroughly washed with water and dried under vacuum. The
loading of lysozyme - LLyz (mg/g) – on mesoporous material was
calculated according the following formula:
s
wwri
mVLysozVLysozVLysozloading ][][][ −−
=
(1)

76
where, [Lysozi] is the protein concentration in the initial solution
(mglysozyme/mLsolution) method; [Lysozr] is the residual concentration of protein
in solution (mglysozyme/mLsolution); [Lysozw] is the protein concentration of
remained in the washing solution (mglysozyme/mLsolution); V is the volume of
the lysozyme solution (mL), Vw is the washings volume (mL), and ms is the
mass of support (g).
4.2.4. In vitro lysozyme release studies The in vitro lysozyme release from the loaded materials was studied
in phosphate buffer solution (PBS) (pH 7.4 , 50 mM), by suspending 50 mg
of lysozyme loaded SBA-15 (or MSE) in 100 mL of PBS and maintained at
37°C in an orbital shaker (100 rpm). These experimental conditions were
chosen according to what previously reported [36]. At fixed time intervals, 5
mL of the releasing solution was withdrawn, and an identical volume of a
fresh PBS solution was added to maintain sink conditions. Lysozyme
concentration in each of the collected samples was measured at 280 nm
using a Cary UV-Vis spectrophotometer. The amount of lysozyme released
at time t, Mt, was determined from the appropriate calibration line (with an
absorption coefficient ε280 = 2.803 ml mg−1 cm−1). The total amount of
lysozyme incorporated in the material was taken as M0, thus, the
percentage of the lysozyme released was expressed as Mt/M0(%). An
exponential decay model was used for the fitting of the experimental data
according to ref. [37].
)1( 1
0
tkt eAMM −−= (2)
where, A is the maximal mass percentage released and k1 is the
release rate constant. The correlation coefficient (r) was calculated to
evaluate the accuracy of the fitting procedure.

77
4.3. Results and discussion 4.3.1. OMMs and protein characterization 4.3.1.1. OMMs characterization
The two investigated OMMs present a different surface from the
chemical point of view. SBA-15 is a silica-based mesoporous structure,
hence its surface is constituted by silanols. MSE is a periodic mesoporous
organosilica in whose synthesis silicon atoms are alternatively connected
by means of -Si-O-Si- and -Si-CH2-CH2-Si- groups. The presence of the
methylene groups confers a higher hydrophobic character to the material
compared to SBA-15. The different chemical composition of OMMs was
qualitatively confirmed by ATR-FTIR spectroscopy (Fig.4.1).
Fig.4.1. ATR-FTIR spectra of original OMMs after lysozyme loading (pH 7 and 9.6) and
release (T = 37 °C and pH 7.4).
SBA-15
MSE
νSi-O(Si-O-Si)
νSi-O(Si-OH)
νSi-O(Si-O-Si)
Amide I Amide IIνO-H
(H 2 O,Si-OH)
νO-H(H 2 O,Si-OH)
Amide I
νC-H(-CH2)
δC-H(-CH2 -CH2 -)
νSi-O(Si-O-Si)
νC-C (-CH2 -CH2 -)
Original sample
Original sample
After release
Amide II
After release
After release
After release
Lysozyme adsorption at pH 9.6
Lysozyme adsorption at pH 7.0
After loading
After loading
After loading
After loading
Lysozyme adsorption at pH 9.6
Lysozyme adsorption at pH 7.0
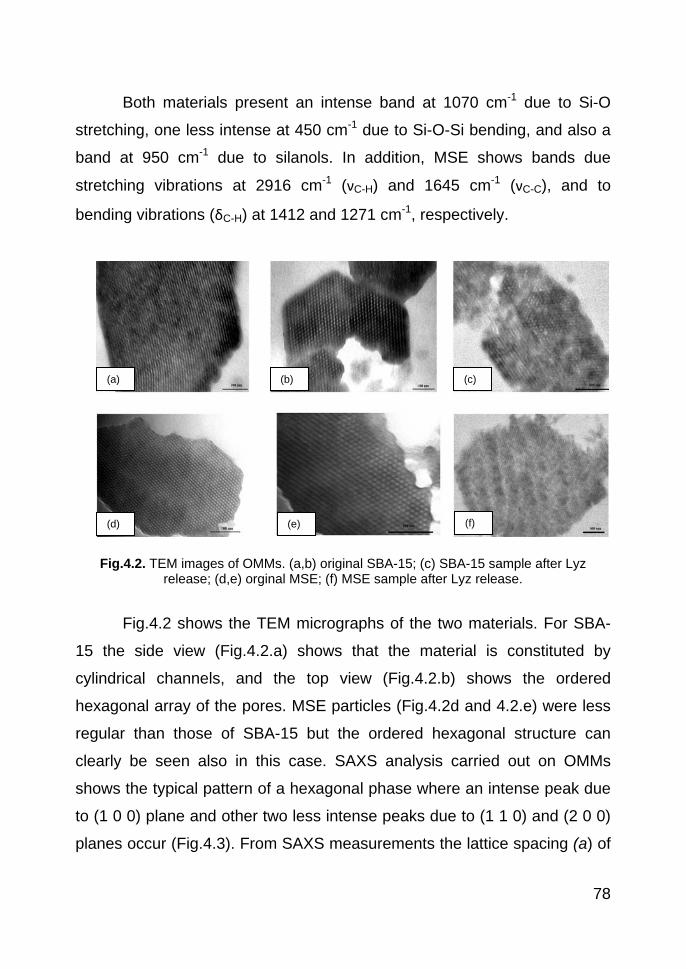
78
Both materials present an intense band at 1070 cm-1 due to Si-O
stretching, one less intense at 450 cm-1 due to Si-O-Si bending, and also a
band at 950 cm-1 due to silanols. In addition, MSE shows bands due
stretching vibrations at 2916 cm-1 (νC-H) and 1645 cm-1 (νC-C), and to
bending vibrations (δC-H) at 1412 and 1271 cm-1, respectively.
Fig.4.2. TEM images of OMMs. (a,b) original SBA-15; (c) SBA-15 sample after Lyz release; (d,e) orginal MSE; (f) MSE sample after Lyz release.
Fig.4.2 shows the TEM micrographs of the two materials. For SBA-
15 the side view (Fig.4.2.a) shows that the material is constituted by
cylindrical channels, and the top view (Fig.4.2.b) shows the ordered
hexagonal array of the pores. MSE particles (Fig.4.2d and 4.2.e) were less
regular than those of SBA-15 but the ordered hexagonal structure can
clearly be seen also in this case. SAXS analysis carried out on OMMs
shows the typical pattern of a hexagonal phase where an intense peak due
to (1 0 0) plane and other two less intense peaks due to (1 1 0) and (2 0 0)
planes occur (Fig.4.3). From SAXS measurements the lattice spacing (a) of
(a)
(f) (e) (d)
(c) (b)
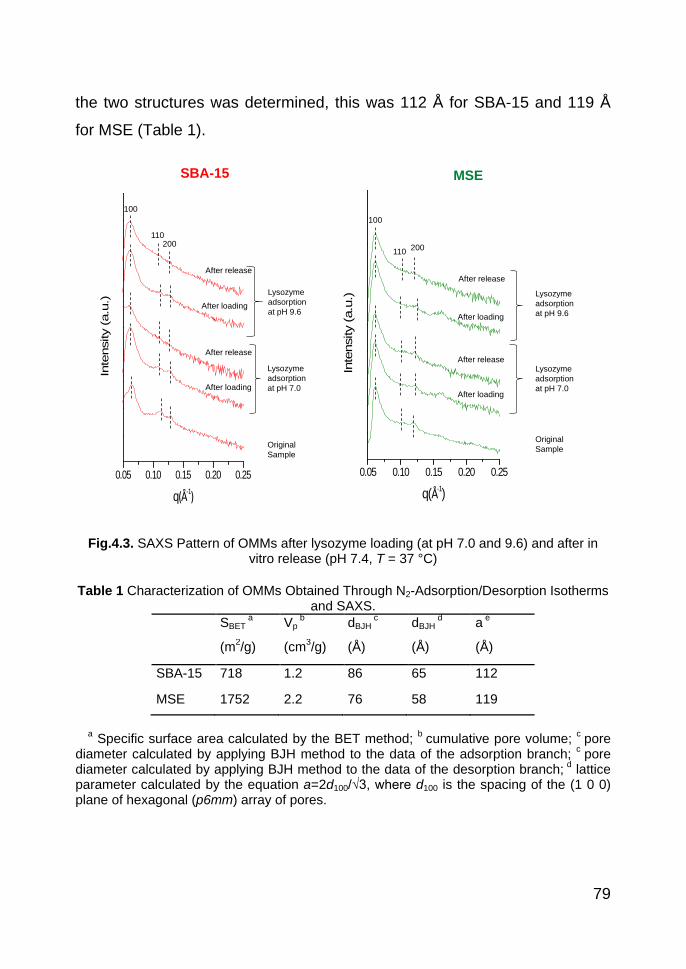
79
the two structures was determined, this was 112 Å for SBA-15 and 119 Å
for MSE (Table 1).
Fig.4.3. SAXS Pattern of OMMs after lysozyme loading (at pH 7.0 and 9.6) and after in vitro release (pH 7.4, T = 37 °C)
Table 1 Characterization of OMMs Obtained Through N2-Adsorption/Desorption Isotherms
and SAXS. SBET
a Vp b dBJH
c dBJH d a e
(m2/g) (cm3/g) (Å) (Å) (Å)
SBA-15 718 1.2 86 65 112
MSE 1752 2.2 76 58 119
a Specific surface area calculated by the BET method; b cumulative pore volume; c pore
diameter calculated by applying BJH method to the data of the adsorption branch; c pore diameter calculated by applying BJH method to the data of the desorption branch; d lattice parameter calculated by the equation a=2d100/√3, where d100 is the spacing of the (1 0 0) plane of hexagonal (p6mm) array of pores.
0.05 0.10 0.15 0.20 0.25
Inte
nsity
(a.u
.)
q(Å-1)0.05 0.10 0.15 0.20 0.25
Inte
nsity
(a.
u.)
q(Å-1)
SBA-15 MSE
100
110200
100
110 200
Lysozyme adsorption at pH 9.6
After release
After releaseAfter release
After release
After loading
After loading
After loading
After loading
Lysozyme adsorption at pH 9.6
Lysozyme adsorption at pH 7.0
Lysozyme adsorption at pH 7.0
Original Sample
Original Sample

80
The OMMs were then characterized through N2
adsorption/desorption isotherms. Both samples show a type IV isotherm,
with a steep increase typical of mesoporous solids at a relative pressure
around 0.70-0.75 (Fig.4.4.a). The presence of a hysteresis cycle, defined
by IUPAC as H1, is closely associated with channel-like mesopores [38].
Table 1 reports the specific surface area (SBET), the total pore volume (Vp),
calculated by BET method [32]. SBA-15 had a SBET = 718m2/g, a Vp= 2.1
cm3/g; a very high value of surface area, SBET = 1752 m2/g and Vp= 2.2
cm3/g was obtained for MSE. The pore size distribution (dBJH) of the
materials was calculated from both adsorption and desorption branches of
the isotherms through the BJH model. A dBJH = 86 Å (adsorption branch)
and dBJH = 65 Å were obtained for SBA-15, whereas a dBJH = 76 Å and dBJH
= 58 Å were obtained for MSE. Although the BJH model is known to
underestimate the diameter of the mesopores, it is still the most used
calculation method because software using more accurate models (i.e.,
NLDFT) [39] is not easily available.
Fig.4.4. Characterization of SBA-15 and MSE. (a) N2-adsorption/desorption isotherms; (b) Surface charge density versus pH.
The last characterization of the ordered mesoporous materials was
the determination of surface charge density as a function of pH that was
carried out through potentiometric titration; results are displayed in
0
500
1000
1500
2000
0 0.2 0.4 0.6 0.8 1
SBA -15
MSE
Volume adsorbed
3 /g)
p/p0
Volu
me
adso
rbed
(cm
3 /g)
p/p0
-20
-15
-10
-5
0
5
3 4 5 6 7 8 9 10
MSESBA-15
surface charge dens
2 )
pH
Surfa
ce c
hage
den
sity
(cha
rges
/nm
2 )
pH
(a) (b)
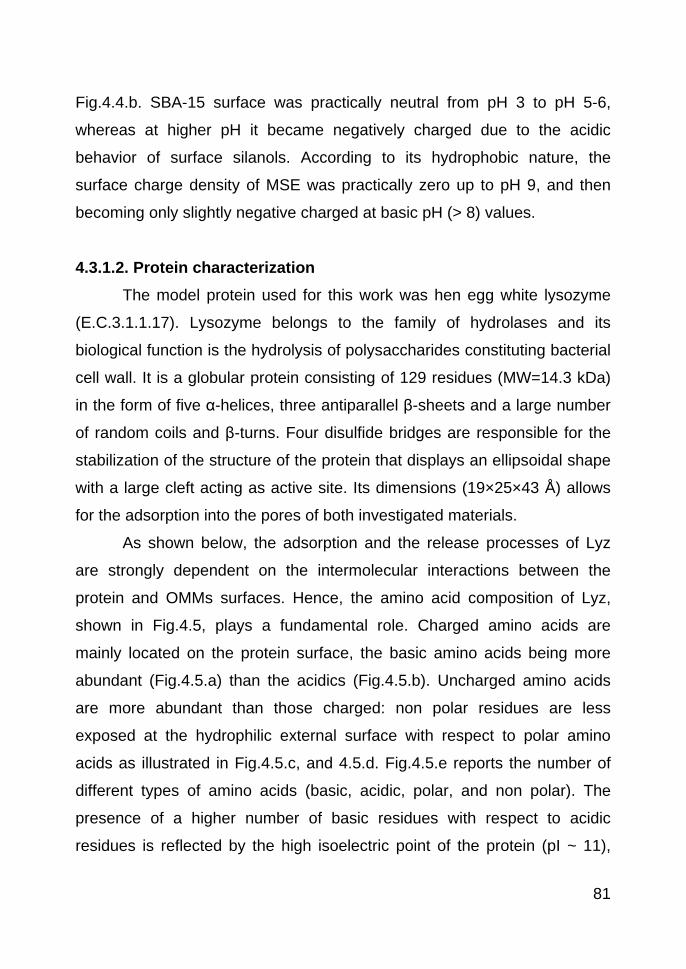
81
Fig.4.4.b. SBA-15 surface was practically neutral from pH 3 to pH 5-6,
whereas at higher pH it became negatively charged due to the acidic
behavior of surface silanols. According to its hydrophobic nature, the
surface charge density of MSE was practically zero up to pH 9, and then
becoming only slightly negative charged at basic pH (> 8) values.
4.3.1.2. Protein characterization
The model protein used for this work was hen egg white lysozyme
(E.C.3.1.1.17). Lysozyme belongs to the family of hydrolases and its
biological function is the hydrolysis of polysaccharides constituting bacterial
cell wall. It is a globular protein consisting of 129 residues (MW=14.3 kDa)
in the form of five α-helices, three antiparallel β-sheets and a large number
of random coils and β-turns. Four disulfide bridges are responsible for the
stabilization of the structure of the protein that displays an ellipsoidal shape
with a large cleft acting as active site. Its dimensions (19×25×43 Å) allows
for the adsorption into the pores of both investigated materials.
As shown below, the adsorption and the release processes of Lyz
are strongly dependent on the intermolecular interactions between the
protein and OMMs surfaces. Hence, the amino acid composition of Lyz,
shown in Fig.4.5, plays a fundamental role. Charged amino acids are
mainly located on the protein surface, the basic amino acids being more
abundant (Fig.4.5.a) than the acidics (Fig.4.5.b). Uncharged amino acids
are more abundant than those charged: non polar residues are less
exposed at the hydrophilic external surface with respect to polar amino
acids as illustrated in Fig.4.5.c, and 4.5.d. Fig.4.5.e reports the number of
different types of amino acids (basic, acidic, polar, and non polar). The
presence of a higher number of basic residues with respect to acidic
residues is reflected by the high isoelectric point of the protein (pI ~ 11),
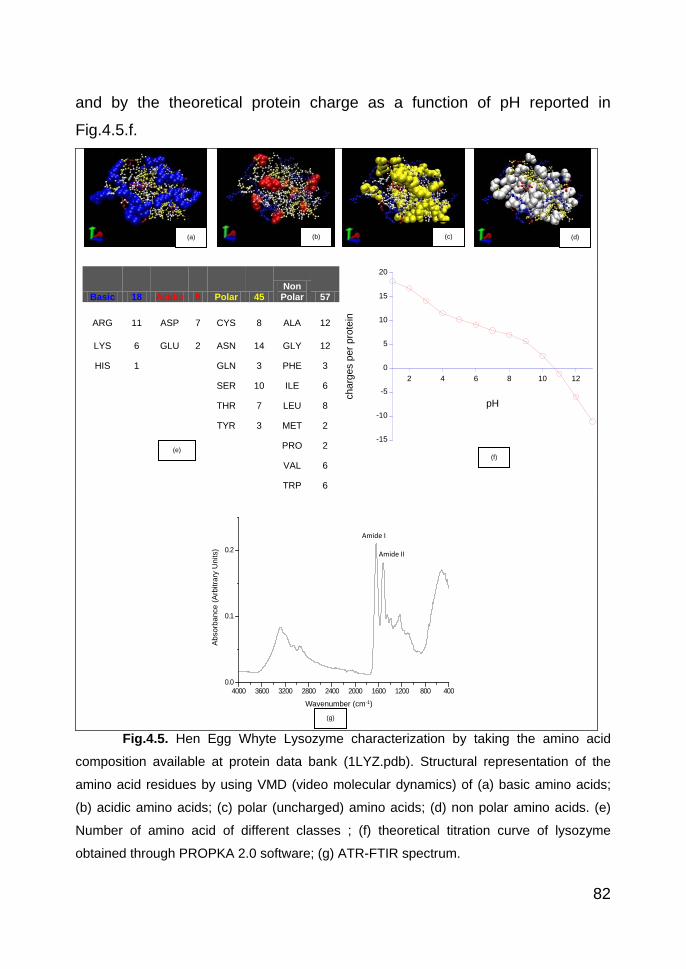
82
and by the theoretical protein charge as a function of pH reported in
Fig.4.5.f.
Basic 18 Acidic 9 Polar 45 Non
Polar 57
ARG 11 ASP 7 CYS 8 ALA 12
LYS 6 GLU 2 ASN 14 GLY 12
HIS 1
GLN 3 PHE 3
SER 10 ILE 6
THR 7 LEU 8
TYR 3 MET 2
PRO 2
VAL 6
TRP 6
Fig.4.5. Hen Egg Whyte Lysozyme characterization by taking the amino acid
composition available at protein data bank (1LYZ.pdb). Structural representation of the
amino acid residues by using VMD (video molecular dynamics) of (a) basic amino acids;
(b) acidic amino acids; (c) polar (uncharged) amino acids; (d) non polar amino acids. (e)
Number of amino acid of different classes ; (f) theoretical titration curve of lysozyme
obtained through PROPKA 2.0 software; (g) ATR-FTIR spectrum.
4000 3600 3200 2800 2400 2000 1600 1200 800 4000.0
0.1
0.2
Abs
orba
nce
(Arb
itrar
y U
nits
)
Wavenumber (cm-1)
Amide I
Amide II
-15
-10
-5
0
5
10
15
20
2 4 6 8 10 12
char
ges
per p
rote
in
pH
A
(a) (b)
(f)
(c) (d)
(e)
(g)

83
4.3.2. Adsorption of lysozyme on OMMs The adsorption of Lyz on the two OMMs matrices was carried out by
suspending a weighed amount of them in a Lyz solution at 37°C. The effect
of pH was also investigated by dissolving lysozyme powder in two different
buffer solutions at pH 7.0 and 9.6. The higher pH was chosen because the
maximal loading is usually obtained in proximity of the protein isoelectric
point [3, 40]. Unfortunately we could not use pH 11 since, at a so high pH,
silica becomes soluble in the solution. Hence, pH 9.6 was chosen as the
best compromise between these two exigencies. Lyz adsorption was
determined through UV spectroscopy (λmax= 280 nm), and loading was
calculated, according to eq. (1), as the difference between protein
concentration in the buffer solution at the beginning and at the end of the
adsorption process.
The adsorption of lysozyme on the OMMs was also qualitatively
demonstrated by means of ATR-FTIR spectroscopy. FTIR spectrum of free
lysozyme shows the two typical bands of proteins namely, amide I at 1643
cm-1, and amide II at 1522 cm-1 (Fig.4.5.g). The same bands, although a bit
shifted in frequency (amide I: 1653 cm-1; amide II: 1537 cm-1), occur in the
spectra of the Lyz-loaded OMMs as shown in Fig.4.1.
The experimental results for Lyz loading on the OMMs at pH 7 and
9.6 are reported in Table 2. Lyz loading at pH 7.0 was 587 mg/g for SBA-15
and 450 mg/g for MSE, whereas at pH 9.6 it was 646 mg/g for SBA-15 and
500 mg/g for MSE. These results deserve some comments. Let us take into
account the experimental surface charge densities of OMMs at pH 7.0 and
9.6 (Table 2) and lysozyme theoretical charge (+8.0 at pH 7.0, and +3.7 at
pH 9.6) taken by the graph shown in Fig.4.4.b.
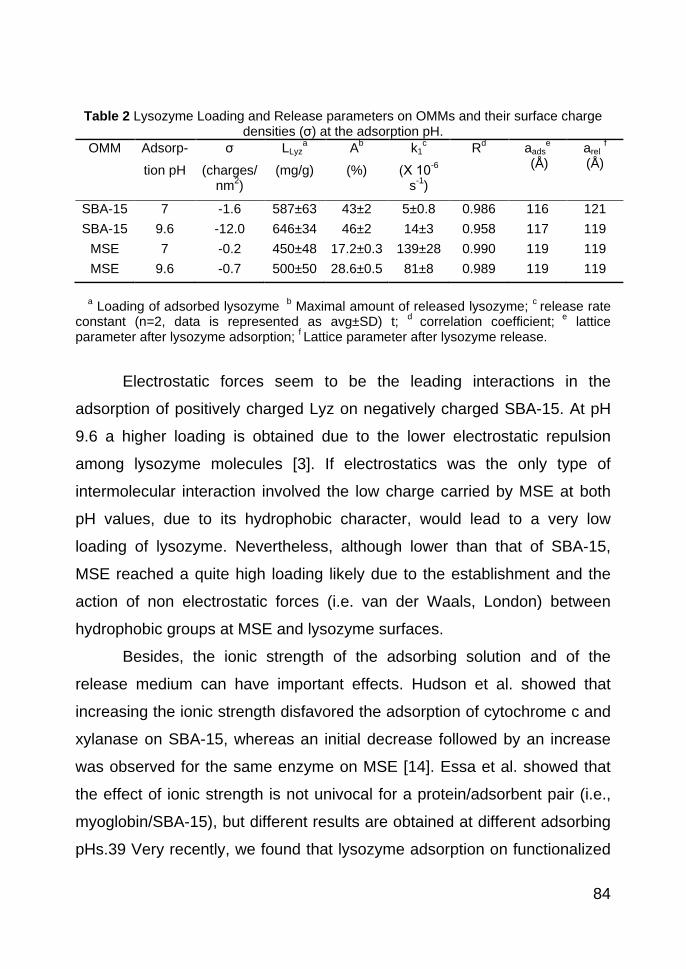
84
Table 2 Lysozyme Loading and Release parameters on OMMs and their surface charge
densities (σ) at the adsorption pH. OMM Adsorp- σ LLyz
a Ab k1c Rd aads
e
(Å) arel f (Å) tion pH (charges/
nm2) (mg/g) (%) (Χ 10-6
s-1)
SBA-15 7 -1.6 587±63 43±2 5±0.8 0.986 116 121 SBA-15 9.6 -12.0 646±34 46±2 14±3 0.958 117 119
MSE 7 -0.2 450±48 17.2±0.3 139±28 0.990 119 119 MSE 9.6 -0.7 500±50 28.6±0.5 81±8 0.989 119 119
a Loading of adsorbed lysozyme b Maximal amount of released lysozyme; c release rate constant (n=2, data is represented as avg±SD) t; d correlation coefficient; e lattice parameter after lysozyme adsorption; f Lattice parameter after lysozyme release.
Electrostatic forces seem to be the leading interactions in the
adsorption of positively charged Lyz on negatively charged SBA-15. At pH
9.6 a higher loading is obtained due to the lower electrostatic repulsion
among lysozyme molecules [3]. If electrostatics was the only type of
intermolecular interaction involved the low charge carried by MSE at both
pH values, due to its hydrophobic character, would lead to a very low
loading of lysozyme. Nevertheless, although lower than that of SBA-15,
MSE reached a quite high loading likely due to the establishment and the
action of non electrostatic forces (i.e. van der Waals, London) between
hydrophobic groups at MSE and lysozyme surfaces.
Besides, the ionic strength of the adsorbing solution and of the
release medium can have important effects. Hudson et al. showed that
increasing the ionic strength disfavored the adsorption of cytochrome c and
xylanase on SBA-15, whereas an initial decrease followed by an increase
was observed for the same enzyme on MSE [14]. Essa et al. showed that
the effect of ionic strength is not univocal for a protein/adsorbent pair (i.e.,
myoglobin/SBA-15), but different results are obtained at different adsorbing
pHs.39 Very recently, we found that lysozyme adsorption on functionalized

85
SBA-15 depends not only on the ionic strength of the solution but also on
the type of salt. We could order the effectiveness of anions and cations on
promoting protein adsorption according to the Hofmeister series [41]. The
involved phenomena are complicated but can be easily explained invoking
Collins’ empirical law of matching water affinities [42]. Briefly, ionic strength
can either promote or disfavor adsorption, depending on the nature
(dispersion and/or electrostatic) of protein-adsorbent interactions.
Concerning the textural properties, pore size is an important parameter that
can affect protein adsorption. Serra et al. investigated the immobilization of
Candida antarctica lipase B on OMMs having different pore sizes [38]. They
found that, during the adsorption process, diffusion limitations occurred
when the pore size was similar to the enzyme size, but these disappeared
when the pore diameter was around twice the largest enzyme dimension.
On the basis of these findings and OMM’s pore size (Table 1), we would
expect an easier adsorption due to faster mass diffusion of lysozyme
(dimensions: 19 × 25 × 43 Å) in SBA-15 compared to that in MSE. In any
case, because we carried out the adsorption process for a long time (96 h),
even a very slow diffusion should take place. Concerning the other textural
properties, the surface area and the pore volume are higher for MSE than
that for SBA-15 and should lead to a higher loading for the former
compared to the latter. Exactly the opposite occurs (Table 2), likely
because enzyme molecules occupy a small fraction of the total volume and
surface [38]. It can be substantially concluded that the obtained loadings
are mainly due to surface properties (charges and hydrophobic/ hydrophilic
character) rather than to textural properties.
4.3.3. Release of lysozyme In vitro release of Lyz from OMMs was carried out, for about 30
days, in a phosphate buffer solution at pH 7.4 and 37°C to mimick

86
physiological conditions. Samples were withdrawn at fixed times and
analyzed by UV spectroscopy. Experimental results of release, shown in
Fig.4.6, were fitted by means of eq. (2) that allowed determining the
maximal mass percentage released A, and the release rate constant k1.
These data are listed in Table 2. A very different behavior between MSE
and SBA-15, also modulated by the adsorption pH, was observed. SBA-15
is the material that releases the highest percentage of Lyz (ApH 9.6 = 46%;
ApH 7.0 = 43%) followed by MSE (ApH 9.6 = 28.6%; ApH 7.0 = 17.2%). The
maximal amount of release was higher for samples where Lyz was
adsorbed at pH 9.6 both for SBA-15 and MSE.
Table 2 reports also the kinetic release constants k1 as determined
by the fitting procedure of experimental data. Lyz molecules adsorbed on
MSE were released faster (k1 = 139 µs-1 at pH 7.0; k1 = 81 µs-1 at pH 9.6)
than those adsorbed on SBA-15 (k1 = 5 µs-1 at pH 7.0; k1 = 14 µs-1 at pH
9.6).
Fig.4.6. Release of lysozyme from OMMs. (pH 7.4, t=37°C)
The fact that more than 50% of adsorbed lysozyme was not released
is not surprising. The reason is evidently due to the strength of the
0
10
20
30
40
50
60
0 100 200 300 400 500 600 700 800
SBA-15 pH 7MSE pH 7
SBA-15 pH 9.6MSE pH 9.6
time (h)
87
interactions between the surfaces of the protein and the hosting material.
Indeed, there are several works in which enzymes are immobilized by
physical adsorption for biocatalytic purposes [4, 8, 14, 43-44]. In those
works, desorption is an unwanted effect that is different than what is
needed for release studies. The amount of lysozyme released depends on
the choice of the protein-adsorbent pair. Very recently, Nieto et al. found
that the amount of released BSA was strongly dependent on the chemical
groups present on the SBA-15 surface [13]. Here, although electrostatic
interactions lead to a higher Lyz loading with SBA-15, this kind of
interaction is not able to retain the protein when in contact with the
releasing medium. A rather burst release occurs. On the other hand,
nonelectrostatic forces, responsible for lysozyme adsorption on the more
hydrophobic MSE, are likely to adsorb more strongly than protein molecules
that, hence, are less available for release. There is also a modulation effect
due to the adsorption pH that increases both the loading and release as it
approaches the isoelectric point of the protein. The higher release rates
observed for MSE matrixes at both pHs, compared to SBA-15, are likely to
be due to the high burst release of Lyz adsorbed on the outer surface of the
MSE particles. Nevertheless, it can be remarked that burst release from
MSE occurs at a much lower extent (and for a much shorter time) than that
from SBA-15. Another effect, not investigated here, might be obtained with
other release medium. In the literature, different media having the same pH
but higher ionic strength (i.e., 0.9% NaCl)13 or SBF (simulated body fluid)
have been used.44 We may expect that a change in the ionic strength, and
also the ionic composition, of the release medium would strongly affect both
the release trends and the material stability [29]. For example, if the
lysozyme-SBA-15 interaction is mainly based on electrostatics, we might
expect an increased release at higher ionic strength due to salt adsorption
at the protein and adsorbent charged groups. The opposite effect would be
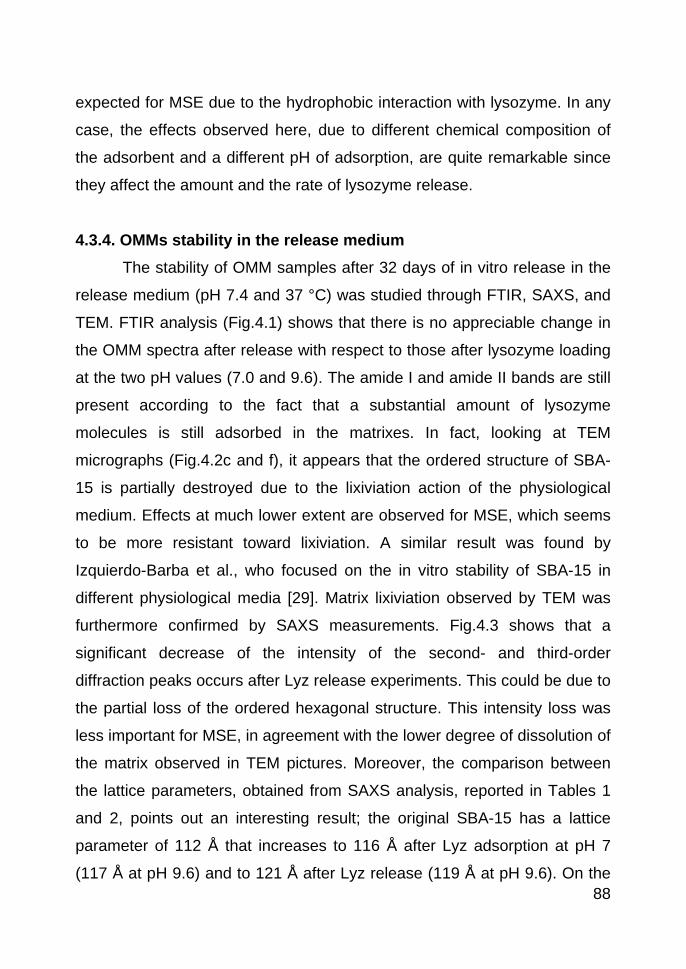
88
expected for MSE due to the hydrophobic interaction with lysozyme. In any
case, the effects observed here, due to different chemical composition of
the adsorbent and a different pH of adsorption, are quite remarkable since
they affect the amount and the rate of lysozyme release.
4.3.4. OMMs stability in the release medium The stability of OMM samples after 32 days of in vitro release in the
release medium (pH 7.4 and 37 °C) was studied through FTIR, SAXS, and
TEM. FTIR analysis (Fig.4.1) shows that there is no appreciable change in
the OMM spectra after release with respect to those after lysozyme loading
at the two pH values (7.0 and 9.6). The amide I and amide II bands are still
present according to the fact that a substantial amount of lysozyme
molecules is still adsorbed in the matrixes. In fact, looking at TEM
micrographs (Fig.4.2c and f), it appears that the ordered structure of SBA-
15 is partially destroyed due to the lixiviation action of the physiological
medium. Effects at much lower extent are observed for MSE, which seems
to be more resistant toward lixiviation. A similar result was found by
Izquierdo-Barba et al., who focused on the in vitro stability of SBA-15 in
different physiological media [29]. Matrix lixiviation observed by TEM was
furthermore confirmed by SAXS measurements. Fig.4.3 shows that a
significant decrease of the intensity of the second- and third-order
diffraction peaks occurs after Lyz release experiments. This could be due to
the partial loss of the ordered hexagonal structure. This intensity loss was
less important for MSE, in agreement with the lower degree of dissolution of
the matrix observed in TEM pictures. Moreover, the comparison between
the lattice parameters, obtained from SAXS analysis, reported in Tables 1
and 2, points out an interesting result; the original SBA-15 has a lattice
parameter of 112 Å that increases to 116 Å after Lyz adsorption at pH 7
(117 Å at pH 9.6) and to 121 Å after Lyz release (119 Å at pH 9.6). On the
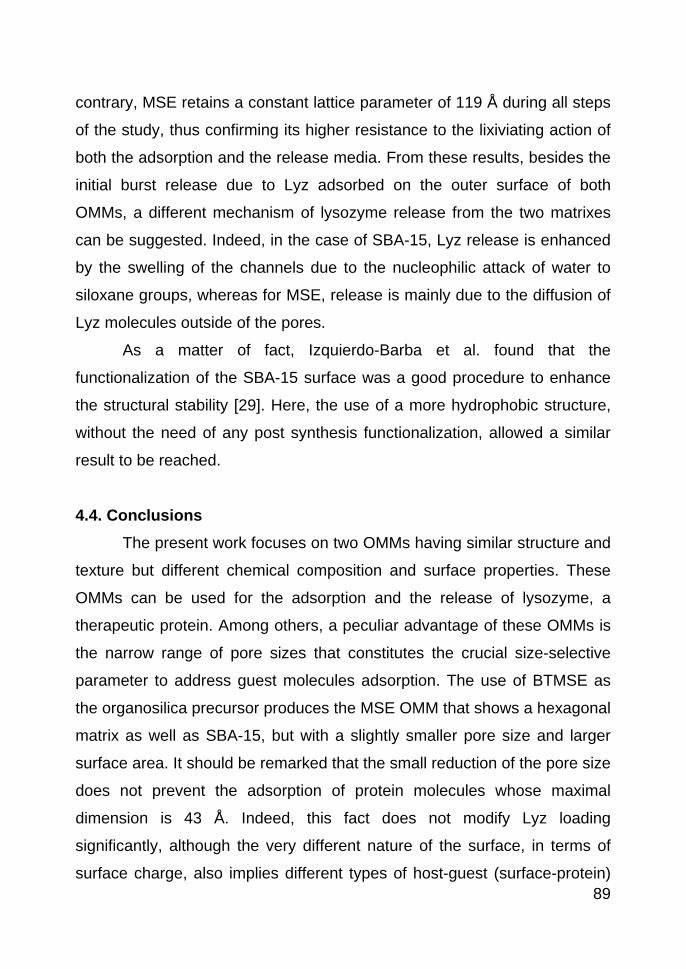
89
contrary, MSE retains a constant lattice parameter of 119 Å during all steps
of the study, thus confirming its higher resistance to the lixiviating action of
both the adsorption and the release media. From these results, besides the
initial burst release due to Lyz adsorbed on the outer surface of both
OMMs, a different mechanism of lysozyme release from the two matrixes
can be suggested. Indeed, in the case of SBA-15, Lyz release is enhanced
by the swelling of the channels due to the nucleophilic attack of water to
siloxane groups, whereas for MSE, release is mainly due to the diffusion of
Lyz molecules outside of the pores.
As a matter of fact, Izquierdo-Barba et al. found that the
functionalization of the SBA-15 surface was a good procedure to enhance
the structural stability [29]. Here, the use of a more hydrophobic structure,
without the need of any post synthesis functionalization, allowed a similar
result to be reached.
4.4. Conclusions The present work focuses on two OMMs having similar structure and
texture but different chemical composition and surface properties. These
OMMs can be used for the adsorption and the release of lysozyme, a
therapeutic protein. Among others, a peculiar advantage of these OMMs is
the narrow range of pore sizes that constitutes the crucial size-selective
parameter to address guest molecules adsorption. The use of BTMSE as
the organosilica precursor produces the MSE OMM that shows a hexagonal
matrix as well as SBA-15, but with a slightly smaller pore size and larger
surface area. It should be remarked that the small reduction of the pore size
does not prevent the adsorption of protein molecules whose maximal
dimension is 43 Å. Indeed, this fact does not modify Lyz loading
significantly, although the very different nature of the surface, in terms of
surface charge, also implies different types of host-guest (surface-protein)

90
interactions. The van der Waals interactions, mainly involved in the
adsorption/release process at the Lyz/MSE interface, seem to produce
stronger protein binding than the electrostatic forces that dominate the
Lyz/SBA-15 interface. As a matter of fact, this strong protein binding in the
Lyz-loaded MSE matrix decreases both the time over which burst release
occurs and the released amount of protein significantly. It is remarkable that
a short burst release, in all cases, suggests that only a small amount of
adsorbed protein is located on the outer surface of the OMM particle.
Another very significant parameter that affects both adsorption and release
is the pH of the adsorbing solution. This allows for a potential modulation of
the global performance, in terms of the loaded amount of protein, and the
rate of release. In other words, a personalized sustained release may be
produced. Another important consideration concerns the longer shelf life in
the physiological medium observed for MSE compared to that for SBA-15.
Silica materials tend to dissolve in biological fluids, and this can develop
toxicity when accumulation above certain concentrations occurs [28].
Hence, if a silica-based drug delivery system has to be projected in view of
possible innovative applications (cf. protein drug delivery) and
performances (cf. sustained release), it is relevant to introduce structural
features that can prolong the shelf life and attenuate dangerous, though not
fatal, side effects.
Finally, the last comment in favor of the MSE OMM being used as a
sustained drug release carrier is given by the relatively easy and
reproducible synthesis; this is a peculiar feature of all OMMs that does not
involve any postsynthesis functionalization step.
4.5. References
[1] M.E. Davis, Ordered porous materials for emerging applications, Nature, 417 (2002) 813-821.

91
[2] S. Hudson, J. Cooney, E. Magner, Proteins in Mesoporous Silicates, Angew. Chem. Int. Ed., 47 (2008) 8582-8594.
[3] A. Salis, D. Meloni, S. Ligas, M.F. Casula, M. Monduzzi, V. Solinas, E. Dumitriu, Physical and chemical adsorption of Mucor javanicus lipase on SBA-15 mesoporous silica. Synthsis, structural characterization, and activity performance, Langmuir, 21 (2005) 5511-5516.
[4] M. Hartmann, D. Jung, Biocatalysis with enzymes immobilized on mesoporous hosts: the status quo and future trends, J Mater Chem, 20 (2010) 844-857.
[5] A. Salis, M.S. Bhattacharyya, M. Monduzzi, V. Solinas, Role of the support surface on the loading and the activity of Pseudomonas fluorescens lipase used for biodiesel synthesis, J. Mol. Catal. B: Enzym., 57 (2009) 262-269.
[6] A. Salis, M.F. Casula, M.S. Bhattacharyya, M. Pinna, V. Solinas, M. Monduzzi, Physical and Chemical Lipase Adsorption on SBA-15: Effect of Different Interactions on Enzyme Loading Catalytic Performance, ChemCatChem, 2 (2010) 322-329.
[7] A. Salis, M. Pisano, M. Monduzzi, V. Solinas, E. Sanjust, Laccase from Pleurotus sajor-caju on functionalised SBA-15 mesoporous silica: Immobilisation and use for the oxidation of phenolic compounds, J. Mol. Catal. B: Enzym., 58 (2009) 175-180.
[8] M. Hartmann, Ordered Mesoporous Materials for Bioadsorption and Biocatalysis, Chem Mater, 17 (2005) 4577-4593.
[9] S. Wang, Ordered mesoporous materials for drug delivery, Micropor. Mesopor. Mater., 117 (2009) 1-9.
[10] M. Vallet-Regí, Nanostructured mesoporous silica matrices in nanomedicine, Journal of Internal Medicine, 267 (2010) 22-43.
[11] J.M. Rosenholm, M. Lindén, Wet-Chemical Analysis of Surface Concentration of Accessible Groups on Different Amino-Functionalized Mesoporous SBA-15 Silicas, Chem. Mater., 19 (2007) 5023-5034.
[12] A. Nieto, F. Balas, M. Colilla, M. Manzano, M. Vallet-Regí, Functionalization degree of SBA-15 as key factor to modulate sodium alendronate dosage, Micropor. Mesopor. Mater., 116 (2008) 4-13.
[13] A. Nieto, M. Colilla, F. Balas, M.a. Vallet-Regí, Surface Electrochemistry of Mesoporous Silicas as a Key Factor in the Design of Tailored Delivery Devices, Langmuir, 26 (2010) 5038-5049.
[14] S. Hudson, E. Magner, J. Cooney, B.K. Hodnett, Methodology for the Immobilization of Enzymes onto Mesoporous Materials, J Phys Chem B, 109 (2005) 19496-19506.
[15] A. Salis, D.F. Parsons, M. Bostrom, L. Medda, B. Barse, B.W. Ninham, M. Monduzzi, Ion Specific Surface Charge Density of SBA-15 Mesoporous Silica, Langmuir, 26 (2010) 2484–2490.
92
[16] A. Salis, M.S. Bhattacharyya, M. Monduzzi, Specific Ion Effects on Adsorption of Lysozyme on Functionalized SBA-15 Mesoporous Silica, J. Phys. Chem. B, (2010).
[17] S.W. Song, K. Hidajat, S. Kawi, Functionalized SBA-15 Materials as Carriers for Controlled Drug Delivery:Influence of Surface Properties on Matrix Drug Interactions, Langmuir, 21 (2005) 9568-9575.
[18] H. Yu, Q.-Z. Zhai, Mesoporous SBA-15 molecular sieve as a carrier for controlled release of nimodipine, Micropor. Mesopor. Mater., 123 (2009) 298-305.
[19] R. Mellaerts, K. Houthoofd, K. Elen, H. Chen, M. Van Speybroeck, J. Van Humbeeck, P. Augustijns, J. Mullens, G. Van den Mooter, J.A. Martens, Aging behavior of pharmaceutical formulations of itraconazole on SBA-15 ordered mesoporous silica carrier material, Micropor. Mesopor. Mater., 130 (2010) 154-161.
[20] M. Van Speybroeck, V. Barillaro, T.D. Thi, R. Mellaerts, J. Martens, J. Van Humbeeck, J. Vermant, P. Annaert, G. Van den Mooter, P. Augustijns, Ordered mesoporous silica material SBA-15: A broad-spectrum formulation platform for poorly soluble drugs, J. Pharm. Sci., 98 (2009) 2648-2658.
[21] A. Díaz, T. López, J. Manjarrez, E. Basaldella, J.M. Martínez-Blanes, J.A. Odriozola, Growth of hydroxyapatite in a biocompatible mesoporous ordered silica, Acta Biomaterialia, 2 (2006) 173-179.
[22] J. Andersson, S. Areva, B. Spliethoff, M. Lindén, Sol-gel synthesis of a multifunctional, hierarchically porous silica/apatite composite, Biomaterials, 26 (2005) 6827-6835.
[23] M. Vallet-Regi, A. Ràmila, R.P. del Real, J. Pérez-Pariente, A New Property of MCM-41: Drug Delivery System, Chem. Mater., 13 (2001) 308-311.
[24] A.L. Doadrio, J.C. Doadrio, J.M. Sánchez-Montero, A.J. Salinas, M. Vallet-Regí, A rational explanation of the vancomycin release from SBA-15 and its derivative by molecular modelling, Micropor. Mesopor. Mater., 132 (2010) 559-566.
[25] A.L. Doadrio, E.M.B. Sousa, J.C. Doadrio, J. Pérez Pariente, I. Izquierdo-Barba, M. Vallet-RegI, Mesoporous SBA-15 HPLC evaluation for controlled gentamicin drug delivery, J. Contr. Rel., 97 (2004) 125-132.
[26] M. Colilla, M. Manzano, M. Vallet-Regí, Recent advances in ceramic implants as drug delivery systems for biomedical applications, Int. J Nanomed., 4 (2008) 403-414.
[27] T. López, E.I. Basaldella, M.L. Ojeda, J. Manjarrez, R. Alexander-Katz, Encapsulation of valproic acid and sodic phenytoin in ordered mesoporous SiO2 solids for the treatment of temporal lobe epilepsy, Opt. Mater., 29 (2006) 75-81.
93
[28] S.P. Hudson, R.F. Padera, R. Langer, D.S. Kohane, The biocompatibility of mesoporous silicates, Biomaterials, 29 (2008) 4045-4055.
[29] I. Izquierdo-Barba, M. Colilla, M. Manzano, M. Vallet-Regí, In vitro stability of SBA-15 under physiological conditions, Microporous Mesoporous Mater, 132 (2010) 442-452.
[30] D. Zhao, J. Feng, Q. Huo, N. Melosh, G.H. Fredrickson, B.F. Chmelka, G.D. Stucky, Triblock Copolymer Syntheses of Mesoporous Silica with Periodic 50 to 300 Angstrom Pores, Science, 279 (1998) 548-552.
[31] X.Y. Bao, X.S. Zhao, X. Li, P.A. Chia, J. Li, A Novel Route toward the Synthesis of High-Quality Large-Pore Periodic Mesoporous Organosilicas, The Journal of Physical Chemistry B, 108 (2004) 4684-4689.
[32] S. Brunauer, P.H. Emmett, E. Teller, Adsorption of Gases in Multimolecular Layers, J Am Chem Soc, 60 (1938) 309-319.
[33] E.P. Barrett, L.G. Joyner, P.P. Halenda, The Determination of Pore Volume and Area Distributions in Porous Substances. I. Computations from Nitrogen Isotherms, J Am Chem Soc, 73 (1951) 373-380.
[34] H. Li, A.D. Robertson, J.H. Jensen, Very fast empirical prediction and rationalization of protein pKa values, Proteins, 61 (2005) 704-721.
[35] D.C. Bas, D.M. Rogers, J.H. Jensen, Very fast prediction and rationalization of pKa values for protein–ligand complexes, Proteins, 73 (2008) 765-783.
[36] I. Izquierdo-Barba, M. Vallet-Regí, N. Kupferschmidt, O. Terasaki, A. Schmidtchen, M. Malmsten, Incorporation of antimicrobial compounds in mesoporous silica film monolith, Biomaterials, 30 (2009) 5729-5736.
[37] A. Nieto, M. Colilla, F. Balas, M.a. Vallet-Regi, Surface Electrochemistry of Mesoporous Silicas as a Key Factor in the Design of Tailored Delivery Devices, Langmuir, 26 (2010) 5038-5049.
[38] E. Serra, A. Mayoral, Y. Sakamoto, R.M. Blanco, I. Díaz, Immobilization of lipase in ordered mesoporous materials: Effect of textural and structural parameters, Microporous Mesoporous Mater, 114 (2008) 201-213.
[39] P.I. Ravikovitch, D. Wei, W.T. Chueh, G.L. Haller, A.V. Neimark, Evaluation of Pore Structure Parameters of MCM-41 Catalyst Supports and Catalysts by Means of Nitrogen and Argon Adsorption, J Phys Chem B, 101 (1997) 3671-3679.
[40] H. Essa, E. Magner, J. Cooney, B.K. Hodnett, Influence of pH and ionic strength on the adsorption, leaching and activity of myoglobin immobilized onto ordered mesoporous silicates, J. Mol. Catal. B: Enzym., 49 (2007) 61-68.

94
[41] A. Salis, M.S. Bhattacharyya, M. Monduzzi, Specific Ion Effects on Adsorption of Lysozyme on Functionalized SBA-15 Mesoporous Silica, J Phys Chem B, 114 (2010) 7996-8001.
[42] K.D. Collins, G.W. Neilson, J.E. Enderby, Ions in water: Characterizing the forces that control chemical processes and biological structure, Biophys Chem, 128 (2007) 95-104.
[43] J. He, Y. Xu, H. Ma, D.G. Evans, Z. Wang, X. Duan, Inhibiting the leaching of lipase from mesoporous supports by polymerization of grafted vinyl groups, Microporous Mesoporous Mater, 94 (2006) 29-33.
[44] S. Hudson, J. Cooney, B.K. Hodnett, E. Magner, Chloroperoxidase on Periodic Mesoporous Organosilanes: Immobilization and Reuse, Chem Mater, 19 (2007) 2049-2055.

95
5. MONOOLEIN BASED FORMULATIONS FOR CAFFEINE
5.1. Introduction One of the successful and novel area of research in drug delivery that
aims to enhance therapeutic efficacy, bioavailability and avoid adverse
effects of the drugs is transdermal/topical drug delivery [1]. Different
approaches such as iontophoresis [2], sonophoresis [3], transdermal gels
[4] nanoemulsions [5] and chemical enhancers [6] have been used to
enhance skin permeation and bioavailability of drugs. Surfactants, a
category of chemical enhancers, can form liquid crystalline (LC) phases in
the presence of water. Lyotropic LC formulations based upon use of
biocompatible lipids have been studied for drug delivery of a wide number
of small molecules as well as proteins and peptides [7]. Emulsions
stabilized by LC phases are one of the most promising approaches for
transdermal/topical delivery of drugs and cosmetics. It presents many
advantages over conventional creams and ointments such as higher
storage stability, good production feasibility, higher thermodynamic stability
and absence of organic solvents [8-12].
LC phases of monoolein present interesting properties for drug
delivery system across the skin and mucosa. Monoolein is a biocompatible
and bioadhesive chemical enhancer and has the ability to incorporate
compounds independently of their solubility. It can protect drugs from
physical and enzymatic degradation and sustain their delivery [13]. It is
non-irritant, non-toxic and safe to the skin and fall under generally
recognized as safe (GRAS) category [14]. It is useful for transdermal/topical
drug delivery since it promotes ceramide extraction and enhancement
of lipid fluidity in the stratum corneum region of the skin [15]. Moreover, it
swells in water and depending on water content and temperature several
LC phases can be formed, including lamellar, bicontinuous cubic and

96
hexagonal phases. The lamellar and bicontinuous cubic phases
of monoolein and water are formed at room temperature, and have been
shown to accommodate and sustain the release of drugs with various
physical and chemical properties [7, 16-17]. The reverse hexagonal phase
of monoolein and water is obtained only at high temperatures, unless a
third nonpolar component (e.g. triglycerides or oleic acid) is added to the
system [18]. Also this phase presents the ability to sustain the delivery of
incorporated compounds [19]. Earlier, it has been showed that an emulsion
prepared by dispersing water in the LC medium shows a long-term shelf life
[11]. The stability of such a system towards phase separation is high. The
use of thermodynamically stable LC phases, preferentially lamellar or
hexagonal microstructure, allows the dispersion of many types of liquids
[11].
Fig.5.1.Chemical structure of caffeine
Model small molecular weight (194.19 Da) water soluble (21.7 mg/ml)
drug caffeine is often used in the release kinetics experiments from
emulsions and microemulsions [20-22]. The chemical structure of caffeine
is represented in Fig.5.1. It is non-irritant and compatible with lipidic
membranes. It has several therapeutic and cosmetic applications. It has
been investigated in the treatment of neonatal apnea [23], in the prevention
of neurodegenerative disorders [24], in the treatment of skin cancer [25]

97
and in the anti-cellulite activity by stimulation of fat metabolism [26]. Several
commercially available topical formulations contain about 3% caffeine [20].
The aim of this study was to investigate the microstructure and
physico-chemical properties of W/O emulsion, lamellar, reverse hexagonal,
and bicontinuous cubic LC formulations prepared with primarily monoolein
and caffeine solution (CS). In order to prepare reverse hexagonal LC
formulations and emulsions stabilized by liquid crystals, triolein was used
as non-polar component. The emulsion and different LC phases were
obtained according to the monoolein-water phase diagram and ternary
phase diagram of monoolein, triolein and water [11, 27]. In vitro release
properties of caffeine from these formulations were investigated.
5.2. Materials and methods 5.2.1. Materials
Monoolein (MO) (98.1 wt.%) was kindly provided by Danisco
Ingredients, Brabrand, Denmark. Triolein (TRI) with technical purity of 65
wt.% (this reagent contains also 1,3- and 1,2-diglycerides, monoglycerides;
the fatty acid chain composition is 90 wt.% as oleic acid and 10 wt.% as
linoleic acid), was from Sigma. Caffeine (99 wt.%) was obtained from
Sigma. Distilled water (W), passed through a Milli-Q water purification
system (Millipore), and deuterated water from Fluka were used to prepare
the samples.
5.2.1. Preparation of formulations
The formulations were prepared according to the components and
composition given in Table 1. Caffeine solution (CS) used for preparing the
formulations was prepared with the fixed concentration of 10 mg/ml in water
(W) or deuterated water (D2O). The samples for NMR experiments were
prepared using D2O instead of W.

98
Table 1 Components and composition of formulation.
Formulation Composition Ratio Amount of caffeine
(mg)/g of formulation
I MO/TRI/W/CS 63/11/19/7 0.7 II MO/TRI/CS 69/11/20 2.0 III MO/CS 85/15 1.5 IV MO/CS 70/30 3.0 V MO/TRI/CS 80/11/9 0.9
For preparation of formulation I, MO (3.77 g) was melted in a glass
test tube (80 ml Duran Schott, Germany) at about 40 °C and TRI (0.66 g)
was added subsequently. A small amount (approximately 200 µl) of W was
added to this mixture and vortexing was done at approximately 2500 rpm
for about 5 min. This was repeated till the total volume of W added
becomes 1110 µl. This sample was centrifuged for about 20 minutes at
2000 rpm. It was kept in incubator at 25 °C overnight to achieve equilibrium.
A small amount (approximately 200 µl) of CS (10 mg/ml) was added to the
LC phases and again vortexing was done. A total of 450 µl of CS was
added and vortexing was done each time. Finally sample was centrifuged
at 1000 rpm for 10 minutes in order to settle down the emulsion stuck on
the wall of glass tube. Formulation II was prepared similarly using CS
instead of W for the formation of LC phase. For the preparation of
formulation III and IV, CS was mixed with monoolein according to the
composition mentioned in Table 1.
5.2.2. Polarized light microscopy (PLM) The anisotropic LC phases were observed by optical microscopy
(Zeiss Axioplan 2) in polarized light at 25 ± 1 °C. The obtained patterns
were compared with the typical textures of other surfactants [28].
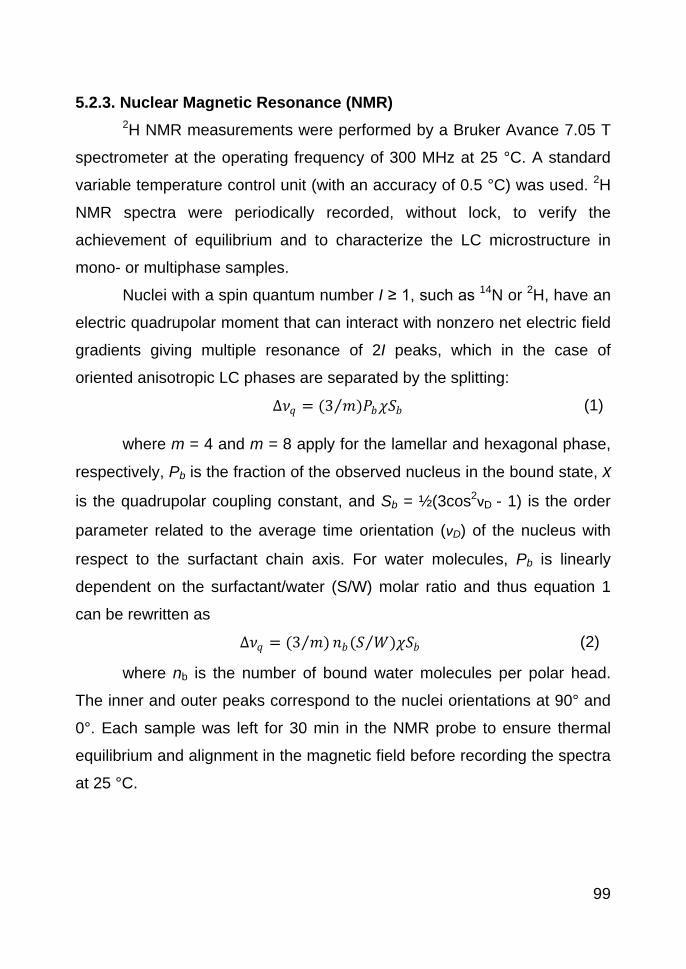
99
5.2.3. Nuclear Magnetic Resonance (NMR) 2H NMR measurements were performed by a Bruker Avance 7.05 T
spectrometer at the operating frequency of 300 MHz at 25 °C. A standard
variable temperature control unit (with an accuracy of 0.5 °C) was used. 2H
NMR spectra were periodically recorded, without lock, to verify the
achievement of equilibrium and to characterize the LC microstructure in
mono- or multiphase samples.
Nuclei with a spin quantum number I ≥ 1, such as 14N or 2H, have an
electric quadrupolar moment that can interact with nonzero net electric field
gradients giving multiple resonance of 2I peaks, which in the case of
oriented anisotropic LC phases are separated by the splitting:
∆𝜈𝜈𝑞𝑞 = (3 𝑓𝑓⁄ )𝑃𝑃𝑜𝑜𝑖𝑖𝑆𝑆𝑜𝑜 (1)
where m = 4 and m = 8 apply for the lamellar and hexagonal phase,
respectively, Pb is the fraction of the observed nucleus in the bound state, Χ
is the quadrupolar coupling constant, and Sb = ½(3cos2νD - 1) is the order
parameter related to the average time orientation (νD) of the nucleus with
respect to the surfactant chain axis. For water molecules, Pb is linearly
dependent on the surfactant/water (S/W) molar ratio and thus equation 1
can be rewritten as
Δ𝜈𝜈𝑞𝑞 = (3 𝑓𝑓)⁄ 𝑛𝑛𝑜𝑜(𝑆𝑆 𝑊𝑊⁄ )𝑖𝑖𝑆𝑆𝑜𝑜 (2)
where nb is the number of bound water molecules per polar head.
The inner and outer peaks correspond to the nuclei orientations at 90° and
0°. Each sample was left for 30 min in the NMR probe to ensure thermal
equilibrium and alignment in the magnetic field before recording the spectra
at 25 °C.

100
5.2.3. SAXS experiments Small-angle X-ray scattering (SAXS) diffraction patterns were
recorded with a S3-MICRO SWAXS camera system (HECUS X-ray
Systems, Graz, Austria). Cu Kα radiation of wavelength 1.542 Å was
provided by a GeniX X-ray generator, operating at 50 kV and 1 mA. A 1D-
PSD-50M system (HECUS X-ray system) containing 1024 channels of
width 54 μm was used for detection of scattered X-rays in the small-angle
region. The working q-range (Å−1) was 0.003 ≤ q ≤ 0.6, where q = 4πsin (θ)
λ−1 is the modulus of the scattering wave vector. To minimize scattering
from air, the camera volume was kept under vacuum during the
measurements. Silver behenate (CH3-(CH2)20-COOAg) with a d spacing
value of 58.38 Å was used as a standard to calibrate the angular scale of
the measured intensity. The diffraction patterns were first recorded in
increasing order of temperature i.e. 25, 32 and 37 ºC and latter it was
decreased to original sample temperature of 25 ºC to study the effect of
temperature on the stability of LC phases. A PC-controlled Peltier element
was used for temperature stabilization and control of the sample. A few
milligrams of the sample were enclosed in a stainless steel sample holder
using a polymeric sheet (Bratfolie, Kalle) window. The distance between the
sample and detector was 254 mm. The lattice parameter (a) of the different
LC phases was determined using the relation d = 2π/q = α/(h2 +k2 +l2)1/2
from linear fits of the plots of q versus (h2 +k2 +l2)1/2, where q is the
measured peak position and h, k, and l are the Miller indices. The lattice
parameters are represented as mean ± standard deviation. Standard
deviation was calculated by considering lattice parameter values for all the
major peaks.
101
5.2.4. In vitro release studies Caffeine release from W/O emulsion and LC formulations was
monitored using Franz diffusion cells. Membrane diffusion was performed
on cellulose membrane (MS CA membrane filter, pore size 0.45 μm,
Membrane Solutions, USA). Test material was applied to
the membrane with a glass rod and a dose (1000 mg) of formulation was
applied and the cells were covered with parafilm in order to avoid water
evaporation. The receptor fluid phosphate buffer pH 7.4 (50 mM) was
stirred constantly and maintained at 37 °C. Sodium azide (0.02% w/v) was
added to the receptor fluid to prevent microbial growth. Membranes were
allowed to equilibrate with the receptor phase for 2h before charging each
donor compartment with the formulations. The sampling times investigated
were 1, 2, 3, 4, 6, 8 and 24 h. Samples (2 ml) of receptor phase were
withdrawn and each sample removed was replaced by an equal volume of
fresh receptor phase. The diffusion experiment was performed 3 times for
each formulation except if noted differently.
5.3. Results and discussion 5.3.1. Phase behaviour
Caffeine release from W/O emulsion and LC formulations was
monitored using Franz diffusion cells. Membrane diffusion was performed
on cellulose membrane (MS CA membrane filter, pore size 0.45 μm,
Membrane Solutions, USA). Test material was applied to
the membrane with a glass rod and a dose (1000 mg) of formulation was
applied and the cells were covered with parafilm in order to avoid water
evaporation. The receptor fluid phosphate buffer pH 7.4 (50 mM) was
stirred constantly and maintained at 37 °C. Sodium azide (0.02% w/v) was
added to the receptor fluid to prevent microbial growth. Membranes were
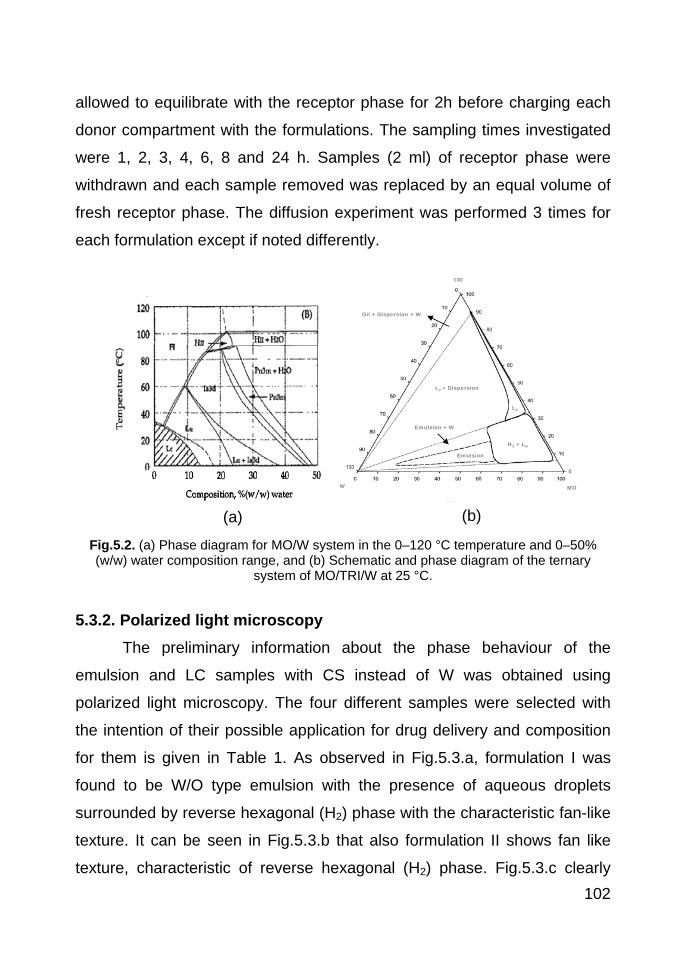
102
allowed to equilibrate with the receptor phase for 2h before charging each
donor compartment with the formulations. The sampling times investigated
were 1, 2, 3, 4, 6, 8 and 24 h. Samples (2 ml) of receptor phase were
withdrawn and each sample removed was replaced by an equal volume of
fresh receptor phase. The diffusion experiment was performed 3 times for
each formulation except if noted differently.
Fig.5.2. (a) Phase diagram for MO/W system in the 0–120 °C temperature and 0–50% (w/w) water composition range, and (b) Schematic and phase diagram of the ternary
system of MO/TRI/W at 25 °C. 5.3.2. Polarized light microscopy
The preliminary information about the phase behaviour of the
emulsion and LC samples with CS instead of W was obtained using
polarized light microscopy. The four different samples were selected with
the intention of their possible application for drug delivery and composition
for them is given in Table 1. As observed in Fig.5.3.a, formulation I was
found to be W/O type emulsion with the presence of aqueous droplets
surrounded by reverse hexagonal (H2) phase with the characteristic fan-like
texture. It can be seen in Fig.5.3.b that also formulation II shows fan like
texture, characteristic of reverse hexagonal (H2) phase. Fig.5.3.c clearly
TRI
W MO
H2 + Lα
Emulsion
Emulsion + W
L2
L2L2 + Dispersion
Oil + Dispersion + W
TRI
(a) (b)

103
shows maltese-crosses which is characteristic of lamellar (Lα) phase and
hence validates lamellar LC structure of formulation III. Formulation IV did
not show any pattern under the polarized light microscope as it was
isotropic. This is typical of cubic phases. All the four types of samples
prepared with CS exhibited similar microscopic pattern to the samples
prepared according to MO/TRI/W and MO/W phase diagrams. This
demonstrates that the caffeine added at the concentration of 10 mg/ml to
the emulsion and LC samples did not cause significant phase transition
among the four samples investigated here.
Fig.5.3. Polarized light microscopy at 25 º C (a) formulation I (320X magnification) (b)
formulation II (200X magnification) and (c) formulation III (200X magnification).
5.3.2 2H NMR 2H NMR spectra for the H2+Lα two-phase and emulsion regions of
MO/TRI/D are reported in reference [11]. It is known that the 2H NMR
spectra of samples prepared with D shows the quadrupolar splitting typical
of anisotropic phases. Fig.5.4 (a) shows the results obtained for the W/O
emulsion sample having the composition MO/TRI/D2O/CS (63/11/19/7). A
single isotropic signal due to isotropic solution ( CS droplets of Fig.5.3.a)
and the two clear quadrupolar splittings due to anisotropic LC phase can be
observed, namely Δ𝜐𝜐𝑞𝑞1 = 501 Hz, Δ𝜐𝜐𝑞𝑞2 = 938 Hz, as expected from the H2
phase which shows both 90° and 0° alignments. The results obtained for
samples containing different amount of CS and having the composition
MO/TO/CS (69/11/20) (formulation I) and (80/11/9) (formulation II) are
100 µm 100 µm 100 µm
(a) (b) (c)
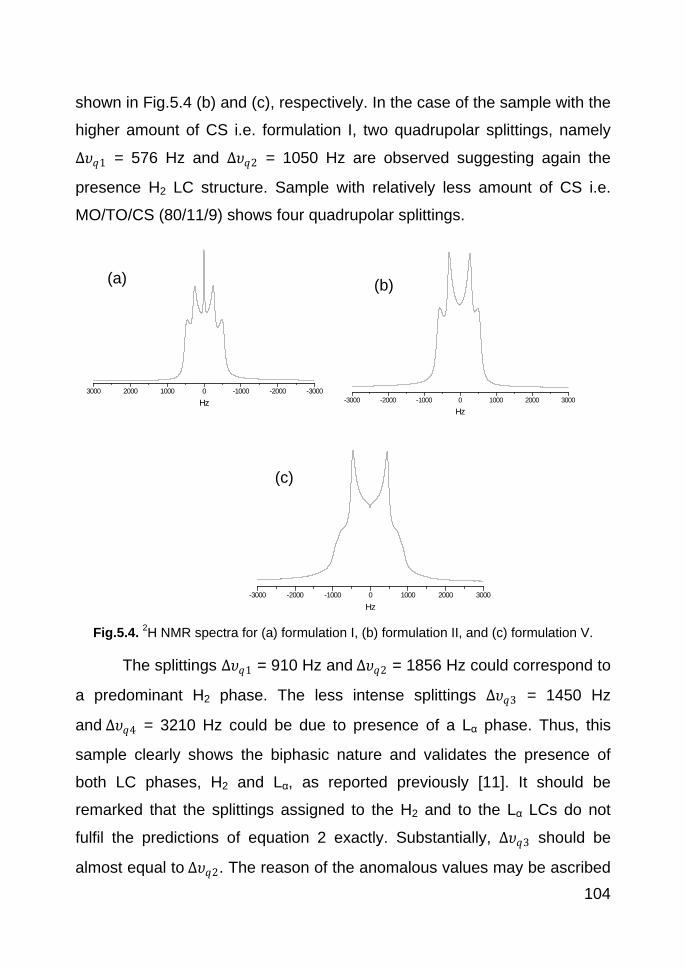
104
shown in Fig.5.4 (b) and (c), respectively. In the case of the sample with the
higher amount of CS i.e. formulation I, two quadrupolar splittings, namely
Δ𝜐𝜐𝑞𝑞1 = 576 Hz and Δ𝜐𝜐𝑞𝑞2 = 1050 Hz are observed suggesting again the
presence H2 LC structure. Sample with relatively less amount of CS i.e.
MO/TO/CS (80/11/9) shows four quadrupolar splittings.
Fig.5.4. 2H NMR spectra for (a) formulation I, (b) formulation II, and (c) formulation V.
The splittings Δ𝜐𝜐𝑞𝑞1 = 910 Hz and Δ𝜐𝜐𝑞𝑞2 = 1856 Hz could correspond to
a predominant H2 phase. The less intense splittings Δ𝜐𝜐𝑞𝑞3 = 1450 Hz
and Δ𝜐𝜐𝑞𝑞4 = 3210 Hz could be due to presence of a Lα phase. Thus, this
sample clearly shows the biphasic nature and validates the presence of
both LC phases, H2 and Lα, as reported previously [11]. It should be
remarked that the splittings assigned to the H2 and to the Lα LCs do not
fulfil the predictions of equation 2 exactly. Substantially, Δ𝜐𝜐𝑞𝑞3 should be
almost equal to Δ𝜐𝜐𝑞𝑞2. The reason of the anomalous values may be ascribed
3000 2000 1000 0 -1000 -2000 -3000
Hz -3000 -2000 -1000 0 1000 2000 3000
Hz
-3000 -2000 -1000 0 1000 2000 3000
Hz
(a) (b)
(c)

105
to the presence of caffeine that, due to its shape, is likely to be
preferentially located in the water layer of the lamellar phase rather than in
the water cylinders of the reverse hexagonal phase. Caffeine partition
should increase the effective thickness of the Lα, water layer, but subtracts
water molecules, thus decreasing the surfactant/water (S/W) molar ratio;
consequently the quadrupolar splitting decreases. Indeed, as depicted by
equation 2, Δ𝜐𝜐𝑞𝑞 of D2O in surfactant/water systems mainly depends on
S/W, provided that enough hydration water molecules are present (nb is
constant). Generally Δ𝜐𝜐𝑞𝑞 decreases with increasing water content.
In conclusion, it can be suggested that the different partition of
caffeine in the water domains of the Lα, and H2 LC phases is responsible for
the observed anomalous quadrupolar splittings of D2O.
5.3.3. SAXS Fig.5.5 and Table 2 show the SAXS patterns and lattice parameters
for formulation I-IV. The SAXS study was performed to understand the
effect of temperature on the LC structure of all formulations. The
formulation I which was W/O type emulsion stabilized by LC phase showed
peculiar results. We could not observe the peaks due to Lα phase, since it
was mainly dominated by H2 phase. The lattice parameter of this sample
decreased from about 65 to 59 Å, when it was warmed from ambient
temperature (25 °C) to physiological temperature (37 °C). It did not revert
back to the original lattice parameter when temperature was decreased to
the ambient temperature; rather it decreased slightly to 58 Å. This effect
could be due to relatively less thermal stability of the emulsion in
comparison to LC phases, alone. Formulation II and III showed typical
scattering pattern of H2 and Lα LC phases, respectively, from temperature
25 to 37 °C and even when they were brought back to ambient temperature
(25 °C). Formulation II showed a slight decrease from 60 to 59 Å with
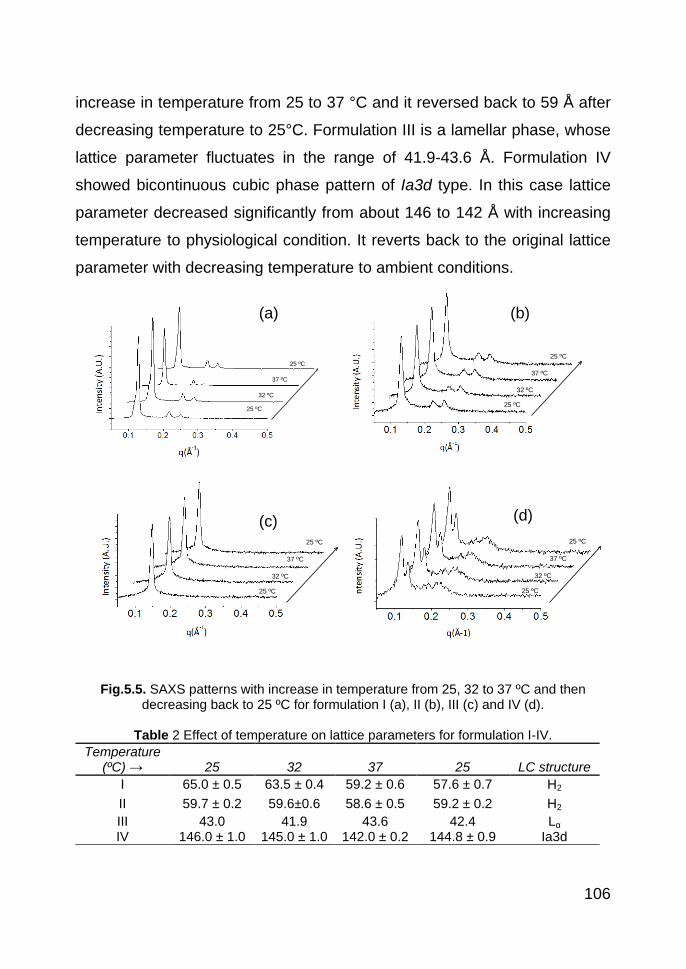
106
increase in temperature from 25 to 37 °C and it reversed back to 59 Å after
decreasing temperature to 25°C. Formulation III is a lamellar phase, whose
lattice parameter fluctuates in the range of 41.9-43.6 Å. Formulation IV
showed bicontinuous cubic phase pattern of Ia3d type. In this case lattice
parameter decreased significantly from about 146 to 142 Å with increasing
temperature to physiological condition. It reverts back to the original lattice
parameter with decreasing temperature to ambient conditions.
Fig.5.5. SAXS patterns with increase in temperature from 25, 32 to 37 ºC and then decreasing back to 25 ºC for formulation I (a), II (b), III (c) and IV (d).
Table 2 Effect of temperature on lattice parameters for formulation I-IV.
Temperature (ºC) → 25 32 37 25 LC structure
I 65.0 ± 0.5 63.5 ± 0.4 59.2 ± 0.6 57.6 ± 0.7 H2 II 59.7 ± 0.2 59.6±0.6 58.6 ± 0.5 59.2 ± 0.2 H2 III 43.0 41.9 43.6 42.4 Lα IV 146.0 ± 1.0 145.0 ± 1.0 142.0 ± 0.2 144.8 ± 0.9 Ia3d
25 ºC
32 ºC
37 ºC
25 ºC
25 ºC
32 ºC
37 ºC
25 ºC
25 ºC
32 ºC
37 ºC
25 ºC
25 ºC
32 ºC
37 ºC
25 ºC
(c)
(a) (b)
(d)
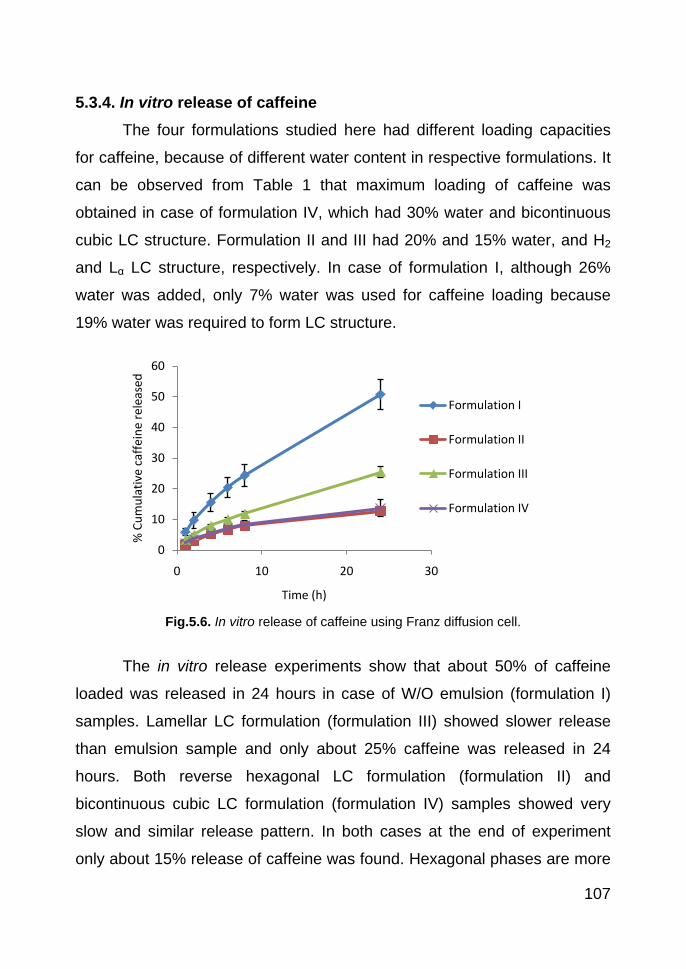
107
5.3.4. In vitro release of caffeine The four formulations studied here had different loading capacities
for caffeine, because of different water content in respective formulations. It
can be observed from Table 1 that maximum loading of caffeine was
obtained in case of formulation IV, which had 30% water and bicontinuous
cubic LC structure. Formulation II and III had 20% and 15% water, and H2
and Lα LC structure, respectively. In case of formulation I, although 26%
water was added, only 7% water was used for caffeine loading because
19% water was required to form LC structure.
Fig.5.6. In vitro release of caffeine using Franz diffusion cell.
The in vitro release experiments show that about 50% of caffeine
loaded was released in 24 hours in case of W/O emulsion (formulation I)
samples. Lamellar LC formulation (formulation III) showed slower release
than emulsion sample and only about 25% caffeine was released in 24
hours. Both reverse hexagonal LC formulation (formulation II) and
bicontinuous cubic LC formulation (formulation IV) samples showed very
slow and similar release pattern. In both cases at the end of experiment
only about 15% release of caffeine was found. Hexagonal phases are more
0
10
20
30
40
50
60
0 10 20 30
% C
umul
ativ
e ca
ffein
e re
leas
ed
Time (h)
Formulation I
Formulation II
Formulation III
Formulation IV
108
viscous than lamellar phases. The bicontinuous cubic phases are very stiff,
and they behave almost like a solid [29]. Thus, the release data obtained
here can be correlated to viscosity of the different LC phases. The reason
for highest release of caffeine from formulation I is that the caffeine might
not have experienced considerable resistance from the LC phases, since it
is mainly present in the water droplets of the emulsion.
Similarity between the release curves can further be elucidated by
the similarity factor, F2, described by FDA, which can be calculated using
the following equation:
𝐹𝐹2 = 50 × 𝑙𝑙𝑓𝑓𝑎𝑎 ��1 +1𝑛𝑛�(𝑅𝑅𝑟𝑟 − 𝑇𝑇𝑟𝑟)2𝑛𝑛
𝑟𝑟=1
�−0.5
× 100� (3)
where n is the number of time points, Rt is the amount released of a
reference product and Tt is the amount released for the test product at time
t. If F2 is between 50 and 100, the two profiles are considered to be similar
and bioequivalent [30].
When the release data for formulation I are compared with that of
formulation II, III and IV, F2 values were 36.5, 44.6 and 37 respectively.
This proves that the formulation I, which is a W/O emulsion shows a
completely different release pattern. Comparing the release data for
formulation II with that of formulation III and IV, the calculated F2 values are
61.3 and 96, respectively. This proves that formulation II, which has mainly
reverse hexagonal structure, releases caffeine at a similar rate to that of
formulation IV having bicontinuous cubic structure. The final amount
released in case of formulation III (lamellar phase) (about25%) was found
to be significantly higher than that from formulation II (reverse hexagonal
phase) (about 15%), nevertheless the initial release for the first eight hours
was very similar. Hence the F2 comparison suggests that these two
formulations are not significantly different in releasing caffeine. The F2
109
value was found to be 63.4, when comparison between release data for
formulation III (lamellar phase) and formulation IV (bicontinuous cubic
phase) was done. This shows that formulation III and IV are also similar in
releasing caffeine. Thus, only significant difference in release of caffeine is
found in case of emulsion sample.
5.4. Conclusions The monoolein based formulations for caffeine were characterized by
polarized light microscopy, 2H NMR and SAXS. The LC structure did not
change, at a macroscopic level, as result of caffeine addition. SAXS study
proved that temperature changes from ambient to physiological conditions
and then reverting back to original temperature can cause significant
variations in lattice parameter of LC phases that stabilize W/O emulsion
system. The in vitro release of caffeine from these formulations was in the
range of 15-50% of the loaded amount of the caffeine after 24 hours. This
preformulation data can be used to design an appropriate
topical/transdermal drug delivery system. Further studies are in progress to
understand the diffusion across the biological membrane, and to obtain
optimized procedures for the preparation of the formulations.
5.5. References [1] R.B. Walker, E.W. Smith, The role of percutaneous penetration
enhancers, Adv Drug Deliv Rev, 18 (1996) 295-301. [2] R.H. Guy, Iontophoresis - Recent developments, J Pharm Pharm
Sci, 50 (1998) 371-374. [3] A. Boucaud, L. Machet, B. Arbeille, M.C. Machet, M. Sournac, A.
Mavon, F. Patat, L. Vaillant, In vitro study of low-frequency ultrasound-enhanced transdermal transport of fentanyl and caffeine across human and hairless rat skin, Int J Pharm, 228 (2001) 69-77.
[4] S. Baboota, F. Shakeel, K. Kohli, Formulation and evaluation of once-a-day transdermal gels of diclofenac diethylamine, Methods Find Exp Clin Pharmacol, 28 (2006) 109-114.

110
[5] F. Shakeel, W. Ramadan, M.A. Ahmed, Investigation of true nanoemulsions for transdermal potential of indomethacin: characterization, rheological characteristics, and ex vivo skin permeation studies, J Drug Target, 17 (2009) 435-441.
[6] S.A. Ibrahim, S.K. Li, Effects of chemical enhancers on human epidermal membrane: Structure-enhancement relationship based on maximum enhancement (Emax), J Pharm Sci, 98 (2009) 926-944.
[7] J.C. Shah, Y. Sadhale, D.M. Chilukuri, Cubic phase gels as drug delivery systems, Adv Drug Deliv Rev, 47 (2001) 229-250.
[8] P. Tyle, S.G. Frank, Phytosterol Stabilized Emulsions: Interpacial Complexation and Structural Investigations, Drug Dev Ind Pharm, 16 (1990) 1605-1618.
[9] A. Otto, J.W. Wiechers, C.L. Kelly, J.C. Dederen, J. Hadgraft, J. du Plessis, Effect of emulsifiers and their liquid crystalline structures in emulsions on dermal and transdermal delivery of hydroquinone, salicylic acid and octadecenedioic acid, Skin Pharmacol Physiol, 23 (2010) 273-282.
[10] A. Semenzato, A. BaÙ, C. Dall'Aglio, M. Nicolini, A. Bettero, I. Calliari, Stability of vitamin A palmitate in cosmetic emulsions: influence of physical parameters, Int J Cosmet Sci, 16 (1994) 139-147.
[11] S. Mele, S. Murgia, F. Caboi, M. Monduzzi, Biocompatible Lipidic Formulations: Phase Behavior and Microstructure, Langmuir, 20 (2004) 5241-5246.
[12] L. Brinon, S. Geiger, V. Alard, J.F. Tranchant, T. Pouget, G. Couarraze, Influence of lamellar liquid crystal structure on percutaneous diffusion of a hydrophilic tracer from emulsions, J Cosmet Sci, 49 (1998) 1-11.
[13] L.B. Lopes, J.L.C. Lopes, D.C.R. Oliveira, J.A. Thomazini, M.T.J. Garcia, M.C.A. Fantini, J.H. Collett, M.V.L.B. Bentley, Liquid crystalline phases of monoolein and water for topical delivery of cyclosporin A: Characterization and study of in vitro and in vivo delivery, Eur J Pharm Biopharm, 63 (2006) 146-155.
[14] A. Ganem-Quintanar, D. Quintanar-Guerrero, P. Buri, Monoolein: A Review of the Pharmaceutical Applications, Drug Dev Ind Pharm, 26 (2000) 809 - 820.
[15] T. Ogiso, M. Iwaki, T. Paku, Effect of various enhancers on transdermal penetration of indomethacin and urea, and relationship between penetration parameters and enhancement factors, J Pharm Sci, 84 (1995) 482-488.
[16] M.G. Lara, M.V.L.B. Bentley, J.H. Collett, In vitro drug release mechanism and drug loading studies of cubic phase gels, Int J Pharm, 293 (2005) 241-250.
111
[17] P. Geraghty, D. Attwood, J. Collett, Y. Dandiker, The in vitro release of some antimuscarinic drugs from monoolein/water lyotropic liquid crystalline gels, Pharm Res, 13 (1996) 1265-1271.
[18] J. Borné, T. Nylander, A. Khan, Phase Behavior and Aggregate Formation for the Aqueous Monoolein System Mixed with Sodium Oleate and Oleic Acid, Langmuir, 17 (2001) 7742-7751.
[19] M.G. Carr, J. Corish, O.I. Corrigan, Drug delivery from a liquid crystalline base across Visking and human stratum corneum, Int J Pharm, 157 (1997) 35-42.
[20] M. Dias, A. Farinha, E. Faustino, J. Hadgraft, J. Pais, C. Toscano, Topical delivery of caffeine from some commercial formulations, Int J Pharm, 182 (1999) 41-47.
[21] P. Clément, C. Laugel, J.-P. Marty, In vitro release of caffeine from concentrated W/O emulsions: effect of formulation parameters, Int J Pharm, 207 (2000) 7-20.
[22] P. Clément, C. Laugel, J.-P. Marty, Influence of three synthetic membranes on the release of caffeine from concentrated W/O emulsions, J Control Release, 66 (2000) 243-254.
[23] M. Amato, M. Isenschmid, P. Hüppi, Percutaneous caffeine application in the treatment of neonatal apnoea, Eur J Pediatr, 150 (1991) 592-594.
[24] J.-F. Chen, K. Xu, J.P. Petzer, R. Staal, Y.-H. Xu, M. Beilstein, P.K. Sonsalla, K. Castagnoli, N. Castagnoli, Jr, M.A. Schwarzschild, Neuroprotection by Caffeine and A2A Adenosine Receptor Inactivation in a Model of Parkinson's Disease, J. Neurosci., 21 (2001) 143RC-.
[25] A.H. Conney, Y.P. Lu, Y.R. Lou, M.T. Huang, Inhibitory effects of tea and caffeine on UV-induced carcinogenesis: Relationship to enhanced apoptosis and decreased tissue fat, European Journal of Cancer Prevention, 11 (2002) S28-S36.
[26] C. Bertin, H. Zunino, J.C. Pittet, P. Beau, P. Pineau, M. Massonneau, C. Robert, J. Hopkins, A double-blind evaluation of the activity of an anti-cellulite product containing retinol, caffeine, and ruscogenine by a combination of several non-invasive methods, J Cosmet Sci, 52 (2001) 199-210.
[27] J. Briggs, H. Chung, M. Caffrey, The temperature-composition phase diagram and mesophase structure characterization of the monoolein/water system, J Phys II, 6 (1996) 723-751.
[28] F.B. Rosevear, The microscopy of the liquid crystalline neat and middle phases of soaps and synthetic detergents, J Am Oil Chem Soc, 31 (1954) 628-639.
[29] G. Montalvo, M. Valiente, E. Rodenas, Rheological Properties of the L Phase and the Hexagonal, Lamellar, and Cubic Liquid Crystals of the CTAB/Benzyl Alcohol/Water System, Langmuir, 12 (1996) 5202-5208.
112
[30] X. Cheng, R. Liu, Y. He, A simple method for the preparation of monodisperse protein-loaded microspheres with high encapsulation efficiencies, Eur J Pharm Biopharm, 76 (2010) 336-341.
113
CONCLUDING REMARKS
In last few decades, smart nanostructured materials, for instance,
triblock copolymers with thermoreversible properties, silica nanoparticles
with different organic functionalizations, and lipids possessing ability to form
different lyotropic liquid crystalline structures, have drawn attention to
obtain novel drug delivery systems. These drug delivery systems are highly
advantageous over conventional pharmaceutical dosage forms, since they
can be tailor-made to achieve controlled release of therapeutic drug
molecules.
In this PhD thesis, the use of different non-ionic surfactants to
prepare and characterize smart nanostructured drug delivery systems was
investigated. The focus was on the evaluation of effectiveness of these
systems to modulate the in vitro release properties of a model protein such
as lysozyme and, a small drug molecule such as caffeine.
Chapter 3 discusses the system consisting of gelatin microspheres
suspended in thermoreversible Pluronic F127 (PF 127) gel. The
characterization of the gelatin microspheres (GMs) crosslinked by two
different cross-linkers viz. D-glucose and glutaraldehyde was done by
Scanning Electron Microscopy (SEM) and ATR-FTIR technique. Evidence
of the spherical shape and different degree of cross-linking was provided.
Aqueous PF 127 gel (20 % w/v) with the presence and the absence of
GMs, were, characterized for rheology and for gel microstructure by Small
Angle X-ray Scattering (SAXS). Sol-gel transition temperature of PF 127 gel
was mostly unaffected when either glucose or glutaraldehyde crosslinked
microspheres were suspended in them. It was found about 22 ⁰C indicating
feasibility of formulations for therapeutic applications. SAXS study
confirmed that the PF 127 gel microstructure was a discrete cubic liquid
crystal of Fm3m type and it was not significantly affected by the presence of
114
0.5 % w/v of both the types of microspheres. The release of lysozyme from
both types of crosslinked GMs was successfully controlled when they were
suspended in PF127 gel.
Chapter 4 discusses about the application of ordered mesoporous
materials (OMMs) as matrices for drug delivery systems. A comparison was
made between the widely studied SBA-15 mesoporous silica with that of
less investigated MSE mesoporous organosilica, towards the adsorption (at
pH 7.0 and 9.6) and in vitro controlled release of lysozyme. Both OMMs
have a hexagonal ordered mesoporous structure and texture, as confirmed
by SAXS, TEM and N2 adsorption isotherms, but differ for the chemical
composition and surface charge density, as determined by ATR-FTIR
spectroscopy and potentiometric titrations, respectively. Rather than the
structural and textural features, the different chemical composition of SBA-
15 and MSE seems to be responsible of the different lysozyme loading and
release, and of the different stability towards the lixiviating action of the
physiological medium.
Chapter 5 discusses the use of monoolein to form W/O emulsion and
liquid crystalline formulations, including reverse hexagonal, lamellar, and
bicontinuous cubic formulations. Caffeine, chosen as a model drug, was
added to these formulations at the concentration of 10mg/ml. The
formulations were then characterized by polarized light microscopy, NMR
and SAXS. It was found that they did not change the liquid crystalline
structure significantly due to the presence of caffeine. The loading capacity
for caffeine solution in these formulations varied between 7 and 30% of the
weight of the formulations. The in vitro release of caffeine from these
formulations was in the range of 15-50% of the loaded amount of the
caffeine after 24 hours. The preformulation data obtained here can be
useful to design an appropriate topical/transdermal drug delivery system.