UNIVERSIDAD DE NAVARRA Facultad de Farmacia y Nutrición
188
UNIVERSIDAD DE NAVARRA Facultad de Farmacia y Nutrición MUCUS-PENETRATING NANOPARTICLES FOR THE ORAL DELIVERY OF INSULIN TESIS DOCTORAL Laura Inchaurraga Casadamon Pamplona, 2017
-
Upload
khangminh22 -
Category
Documents
-
view
1 -
download
0
Transcript of UNIVERSIDAD DE NAVARRA Facultad de Farmacia y Nutrición

UNIVERSIDAD DE NAVARRA
Facultad de Farmacia y Nutrición
MUCUS-PENETRATING NANOPARTICLES FOR THE ORAL
DELIVERY OF INSULIN
TESIS DOCTORAL
Laura Inchaurraga Casadamon
Pamplona, 2017


UNIVERSIDAD DE NAVARRA
Facultad de Farmacia y Nutrición
MUCUS-PENETRATING NANOPARTICLES FOR THE ORAL
DELIVERY OF INSULIN
Trabajo presentado por Dña.Laura Inchaurraga Casadamon para obtener el
Grado de Doctor
Fdo. Laura Inchaurraga Casadamon
Pamplona, 2017


El trabajo aquí recopilado y los resultados de investigación en él contenidos se encuentran en
proceso de protección industrial y por ello son CONFIDENCIALES.
The work here compiled and the results of the research described in it are in process of industrial
protection and are therefore CONFIDENTIAL.


El presente trabajo, titulado “Mucus-penetrating nanoparticles for the oral delivery of
insulin”, presentado por DÑA. LAURA INCHAURRAGA CASADAMON para optar al
grado de Doctor en Farmacia, ha sido realizado bajo nuestra dirección en el Departamento de
Farmacia y Tecnología Farmacéutica de la Universidad de Navarra. Estimamos que puede ser
presentado al tribunal que lo ha de juzgar.
Y para que así conste, firman la presente:
Fdo.: Dr. Juan M. Irache Garreta Fdo.: Dra. Maite Agüeros Bazo
Pamplona, 2017


Esta tesis doctoral se ha llevado a cabo gracias a la
ayuda predoctoral de la ayuda para la formación del
personal investigador de la Asociación de Amigos de la
Universidad de Navarra.
Las investigaciones realizadas en el presente trabajo se
han desarrollado dentro del proyecto, financiado por el
Séptimo Programa Marco de la Unión Europea [FP7
2007/2013], “ALEXANDER” (n° NMP-2011-1.2-2-
280761).


A mis padres, Laura y Juan Mª, y a mi hermano, Iker.
A Jose.


“La esperanza es el sueño del hombre despierto”
Aristóteles

AGRADECIMIENTOS
En primer lugar, quisiera agradecer a la Universidad de Navarra y al Departamento de Farmacia
y Tecnología Farmacéutica por darme la posibilidad de realizar este trabajo y formar parte de su
equipo durante estos años. A la Asociación de Amigos por la aportación económica recibida a
través de su programa de ayudas para la realización de tesis doctorales.
A mis directores, el Dr. Juan Manuel Irache Garreta y la Dra. Maite Agüeros Bazo, la
realización de esta tesis no habría sido posible sin su valiosa ayuda. Ha sido un privilegio
compartir esta experiencia, gratificante en todos sus aspectos, con ellos. El día a día ha sido
inmejorable. Ambos son un ejemplo de trabajo, inquietud y dedicación admirable, así que me
siento agradecida por la confianza que han depositado en mí para desarrollar este trabajo.
Juanma, de ti me llevo lo que bien afirmó Einstein: “No fracasas hasta que dejas de intentarlo”.
Ahora que llega el fin de esta etapa, me vienen a la cabeza innumerable nombres que han hecho
posible que este trabajo salga adelante. No veo la necesidad de nombrar a todos, pues
perfectamente saben en qué medida han estado ahí en el momento indicado. Los más especiales,
por supuesto, son los nanogalenos. Todos y cada uno con los que me he encontrado desde el
inicio de esta aventura hasta hoy, que llega a su fin. Esa piña en la que cobra sentido el trabajo
en equipo. También gente especial del departamento de Farmacia y Tecnología Farmacéutica,
del de Química y Edaflogía, de la Universidad de Greenwich, de la Unidad de Radiofarmacia de
la CUN, del consorcio ALEXANDER y de la Unidad de Morfología y de la Unidad de Imaagen
del CIMA merecen mi sincera gratitud.
A todos mis amigos: Inma, Ana, Maru, Pau, Rakel, Miguel, Vane, Esti, Silvia, Rafa, Cris,
Mirian, Helen, Isa, Pérez, Mery, Amaya, Raul, Enri, Jose Miguel, Javier L., Berrio, Tony,
Morillas, Txomin, Lontxo, Pasky, Javier R., M.A. y Sergio, por ese interés y apoyo en todo
momento. Por darme el placer de verlos disfrutar por mí cada vez que el nano-mundo salía a
relucir.
Por supuesto, a toda mi familia. En especial a mis padres y a mi hermano Iker. Por ese apoyo
incondicional y por creer en mí en todo momento. Por hacerme sentir especial en cada paso que
doy. Por mostrar un profundo interés por lo que hago y por hacerme creer que soy capaz de
hacer lo que me propongo. Por haberme enseñado que los valores de perseverancia y amor son
primordiales en aquello que elegimos, y no, afrontar. Por estar a mi lado en todos los buenos y
malos momentos que han ido surgiendo a lo largo de estos, cortos, cinco años.
A Jose, por comprenderme y sacar de mí el lado más bueno que hace que afronte todas las
situaciones de forma feliz. Por apoyarme en todas las decisiones, hacer que sonría cada día y
que disfrute de cada momento. Contigo todo esto ha sido mucho más fácil.
¡MUCHAS GRACIAS A TODOS!


TABLE OF CONTENTS
CHAPTER1...................................................................................................................................... 23
GENERAL INTRODUCTION
CHAPTER 2 ..................................................................................................................................... 47
OBJECTIVES
CHAPTER 3 ..................................................................................................................................... 51
In vivo study of the mucus-permeating properties of PEG-coated nanoparticles following oral
administration
CHAPTER 4 ..................................................................................................................................... 77
The effect of thiamine-coating nanoparticles on their biodistribution and fate following oral
administration
CHAPTER 5 ................................................................................................................................... 105
The effect of insulin loading in the in vitro mucus-penetrating properties of thiamine decorated
nanoparticles
CHAPTER 6 ................................................................................................................................... 123
Modulation of the fate of zein nanoparticles by their coating with a Gantrez® AN-thiamine
polymer conjugate
CHAPTER 7 ................................................................................................................................... 145
Mucus-penetrating nanoparticles for the oral delivery of insulin
CHAPTER 8 ................................................................................................................................... 169
GENERAL DISCUSSION AND FUTURE PERSPECTIVES
CHAPTER 9 ................................................................................................................................... 181
CONCLUSIONS/CONCLUSIONES


ABBREVIATIONS
99m
Tc Technetium 99 metastable
AAC Area above the curve
AE Association efficiency
AUC Area under the curve
CAGR Compound annual growth rate
CE Caecum
Cl Clearance
Cmax Peak concentration
Cmin Minimum concentration
CSK C-src tirosin kynase
D Diffusion coefficient
DAPI 4 ',6-diamino-2-fenilindol
DM Diabetes mellitus
DNAse Deoxyribonuclease
DS Degree of substitution
E. coli Escherichia coli
EE Encapsulation efficiency
ELSD Evaporative light scattering detector
F Relative bioavailability
FAE Follicle associated epithelium
FDA Food and Drug Administration
FTIR Fourier transformed infrared spectroscopy
GALT Gut associated lymphoid tisssue
GIT Gastrointestinal tract
GRAS Generally recognised as safe
GT Gantrez®
AN-thiamine conjugate
GT-NPZ Zein nanoparticles coated with Gantrez®
AN-thiamine conjugate
H.Pylori Helicobacter pylori
HBV Hepatitis B virus
HCV Hepatitis C virus
HIV Human immunodeficiency virus
HPLC High performance liquid chromatography
HPMCP Hydroxypropyl methylcellulose phtalate
HSA Human serum albumin

I Small intestine portion
I-GT-NP Zein nanoparticles coated with Gantrez®
AN-thiamine conjugate
encapsulating insulin
I-NP Zein nanoparticles encapsulating insulin
I-T-NP Gantrez®
AN-thiamine conjugate encapsulating insulin
I-T-NP-H Gantrez®
AN-thiamine conjugate co-encapsulating insulin and HSA
LPS Lipopolysaccharide
MPT Multiple particle tracking
MRT Mean retention time
MW Molecular weight
MWCO Molecular weight cut off
NP Poly(anhydride) nanoparticles
NP2 PEG2000-coated poly(anhydride) nanoparticles
NP6 PEG6000-coated poly(anhydride) nanoparticles
NP10 PEG10000-coated poly(anhydride) nanoparticles
NPZ Zein nanoparticles
O.C.T.TM
Optimal cutting temperature
o.d. Outer diameter
PA Pharmacological activity
PBS Phosphate buffer saline
PCL Polycaprolactone
PCS Photon correlation spectroscopy
PDI Polydispersity index
PEG Poly(ethylene glycol)
PGA Poly(gycolic acid)
PGSE-NMR Pulse-gradient spin-echo nuclear magnetic resonance
PLGA Poly(lactic-co-glycolic acid)
PMMA Poly(methyl methacrylate)
PP Peyer´s patches
PTS Proline, threonine, serine
R Ratio between the diffusion coefficients obtained for the nanoparticles
formulations and mucin
RBITC Rhodamine B isothiocyanate
RF Flory radius
RNAse Ribonuclease
RT Room temperature
sc Subcutaneous

SEC-MALS Size exclusion chromatography coupled to multi-angle static light
scattering detector
SEM Scanning electron microscopy
SGF Simulated gastric fluid
SIF Simulated intestinal fluid
SPECT-CT Single photon emission computerized tomography
STO Stomach
t1/2 Half-life
TEM Tomography electron microscopy
TMC N-trimethyl chitosan chloride
Tmax Time of peak concentration
T-NP Gantrez®
AN-thiamine conjugate nanoparticles
T-NPA thiamine-coated poly(anhydride) nanoparticles
T-NPB Gantrez®
AN-thiamine conjugate nanoparticles
IU Units of insulin
UV Utraviolet
UWL Unstirred water layer
Vit B1 Vitamin B1
Vit B12 Vitamin B12
WHO World Health Organization


CHAPTER 1
GENERAL INTRODUCTION


CONFIDENTIAL CHAPTER 1: GENERAL INTRODUCTION
25
1. Introduction
Peptides and proteins have gained increased interest as therapeutics during recent years.
More than 60 peptide drugs have reached the market for the benefit of patients and several
hundreds of novel therapeutic peptides and proteins are in preclinical and clinical development.
The key contributor to this success is the potent and specific, yet safe, mode of action of these
biomacromolecules. Nevertheless, peptides have intrinsic weaknesses, including poor chemical
and physical stability and short circulating plasma half-life [1]. Furthermore, most of these
drugs are administered by the parental route and approximately 75% are given as injection. In
spite of the satisfaction in terms of efficacy, the intravenously administration of these
therapeutics shows some drawbacks. The invasive nature of this route of administration leads to
poor regimen adherence that (in some cases) is not as persistent and intense as required [2].
Consequently, alternative routes of administration are gaining increasing attraction. Among the
enteral routes, the oral administration remains between the most attractive due to its cost-
effectiveness and well-established acceptability, and especially because it allows avoiding the
use of needles and other injection materials [3]. However, the oral delivery of macromolecules
presents limitations that end in low bioavailability due to the degradation in the gastrointestinal
tract (GIT) by proteolytic enzymes and severe pH physiological conditions as well as low
permeability through the mucus layer and the intestinal epithelium [4]. To solve these problems,
different strategies have been proposed to increase the bioavailability of macromolecules:
enzymatic inhibitors [5], permeation enhancers [6–8], polymer-drug conjugates [9] or
nanotechnology-based drug delivery systems [10,11].
Among all the approaches developed for the oral delivery of biomacromolecules,
polymeric nanoparticles are in the forefront. In principle, these devices would encapsulate the
active molecule, conferring protection against hydrolytic and enzymatic degradation [12].
Furthermore, these carriers would facilitate the controlled release of the cargo due to their
matrix structure [13].
2. Barriers to the oral delivery of macromolecular drugs
The GIT possesses the largest surface area in the human body. Its main function is to
process ingested food into a form that can be absorbed and used in metabolic pathways but, at
the same, to prevent the penetration of harmful pathogens, toxins and undigested
macromolecules or compounds into the body [14]. The GIT includes three main organs: the
stomach, the small intestine (subdivided in duodenum, jejunum and ileum) and the colon.
Within the small intestine, specialized in the absorption of nutrients and xenobiotics, the
mucosa is made up of three layers: epithelium, lamina propria, and muscularis mucosae (Figure

CONFIDENTIAL CHAPTER1: GENERAL INTRODUCTION
26
1) [15,16]. The epithelium is constituted by cells that are held together by tight junctions, which
effectively form a seal against the external environment. Although the majority of cells
bordering the intestinal lumen are absorptive enterocytes, which are adapted for metabolic and
digestive functions, and globet cells that secrete mucus, other specialized cells (e.g.,
enteroendocrine cells, stem cells and Paneth cells) are also present [17]. This epithelium also
lines the crypts that form the germinal area of the villi involved in the renewal, water,
ion, exocrine and endocrine secretions. In addition, there are two extra levels of protection
against the outer milieu, the secreted mucus layer and the apical glycocalyx rich in digestive
enzymes (Figure 1) [18,19].
Figure 1. Structure and components of the intestinal mucosa.
Moreover, in some parts of the epithelium, there are clusters of lymph nodules called
Peyer's patches (PP) that extends through the submucosa. PP are surrounded by the follicle-
associated epithelium (FAE) that forms the interface between the gut-associated lymphoid tissue
(GALT) and the luminal microenvironment. The FAE contains specialized cells named M (for
microfold) cells that transport luminal components (e.g., dietary proteins and antigens) and
bacteria toward the immune cells that are in the stroma under the epitelium (Figure 2) [20].
The main barriers that hamper the oral delivery of biomacromolecules include the pH
conditions encountered within the gut, the presence of enzymes, the water layer and the tight
junctions of the epithelium.

CONFIDENTIAL CHAPTER 1: GENERAL INTRODUCTION
27
Figure 2. Structure and immune elements of the gut wall.
2.1. The acidic environment
The pH of the stomach contents ranges from 1.0 to 2.5 [21,22]. However, from the
proximal end to the ileum of the small intestine it rises to 6.6– 7.5 and drops to 6.4 at the
ceacum. Then, it rises progressively to 7.0 from the right to the left colon [21]. This pH
variation in the GIT makes it difficult to maintain biomacromolecules and nanoparticles
integrity throughout the entirety of the GIT.
The first major hurdle to overcome is the acidic gastric environment (pH ~1-3), which
favors the denaturation (i.e., unfolding) of peptides and proteins, rendering them more
susceptible to proteolytic degradation from pepsin, a non-specific protease with optimal activity
at pH 2 [23].
Enteric polymers (i.e., polymers providing resistance to the acidic environment of the
stomach, but dissolve in the small intestine) are commonly employed as a coating to protect the
therapeutic macromolecules from the harsh gastric environment [24].
2.2. The enzymatic barrier
The high enzymatic activity along the GIT represents another major obstacle to the
delivery and absorption of macromolecular drugs [25]. Specifically, the stomach contains
pepsin, which degrades proteins [26]. The small intestine contains pancreatic juices comprising
amylase (degrades starch), lipase and maltase (degrades maltose) [27].
Regarding proteins, proteolysis occurs both in the gastric and intestinal environment
due to the presence of numerous peptidases, which hydrolyze peptide bonds of protein drugs
[28]. The digestion process begins in the stomach by pepsin and continues in the small intestine

CONFIDENTIAL CHAPTER1: GENERAL INTRODUCTION
28
by pancreatic peptidases [26]. Peptidases can be classified into endopeptidases (i.e., trypsin, α-
chymotrypsin and elastase) which hydrolyze the peptide bonds at the interior of the peptide
chain and exopeptidases which hydrolyze the terminal peptide bonds (i.e., carboxypeptidases
and aminopeptidases) [29]. Certain peptidases are secreted from the pancreas into the small
intestine, whereas others are located in the brush-border membrane of the enterocytes, the
cytoplasm and the lysosomes [30]. Nucleases, the most significant of which are DNAse I,
DNAse II and RNAse A, also play a prominent role in the digestive process of nucleic acids
[29]. As in the case of peptidases, nucleases can also be divided into endo- and exonucleases,
depending on whether they hydrolyze bonds in the interior of the nucleic acid or terminal bonds
[31].
The modulation of the harsh enzymatic environment along the GIT by co-administration
of auxiliary agents (e.g., enzyme inhibitors) may effectively promote the intestinal absorption of
macromolecules. The beneficial effect of enzyme inhibitors on the bioavailability of peptides
and proteins has been thoroughly investigated. However, the risk of toxicity imparted by
protease inhibitors may outweigh their beneficial effects. A lot of research efforts have been
also undertaken in order to protect therapeutic macromolecules from enzymatic attack (in the
presence or not of enzyme inhibitors) by incorporating them into novel drug delivery systems
enabling both a sustained and controlled drug release [29,32].
2.3. The mucus gel layer
The thickness of the mucus layer is dependent on its location [33]. In the GIT, the
thickness has been reported as 50–600 μm in the stomach and 15–450 μm in intestine and colon
[34,35]. The thickest layers of gastrointestinal mucus are reported to be in the stomach and the
colon [36]. Mucosal delivery of drugs (particularly large hydrophobic molecules and biologicals
as well as delivery vehicles) is hampered by drug entrapment in mucus followed by rapid
clearance [37]. If one could temporarily weaken the mucus barrier to allow the drugs through,
the problem with mucosal delivery of drugs would be circumvented. Permanently disabling or
weakening the mucus barrier is not desired, as this would leave the patient vulnerable to
infections. For example, Ensign et al. reports that “a 30 % depletion of mucus by pilocarpine in
an ex vivo rat intestinal model led to a 3-fold increase in E. coli translocation” [33].
2.3.1 Mucus
Mucus is a water-based, complex and heterogeneous gel whose composition varies
between species, individuals and tissues [38]. The mucus barrier is comprised of a secreted
mucus layer and membrane-bound mucins on the surface of the cells, called the glycocalyx,

CONFIDENTIAL CHAPTER 1: GENERAL INTRODUCTION
29
which together form the mucosal surface [39]. The secreted mucus layer is a mucin-based gel,
where the mucin fibres are crosslinked and intertwined with each other (Figure3).
Figure 3. Glycocalyx and secreted mucus layer covering the intestinal epithelium.
Mucins are the most important compounds for the gel formation of mucus [40] even
though they make up only 5 % or less of the mucus composition [41]. The other 95 % are
mostly water. The secreted and membrane-bound mucins share some common features, but only
the secreted mucins take part in gel formation [42].
Mucins are a diverse family of glycoproteins in the MUC gene family, and so far, at
least 21 MUC genes have been described [43]. They have an overall high molecular weight,
which can range from 0.5 to 40 MDa [37,44,45]. Mucins have a protein backbone that can be
“naked” and hydrophobic in some regions or heavily glycosylated by oligosaccharides of
varying size and grade of branching in other regions (Figure 4) [33]. The various types of
mucins differ by the protein backbone [46], but there are some similarities. One of these are the
proline, threonine and serine region (PTS), which are areas with repeated residues of the amino
acids proline, threonine and serine.
The PTS regions come in various lengths and amounts depending on the specific MUC
gene the mucin originated from, and some regions have been reported to be 5000 amino acids
long [47]. In general, the PTS regions make up about 20 to 55 % of the total composition of
amino acids in the backbone [48].
The threonine and serine amino acid residues in the protein backbone contain hydroxyl groups,
on which the glycan side chains are bound through O-glycosylation linkages (Figure 4). The
glycans are hydrophilic and contain about 1-20 monomers [49]. Some common monomers in
the glycans are N-acetylgalactosamine, N-acetylglucosamine, fructose, galactose, sialic acid and
mannose [45,50]. The glycosylation of the protein backbone gives the mucins a negative charge
on average because of the sulphate and carboxylate groups of the monomers in the glycan side
chains [51]. The carbohydrate side chains of the mucins drastically increase their molecular
weight, and can comprise as much as 80 % of the mucin molecular weight [50]. The glycan side
chains and the intra- and intermucin repulsion caused by their negative charges also increase the

CONFIDENTIAL CHAPTER1: GENERAL INTRODUCTION
30
persistence length of the mucins [47,52], which is a parameter quantifying the stiffness of a
polymer. An increase in persistence length corresponds to a less flexible and more rigid polymer
structure.
The mucins are on average heavily glycosylated, but in between are hydrophobic
regions with no glycosylation, often termed as “naked” regions [37,47]. The hydrophobic
regions contain many cysteine amino acid residues, about 10 % [50], and the disulphide bonds
formed between the cysteine contribute to the more globular shape of these regions [37,53].
Disulphide bonds can also crosslink different mucins together, causing polymerisation of
mucins [47]. The cysteine rich regions are often found at the terminal ends of the mucin
molecules, and large networks of mucins can therefore be formed by this cross-linkage [54].
These networks are not permanent, as the many different interactions between and within mucus
components are constantly shifting. This alternating of hydrophilic and negatively charged
glycosylated regions and hydrophobic cysteine-rich regions along the mucins gives rise to a
heterogeneous charge profile, and many possible interaction sites with other mucins or mucus
components. Cu and Saltzman report that each mucin molecule intersects from about 10 to 100
times with other mucins [44].
Figure 4. Mucin structure.
Mucus also contains various other compounds besides mucins including (Na+, K
+, Ca
2+
and Cl-), lipids, etc. Khanvilkar and co-workers report that about 95 % of mucus is comprised of
water [35]. A layer of lipids is formed on the outward-facing side of the mucus layer. The lipids
protect the mucus against free radicals and add to the selectivity of the mucus barrier [53]. The
lipid layer also inhibits gases and hydrophilic compounds from crossing through the surface of
the mucus layer [47]. The most important lipids are various free fatty acids and phospholipids,
in addition to cholesterol [50]. Various proteins like hormones, lysozymes, immunoglobulins
and others are also part of the mucus composition [53].
Finally, mucus also contains various microorganisms, especially in the GIT [53]. These
microorganisms are generally not harmful and can even be helpful in digestion of some
compounds and in the inhibition of pathogens or potentially harmful microorganisms [55].

CONFIDENTIAL CHAPTER 1: GENERAL INTRODUCTION
31
The interactions of the mucus components to form a gel are not fully understood. As
mentioned, the mucins are thought to be the major contributors to the structure of the mucus gel.
The mucins, with their glycan side chains and hydrophobic regions, form a network through
various interactions like electrostatic and hydrophobic interactions, hydrogen bonds and van der
Waals interactions. These interactions are not static, but rather shift and flicker over time
[47,56]. A degree of mucin entanglement is also necessary for gel formation [45].
The structure of mucus, as described above, gives rise to some important properties of
mucus. Thus, the mucus is shear thinning because its viscosity decreases with increasing shear
rate [57]. The shear thinning properties of mucus gives rise to a slippage plane as the entangled
mucins are pulled apart when the mucus is subjected to shearing [47]. A slippage plane formed
between the two layers allows transport of food through the intestines without damaging the
epithelial cells [33]. This makes mucus an excellent lubricant and demonstrates that mucins are
forming a network through low affinity bonds and weak interactions. Linkages between the
mucins are being continuously broken and reformed, allowing the mucus to maintain its
structure even when put under stress [44]. These flickering weak interactions and bonds also
contribute to the adhesive property of mucus, meaning that mucus sticks to surfaces and
particles [50,53].
On the other hand, mucus exhibits viscoelastic properties. In fact, mucus is
simultaneously viscous and elastic. Viscosity is a measure of the resistance of a fluid to
deformation when subjected to shear stress. In common terms, more and less viscous fluids are
often described as thick and thin. Elasticity is the property of a solid to return to its original state
after being deformed by an outside force. Applying a small force to a mucus gel will cause it a
deformation as the interactions within and between mucus components shift and when the force
is removed, the mucus will regain some degree of its original form [47]. Since mucus is
viscoelastic, it exhibits the properties of both a liquid and solid substance. The mucin content of
the mucus gel is the most important factor for the viscoelastic properties, but the other
components of mucus like water, ions and lipids also contribute [33]. Viscoelastic properties are
often measured and assessed by rheological methods, which measure the deformation of a
substance in response to an applied force.
Mucus effectively hinders particles and microorganisms from passing through by several
mechanisms: the steric, interactive and dynamic barriers [58]. Firstly, the mucins interact with
each other as mentioned above and form a matrix that physically stops particles from moving
through the mucus. This is the steric barrier. This barrier will obstruct particles that are above a
certain size, depending on the mucus pore size, while smaller particles can in theory move
through the pores. The pore size of mucus can vary between or within samples, as factors like
the degree of glycosylation, electrostatic repulsion or attraction, and the extent of hydrophobic
interactions and disulphide bonds can influence the structure of the mucins and, thereby, the

CONFIDENTIAL CHAPTER1: GENERAL INTRODUCTION
32
pore size. Pore size can be used as a measure of the degree of steric hindrance and can span over
a large range. This is demonstrated by records of pore sizes in porcine tracheobronchial mucus
measured to vary between 80 and 1500 nm using PEGylated nanoparticles and atomic force
microscopy [59].
Secondly, the mucins and other mucus components associate with the particle, forming
multiple non-covalent interactions and trapping the particle in place. Although each individual
bond or interaction may be weak, the number of interactions from the mucus to each particle
adds up to a significant force [47]. As mentioned, the mucins are capable of hydrogen bonding
and electrostatic interactions through the glycan side chains and hydrophobic interactions
through naked regions exposing the core protein in addition to van der Waals interactions
[35,60]. All of these possible interaction sites give mucus the attribute of being able to adhere to
particles or microorganisms with a range of properties like a hydrophobic surface or positive or
negative charges [59].
Thirdly, new mucus is constantly produced and secreted from specialized cells and the
rapid turnover removes the trapped particles. This is the dynamic barrier which hinders particles
or microorganisms from reaching the underlying cells to potentially enter the body, unless they
are able to rapidly penetrate the mucus layer. Most of the secreted mucus is digested and the
components are recycled, but some are lost for example in faeces [61]. The mucus shedding and
replenishment is especially high in the GIT [47], and an average human produces about 10 litres
of mucus every day [33].
2.4. The unstirred water layer
Solute absorption from the intestinal lumen to blood implicates molecular diffusion
through the unstirred water layer (UWL) [62], across the epithelial cell, through the interstitial
fluid, and into the blood capillary. The UWL is a more or less stagnant layer of water, mucus
and glycocalyx adjacent to the intestinal wall, and is created because it is virtually impossible to
stir the luminal contents so that complete mixing occurs right up to the intestinal mucosal
surface [63].
Whether the UWL has a major or minor impact on the uptake of a drug from the lumen
is thought to depend on the ability of the drug molecule to permeate the cell membrane [63].
The rate-limiting step in the transmucosal uptake of a low permeability compound is the
transport across the apical membrane, rather than the diffusion through the UWL. Hence, the
UWL can be considered as a negligible barrier to the uptake of slowly absorbed drugs [63].
For a rapidly permeating solute (effective intestinal permeability value, Pelf ~> 2 x 10 -4
cm s-1
) (Lennernfis, 1994), the UWL is suggested to contribute to the major resistance to
intestinal absorption [63–65]. Since absorbed drug is slowly replaced by new molecules from

CONFIDENTIAL CHAPTER 1: GENERAL INTRODUCTION
33
the bulk solution due to slower diffusion across the UWL, a concentration gradient is created
between the exterior side of the UWL and the intestinal wall. By definition, the effective
thickness of the UWL is determined by this concentration difference [65].
2.5. The intestinal epithelium
The intestinal epithelium is composed of a single layer of columnar cells which includes
a mixture of enterocytes, globet cells, endocrine cells and Paneth cells [66]. To be absorbed via
transcellular pathway, a drug has to pass through the epithelial cell layer by means of passive
diffusion, carrier-mediated transport, paracecullar transport, transcelullar transport, M cell
mediated transport or receptor mediated transport (Figure 5).
Figure 5. Different ways of intestinal absorption or translocation: (a) paracelullar transport; (b)
passive diffusion; (c) transcelullar transport; (d) M cell mediated transport; (e) receptor
mediated transport; (f) carrier mediated transport.
The phospholipid bilayer structure of the cell membranes is semi-permeable. Lipid-
soluble molecules can cross plasma membranes by means of passive diffusion, but the passage
of highly charged and large molecules is prevented. Therefore, drugs need appropriate physico-
chemical properties in terms of size, charge, lipophilicity, hydrogen bonding potential and
solution conformation to cross the lipophilic barrier of the apical and basolateral membranes
[67]. In general, the large size and hydrophilic characteristics of peptides and proteins prevent
them to the partitioning the into the cell membrane, and if they are not recognized by an active
transport carrier system, their transport is limited to diffusion through the intercellular spaces
[66,68]. However, movement of large molecules through the intercellular spaces is highly
hampered by the tight junctions. Although molecular size is generally considered to be the
ultimate obstacle for intestinal absorption, it should not be an absolute limitation as indicated by
the inclusion of certain polypeptides drugs (e.g., cyclosporine A and desmopressin) in oral
dosage forms [69].

CONFIDENTIAL CHAPTER1: GENERAL INTRODUCTION
34
The paracellular pathway of drug absorption is an aqueous extracellular route through
the intercellular spaces between adjacent epithelial cells. It has gained interest for delivery of
peptides because of the absence of proteolytic activity [70,71]. However, a zone of dense,
hydrophobic intercellular material circumscribes each intestinal epithelial cell below the brush
border and forms a continuous seal which restricts diffusion of molecules in a charge-specific
and molecular-size manner [67,72]. These intercellular junctional complexes between adjacent
intestinal cells consist of three parts including the tight junctions (zonula ocludens), the
underlaying adherens junctions (zonula adherens) and the most basally located spot
desmosomes (or macula adherens) (Figure 6) [73]. Of all these junctional complexes, the tight
junction is the only type of occluding junction [74] and is composed of a group of
transmembrane and cytosolic proteins that interact with each other and with the membrane and
the cytoskeleton [75]. Tight junctions contain fenestrae or pores [76], the dimensions of which
have been estimated as between 3 and 10Å [77]. The tight junction is selectively permeable to
certain small hydrophilic molecules (i.e. ions, nutrients and certain drugs) and functions both as
a “gate” and a “fence” [78]. The gate function controls diffusion of solutes through the
paracellular route, whereas the fence function maintains polar distributions of the plasma
membrane proteins in apical and basolateral domains [79]. This separation between the apical
and basolateral surfaces maintains the functional asymmetry needed to transport material in only
one direction across the membrane [80]. It is now generally accepted that tight junctions are
dynamic structures that can be regulated by several substances to increase paracellular
permeability [75].
Figure 6. Paracellular pathway of drug absorption and intercellular junctional complexes
between adjacent intestinal cells.
3. Nanoparticles for the oral delivery of biomacromolecules
One of the greatest challenges that limits the success of nanoparticles is their ability to
penetrate through the mucus layer to reach the epithelium [81].

CONFIDENTIAL CHAPTER 1: GENERAL INTRODUCTION
35
As previously described, mucus protects the underlying epithelium by efficiently
trapping pathogens and foreign particulates. Therefore, mucus is an essential component of
body´s defense systems with an important capability to limit the penetration of foreign materials
and limiting their arrival to the absorptive membrane [82]. As a consequence, it also represents
a substantial barrier to mucosal drug delivery. Mucus forms adhesive interactions easily with
particulates via electrostatic interactions, van der Waals forces, hydrophobic forces, hydrogen
bonding and chain entanglement [60,83]. These particulates trapped in the mucus layer may
prolong the residence time [37]. Nanocarriers designed to maximize these interactions with the
mucus are named as mucoadhesive nanoparticles. Furthermore, the encapsulated
biomacromolecule would be released from the nanoparticles far enough from the epithelium to
facilitate their destruction by the digestive enzymes localized in the glycocalix [18]. In order to
overcome this drawback and maximize the residence time of nanoparticles in close contact with
the absorptive epithelium, the use of mucus-penerating nanoparticles has been suggested
(Figure 7) [84].
For the design of mucus-permeating nanoparticles as oral drug delivery systems,
different strategies have been proposed: virus and bacteria mimicking nanoparticles, zeta
potential changing systems, nanoparticles containing mucolytic agents and “slippery”
nanoparticles. Virus and bacteria mimicking nanoparticles are based on the especial properties
of some of these microorganisms that allow an easy passage through the mucus layer in order to
get the colonization of the gastric and duodenum mucosa by means of different strategies:
decreasing mucin synthesis or alteration of mucin assembly. Thus, in an attempt to imitate this
behavior, nanoparticles would be decorated with the components of viruses and
Figure 7. Mucoadhesive nanoparticles (A) vs. mucus-penetrating nanoparticles.
bacteria, as ligands, possessing the ability to develop the strategies mentioned. As an example,
the lipopolysaccharide (LPS) of H. pylori could yield both strategies. On the one hand, it can
reduce the mucin synthesis and, on the other hand, it possesses the ability to inhibit mucin
glycosylation which may have deleterious effects on mucin assembly [85]. Another promising
CONFIDENTIAL CHAPTER1: GENERAL INTRODUCTION
36
strategy is zeta potential changing systems. These carriers consist in negatively charged
nanoparticles during their passage through the mucus layer (in which mucins are negatively
charged), providing sufficient permeability within the mucus layer. Then, once they arrived to
the epithelium surface, they possess the ability to develop a positive or neutral charge in order to
remain anchored to the cell surface or promote their celular uptake, respectively. Bonengel and
co-workers developed polymeric nanoparticles comprising an enzymatically degradable ester
moiety as a strategy for zeta potential changing system. In this way, 6-phosphogluconic acid
was covalently linked to the polymeric backbone of polyethylene imine. In a second step,
nanoparticles were formed out of poly-ion complexes with carboxymethyl cellulose, which was
chosen as anionic polymer. While penetrating the mucus layer, these nanoparticles should be
dephosphorylated by the brush border membrane-bound enzyme, intestinal alkaline phosphatase
which would cause a shift in the zeta potential to positive values [86]. A diffrent strategy may
be to increase the fluidity of mucus. For this purpose, mucolytic nanoparticles have been
proposed. These carriers are capable of cleaving certain substructures within the three-
dimensional network of the mucus. In principle, two types of mucolytic agents may be
employed. On the one hand, the encapsulation of disulphide breaking agents allows the cleavage
of disulphide bonds within the mucus without destroying the mucus layer as a whole [87]. On
the other hand, the decoration of nanoparticles with proteolytic enzymes (papain, bromelain,
pronase and trypsin), by immobilizing them on their surface, may cleave the amide bonds in the
mucin glycoproteins allowing an easier movement across the mucus layer. Pereira de Souza et
al. could provide evidence for a significantly improved mucin mobility after exposure to
enzyme-conjugated nanoparticles. The modified nanoparticles showed 2-fold increase in the
mobility of mucin. [88]. Also “slippery” nanoparticles have been suggested as a plausible
strategy. It consists in minimizing the hydrophobic interactions between the mucus components,
and the generally hydrophobic nature of the polymers used for the preparation of nanoparticles.
For this purpose, nanoparticles may be coated with hydrophilic compounds in order to produce
an effective shield capable of avoiding the mucoadhesive interactions. Lai and collaborators
gave evidence of an increase in the mucus-penetrating properties of PEG-decorated PLGA
nanoparticles. PEG (5 kDa) provided a hydrophilic “brush-dense” coating which reduces the
interactions between nanoparticles and the mucin components [37].
4. Oral administration of insulin as model biomacromolecule in
mucus-penetrating nanoparticles
Diabetes mellitus (DM) is a progressive disease characterized by persistent
hyperglycemia due to insulin deficiency, insulin resistance or both. In principle, it can be

CONFIDENTIAL CHAPTER 1: GENERAL INTRODUCTION
37
differentiated three main types of diabetes: type 1, type 2 and gestational diabetes. Type 1
diabetes mellitus occurs in genetically predisposed people as a consequence of the immune-
mediated destruction of pancreatic islet beta cells that secrete insulin [89]. In type 2 diabetes,
category which accounts for ∼90–95% of those with diabetes, the cause is a combination of
resistance to insulin action and an inadequate compensatory insulin secretory response [90].
Obesity and physical inactivity would be main determinants in DM type 2 [91]. The soonest
consequence of these metabolic disorders is the increase in the blood glucose level and it
translation to the known diabetes complications, including neuropathies, kidney failures,
blindness, stroke, heart diseases and amputations [92]. Gestational diabetes appears during
pregnancy and can lead to serious health risks for both the mother and child. In addition,
gestational diabetes is associated with an increased risk of both mother and child developing
Type 2 diabetes later in life [93].
Over the past decades, the number of people with DM has more than doubled globally,
making it one of the most important public health challenges worldwide. In fact, 415 million
adults (8.8%) are estimated to currently have diabetes, 75% of them are present in low- and
middle- income countries, and it is estimated to rise up to 642 million by 2040 [94,95].
Particularly, type 2 diabetes mellitus is increasingly observed among children, adolescents and
younger adults [96]. Population growth, ageing of populations, and urbanization with associated
lifestyle change should be the main factors associated to this increase in the worldwide numbers
with diabetes by the next decades [97]. Moreover, diabetes accounted for 14.5% of global all-
cause mortality among people aged between 20 and 79 years [95].
Since insulin was first used clinically, in the early 20´s of the last century, important
advances have been made in the management of diabetes. This had resulted in marked
improvements in prognosis and quality of life for both type 1 and type 2 diabetic patients.
However, the need for insulin is different for these two disorders. For type 1 diabetes an
absolute need for the drug exists, because without insulin people will die in a matter of weeks
[98]. By contrast, use of insulin in the management of type 2 diabetes is needed for improved
disease control and its use varies from country to country depending on resources, guidelines,
health-care worker training, and the level of the health system where the diabetes is managed
[99,100]. The global human insulin market was valued at $23,981.6 million in 2014. The market
is expected to grow at a Compound Annual Growth Rate (CAGR) of 12.5% during the period
2015 to 2020 to reach $48,487.7 million value by 2020 [101].
Currently insulin analogs are mainly available as injection for subcutaneous
administration [102,103]. Apart the invasive nature of current forms of insulin therapy, the
parenteral administration of insulin can produce peripheral hyperinsulinaemia due to the non-
natural path of the insulin through the portal vein which has been related to hypertension,
atherosclerosis and an increase of insulin resistance in muscle and peripheral patients receiving

CONFIDENTIAL CHAPTER1: GENERAL INTRODUCTION
38
insulin therapy, would be a poor regimen adherence [104]. As a consequence the glucose
control is not adequate, resulting in increased hospital admissions for diabetes complications
[105,106]. In addition, some patients are also concerned about convenience, interference with
daily living and social stigma [104,106,107].
In the last decades, different strategies have been developed based on the modernization
of the devices for parenteral administration since the discovery of insulin in order to decrease
the suffering, improve the adherence and provide more discreet devices. Thus, the use of
supersonic injectors, infusion pumps, sharp needles and pens (Figure 8) has been adopted
[108].
Figure 8. A: Needle-free injection system (image obtained from http://meearai.com/); B:
infusion pump (image obtained from http://www.dblife.today/services/insulin-pumps-when-
failure-is-an-option/ accessed March 28, 2017) and C: sharp needle in a pen (image obtained
from https://www.123rf.com/photo_4678678_disposable-insulin-injection-pen-on-white-
background.html accessed March 28, 2017).
Despite the availability of modern insulin injection devices with needles that are so
sharp and thin that practically no injection pain takes place, other approaches involving the
delivery of insulin by enteral routes of administration have been also investigated. However, till
now, the number of unconventional formulations of insulin that are commercially available is
reduced. Thus, in the last years, Afrezza® and Oral-Lyn
®, for the pulmonary and buccal delivery
of insulin respectively, have reached the market (Figure 9). In spite of these successes, for
patients with diabetes, the possibility of swallow a tablet with insulin remains a dream [109].
The hope is that this increased compliance in turn leads to better metabolic control, reducing the
risk of development of diabetes-related complications with all their consequences [109]. In
addition, insulin absorbed in the gut, via the portal vein, would be transferred directly toward
the liver. At the liver level, the exogenously applied insulin would control hepatic glucose
production to the same extent, as this is induced by endogenously secreted insulin in healthy
subjects [103]. This more “physiological insulin delivery” would be associated with reduced
peripheral hyperinsulinemia (as is the case with sc insulin administration) [103].

CONFIDENTIAL CHAPTER 1: GENERAL INTRODUCTION
39
Figure 9. A: Afrezza® for the pulmonary delivery of insulin (image obtained
https://www.afrezza.com/storage-and-handling/) and B: Oral-Lyn® for the buccal administration
of insulin (image obtained from http://pharmaexpertise.com/generex-collaborates-university-
health-network-buccal-insulin-project/).
5. Polymer-based nanotechnology delivery systems for the oral
administration of insulin
Polymer knowledge has increased in the last decades with better understanding of
polymer nature and possible modifications of their structure which would allow, roughly
speaking, targeting purposes (e.g. Peyer´s Patches) [110], mucus-penetrating properties [84] or
controlled release profiles among others [37]. Due to the amount of different existing polymeric
materials (from natural or synthetic sources) and the possibility of their use individually or
together [111,112], also the physicochemical properties of nanoparticles such as charge and
association efficiency (AE), can be modulated and nanoparticles can be tailored to retain
macromolecules stability, increase its bioavailability, control the release profiles, stabilize the
systems and modulate the biological behavior [113,114]. This fact turns into an evolution in the
drug delivery field which is focused in developing new and high-quality polymer-based drug
delivery systems in basis to the desired final objective [115].
In this context, several research groups have attempted to obtain an efficient
formulation for the oral delivery of insulin as model biomacromolecule which is especially
arduous due to its labile nature and unfavorable physico-chemical properties. Thus, the
bioavailability and the pharmacological availability of these nanoparticulate delivery systems in
the range size of 150-400 nm are summarized in this section (Table 1).
A combination of chitosan with other polymers, peptides and other chitosan derivatives
emerged as possible solutions to achieve high insulin bioavailability at the intestinal level.
Makhlof et al. formulated chitosan nanoparticles with hydroxypropyl methylcellulose phthalate
(HPMCP), a pH-sensitive polymer, by ionic cross-linking [116]. HPMCP pKa is approximately
5.2, which makes the polymer only soluble at high pH values, thus protecting insulin from the
CONFIDENTIAL CHAPTER1: GENERAL INTRODUCTION
40
harsh conditions of the stomach. As expected, chitosan/HPMCP nanoparticles revealed a
superior acid stability with a significant control over insulin release. After oral administration at
a dose of 12.5 IU/kg, the pharmacological availability conferred by the insulin loaded was
calculated to be 8.5%.
Chitosan derivatives may be also of interest for the oral delivery of insulin. Thus, N-
trimethyl chitosan chloride (TMC) was employed for the oral delivery of insulin. It is a partially
quaternized derivative of chitosan [117] that, similar to chitosan, possesses mucoadhesive
properties, acts as an absorption enhancer and due to its backbone features the modification with
different chemicals to achieve desired properties for oral drug delivery is also posible [113]. Jin
and co-workers used TMC nanoparticles modified with the targeting peptide C-Src tyrosine
kinase (CSK) and the resulting oral bioavailability at a dose of 50 IU/kg was 5.66% compared
to the subcutaneously administered insulin [118].
Nanoparticles prepared from a polysaccharide as it is dextran has been also used for
insulin delivery purposes. Chalasani and collaborators prepared surface modified dextran
nanoparticles by its conjugation with vitamin B12, the loading capacity of these nanoparticles
was 28 µg per mg of nanparticles. After their oral administration at a dose of 20 IU/kg to rats
the pharmacological activity relative to subcutaneous insulin resulted in 26.5% [119].
In another attempt, a different polysaccharide used for the obtention of insulin-loaded
nanoparticles was alginate. Woitiski and co-workers produced nanoparticles formed by alginate
and dextran sulfate nucleating around calcium and bonding to poloxamer, stabilized by
chitosan, and subsequently coated with albumin [120]. Regarding the in vivo studies, in an
administered dose of 50 IU/kg, nanoencapsulated insulin had an oral bioavailability of 13% and
a pharmacological availability of 11% compared to the subcutaneous administration of insulin.
Another strategy, consisting in the preparation of poly(γ-glutamic acid) (γ-PGA) and
chitosan nanoparticles, was developed by Lin et al. γ-PGA is a biodegradable, water-soluble
anionic peptide, originated from the members of genus Bacillus [121]. In the same research
group, Sonaje and collaborators demonstrated the hypoglycemic effect which appeared to result
in a bioavailability of 20% when insulin was administered at a dose of 30 IU/kg [122].
Due to its approval by the Food and Drugs Administration (FDA), poly(lactic-co-
glycolic acid) PLGA, an aliphatic polyester co-polymer, is one of the most used synthetic
polymer to produce nanoparticles for the oral delivery of insulin, also because of its
biodegradability and biocompatibility properties as well as sustained release profiles [123]. The
encapsulation of hydrophilic insulin into the hydrophobic PLGA matrix may be challenging,
thus different strategies may be used to improve its loading efficiency. An insulin-phospholipid
complex made with soybean phosphatidylcholine significantly improved the insulin payload of
PLGA nanoparticles [124]. Orally administered to diabetic rats (20 IU/kg), the oral

CONFIDENTIAL CHAPTER 1: GENERAL INTRODUCTION
41
bioavailability of insulin loaded in these nanoparticles (relative to subcutaneous insulin) was
calculated to be 7.7%.
As another approach, Damgé and co-workers developed a nanocarrier for oral insulin
administration made of a blend between PCL and Eudragit® RS. Polycaprolactone (PCL) is a
biodegradable and biocompatible polyester, recognized for its good sustained release properties.
Indeed, the slower degradation profile of PCL compared to PLGA, for instance, makes it
excellent for prolonged drug delivery. In an administered dose of 50 IU/kg, this formulation had
a bioavailability of 13% compared to subcutaneously administered insulin [10].
Also acrylic polymers have been used for the oral delivery of insulin due to its ability to
inhibit proteases activity, enhance mucoadhesion and alter the cell tight junctions improving the
intestinal uptake [115]. Cui et al., administered carboxylated chitosan grafted poly(methyl
methacrylate) nanoparticles at a dose of 50 IU/kg and the pharmacological availability resulted
in 9.7% compared to subcutaneously administered insulin [125].
Table 1. different attempts of oral delivery of insulin encapsulated in nanoparticles.
Nanoparticles
Formulation Size (nm) Dose (IU/kg) PA (%) F (%)
Chitosan-HPMCP 255 12.5 8.5 -
TMC-CSK 350 50 - 5.7
Dextran-VitB12 200-250 20 26.5 -
Multilayered 396 50 11.0 13.0
Chitosan-γ-PGA 250 30 - 20.0
PLGA 200 20 - 7.7
PCL-Eudragit® RS 360 50 - 13.0
Chitosan-PMMA 250 25 9.7 -

CONFIDENTIAL CHAPTER1: GENERAL INTRODUCTION
42
References
[1] K. Fosgerau, T. Hoffmann, Peptide therapeutics: current status and future directions, Drug
Discov. Today 20 (2015) 122–128.
[2] M. Peyrot, R.R. Rubin, D.F. Kruger, L.B. Travis, Correlates of insulin injection omission,
Diabetes Care 33 (2010) 240–245.
[3] P. Fonte, F. Araújo, S. Reis, B. Sarmento, Oral insulin delivery: how far are we?, J. Diabetes Sci.
Technol. 7 (2013) 520–31.
[4] S. Schubert, J.T. Delaney, U.S. Schubert, Nanoprecipitation and nanoformulation of polymers:
from history to powerful possibilities beyond poly(lactic acid), Soft Matter 7 (2011) 1581–1588.
[5] V. Agarwal, I.K. Reddy, M.A. Khan, Polymethyacrylate based microparticulates of insulin for
oral delivery: preparation and in vitro dissolution stability in the presence of enzyme inhibitors,
Int. J. Pharm. 225 (2001) 31–39.
[6] Y. Obata, T. Sesumi, K. Takayama, K. Isowa, S. Grosh, S. Wick, R. Sitz, T. Nagai, Evaluation of
Skin Damage Caused by Percutaneous Absorption Enhancers Using Fractal Analysis, J. Pharm.
Sci. 89 (2000) 556–561.
[7] C. Prego, M. García, D. Torres, M.J. Alonso, Transmucosal macromolecular drug delivery, J.
Control Release 101 (2005) 151–162.
[8] A. Bernkop-Schnürch, Thiomers: a new generation of mucoadhesive polymers, Adv. Drug Deliv.
Rev. 57 (2005) 1569–1582.
[9] S. Ahn, I.H. Lee, E. Lee, H. Kim, Y.C. Kim, S. Jon, Oral delivery of an anti-diabetic peptide drug
via conjugation and complexation with low molecular weight chitosan, J. Control Release 170
(2013) 226–232.
[10] C. Damgé, P. Maincent, N. Ubrich, Oral delivery of insulin associated to polymeric nanoparticles
in diabetic rats, J. Control Release 117 (2007) 163–170.
[11] W. Shan, X. Zhu, W. Tao, Y. Cui, M. Liu, L. Wu, L. Li, Y. Zheng, Y. Huang, Enhanced oral
delivery of protein drugs using zwitterion-functionalized nanoparticles to overcome both the
diffusion and absorption barriers, ACS Appl. Mater. Interfaces 8 (2016) 25444–25453.
[12] C. Pinto Reis, R.J. Neufeld, A.J. Ribeiro, F. Veiga, Nanoencapsulation II. Biomedical
applications and current status of peptide and protein nanoparticulate delivery systems,
Nanomedicine Nanotechnology, Biol. Med. 2 (2006) 53–65.
[13] J.M. Chan, L. Zhang, R. Tong, D. Ghosh, W. Gao, G. Liao, K.P. Yuet, D. Gray, J.W. Rhee, J.
Cheng, G. Golomb, P. Libby, R. Langer, O.C. Farokhzad, Spatiotemporal controlled delivery of
nanoparticles to injured vasculature, Proc. Natl. Sci. 107 (2010) 2213-2218.
[14] M. Chehade, L. Mayer, Oral tolerance and its relation to food hypersensitivities, J. Allergy Clin.
Immunol. 115 (2005) 3–12.
[15] P. Lundquist, P. Artursson, Oral absorption of peptides and nanoparticles across the human
intestine: opportunities, limitations and studies in human tissues, Adv. Drug Deliv. Rev. 106
(2016) 256–276.
[16] C.A. Peptu, L. Ochiuz, L. Alupei, C. Peptu, M. Popa, Carbohydrate based nanoparticles for drug
delivery across biological barriers, J. Biomed. Nanotechnol. 10 (2014) 2107–48.
[17] L.W. Peterson, D. Artis, Intestinal epithelial cells: regulators of barrier function and immune
homeostasis, Nat. Rev. Immunol. 14 (2014) 141–153.
[18] G.P. Carino, E. Mathiowitz, Oral insulin delivery, Adv. Drug Deliv. Rev. 35 (1999) 249–257.
[19] B.J. Bruno, G.D. Miller, C.S. Lim, Basics and recent advances in peptide and protein drug
delivery, Ther. Deliv. 4 (2013) 1443–67.
[20] J.S. Suk, S.K. Lai, N.J. Boylan, M.R. Dawson, M.P. Boyle, J. Hanes, Rapid transport of muco-
inert nanoparticles in cystic fibrosis sputum treated with N -acetyl cysteine, Nanomedicine 6
(2011) 365–375.
[21] D.F. Evans, G. Pye, R. Bramley, A.G. Clark, T.J. Dyson, J.D. Hardcastle, Measurement of
gastrointestinal pH profiles in normal ambulant human subjects, Gut 29 (1988) 1035–41.
[22] M.J. O’Neill, L. Bourre, S. Melgar, C.M. O’Driscoll, Intestinal delivery of non-viral gene
therapeutics: physiological barriers and preclinical models, Drug Discov. Today 16 (2011) 203–
218.
[23] A.B.R. Thomson, P. Tso, Overview of digestion and absorption, In: Biochemical, physiological
and molecular aspects of human nutrition, M.H. Stipanuk, M.A. Caudill (Eds.),
Elsevier/Saunders, New York, NY,USA, 2012: 122-139.
[24] A. Bernkop-Schnürch, Low Molecular Mass Permeation Enhancers in Oral Delivery of
Macromolecular Drugs, In: Oral delivery of macromolecular drugs: barriers, strategies and future
trends, A. Bernkop-Schnürch (Ed.), Springer US, New York, NY, USA, 2009: pp. 85–101.

CONFIDENTIAL CHAPTER 1: GENERAL INTRODUCTION
43
[25] D.K. Posolosky, M. Camilleri, J.G. Fitz, A.N. Kallo, F. Shanahan, T.C. Wang (Eds.), Textbook of
Gastroenterology, Wiley-Blackwell Publishing Ltd, Hoboken, NJ,U SA, 2009.
[26] P. Langguth, V. Bohner, J. Heizmann, H.P. Merkle, S. Wolffram, G.L. Amidon, S. Yamashita,
The challenge of proteolytic enzymes in intestinal peptide delivery, J. Control Release 46 (1997)
39–57.
[27] M. Gregory, Digestive System. Clinton Community College. [Retrieved date was March 14,
2017].
[28] T. Karamanidou, V. Bourganis, O. Kammona, C. Kiparissides, Lipid-based nanocarriers for the
oral administration of biopharmaceutics, Nanomedicine 11 (2016) 3009–3032.
[29] A. Bernkop-Schnürch (Ed.), Oral delivery of macromolecular drugs: barriers, strategies and
future trends, Springer US, New York, NY, USA 2009.
[30] A.J. Barrett, Classification of peptidases, Methods Enzymol. 244 (1994) 1–15.
[31] T. Nishino, K. Morikawa, Structure and function of nucleases in DNA repair: shape, grip and
blade of the DNA scissors, Oncogene 21 (2002) 9022–9032.
[32] Y.H. Lee, P.J. Sinko, Oral delivery of salmon calcitonin, Adv. Drug Deliv. Rev. 42 (2000) 225–
38.
[33] L.M. Ensign, R. Cone, J. Hanes, Oral drug delivery with polymeric nanoparticles: The
gastrointestinal mucus barriers, Adv. Drug Deliv. Rev. 64 (2012) 557–570.
[34] P. Sinko, D. Norris, Effect of size, surface charge, and hydrophobicity on the translocation of
polystyrene microspheres through gastrointestinal mucin, J. Appl. Polym. Sci. 63 (1997) 1481-
1492.
[35] K. Khanvilkar, M.D. Donovan, D.R. Flanagan, Drug transfer through mucus, Adv. Drug Deliv.
Rev. 48 (2001) 173–93.
[36] L.M. Lichtenberger, The hydrophobic barrier properties of gastrointestinal Mmucus, Annu. Rev.
Physiol. 57 (1995) 565–583.
[37] S.K. Lai, Y.Y. Wang, J. Hanes, Mucus-penetrating nanoparticles for drug and gene delivery to
mucosal tissues, Adv. Drug Deliv. Rev. 61 (2009) 158–171.
[38] L.D. Li, T. Crouzier, A. Sarkar, L. Dunphy, J. Han, K. Ribbeck, Spatial configuration and
Ccomposition of charge modulates transport into a mucin hydrogel barrier, Biophys. J. 105
(2013) 1357–1365.
[39] T. Pelaseyed, J.H. Bergström, J.K. Gustafsson, A. Ermund, G.M.H. Birchenough, A. Schütte, S.
van der Post, F. Svensson, A.M. Rodríguez-Piñeiro, E.E.L. Nyström, C. Wising, M.E. V
Johansson, G.C. Hansson, The mucus and mucins of the goblet cells and enterocytes provide the
first defense line of the gastrointestinal tract and interact with the immune system, Immunol. Rev.
260 (2014) 8–20.
[40] D. Ambort, M.E. V. Johansson, J.K. Gustafsson, A. Ermund, G.C. Hansson, Perspectives on
mucus properties and formation-lessons from the biochemical world, Cold Spring Harb. Perspect.
Med. 2 (2012) a014159–a014159.
[41] J. Celli, B. Gregor, B. Turner, N.H. Afdhal, R. Bansil, S. Erramilli, Viscoelastic properties and
dynamics of porcine gastric mucin, Biomacromolecules 6 (2005) 1329–1333.
[42] T. Lang, G.C. Hansson, T. Samuelsson, Gel-forming mucins appeared early in metazoan
evolution, Proc. Natl. Acad. Sci. 104 (2007) 16209–16214.
[43] HUGO Gene nomenclature Committe, Gene Family: Mucins (MUC). European Bioinformatics
Institute. Available at http://www.genenames.org/cgi-bin/genefamilies/set/648 [retrieved date was
March 16, 2017].
[44] Y. Cu, W.M. Saltzman, Controlled surface modification with poly(ethylene)glycol enhances
diffusion of PLGA nanoparticles in human cervical mucus, Mol. Pharm. 6 (2009) 173–181.
[45] D.J. Thornton, J.K. Sheehan, From mucins to mucus: toward a more coherent understanding of
this essential barrier, Proc. Am. Thorac. Soc. 1 (2004) 54–61.
[46] M.C. Rose, J.A. Voynow, Respiratory tract mucin genes and mucin glycoproteins in health and
disease, Physiol. Rev. 86 (2006) 245–278.
[47] R.A. Cone, Barrier properties of mucus, Adv. Drug Deliv. Rev. 61 (2009) 75–85.
[48] B.J. Van Klinken, J. Dekker, H.A. Büller, A.W. Einerhand, Mucin gene structure and expression:
protection vs. adhesion, Am. J. Physiol. 269 (1995) G613-27.
[49] X. Yang, K. Forier, L. Steukers, S. Van Vlierberghe, P. Dubruel, K. Braeckmans, S. Glorieux,
H.J. Nauwynck, Immobilization of Pseudorabies virus in porcine tracheal respiratory mucus
revealed by single particle tracking, PLoS One 7 (2012) e51054.
[50] R. Bansil, B.S. Turner, Mucin structure, aggregation, physiological functions and biomedical
applications, Curr. Opin. Colloid Interface Sci. 11 (2006) 164–170.
[51] H.S. Davies, P. Singh, T. Deckert-Gaudig, V. Deckert, K. Rousseau, C.E. Ridley, S.E. Dowd,

CONFIDENTIAL CHAPTER1: GENERAL INTRODUCTION
44
A.J. Doig, P.D.A. Pudney, D.J. Thornton, E.W. Blanch, Secondary structure and glycosylation of
mucus glycoproteins by Raman spectroscopies, Anal. Chem. 88 (2016) 11609–11615.
[52] R. Shogren, T.A. Gerken, N. Jentoft, Role of glycosylation on the conformation and chain
dimensions of O-linked glycoproteins: light-scattering studies of ovine submaxillary mucin,
Biochemistry 28 (1989) 5525–5536.
[53] R.A. Cone, Mucus, In: Mucosal Immunology, J. Mestecky, M.E. Lamm, W. Strober, J.
Bienenstock, J.R. McGhee (Eds.), Academic Press, London, UK, 2005: 49-72.
[54] J.K. Sheehan, S. Kirkham, M. Howard, P. Woodman, S. Kutay, C. Brazeau, J. Buckley, D.J.
Thornton, Identification of molecular intermediates in the assembly pathway of the MUC5AC
mucin, J. Biol. Chem. 279 (2004) 15698–15705.
[55] Savage, D.C. Mucosal microbiota, In: Mucosal immunology, J. Mestecky, M.E. Lamm, W.
Strober, J. Bienenstock, J.R. McGhee (Eds.), Academic Press, London, UK, 2005: 19-33.
[56] J. Kočevar-Nared, J. Kristl, J. Šmid-Korbar, Comparative rheological investigation of crude
gastric mucin and natural gastric mucus, Biomaterials 18 (1997) 677–681.
[57] O. Smidsrød, S.T. Moe, Biopolymer Chemistry, Tapir Academic Press. Trondheim, Norway,
2008.
[58] N. Sanders, C. Rudolph, K. Braeckmans, S.C. De Smedt, J. Demeester, Extracellular barriers in
respiratory gene therapy, Adv. Drug Deliv. Rev. 61 (2009) 115–127.
[59] M. Yang, H. Yamamoto, H. Kurashima, H. Takeuchi, T. Yokoyama, H. Tsujimoto, Y.
Kawashima, Design and evaluation of poly(dl-lactic-co-glycolic acid) nanocomposite particles
containing salmon calcitonin for inhalation, Eur. J. Pharm. Sci. 46 (2012) 374–380.
[60] J. Woodley, Bioadhesion, Clin. Pharmacokinet. 40 (2001) 77–84.
[61] K.C. Kwon, D. Verma, N.D. Singh, R. Herzog, H. Daniell, Oral delivery of human
biopharmaceuticals, autoantigens and vaccine antigens bioencapsulated in plant cells, Adv. Drug
Deliv. Rev. 65 (2013) 782–799.
[62] K.W. Smithson, D.B. Millar, L.R. Jacobs, G.M. Gray, Intestinal diffusion barrier: unstirred water
layer or membrane e mucous coat?, Science 214 (1981) 1241–1244.
[63] A.B.R. Thomson, J.M. Dietchy, The role of unstirred water layer in intestinal ermeation, In:
Pharmacology of intestinal permeation II, T.Z. Csaky (Ed.), Springer, Berlin, Germany, 1984:
165-269.
[64] M.D. Levitt, T. Aufderheide, C.A. Fetzer, J.H. Bond, D.G. Levitt, Use of carbon monoxide to
measure luminal stirring in the rat gut, J. Clin. Invest. 74 (1984) 2056–2064.
[65] D. Winnie, Unstirred layer as a diffusion barrier in vitro and in vivo, In: Intestinal absorption and
secretion, E. Skadhauge, K. Heintze (Eds.), MTP Press, Lancaster, UK, 1984: 21-38.
[66] J. Hochman, P. Artursson, Mechanisms of absorption enhancement and tight junction regulation,
J. Control Release 29 (1994) 253–267.
[67] G.M. Pauletti, S. Gangwar, G.T. Knipp, M.M. Nerurkar, F.W. Okumu, K. Tamura, T.J. Siahaan,
R.T. Borchardt, Structural requirements for intestinal absorption of peptide drugs, J. Control
Release 41 (1996) 3–17.
[68] Xin Hua Zhou, Overcoming enzymatic and absorption barriers to non-parenterally administered
protein and peptide drugs, J. Control. Release. 29 (1994) 239–252.
[69] W.C. Shen, Oral peptide and protein delivery: unfulfilled promises?, Drug Discov. Today 8
(2003) 607–8.
[70] V.H.L. Lee, Enzymatic barriers to peptide and protein absorption and the use of penetration
enhancers to modify absorption, In: Delivery systems for peptide drugs, Springer US, Boston,
MA, USA, 1986: 87–104.
[71] G. Pauletti, Improvement of oral peptide bioavailability: peptidomimetics and prodrug strategies,
Adv. Drug Deliv. Rev. 27 (1997) 235–256.
[72] L. Lapierre, The molecular structure of the tight junction, Adv. Drug Deliv. Rev. 41 (2000) 255–
264.
[73] J.L. Madara, Functional morphology of epithelium of the small intestine, In: Comprehensive
physiology, John Wiley & Sons Inc. (Ed.), Hoboken, NJ, USA, 2011: 83-120.
[74] U. Schumacher, D. Schumacher, Functional histology of epithelial relevant for drug delivery, In:
Bioadhesive drug delivery systems, E. Mathiowitz, D.E. Chickering, C.M. Lehr (Eds.), Marcel
Dekker Inc., New York, NY, USA, 1999: 67–83.
[75] P.D. Ward, T.K. Tippin, D.R. Thakker, Enhancing paracellular permeability by modulating
epithelial tight junctions, Pharm. Sci. Technol. Today 3 (2000) 346–358.
[76] G. Camenisch, G. Folkers, H. van de Waterbeemd, Review of theoretical passive drug absorption
models: historical background, recent developments and limitations, Pharm. Acta Helv. 71 (1996)
309–27.

CONFIDENTIAL CHAPTER 1: GENERAL INTRODUCTION
45
[77] H.N. Nellans, (B) Mechanisms of peptide and protein absorption, Adv. Drug Deliv. Rev. 7 (1991)
339–364.
[78] J.M. Diamond, Twenty-first bowditch lecture, The epithelial junction: bridge, gate, and fence,
Physiologist 20 (1977) 10-8.
[79] B. Gumbiner, Structure, biochemistry, and assembly of epithelial tight junctions, Am. J. Physiol.
253 (1987) C749-58.
[80] M.S. Bretscher, The molecules of the cell membrane, Sci. Am. 253 (1985) 100–8.
[81] M. Liu, J. Zhang, W. Shan, Y. Huang, Developments of mucus penetrating nanoparticles, Asian
J. Pharm. Sci. 10 (2015) 275–282.
[82] S. Barua, S. Mitragotri, Challenges associated with penetration of nanoparticles across cell and
tissue barriers: a review of current status and future prospects, Nano Today 9 (2014) 223–243.
[83] Ponchel, Irache, Specific and non-specific bioadhesive particulate systems for oral delivery to the
gastrointestinal tract, Adv. Drug Deliv. Rev. 34 (1998) 191–219.
[84] B.C. Tang, M. Dawson, S.K. Lai, Y.-Y. Wang, J.S. Suk, M. Yang, P. Zeitlin, M.P. Boyle, J. Fu, J.
Hanes, Biodegradable polymer nanoparticles that rapidly penetrate the human mucus barrier,
Proc. Natl. Acad. Sci. 106 (2009) 19268–73.
[85] C. Gamazo, N. Martin-Arbella, A. Brotons, A.I. Camacho, J.M. Irache, Mimicking microbial
strategies for the design of mucus-permeating nanoparticles for oral immunization, Eur. J. Pharm.
Biopharm. 96 (2015) 454–463.
[86] S. Bonengel, F. Prüfert, G. Perera, J. Schauer, A. Bernkop-Schnürch, Polyethylene imine-6-
phosphogluconic acid nanoparticles – a novel zeta potential changing system, Int. J. Pharm. 483
(2015) 19–25.
[87] K. Netsomboon, A. Bernkop-Schnürch, Mucoadhesive vs. mucopenetrating particulate drug
delivery, Eur. J. Pharm. Biopharm. 98 (2016) 76-89.
[88] C. Müller, G. Perera, V. König, A. Bernkop-Schnürch, Development and in vivo evaluation of
papain-functionalized nanoparticles, Eur. J. Pharm. Biopharm. 87 (2014) 125–131.
[89] F.H. Epstein, M.A. Atkinson, N.K. Maclaren, The pathogenesis of insulin-dependent diabetes
mellitus, N. Engl. J. Med. 331 (1994) 1428–1436.
[90] C.C. Thomas, L.H. Philipson, Update on diabetes classification, Med. Clin. North Am. 99 (2015)
1–16.
[91] J. Eriksson, J. Lindström, J. Tuomilehto, Potential for the prevention of type 2 diabetes, Br. Med.
Bull. 60 (2001) 183–199.
[92] D. Daneman, Type 1 diabetes, Lancet. 367 (2006) 847–858.
[93] S.J. Herring, E. Oken, Obesity and diabetes in mothers and their children: can we stop the
intergenerational cycle?, Curr. Diab. Rep. 11 (2011) 20–27.
[94] D.R. Whiting, L. Guariguata, C. Weil, J. Shaw, V. Vijay, V. Chongsuvivatwong, IDF diabetes
atlas: global estimates of the prevalence of diabetes for 2011 and 2030, Diabetes Res. Clin. Pract.
94 (2011) 311–21.
[95] International Diabetes Federation, Diabetes Atlas. Seventh Ed., Brussels, 2015.
[96] L. Chen, D.J. Magliano, P.Z. Zimmet, The worldwide epidemiology of type 2 diabetes mellitus-
present and future perspectives, Nat. Rev. Endocrinol. 8 (2011) 228–236.
[97] J.E. Shaw, R.A. Sicree, P.Z. Zimmet, Global estimates of the prevalence of diabetes for 2010 and
2030, Diabetes Res. Clin. Pract. 87 (2010) 4–14.
[98] N. Saraiya, S.T. Martin, New Options in Insulin Therapy, Conn. Med. 79 (2015) 553–60.
[99] D. Beran, M. Ewen, R. Laing, Constraints and challenges in access to insulin: a global
perspective, Lancet Diabetes Endocrinol. 4 (2016) 275–285.
[100] S. Erpeldinger, M.B. Rehman, C. Berkhout, C. Pigache, Y. Zerbib, F. Regnault, E. Guérin, I.
Supper, C. Cornu, B. Kassaï, F. Gueyffier, R. Boussageon, efficacy and safety of insulin in type 2
diabetes: meta-analysis of randomised controlled trials, BMC Endocr. Disord. 16 (2016) 39.
[101] http://www.prnewswire.com/news-releases/global-human-iinsulin-market-size-of-24-billion-in-
2014-to-witness-13-cagr-during-2015---2020-518797291.html; [Retrieved date was March 17,
2017].
[102] S. Del Prato, F. Leonetti, D.C. Simonson, P. Sheehan, M. Matsuda, R.A. DeFronzo, Effect of
sustained physiologic hyperinsulinaemia and hyperglycaemia on insulin secretion and insulin
sensitivity in man, Diabetologia 37 (1994) 1025–1035.
[103] E. Arbit, M. Kidron, Oral insulin: the rationale for this approach and current developments, J.
Diabetes Sci. Technol. 3 (2009) 562–7.
[104] M. Peyrot, A.H. Barnett, L.F. Meneghini, P.-M. Schumm-Draeger, Insulin adherence behaviours
and barriers in the multinational global attitudes of patients and physicians in insulin therapy
study, Diabet. Med. 29 (2012) 682–689.

CONFIDENTIAL CHAPTER1: GENERAL INTRODUCTION
46
[105] J.A. Cramer, M.J. Pugh, The influence of insulin use on glycemic control: How well do adults
follow prescriptions for insulin?, Diabetes Care 28 (2005) 78–83.
[106] M. Peyrot, R.R. Rubin, D.F. Kruger, L.B. Travis, Correlates of Insulin Injection Omission,
Diabetes Care 33 (2010) 240-245.
[107] M. Brod, J.H. Kongsø, S. Lessard, T.L. Christensen, Psychological insulin resistance: patient
beliefs and implications for diabetes management, Qual. Life Res. 18 (2009) 23–32.
[108] S. Yaturu, Insulin therapies: Current and future trends at dawn, World J. Diabetes 4 (2013) 1–7.
[109] L. Heinemann, Y. Jacques, Oral insulin and buccal insulin: a critical reappraisal, J. Diabetes Sci.
Technol. 3 (2009) 568–84.
[110] M.K. Yoo, S.K. Kang, J.H. Choi, I.K. Park, H.S. Na, H.C. Lee, E.B. Kim, N.K. Lee, J.W. Nah,
Y.J. Choi, C.S. Cho, Targeted delivery of chitosan nanoparticles to Peyer’s patch using M cell-
homing peptide selected by phage display technique, Biomaterials 31 (2010) 7738–7747.
[111] M. Morishita, N.A. Peppas, Is the oral route possible for peptide and protein drug delivery?, Drug
Discov. Today 11 (2006) 905–910.
[112] A. Sosnik, J. das Neves, B. Sarmento, Mucoadhesive polymers in the design of nano-drug
delivery systems for administration by non-parenteral routes: a review, Prog. Polym. Sci. 39
(2014) 2030–2075.
[113] A. Chaudhury, S. Das, Recent Advancement of Chitosan-Based Nanoparticles for Oral Controlled
Delivery of Insulin and Other Therapeutic Agents, AAPS PharmSciTech. 12 (2011) 10–20.
[114] S. Hosseininasab, R. Pashaei-Asl, A.A. Khandaghi, H.T. Nasrabadi, K. Nejati-Koshki, A.
Akbarzadeh, S.W. Joo, Y. Hanifehpour, S. Davaran, Synthesis, characterization, and in vitro
studies of PLGA-PEG nanoparticles for oral insulin delivery, Chem. Biol. Drug Des. 84 (2014)
307–315.
[115] P. Fonte, F. Araújo, C. Silva, C. Pereira, S. Reis, H.A. Santos, B. Sarmento, Polymer-based
nanoparticles for oral insulin delivery: revisited approaches, Biotechnol. Adv. 33 (2015) 1342–
1354.
[116] A. Makhlof, Y. Tozuka, H. Takeuchi, Design and evaluation of novel pH-sensitive chitosan
nanoparticles for oral insulin delivery, Eur. J. Pharm. Sci. 42 (2011) 445–451.
[117] S.M. van der Merwe, J.C. Verhoef, J.H.M. Verheijden, A.F. Kotzé, H.E. Junginger,
Trimethylated chitosan as polymeric absorption enhancer for improved peroral delivery of
peptide drugs, Eur. J. Pharm. Biopharm. 58 (2004) 225–235.
[118] Y. Jin, Y. Song, X. Zhu, D. Zhou, C. Chen, Z. Zhang, Y. Huang, Goblet cell-targeting
nanoparticles for oral insulin delivery and the influence of mucus on insulin transport,
Biomaterials 33 (2012) 1573–1582.
[119] K.B. Chalasani, G.J. Russell-Jones, S.K. Yandrapu, P. V. Diwan, S.K. Jain, A novel vitamin B12-
nanosphere conjugate carrier system for peroral delivery of insulin, J. Control Release 117 (2007)
421–429.
[120] C.B. Woitiski, R.J. Neufeld, F. Veiga, R.A. Carvalho, I. V. Figueiredo, Pharmacological effect of
orally delivered insulin facilitated by multilayered stable nanoparticles, Eur. J. Pharm. Sci. 41
(2010) 556–563.
[121] Y.H. Lin, F.L. Mi, C.T. Chen, W.C. Chang, S.F. Peng, H.F. Liang, H.W. Sung, preparation and
characterization of nanoparticles shelled with chitosan for oral insulin delivery,
Biomacromolecules 8 (2007) 146–152.
[122] K. Sonaje, Y.J. Chen, H.L. Chen, S.P. Wey, J.H. Juang, H.N. Nguyen, C.W. Hsu, K.J. Lin, H.W.
Sung, Enteric-coated capsules filled with freeze-dried chitosan/poly(γ-glutamic acid)
nanoparticles for oral insulin delivery, Biomaterials 31 (2010) 3384–3394.
[123] F. Araújo, N. Shrestha, M.A. Shahbazi, P. Fonte, E.M. Mäkilä, J.J. Salonen, J.T. Hirvonen, P.L.
Granja, H.A. Santos, B. Sarmento, The impact of nanoparticles on the mucosal translocation and
transport of GLP-1 across the intestinal epithelium, Biomaterials 35 (2014) 9199–9207.
[124] F. Cui, K. Shi, L. Zhang, A. Tao, Y. Kawashima, Biodegradable nanoparticles loaded with
insulin–phospholipid complex for oral delivery: preparation, in vitro characterization and in vivo
evaluation, J. Control Release 114 (2006) 242–250.
[125] F. Cui, F. Qian, Z. Zhao, L. Yin, C. Tang, C. Yin, Preparation, Characterization, and oral delivery
of insulin loaded carboxylated chitosan grafted poly(methyl methacrylate) nanoparticles,
Biomacromolecules 10 (2009) 1253–1258.

CHAPTER 2
OBJECTIVES


CONFIDENTIAL CHAPTER 2: OBJECTIVES
49
Objectives
The general objective of this project was the development of “slippery” nanoparticles
with mucus-penetrating properties. More particularly, in this work, the use of hydrophilic
compounds (e.g. PEGs and thiamine) as “decorating” agents of nanocarriers and their influence
on nanoparticles’ capability to diffuse through the protective mucus layer of the gut mucosa was
explored. In addition, insulin (as model of biomacromolecule) was encapsulated in the most
promising formulation for the evaluation of the oral bioavailability and efficacy.
In order to reach this final goal, the following partial objectives were proposed in the
present study:
1- To evaluate the in vivo biodistribution and mucus-permeating properties of PEG-
coated poly(anhydride) nanoparticles.
2- To evaluate and compare the in vitro diffusion in mucin and the mucus-permeating
properties and behaviour in vivo of thiamine-decorated poly(anhydride) nanoparticles
obtained by two different preparative processes. In the former, thiamine was bound to
the surface of the freshly prepared poly(anhydride) nanoparticles. In the latter,
nanoparticles were prepared from a previously synthesised conjugate between Gantrez®
AN and thiamine.
3- To optimize the preparative process of insulin loaded thiamine-decorated
nanoparticles obtained from the Gantrez® AN-thiamine conjugate and to evaluate the
influence of the insulin payload on their diffusion properties in a mucin gel.
4- To evaluate the in vitro mucus-penetrating properties in pig mucus gel and the in vivo
biodistribution of zein nanoparticles coated with Gantrez® AN-thiamine conjugate.
5- To optimize the preparative process of insulin-loaded zein nanoparticles coated with
Gantrez® AN-thiamine conjugate and to evaluate their in vivo capability to promote the
oral absorption, bioavailability and efficacy of this biomacromolecule.


CHAPTER 3
In vivo evaluation of the mucus-permeating properties of PEG-
coated nanoparticles following oral administration


CONFIDENTIAL CHAPTER 3: In vivo evaluation of the mucus-permeating properties of
PEG-coated nanoparticles following oral administration
53
In vivo study of the mucus-permeating properties of PEG-coated
nanoparticles following oral administration
L. Inchaurraga, N.Martín-arbella, V. Zabaleta, G. Quincoces, I. Peñuelas, J.M. Irache, European
Journal of Pharmaceutics and Biopharmaceutics 97 (2015) 280-289
Abstract
The aim of this work was to investigate the mucus-permeating properties of
poly(ethyleneglycol)-coated nanoparticles prepared from the copolymer of methyl vinyl ether
and maleic anhydride (Gantrez® AN) after oral administration in rats. Nanoparticles were
“decorated” with PEGs of different molecular masses (PEG2000, PEG6000 and PEG10000) at a
PEG-to-polymer ratio of 0.125. All the PEG-coated nanoparticles displayed a mean size of ~150
nm, slightly negative ζ values and a “brush” conformation as determined from the calculation of
the PEG density. For in vivo studies, nanoparticles were labelled with either 99m
Tc or fluorescent
tags. Naked nanoparticles displayed a higher ability to interact with the mucosa of the stomach
than with the small intestine. However, these interactions were restricted to the mucus layer
covering the epithelial surface, as visualised by fluorescence microscopy. On the contrary, PEG-
coated nanoparticles moved rapidly to the intestine, as determined by imaging, and, then, were
capable to develop important interactions with the mucosa, reaching the surface of the
epithelium. These mucus permeating properties were more intense for nanoparticles coated with
PEG2000 or PEG6000 than with PEG10000. However, the capability of nanocarriers to develop
adhesive interactions within the mucosa decreased when prepared at excessive PEG densities.

CONFIDENTIAL CHAPTER 3: In vivo evaluation of the mucus-permeating properties
of PEG-coated nanoparticles following oral administration
54
1. Introduction
The oral route is the most convenient and popular way for drug administration thanks to
its patient convenience and adaptability. In addition, it is especially appropriate where
prolonged drug exposure or chronic treatments are needed [1]. However, the oral
administration of many drug candidates remains a challenge. This is particularly the case for
peptide and protein drugs, which face to the following problems: a low stability due to a high
enzymatic activity within the gut and poor penetration properties directly related to their
physico-chemical characteristics (e.g., molecular weight, MW, hydrophilicity, ionised groups,
etc.) [2-4].
In order to overcome these drawbacks and, then, promote the oral absorption and
bioavailability of a number of drugs various strategies such as the use of polymeric
nanoparticles have been pursued. In general, polymeric nanoparticles offer adequate protection
against degradation [5,6] as well as appropriate controlled release properties of the loaded
compound [7,8]. However, in case of biomacromolecules and other compounds with poor
permeability properties, nanoparticles have to cross the continuously renewed mucus layer
covering the epithelial surface [9,10] to conduct the encapsulated drug to the surface of the
epithelium and, thus, effectively promote its oral absorption. This mucus layer acts as a
protective barrier [11] trapping foreign particulates which are subsequently cleared and
eliminated [12-14]. As a consequence, the possibilities for nanoparticles to interact with and/or
adhere to the absorptive membrane of the gut significantly decrease.
In order to overcome this major hurdle, different strategies have been proposed
including the co-encapsulation of mucolytic agents [15], the covalent attachment of proteolytic
enzymes [16] or the generation of “slippery” properties on the surface of nanoparticles [17]. In
this context, the coating of nanoparticles with low molecular weight poly(ethylene glycol)s has
been proposed. In fact, PEG would render more hydrophilic the surface of the resulting
nanoparticles producing a “slippery” surface which facilitates their entry and passage through
the mucus [18,19]. Besides, thanks to the steric stabilising effect of PEG, pegylated
nanoparticles display a low degree of interaction with the lumen components and a high
stability within the gut [20]. This protective (stealth) action of PEG would be mainly due to the
formation of a dense and hydrophilic cloud of long flexible chains on the surface of the
nanoparticles.
In this way, it has been demonstrated in vitro that pegylated poly(styrene) nanoparticles
(with PEG2000) as large as 500 nm can rapidly traverse physiological human cervicovaginal
mucus with diffusivities as high as only 4-fold reduced compared to their rates in pure water
[21]. More recently, the coating of paclitaxel-loaded nanoparticles with either PEG 2000 or

CONFIDENTIAL CHAPTER 3: In vivo evaluation of the mucus-permeating properties of
PEG-coated nanoparticles following oral administration
55
PEG 6000 yielded carriers capable of reaching the surface of the mucosa in a more efficient
way to promote the drug absorption than nanoparticles pegylated with PEG 10000 [22].
The aim of this work was to investigate the mucus-permeating properties of PEG-coated
nanoparticles prepared from the copolymer of methyl vinyl ether and maleic anhydride
(Gantrez® AN). For this purpose, the poly(anhydride) nanoparticles were “decorated” with
PEGs of different molecular weight. After characterisation, the capabilities of these carriers to
reach the surface of the gut mucosa and their biodistribution were evaluated in laboratory
animals.
2. Materials and methods
2.1. Chemicals
Poly (methyl vinyl ether-co-maleic anhydride) or poly(anhydride) (Gantrez® AN 119;
MW 200,000) was kindly gifted by ISP (Barcelona, Spain). Rhodamine B isothiocyanate
(RBITC) was supplied by Sigma (Madrid, Spain). Poly(ethylene glycol) (PEG) with Mw of
2000, 6000 and 10000 Da (PEG 2000; PEG 6000; PEG 10000) were provided by Fluka
(Switzerland). Perylene-Red (BASF Lumogen® F Red 305) was from Kremer Pigments Inc.
(Germany) and O.C.T. TM
Compound Tissue-Tek from Sakura Finetek Europe (The
Netherlands). 4',6-diamidino-2-phenylindole (DAPI) was obtained from Biotium Inc.
(Hayward, CA). Acetone and ethanol were obtained from VWR Prolabo (France) and sodium
hydroxide and methanol from Merck (Darmstadt, Germany).
2.2. Preparation of PEG-poly(anhydride) nanoparticles
Pegylated nanoparticles were prepared as described previously [23] with some minor
modifications. Briefly, 100 mg of the copolymer of methyl vinyl ether and maleic anhydride
(Gantrez® AN) and a variable amount of PEG (PEG 2000, PEG 6000 or PEG 10000) were
dissolved in acetone. After incubation, nanoparticles were formed by the addition of 10 mL of
ethanol and 10 mL of purified water. The organic solvents were eliminated by evaporation
under reduced pressure (Büchi Rotavapor R-144; Büchi, Postfach, Switzerland) and the
nanoparticle suspensions were purified by ultracentrifugation at 17,000 rpm for 20 min (Sigma
3K3D, Germany). The pellets were re-suspended in water and the purification step was
repeated again. Finally, the formulations were frozen and freeze-dried (Genesis 12 EL, Virtis,
PA, USA) using sucrose (5%) as cryoprotector. Control nanoparticles (NP) were prepared in
the same way but in the absence of PEG. For the identification of the different formulations the

CONFIDENTIAL CHAPTER 3: In vivo evaluation of the mucus-permeating properties
of PEG-coated nanoparticles following oral administration
56
following abbreviations were used: NP2 (with PEG 2000), NP6 (with PEG 6000) and NP10
(with PEG 10000).
2.3. Preparation of fluorescently labeled nanoparticles
Nanoparticles were fluorescently labeled with either rhodamine B isothiocyanate
(RBITC) or Lumogen® F Red 305. In the former, 1.25 mg of RBITC in 1 mL of water was
added to the suspension of the freshly prepared nanoparticles. After 5 min of incubation at
room temperature, nanoparticles were purified and freeze-dried as described above. In the
latter, 4 mg of Lumogen® F Red 305 was dissolved in 1 mL of acetone and added to the
solution of the polymer and PEG in this organic solvent. Then, nanoparticles were prepared,
purified and freeze-dried as described above.
2.4. Characterisation of PEG-Gantrez nanoparticles formulations
2.4.1. Size, zeta potential and surface morphology analysis
The particle size and the zeta potential of freeze-dried nanoparticles were determined by
photon correlation spectroscopy (PCS) and electrophoretic laser Doppler anemometry,
respectively, using a Zetaplus apparatus (Brookhaven Instruments Corporation). In all cases,
the size was measured after dispersion of nanoparticles in water whereas the zeta potential was
quantified in KCl 0.1 M.
The shape and morphology of nanoparticles were examined by scanning electron
microscopy (SEM) after re-suspension in water and centrifugation at 27,000 × g for 20 min.
Then, pellets were mounted on TEM (tomography electron microscopy) grids, dried and coated
with a palladium-gold layer using a Quorum Technologies Q150R S sputter-coater. SEM was
performed using a ZEISS model “Ultra Plus” and LEO 435VP high resolution scanning electron
microscope.
Elemental microanalyses were carried out on vacuum-dried samples using an Elemental
Analyser (LECO, CHN-900 Elemental Analyser; Wicklow, Ireland).
2.5. Poly(ethylene glycol) quantification
The amount of PEG associated to the nanoparticles was determined by HPLC coupled
to an evaporative light scattering detector (ELSD) [24]. Briefly, analysis was carried out in a
model 1100 series Liquid Chromatography, Agilent (Waldbronn, Germany) coupled with an
evaporative light scattering detector, ELSD 2000 Alltech (Illinois, USA). As stationary phase a
PL Aquagel-OH 30 column (300 mm×7.5 mm; particle size 8 μm; Agilent Technologies, UK)

CONFIDENTIAL CHAPTER 3: In vivo evaluation of the mucus-permeating properties of
PEG-coated nanoparticles following oral administration
57
heated at 40ºC was used. The mobile phase composition was a mixture of methanol (A) and
water (B) in a gradient elution at a flow rate of 1 mL/min. Under these analytical conditions,
the retention times were 7.7 min for PEG 2000, 6.9 min for PEG 6000 and 6.5 min for PEG
10000. All of these peaks were well resolved from that of Gantrez (4.5 min). Calibration curves
were designed over the range 75-750 µg/mL (r2>0.992). The relative error in each
concentration was calculated in the mean curve and was always lower than 8%. The limit of
quantification for all the analysed PEGs was calculated to be 75 µg/mL. Finally, accuracy
values during the same day were always within the acceptable limits at all concentrations
tested.
For analysis, supernatants collected during the purification step of the preparative
process were centrifuged at 17,000 rpm for 20 min at 4ºC. Then, aliquots of the supernatants
(20 μL) were injected onto the HPLC column. The amount of PEG associated to nanoparticles
was calculated as the difference between the initially added amount of PEG to the solution of
the polymer in acetone and the amount of PEG recovered in the supernatants. This
chromatographic method was also used to calculate the polymer content in the nanoparticles
and the yield of the process:
Yield = (QT-QPA-QPEG) X 100 [Equation 1]
where QT is the initial amounts of poly(anhydride) and PEG used to prepare the nanoparticles.
QPA and QPEG are the amount of polymer and PEG quantified in the supernatants,
respectively.
2.6. Evaluation of the average PEG chain density and conformation state
The PEG surface density (dPEG; Equation 3) was defined as the ratio between the total
number of PEG chains (NPEG) and the nanoparticle surface area (SNP).
In order to calculate the nanoparticle surface area, it was assumed that all the
nanoparticles were spherical, displayed the same size (the mean size calculated by PCS) and
only consisted of polymer (density: 1.03 g/mL [25]).
Then, the mass of one particle (m) was calculated as follows:
m = ρ x V [Equation 2]
in which, is the density of Gantrez and V is the volume of one nanoparticle.

CONFIDENTIAL CHAPTER 3: In vivo evaluation of the mucus-permeating properties
of PEG-coated nanoparticles following oral administration
58
From this “m” value, the number of nanoparticles (NNP) in one mg was calculated. On
the other hand, assuming that all the associated PEG were on the surface of the particles, NPEG,
was determined from the amount of associated PEG (as calculated by HPLC and expressed in
moles) multiplied by Avogadro's number. Then the PEG surface density was calculated with the
following equation:
DPEG = NPEG / SNP [Equation 3]
in which NPEG is the number of PEG chains and SNP is the surface area of one nanoparticle.
From the estimated surface density data it was possible to determine the area occupied
by one PEG chain on a particle:
APEG = SNP / NPEG [Equation 4]
For the estimation of PEG surface conformation, the model proposed by de Gennes and
collaborators [26] was used. For that the Flory radius (RF) and the average distance between
two neighbouring PEG chains (D) were compared. The Flory radius of a polymer is given by:
RF = a x N0.6
[Equation 5]
Where “a” is the monomer length (0.35 nm for PEG [27]) and N is the number of monomer
units in the polymer. For that, the MW of a given PEG can be roughly translated into “n”
monomers by dividing by 44, which is the approximate molecular weight of one ethylene glycol
monomer residue.
Finally, D was calculated from the following equation:
D = 2 x (APEG / ∏) [Equation 6]
2.7. Quantification of RBITC and Lumogen® F red 305
The amount of RBITC loaded into the nanoparticles was determined by colorimetry at
wavelength 540 nm (Labsystems iEMS Reader MF, Finland) [18] after complete hydrolysis of
certain amount of nanoparticles in 0.1 N NaOH (24 h, 37 ºC).
The amount of Lumogen® F Red 305 loaded in the nanoparticles was quantified by UV-
Vis spectrometry at wavelength 573 nm (Labsystems iEMS Reader MF, Finland). For this
purpose, 10 mg of the formulations were re-suspended in 3 mL of water and centrifuged at

CONFIDENTIAL CHAPTER 3: In vivo evaluation of the mucus-permeating properties of
PEG-coated nanoparticles following oral administration
59
21,000 rpm for 20 min. Pellets were dissolved in 10 mL of acetonitrile 75%. These solutions
were finally diluted 1:10 in pure acetonitrile before the analysis.
Prior the use of fluorescently labelled nanoparticles for in vivo studies, the stability of
the marker in the nanoparticles was assessed by incubation in simulated gastric (pH 1.2) and
intestinal (pH 6.8) fluids.
2.8. Labelling of nanoparticles with 99m
Tc
Nanoparticles were labelled with 99m
Tc by reduction with stannous chloride as described
previously [28]. Briefly, 1-2 mCi of freshly eluted 99m
Tc-pertechnetate was reduced with 0.03
mg/mL stannous chloride and the pH was adjusted to 4 with 0.1N HCl. Then, 2 mg of
nanoparticles in 1 mL of water and 99m
Tc were added to pre-reduced tin. The mixture was
vortexed for 30 s and incubated at RT for 10 min. The overall procedure was carried out in
helium-purged vials.
The radiochemical purity was examined by paper chromatography (Whatman 3MM)
developed with NaCl 0.9%. The labelling yield was always over 90%.
2.9. Gastrointestinal transit studies with radiolabelled nanoparticles
These studies were carried out in male Wistar rats weighing 250–300 g that had fasted
for 12 h [28]. All the procedures were performed following a protocol previously approved the
“Ethical and Biosafety Committee for Research on Animals” at the University of Navarra in line
with the European legislation on animal experiments.
Animals were briefly stunned with 2% isoflurane gas (flow of oxygen of 0.2 L/min) for
administration of nanoparticles (above 1 mL) by oral gavage, and then quickly awakened. Each
animal received one single dose of radiolabelled nanoparticles (1 mCi; 0.8-1.0 mg of
radiolabelled nanoparticles that were completed with up to 10 mg with unlabelled
nanoparticles). Three hours after administration of nanoparticles, animals were anaesthetised
with 2% isoflurane gas (flow of oxygen of 0.2L/min) and placed in prone position on the
gammacamera (Symbia T2 Truepoint; Siemens Medical System, USA). SPECT-CT images
were acquired for 25 min, with the following parameters for SPECT: 128 x 128 matrix, 90
images, 7 images per sec and CT: 110 mAs and 130 Kv, 130 images, slice thickness 3 mm
Fused images were processed using the Syngo MI Applications TrueD software.

CONFIDENTIAL CHAPTER 3: In vivo evaluation of the mucus-permeating properties
of PEG-coated nanoparticles following oral administration
60
2.10. Evaluation of the mucus-permeating properties of nanoparticles
These studies were carried out using a protocol described previously [13] with minor
modifications, after approval by the responsible Committee by the University of Navarra
(Ethical and Biosafety Committee for Research on Animals). Briefly, male Wistar rats (average
weight 225 g; Harlan, Barcelona, Spain) were placed in metabolic cages and fasted overnight
but with free access to water. All animals received orally 10 mg RBITC-loaded nanoparticles
dispersed in 1 mL water. At different times, animals were sacrificed. The abdominal cavity was
opened in order to remove the stomach and small intestine, which were removed and carefully
rinsed with PBS in order to eliminate the fraction of nanoparticles remaining in the lumen.
Then, both the stomach and the small intestine were cut into small portions to facilitate their
digestion with NaOH 3M for 24 h and the resulting residues were treated with methanol and
centrifuged. Finally, aliquots of the supernatants were assayed for RBITC content by
spectrofluorimetry (TECAN, Austria) at ex 540 nm and em 580 nm.
For each nanoparticle formulation, the fraction of nanoparticles interacting with the
mucosa was plotted versus time. From these curves, the AUCadh and the MRTadh were estimated
from 0 to 4 h post-administration as described previously [13, 29] and calculated using
WinNonlin 5.2 software (Pharsight Corporation, Mountain View, USA). The AUCadh
(mg.h/mL) is the area under the curve between the fraction of the given dose in close contact
with the mucosa (adhered fraction of nanoparticles) vs. time, and it was calculated using the
trapezoidal rule up to tz. MRTadh (h) is defined as the mean residence time of the adhered
fraction of the nanoparticles to the mucosa. AUCadh would represent the intensity of the
adhesive phenomenon between nanoparticles and components of the gut mucosa whereas
MRTadh would evaluate the relative duration of these interactions.
Finally, the tissue distribution of nanoparticles in the gastrointestinal mucosa was
visualized by fluorescence microscopy. For that purpose, 10 mg of Lumogen® F Red-labelled
nanoparticles were orally administered to rats as described above. Two hours later, animals
were sacrificed by cervical dislocation and the guts were removed. Ileum portions of 1 cm were
collected, cleaned with PBS, stored in the tissue proceeding medium O.C.T.TM
Compound and
frozen at -80 °C. Each portion was then cut into 5 µm sections on a cryostat and attached to
glass slides. Finally, these samples were fixed with formaldehyde and incubated with 4',6-
diamidino-2-phenylindole (DAPI) for 15 min before the cover assembly. The presence of both
fluorescently loaded poly(anhydride) nanoparticles in the intestinal mucosa and the cell nuclei
dyed with DAPI were visualized in a fluorescence microscope (Axioimager M1, Zeiss) with a
coupled camera (Axiocam ICc3, Zeiss) and fluorescent source (HBO 100, Zeiss. The images
were captured with the software ZEN (Zeiss).

CONFIDENTIAL CHAPTER 3: In vivo evaluation of the mucus-permeating properties of
PEG-coated nanoparticles following oral administration
61
2.11. Statistical analysis
Data were compared using the nonparametric Kruskal-Wallis followed by Mann-
Whitney U-test with Bonferroni correction. p values of < 0.05 were considered significant. All
calculations were performed using SPSS®
statistical software program (SPSS® 15.0, Microsoft,
USA).
3. Results
3.1. Preparation of PEG-coated nanoparticles
The first step for the optimization of the coating process of poly(anhydride)
nanoparticles with PEG was to evaluate the time of incubation between both compounds (PEG
and the copolymer of methyl vinyl ether and maleic anhydride). In all cases, a time of
incubation of at least 30 minutes appeared to be necessary to obtain a maximum of PEG
associated to the resulting nanoparticles (Figure 1).
15 min 30 min 60 min
0
10
20
30
40
50
60
70
Asso
cia
ted
PE
G (
g/m
g)
Time of incubation
NP2
NP6
NP10
Figure 1. Influence of the time of incubation on the amount of PEG associated to nanoparticles
(expressed as µg PEG/mg nanoparticles). The PEG/poly(anhydride) ratio was 0.125. NP2:
poly(anhydride) nanoparticles coated with PEG2000; NP6: poly(anhydride) nanoparticles
coated with PEG6000; NP10: poly(anhydride) nanoparticles coated with PEG10000. Data
expressed as mean ±SD (n=3).

CONFIDENTIAL CHAPTER 3: In vivo evaluation of the mucus-permeating properties
of PEG-coated nanoparticles following oral administration
62
The influence of both the PEG/poly(anhydride) ratio and the MW of the poly(ethylene
glycol) on its association to the nanoparticles was also evaluated. Figure 2 depicts these results.
The size of the resulting nanoparticles displayed average sizes ranging from 150 to 165 nm. In
all cases, the amount of PEG associated to poly(anhydride) nanoparticles increased rapidly by
increasing the PEG/poly(anhydride) ratio. However, for ratios higher than 0.15 the amount of
PEG incorporated in the nanoparticles only increased slightly. In addition, ratios higher than
0.25 disturbed the formation of nanoparticles and the yield of the preparative process decreased
(data not shown). Moreover, the MW of the selected PEG also influenced the association degree
of the macrogol to the nanoparticles. Thus, increasing the PEG chain length from 2000 to 6000
or 10000 Da resulted in higher amounts of the excipient associated to the poly(anhydride)
nanoparticles (p<0.05). However, minor differences were observed between PEG 6000 and
PEG 10000 (see Fig. 2). For in vivo studies, nanoparticles prepared after 1 hour of incubation
between PEG and the poly(anhydride) at a ratio of 0.125 were selected.
0,05 0,10 0,15 0,20 0,25
0
10
20
30
40
50
60
70
80
Asso
cia
ted
PE
G (
g/m
g)
PEG/poly(anhydride) ratio
NP2
NP6
NP10
Figure 2. Influence of the PEG/poly(anhydride) ratio on the degree of poly(ethylene glycol)
association to the resulting nanoparticles (expressed as µg PEG/mg nanoparticles). The
incubation time between the poly(anhydride) and PEG was 1 h. NP2: poly(anhydride)
nanoparticles coated with PEG2000; NP6: poly(anhydride) nanoparticles coated with PEG6000;
NP10: poly(anhydride) nanoparticles coated with PEG10000. Data expressed as mean ± SD (n
= 5).
Table 1 summarises the main physico-chemical properties of these nanoparticles. All of
the nanoparticles displayed similar mean sizes of around 150-165 nm, with polydispersity
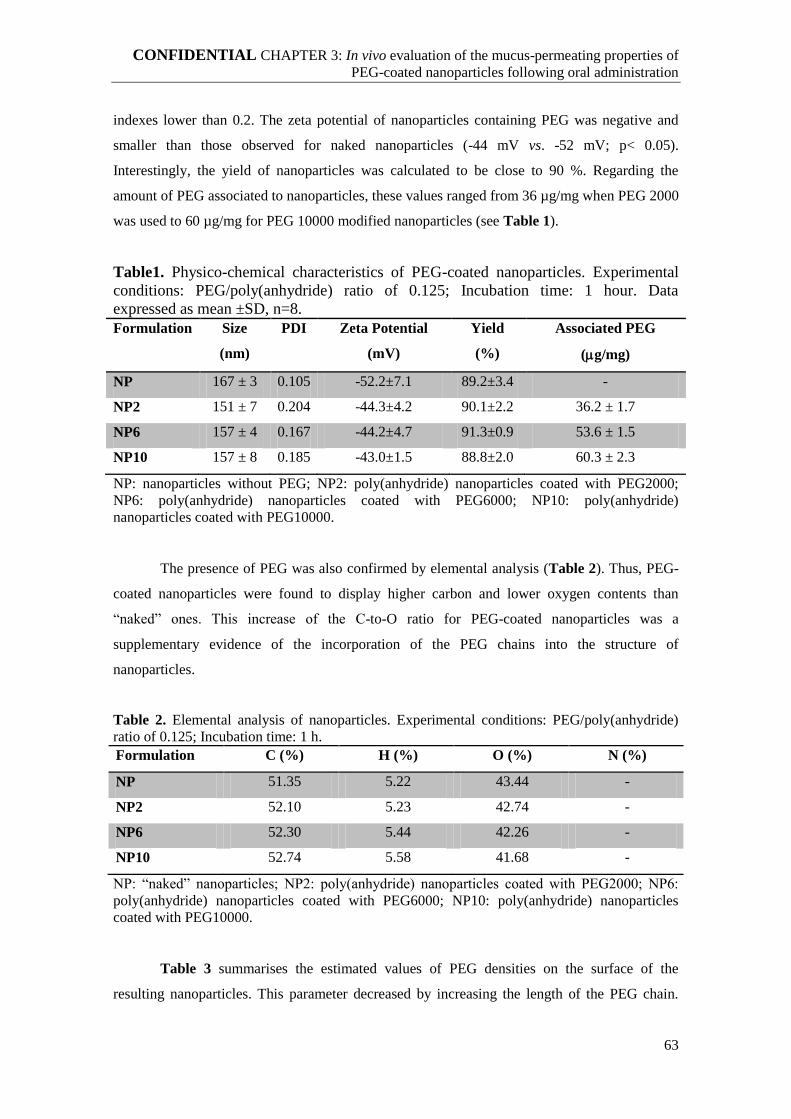
CONFIDENTIAL CHAPTER 3: In vivo evaluation of the mucus-permeating properties of
PEG-coated nanoparticles following oral administration
63
indexes lower than 0.2. The zeta potential of nanoparticles containing PEG was negative and
smaller than those observed for naked nanoparticles (-44 mV vs. -52 mV; p< 0.05).
Interestingly, the yield of nanoparticles was calculated to be close to 90 %. Regarding the
amount of PEG associated to nanoparticles, these values ranged from 36 µg/mg when PEG 2000
was used to 60 µg/mg for PEG 10000 modified nanoparticles (see Table 1).
Table1. Physico-chemical characteristics of PEG-coated nanoparticles. Experimental
conditions: PEG/poly(anhydride) ratio of 0.125; Incubation time: 1 hour. Data
expressed as mean ±SD, n=8.
Formulation Size
(nm)
PDI Zeta Potential
(mV)
Yield
(%)
Associated PEG
(g/mg)
NP 167 ± 3 0.105 -52.2±7.1 89.2±3.4 -
NP2 151 ± 7 0.204 -44.3±4.2 90.1±2.2 36.2 ± 1.7
NP6 157 ± 4 0.167 -44.2±4.7 91.3±0.9 53.6 ± 1.5
NP10 157 ± 8 0.185 -43.0±1.5 88.8±2.0 60.3 ± 2.3
NP: nanoparticles without PEG; NP2: poly(anhydride) nanoparticles coated with PEG2000;
NP6: poly(anhydride) nanoparticles coated with PEG6000; NP10: poly(anhydride)
nanoparticles coated with PEG10000.
The presence of PEG was also confirmed by elemental analysis (Table 2). Thus, PEG-
coated nanoparticles were found to display higher carbon and lower oxygen contents than
“naked” ones. This increase of the C-to-O ratio for PEG-coated nanoparticles was a
supplementary evidence of the incorporation of the PEG chains into the structure of
nanoparticles.
Table 2. Elemental analysis of nanoparticles. Experimental conditions: PEG/poly(anhydride)
ratio of 0.125; Incubation time: 1 h.
Formulation C (%) H (%) O (%) N (%)
NP 51.35 5.22 43.44 -
NP2 52.10 5.23 42.74 -
NP6 52.30 5.44 42.26 -
NP10 52.74 5.58 41.68 -
NP: “naked” nanoparticles; NP2: poly(anhydride) nanoparticles coated with PEG2000; NP6:
poly(anhydride) nanoparticles coated with PEG6000; NP10: poly(anhydride) nanoparticles
coated with PEG10000.
Table 3 summarises the estimated values of PEG densities on the surface of the
resulting nanoparticles. This parameter decreased by increasing the length of the PEG chain.
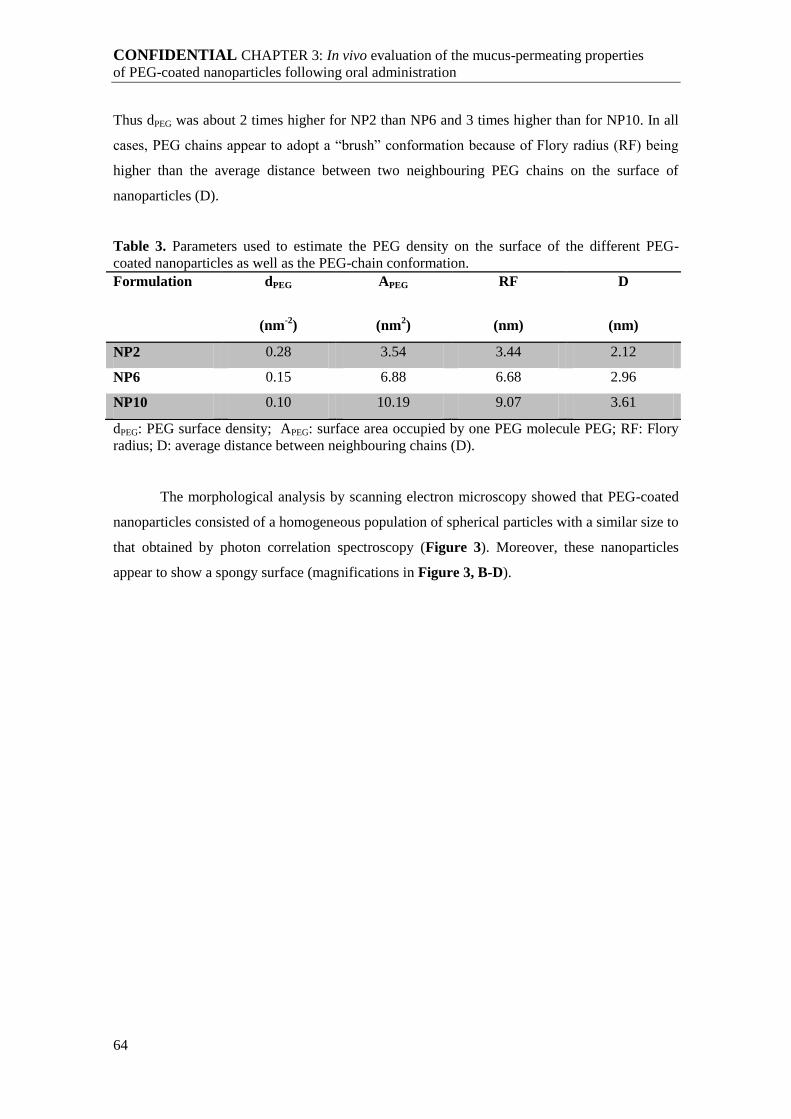
CONFIDENTIAL CHAPTER 3: In vivo evaluation of the mucus-permeating properties
of PEG-coated nanoparticles following oral administration
64
Thus dPEG was about 2 times higher for NP2 than NP6 and 3 times higher than for NP10. In all
cases, PEG chains appear to adopt a “brush” conformation because of Flory radius (RF) being
higher than the average distance between two neighbouring PEG chains on the surface of
nanoparticles (D).
Table 3. Parameters used to estimate the PEG density on the surface of the different PEG-
coated nanoparticles as well as the PEG-chain conformation.
Formulation dPEG
(nm-2
)
APEG
(nm2)
RF
(nm)
D
(nm)
NP2 0.28 3.54 3.44 2.12
NP6 0.15 6.88 6.68 2.96
NP10 0.10 10.19 9.07 3.61
dPEG: PEG surface density; APEG: surface area occupied by one PEG molecule PEG; RF: Flory
radius; D: average distance between neighbouring chains (D).
The morphological analysis by scanning electron microscopy showed that PEG-coated
nanoparticles consisted of a homogeneous population of spherical particles with a similar size to
that obtained by photon correlation spectroscopy (Figure 3). Moreover, these nanoparticles
appear to show a spongy surface (magnifications in Figure 3, B-D).

CONFIDENTIAL CHAPTER 3: In vivo evaluation of the mucus-permeating properties of
PEG-coated nanoparticles following oral administration
65
Figure 3. Scanning Electron Microscopy (SEM) of freeze-dried nanoparticles. A: naked
nanoparticles (NP); B: NP2, poly(anhydride) nanoparticles coated with PEG2000; C: NP6,
poly(anhydride) nanoparticles coated with PEG6000; D: NP10, poly(anhydride) nanoparticles
coated with PEG10000. Experimental conditions: PEG/poly(anhydride) ratio of 0.125;
incubation time: 1 hour. In the above right side, it is shown a magnification of a section of each
photograph.
3.2. Biodistribution studies with 99m
Tc radiolabelled nanoparticles
Figure 4 shows the comparison of the biodistribution of 99m
Tc-NP and pegylated 99m
Tc-
NP formulations when administered by the oral route to laboratory animals. At 3 h post-
administration, an important fraction of NP appeared to remain in the stomach whereas PEG-
coated nanoparticles were mainly visualised in the small intestine of animals. Furthermore, no
activity was observed in the liver or the lungs of the animals.

CONFIDENTIAL CHAPTER 3: In vivo evaluation of the mucus-permeating properties
of PEG-coated nanoparticles following oral administration
66
Figure 4. Volume rendered fused SPECT-CT images from representative animals 3 h after
administration of 99m
Tc-labelled NP by oral gavage. NP: “naked” nanoparticles; NP2:
poly(anhydride) nanoparticles coated with PEG2000; NP6: poly(anhydride) nanoparticles
coated with PEG6000; NP10: poly(anhydride) nanoparticles coated with PEG10000.
3.3. Evaluation of the mucus-permeating properties of nanoparticles
Figure 5 shows the evaluation of the interaction of nanoparticles with the surface of the
stomach mucosa expressed as the adhered fraction of the given dose vs time. In all cases the
animals received a dose of 10 mg of nanoparticles dispersed in 1 mL water. “Naked”
poly(anhydride) nanoparticles displayed a significantly higher capability to interact with the
stomach mucosa than the PEG-coated nanoparticles. In addition this effect was developed quite
rapidly because the maximum of interaction was found just 30 minutes after administration.
Then the adhered fraction decreased but maintained quite high up to 3 h post-administration.
Comparing PEG-coated nanoparticles, NP2 displayed the highest initial capability to interact
with the stomach mucosa. In fact, 1 hour post-administration the estimated amount of
nanoparticles adhered to the stomach was found to be at least 2-times those of NP6 and NP10.
For nanoparticles coated with either PEG6000 or PEG10000, the adhered fraction was always
below 7% of the given dose and quite similar to the fluorescence recovered by the
administration of an aqueous solution of RBITC.

CONFIDENTIAL CHAPTER 3: In vivo evaluation of the mucus-permeating properties of
PEG-coated nanoparticles following oral administration
67
0 1 2 3 4 5
0
5
10
15
20
25
Fra
ctio
n o
f g
ive
n d
ose
(%
)
Time (h)
NP
RBITC solution
NP2
NP6
NP10
Figure 5. Evolution of the adhered fraction of the given dose of RBITC-loaded nanoparticles
(10 mg) vs. time in the stomach of Wistar rats. NP: naked nanoparticles; NP2: poly(anhydride)
nanoparticles coated with PEG2000; NP6: poly(anhydride) nanoparticles coated with PEG6000;
NP10: poly(anhydride) nanoparticles coated with PEG10000. RBITC solution contained a
similar amount of the fluorescent marker as nanoparticles did. Data expressed as mean ± SD (n
= 3).
Figure 6 shows the curves of the adhered fractions of nanoparticles in the
mucosa of the small intestine vs. time. Interestingly the profiles of these curves for
PEG-coated nanoparticles were different to that obtained for “naked” nanoparticles.
Thus, for NP, the maximum of the curve (about 15%) was found just 30 minutes post-
administration. Then, the adhered fraction decreased rapidly with time. For NP2, the
profile of the curve was characterised by a first step in which the adhered fraction
increased up to 22% (1 hour post-administration) followed by a slow decline till the end
of the experiment. In fact, 4 h after the administration, the remained fraction of adhered
nanoparticles was estimated to be higher than 15% of the given dose. For NP6 and
NP10, the profile of the curves was similar to that of NP2 with the difference that the
adhered fractions of nanoparticles increased slowly from 1 to 3h post- administration
after the gavage of rats. Then, the adhered fractions decreased rapidly. For NP10, the
levels of adhered nanoparticles were significantly lower than for NP6 or NP2.

CONFIDENTIAL CHAPTER 3: In vivo evaluation of the mucus-permeating properties
of PEG-coated nanoparticles following oral administration
68
0 1 2 3 4 5
0
5
10
15
20
25
30
35
Fra
ctio
n g
ive
n d
ose
(%
)
Time (h)
NP
RBITC-solution
NP2
NP6
NP10
Figure 6. Evolution of the adhered fraction of the given dose of RBITC-loaded nanoparticles
(10 mg) vs. time in the small intestine of Wistar rats. NP: naked nanoparticles; NP2:
poly(anhydride) nanoparticles coated with PEG2000; NP6: poly(anhydride) nanoparticles
coated with PEG6000; NP10: poly(anhydride) nanoparticles coated with PEG10000. RBITC
solution contained a similar amount of the fluorescent marker as nanoparticles did. Data
expressed as mean ± SD (n = 3).
From these curves, the AUC and the MRT for the different formulations tested were
calculated (Table 4). Within the stomach, the intensity of the adhesive interactions for NP was
more than 2-times higher than for PEG-coated nanoparticles. On the contrary, in the small
intestine, the AUC rank order was as follows: NP6 > NP2 > NP10 > NP. In fact, for NP2 and
NP6, the intensity of the adhesive interactions were around 1.5- and 3-times higher than for
NP10 and NP, respectively. Moreover, for NP2 and NP6, the mean residence time of the
adhered fraction (MRT) was found to be about 45 min longer than for “naked” nanoparticles
and 35 min longer than for NP10.

CONFIDENTIAL CHAPTER 3: In vivo evaluation of the mucus-permeating properties of
PEG-coated nanoparticles following oral administration
69
Table 4. Estimation of the intensity (AUC) and duration (MRT) of the interactions developed
by nanoparticles within the gut mucosa in Wistar rats.
Stomach Small Intestine
AUC (mg h/mL) MRT (h) AUC (mg h/mL) MRT (h)
NP 53.60 1.77 23.82 1.58
NP2 19.43 1.34 71.15 2.33
NP6 14.82 1.87 76.24 2.30
NP10 9.58 1.99 45.23 2.16
NP: naked nanoparticles; NP2: poly(anhydride) nanoparticles coated with PEG2000; NP6:
poly(anhydride) nanoparticles coated with PEG6000; NP10: poly(anhydride) nanoparticles
coated with PEG10000.
On the other hand, the influence of the PEG/poly(anhydride) ratio on the capability of
the resulting nanoparticles to reach the surface of the gut mucosa was also evaluated (Figure 7).
The study was carried out by comparing two different ratios (0.125 and 0.25). Interestingly,
when nanoparticles were prepared at a ratio of 0.25, the adhered fractions of nanoparticles were
significantly lower than when prepared at a ratio of 0.125. This decrease, which was observed in
both the stomach and the small intestine, was more intense for NP2 and NP6 formulations than
for NP10.
NP2 NP6 NP10 NP2 NP6 NP10 NP2 NP6 NP10
0
5
10
15
20
25
30
35
SI (3 h)SI (1 h)
Stomach (1 h)
Fra
ctio
n g
ive
n d
ose
(%
)
Ratio: 0.125
Ratio: 0.25
Figure 7. Comparison of the adhered fraction for RBITC-loaded nanoparticles (10 mg)
prepared at two different PEG/poly(anhydride) ratios (0.125 and 0.25). SI: small intestine. NP2:
poly(anhydride) nanoparticles coated with PEG2000; NP6: poly(anhydride) nanoparticles
coated with PEG6000; NP10: poly(anhydride) nanoparticles coated with PEG10000. Data
expressed as mean ± SD (n = 3).

CONFIDENTIAL CHAPTER 3: In vivo evaluation of the mucus-permeating properties
of PEG-coated nanoparticles following oral administration
70
Figure 8 shows fluorescence microscopy images of ileum samples from the animals
treated with Lumogen® F Red-labelled nanoparticles. “Naked” nanoparticles (NP) displayed a
localisation that appeared to be restricted mainly to the mucus layer protecting the epithelium
(Figure 8.A and 8.B). On the contrary, for PEG-coated nanoparticles it was evident that these
carriers were capable of reaching the epithelium and interact broadly with the intestinal cells
(Figure 8.C-8.F). However, these interactions were more intense for NP2 and NP6 than for
NP10.
Figure 8. Fluorescence microscopic visualisation of PEG-coated nanoparticles (NP2, NP6 and
NP10) and control ones (NP) in a longitudinal section of the ileum of rats. A: “naked”
nanoparticles in the stomach mucosa; B: NP in the ileum mucosa; C and D: poly(anhydride)
nanoparticles coated with PEG2000 (NP2) in the ileum mucosa; E and F: poly(anhydride)
nanoparticles coated with PEG6000 (NP6) in the ileum mucosa; G and H: poly(anhydride)
nanoparticles coated with PEG10000 (NP10) in the ileum mucosa.

CONFIDENTIAL CHAPTER 3: In vivo evaluation of the mucus-permeating properties of
PEG-coated nanoparticles following oral administration
71
4. Discussion
In this work, our aim was to evaluate in vivo the mucus-permeating properties of
poly(anhydride) nanoparticles coated with PEG as well as to gain insight about the factors than
can modulate this effect in vivo.
PEG-coated nanoparticles were prepared by a simple desolvation procedure after the
incubation between the selected PEG and the polymer forming the matrix of nanoparticles in
acetone. The resulting nanoparticles displayed a mean size ranging from 150 to 160 nm, with
slightly higher average sizes by increasing the PEG molecular weight. Furthermore, the zeta
potential of PEG-coated nanoparticles was less negative than for “naked” nanoparticles. This
observation is in line with previous results in which it was demonstrated that the coverage of
nanoparticles with PEG resulted in higher zeta potentials [30, 31]. Interestingly, the amount of
associated PEG to the nanoparticles was affected by the PEG/poly(anhydride) ratio and the
incubation time between both compounds before the formation of nanoparticles. Thus, by
increasing the time of incubation and/or the PEG/poly(anhydride) ratio, the amount of PEG
associated to nanoparticles increased (Figures 1 and 2). Moreover, the amount of PEG
associated to nanoparticles also increased by increasing the MW of the macrogol used. This last
finding is in line with those reported by other researchers who hypothesised that longer PEG
chains would offer greater pegylation degrees till a maximum of about 10000 Da (PEG 10000)
[32, 33]. However, longer PEG chains resulted in lower surface density (dPEG; Table 3). This
can be explained by a steric repulsion induced for the associated PEG chains on the surface of
nanoparticles which hampers the binding of the PEG remaining in solution [34]. The repulsive
force will increase in strength with PEG chain length.
All PEG-coated nanoparticles used have their PEG chains in a “brush” conformation,
independent of the PEG chain molecular weight and preparative conditions. Polymer
conformation can be described in terms of the Flory radius (RF). If the surface density is high
(i.e., the distance D, between the attachment points of polymer to a surface is lower than RF),
polymer chains will acquire a “brush” regime, with long, thin bristles of PEG extending from
the nanoparticle surface [26, 35].
Regarding in vivo studies, the behaviour and distribution of nanoparticles were also
affected by the presence of PEG. Overall, naked nanoparticles (NP) displayed a higher ability to
interact with the mucosa of the stomach (Figure 5) than with the small intestine (Figure 6).
However, these interactions were restricted to the mucus layer covering the epithelial surface
(Figure 8.A and 8.B), confirming the previously reported mucoadhesive properties of these
nanoparticles [13, 36].
Interestingly, pegylation of poly(anhydride) nanoparticles produced nanocarriers that
minimised the interactions within the stomach mucosa. This finding was corroborated by

CONFIDENTIAL CHAPTER 3: In vivo evaluation of the mucus-permeating properties
of PEG-coated nanoparticles following oral administration
72
SPECT-CT imaging (Figure 4). Nevertheless, this inhibition effect would be more intense for
nanoparticles pegylated with PEG6000 or PEG10000 than for those coated with PEG2000
(Figure 5). On the contrary, PEG-coated nanoparticles displayed a high capability to reach the
surface of the cells constituting the mucosa as corroborated by the fluorescence microscopy
images of ileum samples (Figures 8.C-8.F). Moreover, the fate of PEG-coated nanoparticles
appeared to be highly influenced by the MW of the PEG as well as by the PEG/poly(anhydride)
ratio used to prepare these carriers. Thus, 3h post-administration, the fraction of nanoparticles
remaining in close contact with the surface of the small intestine mucosa represented more than
25% given dose for NP6 and around 20% and 15% for NP2 and NP10, respectively (Figure 7).
For NP, this value was only of 5%. In addition, and during the studied period of time, the
intensity and the duration of the interactions between nanoparticles and the small intestine
mucosa were higher for NP2 and NP6 formulations than for NP10 (Table 4). All of these
observations are in line with previous results described by Wang and co-workers who described
that 200 nm poly(styrene) particles coated with either 5kDa-PEG diffused in vitro as rapidly
through mucus as those with 2 kDa PEG, but a further increase of PEG MW to 10 kDa resulted
in 1000-fold slower transport in human cervico vaginal mucus [19] . In fact the 10 kDa PEG
chains may be long enough to significantly entangle with mucins [37].
Another important factor that appears to modulate the mucus-permeating properties of
PEG-coated nanoparticles is the extent of the PEG surface coverage. In principle, as described
previously, a dense coating of PEG around polymeric nanoparticles would be necessary to
facilitate their diffusion through respiratory [38, 39] and vaginal mucus [21]. Unfortunately,
many studies did not quantify the density of surface PEG and it is just indirectly estimated from
the measurement of the zeta potential. However, our results appear to indicate that a PEG-
coating threshold for efficient mucus-permeating properties exists. Thus, when nanoparticles
were prepared at a PEG/poly(anhydride) ratio of 0.25, the capability of the resulting
nanoparticles to interact with the mucosa significantly decreased (Figure 7), compared to those
observed with nanoparticles prepared at a ratio of 0.125. As for both types of nanoparticles the
PEG chains would adopt a theoretical “brush” conformation, an excessive dense coating
appears to hamper the diffusion of PEG-coated nanoparticles through the gut mucosa in vivo. A
possible explanation to this finding would be that a highly dense PEG coating would result in a
less flexible coating with entanglements between the macrogol chains that would facilitate their
interaction with components of the mucus layer. This fact would reduce their capability to
reach the surface of the enterocytes. In this context, the entanglement of PEG chains has been
proposed as the main factor negatively affecting the bioadhesive properties of different dosage
forms [40, 41]. In this way, He and co-workers have recently described that the steric repulsion

CONFIDENTIAL CHAPTER 3: In vivo evaluation of the mucus-permeating properties of
PEG-coated nanoparticles following oral administration
73
of PEG-coated silica nanoparticles against human serum albumin adsorption decreased at high
PEG densities [42].
Another factor than can be highlighted is that, at the light of the present results,
negatively charged nanoparticles may offer mucus-permeating properties. This fact is in line
with previous results reported by Mura and coworkers, who demonstrated that PLGA
nanoparticles coated with Pluronic F68 and negatively charged could diffuse unimpeded
through the mucus layer [43]. In principle, electrostatic repulsive forces between negatively
charged mucin fibers and negatively charged nanoparticles may favor particle transport in the
relatively hydrophilic, low viscous pores of the mucus mesh, where particle transport is less
restricted [10, 44].
5. Conclusions
In summary, all of these results suggest that the coating of poly(anhydride)
nanoparticles with PEG dramatically influenced their fate within the gastrointestinal tract of
animals. First, pegylation of Gantrez® AN nanoparticles inhibited their mucoadhesive
properties as well as their tropism for the stomach mucosa. Within the small intestine, the
coating of poly(anhydride) nanoparticles with PEG yielded nanocarriers with mucus-
permeating properties. However, this fact was clearly influenced by both the MW and surface
density of the PEG. With respect to PEG MW, the intensity and the duration of the interactions
between nanoparticles and the small intestine mucosa were higher for nanoparticles coated with
either PEG2000 or PEG6000 than with PEG10000. Regarding PEG surface density, in spite
that a “brush” conformation appears to be required, the mucus-permeating properties decreased
at excessive PEG densities. In any case, more research is needed to elucidate and understand
this point.
Acknowledgements
The research leading to these results has received funding from the European
Community's Seventh Framework Programme [FP7/2007-2013] for ALEXANDER under grant
agreement n° NMP-2011-1.2-2-280761. Furthermore, Laura Inchaurraga acknowledges
“Asociación de Amigos” of the University of Navarra for the financial support.

CONFIDENTIAL CHAPTER 3: In vivo evaluation of the mucus-permeating properties
of PEG-coated nanoparticles following oral administration
74
References
[1] E. Pasquier, M. Kavallaris, N. Andre, Metronomic chemotherapy: new rationale for new
directions, Nat. Re. Clin. Oncol. 7 (2010) 455-465.
[2] R.I. Mahato, A.S. Narang, L. Thoma, D.D. Miller, Emerging trends in oral delivery of peptide and
proteins, Crit. Rev. Ther. Drug Carrier Syst. 20 (2003) 153–214 .
[3] J.H. Hamman, G.M. Enslin, A.F. Kotze, Oral delivery of peptide drugs, BioDrugs 19 (2005) 165-
177.
[4] M. Bodnar, J.F. Hartmann, J. Borbely, Preparation and characterisation of chitosan-based
nanoparticles, Biomacromol. 6 (2005) 2521-2527.
[5] G. Ponchel, J.M. Irache, Specific and non-specific bioadhesive particulate systems for oral delivery
to the gastrointestinal tract, Adv. Drug Deliv. Rev. 34 (1998) 191-219.
[6] C. Damgé, C. Pinto Reis, P. Maincent, Nanoparticle strategies for the oral delivery of insulin,
Expert Op. Drug Del. 5 (2008) 45-68.
[7] M.C. Chen, K. Sonaje, K.J. Chen, H.W. Sung, A review of the prospects for polymeric
nanoparticle platforms in oral insulin delivery, Biomaterials 32 (2008) 9826-9838.
[8] A. Kumari, S.K. Yadav, S.C. Yadav, Biodegradable polymeric nanoparticles based drug delivery
systems. Colloids and Surfaces B: Biointerfaces 75 (2010) 1–18.
[9] R.A. Cone, Barrier properties of mucus. Adv. Drug Deliv. Rev. 61 (2009) 75–85.
[10] S.K. Lai, Y.Y. Wang, J. Hanes, Mucus-penetrating nanoparticles for drug and gene delivery to
mucosal tissues, Adv. Drug Deliv. Rev. 6 (2009)158–171.
[11] G.C. Hansson, Role of mucus layers in gut infection and inflammation, Curr. Op. Microbiol. 15
(2012) 57-62.
[12] A. Lamprecht, U. Schafer, C.M. Lehr, Size-dependent bioadhesion of micro- and nanoparticulate
carriers to the inflamed colonic mucosa, Pharm. Res. 18 (2001) 788-793.
[13] P. Arbós, M.A. Campanero, M.A. Arangoa, M.J. Renedo, J.M. Irache, Influence of the surface
characteristics of PVM/MA nanoparticles on their bioadhesive properties, J. Control Release 89
(2003) 19-30.
[14] S.A. Galindo-Rodríguez, E. Allemann, H. Fessi, E. Doelker, Polymeric nanoparticles for oral
delivery of drugs and vaccines: a critical evaluation of in vivo studies, Crit. Rev. Ther. Drug Carr.
Syst. 22 (2005) 419-464.
[15] A. Bernkop-Schnurch, A.E. Clausen, Biomembrane permeability of peptides: Strategies to
improve their mucosal uptake, Mini Rev. Med. Chem. 2 (2002) 295-305.
[16] C. Muller, K. Leithner, S. Hauptstein, F. Hintzen, W. Salvenmoser, A. Bernkop-Schnurch,
Preparation and characterisation of mucus-penetrating papain/poly(acrylic acid) nanoparticles for
oral drug delivery applications, J. Nanopart. Res. 15 (2013) 1353- 1365.
[17] F. Laffleur, F. Hintzen, G. Shahnaz, D. Rahmat, K. Leithner, A. Bernkop-Schnürch, Development
and in vitro evaluation of slippery nanoparticles for enhanced diffusion through native mucus,
Nanomedicine 9 (2014) 387-396.
[18] K. Yoncheva, L. Guembe, M.-A. Campanero, J.M. Irache. Evaluation of bioadhesive potential and
intestinal transport of pegylated poly(anhydride) nanoparticles, Int. J. Pharm. 334 (2007) 156-165.
[19] Y.Y. Wang, S.K. Lai, J. Suk, A. Pace, R. Cone, J. Hanes, Addressing the PEG mucoadhesivity
paradox to engineer nanoparticles that “slip” through the human mucus barrier, Angew. Chem. Int.
Ed. 47 (2008) 9726–9729.
[20] M. Tobio, A. Sánchez, A. Vila, I. Soriano, C. Evora, J.L. VilaJato, M.J. Alonso, The role of PEG
on the stability in digestive fluids and in vivo fate of PEG-PLA nanoparticles following oral
administration, Colloid Surface B. 18 (2000) 315–323.
[21] S.K. Lai, D.E. O’Hanlon, S. Harrold, S.T. Man, Y.Y. Wang, R. Cone, J. Hanes, Rapid transport of
large polymeric nanoparticles in fresh undiluted human mucus, Proc. Natl. Acad. Sci. 104 (2007)
1482–1487.
[22] V. Zabaleta, G. Ponchel, H. Salman, M. Agüeros, C. Vauthier, J.M. Irache, Oral administration of
paclitaxel with pegylated poly(anhydride) nanoparticles: permeability and pharmacokinetic study,
Eur. J. Pharm. Biopharm. 81(2012) 514-523.
[23] K. Yoncheva, E. Lizarraga, J.M. Irache, Pegylated nanoparticles based on poly(methyl vinyl ether-
co-maleic anhydride): preparation and evaluation of their bioadhesive properties, Eur. J. Pharm.
Sci. 24 (2005) 411-419.
CONFIDENTIAL CHAPTER 3: In vivo evaluation of the mucus-permeating properties of
PEG-coated nanoparticles following oral administration
75
[24] V. Zabaleta, M.A. Campanero, J.M. Irache , An HPLC with evaporative light scattering detection
method for the quantification of PEGs and Gantrez in PEGylated nanoparticles, J. Pharm. Biomed.
Anal. 44 (2007) 1072-1078.
[25] Ashland Incorpation at www.ashland.com, retrieved date was in August 13, 2014.
[26] P.G. De Gennes, Polymers at an interface - a simplified view, Adv. Colloid Interface Sci. 27
(1987) 189-209.
[27] A.K. Kenworthy, K. Hristova, D. Needham, T.J. McIntosh, Range and magnitude of the steric
pressure between bilayers containing phospholipids with covalently attached poly(ethylene
glycol), Biophys. J., 68 (1995) 1921-1936.
[28] P. Areses, M. Agüeros, G. Quincoces, M. Collantes, J.A. Richter, L.M. López-Sánchez, M.
Sánchez-Martínez, J.M. Irache, I. Peñuelas, Molecular imaging techniques to study the
biodistribution of orally administered 99m
Tc-labelled naive and ligand-tagged nanoparticles, Mol.
Imag. Biol. 13 (2011) 1215-1223.
[29] M.A. Arangoa, M.A. Campanero, M.J. Renedo, G. Ponchel, J.M. Irache, Gliadin nanoparticles as
carriers for the oral administration of lipophilic drugs. Relationship between bioadhesion and
pharmacokinetics, Pharm. Res. 18 (2001) 1521-1527.
[30] M.T. Peracchia, C. Vauthier, C. Passirani, P. Couvreur, D. Labarre, Complement consumption by
poly(ethylene glycol) in different conformations chemically coupled to poly(isobutyl 2-
cyanoacrylate) nanoparticles, Life Sci. 61(1997) 749-761.
[31] K.R. Chaudhari, M. Ukawala, A.S. Manjappa, A. Kumar, P.K. Mundada, A.K. Mishra, R. Mathur,
J. Monkkonen, R.S. Murthy, Opsonization, biodistribution, cellular uptake and apoptosis study of
PEGylated PBCA nanoparticle as potential drug delivery carrier, Pharm. Res. 29 (2012) 53-68.
[32] J. Israelachvili, The different faces of poly(ethylene glycol), Proc. Natl. Aca.d Sci. 94 (1997)
8378-8379.
[33] S.R. Benhabbour, H. Sheardown, A. Adronov, Protein resistance of PEG-functionalized
dendronized surfaces: effect of PEG molecular weight and dendron generation, Macromolecules
41(2008) 4817−4823.
[34] M. Wu, E. Dellacherie, A. Durand, E. Marie, Poly(n-butyl cyanoacrylate) nanoparticles via
miniemulsion polymerization. 2. PEG-based surfactants, Colloids Surf. B Biointerfaces 69 (2009)
147-151.
[35] J.V. Jokerst, T. Lobovkina, R.N. Zare, S.S. Gambhir. Nanoparticle PEGylation for imaging and
therapy, Nanomedicine 6 (2011) 715–728.
[36] S. Gómez, C. Gamazo, B.S. Roman, M. Ferrer, M.L., Sanz, J.M. Irache, S. Gómez, Gantrez® AN
nanoparticles as an adjuvant for oral immunotherapy with allergens, Vaccine 25 (2007) 5263–
5271.
[37] Y. Huang, W. Leobandung, A. Foss, N.A. Peppas, Molecular aspects of muco- and bioadhesion:
tethered structures and site-specific surfaces, J. Controlled Release 65 (2000) 63-71.
[38] B.S. Schuster, J.S. Suk, G.F. Woodworth, J. Hanes, Nanoparticle diffusion in respiratory mucus
from humans without lung disease, Biomaterials 34 (2013) 3439-3446.
[39] J.S. Suk, S.K. Lai, Y.Y. Wang, L.M. Ensign, P.L. Zeitlin, M.P. Boyle, J.Hames, The penetration
of fresh undiluted sputum expectorated by cystic fibrosis patients by non-adhesive polymer
nanoparticles, Biomaterials 30 (2009) 2591–2597.
[40] N.A. Peppas, J.J. Sahlin, Hydrogels as mucoadhesive and bioadhesive materials: a review,
Biomaterials 17 (1996) 1533-1561.
[41] J.W. Lee, J.H. Park, J.R. Robinson, Bioadhesive-based dosage forms: the next generation, J.
Pharm. Sci. 89 (2000) 850-866.
[42] Q. He, J. Zhang, J. Shi, The effect of PEGylation of mesoporous silica nanoparticles on
nonspecific binding of serum proteins and cellular responses, Biomaterials 31 (2010) 1085-1092.
[43] S. Mura, H. Hillaireau, J. Nicolas, S. Kerdine-Romer, B. Le Droumaquet, C. Delomenie, V.
Nicolas, M. Pallardy, N. Tsapis, E. Fattal, Biodegradable nanoparticles meet the bronchial airway
barrier: how surface properties affect their interaction with mucus and epithelial cells,
Biomacromolecules 12 (2011) 4136–4143.
[44] M. Dawson, E. Krauland, D. Wirtz, J. Hanes, Transport of polymeric nanoparticle gene carriers
gastric mucus, Biotechnol. Prog. 20 (2004) 851-857.


CHAPTER 4
The effect of thiamine-coating nanoparticles on their
biodistribution and fate following oral administration


CONFIDENTIAL CHAPTER 4: The effect of thiamine-coating nanoparticles on their
biodistribution and fate following oral administration
79
The effect of thiamine-coating nanoparticles on their biodistribution
and fate following oral administration
Abstract
Two thiamine-coated poly(anhydride) nanoparticle formulations have been prepared in
order to study their mucus-penetrating properties and behavior in vivo. The first method of
preparation consisted in surface modification of freshly prepared poly(anhydride) nanoparticles
by simple incubation with thiamine (T-NPA). The second procedure focused on the preparation
and characterization of a new polymeric conjugate between the poly(anhydride) backbone and
thiamine prior the nanoparticle formation (T-NPB). The resulting nanoparticles displayed
comparable sizes (~200 nm) and slightly negative surface charges. The in vivo studies revealed
that T-NPA and T-NPB moved faster than naked nanoparticles from the stomach to the small
intestine and displayed stronger capability to interact with the mucosa of the small intestine than
within the stomach mucosa. For both thiamine nanoparticles, more than a 30% of the given dose
was found in close contact with the surface of the mucosa compared to a 13.5% in the case of
naked nanoparticles. Interestingly, both types of thiamine nanoparticles showed a greater ability
to cross the mucus layer and interact with the surface of the mucosa compared to naked
nanoparticles which remained adhered in the mucus layer. Overall, both preparative processes
yielded thiamine decorated carriers with similar physico-chemical and biodistribution
properties, increasing the versatility of these nanocarriers as oral delivery systems for a number
of biologically active compounds.

CONFIDENTIAL CHAPTER 4: The effect of thiamine-coating nanoparticles on their
biodistribution and fate following oral administration
80
1. Introduction
The oral route is, in general, perceived by patients as more comfortable and convenient
than other routes of drug administration, especially for chronic medication regimens. However
the oral route remains an important challenge that limits the absorption and bioavailability of
many biologically active compounds, especially for therapeutic peptides and proteins as well as
for drugs suffering from presystemic metabolism. From a biological point of view, the oral
delivery of drugs is faced with several main barriers: (i) the acidic pH environment in the
stomach, (ii) the enzymatic activity along the gut, (iii) the protective mucus gel layer, (iv) the
unstirred water layer adjacent to the epithelium and (v) the surface of absorptive cells, including
the glycocalyx. All of these barriers limit the arrival of the unchanged biologically active
compound to the portal and/or the systemic circulation [1,2].
In order to overcome these hurdles, different delivery systems have been proposed and
are currently under evaluation, including the use of polymer nanoparticles. In principle, some of
these delivery systems (acting as nanocarriers) may minimize the effects of extreme pH
conditions and digestive enzymes on the stability of the loaded compound, offering significant
increases in the oral bioavailability of some drugs [1,3]. However, polymer nanoparticles
encounter a formidable barrier that significantly limits their arrival at the intestinal epithelium,
namely the protective mucus layer lining the epithelium surface of the gut. Nanoparticles
become trapped and, then, rapidly eliminated from the gut mucosa due to the physiological
mucus turn-over [4,5]. In fact, mucus is continuously secreted both to remove pathogens and to
lubricate the epithelium as material passes through [6,7].
In order to address this fundamental limitation, an encouraging strategy would be the
use of nanoparticles with mucus-penetrating properties. For this purpose, different strategies
have been proposed, including the use of agents to minimize the interaction of nanocarriers with
the mucus layer and the application of bio-inspired procedures mimicking key features of
microorganisms. Thus, the fluidity of mucus and, hence, the diffusion of nanoparticles through
the mucus layer may be increased by either the co-encapsulation of mucolytic agents (e.g., N-
acetyl cysteine) [8] or the binding of proteolytic enzymes (e.g., papaine or bromelain) to the
surface of nanocarriers in order to cleave locally the glycoprotein substructures of mucus [9].
A second interesting approach, similar to those developed by microorganisms for
avoiding the mucus protective layer and, then, reach the intestinal epithelium for invasion and
colonization. Within this scenario, virus-mimicking nanoparticles presenting both a hydrophilic
shell and a highly densely charged surface have been proposed [10]. Similarly, the coating of
nanoparticles with either bacterial lipopolysaccharide [11] or flagellin from Salmonella
enteritidis [12] was found adequate to specifically target the intestinal epithelium of animals. A
further set of strategies involves the decoration of nanoparticles with hydrophilic ligands in

CONFIDENTIAL CHAPTER 4: The effect of thiamine-coating nanoparticles on their
biodistribution and fate following oral administration
81
order to minimize the potential hydrophobic interactions of the particles with mucin fibers and
other components of the mucus. These “slippery” nanoparticles can be obtained by using
poly(ethylene glycol)s [13–15], mannose [16] or thiamine [17].
However, one key aspect that sometimes is forgotten during the development and
characterization of nanocarriers for mucosal delivery is the combination of the adequate
biodistribution properties (including the mucus-penetrating capabilities) with a high payload
capability. In fact, the encapsulation of a biologically active molecule may significantly modify
the physico-chemical properties of empty nanoparticles [18] and, hence, negatively affect their
ability to reach the epithelium. This fact may limit the potential use of such nanoparticles for
delivery purposes. In order to overcome this risk, one possible solution is to develop alternative
preparative processes of nanocarriers that are more adapted to the encapsulation of particular
groups of drugs, without affecting their biodistribution and fate. In this context, the aim of this
work was to prepare thiamine-coated nanoparticles by two different preparative processes and,
then, evaluate and compare their mucus-penetrating properties and behavior in vivo.
2. Materials and Methods
2.1. Chemicals
The copolymer of methyl vinyl ether and maleic anhydride or poly(anhydride)
(Gantrez® AN 119) was supplied by Ashland Inc. (Barcelona, Spain). The MW of Gantrez
® AN
119 was 95.5 kDa when calculated by SEC-MALS. Thiamine hydrochloride, lactose and
calcium chloride were purchased from Sigma-Aldrich (Madrid, Spain). Di-sodium hydrogen
phosphate anhydrous and ethanol were provided by Panreac (Barcelona, Spain). Perylene-Red
(BASF Lumogen® F Red 305) was from Kremer Pigmente GmbH & Co. (Aichstetten,
Germany) and O.C.T. TM
Compound Tissue-Tek from Sakura Finetek Europe (Alphen aan Der
Rijn, The Netherlands). 4’,6-diamidino-2-phenylindole (DAPI) was obtained from Biotium Inc.
(Madrid, Spain). Intestinal mucin was obtained from Jeff Pearson (Newcastle University,
Institute for Cell and Biomedical Sciences, Newcastle Upon Tyne, United Kingdom). Acetone
was from (VWR-Prolabo, Linars del Vallès, Spain) and sodium hydroxide and isopropanol from
Merck (Madrid, Spain). Deionized reagent water was prepared by a water purification system
(Wasserlab, Pamplona, Spain). Nitrogen gas (ultrapure, > 99) was produced using an Alltech
nitrogen generator (Ingeniería Analítica, Barcelona, Spain).

CONFIDENTIAL CHAPTER 4: The effect of thiamine-coating nanoparticles on their
biodistribution and fate following oral administration
82
2.2. Preparation of Gantrez® AN-thiamine conjugates (GT)
The conjugate was obtained by the covalent binding of thiamine to the poly(anhydride)
backbone (Figure 1). For this purpose, 5 g Gantrez® AN were dissolved in 200 mL acetone.
Then, 125 mg thiamine were added and the mixture was heated at 50ºC, under magnetic
agitation at 400 rpm, for 3 h. Then, the mixture was filtered through a pleated filter paper and
the organic solvent was eliminated under reduced pressure in a Büchi R-144 apparatus (BÜCHI
Labortechnik AG, Flawil, Switzerland) until the conjugate was totally dry. Finally, the resulting
powder was stored.
Figure 1. Schematic representation of the formation of the new conjugate between Gantrez®
AN
and thiamine.
2.3. Characterization of Gantrez®
AN-thiamine conjugate (GT)
The covalent binding of thiamine to the polymer chains was confirmed by FITR,
elemental and titration analysis. The amount of thiamine bound to the poly(anhydride) was
estimated by HPLC analysis.
2.3.1. FTIR analysis
The binding between the poly(anhydride) and thiamine was determined by Fourier
transform infrared spectroscopy (FTIR). Spectra were collected in a Nicolet-FTIR Avatar 360
spectrometer (Thermo/Nicolet 360 FT IR E.S.P., Thermo Fisher Scientific, Waltham,
Massachusetts, USA), using a MKII Golden Gate ATR device with resolution of 2 cm-1
connected with OMNIC E.S.P. software (Thermo Fisher Scientific, Waltham, Massachusetts,
USA). The spectrum obtained was an average of 32 scans.

CONFIDENTIAL CHAPTER 4: The effect of thiamine-coating nanoparticles on their
biodistribution and fate following oral administration
83
2.3.2. Elemental analysis
The C, H, O and N contents of the synthesized conjugates were determined in a LECO
CHN-900 apparatus (Michigan, USA). For this purpose, 1 mg of each polymer was analyzed by
triplicate and the results were expressed as percentage (%w/w).
2.3.3. Titration
The poly(anhydride) and its conjugate were first hydrated and dispersed in water till
their total solubilization. At this moment the aqueous solutions of the polymers were titrated
with NaOH 0.2N in the presence of phenophtalein, used as indicator. Titration was used to
measure the percentage of free carboxylic groups and calculate the degree of substitution (DS)
of the resulting conjugate. The decrease of the carboxylic groups in the polymer conjugates in
comparison to unmodified Gantrez® AN evidenced the ligand binding.
2.3.4. Thiamine quantification
The amount of thiamine covalently attached to the poly(anhydride) was calculated by a
modification of a chromatographic method previously described [17]. For this purpose, 400 mg
Gantrez® AN and 10 mg of thiamine were added to 20 mL acetone. The mixture was heated at
50 ºC, under magnetic agitation at 400 rpm, for 3 h. The organic solvent was eliminated under
reduced pressure in a Büchi R-144 apparatus (BÜCHI Labortechnik AG, Flawil, Switzerland)
until the conjugate was totally dry. Once dried, the resulting unpurified conjugate was dissolved
in 20 mL acetone. Then, 40 mL deionized water were added until the formation of suspension.
This suspension was centrifuged for 20 minutes at 21,000 rpm and the supernatants were
collected for the quantification of thiamine. The analysis was performed in a model 1100 series
LC Agilent (Waldbornn, Germany) coupled with a UV diode array detection system. Data were
analyzed using the Chem-Station G2171 program. The separation of thiamine was carried out at
40 ºC on a reversed-phase Zobrax NH2 narrow-bore column (4.6 mm × 150 mm; particle size 5
µm) obtained from Agilent (Waldbornn, Germany). The column was protected by a 0.45 µm
filter. The mobile phase composition was potassium phosphate buffer 50 mM (pH 6) and
methanol (80/20, v/v). The flow rate was set to 1 mL/min and the effluent was monitored with
UV detection at 254 nm. Standard curves were designed over the range of 10-600 µg/mL
(R2≥0.999) from a thiamine solution in deionized water.
For sample analysis, samples of 1 mL from the supernatants were transferred to auto-
sampler vials, capped and placed in the HPLC auto-sampler. Then, 10 µL aliquot was injected
onto the HPLC column. Finally, the amount of thiamine associated to the poly(anhydride)
backbone was calculated as the difference between the initial amount of thiamine added and the
amount of thiamine recovered in the supernatants.

CONFIDENTIAL CHAPTER 4: The effect of thiamine-coating nanoparticles on their
biodistribution and fate following oral administration
84
2.4. Preparation of thiamine-coated nanoparticles
Thiamine-coated nanoparticles were prepared from two different experimental
procedures.
The first one consisted in the incubation of “naked” Gantrez® AN nanoparticles and
thiamine following a protocol described previously [17] with minor modifications. Briefly, 400
mg Gantrez® AN were dissolved in 20 mL acetone. Then, the nanoparticles were formed by the
addition of 40 mL absolute ethanol and 40 mL distilled water containing 10 mg thiamine. The
organic solvents were eliminated under reduced pressure in a BÜCHI R-144 apparatus (BÜCHI
Labortechnik AG, Flawil, Switzerland) and the resulting nanoparticles were agitated under
magnetic stirring for 30 min at RT. Then, the nanoparticles suspensions were purified by
centrifugation at 5,000 × g for 20 min (SIGMA Lab. centrifuges, Osterode am Harz, Germany)
using dialysis tubes Vivaspin® 300,000 MWCO (Sartorius AG, Madrid, Spain). Finally, 800 mg
lactose dissolved in 40 mL deionized water was added to the pellet and vortexed for 5 min. The
resulting suspension of nanoparticles was dried in a Büchi Mini Spray Drier B-290 apparatus
(BÜCHI Labortechnik AG, Flawil, Switzerland) under the following experimental conditions:
inlet temperature of 90 ºC, outlet temperature of 60 ºC, spray-flow of 600 L/h, and aspirator at
100 % of the maximum capacity. These nanoparticles were named T-NPA.
As control, “naked” nanoparticles were prepared in the same way as described
previously but in the absence of thiamine. These nanoparticles were identified as NP.
The second procedure, using the GT previously synthesized, was based on a controlled
desolvation of the conjugate (dissolved in acetone) with water and subsequent stabilization with
calcium. For this purpose, 400 mg GT were dissolved in 20 mL acetone and nanoparticles were
obtained by the addition of 40 mL purified water containing 1.6 mg calcium chloride. Acetone
was eliminated under reduced pressure in a BÜCHI R-144 apparatus (BÜCHI Labortechnik
AG, Flawil, Switzerland) and purified by centrifugation at 5,000 × g for 20 min (SIGMA Lab.
centrifuges, Osterode am Harz, Germany) using dialysis tubes Vivaspin® 300,000 MWCO
(Sartorius AG, Madrid, Spain). Finally, 800 mg lactose dissolved in 40 mL deionized water
were added to the pellet and vortexed for 5 min. The resulting suspension was dried by spray-
drying using the same conditions as described above. These nanoparticles based on GT were
identified as T-NPB.
2.5. Preparation of fluorescently labelled nanoparticles
In all cases, for the fluorescent labeling of nanoparticles, 2 mg Lumogen® F Red 305
were dissolved in the solution of acetone containing the polymer (Gantrez® AN or GT) prior the
formation of the nanoparticles as described above. In a similar way, the resulting nanoparticles
were purified and dried as aforementioned.
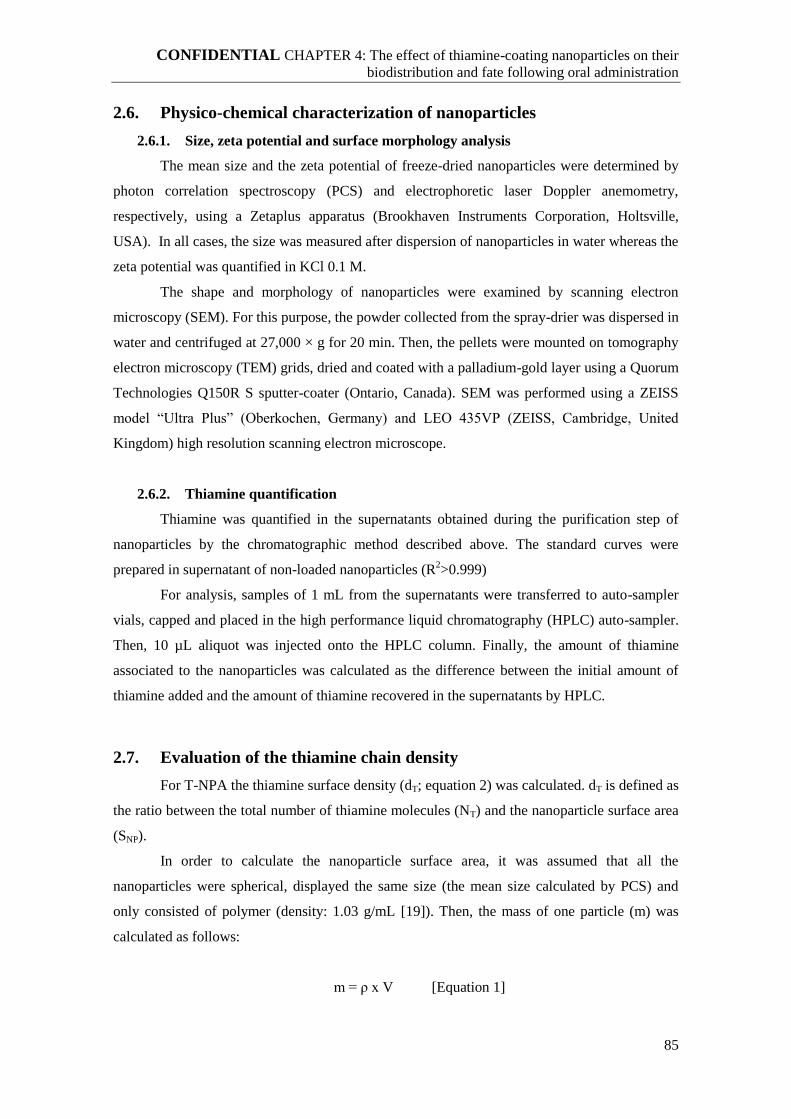
CONFIDENTIAL CHAPTER 4: The effect of thiamine-coating nanoparticles on their
biodistribution and fate following oral administration
85
2.6. Physico-chemical characterization of nanoparticles
2.6.1. Size, zeta potential and surface morphology analysis
The mean size and the zeta potential of freeze-dried nanoparticles were determined by
photon correlation spectroscopy (PCS) and electrophoretic laser Doppler anemometry,
respectively, using a Zetaplus apparatus (Brookhaven Instruments Corporation, Holtsville,
USA). In all cases, the size was measured after dispersion of nanoparticles in water whereas the
zeta potential was quantified in KCl 0.1 M.
The shape and morphology of nanoparticles were examined by scanning electron
microscopy (SEM). For this purpose, the powder collected from the spray-drier was dispersed in
water and centrifuged at 27,000 × g for 20 min. Then, the pellets were mounted on tomography
electron microscopy (TEM) grids, dried and coated with a palladium-gold layer using a Quorum
Technologies Q150R S sputter-coater (Ontario, Canada). SEM was performed using a ZEISS
model “Ultra Plus” (Oberkochen, Germany) and LEO 435VP (ZEISS, Cambridge, United
Kingdom) high resolution scanning electron microscope.
2.6.2. Thiamine quantification
Thiamine was quantified in the supernatants obtained during the purification step of
nanoparticles by the chromatographic method described above. The standard curves were
prepared in supernatant of non-loaded nanoparticles (R2>0.999)
For analysis, samples of 1 mL from the supernatants were transferred to auto-sampler
vials, capped and placed in the high performance liquid chromatography (HPLC) auto-sampler.
Then, 10 µL aliquot was injected onto the HPLC column. Finally, the amount of thiamine
associated to the nanoparticles was calculated as the difference between the initial amount of
thiamine added and the amount of thiamine recovered in the supernatants by HPLC.
2.7. Evaluation of the thiamine chain density
For T-NPA the thiamine surface density (dT; equation 2) was calculated. dT is defined as
the ratio between the total number of thiamine molecules (NT) and the nanoparticle surface area
(SNP).
In order to calculate the nanoparticle surface area, it was assumed that all the
nanoparticles were spherical, displayed the same size (the mean size calculated by PCS) and
only consisted of polymer (density: 1.03 g/mL [19]). Then, the mass of one particle (m) was
calculated as follows:
m = ρ x V [Equation 1]
CONFIDENTIAL CHAPTER 4: The effect of thiamine-coating nanoparticles on their
biodistribution and fate following oral administration
86
in which, is the density of Gantrez®
AN and V is the volume of one nanoparticle.
From this “m” value, the number of nanoparticles (NNP) in one mg was calculated. On
the other hand, assuming that all the associated thiamine were on the surface of the particles, NT
was determined from the amount of associated thiamine (as calculated by HPLC and expressed
in moles) multiplied by Avogadro’s number. Then the thiamine surface density was calculated
with the following equation:
dT = NT / SNP [Equation 2]
in which NT is the number of thiamine groups and SNP is the surface area of one nanoparticle.
From the estimated surface density data it was possible to determine the area occupied
by one thiamine molecule on a particle:
AT = SNM / NT [Equation 3]
2.8. Quantification of Lumogen® F red 305
The amount of Lumogen® F red 305 loaded in the nanoparticles was quantified by UV-
Vis spectrometry at wavelength 573 nm (Labsystems iEMS Reader MF, Vantaa, Finland). For
this purpose, 10 mg of the formulations were resuspended in 3 mL water and centrifuged at
21,000 rpm for 20 min. Pellets were dissolved in 10 mL acetonitrile 75%. These solutions were
finally diluted 1:10 in pure acetonitrile before the analysis. Standard curves were designed over
the range of 10-35 µg/mL (R2≥0.990) from a Lumogen
® F red 305 solution in acetonitrile 75%
and were prepared in supernatant of non-loaded nanoparticles.
Prior the use of fluorescently labelled nanoparticles for in vivo studies, the stability of
the marker in the nanoparticles was assessed by incubation in simulated gastric (pH 1.2) and
intestinal (pH 6.8) fluids.
2.9. Mucin purification from porcine mucus
Pig small intestines were obtained from a local abattoir immediately after slaughter and
transported on ice to the laboratory. Sections of the intestines that did not visibly contain chyme
were cut into 15 cm lengths and mucus was removed. To remove the mucus gentle pressure was
applied to one end of the length with the fingers and continuously applied unidirectionally to the
opposite end. Mucus gel was added to a cocktail of enzyme inhibitors in phosphate buffer, pH
6.8 [20]. The mucin was purified following the protocol described by Taylor et al. [20], with the
CONFIDENTIAL CHAPTER 4: The effect of thiamine-coating nanoparticles on their
biodistribution and fate following oral administration
87
addition of a second cesium chloride gradient to further remove cellular debris from the
glycoprotein component of mucus. All freeze dried samples were stored at -20 °C until used.
2.10. Pulsed-Gradient Spin-Echo NMR assessment of mucin mobility
In order to evaluate the slippery capacities of nanoparticles, the diffusion of intestinal
pig mucin in presence of these nanocarriers was evaluated by pulsed-gradient spin-echo nuclear
magnetic resonance (PGSE-NMR). Measurements were performed on a Bruker DMX400 NMR
spectrometer operating at 400 MHz (1H) using a stimulated echo sequence [21]. All the
experiments were run at 37 °C using the standard heating/cooling system of the spectrometer to
an accuracy of ±0.3 °C.
Generally, the proton NMR spectrum - a series of peaks located at characteristic values,
the so-called chemical shifts measured in ppm - is recorded from the solution with increasing
intensity of the pulsed-gradients. The self-diffusion coefficient, D, is deduced by fitting the
attenuation (decay) of the integral for a chosen peak to equation 4 as a function of the
characteristics of the gradient pulses,
( , , ∆) = 0exp [−k ] [Equation 4]
where is the signal intensity and k = 2 2 2 (∆ − /3 ), given is the magnetogyric ration, ∆
the diffusion time, the gradient pulse length, and is the gradient field strength. The gradient
pulses are ramped to their desired value over a ramp time, σ, typically 250 µs.
For complex spectra such as those encountered here where the observed peaks may
arise from different components within the system, or there may be a range of diffusing rates,
the diffusion data are better analyzed by fitting to this equation 4 the entire spectrum using
“CORE”, a program devised to resolve the various components present in such data [22]. CORE
evaluates the experimental data in two levels, yielding not only estimates of the diffusion
coefficients for each component in the sample but also their relative intensities enabling a more
insightful analysis of complex datasets.
For the mucin diffusion coefficient measurement, the nanoparticles were dispersed in
deuterated water (0.5% w/v) as described before [9]. Then, the nanoparticles suspensions were
added into an intestinal mucin solution (5% w/v) also in deuterated water and left to equilibrate
for 24 h. Finally, 0.6 mL was transferred to 5 mm o.d. Wilmad NMR tubes (Sigma–Aldrich,
Haverhill, UK).

CONFIDENTIAL CHAPTER 4: The effect of thiamine-coating nanoparticles on their
biodistribution and fate following oral administration
88
2.11. Labelling of nanoparticles with 99m
Tc
Nanoparticles were labelled with 99m
Tc by reduction with stannous chloride as described
previously [23]. Briefly, 1-2 mCi of freshly eluted 99m
Tc-pertechnetate was reduced with 0.03
mg/mL stannous chloride and the pH was adjusted to 4 with 0.1N HCl. Then, an amount of
dried powder containing 2 mg nanoparticles were dispersed in 1 mL water prior the addition of
the reduced 99m
Tc. The mixture was vortexed for 30 s and incubated at room temperature for 10
min. The overall procedure was carried out in helium-purged vials. The radiochemical purity
was examined by paper chromatography (Whatman 3MM) developed with NaCl 0.9%. The
labelling yield was always over 90%.
2.12. Gastrointestinal transit studies with radiolabelled nanoparticles
These studies were carried out in male Wistar rats weighing 250–300 g that had fasted
for 12 h. All the procedures were performed following a protocol previously approved by the
“Ethical and Biosafety Committee for Research on Animals” at the University of Navarra in line
with the European legislation on animal experiments.
Animals were briefly stunned with 2% isoflurane gas (flow of oxygen of 0.2 L/min) for
administration of nanoparticles (above 1 mL) by oral gavage, and then quickly awakened. Each
animal received one single dose of radiolabelled nanoparticles (1 mCi; 0.8-1.0 mg of
radiolabelled nanoparticles that were completed with up to 10 mg with unlabelled
nanoparticles). Three hours after administration of nanoparticles, animals were anaesthetised
with 2% isoflurane gas (flow of oxygen of 0.2L/min) and placed in prone position on the
gammacamera (Symbia T2 Truepoint; Siemens Medical System, Malvern, USA). SPECT-CT
images were acquired for 25 min, with the following parameters for SPECT: 128 x 128 matrix,
90 images, 7 images per sec and CT: 110 mAs and 130 Kv, 130 images, slice thickness 3 mm
Fused images were processed using the Syngo MI Applications TrueD software.
2.13. In vivo evaluation of the mucus-penetrating properties of
nanoparticles
These studies were carried out using a protocol described previously [17] with minor
modifications, after approval by the responsible Committee by the University of Navarra
(Ethical and Biosafety Committee for Research on Animals). Briefly, male Wistar rats (average
weight 225 g; Harlan, Barcelona, Spain) were placed in metabolic cages and fasted overnight
but with free access to water. All animals received orally 25 mg of fluorescently labeled
nanoparticles dispersed in 1 mL water. At different times, animals were sacrificed. The
abdominal cavity was opened in order to remove the stomach and small intestine, which were

CONFIDENTIAL CHAPTER 4: The effect of thiamine-coating nanoparticles on their
biodistribution and fate following oral administration
89
removed and carefully rinsed with phosphate buffer saline (PBS) in order to eliminate the
fraction of nanoparticles remaining in the lumen. Then, both the stomach and the small
intestine, were cut into small portions to facilitate their digestion with NaOH 3M for 24 h and
the resulting residues were treated with methanol and centrifuged. Finally, aliquots of the
supernatants were assayed for Lumogen® F Red 305 content by spectrofluorimetry (TECAN,
Grödig, Austria) at ex 485 nm and em 540 nm.
Finally, the tissue distribution of nanoparticles in the gastrointestinal mucosa was
visualized by fluorescence microscopy. For that purpose, 25 mg of Lumogen® F Red-labelled
nanoparticles were orally administered to rats as described above. Two hours later, animals
were sacrificed by cervical dislocation and the guts were removed. Ileum portions of 1 cm were
collected, cleaned with PBS, stored in the tissue proceeding medium O.C.T.TM
compound and
frozen at -80 °C. Each portion was then cut into 5-µm sections on a cryostat and attached to
glass slides. Finally, these samples were fixed with formaldehyde and incubated with DAPI
(4’,6-diamidino-2-phenylindole) for 15 min before the cover assembly. The presence of both
fluorescently loaded poly(anhydride) nanoparticles in the intestinal mucosa and the cell nuclei
dyed with DAPI were visualized in a fluorescence microscope (Axioimager M1, Zeiss,
Oberkochen, Germany) with a coupled camera (Axiocam ICc3, Zeiss, Oberkochen, Germany)
and fluorescent source (HBO 100, Zeiss, Oberkochen, Germany). The images were captured
with the software ZEN (Zeiss, Oberkochen, Germany).
2.14. Statistical analysis
The in vivo data were compared using a one way analisys of the variance (one-way
ANOVA) followed by a Tukey-Kramer multicomparison test, using the NCSS 11 statistical
software (Kaysville, US). The difference was considered as significant when p<0.05 or p<0.001.
3. Results
3.1. Characterization of Gantrez-thiamine conjugates (GT)
The infrared spectroscopy study of the conjugates (Figure 2) showed the formation of a
new binding at ~1,650 cm-1
associated with the stretching of the new amide group v (C=O)
originated as a result of the amine group of the thiamine and the anhydride groups of Gantrez ®
AN 119.

CONFIDENTIAL CHAPTER 4: The effect of thiamine-coating nanoparticles on their
biodistribution and fate following oral administration
90
Figure 2. IR spectra of Gantrez® AN polymer (black line) and Gantrez
® AN-thiamine conjugate
(red line). The arrow shows the new binding formed corresponding to the new amide group.
Regarding elemental analysis (Table 1), the binding of thiamine to the polymer
backbone slightly decreased the percentage of carbon, whereas the hydrogen content increased.
On the other hand, the titration of the hydrated polymer and conjugates confirmed a
reduction in the amount of free carboxylic groups by the binding of thiamine to Gantrez® AN
(Table 1). In fact, under the experimental conditions used here, about 13% of the carboxylic
acid groups from hydrated poly(anhydride) would be used for the covalent binding of thiamine.
In other words, the % of substitution means that 13 molecules of the maleic anhydride groups of
each 100 residues in Gantrez® AN had reacted with thiamine to generate amide group and
carboxylic acid.
By HPLC, the amount of thiamine associated to the poly(anhydride) backbone was
calculated to be 8.7 µg/mg. Finally, with this data, the MW of the conjugate (GT) was 96.33
kDa.
Table 1. Physico-chemical characterization of Gantrez® AN and its conjugate with thiamine
(GT). For titration and HPLC experiments, data expressed as mean ± SD (n=3).
Polymer C% H% O% %Free-
COOH DS (%)
MW
(kDa)
Thiamine
content
(µg/mg G)
G 53.49 5.18 41.33 100 ± 0 0 95.50 -
GT 53.19 5.58 41.23 87 ± 1 13 96.33 8.7 ± 0.6

CONFIDENTIAL CHAPTER 4: The effect of thiamine-coating nanoparticles on their
biodistribution and fate following oral administration
91
3.2. Preparation of thiamine-coated nanoparticles
Thiamine coated nanoparticles were prepared following two different preparative
processes. The first method consisted in the preparation of Gantrez® AN nanoparticles (NP or
“naked” poly(anhydride) nanoparticles) followed by a thiamine coating procedure (T-NPA).
The second method consisted in the preparation of nanoparticles from a Gantrez® AN-thiamine
conjugate previously synthetized (T-NPB). Table 2 shows the main physico-chemical
properties of the resulting nanoparticles. In all cases, the different nanoparticle formulations
displayed a mean size of about 210-220 nm and a negative zeta potential. However, the negative
surface charge was slightly lower for nanoparticles obtained from the GT (T-NPB) than for
thiamine coated nanoparticles (T-NPA) and the “naked” nanoparticles (NP). Interestingly, both
preparative procedures yielded homogeneous batches of nanoparticles (PDI lower than 0.2) and
high yields close to 97.5%. On the other hand, for T-NPA within these results, the estimated
value of thiamine density on the surface of T-NPA (dT) was 0.98 nm-2
and the surface area
occupied by the thiamine molecule was 1,01 nm2. The amount of thiamine associated to the
nanoparticles was 15 µg/mg. Finally, the amount of Lumogen®
F Red 305 incorporated into the
nanoparticles was calculated to be similar for all the formulations tested and close to 0.7 µg/mg
(data not shown).
Table 2. Physico-chemical characterization of nanoparticles. Data expressed as mean ± SD
(n=3).
Formulation Size (nm) PDI Zeta Potential (mV) Thiaminea(µg/mg NP)
NP 213 ± 4 0.031 ± 0.012 -36.2 ± 3.0 -
T-NPA 215 ± 3 0.128 ± 0.023 -38.5 ± 3.2 15 ± 6.0
T-NPB 227 ± 5 0.092 ± 0.020 -30.6 ± 5.4 ND
a thiamine content in nanoparticles’ surface.
NP: “naked” poly(anhydride) nanoparticles; T-NPA: poly(anhydride) nanoparticles coated with
thiamine; T-NPB: Gantrez®
AN-thiamine conjugate nanoparticles.
Figure 3 shows the morphological analysis of the different nanoparticle formulations.
This analysis by SEM confirmed that all batches of nanoparticles consisted of homogeneous
populations of spherical particles. NP presented a smoother surface than thiamine-coated
nanoparticles and T-NPB. In addition, T-NPA appeared to be slightly rougher than T-NPB.

CONFIDENTIAL CHAPTER 4: The effect of thiamine-coating nanoparticles on their
biodistribution and fate following oral administration
92
Figure 3. Scanning electron microphotographs of “naked” poly(anhydride) nanoparticles (A),
T-NPA (B) and T-NPB (C).
3.3. In vitro evaluation of the mucus-penetrating properties of
nanoparticles
PGSE-NMR is a non-invasive technique that allows determination of the diffusive
character of mucin gel and changes in that dynamic property on addition of selected polymer
nanoparticles. The diffusion coefficient is measured from the decrease in intensity of the peaks
in the NMR spectrum, a rapidly decaying signal corresponds to high mobility quantified in
terms of a large diffusion coefficient (Figure 4).

CONFIDENTIAL CHAPTER 4: The effect of thiamine-coating nanoparticles on their
biodistribution and fate following oral administration
93
In complex systems such as those being examined here, it is quite common for the data
to show more than one diffusive rate. These may arise due to the presence of several
components that show peaks at the same chemical shift (so-called overlapping spectra) or that
particular component being present in different physical environments, e.g. gelled or non-gelled
materials. Under those circumstances, it is first useful to consider an average diffusion
coefficient, being the signal intensity-weighted value of the other discrete values, Table 3, when
the different nanoparticle formulations used in this study have been added to the mucin samples.
Analysing the ratio of the mean diffusion coefficients i.e. the mucin plus nanoparticles
value divided by the value from the mucin-only sample, shows that the mucin diffusion was
largely unchanged for the control particle (row ”NP”). On the contrary, the ratio of the weighted
mucin diffusion coefficients increased a factor of 5-fold when both thiamine decorated
nanoparticles were incubated with mucin, addition of the nanoparticles increased the dynamics
of the mucin.
Focusing on the detail within the analysis, the entire PGSE-NMR spectra for mucin
alone fitted best to two diffusive rates, (Figure 4A), with peaks occurring at similar chemical
shifts for both components i.e. the same material. The most straightforward interpretation would
be that the gelled fraction of the mucin (sometimes called “firm”) corresponds to the slower
diffusing component, (Dslow= 2.1 E-13 m2/s), representing 21% of the signal, whereas the faster
term, the greater component, is the non-gelled fraction (Dfast=8.3E-12 m2/s; 79% of the signal).
Interestingly, when nanoparticles were added to the mucin sample, a third much slower
diffusive rate appeared (Figure 4B), respect to the other two components, indicating
modification of the structure of the mucin gel. This modification decreases the mobility of some
of the mucin but significantly increases the mobility of another portion. Notwithstanding the
emergence of this slow component, the diffusion of the bulk of the mucin increased (Table 3,
columns D2 and D3), with the principle component and the average value some 4-5 times
higher for thiamine decorated nanoparticles than for the naked poly(anhydride) nanoparticles.

CONFIDENTIAL CHAPTER 4: The effect of thiamine-coating nanoparticles on their
biodistribution and fate following oral administration
94
AA1 A2
A3
BB1 B2 B3
B4
Figure 4. PGSE-NMR spectra of mucin alone (A3) obtained from the two components forming
the gel (A1-A2) and mucin in the presence of nanoparticles (B4) obtained from the three
components forming the gel (B1-B3). x axis: frequency; y axis: intensity and z axis: trace.
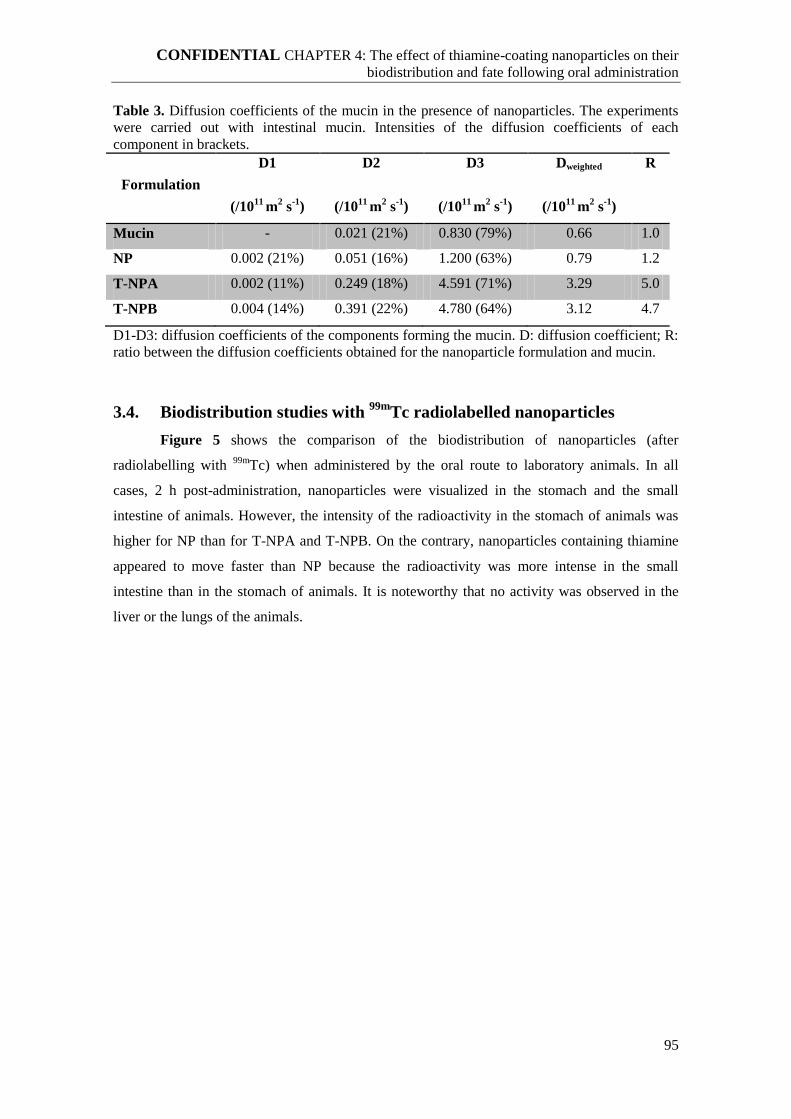
CONFIDENTIAL CHAPTER 4: The effect of thiamine-coating nanoparticles on their
biodistribution and fate following oral administration
95
Table 3. Diffusion coefficients of the mucin in the presence of nanoparticles. The experiments
were carried out with intestinal mucin. Intensities of the diffusion coefficients of each
component in brackets.
Formulation
D1
(/1011
m2 s
-1)
D2
(/1011
m2 s
-1)
D3
(/1011
m2 s
-1)
Dweighted
(/1011
m2 s
-1)
R
Mucin - 0.021 (21%) 0.830 (79%) 0.66 1.0
NP 0.002 (21%) 0.051 (16%) 1.200 (63%) 0.79 1.2
T-NPA 0.002 (11%) 0.249 (18%) 4.591 (71%) 3.29 5.0
T-NPB 0.004 (14%) 0.391 (22%) 4.780 (64%) 3.12 4.7
D1-D3: diffusion coefficients of the components forming the mucin. D: diffusion coefficient; R:
ratio between the diffusion coefficients obtained for the nanoparticle formulation and mucin.
3.4. Biodistribution studies with 99m
Tc radiolabelled nanoparticles
Figure 5 shows the comparison of the biodistribution of nanoparticles (after
radiolabelling with 99m
Tc) when administered by the oral route to laboratory animals. In all
cases, 2 h post-administration, nanoparticles were visualized in the stomach and the small
intestine of animals. However, the intensity of the radioactivity in the stomach of animals was
higher for NP than for T-NPA and T-NPB. On the contrary, nanoparticles containing thiamine
appeared to move faster than NP because the radioactivity was more intense in the small
intestine than in the stomach of animals. It is noteworthy that no activity was observed in the
liver or the lungs of the animals.

CONFIDENTIAL CHAPTER 4: The effect of thiamine-coating nanoparticles on their
biodistribution and fate following oral administration
96
Stomach
Intestine
Figure 5. Volume rendered fused SPECT-CT images from representative animals 2 h after
administration of 99m
Tc-labelled NP by oral gavage. NP: “naked” nanoparticles; T-NPA:
thiamine-coated poly(anhydride) nanoparticles; T-NPB: Gantrez®
AN-thiamine nanoparticles.
3.5. Evaluation of the mucus-penetrating properties of nanoparticles
Figure 6 shows the evaluation of the interaction of nanoparticles with the surface of the
stomach mucosa and the small intestine expressed as the adhered fraction of the given dose. In
all cases the animals received a dose of 25 mg of nanoparticles dispersed in 1 mL water. Two
hours post-administration (Figure 6A), significant differences were found between control
nanoparticles (NP), which displayed a significantly higher capability to interact with the
stomach mucosa than nanoparticles containing thiamine (p<0.05). Actually, the fraction of the
given dose in close contact with the stomach mucosa was almost 3-fold higher than T-NPA and
almost 14-fold higher than for T-NPB.
Regarding the small intestine, the capability of NP to interact with the mucosa was
significantly lower than for nanoparticles containing thiamine. In fact, both T-NPA and T-NPB
presented a strong capability to remain close contact with the surface of the small intestine
(mainly in the I2 segment corresponding with the distal jejunum and proximal ileum). Thus, for
both types of nanoparticles, more than 30% of the given dose was found in close contact with
the surface of the mucosa, compared with a 13.5% in the case of NP.
Four hours post-administration (Figure 6B), the remained fraction of NP in close
contact with the gut mucosa was very low. Only a small amount was quantified in the distal
region of the ileum and caecum. On the contrary, for T-NPA and T-NPB, about 35% of the
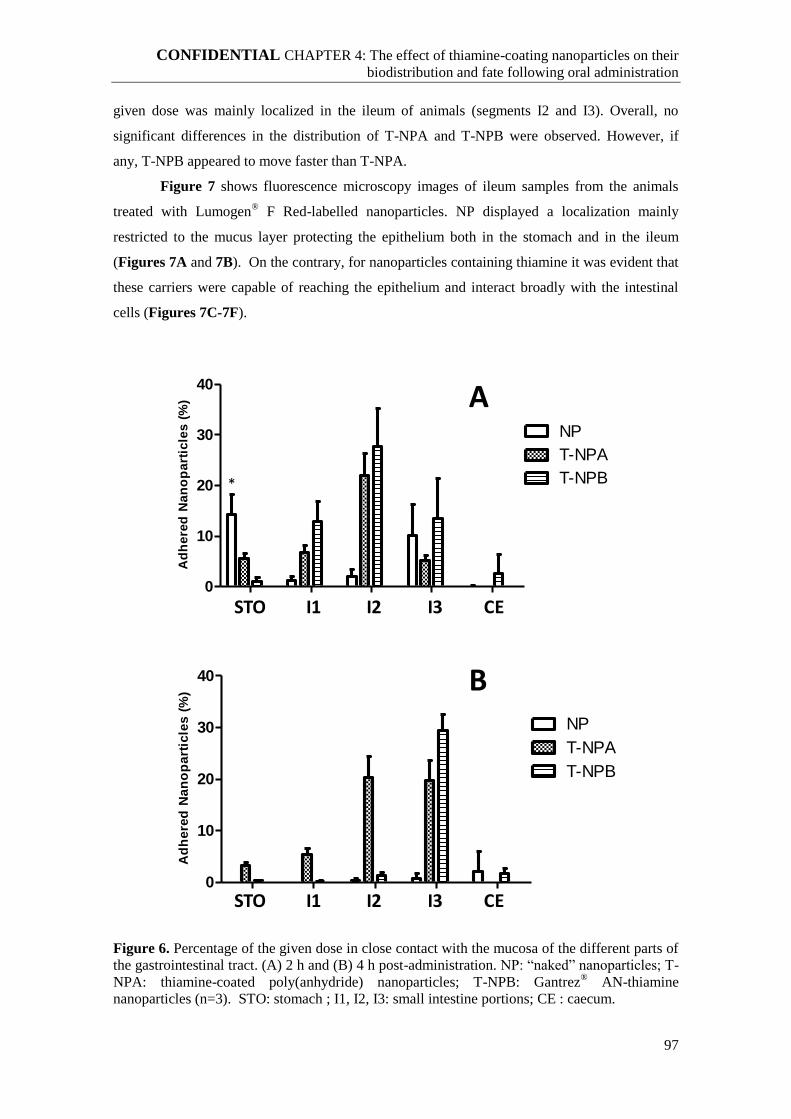
CONFIDENTIAL CHAPTER 4: The effect of thiamine-coating nanoparticles on their
biodistribution and fate following oral administration
97
given dose was mainly localized in the ileum of animals (segments I2 and I3). Overall, no
significant differences in the distribution of T-NPA and T-NPB were observed. However, if
any, T-NPB appeared to move faster than T-NPA.
Figure 7 shows fluorescence microscopy images of ileum samples from the animals
treated with Lumogen® F Red-labelled nanoparticles. NP displayed a localization mainly
restricted to the mucus layer protecting the epithelium both in the stomach and in the ileum
(Figures 7A and 7B). On the contrary, for nanoparticles containing thiamine it was evident that
these carriers were capable of reaching the epithelium and interact broadly with the intestinal
cells (Figures 7C-7F).
STO I1 I2 I3 C
E
0
10
20
30
40
NP
T-NPA
T-NPB
Ad
he
red
Na
no
pa
rtic
les
(%
)
STO I1 I2 I3 C
E
0
10
20
30
40
NP
T-NPA
T-NPB
Ad
he
red
Na
no
pa
rtic
les
(%
)
A
B
*
STO I1 I2 I3 CE
STO I1 I2 I3 CE
Figure 6. Percentage of the given dose in close contact with the mucosa of the different parts of
the gastrointestinal tract. (A) 2 h and (B) 4 h post-administration. NP: “naked” nanoparticles; T-
NPA: thiamine-coated poly(anhydride) nanoparticles; T-NPB: Gantrez® AN-thiamine
nanoparticles (n=3). STO: stomach ; I1, I2, I3: small intestine portions; CE : caecum.

CONFIDENTIAL CHAPTER 4: The effect of thiamine-coating nanoparticles on their
biodistribution and fate following oral administration
98
Lumen
Epithelium
Mucus layer
Figure 7. Fluorescence microscopic visualisation of nanoparticles containing thiamine (T-NPA
and T-NPB) and control ones (NP) in a longitudinal section of the ileum of rats 2 h post
administration. A: NP in the stomach mucosa; B: NP in the ileum mucosa; C and D: T-NPA in
the ileum mucosa; E and F: T-NPB in the ileum mucosa.
4. Discussion
In this work, the effect of the preparative process of thiamine-coated nanoparticles on
their distribution within the gut (after oral administration) was evaluated. For this purpose, two
different procedures for the preparation of these nanocarriers were compared.
In the former, a conventional procedure with two consecutive steps was employed [17].
In this approach, the copolymer of methyl vinyl ether and maleic anhydride (Gantrez® AN) was
initially transformed into poly(anhydride) nanoparticles and, subsequently, functionalized with

CONFIDENTIAL CHAPTER 4: The effect of thiamine-coating nanoparticles on their
biodistribution and fate following oral administration
99
thiamine before purification and drying. With this approach, the resulting thiamine-coated
nanoparticles (T-NPA) displayed a mean size of about 215 nm and a negative zeta potential of –
38 mV (Table 2). These physico-chemical characteristics were quite similar to that observed for
bare nanoparticles (NP); although T-NPA, when observed by SEM (Figure 2), displayed a
rougher surface than NP. In addition, the amount of thiamine associated with T-NPA
nanoparticles was about 15 µg/mg with a surface density (dT) of about 0.98 molecules per nm2.
In spite of its simplicity, this typical approach may be not the most adequate when biologically
active compounds of hydrophilic nature (e.g., therapeutic peptides and proteins) have to be
encapsulated into these nanoparticles. In fact, during the functionalization process, a significant
fraction of the encapsulated compound may be lost due to a premature release in the medium in
which the binding takes place [24–26]. This migration of the loaded compound (from the
nanoparticle matrix through the external medium) may also affect the surface properties of the
resulting nanoparticles and, thus, their behaviour in vivo.
In the latter, the first step was to build a conjugate (between Gantrez® AN and thiamine)
to be used as material for the preparation of the functionalized nanoparticles. This strategy is
more time-demanding due to the necessary synthesis of the precursor. However, the subsequent
preparation step to form the nanoparticles is simpler and shorter, minimizing the negative
effects on the payload.
In our case, the synthesized conjugate between Gantrez® AN and vitamin B1 contained
about 9 µg thiamine per mg, with a substitution degree of 13%. From this polymer conjugate,
the resulting nanoparticles (T-NPB) displayed comparable sizes (227 vs. 215 nm, Table 2) and
a slightly lower negative zeta potential (-30 vs. -38 mV, Table 2) than T-NPA. By SEM, T-NPB
presented a similarly rough surface as did T-NPA (Figure 2). However, the main concern by
using the Gantrez® AN-thiamine conjugate was the impossibility of precisely determined the
number of thiamine molecules on the surface of the resulting nanoparticles (T-NPB). For other
types of hydrophilic conjugates, such as copolymers between polyesters and poly(ethylene
glycol) (e.g. PLGA-PEG), it has been confirmed that during the formation of nanoparticles the
polyester chains form the core, while PEG chains are oriented to the water phase [27,28]. In our
case, it is plausible to imagine that the hydrophilic residues of thiamine would be mainly
exposed on the surface of nanoparticles. In order to confirm this hypothesis, the mucus
penetrating properties of nanoparticles as well as their fate in vivo was studied.
When T-NPA or T-NPB were orally administered to rats, they distributed along the
gastrointestinal tract (Figure 4) with a lower tendency to concentrate in the stomach of animals
than bare nanoparticles. This observation was corroborated by the measurement of the
fluorescence marker associated with the nanoparticles in different gut sections (Figure 5). Thus,
2 h post-administration, about 15% of the given dose of NP was quantified in contact with the

CONFIDENTIAL CHAPTER 4: The effect of thiamine-coating nanoparticles on their
biodistribution and fate following oral administration
100
stomach mucosa. This value represented at least 3-times greater dose than for T-NPA or T-
NPB. On the contrary, the amounts of T-NPA or T-NPB adhered to the small intestine mucosa
(mainly in the distal jejunum and proximal ileum, I2 segment in Figure 5A) were significantly
higher than for NP (p<0.001). Four hours post-administration, the amount of bare nanoparticles
adhered to the gut mucosa was very low, whereas, for T-NPA and T-NPB, the fraction of the
given dose in close contact with the small intestine mucosa remained higher than 30%. These
observations are in line with our previous results in which the coating of poly(anhydride)
nanoparticles with thiamine (T-NPA) increased 3-fold the capability of these nanocarriers to
develop adhesive interactions within the gut and, at the same time, decreased their elimination
rate from the mucosa [17]. In addition, it was clear, when analysed microscopically, that bare
nanoparticles displayed a different behaviour than thiamine-nanoparticles (T-NPA and T-NPB)
(Figure 6). Thus, within the gut mucosa, NP were localized in the protective mucus layer
confirming their mucoadhesive capability [29]. On the contrary, thiamine nanoparticles
appeared to be capable of reaching the intestinal epithelium, confirming their mucus-penetraing
properties. These results agree well with those obtained from the in vitro evaluation of the
diffusion of the intestinal mucin by PGSE-NMR (Figure 3, Table 3). Interestingly, the
diffusion coefficient of intestinal mucin was not affected when bare nanoparticles were added.
However, when incubated with T-NPA or T-NPB, there was a significant increase in the
diffusion coefficient of the mucin (about 5-fold). These differences can only be attributed to the
presence of thiamine on the surface of nanoparticles that would transform their surface
conferring slippery properties and facilitating their permeability through a mucus gel layer. It is
also worth noting that the mucin alone, and due to its heterogeneous composition, fitted well to
two diffusion coefficients, as described previously [9] (Dfast=8.3E-12 m2/s, 21% of the signal;
Dslow= 2.1 E-13 m2/s, 79% f the signal).
On the other hand, when nanoparticles were added to the mucin samples the spectra
fitted best to 3 diffusion coefficients indicating that poly(anhydride) nanoparticles possess a
hydrophobic surface and one could imagine a strong interaction with the hydrophobic portions
of the mucin molecule, which would lead to a mucoadhesive property and presumably a
viscosification of the sample as the particles act as nodes for the enhancement of the mucin gel
cross-linking. However, the polymer backbone forming the thiamine decorated nanoparticles
has a highly dense coat of the low MW and highly hydrophilic compound, thiamine, which one
assumes will prevent an interaction with the mucin network.

CONFIDENTIAL CHAPTER 4: The effect of thiamine-coating nanoparticles on their
biodistribution and fate following oral administration
101
5. Conclusion
In summary, the mucoadhesive poly(anhydride) nanoparticles were transformed into
mucus-penetrating ones by their coating with vitamin B1. These thiamine-nanoparticles
displayed a high ability to diffuse and cross through the protective mucus layer in order to reach
the intestinal epithelium. In consequence, thiamine-decorated nanoparticles may be prepared by
two different procedures. Both approaches yield nanocarriers with similar physico-chemical and
biodistribution properties. This result increases the versatility of such nanocarriers as oral
delivery systems for a number of biologically active compounds.
Acknowledgements
The research leading to these results has received funding from the European
Community's Seventh Framework Programme [FP7/2007-2013] for ALEXANDER under grant
agreement n° NMP-2011-1.2-2-280761. Furthermore, Laura Inchaurraga acknowledges
“Asociación de Amigos” of the University of Navarra for the financial support.
CONFIDENTIAL CHAPTER 4: The effect of thiamine-coating nanoparticles on their
biodistribution and fate following oral administration
102
References
[1] E. Roger, F. Lagarce, E. Garcion, J.P. Benoit, Biopharmaceutical parameters to consider in order
to alter the fate of nanocarriers after oral delivery, Nanomedicine 5 (2010) 287–306.
[2] J.D. Schulz, M.A. Gauthier, J.C. Leroux, Improving oral drug bioavailability with polycations?,
Eur. J. Pharm. Biopharm. 97 (2015) 427–437.
[3] A. des Rieux, V. Fievez, M. Garinot, Y.J. Schneider, V. Préat, Nanoparticles as potential oral
delivery systems of proteins and vaccines: A mechanistic approach, J. Control Release 116 (2006)
1–27.
[4] J.S. Suk, S.K. Lai, Y.Y. Wang, L.M. Ensign, P.L. Zeitlin, M.P. Boyle, J. Hanes, The penetration
of fresh undiluted sputum expectorated by cystic fibrosis patients by non-adhesive polymer
nanoparticles, Biomaterials 30 (2009) 2591–2597.
[5] L. Inchaurraga, N. Martín-Arbella, V. Zabaleta, G. Quincoces, I. Peñuelas, J.M. Irache, In vivo
study of the mucus-permeating properties of PEG-coated nanoparticles following oral
administration, Eur. J. Pharm. Biopharm. 97 (2015) 280–289.
[6] T. Pelaseyed, J.H. Bergström, J.K. Gustafsson, A. Ermund, G.M.H. Birchenough, A. Schütte, S.
van der Post, F. Svensson, A.M. Rodríguez-Piñeiro, E.E.L. Nyström, C. Wising, M.E. V
Johansson, G.C. Hansson, The mucus and mucins of the goblet cells and enterocytes provide the
first defense line of the gastrointestinal tract and interact with the immune system, Immunol. Rev.
260 (2014) 8–20.
[7] L.M. Ensign, R. Cone, J. Hanes, Oral drug delivery with polymeric nanoparticles: The
gastrointestinal mucus barriers, Adv. Drug Deliv. Rev. 64 (2012) 557–570.
[8] V. Bourganis, T. Karamanidou, E. Samaridou, K. Karidi, O. Kammona, C. Kiparissides, On the
synthesis of mucus permeating nanocarriers, Eur. J. Pharm. Biopharm. 97 (2015) 239–249.
[9] I. Pereira de Sousa, B. Cattoz, M.D. Wilcox, P.C. Griffiths, R. Dalgliesh, S. Rogers, A. Bernkop-
Schnürch, Nanoparticles decorated with proteolytic enzymes, a promising strategy to overcome
the mucus barrier, Eur. J. Pharm. Biopharm. 97 (2015) 257–264.
[10] I. Pereira de Sousa, C. Steiner, M. Schmutzler, M.D. Wilcox, G.J. Veldhuis, J.P. Pearson, C.W.
Huck, W. Salvenmoser, A. Bernkop-Schnürch, Mucus permeating carriers: formulation and
characterization of highly densely charged nanoparticles, Eur. J. Pharm. Biopharm. 97 (2015)
273–279.
[11] S. Gómez, C. Gamazo, B.S. Roman, M. Ferrer, M.L. Sanz, J.M. Irache, Gantrez® AN
nanoparticles as an adjuvant for oral immunotherapy with allergens, Vaccine 25 (2007) 5263–
5271.
[12] H.H. Salman, C. Gamazo, M.A. Campanero, J.M. Irache, Salmonella-like bioadhesive
nanoparticles, J. Control Release 106 (2005) 1–13.
[13] Y.Y. Wang, S.K. Lai, J.S. Suk, A. Pace, R. Cone, J. Hanes, Addressing the PEG Mucoadhesivity
Paradox to Engineer Nanoparticles that “Slip” through the Human Mucus Barrier, Angew.
Chemie Int. Ed. 47 (2008) 9726–9729.
[14] V. Zabaleta, G. Ponchel, H. Salman, M. Agüeros, C. Vauthier, J.M. Irache, Oral administration of
paclitaxel with pegylated poly(anhydride) nanoparticles: Permeability and pharmacokinetic study,
Eur. J. Pharm. Biopharm. 81 (2012) 514–523.
[15] F. Laffleur, F. Hintzen, G. Shahnaz, D. Rahmat, K. Leithner, A. Bernkop-Schnürch, Development
and in vitro evaluation of slippery nanoparticles for enhanced diffusion through native mucus,
Nanomedicine 9 (2014) 387–396.
[16] H.H. Salman, C. Gamazo, M.A. Campanero, J.M. Irache, Bioadhesive Mannosylated
Nanoparticles for Oral Drug Delivery, J. Nanosci. Nanotechnol. 6 (2006) 3203–3209.
[17] H.H. Salman, C. Gamazo, M. Agüeros, J.M. Irache, Bioadhesive capacity and immunoadjuvant
properties of thiamine-coated nanoparticles, Vaccine 25 (2007) 8123–8132.
[18] R. Singh, J.W. Lillard, Nanoparticle-based targeted drug delivery, Exp. Mol. Pathol. 86 (2009)
215–223.
[19] Ashland Incorpation at www.ashland.com, [retrieved date was August 13, 2014]
[20] C. Taylor, A. Allen, P.W. Dettmar, J.P. Pearson, Two rheologically different gastric mucus
secretions with different putative functions, Biochim. Biophys. Acta - Gen. Subj. 1674 (2004)
131–138.
[21] P.T. Callaghan, Principles of nuclear magnetic resonance microscopy, Oxford University Press,
Oxford, 1991.
[22] P. Stilbs, and K. Paulsen, P.C. Griffiths, Global least-squares analysis of large, correlated
spectral data sets: application to component-resolved FT-PGSE NMR spectroscopy, (1996).
[23] P. Areses, M.T. Agüeros, G. Quincoces, M. Collantes, J.Á. Richter, L.M. López-Sánchez, M.

CONFIDENTIAL CHAPTER 4: The effect of thiamine-coating nanoparticles on their
biodistribution and fate following oral administration
103
Sánchez-Martínez, J.M. Irache, I. Peñuelas, Molecular imaging techniques to study the
biodistribution of orally administered 99mTc-labelled naive and ligand-tagged nanoparticles,
Mol. Imaging Biol. 13 (2011) 1215–1223.
[24] B.C. Tang, M. Dawson, S.K. Lai, Y.Y. Wang, J.S. Suk, M. Yang, P. Zeitlin, M.P. Boyle, J. Fu, J.
Hanes, Biodegradable polymer nanoparticles that rapidly penetrate the human mucus barrier,
Proc. Natl. Acad. Sci. 106 (2009) 19268–73.
[25] G. Dalwadi, H.A.E. Benson, Y. Chen, Comparison of diafiltration and tangential flow filtration
for purification of nanoparticle suspensions, Pharm. Res. 22 (2005) 2152–2162.
[26] Y.B. Patil, U.S. Toti, A. Khdair, L. Ma, J. Panyam, Single-step surface functionalization of
polymeric nanoparticles for targeted drug delivery, Biomaterials 30 (2009) 859–866.
[27] Y.P. Li, Y.Y. Pei, X.Y. Zhang, Z.H. Gu, Z.H. Zhou, W.F. Yuan, J.J. Zhou, J.H. Zhu, X.J. Gao,
PEGylated PLGA nanoparticles as protein carriers: synthesis, preparation and biodistribution in
rats, J. Control Release 71 (2001) 203–211.
[28] S. Schubert, J.T. Delaney, Jr, U.S. Schubert, Nanoprecipitation and nanoformulation of polymers:
from history to powerful possibilities beyond poly(lactic acid), Soft Matter 7 (2011) 1581–1588.
[29] P. Arbós, M.A. Arangoa, M.A. Campanero, J.M. Irache, Quantification of the bioadhesive
properties of protein-coated PVM/MA nanoparticles, Int. J. Pharm. 242 (2002) 129–136.


CHAPTER 5
The effect of insulin loading in the in vitro mucus-penetrating
properties of thiamin decorated nanoparticles


CONFIDENTIAL CHAPTER 5: The effect of insulin loading in the in vitro mucus-
penetrating properties of thiamine decorated nanoparticles
107
The effect of insulin loading in the in vitro mucus-penetrating
properties of thiamine decorated nanoparticles
Abstract
The mucus-penetrating properties of insulin-loaded thiamine-decorated nanoparticles
have been evaluated in vitro. In a previous chapter it was demonstrated that thiamine-decorated
nanoparticles based on the Gantrez® AN-thiamine (GT) conjugate displayed an important
capability to penetrate through the mucus protective layer. In this chapter the idea was to
evaluate the influence of the cargo (insulin) in this capability. The resulting nanoparticles
displayed comparable sizes (~200 nm) and slightly negative surface charges. The amount of
insulin encapsulated was optimized and ranged from 55 µg/mg to 108 µg/mg of nanoparticle,
depending on the insulin/GT ratio used in the preparative process. In vitro evaluation of
nanoparticles in intestinal pig mucin by Pulsed-Gradient Spin-Echo nuclear magnetic resonance
(PGSE-NMR) assays. These studies revealed a significant decrease in the mucin mobility and in
the mucus-penetrating properties of insulin-loaded nanoparticles. In addition, in vitro release
studies revealed that insulin was not released from nanoparticles. This fact may be related to the
formation of bonds between the protein and the polymer conjugate. In order to solve this
drawback, human serum albumin (HSA) was co-encapsulated with insulin in GT-nanoparticles.
The resulting nanocarriers displayed similar physico-chemical properties to those prepared in
the absence of albumin. However, the effect was discrete and only a 6% of the insulin content of
nanoparticles was released.

CONFIDENTIAL CHAPTER 5: The effect of insulin loading in the in vitro mucus-
penetrating properties of thiamine decorated nanoparticles
108
1. Introduction
The vast majority of currently marketed therapeutic proteins are delivered by injection
on account of stability issues and low permeability through the mucosal surfaces. For this
purpose, conventional delivery of therapeutic proteins employs sterile needles and syringes
(e.g., via intramuscular, subcutaneous or intradermal). The World Health Organization (WHO)
estimates that 12 billion injections are administered worldwide annually, of which 600 million
are vaccines and 11.4 billion for other treatments [1,2]. However, this way of administration is
associated to some side effects derived from inadequate practices and accidents during
manipulation including the risk of transmission of blood-borne diseases [3]. In fact, worldwide
unsafe medical injections have led to 15 million hepatitis B virus (HBV) infections, 1 million
hepattis C virus (HCV) infections, 340,000 human immunodeficiency virus (HIV) infections, 3
million bacterial infections and 850,000 injection site abscesses [4].
Another important factor associated to the parenteral delivery of biomacromolecules is
compliance, especially among patients with chronic diseases that need daily medication to
control their disease. Thus, it has been calculated that diabetic patients may take more than
60,000 injections during their life time [5]. Although new technologies for the parenteral
delivery of insulin (e.g., injection ports, jet injectors or implantable pumps) provide new
alternatives to daily injections, there have been several disadvantages, including skin irritation,
erythema, abscess formation, scarring and site infections [6,7].
Oral route through gastrointestinal tract (GIT) is an ideal choice for administration of
most drugs for its simplicity and convenience. For diabetes patients, this delivery route is very
attractive because it can avoid invasive administration of insulin as well as peripheral
hyperinsulinemia, which is associated with neuropathy and retinopathy [8–10]. However, oral
delivery of insulin has important limitations, including a very low bioavailability due to insulin
degradation in the GIT by the harsh pH conditions and the effect of proteolytic enzymes as well
as by a poor permeability through the intestinal epithelium [11,12]. In order to solve this
important hurdle, different approaches have been proposed including the use of permeation
enhancers or the employment of specialized particulate formulation vehicles with mucoadhesive
or mucus-penetrating properties.
In general, permeation enhancers improve the absorption of peptides and proteins by
disrupting (and reversible opening) of tight junctions between the cells of the mucosal
epithelium and/or by modifying the protective properties of the mucus gel layer [13]. Thus, it is
well known that surfactants may disrupt the intestinal membrane, leading to increased
permeability of proteins and peptides crossing the cell epithelium through the transcellular
pathway [14]. A similar mechanism has been described for chelating agents [15], chitosan and
its derivatives [16] or thiolated polymers [17]. On the other hand, bile salts may increase the

CONFIDENTIAL CHAPTER 5: The effect of insulin loading in the in vitro mucus-
penetrating properties of thiamine decorated nanoparticles
109
permeability of biomacromolecules through the decrease in mucus viscosity and peptidase
activity [18].
One of the most common approaches employed for the oral delivery of insulin has been
the use of mucoadhesive devices. In this case, the idea is to design a pharmaceutical device
capable of adhering to the mucus gel layer and facilitate the establishment of a concentration
gradient between the dosage form and the surface of the gut epithelium. For this purpose,
microparticles based on dextran and chitosan [19] or whey proteins and alginate [20] have been
proposed. Other mucoadhesive forms that have shown interesting results include liposomes
[21], chitosan derivatives-based nanoparticles [22,23] or blends of poly(epsilon-caprolactone)
and Eudragit® RS [24].
More recently, in order to overcome the mucus barrier, biodegradable mucus-
penetrating nanoparticles have been proposed [25–28]. Overall, the idea is to enhance the
diffusion of the nanocarriers into deeper mucus regions and facilitate their arrival to the surface
of cells constituting the gut epithelium (i.e., enterocytes). Once on the epithelium, nanoparticles
should release their cargo in a controlled way. In this context, we have developed thiamine-
decorated nanoparticles based on the copolymer of methyl vinyl ether and maleic anhydride
displaying interesting mucus-penetrating properties in vitro and in vivo [29, Chapter 4].
Thus, the aim of this work was the optimization of the preparative process of insulin-
loaded thiamine-decorated nanoparticles and the evaluation of the influence of the payload on
their diffusion properties in a pig mucin gel.
2. Materials and Methods
2.1. Chemicals
The copolymer of methyl vinyl ether and maleic anhydride or poly(anhydride)
(Gantrez® AN 119) was supplied by Ashland Inc. (Barcelona, Spain). Thiamine hydrochloride,
recombinant human insulin 10 mg/mL, lactose, sodium cloride and calcium chloride were
purchased from Sigma-Aldrich (Madrid, Spain). Di-sodium hydrogen phosphate anhydrous,
hydrochloric acid 37%, sodiumhydroxide, ethanol and acetonitrile were provided by Panreac
(Barcelona, Spain). Intestinal mucin was obtained from Jeff Pearson (Newcastle University,
Institute for Cell and Biomedical Sciences, Newcastle Upon Tyne, United Kingdom). Acetone
was from (VWR-Prolabo, Linars del Vallès, Spain) and sodium hydroxide and isopropanol from
Merck (Madrid, Spain). Deionized reagent water was prepared by a water purification system
(Wasserlab, Pamplona, Spain). Nitrogen gas (ultrapure, > 99) was produced using an Alltech
nitrogen generator (Ingeniería Analítica, Barcelona, Spain).

CONFIDENTIAL CHAPTER 5: The effect of insulin loading in the in vitro mucus-
penetrating properties of thiamine decorated nanoparticles
110
2.2. Preparation of Gantrez ® AN-thiamine conjugate (GT)
The conjugate was obtained by a method previously described previously [Chapter 4].
Briefly, 5 g Gantrez® AN were dissolved in 200 mL acetone. Then, 125 mg thiamine were
added and the mixture was heated at 50 ºC, under magnetic agitation at 400 rpm, for 3 h. Then,
the mixture was filtered through a pleated filter paper and the organic solvent was eliminated
under reduced pressure in a Büchi R-144 apparatus (BÜCHI Labortechnik AG, Flawil,
Switzerland) until the conjugate was totally dryed. Finally, the resulting powder was stored.
2.3. Preparation of insulin loaded thiamine decorated nanoparticles (I-T-
NP)
Thiamine-coated nanoparticles were prepared from two different experimental
procedures.
The first one consisted in the preparation of nanoparticles using the GT previously
synthesized. The procedure was based on a controlled desolvation of the conjugate (dissolved in
acetone) with water and subsequent stabilization with calcium. For this purpose, 200 mg GT
were dissolved in 10 mL acetone and nanoparticles were obtained by the addition of 20 mL
purified water containing 0.8 mg calcium chloride. Different amounts of insulin were added in
the aqueous solution of calcium chloride (10 mg, 15 mg and 20 mg). Acetone was eliminated
under reduced pressure in a BÜCHI R-144 apparatus (BÜCHI Labortechnik AG, Flawil,
Switzerland) and purified by centrifugation at 5,000 × g for 20 min (SIGMA, Osterode am
Harz, Germany) using dialysis tubes Vivaspin® 300,000 MWCO (Sartorius AG, Madrid, Spain).
Finally, 400 mg lactose dissolved in 20 mL deionized water were added to the pellet and
vortexed for 5 min. The resulting suspension of nanoparticles was dried in a Büchi Mini Spray
Drier B-290 apparatus (BÜCHI Labortechnik AG, Flawil, Switzerland) under the following
experimental conditions: inlet temperature of 90 ºC, outlet temperature of 60 ºC, spray-flow of
600 L/h, and aspirator at 100 % of the maximum capacity. These nanoparticles were named I-T-
NP. Control nanoparticles prepared in the same way but in the absence of insulin were
identified as T-NP.
The second procedure was performed using human serum albumin (HSA) in the
formulation. For this purpose, 200 mg GT were dissolved in 10 mL acetone and incubated with
either 0.2 mg or 2 mg HSA. Nanoparticles were obtained by the addition of 20 mL purified
water containing 0.8 mg calcium chloride and 15 mg insulin. Acetone was eliminated under
reduced pressure in a BÜCHI R-144 apparatus (BÜCHI Labortechnik AG, Flawil, Switzerland)
and purified by centrifugation at 5,000 × g for 20 min (SIGMA, Osterode am Harz, Germany)
using dialysis tubes Vivaspin® 300,000 MWCO (Sartorius AG, Madrid, Spain). Finally, 20 mL

CONFIDENTIAL CHAPTER 5: The effect of insulin loading in the in vitro mucus-
penetrating properties of thiamine decorated nanoparticles
111
of an aqueous solution of lactose (400 mg) were added to the pellet and vortexed for 5 min. The
resulting suspension of nanoparticles was dried in a Büchi Mini Spray Drier B-290 apparatus
(BÜCHI Labortechnik AG, Flawil, Switzerland) under the same conditions described above.
These nanoparticles were named I-T-NP-H.
2.4. Physico-chemical characterization of nanoparticles
2.4.1. Size, zeta potential and surface morphology analysis
The mean size and the zeta potential of freeze-dried nanoparticles were determined by
photon correlation spectroscopy (PCS) and electrophoretic laser Doppler anemometry,
respectively, using a Zetaplus apparatus (Brookhaven Instruments Corporation, Holtsville,
USA). In all cases, the size was measured after dispersion of nanoparticles in water whereas the
zeta potential was quantified in KCl 0.1 M.
2.4.2. Yield of nanoparticles formation
GT was quantified in the filtrates obtained during the purification step of empty
nanoparticles by a chromatographic method previously described [30]. The apparatus used for
the analysis was a HPLC Agilent model 1100 series LC (Waldbronn, Germany) coupled with an
evaporative light scattering detector, ELSD 2000 (Alltech, Illinois, USA). A nitrogen generator
(Alltech) was used as the source of the nitrogen gas. Data acquisition and analysis were
performed with a Hewlett-Packard computer using the ChemStation G2171 AA program. The
analysis was carried out at 50 ºC on a reversed-phase Zorbax Eclipse XDB-Phenyl column (2.1
mm × 150 mm; particle size 5 µm) obtained from Agilent Technologies (Waldbronn, Germany).
This column was protected by a 0.45 µm filter (Teknokroma, Spain). ELSD conditions were set
at 115 °C, the nitrogen flow was maintained at 3.2 L/min and the gain was set to 1. The mobile
phase composition was a mixture of acetonitrile and water in a gradient elution at a flow-rate of
0.25 mL/min. Standard curves were designed over the range of 50-1000 µg/mL (R2≥0.999) by
dilution of a GT stock solution with appropriate volumes of acetonitrile.
For analysis, 1 mL samples from the filtrates of the purification steps were transferred
to auto-sampler vials, capped and placed in the HPLC auto-sampler. Then, 5 µL aliquot was
injected onto the HPLC column. Finally, the amount of GT forming the nanoparticles was
calculated as the difference between the initial amount of GT used for the preparation of
nanoparticles and the amount of GT recovered in the filtrates by HPLC.
2.4.3. Insulin quantification
Insulin was quantified in the filtrates obtained during the purification step of
nanoparticles by a chromatographic method. For this purpose insulin was determined in an

CONFIDENTIAL CHAPTER 5: The effect of insulin loading in the in vitro mucus-
penetrating properties of thiamine decorated nanoparticles
112
Agilent model 1100 series LC and a diode-array detector set at 220 nm (Las Rozas, Spain). The
chromatographic system was equipped with a TSKgel4000 (7.8 mm x 30 cm) TosoHaas column
(Tosoh Bioscience GmbH, Griesheim, Germany). The mobile phase was a 0.3 M NaCl solution
in 0.05 M phosphate buffer. The flow-rate was 0.8 mL/min. The column was placed at 27 °C
and the injection volume was 40 µL. Standard curves were designed over the range of 2-100
µg/mL (R2≥0.999) from a human insulin solution and were prepared in supernatant of non-
loaded nanoparticles. The quantification limit was 2 µg/mL.
For analysis, samples of 1 mL from the filtrates of the purification steps were
transferred to auto-sampler vials, capped and placed in the HPLC auto-sampler. Then, 40 µL
aliquot was injected onto the HPLC column. Finally, the amount of insulin associated to the
nanoparticles was calculated as the difference between the initial amount of insulin added and
the amount of insulin recovered in the filtrates by HPLC.
2.5. Mucin purification from porcine mucus
Pig small intestines were obtained from a local abattoir immediately after slaughter and
transported on ice to the laboratory. Sections of the intestines that did not visibly contain chyme
were cut into 15 cm lengths and mucus was removed. To remove the mucus gentle pressure was
applied to one end of the length with the fingers and continuously applied unidirectionally to the
opposite end. Mucus gel was added to a cocktail of enzyme inhibitors in phosphate buffer, pH
6.8 [31]. The mucin was purified following the protocol described by Taylor et al. [31], with the
addition of a second caesium chloride gradient to further remove cellular debris from the
glycoprotein component of mucus. All freeze dried samples were stored at -20 °C until used.
2.6. Pulsed-Gradient Spin-Echo NMR assessment of mucin mobility
In order to evaluate the slippery capacities of nanoparticles, the diffusion of intestinal
pig mucin in presence of these nanocarriers was evaluated by pulsed-gradient spin-echo NMR
(PGSE-NMR). Measurements were performed on a Bruker DMX400 NMR spectrometer
operating at 400 MHz (1H) using a stimulated echo sequence [32]. All the experiments were run
at 37 °C using the standard heating/cooling system of the spectrometer to an accuracy of ±0.3
°C.
Generally, the proton NMR spectrum - a series of peaks located at characteristic values,
the so-called chemical shifts measured in ppm - is recorded from the solution with increasing
intensity of the pulsed-gradients. The self-diffusion coefficient, D, is deduced by fitting the
attenuation (decay) of the integral for a chosen peak to equation 4 as a function of the
characteristics of the gradient pulses,

CONFIDENTIAL CHAPTER 5: The effect of insulin loading in the in vitro mucus-
penetrating properties of thiamine decorated nanoparticles
113
( , , ∆) = 0exp [−k ] [Equation 1]
where is the signal intensity and k = 2 2 2 (∆ − /3 ), given is the magnetogyric ration, ∆
the diffusion time, the gradient pulse length, and is the gradient field strength. The gradient
pulses are ramped to their desired value over a ramp time, σ, and typically 250 µs.
For complex spectra such as those encountered here where the observed peaks may
arise from different components within the system, or there may be a range of diffusing rates,
the diffusion data are better analyzed by fitting to this equation 4 the entire spectrum using
“CORE”, a program devised to resolve the various components present in such data [33]. CORE
evaluates the experimental data in two levels, yielding not only estimates of the diffusion
coefficients for each component in the sample but also their relative intensities enabling a more
insightful analysis of complex datasets.
For the mucin diffusion coefficient measurement, the nanoparticles were dispersed in
deuterated water (0.5% w/v) as described before [28]. Then, the nanoparticles suspensions were
added into an intestinal mucin solution (5% w/v) also in deuterated water and left to equilibrate
for 24 h. Finally, 0.6 mL was transferred to 5 mm o.d. Wilmad NMR tubes (Sigma–Aldrich,
Haverhill, UK).
2.7. In vitro release studies
The release studies were performed in simulated gastric (SGF) and intestinal fluids
(SIF). For these purpose Float-A-Lyzer® devices with a MWCO of 300 kDa (Spectrum Labs,
Breda, The Nederlands) were used. First, the dialysis bags were washed with ethanol 10% for
10 min and, then, with water. The bags were filled with nanoparticles containing 10 mg insulin
dispersed in 5 mL water and placed into a vessel containing 45 mL of SGF. The vessel was
maintained under magnetic agitation and 500 µL samples were withdrawn at fixed time
intervals and replaced with equal volumes of SGF. After two hours of incubation in this gastric
fluid, the bags were transferred to a second vessel with 45 mL SIF. Again, at fixed times, 500
µL were withdrawn and replaced with free SIF. Insulin was quantified by the HPLC method
described above. Calibration curves in the simulated mediums (2-100 µg/mL; R2≥0.999 in both
cases) were generated.

CONFIDENTIAL CHAPTER 5: The effect of insulin loading in the in vitro mucus-
penetrating properties of thiamine decorated nanoparticles
114
3. Results
3.1. Preparation of insulin-loaded thiamine decorated nanoparticles (I-T-
NP)
The preparative process of insulin-loaded nanoparticles was optimized in terms of
insulin loading. Nanoparticles were prepared from the conjugate between Gantrez® AN and
thiamine by a controlled desolvation method. Insulin-loaded nanoparticles displayed
homogeneous sizes distributions of around 195-225 nm and negative surface charges. The
surface charge of empty nanoparticles was slightly more negative than for nanoparticles
containing insulin (Figure 1). The formation yield calculated for empty nanoparticles, used for
the calculations of the loading capacity and encapsulation efficiency, was estimated to be 92% ±
2.
Independently of the amount of insulin used in the preparation of the nanoparticles, and
under the experimental conditions tested, the encapsulation efficiency was in all cases close to
100%. At the maximum insulin/GT ratio tested (0.1), the loading capacity reached a maximum
of 108 µg insulin per mg nanoparticles. Higher insulin/GT ratios increased the formulation
polydispersity index (data not shown).
Co-encapsulation of HSA with insulin, as second approach, was developed for the
preparation of insulin-loaded nanoparticles. The insulin/GT ratio tested was 0.075. Two
different proportions of HSA/GT were used for the preparation of these nanoparticles (0.1% and
1%). Table 1 summarizes the main physico-chemical properties of the formulations. Both types
of nanoparticles displayed higher sizes than nanoparticles containing only insulin. Actually,
nanoparticles containing 0.1% of HSA showed a size of 230 and when 1% of HSA was used the
size was 250 nm and the polydispersity indexes were high in comparison with nanoparticles
prepared in the absence of HSA which showed a size of 201 nm.
The negative surface charges were slightly less negative, -35 mV, than for nanoparticles
prepared with insulin alone that displayed a surface charge of -39 mV. The payload of the
resulting nanocarriers was in all cases similar and close to 80 µg insulin per mg nanoparticles
that represented an EE of about 100%.
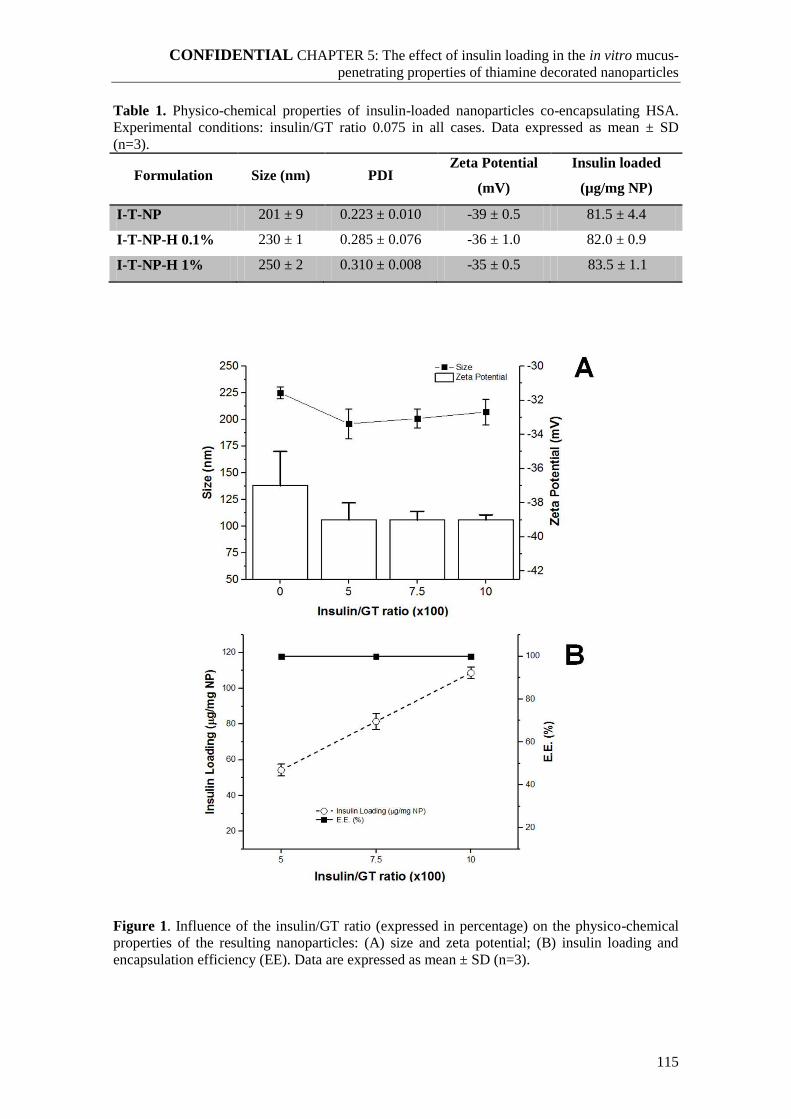
CONFIDENTIAL CHAPTER 5: The effect of insulin loading in the in vitro mucus-
penetrating properties of thiamine decorated nanoparticles
115
Table 1. Physico-chemical properties of insulin-loaded nanoparticles co-encapsulating HSA.
Experimental conditions: insulin/GT ratio 0.075 in all cases. Data expressed as mean ± SD
(n=3).
Formulation Size (nm) PDI Zeta Potential
(mV)
Insulin loaded
(µg/mg NP)
I-T-NP 201 ± 9 0.223 ± 0.010 -39 ± 0.5 81.5 ± 4.4
I-T-NP-H 0.1% 230 ± 1 0.285 ± 0.076 -36 ± 1.0 82.0 ± 0.9
I-T-NP-H 1% 250 ± 2 0.310 ± 0.008 -35 ± 0.5 83.5 ± 1.1
Figure 1. Influence of the insulin/GT ratio (expressed in percentage) on the physico-chemical
properties of the resulting nanoparticles: (A) size and zeta potential; (B) insulin loading and
encapsulation efficiency (EE). Data are expressed as mean ± SD (n=3).

CONFIDENTIAL CHAPTER 5: The effect of insulin loading in the in vitro mucus-
penetrating properties of thiamine decorated nanoparticles
116
3.2. Pulsed-Gradient Spin-Echo NMR assessment of mucin mobility
PGSE-NMR is a non-invasive technique that allows determination of the diffusive
character of mucin gel and changes in that dynamic property on addition of selected polymer
nanoparticles. The diffusion coefficient is measured from the decrease in intensity of the peaks
in the NMR spectra; a rapidly decaying signal corresponds to high mobility quantified in terms
of a large diffusion coefficient (Figure 2).
In complex systems such as those being examined here, it is quite common for the data
to show more than one diffusive rate. These may arise due to the presence of several
components that each shows peaks at the same chemical shift (so-called overlapping spectra) or
that particular component being present in different physical environments, e.g. gelled or non-
gelled materials. Under those circumstances, it is first useful to consider an average diffusion
coefficient, being the signal intensity-weighted value of the other discrete values, Table 2, when
the different nanoparticle formulations used in this study have been added to the mucin samples.
Analysing the ratio of the mean diffusion coefficients i.e. the mucin plus NP value
divided by the value from the mucin-only sample, shows that the mucin diffusion was largely
changed for the unloaded nanoparticles (T-NP). On the contrary, the ratio of the weighted mucin
diffusion coefficients decreased a factor of 3-fold, regarding unloaded nanoparticles, when
insulin-loaded nanoparticles were incubated with mucin, addition of these insulin-loaded
nanoparticles decreased the dynamics of the mucin (Figure 2).
Table 2. Diffusion coefficients of the mucin in the presence of nanoparticles. The experiments
were carried out with intestinal mucin.
D: diffusion coefficient; R: Ratio between the diffusion
coefficients obtained for the nanoparticle formulation and
mucin.
FORMULATION
(I/GT) Dweighted (/10
11 m
2 s
-1) R
Mucin 0.66 1
T-NP 3.12 4.72
I-T-NP (0.050) 0.74 1.11
I-T-NP (0.075) 0.98 1.48
I-T-NP (0.100) 1.16 1.76

CONFIDENTIAL CHAPTER 5: The effect of insulin loading in the in vitro mucus-
penetrating properties of thiamine decorated nanoparticles
117
Figure 2. PGSE-NMR spectra of mucin in the presence of T-NP (A), mucin in the presence of
I-T-NP (0.050) (B), mucin in the presence of I-T-NP (0.075) (C) and mucin in the presence of I-
T-NP (0.100) (D). x axis: frequency; y axis: intensity and z axis: trace.
3.3. In vitro release studies
Figure 3 shows the in vitro release profiles of insulin-loaded nanoparticles prepared
either in presence or absence of HSA at an insulin/GT ratio of 0.075. For insulin-loaded
nanoparticles prepared in the absence of human serum albumin, no release of the protein was
observed in any of the media employed (SGF and SIF).
For nanoparticles prepared with HSA, about 5.5% of the insulin content was released
after 2 h of incubation in SGF. Nevertheless, when these nanoparticles (I-T-NP-H) were
incubated in SIF, no more release of the protein was observed during the following 22 h.

CONFIDENTIAL CHAPTER 5: The effect of insulin loading in the in vitro mucus-
penetrating properties of thiamine decorated nanoparticles
118
0 2 4 6 10 20
0
2
4
6
Ins
uli
n R
ele
as
ed
(%
)
Time (h)
I-T-NP
I-T-NP-HSA 1%
SG
F (
pH
1.2
) SIF (pH 6.8)
Figure 3. In vitro release profiles of insulin loaded nanoparticles. I-T-NP: insulin loaded
thiamine decorated nanoparticles (white aquare) and I-T-NP-H 1%: insulin loaded thiamine
decorated nanoparticles containing 1% of HSA (black circle).
4. Discussion
In this work, a polymeric conjugate prepared from the covalent binding of thiamine to a
poly(anhydride) backbone has been used to produce polymer nanoparticles for the oral delivery
of insulin. In a previous study we demonstrated that these thiamine-Gantrez® AN nanoparticles
presented mucus-penetrating properties when evaluated in vitro with pig intestinal mucus and in
vivo after their oral administration to rats [30]. For the optimization of the preparative process of
insulin-loaded nanoparticles two main parameters were evaluated: the insulin loading in terms
of insulin/GT ratio and the quantity of HSA employed in the preparation of nanoparticles by a
second procedure.
Under the selected experimental conditions, the nanoparticles presented homogeneous
sizes distributions with a mean size of about 220 nm and negative surface charge. Interestingly,
CONFIDENTIAL CHAPTER 5: The effect of insulin loading in the in vitro mucus-
penetrating properties of thiamine decorated nanoparticles
119
the insulin payload was calculated to be about 11% with an encapsulation efficiency close to
100%.
When these nanoparticles were evaluated in vitro, the permeability test revealed a
significant decrease in the mucin mobility and, hence, in the mucus-penetrating properties of
nanoparticles containing insulin (Figure 2, Table 2). In fact, the diffusion coefficient of pig
intestinal mucin when incubated with insulin-loaded nanoparticles was calculated to be around
3-fold lower than for unloaded nanoparticles. Moreover, these diffusion coefficients were
similar to that observed for mucoadhesive Gantrez® AN nanoparticles (NP).
These results are clear evidence that the entrapment of insulin in Gantrez® AN-thiamine
nanoparticles modified their surface, annihilating their mucus-penetrating properties. It is well
known that the localization of the biologically active compound in a nanodevice may be
influenced by the nature of the encapsulant material [34], the drug/polymer ratio [35] and the
process employed to prepare these nanoparticles [36,37]. In our case, the localization of insulin
in the outer areas of the nanoparticle structure would be mainly due to the preparative process of
nanoparticles, in which the protein is incorporated at the same moment that the desolvating
medium (water) containing the cross-linking agent (calcium). In addition, the hydrophilic
character of the protein would difficult its migration and inclusion in the hydrophobic core of
the nanoparticles.
In addition, from the in vitro release studies (Figure 3), it was clear that insulin was not
released from nanoparticles in any of the evaluated media (SGF and SIF). This observation
would be related to the establishment of bonds between the protein and the functional groups of
Gantrez®
AN. In fact, in an aqueous environment and in the presence of calcium, the remaining
anhydride groups (after the binding of thiamine to the polymer backbone) would be transformed
into carboxylic acid residues [38]. Some of them would be used by calcium to act as a cross-
linker and stabilize the resulting nanoparticles. However, some of these carboxylic acids would
also be capable of interact by ionic bindings and/or hydrogen bonds with functional groups of
the protein, generating stable “complexes”. This possibility would be in line with previous
observations from Cui and collaborators [40], who reported the interaction between insulin and
carboxylated chitosan grafted poly(methyl methacrylate) nanoparticles via electrostatic
interactions, hydrogen bonding and Van der Waals forces [30]. Similar interactions between
insulin and polymer matrix have also been described with PLGA-based devices [40,41].
In order to solve this problem and minimize the “irreversible” interaction between
insulin and the polymer backbone, nanoparticles were prepared in the presence of human serum
albumin. In fact, albumins have been proposed as stabilizers in the preparation of nano- and
microparticles to protect the loaded protein from premature degradation [42,43] or to reduce the
self-aggregation of the therapeutic protein [44,45]. In this case, the incorporation of albumin

CONFIDENTIAL CHAPTER 5: The effect of insulin loading in the in vitro mucus-
penetrating properties of thiamine decorated nanoparticles
120
would also interact with the functional groups of Gantrez® AN and, hence, decrease the
interaction of insulin with the polymer. For this purpose, the conjugate between Gantrez® AN
and thiamine was first incubated with albumin prior the formation of the insulin-loaded
nanoparticles. The resulting nanocarriers displayed physico-chemical properties quite similar to
those prepared in the absence of HSA. Again the zeta potential was negative and the insulin
payload was high, with an encapsulation efficiency of about 100% (Table 1). From in vitro
release studies, the incorporation of albumin as “blocker agent” of the functional groups of
Gantrez® AN only induced a modest improvement. Thus, for these nanoparticles, about 6% of
the insulin content of nanoparticles was released when incubated in SGF. However, no release
of the protein from these nanoparticles was observed when incubated in SIF for 22 h.
5. Conclusion
In summary, insulin-loaded nanoparticles prepared from Gantrez® AN-thiamine
conjugate displayed a high loading capacity. However, the resulting nanoparticles did show
neither mucus-penetrating properties nor adequate release profiles for an oral administration.
These facts may be explained by the presence of protein molecules on the outer layer of the
resulting nanoparticles and the development of “strong” interactions with the polymer,
respectively. The co-encapsulation of human serum albumin with insulin only induced a very
modest amelioration in the release profile of the therapeutic protein. In any case, more
formulation studies would be necessary to inhibit this interaction polymer-insulin and facilitate
the accommodation of the protein in the core of the nanoparticle matrix.
Acknowledgements
The research leading to these results has received funding from the European
Community's Seventh Framework Programme [FP7/2007-2013] for ALEXANDER under grant
agreement n° NMP-2011-1.2-2-280761. Furthermore, Laura Inchaurraga acknowledges
“Asociación de Amigos” of the University of Navarra for the financial support.

CONFIDENTIAL CHAPTER 5: The effect of insulin loading in the in vitro mucus-
penetrating properties of thiamine decorated nanoparticles
121
References
[1] M. Kermode, Unsafe injections in low-income country health settings: need for injection safety
promotion to prevent the spread of blood-borne viruses, Health Promot. Int. 19 (2004) 95–103.
[2] K.C. Kwon, D. Verma, N.D. Singh, R. Herzog, H. Daniell, Oral delivery of human
biopharmaceuticals, autoantigens and vaccine antigens bioencapsulated in plant cells, Adv. Drug
Deliv. Rev. 65 (2013) 782–799.
[3] S. Gyawali, D.S. Rathore, P.R. Shankar, K.V. Kumar, Strategies and challenges for safe injection
practice in developing countries, J. Pharmacol. Pharmacother. 4 (2013) 8–12.
[4] Report of the SIGN 2010 Meeting: annual meeting of the safe injection global network; Dubai.
2010. http://www.who.int/injection_safety/toolbox/sign2010_meeting.pdf.
[5] N.S. Chauhan, S. Chauhan Nitesh, C. Sanjeev, H. Vandana, A. Alka, S. Vijender, Recent
advances in insulin delivery systems: an update, World Appl. Sci. J. 11 (2010) 1552–1556.
[6] T. Blevins, S.L. Schwartz, B. Bode, S. Aronoff, C. Baker, K.T. Kimball, R.B. Harrist, C.
Donnelly, L.C. Burns, A.M. Wooldridge, A study assessing an injection port for administration of
insulin, Diabetes Spectr. 21 (2008).
[7] F. Akhrass, N. Skinner, K. Boswell, L.B. Travis, Evolving trends in insulin delivery in pursuit of
improvements in diabetes management, Am. Heal. Drug Benefits. 3 (2010) 117–22.
[8] E.S. Khafagy, M. Morishita, Y. Onuki, K. Takayama, Current challenges in non-invasive insulin
delivery systems: A comparative review, Adv. Drug Deliv. Rev. 59 (2007) 1521–1546.
[9] J.A. Tracy, P.J.B. Dyck, The spectrum of diabetic neuropathies, Phys. Med. Rehabil. Clin. N.
Am. 19 (2008) 1–26.
[10] W.T. Cade, Diabetes-related microvascular and macrovascular diseases in the physical therapy
setting., Phys. Ther. 88 (2008) 1322–35.
[11] L.M. Ensign, R. Cone, J. Hanes, Oral drug delivery with polymeric nanoparticles: The
gastrointestinal mucus barriers, Adv. Drug Deliv. Rev. 64 (2012) 557–570.
[12] B.J. Bruno, G.D. Miller, C.S. Lim, Basics and recent advances in peptide and protein drug
delivery., Ther. Deliv. 4 (2013) 1443–67.
[13] P. Anilkumar, A. V Badarinath, N. Naveen, K. Prasad, B. Ravi, S. Reddy, M. Hyndhavi, M.
Nirosha, A rationalized description on study of intestinal barrier, drug permeability and
permeation enhancers, J. Glob. Trends Pharm. Sci. 2 (n.d.) 431–449.
[14] B. Aungst, C.K. Svensson, B.J. Aungst, Absorption enhancers: applications and advances, aaps J.
(2012) 10-18.
[15] K. Park, I.C. Kwon, K. Park, Oral protein delivery: Current status and future prospect, React.
Funct. Polym. 71 (2011) 280–287.
[16] A. Muheem, F. Shakeel, M.A. Jahangir, M. Anwar, N. Mallick, G.K. Jain, M.H. Warsi, F.J.
Ahmad, A review on the strategies for oral delivery of proteins and peptides and their clinical
perspectives, Saudi Pharm. J. 24 (2016) 413–428.
[17] A. Bernkop-Schnürch, C.E. Kast, D. Guggi, Permeation enhancing polymers in oral delivery of
hydrophilic macromolecules: thiomer/GSH systems, J. Control Release 93 (2003) 95–103.
[18] F. Mahmud, O.C. Jeon, T.A. Al-Hilal, S. Kweon, V.C. Yang, D.S. Lee, Y. Byun, Absorption
Mechanism of a Physical Complex of Monomeric Insulin and Deoxycholyl- l -lysyl-methylester
in the Small Intestine, Mol. Pharm. 12 (2015) 1911–1920.
[19] N.G. Balabushevich, M.A. Pechenkin, E.D. Shibanova, D. V. Volodkin, E. V. Mikhalchik,
Multifunctional Polyelectrolyte Microparticles for Oral Insulin Delivery, Macromol. Biosci. 13
(2013) 1379–1388.
[20] E. Déat-Lainé, V. Hoffart, G. Garrait, J.F. Jarrige, J.M. Cardot, M. Subirade, E. Beyssac, Efficacy
of Mucoadhesive Hydrogel Microparticles of Whey Protein and Alginate for Oral Insulin
Delivery, Pharm. Res. 30 (2013) 721–734.
[21] I.T. Değim, B. Gümüşel, Z. Değim, T. Ozçelikay, A. Tay, S. Güner, Oral administration of
liposomal insulin, J. Nanosci. Nanotechnol. 6 (2006) 2945–9.
[22] M.R. Rekha, C.P. Sharma, Simultaneous effect of thiolation and carboxylation of chitosan
particles towards mucoadhesive oral insulin delivery applications: an in vitro and in vivo
evaluation, J. Biomed. Nanotechnol. 11 (2015) 165–76.
[23] P. Fonte, F. Andrade, F. Araújo, C. Andrade, J. das Neves, B. Sarmento, Chitosan-Coated Solid
Lipid Nanoparticles for Insulin Delivery, Nanomed. 508 (2012) 295–314.
[24] C. Damgé, H. Vranckx, P. Balschmidt, P. Couvreur, Poly(alkyl cyanoacrylate) nanospheres for
oral administration of insulin, J. Pharm. Sci. 86 (1997) 1403–9.
[25] Y. Gan, X. Li, D. Chen, C. Le, C. Zhu, L. Hovgaard, M. Yang, Novel mucus-penetrating
liposomes as a potential oral drug delivery system: preparation, in vitro characterization, and

CONFIDENTIAL CHAPTER 5: The effect of insulin loading in the in vitro mucus-
penetrating properties of thiamine decorated nanoparticles
122
enhanced cellular uptake, Int. J. Nanomedicine. Volume 6 (2011) 3151.
[26] X. Li, S. Guo, C. Zhu, Q. Zhu, Y. Gan, J. Rantanen, U.L. Rahbek, L. Hovgaard, M. Yang,
Intestinal mucosa permeability following oral insulin delivery using core shell corona
nanolipoparticles, Biomaterials 34 (2013) 9678–9687.
[27] C. Müller, G. Perera, V. König, A. Bernkop-Schnürch, Development and in vivo evaluation of
papain-functionalized nanoparticles, Eur. J. Pharm. Biopharm. 87 (2014) 125–131.
[28] I. Pereira de Sousa, B. Cattoz, M.D. Wilcox, P.C. Griffiths, R. Dalgliesh, S. Rogers, A. Bernkop-
Schnürch, Nanoparticles decorated with proteolytic enzymes, a promising strategy to overcome
the mucus barrier, Eur. J. Pharm. Biopharm. 97 (2015) 257–264.
[29] H.H. Salman, C. Gamazo, M. Agüeros, J.M. Irache, Bioadhesive capacity and immunoadjuvant
properties of thiamine-coated nanoparticles, Vaccine 25 (2007) 8123–8132.
[30] M. Agüeros, M.A. Campanero, J.M. lrache, Simultaneous quantification of different
cyclodextrins and Gantrez by HPLC with evaporative light scattering detection, J. Pharm.
Biomed. Anal. 39 (2005) 495–502.
[31] C. Taylor, A. Allen, P.W. Dettmar, J.P. Pearson, Two rheologically different gastric mucus
secretions with different putative functions, Biochim. Biophys. Acta - Gen. Subj. 1674 (2004)
131–138.
[32] P.T. Callaghan, Principles of Nuclear Magnetic Resonance Microscopy, Oxford University Press,
Oxford, 1991.
[33] P. Stilbs, and K. Paulsen, P.C. Griffiths, Global Least-squares analysis of large, correlated
spectral data sets: application to component-resolved FT-PGSE NMR spectroscopy, J.Phys.
Chem. A 10 (1996) 8180-8189.
[34] E. Sah, H. Sah, E. Sah, H. Sah, Recent trends in preparation of poly(lactide- co -glycolide)
nanoparticles by mixing polymeric organic solution with antisolvent, J. Nanomater. 2015 (2015)
1–22.
[35] H.M. Redhead, S.S. Davis, L. Illum, Drug delivery in poly(lactide-co-glycolide) nanoparticles
surface modified with poloxamer 407 and poloxamine 908: in vitro characterisation and in vivo
evaluation, J. Control Release 70 (2001) 353–363.
[36] B. Slütter, P.C. Soema, Z. Ding, R. Verheul, W. Hennink, W. Jiskoot, Conjugation of ovalbumin
to trimethyl chitosan improves immunogenicity of the antigen, J. Control Release 143 (2010)
207–214.
[37] M.T. Karishma, K.T. Mody, A. Popat, D. Mahony, A.S. Cavallaro, C. Yu, N. Mitter, Mesoporous
silica nanoparticles as antigen carriers and adjuvants for vaccine delivery, Nanoscale 5 (2013)
5167.
[38] P. Arbós, M.A. Campanero, M.A. Arangoa, M.J. Renedo, J.M. Irache, Influence of the surface
characteristics of PVM/MA nanoparticles on their bioadhesive properties, J. Control Release 89
(2003) 19–30.
[39] F. Cui, F. Qian, Z. Zhao, L. Yin, C. Tang, C. Yin, Preparation, characterization, and oral delivery
of insulin loaded carboxylated chitosan grafted poly(methyl methacrylate) nanoparticles,
Biomacromolecules 10 (2009) 1253–1258.
[40] M. Simon, M. Wittmar, U. Bakowsky, T. Kissel, Self-assembling nanocomplexes from insulin
and water-soluble branched polyesters, poly[(vinyl-3-(diethylamino)- propylcarbamate-co-(vinyl
acetate)-co-(vinyl alcohol)]-graft- poly(l-lactic acid): a novel carrier for transmucosal delivery of
peptides, Bioconjug. Chem. 15 (2004) 841-849.
[41] V. Lassalle, M.L. Ferreira, PLGA based drug delivery systems (DDS) for the sustained release of
insulin: insight into the protein/polyester interactions and the insulin release behavior, J. Chem.
Technol. Biotechnol. 85 (2010) 1588–1596.
[42] L. Meinel, O.E. Illi, J. Zapf, M. Malfanti, H. Peter Merkle, B. Gander, Stabilizing insulin-like
growth factor-I in poly(d,l-lactide-co-glycolide) microspheres, J Control Release 70 (2001) 193–
202.
[43] S.P. Schwendeman, Recent advances in the stabilization of proteins encapsulated in injectable
PLGA delivery systems., Crit. Rev. Ther. Drug Carrier Syst. 19 (2002) 73–98.
[44] Y.K. Katare, A.K. Panda, Influences of excipients on in vitro release and in vivo performance of
tetanus toxoid loaded polymer particles, Eur. J. Pharm. Sci. 28 (2006) 179–188.
[45] J. He, M. Feng, X. Zhou, S. Ma, Y. Jiang, Y. Wang, H. Zhang, Stabilization and encapsulation of
recombinant human erythropoietin into PLGA microspheres using human serum albumin as a
stabilizer, Int. J. Pharm. 416 (2011) 69–76.

CHAPTER 6
Modulation of the fate of zein nanoparticles by their coating
with a Gantrez® AN-thiamine polymer conjugate


CONFIDENTIAL CHAPTER 6: Modulation of the fate of zein nanoparticles by their coating
with a Gantrez® AN-thiamine conjugate
125
Modulation of the fate of zein nanoparticles by their coating with
a Gantrez® AN-thiamine polymer conjugate
Abstract
Zein nanoparticles coated with a Gantrez®
AN-thiamine conjugate (GT) at different
GT/zein ratios (0.025, 0.05 and 0.1; GT-NPZ1, GT-NPZ2 and GT-NPZ3) were prepared and
their in vitro mucus-penetrating properties and in vivo behaviour were evaluated compared to
bare zein nanoparticles. The resulting nanoparticles increased their mean sizes and negative zeta
potentials by increasing the amount of GT (from 235 to 345 nm and from -35 to -55 mV,
respectively). The coating layer surrounding the surface of particles represented about 10% of
the total mean size of the resulting GT-NPZ. By multiple particle tracking GT-NPZ1 showed
2.5-fold higher diffusion ability than zein nanoparticles whereas GT-NPZ2 showed almost 28-
fold higher capability to move through mucus than bare nanoparticles. However, the diffusive
properties of GT-NPZ3 significantly decreased being similar to that of mucoadhesive PLGA
nanoparticles. Gastro-intestinal transit studies with radio-labelled nanoparticles revealed that the
intensity of the signal was higher in the stomach than in the small intestine in the case of zein
nanoparticles (NPZ) and GT-NPZ3. However, the intensity of the signal for GT-NPZ1 and GT-
NPZ2 in the small intestine was stronger than in the case of bare zein nanoparticles, suggesting
a faster movement from the stomach to the small intestine. The mucoadhesive character of NPZ
was corroborated by fluorescence microscopy study, in which these nanoparticles were found
trapped in the mucus layer covering the epithelium. On the contrary, GT-coated zein
nanoparticles (particularly GT-NPZ2) were capable of reaching the intestinal epithelium. In
summary, the coating of zein nanoparticles with a hydrophilic conjugate (GT) transformed their
mucoadhesive properties into mucus-penetrating abilities.

CONFIDENTIAL CHAPTER 6: Modulation of the fate of zein nanoparticles by their coating
with a Gantrez® AN-thiamine conjugate
126
1. Introduction
In 1982, the Food and Drug Administration (FDA) approved the first commercially-
available recombinant protein for the treatment of diabetes mellitus [1]. Three decades after the
approval of recombinant insulin, more than 130 different therapeutic proteins and peptides have
already been approved for clinical use [2]. All of these new therapeutic compounds have
contributed with a variety of benefits in the treatment of ailments such as diabetes, cancer and
other chronic diseases. Among other, peptides and proteins offer a higher specificity and
potency as well as a lower interference with normal biological processes than conventional
small-molecule drugs [3,4]. In general, all of these compounds are administered as injections by
a parenteral route of administration (i.e., intravenous, intramuscular or subcutaneous). However,
the inherent short half-lives of these biomacromolecules require frequent injections that may
compromise patient compliance and, thus, restrict their therapeutic value, particularly for
chronic diseases such as diabetes [5,6].
In the last decades, enormous research efforts have been devoted to the development of
formulation strategies for the oral delivery of these compounds. The oral administration of
proteins and peptides is attractive for many patients due to the absence of pain and discomfort
associated to injections [7]. In addition, from a technological point of view, the manufacture of
oral medicines does not require particular facilities, process or containers to produce and
maintain sterile conditions. In addition, for certain polypeptides, such as insulin, the oral
delivery route is more physiological than the subcutaneous one [8]. However, till now, the oral
delivery of proteins and peptides remains an important challenge with many problems to solve
in their development. In fact, the physico-chemical properties (MW, hydrophilic character,
ionisable functional groups, etc) and enzymatic sensitivity strongly hamper the absorption of
therapeutic proteins and peptides. As a consequence, their oral bioavailability (in general) is
really low (< 1%) [7,9].
In order to solve these drawbacks, the use of biodegradable nanoparticles has been
proposed. In principle, these pharmaceutical dosage forms may encapsulate the therapeutic
compound and, thus, offer protection against its eventual hydrolytic or enzymatic degradation.
In addition, and due to their matrix structure, these nanoparticles may control the release of the
cargo. However, in many cases, these devices possess mucoadhesive properties and remain
trapped in the protective mucus layer covering the gut epithelium [10,11]. In the particular case
of protein and peptide delivery, this fact may be an important limitation. Thus, the release of the
loaded protein in a sustained way from the nanodevice, trapped in the mucus layer, would
facilitate the effect of the digestive enzymes localized in the glycocalyx covering the surface of
the enterocytes [12,13]. In addition, for mucoadhesive devices, their residence time within the
gut mucosa is determined by the mucus turn-over and, thus, limited to a few hours [11,14].

CONFIDENTIAL CHAPTER 6: Modulation of the fate of zein nanoparticles by their coating
with a Gantrez® AN-thiamine conjugate
127
Recently, the use of mucus-penetrating nanocarriers has been suggested as an
alternative to minimize these drawbacks. In order to generate these devices, different
alternatives have been proposed, including the use of immobilized proteolytic enzymes on the
surface of the nanocarriers [15], the co-encapsulation of mucolytic agents [16] or the design of
zeta potential changing systems [17]. Another possibility may be the use of “slippery”
nanoparticles. In this case, the strategy consists in the highly-dense coating of nanoparticles
with hydrophilic compounds that would shell the hydrophobic interactions between the
nanoparticles and the components of the mucus, facilitating their passage through this protective
layer. For this purpose, the decoration of nanoparticles with poly(ethylene glycol) [18,19] or
surfactants such as Pluronic® F 127 [20] has been suggested.
In this context, the aim of this work was to develop and evaluate the mucus-permeating
properties of nanocarriers based on the coating of zein nanoparticles with a Gantrez®
AN-
thiamine conjugate. Zein is a protein with a GRAS status (Generally Recognised as Safe). Due
to its composition and amphiphilic character, it can easily interact with a wide group of
compounds, including proteins [21]. Furthermore, nanoparticles based on the conjugate
bertween Gantrez®
AN and thiamine have demonstrated an important mucus-permeating
character [Chapter 4].
2. Materials and Methods
2.2. Chemicals
The copolymer of methyl vinyl ether and maleic anhydride or poly(anhydride)
(Gantrez® AN 119) was supplied by Ashland Inc. (Barcelona, Spain). Thiamine hydrochloride,
zein, mannitol, lysine, agarose, glutaraldehyde and EPONTM
were purchased from Sigma-
Aldrich (Madrid, Spain). Ethanol were provided by Panreac (Barcelona, Spain). Acetone was
obtained from VWR-Prolabo, (Linars del Vallès, Spain). Deionized reagent water (18.2 MΩ-cm
resistivity) was prepared by a water purification system (Wasserlab, Pamplona, Spain). Nitrogen
gas (ultrapure, >99%) was produced using an Alltech nitrogen generator (Ingeniería Analítica,
Barcelona, Spain). Perylene-Red (BASF Lumogen® F Red 305) was from Kremer Pigmente
GmbH & Co. (Aichstetten, Germany) and O.C.T.TM
Compound Tissue-Tek from Sakura
Finetek Europe (Alphen aan Der Rijn, The Netherlands). 4’,6-diamidino-2-phenylindole (DAPI)
was obtained from Biotium Inc. (Madrid, Spain). Glass bottom imaging dishes (35 mm diameter
dish with a glass coverslip at 1.5 mm thick and 10 mm diameter) were from MatTek
Corporation (Ashland, USA). PLGA nanoparticles (PDLG-5002 containing lactic:glycolic at

CONFIDENTIAL CHAPTER 6: Modulation of the fate of zein nanoparticles by their coating
with a Gantrez® AN-thiamine conjugate
128
50%:50%, MW 17 KDa.) with a mean size of 161±0.03 nm and a zeta potential of -29.2±2.11,
were supplied by Nanomi B.V. (Oldenzaal, The Netherlands).
2.3. Mucus
Freshly isolated pig intestinal ileum (2 m in length from proximal region) was obtained
from a local abattoir (Cardiff, UK) and kept in ice-cold oxygenated phosphate buffered saline
(PBS) (no longer than 2 h) prior to sample processing. The ileum was processed into 25 cm
lengths with each length incised longitudinally to allow intestinal food and other waste debris to
be was gently rinsed away by ice-cold PBS. The mucus was then harvested by an approach
recognised to optimise the yield of not only the loose mucus layer but critically also a high
content of the adherent mucus layer [22]. Simply it involved gentle scraping from the intestinal
surface by spatula avoiding the shedding of significant intestinal epithelial tissue. Mucus was
divided into aliquots (0.5 g) and kept at -20 °C prior to experimentation [23].
2.4. Preparation of Gantrez® AN-thiamine conjugate (GT)
The conjugate was obtained by the covalent binding of thiamine to the poly(anhydride)
backbone. For this purpose, 5 g Gantrez® AN were dissolved in 200 mL acetone. Then, 125 mg
thiamine were added and the mixture was heated at 50 ºC, under magnetic agitation at 400 rpm,
for 3 h. Then, the mixture was filtered through a pleated filter paper and the organic solvent was
eliminated under reduced pressure in a Büchi R-144 apparatus (BÜCHI Labortechnik AG,
Flawil, Switzerland). Finally, the resulting powder was stored at room temperature. The
conjugate was named GT.
2.5. Preparation of zein nanoparticles coated with the Gantrez® AN-
thiamine conjugate (GT-NPZ)
Zein nanoparticles were prepared by a desolvation procedure previously described [24]
and, then, coated with the synthesized Gantrez® AN-thiamine conjugate. Then, the resulting
nanoparticles were purified, concentrated and, finally, dried. In brief, 200 mg zein and 30 mg
lysine were dissolved in 20 mL ethanol 55% and incubated under agitation at RT for 15 min. In
parallel, a 2% aqueous solution of the Gantrez® AN-thiamine conjugate was prepared by
dispersing the polymer in purified water till complete solubilisation. Nanoparticles were
obtained after the addition of 20 mL purified water to the hydroalcoholic solution of zein and
lysine. Then, a determined volume of GT solution (0.25, 0.5 or 1 mL) was added and the
mixture was maintained under agitation at RT for 30 min. The resulting suspension of
nanoparticles was purified and concentrated till 20 mL by ultrafiltration through a polysulfone
CONFIDENTIAL CHAPTER 6: Modulation of the fate of zein nanoparticles by their coating
with a Gantrez® AN-thiamine conjugate
129
membrane cartridge of 500 kDa pore size (Medica SPA, Medolla, Italy). Finally, 10 mL of a
mannitol aqueous solution (4% w/v) was added to the suspension of nanoparticles and the
mixture was dried in a Büchi Mini Spray Drier B-290 apparatus (Büchi Labortechnik AG,
Switzerland). For this purpose, the following parameters were selected: inlet temperature of 90
ºC, outlet temperature of 60 ºC, spray-flow of 600 L/h, and aspirator at 100% of the maximum
capacity. The zein coated nanoparticles were named as GT-NPZ.
As control, “naked” zein nanoparticles (NPZ) were prepared in the same way as
described above but in the absence of GT.
For different in vitro and in vivo studies fluorescently labelled nanoparticles were used.
For this purpose, 2.5 mL of a 0.04% Lumogen® F Red 305 solution in pure ethanol was added
to the hydroalcoholic solution containing zein and lysine. The mixture was maintained under
agitation. Then, the nanoparticles were prepared, purified and dried as described above.
2.6. Preparation of poly(anhydride) nanoparticles (PA-NP)
Nanoparticles based on Gantrez® AN were prepared as described previously [25].
Briefly, 400 mg of Gantrez® AN were dissolved in 20 mL acetone. Then, the nanoparticles were
formed by the addition of 40 mL ethanol followed of the addition of 40 mL purified water. The
organic solvents were eliminated under reduced pressure in a BÜCHI R-144 apparatus (BÜCHI
Labortechnik AG, Flawil, Switzerland). Then, the nanoparticles suspensions were purified by
centrifugation at 5,000 × g for 20 min (SIGMA Lab. centrifuges, Osterode am Harz, Germany)
using dialysis tubes Vivaspin® 300,000 MWCO (Sartorius AG, Madrid, Spain). Finally, 800 mg
lactose dissolved in 40 mL deionized water was added to the pellet and vortexed for 5 min. The
resulting suspension of nanoparticles was dried in a Büchi Mini Spray Drier B-290 apparatus
(BÜCHI Labortechnik AG, Flawil, Switzerland) under the following experimental conditions:
inlet temperature of 90 ºC, outlet temperature of 60 ºC, spray-flow of 600 L/h, and aspirator at
100% of the maximum capacity. These nanoparticles were named PA-NP. The nanoparticles
displayed a size of 213 ± 2 nm and a zeta potential of -53 ± 2 mV.
2.7. Characterization of nanoparticles
2.7.1. Particle size, zeta potential and yield
The particle size, polydispersity index (PDI) and zeta-potential were determined by
photon correlation sprectroscopy (PCS) and electrophoretic laser Doppler anemometry
respectively, using a Zetasizer analyser system (Brookhaven Instruments Corporation, New
York, USA). The diameter of the nanoparticles was determined after dispersion in ultrapure
water (1/10) and measured at 25 ºC by dynamic light scattering angle of 90 ºC. The zeta

CONFIDENTIAL CHAPTER 6: Modulation of the fate of zein nanoparticles by their coating
with a Gantrez® AN-thiamine conjugate
130
potential was determined as follows: 200 μL of the samples were diluted in 2 mL of a 0.1 mM
KCl solution adjusted to pH 7.4.
In order to quantify the amount of protein transformed into nanoparticles, 10 mg of the
nanoparticle formulation was dispersed in water and centrifuged at 17,000 x g for 20 min.
Supernatants were discarded and the pellets were digested with ethanol 75%. Then, the amount
of protein was quantified by UV spectrophotometry at 278 nm in an Agilent 8453 system
(Agilent Technologies, USA). For analysis, calibration curves were constructed between 90 and
1200 µg/mL (R2 > 0.999; quantitation limit = 143 µg/mL). The amount of protein forming
nanoparticles in the formulation was estimated as the ratio between the amount of the protein
quantified in the pellet of the centrifuged samples and the total amount of protein used for the
preparation of nanoparticles and expressed in percentage.
2.7.2. Morphology and shape
The morphology and shape of nanoparticles were evaluated by TEM. In brief, 20 mg of
the spray dried powder containing the nanoparticles were dispersed in 2 mL of cocodilate 0.1 M
containing glutaraldehyde 4%. After one hour of incubation, nanoparticles were centrifuged at
1,000 rpm (5 min). The pellet was resuspended in 2 mL water and centrifuged again. Then, 2
mL of osmium 1% was added to the nanoparticles and kept at 4 °C during 1 h. The excess of
osmium was eliminated by centrifugation at 1,000 rpm for 5 min. Nanoparticles were
resuspended in 2 mL water and centrifuged again. Then, 200 µL of agarose 2% were added to
the nanoparticles, vortexed for 1 minute and kept at 4 °C overnight. From this sample, 1 mL
was inserted in an embedding flask and dehydrated with alcohols of increasing graduation for 3
h. Then, gelatin capsules were filled with a solution of propylene oxide-EPONTM
(1:1) and the
samples were inserted. These capsules were incubated at increasing temperatures (37 °C, 45 °C
and 60 °C) for the polymerization of the EPONTM
. Finally, 50-70 nm sections of the samples
were obtained with a Leica Ultracut R ultramicrotome (Wetzlar, Germany). The sections were
placed in a copper grid and treated with 3% uranil acetate-lead for 5 min and completely dried
at room temperature. For the visualization of nanoparticles, a Zeiss Libra 120 Transmission
Electron Microscope (Oberkochen, Germany) coupled with a digital imaging system Gatan
Ultrascan 1000 2k x 2k CCD was used.
2.7.3. Quantification of Lumogen® F red 305
The amount of Lumogen® F Red 305 loaded in the nanoparticles was quantified by UV-
Vis spectrometry at wavelength 580 nm (Labsystems iEMS Reader MF, Vantaa, Finland). For
this purpose, the difference between its initial concentration added and the concentration found
in the supernatant after the centrifugation of the samples in water (17,000 rpm for 20 min) was

CONFIDENTIAL CHAPTER 6: Modulation of the fate of zein nanoparticles by their coating
with a Gantrez® AN-thiamine conjugate
131
calculated. For quantification, standard curves of Lumogen® F Red in ethanol 75% were used
(concentration range of 5-30 µg/mL; R2≥0.999).
2.8. Radiolabeling of nanoparticles with 99m
Tc
Nanoparticles were radiolabeled with 99m
Tc by reduction with stannous chloride as
described [26]. For this purpose, 0.8-1.0 mg nanoparticles were pre-tinned with 0.05 mg/mL of
SnCl2 and subsequently labelled for 30 min with 1-2 mCi of freshly eluted 99m
Tc-pertechnetate.
The overall procedure was carried out in helium-purged vials.
The radiochemical purity was analysed by radiochromatography (Whatman 3MM, NaCl
0.9%). The radiolabeling yield was always over 95%.
2.9. Multiple particle tracking (MPT) in mucus
The diffusion of nanoparticles through porcine intestinal mucus barrier was assessed by
MPT technique at Cardiff University following the method described previously by their group
[27,28]. Samples (0.5 g) of porcine intestinal mucus were incubated in glass-bottom MatTek
imaging dishes at 37 °C. The fluorescently labelled nanoparticles were inoculated into each 0.5
g mucus sample in a 25 µL aliquot at a suspension concentration of 0.002%. To ensure effective
particle distribution following inoculation within the mucus, a 2 h period of equilibration was
adopted prior the capture of nanoparticle movements by video microscopy. Video capture
involved 2- dimensional imaging on a Leica DM IRB wide-field epifluorescence microscope
(x63 magnification oil immersion lens) using a high speed camera (Allied Vision Technologies,
Stadtroda, Germany) running at a frame rate of 33 ms, i.e. capturing 30 frames sec-1
; each
completed video film comprised 300 frames. For each 0.5 g mucus sample approximately 120
nanoparticles were simultaneously tracked and their movements captured. Videos were
imported into Fiji ImageJ software to convert the movement of each nanoparticle into individual
nanoparticles trajectories across the full duration of the 10 sec videos. However, for the analysis
of particle diffusion only a 30 frame video period (1 sec) was used, with the criterion that any
individual particle tracked must display a continuous presence in the X-Y plane 8 throughout
the respective 30 sequential frames. The individual particle trajectories were converted into
numeric pixel data (Mosaic Particle Tracker within Fiji ImageJ) which, based on the microscope
and video capture settings, was converted into metric distance. The distances moved by every
individual particle over a selected time interval (Δt) in the X-Y trajectory were then expressed
as a squared displacement (SD). The mean square displacement (MSD) of any single particle (n)
represents the geometric mean of that particles’ squared displacements throughout its entire 30-
frame trajectory. MSD was determined as follows [29]:

CONFIDENTIAL CHAPTER 6: Modulation of the fate of zein nanoparticles by their coating
with a Gantrez® AN-thiamine conjugate
132
MSD(n) = (XΔt) 2 + (YΔt) 2 [Equation 1]
For each nanoparticle type under study an “ensemble mean square displacement”
(defined by <MSD>) was then determined for each of the three replicate studies. The Effective
Diffusion Coefficient (<Deff>) for a particular nanoparticle type was then calculated by:
<Deff>=<MSD> / (4 x Δt) [Equation 2]
where 4 is a constant relating to the 2-dimensional mode of video capture and Δt is the selected
time interval.
The proportion of diffusive particles through the mucus matrix was evaluated by
measuring particle diffusion across various time intervals [11]. Equation 3 was used to
determine a Diffusivity Factor (DF) which expresses the effective diffusion coefficient for each
individual particle (Deff) across the time intervals (Δt) of 1 sec and 0.2 sec, when it is
considered as Brownian motion.
DF = Deff Δt=1 sec / Deff Δt=0.2 sec [Equation 3]
Where the individual particle Deff = MSD/ (4 x Δt). Particles with a DF value of 0.9
and greater were defined as diffusive. The proportion of the diffusive particles within a given
NP type under study was then calculated and expressed as %Diffusive particles.
In parallel, the particles’ diffusion coefficient (D°) in water was calculated by the
Stokes-Einstein equation at 37ºC [30]. For this purpose, equation 5 was applied:
D° = κT / 6πηr [Equation 4]
Where k is Boltzmann constant, T is absolute temperature, η is water viscosity and r is radius of
the particle.
The diffusion of all particles was also expressed as the parameter, %ratio [Deff] / [D°]
which provided a measure of the relative efficiency of particle diffusion through mucus when
particles’ intrinsic free Brownian motion in water is taken into account. As such it affords
comparison of particle diffusion in mucus after accounting for the impact of a particles´ surface
composition upon its unrestricted diffusion in solution. It is essentially a measure that more
directly addresses the relative impact between particles of differing surface physico-chemical
properties and the interactions and the steric hindrance of the mucin network.

CONFIDENTIAL CHAPTER 6: Modulation of the fate of zein nanoparticles by their coating
with a Gantrez® AN-thiamine conjugate
133
2.10. Gastrointestinal transit studies with 99m
Tc-nanoparticles
These studies were carried out in female Wistar rats weighing 250–300 g. All the
procedures were performed following a protocol previously approved by the “Ethical and
Biosafety Committee for Research on Animals” at the University of Navarra in line with the
European legislation on animal experiments.
Animals were stunned with 2% isoflurane gas for administration of nanoparticles
(above 1 mL) by oral gavage, and then quickly awakened. Each animal received one single dose
of radiolabeled nanoparticles (1 mCi; 0.8-1.0 mg radiolabeled nanoparticles that were
completed with up to 10 mg with unlabelled nanoparticles). SPECT/CT studies were performed
three hours after administration of 99m
Tc-nanoparticles, animals were anaesthetised with 2%
isoflurane gas and placed in prone position on the gammacamera (Symbia T2 Truepoint;
Siemens Medical System, Malvern, USA). The acquisition parameters for SPECT studies were:
128 x 128 matrix, 90 images, 7 images per sec and CT: 110 mAs and 130 Kv, 130 images, slice
thickness 3 mm. Fused images were processed using the Syngo MI Applications TrueD
software.
2.11. Biodistribution studies with fluorescently labeled nanoparticles
The tissue distribution of nanoparticles in the gastrointestinal mucosa was visualized by
fluorescence microscopy. For that purpose, 25 mg of Lumogen® F Red-labelled nanoparticles
were orally administered to rats as described above. Two hours later, animals were sacrificed by
cervical dislocation and the guts were removed. Ileum portions of 1 cm were collected, cleaned
with PBS, stored in the tissue proceeding medium O.C.T.TM
compound and frozen at -80 °C.
Each portion was then cut into 5-µm sections on a cryostat and attached to glass slides. Finally,
these samples were fixed with formaldehyde and incubated with DAPI (4’,6-diamidino-2-
phenylindole) for 15 min before the cover assembly. The presence of both fluorescently loaded
poly(anhydride) nanoparticles in the intestinal mucosa and the cell nuclei dyed with DAPI were
visualized in a fluorescence microscope (Axioimager M1, Zeiss, Oberkochen, Germany) with a
coupled camera (Axiocam ICc3, Zeiss, Oberkochen, Germany) and fluorescent source (HBO
100, Zeiss, Oberkochen, Germany). The images were captured with the software ZEN (Zeiss,
Oberkochen, Germany). As control, a suspension of Lumogen® F Red 305 was administered.

CONFIDENTIAL CHAPTER 6: Modulation of the fate of zein nanoparticles by their coating
with a Gantrez® AN-thiamine conjugate
134
3. Results
3.1. Preparation of GT-coated zein nanoparticles
The first approach was to optimize the coating process of zein nanoparticles. For this
purpose, the influence of the GT/zein ratio on the physico-chemical properties of nanoparticles
was evaluated (Table 1). As expected, by increasing the GT/zein ratio, the mean size and the
negative zeta potential of the resulting nanoparticles increased. On the other hand, and under the
experimental conditions tested, all the nanoparticle formulations displayed homogeneous
characteristics with a PDI below 0.2. All the nanoparticles displayed negative surface charges,
however, formulations presenting the GT coating showed slightly more negative surface
charges than “bare” nanoparticles. All the formulations encapsulated around 3 µg Lumogen® F
Red 305 per mg of dried powder.
Table 1. Influence of the GT/zein ratio (expressed in percentage) on the physico-chemical
properties of the resulting nanoparticles. Data expressed as mean ± SD (n=3).
Formulation GT/zein ratio (%) Size (nm) PDI Zeta Potential (mV)
NPZ 0 235 ± 3 0.120±0.01 -35 ± 4
GT-NPZ1 2.5 258 ± 2 0.091±0.03 -45 ± 2
GT-NPZ2 5.0 271 ± 1 0.151±0.02 -45 ± 3
GT-NPZ3 10.0 345 ± 8 0.182±0.08 -55 ± 5
Figure 1 shows TEM photographs of bare zein nanoparticles and zein nanoparticles
coated with GT at a GT/zein ratio of 5% (GT-NP2). These nanocarriers displayed spherical
shape and similar sizes to those obtained by photon correlation spectroscopy. It is worthy to
emphasize that coated nanoparticles showed a clear corona that was missing in uncoated zein
nanoparticles.
The diameter of the corona was calculated to be about 28 nm which represented about
10% of the total size.

CONFIDENTIAL CHAPTER 6: Modulation of the fate of zein nanoparticles by their coating
with a Gantrez® AN-thiamine conjugate
135
100 nm
200 nm
A
B
Figure 1. Tomography electron microscopy of (A) “naked” zein nanoparticles (NPZ) and (B)
GT-coated nanoparticles (GTZ-NP).
3.2. Multiple particle tracking (MPT) in mucus
The influence of the GT/zein ratio used for the preparation of nanoparticles on the
diffusion through porcine intestinal mucus was assessed by MPT technique (Table 2).
GT-coated nanoparticles at a GT/zein ratio of 2.5% and 5% displayed higher ability to
diffuse through the mucus than bare nanoparticles (NPZ), which showed a similar capacity to
diffuse than poly(anhydride) nanoparticles (PA-NP). Actually, the <Deff> of GT-NP 2.5% was
2.2-fold higher than NPZ. Interestingly, the <Deff> of GT-NP 5% was 24-fold higher than bare
zein nanoparticles. However, when the GT/Zein ratio was increased up to 10%, the ability of the
nanoparticles to diffuse through the mucus significantly decrease, being even slower than

CONFIDENTIAL CHAPTER 6: Modulation of the fate of zein nanoparticles by their coating
with a Gantrez® AN-thiamine conjugate
136
uncoated nanoparticles and quite similar to PLGA-NP. In fact, GT-NPZ3 displayed an
important tendency to form aggregates with mucus.
Table 2. Diffusion behaviour of the different formulations tested. Data expressed as mean ± SD
(n=3).
Formulation D° (water) cm2. S
-1 x10
-9
<Deff> (mucus) cm2. S
-1
x10-9
Mean (± SD) %<Deff>/D° R
PLGA-NP 27.91 0.013 (±0.008) 0.0005 0.06
PA-NP 20.71 0.00167 (±0.096) 0.0081 0.91
NPZ 19.12 0.00171 (±0.034) 0.0089 1.00
GT-NPZ1 17.42 0.00376 (±0.095) 0.0216 2.42
GT-NPZ2 16.58 0.04129 (±1.639) 0.2490 27.98
GT-NPZ3 13.03 0.00030 (±0.006) 0.0023 0.26
D°: diffusion coefficient in water; <Deff>: diffusion coefficient in mucus; ratio %<Deff>/ D°:
relative efficiency of particles diffusion; R: ratio of %<Deff>/ D° of the different formulations
tested and %<Deff>/ D° of bare zein nanoparticles; PLGA-NP: PLGA nanoparticles; PA-NP:
poly(anhydride) nanoparticles; NP: zein nanoparticles; GT-NP1: GT-coated zein nanoparticles
at a GT/zein ratio 2.5%; GT-NP2: GT-coated zein nanoparticles at a GT/zein ratio 5%; GT-
NP3: GT-coated zein nanoparticles at a GT/zein ratio 10%.
3.3. Gastrointestinal transit studies with 99m
Tc-nanoparticles
Figure 2 shows the comparison of the biodistribution of nanoparticles (after
radiolabeling with 99m
Tc) when administered by the oral route to laboratory animals. In all
cases, 2 h post-administration, nanoparticles were visualized in the stomach and the small
intestine of animals. However, the intensity of the radioactivity in the stomach of animals was
higher for NPZ than for GT-NPZ1 (data not shown) and GT-NPZ2. On the contrary,
nanoparticles containing GT as coating material appeared to move faster than uncoated ones
because the radioactivity was more intense in the small intestine than in the stomach of animals.
Surprisingly, GT-NPZ3 showed a significantly lower intensity of the radioactivity in the small
intestine than GT-NPZ1 and GT-NPZ2. In all cases, no activity was observed in the liver or the
lungs of the animals.

CONFIDENTIAL CHAPTER 6: Modulation of the fate of zein nanoparticles by their coating
with a Gantrez® AN-thiamine conjugate
137
Stomach
Intestine
Figure 2. Volume rendered fused SPECT-CT images from representative animals 2 h after
administration of 99m
Tc-labelled nanoparticles by oral gavage. NPZ: “naked” nanoparticles; GT-
NPZ2: Gantrez® AN-thiamine-coated zein nanoparticles at a GT/zein ratio of 5%; GT-NPZ3:
Gantrez® AN -thiamine-coated zein nanoparticles at a GT/zein ratio of 10%.
3.4. Biodistribution studies with fluorescently labeled nanoparticles
Figure 3 shows fluorescence microscopy images of ileum samples from the animals
treated with Lumogen® F Red-labelled nanoparticles. Control formulation (an aqueous
suspension of the fluorescent marker) was visualized as large aggregates in the lumen of
animals or in contact with the external mucus layer (data not shown). Bare nanoparticles
displayed a localisation mainly restricted to the mucus layer protecting the epithelium in the
ileum (Figures 3A and 3B). On the contrary, for nanoparticles containing GT as coating
material it was evident that these carriers were capable of reaching the epithelium and interact
broadly with the intestinal cells (Figures 3C-3H). This interaction was higher for GT-NPZ2
than for GT-NPZ1 and GT-NPZ3.

CONFIDENTIAL CHAPTER 6: Modulation of the fate of zein nanoparticles by their coating
with a Gantrez® AN-thiamine conjugate
138
Lumen
Epithelium
Mucus layer
Figure 3. Fluorescence microscopic visualisation of nanoparticles containing GT (GT-NPZ1,
GT-NPZ2 and GT-NPZ3) and control ones (NPZ) in a longitudinal section of the ileum of rats 2
hours post administration. A and B: NPZ; C and D: GT-NPZ1; E and F: GT-NPZ2; G and H:
GT-NPZ3.

CONFIDENTIAL CHAPTER 6: Modulation of the fate of zein nanoparticles by their coating
with a Gantrez® AN-thiamine conjugate
139
4. Discussion
The objective of this work was to explore the effect of the coating of zein nanoparticles
with a hydrophilic conjugate (based on the binding of thiamine to Gantrez® AN) on the
mucoadhesive/mucus-penetrating properties of the resulting nanocarriers. When zein
nanoparticles were coated with the GT conjugate, their mean size increased by increasing the
GT/protein ratio (Table 1). This increasing in the size of coated nanoparticles was attributed to
the formation of a polymer layer around the surface of zein nanoparticles (Figure 1). In the case
of nanoparticles coated with a GT/zein ratio of 0.05 (GT-NPZ2), the resulting corona presented
a thickness of about 30 nm (for a total mean diameter of 271 nm). Another interesting
observation was that the coating process increased the negative zeta potential of bare
nanoparticles. This fact would be directly related to the presence of the conjugate on the surface
of the nanoparticles. In fact, and as described previously, the binding of thiamine to the polymer
backbone (through the reaction and opening of the anhydride groups) would yield carboxylic
acids susceptible of ionization [Chapter 5]. During the coating process, the hydrophobic
portions of GT would interact with the hydrophobic areas of zein nanoparticles, whereas the
hydrophilic thiamine groups and the carboxylic acids would remain oriented through the
external layer of the nanocarriers in contact with the dispersant aqueous medium. This
hypothesis would be in line with Rouzes and co-workers, who proposed a similar mechanism to
explain the disposition of an amphiphilic dextran derivative when adsorbed on poly(lactic acid)
nanoparticles [31].
In order to study the capability of zein-based nanoparticles to diffuse through a mucus
layer in vitro, we used the multiple particle tracking technique and intestinal pig mucus. In this
study the different nanoparticles tested displayed negative zeta potentials and mean sizes
ranging from 160 nm (for control PLGA nanoparticles) till 350 nm (for GT-NPZ3). MPT
studies revealed that the coating of zein nanoparticles with the Gantrez®
AN-thiamine conjugate
clearly modified their diffusion in intestinal pig mucus (Table 2). This is in accordance with
previous observations describing that the capability of nanoparticles to pass through a network
of intestinal mucus is highly dependent on the particle surface chemistry [32,33]. PLGA
nanoparticles, used here as control, displayed a very poor capability to diffuse through the
mucus. This finding agrees well with previous reports in which it has been suggested that the
hydrophobic surface characteristics of PLGA nanoparticles would facilitate their interaction and
binding with the hydrophobic domains of the mucin chains [34,35]. For zein nanoparticles, their
diffusivity in the mucus was found to be higher than for PLGA nanoparticles. Probably the
presence of functional groups due to the zein amino acid composition would minimize the
development of hydrophobic interactions with mucins, facilitating their diffusion through the
mucus layer. In addition, the diffusion of zein nanoparticles in intestinal mucus was found to be

CONFIDENTIAL CHAPTER 6: Modulation of the fate of zein nanoparticles by their coating
with a Gantrez® AN-thiamine conjugate
140
similar to that of poly(anhydride) nanoparticles (Table 2), that have been defined as
mucoadhesive nanocarriers [25,36,37].
Encouragingly, when nanoparticles were coated with GT (up to a GT/protein ratio of
0.05), the resulting nanocarriers improved their capability to diffuse in the intestinal mucus.
This capability was particularly high for GT-NPZ2 with a diffusion coefficient about 28-times
higher than for bare nanoparticles.
Surprisingly, when nanoparticles were coated with a GT/zein ratio of 0.1 (GT-NPZ3),
their diffusivity in the intestinal mucus was similar to that observed for PLGA nanoparticles.
This fact would be directly related with the observation that these nanoparticles displayed a
tendency to form aggregates when mixed with mucus. The high mean size of these
nanoparticles (about 350 nm, Table 1) may also be another important factor affecting this low
capability to diffuse in a mucus gel.
The gastrointestinal-transit studies with radiolabelled nanoparticles revealed that, 2 h
post-administration, nanoparticles with the lowest in vitro diffusivity (e.g., NPZ and GT-NPZ3)
were mainly localized in the stomach mucosa. This fact was particularly intense for GT-NPZ3
(Figure 2). On the contrary, the radioactivity associated to GT-NPZ2 was observed (in a vast
majority) in the small intestine of animals. In addition, in vivo studies with the fluorescently
labelled nanoparticles corroborated the mucoadhesive properties of NPZ (Figures 3A and 3B),
as well as the mucus-permeating capabilities of GT coated nanoparticles (Figures 3C-3F).
Another important aspect to highlight is that the coating of zein nanoparticles with GT
produces nanocarriers capable of entering rapidly in the small intestine, with a low residence
time within the stomach. This behaviour has been previously observed for pegylated
nanoparticles [19] and might be an indication that the “slippery” nanocarriers also offer
“targeting” properties for the small intestine.
5. Conclusion
In summary, zein nanoparticles were coated with a Gantrez® AN-thiamine conjugate to
yield a continuous and homogeneous corona of about 30 nm thickness. At GT/zein ratios up to
0.05, the resulting nanoparticles displayed an improved diffusion in intestinal mucus,
transforming the mucoadhesive properties of bare nanoparticles into mucus-permeating
characteristics. In addition, a good concordance between in vitro MPT studies and in vivo
results has been found.

CONFIDENTIAL CHAPTER 6: Modulation of the fate of zein nanoparticles by their coating
with a Gantrez® AN-thiamine conjugate
141
Acknowledgements
The research leading to these results has received funding from the European
Community's Seventh Framework Programme [FP7/2007-2013] for ALEXANDER under grant
agreement n° NMP-2011-1.2-2-280761. Furthermore, Laura Inchaurraga acknowledges
“Asociación de Amigos” of the University of Navarra for the financial support.

CONFIDENTIAL CHAPTER 6: Modulation of the fate of zein nanoparticles by their coating
with a Gantrez® AN-thiamine conjugate
142
References
[1] B. Leader, Q.J. Baca, D.E. Golan, Protein therapeutics: a summary and pharmacological
classification, Nat. Rev. Drug Discov. 7 (2008) 21–39.
[2] D.J. Craik, D.P. Fairlie, S. Liras, D. Price, The future of peptide-based drugs, Chem. Biol. Drug
Des. 81 (2013) 136–147.
[3] S. Mitragotri, P.A. Burke, R. Langer, overcoming the challenges in administering
biopharmaceuticals: formulation and delivery strategies, Nat. Publ. Gr. 13 (2014).
[4] N. Skalko-Basnet, Biologics: the role of delivery systems in improved therapy, Biologics 8
(2014) 107–14.
[5] R. Soltero, Oral protein and peptide drug delivery, Drug Deliv. Princ. Appl. Wiley Inte (2005)
189.
[6] G. Remington, Y. Rodriguez, D. Logan, C. Williamson, K. Treadaway, Facilitating medication
adherence in patients with multiple sclerosis, Int. J. MS Care. 15 (2013) 36–45.
[7] J. Shaji, V. Patole, Protein and peptide drug delivery: oral approaches, Indian J. Pharm. Sci. 70
(2008) 269-277.
[8] P. Fonte, F. Araújo, S. Reis, B. Sarmento, Oral insulin delivery: how far are we?, J. Diabetes Sci.
Technol. 7 (2013) 520–31.
[9] N. Yin, M.A. Brimble, P.W. Harris, J. Wen, Enhancing the oral bioavailability of peptide drugs
by using chemical modification and other approaches, Med. Chem. 4 (2014) 763-769.
[10] L.M. Ensign, R. Cone, J. Hanes, Oral drug delivery with polymeric nanoparticles: the
gastrointestinal mucus barriers, Adv. Drug Deliv. Rev. 64 (2012) 557–570.
[11] S.K. Lai, Y.Y. Wang, J. Hanes, Mucus-penetrating nanoparticles for drug and gene delivery to
mucosal tissues, Adv. Drug Deliv. Rev. 61 (2009) 158–171.
[12] G.P. Carino, E. Mathiowitz, Oral insulin delivery, Adv. Drug Deliv. Rev. 35 (1999) 249–257.
[13] B.J. Bruno, G.D. Miller, C.S. Lim, Basics and recent advances in peptide and protein drug
delivery, Ther. Deliv. 4 (2013) 1443–67.
[14] M. Dawson, E. Krauland, D. Wirtz, J. Hanes, Transport of polymeric nanoparticle gene carriers in
gastric mucus, Biotechnol. Prog. 20 (2004) 851–857.
[15] I. Pereira de Sousa, B. Cattoz, M.D. Wilcox, P.C. Griffiths, R. Dalgliesh, S. Rogers, A. Bernkop-
Schnürch, Nanoparticles decorated with proteolytic enzymes, a promising strategy to overcome
the mucus barrier, Eur. J. Pharm. Biopharm. 97 (2015) 257–264.
[16] K. Netsomboon, A. Bernkop-Schnürch, Mucoadhesive vs. mucopenetrating particulate drug
delivery, Eur. J. Pharm. Biopharm. 98 (2016) 76-89.
[17] G. Perera, M. Zipser, S. Bonengel, W. Salvenmoser, A. Bernkop-Schnürch, Development of
phosphorylated nanoparticles as zeta potential inverting systems, Eur. J. Pharm. Biopharm. 97
(2015) 250–256.
[18] Y.P. Li, Y.Y. Pei, X.Y. Zhang, Z.H. Gu, Z.H. Zhou, W.F. Yuan, J.J. Zhou, J.H. Zhu, X.J. Gao,
PEGylated PLGA nanoparticles as protein carriers: synthesis, preparation and biodistribution in
rats, J. Control Release 71 (2001) 203–211.
[19] L. Inchaurraga, N. Martín-Arbella, V. Zabaleta, G. Quincoces, I. Peñuelas, J.M. Irache, In vivo
study of the mucus-permeating properties of PEG-coated nanoparticles following oral
administration, Eur. J. Pharm. Biopharm. 97 (2015) 280–289.
[20] M. Yang, S.K. Lai, Y.Y. Wang, W. Zhong, C. Happe, M. Zhang, J. Fu, J. Hanes, Biodegradable
Nanoparticles Composed Entirely of Safe Materials that Rapidly Penetrate Human Mucus,
Angew. Chem. Int. Engl. 50 (2011) 2597-2600.
[21] T. Cserháti, E. Forgács, Effect of pH and salts on the binding of free amino acids to the corn
protein zein studied by thin-layer chromatography, Amino Acids 28 (2005) 99–103.
[22] R.A. Cone, Barrier properties of mucus, Adv. Drug Deliv. Rev. 61 (2009) 75–85.
[23] A.W. Larhed, P. Artursson, E. Björk, The influence of intestinal mucus components on the
diffusion of drugs, Pharm. Res. 15 (1998) 66–71.
[24] R. Peñalva, I. Esparza, C.J. González-Navarro, G. Quincoces, I. Peñuelas, J.M. Irache, Zein
nanoparticles for oral folic acid delivery, J. Drug Deliv. Sci. Technol. 30 (2015) 450–457.
[25] P. Arbós, M.A. Arangoa, M.A. Campanero, J.M. Irache, Quantification of the bioadhesive
properties of protein-coated PVM/MA nanoparticles, Int. J. Pharm. 242 (2002) 129–136.
[26] P. Areses, M.T. Agüeros, G. Quincoces, M. Collantes, J.Á. Richter, L.M. López-Sánchez, M.
Sánchez-Martínez, J.M. Irache, I. Peñuelas, Molecular imaging techniques to study the
biodistribution of orally administered 99mTc-labelled naive and ligand-tagged nanoparticles,
Mol. Imaging Biol. 13 (2011) 1215–1223.
[27] M. Abdulkarim, N. Agulló, B. Cattoz, P. Griffiths, A. Bernkop-Schnürch, S.G. Borros, M.
CONFIDENTIAL CHAPTER 6: Modulation of the fate of zein nanoparticles by their coating
with a Gantrez® AN-thiamine conjugate
143
Gumbleton, Nanoparticle diffusion within intestinal mucus: three-dimensional response analysis
dissecting the impact of particle surface charge, size and heterogeneity across polyelectrolyte,
pegylated and viral particles, Eur. J. Pharm. Biopharm. 97 (2015) 230–238.
[28] J. Rohrer, A. Partenhauser, S. Hauptstein, C.M. Gallati, B. Matuszczak, M. Abdulkarim, M.
Gumbleton, A. Bernkop-Schnürch, Mucus permeating thiolated self-emulsifying drug delivery
systems, Eur. J. Pharm. Biopharm. 98 (2016) 90–97.
[29] A. Macierzanka, A.R. Mackie, B.H. Bajka, N.M. Rigby, F. Nau, D. Dupont, Transport of
particles in intestinal mucus under simulated infant and adult physiological conditions: impact of
mucus structure and extracellular DNA, PLoS One 9 (2014) e95274.
[30] J. Philibert, One and a half century of diffusion: Fick, Einstein, before and beyond, Diffusion
Fundamentals 2 (2005) 1-10.
[31] C. Rouzes, R. Gref, M. Leonard, A. De Sousa Delgado, E. Dellacherie, Surface modification of
poly(lactic acid) nanospheres using hydrophobically modified dextrans as stabilizers in an o/w
emulsion/evaporation technique, J. Biomed. Mater. Res. 50 (2000) 557–65.
[32] J.S. Suk, S.K. Lai, N.J. Boylan, M.R. Dawson, M.P. Boyle, J. Hanes, Rapid transport of muco-
inert nanoparticles in cystic fibrosis sputum treated with N -acetyl cysteine, Nanomedicine 6
(2011) 365–375.
[33] H.M. Yildiz, C.A. McKelvey, P.J. Marsac, R.L. Carrier, Size selectivity of intestinal mucus to
diffusing particulates is dependent on surface chemistry and exposure to lipids, J. Drug Target. 23
(2015) 768–74.
[34] S. Mura, H. Hillaireau, J. Nicolas, S. Kerdine-Römer, B. Le Droumaguet, C. Deloménie, V.
Nicolas, M. Pallardy, N. Tsapis, E. Fattal, Biodegradable nanoparticles meet the bronchial airway
barrier: how surface properties affect their interaction with mucus and epithelial cells,
Biomacromolecules 12 (2011) 4136–4143.
[35] O. Mert, S.K. Lai, L. Ensign, M. Yang, Y.Y. Wang, J. Wood, J. Hanes, A poly(ethylene glycol)-
based surfactant for formulation of drug- loaded mucus penetrating particles, J Control Release
10 (2012) 455–460.
[36] P. Arbós, M.A. Campanero, M.A. Arangoa, M.J. Renedo, J.M. Irache, Influence of the surface
characteristics of PVM/MA nanoparticles on their bioadhesive properties, J. Control Release 89
(2003) 19–30.
[37] K. Yoncheva, E. Lizarraga, J.M. Irache, Pegylated nanoparticles based on poly(methyl vinyl
ether-co-maleic anhydride): preparation and evaluation of their bioadhesive properties, Eur. J.
Pharm. Sci. 24 (2005) 411–419.

CHAPTER 7
Mucus-penetrating nanoparticles for the oral delivery of insulin


CONFIDENTIAL CHAPTER 7: Mucus-penetrating nanoparticles for the oral delivery of
insulin
147
Mucus-penetrating nanoparticles for the oral delivery of insulin
Abstract
Oral delivery of insulin is in the forefront in terms of routes of administration. However,
the harsh conditions of the gastrointestinal tract hampered its stability leading to poor
bioavailability. In order to solve this drawback, mucus-penetrating nanocarriers prepared from
zein nanoparticles coated with a poly(anhydride)-thimaine conjugate (GT) have been developed
for the oral delivery of insulin. Nanoparticles displayed a size of around 250 nm and negative
surface charges. The loading capacity of insulin was around 80 µg per mg of nanoparticles. In
SGF, GT-coated nanoparticles released a significantly lower amount of insulin than bare
nanoparticles by an anomalous diffusion mechanism. In SIF, the release rate of insulin from
coated nanoparticles was slower and more sustained than in SGF and appeared to be governed
by a combination of diffusion and erosion mechanisms. Furthermore, the influence of the
erosion mechanism was higher by increasing the GT/zein ratio. In vivo, the hypoglycemic effect
of the nanoparticles started 4 h post-administration, reaching a maximum at 9 h. The glycemia
of animals slowly increased during the next 11 h before reaching the basal levels. The
pharmacological availability of insulin encapsulated in zein coated nanoparticles was 13.5%.
Pharmacokinetic study confirmed the presence of insulin in serum when orally administered. In
fact, this oral formulation leads to a maximum serum insulin level at 4 h, from when it started to
decrease till basal levels 10 h post-administration. The oral bioavailability of insulin
encapsulated in these zein coated nanoparticles was calculated to be 5.2%.

CONFIDENTIAL CHAPTER 7: Mucus-penetrating nanoparticles for the oral delivery of
insulin
148
1. Introduction
Diabetes mellitus (DM) represents a progressive disease typified by sustained and high
glucose levels caused by a disability in the insulin production or an inadequate response to the
insulin produced by the body. Two main types of DM can be distinguished: type 1 and type 2.
Type 1 diabetes is a chronic disorder that occurs as a consequence of an auto-immune
destruction of pancreatic β-cells in charge of insulin production [1]. In type 2 diabetes, which
accounts ~90% of the DM cases, the cause is a resistance to insulin and an inappropriate insulin
secretion response [2]. DM represents one of the most challenging issues worldwide regarding
public health. Actually, 415 million people (8.8%) are estimated to currently have diabetes and
it is predicted to rise up to 642 million by 2040 [3]. In addition, diabetes reported 14.5% of
global all-cause mortality among people aged between 20 and 79 years [4].
The actual treatment of type 1 diabetes involves an uninterrupted supply of insulin,
which implicates the daily injection of regular quick-acting human insulin analogs before meals
and the injection of long-acting analogs as basal insulin mimetic [5,6]. Non-insulin-dependent
diabetes or type 2 diabetes is a different disease and although the use of other hypoglycemic
agents such as sulfonylureas and metformin are useful in the glycemic control, insulin injections
are also needed [7,8].
The conventional way of insulin administration, through a parenteral route, involves
some drawbacks including the lack of patient compliance to the treatment associated due to the
uncomfortable use of injections and needles [9]. In addition, parenteral insulin may produce
peripheral hyperinsulinemia, which has been related to hypertension, atherosclerosis and an
increase of insulin resistance in muscle and peripheral tissues [10,11]. Other problems such as
allergic reactions, lipodystrophy around the site of injection and a certain risk of infectious
disease transmission are also related to this way of administration [12].
Among all the routes of administration, the oral route is presented in the forefront in
terms of insulin delivery as it is non-invasive, cost-effectiveness and shows a well-established
acceptability by patients [13]. Furthermore, oral insulin mimics the pathway after endogenous
insulin secretion [14] and it would be possible to tune the dosing schedule of insulin to the
responses of individual patients [15]. In spite of the benefits of an oral insulin formulation, this
route also presents some limitations leading to a very poor bioavailability. In fact, the harsh
chemical and enzymatic conditions of the gastrointestinal tract highly hampered its stability and
activity [16].
In order to solve these problems, different strategies have been proposed such as its
encapsulation in polymeric nanoparticles [17,18], solid lipid nanoparticles [16], chitosan
nanocarriers [19], liposomes [20] or micelles [21]. All of these devices may offer protection

CONFIDENTIAL CHAPTER 7: Mucus-penetrating nanoparticles for the oral delivery of
insulin
149
against premature insulin degradation and, in some cases, show controlled release properties
that may be of interest to sustain therapeutic levels of the biomacromolecule in blood.
However, these nanocarriers are faced to the mucus gel barrier that traps these
macromolecular assemblies preventing their arrival to the gut epithelium. As a consequence, the
efficiency of these nanotransporters for insulin oral delivery has to be still improved.
In this context, our approach consisted in the use of mucus-penetrating nanocarriers,
made from the coating of zein nanoparticles with a polymeric conjugate that confers “slippery”
properties to the resulting nanocarriers facilitating their diffusion through the protective mucus
layer [Chapter 6]. Zein is a biodegradable protein from corn that can be used to easily prepare
nanoparticles, under environmentally acceptable conditions, with controlled release properties
[22,23]. The polymeric conjugate is obtained by the binding of thiamine to Gantrez® AN
[Chapter 4].
Therefore, the aim of this work was to optimize the preparative process of insulin-
loaded zein nanoparticles coated with a Gantrez® AN-thiamine conjugate and to evaluate the in
vivo capability of the developed nanocarriers to promote the oral absorption and bioavailability
of this biomacromolecule in a diabetic Wistar rat model.
2. Materials and Methods
2.1. Chemicals
The copolymer of methyl vinyl ether and maleic anhydride or poly(anhydride)
(Gantrez® AN 119) was supplied by Ashland Inc. (Barcelona, Spain). Thiamine hydrochloride,
recombinant human insulin 10 mg/mL, zein, mannitol, lysine, citric acid monohydrated, tribasic
sodium citrate, sodium chloride and streptozotocin were purchased from Sigma-Aldrich
(Madrid, Spain). Di-sodium hydrogen phosphate anhydrous, sodium hydroxide, hydrochloric
acid 37 % and ethanol were provided by Panreac (Barcelona, Spain). Acetone was obtained
from VWR-Prolabo, (Linars del Vallès, Spain). Deionized reagent water (18.2 MΩ-cm
resistivity) was prepared by a water purification system (Wasserlab, Pamplona, Spain). Nitrogen
gas (ultrapure, >99%) was produced using an Alltech nitrogen generator (Ingeniería Analítica,
Barcelona, Spain). Formvar® was purchased from Agar Scientific (Stansted, UK) and Insulin
EIA kit was purchased from Arbor Assays (Ann Arbor, Michigan, USA).

CONFIDENTIAL CHAPTER 7: Mucus-penetrating nanoparticles for the oral delivery of
insulin
150
2.2. Preparation of Gantrez® AN-thiamine conjugate (GT)
The conjugate was obtained by the covalent binding of thiamine to the poly(anhydride)
backbone. For this purpose, 5 g Gantrez® AN were dissolved in 200 mL acetone. Then, 125 mg
thiamine were added and the mixture was heated at 50 ºC, under magnetic agitation at 400 rpm,
for 3 h. Then, the mixture was filtered through a pleated filter paper and the organic solvent was
eliminated under reduced pressure in a Büchi R-144 apparatus (BÜCHI Labortechnik AG,
Flawil, Switzerland) until the conjugate was totally dry. Finally, the resulting powder was
stored. The conjugate was named GT.
2.3. Preparation of zein nanoparticles coated with the Gantrez® AN-
thiamine conjugate (GT-NPZ)
Zein nanoparticles were prepared by a desolvation procedure previously described [23]
and, then, coated with the previously synthesized Gantrez® AN-thiamine conjugate. In brief,
200 mg zein, 30 mg lysine and a variable amount of insulin were dissolved in 20 mL ethanol
55% and incubated under agitation at room temperature (RT) for 15 min. In parallel, an aqueous
solution of the Gantrez® AN-thiamine conjugate was prepared by dispersing the polymer in
purified water till complete solubilisation. Nanoparticles were obtained after the addition of 20
mL purified water to the hydroalcoholic solution of zein, lysine and insulin. Then, a determined
volume of GT solution (0.25, 0.5 or 1 mL) was added and the mixture was maintained under
agitation at RT for 30 min. The resulting suspension of nanoparticles was purified and
concentrated till 20 mL by ultrafiltration through a polysulfone membrane cartridge of 500 kDa
pore size (Medica SPA, Medolla, Italy).
Finally, 10 mL of a mannitol aqueous solution (4% w/v) was added to the suspension of
nanoparticles and the mixture was dried in a Büchi Mini Spray Drier B-290 apparatus (Büchi
Labortechnik AG, Switzerland). For this purpose, the following parameters were selected: inlet
temperature of 90 ºC, outlet temperature of 60 ºC, spray-flow of 600 L/h, and aspirator at 100 %
of the maximum capacity. The insulin-loaded nanoparticles were named as I-GT-NP.
The encapsulation of insulin in “naked” zein nanoparticles (I-NP) was performed in the
same way as described above but in the absence of GT. Similarly, empty nanoparticles used as
controls were also prepared but in the absence of insulin (GT-NP) and GT (NP).
CONFIDENTIAL CHAPTER 7: Mucus-penetrating nanoparticles for the oral delivery of
insulin
151
2.4. Characterization of nanoparticles
2.4.1. Particle size, zeta potential and yield
The particle size, polydispersity index (PDI) and zeta-potential (ζ) were determined by
photon correlation sprectroscopy (PCS) and electrophoretic laser doppler anemometry
respectively, using a Zetasizer analyser system (Brookhaven Instruments Corporation, New
York, USA). The diameter of the nanoparticles was determined after dispersion in ultrapure
water (1/10) and measured at 25 ºC by dynamic light scattering angle of 90 ºC. The zeta
potential was determined as follows: 200 μL of the samples were diluted in 2 mL of a 0.1 mM
KCl solution adjusted to pH 7.4.
The yield of the preparative process of nanoparticles was calculated by gravimetry [24].
2.4.2. Morphology and shape
The morphology and shape of nanoparticles were evaluated by TEM. For this purpose,
in brief, 1.2 mg of the spray-dried powder containing the nanoparticles were dispersed in 1 mL
water and one drop was placed in a copper grid coated with Formvar®. Samples were cleaned by
the addition of deionised water. Then, nanoparticles were treated with 3% uranil acetate for 5
min and completely dried at room temperature. For the visualisation of nanoparticles, a Zeiss
Libra 120 Transmission Electron Microscope (Oberkochen, Germany) coupled with a digital
imaging system Gatan Ultrascan 1000 2k x 2k CCD was used.
2.4.3. Insulin analysis
For the calculation of the amount of insulin loaded in nanoparticles, we applied a protocol
involving two analysis. In the former, the filtrates obtained during the purification step by
ultrafiltration were collected and 1.5 mL of these liquids mixed with 6 mL of 0.05 M phosphate
buffer containing 0.3 M NaCl. The mixture was filtered through a 0.45 µm pore size cellulose
membrane (Merc KGaA, Darmstadt, Germany). In the later, 5 mg of spray-dried powder
containing the nanoparticles were dispersed in 1 mL water and filtered through a 0.2 µm pore
size PTFE membrane (Merc KGaA, Darmstadt, Germany). In both cases, samples were
transferred to auto-sampler vials, capped and placed in the HPLC auto-sampler. The insulin
loading was calculated as the difference between the initial amount of insulin used to prepare
the nanoparticles and the sum of insulin determined in the liquids collected during the
purification step and those obtained after the filtration of nanoparticles reconstituted in water.
The results were expressed as the amount of insulin (µg) per mg nanoparticles.
Insulin was determined in an Agilent model 1100 series LC and a diode-array detector
set at 220 nm (Waldbronn, Germany). The chromatographic system was equipped with a
TSKgel4000 (7.8 mm x 30 cm) TosoHaas column (Tosoh Bioscience GmbH, Griesheim,

CONFIDENTIAL CHAPTER 7: Mucus-penetrating nanoparticles for the oral delivery of
insulin
152
Germany). The mobile phase was a 0.3 M NaCl solution in 0.05 M phosphate buffer. The flow-
rate was 0.8 mL/min. The column was placed at 27 °C and the injection volume was 40 µL.
Standard curves were designed over the range of 2-100 µg/mL (R2≥0.999) from a human insulin
solution and were prepared in supernatant of non-loaded nanoparticles. The quantification limit
was 2 µg/mL.
2.5. In vitro release studies
The release studies were performed in simulated gastric (SGF) and intestinal fluids
(SIF). For these purpose Float-A-Lyzer® devices with a MWCO of 300 kDa (Spectrum Labs,
Breda, The Nederlands) were used. First, the dyalisis bags were washed with ethanol 10% for
10 min and, then, with water. The bags were filled with 62,5 mg nanoparticles dispersed in 5
mL water and, then, placed into a vessel containing 45 mL of SGF. The vessel was maintained
under magnetic agitation and 500 µL samples were withdrawn at fixed time intervals and
replaced with equal volumes of SGF. After two hours of incubation in this gastric fluid, the bags
were transferred to a second vessel with 45 mL SIF. Again, at fixed times, 500 µL were
withdrawn and replaced with free SIF.
Insulin was quantified by the HPLC method described above. Calibration curves in the
simulated mediums (2-100 µg/mL; R2≥0.999 in both cases) were generated.
In order to ascertain the insulin release mechanism, the obtained data were fitted to
Korsmeyer-Peppas and Peppas-Sahlin models. The Korsmeyer–Peppas model is a simple semi-
empirical approach which exponentially relates drug release with the elapsed time as expressed
in the following equation [25].
Mt/M∞ = KKP·tn
[Equation 1]
In which Mt/M∞ is the drug release fraction at time t, KKP is a constant incorporating the
structural and geometric characteristics of the matrix and n is the release exponent indicative of
the drug release mechanism. The value of n indicates the mechanism of the release.[26]. Values
close to 0.5 indicate a Case I (Fickian) diffusion mechanism, values between 0.5 and 0.89 are
associated with an anomalous (non-Fickian) diffusion process, whereas an “n” between 0.89
and 1 is related with a Case II transport due to the erosion of the matrix.
The contribution of Fickian and non-Fickian release was also evaluated by using the
Peppas– Sahling model equation [26].
Mt/M∞ = KD·t1/2 + KE·t [Equation 2]

CONFIDENTIAL CHAPTER 7: Mucus-penetrating nanoparticles for the oral delivery of
insulin
153
where the first term of the right-hand side is the Fickian contribution (KD is the diffusional
constant) and the second term is the Case II erosional contribution (KE is the erosional
constant). KD and KE values were used to calculate the contribution percentage of diffusion (D)
and erosion (E), with Equations 3 and 4 [26]:
1 = D·(1 + KE/KD·t1/2
) [Equation 3]
E/D = KE/KD·t1/2
[Equation 4]
To fit the experimental data to the previous equations, only the portion of the release
profile in which Mt/M∞ was lower than 0.6 was used.
2.6. In vivo studies
Male Wistar rats weighing 180 g were housed under controlled temperature, humidity,
and a 12–12h light–dark cycle fasted for 12 h. All the procedures were performed following a
protocol previously approved by the “Ethical and Biosafety Committee for Research on
Animals” at the University of Navarra in line with the European legislation on animal
experiments. Diabetes was induced with an intraperitoneal injection of 80 mg/kg streptozotocin
in citrate buffer 0.1M (pH 4.5). After 8–10 days, rats with frequent urination, loss of weight and
fasting plasma glucose levels higher than 250 mg/dL, were randomized for in vivo studies. The
diabetic rats were fasted for 12 h before experiments and, then, divided in three groups. The first
group of animals received a single subcutaneous dose of an aqueous solution of insulin (5
IU/kg). In the second group, animals received by oral gavage 50 IU/kg as single dose of insulin-
loaded nanoparticles (I-GT-NPZ) dispersed in 1 mL water. Finally, the third group of animals
received orally 50 IU/kg of insulin formulated as aqueous solution (1 mL).
Blood samples were collected from the tail vein of the rats prior insulin
administration in order to establish baseline glucose levels and at different times after the
administration of the different formulations. Glucose levels were measured with a glucometer
(Accu-Check® Aviva glucometer; Roche Diagnostics, Basel, Switzerland). In a similar way,
insulin levels were quantified from the sera of animals. Insulin was quantified using an ELISA
(EIA insulin kit, Arbor Assays, Ann Arbor, USA).
2.7. Pharmacokinetic and pharmacodynamic analysis
The determined pharmacodynamic parameters include the hypoglycemic effect
quantified by the area above the curve (AAC0–24h) by linear trapezoidal method.

CONFIDENTIAL CHAPTER 7: Mucus-penetrating nanoparticles for the oral delivery of
insulin
154
Pharmacological availability (PA) calculated as the cumulative hypoglycemic effect relative to
100% PA of sc free insulin (equation 5), the time of minimum glycemia (Tmax) and the
minimum glucose concentration in the blood (Cmin).
Pharmacokinetic parameters include the maximum concentration of insulin in serum
(Cmax) the AUC calculated by the linear trapezoid method and time that insulin is at the
maximum concentration (Tmax). The bioavailability of oral insulin calculated by the dose-
corrected area under the curve of serum insulin levels overtime (AUC0–8h) relative to 100%
bioavailability of sc free-form insulin (equation 6). The pharmacokinetic parameters were
obtained using WinNonline® software (Certara USA Int., Princeton, US)
The relative oral bioavailability based on either blood insulin level (F%) or glucose
levels (PA%) were calculated using the following equations:
PA% = AACoral x Doses.c./AACs.c. x Doseoral x 100 [Equation 5]
F% = AUCoral x Doses.c./AUCs.c. x Doseoral x 100 [Equation 6]
In which, AUC is the total area under the curve of the serum insulin concentration versus time
profile and AAC is the total area above the glycemia curve.
2.8. Statistical analysis
The means and standard errors were calculated. For group comparisons in the in vivo
efficacy study data were analysed by a one way analysis of variance (ANOVA) followed by a
Bonferroni multicomparison test using the NCSSTM
11 statistical software (NCSS, LCC.
Kaysville, US). The difference was considered as significant when P<0.05. The analysis of
farmacokinetic parameters were carried aout by a one way analysis of the variance (ANOVA)
followed by a Tukey-Kremer multicomparison test using the NCSSTM
11 statistical software
(NCSS, LCC. Kaysville, US). The difference was considered significant when p<0.01 or
p<0.001.
3. Results
3.1. Preparation of insulin loaded nanoparticles
The preparative process of the nanoparticles employed in this study comprised two
different steps: (i) formation of insulin loaded zein nanoparticles and (ii) coating of these
nanoparticles with the GT conjugate.

CONFIDENTIAL CHAPTER 7: Mucus-penetrating nanoparticles for the oral delivery of
insulin
155
As a first step, the encapsulation of insulin on zein nanoparticles was optimized. Figure
1A shows the influence of the insulin/zein ratio on the physico-chemical properties of
nanoparticles. The mean size of zein nanoparticles increased by increasing the insulin/zein ratio
(Figure 1A). On the contrary, under the experimental conditions evaluated, no influence on the
negative zeta potential of the resulting nanoparticles was observed. Nevertheless, when
nanoparticles were prepared at a insulin/zein ratio of 0.2, the resulting batches displayed a high
variability (Figure 1A).
Regarding the payload, the insulin loading increased by increasing the insulin/zein ratio,
till a plateau was reached (Figure 1B). This plateau was achieved at a insulin/zein ratio of 0.1,
which corresponded with an insulin loading of about 84 µg/mg nanoparticles and an
encapsulation efficiency higher than 80%. At insulin/zein ratios higher than 0.1, the insulin
loading did not significantly increased but the encapsulation efficiency dramatically fell. Under
these circumstances, insulin-loaded nanoparticles were prepared and analyzed at an insulin/zein
ratio of 0.1 for further investigations
The second step consisted in the optimization of the coating process of insulin-loaded
nanoparticles. For this purpose, the influence of the conjugate/zein ratio on the properties of
nanoparticles was evaluated (Table 1). As expected, by increasing the GT/zein ratio, the mean
size and the negative zeta potential of the resulting nanoparticles increased. On the other hand,
and under the experimental conditions tested, all the nanoparticle formulations displayed
homogeneous characteristics with a PDI below 0.2. Another important aspect that merits to be
highlighted is that no lost of significant amounts of insulin during the coating step of
nanoparticles was observed.

CONFIDENTIAL CHAPTER 7: Mucus-penetrating nanoparticles for the oral delivery of
insulin
156
Figure 1. Influence of the insulin/zein ratio (expressed in percentage) on the physico-chemical
properties of the resulting nanoparticles: (A) size and zeta potential; (B) insulin loading and
encapsulation efficiency (EE). Data are expressed as mean ± SD (n=3).
.

CONFIDENTIAL CHAPTER 7: Mucus-penetrating nanoparticles for the oral delivery of
insulin
157
Table 1. Influence of the GT/zein ratio (expressed in percentage) on the physico-chemical
properties of the resulting nanoparticles. Data expressed as mean ± SD (n=3). Experimental
conditions: insulin/zein ratio of 0.1.
FORMULATION GT/zein
ratio (%) Size (nm) PDI
Zeta
Potential
(mV)
Insulin
Loading
(µg/mg NP)
I-NP 0 222 ± 2 0.120±0.014 -41 ± 4 87 ± 3
I-GT-NP1 2.5 261 ± 3 0.091±0.033 -38 ± 2 80 ± 2
I-GT-NP2 5.0 273 ± 1 0.151±0.016 -43 ± 3 84 ± 3
I-GT-NP3 10.0 327 ± 8 0.182±0.078 -55 ± 5 85 ± 5
Figure 2 shows TEM photographs of empty zein nanoparticles and insulin-loaded
nanoparticles, uncoated and coated with GT. These nanocarriers displayed spherical shape and
similar sizes to those obtained by photon correlation spectroscopy.
.

CONFIDENTIAL CHAPTER 7: Mucus-penetrating nanoparticles for the oral delivery of
insulin
158
Figure 2. Tomography Electron Microscopy of zein nanoparticles (NP; A), zein nanoparticles
containing insulin (I-NP; B) and coated zein nanparticles containing insulin (I-GT-NP; C).
Experimental conditions: insulin/zein ratio of 0.1.

CONFIDENTIAL CHAPTER 7: Mucus-penetrating nanoparticles for the oral delivery of
insulin
159
3.2. In vitro release studies
When incubated in SGF, uncoated nanoparticles (I-NP) released about 45% of their
insulin content in 2 h. This profile adjusted well to the Korsmeyer-Peppas equation (equation 1;
Table 2) with an exponent “n” of 0.722, which was an evidence of an anomalous diffusion
process. In accordance with the Peppas-Shalin equation (equation 2), the release of insulin from
bare zein nanoparticles would be the result of the combination between both a diffusion (KD:
0.152 h-0.5
) and an erosion (KE: 0.126 h) processes.
Under SIF (pH 6.8), the release rate of insulin from zein nanoparticles was 4-times
lower than in SGF. In this case, the release was mainly driven by a diffusion phenomenon
(n=0.471).
On the other hand, the amount of insulin released from GT-coated nanoparticles when
incubated in SGF was significantly lower (about 30% in 2 h) than for bare nanoparticles
(Figure 3). This observation was confirmed according to the Korsmeyer-Peppas constant values
obtained (KKP, equation 1). Again, the release of insulin from these coated zein nanoparticles
appeared to be controlled by a combination of diffusion and erosion mechanism (coefficient n
between 0.5 and 0.89) [25]. Interestingly, the diffusion component decreased by increasing the
GT/zein ratio used to coat the nanoparticles (Table 2). Finally, in SIF, coated-nanoparticles
displayed a similar behavior than I-NP with release rate significantly lower than in SGF.
However, with these coated formulations, the release of insulin was also affected by the erosion
of the matrix of nanoparticles. In addition, the influence of the erosion component in the release
of insulin from coated-nanoparticles increased by increasing the GT/zein ratio.
Table 2. Analysis of the insulin release mechanism from zein nanoparticles and zein
nanoparticles coated with the Gantrez® AN-thiamine conjugate.
Korsmeyer-Peppas Peppas-Shalin
kKP(h-n
) n R2 KD(h
-m) KE(h
-2m) R
2
I-NP SGF 0.282 0.722 0.999 0.152 0.126 0.998
I-NP SIF 0.066 0.471 0.986 0.065 -0.001* 0.986
I-GT-NP1 SGF 0.157 0.791 0.993 0.062 0.092 0.991
I-GT-NP1 SIF 0.047 0.598 0.997 0.045 0.004 0.997
I-GT-NP2 SGF 0.143 0.815 0.982 0.049 0.092 0.978
I-GT-NP2 SIF 0.034 0.706 0.998 0.030 0.007 0.997
I-GT-NP3 SGF 0,177 0,848 0,976 0.047 0.127 0.973
I-GT-NP3 SIF 0.026 0.814 0.996 0.018 0.011 0.997
*negative value indicates the absence of erosion mechanism.

CONFIDENTIAL CHAPTER 7: Mucus-penetrating nanoparticles for the oral delivery of
insulin
160
0 5 10 15 20 25
0
10
20
30
40
50
60
70
80
90
100
SG
F (
pH
1.0
)
SIF (pH 6.8)
Insu
lin
rele
ased
(%
)
Time (h)
I-NPZ
I-NPZ-2.5
I-NPZ-5
I-NPZ-10
I-NPZI-GT-NPZ 2.5%I-GT-NPZ 5%I-GT-NPZ-10%
I-NPI-GT-NP 2.5%I-GT-NP 5%I-GT-NP 10%
I-NPI-GT-NP1I-GT-NP2I-GT-NP3
Figure 3. Influence of the GT coating on the in vitro release properties of insulin from zein
nanoparticles. I-NP: bare zein nanoparticles (black square); I-GT-NP 2.5%: zein nanoparticles
coated with a GT/zein ratio of 2.5% (white square); I-GT-NP 5%: zein nanoparticles coated
with a GT/zein ratio of 5% (white circle); I-GT-NP 10%%: zein nanoparticles coated with a
GT/zein ratio of 10% (white triangle).
3.3. In vivo studies
For in vivo studies, I-GT-NP prepared at a conjugate/polymer ratio of 5% was used. The
pharmacological effect of orally delivered nanoencapsulated insulin was evaluated at 50 IU/kg
dose. Blood glucose levels were compared to that of orally delivered free-form insulin at the
same dose and to sc injected free-form insulin at 5 IU/kg. Changes in plasma glucose are shown
in Figure 4 whereas Table 3 summarises the pharmacodynamic parameters.
After subcutaneous administration of the insulin solution to diabetic fasted rats, blood
glucose levels decreased rapidly. Thus, the glycemia was reduced by sc insulin by 60%
(p<0.001) after 1 h. The maximal reduction (about 80%) was observed between 2 and 4 h. Then,
glycemia increased slowly returning to its basal level 16 h post-administration (Figure 4).
Insulin loaded-nanoparticles coated with GT (I-GT-NP) and administered orally at a
dose of 50 IU/kg displayed a slightly different profile. Thus, after administration of
nanoparticles at an insulin single dose of 50 IU/kg, the glucose levels of animals remained

CONFIDENTIAL CHAPTER 7: Mucus-penetrating nanoparticles for the oral delivery of
insulin
161
unvariable during the first 2 h post-administration. After this first phase of lag-time, the
glycemia of animals slowly decreased reaching a minimum about 6-10 h post-administration.
The maximum decrease on the glycemia levels was -60% (p<0.01). Then, the glucose
levels slowly increased with time and the basal levels were reached 20 h post-administration.
When insulin was orally administered as aqueous solution, the glycemia levels were not
affected (Figure 4; p<0.001).
0 5 10 15 20 25
0
20
40
60
80
100
120
Blo
od
Glu
co
se
Le
ve
ls (
%)
Time (h)
sc insulin
I-GT-NP2
oral insulin
Figure 4. Blood glucose levels of diabetic rats treated with different formulations: i)
subcutaneous administration of insulin (circle), ii) oral administration of insulin loaded in zein
nanoparticles coated with Gantrez® AN-thiamine conjugate (square) and iii) insulin orally
administered (triangle). Data represents the mean±S.D., n=6 per group.
From these curves, the pharmacodynamic parameters associated to the administration of
the insulin formulations were calculated (Table 3). From these data, it is important to highlight
that the oral I-GT-NP formulation demonstrated a similar capability than the solution of insulin
sc administered to decrease the glycemia (Cmin). Nevertheless, the subcutaneous insulin needed
only two hours to induce this decrease, whereas insulin in nanoparticles took about 9 h to
produce the same effect. On the other hand, the relative oral bioavailability based in the

CONFIDENTIAL CHAPTER 7: Mucus-penetrating nanoparticles for the oral delivery of
insulin
162
hypoglycemia effect (comparing with subcutaneous administration of insulin) was calculated to
be 13.5%.
Table 3. Pharmacodynamic parameters after oral delivery of 50 IU/kg insulin formulated as
nanoparticles (I-GT-NP) and subcutaneous injection of 5 IU/kg insulin free-form. Data
represents the mean±S.D. (n=6)
Dose (IU/kg) AAC (µU/hmL) T (h) Cmin (% basal glucose) PA (%)
s.c. insulin 5 625.9±98 2±0 18.2±5.02 100
I-GT-NPZ 50 845.8±94 9±1 20.3±3.74 13.5
AAC: area above the curve; T: time at which the maximum effect is observed, Cmin: minimum
concentration of blood glucose levels and PA: pharmacological availability.
0 5 10
0
100
200
300
400
Se
rum
In
su
lin
Le
ve
ls (
IU/m
L)
Time (h)
sc insulin
I-GT-NP
Figure 5. Serum insulin levels vs. time after the administration of either a subcutaneous
solution of insulin (sc insulin; black circle) or an oral suspension of insulin loaded nanoparticles
(I-GT-NP; open square). Data expressed as mean ± SD (n=6).

CONFIDENTIAL CHAPTER 7: Mucus-penetrating nanoparticles for the oral delivery of
insulin
163
Table 4. Pharmacokinetic parameters of insulin. Data expressed as mean ± SD (n=6).
SC insulin I-GT-NP
Dose (IU/kg) 5 50
Cmax (µIU/mL) 369±77** 129±25
Tmax (h) 1.7 4.0
t1/2 (h) 0.92±0.17 1.40±0.19**
Cl (µIU/hmL) 1116±195 1113±301
MRT (h) 1.98±0.47 4.62±0.62**
K (h-1
) 0.77±0.14 0.52±0.08*
AUC (µIUh/mL) 896±136** 467±110
F% 100 5.2
I-GT-NP: insulin-loaded nanoparticles (50 IU/kg) and subcutaneous insulin (5
IU/kg).*p<0.01; **p<0.001.
The data were adjusted by non-compartmental model. The pharmacokinetic parameters
calculated are presented in Table 4. Figure 5 shows the insulin serum concentration as a
function of time in animals treated with either a subcutaneous solution of the hormone or
encapsulated in zein nanoparticles orally administered. Table 4 summarizes the main
pharmacokinetic parameters derived from these curves. For the subcutaneous formulation, the
typical profile characterized by a Cmax reached during the first two hours post-administration
and a rapid descent during the following 4 h was observed. The half-life of insulin
subcutaneously delivered was calculated to be 0.92 h. The insulin clearance was 1116 µIU/hmL.
When insulin was orally administered in zein nanoparticles, the profile of the curve was
characterized by a Cmax that was reached 4 h post administration. This Cmax was significantly
lower than the insulin subcutaneously administered (p<0.001). Then, the serum insulin levels
decreased slowly during the following 6 h. Interestingly, the insulin half-life when administered
as I-GT-NP was 1.5-fold higher than for the subcutaneous solution of insulin. Similarly, the
elimination constant was also 1.5-fold lower when insulin was orally administered in the form
of nanoparticles than subcutaneously as aqueous solution orally administered. There were no
significant differences regarding the clearance, which was 1113 µIU/hmL when insulin was
given per oral route. The relative oral bioavailability of insulin, encapsulated in zein
nanoparticles, in comparison with the subcutaneous route was 5.2%.

CONFIDENTIAL CHAPTER 7: Mucus-penetrating nanoparticles for the oral delivery of
insulin
164
4. Discussion
Polymer nanoparticles appear to be adequate carriers for the oral delivery of sensitive
compounds including peptides and therapeutic proteins. In principle, these carriers may be used
for the accommodation of these biologically active compounds in the core of their matrix
structure. In this way, the encapsulated drug may be protected against degradation from the
harsh conditions as well as the effect of the digestive enzymes and bile salts. In addition, these
polymeric nanoparticles may control the release of their cargo. However, in order to reach the
absorptive gut membrane, nanoparticles have to cross the mucus gel layer that covers and
protect the surface of the epithelium. This protective layer constitutes a formidable barrier in
which nanoparticles may remain trapped in the mucus network due to the establishment of
mucoadhesive interactions [27–29]. For protein delivery, these mucoadhesive interactions are
not desirable. First, nanoparticles trapped in the mucus layer remain far away from their
destination (the surface of the enterocytes). Second, these nanoparticles are immobilized in a
structure that is continuously renewed from below by the synthesis and secretion of new mucus
from globet cells. In fact, the small intestine mucus turn-over would be of 24-48 h [30]. Third,
the cargo is released in a medium rich in digestive enzymes that may rapidly inactivate its
therapeutic effect.
In order to improve the capability of nanocarriers to reach the absorptive epithelium,
one alternative may be the surface decoration with hydrophilic compounds in order to render
mucus-penetrating properties to the resulting nanocarriers. In this context, one strategy was to
coat zein nanoparticles (containing insulin) with a polymer conjugate between Gantrez® AN and
thiamine [Chapter 6].
Insulin-loaded nanoparticles produced by decoration of zein followed by coating with a
Gantrez® AN-thiamine conjugate. The resulting nanoparticles had a mean diameter of
approximately 280 nm and a negative surface charge. Regarding the payload, insulin-loaded
nanoparticles displayed an insulin content of about 8% that was not affected by the coating
process of nanocarriers with the GT conjugate. This loading capacity of zein nanocarriers is in
line with others reported data involving alginate/chitosan nanoparticles [19] chitosan/dextran
nanocarriers [16], multilayered nanodevices [31] or poly(Ɛ-caprolactone)/eudragit nanoparticles
[32].
The release of insulin from nanoparticles was characterized by a rapid release within the
2 h in which they were incubated in SGF. In this acidic medium, insulin was released following
a zero-order rate. Then, after transferring the nanoparticles to SIF, the release rate of
nanoparticles decreased; although insulin continued to be released following a zero-order
kinetic. Interestingly, for bare zein nanoparticles the release of insulin was mainly due to a
diffusion phenomenon. However, after coating the insulin-loaded zein nanoparticles with the

CONFIDENTIAL CHAPTER 7: Mucus-penetrating nanoparticles for the oral delivery of
insulin
165
GT conjugate, the diffusion of the protein appeared to be controlled by the presence of the
polymer conjugate on the surface of zein nanoparticles. Thus, for coated nanoparticles, insulin
was released by a combination of diffusion and erosion of the matrix forming the structure of
the nanoparticles. As a consequence, nanoparticles coated with the conjugate displayed a higher
control of the insulin release from these nanocarriers.
The hypoglycemic effect of nanoencapsulated insulin began 4 h post-administration
with a maximum effect that was observed 9 h after the oral administration of nanoparticles.
Then, the glycemia of animals slowly increased during the following 11 h till reaching the basal
levels. This profile was quite different to that observed for subcutaneous insulin, characterized
by a short lag-time and a minimum of glycemia 2 h post-administration. This subcutaneous
profile of insulin was similar to that previously published by other research groups [31,33,34].
On the other hand, the pharmacological availability of orally administered insulin in
nanoparticles was calculated to be 13.5% (Table 3). This result is slightly higher than other
previously published and involving the use of chitosan-based [35,36] or multilayered devices
containing alginate, dextran, poloxamer, albumin and chitosan [31].
Serum insulin levels after the oral administration of insulin encapsulated in
nanoparticles reached a maximum after 4 h and, then, the levels were decreasing down to a
minimum 10 h post-administration. This profile is quite different from the subcutaneous profile,
which showed a quick maximum at 1h post-administration and a fast decrease. The relative oral
bioavailability of insulin when orally administered in nanoparticles was 5.2%. Again, this value
is in line with data reported by Sarmento and co-workers, involving chitosan-based
nanoparticles [19] or by Jin and collaborators who used targeted peptide ligand trimethyl
chitosan [37].
5. Conclusion
Zein nanoparticles, coated with a slippery conjugate of Gantrez® AN and thiamine,
enhanced the intestinal absorption of insulin following oral administration. Nanoparticles
decreased the blood glucose levels in diabetic rats at a dose of 50 IU/kg up to 20% of their basal
glucose levels. Moreover, the hypoglycemic effect was observed during at least 18 h. A
significant improvement was obtained in terms of pharmacological activity and relative
bioavailability, 13.5% and 5.2% respectively. These results are encouraging and more
experiments are needed to validate this strategy and improve the efficacy of these nanocarriers
as vehicles for insulin and other therapeutic proteins.
CONFIDENTIAL CHAPTER 7: Mucus-penetrating nanoparticles for the oral delivery of
insulin
166
Acknowledgements
The research leading to these results has received funding from the European
Community's Seventh Framework Programme [FP7/2007-2013] for ALEXANDER under grant
agreement n° NMP-2011-1.2-2-280761. Furthermore, Laura Inchaurraga acknowledges
“Asociación de Amigos” of the University of Navarra for the financial support.

CONFIDENTIAL CHAPTER 7: Mucus-penetrating nanoparticles for the oral delivery of
insulin
167
References
[1] M.L. Marré, E.A. James, J.D. Piganelli, β cell ER stress and the implications for immunogenicity
in type 1 diabetes, Front. Cell Dev. Biol. 3 (2015) 67.
[2] C.C. Thomas, L.H. Philipson, Update on Diabetes Classification, Med. Clin. North Am. 99
(2015) 1–16.
[3] N.S. Chauhan, S. Chauhan Nitesh, C. Sanjeev, H. Vandana, A. Alka, S. Vijender, advances in
insulin delivery systems: an update, World Appl. Sci. J. 11 (2010) 1552–1556.
[4] A. Bahar, Z. Kashi, E. Daneshpour, O. Akha, S. Ala, Effects of cabergoline on blood glucose
levels in type 2 diabetic patients: A double-blind controlled clinical trial, Medicine (Baltimore) 95
(2016) e4818.
[5] P. Rossetti, S. Pampanelli, C. Fanelli, F. Porcellati, E. Costa, E. Torlone, L. Scionti, G.B. Bolli,
Intensive replacement of basal insulin in patients with type 1 diabetes given rapid-acting insulin
analog at mealtime, Diabetes Care 26 (2003) 1490-1296.
[6] E. Varanauskiene, I. Varanauskaite, J. Ceponis, An update on multiple insulin injection therapy in
type 1 and 2 diabetes, Medicine (Kaunas) 42 (2006) 770–779.
[7] A.H. Barnett, Insulin glargine in the treatment of type 1 and type 2 diabetes., Vasc. Health Risk
Manag. 2 (2006) 59–67.
[8] D.M. Nathan, J.B. Buse, M.B. Davidson, E. Ferrannini, R.R. Holman, R. Sherwin, B. Zinman,
Medical management of hyperglycemia in type 2 diabetes: a consensus algorithm for the
initiation and adjustment of therapy: a consensus statement of the American Diabetes Association
and the European Association for the Study of Diabetes, Diabetes Care 32 (2009) 193–203.
[9] P. Fonte, F. Araújo, C. Silva, C. Pereira, S. Reis, H.A. Santos, B. Sarmento, Polymer-based
nanoparticles for oral insulin delivery: revisited approaches, Biotechnol. Adv. 33 (2015) 1342–
1354.
[10] S. Del Prato, F. Leonetti, D.C. Simonson, P. Sheehan, M. Matsuda, R.A. DeFronzo, Effect of
sustained physiologic hyperinsulinaemia and hyperglycaemia on insulin secretion and insulin
sensitivity in man, Diabetologia 37 (1994) 1025–1035.
[11] E. Arbit, M. Kidron, Oral insulin: the rationale for this approach and current developments, J.
Diabetes Sci. Technol. 3 (2009) 562–7.
[12] S. Hosseininasab, R. Pashaei-Asl, A.A. Khandaghi, H.T. Nasrabadi, K. Nejati-Koshki, A.
Akbarzadeh, S.W. Joo, Y. Hanifehpour, S. Davaran, Synthesis, characterization, and in vitro
studies of PLGA-PEG nanoparticles for oral insulin delivery, Chem. Biol. Drug Des. 84 (2014)
307–315.
[13] P. Fonte, F. Araújo, S. Reis, B. Sarmento, Oral insulin delivery: how far are we?, J. Diabetes Sci.
Technol. 7 (2013) 520–31.
[14] L. Heinemann, Y. Jacques, Oral insulin and buccal insulin: a critical reappraisal, J. Diabetes Sci.
Technol. 3 (2009) 568–84.
[15] L. Plapied, N. Duhem, A. des Rieux, V. Préat, Fate of polymeric nanocarriers for oral drug
delivery, Curr. Opin. Colloid Interface Sci. 16 (2011) 228–237.
[16] B. Sarmento, S. Martins, D. Ferreira, E.B. Souto, Oral insulin delivery by means of solid lipid
nanoparticles, Int. J. Nanomedicine 2 (2007) 743–9.
[17] K.B. Chalasani, G.J. Russell-Jones, S.K. Yandrapu, P. V. Diwan, S.K. Jain, A novel vitamin B12-
nanosphere conjugate carrier system for peroral delivery of insulin, J. Control Release 117 (2007)
421–429.
[18] B. Deutel, M. Greindl, M. Thaurer, A. Bernkop-Schnürch, Novel insulin thiomer nanoparticles: in
vivo evaluation of an oral drug delivery system, Biomacromolecules 9 (2008) 278–285.
[19] P. Fonte, F. Andrade, F. Araújo, C. Andrade, J. das Neves, B. Sarmento, Chitosan-coated solid
lipid nanoparticles for insulin delivery, Nanomedicine 508 (2012) 295–314.
[20] I.T. Değim, B. Gümüşel, Z. Değim, T. Ozçelikay, A. Tay, S. Güner, Oral administration of
liposomal insulin, J. Nanosci. Nanotechnol. 6 (2013) 2945–9.
[21] M.S. Alai, W.J. Lin, S.S. Pingale, Application of polymeric nanoparticles and micelles in insulin
oral delivery, J. Food Drug Anal. 23 (2015) 351–358.
[22] R. Paliwal, S. Palakurthi, Zein in controlled drug delivery and tissue engineering, J. Control
Release 189 (2014) 108–122.
[23] R. Penalva, I. Esparza, E. Larraneta, C.J. González-Navarro, C. Gamazo, J.M. Irache, Zein-based
nanoparticles improve the oral bioavailability of resveratrol and its anti-inflammatory effects in a
mouse model of endotoxic shock, J. Agric. Food Chem. 63 (2015) 5603–5611.
[24] P. Arbós, M.. Arangoa, M.. Campanero, J.. Irache, Quantification of the bioadhesive properties of
protein-coated PVM/MA nanoparticles, Int. J. Pharm. 242 (2002) 129–136.

CONFIDENTIAL CHAPTER 7: Mucus-penetrating nanoparticles for the oral delivery of
insulin
168
[25] P.L. Ritger, N.A. Peppas, A simple equation for description of solute release I. Fickian and non-
fickian release from non-swellable devices in the form of slabs, spheres, cylinders or discs, J.
Control Release 5 (1987) 23–36.
[26] N.A. Peppas, J.J. Sahlin, A simple equation for the description of solute release. III. Coupling of
diffusion and relaxation, Int. J. Pharm. 57 (1989) 169–172.
[27] B.C. Tang, M. Dawson, S.K. Lai, Y.Y. Wang, J.S. Suk, M. Yang, P. Zeitlin, M.P. Boyle, J. Fu, J.
Hanes, Biodegradable polymer nanoparticles that rapidly penetrate the human mucus barrier.,
Proc. Natl. Acad. Sci. 106 (2009) 19268–73.
[28] L.M. Ensign, R. Cone, J. Hanes, Oral drug delivery with polymeric nanoparticles: The
gastrointestinal mucus barriers, Adv. Drug Deliv. Rev. 64 (2012) 557–570.
[29] S. Barua, S. Mitragotri, Challenges associated with penetration of nanoparticles across cell and
tissue barriers: a review of current status and future prospects, Nano Today. 9 (2014) 223–243.
[30] M. Dawson, E. Krauland, D. Wirtz, J. Hanes, Transport of Polymeric Nanoparticle Gene Carriers
in Gastric Mucus, Biotechnol. Prog. 20 (2004) 851–857.
[31] C.B. Woitiski, R.J. Neufeld, F. Veiga, R.A. Carvalho, I. V. Figueiredo, Pharmacological effect of
orally delivered insulin facilitated by multilayered stable nanoparticles, Eur. J. Pharm. Sci. 41
(2010) 556–563.
[32] C. Damgé, P. Maincent, N. Ubrich, Oral delivery of insulin associated to polymeric nanoparticles
in diabetic rats, J. Control Release 117 (2007) 163–170.
[33] J. Sheng, L. Han, J. Qin, G. Ru, R. Li, L. Wu, D. Cui, P. Yang, Y. He, J. Wang, N -trimethyl
chitosan chloride-coated plga nanoparticles overcoming multiple barriers to oral insulin
absorption, ACS Appl. Mater. Interfaces. 7 (2015) 15430–15441.
[34] G. Sharma, C.F. van der Walle, M.N.V. Ravi Kumar, Antacid co-encapsulated polyester
nanoparticles for peroral delivery of insulin: Development, pharmacokinetics, biodistribution and
pharmacodynamics, Int. J. Pharm. 440 (2013) 99–110.
[35] F. Cui, F. Qian, Z. Zhao, L. Yin, C. Tang, C. Yin, Preparation, Characterization, and Oral
Delivery of Insulin Loaded Carboxylated Chitosan Grafted Poly(methyl methacrylate)
Nanoparticles, Biomacromolecules 10 (2009) 1253–1258.
[36] A. Makhlof, Y. Tozuka, H. Takeuchi, Design and evaluation of novel pH-sensitive chitosan
nanoparticles for oral insulin delivery, Eur. J. Pharm. Sci. 42 (2011) 445–451.
[37] Y. Jin, Y. Song, X. Zhu, D. Zhou, C. Chen, Z. Zhang, Y. Huang, Goblet cell-targeting
nanoparticles for oral insulin delivery and the influence of mucus on insulin transport,
Biomaterials 33 (2012) 1573–1582.

CHAPTER 8
GENERAL DISCUSSION AND FUTURE PERSPECTIVES


CONFIDENTIAL CHAPTER 8: GENERAL DISCUSSION AND FUTURE
PERSPECTIVES
171
General discussion
The aim of this work was the development of mucus-penetrating formulations [Chapter
3, 4 and 6], based on surface modified nanoparticles, and the evaluation of their permeability
through the gastrointestinal mucosa by different in vitro and in vivo techniques. Nanoparticles
were prepared by different preparative processes leading to three types of nanoparticles (Figure
1). In the first one, poly(anhydride) nanoparticles coated with poly(ethylene glycol)s (PEGs) of
different molecular weight (MW) were obtained. As second approach, thiamine-decorated
poly(anhydride) nanoparticles were prepared from a new polymeric conjugate obtained by the
covalent bonding of vitamin B1 to the anhydride residues of Gantrez® AN. In the last one, zein
nanoparticles were coated with the Gantrez® AN-thiamine conjugate. Finally, insulin was
encapsulated as model biomacrolecule in the most promising formulation and its oral
bioavailability and pharmacological activity in vivo were assessed.
Figure 1. Schematic representation of the different types of nanoparticles. G: Gantrez
® AN;
PEG: polyethylene glycol; T: thiamine; NPA: Gantrez® AN nanoparticles; P-NPA: polyethylene
glycol-coated Gantrez® AN nanoparticles; T-NPA: thiamine-coated Gantrez
® AN nanoparticles;
T-NPB: nanoparticles prepared from Gantrez® AN-thiamine conjugate; Z: zein; NPZ: zein
nanoparticles and GT-NPZ: Gantrez® AN-thiamine conjugate-coated zein nanoparticles.

CONFIDENTIAL CHAPTER 8: GENERAL DISCUSSION AND FUTURE
PERSPECTIVES
172
1. Why mucus-penetrating nanoparticles?
Polymer nanoparticles are usually employed for the encapsulation of a biologically
active compound. This approach offers a number of advantages such as protection against drug
degradation or inactivation as well as controlled release properties. As consequence, polymer
nanoparticles have been proposed to improve the oral bioavailability of a number of drugs,
mainly “small molecules” assigned to the Class II of the Biopharmaceutical Classification
System [1–3].
For other classes of therapeutic compounds, such as biomacromolecules (i.e., proteins
and peptides), the improvements on their oral bioavailability have been found to be discrete.
This fact would be, at least in part, directly related to the presence of the mucus gel protective
layer that covers the gut epithelium. Thus, orally administered, conventional nanocarriers would
be trapped in this mucus layer far away from the absorptive membrane and in an environment
rich in digestive enzymes. In order to minimize this phenomenon and to promote the arrival of
nanocarriers to the surface of the epithelium, the use of nanoparticles with mucus-penetrating
properties has been proposed [4,5] (Figure 2).
Figure 2. Mucoadhesive nanoparticles (A) vs. mucus-penetrating nanoparticles (B).
2. What are the most promising strategies to generate nanoparticles with
mucus-penetrating properties?
In order to overcome the mucus layer and to facilitate the arrival of nanocarriers to the
intestinal epithelium the following approaches, among others, have been suggested: virus-

CONFIDENTIAL CHAPTER 8: GENERAL DISCUSSION AND FUTURE
PERSPECTIVES
173
mimicking nanoparticles [6], zeta potential changing systems [7], mucolytic nanoparticles [5]
and slippery nanocarriers [8].
3. Are PEGs adequate for the production of mucus-penetrating
nanoparticles?
Yes, they are. PEG, as coating material of nanoparticles, would provide a hydrophilic
shield on the surface of nanocarriers that would facilitate their passage through the mucus gel
layer by decreasing their interactions with the mucin fibers [9]. However, different aspects have
to be taken into account. First of all, the MW is of great importance since PEG 10 kDa has
demonstrated low ability to facilitate the passage through the mucus layer compared to PEGs of
small MW as PEG 2 kDa or PEG 5-6 kDa [9,10]. This fact is attributed to the longer chains that
would not adopt a “brush” conformation facilitating the entanglement of the carrier in the mucin
mesh. Second, the PEG density generated on the nanoparticles’ surface. It appears that a
particular density threshold for efficient mucus-penetrating properties has to be obtained [9].
For PEGs, above this threshold density, its disposition on the surface of nanoparticle would
adopt a “brush” conformation that would facilitate the slippery properties of the resulting
nanocarriers [8].
4. What are the reasons to change the strategy to produce mucus-
penetrating nanoparticles based on Gantrez®
AN conjugates?
The main reason was that the procedure described for the preparation of PEG coated
nanoparticles did not give good results in the case of thiamine functionalized nanoparticles. In
addition, we also took into consideration the possibility of thiamine lost during the formation of
nanoparticles. In fact, thiamine (as many others “small molecules”) may be largely transferred
to the external aqueous phase during the formation of nanoparticles and, thus, resulting in
nanoparticles poorly functionalized with the hydrophilic ligand.
5. Is thiamine adequate for the obtention of mucus-penetrating
nanoparticles?
Yes, it is. In vitro pulse-gradient spin-echo nuclear magnetic resonance (PGSE-NMR)
experiments revealed that the diffusion coefficient of mucin, in the presence of poly(anhydride)-
thiamine nanoparticles, increased 5-fold compared to bare nanoparticles (see Chapter 4). A
more profound evaluation of the mucin gel suggested that conventional poly(anhydride)
nanoparticles possessed a hydrophobic surface that could easily interact with the hydrophobic

CONFIDENTIAL CHAPTER 8: GENERAL DISCUSSION AND FUTURE
PERSPECTIVES
174
moieties of mucins producing an important increase in the viscosity of mucus samples as the
particles act as nodes for the enhancement of mucin gel cross-linking by interaction with the
hydrophobic regions of mucins. However, thiamine-decorated nanoparticles possess a
hydrophilic coat which would properly shield and, thus, prevent the interaction between the
hydrophobic backbone of nanoparticles and the hydrophobic regions of the mucins.
The in vivo mucus-penetrating properties and biodistribution in the gastrointestinal tract
of thiamine-coated poly(anhydride) nanoparticles prepared by two different procedures
(thiamine-coated Gantrez® AN nanoparticles and nanoparticles prepared from Gantrez
® AN-
thiamine conjugate) were assessed. Both types of nanoparticles showed the ability to move
through the mucus layer and reach the intestinal epithelium to interact with it. Actually, for
both types of nanoparticles, more than 30% of the given dose was found in close contact with
the surface of the intestinal mucosa 2 h post-administration, compared to a 13.5% in the case of
unmodified poly(anhydride) nanoparticles [Chapter 4].
6. What problems arose when encapsulating insulin in conjugate-based
nanoparticles?
By PGSE-NMR technique it was shown that insulin loaded in T-NPB displayed 3-fold
lower diffusion coefficient of the mucin compared to unloaded nanoparticles (T-NPB). This
modification of the mucus-penetrating properties would be due to the presence of, at least, a
fraction of the protein in the surface of the nanocarriers (Figure 3). The localization of the
insulin in the outer side of the nanoparticles would be related with the incorporation of the
protein in the aqueous phase used to induce the desolvation of the polymer and the formation of
nanoparticles and not in the acetone phase containing the polymer due to the insolubility of
insulin in this organic solvent. Under these experimental conditions, and also due to the high
aqueous solubility of insulin, the protein would remain in the outer regions of the just formed
nanocarriers. In addition, the in vitro release studies revealed an inadequate profile for oral
insulin delivery. Actually, no release of the biomacromolecule was observed during the duration
of the experiment (26 h). This fact would be due to the establishment of ionic and/or hydrogen
interactions between the carboxylic acid groups of the polymer backbone and the functional
groups of the protein which would yield stable “complexes” as has been previously described
[11]. In order to minimize this problem, the co-encapsulation of albumin and insulin in the
nanoparticles was evaluated. In this case, the albumin would also interact with the functional
groups of GT and the interactions between insulin and the polymer would be minimized. The
incorporation of albumin as “blocking agent” only induced a slightly improvement of these
nanocarriers in the ability of release the cargo. In consequence, this strategy was abandoned.

CONFIDENTIAL CHAPTER 8: GENERAL DISCUSSION AND FUTURE
PERSPECTIVES
175
Figure 3. Schematic representation of nanoparticles obtained from Gantrez
® AN-thiamine
conjugate incorporating insulin (I-T-NPB).
7. Why GT-coated zein nanoparticles?
As a solution to the previously described problems, zein nanopartices coated with the
synthesized poly(anhydride)-thiamine conjugate were chosen. Zein nanoparticles are
mucoadhesive carriers based on the storage protein of corn. In principle, these nanocarriers are
adequate for the accommodation of highly payloads of biomacromolecules in their core
[unpublished results]. In order to modify their surface and confer mucus-penetrating properties,
insulin-loaded zein nanoparticles were coated with the Gantrez® AN-thiamine conjugate.
Multiple particle tracking (MPT) studies assessed that mucoadhesive bare zein nanoparticles
were transformed into mucus-penetrating nanoparticles when coated with the conjugate, being
the ability to move through the mucus layer 24.5-fold higher than bare zein nanoparticles
[Chapter 6].

CONFIDENTIAL CHAPTER 8: GENERAL DISCUSSION AND FUTURE
PERSPECTIVES
176
8. What results were obtained when insulin loaded GT-coated zein
nanoparticles (I-GT-NPZ) nanoparticles were orally administered?
When insulin was orally administered encapsulated in GT-zein nanoparticles, a different
hypoglycemic profile to the subcutaneous administration of the free protein was observed. This
hypoglycemic effect started 4h post-administration and decreased during the next 11h before
reaching the basal values and after having reached a minimum 9h post-administration. In basis
to these curve profiles, the pharmacological activity of insulin administered in GT-zein
nanoparticles was calculated to be 13.5%. The oral serum insulin levels also showed a different
profile to the subcutaneous one. In this case, the maximum serum insulin levels were reached 4h
post administration, from when the levels started to decrease till basal levels 10h post-
administration. Finally, the oral bioavailability of insulin encapsulated in GT-zein nanoparticles
was calculated to be 5.2%.
Future perspectives
1. Improving the mucus-penetrating properties of GT-NPZ.
In order to improve the mucus-penetrating properties of nanocarriers, one possibility
would be to increase the amount of thiamine groups bound to the poly(anhydride) backbone.
For this purpose, one possible solution would be the binding of thiamine through an
intermediate, such as a carbodiimide derivative (Figure 4).

CONFIDENTIAL CHAPTER 8: GENERAL DISCUSSION AND FUTURE
PERSPECTIVES
177
Figure 4. Synthesis of Gantrez
® AN-thiamine conjugate via carbodiimide derivative.
2. Increasing the oral bioavailability of insulin
In order to increase the oral bioavailability of insulin obtained in this work (~5.2%) the
strategy of co-encapsulating the hormone with other compounds could be taken into account in
basis to some problems that still may remain present. Once the nanoparticles are in close contact
with the intestinal epithelium, they would start the release of the cargo. The high MW of insulin,
as well as its physico-chemical properties, would not be the most adequate for a rapid
absorption through the intestinal epithelium which would, in addition, facilitate the
confrontation of insulin to an environment rich in digestive enzymes (i.e. glycocalix) that would
digest and, subsequently, inactivate the protein. In order to minimize these problems, different
strategies may be envisaged:
- Enzymatic inhibitors. One possibility may be the co-encapsulation of insulin with
enzymatic inhibitors. Among others the following compounds have been proposed to
inhibit the activity of digestive enzymes: chicken and duck ovomucoids [12] and
carboxymethyl cellulose-elastinal [13,14].
- Absorption enhancers. Another possibility to improve the oral bioavailability of
insulin would be the co-encapsulation of absorption enhancers in these nanoparticles.
Among others, the following compounds have been proposed to increase the absorption

CONFIDENTIAL CHAPTER 8: GENERAL DISCUSSION AND FUTURE
PERSPECTIVES
178
rate of biomacromolecules: fatty acids and bile salts [15], chitosan [16] or thiolated polymers
[17].
3. Application of GT-NPZ to the oral delivery of small analogues of
peptides.
On one hand, as the majority of peptides cross the intestinal epithelium by diffusive
transport via paracelullar or, rarely, transcelullar pathways, it is understandable that higher
biomacromolecule sizes would difficult the efficient passage through the systemic circulation.
On the other hand, biologically active native peptides in general do not cross cell
membranes and even if they would be able to overcome them, they are generally characterized
by short half-lives, as well as suboptimal physical and chemical properties [18] which makes
necessary, normally, the intravascular administration. Consequently, traditional rational design
of peptide therapeutics has focused on techniques to mitigate these weaknesses (substitution of
amino acids, building of structure-activity relations or identification of enzymatic cleavage
sites) [19–21]. The main disease areas driving the therapeutic use of peptide drugs are metabolic
diseases and oncology. In this context, peptide analogues of small molecular weights (1-4kDa)
would be adequate drug candidates for the oral delivery in these mucus-penetrating
nanoparticles. Thus, therapeutic compounds such as desmopressin (1069 Da), exenatide (4186
Da) and liraglutide (3751 Da) may be of interest to explore the potential of these mucus-
penetrating nanoparticles.

CONFIDENTIAL CHAPTER 8: GENERAL DISCUSSION AND FUTURE
PERSPECTIVES
179
References
[1] C. Leuner, J. Dressman, Improving drug solubility for oral delivery using solid dispersions, Eur.
J. Pharm. Biopharm. 50 (2000) 47–60.
[2] M. Morgen, C. Bloom, R. Beyerinck, A. Bello, W. Song, K. Wilkinson, R. Steenwyk, S.
Shamblin, Polymeric nanoparticles for increased oral bioavailability and rapid absorption using
celecoxib as a model of a low- solubility, high-permeability drug, Pharm. Res. 29 (2012) 427-
440.
[3] J. Huarte, S. Espuelas, Y. Lai, B. He, J. Tang, J.M. Irache, Oral delivery of camptothecin using
cyclodextrin/poly(anhydride) nanoparticles, Int. J. Pharm. 506 (2016) 116–128.
[4] L.M. Ensign, R. Cone, J. Hanes, Oral drug delivery with polymeric nanoparticles: the
gastrointestinal mucus barriers, Adv. Drug Deliv. Rev. 64 (2012) 557–570.
[5] K. Netsomboon, A. Bernkop-Schnürch, Mucoadhesive vs. mucopenetrating particulate drug
delivery, Eur. J. Pharm. Biopharm. 98 (2016) 76–89.
[6] I. Pereira de Sousa, C. Steiner, M. Schmutzler, M.D. Wilcox, G.J. Veldhuis, J.P. Pearson, C.W.
Huck, W. Salvenmoser, A. Bernkop-Schnürch, Mucus permeating carriers: formulation and
characterization of highly densely charged nanoparticles, Eur. J. Pharm. Biopharm. 97 (2015)
273–279.
[7] S. Bonengel, F. Prüfert, G. Perera, J. Schauer, A. Bernkop-Schnürch, Polyethylene imine-6-
phosphogluconic acid nanoparticles – a novel zeta potential changing system, Int. J. Pharm. 483
(2015) 19–25.
[8] S.K. Lai, Y.Y. Wang, J. Hanes, Mucus-penetrating nanoparticles for drug and gene delivery to
mucosal tissues, Adv. Drug Deliv. Rev. 61 (2009) 158–171.
[9] B.C. Tang, M. Dawson, S.K. Lai, Y.Y. Wang, J.S. Suk, M. Yang, P. Zeitlin, M.P. Boyle, J. Fu, J.
Hanes, Biodegradable polymer nanoparticles that rapidly penetrate the human mucus barrier,
Proc. Natl. Acad. Sci. 106 (2009) 19268–73.
[10] L. Inchaurraga, N. Martín-Arbella, V. Zabaleta, G. Quincoces, I. Peñuelas, J.M. Irache, In vivo
study of the mucus-permeating properties of PEG-coated nanoparticles following oral
administration, Eur. J. Pharm. Biopharm. 97 (2015) 280–289.
[11] F. Cui, F. Qian, Z. Zhao, L. Yin, C. Tang, C. Yin, Preparation, Characterization, and Oral
Delivery of Insulin Loaded Carboxylated Chitosan Grafted Poly(methyl methacrylate)
Nanoparticles, Biomacromolecules 10 (2009) 1253–1258.
[12] Intestinal transport of insulin. Evidence of active transport, Pharm. Technol. Oct. (2001).
www.pharmtech.com (accessed February 6, 2017).
[13] K. Park, I.C. Kwon, K. Park, Oral protein delivery: Current status and future prospect, React.
Funct. Polym. 71 (2011) 280–287.
[14] M.K. Marschuk Tz, A. Bernkop-Schnu, K. Rch, Oral peptide drug delivery: polymer inhibitor
conjugates protecting insulin from enzymatic degradation in vitro, Biomaterials 21 (2000) 1499–
1507.
[15] Y. Obata, T. Sesumi, K. Takayama, K. Isowa, S. Grosh, S. Wick, R. Sitz, T. Nagai, Evaluation of
skin damage caused by percutaneous absorption enhancers using fractal analysis, J. Pharm. Sci.
89 (2000) 556–61.
[16] C. Prego, M. García, D. Torres, M.J. Alonso, Transmucosal macromolecular drug delivery, J.
Control Release 101 (2005) 151–162.
[17] A. Bernkop-Schnürch, Thiomers: a new generation of mucoadhesive polymers, Adv. Drug Deliv.
Rev. 57 (2005) 1569–1582.
[18] K. Fosgerau, T. Hoffmann, Peptide therapeutics: current status and future directions, Drug
Discov. Today. 20 (2015) 122–128.
[19] E. V Rosca, J.E. Koskimaki, N.B. Pandey, A.P. Tamiz, A.S. Popel, Structure-activity relationship
study of collagen-derived anti-angiogenic biomimetic peptides, Chem. Biol. Drug Des. 80 (2012)
27–37.
[20] S. Sim, Y. Kim, T. Kim, S. Lim, M. Lee, Directional assembly of α-helical peptides induced by
cyclization, J. Am. Chem. Soc. 134 (2012) 20270–20272.
[21] B.D. Larsen, Zealand Pharma A/S. Pharmacological ative peptides conjugates having a reduced
tendency towards enzymatic hydrolisis. United States patent US 0015,152. 2008 Jan 17.

CHAPTER 9
CONCLUSIONS/CONCLUSIONES


CONFIDENTIAL CHAPTER 9: CONCLUSIONS/CONCLUSIONES
183
CONCLUSIONS
1- The coating of poly(anhydride) nanoparticles with poly(ethylene glycol)s modified their
fate within the gastrointestinal tract of laboratory animals. Thus, pegylation of nanoparticles
inhibits their mucoadhesive properties and their tropism for the stomach mucosa. Within
the small intestine, PEGylated nanoparticles display mucus-penetrating properties, although
this fact is influenced by the MW and surface density of the poly(athylene glycol).
2- The mucus-penetrating properties of pegylated nanoparticles is dependent on the surface
density and MW of poly(ethylene glycol). Thus, the intensity and duration of the
interactions between nanoparticles and the small intestine mucosa are higher for
nanoparticles coated with either PEG2000 or PEG6000. Similarly, a brush conformation is
required to facilitate the diffusion of nanoparticles through the mucus gel layer.
3- The mucoadhesive properties of poly(anhydride) nanoprticles were transformed into
mucus-penetrating ones by their coating with vitamin B1 (thiamine). These thiamine-
decorated nanoparticles were prepared by two different procedures. In the former, freshly
prepared poly(anhydride) nanoparticles were incubated with thiamine. In the latter,
nanoparticles were obtained from a polymer conjugate between Gantrez® AN and thiamine
previously synthesized. Both procedures yielded nanocarriers with similar physico-
chemical and biodistribution properties.
4- Nanoparticles prepared from the Gantrez® AN-thiamine conjugate presented high insulin
loading. However, the resulting nanoparticles did show neither mucus-penetrating
properties nor adequate release profiles for an oral administration. These observations
would be related to the presence of the therapeutic protein on the outer layer of
nanoparticles and the development of interactions with the polymer conjugate. The co-
encapsulation of human serum albumin as blocking agent only induced a modest
amelioration in the release profile of insulin.
5- Zein nanoparticles were successfully coated with Gantrez® AN-thiamine conjugate,
generating a homogeneous corona of about 30 nm thickness. The resulting nanoparticles
possessed both in vitro and in vivo mucus-penetrating characteristics.
CONFIDENTIAL CHAPTER 9: CONCLUSIONS/CONCLUSIONES
184
6- Zein nanoparticles coated with the Gantrez® AN-thiamine conjugate enhanced the intestinal
absorption of insulin following oral administration. At a dose of 50 IU/kg, nanoparticles
decreased the blood gucose levels in diabetic rats and the hypoglycemic effect was
observed during 18 h. The pharmacological activity and the relative oral bioavailability of
nanoencapsulated insulin were calculated to be 13.5% and 5.2% respectively.

CONFIDENTIAL CHAPTER 9: CONCLUSIONS/CONCLUSIONES
185
CONCLUSIONES
1- El recubrimieno de nanpartículas de poli(anhídrido) con poli(etilengicol) modificó su
destino en el tracto gastrointestinal de animales de laboratorio. Por consiguiente, la
pegilación de nanopartículas inhibe sus propiedades mocoadhesivas y su tropismo por la
mucosa estomacal. En el intestino delgado, las nanopartículas pegiladas exhiben
propiedades mucopenetrantes, aunque este hecho está influenciado por el peso molecular y
la densidad superficial del poli(etilenglicol).
2- Las propiedades mucopenetrantes de nanopartículas pegiladas es dependiente de la
densidad superficial y del peso molecular del poli(etilengicol). Así, la intensidad y duració
de las interacciones entre nanopartículas y la mucosa del intestino delgado son mayores
para las nanopartículas recubiertas con PEG2000 o PEG6000. Así mismo, una
conformación en “cepillo” es requerida para facilitar la difusión de las nanopartículas a
través de la capa de moco gelificada.
3- Las propiedades mucoadhesivas de nanopartícula de poli(anhídrido) fueron transfrmadas en
mucopenetrantes por su recubrimiento con vitamina B1 (tiamina). Estas nanopartículas
decoradas con tiamina fueron preparadas mediante dos procedimientos diferentes. En el
primer método, nanopartículas de poli(anhídrido) recién preparadas fueron incubadas con
tiamina. En el método posterior, las nanopartículasse obtuvieron desde un conjugado
polimérico entre Gantrez® AN y tiamina previamente sintetizado. Ambs procedimientos
rindieron nanotransportadores con similares propiedades físicoquímicas y de
biodistribución.
4- Las nanopartículas preparadas a partir del conjugado de Gantrez® AN y tiamina presentaron
alta carga de insulin. Sin embargo, las nanopartículas resultantes no mostraron propiedades
mucopenetrantes ni un adecuado perfil de liberación para administración oral. Estas
observaciones estarían relacionadas con la presencia de la proteína terapéutica en la capa
externa de las nanopartículas y con el desarrollo de interacciones con el conjugado
polimérico.

CONFIDENTIAL CHAPTER 9: CONCLUSIONS/CONCLUSIONES
186
5- Las nanopartículas de zeína fueron satisfactoriamente recuebiertas con el conjugado de
Gantrez® AN y tiamina, generando una corona de alrededor dde 30 nm de grosor. Las
nanopartículas resultants obuvieron características mucopenetrantes tanto in vitro como in
vivo.
6- Las nanopartículas de zeína recubiertas con el conjugado de Gantrez® AN y tiamina
aumentaron la absorción intestinal de insulin tras su administración oral. A una dosis de 50
UI/kg, las nanopartículas disminuyeron los niveles sanguíneos de glucose en ratas
diabéticas y el efecto hipoglicémico se observe durante 18 h. La actividad farmacológica y
la biodisponibilidad relative de la insulin nanoencapsuada result en un 13.5% y un 5.2%
respectivamente.