
UNIVERSIDAD COMPLUTENSE DE MADRID
163
UNIVERSIDAD COMPLUTENSE DE MADRID FACULTAD DE CIENCIAS FÍSICAS DEPARTAMENTO ÓPTICA TESIS DOCTORAL Optical and structural properties of the crystalline lens: Accomodation and aging Propiedades ópticas y estructurales del cristalino: acomodación y envejecimiento MEMORIA PARA OPTAR AL GRADO DE DOCTORA PRESENTADA POR Judith Birkenfeld Directora Susana Marcos Celestino Madrid, 2015 ©Judith Birkenfeld, 2015
-
Upload
khangminh22 -
Category
Documents
-
view
0 -
download
0
Transcript of UNIVERSIDAD COMPLUTENSE DE MADRID
UNIVERSIDAD COMPLUTENSE DE MADRID
FACULTAD DE CIENCIAS FÍSICAS DEPARTAMENTO ÓPTICA
TESIS DOCTORAL
Optical and structural properties of the crystalline lens: Accomodation and aging
Propiedades ópticas y estructurales del cristalino:
acomodación y envejecimiento
MEMORIA PARA OPTAR AL GRADO DE DOCTORA
PRESENTADA POR
Judith Birkenfeld
Directora
Susana Marcos Celestino
Madrid, 2015 ©Judith Birkenfeld, 2015
Universidad Complutense de Madrid
Facultad de Ciencias Fısicas
Departamento de Optica
Instituto de Optica “Daza de Valdes”
Consejo Superior de Investigaciones Cientıficas
Tesis Doctoral:
Optical and Structural Properties
of the Crystalline Lens:
Accommodation and Aging
Propiedades Opticas y Estructurales del Cristalino:
Acomodacion y Envejecimiento
Presentada por:
Judith Birkenfeld
Director de Tesis:
Prof. Susana Marcos Celestino
Contents
1 Introduction 6
1.1 Motivation . . . . . . . . . . . . . . . . . . . . . . . . . . . . . . . . . . . 6
1.2 The crystalline lens with age and accommodation . . . . . . . . . . . . . 7
1.2.1 Change of ex vivo crystalline lens shape and optics with aging . . 8
1.2.2 Change of ex vivo crystalline lens shape and optics with simulated
accommodation . . . . . . . . . . . . . . . . . . . . . . . . . . . . 10
1.2.3 Change of in vivo Crystalline lens shape and optics with aging . . 12
1.2.4 Change of in vivo Crystalline lens shape and optics with accom-
modation . . . . . . . . . . . . . . . . . . . . . . . . . . . . . . . 15
1.2.5 Lens Astigmatism . . . . . . . . . . . . . . . . . . . . . . . . . . . 17
1.2.6 Lens shape and OCT imaging . . . . . . . . . . . . . . . . . . . . 18
1.2.7 Lens topography . . . . . . . . . . . . . . . . . . . . . . . . . . . 21
1.3 Gradient Refractive Index . . . . . . . . . . . . . . . . . . . . . . . . . . 21
1.3.1 Measurement methods . . . . . . . . . . . . . . . . . . . . . . . . 22
1.3.2 GRIN Models . . . . . . . . . . . . . . . . . . . . . . . . . . . . . 25
1.3.3 Equivalent Refractive Index . . . . . . . . . . . . . . . . . . . . . 27
1.3.4 GRIN change with age . . . . . . . . . . . . . . . . . . . . . . . . 27
1.3.5 GRIN change with accommodation . . . . . . . . . . . . . . . . . 28
1.4 Microscopic Anatomy of the human lens . . . . . . . . . . . . . . . . . . 28
1.4.1 The Lens Capsule . . . . . . . . . . . . . . . . . . . . . . . . . . . 28
1.4.2 The Lens Epithelium . . . . . . . . . . . . . . . . . . . . . . . . . 29
1.4.3 Lens Fibers and Lens Suture . . . . . . . . . . . . . . . . . . . . . 29
1.4.4 Measurement of Lens Structures using Microscopy . . . . . . . . . 31
1
1.5 Open Questions . . . . . . . . . . . . . . . . . . . . . . . . . . . . . . . . 33
1.6 Goal of this Thesis . . . . . . . . . . . . . . . . . . . . . . . . . . . . . . 34
1.7 Hypothesis . . . . . . . . . . . . . . . . . . . . . . . . . . . . . . . . . . . 34
1.8 Structure of this thesis . . . . . . . . . . . . . . . . . . . . . . . . . . . . 35
2 Methods and Materials 36
2.1 Experimental Techniques . . . . . . . . . . . . . . . . . . . . . . . . . . . 36
2.1.1 Spectral domain 3D Optical Coherence Tomograph . . . . . . . . 36
2.1.2 Time domain 2D Optical Coherence Tomograph . . . . . . . . . . 37
2.1.3 Laser Ray Tracer . . . . . . . . . . . . . . . . . . . . . . . . . . . 37
2.1.4 Ex Vivo Accommodation Simulator II (EVAS II) . . . . . . . . . 40
2.1.5 Confocal Microscopy . . . . . . . . . . . . . . . . . . . . . . . . . 41
2.1.6 Eyes . . . . . . . . . . . . . . . . . . . . . . . . . . . . . . . . . . 42
2.1.7 Data Analysis . . . . . . . . . . . . . . . . . . . . . . . . . . . . . 44
2.1.8 GRIN model . . . . . . . . . . . . . . . . . . . . . . . . . . . . . . 45
2.1.9 Search algorithm . . . . . . . . . . . . . . . . . . . . . . . . . . . 46
2.1.10 Computational Ray Tracing and Zernike fitting . . . . . . . . . . 47
2.1.11 Power Vector Analysis . . . . . . . . . . . . . . . . . . . . . . . . 47
2.1.12 Software . . . . . . . . . . . . . . . . . . . . . . . . . . . . . . . . 48
3 Contribution of the GRIN and Shape to the Crystalline Lens Spherical
Aberration and Astigmatism 49
3.1 Introduction . . . . . . . . . . . . . . . . . . . . . . . . . . . . . . . . . . 50
3.2 Methods . . . . . . . . . . . . . . . . . . . . . . . . . . . . . . . . . . . . 50
3.2.1 Lens Specimens and preparation . . . . . . . . . . . . . . . . . . . 50
3.2.2 Optical Coherence Tomography system . . . . . . . . . . . . . . . 51
3.2.3 Laser Ray Tracing . . . . . . . . . . . . . . . . . . . . . . . . . . 51
3.3 Results . . . . . . . . . . . . . . . . . . . . . . . . . . . . . . . . . . . . . 54
3.3.1 Lens Geometry . . . . . . . . . . . . . . . . . . . . . . . . . . . . 54
3.3.2 Gradient Index Distribution . . . . . . . . . . . . . . . . . . . . . 57
3.4 Discussion . . . . . . . . . . . . . . . . . . . . . . . . . . . . . . . . . . . 60
2
4 Influence of shape and GRIN in the Accommodative Changes of Spher-
ical Aberration in Non-human Primate Crystalline Lenses 63
4.1 Introduction . . . . . . . . . . . . . . . . . . . . . . . . . . . . . . . . . . 64
4.2 Methods . . . . . . . . . . . . . . . . . . . . . . . . . . . . . . . . . . . . 65
4.2.1 Donor Tissue . . . . . . . . . . . . . . . . . . . . . . . . . . . . . 65
4.2.2 Tissue Preparation . . . . . . . . . . . . . . . . . . . . . . . . . . 65
4.2.3 Stretching . . . . . . . . . . . . . . . . . . . . . . . . . . . . . . . 66
4.2.4 OCT Imaging . . . . . . . . . . . . . . . . . . . . . . . . . . . . . 66
4.2.5 Lens Back Vertex Power Measurements . . . . . . . . . . . . . . . 66
4.2.6 Experimental Protocols . . . . . . . . . . . . . . . . . . . . . . . . 66
4.2.7 OCT Image Analysis . . . . . . . . . . . . . . . . . . . . . . . . . 67
4.2.8 GRIN Reconstruction . . . . . . . . . . . . . . . . . . . . . . . . . 67
4.2.9 Estimated Thickness of Lens Nucleus and Cortex . . . . . . . . . 68
4.2.10 Estimated Power and Spherical Aberration . . . . . . . . . . . . . 69
4.3 Results . . . . . . . . . . . . . . . . . . . . . . . . . . . . . . . . . . . . . 69
4.3.1 Stretching Versus Refractive Change . . . . . . . . . . . . . . . . 69
4.3.2 Changes of the Lens Geometry With Accommodation . . . . . . . 70
4.3.3 Changes of the Lens GRIN With Accommodation . . . . . . . . . 71
4.3.4 Contributions of Nucleus and Cortex to Lens Thickness . . . . . . 72
4.3.5 Contributions to Lens Power Changes With Accommodation . . . 73
4.3.6 Spherical Aberration . . . . . . . . . . . . . . . . . . . . . . . . . 74
4.3.7 Spherical Aberration Changes With Accommodation. Contribu-
tion of the Surfaces. . . . . . . . . . . . . . . . . . . . . . . . . . 75
4.4 Discussion . . . . . . . . . . . . . . . . . . . . . . . . . . . . . . . . . . . 75
5 Contribution of shape and gradient refractive index to the spherical
aberration of isolated human lenses 81
5.1 Introduction . . . . . . . . . . . . . . . . . . . . . . . . . . . . . . . . . . 82
5.2 Methods . . . . . . . . . . . . . . . . . . . . . . . . . . . . . . . . . . . . 82
5.2.1 Human lens samples and preparation . . . . . . . . . . . . . . . . 82
5.2.2 Optical Coherence Tomography Imaging . . . . . . . . . . . . . . 83
5.2.3 Laser Ray Traing . . . . . . . . . . . . . . . . . . . . . . . . . . . 84
3
5.2.4 Image Processing . . . . . . . . . . . . . . . . . . . . . . . . . . . 84
5.2.5 GRIN reconstruction . . . . . . . . . . . . . . . . . . . . . . . . . 85
5.2.6 GRIN model and Search Algorithm . . . . . . . . . . . . . . . . . 85
5.2.7 Equivalent refractive index and average refractive index . . . . . . 85
5.2.8 Computational ray tracing analysis . . . . . . . . . . . . . . . . . 86
5.2.9 Lens surface elevation . . . . . . . . . . . . . . . . . . . . . . . . 86
5.3 Results . . . . . . . . . . . . . . . . . . . . . . . . . . . . . . . . . . . . . 86
5.3.1 Lens surface elevation maps . . . . . . . . . . . . . . . . . . . . . 86
5.3.2 Age-dependence of crystalline lens shape . . . . . . . . . . . . . . 87
5.3.3 Distribution of the gradient refractive index . . . . . . . . . . . . 89
5.3.4 Equivalent refractive index and average refractive index . . . . . . 90
5.3.5 Experimental back focal length . . . . . . . . . . . . . . . . . . . 90
5.3.6 Spherical aberration: surface and GRIN contributions . . . . . . . 92
5.3.7 Lens surface topography: HO Zernike terms . . . . . . . . . . . . 93
5.3.8 Lens elevation high order Zernike terms: changes with age . . . . 94
5.3.9 Relative contribution of different Zernike terms to the lens surface
elevations . . . . . . . . . . . . . . . . . . . . . . . . . . . . . . . 95
5.4 Discussion . . . . . . . . . . . . . . . . . . . . . . . . . . . . . . . . . . . 97
5.4.1 Crystalline lens shape changes with age . . . . . . . . . . . . . . . 98
5.4.2 GRIN distribution and equivalent refractive Index . . . . . . . . . 101
5.4.3 Lens Topography . . . . . . . . . . . . . . . . . . . . . . . . . . . 104
6 Astigmatism of the in vitro human lens: Surface and gradient refractive
index contributions 106
6.1 Introduction . . . . . . . . . . . . . . . . . . . . . . . . . . . . . . . . . . 107
6.2 Methods . . . . . . . . . . . . . . . . . . . . . . . . . . . . . . . . . . . . 108
6.2.1 Human lens samples and preparation . . . . . . . . . . . . . . . . 108
6.2.2 Optical Coherence Tomography Imaging . . . . . . . . . . . . . . 108
6.2.3 Laser Ray Tracing . . . . . . . . . . . . . . . . . . . . . . . . . . 109
6.2.4 Image Processing and GRIN Reconstruction . . . . . . . . . . . . 109
6.2.5 Calculation of Lens Astigmatism (magnitude and axis) . . . . . . 110
4
6.3 Results . . . . . . . . . . . . . . . . . . . . . . . . . . . . . . . . . . . . . 111
6.3.1 Change of magnitude of astigmatism with age . . . . . . . . . . . 111
6.3.2 Change of relative astigmatic angles with age . . . . . . . . . . . 113
6.4 Discussion . . . . . . . . . . . . . . . . . . . . . . . . . . . . . . . . . . . 117
7 Imaging crystalline lens microscopic structures of intact in vitro mam-
mal lenses using confocal microscopy 119
7.1 Introduction . . . . . . . . . . . . . . . . . . . . . . . . . . . . . . . . . . 119
7.2 Methods . . . . . . . . . . . . . . . . . . . . . . . . . . . . . . . . . . . . 121
7.2.1 Lens sample preparation . . . . . . . . . . . . . . . . . . . . . . . 121
7.2.2 Confocal microscopy . . . . . . . . . . . . . . . . . . . . . . . . . 121
7.2.3 Imaging protocol . . . . . . . . . . . . . . . . . . . . . . . . . . . 121
7.2.4 Data analysis . . . . . . . . . . . . . . . . . . . . . . . . . . . . . 123
7.3 Results . . . . . . . . . . . . . . . . . . . . . . . . . . . . . . . . . . . . . 123
7.4 Discussion . . . . . . . . . . . . . . . . . . . . . . . . . . . . . . . . . . . 127
Bibliography 129
8 Activities during the Ph.D. Period 2010-14 154
8.1 Publications . . . . . . . . . . . . . . . . . . . . . . . . . . . . . . . . . . 154
8.1.1 Works in Progress . . . . . . . . . . . . . . . . . . . . . . . . . . . 157
8.2 Diffusion of the results . . . . . . . . . . . . . . . . . . . . . . . . . . . . 157
8.2.1 Summary . . . . . . . . . . . . . . . . . . . . . . . . . . . . . . . 157
8.2.2 Talks and poster presented by Judith Birkenfeld . . . . . . . . . . 157
8.2.3 Presentation by Judith Birkenfeld’s collaborators . . . . . . . . . 158
8.3 Visits and Stays in Research Institutions . . . . . . . . . . . . . . . . . . 160
Acknowledgements 160
5

1Introduction
1.1 Motivation
This thesis addresses the influence of shape and gradient refractive index to the optical
properties of various mammal lenses, in relation to age or accommodation. With age,
the human lens undergoes various physical, biometrical and optical changes. Physical
and biometrical changes are well documented in the literature. Optical changes of the
lens have been most often assessed from geometrical and biometrical measurements of
cornea and lens, and not from the optical properties from the lens itself. The optics
of the crystalline lens, especially the gradient refractive index (GRIN) distribution are
still under discussion. Although lens shape and GRIN have been measured with various
methods, the information on it is usually obtained separately. In this work, we measured
the lens shape and the focal length of crystalline lenses and combined this information
with the reconstructed GRIN of the same lens to draw conclusion about the lens’ optics
and the influence of the GRIN as a parameter of optical lens property. The understand-
ing of the structural changes of the crystalline lens with aging and accommodation is
important to gain insights into the mechanisms of aging of the eye, and in particular
presbyopia development, and its potential treatment. For a deeper understanding of lens
structure and mechanics of accommodation on a microscopic level, we used a custom
built confocal microscope to image microscopic structures of the crystalline lens. The
6

development of instruments to analyze the accommodating lens on a microscopic level
is important for the understanding of the lens mechanics. This is especially interesting
when thinking of future developments of accommodative intraocular lenses.
1.2 The crystalline lens with age and accommoda-
tion
The crystalline lens, as part of the anterior segment of the eye, is located behind the
cornea and the iris. It is composed of a clear membrane (the lens capsule), a subcapsular
lens epithelium (only anteriorly), and lens fibers, which emerge from the epithelium cells.
The lens, together with the cornea, transmits and refracts light to form an image of the
Figure 1.1: The crystalline lens is located behind the cornea and the iris. Reproducedfrom Gray’s Anatomy[240].
world on the retina. The elastic young crystalline lens changes shape via constriction
and/or relaxation of the ciliary muscle to which the lens zonules are attached, resulting
in a change of the optical power of the eye which provides a focused image of objects
both near and far. With aging, the human lens becomes thicker, relatively steeper, and
7

looses the ability to accommodate [10, 58, 72], a condition known as presbyopia. The
refractive index of the lens is not homogeneous. It is distributed over the lens gradually,
with a high refractive index in the lens center, and a lower refractive index towards the
lens surface. This gradient refractive index (GRIN) changes with age[39, 48, 89, 104].
1.2.1 Change of ex vivo crystalline lens shape and optics with
aging
Measurements on lens shape and optical properties have been done, both on in vitro
and in vivo lenses. An important difference between in vivo and in vitro is, that in
vitro lenses are usually cut off from any zonular tension and, therefore, remain in their
most accommodated state. In the last decades, there have been numerous reports of
in vitro measurements[32, 73, 96, 145, 183, 195, 218]. The first studies typically used
frozen cadaver lenses, cut into thin sections, to study the lens shape[96, 183]. In the
last years, laser ray tracing, linked to photographical or digitized recording were used.
Pierscionek and Augusteyn[195] for example measured lens dimensions using laser ray
tracing. The entrance beam was split into several component rays and the ray paths were
recorded photographically. The lens shape was then determined from the photographic
negatives. The results suggested that growth in sagittal width is predominantly in the
anterior part of the lens. Glasser and Campbell[73] studied the biometric, optical and
physical properties of in vitro human lenses. Focal length and spherical aberration were
measured using a similar scanning laser apparatus. The radius of curvature and lens
were obtained by digitizing the lens profiles.
Manns et al.[145] measured the shape of the anterior and posterior surface of human
cadaver lenses in situ using a corneal topography system. Rosen et al.[218] and Borja et
al.[32] determined dimensions, curvatures and asphericity of excised human lenses using
shadow photography.
In general, with the in vitro lens maximally accommodated, the anterior and posterior
lens surface radii of curvature tend to increase with age, at least up to past the presbyopia
onset[145]. At the same time, the lens thickness increases with age from around 3.5 mm
to 4.5 mm. However, between the age of 40 and 60 years, when the lens suffers from
presbyopia, the radii of curvature decreases again.
Measurements of other geometrical aspects of the lens surfaces, such as their asphericity,
are scarce. From above mentioned authors for example, only Manns et al. and Parker
and Howcraft included aspherity measurements in their studies. It was suggested by
Perez-Escudero et al.[203] that lens radius of curvature and asphericity should not be
interpreted separately.
8
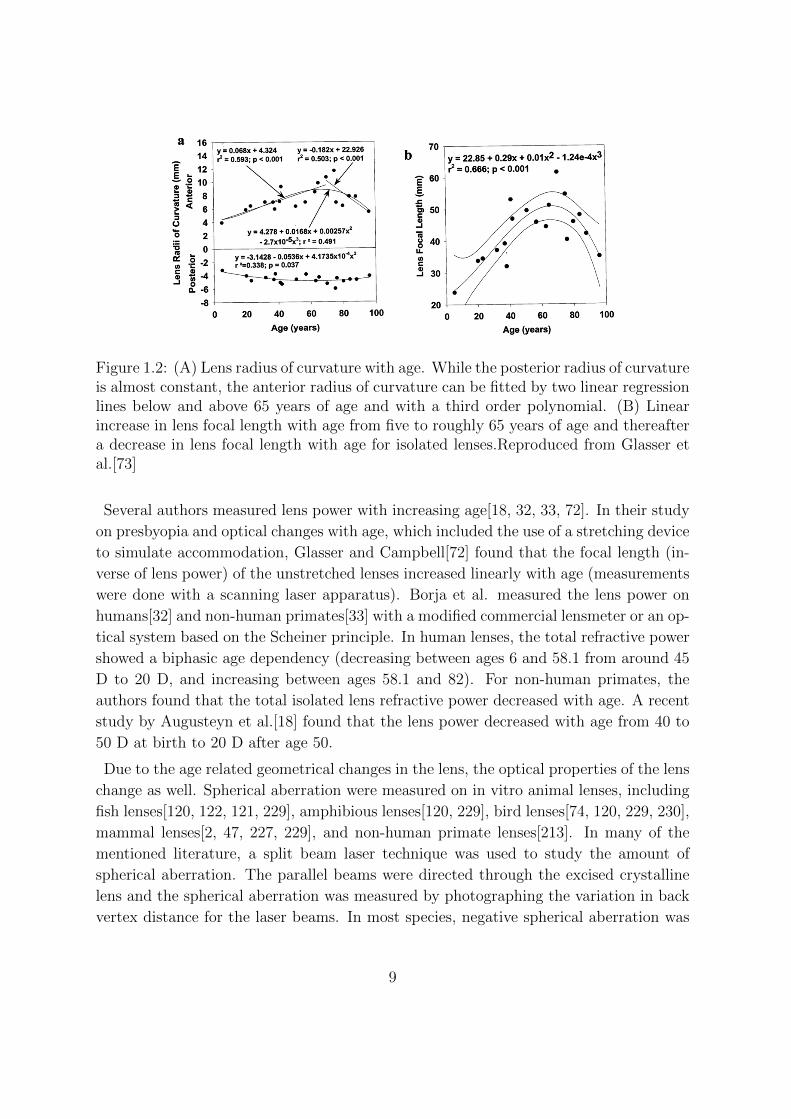
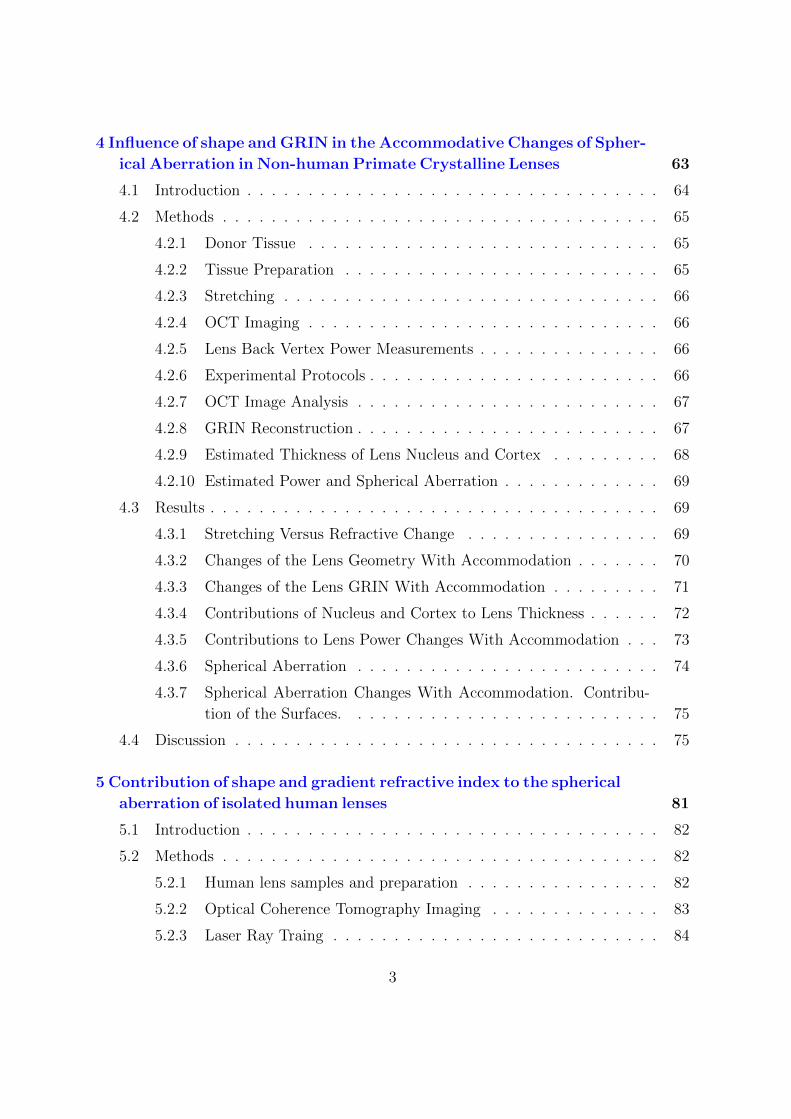
Figure 1.2: (A) Lens radius of curvature with age. While the posterior radius of curvatureis almost constant, the anterior radius of curvature can be fitted by two linear regressionlines below and above 65 years of age and with a third order polynomial. (B) Linearincrease in lens focal length with age from five to roughly 65 years of age and thereaftera decrease in lens focal length with age for isolated lenses.Reproduced from Glasser etal.[73]
Several authors measured lens power with increasing age[18, 32, 33, 72]. In their study
on presbyopia and optical changes with age, which included the use of a stretching device
to simulate accommodation, Glasser and Campbell[72] found that the focal length (in-
verse of lens power) of the unstretched lenses increased linearly with age (measurements
were done with a scanning laser apparatus). Borja et al. measured the lens power on
humans[32] and non-human primates[33] with a modified commercial lensmeter or an op-
tical system based on the Scheiner principle. In human lenses, the total refractive power
showed a biphasic age dependency (decreasing between ages 6 and 58.1 from around 45
D to 20 D, and increasing between ages 58.1 and 82). For non-human primates, the
authors found that the total isolated lens refractive power decreased with age. A recent
study by Augusteyn et al.[18] found that the lens power decreased with age from 40 to
50 D at birth to 20 D after age 50.
Due to the age related geometrical changes in the lens, the optical properties of the lens
change as well. Spherical aberration were measured on in vitro animal lenses, including
fish lenses[120, 122, 121, 229], amphibious lenses[120, 229], bird lenses[74, 120, 229, 230],
mammal lenses[2, 47, 227, 229], and non-human primate lenses[213]. In many of the
mentioned literature, a split beam laser technique was used to study the amount of
spherical aberration. The parallel beams were directed through the excised crystalline
lens and the spherical aberration was measured by photographing the variation in back
vertex distance for the laser beams. In most species, negative spherical aberration was
9
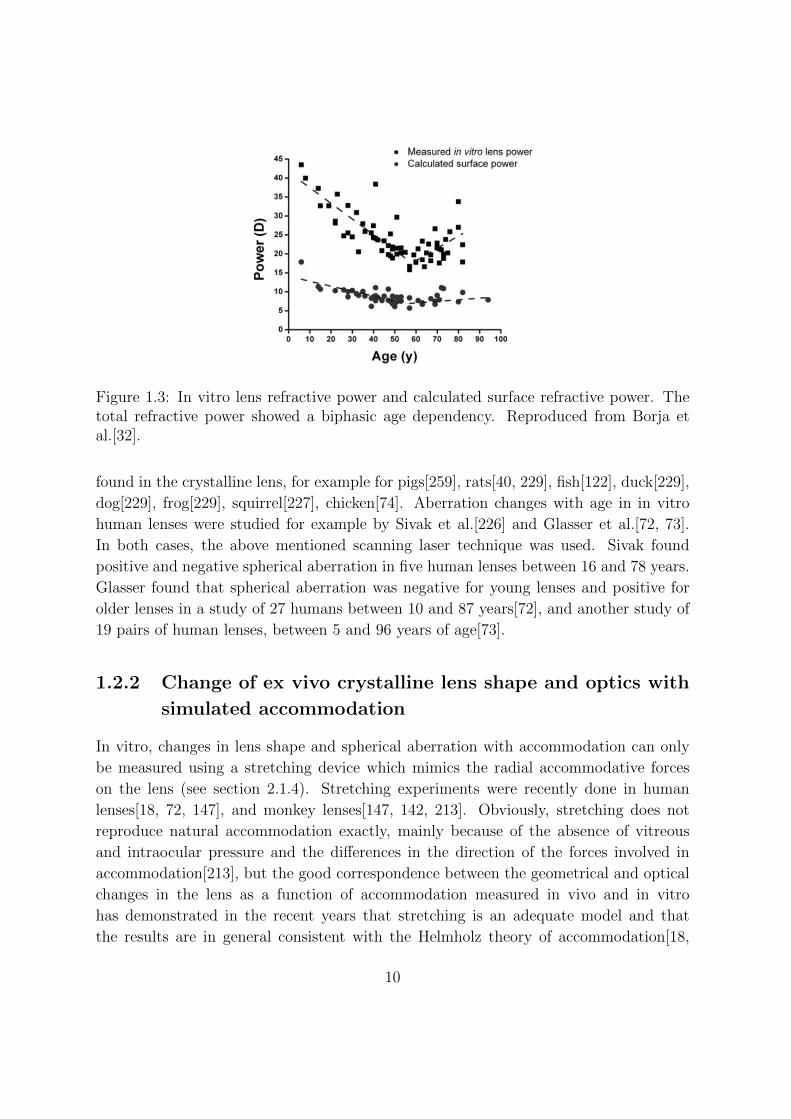
Figure 1.3: In vitro lens refractive power and calculated surface refractive power. Thetotal refractive power showed a biphasic age dependency. Reproduced from Borja etal.[32].
found in the crystalline lens, for example for pigs[259], rats[40, 229], fish[122], duck[229],
dog[229], frog[229], squirrel[227], chicken[74]. Aberration changes with age in in vitro
human lenses were studied for example by Sivak et al.[226] and Glasser et al.[72, 73].
In both cases, the above mentioned scanning laser technique was used. Sivak found
positive and negative spherical aberration in five human lenses between 16 and 78 years.
Glasser found that spherical aberration was negative for young lenses and positive for
older lenses in a study of 27 humans between 10 and 87 years[72], and another study of
19 pairs of human lenses, between 5 and 96 years of age[73].
1.2.2 Change of ex vivo crystalline lens shape and optics with
simulated accommodation
In vitro, changes in lens shape and spherical aberration with accommodation can only
be measured using a stretching device which mimics the radial accommodative forces
on the lens (see section 2.1.4). Stretching experiments were recently done in human
lenses[18, 72, 147], and monkey lenses[147, 142, 213]. Obviously, stretching does not
reproduce natural accommodation exactly, mainly because of the absence of vitreous
and intraocular pressure and the differences in the direction of the forces involved in
accommodation[213], but the good correspondence between the geometrical and optical
changes in the lens as a function of accommodation measured in vivo and in vitro
has demonstrated in the recent years that stretching is an adequate model and that
the results are in general consistent with the Helmholz theory of accommodation[18,
10
72]. With increasing stretching steps, the radius of curvature increases for anterior and
posterior lens surface when stretching the lens, indicating a flattening of the surfaces[142,
189, 193]. The change is greater for the anterior than for the posterior surface[193]. With
the change of radius of curvature, the lens diameter increases[18, 147], more so for the
young lens. Augusteyn[18] observed 0.7 mm of total lens diameter change in human
lenses younger than 20 years, and 0.16 ± 0.1 mm in lenses older than 40 years. The
lens thickness on the other hand decreases with stretching[18, 142, 189, 193] from as
much as 0.5 mm for very young lenses (2 year old) to under 0.2 mm after the age of
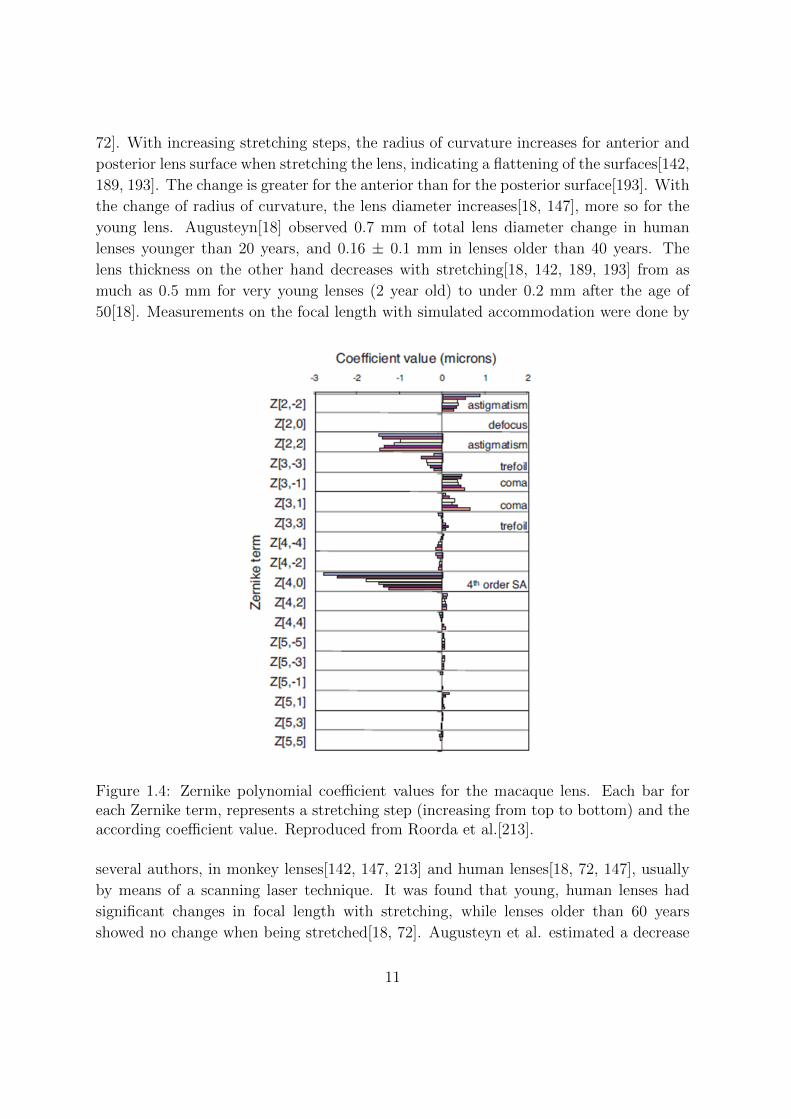
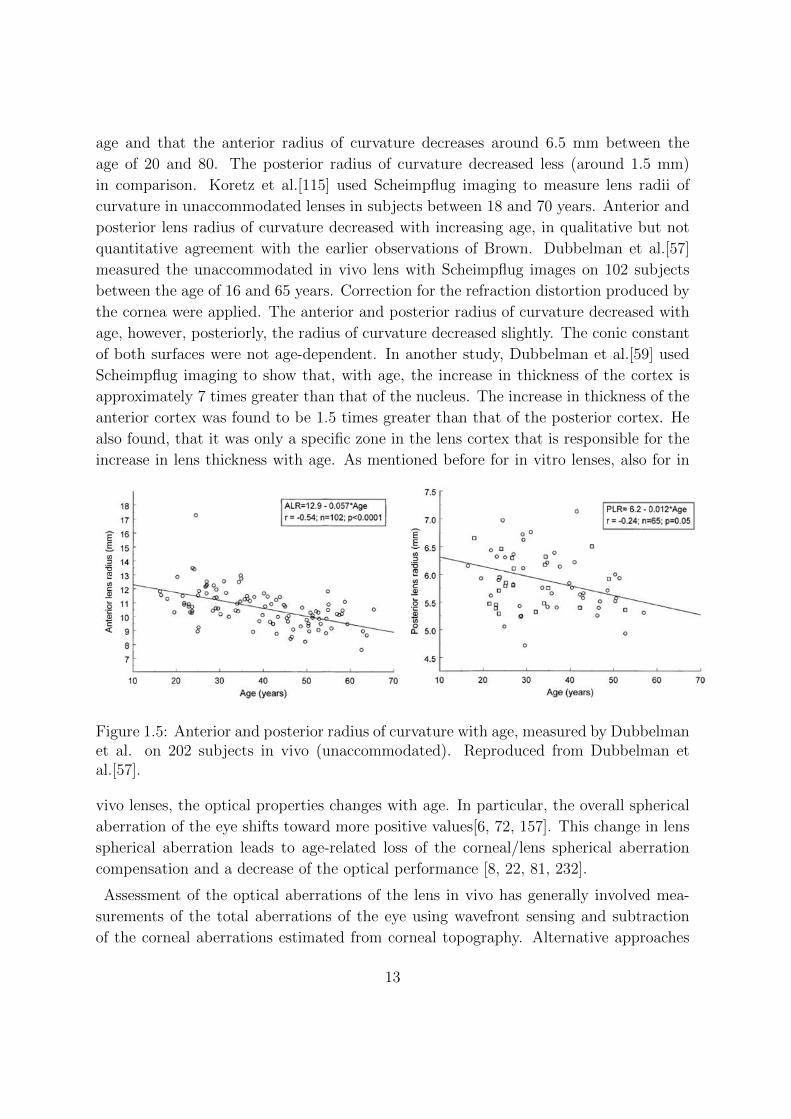
50[18]. Measurements on the focal length with simulated accommodation were done by
Figure 1.4: Zernike polynomial coefficient values for the macaque lens. Each bar foreach Zernike term, represents a stretching step (increasing from top to bottom) and theaccording coefficient value. Reproduced from Roorda et al.[213].
several authors, in monkey lenses[142, 147, 213] and human lenses[18, 72, 147], usually
by means of a scanning laser technique. It was found that young, human lenses had
significant changes in focal length with stretching, while lenses older than 60 years
showed no change when being stretched[18, 72]. Augusteyn et al. estimated a decrease
11
of the accommodative amplitude from 12 to 14 D in the young lens to around 0 D,
already by the age of 40-50, leaving the mature eye at a lens power of around 20 D.
This age-dependency in lens power-decrease with stretching was also found for monkey
lenses[147].
There are only a few studies which measure spherical aberration with simulated ac-
commodation [72, 213]. Usually a laser scanning technique is applied to define the
amount of spherical aberration. Roorda et al.[213] used a least squares procedure to fit
a Zernike polynomial function, which was obtained from local slopes of the wavefront
which emerged from the measured trajectories for an array of narrow refracted laser
beams scanned through the lens[213]. Glasser et al. also used a scanning laser tech-
nique to calculate the spherical aberration on human lenses. He scanned the lens, and
recorded beam height from the optical axis at the entrance beam, and the distance from
the principal point of the exit beam to its intersection with the optical axis. A fourth
order polynomial was fitted to these coordinates. The spherical aberration was then
calculated from the difference in dioptric distance of peripheral refracted rays incident
at the lens periphery and paraxial refracted rays incident near the optical axis of the
lens. For both, monkey lenses and human lenses it was found that spherical aberration
became less negative with stretching (that is, more negative with accommodation).
1.2.3 Change of in vivo Crystalline lens shape and optics with
aging
The first attempts to measure the shape of the anterior crystalline lens surface in vivo
used slit lamp photography on iridectomized eyes[35, 36, 139, 140]. Lowe et al.[139,
140] measured only the anterior curvature of eyes, while Brown et al.[36] measured
via Scheimpflug photography, on average in younger eyes than Lowe, and included the
posterior radius of curvature.
The first Scheimpflug imaging system used for investigation of the crystalline lens in
vivo was developed by Brown himself[35]. The Scheimpflug configuration allows to image
the anterior segment of the eye with large depth of focus, but a geometrical and optical
distortions are introduced, since the magnification is not constant, and each surface of
the anterior segment is seen through the previous surface. In order to obtain reliable
information from those images, a distortion correction must be introduced. If corrected,
for example with the approximation of a constant refractive index within the lens, lens
shape and its change with age and accommodation can be obtained[35, 36, 59, 116,
115, 214, 216]. In Brown’s study on one hundred healthy, emmetropic subjects between
the age of 3 and 82 years, he demonstrated that the lens becomes more convex with
12
age and that the anterior radius of curvature decreases around 6.5 mm between the
age of 20 and 80. The posterior radius of curvature decreased less (around 1.5 mm)
in comparison. Koretz et al.[115] used Scheimpflug imaging to measure lens radii of
curvature in unaccommodated lenses in subjects between 18 and 70 years. Anterior and
posterior lens radius of curvature decreased with increasing age, in qualitative but not
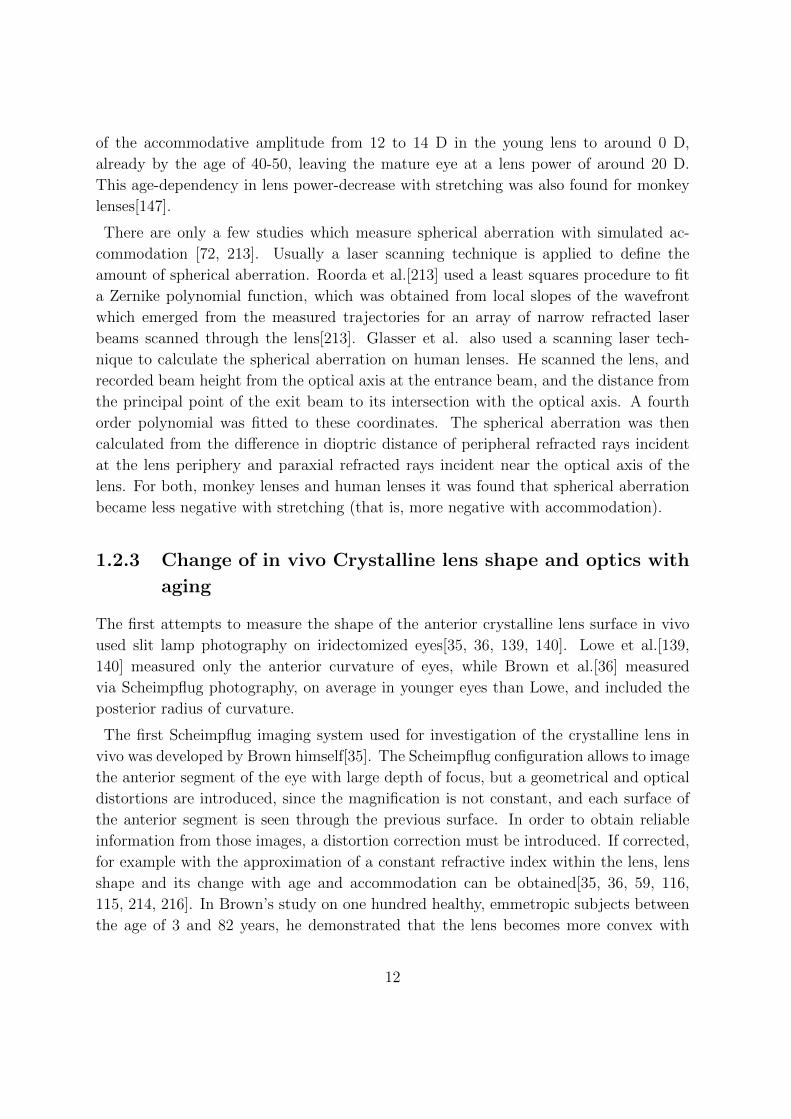
quantitative agreement with the earlier observations of Brown. Dubbelman et al.[57]
measured the unaccommodated in vivo lens with Scheimpflug images on 102 subjects
between the age of 16 and 65 years. Correction for the refraction distortion produced by
the cornea were applied. The anterior and posterior radius of curvature decreased with
age, however, posteriorly, the radius of curvature decreased slightly. The conic constant
of both surfaces were not age-dependent. In another study, Dubbelman et al.[59] used
Scheimpflug imaging to show that, with age, the increase in thickness of the cortex is
approximately 7 times greater than that of the nucleus. The increase in thickness of the
anterior cortex was found to be 1.5 times greater than that of the posterior cortex. He
also found, that it was only a specific zone in the lens cortex that is responsible for the
increase in lens thickness with age. As mentioned before for in vitro lenses, also for in
Figure 1.5: Anterior and posterior radius of curvature with age, measured by Dubbelmanet al. on 202 subjects in vivo (unaccommodated). Reproduced from Dubbelman etal.[57].
vivo lenses, the optical properties changes with age. In particular, the overall spherical
aberration of the eye shifts toward more positive values[6, 72, 157]. This change in lens
spherical aberration leads to age-related loss of the corneal/lens spherical aberration
compensation and a decrease of the optical performance [8, 22, 81, 232].
Assessment of the optical aberrations of the lens in vivo has generally involved mea-
surements of the total aberrations of the eye using wavefront sensing and subtraction
of the corneal aberrations estimated from corneal topography. Alternative approaches
13

have involved measurements in immersion, which canceled the aberrations of the anterior
cornea. In both cases, these indirect measurements include, apart from the crystalline
lens aberrations, contributions from the posterior cornea as well as the effect of the beam
convergence onto the lens. By using the method of subtracting the corneal aberrations,
Jenkins et al.[103] suggested that the lens’ spherical aberration was approximately zero.
El Hage et al.[82] measured the contribution of the crystalline lens to the spherical aber-
ration of the eye, and concluded that the lens, showing negative spherical aberration,
plays an important compensatory role, reducing the positive spherical aberration of the
cornea. The results of Millodot et al.[159], who eliminated the corneal power by using
swimming goggles filled with saline water, showed that the aberration of the lens does
not systematically neutralize that of the cornea. Tomlinson et al.[252] reported in vivo
data for 20 subjects between 20 and 56 years, and found that the spherical aberration
of the crystalline lens was generally negative and in the range of 0 to -0.81 D. Smith
et al.[232] supported Tomlinson’s findings with 26 tested subjects (between 20 and 72
years). He found an age effect, with older eyes having a larger aberration for the whole
eye, and concluded that this change is most likely due to the age related changes in the
crystalline lens with the spherical aberration of the lens becoming less negative with
age. In a study by Artal et al.[9], the aberrations of the internal surfaces were obtained
Figure 1.6: Schematic representation of the methods by Artal et al. The aberrationsof the internal ocular media were obtained by direct subtraction of the anterior cornealwave aberration from the ocular wave aberration. Reproduced from Artal et al.[9].
by direct subtraction of the ocular and corneal wave-front data. The data was obtained
using a Hartmann-Shack sensor and a corneal topography system. He measured a differ-
ence between total ocular aberration and corneal aberration in younger eyes, with total
14
ocular aberration lower than corneal aberrations, and found that the opposite occurred
in older eyes. These results were supported by Barbero et al.[22].
1.2.4 Change of in vivo Crystalline lens shape and optics with
accommodation
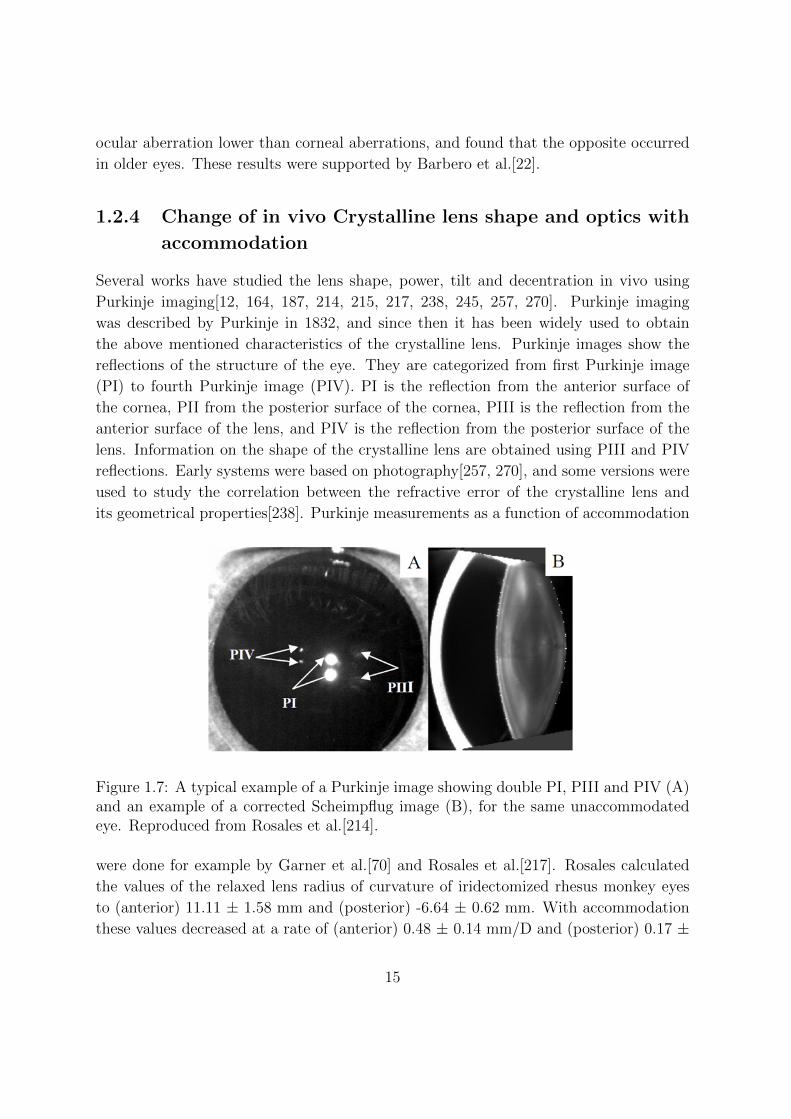
Several works have studied the lens shape, power, tilt and decentration in vivo using
Purkinje imaging[12, 164, 187, 214, 215, 217, 238, 245, 257, 270]. Purkinje imaging
was described by Purkinje in 1832, and since then it has been widely used to obtain
the above mentioned characteristics of the crystalline lens. Purkinje images show the
reflections of the structure of the eye. They are categorized from first Purkinje image
(PI) to fourth Purkinje image (PIV). PI is the reflection from the anterior surface of
the cornea, PII from the posterior surface of the cornea, PIII is the reflection from the
anterior surface of the lens, and PIV is the reflection from the posterior surface of the
lens. Information on the shape of the crystalline lens are obtained using PIII and PIV
reflections. Early systems were based on photography[257, 270], and some versions were
used to study the correlation between the refractive error of the crystalline lens and
its geometrical properties[238]. Purkinje measurements as a function of accommodation
Figure 1.7: A typical example of a Purkinje image showing double PI, PIII and PIV (A)and an example of a corrected Scheimpflug image (B), for the same unaccommodatedeye. Reproduced from Rosales et al.[214].
were done for example by Garner et al.[70] and Rosales et al.[217]. Rosales calculated
the values of the relaxed lens radius of curvature of iridectomized rhesus monkey eyes
to (anterior) 11.11 ± 1.58 mm and (posterior) -6.64 ± 0.62 mm. With accommodation
these values decreased at a rate of (anterior) 0.48 ± 0.14 mm/D and (posterior) 0.17 ±
15
0.03 mm/D for anterior and posterior lens surfaces, respectively. Tilt and decentration
did not change significantly with accommodation except for tilt around the horizontal
axis. In his studies on age and accommodation, Dubbelman et al. took Scheimpflug
images of both, unaccommodated and accommodated eyes of 102 subjects (16-65 y)[59].
He concluded that, with accommodation, the nucleus becomes thicker, but the thickness
of the cortex remains constant. In a later study, including 65 subjects between 16 and
51 years, he showed a decrease in anterior and posterior radius of curvature during
accommodation[58]. He found that the increase in lens thickness with accommodation
is higher than the decrease in the anterior chamber depth, and, therefore, suggested that
the posterior lens surface moves backwards with accommodation. A comparison study
between Scheimpflug imaging and Purkinje imaging was done by Rosales et al.[214].
Measurements of the lens radius of curvature were performed using both instruments.
Comparisons were also made as a function of accommodation (0 to 7 D) in a subset
of 11 eyes. It was concluded that both techniques provide comparable lens radii and
similar changes with accommodation. Purkinje imaging tended to overestimate the
posterior lens radius, while pupil size limited the acquisition of posterior lens data with
the Scheimpflug camera.
The change in lens shape during accommodation, results in a change in aberrations of
the eye. There are several reports on the change in optical quality of the eye with ac-
commodation in vivo in humans[10, 42, 68, 87, 141] and non-human primates[261, 260].
Atchison et al.[10] measured monochromatic ocular aberrations of 15 human eyes as a
function of accommodation using an advanced Howland Aberroscope Technique. The
instrument included a fundus camera for photography, a stimulus system for accom-
modation, and a method for correction for grid projection at the entrance pupil of the
eye. With increase in accommodation, a trend towards negative spherical aberration
was found for about half of the subjects tested. These results were also confirmed by
He et al.[87], who measured wave-front aberration for eight undilated subjects using a
spatially resolved refractometer and accommodation stimuli from 0 to -6 D. Besides, He
et al. found a systematic shift towards more negative or less positive aberration in all
eyes. On average, ocular spherical aberration crossed zero for about a 2-D stimulus.
Dubbelman[58] indirectly supported these results with his earlier mentioned study on
lens shape with accommodation. He found that during accommodation, the anterior lens
surface becomes more hyperbolic, which is consistent with the mentioned shift in spher-
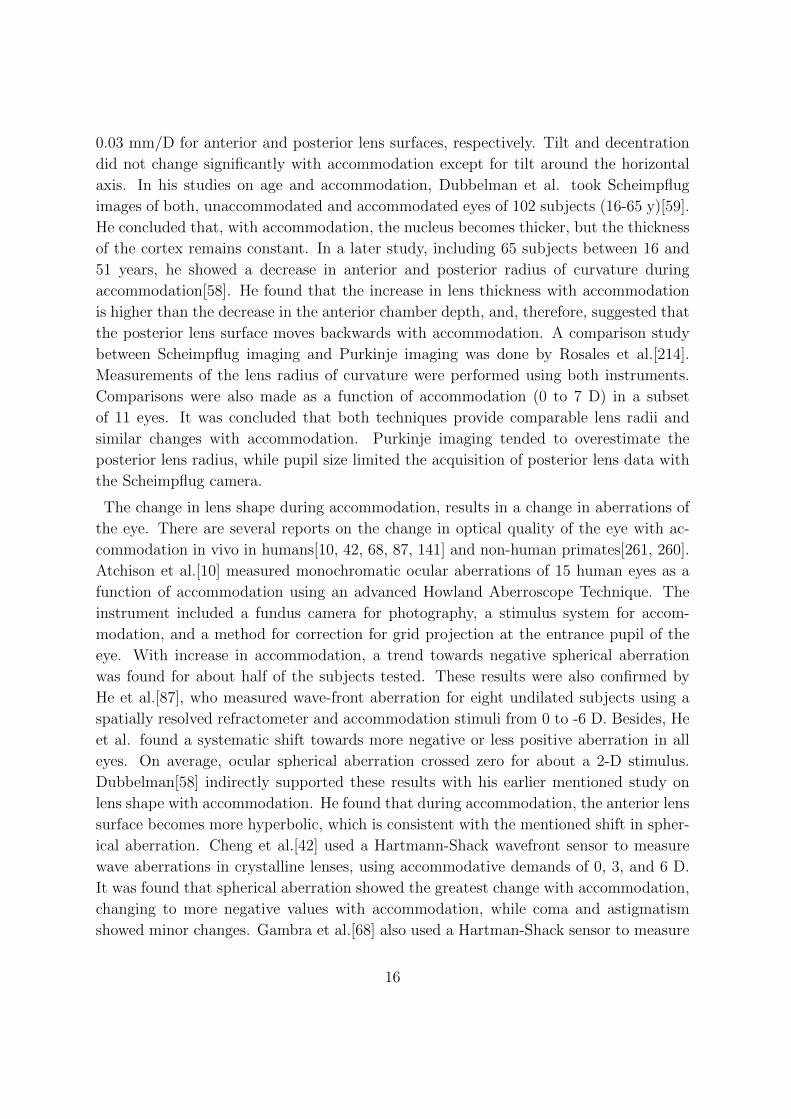
ical aberration. Cheng et al.[42] used a Hartmann-Shack wavefront sensor to measure
wave aberrations in crystalline lenses, using accommodative demands of 0, 3, and 6 D.
It was found that spherical aberration showed the greatest change with accommodation,
changing to more negative values with accommodation, while coma and astigmatism
showed minor changes. Gambra et al.[68] also used a Hartman-Shack sensor to measure
16
Figure 1.8: The coefficient for spherical aberration as a function of the change in accom-modative response 76 young subjects under different accommodation stimulus. Repro-duced from Cheng et al.[42].
the accommodative response (to a stimulus moving from 0 to 6 D in increments of 1 D)
and aberration changes on 5 subjects for natural, corrected and induced optical aber-
rations. In this study it was demonstrated that aberrations influence accommodative
lag and fluctuations of accommodation. Spherical aberration was the term that varied
the most during accommodation (shift towards more negative values). Other aberration
terms, like coma and astigmatism did not change systematically with accommodation.
Their slope could be compared to above mentioned literature[42, 87].
In a study with iridectomized rhesus monkey eyes by Vilupuru et al.[261], accommoda-
tion was centrally stimulated to various accommodative demands (0 D to ∼11 D). The
spherical aberration became more negative with accommodation, while vertical coma
increased. It was also found that the change in lens power with accommodation was
much more pronounced in the lens center than in the lens periphery.
1.2.5 Lens Astigmatism
Early attempts to measure the astigmatism of the internal ocular surfaces involved the
use of videokeratography, A-scan ultrasonography, and autorefractometry along with
multi-meridional phakometric measurements of Purkinje images[214]. As recognized by
the authors[26], the ophthalmo-phakometric method was prone to considerable accumu-
17
lated experimental errors. However, the work reports some interesting findings, such as
predominance of inverse astigmatism (defined as the one where the steeper meridian is
in the horizontal axis) in the posterior cornea and in the posterior lens surface, while the
astigmatism of the anterior surface of the lens was direct (defined as the one where the
steeper meridian is in the vertical axis). Compensatory effects of corneal astigmatism by
the crystalline lens[7, 8, 110, 109] by evaluation of corneal and total astigmatism have
been reported, as well as compensatory effects of the anterior corneal astigmatism by the
posterior corneal surface[55, 60, 61, 180, 205, 209]. In addition, in his PhD thesis[63],
Elawad measured ocular component contributions to residual astigmatism in human
eyes, and found, whilst the astigmatic contributions of the posterior corneal and lens
surfaces were found to be predominantly inverse, that direct astigmatism came from the
anterior lens surface.
1.2.6 Lens shape and OCT imaging
Optical Coherence Tomography (OCT) allows a non-invasive insight into the human
body, therefore, it has become an important tool in medicine. 3D OCT imaging creates
a set of sliced images which can be reconstructed into a 3D image. OCT is based on
light interference. The coherent light is separated into a reference beam and the beam
which focuses on the sample. The light is reflected by the sample and returns to the
reference beam where they interfere[54]. The use of light allows a high resolution and
does not require any contact with the tissue. Since ocular tissue is transparent, it is
very suitable for OCT imaging. In comparison to aforementioned imaging modalities,
OCT has some strong advantages when imaging the eye, because of the high resolution
images, the imaging range, and the direct view it gives into the eye. Usually the tissue
is scanned both, in depth and laterally, by means of a time-coherent light source. If the
depth scan is attained by moving the reference mirror, the OCT is time-domain. If the
interference signals are obtained by splitting up from a light source with a wider band-
width, the OCT is spectral-domain. OCT imaging was used to image the crystalline
lens ex vivo and in vitro. Uhlhorn et al.[254] used a custom built time-domain OCT
(2-D) to develop a method to measure the axial thickness and the average refractive
index of the 40 ex vivo lens from a single recorded image. He used the optical thickness
of the lens and the optical displacement of the posterior window of the sample chamber
to calculate thickness and group refractive index. Borja et al.[34] quantified the poste-
rior surface distortion in 2-D OCT images of in vitro crystalline lenses. The lens was
flipped over in between the measurement to obtain the undistorted and distorted (due
to refraction at the anterior lens and the index gradient) shape of the posterior lens
surface. Radius of curvature and asphericity could then be compared for the distorted
18
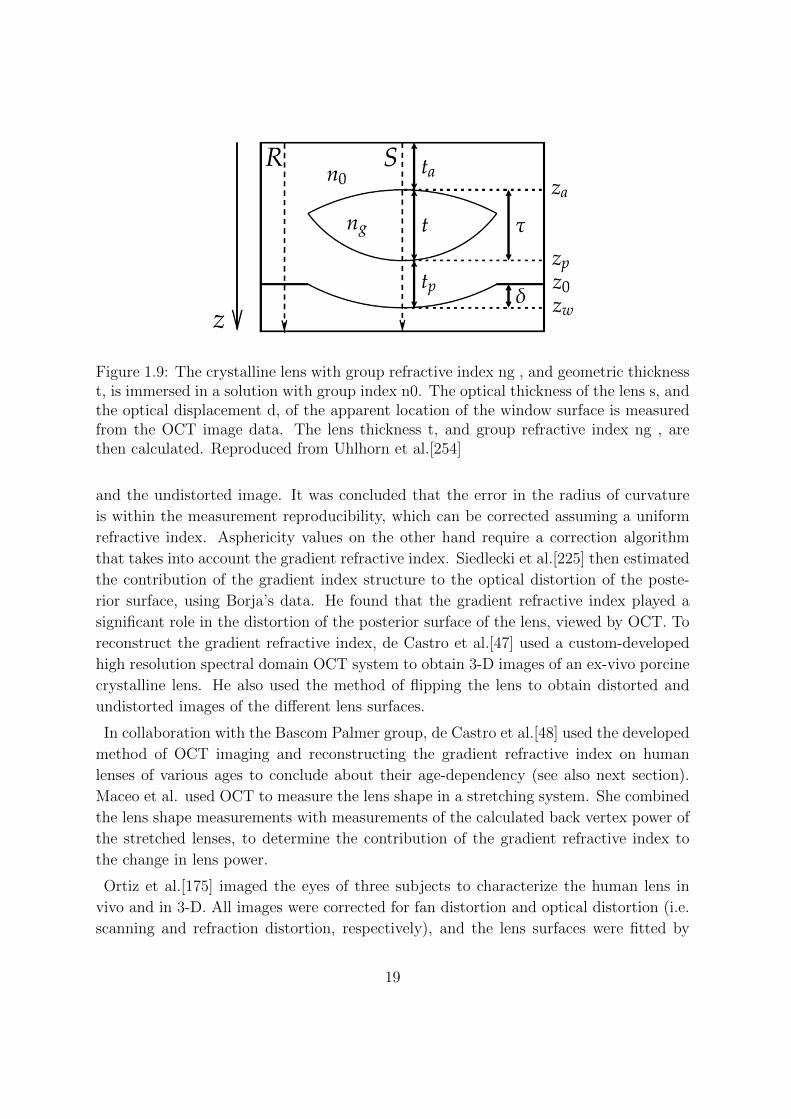
Figure 1.9: The crystalline lens with group refractive index ng , and geometric thicknesst, is immersed in a solution with group index n0. The optical thickness of the lens s, andthe optical displacement d, of the apparent location of the window surface is measuredfrom the OCT image data. The lens thickness t, and group refractive index ng , arethen calculated. Reproduced from Uhlhorn et al.[254]
and the undistorted image. It was concluded that the error in the radius of curvature
is within the measurement reproducibility, which can be corrected assuming a uniform
refractive index. Asphericity values on the other hand require a correction algorithm
that takes into account the gradient refractive index. Siedlecki et al.[225] then estimated
the contribution of the gradient index structure to the optical distortion of the poste-
rior surface, using Borja’s data. He found that the gradient refractive index played a
significant role in the distortion of the posterior surface of the lens, viewed by OCT. To
reconstruct the gradient refractive index, de Castro et al.[47] used a custom-developed
high resolution spectral domain OCT system to obtain 3-D images of an ex-vivo porcine
crystalline lens. He also used the method of flipping the lens to obtain distorted and
undistorted images of the different lens surfaces.
In collaboration with the Bascom Palmer group, de Castro et al.[48] used the developed
method of OCT imaging and reconstructing the gradient refractive index on human
lenses of various ages to conclude about their age-dependency (see also next section).
Maceo et al. used OCT to measure the lens shape in a stretching system. She combined
the lens shape measurements with measurements of the calculated back vertex power of
the stretched lenses, to determine the contribution of the gradient refractive index to
the change in lens power.
Ortiz et al.[175] imaged the eyes of three subjects to characterize the human lens in
vivo and in 3-D. All images were corrected for fan distortion and optical distortion (i.e.
scanning and refraction distortion, respectively), and the lens surfaces were fitted by
19
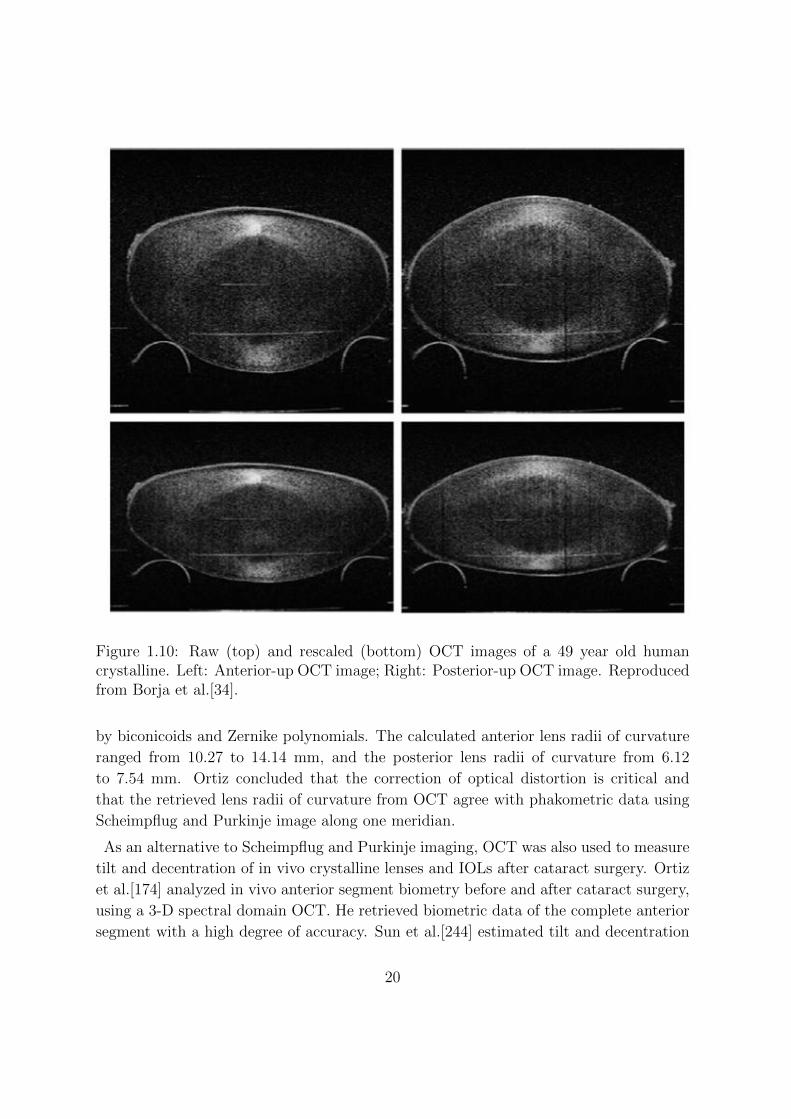
Figure 1.10: Raw (top) and rescaled (bottom) OCT images of a 49 year old humancrystalline. Left: Anterior-up OCT image; Right: Posterior-up OCT image. Reproducedfrom Borja et al.[34].
by biconicoids and Zernike polynomials. The calculated anterior lens radii of curvature
ranged from 10.27 to 14.14 mm, and the posterior lens radii of curvature from 6.12
to 7.54 mm. Ortiz concluded that the correction of optical distortion is critical and
that the retrieved lens radii of curvature from OCT agree with phakometric data using
Scheimpflug and Purkinje image along one meridian.
As an alternative to Scheimpflug and Purkinje imaging, OCT was also used to measure
tilt and decentration of in vivo crystalline lenses and IOLs after cataract surgery. Ortiz
et al.[174] analyzed in vivo anterior segment biometry before and after cataract surgery,
using a 3-D spectral domain OCT. He retrieved biometric data of the complete anterior
segment with a high degree of accuracy. Sun et al.[244] estimated tilt and decentration
20
of IOLs after cataract surgery, using the same OCT as Ortiz et al. Sun et al. used
a Purkinje-based methodology from anterior segment en face OCT imaging. En face
OCT images as Purkinje-like images that correspond to the specular reflections from
the corneal and IOL surfaces. It was shown that average IOL tilt and decentration from
Purkinje were 3.30 ± 4.68 deg and 0.16 ± 0.16 mm, respectively, and differed on average
by 0.5 deg and 0.09 mm, respectively, from direct measurements on distortion-corrected
OCT images.
1.2.7 Lens topography
Given its high accessibility, the corneal topography has been characterized much more
excessively than the lens topography. Corneal irregularities in the elevation map and
astigmatism are common. Interestingly, the posterior corneal surface appears to com-
pensate part of the errors of the anterior cornea. In particular, the posterior cornea has
been reported to compensate around 3.5% of the coma of the anterior surface[56]. There
are also numerous reports of the compensation of the corneal astigmatism by the astig-
matism of the crystalline lens using corneal and refractive parameters[110, 119, 136, 182].
However, there is little information on possible compensations within the crystalline lens
itself, i.e. between anterior and posterior surface or between its surfaces and its GRIN.
Manns et al.[145] presented an experimental technique to measure the topography of
the lenses of Eye-Bank eyes in situ, using the PAR Corneal Topography System. He
presented typical lens topography maps and height data, but the focus of the work was
to introduce the measurement method as an effective way to obtain the shape of the
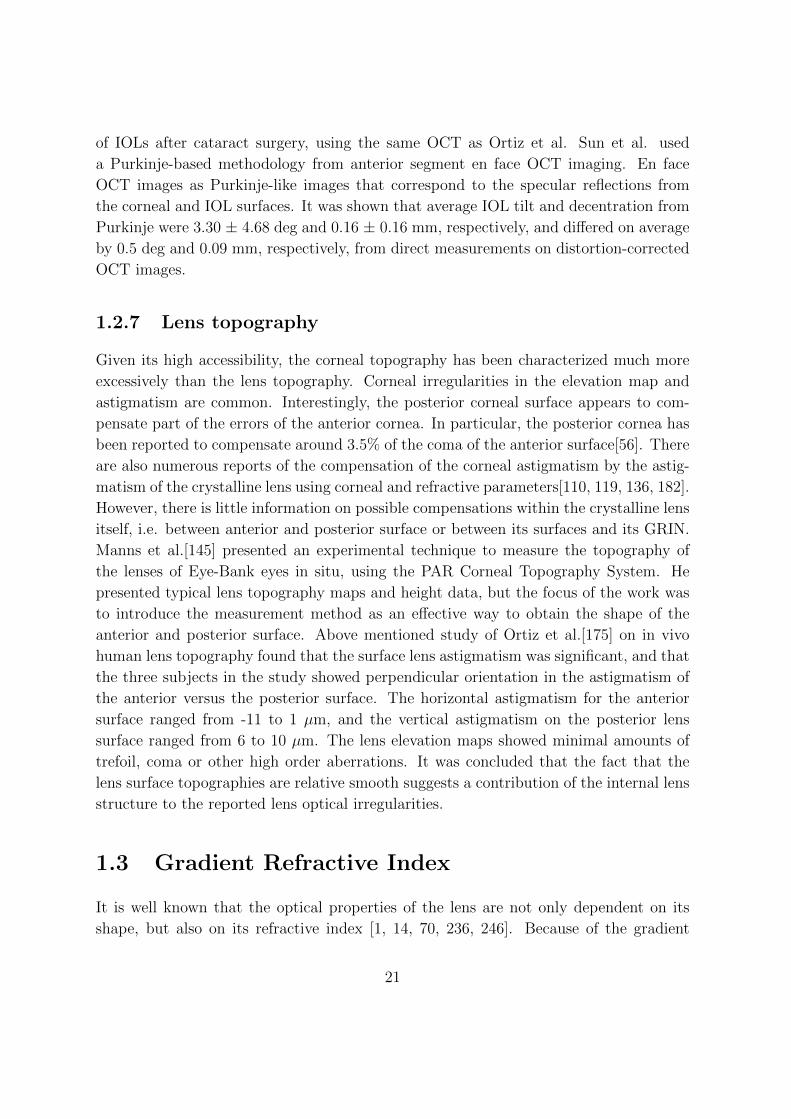
anterior and posterior surface. Above mentioned study of Ortiz et al.[175] on in vivo
human lens topography found that the surface lens astigmatism was significant, and that
the three subjects in the study showed perpendicular orientation in the astigmatism of
the anterior versus the posterior surface. The horizontal astigmatism for the anterior
surface ranged from -11 to 1 µm, and the vertical astigmatism on the posterior lens
surface ranged from 6 to 10 µm. The lens elevation maps showed minimal amounts of
trefoil, coma or other high order aberrations. It was concluded that the fact that the
lens surface topographies are relative smooth suggests a contribution of the internal lens
structure to the reported lens optical irregularities.
1.3 Gradient Refractive Index
It is well known that the optical properties of the lens are not only dependent on its
shape, but also on its refractive index [1, 14, 70, 236, 246]. Because of the gradient
21
Figure 1.11: Quantitative anterior (top) and posterior (bottom) crystalline lens elevationmaps in 3 eyes in vivo, after full distortion correction. Maps are Zernike fits to theelevation maps, relative to the best fitting sphere. Data are for 5-mm pupils. Reproducedfrom Ortiz et al.[175]
refractive index of the crystalline lens (GRIN), refraction does not take place only at the
lens surface, but also within the lens medium. The gradient distribution of the refractive
index is due to a non-uniform distribution of protein concentrations within the lens and
varies across species[16, 198, 236].
1.3.1 Measurement methods
The gradient refractive index has been measured in several species, for example fish[100,
258], rat[39], cat[99, 165], rabbit[166, 190], porcine[256, 47, 196], and human[167, 194,
104, 107, 48]), using both, direct destructive[190][194] and indirect non-destructive meth-
ods (Ray Tracing[39, 256, 71, 196]; MRI[104, 107, 71], and OCT[258, 47, 48]). In the
following, we give a brief overview over the techniques.
Destructive Methods
Destructive techniques to measure the lens gradient refractive index were done as early
as 1880 by Matthiessen et al.[156]. In this study, the GRIN was measured using Abbe
refractonomy, a method which was also employed by Huggert et al.[98]. Nakao et
22
al. used Schlieren interferometry to measure the GRIN of rabbit[166] and human[167]
lenses. Therefore, the lenses were frozen and thin layers were cut off from the lens to
study Fraunhofer diffraction patterns. This method would show the different sections
of the GRIN. Other destructive methods to measure the GRIN include Pulfrich refrac-
tometry, where lenses were cut and the refractive index was measured in the sample
surface[181, 99] and Reflectometry[190]. In Reflectometry, a fiber optic sensor is used
to to estimate the lens GRIN. The method is based on the fact that the amount of
light reflected in the interface between different media depends on the difference of the
refractive index. Pierscionek used this method to analyze the GRIN of different species,
like sheep, rabbit[190], bovine[191], and human lenses[194, 192].
Non Destructive Methods
Ray Tracing A report on the first non destructive method to measure the GRIN was
written by Campbell et al. in 1984[39], based on the work by Chu[43] and Barrel and
Pask[25]. Cambell measured the refractive index relative to the value at the lens surface.
After passing through the lens, angular deviations of laser beams are measured and an
inversion procedure is applied to the data leading to the refractive index. The lens itself
has to be immersed into a medium that matches the surface refractive index of the lens.
Ray tracing was also used by Garner et al. [71] with similar results. Pierscionek et al.
used ray tracing to measure the GRIN in different species ([196, 197, 188]. For porcine
lenses, she used two different wavelength and found the wavelength dependency to be
small.
Magnet Resonance Imaging Moffat and Pope[160] reported a linear relationship
between the refractive index and nuclear spin transverse relaxation rates. This knowledge
permitted measurements of the GRIN using MRI[162]. Subsequently, Garner et al. used
MRI technique to measure the GRIN and compared it to laser ray tracing results[71].
The comparison showed good agreement int the cortical zone, but MRI measurements
were not possible in the lens core, due to the lack of free water. Jones et al.[104]
measured the GRIN of 20 human lenses between the age of 7 and 82, using MRI. They
found the refractive index profiles to become flatter in the central region and steeper in
periphery. Kasthurirangan et al.[107] used MRI to map the GRIN in vivo, and found
a high refractive index plateau region and a decline of the refractive index towards the
periphery. In the youngest age group the peripheral decline was the least steep. The
axial thickness of the central plateau increased with age, but not with accommodation.
In general it was found that the refractive index of the plateau region in the lens center
did not change neither with age nor accommodation, but that the size of the plateau
23

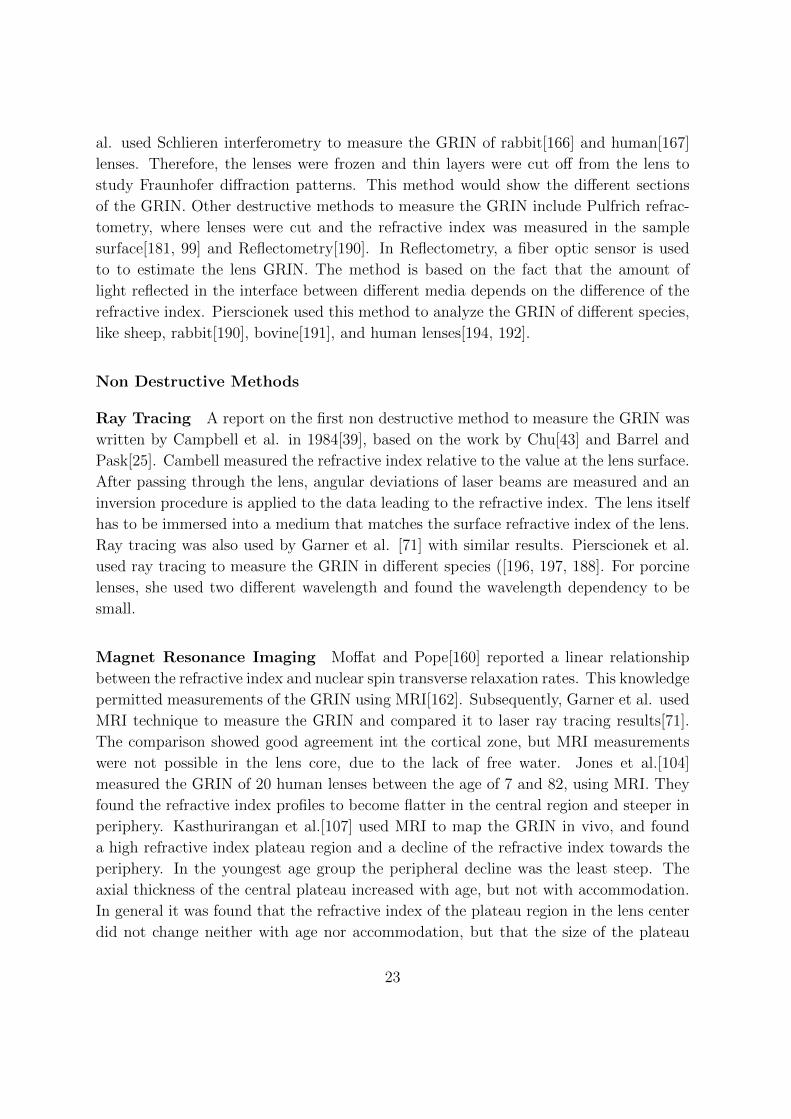
Figure 1.12: Ray tracing method to measure the GRIN (reproduced from Pierscioneket al[198]. The rays paths through a porcine lens in equatorial (Figure a and c) andsagittal (Figure b and d) planes for two wavelengths (633 nm and 532 nm).
increases with age.
Optical Coherence Tomography In recent years, OCT has been used to character-
ize the GRIN. First experiments were done by Verma et al. on zebrafish[258]. Verma
compared the OPD (optical path difference) from the OCT measurements with com-
puted ray paths. The computed ray paths were based on the assumption of a polynomial
GRIN. First OCT GRIN measurements with human donor lenses were done by Uhlhorn
et al.[254]. 40 human donor lenses between 6-82 years were imaged by means of OCT,
and thickness and average refractive index were measured. The measured average group
refractive index was then converted to the average phase refractive index. The average
refractive index was in agreement with mentioned MRI measurement (1.408 ± 0.005).
Recently, de Castro et al.[47] reconstructed the GRIN of a in vitro porcine lens from
3D OCT images. He used the OPD extracted from the OCT data and the lens shape
data as input parameters for a 4-variable GRIN model. The reconstruction algorithm
was based on a genetic algorithm that searched for the parameters that best fit the dis-
torted posterior surface of the lens. Subsequently, de Castro et al.[48] used 2D OCT to
investigate the age-dependent variation of the GRIN profile in human crystalline lenses,
using a similar reconstruction algorithm as before. Age-dependency of the GRIN was
consistent with previous data using MRI. The formation of a refractive index plateau
with age was also supported.
24
1.3.2 GRIN Models
The first time the GRIN was incorporated into an eye model was in 1924 with the
Gullstrand Eye model[88]. Since then, many models were proposed to describe and
calculate the GRIN. In 1971, Pomerantzeff et al.[200] built a wide angle optical eye
model and simulated the GRIN distribution as a shell like structure with a high number
of shells. Each shell would have a different refractive index, curvature and thickness.
As input data focal length and spherical aberration were used. Almost 20 years later,
Smith et al.[235] used a mathematical model based on ellipsoidal iso-indical contours
that are concentric with the lens surfaces to describe the lens GRIN. Smith’s model was
studied by Atchison et al.[11] who described mathematically how to transform a GRIN
distribution into a shell model. Within the shells, the refractive index was thought to
be constant.
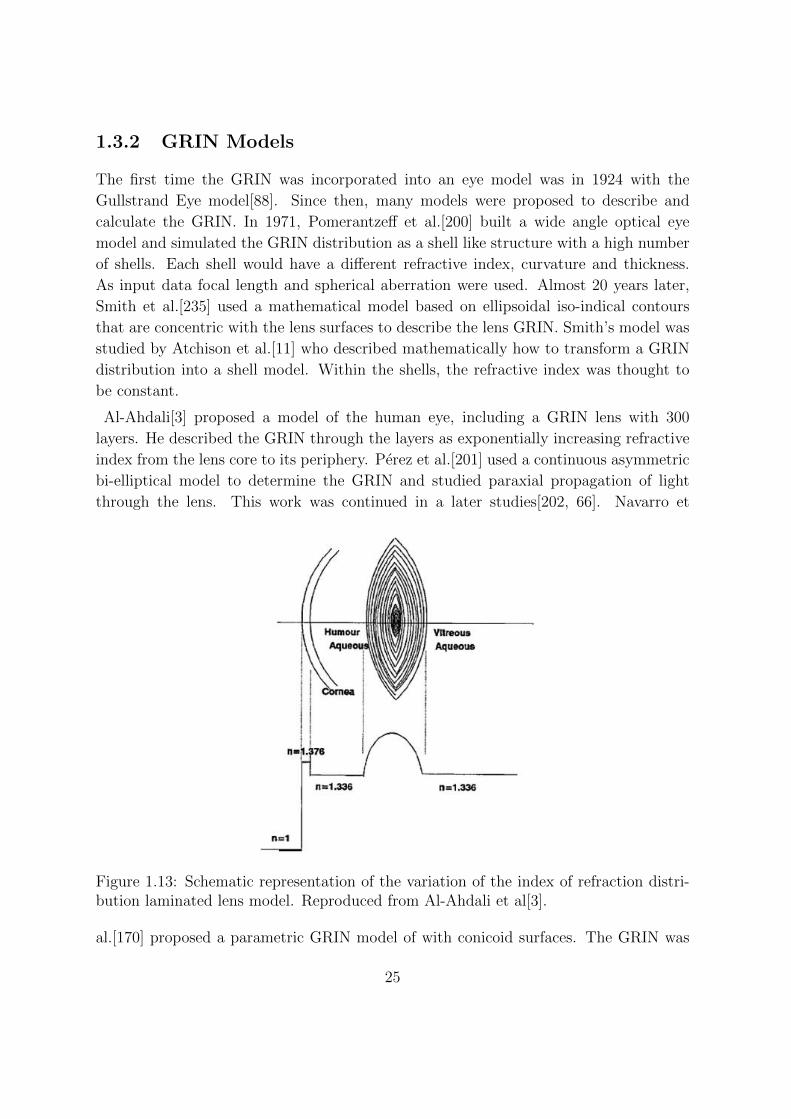
Al-Ahdali[3] proposed a model of the human eye, including a GRIN lens with 300
layers. He described the GRIN through the layers as exponentially increasing refractive
index from the lens core to its periphery. Perez et al.[201] used a continuous asymmetric
bi-elliptical model to determine the GRIN and studied paraxial propagation of light
through the lens. This work was continued in a later studies[202, 66]. Navarro et
Figure 1.13: Schematic representation of the variation of the index of refraction distri-bution laminated lens model. Reproduced from Al-Ahdali et al[3].
al.[170] proposed a parametric GRIN model of with conicoid surfaces. The GRIN was
25
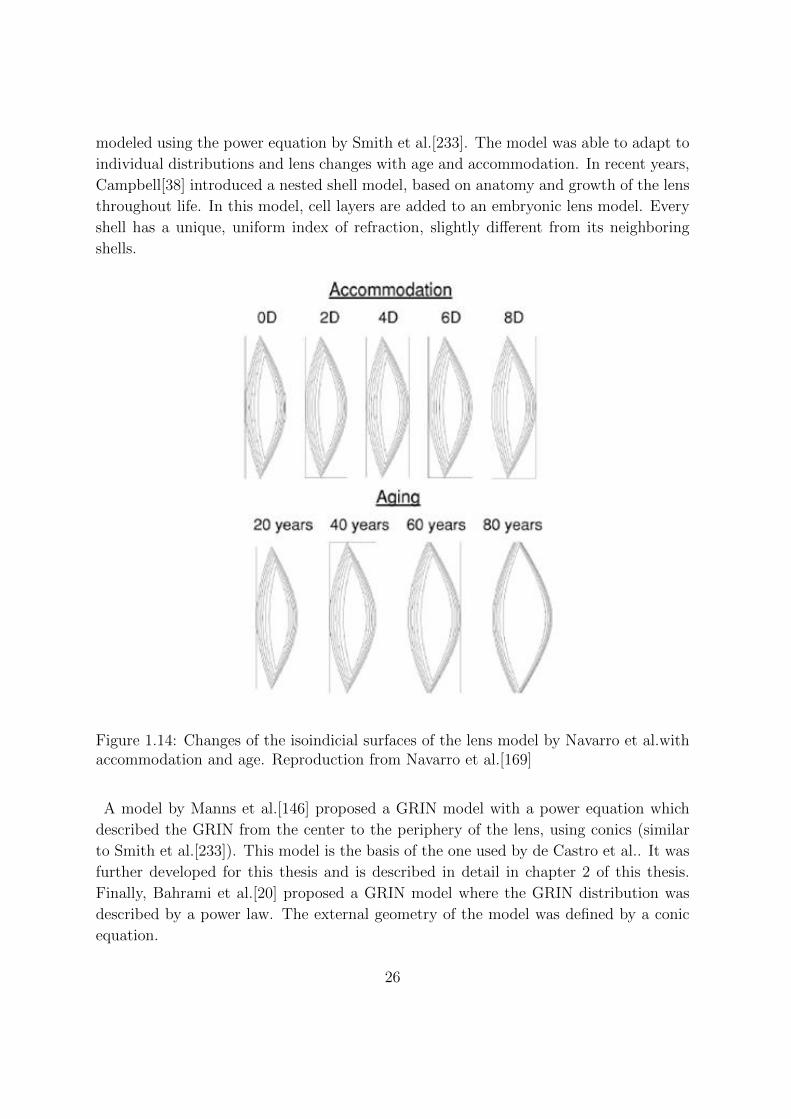
modeled using the power equation by Smith et al.[233]. The model was able to adapt to
individual distributions and lens changes with age and accommodation. In recent years,
Campbell[38] introduced a nested shell model, based on anatomy and growth of the lens
throughout life. In this model, cell layers are added to an embryonic lens model. Every
shell has a unique, uniform index of refraction, slightly different from its neighboring
shells.
Figure 1.14: Changes of the isoindicial surfaces of the lens model by Navarro et al.withaccommodation and age. Reproduction from Navarro et al.[169]
A model by Manns et al.[146] proposed a GRIN model with a power equation which
described the GRIN from the center to the periphery of the lens, using conics (similar
to Smith et al.[233]). This model is the basis of the one used by de Castro et al.. It was
further developed for this thesis and is described in detail in chapter 2 of this thesis.
Finally, Bahrami et al.[20] proposed a GRIN model where the GRIN distribution was
described by a power law. The external geometry of the model was defined by a conic
equation.
26

1.3.3 Equivalent Refractive Index
The equivalent refractive index is defined as a homogeneous lens which has the same
shape and the same lens power as the corresponding GRIN lens. The expression is
usually used to quantify the GRIN contribution to the optical properties of the lens.
Studies for both, in vivo and in vitro lenses have shown that the equivalent index, as
does the contribution of the GRIN to the lens power, decreases with age[32, 33, 57].
Figure 1.15: Age dependence the equivalent refractive index of in vitro human lenses.Reproduced from Borja et al.[32]
1.3.4 GRIN change with age
Several studies reveal changes of GRIN in human crystalline lenses with age, with a
progressive flattening of the GRIN profile in older lenses[17, 104, 160, 89, 107, 48], likely
associated to age-related changes of the lens spherical aberration with age ([32, 146, 73,
104]. Hemenger et al.[89] investigated the GRIN change in two age groups (19-31 years
and 49 to 61 years) and evaluated a continuum of index values between a fixed surface
and nucleus index, which were dependent on only one parameter. This GRIN parameter
was found to be well separated between the age groups with a flatter GRIN near the
lens center for the older age group. In already mentioned MRI studies, Augusteyn et
al.[15], Moffat et al.[161] and Jones et al.[104] confirmed this behavior with age. The
progressive formation of a refractive index plateau was also found by de Castro et al.
using OCT imaging on human lenses with ages ranging from 6 to 72 years.
27
1.3.5 GRIN change with accommodation
The redistribution of the GRIN in the accommodating lens has remained relatively un-
explored. Garner and Smith[70] used Purkinje-based phakometry data, in combination
with a one-variable bi-elliptical GRIN model to predict, amongst others, the change of
GRIN power with accommodation. The GRIN power increased from 9.70 D to 13.74 D
for the maximum accommodation stimulus of 8 D. It was concluded that a substantial
part of the increase in power with accommodation results from the GRIN distribution
within the lens. Maceo et al.[142] investigated the GRIN contribution on stretched pri-
mate lenses. To obtain the GRIN contribution to the change in lens power, the power of
the lens surfaces was subtracted from the measured lens power. The contribution of the
surfaces and the GRIN increased linearly with accommodation. It was found that the
GRIN contributed around 65% to the total power change during accommodation. When
expressed in percent of the total power change, the relative contribution of the GRIN
was constant with accommodation and age. Prior theoretical studies on the potential
impact of the GRIN on accommodation point to an important contribution of the GRIN
in the value[20, 50] and change of spherical aberration with accommodation[237].
1.4 Microscopic Anatomy of the human lens
1.4.1 The Lens Capsule
The lens capsule is the thickest base membrane in the human body, and appears dense
and homogeneous under light microscopy, appears very dense and homogeneous. At
the ultrastructure, the lens capsule consists in most part of type IV collagen combined
with about 10 % glycosaminoglycan[53, 199]. The type IV collagen plays an important
role in the formation of a 3D molecular network[251, 123]. The thickness of the capsule
varies throughout the lens perimeter and age. The lens capsule is the thickest at the
anterior midperiphery. Depending on age, it varies between 13.5 µm to 16 µm. Pre-
equatorially and on the posterior pole, there are no age changes and the capsule is
significantly thinner (7µm and 3.5 µm, mean value, respectively). The average thickness
at the posterior periphery decreases from 9 to 4 µm[24]. The growth of the lens capsule
is of practical relevance, to adjust to the increasing volume of the crystalline lens.
28
1.4.2 The Lens Epithelium
The inner anterior lens capsule is in immediate contact with the basal surface of the
lens epithelium. Indeed, it is the lens epithelium that synthesizes the anterior lens
capsule[272, 208]. The lens epithelium consists of a monolayer of non-specialized, pre-
dominantly cuboidal cells (except the cells at the equatorial zone which are more cylin-
drical). The epithelium layer surfaces the anterior pole up to the lens equator. On
the other side of the lens epithelium, the cells make contact with the elongated lens
fiber cells. There are three different cell regions of lens epithelium, which are in non-
dividing phase (central epithelium), in dividing phase (germinative) and differentiating
phase (equatorial)[29]. Therefore, the size of the cells differ between 8 µm and 21 µm
(in diameter) with most of the cells lying in a range from 9µm to 17 µm[37]. The
cell height has been reported to be about 5.5 µm to 8 µm[94]. With age, the cell size
increases[186]. All lens epithelial cells have a large lens nucleus, together with granu-
lar cytoplasm, mitochondria, Golgi apparatus, ribosomes, rough endoplasmic reticulum
(ER), and numerous small filaments[266, 94]. Unlike lens fibers, the lens epithelium has
characteristics of a ”normal” cell monolayer.
1.4.3 Lens Fibers and Lens Suture
Lens fibers form the main part of the lens. They are very long (up to 12 mm) and thin
(typically around 7 µm wide, and 4.5 µm thick)[94]. Most fiber cells are hexagonal and
stacked one upon another in well organized rows[44][206][125][231, 28, 4, 129, 130]. Their
intercellular distance is only about 15-20 nm[27]. Interestingly, the average equatorial
fiber width and fiber thickness does not vary much between different species. Therefore,
the shape and the size of crystalline lenses are dependent on how the containing lens
fibers are organized and how many fibers are part of the lens[131]. Lens fibers are
divided into primary and secondary lens fibers. Primary lens fibers develop during
embryonic development and become an inert structure of the lens. Secondary lens fibers
are generated throughout life. They arise from the germinative zone, and elongate in
direction of anterior and posterior lens surface. Finally, they lose contact with the capsule
and the epithelium. They indeed unwrap the lens from both sides. This continuous
addition of lens fibers throughout life leads to the changes in lens shape and thickness.
As the lens grows larger, the lens fiber ends cannot reach the poles of the lens anymore,
which results in a so called lens suture. Lens sutures vary between species. There
are basically four distinct types of lens suture types, the umbilical, line, Y, and star,
in order of increasing complexity[131]. Examples with umbilical and line suture are
chicken and rabbits, respectively. Pigs and primate lenses are an example of Y sutures,
29
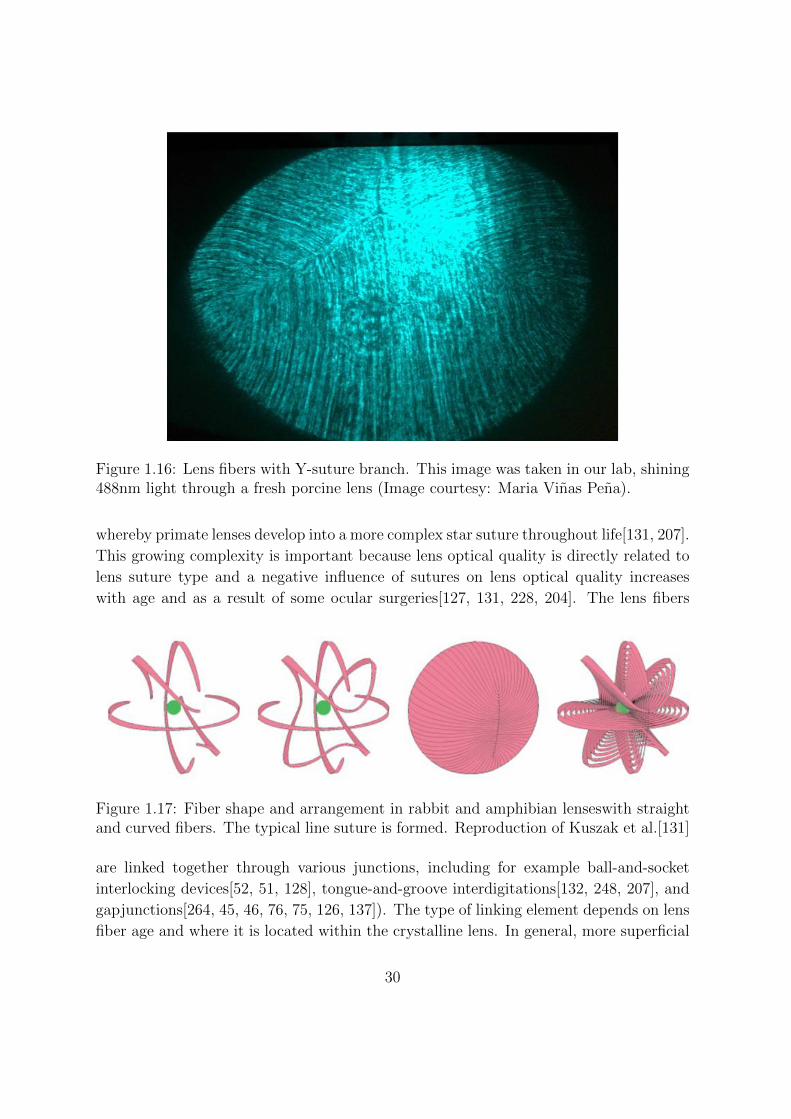
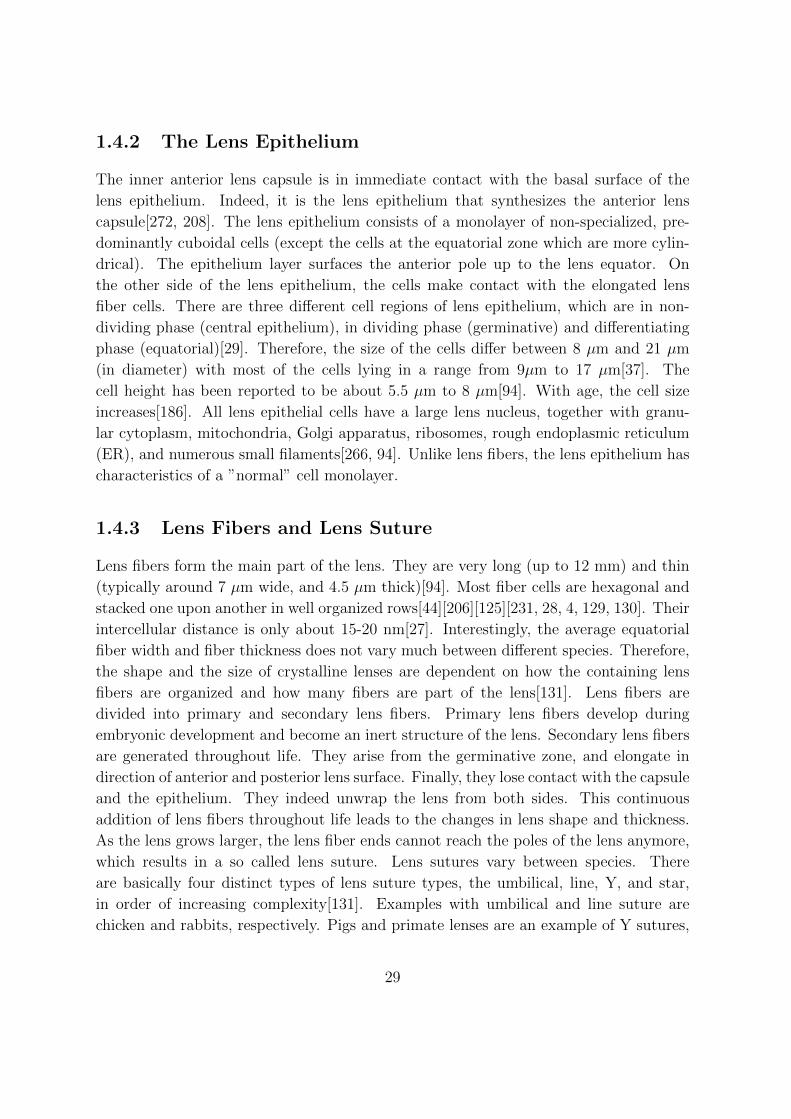
Figure 1.16: Lens fibers with Y-suture branch. This image was taken in our lab, shining488nm light through a fresh porcine lens (Image courtesy: Maria Vinas Pena).
whereby primate lenses develop into a more complex star suture throughout life[131, 207].
This growing complexity is important because lens optical quality is directly related to
lens suture type and a negative influence of sutures on lens optical quality increases
with age and as a result of some ocular surgeries[127, 131, 228, 204]. The lens fibers
Figure 1.17: Fiber shape and arrangement in rabbit and amphibian lenseswith straightand curved fibers. The typical line suture is formed. Reproduction of Kuszak et al.[131]
are linked together through various junctions, including for example ball-and-socket
interlocking devices[52, 51, 128], tongue-and-groove interdigitations[132, 248, 207], and
gapjunctions[264, 45, 46, 76, 75, 126, 137]). The type of linking element depends on lens
fiber age and where it is located within the crystalline lens. In general, more superficial
30
lens fibers are linked together via so called ”ball-and-socket” interdigitations. Deeper
fibers have additionally ”tongue-and-groove” junctions.
1.4.4 Measurement of Lens Structures using Microscopy
Different microscopy imaging modalities have been used to characterize the capsule,
the lens epithelium and lens fibers, including scanning electron microscopy, confocal
microscopy, multi photon microscopy, or Brillouin microscopy.
Scanning electron microscopy (SEM) was used extensively to investigate the structure
of lens fiber cells of different mammals, including rats[65, 83, 266], rabbits [84, 266, 267],
porcine[97], monkeys[52, 132, 266, 268], and humans[44, 132, 155, 248, 253, 263]. SEM
has also been used to investigate on the lens epithelium[83, 265], the lens capsule[83],
cataract [51, 111, 133, 219, 253], the influence on calcium on the lens fibers[64] or on the
electric coupling of lens epithelium with lens fibers[206].
Advantages of an SEM include its large depth of focus and its ability to resolve details on
the surface of the sample. An obvious disadvantage for biological samples is the required
preparation procedure. Samples have to be dried and heavily prepared (coated) since
they must be electrically conductive. In contrast, confocal microscopy allows observation
of the eye in an unstained, unfixed, living condition, confocal microscopy has been
used. It provides high-resolution, high-contrast images, and the capability to section the
sample without contact. The cornea has been a primary target for confocal microscopy,
with commercial instruments used in the clinic for diagnostics on a regular basis [31,
101, 134, 135, 144, 152, 153, 171, 173, 184, 185, 271]. Applications of crystalline lens
investigation, realized with confocal microscopy are scarce. Jeacocke et al.[102] and Xiao
et al.[271] observed an isolated crystalline lens of a rabbit with a confocal microscopy.
Xiao et al. could image lens fibers of a freshly excised lens about 200 µm below the lens
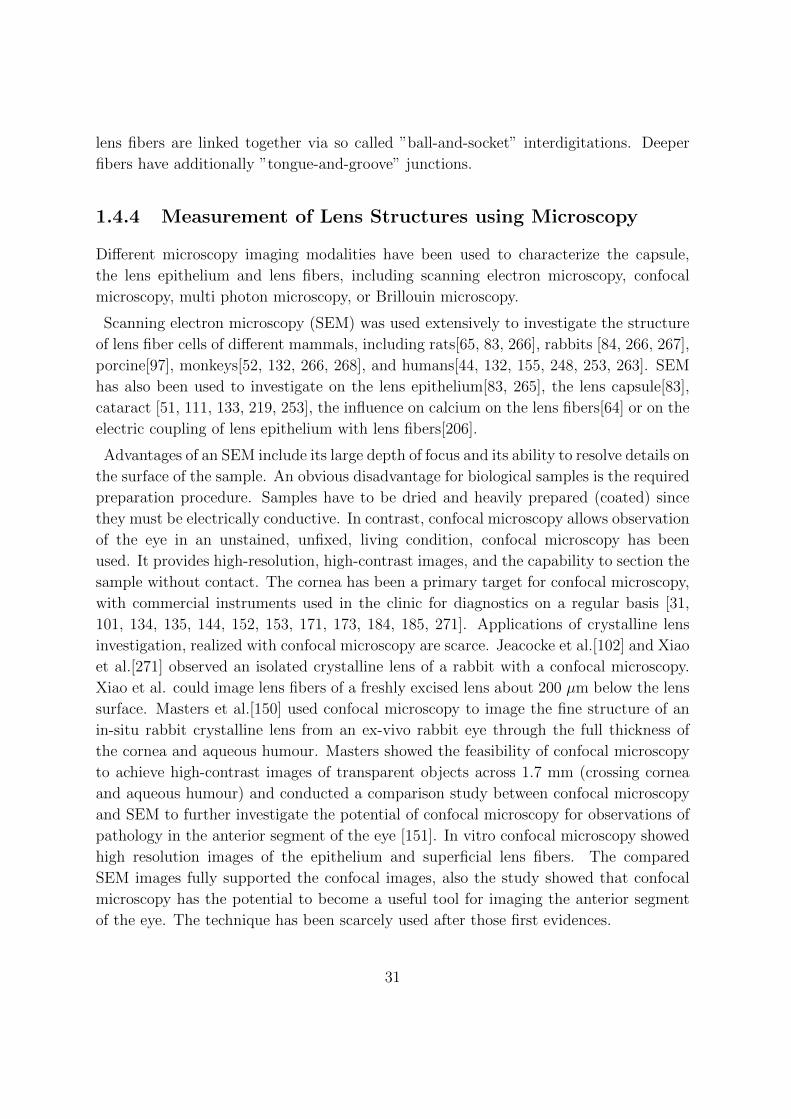
surface. Masters et al.[150] used confocal microscopy to image the fine structure of an
in-situ rabbit crystalline lens from an ex-vivo rabbit eye through the full thickness of
the cornea and aqueous humour. Masters showed the feasibility of confocal microscopy
to achieve high-contrast images of transparent objects across 1.7 mm (crossing cornea
and aqueous humour) and conducted a comparison study between confocal microscopy
and SEM to further investigate the potential of confocal microscopy for observations of
pathology in the anterior segment of the eye [151]. In vitro confocal microscopy showed
high resolution images of the epithelium and superficial lens fibers. The compared
SEM images fully supported the confocal images, also the study showed that confocal
microscopy has the potential to become a useful tool for imaging the anterior segment
of the eye. The technique has been scarcely used after those first evidences.
31
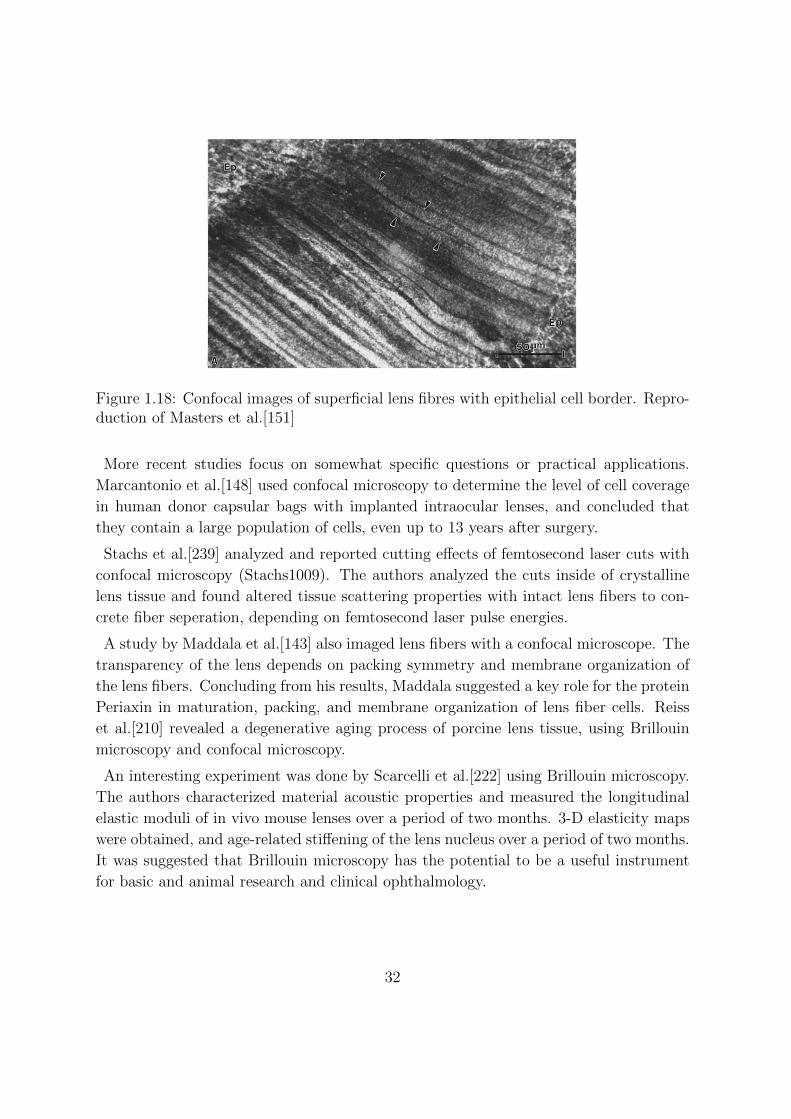
Figure 1.18: Confocal images of superficial lens fibres with epithelial cell border. Repro-duction of Masters et al.[151]
More recent studies focus on somewhat specific questions or practical applications.
Marcantonio et al.[148] used confocal microscopy to determine the level of cell coverage
in human donor capsular bags with implanted intraocular lenses, and concluded that
they contain a large population of cells, even up to 13 years after surgery.
Stachs et al.[239] analyzed and reported cutting effects of femtosecond laser cuts with
confocal microscopy (Stachs1009). The authors analyzed the cuts inside of crystalline
lens tissue and found altered tissue scattering properties with intact lens fibers to con-
crete fiber seperation, depending on femtosecond laser pulse energies.
A study by Maddala et al.[143] also imaged lens fibers with a confocal microscope. The
transparency of the lens depends on packing symmetry and membrane organization of
the lens fibers. Concluding from his results, Maddala suggested a key role for the protein
Periaxin in maturation, packing, and membrane organization of lens fiber cells. Reiss
et al.[210] revealed a degenerative aging process of porcine lens tissue, using Brillouin
microscopy and confocal microscopy.
An interesting experiment was done by Scarcelli et al.[222] using Brillouin microscopy.
The authors characterized material acoustic properties and measured the longitudinal
elastic moduli of in vivo mouse lenses over a period of two months. 3-D elasticity maps
were obtained, and age-related stiffening of the lens nucleus over a period of two months.
It was suggested that Brillouin microscopy has the potential to be a useful instrument
for basic and animal research and clinical ophthalmology.
32
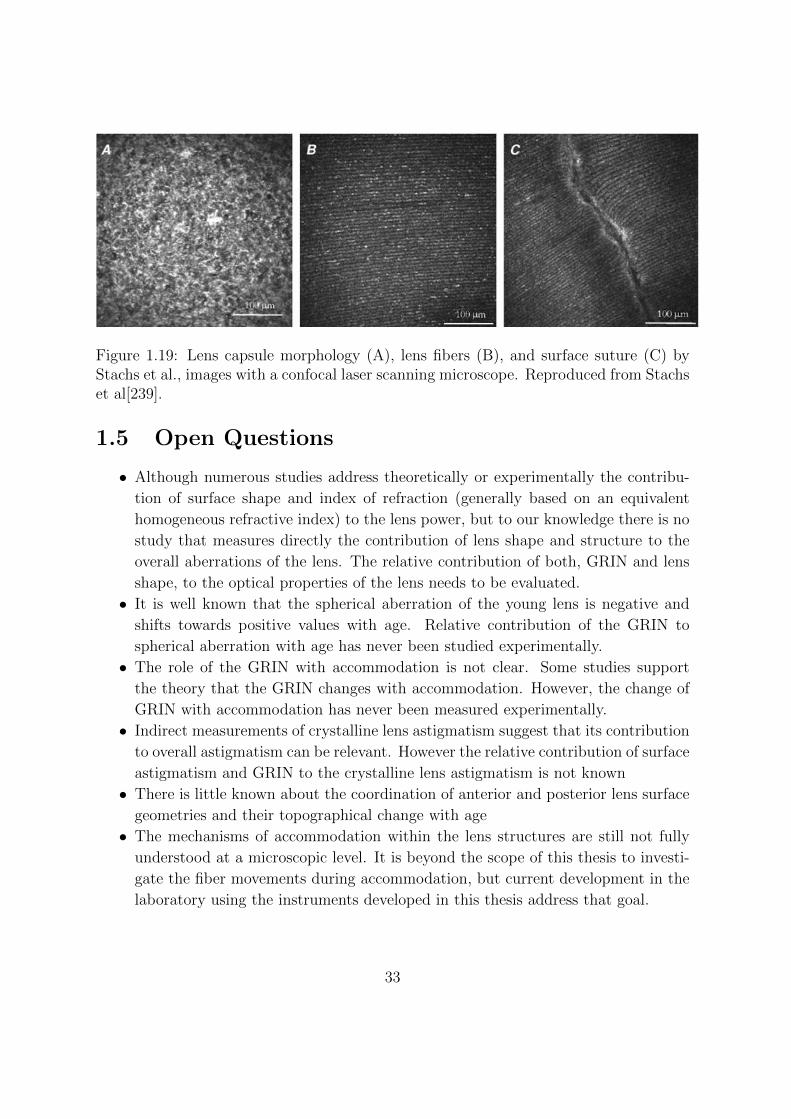
Figure 1.19: Lens capsule morphology (A), lens fibers (B), and surface suture (C) byStachs et al., images with a confocal laser scanning microscope. Reproduced from Stachset al[239].
1.5 Open Questions
• Although numerous studies address theoretically or experimentally the contribu-
tion of surface shape and index of refraction (generally based on an equivalent
homogeneous refractive index) to the lens power, but to our knowledge there is no
study that measures directly the contribution of lens shape and structure to the
overall aberrations of the lens. The relative contribution of both, GRIN and lens
shape, to the optical properties of the lens needs to be evaluated.
• It is well known that the spherical aberration of the young lens is negative and
shifts towards positive values with age. Relative contribution of the GRIN to
spherical aberration with age has never been studied experimentally.
• The role of the GRIN with accommodation is not clear. Some studies support
the theory that the GRIN changes with accommodation. However, the change of
GRIN with accommodation has never been measured experimentally.
• Indirect measurements of crystalline lens astigmatism suggest that its contribution
to overall astigmatism can be relevant. However the relative contribution of surface
astigmatism and GRIN to the crystalline lens astigmatism is not known
• There is little known about the coordination of anterior and posterior lens surface
geometries and their topographical change with age
• The mechanisms of accommodation within the lens structures are still not fully
understood at a microscopic level. It is beyond the scope of this thesis to investi-
gate the fiber movements during accommodation, but current development in the
laboratory using the instruments developed in this thesis address that goal.
33

1.6 Goal of this Thesis
The specific goals of this thesis are
• To measure the GRIN distribution in porcine, non human primate and human
lenses
• To use available technologies in the Visual Optics and Biophotonics Lab (and col-
laborative institution Bascom Palmer Eye Research Institute) -Optical Coherence
Tomography and crystalline lens stretcher- and technology newly developed for
this thesis, to measure crystalline lens shape ad gradient index ex vivo.
• To measure the change of the GRIN with age in donor human lenses, in 3-
dimensions. To explore the relative contribution of lens shape and GRIN to the
spherical aberration in unaccommodated lenses, as a function of aging and as a
function of accommodation
• To explore the topography of the lens surfaces and investigate their individual
contribution to the lens’ optical properties like astigmatism
• To develop a custom built confocal microscope and design an experimental setup
to image microscopic lens structures
1.7 Hypothesis
• The negative values of the lens spherical aberration are in parts a result from
the gradient refractive index in the lens. We will test the relative contribution of
the GRIN to the lens spherical aberration by evaluating both, GRIN and shape
of several crystalline lenses of different species, and evaluate the influence of the
GRIN by comparing the results to lenses with an equivalent homogeneous refractive
index.
• The GRIN changes with accommodation. We will reconstruct the GRIN on lenses
in different accommodation states, using a lens stretcher.
• The GRIN profile is age dependent. We will evaluate the GRIN dependency on
human donor lenses with age and its influence on the lens optical properties with
age
• The individual lens surface topographies (anterior surface and posterior surface)
are to some degree correlated to each other
• It is possible to evaluate lens structures using confocal microscopy
34
1.8 Structure of this thesis
This thesis has been organized by chapters, which are based on published articles.
Chapter 1: gives a state of the art and motivation of the thesis
Chapter 2: introduces the instruments and methods used
Chapter 3: presents a study on the influence of GRIN and shape on the lens properties of ten
in vitro porcine lenses
Chapter 4: presents the results of a collaboration with the Bascom Palmer Eye Institute (Uni-
versity of Miami, FL), on the change of GRIN and lens properties with accommo-
dation
Chapter 5: presents an extensive study on human donor lenses. The GRIN and lens shape
was calculated and computational laser ray tracing was used to find out about the
influence of lens properties on spherical aberration
Chapter 6: is a continuation study of Chapter 5, in which the lens astigmatism is evaluated,
using the calculated GRIN and lens shape
Chapter 7: introduces a custom-built confocal microscope and its use to study structural prop-
erties of the crystalline lens.
Chapter 8: includes a summary of all chapters in English and Spanish, and gives an overview
of the activities done during the Ph.D. period 2010-14.
35
2Methods and Materials
In this chapter the experimental and theoretical techniques are described. The imaging
systems used for this work were custom-developed instruments, either at the Visual Op-
tics and Biophotonics Lab, Instituto de Optica, CSIC, Madrid (high speed spectral 3-D
OCT, laser ray tracer, confocal microscope), or at the Ophthalmic Biophysics Center,
Bascom Palmer Eye Institute, Miami, FL (time-domain 2-D OCT, Ex Vivo Accommo-
dation Simulator II). The GRIN algorithm and the distortion correction algorithm were
developed by Alberto de Castro and Sergio Ortiz, respectively, at the Visual Optics and
Biophotonics Lab. The author of this thesis built the laser ray tracer and the confocal
microscope, designed the experiments, and developed image processing and analysis rou-
tines (mainly in collaboration with Alberto de Castro, Jorge Lamela, Sergio Ortiz, and
Bianca Maceo). Principal investigators of the laboratories were Susana Marcos, Fabrice
Manns, and Jean-Marie Parel.
2.1 Experimental Techniques
2.1.1 Spectral domain 3D Optical Coherence Tomograph
The OCT system in our group was developed in collaboration with Nicolaus Copernicus
University (Poland)[79]. The system (figure 2.1) is based on a fiber-optic Michelson
36
interferometer, an 840-nm SLD diode as illumination source (near Gaussian emission in
849nm, bandwidth 50nm, Superlum, Ireland, and a spectrometer consisting of a volume
diffraction grating and a 12-bit line-scan CMOS camera (4096px) as detector. The
system has an acquisition speed of 25000 A-Scans/s. The axial range is 7 mm (which
corresponds to a pixel resolution of 3.42 µm, and the axial resolution was calculated to
6.9 µm. The imaging of the crystalline lens with the OCT results in results in different
distortions, which has to be corrected to quantitatively analyze the captured images.
Therefore, Ortiz et al.[177] have developed a distortion correction algorithm to correct
for fan and optical distortion. Fan distortion (see figure 2.2) arises directly from the
scanning architecture of the OCT (separation of scanning mirrors and aberrations of
optical components), affecting the radius of curvature by about 3% and asphericity
by about 125%). Optical distortion arises from viewing the internal optical surfaces
through refracting preceding surfaces (for example viewing the posterior lens surface
through the anterior lens surface and the lens GRIN). After distortion correction the
radius of curvature and asphericity of an artificial lens could be measured with > 90%
accuracy (compared to non contact profilometry)[178]. For all measurements, a special
platform was used, so that the incoming laser beam would hit the horizontally positioned
cuvette with the lens sample vertically (figure 2.3).
2.1.2 Time domain 2D Optical Coherence Tomograph
The OCT system is a custom built device developed at the Ophthalmic Biophysics
Center at the Bascom Palmer Institute in Miami, Florida (Uhlhorn2008)(see figure 2.4).
It consists of a superluminescent diode as light source (Gaussian emission centered in
825 nm, bandwidth 25 nm, SLD-38-HP, Superlum, Cork, Ireland). The axial resolution
is 12 µm, the maximum lateral length imaged is 20 mm. The scan length in tissue is
approximately 7.5 mm. A flat scanning field is produced by a telecentric scanner as
beam delivery. The depth of focus was around 10 mm.
2.1.3 Laser Ray Tracer
A Laser Ray Tracer (LRT) was custom developed in our group to measure the focal
length of the lenses (see figure 2.5). Illumination came from an 849 nm SLD (Superlum,
Cork, Ireland). The beam diameter at the plane of the lens was 600 m. A 2-mirror
galvanometric scanning system, in combination with a 400 mm collimating lens was
used to scan rings of light of 2 and 4 mm diameter onto the lens surface. A CMOS
camera placed behind the cuvette captured a series of through-focus images around the
focal plane of the system composed by the lens. The step size from image to image
37
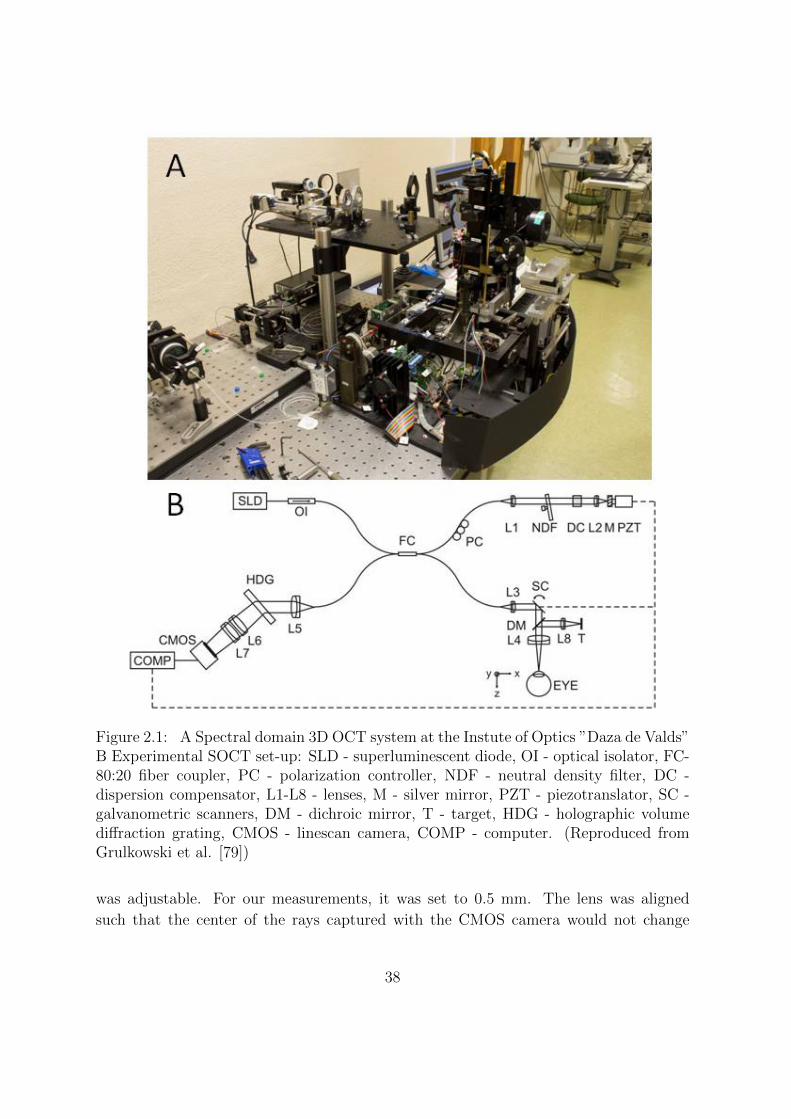
Figure 2.1: A Spectral domain 3D OCT system at the Instute of Optics ”Daza de Valds”B Experimental SOCT set-up: SLD - superluminescent diode, OI - optical isolator, FC-80:20 fiber coupler, PC - polarization controller, NDF - neutral density filter, DC -dispersion compensator, L1-L8 - lenses, M - silver mirror, PZT - piezotranslator, SC -galvanometric scanners, DM - dichroic mirror, T - target, HDG - holographic volumediffraction grating, CMOS - linescan camera, COMP - computer. (Reproduced fromGrulkowski et al. [79])
was adjustable. For our measurements, it was set to 0.5 mm. The lens was aligned
such that the center of the rays captured with the CMOS camera would not change
38

Figure 2.2: Visualization of fan distortion (Reproduced from Ortiz et al. [179])
Figure 2.3: Human crystalline lens, mounted on the spectral-domain OCT at viobiogroup.
within the range of movement of the camera (35 mm). The system was calibrated with
commercial artificial lenses (Edmund Optics Inc. Barrington, NJ USA). Comparison of
the back focal length estimates from the experimental system with computational ray
tracing programs (Zemax, Radiant Zemax, Redmond, WA, USA) allowed estimation of
the back focal length of the lens in preservation media (see figure 6). The precision of the
measurements was estimated to be 0.8 mm. The back focal length could be expressed in
diopters as the inverse of the back focal length multiplied by the group refractive index
of the solution n = 1.345 at 825 nm[34]. The captured images from the CMOS camera
were analyzed with a custom developed algorithm developed in imagej to find the focal
spot.
39

Figure 2.4: Time domain 2D OCT at the Ophthalmic Biophysics Center at the bascomPalmer Eye Institute, Miami, FL.
2.1.4 Ex Vivo Accommodation Simulator II (EVAS II)
The EVAS II reproduces dis-accommodation by simultaneous radial stretching of the
eight scleral segments of the eye up to 2.5 mm radially. The following description of the
stretcher is based on an article by Klaus Ehrmann, one of the designers of EVASII[62].
The stretcher consists of eight identical linear motion stages with integrated force trans-
ducer. Each stage is mounted on a motorized linear stage with five millimetres of travel
(M110.1DG, Physik Instrumente, Germany). The eight stages are symmetrically ar-
ranged and connected to a computer. At the center of the instrument, a lens power
measurement assembly can be inserted (0.25 inch CCD camera (GP-CX261V, Pana-
sonic, Japan), vertically motorized). To control the stretching steps, and to receive
the optical power readings, customized control software was developed. When using
the stretcher, a scleral ring of the eye is glued symmetrically to eight shoes which are
connected to the motion stages. The section of the scleral ring contains intact ciliary
muscle, zonules and the crystalline. The posterior section of the globe, as well as the
cornea and the iris, are removed.
40
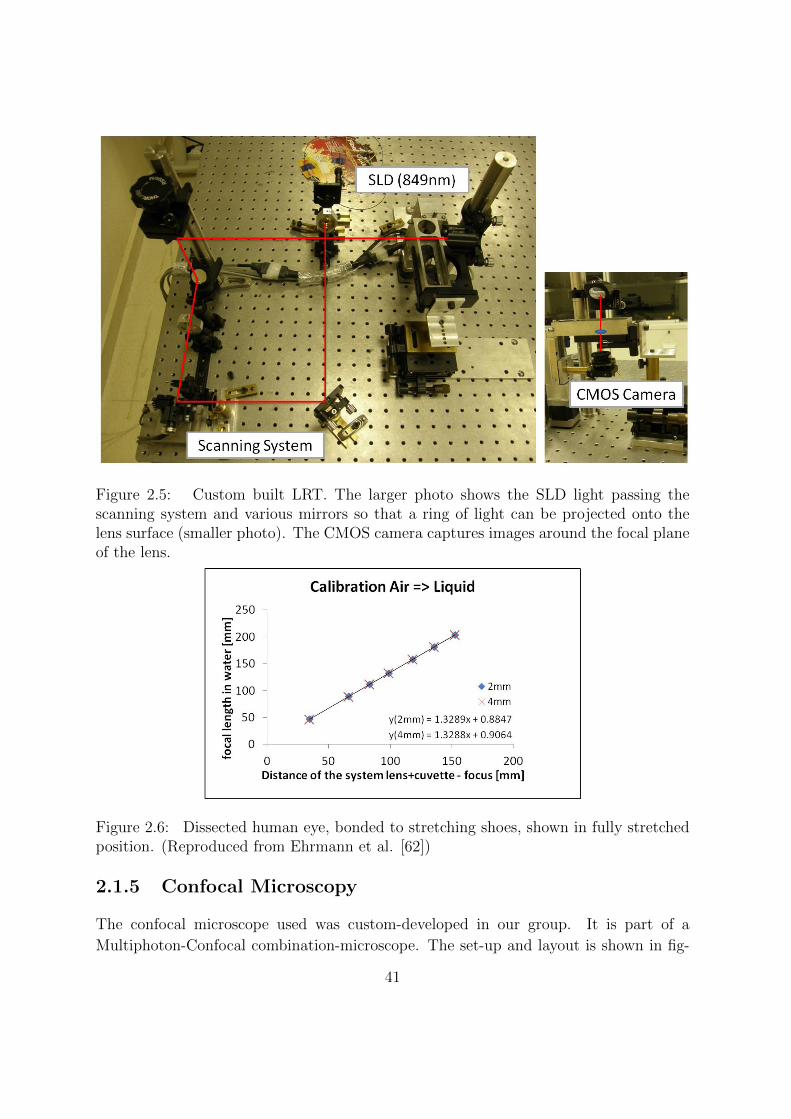
Figure 2.5: Custom built LRT. The larger photo shows the SLD light passing thescanning system and various mirrors so that a ring of light can be projected onto thelens surface (smaller photo). The CMOS camera captures images around the focal planeof the lens.
Figure 2.6: Dissected human eye, bonded to stretching shoes, shown in fully stretchedposition. (Reproduced from Ehrmann et al. [62])
2.1.5 Confocal Microscopy
The confocal microscope used was custom-developed in our group. It is part of a
Multiphoton-Confocal combination-microscope. The set-up and layout is shown in fig-
41
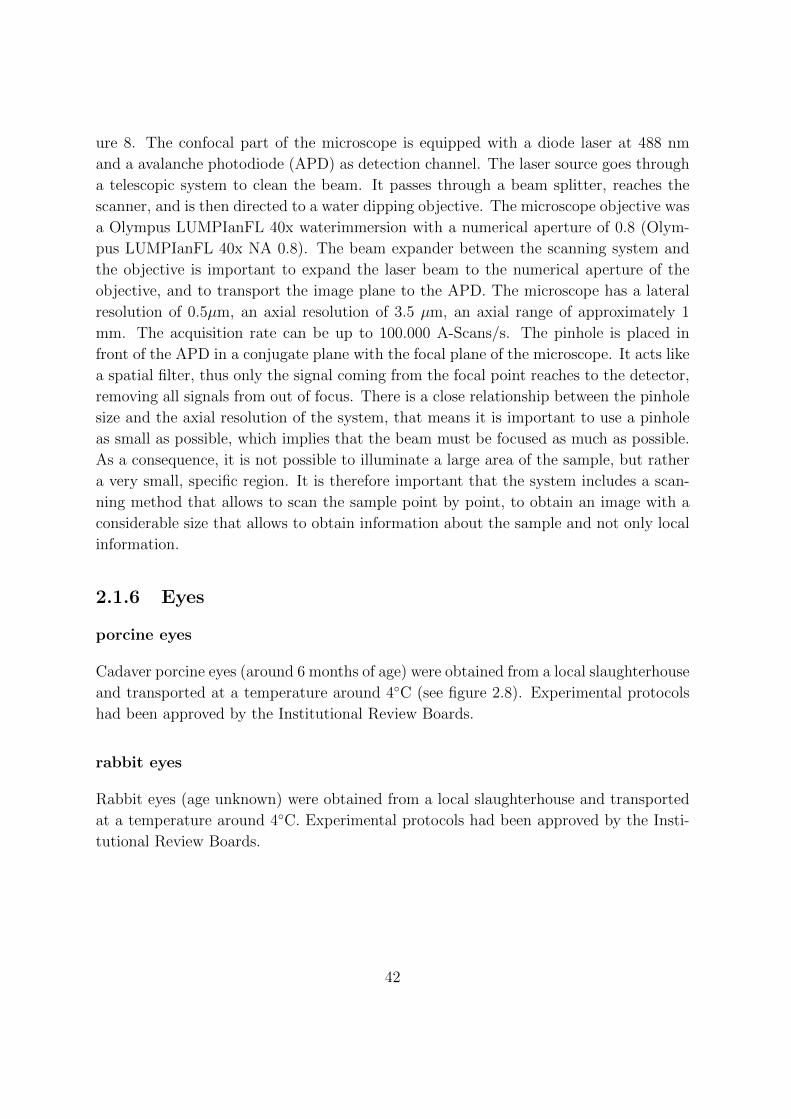
ure 8. The confocal part of the microscope is equipped with a diode laser at 488 nm
and a avalanche photodiode (APD) as detection channel. The laser source goes through
a telescopic system to clean the beam. It passes through a beam splitter, reaches the
scanner, and is then directed to a water dipping objective. The microscope objective was
a Olympus LUMPIanFL 40x waterimmersion with a numerical aperture of 0.8 (Olym-
pus LUMPIanFL 40x NA 0.8). The beam expander between the scanning system and
the objective is important to expand the laser beam to the numerical aperture of the
objective, and to transport the image plane to the APD. The microscope has a lateral
resolution of 0.5µm, an axial resolution of 3.5 µm, an axial range of approximately 1
mm. The acquisition rate can be up to 100.000 A-Scans/s. The pinhole is placed in
front of the APD in a conjugate plane with the focal plane of the microscope. It acts like
a spatial filter, thus only the signal coming from the focal point reaches to the detector,
removing all signals from out of focus. There is a close relationship between the pinhole
size and the axial resolution of the system, that means it is important to use a pinhole
as small as possible, which implies that the beam must be focused as much as possible.
As a consequence, it is not possible to illuminate a large area of the sample, but rather
a very small, specific region. It is therefore important that the system includes a scan-
ning method that allows to scan the sample point by point, to obtain an image with a
considerable size that allows to obtain information about the sample and not only local
information.
2.1.6 Eyes
porcine eyes
Cadaver porcine eyes (around 6 months of age) were obtained from a local slaughterhouse
and transported at a temperature around 4◦C (see figure 2.8). Experimental protocols
had been approved by the Institutional Review Boards.
rabbit eyes
Rabbit eyes (age unknown) were obtained from a local slaughterhouse and transported
at a temperature around 4◦C. Experimental protocols had been approved by the Insti-
tutional Review Boards.
42
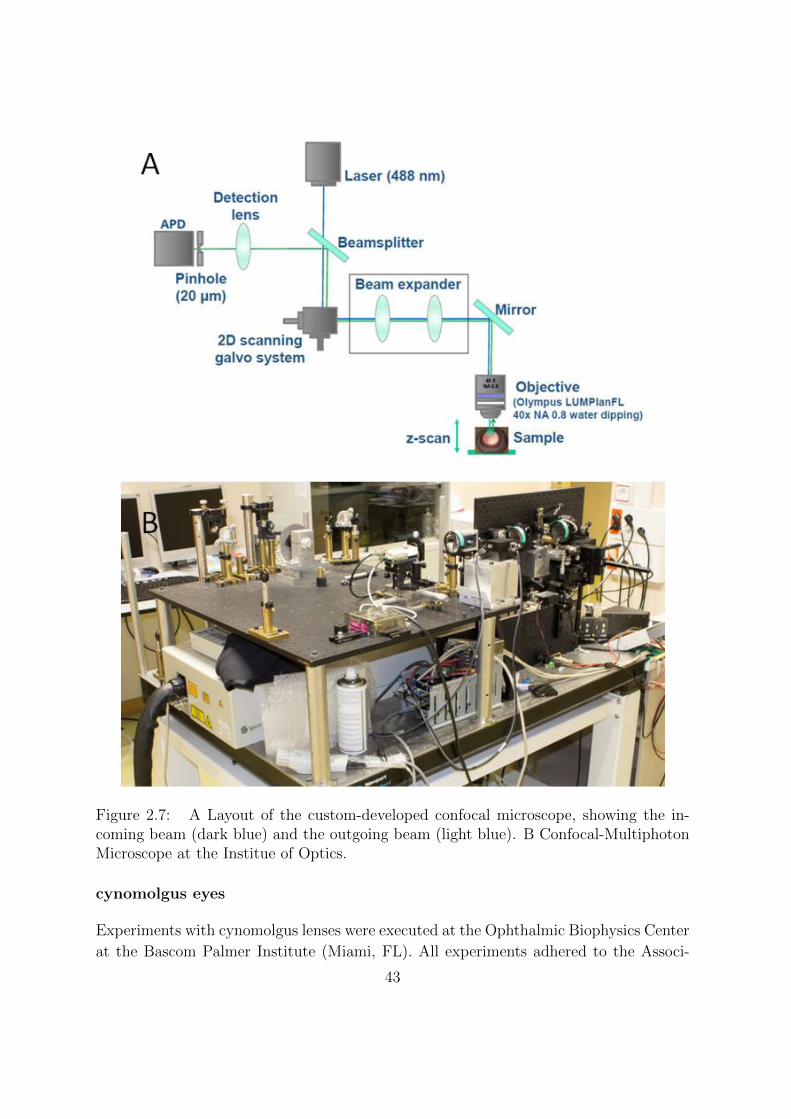
Figure 2.7: A Layout of the custom-developed confocal microscope, showing the in-coming beam (dark blue) and the outgoing beam (light blue). B Confocal-MultiphotonMicroscope at the Institue of Optics.
cynomolgus eyes
Experiments with cynomolgus lenses were executed at the Ophthalmic Biophysics Center
at the Bascom Palmer Institute (Miami, FL). All experiments adhered to the Associ-
43
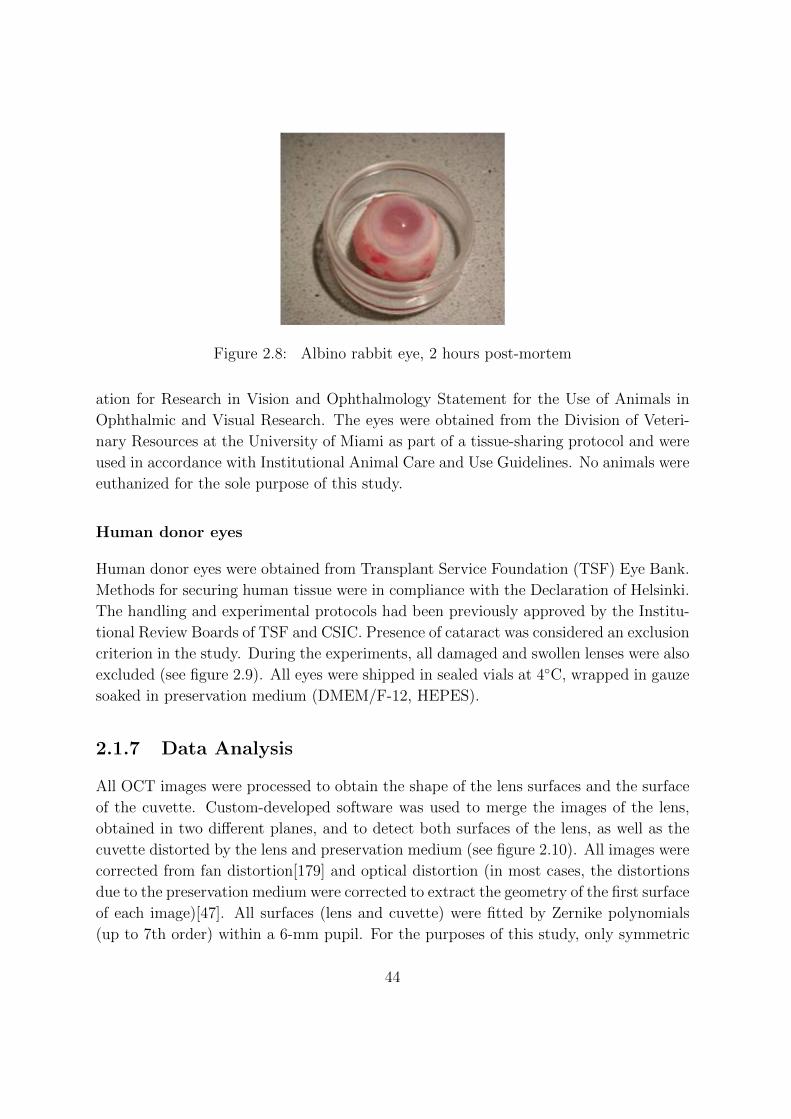
Figure 2.8: Albino rabbit eye, 2 hours post-mortem
ation for Research in Vision and Ophthalmology Statement for the Use of Animals in
Ophthalmic and Visual Research. The eyes were obtained from the Division of Veteri-
nary Resources at the University of Miami as part of a tissue-sharing protocol and were
used in accordance with Institutional Animal Care and Use Guidelines. No animals were
euthanized for the sole purpose of this study.
Human donor eyes
Human donor eyes were obtained from Transplant Service Foundation (TSF) Eye Bank.
Methods for securing human tissue were in compliance with the Declaration of Helsinki.
The handling and experimental protocols had been previously approved by the Institu-
tional Review Boards of TSF and CSIC. Presence of cataract was considered an exclusion
criterion in the study. During the experiments, all damaged and swollen lenses were also
excluded (see figure 2.9). All eyes were shipped in sealed vials at 4◦C, wrapped in gauze
soaked in preservation medium (DMEM/F-12, HEPES).
2.1.7 Data Analysis
All OCT images were processed to obtain the shape of the lens surfaces and the surface
of the cuvette. Custom-developed software was used to merge the images of the lens,
obtained in two different planes, and to detect both surfaces of the lens, as well as the
cuvette distorted by the lens and preservation medium (see figure 2.10). All images were
corrected from fan distortion[179] and optical distortion (in most cases, the distortions
due to the preservation medium were corrected to extract the geometry of the first surface
of each image)[47]. All surfaces (lens and cuvette) were fitted by Zernike polynomials
(up to 7th order) within a 6-mm pupil. For the purposes of this study, only symmetric
44
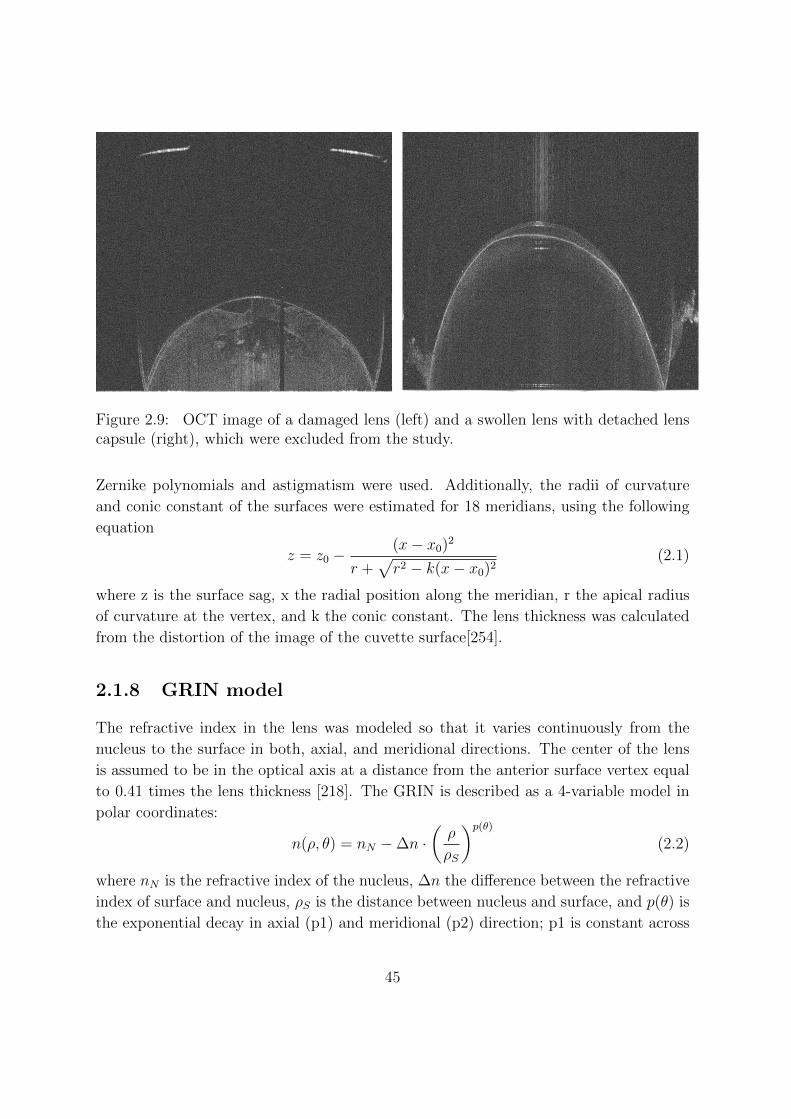
Figure 2.9: OCT image of a damaged lens (left) and a swollen lens with detached lenscapsule (right), which were excluded from the study.
Zernike polynomials and astigmatism were used. Additionally, the radii of curvature
and conic constant of the surfaces were estimated for 18 meridians, using the following
equation
z = z0 −(x− x0)2
r +√r2 − k(x− x0)2
(2.1)
where z is the surface sag, x the radial position along the meridian, r the apical radius
of curvature at the vertex, and k the conic constant. The lens thickness was calculated
from the distortion of the image of the cuvette surface[254].
2.1.8 GRIN model
The refractive index in the lens was modeled so that it varies continuously from the
nucleus to the surface in both, axial, and meridional directions. The center of the lens
is assumed to be in the optical axis at a distance from the anterior surface vertex equal
to 0.41 times the lens thickness [218]. The GRIN is described as a 4-variable model in
polar coordinates:
n(ρ, θ) = nN −∆n ·(ρ
ρS
)p(θ)(2.2)
where nN is the refractive index of the nucleus, ∆n the difference between the refractive
index of surface and nucleus, ρS is the distance between nucleus and surface, and p(θ) is
the exponential decay in axial (p1) and meridional (p2) direction; p1 is constant across
45
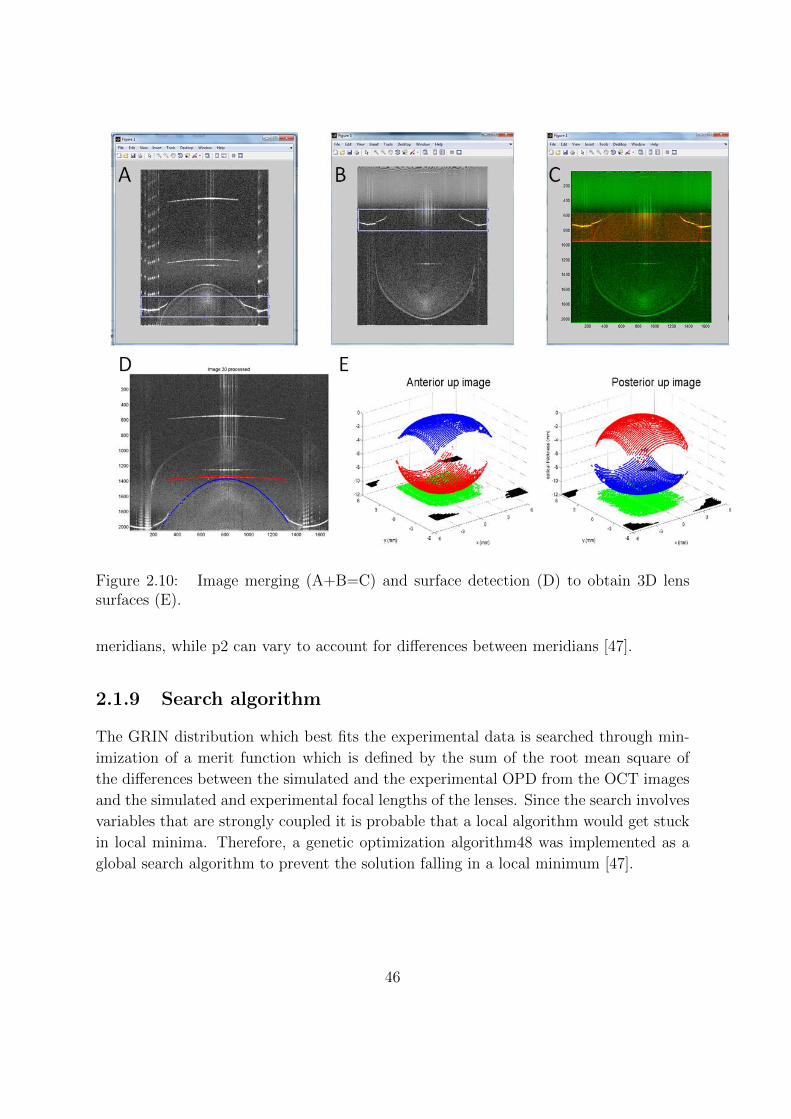
Figure 2.10: Image merging (A+B=C) and surface detection (D) to obtain 3D lenssurfaces (E).
meridians, while p2 can vary to account for differences between meridians [47].
2.1.9 Search algorithm
The GRIN distribution which best fits the experimental data is searched through min-
imization of a merit function which is defined by the sum of the root mean square of
the differences between the simulated and the experimental OPD from the OCT images
and the simulated and experimental focal lengths of the lenses. Since the search involves
variables that are strongly coupled it is probable that a local algorithm would get stuck
in local minima. Therefore, a genetic optimization algorithm48 was implemented as a
global search algorithm to prevent the solution falling in a local minimum [47].
46
2.1.10 Computational Ray Tracing and Zernike fitting
To investigate the relative effect of the lens geometry and GRIN distribution on the
aberrations of the lens, a computational ray tracing analysis was performed at multiple
meridians, based on the experimental lens parameters retrieved for each meridian of the
lens. The custom developed ray tracing algorithm was programmed in MatLab (Math-
Works, Natick MA). The basic components of the algorithm are the implementation of
the Stavroudis formula to trace rays through conical surfaces [241], the Sharma algo-
rithm for ray tracing in the GRIN media [223], and a procedure to calculate the impact
of the ray in the posterior surface of the lens [242]. Aberrations were calculated for a
6 mm pupil diameter by fitting the wave front up to a 7th order Zernike polynomial
expansion using the reconstructed 3D GRIN distribution or the equivalent refractive
index. The equivalent refractive index, defined as the homogeneous index of a lens with
the same external geometry and focal length as the crystalline lens, was calculated.
Astigmatism and spherical aberration coefficient (obtained from the wavefront fitting)
were compared across lenses, assuming a homogeneous equivalent refractive index or the
estimated GRIN. The astigmatism was calculated with the Zernike polynomials using
the power vector defined by Thibos et al. [249].
2.1.11 Power Vector Analysis
Lens GRIN astigmatism
The lens total astigmatism was calculated using the measured lens shape and the recon-
structed GRIN by means of a computational ray tracing analysis[47]. The calculated
wave aberrations were fit by Zernike polynomials and the magnitude of astigmatism C
and angle α were calculated in [250] as:
C = −2√J245 + J2
180 (2.3)
α =1
2tan−1
(J45J180
), (2.4)
where J180 is the power at axis α = 0o = 180o and J45 is the power at axis α = 45o, and
J180 = −2 ·√
6 · Z−22
r2(2.5)
J45 = −2 ·√
6 · Z22
r2(2.6)
47
where Z−22 and Z2
2 are the corresponding astigmatism Zernike terms, and r the pupil
radius (3 mm in this study).
Surface Lens Astigmatism
The lens surface astigmatism CS was calculated as
CS = (n2 − n1) ·(
1
Rx
− 1
Ry
)(2.7)
where Rx is the astigmatic angle and Ry is the axis perpendicular to Rx. n1 and n2 are
the refractive indices of the lens immersion medium and the lens cortex, respectively.
2.1.12 Software
Matlab
Matlab (The MathWorks, Natick, MA) was used for image processing, surface detection,
GRIN reconstruction, computational ray tracing, and data analysis.
Amira
Amira (FEI Visualization Sciences Group, Bordeaux, France and the Zuse Institute
Berlin (ZIB), Germany) is a software platform for 3D and 4D data visualization. For
this thesis, it was used for image processing, image analysis, and visualization of data
obtained with the confocal microscope.
Imagej
Imagej (National Institute of Health) is a Java-based image processing program. For
this thesis is was used for Image processing and image alignment.
Zemax
Zemax (Radiant Zemax) is an optical design program. It is used for design and analysis
of imaging and illumination systems.
48
3Contribution of the GRIN and Shape to the
Crystalline Lens Spherical Aberration and
Astigmatism
This chapter is based on the paper by Birkenfeld et al. ”Contribution of the gradient
refractive index and shape to the crystalline lens spherical aberration and astigmatism ”
(Vision Research, 2013, 86, 27-34). The coauthors of this study were Alberto de Castro,
Sergio Ortiz, Daniel Pascual, and Susana Marcos. The author of this thesis (i) designed
the Laser Ray Tracer (in collaboration with Susana Marcos) (ii) built the Laser Ray
Tracer (in collaboration with Sergio Ortiz and Daniel Pascual), (iii) modified the exper-
imental setup (OCT) (iv) did the sample preparation (v) performed the experiments (in
collaboration with Alberto de Castro) (vi) performed data processing (in collaboration
with Alberto de Castro), (vii) analyzed the results (in collaboration with Alberto de
Castro) (viii) prepared the manuscript (in collaboration with Alberto de Castro and
Susana Marcos) . As a result of this work, we could perform the first systematic ex-
perimental study of the relative contribution of geometry and GRIN to the aberrations
in a mammal lens. It was found that the presence of GRIN shifted the lens’ spherical
aberration towards negative values, and, in addition, produced a decrease in the total
amount of lens astigmatism in most lenses.
49

3.1 Introduction
The optical properties of the crystalline lens are determined by its shape and refractive
index distribution. However, to date, those properties have not been measured together
in the same lens, and therefore their relative contributions to the lens’ optical aberration
are not fully understood. In this chapter, we measured the shape, the optical path dif-
ference, and the focal length of ten in vitro porcine lenses (age around 6 months) using
Optical Coherence Tomography and a custom built laser ray tracer, both described in
chapter2. The 3D Gradient Refractive Index distribution was then reconstructed by
means of the optimization method. The optimization method searched for the param-
eters of a 4-variable GRIN model that best fits the distorted posterior surface of the
lens in 18 different meridians. Spherical aberration and astigmatism of the lenses were
estimated using computational ray tracing, with the reconstructed GRIN lens and an
equivalent homogeneous refractive index. Although there is extensive literature that
studies theoretically [30][235] or experimentally [32][57][73][104][117][142][160][254] the
contribution of surface shape and index of refraction (generally based on an equivalent
homogeneous refractive index) to the lens power, to our knowledge there is no study that
measures directly the contribution of lens shape and structure in the overall aberrations
of the lens. The only systematic experimental analysis, which investigated the role of
the GRIN on spherical aberration we are aware of is on fish lenses. Fish lenses are
known to have very low amounts of spherical aberration, despite being nearly spherical
in shape. Jagger[100] compared the expected spherical aberration of an artificial spheri-
cal lens with homogenous index of refraction with that of the fish lens, and hypothesized
that the presence of a GRIN distribution in the lens balanced the lens surface spherical
aberration. Kroeger et al. [122] demonstrated the relative contribution (and balance)
of the lens surface and GRIN on spherical aberration in African teleost fish lenses. A
more recent study used Optical Coherence Tomography in combination with an iterative
optical path fitting to estimate the GRIN distribution in Zebrafish [258].
3.2 Methods
3.2.1 Lens Specimens and preparation
Ten cadaver porcine eyes (around 6 months of age) were obtained from a local slaughter-
house and transported at a temperature around 4C. Experiments were performed within
three to eight hours after enucleation. Immediately before the measurements, the eye
globes were cut and the crystalline lens was carefully dissected and placed in a cuvette
50
filled with a preservation solution (DMEM/F-12, HEPES, no phenol red, Invitrogen,
GIBCO) [19]. The overall duration of the experiment was about one hour per lens.
Experimental protocols had been approved by the Institutional Review Boards.
3.2.2 Optical Coherence Tomography system
The lenses were imaged in 3D using a custom developed OCT system described in
chapter2. All images were provided with fan distortion correction algorithms that arise
from the scanning architecture of the instrument [177]. The lens axis was aligned with
the OCT scan axis such that a specular reflection was seen from the surfaces of the lens.
Care was taken that the lens did not appear tilted in the image preview, for neither
0 and 90 degrees. One image contains 1668 A-Scans and 70 B-Scans on a 12x12 mm
lateral range. Each set of 3D images consisted of two acquisitions at two different planes
of focus which were merged to produce a complete image of anterior surface, posterior
surface, and the cuvette holding the lens, using customized Matlab programs[47]. The
acquisition time for each OCT image was 4.5s
3.2.3 Laser Ray Tracing
Our custom developed LRT system, described in chapter2, was used to measure the focal
length of the lenses for two different pupil diameters. The beam diameter at the plane
of the lens was 600 µm. A 2-mirror galvanometric scanning system, in combination
with a 400 mm collimating lens was used to scan rings of light of 2 and 4 mm diameter
onto the lens surface. A CMOS camera placed behind the cuvette captured a series
of through-focus images around the focal plane of the system composed by the lens
immersed in preservation media and the cuvette. The step size from image to image
was set to 0.5 mm. The lens was aligned such that the center of the rays captured with
the CMOS camera would not change within the range of movement of the camera (35
mm). The precision of the measurements was estimated to be 0.8 mm. The back focal
length could be expressed in diopters as the inverse of the back focal length multiplied
by the group refractive index of the solution n = 1.345 at 825 nm [34]. To estimate
spherical aberration from the experimental power measurements it was assumed that
the focal length measured for a circle of light with a radius of r=1 mm corresponds
to the paraxial focal length. The 4th order Zernike spherical aberration Z04 was then
obtained using
Z04 =
M r2
12√
5(3.1)
51

where M is the difference in power, experimentally determined between the paraxial (2
mm diameter) and the non paraxial ring (4 mm diameter), and r is the pupil radius, in
our measurements 2 mm[247].
Experimental Protocols
All lenses were imaged in the cuvette immersed in preservation medium, first with the
OCT system and then with the Laser Ray Tracing (LRT) apparatus. OCT 3D imaging
was performed with the posterior surface lens facing the OCT beam (posterior up image).
The lens was then flipped around a predetermined horizontal axis (the same for all lenses)
to image it again, this time with the anterior surface facing the OCT beam (anterior up
image). The procedure is similar to that described in prior publications [34][47]. After
completing the OCT imaging, the lens in the cuvette was aligned in the LRT with the
anterior surface facing up. A through focus series of 10-15 images was collected with the
CMOS camera to estimate the back focal length of the lens.
OCT Image Data Processing
The OCT images were used to obtain the shape of the anterior and posterior lens sur-
faces, the thickness of the lens and the optical path accumulated by the rays passing
through the lens and arriving to the cuvette, which served (along with the focal length
measurements) as input parameters in a GRIN reconstruction algorithm. The image
processing algorithms are described in chapter 2. The data were corrected from fan dis-
tortion [179]. The distortions due to the preservation medium were corrected to extract
the geometry of the first surface of each image. The detected edges of the distorted
lens -i.e. subject to the optical distortion produced by refraction by the preceding lens
surface [177] and GRIN [224]-, the undistorted surfaces and the cuvette were fitted by
Zernike polynomials (up to 7th order) within a 6 mm pupil. However, since the ray
tracing algorithm is defined assuming conic surfaces, only symmetric Zernike polyno-
mials and astigmatism were used to implement the lens surfaces in the algorithm. The
radii of curvature and conic constants were calculated for 18 meridians. Previous studies
using the same instrument estimate an accuracy in radius of curvature estimates of 1%
in glass lenses[177]. Some of the variability is associated to interdependencies between
radius of curvature and conic constant in a conic fitting [203]. Maximum and minimum
radii of curvature and conic constants across meridians are reported. The lens thickness
was calculated using the method proposed by Uhlhorn [254].
52
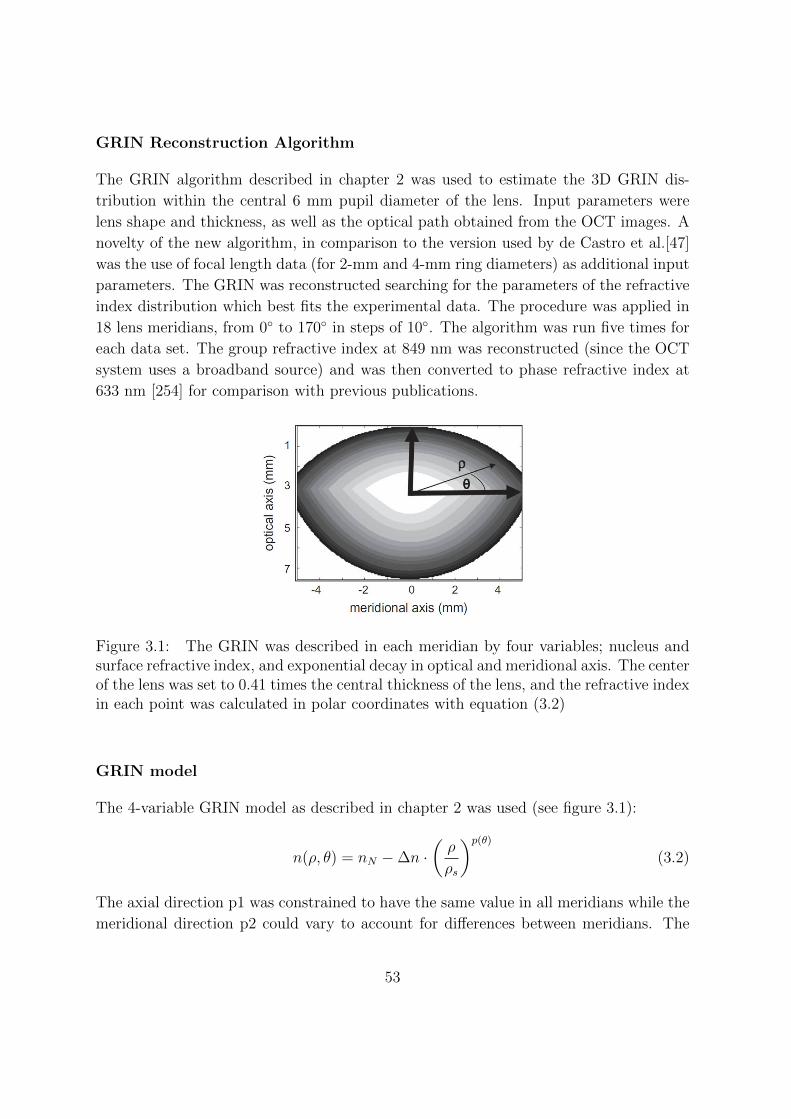
GRIN Reconstruction Algorithm
The GRIN algorithm described in chapter 2 was used to estimate the 3D GRIN dis-
tribution within the central 6 mm pupil diameter of the lens. Input parameters were
lens shape and thickness, as well as the optical path obtained from the OCT images. A
novelty of the new algorithm, in comparison to the version used by de Castro et al.[47]
was the use of focal length data (for 2-mm and 4-mm ring diameters) as additional input
parameters. The GRIN was reconstructed searching for the parameters of the refractive
index distribution which best fits the experimental data. The procedure was applied in
18 lens meridians, from 0◦ to 170◦ in steps of 10◦. The algorithm was run five times for
each data set. The group refractive index at 849 nm was reconstructed (since the OCT
system uses a broadband source) and was then converted to phase refractive index at
633 nm [254] for comparison with previous publications.
Figure 3.1: The GRIN was described in each meridian by four variables; nucleus andsurface refractive index, and exponential decay in optical and meridional axis. The centerof the lens was set to 0.41 times the central thickness of the lens, and the refractive indexin each point was calculated in polar coordinates with equation (3.2)
GRIN model
The 4-variable GRIN model as described in chapter 2 was used (see figure 3.1):
n(ρ, θ) = nN −∆n ·(ρ
ρs
)p(θ)(3.2)
The axial direction p1 was constrained to have the same value in all meridians while the
meridional direction p2 could vary to account for differences between meridians. The
53
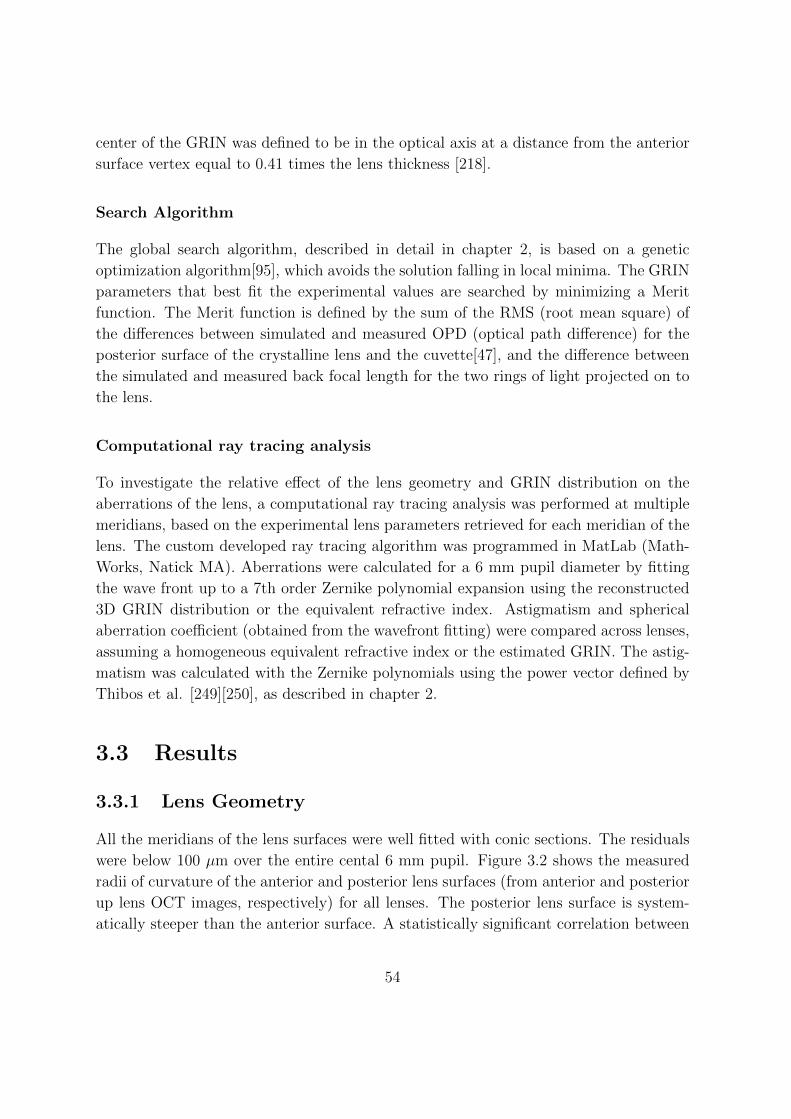
center of the GRIN was defined to be in the optical axis at a distance from the anterior
surface vertex equal to 0.41 times the lens thickness [218].
Search Algorithm
The global search algorithm, described in detail in chapter 2, is based on a genetic
optimization algorithm[95], which avoids the solution falling in local minima. The GRIN
parameters that best fit the experimental values are searched by minimizing a Merit
function. The Merit function is defined by the sum of the RMS (root mean square) of
the differences between simulated and measured OPD (optical path difference) for the
posterior surface of the crystalline lens and the cuvette[47], and the difference between
the simulated and measured back focal length for the two rings of light projected on to
the lens.
Computational ray tracing analysis
To investigate the relative effect of the lens geometry and GRIN distribution on the
aberrations of the lens, a computational ray tracing analysis was performed at multiple
meridians, based on the experimental lens parameters retrieved for each meridian of the
lens. The custom developed ray tracing algorithm was programmed in MatLab (Math-
Works, Natick MA). Aberrations were calculated for a 6 mm pupil diameter by fitting
the wave front up to a 7th order Zernike polynomial expansion using the reconstructed
3D GRIN distribution or the equivalent refractive index. Astigmatism and spherical
aberration coefficient (obtained from the wavefront fitting) were compared across lenses,
assuming a homogeneous equivalent refractive index or the estimated GRIN. The astig-
matism was calculated with the Zernike polynomials using the power vector defined by
Thibos et al. [249][250], as described in chapter 2.
3.3 Results
3.3.1 Lens Geometry
All the meridians of the lens surfaces were well fitted with conic sections. The residuals
were below 100 µm over the entire cental 6 mm pupil. Figure 3.2 shows the measured
radii of curvature of the anterior and posterior lens surfaces (from anterior and posterior
up lens OCT images, respectively) for all lenses. The posterior lens surface is system-
atically steeper than the anterior surface. A statistically significant correlation between
54

anterior and posterior radius of curvature, reported in previous studies [259] was not
found. The astigmatism of anterior and posterior lens surfaces was not aligned, i.e. the
Figure 3.2: Radius of curvature of the 10 studied porcine lenses. Data are maximumand minimum radii of curvature from fits to 18 meridians
axis of astigmatism of posterior surface was rotated with respect to the axis of astig-
matism of the anterior surface. The amount of astigmatic axis rotation differed across
lenses: in five out of ten lenses the rotation was around 45, and in two of them nearly
90. This crossed astigmatism between anterior and posterior lens surfaces is consistent
with previous observations in vitro ([47], porcine lenses). and in vivo ( [176], human
lenses). Figure 3.3 shows the anterior and posterior lens asphericity (conic constant
k = Q + 1) for all lenses (average across meridians). The values were in the positive
range without exception describing the lenses surfaces as prolate ellipsoids (0 < k < 1)
or oblate ellipsoids (k > 1) [58]. Figure 3.4 shows the estimated central thickness of the
lenses. Lens thickness ranged from 7.56 mm to 7.89 mm.
Laser Ray Tracing
The back focal length of the lenses was studied using a laser ray tracing system which
projects circles of lights of different diameters on the lens. The measured back focal
length in the preservation medium was on average 21.7 ± 0.8 mm (ranging from 20.4 to
22.7 mm) and 22.0 ± 0.8 mm (ranging from 20.8 to 22.9 mm) for the 2 mm and 4 mm
diameter rings of light, respectively, corresponding to a power of 61.9 ± 2.4 D and 61.0
± 2.1 D in solution, respectively. In nine out of ten lenses, a shorter back focal length
for a smaller diameter was found. The shorter back focal length for a smaller diameter is
consistent with a negative spherical aberration in the crystalline lenses. Using equation
55
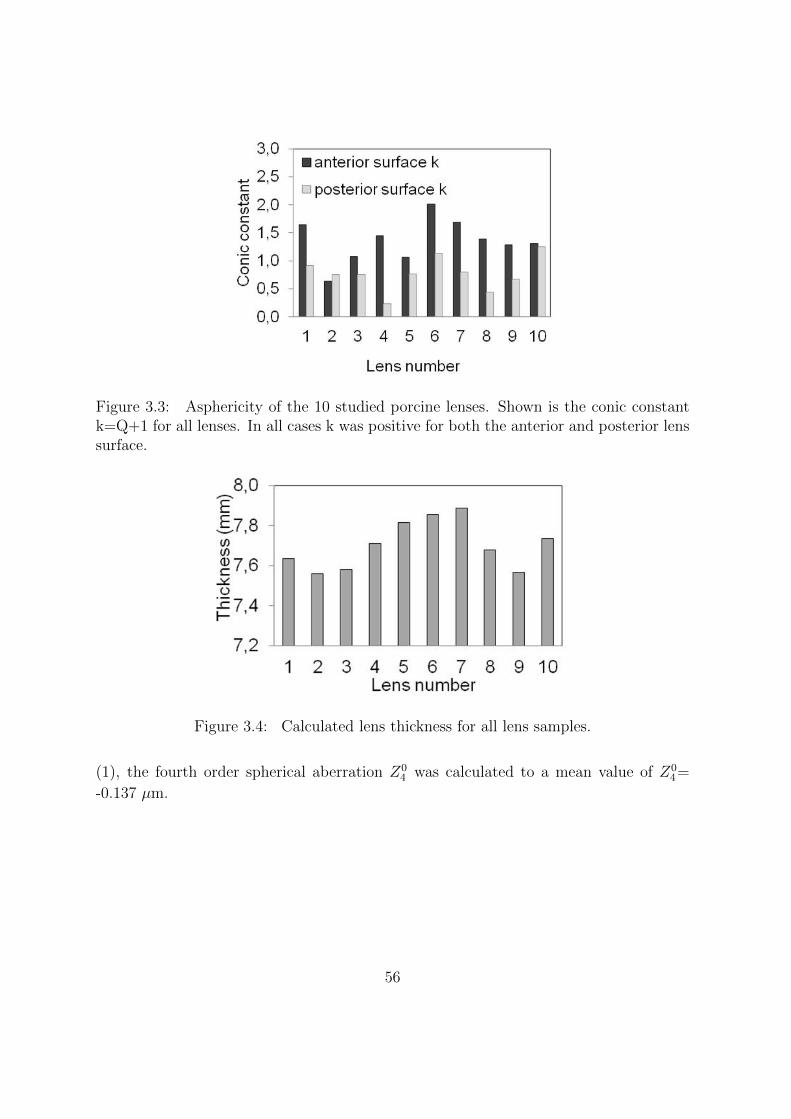
Figure 3.3: Asphericity of the 10 studied porcine lenses. Shown is the conic constantk=Q+1 for all lenses. In all cases k was positive for both the anterior and posterior lenssurface.
Figure 3.4: Calculated lens thickness for all lens samples.
(1), the fourth order spherical aberration Z04 was calculated to a mean value of Z0
4=
-0.137 µm.
56
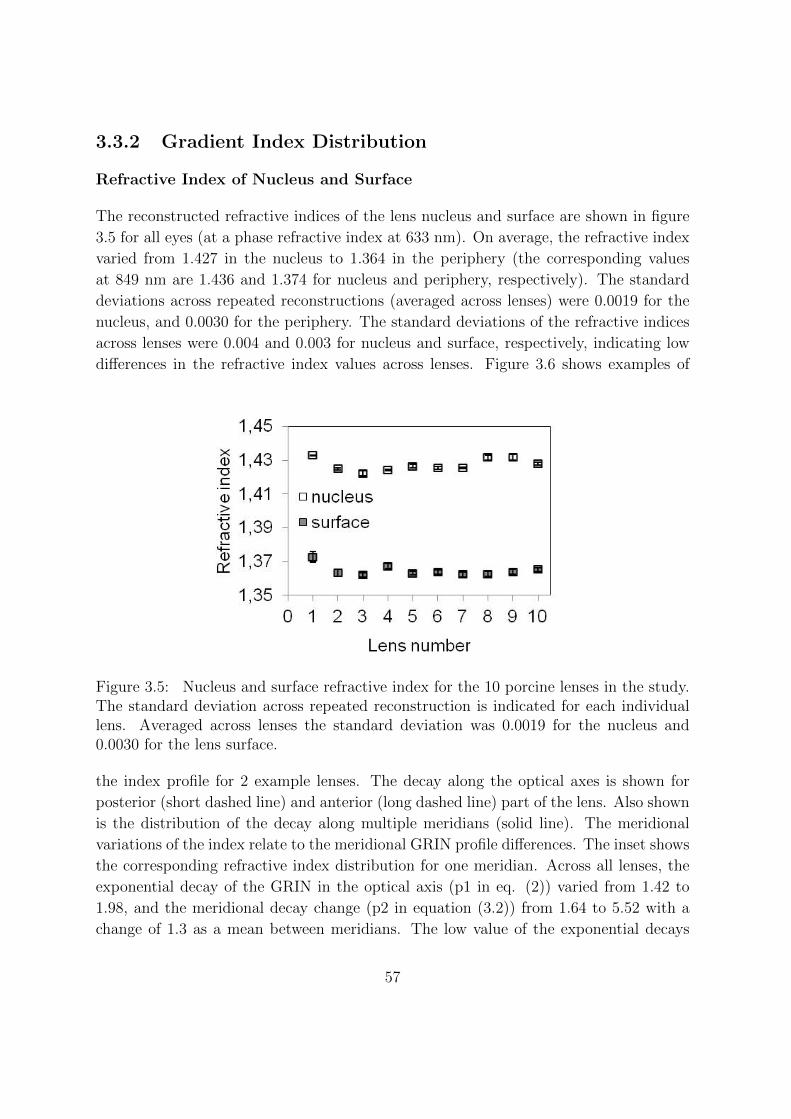
3.3.2 Gradient Index Distribution
Refractive Index of Nucleus and Surface
The reconstructed refractive indices of the lens nucleus and surface are shown in figure
3.5 for all eyes (at a phase refractive index at 633 nm). On average, the refractive index
varied from 1.427 in the nucleus to 1.364 in the periphery (the corresponding values
at 849 nm are 1.436 and 1.374 for nucleus and periphery, respectively). The standard
deviations across repeated reconstructions (averaged across lenses) were 0.0019 for the
nucleus, and 0.0030 for the periphery. The standard deviations of the refractive indices
across lenses were 0.004 and 0.003 for nucleus and surface, respectively, indicating low
differences in the refractive index values across lenses. Figure 3.6 shows examples of
Figure 3.5: Nucleus and surface refractive index for the 10 porcine lenses in the study.The standard deviation across repeated reconstruction is indicated for each individuallens. Averaged across lenses the standard deviation was 0.0019 for the nucleus and0.0030 for the lens surface.
the index profile for 2 example lenses. The decay along the optical axes is shown for
posterior (short dashed line) and anterior (long dashed line) part of the lens. Also shown
is the distribution of the decay along multiple meridians (solid line). The meridional
variations of the index relate to the meridional GRIN profile differences. The inset shows
the corresponding refractive index distribution for one meridian. Across all lenses, the
exponential decay of the GRIN in the optical axis (p1 in eq. (2)) varied from 1.42 to
1.98, and the meridional decay change (p2 in equation (3.2)) from 1.64 to 5.52 with a
change of 1.3 as a mean between meridians. The low value of the exponential decays
57

means that there is no plateau built up along the axis, this is, that the gradient refractive
index is well distributed across all lenses.
Figure 3.6: Refractive index profile from nucleus to surface along the optical axis andalong the meridional direction. Insets show the corresponding reconstructed values ofnucleus and surface refractive indices(nN and nS) and the exponential decay factor p1and p2 from equation (3.2). On the upper right side, the GRIN distribution map isshown for a single meridian.
Equivalent refractive index
The mean equivalent refractive index found across lenses was 1.449 0.003. The standard
deviation of the results of the five repetitions of the search algorithm was below the
standard deviation across all lenses. Spherical Aberration Figure 3.7 shows the 4th order
spherical aberration for all lenses (6 mm pupil diameter), calculated from the measured
lens shape and both the reconstructed GRIN distribution and the equivalent refractive
index. Results are shown for both the corresponding equivalent refractive index and
the measured GRIN distribution. Spherical aberration was consistently positive with
the homogeneous index (1.17 ± 0.21 µm) and shifted towards negative values in the
presence of GRIN (-0.71 ± 0.67 µm). GRIN shifted spherical aberration between 1.12
µm and 2.7 µm. A negative spherical aberration was found in 8 out of the 10 lenses.
Astigmatism
Figure 3.8 shows the amount of astigmatism in the lens for an equivalent refractive
index lens and the corresponding GRIN lens. Sources of astigmatism in the lens are the
58
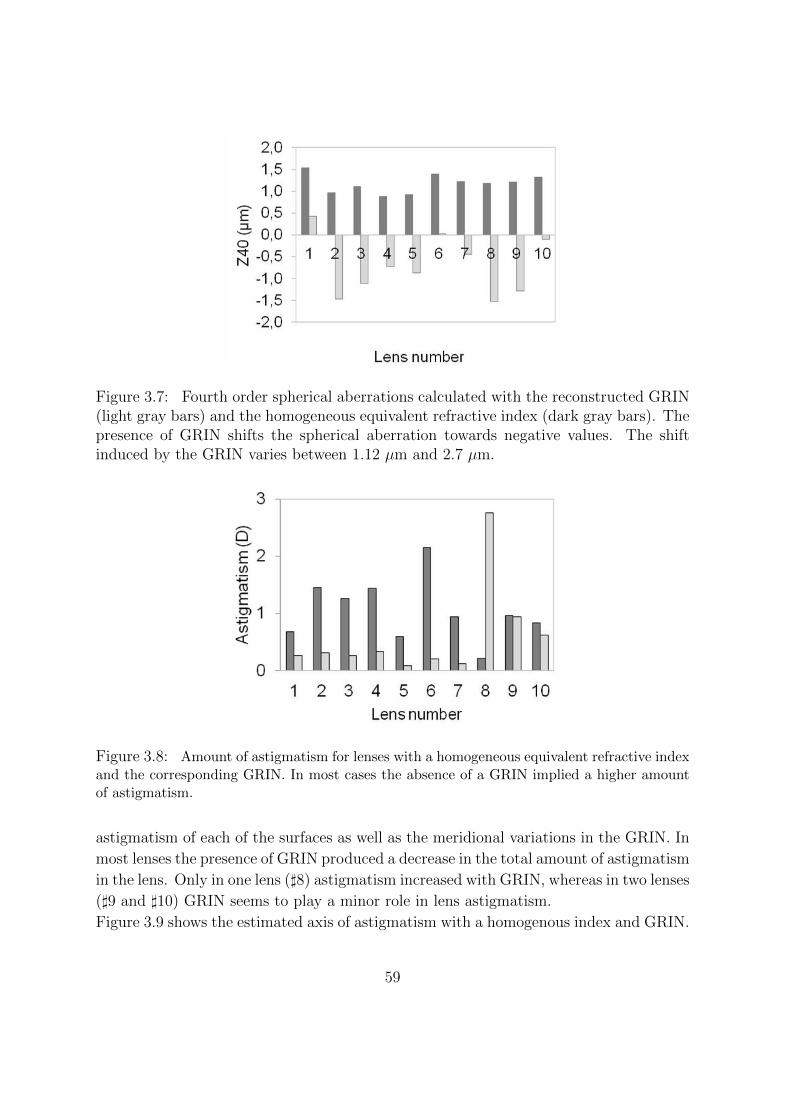
Figure 3.7: Fourth order spherical aberrations calculated with the reconstructed GRIN(light gray bars) and the homogeneous equivalent refractive index (dark gray bars). Thepresence of GRIN shifts the spherical aberration towards negative values. The shiftinduced by the GRIN varies between 1.12 µm and 2.7 µm.
Figure 3.8: Amount of astigmatism for lenses with a homogeneous equivalent refractive indexand the corresponding GRIN. In most cases the absence of a GRIN implied a higher amountof astigmatism.
astigmatism of each of the surfaces as well as the meridional variations in the GRIN. In
most lenses the presence of GRIN produced a decrease in the total amount of astigmatism
in the lens. Only in one lens (]8) astigmatism increased with GRIN, whereas in two lenses
(]9 and ]10) GRIN seems to play a minor role in lens astigmatism.
Figure 3.9 shows the estimated axis of astigmatism with a homogenous index and GRIN.
59
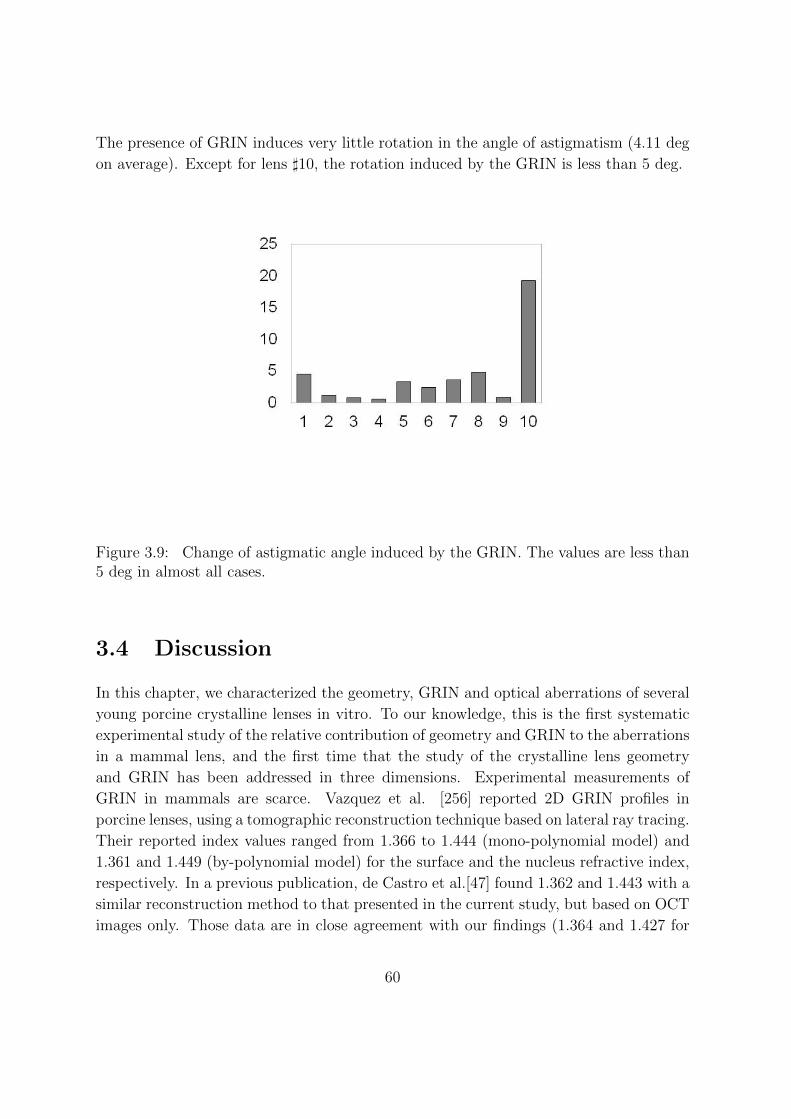
The presence of GRIN induces very little rotation in the angle of astigmatism (4.11 deg
on average). Except for lens ]10, the rotation induced by the GRIN is less than 5 deg.
Figure 3.9: Change of astigmatic angle induced by the GRIN. The values are less than5 deg in almost all cases.
3.4 Discussion
In this chapter, we characterized the geometry, GRIN and optical aberrations of several
young porcine crystalline lenses in vitro. To our knowledge, this is the first systematic
experimental study of the relative contribution of geometry and GRIN to the aberrations
in a mammal lens, and the first time that the study of the crystalline lens geometry
and GRIN has been addressed in three dimensions. Experimental measurements of
GRIN in mammals are scarce. Vazquez et al. [256] reported 2D GRIN profiles in
porcine lenses, using a tomographic reconstruction technique based on lateral ray tracing.
Their reported index values ranged from 1.366 to 1.444 (mono-polynomial model) and
1.361 and 1.449 (by-polynomial model) for the surface and the nucleus refractive index,
respectively. In a previous publication, de Castro et al.[47] found 1.362 and 1.443 with a
similar reconstruction method to that presented in the current study, but based on OCT
images only. Those data are in close agreement with our findings (1.364 and 1.427 for
60
surface and nucleus indices) using both OCT and focal length as input measurements.
Vilupuru et al. studied the biometrical and optical properties of the isolated pig lenses
using a scanner laser apparatus [259]. The lens radii of curvature values in our current
study (6.5-7.5 mm for the anterior lens and 4.5-5.3 mm for the posterior lens) fall within
the ranges reported by Vilupuru et al. (5.5-7.5 mm and 5-7 mm, respectively). Unlike
in their study, no significant correlations between the dimensions of the anterior and
posterior lens were found, most likely because of the limited age range of the subjects
in this study and, therefore, more similar lens geometry across the sample (all eyes were
around 6 months of age in our study, compared to 3-8 years in the previous study).
To our knowledge, asphericities in the porcine lens have never been reported. Inter-
estingly, unlike the primate lens, which tends to show negative asphericity in the lens
surfaces in vivo and in vitro [32][57], we found positive and negative asphericities in
the anterior and posterior surfaces. And unlike the great intersubject variability in lens
asphericities found in vivo [57], we found relatively low intersubject variability in the
asphericity measured in this group of pigs. The focal length measured in this study,
ranging from 20.4 to 22.7 mm and from 20.8 to 22.9 mm for the for the 2 mm and 4 mm
diameter rings of light, respectively), seemed in general lower than the ones by Vilupuru
et al. with laser scan measurements who reported a wide range of values (around 23-34
mm) [259]. Contrarily, a study by Jones et al. [105] measured the focal length of six
different porcine lenses (age unknown) with both, optical methods and MRI measure-
ments, and reported in average a shorter focal length (19.0 1.2 mm for ray tracing
and 19.6 0.77 using the GRIN estimated with MRI) than the one in the present study.
The differences may arise from the mentioned differences in age. The results from the
ray tracing measurements showed negative spherical aberration in most of the lenses.
As expected, since these data were used as input values in the GRIN reconstruction,
the ray tracing estimates of spherical aberration based on the lens shape and GRIN
are consistent with those negative values. The calculated spherical aberration using the
reconstructed GRIN was -0.71 µm (for a 6 mm pupil diameter). The lower value found
from laser ray tracing (-0.137 µm) is consistent with the smaller sampled lens area in the
experimental measurements (4 mm diameter). The calculated value based on ray trac-
ing computations is similar to the spherical aberration reported, using laser ray tracing
[213] on a single porcine lens (around -1 m for a 6-mm pupil diameter) and the results
using a point-diffraction interferometer [2] on 12 porcine lenses (around -1 m for a 6
mm pupil diameter). Also, most porcine lenses (16 out of 20) studied by Vilupuru et al.
showed negative spherical aberration but the data showed a high variability [259]. The
reported mean spherical was equivalent to a much higher Zernike spherical aberration
value (-2.5 ± 3.35 m) than our results. An earlier study, in which beams from a He
Ne laser of varying separations were directed through crystalline lenses of a number of
61
vertebrates, found pig lenses to be almost free of aberration [226]. We have found that
the GRIN appears well distributed within the porcine lenses of the study (low exponen-
tial decay values in the GRIN distribution), more similar to the young human lens than
to the plateau distribution of the old human lens[48, 104]. Our results show that the
GRIN distribution plays an important role in the negative spherical aberration of the
crystalline lens in pig. The shift of spherical aberration towards negative values with the
GRIN in pig lenses had been suggested by [255] and was also apparent in the experimen-
tal study by Wong et al. [269] on polymer refilled pig lenses. Wong et al. reported that
the spherical aberration of a lens refilled with a homogeneous refractive index gel was
positive, while it was negative before refilling. This compensation of the surface positive
spherical aberration by the GRIN is well known in spherical and nearly spherical lenses
such as in fish [100][122] where the lens spherical aberration is close to zero. In fish,
potential corneal aberrations are irrelevant due to the water immersion. In humans, the
negative spherical aberration of the crystalline lens serves to compensate the positive
spherical aberration of the cornea [9][23]. This was also reported in primates [213], and
may be also the case in pigs. Similarly to spherical aberration, compensatory effects
of corneal astigmatism by lenticular astigmatism have been previously reported [9][110].
Population studies conclude that the crystalline lens compensates about 0.5 D of corneal
astigmatism in human eyes[209]. As for spherical aberration, the balance of astigmatism
tends to be lost with age, by a prevalent shift of corneal astigmatism from with-the rule
to against the rule with age[221]. While the internal astigmatism is generally evaluated
indirectly from corneal keratometry or corneal topography and ocular refractions, the
sources of lenticular astigmatism have generally not been investigated. By measuring
the lens shapes and GRIN we have been able to analyze the contribution of the astig-
matism of the anterior and posterior lens surfaces and the GRIN distribution to the
astigmatism of the porcine lens. Interestingly, the magnitude of the astigmatism was
lower in the lens with the reconstructed GRIN than in the lens with the homogeneous
index in 8 out of 10 lenses, although the presence of GRIN generally did not entailed a
relevant change in astigmatism axis. In summary, in this chapter we have investigated
the contribution of the gradient refractive index and shape to the crystalline lens spher-
ical aberration and astigmatism for the first time in a mammal lens. Understanding the
sources of these aberrations in the human lens is important to gain further insights on
the image forming properties of the lens, and is of particular interest in the development
of intraocular lenses. Aspheric and toric designs aim at mimicking the compensatory
role of the corneal aberrations by the young lens. Better designs can be envisioned by a
gaining deeper knowledge of the strategies followed in natural lenses, including different
animal species.
62
4Influence of shape and GRIN in the
Accommodative Changes of Spherical
Aberration in Non-human Primate
Crystalline Lenses
This chapter is based on the paper by de Castro et al. ”Influence of shape and Gradient
Refractive Index in the Accommodative Changes of Spherical Aberration in Non-human
Primate Crystalline Lenses” (Invest Ophthalmol Vis Sci. 2013 Sep 11;54(9):6197-207).
The author of this thesis was first coauthor. Other coauthor included Bianca Maceo,
Fabrice Manns, Esdras Arrieta, Jean-Marie Parel, and Susana Marcos. The author of
this thesis (i) modified the experimental setup, (ii) performed the experiments (in collab-
oration with Bianca Maceo and Esdras Arrieta), (iii) modified existing Matlab code (in
collaboration with Alberto de Castro), (iv) performed data processing (in collaboration
with Bianca Maceo and Alberto de Castro), and (v) reviewed the manuscript. This work
allowed us to investigate lens shape and GRIN of in vitro money lenses under simulated
accommodation. As a result it was concluded that the reconstructed GRIN lens has
more negative spherical aberration and a larger shift toward more negative values with
accommodation.
63
4.1 Introduction
In the last chapter we measured the shape, the optical path difference, and the focal
length of ten porcine lenses using 3D Optical Coherence Tomography and a custom built
laser ray tracer. With this data we could reconstruct the 3D Gradient Refractive Index
distribution (GRIN) and use computational ray tracing to estimate spherical aberration
and astigmatism of the GRIN lenses and lenses with an equivalent refractive index. All
lenses were deattached from any zonular tension, therefore, they were in their most
”accommodated state”. Since porcine lenses only accommodate at a very young age,
this term should be understood as a state ”without any zonular tension”.
In this chapter, we are using in vitro cynomolgus monkey crystalline lenses (which
naturally accommodate in vivo), and mimic accommodation experimentally using a
computer controlled motorized stretcher.
We present the experimental measurements of the lens geometry and of the recon-
structed GRIN profiles as a function of accommodation. The contribution to the spher-
ical aberration and its change with accommodation is calculated by means of computa-
tional ray tracing through a lens model, mentioned in the previous chapter.
The aberrations of the eye are known to change with accommodation[141][10][87][42][68],
and these changes are related to modifications of the shape and internal structure of the
crystalline lens. Several studies have reported the shape of the surfaces and the op-
tics of the accommodating crystalline lens[35][116][58]. However, although of critical
importance to understand the optical changes of the lens with accommodation, the rel-
ative contribution of the crystalline lens shape and GRIN to the change in the optical
properties that the lens undergoes with accommodation is not known.
In addition, the redistribution of the GRIN in the accommodating lens has remained
relatively unexplored. Garner and Smith[70] used Purkinje-based phakometry data, in
combination with a one-variable bi-elliptical GRIN model to predict the change of the
lens focal length with accommodation. A more recent study attempted the use of MRI
in vivo[107] to study the changes in axial and equatorial GRIN profile modeled by power
functions. Recent studies have investigated the lens power change with accommodation,
and the role of the GRIN in cynomolgus monkeys and hamadryas baboons, assuming a
value for the outer cortex refractive index [33][142]. The relative contribution of GRIN to
lens power appears to remain constant with accommodation[33][142][70]. This suggests
that a homogenous index material in lens refilling procedure would be equally efficient
in producing a refractive power change (assuming identical lens shape changes) than the
natural lens GRIN material.
To contribute to a deeper understanding of the role and relative importance of the
64

GRIN on the optics of the crystalline lens, this study served to experimentally explore
the GRIN redistribution with accommodation in non-human primate lenses and studies
its influence in the spherical aberration of the eye.
4.2 Methods
4.2.1 Donor Tissue
We studied 15 young cynomolgus lenses (Macaca fascicularis) with ages between 3.0 and
7.3 years old (average 5.7 ± 1.1 years). All experiments adhered to the Association for
Research in Vision and Ophthalmology Statement for the Use of Animals in Ophthalmic
and Visual Research. The eyes were obtained from the Division of Veterinary Resources
at the University of Miami as part of a tissue-sharing protocol and were used in accor-
dance with Institutional Animal Care and Use Guidelines. The eyes were enucleated
immediately after euthanasia, wrapped in gauze, and placed in a closed container. No
animals were euthanized for the sole purpose of this study. Upon arrival at the labora-
tory, all eyes were either directly prepared for stretching experiments or refrigerated at
4 ◦C before testing[168]. The time between euthanasia and use was 11 ± 14 (range 1,
48) hours in this study.
4.2.2 Tissue Preparation
The tissue preparation protocol has been described in chapter 2 and in previous literature[147][62].
In summary, the sclera was bonded on the eight segments of the stretching device using
cyanoacrylate. The segments fit 1 mm posterior to the limbus to the equator of the eye.
The posterior calotte of the eye was dissected and posterior vitreous was carefully re-
moved to leave the anterior vitreous and hyaloid membrane and ciliary body untouched.
The tissue section was then transferred on a Petri dish placed on a retro-illuminated
station positioned under the operation microscope, the cornea was dissected at the level
of the limbus, meridional incisions were made in the sclera between the mobile segment
to produce eight independent segments and the iris was removed. The tissue section was
then transferred to Ex Vivo Accommodation Simulator II (EVAS II)[62]. During the
dissection and the EVAS II testing experiment, the tissue was immersed in a chamber
filled with Dulbecco’s Modified Eagle Medium (DMEM)[19].
65
4.2.3 Stretching
The EVAS II reproduces dis-accommodation by simultaneous radial stretching of the
eight scleral segments up to 2.5 mm radially. For this study, steps of 0.25 mm, result-
ing in 11 accommodative steps, were used except for two of the lenses where only 6
accommodative steps were measured.
4.2.4 OCT Imaging
Cross-sectional images of the crystalline lens were obtained with a custom designed
time-domain OCT system that uses a superluminescent diode with a nearly Gaussian
spectrum, a specified central wavelength of 825 nm and a bandwidth of 25 nm. The
system has an optical scan depth of 10 mm and an axial resolution of 12 m in air (16
m in the preservation medium). Images were recorded with 5000 points/A-line and, 500
A-lines/B-scan, and a lateral scan length of 10 mm[254].
4.2.5 Lens Back Vertex Power Measurements
The lens back vertex power was measured, for each stretching step, using a method
described in chapter 2 and previous literature[142][32]. Essentially, the OCT light source
was used to project a collimated circular ring of 1.5-mm radius on to the center of the
lens. Below the cuvette holding the lens and preservation medium, a CCD camera
mounted on a vertical translation stage was used to locate the focus. The mean position
resulting from three stretching runs was used in a paraxial optical model to calculate
the back vertex power of the lens in diopters (D). The accuracy of the measurements
was determined to be ±0.5 D by calibration tests using a set of glass lenses.
4.2.6 Experimental Protocols
To obtain lens shape and avoid the optical distortions, testing was first performed with
the lens anterior surface facing the OCT (anterior up, figure 4.1A) and then the segment
was inverted with the posterior segment facing the OCT (posterior up, figure 4.1B). Fol-
lowing the stretching runs to image the lens, more stretching experiments were performed
to measure the back vertex power of the lenses both anterior-up and posterior-up. In all
the measurements, the lenses were centered using the OCT system such that the spec-
ular reflection produced by the lens apex[254] was seen from the anterior or posterior
surfaces of the lens. By placing the segments on EVAS II in the same orientation for
66
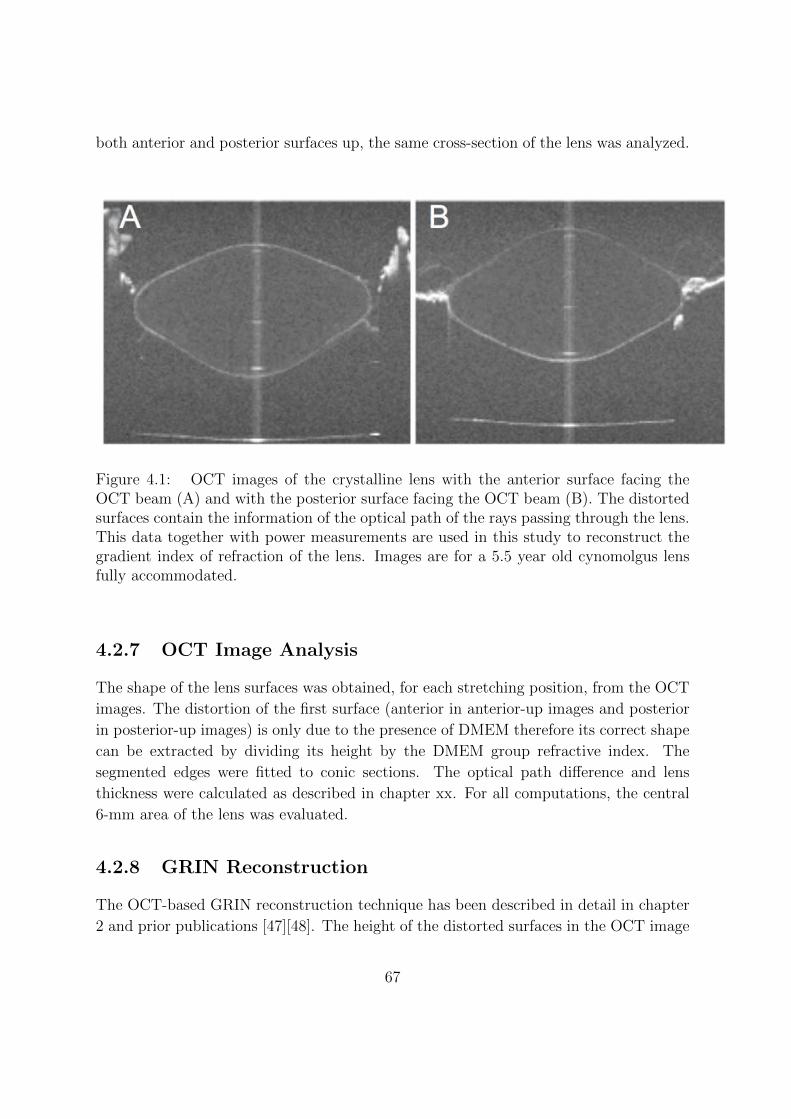
both anterior and posterior surfaces up, the same cross-section of the lens was analyzed.
Figure 4.1: OCT images of the crystalline lens with the anterior surface facing theOCT beam (A) and with the posterior surface facing the OCT beam (B). The distortedsurfaces contain the information of the optical path of the rays passing through the lens.This data together with power measurements are used in this study to reconstruct thegradient index of refraction of the lens. Images are for a 5.5 year old cynomolgus lensfully accommodated.
4.2.7 OCT Image Analysis
The shape of the lens surfaces was obtained, for each stretching position, from the OCT
images. The distortion of the first surface (anterior in anterior-up images and posterior
in posterior-up images) is only due to the presence of DMEM therefore its correct shape
can be extracted by dividing its height by the DMEM group refractive index. The
segmented edges were fitted to conic sections. The optical path difference and lens
thickness were calculated as described in chapter xx. For all computations, the central
6-mm area of the lens was evaluated.
4.2.8 GRIN Reconstruction
The OCT-based GRIN reconstruction technique has been described in detail in chapter
2 and prior publications [47][48]. The height of the distorted surfaces in the OCT image
67
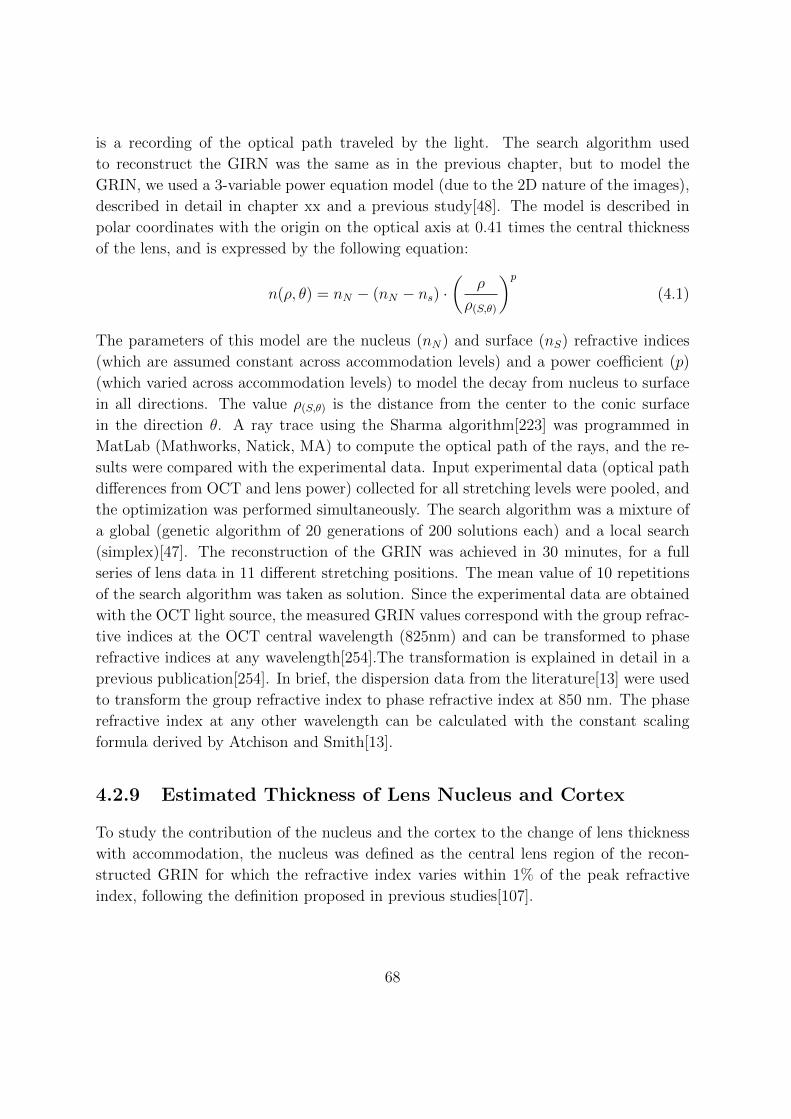
is a recording of the optical path traveled by the light. The search algorithm used
to reconstruct the GIRN was the same as in the previous chapter, but to model the
GRIN, we used a 3-variable power equation model (due to the 2D nature of the images),
described in detail in chapter xx and a previous study[48]. The model is described in
polar coordinates with the origin on the optical axis at 0.41 times the central thickness
of the lens, and is expressed by the following equation:
n(ρ, θ) = nN − (nN − ns) ·(
ρ
ρ(S,θ)
)p(4.1)
The parameters of this model are the nucleus (nN) and surface (nS) refractive indices
(which are assumed constant across accommodation levels) and a power coefficient (p)
(which varied across accommodation levels) to model the decay from nucleus to surface
in all directions. The value ρ(S,θ) is the distance from the center to the conic surface
in the direction θ. A ray trace using the Sharma algorithm[223] was programmed in
MatLab (Mathworks, Natick, MA) to compute the optical path of the rays, and the re-
sults were compared with the experimental data. Input experimental data (optical path
differences from OCT and lens power) collected for all stretching levels were pooled, and
the optimization was performed simultaneously. The search algorithm was a mixture of
a global (genetic algorithm of 20 generations of 200 solutions each) and a local search
(simplex)[47]. The reconstruction of the GRIN was achieved in 30 minutes, for a full
series of lens data in 11 different stretching positions. The mean value of 10 repetitions
of the search algorithm was taken as solution. Since the experimental data are obtained
with the OCT light source, the measured GRIN values correspond with the group refrac-
tive indices at the OCT central wavelength (825nm) and can be transformed to phase
refractive indices at any wavelength[254].The transformation is explained in detail in a
previous publication[254]. In brief, the dispersion data from the literature[13] were used
to transform the group refractive index to phase refractive index at 850 nm. The phase
refractive index at any other wavelength can be calculated with the constant scaling
formula derived by Atchison and Smith[13].
4.2.9 Estimated Thickness of Lens Nucleus and Cortex
To study the contribution of the nucleus and the cortex to the change of lens thickness
with accommodation, the nucleus was defined as the central lens region of the recon-
structed GRIN for which the refractive index varies within 1% of the peak refractive
index, following the definition proposed in previous studies[107].
68
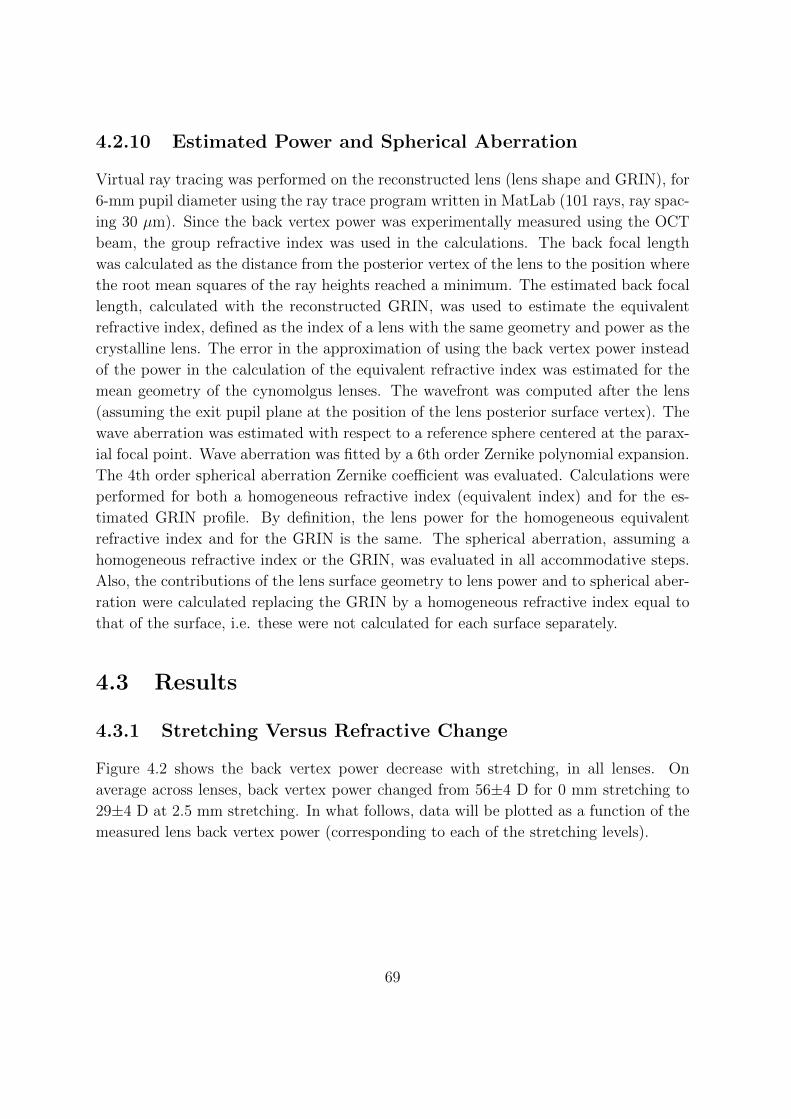
4.2.10 Estimated Power and Spherical Aberration
Virtual ray tracing was performed on the reconstructed lens (lens shape and GRIN), for
6-mm pupil diameter using the ray trace program written in MatLab (101 rays, ray spac-
ing 30 µm). Since the back vertex power was experimentally measured using the OCT
beam, the group refractive index was used in the calculations. The back focal length
was calculated as the distance from the posterior vertex of the lens to the position where
the root mean squares of the ray heights reached a minimum. The estimated back focal
length, calculated with the reconstructed GRIN, was used to estimate the equivalent
refractive index, defined as the index of a lens with the same geometry and power as the
crystalline lens. The error in the approximation of using the back vertex power instead
of the power in the calculation of the equivalent refractive index was estimated for the
mean geometry of the cynomolgus lenses. The wavefront was computed after the lens
(assuming the exit pupil plane at the position of the lens posterior surface vertex). The
wave aberration was estimated with respect to a reference sphere centered at the parax-
ial focal point. Wave aberration was fitted by a 6th order Zernike polynomial expansion.
The 4th order spherical aberration Zernike coefficient was evaluated. Calculations were
performed for both a homogeneous refractive index (equivalent index) and for the es-
timated GRIN profile. By definition, the lens power for the homogeneous equivalent
refractive index and for the GRIN is the same. The spherical aberration, assuming a
homogeneous refractive index or the GRIN, was evaluated in all accommodative steps.
Also, the contributions of the lens surface geometry to lens power and to spherical aber-
ration were calculated replacing the GRIN by a homogeneous refractive index equal to
that of the surface, i.e. these were not calculated for each surface separately.
4.3 Results
4.3.1 Stretching Versus Refractive Change
Figure 4.2 shows the back vertex power decrease with stretching, in all lenses. On
average across lenses, back vertex power changed from 56±4 D for 0 mm stretching to
29±4 D at 2.5 mm stretching. In what follows, data will be plotted as a function of the
measured lens back vertex power (corresponding to each of the stretching levels).
69
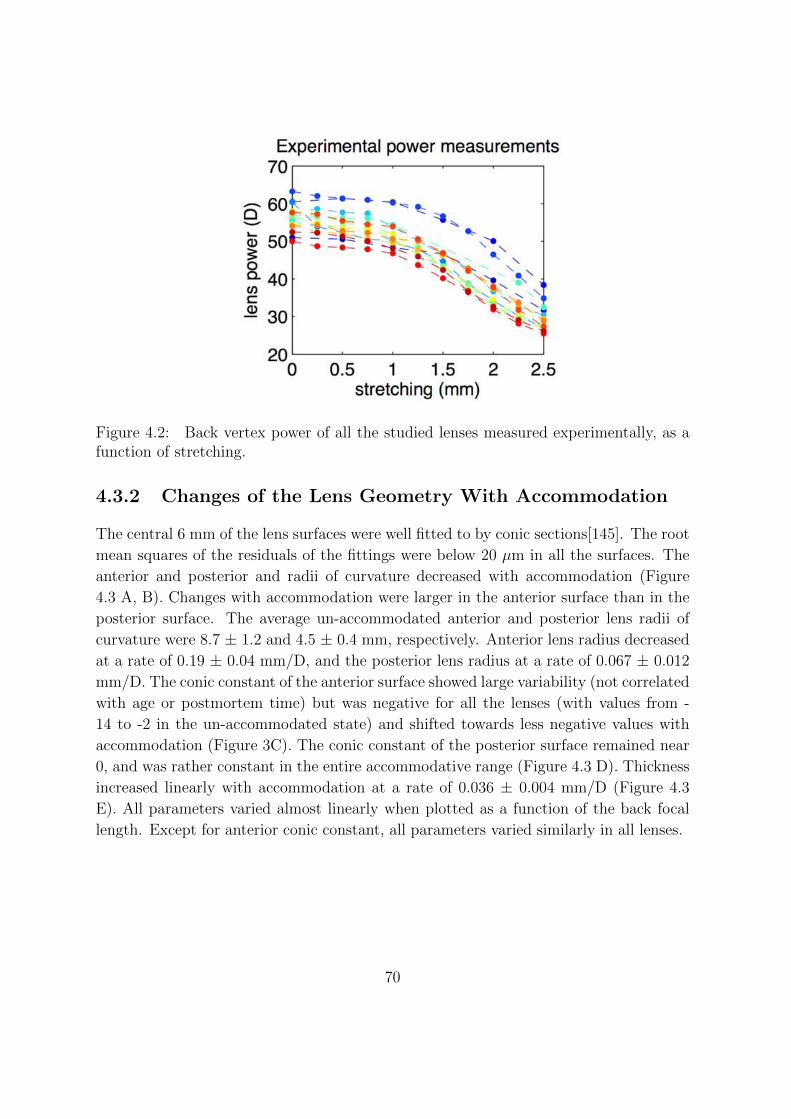
Figure 4.2: Back vertex power of all the studied lenses measured experimentally, as afunction of stretching.
4.3.2 Changes of the Lens Geometry With Accommodation
The central 6 mm of the lens surfaces were well fitted to by conic sections[145]. The root
mean squares of the residuals of the fittings were below 20 µm in all the surfaces. The
anterior and posterior and radii of curvature decreased with accommodation (Figure
4.3 A, B). Changes with accommodation were larger in the anterior surface than in the
posterior surface. The average un-accommodated anterior and posterior lens radii of
curvature were 8.7 ± 1.2 and 4.5 ± 0.4 mm, respectively. Anterior lens radius decreased
at a rate of 0.19 ± 0.04 mm/D, and the posterior lens radius at a rate of 0.067 ± 0.012
mm/D. The conic constant of the anterior surface showed large variability (not correlated
with age or postmortem time) but was negative for all the lenses (with values from -
14 to -2 in the un-accommodated state) and shifted towards less negative values with
accommodation (Figure 3C). The conic constant of the posterior surface remained near
0, and was rather constant in the entire accommodative range (Figure 4.3 D). Thickness
increased linearly with accommodation at a rate of 0.036 ± 0.004 mm/D (Figure 4.3
E). All parameters varied almost linearly when plotted as a function of the back focal
length. Except for anterior conic constant, all parameters varied similarly in all lenses.
70
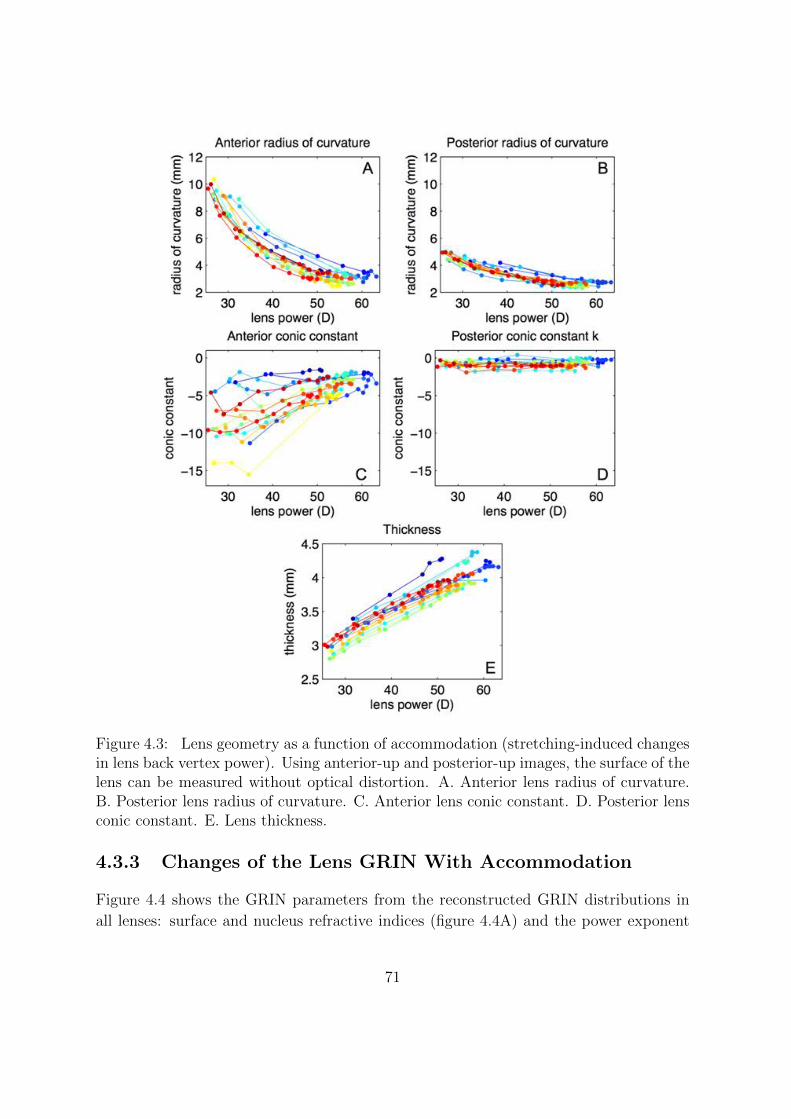
Figure 4.3: Lens geometry as a function of accommodation (stretching-induced changesin lens back vertex power). Using anterior-up and posterior-up images, the surface of thelens can be measured without optical distortion. A. Anterior lens radius of curvature.B. Posterior lens radius of curvature. C. Anterior lens conic constant. D. Posterior lensconic constant. E. Lens thickness.
4.3.3 Changes of the Lens GRIN With Accommodation
Figure 4.4 shows the GRIN parameters from the reconstructed GRIN distributions in
all lenses: surface and nucleus refractive indices (figure 4.4A) and the power exponent
71
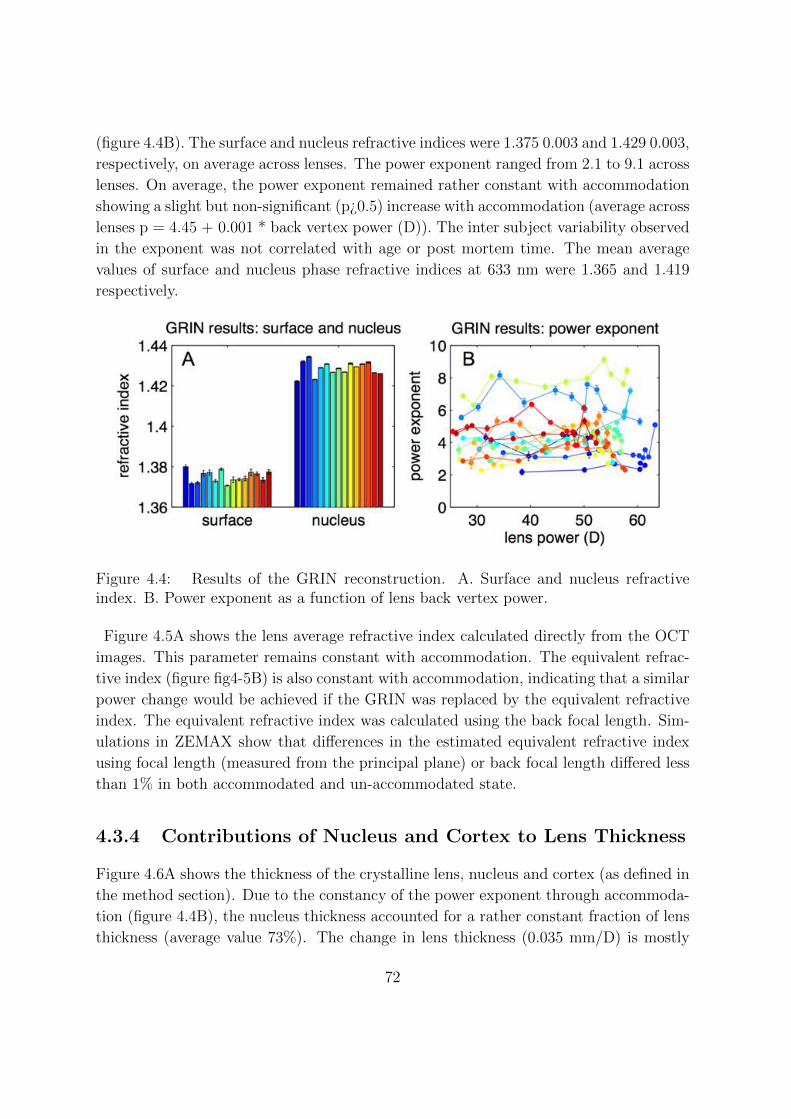
(figure 4.4B). The surface and nucleus refractive indices were 1.375 0.003 and 1.429 0.003,
respectively, on average across lenses. The power exponent ranged from 2.1 to 9.1 across
lenses. On average, the power exponent remained rather constant with accommodation
showing a slight but non-significant (p¿0.5) increase with accommodation (average across
lenses p = 4.45 + 0.001 * back vertex power (D)). The inter subject variability observed
in the exponent was not correlated with age or post mortem time. The mean average
values of surface and nucleus phase refractive indices at 633 nm were 1.365 and 1.419
respectively.
Figure 4.4: Results of the GRIN reconstruction. A. Surface and nucleus refractiveindex. B. Power exponent as a function of lens back vertex power.
Figure 4.5A shows the lens average refractive index calculated directly from the OCT
images. This parameter remains constant with accommodation. The equivalent refrac-
tive index (figure fig4-5B) is also constant with accommodation, indicating that a similar
power change would be achieved if the GRIN was replaced by the equivalent refractive
index. The equivalent refractive index was calculated using the back focal length. Sim-
ulations in ZEMAX show that differences in the estimated equivalent refractive index
using focal length (measured from the principal plane) or back focal length differed less
than 1% in both accommodated and un-accommodated state.
4.3.4 Contributions of Nucleus and Cortex to Lens Thickness
Figure 4.6A shows the thickness of the crystalline lens, nucleus and cortex (as defined in
the method section). Due to the constancy of the power exponent through accommoda-
tion (figure 4.4B), the nucleus thickness accounted for a rather constant fraction of lens
thickness (average value 73%). The change in lens thickness (0.035 mm/D) is mostly
72

Figure 4.5: A. Average refractive index estimated from the distortion present in thecuvette in the OCT images as a function of back vertex power. B. Equivalent refractiveindex calculated from the back focal length for each accommodative state as as functionof the back vertex power. The first index relates with the GRIN profile in optical axisand the second with the focal power of the crystalline lens (surface and GRIN).
due to an increase in the nucleus thickness (0.024 mm/D) while the contribution to the
change of thickness of the cortex is moderate (0.005 and 0.007 mm/D for anterior and
posterior cortex respectively) with accommodation (Figure 4.6B). During accommoda-
tion the lens increases its thickness by a factor of 1.42. Relatively, the larger thickness
change occurs at the cortex. The nucleus, anterior cortex and posterior cortex sections
increase by a factor of 1.38, 1.53 and 1.52 respectively).
4.3.5 Contributions to Lens Power Changes With Accommo-
dation
The lens surface shape contributed on average 35-40% to the back vertex power of
the crystalline lens in all accommodative states. The fact that this contribution is
constant with accommodation indicates that the contribution of the external geometry
to the amplitude of accommodation is similar. Surfaces contributed 8.4 ± 1.2 D to the
amplitude of accommodation of the lens (27 ± 4 D), while GRIN was found responsible
for almost 20 D of accommodation.
73
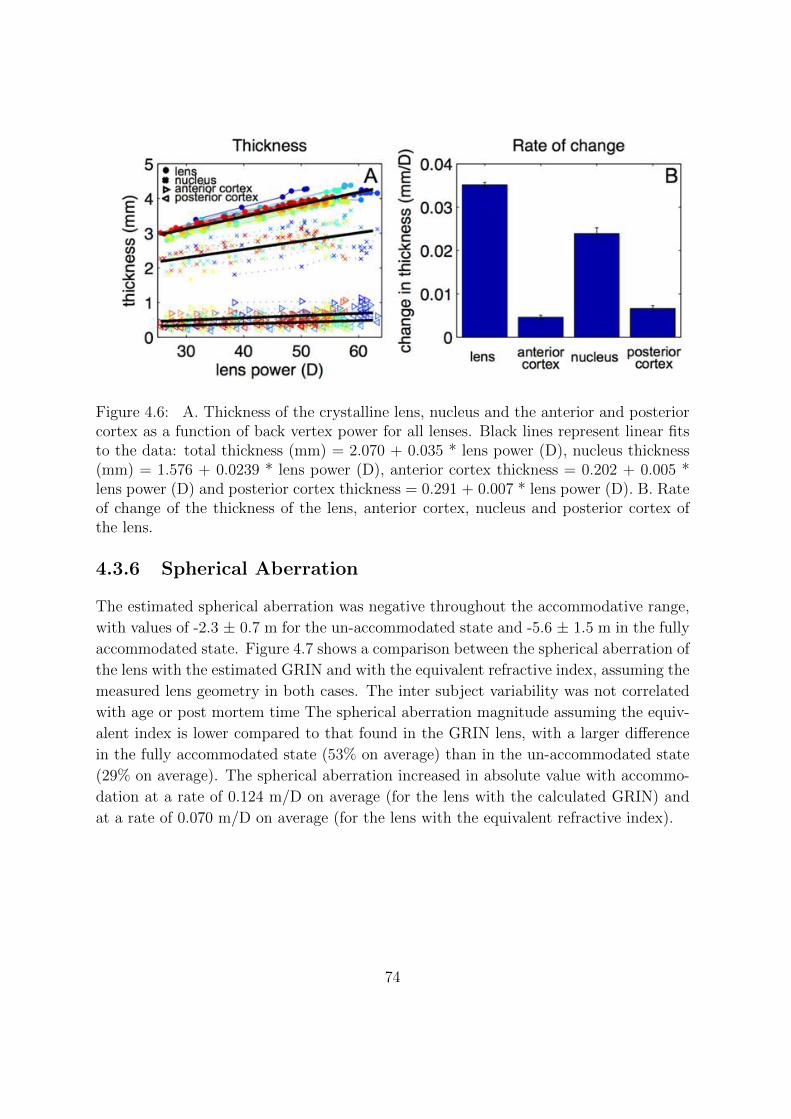
Figure 4.6: A. Thickness of the crystalline lens, nucleus and the anterior and posteriorcortex as a function of back vertex power for all lenses. Black lines represent linear fitsto the data: total thickness (mm) = 2.070 + 0.035 * lens power (D), nucleus thickness(mm) = 1.576 + 0.0239 * lens power (D), anterior cortex thickness = 0.202 + 0.005 *lens power (D) and posterior cortex thickness = 0.291 + 0.007 * lens power (D). B. Rateof change of the thickness of the lens, anterior cortex, nucleus and posterior cortex ofthe lens.
4.3.6 Spherical Aberration
The estimated spherical aberration was negative throughout the accommodative range,
with values of -2.3 ± 0.7 m for the un-accommodated state and -5.6 ± 1.5 m in the fully
accommodated state. Figure 4.7 shows a comparison between the spherical aberration of
the lens with the estimated GRIN and with the equivalent refractive index, assuming the
measured lens geometry in both cases. The inter subject variability was not correlated
with age or post mortem time The spherical aberration magnitude assuming the equiv-
alent index is lower compared to that found in the GRIN lens, with a larger difference
in the fully accommodated state (53% on average) than in the un-accommodated state
(29% on average). The spherical aberration increased in absolute value with accommo-
dation at a rate of 0.124 m/D on average (for the lens with the calculated GRIN) and
at a rate of 0.070 m/D on average (for the lens with the equivalent refractive index).
74
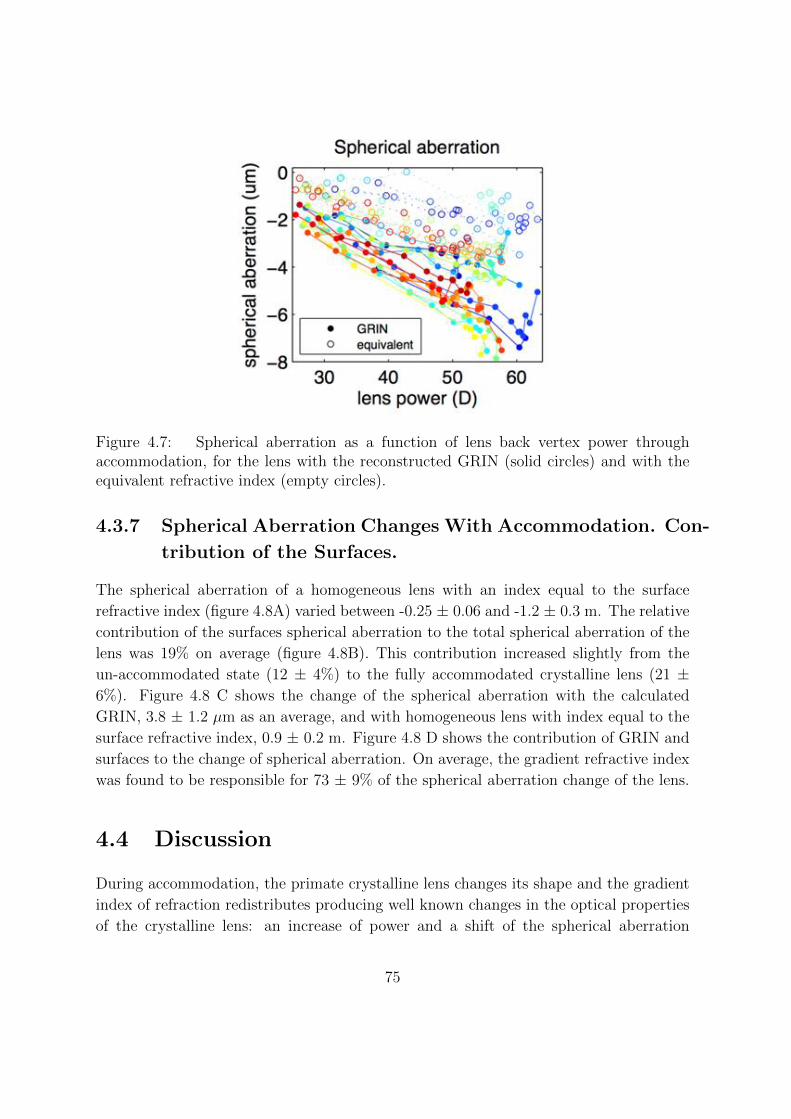
Figure 4.7: Spherical aberration as a function of lens back vertex power throughaccommodation, for the lens with the reconstructed GRIN (solid circles) and with theequivalent refractive index (empty circles).
4.3.7 Spherical Aberration Changes With Accommodation. Con-
tribution of the Surfaces.
The spherical aberration of a homogeneous lens with an index equal to the surface
refractive index (figure 4.8A) varied between -0.25 ± 0.06 and -1.2 ± 0.3 m. The relative
contribution of the surfaces spherical aberration to the total spherical aberration of the
lens was 19% on average (figure 4.8B). This contribution increased slightly from the
un-accommodated state (12 ± 4%) to the fully accommodated crystalline lens (21 ±6%). Figure 4.8 C shows the change of the spherical aberration with the calculated
GRIN, 3.8 ± 1.2 µm as an average, and with homogeneous lens with index equal to the
surface refractive index, 0.9 ± 0.2 m. Figure 4.8 D shows the contribution of GRIN and
surfaces to the change of spherical aberration. On average, the gradient refractive index
was found to be responsible for 73 ± 9% of the spherical aberration change of the lens.
4.4 Discussion
During accommodation, the primate crystalline lens changes its shape and the gradient
index of refraction redistributes producing well known changes in the optical properties
of the crystalline lens: an increase of power and a shift of the spherical aberration
75
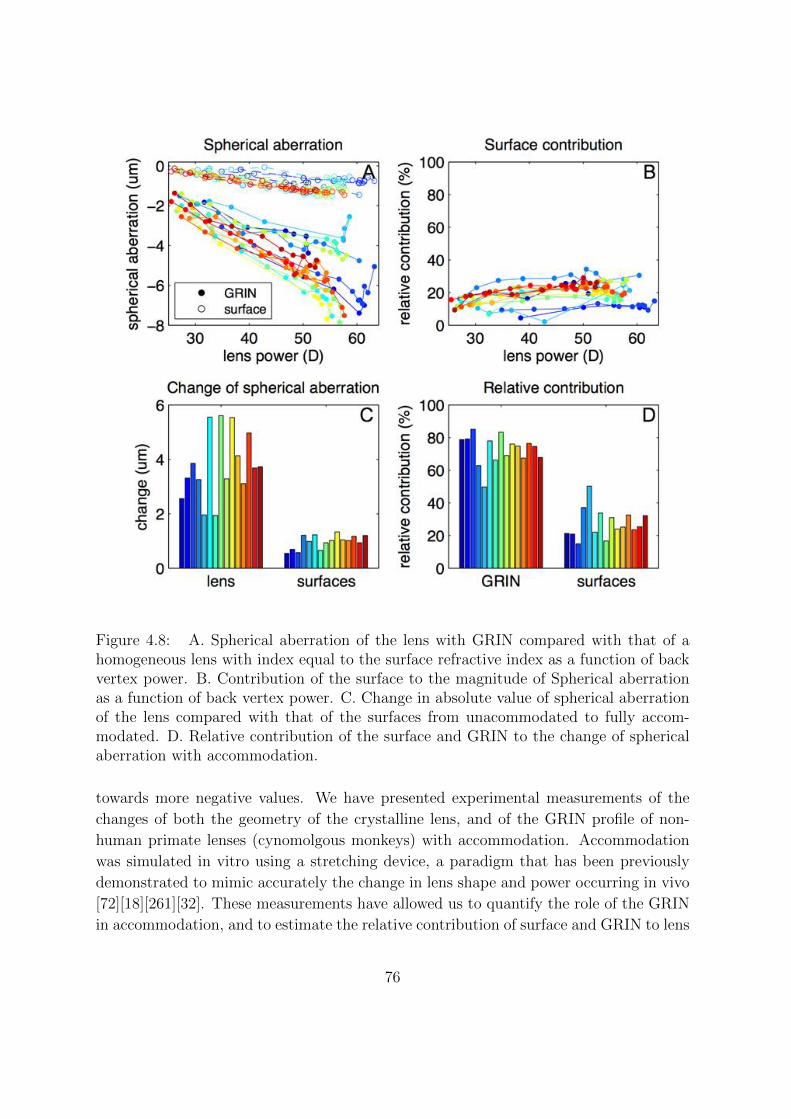
Figure 4.8: A. Spherical aberration of the lens with GRIN compared with that of ahomogeneous lens with index equal to the surface refractive index as a function of backvertex power. B. Contribution of the surface to the magnitude of Spherical aberrationas a function of back vertex power. C. Change in absolute value of spherical aberrationof the lens compared with that of the surfaces from unacommodated to fully accom-modated. D. Relative contribution of the surface and GRIN to the change of sphericalaberration with accommodation.
towards more negative values. We have presented experimental measurements of the
changes of both the geometry of the crystalline lens, and of the GRIN profile of non-
human primate lenses (cynomolgous monkeys) with accommodation. Accommodation
was simulated in vitro using a stretching device, a paradigm that has been previously
demonstrated to mimic accurately the change in lens shape and power occurring in vivo
[72][18][261][32]. These measurements have allowed us to quantify the role of the GRIN
in accommodation, and to estimate the relative contribution of surface and GRIN to lens
76
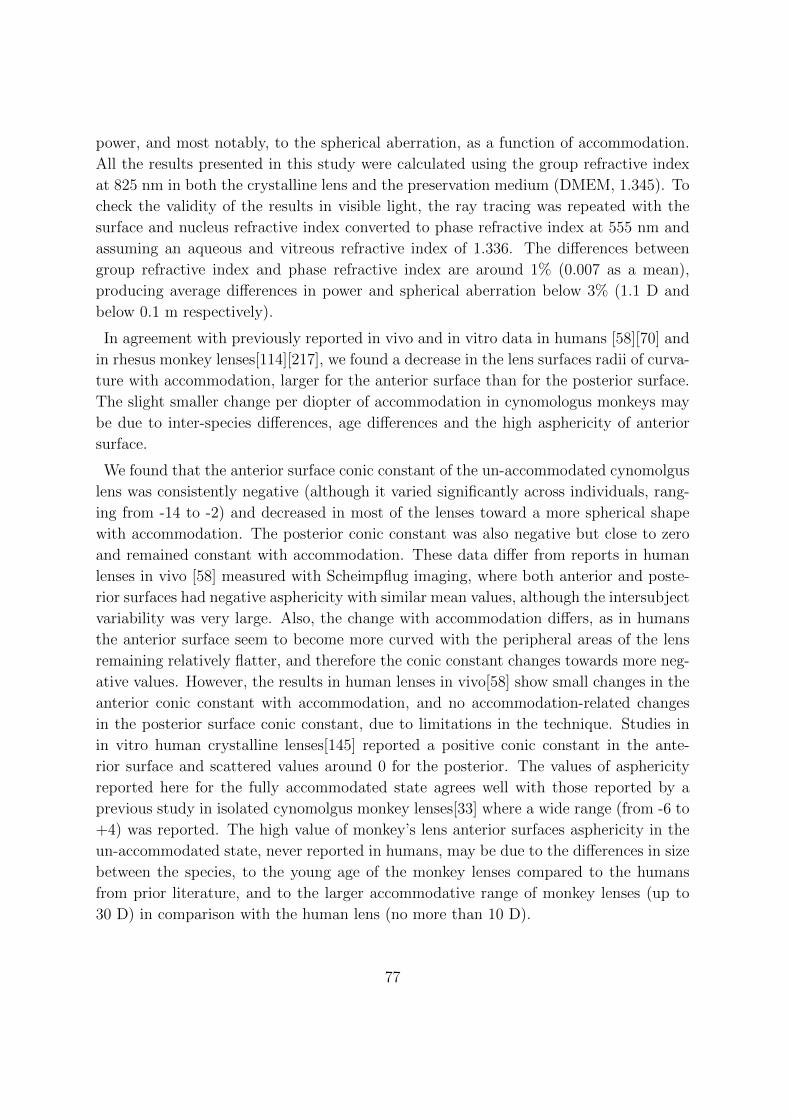
power, and most notably, to the spherical aberration, as a function of accommodation.
All the results presented in this study were calculated using the group refractive index
at 825 nm in both the crystalline lens and the preservation medium (DMEM, 1.345). To
check the validity of the results in visible light, the ray tracing was repeated with the
surface and nucleus refractive index converted to phase refractive index at 555 nm and
assuming an aqueous and vitreous refractive index of 1.336. The differences between
group refractive index and phase refractive index are around 1% (0.007 as a mean),
producing average differences in power and spherical aberration below 3% (1.1 D and
below 0.1 m respectively).
In agreement with previously reported in vivo and in vitro data in humans [58][70] and
in rhesus monkey lenses[114][217], we found a decrease in the lens surfaces radii of curva-
ture with accommodation, larger for the anterior surface than for the posterior surface.
The slight smaller change per diopter of accommodation in cynomologus monkeys may
be due to inter-species differences, age differences and the high asphericity of anterior
surface.
We found that the anterior surface conic constant of the un-accommodated cynomolgus
lens was consistently negative (although it varied significantly across individuals, rang-
ing from -14 to -2) and decreased in most of the lenses toward a more spherical shape
with accommodation. The posterior conic constant was also negative but close to zero
and remained constant with accommodation. These data differ from reports in human
lenses in vivo [58] measured with Scheimpflug imaging, where both anterior and poste-
rior surfaces had negative asphericity with similar mean values, although the intersubject
variability was very large. Also, the change with accommodation differs, as in humans
the anterior surface seem to become more curved with the peripheral areas of the lens
remaining relatively flatter, and therefore the conic constant changes towards more neg-
ative values. However, the results in human lenses in vivo[58] show small changes in the
anterior conic constant with accommodation, and no accommodation-related changes
in the posterior surface conic constant, due to limitations in the technique. Studies in
in vitro human crystalline lenses[145] reported a positive conic constant in the ante-
rior surface and scattered values around 0 for the posterior. The values of asphericity
reported here for the fully accommodated state agrees well with those reported by a
previous study in isolated cynomolgus monkey lenses[33] where a wide range (from -6 to
+4) was reported. The high value of monkey’s lens anterior surfaces asphericity in the
un-accommodated state, never reported in humans, may be due to the differences in size
between the species, to the young age of the monkey lenses compared to the humans
from prior literature, and to the larger accommodative range of monkey lenses (up to
30 D) in comparison with the human lens (no more than 10 D).
77
We found that the lens thickness increased with accommodation at a rate of 0.036±0.004
mm/D. This thickness variation is comparable to that reported in vivo in rhesus mon-
keys under stimulated accommodation, around 0.041 mm/D[114] and 0.063 mm/D[260],
and in vivo in humans, 0.045 mm/D[58] and 0.064 mm/D[212]
In agreement with previous findings we have found that a rather constant value of the
parameters defining the GRIN best fitted the experimental data[70][91] and that the
equivalent refractive index did not change with accommodation [70][142][91].
Despite the simplicity of the GRIN model, the estimated parameters allow reproducing
the experimental input data with great accuracy (mean RMS¡40 m), for all accommoda-
tion levels, using our recently developed optimization method based on OCT imaging[47].
Previous studies with simpler GRIN models suggested that no change in the parame-
ters of the model was needed to account for a change of power of the crystalline lens
with accommodation [70][91]. We have found a slight trend for an increase in the power
exponent parameter of our GRIN model (expansion of the central plateau in the GRIN
distribution), although this was not statistically significant. This was in contrast with
a report using MRI[107], which suggested a decrease of this parameter (only significant
in the meridional direction), and a 50% contribution of the lens thickness nucleus to the
change of lens thickness with accommodation. Studies based on Scheimpflug imaging
revealed a much higher contribution of the lens nucleus (90%) in humans[35][59][90] and
rhesus monkey[113]. While differences arising from the definition of the lens nucleus
and the data analysis are expected, our study on cynomolgus monkeys also supports a
large contribution of the lens nucleus in thickness changes (69%, following the defini-
tion proposed by Kasthurirangan et al.[107]). This conclusion is highly dependent of
the adopted definition for the nucleus. While the current definition does not necessar-
ily best describe the physiological area of the lens nucleus, it allows comparison with
prior literature using this definition[107]. Nevertheless the estimated nucleus thickness
relative to the total thickness (73%) with that definition is only slightly larger than
that obtained from direct imaging of the lens (65%, from Scheimpflug imaging in young
human subjects in vivo[59]; 57% from OCT imaging as an average in isolated human
crystalline lenses of different ages[49]).
We found the spherical aberration of the un-accommodated cynomologous lens to be
negative (-2.3 µm, 6-mm pupil diameter), as reported in young human lenses (-0.16
µm, 6-mm pupil in vivo[22]) and rhesus monkey (-1 µm, 7-mm in vitro[213] and -0.5
µm, 8-mm in vivo[261]). Previous studies have reported a compensatory role of the
GRIN in different species such as fish[100], rat[40], and porcine lenses[47][255][269].
With those lens geometries, and with a homogeneous index of refraction, the spherical
aberration of the lens was positive, and the presence of GRIN shifted the lens towards
78

less positive values (or close to zero, such as in fish) or towards negative values, which
tended to compensate the positive spherical aberration of the cornea. In cynomolgus
lenses we have also found a compensatory role of GRIN. However, in this case, the
GRIN did not reverse the sign of the spherical aberration, already negative with an
equivalent refractive index, but rather doubled its magnitude. The spherical aberration
value of the lens with an equivalent refractive index was on average 41% of that of
the corresponding GRIN lens. Also, the presence of GRIN emphasized the change of
spherical aberration with accommodation. The change in spherical aberration with
accommodation estimated with the equivalent refractive index was on average 29% of the
change for the corresponding GRIN lens. While there is a large intersubject variability
(which we did not find to be correlated with age or post mortem time), we have found
that the contribution of GRIN in the spherical aberration is slightly larger in the fully
accommodated state.
As in rhesus monkeys [213][261], we found a shift of the spherical aberration during
accommodation towards more negative values. We found larger differences (unaccom-
modated - fully accommodative state) in spherical aberration in cynomolgous (3.3 µm
for a 6-mm pupil) than in rhesus monkeys (around 2 µm, 8-mm, in vivo[261]; 1.7 m,
7-mm, in vitro[213]). However, as the accommodation amplitude is larger in cynomolgus
(20-30 D) than in rhesus (around 17 D), the shift of spherical aberration per diopter
of accommodation appears relatively similar across species (-0.124 m/D in the current
study in cynomolgus monkeys; around -0.11 m/D in vitro[213] and -0.19 and -0.24 m/D
in [261] in rhesus). These values are higher than those reported in humans for 6-mm
(-0.013 m/D5, -0.083 m/D3). The calculated spherical aberration value may be affected
by errors in the calculation of the geometry of the surfaces of the crystalline lens, in the
reconstruction of GRIN and in the accuracy of the GRIN model itself.
As in previous studies[70][142][20][237][104], the contributions of the GRIN to the power
and spherical aberration were computed by comparing the lens optical properties with
those produced by refraction in the surfaces only. While previous publications assumed
a fixed surface refractive index to estimate the contribution of the surfaces to the change
of power of the lens, in this study the surface index was obtained directly for each lens
from the GRIN reconstructed from the experimental data. The contribution of the GRIN
to the power and accommodative amplitude of the lens reported is in agreement with
previous studies in vitro in baboon and cynomolgus monkeys[142] and in humans[32].
For spherical aberration, we found that the surface contribution was around 20%, and
that the contribution was larger in the fully accommodated state. These results are
indicative of a large contribution (almost 80%) of the GRIN to the value of lens spherical
aberration in the entire accommodative range. Also the redistribution of the GRIN was
found to be responsible for more than 70% of the change of spherical aberration through
79
accommodation.
For these calculations, we defined the spherical aberration contribution of the GRIN as
the difference between the spherical aberration of the reconstructed GRIN lens and the
spherical aberration of a lens with a homogeneous refractive index equal to that of the
surface, in a similar way as previously evaluated for the surface / GRIN contributions
to the power of the lens[70][142][32][104]. There are other possible definitions or values
of the index of the homogeneous lens that could be used, which may produce different
numerical results, but we expect that the general finding regarding the importance of
the GRIN will not change. For instance, our analysis shows that the change in spherical
aberration of the lens with homogeneous index equal to the equivalent index (instead of
the surface index) is still only 56% of the change found with the GRIN lens.
Theoretical analyses[172][138] have shown that model eyes that simulate the change
of spherical aberration with accommodation can be designed using a lens model with
a shape, and a homogeneous equivalent refractive index (n=1.429), based on the mea-
surements of Dubbelman et al.8 However, this lens model does not provide accurate
predictions of the actual value of lens spherical aberration, most likely due to uncer-
tainties in the lens surface asphericity values[172]. Our experimental studies on monkey
lenses are in disagreement with the conclusion of Lopez-Gil et al.[138] regarding the
contribution of the GRIN to the change of spherical aberration with accommodation.
We find that the equivalent homogeneous lens predicts the general trend of the change
in spherical aberration with accommodation, but it does not reproduce the actual spher-
ical aberration value and its change with accommodation, obtained with experimental
measurements of the crystalline lens shape and GRIN.
80
5Contribution of shape and gradient
refractive index to the spherical aberration
of isolated human lenses
This chapter is based on the paper by Birkenfeld et al. ”Contribution of shape and
gradient refractive index to the spherical aberration of isolated human lenses” (Invest
Ophthalmol Vis Sci. 2014; 55:2599-2607) and the paper by Sun et al. ”OCT 3-D surface
topography of isolated human crystalline lenses”. The coauthors of the first paper were
Alberto de Castro and Susana Marcos. The author of the thesis was first coauthor in
the second paper. Other coauthors were Alberto de Castro, Sergio Ortiz, and Susana
Marcos. For the first paper, the author of this thesis (i) modified the experimental setup
(OCT), (ii) did the sample preparation (iii) performed the experiments (in collaboration
with Alberto de Castro) (iv) performed data processing (in collaboration with Alberto
de Castro), (v) analyzed the results (vi) prepared the manuscript (in collaboration with
Alberto de Castro and Susana Marcos). For the second paper, the author of this thesis
(i) modified the experimental setup (OCT), (ii) did the sample preparation (iii) per-
formed the experiments (in collaboration with Alberto de Castro), (iv) performed data
processing (in collaboration with Mengchan Sun) (v) analyzed the results (in collabora-
tion with Mengchan Sun) (vi) prepared the manuscript (in collaboration with Mengchan
81

Sun and Susana Marcos). The studies allowed us to investigate the influence of shape
and GRIN on the spherical aberrations of human lenses. As a result we concluded that
both, geometrical changes and GRIN contributes to the age-dependent shift of negative
spherical aberration. It also allowed us to study 3D surface topography on human crys-
talline lenses in vitro, and to describe the surfaces by means of Zernike polynomials, and
evaluate the correlations between anterior and posterior surface topography.
5.1 Introduction
In the last chapters we reconstructed the GRIN of porcine and monkey lenses and
investigated its influence on optical aberration in different states of accommodation.
In this chapter we use 3-D OCT and LRT measurements of 35 isolated human donor
lenses (between the age of 19 and 71 years) to fully characterize the lens surface ge-
ometry, the GRIN distribution, optical properties, and, in addition, analyze their age-
dependencies. With age, the human lens undergoes various physical, biometrical and
optical changes[73][36][89][115][57][140][70][12], such as thickness increase, surface steep-
ening and mass and volume linear growth. The changes in optical property result from
changes of the lens’ shape and its refractive index. In particular, the overall spheri-
cal aberration of the eye shifts toward positive values[72][157][6]. This change in lens
spherical aberration leads to age-related loss of the corneal/lens spherical aberration
compensation and decrease of the optical performance [8][81][234][22].
In contrast to the cornea, there is little information on lens topography and possible
compensations within the crystalline lens itself, i.e. between anterior and posterior
surface or between its surfaces and its GRIN, although there are also numerous reports
of the compensation of the corneal astigmatism by the astigmatism of the crystalline
lens using corneal and refractive parameters [110][119][182][136]. As an additional part
of this work, we characterized the lens topography, using lens surface elevation maps. As
descriptive parameters we included individual surface Zernike coefficients and the root
mean square (RMS) of combination of some terms or Zernike orders.
5.2 Methods
5.2.1 Human lens samples and preparation
Human donor eyes were obtained from Transplant Service Foundation (TSF) Eye Bank.
The handling and experimental protocols had been previously approved by the Institu-
82
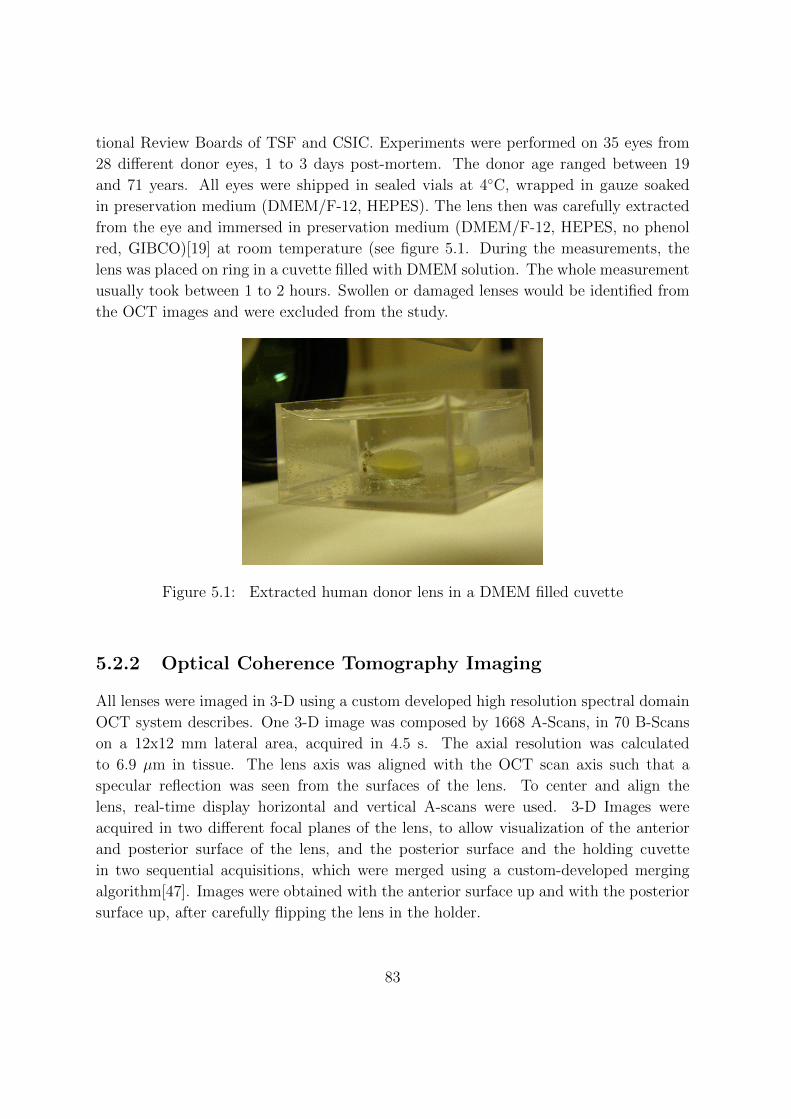
tional Review Boards of TSF and CSIC. Experiments were performed on 35 eyes from
28 different donor eyes, 1 to 3 days post-mortem. The donor age ranged between 19
and 71 years. All eyes were shipped in sealed vials at 4◦C, wrapped in gauze soaked
in preservation medium (DMEM/F-12, HEPES). The lens then was carefully extracted
from the eye and immersed in preservation medium (DMEM/F-12, HEPES, no phenol
red, GIBCO)[19] at room temperature (see figure 5.1. During the measurements, the
lens was placed on ring in a cuvette filled with DMEM solution. The whole measurement
usually took between 1 to 2 hours. Swollen or damaged lenses would be identified from
the OCT images and were excluded from the study.
Figure 5.1: Extracted human donor lens in a DMEM filled cuvette
5.2.2 Optical Coherence Tomography Imaging
All lenses were imaged in 3-D using a custom developed high resolution spectral domain
OCT system describes. One 3-D image was composed by 1668 A-Scans, in 70 B-Scans
on a 12x12 mm lateral area, acquired in 4.5 s. The axial resolution was calculated
to 6.9 µm in tissue. The lens axis was aligned with the OCT scan axis such that a
specular reflection was seen from the surfaces of the lens. To center and align the
lens, real-time display horizontal and vertical A-scans were used. 3-D Images were
acquired in two different focal planes of the lens, to allow visualization of the anterior
and posterior surface of the lens, and the posterior surface and the holding cuvette
in two sequential acquisitions, which were merged using a custom-developed merging
algorithm[47]. Images were obtained with the anterior surface up and with the posterior
surface up, after carefully flipping the lens in the holder.
83
5.2.3 Laser Ray Traing
The paraxial and non-paraxial focal length of each lens were measured using a 2-mirror
galvanometric scanning laser ray tracing system introduced in chapter 2. It scanned
rings of light of different diameters (2 and 4 mm) onto the crystalline lens and the
CMOS camera captured a series of through-focus images around the focal plane (full
range: 35 mm; step size: 0.5 mm). The lens was placed in a cuvette (posterior up) and
was aligned with the LRT system, such that the lens and principal ray was collinear to
the center of the CMOS in the entire focus range. Measurements of the focal length at
two different pupil diameters allowed an approximate experimental estimate of the 4th
order Zernike spherical aberration, using the following equation [247]
Z04 =
M r2
12√
5(5.1)
where r is the paraxial pupil radius, and M=M(non-paraxial power)-M(paraxial power).
The group refractive index of the solution was taken as n = 1.345 at 825nm [34].
5.2.4 Image Processing
All OCT images were processed to obtain the shape of the lens surfaces and the surface
of the cuvette, using algorithms described in detail in chapter 2. Images at different
focal planes were merged into one complete 3-D image of the lens. Images were then
corrected from fan distortion (Ortiz2009) and optical distortion induced by the presence
of the preservation medium. The full geometry of the lens was obtained from analysis
of the anterior surface measured in each condition. All surfaces (lens and cuvette) were
fitted by Zernike polynomials (up to 7th order) within a 6-mm pupil. For the purposes
of this study, only symmetric Zernike polynomials and astigmatism were used[145], Ad-
ditionally, the radii of curvature and conic constant of the surfaces were estimated for
18 meridians, using the following equation
z = z0 −(x− x0)2
r +√r2 − k(x− x0)2
(5.2)
where z is the height, x the radial position along the meridian, r the apical radius of
curvature at the vertex, and k the conic constant. The lens thickness was calculated
from the distortion of the image of the cuvette surface[254].
84

5.2.5 GRIN reconstruction
The 3-D GRIN was reconstructed from lens geometry, optical path difference, and lens
focal length using the global search algorithm described in chapter 2. The GRIN was
estimated for a 6-mm pupil. The algorithm was run five times for each data set, and
was applied in 18 cross-sectional meridians (0-170, in steps of 10◦). The reconstruction
was done for a refractive index at 849 nm and was converted to a phase refractive index
at 633 nm (Uhlhorn2008), to allow comparison with prior literature.
5.2.6 GRIN model and Search Algorithm
The GRIN model used was described in detail in chapter 2. In short, the refractive
index in the lens is modeled so that it varies continuously from nucleus to the surface
in both, axial and meridional directions. The center of the lens is assumed to be in the
optical axis at a distance from the anterior surface vertex equal to 0.41 times the lens
thickness[218]. The GRIN is described as a 4-variable model in polar coordinates:
n(ρ, θ) = nN −∆n ·(ρ
ρs
)p(θ)(5.3)
where nN is the refractive index of the nucleus, ∆n the difference between the refractive
index of surface and nucleus, ρS is the distance between nucleus and surface, and p(θ) is
the exponential decay in axial (p1) and meridional (p2) direction; p1 is constant across
meridians, while p2 can vary to account for differences between meridians. The GRIN
distribution which best fits the experimental data is searched through minimization of
a merit function. A genetic optimization algorithm[95] was implemented as a global
search algorithm to prevent the solution falling in a local minimum[47].
5.2.7 Equivalent refractive index and average refractive index
The homogeneous equivalent index was calculated by matching the refractive index
producing the same focal length than the lens with the estimated GRIN and the same
3D geometry. Unless otherwise noted, the equivalent index was estimated for 6-mm
pupil diameters. The average refractive index was estimated as is the mean value of the
GRIN profile along the optical axis of the lens
85
5.2.8 Computational ray tracing analysis
The optical aberrations of individual lenses were investigated by means of a compu-
tational ray tracing analysis (performed at multiple meridians) using the experimental
geometric data of the lens and the reconstructed GRIN. Additionally, aberrations were
estimated for lenses of similar geometry and a homogeneous equivalent refractive in-
dex, allowing accounting for the relative contribution of lens geometry and GRIN to
the optical properties of the lens. The custom-developed ray-tracing algorithm used
is describes in detail in chapter 2. In short, the Stavroudis formula[241], and Sharma
algorithm[223] are used to to trace rays through conical surfaces and GRIN, respec-
tively. The calculated wave aberrations were fit by Zernike polynomial expansions. In
particular, 4th order spherical aberration were calculated for GRIN lenses and their
corresponding equivalent refractive index lenses.
5.2.9 Lens surface elevation
Lens surface elevation maps were obtained by subtraction of the best fitting spheres
from the segmented surfaces and fitted to 6th order Zernike polynomials. All fittings
were done for a 6-mm diameter optical zone. Descriptive parameters of the surface
elevation maps include individual surface Zernike coefficients (up to 6th order), and the
root mean square (RMS) of combination of some terms (RMS astigmatism, RMS trefoil,
RMS tetrafoil, RMS spherical terms, RMS coma and RMS 4th order Astigmatism), or
Zernike orders (from 2nd order to 6th order RMS). We studied the changes of those
parameters with age as well as relationships between the anterior and the posterior
surfaces. As the relative angle of the lens with respect to the cornea and the body is
unknown, for convention, all lenses were aligned such that the astigmatic axis of the
anterior lens was on the vertical meridian. The results of the lens surface elevation maps
are based on a more recent study, therefore, one more lens is included.
5.3 Results
5.3.1 Lens surface elevation maps
Figure 5.2 shows all Zernike fittings to the anterior and posterior lens surface elevations
(relative to the best fitting sphere) for all lenses of the study, sorted by age. The first
and third columns show the astigmatic Zernike terms only, and the second and fourth
columns represent astigmatism and high order aberrations (up to the 6th order terms) of
86
anterior and posterior surface respectively. Because all lenses have been aligned such that
the anterior lens steepest meridian is vertical, the anterior maps show only astigmatic
component. In many cases the astigmatic axis of the posterior lens surface is rotated
with respect to the anterior lens surface. A certain degree of similarity occurs in the high
order aberration maps of both eyes from the same donor eyes, marked with asterisks (lens
]7&8, lens ]11&12, lens ]15&16, lens ]17&18, lens ]23&24, lens ]27&28, lens ]35&36).
On average, for eye pairs from the same donor, the average correlation coefficients for
the high order Zernikes between eyes are r= 0.78 (p=0.002) for the anterior, and r=0.53
(p=0.03) for the posterior lens surface, while the average correlation coefficients when
compared to eyes from other eyes are r=0.10 and r=0.17 for the anterior and posterior
lens surface, respectively.
5.3.2 Age-dependence of crystalline lens shape
All lens surfaces were well fitted by conic sections for the central 6 mm of the surface. The
root mean square of the residuals of the fittings was below 30 m. Lens thickness, radii
of curvature and conic constants of the anterior and posterior surfaces were analyzed as
a function of age. The thickness increased linearly with age at a rate of 0.0196 mm/year
(figure 5.3). Anterior and posterior radii of curvature (Figure 5.4) were fit by a 3rd order
and 2nd order polynomial, respectively. The anterior lens radii of curvature increased
almost linearly up to age 60 (a linear fit between 19 and 60 years showed an increase
of 0.119 mm/year), and tended to decrease beyond that age. Posterior lens radii of
curvature tended to increase slightly with age.
Anterior and posterior lens conic constants (Figure 5.5) were fit by linear regressions.
The anterior surface conic constant was negative for 26 of the 35 lenses (ranging from
-16.2 to -0.08), and for all lenses under 47 years. It shifted towards positive values in
older lenses, increasing linearly with age at a rate of 0.228/year (p¡0.001). The posterior
surface conic constant was -0.17 on average with values between 1.17 and -1.89, and
showed a small increase of 0.0275/year (p=0.002).
Across meridians, the radius of curvature changed by 0.8 mm and 0.32 mm, and the
conic constant changed by 2 and 0.12, for anterior and posterior surface, respectively
(average values). We did not find any correlation of meridional changes with age. In
addition, the magnitude of the changes in the anterior surface was not correlated with
those of the posterior surface.
87
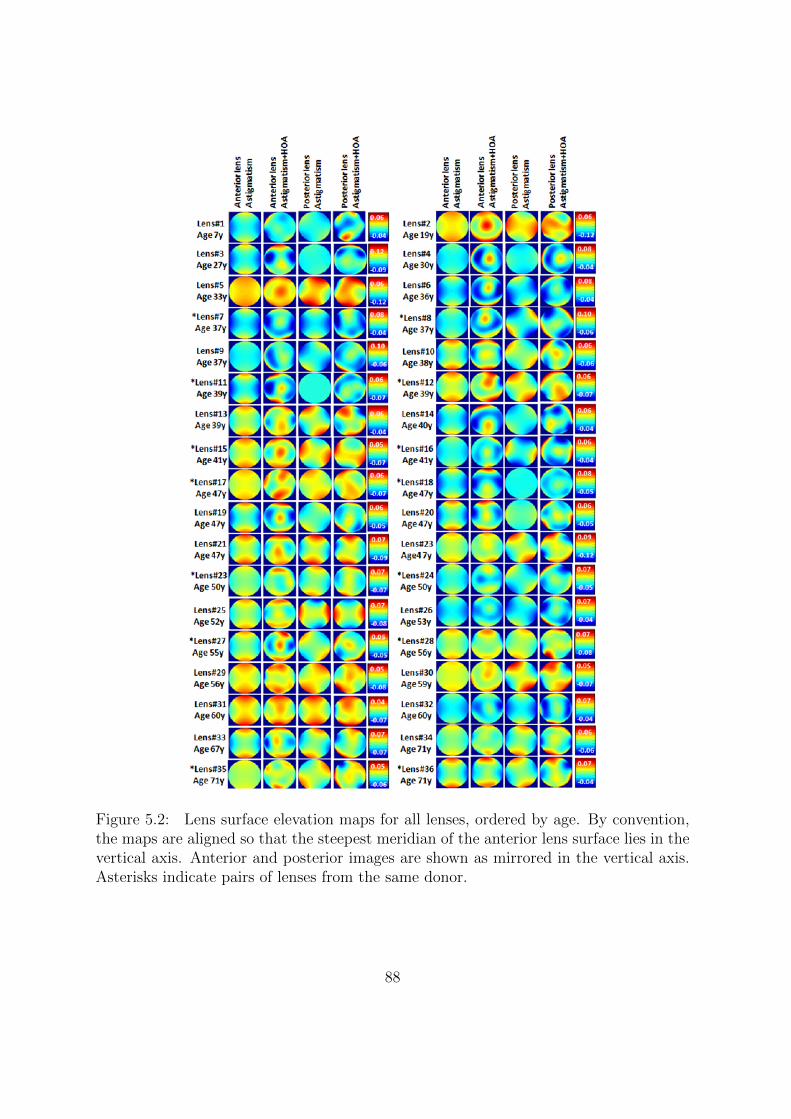
Figure 5.2: Lens surface elevation maps for all lenses, ordered by age. By convention,the maps are aligned so that the steepest meridian of the anterior lens surface lies in thevertical axis. Anterior and posterior images are shown as mirrored in the vertical axis.Asterisks indicate pairs of lenses from the same donor.
88
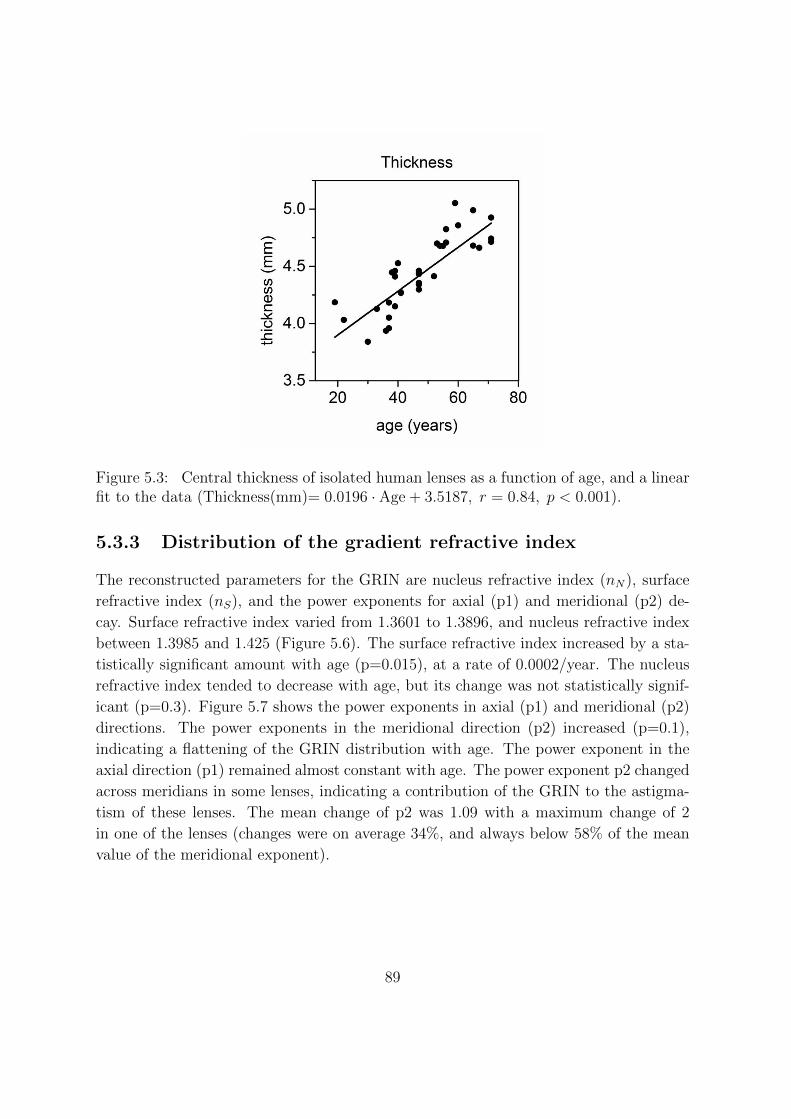
Figure 5.3: Central thickness of isolated human lenses as a function of age, and a linearfit to the data (Thickness(mm)= 0.0196 · Age + 3.5187, r = 0.84, p < 0.001).
5.3.3 Distribution of the gradient refractive index
The reconstructed parameters for the GRIN are nucleus refractive index (nN), surface
refractive index (nS), and the power exponents for axial (p1) and meridional (p2) de-
cay. Surface refractive index varied from 1.3601 to 1.3896, and nucleus refractive index
between 1.3985 and 1.425 (Figure 5.6). The surface refractive index increased by a sta-
tistically significant amount with age (p=0.015), at a rate of 0.0002/year. The nucleus
refractive index tended to decrease with age, but its change was not statistically signif-
icant (p=0.3). Figure 5.7 shows the power exponents in axial (p1) and meridional (p2)
directions. The power exponents in the meridional direction (p2) increased (p=0.1),
indicating a flattening of the GRIN distribution with age. The power exponent in the
axial direction (p1) remained almost constant with age. The power exponent p2 changed
across meridians in some lenses, indicating a contribution of the GRIN to the astigma-
tism of these lenses. The mean change of p2 was 1.09 with a maximum change of 2
in one of the lenses (changes were on average 34%, and always below 58% of the mean
value of the meridional exponent).
89
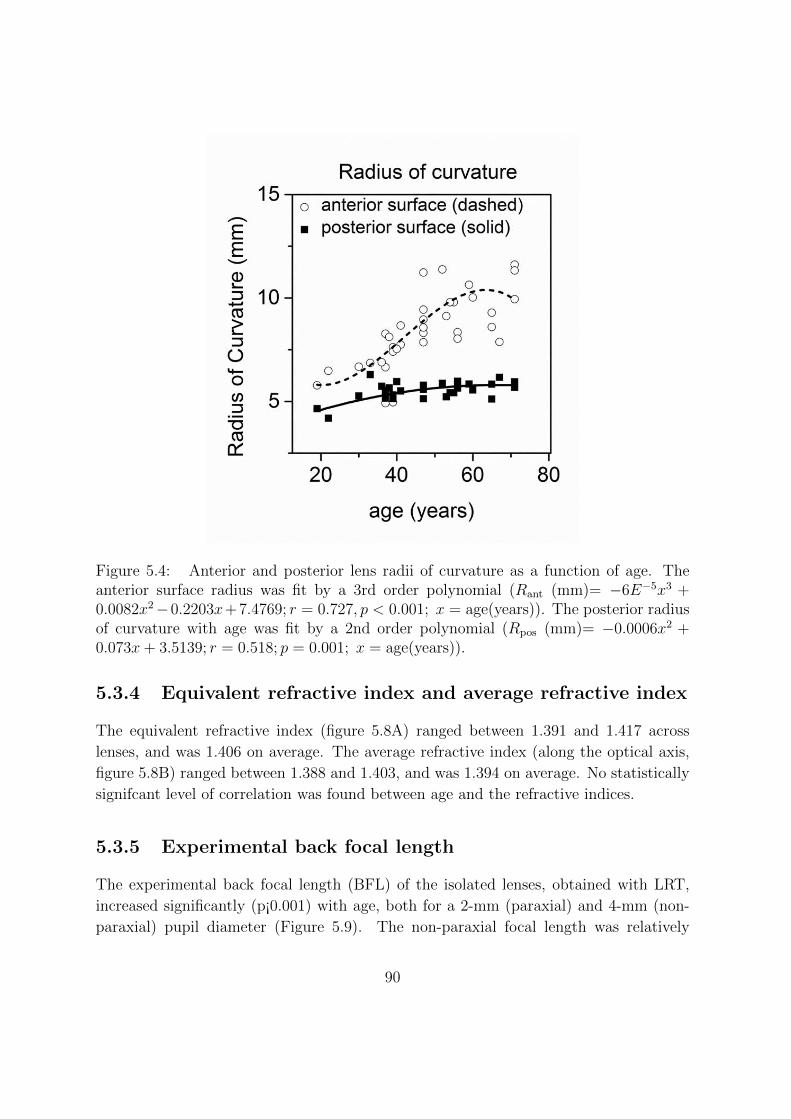
Figure 5.4: Anterior and posterior lens radii of curvature as a function of age. Theanterior surface radius was fit by a 3rd order polynomial (Rant (mm)= −6E−5x3 +0.0082x2−0.2203x+7.4769; r = 0.727, p < 0.001; x = age(years)). The posterior radiusof curvature with age was fit by a 2nd order polynomial (Rpos (mm)= −0.0006x2 +0.073x+ 3.5139; r = 0.518; p = 0.001; x = age(years)).
5.3.4 Equivalent refractive index and average refractive index
The equivalent refractive index (figure 5.8A) ranged between 1.391 and 1.417 across
lenses, and was 1.406 on average. The average refractive index (along the optical axis,
figure 5.8B) ranged between 1.388 and 1.403, and was 1.394 on average. No statistically
signifcant level of correlation was found between age and the refractive indices.
5.3.5 Experimental back focal length
The experimental back focal length (BFL) of the isolated lenses, obtained with LRT,
increased significantly (p¡0.001) with age, both for a 2-mm (paraxial) and 4-mm (non-
paraxial) pupil diameter (Figure 5.9). The non-paraxial focal length was relatively
90

Figure 5.5: Anterior and posterior lens asphericity as a function of age, and linear fitto the data for the anterior lens (kant = 0.228 ·Age− 14.853; r = 0.604; p < 0.001), andfor the posterior lens (kpos = 0.0275x− 1.4798; r = 0.5; p = 0.002).
higher in younger lenses and changed with age at a lower rate (0.285mm/year) than the
paraxial focal length (0.466mm/year). Therefore, the difference between paraxial and
non-paraxial lens power decreased with age, approaching zero at around 60 years of age.
The higher central lens power (i.e. a shorter BFL) in the paraxial zone for younger lenses
is consistent with negative spherical aberration. Therefore, the decrease in the paraxial
and non-paraxial BFL difference is consistent with of a shift of spherical aberration
from negative to more positive values. Using equation 5.1, the 4th order spherical
aberration Z40 the Zernike was calculated for the lenses, showing a linear shift with age
from negative values in young lenses to closer to zero in older eyes (Z40=0.0029*Age -
0.1904;r=0.455,p=0.022).
91
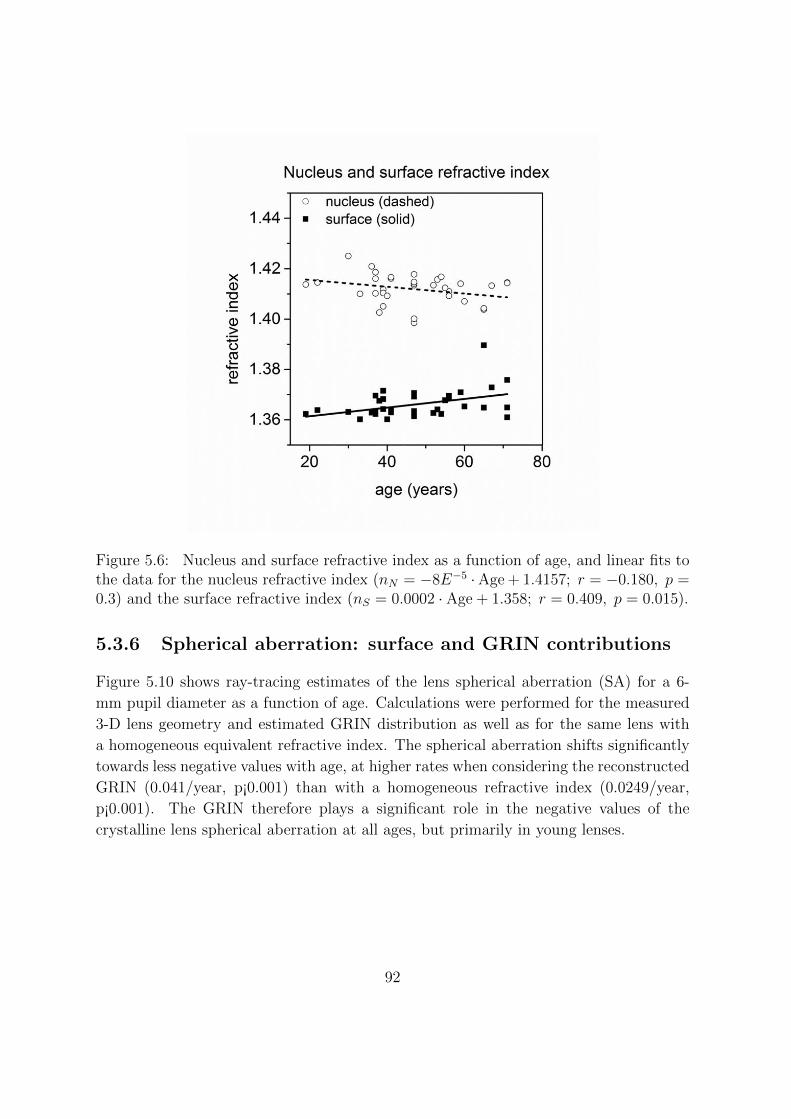
Figure 5.6: Nucleus and surface refractive index as a function of age, and linear fits tothe data for the nucleus refractive index (nN = −8E−5 ·Age + 1.4157; r = −0.180, p =0.3) and the surface refractive index (nS = 0.0002 · Age + 1.358; r = 0.409, p = 0.015).
5.3.6 Spherical aberration: surface and GRIN contributions
Figure 5.10 shows ray-tracing estimates of the lens spherical aberration (SA) for a 6-
mm pupil diameter as a function of age. Calculations were performed for the measured
3-D lens geometry and estimated GRIN distribution as well as for the same lens with
a homogeneous equivalent refractive index. The spherical aberration shifts significantly
towards less negative values with age, at higher rates when considering the reconstructed
GRIN (0.041/year, p¡0.001) than with a homogeneous refractive index (0.0249/year,
p¡0.001). The GRIN therefore plays a significant role in the negative values of the
crystalline lens spherical aberration at all ages, but primarily in young lenses.
92

Figure 5.7: Power exponent in the axial direction (p1) and in the meridional direction(p2) as a function of age, and linear fit to the data for p1 (axial decay = −9.9E−4 ·Age+2.3878; r = −0.025, p = 0.89) and p2 (meridional decay = 0.021 · Age + 2.2973; r =0.281, p = 0.1). For p2, each symbol is the average across 18 meridians. A higher pis consistent to a flatter plateau in the GRIN, and rapid changes towards the surface.The colored insets illustrate a cross-section of the GRIN distribution in one meridian.Examples are for lenses of 30, 52 and 71 years
5.3.7 Lens surface topography: HO Zernike terms
Lens elevation high order Zernike terms: anterior and posterior lens relationships We
tested the similarity of anterior and posterior lens topographies by evaluating the cor-
relation of the high order Zernike terms in the anterior and posterior lens surfaces. We
found that several high order Zernike terms were statistically significantly correlated in
anterior and posterior lens surfaces. As an example, Figure 5.11 shows linear regressions
between anterior and posterior surface for vertical trefoil (Z−3 3), 3rd order RMS, RMS
Coma and 4th order RMS. Table 5.1 shows the mean and standard deviation of different
parameters describing the shape of the anterior and posterior surface in terms of RMS,
93
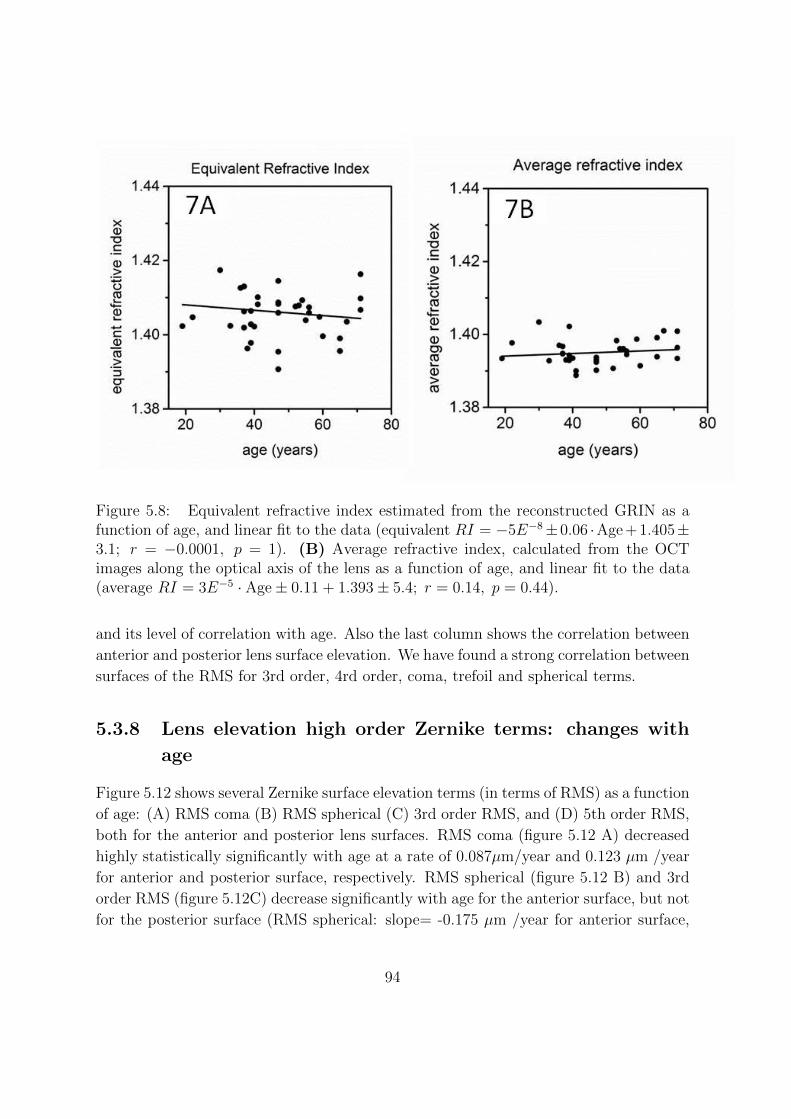
Figure 5.8: Equivalent refractive index estimated from the reconstructed GRIN as afunction of age, and linear fit to the data (equivalent RI = −5E−8±0.06 ·Age + 1.405±3.1; r = −0.0001, p = 1). (B) Average refractive index, calculated from the OCTimages along the optical axis of the lens as a function of age, and linear fit to the data(average RI = 3E−5 · Age± 0.11 + 1.393± 5.4; r = 0.14, p = 0.44).
and its level of correlation with age. Also the last column shows the correlation between
anterior and posterior lens surface elevation. We have found a strong correlation between
surfaces of the RMS for 3rd order, 4rd order, coma, trefoil and spherical terms.
5.3.8 Lens elevation high order Zernike terms: changes with
age
Figure 5.12 shows several Zernike surface elevation terms (in terms of RMS) as a function
of age: (A) RMS coma (B) RMS spherical (C) 3rd order RMS, and (D) 5th order RMS,
both for the anterior and posterior lens surfaces. RMS coma (figure 5.12 A) decreased
highly statistically significantly with age at a rate of 0.087µm/year and 0.123 µm /year
for anterior and posterior surface, respectively. RMS spherical (figure 5.12 B) and 3rd
order RMS (figure 5.12C) decrease significantly with age for the anterior surface, but not
for the posterior surface (RMS spherical: slope= -0.175 µm /year for anterior surface,
94

Figure 5.9: Experimental back focal length for a 1-mm pupil radius (paraxial)and a 2-mm pupil radius (non-paraxial), and linear fit to the data for the paraxial(exp.bfl1mm(mm) = 0.466 · Age + 27.81; r = 0.95, p < 0.001) and non-paraxial data(exp.bfl2mm(mm) = 0.285 · Age + 39.070; r = 0.66, p < 0.001).
slope =-0.05 µm /year for posterior surface; 3rd order RMS: slope=-0.083µm/year for
anterior surface). 5th and 6th order RMS do not show statistically significant changes
with age. Table 1 (4th and 5th columns) shows the correlations with age for different
RMS orders.
5.3.9 Relative contribution of different Zernike terms to the
lens surface elevations
Figure 5.13 shows the average relative contribution of lower and higher order Zernike
terms in both surfaces. Relative contributions are accounted for in terms of variance
(RMS2). Astigmatism is the predominant term both in the anterior surface (54.96%)
and in the posterior surface (62.95%), followed by spherical (25.10%, 17.85%), coma
(10.91%, 6.38%), trefoil (6.01%, 8.73%), tetrafoil (1.76%, 2.80%) and 4th order astig-
95

Figure 5.10: Estimated spherical aberration as a function of age for GRIN lenses andlenses with a homogeneous refractive index, and linear fits for GRIN lenses (SAGRIN =0.041 · Age − 3.4075; r = 0.654, p < 0.001) and homogeneous refractive index lenses(SAhomogeneous = 0.0249 · Age− 1.4043; r = 0.696, p < 0.001). The GRIN shifts the SAtowards more negative values.
matism (1.27%, 1.30%), for anterior and posterior surface, respectively. We also studied
the change of these relative contribution with age (not shown) and found that for the
anterior surface, the two predominant terms, astigmatism and spherical, change with
age. The relative proportion of astigmatism increased with age at a rate of 0.702 /year
(r=0.427, p=0.009), while the percentage of spherical term decreased significantly with
age at a rate of -0.616/year (r= 0.474, p=0.004). For the posterior surface, we only found
a significant change in the proportion of coma (slope=-0.307/year, r= 0.450, p=0.006).
96

Figure 5.11: (a) Trefoil-v : Anterior vs. Posterior (Slope= 0.387, r = 0.467, p =0.004 ) (b) RMS 3th order terms: Anterior vs. Posterior (Slope= 0.019; r = 0.477, p =0.003; (c) RMS Coma: Anterior vs. Posterior (Slope= 0.387; r = 0.617, p = 0.0001)(d) 4th order RMS: Anterior vs. Posterior (Slope= 0.387; r = 0.423, p = 0.010).
5.4 Discussion
We have used spectral Optical Coherence Tomography to image isolated crystalline
lenses of different ages. These measurements allowed quantification of the lens shape
97
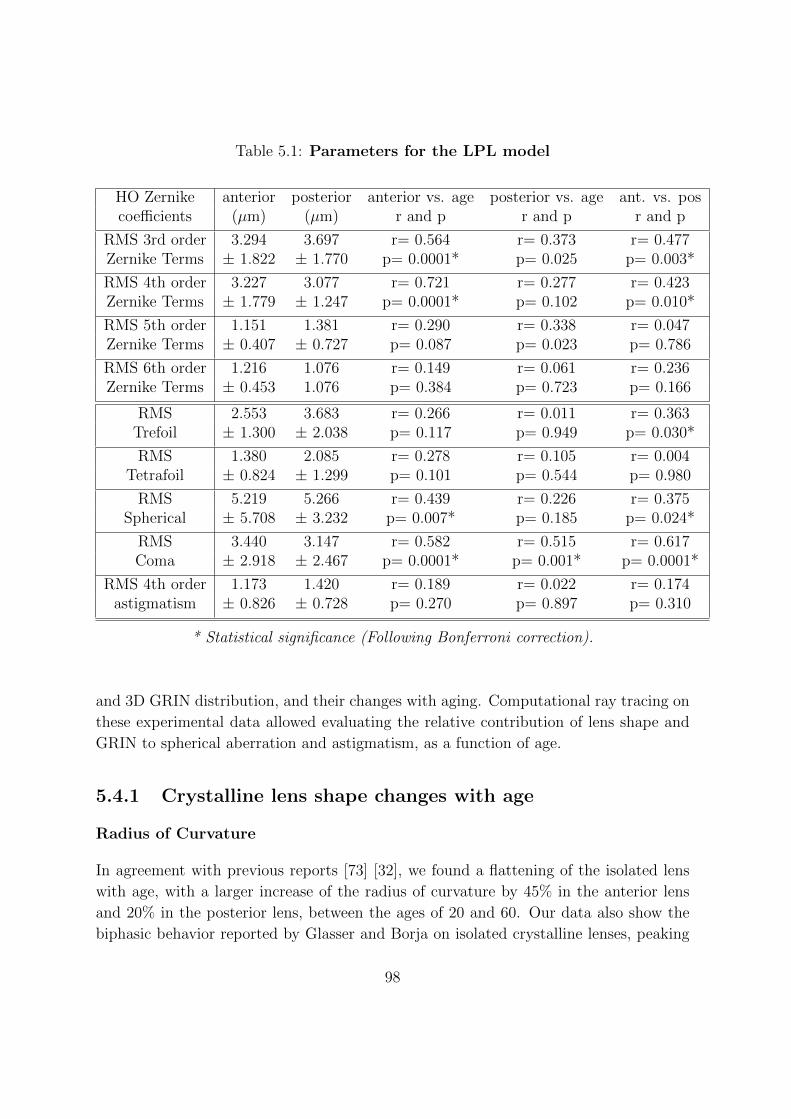
Table 5.1: Parameters for the LPL model
HO Zernike anterior posterior anterior vs. age posterior vs. age ant. vs. poscoefficients (µm) (µm) r and p r and p r and p
RMS 3rd order 3.294 3.697 r= 0.564 r= 0.373 r= 0.477Zernike Terms ± 1.822 ± 1.770 p= 0.0001* p= 0.025 p= 0.003*
RMS 4th order 3.227 3.077 r= 0.721 r= 0.277 r= 0.423Zernike Terms ± 1.779 ± 1.247 p= 0.0001* p= 0.102 p= 0.010*
RMS 5th order 1.151 1.381 r= 0.290 r= 0.338 r= 0.047Zernike Terms ± 0.407 ± 0.727 p= 0.087 p= 0.023 p= 0.786
RMS 6th order 1.216 1.076 r= 0.149 r= 0.061 r= 0.236Zernike Terms ± 0.453 1.076 p= 0.384 p= 0.723 p= 0.166
RMS 2.553 3.683 r= 0.266 r= 0.011 r= 0.363Trefoil ± 1.300 ± 2.038 p= 0.117 p= 0.949 p= 0.030*
RMS 1.380 2.085 r= 0.278 r= 0.105 r= 0.004Tetrafoil ± 0.824 ± 1.299 p= 0.101 p= 0.544 p= 0.980
RMS 5.219 5.266 r= 0.439 r= 0.226 r= 0.375Spherical ± 5.708 ± 3.232 p= 0.007* p= 0.185 p= 0.024*
RMS 3.440 3.147 r= 0.582 r= 0.515 r= 0.617Coma ± 2.918 ± 2.467 p= 0.0001* p= 0.001* p= 0.0001*
RMS 4th order 1.173 1.420 r= 0.189 r= 0.022 r= 0.174astigmatism ± 0.826 ± 0.728 p= 0.270 p= 0.897 p= 0.310
* Statistical significance (Following Bonferroni correction).
and 3D GRIN distribution, and their changes with aging. Computational ray tracing on
these experimental data allowed evaluating the relative contribution of lens shape and
GRIN to spherical aberration and astigmatism, as a function of age.
5.4.1 Crystalline lens shape changes with age
Radius of Curvature
In agreement with previous reports [73] [32], we found a flattening of the isolated lens
with age, with a larger increase of the radius of curvature by 45% in the anterior lens
and 20% in the posterior lens, between the ages of 20 and 60. Our data also show the
biphasic behavior reported by Glasser and Borja on isolated crystalline lenses, peaking
98

Figure 5.12: Lens elevation high order RMS terms; RMS coma: slope=-0.087µm/year,r= 0.582 and p=0.0001 for anterior surface, slope=-0.123µm/year, r= 0.515 and p=0.001for posterior surface; (b) RMS spherical: slope= -0.175 µmm /year, r= 0.439, p=0.007for anterior surface only (c) 3rd order RMS: slope=-0.083µm/year, r= 0.564 andp=0.0001 for anterior surface only
around 60 years of age. Data are also consistent with measurements in vivo using
corrected Scheimpflug imaging[116], Purkinje imaging[214] and OCT [67]as function of
accommodation and/or aging.
99
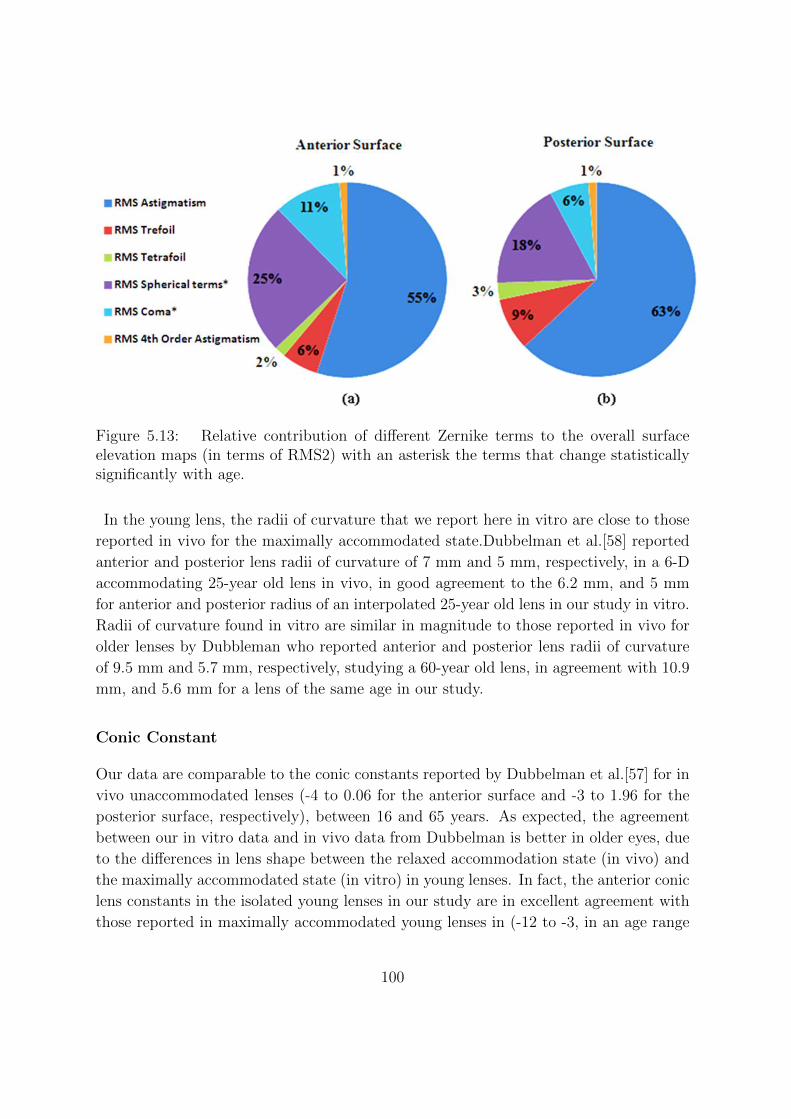
Figure 5.13: Relative contribution of different Zernike terms to the overall surfaceelevation maps (in terms of RMS2) with an asterisk the terms that change statisticallysignificantly with age.
In the young lens, the radii of curvature that we report here in vitro are close to those
reported in vivo for the maximally accommodated state.Dubbelman et al.[58] reported
anterior and posterior lens radii of curvature of 7 mm and 5 mm, respectively, in a 6-D
accommodating 25-year old lens in vivo, in good agreement to the 6.2 mm, and 5 mm
for anterior and posterior radius of an interpolated 25-year old lens in our study in vitro.
Radii of curvature found in vitro are similar in magnitude to those reported in vivo for
older lenses by Dubbleman who reported anterior and posterior lens radii of curvature
of 9.5 mm and 5.7 mm, respectively, studying a 60-year old lens, in agreement with 10.9
mm, and 5.6 mm for a lens of the same age in our study.
Conic Constant
Our data are comparable to the conic constants reported by Dubbelman et al.[57] for in
vivo unaccommodated lenses (-4 to 0.06 for the anterior surface and -3 to 1.96 for the
posterior surface, respectively), between 16 and 65 years. As expected, the agreement
between our in vitro data and in vivo data from Dubbelman is better in older eyes, due
to the differences in lens shape between the relaxed accommodation state (in vivo) and
the maximally accommodated state (in vitro) in young lenses. In fact, the anterior conic
lens constants in the isolated young lenses in our study are in excellent agreement with
those reported in maximally accommodated young lenses in (-12 to -3, in an age range
100
of 24 to 34 years). The positive anterior lens conic constant in the older eyes is also
consistent with results from a study by Manns et al.[145] who reported an average value
of 4.27 in a group of old isolated human lenses (average age 76.4 years).
5.4.2 GRIN distribution and equivalent refractive Index
Age dependence on nucleus/surface refractive index
We found a tendency for the nucleus refractive index to decrease with age, and the surface
refractive index to increase with age, although only the changes in the surface refractive
index showed statistical significance. The range of nucleus and surface refractive index
agree with those reported by de Castro et al.[48] using a similar GRIN reconstruction
technique, but based on 2-D cross sectional OCT images and a smaller lens sample
(n=9), although the relatively high scattering of the values prevented from observing a
clear behavior. The higher number of lenses of the current study (n=35) and smaller
uncertainties due to the 3-D nature of the data allowed us to reach near statistical
significance. These data are in agreement with the change in surface refractive index of
human lenses (anterior pole only) reported by Pierscionek[194] (n=14), using destructive
methods, and the decrease of nucleus refractive index reported by Jones et al.[104]
(n=20), using an MRI approach. Also, the decrease of the nucleus refractive index
with age is consistent with the hypothesis by Moffat et al.[161] that the lens nucleus
experiences an age-related decrease in the soluble protein.
Power exponent change
The shape of the GRIN profile changed with age, predominantly in the meridional di-
rection. For some lenses the meridional power exponent p2 changed across meridians,
but the magnitude of change was not correlated with age or surface shape (radii, conic
constant). The findings of a more distributed index in younger lenses and an increase of
the central plateau with age agree with earlier findings by Hemenger et al.[89], Moffat
et al.[161], Jones et al.[104] and de Castro et al.[48] Also, Kasthurirangan et al.[107]
reported higher exponents in the equatorial direction, than in the axial direction in both
young (accommodated) lenses and older lenses, with a larger increase for the equato-
rial power exponent (from 5.09 to 10.28) than for the axial power exponent (from 4.04
to 6.7) with age. Although the reported power exponent values of the GRIN should
better describe those of fully accommodated lenses, as isolated lenses approach a fully
accommodated state, we anticipate that the power exponent changes with age in the
current study are largely associated with age, and not the accommodation state. This
101
is supported by the finding in chapter 4, of the GRIN distribution with simulated ac-
commodation of cynomolgous monkey lenses in vitro, showing no significant differences
in the meridional or axial power exponent with accommodation. It is noticeable that,
despite the variability of the results, our estimated power exponents are lower (particu-
larly in older lenses) than earlier reports[48][107], although they support the increase of
the meridional exponent with age. To rule out potential differences associated with the
reconstruction model we repeated the reconstruction using a subset of 2D cross-sections
from our complete 3D dataset, and a 3-variable model with only one power exponent. In
comparison, the power exponent derived from the 2D model showed an age-dependence
similar to the meridional power exponent derived from the 3D model. This finding sug-
gests that the differences with respect to earlier results obtained from 2D data are likely
related to the measured sample, and not to the 2D versus 3D nature of the data. Our
power exponent findings reconcile the apparent contradiction in the expression reported
by Charman and Atchison in a recent article[41], where if the power exponent increases
(as typically reported to happen with age), then the average refractive index should show
a major increase with age. In contrast, another study reports a decrease of the average
refractive index with age45. Since the average refractive index is only dependent on
the axial power exponent, our finding that axial power exponent is practically constant
with age predicts only small differences in the average refractive index with age. Our
experimental measurements of average refractive index show a minor increase with age
(increase +0.002 from 20 to 70-year old lenses) in good agreement with the predicted
increase (+0.003 in the same age range) by Charman and Atchison. It should be men-
tioned that our average refractive index results (slightly lower than previous reports) are
derived directly from the OCT images (i.e. independent from the GRIN reconstruction).
Equivalent refractive index
We only found small, not statistically significant, decrease of the equivalent refrac-
tive index with age. Earlier literature found evidence for a decreasing equivalent re-
fractive index with age in vivo[57][70][12] but the in vitro results vary[72][32]. While
Pierscionek[194] (isolated lenses) and Glasser et al.[73] (isolated lenses) did not find
an age dependency of the equivalent refractive index, Borja et al.[32] (isolated lenses)
found a significant decrease with age. We expect that this variation is largely associ-
ated with age-related changes, and not due to accommodation, and therefore possibly
extrapolated in vivo, given the independence of refractive index with accommodation
recently reported in monkey lenses[142]. A reason for the discrepancy across data in
the equivalent refractive index values in the literature (and its change with age) may be
that indirect measurements of the lens power, such as those obtained by comparing lens
102
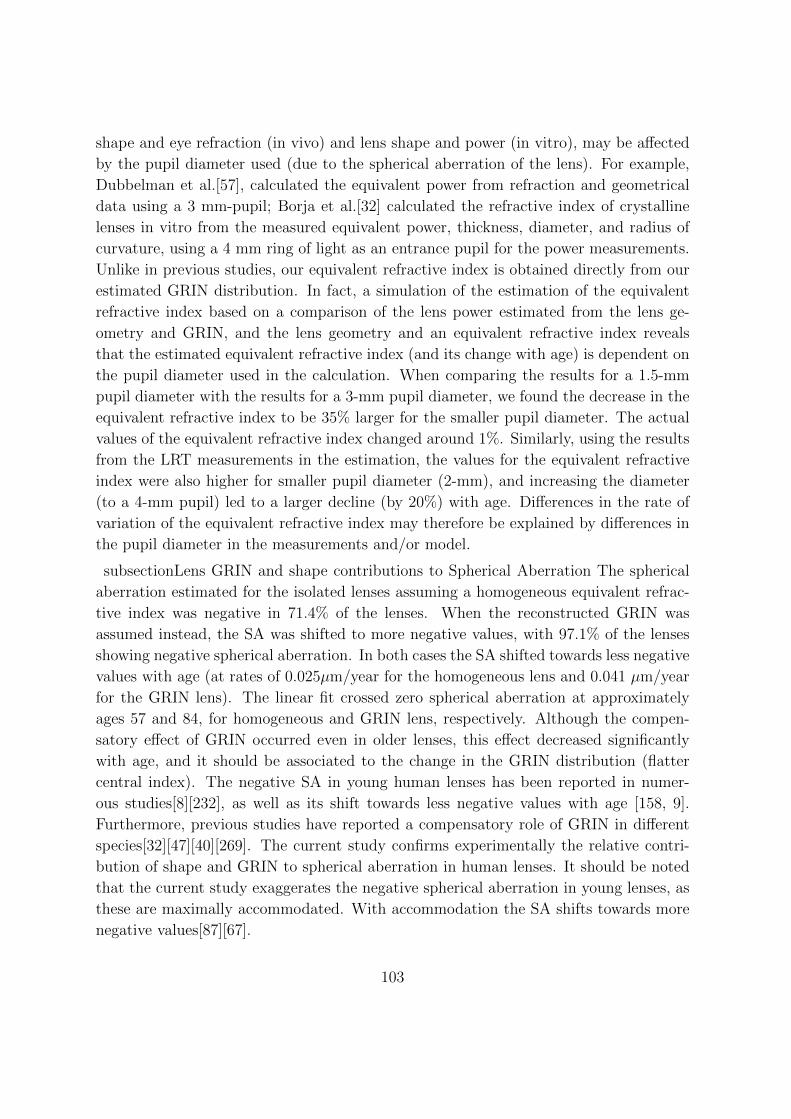
shape and eye refraction (in vivo) and lens shape and power (in vitro), may be affected
by the pupil diameter used (due to the spherical aberration of the lens). For example,
Dubbelman et al.[57], calculated the equivalent power from refraction and geometrical
data using a 3 mm-pupil; Borja et al.[32] calculated the refractive index of crystalline
lenses in vitro from the measured equivalent power, thickness, diameter, and radius of
curvature, using a 4 mm ring of light as an entrance pupil for the power measurements.
Unlike in previous studies, our equivalent refractive index is obtained directly from our
estimated GRIN distribution. In fact, a simulation of the estimation of the equivalent
refractive index based on a comparison of the lens power estimated from the lens ge-
ometry and GRIN, and the lens geometry and an equivalent refractive index reveals
that the estimated equivalent refractive index (and its change with age) is dependent on
the pupil diameter used in the calculation. When comparing the results for a 1.5-mm
pupil diameter with the results for a 3-mm pupil diameter, we found the decrease in the
equivalent refractive index to be 35% larger for the smaller pupil diameter. The actual
values of the equivalent refractive index changed around 1%. Similarly, using the results
from the LRT measurements in the estimation, the values for the equivalent refractive
index were also higher for smaller pupil diameter (2-mm), and increasing the diameter
(to a 4-mm pupil) led to a larger decline (by 20%) with age. Differences in the rate of
variation of the equivalent refractive index may therefore be explained by differences in
the pupil diameter in the measurements and/or model.
subsectionLens GRIN and shape contributions to Spherical Aberration The spherical
aberration estimated for the isolated lenses assuming a homogeneous equivalent refrac-
tive index was negative in 71.4% of the lenses. When the reconstructed GRIN was
assumed instead, the SA was shifted to more negative values, with 97.1% of the lenses
showing negative spherical aberration. In both cases the SA shifted towards less negative
values with age (at rates of 0.025µm/year for the homogeneous lens and 0.041 µm/year
for the GRIN lens). The linear fit crossed zero spherical aberration at approximately
ages 57 and 84, for homogeneous and GRIN lens, respectively. Although the compen-
satory effect of GRIN occurred even in older lenses, this effect decreased significantly
with age, and it should be associated to the change in the GRIN distribution (flatter
central index). The negative SA in young human lenses has been reported in numer-
ous studies[8][232], as well as its shift towards less negative values with age [158, 9].
Furthermore, previous studies have reported a compensatory role of GRIN in different
species[32][47][40][269]. The current study confirms experimentally the relative contri-
bution of shape and GRIN to spherical aberration in human lenses. It should be noted
that the current study exaggerates the negative spherical aberration in young lenses, as
these are maximally accommodated. With accommodation the SA shifts towards more
negative values[87][67].
103
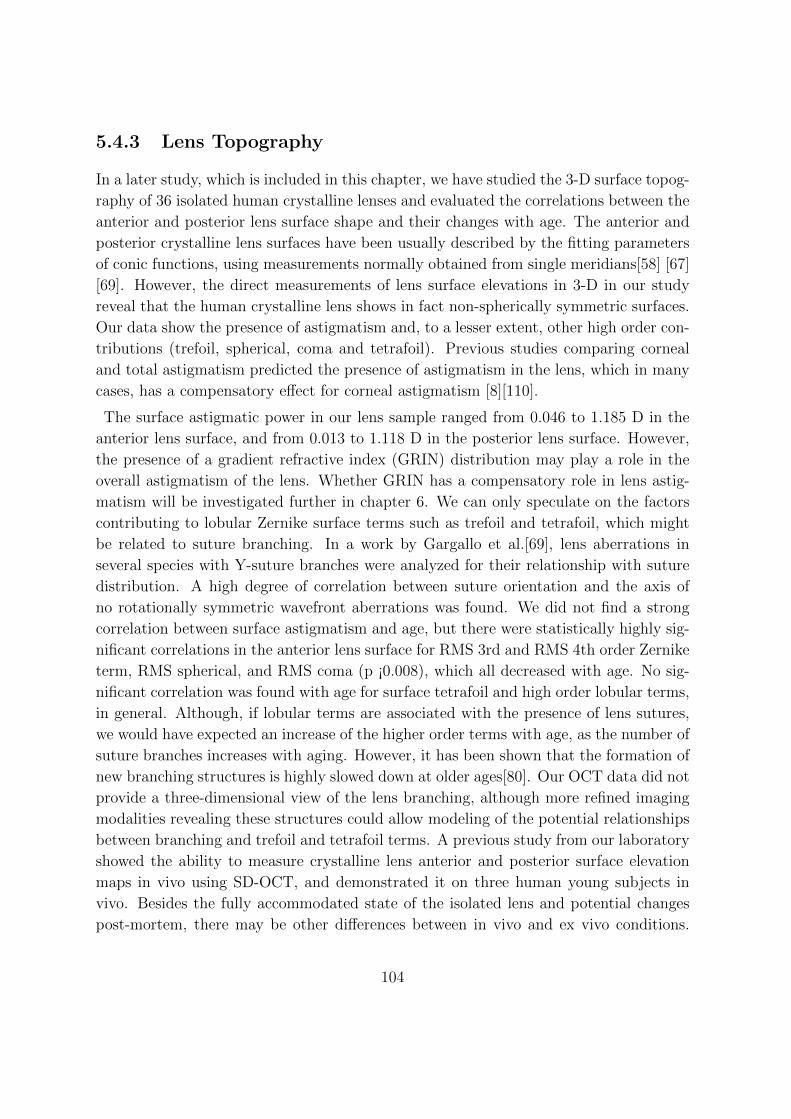
5.4.3 Lens Topography
In a later study, which is included in this chapter, we have studied the 3-D surface topog-
raphy of 36 isolated human crystalline lenses and evaluated the correlations between the
anterior and posterior lens surface shape and their changes with age. The anterior and
posterior crystalline lens surfaces have been usually described by the fitting parameters
of conic functions, using measurements normally obtained from single meridians[58] [67]
[69]. However, the direct measurements of lens surface elevations in 3-D in our study
reveal that the human crystalline lens shows in fact non-spherically symmetric surfaces.
Our data show the presence of astigmatism and, to a lesser extent, other high order con-
tributions (trefoil, spherical, coma and tetrafoil). Previous studies comparing corneal
and total astigmatism predicted the presence of astigmatism in the lens, which in many
cases, has a compensatory effect for corneal astigmatism [8][110].
The surface astigmatic power in our lens sample ranged from 0.046 to 1.185 D in the
anterior lens surface, and from 0.013 to 1.118 D in the posterior lens surface. However,
the presence of a gradient refractive index (GRIN) distribution may play a role in the
overall astigmatism of the lens. Whether GRIN has a compensatory role in lens astig-
matism will be investigated further in chapter 6. We can only speculate on the factors
contributing to lobular Zernike surface terms such as trefoil and tetrafoil, which might
be related to suture branching. In a work by Gargallo et al.[69], lens aberrations in
several species with Y-suture branches were analyzed for their relationship with suture
distribution. A high degree of correlation between suture orientation and the axis of
no rotationally symmetric wavefront aberrations was found. We did not find a strong
correlation between surface astigmatism and age, but there were statistically highly sig-
nificant correlations in the anterior lens surface for RMS 3rd and RMS 4th order Zernike
term, RMS spherical, and RMS coma (p ¡0.008), which all decreased with age. No sig-
nificant correlation was found with age for surface tetrafoil and high order lobular terms,
in general. Although, if lobular terms are associated with the presence of lens sutures,
we would have expected an increase of the higher order terms with age, as the number of
suture branches increases with aging. However, it has been shown that the formation of
new branching structures is highly slowed down at older ages[80]. Our OCT data did not
provide a three-dimensional view of the lens branching, although more refined imaging
modalities revealing these structures could allow modeling of the potential relationships
between branching and trefoil and tetrafoil terms. A previous study from our laboratory
showed the ability to measure crystalline lens anterior and posterior surface elevation
maps in vivo using SD-OCT, and demonstrated it on three human young subjects in
vivo. Besides the fully accommodated state of the isolated lens and potential changes
post-mortem, there may be other differences between in vivo and ex vivo conditions.
104
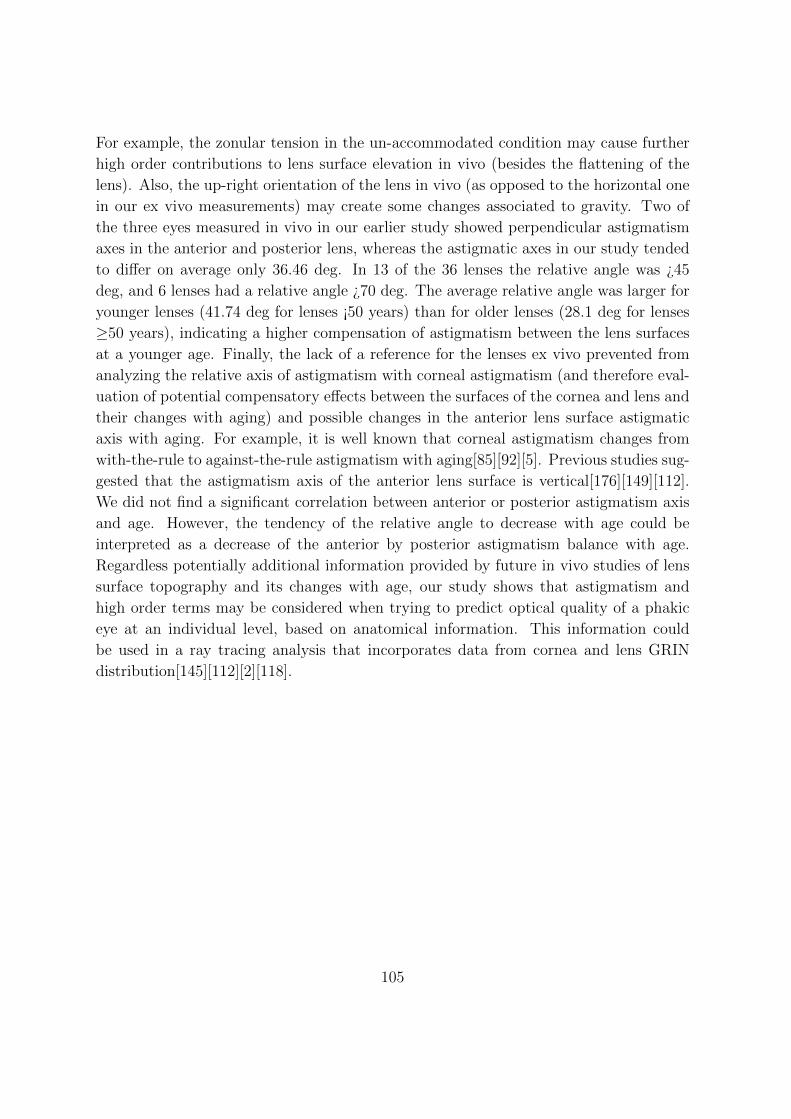
For example, the zonular tension in the un-accommodated condition may cause further
high order contributions to lens surface elevation in vivo (besides the flattening of the
lens). Also, the up-right orientation of the lens in vivo (as opposed to the horizontal one
in our ex vivo measurements) may create some changes associated to gravity. Two of
the three eyes measured in vivo in our earlier study showed perpendicular astigmatism
axes in the anterior and posterior lens, whereas the astigmatic axes in our study tended
to differ on average only 36.46 deg. In 13 of the 36 lenses the relative angle was ¿45
deg, and 6 lenses had a relative angle ¿70 deg. The average relative angle was larger for
younger lenses (41.74 deg for lenses ¡50 years) than for older lenses (28.1 deg for lenses
≥50 years), indicating a higher compensation of astigmatism between the lens surfaces
at a younger age. Finally, the lack of a reference for the lenses ex vivo prevented from
analyzing the relative axis of astigmatism with corneal astigmatism (and therefore eval-
uation of potential compensatory effects between the surfaces of the cornea and lens and
their changes with aging) and possible changes in the anterior lens surface astigmatic
axis with aging. For example, it is well known that corneal astigmatism changes from
with-the-rule to against-the-rule astigmatism with aging[85][92][5]. Previous studies sug-
gested that the astigmatism axis of the anterior lens surface is vertical[176][149][112].
We did not find a significant correlation between anterior or posterior astigmatism axis
and age. However, the tendency of the relative angle to decrease with age could be
interpreted as a decrease of the anterior by posterior astigmatism balance with age.
Regardless potentially additional information provided by future in vivo studies of lens
surface topography and its changes with age, our study shows that astigmatism and
high order terms may be considered when trying to predict optical quality of a phakic
eye at an individual level, based on anatomical information. This information could
be used in a ray tracing analysis that incorporates data from cornea and lens GRIN
distribution[145][112][2][118].
105

6Astigmatism of the in vitro human lens:
Surface and gradient refractive index
contributions
This chapter is based on the paper in revision by Birkenfeld et al. ”Astigmatism of the
in vitro human lens: Surface and gradient refractive index contributions” (Invest Oph-
thalmol, 2014). The author of this thesis (i) did the sample preparation, (ii) performed
the experiments (in collaboration with Alberto de Castro), (iii) performed data process-
ing (in collaboration with Alberto de Castro), (iv) wrote additional Matlab code, (v)
analyzed the results, and (vi) wrote the manuscript (in collaboration with Alberto de
Castro and Susana Marcos). In this study, we distinguished between lens astigmatism
and surface astigmatism to find how the different lens characteristics relate to each other.
We found a significant decrease of the astigmatic magnitude of the anterior surface with
age, while the posterior surface and the GRIN of the lens did not change significantly
with age. The total astigmatism of the lens decreased from negative values towards zero.
These results suggest that the anterior lens surface has a larger impact to the total lens
astigmatism, and that the influence of the GRIN to the lens astigmatism is limited.
106

6.1 Introduction
In the last chapter, we used 3-D OCT and LRT measurements to fully characterize
the surface geometry, topography, the GRIN distribution, and optical properties of 35
human donor lenses with age. We were able to investigate the influence of shape and
GRIN on the spherical aberrations of human lenses. As a result we concluded that
both, geometrical changes and GRIN contributes to the age-dependent shift of negative
spherical aberration. In this chapter, we use the collected date to draw conclusion about
the impact of lens surfaces and GRIN on the total astigmatism of the lens.
While the contributions of the cornea and lens, and the lens shape and GRIN to
spherical aberration have been relatively well studied, a similar analysis has not been
performed on the relative contributions to astigmatism, likely because most lens studies
to date only had access to 2-D data. Compensatory effects of anterior and posterior
corneal astigmatism have been reported[55, 60][61, 180, 205, 209]. Also, longitudinal
studies report changes in the cornea from with-the-rule (direct) to against-the-rule (in-
direct) astigmatism with age[21]. Measurements of total and corneal astigmatism from
ocular refraction[108, 109] or ocular aberration measurements[8, 110] suggest at least
partial compensation of total and internal astigmatism. In those studies, the contribu-
tions of the posterior cornea and lens to the internal optics cannot be isolated. In an
interesting study using an ophthalmophakometric technique, Elawad et al.[63] estimated
the ocular component contributions to residual astigmatism in human eyes, and found
that, whilst the astigmatic contributions of the posterior corneal and lens surfaces were
found to be predominantly inverse, that direct astigmatism came from the anterior lens
surface. Similar conclusions were reached by Dunne et al.[61] in a later work, although
the authors recognized that the method was indirect and prone to accumulated experi-
mental errors. To our knowledge, the only direct measurement of crystalline lens surface
astigmatism on ex vivo human lenses comes from surface topographic analysis (using
OCT)[243]. In that study we found that astigmatism was the predominant lens surface
aberration. We did not find a significant change in the amount of surface astigmatism
aberration with age, although the relative angle of astigmatism between the anterior
and posterior lens surfaces tended to decrease with age, indicating a potential decrease
in the compensatory effects of anterior and posterior lens astigmatism with age. The
study did not consider potential effects of the GRIN distribution with age. Access to
both, lens shape and GRIN in 3-D opens the possibility of evaluating the relative role
of lens surface and GRIN astigmatism to lens astigmatism, and the potential changes
with age, as in similar analysis of contributors of spherical aberration.
107
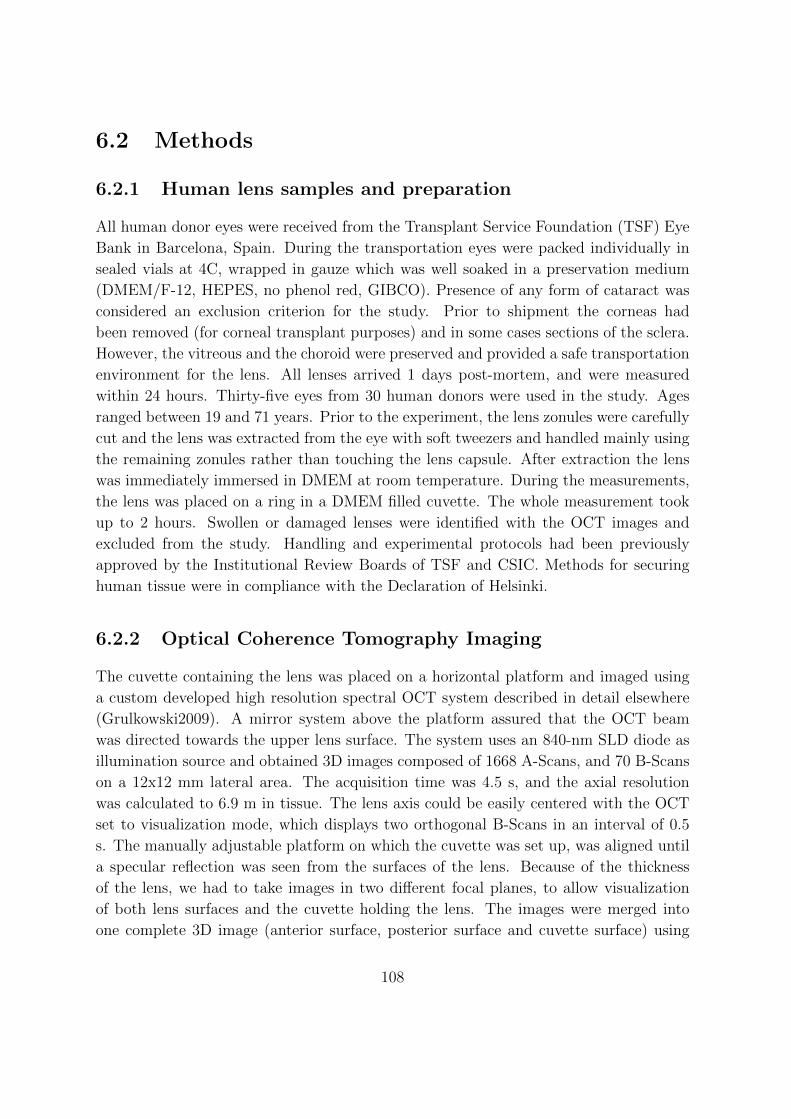
6.2 Methods
6.2.1 Human lens samples and preparation
All human donor eyes were received from the Transplant Service Foundation (TSF) Eye
Bank in Barcelona, Spain. During the transportation eyes were packed individually in
sealed vials at 4C, wrapped in gauze which was well soaked in a preservation medium
(DMEM/F-12, HEPES, no phenol red, GIBCO). Presence of any form of cataract was
considered an exclusion criterion for the study. Prior to shipment the corneas had
been removed (for corneal transplant purposes) and in some cases sections of the sclera.
However, the vitreous and the choroid were preserved and provided a safe transportation
environment for the lens. All lenses arrived 1 days post-mortem, and were measured
within 24 hours. Thirty-five eyes from 30 human donors were used in the study. Ages
ranged between 19 and 71 years. Prior to the experiment, the lens zonules were carefully
cut and the lens was extracted from the eye with soft tweezers and handled mainly using
the remaining zonules rather than touching the lens capsule. After extraction the lens
was immediately immersed in DMEM at room temperature. During the measurements,
the lens was placed on a ring in a DMEM filled cuvette. The whole measurement took
up to 2 hours. Swollen or damaged lenses were identified with the OCT images and
excluded from the study. Handling and experimental protocols had been previously
approved by the Institutional Review Boards of TSF and CSIC. Methods for securing
human tissue were in compliance with the Declaration of Helsinki.
6.2.2 Optical Coherence Tomography Imaging
The cuvette containing the lens was placed on a horizontal platform and imaged using
a custom developed high resolution spectral OCT system described in detail elsewhere
(Grulkowski2009). A mirror system above the platform assured that the OCT beam
was directed towards the upper lens surface. The system uses an 840-nm SLD diode as
illumination source and obtained 3D images composed of 1668 A-Scans, and 70 B-Scans
on a 12x12 mm lateral area. The acquisition time was 4.5 s, and the axial resolution
was calculated to 6.9 m in tissue. The lens axis could be easily centered with the OCT
set to visualization mode, which displays two orthogonal B-Scans in an interval of 0.5
s. The manually adjustable platform on which the cuvette was set up, was aligned until
a specular reflection was seen from the surfaces of the lens. Because of the thickness
of the lens, we had to take images in two different focal planes, to allow visualization
of both lens surfaces and the cuvette holding the lens. The images were merged into
one complete 3D image (anterior surface, posterior surface and cuvette surface) using
108
a custom-developed merging algorithm. The lens was first completely imaged with the
anterior surface facing the OCT beam, and was then flipped around a predetermined
axis and imaged again with the posterior surface up.
6.2.3 Laser Ray Tracing
After the OCT measurements, the focal length of each lens was calculated with the cus-
tom developed Laser Ray Tracer (LRT). The crystalline lenses were placed horizontally
in a cuvette (anterior up position), positioned on a stable platform. The bottom of the
cuvette consisted of optical glass, and a motorized CMOS camera was placed right under
the cuvette to capture a series of through-focus images from the beam directed through
the lens. The lenses were aligned with the LRT, such that the lens and principal ray
were collinear to the center of the CMOS camera, in the entire focus range (which was
the range of the motor, 35mm). With this set up the paraxial and non-paraxial focal
lengths of each lens were measured projecting rings of light of different diameters (2 and
4 mm) onto the crystalline lens’ upper surface. The estimated precision of the focal
length measurements was 0.8 mm. The focal length data was used as input data for the
GRIN reconstruction algorithm as described in.
6.2.4 Image Processing and GRIN Reconstruction
All OCT images were corrected from optical distortions and all surfaces (lens and cu-
vette) were fitted by Zernike polynomials (up to 7th order) within a 6-mm pupil. The
GRIN was reconstructed by means of a search algorithm using the optical path measured
from the OCT images and the measured back focal length. The gradient refractive index
is described as a 4-variable model expressed in polar coordinates centered in the center
of the lens as
n(ρ, θ) = nN −∆n ·(ρ
ρS
)p(θ)(6.1)
where is the refractive index of the nucleus, ∆n the difference between the refractive
index of surface and nucleus, is the distance between nucleus and surface, and is the
exponential decay for axial (p1) and meridional (p2) direction. The axial decay p1 is
constant across meridians while p2 can vary to account for differences between meridians.
The change of the power exponent p2, the decay of the GRIN in the meridional direction,
is an indicator of the GRIN contributor to astigmatism. A constant p2 across the lens is
indicative of no GRIN astigmatism. A sinusoidal variation of p2 across lens meridians is
indicative of the presence of GRIN astigmatism. In all computations The center of the
lens is assumed to be placed at a distance form the anterior vertex equal to 0.41 times
109
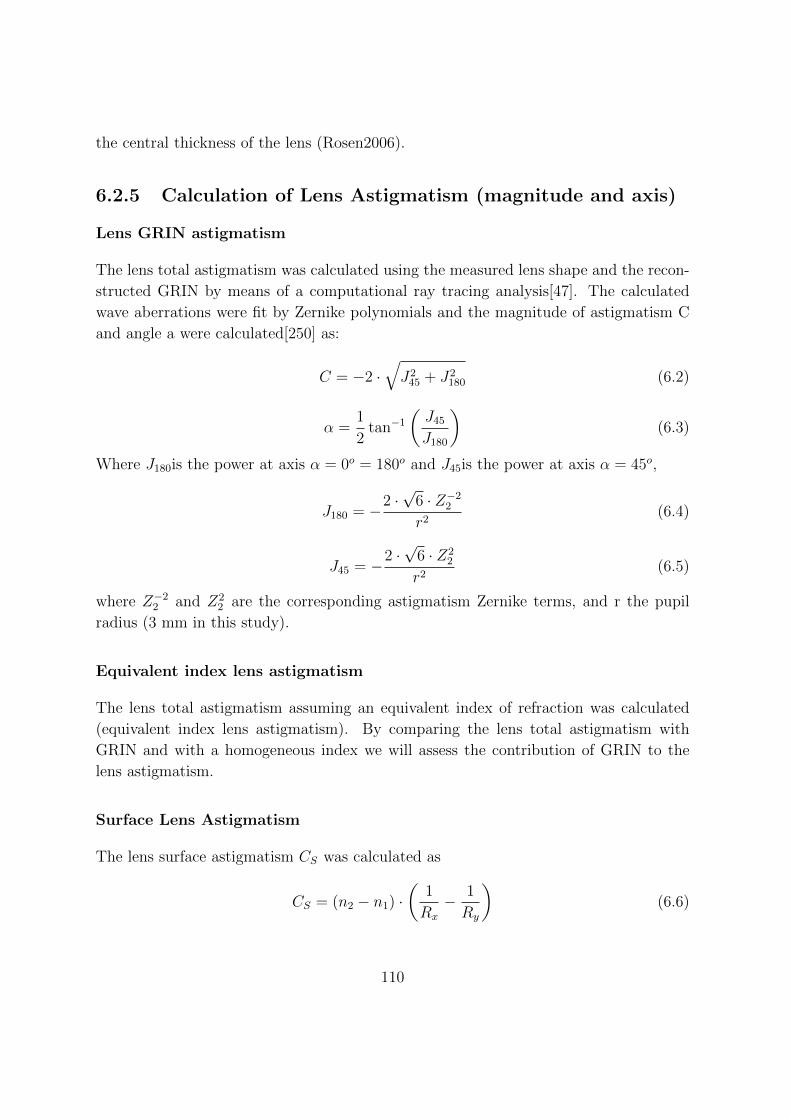
the central thickness of the lens (Rosen2006).
6.2.5 Calculation of Lens Astigmatism (magnitude and axis)
Lens GRIN astigmatism
The lens total astigmatism was calculated using the measured lens shape and the recon-
structed GRIN by means of a computational ray tracing analysis[47]. The calculated
wave aberrations were fit by Zernike polynomials and the magnitude of astigmatism C
and angle a were calculated[250] as:
C = −2 ·√J245 + J2
180 (6.2)
α =1
2tan−1
(J45J180
)(6.3)
Where J180is the power at axis α = 0o = 180o and J45is the power at axis α = 45o,
J180 = −2 ·√
6 · Z−22
r2(6.4)
J45 = −2 ·√
6 · Z22
r2(6.5)
where Z−22 and Z2
2 are the corresponding astigmatism Zernike terms, and r the pupil
radius (3 mm in this study).
Equivalent index lens astigmatism
The lens total astigmatism assuming an equivalent index of refraction was calculated
(equivalent index lens astigmatism). By comparing the lens total astigmatism with
GRIN and with a homogeneous index we will assess the contribution of GRIN to the
lens astigmatism.
Surface Lens Astigmatism
The lens surface astigmatism CS was calculated as
CS = (n2 − n1) ·(
1
Rx
− 1
Ry
)(6.6)
110

where Rx is the astigmatic angle and Ry is the axis perpendicular to Rx. n1 and n2 are
the refractive indices of the lens immersion medium and the lens cortex, respectively.
The index of refraction of the lens cortex (n2) was taken directly from our results from
the GRIN reconstruction, individually for every lens. The refractive index of aqueous
(n1) was assumed to be 1.336[142].
Relative Astigmatic Angle
Since the orientation of the isolated lens during the measurements is arbitrary, i.e. not
corresponding to its actual orientation in vivo (up, down, nasal, temporal), the calculated
axis of astigmatism of the lens surfaces is arbitrary. However, the relative angle between
the different axes of astigmatism (anterior, posterior, GRIN, and total astigmatic axis
(the latter for GRIN lens and equivalent refractive index lens)) can be computed, and
defined, in a range between 0 and 90 deg. The axis of astigmatism of the GRIN is defined
as the meridian with the minimum value of p2 (exponential decay of the refractive index
in meridional direction) which is associated with the most increase in lens power.
Power Vector Analysis
To illustrate the magnitude of astigmatism and angle, the results are presented using a
power vector graph (Thibos01, Liu11). For this we assumed that the axis of astigmatism
of the anterior lens surface is aligned vertically in all lenses. This way we could see
how the GRIN astigmatism and the posterior surface lens astigmatism is rotated with
respect to the vertical aligned anterior surface, and how these relative angles change
with age. Furthermore, we could compare the lens astigmatism of the GRIN lens and
the corresponding homogenous lens.
6.3 Results
6.3.1 Change of magnitude of astigmatism with age
Figure 6.1 shows the change of the anterior and posterior lens surface astigmatism with
age, fitted by linear regression. While the posterior lens surface astigmatism does not
change significantly with age (r=0.189, p=0.276), the anterior lens surface astigma-
tism decreases significantly with age (r= 0.397 and p=0.018). Figure 6.2 a shows the
change of the lens magnitude of astigmatism with age for the crystalline lenses with
the reconstructed GRIN (r= 0.359, p=0.034) in comparison to the lens magnitude of
111
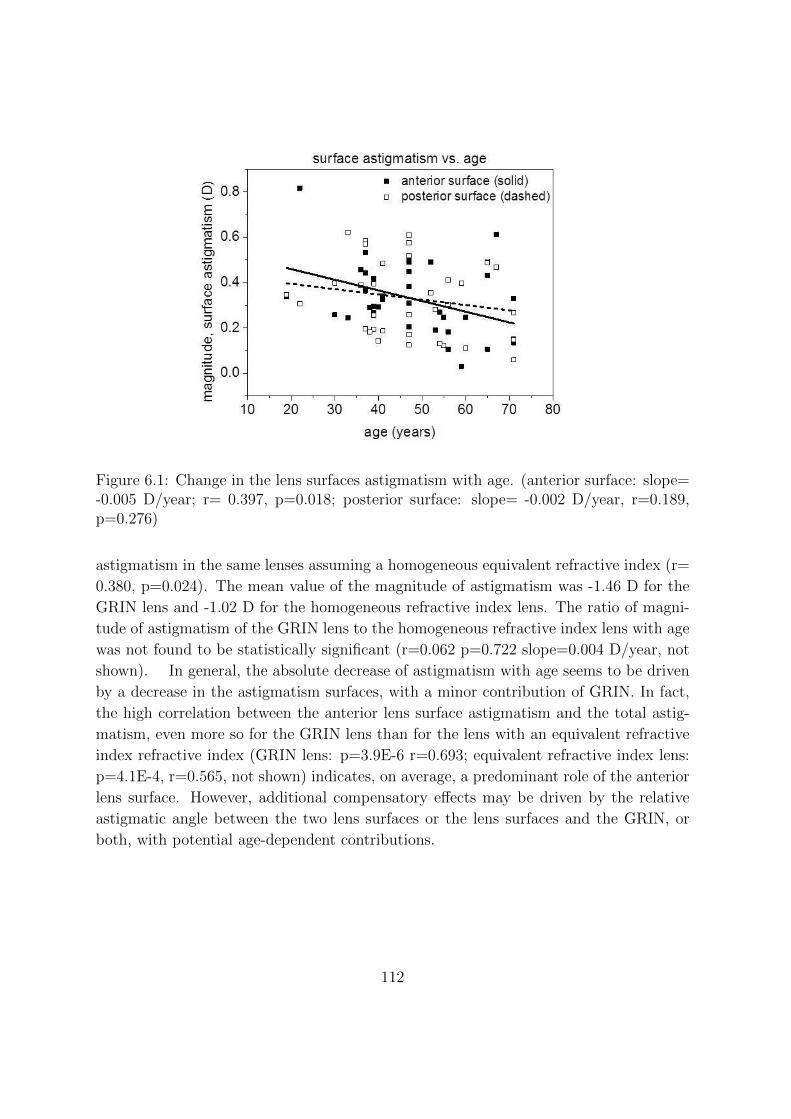
Figure 6.1: Change in the lens surfaces astigmatism with age. (anterior surface: slope=-0.005 D/year; r= 0.397, p=0.018; posterior surface: slope= -0.002 D/year, r=0.189,p=0.276)
astigmatism in the same lenses assuming a homogeneous equivalent refractive index (r=
0.380, p=0.024). The mean value of the magnitude of astigmatism was -1.46 D for the
GRIN lens and -1.02 D for the homogeneous refractive index lens. The ratio of magni-
tude of astigmatism of the GRIN lens to the homogeneous refractive index lens with age
was not found to be statistically significant (r=0.062 p=0.722 slope=0.004 D/year, not
shown). In general, the absolute decrease of astigmatism with age seems to be driven
by a decrease in the astigmatism surfaces, with a minor contribution of GRIN. In fact,
the high correlation between the anterior lens surface astigmatism and the total astig-
matism, even more so for the GRIN lens than for the lens with an equivalent refractive
index refractive index (GRIN lens: p=3.9E-6 r=0.693; equivalent refractive index lens:
p=4.1E-4, r=0.565, not shown) indicates, on average, a predominant role of the anterior
lens surface. However, additional compensatory effects may be driven by the relative
astigmatic angle between the two lens surfaces or the lens surfaces and the GRIN, or
both, with potential age-dependent contributions.
112
Figure 6.2: Change in the lens total astigmatism with age; lens with GRIN: slope: 0.022D/year r= 0.359, p=0.034; Lens with equivalent refractive index: slope: 0.018D/year,r= 0.380, p=0.024).
6.3.2 Change of relative astigmatic angles with age
The lack of information on the actual orientation of the lens in vivo resulted in the defi-
nition of the astigmatic relative angle. We studied potential changes with age of the rel-
ative astigmatic angle between anterior and posterior surface axis of astigmatism, GRIN
axis and anterior axis of astigmatism, GRIN axis and posterior axis of astigmatism, and
between the lens total astigmatism axis with GRIN and the lens total astigmatism axis
with a homogeneous refractive index. Figure 6.3 and 6.4 show polar plots (using the
power vector analysis notation) for astigmatic magnitude and axes of the lens surface,
the GRIN (the axis of GRIN astigmatism was associated with the axis of minimum
value of the power exponent p2 which would give the most increase in lens power), and
the lens with both, GRIN and equivalent refractive index. For illustration purposes we
assumed that all lenses were aligned such that the anterior lens axis was aligned with
the steepest meridian along the vertical axis. The magnitude of astigmatism is indicated
on the left scale in absolute values, and the angle, indicated in the polar plot, represent
the aligned angle or the relative angle. Each dot represents one lens. Figure 6.3 a shows
magnitude and aligned (steepest) meridian of the anterior surface astigmatism. Figure
6.3 b shows the shift in angle of the posterior surface astigmatic axis, relative to the
aligned anterior axis, and the values of astigmatic magnitude of the posterior lens surface
astigmatism. The average relative angel between anterior and posterior surface was 48.3
113
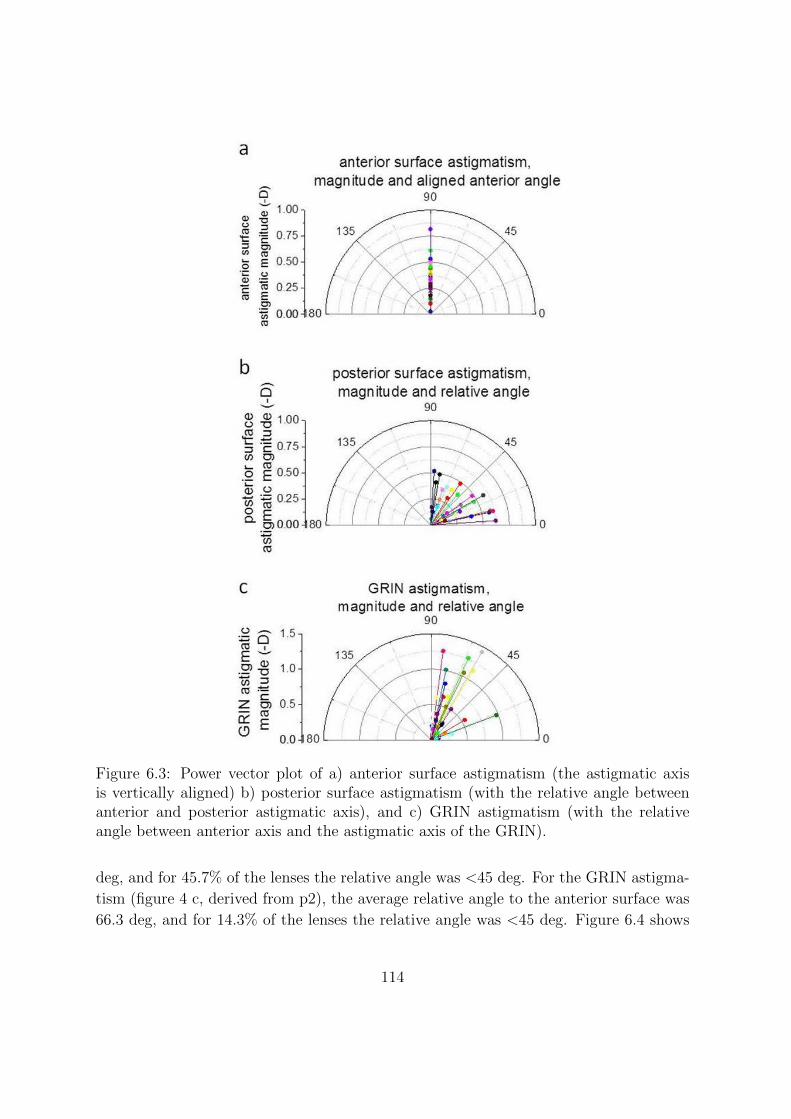
Figure 6.3: Power vector plot of a) anterior surface astigmatism (the astigmatic axisis vertically aligned) b) posterior surface astigmatism (with the relative angle betweenanterior and posterior astigmatic axis), and c) GRIN astigmatism (with the relativeangle between anterior axis and the astigmatic axis of the GRIN).
deg, and for 45.7% of the lenses the relative angle was <45 deg. For the GRIN astigma-
tism (figure 4 c, derived from p2), the average relative angle to the anterior surface was
66.3 deg, and for 14.3% of the lenses the relative angle was <45 deg. Figure 6.4 shows
114
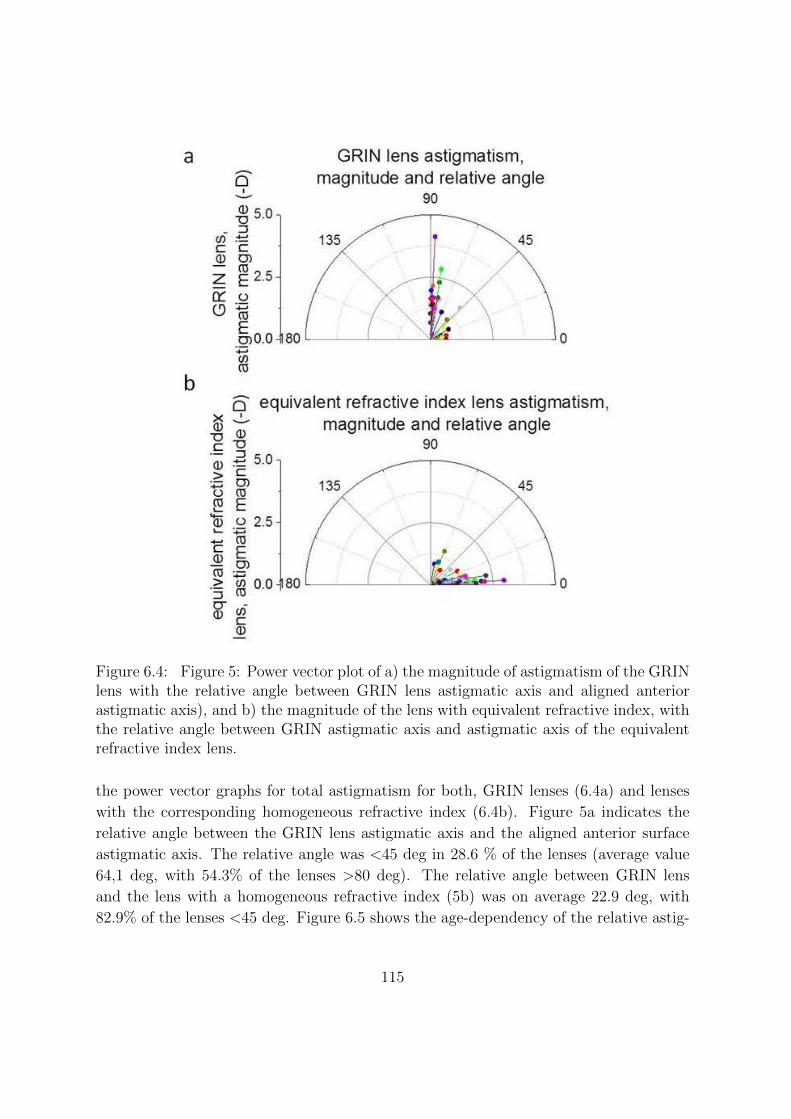
Figure 6.4: Figure 5: Power vector plot of a) the magnitude of astigmatism of the GRINlens with the relative angle between GRIN lens astigmatic axis and aligned anteriorastigmatic axis), and b) the magnitude of the lens with equivalent refractive index, withthe relative angle between GRIN astigmatic axis and astigmatic axis of the equivalentrefractive index lens.
the power vector graphs for total astigmatism for both, GRIN lenses (6.4a) and lenses
with the corresponding homogeneous refractive index (6.4b). Figure 5a indicates the
relative angle between the GRIN lens astigmatic axis and the aligned anterior surface
astigmatic axis. The relative angle was <45 deg in 28.6 % of the lenses (average value
64,1 deg, with 54.3% of the lenses >80 deg). The relative angle between GRIN lens
and the lens with a homogeneous refractive index (5b) was on average 22.9 deg, with
82.9% of the lenses <45 deg. Figure 6.5 shows the age-dependency of the relative astig-
115

Figure 6.5: Relative astigmatic angle between (a) the anterior and posterior surfaceastigmatic axis as a function of age (r=0.290 p=0.091 slope=0.586 deg/year); (b) theanterior astigmatic axis and the GRIN astigmatic axis as a function of age (r=0.007p=0.966 slope=-0.012 deg/year); (c) anterior lens surface astigmatism and total lensastigmatism (with GRIN); r=0.452 p=0.006 slope=-0.997 deg/year and with homoge-neous refractive index (r=0.281 p=0.102 slope=-0.384), and (d) GRIN astigmatic axisand equivalent refractive index lens astigmatic axis as a function of age (r=0.393 p=0.169slope=-0.384 deg/year).
matic angle. Although there is a tendency for the relative astigmatic angle between the
anterior and posterior lens to increase with age, this change does not reach statistical
significance (Figure 4a; r= 0.290, p= 0.091, slope: 0.586). The meridional change of p2
did not show any age dependency (figure 6.5b, r=0.007 p=0.966 slope=-0.012, fit not
shown). Interestingly, there is a difference between the total lens astigmatic axis (with
GRIN) and that of the anterior lens axis (taken as a reference for each lens), and this
difference decreases statistically significantly with age (Figure 6.5c; r=0.452 p=0.006
slope=-0.997). On average, the relative axis between the anterior lens and total lens
astigmatism is close to 90 deg in the young lens, suggesting a compensatory role by the
116
GRIN and posterior surface, with age this relative angle decreases to values closer to 45
deg in the older lenses. Conversely, when the astigmatic axis with equivalent refractive
index is similarly compared with the anterior lens, this dependency was not present (4c,
dashed line, r=0.281 p=0.102 slope=-0.384), neither was any age dependency detected
for the posterior lens surface (not shown). Figure 4d shows the relative angle between
GRIN astigmatic axis and the astigmatic axis of the lens with the equivalent refractive
index with age. As mentioned before, most of the lenses (82.9%) had a relative angle <
45 deg, throughout all ages. No age-dependency was found.
6.4 Discussion
In this study, we distinguish between lens astigmatism and surface astigmatism to find
how the different lens characteristics (GRIN, individual surfaces) relate to each other.
We found a significant decrease of the astigmatic magnitude of the anterior surface
with age, from positive values towards zero (slope= -0.005 D/year; r= 0.397, p=0.018),
while the posterior surface and the GRIN of the lens did not change significantly with
age. The total astigmatism of the lens decreased from negative values towards zero
(GRIN: slope: 0.022 D/year r= 0.359, p=0.034; Lens with equivalent refractive index:
slope: 0.018D/year, r= 0.380, p=0.024). These results suggest that the anterior lens
surface has a larger impact to the total lens astigmatism, and that the influence of the
GRIN to the lens astigmatism is limited. This behavior is also supported by the high
correlation between the total lens astigmatism and the anterior lens astigmatism (GRIN
lens: p=3.9E-6 r=0.693; equivalent refractive index lens: p=4.1E-4, r=0.565). Although
our results regarding the orientation of the astigmatic axis lack of information on the
actual orientation of the lens in vivo, we could study the relative angle between anterior
and posterior surface axis of astigmatism, GRIN axis and anterior axis of astigmatism,
GRIN axis and posterior axis of astigmatism, and between the lens total astigmatism
axis with GRIN and the lens total astigmatism axis with a homogeneous refractive
index. We did not find that the GRIN plays part in the astigmatism compensation
with age, indeed, the relative angle between the GRIN lens astigmatic axis and the
astigmatic axis of the equivalent refractive index lens was on average 22.9 deg, with
82.9% of the lenses <45 deg. In keeping with the predominant role of the anterior
lens, we found a strong correlation between the anterior astigmatic axis and the GRIN
astigmatic axis as a function of age (r=0.007 p=0.966 slope=-0.012 deg/year). The
relative angle between anterior and posterior astigmatic axis had a tendency to increase,
but showed no significant correlation (r=0.290 p=0.091 slope=0.586 deg/year).
Our results support the findings from Elawad[63] who found that direct astigmatism
117
came from the anterior lens surface. The magnitude and axis of the internal crystalline
lens astigmatism has been a matter of controversy. Traditionally, Javals rule is assumed,
implying a linear relationship between corneal and refractive astigmatism, with a con-
stant offset of 0.5 D of against-the-rule astigmatism (arising from internal astigmatism).
However, multiple modifications of this rule have been proposed, and significant devia-
tions in the relationship between ocular and corneal astigmatism have been reported with
age[108, 77, 78]. Corneal astigmatism is known to change its axis with age (from with-
the-rule to against-the-rule[220][86]). Reports of the magnitude of corneal and refractive
astigmatism differ across studies, with some works reporting no change of either, while
others report significant changes of one or both. In those studies, internal astigmatism
is computed indirectly from comparisons of corneal and ocular astigmatism, sometimes
from different datasets, which may pose uncertainties.
The lack of knowledge of the real orientation to the cornea in our study, sets obvious
limitations. Nevertheless, the study showed, that the crystalline lens’ individual optics,
like lens surfaces and the GRIN, can be studied individually to understand the purpose
of every component in the crystalline lens as an optical instrument. In vivo studies
are necessary to investigate these components with accommodation, but an ongoing
challenge is the measurement of the GRIN in vivo from OCT data. Off-axis OCT seems
to be a possible answer, as it was shown by de Castro et al. (A. de Castro,poster,
ARVO2014).
118
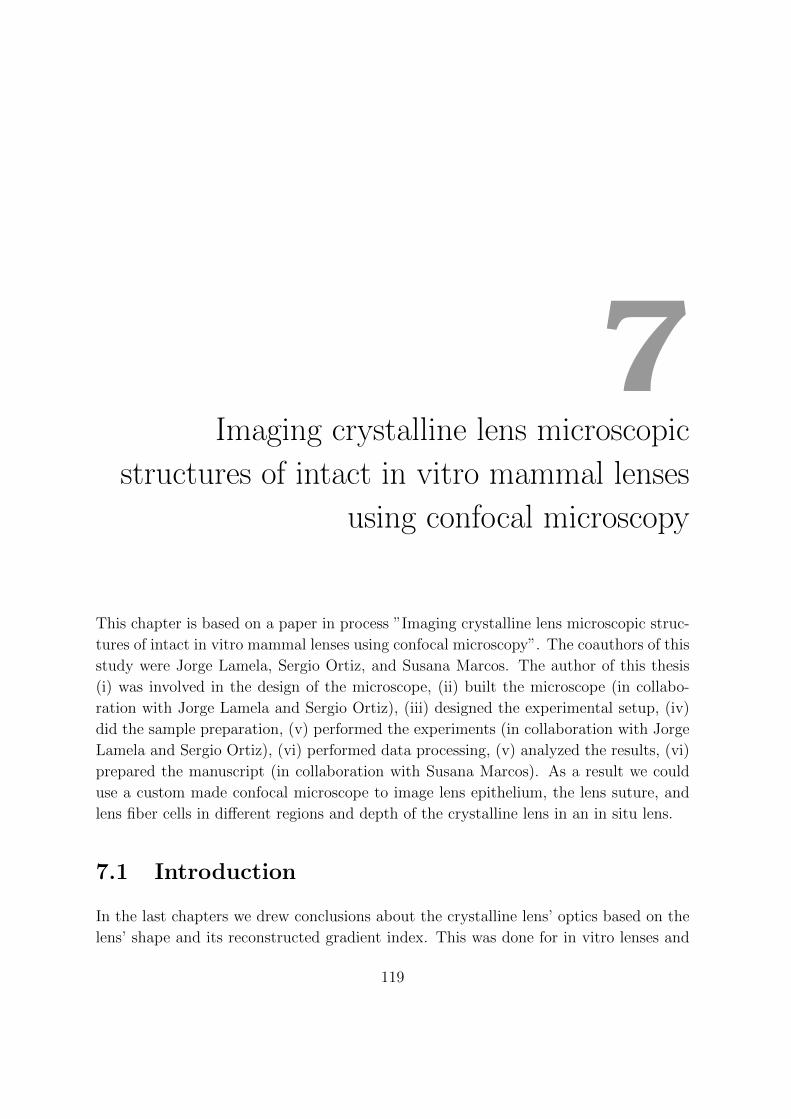
7Imaging crystalline lens microscopic
structures of intact in vitro mammal lenses
using confocal microscopy
This chapter is based on a paper in process ”Imaging crystalline lens microscopic struc-
tures of intact in vitro mammal lenses using confocal microscopy”. The coauthors of this
study were Jorge Lamela, Sergio Ortiz, and Susana Marcos. The author of this thesis
(i) was involved in the design of the microscope, (ii) built the microscope (in collabo-
ration with Jorge Lamela and Sergio Ortiz), (iii) designed the experimental setup, (iv)
did the sample preparation, (v) performed the experiments (in collaboration with Jorge
Lamela and Sergio Ortiz), (vi) performed data processing, (v) analyzed the results, (vi)
prepared the manuscript (in collaboration with Susana Marcos). As a result we could
use a custom made confocal microscope to image lens epithelium, the lens suture, and
lens fiber cells in different regions and depth of the crystalline lens in an in situ lens.
7.1 Introduction
In the last chapters we drew conclusions about the crystalline lens’ optics based on the
lens’ shape and its reconstructed gradient index. This was done for in vitro lenses and
119
lenses in a stretching system to simulate the lens’ natural accommodation in vivo. In
the long run, these information have to be connected with structural aspects on the
microscopic level. The ability to investigate the lens’ shape, GRIN and microscopic
structures with simulated accommodation (or in the living eye), would give greater
insights into the interplay of optical properties and lens structures and would lead to a
better and more comprehensive understanding of lens mechanisms. As a first step, we
investigated the ability to image essential lens structures in an intact rabbit lens (still
attached to the eye) by means of a custom built confocal microscope.
Confocal microscopy has been used as a way to observe the eye in an unstained, unfixed,
living condition. It provides high-resolution, high-contrast images, and the capability
to section the sample without contact. One of the main research fields of the confocal
microscope in eye research is the in vivo investigation of the cornea[152, 271, 153, 31,
173, 184, 101, 185, 171, 144, 135, 134]. Therefore, literature on crystalline lens inves-
tigation, realized with confocal microscopy are scarce. Jeacocke et al.[102] and Xiao
et al.[271] observed an isolated crystalline lens of a rabbit with a confocal microscopy.
Xiao et al. could image lens fibers of a freshly excised lens about 200um below the lens
surface. Masters et al.[150] used confocal microscopy to image the fine structure of an
in-situ rabbit crystalline lens from an ex-vivo rabbit eye through the full thickness of
the cornea and aqueous humour. With this study, Masters could show the feasibility
of confocal microscopy to achieve high-contrast images of transparent objects across 1.7
mm (crossing cornea and aqueous humour). Masters did a comparison study between
confocal microscopy and SEM to further investigate the potential of confocal microscopy
for observations of pathology in the anterior segment of the eye[154]. In vitro confocal
microscopy showed high resolution images of the epithelium and superficial lens fibers.
The compared SEM images fully supported the confocal images, and the study showed
that confocal microsopy has the potential to become a useful tool for imaging the anterior
segment of the eye.
Marcantonio et al.[148] used confocal microscopy to determine the level of cell coverage
in human donor capsular bags with implants intraocular lenses, and concluded that they
contain a large population of cells, even up to 13 years after surgery. Stachs et al. an-
alyzed different cutting effects of femtosecond laser cuts with confocal microscopy[239].
He analyzed the cuts inside of crystalline lens tissue and found altered tissue scattering
properties with intact lens fibers to concrete fiber seperation, depending on femtosec-
ond laser pulse energies. A study by Maddala et al.[143] also imaged lens fibers with
a confocal microscope. The transparency of the lens depends on packing symmetry
and membrane organization of the lens fibers. Concluding from his results, Maddala
suggested a key role for the protein Periaxin in maturation, packing, and membrane
organization of lens fiber cells. Reiss et al.[211] revealed a degenerative aging process
120
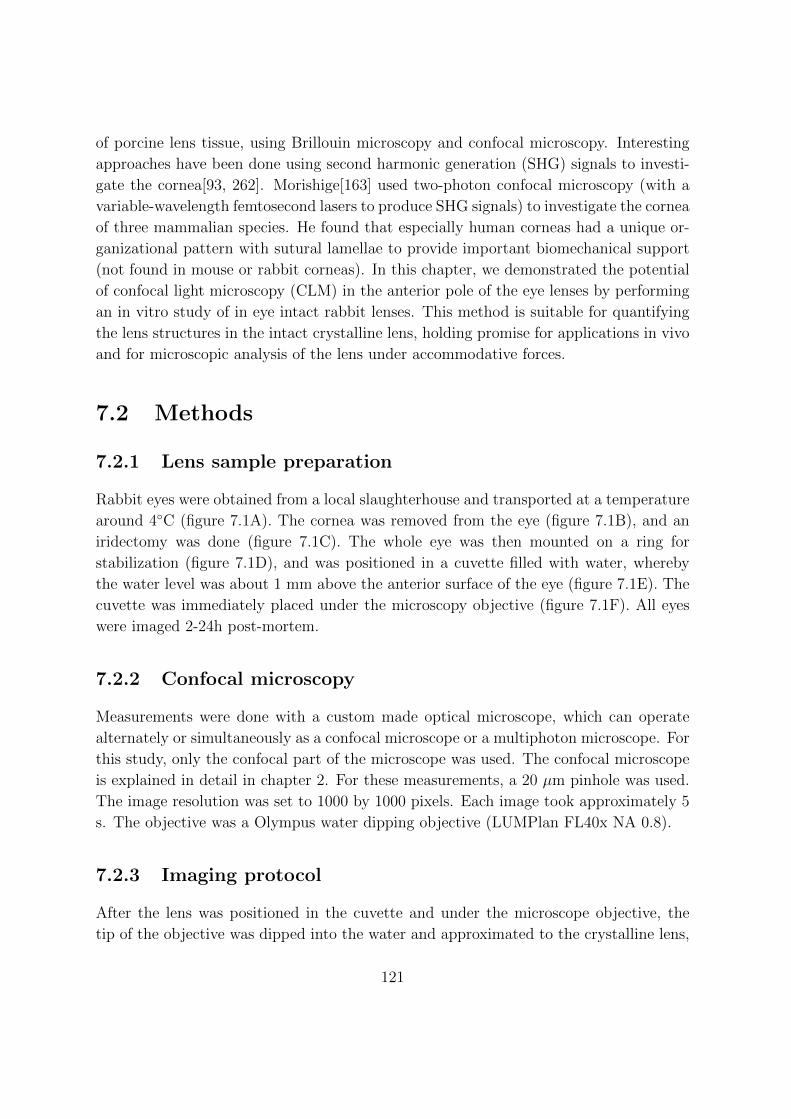
of porcine lens tissue, using Brillouin microscopy and confocal microscopy. Interesting
approaches have been done using second harmonic generation (SHG) signals to investi-
gate the cornea[93, 262]. Morishige[163] used two-photon confocal microscopy (with a
variable-wavelength femtosecond lasers to produce SHG signals) to investigate the cornea
of three mammalian species. He found that especially human corneas had a unique or-
ganizational pattern with sutural lamellae to provide important biomechanical support
(not found in mouse or rabbit corneas). In this chapter, we demonstrated the potential
of confocal light microscopy (CLM) in the anterior pole of the eye lenses by performing
an in vitro study of in eye intact rabbit lenses. This method is suitable for quantifying
the lens structures in the intact crystalline lens, holding promise for applications in vivo
and for microscopic analysis of the lens under accommodative forces.
7.2 Methods
7.2.1 Lens sample preparation
Rabbit eyes were obtained from a local slaughterhouse and transported at a temperature
around 4◦C (figure 7.1A). The cornea was removed from the eye (figure 7.1B), and an
iridectomy was done (figure 7.1C). The whole eye was then mounted on a ring for
stabilization (figure 7.1D), and was positioned in a cuvette filled with water, whereby
the water level was about 1 mm above the anterior surface of the eye (figure 7.1E). The
cuvette was immediately placed under the microscopy objective (figure 7.1F). All eyes
were imaged 2-24h post-mortem.
7.2.2 Confocal microscopy
Measurements were done with a custom made optical microscope, which can operate
alternately or simultaneously as a confocal microscope or a multiphoton microscope. For
this study, only the confocal part of the microscope was used. The confocal microscope
is explained in detail in chapter 2. For these measurements, a 20 µm pinhole was used.
The image resolution was set to 1000 by 1000 pixels. Each image took approximately 5
s. The objective was a Olympus water dipping objective (LUMPlan FL40x NA 0.8).
7.2.3 Imaging protocol
After the lens was positioned in the cuvette and under the microscope objective, the
tip of the objective was dipped into the water and approximated to the crystalline lens,
121
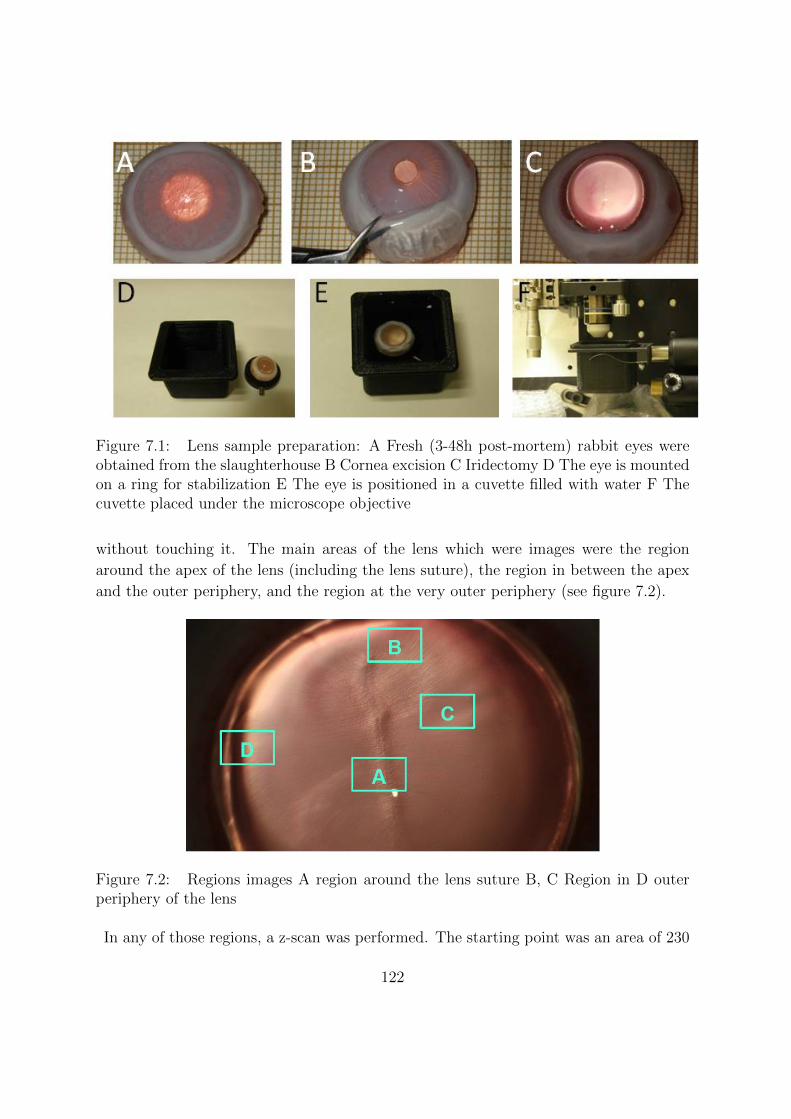
Figure 7.1: Lens sample preparation: A Fresh (3-48h post-mortem) rabbit eyes wereobtained from the slaughterhouse B Cornea excision C Iridectomy D The eye is mountedon a ring for stabilization E The eye is positioned in a cuvette filled with water F Thecuvette placed under the microscope objective
without touching it. The main areas of the lens which were images were the region
around the apex of the lens (including the lens suture), the region in between the apex
and the outer periphery, and the region at the very outer periphery (see figure 7.2).
Figure 7.2: Regions images A region around the lens suture B, C Region in D outerperiphery of the lens
In any of those regions, a z-scan was performed. The starting point was an area of 230
122
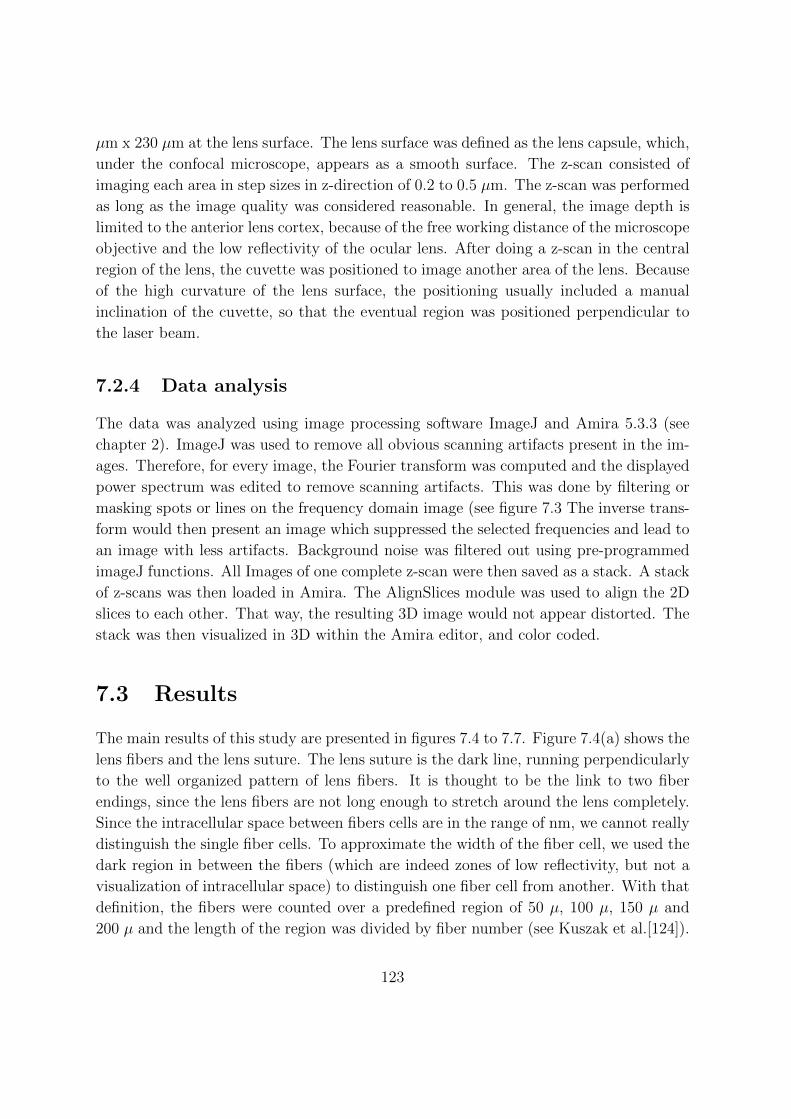
µm x 230 µm at the lens surface. The lens surface was defined as the lens capsule, which,
under the confocal microscope, appears as a smooth surface. The z-scan consisted of
imaging each area in step sizes in z-direction of 0.2 to 0.5 µm. The z-scan was performed
as long as the image quality was considered reasonable. In general, the image depth is
limited to the anterior lens cortex, because of the free working distance of the microscope
objective and the low reflectivity of the ocular lens. After doing a z-scan in the central
region of the lens, the cuvette was positioned to image another area of the lens. Because
of the high curvature of the lens surface, the positioning usually included a manual
inclination of the cuvette, so that the eventual region was positioned perpendicular to
the laser beam.
7.2.4 Data analysis
The data was analyzed using image processing software ImageJ and Amira 5.3.3 (see
chapter 2). ImageJ was used to remove all obvious scanning artifacts present in the im-
ages. Therefore, for every image, the Fourier transform was computed and the displayed
power spectrum was edited to remove scanning artifacts. This was done by filtering or
masking spots or lines on the frequency domain image (see figure 7.3 The inverse trans-
form would then present an image which suppressed the selected frequencies and lead to
an image with less artifacts. Background noise was filtered out using pre-programmed
imageJ functions. All Images of one complete z-scan were then saved as a stack. A stack
of z-scans was then loaded in Amira. The AlignSlices module was used to align the 2D
slices to each other. That way, the resulting 3D image would not appear distorted. The
stack was then visualized in 3D within the Amira editor, and color coded.
7.3 Results
The main results of this study are presented in figures 7.4 to 7.7. Figure 7.4(a) shows the
lens fibers and the lens suture. The lens suture is the dark line, running perpendicularly
to the well organized pattern of lens fibers. It is thought to be the link to two fiber
endings, since the lens fibers are not long enough to stretch around the lens completely.
Since the intracellular space between fibers cells are in the range of nm, we cannot really
distinguish the single fiber cells. To approximate the width of the fiber cell, we used the
dark region in between the fibers (which are indeed zones of low reflectivity, but not a
visualization of intracellular space) to distinguish one fiber cell from another. With that
definition, the fibers were counted over a predefined region of 50 µ, 100 µ, 150 µ and
200 µ and the length of the region was divided by fiber number (see Kuszak et al.[124]).
123
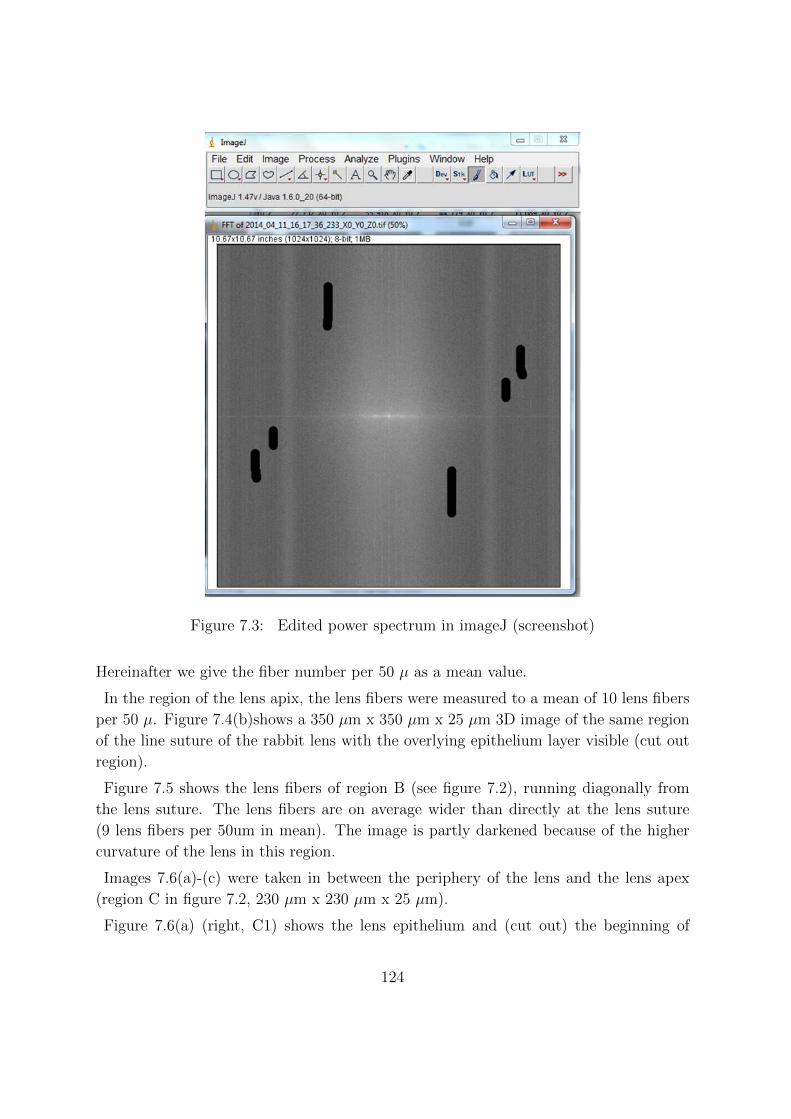
Figure 7.3: Edited power spectrum in imageJ (screenshot)
Hereinafter we give the fiber number per 50 µ as a mean value.
In the region of the lens apix, the lens fibers were measured to a mean of 10 lens fibers
per 50 µ. Figure 7.4(b)shows a 350 µm x 350 µm x 25 µm 3D image of the same region
of the line suture of the rabbit lens with the overlying epithelium layer visible (cut out
region).
Figure 7.5 shows the lens fibers of region B (see figure 7.2), running diagonally from
the lens suture. The lens fibers are on average wider than directly at the lens suture
(9 lens fibers per 50um in mean). The image is partly darkened because of the higher
curvature of the lens in this region.
Images 7.6(a)-(c) were taken in between the periphery of the lens and the lens apex
(region C in figure 7.2, 230 µm x 230 µm x 25 µm).
Figure 7.6(a) (right, C1) shows the lens epithelium and (cut out) the beginning of
124
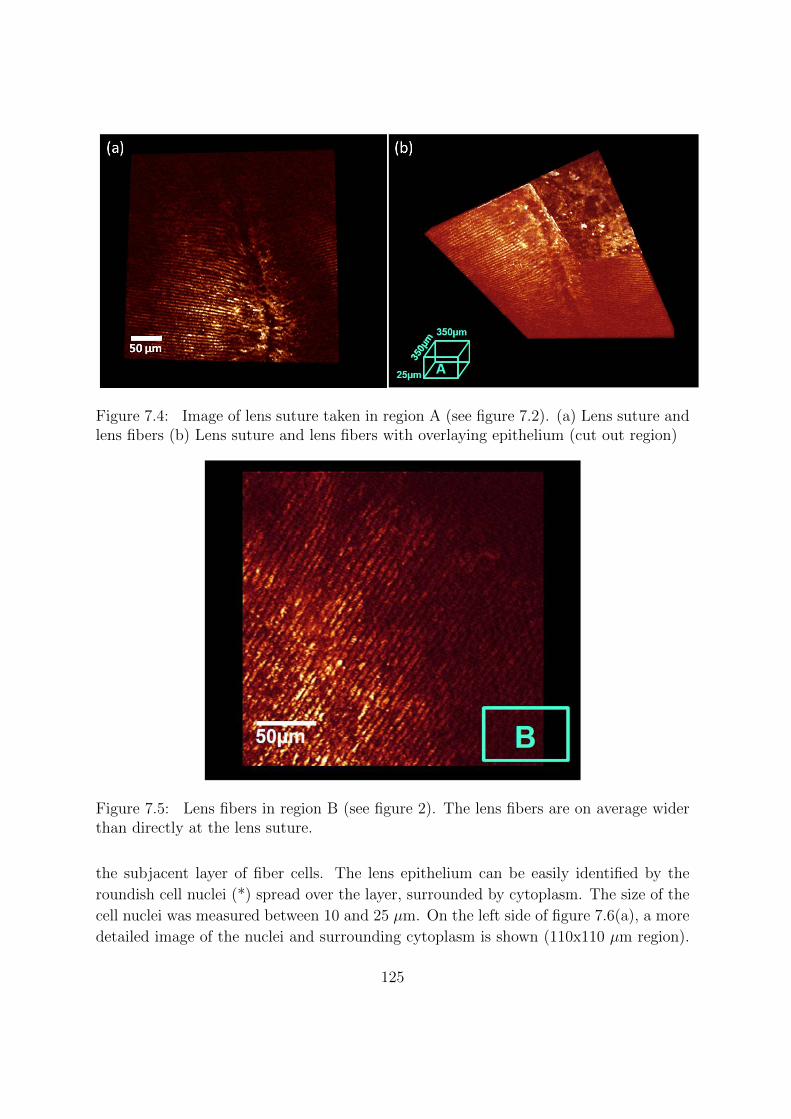
Figure 7.4: Image of lens suture taken in region A (see figure 7.2). (a) Lens suture andlens fibers (b) Lens suture and lens fibers with overlaying epithelium (cut out region)
Figure 7.5: Lens fibers in region B (see figure 2). The lens fibers are on average widerthan directly at the lens suture.
the subjacent layer of fiber cells. The lens epithelium can be easily identified by the
roundish cell nuclei (*) spread over the layer, surrounded by cytoplasm. The size of the
cell nuclei was measured between 10 and 25 µm. On the left side of figure 7.6(a), a more
detailed image of the nuclei and surrounding cytoplasm is shown (110x110 µm region).
125
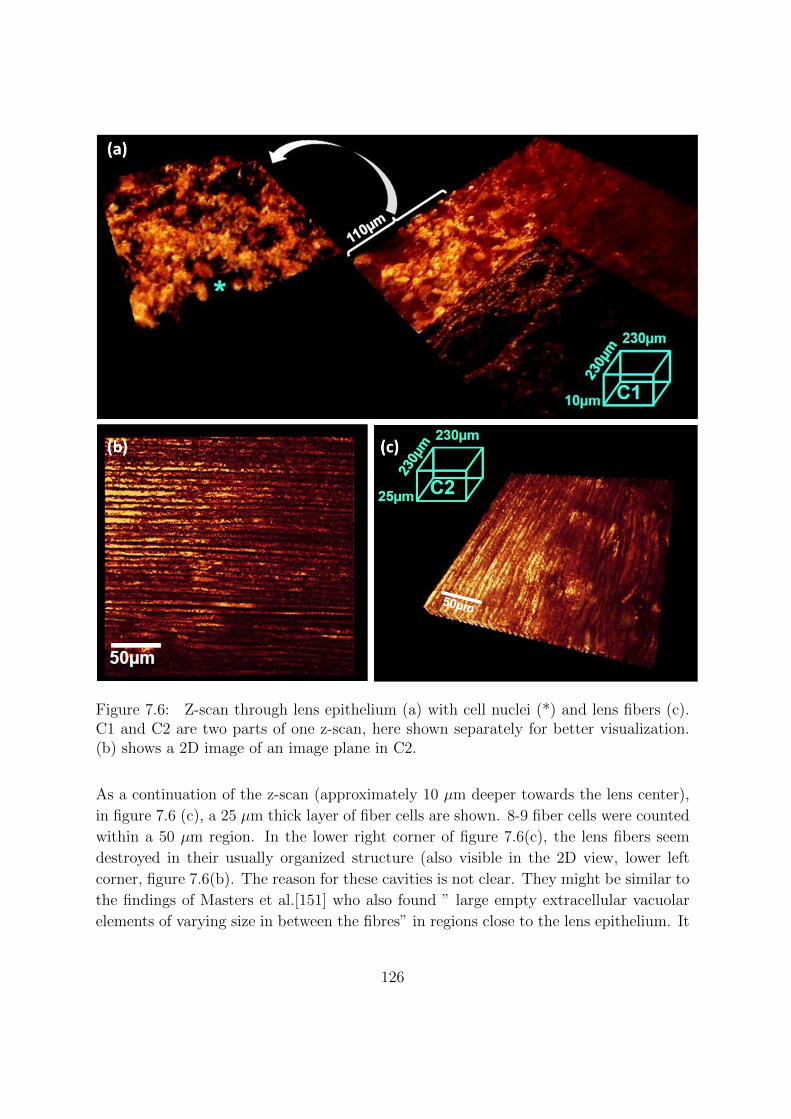
Figure 7.6: Z-scan through lens epithelium (a) with cell nuclei (*) and lens fibers (c).C1 and C2 are two parts of one z-scan, here shown separately for better visualization.(b) shows a 2D image of an image plane in C2.
As a continuation of the z-scan (approximately 10 µm deeper towards the lens center),
in figure 7.6 (c), a 25 µm thick layer of fiber cells are shown. 8-9 fiber cells were counted
within a 50 µm region. In the lower right corner of figure 7.6(c), the lens fibers seem
destroyed in their usually organized structure (also visible in the 2D view, lower left
corner, figure 7.6(b). The reason for these cavities is not clear. They might be similar to
the findings of Masters et al.[151] who also found ” large empty extracellular vacuolar
elements of varying size in between the fibres” in regions close to the lens epithelium. It
126
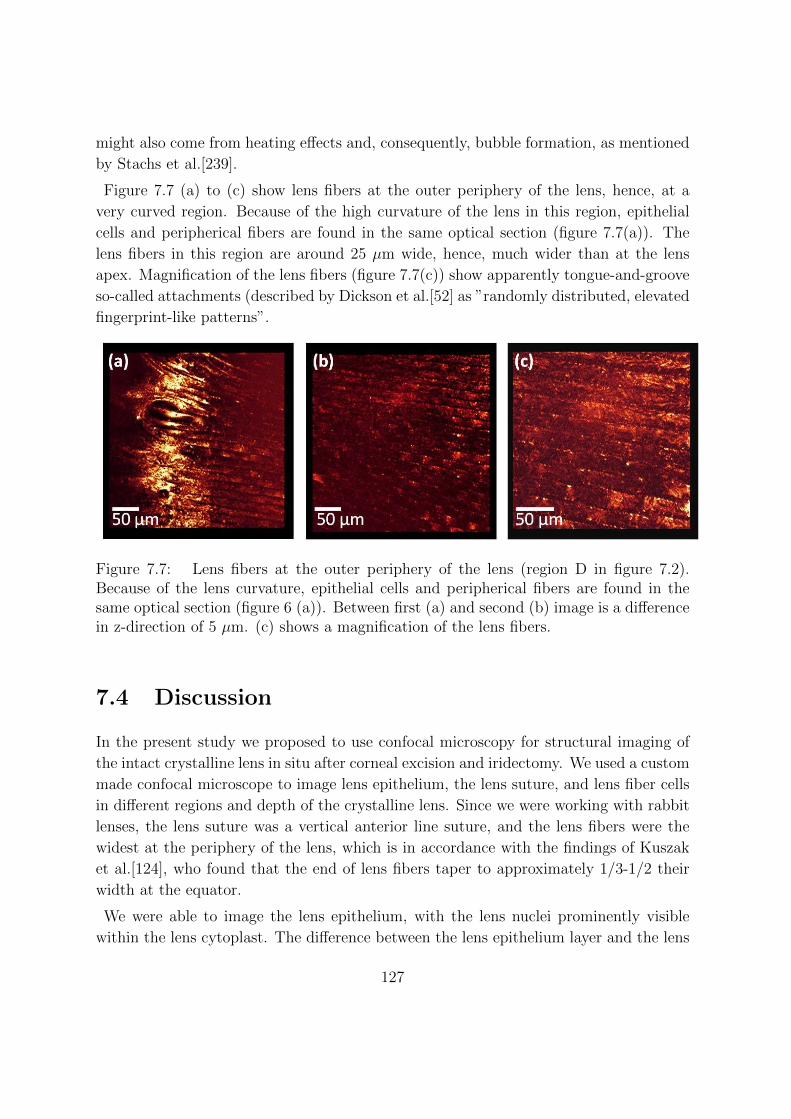
might also come from heating effects and, consequently, bubble formation, as mentioned
by Stachs et al.[239].
Figure 7.7 (a) to (c) show lens fibers at the outer periphery of the lens, hence, at a
very curved region. Because of the high curvature of the lens in this region, epithelial
cells and peripherical fibers are found in the same optical section (figure 7.7(a)). The
lens fibers in this region are around 25 µm wide, hence, much wider than at the lens
apex. Magnification of the lens fibers (figure 7.7(c)) show apparently tongue-and-groove
so-called attachments (described by Dickson et al.[52] as ”randomly distributed, elevated
fingerprint-like patterns”.
Figure 7.7: Lens fibers at the outer periphery of the lens (region D in figure 7.2).Because of the lens curvature, epithelial cells and peripherical fibers are found in thesame optical section (figure 6 (a)). Between first (a) and second (b) image is a differencein z-direction of 5 µm. (c) shows a magnification of the lens fibers.
7.4 Discussion
In the present study we proposed to use confocal microscopy for structural imaging of
the intact crystalline lens in situ after corneal excision and iridectomy. We used a custom
made confocal microscope to image lens epithelium, the lens suture, and lens fiber cells
in different regions and depth of the crystalline lens. Since we were working with rabbit
lenses, the lens suture was a vertical anterior line suture, and the lens fibers were the
widest at the periphery of the lens, which is in accordance with the findings of Kuszak
et al.[124], who found that the end of lens fibers taper to approximately 1/3-1/2 their
width at the equator.
We were able to image the lens epithelium, with the lens nuclei prominently visible
within the lens cytoplast. The difference between the lens epithelium layer and the lens
127
fiber layer was well defined when imaging the lens in a region with great curvature, where
epithelial cells and peripherical fibers cells could be found in the same optical section.
At the periphery the lens fibers showed small linking structures, like ball-and-socket
interdigitations, tongue-and-groove attachments, and spikey possesses, which can be
compared with images from scanning electron microscopy literature[52]. Usually the
organization of lens fibers are investigated by means of scanning electron microscopy (for
rabbit lenses for example Willekens et al.[267] and Kappelhof et al.[106]). SEM gives
a great insight into lens structures up to nm range. Therefore, literature on lens fiber
cells and their interlocking structure are usually based on SEM microscopy. Examples of
different mammals are rats[266, 83, 65], rabbits [266, 84, 267], pigs[97], monkeys[266][52,
132, 268], and humans[132, 155, 253, 263, 44, 248]. The obvious downside of SEM is
the destructive method it applies to obtain images. Confocal microscopy, on the other
hand, can be used without even touching the lens, and this study was conducted to
show the potential of confocal light microscopy in the anterior pole of the eye lenses,
and to show that this method is suitable for quantifying the lens structures in the intact
crystalline lens, holding promise for applications in vivo and for microscopic analysis
of the lens under accommodative forces (as introduced by Glasser, ARVO2010). We
found that confocal microscopy is well suited for possible investigations with simulated
accommodation or even in vivo measurements to investigate the mechanics of lens fibers
when accommodating.
128
Bibliography
[1] Roland Ackermann, Kathleen S. Kunert, Robert Kammel, Sabine Bischoff,
Stephanie C. Bhren, Harald Schubert, Marcus Blum, and Stefan Nolte. Fem-
tosecond laser treatment of the crystalline lens: a 1-year study of possible catarac-
togenesis in minipigs. Graefes Arch Clin Exp Ophthalmol, 249(10):1567–1573, Oct
2011.
[2] Eva Acosta, Juan M Bueno, Christina Schwarz, and Pablo Artal. Relationship
between wave aberrations and histological features in ex vivo porcine crystalline
lenses. J Biomed Opt, 15(5):055001, 2010.
[3] I. H. Al-Ahdali and M. A. El-Messiery. Examination of the effect of the fibrous
structure of a lens on the optical characteristics of the human eye: a computer-
simulated model. Appl Opt, 34(25):5738–5745, Sep 1995.
[4] KJ Al-Ghoul and MJ Costello. Light microscopic variation of fiber cell size, shape
and ordering in the equatorial plane of bovine and human lenses. Mol Vis, 3(2),
1997.
[5] Lawrence J Alvarez, Helen C Turner, Oscar A Candia, and Lee A Polikoff. Beta-
adrenergic inhibition of rabbit lens anterior-surface k+ conductance. Current eye
research, 26(2):95–105, 2003.
[6] Shiro Amano, Yuki Amano, Satoru Yamagami, Takashi Miyai, Kazunori Miyata,
Tomokazu Samejima, and Tetsuro Oshika. Age-related changes in corneal and
ocular higher-order wavefront aberrations. American journal of ophthalmology,
137(6):988–992, 2004.
[7] P. Artal and A. Guirao. Contributions of the cornea and the lens to the aberrations
of the human eye. Opt Lett, 23(21):1713–1715, Nov 1998.
[8] P. Artal, A. Guirao, E. Berrio, and D. R. Williams. Compensation of corneal
aberrations by the internal optics in the human eye. J Vis, 1(1):1–8, 2001.
129

[9] Pablo Artal, Esther Berrio, Antonio Guirao, and Patricia Piers. Contribution of
the cornea and internal surfaces to the change of ocular aberrations with age. J
Opt Soc Am A, 19(1):137–143, Jan 2002.
[10] D. A. Atchison, M. J. Collins, C. F. Wildsoet, J. Christensen, and M. D. Wa-
terworth. Measurement of monochromatic ocular aberrations of human eyes as a
function of accommodation by the howland aberroscope technique. Vision Res,
35(3):313–323, Feb 1995.
[11] D. A. Atchison and G. Smith. Continuous gradient index and shell models of the
human lens. Vision Res, 35(18):2529–2538, Sep 1995.
[12] David A Atchison, Emma L Markwell, Sanjeev Kasthurirangan, James M Pope,
George Smith, and Peter G Swann. Age-related changes in optical and biometric
characteristics of emmetropic eyes. J Vis, 8(4):29.1–2920, 2008.
[13] David A Atchison and George Smith. Chromatic dispersions of the ocular media
of human eyes. J Opt Soc Am A, 22(1):29–37, Jan 2005.
[14] David A Atchison, George Smith, and George Smith. Optics of the human eye.
2000.
[15] Robert C Augusteyn. Growth of the lens: in vitro observations. Clin Exp Optom,
91(3):226–239, May 2008.
[16] Robert C. Augusteyn. On the growth and internal structure of the human lens.
Exp Eye Res, 90(6):643–654, Jun 2010.
[17] Robert C Augusteyn, Catherine E Jones, and James M Pope. Age-related devel-
opment of a refractive index plateau in the human lens: evidence for a distinct
nucleus. Clin Exp Optom, 91(3):296–301, May 2008.
[18] Robert C. Augusteyn, Ashik Mohamed, Derek Nankivil, Pesala Veerendranath,
Esdras Arrieta, Mukesh Taneja, Fabrice Manns, Arthur Ho, and Jean-Marie Parel.
Age-dependence of the optomechanical responses of ex vivo human lenses from
india and the usa, and the force required to produce these in a lens stretcher: the
similarity to in vivo disaccommodation. Vision Res, 51(14):1667–1678, Jul 2011.
[19] Robert C Augusteyn, Alexandre M Rosen, David Borja, Noel M Ziebarth, and
Jean Marie Parel. Biometry of primate lenses during immersion in preservation
media. Mol Vis, 12:740–747, 2006.
130
[20] Mehdi Bahrami and Alexander V. Goncharov. Geometry-invariant gradient re-
fractive index lens: analytical ray tracing. J Biomed Opt, 17((5)):055001, 2012.
[21] WILLIAM R Baldwin and D Mills. A longitudinal study of corneal astigmatism
and total astigmatism. American journal of optometry and physiological optics,
58(3):206–211, 1981.
[22] Sergio Barbero, Susana Marcos, and Jess Merayo-Lloves. Corneal and total optical
aberrations in a unilateral aphakic patient. J Cataract Refract Surg, 28(9):1594–
1600, Sep 2002.
[23] Sergio Barbero, Susana Marcos, Jesus Merayo-Lloves, and Esther Moreno-
Barriuso. Validation of the estimation of corneal aberrations from videokeratog-
raphy in keratoconus. J Refract Surg, 18(3):263–270, 2002.
[24] Rafael I Barraquer, Ralph Michael, Rodrigo Abreu, Jose Lamarca, and Francisco
Tresserra. Human lens capsule thickness as a function of age and location along the
sagittal lens perimeter. Investigative ophthalmology & visual science, 47(5):2053–
2060, 2006.
[25] K.F. Barrell and C. Pask. Nondestructive index profile measurement of noncircular
optical fibre preforms. Optics Communications, 27(2):230 – 234, 1978.
[26] J. C. Barry, M. Dunne, and T. Kirschkamp. Phakometric measurement of ocular
surface radius of curvature and alignment: evaluation of method with physical
model eyes. Ophthalmic Physiol Opt, 21(6):450–460, Nov 2001.
[27] Steven Bassnett, Yanrong Shi, and Gijs FJM Vrensen. Biological glass: structural
determinants of eye lens transparency. Philosophical Transactions of the Royal
Society B: Biological Sciences, 366(1568):1250–1264, 2011.
[28] Steven Bassnett and Peggy A Winzenburger. Morphometric analysis of fibre cell
growth in the developing chicken lens. Experimental eye research, 76(3):291–302,
2003.
[29] S Bhat. The ocular lens epithelium. Bioscience reports, 21:537–563, 2001.
[30] J. W. Blaker. Toward an adaptive model of the human eye. J Opt Soc Am,
70(2):220–223, Feb 1980.
[31] Matthias Bohnke and Barry R Masters. Confocal microscopy of the cornea.
Progress in retinal and eye research, 18(5):553–628, 1999.
131
[32] David Borja, Fabrice Manns, Arthur Ho, Noel Ziebarth, Alexandre M Rosen,
Rakhi Jain, Adriana Amelinckx, Esdras Arrieta, Robert C Augusteyn, and
Jean Marie Parel. Optical power of the isolated human crystalline lens. Invest
Ophthalmol Vis Sci, 49(6):2541–2548, Jun 2008.
[33] David Borja, Fabrice Manns, Arthur Ho, Noel M Ziebarth, Ana Carolina Acosta,
Esdras Arrieta-Quintera, Robert C Augusteyn, and Jean Marie Parel. Refractive
power and biometric properties of the nonhuman primate isolated crystalline lens.
Invest Ophthalmol Vis Sci, 51(4):2118–2125, Apr 2010.
[34] David Borja, Damian Siedlecki, Alberto de Castro, Stephen Uhlhorn, Sergio Ortiz,
Esdras Arrieta, Jean Marie Parel, Susana Marcos, and Fabrice Manns. Distortions
of the posterior surface in optical coherence tomography images of the isolated
crystalline lens: effect of the lens index gradient. Biomed Opt Express, 1(5):1331–
1340, Dec 2010.
[35] N. Brown. The change in shape and internal form of the lens of the eye on
accommodation. Exp Eye Res, 15(4):441–459, Apr 1973.
[36] N. Brown. The change in lens curvature with age. Exp Eye Res, 19(2):175–183,
Aug 1974.
[37] Nicholas AP Brown and Anthony J Bron. An estimate of the human lens epithelial
cell size in vivo. Experimental eye research, 44(6):899–906, 1987.
[38] Charles E Campbell. Nested shell optical model of the lens of the human eye. J
Opt Soc Am A, 27(11):2432–2441, Nov 2010.
[39] M. C. Campbell. Measurement of refractive index in an intact crystalline lens.
Vision Res, 24(5):409–415, 1984.
[40] M. C. Campbell and A. Hughes. An analytic, gradient index schematic lens and
eye for the rat which predicts aberrations for finite pupils. Vision Res, 21(7):1129–
1148, 1981.
[41] W Neil Charman and David A Atchison. Age-dependence of the average and
equivalent refractive indices of the crystalline lens. Biomedical optics express,
5(1):31–39, 2014.
[42] Han Cheng, Justin K Barnett, Abhiram S Vilupuru, Jason D Marsack, Sanjeev
Kasthurirangan, Raymond A Applegate, and Austin Roorda. A population study
on changes in wave aberrations with accommodation. J Vis, 4(4):272–280, Apr
2004.
132
[43] P.L. Chu. Nondestructive measurement of index profile of an optical-fibre preform.
Electronics Letters, 13(24):736 –738, 24 1977.
[44] Adolph I Cohen. The electron microscopy of the normal human lens. Investigative
Ophthalmology & Visual Science, 4(4):433–446, 1965.
[45] MJ Costello, TJ McIntosh, and JD Robertson. Distribution of gap junctions and
square array junctions in the mammalian lens. Investigative ophthalmology & visual
science, 30(5):975–989, 1989.
[46] MJ Costello, TN Oliver, and LM Cobo. Cellular architecture in age-related human
nuclear cataracts. Investigative ophthalmology & visual science, 33(11):3209–3227,
1992.
[47] Alberto de Castro, Sergio Ortiz, Enrique Gambra, Damian Siedlecki, and Susana
Marcos. Three-dimensional reconstruction of the crystalline lens gradient index
distribution from oct imaging. Opt Express, 18(21):21905–21917, Oct 2010.
[48] Alberto de Castro, Damian Siedlecki, David Borja, Stephen Uhlhorn, Jean Marie
Parel, Fabrice Manns, and Susana Marcos. Age-dependent variation of the gra-
dient index profile in human crystalline lenses. Journal of Modern Optics, 58(19-
20):1781–1787, 2011.
[49] Carolina P. de Freitas, Marco Ruggeri, Bianca Maceo, Stephen Uhlhorn, Esdras
Arrieta, Fabrice Manns, Robert Augusteyn, Arthur Ho, and Jean-Marie Parel.
Internal crystalline lens structure imaging using long range optical coherence to-
mography. Invest Ophthalmol Vis Sci, 52: E-Abstract 818, 2011.
[50] Jose A. Dıaz, Jose Fernandez-Dorado, and Francisco Sorroche. Role of the human
lens gradient-index profile in the compensation of third-order ocular aberrations.
J Biomed Opt, 17(7):075003, Jul 2012.
[51] D Howard Dickson and GW Crock. Fine structure of primate lens fibers. Cataract
and Abnormalities of the Lens, pages 49–59, 1975.
[52] DH Dickson and GW Crock. Interlocking patterns on primate lens fibers. Inves-
tigative Ophthalmology & Visual Science, 11(10):809–815, 1972.
[53] Zacharias Dische and Ginevra Zelmenis. The content and structural characteristics
of the collagenous protein of rabbit lens capsules at different ages. Investigative
Ophthalmology & Visual Science, 4(2):174–180, 1965.
133
[54] Wolfgang Drexler and James G Fujimoto. Optical coherence tomography: technol-
ogy and applications. Springer, 2008.
[55] Michiel Dubbelman, Victor Arni D. P. Sicam, and Rob G. L. van der Heijde. The
shape of the anterior and posterior surface of the aging human cornea. Vision Res,
46(6-7):993–1001, Mar 2006.
[56] Michiel Dubbelman, Victor Arni D. P. Sicam, and Rob G. L. van der Heijde. The
contribution of the posterior surface to the coma aberration of the human cornea.
J Vis, 7(7):10.1–10.8, 2007.
[57] Michiel Dubbelman and Rob G. L. van der Heijde. The shape of the aging human
lens: curvature, equivalent refractive index and the lens paradox. Vision Res,
41(14):1867–1877, Jun 2001.
[58] Michiel Dubbelman, Rob G. L. van der Heijde, and Henk A. Weeber. Change
in shape of the aging human crystalline lens with accommodation. Vision Res,
45(1):117–132, Jan 2005.
[59] Michiel Dubbelman, Rob G. L. van der Heijde, Henk A. Weeber, and G. F J. M.
Vrensen. Changes in the internal structure of the human crystalline lens with age
and accommodation. Vision Res, 43(22):2363–2375, Oct 2003.
[60] Mark Dunne. Scheme for the calculation of ocular components in a four-surfaced
eye without need for measurement of the anterior crystalline lens surface purkinje
images. Ophthalmic and Physiological Optics, 12(3):370–375, 1992.
[61] Mark Dunne, Mohamed EA Elawad, and Derek A Barnes. Measurement of astig-
matism arising from the internal ocular surfaces. Acta Ophthalmologica Scandi-
navica, 74(1):14–20, 1996.
[62] Klaus Ehrmann, Arthur Ho, and Jean-Marie Parel. Biomechanical analysis of the
accommodative apparatus in primates. Clin Exp Optom, 91(3):302–312, May 2008.
[63] Mohamed EA Elawad. Measurement of ocular component contributions to residual
astigmatism in adult human eyes. PhD thesis, Aston University, 1995.
[64] Per P Fagerholm. The influence of calcium on lens fibers. Experimental eye
research, 28(2):211–222, 1979.
[65] PN Farnsworth and SE Shyne. Anterior zonular shifts with age. Experimental eye
research, 28(3):291–297, 1979.
134
[66] M T Flores-Arias, A Daz del Rio, C Bao-Varela, M V Prez, and C Gmez-Reino.
Description of gradient-index human eye by a first-order optical system. J Opt A,
11(12):125301, 2009.
[67] Enrique Gambra, Sergio Ortiz, Pablo Perez-Merino, Michalina Gora, Maciej Wo-
jtkowski, and Susana Marcos. Static and dynamic crystalline lens accommodation
evaluated using quantitative 3-d oct. Biomedical optics express, 4(9):1595–1609,
2013.
[68] Enrique Gambra, Lucie Sawides, Carlos Dorronsoro, and Susana Marcos. Accom-
modative lag and fluctuations when optical aberrations are manipulated. Invest
Ophthalmol Vis Sci, 9(6):4.1–415, 2009.
[69] Ana Gargallo, Justo Arines, and Eva Acosta. Lens aberrations and their relation-
ship with lens sutures for species with y-suture branches. Journal of biomedical
optics, 18(2):025003–025003, 2013.
[70] L. F. Garner and G. Smith. Changes in equivalent and gradient refractive index
of the crystalline lens with accommodation. Optom Vis Sci, 74(2):114–119, Feb
1997.
[71] L. F. Garner, G. Smith, S. Yao, and R. C. Augusteyn. Gradient refractive index
of the crystalline lens of the Black Oreo Dory (Allocyttus Niger): comparison
of magnetic resonance imaging (MRI) and laser ray-trace methods. Vision Res,
41(8):973–979, Apr 2001.
[72] A. Glasser and M. C. Campbell. Presbyopia and the optical changes in the human
crystalline lens with age. Vision Res, 38(2):209–229, Jan 1998.
[73] A. Glasser and M. C. Campbell. Biometric, optical and physical changes in the
isolated human crystalline lens with age in relation to presbyopia. Vision Res,
39(11):1991–2015, Jun 1999.
[74] A. Glasser and H. C. Howland. In vitro changes in back vertex distance of chick and
pigeon lenses: species differences and the effects of aging. Vision Res, 35(13):1813–
1824, Jul 1995.
[75] Daniel A Goodenough. Lens gap junctions: a structural hypothesis for nonregu-
lated low-resistance intercellular pathways. Investigative ophthalmology & visual
science, 18(11):1104–1122, 1979.
135
[76] Daniel A Goodenough. The crystalline lens. a system networked by gap junctional
intercellular communication. In Seminars in cell biology, volume 3, pages 49–58.
Elsevier, 1992.
[77] T Grosvenor, S Quintero, and DM Perrigin. Predicting refractive astigmatism: a
suggested simplification of javal’s rule. American journal of optometry and physi-
ological optics, 65(4):292–297, 1988.
[78] THEODORE GROSVENOR and RAMAKRISHNA RATNAKARAM. Is the re-
lation between keratometric astigmatism and refractive astigmatism linear? Op-
tometry & Vision Science, 67(8):606–609, 1990.
[79] Ireneusz Grulkowski, Michalina Gora, Maciej Szkulmowski, Iwona Gorczynska,
Daniel Szlag, Susana Marcos, Andrzej Kowalczyk, and Maciej Wojtkowski. Ante-
rior segment imaging with spectral oct system using a high-speed cmos camera.
Opt Express, 17(6):4842–4858, Mar 2009.
[80] Elinborg Gudmundsdottir, Fridbert Jonasson, Vesteinn Jonsson, Einar Stefansson,
Hiroshi Sasaki, and Kazuyuki Sasaki. with the rule astigmatism is not the rule in
the elderly. Acta Ophthalmologica Scandinavica, 78(6):642–646, 2000.
[81] A. Guirao, M. Redondo, and P. Artal. Optical aberrations of the human cornea
as a function of age. J Opt Soc Am A, 17(10):1697–1702, Oct 2000.
[82] Sami G El Hage and Francoise Berny. Contribution of the crystalline lens to the
spherical aberration of the eye. JOSA, 63(2):205–211, 1973.
[83] Hans-Arne Hansson. Scanning electron microscopy of the lens of the adult rat.
Zeitschrift fur Zellforschung und Mikroskopische Anatomie, 107(2):187–198, 1970.
[84] CV Harding, S Susan, and H Murphy. Scanning electron microscopy of the adult
rabbit lens. Ophthalmic Research, 8(6):443–455, 1976.
[85] K Hayashi, M Masumoto, S Fujino, and F Hayashi. [changes in corneal astigmatism
with aging]. Nippon Ganka Gakkai Zasshi, 97(10):1193–1196, 1993.
[86] Ken Hayashi, Hideyuki Hayashi, and Fumihiko Hayashi. Topographic analysis of
the changes in corneal shape due to aging. Cornea, 14(5):527–532, 1995.
[87] J. C. He, S. A. Burns, and S. Marcos. Monochromatic aberrations in the accom-
modated human eye. Vision Res, 40(1):41–48, 2000.
136
[88] Helmholtz. Treatise on Physiological Optics. The Optical Society of America
(translated from Third German Edition by J. P. C. Southall), 1924.
[89] R. P. Hemenger, L. F. Garner, and C. S. Ooi. Change with age of the refractive
index gradient of the human ocular lens. Invest Ophthalmol Vis Sci, 36(3):703–707,
Mar 1995.
[90] Erik A. Hermans, Michiel Dubbelman, Rob G. L. van der Heijde, and Rob
Heethaar. The shape of the human lens nucleus with accommodation. J Vis,
7(10):16.1–1610, 2007.
[91] Erik A. Hermans, Michiel Dubbelman, Rob G. L. van der Heijde, and Rob M.
Heethaar. Equivalent refractive index of the human lens upon accommodative
response. Optom Vis Sci, 85(12):1179–1184, Dec 2008.
[92] Jau-Der Ho, Shiow-Wen Liou, Ray Jui-Fang Tsai, and Ching-Yao Tsai. Effects of
aging on anterior and posterior corneal astigmatism. Cornea, 29(6):632–637, 2010.
[93] BF Hochheimer. Second harmonic light generation in the rabbit cornea. Applied
optics, 21(8):1516–1518, 1982.
[94] MJ Hogan, JA Alvarado, and JE Weddell. Histology of the human eye. 1971. WB
Saunders Philadelphia.
[95] J. H. Holland. Adaptation in Natural and Artificial Systems. Ann Arbor: Univer-
stiy of Michigan Press, 1975.
[96] M. J. Howcroft and J. A. Parker. Aspheric curvatures for the human lens. Vision
Res, 17(10):1217–1223, 1977.
[97] HE Hoyer. Scanning electron-microscopic study of lens fibers of the pig. Cell and
tissue research, 224(1):225–232, 1982.
[98] Arne Huggert. On the form of the iso-indicial surfaces of the human crystalline
lens. Acta Ophthalmologica supplementum, 1948.
[99] W. S. Jagger. The refractive structure and optical properties of the isolated crys-
talline lens of the cat. Vision Res, 30(5):723–738, 1990.
[100] W. S. Jagger. The optics of the spherical fish lens. Vision Res, 32(7):1271–1284,
Jul 1992.
137

[101] I Jalbert, F Stapleton, E Papas, DF Sweeney, and M Coroneo. In vivo confocal
microscopy of the human cornea. British Journal of Ophthalmology, 87(2):225–236,
2003.
[102] RE Jeacocke. Confocal microscopy of the cornea and crystalline lens. Trans. R.
Microsc. Soc, 1:341–344, 1990.
[103] T. C. Jenkins. Aberrations of the eye and their effects on vision: part 1. Br J
Physiol Opt, 20:59–91, 1963.
[104] C. E. Jones, D. A. Atchison, R. Meder, and J. M. Pope. Refractive index distri-
bution and optical properties of the isolated human lens measured using magnetic
resonance imaging (MRI). Vision Res, 45(18):2352–2366, Aug 2005.
[105] C. E. Jones and J. M. Pope. Measuring optical properties of an eye lens using
magnetic resonance imaging. Magn Reson Imaging, 22(2):211–220, Feb 2004.
[106] JP Kappelhof, GFJM Vrensen, CAM Vester, JH Pameyer, PTVM De Jong, and
BLJC Willekens. The ring of soemmerring in the rabbit. Graefe’s archive for
clinical and experimental ophthalmology, 223(3):111–120, 1985.
[107] Sanjeev Kasthurirangan, Emma L Markwell, David A Atchison, and James M
Pope. In vivo study of changes in refractive index distribution in the human crys-
talline lens with age and accommodation. Invest Ophthalmol Vis Sci, 49(6):2531–
2540, Jun 2008.
[108] Peter R Keller, Michael J Collins, Leo G Carney, Brett A Davis, and Paul P
Van Saarloos. The relation between corneal and total astigmatism. Optometry &
Vision Science, 73(2):86–91, 1996.
[109] Peter R Keller, Charles NJ McGhee, and Kathryn H Weed. Fourier analysis of
corneal topography data after photorefractive keratectomy. Journal of Cataract &
Refractive Surgery, 24(11):1447–1455, 1998.
[110] Jennifer E Kelly, Toshifumi Mihashi, and Howard C Howland. Compensation of
corneal horizontal/vertical astigmatism, lateral coma, and spherical aberration by
internal optics of the eye. J Vis, 4(4):262–271, Apr 2004.
[111] Y Kobayashi and T Suzuki. The aging lens: ultrastructural changes in cataract.
Cataract and Abnormalities of the Lens, 296:313–343, 1975.
138
[112] Douglas D Koch, Shazia F Ali, Mitchell P Weikert, Mariko Shirayama, Richard
Jenkins, and Li Wang. Contribution of posterior corneal astigmatism to total
corneal astigmatism. Journal of Cataract & Refractive Surgery, 38(12):2080–2087,
2012.
[113] J. F. Koretz, A. M. Bertasso, M. W. Neider, and P. L. Kaufman. Slit-lamp studies
of the rhesus monkey eye: III. the zones of discontinuity. Exp Eye Res, 46(6):871–
880, Jun 1988.
[114] J. F. Koretz, A. M. Bertasso, M. W. Neider, B. A. True-Gabelt, and P. L. Kaufman.
Slit-lamp studies of the rhesus monkey eye: II. Changes in crystalline lens shape,
thickness and position during accommodation and aging. Exp Eye Res, 45(2):317–
326, Aug 1987.
[115] J. F. Koretz, C. A. Cook, and P. L. Kaufman. Aging of the human lens: changes
in lens shape at zero-diopter accommodation. J Opt Soc Am A, 18(2):265–272,
Feb 2001.
[116] J. F. Koretz, G. H. Handelman, and N. P. Brown. Analysis of human crys-
talline lens curvature as a function of accommodative state and age. Vision Res,
24(10):1141–1151, 1984.
[117] J. F. Koretz, P. L. Kaufman, M. W. Neider, and P. A. Goeckner. Accommodation
and presbyopia in the human eye–aging of the anterior segment. Vision Res,
29(12):1685–1692, 1989.
[118] Jane E Koretz, Susan A Strenk, Lawrence M Strenk, and John L Semmlow.
Scheimpflug and high-resolution magnetic resonance imaging of the anterior seg-
ment: a comparative study. J Opt Soc Am A, 21(3):346–354, Mar 2004.
[119] Aachal Kotecha, Richard A Russell, Angelos Sinapis, Sayeh Pourjavan, Dimitros
Sinapis, and David F Garway-Heath. Biomechanical parameters of the cornea
measured with the ocular response analyzer in normal eyes. BMC ophthalmology,
14(1):11, 2014.
[120] RO Kreuzer and JG Sivak. Chromatic aberration of the vertebrate lens. Oph-
thalmic and Physiological Optics, 5(1):33–41, 1985.
[121] R. H. Krger, M. C. Campbell, and R. D. Fernald. The development of the crys-
talline lens is sensitive to visual input in the African cichlid fish, Haplochromis
burtoni. Vision Res, 41(5):549–559, Mar 2001.
139
[122] R. H. Krger, M. C. Campbell, R. Munger, and R. D. Fernald. Refractive index
distribution and spherical aberration in the crystalline lens of the African cichlid
fish Haplochromis burtoni. Vision Res, 34(14):1815–1822, Jul 1994.
[123] Eugene Joseph Kucharz. The collagens: biochemistry and pathophysiology.
Springer, 1992.
[124] J. R. Kuszak, M. Mazurkiewicz, L. Jison, A. Madurski, A. Ngando, and R. K.
Zoltoski. Quantitative analysis of animal model lens anatomy: accommodative
range is related to fiber structure and organization. Vet Ophthalmol, 9(5):266–
280, 2006.
[125] J. R. Kuszak, K. L. Peterson, and H. G. Brown. Electron microscopic observations
of the crystalline lens. Microsc Res Tech, 33(6):441–479, Apr 1996.
[126] J. R. Kuszak, K. L. Peterson, J. G. Sivak, and K. L. Herbert. The interrelationship
of lens anatomy and optical quality. II. primate lenses. Exp Eye Res, 59(5):521–535,
Nov 1994.
[127] J. R. Kuszak, J. G. Sivak, and J. A. Weerheim. Lens optical quality is a direct
function of lens sutural architecture. Invest Ophthalmol Vis Sci, 32(7):2119–2129,
Jun 1991.
[128] JR Kuszak. The ultrastructure of epithelial and fiber cells in the crystalline lens.
International review of cytology, 163:305–350, 1995.
[129] JR Kuszak, MS Macsai, KJ Bloom, JL Rae, and RS Weinstein. Cell-to-cell fusion
of lens fiber cells¡ i¿ in situ¡/i¿: Correlative light, scanning electron microscopic,
and freeze-fracture studies. Journal of ultrastructure research, 93(3):144–160, 1985.
[130] JR Kuszak and JL Rae. Scanning electron microscopy of the frog lens. Experi-
mental eye research, 35(5):499–519, 1982.
[131] JR Kuszak, RK Zoltoski, and C Sivertson. Fibre cell organization in crystalline
lenses. Experimental eye research, 78(3):673–687, 2004.
[132] Toichiro Kuwabara. The maturation of the lens cell: a morphologic study. Exper-
imental eye research, 20(5):427–443, 1975.
[133] Toichiro Kuwabara, Jin H Kinoshita, and David G Cogan. Electron microscopic
study of galactose-induced cataract. Investigative Ophthalmology & Visual Science,
8(2):133–149, 1969.
140
[134] Michael A Lemp, P Noel Dilly, and Alan Boyde. Tandem-scanning (confocal)
microscopy of the full-thickness cornea. Cornea, 4(4):205–209, 1984.
[135] Hong Fang Li, W Matthew Petroll, Torben Møller-Pedersen, James K Maurer,
H Dwight Cavanagh, and James V Jester. Epithelial and corneal thickness mea-
surements by in vivo confocal microscopy through focusing (cmtf). Current eye
research, 16(3):214–221, 1997.
[136] Laurence Lim, Gus Gazzard, Yiong-Huak Chan, Allan Fong, Aachal Kotecha, Ee-
Ling Sim, Donald Tan, Louis Tong, and Seang-Mei Saw. Cornea biomechanical
characteristics and their correlates with refractive error in singaporean children.
Investigative ophthalmology & visual science, 49(9):3852–3857, 2008.
[137] Woo-Kuen Lo and Clifford V Harding. Structure and distribution of gap junctions
in lens epithelium and fiber cells. Cell and tissue research, 244(2):253–263, 1986.
[138] Norberto Lopez-Gil and Vicente Fernandez-Sanchez. The change of spherical aber-
ration during accommodation and its effect on the accommodation response. Jour-
nal of vision, 10(13):12, 2010.
[139] Ronald F Lowe. Anterior lens curvature. comparisons between normal eyes and
those with primary angle-closure glaucoma. The British journal of ophthalmology,
56(5):409, 1972.
[140] Ronald F Lowe and BA Clark. Radius of curvature of the anterior lens surface. cor-
relations in normal eyes and in eyes involved with primary angle-closure glaucoma.
The British journal of ophthalmology, 57(7):471, 1973.
[141] C. Lu, R. Munger, and M. C. W. Campbell. Monochromatic aberrations in ac-
commodated eyes. Ophthalmic and Physiological Optics. Technical digest series,
vol 3, 1993.
[142] Bianca M. Maceo, Fabrice Manns, David Borja, Derek Nankivil, Stephen Uhlhorn,
Esdras Arrieta, Arthur Ho, Robert C. Augusteyn, and Jean Marie Parel. Con-
tribution of the crystalline lens gradient refractive index to the accommodation
amplitude in non-human primates: In vitro studies. Journal of Vision, 11(13),
2011.
[143] Rupalatha Maddala, Nikolai P Skiba, Robert Lalane III, Diane L Sherman, Peter J
Brophy, and Ponugoti V Rao. Periaxin is required for hexagonal geometry and
membrane organization of mature lens fibers. Developmental biology, 357(1):179–
190, 2011.
141
[144] Rayaz A Malik, P Kallinikos, CA Abbott, Carine HM van Schie, P Morgan, Nathan
Efron, and Andrew JM Boulton. Corneal confocal microscopy: a non-invasive
surrogate of nerve fibre damage and repair in diabetic patients. Diabetologia,
46(5):683–688, 2003.
[145] Fabrice Manns, Viviana Fernandez, Stanley Zipper, Samith Sandadi, Marie
Hamaoui, Arthur Ho, and Jean Marie Parel. Radius of curvature and asphericity
of the anterior and posterior surface of human cadaver crystalline lenses. Exp Eye
Res, 78(1):39–51, Jan 2004.
[146] Fabrice Manns, Arthur Ho, David Borja, and Jean Marie Parel. Comparison of
uniform and gradient paraxial models of the crystalline lens. Invest Ophthalmol
Vis Sci, 51: E–Abstract 789, April 2010.
[147] Fabrice Manns, Jean Marie Parel, David Denham, Christian Billotte, Noel
Ziebarth, David Borja, Viviana Fernandez, Mohammed Aly, Esdras Arrieta,
Arthur Ho, and Brien Holden. Optomechanical response of human and monkey
lenses in a lens stretcher. Invest Ophthalmol Vis Sci, 48(7):3260–3268, Jul 2007.
[148] Julia M Marcantonio, Jean-Marie Rakic, Gijs FJM Vrensen, and George Duncan.
Lens cell populations studied in human donor capsular bags with implanted in-
traocular lenses. Investigative ophthalmology & visual science, 41(5):1130–1141,
2000.
[149] Susana Marcos, Patricia Rosales, Lourdes Llorente, and Ignacio Jimnez-Alfaro.
Change in corneal aberrations after cataract surgery with 2 types of aspherical
intraocular lenses. J Cataract Refract Surg, 33(2):217–226, Feb 2007.
[150] Barry R Masters. Confocal microscopy of the in-situ crystalline lens. Journal of
microscopy, 165(1):159–167, 1992.
[151] Barry R Masters. Confocal microscopy of biological tissues. In CIS Selected Papers:
Coherence Domain Methods in Biomedical Optics, pages 155–167. International
Society for Optics and Photonics, 1996.
[152] Barry R Masters and Stephen W Paddock. Three-dimensional reconstruction of
the rabbit cornea by confocal scanning optical microscopy and volume rendering.
Applied optics, 29(26):3816–3822, 1990.
[153] Barry R Masters and Andreas A Thaer. Real-time scanning slit confocal mi-
croscopy of the in vivo human cornea. Applied optics, 33(4):695–701, 1994.
142
[154] Barry R Masters, Gijs Fjm Vrensen, Ben Willekens, and Jan Van Marle. Con-
focal light microscopy and scanning electron microscopy of the human eye lens.
Experimental eye research, 64(3):371–377, 1997.
[155] T Matsuto. Scanning electron microscopic studies on the normal and se-
nile cataractous human lenses (author’s transl). Nippon Ganka Gakkai zasshi,
77(8):853, 1973.
[156] L. Matthiessen. Untersuchungen ueber den aplanatismus und die periscopie der
krystallinsen in den augen der fische. Pfluegers Arch. Physiol.
[157] J. S. McLellan, S. Marcos, and S. A. Burns. Age-related changes in monochromatic
wave aberrations of the human eye. Invest Ophthalmol Vis Sci, 42(6):1390–1395,
May 2001.
[158] James S McLellan, Susana Marcos, Pedro M Prieto, and Stephen A Burns. Imper-
fect optics may be the eye’s defence against chromatic blur. Nature, 417(6885):174–
176, May 2002.
[159] M. Millodot and J. Sivak. Contribution of the cornea and lens to the spherical
aberration of the eye. Vision Res, 19(6):685–687, 1979.
[160] B. A. Moffat, D. A. Atchison, and J. M. Pope. Age-related changes in refractive
index distribution and power of the human lens as measured by magnetic resonance
micro-imaging in vitro. Vision Res, 42(13):1683–1693, Jun 2002.
[161] B. A. Moffat and J. M. Pope. Anisotropic water transport in the human eye lens
studied by diffusion tensor NMR micro-imaging. Exp Eye Res, 74(6):677–687, Jun
2002.
[162] BA Moffat and JM Pope. The interpretation of multi-exponential water proton
transverse relaxation in the human and porcine eye lens. Magnetic resonance
imaging, 20(1):83–93, 2002.
[163] Naoyuki Morishige, W Matthew Petroll, Teruo Nishida, M Cristina Kenney, and
James V Jester. Noninvasive corneal stromal collagen imaging using two-photon-
generated second-harmonic signals. Journal of Cataract & Refractive Surgery,
32(11):1784–1791, 2006.
[164] D. O. Mutti, K. Zadnik, and A. J. Adams. A video technique for phakometry of
the human crystalline lens. Invest Ophthalmol Vis Sci, 33(5):1771–1782, Apr 1992.
143
[165] S. Nakao, S. Fujimoto, M. Higuchi, and Y. Ito. [a refractive index distribution of
the crystalline lens of the cat eye]. Nippon Ganka Kiyo, 19(3):343–347, Mar 1968.
[166] S. Nakao, S. Fujimoto, R. Nagata, and K. Iwata. Model of refractive-index distri-
bution in the rabbit crystalline lens. J Opt Soc Am, 58(8):1125–1130, Aug 1968.
[167] S. Nakao and T. Ono. [refractive index distribution in the primate crystalline lens
and its schematic eye]. Nippon Ganka Kiyo, 20(5):533–536, May 1969.
[168] Derek Nankivil, Fabrice Manns, Esdras Arrieta-Quintero, Noel Ziebarth, David
Borja, Adriana Amelinckx, Andres Bernal, Arthur Ho, and Jean Marie Parel.
Effect of anterior zonule transection on the change in lens diameter and power
in cynomolgus monkeys during simulated accommodation. Invest Ophthalmol Vis
Sci, 50(8):4017–4021, Aug 2009.
[169] Rafael Navarro, Fernando Palos, and Luis M Gonzlez. Adaptive model of the
gradient index of the human lens. I. Formulation and model of aging ex vivo
lenses. J Opt Soc Am A, 24(8):2175–2185, Aug 2007.
[170] Rafael Navarro, Fernando Palos, and Luis M Gonzlez. Adaptive model of the
gradient index of the human lens. II. Optics of the accommodating aging lens. J
Opt Soc Am A, 24(9):2911–2920, Sep 2007.
[171] Rachael L Niederer, Divya Perumal, Trevor Sherwin, and Charles NJ McGhee.
Age-related differences in the normal human cornea: a laser scanning in vivo
confocal microscopy study. British Journal of Ophthalmology, 91(9):1165–1169,
2007.
[172] Sverker Norrby. The Dubbelman eye model analysed by ray tracing through as-
pheric surfaces. Ophthalmic Physiol Opt, 25(2):153–161, Mar 2005.
[173] Laura Oliveira-Soto and Nathan Efron. Morphology of corneal nerves using con-
focal microscopy. Cornea, 20(4):374–384, 2001.
[174] Sergio Ortiz, Pablo Perez-Merino, Sonia Duran, Miriam Velasco-Ocana, Judith
Birkenfeld, Alberto de Castro, Ignacio Jimenez-Alfaro, and Susana Marcos. Full
oct anterior segment biometry: an application in cataract surgery. Biomedical
optics express, 4(3):387–396, 2013.
[175] Sergio Ortiz, Pablo Perez-Merino, Enrique Gambra, Alberto de Castro, and Su-
sana Marcos. In vivo human crystalline lens topography. Biomed. Opt. Express,
3(10):2471–2488, Oct 2012.
144
[176] Sergio Ortiz, Pablo Prez-Merino, Nicolas Alejandre, E. Gambra, I. Jimenez-Alfaro,
and Susana Marcos. Quantitative oct-based corneal topography in keratoconus
with intracorneal ring segments. Biomed Opt Express, 3(5):814–824, May 2012.
[177] Sergio Ortiz, Damian Siedlecki, Ireneusz Grulkowski, Laura Remon, Daniel Pas-
cual, Maciej Wojtkowski, and Susana Marcos. Optical distortion correction in
optical coherence tomography for quantitative ocular anterior segment by three-
dimensional imaging. Opt Express, 18(3):2782–2796, Feb 2010.
[178] Sergio Ortiz, Damian Siedlecki, Pablo Perez-Merino, Noelia Chia, Alberto de Cas-
tro, Maciej Szkulmowski, Maciej Wojtkowski, and Susana Marcos. Corneal topog-
raphy from spectral optical coherence tomography (sOCT). Biomed Opt Express,
2(12):3232–3247, Dec 2011.
[179] Sergio Ortiz, Damian Siedlecki, Laura Remon, and Susana Marcos. Optical coher-
ence tomography for quantitative surface topography. Appl Opt, 48(35):6708–6715,
Dec 2009.
[180] Tetsuro Oshika, Atsuo Tomidokoro, and Hideki Tsuji. Regular and irregular re-
fractive powers of the front and back surfaces of the cornea. Experimental eye
research, 67(4):443–447, 1998.
[181] D. A. Palmer and J. Sivak. Crystalline lens dispersion. J Opt Soc Am, 71(6):780–
782, Jun 1981.
[182] Choul Yong Park, Jong-Hyun Oh, and Roy S Chuck. Predicting ocular residual
astigmatism using corneal and refractive parameters: A myopic eye study. Current
eye research, 38(8):851–861, 2013.
[183] J. A. Parker. Aspheric optics of the human lens. Can J Ophthalmol, 7(2):168–175,
Apr 1972.
[184] Sanjay V Patel, Jay W McLaren, David O Hodge, and William M Bourne. Normal
human keratocyte density and corneal thickness measurement by using confocal
microscopy in vivo. Investigative ophthalmology & visual science, 42(2):333–339,
2001.
[185] Sanjay V Patel, Jay W McLaren, David O Hodge, and William M Bourne. Confo-
cal microscopy in vivo in corneas of long-term contact lens wearers. Investigative
ophthalmology & visual science, 43(4):995–1003, 2002.
145

[186] MM Perry, J Tassin, and Y Courtois. A comparison of human lens epithelial cells
in situ and in vitro in relation to aging: an ultrastructural study. Experimental
eye research, 28(3):327–341, 1979.
[187] P. Phillips, J. Prez-Emmanuelli, H. D. Rosskothen, and C. J. Koester. Measure-
ment of intraocular lens decentration and tilt in vivo. J Cataract Refract Surg,
14(2):129–135, Mar 1988.
[188] B. K. Pierscionek. Growth and ageing effects on the refractive index in the equa-
torial plane of the bovine lens. Vision Res, 29(12):1759–1766, 1989.
[189] B. K. Pierscionek. In vitro alteration of human lens curvatures by radial stretching.
Exp Eye Res, 57(5):629–635, Nov 1993.
[190] B. K. Pierscionek. Surface refractive index of the eye lens determined with an
optic fiber sensor. J Opt Soc Am A, 10(9):1867–1871, Sep 1993.
[191] B. K. Pierscionek. Refractive index of decapsulated bovine lens surfaces measured
with a reflectometric sensor. Vision Res, 34(15):1927–1933, Aug 1994.
[192] B. K. Pierscionek. Refractive index of the human lens surface measured with an
optic fibre sensor. Ophthalmic Res, 26(1):32–35, 1994.
[193] B. K. Pierscionek. Age-related response of human lenses to stretching forces. Exp
Eye Res, 60(3):325–332, Mar 1995.
[194] B. K. Pierscionek. Refractive index contours in the human lens. Exp Eye Res,
64(6):887–893, Jun 1997.
[195] B. K. Pierscionek and R. C. Augusteyn. Structure/function relationship between
optics and biochemistry of the lens. Lens Eye Toxic Res, 8(2-3):229–243, 1991.
[196] B. K. Pierscionek, A. Belaidi, and H. H. Bruun. Refractive index distribution in
the porcine eye lens for 532 nm and 633 nm light. Eye (Lond), 19(4):375–381, Apr
2005.
[197] B. K. Pierscionek and D. Y. Chan. Refractive index gradient of human lenses.
Optom Vis Sci, 66(12):822–829, Dec 1989.
[198] Barbara K. Pierscionek and Justyn W. Regini. The gradient index lens of the eye:
an opto-biological synchrony. Prog Retin Eye Res, 31(4):332–349, Jul 2012.
[199] Antoinette Pirie. Composition of ox lens capsule. Biochemical Journal, 48(3):368,
1951.
146

[200] Oleg Pomerantzeff, Hal Fish, Jacques Govignon, and Charles L. Schepens. Wide-
angle optical model of the eye. Journal of Modern Optics, 19(5):387–8, 1972.
[201] M V Prez, C Bao, M T Flores-Arias, M A Rama, and C Gmez-Reino. Gradient
parameter and axial and field rays in the gradient-index crystalline lens model. J
Opt A, 5(5):S293, 2003.
[202] M V Prez, C Bao, M T Flores-Arias, M A Rama, and C Gmez-Reino. Description
of gradient-index crystalline lens by a first-order optical system. J Opt A, 7(3):103,
2005.
[203] Alfonso Prez-Escudero, Carlos Dorronsoro, and Susana Marcos. Correlation be-
tween radius and asphericity in surfaces fitted by conics. J Opt Soc Am A,
27(7):1541–1548, Jul 2010.
[204] S. Priolo, J. G. Sivak, and J. R. Kuszak. Effect of age on the morphology and
optical quality of the avian crystalline lens. Exp Eye Res, 69(6):629–640, Dec 1999.
[205] Olivier Prisant, Thanh Hoang-Xuan, Cinthia Proano, Everardo Hernandez, Shadi
Awad, and Dimitri T Azar. Vector summation of anterior and posterior corneal
topographical astigmatism. Journal of Cataract & Refractive Surgery, 28(9):1636–
1643, 2002.
[206] JL Rae and JR Kuszak. The electrical coupling of epithelium and fibers in the
frog lens. Experimental eye research, 36(3):317–326, 1983.
[207] Nancy S Rafferty. Lens morphology. The Ocular Lens: structure, function and
pathology (Edited by: Harry Maisel) Marcel Dekker, Inc, pages 51–53, 1985.
[208] Nancy S Rafferty and William Goossens. Cytoplasmic filaments in the crys-
talline lens of various species: functional correlations. Experimental eye research,
26(2):177–190, 1978.
[209] Scott A Read, Tobias Buehren, and Michael J Collins. Influence of accommodation
on the anterior and posterior cornea. Journal of Cataract & Refractive Surgery,
33(11):1877–1885, 2007.
[210] Stephan Rei, Gerolf Burau, Oliver Stachs, Rudolf Guthoff, and Heinrich Stolz.
Spatially resolved brillouin spectroscopy to determine the rheological properties of
the eye lens. Biomed Opt Express, 2(8):2144–2159, Aug 2011.
147
[211] Stephan Reiß, Karsten Sperlich, Marine Hovakimyan, Philipp Martius, Rudolf F
Guthoff, Heinrich Stolz, and Oliver Stachs. Ex vivo measurement of postmortem
tissue changes in the crystalline lens by brillouin spectroscopy and confocal re-
flectance microscopy. Biomedical Engineering, IEEE Transactions on, 59(8):2348–
2354, 2012.
[212] Kathryn Richdale, Loraine T. Sinnott, Mark A. Bullimore, Peter A. Wasse-
naar, Petra Schmalbrock, Chiu-Yen Kao, Samuel Patz, Donald O. Mutti, Adrian
Glasser, and Karla Zadnik. Quantification of age-related and per diopter accom-
modative changes of the lens and ciliary muscle in the emmetropic human eye.
Invest Ophthalmol Vis Sci, Jan 2013.
[213] Austin Roorda and Adrian Glasser. Wave aberrations of the isolated crystalline
lens. J Vis, 4(4):250–261, Apr 2004.
[214] Patricia Rosales, Michiel Dubbelman, Susana Marcos, and Rob G. L. van der
Heijde. Crystalline lens radii of curvature from Purkinje and Scheimpflug imaging.
J Vis, 6(10):1057–1067, 2006.
[215] Patricia Rosales and Susana Marcos. Phakometry and lens tilt and decentration
using a custom-developed Purkinje imaging apparatus: validation and measure-
ments. J Opt Soc Am A, 23(3):509–520, Mar 2006.
[216] Patricia Rosales and Susana Marcos. Pentacam Scheimpflug quantitative imaging
of the crystalline lens and intraocular lens. J Refract Surg, 25(5):421–428, May
2009.
[217] Patricia Rosales, Mark Wendt, Susana Marcos, and Adrian Glasser. Changes in
crystalline lens radii of curvature and lens tilt and decentration during dynamic
accommodation in rhesus monkeys. J Vis, 8(1):18.1–1812, 2008.
[218] Alexandre M Rosen, David B Denham, Viviana Fernandez, David Borja, Arthur
Ho, Fabrice Manns, Jean Marie Parel, and Robert C Augusteyn. In vitro di-
mensions and curvatures of human lenses. Vision Res, 46(6-7):1002–1009, Mar
2006.
[219] Machiko Sakuragawa, Toichiro Kuwabara, Jin H Kinoshita, and Henry N Fukui.
Swelling of the lens fibers. Experimental eye research, 21(4):381–394, 1975.
[220] H Saunders. Changes in the axis of astigmatism: a longitudinal study. Ophthalmic
and Physiological Optics, 8(1):37–42, 1988.
148
[221] Harold Saunders. The astigmatic modulus and its age-dependence. Ophthalmic
and Physiological Optics, 4(3):215–222, 1984.
[222] Giuliano Scarcelli, Pilhan Kim, and Seok Hyun Yun. In vivo measurement of age-
related stiffening in the crystalline lens by brillouin optical microscopy. Biophysical
journal, 101(6):1539–1545, 2011.
[223] A. Sharma, D. V. Kumar, and A. K. Ghatak. Tracing rays through graded-index
media: a new method. Appl Opt, 21(6):984–987, Mar 1982.
[224] Damian Siedlecki, Alberto de Castro, Enrique Gambra, Sergio Ortiz, David Borja,
Stephen Uhlhorn, Fabrice Manns, Susana Marcos, and Jean Marie Parel. Distor-
tion correction of OCT images of the crystalline lens: Gradient index approach.
Optom Vis Sci, 89(5):709718, Mar 2012.
[225] Damian Siedlecki, Alberto de Castro, Sergio Ortiz, David Borja, Fabrice Manns,
and Susana Marcos. Estimation of contribution of gradient index structure to the
amount of posterior surface optical distortion for in-vitro human crystalline lenses
imaged by optical coherence tomography. presented at the EMVPO, 2010.
[226] J. G. Sivak and A. Dovrat. Aging and the optical quality of the rat crystalline
lens. Invest Ophthalmol Vis Sci, 24(9):1162–1166, Sep 1983.
[227] J. G. Sivak, M. Gur, and A. Dovrat. Spherical aberration of the lens of the ground
squirrel (Spermophilis tridecemlineatus). Ophthalmic Physiol Opt, 3(3):261–265,
1983.
[228] J. G. Sivak, K. L. Herbert, K. L. Peterson, and J. R. Kuszak. The interrelationship
of lens anatomy and optical quality. I. Non-primate lenses. Exp Eye Res, 59(5):505–
520, Nov 1994.
[229] J. G. Sivak and R. O. Kreuzer. Spherical aberration of the crystalline lens. Vision
Res, 23(1):59–70, 1983.
[230] J. G. Sivak, B. Levy, A. P. Weber, and R. F. Glover. Environmental influence on
shape of the crystalline lens: the amphibian example. Exp Biol, 44(1):29–40, 1985.
[231] George K Smelser. Embryology and morphology of the lens. Investigative Oph-
thalmology & Visual Science, 4(4):398–410, 1965.
[232] G. Smith and D. A. Atchison. The gradient index and spherical aberration of the
lens of the human eye. Ophthalmic Physiol Opt, 21(4):317–326, Jul 2001.
149

[233] G. Smith, D. A. Atchison, and B. K. Pierscionek. Modeling the power of the aging
human eye. J Opt Soc Am A, 9(12):2111–2117, Dec 1992.
[234] G. Smith, M. J. Cox, R. Calver, and L. F. Garner. The spherical aberration of the
crystalline lens of the human eye. Vision Res, 41(2):235–243, Jan 2001.
[235] G. Smith, B. K. Pierscionek, and D. A. Atchison. The optical modelling of the
human lens. Ophthalmic Physiol Opt, 11(4):359–369, Oct 1991.
[236] George Smith. The optical properties of the crystalline lens and their significance.
Clin Exp Optom, 86(1):3–18, Jan 2003.
[237] George Smith, Phillip Bedggood, Ross Ashman, Mary Daaboul, and Andrew
Metha. Exploring ocular aberrations with a schematic human eye model. Opt
Vis Sci, 85(5):330–340, 2008.
[238] A. Sorsby, B. Benjamin, M. Sheridan, J. Stone, and G. A. Leary. Refraction and
its components during the growth of the eye from the age of three. Memo Med
Res Counc, 301(Special):1–67, 1961.
[239] Oliver Stachs, Silvia Schumacher, Marine Hovakimyan, Michael Fromm, Alexan-
der Heisterkamp, Holger Lubatschowski, and Rudolf Guthoff. Visualization of fem-
tosecond laser pulse–induced microincisions inside crystalline lens tissue. Journal
of Cataract & Refractive Surgery, 35(11):1979–1983, 2009.
[240] Susan Standring. Gray\’s anatomy: The anatomical basis of clinical practice.
2008.
[241] O. O. Stavroudis. The optics of rays, wavefrons and caustics. New York Academic
Press, 1972.
[242] Bryan D. Stone and G. W. Forbes. Optimal interpolants for runge-kutta ray
tracing in inhomogeneous media. J Opt Soc Am A, 7(2):248–254, Feb 1990.
[243] Mengchan Sun, Judith Birkenfeld, Alberto de Castro, Sergio Ortiz, and Susana
Marcos. Oct 3-d surface topography of isolated human crystalline lenses. Biomed-
ical Optics Express, 5(10):3547–3561, 2014.
[244] Mengchan Sun, Alberto de Castro, Sergio Ortiz, Pablo Perez-Merino, Judith
Birkenfeld, and Susana Marcos. Intraocular lens alignment from an en face op-
tical coherence tomography image purkinje-like method. Optical Engineering,
53(6):061704–061704, 2014.
150
[245] Juan Tabernero, Antonio Benito, Vincent Nourrit, and Pablo Artal. Instrument for
measuring the misalignments of ocular surfaces. Opt Express, 14(22):10945–10956,
Oct 2006.
[246] Juan Tabernero, Esther Berrio, and Pablo Artal. Modeling the mechanism of
compensation of aberrations in the human eye for accommodation and aging. J
Opt Soc Am A, 28(9):1889–1895, Sep 2011.
[247] Janice Tarrant, Austin Roorda, and Christine F. Wildsoet. Determining the ac-
commodative response from wavefront aberrations. J Vis, 10(5):4, 2010.
[248] Virginia L Taylor, Kristin J Al-Ghoul, C Wesley Lane, V Andrew Davis, Jerome R
Kuszak, and M Joseph Costello. Morphology of the normal human lens. Inves-
tigative ophthalmology & visual science, 37(7):1396–1410, 1996.
[249] L. N. Thibos, W. Wheeler, and D. Horner. Power vectors: an application of fourier
analysis to the description and statistical analysis of refractive error. Optom Vis
Sci, 74(6):367–375, Jun 1997.
[250] Larry N Thibos and Douglas Horner. Power vector analysis of the optical outcome
of refractive surgery. Journal of Cataract & Refractive Surgery, 27(1):80–85, 2001.
[251] Rupert Timpl, Hanna Wiedemann, Vera DELDEN, Heinz Furthmayr, and Klaus
KUHN. A network model for the organization of type iv collagen molecules in
basement membranes. European Journal of Biochemistry, 120(2):203–211, 1981.
[252] A. Tomlinson, R. P. Hemenger, and R. Garriott. Method for estimating the
spheric aberration of the human crystalline lens in vivo. Invest Ophthalmol Vis
Sci, 34(3):621–629, Mar 1993.
[253] Ramesh C Tripathi and Brenda J Tripathi. Lens morphology, aging, and cataract.
Journal of gerontology, 38(3):258–270, 1983.
[254] Stephen R Uhlhorn, David Borja, Fabrice Manns, and Jean Marie Parel. Re-
fractive index measurement of the isolated crystalline lens using optical coherence
tomography. Vision Res, 48(27):2732–2738, Dec 2008.
[255] D. Vazquez. Tomographic reconstruction of the gradient indices with rotational
symmetry. Application to crystalline lenses. PhD thesis, Universidad de Santiago
de Compostela, 2007.
151
[256] Daniel Vazquez, Eva Acosta, George Smith, and Leon Garner. Tomographic
method for measurement of the gradient refractive index of the crystalline lens. II.
The rotationally symmetrical lens. J Opt Soc Am A, 23(10):2551–2565, Oct 2006.
[257] H. G. Van Veen and D. A. Goss. Simplified system of Purkinje image photography
for phakometry. Am J Optom Physiol Opt, 65(11):905–908, Nov 1988.
[258] Y. Verma, K.D. Rao, M.K. Suresh, H.S. Patel, and P.K. Gupta. Measurement of
gradient refractive index profile of crystalline lens of fisheye in vivo using optical
coherence tomography. Appl Phys B, 87:607–610, 2007.
[259] A. S. Vilupuru and A. Glasser. Optical and biometric relationships of the isolated
pig crystalline lens. Ophthalmic Physiol Opt, 21(4):296–311, Jul 2001.
[260] Abhiram S Vilupuru and Adrian Glasser. The relationship between refractive and
biometric changes during Edinger-Westphal stimulated accommodation in rhesus
monkeys. Exp Eye Res, 80(3):349–360, Mar 2005.
[261] Abhiram S Vilupuru, Austin Roorda, and Adrian Glasser. Spatially variant
changes in lens power during ocular accommodation in a rhesus monkey eye. J
Vis, 4(4):299–309, Apr 2004.
[262] B Vohnsen and P Artal. Second-harmonic microscopy of ex vivo porcine corneas.
Journal of microscopy, 232(1):158–163, 2008.
[263] GFJM Vrensen and B Willekens. Biomicroscopy and scanning electron microscopy
of early opacities in the aging human lens. Investigative ophthalmology & visual
science, 31(8):1582–1591, 1990.
[264] Gijs Vrensen, Jan Van Marle, Henk Van Veen, and Ben Willekens. Membrane
architecture as a function of lens fibre maturation: a freeze fracture and scan-
ning electron microscopic study in the human lens. Experimental eye research,
54(3):433–446, 1992.
[265] Theodor Wanko and Mary Ann Gavin. The fine structure of the lens epithelium:
an electron microscopic study. AMA archives of ophthalmology, 60(5):868–879,
1958.
[266] Theodor Wanko and Mary Ann Gavin. Electron microscope study of lens fibers.
The Journal of biophysical and biochemical cytology, 6(1):97, 1959.
152
[267] B Willekens and GFJM Vrensen. The three-dimensional organization of lens fibers
in the rabbit. Albrecht von Graefes Archiv fur klinische und experimentelle Oph-
thalmologie, 216(4):275–289, 1981.
[268] B Willekens and GFJM Vrensen. The three-dimensional organization of lens fibers
in the rhesus monkey. Graefe’s Archive for Clinical and Experimental Ophthalmol-
ogy, 219(3):112–120, 1982.
[269] Kwok-Hoi Wong, Steven A Koopmans, Thom Terwee, and Aart C Kooijman.
Changes in spherical aberration after lens refilling with a silicone oil. Invest Oph-
thalmol Vis Sci, 48(3):1261–1267, Mar 2007.
[270] J. W. Wulfeck. Infrared photography of the so-called third Purkinje image. J Opt
Soc Am, 45(11):928–930, Nov 1955.
[271] GQ Xiao, GS Kino, and BR Masters. Observation of the rabbit cornea and lens
with a new real-time confocal scanning optical microscope. Scanning, 12(3):161–
166, 1990.
[272] Richard W Young and David E Ocumpaugh. Autoradiographic studies on the
growth and development of the lens capsule in the rat. Investigative Ophthalmology
& Visual Science, 5(6):583–593, 1966.
153

8Activities during the Ph.D. Period 2010-14
8.1 Publications
ISI-WOK JCR data refers to the 2012 database
journal category: Ophthalmology (oph), Optics (opt)
(Authors are indicated by signature order)
1. [2014] Mengchan Sun, Judith Birkenfeld, Alberto de Castro, Sergio Ortiz, Susana
Marcos, OCT 3-D surface topography of isolated human crystalline lenses
Article in Journal: BOE, vol. 5, pp. 3547-3561
(5year-IF: 3.179, 8/80 Opt. JCR 2012)
Publication date: 10/2014
2. [2014] Judith Birkenfeld, Alberto de Castro, Susana Marcos, Contribution of shape
and gradient refractive index to the spherical aberration of isolated human lenses.
Article in Journal: IOVS, vol. 55, pp. 2599-2607
(5year-IF: 3.730, 6/59 Oph. JCR 2012)
Publication date: 04/2014
3. [2014] Pablo Prez-Merino, Judith Birkenfeld, Carlos Dorronsoro, Sergio Ortiz, So-
nia Durn, Ignacio Jimnez-Alfaro, Susana Marcos, Aberrometry in patients im-
planted with Accommodative Intraocular Lenses.
154
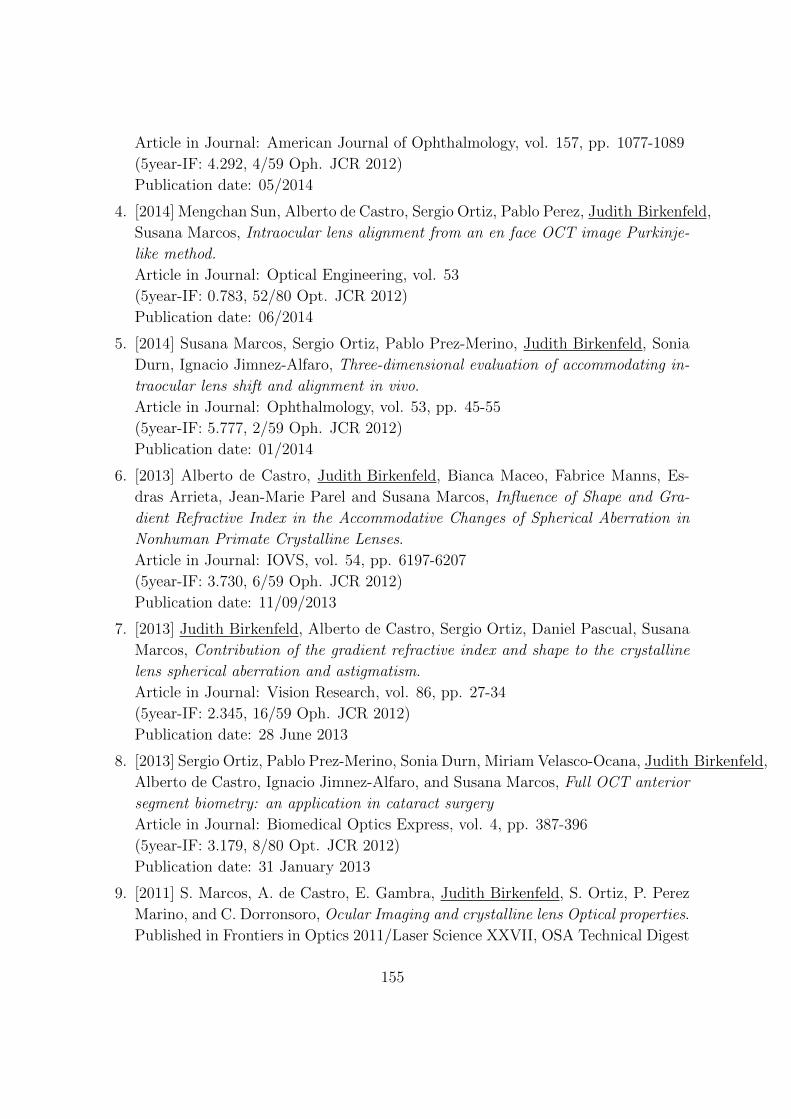
Article in Journal: American Journal of Ophthalmology, vol. 157, pp. 1077-1089
(5year-IF: 4.292, 4/59 Oph. JCR 2012)
Publication date: 05/2014
4. [2014] Mengchan Sun, Alberto de Castro, Sergio Ortiz, Pablo Perez, Judith Birkenfeld,
Susana Marcos, Intraocular lens alignment from an en face OCT image Purkinje-
like method.
Article in Journal: Optical Engineering, vol. 53
(5year-IF: 0.783, 52/80 Opt. JCR 2012)
Publication date: 06/2014
5. [2014] Susana Marcos, Sergio Ortiz, Pablo Prez-Merino, Judith Birkenfeld, Sonia
Durn, Ignacio Jimnez-Alfaro, Three-dimensional evaluation of accommodating in-
traocular lens shift and alignment in vivo.
Article in Journal: Ophthalmology, vol. 53, pp. 45-55
(5year-IF: 5.777, 2/59 Oph. JCR 2012)
Publication date: 01/2014
6. [2013] Alberto de Castro, Judith Birkenfeld, Bianca Maceo, Fabrice Manns, Es-
dras Arrieta, Jean-Marie Parel and Susana Marcos, Influence of Shape and Gra-
dient Refractive Index in the Accommodative Changes of Spherical Aberration in
Nonhuman Primate Crystalline Lenses.
Article in Journal: IOVS, vol. 54, pp. 6197-6207
(5year-IF: 3.730, 6/59 Oph. JCR 2012)
Publication date: 11/09/2013
7. [2013] Judith Birkenfeld, Alberto de Castro, Sergio Ortiz, Daniel Pascual, Susana
Marcos, Contribution of the gradient refractive index and shape to the crystalline
lens spherical aberration and astigmatism.
Article in Journal: Vision Research, vol. 86, pp. 27-34
(5year-IF: 2.345, 16/59 Oph. JCR 2012)
Publication date: 28 June 2013
8. [2013] Sergio Ortiz, Pablo Prez-Merino, Sonia Durn, Miriam Velasco-Ocana, Judith Birkenfeld,
Alberto de Castro, Ignacio Jimnez-Alfaro, and Susana Marcos, Full OCT anterior
segment biometry: an application in cataract surgery
Article in Journal: Biomedical Optics Express, vol. 4, pp. 387-396
(5year-IF: 3.179, 8/80 Opt. JCR 2012)
Publication date: 31 January 2013
9. [2011] S. Marcos, A. de Castro, E. Gambra, Judith Birkenfeld, S. Ortiz, P. Perez
Marino, and C. Dorronsoro, Ocular Imaging and crystalline lens Optical properties.
Published in Frontiers in Optics 2011/Laser Science XXVII, OSA Technical Digest
155

(Optical Society of America, 2011), paper FTuH4.
http://www.opticsinfobase.org/abstract.cfm?URI=FiO-2011-FTuH4
156
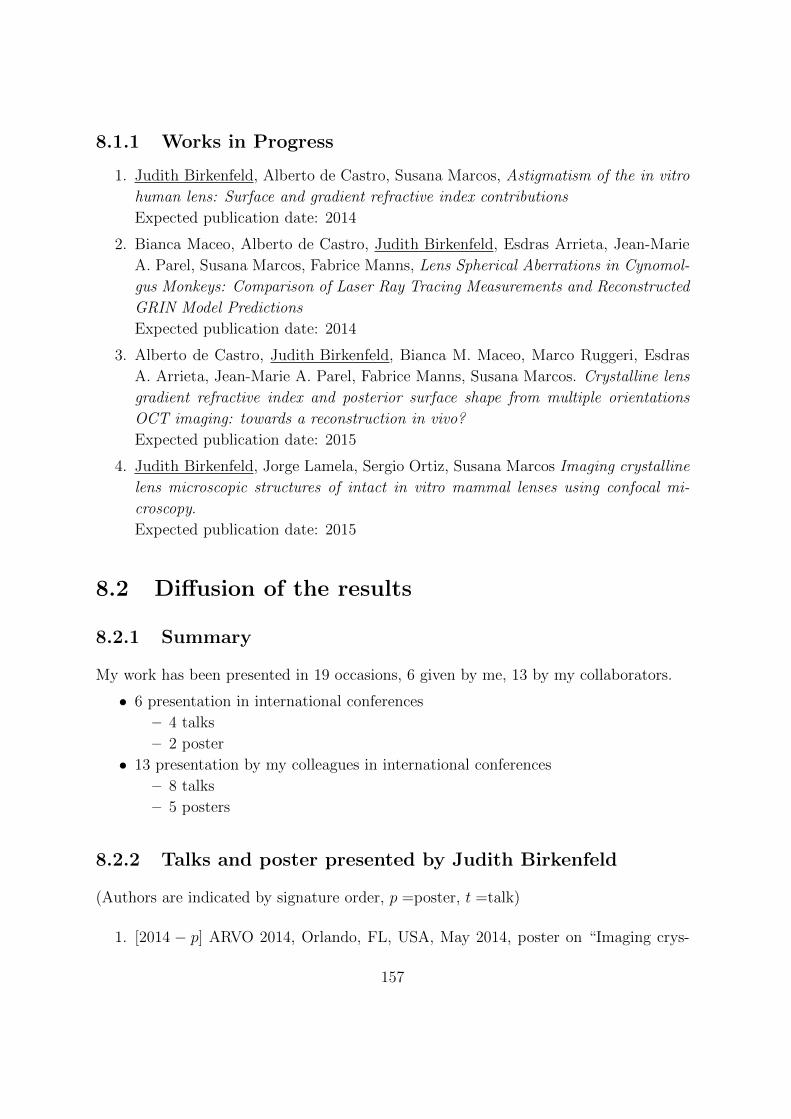
8.1.1 Works in Progress
1. Judith Birkenfeld, Alberto de Castro, Susana Marcos, Astigmatism of the in vitro
human lens: Surface and gradient refractive index contributions
Expected publication date: 2014
2. Bianca Maceo, Alberto de Castro, Judith Birkenfeld, Esdras Arrieta, Jean-Marie
A. Parel, Susana Marcos, Fabrice Manns, Lens Spherical Aberrations in Cynomol-
gus Monkeys: Comparison of Laser Ray Tracing Measurements and Reconstructed
GRIN Model Predictions
Expected publication date: 2014
3. Alberto de Castro, Judith Birkenfeld, Bianca M. Maceo, Marco Ruggeri, Esdras
A. Arrieta, Jean-Marie A. Parel, Fabrice Manns, Susana Marcos. Crystalline lens
gradient refractive index and posterior surface shape from multiple orientations
OCT imaging: towards a reconstruction in vivo?
Expected publication date: 2015
4. Judith Birkenfeld, Jorge Lamela, Sergio Ortiz, Susana Marcos Imaging crystalline
lens microscopic structures of intact in vitro mammal lenses using confocal mi-
croscopy.
Expected publication date: 2015
8.2 Diffusion of the results
8.2.1 Summary
My work has been presented in 19 occasions, 6 given by me, 13 by my collaborators.
• 6 presentation in international conferences
– 4 talks
– 2 poster
• 13 presentation by my colleagues in international conferences
– 8 talks
– 5 posters
8.2.2 Talks and poster presented by Judith Birkenfeld
(Authors are indicated by signature order, p =poster, t =talk)
1. [2014 − p] ARVO 2014, Orlando, FL, USA, May 2014, poster on “Imaging crys-
157

talline lens microscopic structures of intact in vitro mammal lenses using confocal
microscopy”, coauthors: Jorge Lamela, Sergio Ortiz, Susana Marcos
2. [2013 − p] ARVO 2013, Seattle, WA, USA, 8 May 2013, poster on “Contribution
of shape and gradient index to the spherical aberration of donor human lenses”,
coauthors: Alberto de Castro, and Susana Marcos
3. [2012−t] Accommodation Club 2012, Miami, FL, USA, 11 May 2012, talk “Change
in the Gradient Refractive Index of Cynomolgus Monkey Lenses with Simulated
Accommodation”, coauthors: Alberto de Castro, Bianca Maceo, Esdras Arrieta,
Fabrice Manns, Jean-Marie Parel, Susana Marcos
4. [2012− t] ARVO 2012, Fort Lauderdale, FL, USA, 7 May 2012, talk “Contribution
of Crystalline Lens Surface Shape and Gradient Index Distribution to Spherical
Aberration”, coauthors: Alberto de Castro, Sergio Ortiz, Pablo Prez-Merino, En-
rique Gambra, Daniel Pascual, Susana Marcos
5. [2012− t] IONS 11, Paris, France, 22 February 2012, talk “Role of lens surface and
gradient index for spherical aberration in mammal lenses”, coauthors: Alberto de
Castro, Sergio Ortiz, Pablo Prez-Merino, Enrique Gambra, Daniel Pascual, and
Susana Marcos
6. [2011 − t] ARVO 2011, Fort Lauderdale, FL, USA, 3 May 2011, talk “Three-
dimensional reconstruction of the isolated human crystalline lens Gradient Index
distribution”, coauthors: Alberto de Castro, Sergio Ortiz, Pablo Prez-Merino,
Enrique Gambra, Susana Marcos
8.2.3 Presentation by Judith Birkenfeld’s collaborators
(Authors are indicated by signature order, p =poster, t =talk)
1. [2014 − t] ARVO 2014, Orlando, FL, USA, May 2014, talk “OCT-based recon-
struction of the crystalline lens Gradient Refractive index: changes with age and
accommodation”, authors: Susana Marcos et al.
2. [2014− p] ARVO 2014, Orlando, FL, USA, May 2014, poster on “Crystalline lens
gradient refractive index and posterior surface shape from multiple orientations
OCT imaging: towards a reconstruction in vivo?”, authors: Alberto de Castro,
Judith Birkenfeld, Bianca M. Maceo, Marco Ruggeri, Esdras A. Arrieta, Jean-
Marie A. Parel, Fabrice Manns, Susana Marcos
3. [2014 − p] ARVO 2014, Orlando, FL, USA, May 2014, poster on “OCT 3-D sur-
face topography of isolated human crystalline lenses”, authors: Mengchan Sun,
Judith Birkenfeld, Alberto de Castro, Sergio Ortiz, Susana Marcos
158
4. [2014 − p] ARVO 2014, Orlando, FL, USA, May 2014, poster on “Lens Spherical
Aberrations in Cynomolgus Monkeys: Comparison of Laser Ray Tracing Measure-
ments and Reconstructed GRIN Model Predictions”, authors: Bianca M. Maceo,
Alberto de Castro, Judith Birkenfeld, Esdras Arrieta, Jean-Marie A. Parel, Susana
Marcos, Fabrice Manns
5. [2013 − t] International Myopia Conference, Asilomar, CA, USA, 19.-22. August
2013, talk “In vivo 3-D quantification of the crystalline lens based on Optical
Coherence Tomography”, authors: Susana Marcos, Sergio Ortiz, Enrique Gambra,
J.B., Mengchan Sun, Pablo Prez-Merino
6. [2013− t] Bienal de Fsica 2013, Valencia, Spain, 15.-18. July 2013, talk “Microsco-
pas multifotnica y de generacin de segundo armnico: Aplicaciones al estudio del
fenmeno de la acomodacin del ojo y de nuevos tratamientos oculares”, authors:
Jorge Lamela, J.B., Sergio Ortiz, Daniel Pascual, Susana Marcos
7. [2013−t] Bienal de Fsica 2013, Valencia, Spain, 15.-18. July 2013, talk “Geometra
y biometra 3D del segmento anterior del ojo con OCT”, authors: Sergio Ortiz,
Pablo Prez-Merino, Judith Birkenfeld, Nicolas Alejandre, Sonia Duran, Susana
Marcos
8. [2013 − t] ARVO 2013, Fort Lauderdale, FL, USA, 5 May 2013, talk “Three-
dimensional biometry and alignment in eyes implanted with Accommodative IOLs
as a function of accommodative demand”, authors: Susana Marcos, Sergio Or-
tiz, Pablo Perez-Merino, Miriam Velasco, Mengchan Sun, Judith Birkenfeld, Sonia
Duran, Ignacio Jimenez-Alfaro
9. [2012− t] X Reunin Nacional de ptica, Zaragoza, Spain, 4-7 September 2012, talk
“Anlisis y cuantificacin de imgenes 3D de OCT del segmento anterior del ojo: Tc-
nicas y aplicaciones”, authors: Sergio Ortiz, Pablo Prez-Merino, Judith Birkenfeld,
Nicolas Alejandre, Susana Marcos
10. [2012−p] X Reunin Nacional de ptica, Zaragoza, Spain, 4-7 September 2012, poster
on “Lneas de Investigacin del Laboratorio de Optica Visual y Biofotnica (Instituto
de ptica, CSIC)”, authors: S. Marcos, S. Barbero, J. Birkenfeld, C. Dorronsoro,
A. de Castro, D. Corts, E. Gambra, P. de Gracia, S. Kling, J. Lamela, D. Pascual,
P. Prez-Merino, S. Ortiz, A. Radhakrishan, L. Sawides, M. Sun, M. Velasco, M.
Vias, N. Alejandre, S. Durn, I. Jimnez-Alfaro
11. [2012−p] 6th Topical Meeting of Vision and Physiological Optics (EMVPO-2012),
European Optical Society, Dublin, Ireland , 22 August 2012, talk “Quantifying per-
formance of accommodative intraocular lenses with 3-D anterior segment OCT”,
authors: Susana Marcos, Sergio Ortiz, Pablo Prez-Merino, Judith Birkenfeld, So-
159

nia Durn, Ignacio Jimnez-Alfaro
12. [2012 − t] 6th European Meeting on Visual And Physiological Optics (EMVPO
Dublin, Ireland, 20 August 2012, talk “Gradient refractive index reconstruction
in accommodating non-human primate crystalline lenses”, authors: Alberto de
Castro, Judith Birkenfeld, Bianca Maceo, Esdras Arrieta, Fabrice Manns, Jean-
Marie Parel, Susana Marcos
13. [2011−t] Frontiers in Optics, San Jose, CA, USA, 16-20 October 2011, talk “Ocular
Imaging and crystalline lens Optical properties”, authors: Susana Marcos, Alberto
de Castro, Enrique Gambra, Judith Birkenfeld, Sergio Ortiz, Pablo Perez Marino,
and Carlos Dorronsoro
8.3 Visits and Stays in Research Institutions
1. [10/2013] Bascom Palmer Eye Institute, Miami, USA 2 weeks, from October 8 to
October 25 of 2013. Topics: Gradient refractive index in monkey eyes / Off-axis
OCT
2. [05/2012 − 07/2012] Bascom Palmer Eye Institute, Miami, USA 9.5 weeks, from
May 5 to July 12 of 2012. Topics: Gradient refractive index in monkey eyes
3. [09/2011 − 12/2011] Bascom Palmer Eye Institute, Miami, USA 12 weeks, from
September 16 to December 13 of 2011. Topics: Gradient refractive index in monkey
eyes
160

Acknowledgements
This work would have never been accomplished without the help and the dedication of
the following people:
From the viobio group in Madrid I would like to thank first and foremost my su-
pervisor Susana Marcos for the opportunity to work with her, for the guidance and
support, for the opportunity to send me to conferences and present our work, and for
the collaborations you made possible. I would also like to thank Alberto de Castro
for mentoring me with patience for the last four years, Sergio Ortiz for the guidance
regarding optical setups, Jorge Lamela for the collective work on the microscope, Pablo
Perez for the collective work on the IOL patients, and to my coauthors Daniel Pascual,
Miriam Velasco-Ocana, Nicolas Alejandre, Sonia Duran, and Ignacio Jimenez-Alfaro.
I would also like to thank Enrique Bustos, Carlos Dorronsoro, Enrique Gambra, Jose
Requejo-Isidro, and Sergio Barbero for various scientific discussions and administrative
help. Thank you to the viobio group for the time spent. And a special thank you to the
group of patients who came to our lab several times for many hours to sit through the
measurements.
From the Bascom Palmer Eye Institute in Miami I would like to thank Bianca Maceo,
Esdras Arrieta, Marco Ruggeri, Mariela Aguilar, Fabrice Manns, and Jean-Marie Parel.
Thank you and to the whole OBC team for welcoming me so cordially throughout the
years, and for the great opportunity to work with you.
From the Wellman Center in Boston, MA, I would like to thank Irene Kochevar and
Conor Evans for many long-distance advices.
I would also like to acknowledge the Spanish government for the financial support I
received in form of the JAE-Predoc.
161