Seismic safety assessment of unreinforced masonry low-rise ...
Upload
independentCategory
view
1download
0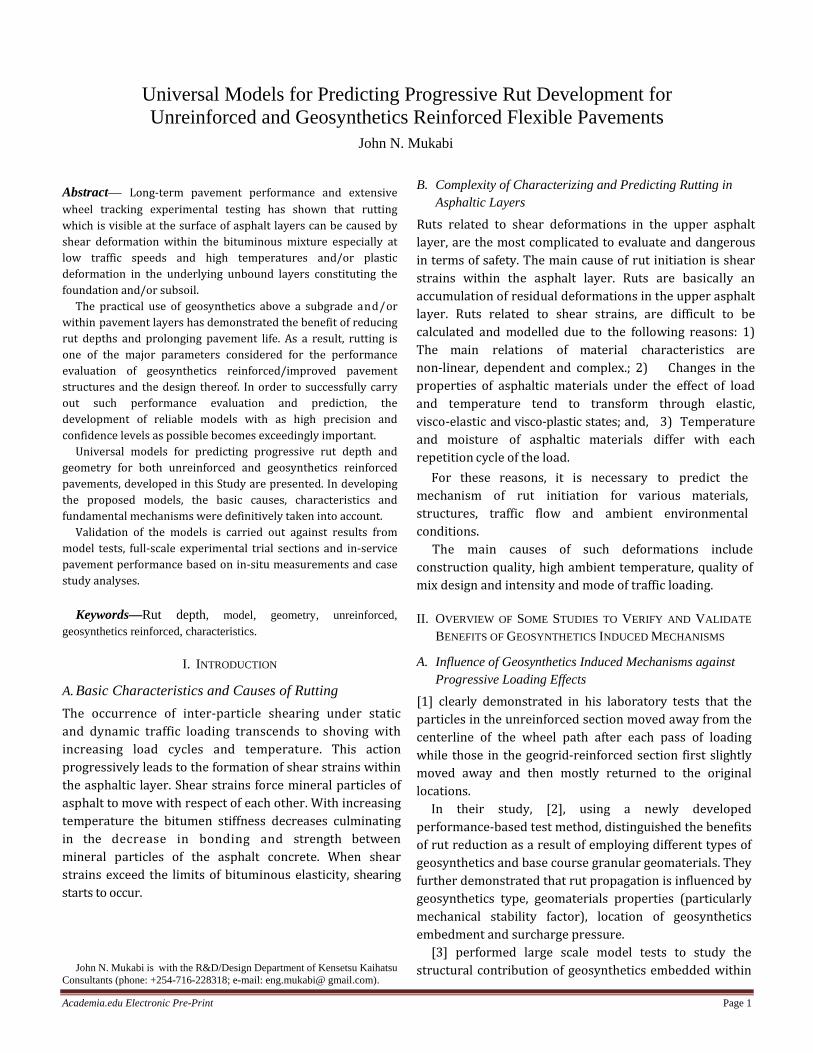
Academia.edu Electronic Pre-Print Page 1
Abstract— Long-term pavement performance and extensive wheel tracking experimental testing has shown that rutting which is visible at the surface of asphalt layers can be caused by shear deformation within the bituminous mixture especially at low traffic speeds and high temperatures and/or plastic deformation in the underlying unbound layers constituting the foundation and/or subsoil. The practical use of geosynthetics above a subgrade and/or within pavement layers has demonstrated the benefit of reducing rut depths and prolonging pavement life. As a result, rutting is one of the major parameters considered for the performance evaluation of geosynthetics reinforced/improved pavement structures and the design thereof. In order to successfully carry out such performance evaluation and prediction, the development of reliable models with as high precision and confidence levels as possible becomes exceedingly important. Universal models for predicting progressive rut depth and geometry for both unreinforced and geosynthetics reinforced pavements, developed in this Study are presented. In developing the proposed models, the basic causes, characteristics and fundamental mechanisms were definitively taken into account. Validation of the models is carried out against results from model tests, full-scale experimental trial sections and in-service pavement performance based on in-situ measurements and case study analyses.
Keywords—Rut depth, model, geometry, unreinforced, geosynthetics reinforced, characteristics.
I. INTRODUCTION
A. Basic Characteristics and Causes of Rutting
The occurrence of inter-particle shearing under static and dynamic traffic loading transcends to shoving with increasing load cycles and temperature. This action progressively leads to the formation of shear strains within the asphaltic layer. Shear strains force mineral particles of asphalt to move with respect of each other. With increasing temperature the bitumen stiffness decreases culminating in the decrease in bonding and strength between mineral particles of the asphalt concrete. When shear strains exceed the limits of bituminous elasticity, shearing starts to occur.
John N. Mukabi is with the R&D/Design Department of Kensetsu Kaihatsu
Consultants (phone: +254-716-228318; e-mail: eng.mukabi@ gmail.com).
B. Complexity of Characterizing and Predicting Rutting in Asphaltic Layers
Ruts related to shear deformations in the upper asphalt layer, are the most complicated to evaluate and dangerous in terms of safety. The main cause of rut initiation is shear strains within the asphalt layer. Ruts are basically an accumulation of residual deformations in the upper asphalt layer. Ruts related to shear strains, are difficult to be calculated and modelled due to the following reasons: 1) The main relations of material characteristics are non-linear, dependent and complex.; 2) Changes in the properties of asphaltic materials under the effect of load and temperature tend to transform through elastic, visco-elastic and visco-plastic states; and, 3) Temperature and moisture of asphaltic materials differ with each repetition cycle of the load. For these reasons, it is necessary to predict the mechanism of rut initiation for various materials, structures, traffic flow and ambient environmental conditions. The main causes of such deformations include construction quality, high ambient temperature, quality of mix design and intensity and mode of traffic loading.
II. OVERVIEW OF SOME STUDIES TO VERIFY AND VALIDATE
BENEFITS OF GEOSYNTHETICS INDUCED MECHANISMS
A. Influence of Geosynthetics Induced Mechanisms against Progressive Loading Effects
[1] clearly demonstrated in his laboratory tests that the particles in the unreinforced section moved away from the centerline of the wheel path after each pass of loading while those in the geogrid-reinforced section first slightly moved away and then mostly returned to the original locations. In their study, [2], using a newly developed performance-based test method, distinguished the benefits of rut reduction as a result of employing different types of geosynthetics and base course granular geomaterials. They further demonstrated that rut propagation is influenced by geosynthetics type, geomaterials properties (particularly mechanical stability factor), location of geosynthetics embedment and surcharge pressure. [3] performed large scale model tests to study the structural contribution of geosynthetics embedded within
John N. Mukabi
Universal Models for Predicting Progressive Rut Development for Unreinforced and Geosynthetics Reinforced Flexible Pavements
Academia.edu Electronic Pre-Print Page 2
a 300mm gravel aggregate base course layer overlain by a 75mm asphalt wearing course and underlain by a 450mm sand subgrade. The base course thickness of the unreinforced layer varied between 300mm and 500mm. Some of the typical results are presented in Figures 4.12
and 13 and Plates 4.4 and 4.5. Simulation of subgrade bearing strengths of CBR = 1%, 3%, 8% and 18%, was carried out by varying the degree of moisture ~ suction.
Figure 1 a) LHS: Effect of dynamic loading and subgrade bearing strength on progressive rut development; and, b) RHS: Effect of
dynamic loading, GRI and structural thickness on progressive rut development (Montanelliand Rimoldi, 1997)
Figure 2 Typical permanent deformation geometry of geosynthetics reinforced and unreinforced gravel aggregate base course measured
at: a) LHS: the asphalt-gravel aggregate interface; and, b) RHS: the base gravel aggregate-sand subgrade interface (Montanelli and Rimoldi, 1997)
The following derivations can be made from the graphical plots provided in Figures 1 and 2.
1. Progressive rutting occurs quasi-exponentially with increased load cycles (Figures1a and 1b).
2. Performance of reinforced pavement structure is significantly enhanced at low subgrade bearing strengths when compared to the unreinforced one (Figure 1a). This observation validates the fact that lateral restraint and bearing strength are increased as a result of geosynthetics reinforcement (interlock mechanism).
3. Depending on the environmental factors, reinforcement may not be necessary when pavements are founded on subgrades with high bearing strengths (Figure 1a). These results are in agreement with the analytical results obtained in This Study (recommendations of appropriate use are made in the structural design guidelines developed based on the findings of This Study).
4. A 300mm thick reinforced gravel base layer performed better than a 400mm unreinforced layer constituent of similar geomaterials (Figure 1b).
0
50
100
150
100 1000 10000 100000
Ru
t D
epth
(m
m)
Load Cycles
Unreinforced CBR 1%
Reinforced CBR 1%
Unreinforced CBR 3%
Reinforced CBR 3%
Unreinforced CBR 8%
Reinforced CBR 8%
Unreinforced CBR 18%
Reinforced CBR 18%
0
20
40
60
80
100
100 1000 10000 100000
Ru
t D
epth
(m
m)
Load Cycles
Unreinforced 300mm gravel
Unreinforced 350mm gravel
Unreinforced 400mm gravel
Reinforced 300mm gravel
Unreinforced 500mm gravel
CBR=3%
Academia.edu Electronic Pre-Print Page 3
These results validate the Base Course Reduction (BCR) design criteria applied for geosynthetics reinforced pavement layers.
5. Reinforcement notwithstanding, structural thickness contributes significantly to the performance of pavement structures (Figure 1b).
6. Geosynthetics reinforcement influences the geometry of rutting (Figure 2a and 2b).
The lateral restraint mechanism induced by geosynthetics reinforcement is evident in Figure 2a, while the increase in bearing capacity as a result of change in strength path of the same is evident in Figure 2b.
7. Increase in lateral restraint and bearing strength due to geosynthetics reinforcement is evident from Figures 2a and 2b.
8. Reduction in the load intensity due to broadened stress distribution is particularly evident from Figure 2a.
9. From Figure 2a it is evident that the stress intensity is reduced due to multiple geosynthetics reinforcement (two layers reinforced by geogrids @ mid depth of base course layer and base – subgrade interface).
10. From Figure 2b it is evident that the effect of stress intensity reduction diminished prior to coupling with the geogrid embedded at the base – subgrade interface.
11. From a Value Engineering perspective, multiple-reinforcement is not economically viable in this case.
B. Effects of Location of Embedment and Surcharge on Rutting Mitigation Mechanisms
B1. Method of testing and material properties
Method of testing and apparatus
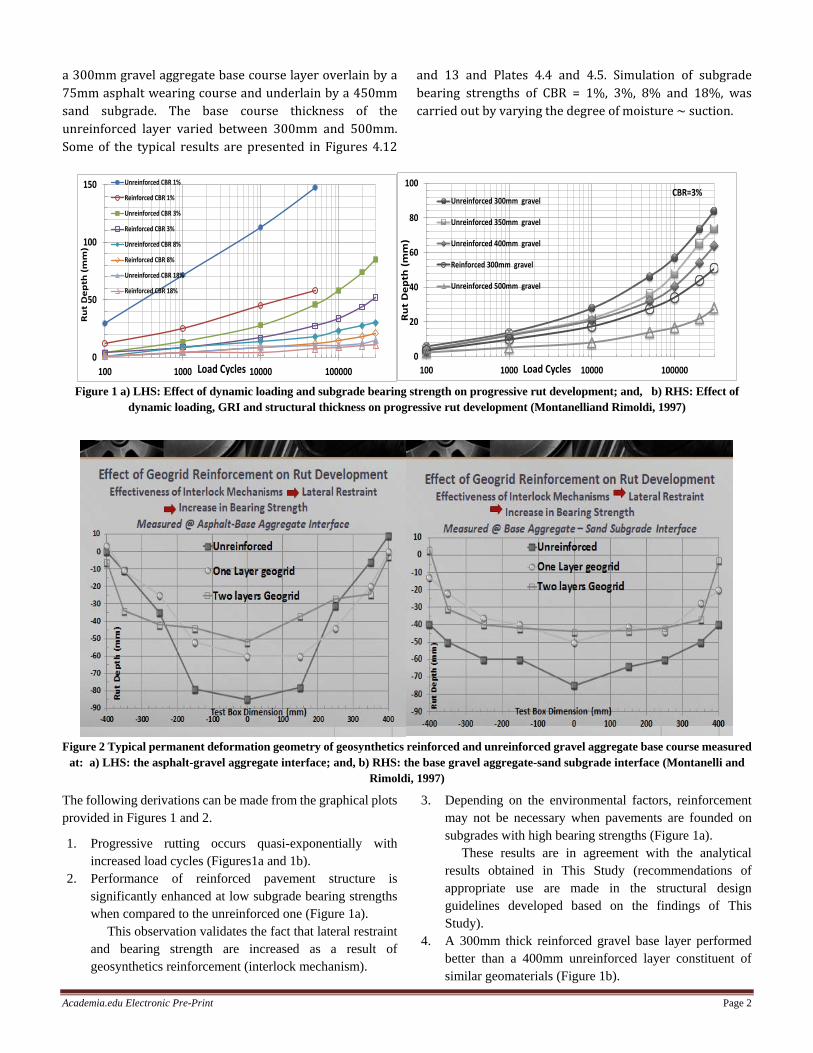
With the main objective of investigating the influence of geosynthetic ~ geomaterial confinement and distinguish the benefits accruing from different types of geosynthetics and geomaterials, including effects of location of embedment and surcharge, [2] used a newly developed performance based test method modified from the Asphalt Pavement Analyzer (refer to Figure 3 and Figure 4). As shown in Figure 6, a loaded wheel can move back and forth on the surface of soil. The wheels and air pressurized hoses and the placement of the geosynthetic sheet within t h e base course g e o m a t e r i a l were typically as shown in Figures 3 ~ 5. The wheel moving direction was parallel to the machine direction of the geosynthetics. Rut depth was measured manually or automatically after a certain number of passes. C o m p a r i s on o f t he relationship between rut depth and number of passes of a geosynthetic-reinforced base to that
of an unreinforced base was applied to evaluate the effect of confinement for the varying geosynthetics types.
Figure 3 Cross-section of test set up (Han et al, 2011)
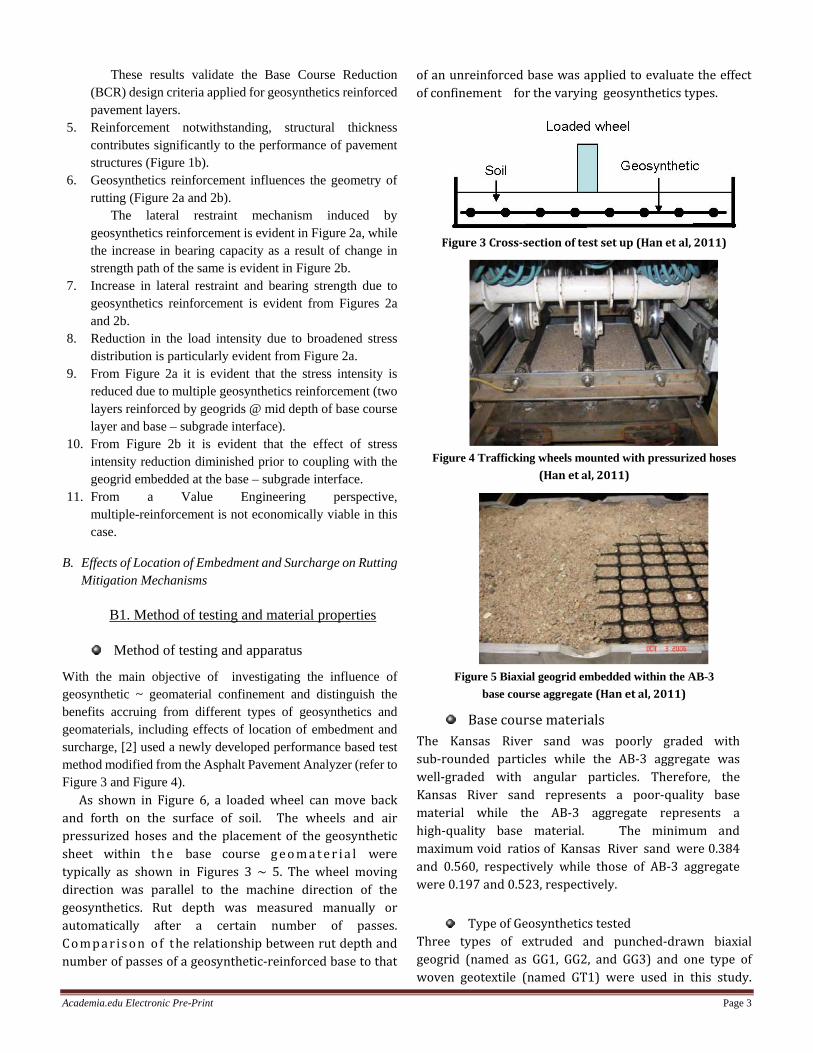
Figure 4 Trafficking wheels mounted with pressurized hoses
(Han et al, 2011)
Figure 5 Biaxial geogrid embedded within the AB-3
base course aggregate (Han et al, 2011)
Base course materials The Kansas River sand was poorly graded with sub-rounded particles while the AB-3 aggregate was well-graded with angular particles. Therefore, the Kansas River sand represents a poor-quality base material while the AB-3 aggregate represents a high-quality base material. The minimum and maximum void ratios of Kansas River sand were 0.384 and 0.560, respectively while those of AB-3 aggregate were 0.197 and 0.523, respectively.
Type of Geosynthetics tested
Three types of extruded and punched-drawn biaxial geogrid (named as GG1, GG2, and GG3) and one type of woven geotextile (named GT1) were used in this study.
Academia.edu Electronic Pre-Print Page 4
The properties of these geosynthetics are provided in Table 1. In terms of ultimate tensile strength and tensile strength at 5% strain, GT1 had the highest strength values followed by GG3, GG2, and GG1. However, GG3 had slightly higher tensile strength values at 2% strain. In this study, two locations of geosynthetics embedment were adopted.
Table 1 Properties of geosynthetics used in Han et al. (2011) study
B2. Effect of location of embedment
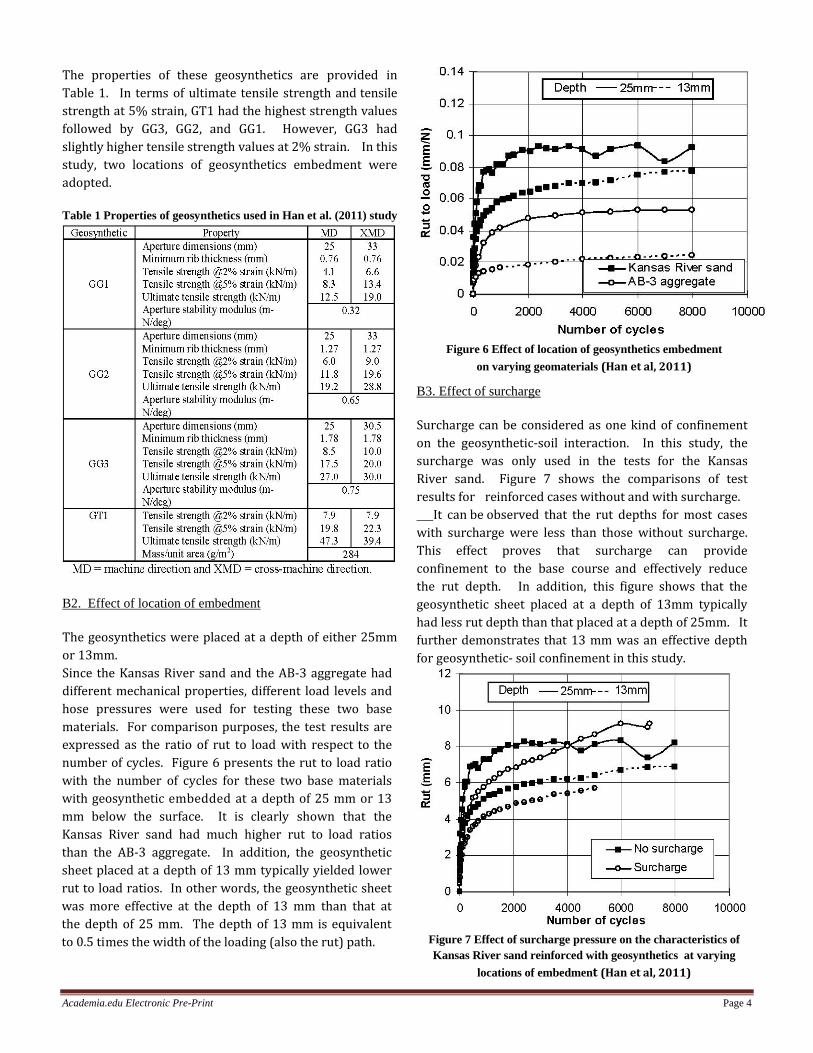
The geosynthetics were placed at a depth of either 25mm or 13mm. Since the Kansas River sand and the AB-3 aggregate had different mechanical properties, different load levels and hose pressures were used for testing these two base materials. For comparison purposes, the test results are expressed as the ratio of rut to load with respect to the number of cycles. Figure 6 presents the rut to load ratio with the number of cycles for these two base materials with geosynthetic embedded at a depth of 25 mm or 13 mm below the surface. It is clearly shown that the Kansas River sand had much higher rut to load ratios than the AB-3 aggregate. In addition, the geosynthetic sheet placed at a depth of 13 mm typically yielded lower rut to load ratios. In other words, the geosynthetic sheet was more effective at the depth of 13 mm than that at the depth of 25 mm. The depth of 13 mm is equivalent to 0.5 times the width of the loading (also the rut) path.
Figure 6 Effect of location of geosynthetics embedment
on varying geomaterials (Han et al, 2011)
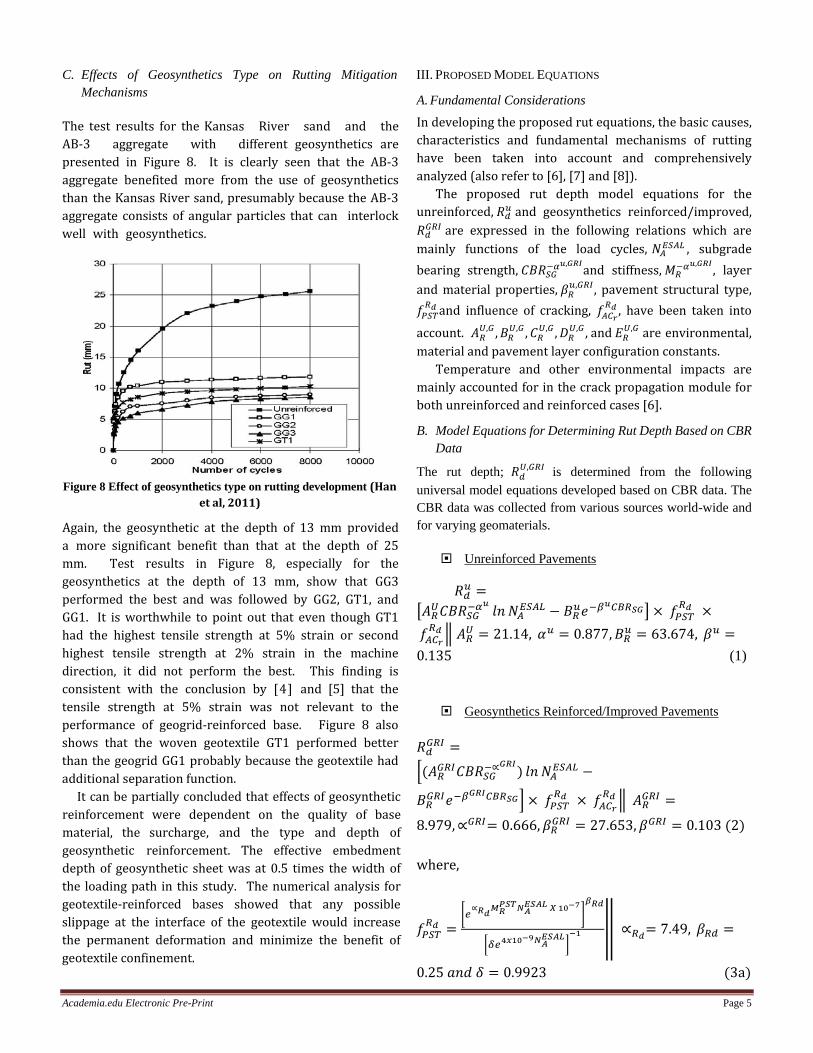
B3. Effect of surcharge
Surcharge can be considered as one kind of confinement on the geosynthetic-soil interaction. In this study, the surcharge was only used in the tests for the Kansas River sand. Figure 7 shows the comparisons of test results for reinforced cases without and with surcharge. It can be observed that the rut depths for most cases with surcharge were less than those without surcharge. This effect proves that surcharge can provide confinement to the base course and effectively reduce the rut depth. In addition, this figure shows that the geosynthetic sheet placed at a depth of 13mm typically had less rut depth than that placed at a depth of 25mm. It further demonstrates that 13 mm was an effective depth for geosynthetic- soil confinement in this study.
Figure 7 Effect of surcharge pressure on the characteristics of Kansas River sand reinforced with geosynthetics at varying
locations of embedment (Han et al, 2011)
Academia.edu Electronic Pre-Print Page 5
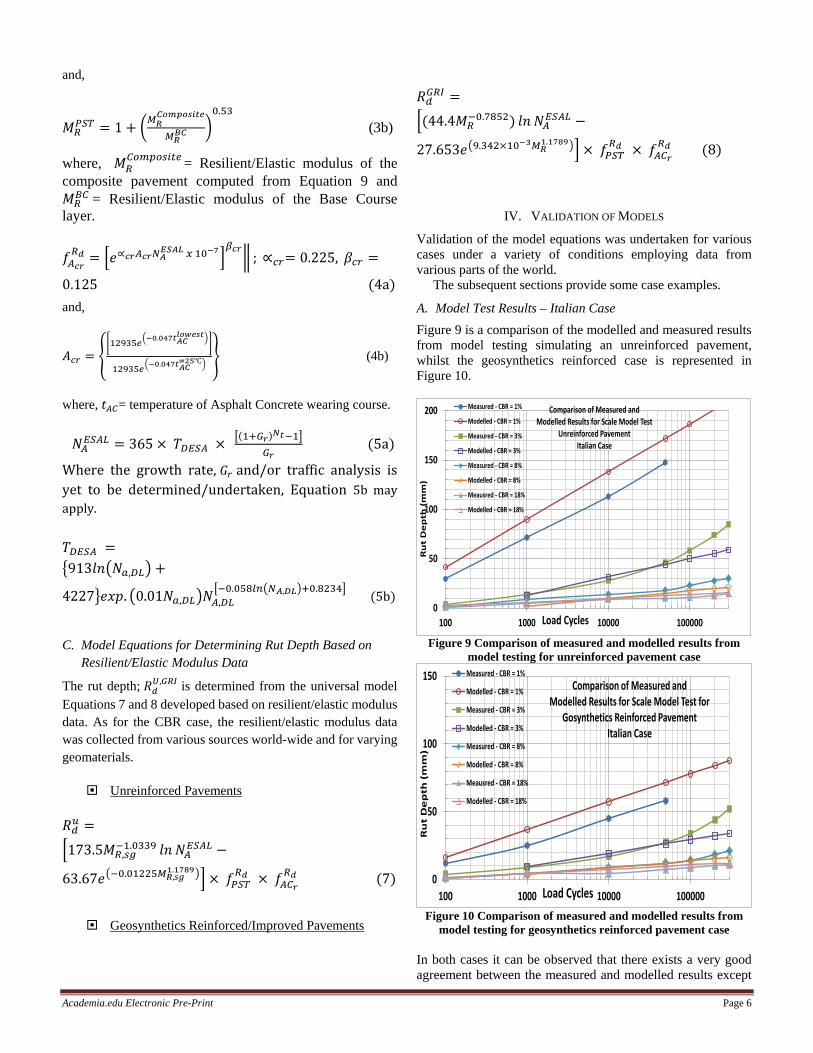
C. Effects of Geosynthetics Type on Rutting Mitigation Mechanisms
The test results for the Kansas River sand and the AB-3 aggregate with different geosynthetics are presented in Figure 8. It is clearly seen that the AB-3 aggregate benefited more from the use of geosynthetics than the Kansas River sand, presumably because the AB-3 aggregate consists of angular particles that can interlock well with geosynthetics.
Figure 8 Effect of geosynthetics type on rutting development (Han
et al, 2011)
Again, the geosynthetic at the depth of 13 mm provided a more significant benefit than that at the depth of 25 mm. Test results in Figure 8, especially for the geosynthetics at the depth of 13 mm, show that GG3 performed the best and was followed by GG2, GT1, and GG1. It is worthwhile to point out that even though GT1 had the highest tensile strength at 5% strain or second highest tensile strength at 2% strain in the machine direction, it did not perform the best. This finding is consistent with the conclusion by [4] and [5] that the tensile strength at 5% strain was not relevant to the performance of geogrid-reinforced base. Figure 8 also shows that the woven geotextile GT1 performed better than the geogrid GG1 probably because the geotextile had additional separation function. It can be partially concluded that effects of geosynthetic reinforcement were dependent on the quality of base material, the surcharge, and the type and depth of geosynthetic reinforcement. The effective embedment depth of geosynthetic sheet was at 0.5 times the width of the loading path in this study. The numerical analysis for geotextile-reinforced bases showed that any possible slippage at the interface of the geotextile would increase the permanent deformation and minimize the benefit of geotextile confinement.
III. PROPOSED MODEL EQUATIONS
A. Fundamental Considerations In developing the proposed rut equations, the basic causes, characteristics and fundamental mechanisms of rutting have been taken into account and comprehensively analyzed (also refer to [6], [7] and [8]).
The proposed rut depth model equations for the unreinforced, 𝑅𝑑𝑢 and geosynthetics reinforced/improved, 𝑅𝑑𝐺𝐺𝐺 are expressed in the following relations which are mainly functions of the load cycles, 𝑁𝐴𝐸𝐸𝐴𝐸 , subgrade bearing strength, 𝐶𝐶𝑅𝐸𝐺−𝛼
𝑢,𝐺𝐺𝐺and stiffness, 𝑀𝐺−𝛼𝑢,𝐺𝐺𝐺 , layer
and material properties, 𝛽𝐺𝑢,𝐺𝐺𝐺, pavement structural type,
𝑓𝑃𝐸𝑃𝐺𝑑 and influence of cracking, 𝑓𝐴𝐴𝑟
𝐺𝑑 , have been taken into
account. 𝐴𝐺𝑈,𝐺 ,𝐶𝐺
𝑈,𝐺 ,𝐶𝐺𝑈,𝐺 ,𝐷𝐺
𝑈,𝐺 , and 𝐸𝐺𝑈,𝐺 are environmental,
material and pavement layer configuration constants. Temperature and other environmental impacts are
mainly accounted for in the crack propagation module for both unreinforced and reinforced cases [6].
B. Model Equations for Determining Rut Depth Based on CBR Data
The rut depth; 𝑅𝑑𝑈,𝐺𝐺𝐺 is determined from the following
universal model equations developed based on CBR data. The CBR data was collected from various sources world-wide and for varying geomaterials.
Unreinforced Pavements
𝑅𝑑𝑢 =�𝐴𝐺𝑈𝐶𝐶𝑅𝐸𝐺−𝛼
𝑢 𝑙𝑙 𝑁𝐴𝐸𝐸𝐴𝐸 − 𝐶𝐺𝑢𝑒−𝛽𝑢𝐴𝐶𝐺𝑆𝐺� × 𝑓𝑃𝐸𝑃
𝐺𝑑 × 𝑓𝐴𝐴𝑟𝐺𝑑 � 𝐴𝐺𝑈 = 21.14, 𝛼𝑢 = 0.877,𝐶𝐺𝑢 = 63.674, 𝛽𝑢 =
0.135 (1)
Geosynthetics Reinforced/Improved Pavements
𝑅𝑑𝐺𝐺𝐺 =�(𝐴𝐺𝐺𝐺𝐺𝐶𝐶𝑅𝐸𝐺−∝
𝐺𝐺𝐺) 𝑙𝑙 𝑁𝐴𝐸𝐸𝐴𝐸 −
𝐶𝐺𝐺𝐺𝐺𝑒−𝛽𝐺𝐺𝐺𝐴𝐶𝐺𝑆𝐺� × 𝑓𝑃𝐸𝑃
𝐺𝑑 × 𝑓𝐴𝐴𝑟𝐺𝑑 � 𝐴𝐺𝐺𝐺𝐺 =
8.979,∝𝐺𝐺𝐺= 0.666,𝛽𝐺𝐺𝐺𝐺 = 27.653,𝛽𝐺𝐺𝐺 = 0.103 (2) where,
𝑓𝑃𝐸𝑃𝐺𝑑 =
�𝑒∝𝐺𝑑𝑀𝐺𝑃𝑆𝑃𝑁𝐴
𝐸𝑆𝐴𝐸 𝑋 10−7�𝛽𝐺𝑑
�𝛿𝑒4𝑥10−9𝑁𝐴
𝐸𝑆𝐴𝐸�−1 � ∝𝐺𝑑= 7.49, 𝛽𝐺𝑑 =
0.25 𝑎𝑙𝑎 𝛿 = 0.9923 (3a)
Academia.edu Electronic Pre-Print Page 6
and,
𝑀𝐺𝑃𝐸𝑃 = 1 + �𝑀𝐺
𝐶𝐶𝐶𝐶𝐶𝐶𝐶𝐶𝐶
𝑀𝐺𝐵𝐶 �
0.53
(3b)
where, 𝑀𝐺𝐴𝐶𝐶𝐶𝐶𝐶𝐶𝐶𝑒= Resilient/Elastic modulus of the
composite pavement computed from Equation 9 and 𝑀𝐺𝐶𝐴 = Resilient/Elastic modulus of the Base Course
layer.
𝑓𝐴𝑐𝑟𝐺𝑑 = �𝑒∝𝑐𝑟𝐴𝑐𝑟𝑁𝐴
𝐸𝑆𝐴𝐸 𝑥 10−7�𝛽𝑐𝑟� ; ∝𝑐𝑐= 0.225, 𝛽𝑐𝑐 =
0.125 (4a) and,
𝐴𝑐𝑐 = ��12935𝑒�−0.047𝐶𝐴𝐶
𝑙𝐶𝑙𝐶𝐶𝐶��
12935𝑒�−0.047𝐶𝐴𝐶=25℃�
� (4b)
where, 𝑡𝐴𝐴= temperature of Asphalt Concrete wearing course.
𝑁𝐴𝐸𝐸𝐴𝐸 = 365 × 𝑇𝐷𝐸𝐸𝐴 × �(1+𝐺𝑟)𝑁𝐶−1�𝐺𝑟
(5a)
Where the growth rate, 𝐺𝑐 and/or traffic analysis is yet to be determined/undertaken, Equation 5b may apply. 𝑇𝐷𝐸𝐸𝐴 =�913𝑙𝑙�𝑁𝑎,𝐷𝐸� +
4227�𝑒𝑒𝑒. �0.01𝑁𝑎,𝐷𝐸�𝑁𝐴,𝐷𝐸�−0.058𝑙𝑙�𝑁𝐴,𝐷𝐸�+0.8234� (5b)
C. Model Equations for Determining Rut Depth Based on Resilient/Elastic Modulus Data
The rut depth; 𝑅𝑑𝑈,𝐺𝐺𝐺 is determined from the universal model
Equations 7 and 8 developed based on resilient/elastic modulus data. As for the CBR case, the resilient/elastic modulus data was collected from various sources world-wide and for varying geomaterials.
Unreinforced Pavements
𝑅𝑑𝑢 =�173.5𝑀𝐺,𝐶𝑠
−1.0339 𝑙𝑙 𝑁𝐴𝐸𝐸𝐴𝐸 −
63.67𝑒�−0.01225𝑀𝐺,𝐶𝑠1.1789�� × 𝑓𝑃𝐸𝑃
𝐺𝑑 × 𝑓𝐴𝐴𝑟𝐺𝑑 (7)
Geosynthetics Reinforced/Improved Pavements
𝑅𝑑𝐺𝐺𝐺 =�(44.4𝑀𝐺
−0.7852) 𝑙𝑙 𝑁𝐴𝐸𝐸𝐴𝐸 −
27.653𝑒�9.342×10⁻³𝑀𝐺1.1789�� × 𝑓𝑃𝐸𝑃
𝐺𝑑 × 𝑓𝐴𝐴𝑟𝐺𝑑 (8)
IV. VALIDATION OF MODELS
Validation of the model equations was undertaken for various cases under a variety of conditions employing data from various parts of the world. The subsequent sections provide some case examples.
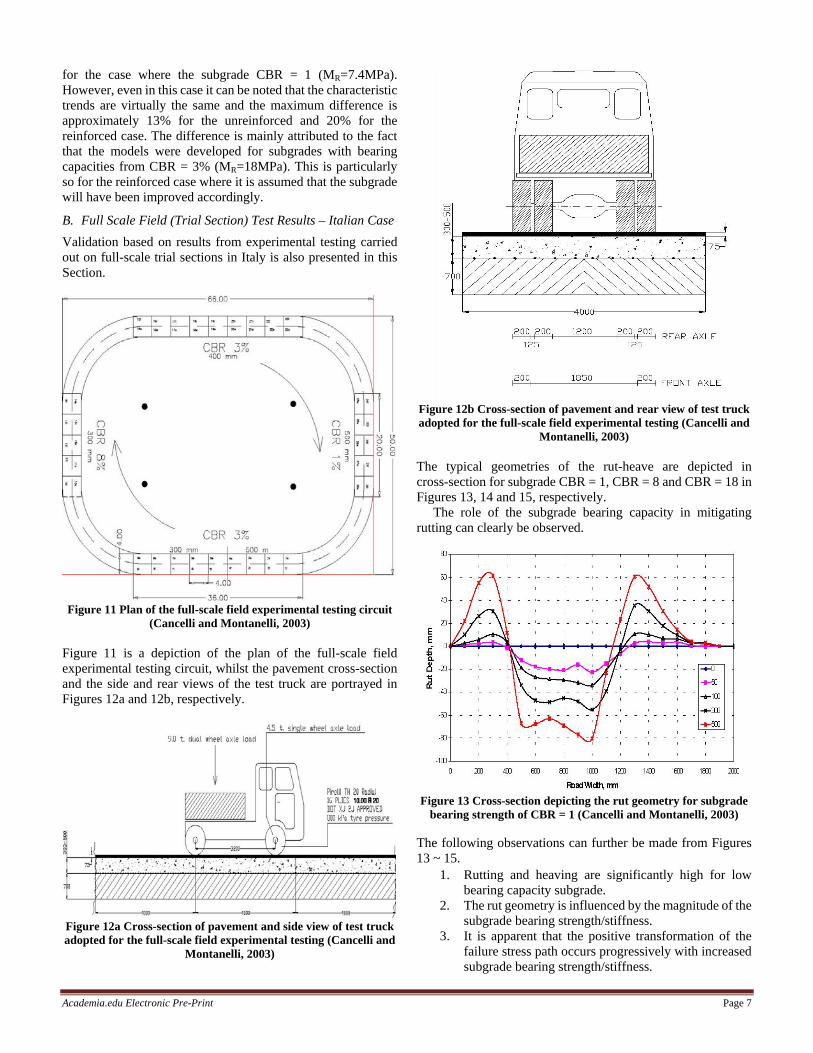
A. Model Test Results – Italian Case Figure 9 is a comparison of the modelled and measured results from model testing simulating an unreinforced pavement, whilst the geosynthetics reinforced case is represented in Figure 10.
Figure 9 Comparison of measured and modelled results from
model testing for unreinforced pavement case
Figure 10 Comparison of measured and modelled results from
model testing for geosynthetics reinforced pavement case In both cases it can be observed that there exists a very good agreement between the measured and modelled results except
0
50
100
150
200
100 1000 10000 100000
Ru
t D
ep
th (
mm
)
Load Cycles
Comparison of Measured and Modelled Results for Scale Model Test
Unreinforced PavementItalian Case
Measured - CBR = 1%
Modelled - CBR = 1%
Measured - CBR = 3%
Modelled - CBR = 3%
Measured - CBR = 8%
Modelled - CBR = 8%
Meausred - CBR = 18%
Modelled - CBR = 18%
0
50
100
150
100 1000 10000 100000
Ru
t D
ep
th (
mm
)
Load Cycles
Comparison of Measured and Modelled Results for Scale Model Test for
Gosynthetics Reinforced PavementItalian Case
Measured - CBR = 1%
Modelled - CBR = 1%
Measured - CBR = 3%
Modelled - CBR = 3%
Measured - CBR = 8%
Modelled - CBR = 8%
Meausred - CBR = 18%
Modelled - CBR = 18%
Academia.edu Electronic Pre-Print Page 7
for the case where the subgrade CBR = 1 (MR=7.4MPa). However, even in this case it can be noted that the characteristic trends are virtually the same and the maximum difference is approximately 13% for the unreinforced and 20% for the reinforced case. The difference is mainly attributed to the fact that the models were developed for subgrades with bearing capacities from CBR = 3% (MR=18MPa). This is particularly so for the reinforced case where it is assumed that the subgrade will have been improved accordingly.
B. Full Scale Field (Trial Section) Test Results – Italian Case Validation based on results from experimental testing carried out on full-scale trial sections in Italy is also presented in this Section.
Figure 11 Plan of the full-scale field experimental testing circuit
(Cancelli and Montanelli, 2003)
Figure 11 is a depiction of the plan of the full-scale field experimental testing circuit, whilst the pavement cross-section and the side and rear views of the test truck are portrayed in Figures 12a and 12b, respectively.
Figure 12a Cross-section of pavement and side view of test truck adopted for the full-scale field experimental testing (Cancelli and
Montanelli, 2003)
Figure 12b Cross-section of pavement and rear view of test truck adopted for the full-scale field experimental testing (Cancelli and
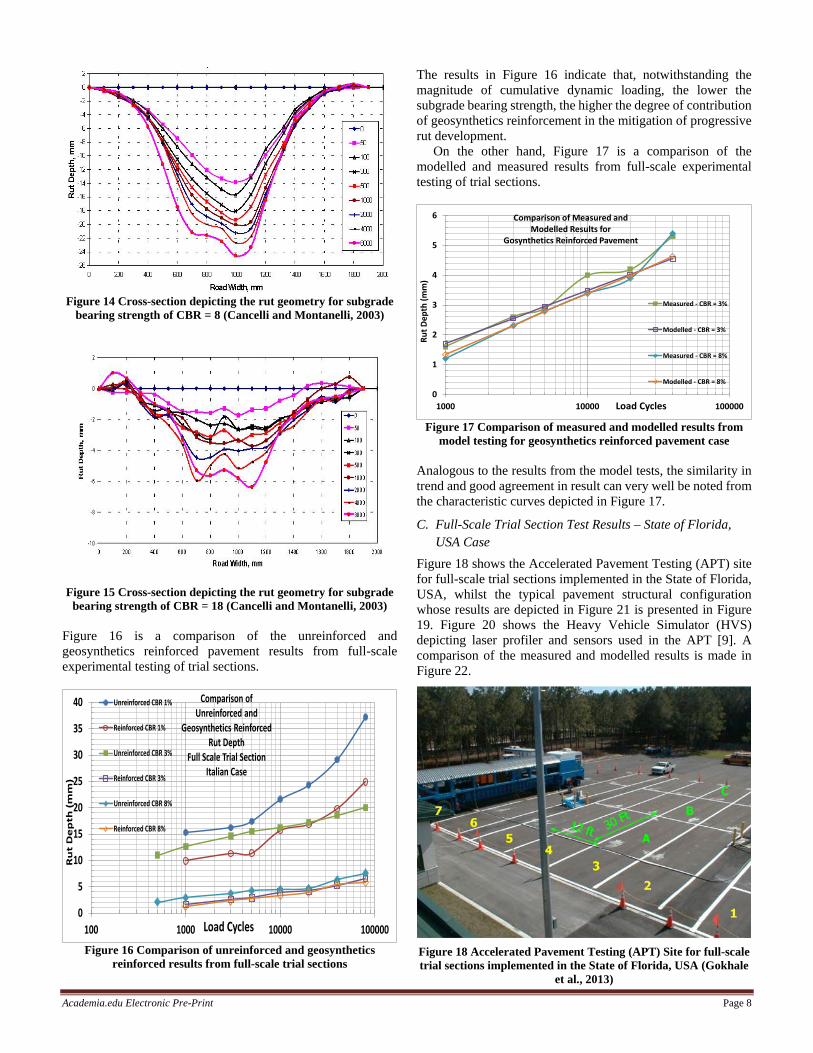
Montanelli, 2003) The typical geometries of the rut-heave are depicted in cross-section for subgrade CBR = 1, CBR = 8 and CBR = 18 in Figures 13, 14 and 15, respectively. The role of the subgrade bearing capacity in mitigating rutting can clearly be observed.
Figure 13 Cross-section depicting the rut geometry for subgrade
bearing strength of CBR = 1 (Cancelli and Montanelli, 2003)
The following observations can further be made from Figures 13 ~ 15.
1. Rutting and heaving are significantly high for low bearing capacity subgrade.
2. The rut geometry is influenced by the magnitude of the subgrade bearing strength/stiffness.
3. It is apparent that the positive transformation of the failure stress path occurs progressively with increased subgrade bearing strength/stiffness.
Academia.edu Electronic Pre-Print Page 8
Figure 14 Cross-section depicting the rut geometry for subgrade
bearing strength of CBR = 8 (Cancelli and Montanelli, 2003)
Figure 15 Cross-section depicting the rut geometry for subgrade bearing strength of CBR = 18 (Cancelli and Montanelli, 2003)
Figure 16 is a comparison of the unreinforced and geosynthetics reinforced pavement results from full-scale experimental testing of trial sections.
Figure 16 Comparison of unreinforced and geosynthetics
reinforced results from full-scale trial sections
The results in Figure 16 indicate that, notwithstanding the magnitude of cumulative dynamic loading, the lower the subgrade bearing strength, the higher the degree of contribution of geosynthetics reinforcement in the mitigation of progressive rut development. On the other hand, Figure 17 is a comparison of the modelled and measured results from full-scale experimental testing of trial sections.
Figure 17 Comparison of measured and modelled results from
model testing for geosynthetics reinforced pavement case Analogous to the results from the model tests, the similarity in trend and good agreement in result can very well be noted from the characteristic curves depicted in Figure 17.
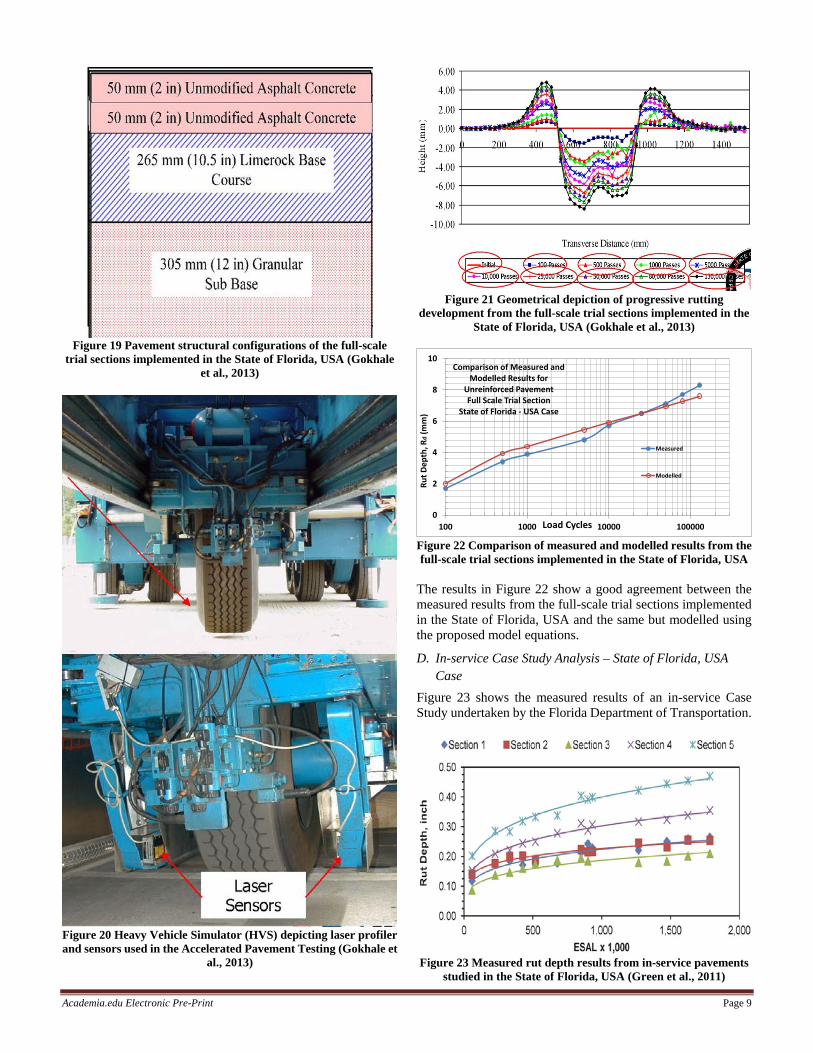
C. Full-Scale Trial Section Test Results – State of Florida, USA Case
Figure 18 shows the Accelerated Pavement Testing (APT) site for full-scale trial sections implemented in the State of Florida, USA, whilst the typical pavement structural configuration whose results are depicted in Figure 21 is presented in Figure 19. Figure 20 shows the Heavy Vehicle Simulator (HVS) depicting laser profiler and sensors used in the APT [9]. A comparison of the measured and modelled results is made in Figure 22.
Figure 18 Accelerated Pavement Testing (APT) Site for full-scale trial sections implemented in the State of Florida, USA (Gokhale
et al., 2013)
0
5
10
15
20
25
30
35
40
100 1000 10000 100000
Ru
t D
ep
th (
mm
)
Load Cycles
Comparison of Unreinforced and
Geosynthetics Reinforced Rut Depth
Full Scale Trial SectionItalian Case
Unreinforced CBR 1%
Reinforced CBR 1%
Unreinforced CBR 3%
Reinforced CBR 3%
Unreinforced CBR 8%
Reinforced CBR 8%
0
1
2
3
4
5
6
1000 10000 100000
Rut D
epth
(mm
)
Load Cycles
Comparison of Measured and Modelled Results for
Gosynthetics Reinforced Pavement
Measured - CBR = 3%
Modelled - CBR = 3%
Measured - CBR = 8%
Modelled - CBR = 8%
Academia.edu Electronic Pre-Print Page 9
Figure 19 Pavement structural configurations of the full-scale
trial sections implemented in the State of Florida, USA (Gokhale et al., 2013)
Figure 20 Heavy Vehicle Simulator (HVS) depicting laser profiler and sensors used in the Accelerated Pavement Testing (Gokhale et
al., 2013)
Figure 21 Geometrical depiction of progressive rutting
development from the full-scale trial sections implemented in the State of Florida, USA (Gokhale et al., 2013)
Figure 22 Comparison of measured and modelled results from the full-scale trial sections implemented in the State of Florida, USA
The results in Figure 22 show a good agreement between the measured results from the full-scale trial sections implemented in the State of Florida, USA and the same but modelled using the proposed model equations.
D. In-service Case Study Analysis – State of Florida, USA Case
Figure 23 shows the measured results of an in-service Case Study undertaken by the Florida Department of Transportation.
Figure 23 Measured rut depth results from in-service pavements
studied in the State of Florida, USA (Green et al., 2011)
0
2
4
6
8
10
100 1000 10000 100000
Rut D
epth
, Rd
(mm
)
Load Cycles
Comparison of Measured and Modelled Results for
Unreinforced PavementFull Scale Trial Section
State of Florida - USA Case
Measured
Modelled
Academia.edu Electronic Pre-Print Page 10
The characteristic curves graphically depicted in Figure 23 also make a comparison of unreinforced sections to sections with varying geosynthetics reinforcement types, modes and configurations. The particulars are presented Table 2 below [10]. Table 2 Summary of particulars of types and modes of reinforcement
S/N Section No. Particulars 1. 1 Rigid extruded geogrid placed at base
course/subgrade interface and Rigid extruded geogrid at interface of selected fill and peat
2. 2 Rigid extruded geogrid placed at base course/subgrade interface and woven geotextile at interface of selected fill and peat
3. 3 Woven geotextile placed at base course/subgrade interface and woven geotextile at interface of selected fill and peat
4. 4 Flexible woven geotextile placed at base course/subgrade interface and woven geotextile at interface of selected fill and peat
5. 5 No reinforcement On the other hand, a comparison of the measured results from Figure 23 and those modelled employing the proposed equations is made in Figure 24 for Sections 2, 3 and 5.
Figure 24 Comparison of measured and modelled results from the In-service Case Study implemented in the State of Florida, USA
Similar to the previous Italian and USA experimental trial section results, a good agreement between the measured and modelled results can be observed.
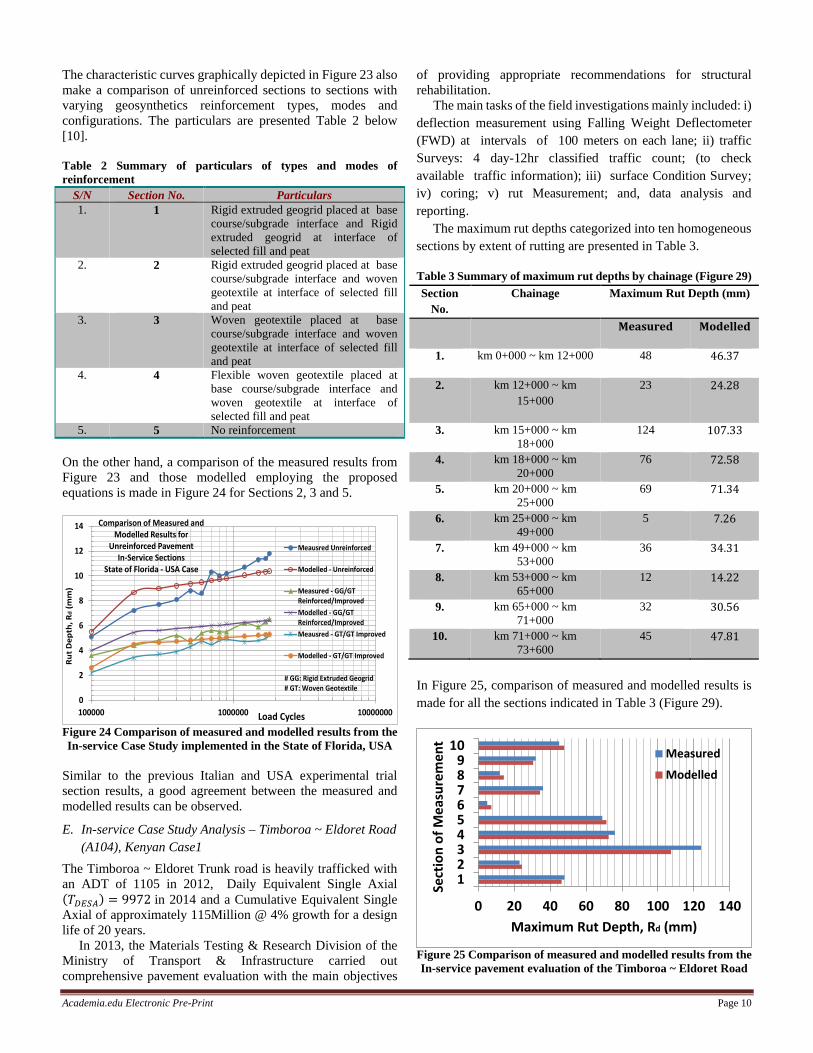
E. In-service Case Study Analysis – Timboroa ~ Eldoret Road (A104), Kenyan Case1
The Timboroa ~ Eldoret Trunk road is heavily trafficked with an ADT of 1105 in 2012, Daily Equivalent Single Axial (𝑇𝐷𝐸𝐸𝐴) = 9972 in 2014 and a Cumulative Equivalent Single Axial of approximately 115Million @ 4% growth for a design life of 20 years. In 2013, the Materials Testing & Research Division of the Ministry of Transport & Infrastructure carried out comprehensive pavement evaluation with the main objectives
of providing appropriate recommendations for structural rehabilitation. The main tasks of the field investigations mainly included: i) deflection measurement using Falling Weight Deflectometer (FWD) at intervals of 100 meters on each lane; ii) traffic Surveys: 4 day-12hr classified traffic count; (to check available traffic information); iii) surface Condition Survey; iv) coring; v) rut Measurement; and, data analysis and reporting. The maximum rut depths categorized into ten homogeneous sections by extent of rutting are presented in Table 3.
Table 3 Summary of maximum rut depths by chainage (Figure 29) Section
No. Chainage Maximum Rut Depth (mm)
Measured Modelled
1. km 0+000 ~ km 12+000 48 46.37
2. km 12+000 ~ km 15+000
23 24.28
3. km 15+000 ~ km 18+000
124 107.33
4. km 18+000 ~ km 20+000
76 72.58
5. km 20+000 ~ km 25+000
69 71.34
6. km 25+000 ~ km 49+000
5 7.26
7. km 49+000 ~ km 53+000
36 34.31
8. km 53+000 ~ km 65+000
12 14.22
9. km 65+000 ~ km 71+000
32 30.56
10. km 71+000 ~ km 73+600
45 47.81
In Figure 25, comparison of measured and modelled results is made for all the sections indicated in Table 3 (Figure 29).
Figure 25 Comparison of measured and modelled results from the In-service pavement evaluation of the Timboroa ~ Eldoret Road
0
2
4
6
8
10
12
14
100000 1000000 10000000
Rut D
epth
, Rd
(mm
)
Load Cycles
Comparison of Measured and Modelled Results for
Unreinforced PavementIn-Service Sections
State of Florida - USA Case
Meausred Unreinforced
Modelled - Unreinforced
Measured - GG/GTReinforced/ImprovedModelled - GG/GTReinforced/ImprovedMeausred - GT/GT Improved
Modelled - GT/GT Improved
# GG: Rigid Extruded Geogrid# GT: Woven Geotextile
0 20 40 60 80 100 120 140
123456789
10
Maximum Rut Depth, Rd (mm)
Sect
ion
of M
easu
rem
ent
Measured
Modelled
Academia.edu Electronic Pre-Print Page 11
F. Summary of Models Validation Results Based on the discussions made in the foregoing sections on comparative analysis of measured and modelled results from model, full-scale trial sections and in-service roads in Italy, USA and Kenyan cases, It can be derived that the proposed model equations are effective and useful in predicting progressive structural rut development.
V. SIMULATION BASED ON PROPOSED MODELS
A. Brief Background of Simulation Project The Timboroa – Eldoret Road (A104) was identified for improvement as part of the European Union’s Northern Corridor Backlog Maintenance and Rehabilitation Programme. The project road is 73 km in length, and is located in Rift Valley Province. It begins at Timboroa Primary School, continues in a north westerly direction, passing through the trading centres of Timboroa, Nabkoi, Kondoo, Burnt Forest, Cheptiret and finally Eldoret Municipality, before ending about 1 km north of the Municipality boundary at Maile Nne. The road is part of the A104, which in turn is part of the Northern Corridor. The road is part of the major highway linking the port of Mombasa to Uganda, the landlocked countries of Rwanda and Burundi, as well as Eastern DRC and South Sudan. Consequently it is heavily trafficked, with some 4000 vehicles plying it per day, of which more than one third comprises freight [11]. The adjoining sections of the road that is from Mombasa to Nairobi, Nairobi to Nakuru, and Nakuru (Njoro Turnoff) to Timboroa have been either recently rehabilitated. The Eldoret – Webuye – Malaba Road is also under rehabilitation.
B. Typical Pavement Structural Configuration The typical pavement structural configuration of the Timboroa ~ Eldoret Trunk Road (A104) is depicted in Figure 26.
Figure 28 Typical pavement structural configuration of the
Timboroa ~ Eldoret Trunk Road (A104)
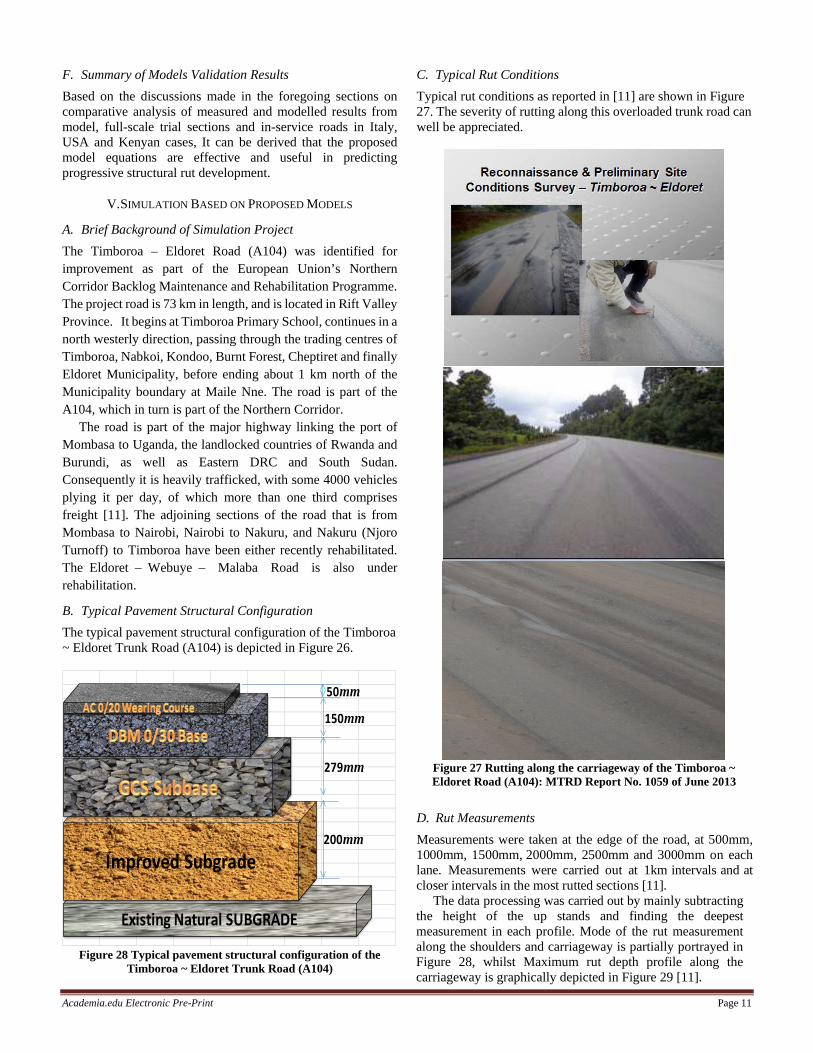
C. Typical Rut Conditions Typical rut conditions as reported in [11] are shown in Figure 27. The severity of rutting along this overloaded trunk road can well be appreciated.
Figure 27 Rutting along the carriageway of the Timboroa ~ Eldoret Road (A104): MTRD Report No. 1059 of June 2013
D. Rut Measurements Measurements were taken at the edge of the road, at 500mm, 1000mm, 1500mm, 2000mm, 2500mm and 3000mm on each lane. Measurements were carried out at 1km intervals and at closer intervals in the most rutted sections [11]. The data processing was carried out by mainly subtracting the height of the up stands and finding the deepest measurement in each profile. Mode of the rut measurement along the shoulders and carriageway is partially portrayed in Figure 28, whilst Maximum rut depth profile along the carriageway is graphically depicted in Figure 29 [11].
Existing Natural SUBGRADE
Improved Subgrade
50mm
150mm
279mm
200mm

Academia.edu Electronic Pre-Print Page 12
Figure 28 Rut measurement along the shoulders and carriageway of the Timboroa ~ Eldoret Road (A104): MTRD Report No. 1059
of June 2013
Figure 29 Maximum rut depth profile along the carriageway of
the Timboroa ~ Eldoret Road (A104): MTRD Report No. 1059 of June 2013
The Kenyan specifications on rutting are as presented in Table 4 below.
Table 4 Kenyan Rut depth Index: MTRD Report No. 1059 of June 2013 Index Rut depth Remark
D1 <10mm Sound
D2 10-15mm Changes of ponding with 2,5% cross fall
D3 15-20mm Requires minor overlay for more than 20 % of the road length
D4 20-25mm Requires minor overlay for more than 20 % of the road length
D5 >25mm Requires reconstruction E. Rut Prediction, Analysis and Simulation For purposes of predicting progressive rut development, carrying out the analysis and simulating the effects, the data presented in Tables 5, 6, 7 and 8 was adopted accordingly.
Table 5 Design DESA and CESA
The data provided in Tables 5 and 6 was determined and reported in [10], whilst that presented in Tables 7 and 8 is analyzed from This Study.
Section of Road
DESIGN DESA DESIGN CESA (15 YEARS)
BASED ON TOTAL
TRAFFIC
BASED ON 80% OF TOTAL TRAFFIC
BASED ON
TOTAL TRAFFIC
BASED ON 80% OF TOTAL
TRAFFIC
Section 1 (Km 0 - Km 25) 8398 6718 57,011,066 45,608,852
Section 2 (Km 25 - Km 60.5) 10434 8348 70,835,165 56,668,132
Section 3 (Km 60.5 - Km 65) 10614 8491 72,051,536 57,641,228
Section 4 (Km 65 - Km 67) 15237 12189 103,434,987 82,747,990
Section 5 (Km 67 - Km 73.3) 10614 8491 72,051,536 57,641,228
Table 6 Subbase and Improved Subgrade Layer Thickness: MTRD Report No. 1059 of June 2013
Chainage
Subbase and Improved Subgrade Layer Thickness (mm)
Subbase (GCS) Improved Subgrade 0+399 LHS 300 150
9+900 RHS 350 150
12+950 LHS 400 150
20+525 LHS 230 230
30+200 RHS 300 230
Academia.edu Electronic Pre-Print Page 13
40+000 LHS 230 285
50+253 RHS 220 270
60+620 LHS 250 180
70+165 RHS 230 150 Average 279 199
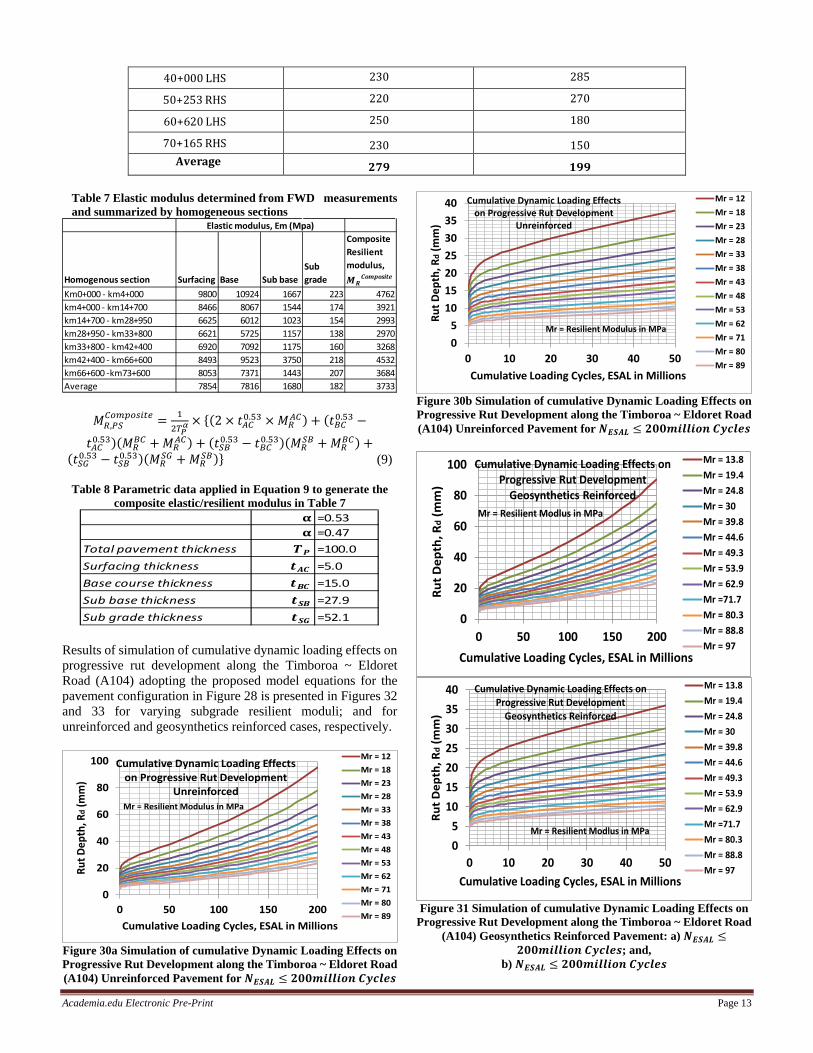
Table 7 Elastic modulus determined from FWD measurements and summarized by homogeneous sections
𝑀𝐺,𝑃𝐸𝐴𝐶𝐶𝐶𝐶𝐶𝐶𝐶𝑒 = 1
2𝑃𝑃𝛼 × {(2 × 𝑡𝐴𝐴0.53 × 𝑀𝐺
𝐴𝐴) + (𝑡𝐶𝐴0.53 −
𝑡𝐴𝐴0.53)(𝑀𝐺𝐶𝐴 + 𝑀𝐺
𝐴𝐴) + (𝑡𝐸𝐶0.53 − 𝑡𝐶𝐴0.53)(𝑀𝐺𝐸𝐶 + 𝑀𝐺
𝐶𝐴) +(𝑡𝐸𝐺0.53 − 𝑡𝐸𝐶0.53)(𝑀𝐺
𝐸𝐺 + 𝑀𝐺𝐸𝐶)} (9)
Table 8 Parametric data applied in Equation 9 to generate the
composite elastic/resilient modulus in Table 7
Results of simulation of cumulative dynamic loading effects on progressive rut development along the Timboroa ~ Eldoret Road (A104) adopting the proposed model equations for the pavement configuration in Figure 28 is presented in Figures 32 and 33 for varying subgrade resilient moduli; and for unreinforced and geosynthetics reinforced cases, respectively.
Figure 30a Simulation of cumulative Dynamic Loading Effects on Progressive Rut Development along the Timboroa ~ Eldoret Road (A104) Unreinforced Pavement for 𝑵𝑬𝑬𝑬𝑬 ≤ 𝟐𝟐𝟐𝒎𝒎𝒎𝒎𝒎𝒎𝒎 𝑪𝑪𝑪𝒎𝑪𝑪
Figure 30b Simulation of cumulative Dynamic Loading Effects on Progressive Rut Development along the Timboroa ~ Eldoret Road (A104) Unreinforced Pavement for 𝑵𝑬𝑬𝑬𝑬 ≤ 𝟐𝟐𝟐𝒎𝒎𝒎𝒎𝒎𝒎𝒎 𝑪𝑪𝑪𝒎𝑪𝑪
Figure 31 Simulation of cumulative Dynamic Loading Effects on
Progressive Rut Development along the Timboroa ~ Eldoret Road (A104) Geosynthetics Reinforced Pavement: a) 𝑵𝑬𝑬𝑬𝑬 ≤
𝟐𝟐𝟐𝒎𝒎𝒎𝒎𝒎𝒎𝒎 𝑪𝑪𝑪𝒎𝑪𝑪; and, b) 𝑵𝑬𝑬𝑬𝑬 ≤ 𝟐𝟐𝟐𝒎𝒎𝒎𝒎𝒎𝒎𝒎 𝑪𝑪𝑪𝒎𝑪𝑪
Homogenous section Surfacing Base Sub baseSub grade
Composite Resilient modulus, M R
Composite
Km0+000 - km4+000 9800 10924 1667 223 4762km4+000 - km14+700 8466 8067 1544 174 3921km14+700 - km28+950 6625 6012 1023 154 2993km28+950 - km33+800 6621 5725 1157 138 2970km33+800 - km42+400 6920 7092 1175 160 3268km42+400 - km66+600 8493 9523 3750 218 4532km66+600 -km73+600 8053 7371 1443 207 3684Average 7854 7816 1680 182 3733
Elastic modulus, Em (Mpa)
α =0.53α =0.47
Total pavement thickness T P =100.0Surfacing thickness t AC =5.0Base course thickness t BC =15.0Sub base thickness t SB =27.9Sub grade thickness t SG =52.1
0
20
40
60
80
100
0 50 100 150 200
Rut D
epth
, Rd
(mm
)
Cumulative Loading Cycles, ESAL in Millions
Cumulative Dynamic Loading Effects on Progressive Rut Development
Unreinforced
Mr = 12Mr = 18Mr = 23Mr = 28Mr = 33Mr = 38Mr = 43Mr = 48Mr = 53Mr = 62Mr = 71Mr = 80Mr = 89
Mr = Resilient Modulus in MPa
05
10152025303540
0 10 20 30 40 50
Rut D
epth
, Rd
(mm
)
Cumulative Loading Cycles, ESAL in Millions
Cumulative Dynamic Loading Effects on Progressive Rut Development
Unreinforced
Mr = 12Mr = 18Mr = 23Mr = 28Mr = 33Mr = 38Mr = 43Mr = 48Mr = 53Mr = 62Mr = 71Mr = 80Mr = 89
Mr = Resilient Modulus in MPa
0
20
40
60
80
100
0 50 100 150 200
Rut D
epth
, Rd
(mm
)
Cumulative Loading Cycles, ESAL in Millions
Cumulative Dynamic Loading Effects on Progressive Rut Development
Geosynthetics Reinforced
Mr = 13.8Mr = 19.4Mr = 24.8Mr = 30Mr = 39.8Mr = 44.6Mr = 49.3Mr = 53.9Mr = 62.9Mr =71.7Mr = 80.3Mr = 88.8Mr = 97
Mr = Resilient Modlus in MPa
05
10152025303540
0 10 20 30 40 50
Rut D
epth
, Rd
(mm
)
Cumulative Loading Cycles, ESAL in Millions
Cumulative Dynamic Loading Effects on Progressive Rut Development
Geosynthetics Reinforced
Mr = 13.8Mr = 19.4Mr = 24.8Mr = 30Mr = 39.8Mr = 44.6Mr = 49.3Mr = 53.9Mr = 62.9Mr =71.7Mr = 80.3Mr = 88.8Mr = 97
Mr = Resilient Modlus in MPa
Academia.edu Electronic Pre-Print Page 14
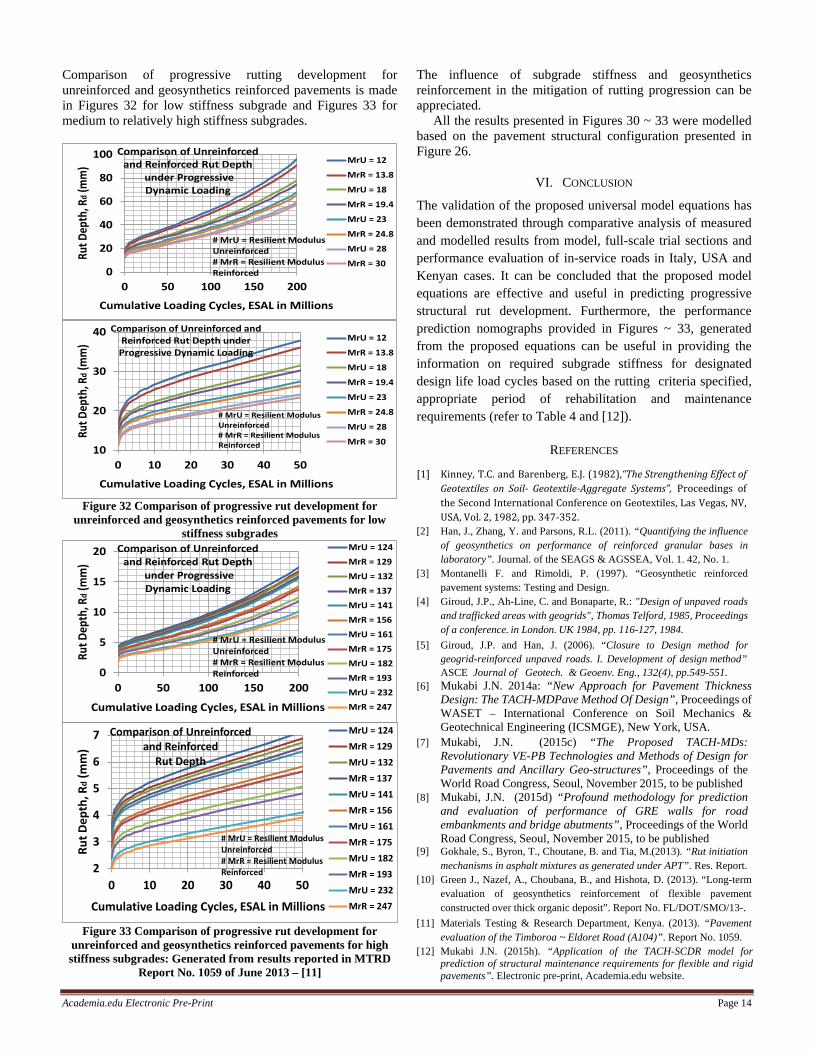
Comparison of progressive rutting development for unreinforced and geosynthetics reinforced pavements is made in Figures 32 for low stiffness subgrade and Figures 33 for medium to relatively high stiffness subgrades.
Figure 32 Comparison of progressive rut development for
unreinforced and geosynthetics reinforced pavements for low stiffness subgrades
Figure 33 Comparison of progressive rut development for
unreinforced and geosynthetics reinforced pavements for high stiffness subgrades: Generated from results reported in MTRD
Report No. 1059 of June 2013 – [11]
The influence of subgrade stiffness and geosynthetics reinforcement in the mitigation of rutting progression can be appreciated. All the results presented in Figures 30 ~ 33 were modelled based on the pavement structural configuration presented in Figure 26.
VI. CONCLUSION
The validation of the proposed universal model equations has been demonstrated through comparative analysis of measured and modelled results from model, full-scale trial sections and performance evaluation of in-service roads in Italy, USA and Kenyan cases. It can be concluded that the proposed model equations are effective and useful in predicting progressive structural rut development. Furthermore, the performance prediction nomographs provided in Figures ~ 33, generated from the proposed equations can be useful in providing the information on required subgrade stiffness for designated design life load cycles based on the rutting criteria specified, appropriate period of rehabilitation and maintenance requirements (refer to Table 4 and [12]).
REFERENCES
[1] Kinney, T.C. and Barenberg, E.J. (1982),“The Strengthening Effect of Geotextiles on Soil- Geotextile-Aggregate Systems”, Proceedings of the Second International Conference on Geotextiles, Las Vegas, NV, USA, Vol. 2, 1982, pp. 347-352.
[2] Han, J., Zhang, Y. and Parsons, R.L. (2011). “Quantifying the influence of geosynthetics on performance of reinforced granular bases in laboratory”. Journal. of the SEAGS & AGSSEA, Vol. 1. 42, No. 1.
[3] Montanelli F. and Rimoldi, P. (1997). “Geosynthetic reinforced pavement systems: Testing and Design.
[4] Giroud, J.P., Ah-Line, C. and Bonaparte, R.: "Design of unpaved roads and trafficked areas with geogrids", Thomas Telford, 1985, Proceedings of a conference. in London. UK 1984, pp. 116-127, 1984.
[5] Giroud, J.P. and Han, J. (2006). “Closure to Design method for geogrid-reinforced unpaved roads. I. Development of design method” ASCE Journal of Geotech. & Geoenv. Eng., 132(4), pp.549-551.
[6] Mukabi J.N. 2014a: “New Approach for Pavement Thickness Design: The TACH-MDPave Method Of Design”, Proceedings of WASET – International Conference on Soil Mechanics & Geotechnical Engineering (ICSMGE), New York, USA.
[7] Mukabi, J.N. (2015c) “The Proposed TACH-MDs: Revolutionary VE-PB Technologies and Methods of Design for Pavements and Ancillary Geo-structures”, Proceedings of the World Road Congress, Seoul, November 2015, to be published
[8] Mukabi, J.N. (2015d) “Profound methodology for prediction and evaluation of performance of GRE walls for road embankments and bridge abutments”, Proceedings of the World Road Congress, Seoul, November 2015, to be published
[9] Gokhale, S., Byron, T., Choutane, B. and Tia, M.(2013). “Rut initiation mechanisms in asphalt mixtures as generated under APT”. Res. Report.
[10] Green J., Nazef, A., Choubana, B., and Hishota, D. (2013). “Long-term evaluation of geosynthetics reinforcement of flexible pavement constructed over thick organic deposit”. Report No. FL/DOT/SMO/13-.
[11] Materials Testing & Research Department, Kenya. (2013). “Pavement evaluation of the Timboroa ~ Eldoret Road (A104)”. Report No. 1059.
[12] Mukabi J.N. (2015h). “Application of the TACH-SCDR model for prediction of structural maintenance requirements for flexible and rigid pavements”. Electronic pre-print, Academia.edu website.
0
20
40
60
80
100
0 50 100 150 200
Rut D
epth
, Rd
(mm
)
Cumulative Loading Cycles, ESAL in Millions
Comparison of Unreinforced and Reinforced Rut Depth
under Progressive Dynamic Loading
MrU = 12
MrR = 13.8
MrU = 18
MrR = 19.4
MrU = 23
MrR = 24.8
MrU = 28
MrR = 30
# MrU = Resilient ModulusUnreinforced# MrR = Resilient ModulusReinforced
10
20
30
40
0 10 20 30 40 50
Rut D
epth
, Rd
(mm
)
Cumulative Loading Cycles, ESAL in Millions
Comparison of Unreinforced andReinforced Rut Depth underProgressive Dynamic Loading
MrU = 12
MrR = 13.8
MrU = 18
MrR = 19.4
MrU = 23
MrR = 24.8
MrU = 28
MrR = 30
# MrU = Resilient ModulusUnreinforced# MrR = Resilient ModulusReinforced
0
5
10
15
20
0 50 100 150 200
Rut D
epth
, Rd
(mm
)
Cumulative Loading Cycles, ESAL in Millions
Comparison of Unreinforced and Reinforced Rut Depth
under Progressive Dynamic Loading
MrU = 124MrR = 129MrU = 132MrR = 137MrU = 141MrR = 156MrU = 161MrR = 175MrU = 182MrR = 193MrU = 232MrR = 247
# MrU = Resilient ModulusUnreinforced# MrR = Resilient ModulusReinforced
2
3
4
5
6
7
0 10 20 30 40 50
Rut D
epth
, Rd
(mm
)
Cumulative Loading Cycles, ESAL in Millions
Comparison of Unreinforced and Reinforced
Rut Depth
MrU = 124MrR = 129MrU = 132MrR = 137MrU = 141MrR = 156MrU = 161MrR = 175MrU = 182MrR = 193MrU = 232MrR = 247
# MrU = Resilient ModulusUnreinforced# MrR = Resilient ModulusReinforced
Copyright © 2022 FDOKUMEN