UNIT II REQUIREMENTS ANALYSIS AND SPECIFICATION
33
CS8484-SOFTWARE ENGINEERING Department of CSE 1 2020-2021 Jeppiaar Institute of Technology UNIT II REQUIREMENTS ANALYSIS AND SPECIFICATION Software Requirements: Functional and Non-Functional, User requirements, System requirements, Software Requirements Document – Requirement Engineering Process: Feasibility Studies, Requirements elicitation and analysis, requirements validation, requirements management -Classical analysis: Structured system Analysis, Petri Nets- Data Dictionary. 2.1 SOFTWARE REQUIREMENTS The process of establishing the services that the customer requires from a system and the constraints under which it operates and is developed Requirements may be functional or non-functional Functional requirements describe system services or functions Non-functional requirements is a constraint on the system or on the development process. Types of requirements User requirements • Statements in natural language (NL) plus diagrams of the services the system provides and its operational constraints. Written for customers System requirements • A structured document setting out detailed descriptions of the system services. Written as a contract between client and contractor Software specification • A detailed software description which can serve as a basis for a design or implementation. Written for developers 2.1.1 FUNCTIONAL AND NON-FUNCTIONAL COMPONENTS: a) Functional requirements: Functionality or services that the system is expected to provide. Functional requirements may also explicitly state what the system shouldn‘t do. Functional requirements specification should be: Complete: All services required by the user should be defined Consistent: should not have contradictory definition (also avoid ambiguity d on‘t leave room for different interpretations) b) Examples: The LIBSYS system A library system that provides a single interface to a number of databases of articles in different libraries. Users can search for, download and print these articles for personal study.
-
Upload
khangminh22 -
Category
Documents
-
view
4 -
download
0
Transcript of UNIT II REQUIREMENTS ANALYSIS AND SPECIFICATION
CS8484-SOFTWARE ENGINEERING Department of CSE
1
2020-2021 Jeppiaar Institute of Technology
UNIT II
REQUIREMENTS ANALYSIS AND SPECIFICATION
Software Requirements: Functional and Non-Functional, User requirements, System
requirements, Software Requirements Document – Requirement Engineering Process:
Feasibility Studies, Requirements elicitation and analysis, requirements validation,
requirements management -Classical analysis: Structured system Analysis, Petri Nets- Data
Dictionary.
2.1 SOFTWARE REQUIREMENTS
The process of establishing the services that the customer requires from a system and the
constraints under which it operates and is developed
Requirements may be functional or non-functional
Functional requirements describe system services or functions
Non-functional requirements is a constraint on the system or on the development process.
Types of requirements
User requirements
• Statements in natural language (NL) plus diagrams of the services the system provides and its
operational constraints. Written for customers
System requirements
• A structured document setting out detailed descriptions of the system services. Written as a
contract between client and contractor
Software specification
• A detailed software description which can serve as a basis for a design or implementation. Written
for developers
2.1.1 FUNCTIONAL AND NON-FUNCTIONAL COMPONENTS:
a) Functional requirements:
Functionality or services that the system is expected to provide.
Functional requirements may also explicitly state what the system shouldn‘t do.
Functional requirements specification should be:
Complete: All services required by the user should be defined
Consistent: should not have contradictory definition (also avoid ambiguity don‘t leave
room for different interpretations)
b) Examples:
The LIBSYS system
A library system that provides a single interface to a number of databases of articles in different
libraries.
Users can search for, download and print these articles for personal study.

CS8484-SOFTWARE ENGINEERING Department of CSE
2
2020-2021 Jeppiaar Institute of Technology
c) The user shall be able to search either all of the initial set of databases or select a subset from
it.
d) The system shall provide appropriate viewers for the user to read documents in the document
store.
e) Every order shall be allocated a unique identifier (ORDER_ID) which the user shall be able to
copy to the account‘s permanent storage area.
f) Non-Functional requirements:
Requirements that are not directly concerned with the specific functions delivered by the system
Typically relate to the system as a whole rather than the individual system features
Often could be deciding factor on the survival of the system (e.g. reliability, cost, response time)
g) Non-Functional requirements classifications:
Figure 2.1 Non Functional Requirement Classification
We can see from this diagram that the non-functional requirements may come from
required characteristics of the software (product requirements), the organization developing the
software (organizational requirements) or from external sources.
The types of non-functional requirements are:
h) Product requirements
Specify the desired characteristics that a system or subsystem must possess.
Most NFRs are concerned with specifying constraints on the behavior of the executing system.

CS8484-SOFTWARE ENGINEERING Department of CSE
3
2020-2021 Jeppiaar Institute of Technology
o Performance
o Capacity
Others are more difficult to quantify and, consequently, are often stated informally
o Usability
i) Organisational requirements
Process requirements are constraints placed upon the development process of the system
Process requirements include:
o Performance
o Capacity
Others are more difficult to quantify and, consequently, are often stated informally
o Usability
j) Organisational requirements
Process requirements are constraints placed upon the development process of the system
Process requirements include:
o Requirements on development standards and methods which must be followed
o CASE tools which should be used
o The management reports which must be provided
k) Examples of process requirements
The development process to be used must be explicitly defined and must be conformant with ISO
9000 standards
The system must be developed using the XYZ suite of CASE tools
Management reports setting out the effort expended on each identified system component must be
produced every two weeks
A disaster recovery plan for the system development must be specified
i) External requirements
May be placed on both the product and the process
Derived from the environment in which the system is developed
External requirements are based on:
o Application domain information
Organizational considerations.
The need for the system to work with other systems
Health and safety or data protection regulations
Or even basic natural laws such as the laws of physics.
j) Examples of external requirements
Medical data system: The organization’s data protection officer must certify that all data is
maintained according to data protection legislation before the system is put into operation.
Train protection system: The time required to bring the train to a complete halt is computed using
the following function:
The deceleration of the train shall be taken as:

CS8484-SOFTWARE ENGINEERING Department of CSE
4
2020-2021 Jeppiaar Institute of Technology
2.1.2 USER REQUIREMENT:
The user requirement(s) document (URD) or user requirement(s) specification is a document
usually used in software engineering that specifies the requirements the user expects
from software to be constructed in a software project.
Once the required information is completely gathered it is documented in a URD, which is meant
to spell out exactly what the software must do and becomes part of the contractual agreement.
A customer cannot demand features not in the URD, whilst the developer cannot claim the product
is ready if it does not meet an item of the URD.
The URD can be used as a guide to planning cost, timetables, milestones, testing, etc. The explicit
nature of the URD allows customers to show it to various stakeholders to make sure all necessary
features are described.
Formulating a URD requires negotiation to determine what is technically and economically
feasible.
Preparing a URD is one of those skills that lies between a science and an art, requiring both
software technical skills and interpersonal skills.
Often a URD includes priority ranking for each requirement. A typical system might be as follows:
M Mandatory requirement. This feature must be built into the final system.
D Desirable requirement. This feature should be built into the final system unless the cost is too
high.
Optional requirement.
E Possible future enhancement.
2.1.3 SYSTEM REQUIREMENTS
Purpose of SRS
Official statement of what is required by the system developer.
It should include user requirements and specification of system requirements
It should describe what the system should do.
Ways of writing an SRS:
1. Natural Language
2. Structured Natural Language
3. Design Description Language
4. Graphical Notations
5. Mathematical specification
Guidelines for Writing SRS:
1. Use standard formats
2. Use “shall” for mandatory requirements and “should” for desirable requirements.
3. Use text highlighting to identify key parts of requirements.
4. Include rationale of why a requirements is necessary
To be used efficiently, all computer software needs certain hardware components or other software
resources to be present on a computer.

CS8484-SOFTWARE ENGINEERING Department of CSE
5
2020-2021 Jeppiaar Institute of Technology
Most software defines two sets of system requirements: minimum and recommended.
With increasing demand for higher processing power and resources in newer versions of software,
system requirements tend to increase over time. Industry analysts suggest that this trend plays a
bigger part in driving upgrades to existing computer systems than technological advancements.
A second meaning of the term of System requirements is a generalization of this first definition,
giving the requirements to be met in the design of a system or sub-system.
Typically an organization starts with a set of Business requirements and then derives the System
requirements from there.
2.2 SOFTWARE REQUIREMENT DOCUMENT
Should provide for communication among team members
Should act as an information repository to be used by maintenance engineers
Should provide enough information to management to allow them to perform all program
management related activities
Should describe to users how to operate and administer the system
specify external system behavior
Specify implementation constraints
Easy to change
Serve as reference tool for maintenance
Record forethought about the life cycle of the system i.e. predict changes
Characterize responses to unexpected events.
Figure 2.2 Users of a requirements document
IEEE suggests the following structure for requirements document
1. Introduction
1.1 Purpose of the requirements document
1.2 Scope of the product
1.3 Definitions, acronyms and abbreviations

CS8484-SOFTWARE ENGINEERING Department of CSE
6
2020-2021 Jeppiaar Institute of Technology
1.4 Overview of the remainder of the document
2. General description
2.1 Product perspective
2.2 Product functions
2.3 User characteristics
2.4 General constraints
2.5 Assumptions and dependencies
3. Specific requirements cover functional, non-functional and interface requirements.
i) This is obviously the most substantial part of the document but because of the wide variability in
organizational practice, it is not appropriate to define standard structure for this section.
ii) The requirements may document external interfaces, describe system functionality and
performance, specify logical database requirements, design constraints, emergent system
properties and quality characteristics.
4. Appendices
5. Index

CS8484-SOFTWARE ENGINEERING Department of CSE
7
2020-2021 Jeppiaar Institute of Technology
2.3 REQUIREMENT ENGINEERING PROCESS
Figure 2.3:The requirements engineering process
The requirements engineering process includes a feasibility study, requirements elicitation and
analysis, requirements specification and requirements management
2.3.1 Feasibility Studies
A feasibility study decides whether or not the proposed system is worthwhile
A short focused study that checks
• If the system contributes to organizational objectives
• If the system can be engineered using current technology and within budget
• If the system can be integrated with other systems that are used
Based on information assessment (what is required), information collection and report writing
Questions for people in the organization
• What if the system wasn‘t implemented?
• What are current process problems?
• How will the proposed system help?
• What will be the integration problems?
• Is new technology needed? What skills?
• What facilities must be supported by the proposed system?
2.3.2 Requirement Elicitation and analysis
Sometimes called requirements elicitation or requirements discovery
Involves technical staff working with customers to find out about
• The application domain

CS8484-SOFTWARE ENGINEERING Department of CSE
8
2020-2021 Jeppiaar Institute of Technology
May involve end-users, managers, engineers involved in maintenance, domain experts, trade
unions, etc.
• These are called stakeholders
a) Problems of requirements analysis
Stakeholders don‘t know what they really want
Stakeholders express requirements in their own terms
Different stakeholders may have conflicting requirements
Organizational and political factors may influence the system requirements
The requirements change during the analysis process
• New stakeholders may emerge and the business environment change.
b) System models
Different models may be produced during the requirements analysis activity
Requirements analysis may involve three structuring activities which result in these different
models
• Partitioning – Identifies the structural (part-of) relationships between entities
• Abstraction – Identifies generalities among entities
• Projection – Identifies different ways of looking at a problem
c) Scenarios
Scenarios are descriptions of how a system is used in practice
They are helpful in requirements elicitation as people can relate to these more readily than abstract
statement of what they require from a system
Scenarios are particularly useful for adding detail to an outline requirements description
d) Ethnography
A social scientists spends a considerable time observing and analyzing how people actually work
People do not have to explain or articulate their work
Social and organizational factors of importance may be observed
Ethnographic studies have shown that work is usually richer and more complex than suggested by
simple system models.
2.3.3 Requirements validation
Concerned with demonstrating that the requirements define the system that the customer really
wants.
Requirements error costs are high so validation is very important.
• Fixing a requirements error after delivery may cost up to 100 times the cost of fixing an
implementation error.
Requirements checking
• Validity
• Consistency
• Completeness
• Realism

CS8484-SOFTWARE ENGINEERING Department of CSE
9
2020-2021 Jeppiaar Institute of Technology
Requirements validation techniques
Reviews
• Systematic manual analysis of the requirements
Prototyping
• Using an executable model of the system to check requirements.
Test-case generation
• Developing tests for requirements to check testability
Automated consistency analysis
• Checking the consistency of a structured requirements description
2.3.4 Requirements management
Requirements management is the process of managing changing requirements during the
requirements engineering process and system development
Requirements are inevitably incomplete and inconsistent
New requirements emerge during the process as business needs change and a better
understanding of the system is developed
Different viewpoints have different requirements and these are often contradictory.
2.3.4.1 Enduring and volatile requirements:
Enduring requirements:
These are the stable requirements that are derived from the core activity of the organization.
These requirements are dependent upon the application domain of the software.
For example: For banking system, transfer of money from one account to another is the enduring
requirement.
Volatile requirements:
For certain requirements if there is a possibility that those requirements may get changed during
the development stage or after the system becomes operational, then such requirements are called
volatile requirements.
2.3.4.2 Requirement Management Planning
Traceability is concerned with relationship between requirements their sources and the system
design. Using traceability the requirement finding becomes easy.
Various types of traceability are
1. Source traceability
2. Requirements traceability
3. Design traceability
Steps involved in planning requirement process
Requirement identification : Requirements are individually identified
Change Management Process : Process plan followed when analysing a requirement
Traceability Policies : The amount of information about requirement
Case Tool Support : The tool support which is required to manage

CS8484-SOFTWARE ENGINEERING Department of CSE
10
2020-2021 Jeppiaar Institute of Technology
Rapid, iterative development of the prototype is essential so that costs are controlled and system
stakeholders can experiment with the prototype early in the software process.
A software prototype can be used in a software development process in several ways:
1. In the requirements engineering process, a prototype can help with the elicitationand validation of
system requirements.
2. In the system design process, a prototype can be used to explore particular softwaresolutions and
to support user interface design.
3. In the testing process, a prototype can be used to run back-to-back tests withthe system that will
be delivered to the customer.
System prototypes allow users to see how well the system supports their work.
They may get new ideas for requirements and find areas of strength and weakness in the software.
They may then propose new system requirements. Furthermore, as the prototype is developed, it
may reveal errors and omissions in the requirements that have been proposed.
A system prototype may be used while the system is being designed to carry out design
experiments to check the feasibility of a proposed design.
For example,
A database design may be prototyped and tested to check that it allows for the most efficient data
access for the most common user queries.
Prototyping is also an essential part of the user interface design process.
Because of the dynamic nature of user interfaces, textual descriptions and diagrams are not good
enough for expressing the user interface requirements.
When a system prototype is available, we can reduce the effort involved in result checking by
running back-to-back tests figure Back-to back testing. The same test cases are submitted to the
prototype and to the system under test. If both systems give the same result, the test case has
probably not detected a fault. If the results differ, it may mean that there is a system fault and the
reasons for the difference should be investigated.
Finally, as well as supporting software process activities, prototypes can be used to reduce the time
required to develop user documentation and to train users with the system.
Figure 2.4: Back-to back testing
CS8484-SOFTWARE ENGINEERING Department of CSE
11
2020-2021 Jeppiaar Institute of Technology
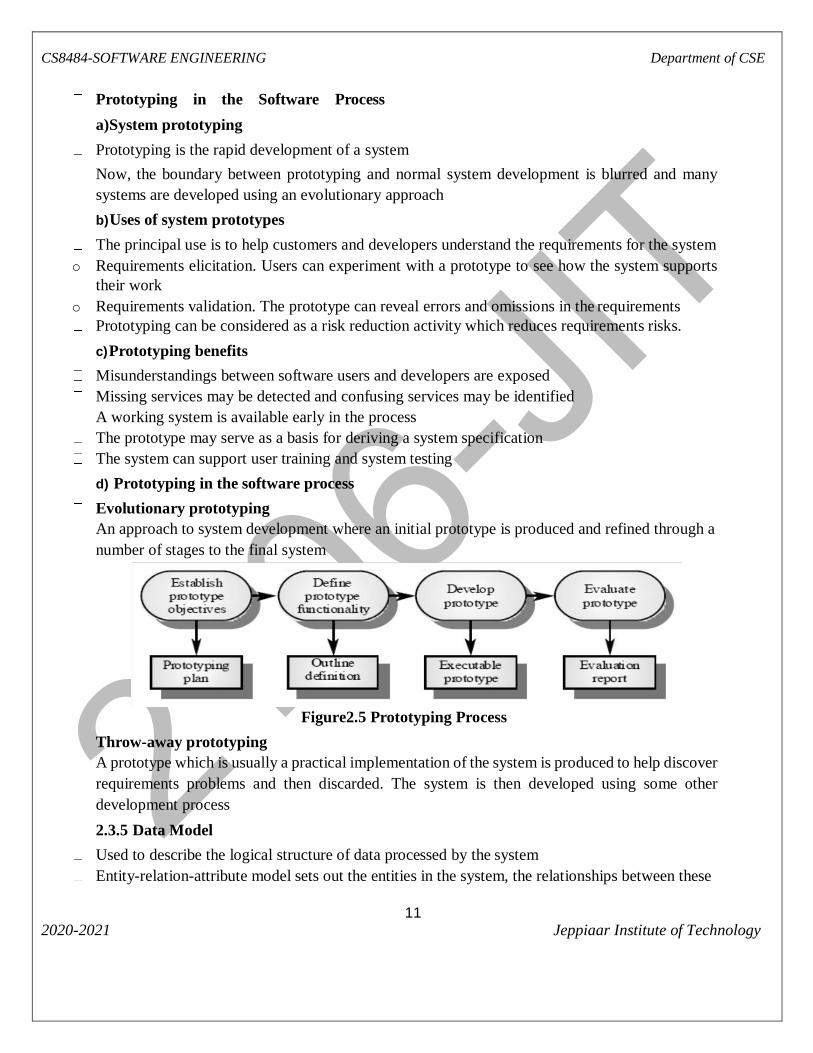
Prototyping in the Software Process
a)System prototyping
Prototyping is the rapid development of a system
Now, the boundary between prototyping and normal system development is blurred and many
systems are developed using an evolutionary approach
b) Uses of system prototypes
The principal use is to help customers and developers understand the requirements for the system
o Requirements elicitation. Users can experiment with a prototype to see how the system supports
their work
o Requirements validation. The prototype can reveal errors and omissions in the requirements
Prototyping can be considered as a risk reduction activity which reduces requirements risks.
c) Prototyping benefits
Misunderstandings between software users and developers are exposed
Missing services may be detected and confusing services may be identified
A working system is available early in the process
The prototype may serve as a basis for deriving a system specification
The system can support user training and system testing
d) Prototyping in the software process
Evolutionary prototyping
An approach to system development where an initial prototype is produced and refined through a
number of stages to the final system
Figure2.5 Prototyping Process
Throw-away prototyping
A prototype which is usually a practical implementation of the system is produced to help discover
requirements problems and then discarded. The system is then developed using some other
development process
2.3.5 Data Model
Used to describe the logical structure of data processed by the system
Entity-relation-attribute model sets out the entities in the system, the relationships between these

CS8484-SOFTWARE ENGINEERING Department of CSE
12
2020-2021 Jeppiaar Institute of Technology
i) The UML does not include a specific notation for this database modelling, as it assumes an object-
oriented development process and models data using objects and their relationships. However, you
can use the UML to represent a semantic data model. You can think of entities in an ERA model
as simplified object classes (they have no operations), attributes as class attributes and named
associations between the classes as relations.
ii) Like all graphical models, data models lack detail, and you should maintain more detailed
descriptions of the entities, relationships and attributes that are included in the model. You may
collect these more detailed descriptions in a repository or data dictionary.
The advantages of using a data dictionary are:
1. It is a mechanism for name management. Many people may have to invent names for entities
and relationships when developing a large system model. These names should be used consistently
and should not clash. The data dictionary software can check for name uniqueness where necessary
and warn requirements analysts of name duplications.
2. It serves as a store of organisational information.
As the system is developed, information that can link analysis, design, implementation and
evolution is added to the data dictionary, so that all information about an entity is in one place.
Figure 2.6: Examples of data dictionary entries
Figure 2.7:Semantic data model for the LIBSYS system

CS8484-SOFTWARE ENGINEERING Department of CSE
13
2020-2021 Jeppiaar Institute of Technology
The data dictionary entries shown in Figure 2.8(Examples of data dictionary entries) define the
names in the semantic data model for LIBSYS.
2.3.6 Functional Model
Information is transformed as it flows through a computer-based system.
The system accepts input in a variety of forms; applies hardware, software, and human elements
to transform it; and produces output in a variety of forms.
Figure 2.8 Information flow model
Input may be a control signal transmitted by a transducer, a series of numbers typed by a human
operator, a packet of information transmitted on a network link, or a voluminous data file retrieved
from secondary storage.
The transform(s) may comprise a single logical comparison, a complex numerical algorithm, or a
rule-inference approach of an expert system.
Output may light a single LED or produce a 200-page report.
In effect, we can create a flow model for any computer-based system, regardless of size and
complexity.
Structured analysis began as an information flow modeling technique. A computer-based system
is represented as an information transform as shown in Figure 2.8 above.
A rectangle is used to represent an external entity; that is, a system element (e.g., hardware, a
person, and another program) or another system that produces information for transformation by
the software or receives information produced by the software.
A circle (sometimes called a bubble) represents a process or transform that is applied to data (or
control) and changes it in some way.
An arrow represents one or more data items (data objects). All arrows on a data flow diagram
should be labeled.
The double line represents a data store—stored information that is used by the software.
It is important to note that no explicit indication of the sequence of processing or conditional logic
is supplied by the diagram.
Procedure or sequence may be implicit in the diagram.

CS8484-SOFTWARE ENGINEERING Department of CSE
14
2020-2021 Jeppiaar Institute of Technology
2.3.7 Data Flow Diagrams
A data flow diagram is a graphical representation that depicts information flow and the transforms
that are applied as data move from input to output.
The basic form of a data flow diagram, also known as a data flow graph or a bubble chart, is
illustrated in Figure 2.8.
The data flow diagram may be used to represent a system or software at any level of abstraction.
In fact, DFDs may be partitioned into levels that represent increasing information flow and
functional detail.
Therefore, the DFD provides a mechanism for functional modeling as well as information flow
modeling.
A level 0 DFD, also called a fundamental system model or a context model, represents the entire
software element as a single bubble with input and output data indicated by incoming and outgoing
arrows, respectively.
Additional processes (bubbles) and information flow paths are represented as the level 0 DFD is
partitioned to reveal more detail.
For example, a level 1 DFD might contain five or six bubbles with interconnecting arrows.
As we noted earlier, each of the bubbles may be refined or layered to depict more detail.
Figure 2.9below illustrates this concept. A fundamental model for system F indicates the primary
input is A and ultimate output is B.
Figure 2.9 Information flow model
We refine the F model into transformsf1 to f7.
Note that information flow continuity must be maintained; that is, input and output to each
refinement must remain the same.
This concept, sometimes called balancing, is essential for the development of consistent models.
Further refinementoff4 depicts detail in the form of transforms f41 to f45. Again, the input (X, Y)
and output (Z) remain unchanged.
DFD graphical notation must be augmented with descriptive text.
A process specification (PSPEC) can be used to specify the processing details implied by a bubble
within a DFD.
The process specification describes the input to a function, the algorithm that is applied to
transform the input, and the output that is produced.

CS8484-SOFTWARE ENGINEERING Department of CSE
15
2020-2021 Jeppiaar Institute of Technology
In addition, the PSPEC indicates restrictions and limitations imposed on the process (function),
performance characteristics that are relevant to the process, and design constraintsthat may
influence the way in which the process will be implemented.
a) Extensions for Real-Time Systems
A real-time system must interact with the real world in a time frame dictated by the real world.
Aircraft avionics, manufacturing process control, consumer products, andindustrial
instrumentation are but a few of hundreds of real-time software applications.
To accommodate the analysis of real-time software, a number of extensions to the basic Notation
for structured analysis have been defined.
These extensions, developed by Ward and Mellor and Hatley and Pirbhai and illustrated.
b) Ward and Mellor Extensions
Ward and Mellor extend basic structured analysis notation to accommodate the following
demands imposed by a real-time system:
• Information flow is gathered or produced on a time-continuous basis.
• Control information is passed throughout the system and associated controlprocessing.
• Multiple instances of the same transformation are sometimes encountered in multitasking
situations.
• Systems have states and a mechanism causes transition between states.
In a significant percentage of real-time applications, the system must monitor
timecontinuousinformation generated by some real-world process.
For example, a real time test monitoring system for gas turbine engines might be required to
monitor turbine speed, combustor temperature, and a variety of pressure probes on a continuous
basis.
One extension to basic structured analysis notation, shown in Figure 2.10 above, provides a
mechanism for representing time-continuous data flow.
The double headed arrow is used to represent time-continuous flow while a single headed arrow
is used to indicate discrete data flow.
In the figure 2.10, monitored temperature is measured continuously while a single value for
temperature set point is also provided.
The process shown in the figure 2.10produces a time-continuous output, corrected value.
Figure 2.10 Time-continuous Flow

CS8484-SOFTWARE ENGINEERING Department of CSE
16
2020-2021 Jeppiaar Institute of Technology
A process that handles only control flows, called a control process, is similarly represented using
a dashed bubble.
Control flow can be input directly to a conventional process or into a control process.
Figure 2.12 illustrates control flow and processing as it would be represented using Ward and
Mellor notation.
The figure 2.12 illustrates a top-level view of a data and control flow for a manufacturing cell.
As components to be assembled by a robot are placed on fixtures, a status bit is set within a parts
status buffer (a control store) that indicates the presence or absence of each component.
Figure 2.11 Data and Control Flows
Event information contained within the parts status buffer is passed as a bit string to a process,
monitor fixture and operator interface.
The process will read operator commands only when the control information, bit string, indicates
that all fixtures contain components.
An event flag, start/stop flag, is sent to robot initiation control, a control process that enables
further command processing.
Other data flows occur as a consequence of the process activate event that is sent to process robot
commands.
c) Hatley and Pirbhai Extensions
The Hatley and Pirbhai focus less on the creation of additional graphical symbols and more on the
representation and specification of the control-oriented aspects of the software.
The dashed arrow is once again used to represent control or event flow.
Unlike Ward and Mellor, Hatley and Pirbhai suggest that dashed and solid notation be represented
separately.
Therefore, a control flow diagram is defined.
The CFD contains the same processes as the DFD, but shows control flow, rather than data flow.
Instead of representing control processes directly within the flow model, a notational reference (a
solid bar) to a control specification (CSPEC) is used.

CS8484-SOFTWARE ENGINEERING Department of CSE
17
2020-2021 Jeppiaar Institute of Technology
In essence, the solid bar can be viewed as a "Window" into an "executive" (the CSPEC) that
controls the processes (functions) represented in the DFD based on the event that is passed through
the window.
A process specification is used to describe the inner workings of a process represented in a flow
diagram.
Data flow diagrams are used to represent data and the processes that manipulate it.
Control flow diagrams show how events flow among processes and illustrate those external events
that cause various processes to be activated.
The interrelationship between the process and control models is shown schematically in Figure
2.12.
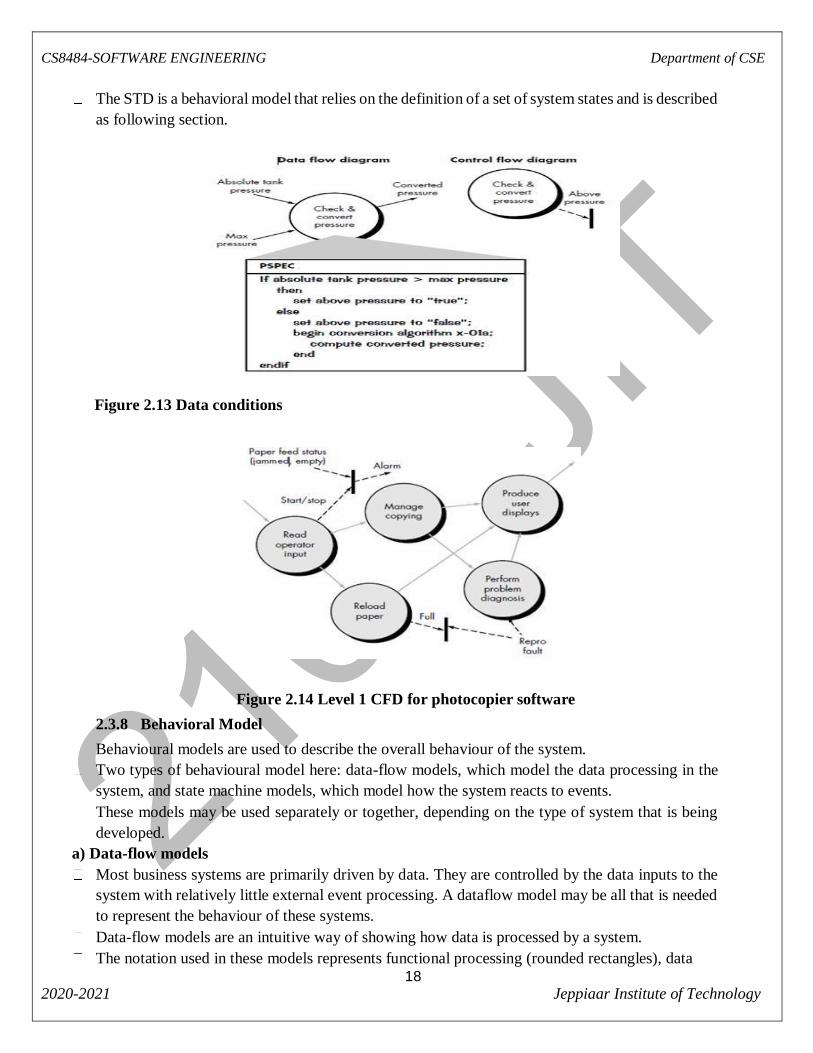
The process model is "connected" to the control model through data conditions.
The control model is "connected" to the process model through process activation information
contained in the CSPEC.
A data condition occurs whenever data input to a process result in control output.
This situation is illustrated in Figure 2.12, part of a flow model for an automated monitoring and
control system for pressure vessels in an oil refinery.
The process check and convert pressure implements the algorithm described in the PSPEC pseudo
code shown.
When the absolute tank pressure is greater than an allow able maximum, an above pressure
event is generated.
Note that when Hatley and Pirbhai notation is used, the data flow is shown as part of a DFD, while
the control flow is noted separately as part of a control flow diagram.
As we noted earlier, the vertical solid bar into which the above pressure event flows is a pointer
to the CSPEC.
Therefore, to determine what happens when this event occurs, we must check the CSPEC.
The control specification (CSPEC) contains a number of important modeling tools.
A process activation table is used to indicate which processes are activated by a given event.
For example, a process activation table (PAT)for Figure 2.12might indicate that the above
pressure event would cause a process reduce tank pressure (not shown) to be invoked.
Figure 2.12 Relationship between data and control models
CS8484-SOFTWARE ENGINEERING Department of CSE
18
2020-2021 Jeppiaar Institute of Technology
The STD is a behavioral model that relies on the definition of a set of system states and is described
as following section.
Figure 2.13 Data conditions
Figure 2.14 Level 1 CFD for photocopier software
2.3.8 Behavioral Model
Behavioural models are used to describe the overall behaviour of the system.
Two types of behavioural model here: data-flow models, which model the data processing in the
system, and state machine models, which model how the system reacts to events.
These models may be used separately or together, depending on the type of system that is being
developed.
a) Data-flow models
Most business systems are primarily driven by data. They are controlled by the data inputs to the
system with relatively little external event processing. A dataflow model may be all that is needed
to represent the behaviour of these systems.
Data-flow models are an intuitive way of showing how data is processed by a system.
The notation used in these models represents functional processing (rounded rectangles), data

CS8484-SOFTWARE ENGINEERING Department of CSE
19
2020-2021 Jeppiaar Institute of Technology
Figure2.15: Data-flow diagram of order processing
Data-flow models are used to show how data flows through a sequence of processing steps.
For example, a processing step could be to filter duplicate records in a customer database.
The data is transformed at each step before moving on to the next stage.
These processing steps or transformations represent software processes or functions when data-
flow diagrams are used to document a software design.
A data-flow model, which shows the steps involved in processing an order for goods (such as
computer equipment) in an organisation, is illustrated in the above figure 2.14
This particular model describes the data processing in the Place equipment order activity in the
overall process model shown in below Figure 2.15 (Process model of equipment procurement.)
illustrates a process model for the process of procuring equipment in an organisation.
This involves specifying the equipment required, finding and choosing suppliers, ordering the
equipment, taking delivery of the equipment and testing it after delivery.
When specifying computer support for this process, you have to decide which of these activities
will actually be supported. The other activities are outside the boundary of the system.
Figure2.16: Process model of equipment procurement

CS8484-SOFTWARE ENGINEERING Department of CSE
20
2020-2021 Jeppiaar Institute of Technology
Figure 2.17: Data-flow diagram of an insulin pump
2.3.9 State machine models
They show the system‘s responses to stimuli so are often used for modeling real-time systems
State machine models show system states as nodes and events as arcs between these nodes.
When an event occurs, the system moves from one state to another
State charts are an integral part of the UML
It does not show the flow of data within the system.
This typeof model is often used for modelling real-time systems.
For example, the real-time alarm system responds to stimuli from movement sensors, door opening
sensors, and so on.
A state machine model of a system assumes that, at any time, the system is in one of a number of
possible states.
When a stimulus is received, this may trigger a transition to a different state.
For example, a system controlling a valve may move from a state ‘Valve open’ to a state ‘Valve
closed’ when an operator command (the stimulus) is received.
This approach to system modelling is illustrated in Figure 2.18(State machine model of a simple
microwave oven)
This diagram shows a state machine model of a simple microwave oven equipped with buttons to
set the power and the timer and to start the system.
Figure2.18: State machine model of a simple microwave oven

CS8484-SOFTWARE ENGINEERING Department of CSE
21
2020-2021 Jeppiaar Institute of Technology
The sequence of actions in using the microwave is:
Select the power level (either half-power or full-power).
Input the cooking time.
Press Start, and the food is cooked for the given time.
For safety reasons, the oven should not operate when the door is open and, on completion of
cooking, a buzzer is sounded.
The oven has a very simple alphanumeric display that is used to display various alerts and warning
messages.
The rounded rectangles in model represent system states.
They include a brief description(following ‘do’) ofthe actions taken in that state.
The labelled arrows represent stimuli that force a transition from one state to another.
Therefore, from Figure that the system responds initially to either the full-power or the half- power
button.
Users can change their mind after selecting one of these and press the other button.
The time is set and, if the door is closed, the Start button is enabled. Pushing this button starts the
oven operation and cooking takes place for the specified time.
The problem with the state machine approach is that the number of possible states increases
rapidly.
For large system models, therefore, some structuring of these state models is necessary.
One way to do this is by using the notion of a super state that encapsulates a number of separate
states.
This super state looks like a single state on a high-level model but is then expanded in more detail
on a separate diagram.
To illustrate this concept, consider the Operation state in Figure 2.18(State machine model of a
simple microwave oven). This is a superstatethat can be expanded, as illustrated in Figure 2.19
(Microwave oven operation).
The Operation state includes a number of sub-states.
It shows that operation starts with a status check, and that if any problems are discovered, an alarm
is indicated and operation is disabled.
Cooking involves running the microwave generator for the specified time; on completion, a buzzer
is sounded.
Figure 2.19: Microwave oven operation

CS8484-SOFTWARE ENGINEERING Department of CSE
22
2020-2021 Jeppiaar Institute of Technology
2.4 STRUCTURED ANALYSIS
2.4.1 Creating an Entity/Relationship Diagram
The entity/relationship diagram enables a software engineer to fully specify the data objects that
are input and output from a system, the attributes that define the properties of these objects, and
their relationships.
The following approach is taken:
1. During requirements elicitation, customers are asked to list the “things” thatthe application
orbusiness process addresses. These “things” evolve into a list of input and output data objects as
well as external entities that produce or consume information.
2. Taking the objects one at a time, the analyst and customer define whether or not a connection
(unnamed at this stage) exists between the data object and other objects.
3. Wherever a connection exists, the analyst and the customer create one or more
object/relationship pairs.
4. For each object/relationship pair, cardinality and modality are explored.
5. Steps 2 through 4 are continued iteratively until all object/relationships have been defined. It is
common to discover omissions as this process continues. New objects and relationships will
invariably be added as the number of iterations grows.
6. The attributes of each entity are defined.
7. An entity relationship diagram is formalized and reviewed.
8. Steps 1 through 7 are repeated until data modelling is complete.
For Safe Home the following (partial) list of “things” are relevant to the problem:
• homeowner
• control panel
• sensors
• security system
For example, referring to Figure 2.20 (Establishing connections), a direct connection exists
between homeowner and control panel, security system, and monitoring service.
A single connection exists between sensor and security system, and so forth.
For example, the connection between sensor and security system is determined to have the
following object/relationship pairs:
1. security system monitors sensor
2. security system enables/disables sensor
3. security system tests sensor
4. security system programs sensor
Figure 2.20: Establishing connections

CS8484-SOFTWARE ENGINEERING Department of CSE
23
2020-2021 Jeppiaar Institute of Technology
Each of these object/relationship pairs is analysed to determine cardinality and modality.
For example, considering the object/relationship pair security system monitors sensor, the
cardinality between security system and sensor is one to many.
The modality is one occurrence of security system (mandatory) and at least one occurrence
ofsensor (mandatory).
Connecting line between security system and sensor would be modified as shown in below Figure
2.21. Similar analysis would be applied to all other data objects.
Figure 2.21: Developing relationships and cardinality/ modality
2.4.2 Creating a Data Flow Model
The data flow diagram enables the software engineer to develop models of the information domain
and functional domain at the same time. the DFD is refined into greater levels of detail, so
decomposition of the system, takes place.
A few simple guidelines can aid immeasurably during derivation of a data flow diagram:
(1) The level 0 data flow diagram should depict the software/system as a single bubble;
(2) Primary input and output should be carefully noted;
(3) Refinement should begin by isolating candidate processes, data objects, and stores to
berepresented at the next level;
(4) All arrows and bubbles should be labelled with meaningful names;
(5) Information flow continuity must be maintained from level to level, and
(6) One bubble at a time should be refined. There is a natural tendency to
overcomplicate the data flow diagram.
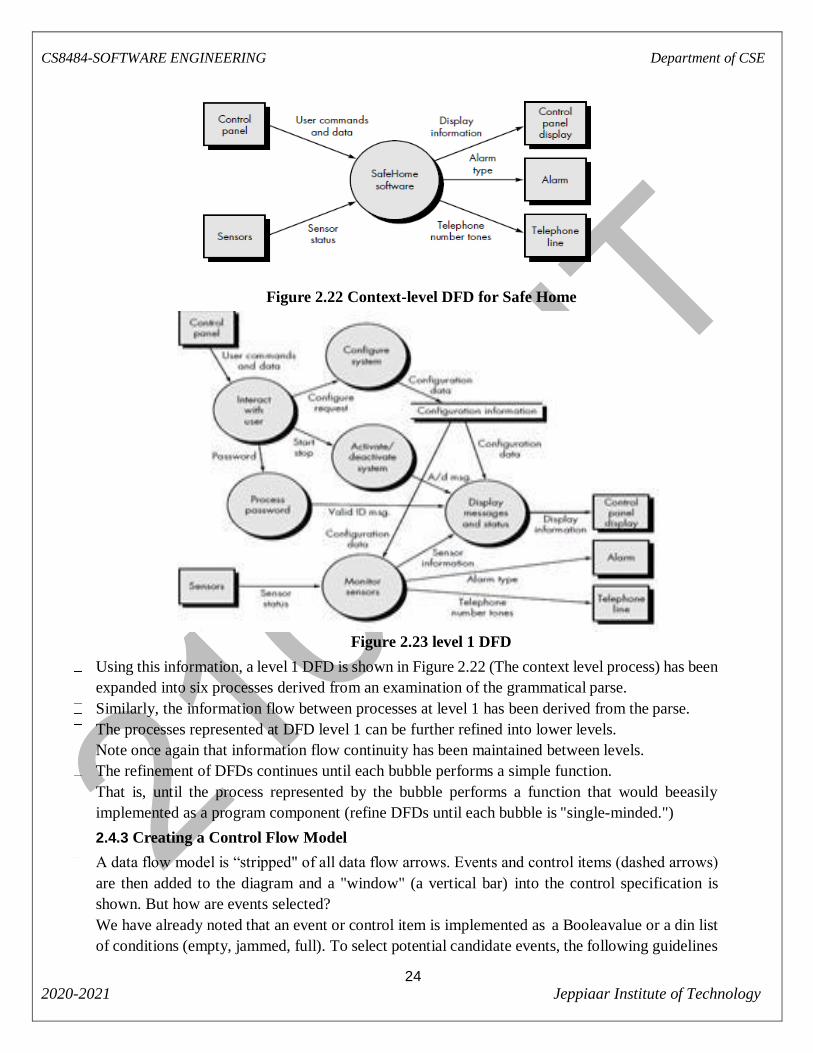
Again considering the SafeHomeproduct, a level 0 DFD for the system is shown in
Figure2.23Context-level DFD for Safe Home. The primary external entities (boxes) produce
information for use by the system and consume information generated by the system.
The labelled arrows represent data objects or data object type hierarchies.
The level 0 DFD is now expanded into a level 1 model.
All verbs areSafeHomeprocesses; that is, they may ultimately be represented as bubbles in a sub-
sequent DFD. All nouns are either external entities (boxes), data or control objects (arrows), or
CS8484-SOFTWARE ENGINEERING Department of CSE
24
2020-2021 Jeppiaar Institute of Technology
Figure 2.22 Context-level DFD for Safe Home
Figure 2.23 level 1 DFD
Using this information, a level 1 DFD is shown in Figure 2.22 (The context level process) has been
expanded into six processes derived from an examination of the grammatical parse.
Similarly, the information flow between processes at level 1 has been derived from the parse.
The processes represented at DFD level 1 can be further refined into lower levels.
Note once again that information flow continuity has been maintained between levels.
The refinement of DFDs continues until each bubble performs a simple function.
That is, until the process represented by the bubble performs a function that would beeasily
implemented as a program component (refine DFDs until each bubble is "single-minded.")
2.4.3 Creating a Control Flow Model
A data flow model is “stripped" of all data flow arrows. Events and control items (dashed arrows)
are then added to the diagram and a "window" (a vertical bar) into the control specification is
shown. But how are events selected?
We have already noted that an event or control item is implemented as a Booleavalue or a din list
of conditions (empty, jammed, full). To select potential candidate events, the following guidelines

CS8484-SOFTWARE ENGINEERING Department of CSE
25
2020-2021 Jeppiaar Institute of Technology
Figure 2.24 Level 2 DFD that refines the monitor sensors process
• List all sensors that are "read" by the software.
• List all interrupt conditions.
• List all "switches" that are actuated by an operator.
• List all data conditions.
• Recalling the noun/verb parse that was applied to the processing narrative,review all "control
items" as possible CSPEC inputs/outputs.
• Describe the behaviour of a system by identifying its states; identify how each
state is reached; and define the transitions between states.
• Focus on possible omissions—a very common error in specifying control;
Forexample, ask: "Is there any other way I can get to this state or exit from it?"
A level 1 CFD for SafeHomesoftware is illustrated.
Among the events and control items noted are sensor event ,blink flag and start/stop switch.
When the event flows into the CSPEC window from the outside world, it implies that the CSPEC
will activate one or more of the processes shown in the CFD.
When a control item emanates from a process and flows into the CSPEC window, control and
activation of some other process or an outside entity is implied.
2.4.4 The Control Specification
The control specification (CSPEC) represents the behaviour of the system in two different ways.
The CSPEC contains a state transition diagram that is a sequential specification of behaviour. It
can also contain a program activation table—a combinatorial specification of behaviour.
The labelled transition arrows indicate how the system responds to events as it traverses the four
states defined at this level
For example, in the figure STD indicates that the only transition from the reading user input state
occurs when the start/stop switch is encountered and a transition to the monitoring system status
state occurs.
This is an error in specification and would, we hope, be uncovered during review and corrected.

CS8484-SOFTWARE ENGINEERING Department of CSE
26
2020-2021 Jeppiaar Institute of Technology
Figure 2.25 Level 1 CFD for Safe Home
Figure 2.26 State transition diagram for Safe Home
A somewhat different mode of behavioral representation is the process activation table.
The PAT represents information contained in the STD in the context of processes, not states.
That is, the table indicates which processes (bubbles) in the flow model will be invoked when an
event occurs.
Figure 2.27 Process activation table for Safe Home

CS8484-SOFTWARE ENGINEERING Department of CSE
27
2020-2021 Jeppiaar Institute of Technology
2.4.5 The Process Specification
The process specification (PSPEC) is used to describe all flow model processes that appear at the
final level of refinement.
The content of the process specification can include narrative text, a program design language
(PDL) description of the process algorithm, mathematical equations, tables, diagrams, or charts.
To illustrate the use of the PSPEC, consider the process password transform represented in the
flow model for Safe Home. The PSPEC for this function might take the form:
a) PSPEC: process password
The process password transform performs all password validation for the SafeHomesystem.
Process password receives a four-digit password from the interact with user function.
The password is first compared to the master password stored within the system.
If the master password matches, <valid id message = true> is passed to the message and status
display function.
If the master password does not match, the four digits are compared to a table of secondary
passwords (these may be assigned to house guests and/or workers who require entry to the home
when the owner is not present).
If the password matches an entry within the table, <valid id message = true> is passed to the
message and status display function.
If there is no match, <valid id message = false> is passed to the message and status display
function.
2.5 CLASSICAL ANALYSIS:
2.5.1 Structured System Analysis
● Structures system analysis — A nine-step technique to analyse client’s needs
● Step-wise refinement is used in many of steps
Step 1: Draw the Data Flow Diagram (DFD)
A pictorial representation of all aspects of the logical data flow
Logical data flow — What happens
Physical data flow — How it happens
Any non-trivial product contains many elements
DFD is developed by stepwise refinement
For large products a hierarchy of DFDs instead of one DFD
Constructed by identifying data flows: Within requirements document or rapid prototype
Four basic symbols
Source or destination of data
(double-square box)
Data flow (arrow)
Process (rounded rectangle)
Data store (open-ended
rectangle)

CS8484-SOFTWARE ENGINEERING Department of CSE
28
2020-2021 Jeppiaar Institute of Technology
Figure 2.28 Basic symbols
Step 2: Decide what sections to computerize and how (batchor online)
Depending on client’s needs and budget limitations
Cost-benefit analysis is applied
Step 3: Determine details of data flows
Decide what data items must go into various data flows.
Stepwise refinement of each flow.
For larger products, a data dictionary is generated.
Step 4: Define logic of processes
Determine what happens within each process.
Use of decision trees to consider all cases.
Figure 2.29 Data flow
Step 5: Define data stores
Exact contents of each store and its representation (format)
Step 6: Define physical resources
File names, organization (sequential, indexed, etc.), storage medium, and records
If a database management system (DBMS) used: Relevant information for each table
Step 7: Determine input-output specifications
Input forms and screens
Printed outputs
Step 8: Determine sizing
Computing numerical data to determine hardware requirements
Volume of input (daily or hourly)
Frequency of each printed report and its deadline
Size and number of records of each type to pass between CPUand mass storage

CS8484-SOFTWARE ENGINEERING Department of CSE
29
2020-2021 Jeppiaar Institute of Technology
Step 9: Determine hardware requirements
Use of sizing information to determine mass storage requirements
Mass storage for backup
Determine if client’s current hardware system is adequate
After approval by client: Specification document is handed to design team, and software process
continues
2.6 PETRI NETS
● Petri nets — Formal technique for describing concurrent interrelated activities
● Invented by Carl Adam Petri, 1962
● Consists of four parts
(1) A set of places
(2) A set of transitions
(3) An input function
(4) An output function
● Originally of interest to automata theorists
● Found wide applicability in computer science
Performance evaluation
Operating systems
Software engineering
The Classical Petri Net Model:
A Petri net is a network composed of places(O) and transitions(∏)
Connections are directed and between a place and a transition, or a transition and a place(e.g.
Between “p1 and t1” or “t1 and p2” above)Tokens(.) are the dynamic objects.Another (equivalent)
notation is to use a solid bar for the transitions:
We may use either notation since they are equivalent, sometimes one makes the diagram easier to
read than the other.
The state of a Petri net is determined by the distribution of tokens over the places (we could
represent the above state as (1,2,1,1) for (p1,p2,p3,p4))

CS8484-SOFTWARE ENGINEERING Department of CSE
30
2020-2021 Jeppiaar Institute of Technology
Transition t1 has three input places (p1, p2 and p3) and two output places (p3 and p4).
Place p3 is both an input and an output place of t1.
Enabling Condition:
Transitions are the active components and places and tokens are passive components.
A transition is enabled if each of the input places contains tokens.
Transition t1 is not enabled, transition t2 is enabled.
Firing:
An enabled transition may fire.
Firing corresponds to consuming tokens from the input places and producing tokens for the output
places.
Firing is atomic (only one transition fires at a time, even if more than one is enabled)
2.7 THE DATA DICTIONARY
Data dictionary provide an organized approach for representing the characteristics of each data
object and control item.
The data dictionary has been proposed as a quasi-formal grammar for describing the content of
objects defined during structured analysis.
This important modelling notation has been defined in the following manner :
The data dictionary is an organized listing of all data elements that are pertinent to the system,
with precise, rigorous definitions so that both user and system analyst will have a common
understanding of inputs, outputs, components of stores and [even] intermediate calculations.
Today, the data dictionary is always implemented as part of a CASE "structured analysis and
design tool."
Although the format of dictionaries varies from tool to tool, most contain the following
information:
Name Description
Name The primary name of the data or control item, the data store or
an external entity. Alias other names used for the first entry
Where-used/how-
used
a listing of the processes that use the data or control item and
how itis used (e.g., input to the process, output from the process
process, as a store, as an external entity.

CS8484-SOFTWARE ENGINEERING Department of CSE
31
2020-2021 Jeppiaar Institute of Technology
When a dictionary entry is created, the CASE tool scans DFDs and CFDs to determine which
processes use the data or control information and how it is used.
For large projects, it is often quite difficult to determine the impact of a change.
Many a software engineer has asked, "Where is this data object used? What else will have to
change if we modify it? What will the overall impact of the change be?" Because the data
dictionary can be treated as a database, the analyst can ask "where used/how used" questions, and
get answers to these queries.
The notation used to develop a content description is noted in the following table:
The notation enables a software engineer to represent composite data in one of the three
fundamental ways that it can be constructed:
1. As a sequence of data items.
2. As a selection from among a set of data items.
3. As a repeated grouping of data items. Each data item entry that is representedas part of a
sequence, selection, or repetition may itself be another compositedata item that needs further
refinement within the dictionary.
The use of the data dictionary:
The data dictionary provides us with a precise definition of telephone number for the DFD in
question.
It indicates where and how this data item is used and any supplementary information that is
relevant to it.
The data dictionary entry begins as follows:
The content description is expanded until all composite data items have been represented as
elementary items or until all composite
Items are represented in terms that would be well-known and unambiguous to all readers.
It is also important to note that a specification of elementary data often restricts a system.
For example, the definition of area code indicates that only three area codes (two toll-free and
one in South Florida) are valid for this system.
The data dictionary defines information items unambiguously.

CS8484-Software Engineering Department of CSE
2020 - 2021 1 Jeppiaar Institute of Technology
Advantages:
1. Data dictionary support name management and avoid duplication.
2. It is a store of organisational knowledge linking analysis,design and implementation.
Important questions:
Difference between Functional and Non-functional Requirements
Functional Requirements Non-functional Requirements
The functional requirements specify the
features of the software system
The non-functional requirements specify the
properties of the software system.
Functional Requirements describe what the
product must do.
Non-functional Requirements describe how
he product should perform
The functional requirements specify the
actions with which the work is concerned.
The non-functional requirements specify the
experience of the user while using the
system.
Example: For a library management system
allowing user to read the article online is a
functional requirement.
Example: For a library management system,
for a user who wishes to read the article
online must be authenticated first.
Difference between Functional and Behavioural models:
Functional model Behavioural model
The functional model depicts all the
essential functionalities of the system
The behavioral model represents how system
behaves
The functional model is represented by
data flow and control flow diagrams
The behavioral model is represented by state
chart diagram
The DFDS can be represented by levels The state diagram has some number of states
and transitions
The functional diagram gives detailed
scenario of system which has to be
developed.
The behavioral model gives the abstract
representation of the system.
Difference between Data flow diagram and state transition diagram
Data flow diagram State Transition Diagram
Data flow diagram is graphical representation for
representing the information flow and the transforms
that are applied as data move from input to output
State transition diagram is a graphical
representation for representing the
behavior of a system by depicting its states
and the events that cause the system, to
change state
The data flow diagram is a collection of
process data store, flow of data
The State transition diagram is a collection
of states and events.
The data flow diagrams are used to represent the
system at any level of abstractions and the increasing
levels are used to expose more and more
functionalities in the system.
The state transition diagrams are typically
drawn at single level .They intended to
expose the overall behavior of the system.

CS8484-Software Engineering Department of CSE
2020 - 2021 1 Jeppiaar Institute of Technology