Directly coupled HPLC���NMR and HPLC���NMR���MS in pharmaceutical research and development
ORIGINAL PAPER
Unilateral NMR, 13C CPMAS NMR spectroscopyand micro-analytical techniques for studying the materialsand state of conservation of an ancient Egyptianwooden sarcophagus
Noemi Proietti & Federica Presciutti & Valeria Di Tullio & Brenda Doherty &
Anna Maria Marinelli & Barbara Provinciali & Nicola Macchioni & Donatella Capitani &Costanza Miliani
Received: 16 July 2010 /Revised: 14 September 2010 /Accepted: 14 September 2010 /Published online: 8 October 2010# Springer-Verlag 2010
Abstract A multi-technique approach was employed tostudy a decorated Egyptian wooden sarcophagus (XXV–XXVI dynasty, Third Intermediate Period), belonging to theMuseo del Vicino Oriente of the Sapienza University ofRome. Portable non-invasive unilateral NMR was applied toevaluate the conservation state of the sarcophagus. Moreover,using unilateral NMR, a non-invasive analytical protocol wasestablished to detect the presence of organic substances on thesurface and/or embedded in the wooden matrix. This protocolallowed for an educated sampling campaign aimed at further
investigating the state of degradation of the wood and thepresence of organic substances by 13C cross polarizationmagic angle spinning (CPMAS) NMR spectroscopy. Thecomposition of the painted layer was analysed by opticalmicroscopy (OM), scanning electron microscopy–energydispersive spectroscopy (SEM–EDS), Raman and surfaceenhanced (resonance) Raman spectroscopy (SERS/SERRS),infrared and GC–MS techniques, evidencing original compo-nents such as clay minerals, Egyptian green, indigo, naturalgums, and also highlighting restoration pigments and
Published in the special issue Analytical Chemistry for CulturalHeritage with Guest Editors Rocco Mazzeo, Silvia Prati, and AldoRoda.
N. Proietti :V. Di Tullio :D. CapitaniLaboratorio di Risonanza Magnetica “Annalaura Segre” Istituto diMetodologie Chimiche CNR,Area della Ricerca di Roma, Via Salaria Km 29.300,00015 Monterotondo, RM, Italy
F. PresciuttiINSTM c/o Dipartimento di Chimica, Università di Perugia,Via Elce di Sotto 8,06123 Perugia, Italy
F. Presciutti (*) : B. Doherty :C. MilianiCentro di Eccellenza SMAART, Dipartimento di Chimica,Università di Perugia,Via Elce di Sotto 8,06123 Perugia, Italye-mail: [email protected]
C. MilianiCNR-ISTM,Via Elce di Sotto 8,06123 Perugia, Italy
A. M. Marinelli :B. ProvincialiISCR - Mibac,Via di San Michele 22,00153 Rome, Italy
N. MacchioniIstituto per la Valorizzazione del Legno e delle Specie Arboree,Area della Ricerca di Firenze, Via Madonna del Piano, 10,50019 Sesto Fiorentino, Florence, Italy
V. Di TullioCentro di Ricerca per le Scienze Applicate alla Protezione dell'Ambiente e dei Beni Culturali c/o Dipartimento di Chimica,Sapienza Università di Roma,Piazzale Aldo Moro 5,Rome 00185, Italy
Anal Bioanal Chem (2011) 399:3117–3131DOI 10.1007/s00216-010-4229-z
alteration compounds. The identification of the wood, of greatvalue for the reconstruction of the history of the artwork, wasachieved by means of optical microscopy.
Keywords Unilateral NMR . 13C CPMAS spectroscopy .
SERS .Wooden sarcophagus . Egyptian green
Introduction
A multi-analytical study was carried out to evaluate thestate of conservation and the constitutive elements of adecorated wooden sarcophagus. This artefact is part of anEgyptian collection belonging to the Museo del VicinoOriente of the Sapienza University of Rome. The sarcoph-agus consists of two side panels with green monochromedecorations, probably dating from the XXV–XXVI dynas-ty, Third Intermediate Period. The monitoring of the state ofdegradation and of the constitutive elements was mandatoryfor determining a suitable conservation treatment strategy.
The campaign of measurements was developed in twosuccessive steps. During the first step non-invasive meas-urements were performed in the museum. The resultsobtained gave important information regarding the state ofconservation of the artefact and suggested suitable areas forsampling. During the second step of measurements on thecollected samples micro-invasive analyses were performedto obtain detailed information on the constitutive materialsof the object.
Unilateral NMR, a portable non-invasive technique,allows measurements to be performed in situ without anysampling. The magnetic field is applied to one side of theobject; therefore, measurements can be performed directlyon large objects such as wall paintings, monuments and ingeneral any building, fully preserving the integrity and thedimension of the object under investigation. As far as thecultural heritage field is concerned, unilateral NMR hasbeen previously used for studying paper degradation [1, 2],for the analysis of historical porous building materials [3],to study the performances of protective and/or consolidat-ing processes on porous stones [4], for assessing the state ofconservation of wall paintings [5], for quantitativelymapping the moisture in ancient wall paintings [6, 7], andfor differentiating and characterizing micrometre-thick oilstains on paper [8].
In the case study reported here, the state of conservation ofa panel of the sarcophagus was monitored by unilateral NMR.In particular the relaxation times, namely the spin-lattice (T1)and the spin-spin (T2) relaxation times were measured. As T2is sensitive to the wood degradation [9] it is possible todifferentiate between wood in a good state of conservationand deteriorated wood. T1 is sensitive to the possiblepresence of paramagnetic elements in pigments [10].
Another single-sided NMR sensor with a flat sensitivevolume external to the device was also used to provide,non-invasively, depth profiles of the artefact, spanningseveral millimetres in depth. Depth profiles have beenpreviously used to scan entire paintings to construct a 2Dmap of the stratigraphy [11], to detect natural moisture inmosaics, to scan the back of different master violins, and tostudy the sublimation process of cyclododecane, a tempo-rary protective, in different porous materials [12].
The results obtained by the non-invasive study allowedthe planning of a minimal representative sampling cam-paign to perform a set of micro-invasive analyticaltechniques, namely 13C cross polarization magic anglespinning (CPMAS) NMR spectroscopy, optical microscopy(OM) and scanning electron microscopy–energy dispersivespectroscopy (SEM–EDS), Raman and surface enhanced(resonance) Raman spectroscopy (SERS/SERRS), IR spec-troscopy and GC–MS. These analyses allowed the identi-fication of the constitutive materials of the painted layerand their state of conservation, the identification of the typeof wood and the detailed investigation of the nature oforganic substances detected in the wood possibly due toprevious undocumented restoration.
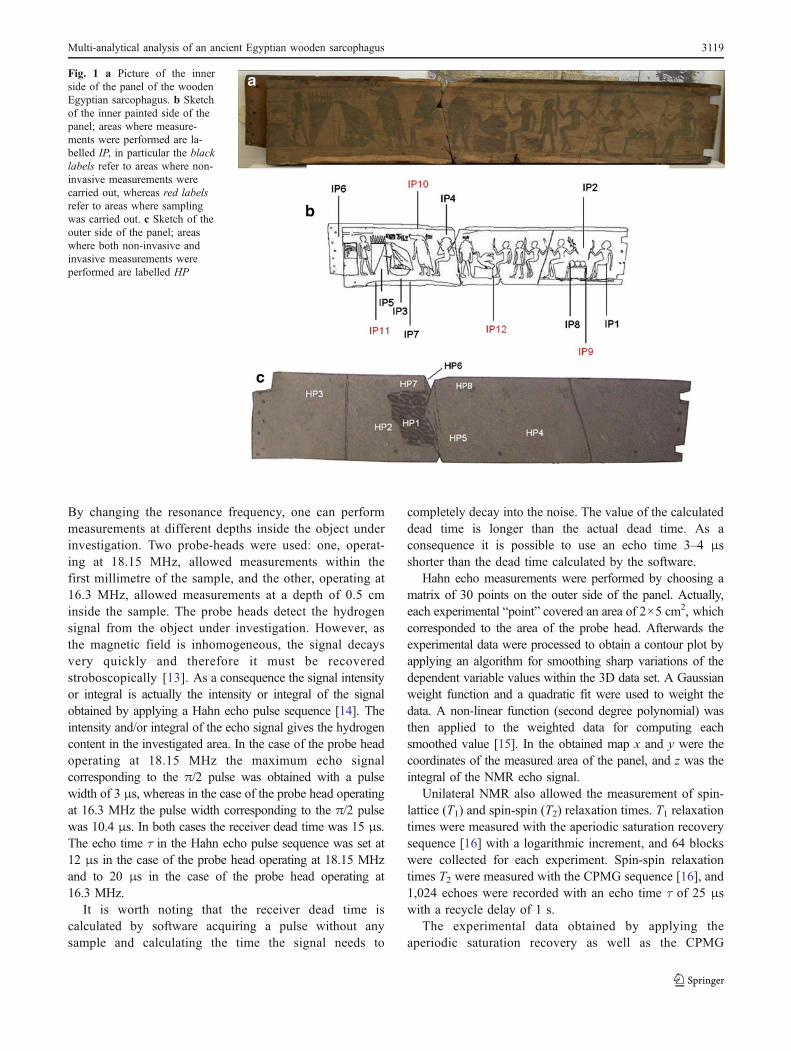
Only limited information is available concerning thesarcophagus which was sold by a private collector. As oneof a number of objects entering the museum’s collectionfrom private hands, it had been altered before the arrival inthe museum to render the artefact transportable. Inparticular the lid and the bottom of the sarcophagus weremissing, only the two side wooden panels remained andeach panel had been sawn into three pieces. After arrivingat the museum in 1969, both panels underwent a restorationprocess which is, however, undocumented. Both panelsshow green monochrome decorations on the inner side. Thecampaign of measurements was carried out on just one ofthese two panels; the inner painted side of the panel isshown in Fig. 1a. Figure 1b shows a sketch of the paintedside of the panel; the labels IP refer to areas measured byunilateral NMR and to areas where sampling was carriedout. Figure 1c shows a sketch of the outer unpainted side ofthe panel; again the labels HP refer to areas measured byunilateral NMR and to areas where sampling was carriedout.
Experimental
Unilateral NMR
Measurements were carried out in situ with a unilateralNMR instrument from Bruker BioSpin. The magnetic fieldpenetrating the object is rather inhomogeneous anddecreases with the distance from the surface of the magnet.
3118 N. Proietti et al.
By changing the resonance frequency, one can performmeasurements at different depths inside the object underinvestigation. Two probe-heads were used: one, operat-ing at 18.15 MHz, allowed measurements within thefirst millimetre of the sample, and the other, operating at16.3 MHz, allowed measurements at a depth of 0.5 cminside the sample. The probe heads detect the hydrogensignal from the object under investigation. However, asthe magnetic field is inhomogeneous, the signal decaysvery quickly and therefore it must be recoveredstroboscopically [13]. As a consequence the signal intensityor integral is actually the intensity or integral of the signalobtained by applying a Hahn echo pulse sequence [14]. Theintensity and/or integral of the echo signal gives the hydrogencontent in the investigated area. In the case of the probe headoperating at 18.15 MHz the maximum echo signalcorresponding to the π/2 pulse was obtained with a pulsewidth of 3 μs, whereas in the case of the probe head operatingat 16.3 MHz the pulse width corresponding to the π/2 pulsewas 10.4 μs. In both cases the receiver dead time was 15 μs.The echo time τ in the Hahn echo pulse sequence was set at12 μs in the case of the probe head operating at 18.15 MHzand to 20 μs in the case of the probe head operating at16.3 MHz.
It is worth noting that the receiver dead time iscalculated by software acquiring a pulse without anysample and calculating the time the signal needs to
completely decay into the noise. The value of the calculateddead time is longer than the actual dead time. As aconsequence it is possible to use an echo time 3–4 μsshorter than the dead time calculated by the software.
Hahn echo measurements were performed by choosing amatrix of 30 points on the outer side of the panel. Actually,each experimental “point” covered an area of 2×5 cm2, whichcorresponded to the area of the probe head. Afterwards theexperimental data were processed to obtain a contour plot byapplying an algorithm for smoothing sharp variations of thedependent variable values within the 3D data set. A Gaussianweight function and a quadratic fit were used to weight thedata. A non-linear function (second degree polynomial) wasthen applied to the weighted data for computing eachsmoothed value [15]. In the obtained map x and y were thecoordinates of the measured area of the panel, and z was theintegral of the NMR echo signal.
Unilateral NMR also allowed the measurement of spin-lattice (T1) and spin-spin (T2) relaxation times. T1 relaxationtimes were measured with the aperiodic saturation recoverysequence [16] with a logarithmic increment, and 64 blockswere collected for each experiment. Spin-spin relaxationtimes T2 were measured with the CPMG sequence [16], and1,024 echoes were recorded with an echo time τ of 25 μswith a recycle delay of 1 s.
The experimental data obtained by applying theaperiodic saturation recovery as well as the CPMG
Fig. 1 a Picture of the innerside of the panel of the woodenEgyptian sarcophagus. b Sketchof the inner painted side of thepanel; areas where measure-ments were performed are la-belled IP, in particular the blacklabels refer to areas where non-invasive measurements werecarried out, whereas red labelsrefer to areas where samplingwas carried out. c Sketch of theouter side of the panel; areaswhere both non-invasive andinvasive measurements wereperformed are labelled HP
Multi-analytical analysis of an ancient Egyptian wooden sarcophagus 3119
pulse sequence were fit according to the followingequation:
Y ¼ C0 þXn
i¼1
Wie�tTi ð1Þ
where n is the number of components of the decay of themagnetization, Wi is the weight of the i-th component, C0
is the offset value which accounts for the noise of themeasurement, and Ti is the relaxation time of the i-thcomponent. Note that Ti=T1i when experimental datawere collected by applying the aperiodic saturationrecovery sequence, and Ti= T2i and t=2τ when experi-mental data were collected by applying the CPMG pulsesequence.
Depth profiles were obtained with a purpose-built single-sided sensor by RWTH Aachen University, Aachen,Germany [17]. This sensor generates a magnetic field withan extremely uniform gradient to resolve the near-surfacestructure of arbitrary large samples. Measurements werecarried out at 13.55 MHz.
Each point of the depth profiles was obtained as theaddition of the first eight echoes acquired with a CPMGsequence with an echo time τ of 25 μs, the recycle delaywas 1 s. The acquisition window was set to 11 μs, which inthe presence of the uniform gradient defined a nominalresolution of 57 μm. The sample profiling was acquired byrepositioning the single-sided sensor in steps of 57 μm tocover the desired spatial range, from the surface of theartefact at 0 μm to a depth of 5,000 μm inside the artefact.The full profiles had a field of view of 5,000 μm.
13C CPMAS NMR spectroscopy
Wood samples (of a few milligrams) were obtained fromthe inner and outer sides of the panel of the sarcophagus. Inboth cases samples were collected on fully unpainted areas.As a result of the very small amount of sample, thecollected samples were packed into 4-mm zirconia rotorswith an available volume reduced to 50 μl, and sealed withKel-F caps.
Solid-state 13C CPMAS NMR spectra were measured at100.63 MHz on a Bruker Avance III spectrometer. The spinrate was 12,000 Hz. The contact time for the cross-polarization was 1.5 ms, the recycle delay was 3 s, andthe 1H π/2 pulse was 3.5 μs. The cross-polarization wasperformed by applying the variable spin-lock sequenceRAMP–CPMAS [18], the RAMP was applied on the 1Hchannel, and during the contact time the amplitude of theRAMP was increased from 50 to 100% of the maximumvalue. Spectra acquired with a time domain of 1,024 datapoints were zero filled and Fourier transformed with a sizeof 4,096 data points applying an exponential multiplicationwith a line broadening of 8 Hz.
The heteronuclear 13C–1H J-coupled correlation experi-ment was performed with frequency-switched Lee–Goldburghomonuclear decoupling [19]. The duration of FSLG pulseswas optimized to 10.22 μs, and the magic angle pulse lengthwas 2.13 μs. The selected value of the J-coupling was 80 kHz.The 1H π/2 pulse was 3.5 μs, and the 13C π pulse was7.4 μs. The heteronuclear 13C–1H J-coupled correlationexperiment was obtained by synchronizing the time for theJCH coupling evolution with the spin rate which was set at9,794 Hz. The time domain was 1,024 in the f2 (13C)dimension and 64 slices were collected in the f1 (1H)dimension. The contact timewas 1.5 ms. 1H and 13C chemicalshifts were referenced to glycine used as an external reference.
The deconvolution of 13C CPMAS spectra was performedby using the dm2006 software package [20]. Each carbonresonance was characterized by the amplitude, the chemicalshift and the width at half height. The integral of eachresonance was obtained by applying the deconvolution.
Identification of wood
In order to identify the wood species both side panels of thesarcophagus were sampled at four points. Three sampleswere obtained from the wooden boards, while the fourthsample was obtained from an original wooden nail. Thesmall wooden flakes were boiled in demineralised water tofacilitate the cutting of thin sections (20–30 μm ofthickness). The obtained sections were then mounted onglasses to be observed by transmission optical microscope.The observation and description of the anatomical featuresallowed the identification of the taxon of the woodensample through comparison with the description availablein the literature [21–23] and with the materials preserved inthe xylarium of CNR-IVALSA.
Optical and electron microscopy
Morphological and stratigraphic investigations were per-formed by using optical microscopy (OM) and scanningelectron microscopy coupled with energy dispersive x-rayspectrometry (SEM–EDS). OM images were taken with aLeica DMR microscope equipped with a Leica DC300digital camera. SEM images, by backscattered electrons(BSE), and EDS analyses were taken with a Philips XL30instrument with an LaB6 source and an EDAX/DX4detector. Epoxy resin (Epofix, Struers) was used for thepreparation of cross sections and they were coated with athin layer of graphite to make the surface conductive.
Infrared spectroscopy
FTIR analyses were carried out with a JASCO FTIR 470-plus spectrophotometer. Measurements were performed in
3120 N. Proietti et al.
transmittance mode dispersing the sample in KBr pellets (1/100 weight fraction).
Micro-Raman and surface enhanced Raman spectroscopy
Conventional Raman and SERS/SERRS spectra wererecorded by utilizing a JASCO® Ventuno dispersivemicro-Raman spectrophotometer with excitation wave-length of 532 nm optimizing both resonance Ramanconditions (RR) and surface enhanced resonance Ramanconditions (SERRS). Laser power at the sample was ca.2 mW and the spectral resolution was 2 cm−1/pixel. Theinstrument and all spectra were calibrated with polystyrene.
In particular the SERS measurements were carried outusing silver colloids prepared by citrate reduction [24] withan absorption maximum at approximately 404 nm and full-width half height (FWHH) of 100 nm. A minute portion ofsample was directly added to 2 μl of salt-aggregatedcolloid. Analysis was effectuated in the following 2–10 min where attention was paid to any residual colloidbands [25] as well as to any photodegradation of thesamples in SERS that could lead to a featureless carbon-likebackground [26].
Gas chromatography–mass spectrometry (GC–MS)
The samples were prepared for the analysis using proce-dures noted in the literature [27].
Samples were analysed by using a 6890 N gaschromatograph (Agilent Technologies) with split/splitlessinjector, interfaced to a model 5973 quadropole massspectrometer (MS). Injector and transfer lines were kept ata temperature of 230 °C and 280 °C, respectively. Whilethe MS ion source temperature was kept at 230 °C, themass quadropole was maintained at a temperature of 150 °C. The MS operated in the EI mode at 70 eV. Helium at aconstant flow of 1 ml/min was used as a carrier gas. TheGC employed a fused silica capillary column, model HP-5MS, with a 5% diphenyl, 95% dimethylpolysiloxanestationary phase, of 30-m length with internal diameter of0.25 mm and 0.25-μm film thickness (J&W Scientific,Agilent Technologies, Palo Alto, CA).
Results and discussion
Unilateral NMR measurements
All areas measured on the inner side of the panel of thesarcophagus showed a mono-exponential trend with asingle time constant T1. In areas with the green decorations,namely IP1 and IP8, T1 was about one half of that measuredin unpainted areas, namely IP3, IP4 and IP6, see Fig. 2a
and Table 1. As is well known, the T1 relaxation time isshortened by paramagnetic impurities; our results clearlyindicate the presence of paramagnetic elements in thedecorations which possibly migrated from the greenpigment to the very first layers of the wood underlyingthe painted layer. Some areas measured on the unpaintedouter side of the panel of the sarcophagus showed a bi-exponential trend: the fast-relaxing component T1a wasfound to be 15–20 ms, whereas the slow-relaxing compo-nent T1b was rather long, about 140–250 ms; see HP2, HP4and HP7 in Fig. 2b and Table 1. Other areas showed amono-exponential trend with T1 values strictly resemblingthose found in the inner side, see HP3 in Fig. 2b andTable 1.
Unilateral NMR was also used to monitor the state ofconservation of the wood of the panel. It has beenpreviously shown [9] that in degraded wood, due to a lossof bound water, the spin-spin relaxation time T2 is usuallyshorter than in well-preserved wood. Actually T2 may be asuitable parameter to differentiate between wood in a goodstate of conservation and deteriorated wood. In Fig. 2c thedecays obtained by applying a CPMG sequence are shownin a semi-logarithmic scale. Areas measured on the innerside of the panel, namely IP4 and IP7, showed a bi-exponential trend. Two T2 values were obtained, namelyT2a and T2b in the range 0.10–0.12 ms and 0.50–0.53 msrespectively. The relative amounts of T2a and T2b werealways found to be about 80% and 20% respectively. Notethat the measurements shown in Fig. 2c are representative ofthe general trend. In Fig. 2c the results obtained byperforming CPMG measurements on areas of the outer sideof the panel, namely HP2 and HP3, are also reported. Theseareas showed a bi-exponential trend. It is interesting to notethat the decays measured on the outer side were, on average,always shorter than those measured on the inner side withT2b shortened to about 0.35 ms, see also Table 1. This resultis quite reasonable as the outer side of the panel is mostlikely more affected by degradation than the inner side.
Because the wood of the panel was found to be yewwood by OM, we compared the T2 results obtained on theinner and outer sides of the panel with those obtained on apiece of seasoned yew wood, see Fig. 2c. In seasoned yewwood three T2 values, namely T2a, T2b and T2c wereobtained. Note that T2a and T2b values matched very wellthe values previously found by measuring the inner side ofthe panel, whereas the longest T2c value was only found inseasoned yew wood. Note that, as the relaxation measure-ments reported in this paper were performed with aninhomogeneous magnetic field, the obtained T2 values weresystematically shorter than those reported in the literature [28].
It has been previously shown [28] that the analysis ofspin-spin relaxation times measured in seasoned woodallows the separation and the detection of water into three
Multi-analytical analysis of an ancient Egyptian wooden sarcophagus 3121
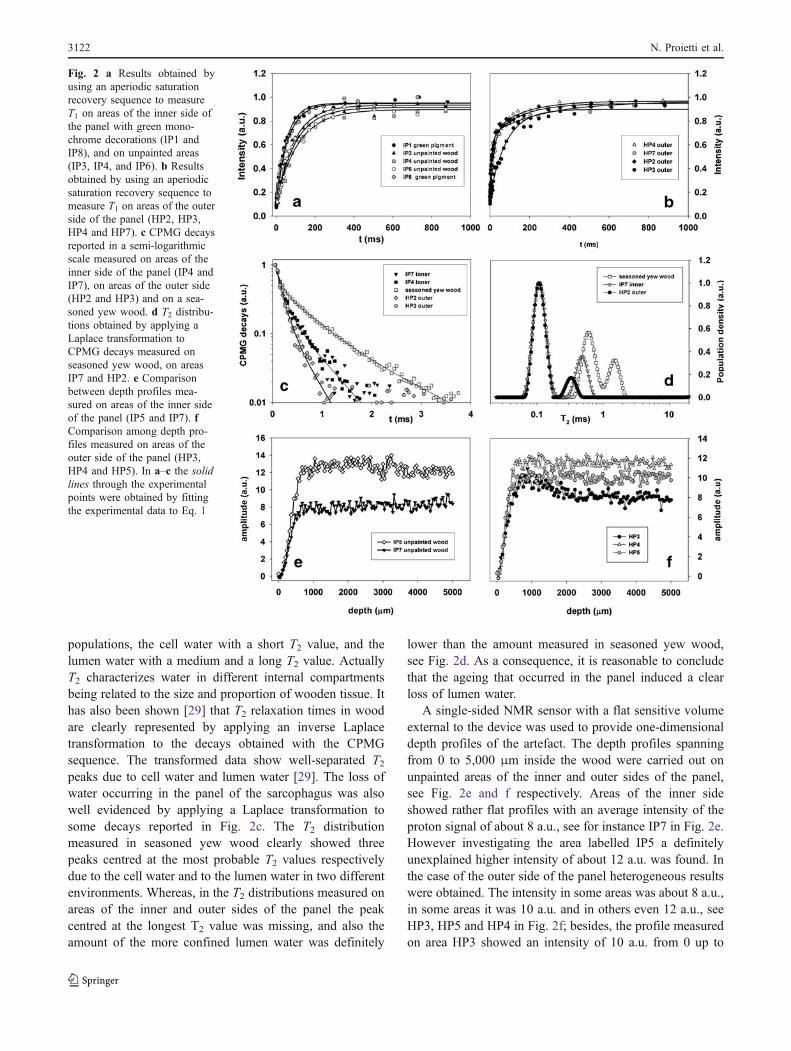
populations, the cell water with a short T2 value, and thelumen water with a medium and a long T2 value. ActuallyT2 characterizes water in different internal compartmentsbeing related to the size and proportion of wooden tissue. Ithas also been shown [29] that T2 relaxation times in woodare clearly represented by applying an inverse Laplacetransformation to the decays obtained with the CPMGsequence. The transformed data show well-separated T2peaks due to cell water and lumen water [29]. The loss ofwater occurring in the panel of the sarcophagus was alsowell evidenced by applying a Laplace transformation tosome decays reported in Fig. 2c. The T2 distributionmeasured in seasoned yew wood clearly showed threepeaks centred at the most probable T2 values respectivelydue to the cell water and to the lumen water in two differentenvironments. Whereas, in the T2 distributions measured onareas of the inner and outer sides of the panel the peakcentred at the longest T2 value was missing, and also theamount of the more confined lumen water was definitely
lower than the amount measured in seasoned yew wood,see Fig. 2d. As a consequence, it is reasonable to concludethat the ageing that occurred in the panel induced a clearloss of lumen water.
A single-sided NMR sensor with a flat sensitive volumeexternal to the device was used to provide one-dimensionaldepth profiles of the artefact. The depth profiles spanningfrom 0 to 5,000 μm inside the wood were carried out onunpainted areas of the inner and outer sides of the panel,see Fig. 2e and f respectively. Areas of the inner sideshowed rather flat profiles with an average intensity of theproton signal of about 8 a.u., see for instance IP7 in Fig. 2e.However investigating the area labelled IP5 a definitelyunexplained higher intensity of about 12 a.u. was found. Inthe case of the outer side of the panel heterogeneous resultswere obtained. The intensity in some areas was about 8 a.u.,in some areas it was 10 a.u. and in others even 12 a.u., seeHP3, HP5 and HP4 in Fig. 2f; besides, the profile measuredon area HP3 showed an intensity of 10 a.u. from 0 up to
Fig. 2 a Results obtained byusing an aperiodic saturationrecovery sequence to measureT1 on areas of the inner side ofthe panel with green mono-chrome decorations (IP1 andIP8), and on unpainted areas(IP3, IP4, and IP6). b Resultsobtained by using an aperiodicsaturation recovery sequence tomeasure T1 on areas of the outerside of the panel (HP2, HP3,HP4 and HP7). c CPMG decaysreported in a semi-logarithmicscale measured on areas of theinner side of the panel (IP4 andIP7), on areas of the outer side(HP2 and HP3) and on a sea-soned yew wood. d T2 distribu-tions obtained by applying aLaplace transformation toCPMG decays measured onseasoned yew wood, on areasIP7 and HP2. e Comparisonbetween depth profiles mea-sured on areas of the inner sideof the panel (IP5 and IP7). fComparison among depth pro-files measured on areas of theouter side of the panel (HP3,HP4 and HP5). In a–c the solidlines through the experimentalpoints were obtained by fittingthe experimental data to Eq. 1
3122 N. Proietti et al.
1,500 μm then it decreased down to 8 a.u. These resultsprompted us to carefully map the integral of the NMRsignal on the outer side of the panel both in the very firstlayer of the wood and at a depth of 0.5 cm, and the obtainedmaps are reported in Fig. 3a and b. In these maps the darkbrown colour indicates the areas where the lowest integralwas measured, and the white colour indicates the areaswere the highest integral was found. It is shown thatunexplained intense integrals were found in many areas.These results prompted us to perform sampling in a fewselected areas to investigate their structural composition by13C CPMAS NMR spectroscopy.
13C CPMAS NMR spectroscopy: wood characterisationof the inner and outer sides of the panel
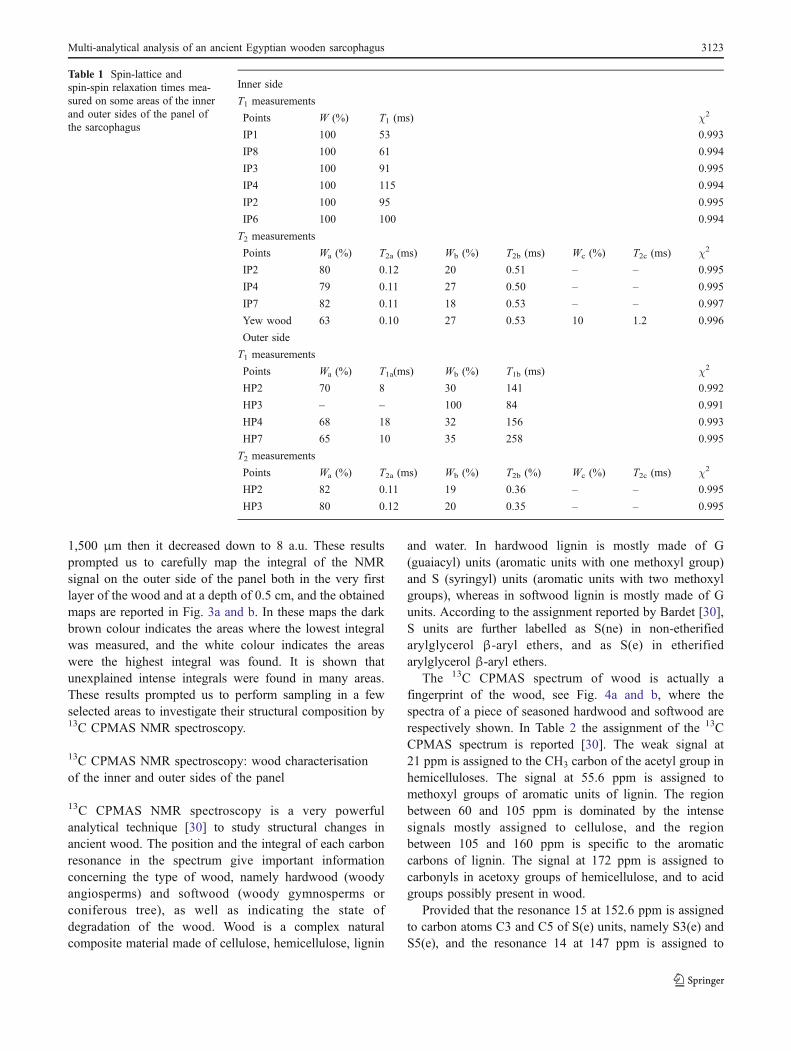
13C CPMAS NMR spectroscopy is a very powerfulanalytical technique [30] to study structural changes inancient wood. The position and the integral of each carbonresonance in the spectrum give important informationconcerning the type of wood, namely hardwood (woodyangiosperms) and softwood (woody gymnosperms orconiferous tree), as well as indicating the state ofdegradation of the wood. Wood is a complex naturalcomposite material made of cellulose, hemicellulose, lignin
and water. In hardwood lignin is mostly made of G(guaiacyl) units (aromatic units with one methoxyl group)and S (syringyl) units (aromatic units with two methoxylgroups), whereas in softwood lignin is mostly made of Gunits. According to the assignment reported by Bardet [30],S units are further labelled as S(ne) in non-etherifiedarylglycerol β-aryl ethers, and as S(e) in etherifiedarylglycerol β-aryl ethers.
The 13C CPMAS spectrum of wood is actually afingerprint of the wood, see Fig. 4a and b, where thespectra of a piece of seasoned hardwood and softwood arerespectively shown. In Table 2 the assignment of the 13CCPMAS spectrum is reported [30]. The weak signal at21 ppm is assigned to the CH3 carbon of the acetyl group inhemicelluloses. The signal at 55.6 ppm is assigned tomethoxyl groups of aromatic units of lignin. The regionbetween 60 and 105 ppm is dominated by the intensesignals mostly assigned to cellulose, and the regionbetween 105 and 160 ppm is specific to the aromaticcarbons of lignin. The signal at 172 ppm is assigned tocarbonyls in acetoxy groups of hemicellulose, and to acidgroups possibly present in wood.
Provided that the resonance 15 at 152.6 ppm is assignedto carbon atoms C3 and C5 of S(e) units, namely S3(e) andS5(e), and the resonance 14 at 147 ppm is assigned to
Inner side
T1 measurements
Points W (%) T1 (ms) χ2
IP1 100 53 0.993
IP8 100 61 0.994
IP3 100 91 0.995
IP4 100 115 0.994
IP2 100 95 0.995
IP6 100 100 0.994
T2 measurements
Points Wa (%) T2a (ms) Wb (%) T2b (ms) Wc (%) T2c (ms) χ2
IP2 80 0.12 20 0.51 – – 0.995
IP4 79 0.11 27 0.50 – – 0.995
IP7 82 0.11 18 0.53 – – 0.997
Yew wood 63 0.10 27 0.53 10 1.2 0.996
Outer side
T1 measurements
Points Wa (%) T1a(ms) Wb (%) T1b (ms) χ2
HP2 70 8 30 141 0.992
HP3 – – 100 84 0.991
HP4 68 18 32 156 0.993
HP7 65 10 35 258 0.995
T2 measurements
Points Wa (%) T2a (ms) Wb (%) T2b (%) Wc (%) T2c (ms) χ2
HP2 82 0.11 19 0.36 – – 0.995
HP3 80 0.12 20 0.35 – – 0.995
Table 1 Spin-lattice andspin-spin relaxation times mea-sured on some areas of the innerand outer sides of the panel ofthe sarcophagus
Multi-analytical analysis of an ancient Egyptian wooden sarcophagus 3123

carbon atoms C3 and C5 of S(ne) units, namely S3(ne) andS5(ne), and to carbon atoms C1 and C4 of G units, namelyG1 and G4, the 13C CPMAS spectrum allows the easy andquick recognition of the wood as a hardwood or softwood.In fact in hardwood the ratio between the integral of theresonance at 152.6 ppm, I(15), and the integral of theresonance at 147 ppm, I(14), is greater than 1, whereas insoftwood this ratio is lower than 1. By applying adeconvolution procedure to the spectra reported in Fig. 4aand b it is possible to obtain the integral of each resonance,see Table 2. For the sake of clarity the deconvoluted spectra(red line) overlapped with the experimental ones (black
line), see Fig. 4a and b. By using the integrals reported inTable 2, the ratio I(15)/I(14) was found to be about 1.3 inhardwood and about 0.51 in softwood.
The spectra (black line) of the two samples of woodfrom the inner and outer sides of the panel of thesarcophagus are shown in Fig. 4c and d respectively. Thedeconvoluted spectra (red line) overlapped with theexperimental ones. The integrals obtained by deconvolutingthe experimental spectra are reported in Table 2. Inspectrum c the ratio I(15)/I(14) was found to be 0.48allowing the recognition of the wood of the panel as asoftwood.
Fig. 3 Proton density maps ofthe outer side of the panel of thesarcophagus measured in thevery first layers of the wood (a)and at a depth of 0.5 cm (b).Dark brown colour indicates theareas where the lowest integralwas measured, and white colourindicates the areas were thehighest integral of the NMRsignal was measured. The labelsreported on the maps indicatethe matrix of points measured toobtain the maps
Fig. 4 13C CPMAS spectra ofwood samples: a hardwoodalong with the assignment of allresonances, b softwood, c sam-ple from the inner side of thepanel of the sarcophagus (IP11),d sample from the outer side ofthe panel (HP1). The deconvo-luted spectra (red line) aresuperimposed on the experi-mental ones (black line)
3124 N. Proietti et al.
The ratio of the integrals of resonances 15 and 14 alsoallowed the evaluation of the depletion of the β-O-4 linkagesinside the lignin which could occur due to the degradation.The ratio I(15)/I(14) was found to be 0.25 in the sample fromthe outer side of the panel, see Fig. 4d. This value wasdefinitely lower than that found in the inner side of the panel,i.e. 0.48. According to these results, it is possible to concludethat in the sample from the outer side a depletion of β-O-4linkages inside the lignin occurred, whereas the sample fromthe inner side was slightly affected, with this ratio beingabout 0.51 in a seasoned well-preserved softwood.
In samples from the inner and outer sides, the resonanceat 21 ppm (acetyl groups of hemicellulose) is definitelyweaker than in seasoned softwood, indicating the occur-rence of hemicellulose depletion.
By using the integral of the resonance 9 at 104.8 ppm, I(9) (anomeric carbon of cellulose), as a reference, and theintegral of the resonance 2 at 55.6 ppm, I(2) (methoxylgroups of lignin), the relative amounts of carbohydrates andlignin in the inner and outer sides of the panel wereevaluated. It clearly appears that lignin signals have a muchhigher intensity in the sample collected from the outer sidethan in the sample collected from the inner side, see Fig. 4cand d. Besides, the ratio between I(9) and I(2) was found tobe 1.58 in the sample from the inner side, and 0.87 in thesample from the outer side, whereas this ratio was found tobe about 2.17 in the sample of seasoned softwood shown inFig. 4b. These results indicate that both samples from theinner and outer sides of the panel showed a depletion of
carbohydrates; however, the depletion was higher in thesample from the outer side than in the sample from theinner side. In both samples the line widths of the signals didnot significantly change, indicating that, while ageinginduced a depletion of carbohydrate, no chemical rear-rangements inside the bio-polymeric network occurred.
13C CPMAS NMR spectroscopy: detection of organicsubstances beyond wood
After characterizing the wood of the panel and its state ofdegradation, the question of explaining the very high NMRintegral found by unilateral NMR in some investigatedareas was addressed. A few areas of the outer side of thepanel were selected to perform sampling suitable for 13CCPMAS investigations. Note that to avoid relevant dam-ages to the panel, the sampling was actually performed onthe first layers of the wood surface. The proton density mapmeasured at the surface of the panel, see Fig. 3a, was veryhelpful in the selection for areas requiring samplingshowing high, medium and low values of the integral ofthe NMR signal. In fact area HP4 was chosen as it wasrepresentative of areas of the map showing a high value ofthe integral, whereas areas HP7 and HP8 showed a mediumvalue of the integral. The area HP1 was sampled inside alacuna represented as a grey area in the map, see Fig. 3a; inthis area the integral was found to be very low. In the innerside, area IP5 was chosen based on the high intensity of thedepth profile, see Fig. 2e.
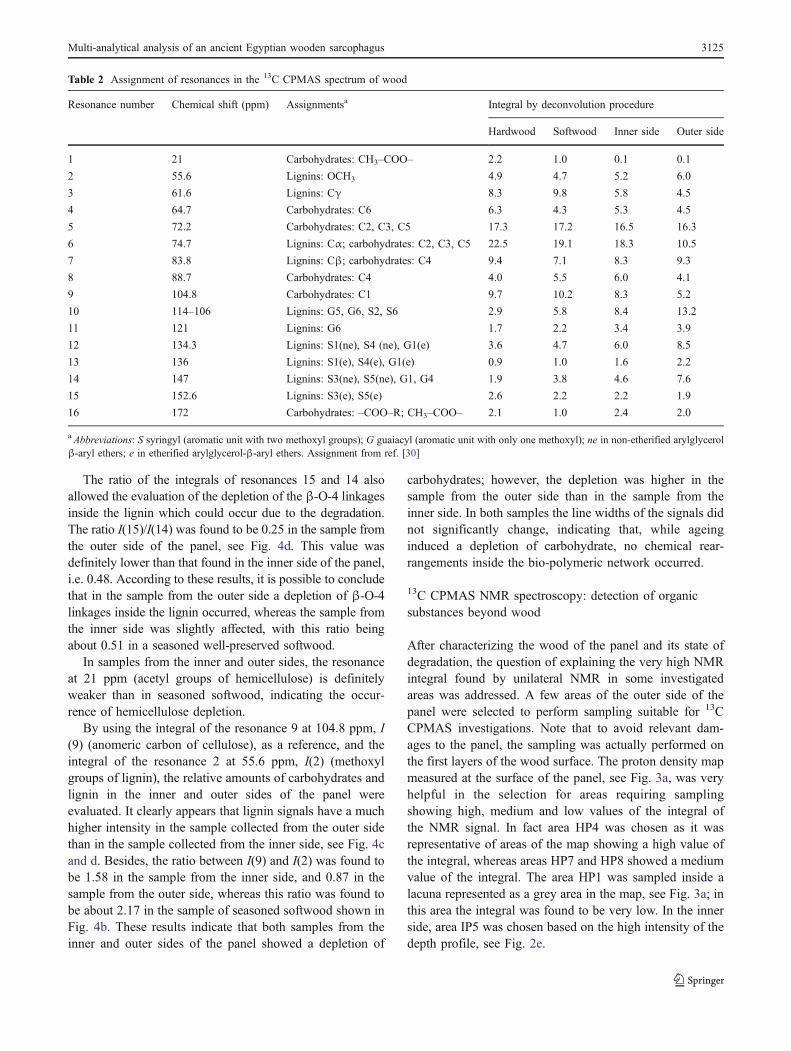
Table 2 Assignment of resonances in the 13C CPMAS spectrum of wood
Resonance number Chemical shift (ppm) Assignmentsa Integral by deconvolution procedure
Hardwood Softwood Inner side Outer side
1 21 Carbohydrates: CH3–COO– 2.2 1.0 0.1 0.1
2 55.6 Lignins: OCH3 4.9 4.7 5.2 6.0
3 61.6 Lignins: Cγ 8.3 9.8 5.8 4.5
4 64.7 Carbohydrates: C6 6.3 4.3 5.3 4.5
5 72.2 Carbohydrates: C2, C3, C5 17.3 17.2 16.5 16.3
6 74.7 Lignins: Cα; carbohydrates: C2, C3, C5 22.5 19.1 18.3 10.5
7 83.8 Lignins: Cβ; carbohydrates: C4 9.4 7.1 8.3 9.3
8 88.7 Carbohydrates: C4 4.0 5.5 6.0 4.1
9 104.8 Carbohydrates: C1 9.7 10.2 8.3 5.2
10 114–106 Lignins: G5, G6, S2, S6 2.9 5.8 8.4 13.2
11 121 Lignins: G6 1.7 2.2 3.4 3.9
12 134.3 Lignins: S1(ne), S4 (ne), G1(e) 3.6 4.7 6.0 8.5
13 136 Lignins: S1(e), S4(e), G1(e) 0.9 1.0 1.6 2.2
14 147 Lignins: S3(ne), S5(ne), G1, G4 1.9 3.8 4.6 7.6
15 152.6 Lignins: S3(e), S5(e) 2.6 2.2 2.2 1.9
16 172 Carbohydrates: –COO–R; CH3–COO– 2.1 1.0 2.4 2.0
a Abbreviations: S syringyl (aromatic unit with two methoxyl groups); G guaiacyl (aromatic unit with only one methoxyl); ne in non-etherified arylglycerolβ-aryl ethers; e in etherified arylglycerol-β-aryl ethers. Assignment from ref. [30]
Multi-analytical analysis of an ancient Egyptian wooden sarcophagus 3125
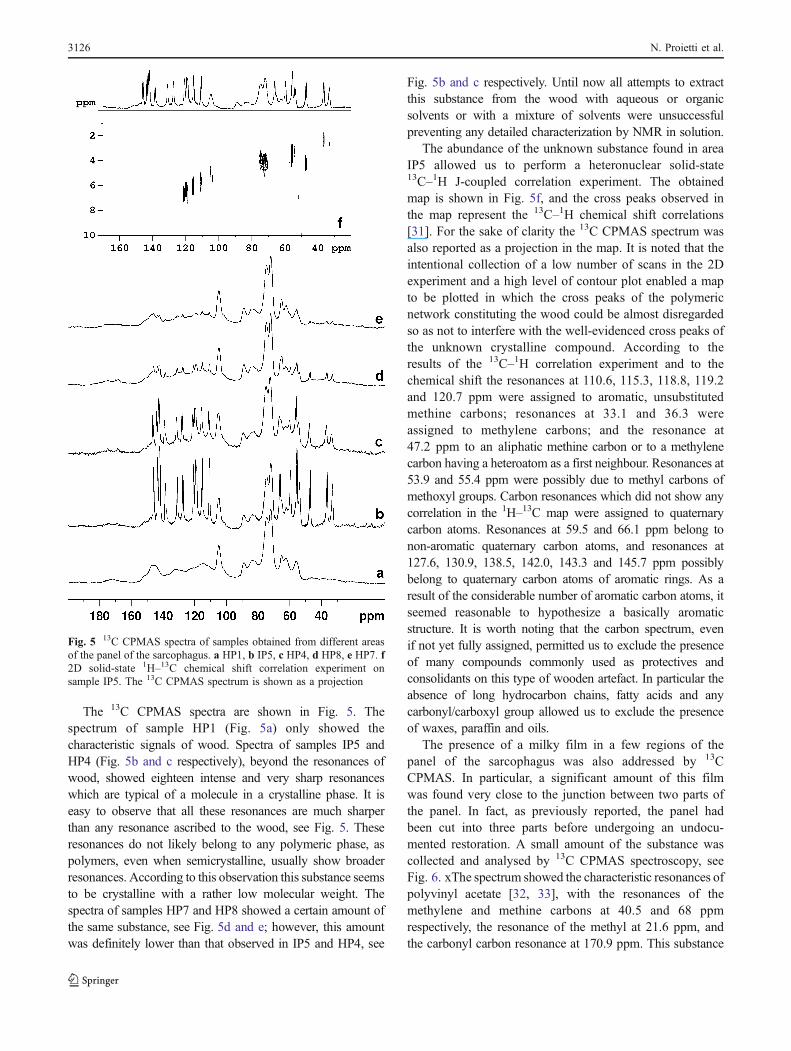
The 13C CPMAS spectra are shown in Fig. 5. Thespectrum of sample HP1 (Fig. 5a) only showed thecharacteristic signals of wood. Spectra of samples IP5 andHP4 (Fig. 5b and c respectively), beyond the resonances ofwood, showed eighteen intense and very sharp resonanceswhich are typical of a molecule in a crystalline phase. It iseasy to observe that all these resonances are much sharperthan any resonance ascribed to the wood, see Fig. 5. Theseresonances do not likely belong to any polymeric phase, aspolymers, even when semicrystalline, usually show broaderresonances. According to this observation this substance seemsto be crystalline with a rather low molecular weight. Thespectra of samples HP7 and HP8 showed a certain amount ofthe same substance, see Fig. 5d and e; however, this amountwas definitely lower than that observed in IP5 and HP4, see
Fig. 5b and c respectively. Until now all attempts to extractthis substance from the wood with aqueous or organicsolvents or with a mixture of solvents were unsuccessfulpreventing any detailed characterization by NMR in solution.
The abundance of the unknown substance found in areaIP5 allowed us to perform a heteronuclear solid-state13C–1H J-coupled correlation experiment. The obtainedmap is shown in Fig. 5f, and the cross peaks observed inthe map represent the 13C–1H chemical shift correlations[31]. For the sake of clarity the 13C CPMAS spectrum wasalso reported as a projection in the map. It is noted that theintentional collection of a low number of scans in the 2Dexperiment and a high level of contour plot enabled a mapto be plotted in which the cross peaks of the polymericnetwork constituting the wood could be almost disregardedso as not to interfere with the well-evidenced cross peaks ofthe unknown crystalline compound. According to theresults of the 13C–1H correlation experiment and to thechemical shift the resonances at 110.6, 115.3, 118.8, 119.2and 120.7 ppm were assigned to aromatic, unsubstitutedmethine carbons; resonances at 33.1 and 36.3 wereassigned to methylene carbons; and the resonance at47.2 ppm to an aliphatic methine carbon or to a methylenecarbon having a heteroatom as a first neighbour. Resonances at53.9 and 55.4 ppm were possibly due to methyl carbons ofmethoxyl groups. Carbon resonances which did not show anycorrelation in the 1H–13C map were assigned to quaternarycarbon atoms. Resonances at 59.5 and 66.1 ppm belong tonon-aromatic quaternary carbon atoms, and resonances at127.6, 130.9, 138.5, 142.0, 143.3 and 145.7 ppm possiblybelong to quaternary carbon atoms of aromatic rings. As aresult of the considerable number of aromatic carbon atoms, itseemed reasonable to hypothesize a basically aromaticstructure. It is worth noting that the carbon spectrum, evenif not yet fully assigned, permitted us to exclude the presenceof many compounds commonly used as protectives andconsolidants on this type of wooden artefact. In particular theabsence of long hydrocarbon chains, fatty acids and anycarbonyl/carboxyl group allowed us to exclude the presenceof waxes, paraffin and oils.
The presence of a milky film in a few regions of thepanel of the sarcophagus was also addressed by 13CCPMAS. In particular, a significant amount of this filmwas found very close to the junction between two parts ofthe panel. In fact, as previously reported, the panel hadbeen cut into three parts before undergoing an undocu-mented restoration. A small amount of the substance wascollected and analysed by 13C CPMAS spectroscopy, seeFig. 6. xThe spectrum showed the characteristic resonances ofpolyvinyl acetate [32, 33], with the resonances of themethylene and methine carbons at 40.5 and 68 ppmrespectively, the resonance of the methyl at 21.6 ppm, andthe carbonyl carbon resonance at 170.9 ppm. This substance
Fig. 5 13C CPMAS spectra of samples obtained from different areasof the panel of the sarcophagus. a HP1, b IP5, c HP4, d HP8, e HP7. f2D solid-state 1H–13C chemical shift correlation experiment onsample IP5. The 13C CPMAS spectrum is shown as a projection
3126 N. Proietti et al.

was easily recognized to be polyvinyl acetate which has beenone of the most common synthetic resins used in restorationby the Organization of Egyptian Antiquities [34].
Identification of the wood
All the samples drawn from the wooden boards of the panelwere identified as Gymnosperm wood, more precisely yew(Taxus baccata L.). This wood is macroscopically charac-
terised by a thin external layer of a whitish sapwood, whilethe heartwood is reddish-brown with a frequently irregularshape, see Fig. 7a and b. As a result of the growth ringsbeing clearly visible and generally very thin, and thegradual transition between early and latewood, yew wood isconsidered to have a very fine texture. Yew wood isamongst the heaviest softwoods and its heartwood is verydurable. From the anatomical point of view yew wood ischaracterised by the absence of resin ducts, by the presenceof helicoidal (spiral) thickenings on the longitudinaltracheids and by the piceoid-type punctuations on the crossfields between radial parenchyma and axial tracheids.
The sample obtained from the wooden nail is from ahardwood (Angiosperm), belonging to the genus Tamarixsp., see Fig. 7c. The wood coming from the species of thisgenus cannot be anatomically differentiated from oneanother; however, the origin of the artefact would suggestthe species Tamarix africana Poir. It is a wood with a lightsapwood and brown heartwood, both characteristically hardand heavy. Anatomically it is characterised by the presenceof a porous ring in the earlywood, with a characteristicseriated axial parenchyma. The radial parenchyma is inquite big homocellular rays.
Identification of painting layer materials
As previously described the inner side of the sarcophagus isdecorated by green monochrome figures surrounded by a
Fig. 6 13C CPMAS spectrum of sample HP6 along with theassignment of resonances
Fig. 7 a A transverse section of a sample from the wooden board(reference bar 0.1 mm). It is possible to observe the gradual transitionbetween early and latewood, before the closing of the annual growth. bA tangential section of the sample (ref. bar 50 μm) where the typical
spiral thickenings of the tracheids of yew wood are clearly visible. c Atangential section of the sample from a nail (ref. bar 0.1 mm). Theparenchymatic rays are quite big; a solitary vessel is also visible,surrounded by axial parenchyma
Multi-analytical analysis of an ancient Egyptian wooden sarcophagus 3127
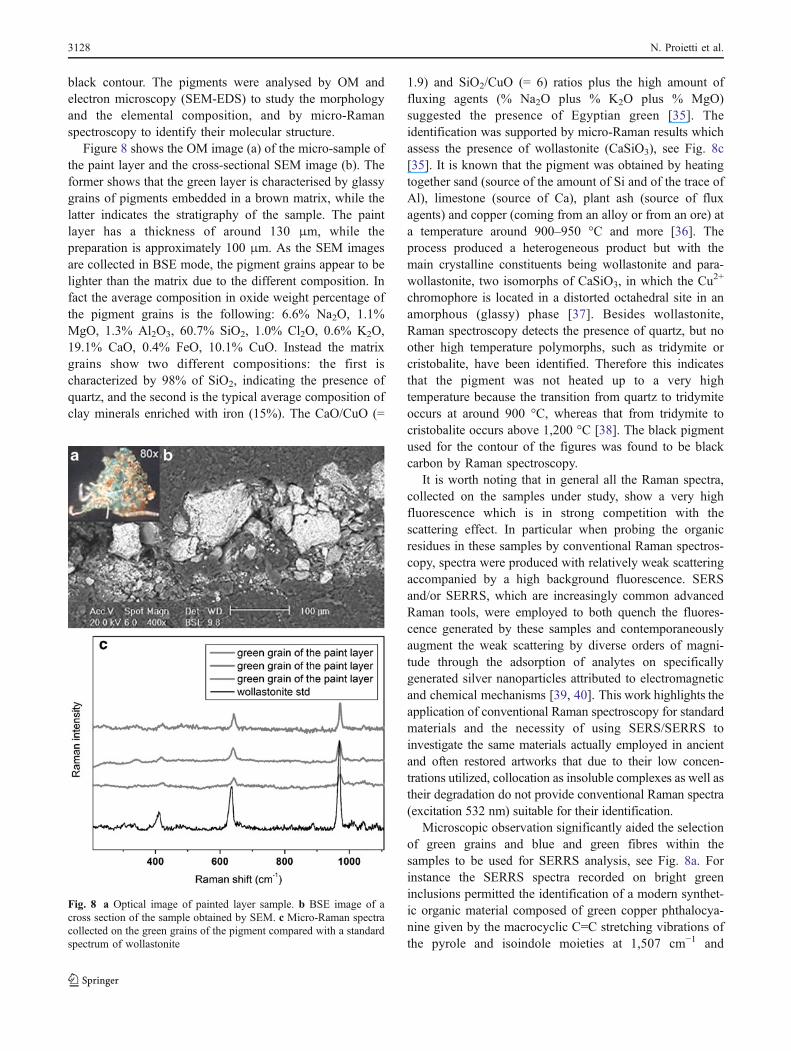
black contour. The pigments were analysed by OM andelectron microscopy (SEM-EDS) to study the morphologyand the elemental composition, and by micro-Ramanspectroscopy to identify their molecular structure.
Figure 8 shows the OM image (a) of the micro-sample ofthe paint layer and the cross-sectional SEM image (b). Theformer shows that the green layer is characterised by glassygrains of pigments embedded in a brown matrix, while thelatter indicates the stratigraphy of the sample. The paintlayer has a thickness of around 130 μm, while thepreparation is approximately 100 μm. As the SEM imagesare collected in BSE mode, the pigment grains appear to belighter than the matrix due to the different composition. Infact the average composition in oxide weight percentage ofthe pigment grains is the following: 6.6% Na2O, 1.1%MgO, 1.3% Al2O3, 60.7% SiO2, 1.0% Cl2O, 0.6% K2O,19.1% CaO, 0.4% FeO, 10.1% CuO. Instead the matrixgrains show two different compositions: the first ischaracterized by 98% of SiO2, indicating the presence ofquartz, and the second is the typical average composition ofclay minerals enriched with iron (15%). The CaO/CuO (=
1.9) and SiO2/CuO (= 6) ratios plus the high amount offluxing agents (% Na2O plus % K2O plus % MgO)suggested the presence of Egyptian green [35]. Theidentification was supported by micro-Raman results whichassess the presence of wollastonite (CaSiO3), see Fig. 8c[35]. It is known that the pigment was obtained by heatingtogether sand (source of the amount of Si and of the trace ofAl), limestone (source of Ca), plant ash (source of fluxagents) and copper (coming from an alloy or from an ore) ata temperature around 900–950 °C and more [36]. Theprocess produced a heterogeneous product but with themain crystalline constituents being wollastonite and para-wollastonite, two isomorphs of CaSiO3, in which the Cu2+
chromophore is located in a distorted octahedral site in anamorphous (glassy) phase [37]. Besides wollastonite,Raman spectroscopy detects the presence of quartz, but noother high temperature polymorphs, such as tridymite orcristobalite, have been identified. Therefore this indicatesthat the pigment was not heated up to a very hightemperature because the transition from quartz to tridymiteoccurs at around 900 °C, whereas that from tridymite tocristobalite occurs above 1,200 °C [38]. The black pigmentused for the contour of the figures was found to be blackcarbon by Raman spectroscopy.
It is worth noting that in general all the Raman spectra,collected on the samples under study, show a very highfluorescence which is in strong competition with thescattering effect. In particular when probing the organicresidues in these samples by conventional Raman spectros-copy, spectra were produced with relatively weak scatteringaccompanied by a high background fluorescence. SERSand/or SERRS, which are increasingly common advancedRaman tools, were employed to both quench the fluores-cence generated by these samples and contemporaneouslyaugment the weak scattering by diverse orders of magni-tude through the adsorption of analytes on specificallygenerated silver nanoparticles attributed to electromagneticand chemical mechanisms [39, 40]. This work highlights theapplication of conventional Raman spectroscopy for standardmaterials and the necessity of using SERS/SERRS toinvestigate the same materials actually employed in ancientand often restored artworks that due to their low concen-trations utilized, collocation as insoluble complexes as well astheir degradation do not provide conventional Raman spectra(excitation 532 nm) suitable for their identification.
Microscopic observation significantly aided the selectionof green grains and blue and green fibres within thesamples to be used for SERRS analysis, see Fig. 8a. Forinstance the SERRS spectra recorded on bright greeninclusions permitted the identification of a modern synthet-ic organic material composed of green copper phthalocya-nine given by the macrocyclic C=C stretching vibrations ofthe pyrole and isoindole moieties at 1,507 cm−1 and
Fig. 8 a Optical image of painted layer sample. b BSE image of across section of the sample obtained by SEM. c Micro-Raman spectracollected on the green grains of the pigment compared with a standardspectrum of wollastonite
3128 N. Proietti et al.
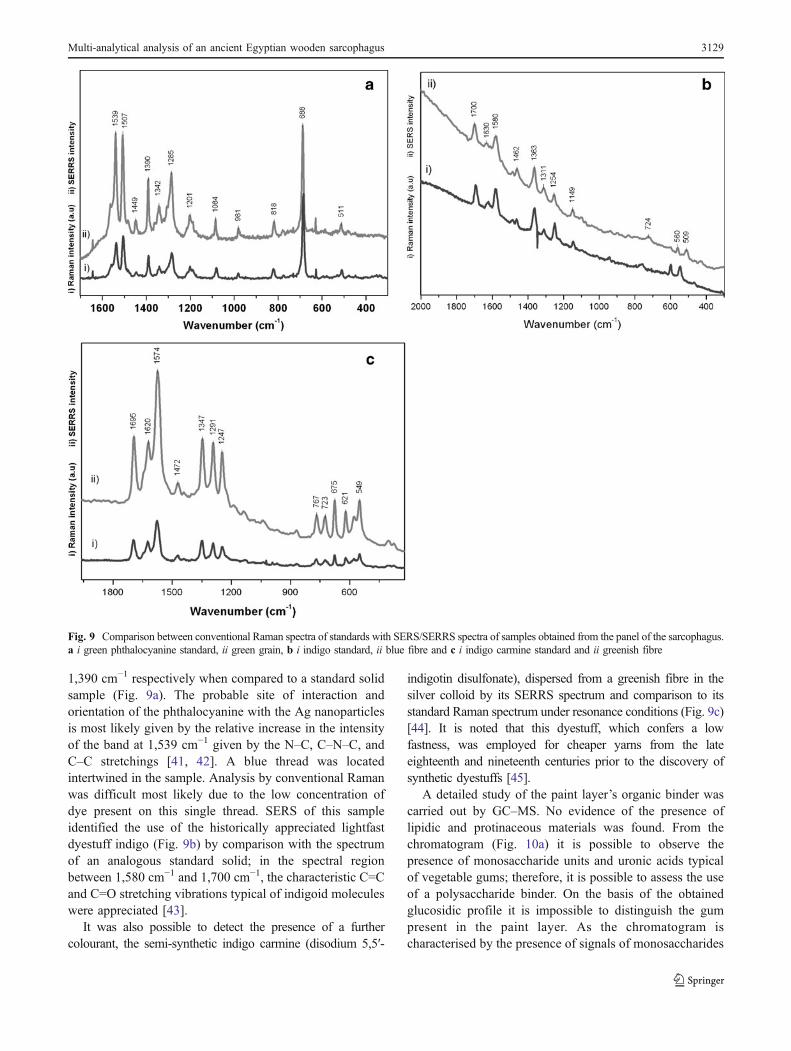
1,390 cm−1 respectively when compared to a standard solidsample (Fig. 9a). The probable site of interaction andorientation of the phthalocyanine with the Ag nanoparticlesis most likely given by the relative increase in the intensityof the band at 1,539 cm−1 given by the N–C, C–N–C, andC–C stretchings [41, 42]. A blue thread was locatedintertwined in the sample. Analysis by conventional Ramanwas difficult most likely due to the low concentration ofdye present on this single thread. SERS of this sampleidentified the use of the historically appreciated lightfastdyestuff indigo (Fig. 9b) by comparison with the spectrumof an analogous standard solid; in the spectral regionbetween 1,580 cm−1 and 1,700 cm−1, the characteristic C=Cand C=O stretching vibrations typical of indigoid moleculeswere appreciated [43].
It was also possible to detect the presence of a furthercolourant, the semi-synthetic indigo carmine (disodium 5,5′-
indigotin disulfonate), dispersed from a greenish fibre in thesilver colloid by its SERRS spectrum and comparison to itsstandard Raman spectrum under resonance conditions (Fig. 9c)[44]. It is noted that this dyestuff, which confers a lowfastness, was employed for cheaper yarns from the lateeighteenth and nineteenth centuries prior to the discovery ofsynthetic dyestuffs [45].
A detailed study of the paint layer’s organic binder wascarried out by GC–MS. No evidence of the presence oflipidic and protinaceous materials was found. From thechromatogram (Fig. 10a) it is possible to observe thepresence of monosaccharide units and uronic acids typicalof vegetable gums; therefore, it is possible to assess the useof a polysaccharide binder. On the basis of the obtainedglucosidic profile it is impossible to distinguish the gumpresent in the paint layer. As the chromatogram ischaracterised by the presence of signals of monosaccharides
Fig. 9 Comparison between conventional Raman spectra of standards with SERS/SERRS spectra of samples obtained from the panel of the sarcophagus.a i green phthalocyanine standard, ii green grain, b i indigo standard, ii blue fibre and c i indigo carmine standard and ii greenish fibre
Multi-analytical analysis of an ancient Egyptian wooden sarcophagus 3129
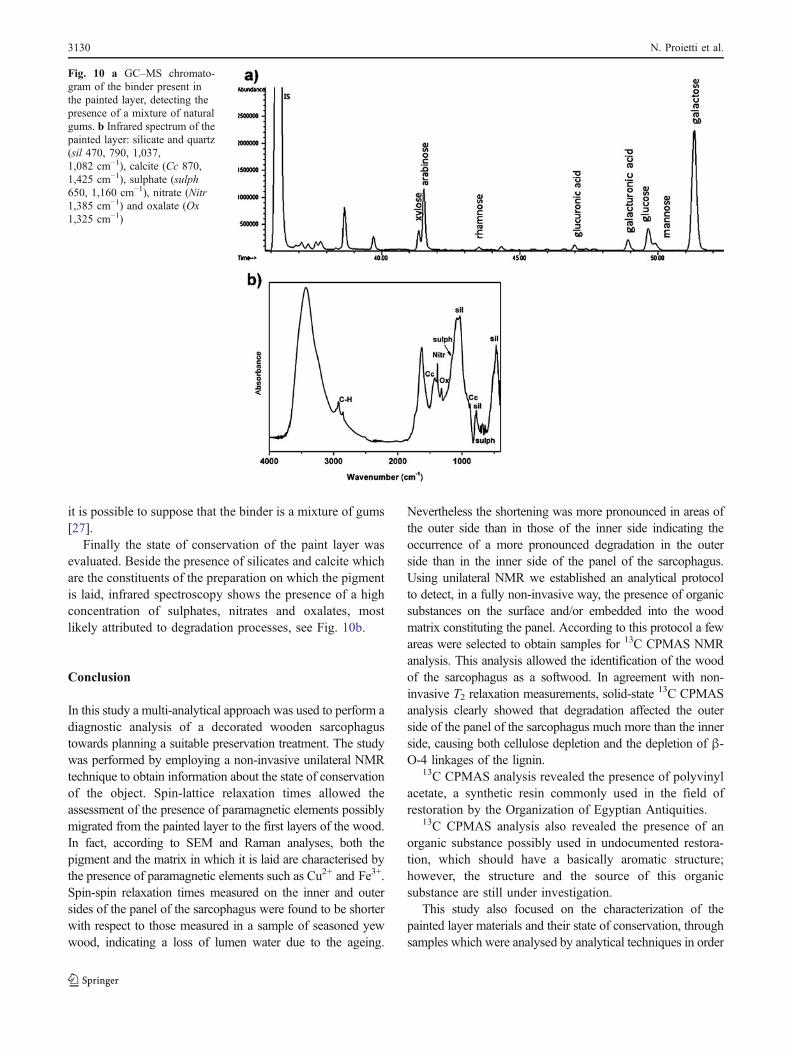
it is possible to suppose that the binder is a mixture of gums[27].
Finally the state of conservation of the paint layer wasevaluated. Beside the presence of silicates and calcite whichare the constituents of the preparation on which the pigmentis laid, infrared spectroscopy shows the presence of a highconcentration of sulphates, nitrates and oxalates, mostlikely attributed to degradation processes, see Fig. 10b.
Conclusion
In this study a multi-analytical approach was used to perform adiagnostic analysis of a decorated wooden sarcophagustowards planning a suitable preservation treatment. The studywas performed by employing a non-invasive unilateral NMRtechnique to obtain information about the state of conservationof the object. Spin-lattice relaxation times allowed theassessment of the presence of paramagnetic elements possiblymigrated from the painted layer to the first layers of the wood.In fact, according to SEM and Raman analyses, both thepigment and the matrix in which it is laid are characterised bythe presence of paramagnetic elements such as Cu2+ and Fe3+.Spin-spin relaxation times measured on the inner and outersides of the panel of the sarcophagus were found to be shorterwith respect to those measured in a sample of seasoned yewwood, indicating a loss of lumen water due to the ageing.
Nevertheless the shortening was more pronounced in areas ofthe outer side than in those of the inner side indicating theoccurrence of a more pronounced degradation in the outerside than in the inner side of the panel of the sarcophagus.Using unilateral NMR we established an analytical protocolto detect, in a fully non-invasive way, the presence of organicsubstances on the surface and/or embedded into the woodmatrix constituting the panel. According to this protocol a fewareas were selected to obtain samples for 13C CPMAS NMRanalysis. This analysis allowed the identification of the woodof the sarcophagus as a softwood. In agreement with non-invasive T2 relaxation measurements, solid-state 13C CPMASanalysis clearly showed that degradation affected the outerside of the panel of the sarcophagus much more than the innerside, causing both cellulose depletion and the depletion of β-O-4 linkages of the lignin.
13C CPMAS analysis revealed the presence of polyvinylacetate, a synthetic resin commonly used in the field ofrestoration by the Organization of Egyptian Antiquities.
13C CPMAS analysis also revealed the presence of anorganic substance possibly used in undocumented restora-tion, which should have a basically aromatic structure;however, the structure and the source of this organicsubstance are still under investigation.
This study also focused on the characterization of thepainted layer materials and their state of conservation, throughsamples which were analysed by analytical techniques in order
Fig. 10 a GC–MS chromato-gram of the binder present inthe painted layer, detecting thepresence of a mixture of naturalgums. b Infrared spectrum of thepainted layer: silicate and quartz(sil 470, 790, 1,037,1,082 cm−1), calcite (Cc 870,1,425 cm−1), sulphate (sulph650, 1,160 cm−1), nitrate (Nitr1,385 cm−1) and oxalate (Ox1,325 cm−1)
3130 N. Proietti et al.
to obtain a description of the system. Two original pigments,Egyptian green and black carbon, embedded in a silicate iron-rich matrix, were identified by optical and electron microscopyand Raman spectroscopy.
The utility of surface enhanced (resonance) Ramanspectroscopy for the identification of natural, semi-synthetic and synthetic colourants and dyestuffs washighlighted by the presence of an indigo dyed fibre, anindigo carmine tinted fibre and grains of green phthalocy-anine respectively. It is probable that the last two dyestuffswere employed during the undocumented restoration. Thepresence of the threads intertwined with the grains of thepainted layer may suggest that the bandages of the mummyconserved inside the sarcophagus were dyed with indigo.
GC–MS was useful for the determination of the binderwhich was a mixture of natural gums, and infraredspectroscopy was useful for the assessment of the state ofconservation of the painted layer.
Finally the wood of the board was identified to be yew(Taxus baccata L.) and the nails were made from Tamarix.The yew tree is not native to Egypt; therefore, it wasprobably imported from Turkey or north-west Africa [46].This wood was probably chosen due to its durability whichguaranteed a better preservation of the mummy conserved inthe sarcophagus.
Acknowledgements The authors are pleased to thank Prof. Lor-edana Sist and Dott. Maurizio Necci of Sapienza University of Rome,for offering the possibility to access the sarcophagus and the usefuldiscussion; Dott. Lorena Sozzi of the CNR-IVALSA (Florence) for theidentification of the wood and Dott. Laura Cartechini and PaolaRocchi of CNR-ISTM (Perugia) for the GC–MS analysis.
References
1. Proietti N, Capitani D, Pedemonte E, Blumich B, Segre AL(2004) J Magn Reson 170:113–120
2. Blümich B, Anferova S, Sharma S, Segre AL, Federici C (2003) JMagn Reson 161:204–209
3. Sharma S, Casanova F, Wache W, Segre AL, Blümich B (2003)Magn Reson Imaging 21:249–255
4. Proietti N, Capitani D, Cozzolino S, Valentini M, Pedemonte E, PrinciE, Vicini S, Segre AL (2006) J Phys Chem B 110:23719–23728
5. Proietti N, Capitani D, Lamanna R, Presciutti F, Rossi E, SegreAL (2005) J Magn Reson 177:111–117
6. Capitani D, Proietti N, Gobbino M, Soroldoni L, Casellato U,Valentini M, Rosina E (2009) Anal Bioanal Chem 395:2245–2253
7. Di Tullio V, Proietti N, Gobbino M, Capitani D, Olmi R, Priori S,Riminesi C, Giani E (2010) Anal Bioanal Chem 396:1885–1896
8. Del Federico E, Centeno SA, Kehlet C, Currier P, Stockman D,Jerschow A (2010) Anal Bioanal Chem 396:213–220
9. Viel S, Capitani D, Proietti N, Ziarelli F, Segre AL (2004) ApplPhys A 79:357–361
10. Castro K, Pessanha S, Proietti N, Princi E, Capitani D, CarvalhoML, Madariaga JM (2008) Anal Bioanal Chem 391:433–441
11. Presciutti F, Perlo J, Casanova F, Glöggler S, Miliani C, BlümichB, Brunetti BG, Sgamellotti A (2008) Appl Phys Lett 93:033505
12. Blümich B, Casanova F, Perlo J, Presciutti F, Anselmi C, DohertyB (2010) Acc Chem Res 43:761–770
13. Blümich B, Anferova S, Kremer K, Sharma S, Hermann V, SegreAL (2003) Spectroscopy 18:18–29
14. Hahn EL (1950) Phys Rev 80:58015. Press WH, Teukolsky SA, Vetterling WT, Flannery BP (1994) In:
Numerical recipe in chemistry. Cambridge University Press, NewYork16. Farrar TC, Becker ED (1971) Pulse and Fourier transform NMR.
Academic Press, New York17. Perlo J, Casanova F, Blümich B (2005) J Magn Reson 176:64–7018. Metz G, Wu X, Smith SO (1994) J Magn Reson 110:219–22719. Van Rossum BJ, Förster H, De Grot HJ (1997) J Magn Reson
124:516–51920. Massiot D, Fayon F, Capron M, King I, LeCalvé S, Alonso B,
Durand JO, Bujoli B, Gan Z, Hoatson G (2002) Magn ResonChem 40:70–76
21. Schweingruber FH (1990) Anatomy of European woods. WSLFNP Paul Haupt Berne and Stuttgart Publishers, Stuttgart
22. Hoadley RB (1990) Identifying wood. Accurate results withsimple tools. Tauton Press, Newtown
23. Baas P, Blokhina N, Fujii T, Gasson P, Grosser D, Heinz I, Ilic J,Xiaomei J, Miller R, Newsom LA, Noshiro S, Richter H G,Suzuki M, Terrazas T, Wheeler E, Wiedenhoeft A (2004) IAWAlist of microscopic features for softwood identification. In: RichterHG, Grosser D, Heinz I, Gasson PE (eds) IAWA J 25 (1):1–70
24. Lee PC, Meisel D (1982) J Phys Chem 86:3391–339525. Yaffe NR, Blanch EW (2008) Vib Spectrosc 48:196–20126. Cañamares MV, Garcia-Ramos JV, Sanchez-Cortes S (2006) Appl
Spectrosc 60:1386–139127. Bonaduce I, Brecoulaki H, Colombini MP, Lluveras A, Restivo V,
Ribechini E (2007) J Chrom A 1175(2):275–28228. Araujo CD, MacKey AL, Whitall KP, Hailey JRT (1993) J Magn
Reson 101B:248–26129. Araujo CD, MacKey AL, Hailey JRT, Whitall KP, Le H (1992)
Wood Sci Technol 26:101–11330. Bardet M, Gerbaud G, Giffard M, Doan C, Hediger S, Le Pape L
(2009) Prog Nucl Magn Reson Spectrosc 55:199–21431. Braun S, Kalinowski HO, Berger S (1998) 150 and more basic
NMR experiments, 2nd edn. Wiley-VCH, Weinheim32. Dutta K, Mukehrjee M, Brar AS (1999) J Polym Sci A Polym
Chem 37:551–55633. Rimez B, Rahier H, Van Assche G, Artoos T, Biesemans M, Van
Mele B (2008) Polym Degrad Stab 93:800–81034. Nakha SM (1986) Stud Conserv 31:38–4435. Pagès-Camagna S, Colinart S (2003) Archaeometry 45(4):637–65836. Eastaugh N, Walsh V, Chaplin T, Siddall R (2004) Pigment
compendium. Elsevier Butterworth-Heinemann, Oxford37. Pagès-Camagna S, Reiche I, Brouder C, Cabaret D, Rossano S,
Kanngießer B, Erko A (2006) X-Ray Spectrom 35:141–14538. Cuomo di Caprio N (2007) La Ceramica in Archeologia 2.
L’Erma di Bretschneider, Roma39. Aroca R (2006) Surface enhanced Raman spectroscopy. Wiley,
London40. Moskovits M (1985) Rev Mod Phys 57:783–82641. Basova TV, Kiselev VG, Schuster B-E, Peisert H, Chasse T
(2009) J Raman Spectrosc 40:2080–208742. Gaffo L, Constantino CJL, Moreira WC, Aroca RF, Oliveira ON
Jr (2004) Spectrochim Acta A 60:321–32743. Vandenabeele P, Bode S, Alonso A, Moensa L (2005) Spectro-
chim Acta A 61:2349–235644. Shadi IT, Chowdhry BZ, Snowden MJ, Withnall R (2003)
Spectrochim Acta A 59:2201–220645. Hofenk de Graaff JH(2004) The colourful past. Abegg-Stifung
and Archetype, Riggisberg46. Nicholson P, Shaw I (2000) Ancient Egyptian materials and
technologies. Cambridge University Press, Cambridge
Multi-analytical analysis of an ancient Egyptian wooden sarcophagus 3131
All in-text references underlined in blue are linked to publications on ResearchGate, letting you access and read them immediately.
Copyright © 2022 FDOKUMEN