Reproducing wooden and marble patterns using multi ...
67
Rochester Institute of Technology RIT Scholar Works eses esis/Dissertation Collections 8-1-2011 Reproducing wooden and marble paerns using multi-channel ICC profile Saurabh Chaturvedi Follow this and additional works at: hp://scholarworks.rit.edu/theses is esis is brought to you for free and open access by the esis/Dissertation Collections at RIT Scholar Works. It has been accepted for inclusion in eses by an authorized administrator of RIT Scholar Works. For more information, please contact [email protected]. Recommended Citation Chaturvedi, Saurabh, "Reproducing wooden and marble paerns using multi-channel ICC profile" (2011). esis. Rochester Institute of Technology. Accessed from
-
Upload
khangminh22 -
Category
Documents
-
view
3 -
download
0
Transcript of Reproducing wooden and marble patterns using multi ...

Rochester Institute of TechnologyRIT Scholar Works
Theses Thesis/Dissertation Collections
8-1-2011
Reproducing wooden and marble patterns usingmulti-channel ICC profileSaurabh Chaturvedi
Follow this and additional works at: http://scholarworks.rit.edu/theses
This Thesis is brought to you for free and open access by the Thesis/Dissertation Collections at RIT Scholar Works. It has been accepted for inclusionin Theses by an authorized administrator of RIT Scholar Works. For more information, please contact [email protected].
Recommended CitationChaturvedi, Saurabh, "Reproducing wooden and marble patterns using multi-channel ICC profile" (2011). Thesis. Rochester Instituteof Technology. Accessed from

Reproducing Wooden and Marble Patterns
Using Multi-channel ICC Profile
By Saurabh Chaturvedi
Thesis submitted in partial fulfillment of the requirements
for the degree of Master of Science
in the School of Print Media
in the college of Imaging Arts and Sciences
of the Rochester Institute of Technology
August 2011
Primary Thesis Advisor: Professor Robert Chung
Secondary Thesis Advisor: Professor Franz Sigg
ii
School of Print Media
Rochester Institute of Technology
Rochester, New York
Certificate of Approval
Reproducing Wooden and Marble Patterns
Using Multi-channel ICC Profile
This is to certify that the Master’s Thesis of
Saurabh Chaturvedi
has been approved by the Thesis Committee as satisfactory
for the thesis requirement for the Master of Science degree
at the convocation of
May 2011
Thesis Committee:
__________________________________________
Primary Thesis Advisor
__________________________________________
Secondary Thesis Advisor
__________________________________________
Graduate Thesis Coordinator
__________________________________________
Chair, School of Print Media

iii
ACKNOWLEDGMENTS
Working on this research paper as a Master Thesis at Rochester Institute of Technology has been
an interesting, challenging, and great valuable learning experience for me. In this research I
would like to recognize and thank my primary thesis advisor Prof. Robert Chung for his
dedicated support, guidance, and encouragement. I would also like to thank Prof. Franz Sigg for
his guidance and support for my research.
I would also like to offer sincere gratitude to Mr. Rodrigo Sosa from Armstrong Industries and
the faculty members at RIT for helping me to finish my thesis successfully. I am also thankful
for the School of Print Media for funding my research.
Finally, I would like to thank my family, and friends for their encouragement and support.

iv
TABLE OF CONTENTS
Acknowledgement……………………………………………………………………………….. iii
List of Figures…………………………………………………………………………………… iv
Abstract…………………………………………………………………………………………..viii
Chapter 1: Introduction and Statement of the Problem ...................................................................1
Color Management...............................................................................................................2
Reason of Interest in the Study............................................................................................4
Chapter 2: Literature Review........................................................................................................... 7
Color Reproduction ………………..................................................................................... 4
ICC Color Management....................................................................................................... 6
Analysis of Color Image Reproduction……………………………………………..…….9
Chapter 3: Research Questions .....................................................................................................23
Equipments/Software .......................................................................................................23
Chapter 4: Methodology ............................................................................................................... 25
Printer Characterization....................................................................................................26
Color Conversion............................................................................................................... 32
Color Synthesis .................................................................................................................33
Method of Analysis............................................................................................................ 34
Process Drift ......................................................................................................................35
Chapter 5: Results …………………….………………………………………………………... 41
Color Match …………………….………………………………………………………42
Process Drift ...………………….…………………………………………………........44
v
Chapter 6: Discussion and Conclusion.........……………………………………….…………… 46
Further Research …………………………………………………………………………….49
Shortcoming in profiles .......................................................................................................49
Conclusion .............................................................................................................................50
Bibliography ................................................................................................................................52
Appendix ......................................................................................................................................55

vi
List of Figures
Fig. 1 Proprietary Workflow ..........................................................................................................15
Fig. 2 Analysis of workflow ..........................................................................................................26
Fig. 3 The Six Composite Images .................................................................................................27
Fig. 4 Gamut of Images and Primaries ........................................................................................ 29
Fig. 5 Test Chart Generator ...........................................................................................................29
Fig. 6 Test Chart ............................................................................................................................30
Fig. 7 HP Indigo 5500 ....................................................................................................................30
Fig. 8 Eye one-iSis ........................................................................................................................31
Fig. 9 Profilemaker 5 .....................................................................................................................31
Fig. 10 Conversion and syntheis ...................................................................................................32
Fig. 11 Convert To .........................................................................................................................33
Fig. 12 PDF Settings ......................................................................................................................34
Fig. 13 Drift Simulation ................................................................................................................36
Fig.14 Composite Image 2 ............................................................................................................37
Fig. 15 Sampling in CCT ...............................................................................................................38
Fig. 16 Workflow Process Drift .....................................................................................................42
Fig. 17 Analysis of Color Match....................................................................................................43
Fig. 21 CRF for color match ..........................................................................................................43

vii
Fig. 20 Variations for spot and CMYK .........................................................................................50
Fig. 21 Gamut Comparison ............................................................................................................51
Fig. 22 Gamut Volume Comparison ..............................................................................................53
viii
Abstract
Gravure can reproduce a high quality images because of its capacity to lay down ink films of
variable thickness, especially for long runs and high color saturation; this aspect provides a very
high shadow detail just like photograph. Many organizations have tried to standardize printing
like Fogra, ISO, and more. Larger gamut are being built to cover more out-of-gamut colors, but
designs, graphics and colorfulness of the products, are limited due to the involvement of several
process variables.
In publication printing, only four colors of ink are used: yellow, magenta, cyan, and black.
CMYK primaries are generally used because the images to be printed have memory colors (blue
sky, green grass) or colors that are obtainable within the CMYK gamut. ICC color management
helps the user to build ICC profile is to establish which color is produced when a given
combination of CMYK dots are printed.
However flooring and wooden patterns printing industry, which often uses gravure printing, use
non-CMYK primaries because they are better tuned to the limited color space of such patterns.
To successfully reproduce these colors, a smaller or customized gamut is selected. Today
proprietary software applications are being used for selection and separation of the non-CMYK
primaries to obtain the smaller gamut. This research focused on new non proprietary software for
selecting primaries and building multi-channel spot color ICC profiles for reproducing the
marble and tile patterns.

ix
When using spot color for images with limited range of colors the gamut produced by the
primaries can be made small, just big enough to cover the range of required colors. This way
tighter printing process control is achieved because the same natural mechanical variation in dot
size has a smaller effect when using inks that result in a small gamut. CMYK on other hand has a
gamut which is quite big and hence process variability will have a larger effect. When
characterizing a non CMYK printing device, the key criterion is the ability is to render color of
interest as opposed to achieve large gamut (Chung, 2008).
Results obtained after this research are based on the procedure, which is described in
detail in methodology and appendix section. The results show that both standard CMYK and
multi-channel gamut can be used to obtain a good match to the original image. An added
advantage of multi-channel icc profile is that they are more stable and the effect of process drift
is very less as compared to CMYK printing. So this research proves that ICC-based multi-
channel color reproduction technology is ready for prime time applications in product gravure
printing industry.

1
Chapter One
Introduction
The goal of achieving a print that is as close as possible to the original has always
been very demanding due to a process that comprises of multiple process variables. A
variety of standard guidelines and recommendations have been established by various
print organizations, aiming towards print standardizations. FOGRA, DIN, ISO,
IDEAlliance and UGRA are the major associations and organizations that have
developed various standards for the print industry nationally and internationally.
Different sectors such as publishers, consumer products companies, and
packaging industries, strive for high fidelity colors and larger color gamuts to increase
their business. But even the best efforts made in enhancing the designs, graphics and
colorfulness of the products, are limited due to the involvement of several process
variables. Color management and process control are tools to achieve consistent printing
and pleasing pictorial color reproduction. Yet, even with the implementation of these
specifications, standards, and guidelines in a process-controlled workflow, the printer has
been challenged to achieve consistent printing and pleasing pictorial color reproduction.

2
Color Management
Color management uses colorimetric data to construct profiles for the press,
proofer, monitor and input devices that allow color to be controlled throughout the
graphics workflow. Key advantages of color management include the ability to accurately
predict, and achieve colors. For it to work well there needs to be a calibrated,
standardized, repeatable production process.
ICC based Color management
ICC color management helps to achieve color portability through the use of
device profiles. Most press profiles use CMYK inks as their primaries e.g. ISOcoated,
Gracol, etc. When reproducing pictorial color images with important neutrals, small
amount of device variations e.g. TVI, often means large colorcast. One way to minimize
colorcast due to device variation is to choose primaries that result in a smaller gamut, yet
is large enough to reproduce the image colors of interest.
Color management using CMYK primaries
Color is measured using, most commonly, a spectrophotometer, the output of
which is used to construct ICC profiles. A profile is a "look-up" table that shows how a
piece of equipment produces colors in terms of RGB pixels and CMYK dot percentages.
The objective of an output ICC profile is to establish which color is produced when a
given combination of CMYK dots are printed. Software such as Illustrator, InDesign,
PhotoShop, Acrobat, and QuarkXPress all allow profiles to be assigned to the images in
order to define their appearance. Color Management also helps color to remain constant
3
for different output devices. Gray component replacement is a software function that
helps with color separations by allowing black content to be varied. Shadows can be built
using black or CMY content.
Color Management using Spot color primaries
Today many software systems are available that also help to create and apply
custom profiles for spot and process colors, which is particularly useful for the packaging
industry.
Basically there are two types of software tools to implement color management
using spot color primaries.
1. Proprietary
Software applications, such as AVA, a UK based program, uses Production
Color Profiling (PCP) to build profiles for the job to be printed. These profiles
are built according to the printer and his production needs. According to
AVA, ―PCP Custom Overprint Optimization software models the behavior of
inks and dyes in combination on different substrates in production using
complex proprietary algorithms‖ (AVA Production Color Profiling (PCP),
2007).Thus the color management applied here is not standardized.

4
2. Standard (multi-channel)
Reproduction of spot colors is becoming more and more important in the
printing industry. Inks if chosen specifically for particular image, it is possible
in many cases to achieve vivid colors with just small number of inks and at no
greater cost than four process colors. In fact, custom ink sets can be used to
obtain smaller gamut, and the process variation will have less of its effect
compared to bigger gamut.
In Summary, the difference between Proprietary and standard color management
using non-CMYK primaries are shown in Table 1.
Proprietary Standard
AVA Multichannel ICC
Requires Annual Licensing fee One time purchase; no annual
licensing fee
Requires extensive image
editing to match the source image
Does not require image editing
as exact reproduction is the goal
Table 1. Proprietary v/s Standard
Motivation/ Reasons for conducting the Research
Many gravure product manufacturing industries are using AVA and other types of
software which work on customized settings of printers.
Due to advancement of ICC color management, it is possible to adopt
multichannel ICC profiles in gravure product manufacturing. So the challenge is to select
the primary color and set up a multi-channel spot color ICC workflow.

5
By using multi-channel spot color primaries for printing color patterns such as wood
grain, and tile in gravure product industry, exact color reproduction is possible. Can the
product gravure printing industry take advantages of ICC multi-channel color
management capability in lieu of its current proprietary solutions?
Significance of this study
Multi-channel ICC color management is a relatively recent development. It has
the potential to match the source images using spot color primaries, while making the
outcome more predictable. In other words Multichannel ICC color management can take
the guess work out of the color conversion process that is unavoidable in proprietary
software. Predictability and stability are the two significant factors that prompt this study.
In multichannel ICC color management, by using right-size gamut, formed by
selection of right primaries, has an advantage of being more stable than regular CMYK
counterpart.
If reproducing special pictorial images with a limited range of colors, then it is
advantageous to use an ink set with right-size color gamut because that way process
variability has less of an effect on color stability. Also, make-ready times and process
variability can be greatly reduced by using Spot colors as it has right size color gamut as
compared to CMYK.

6
Personal Interest of Study
The researcher took a course called ―Gravure Printing‖; which is a graduate
course that gives hands on experience in color management related to Gravure printing.
This course required the students to make many field trips to the industries, in one such
field trip made to Armstrong industry; the researcher came across the AVA software
which is proprietary and is customized to owner‘s need for printing on customized ink
and paper. Armstrong Industry is a world leading flooring and ceiling industry. They
print tile and wooden patterns using Gravure printing. Gravure printing being the most
versatile printing, i.e., it can print on any paper, plastic as well as products like linoleum;
it can be put to great use for printing different substrates with different images.
After reading a few articles, the researcher talked with Prof. Robert Chung, who
is experienced in color management in and teaches it in the School of Print Media. It was
him who suggested the idea of building an ICC profile for reproducing wooden and tile
patterns and thus making the whole process standardized. The researcher believes this
research has a great value in today‘s market of gravure printing.

7
Chapter Two
Literature Review
Not many scholarly articles are available on the topic of color managing or
printing of spot colors. However as the researcher went through some articles, he found
that much work remains to be done on exact reproduction using multi-channel ICC color
management workflow. The review starts with a general discussion about color
reproduction which is followed by basic definitions of spot color and process colors. Next
will be the ICC color management for CMYK and the proprietary color management
being followed in industries for spot color. Finally the definition of gamut, extended
gamut, and its effect on printing will be reviewed.
Color Reproduction
Achieving color fidelity to an original is the basic underlying purpose of color
reproduction. The process involves the matching original color values to values for
proof, hard or soft, and to values for the final print (Klaman, 2002).
There are three steps of evaluation and development, initial step is to evaluate
tone reproduction capability of the printing device, evaluation of spatial resolution forms
the second step of the process and last step is the evaluating imaging system‘s color
rendering capabilities (Fairchild, 2005).
Colorimetric objective was the basic idea to evaluate and optimize the color
reproduction capability of the imaging system. Such an objective is based on minimizing

8
a color difference metric. ―In its simplest form, a color difference metric is a Euclidean
distance between a pair of colorimetric coordinates in a color space, quantifying the
visual difference between two different stimuli‖ (Fairchild, 2005).
Tone Reproduction
Tone reproduction is in direct relation to the reproduction of the density of the
image being printed to the corresponding original density. This relation can be best
described by use of graphical techniques. Tone reproduction has two aspects mainly tonal
compression for an original and ―tonal adjustments due to platemaking and printing
conditions‖. Good tonal reproduction is the first and foremost objective in achieving
good color reproduction. Tonal compression from original to reproduction greatly
influences the resulting quality. (Fraser & Murphy, 2005)
The adjustment of the slope of tone reproduction curve (TRC) can be used to
emphasize highlight, midtone, or shadow detail, as required by the image content, to
accentuate tone curve of the image. The L* channel in CIELAB color space can be used
to modify the tone reproduction curve without causing color balance shifts. The tone
distinctions can be emphasized by adjusting the K or black channel. For a good tone
reproduction to be possible it is important to ―(1) print the highest possible total area
coverage, (2) carefully choose the lightest and darkest image points, and (3) bend the tone
reproduction curve to emphasize tonal separation in the image‘s interest area‖. (Field,
2004)

9
Spatial Resolution
There are two aspects of spatial resolution: (1) input resolution in terms of pixels
per inch of RGB files, and (2) output resolution in terms of lines per inch (lpi) of CMYK
files. High quality printed reproduction requires the use of 150-175 lpi screen ruling, and
this will demand input spatial resolution to be twice the output resolution i.e., 300-350
pixels per inch (Chung, 2010).
Limited resolution of the human visual system is what forms the idea of
halftoning, which forms the impression of continuous tone on high frequency, where
continuous tone is compared to threshold matrix. (Sigg, 2006) Spatial sensitivity of
human visual system peaks at 6mm/cycle. This if translated turn out to be 150lpi for color
reproduction. This in turn relates to spatial resolution of 300 pixels per inch in the image
capturing stage (Chung, 2010)

10
Color Rendering
Control over color reproduction on printed media involves the knowledge of,
color rendering in different processes and on different substrates and each of the
parameters associated with reproduction. Each step in the process includes several
essential parameters that will influence the color rendering to a lesser or greater degree.
Hence it is essential to control every single step and to possess the knowledge of
important aspects like the different materials involved, the different parameters and the
different techniques, that will influence the color output (Klaman, 2002).
There are certain limitations that play an important role in determining the range
of colors that can be reproduced (gamut). Some of these factors are press with its certain
characteristics, will limit the possibilities in reproduction; the substrate used will limit the
gamut, as will the inks or toners used. There can be huge variations in color reproduction
even with the slight deviation of the printing press from the standard condition (Klaman,
2002).
Pictorial color image reproduction using non- process inks follows the same
concept as using process inks, i.e. (1) characterization of printer, (2) conversion of color,
and (3) printing of color (Chung, 2008).
Color Reproduction using CMYK Primaries
In process color printing, the image is reproduced by printing CMYK, four–color
process. The file is basically a composite of four color separation: Cyan (C), Magenta
(M), Yellow (Y) and Black (K). During separation, small dots comprise to form screen
tints, which are applied at different screen angles. These separations are then transferred

11
to four different printing plates individually; these plates reproduce an image with one
color overprinting the next. The composite image gives the illusion of continuous tone
image due to limited resolution of the eye. Printing with CMYK is called as subtractive
process because every color absorbs or subtracts one third of the light reflected from the
surface of the paper. ―Using percentages of Cyan, Magenta, Yellow and Black inks,
printers are able to create approximately 15,000 different colors from one end of the
spectrum to the other‖ (PMS, 2003).
With the vast amount of research, knowledge, and information that is readily
available, color management for process color is very robust in areas such as color
repeatability, early or late device binding, color consistency, profiling printer, color
control, visual perception, color reproduction, color measurement, conditioning, color-
managing a workflow, workflow optimization, etc. (Prakhya, 2008)
Color Reproduction using Spot Color Primaries
Any colors other than standard CMYK are known as spot colors. The Pantone
Matching System defines the spot colors in their swatch book or color library plugins in
Adobe Creative Suite. Spot colors are best described by their L* a* b* values in the
CIELAB color space, which is a device independent color space. Spot colors are either
used for single color printing, usually used for brand recognition such as Coca Cola red,
or can be used in addition to CMYK to enhance the gamut.
Using spot colors as subtractive primaries is rather uncommon. This is because
there is no easy solution to convert source image into spot color space with any degree of
colorimetric accuracy. ICC color management removed all of these restrictions with

12
multi-channel color management tools, such as X-Rite Profilemaker 5, we can produce
screened separations as easy as CMYK separations (Chung, 2010).
According to the X –rite Help Manual, more tools and features have been made
available in multi-channel color reproduction such as:
The user can ―make custom MultiColor test charts in MeasureTool 5, then use
ProfileMaker 5‘s MultiColor printer module to make multichannel printer
profiles.‖
―A new Photoshop plug-in makes MultiColor separations using a ProfileMaker 5
MultiColor profile. After separation, the image can be manually edited in
Photoshop, if necessary.‖
―A new Photoshop plug-in allows user to soft- and hard-proof MultiColor
separations. The plug-in displays the image in true colors and can also convert the
data to a proofer to simulate the press‖ (X –rite Help, n.d)

13
ICC Color Management
The basic idea of color management is to preserve the color values from the input
to the output, and this can be accomplished by controlling several factors or variations in
printing. ICC (International Color Consortium) is the basic platform on which the color
management is based. With devices such as scanners, digital cameras, monitors and
printers, handling color in vastly different ways, color management is required to achieve
uniformity between these devices. It is always possible that when the user sends the same
RGB file to five different printers, the color reproduction obtained from each of them will
have big differences. ICC profiles provide a solution to understand how each device
interprets the numbers in a file. ICC profiles are small files that contain data which, in the
simplest terms, convert colorimetric values from A to B to A color spaces. Once the user
can fingerprint two different devices and understand how they will react when we send
them a digital file, one can control the color reproduction of the printer. In the end, the
print comes out as expected. (Rodney, 2001)
ICC defines three commonly used profiles today in the printing industry: input,
display, and output profiles. Characterization data forms the basic building block of the
profile, and it can be stored using either a matrix model or a look-up-table (LUT).
―Matrix model consist of matrix of CIE XYZ which follow matrix operations. Profiles
based on LUTs contain a number of tags and LUTs‖, LUTs offer much better
relationships between the data sets as compared to matrix model (Chung, 1999).

14
In an ICC color management system the input device dependent color space is
converted into a corresponding device independent color space, called Profile Connection
Space (PCS). CIELAB color space is the standard color space used for PCS. Look Up
Tables (LUTs) map the color values in a device dependent color space to corresponding
color values in PCS by a complex interpolation method. Spectral data or colorant
parameters are not part of ICC profiles; instead profiles contain CIELAB values to
predict the color rendition of CMYK printing device (Sharma, 2003).
The A2B2A conversion in color management terms can be described as
conversion of colorimetric values in original file from CMYK/RGB/Spot (native device
color space) mode to profile connection space and then again converted to output device
color space (Fraser, 2003).
There are proprietary application programs which provide solutions for coloring
and separation as Photoshop was made for photography. Typically, software like AVA
allows the user to create a database of all inks correlated to their workflow. These
application programs also help in determining the tonal range and the overprint to predict
how it will look as final product. (Sosa, 2010)
As discussed before, for good color reproduction it is important to have a good spatial
resolution which is obtained by using a high end scanner or camera. Color conversion
forms the next step and it is usually from RGB to CIELAB to CMYK, and last but not
least is the color rendering.

15
Figure 1. Proprietary Workflow
The image is first captured by a high resolution camera such as ‗Cruse‘. The image so
obtained is in RGB color space (sRGB or Adobe RGB) and the file at this stage is a TIFF
file. This TIFF file is then opened in an API (Application Programming Interface) which
in this case is Photoshop. The file is opened in Photoshop and the working space is
converted to CMYK primaries by applying a standard SWOP profile. An Alpha channel
is also applied to the image, which is used to make and store color selections. Alpha
channels define a selection in black, white, and varying shades of gray pixels. The spot
color primaries are used to substitute the CMYK primaries, at this stage extensive image
editing is required to match the source image. Image editing forms a critical step of the
process because it is here that the image undergoes changes with the use of the alpha

16
channel to make is visually more pleasing and acceptable to the customers. It is here that
the image reproduction becomes preferred rather than exact.
The image is stored in TIFF format in Photoshop before it moves to AVA
CAD/CAM software. AVA software is the heart of this operation because at this stage,
the best-suited primaries are selected from the library provided by the AVA. This API
also allows the users to do Softproofing of the image, try the various combinations of
inks and determine the best set of primaries for a particular job. The file with the AVA
custom profile is then saved with an .ava extension and sent for digital proofing or to the
Gravure press for production (Sosa, 2010).
Analysis of color image reproduction
There are two different types of color reproductions that apply to practical
challenges faced by printing industry and they are colorimetric match and preferred
match. Point-by-point colorimetric match forms the basis of colorimetric reproduction.
The objective of ―exact reproduction‖ is relevant to those reproductions which have to be
both visual and colorimetric match to the original, when viewed under the same
conditions. ―Preferred‖ on other hand is used to describe a color reproduction that
deviates from an original in such a way that it is more pleasing and acceptable to the
observers. It usually involves the adjustments which may be done during the
reproduction process to correct the unwanted distortions (Hunt, 1970).
17
Printing with CMYK limits the color gamut and thus renders the reproduction of
the image captured on film to a fraction of that which can be achieved by the visual
system. ―Both manual and automated processes for printing with an enlarged color gamut
have proven too difficult, labor intensive, expensive, and dependent upon highly skilled
craft-persons to be widely used in the graphic arts‖. Although the gamut obtained from
CMYK printing is large, there are still out of gamut pixels/colors that are truncated.
Special colors used in combinations to enlarge the gamut only leads to additional
problems in printing. Hence an optimal gamut with the right set of inks must be
developed which can incorporate all the pixels and colors in that gamut. (Carli & Davis,
1991)
―ΔEs of many samples have a non-gaussian distribution. This is because ΔE is a
positive quantity and zero ΔE represents a special (end) point‖. The use of average ΔE for
measuring the process precision can be misleading, as it can only accounts for about half
of the process variation (Chung, 2010). CRF was applied to the ΔE distribution between
images reproduced by CMYK primaries and spot color primaries in this study.
Calculating deviation and variation by using the CRF method consists of
calculating the ΔE* values, sorting them in order of increasing values, and then
expressing the rank order in terms of percent of total samples. These percent rank
numbers are plotted against the ΔE* values. Sometimes people report only the 10, 50 and
90 percentiles of a CRF curve as a simple image quality metric (Sigg, 2004).
18
Process Variation
Process variation is an inherent part of any manufacturing process. Excessive
process variation is the main reason for quality problems, whether in business
(transactional) or production processes. Printing is a very complex process with many
variables such as: four colors CMYK plus spot colors; interacting with other variables
such as substrate, machine speed, ink/water balance, solvent, pressure settings,
plate/cylinder making; and many more. Tight process control is the bases to reduce the
problems caused by variations. Process control becomes easier if the margin of error can
be reduced. Gravure is known for consistent printing and long run capability. This
advantage of productivity coupled with right size gamut is the way to minimize the
variation (Zhang, 2006).
Both CMYK and spot color are being used in commercial printing as well as
packaging; In many of the printing companies, the spot color is reproduced by using
CMYK inks. Variations involved with spot color printing is less tedious as compared to
process color printing. ―For example, ink film thickness (IFT) variation in the case of
spot color printing can only cause variation in the chroma or lightness of the color being
reproduced, whereas IFT variation in process color variation can cause lightness, hue and
chroma variation‖. The two most common types of variations in printing mainly spatial
uniformity; it is to the variation from side to side on a press sheet, and the other is
temporal variation which accounts for beginning to end variation. The use of as
compared to for the measurement of color differences is more advantageous, as the

19
variations are better accounted by in case of visual response of the human eye
(Chung, 2005).
Gamut as function of primaries
Like for any process to improve it is important to understand the factors affect
the output immensely, choosing different ink sets can have an impact on the color gamut.
―Even for traditional, non-gamut expanding approaches, it is valuable to understand the
color gamut for process control and continuous improvement‖. Some of the factors that
affect the color gamut are: substrate, inks/colorants, color sequence, other process
consumables, the type of printing process itself, and others (Sigg & Hsu, 2009).
The color which can or cannot be reproduced is dependent on the choice of ink
set. More saturated and chromatic colors can be obtained at a given lightness level, for
one ink set than the other. The ink set so selected forms or renders a range of colors
which is known as gamut (Pearson, 1964).
Pigments, which give the ink its color property, determine the gamut or color
range that can be reproduced on a printing press. The objective from the color
reproduction point of view is to choose those pigments that will produce optimal gamut.
Several factors affect the color gamut of a printing process these include ink trapping, ink
transparency, substrate properties, printing sequence, IFT, etc. (Field, 2004).
In CMYK colorant space, using tone values as units, the gamut boundary can be
considered as the faces of a cube, which has the solid colorants and their secondary

20
combinations at the vertices. By interpolation, from the vertices, one can determine the
colors on the face of the gamut. Conceptually, CIELAB color space can be considered a
sphere, where the white and black points forms the pole and the ‗equator‘ ―consists of the
primary colorants and their secondary combinations, together with all the intermediate
colors in which at least one primary is held at 100%‖. So the gamut is the imaginary set
of combinations of points around the equator, which resemble the ‗longitude‘ on the
boundary surface, and the ‗latitude‘ is steps of lightness level at each colorant
combination. (Green, 2000).
The gamut boundary of a real output device when represented in a device-
independent color space such as CIELAB will not of course be spherical but will have an
irregular shape.
Right-size vs. one-size fit all gamut
The right size gamut or custom gamut is a unique idea in itself. The main idea
behind this research is that process color or CMYK printing provides a relatively large
color gamut in comparison to non-CMYK subtractive primaries. Even though a larger
gamut allows all the hues to be reproduced, the disadvantage of using CMYK colors is
that normal process variations produce larger visual effects than similar process variation
when using a smaller gamut. With the smaller gamut this risk is reduced because the
room for error decreases tremendously, so we can state that color variation will be
reduced significantly (Chung, 2010).

21
To successfully have image reproductions using spot colors, it is essential to take
the following points into consideration:
1. Determining whether or not the colors of the original image are all inside the
printer gamut.
2. Mapping out of gamut colors to printable colors using appropriate gamut
mapping algorithms and determining the new target L* a* b* values.
However, if the chosen spot color inks truly produce the ‗right size‘ gamut, then there
are no out of gamut colors (Chung, 2010)
There are two methods that can be used to solve the problem (Colorant selection
for six color lithographic printing). First approach towards this problem is the ‗volume
method‘, in the CIELAB color space. This criterion is image-independent. This method is
oriented to provide a solution for a wide range of original images. The second method is
the ―fraction of colors within a digital image‖ that is contained in the gamut. This
criterion is image-dependent and should be verified by only considering relevant colors
of the image.
There are few critical factors in the gamut size computations, which have a
profound influence on the result. The prominent factors include the color of the paper and
the colors of the individual inks printed on this paper. These are regarded as first-order
factors, because of their profound influence on the results, care should be taken to see
that they are measured accurately. There are second-order factors that have a significant
effect on the accuracy of the results, though not nearly as profound as the first order
factors. These factors include the color of two-, three-, four–, and higher-order overprints.

22
While the accuracy for second-order factors is important, it is not necessary to treat them
with the same level of attention as the first-order factors. Lastly, there are some factors
which have very less influence on the results than the second-order factors. These include
the interactions of the colorants between the gamut-limiting colors, i.e., the corners of the
gamut. Even as these factors have a significant influence on the actual size of the gamut,
it can be postulated that it only affects prints produced under similar conditions by a
similar amount. Thus, ―for the purposes of comparing gamut size, these higher-order
factors are much less important than the others‖ (Viggiano & Hoagland, 1998).

23
Chapter Three
Research Question
This research is based on scientific findings and hence therefore, it does not contain a
hypothesis to be accepted or rejected using any statistical data analysis. All the steps or
methodology that follows, aims at answering these two questions.
1. Is exact color pictorial reproduction obtainable by either a large CMYK gamut or
a right-size spot color gamut?
2. Is the effect (in terms of CIELAB) of the same process drift (in terms of dot gain
or SID) different for spot color compared to CMYK printing?
Equipment and Software Used
HP 5500- An electrophotographic digital printer. It has seven printing units, CMYK+ 3
spot colors. It was used for printing the profiling target and the images.
X-Rite‘s Eye-One iSis- a spectrophotometer which has the capability of measuring with
and without UV light. Used for measuring the profile target and color image
reproduction.

24
Photoshop CS4- has built-in multichannel color conversion. It is in the Advanced settings
of color ―convert to profile‖.
Profile Maker5- this modular software solution helps build high quality, reliable and
customizable ICC profiles, to connect the various steps in color imaging workflow. This
software helps to build, edit and fine tune color custom profiles.
InDesign CS4- has better layout options, it creates image graphics, has a live pre-flight
option, cross references and much better efficient cross links or the missing links as
compared to CS3.
Microsoft Excel 2004- was used to create a list of CIELAB values which was saved in txt
format and then re-opened in ColorThink 3.0 Pro. It was also used to create graphs and
make conclusions shown in later sections.
Color Think 3.0 Pro- has very useful tools such as profile manager, profile medic, the
worksheet, profile inspector, 2D graphing, 3D graphing, etc

25
Chapter Four
Methodology
This thesis involves the selection of three Pantone colors, paper white and a
process black. It deals with the development of methods to predict primary colors, to
characterize color rendering, and to check color consistency with the introduction of
drifts, on printed media. All these factors are crucial for achieving, in the end, a high print
quality with the main focus on color quality. The need to make an accurate assessment of
the available color gamut or of the difference between a test print and a reference original
arises, not only when final prints are compared with each other but also with an original.
In product gravure printing, specific color inks are generally used to meet the
requirements of a customer. The overall objective of this investigation is to establish an
Optimization in the production for product gravure printing. The methodology has been
divided into sections as per the research questions. The first one deals with color match
and the other with stability after the introduction of drift.
There are four steps in the process of the experiment; they are Color Analysis
(Printer Characterization), Color Conversion, Color synthesis (printing), and evaluation.
Each of the four sections has been described in detail. A summary of the analysis aspect
of the workflow is shown in Figure 2. Starting from the CMYK side, the workflow
addresses that IT8.7/4 Random (CGATS, 2009) was generated in Profile Maker 5 using

26
the MeasureTool with patch size of 6x6 mm. This profiling chart contained 1,617
patches.
This target was printed on HP 5500 using the CMYK inks. This printed chart was
measured using X-Rite‘s eye-one-iSis. Thus the CMYK profile was generated and was
named as Indigo_IT78.4(093).
Figure 2. The Analysis aspect of the Workflow
On the multi-channel side of the workflow, Six images having similar gamut but
different patterns (wood and marble) were selected from http://www.cgtextures.com/
(royalty free) and Armstrong industries. All the images selected were in .TIFF format and

27
high resolution files (300ppi) of 4 MB each. The embedded profile in these images was
Adobe RGB. The images are shown in Figure 3.
Figure 3. The six composite images
Sample Image gamut
1. Each of these six files were opened in Color Think 3.0 Pro individually and the
unique colors were extracted.
2. All the images had at least 16,000 unique colors, one of them 21,000 different
colors. These extracted unique colors were in L*a*b* format and the list was
saved as a text file (.txt).

28
3. All the unique colors obtained from individual files are shown in Figure 4 as a
three-dimensional plot using the ―Grapher‖ option of the Chromix Color Think
3.0 Pro (CCT).
4. A dense cloud of these unique colors were obtained, and using the Slicer option of
CCT, the highest chromatic (C*) point at a particular lightness (L*) was
determined and their L*a*b* values were noted.
5. The point of maximum chroma at any hue angle is often referred to as the ‗cusp‘.
For some hues the cusp may be close to the midpoint of the lightness dimension,
for yellow and blue, L* is higher and lower respectively.
Selecting spot Color Primaries
6. The way to find the three spot color primaries along with the colors of the paper
white and the black, is to pick three spot colors with the use of the ColorThink 3.0
Pro Gamut Slicer. The selection process is visual and is subjective. The key
decision is to be sure that the right-sized gamut is large enough to encompass all
image elements.
7. Pantone colors were then selected that match the three primaries as close as
possible with the help of Photoshop CS4. The Pantone shades so obtained are
described in the results section.

29
Figure 4. Gamut of all six images and the chosen primaries
Print and Measure / Build Multi-Channel Profile
1. The primaries so obtained from the color analysis procedure were then used to
generate a test chart in MeasureTool software of Profile Maker 5, which allows
the users to make Multicolor Profiles.
Figure 5. Test Chart Generator
2. This test chart, shown in Figure 7, contains many randomized patches that sample
the limited color gamut.

30
Figure 6. Test Chart
3. This test chart was then printed by using the three Pantone shades, and process
black on HP Indigo 5500, which is a seven-color electrophotographic digital
printer. The ink sequence is black-7407-1795-5425.
Figure 7. HP Indigo 5500

31
4. This printed test chart was measured with X-Rite‘s eye-one-iSis (Figure 8), both
Ultraviolet (UV) included and UV excluded readings were obtained and saved as
text files.
Figure 8. X-Rite‘s eye-one-iSis and test target
5. Two samples of the printed target were measured and, and by using the Averaging
function of MeasureTool, averaged to obtain the data set for this printing
condition. A Multi-channel ICC profile was generated form this data set using
ProfileMaker 5 (Figure 9) and was named as Indigo_Pantone(093).icc.
Figure 9. ProfileMaker 5.0

32
The profile specifications are (1) Profile size: large, (2) Rendering Intent: Absolute
Neutral color, (3) Viewing Light Source: D50, (4) TAC: 320%, GCR3, and (5) Black
start point: 5% in separation function.
II Color Conversion
This stage addresses the conversion of the source images to the device color space,
by applying the profile to the source images, created in the previous stage. Figure 10
elaborates the workflow and the detailed explanation follows it.
Figure 10. Conversion and synthesis aspect of the worklflow

33
1. The CMYK (Indigo_IT78.4(093)) and Spot color (Indigo_Pantone(093)) profiles
were then applied to Composite Image in Photoshop CS4 using the multi-channel
plug-in in advance option of ―Convert to‖.
Figure 11. ‗Convert To‘
2. The six images are then assembled in InDesign, with other control elements like
color bar, color patches and step wedge also laid out in the test form. the size of
each image was 5.5 x 5.5 inches. Thus six images fit on a sheet size of 13‖ x 19‖
at a resolution of 300ppi. This file was termed as Composite_AdobeRGB_300ppi.
(Figure 3)
3. The file was exported to PDF using the ―press quality‖ job option. The settings
are shown in Figure 12.

34
Figure 12. PDF Settings
III Color Synthesis
In this stage, the two DPF files created in the Color Conversion process, were
printed on HP Indigo 5500 individually. This process is called synthesis because in
this stage the color separations, obtained from image elements and primaries, are
combined together on the printer to give an image. The images were printed on HP
5500 digital press using only the channels that were required for the respective files.
IV Evaluation
This stage deals with evaluation of the reproduction, visually and colorimetrically.
The samples for visual match have been provided in the appendix. For colorimetric
match the detailed procedure is mentioned below.
35
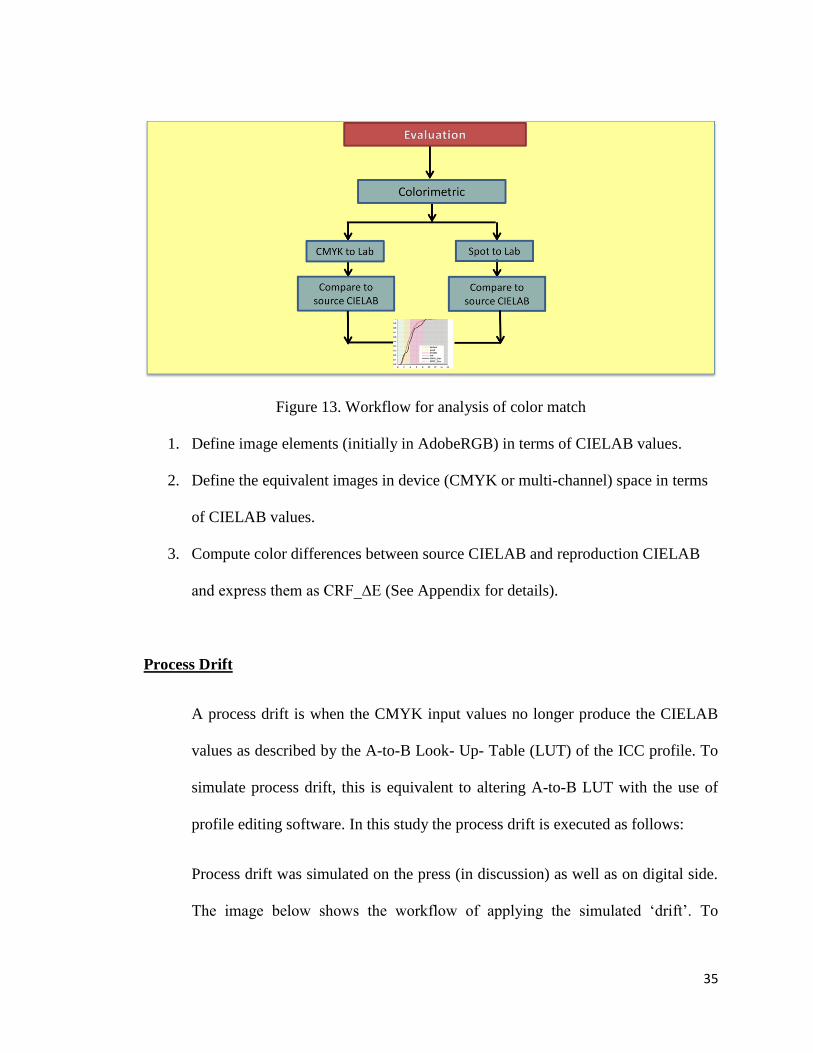
Figure 13. Workflow for analysis of color match
1. Define image elements (initially in AdobeRGB) in terms of CIELAB values.
2. Define the equivalent images in device (CMYK or multi-channel) space in terms
of CIELAB values.
3. Compute color differences between source CIELAB and reproduction CIELAB
and express them as CRF_∆E (See Appendix for details).
Process Drift
A process drift is when the CMYK input values no longer produce the CIELAB
values as described by the A-to-B Look- Up- Table (LUT) of the ICC profile. To
simulate process drift, this is equivalent to altering A-to-B LUT with the use of
profile editing software. In this study the process drift is executed as follows:
Process drift was simulated on the press (in discussion) as well as on digital side.
The image below shows the workflow of applying the simulated ‗drift‘. To

36
simulate process drift, the profiles were edited by changing the tonal transfer
curves. The details have been mentioned in the Appendix.
Figure 14. Drift Simulation
Application of the Altered Profiles
a. Four out of six images were laid out in InDesign CS4 and their layout is
shown in Figure 12.
b. This composite image was then exported out of InDesign as a JPEG file with
no compression.
c. Next it was opened in Photoshop CS4 and converted in to TIFF file. This
TIFF file was then used in CCT to simulate the drift process by application of
the six n-channel profiles and six CMYK profiles.

37
Figure 15. Composite Image 2 used for Drift
d. As this file has no embedded profile, the Adobe RGB 1998 profile was
applied to it when it was opened in CCT. Next the file was sampled with
20x20 pixels so we get 400 CIELAB as well as RGB values for the selected
pixels.
e. A Spot Color profile (Indigo_Pantone(093)) was then applied to the sampled
image in CCT with the rendering intent being ‗Relative‘. This converted the
file to a four channel image (Figure 13). To go from A to B to A, the spot
color profile which was edited (refer editing profile section) was again applied
to the composite image of Figure 12, and this gave the 400 CIELAB values
for the spot color method.

38
Figure 16. Sampling in CCT
f. These CIELAB values were saved as an Excel text file for calculating the
‗variation‘ which the image goes through when there is a drift in the process.
g. Variation is calculated by using the Mean-Color-Difference from the Mean
(MCDM). A mean for L*, a* and b* was obtained for each pixel, with six
different conditions (six edited profiles), respectively. This resulted in 400
averaged CIELAB values for 400 pixels, this averaged or mean CIELAB
value of each pixel was used to calculate ∆E between each pixel for six
different edited profiles.

39
h. Color difference was then calculated in CCT by selecting the ∆E76 option and
the values were saved in an Excel sheet for calculating the ‗deviation‘ the
image went through from the OK sheet when there is drift in the process.
i. The same steps from g to i were followed for rest of the other five edited
profiles. The color difference and the list of Lab values were saved in an
Excel sheet for calculating the ‗deviation‘, that the image went through from
the OK sheet.
j. Steps a to i were repeated for CMYK process drift and CRF curves were
generated for both ‗variation and ‗deviation‘ the results obtained are discussed
in the next chapter.
Evaluation of process drift using CRF_∆E by simulation
Figure 17. Workflow of process drift by simulation

40
1. Start with device values in CMYK or multi-channel space
2. Assign 6 altered profiles and obtain their CIELAB values.
3. Combine all CIELAB values and find their mean CIELAB values.
Compute color differences between the mean CIELAB and all CIELAB and express
them as CRF_∆E.
The results so obtained are discussed in the next section.
41
Chapter Five
Results
The thesis experiment was formulated to reproduce the images which comprised of
three tiles/marble pattern and three wooden patterns. These images were selected in such
a way that the gamut of these respective images is located between positive a* and b* but
varying on the L* axis. In other words the images were selected such that their gamut
falls between yellow and red region.
The methodology of the experiment is intended to answer the question regarding the
idea of small gamut for spot colors, i.e.,
1. Is exact color pictorial reproduction obtainable by either a large CMYK gamut or a
right sized spot color gamut?
Color Match
The whole methodology described in previous section deals with finding the
closest match to the original by the two reproductions.
Simulation
The data obtained from sampling the image (Figure 12), 20x20 i.e.
colorimetric value (Lab) of 400 pixels was used to find the color
difference between the original and both the processes (CMYK and Spot),
is plotted and the CRF curve was obtained the results are shown below.

42
Figure 18. CRF curve for color match
Both CMYK and Spot reproduction are well within color difference tolerances. At
the 90th
percentile the color difference for CMYK process from the original is 1.3
and ∆E for spot is 1.6. The color difference of 0.3 is negligible in ICC Color
management. The color difference at the 90th
percentile, being less than 2 ∆E,
indicates that there is no visual difference between the reproduction and its source
image.
From the above result we can conclude that both spot color and CMYK process can
be used to print the pictorial image but spot color has an added advantage of less
variability, in the case that drift occurs.
0
0.1
0.2
0.3
0.4
0.5
0.6
0.7
0.8
0.9
1.0
0 1 2 3 4 5 6 7 8
Delta E*76
Pro
ba
blit
y
CMYK
Spot

43
Process Drift
2. Is the effect of process variability (in terms of dot gain or SID) different for non-
CMYK compared to CMYK printing?
An effort was made to simulate process drift with the use of the RIP settings. The
result, in terms of ∆E, resembles that obtained by simulation. Editing profiles proved to
be an effective means of simulating process drift. The use of CRF_∆E Curve was
effective in communicating both color accuracy and color variation.
Simulations were performed (procedure mentioned in Methodology) and the results
obtained for both variation and deviation are shown below (Figure 19). The variation
from the average seems to be a better metric to describe the impact of process drift
between the spot color and the CMYK ICC profile.
Figure 19. Variations for Spot and CMYK from Original
0
0.1
0.2
0.3
0.4
0.5
0.6
0.7
0.8
0.9
1.0
0 1 2 3 4 5 6 7 8
Delta E*76
Pro
ba
blit
y
CMYK Variation
Spot Variation

44
Graph 2 shows the variation data that was calculated from MCDM, it means that this
method involved variation from the average. At the 90th
percentile the ∆E for the multi-
channel reproduction with 14% increase in TVI would be 3 and that for CMYK would be
6. At the 90th
percentile, the variation in CMYK printing (6+ ∆E) is twice the variation in
spot color printing (3 ∆E).
Figure 20. Deviations for Spot and CMYK reproduction
Deviation is the difference between a measured value and the expected value of a
variable. Here it‘s the color difference of a pixel obtained from six different profiles
individually and plotted on a CRF. Graph 3 shows the CRF curve of 2400 ∆E which were
averaged. At 90th
percentile for spot color, color difference will be 1.8 whereas for
CMYK its 4.8.
0
0.1
0.2
0.3
0.4
0.5
0.6
0.7
0.8
0.9
1.0
0 1 2 3 4 5 6 7 8
Delta E*76
Pro
ba
blit
y
CMYK Deviation
Spot Deviation

45
With all the results that were obtained by simulation on computer and actual
printing it can be concluded that process variation has less of an effect on the n-channel
reproduction than the CMYK color reproduction.
46
Chapter Six
Discussion &Conclusion
This chapter discusses the limitations, shortcoming in the profile generation, the
gamut volume comparison of CMYK and spot color, and conclusion.
The main idea behind this research is that process color or CMYK printing provides
a relatively large color gamut in comparison to non-CMYK subtractive primaries. Even
though a larger gamut allows all the hues to be reproduced, the normal process variations
produce larger visual effects than similar process variation when using a smaller gamut.
With the smaller gamut this risk is reduced because the room for error decreases
tremendously, so it can be stated that color variation will be reduced significantly. The
results obtained in the previous section, attested the research questions that were
developed for this thesis.
Limitations
CMYK primaries are the default primaries for HP Indigo 5500: This research
involves the use of the HP Indigo 5500; this is a seven color printing, hence the color
reproduction is limited to this printer.

47
Non-CMYK primaries were chosen so that the resulting gamut includes all image
colors of the same tones (wood and tile patterns which belong to earth or warm tone color
area of Lab color space).
Paper: The same coated paper is used for both CMYK and Non-CMYK primaries.
API (Application Programming Interface): Adobe creative suite CS4 is used.
Further Research Suggestions
Shortcomings in profile generation
Figure 21. Shortcoming in profile
Figure 21 shows that there is a discrepancy in profile generation, as implied
before, choosing the right set of primaries and ensuring their correct reproduction
Double hit
required

48
is very important part of color reproduction. While printing test charts during the
Color Conversion process (refer to Methodology) the researcher gained a
learning experience that high chromatic colors need a double hit (print twice) to
achieve that chroma (C*). Because of the shortcoming, two images in particular
did not reproduce up to the expectation.
i. Primaries are very chromatic.
ii. Double hits were required for these chromatic colors on profiling target.
iii. Many colors are clipped out from the gamut (especially for the warm color such
as brown)
Gamut volume differences and pros/cons of CMYK vs. N-channel
It is possible that, regardless of the number of impressions, the inks may be selected
solely on the basis of their color gamut. These inks do not have to be to be cyan,
magenta, and yellow nor is it required that they should be transparent. There are
numerous advantages, one of them being process control (Hardy & Wurzburg, 1948).
This statement clearly stands in agreement to the research question. The advantage of
using spot color is that the gamut obtained is smaller as compared to that of process
colors and thus allows better process control. And high fidelity images can be obtained.
Figure 22 illustrates the gamut size of the two processes. It clearly shows that the gamut
size of spot colors is quite small.

49
Figure 22. Gamut comparison between CMYK and spot color
This way, tighter process control while printing is achieved because the same
natural variability in dot size has a smaller effect when using inks that result in a small
gamut. CMYK, on the other hand has a gamut which is quite big, hence process
variability will have larger effect. The gamut volume was calculated for CMYK as well
as N-Channel profiles in CCT (Chromix Color Think).
Figure 23 shows the gamut comparison and it can be seen that Gamut volume is
very small for the N-Channel profile, almost 10% of CMYK gamut. Thus with a smaller
gamut one can have better press control and reduced make-ready times.

50
One problem with a smaller gamut is that the primaries that are chosen have to be
very precise and it should be made sure that none of the image points get clipped off.
Gamut Volume CMYK 409,620
Gamut Volume N-Channel 55,260
Figure 23. Gamut Volume Spot Color
Conclusion
The objective of this thesis was to find out the color match to the original, by
using both CMYK and spot colors and to check if and when there is variation which one
of the two reproductions is more stable.
Traditionally pictorial color images are reproduced using CMYK primaries,
which is a larger gamut, and encompasses mostly all the image elements, but there are
few saturated colors that are always out-of-gamut. In order to reproduce these out-of-
gamut or specific colors, HiFi Color printing such as Hexachrome, MaxCYM and

51
Opaltone have been developed, but with more colors being overprinted, the complexity
also increases.
The idea of a right size gamut, a gamut that can encompass all the image elements
and still be smaller in volume as compared to the CMYK gamut, is unique in itself. When
the image gamut is limited, then a right-size color gamut, yielded by spot color primaries,
can do as good a job as CMYK printing can, plus spot color printing will yield
significantly less variation due to potential process drift.
ICC-based multi-channel color reproduction technology is ready for prime time
applications in the product gravure printing industry.

52
Bibliography
Andrew Rodney. (2001, October). Color management: The first steps. Photo District
News, 21(10), P26-P28.
CGATS.4 (2006) Graphic technology — Graphic arts reflection densitometry
measurements — Terminology, equations, image elements and procedures, CGATS
Chung, R. (1977)―A Statistical Method for Image Classification and Tone Reproduction
Determination,‖ Journal of Applied Photographic Engineering.
Chung, R. (2006, August). Predictable Color Methodology. Gravure Magazine, 16-24.
Chung R. (2008) Non- CMYK Pictorial Color Image Reproduction. Test Target 8.0, p.
44- 48
Chung R.; Prakhya, S.H. and Riordan, M. (2008) Predictability of spot color overprints,
Advances in Color Reproduction: proceeding of 35th
IARIGAI Research Conference
Chung, R.; Hsu, F.; Clark, D, and Husain, K. (2009) ―Weight‐based Ink Trapping
Assessment,‖ TAGA Proceedings, (in press) TAGA.
Chung, R.; Hsu F. Predicting Color of Overprint Solid (2009, May 31) TAGA 2005.
Clausmann, M. (2003, July 10). Technical Spot Color Logos [Using Spot color Pros
and Cons]. Retrieved from http://www.thelogofactory.com/library/articles/spot-color-logo.html
D. Carli and M. Davis, High fidelity color rendering and reproduction, TAGA Proc., 8-

53
19 (1991).
Digital Dots, P. L. (2007, November 9). Advanced Proofing- Spot colors.
Fernandez, S., Fairchild, M., & Braun, K. (n.d.). Analysis of Observer and Cultural
Variability while Generating ―Preferred‖ Color Reproductions of Pictorial
Images. In The Scociety for Imaging Arts and Technology (Reprinted from The
Journal of Imaging Scieneand Technology, 2005, January, 49, p. 96)
Freedman H. Measuring Spot Color Productivity. (2009, August 31). Graphic Arts.
Abstract retrieved from http://www.graphicartsonline.com/article/
338892-Measuring_Spot_Color_Productivity.php?q=spot
Gupta, M.; Gormish, M.; Stork, D.G.; , "Block color quantization: a new method for
color halftoning," Image Processing, 2000. Proceedings. 2000 International
Conference on , vol.3, no., pp.460-463 vol.3, 2000 doi: 10.1109/ICIP.2000.899438
Harrell, T. (n.d.). Color Management In Packaging. IPA Bulletin, 17.
Holub, R.; Pearson, C.; and Kearsley, W 1986 Spectral Measurement of Overprints on
Press Sheets and Proofs, TAGA Proceedings, pp. 166‐196, TAGA
Homann, J. P. (2007). True Spot Colors in ICC workflow. In Digital Color Management-
principles and startegies for standard print production (3rd ed., pp. 155-156).
Germany: Springer. (Original work published 1998)
K. A. Husain (2008). Prediction of Spot Color Overprints. Test Target 8.0, p. 7-17

54
Klaman, Marianne (2002). Aspects on colour rendering, colour prediction and colour
control in printed media. Ph.D. dissertation, Kungliga Tekniska Hogskolan
(Sweden), Sweden.
Viggiano, J. A. S., & Hoagland, W. J. (n.d.). Colorant Selection for Six- Color
Lithographic Printing. Rochester NY: RIT Research Corporation.
Sharma, A. (2008, April). Color Management for Packaging: Spectral Colors &
Beyond. GravurEzine, pp 32
Sigg, F. (2006, July 10). Testing for Resolution and Contrast. Test Target 6, RIT.
Viggiano, J A and Prakhya, Sri (2008) ―Prediction of Overprint Spectra Using Trapping
Models: A Feasibility Study,‖ TAGA Student Publication, RIT
Zhang, L. (2006, August 24) ―Lean Manufacturing in Reproduction of Fine Arts,‖
ArtsMagzine, Shanghai

55
Appendix I
Procedure for creation of Patches
a. Individual RGB images in Color Think were extracted for the unique colors.
b. The list so obtained in Lab form was saved in txt format. The data was then
sorted first by L*, then by a* and in the end by b*. The first value and the last
L* value obtained from sorted data was used for tone reproduction.
c. The CIELAB values were entered in Photoshop and gradation tool was used
for getting the spectrum.
d. Out of 20 patches for each image, 7 of them were used for L*, 7 for a* and 6
for b*.
e. The whole process was repeated for the all the six images and the patches
were added to images respectively.
Color match to original
Simulation was done for verifying the color match, to determine which of the
two reproductions produces the closest match to the original.
Simulation
a) The composite image was opened in CCT and Adobe RGB 1998
was applied to the image. The image was sampled by 20x 20
which equals 400 pixels.
b) These values were in both RGB and CIELAB format, to have A to
B conversion, the image was then converted to 4 channel image by

56
application and to have B to A conversion the same profile
(Indigo_Pantone(093)) was applied again the CIELAB values so
obtained where then used to get ∆E76 between the two profiles.
These ∆E values were plotted on CRF curves and the results are
discussed in the next chapter.
c) Same steps were repeated for CMYK reproduction too.
Editing the Profiles
To simulate process drift, the profiles were edited by changing the tonal value
curves. The details of the process are described below.
a. The spot color profile (Indigo_Pantone(093)) was opened in
Profile Editor (part of solution package of ProfileMaker5).
b. Next B2A selection was made for the profile as shown in the
Figure (Lab to 4CLR).
c. The ‗Tool‖ option was opened and in that the Tonal Value Curves
for each color individually and then in combination of two, were
increased by 14 %. i.e.
INPUT: 50 OUTPUT: 57
d. This edited profile was then saved under Indigo_Pantone (093)
K+14% with the .icc extension.
e. Similarly rests of the five profiles were edited first by selecting one
channel out of four and second by selecting two channels and

57
increasing the TVI in them and naming them according with .icc
extensions.
The same steps from a. to d. were repeated for CMYK profile. This was done to in-order
to apply similar effects on the tone reproduction for CMYK and spot color
methods.