Eléments de méthode pour l'analyse du tissu économique local
Upload
khangminh22Category
view
0download
0
HAL Id: tel-03573818https://hal.archives-ouvertes.fr/tel-03573818
Submitted on 14 Feb 2022
HAL is a multi-disciplinary open accessarchive for the deposit and dissemination of sci-entific research documents, whether they are pub-lished or not. The documents may come fromteaching and research institutions in France orabroad, or from public or private research centers.
L’archive ouverte pluridisciplinaire HAL, estdestinée au dépôt et à la diffusion de documentsscientifiques de niveau recherche, publiés ou non,émanant des établissements d’enseignement et derecherche français ou étrangers, des laboratoirespublics ou privés.
Une analyse technico-économique de la transition versles véhicules électriques
Bassem Haidar
To cite this version:Bassem Haidar. Une analyse technico-économique de la transition vers les véhicules électriques: Pol-icy, Infrastructure, Usage, and Design. Quantitative Finance [q-fin]. Université Paris-Saclay, 2021.English. �NNT : 2021UPAST122�. �tel-03573818�

A Techno-Economic Analysis of the
Electric Vehicle Transition: Policy, Infrastructure, Usage, and Design
Thèse de doctorat de l'Université Paris-Saclay
École doctorale n°573 : interfaces : approches interdisciplinaires, fondements,
applications et innovation (Interfaces) Spécialité de doctorat: Ingénierie des systèmes complexes
Unité de recherche : Université Paris-Saclay, CentraleSupélec, Laboratoire Génie
Industriel, 91190, Gif-sur-Yvette, France.
Référent : CentraleSupélec
Thèse présentée et soutenue à Paris-Saclay, le 10 Décembre 2021, par
Bassem HAIDAR
Composition du Jury
Yannick PEREZ Professeur, CentraleSupélec
Président
Carole DONADA Professeure, ESSEC Business School
Rapportrice & Examinatrice
Frédéric LANTZ Professeur, IFP School
Rapporteur & Examinateur
Frances SPREI Professeure Associée, Université de Technologie de Chalmers
Examinatrice
François LEVEQUE Professeur, Mines ParisTech
Examinateur
Willett KEMPTON Professeur, Université du Delaware
Examinateur
Clément DUMAND Ingénieur Chercheur, Stellantis
Invité Industriel
Pascal DA COSTA Professeur, CentraleSupélec
Directeur de thèse
Jan LEPOUTRE Professeur, ESSEC Business School
Co-Encadrant de thèse
Fabrice VIDAL Ingénieur Chercheur, Stellantis
Co-Encadrant de thèse
Th
èse
de d
oct
ora
t
NN
T : 2
021U
PA
ST122


Titre : Une analyse technico-économique de la transition vers les véhicules électriques : politique, infrastructure, usages
et conception
Mots clés : capacité de batterie, infrastructure de recharge, véhicule électrique, véhicule hybride rechargeable, étude
technico-économique
Résumé : Le transport routier représentant une part
importante des émissions mondiales de gaz à effet de serre.
Les véhicules électriques (VE), y compris les VE à batterie
(BEV) et les VE hybrides rechargeables (PHEV), offrent
une alternative prometteuse pour remplacer les véhicules
à moteur à combustion interne (ICEV), dépendants des
combustibles fossiles, pour une solution de transport à
émissions faibles ou nulles. Bien que l'adoption de ces
technologies ait rapidement augmenté au cours de la
dernière décennie, leur part de marché reste limitée par des
obstacles socio-technico-économiques dans la plupart des
pays. Surmonter ces barrières est une étape essentielle vers
un marché massive des véhicules électriques. Cette thèse
vise donc à étudier des modèles économiques innovants,
en examinant les transactions entre les membres de
l'écosystème des VE. Cette thèse traite de recherches
prospectives et multidisciplinaires en sciences
économiques et de gestion, et sciences de l'ingénieur, sur
l'avenir des systèmes automobiles décarbonés. Tout
d'abord, cette thèse aborde les principaux obstacles au
déploiement des infrastructures de recharge, en présentant
une revue de la littérature sur les méthodologies de
déploiement et en soulignant l'ensemble des paramètres
négligés dans la littérature, lesquels présentent des
questions de recherche que la thèse aborde par la suite.
Ensuite, cette thèse étudie les compromis entre
infrastructure de recharge de différentes puissances et
autonomie des BEV. Nous concluons sur la capacité de
la batterie du BEV la plus adaptée aux besoins urbains
et ruraux, et sur l'investissement dans les chargeurs
rapides. De plus, cette thèse analyse l'influence des
facteurs socio-démographiques, économiques et
techniques sur l'adoption des VE dans les départements
français au moyen d’une régression à effets mixtes.
Nous concluons à travers des recommandations de
politiques économiques pour accélérer la transition vers
la mobilité électrique. Enfin, cette thèse analyse
l'influence du règlement européen (EU)2019/631 sur
l’offre des constructeurs automobiles et permet de
discuter les résultats attendus par la directive de la
Commission européenne.
Title: A Techno-Economic Analysis of the Electric Vehicle Transition: Policy, Infrastructure, Usage, and design
Keywords: battery capacity, recharging infrastructure, electric vehicle, plug-in hybrid vehicle, techno-economic study
Abstract: Since road transport accounts for a high share
of global Greenhouse Gas (GHG) emissions, Electric
Vehicles (EVs), including Battery EVs (BEVs) and Plug-
in Hybrid EVs (PHEVs), offer a promising alternative to
replace fossil-fuel dependent Internal Combustion Engine
Vehicles (ICEVs), with a low-or zero-emission transport
solution. While this technology's adoption has been
rapidly increasing over the last decade, its market share
remains restrained by socio-techno-economic barriers in
most countries. Overcoming these barriers is an essential
step into a massive purchasing activity of electric vehicles.
This dissertation aims at investigating innovative business
models by examining the transactions within the members
of the EV ecosystem. This dissertation deals with future
and multidisciplinary research in economics,
management, and engineering sciences on decarbonised
car systems' future. First, this thesis addresses the main
charging infrastructure deployment barrier by presenting a
literature review about the deployment methodologies and
pointing out the neglected set of parameters that present
our research gaps. Second, it investigates the trade-offs
between the different-power charging infrastructure and
the BEV owner by considering: BEV investment and
range, public infrastructure availability, at-home
charger availability, and the adaptability between
charger and BEV in terms of technical constraints. It
also concludes with the most suitable BEV battery
capacity for urban and rural needs, and the installation
of fast chargers. Next, it analyses the influence of socio-
demographic, economic, and technical factors on
electric vehicle adoption in French departments, using
mixed-effects regression. This chapter points out policy
recommendations to accelerate the electric mobility
transition. Finally, this thesis analyses the influence of
the Regulation number (EU)2019/631 on the automotive
manufacturers’ portfolio, and compares the results with
the directive of the European Commission.

Acknowledgements
The Armand Peugeot Chair in collaboration with Stellantis (the fusion between Groupe PSA and FCA Group),
CentraleSupélec Engineering School (Université Paris-Saclay), Laboratoire Genie Industriel / Sustainable
Economics Group, and ESSEC Business School fund Bassem Haidar’s thesis under the ‘ANRT-CIFRE’
contract 2018/1162.

Remerciements
Mes premiers remerciements s’adressent à mes directeurs de thèse : Pascal da Costa, Jan
Lepoutre et Fabrice Vidal. Merci Pascal pour ton temps, tes encouragements, ton soutien et ton
aide afin de réaliser cette thèse ! Merci parce que tu étais disponible à chaque fois que je
t’appelai ! Merci Jan pour ton aide : c’était grâce à tes conseils et critiques que j’ai pu autant
monter en compétences ! Merci Fabrice pour ton temps, tes précieux conseils et ton soutien
constant. Merci à vous trois pour votre confiance ! J'aimerais également vous dire à quel point
j’ai apprécié vos grandes disponibilités et votre respect sans faille des délais serrés de relecture
des documents que je lui ai adressés. Enfin, j’ai été extrêmement sensible à vos qualités
humaines d'écoute et de compréhension tout au long de ce travail doctoral.
Merci également à Yannick Perez, Titulaire de la Chaire Armand Peugeot en
Electromobilité pour m’avoir accordé une confiance totale : merci pour tes encouragements
depuis mes années de Master. Merci à Stellantis de m’avoir soutenu financièrement durant ces
trois années. C’est toujours une grande fierté de faire partie d’un groupe mondial fort de 400,000
employés dans 50 pays.
Je remercie également les deux rapporteurs: Carole Donada et Frédéric Lantz ; ainsi que
les examinateurs: Frances Sprei, François Lévêque, Willett Kempton et Clément Dumand pour
avoir accepté de faire partie de mon jury de thèse. Merci à Yannick Perez d'accepter de présider
mon jury.
Ce travail n’aurait pu être mené à bien sans la disponibilité et l’aide de mes encadrants
de thèse et d’Olivier Massol, Elisa Operti, Sen Chai et Adelaïde Fadhuile. Merci pour vos
conseils, votre aide et vos critiques sur mes travaux. Merci à Maria Teresa Aguilar Rojas avec
qui j’avais le plaisir de travailler sur une étude.
Je remercie chaleureusement l’équipe d’organisation de la conférence internationale
IAEE2021. Merci Yannick de m’avoir accordé cette responsabilité : j’espère que j’étais à la
hauteur de tes attentes. Merci également à Olga Pushkash, Albert Hiesl, Chiara Canestrini, au
Président IAEE/FAEE Christophe Bonnery et à toute l’équipe de 30 personnes avec qui j’avais
l'honneur de travailler.
Merci encore à Pascal da Costa, Yannick Perez, Arnaud Lafont et Pierre Jehel qui m’ont
donné l’opportunité de donner des cours et d’encadrer des projets à CentraleSupélec/Université
Paris-Saclay. Merci à mes étudiants car c’est grâce à eux que j’ai pu monter autant en
compétence.
Je remercie encore mes autres camarades du LGI pour l’ambiance de ces belles années.
Merci donc à Lara Qasim, Naouress Fatfouta, Yasmine Salehy, Icaro Gomes, Marc-Olivier
Metais, Tjark Gall, Joseph Mansour, Robin Lecomte, Gustavo Santamaria, Emilien Ravigné,
Emma Jagu, Quentin Hoarau, Fawaz Salihou, Maxime Guymard, Félix Carreira, Jean Hassler,
Felipe Venegas, Mariana Reyes... Vous êtes très nombreux! Je souhaite également une très
bonne thèse pour les nouveaux arrivants. Merci à l’équipe administrative du LGI : Delphine
Martin, Corinne Ollivier, Carole Stoll, Astrid Blanchard, Sylvie Guillemain et Mathieu
Tournadre, ainsi qu’à l’ESSEC : Zoubida Berkane et Christine Gil. Merci au directeur du
Laboratoire Génie Industriel de CentraleSupélec Professeur Bernard Yannou.

Merci encore à ma seconde famille -mes amis- avec leur question récurrente : « quand
est-ce que tu la soutiens cette thèse ? »: Andreas Markoulidakis, Kifah Dakdouk, Elissar Khatib,
Hilda Narch, Elias Chiti, Naji Nassar, Myriam Bahja, Samer Murr, Sarah Jnad, Niklass Wulff,
Nagham Chehade, Georges Everikian et Gilbert Yaman.
Je remercie aussi l’équipe R&D SEPC avec qui j’avais l’honneur de travailler et, en
particulier, Clément Dumand, Bernard Sahut, Ladimir Prince et Eric Lalliard. Merci encore à
l’équipe d’animation PhD de Stellantis: Jamila Leite Costa, Sandrine Loze, Mathieu Moze et
Stéphane Delalande.
Un grand merci à CentraleSupélec : ma seconde maison où j’ai passé 5 ans de ma vie.
Je n’oublierai jamais les moments passés sur les trois bâtiments de ce grand campus ! Je tiens
à remercier le directeur Patrick Aldebert, Xavière Marcy, Divya Madhavan Brochier et Claude
Mézin-Wilkinson.
Enfin, au terme de ce parcours, je remercie enfin celles et ceux qui me sont chers et que
j’ai quelque peu délaissés ces derniers mois pour achever cette thèse. Leurs attentions et
encouragements m’ont accompagné tout au long de ces années. Je suis redevable à mes parents,
Nariman et Bassam, pour leur soutien moral, matériel et leur confiance indéfectible dans mes
choix. Leur présence et leurs encouragements sont pour moi les piliers fondateurs de ce que je
suis et de ce que je fais. Il ne me reste plus qu'à saluer mon frère Karim qui était là… quand
personne d’autre ne l’était.
Bassem Haidar
France, Décembre 2021

It’s not about being the biggest… It's about pursuing greatness!


Table of Contents
1
Table of Contents List of Figures ......................................................................................................................................... 5
List of Tables ........................................................................................................................................... 7
List of Abbreviations ............................................................................................................................... 8
Summary ................................................................................................................................................. 9
Résumé .................................................................................................................................................. 13
Chapter 1: General Introduction ............................................................................................................ 17
1. Climate Change: from Global Warming to Road Transportation Decarbonization ...... 19
1.1. Definition of Climate Change ........................................................................................... 19
1.2. The Necessity for Public Interventions ............................................................................. 22
1.3. Solutions for a Decarbonized Road Transportation .......................................................... 23
2. Electric Vehicles as a Solution ...................................................................................... 25
2.1. Definition of Electric Vehicles .......................................................................................... 25
2.2. Types of Electric Vehicles ................................................................................................. 25
2.3. Brief History of Electric Vehicles ..................................................................................... 26
2.4. Technical Components of EV ........................................................................................... 28
2.5. The Environmental Footprint of EV .................................................................................. 33
3. Barriers to Adoption of EV ........................................................................................... 36
3.1. Technical Barriers ............................................................................................................. 36
3.2. Social Barriers ................................................................................................................... 37
3.3. Economic Barriers ............................................................................................................. 37
3.4. Infrastructure Barriers ....................................................................................................... 38
3.5. Policy Barriers ................................................................................................................... 38
4. Charging Infrastructure for Electric Vehicles ............................................................... 40
4.1. EV Infrastructure Characteristics ...................................................................................... 40
4.2. The Chicken and Egg Electric-Mobility Dilemma ............................................................ 41
5. Business model and scenario definition ........................................................................ 42
5.1. Business Model Definition ................................................................................................ 42
5.2. Electric Vehicle Ecosystem Members ............................................................................... 43
6. Contributions of This Dissertation ................................................................................ 47
6.1. Research Gaps Identification ............................................................................................. 47
6.2. Research Questions and Scope .......................................................................................... 48
6.3. Graphical Presentation of the Research Questions ............................................................ 49
6.4. Description of Chapters ..................................................................................................... 49
References ............................................................................................................................ 56
Chapter 2: Review of Optimization Objectives and Their Consequences for Electric-Vehicle Charging
Infrastructure ......................................................................................................................................... 63

Table of Contents
2
1. Introduction ................................................................................................................... 65
2. Methodology ................................................................................................................. 67
2.1. Literature Selection ........................................................................................................... 67
2.2. Structure of Reviewed Articles ......................................................................................... 67
3. Introduction to Technical Aspects ................................................................................. 71
3.1. Electric Vehicles ................................................................................................................ 71
3.2. Charging Infrastructure ..................................................................................................... 71
3.3. Problem Identification ....................................................................................................... 72
4. Analysis of Charging Infrastructure Optimization Objectives ...................................... 73
4.1. Minimizing the Cost .......................................................................................................... 73
4.2. Maximizing Coverage ....................................................................................................... 75
4.3. Minimizing Failed Trips .................................................................................................... 77
4.4. Minimizing the Environmental Impact.............................................................................. 78
4.5. Minimizing the Distance between Demand and Charging Points ..................................... 78
4.6. Other Optimization Objectives .......................................................................................... 79
5. Discussion and determination of research gaps ............................................................ 80
5.1. Gaps in Input Data ............................................................................................................. 80
5.2. Gaps in the Optimization Procedure .................................................................................. 86
6. Conclusion and Perspectives ......................................................................................... 88
References .......................................................................................................................... 100
Chapter 3: Assessing the trade-offs between battery capacity and public charging infrastructure of
electric vehicles: urban and rural French case studies for daily needs ................................................ 109
1. Introduction ................................................................................................................. 111
2. Literature Review ........................................................................................................ 114
2.1. Estimating drivers’ needed range .................................................................................... 114
2.2. Determining The Optimal Battery Capacity .................................................................... 115
2.3. Deployment of Charging Infrastructures ......................................................................... 116
2.4. Investments in Both Technologies .................................................................................. 117
3. Methodology ............................................................................................................... 118
3.1. Modelling the BEV Charging Needs ............................................................................... 119
3.2. Modelling the Charging Infrastructure Demand ............................................................. 119
3.3. Cost Model ...................................................................................................................... 120
4. Data and Techno-Economic Parameters ..................................................................... 123
5. Results ......................................................................................................................... 125
5.1. Individual Driving Profiles .............................................................................................. 126
5.2. Charging Infrastructure Demand ..................................................................................... 126
5.3. Costs Models ................................................................................................................... 127
5.4. Sensitivity Tests .............................................................................................................. 131
Table of Contents
3
6. Conclusion and Policy Recommendations .................................................................. 138
6.1. Conclusion ....................................................................................................................... 138
6.2. Policy Recommendations ................................................................................................ 139
References .......................................................................................................................... 141
Appendix 3.A Techno-Economic Parameters of the Cost Models .................................... 145
Chapter 4: The Influence of Public Charging Infrastructure Deployment and Other Socio-Economic
Factors on Electric Vehicle Adoption in France ................................................................................. 147
1. Introduction ................................................................................................................. 149
2. Literature Review ........................................................................................................ 151
3. Data and Methodology ................................................................................................ 154
3.1. Data ................................................................................................................................. 154
3.2. Methodology ................................................................................................................... 159
4. Results ......................................................................................................................... 162
4.1. BEV Model Regression ................................................................................................... 162
4.2. PHEV Model Regression ................................................................................................ 164
4.3. Comparison of BEV and PHEV Models with the Literature .......................................... 165
4.4. Policy Recommendations ................................................................................................ 167
5. Robustness Checks ...................................................................................................... 169
5.1. Robustness Check 1: Removing Random Departments .................................................. 170
5.2. Robustness Check 2: Excluding Departments with Big Cities ........................................ 170
5.3. Robustness Check 3: Removing Charging Infrastructure Control Variables .................. 170
6. Conclusion ................................................................................................................... 171
References .......................................................................................................................... 173
Appendix 4.A: Overview of the BEV and PHEV Evolution in France ............................. 177
Appendix 4.B: Correlation Between Model Covariates ..................................................... 178
Appendix 4.C: Results of Regressions with Robustness Checks ....................................... 179
Chapter 5: Assessing the 2021-2025-2030 CO2 Standards on Automakers' Portfolio Vehicles'
Segments ............................................................................................................................................. 183
1. Introduction ................................................................................................................. 185
2. Literature Review ........................................................................................................ 188
3. Methodology ............................................................................................................... 191
3.1. Calculation of CO2 Targets ............................................................................................. 191
3.2. Determination of PHEV/BEV sales share ....................................................................... 193
4. Data ............................................................................................................................. 194
4.1. PHEV and BEV Cost Assumptions ................................................................................. 194
4.2. PHEV and BEV Techno-environmental Assumptions .................................................... 196
5. Results ......................................................................................................................... 198
5.1. Results ............................................................................................................................. 199

Table of Contents
4
5.2. Discussion ....................................................................................................................... 204
6. Conclusion and Future Research ................................................................................. 207
References .......................................................................................................................... 209
Chapter 6: General Conclusion ........................................................................................................... 213
1. Summary of Chapters ..................................................................................................... 213
Chapter 1 ..................................................................................................................................... 213
Chapter 2 ..................................................................................................................................... 214
Chapter 3 ..................................................................................................................................... 214
Chapter 4 ..................................................................................................................................... 215
Chapter 5 ..................................................................................................................................... 216
2. Transversal Considerations ............................................................................................ 216
2.1. Ecosystem Cooperation ........................................................................................................ 216
2.2. Policies Identification ........................................................................................................... 217
3. Future Works .................................................................................................................. 218
3.1. Battery Capacity and Public Charging Infrastructure Trade-Offs ........................................ 218
3.2. Analysis of the BEV and PHEV Markets in France ............................................................. 219
3.3. Analysis of the CO2 Regulations on the OEM's Portfolio ................................................... 219
3.4. Beyond the Chapters............................................................................................................. 220

List of Figures
5
List of Figures Figure 1.1 Global Average Temperature Anomaly from 1850 to 2018 ................................... 19
Figure 1.2 Atmospheric CO₂ Concentration, 803719 BCE to 2018 ........................................ 20
Figure 1.3 Annual Total CO2 Emissions, by World Region, from 1751 to 2017 ................... 20
Figure 1.4 Per Capita CO2 Emissions (in t CO2/cap/yr) from Fossil Fuel Use, industrial
processes, and product use ...................................................................................................... 21
Figure 1.5 Total Global Annual Emissions of Fossil CO2 in Gt CO2/yr by Sector ................ 21
Figure 1.6 GHG Emissions by the Transportation Sector ........................................................ 22
Figure 1.7 Different Configurations of Electric Vehicles ........................................................ 28
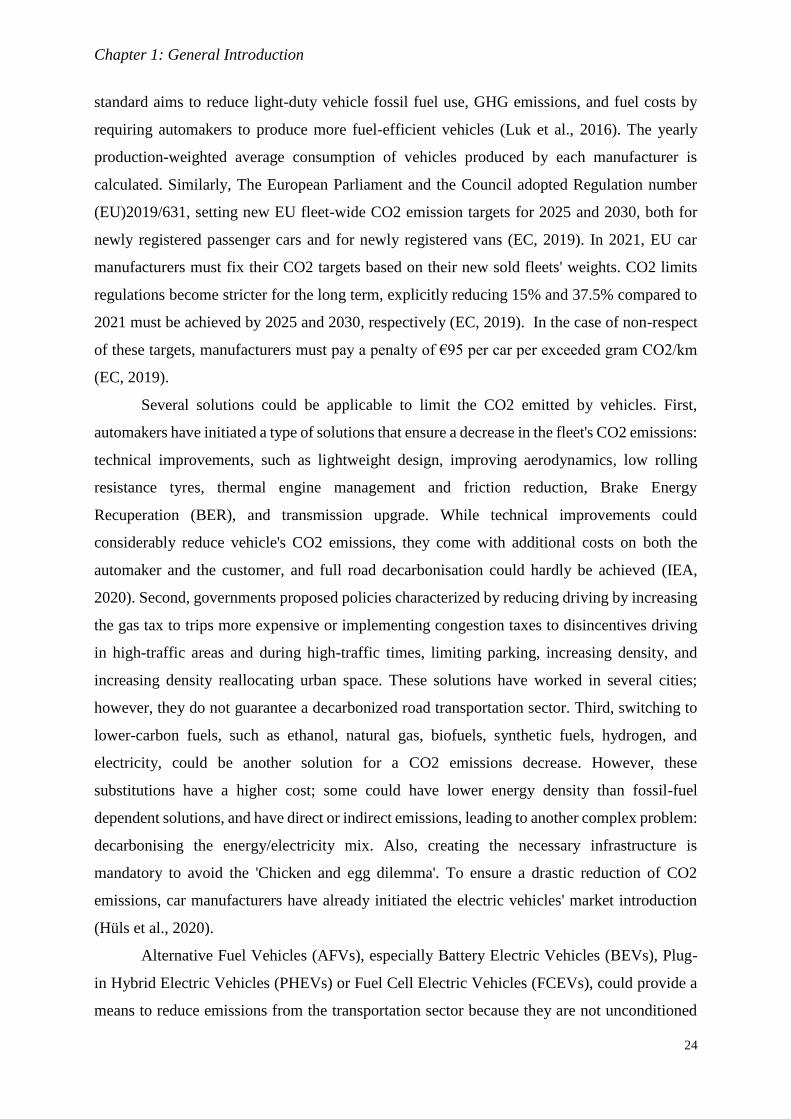
Figure 1.8 Charging process of electric vehicles ..................................................................... 32
Figure 1.9 Charging Connector in Electric Vehicles ............................................................... 33
Figure 1.10 Simplified View of the Well-to-Wheels and Equipment Flows ........................... 34
Figure 1.11 EV Ecosystem Members ....................................................................................... 43
Figure 1.12 Characteristics of the BEV Considered in this Thesis .......................................... 44
Figure 1.13 Characteristics of the BEV Considered in this Thesis .......................................... 45
Figure 1.14 Characteristics of the Charging Infrastructure Considered in this Thesis ............ 47
Figure 1.15 Graphical Presentation of the Research Questions ............................................... 49
Figure 2.1 Number of Publications in Google Scholar (until October 2019) .......................... 68
Figure 2.2 Structure of Reviewed Articles ............................................................................... 69
Figure 2.3 Problem Identification within the Three Parties ..................................................... 74
Figure 3.1 Model Overview ................................................................................................... 118
Figure 3.2 Urban and Rural Case Studies Areas .................................................................... 125
Figure 3.3 Number of BEVs That Use One Charger as a Function of Battery Capacity ....... 127
Figure 3.4 The Cost Model (ΔEAC) and Monthly Charging Duration for the BEV Customer
(Urban & Rural Needs) .......................................................................................................... 129
Figure 3.5 The Cost Model of the Charging Point Operator .................................................. 130
Figure 3.6 Win-Win situations presentation .......................................................................... 131
Figure 3.7 Sensitivity Test 1 Results: BEV Purchasing Subsidies Variation ........................ 132
Figure 3.8 Sensitivity Test 1 Results: Charger Instalment Subsidies Variation .................... 133
Figure 3.9 Sensitivity Test 2 Results on the Urban Case Study Variation ............................. 134
Figure 3.10 Sensitivity Test 3 Results on the Urban Case Study Variation ........................... 135
Figure 3.11 Sensitivity Test 3 Results on the Rural Case Study Variation ............................ 135
Figure 3.12 Sensitivity Test 4 Results on the Urban Case Study ........................................... 136
Figure 3.13 Sensitivity Test 4 Results on the Rural Case Study Variation ............................ 136
Figure 4.1 Evolution Percentage of the BEV (Left) and PHEV (Right) Market Shares in 95
French Departments between 2015 and 2019. ....................................................................... 176
Figure 5.1 Schematic Illustration of a New Car Average CO2 Emission Levels in the E.U. in
2000–2030 .............................................................................................................................. 183
Figure 5.2 Methodology Overview ........................................................................................ 188
Figure 5.3 Calculation of CO2 Targets Methodology ............................................................ 189
Figure 5.4 Representation of the Transportation Sector's Structure Used in this Study ........ 191
Figure 5.5 Li-Ion Battery Packs Price Projection .................................................................. 192
Figure 5.6 Incremental Costs of BEV and PHEV for 2020, 2025, 2030 ............................... 193
Figure 5.7 Simplified View of the Well-to-Wheels and Equipment Flows ........................... 194
Figure 5.8 The determination of 2021 CO2 Targets of Different Scenarios in gCO2/km ..... 197
Figure 5. 9 Total Costs (Incremental Costs and CO2 Fines) for Four Vehicles Segments and

List of Figures
6
2021, 2025, 2030 .................................................................................................................... 200
Figure 5.10 BEV and PHEV Sales Shares That Ensure the Minimization of the Costs ........ 200
Figure 5.11 Combinations of BEV and PHEV Sales Shares That Ensure the Minimum Cost
and the Respect of CO2 Engagement (P=0) for four Segments and 2021, 2025, 2030 ......... 201

List of Tables
7
List of Tables Table 1.1 Typical Electric Vehicles and Their Main Characteristics....................................... 29
Table 1.2 ICEV, BEV, and PHEV Main Components ............................................................. 31
Table 1.3 Barriers Types Considered in this Thesis ................................................................. 41
Table 1.4 Charging Infrastructure Main Characteristics .......................................................... 44
Table 1.5 Literature Gaps Considered in this Thesis ............................................................... 51
Table 2.1 Methods Names Abbreviations ................................................................................ 71
Table 2.2 Charging Modes Parameters .................................................................................... 73
Table 2.3 Publications Having Cost Minimization as the Optimization Objective ................. 92
Table 2.4 Publications Having Maximization Demand Coverage as the Optimization
Objective .................................................................................................................................. 96
Table 2.5 Publications Having Minimization of Failed Trips as the Optimization Objective . 97
Table 2.6 Publications Considering Minimizing the Distance between Demand and Charging
Points ........................................................................................................................................ 98
Table 2.7 Publications Considering Various Optimization Objectives .................................... 99
Table 3.1 Techno-Economic Parameters of EACVEH ............................................................. 122
Table 3.2 Techno-Economic Parameters of EACCPO ............................................................. 123
Table 3.3 Summary of sensitivity tests .................................................................................. 137
Table 3.4 Charging Tariffs of Different Operators ................................................................ 145
Table 3.5 BEV Techno-Economic Parameters ...................................................................... 145
Table 3.6 ICEV Techno-Economic Parameters ..................................................................... 146
Table 3.7 Charging Infrastructure Techno-Economic Parameters ......................................... 146
Table 4.1 Overview of Econometric Studies Presented in the Literature Review ................. 155
Table 4.2 Charging Costs of Different Charging Powers ...................................................... 156
Table 4.3 Summary Statistics of Covariates .......................................................................... 159
Table 4.4 Regression Results of Logarithmic form of BEV and PHEV Market Shares
log(PEV) ................................................................................................................................. 165
Table 4.5 Variable Correlation Coefficients .......................................................................... 177
Table 4.6 Sensitivity of Regression Results for Models against the Departments Exclusion 178
Table 4.7 Sensitivity of Regression Results for Models against the Exclusion of Big Cities 179
Table 4.8 Sensitivity of Regression Results for Models against the Exclusion of Charging
Infrastructure Control Variables ............................................................................................. 180
Table 5.1 Variables Definition ............................................................................................... 190
Table 5.2 Variables Definition ............................................................................................... 190
Table 5.3 ICEV, BEV, and PHEV Parameters....................................................................... 193
Table 5.4 Weight and CO2 Emissions of Passenger Car fleet used in this Study ................ 195
Table 5.5 Comparing the arguments of defending PHEVs and BEVs ................................... 204

List of Abbreviations
8
List of Abbreviations AFVs Alternative Fuel Vehicles
AC Alternative Current
BEVs Battery Electric Vehicles
CAFE Corporate Average Fuel Economy
CAPEX Capital Expenditure
CO2 Carbon dioxide
CPO Charging Point Operator
C-Rate Charging Rate
DC Direct Current
EC European Commission
EMSP Electric Mobility Service Provider
EU European Union
EVs Electric Vehicles
FCEVs Fuel Cell Electric Vehicles
GHG Greenhouse Gas
GPS Global Positioning System
HEVs Hybrid Electric Vehicles
ICEVs Internal Combustion Engine Vehicles
kW Kilowatt
kWh Kilowatt-hour
LCA Life Cycle Assessment
NEDC New European Driving Cycle
OPEX Operational Expenditure
PEVs Plug-in Electric Vehicles
PHEVs Plug-in Hybrid Electric Vehicles
SoC State of Charge
TTW Tank-To-Wheel
V2G Vehicle-to-Grid
WLTP Worldwide Harmonized Light-Duty Vehicles Test Procedure
WTT Well-To-Tank
WTW Well-To-Wheel

Summary
9
Summary
Climate change is a global phenomenon characterized by changes in the normal climate
in terms of temperature, precipitation, and wind, over 30 years worldwide, and presents one of
the world's most pressing challenges. According to the European Environment Agency, around
22% of the total global emissions are related to the transportation sector (and combustion
engines - except in the industry). Road transportation emits 70% of the whole transportation
sector’s GHG emissions. More specifically, standard cars emit 44.3% of the GHG emissions
associated with transportation. Public authorities, governments and world unions need to stop
this upward trend by applying several public interventions. In 2011, The European Union set
the goal to reduce 60% of all GHG emissions from the transportation sector by 2050, compared
to 1990. Therefore, additionally to the Paris Agreement of 2016, The European Commission
(EC) implemented the directive (EC)443/2009 and The European Parliament and the Council
adopted Regulation (EU)2019/631. These directives force automotive industries to reach an
average of 95 gCO2/km/vehicle by 2020 in all European markets, based on their vehicle’s
weight sales, and to respect a decrease of these emissions by 37.5% in 2030 compared to 2020.
Several solutions could be applicable to limit the CO2 emitted by vehicles. First,
automakers have initiated a solution that ensures a decrease in the fleet's CO2 emissions:
technical improvements, such as lightweight design and improving aerodynamics. While
technical improvements could considerably reduce a vehicle's CO2 emissions, they come with
additional costs on both the automaker and the customer, and meeting CO2 long-term
engagement decarbonisation could hardly be achieved with. Switching to lower-carbon fuels,
such as ethanol, natural gas, biofuels, synthetic fuels, hydrogen, and electricity, could be
another solution for achieving strict CO2 emissions targets. Electric Vehicles, Battery Electric
Vehicles (BEVs) or Plug-In Hybrid Electric Vehicles (PHEVs) present a promising solution for
replacing Internal Combustion Engine Vehicles (ICEVs) thanks to their low or zero-emission.
Indeed, these emissions highly depend on the electricity mix of the country. However, several
barriers are still facing its widespread purchasing activity: namely technical (battery technology
and Research & Development (R&D)), social (lack of knowledge, and perspective,
acceptability or social feasibility), economic (vehicle price, battery cost), infrastructure
(charging infrastructure coverage), and policy (lack of clear governmental roadmap).
Additionally to the automaker and the client, a new member is involved in the charging
infrastructure's business ecosystem. Such infrastructure development is very capital intensive
and requires the high adoption of electric vehicles. This so-called "egg and chicken problem"

Summary
10
dilemma is a significant issue in the electrification of passenger cars and has significant
consequences on the design of support policies. Moreover, the emergence of EVs as an
alternative to conventional cars (with an internal combustion engine) is pushing automotive
manufacturers to adjust their business models and investigate new innovative ones.
This dissertation aims at investigating innovative business models by examining the
transactions within the members of the EV ecosystem. This dissertation deals with prospective
and multidisciplinary research in economics, management sciences, and engineering sciences
on decarbonised car systems' future. This thesis explores various facets of the electric cars
transition. It evaluates the technical, economic, and environmental perspectives of specific
questions that ensure the decarbonisation of the automotive transportation sector and boost the
electric vehicle market in Europe and especially in France. This report comprises autonomous
and heterogeneous chapters that share the same goal: boosting the energy transition in the
automobile sector by eliminating the barriers stopping the electric vehicle uptake.
The First Chapter exposes the background of this thesis by providing an overview of
techno-economic-environmental aspects of electric mobility transition, detailing the main key
factors, and pointing out the main research gaps and questions in the literature. The Second
Chapter addresses the charging point operator member interactions within the ecosystem by
addressing the infrastructure deployment main barriers. This chapter presents a literature review
about the charging infrastructure deployment methodologies, and it mentions the neglected set
of parameters that are noteworthy and should be considered in further studies of charging
network deployment: namely the application in urban and rural areas while considering driving
behaviours and the driver’s comfort, temporal horizon, environmental impact (LCA chargers),
new mobility services, and external conditions. The Third Chapter investigates the trade-offs
between the different-power charging infrastructure and the BEV owner by considering: BEV
investment and range, public infrastructure availability, at-home charger availability, and the
adaptability between charger and BEV in terms of technical constraints. We concluded with the
most suitable BEV battery capacity for urban and rural different needs, and the installation of
fast chargers. The main goal of the Fourth Chapter is to analyse the influence of socio-
demographic (population density, age, unemployment rate), economic (subsidies, taxes
exemption, income, gasoline price), availability (number of BEV models, number of PHEV
models), and technical (density of slow-and-normal chargers, density of fast chargers, density
of ultra-fast chargers) factors on the electric vehicle adoption in French departments, from 2015
to 2019, using mixed-effects regression. This chapter points out policy recommendations to
accelerate the electric mobility transition. The Fifth Chapter analyses the influence of the

Summary
11
Regulation number (EU)2019/631 adopted by The European Union and Commission on the
automotive manufacturers’ portfolio and compares the results with the directive of the European
Commission.
These findings could be analysed using a transversal approach to link the chapters. We
identify two main dimensions. First, this dissertation focuses on ecosystem cooperation by
providing solutions that maximize the utilities of all members in terms of battery capacity and
charging power. Second, this dissertation comes with policy identification that helps to identify
roadmaps for electric mobility transition.

12

Résumé
13
Résumé
Le dérèglement climatique est un phénomène global caractérisé par des modifications
du climat en termes de température, de précipitations et de vent, depuis une période de 30 ans,
à l'échelle mondiale, et constitue l'un des défis les plus pressants pour la Planète. Selon l'Agence
européenne pour l'environnement, environ 22 % du total des émissions mondiales sont liées au
secteur des transports (et aux moteurs à combustion - sauf dans l'industrie). Le transport routier
émet 70 % des émissions de GES de l'ensemble du secteur des transports. Plus précisément, les
voitures standard émettent 44,3 % des émissions de GES associées au transport. Les autorités
publiques, les gouvernements et les organisations mondiales doivent arrêter cette tendance à la
hausse en appliquant plusieurs modes d’interventions publiques. En 2011, l'Union européenne
s'est fixé pour objectif de réduire de 60 % les émissions de GES du secteur des transports d'ici
2050, par rapport à 1990. Par conséquent, en plus de l'accord de Paris de 2016, la Commission
européenne (CE) a mis en œuvre la directive (CE)443/2009 et le Parlement européen avec son
Conseil ont adopté le règlement(UE)2019/631 : ces directives obligent les industries
automobiles à atteindre une moyenne de 95 gCO2/km/véhicule d'ici 2020 sur tous les marchés
européens, sur la base du poids des véhicules vendus, et à respecter une diminution de ces
émissions de 37,5% en 2030, par rapport à 2020.
Plusieurs solutions pourraient être appliquées pour limiter les émissions de CO2 des
véhicules. Tout d'abord, les constructeurs automobiles ont lancé des solutions qui garantissent
ensemble une diminution des émissions de CO2 de la flotte : toutes les améliorations
techniques, telles que la conception légère et l'amélioration de l'aérodynamisme, etc. Bien que
ces améliorations techniques puissent réduire considérablement les émissions de CO2 d'un
véhicule, elles s'accompagnent de coûts supplémentaires tant pour le constructeur que pour le
client, et semblent insuffisantes pour respecter l'engagement de décarbonisation à long terme.
Le passage à des carburants à faible teneur en carbone, comme l'éthanol, le gaz naturel, les
biocarburants, les carburants synthétiques, l'hydrogène et l'électricité, pourrait être une autre
solution pour atteindre des objectifs stricts en matière d'émissions de CO2. Les véhicules
électriques, les véhicules électriques à batterie (BEV) ou les véhicules électriques hybrides
rechargeables (PHEV) constituent une solution prometteuse pour remplacer les véhicules à
moteur à combustion interne (ICEV), grâce à leurs émissions faibles ou nulles. Ces émissions
dépendent fortement du mix électrique du pays. Cependant, plusieurs obstacles se dressent
encore devant la généralisation de l'achat de ces véhicules : des obstacles techniques
(technologie des batteries et recherche et développement (R&D)), sociaux (manque de

Résumé
14
connaissances et de perspectives, acceptabilité ou faisabilité sociale), économiques (prix des
véhicules, coût des batteries), d’infrastructures (couverture de l'infrastructure de recharge) et
politiques (absence de feuille de route gouvernementale claire, précise). En plus du constructeur
automobile et du client, un nouveau membre est impliqué dans l'écosystème : l'infrastructure
de recharge. Le développement d'une telle infrastructure est capitalistique et nécessite une forte
adoption des véhicules électriques. Ce dilemme dit de "l'œuf et de la poule" est un problème
central dans l'électrification des voitures particulières et a des conséquences significatives sur
la conception des politiques de soutien. De plus, l'émergence des VE en tant qu'alternative aux
voitures conventionnelles (avec un moteur à combustion interne) pousse les constructeurs
automobiles à ajuster leurs modèles d'affaires et à en rechercher de nouveaux.
Cette thèse vise donc à étudier les modèles commerciaux innovants en examinant les
transactions au sein des membres de l'écosystème des VE. Cette thèse traite de recherches
prospectives et multidisciplinaires en sciences économiques et de gestion, et sciences de
l'ingénieur, sur l'avenir des systèmes automobiles décarbonés. Cette thèse explore les
différentes facettes de la transition vers la voiture électrique. Elle évalue les perspectives
techniques, économiques et environnementales de questions spécifiques, permettant d'assurer
la décarbonisation du secteur du transport automobile et de dynamiser le marché du véhicule
électrique en Europe et notamment en France. Ce rapport est composé de chapitres autonomes
et hétérogènes qui partagent le même objectif : favoriser la transition énergétique dans le secteur
automobile en éliminant les barrières qui freinent l'adoption du véhicule électrique.
Le premier chapitre expose le contexte de cette thèse en fournissant une vue d'ensemble
des aspects technico-économiques-écologiques de la transition vers la mobilité électrique, en
détaillant les principaux facteurs clés et en soulignant les principales lacunes et questions de
recherche. Le deuxième chapitre traite des interactions entre les membres de l'opérateur de
borne de recharge au sein de l'écosystème, en abordant les principaux obstacles au déploiement
de l'infrastructure. Ce chapitre présente une revue de la littérature sur les méthodologies de
déploiement des infrastructures de recharge et mentionne l'ensemble des paramètres négligés
qui sont dignes d'intérêt et qui devraient être pris en compte dans les études ultérieures sur le
déploiement des réseaux de recharge : à savoir l'application dans les zones urbaines et rurales,
tout en tenant compte des comportements de conduite et du confort du conducteur, de l'horizon
temporel, de l'impact environnemental (chargeurs LCA), des nouveaux services de mobilité et
des conditions extérieures. Le troisième chapitre étudie les compromis entre infrastructure de
recharge de différentes puissances et l'autonomie du BEV, ainsi que la disponibilité de
l'infrastructure publique, la disponibilité du chargeur à domicile, et l'adaptabilité entre le

Résumé
15
chargeur et le BEV en termes de contraintes techniques. Nous concluons sur la capacité de la
batterie du BEV la plus adaptée aux besoins urbains et ruraux, et sur l'installation de chargeurs
rapides. L'objectif principal du quatrième chapitre est d'analyser l'influence des facteurs
sociodémographiques (densité de population, âge, taux de chômage), économiques
(subventions, exonération d'impôts, revenus, prix de l'essence), de disponibilité (nombre de
modèles de BEV, nombre de modèles de PHEV) et techniques (densité de chargeurs lents et
normaux, densité de chargeurs rapides, densité de chargeurs ultra-rapides) sur l'adoption des
véhicules électriques dans les départements français, de 2015 à 2019, en utilisant une régression
mixed-effects. Ce chapitre met en avant des recommandations politiques pour accélérer la
transition vers la mobilité électrique. Le cinquième chapitre analyse l'influence du règlement
numéro (UE)2019/631 adopté par l'Union européenne et la Commission sur le portefeuille des
constructeurs automobiles et compare les résultats obtenus avec ceux de la directive
européenne.
Nos résultats pourraient être analysés en utilisant une approche transversale pour relier
les chapitres de la thèse. Nous pouvons identifier deux dimensions principales. Premièrement,
cette thèse se concentre sur la coopération de l'écosystème en fournissant des solutions qui
maximisent les utilités de tous les membres, en termes de capacité de batterie et de puissance
de charge. Deuxièmement, cette thèse s'accompagne d'une identification des politiques laquelle
permet de définir des feuilles de route pour une transition vers la mobilité électrique.

16

Chapter 1: General Introduction
17
Chapter 1: General Introduction
This dissertation deals with prospective multidisciplinary research on the future of
decarbonised transportation systems in economics, management sciences, and engineering
sciences. We evaluated the technical, economic, and environmental trade-offs of specific
questions that deal with the decarbonisation of the automotive transportation sector and aims to
boost the electric vehicle market in Europe, especially in France. These questions are issued
from the interactions between the members or stakeholders of the electric vehicle (EV)
ecosystem, such as building new innovative business models for charging operators,
investigating the CO2 regulations and their influence on the automotive manufacturers. The
following sections of this introductory chapter will provide the readers with a general review
of global warming and the role of electric vehicles in decarbonizing the road transportation
sector. Section 2 develops the techno-economic-environmental parameters of electric vehicles
before detailing the different types of barriers facing a high adoption of EVs. Section 3 provides
an overview of charging infrastructure characteristics before detailing the electric vehicle
ecosystem members and the scenario considered in this thesis in Section 4. This Chapter ends
with identifying the research gaps in the literature, the research questions of this Thesis, and a
summary of the Chapters of this dissertation.

Chapter 1: General Introduction
18

Chapter 1: General Introduction
19
1. Climate Change: from Global Warming to Road
Transportation Decarbonization
1.1.Definition of Climate Change
Climate change is a global phenomenon characterized by changes in the “normal”
climate, temperature, precipitation, and wind, over 30 years worldwide. It is one of the world's
most human pressing challenges. Emissions of greenhouse gases (GHG), including carbon
dioxide (CO2), nitrous oxide, methane, and others, have significantly increased global
temperatures by around 1℃ since pre-industrial times. It is now well accepted that GHG
emissions mainly come from human activities' burning fossil fuels (oil, gas, or coal). Figure 1.1
presents the global average temperature anomaly, due to its sharp increase, between 1850 and
2018. After the Industrial Revolution in 1760-1840, global temperatures have risen to around
0.7°C higher than the baseline of 1960-1990, and around 1.1°C compared to 1850.
Figure 1.1 Global Average Temperature Anomaly from 1850 to 2018 (Source: Hadley
Centre)
Figure 1.2 presents the CO2 concentrations in the atmosphere in a different period, from
800,000 years BCE to 2018, and shows a link between global temperatures and CO2
concentrations throughout Earth's history. The CO2 concentration fluctuated over this period,
between 170 ppm (parts per million) and 300 ppm, identifying two essential periods in history:
when CO2 levels are low as it is captured in ice ages and interglacial when CO2 scored high
values. Since the Industrial Revolution, the CO2 concentration sharply jumped to exceed 400
ppm in 2018. This rise is mainly explained by the dependency of human activities on fossil
fuels, especially after the revolution era. The Intergovernmental Panel on Climate Change
(IPCC) clearly stated that humans are the main reason behind climate change: "Human
influence on climate has been the dominant cause of observed warming since the mid-20th
century, while global average surface temperature warmed by 0.85°C between 1880 and 2012"
(IPCC, 2018).

Chapter 1: General Introduction
20
Figure 1.2 Atmospheric CO₂ Concentration, 803719 BCE to 2018 (Source: EPICA Dome C
CO2 record (2015) & NOAA (2018))
Not all countries around the world share the same trend of CO2 emissions. As illustrated
in Figure 1.3, the annual total CO2 emissions are experiencing modest downward trends for
Europe, The United States of America, Africa, and the Middle East. Contrary to these regions,
the related emissions emitted by the Asian regions, especially in China, are steeply growing. It
should be noted that, according to Figure 1.4, the contribution of the CO2 emissions per capita
is the highest for the United States, followed by Russia, China and the European Union
countries.
Figure 1.3 Annual Total CO2 Emissions, by World Region, from 1751 to 2017 (Source:
Carbon Dioxide Information Analysis Center (CDIAC) & Global Carbon Project (GCP))

Chapter 1: General Introduction
21
Figure 1.4 Per Capita CO2 Emissions (in t CO2/cap/yr) from Fossil Fuel Use, industrial
processes, and product use (Source: (Crippa et al., 2019))
Figure 1.5 shows global GHG emissions by primary sectoral utilization: power industry,
other industrial combustion, buildings, transportation, and other services. The CO2 emissions
associated with the power industry accounts for the highest value: more than 33% of the total
emissions. Around 22% of the total emissions are related to each of the transportation and other
industrial combustion sectors. Similarly, each of the buildings and other sectors emits around
10% of the total value.
Figure 1.5 Total Global Annual Emissions of Fossil CO2 in Gt CO2/yr by Sector (Source:
(Crippa et al., 2019))
According to the European Environment Agency (Figure 1.6), road transportation emits
the most GHG emissions (71.7%), followed by aviation (13.9%) and maritime transportation
(13.3%). Regarding the road transportation sector, 44.3% of the GHG emissions associated with
the transportation sector are emitted by standard cars. Heavy-duty trucks and buses emit around

Chapter 1: General Introduction
22
19% of these emissions, while light-duty trucks emit 8.7%.
Figure 1.6 GHG Emissions by the Transportation Sector (Source: European Environment
Agency, 2020)
Moreover, the problem of "Air quality" recently received widespread attention. It refers
to the condition of the air in our surroundings. Local air quality is determined by evaluating
various pollution indicators: natural or manufactured factors. Natural resources include
volcanic eruptions and storm dust. Manufactured pollution sources include emissions caused
by moving vehicles, toxic gases produced by industries, coal power plants, open burning of
wood or other materials, and landfills. Both sources affect the overall air quality and may cause
serious human health problems. Good air quality is related to the degree of air being clean,
clean, free of pollutants (such as smoke, dust and smog) and other gaseous impurities in the air.
The issue of air quality has become critical in recent years and concerns most major cities and
some industrial regions of the world, mainly in Asia, where air quality regulation has struggled
to keep pace with rapid industrial development and urbanisation (IEA, 2016). Local air quality
and global climate change prove two sides of the same coin: policies are aimed at reducing
greenhouse gas emissions and other pollutants from current transportation, especially cars.
Isaac (2020) divided the interventions into vehicle/fuel, planning design, industrial agricultural,
and behavioral interventions. Regarding road transportation interventions – the scope of the
thesis - air quality is likely to be improved by any intervention that promotes the uptake of low
and zero-exhaust emission vehicles, particularly electric vehicles.
1.2.The Necessity for Public Interventions
As seen in Figure 1.5, global GHG emissions have been steeply rising over the last few
decades. Therefore, governments need to stop this upward trend. Since 1992, fruitful

Chapter 1: General Introduction
23
international agreements have been reached during negotiations at events like the Conference
of the Parties (COP), such as The United Nations Framework Convention on Climate Change
(1992), The Paris Agreement (2015), and recent COPs. All these summits had well-defined
objectives: to limit the global temperature rise, build a global strategy for the fight against
climate change for the post-2020 period, and provide financial support for this roadmap. The
long-term objective is to stabilise atmospheric greenhouse gas concentrations at a level that
would prevent dangerous anthropogenic interference with the climate system. Regarding
national interventions, each country – or a group of countries - has set itself a goal of GHG
reductions and decided to adopt specific laws, such as The adoption of the Corporate Average
Fuel Economy in the United States of America in 1975, the European Commission (EC)
implemented EC directive 443/2009 and 631/2019, and the recent European green Deal. In this
thesis, we will exclusively consider European regulations.
The European Union (EU) has set the goal to reduce 60% of all GHG emissions from
the transportation sector by 2050, compared to 1990. The European Commission (EC)
implemented EC directive 443/2009 and 631/2019 (EC, 2019), forcing automotive industries
to reach an average of 95 gCO2/km/car by 2020 in all European markets. This goal is reduced
to 20 gCO2/km by 2050 to reach a decrease of 2°C (Gnann, 2015).
From the 30th of November 2015 to the 12th of December 2015, the 21st Conference
of Parties on Climate Change was held in Paris, resulting in a signature of a historical agreement
of 196 countries to undertake ambitious efforts to combat climate change. It required all parties
to put forward their best efforts through "nationally determined contributions". The 196 parties
agreed on a common goal to "hold the increase in the global average temperature to well below
2°C above pre-industrial levels and pursuing efforts to limit the temperature increase to 1.5°C"
(UNFCCC Secretariat, 2015). In order to ensure environmental integrity, a transparency
framework was created, and 5-yearly Global Stocktakes from 2023 onwards were planned.
1.3.Solutions for a Decarbonized Road Transportation
Policymakers decided to impose stringent regulation on fleet GHG Tailpipe emissions
to stimulate the R&D efforts of automotive manufacturers, leading to less-polluting vehicles.
As mentioned before, it could be achieved by boosting the energy efficiency for ICEVs or by
battery technologies and electric engines for EVs if decarbonisation of the energy sector
accompanies it. Therefore, automotive manufacturers must diversify their alternative fuel
vehicles and make these vehicles attractive to customers. This regulation was first introduced
in 1975 in the U.S. under the CAFE standard "Corporate Average Fuel Economy". This
Chapter 1: General Introduction
24
standard aims to reduce light-duty vehicle fossil fuel use, GHG emissions, and fuel costs by
requiring automakers to produce more fuel-efficient vehicles (Luk et al., 2016). The yearly
production-weighted average consumption of vehicles produced by each manufacturer is
calculated. Similarly, The European Parliament and the Council adopted Regulation number
(EU)2019/631, setting new EU fleet-wide CO2 emission targets for 2025 and 2030, both for
newly registered passenger cars and for newly registered vans (EC, 2019). In 2021, EU car
manufacturers must fix their CO2 targets based on their new sold fleets' weights. CO2 limits
regulations become stricter for the long term, explicitly reducing 15% and 37.5% compared to
2021 must be achieved by 2025 and 2030, respectively (EC, 2019). In the case of non-respect
of these targets, manufacturers must pay a penalty of €95 per car per exceeded gram CO2/km
(EC, 2019).
Several solutions could be applicable to limit the CO2 emitted by vehicles. First,
automakers have initiated a type of solutions that ensure a decrease in the fleet's CO2 emissions:
technical improvements, such as lightweight design, improving aerodynamics, low rolling
resistance tyres, thermal engine management and friction reduction, Brake Energy
Recuperation (BER), and transmission upgrade. While technical improvements could
considerably reduce vehicle's CO2 emissions, they come with additional costs on both the
automaker and the customer, and full road decarbonisation could hardly be achieved (IEA,
2020). Second, governments proposed policies characterized by reducing driving by increasing
the gas tax to trips more expensive or implementing congestion taxes to disincentives driving
in high-traffic areas and during high-traffic times, limiting parking, increasing density, and
increasing density reallocating urban space. These solutions have worked in several cities;
however, they do not guarantee a decarbonized road transportation sector. Third, switching to
lower-carbon fuels, such as ethanol, natural gas, biofuels, synthetic fuels, hydrogen, and
electricity, could be another solution for a CO2 emissions decrease. However, these
substitutions have a higher cost; some could have lower energy density than fossil-fuel
dependent solutions, and have direct or indirect emissions, leading to another complex problem:
decarbonising the energy/electricity mix. Also, creating the necessary infrastructure is
mandatory to avoid the 'Chicken and egg dilemma'. To ensure a drastic reduction of CO2
emissions, car manufacturers have already initiated the electric vehicles' market introduction
(Hüls et al., 2020).
Alternative Fuel Vehicles (AFVs), especially Battery Electric Vehicles (BEVs), Plug-
in Hybrid Electric Vehicles (PHEVs) or Fuel Cell Electric Vehicles (FCEVs), could provide a
means to reduce emissions from the transportation sector because they are not unconditioned

Chapter 1: General Introduction
25
to fossil fuel. Yet, they could emit indirect emissions, depending on their Life Cycle Assessment
and the decarbonisation of the electricity sector, that are lower than ICEV's direct emissions.
The environmental impact will be further discussed in this introductory chapter.
2. Electric Vehicles as a Solution
This section presents an overview of electric vehicles and introduces their main elements
and charging infrastructures. First, we will present some generalities about electric vehicles
(definitions, categories, history of EVs, advantages and EVs, advantages and disadvantages,
architectures and main components). Then, we will discuss their charging, the different energy
sources, and the different topologies and means of charging. Finally, we address the energy
flows in a charging system, namely the flows from the network to the vehicle (G2V) and from
the vehicle to the network (V2G).
2.1.Definition of Electric Vehicles
An electric vehicle (EV) is an alternative fuel automobile that uses electric motors and
motor controllers instead of more common propulsion methods such as the Internal Combustion
Engine Vehicle (ICEV). EVs partially or rely on electricity, stored in an energy storage device
- i.e. a battery or a fuel cell-, as a transportation fuel to power their propulsion. The job of an
electric motor transfers the energy from the battery to the vehicle's wheels. Batteries are charged
using an external electrical source using a charger. EVs are different from ICEVs in that they
can receive their energy from a wide range of sources, depending on their types, such as fossil
fuels, nuclear power, and renewable sources (tidal power, solar power, and wind power).
2.2.Types of Electric Vehicles
There are several types of EVs: Battery Electric Vehicles (BEVs), Plug-In Hybrid
Electric Vehicles (PHEVs), Hybrid Electric Vehicles (HEVs), and Fuel Cells Electric Vehicles
(FCEVs). Table 1.1 shows several details of one of the most famous electric vehicles models
in 2020-2021. Regarding the scope of this study, only BEV and PHEV are considered.
Battery Electric Vehicle (BEV): These vehicles rely on batteries as a primary energy
source. The energy sources for this type of vehicle are batteries recharged by the
electrical grid or other renewable energies, such as renewable energies (solar, wind).
These vehicles' batteries are recharged by fixed electrical outlets or by battery exchange.

Chapter 1: General Introduction
26
Plug-in Hybrid Electric Vehicle (PHEV): These vehicles rely on the fossil fuel tank
as a primary energy source and battery as a second energy source. These vehicles are
powered by an internal combustion engine, replaced by an electric motor for city traffic.
The latter is powered by a battery coupled, charged by external sockets, with an internal
combustion engine via an alternator.
Hybrid Electric Vehicle (HEV): HEVs contains a conventional internal combustion
engine and an electric propulsion system. The primary engine is the internal combustion
one, while the electric motor assists the engine, with its primary purpose being to
increase the fuel economy. Batteries cannot plug-in and recharge from the grid, so they
use their internal combustion engines and regenerative braking systems to recharge their
propulsion vehicle batteries.
Fuel Cell Electric Vehicle (FCEV): FCEVs do not have a combustion engine nor
battery, but electrochemical cells transform hydrogen into power.
Table 1.1 Typical Electric Vehicles and Their Main Characteristics (Source: official websites
of brands)
Vehicle Model Peugeot
e208
Citroën
ami
Toyota
Prius
Mitsubishi
Outlander
Toyota Mirai
Release year 2020 2020 2018 2018 2018
Type BEV BEV HEV PHEV FCEV
Entry price (€) 33000 7000 32300 37000 78900
Battery size (kWh) 46 5.5 1.3 13.8 1.6
Fossil-fuel autonomy (km) 0 0 500 550 6501
Electric autonomy2 (km) 450 75 0 55 0
CO2 emissions (g/km) 0 0 106 46 0
2.3.Brief History of Electric Vehicles
The idea of using electrical energy to move vehicles is not new and was introduced more
than 100 years ago. During this period, EV technology experienced several starts and stops.
The creation of EVs was a series of breakthroughs and was not associated with one inventor or
a country. It was during the 19th century that the first electric vehicle was introduced.
In the early 19th century, innovators in Hungary, the Netherlands and the United States
began developing batteries-powered vehicles and created the first small-scale electric vehicles.
1 Toyota Mirai uses Hydrogen as a source of energy. 2 In WLTP needs.

Chapter 1: General Introduction
27
During the second half of the 19th century, specifically in 1880, French inventors Charles
Jeantaud, Camille Faure, Gustave Trouvé and Nicolas Raffard created the first electric vehicles.
This technological feat could not have been achieved without the lead battery invention by
Gaston Planté and Camille Faure twenty years earlier. Nevertheless, in May 1899, the viability
of the electric car was revealed to the world. Indeed, the "Jamais Contente" driven by the
Belgian Camille Jenatzy exceeded 105 km/h (Høyer, 2008; Kant, 1995; Nouh, 2008).
In the 20th century, there was no considerable advancement in the technology of electric
vehicles. Research and development mainly focused on technological updates of ICEVs, made
these vehicles cheaper and more ecological with lower GHG emissions. In 1976, the US
Congress and various automakers, such as General Motors, decided to invest in the Electric and
Hybrid Vehicle Research and Development due to several worldwide crises, namely the oil
prices that rocketed and the shortage in gasoline, especially with the 1973 Arab Oil Embargo
(Matulka, 2014).
In the 21st century, and after the 2008 oil shock, electric mobility was believed to
become the "Second Automobile Revolution" (Villareal, 2014). The automotive sector, which
has already been challenged with various oil obstacles, are now confronted with the inevitable
scarcity of oil, global warming, and emissions standards imposed on the industry as a whole by
local and international authorities. The automotive industry proposes more ecological,
environmental, and independent of fossil fuels alternative solutions to address these issues.
Among the solutions put forward by car manufacturers are cars that run on biofuels, such as
ethanol gasoline, and those using other types of vehicles: electric cars.
During the 21st century, the true revival of commercial electric vehicles happened.
Released by Toyota in Japan in 1997 and worldwide in 2000, the Prius became the world's first
commercial and mass-produced hybrid electric vehicle (Matulka, 2014). In 1997, the Citroën
Berlingo was released, and it represented the first generation of this type of vehicle (Mkahl,
2015). In February 2008, Tesla released the first highway legal serial production BEVs to use
lithium-ion battery cells, with a range of more than 320 kilometres per charge (Shahan, 2015).
In late 2010, Chevrolet released the first PHEV in the US market: the Chevy Volt, a gasoline
engine and an electric drive (Matulka, 2014). Volt drivers use the electric part for most trips
and gasoline to extend their range when depleting the battery. Since late 2015, Toyota released
the Toyota Mirai, and it is recognized as the world's first FCEV car to be produced on a large
scale (Automobile Propre, 2020).

Chapter 1: General Introduction
28
2.4.Technical Components of EV
As mentioned earlier, an EV is powered by an electric motor driven by an energy source
(fuel cell, battery or internal combustion engine generator), and thus, differences are noticed
regarding the technical components of EVs.
The powertrains' technological differences are detailed in Table 1.2. ICEVs are fully
powered by traditional gasoline, diesel, biofuels, or even natural gas engines. On the contrary,
BEVs have no internal combustion engine, emission control, nor fuel tank and run on a fully
electric drivetrain powered by batteries that could be charged by plugging into an external
power source. Regarding PHEV, this type of vehicle contains a hybrid drivetrain and uses both
an internal combustion engine and an electric engine. Their battery could be charged externally
by plugging into an external power source. When the battery is depleted, the PHEV starts acting
as a regular hybrid, with the combustion engine taking the primary power source role. Yet, since
the battery is a second power source in a PHEV, its capacity is much smaller than BEV. Figure
1.7 represents the different configurations of these types of vehicles.
Figure 1.7 Different Configurations of Electric Vehicles3
3 https://thedriven.io/2018/11/14/the-ice-age-is-over-why-battery-cars-will-beat-hybrids-and-fuel-cells/

Chapter 1: General Introduction
29
Table 1.2 ICEV, BEV, and PHEV Main Components
ICEV BEV PHEV
Glider
Emission control
Integrated traction drive
Combustion engine
Electric engine
Battery
Generator, transmission, rest
2.4.1. Electric Engine
Different types of motors can be used to drive electric vehicles — motors with brushes
(e.g. DC motor) or brushless motors (e.g. synchronous or asynchronous motor) (Mkahl, 2015).
Direct current motors (DCM) are the most widely used motors. However, because of the recent
development of power electronics associated with permanent magnets, other motors could be
used in EVs, such as synchronous, synchronous, and asynchronous motors (MSAP) (Nouh,
2008).
2.4.2. Battery
Alessandro Volta invented the first battery in a voltaic cell in the 1800s (Becherif et al.,
2011). There are two types of batteries: the first one that, once used, cannot be recharged, and
the second one, which is installed in an EV, can be recharged using an external power source
and reused. The EV differs from the hybrid vehicle because it must also store the energy
necessary to ensure broader autonomy and acceptable performances. The storage requirements
are not the same for both types of vehicles. Indeed, for an EV, a high storage capacity is needed.
Batteries are "reversible" generators. They can store electrical energy in chemical form
and then restore it at any time, thanks to the reversibility of the transformation (Loukakou et
al., 2012). With the development of EVs, several battery technologies have emerged: Lead,
Nickel-Cadmium (Ni-Cd), Lithium-Ion (Li-Ion), Lithium iron phosphate (Li- phosphate),
Lithium Polymer (Li-Polymer), Nickel-Metal Hydride (Ni-MH), Zebra, and Zinc-air battery
(Mkahl, 2015). The most common type of battery installed in EVs is the Li-Ion battery.
Lithium-ion batteries have many advantages: a high power-to-weight ratio, a high energy
efficiency, and good high-temperature performance. Also, Li-Ion batteries have a low "self-
discharge" rate -i.e. they can maintain a full charge over time- compared to other technologies.

Chapter 1: General Introduction
30
Additionally, most Li-Ion battery parts are recyclable, making this technology an eco-friendly
one. The following three parameters characterize a battery:
- Usable power (P = V.I) in kW: The usable power is the battery voltage (V) product
and the maximum current it can deliver (I). The usable power must be at least equal
to the electric motor's peak power to allow it to be powered over its entire operating
range.
- Stored energy in kWh: This energy can be comparable to the volume of a vehicle's
fuel tank. The stored energy will determine an EV's autonomy and the possibilities
of recovery for a hybrid vehicle. An electric battery's energy is expressed as a
function of its capacity in Ampere hours (Ah) and its voltage.
- Charging Rate (C-Rate): First, battery sizing mainly depends on the capacity (Ah)
and the charging current (A), two parameters that define the battery C-rate: the
battery capacity rate is charged/discharged (Yong et al., 2015). The link between
the battery capacity and the charging power could be defined by the C-rate formula,
using Equation 1.1:
𝐶𝑟 =𝐼
𝐸𝑟
(1.1)
Where:
𝐶𝑟: is the C-rate (h-1)
𝐼: is the charging current (A)
𝐸𝑟: is the Energy rated (Ah).
A C-rate of 1C is also known as a one-hour discharge; 0.5C or C/2 is a two-hour
discharge, and 0.2C or C/5 is a 5-hour discharge. Some high-performance batteries can be
charged and discharged above 1C with moderate stress. The main challenge is identifying the
C-rate that makes capacity utilization and battery charging speed well balanced (Duru et al.,
2021). Indeed, achieving a high capacity utilization with low charging current rates could
aggravate the battery premature ageing process, cause the slowdown of the battery's speed and
further hurt BEV usage (Duru et al., 2021). This problem reveals the complexity of adapting
battery sizes to charging powers since charging a small battery capacity with a high current
could decrease the battery's energy storage efficiency (Waldmann et al., 2018). As EVs are

Chapter 1: General Introduction
31
evolving fast, the batteries need to improve and adapt to the stringent requirements of
automotive EVs. The Battery Management System (BMS) is a critical part of EVs to guarantee
that batteries operate safely, are protected, and last longer. The BMS will also monitor voltage,
different temperature parameters, and coolant flow (EVreporter, 2020). To clarify, when the
battery is charging, the EV BMS determines the maximum current that an individual cell could
receive. Therefore,
Overall, the literature in (Bhagavathy et al., 2021) shows that charging rates above 1C-
rate negatively affect battery life. Indeed, rapid chargers can accelerate the degradation of
batteries in vehicles. Therefore, the battery management system installed in vehicles will limit
the level of power received to prevent accelerated degradation. Therefore, the impact of rapid
charging also depends on these limits, which can be used as the numerator instead of the
charger’s power level to calculate the C-rate. Yet, the optimal C-rate varies with the chemical
composition of the battery itself.
- State of charge of the battery (SoC): The State of Charge (in %) is the level of charge
of an electric battery relative to its capacity at a given time. When a battery is fully
charged, its state of charge is charged, its state of charge is SOC = 100%. The SoC
of the battery should always stay between 20% and 80%, leading to a higher battery
lifetime (Redondo-Iglesias et al., 2019).
The range of an electric vehicle primarily depends on its battery capacity –i.e. the stored
amount of electricity. Also, an EV's autonomy is affected by other factors, such as the average
driving speed, energy efficiency, acceleration intensity, road topography, weather, number of
passengers, and baggage weight in the trunk. Therefore, two vehicles with the same battery
capacity do not share the same range; two people driving the same EV will not necessarily
obtain the same range. Since potential EV buyers aim to analyse and compare the range of
different vehicles on the market using a universal standard, several test protocols have been
developed to limit the difference between theoretical and actual ranges. Introduced by the
European Union in 1992, the standardised New European Driving Cycle (NEDC) provided
comparable fuel consumption values for all passenger vehicles and light commercial vehicles.
In September 2017, The Worldwide Harmonized Light-Duty Vehicles Test Procedure (WLTP),
a worldwide standard for testing passenger vehicles and light commercial vehicles, replaced the
NEDC standard. WLTP standard was introduced to close the gap between theoretical and actual
ranges by providing range values similar to those that a driver might experience in their daily
Chapter 1: General Introduction
32
trips, including a combination of usages: urban, suburban, and freeway travel. Indeed, driving
on highways consume up to two more than city usage. For instance, a Peugeot e208 with a 50
kWh battery capacity provides 340 kilometres of autonomy in the WLTP cycle or 450 km with
the old NEDC standard.
2.4.3. Power Converter
The third main component of an EV is the power converter. Since different energy
sources with different characteristics are used, deploying a power converter is necessary. It is
noteworthy to note that a Direct Current charges a battery. Figure 1.8 presents the current
conversion placement. The power converters that can be used on an EV are of the following
types (Boucherit, 2011; Nouh, 2008):
- Chopper: a DC to DC converter of different voltage DC/DC.
- Inverter: a DC to AC converter.
- Rectifier: an AC to DC converter.
Figure 1.8 Charging process of electric vehicles (Source:(Metais et al., 2021)
2.4.4. Charging Connector
The choice of the power converter, which depends on the vehicle and thus the
automaker's strategy, Figure 1.19, will determine the charging technology compatible with the

Chapter 1: General Introduction
33
vehicle. There is no clear charging connector standardization. Generally, vehicles are equipped
with a Type 1 (the standard connector in America and Japan) or a Type 2 (the standard
connector in Europe) connector for AC charging. Only some vehicles have a second connector
prepared for DC charging (CHAdeMO or Combined Charging System (CCS)). CCS plug is an
improved version of the Type 2 plug with two additional contacts and allows fast charging. It
also supports both AC and DC charging. More information on charging sockets are detailed in
the charging infrastructure section.
Figure 1.9 Charging Connector in Electric Vehicles4
2.5.The Environmental Footprint of EV
BEV, PHEV, HEV, and FCEV are not pollution-free due to their full-electric modes
indirectly emit air pollutants, especially CO2. GHG emissions related to EVs should be
evaluated based on their Life Cycle Assessment, a methodology for assessing environmental
impacts associated with all the life-cycle stages of a commercial product, process, service, and
components recycling. Figure 1.10 presents a simplified view of the Life Cycle Assessment of
the production process of a vehicle. Vehicles emit GHG emissions throughout their life cycle,
called Well-To-Wheels emissions (WTW), which focuses on the energy carrier's life cycle used
to move the vehicle, such as fossil fuel or electricity. The TWT life cycle can be divided into
the Well-To-Tank (WTT) and the Tank-To-Wheel stage. The WTT stage defines the emissions
required to deliver energy from its source to the vehicle's storage equipment by considering all
processes from harnessing a primary energy flow or stock to different conversion forms,
distribution, and energy carriers' storage. The TTW stage defines the emissions where the
energy carrier is used to move the vehicle while driving. The environmental burden of the WTT
stage differs a lot, depending on how the energy carrier is produced.
4 www.wallbox.com

Chapter 1: General Introduction
34
Figure 1.10 Simplified View of the Well-to-Wheels and Equipment Flows (a more detailed
view would include, for example, recycling options) (Source: (Nordelöf et al., 2014))
The main factors influencing the life-cycle CO2 emissions of electric vehicles are: the
carbon content of the electricity used for charging, the battery size and its manufacturing and
the vehicle mileage (Ellingsen et al., 2017; Jochem et al., 2015; Temporelli et al., 2020). Life
Cycle Assessment of EVs varies along with the country's electricity mix. As the power mix
may vary on several temporal scales (from hour to decades), it has been advised to control EVs'
charging could lower their indirect emissions from electricity (Jochem et al., 2015). Although
the WtT GHG emissions of electricity far from zero depend on a country's electricity mix, it is
however ignored by the European and worldwide legislations in favour of the TtW GHG
emissions, which is equal to close to zero for electric vehicles (Helmers and Marx, 2012; Jang
and Song, 2015; Jeon et al., 2020; Khan et al., 2019). Hence, our study focuses on analyzing
TtW GHG emissions considered for assessing CO2 standards in Europe.
In BEV, no CO2 emissions are released while driving, leading to zero TtW emissions.
On the contrary, since a PHEV is partially dependent on fossil fuels, the emissions of PHEVs
are calculated as a combination of the combustion engine's emissions and the electric engine,
depending on the electric driving range and with differences in the regional legislation (Hüls et
al., 2020). Thus, its TtW emissions are positive and dependent on the vehicle's segment and
driving and behaviours.
Additionally to TtW emissions, electric vehicles also have other environmental impacts
due to Particulate Matter emissions from erosion of road usage, brake and types erosion. Also,
battery production and recycling have environmental implications in mineral depletion and
Chapter 1: General Introduction
35
mining, acidification, photochemical smog pollution and air acidification, ecotoxicity and water
pollution, and GHGs emissions. Several life-cycle assessments (LCA) evaluate EVs' impact on
water and local pollution, metal rarefaction, scarce earth material. Nevertheless, battery
technology received recent widespread attention from researchers to limit its impact by
improving its technology (Hoekstra, 2019). (Aichberger and Jungmeier, 2020) provides an
extensive literature review of 50 published articles from 2005–2020 about LCA of Li-ion
batteries to assess the environmental effects of production, use, and end of life for application
in electric vehicles. Investigated LCAs showed that a battery pack of 280 kWh for the primary
energy consumption is around 120 kgCO2-eq/kWh for greenhouse gas emissions. The review
demonstrates the significant contributing aspects for the production and end-of-life life cycle
steps of EV batteries. Also, the environmental impact of battery production depends on the
country's electricity mix where these batteries are produced. Indeed, the environmental impact
will be higher for a fossil-fuel dependent electricity mix than a renewable-based one. The
European Commission, as part of the European Green Deal, the Circular Economy Action, and
the New Industrial Strategy, aims to ensure a competitive, circular, sustainable and safe value
chain for all batteries placed on the European market. The production of these batteries in
Europe is accompanied with a storing intermittent renewable energy mix. One of the European
Commission objectives, reducing GHG emissions during the entire life cycle of batteries, will
increase the expected CO2 emission reduction even further (EC, 2020). Also, regarding
recycling processes, GHG emissions outweigh the negative environmental impacts of recycling
and can reduce the life cycle greenhouse gas emissions by 20 kgCO2-eq/kWh (Aichberger and
Jungmeier, 2020).
Finally, (van Essen et al., 2011) proved that the transportation sector's, primarily
passenger cars, environmental impact has severe economic consequences. The cost could vary
from 30 €/1000 km for car usage to 15 €/1000 km for rail passengers. In 2008, the total external
transport costs in the European Union (added to Norway and Switzerland) amounted to more
than € 500 billion/year. Passenger transport causes 77% of these costs, and the responsibility
relies on passenger car usage that accounts for the highest part. Therefore, limiting the
environmental impact of the fossil-fuel dependent road transportation sector could decrease the
CO2 emissions and the economic implications of such externalities.

Chapter 1: General Introduction
36
3. Barriers to Adoption of EV
The adoption activity of EVs has been increasing since 2015. Yet, several barriers are
still facing its widespread purchasing activity. Various articles investigated the modest electric
mobility market and pointed to many barriers to the successful diffusion of EVs throughout
Europe, China, India, and the U.S., based on surveys and questionnaires. This Section aims at
defining the significant barriers presented in Table 1.3 that are facing EV adoption. For a more
detailed analysis of barriers, please refer to (Adhikari et al., 2020; Biresselioglu et al., 2018;
Noel et al., 2020; Shetty et al., 2020). The identified barriers are classified into five categories:
technical, social, economic, infrastructure, and policy. Also, we define the barriers that will be
considered in this thesis.
3.1.Technical Barriers
Technical progress in the vehicle industry plays an important role in the purchasing
activity towards the client. EVs are a relatively new technology, and potential users are
unwilling to pay for a new invention due to the lack of evidence regarding reliability and
performance (Goel et al., 2021). Also, as mentioned before, an EV has a limited range due to
the battery size. A BEV ranges from 75 km (Citroën Ami) to 620 km (Tesla Model 3). Indeed,
purchasing a large-battery BEV comes with a higher cost to the owner than small- or medium-
battery BEVs. If a driver wants to limit the price of the vehicle by purchasing a small-battery
BEV, he/she could suffer from range anxiety. Range anxiety, the fear of blackout in the middle
of the trip, presents one of the significant barriers hindering EV purchasing (Noel et al., 2020;
Zhang et al., 2013). This anxiety could impact the driver’s daily trips (Home-Work and Work-
Home) and the driver’s long trips (Vacations), leading to higher charging frequency to keep the
battery’s SoC around 80%.
Another technical barrier is the battery life that requires frequent replacements, which
is a significant burden on EV drivers (Graham-Rowe et al., 2012, p.). Indeed, EV batteries,
similarly to other types of batteries, will deteriorate over time. However, certain circumstances
can promote faster degradation, such as severe weather conditions. Drivers who are willing to
purchase an EV face this obstacle that could lead to higher expenses regarding the battery
replacement. Moreover, (Goel et al., 2021) and (Egbue and Long, 2012) concluded that the
charging duration obstacle could reach more than 10 hours. Charging a 50-kWh BEV with a 3
kW charger (so-called at-home charger) could take more than 10 hours. A charging event could
take more than an overnight, discouraging customers from buying electric vehicles. Indeed,
many solutions are available for drivers who want to use fast chargers. More information about

Chapter 1: General Introduction
37
the charging process and parameters are detailed in the Section related to the charging
infrastructure. Finally, a few models number of EVs could lead to limited EV market visibility
(Xue et al., 2014). Certainly, limited models of EVs will not give the customer a variety of
choices to choose from, leading to lower sales.
3.2.Social Barriers
Social factors, identified by information communication and the consumer
understanding of EVs, are being recognized as significant influencing variables for users
switching from ICEVs to EVs (Noel et al., 2020). Many potential EV buyers lack sufficient
information on electric vehicles and their environmental benefits (Barisa et al., 2016).
Additionally, these EV buyers are uncertain of the potential impact of EVs in decreasing CO2
emissions, thus benefiting the environment. EV buyers think that “if electric vehicles are
electricity-dependent; therefore, an increase in electric power demand will lead to higher CO2
emissions” (Kasten and Hacker, 2014). Indeed, many potential EV buyers do not have the
information about the energy mix; thus, they question the environmental-friendliness of EVs.
Besides the increased power demand, potential EV drivers consider the disposal of used
batteries as harmful to the environment, increasing uncertainty about environmental benefits
(Haddadian et al., 2015). Such concerns may be alleviated by providing consumers with reliable
information about the environmental impact of EVs (Goel et al., 2021; Shetty et al., 2020).
3.3.Economic Barriers
ICEVs have an economic advantage because they come with lower purchasing prices
than EVs. This ICEV relative advantage hinders EV uptake, leading to a significant barrier
(Biresselioglu et al., 2018; Noel et al., 2020; Sierzchula et al., 2014). Even though the total cost
of ownership of electric vehicles is lower than in ICEVs, due to fuel savings and lower
maintenance costs, many potential EV users are not aware of these benefits and only compare
the price of both types of vehicles. Also, battery replacement presents one of the barriers due to
the high cost of battery packs and their limited lifetime (Krause et al., 2013). Besides, since EV
uses electricity as a primary energy source, high electricity prices do not motivate the potential
customers to buy an EV, leading to high charging fees compared to refuelling an ICEV(Goel et
al., 2021). Finally, lack of monetary incentives, such as subsidies and tax exemption, decrease
the interest of customers in these types of vehicles (Farla et al., 2010; Wikström et al., 2016),

Chapter 1: General Introduction
38
3.4.Infrastructure Barriers
As mentioned before, range anxiety is a primary barrier that is stopping mass EV
adoption. Indeed, range anxiety could be solved by installing more charging stations. However,
this solution reveals complexity due to the “Chicken and egg electric mobility dilemma”.
Operators will not deploy charging infrastructure before high EV market share. Meanwhile, a
driver will not buy an EV if no charging stations are installed. The lack of charging networks
has been recognized as a crucial factor for consumers to buy EVs (Biresselioglu et al., 2018;
Krupa et al., 2014; Noel et al., 2020). Until today, the early adopters of EVs have deployed
private chargers at their homes. (Noel et al., 2020) and (Caperello and Kurani, 2012) identified
a lack in deploying at-home private chargers. Many households are not equipped with private
parking and should rely on public or semi-public charging infrastructure. (Lane and Potter,
2007) concluded with the insufficient number of charging stations on highways, which are a
solution for long-distance trips. Also, (Noel et al., 2020) and (Jensen et al., 2013) zoomed into
the absence of workplace charging infrastructure deployment. Besides, current EV owners are
disappointed due to the shortage in EV repair and maintenance centres or workshops compared
to ICEVs (Adhikari et al., 2020; Weiller and Neely, 2014).
3.5.Policy Barriers
While some countries already established a clear vision about neutral climate and the
diffusion of EVs, especially in Europe, The US, and China, other countries still face some
delays. The lack of long-term planning and goals on the government's part is identified as a
barrier for EV uptake (Broadbent et al., 2018). Also, the absence of an annual tax exemption
strategy encourages customers to switch to electric mobility (Farla et al., 2010). Table 1.3
details various barriers facing the adoption of electric vehicles and those considered in this
thesis.

Chapter 1: General Introduction
39
Table 1.3 Barriers Types Considered in this Thesis
Barrier Type Barrier Sources Considered
in this thesis
Technical Barriers
Lack of evidence on reliability
and performance
(Goel et al., 2021)
Limited range (Noel et al., 2020; Zhang et al., 2013)
Limited battery lifetime (Graham-Rowe et al., 2012, p.)
Charging duration (Egbue and Long, 2012; Goel et al.,
2021)
Fewer EV models (Xue et al., 2014)
Social Barriers Lack of knowledge on EVs (Noel et al., 2020)
Lack of environmental
awareness regarding EVs
(Goel et al., 2021; Shetty et al., 2020)
Economic Barriers High purchase price (Biresselioglu et al., 2018; Noel et al.,
2020; Sierzchula et al., 2014)
Battery replacement cost (Krause et al., 2013)
Higher electricity price for
charging
(Goel et al., 2021)
Lack of credit access for EVs (Wikström et al., 2016)
Infrastructure
Barriers
Lack of public charging stations (Biresselioglu et al., 2018; Krupa et
al., 2014; Noel et al., 2020)
Lack of public charging stations
on highways
(Lane and Potter, 2007)
Lack of charging stations at
workplace
(Jensen et al., 2013; Noel et al., 2020)
Lack of charging stations at
home
(Caperello and Kurani, 2012; Noel et
al., 2020)
Lack of repair and maintenance
workshops
(Adhikari et al., 2020; Weiller and
Neely, 2014)
Policy Barriers Lack of long-term planning and
goals on the government's part
(Broadbent et al., 2018)
Absence of an annual tax
exemption
(Farla et al., 2010)

Chapter 1: General Introduction
40
4. Charging Infrastructure for Electric Vehicles
With electric vehicles, the fact that oil is replaced by electricity stored in batteries means
that the charging infrastructure operator plays a significant role in the emergence of EVs. As
mentioned before, the lack of charging infrastructure deployment is one of the main barriers
facing the uptake of EVs. Also, charging a BEV takes a much longer duration (30 minutes to
more than 10 hours) than refuelling an ICEV (2.5 minutes). This Section aims at identifying a
global review of the charging infrastructure issues.
4.1.EV Infrastructure Characteristics
Three main infrastructure characteristics that differentiate chargers from one another
(IEA, 2018):
- Level: the power output range of the charger;
- Type: the socket and connector used for charging;
- Mode: the communication protocol between the vehicle and the charger.
There are many charging techniques: parked charging (conductive or wireless), battery
swapping, and supply while driving (conductive or wireless) (Grauers et al., 2013). This thesis
will cover only the conductive parked charging technique, using "a charger". The charging time
depends on the charger's speeds (amperage), battery capacity, battery SoC, vehicle's technology
(AC/DC alternative, direct current), and charging cable. We can identify and qualify a charging
point by its location, power, socket model, and current type (AC/DC, single or triple phase).
According to the international standard IEC 61851, the slowest is Mode 1, usually installed in
houses, and has a power of 3 kW using AC. Home-charging represents the primary location of
EV charging, with 80-90% of charging events (IEA, 2020). However, charging a 50 kWh BEV
could take more than 12 hours. Also, households need to be occupied with an individual and
easily accessible parking space. However, private parking availability depends on the urbanity
degree: while households are equipped with private parking in rural areas, this is not the case
for urban ones (INSEE, 2020). Yet, long charging durations push EV owners to install Level 2
chargers or search for a vacant Level 2 public charger. Mode 2 chargers power between 3 and
22kW at AC is generally found in homes or private or public parking spaces (such as parking
lots, workplaces, commercial centres). A Mode 3 charger operates at up to 50kW, using DC,
and is generally not found in personal homes. These charging points are preferably installed in
public and parking spaces. Finally, ultra-fast chargers or Mode 4 operate at powers above 50kW
using DC and are generally installed on corridors (highways). Table 1.4 provides an overview
of these charging modes, and the time is generally taken for a car to charge for 160 km. Besides,

Chapter 1: General Introduction
41
different communication protocols, which rely on different physical connections, are used by
chargers. There is a single protocol per type in Level 2 and 3 AC chargers, and the same protocol
is also used for Tesla connectors. In the case of DC fast chargers, Combined Charging System
(CCS) connectors are coupled with Power Line Communication (PLC) protocols (typically
used in smart grid communications). In contrast, CHAdeMO, Tesla and GB/T use Controller
Area Network Communication (developed initially for components inside cars)5.
A more detailed analysis about geographic spread, the calculation of charging points
while respecting the EV owner waiting time is provided in Chapter 2 and Chapter 3 of this
dissertation.
Table 1.4 Charging Infrastructure Main Characteristics
Mode [IEC 6185] Power
(kW)
Type Location Current
type
Charging time
Mode 1 (Level 1) 1 - 3 Private Home AC >10h
Mode 2 (Level 2) 3 - 22 Private/Semi-
public
Home,
Workplace
AC 2 – 12h
Mode 3 (Level 3) 22 - 50 Semi-
public/Public
Workplace, on-
street
DC 0.5 – 1.5h
Mode 4 (Level 3) >50 Public Highways DC <30 min
Refuelling an ICEV - Public Everywhere - 2.5 minutes
4.2.The Chicken and Egg Electric-Mobility Dilemma
To follow the EV uptake, deploying chargers at home and the workplace is insufficient.
Public charging infrastructure deployment at different powers, from slow charging to fast and
ultra-fast charging, is needed, and it presents an essential element for EV large-scale diffusion
(Hardman, 2019). However, such infrastructure development is very capital intensive and
requires the high adoption of electric vehicles. As long as there is not a sufficient number of
EVs, a potential charging infrastructure operator is unlikely to take the risk of installing and
operating charging infrastructure on a significant scale. On the other hand, there will not be
enough EVs in the first place as long as there are not many charging points to support them.
This lock-in effect is often called a “chicken-egg dilemma” where neither of the two parties
acts; neither charging infrastructure operators nor EV manufacturers will act before the other.
It has significant consequences on the design of support policies (Lepoutre et al., 2019; Meunier
and Ponssard, 2020).
The problem of deploying public charging infrastructure for EVs transforms a double
5 www.chademo.com

Chapter 1: General Introduction
42
transaction between the driver and the charging operator into complex businesses between
different stakeholders. Beyond the "egg or chicken problem", EV charging gathers multiple
actors, forming a business ecosystem (Kley et al., 2011; Madina et al., 2016). Infrastructure
operators install charging points and ensure their maintenance. Mobility service providers
propose EV owners an interface to use charging points. They can typically provide users with
phone apps that indicate locations of charging stations and offer roaming services. They can
also handle payment aspects. Infrastructure operators may be mobility service providers.
Interoperability platforms intermediate mobility services providers and infrastructure operators
and allow them to contract roaming agreements. Network operators ensure the connection
between charging points and the power grid.
5. Business model and scenario definition
5.1.Business Model Definition
A clear definition is given by (Zott et al., 2011): " The business model depicts “the
content, structure, and governance of transactions designed to create value through the
exploitation of business opportunities. Based on the fact that transactions connect activities,
the authors further evolved this definition to conceptualize a firm’s business model as “a system
of interdependent activities that transcends the focal firm and spans its boundaries”. Every
elaboration of business models should consider (Afuah, 2002):
- Possible revenues of the solution under the realistic hypothesis of market rules;
- Costs of implementation of the solution;
- Risks associated with the development of the solution;
- The willingness of users to adopt the solution;
- Cooperation with other actors of the value chain and interfaces to develop.
In order to identify the most suitable business model for the EVs industry, it is essential
to resume vital information about ICEVs. ICEVs manufacturers use the classical business
model, which is product-oriented. The car manufacturer is engaged to deliver the customer a
high-quality vehicle with the customer's features. These features could vary from the type of
the vehicle (sports car, hatchback, sedan), the colour, type of transmission (automatic or
manual), etc. One possibility to increase the ICEVs market penetration is to offer after-sales
services such as operation and maintenance, insurance, repair, financing. The fuelling process
is not facing market penetration because of the considerable autonomy of the vehicle, the
availability of fuelling stations, and the limited charging process. EVs and ICEVs differ in
techno-economic-environmental aspects, especially propulsion technology, which has a

Chapter 1: General Introduction
43
considerable impact on the functioning and driving experience of the vehicle regarding the
driver (Bohnsack et al., 2014). Therefore, the product-oriented business model applied in
ICEVs is no longer valid for electromobility due to various technical restrictions. Although EVs
have been getting widespread attention in the last few years, some barriers are facing their
adoption; mainly, the price, the charging duration, and the availability of charging stations. The
creation of economic value is, therefore, inescapable to boost the market penetration of EVs.
The emergence of EVs as an alternative to conventional cars with an internal combustion engine
pushes these firms to adjust their business models and investigate new innovative ones (Amit
and Zott, 2001). This step can amplify the benefits for the client and attract a large number of
customers, making the product more competitive among the companies (Bohnsack et al., 2014;
Budde Christensen et al., 2012; Fähnrich and Opitz, 2003; Kley et al., 2011; Madina et al.,
2016).
The diffusion of EVs could move from product-based to service-based business models
(Ceschin and Vezzoli, 2010) while empowering more mobility services (Kley et al., 2011).
Consequently, automotive firms' perspectives will adopt the service-oriented business models:
either user-oriented, result-oriented, or both. This thesis will focus on the result-oriented
business model by detailing different business models considering the charging point operator.
5.2.Electric Vehicle Ecosystem Members
Figure 1.11 EV Ecosystem Members
It can be seen, from Figure 1.11, that the EV industry ecosystem is a complex one, where
different transactions could be operated either from Business to Customer or Business to
Business between different members that do not share the same goals. We will present the
different scenarios of utilization elaborated by (Gnann, 2015; Kley et al., 2011; Madina et al.,

Chapter 1: General Introduction
44
2016) using morphological boxes for the customer and the charging point operator:
- Automotive manufacturer: In this dissertation, we consider that automotive
manufacturers aim to reduce the CO2 emissions of their sold fleet (in order to
comply with regulatory requirements by feet electrification : BEV and PHEV) while
maximizing their revenues. Figure 1.12 describes the business models for batteries
and vehicles using morphological boxes. Looking at the box, it becomes evident that
several utilisation scenarios that refer to business models for the automotive
manufacturer could be studied adopted from (Kley et al., 2011). One simple question
to answer when considering new business models is who owns the vehicle or the
battery. We consider that the vehicle and the battery belong to the client and are only
used by the owner. Also, we will only take into account privately-purchased
vehicles. The owner will charge the vehicle using charging infrastructure that
belongs to an independent operator. Also, we estimate that the automaker provides
after-sales services.
Figure 1.12 Characteristics of the BEV Considered in this Thesis (Concerning the
Automaker) (Source: adopted from (Kley et al., 2011))

Chapter 1: General Introduction
45
- BEV/PHEV owner: The BEV/PHEV owner/driver is the centre of interest in the
business model since the main target is to convince the driver to purchase a BEV.
All relationships with other members are considered as Business-to-Customer.
Figure 1.13 describes the business models for the BEV owner using morphological
boxes. We consider that the customer, who is the only owner of the car, will pay at
one time to purchase the vehicle, including the battery, rather than renting them and
paying a monthly fixed rate. Government subsidies are received regarding the BEV
price. Vehicles users consider many aspects when deciding which type, brand, and
model of vehicle they buy (Kley et al., 2011). The customer will use the BEV for
daily purposes; therefore, he/she will search for the most economical solution that
comes with lower costs rather than a luxurious one. Regarding the relationships with
CPO, charging procedures considered in our case are only using the public
infrastructure and using the "per hour" billing type. Subscription fees are paid to the
EMSP in order to have access to the charging stations. We consider zero additional
incomes from other services in this thesis. Figure 1.13 describes the business models
for batteries and vehicles using morphological boxes.
Figure 1.13 Characteristics of the BEV Considered in this Thesis (Concerning the BEV
Owner) (Source: adopted from (Kley et al., 2011))

Chapter 1: General Introduction
46
- Charging Point Operator (CPO): Different publications elaborated on the CPO
business model (Kley et al., 2011; Madina et al., 2016; Markkula et al., 2013). Figure
1.14 describes the business models for batteries and vehicles using morphological
boxes. The CPO has the role of physically operating infrastructure to supply the
charging process of the EV. Additional roles are the management of the charging
sessions, monitoring, maintaining, and controlling charging stations. B2B
coordination with the EMSP is essential either directly or through an agreement with
a third party, such as a marketplace operator (Madina et al., 2016). Upon this accord,
the CPO offers access to the charging infrastructure and electricity to the EMSP. We
consider that charging could be accomplished using a cable (charger) rather than the
wireless and battery swapping technologies. The accessibility category could
differentiate three types of charging infrastructure: private (at home), semi-public
(at work, supermarkets), and the public case that is our study case (on roads). These
types are categorized based on their current charging power levels: <3.7 kW-AC for
low speed, 3.7- 22 kW-AC for normal ones, 22 – 50 kW-DC for fast ones, and > 50
kW-DC for ultra-fast ones. Additionally, charging stations could come with either a
unidirectional or a bidirectional current flow. Only 7, 22, 50 kW unidirectional
chargers are studied in this thesis. We will not consider a charger-driver; therefore,
he/she will not know any information about the availability of the charger and cannot
book it. Possible operators, which take on the responsibility for installation,
maintenance, and repair of the infrastructure, are private households, semi-public
organizations, energy utilities, other independent operators, or the state. How the
operator bills the user can vary: no fee, pay per use (per kWh or per charging
duration), or a fixed rate.
- Electric Mobility Service Provider (EMSP): This actor has one of the most crucial
roles in the EV industry business model, similar to the CPO. It offers electromobility
services for EV drivers such as charging services, booking a charger, etc. An
identification card bought by the driver is mandatory to access the infrastructure. Its
price is in the upper bound of 10 – 200 USD (Wiederer and Philip, 2010). No
additional revenues for the client are measured; since Vehicle-to-Home (V2H),
Vehicle-to-Grid (V2G), smart charging, charging level control, and other services
are not the scope of the Chapter.
Due to the lack of data, we consider that CPO and EMSP are one actor, and it will be

Chapter 1: General Introduction
47
noted under CPO for the rest of the thesis. Figure 1.14 describes the business models for
batteries and vehicles using morphological boxes.
Figure 1.14 Characteristics of the Charging Infrastructure Considered in this Thesis (Source:
adopted from (Kley et al., 2011))
6. Contributions of This Dissertation
6.1.Research Gaps Identification
We identified different literature gaps that cover all the BEV ecosystem members. Table
1.5 presents the research gaps, the papers trying to bridge this gap, and the remaining gaps that
were not considered.
First, we identified the question regarding the trade-offs between bigger battery capacity
and higher power charging infrastructure. Funke et al. (2019) analysed the trade-off between
bigger battery capacity and higher-power charging infrastructure for German long-trips needs.

Chapter 1: General Introduction
48
However, some gaps remain regarding the trade-off for daily-trips needs and for drivers who
cannot install a private charger is not considered. This question presents a crucial element for a
better electric mobility transition, especially for laggards who are an essential part of the drivers.
The second question was recognized regarding the key factors that boost the electric
mobility transition, especially the different power charging infrastructure. Many articles tried
to fill the gaps by analysing the effect of deploying charging infrastructure in various countries
(Münzel et al., 2019; Sierzchula et al., 2014; Wee et al., 2018). Yet, none of these papers
considered the influence of multi-power charging infrastructure on the EV market, which
reveals complexity for charging operators' strategy and investments.
Finally, the third question is picked out concerning the influence of electrification on
the automotive manufacturer's budget. Al-Alawi and Bradley (2014) quantified the value of
PHEVs in estimating the cost of CAFE compliance for Fiat-Chrysler, Ford, and General
Motors. Nevertheless, the quantification of BEVs in estimating the cost of CAFE compliance
and the trade-off between paying the penalty and electrification is not considered.
Table 1.5 Literature Gaps Considered in this Thesis
Research questions Papers trying to bridge this gap Remaining gaps that
were not considered
What are the trade-offs between
bigger battery capacity and higher-
power charging infrastructure?
Funke et al. (2019) analysed the trade-off
between bigger battery capacity and
higher-power charging infrastructure for
German long-trips needs.
The trade-off for daily-
trips needs and for drivers
who cannot install a private
charger is not considered.
Which charging power should
publicly be installed to boost the
electric mobility transition?
(Münzel et al., 2019; Sierzchula et al.,
2014; Wee et al., 2018) analysed the effect
of deploying charging infrastructure in
various countries.
None considered the effect
of deploying different
charging power chargers.
The influence of electrification on the
automotive manufacturer's budget.
(Al-Alawi and Bradley, 2014) quantified
the value of PHEVs in estimating the cost
of CAFE compliance for Fiat-Chrysler,
Ford, and General Motors.
The quantification of
BEVs in estimating the
cost of CAFE compliance
is not considered.
6.2.Research Questions and Scope
This thesis explores various facets of the electric mobility transition. It is divided into
four chapters, each self-contained and arranged according to a transformation chronology.
Indeed, this dissertation does not claim to include all facets of the automotive system's energy
transition. Chapter one deals with the charging infrastructure optimization methods. Chapter
two considers the trade-offs between the battery capacity of BEVs and charging infrastructure

Chapter 1: General Introduction
49
deployment of different powers. Chapter three analyses the BEV and PHEV purchasing activity
in France between 2015-2019 using mixed-effects regression. Chapter four focuses on the
assessment of 2021-2025-2030 CO2 standards on automakers' portfolio vehicles' segments.
6.3.Graphical Presentation of the Research Questions
Figure 1.15 illustrates the research questions that will be treated in the following
chapters of this literature. As it can be seen, this thesis evaluated different research questions
that are identified based on the interaction between the members of the EV ecosystem. Research
Question 1 evaluates the interaction of all the ecosystem members to evaluate the key factors
that boost electric vehicle adoption. Regarding Research Question 2, it comes to evaluate the
intersection between the EV owner and the charging point operator by determining the trade-
offs between charging infrastructure and battery capacities for laggards. Finally, Research
Question 3 assesses the CO2 regulations on the OEM’s portfolio; and thus considers two
members of the ecosystem: the automaker and public authorities.
Figure 1.15 Graphical Presentation of the Research Questions
6.4.Description of Chapters
6.4.1. Chapter Two: Charging Infrastructure Deployment Methods
The Second Chapter focuses on the charging infrastructure deployment methods for
electric vehicles through a literature review.
Range anxiety, the fear of not reaching one's destination conveniently, is one of the main
barriers that stop EV uptake. It is related to the limited battery technology on the one hand, and
the availability of recharging networks on the other. Both variables determine the range of the
vehicle and the time needed to charge the battery. While one solution to reduce range anxiety

Chapter 1: General Introduction
50
could be to increase the battery size simply, this significantly increases the cost of the vehicle,
as the battery remains one of the most expensive components of an EV. Another solution could
then be to reduce the battery size in the vehicle and depend more on the presence of optimal
and easy-access charging infrastructure by an optimized spatial localization. The optimal way
to deploy recharging infrastructure depends on a complex set of variables that need to be
considered: specific times and locations, electricity grid problems (peak load and voltage
fluctuations). Concerning the EV user, the deployment of these infrastructures must be aligned
with the EV drivers' behaviour and allow the driver to charge where and when s/he wants and
in the most convenient and generally the fastest way possible. The study of charging sites
placement gained increasing attention in the last few years since it is a complex and dynamic
problem (Gnann and Plötz, 2015; Islam, 2015; Jing et al., 2016; Shareef et al., 2016). While
previous literature reviews made significant contributions to our understanding of EV charging
infrastructure localization methods, they fall short of providing an overview of optimization
goals used in these studies and the broader interdependencies between them, pointing out only
some of the mandatory research gaps.
This chapter aims to analyse 64 research publications better to understand the actual
scientific development in infrastructure location using optimization methods. Then, we discuss
the selected articles in detail concerning their used data for optimization and theoretical
methods to solve the charging infrastructure deployment. The Chapter ends by identifying
eleven research questions unanswered in the existing literature and proposes recommendations
for further research to answer them. We conclude that the studied papers were primarily data-
oriented, but data is the main restriction for the charging infrastructure deployment. Therefore,
we derived the literature's research gaps that were not covered or covered too briefly by
categorising the publications regarding the used input data. We consider that some factors
should be reviewed in more detail, such as GPS-based geographic resolution, distribution grid
constraints, driver's data (daily travelled mileage, destinations, charging behaviour), technical
parameters, temporal horizon, environmental impact, new mobility services, and external
conditions. Additionally, since queues can occur at stations, queuing theory can play an
essential role concerning the number, the speed of the chargers, and the service pricing. Based
on the discussed publications, we recommend further studies to consider more real-data
oriented models by considering a time resolution, different charging levels, the driver's comfort
factor while minimizing the cost, and taking chargers and battery LCAs as main constraints.

Chapter 1: General Introduction
51
6.4.2. Chapter Three: Assessing the trade-offs between battery capacities and public
charging infrastructure
The Third Chapter evaluates the trade-offs between battery capacities and different
power public charging infrastructure for BEVs for daily trips needs.
To reach mass penetration, BEVs will have to offer solutions that address customer
concerns in terms of economic cost (purchasing price) and daily mobility needs, as well as
convenience, such as the ability to reach one's destination in a timely and trouble-free manner.
Eliminating these barriers involves a trade-off: while integrating bigger batteries in cars
provides more range (and hence less worry about conveniently reaching one's destination), this
also comes with a higher vehicle-purchasing price. If one wants to keep purchasing prices low
by integrating smaller batteries in the vehicle, range anxiety can only be addressed by fostering
a high penetration of public charging infrastructure, with additional investments for the
charging operator. Also, destination recharging comes with a last (but not least) dilemma:
Battery size influences charging infrastructure since not all vehicles are adapted with all
charging powers. The question of adaptability between battery capacity and charging power
transfers a simple-unitary transaction for the automotive manufacturer (one car, one battery),
into complicated and costly-shared infrastructure investment, since charging operators have to
deploy various power chargers to fill the needs of all-sizes BEVs. Studying the battery size /
public recharging network question by considering different types of charging speeds and
specificities of different territories - urban versus rural areas - with real data is essential if one
wants to understand how to create the conditions for mass BEV adoption. Customer-range
needs are higher for rural areas than urban ones, making the BEV autonomy diverse the private
parking availability where at-home chargers are installed.
While determining the optimal battery size of BEVs and optimizing the charging
network have received widespread attention in the literature, the implication that battery size
influences - or makes necessary particular - charging speeds has rarely been considered.
Moreover, answering the question of battery size - public charging infrastructure combinations
reveals complexity. The customer's dual goals are to minimize purchase and operating costs
and the time spent charging the vehicle. The charging operator aims to deploy the optimal
number of chargers and minimize investment and operating costs. Since these members of the
BEV ecosystem's goals are often antagonistic, it is crucial to determine which combination of
battery capacity and recharging network investment is the most cost-efficient for each, the
customer and the charging operator.
This Chapter will analyze and compare BEV owner purchasing and usage costs,

Chapter 1: General Introduction
52
considering French government subsidies and environmental taxes, on the one hand, and CPO
investment and operational costs, taking into account French real-market charging tariffs, on
the other hand. We computed the cost and revenue models based on the Equivalent Annual Cost
(EAC) method, i.e. the cost of owning, operating, and maintaining an asset over its entire
lifetime. We assess the trade-off between bigger batteries and more chargers, with mainly four
relevant and novel contributions by i) Considering spatial analysis in terms of French urban-
and rural-mobility needs and availability of at-home chargers – considering drivers who cannot
install private chargers at-home and are obliged to use the public charging infrastructure, ii)
Taking into account technical constraints regarding the combinations of battery size and charger
speed, based on their compatibility, iii) Addressing the two main cost EAC models of the BEV
ecosystem: BEV customer and charging point operator, and iv) Concluding about profitable -
win-win - solutions for both parties based on Pareto fronts concept.
6.4.3. Chapter Four: Analyzing the BEV and PHEV sales in France
The Fourth Chapter analyses the influence of different power charging network
instalments, and other socio-economic factors, on the BEV and PHEV sales in 95 French
departments between 2015 and 2019.
French authorities have set an ambitious goal to reduce CO2 emissions and the
dependency of petroleum products from the transport sector by 20% by 2020, to bring them
back to the level they had in 1990. However, PEVs sales presented only a modest market share
of total vehicles sales in 2020, around 2%. While these technologies have been rapidly
increasing over the last decade, their market share remains low in most countries. The reasons
for the slow uptake of EVs are generally divided into technical (charging time, limited BEV
range), economic (PEV purchase, electricity, and fuel prices), awareness (client behaviour
towards new inventions, charging stations visibility, number of PEV models), and socio-
demographic factors (age, education, income, environmentalism, and urbanity degree). To
boost market share, the local authorities, such as municipalities, contributed to making EVs
more attractive to consumers by offering financial subsidies of a maximum of 5000€ to each
driver switching to electric mobility additionally to tax exemption, free parking, and access to
bus lanes. Since the lack of charging infrastructure still presents a barrier to growth in the EV
market, national and local authorities in France boosted the deployment of this infrastructure
by both installing more on-street chargers (e.g. Corri-door project) and offering up to 50% of
the cost of the charger for both private and public usage (e.g. ADVENIR project).

Chapter 1: General Introduction
53
Based on a state-of-the-art of 16 published articles that analyzed the purchasing activity
of PEVs in 30 countries using local- and country-level approaches, we begin by identifying the
market-stimulating factors associated with these studies. The impact of these factors differs
significantly between countries, as consumer behaviour varies. While investigating the
influence of these factors on the market penetration of PEVs received widespread attention in
the literature and is a vast field of research, only limited investigation has been carried out about
the potential impact of the charging infrastructure on demand for BEV/PHEV. Another research
gap, which we will try to fill in this Chapter, remains on the influence of different power
charging infrastructure deployment on PEV adoption. Finally, we aim to evaluate how the
studied factors vary between the BEV and PHEV markets.
To fill these three research gaps, we analyze the influence of different covariates on
privately-purchased BEV and PHEV markets, separately, in French departments from 2015 to
2019 using mixed-effects regression. These factors are divided into different categories: socio-
demographic (population density, age, unemployment rate), economic (subsidies, taxes
exemption, income, gasoline price), availability (number of BEV models, number of PHEV
models), and technical (density of slow-and-normal chargers, density of fast chargers, density
of ultra-fast chargers) covariates. The data of these factors were gathered from different sources,
including government websites and WordPress articles. To the best of our knowledge, our study
is the first to isolate the impacts of local-level incentives and four charging speeds (slow,
normal, fast, and ultra-fast chargers) on the adoption rate of BEVs PHEVs in France. We find
different sets of covariates to be significantly correlated with BEV and PHEV market shares,
respectively, leading to different interpretations regarding the vehicle’s technology. The
number of available BEV/PHEV models and energy prices are positively associated with BEV
and PHEV adoption. While fast, ultrafast charger density and financial incentives boost BEV
sales, more slow-and-normal charger density leads to higher PHEV sales. On the contrary,
financial incentives for PHEVs, relative to vehicles’ prices, do not boost sales and is open for
further studies.
Policy recommendations are discussed based on the results for the automotive industry,
the charging operator, and the local authorities. First, it is recommended that the automotive
industry provide various models on the market of different sizes, battery capacities/autonomies,
styles, and designs. A variety of choices could increase the awareness towards clients, resulting
in buying a BEV/PHEV. Second, charging infrastructure operators should consider a strategic
plan while deploying chargers by providing public fast and ultrafast chargers rather than slow-
and-normal speeds. In addition, we recommend operators provide different charging pricing

Chapter 1: General Introduction
54
methods and tariffs, taking into account a variety of BEV and PHEV types, with different
battery sizes. Finally, local and national governments should consider economic incentives such
as gasoline taxes and subsidies as tools to encourage clients to buy PEVs. Besides, we
recommend local authorities concentrate their efforts on providing and/or increasing economic
incentives (e.g. subsidies) to the instalment of fast and ultrafast public chargers instead of
providing incentives to the instalment slow-and-normal public chargers.
6.4.4. Chapter Five: Assessing the 2021-2025-2030 CO2 standards on automakers'
portfolio vehicles' segments
The Fifth Chapter analyses the assessment of the 2021-2025-2030 CO2 standards on
automakers' portfolio vehicles' segments.
To achieve an intermediate target of at least 55% net reduction in GHG emissions by
2030 and a climate-neutral EU by 2050, the European Parliament and the Council adopted
Regulation number (EU)2019/631, setting new EU fleet-wide CO2 emission targets for 2025
and 2030, both for newly registered passenger cars and for newly registered vans. In 2021, EU
car manufacturers should fix their CO2 targets based on their new sold fleets' weights. For the
long term, CO2 limits regulations become stricter, explicitly reducing 15% and 37.5%
compared to 2021 must be achieved for 2025 and 2030, respectively. In the case of non-respect
of these targets, manufacturers must pay a penalty of €95 per gram CO2 of exceedance per sold
car. While technical improvements could considerably reduce the fleet's CO2 emissions, long-
term emissions targets could hardly be achieved. Therefore, car manufacturers have already
initiated fleet hybridisation and electrification, i.e. selling more electric and hybrid vehicles,
which proves to be one of the promising solutions to achieve strict CO2 targets. Recently, the
discussion regarding the cost-effectiveness of CO2 regulations has been modernized due to the
stricter CO2 targets, pushing researchers to evaluate the cost implication of technical
improvements on both the client and the automotive manufacturer. While the impact of
technical improvements has received widespread attention in the literature, questions remain
on the influence of fleet electrification, using both BEVs and PHEVs on the automaker's budget.
This Chapter aims to close the literature gap, to investigate whether BEVs and PHEVs
can offer an economic value in helping an automobile manufacturer comply with CO2
standards. This study also focuses on assessing the trade-off between BEV/PHEV incremental
costs – the difference in production cost between a BEV/PHEV and ICEV of the same segment
- and the penalty cost under the EU CO2 regulations. To address this question, this Chapter
describes a model of the CO2 compliance for the automaker for the years 2021–2030, using

Chapter 1: General Introduction
55
four vehicle segments. First, we calculate the 2021-2025-2030 CO2 targets based on the weight
of the vehicle. Second, we determine the combinations of BEV and PHEV sales shares that
ensure minimum costs (incremental costs and penalty if applied). Third, we determine the
combinations of BEV and PHEV sales shares that ensure respect for the CO2 targets (no penalty
applied for non-respect of the regulations). Finally, we evaluated the trade-offs between these
two options to address this trade-off for every segment and year. Based on our assumptions, we
found that the minimum costs are conditioned with three criteria: the evolution of regulations
per year, the vehicle's size –i.e. weight and emissions-, and the electrification type
(BEV/PHEV).
Globally, we found that minimizing the costs comes concerning CO2 standards, thus,
zero fines. Results could be presented based on two dimensions: per year and segment. First,
since long-term standards become stricter, fines will sharply increase with 0% BEV/PHEV
sales. Also, respecting long-term CO2 targets by electrification comes with a trade-off: Indeed,
while electrification will ensure the CO2 engagement, it comes with higher costs than fines,
especially with a 100% BEV scenario compared to 100% PHEV scenario, since the battery
packs price presents most of the vehicle's incremental cost. Therefore, even if the battery packs
price would decrease, the optimum would be achieved with specific BEV/PHEV sales
combinations. Regarding the Segment analysis, selling more oversized vehicles comes with
several trade-offs: more weight leads to less strict CO2 standards, more CO2 emissions, and
more incremental costs due to the battery price. Results showed that the bigger the vehicle, the
more BEV/PHEV sales are needed.

Chapter 1: General Introduction
56
References
Adhikari, M., Ghimire, L.P., Kim, Y., Aryal, P., Khadka, S.B., 2020. Identification and Analysis of
Barriers against Electric Vehicle Use. Sustainability 12, 4850.
https://doi.org/10.3390/su12124850
Afuah, 2002. Afuah, A. (2004): Business models: a strategic management approach, 1, Bier-nat, J.E.
(Hrsg.), New York: McGraw-Hill/Irwin. [WWW Document]. URL
https://www.abebooks.fr/9780072883640/Business-Models-Strategic-Management-Approach-
0072883642/plp (accessed 4.20.20).
Aichberger, C., Jungmeier, G., 2020. Environmental Life Cycle Impacts of Automotive Batteries
Based on a Literature Review. Energies 13, 6345. https://doi.org/10.3390/en13236345
Al-Alawi, B.M., Bradley, T.H., 2014. Analysis of corporate average fuel economy regulation
compliance scenarios inclusive of plug in hybrid vehicles. Appl. Energy 113, 1323–1337.
https://doi.org/10.1016/j.apenergy.2013.08.081
Amit, R., Zott, C., 2001. Amit, R., Zott, C., 2001. Value creation in E-business. Strategic Management
Journal22, 493–520. Strateg. Manag. J. 22, 493–520. https://doi.org/10.1002/smj.187
Automobile Propre, 2020. Hydrogène : les voitures et utilitaires légers disponibles en France. URL
https://www.automobile-propre.com/hydrogene-les-voitures-et-utilitaires-legers-disponibles-
en-france/ (accessed 4.10.21).
Barisa, A., Rosa, M., Kisele, A., 2016. Introducing Electric Mobility in Latvian Municipalities:
Results of a Survey. Energy Procedia 95, 50–57. https://doi.org/10.1016/j.egypro.2016.09.015
Becherif, M., Ayad, M.Y., Hissel, D., Mkahl, R., 2011. Design and sizing of a stand-alone recharging
point for battery electrical vehicles using photovoltaic energy, in: 2011 IEEE Vehicle Power
and Propulsion Conference. Presented at the 2011 IEEE Vehicle Power and Propulsion
Conference, pp. 1–6. https://doi.org/10.1109/VPPC.2011.6043075
Bhagavathy, S.M., Budnitz, H., Schwanen, T., McCulloch, M., 2021. Impact of Charging Rates on
Electric Vehicle Battery Life. Findings 21459. https://doi.org/10.32866/001c.21459
Biresselioglu, M.E., Demirbag Kaplan, M., Yilmaz, B.K., 2018. Electric mobility in Europe: A
comprehensive review of motivators and barriers in decision making processes. Transp. Res.
Part Policy Pract. 109, 1–13. https://doi.org/10.1016/j.tra.2018.01.017
Bohnsack, R., Pinkse, J., Kolk, A., 2014. Business models for sustainable technologies: Exploring
business model evolution in the case of electric vehicles. Res. Policy 43, 284–300.
https://doi.org/10.1016/j.respol.2013.10.014
Boucherit, A., 2011. Conception d’un convertisseur de puissance pour véhicules électriques multi-
sources. Université de Technologie de Belfort-Montbeliard.
Broadbent, G.H., Drozdzewski, D., Metternicht, G., 2018. Electric vehicle adoption: An analysis of
best practice and pitfalls for policy making from experiences of Europe and the US. Geogr.
Compass 12, e12358. https://doi.org/10.1111/gec3.12358
Budde Christensen et al., 2012. Budde Christensen, T., Wells, P., Cipcigan, L., 2012. Can innovative
business modelsovercome resistance to electric vehicles? Better place and battery electric
carsin Denmark. Energy Policy 48, 498–505. [WWW Document]. URL
https://www.sciencedirect.com/science/article/abs/pii/S0301421512004673 (accessed
4.20.20).
Caperello, N.D., Kurani, K.S., 2012. Households’ Stories of Their Encounters With a Plug-In Hybrid
Electric Vehicle. Environ. Behav. 44, 493–508. https://doi.org/10.1177/0013916511402057
Ceschin and Vezzoli, 2010. Ceschin, F., Vezzoli, C., 2010. The role of public policy in stimulating
radical envi-ronmental impact reduction in the automotive sector: the need to focus onproduct-
service system innovation. International Journal of Automotive Tech-nology and Management
10, 321–341. [WWW Document]. ResearchGate. URL
https://www.researchgate.net/publication/240295761_The_role_of_public_policy_in_stimulati
ng_radical_environmental_impact_reduction_in_the_automotive_sector_The_need_to_focus_
on_product-service_system_innovation (accessed 4.20.20).
Crippa, M., Oreggioni, G., Guizzardi, D., Muntean, M., Schaaf, E., Lo Vullo, E., Solazzo, E.,
Monforti-Ferrario, F., Olivier, J.G.J., Vignati, E., European Commission, Joint Research
Centre, 2019. Fossil CO2 and GHG emissions of all world countries: 2019 report.

Chapter 1: General Introduction
57
Duru, K.K., Karra, C., Venkatachalam, P., Betha, S.A., Madhavan, A.A., Kalluri, S., 2021. Critical
Insights Into Fast Charging Techniques for Lithium-Ion Batteries in Electric Vehicles. IEEE
Trans. Device Mater. Reliab. 21, 137–152. https://doi.org/10.1109/TDMR.2021.3051840
EAFO, 2020. Passenger cars | EAFO [WWW Document]. URL https://www.eafo.eu/vehicles-and-
fleet/m1 (accessed 7.26.20).
EC, 2020. Batteries — moderniser les règles de l’UE.
EC, 2019. CO2 emission standards for passenger cars and light-commercial vehicles in the European
Union | International Council on Clean Transportation.
Egbue, O., Long, S., 2012. Barriers to widespread adoption of electric vehicles: An analysis of
consumer attitudes and perceptions. Energy Policy 48, 717–729.
https://doi.org/10.1016/j.enpol.2012.06.009
Ellingsen, L.A.-W., Hung, C.R., Strømman, A.H., 2017. Identifying key assumptions and differences
in life cycle assessment studies of lithium-ion traction batteries with focus on greenhouse gas
emissions. Transp. Res. Part Transp. Environ. 55, 82–90.
https://doi.org/10.1016/j.trd.2017.06.028
EVreporter, 2020. Why is a Battery Management System needed in Electric Vehicles? • EVreporter
[WWW Document]. URL https://evreporter.com/battery-management-system-for-electric-
vehicles/ (accessed 6.24.21).
Fähnrich, K.-P., Opitz, M., 2003. Fähnrich, K.-P.; Opitz, M. (2006): Service-Engineering –
Entwicklungspfad und Bild einer jungen Disziplin. In: Bullinger, H.-J.; Scheer, A.-W.:
Service-Engineering. Entwicklung und Gestaltung innovativer Dienstleistungen, S. 85-112.,
in: Bullinger, H.-J., Scheer, A.-W. (Eds.), Service Engineering: Entwicklung und Gestaltung
innovativer Dienstleistungen. Springer, Berlin, Heidelberg, pp. 83–115.
https://doi.org/10.1007/978-3-662-09871-4_4
Farla, J., Alkemade, F., Suurs, R., 2010. Analysis of barriers in the transition toward sustainable
mobility in the Netherlands. Technol. Forecast. Soc. Change 77, 1260–1269.
https://doi.org/10.1016/j.techfore.2010.03.014
Funke, S.Á., Plötz, P., Wietschel, M., 2019. Invest in fast-charging infrastructure or in longer battery
ranges? A cost-efficiency comparison for Germany. Appl. Energy 235, 888–899.
https://doi.org/10.1016/j.apenergy.2018.10.134
Gnann, T., 2015. Market diffusion of plug-in electric vehicles and their charging infrastructure, Book
series “Innovation potentials.” Fraunhofer-Verl, Stuttgart.
Gnann, T., Plötz, P., 2015. A review of combined models for market diffusion of alternative fuel
vehicles and their refueling infrastructure. Renew. Sustain. Energy Rev. 47, 783–793.
https://doi.org/10.1016/j.rser.2015.03.022
Goel, S., Sharma, R., Rathore, A.K., 2021. A review on barrier and challenges of electric vehicle in
India and vehicle to grid optimisation. Transp. Eng. 4, 100057.
https://doi.org/10.1016/j.treng.2021.100057
Graham-Rowe, E., Gardner, B., Abraham, C., Skippon, S., Dittmar, H., Hutchins, R., Stannard, J.,
2012. Mainstream consumers driving plug-in battery-electric and plug-in hybrid electric cars:
A qualitative analysis of responses and evaluations. Transp. Res. Part Policy Pract. 46, 140–
153. https://doi.org/10.1016/j.tra.2011.09.008
Grauers, A., Sarasini, S., Karlström, M., 2013. Why electromobility and what is it? [WWW
Document]. URL https://research.chalmers.se/en/publication/211430 (accessed 6.23.20).
Hardman, S., 2019. Understanding the impact of reoccurring and non-financial incentives on plug-in
electric vehicle adoption – A review. Transp. Res. Part Policy Pract. 119, 1–14.
https://doi.org/10.1016/j.tra.2018.11.002
Helmers, E., Marx, P., 2012. Electric cars: technical characteristics and environmental impacts.
Environ. Sci. Eur. 24, 14. https://doi.org/10.1186/2190-4715-24-14
Hoekstra, A., 2019. The Underestimated Potential of Battery Electric Vehicles to Reduce Emissions.
Joule 3, 1412–1414. https://doi.org/10.1016/j.joule.2019.06.002
Høyer, K.G., 2008. The history of alternative fuels in transportation: The case of electric and hybrid
cars. Util. Policy, Sustainable Energy and Transportation Systems 16, 63–71.
https://doi.org/10.1016/j.jup.2007.11.001

Chapter 1: General Introduction
58
Hüls, C., Thies, C., Kieckhäfer, K., Spengler, T.S., 2020. Limiting CO2 fleet emissions in the
automotive industry – a portfolio planning approach. Int. J. Automot. Technol. Manag. 20,
349–368.
IEA, 2020. Global EV Outlook 2020 – Analysis.
IEA, 2018. Global EV Outlook 2018 Towards cross-modal electrification.
IEA, 2016. WEO-2016 Special Report: Energy and Air Pollution – Analysis.
INSEE, 2020. Définition - Espace rural / Espace à dominante rurale / Espace à dominante rurale |
Insee [WWW Document]. URL https://www.insee.fr/fr/metadonnees/definition/c1034
(accessed 2.16.21).
IPCC, 2018. Allen, M.R., O.P. Dube, W. Solecki, F. Aragón-Durand, W. Cramer, S. Humphreys, M.
Kainuma, J. Kala, N. Mahowald, Y. Mulugetta, R. Perez, M.Wairiu, and K. Zickfeld, 2018:
Framing and Context. In: Global Warming of 1.5°C. An IPCC Special Report on the impacts
of global warming of 1.5°C above pre-industrial levels and related global greenhouse gas
emission pathways, in the context of strengthening the global response to the threat of climate
change, sustainable development, and efforts to eradicate poverty [Masson-Delmotte, V., P.
Zhai, H.-O. Pörtner, D. Roberts, J. Skea, P.R. Shukla, A. Pirani, W. Moufouma-Okia, C. Péan,
R. Pidcock, S. Connors, J.B.R. Matthews, Y. Chen, X. Zhou, M.I. Gomis, E. Lonnoy, T.
Maycock, M. Tignor, and T. Waterfield (eds.)]. In Press.
IPCC, 2014. Summary for Policymakers, Climate Change 2014: Mitigation of Climate Change.
Contribution of Working Group III to the Fifth Assessment Report of the Intergovernmental
Panel on Climate Change. URL https://www.ipcc.ch/report/ar5/wg3/ (accessed 6.17.20).
Isaac, J., 2020. Review of interventions to improve outdoor air quality and public health: Principal
interventions for local authorities. Public Health England.
Islam, Md., 2015. A Review of Techniques for Optimal Placement and Sizing of Electric Vehicle
Charging Stations. PRZEGLĄD ELEKTROTECHNICZNY 1, 124–128.
https://doi.org/10.15199/48.2015.08.29
Jang, J.J., Song, H.H., 2015. Well-to-wheel analysis on greenhouse gas emission and energy use with
petroleum-based fuels in Korea: gasoline and diesel. Int. J. Life Cycle Assess. 20, 1102–1116.
https://doi.org/10.1007/s11367-015-0911-x
Jensen, A.F., Cherchi, E., Mabit, S.L., 2013. On the stability of preferences and attitudes before and
after experiencing an electric vehicle. Transp. Res. Part Transp. Environ. 25, 24–32.
https://doi.org/10.1016/j.trd.2013.07.006
Jeon, S., Roh, M., Heshmati, A., Kim, S., 2020. An Assessment of Corporate Average Fuel Economy
Standards for Passenger Cars in South Korea. Energies 13, 4533.
https://doi.org/10.3390/en13174533
Jing, W., Yan, Y., Kim, I., Sarvi, M., 2016. Electric vehicles: A review of network modelling and
future research needs. Adv. Mech. Eng. 8, 1687814015627981.
https://doi.org/10.1177/1687814015627981
Jochem, P., Babrowski, S., Fichtner, W., 2015. Assessing CO₂ emissions of electric vehicles in
Germany in 2030. Transp. Res. Part Policy Pract. 78.
Kant, M., 1995. La voiture électrique. Tech. L’ingénieur Traité Génie Électr. 21.
Kasten, P., Hacker, F., 2014. DEFINE: Development of an Evaluation Framework for the Introduction
of Electromobility, Öko-Institut. Germany.
Khan, M.I., Shahrestani, M., Hayat, T., Shakoor, A., Vahdati, M., 2019. Life cycle (well-to-wheel)
energy and environmental assessment of natural gas as transportation fuel in Pakistan. Appl.
Energy 242, 1738–1752. https://doi.org/10.1016/j.apenergy.2019.03.196
Kley, F., Lerch, C., Dallinger, D., 2011. New business models for electric cars—A holistic approach.
Energy Policy 39, 3392–3403. https://doi.org/10.1016/j.enpol.2011.03.036
Krause, R.M., Carley, S.R., Lane, B.W., Graham, J.D., 2013. Perception and reality: Public knowledge
of plug-in electric vehicles in 21 U.S. cities. Energy Policy 63, 433–440.
https://doi.org/10.1016/j.enpol.2013.09.018
Krupa, J.S., Rizzo, D.M., Eppstein, M.J., Brad Lanute, D., Gaalema, D.E., Lakkaraju, K., Warrender,
C.E., 2014. Analysis of a consumer survey on plug-in hybrid electric vehicles. Transp. Res.
Part Policy Pract. 64, 14–31. https://doi.org/10.1016/j.tra.2014.02.019

Chapter 1: General Introduction
59
Lane, B., Potter, S., 2007. The adoption of cleaner vehicles in the UK: exploring the consumer
attitude–action gap. J. Clean. Prod., The Automobile Industry & Sustainability 15, 1085–1092.
https://doi.org/10.1016/j.jclepro.2006.05.026
Lebrun, P., 2003. Conception et réalisation d’un véhicule électrique. Rev. Technol. 56–58.
Lepoutre, J., Perez, Y., Petit, M., 2019. Energy Transition and Electromobility: A Review, in: Gawel,
E., Strunz, S., Lehmann, P., Purkus, A. (Eds.), The European Dimension of Germany’s
Energy Transition: Opportunities and Conflicts. Springer International Publishing, Cham, pp.
509–525. https://doi.org/10.1007/978-3-030-03374-3_29
Loukakou, D., Espanet, C., Dubas, F., 2012. Modélisation, Conception et Expérimentation d’un
véhicule hybride léger pour usages urbains (Sciences de l’ingénieur [physics]). Université de
Franche-Comté.
Madina, C., Zamora, I., Zabala, E., 2016. Methodology for assessing electric vehicle charging
infrastructure business models. Energy Policy 89, 284–293.
https://doi.org/10.1016/j.enpol.2015.12.007
Markkula, J., Rautiainen, R., Järventausta, P., 2013. The business case of electric vehicle quick
charging – no more chicken or egg problem. EVS27 Symposium. November. Barcelona.
[WWW Document]. ResearchGate. URL
https://www.researchgate.net/publication/318306674_The_business_case_of_electric_vehicle
_quick_charging_-_no_more_chicken_or_egg_problem (accessed 4.16.20).
Matulka, R., 2014. The History of the Electric Car [WWW Document]. Energy.gov. URL
https://www.energy.gov/articles/history-electric-car (accessed 4.10.21).
Metais, M., Jouini, O., Perez, Y., Berrada, J., Suomalainen, E., 2021. Too much or not enough?
Planning electric vehicle charging infrastructure: a review of modeling options.
Meunier, G., Ponssard, J.-P., 2020. Optimal policy and network effects for the deployment of zero
emission vehicles. Eur. Econ. Rev. 126, 103449.
https://doi.org/10.1016/j.euroecorev.2020.103449
Mkahl, R., 2015. Contribution à la modélisation, au dimensionnement et à la gestion des flux
énergétiques d’un système de recharge de véhicules électriques : étude de l’interconnexion
avec le réseau électrique (Theses). Université de Technologie de Belfort-Montbeliard.
Münzel, C., Plötz, P., Sprei, F., Gnann, T., 2019. How large is the effect of financial incentives on
electric vehicle sales? – A global review and European analysis. Energy Econ. 84, 104493.
https://doi.org/10.1016/j.eneco.2019.104493
Noel, L., Zarazua de Rubens, G., Kester, J., Sovacool, B.K., 2020. Understanding the socio-technical
nexus of Nordic electric vehicle (EV) barriers: A qualitative discussion of range, price,
charging and knowledge. Energy Policy 138, 111292.
https://doi.org/10.1016/j.enpol.2020.111292
Nouh, A., 2008. Contribution Au Développement d’un Simulateur Pour Les Véhicules Électriques
Routiers.
Redondo-Iglesias, E., Vinot, E., Venet, P., Pelissier, S., 2019. Electric vehicle range and battery
lifetime: a trade-off, in: EVS32. Lyon, France, p. 9p.
Shahan, Z., 2015. Electric Car History (In Depth) [WWW Document]. CleanTechnica. URL
https://cleantechnica.com/2015/04/26/electric-car-history/ (accessed 4.10.21).
Shareef, H., Islam, Md.M., Mohamed, A., 2016. A review of the stage-of-the-art charging
technologies, placement methodologies, and impacts of electric vehicles. Renew. Sustain.
Energy Rev. 64, 403–420. https://doi.org/10.1016/j.rser.2016.06.033
Shetty, D.K., Shetty, S., Raj Rodrigues, L., Naik, N., Maddodi, C.B., Malarout, N., Sooriyaperakasam,
N., 2020. Barriers to widespread adoption of plug-in electric vehicles in emerging Asian
markets: An analysis of consumer behavioral attitudes and perceptions. Cogent Eng. 7,
1796198. https://doi.org/10.1080/23311916.2020.1796198
Sierzchula, W., Bakker, S., Maat, K., van Wee, B., 2014. The influence of financial incentives and
other socio-economic factors on electric vehicle adoption. Energy Policy 68, 183–194.
https://doi.org/10.1016/j.enpol.2014.01.043
Temporelli, A., Carvalho, M.L., Girardi, P., 2020. Life Cycle Assessment of Electric Vehicle
Batteries: An Overview of Recent Literature. Energies 13, 2864.
https://doi.org/10.3390/en13112864

Chapter 1: General Introduction
60
van Essen, H., Schroten, A., Matthijs, O., Sutter, D., Schreyer, C., Remo, R., Maibach, M., Doll, C.,
2011. External costs of transport in Europe. CE Delft, Infras, Fraunhofer ISI.
Villareal, A., 2014. L’industrie automobile à l’épreuve des voitures électriques : entre changement et
continuité (Theses). Université de Bordeaux.
Waldmann, T., Hogg, B.-I., Wohlfahrt-Mehrens, M., 2018. Li plating as unwanted side reaction in
commercial Li-ion cells – A review. J. Power Sources 384, 107–124.
https://doi.org/10.1016/j.jpowsour.2018.02.063
Wee, S., Coffman, M., La Croix, S., 2018. Do electric vehicle incentives matter? Evidence from the 50
U.S. states. Res. Policy 47, 1601–1610. https://doi.org/10.1016/j.respol.2018.05.003
Weiller, C., Neely, A., 2014. Using electric vehicles for energy services: Industry perspectives. Energy
77, 194–200. https://doi.org/10.1016/j.energy.2014.06.066
Wiederer and Philip, 2010. Wiederer, A., Philip, R., 2010. Policy options for electric vehicle chargin
infrastructure in C40 cities.Transportation Clinton Climate Initiative. [WWW Document].
URL https://www.innovations.harvard.edu/policy-options-electric-vehicle-charging-
infrastructure-c40-cities (accessed 4.20.20).
Wikström, M., Hansson, L., Alvfors, P., 2016. Investigating barriers for plug-in electric vehicle
deployment in fleets. Transp. Res. Part Transp. Environ. 49, 59–67.
https://doi.org/10.1016/j.trd.2016.08.008
Xue, Y., You, J., Shao, L., 2014. Understanding Socio-Technical Barriers to Sustainable Mobility –
Insights from Demonstration Program of EVs in China (SSRN Scholarly Paper No. ID
2383759). Social Science Research Network, Rochester, NY.
Yong, J.Y., Ramachandaramurthy, V.K., Tan, K.M., Mithulananthan, N., 2015. A review on the state-
of-the-art technologies of electric vehicle, its impacts and prospects. Renew. Sustain. Energy
Rev. 49, 365–385. https://doi.org/10.1016/j.rser.2015.04.130
Zhang, X., Wang, K., Hao, Y., Fan, J.-L., Wei, Y.-M., 2013. The impact of government policy on
preference for NEVs: The evidence from China. Energy Policy 61, 382–393.
https://doi.org/10.1016/j.enpol.2013.06.114
Zott, C., Amit, R., Massa, L., 2011. The Business Model: Recent Developments and Future Research.
J. Manag. 37, 1019–1042. https://doi.org/10.1177/0149206311406265

Chapter 1: General Introduction
61

Chapter 1: General Introduction
62

Chapter 2: Review of Optimization Objectives and Their Consequences for Electric-Vehicle
Charging Infrastructure
63
Chapter 2: Review of Optimization Objectives and Their
Consequences for Electric-Vehicle Charging Infrastructure
Since road transport accounts for a high share of Greenhouse Gas (GHG) emissions, Electric
Vehicles (EVs) offer a promising alternative to replace fossil-fuel dependent Internal
Combustion Engine Vehicles (ICEVs) with a low-or zero-emission transport solution. While
an essential lever in the transition towards higher diffusion of EVs is the availability of public
charging stations, our knowledge about how to organize best and physically distribute these
recharging networks is still emerging. In this chapter, we address this research gap by presenting
an extensive review of our current knowledge and literature about the location optimization of
public charging stations. A classification scheme is proposed regarding optimization objectives
with a detailed analysis of each publication, highlighting neglected essential constraints such
as queuing model, temporal horizon, and environmental impact. This chapter ends with
suggestions and recommendations for future research.
This Chapter will be submitted as follows:
Bassem Haidar, Pascal Da Costa, Jan Lepoutre, Fabrice Vidal. Review of Optimization
Objectives and Their Consequences for Electric-Vehicle Charging Infrastructure.

Chapter 2: Review of Optimization Objectives and Their Consequences for Electric-Vehicle
Charging Infrastructure
64

Chapter 2: Review of Optimization Objectives and Their Consequences for Electric-Vehicle
Charging Infrastructure
65
1. Introduction
The transportation sector is responsible for 20% of global CO2 emissions, of which 72%
are emitted by road transportation (IPCC, 2018). Electric Vehicles (EVs), including Battery
EVs (BEVs) and Plug-in Hybrid EVs (PHEVs), are considered one of the most promising
solutions for the replacement of Internal Combustion Engine Vehicles (ICEVs) because of their
potential to significantly reduce Greenhouse Gas Emissions (GHG) and particle emissions.
These types of vehicles have gained much recent attention because of their economic and
environmental benefits (Amjad et al., 2018), compelling governments to promote EVs as a
viable solution (Cao et al., 2020; H. Chen et al., 2017; Moradijoz et al., 2013). However, the
apparent fast-growing number of EVs remains, in reality, a modest absolute proportion of the
market. The literature generally relates this limited uptake to several reasons, but with “range
anxiety” and “purchase price” being mentioned as the main hurdles (Dong et al., 2014). Range
anxiety, the fear of not being able to reach one’s destination conveniently, is related to the
limited by battery technology on the one hand, and the availability of recharging networks on
the other hand (Eberle and Helmolt, 2010; Gert Berckmans et al., 2017; Pelletier et al., 2018,
2017; Shen et al., 2019). Both of these variables determine the range of the vehicle and the time
needed to charge the battery. While one solution to reduce range anxiety could be to increase
the battery size, this significantly increases the cost of the vehicle, as the battery remains one
of the most expensive components of an EV. Another solution could then be to reduce the
battery size in the vehicle, and depend more on the presence of optimal and easy-access
charging infrastructure (Funke et al., 2019). In other words, in order to alleviate buyer concerns
about EV driving range and to convince ICEV drivers to switch into electromobility, it is crucial
not only to increase the availability of electric charging infrastructure, but also to optimize its
spatial localization (Deb et al., 2019; Graham-Rowe et al., 2012).
However, the optimal way to deploy recharging infrastructure depends on a complex set
of variables that need to be considered. For example, when charging infrastructure is
concentrated in specific times and locations, this may lead to balancing problems on the
electricity grid, such as peak load and voltage fluctuations, especially on the low-voltage
distribution network. In order to decrease the costs that would be required to reinforce grid
capacity to deal with such conditions, it may be required to spread out charging stations and
trigger optimal use in time. However, from the EV user’s perspective, the deployment of these
infrastructures must be aligned with the EV drivers’ behaviour, and therefore allow the driver
to charge where and when s/he wants and in the most convenient and hence generally the fastest

Chapter 2: Review of Optimization Objectives and Their Consequences for Electric-Vehicle
Charging Infrastructure
66
way possible. Because this situation induces trade-offs between infrastructure costs and BEV
owner convenience, the study of charging sites placement gained increasing attention in the last
few years since it is a complex and dynamic problem.
Previous state-of-arts considered reviewing the optimal development of the existing
stations by adding more chargers or building new stations to satisfy or anticipate the demand.
Jing et al. (2016) studied traffic assignment problems with EVs in the network and limited
charging facilities. Islam (2015) and Shareef et al. (2016) presented an extensive review of the
three critical areas of EV research: charging technologies, the various impacts of EVs on the
electric power system, and the optimal EV charging station placement and sizing using heuristic
approaches towards a satisfactory solution rather than a guaranteed one. Gnann and Plötz (2015)
reviewed refuelling/charging infrastructure models for Alternative Fuel Vehicles (AFVs),
which combine EVs and FCEVs and refuelling infrastructure to identify research gaps. Pagany
et al. (2018) provided an extensive overview of spatial charging infrastructure methods. Shen
et al. (2019) reviewed the state-of-art of mathematical modelling methods and classified the
papers according to recurring themes: charging infrastructure planning, charging operations,
public policy, and business models. Deb et al. (2018) started by describing the charging
infrastructure planning across selected countries and then presented a general overview and
brief classification of the problem before identifying the future direction of work.
While these articles made significant contributions to our understanding of EV charging
infrastructure localization methods, they fall short of providing an overview of optimization
goals, pointing out only some of the mandatory research gaps. This Chapter presents an in-
depth review of optimization objectives for charging infrastructure localization by grouping the
publications according to their optimization objectives, and concluding with mandatory
research gaps.
In this chapter, we aim to analyse research publications to better extrapolate the actual
scientific development in infrastructure location using optimization methods. Therefore, a new
approach for the classification of optimization goals was derived, accompanied by an in-depth
analysis of 64 publications, to understand better locating processes. The selected papers are
then discussed in detail concerning their optimization objective, used data for optimization,
theoretical methods solving the problem. This article identifies eleven research questions and
proposes recommendations to fill these gaps providing new perspectives for further research
studies.
Section 2 presents the methodology, including literature selection and the structure of
the reviewed publications. Section 3 discusses technical aspects of EVs, charging infrastructure

Chapter 2: Review of Optimization Objectives and Their Consequences for Electric-Vehicle
Charging Infrastructure
67
and the interaction between them. Section 4 provides a detailed overview of the various
optimization objectives. Section 5 will discuss the data used to solve the location problem and
highlight future research directions before concluding in Section 6.
2. Methodology
2.1.Literature Selection
In order to gauge a quantitative assessment of recent evolutions in the literature on BEV
charging infrastructure optimization, we used Google Scholar as a search tool, as it includes a
broad range of electronic databases (Martín-Martín et al., 2018), including ScienceDirect,
Elsevier, and IEEE. We chose to focus on both conference and journal papers in English from
2005 to (October) 2019. We used a combination of the search terms “charging infrastructure”,
“optimization methods”, “charging stations”, and “electric vehicles”. Papers not directly related
to the focus of our review, such as battery-swapping station localization, Vehicle-to-Grid
(V2G), or wireless charging, were excluded.
Figure 2.1 Number of Publications in Google Scholar (until October 2019)
2.2.Structure of Reviewed Articles
In this sub-section, we offer a descriptive analysis of the reviewed articles. Figure 2.1
shows the evolution of the number of papers published on the topic reviewed. As one can, see
the number of publications has multiplied by seven between 2005 and 2018 and shows a linear
increase over time. In terms of content, Figure 2.2 offers a structural overview of the variety of
topics covered by these articles. This structure is divided into three main parts: input data,
optimization process that groups the optimization procedure and the constraints, and the type
of the results.
0
500
1000
1500
2000
2500
3000
3500
20
05
20
06
20
07
20
08
20
09
20
10
20
11
20
12
20
13
20
14
20
15
20
16
20
17
20
18
20
19
Nu
mb
er o
f p
ub
licat
ion
s
Year of publication

Chapter 2: Review of Optimization Objectives and Their Consequences for Electric-Vehicle
Charging Infrastructure
68
Figure 2.2 Structure of Reviewed Articles
2.2.1. Input Data
As a first distinguishing structural element in the literature, we noticed that the articles
took four input parameters into account as part of the optimization of localization methodology:
Charging needs, route parameters, charging infrastructure, and cost parameters.
First, charging needs are derived either from case studies, e.g., taxi connected fleet (Han
et al., 2016; Salmon, 2016; Yang et al., 2017) or from a theoretical approach (Chen and Hua,
2014; Davidov and Pantoš, 2017; Zeng et al., 2016). The charging needs are conducted either
from the remaining stored electricity in the EVs’ battery (known by SoC, State of Charge)
(Baouche et al., 2014; Hidalgo et al., 2016; Wood et al., 2017) or from charging demand density
of specific areas (Andrenacci et al., 2016; Brooker and Qin, 2015; Wood et al., 2015).
Additionally, some publications inferred the energy needs from travel data of fossil-fuel-based
vehicles (Funke et al., 2019; Gnann et al., 2018, 2016). Route parameters tend to be GPS-based
(Wang and Wang, 2010; Wood et al., 2017; Yi and Bauer, 2016). Some papers added additional
information, such as route type, e.g., highway (Z. Chen et al., 2017; Chung and KWon, 2015;
Sathaye and Kelley, 2013) and route elevation level (Yi and Bauer, 2016). Various charging
assumptions about charging options are considered, such as charging speeds (slow, fast, or a
mix of different speeds) and charging modes (alternative or direct current). Furthermore, cost
parameters are included in the model, such as electricity price (Gnann et al., 2018, 2016; Nie
and Ghamami, 2013; Salmon, 2016) and fuel price (Funke et al., 2019).
2.2.2. Optimization Procedure
Two models can be used to achieve the charging needs under several conditions: The
bottom-up or the top-down approaches. A bottom-up approach combines several detailed
assumptions of limited areas, such as technological and economic parameters, to conclude the

Chapter 2: Review of Optimization Objectives and Their Consequences for Electric-Vehicle
Charging Infrastructure
69
whole system. They can be divided into optimization models, simulation models, and
accounting frameworks (Gnann and Plötz, 2015). On-street charger localization is a perfect
example of the bottom-up approach; since GPS locations, battery energy demand, drivers’
destination, and many other micro-input data are analyzed to suitably locating stations.
As mentioned in Figure 2.2, a second structural parameter relates to the optimization
objectives used to determine the optimum level of charging infrastructure deployment,
responding to an objective function with several data as control variables and as constraints.
Studies using optimization methods to determine charging-station location distribution employ
generalized mathematical formulation (1) to (7).
𝑚𝑖𝑛(𝐹) = 𝑓(𝑝, 𝑢𝑠𝑝𝑒𝑒𝑑) (2.1)
Where F is the objective function, and p and u represent the decision variables being optimized.
Depending on the particular focus of the study, p can represent the number of locations of
charging stations on nodes of the electricity distribution network, on nodes of the road network,
or others. U represents the number of chargers divided into different groups regarding the
charging speed (Section 3.2). F can include the cost, EV flow (traffic), distance from the
demand point into the supply point, exact demand localization. Equation (2.1) is subjected to
several constraints, generally are equality and/or inequality constraints, elaborated from
equation (2.2) to (2.7).
𝑔𝑖(𝑝, 𝑢𝑠𝑝𝑒𝑒𝑑) = 0 (2.2)
𝑢𝑠𝑝𝑒𝑒𝑑𝑚𝑖𝑛 ≤ 𝑢𝑠𝑝𝑒𝑒𝑑 ≤ 𝑢𝑠𝑝𝑒𝑒𝑑
𝑚𝑖𝑛 (2.3)
ℎ𝑗(𝑞 ∗ 𝑢𝑠𝑝𝑒𝑒𝑑) ≤ 𝑀 (2.4)
𝑑𝑘(𝑥, 𝑦) ≤ 𝑁 (2.5)
20% ≤ 𝑆𝑜𝐶 ≤ 80% (2.6)
𝑊𝑞 ≤ 𝑎 𝑚𝑖𝑛𝑠
𝑖 = 1,… , 𝐼
𝑗 = 1,… , 𝐽
𝑘 = 1,… , 𝐾
(2.7)
Equation (2.2), an equality constraint, can balance the charging or power demand. Equation
(2.3), an inequality constraint, indicates the minimum and the maximum number of charging
stations of the studied area. Another inequality constraint given by Equation (2.4) can include

Chapter 2: Review of Optimization Objectives and Their Consequences for Electric-Vehicle
Charging Infrastructure
70
voltage limit, current limit, budget limit, where q is a parameter depending on the optimization
objective (cost, power, current of a charger) and M the maximum value. (2.5) can be used to
determine the maximal distance between two charging points (x and y). (2.6) is a mandatory
one and implies technical constraints on the battery’s state of charge. Comfort constraints such
as an a-minute maximum waiting time of the passenger or charging delay time are implied by
the 7th constraint.
Different mathematical methods are used to solve these problems, e.g., linear, mixed-
integer linear and non-linear programming (see abbreviations of methods in Table 2.1) using a
variety of software: IBM ILOG CPLEX, MATLAB, LINGO, NOMAD, EXCEL, etc. In the
context of our Chapter, optimization models allow us to suggest potential pathways or
representations of the future minimizing costs, loads, grid impacts, or maximizing global
welfare coverage area. These parameters and the different assumptions considered will be
detailed in Sections 4 and 5.
Table 2.1 Methods Names Abbreviations
Abbreviation Method name Example of papers
BIP Binary Integer Program (Shukla et al., 2011)
FCLM Flow-Capturing Location Model (Cruz-Zambrano et al., 2013)
FCDLM Flow Charge Dispersion Location Model (Baouche et al., 2014)
FLPM Facility Location Planning Model (Eisel et al., 2014)
FRLM Flow Refuelling Location Model (Chung and KWon, 2015)
GA Genetic Algorithm (Spieker et al., 2017)
MBINLP Multi Binary Integer Non Linear Model (He et al., 2016)
MILPM Mixed Integer Programming Linear Model (Jia et al., 2014)
MINLP Mixed Integer Non Linear Programming (Sadeghi-Barzani et al., 2014)
MIP Mixed Integer Programming (Sun et al., 2018)
MOGA Multi-Objective Genetic Algorithm (Hidalgo et al., 2016)
MRLM Multipath Refuelling Location Model (Huang et al., 2015)
STDCLM Spatial-Temporal Demand Coverage Location Model (Tu et al., 2016)
2.2.3. Results Types
Finally, we noticed three types of results in the literature. In order to fulfil the EV energy
needs, some papers identified exact locations to build charging stations (Chen et al., 2016; Guo
et al., 2016; M. Li et al., 2017), others reported a charging density (charging points per km²) for
a given territory (Efthymiou et al., 2012; Li and Huang, 2014; Namdeo et al., 2014). A third

Chapter 2: Review of Optimization Objectives and Their Consequences for Electric-Vehicle
Charging Infrastructure
71
objective is not to report on a specific localization but an optimal number of charging stations
or points (Farkas and Prikler, 2012; Gnann et al., 2018; Funke et al., 2019).
3. Introduction to Technical Aspects
3.1.Electric Vehicles
We define electro-mobility as the act of using electricity as a source of energy for the
propulsion of a vehicle, either as a replacement of diesel or fuel as used for ICEVs or as an
addition to such energy sources (hybrid vehicles). The energy source for powering the electric
engines can be drawn from a battery (Battery EVs or Hybrid EVs) or a Fuel Cell EV (FCEVs),
with the latter using a fuel cell to turn hydrogen into electricity. In the case of BEVs, the
electricity is drawn from either an external electricity source that is plugged into the vehicle
(Plug-in EVs) or from power recovered in breaking cycles (non-plug-in Hybrid EVs). In the
case of Plug-in Hybrid EVs (PHEV), cars use electricity as a source of energy, but in
combination with an ICE motor that requires fuel.
3.2.Charging Infrastructure
There are many charging techniques: Parked charging (conductive or wireless), battery
swapping, and supply while driving (conductive or wireless) (Grauers et al., 2013). This
Chapter will cover only the conductive parked charging technique, using “a charger”. The
charging time not only depends on the charger’s speeds (amperage) but also on the battery
capacity, the battery SoC, the vehicle’s technology (AC/DC alternative, direct current
conversion), and the charging cable. We can identify and qualify a charging point by its
location, power, socket model, and current type (AC/DC, single or triple phase). According to
the international standard IEC 61851, the slowest is Mode 1, usually installed in houses, and
has a power of 3 kW using AC. Mode 2 chargers power between 3 and 22kW at AC are
generally found in homes or private or public parking spaces (such as parking lots). A Mode 3
charger operates at up to 50kW, using DC, and is generally not found in personal homes. These
charging points are preferably installed in public and parking spaces. Finally, ultra-fast chargers
or Mode 4 operate at powers above 50kW using DC and are generally installed on corridors
(highways). Table 2.2 provides an overview of these charging modes, and the time is generally
taken for a car to charge for 160 km.

Chapter 2: Review of Optimization Objectives and Their Consequences for Electric-Vehicle
Charging Infrastructure
72
Table 2.2 Charging Modes Parameters
Mode [IEC 6185] Power
(kW)
Type Location Current
type
Charging time
Mode 1 (Level 1) 1 - 3 Private Home AC >10h
Mode 2 (Level 2) 3 - 22 Private/Semi-
public
Home,
Workplace
AC 2 – 12h
Mode 3 (Level 3) 22 - 50 Semi-
public/Public
Workplace, on-
street
DC 0.5 – 1.5h
Mode 4 (Level 4) >50 Public Highways DC <30 min
3.3.Problem Identification
In the ICEV case, there is a direct relation between the client and the automotive
manufacturer thanks to the considerable autonomy and the availability of gas stations
everywhere. However, a new private actor is involved in the EV case: The charging operator
under public recommendations from the state and authorities, as mentioned in Figure 2.3 (Shen
et al., 2019).
Based on Egbue and Long (2012b)’s survey and the 40-paper review of W. Li et al.
(2017), the interaction between EV manufacturers and EV drivers presents a lack of confidence:
the future of EV development remains uncertain due to the immaturity and the high price of the
battery technology. Similarly, the relation between EV manufacturers and charging
infrastructure operators can be reflected in the “Chicken and Egg Dilemma” discussed earlier
in this Chapter. Thus, research and development cooperation is inescapable for the growth of
EV sales.
The relation between charging operators and clients is not well established: the modest
awareness of the public infrastructure development and pricing rules according to the charging
speeds, e.g., different subscriptions and parking fees. According to the results of econometrics
models based on EV sales and client surveys, an increase in the EV market share is not only
related to locating more charging stations but also to the accessibility of charging stations and
charging speeds (Axsen et al., 2017; Bailey et al., 2015; Egbue and Long, 2012; Hackbarth and
Madlener, 2013; Hidrue et al., 2011; S. Li et al., 2017; Mersky et al., 2016; Sierzchula et al.,
2014; Springel, 2017; Tran et al., 2012).
Governments and public authorities play a crucial role in introducing and boosting the
EV market by regulating all three parties. They are implementing various policies, including
financial and non-financial incentives, consumer subsidies, tax exemption on EV, more taxes
on fossil fuel, public charging infrastructure.

Chapter 2: Review of Optimization Objectives and Their Consequences for Electric-Vehicle
Charging Infrastructure
73
Concerning the scope of our article, we will be interested in the interaction between
charging infrastructure operators and drivers to suitably develop methods for optimal location
stations based on consumers’ preferences.
Figure 2.3 Problem Identification within the Three Parties
4. Analysis of Charging Infrastructure Optimization
Objectives
Ensuring the availability, visibility, and exact number of charging stations is imperative
to building an extensive public infrastructure. For a more detailed literature review, 64
publications, whose common objective is identifying candidate areas for charging stations, are
selected. Our review is based on grouping papers with similar optimization objectives, as
mentioned in Figure 2.2, and on mentioning the used data in the optimization procedure
detailing parameters of the paper: different authors’ names, methodology (method, model, and
used software), the results type, geographic, EV, drivers, demographic parameters as well as
constraints. Therefore, tables grouping all these data are detailed after every optimization goal
section.
4.1.Minimizing the Cost
A variety of studies have proposed various optimization approaches. Our review showed
that the optimization models generally had as their objective function to minimize overall costs
(Equation 2.8). We identified different costs: technical such as charging infrastructure (CI)
CAPEX and OPEX (Ahn and Yeo, 2015), comfort (waiting and service times (He et al., 2016),
the additional trip to reach the station (Liu and Wang, 2017), and environment costs (Zhang et

Chapter 2: Review of Optimization Objectives and Their Consequences for Electric-Vehicle
Charging Infrastructure
74
al., 2015). The papers reviewed also vary along with their choices between two business
models: the first one aggregates the costs as if carried by charging infrastructure operators and
aims to minimize deployment costs and maximizing profits. The second business model
aggregates the costs from customer perspectives and aims to minimize the costs paid by the EV
owner, including comfort-related costs (waiting time). Table 2.3 detailed all the reviewed
papers considering the minimization of costs as the primary function. The minimization
equation (2.8) is formulated as follows:
min𝐹 = 𝑓(𝐶𝐼𝐶𝐴𝑃𝐸𝑋 , 𝐶𝐼𝑂𝑃𝐸𝑋 , 𝐵𝐸𝑉𝐶𝐴𝑃𝐸𝑋, 𝐵𝐸𝑉𝑂𝑃𝐸𝑋, 𝐶𝑜𝑠𝑡𝑐𝑜𝑚𝑓𝑜𝑟𝑡, 𝐶𝑜𝑠𝑡𝑒𝑛𝑣𝑖𝑟𝑜𝑛𝑚𝑒𝑛𝑡) (2.8)
Subjected to similar constraints in Section 2.2.2.:
0 ≤ 𝑋 ≤ 𝑀 (2.9)
𝑔(𝑥𝑖 , 𝑦𝑗) ≤ 𝑀 (2.10)
𝑊𝑞 ≤ 5 𝑚𝑖𝑛𝑠 (2.11)
Where:
𝑥𝑖: charging point location
𝑦𝑗: demand location
Yang et al. (2017), Davidov and Pantoš (2017), Zeng et al. (2016), Baouche et al. (2014),
Hidalgo et al. (2016), Gnann et al. (2018), Wang and Wang (2010), and Yi and Bauer (2016)
took into account the charger’s investments as well as building, construction costs in the
optimization procedure. Huang et al. (2015), Li and Huang (2014), and Zhang et al. (2015)
mixed the investments in charging points and operation and yearly management expenses. Chen
and Hua (2014), Jia et al. (2014), Islam et al. (2016), Islam et al. (2015) proposed to transform
gas stations into electric ones; thus, transformation costs are included in addition to investments.
Funke et al. (2019b) and Nie and Ghamami (2013) compared the investment in increasing the
charging infrastructure, on the one hand, with adding more battery capacity in the EVs, on the
other hand, using technical costs: the costs of chargers and batteries. The novelty of Gnann et
al. (2016) is to include the annual paid cost in the model, such as taxes, charger’s operating
costs, and electricity expenses. Han et al. (2016), Chen et al. (2016), Z. Chen et al. (2017), Ahn
and Yeo (2015) combined technical and comfort costs. They minimized the additional trip from
the demand point into the charging stations’ location and the delay time in the queue waiting to

Chapter 2: Review of Optimization Objectives and Their Consequences for Electric-Vehicle
Charging Infrastructure
75
access the charger. Zhang et al. (2015) considered diversification and selected the minimum
costs of investment, operation, and environment, the originality of this paper. Salmon (2016)
investigated the location and number of charging stations that would be required to meet the
demands of a subset of the electric taxi while maximizing their profits. Based on a theoretical
study, Guo et al. (2016) maximized the net benefits during the operational stage minus the total
investment (land acquisition and equipment purchase). Deb et al. (2019)’s allocation problem,
for Guwahati city in India, was framed in a multi-objective framework considering the
economic factors, power grid characteristics (voltage stability, reliability, power loss)
additionally to EV user’s convenience, and random road traffic. Mohsenzadeh et al. (2015)
presented optimal planning of CS in the presence of capacitors to maintain voltage and improve
power loss in electrical distribution networks while minimizing the cost of chargers’
investments and power loss costs;
Since generating electricity can produce pollutants such as SO2, NOx, CO2, Co, and TSP,
Zhang et al. (2015) minimized the environmental cost, which remains strongly lacking in the
literature.
The most used optimization goal to deploy charging infrastructure is to minimise costs
for different members of the EV industry. Investments and operation and maintenance costs are
identified for both charging infrastructure operators and EV drivers. Additional costs associated
with the driver's comfort, namely waiting time cost and additional trip cost, are also optimized
in some publications. Taking into account the environmental costs of the LCA of both charging
infrastructure and EVs is entirely lacking in the literature.
4.2.Maximizing Coverage
A second optimization objective found in the reviewed papers is to maximize the
coverage of charging stations in the studied area. This optimization objective reveals to select
the candidate locations for installing on-street chargers that captures the most potential
customers in the coverage area. It is argued that the benefits of maximizing coverage increase
public visibility of charging stations on the one hand and maximize the availability of charging
stations, especially along high-density traffic routes. Since charging stations are non-optimally
deployed, they are not best used (Funke et al., 2019). Locating the charging infrastructure based
on maximizing coverage locations may be, therefore, the key to increase their usage (Spieker
et al., 2017). Economic parameters such as costs are rarely taken into account in these types of
methods as constraints.

Chapter 2: Review of Optimization Objectives and Their Consequences for Electric-Vehicle
Charging Infrastructure
76
Throughout Spieker et al. (2017)’s paper, dual-optimisation methods are taken into
account: Maximizing demand coverage of the points of interest areas and maximizing traffic
coverage leads to placing charging stations close to high traffic points. Chung and KWon
(2015)’s objective is to maximize the traffic flow using a multi-period optimization model for
strategic charging station location planning on Korean corridors. Xi et al. (2013) developed an
optimization model to maximize demand coverage and apply it in the Ohio region. Tu et al.
(2016) used the case study of electric taxis to develop a spatial-temporal demand-coverage
approach for maximizing the demand coverage, taking travelled distances into account. Zhang
et al. (2017) provided an arc cover-path cover model (AC-PC) to maximize traffic flow across
all periods. Wanting Lin and Guowei Hua (2015)’s optimization method is to maximize the
intercepted traffic flow based on a particle swarm optimization algorithm using economic
constraint. Yi and Bauer (2016) and Wang and Wang (2010) had not only a cost optimization
procedure but also maximization of demand coverage from the viewpoint of reaching the most
significant number of customers or households. Sun et al. (2018) proposed a maximization of
the demand coverage location model for charging stations based on the characteristics of urban
EV driver travel behaviors pointing out that the economic aspect is a critical factor. Their model
can be divided into two parts: slow charging speed for short trips and fast chargers for long
ones. Gao and Guo (2013) applied the same model using the branch and bound method under
the Voronoi diagram that guarantees a reasonable distribution and taking into account queuing
models as constraints. They also calculated the number of chargers based on budget
minimization. Frade et al. (2011) presented a study for an urban area of Lisbon, Portugal
characterized by a high population density and a strong rate of employment. They applied the
maximal coverage goal of slow chargers since the EV in this area park for several hours within
the 24-h period.
An optimization target of maximizing coverage will increase the usage of charging
infrastructure by increasing their visibility. Maximizing coverage could be one of the ideal
optimization objectives to locate the charging infrastructure for EVs. Table 2.4 details all the
reviewed papers considering the maximization demand coverage as the primary function. The
following equation (2.12) then formulates the main equation of maximizing demand coverage:
max𝐹 =∑𝑓𝑣𝑦𝑣𝑣𝜖𝑉
(2.12)
Where:

Chapter 2: Review of Optimization Objectives and Their Consequences for Electric-Vehicle
Charging Infrastructure
77
𝑓𝑣: is the rate of traffic flow along any path 𝑣𝜖𝑉
𝑦𝑣 = {1 𝑖𝑓 𝑎𝑡 𝑙𝑒𝑎𝑠𝑡 𝑜𝑛𝑒 𝑐ℎ𝑎𝑟𝑔𝑖𝑛𝑔 𝑝𝑜𝑖𝑛𝑡 𝑖𝑠 𝑖𝑛𝑠𝑡𝑎𝑙𝑙𝑒𝑑 𝑜𝑛 𝑝𝑎𝑡ℎ 𝑣
0 𝑜𝑡ℎ𝑒𝑟𝑤𝑖𝑠𝑒
Subjected to similar constraints in Section 2.2.2.
4.3.Minimizing Failed Trips
As was mentioned before, one of the main hurdles in the adoption of EVs is range
anxiety. In order to optimize the locations of recharging infrastructure, one would need to
minimize the likelihood that an EV driver experiences a failed trip as a result of lacking
recharging infrastructure. A failed trip is then defined as the EV driver’s obligation to search
for a charging station to recharge his vehicle with electricity, waste time reaching a charging
station, and/or waste time while recharging. Dong et al. (2014) examined the impact of
deploying different charging levels on reducing range anxiety using an optimization model that
minimizes the missed trips based on real data and is subjected to an economic constraint.
Hidalgo et al. (2016) had dual objectives: minimizing the total cost in addition to the number
of missed trips in Singapore. Asamer et al. (2016) maximized the sum of covered taxi trip
counts, which reduces failed trips using more than 720,000 BEV taxi trips in Vienna with
known start and end positions. Similar to the above, Shahraki et al. (2015) enlarged the part of
vehicle-miles-travelled being electrified, focusing on PHEV rather than BEV. The allocation
model presented in Alhazmi et al. (2017) has two stages: modelling the trip-success ratio
indicator to estimate the range and allocation of the charging stations. Their proposed model
evaluates the charging station network based on two components: the service range of charging
stations and the completed (virtual) trips by EVs.
After all, minimizing the failed trips of EVs is the ideal optimization goal that addresses
the driver’s range anxiety for BEVs drivers and the most suitable objective to maximize the
usage of the battery for PHEV case studies. Table 2.5 details all the reviewed papers considering
the minimization of failed trips as the main function. The general optimization equation (2.13)
can be detailed as follow, subjected to similar constraints as Section 2.2.2:
min𝑓(𝑥) =∑∑𝑦𝑗,𝑑𝑑𝑗
(2.13)
Where: 𝑦𝑗,𝑑: is the failed trip of the driver “j”, on the day “d”

Chapter 2: Review of Optimization Objectives and Their Consequences for Electric-Vehicle
Charging Infrastructure
78
4.4.Minimizing the Environmental Impact
Among the papers that have other objectives than the ones reviewed already and that
generally only had a few papers focusing on these objectives, the first set of papers focused on
minimising environmental impact. Surprisingly, GHG emissions of EVs, however, were never
evaluated in the papers reviewed. It should be noted that EVs have zero emissions only while
driving, but not during the manufacturing, recycling, and charging processes, namely Life Cycle
Assessment, and in the production of electricity (power mix of the studied country). Shahraki
et al. (2015), which included the environmental aspect while maximizing the electrified mileage
fleet, did not ensure maximum benefits regarding the environment. Besides, as mentioned
before, Zhang et al. (2015) did not only minimize the investment and operation costs, but also
they included environmental ones while taking into account GHG emissions per unit of
electricity, per power generation technology, and per pollutant (SO2, NOx, CO2, CO, and TSP).
Studying the environmental impact while deploying the charging infrastructure of EVs
is scarcely considered in the reviewed publications. While some articles considered the
environmental impact of BEVs, they failed to expand the impact to cover the charging
infrastructure emissions. It is recommended that researchers aim to study the environmental
impact of the deployment of charging stations to minimise the environmental impact.
4.5.Minimizing the Distance between Demand and Charging Points
Another optimization target is to minimize the total distance between demand and
supply (charging) points. Sathaye and Kelley (2013)’s approach is to estimate the minimum EV
charging infrastructure needs based on minimizing the deviation along the corridor from
drivers’ initial trip paths. Andrenacci et al. (2016) used Euclidean distance as driving criteria
while minimizing the sum of the distances when drivers search for their nearest charging
station. As discussed in Section 4.1, some papers consider minimising additional trip costs from
the demand point into the charging station. For this reason, the distance between demand and
charging point is considered in the optimization procedure of Han et al. (2016), Yi and Bauer
(2016), Chen et al. (2016), Ahn and Yeo (2015), Liu and Wang (2017), He et al. (2015), Li et
al. (2016), Tian et al. (2018), Y. Zhang et al. (2016), and H. Zhang et al. (2016).
The distance between demand and supply points is indirectly considered in various
optimization objectives discussed earlier in this Chapter. Contrary, other publications decided
to minimise the distances as the main target of the paper to alleviate range anxiety and concerns
about charging convenience. Table 2.6 detailed all the reviewed papers considering the
minimization of the distance between demand and charging points. The optimization equation

Chapter 2: Review of Optimization Objectives and Their Consequences for Electric-Vehicle
Charging Infrastructure
79
(2.14) is formulated as follow, subjected to similar constraints as Section 2.2.2.:
min𝑓(𝑥, 𝑦) = 𝑑(𝑥𝑖; 𝑦𝑗) (2.14)
Where:
𝑥𝑖: The demand point localization
𝑦𝑗: The charging station localization
4.6.Other Optimization Objectives
In this section, we will present many objectives that cannot be grouped according to
previous goals. Table 2.7 presents an exhaustive review of the reviewed publications.
Brooker and Qin (2015), Pagany et al. (2019), and Morrissey et al. (2016) identified the
location of charging stations regarding the points of interest and the destination and based on
real-world data. Efthymiou et al. (2012) proposed a linear model based on a multi-criteria
analysis technique to identify candidate locations of charging stations after analyzing variables
such as population, point of interest, and electric grid characteristics. Increasing the visibility
of fuelling stations is proposed by Eisel et al. (2014), based on implementing customers'
preferences into a facility location planning model. Yaping Gao and Xiaochun Lu (2015)
considered the real-road conditions and population density while improving the travelling
simulation model of EVs.
Based on real electric taxi trajectories in Beijing, M. Li et al. (2017) conducted a time-
series simulation to derive perceptions for the public charging station deployment plan:
location, number, and types of chargers. Namdeo et al. (2014) adopted a multi-dimensional
spatial modelling framework, taking as input a combination of socio-demographic and travel
data to determine candidate locations of stations. The approach presented in Rajabi-Ghahnavieh
and Sadeghi-Barzani (2017) aims to determine charging stations' optimal capacity and location
based on urban traffic circulation EV user behaviour, hourly electric grid load scenarios.
Furthermore, Said et al. (2013) relied on a model of communication between vehicles and
charging infrastructure operators beforehand to minimize the service time at stations. He et al.
(2013) applied an active-set algorithm while maximizing the social welfare associated with
coupled networks. Based on a theoretical approach, Farkas and Prikler (2012) compared the
installation of a large number of slow charging points with a low number of fast chargers taking
into account M/M/c/N queuing model consequences, which can be applied to semi-public
locations, e.g., malls, schools, etc. Jung et al. (2014) proposed a dual-level minimization
procedure based on shared EV taxis’ data taking into account queues delays. A lower-level

Chapter 2: Review of Optimization Objectives and Their Consequences for Electric-Vehicle
Charging Infrastructure
80
minimizes the passenger’s waiting and travel time, and an upper-level reduces the EV’s queue
delay and travel time. Martins and Trindade (2015) studied the allocation of fast charging
stations in an urban area based on time series analysis considering the variation of load during
the day and minimizing the power losses caused by the installation of fast-charging stations.
Table 2.7 details all the reviewed papers considering various optimization objectives.
To sum up, various charging optimization goals are not fully elaborated and used by researchers
in the literature, taking into account socio-techno-economic data.
5. Discussion and determination of research gaps
Although many works have been conducted on EV charging station localization
purposes, we believe that significant research gaps remain. Based on the reviewed papers, we
highlight a variety of possible research directions that should be detailed from different
perspectives. Section 5 provided the reader with a detailed analysis of the different parameters
of the reviewed publications. We found around eleven research gaps and recommendations that
will be conducted after analyzing them in detail. We divided these gaps into main groups: the
first one analyses the gaps of input data, and the second one details the ones of the optimization
procedure.
5.1.Gaps in Input Data
5.1.1. Spatial Resolution
Almost all reviewed papers applied the optimization procedure on a specific area of
study to validate the methodology rather than a theoretical study using online maps software
(ArcGIS, QGIS, Google maps, etc.). We identified two central future research positions in terms
of geographical resolution: not applying the optimization process on rural areas, the non-usage
of GPS data for spatial localization.
Based on the reviewed literature, most of the models are tested in urban areas, such as
Rome (Andrenacci et al., 2016), Beijing (Liu et al., 2012), Washington (Wood et al., 2015),
New York (Salmon, 2016), where socio-demographic parameters: population density, driving
behaviour, types of accommodation, GDP, roads, carpooling, traffic are not similar to those in
rural areas. Since the input data for locating charging stations could determine the urbanity
level, it will not directly impact the optimization procedure. However, to overcome the
“Chicken and Egg Dilemma” between EVs adoption trend and public charging infrastructure
deployment in rural regions, we strongly recommend applying optimization procedure
charging-station localization in a rural area.

Chapter 2: Review of Optimization Objectives and Their Consequences for Electric-Vehicle
Charging Infrastructure
81
As mentioned in Figure 2.2, three results were identified: locating the exact GPS
location of charging stations, determining the station densities in the studied regions, or the
number of charging points. Since GPS-based models allow for reaching very high spatial
resolution through mapping large sets of data, it is vital to use GPS data that reflects the real
situation of the studied area. It can help us to determine the exact location of every charging
point and to know the geographical constraints in terms of flow direction, nodes, highways,
public areas, existing gas stations which locations could be candidate ones such as (Baouche et
al., 2014), (Nie and Ghamami, 2013), (Shahraki et al., 2015), and (Alhazmi et al., 2017). Cai et
al. (2014) concluded that charging at gas stations using fast chargers will not affect the driver’s
habits, and it will maintain the utilization of the public infrastructure in the long term after the
pure electrification of the road transportation sector. However, it is not ideal for charging using
slow and normal chargers since drivers cannot wait for hours in the queue.
Regarding parking-lot-based locations, where parking fees are applicable, they are best
suited for long-duration charging, such as companies, supermarkets, hospitals, theatres,
museums. Yi and Bauer (2016) used the locations of drivers’ destinations (malls, universities,
airports) while maximizing the number of reachable households and minimized overall e-
transportation energy cost. Modelling real GPS data of drivers’ trajectories on maps and other
sources can precisely determine the traffic flow on roads, highways, corridors, and nodes,
especially during holidays and peak hours. This parameter can indicate where more charging
points are needed, the charging power, or the number of chargers.
To sum up, all models present limitations. We believe that an approach that uses real
input data like GPS locations will significantly benefit our ability to optimize recharging
infrastructure locations. A widely adopted approach to this design problem aims to locate
charging facilities near the urban activity centers of EV owners (homes, shopping malls, gas
stations, and workplaces) to maximize the overall accessibility and minimize the cost of
transformation. However, these findings are unfit for rural areas where the optimization may
have to follow a very different logic and where equilibria between costs for recharging
infrastructure operators and EV drives may have to be balanced differently. Finally, the
remaining question concerns the degree of accuracy to be reached depending on the research
question and the level of complexity that will surely change over time.
Chapter 2: Review of Optimization Objectives and Their Consequences for Electric-Vehicle
Charging Infrastructure
82
5.1.2. Driver’s Data
5.1.2.1.EV Market Share Penetration
A multi-type vehicle research design is almost inexistent in the papers reviewed. This is
the case of almost all of the reviewed papers, especially taxi fleet case studies which used
identical 24 – 40 kWh electric vehicles fleets, such as in (Han et al., 2016), (Salmon, 2016),
(Yang et al., 2017), (Z. Chen et al., 2017). It is known that a variety of PEV models is available
on the market, regardless of their type BEV or PHEV, with different battery capacities between
2 kWh and can exceed 100 kWh. In order to achieve a realistic perspective on the trade-offs
between infrastructure costs, it is necessary to consider a scenario with both types of vehicles
on the market. A notable exemption is a paper by Soylu et al. (2016), where they weigh different
scenarios with a different market share of PHEV and BEV. Besides, Jia et al. (2014) took into
account BEV and PHEV and classed the vehicles regarding their type: short-term taxi, long-
term taxi, and private EVs.
Eventually, various penetration rates of electric mobility can stimulate the need to install
(or lack thereof) new public charging stations and, therefore, optimize unnecessary costs.
5.1.2.2.Charging Behaviour
Based on surveys and data analyses in Columbia (Dunckley, 2016), in Norway
(Figenbaum and Kolbenstvedt, 2016), in Germany (Gnann et al., 2018, 2016), in Spain
(Martínez-Lao et al., 2017) and (Brady and O’Mahony, 2016; Morrissey et al., 2016), between
75 and 95% of EVs owners prefer to charge their vehicle at home during residual peak hours.
Data from 79 EV users were assessed during a 6-month study in Germany (Franke and Krems,
2013), and on average, only between 1% and 4.8% of the users charged using public
infrastructure similarly to (Franke and Krems, 2013).
These studies can confirm Funke et al. (2019)’s contribution that public infrastructure
is barely used and oversized. We can conclude that almost 80% of owners charge their vehicles
at home. A private charger is then a factor that should be adapted in the optimization procedure.
This is the case of Han et al. (2016), Yang et al. (2017), Hidalgo et al. (2016), Yi and Bauer
(2016), Z. Chen et al. (2017), Sathaye and Kelley (2013), M. Li et al. (2017), Xi et al. (2013),
Zhang et al. (2017), and Jung et al. (2014), that considered a full initial battery SoC, assuming
that all vehicles can charge at home. This hypothesis should be revised since private charger
installation differs from one city to another depending on the degree of urbanity and the type of
households.

Chapter 2: Review of Optimization Objectives and Their Consequences for Electric-Vehicle
Charging Infrastructure
83
Besides, the real energy-charged using the public charging infrastructure remains
unclear. Since keeping the battery SoC between 20% and 80% is recommended because
charging till 100% could harm the battery technology and takes a longer time than predicted,
the charging frequency using the public infrastructure is still blurry. Also, the driver’s
preferences regarding charging speeds remain fuzzy, introducing a trade-off between charging
duration, charging power, and fees. Contrary to a fast charger, the usage of a slow charger
comes with low fees and long charging durations. Since various charging speeds are available
on the market (Table 2.2), we recommend further researchers investigate the drivers'
preferences regarding the trade-off power/duration/fees and consider it in the charging
infrastructure deployment.
Eventually, taking into account the driver’s charging behaviour is essential, especially
the private charger installation, the usage frequency of the public charging infrastructure, and
the preferable charging power for the driver. These recommendations will optimize the
charging infrastructure and improve the EV adoption trend for drivers who are not equipped
with at-home or at-work chargers.
5.1.2.3.Driver’s Satisfaction
This parameter is a qualitative factor that can interpret the psychological aspect of the
driver. The goal of optimizing charging point locations is to overcome the driver’s range anxiety
by not changing his/her daily habits. For instance, whether the use of radio, air-conditioning,
driving speed, charging times, and acceleration should remain unchanged after switching to
PEV may be a vital factor to consider when one intends to understand how to increase the
diffusion of EVs. Thus, while increasing the infrastructure quality of service (QoS) by installing
fast chargers depending on maximum range, this may result by adding the costs related to the
client’s satisfaction, such as in (Davidov and Pantoš, 2017) where the QoS is improved by
minimizing the total cost.
Besides, as mentioned in Section 5.2, waiting time due to queues can occur if the
demand for EVs and the supply of charging points are not equal. For Funke et al. (2019), Gnann
et al. (2018), and Gnann et al. (2016), EV drivers are only willing to wait up to 15 minutes in
order to plug in their vehicles. Eventually, taking into account the driver’s satisfaction is a
mandatory psychological factor that will help improve the EV market share after eliminating
the range anxiety.

Chapter 2: Review of Optimization Objectives and Their Consequences for Electric-Vehicle
Charging Infrastructure
84
5.1.2.4.New Mobility Services
EV car-sharing, booking a charging station, and various new electromobility services
can change the driver’s behaviour. Car sharing, where individuals rent cars to other individuals
in peer-to-peer or from companies, is gaining popularity in many countries. Recent studies show
that these vehicles are generally used for a short period, usually for up to one to two hours per
day (Shen et al., 2019). Not only is car-sharing gaining traction among the population, but many
local governments are also stimulating electromobility by designing new offers for this service
(Bakker and Jacob Trip, 2013). As the business model associated with these services is not
mature enough, it seems likely that drivers can overcome barriers using shared cars (Shen et
al., 2019). Another electric mobility service is to book a charging station.
Similarly to car-sharing services, ensuring chargers’ reservations is an ongoing
business. However, it will ensure the driver's freedom to charge his/her EV depending on his/her
time preferences by booking a charger on an application. These services are being developed
and forecasted to be more favoured by future EV clients; they are, therefore, parameters to add
in the driver’s input data.
5.1.3. Technical Parameters
Although the scope of our review is not to detail the electric transfer from the grid to the
battery, we will briefly elaborate on two critical technical factors of the charging infrastructure
and battery technology. Han et al. (2016), Davidov and Pantoš (2017), Zeng et al. (2016),
Hidalgo et al. (2016), Yi and Bauer (2016), Z. Chen et al. (2017) and Islam et al. (2016) included
the energy conversion factor of the charging process whose value varies between 88% and 94%
depending on the current type (AC/DC), charger’s power, and conversion techniques. More
detailed efficiency parameters of the battery, power converter, e-motor controller, e-motor, and
mechanical powertrain are taken into account in the study of Yi and Bauer (Yi and Bauer, 2016)
while analyzing the energy demand of a specific GPS location. In addition to this factor, battery
deterioration can occur due to multiple charge/discharge cycles. For more details please refer
to (Pelletier et al., 2018) and (Pelletier et al., 2017).
Since the optimization of charging infrastructure is interdependent on technical features
of both charging infrastructure and the vehicle, technical parameters should ideally also be
taken into accounts, such as the energy conversion factor and the real duration of the charging
process.

Chapter 2: Review of Optimization Objectives and Their Consequences for Electric-Vehicle
Charging Infrastructure
85
5.1.4. Temporal Horizon
While no clear time horizon was identified in the studies, researchers only analyzed an
actual situation without comparing it to the future evolution of EVs' number in the studied area.
Soylu et al. (2016)’s study is based on the European Commission suggestions: to achieve 1.5
million charging points in Germany by 2020, 150,000 should be publicly accessible charging
points to fulfil the forecasted EV market share needs. The variability of the EV market requires
an adequate temporal resolution in order to be adequately addressed. Indeed, concerning future
developments, new fast chargers (Power > 150 kW) will be available on the market (Serradilla
et al., 2017), battery technology is accompanied by a price decrease (Gnann et al., 2018) will
be improved thanks to the non-stopped research and development studies. The cost of 1 kWh
Lithium-Ion battery packs was up to USD 800 in 2012 and is forecasted to fall to USD 125 in
2022 (Pelletier et al., 2017) and reach around USD 100 in 2030 (Gert Berckmans et al., 2017).
Similarly, the investments in charging stations are predicted to decrease in the next few years
(Schroeder and Traber, 2012).
In order to capture this potential, an essential factor that should be taken into account is
the temporal horizon of the considered models. Therefore, neglecting this potential due and
zooming into a specific situation may lower the accuracy of the results. Taking 2030-2050 as a
temporal horizon could help the different stakeholders of the EV industry avoid additional costs,
overcome barriers facing the EV adoption, and manage the future EV market penetration.
5.1.5. External Conditions
Based on the reviewed publications, weather parameters were scarcely considered as
external conditions in the models. Temperature and wind speed can be added as external factors
since they directly impact battery degradation; thus, the vehicle’s energy needs. Under extreme
temperatures, heating or air conditioning can be turned on, which will lead to a decrease in the
driving range and, therefore, an increase in charging demands. Han et al. (2016) gathered
experimental data from three EV taxis in September 2013 (average temperature was 21.4°C).
They noticed that the differences in the charging time in the EV data come mainly from the
battery temperature. Han et al. (2016) and H. Zhang et al. (2016) studied three scenarios of day
temperature: 6, 20, and 35 °C, and concluded on the significance of this factor. Wood et al.
(2015) and Yi and Bauer (2016) localized Level 2 chargers in the Seattle area in the United
States and used BLAST-V (an EV simulator) that takes as input temperature and vehicle’s
driving speed. The environmental information can include weather conditions such as wind
speed, temperature, and road surface conditions. The energy consumption can be computed by

Chapter 2: Review of Optimization Objectives and Their Consequences for Electric-Vehicle
Charging Infrastructure
86
integrating a differential equation that provides an EV's instantaneous power (Yi and Bauer,
2016). While some papers zoomed into the impact of temperature on the charging process
(Lindgren and Lund, 2016) and (Motoaki et al., 2018), this topic remains open for further
researches.
Last but not least, in order to avoid theoretical results, the influence of weather
conditions in the target area should be carefully taken into account, which may vary from a
study case to another.
5.2.Gaps in the Optimization Procedure
These recommendations present mandatory constraints to take into account in the
optimization process.
5.2.1. Queuing Models
As mentioned in Section 4.1, queues can occur when there is no balance between supply
and demand. Queuing theory is a branch of operational research that investigates the
relationships between the demand and the supply for a system (Marchi et al., 2018). To begin
with, a queuing model can be defined as follows: X/X/c/N. The first “X” represents the inter-
arrival time distribution of EVs and can model the EV arrival rate; the second “X” refers to
service-time distribution, charging time in our case, modelled by service rate as a parameter.
For these two parameters: “M” refers to Markovian exponential distribution and “G” the general
one; “c” is for the number of service points (chargers) per station, and “N” is the system capacity
(number of parking stations, including “c”). For more information, please refer to Bhat (Bhat,
2015).
Funke et al. (2019) used M/G/c model while finding cost-efficient ways to address the
trade-off between battery ranges and the availability of public fast chargers. Gnann et al. (2018)
analyzed current charging behaviour taking the M/G/1 model for future fast-charging needs.
Tian et al. (2018), Y. Zhang et al. (2016) determined the number of sockets per charging station
while minimizing the total cost using M/M/s model. The second group of publications took the
parking constraints into account, such as M/M/c/N for Yang et al. (2017) and M/M/1/2 (Gnann
et al., 2016). Marchi et al. (2018) compared two analytical models to conclude with the effect
of the limited parking places model considering variable rates for EV arrivals and services
(high, medium, and low), the paper's novelty. Besides, Farkas and Prikler (2012) proposed a
purely mathematical model of charging stations by comparing two scenarios: few fast chargers
and parking places (M/M/20/50) compared to a large number of slow chargers and parking
places (M/M/100/150).

Chapter 2: Review of Optimization Objectives and Their Consequences for Electric-Vehicle
Charging Infrastructure
87
Finally, queuing theory is a significant constraint to take into account while determining
the number of chargers in a charging station towards avoiding queues, increasing the client's
comfort, and improving the quality of service, especially on the waiting and delay time. Since
‘X/X/c’ queue model with constant arrival and service rate, which is considered in almost all
the publications that include queueing constraint, does not reflect the real situation, we strongly
urge future studies to simulate the ‘X/X/c/N’ model with variable arrival and service rates, in
order to achieve results that are more real. Some add-in features could be taken into account to
characterize the natural behaviour of the driver: baulking when the driver leaves and comes
back and reneging when he/she cannot wait any longer in the queue and quits.
5.2.2. Distribution Grid
Merging non-controlled EV charging events with typical consumption, mostly during
peak hours, can severely impact the grid, especially the distribution network, e.g., harmonics
parasites, power loss, breakdowns, peak loads. The scope of this Chapter does not allow us to
go into details in technical aspects (distribution, grid, network) but to present an overview of
the used methods. Fast charging might dramatically impact the local grid by increasing peak
loads; there are benefits to be gained by controlled charging (Azadfar et al., 2015; Babrowski
et al., 2014) to avoid low voltage distribution problems (Heinrichs and Jochem, 2016). Le et al.
(2015), Mehboob et al. (2014), Mets et al. (2012), and Torabikalaki and Gomes (2014)
developed a method of minimizing peak loads using different approaches without changing the
drivers’ habits. Furthermore, other papers fixed, as an objective for their study, avoiding grid
problems such as frequency and voltage fluctuations, harmonics, power losses, such as (Deilami
et al., 2011), (Oliveira et al., 2013), (Rahimi et al., 2014), (Ruiqin and Zhongjing, 2015), and
(Zhou and Cai, 2014). Some papers took grid issues as constraints while optimizing the total
cost, such as in (Sadeghi-Barzani et al., 2014) and (Zhang et al., 2015). Building charging
stations can generate costs, e.g., improving the grid (cables, transformer) and losses due to
electricity problems; thus, clients' charging prices will increase to compensate for the loss.
Including grid issues as constraints in the procedure regardless of the optimization goal
presented. For more information about energy optimization methods for EV charging events,
please refer to the literature review provided by (Amjad et al., 2018).
5.2.3. Environmental Impact
Minimizing the environmental impact infrequently occurs in the literature. Although
EVs’ LCA depends on the fuel mix of electricity generation (Torchio and Santarelli, 2010),

Chapter 2: Review of Optimization Objectives and Their Consequences for Electric-Vehicle
Charging Infrastructure
88
charging the vehicle instead of using fossil-based fuels can relocate emissions from “while
driving” emissions into “while charging” in power plant emissions. Zhang et al. (2015) and
Shahraki et al. (2015) included EV GHG emissions during the optimization procedure.
However, the LCA of charging points is not covered at all, to the best of our knowledge, while
locating charging stations. Lucas et al. (2012) concluded that EV charging infrastructure is more
carbon-intensive than ICEV supply infrastructure in Portugal: 3.7-8.5 gCO2eq/km for EV
compared to 0.03-1.5 gCO2eq/km for ICEV that depends on the gasoline and diesel energy
source. In China, chargers' exigent global potential warming values are 94.06 gCO2eq/kWh
(Zhang et al., 2019).
It might seem an unexpected conclusion, where under specific hypotheses, the
environmental impact is either ignored or demonstrated as higher for electromobility than for
ICEVs. An optimized solution of locating charging points should be investigated to guarantee
lower emissions of the overall system: infrastructure and vehicles. Therefore, we propose that
researchers expand their optimisation focus to include the environmental impact of recharging
networks.
6. Conclusion and Perspectives
This chapter gives the reader a broad overview of the literature for charging
infrastructure optimization goals. It shows that charging station localization uses several
approaches, methods, models, and data. The diversity of reviewed published articles ranges
from pure theoretical mathematical to real-world on-street localization.
We first identified our methodology and the past-published literature reviews focusing
on charging station localization in this comprehensive state-of-art literature. Then, we briefly
discussed technical aspects as well as the business model for this infrastructure. Subsequently,
several publications were classified regarding their optimization objectives; We summarized
every publication and detailed every goal. Next, we identified the future research opportunities
that should be carefully considered in the optimization procedure.
In the EV context, charging infrastructure remains a primary barrier to developing the
electric mobility sector. This infrastructure is strongly correlated and highly significant to EV
sales based on discussed surveys, questionnaires, and econometrics studies that reflect the
drivers’ behaviour. ICEV drivers are not ready yet to purchase an EV since charging stations
are not optimally distributed, and not mature enough. Thus, the “Chicken and Egg Dilemma”
is not surpassed today, since neither charging infrastructure operators nor EV manufacturers

Chapter 2: Review of Optimization Objectives and Their Consequences for Electric-Vehicle
Charging Infrastructure
89
will act before the other. Optimal allocation of electric charging infrastructure can be the
leading solution to gain driver confidence.
Almost all publications have the same organization. First, hypotheses are fixed
regarding the territory of study, the charging speed, and the EV data, especially the demand or
SoC (collected from study cases of fleets, surveys, connected vehicles, or theoretical
approaches). Second, one (or more) optimization goals are fixed and solved under a specific
method or model using the collected data of step 1 and solved using various well-known
software. Finally, results can be represented in three primary forms: exact localization, chargers
density of the studied territory, or merely the number of charging points.
Based on the reviewed publications, there is a diversity of optimization goals for
locating charging stations: Minimization of technical, social, and environmental costs,
maximizing coverage area, minimizing the grid impact. Indeed, minimizing the budget remains
one of the most used optimization objectives since it is a severe constraint in these types of
problems: The prices of chargers and batteries remain incredibly high. Maximizing coverage
could be one of the ideal optimization objectives to locate the charging infrastructure for EVs.
It is recommended that researchers be willing to include the battery range in the deployment of
charging stations to minimise the vehicles' failed trips. Minimizing the environmental impact
is the optimization objective for researchers aiming to elaborate on the LCA aspect of the
charging stations' deployment procedure.
Based on our state of the art, the studied papers were data-oriented, and lack of data
proves the main restriction. This may also justify the low number of real-world case studies.
Therefore, this chapter also derived the research gaps that were not covered or covered too
briefly by the literature by categorising the publications regarding the user input data. While
some constraints are considered in the optimization procedure, such as GPS-based geographic
resolution, distribution grid constraints, driver’s data (daily travelled mileage, destinations,
charging behaviour) and technical parameters, we strongly consider these factors to be reviewed
in detail. However, temporal horizon, environmental impact, new mobility services, and
external conditions were scarcely considered in studies. Due to the restricted and neglected set
of parameters, charging station allocation is not yet controlled: They are not optimally localized
and used. Besides, we strongly suggest adding the environmental LCA chargers towards
minimizing GHG emissions to future research studies. Additionally, since queues can occur at
stations, queuing theory can play an essential role concerning the number, the speed of the
chargers, and the service pricing.

Chapter 2: Review of Optimization Objectives and Their Consequences for Electric-Vehicle
Charging Infrastructure
90
Concerning the identified optimization goals for modelling charging infrastructure for
EVs, we conclude that more research should develop these approaches. Based on the discussed
publications, huge limitations are identified due to the strictly required assumptions and
hypotheses. More real-data-oriented models should be considered for further research on this
topic to fill the research gaps. Solving the charging station placement requires positioning the
charging sites in the road network, considering a time resolution, different levels of charging,
the driver’s comfort factor while minimizing the cost, and taking chargers and battery LCAs as
main constraints.

Chapter 2: Review of Optimization Objectives and Their Consequences for Electric-Vehicle Charging Infrastructure
91
Table 2.3 Publications Having Cost Minimization as the Optimization Objective
Methodology Results type Spatial data EV technical data Driver’s behavior Charging
infrastructure
Costs parameters
Pa
pers
Mo
del
So
ftw
are
Qu
euin
g M
od
el
Cas
e/T
heo
rati
cal
Stu
dy
CS
den
sity
CS
ex
act
loca
tio
n
CS
nu
mb
er
Tra
ffic
flo
w
GP
S l
oca
tio
n
Hig
hw
ay S
tud
y
Ty
pe
(BE
V/P
HE
V)
Bat
tery
cap
acit
y (
kW
h)
So
C
Ex
tern
alit
ies(
Tem
pera
ture
, S
pee
d)
Dem
and
den
sity
Tra
vel
dis
tan
ce
Ori
gin
/Des
tin
atio
n
Dem
and
-Sta
tio
n d
ista
nce
Pri
vat
e ch
arg
er
Ch
arg
ing
ho
urs
Ch
arg
ing
lev
el (
Po
wer
(k
W))
Eff
icie
ncy
fac
tor
Ch
arg
er’s
CA
PE
X
Ch
arg
er’s
OP
EX
Lan
d c
ost
Bu
ild
ing
co
st
Dis
trib
uti
on
co
st
Tra
nsf
orm
atio
n c
ost
EV
co
st (
bat
tery
co
st)
Mis
sed
tri
ps
cost
Ad
dit
ion
al
trip
co
st
Del
ay t
ime
cost
Tax
es
Rev
enu
es (
fro
m c
har
gin
g e
ven
t)
(Ahn and
Yeo, 2015)
X CS X X X 22 X X Fast X X X X
(Baouche
et al.,
2014)
FCDLM CPLE
X
MATL
AB
CS X X X BEV 20 X X X X X L2-4
(22-50)
X X
(Chen and
Hua,
2014)
Monte
Carlo
LING
O
TS X X X X X L1-2-3-4 X
(Chen et
al., 2016)
MINLP CPLE
X
CS X X X BEV 24 X X X L1-2-4
(1.4 –
91)
X X
(Z. Chen
et al.,
2017)
MILP CPLE
X
CS X X BEV 24 X X X X Fast
(100)
X X X X X
(Cruz-
Zambran
o et al.,
2013)
FCLM CPLE
X
CS X X X X Fast (50) X
(Han et
al., 2016)
Based
flow-
intercep
X CS X X X BEV 22 X X X X Fast X X X X X
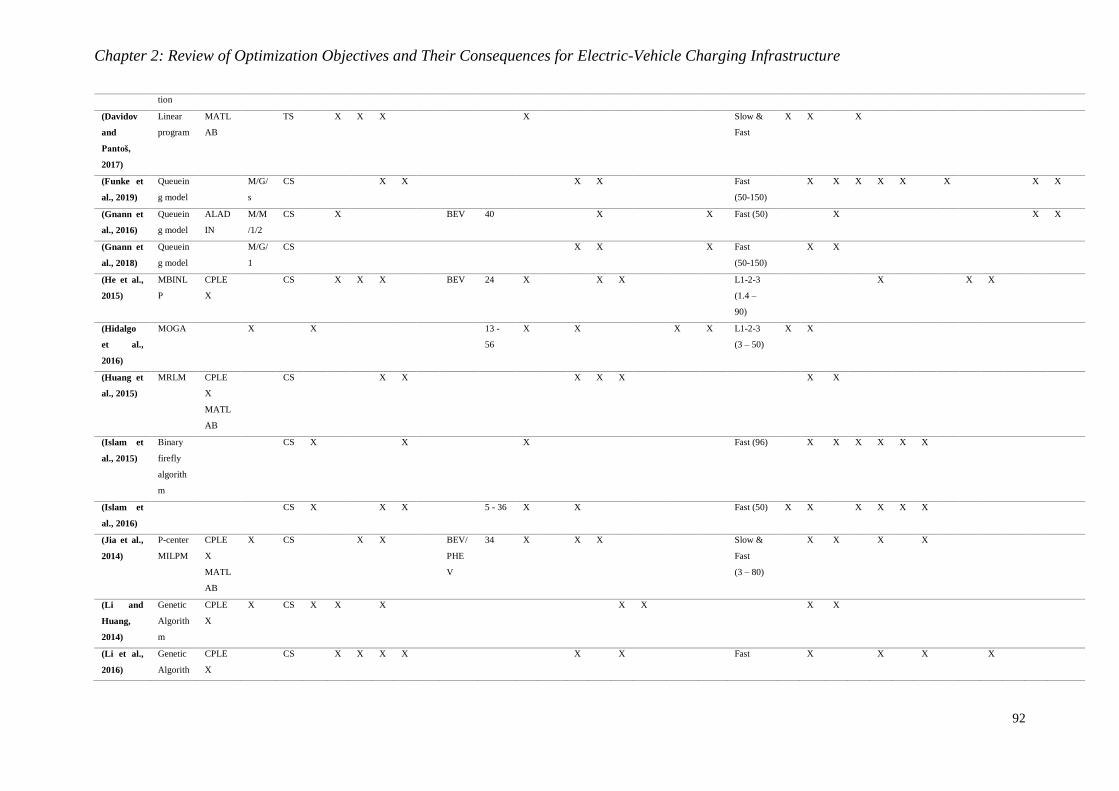
Chapter 2: Review of Optimization Objectives and Their Consequences for Electric-Vehicle Charging Infrastructure
92
tion
(Davidov
and
Pantoš,
2017)
Linear
program
MATL
AB
TS X X X X Slow &
Fast
X X X
(Funke et
al., 2019)
Queuein
g model
M/G/
s
CS X X X X Fast
(50-150)
X X X X X X X X
(Gnann et
al., 2016)
Queuein
g model
ALAD
IN
M/M
/1/2
CS X BEV 40 X X Fast (50) X X X
(Gnann et
al., 2018)
Queuein
g model
M/G/
1
CS X X X Fast
(50-150)
X X
(He et al.,
2015)
MBINL
P
CPLE
X
CS X X X BEV 24 X X X L1-2-3
(1.4 –
90)
X X X
(Hidalgo
et al.,
2016)
MOGA X X 13 -
56
X X X X L1-2-3
(3 – 50)
X X
(Huang et
al., 2015)
MRLM CPLE
X
MATL
AB
CS X X X X X X X
(Islam et
al., 2015)
Binary
firefly
algorith
m
CS X X X Fast (96) X X X X X X
(Islam et
al., 2016)
CS X X X 5 - 36 X X Fast (50) X X X X X X
(Jia et al.,
2014)
P-center
MILPM
CPLE
X
MATL
AB
X CS X X BEV/
PHE
V
34 X X X Slow &
Fast
(3 – 80)
X X X X
(Li and
Huang,
2014)
Genetic
Algorith
m
CPLE
X
X CS X X X X X X X
(Li et al.,
2016)
Genetic
Algorith
CPLE
X
CS X X X X X X Fast X X X X

Chapter 2: Review of Optimization Objectives and Their Consequences for Electric-Vehicle Charging Infrastructure
93
m
(Liu and
Wang,
2017)
MBINL
P
CPLE
X
Gurobi
CS X X X BEV 24 X X X Fast X X
(Liu et al.,
2012)
Swarm
Optimiz
ation
X X X X X L1-2-3-4 X X
(Nie and
Ghamami
, 2013)
Integer
program
CPLE
X
CS X X X L1-2
(1.4-7.2)
X X X X X
(Rajabi-
Ghahnavi
eh and
Sadeghi-
Barzani,
2017)
MINLP TS X X X
(Salmon,
2016)
Genetic
algorith
m
CS X X X X BEV 24 X X X Fast X
(Tian et
al., 2018)
SCE-
UA
algorith
m
MATL
AB
M/M
/s
CS X X X BEV X X X X X X Fast X X X
(Wang
and Lin,
2009)
FRLM ILOG CS X X X X X X Slow &
Fast
X X X
(Wang
and
Wang,
2010)
Branch-
and-
bound
LING
O
CS X X X X X X Fast X X X
(Xiang et
al., 2016)
Networ
k
equilibri
um
traffic
flow
MATL
AB
M/M
/s
CS X X X Buses X X Slow &
Fast
(2-30)
X X X

Chapter 2: Review of Optimization Objectives and Their Consequences for Electric-Vehicle Charging Infrastructure
94
(Yang et
al., 2017)
Linear
program
Gurobi M/M
/s/N
CS X X BEV 40 X X X X X L2-3
(13-80)
X X X
(Yi and
Bauer,
2016)
No-
linear
program
NOMA
D
CS X X X X BEV 24-95 X X X X X X X X X
(Zeng et
al., 2016)
Chaos
&
harmon
y search
algorith
m
TS X X BEV 60 X X X Fast (50) X X X X X X
(Zhang et
al., 2015)
TS X X
(Y. Zhang
et al.,
2016)
M/M
/s
CS X X X BEV 80 X X L1-2-3 X X X X X X X
(H. Zhang
et al.,
2016)
Voronoi
diagram
/ Monte-
Carlo
simulati
on
X CS X X X X BEV 24 X X X X Fast X X X X X X X
(Zhu et
al., 2016)
Genetic
Algorith
m
CS X X X X X X X

Chapter 2: Review of Optimization Objectives and Their Consequences for Electric-Vehicle Charging Infrastructure
95
Table 2.4 Publications Having Maximization Demand Coverage as the Optimization Objective
Methodology Results type Spatial data EV technical data Driver’s behavior Chargi
ng data
Demogra
phical
data
Constraints
Pa
per
s
Mod
el
So
ftw
are
Qu
euin
g M
od
el
Cas
e/T
heo
reti
cal
Stu
dy
Den
sity
Lo
cati
on
Nu
mber
Tra
ffic
GP
S l
oca
tio
n
Hig
hw
ay S
tud
y
Typ
e (B
EV
/PH
EV
)
Bat
tery
cap
acit
y (
kW
h)
So
C
Tem
per
atu
re,
Sp
eed,
etc.
Dem
and
den
sity
Tra
vel
dis
tance
Ori
gin
/Des
tinat
ion
Dem
and
-Sta
tion
dis
tance
Pri
vat
e ch
arger
Char
gin
g h
ou
rs
Char
gin
g l
evel
Po
pu
lati
on/E
mp
loym
ent
Budg
et c
onst
rain
t
Gri
d c
on
stra
int
(Spieker et al., 2017) GA CS X X X X B X X X X 2 (22
kW)
X
(Chung and KWon, 2015) FRLM CPLEX CS X X X X X X X X X
(Xi et al., 2013) Linear
model
CS X P ~2 X X X X L1,2,3 X
(Tu et al., 2016) STDCLM CS X X X X X X X Fast X
(Zhang et al., 2017) MINLP CPLEX CS X X X X X Fast X
(Wanting Lin and Guowei
Hua, 2015)
MINLP CPLEX CS X X X
(Shukla et al., 2011) BIP CPLEX CS X X X X X X X X
(Yi and Bauer, 2016) MIP EVRE CS X X X X X X X X X
(Sun et al., 2018) MIP CPLEX CS X X X X X X X X Slow
Fast
X
(Wang and Wang, 2010) MIP Lingo CS X X X X X X X X Fast X
(Gao and Guo, 2013) Voronoi
diagram
Lingo M/M/s TS X X
X B 20 X X X X
(Frade et al., 2011) p-median CS X X X X B ~20 X X X L1 (3
kW)
X

Chapter 2: Review of Optimization Objectives and Their Consequences for Electric-Vehicle Charging Infrastructure
96
Table 2.5 Publications Having Minimization of Failed Trips as the Optimization Objective
Methodology Results type Spatial data EV technical data Driver’s behavior Charging data Constraints
Pa
per
s
Mod
el
So
ftw
are
Cas
e/T
heo
reti
cal
Stu
dy
Den
sity
Lo
cati
on
Nu
mber
Tra
ffic
GP
S l
oca
tio
n
Hig
hw
ay S
tud
y
Typ
e (B
EV
/PH
EV
)
Bat
tery
cap
acit
y (
kW
h)
So
C
Dem
and
den
sity
Tra
vel
dis
tance
O/D
Dem
and
-Sta
tion
dis
tance
Pri
vat
e ch
arger
Char
gin
g h
ou
rs
Char
gin
g l
evel
Eff
icie
ncy
fac
tor
Budg
et c
onst
rain
t
Gri
d c
on
stra
int
Env
iro
nm
ent
con
stra
int
(Hidalgo et al.,
2016)
MOGA CS X BEV 13-
56
X X X X L1,2,3
3-50 kW
X X
(Asamer et al.,
2016)
MILP CPLEX CS X X X BEV 24 X X X L1,2,3
2-240 kW
(Shahraki et al.,
2015)
MINLP GAMS/C
PLEX
CS X X PHEV/
BEV
X X L1,2,3
7-37 kW
X
(Alhazmi et al.,
2017)
MCLP CS X X X X X BEV 16 -
>
54
X X X X X X X
(Dong et al., 2014) Genetic
algorithm
[at]risk CS X X X BEV X X X L1,2,3
1.4-90 kW
X

Chapter 2: Review of Optimization Objectives and Their Consequences for Electric-Vehicle Charging Infrastructure
97
Table 2.6 Publications Considering Minimizing the Distance between Demand and Charging Points
Methodology Results type Spatial data EV technical data Driver’s behavior Charging
data
Constraints
Pa
per
s
Mod
el
So
ftw
are
Cas
e/T
heo
reti
cal
Stu
dy
CS
den
sity
CS
lo
cati
on
CS
nu
mb
er
Tra
ffic
flo
w
GP
S l
oca
tio
n
Hig
hw
ay S
tud
y
Typ
e (B
EV
/PH
EV
)
Bat
tery
cap
acit
y (
kW
h)
So
C
Sp
eed
of
the
EV
Dem
and
den
sity
Tra
vel
dis
tance
O/D
Dem
and
-Sta
tion
dis
tance
Pri
vat
e ch
arger
Char
gin
g h
ou
rs
Char
gin
g l
evel
Budg
et c
onst
rain
t
Gri
d c
on
stra
int
Inco
me,
Popu
lati
on
(Sathaye and
Kelley, 2013)
Non linear
model
CS X X X X Both X X X X X L3 X X X
(Andrenacci
et al., 2016)
k-mean
clustring
MATLAB CS X X X BEV 16-22 X X X X

Chapter 2: Review of Optimization Objectives and Their Consequences for Electric-Vehicle Charging Infrastructure
98
Table 2.7 Publications Considering Various Optimization Objectives
Methodology Results type Spatial
parameters
EV technical data Driver’s behavior CS technical
parameters
Demographic
parameters
Constraints
Pa
per
s
Mod
el
So
ftw
are
Cas
e/T
heo
reti
cal
Stu
dy
Qu
euin
g m
odel
CS
den
sity
CS
ex
act
loca
tion
CS
nu
mb
er
Tra
ffic
GP
S l
oca
tio
n
Hig
hw
ay S
tud
y
Typ
e (B
EV
/PH
EV
)
Bat
tery
cap
acit
y (
kW
h)
So
C
Dem
and
den
sity
Tra
vel
dis
tance
Des
tin
atio
n
Dem
and
-Sta
tion
dis
tance
Pri
vat
e ch
arger
Char
gin
g h
ou
rs
Char
gin
g l
evel
Po
pu
lati
on/E
mp
loym
ent
Budg
et c
onst
rain
t
Gri
d c
on
stra
int
(Brooker
and Qin,
2015)
CS X X X X X X X L1-2 X X
(Pagany et
al., 2019)
Spatial
modelling
CS X X X X X X L2 X X
(Morrissey
et al., 2016)
CS X X X X Fast X
(Efthymio
u et al.,
2012)
Linear
model
ArcGIS CS X X X X X
(Eisel et al.,
2014)
FLPM CS X X X PHEV X X X X
(Yaping
Gao and
Xiaochun
Lu, 2015)
ANYL
OGIC
CS X X X X X X
(S. Li et al.,
2017)
K-means
cluster
CS X X PHEV X X X X X X Slow & Fast
(6-60 kW)
(Namdeo
et al., 2014)
Spatial
modelling
ArcGIS CS X X X X X Slow & Fast X

Chapter 2: Review of Optimization Objectives and Their Consequences for Electric-Vehicle Charging Infrastructure
99
(Rajabi-
Ghahnavie
h and
Sadeghi-
Barzani,
2017)
CS X X X X X X X Fast (96 kW) X X
(Said et al.,
2013)
MATL
AB
TS M/
M/
c
X X X X
(He et al.,
2013)
TS X X PHEV
(Farkas
and
Prikler,
2012)
Mathematic
al approach
EXCEL
VBA
TS M/
M/
c/N
Comparing
slow/fast
(Jung et
al., 2014)
Bi-level
optimizatio
n
M/
M/
c
X X X BEV 24 X X X X X X L 1-2-3 X
(Martins
and
Trindade,
2015)
GA,
Particle
Swarm
CS X BEV 30 X X X 20-50 W
Chapter 2: Review of Optimization Objectives and Their Consequences for Electric-Vehicle
Charging Infrastructure
100
References
Ahn, Y., Yeo, H., 2015. An Analytical Planning Model to Estimate the Optimal Density of Charging
Stations for Electric Vehicles. PLoS ONE 10, e0141307.
https://doi.org/10.1371/journal.pone.0141307
Alhazmi, Y.A., Mostafa, H.A., Salama, M.M.A., 2017. Optimal allocation for electric vehicle
charging stations using Trip Success Ratio. International Journal of Electrical Power & Energy
Systems 91, 101–116. https://doi.org/10.1016/j.ijepes.2017.03.009
Amjad, M., Ahmad, A., Rehmani, M.H., Umer, T., 2018. A review of EVs charging: From the
perspective of energy optimization, optimization approaches, and charging techniques.
Transportation Research Part D: Transport and Environment 62, 386–417.
https://doi.org/10.1016/j.trd.2018.03.006
Andrenacci, N., Ragona, R., Valenti, G., 2016. A demand-side approach to the optimal deployment of
electric vehicle charging stations in metropolitan areas. Applied Energy 182, 39–46.
https://doi.org/10.1016/j.apenergy.2016.07.137
Asamer, J., Reinthaler, M., Ruthmair, M., Straub, M., Puchinger, J., 2016. Optimizing charging station
locations for urban taxi providers. Transportation Research Part A: Policy and Practice 85,
233–246. https://doi.org/10.1016/j.tra.2016.01.014
Axsen, J., Langman, B., Goldberg, S., 2017. Confusion of innovations: Mainstream consumer
perceptions and misperceptions of electric-drive vehicles and charging programs in Canada.
Energy Research & Social Science 27, 163–173. https://doi.org/10.1016/j.erss.2017.03.008
Azadfar, E., Sreeram, V., Harries, D., 2015. The investigation of the major factors influencing plug-in
electric vehicle driving patterns and charging behaviour. Renewable and Sustainable Energy
Reviews 42, 1065–1076. https://doi.org/10.1016/j.rser.2014.10.058
Babrowski, S., Heinrichs, H., Jochem, P., Fichtner, W., 2014. Load shift potential of electric vehicles
in Europe. Journal of Power Sources 255, 283–293.
https://doi.org/10.1016/j.jpowsour.2014.01.019
Bailey, J., Miele, A., Axsen, J., 2015. Is awareness of public charging associated with consumer
interest in plug-in electric vehicles? Transportation Research Part D: Transport and
Environment 36, 1–9. https://doi.org/10.1016/j.trd.2015.02.001
Bakker, S., Jacob Trip, J., 2013. Policy options to support the adoption of electric vehicles in the urban
environment. Transportation Research Part D: Transport and Environment 25, 18–23.
https://doi.org/10.1016/j.trd.2013.07.005
Baouche, F., Billot, R., Trigui, R., EL FAOUZI, N.-E., 2014. Electric Vehicle Charging Stations
Allocation Model, in: ROADEF - 15ème Congrès Annuel de La Société Française de
Recherche Opérationnelle et d’aide à La Décision. Société française de recherche
opérationnelle et d’aide à la décision, Bordeaux, France.
Bhat, U.N., 2015. An Introduction to Queueing Theory: Modeling and Analysis in Applications, 2nd
ed, Statistics for Industry and Technology. Birkhäuser Basel. https://doi.org/10.1007/978-0-
8176-8421-1
Brady, J., O’Mahony, M., 2016. Modelling charging profiles of electric vehicles based on real-world
electric vehicle charging data. Sustainable Cities and Society 26, 203–216.
https://doi.org/10.1016/j.scs.2016.06.014
Brooker, R.P., Qin, N., 2015. Identification of potential locations of electric vehicle supply equipment.
Journal of Power Sources 299, 76–84. https://doi.org/10.1016/j.jpowsour.2015.08.097
Cai, H., Jia, X., Chiu, A.S.F., Hu, X., Xu, M., 2014. Siting public electric vehicle charging stations in
Beijing using big-data informed travel patterns of the taxi fleet. Transportation Research Part
D: Transport and Environment 33, 39–46. https://doi.org/10.1016/j.trd.2014.09.003
Cao, Y., Huang, L., Li, Y., Jermsittiparsert, K., Ahmadi-Nezamabad, H., Nojavan, S., 2020. Optimal
scheduling of electric vehicles aggregator under market price uncertainty using robust
optimization technique. International Journal of Electrical Power & Energy Systems 117,
105628. https://doi.org/10.1016/j.ijepes.2019.105628
Chen, C., Hua, G., 2014. A New Model for Optimal Deployment of Electric Vehicle Charging and
Battery Swapping Stations. IJCA 7, 247–258. https://doi.org/10.14257/ijca.2014.7.5.27

Chapter 2: Review of Optimization Objectives and Their Consequences for Electric-Vehicle
Charging Infrastructure
101
Chen, H., Zhang, H., Hu, Z., Liang, Y., Luo, H., Wang, Y., 2017. Plug-in Electric Vehicle Charging
Congestion Analysis Using Taxi Travel Data in the Central Area of Beijing.
arXiv:1712.07300 [cs, math].
Chen, Z., He, F., Yin, Y., 2016. Optimal deployment of charging lanes for electric vehicles in
transportation networks. Transportation Research Part B: Methodological 91, 344–365.
https://doi.org/10.1016/j.trb.2016.05.018
Chen, Z., Liu, W., Yin, Y., 2017. Deployment of stationary and dynamic charging infrastructure for
electric vehicles along traffic corridors. Transportation Research Part C: Emerging
Technologies 77, 185–206. https://doi.org/10.1016/j.trc.2017.01.021
Chung, S.H., KWon, C., 2015. Multi-period planning for electric car charging station locations: A case
of Korean Expressways. European Journal of Operational Research 242, 677–687.
https://doi.org/10.1016/j.ejor.2014.10.029
Cruz-Zambrano, M., Corchero, C., Igualada-Gonzalez, L., Bernardo, V., 2013. Optimal location of
fast charging stations in Barcelona: A flow-capturing approach, in: 2013 10th International
Conference on the European Energy Market (EEM). Presented at the 2013 10th International
Conference on the European Energy Market (EEM 2013), IEEE, Stockholm, pp. 1–6.
https://doi.org/10.1109/EEM.2013.6607414
Davidov, S., Pantoš, M., 2017. Planning of electric vehicle infrastructure based on charging reliability
and quality of service. Energy 118, 1156–1167. https://doi.org/10.1016/j.energy.2016.10.142
Deb, S., Tammi, K., Kalita, K., Mahanta, P., 2019. Charging Station Placement for Electric Vehicles:
A Case Study of Guwahati City, India. IEEE Access 7, 100270–100282.
https://doi.org/10.1109/ACCESS.2019.2931055
Deb, S., Tammi, K., Kalita, K., Mahanta, P., 2018. Review of recent trends in charging infrastructure
planning for electric vehicles. WIREs Energy and Environment 7, e306.
https://doi.org/10.1002/wene.306
Deilami, S., Masoum, A.S., Moses, P.S., Masoum, M.A.S., 2011. Real-Time Coordination of Plug-In
Electric Vehicle Charging in Smart Grids to Minimize Power Losses and Improve Voltage
Profile. IEEE Transactions on Smart Grid 2, 456–467.
https://doi.org/10.1109/TSG.2011.2159816
Dong, J., Liu, C., Lin, Z., 2014. Charging infrastructure planning for promoting battery electric
vehicles: An activity-based approach using multiday travel data. Transportation Research Part
C: Emerging Technologies 38, 44–55. https://doi.org/10.1016/j.trc.2013.11.001
Dunckley, J., 2016. Plug-In Electric Vehicle Multi-State Market and Charging Survey. EPRI, Palo
Alto, CA: 2016. 3002007495. 58.
Eberle, D.U., Helmolt, D.R. von, 2010. Sustainable transportation based on electric vehicle concepts: a
brief overview. Energy Environ. Sci. 3, 689–699. https://doi.org/10.1039/C001674H
Efthymiou, D., Antoniou, C., Tyrinopoylos, Y., Mitsakis, E., 2012. Spatial Exploration of Effective
Electric Vehicle Infrastructure Location. Procedia - Social and Behavioral Sciences 48, 765–
774. https://doi.org/10.1016/j.sbspro.2012.06.1054
Egbue, O., Long, S., 2012. Barriers to widespread adoption of electric vehicles: An analysis of
consumer attitudes and perceptions. Energy Policy 48, 717–729.
https://doi.org/10.1016/j.enpol.2012.06.009
Eisel, M., Schmidt, J., Kolbe, L.M., 2014. Finding suitable locations for charging stations, in: 2014
IEEE International Electric Vehicle Conference (IEVC). Presented at the 2014 IEEE
International Electric Vehicle Conference (IEVC), pp. 1–8.
https://doi.org/10.1109/IEVC.2014.7056134
Farkas, C., Prikler, L., 2012. Stochastic modelling of EV charging at charging stations. REPQJ 1046–
1051. https://doi.org/10.24084/repqj10.574
Figenbaum, E., Kolbenstvedt, M., 2016. Learning from Norwegian Battery Electric and Plug-in
Hybrid Vehicle users: Results from a survey of vehicle owners. TØI Report.
Frade, I., Ribeiro, A., Gonçalves, G., Antunes, A.P., 2011. Optimal Location of Charging Stations for
Electric Vehicles in a Neighborhood in Lisbon, Portugal. Transportation Research Record
2252, 91–98. https://doi.org/10.3141/2252-12

Chapter 2: Review of Optimization Objectives and Their Consequences for Electric-Vehicle
Charging Infrastructure
102
Franke, T., Krems, J.F., 2013. Understanding charging behaviour of electric vehicle users.
Transportation Research Part F: Traffic Psychology and Behaviour 21, 75–89.
https://doi.org/10.1016/j.trf.2013.09.002
Funke, S.Á., Plötz, P., Wietschel, M., 2019. Invest in fast-charging infrastructure or in longer battery
ranges? A cost-efficiency comparison for Germany. Applied Energy 235, 888–899.
https://doi.org/10.1016/j.apenergy.2018.10.134
Gao, Y., Guo, Y., 2013. Optimal Planning of Charging Station for Phased Electric Vehicle. EPE 05,
1393–1397. https://doi.org/10.4236/epe.2013.54B264
Gert Berckmans, Maarten Messagie, Jelle Smekens, Noshin Omar, Lieselot Vanhaverbeke, Joeri Van
Mierlo, 2017. Cost Projection of State of the Art Lithium-Ion Batteries for Electric Vehicles
Up to 2030. Energies 10, 1314. https://doi.org/10.3390/en10091314
Gnann, T., Funke, S., Jakobsson, N., Plötz, P., Sprei, F., Bennehag, A., 2018. Fast charging
infrastructure for electric vehicles: Today’s situation and future needs. Transportation
Research Part D: Transport and Environment 62, 314–329.
https://doi.org/10.1016/j.trd.2018.03.004
Gnann, T., Goldbach, D., Jakobsson, N., Plötz, P., Bennehag, A., Sprei, F., 2016. A Model for Public
Fast Charging Infrastructure Needs. WEVJ 8, 943–954. https://doi.org/10.3390/wevj8040943
Gnann, T., Plötz, P., 2015. A review of combined models for market diffusion of alternative fuel
vehicles and their refueling infrastructure. Renewable and Sustainable Energy Reviews 47,
783–793. https://doi.org/10.1016/j.rser.2015.03.022
Graham-Rowe, E., Gardner, B., Abraham, C., Skippon, S., Dittmar, H., Hutchins, R., Stannard, J.,
2012. Mainstream consumers driving plug-in battery-electric and plug-in hybrid electric cars:
A qualitative analysis of responses and evaluations. Transportation Research Part A: Policy
and Practice 46, 140–153. https://doi.org/10.1016/j.tra.2011.09.008
Grauers, A., Sarasini, S., Karlström, M., 2013. Why electromobility and what is it? [WWW
Document]. URL https://research.chalmers.se/en/publication/211430 (accessed 6.23.20).
Guo, Z., Deride, J., Fan, Y., 2016. Infrastructure planning for fast charging stations in a competitive
market. Transportation Research Part C: Emerging Technologies 68, 215–227.
https://doi.org/10.1016/j.trc.2016.04.010
Hackbarth, A., Madlener, R., 2013. Consumer preferences for alternative fuel vehicles: A discrete
choice analysis. Transportation Research Part D: Transport and Environment 25, 5–17.
https://doi.org/10.1016/j.trd.2013.07.002
Han, D., Ahn, Y., Park, S., Yeo, H., 2016. Trajectory-interception based method for electric vehicle
taxi charging station problem with real taxi data. International Journal of Sustainable
Transportation 10, 671–682. https://doi.org/10.1080/15568318.2015.1104565
He, F., Wu, D., Yin, Y., Guan, Y., 2013. Optimal deployment of public charging stations for plug-in
hybrid electric vehicles. Transportation Research Part B: Methodological 47, 87–101.
https://doi.org/10.1016/j.trb.2012.09.007
He, F., Yin, Y., Zhou, J., 2015. Deploying public charging stations for electric vehicles on urban road
networks. Transportation Research Part C: Emerging Technologies 60, 227–240.
https://doi.org/10.1016/j.trc.2015.08.018
He, S.Y., Kuo, Y.-H., Wu, D., 2016. Incorporating institutional and spatial factors in the selection of
the optimal locations of public electric vehicle charging facilities: A case study of Beijing,
China. Transportation Research Part C: Emerging Technologies 67, 131–148.
https://doi.org/10.1016/j.trc.2016.02.003
Heinrichs, H.U., Jochem, P., 2016. Long-term impacts of battery electric vehicles on the German
electricity system. Eur. Phys. J. Spec. Top. 225, 583–593. https://doi.org/10.1140/epjst/e2015-
50115-x
Hidalgo, P.A.L., Ostendorp, M., Lienkamp, M., 2016. Optimizing the charging station placement by
considering the user’s charging behavior, in: 2016 IEEE International Energy Conference
(ENERGYCON). Presented at the 2016 IEEE International Energy Conference
(ENERGYCON), pp. 1–7. https://doi.org/10.1109/ENERGYCON.2016.7513920
Hidrue, M.K., Parsons, G.R., Kempton, W., Gardner, M.P., 2011. Willingness to pay for electric
vehicles and their attributes. Resource and Energy Economics 33, 686–705.
https://doi.org/10.1016/j.reseneeco.2011.02.002

Chapter 2: Review of Optimization Objectives and Their Consequences for Electric-Vehicle
Charging Infrastructure
103
Huang, Y., Li, S., Qian, Z.S., 2015. Optimal Deployment of Alternative Fueling Stations on
Transportation Networks Considering Deviation Paths. Netw Spat Econ 15, 183–204.
https://doi.org/10.1007/s11067-014-9275-1
IPCC, 2018. Allen, M.R., O.P. Dube, W. Solecki, F. Aragón-Durand, W. Cramer, S. Humphreys, M.
Kainuma, J. Kala, N. Mahowald, Y. Mulugetta, R. Perez, M.Wairiu, and K. Zickfeld, 2018:
Framing and Context. In: Global Warming of 1.5°C. An IPCC Special Report on the impacts
of global warming of 1.5°C above pre-industrial levels and related global greenhouse gas
emission pathways, in the context of strengthening the global response to the threat of climate
change, sustainable development, and efforts to eradicate poverty [Masson-Delmotte, V., P.
Zhai, H.-O. Pörtner, D. Roberts, J. Skea, P.R. Shukla, A. Pirani, W. Moufouma-Okia, C. Péan,
R. Pidcock, S. Connors, J.B.R. Matthews, Y. Chen, X. Zhou, M.I. Gomis, E. Lonnoy, T.
Maycock, M. Tignor, and T. Waterfield (eds.)]. In Press.
Islam, Md., 2015. A Review of Techniques for Optimal Placement and Sizing of Electric Vehicle
Charging Stations. ELECTROTECHNICAL REVIEW 1, 124–128.
https://doi.org/10.15199/48.2015.08.29
Islam, M.M., Mohamed, A., Shareef, H., 2015. Optimal allocation of rapid charging stations for
electric vehicles, in: 2015 IEEE Student Conference on Research and Development
(SCOReD). Presented at the 2015 IEEE Student Conference on Research and Development
(SCOReD), pp. 378–383. https://doi.org/10.1109/SCORED.2015.7449360
Islam, M.M., Shareef, H., Mohamed, A., 2016. Optimal siting and sizing of rapid charging station for
electric vehicles considering Bangi city road network in Malaysia. https://doi.org/10.3906/elk-
1412-136
Jia, L., Hu, Z., Liang, W., Lang, W., Song, Y., 2014. A novel approach for urban electric vehicle
charging facility planning considering combination of slow and fast charging, in: 2014
International Conference on Power System Technology. Presented at the 2014 International
Conference on Power System Technology, pp. 3354–3360.
https://doi.org/10.1109/POWERCON.2014.6993928
Jing, W., Yan, Y., Kim, I., Sarvi, M., 2016. Electric vehicles: A review of network modelling and
future research needs. Advances in Mechanical Engineering 8, 1687814015627981.
https://doi.org/10.1177/1687814015627981
Jung, J., Chow, J.Y.J., Jayakrishnan, R., Park, J.Y., 2014. Stochastic dynamic itinerary interception
refueling location problem with queue delay for electric taxi charging stations. Transportation
Research Part C: Emerging Technologies 40, 123–142.
https://doi.org/10.1016/j.trc.2014.01.008
Le, T.N., Al-Rubaye, S., Liang, H., Choi, B.J., 2015. Dynamic charging and discharging for electric
vehicles in microgrids, in: 2015 IEEE International Conference on Communication Workshop
(ICCW). Presented at the 2015 IEEE International Conference on Communication Workshop
(ICCW), pp. 2018–2022. https://doi.org/10.1109/ICCW.2015.7247477
Li, M., Jia, Y., Shen, Z., He, F., 2017. Improving the electrification rate of the vehicle miles traveled
in Beijing: A data-driven approach. Transportation Research Part A: Policy and Practice 97,
106–120. https://doi.org/10.1016/j.tra.2017.01.005
Li, S., Huang, Y., 2014. Heuristic approaches for the flow-based set covering problem with deviation
paths. Transportation Research Part E: Logistics and Transportation Review 72, 144–158.
https://doi.org/10.1016/j.tre.2014.10.013
Li, S., Huang, Y., Mason, S.J., 2016. A multi-period optimization model for the deployment of public
electric vehicle charging stations on network. Transportation Research Part C: Emerging
Technologies 65, 128–143. https://doi.org/10.1016/j.trc.2016.01.008
Li, S., Tong, L., Xing, J., Zhou, Y., 2017. The Market for Electric Vehicles: Indirect Network Effects
and Policy Design. Journal of the Association of Environmental and Resource Economists 4,
89–133. https://doi.org/10.1086/689702
Li, W., Long, R., Chen, H., Geng, J., 2017. A review of factors influencing consumer intentions to
adopt battery electric vehicles. Renewable and Sustainable Energy Reviews 78, 318–328.
https://doi.org/10.1016/j.rser.2017.04.076

Chapter 2: Review of Optimization Objectives and Their Consequences for Electric-Vehicle
Charging Infrastructure
104
Lindgren, J., Lund, P.D., 2016. Effect of extreme temperatures on battery charging and performance of
electric vehicles. Journal of Power Sources 328, 37–45.
https://doi.org/10.1016/j.jpowsour.2016.07.038
Liu, H., Wang, D.Z.W., 2017. Locating multiple types of charging facilities for battery electric
vehicles. Transportation Research Part B: Methodological 103, 30–55.
https://doi.org/10.1016/j.trb.2017.01.005
Liu, Z., Zhang, W., Ji, X., Li, K., 2012. Optimal Planning of charging station for electric vehicle based
on particle swarm optimization, in: IEEE PES Innovative Smart Grid Technologies. Presented
at the IEEE PES Innovative Smart Grid Technologies, pp. 1–5. https://doi.org/10.1109/ISGT-
Asia.2012.6303112
Lucas, A., Alexandra Silva, C., Costa Neto, R., 2012. Life cycle analysis of energy supply
infrastructure for conventional and electric vehicles. Energy Policy, Modeling Transport
(Energy) Demand and Policies 41, 537–547. https://doi.org/10.1016/j.enpol.2011.11.015
Marchi, B., Zanoni, S., Pasetti, M., Zavanella, L., Ferretti, I., 2018. A queuing theory decision support
model and discrete event simulations for the smart charging of electric vehicles [WWW
Document]. ResearchGate. URL
https://www.researchgate.net/publication/327797233_A_queuing_theory_decision_support_m
odel_and_discrete_event_simulations_for_the_smart_charging_of_electric_vehicles (accessed
6.23.20).
Martínez-Lao, J., Montoya, F.G., Montoya, M.G., Manzano-Agugliaro, F., 2017. Electric vehicles in
Spain: An overview of charging systems. Renewable and Sustainable Energy Reviews 77,
970–983. https://doi.org/10.1016/j.rser.2016.11.239
Martín-Martín, A., Orduna-Malea, E., Thelwall, M., López-Cózar, E.D., 2018. Google Scholar, Web
of Science, and Scopus: a systematic comparison of citations in 252 subject categories.
https://doi.org/10.31235/osf.io/42nkm
Martins, M.C.S., Trindade, F.C.L., 2015. Time series studies for optimal allocation of electric
charging stations in urban area, in: 2015 IEEE PES Innovative Smart Grid Technologies Latin
America (ISGT LATAM). Presented at the 2015 IEEE PES Innovative Smart Grid
Technologies Latin America (ISGT LATAM), pp. 142–147. https://doi.org/10.1109/ISGT-
LA.2015.7381143
Mehboob, N., Cañizares, C., Rosenberg, C., 2014. Day-ahead dispatch of PEV loads in a residential
distribution system, in: 2014 IEEE PES General Meeting | Conference Exposition. Presented
at the 2014 IEEE PES General Meeting | Conference Exposition, pp. 1–5.
https://doi.org/10.1109/PESGM.2014.6939492
Mersky, A.C., Sprei, F., Samaras, C., Qian, Z. (Sean), 2016. Effectiveness of incentives on electric
vehicle adoption in Norway. Transportation Research Part D: Transport and Environment 46,
56–68. https://doi.org/10.1016/j.trd.2016.03.011
Mets, K., D’hulst, R., Develder, C., 2012. Comparison of intelligent charging algorithms for electric
vehicles to reduce peak load and demand variability in a distribution grid. Journal of
Communications and Networks 14, 672–681. https://doi.org/10.1109/JCN.2012.00033
Mohsenzadeh, A., Pazouki, S., Haghifam, M.-R., Pang, C., 2015. Optimal planning of parking lots and
demand response programs in distribution network considering power loss and voltage profile,
in: 2015 IEEE Power Energy Society Innovative Smart Grid Technologies Conference
(ISGT). Presented at the 2015 IEEE Power Energy Society Innovative Smart Grid
Technologies Conference (ISGT), pp. 1–5. https://doi.org/10.1109/ISGT.2015.7131899
Moradijoz, M., Parsa Moghaddam, M., Haghifam, M.R., Alishahi, E., 2013. A multi-objective
optimization problem for allocating parking lots in a distribution network. International
Journal of Electrical Power & Energy Systems 46, 115–122.
https://doi.org/10.1016/j.ijepes.2012.10.041
Morrissey, P., Weldon, P., O’Mahony, M., 2016. Future standard and fast charging infrastructure
planning: An analysis of electric vehicle charging behaviour. Energy Policy 89, 257–270.
https://doi.org/10.1016/j.enpol.2015.12.001
Motoaki, Y., Yi, W., Salisbury, S., 2018. Empirical analysis of electric vehicle fast charging under
cold temperatures. Energy Policy 122, 162–168. https://doi.org/10.1016/j.enpol.2018.07.036

Chapter 2: Review of Optimization Objectives and Their Consequences for Electric-Vehicle
Charging Infrastructure
105
Namdeo, A., Tiwary, A., Dziurla, R., 2014. Spatial planning of public charging points using multi-
dimensional analysis of early adopters of electric vehicles for a city region. Technological
Forecasting and Social Change 89, 188–200. https://doi.org/10.1016/j.techfore.2013.08.032
Nie, Y. (Marco), Ghamami, M., 2013. A corridor-centric approach to planning electric vehicle
charging infrastructure. Transportation Research Part B: Methodological 57, 172–190.
https://doi.org/10.1016/j.trb.2013.08.010
Oliveira, D.Q., Zambroni de Souza, A.C., Delboni, L.F.N., 2013. Optimal plug-in hybrid electric
vehicles recharge in distribution power systems. Electric Power Systems Research 98, 77–85.
https://doi.org/10.1016/j.epsr.2012.12.012
Pagany, R., Camargo, L.R., Dorner, W., 2018. A review of spatial localization methodologies for the
electric vehicle charging infrastructure [WWW Document]. URL
https://www.tandfonline.com/doi/full/10.1080/15568318.2018.1481243 (accessed 6.23.20).
Pagany, R., Marquardt, A., Zink, R., 2019. Electric Charging Demand Location Model—A User- and
Destination-Based Locating Approach for Electric Vehicle Charging Stations. Sustainability
11, 2301. https://doi.org/10.3390/su11082301
Pelletier, S., Jabali, O., Laporte, G., 2018. Charge scheduling for electric freight vehicles.
Transportation Research Part B: Methodological 115, 246–269.
https://doi.org/10.1016/j.trb.2018.07.010
Pelletier, S., Jabali, O., Laporte, G., Veneroni, M., 2017. Battery degradation and behaviour for
electric vehicles: Review and numerical analyses of several models. Transportation Research
Part B: Methodological, Green Urban Transportation 103, 158–187.
https://doi.org/10.1016/j.trb.2017.01.020
Rahimi, S., Zhu, K., Massucco, S., Silvestro, F., Steen, D., 2014. Using the advanced DMS functions
to handle the impact of plug-in Electric vehicles on distribution networks, in: 2014 IEEE
International Electric Vehicle Conference (IEVC). Presented at the 2014 IEEE International
Electric Vehicle Conference (IEVC), pp. 1–8. https://doi.org/10.1109/IEVC.2014.7056127
Rajabi-Ghahnavieh, A., Sadeghi-Barzani, P., 2017. Optimal Zonal Fast-Charging Station Placement
Considering Urban Traffic Circulation. IEEE Transactions on Vehicular Technology 66, 45–
56. https://doi.org/10.1109/TVT.2016.2555083
Ruiqin, D., Zhongjing, M., 2015. Resident electric vehicles charging optimization strategy in the smart
grid, in: 2015 34th Chinese Control Conference (CCC). Presented at the 2015 34th Chinese
Control Conference (CCC), pp. 9054–9059. https://doi.org/10.1109/ChiCC.2015.7261072
Sadeghi-Barzani, P., Rajabi-Ghahnavieh, A., Kazemi-Karegar, H., 2014. Optimal fast charging station
placing and sizing. Applied Energy 125, 289–299.
https://doi.org/10.1016/j.apenergy.2014.03.077
Said, D., Cherkaoui, S., Khoukhi, L., 2013. Queuing model for EVs charging at public supply stations,
in: 2013 9th International Wireless Communications and Mobile Computing Conference
(IWCMC). Presented at the 2013 9th International Wireless Communications and Mobile
Computing Conference (IWCMC 2013), IEEE, Sardinia, Italy, pp. 65–70.
https://doi.org/10.1109/IWCMC.2013.6583536
Salmon, J., 2016. Systems optimization of charging infrastructure for electric vehicles, in: 2016
Annual IEEE Systems Conference (SysCon). Presented at the 2016 Annual IEEE Systems
Conference (SysCon), pp. 1–8. https://doi.org/10.1109/SYSCON.2016.7490573
Sathaye, N., Kelley, S., 2013. An approach for the optimal planning of electric vehicle infrastructure
for highway corridors. Transportation Research Part E: Logistics and Transportation Review
59, 15–33. https://doi.org/10.1016/j.tre.2013.08.003
Schroeder, A., Traber, T., 2012. The economics of fast charging infrastructure for electric vehicles.
Energy Policy 43, 136–144. https://doi.org/10.1016/j.enpol.2011.12.041
Serradilla, J., Wardle, J., Blythe, P., Gibbon, J., 2017. An evidence-based approach for investment in
rapid-charging infrastructure. Energy Policy 106, 514–524.
https://doi.org/10.1016/j.enpol.2017.04.007
Shahraki, N., Cai, H., Turkay, M., Xu, M., 2015. Optimal locations of electric public charging stations
using real world vehicle travel patterns. Transportation Research Part D: Transport and
Environment 41, 165–176. https://doi.org/10.1016/j.trd.2015.09.011

Chapter 2: Review of Optimization Objectives and Their Consequences for Electric-Vehicle
Charging Infrastructure
106
Shareef, H., Islam, Md.M., Mohamed, A., 2016. A review of the stage-of-the-art charging
technologies, placement methodologies, and impacts of electric vehicles. Renewable and
Sustainable Energy Reviews 64, 403–420. https://doi.org/10.1016/j.rser.2016.06.033
Shen, Z.-J.M., Feng, B., Mao, C., Ran, L., 2019. Optimization models for electric vehicle service
operations: A literature review. Transportation Research Part B: Methodological 128, 462–
477. https://doi.org/10.1016/j.trb.2019.08.006
Shukla, A., Pekny, J., Venkatasubramanian, V., 2011. An optimization framework for cost effective
design of refueling station infrastructure for alternative fuel vehicles. Computers & Chemical
Engineering 35, 1431–1438. https://doi.org/10.1016/j.compchemeng.2011.03.018
Sierzchula, W., Bakker, S., Maat, K., van Wee, B., 2014. The influence of financial incentives and
other socio-economic factors on electric vehicle adoption. Energy Policy 68, 183–194.
https://doi.org/10.1016/j.enpol.2014.01.043
Soylu, T., Anderson, J.E., Böttcher, N., Weiß, C., Chlond, B., Kuhnimhof, T., 2016. Building Up
Demand-Oriented Charging Infrastructure for Electric Vehicles in Germany. Transportation
Research Procedia 19, 187–198. https://doi.org/10.1016/j.trpro.2016.12.079
Spieker, H., Hagg, A., Gaier, A., Meilinger, S., Asteroth, A., 2017. Multi-stage Evolution of Single-
and Multi-objective MCLP. Soft Comput. 21, 4859–4872. https://doi.org/10.1007/s00500-
016-2374-9
Springel, K., 2017. Network Externality and Subsidy Structure in Two-Sided Markets: Evidence from
Electric Vehicle Incentives 63.
Sun, Z., Gao, W., Li, B., Wang, L., 2018. Locating charging stations for electric vehicles. Transport
Policy S0967070X17306583. https://doi.org/10.1016/j.tranpol.2018.07.009
Tian, Z., Hou, W., Gu, X., Gu, F., Yao, B., 2018. The location optimization of electric vehicle
charging stations considering charging behavior. SIMULATION 94, 625–636.
https://doi.org/10.1177/0037549717743807
Torabikalaki, R., Gomes, A., 2014. Optimizing the Coordinated Charging of a Group of Electric
Vehicles, in: 2014 IEEE Vehicle Power and Propulsion Conference (VPPC). Presented at the
2014 IEEE Vehicle Power and Propulsion Conference (VPPC), pp. 1–6.
https://doi.org/10.1109/VPPC.2014.7007116
Torchio, M.F., Santarelli, M.G., 2010. Energy, environmental and economic comparison of different
powertrain/fuel options using well-to-wheels assessment, energy and external costs –
European market analysis. Energy 35, 4156–4171.
https://doi.org/10.1016/j.energy.2010.06.037
Tran, M., Banister, D., Bishop, J.D.K., McCulloch, M.D., 2012. Realizing the electric-vehicle
revolution. Nature Clim Change 2, 328–333. https://doi.org/10.1038/nclimate1429
Tu, W., Li, Q., Fang, Z., Shaw, S., Zhou, B., Chang, X., 2016. Optimizing the locations of electric taxi
charging stations: A spatial–temporal demand coverage approach. Transportation Research
Part C: Emerging Technologies 65, 172–189. https://doi.org/10.1016/j.trc.2015.10.004
Wang, Y.-W., Lin, C.-C., 2009. Locating road-vehicle refueling stations. Transportation Research Part
E: Logistics and Transportation Review 45, 821–829.
https://doi.org/10.1016/j.tre.2009.03.002
Wang, Y.-W., Wang, C.-R., 2010. Locating passenger vehicle refueling stations. Transportation
Research Part E: Logistics and Transportation Review 46, 791–801.
https://doi.org/10.1016/j.tre.2009.12.001
Wanting Lin, Guowei Hua, 2015. The flow capturing location model and algorithm of electric vehicle
charging stations, in: 2015 International Conference on Logistics, Informatics and Service
Sciences (LISS). Presented at the 2015 International Conference on Logistics, Informatics and
Service Sciences (LISS), pp. 1–6. https://doi.org/10.1109/LISS.2015.7369788
Wood, E., Neubauer, J.S., Burton, E., 2015. Measuring the Benefits of Public Chargers and Improving
Infrastructure Deployments Using Advanced Simulation Tools. Presented at the SAE 2015
World Congress & Exhibition, pp. 2015-01–1688. https://doi.org/10.4271/2015-01-1688
Wood, E., Raghavan, S., Rames, C., Eichman, J., Melaina, M., 2017. Regional Charging Infrastructure
for Plug-In Electric Vehicles: A Case Study of Massachusetts (No. NREL/TP--5400-67436,
1339074). https://doi.org/10.2172/1339074

Chapter 2: Review of Optimization Objectives and Their Consequences for Electric-Vehicle
Charging Infrastructure
107
Xi, X., Sioshansi, R., Marano, V., 2013. Simulation–optimization model for location of a public
electric vehicle charging infrastructure. Transportation Research Part D: Transport and
Environment 22, 60–69. https://doi.org/10.1016/j.trd.2013.02.014
Xiang, Y., Liu, J., Li, R., Li, F., Gu, C., Tang, S., 2016. Economic planning of electric vehicle
charging stations considering traffic constraints and load profile templates. Applied Energy
178, 647–659. https://doi.org/10.1016/j.apenergy.2016.06.021
Yang, J., Dong, J., Hu, L., 2017. A data-driven optimization-based approach for siting and sizing of
electric taxi charging stations. Transportation Research Part C: Emerging Technologies 77,
462–477. https://doi.org/10.1016/j.trc.2017.02.014
Yaping Gao, Xiaochun Lu, 2015. Analysis of the electric vehicle charging station’s layout in Beijing
based on improved traveling simulation model, in: 2015 International Conference on
Logistics, Informatics and Service Sciences (LISS). Presented at the 2015 International
Conference on Logistics, Informatics and Service Sciences (LISS), pp. 1–6.
https://doi.org/10.1109/LISS.2015.7369699
Yi, Z., Bauer, P.H., 2016. Optimization models for placement of an energy-aware electric vehicle
charging infrastructure. Transportation Research Part E: Logistics and Transportation Review
91, 227–244. https://doi.org/10.1016/j.tre.2016.04.013
Zeng, M., Zhan, X., Li, Y., 2016. Optimal Planning for Electric Vehicle Charging Station Considering
the Constraint of Battery Capacity, in: Proceedings of the 2016 International Conference on
Artificial Intelligence: Technologies and Applications. Presented at the 2016 International
Conference on Artificial Intelligence: Technologies and Applications, Atlantis Press,
Bangkok, Thailand. https://doi.org/10.2991/icaita-16.2016.86
Zhang, A., Kang, J.E., KWon, C., 2017. Incorporating demand dynamics in multi-period capacitated
fast-charging location planning for electric vehicles. Transportation Research Part B:
Methodological 103, 5–29. https://doi.org/10.1016/j.trb.2017.04.016
Zhang, F., Liu, K., Zhang, Q., Tian, B., Li, W., Qin, L., 2015. The research on the planning model of
rural distribution network containing diversification loads, in: 2015 5th International
Conference on Electric Utility Deregulation and Restructuring and Power Technologies
(DRPT). Presented at the 2015 5th International Conference on Electric Utility Deregulation
and Restructuring and Power Technologies (DRPT), pp. 578–582.
https://doi.org/10.1109/DRPT.2015.7432295
Zhang, H., Hu, Z., Xu, Z., Song, Y., 2016. An Integrated Planning Framework for Different Types of
PEV Charging Facilities in Urban Area. IEEE Transactions on Smart Grid 7, 2273–2284.
https://doi.org/10.1109/TSG.2015.2436069
Zhang, Y., Qi, D., Jiang, W., Lei, S., 2016. Optimal Allocation of Changing Station for Electric
Vehicle Based on Queuing Theory. PROMET 28, 497–505.
https://doi.org/10.7307/ptt.v28i5.1974
Zhang, Z., Sun, X., Ding, N., Yang, J., 2019. Life cycle environmental assessment of charging
infrastructure for electric vehicles in China. Journal of Cleaner Production 227, 932–941.
https://doi.org/10.1016/j.jclepro.2019.04.167
Zhou, K., Cai, L., 2014. Randomized PHEV Charging Under Distribution Grid Constraints. IEEE
Transactions on Smart Grid 5, 879–887. https://doi.org/10.1109/TSG.2013.2293733
Zhu, Z.-H., Gao, Z.-Y., Zheng, J.-F., Du, H.-M., 2016. Charging station location problem of plug-in
electric vehicles. Journal of Transport Geography 52, 11–22.
https://doi.org/10.1016/j.jtrangeo.2016.02.002

Chapter 2: Review of Optimization Objectives and Their Consequences for Electric-Vehicle
Charging Infrastructure
108

Chapter 3: Assessing the trade-offs between battery capacity and public charging
infrastructure of electric vehicles: urban and rural French case studies for daily needs
109
Chapter 3: Assessing the trade-offs between battery capacity
and public charging infrastructure of electric vehicles: urban
and rural French case studies for daily needs
Abstract
Battery Electric Vehicles (BEVs) are considered a promising solution for the reduction of
greenhouse-gas emissions. Despite increasing sales, techno-economic barriers still hinder their
widespread adoption. Market stakeholders face a dilemma in overcoming these obstacles,
especially as they seem to disagree on investment scenarios regarding battery capacity and
charging infrastructure, with different implications as to who should bear the costs of addressing
these dilemmas. While previous research has considered battery vs recharging infrastructure
choices separately, they are interdependent in reality, as battery choices influence car price,
charging speed and accessibility. These choices are all the more important for an often
overlooked but important group of potential EV owners: households that cannot charge at home
and for whom solutions that can address range anxiety are of particular importance. In this
Chapter, we analyse how techno-economic barriers can overcome this customer group while
considering the interdependencies mentioned.
Using data obtained for real-world mobility needs in France, we simulate BEV-owner and
charging infrastructure-operator cost implications for several combinations of privately-
purchased BEVs that vary in 1) battery capacity, 2) charging power and, 3) whether or not the
owner lives in a rural or urban area. Furthermore, we explore Pareto fronts in order to determine
optimal combinations. This Chapter shows that for urban (vs rural) areas, purchasing a 40-50-
kWh (55-kWh) BEV and deploying 50-kW chargers (50-kW) proves to be the most social cost-
efficient solution. Policy implications are then discussed, and we recommend a thorough review
of the charging tariffs.
This Chapter was presented at the 2021 IEW Workshop, the 2021 Applied Energy
Symposium, and the 2021 International IAEE conference:
Bassem Haidar, Pascal da Costa, Jan Lepoutre, Fabrice Vidal. Addressing Electric-
Vehicle Range Anxiety In Urban And Rural Areas. International Energy Workshop
2021, Fraunhofer Institute for Solar Energy Systems ISE, 2021, Fribourg, Germany.
Bassem Haidar. Assessing the trade-offs between battery capacity and charging power
of battery electric vehicles: A French case study. Applied Energy Symposium:MIT
A+B, MIT and Harvard, 2021, Boston, United States.

Chapter 3: Assessing the trade-offs between battery capacity and public charging
infrastructure of electric vehicles: urban and rural French case studies for daily needs
110
Bassem Haidar, Pascal da Costa, Jan Lepoutre, Fabrice Vidal. Which combination of
battery capacity and charging power for battery electric vehicles: urban versus rural
French case studies. Energy, COVID, and Climate Change, 2021, Paris, France.
This Chapter is submitted to Research in Transportation Economics Journal as follows:
Bassem Haidar, Pascal da Costa, Jan Lepoutre, Fabrice Vidal. Assessing the trade-offs between
battery capacity and public charging infrastructure of electric vehicles: urban and rural French
case studies for daily needs.

Chapter 3: Assessing the trade-offs between battery capacity and public charging
infrastructure of electric vehicles: urban and rural French case studies for daily needs
111
1. Introduction In order to reach ambitious climate change mitigation targets, the Intergovernmental
Panel on Climate Change (IPCC) called for a reduction of greenhouse gas emissions (GHG),
especially in the energy and transportation sectors that are currently heavily fossil-fuel
dependent (IEA, 2019; IPCC, 2018). Transportation, responsible for 20% of global CO2
emissions, of which 72% are emitted by road transportation, should become emission-free by
2050 to reach world ambitions (IPCC, 2018). Electric vehicles (EVs), including Battery EVs
(BEVs) and Plug-in EVs (PHEVs), have the potential to improve the environmental impact of
personal-road transportation because of their potential non-fossil-fuel dependency (Amjad et
al., 2018). As a result, BEVs have attracted much attention, pushing governments to promote
this technology as an auspicious solution (Gnann et al., 2018).
Although BEV sales have sharply risen in the past years in many developed countries,
their sales remain limited in absolute terms. To reach BEV mass adoption, economic-,
psychological-, comfort-customer concerns, etc. are still hindering its expansion: indeed, higher
vehicle prices, anxiety about the ability to complete both daily and long mobility needs, the
availability of either private or public chargers, and the often longer time required to recharge
(vs refill) are some of the more essential barriers (Berkeley et al., 2017; Biresselioglu et al.,
2018). In the specific case of France, for example, EVs represented only about 2% of total
vehicles sales in 2020 (French Ministry of Ecological Transition, 2020). To boost sales, the
French government has tried making EVs more attractive to consumers by offering various
subsidies, on both national and local levels, tax exemptions, free parking, access to bus lanes to
each driver switching to electric mobility. The main subsidy can go up to 5000€/BEV6,
depending on the vehicle's initial price. Furthermore, since the lack of charging infrastructure
still presents a significant barrier to EV adoption, the government has been boosting the
deployment of the infrastructure by installing more chargers (EC, 2013), and currently offering
up to 50% of the cost of the charger for both private and public usage (e.g. ADVENIR project
(Advenir, 2020)).
Completing daily or long mobility needs (or eliminating the autonomy barriers) involves
an economic trade-off. While integrating bigger batteries in cars provides more range and could
solve the range anxiety concern by conveniently reaching one’s destination, it comes with a
6 Note that due to COVID19 crisis, and within the framework of the French recovery plan, the French government
increased the subsidy up to 7000€/BEV, from the last quarter of 2020 for few months. (Service Public, 2020).
These upward subsidies are temporary, which is why, in this study, we can consider a more permanent subsidy of
5000€/BEV.

Chapter 3: Assessing the trade-offs between battery capacity and public charging
infrastructure of electric vehicles: urban and rural French case studies for daily needs
112
higher vehicle-purchasing price. Contrary to small-battery BEVs, which come with lower
purchasing costs but with a smaller range (around 75-125 km), large-battery BEVs offer
extended autonomy (up to 450-630 km), yet significantly higher purchase cost.
In order to keep purchasing prices low by integrating smaller batteries in the vehicle,
investing more in high penetration of public charging network is indispensable, especially near
accommodation places and on highways, e.g. Corri-Door or Ionity projects France (EC, 2013;
Ionity, 2021). The French Government recently allocated a budget of € 100 million for fast
charging stations on motorways and the national road network, aiming to foster range-anxiety-
free long-distance travel (Ministry of Ecological Transition, 2020). However, the cost of such
infrastructure investments is not with the purchaser of the car and represents considerable
expenditures for charging operators (Funke et al., 2019; Gnann et al., 2018; Greene et al., 2020).
Spatial considerations further complicate this issue since charging needs vary between French
rural and urban areas, with higher needs in rural (ENTD, 2019, 2008).
Finally, the fact that in France currently 90% of recharging events are done at home with
private chargers (AVERE, 2020) shows that a large population of potential customers, who
cannot install an at-home private charger, face a practical barrier that prevents them from
buying an EV. Private charger installation depends mainly on the housing type (free standing
house vs condominium apartment), private parking availability, and area type (rural vs urban).
37% of primary residences in France do not have any home parking, neither in individual or
collective housing (Huguette and Stéphane, 2019). Indeed, home parking unavailability is lower
in rural areas (where the housing type is mainly free-standing houses) than in urban ones (where
the share of people living in condominiums is much higher) (INSEE, 2020a). Moreover, people
living in rural or peri-urban areas tend to be more dependent on their cars due to lower
penetration of alternative transport modes, such as public transport. Switching from ICEV to
BEV is then a risky proposition for these drivers, as they have to anticipate, during their
everyday trips (home-work, school-home, home-shopping, etc.), BEVs range limitations that
come with their battery size, restricted availability of public charging infrastructure, various
charging powers that adopt diverse charging tariffs and pricing methods, and the waiting time
to access an on-street charger, especially during peak hours. These are all dilemmas that this
Chapter aims to study. Studying solutions for non-home charging EV owners is important, as
they represent a vital target customer for the BEV market's future, as withdrawing these
“laggards’ obstacles” could strongly increase BEV penetration.
To make progress on this question, we must consider an often forgotten interdependence
between battery size and recharging speed, technically called the C-Rate (Charging-Rate).

Chapter 3: Assessing the trade-offs between battery capacity and public charging
infrastructure of electric vehicles: urban and rural French case studies for daily needs
113
Indeed, the smaller the battery size, the more limited the power at which the car can be charged,
hence the charging speed (Electric Vehicle Database, 2021). Since charging speed depends on
the combination of battery capacity and charging power, it transfers a simple-unitary transaction
for the automotive manufacturer (one car, one battery) into a complicated and costly-shared
infrastructure investment. Therefore, solving the recharging speed and cost question is a
complex set of interdependent variables that connect battery size and charging power with
diverse stakeholders: adopting large-battery BEVs to avoid range anxiety will oblige operators
to install fast chargers and different charging speeds that come with high investments.
While determining the optimal battery size of BEVs and optimizing the charging
network have received widespread attention in the literature, the implication that battery size
influences charging powers has rarely been considered and reveals a high complexity level. To
answer the battery sizes and charging power combinations question, this article will analyse
and compare BEV owner purchasing and usage costs, considering French government subsidies
and environmental (CO2) taxes on the one hand, and CPO investment and operational costs,
taking into account French government subsidies and real-market charging tariffs, on the other
hand. We computed the cost and revenue models based on the Equivalent Annual Cost (EAC)
method, i.e. the cost of owning, operating, and maintaining an asset over its entire lifetime
(Funke et al., 2019). The EAC method is appropriate since BEVs and charging infrastructure
do not share identical lifetimes or own, operate, or maintain costs.
The trade-off question is highly individual and depends on the driver’s needs and
behaviour, which significantly depends on the urbanization level of the individual’s home and
work situation. Thus, we applied the cost comparison methodology by considering cluster areas
using two typical examples of urban – Paris – and rural – Ambérieu-en-Bugey – French areas,
which differ in their socio-economic characteristics.
To sum up, this article assesses the trade-off between bigger batteries and more chargers,
with various relevant and novel contributions by:
i) Considering several input data for the costs models, namely:
Spatial analysis in French urban- and rural-mobility needs, and non-availability of at-home
chargers (Paris versus Ambérieu-en-Bugey).
Considering technical constraints regarding the combinations of battery size and charger speed,
based on their C-Rate. Note we also address a sensitivity analysis of the mix of the BEV-charger
compatibility.
ii) Concluding with several innovative deductions:

Chapter 3: Assessing the trade-offs between battery capacity and public charging
infrastructure of electric vehicles: urban and rural French case studies for daily needs
114
Addressing the two main cost EAC models of the BEV ecosystem: BEV customer and charging
point operator.
Concluding about profitable win-win solutions for both parties or Pareto fronts.
Discussing policy implications for the whole BEV ecosystem: the automotive industry, the
charging operator, and the policymaker.
The results of this article suggest that the optimal overall investment strategy is to
favour investment in fast-charging infrastructure rather than bigger batteries: Based on
Pareto fronts, purchasing a 40-50 kWh BEV for the selected urban area -versus 55 kWh BEV
for rural- and deploying 50 kW chargers -50 kW for the selected rural- prove the most cost-
efficient and profitable solutions, for both BEV owners as well as charging operators.
Our Chapter is structured as follows: Section 2 presents the literature review. Section 3
discusses the methodology and, in Section 4, the data and the techno-economic parameters. The
results of the study are presented in Section 5. The conclusion, discussion, and policy
recommendations are drawn up in Section 6.
2. Literature Review
The literature dedicated to understanding optimal responses to electric vehicle customer
needs can be divided into four main streams. The first estimates the drivers’ needed range.
Second, the determination of the optimal battery capacity is elaborated. Third, a group of
publications investigates the deployment of charging infrastructure. Last, the fourth stream
compares the investment in both technologies.
2.1.Estimating drivers’ needed range
The first stream of articles has focused on determining the appropriate battery capacity
to satisfy customer transportation requirements. The question is challenging, as range
requirements can vary with social and driving behaviours changes. Consequently, large datasets
of trips for many drivers over a long period are required, for example, surveys and
questionnaires at a national scale, data on long-mileage trips, and GPS-based trips.
The first articles use surveys and questionnaires, including national travel surveys, of
all types of trips. Zhang et al. (2013) used a dataset of 20,295 privately owned vehicles in
California travelling 83,005 single daily trips or 7.85 trips each, from the 2009 National
Household Travel Survey (NHTS). They found that 88% of the trips could be operated using a
BEV with a 95-km range, using only at-home charging. Similarly, Zhou et al. (2020) conducted
a stated preference survey in Beijing to estimate the different recharging behaviours of two

Chapter 3: Assessing the trade-offs between battery capacity and public charging
infrastructure of electric vehicles: urban and rural French case studies for daily needs
115
clusters of BEV drivers in Beijing. They concluded that a 482-km BEV could cover 90% of the
drivers' travel demands, while a 160-km BEV can satisfy 80%.
The second group of articles is based on survey data of long-distance trips. Since data
on BEV trips are still rare, especially for long-distance trips, Weiss et al. (2014) used statistical
mobility surveys: the German Mobility Panel study on individual car mileage and fuel
consumption, and the long-distance travel survey INVERMO, from which they concluded that
only 13% of private vehicles users never exceed 100 km, 16% of private vehicle data exceeded
range requirements of 100 km for only 1-4 days a year, concluding with the unnecessity of a
bigger range than 100 km for around 30% of users.
The last group of articles used GPS-based data of trips. Pearre et al. (2011) analyzed the
driving patterns of 484 ICEVs over one year in the US and assumed that these drivers would
not change their driving behaviour after switching to a BEV. They found that 9% of users never
exceeded 160 km in a day, and 21% never exceeded 240 km and would satisfy their needs with
a small battery BEV. This percentage could increase up to 32% if drivers were willing to adjust
their driving behaviour for long-distance trips done once per month. Neubauer and Wood
(2014) claimed that after analyzing the trips of 317 ICEVs over one year, a 120 km-range BEV
could fill the needs of 75% of the drivers without public charging infrastructure and increase
90% with such charging infrastructure available. Meinrenken et al. (2020) concluded that the
battery's optimal range would be 158 km, based on 412 cars and GPS data for 384,869
individual trips while maximizing GHG savings. Overall, this stream shows that range
requirements are low for most of the population and uses (a 100-250 km BEV could satisfy the
needs of a large group of drivers), but that diversity exists depending on geographical origin
and exceptional trips.
2.2.Determining The Optimal Battery Capacity
Determining the optimal battery7 capacity for a BEV is subjected to technical (battery
technology, charging power), economic (the price of the battery pack), and drivers’ behaviour
(needed range and access to charging infrastructure) factors (Mies et al., 2018). First, battery
sizing mainly depends on the capacity (Ah) and the charging current (A), two parameters that
define the battery C-rate: the rate at which a battery can be charged and discharged (Yong et
al., 2015). A C-rate of 1C is also known as a one-hour discharge; 0.5C or C/2 is a two-hour
discharge, and 0.2C or C/5 is a 5-hour discharge. The main challenge is identifying the C-rate
7 We consider that the BEV battery is a lithium-ion one.

Chapter 3: Assessing the trade-offs between battery capacity and public charging
infrastructure of electric vehicles: urban and rural French case studies for daily needs
116
that makes capacity utilization and battery charging speed well balanced (Duru et al., 2021).
Indeed, achieving a high capacity utilization with low charging current rates could speed up the
battery wear and ageing process, cause the slowdown of the battery's charging speed and further
hurt BEV usage (Duru et al., 2021). (Bhagavathy et al., 2021) shows that charging rates above
1C-rate negatively affects some batteries’ lifetimes. Fast chargers can accelerate the
degradation of batteries in vehicles, which may require premature replacement and, hence,
increase the cost. This problem reveals the complexity of adapting battery sizes to charging
powers since charging a small battery capacity with a high current could decreases the battery's
energy storage efficiency (Waldmann et al., 2018). As a result, car manufacturers manage the
C-rate of the battery through its Battery Management System (BMS), and generally, larger
battery sizes can accommodate higher C-rates and, hence, charge speeds. Second, the battery
size is linked to the BEV cost. Although battery pack prices are experiencing a downward trend,
from 1037€/kWh in 2010 to 150€/kWh in 2020 (Groupe Renault, 2020), a battery pack still
remains a significant cost in the car’s purchase price. Thirdly, as elaborated in Section 2.1.,
sizing the battery capacity relies on the drivers’ needed range and access to charging
infrastructure (at home or not), and the tolerated charging duration if using the public charging
infrastructure. In sum, while bigger battery capacities will provide extended autonomy and
faster charging, they come with a higher purchasing cost for the driver. Based on these factors,
a driver, who has an at-home charger and drives for short distances, is more likely to purchase
a small-battery BEV than a large one, limiting the purchasing price.
2.3.Deployment of Charging Infrastructures
The question of charging-station geo-locations has been extensively studied in the
literature. Research has focused on optimizing the locations of charging infrastructure based on
various objectives: minimizing the charging operator’s costs (Yang et al., 2017), minimizing
the travelled distance (Sathaye and Kelley, 2013), maximizing the coverage (Wang and Wang,
2010), minimizing failed trips (Alhazmi et al., 2017), minimizing the distance between demand
and charging sites (Sathaye and Kelley, 2013). Various spatial-optimisation methods have also
been considered in determining the optimal location of recharging network locations (Pagany
et al., 2019; Shareef et al., 2016; Shen et al., 2019). These articles helped us to understand the
empirical methodology behind the spatial localisation of the charging network. However, these
studies generally only focus on the charging infrastructure geo-localization while ignoring or
holding constant data related to the BEVs, such as the battery capacity or autonomy. Since some
BEVs are not compatible with fast charging technologies (as mentioned before), our insight

Chapter 3: Assessing the trade-offs between battery capacity and public charging
infrastructure of electric vehicles: urban and rural French case studies for daily needs
117
into the appropriate recharging infrastructure deployment requires simultaneous consideration
of both battery specifications and recharging network characteristics.
2.4.Investments in Both Technologies
The comparison between deploying charging infrastructure and increasing battery
capacity has only received scarce attention in the literature. Jabbari and Mackenzie (2017)
examined the trade-off between DC fast-charging availability, the capacity to charge many
BEVs using a theoretical queuing model, and the cost of charging-infrastructure deployment.
They concluded that for a charging station with few chargers, it is difficult to achieve cost
effective levels of utilization while maintaining reliable access for arriving vehicles. Large
numbers of chargers per station make it possible to maintain a high reliability of access and a
high utilization rate. Wood et al. (2015) studied various fast-charging infrastructure deployment
scenarios and found that adding 100 km to the BEV autonomy is more costly than deploying
more fast-charging infrastructure. However, analyzing the interdependent effects of these
deployment scenarios would require a greater understanding of both the nature of driving and
charging behaviours.
The originality of (Funke et al., 2019)’s study is to combine all the three streams
presented above: identification of BEV needs for German long-mileage trips, determining the
number of needed fast chargers, and comparing both of them, using a techno-economic
approach, in order to address this trade-off. They compared the EAC of owning a BEV and
expanding the fast-charging infrastructure for doubled and tripled BEVs battery size. They
concluded that the investments in only fast charging infrastructure (50 and 150 kW chargers)
are low compared to larger batteries due to the high price of battery packs (350€/kWh). While
(Funke et al., 2019) made significant improvements in this field, questions remain regarding
socio-techno-economic assumptions.
First, various BEV types could be available on the market with different battery
capacities, and each type is compatible with specified charging power. While some vehicles,
especially small-battery ones, can only charge using 7-22 kW chargers due to their non-
compatibility with fast charging technology, others can use all types of charging powers, mostly
BEVs with battery capacity higher than 50 kWh. Furthermore, since the extended part of the
BEV range is occasionally used (Funke et al., 2019), the question of the trade-off between
battery capacity and charging infrastructure cost comparison for daily needs, such as home-
work trips, has not been elaborated in the literature. Besides, the question of when there are no
charging possibilities at home has not been addressed. Besides, none of the papers considered

Chapter 3: Assessing the trade-offs between battery capacity and public charging
infrastructure of electric vehicles: urban and rural French case studies for daily needs
118
real charging tariffs from operators on the market. Lastly, the question of the optimum battery
capacity or the optimum deployment of charging infrastructure was only studied with a focus
on one single actor, either society as a whole, the charging operator, or the BEV customer,
neglecting the fact that their interests may be antagonistic, and only a small number of solutions
to this trade-off could be profitable for all actors. This Chapter aims to close these research
gaps.
3. Methodology
This section applies a techno-economic model to identify the investments related to
batteries and the charging infrastructure network, inspired by (Funke et al., 2019). As illustrated
in Figure 3.1, we simulated 12 scenarios of 5,000-identical BEVs, taking into account their
daily trips' needs to determine their energy demands (Section 3.1). Based on the BEV’s energy
demands, the number of charging stations is identified based on M/M/2 queue model, taking
into account a maximum waiting time of 15 minutes (Section 3.2). After, we aimed to identify
an optimal balance of costs, considering costs and benefits for the customer and the Charge
Point Operator (CPO). We then compared the BEV customer’s and the charging operator's cost
models before concluding about profitable solutions for both parties based on Pareto fronts
(Section 3.3). In what follows, we offer a more detailed description of our methodological
framework.
Figure 3.1 Model Overview

Chapter 3: Assessing the trade-offs between battery capacity and public charging
infrastructure of electric vehicles: urban and rural French case studies for daily needs
119
3.1.Modelling the BEV Charging Needs
We modelled the energy needs of 12 scenarios of 5,000 individual-identical private BEV
profiles, taking into account their daily needed kilometres in urban and rural areas separately.
We then increased the battery capacity by 5 kWh from a scenario to another. This section
focuses on BEVs used for private transport and excluded BEVs used for professional transport
such as taxis or delivery vans. To determine Worldwide harmonized Light vehicles Test
Procedures (WLTP) needs, a conversion factor from real to WLTP standards was used for daily
home-work-home trips. This conversion factor, which will be elaborated in the next data
section, differs from the driving speed. For instance, driving on the highway requires a higher
speed than in cities; thus, higher energy is needed for the same distance.
Furthermore, a random initial State of Charge (SoC) is given to all BEVs. We consider
that drivers will charge their vehicles 80% if the next day’s SoC reaches 20% (or less) before
returning home. The SoC of the battery should always stay between 20% and 80%, leading to
a higher lifetime of the battery (Redondo-Iglesias et al., 2019). The SoC is then calculated,
taking into account technical parameters such as energy consumption (𝑐𝑖𝑒), the vehicle
kilometres travelled of the next day (𝑉𝐾𝑇), and a normal distribution variable (𝑎) (Equation
3.1). After simulating all the BEV driving profiles and determining the number of charging
stations that could fill the BEVs' energy needs, we determine the yearly charged energy for
every BEV profile for the twelve scenarios:
𝑆𝑜𝐶𝑖,𝑗 = {𝑆𝑜𝐶𝑖,𝑗 − (
𝑎 ∗ 𝑉𝐾𝑇(𝑗 + 1) ∗ 𝑐𝑖𝑒
𝑐𝑖𝑏𝑎𝑡𝑡 ) ∗ 100 𝑖𝑓 (𝑆𝑜𝐶𝑖,𝑗+1 ≥ 20%)
80 𝑖𝑓 (𝑆𝑜𝐶𝑖,𝑗+1 ≤ 20%)
(3.1)
Where:
- 𝑖 = 1, … ,𝑁 is the driving profile
- 𝑗 is the day
- 𝑐𝑖𝑒 the energy consumption, 𝑐𝑖
𝑏𝑎𝑡𝑡 the battery capacity of the BEV ‘i’
3.2.Modelling the Charging Infrastructure Demand
As mentioned in Section 2.3., different charging powers are available. We assume that
every BEV size segment will charge at the maximum speed level it can technically take (i.e.,
what its BMS will allow). Therefore, a BEV with a battery capacity of less than 20 kWh will
use a 7 kW charger; those BEVs with batteries between 20 kWh and 35 kWh will use a 22 kW
charger. Finally, we consider that BEVs with a battery capacity higher than 40 kWh, which are
compatible with fast charging technology (50 kW), will charge at this level. We do not consider

Chapter 3: Assessing the trade-offs between battery capacity and public charging
infrastructure of electric vehicles: urban and rural French case studies for daily needs
120
slow chargers (2.8 to 3.7 kW) because they are generally installed at home and are not available
to our population sample. Also, ultra-fast chargers with power above 50 kW are excluded, as
they are mainly used for recharging on long-distance trips and rarely regularly that is the focus
of our study.
After determining the BEVs’ daily energy needs that are consumed to accomplish the
daily trips, we determine the number of charging stations to be installed to cover the demand
based on a queuing model. On the one hand, users want to find a vacant CP when they arrive at
a charging site. On the other hand, charging infrastructure operators cannot install an excessive
number of on-street or destination chargers due to the charger price that is increasingly
expensive for a higher power. Therefore, we determined the number of on-street two-charger
stations using an M/M/s queueing model, neglecting the limited-parking lots constraint, and
under the constraint of an average maximal waiting time of 15 minutes (Gnann et al., 2018).
For the M/M/s queuing model, the critical input parameters are the arrival rate and the
service rate and are identified for every battery-capacity scenario. The BEVs arrival rate, λ
[#BEVs/hour], is deduced from the number of BEVs that cannot charge at home and are obliged
to use the charging stations at a particular hour. We consider that the BEVs arrival rate is equal
on all charging stations, and the stations have two identical chargers (s=2). We also realistically
consider no arrival for BEVs to charging stations from 00:00 to 06:00 am; 62% of the BEVs
arrive from 02:00 pm to 7:00 pm (the peak hours) (Groupe Alpha et al., 2018).
The service rate, μ [BEV/hour], was derived from the charging need model (section 3.1)
and was calculated based on the charging power for every battery capacity scenario. As
mentioned before, the BEV will charge if its SoC is near 20%. μ is the reciprocal value of the
average charging time estimated in our study, taking into account an efficiency factor of
ηcharger=85% for all chargers.
Finally, since we have defined a minimal quality of service, we ensure that users' waiting
time remains limited. The average waiting time (𝑊𝑞𝑀/𝑀/2
) of 15 minutes maximum was applied
to determine the number of stations for every charging power. For more information on queuing
models, refer to (Bhat, 2015).
3.3.Cost Model
The method aims to minimize the total cost of both charging infrastructure and the BEV,
which was calculated for every driving profile ‘i’ based on our assumptions discussed earlier in
this Chapter. Based on (Funke et al., 2019), we decided to use the Equivalent Annual Cost
(EAC) method for BEVs and charging infrastructure, yet extending it to allow for (1) different

Chapter 3: Assessing the trade-offs between battery capacity and public charging
infrastructure of electric vehicles: urban and rural French case studies for daily needs
121
charging power and battery combinations, (2) analyzing the various costs for different parties
in the BEV ecosystem, and (3) for analysing both urban and rural household needs.
3.3.1. The Cost Model of the BEV Customer
Regarding the cost model of the BEV customer, we assume that the customer’s goals
are to minimize purchase and operating costs, and the time spent charging the vehicle, including
the waiting time to access a non-home charger. Therefore, we compare the difference between
purchasing a BEV and a conventional ICEV for every profile and every scenario, and we
assume that a person would buy a BEV when the average associated profits ∆𝐸𝐴𝐶𝑖, as shown
in Equation (3.2), are negative. And:
∆𝑬𝑨𝑪𝒊 = 𝑬𝑨𝑪𝑰𝑪𝑬𝑽,𝒊 − 𝑬𝑨𝑪𝑩𝑬𝑽,𝒊
(3.2)
Next, Equation 3.3 applies to all types of vehicles, electric or conventional: it is
composed of the sum of amortized investments of the car body and the battery capacity (in the
case of BEV), annual operating and maintenance costs that differ for every driving profile due
to the individual 𝑎𝑉𝐾𝑇𝑖, and charging or refuelling costs as noted in (Gnann, 2015; Plötz et al.,
2014). While registration taxes for ICEVs are determined based on the vehicle’s CO2
emissions, 𝐿𝐶𝐴𝐼𝐶𝐸𝑉,𝑧 in Equation 3, (French Property, 2020), BEVs are exempted from these
taxes. Note there is no battery cost, subsidy, or subscription fee to access a conventional
vehicle's charging infrastructure.
𝐸𝐴𝐶𝑉𝐸𝐻,𝑖 =(1 + 𝑟𝑉𝐸𝐻)
𝑇𝑉𝐸𝐻 ∗ 𝑟𝑉𝐸𝐻(1 + 𝑟𝑉𝐸𝐻)𝑇𝑉𝐸𝐻 − 1
(𝐼𝑉𝐸𝐻,𝑧 + 𝑐𝑏𝑎𝑡𝑡,𝑖 ∗ 𝑝1𝑘𝑊ℎ − 𝑐𝐵𝐸𝑉,𝑠𝑢𝑏𝑠𝑖𝑑𝑖𝑒𝑠) + 𝑎𝑉𝐾𝑇𝑖
∗ (𝑐𝑉𝐸𝐻,𝑂&𝑀,𝑧 + 𝑐𝑉𝐸𝐻,𝑐ℎ𝑎𝑟𝑔𝑖𝑛𝑔) + 𝑐𝐵𝐸𝑉,𝑐𝑎𝑟𝑑 + 𝐿𝐶𝐴𝐼𝐶𝐸𝑉,𝑧 ∗ 𝑝𝐶𝑂2
(3.3)
Where:
𝑐𝑉𝐸𝐻,𝑐ℎ𝑎𝑟𝑔𝑖𝑛𝑔 = {𝑐𝑓,𝑒𝑙 ∗
𝑐𝑜𝑛𝑠𝑉𝐸𝐻,𝑧𝑃𝑧 ∗ 𝜂
; 𝑖𝑓 𝑉𝐸𝐻 = 𝐵𝐸𝑉
𝑐𝑓,𝑒𝑙 ∗ 𝑐𝑜𝑛𝑠𝑉𝐸𝐻,𝑧; 𝑖𝑓 𝑉𝐸𝐻 = 𝐼𝐶𝐸𝑉
- 𝑖 = 1, … ,𝑁 is the driving profile
- 𝑧 = {
𝑆𝑚𝑎𝑙𝑙 ; 𝑖𝑓 𝑐𝑏𝑎𝑡𝑡 ≤ 20 𝑘𝑊ℎ𝑀𝑒𝑑𝑖𝑢𝑚; 𝑖𝑓 20 𝑘𝑊ℎ < 𝑐𝑏𝑎𝑡𝑡 < 50 𝑘𝑊ℎ
𝐿𝑎𝑟𝑔𝑒 ; 𝑖𝑓 𝑐𝑏𝑎𝑡𝑡 ≥ 50 𝑘𝑊ℎ
Table 3.1 details the parameters of Equation 3.3, and all the values are presented in Appendix
3.A.

Chapter 3: Assessing the trade-offs between battery capacity and public charging
infrastructure of electric vehicles: urban and rural French case studies for daily needs
122
Table 3.1 Techno-Economic Parameters of EACVEH
𝑬𝑨𝑪𝑽𝑬𝑯,𝒊 Equivalent Annual Cost of the driving profile
‘i’
[€/Year]
𝒓𝑽𝑬𝑯 Interest rate [-]
𝑻𝑽𝑬𝑯 Lifetime [Years]
𝑰𝑽𝑬𝑯,𝒛 Vehicle investment of Type z (w/o battery) [€]
𝒄𝒃𝒂𝒕𝒕,𝒊 Battery capacity [kWh]
𝒑𝟏𝒌𝑾𝒉 Price of 1 kWh [€/kWh]
𝒄𝑩𝑬𝑽,𝒔𝒖𝒃𝒔𝒊𝒅𝒊𝒆𝒔 Subsidies [€]
𝒂𝑽𝑲𝑻𝒊 Annual Vehicle Km Travelled [km/Year]
𝒄𝑽𝑬𝑯,𝑶&𝑴,𝒛 Operation and Maintenance cost of a vehicle Type
‘z’
[€/km]
𝒄𝑽𝑬𝑯,𝒄𝒉𝒂𝒓𝒈𝒊𝒏𝒈 Charging fees [€/Year]
𝒄𝒇,𝒆𝒍 Fuel/Electricity cost [€/l] or [€/min]
𝒄𝒐𝒏𝒔𝑽𝑬𝑯,𝒛 Fuel/Electricity consumption [l/km] or [kWh/km]
𝑷𝒛 Charging power mode according to battery type z [kW]
𝜼 The efficiency factor of the CP [-]
𝒄𝑩𝑬𝑽,𝒄𝒂𝒓𝒅 Subscription fee to access the charging
infrastructure
[€/year]
𝑳𝑪𝑨𝑰𝑪𝑬𝑽,𝒛 Life Cycle Assessment of ICEV Type ‘z’ [tCO2/Year]
𝒑𝑪𝑶𝟐 Price of 1 tonne of CO2 [€/tCO2]
3.3.2. Charging Point Operator Business Model
The charging operator aims to deploy the optimal number of chargers to minimize
investment and operating costs one the one hand, while considering various chargers of
different powers that differ in investment cost, technical characteristics, and services, on the
other hand. Based on a benchmark of charging operators (in Appendix 3.A), we consider these
firms use third-degree price discrimination, charging prices differently based on the category
of clients, and hence, on the used charging power and the battery capacity of the BEV. Equation
3.4 allows us to assess the profitability of its business model:
𝑬𝑨𝑪𝑪𝑷𝑶 =∑𝑬𝑨𝑪𝑪𝑷𝑶,𝒊
𝑵
𝒊=𝟏
(3.4)
Where:
- 𝑖 = 1, … ,𝑁 is the CP
The costs for the CPO are related to the charging infrastructure that includes investments
related to the charger, civil engineering works, installation costs, and grid reinforcement.
Operation and maintenance costs, electricity expenses (per kWh consumed), and
communication costs are added to the Model. Regarding the revenues, we consider government

Chapter 3: Assessing the trade-offs between battery capacity and public charging
infrastructure of electric vehicles: urban and rural French case studies for daily needs
123
subsidies the operator receives for installing new charging stations and revenues from the BEV
customer per charging event and a subscription fee.
𝐸𝐴𝐶𝐶𝑃𝑂,𝑗 = −((1 + 𝑟𝐶𝑃𝑂)
𝑇𝐶𝑃𝑂 ∗ 𝑟𝐶𝑃𝑂(1 + 𝑟𝐶𝑃𝑂)
𝑇𝐶𝑃𝑂 − 1(𝐼𝐶𝑃,𝑧 + 𝐼𝐶𝑃𝑂,𝐶𝑖𝑣𝑖𝑙 𝑤𝑜𝑟𝑘𝑠,𝑧 + 𝐼𝐶𝑃𝑂,𝐼𝑛𝑠𝑡𝑎𝑙𝑙𝑎𝑡𝑖𝑜𝑛,𝑧 + 𝐼𝐶𝑃𝑂,𝐺𝑟𝑖𝑑 𝑐𝑜𝑛𝑛𝑒𝑐𝑡𝑖𝑜𝑛𝑠,𝑧
− 𝑐𝐶𝑃𝑂,𝑠𝑢𝑏𝑠𝑖𝑑𝑖𝑒𝑠) + 𝑐𝐶𝑃𝑂,𝑂&𝑀 + 𝑐𝐶𝑃𝑂,𝑀𝐵 + 𝑐𝐶𝑃𝑂,𝑐𝑜𝑚)
+∑(𝑐𝐶𝑃𝑂,𝑐ℎ𝑎𝑟𝑔𝑖𝑛𝑔,𝑘 + 𝑐𝐶𝑃𝑂,𝑐𝑎𝑟𝑑,𝑘 − 𝑐𝐶𝑃𝑂,𝑒𝑙𝑒𝑐 ∗ 𝑌𝐶𝐸𝑘)
𝑟
𝑘=1
(3.5)
Where:
- 𝑗 is the charger
- 𝑧 = {7 𝑘𝑊 22 𝑘𝑊50 𝑘𝑊
- 𝑘 = 1,… , 𝑟 is the BEV that uses the studied charger
Table 3.2 details the parameters of Equation 3.5, and the values are presented in Appendix 3.A.
Table 3.2 Techno-Economic Parameters of EACCPO
𝑬𝑨𝑪𝑪𝑷𝑶,𝒋 Equivalent Annual Cost of a charger ‘j’ [€/Year]
𝒓𝑪𝑷𝑶 Interest rate [-]
𝑻𝑪𝑷𝑶 Lifetime [Years]
𝑰𝑪𝑷,𝒛 CP investment of Type ‘z’ [€]
𝑰𝑪𝑷𝑶,𝑪𝒊𝒗𝒊𝒍 𝒘𝒐𝒓𝒌𝒔,𝒛 Civil works investment of Type ‘z’ [€]
𝑰𝑪𝑺𝑶,𝑰𝒏𝒔𝒕𝒂𝒍𝒍𝒂𝒕𝒊𝒐𝒏,𝒛 Installation investment of Type ‘z’ [€]
𝑰𝑪𝑷𝑶,𝑮𝒓𝒊𝒅 𝒄𝒐𝒏𝒏𝒆𝒄𝒕𝒊𝒐𝒏𝒔,𝒛 Grid connections investment of Type ‘z’ [€]
𝒄𝑪𝑷𝑶,𝒔𝒖𝒃𝒔𝒊𝒅𝒊𝒆𝒔,𝒛 Subsidies of Type ‘z’ [€]
𝒄𝑪𝑷𝑶,𝑶&𝑴,𝒛 Operation and Maintenance cost of Type ‘z’ [€]
𝒄𝑪𝑷𝑶,𝑴𝑩 Metering and billing cost [€]
𝒄𝑪𝑷𝑶,𝒄𝒐𝒎 Communication cost [€]
𝒓 The number of BEV that use one charger [-]
𝒄𝑪𝑷𝑶,𝒄𝒉𝒂𝒓𝒈𝒊𝒏𝒈,𝒌 Charging cost for the driver of the vehicle ‘k’
(=𝒄𝑩𝑬𝑽,𝒄𝒉𝒂𝒓𝒈𝒊𝒏𝒈,𝒌)
[€]
𝒄𝑪𝑷𝑶,𝒄𝒂𝒓𝒅,𝒌 Subscription fee to access the charging infrastructure ‘k’
(=𝒄𝑩𝑬𝑽,𝒄𝒂𝒓𝒅)
[€/Year]
𝒄𝑪𝑷𝑶,𝒆𝒍𝒆𝒄 Electricity cost for the CPO [€/kWh]
𝒀𝑪𝑬𝒌 Yearly Charged Energy of BEV ‘k’ [kWh/Year]
4. Data and Techno-Economic Parameters
To determine range needs, we collected the average travelled kilometres for home-work
trips per town from (ENTD, 2019), and those of the weekends is 25 km for a Saturday and 20

Chapter 3: Assessing the trade-offs between battery capacity and public charging
infrastructure of electric vehicles: urban and rural French case studies for daily needs
124
km for a Sunday (ENTD, 2008). To use realistic data, we chose data from Paris, and the rural
village, Ambérieu-en-Bugey. The latter was chosen because it represented a typical village
where 30% of the population lives in condominiums, with no ability to install home chargers,
and where the majority of the population commutes to work outside the village. 70% of the
population of Paris lives in residences non-equipped with private parking, while about 70% of
the rural population live in individual houses equipped with private parking (INSEE, 2020a).
Furthermore, people living in rural areas rely more on their vehicles than public transportation
due to the lack of an extensive transportation services network: 33.5% of urban people - versus
79.5% of rural people - use the vehicle for their daily needs (ENTD, 2020). The vehicle-
travelled kilometre per day is 15 km/day for Paris, compared to 70 km/day for Ambérieu-en-
Bugey. These “real” kilometres were converted into WLTP autonomy-scale by multiplying
them using a factor 0.75 for city trips, 1 for roads, and 2 for highways, since higher energy is
required for highway trips than for city trips. The individual-annual kilometre travelled for
regular daily trips varies between 5,000-12,000 for Paris and between 35,000-42,500 km/year
for rural areas (ENTD, 2019, 2008). Figure 3.2 presents our two case studies.
Regarding cost models, we compare the EAC of a BEV and an ICEV of the same size.
Vehicles were divided into three sizes depending on their battery capacity and detailed in
Appendix 3.A (Tables 3.5 and 3.6). These parameters include energy consumption (electricity
for BEV and fuel for ICEV), vehicle cost (without the battery), operation and maintenance
costs, and CO2 taxes. Our study assumed that vehicle ownership duration is 9.5 years for BEV
and ICEV (ACEA, 2019). We consider the price of battery packs as 150 €/kWh (Groupe
Renault, 2020) and the price of 1 tonne of CO2 as € 100 (Fox et al., 2017; Quinet et al., 2009).
A € 5,000 governmental subsidy in France is offered to the BEV customer if the battery capacity
is less than 50 kWh. This amount decreases to € 3,000 if the battery capacity is between 50
kWh and 70 kWh and is cancelled for large BEVs with 70 kWh and more (French Government,
2020).
The CPO's EAC includes the amortized investments needed for charging infrastructure
during the ownership of 15 years. The investment is the sum of the charger price, civil
engineering works, installation costs, and grid reinforcement, which are summarised in Table
3.7 of Appendix 3.A. Similarly to the BEV customer, governmental subsidies (ADVENIR
project) are offered to CPOs: 40% of the charger price for deploying a slow charger and 1,500€
for normal and fast ones (Advenir, 2020). The annual costs for operations and maintenance are
assumed to be 10% of the charger price, communication costs are 100€ per charger, and
metering and billing are 188€ per charger (Groupe Alpha et al., 2018). An efficiency factor of

Chapter 3: Assessing the trade-offs between battery capacity and public charging
infrastructure of electric vehicles: urban and rural French case studies for daily needs
125
85% is applied to the conversion between the charger and the battery.
The charging/refuelling tariffs are fixed based on the French market. The fuel cost is
fixed as 1.518€/liter (French Ministry of Economy and Finance, 2020), and the charging pass
costs 5€/BEV/month. Charging tariffs are set as follow: 1 €/hour using a 7 kW charger, € 1.5
for the first hour and 0.2€/minute after the first hour for a 22 kW charger, and € 2 for the access
to a 50 kW charger, plus a cost of 0.247€/min (Chargemap, 2020). The industrial electricity
bought by the charging operator is 0.18€/kWh (Eurostat, 2020). A maximal interest rate for
purchasing a BEV or ICEV is 3%, for the charging infrastructure is 5%.
Figure 3.2 Urban and Rural Case Studies Areas
5. Results
Three steps present the results related to identifying a cost-efficient trade-off between
longer BEV ranges and more charging stations. First, we simulate a fleet of BEVs to identify
energy needs (Section 5.1). Second, we quantify the number of charging stations required to

Chapter 3: Assessing the trade-offs between battery capacity and public charging
infrastructure of electric vehicles: urban and rural French case studies for daily needs
126
respond to these needs, assuming that supply will match demand (Section 5.2). Third, the results
compare the investments in both technologies and detail the cost models of the various BEV
ecosystem members (Section 5.3).
5.1.Individual Driving Profiles
To quantify the BEVs' electric needs, we simulated 12 scenarios of 5,000 identical BEVs
per scenario, separately for urban and rural needs, by increasing the battery capacity from 15
kWh to 120 kWh from one scenario to another in steps of 5 kWh. We modelled the individual
driving profiles considering socio-technical parameters: daily travelled kilometres (ENTD,
2019, 2008), and electricity consumption per kilometre (Gnann, 2015), which varies with the
size of the vehicle. The daily travelled kilometres for “home-work-home” trips on weekdays
are on average 15 km9/day for urban needs and 135 km9/day for rural needs8.
Since each type of BEV could only charge using a well-defined charging power, the
charging duration of a single charging event increases with battery capacity, contrary to the
frequency of events.
5.2.Charging Infrastructure Demand
As mentioned earlier in this Chapter, some BEVs are not compatible with fast charging
technology. For this reason, as mentioned in Section 3.2., we consider that every BEV size
segment will always charge at a maximum of 1C-rate. Figure 3.3 presents how many BEVs an
available charger could serve: It shows that the more the charging power, the less the need for
charging infrastructure. For the same charging power, however, increasing BEV battery
capacities increases the required number of chargers. Indeed, while larger battery BEVs will
less frequently stop to charge, it will take more time than smaller battery capacity BEVs to
charge (when charging power is held constant). In order to respect the 15 minutes maximum
waiting time constraint, the required number of chargers having the same power increases with
bigger battery capacities.
Furthermore, since more drivers can install private chargers at home in rural areas than
in urban areas, results show that one charger can serve more BEVs in urban areas than in rural
ones; thus, fewer deploying needs infrastructure comparing the two areas. Regarding the urban
needs, on average, one 7 kW charger can serve up to 18 small-battery BEVs per day, one 22
kW charger up to 46 medium-battery BEVs per day, and one 50 kW charger up to 80 large-
8 Since rural drivers travel higher distances than urban drivers, BEVs with a battery capacity between 15 kWh
and 35 kWh were excluded, for the rural case study, due to their limited autonomy.

Chapter 3: Assessing the trade-offs between battery capacity and public charging
infrastructure of electric vehicles: urban and rural French case studies for daily needs
127
battery BEVs per day. One 22 kW charger can serve up to 8 medium-battery BEVs per day in
rural areas, and one 50 kW charger up to 26 large-battery BEVs per day.
We can conclude that having more BEVs with a bigger battery increases the need for
charging infrastructure when holding charger speed constant. However, if we compare different
charging powers' results, it is clear that the need for charging infrastructure becomes lower for
a 50 kW charger than 22 kW and 7kW chargers. Currently, deploying charging infrastructure
is based on technical factors and neglects some psychological factors such as range anxiety due
to the limited data. Indeed, range anxiety, which will lead to higher charging frequency towards
the drivers, could require a higher number of chargers.
Figure 3.3 Number of BEVs That Use One Charger as a Function of Battery Capacity
5.3.Costs Models
In order to understand the cost implications of the trade-off between bigger batteries and
charging stations, we compare their respective investments for the BEV customer on the one
hand, and the CPO on the other hand, and seek to determine the most cost-efficient solution for
both parties: Pareto optimum.
5.3.1. The Cost Model of the BEV Customer
From the BEV customer’s perspective, we first analyze the difference between the EAC
of purchasing a BEV and an ICEV for the customer: ∆𝐸𝐴𝐶. A negative ∆𝐸𝐴𝐶 indicates that a
BEV comes with higher costs than an ICEV. Figure 3.4 indicates the average ∆𝐸𝐴𝐶 and the
monthly charging duration for every battery capacity, for both urban and rural case studies.
Regarding the urban needs (Figure 3.4), results show that negative ∆𝐸𝐴𝐶 is guaranteed
for purchasing a BEV with a battery capacity between 15 kWh and 50 kWh. Indeed, purchasing
0
10
20
30
40
50
60
70
80
90
100
0 5 10 15 20 25 30 35 40 45 50 55 60 65 70 75 80 85 90 95 100 105 110 115 120 125 130
Nu
mb
er o
f B
EVs
that
use
on
e ch
arge
r
Battery capacity [kWh]
URBAN RURAL

Chapter 3: Assessing the trade-offs between battery capacity and public charging
infrastructure of electric vehicles: urban and rural French case studies for daily needs
128
a 15 kWh BEV is the most cost-efficient for the customer (with the lowest ∆𝐸𝐴𝐶: 1120
€/BEV/Year). However, the driver will spend around 10 hours/month to charge his vehicle. For
medium-battery BEV, ∆𝐸𝐴𝐶 has a negative value between 35 kWh and 45 kWh, while the
charging duration fluctuates around 5 hours/month. For large-battery BEVs, a 50 kWh vehicle
comes with a dual-advantage: Lower cost than an ICEV (∆𝐸𝐴𝐶=105€/BEV/Year) and low
charging duration (3 hours/month). Purchasing a BEV with a battery capacity of more than 55
kWh is not profitable for the client (negative ∆𝐸𝐴𝐶), even though the charging duration does
not exceed 3 hours/month.
For rural needs (Figure 3.4) (and after excluding BEVs with a battery capacity between
15 kWh and 35 kWh due to their limited autonomy), results show that purchasing a 55 kWh
vehicle is the most cost-efficient solution for the driver: It comes with the lowest positive ∆𝐸𝐴𝐶
(∆𝐸𝐴𝐶=-85€/BEV/Year) and the lowest charging duration (7hours/month). The BEV choice is
highly individual because for some drivers, the autonomy of 40-50 kWh BEV represents a
potential risk of blackout during the “home-work-home” trip, depending on the driver’s choice
and the usual rural vehicle travelled kilometres. Based on our data, we found a positive ∆𝐸𝐴𝐶
40-50 kWh BEV (∆𝐸𝐴𝐶=-500; -700€/BEV/Year), due to the high charging frequency.
To conclude, our results indicate that, for the customer, there is a trade-off between cost
and charging duration: small-battery BEVs are the most cost-efficient solution, but they come
with a long charging duration. If customers search for an economical solution rather than a
luxurious one, purchasing a BEV with a battery capacity between 15 kWh and 50 kWh is cost-
efficient for urban needs (∆𝐸𝐴𝐶 is positive). A 55 kWh BEV would satisfy drivers' driving
needs for rural areas, willing to eliminate the risk of limited autonomy, and comes with the
lowest monthly charging duration. Yet, its ∆𝐸𝐴𝐶 is negative.

Chapter 3: Assessing the trade-offs between battery capacity and public charging
infrastructure of electric vehicles: urban and rural French case studies for daily needs
129
Figure 3.4 The Cost Model (ΔEAC) and Monthly Charging Duration for the BEV Customer
(Urban & Rural Needs)
5.3.2. The Cost Model of the Charging Point Operator
We calculated the EAC of the whole infrastructure, in both urban and rural areas,
regarding the CPO. Results are given in Figure 3.5. As a reminder, we consider that each BEV
size is only compatible with one charging power, and charging pricing differs with charging
powers (Benchmark of offers is provided in Appendix 3.A Table 3.4). It is assumed that all
BEVs’ customers purchased a subscription card to access the charging infrastructure.
Regarding urban needs, Figure 3.5 indicates that deploying a slow charging
infrastructure is not profitable for the operator due to a high number of required chargers,
resulting in higher charging tariffs than 1€/hour. Regarding the 22 kW infrastructure, a fleet of
BEVs with a 25 and 30 kWh battery capacity is not profitable for the operator. Since the
charging duration does not exceed 1 hour, it is recommended to review the first-hour tariff to
avoid positive costs. It becomes profitable for the operator to deploy these chargers for battery
capacity between 35 and 45 kWh, charging durations exceeding one hour. These profits
increase with bigger battery capacity because of the exceeded minute pricing method.
Regarding the fast charging infrastructure, the operator generates profits by deploying 50 kW
chargers using real-market tariffs. It is essential to stress the fact that the profits slightly
decrease with broader autonomy. Overall, the operator receives profits for a fleet of 35 to 120
kWh BEVs, with a maximum for a 40 kWh BEV, because of two main reasons: The 2-hour
charging duration per vehicle and the “per exceeded minute” pricing method. Urban and rural
-25
-20
-15
-10
-5
0
5
10
15
-2500
-2000
-1500
-1000
-500
0
500
1000
1500
0 5 10 15 20 25 30 35 40 45 50 55 60 65 70 75 80 85 90 95 100105110115120
Ch
argi
ng
du
rati
on
per
mo
nth
(h
ou
rs/m
on
th)
ΔEA
C (€
/BEV
/Yea
r)
Battery capacity (kWh)
ΔEAC - Urban ΔEAC - Rural
Charging duration month - Urban Charging duration month - Rural

Chapter 3: Assessing the trade-offs between battery capacity and public charging
infrastructure of electric vehicles: urban and rural French case studies for daily needs
130
share the same results.
To sum up, based on our tariffs, a fleet of 45-120 kWh vehicles for urban and rural needs
that use 50 kW charging infrastructure generates profits for the operator. These underline that
the charging operator could have a profitable business model if the optimal number of chargers
is deployed and the correct pricing method and tariffs are used.
Figure 3.5 The Cost Model of the Charging Point Operator
5.3.3. Win-Win Situations
After detailing the cost models of the driver and the charging point operator, we will
represent all the solutions found, based on the Pareto fronts, where none of both parties realizes
a loss, i.e. ∆𝐸𝐴𝐶𝐵𝐸𝑉 𝑐𝑢𝑠𝑡𝑜𝑚𝑒𝑟 > 0 and 𝐸𝐴𝐶𝐶𝑃𝑂 > 0 in Figure 3.6. Different solutions regarding
the urban needs present a Pareto front: 40-50 kWh BEV and deploying 50 kW chargers.
Similarly, a Pareto optimum solution for the rural case study is: 55 kWh BEV and 50 kW
chargers (the driver's lowest costs and the charging operator's highest profits).
-1000
-500
0
500
1000
1500
2000
0 5 10 15 20 25 30 35 40 45 50 55 60 65 70 75 80 85 90 95 100 105 110 115 120
EAC
(1
00
0€
/Yea
r)
Battery capacity [kWh]
EAC - Urban EAC - Rural

Chapter 3: Assessing the trade-offs between battery capacity and public charging
infrastructure of electric vehicles: urban and rural French case studies for daily needs
131
Figure 3.6 Win-Win situations presentation
5.4.Sensitivity Tests
We apply four sensitivity tests to explore how charging behaviour changes and charging
pricing methods would affect our results. First, we tested different amounts of purchasing
subsidies for BEV owners and instalment subsidies for charging operators. Second, we
evaluated the effect of a 50% increase on charging tariffs. Also, we evaluated the effect of
mixing the adaptability between chargers and BEV battery size. Finally, we tested different
charging tariffs from different operators. Table 3.3 presents a summary of the results of the
sensitivity tests.
5.4.1. Changes in Subsidies
5.4.1.1.Changes in BEV Customer Purchasing Subsidies
As a first sensitivity test, we tested the effect of different amounts of subsidies on the
cost model of the BEV customer. As mentioned before, we note Scenario 0 the actual subsidies,
which depend on the price of the vehicle, and thus, on the battery capacity. We tested the effect
of changing the subsidies on the cost model of the client by variating the governmental
purchasing subsidies from 0 €/BEV (Scenario 1) to 7000 €/BEV (Scenario 2) for all vehicles.
Results, contained in Figure 3.7, show the effect of variating the amount of purchasing
subsidies: The amount of subsidies affects the battery capacity range, where ∆𝐸𝐴𝐶𝐵𝐸𝑉 𝑐𝑢𝑠𝑡𝑜𝑚𝑒𝑟
-2500
-2000
-1500
-1000
-500
0
500
1000
1500
2000
0 5 10 15 20 25 30 35 40 45 50 55 60 65 70 75 80 85 90 95 100 105 110 115 120
BEV
ΔEA
C (€
/BEV
/Yea
r) a
nd
CP
O E
AC
(1
00
0€
/Yea
r)
Battery capacity (kWh)
CPO EAC - Urban CPO EAC - Rural BEV ΔEAC - Urban BEV ΔEAC - Rural

Chapter 3: Assessing the trade-offs between battery capacity and public charging
infrastructure of electric vehicles: urban and rural French case studies for daily needs
132
is positive. Changing BEV purchasing subsidies could provide urban drivers with various
battery sizes that ensure a negative ΔEAC; contrary to rural drivers. For the urban case study,
a negative ΔEAC for the customer is guaranteed between 15 kWh and 35 kWh for Scenario 1
(75 kWh for Scenario 2). For the rural case study, a negative ∆𝐸𝐴𝐶𝐵𝐸𝑉 𝑐𝑢𝑠𝑡𝑜𝑚𝑒𝑟 for the
customer is guaranteed for between 50 kWh and 60 kWh for 7000 €/BEV as purchasing
subsidies (Scenario 2).
The Pareto fronts that guarantee win-win situations for both BEV owners and charging
operators (∆𝐸𝐴𝐶𝐵𝐸𝑉 𝑐𝑢𝑠𝑡𝑜𝑚𝑒𝑟 > 0 and 𝐸𝐴𝐶𝐶𝑃𝑂 > 0) cannot be achieved without subsidies.
Therefore, we recommend that public authorities keep (urban drivers), or increase (rural
drivers), purchasing subsidies, especially for battery capacities higher than 35 kWh.
Figure 3.7 Sensitivity Test 1 Results: BEV Purchasing Subsidies Variation (Sc 0: Base
Scenario; Sc 1: 0€/BEV; Sc 2: 7000€/BEV)
5.4.1.2.Changes in Charger Instalment Subsidies
We also tested the effect of 100% (Scenario 1) and 200% increase (Scenario 2)
instalment subsidies increases (Scenario 1), compared to those provided in Table 3.7 (Scenario
0), on the charging operator cost model 𝐸𝐴𝐶𝐶𝑃𝑂. Generally, the results come in-line with our
conclusions in Section 5.3.3. For the urban case study, providing more than a 100% increase in
incentives could make the installation of 7 kW chargers profitable. Similarly, providing more
than a 200% increase in incentives is could make the installation of 22 kW chargers profitable.
For the rural case study, there are no modifications regarding the win-win situations. Results
are provided in Figure 3.8. Overall, we recommend providing more incentives for charging
operators to install 7 and 22 kW chargers rather than fast ones, especially in urban areas.
-3500
-3000
-2500
-2000
-1500
-1000
-500
0
500
1000
1500
2000
-3500
-3000
-2500
-2000
-1500
-1000
-500
0
500
1000
1500
2000
0 5 10 15 20 25 30 35 40 45 50 55 60 65 70 75 80 85 90 95 100 105 110 115 120 125 130
BEV
Cu
sto
mer
ΔEA
C (€
/Yea
r/B
EV)
Ch
argi
ng
Op
erat
or
EAC
(€
/Yea
r)
Battery capacity (kWh)
CPO EAC Sc 0 Urban CPO EAC Sc 0 Rural BEV ΔEAC Sc 0 Urban BEV ΔEAC Sc 1 Urban
BEV ΔEAC Sc 2 Urban BEV ΔEAC Sc 0 Rural BEV ΔEAC Sc 1 Rural BEV ΔEAC Sc 2 Rural
Sc 2
Sc 0
Sc
2

Chapter 3: Assessing the trade-offs between battery capacity and public charging
infrastructure of electric vehicles: urban and rural French case studies for daily needs
133
Figure 3.8 Sensitivity Test 1 Results: Charger Instalment Subsidies Variation (Sc 0: Base
Scenario; Sc 1: 100% Increase of Subsidies; Sc 2: 200% Increase of Subsidies)
5.4.2. Increasing the Charging Tariffs
We evaluated a 50% charging tariffs' increase influence on the Pareto fronts as a second
sensitivity test. Figure 3.9 presents the results for the urban and rural case studies. If the tariffs
increase by 50%, we observe that the owners' costs (∆𝐸𝐴𝐶𝐵𝐸𝑉 𝑐𝑢𝑠𝑡𝑜𝑚𝑒𝑟 ) increase by far more
than 50%: ∆𝐸𝐴𝐶𝐵𝐸𝑉 𝑐𝑢𝑠𝑡𝑜𝑚𝑒𝑟 is highly elastic concerning tariffs for both urban and rural needs.
We note that we have a high elasticity when we start using the 50 kW chargers, especially for
the battery capacities between 40 kWh and 55 kWh for urban needs and between 55 kWh and
70 kWh for rural needs. Results in Figure 3.9, show that a 50% increase impacts the Pareto
fronts: No Pareto fronts are detected for the urban and rural needs, leading to the high impact
of the charging tariffs increase on the Model.
-2500
-2000
-1500
-1000
-500
0
500
1000
1500
2000
2500
15 20 25 30 35 40 45 50 55 60 65 70 75 80 85 90 95 100 105 110 115 120
BEV
ΔEA
C (€
/BEV
/Yea
r) a
nd
CP
O E
AC
(10
00€
/Yea
r)
Battery capacity (kWh)
BEV ΔEAC Sc 0 Urban CPO EAC Sc 0 Urban CPO EAC Sc 1 Urban CPO EAC Sc 2 Urban
BEV ΔEAC Sc 0 Rural CPO EAC Sc 0 Rural CPO EAC Sc 1 Rural CPO EAC Sc 2 Rural
Sc 0 Sc 0
/Sc 1
/Sc 2
/Sc 3
Sc 1
Sc 2
Sc
1
Sc
2

Chapter 3: Assessing the trade-offs between battery capacity and public charging
infrastructure of electric vehicles: urban and rural French case studies for daily needs
134
Figure 3.9 Sensitivity Test 2 Results on the Urban Case Study Variation (Sc 0: Base Scenario;
Sc 1: 50% Increase Of Charging Tariffs)
5.4.3. Mixing the charging powers and the BEV battery size
In this study, small-battery BEVs use the 7 kW chargers, medium-battery BEVs use 22
kW, and large-battery BEVs use 50kW to charge (Scenario 0). Since it could depend on the
drivers’ charging behaviour, we studied three additional scenarios by mixing chargers' usage
with the battery sizes and disassociating battery size and charger power. Therefore, we defined
three additional scenarios: Scenario 1, when all BEVs charge using 7 kW chargers; Scenario 2
using 22 kW; And Scenario 3, using 50 kW chargers (even though some BEVs are not
compatible with fast charging technology). Results show that the customer's benefits and those
of the operator are antagonistic but in-line with our conclusions (Figures 3.10-3.11). For urban
needs, BEVs, with battery capacity between 35 kWh and 50 kWh, are the most cost-efficient
with the deployment of 22 kW or 50 kW chargers. A 55 kWh BEV presents the Pareto optimum
solution for the customer and the operator simultaneously regarding the rural needs.
Overall, based on our assumptions, we recommend that charging operators invest in 50
kW chargers rather than other charging powers.
-6000
-5000
-4000
-3000
-2000
-1000
0
1000
2000
3000
4000
5000
-6000
-5000
-4000
-3000
-2000
-1000
0
1000
2000
3000
4000
5000
15 20 25 30 35 40 45 50 55 60 65 70 75 80 85 90 95 100 105 110 115 120
BEV
Cu
sto
mer
ΔEA
C (€/
Year
/BEV
)
Ch
argi
ng
Op
erat
or
EAC
(1
00
0€/
Year
)
Battery capacity (kWh)
CPO EAC Sc 0 Urban CPO EAC Sc 1 Urban CPO EAC Sc 0 Rural CPO EAC Sc 1 Rural
BEV ΔEAC Sc 0 Urban BEV ΔEAC Sc 1 Urban BEV ΔEAC Sc 0 Rural BEV ΔEAC Sc 1 Rural
Sc 0

Chapter 3: Assessing the trade-offs between battery capacity and public charging
infrastructure of electric vehicles: urban and rural French case studies for daily needs
135
Figure 3.10 Sensitivity Test 3 Results on the Urban Case Study Variation (Sc 0: Base
Scenario; Sc 1: 7 kW, Charger; Sc 2: 22 kW Charger; Sc 3: 50 kW Charger)
Figure 3.11 Sensitivity Test 3 Results on the Rural Case Study Variation (Sc 0: Base
Scenario; Sc 1: 7 kW, Charger; Sc 2: 22 kW Charger; Sc 3: 50 kW Charger)
5.4.4. Changing Charging Tariffs
As a fourth sensitivity test, we applied different charging tariffs than our Baseline
Scenario: Indigo for 7 kW chargers, Belib for 22 kW, and Total for 50 kW (Table 3.4 in
Appendix 3.A). Figures 3.12 and 3.13 present the results for the urban and rural case studies,
respectively. Conclusions come in line with our study conclusions about the Pareto fronts for
urban needs. No fronts were detected for rural ones. We recommend revising the 22 kW
charging tariffs due to the positive 𝐸𝐴𝐶𝐶𝑃𝑂.
-2500
-2000
-1500
-1000
-500
0
500
1000
1500
2000
-2500
-2000
-1500
-1000
-500
0
500
1000
1500
2000
0 5 10 15 20 25 30 35 40 45 50 55 60 65 70 75 80 85 90 95 100105110115120125130
BEV
Cu
sto
mer
ΔEA
C (€
/Yea
r/B
EV)
Ch
argi
ng
Op
erat
or
EAC
(1
00
0€
/Yea
r)
Battery Capacity (kWh)
CPO EAC Sc 0 CPO EAC Sc 1 CPO EAC Sc 2 CPO EAC Sc 3
BEV ΔEAC Sc 0 BEV ΔEAC Sc 1 BEV ΔEAC Sc 2 BEV ΔEAC Sc 3
-5000
-4000
-3000
-2000
-1000
0
1000
2000
3000
4000
-5000
-4000
-3000
-2000
-1000
0
1000
2000
3000
4000
15 20 25 30 35 40 45 50 55 60 65 70 75 80 85 90 95 100 105 110 115 120
ΔEA
C (€
/BEV
/Yea
r)
Ch
argi
ng
Po
int
Op
erat
or
EAC
[1
00
0€
/Yea
r]
Battery capacity [kWh]
CPO EAC Sc 0 CPO EAC Sc 1 CPO EAC Sc 2 CPO EAC Sc 3
BEV ΔEAC Sc 0 BEV ΔEAC Sc 1 BEV ΔEAC Sc 2 BEV ΔEAC Sc 3
Sc 3
Sc 3
Sc 2
Sc 0
Sc 2
Sc 0

Chapter 3: Assessing the trade-offs between battery capacity and public charging
infrastructure of electric vehicles: urban and rural French case studies for daily needs
136
Figure 3.12 Sensitivity Test 4 Results on the Urban Case Study (Sc 0: Base Scenario; Sc 1:
Changing Charging Tariffs)
Figure 3.13 Sensitivity Test 4 Results on the Rural Case Study Variation (Sc 0: Base
Scenario; Sc 1: Changing Charging Tariffs)
-2500
-2000
-1500
-1000
-500
0
500
1000
1500
2000
2500
-2500
-2000
-1500
-1000
-500
0
500
1000
1500
2000
2500
15 20 25 30 35 40 45 50 55 60 65 70 75 80 85 90 95 100 105 110 115 120
BEV
Cu
sto
mer
ΔEA
C (€
/Yea
r/B
EV)
Ch
argi
ng
Op
erat
or
EAC
(1
00
0€
/Yea
r)
Battery capacity (kWh)
CPO EAC Sc 0 Urban CPO EAC Sc 1 Urban BEV ΔEAC Sc 0 Urban BEV ΔEAC Sc 1 Urban
-3500-3000-2500-2000-1500-1000-500050010001500200025003000350040004500
-3500-3000-2500-2000-1500-1000
-5000
50010001500200025003000350040004500
15 20 25 30 35 40 45 50 55 60 65 70 75 80 85 90 95 100 105 110 115 120
BEV
Cu
sto
mer
ΔEA
C (€
/Yea
r/B
EV)
Ch
argi
ng
Op
erat
or
EAC
(€
/Yea
r)
Battery capacity (kWh)
CPO EAC Sc 0 Rural CPO EAC Sc 1 Rural BEV ΔEAC Sc 0 Rural BEV ΔEAC Sc 1 Rural
Sc 1
Sc 0

Chapter 3: Assessing the trade-offs between battery capacity and public charging
infrastructure of electric vehicles: urban and rural French case studies for daily needs
137
Table 3.3 Summary of sensitivity tests
Sensitivity
Test
Contents Results Policy recommendations
Sensitivity
Test 1
Changes in BEV
Customer Purchasing
Subsidies from
0€/BEV to
7000€/BEV.
Urban needs: No win-win
situations fronts are
detected for a subsidy of
0€/BEV. More win-win
solutions are detected for
higher subsidies.
For governments/local
authorities:
Urban needs: Maintain and
increase the purchasing subsidies
for more offers.
Rural needs: similar to our
results. Yet, a subsidy of
7000€/BEV for 55 kWh
and 60 kWh come with a
negative
∆𝐸𝐴𝐶𝐵𝐸𝑉 𝑐𝑢𝑠𝑡𝑜𝑚𝑒𝑟 .
For governments/local
authorities:
Rural needs: Increase the
purchasing subsidies in order to
ensure a negative
∆𝐸𝐴𝐶𝐵𝐸𝑉 𝑐𝑢𝑠𝑡𝑜𝑚𝑒𝑟 , especially for
a 55 kWh BEV.
Increasing the
charger instalment
subsidies by 100%
and 200%.
Urban needs: Win-win
situations are achieved for
increasing the subsidies by
100% for 7 kW chargers.
For governments/local
authorities: Urban needs: we
recommend providing more
incentives for charging operators
to install 7 and 22 kW chargers
rather than fast ones.
Rural needs: The
conclusions are in-line
with our results.
Purchasing a 55 kWh BEV
and instalment of 50 kW
chargers, while keeping
the charger instalment
subsidies.
For governments/local
authorities: Rural needs: No
policy recommendation
Sensitivity
Test 2
Increasing the
Charging Tariffs by
50%.
Urban and Rural needs:
No win-win situations are
detected after the 50%
tariffs increase.
For charging operators:
Consider the impact charging
tariffs increase on the cost model
of the BEV driver.
Sensitivity
Test 3
Mixing the charging
powers and the BEV
battery size.
Urban and Rural needs:
The utilisation of 50 kW
chargers is the most cost-
efficient choice for both
the BEV driver and the
charging operator, among
7 and 22 kW chargers.
For charging operators:
The instalment of 50 kW
chargers would be a benefit for
all BEV sizes.
For governments/local
authorities:
Consider higher purchasing
subsidies for 50 kW chargers.
Sensitivity
Test 4
Changing Charging
Tariffs by
considering another
existing operator.
The conclusions are in-line
with our results.
Urban needs:
Purchasing a 50 kWh BEV
and instalment of 50 kW
chargers.
Rural needs:
Purchasing a 55 kWh BEV
and instalment of 50 kW
chargers.
For charging operators:
Revise charging tariffs for only
22 kW chargers where losses are
extreme for operators in any
tariffs cases.

Chapter 3: Assessing the trade-offs between battery capacity and public charging
infrastructure of electric vehicles: urban and rural French case studies for daily needs
138
6. Conclusion and Policy Recommendations
6.1.Conclusion
To reach global ambitions regarding GHG emissions, achieving growth in BEV market
share is of paramount importance. Range anxiety, a primary barrier to BEV adoption, could be
solved using two interdependent and complementary options: Increasing the battery capacity
and/or enlarging the charging network. Both choices, however, come with costs that are either
carried by car owners or by charge point operators. This Chapter presents a novel approach to
answer the trade-offs involved in addressing range anxiety barriers to EV adoption by
calculating the EAC of different battery capacity and recharging infrastructure development
scenarios. Here, we addressed customer profiles that tend to be overlooked and may want to
become EV owners, known as ‘laggards’: These customers do not have any possibility to charge
at-home and are obliged to use the public charging infrastructure and aim to purchase a BEV
for daily use, but not for holidays, such as those with an EV as a second car. Since the BEV
choice is highly dependent on individual situations, we applied our study to two French areas:
An urban metropole (Paris), and a small rural village (Ambérieux-en-Bugey). We modelled
public infrastructure usage by simulating 5,000 privately-purchased BEVs, taking into account
their daily driving needs for urban and rural scenarios separately (without long-distance trips,
e.g. vacations), while aiming to minimize the BEV cost. We also categorized the vehicles into
three parts based on their battery capacity, taking into account the BEV-charger adaptability
(so-called c-rate): small-battery BEVs that can only charge using 7 kW chargers, medium-
battery EVs using 22 kW chargers, and large-battery EVs that can connect to 50 kW fast
chargers. This Model could be applied to different territories by changing the values of these
parameters. However, it does not deliver a geo-spatial allocation of charging infrastructure since
that was not the main scope of this Chapter.
Our analyses showed that bigger batteries come with a significant additional cost, both
in terms of car cost and recharging infrastructure costs. In our study, the operator proposes
specific charging tariffs and pricing methods for each vehicle size. Our outcomes demonstrate
that the battery capacity and CPs are correlated since the charger usage depends on the battery
size.
After detailing and comparing the different cost models of the BEV ecosystem parties,
the analyses for urban needs showed that 40 kWh to 50 kWh BEVs with 50 kW chargers are
cost-efficient based on the Pareto front. The used pricing method is fixed pricing one: A fee for
access tariff per minute charged for 50 kW chargers. Similarly, the most cost-efficient solution
for rural needs is a 55 kWh BEV with 50 kW chargers using a fixed pricing method: A fee for

Chapter 3: Assessing the trade-offs between battery capacity and public charging
infrastructure of electric vehicles: urban and rural French case studies for daily needs
139
access tariff per minute charged. Yet, the choice is highly individual, especially for rural needs,
where more driving range could be needed.
Although our Model's design presents a dual analysis for both parties (i.e. BEV driver,
and the charging infrastructure operator), it has some limitations due to several assumptions
related to driving and charging behaviours due to the lack of data and parameters calibration
choices. Therefore, we applied several sensitivity tests to measure the effect of different
scenarios variations on the results, by (i) testing the different amounts of purchasing subsidies
for BEV owners and instalment subsidies for charging operators, (ii) evaluating the effect of a
50% increase on charging tariffs, (iii) evaluating mixing the adaptability between chargers and
BEV battery size, and (iv) testing different charging tariffs from different charging operators.
In future work, the assumption of driving and charging behaviour should be considered,
because the driver could change their attitudes in terms of additional trips, such as home-school
travels, or other activity centres, malls, where semi-public charging stations could be available.
For this reason, the arrival rate to the charging stations may change, causing a different number
of chargers. When simulating BEV profiles, we neglected comfort parameters such as heating,
cooling, lights, radio, and data that may increase BEVs' energy demand. Besides driving
behaviour, some hypotheses about the operator’s cost model are not considered, such as
avoiding grid expansion costs through smart charging or variations in land prices. Overall, it is
vital to use real-world data that reflect BEV drivers' driving and charging behaviours, such as
trip mileage, arrival rates, and actual charging durations. Finally, based on these real-data,
charging tariffs and pricing methods should be revised, taking into account an oligopolistic
market where charging operators are slowly emerging.
6.2.Policy Recommendations
Based on our analysis results, this Chapter provides policy recommendations for the
BEV ecosystem members: the automotive industry, the charging operator, and government or
public authorities. First, our results offer insights into how car manufacturers can consider
various models for different customer categories, especially those willing to limit their BEV
investment, and have no home-charging availability. More 40-50 kWh BEVs should interest
customers more in urban areas, while a minimum of 55 kWh BEVs should be more interesting
in rural areas. These sizes present a dual solution for the drivers: Limited investments and
comfort costs, i.e. reasonable monthly charging durations.
Second, charging operators should consider deploying more 50 kW chargers for urban
and rural areas, ensuring the operator's profitability and the BEV driver (in terms of expenses

Chapter 3: Assessing the trade-offs between battery capacity and public charging
infrastructure of electric vehicles: urban and rural French case studies for daily needs
140
and comfort cost –i.e. charging duration). Also, we recommend operators consider the impact
of charging tariffs increases on the BEV driver's cost model and revise the charging tariffs of
22 kW chargers.
Finally, it is recommended to keep or increase BEV purchasing subsidies for urban areas
and increase these subsidies for rural areas. Also, we suggest revising charger instalment
subsidies, as 50 kW chargers come with high investment.

Chapter 3: Assessing the trade-offs between battery capacity and public charging
infrastructure of electric vehicles: urban and rural French case studies for daily needs
141
References
ACEA, 2019. ACEA Report Vehicles in use-Europe 2019 [WWW Document]. URL
https://www.acea.be/uploads/publications/ACEA_Report_Vehicles_in_use-Europe_2019.pdf
(accessed 10.13.20).
Advenir, project, 2020. ADVENIR ∣ Primes CEE pour points de recharge des véhicules électriques
[WWW Document]. ADVENIR. URL https://advenir.mobi/ (accessed 10.26.20).
Alhazmi, Y.A., Mostafa, H.A., Salama, M.M.A., 2017. Optimal allocation for electric vehicle
charging stations using Trip Success Ratio. Int. J. Electr. Power Energy Syst. 91, 101–116.
https://doi.org/10.1016/j.ijepes.2017.03.009
Alizécharge, 2020. Alizé Charge - Bornes de recharge pour voitures électriques [WWW Document].
URL https://alizecharge.com/fr/ (accessed 10.27.20).
Amjad, M., Ahmad, A., Rehmani, M.H., Umer, T., 2018. A review of EVs charging: From the
perspective of energy optimization, optimization approaches, and charging techniques. Transp.
Res. Part Transp. Environ. 62, 386–417. https://doi.org/10.1016/j.trd.2018.03.006
Berkeley, N., Bailey, D., Jones, A., Jarvis, D., 2017. Assessing the transition towards Battery Electric
Vehicles: A Multi-Level Perspective on drivers of, and barriers to, take up. Transp. Res. Part
Policy Pract. 106, 320–332. https://doi.org/10.1016/j.tra.2017.10.004
Bhat, U.N., 2015. An Introduction to Queueing Theory: Modeling and Analysis in Applications, 2nd
ed, Statistics for Industry and Technology. Birkhäuser Basel. https://doi.org/10.1007/978-0-
8176-8421-1
Biresselioglu, M.E., Demirbag Kaplan, M., Yilmaz, B.K., 2018. Electric mobility in Europe: A
comprehensive review of motivators and barriers in decision making processes. Transp. Res.
Part Policy Pract. 109, 1–13. https://doi.org/10.1016/j.tra.2018.01.017
Carbone4, 2018. La France amorce le virage vers le véhicule électrique [WWW Document]. URL
http://www.carbone4.com/wp-content/uploads/2018/09/Publication-Carbone-4-Mobilite-
electrique.pdf (accessed 10.26.20).
chargemap, 2020. Chargemap - bornes de recharge pour voitures électriques [WWW Document]. URL
https://fr.chargemap.com/ (accessed 10.26.20).
Cox, B., Bauer, C., Mendoza Beltran, A., van Vuuren, D.P., Mutel, C.L., 2020. Life cycle
environmental and cost comparison of current and future passenger cars under different
energy scenarios. Appl. Energy 269, 115021. https://doi.org/10.1016/j.apenergy.2020.115021
Duru, K.K., Karra, C., Venkatachalam, P., Betha, S.A., Madhavan, A.A., Kalluri, S., 2021. Critical
Insights Into Fast Charging Techniques for Lithium-Ion Batteries in Electric Vehicles. IEEE
Trans. Device Mater. Reliab. 21, 137–152. https://doi.org/10.1109/TDMR.2021.3051840
EC, 2013. Corri-Door Project [WWW Document]. URL
https://ec.europa.eu/inea/sites/inea/files/download/project_fiches/multi_country/fichenew_201
3eu92055s_final_1.pdf (accessed 2.18.21).
Electric Vehicle Database, 2021. EV Database [WWW Document]. EV Database. URL https://ev-
database.org/ (accessed 1.19.21).
ENTD, 2020. Comment les Français se déplacent-ils en 2019 ? Résultats de l’enquête mobilité des
personnes [WWW Document]. Données Études Stat. Pour Chang. Clim. Lénergie Environ.
Logement Transp. URL https://www.statistiques.developpement-durable.gouv.fr/comment-
les-francais-se-deplacent-ils-en-2019-resultats-de-lenquete-mobilite-des-personnes (accessed
3.26.21).
ENTD, 2019. Enquête sur la mobilité des personnes 2018-2019 | Données et études statistiques
[WWW Document]. URL https://www.statistiques.developpement-durable.gouv.fr/enquete-
sur-la-mobilite-des-personnes-2018-2019 (accessed 7.28.20).
ENTD, 2008. Présentation statistique − Enquête nationale transports et déplacements 2007/2008 |
Insee [WWW Document]. URL
https://www.insee.fr/fr/metadonnees/source/operation/s1367/presentation (accessed 10.22.20).
Eurostat, 2020. Statistiques sur le prix de l’énergie - Statistics Explained [WWW Document]. URL
https://ec.europa.eu/eurostat/statistics-
explained/index.php?title=Energy_price_statistics/fr&oldid=291900 (accessed 10.13.20).

Chapter 3: Assessing the trade-offs between battery capacity and public charging
infrastructure of electric vehicles: urban and rural French case studies for daily needs
142
Fox, J., Axsen, J., Jaccard, M., 2017. Picking Winners: Modelling the Costs of Technology-specific
Climate Policy in the U.S. Passenger Vehicle Sector. Ecol. Econ. 137, 133–147.
https://doi.org/10.1016/j.ecolecon.2017.03.002
French Government, 2020. Bonus écologique pour un véhicule électrique ou hybride (voiture, vélo...)
[WWW Document]. URL https://www.service-public.fr/particuliers/vosdroits/F34014
(accessed 10.26.20).
French Ministry of Ecological Transition, 2020. Données sur les immatriculations des véhicules
[WWW Document]. Données Études Stat. Pour Chang. Clim. Lénergie Environ. Logement
Transp. URL https://www.statistiques.developpement-durable.gouv.fr/donnees-sur-les-
immatriculations-des-vehicules (accessed 1.12.21).
French Ministry of Economy and Finance, 2020. Données publiques [WWW Document]. URL
https://www.prix-carburants.gouv.fr/rubrique/opendata/ (accessed 7.27.20).
French Property, 2020. French car and vehicle carte grise registration taxes [WWW Document]. Fr.-
Prop. URL https://www.french-property.com/guides/france/driving-in-france/vehicle-
registration-taxes (accessed 12.9.20).
Funke, S.Á., Plötz, P., Wietschel, M., 2019. Invest in fast-charging infrastructure or in longer battery
ranges? A cost-efficiency comparison for Germany. Appl. Energy 235, 888–899.
https://doi.org/10.1016/j.apenergy.2018.10.134
Gnann, T., 2015. Market diffusion of plug-in electric vehicles and their charging infrastructure, Book
series “Innovation potentials.” Fraunhofer-Verl, Stuttgart.
Gnann, T., Funke, S., Jakobsson, N., Plötz, P., Sprei, F., Bennehag, A., 2018. Fast charging
infrastructure for electric vehicles: Today’s situation and future needs. Transp. Res. Part
Transp. Environ. 62, 314–329. https://doi.org/10.1016/j.trd.2018.03.004
Greene, D.L., Kontou, E., Borlaug, B., Brooker, A., Muratori, M., 2020. Public charging infrastructure
for plug-in electric vehicles: What is it worth? Transp. Res. Part Transp. Environ. 78, 102182.
https://doi.org/10.1016/j.trd.2019.11.011
Groupe Alpha, INTERGROS (France), France, Direction générale des entreprises (2014-....), 2018.
L’impact des mutations technologiques et de la digitalisation sur le modèle économique du
commerce de gros. Direction générale des entreprises, Paris.
Groupe Renault, 2020. Le prix d’une batterie de voiture électrique [WWW Document]. Easy Electr.
Life. URL https://easyelectriclife.groupe.renault.com/fr/au-quotidien/recharge/quel-est-le-
prix-dune-batterie-de-voiture-electrique/ (accessed 12.5.20).
Huguette, T., Stéphane, P., 2019. Les scénarios technologiques permettant ’atteindre l’objectif d’un
arrêt de la ommercialisation des véhicules hermiques en 2040.
IEA, 2019. Global Electric Vehicle Outlook 2019 [WWW Document]. IEA. URL
https://www.iea.org/reports/global-ev-outlook-2019 (accessed 6.17.20).
INSEE, 2020a. Définition - Espace rural / Espace à dominante rurale / Espace à dominante rurale |
Insee [WWW Document]. URL https://www.insee.fr/fr/metadonnees/definition/c1034
(accessed 2.16.21).
INSEE, 2020b. Estimation de la population au 1er janvier 2020 | Insee [WWW Document]. URL
https://www.insee.fr/fr/statistiques/1893198 (accessed 7.28.20).
Ionity, 2021. IONITY EU [WWW Document]. URL https://ionity.eu/ (accessed 2.20.21).
IPCC, 2018. Allen, M.R., O.P. Dube, W. Solecki, F. Aragón-Durand, W. Cramer, S. Humphreys, M.
Kainuma, J. Kala, N. Mahowald, Y. Mulugetta, R. Perez, M.Wairiu, and K. Zickfeld, 2018:
Framing and Context. In: Global Warming of 1.5°C. An IPCC Special Report on the impacts
of global warming of 1.5°C above pre-industrial levels and related global greenhouse gas
emission pathways, in the context of strengthening the global response to the threat of climate
change, sustainable development, and efforts to eradicate poverty [Masson-Delmotte, V., P.
Zhai, H.-O. Pörtner, D. Roberts, J. Skea, P.R. Shukla, A. Pirani, W. Moufouma-Okia, C. Péan,
R. Pidcock, S. Connors, J.B.R. Matthews, Y. Chen, X. Zhou, M.I. Gomis, E. Lonnoy, T.
Maycock, M. Tignor, and T. Waterfield (eds.)]. In Press.
Jabbari, P., Mackenzie, D., 2017. EV Everywhere or EV Anytime? Co-locating Multiple DC Fast
Chargers to Improve Both Operator Cost and Access Reliability.
Kley, F., Lerch, C., Dallinger, D., 2011. New business models for electric cars—A holistic approach.
Energy Policy 39, 3392–3403. https://doi.org/10.1016/j.enpol.2011.03.036

Chapter 3: Assessing the trade-offs between battery capacity and public charging
infrastructure of electric vehicles: urban and rural French case studies for daily needs
143
Madina, C., Zamora, I., Zabala, E., 2016. Methodology for assessing electric vehicle charging
infrastructure business models. Energy Policy 89, 284–293.
https://doi.org/10.1016/j.enpol.2015.12.007
Meinrenken, C.J., Shou, Z., Di, X., 2020. Using GPS-data to determine optimum electric vehicle
ranges: A Michigan case study. Transp. Res. Part Transp. Environ. 78, 102203.
https://doi.org/10.1016/j.trd.2019.102203
Mies, J., Helmus, J., van den Hoed, R., 2018. Estimating the Charging Profile of Individual Charge
Sessions of Electric Vehicles in The Netherlands. World Electr. Veh. J. 9, 17.
https://doi.org/10.3390/wevj9020017
Ministry of Ecological Transition, 2020. Objectif 100 000 bornes : tous mobilisés pour accélérer le
virage du véhicule électrique [WWW Document]. Ministère Transit. Écologique. URL
https://www.ecologie.gouv.fr/objectif-100-000-bornes-tous-mobilises-accelerer-virage-du-
vehicule-electrique (accessed 3.24.21).
Mock, P., 2019. CO2 emission standards for passenger cars and light-commercial vehicles in the
European Union | International Council on Clean Transportation.
Neubauer, J., Wood, E., 2014. Thru-life impacts of driver aggression, climate, cabin thermal
management, and battery thermal management on battery electric vehicle utility. J. Power
Sources 259, 262–275. https://doi.org/10.1016/j.jpowsour.2014.02.083
Pagany, R., Camargo, L.R., Dorner, W., 2019. A review of spatial localization methodologies for the
electric vehicle charging infrastructure. Int. J. Sustain. Transp. 13, 433–449.
https://doi.org/10.1080/15568318.2018.1481243
Pearre, N.S., Kempton, W., Guensler, R.L., Elango, V.V., 2011. Electric vehicles: How much range is
required for a day’s driving? Transp. Res. Part C Emerg. Technol. 19, 1171–1184.
https://doi.org/10.1016/j.trc.2010.12.010
Plötz, P., Gnann, T., Wietschel, M., 2014. Modelling market diffusion of electric vehicles with real
world driving data — Part I: Model structure and validation. Ecol. Econ. 107, 411–421.
https://doi.org/10.1016/j.ecolecon.2014.09.021
Quinet, A., Baumstark, L., Centre d’analyse stratégique (France), 2009. La valeur tutélaire du carbone.
Documentation française, Paris.
Sathaye, N., Kelley, S., 2013. An approach for the optimal planning of electric vehicle infrastructure
for highway corridors. Transp. Res. Part E Logist. Transp. Rev. 59, 15–33.
https://doi.org/10.1016/j.tre.2013.08.003
Service Public, 2020. Bonus écologique et prime à la conversion : ce qui change [WWW Document].
URL https://www.service-public.fr/particuliers/actualites/A14391 (accessed 2.18.21).
Shareef, H., Islam, Md.M., Mohamed, A., 2016. A review of the stage-of-the-art charging
technologies, placement methodologies, and impacts of electric vehicles. Renew. Sustain.
Energy Rev. 64, 403–420. https://doi.org/10.1016/j.rser.2016.06.033
Shen, Z.-J.M., Feng, B., Mao, C., Ran, L., 2019. Optimization models for electric vehicle service
operations: A literature review. Transp. Res. Part B Methodol. 128, 462–477.
https://doi.org/10.1016/j.trb.2019.08.006
Van Mierlo, J., Messagie, M., Rangaraju, S., 2017. Comparative environmental assessment of
alternative fueled vehicles using a life cycle assessment. Transp. Res. Procedia, World
Conference on Transport Research - WCTR 2016 Shanghai. 10-15 July 2016 25, 3435–3445.
https://doi.org/10.1016/j.trpro.2017.05.244
Waldmann, T., Hogg, B.-I., Wohlfahrt-Mehrens, M., 2018. Li plating as unwanted side reaction in
commercial Li-ion cells – A review. J. Power Sources 384, 107–124.
https://doi.org/10.1016/j.jpowsour.2018.02.063
Wang, Y.-W., Wang, C.-R., 2010. Locating passenger vehicle refueling stations. Transp. Res. Part E
Logist. Transp. Rev. 46, 791–801. https://doi.org/10.1016/j.tre.2009.12.001
Weiss, C., Chlond, B., Heilig, M., Vortisch, P., 2014. Capturing the Usage of the German Car Fleet for
a One Year Period to Evaluate the Suitability of Battery Electric Vehicles – A Model based
Approach. Transp. Res. Procedia, Planning for the future of transport: challenges, methods,
analysis and impacts - 41st European Transport Conference Selected Proceedings 1, 133–141.
https://doi.org/10.1016/j.trpro.2014.07.014

Chapter 3: Assessing the trade-offs between battery capacity and public charging
infrastructure of electric vehicles: urban and rural French case studies for daily needs
144
Wiederer and Philip, 2010. Wiederer, A., Philip, R., 2010. Policy options for electric vehicle chargin
infrastructure in C40 cities.Transportation Clinton Climate Initiative. [WWW Document].
URL https://www.innovations.harvard.edu/policy-options-electric-vehicle-charging-
infrastructure-c40-cities (accessed 4.20.20).
Wood, E., Neubauer, J., Burton, E., 2015. Quantifying the Effect of Fast Charger Deployments on
Electric Vehicle Utility and Travel Patterns via Advanced Simulation: Preprint (No.
NREL/CP-5400-63423). National Renewable Energy Lab. (NREL), Golden, CO (United
States). https://doi.org/10.4271/2015-01-1687
Yang, J., Dong, J., Hu, L., 2017. A data-driven optimization-based approach for siting and sizing of
electric taxi charging stations. Transp. Res. Part C Emerg. Technol. 77, 462–477.
https://doi.org/10.1016/j.trc.2017.02.014
Yong, J.Y., Ramachandaramurthy, V.K., Tan, K.M., Mithulananthan, N., 2015. A review on the state-
of-the-art technologies of electric vehicle, its impacts and prospects. Renew. Sustain. Energy
Rev. 49, 365–385. https://doi.org/10.1016/j.rser.2015.04.130
Zhang, L., Brown, T., Samuelsen, S., 2013. Evaluation of charging infrastructure requirements and
operating costs for plug-in electric vehicles. J. Power Sources 240, 515–524.
https://doi.org/10.1016/j.jpowsour.2013.04.048
Zhou, Y., Wen, R., Wang, H., Cai, H., 2020. Optimal battery electric vehicles range: A study
considering heterogeneous travel patterns, charging behaviors, and access to charging
infrastructure. Energy 197, 116945. https://doi.org/10.1016/j.energy.2020.116945

Chapter 3: Assessing the trade-offs between battery capacity and public charging
infrastructure of electric vehicles: urban and rural French case studies for daily needs
145
Appendix 3.A Techno-Economic Parameters of the Cost
Models
Table 3.4 Charging Tariffs of Different Operators
Access fee P = 7 kW P = 22 kW P = 50 kW Availability on the
market
Source
Belib
1 €/hour * 0,022 €/min 0,293 €/min after
1 hour
++ (chargemap, 2020)
Indigo
0,036 €/min 0,036 €/min
+
Virta
0,218 €/min
-
Freshmile
0,011 €/min (no
access fee)
1.5€ for the 1st
hour. 0,2 €/min
after 1 hour
+
New motion
0,027 €/min 0,053 €/min
+
EFFIA 4,4 €/event 0,587 €/min 0,587 €/min
+
Izivia 4,396
€/event
0,053 €/min after 1
hour
0,053 €/min after
1 hour
+
Electric 55
charging
0,026 €/min
-
Corri-door 2 €/event
0,247 €/min ++
Seymaborne 0,88
€/event
0,023 €/min 0,068 €/min
-
Total
0,428 €/min +
ZEborne 0,218 €/min -
Alizé
0,04 €/min 3,75 €/20 min
After, 0,1875
€/min
+ (Alizécharge, 2020)
Unknown 1
5 €/45min (Groupe Alpha et al.,
2018) Unknown 2
0,06 €/min
Unknown 3
0,7 €/5min
* Sometimes free from 08:00 pm to 08:00 am
Table 3.5 BEV Techno-Economic Parameters
Variables
Small BEV Medium BEV Large BEV Source
𝑷𝑻𝒚𝒑𝒆,𝒊 Charging power [kW] 7 kW 22 kW 50 kW
𝜼 Efficiency factor [%] 85%
𝒓𝑩𝑬𝑽 Interest rate [%] 3% (Funke et al., 2019)
𝑻𝑩𝑬𝑽 Lifetime [Years] 9.5 (ACEA, 2019)
𝑰𝑩𝑬𝑽,𝒗𝒆𝒉 Vehicle investment [€] 10480 17600 30930 (Gnann, 2015)
𝒄𝒃𝒂𝒕𝒕,𝒊 Battery capacity [kWh] Variable
𝒄𝑩𝑬𝑽,𝒔𝒖𝒃𝒔𝒊𝒅𝒊𝒆𝒔 Subsidies [€] 5000€/BEV for 𝑐𝑏𝑎𝑡𝑡≤50 kWh
3000€/BEV for 50 kWh≤𝑐𝑏𝑎𝑡𝑡≤70 kWh
0€/BEV for 𝑐𝑏𝑎𝑡𝑡>70 kWh
(French
Government, 2020)
𝒑𝟏𝒌𝑾𝒉 Price of 1 kWh [€/kWh] 150€/kWh (Groupe Renault,
2020)
𝒂𝑽𝑲𝑻𝒊 Annual Vehicle Km Travelled [km] Depends on every BEV profile (ENTD, 2019)
𝒄𝑩𝑬𝑽,𝒄𝒉𝒂𝒓𝒈𝒊𝒏𝒈 Charging fees [€/hour] 1€/hour 1.5€ for the
1st hour
0.2€/min
2€ for the 1st
hour
0.247€/min
(chargemap, 2020)
𝒄𝒐𝒏𝒔𝒊 Electricity consumption [kWh/km] 0.164
kWh/km
0.201
kWh/km
0.216
kWh/km
(Gnann, 2015)
𝒄𝑩𝑬𝑽,𝑶&𝑴 Operation and Maintenance cost [€/km] 0.021€/km 0.040€/km 0.062€/km (Gnann, 2015)
𝒄𝑩𝑬𝑽,𝒄𝒂𝒓𝒅 Card cost [€/year] 5€/month 5€/month 5€/month (Wiederer and
Philip, 2010)

Chapter 3: Assessing the trade-offs between battery capacity and public charging
infrastructure of electric vehicles: urban and rural French case studies for daily needs
146
Table 3.6 ICEV Techno-Economic Parameters
Variables
Small ICEV Medium ICEV Large ICEV Source
𝒓𝑰𝑪𝑬𝑽 Interest rate [%] 5% (Funke et al., 2019)
𝑻𝑰𝑪𝑬𝑽 Lifetime [Years] 11 (Funke et al., 2019)
𝑰𝑰𝑪𝑬𝑽,𝒗𝒆𝒉 Vehicle investment [€] 12600 19480 32980 (Gnann, 2015)
𝒂𝑽𝑲𝑻𝒊 Annual Vehicle Km Travelled [km] Depends on every BEV profile INSEE surveys
𝒄𝒐𝒏𝒔𝒊 Fuel consumption [L/km] 0.046 L/km 0.057 L/km 0.071 L/km (Gnann, 2015)
𝒄𝒇𝒖𝒆𝒍 Fuel cost [€/L] 1.518 €/L (Funke et al., 2019)
𝒄𝑰𝑪𝑬𝑽,𝑶&𝑴 Operation and Maintenance cost [€/km] 0.018€/km 0.048€/km 0.076€/km (Gnann, 2015)
𝑳𝑪𝑨𝑰𝑪𝑬𝑽,𝒊 Life Cycle Assessment [tCO2/ICEV] 21.15 32.1 44.8 (Carbone4, 2018, p.
4)
𝒑𝑪𝑶𝟐 CO2 price [€/tCO2] 100 €/tCO2 (Quinet et al., 2009)
Table 3.7 Charging Infrastructure Techno-Economic Parameters
Variables Slow charger Normal charger Fast charger Source
Power of the charger 7 kW 22 kW 50 kW
Availability On-street On-street On-street
parking
spaces
𝒓𝑪𝑷𝑶 Interest rate [%] 5% (Funke et al., 2019)
𝑻𝑪𝑷𝑶 Lifetime [Years] 15 (Funke et al., 2019)
𝑰𝑪𝑷𝑶 Charging infrastructure investment [€] 2500€ 4000€ 25300€ (Groupe Alpha et
al., 2018) 𝑰𝑪𝑷𝑶,𝑪𝒊𝒗𝒊𝒍 𝒘𝒐𝒓𝒌𝒔 Civil works investment [€] 1063€ 1063€ 1553€
𝑰𝑪𝑷𝑶,𝑰𝒏𝒔𝒕𝒂𝒍𝒍𝒂𝒕𝒊𝒐𝒏 Installation investment [€] 817€ 817€ 1822€
𝑰𝑪𝑷𝑶,𝑮𝒓𝒊𝒅 𝒄𝒐𝒏𝒏𝒆𝒄𝒕𝒊𝒐𝒏𝒔 Grid connections investment [€] 957€ 957€ 1611€
𝒄𝑪𝑷𝑶,𝒔𝒖𝒃𝒔𝒊𝒅𝒊𝒆𝒔 Subsidies [€] 40% of 𝑰𝐶𝐼 1500€ 1500€ (Advenir, 2020)
𝒄𝑪𝑷𝑶,𝒄𝒐𝒎 Communication cost [€] 100€ 100€ 100€ (Madina et al.,
2016)
𝒄𝑪𝑷𝑶,𝑴 Metering and billing cost [€] 188€ 188€ 188€ (Madina et al.,
2016)
𝒄𝑪𝑷𝑶,𝑶&𝑴 Operation and Maintenance cost
[€/km]
10% of 𝑰𝐶𝐼 Literature
𝒄𝑪𝑷𝑶,𝒆𝒍𝒆𝒄 Electricity cost for the CSO [€/kWh] 0.18€/kWh (Eurostat, 2020)
𝒀𝑪𝑬𝒊 Yearly Charged Energy of BEV ‘j’
[kWh]
Depends on every BEV profile Our study
𝒄𝑪𝑷𝑶,𝒄𝒉𝒂𝒓𝒈𝒊𝒏𝒈 Electricity cost [€/kWh]
Paid by the driver
1€/hour 1.5€ for the 1st
hour
0.2€/min
2€ to access
0.247€/min
(chargemap, 2020)
𝒄𝑪𝑷𝑶,𝒄𝒂𝒓𝒅 Card cost [€/year] 5€/month 5€/month 5€/month (Wiederer and
Philip, 2010)
Excluded charging powers: 3 kW chargers available at-home, >50 kW chargers available on highways

Chapter 4: The Influence of Public Charging Infrastructure Deployment and Other Socio-
Economic Factors on Electric Vehicle Adoption in France
147
Chapter 4: The Influence of Public Charging Infrastructure
Deployment and Other Socio-Economic Factors on Electric
Vehicle Adoption in France
Battery Electric Vehicles (BEVs) and Plug-in Hybrid Electric Vehicles (PHEVs) offer a
promising choice to replace fossil-fuel dependent Internal Combustion Engine Vehicles
(ICEVs) with a low-emission transport solution. Governments, automotive manufacturers, and
charging infrastructure operators have deployed market-boosting initiatives to overcome
barriers hindering purchasing activity. Yet, their market diffusion is limited due to several
barriers. To shed light on the main factors causing this situation, and based on an extensive
state-of-the-art, we used an original database and statistically analyzed the influence of 14
socio-demographic, technical, and economic factors on the newly-registered BEV and PHEV
markets, separately, in 94 French departments from 2015 to 2019, using mixed-effect
regression. We find different sets of covariates to be significantly correlated with BEV and
PHEV market shares, respectively, leading to different interpretations regarding the vehicle’s
technology. The number of available BEV/PHEV models and energy prices are positively
associated with BEV and PHEV adoption. While fast, ultrafast charger density and financial
incentives boost BEV sales, more slow-and-normal charger density leads to higher PHEV sales.
On the contrary, financial incentives for PHEVs, relative to vehicles’ prices, do not boost sales
and is open for further studies. Based on the results, policy recommendations are considered
for the automotive industry, the charging operator, and the local authorities to draw a roadmap
for electric mobility transition in France.
This Chapter was presented at the 2019 European IAEE conference and the 2021
International IAEE conference:
Bassem Haidar, Pascal da Costa, Jan Lepoutre, Yannick Perez. Corri-Door Project: Did
It Really Boost The French Electric Vehicle Market?. Energy Challenges for the Next
Decade, Aug 2019, Ljubljana, Slovenia.
Bassem Haidar, Maria Teresa Aguilar Rojas. The Influence of Public Charging
Infrastructure Deployment and Other Socio-Economic Factors on Electric Vehicle
Adoption in France. Energy, COVID, and Climate Change, Jun 2021, Paris, France.
This Chapter is submitted to Research in Transportation Economics Journal as follows:
Bassem Haidar, Maria Teresa Aguilar Rojas. The Influence of Public Charging Infrastructure
Deployment and Other Socio-Economic Factors on Electric Vehicle Adoption in France.

Chapter 4: The Influence of Public Charging Infrastructure Deployment and Other Socio-
Economic Factors on Electric Vehicle Adoption in France
148

Chapter 4: The Influence of Public Charging Infrastructure Deployment and Other Socio-
Economic Factors on Electric Vehicle Adoption in France
149
1. Introduction
Greenhouse gas (GHG) emissions contribute to the climate change phenomenon. France
has set the ambitious goal to reduce CO2 emissions and the dependency on petroleum products
by 40% by 2030, with respect to the emissions level in 1990, and ban high-emission vehicles
by 2030 (French National Assembly, 2021). Plug-in Electric Vehicles (PEVs) have noteworthy
potential to reduce petroleum dependency and GHGs emissions related to the road
transportation sector towards global decarbonization (Hainsch et al., 2021). PEVs encompass
Battery Electric Vehicles (BEV), which use the electricity stored in the battery as a primary
energy source, and Plug-in Hybrid Electric Vehicles (PHEV), which use both fossil fuel and
battery as sources of energy. If the electricity is produced using renewable energy sources, the
GHG emissions from transportation are significantly lower than fossil-fuel based transport.
While this technology's adoption has been rapidly increasing over the last decade, its market
share remains restrained by socio-techno-economic barriers (Egbue and Long, 2012). The
reasons for the slow uptake of PEVs compared to ICEVs are generally divided into technical
(long charging duration, limited BEV range), economic (PEV purchase, electricity, and fuel
prices), awareness (client behaviour towards new inventions, charging stations visibility,
number of PEV models), and socio-demographic factors (age, education, income,
environmentalism, and urbanity degree) (Egbue and Long, 2012; Javid and Nejat, 2017;
Sierzchula et al., 2014; Tran et al., 2012). To overcome these obstacles, governments applied
national and local, monetary, and non-monetary policies for all the PEV supply chain members
(Sykes and Axsen, 2017).
PEVs presented around 4% of France's total vehicle sales until 2020 (French Ministry
of Ecological Transition, 2020a). France adopted several laws to reduce fossil-fuel
dependencies, such as Provisions of the Energy Transition Law for Green Growth and the
Mobility Orientation Law (French Ministry of Ecological Transition, 2021). Increasing fossil-
fuel prices, a statute in these laws, proved to be a solution that pushes drivers to switch from
ICEVs to PEVs in several countries (S. Li et al., 2017; Plötz et al., 2016). However, it led to
the Yellow Vests social movement, pushing the French government to search for other solutions
to accelerate the electric mobility transition. Meanwhile, local authorities, such as
municipalities at Ile-de-France, Marseille, and Nice, contributed to making EVs more attractive
to consumers by offering financial subsidies of a maximum of 5000€ to each driver switching
to electric mobility to tax exemption, free parking, and access to bus lanes. Since the lack of
charging infrastructure still presents a barrier to growth in the PEV market, as the driver suffers

Chapter 4: The Influence of Public Charging Infrastructure Deployment and Other Socio-
Economic Factors on Electric Vehicle Adoption in France
150
from range anxiety –the fear of a blackout in the middle of the road– national and local
authorities in France boosted the deployment of this infrastructure by both installing more on-
street chargers (e.g. Corri-door project (EC, 2013)) and offering up to 50% of the cost of the
charger for both private and public usage (e.g. ADVENIR project (Advenir, 2020)). In sum, the
French government allocated 100 million euros to finance more than 45,000 new charging
points by the end of 2023 (Advenir, 2020).
Investigating the key factors that could boost the BEV and PHEV uptake is crucial to
accelerate the French electric mobility transition. Several studies evaluated the influence of
socio-techno-economic factors on the PEV purchasing activity using empirical methods, such
as Vergis and Chen (2015) in the U.S., Wang et al. (2017) in China, Mersky et al. (2016) in
Norway, and Münzel et al. (2019) for a global review. Yet, several factors are still unexplored
in the existing literature. First, as the influence of market-booster factors differs significantly
between countries due to different consumer behaviours (Münzel et al., 2019), the French local-
based case study is still lacking and needs to be considered to help the government attain
ambitious national targets. Second, while the study on the influence of government policies has
received widespread attention in the literature (Hardman, 2019; Jenn et al., 2018; Münzel et al.,
2019), the influence of PEV subsidies is analyzed in the literature as a constant variable. Indeed,
an adjustable measure of subsidies concerning the price of the purchased vehicle still lacks, as
the vehicle’s investment is essential to capture the battery packs cost variation. Third, charging
infrastructure proved to be an essential factor in boosting PEV markets (X. Li et al., 2017; Plötz
et al., 2016). Still, the literature considered charging infrastructure as one covariate and failed
to mention that different charging speeds are available. Therefore, the potential impact of
different-power charging infrastructure on BEV/PHEV demand is still missing (Morganti et al.,
2016). Fourth, previous studies did not include a variable describing a vehicle’s electric range,
which could be an essential factor in solving the range anxiety problem, especially for BEV
drivers and understanding the customers choice towards different-size vehicles. The novelty of
our study will be to: (1) consider a department-level French case, (2) study the influence of
different-power charging infrastructure deployment, (2) assess the influence of French
department-level subsidies concerning the vehicle’s price, (3) evaluate the influence of the
vehicle’s electric range on PEV adoption. We also contribute to the scarce literature, only
considered in (Vergis and Chen, 2015), that suggests BEV and PHEV markets respond to
different market shares’ boosting strategies by evaluating how the studied factors vary between
the two markets.
This Chapter seeks to fill these gaps by assessing the privately-purchased BEV and

Chapter 4: The Influence of Public Charging Infrastructure Deployment and Other Socio-
Economic Factors on Electric Vehicle Adoption in France
151
PHEV market shares separately, using a mixed-effects regression on a local level in France
from 2015 to 2019, taking into account the charging infrastructure deployment of different
power speeds and other socio-economic factors. The data of these 14 covariates were gathered
from various governmental and press sources and allow us to build an original and recent
database of 94 French states for five years. These covariates could vary within three
dimensions: the French-local level, the year, and EV type. To the best of our knowledge, our
study is the first to isolate the impacts of local-level incentives regarding the vehicle’s price,
the vehicle’s electric range, and four charging powers on the adoption rate of BEVs and PHEVs
separately in France. Also, our work differs from existing studies in using mixed-effects
regression that captures the effect of time-variant and constant covariates. It should be noted
that methods applied in our study could help the French government build a clear roadmap for
electric mobility transition by identifying the market-booster factors and concluding with policy
recommendations rather than definitive causation.
The rest of this Chapter is organized as follows. Section 2 presents an extensive
overview of econometrics studies on PEV adoption. In Section 3, we describe the data and
methodology used. Section 4 details the BEV and PHEV models' regression results and policy
recommendations, followed by robustness checks in Section 5. Conclusions are provided in
Section 6.
2. Literature Review
Based on academic-published papers focusing on PEV adoption in different countries
and periods, this section identifies the candidate variables that could boost the market. We will
neglect other research papers focusing on AFVs (HEV, FCEV)9. Table 4.1 summarises the
discussed papers, their case studies (countries, period), methodologies, datasets, and the used
control variables.
Sierzchula et al. (2014) analyzed the relationship between governmental incentives,
socio-economic factors, and 30 national electric-vehicle market shares in 2012, using a country-
based multiple linear regression analysis. They found financial incentives, charging
infrastructure, and the local presence of production facilities to significantly affect a country's
electric vehicle market share. Results suggest that charging infrastructure was the strongest
related factor to electric vehicle adoption. However, they pointed out that neither financial
9 AFV: Alternative Fuel Vehicle; HEV: Hybrid Electric Vehicle (could not be charged using an external
charger); FCEV: Fuel Cells Electric Vehicle.

Chapter 4: The Influence of Public Charging Infrastructure Deployment and Other Socio-
Economic Factors on Electric Vehicle Adoption in France
152
incentives nor charging infrastructure could ensure high electric vehicle adoption rates. Plötz et
al. (2016) analyzed country-based market shares of both BEV and PHEV market shares in
different European countries and state-based PEV stock in the United States using a Pooled
OLS regression with data from 2010 to 2014. Their results show that economic factors such as
income and gasoline prices are mandatory in analysing policies since they could explain PEV
adoption rates variance. Besides, both direct and indirect incentives positively affect PEV
adoption, based on empirical PEV market data from the U.S. and Europe. They concluded that
the effects of different factors, such as the electricity price and public charging infrastructure,
remain open for further research.
Another group of publications used the stepwise linear regression10 to analyze the PEV
adoption. Mersky et al. (2016) analyzed the impact of socio-demographic factors (population,
average kilometres travelled), economic factors (income), and EV infrastructure (number of
charging points) on the BEV yearly sales in Norway from 2010 to 2013 on both regional and
municipal level. The authors excluded financial incentives (tax benefits) since they were
offered on national and non-financial incentives (free parking) since data was unavailable.
Results showed that charging infrastructure is the most powerful predictor for BEV sales share.
Wang et al. (2017) explored the key factors that promote EVs using a Partial Least Squares
structural equation analysis to analyze the BEV and PHEV city-level sales in China,
considering incentive measures and socio-demographic data between 2013 and 2014. Results
show that the density of charging infrastructure, license fee exemption, no driving restriction,
and priority to charging infrastructure construction lands are the four most important factors to
promote EVs. This Chapter recommends that local municipalities or governments should
strengthen the charging infrastructures as preferential policy by solving the problems related to
civil construction, grid connections, and smart grids. Vergis and Chen (2015) examined the
correlation between social, economic, geographic, and policy factors on both BEV and PHEV
adoption across U.S. states in 2013. After applying a stepwise regression on state-level PEV
market shares, their results showed that the significant variables are the consumer attribute
variables (education, awareness of electric vehicles), geographic variables (average winter
temperature, population density), variables related to the cost of energy (gasoline and electricity
costs) and the ability to access charging infrastructure away from home. The variables that
significantly influence PHEV market shares are market characteristics (the number of available
PHEV models), incentives (financial and non-financial incentives), and average winter
10 It should be noted that stepwise linear regression has been criticized for yielding over-confident predictors
(Harrell, 2001; Münzel et al., 2019).

Chapter 4: The Influence of Public Charging Infrastructure Deployment and Other Socio-
Economic Factors on Electric Vehicle Adoption in France
153
temperatures.
The third group of papers took advantage of their data's panel structure and built a panel
data regression considering the temporal evolution. Gallagher and Muehlegger (2011) applied
time and state fixed effects on BEV sales per capita on a quarterly U.S. state-level from 2000
to 2006, taking into account different socio-demographic (mean age, female percentage,
education level), and economic (income, gasoline prices, incentives) variables. They found
evidence that hybrid vehicle adoption is positively affected by incentives, income, and gasoline
prices. Clinton and Steinberg (2019) applied the same model by adding charging infrastructure
and electricity price covariates on the BEV sales per capita of the U.S. states between 2010 and
2015. Their findings indicate that incentives offered as state income tax credits do not have a
statistically significant effect on BEV adoptions. Jenn et al. (2018) found that financial
incentives have a significant and positive effect on PEV sales after analyzing monthly U.S.
state-level data for 2010 to 2015, including fixed effects for time-varying, regional, and vehicle
model-specific factors, using a Generalized Method of Moments (GMM) to estimate their
regression. Also, they included a lagged-dependent variable to account for suspected
endogeneity in their model. Wee et al. (2018) analyzed semi-annual state-level newly registered
EV by make, from 2010 to 2015, and state-level policies using a panel data regression. They
pointed out that an additional 1000€/BEV of subsidies could increase sales by 5 to 11%. Based
on quarterly EV sales and charging station deployment in 353 metropolitan areas in the U.S.
from 2011 to 2013, S. Li et al. (2017) found that sales incentives substantially affect EV sales.
Also, results showed that the effect would be more significant if the subsidy had been directed
toward charging infrastructure instead. Soltani-Sobh et al. (2017) conducted a cross-
sectional/time–series panel analysis on the EV sales in the U.S. from 2003 to 2011, using socio-
demographic (degree of urbanity, vehicle mileage travelled) and economic (income, gas prices,
electricity prices, financial incentive) factors. The results showed that electricity prices were
negatively associated with EV adoption, while urban roads and government incentives
positively affected states’ electric vehicle market share. Using a fixed-effects regression model,
X. Li et al. (2017) studied the impacts of seven factors on EV densities from fourteen countries
between 2010 and 2015. The authors found that the percentage of renewable energies in
electricity generation, the number of charging stations, the education level, the population
density have apparent and positive impacts on the demands, contrary to the GDP per capita and
urbanization. The gasoline price affects the demands for BEVs more than that for PHEVs.
Münzel et al. (2019) reviewed econometric studies on the effect size of purchase incentives and
analyzed data on PEV sales from 32 European countries from 2010 to 2017 using panel data

Chapter 4: The Influence of Public Charging Infrastructure Deployment and Other Socio-
Economic Factors on Electric Vehicle Adoption in France
154
regression. They used as control variables both monetary and non-monetary incentives, socio-
economic variables, such as electricity and diesel prices, and slow and fast charging
infrastructure. They found that energy prices and financial incentives influence PEV adoption
positively.
We completed and adapted the literature review provided by Münzel et al. (2019) in
Table 4.1, by adding the articles of (X. Li et al., 2017; Münzel et al., 2019; Soltani-Sobh et al.,
2017), by considering only academic-published articles, and by eliminating the articles
discussing the evolution of HEVs and FCEVs. We found that the independent variable is
generally measured by the PEV market share and is analyzed using various econometric
methods: OLS, panel, and stepwise regressions. Various social, demographic, economic, and
technical covariates were used, primarily monetary and non-monetary incentives, income,
energy prices, population density, and charging infrastructure deployment. As it can be seen in
Table 4.1, the studied covariates do not share the same influence on the PEV sales since it is
highly dependent on the year of study, the spatial resolution (national or local analysis), the
owners’ driving behaviour, and the technological progress of PEV. Therefore, general
conclusions could not be transferred to the French local-based case study without a detailed
market analysis.
While many articles in the literature zoomed into the impact of various covariates, the
research gaps, which we will try to fill in this Chapter, remain on: (1) the influence of different-
power charging infrastructure deployment, (2) the influence of the French department11-level
subsidies concerning the vehicle’s price, (3) the influence of the vehicle’s electric range on PEV
adoption, and (4) evaluating how the studied factors vary between the BEV and PHEV markets.
Moreover, here we apply mixed-effects regression method, which was not considered in none
of the existing studies - as we are aware - that captures the effect of both time-variant and
constant covariates. As a final step, regression results are used to conclude with policy
recommendations for the EV ecosystem members: the automotive manufacturer, the charging
operator, and public authorities.
3. Data and Methodology
3.1.Data
To estimate the influence of different socio-techno-economic factors on the French BEV
11 In the administrative divisions of France, the department (département) is one of the three levels of government
under the national level, between the administrative “regions” and the “communes”. France is composed of 13
regions, 95 departments (94 in metropolitan France (in French, France métropolitaine) and Corsica), and 34670
communes.

Chapter 4: The Influence of Public Charging Infrastructure Deployment and Other Socio-
Economic Factors on Electric Vehicle Adoption in France
155
and PHEV market shares, we collected this dataset from different governmental sources and
press articles sources for the 94 French departments from 2014 to 2019. It should be noted that
we discarded five overseas departments12 and the island of Corsica. Table 4.3 contains the
summary statistics of the data used in our study, the sources, and the name and description of
the variables used in the model.
3.1.1. Dependent Variable: BEVs and PHEVs Market Shares
To address the PEV sales, we used BEVs and PHEVs yearly privately-purchased,
neglecting other types of vehicles, car registration shares of 94 departments in France from
2015 to 2019 (French Ministry of Ecological Transition, 2020a). The collected dataset is
balanced without any missing values in any years and departments13. Figure 4.1 in Appendix
4.A summarises both BEV and PHEV market share evolutions in the French departments from
2015 to 2019. The BEV market share's growth from 2015 to 2019 varies from 1% to more than
12%, and for the PHEV, market share fluctuates from 0% to more than 7%.
3.1.2. Technical Factors
To investigate the effect of the recent deployment of public charging infrastructure on
PEV adoptions, we collected the number of semi-public and public chargers per department
and per power from the official French data website (French data official site, 2020). The at-
home (private) charger density is not considered due to the lack of data. Also, we did not have
the installation date for every charging station. Therefore, to build the backWard evolution trend
of the infrastructure deployment from 2014 to 2018, we applied the percentage increase
collected from (EAFO, 2020) equally to these departments. Chargers with 3-7 kW power are
considered slow chargers, 22 kW as normal, between 50 kW as fast, and more than 150 kW as
ultra-fast.
The results section should note that chargers with different powers do not share the same
price, charging tariffs, or availability. Also, the charging tariffs depend on the charging
operator. Table 4.2 details the charger’s price, the tariffs, and the charging durations and fees
for a 50-kWh BEV and a 17-kWh PHEV. It should be noted that most PHEVs are not
compatible with fast and ultra-fast charging technology (Fastned, 2021).
12 The five overseas departments (in French, départements d’outre mer) excluded from our study are the islands
of Guadeloupe, Martinique, Mayotte, La Réunion, and the French Guiana. 13 It should be noted that no PHEV sales were recorded in the department number 48 in 2016.

Chapter 4: The Influence of Public Charging Infrastructure Deployment and Other Socio-Economic Factors on Electric Vehicle Adoption in
France
156
Table 4.1 Overview of Econometric Studies Presented in the Literature Review (adapted from (Münzel et al., 2019))
Author (Year) Observations
Time
resolution
Vehicle
Type N Method Dependent variable Covariates
Fin
an
cia
l in
cen
tiv
es
No
n-F
ina
ncia
l in
cen
tiv
es
Ch
arg
ing
in
fra
stru
ctu
re
(Pri
va
te)
Ch
arg
ing
in
fra
stru
ctu
re
(Pu
bli
c)
Veh
icle
pric
e
Incom
e
Ed
uca
tio
n
Ga
soli
ne p
rice
Ele
ctr
icit
y p
ric
e
Po
pu
lati
on
den
sity
Mil
eag
e
Un
em
plo
ym
en
t ra
te
Perce
nta
ge
of
fem
ale
En
vir
on
men
tali
sm
Nu
mb
er o
f a
vail
ab
le v
eh
icle
s m
od
els
Ren
ew
ab
le E
ner
gy
pro
du
cti
on
Clinton & Steinberg
(2019) United States (State level)
2010-2015,
Monthly BEV 3864 Fixed Effect panel data regression Sales per capita NA - + + + + + - + +
Jenn et al. (2018) United States (State level)
2010-2014,
Quarterly PEV 18644
Fixed Effect panel data regression/LDV
Model with GMM estimator Absolute sales NA NA
Gallagher &
Muehlegger (2011) United States (State level)
2000-2006,
Quarterly PEV 4630 Fixed Effect panel data regression Sales per capita + + + + +
Li et al. (2017) United States (Metro areas)
2011-2013,
Yearly PEV 14563 OLS and GMM regressions Absolute sales + + + + + +
X. Li et al. (2017) 14 countries
2010 to
2015, Yearly
PHEV,
BEV 84 Fixed Effect panel data regression EV density + NA + + NA +
Mersky et al. (2016) Norway (Municipality level) 2000-2013, Yearly BEV 163/20 Stepwise linear regression Sales per capita
0 + + + NA - NA
Munzel et al. (2019)
A global review and 32
European countries
2010 to
2017, Yearly PEV 189/226 Fixed Effect panel data regression Sales share + + - +
Plotz et al. (2016) 12 European countries and the United States
2010-2014, Yearly PEV 35/125 Pooled OLS regression
Sales share and Stock per capita
NA + + NA + -
Sierzchula et al.
(2014) 30 countries 2012, Yearly PEV 30 Pooled OLS regression Sales share + + + - + - - + + +
Soltani-Sobh et al. (2017) United States (State level)
2003 to 2011, Yearly PEV 171 Fixed and random effect panel data regression Sales share
+ + + - + +
Vergis & Chen
(2015) United States (State level) 2013, Yearly
PHEV,
BEV 50 Stepwise linear regression Sales share + + + + + - + - + +
Wang et al. (2017) China (City level) 2013-2014, Yearly
PHEV, BEV 41 Stepwise linear regression Sales per capita
0 0 + 0
Wee et al. (2018) United States (State level)
2010-2015,
Yearly
PHEV,
BEV
1952-
4287 Multi-level Fixed Effect regression Absolute sales + - - + + - + +
« + » positive impact, « - » negative impact, « NA » Not Available impact, « 0 » not reported Colors indicate the significance level: ‘light grey’: low significance, ‘grey’: modest significance, ‘dark grey’: high significance, ‘white’: no significance
Adapted from: (Münzel et al., 2019) by adding the articles of (X. Li et al., 2017; Münzel et al., 2019; Soltani-Sobh et al., 2017) and by eliminating the articles discussing the evolution of Hybrid EV (HEV) and Flex-Fuel Vehicles (FFV).

Chapter 4: The Influence of Public Charging Infrastructure Deployment and Other Socio-
Economic Factors on Electric Vehicle Adoption in France
157
Finally, we included a variable describing the average electric range of sold BEV and
PHEV models per department and per year, derived from the onboard battery, to explain
adopters range anxiety issues. Indeed, a vehicle’s electric range is influenced by various factors,
such as the vehicle’s weight and the driving behaviour (i.e. driving speed, number of stops, and
weather conditions) (Sweeting et al., 2011). We gathered the vehicles’ electric range in WLTP14
worldwide standards from the official websites of brands. The range provided by the fuel tank
of a PHEV is not considered. Indeed, BEVs’ electric ranges are higher than those of PHEVs.
Table 4.2 Charging Costs of Different Charging Powers (Source: chargemap.com)
50 kWh BEV 17 kWh PHEV
Charging
speed
Charging
power
Charger’s
price
Availability Charging
pricing system
Charging
duration
Charging
fees
Charging
duration
Charging
fees
Slow
charger
3-7 kW 2000€ At-home, on-street
(Cities)
1 €/hour
sometimes free
11 hours 11 € 4 hours 4 €
Normal
charger
22 kW 4000€ On-street, points of
interest (supermarkets),
(Cities)
1.5€/first hour
0.2€/min after
2.7 hours 20 € 0.9 hours 1.2 €
Fast
charger
50 kW 25000€ On-street, points of
interest (supermarkets),
(Cities)
2€/access
0.4€/min
1.2 hours 25 € Not compatible
Ultrafast
charger
150 kW 40000€ Highways 4€/access
0.8€/min
0.4 hour 30 € Not compatible
3.1.3. Economic Factors
Several economic factors could stimulate PEV purchasing activity. First, financial
incentives, such as local subsidies, could help overcome the vehicle's high cost (Sierzchula et
al., 2014). Information on French-local subsidies was gathered from departments and
municipalities’ websites and press reviews. These local subsidies, which are fix for all vehicles’
prices, vary between 0€ and 5000€ for BEV and between 0€ and 2500€ for PHEV, based on
the department and the year. Indeed, the ratio of subsidies concerning the vehicle’s investment
could vary. For instance, regarding BEVs, the purchasing price of a Renault Zoé (52 kWh) is
32000€ compared to 45000€ for a Tesla Model 3 (75 kWh). Regarding PHEVs, a BMW Serie
2 (7.6 kWh) purchase price is 45000€ compared to 90000€ for a Porsche Cayenne (14.1 kWh).
Hence, we considered the ratio of subsidies over the price of the most sold vehicle in each
department and each year. We included the price of the most sold vehicle per department and
per year, similarly to Sierzchula et al. (2014). Prices were gathered from different press articles
(i.e. Automobile Propre, 2015-2019; Elite Auto, 2015-2019; La Revue Automobile, 2015-2019;
14 World harmonized Light-duty vehicles Test Procedure

Chapter 4: The Influence of Public Charging Infrastructure Deployment and Other Socio-
Economic Factors on Electric Vehicle Adoption in France
158
L’Argus, 2015-2019). We did not consider national subsidies, since they are offered equally on
the French territory. Additionally, BEVs are exempt from either 50% or 100% of the total
registration fee in specific departments during this study period. We collected the difference
between BEV and ICEV registration fees from press articles (Le Figaro, 2019, 2018, 2017,
2016, 2015). This difference captures the monetary savings in taxes of a BEV compared to an
ICEV. Registration fee exemption for PHEV adopters depends on the emissions cap of each
vehicle. Since we do not know the distribution of PHEVs that are exempted per department, we
decided not to consider this incentive for PHEVs. No reliable source was found for other local
monetary and non-monetary incentives (free parking, access to restricted traffic sones, access
to bus lanes), making it impossible to include them in our study.
Previous research indicates that energy costs played a crucial role in boosting PEV
purchasing activity and were found to firmly affect switching into electric mobility (Gallagher
and Muehlegger, 2011; S. Li et al., 2017; Plötz et al., 2016; Vergis and Chen, 2015). A high
electricity cost discourages PEV purchase, while a high gasoline price does the opposite. To
obtain the relative gain in energy prices, we compute the ratio between electricity and gasoline
prices. We obtained the yearly-average electricity and gasoline prices per department using
daily gasoline prices and yearly national-electricity prices for the studied period (French
Ministry of Economy and Finance, 2020a).
Additionally, we grouped the average amount of income declared per household to the
tax authorities from 2014 to 2018 (French Ministry of Economy and Finance, 2020b), according
to existing literature (Gallagher and Muehlegger, 2011; S. Li et al., 2017).
Finally, to adjust for the effects of inflation/deflation during our analysis period, we
divided all the economic covariates by the GDP deflator by considering 2015 as the base year
(World Bank, 2020)15.
3.1.4. Socio-demographic Factors
As described in the literature review section, socio-demographic factors could influence
the adoption of PEVs, namely age, sex, education level, population density, and
environmentalism (Clinton and Steinberg, 2019; S. Li et al., 2017; Soltani-Sobh et al., 2017;
Vergis and Chen, 2015). Thus, we obtain official socio-demographic data for every department:
the population density (INSEE, 2020a), the average age (INSEE, 2020b), and the average
unemployment rate (INSEE, 2020c).
15 The GDP deflator measures the change in prices for all goods and services in an economy. Constant prices are obtained by dividing nominal
prices (the prices in a given year) to the GDP deflator (for a base year). Then, constant prices reflect the value of goods, with respect to a base year, correcting by the effects of inflation.
Chapter 4: The Influence of Public Charging Infrastructure Deployment and Other Socio-
Economic Factors on Electric Vehicle Adoption in France
159
To evaluate the influence of drivers' daily trip's needs on the BEV and PHEV purchasing
sales, we added a covariate that measures the average-daily vehicle travelled kilometres (home-
work and work-home trips) of the drivers living in the department (ENTD, 2019).
Besides, we included a public availability factor, measured by the number of available
BEV and PHEV models, which could significantly impact the PEV sales (Sierzchula et al.,
2014; Vergis and Chen, 2015).
3.2.Methodology
Based on the literature, we chose the mixed-effects regression for the analysis of PEV
adoption. Mixed-effects are an extension to linear models since they allow for incorporating
both fixed and random effects. Predictors in the model are considered fixed effects, while
grouping variables are random effects (Garson, 2013). A simple fixed-effects model would treat
data points as if they are entirely independent. However, data is not independent but somewhat
hierarchical, and random effects need to be incorporated besides the fixed effects. Hierarchical
structures could appear when several observations are taken from the same unit of observation
over time or when those units of observations violate the independence assumption, as they are
related to each other. In our case, PEV market shares are nested within the year but also nested
within the department. Mixed-effects modelling is advantageous in our case since it gives us
group-specific estimates of the parameters in the model, allowing us to understand precisely
how the groups differ from one another. In addition, it takes into account the effect of variables,
such as “Vehicle travelled mileage”, that do not vary in time (a fixed-effect model would draw
that out) but are essential to explain PEV sales. An alternative to mixed-effects models could
be Generalized Linear models (GLM), which is also helpful for nested data. When using mixed-
effects models, factors may have both a fixed and a random component, differing from
Generalized Linear Models (GLM), where one must consider each factor as either fixed or
random. Still, parameter estimations in GLM can be problematic, which leads us to prefer the
mixed-effects estimation (Garson, 2013).

Chapter 4: The Influence of Public Charging Infrastructure Deployment and Other Socio-Economic Factors on Electric Vehicle Adoption in
France
160
Table 4.3 Summary Statistics of Covariates
Variable Variable description Years Unit N Mean St. Dev. Min Max Sources
Dependent variables
𝑷𝑬𝑽𝒎𝒔𝑩𝑬𝑽 BEV market share 2015-2019 - 470 0.014 0.005 0.002 0.045 (French Ministry of Ecological Transition, 2020a)
𝑷𝑬𝑽𝒎𝒔𝑷𝑯𝑬𝑽 PHEV market share 2015-2019 - 470 0.004 0.003 0.0004 0.023
Socio-demographic Covariates
𝒅𝒑𝒐𝒑𝒖𝒍𝒂𝒕𝒊𝒐𝒏 Population density 2015-2019 People/km² 470 592.696 2,461.916 15 21014 (INSEE, 2020a)
𝒂𝒈𝒆 Average age 2015-2019 - 470 42.285 2.682 35 48 (INSEE, 2020b)
𝒖𝒏𝒆𝒎𝒑𝒍𝒐𝒚𝒎𝒆𝒏𝒕𝒓𝒂𝒕𝒆 Unemployment rate 2015-2019 - 470 9.141 1.871 5.05 15.525 (INSEE, 2020c)
𝑽𝑲𝑻 Vehicle Travelled Kilometres 2015-2019 km 470 12.734 2.764 7 20 (ENTD, 2019)
Availability Covariates
𝒏𝒃 𝒎𝒐𝒅𝒆𝒍𝒔𝑩𝑬𝑽 Number of available BEV models 2015-2019 - 470 21 4,152 18 29 (Avem, 2020)
𝒏𝒃 𝒎𝒐𝒅𝒆𝒍𝒔𝑷𝑯𝑬𝑽 Number of available PHEV models 2015-2019 - 470 28.2 12.573 16 52
Economic Covariates16
𝒔𝒖𝒃𝒔𝒊𝒅𝒊𝒆𝒔𝑩𝑬𝑽 Subsidies for purchasing a BEV 2015-2019 € 470 691.489 1,463.680 0 5,000 (Automobile Propre, 2020; Beev, 2019; Charente Libre, 2016; CompteCO2, 2015; Nicematin, 2017)
𝒔𝒖𝒃𝒔𝒊𝒅𝒊𝒆𝒔𝑷𝑯𝑬𝑽 Subsidies for purchasing a PHEV 2015-2019 € 470 345.745 731.840 0 2,500
𝒑𝒓𝒊𝒄𝒆𝑩𝑬𝑽 Average price of the most sold BEV 2015-2019 € 470 38,480.07 1,853.241 23,250 40,030 (Automobile Propre, 2015; Elite Auto, 2015; La Revue Automobile, 2015; L’Argus, 2015)
𝒑𝒓𝒊𝒄𝒆𝑷𝑯𝑬𝑽 Average price of the most sold PHEV 2015-2019 € 469 49,772.340 14,020.320 26,100 111,902
𝒅𝒊𝒇𝒇𝒕𝒂𝒙𝒆𝒔 Difference in registration taxes 2015-2019 € 470 36.019 14.298 0 51.2 (Le Figaro, 2019, 2018, 2017, 2016, 2015)
𝒑𝒈𝒂𝒔𝒐𝒍𝒊𝒏𝒆 Gasoline price (SP95) 2015-2019 €/l 470 1.435 0.085 1.302 1.759 (French Ministry of Economy and Finance, 2020)
𝒑𝒆𝒍𝒆𝒄𝒕𝒓𝒊𝒄𝒊𝒕𝒚 Electricity price 2015-2019 €/kWh 470 0.174 0.005 0.168 0.180 (French Ministry of Ecological Transition, 2020b)
𝒊𝒏𝒄𝒐𝒎𝒆 Average amount of income declared per
household
2014-2018 € 470 24,815.910 3,835.549 19,249 44,794 (French Ministry of Economy and Finance, 2020b)
Technical Covariates
𝒅𝒔𝒍𝒐𝒘 𝒄𝒉𝒂𝒓𝒈𝒆𝒓𝒔 Slow chargers density 2014-2018 charger/km² 470 0.104 0.791 0.001 11.61 (EAFO, 2020; French data official site, 2020)
𝒅𝒏𝒐𝒓𝒎𝒂𝒍 𝒄𝒉𝒂𝒓𝒈𝒆𝒓𝒔 Normal chargers density 2014-2018 charger/km² 470 0.034 0.114 0.001 1.381
𝒅𝒇𝒂𝒔𝒕 𝒄𝒉𝒂𝒓𝒈𝒆𝒓𝒔 Fast chargers density 2014-2018 charger/km² 470 0.002 0.006 0 0.076
𝒅𝒖𝒍𝒕𝒓𝒂−𝒇𝒂𝒔𝒕 𝒄𝒉𝒂𝒓𝒈𝒆𝒓𝒔 Ultra-fast chargers density 2014-2018 charger/km² 470 0.001 0.006 0 0.090
𝒆𝒍𝒆𝒄𝒕𝒓𝒊𝒄 𝒓𝒂𝒏𝒈𝒆𝑩𝑬𝑽 BEV electric range 2015-2019 km 470 150.283 4.354 150 243 Own sources and Official brands websites
𝒆𝒍𝒆𝒄𝒕𝒓𝒊𝒄 𝒓𝒂𝒏𝒈𝒆𝑷𝑯𝑬𝑽 PHEV electric range 2015-2019 km 469 39.365 9.985 22 66
16 The deflator is considered in the economic covariates.

Chapter 4: The Influence of Public Charging Infrastructure Deployment and Other Socio-
Economic Factors on Electric Vehicle Adoption in France
161
We studied the logarithmic form of the new registered BEV and PHEV market shares
for 94 departments in France, as the logarithmic form is highly recommended when the
dependent variable is a percentage because it ensures the residuals' normality (Sprei, 2018;
Wooldridge, 2012). Our analysis accounts for infrastructure availability because users will not
buy vehicles they cannot recharge. However, charging infrastructure operators await a
meaningful market share of vehicles so that charging stations become a profitable business.
The so-called “the chicken-egg electric mobility problem”, where each party awaits the
other before acting. To avoid endogeneity problems from the simultaneity between PEV market
shares and the installation of charging infrastructure, we studied the influence of the lagged
form of charging infrastructure departments densities of slow-and-normal speed combined, fast
and fast ultra-fast speeds on BEV/PHEV market shares. In other words, we consider the effect
of charging infrastructure densities, in chargers/km², for the year ‘t-1’ on the market shares of
the year ‘t’ (i.e., 2014 to 2018). In addition, we consider the ratio of subsidies and the most sold
vehicle in the department to capture the relative effect of subsidies over vehicle prices.
Similarly, we compute the ratio of electricity prices (in €/kWh) and gasoline prices (in €/l),
following Münzel et al. (2019), since only the ratio will allow us to obtain the relative savings
of energy costs of PEVs compared to ICEVs. We only include gasoline prices since including
diesel prices would lead to potential collinearity among the two prices. Besides, we include the
vehicle’s electric range to account for range anxiety in the purchase decision and the vehicle
travelled kilometre (VKT) daily trips. We transform the slow-and-normal chargers’ density and
the electricity over gasoline price ratio to the logarithmic form to linearize the model. To avoid
the loss of observations with zero values, we transformed the fast and ultrafast chargers
densities, and the ratio of subsidies and the most sold vehicle price using ln(𝑥 + √1 + 𝑥2)
(Busse et al., 2010). We denote such transformations as ��𝑓𝑎𝑠𝑡 𝑐ℎ𝑎𝑟𝑔𝑒𝑟𝑠 and ��𝑢𝑙𝑡𝑟𝑎−𝑓𝑎𝑠𝑡 𝑐ℎ𝑎𝑟𝑔𝑒𝑟𝑠 for the
fast and ultrafast chargers’ densities, respectively, and 𝑠𝑢𝑏𝑠𝑖𝑑𝑖𝑒𝑠
𝑝𝑟𝑖𝑐𝑒
for the ratio of subsidies and
vehicle price. In addition, we added the difference in registration taxes, which are measured in
Euros/BEV for every department. We include the number of available models for BEVs and
PHEVs to capture the influence of PEV availability on purchase. Our model also investigates
the impact of socio-demographic-economic factors: income (in thousands of Euros) for the year
‘t-1’, the population density in people/km², the average age of the population, and the
unemployment rate.
We used a mixed-effects regression to analyze the impact of charging infrastructure
deployment and other socio-economic factors separately on both BEV and PHEV market
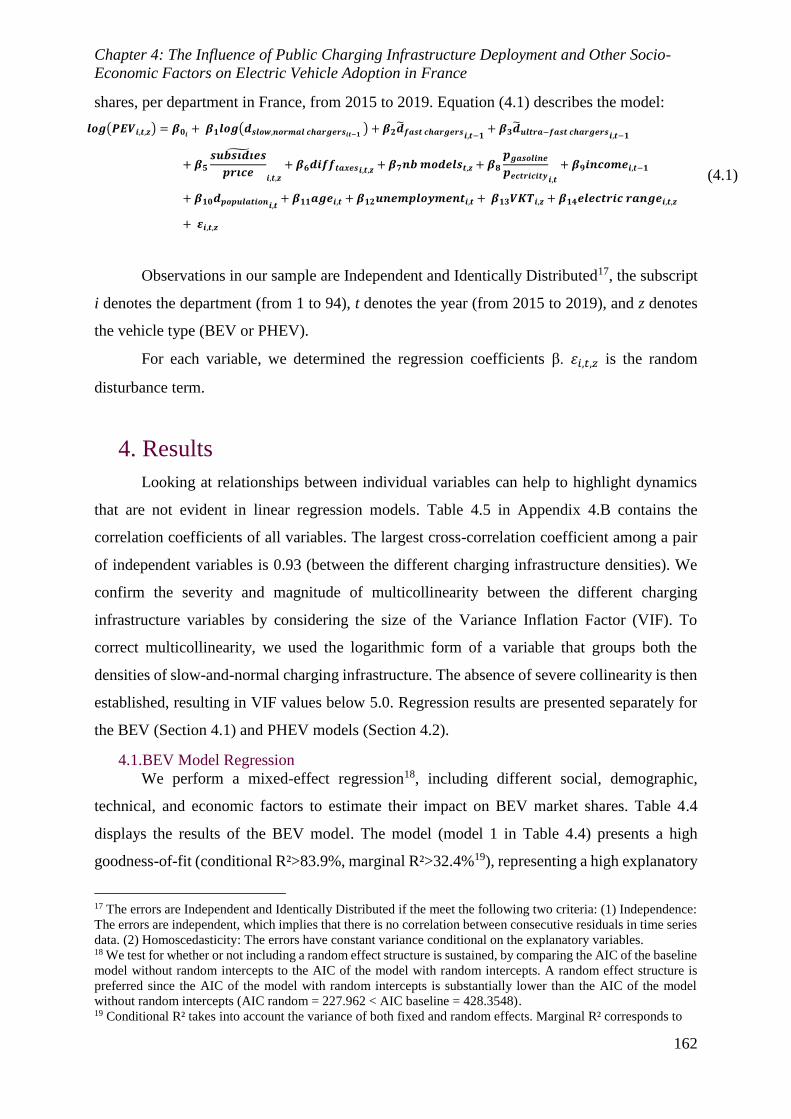
Chapter 4: The Influence of Public Charging Infrastructure Deployment and Other Socio-
Economic Factors on Electric Vehicle Adoption in France
162
shares, per department in France, from 2015 to 2019. Equation (4.1) describes the model:
𝒍𝒐𝒈(𝑷𝑬𝑽𝒊,𝒕,𝒛) = 𝜷𝟎𝒊 + 𝜷𝟏𝒍𝒐𝒈(𝒅𝒔𝒍𝒐𝒘,𝒏𝒐𝒓𝒎𝒂𝒍 𝒄𝒉𝒂𝒓𝒈𝒆𝒓𝒔𝒊𝒕−𝟏 ) + 𝜷𝟐��𝒇𝒂𝒔𝒕 𝒄𝒉𝒂𝒓𝒈𝒆𝒓𝒔𝒊,𝒕−𝟏+ 𝜷𝟑��𝒖𝒍𝒕𝒓𝒂−𝒇𝒂𝒔𝒕 𝒄𝒉𝒂𝒓𝒈𝒆𝒓𝒔𝒊,𝒕−𝟏
+ 𝜷𝟓𝒔𝒖𝒃𝒔𝒊𝒅𝒊𝒆𝒔
𝒑𝒓𝒊𝒄𝒆
𝒊,𝒕,𝒛
+𝜷𝟔𝒅𝒊𝒇𝒇𝒕𝒂𝒙𝒆𝒔𝒊,𝒕,𝒛 +𝜷𝟕𝒏𝒃 𝒎𝒐𝒅𝒆𝒍𝒔𝒕,𝒛 + 𝜷𝟖𝒑𝒈𝒂𝒔𝒐𝒍𝒊𝒏𝒆
𝒑𝒆𝒄𝒕𝒓𝒊𝒄𝒊𝒕𝒚𝒊,𝒕+ 𝜷𝟗𝒊𝒏𝒄𝒐𝒎𝒆𝒊,𝒕−𝟏
+ 𝜷𝟏𝟎𝒅𝒑𝒐𝒑𝒖𝒍𝒂𝒕𝒊𝒐𝒏𝒊,𝒕+ 𝜷𝟏𝟏𝒂𝒈𝒆𝒊,𝒕 + 𝜷𝟏𝟐𝒖𝒏𝒆𝒎𝒑𝒍𝒐𝒚𝒎𝒆𝒏𝒕𝒊,𝒕 + 𝜷𝟏𝟑𝑽𝑲𝑻𝒊,𝒛 + 𝜷𝟏𝟒𝒆𝒍𝒆𝒄𝒕𝒓𝒊𝒄 𝒓𝒂𝒏𝒈𝒆𝒊,𝒕,𝒛
+ 𝜺𝒊,𝒕,𝒛
(4.1)
Observations in our sample are Independent and Identically Distributed17, the subscript
i denotes the department (from 1 to 94), t denotes the year (from 2015 to 2019), and z denotes
the vehicle type (BEV or PHEV).
For each variable, we determined the regression coefficients β. 𝜀𝑖,𝑡,𝑧 is the random
disturbance term.
4. Results
Looking at relationships between individual variables can help to highlight dynamics
that are not evident in linear regression models. Table 4.5 in Appendix 4.B contains the
correlation coefficients of all variables. The largest cross-correlation coefficient among a pair
of independent variables is 0.93 (between the different charging infrastructure densities). We
confirm the severity and magnitude of multicollinearity between the different charging
infrastructure variables by considering the size of the Variance Inflation Factor (VIF). To
correct multicollinearity, we used the logarithmic form of a variable that groups both the
densities of slow-and-normal charging infrastructure. The absence of severe collinearity is then
established, resulting in VIF values below 5.0. Regression results are presented separately for
the BEV (Section 4.1) and PHEV models (Section 4.2).
4.1.BEV Model Regression
We perform a mixed-effect regression18, including different social, demographic,
technical, and economic factors to estimate their impact on BEV market shares. Table 4.4
displays the results of the BEV model. The model (model 1 in Table 4.4) presents a high
goodness-of-fit (conditional R²>83.9%, marginal R²>32.4%19), representing a high explanatory
17 The errors are Independent and Identically Distributed if the meet the following two criteria: (1) Independence:
The errors are independent, which implies that there is no correlation between consecutive residuals in time series
data. (2) Homoscedasticity: The errors have constant variance conditional on the explanatory variables. 18 We test for whether or not including a random effect structure is sustained, by comparing the AIC of the baseline
model without random intercepts to the AIC of the model with random intercepts. A random effect structure is
preferred since the AIC of the model with random intercepts is substantially lower than the AIC of the model
without random intercepts (AIC random = 227.962 < AIC baseline = 428.3548). 19 Conditional R² takes into account the variance of both fixed and random effects. Marginal R² corresponds to

Chapter 4: The Influence of Public Charging Infrastructure Deployment and Other Socio-
Economic Factors on Electric Vehicle Adoption in France
163
power of our models.
Regarding economic factors, we obtain that subsidies, relative to the price of the vehicle,
and registration tax exemption increase BEV purchase since they lower its upfront cost. A
person receiving the largest amount of local subsidies, additional to the 5000€ national subsidies
and paying zero registration fees, has a higher chance of purchasing a BEV. As expected, lower
taxes for BEVs incentivize consumers to switch to this type of vehicle. On the other hand, the
ratio of electricity price over the gasoline price negatively influences BEV sales at a 1% level.
Higher gasoline prices increase the trip cost of ICEVs and decrease the utility of this type of
vehicle. They could potentially motivate consumers to switch to BEVs, leading to lower
travelling costs and higher market shares. Paralelly, higher electricity prices relative to gasoline
prices act as a disincentive to buy battery electric vehicles since it could motivate consumers to
buy an ICEV compared to a BEV. Income is also a relevant factor in explaining BEV sales.
Additionally, the β coefficient on the number of BEV models available on the market is
positive and statistically significant at a 1% level. Indeed, a 1% increase in the number of
models in the market increases BEV market share by 2.7 percentage points. Providing a variety
of models on the market by the automotive industry will enhance the client's availability and,
consequently, result in higher BEV sales.
Regarding the charging infrastructure deployment, we studied the impact of the lagged
and logarithmic form of the public charging infrastructure densities on the log(𝐵𝐸𝑉𝑚𝑠). Fast
and ultrafast chargers densities coefficients are statistically significant at a 5% level with β
coefficients of 6.01 and 3.99, respectively, meaning that an increase of 1 percentage point will
increase 6.01 and 3.99 percentage points BEV sales in the following period. On the contrary,
the coefficient of the slow-and-normal chargers density is not statistically significant. Since
slow, normal, and fast chargers are generally available in cities, regression results (Table 4.4)
show that fast public chargers mainly influence BEV adopters. Several reasons could interpret
these results. We believe that charging tariffs and durations play a vital role in driver
preferences: BEV owners prefer to spend the shortest time charging the vehicle and paying
more for charging services. This result is justified by a French survey (EVBox, 2020), where
most respondents (46 % of BEV drivers) are ready to pay more for the less charging duration.
Yet, it is impossible to include charging tariffs and durations in the regressions because they do
not vary in time nor within the departments. Alternatively, results show that BEV adopters are
convinced by ultrafast charging, available on highways to solve long-distance trips. This result
the variance of the fixed effects only (Bartoń, 2020).

Chapter 4: The Influence of Public Charging Infrastructure Deployment and Other Socio-
Economic Factors on Electric Vehicle Adoption in France
164
is justified by (EVBox, 2020), where most respondents (55 % of BEV drivers) privilege the
usage of ultra-fast chargers available on highways. However, further studies are needed to draw
definitive conclusions about the influence on charging tariffs and durations.
Population density, the average age, the unemployment rate, the daily travelled
kilometres, and the vehicle’s range showed no significant effect on BEV adoption.
4.2.PHEV Model Regression
We perform mixed-effect regression20, including different social, demographic,
technical, and economic factors, to estimate their impact on PHEV market shares using the
logarithmic form. Table 4.4 displays the results of these models. Since different incentives are
given to PHEV buyers, it should be noted that the difference in registration taxes is not included
in the PHEV model, and the PHEV subsidies account for 50% of those offered to BEV adopters.
Additionally, the number of available models covariate accounts for PHEV models only, and
the price of the most sold vehicle is that of PHEV. The model (model 2 in Table 4.4) presents
a high goodness-of-fit measure (conditional R²>83%, marginal R²>61.9%).
Regarding the socio-demographic covariates, only the daily vehicle travelled kilometre
(VKT) is positively correlated at a 10% level. An increase of 1% on the VKT increases PHEV
market share by 2.2 percentage points, meaning that owners, who drive daily long-distance
trips, are more likely to purchasing PHEVs.
As for the economic factors, the ratio of electricity price over the gasoline price
negatively influences PHEV sales at a 5% level: an increase of 1 percentage point in electricity
price compared to gasoline price will lead to a decrease of 5 percentage points in the PHEV
sales. Therefore, travel cost savings are achieved using a PHEV, leading to higher sales. Also,
the β coefficient of the household’s income is positive and significantly significant at a 1%
level. An interesting result is achieved: the ratio of subsidies over the vehicle’s price showed
that it is negatively influencing PHEV sales. It should be noted that a maximum of 2500€ local
subsidies, which presents less than 3% of a plug-in hybrid vehicle’s price, a small part of the
overall vehicle investment, is offered to newly PHEV owners, leading to a negative effect on
overall sales.
Additionally, similarly to the BEV model, the β coefficient of the number of PHEV
models available on the market is positive and statistically significant at a 1% level. An increase
20 We test for whether or not including a random effect structure is sustained, by comparing the AIC of the baseline
model without random intercepts to the AIC of the model with random intercepts. A random effect structure is
preferred since the AIC of the model with random intercepts is substantially lower than the AIC of the model
without random intercepts (AIC random = 728.479 < AIC baseline = 854.594).

Chapter 4: The Influence of Public Charging Infrastructure Deployment and Other Socio-
Economic Factors on Electric Vehicle Adoption in France
165
of 1 percentage point in the number of models available increases PHEV market share by 1.2
percentage points. On the other hand, population density is negative and statistically significant
at a 10% level.
The lagged form of slow-and-normal chargers densities coefficient is statistically
significant at a 1% level regarding the charging infrastructure deployment. An increase of 1
percentage point in the density of slow-an-normal chargers will increase PHEV sales by 0.12
percentage points in the following period.
The vehicle’s range, the unemployment rate, and the average age showed no significant
effect on the model.
4.3.Comparison of BEV and PHEV Models with the Literature
Generally, the significant variables in our models, correlated with higher BEV and
PHEV sales, are consistent with the literature (detailed in Table 4.1), such as subsidies, charging
infrastructure deployment, income, electricity and diesel prices, population density. However,
some factors, which existing literature found to be vital in higher PEV markets, do not have the
same effect in France: namely daily travelled kilometres for BEV (Mersky et al., 2016),
unemployment (Mersky et al., 2016), and the population density (Soltani-Sobh et al., 2017;
Wee et al., 2018). In addition, other variables were not included due to the lack of data: private
charger installation (Clinton and Steinberg, 2019; S. Li et al., 2017) and non-financial
incentives (Plötz et al., 2016; Soltani-Sobh et al., 2017). These covariates are noteworthy for
further studies to develop the BEV and PHEV market in France. We contribute to the literature
by considering the effect of the different charging speeds in PEV adoption, analyzing a
department-level French case study, and considering the price of the most sold PEV using
mixed-effect regression.

Chapter 4: The Influence of Public Charging Infrastructure Deployment and Other Socio-
Economic Factors on Electric Vehicle Adoption in France
166
Table 4.4 Regression Results of Logarithmic form of BEV and PHEV Market Shares log(PEV)
Dependent Variable
Log BEV Market Share Log PHEV Market Share
(1) (2)
Log Slow-and-normal Chargers Density -0.019 0.123*** (0.012) (0.017)
Log Fast Chargers Density 6.014** - (2.367)
Log Ultra-Fast Chargers Density 3.996** - (2.031)
Log Subsidies/Vehicle_price 0.769* -2.870** (0.399) (1.366)
Difference in Registration Tax 0.003*** - (0.001)
Number of Models 0.027*** 0.012*** (0.003) (0.002)
Log Electricity_price/SP95_price -1.570*** -4.963*** (0.308) (0.458)
VKT 0.010 0.022*
(0.011) (0.012)
Vehicle’s electric range -0.002 -0.001
(0.002) (0.002)
Income 0.00003** 0.00006*** (0.00001) (0.00001)
Population Density -0.00002 -0.00003* (0.0002) (0.00002)
Age 0.012 -0.019 (0.012) (0.014)
Unemployment -0.0005 -0.007 (0.017) (0.019)
Constant -9.498*** -17.066*** (1.048) (1.320)
Observations 470 469
Conditional R2 0.839 0.830
Marginal R2 0.324 0.619
Note: *p<10%; **p<5%; ***p<1%

Chapter 4: The Influence of Public Charging Infrastructure Deployment and Other Socio-
Economic Factors on Electric Vehicle Adoption in France
167
By comparing the BEV and PHEV regression models, we found that the number of
available PEV models, income, and energy prices positively affect the market shares. Therefore,
an increase in these control variables will positively and significantly impact the transition into
electric mobility, such as in (S. Li et al., 2017; Vergis and Chen, 2015). Regarding economic
factors, clients receiving local subsidies and registration fees exemption are more likely to buy
a BEV, similarly to (S. Li et al., 2017; Soltani-Sobh et al., 2017; Wee et al., 2018). On the
contrary, since subsidies presents a small part of the PHEV’s investment, the ratio of subsidies
over vehicle price negatively affects PHEV sales, mainly due to the high price of PHEVs.
Results prove that the ratio of energy prices has a stronger negative influence on PHEV sales
than BEV sales: a one percentage point increase in the ratio leads to a decrease of 1.5 (4.9)
percentage points in BEV (PHEV) sales. This result is expected since a PHEV is highly
dependent on fossil fuels. Contrary to BEV users, PHEV users have to constantly do a tradeoff
between using electricity or gasoline to fuel their vehicles.
Concerning the public charging infrastructure deployment, several studies found this
covariate to be a vital factor for purchasing a PEV (S. Li et al., 2017; Münzel et al., 2019; Plötz
et al., 2016). Indeed, the influence of different charging speeds, which presents the novelty of
this Chapter, was not considered in previous literature. We found that setting up fast chargers
in cities and ultrafast chargers on corridors could boost the BEV adoption trend. Contrary to
the BEV market, where there is no effect, slow-and-normal chargers positively impact PHEV
adoption. Since PHEVs cannot be charged using fast and ultra-fast chargers, these charging
powers were not considered in our analysis of the plug-in hybrid market.
Among socio-demographic covariates, only the coefficient of daily travelled kilometres
was significant and positively correlated to PHEV sales and did not influence BEV sales. Other
covariates, namely vehicle’s electric range, unemployment rate, and age, had no influence on
the BEV and PHEV market shares in contrast to (Gallagher and Muehlegger, 2011; Mersky et
al., 2016; Wee et al., 2018).
Overall, our results are in line with the existing literature on early PEV adopters across
the countries. However, it is essential to consider other covariates in further studies, such as
non-financial incentives and private charging infrastructure deployment.
4.4.Policy Recommendations
Based on our results and to accelerate the electric mobility transition in France, this
Chapter provides policy recommendations for the members of the PEV ecosystem: the
automotive industry, the charging operator, and government/local authorities.
Chapter 4: The Influence of Public Charging Infrastructure Deployment and Other Socio-
Economic Factors on Electric Vehicle Adoption in France
168
First, our results found that the number of available models on the market is positively
correlated to both BEV and PHEV sales. Also, we figured out that the daily vehicle travelled
kilometre is positively influencing PHEV sales. Therefore, we recommend automotive
manufacturers adopt a strategy to promote PEVs by (1) providing various models of different
sizes, battery capacities/ranges, styles, and designs. This recommendation implies incurring in
R&D and manufacturing costs but can potentially increase brand visibility and help
differentiate from competitors. Furthermore, their strategy could concentrate on (2) raising the
awareness of PHEVs in rural areas, where drivers travel daily long-distance trips.
Second, we confirm that deploying charging infrastructure could eliminate range
anxiety towards the drivers. Results show that deploying fast and ultrafast chargers boost the
BEV market, while slow-and-normal chargers boost the PHEV market. Therefore, charging
infrastructure operators should consider a strategic plan that includes providing public fast
chargers to target potential BEV users, public slow-and-normal chargers to target potential
PHEV users and ultrafast chargers on highways rather than other charging speeds. However,
we should consider that the installation of the different charging stations entails various costs
and benefits. Regarding costs, fast and ultra-fast chargers come with higher investments than
slow-and-normal chargers (Table 4.2) and additional costs, such as grid reinforcement and
connection. Regarding benefits, charging operators should consider the charging behaviours of
PEV users in order to evaluate their revenues and fix their charging tariffs.
As discussed before, economic factors present promising opportunities for new policies
to achieve low-emissions goals. Results show that local subsidies and registration tax
exemption are two crucial reasons for mass BEV adoption. Indeed, the higher the ratio subsidy
over vehicle price, the higher the chance is to buy a BEV. Therefore, we suggest local
authorities offer subsidies based on the vehicle’s price: more subsidies should be offered for
higher BEV prices. The relationship between the ratio of PHEV subsidies over the vehicle’s
investment presented a negative correlation with PHEV sales. Therefore, we recommend that
local authorities offer purchasing subsidies for new BEV owners rather than PHEV ones. The
case of PHEV remains open for further studies. By modifying these financial incentives and
economic factors, local authorities and governments should expand their PEV markets and
potentially help achieve their road electrification targets. Besides, we recommend local
authorities concentrate their efforts on providing and/or increasing subsidies to the instalment
of fast chargers where BEVs are ascending, slow-and-normal chargers where PHEVs are
ascending, and ultrafast public chargers on highways.
Moreover, gasoline prices have a significant and positive impact on BEV and PHEV

Chapter 4: The Influence of Public Charging Infrastructure Deployment and Other Socio-
Economic Factors on Electric Vehicle Adoption in France
169
markets. Since travel cost savings could be achieved by purchasing a PEV, governments should
consider gasoline taxes as tools to encourage clients to buy PEVs. Indeed, the French
government adopted their strategy to add taxes on fossil fuel prices, namely the carbon tax, the
fourth governmental source of income (Senat, 2018). The government has been increasing the
diesel price more than gasoline price due to its environmental impact, pushing ICEV owners to
switch to low-emission vehicles (Pennec, 2017). Under the two laws: Energy Transition Law
for Green Growth21 and The National Low-Carbon Strategy22, this strategy provides price
signals encouraging low-carbon mobility to drivers (French Ministry of Ecological Transition,
2020c; Pennec, 2017).
However, increasing the carbon tax led to social movements, namely the "Yellow
Vests", pushing the French government to suspend additional taxes on fossil fuels prices.
Indeed, increasing taxes has no social acceptability in France23 since the country is one of the
top-taxed countries in the European Union (OECD, 2021). Overall, the French government
should create a roadmap that accompanies the electric mobility transition: by (1) increasing
subsidies for BEVs and revising those for PHEVs, (2) decreasing the electricity price and/or
increase gasoline price, (3) offering subsidies for charging operators to install the right charging
power at the right place. Despite the influence of these recommendations on achieving climate
targets, governments should consider social and budgetary costs in implementing them. For
instance, increasing subsidies for consumers and charging operators entail increasing taxes, and
governments should first determine the less costly option. Besides, increasing gasoline taxes,
which presents a source of revenue for the government (Senat, 2018), could provoke social
movements. As for decreasing electricity prices, the French government should evaluate its
feasibility since prices are managed at the European level. Indeed, a Cost-Benefit Analysis,
which is not the goal of this Chapter, is needed to prioritize policies according to their social,
environmental and economic impacts.
5. Robustness Checks
We applied different robustness checks, such as omitting nineteen random regions,
excluding big cities, removing charging infrastructure covariates to identify their impact on our
models.
21 Loi de la Transition Energétique pour la Croissance Verte (LTCEV) 22 Stratégie Nationale Bas-Carbone (SNBC) 23 (“Les Français refusent de payer à nouveau la taxe carbone,” 2019; “Relance économique,” 2021)

Chapter 4: The Influence of Public Charging Infrastructure Deployment and Other Socio-
Economic Factors on Electric Vehicle Adoption in France
170
5.1.Robustness Check 1: Removing Random Departments
As a robustness check, we examined the impact of omitting random 19 departments on the
model; results are shown in Table 4.5 in Appendix 4.C (models 2 and 4). It should be noted that
the coefficients of the regression are an estimation of all the studied regions and are equally
calculated for all the departments. We conclude that the model is robust since the estimation
results of both BEVs and PHEVs market shares do not significantly change in any coefficients
or significance.
5.2.Robustness Check 2: Excluding Departments with Big Cities
We omit departments where Paris, Marseille, and Lyon24 are located25. Results are
shown in Table 4.6 in Appendix 4.C (models 2 and 4). We obtain that fast chargers density
have no impact on BEV market share, mainly due to the different types of usage of BEV in
small and big cities. In small cities, contrary to big ones, the fact that more private parking is
available at households (INSEE, 2016), leads to a higher probability of at-home chargers
installation; and, thus, lower usage for public fast chargers. Also, the ultra-fast charging density
remains significant because it is mainly used for long-distance trips and these chargers are
available on highways.
5.3.Robustness Check 3: Removing Charging Infrastructure Control Variables
As a third robustness check, we exclude charging infrastructure variables. The results,
which are shown in Table 4.7 in Appendix 4.C (models 2 and 4), showed slight variations in
the coefficients and significance of the control variables of the BEV/PHEV regression models.
For instance, the ratio of subsidies and price, and the ratio of electricity and gasoline price
increase in absolute value, compared to the case with charging infrastructure. Not considering
charging infrastructure leads to an overestimation of both the subsidies and the energy prices
ratios in the BEV model.
Only a maximum of 1% of the variation in the conditional goodness-of-fit was measured
for all the models. While the charging infrastructure variables are essential predictors of BEV
and PHEV sales, these variables are not the largest predictors of vehicle sales. However,
including charging infrastructure variables is essential since they slightly improve the
goodness-of-fit and reduce the predicted value’s bias in other independent variables of the
model.
24 We eliminated Paris, Lyon and Marseille as they are the most populated cities in France, and they have the
largest metropolitan areas (INSEE, 2020d). 25 The departments removed are Paris (75), Bouches du Rhône (13), and Rhône (69).

Chapter 4: The Influence of Public Charging Infrastructure Deployment and Other Socio-
Economic Factors on Electric Vehicle Adoption in France
171
6. Conclusion
This Chapter explores the impact of different socio-techno-economic factors across the
PEV adoption activity in 94 French departments between 2015 and 2019 using mixed-effects
regression. We identified candidate factors that could potentially impact BEV or PHEV sales
based on a literature review before gathering their datasets from various sources. Then, we
chose to apply mixed-effects models to investigate BEV and PHEV purchasing activity
evolution separately. The purpose of developing these two models is to: (1) study the influence
of different-power charging infrastructure deployment, French department-level subsidies
concerning the vehicle’s price, and the vehicle’s electric range on PEV adoption, and (2)
conclude with policy recommendations to draw a roadmap for electric mobility transition in
France.
Our BEV and PHEV models present goodness-of-fit measures (conditional R²>83.9%
for the BEV model and conditional R²>83% for the PHEV model). The results show that the
number of available PEV models, income, and energy prices positively affect BEV and PHEV
market shares. Results indicate that the covariates with a positive effect on BEV sales include
economic variables (income, taxes exemption, the ratio of subsidies over the vehicle’s price),
technical variables (fast and ultra-fast charging density), and the number of available BEV
models. Yet, higher electricity price regarding gasoline price is negatively affecting BEV sales.
Besides, the positively correlated variables with PHEV sales include the number of PHEV
models, income, slow-and-normal chargers density, and daily travelled kilometres. However,
subsidies accounting for a small part of the PHEV investment and electricity price significantly
but negatively affect PHEV sales.
This Chapter ends with policy recommendations to the automakers by increasing the
variety of PEV choices and the charging operator by providing fast chargers in BEV- ascending
cities, slow-and-normal chargers in PHEV-ascending cities, and ultra-fast chargers on
highways. Moreover, we proposed a roadmap for the French government to follow the electric
mobility transition: by (1) increasing subsidies for BEVs and revising those for PHEVs, (2)
decreasing the electricity price or increasing gasoline price, (3) offering subsidies for charging
operators to install the right charging power at the right place.
While some of the findings of this study were expected and despite the high resolution
of our analysis, further studies are suggested to boost these models by considering other socio-
techno-economic factors that were not considered due to the lack of data, namely at-home and
at-work charging infrastructures of both the department of residence and work, the tariffs of

Chapter 4: The Influence of Public Charging Infrastructure Deployment and Other Socio-
Economic Factors on Electric Vehicle Adoption in France
172
public charging infrastructure, local non-financial incentives, and electric mobility services
(Vehicle-to-Grid, smart charging, and carsharing). Our model can only draw general
conclusions since the PEV market share in France represents less than 5%, so-called Early
Adopters stage. It would be helpful to perform a follow-up study in a more developed market.
Additionally, the model does not capture the customer's psychological effect, which could be
affected by the marketing campaign of both automotive manufacturers and charging
infrastructure operators. The Chapter aims to draw a clear roadmap for electric mobility
transition by identifying the market-booster factors rather than concluding with definitive
causation. Therefore, to know if these policies are efficient in a societal and economic sense,
we recommend that future studies consider a cost-benefit analysis.

Chapter 4: The Influence of Public Charging Infrastructure Deployment and Other Socio-
Economic Factors on Electric Vehicle Adoption in France
173
References
Advenir, project, 2020. ADVENIR ∣ Primes CEE pour points de recharge des véhicules électriques
[WWW Document]. ADVENIR. URL https://advenir.mobi/ (accessed 10.26.20).
Automobile Propre, 2020. Aides locales, prime et bonus : jusqu’à 18.000 € de remise sur votre voiture
électrique ! [WWW Document]. Automob. Propre. URL https://www.automobile-
propre.com/aides-locales-prime-et-bonus-jusqua-18-000-e-de-remise-sur-votre-voiture-
electrique/ (accessed 1.13.21).
Automobile Propre, 2015. Essai Mitsubishi Outlander PHEV 2017 : subtiles évolutions [WWW
Document]. URL https://www.automobile-propre.com/essai-mitsubishi-outlander-phev-2017/
(accessed 7.5.21).
Avem, 2020. Voiture électrique - Liste des modèles disponibles en France [WWW Document]. URL
http://www.avem.fr/voiture-electrique.html (accessed 1.13.21).
Bartoń, K., 2020. MuMIn: Multi-Model Inference.
Beev, 2019. Les aides régionales pour les voitures électriques en France [WWW Document]. Beev -
Votre Voiture Électr. En Quelques Clics. URL https://beev.co/financement/aides-regionales-
voitures-electriques/ (accessed 1.13.21).
Busse, M., Königer, J., Nunnenkamp, P., 2010. FDI promotion through bilateral investment treaties:
more than a bit? Rev. World Econ. 146, 147–177. https://doi.org/10.1007/s10290-009-0046-x
Charente Libre, 2016. Nouvelle Aquitaine: la prime de 1000€ pour l’achat d’un véhicule électrique
n’est pas reconduite [WWW Document]. CharenteLibre.fr. URL
https://www.charentelibre.fr/2016/11/24/les-constructeurs-decouvrent-qu-ils-ont-perdu-le-
super-banco-regional,3069882.php (accessed 1.13.21).
Clinton, B.C., Steinberg, D.C., 2019. Providing the Spark: Impact of financial incentives on battery
electric vehicle adoption. J. Environ. Econ. Manag. 98, 102255.
https://doi.org/10.1016/j.jeem.2019.102255
CompteCO2, 2015. Super bonus écologique pour rouler électrique - Compte CO2 [WWW Document].
URL https://www.compteco2.com//article/comment-marche-le-super-bonus-ecologique-
vehicule-electrique/ (accessed 1.13.21).
EAFO, 2020. Country detail electricity | EAFO [WWW Document]. URL
https://www.eafo.eu/countries/france/1733/infrastructure/electricity (accessed 7.28.20).
EC, 2013. Corri-Door Project [WWW Document]. URL
https://ec.europa.eu/inea/sites/inea/files/download/project_fiches/multi_country/fichenew_201
3eu92055s_final_1.pdf (accessed 2.18.21).
Egbue, O., Long, S., 2012. Barriers to widespread adoption of electric vehicles: An analysis of
consumer attitudes and perceptions. Energy Policy 48, 717–729.
https://doi.org/10.1016/j.enpol.2012.06.009
Elite Auto, 2015. PRIX ET TARIF BMW X5 G05 HYBRIDE PAR MANDATAIRE [WWW
Document]. URL https://www.elite-auto.fr/vente-voiture/bmw-4/x5-g05-6972.html (accessed
7.5.21).
ENTD, 2019. Enquête sur la mobilité des personnes 2018-2019 | Données et études statistiques
[WWW Document]. URL https://www.statistiques.developpement-durable.gouv.fr/enquete-
sur-la-mobilite-des-personnes-2018-2019 (accessed 7.28.20).
EVBox, 2020. Baromètre EVBox de la Mobilité : 4 Français sur 10 prêts à rouler électrique si les
points de charge ultra-rapides se développent [WWW Document]. EVBox Salle Presse. URL
http://news.evbox.com/fr-FR/193214-barometre-evbox-de-la-mobilite-4-francais-sur-10-prets-
a-rouler-electrique-si-les-points-de-charge-ultra-rapides-se-developpent (accessed 12.15.20).
Fastned, 2021. Can I charge at Fastned with my plug-in hybrid? [WWW Document]. Fastned Support.
URL https://support.fastned.nl/hc/en-gb/articles/205694697-Can-I-charge-at-Fastned-with-
my-plug-in-hybrid- (accessed 6.22.21).
French data official site, 2020. Fichier consolidé des Bornes de Recharge pour Véhicules Électriques
(IRVE) - data.gouv.fr [WWW Document]. URL /fr/datasets/fichier-consolide-des-bornes-de-
recharge-pour-vehicules-electriques/ (accessed 7.27.20).
French Ministry of Ecological Transition, 2021. Développer l’automobile propre et les voitures
électriques [WWW Document]. Ministère Transit. Écologique. URL

Chapter 4: The Influence of Public Charging Infrastructure Deployment and Other Socio-
Economic Factors on Electric Vehicle Adoption in France
174
https://www.ecologie.gouv.fr/developper-lautomobile-propre-et-voitures-electriques (accessed
6.16.21).
French Ministry of Ecological Transition, 2020a. Données sur les immatriculations des véhicules
[WWW Document]. Données Études Stat. Pour Chang. Clim. Lénergie Environ. Logement
Transp. URL https://www.statistiques.developpement-durable.gouv.fr/donnees-sur-les-
immatriculations-des-vehicules (accessed 1.12.21).
French Ministry of Ecological Transition, 2020b. Prix de l’électricité en France et dans l’Union
européenne en 2019 [WWW Document]. Données Études Stat. Pour Chang. Clim. Lénergie
Environ. Logement Transp. URL https://www.statistiques.developpement-
durable.gouv.fr/prix-de-lelectricite-en-france-et-dans-lunion-europeenne-en-2019-0 (accessed
7.5.21).
French Ministry of Ecological Transition, 2020c. La Stratégie Nationale Bas-Carbone: La Transition
Ecologique et Solidaire vers la neutralité carbone.
French Ministry of Economy and Finance, 2020a. Données publiques [WWW Document]. URL
https://www.prix-carburants.gouv.fr/rubrique/opendata/ (accessed 7.27.20).
French Ministry of Economy and Finance, 2020b. L’impôt sur le revenu par collectivité territoriale -
data.gouv.fr [WWW Document]. URL /fr/datasets/l-impot-sur-le-revenu-par-collectivite-
territoriale/ (accessed 12.10.20).
French National Assembly, 2021. Projet de loi no 3875 portant lutte contre le dérèglement climatique
et renforcement de la résilience face à ses effets.
Gallagher, K.S., Muehlegger, E., 2011. Giving green to get green? Incentives and consumer adoption
of hybrid vehicle technology. J. Environ. Econ. Manag. 61, 1–15.
https://doi.org/10.1016/j.jeem.2010.05.004
Garson, G.D., 2013. Fundamentals of Hierarchical Linear and Multilevel Modeling, in: Hierarchical
Linear Modeling: Guide and Applications. SAGE Publications, Inc., 2455 Teller
Road, Thousand Oaks California 91320 United States, pp. 3–26.
https://doi.org/10.4135/9781483384450.n1
Hainsch, K., Burandt, T., Löffler, K., Kemfert, C., Oei, P.-Y., von Hirschhausen, C., 2021. Emission
Pathways Towards a Low-Carbon Energy System for Europe: A Model-Based Analysis of
Decarbonization Scenarios. Energy J. 42. https://doi.org/10.5547/01956574.42.5.khai
Hardman, S., 2019. Understanding the impact of reoccurring and non-financial incentives on plug-in
electric vehicle adoption – A review. Transp. Res. Part Policy Pract. 119, 1–14.
https://doi.org/10.1016/j.tra.2018.11.002
Harrell, F.E., 2001. Resampling, Validating, Describing, and Simplifying the Model, in: Harrell, F.E.
(Ed.), Regression Modeling Strategies: With Applications to Linear Models, Logistic
Regression, and Survival Analysis, Springer Series in Statistics. Springer, New York, NY, pp.
87–103. https://doi.org/10.1007/978-1-4757-3462-1_5
INSEE, 2020a. Population de 1999 à 2020 | Insee [WWW Document]. URL
https://www.insee.fr/fr/statistiques/2012713 (accessed 7.28.20).
INSEE, 2020b. Estimation de la population au 1er janvier 2020 | Insee [WWW Document]. URL
https://www.insee.fr/fr/statistiques/1893198 (accessed 7.28.20).
INSEE, 2020c. Taux de chômage localisés au 2e trimestre 2020 | Insee [WWW Document]. URL
https://www.insee.fr/fr/statistiques/2012804 (accessed 11.16.20).
INSEE, 2020d. Définition - Unité urbaine / Agglomération / Agglomération multicommunale /
Agglomération urbaine / Agglomération / Agglomération multicommunale / Agglomération
urbaine | Insee [WWW Document]. URL
https://www.insee.fr/fr/metadonnees/definition/c1501 (accessed 7.7.21).
INSEE, 2016. Caractéristiques générales des résidences principales et de leurs occupants en 2013 −
Les conditions de logement en 2013 | Insee [WWW Document]. URL
https://www.insee.fr/fr/statistiques/1912703?sommaire=1912749 (accessed 7.5.21).
Javid, R.J., Nejat, A., 2017. A comprehensive model of regional electric vehicle adoption and
penetration. Transp. Policy 54, 30–42. https://doi.org/10.1016/j.tranpol.2016.11.003
Jenn, A., Springel, K., Gopal, A.R., 2018. Effectiveness of electric vehicle incentives in the United
States. Energy Policy 119, 349–356. https://doi.org/10.1016/j.enpol.2018.04.065

Chapter 4: The Influence of Public Charging Infrastructure Deployment and Other Socio-
Economic Factors on Electric Vehicle Adoption in France
175
La Revue Automobile, 2015. Fiche technique Mitsubishi Outlander PHEV 2016 [WWW Document].
URL https://www.larevueautomobile.com/Fiche-Technique-Auto/Caracteristique-
Mitsubishi_Outlander_15843.2016 (accessed 7.5.21).
L’Argus, 2015. Prix Renault Zoé (2015) : des tarifs à partir de 21 900 euros [WWW Document].
www.largus.fr. URL https://www.largus.fr/actualite-automobile/prix-renault-zoe-2015-des-
tarifs-a-partir-de-21-900-euros-6046386.html (accessed 7.5.21).
Le Figaro, 2019. Les prix de la carte grise pour 2019 [WWW Document]. URL
http://leparticulier.lefigaro.fr/article/les-prix-de-la-carte-grise-pour-2019/ (accessed 1.12.21).
Le Figaro, 2018. Les prix de la carte grise pour 2018 [WWW Document]. URL
http://leparticulier.lefigaro.fr/jcms/p1_1708294/les-prix-de-la-carte-grise-pour-2018 (accessed
1.12.21).
Le Figaro, 2017. Prix de la carte grise 2017: jusqu’à 400 % de hausse [WWW Document]. URL
http://leparticulier.lefigaro.fr/jcms/p1_1625664/prix-de-la-carte-grise-2017-jusqu-a-400-de-
hausse (accessed 1.12.21).
Le Figaro, 2016. Carte grise: les prix du cheval fiscal en 2016 [WWW Document]. URL
http://leparticulier.lefigaro.fr/jcms/p1_1605335/carte-grise-les-prix-du-cheval-fiscal-en-2016
(accessed 1.12.21).
Le Figaro, 2015. Carte grise: les prix du cheval fiscal en 2015 [WWW Document]. URL
http://leparticulier.lefigaro.fr/jcms/p1_1578234/carte-grise-les-prix-du-cheval-fiscal-en-2015
(accessed 1.12.21).
Les Français refusent de payer à nouveau la taxe carbone [WWW Document], 2019. . Mieux Vivre
Votre Argent. URL https://www.mieuxvivre-votreargent.fr/vie-pratique/2019/03/20/les-
francais-refusent-de-payer-a-nouveau-la-taxe-carbone/ (accessed 6.25.21).
Li, S., Tong, L., Xing, J., Zhou, Y., 2017. The Market for Electric Vehicles: Indirect Network Effects
and Policy Design. J. Assoc. Environ. Resour. Econ. 4, 89–133.
https://doi.org/10.1086/689702
Li, X., Chen, P., Wang, X., 2017. Impacts of renewables and socioeconomic factors on electric vehicle
demands – Panel data studies across 14 countries. Energy Policy 109, 473–478.
https://doi.org/10.1016/j.enpol.2017.07.021
Mersky, A.C., Sprei, F., Samaras, C., Qian, Z. (Sean), 2016. Effectiveness of incentives on electric
vehicle adoption in Norway. Transp. Res. Part Transp. Environ. 46, 56–68.
https://doi.org/10.1016/j.trd.2016.03.011
Morganti, E., Boutueil, V., Leurent, F., 2016. BEVs and PHEVs in France: Market trends and key
drivers of their short term development.
Münzel, C., Plötz, P., Sprei, F., Gnann, T., 2019. How large is the effect of financial incentives on
electric vehicle sales? – A global review and European analysis. Energy Econ. 84, 104493.
https://doi.org/10.1016/j.eneco.2019.104493
Nicematin, 2017. Bénéficiez d’une subvention de 2.000 euros pour l’achat d’un véhicule électrique en
2017 [WWW Document]. Nice-Matin. URL https://www.nicematin.com/vie-
locale/beneficiez-dune-subvention-de-2000-euros-pour-lachat-dun-vehicule-electrique-en-
2017-109683 (accessed 1.13.21).
OECD, 2021. Taxing Wages 2021.
Pennec, P., 2017. Le gazole plus cher que l’essence en 2021 ! Autoplus. URL
https://www.autoplus.fr/societe-economie/le-gazole-plus-cher-que-lessence-en-2021-
404619.html (accessed 6.22.21).
Plötz, P., Gnann, T., Sprei, F., 2016. Can policy measures foster plug-in electric vehicle market
diffusion? World Electr. Veh. J. 8, 789–797. https://doi.org/10.3390/wevj8040789
Relance économique : les Français sont vivement opposés à la taxation de l’épargne [WWW
Document], 2021. . Mieux Vivre Votre Argent. URL https://www.mieuxvivre-
votreargent.fr/vie-pratique/2021/04/20/relance-economique-les-francais-plebiscitent-la-
taxation-des-plus-hauts-revenus/ (accessed 6.25.21).
Senat, 2018. Hausse du prix des carburants - Sénat [WWW Document]. URL
https://www.senat.fr/questions/base/2018/qSEQ180605600.html (accessed 6.22.21).

Chapter 4: The Influence of Public Charging Infrastructure Deployment and Other Socio-
Economic Factors on Electric Vehicle Adoption in France
176
Sierzchula, W., Bakker, S., Maat, K., van Wee, B., 2014. The influence of financial incentives and
other socio-economic factors on electric vehicle adoption. Energy Policy 68, 183–194.
https://doi.org/10.1016/j.enpol.2014.01.043
Soltani-Sobh, A., Heaslip, K., Stevanovic, A., Bosworth, R., Radivojevic, D., 2017. Analysis of the
Electric Vehicles Adoption over the United States. Transp. Res. Procedia, 19th EURO
Working Group on Transportation Meeting, EWGT2016, 5-7 September 2016, Istanbul,
Turkey 22, 203–212. https://doi.org/10.1016/j.trpro.2017.03.027
Sweeting, W.J., Hutchinson, A.R., Savage, S.D., 2011. Factors affecting electric vehicle energy
consumption. Int. J. Sustain. Eng. 4, 192–201. https://doi.org/10.1080/19397038.2011.592956
Sykes, M., Axsen, J., 2017. No free ride to zero-emissions: Simulating a region’s need to implement
its own zero-emissions vehicle (ZEV) mandate to achieve 2050 GHG targets. Energy Policy
110, 447–460. https://doi.org/10.1016/j.enpol.2017.08.031
Tran, M., Banister, D., Bishop, J.D.K., McCulloch, M.D., 2012. Realizing the electric-vehicle
revolution. Nat. Clim. Change 2, 328–333. https://doi.org/10.1038/nclimate1429
Vergis, S., Chen, B., 2015. Comparison of plug-in electric vehicle adoption in the United States:
A state by state approach. Res. Transp. Econ., Sustainable Transportation 52, 56–64.
https://doi.org/10.1016/j.retrec.2015.10.003
Wang, N., Pan, H., Zheng, W., 2017. Assessment of the incentives on electric vehicle promotion in
China. Transp. Res. Part Policy Pract. 101, 177–189. https://doi.org/10.1016/j.tra.2017.04.037
Wee, S., Coffman, M., La Croix, S., 2018. Do electric vehicle incentives matter? Evidence from the 50
U.S. states. Res. Policy 47, 1601–1610. https://doi.org/10.1016/j.respol.2018.05.003
World Bank, 2020. GDP deflator (base year varies by country) - | Data [WWW Document]. URL
https://data.worldbank.org/indicator/NY.GDP.DEFL.ZS?locations=FR%20 (accessed
12.11.20).

Chapter 4: The Influence of Public Charging Infrastructure Deployment and Other Socio-Economic Factors on Electric Vehicle Adoption in France
177
Appendix 4.A: Overview of the BEV and PHEV Evolution in France
Figure 4.1 Evolution Percentage of the BEV (Left) and PHEV (Right) Market Shares in 95 French Departments between 2015 and 2019

Chapter 4: The Influence of Public Charging Infrastructure Deployment and Other Socio-Economic Factors on Electric Vehicle Adoption in France
178
Appendix 4.B: Correlation Between Model Covariates
Table 4.5 Variable Correlation Coefficients
Log(BEV
MS)
log(PHEV
MS)
Log slow and
normal chargers’
density
Density of
slow chargers
Density of
normal
chargers
Density of
fast chargers
Density of
ultrafast
chargers
Difference in
taxes
Number of
models BEV
Number of
models PHEV
Log
Subsidies
BEV
Log
Subsidies
PHEV
VKT
Vehicle’s
electric range
BEV
Vehicle’s
electric range
PHEV
Income Population
density Age Unemployment
Log(BEV MS) 1
Log(PHEV MS) 0.52* * * 1
Log slow and normal
chargers density 0.35* * * 0.64* * * 1
Density of slow
chargers 0.25* * * 0.32* * * 0.49* * * 1
Density of normal
chargers 0.30* * * 0.43* * * 0.68* * * 0.93* * * 1
Density of fast chargers 0.31* * * 0.43* * * 0.70* * * 0.83* * * 0.92* * * 1
Density of ultrafast
chargers 0.17* * * 0.30* * * 0.50* * * 0.35* * * 0.54* * * 0.48* * * 1
Difference in taxes 0.24* * * 0.26* * * 0.23* * * 0.09 0.13* * 0.16* * * 0.11* 1
Number of models BEV 0.43* * * 0.47* * * 0.34* * * 0.07 0.13* * 0.14* * 0.12* 0.18* * * 1
Number of models
PHEV 0.41* * * 0.49* * * 0.40* * * 0.07 0.13* * 0.15* * 0.12* * 0.21* * * 0.98* * * 1
Subsidies BEV 0.25* * * 0.38* * * 0.59* * * 0.40* * * 0.54* * * 0.50* * * 0.38* * * 0.18* * * 0.19* * * 0.20* * * 1
Subsidies PHEV 0.22* * * 0.34* * * 0.52* * * 0.30* * * 0.44* * * 0.39* * * 0.34* * * 0.17* * * 0.20* * * 0.21* * * 0.97* * * 1
VKT -0.00 0.02 -0.14* * -0.20* * * -0.24* * * -0.23* * * -0.19* * * -0.14* * 0.00 0.00 -0.04 -0.01 1
Vehicle’s electric range
BEV -0.01 0.02 0.03 0.06 0.05 0.04 0.01 0.02 -0.00 -0.00 -0.00 -0.01 -0.07 1
Vehicle’s electric range
PHEV 0.29* * * 0.26* * * 0.14* * -0.00 0.02 0.03 0.01 0.10* 0.62* * * 0.59* * * 0.06 0.08 0.06 -0.06 1
Income 0.33* * * 0.59* * * 0.59* * * 0.50* * * 0.61* * * 0.53* * * 0.33* * * 0.13* * 0.08 0.08 0.48* * * 0.42* * * -0.14*
* 0.01 -0.04 1
Population density 0.22* * * 0.39* * * 0.61* * * 0.77* * * 0.84* * * 0.81* * * 0.48* * * 0.14* * 0.00 0.00 0.46* * * 0.36* * * -0.29*
* * 0.03 -0.07 0.61* * * 1
Age -0.02 -0.33* * * -0.40* * * -0.14* * -0.26* * * -0.28* * * -0.24* * * -0.02 0.11* 0.11* -0.40* * * -0.38* * * -0.03 -0.01 0.12* * -0.56* * * -0.30* * * 1
Unemployment rate -0.29* * * -0.22* * * -0.17* * * -0.12* * -0.14* * -0.11* -0.10* -0.27* * * -0.29* * * -0.31* * * -0.12* -0.10*
0.15*
* 0.06 -0.14* * -0.39* * * -0.09
-
0.05
1
Note: *p<10%; **p<5%; ***p<1%

Chapter 4: The Influence of Public Charging Infrastructure Deployment and Other Socio-
Economic Factors on Electric Vehicle Adoption in France
179
Appendix 4.C: Results of Regressions with Robustness
Checks
Table 4.6 Sensitivity of Regression Results for Models against the Exclusion of Departments
Dependent variable: Log BEV Market Share Log PHEV Market Share
Base model
(1)
Excluding departments
(2)
Base model
(3)
Excluding departments
(4)
Log Slow and Normal Chargers
Density -0.019 -0.012 0.123*** 0.132***
(0.012) (0.014) (0.017) (0.019)
Log Fast Chargers Density 6.014** 5.918** - -
(2.367) (2.515)
Log Ultra-Fast Chargers Density 3.996** 4.033* - -
(2.031) (2.096)
Log Subsidies/Vehicle_price 0.769* 0.584 -2.870** -2.980*
(0.399) (0.487) (1.366) (1.563)
Difference in Registration Tax 0.003*** 0.003*** - -
(0.001) (0.001)
Number of Models 0.027*** 0.025*** 0.012*** 0.011***
(0.003) (0.003) (0.002) (0.002)
Log Electricity_price/SP95_price -1.570*** -1.728*** -4.963*** -4.950***
(0.308) (0.356) (0.458) (0.518)
VKT 0.010 -0.002 0.022* 0.028**
(0.011) (0.014) (0.012) (0.014)
Vehicle’s electric range -0.002 -0.002 -0.001 -0.0003
(0.002) (0.002) (0.002) (0.002)
Income 0.00003** 0.00003** 0.00006*** 0.00007***
(0.00001) (0.00001) (0.00001) (0.00002)
Population Density -0.00002 -0.00002 -0.00003* -0.00003
(0.0002) (0.00002) (0.00002) (0.00002)
Age 0.012 0.017 -0.019 -0.016
(0.012) (0.014) (0.014) (0.016)
Unemployment -0.0005 -0.001 -0.007 0.002
(0.017) (0.020) (0.019) (0.022)
Constant -9.498*** -9.810*** -17.066*** -17.257***
(1.048) (1.221) (1.320) (1.512)
Observations 470 470 469 469
Conditional R2 0.839 0.839 0.830 0.836
Marginal R2 0.324 0.307 0.619 0.629
Note: *p<10%; **p<5%; ***p<1%

Chapter 4: The Influence of Public Charging Infrastructure Deployment and Other Socio-
Economic Factors on Electric Vehicle Adoption in France
180
Table 4.7 Sensitivity of Regression Results for Models against the Exclusion of Big Cities
Dependent variable: Log BEV Market Share Log PHEV Market Share
Base model
(1)
Excluding big cities
(2)
Base model
(3)
Excluding big cities
(4)
Log Slow and Normal Chargers Density
-0.019 -0.017 0.123*** 0.128***
(0.012) (0.012) (0.017) (0.017)
Log Fast Chargers Density 6.014** 3.136 - -
(2.367) (3.164)
Log Ultra-Fast Chargers Density 3.996** 4.445** - -
(2.031) (2.047)
Log Subsidies/Vehicle_price 0.769* 0.676 -2.870** -2.918**
(0.399) (0.427) (1.366) (1.443)
Difference in Registration Tax 0.003*** 0.003*** - -
(0.001) (0.001)
Number of Models 0.027*** 0.026*** 0.012*** 0.012***
(0.003) (0.003) (0.002) (0.002)
Log Electricity_price/SP95_price -1.570*** -1.555*** -4.963*** -4.953***
(0.308) (0.313) (0.458) (0.468)
VKT 0.010 0.011 0.022* 0.022*
(0.011) (0.012) (0.012) (0.012)
Vehicle’s electric range -0.002 -0.002 -0.001 -0.002
(0.002) (0.002) (0.002) (0.002)
Income 0.00003** 0.00003** 0.00006*** 0.00007***
(0.00001) (0.00001) (0.00001) (0.00001)
Population Density -0.00002 -0.000002 -0.00003* -0.00003
(0.0002) (0.00003) (0.00002) (0.00003)
Age 0.012 0.013 -0.019 -0.015
(0.012) (0.013) (0.014) (0.015)
Unemployment -0.0005 -0.003 -0.007 -0.010
(0.017) (0.017) (0.019) (0.019)
Constant -9.498*** -9.377*** -17.066*** -17.281***
(1.048) (1.082) (1.320) (1.349)
Observations 470 470 469 469
Conditional R2 0.839 0.834 0.830 0.812
Marginal R2 0.324 0.280 0.619 0.593
Note: *p<10%; **p<5%; ***p<1%

Chapter 4: The Influence of Public Charging Infrastructure Deployment and Other Socio-
Economic Factors on Electric Vehicle Adoption in France
181
Table 4.8 Sensitivity of Regression Results for Models against the Exclusion of Charging
Infrastructure Control Variables
Dependent variable: Log BEV Market Share Log PHEV Market Share
Base model
(1)
No charging infrastructure
(2)
Base model
(3)
No charging
infrastructure
(4)
Log Slow and Normal Chargers Density
-0.019 - 0.123*** -
(0.012) (0.017)
Log Fast Chargers Density 6.014** - - -
(2.367)
Log Ultra-Fast Chargers Density 3.996** - - -
(2.031)
Log Subsidies/Vehicle_price 0.769* 1.111*** -2.870** -0.744
(0.399) (0.361) (1.366) (1.396)
Difference in Registration Tax 0.003*** 0.003*** - -
(0.001) (0.001)
Number of Models 0.027*** 0.026*** 0.012*** 0.016***
(0.003) (0.003) (0.002) (0.002)
Log Electricity_price/SP95_price -1.570*** -1.765*** -4.963*** -4.623***
(0.308) (0.303) (0.458) (0.474)
VKT 0.010 0.007 0.022* 0.027**
(0.011) (0.011) (0.012) (0.013)
Vehicle’s electric range -0.002 -0.002 -0.001 -0.002
(0.002) (0.002) (0.002) (0.002)
Income 0.00003** 0.00003*** 0.00006*** 0.00007***
(0.00001) (0.00001) (0.00001) (0.00001)
Population Density -0.00002 -0.00001 -0.00003* 0.00001
(0.0002) (0.00002) (0.00002) (0.00002)
Age 0.012 0.012 -0.019 -0.020
(0.012) (0.012) (0.014) (0.015)
Unemployment -0.0005 0.008 -0.007 -0.027
(0.017) (0.015) (0.019) (0.020)
Constant -9.498*** -9.903*** -17.066*** -16.750***
(1.048) (1.046) (1.320) (1.399)
Observations 470 470 469 469
Conditional R2 0.839 0.836 0.830 0.824
Marginal R2 0.324 0.322 0.619 0.582
Note: *p<10%; **p<5%; ***p<1%

Chapter 4: The Influence of Public Charging Infrastructure Deployment and Other Socio-
Economic Factors on Electric Vehicle Adoption in France
182

Chapter 5: Assessing the 2021-2025-2030 CO2 Standards on Automakers' Portfolio Vehicles'
Segments
183
Chapter 5: Assessing the 2021-2025-2030 CO2 Standards on
Automakers' Portfolio Vehicles' Segments
The E.U. vehicle emission standards defined by the European Commission adopted Regulation
number (E.U.)2019/631, which will become stricter by 15% in 2025 and 35% compared to
2021, cannot be achieved without fleet electrification - either fully electric or a combination of
electric and internal combustion propulsion. This study compares the costs of fleet portfolio
changes in terms of both CO2 compliance and vehicles production costs. To address this trade-
off, we calculated the minimized production costs, from the automaker's point of view, of
replacing Internal Combustion Engine Vehicles with Battery Electric Vehicles and Plug-in
Hybrid Electric Vehicles for 12 scenarios that combine four vehicle segments and three
regulatory regimes: targets set for 2021, 2025 and 2030. Results show that the introduction of
BEVs and PHEVs into the vehicle fleet reduces the costs of CO2 compliance relative to a pure
ICEV scenario for all vehicle segments. However, our results also suggest optimal
combinations of vehicle segments, BEVs and PHEVs relative to ICEV to ensure minimum costs
to the automaker. Results show that it is more beneficial for automakers to respect the CO2
targets rather than paying penalties, but that generally, the minimum costs are achieved by
favouring PHEVs rather than BEVs in the portfolio, regardless of the segment. Finally, we
analyze the results and compare them to the directive of the European Commission. We
recommend that future research consider the vehicle's actual fuel consumption instead of
standard cycle fuel consumption.
This Chapter was presented at the 2021 Gerpisa International Colloquium, 2021 Applied
Energy Symposium, and 2021 ITEA international conference:
Bassem Haidar, Fabrice Vidal, Pascal da Costa, Jan Lepoutre. Assessment of 2021-
2025-2030 CO2 standards on automakers' portfolio vehicles' segments. International
colloquium of Gerpisa 2021, 2021, Paris, France.
Bassem Haidar, Pascal da Costa, Jan Lepoutre, Fabrice Vidal. Assessment of 2021-
2025-2030 CO2 standards on automakers' portfolio vehicles' segments. The Annual
School and Conference of the International Transportation Economics Association,
2021, Rome, Italy.
Bassem Haidar, Pascal da Costa, Jan Lepoutre, Fabrice Vidal. Assessing the trade-offs
between battery capacity and charging power of battery electric vehicles: A French case
study. Applied Energy Symposium:MIT A+B, MIT and Harvard, 2021, Boston,
United States.

Chapter 5: Assessing the 2021-2025-2030 CO2 Standards on Automakers' Portfolio Vehicles'
Segments
184

Chapter 5: Assessing the 2021-2025-2030 CO2 Standards on Automakers' Portfolio Vehicles'
Segments
185
1. Introduction
In order to reach ambitious climate change mitigation targets, the Intergovernmental
Panel on Climate Change (IPCC) called for a reduction of greenhouse gas emissions (GHG)
emissions, especially in the energy and transportation sectors that are currently heavily fossil-
fuel dependent (IEA, 2019; IPCC, 2018). The transportation sector, responsible for 20% of
global CO2 emissions, of which 72% are emitted by road transportation, should become
emission-free by 2050 to reach world ambitions: holding the increase in the global average
temperature to well below 2°C above pre-industrial levels and pursuing efforts to limit the
temperature increase to 1.5°C (IPCC, 2018).
To achieve an intermediate target of at least 55% net reduction in GHG emissions by
2030 and a climate-neutral E.U. by 2050, the European Commission has set regulatory targets
regarding the overall and average CO2 fleet emissions of vehicles sold per year. The European
Parliament and the Council adopted Regulation number (E.U.)2019/631, setting new E.U. fleet-
wide CO2 emission targets for 2025 and 2030, both for newly registered passenger cars and
newly registered Light Duty Trucks (E.C., 2019a). Figure 5.1 represents a schematic illustration
of a new car average CO2 emission levels in the E.U. in 2000–2030. From 2021 onwards, car
manufacturers are given CO2 emission targets for the "average car", i.e. the total level of
emissions of cars sold, divided by the number of cars sold, yet with weight specific corrections
applied. Furthermore, CO2 limits regulations are set to become stricter for the long term,
explicitly reducing 15% and 37.5% compared to 2021 must be achieved for 2025 and 2030,
respectively (E.C., 2019a). In the case of non-respect of these targets, manufacturers have to
pay a penalty of €95 per excessive gram of CO2 per sold car (E.C., 2019a).

Chapter 5: Assessing the 2021-2025-2030 CO2 Standards on Automakers' Portfolio Vehicles'
Segments
186
Figure 5.1 Schematic Illustration of a New Car Average CO2 Emission Levels in the E.U. in
2000–2030 (Source: European Commission (E.C., 2019a)
To reach CO2 targets, car manufacturers are challenged to develop new solutions and
improve their existing ones to limit their fleet emissions relying on several technical and non-
technical solutions. First, technical solutions, such as higher efficiency of combustion engines
and lightweight design, have been suggested to potentially decrease a medium ICEV's (Internal
Combustion Engine Vehicle) emissions from 140 gCO2/km to 70 gCO2/km by 2030 (Hüls et
al., 2020). Second, fleet hybridization and electrification, i.e. selling more electric and hybrid
vehicles, proves to be one of the promising solutions to achieve strict CO2 targets (Amjad et
al., 2018). While technical improvements on ICEVs could considerably reduce a fleet's CO2
emissions, long-term emission targets are unlikely to be achieved with this approach only.
Consequently, car manufacturers are forced to electrify their fleet, so most car manufacturers
have already significantly increased the proportion of electrified vehicles in their portfolio
(Hüls et al., 2020).
Electric vehicles (E.V.s), including Battery E.V.s (BEVs) and Plug-in E.V.s (PHEVs),
have the potential to of improving the environmental impact of personal-road transportation
because of their ability to be non- and partial-fossil-fuel dependency (Amjad et al., 2018). E.U.
regulatory standards consider BEVs to have 0 g CO2/km tank-to-wheel emission (Tank-to-
Wheel focusing exclusively on the emissions produced by the car and excluding how the
electricity was produced from the emissions analysis). Conversely, since PHEVs partially

Chapter 5: Assessing the 2021-2025-2030 CO2 Standards on Automakers' Portfolio Vehicles'
Segments
187
depend on fossil fuels, their emissions are determined based on a combination of their ICE and
electric engines' emissions and depend on the vehicle design.
Unfortunately, meeting the strict CO2 regulations has come with additional costs per
vehicle for the automotive manufacturer. First, to meet CO2 regulations by technical
improvements, R&D costs and higher production costs to embark new technologies in the
vehicle have increased vehicle prices for the clients (Hüls et al., 2020; Islam et al., 2018; Luk
et al., 2016). Most importantly, electric vehicles are relatively more expensive than ICEVs,
primarily because of the high costs of the battery pack (Hüls et al., 2020; Islam et al., 2018).
Recently, the discussion regarding the cost-effectiveness of CO2 regulations has been
modernized due to the stricter CO2 targets, pushing researchers to evaluate the cost implication
of technical improvements on both the client and the automotive manufacturer. These studies
proved that limiting CO2 emissions influences the vehicle purchasing price and thus the client's
choice. Other articles concerning the automotive manufacturer showed that stricter CO2
regulations improve fleets' fuel economy, fleet composition, and job displacement (Al-Alawi
and Bradley, 2014).
Moreover, policymakers, such as governments and public and local authorities, offer
several financial incentives for newly BEV/PHEV adopters. The maximum amount of subsidies
varies from one country to another: 4000€ in Germany and Belgium, 5000€ in the United
Kingdom, 5700€ in Sweden, and 11000€ in France (Wavestone, 2019). These policymakers
aim to evaluate the cost-effectiveness of CO2 regulatory compliance using non-technical
improvements solutions, i.e. hybridization and electrification, which help reach emissions
targets faster. Indeed, various articles zoomed into the value of PHEV towards the customers
(Al-Alawi and Bradley, 2013). Until now, studies evaluating the value of E.V.s to automotive
manufacturers and policymakers to achieve emissions targets remain limited. To the best of our
knowledge, only (Al-Alawi and Bradley, 2014) studied whether PHEVs can offer a cost value
in helping an automobile manufacturer comply with US CO2 standards, considering different
PHEV scenarios in terms of sizes, fuel economy, and costs.
Al-Alawi and Bradley (2014) have calculated the relative value that PHEVs can have in
reducing an automaker's costs of CAFE compliance and concluded that PHEVs have a lower
cost of compliance with CAFE regulations than conventional technologies. However, questions
remain on several assumptions: (1) the effect of European regulations (instead of U.S.

Chapter 5: Assessing the 2021-2025-2030 CO2 Standards on Automakers' Portfolio Vehicles'
Segments
188
regulations) on the automotive manufacturers' portfolio, (2) the relative value of BEV and
PHEV in avoiding costs of CO2 emission regulations, and (3) the trade-off between paying the
CO2 penalty or increasing the BEV/PHEV sales shares. Our study aims to close these research
gaps in the literature and evaluate the economic effect of electrification, both BEV and PHEV,
on the automotive manufacturer. This study develops a model of the CO2 compliance for
automakers for the regulatory regime years 2021, 2025, 2030, taking into account different
segments of BEV and PHEV emerging technologies and considering European regulations.
However, the European level puts PHEV technology under pressure because the E.U. policy
plans to limit the transition technology by a shorter lifespan than envisaged by some leading
automakers.
Our Chapter is structured as follows: Section 2 presents the literature review. Section 3
discusses the methodology and, in Section 4, the data and the techno-economic parameters. The
results of the study and the discussions are presented in Section 5. The conclusions and future
researches are drawn up in Section 6.
2. Literature Review
A voluntary agreement between the automakers was the origin of improving fuel
economy in Germany, based on the ACEA 10-years roadmap. In 1978, the German automotive
industry improved fuel efficiency by 15% from 1978 to 1985 and 25% from 1990 to 2008.
These German voluntary agreements, so-called VDA Agreements, were achieved successfully
(Gadesmann and Kuhnert, 2007). Then, the European automotive industry decided to respect
the E.C.'s 1996 objective to reduce the average CO2 emissions of new passenger cars to 120
g/km by 2005. Technological developments mainly achieved the regulations' targets by
improving car characteristics and market changes linked to these developments. After
manufacturers announcing that they would not meet the 1998 commitment by 2008, in February
2007, the E.C. announced the imposition of CO2 emission targets for 2012, joining the U.S.,
China, and Japan to pass legally binding fuel economy targets. The objective is to reduce
emissions from the average new car to 120 gCO2/km by 2012. An additional 10 gCO2/km
could be added if the automaker achieved the targets using biofuels and other technological
improvements. After that, the E.C. began setting up stricter regulations in order to reach carbon
neutrality by 2050.

Chapter 5: Assessing the 2021-2025-2030 CO2 Standards on Automakers' Portfolio Vehicles'
Segments
189
Respecting CO2 targets by electrification implies a transformation of powertrain
portfolios – from combustion to electric engine - which is further complicated by dynamic and
uncertain developments. Numerous studies studied the impact of CO2 standards on the
automotive industry: higher CO2 targets are responsible and effective for improving fleet fuel
economy (Goldberg, 1998; Greene, 2007, 1998). Also, other studies found that stricter
standards lead to fleet makeup (Bezdek and Wendling, 2005), job displacement (Dacy et al.,
1992), and higher budgets, especially in R&D (MacDuffie, 2018; Perkins and Murmann, 2018).
Also, other researchers have debated the cost-effectiveness of CO2 standards in effectively
improving fleet fuel economy and its impact on the automotive manufacturer and the customer,
considering technical and non-technical solutions.
First, the impact of respecting CO2 standards on vehicle fleet attributes, i.e. technical
specifications and vehicle's price, have received widespread attention in the literature. These
techno-economic or econometric studies were mainly done in US-CAFE (Corporate Average
Fuel Economic) regulations. These studies have shown that higher CO2 standards are
responsible and effective for improving automotive manufacturers average fleet fuel economy,
primarily by increasing the rate of technological improvements impacting CO2 emissions in
new passenger cars (Wang and Miao, 2021). Also, several studies found that strict CO2
standards have unintended consequences to fleet makeup, such as smaller engine and a decrease
in interior volume (Knittel, 2011; Luk et al., 2016), job displacement (Al-Alawi and Bradley,
2014), and novel portfolio planning (Hüls et al., 2020). Furthermore, research has also shown
that respecting CO2 emissions comes with additional costs on the automotive manufacturer;
and, thus, on the client by higher vehicle price. Luk et al. (2016) concluded that expected
technology cost reductions over time would be insufficient to offset the costs of other fuel
efficiency technologies that could be used to meet the 2025 fuel economy target while
maintaining other vehicle attributes (acceleration and interior volume). Their results showed
that a 66% increase in fuel economy from 2012 to 2025 could be achieved with only a 10%
($2070) vehicle price increase. The National Highway Transportation Safety Administration
concluded that vehicle prices would increase by $1870–2120 in response to 2012–2025 fuel
economy targets as automakers add fuel efficiency technologies to vehicles maintaining size
and acceleration. Overall, while improving technical specifications, respecting strict CAFE
engagement comes with a cost on both the automotive manufacturer and the client due to the
fuel economy technologies costs and could affect the customer's choice.

Chapter 5: Assessing the 2021-2025-2030 CO2 Standards on Automakers' Portfolio Vehicles'
Segments
190
Second, achieving long-term fuel economy by 2030 is challenging since automakers
must respect strict CAFE standards. Hybridization and electrification are two unescapable
solutions to achieve these standards. Several studies have quantified the cost and benefits of
purchasing a PHEV/BEV to the customer, using several techno-economic approaches, such as
Total Cost of Ownership (TCO) (Al-Alawi and Bradley, 2013) and Equivalent Annual Cost
(EAC) (Haidar et al., 2020). To date, few studies have considered the cost implication of
PHEVs to automotive manufacturers, considering updated electrification costs. Indeed, Cheah
and Heywood evaluated the cost implication of electrification by considering only one PHEV
design and its compliance costs with other HEV technologies' costs (Cheah and Heywood,
2011). They concluded that achieving an increase in fuel economy by 2030 is challenging but
more feasible because the U.S. automotive manufacturer will have more time to respect their
CAFE engagements. More rigorous quantification of PHEVs' value to the automaker is
provided by (Al-Alawi and Bradley, 2014) by estimating the cost of CAFE compliance with
two-design PHEVs as a component of the domestic passenger and light-truck vehicle fleet.
They concluded that for many U.S. automakers (Fiat-Chrysler, Ford, and General Motors) and
various PHEV design scenarios, passenger car PHEVs reduce CAFE regulation compliance
costs for the U.S. automakers.
While Al-Alawi and Bradley (2014) made significant improvements in this field,
questions remain regarding several hypotheses. First, they considered only PHEV as a means
to achieve CO2 standards, neglecting the fact that BEVs offer a more effective solution because
of their non-dependency on fossil fuels and their zero CO2 emissions. Yet, BEV comes with a
higher manufacturing cost than PHEVs due to the higher battery capacity. Also, actual tests
prove that PHEV could emit more CO2 emissions than expected. Second, their perspective was
focused on compliance with US CAFE regulation, begging the question of whether similar
conclusions could be drawn for other regulatory regimes, such as those in Europe. Our Chapter
aims to close these research gaps. Based on this understanding of the field, the purpose of this
study is to evaluate the economic value of electrification, both BEV and PHEV, on the
automotive manufacturer. This study describes a model of CO2 compliance to meeting 2021-
2025-2030 targets for European automakers. We consider four segments of PHEV/BEV of
different sizes battery capacities to evaluate the trade-off between the production costs and
penalty costs for on-respecting the standards.

Chapter 5: Assessing the 2021-2025-2030 CO2 Standards on Automakers' Portfolio Vehicles'
Segments
191
3. Methodology
The trade-off between increasing BEV and PHEV sales is evaluated based on a three-
step methodology, as shown in Figure 5.2. A differentiation per vehicle segment is proposed
(Hüls et al., 2020; Islam et al., 2018). First, we determine the CO2 targets based on the weight
of sold vehicles. Second, we determine the BEV and PHEV sales while minimizing the total
costs associated with the automaker, including the incremental cost - i.e. the difference in
production costs between a BEV/PHEV and an ICEV of the same type - and the penalty, if
applicable, respecting the CO2 standards - i.e. with a zero penalty. Finally, we compared the
results in order to address the trade-off. We repeat this methodology considering four vehicle's
segments and for 2021, 2025, and 2030.
Figure 5.2 Methodology Overview
3.1. Calculation of CO2 Targets
In 2021, European vehicle manufacturers must determine their short and long-term CO2
emissions targets, based on Figure 5.1. Table 5.1 details the variables and their significations.
To begin with, it should be noted that a ZLEV (Zero- and Low- Emissions Vehicles) is defined
as a passenger car with CO2 emissions between 0 and 50 g/km. For calculating the ZLEV sales
share in a manufacturer's fleet, an accounting rule applies, giving greater weight to BEV than
PHEV (𝛼𝑃𝐻𝐸𝑉 = (1 −0.7∗min (𝑒𝑃𝐻𝐸𝑉,50)
50) ∗ 𝛼𝐵𝐸𝑉). A BEV will be counted as 30% of a PHEV
that emits 50 gCO2/km. Regarding the calculation of CO2 targets, for 2021, this target is
determined based on sold vehicles' weight, as mentioned in Figure 5.3 and Table 5.1. (E.C.,

Chapter 5: Assessing the 2021-2025-2030 CO2 Standards on Automakers' Portfolio Vehicles'
Segments
192
2019a). For medium and long-term targets, a further emission reduction by 15% and 37.5%
compared to 2021 must be achieved for 2025 and 2030, respectively. Then, a specific CO2
emission target will be relaxed if its share of ZLEV registered in a given year exceeds the
following benchmarks: 15% ZLEV from 2025 and 35% ZLEV from 2030. Indeed, a one
percentage point exceedance of the ZLEV benchmark will increase the manufacturer's CO2
target by one per cent. The target relaxation is capped at a maximum of 5% to safeguard the
regulation's environmental integrity. If the CO2 targets are not respected, the automaker must
pay a 95 €/exceeded gCO2/km/vehicle penalty. Figure 5.3 presents a detailed methodology for
CO2 targets calculations.
Figure 5.3 Calculation of CO2 Targets Methodology

Chapter 5: Assessing the 2021-2025-2030 CO2 Standards on Automakers' Portfolio Vehicles'
Segments
193
Table 5.1 Variables Definition
Variable Description Unit
𝑇𝐶𝑂220𝑥𝑥 CO2 Targets for the year 20𝑥𝑥 gCO2/km
𝑟20𝑥𝑥 Emissions reduction for the year 20𝑥𝑥 -
𝑇𝑍𝐿𝐸𝑉20𝑥𝑥 BEV and PHEV quota for the year 20𝑥𝑥 -
𝛼𝑖,20𝑥𝑥 BEV, PHEV, or ICEV Sales Share for the year 20𝑥𝑥 -
𝑒𝑃𝐻𝐸𝑉 CO2 emissions of the vehicle gCO2/km
𝑚𝑖 Weight of the vehicle '𝑖' kg
3.2. Determination of PHEV/BEV sales share
To determine the BEV and PHEV sales share, using Equation 1, we minimize the total
costs associated with the automaker, including the incremental cost per vehicle type and the
penalty, if applied. Table 5.2 details the variables and their significations. We also determine
the sales share that allows for respecting the CO2 targets and for which no penalties are applied.
We solve these equations by simulation procedure: we vary the PHEV sales share from 0% to
100%, with a step of 1%, and we dedicate the associated BEV sales share.
{
𝑚𝑖𝑛𝛼𝐵, 𝛼𝑃𝐻𝐸𝑉
(−∑𝛼𝑖,20𝑥𝑥 ∗ 𝐼𝐶𝑖,20𝑥𝑥 + 𝑝𝐶𝑂2 ∗ (𝐸 − 𝑇𝐶𝑂220𝑥𝑥)) ; 𝑖𝑓𝐸 > 𝑇𝐶𝑂220𝑥𝑥
𝑚𝑖𝑛𝛼𝐵, 𝛼𝑃𝐻𝐸𝑉
(−∑𝛼𝑖,20𝑥𝑥 ∗ 𝐼𝐶𝑖,20𝑥𝑥) ; 𝑖𝑓𝐸 ≤ 𝑇𝐶𝑂220𝑥𝑥
(1)
With:
- 𝑖= type of the vehicle: BEV, PHEV, or ICEV
- 𝐸 = ∑𝛼𝑖,20𝑥𝑥𝑒𝑖
Table 5.2 Variables Definition
Variable Description Unit
𝑇𝐶𝑂220𝑥𝑥 CO2 Targets for the year 20𝑥𝑥 gCO2/km
𝛼𝑖,20𝑥𝑥 BEV, PHEV, or ICEV Sales Share -
𝐼𝐶𝑖,20𝑥𝑥 Incremental Costs of BEV and PHEV for the year 20𝑥𝑥 €/vehicle
𝑒𝑖 CO2 emissions of the vehicle '𝑖' gCO2/km
𝐸 CO2 emissions of the fleet gCO2/km
𝑝𝐶𝑂2 Penalty for non-respect of CO2 standards €/gCO2/km/vehicle
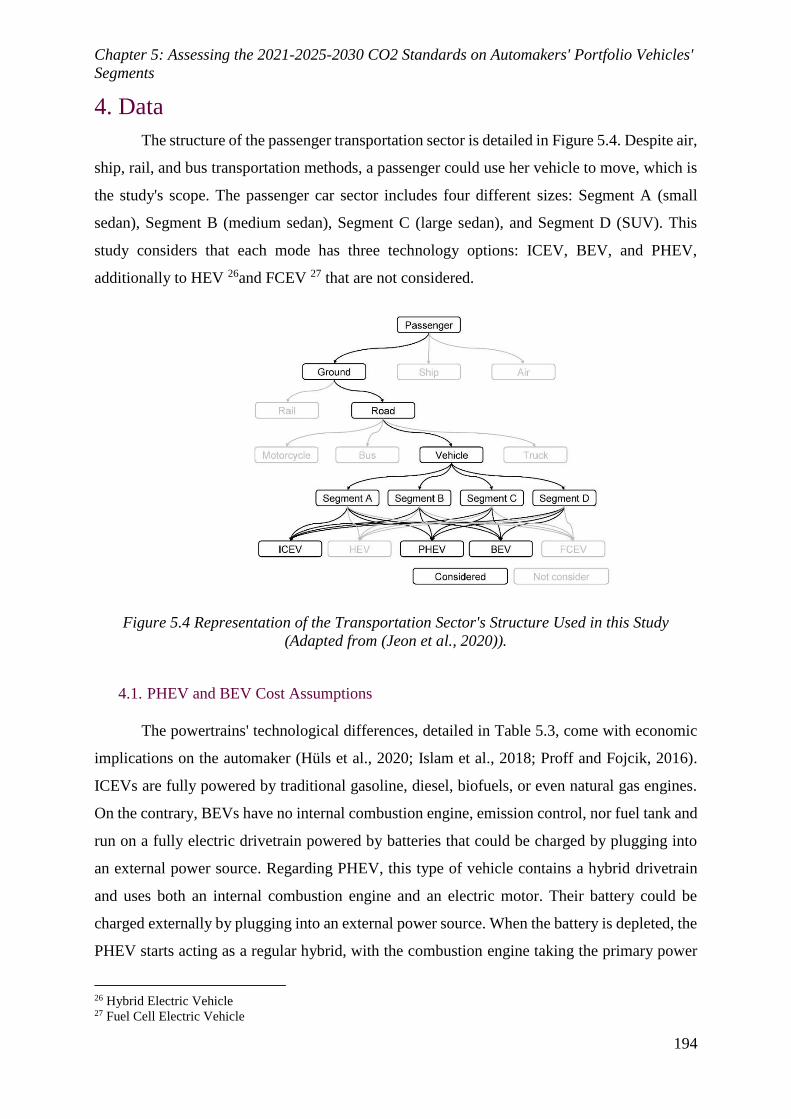
Chapter 5: Assessing the 2021-2025-2030 CO2 Standards on Automakers' Portfolio Vehicles'
Segments
194
4. Data
The structure of the passenger transportation sector is detailed in Figure 5.4. Despite air,
ship, rail, and bus transportation methods, a passenger could use her vehicle to move, which is
the study's scope. The passenger car sector includes four different sizes: Segment A (small
sedan), Segment B (medium sedan), Segment C (large sedan), and Segment D (SUV). This
study considers that each mode has three technology options: ICEV, BEV, and PHEV,
additionally to HEV 26and FCEV 27 that are not considered.
Figure 5.4 Representation of the Transportation Sector's Structure Used in this Study
(Adapted from (Jeon et al., 2020)).
4.1. PHEV and BEV Cost Assumptions
The powertrains' technological differences, detailed in Table 5.3, come with economic
implications on the automaker (Hüls et al., 2020; Islam et al., 2018; Proff and Fojcik, 2016).
ICEVs are fully powered by traditional gasoline, diesel, biofuels, or even natural gas engines.
On the contrary, BEVs have no internal combustion engine, emission control, nor fuel tank and
run on a fully electric drivetrain powered by batteries that could be charged by plugging into
an external power source. Regarding PHEV, this type of vehicle contains a hybrid drivetrain
and uses both an internal combustion engine and an electric motor. Their battery could be
charged externally by plugging into an external power source. When the battery is depleted, the
PHEV starts acting as a regular hybrid, with the combustion engine taking the primary power
26 Hybrid Electric Vehicle 27 Fuel Cell Electric Vehicle

Chapter 5: Assessing the 2021-2025-2030 CO2 Standards on Automakers' Portfolio Vehicles'
Segments
195
source role. Yet, since the battery is a second power source in a PHEV, its capacity is much
smaller than BEV. Battery costs for modern lithium-ion (Li-Ion) batteries are derived from
several sources, as illustrated in Figure 5.5: Berckmans et al. (2017), BloombergNEF (2019),
Hsieh et al., (2019), and Lutsey and Nicholas (2019). Overall, the cost for Li-Ion battery packs
is expected to decrease by 43% for 2025 and 54% for 2030.
Figure 5.5 Li-Ion Battery Packs Price Projection
To evaluate the cost implication of electrification, we are interested in the BEV/PHEV
incremental cost, which is the difference in costs between producing a BEV/PHEV and an
ICEV of the same Segment. The incremental cost includes all vehicle components not available
in an ICEV, such as electric drive, electric accessories, battery, energy storage systems, and
internal charger. The costs for each Li-Ion battery are added to the incremental component cost
to represent the incremental cost of BEV production. Figure 5.6 presents the incremental costs
of BEV and PHEV of four segments for 2021-2025-2030. The incremental costs present our
analysis based on different sources: Islam et al. (2018), Hüls et al. (2020), Lutsey and Nicholas
(2019), and own sources28. Even though ICEs are more complex than electric engines and cost
more, producing a BEV and PHEV is relatively more expensive due to the critical cost of the
battery. As a result, the BEV incremental costs are higher than PHEV, having much smaller
batteries. However, since battery pack prices are expected to decrease in the coming years
28
Internal sources such as World Automotive Powertrain Outlook (WAPO)
0
20
40
60
80
100
120
140
160
180
2019 2020 2021 2022 2023 2024 2025 2026 2027 2028 2029 2030 2031
Bat
tery
co
st (
€/k
Wh)
YearBerckmans et al. (2017) Berckmans et al. (2017) BloombergNEF (2019)
Hsieh et al. (2019) Lutsey and Nicholas (2019) Lutsey and Nicholas (2019)
Lutsey and Nicholas (2019)

Chapter 5: Assessing the 2021-2025-2030 CO2 Standards on Automakers' Portfolio Vehicles'
Segments
196
compared to 2020, the incremental costs are expected to experience a downward trend for the
long term.
Table 5.3 ICEV, BEV, and PHEV Parameters
ICEV BEV PHEV
Glider
Emission control
Integrated traction drive
Combustion engine
Electric motor
Battery
Generator, transmission, rest
Figure 5.6 Incremental Costs of BEV and PHEV for 2020, 2025, 2030 (The Authors Define
Vehicles Sizing, Costs Elements are Defined by (Islam et al., 2018), (Hüls et al., 2020),
(Lutsey and Nicholas, 2019), and own sources)
4.2. PHEV and BEV Techno-environmental Assumptions
4.2.1. Vehicle Weight Assumptions
As mentioned in Equation 1, the average weight of sold vehicles is mandatory to
determine the CO2 targets for 2021. We gathered data on vehicle weight from different official
brands. They are detailed in Table 5.4.
0
2000
4000
6000
8000
10000
12000
14000
2020 2025 2030
Incr
emen
tal
cost
s (€
/veh
icle
)
Year
BEV 22 kWh
PHEV 8 kWh
BEV 50 kWh
PHEV 8,9 kWh
BEV 62 kWh
PHEV 9,8 kWh
BEV 72 kWh
PHEV 11,6 kWh

Chapter 5: Assessing the 2021-2025-2030 CO2 Standards on Automakers' Portfolio Vehicles'
Segments
197
4.2.2. Vehicle GHG Emissions Assumptions
Vehicles emit GHG emissions through their life cycle, called Well-To-Wheel emissions
(WTW), which focuses on the energy carrier's life cycle used to move the vehicle, such as fossil
fuel or electricity. Figure 5.7 presents a simplified view of the Life Cycle Assessment of the
production process of a vehicle. The TWT life cycle can be divided into the Well-To-Tank
(WTT) and the Tank-To-Wheel stage. The WTT stage defines the emissions required to deliver
energy from its source to the vehicle's storage equipment by considering all processes from
harnessing a primary energy flow or stock to different conversion forms, distribution, and
energy carriers' storage. The TTW stage defines the emissions where the energy carrier is used
to move the vehicle while driving. The environmental burden of the WTT stage differs a lot,
depending on how the energy carrier is produced.
Figure 5.7 Simplified View of the Well-to-Wheels and Equipment Flows (a more detailed view
would include, for example, recycling options) (Source:(Nordelöf et al., 2014))
The vehicles' emissions are based on the Life Cycle Assessment, which differs from a
country to another, based on their energy mix. Several studies have found that TtW GHG
emissions present the major contributor, 70%-90% of life-cycle GHG emissions (Jang and
Song, 2015; Jeon et al., 2020; Khan et al., 2019). Hence, this study focuses on analyzing TtW
GHG emissions considered for assessing CO2 standards in Europe.
In BEVs, no CO2 emissions are released during their use, leading to zero TtW
emissions. On the contrary, since PHEVs are partially dependent on fossil fuels, the emissions
are calculated as a combination of the combustion engine's emissions and the electric engine,

Chapter 5: Assessing the 2021-2025-2030 CO2 Standards on Automakers' Portfolio Vehicles'
Segments
198
depending on the electric driving range and with differences in the regional legislation (Hüls et
al., 2020). Thus, its TtW emissions are positive and dependent on the vehicle's segment. Indeed,
the bigger the vehicle, the more GHG emissions are emitted. Data on CO2 emissions, gathered
from different official brands, are detailed in Table 5.4.
Table 5.4 Weight and CO2 Emissions of Passenger Car fleet used in this Study (Source:
Official brands sites)
Example Type Mass (kg) CO2 Emissions
(gCO2/km)
Segment A Peugeot 108 ICEV Essence 840 109
Segment A29 ICEV Diesel
Segment A Renault Twingo BEV (22 kWh) 1160 0
Segment A30 PHEV (8 kWh) 1500 26
Segment B Peugeot 208 ICEV Essence 1090 129
Segment B Peugeot 208 ICEV Diesel 1090 108
Segment B Peugeot 208 BEV (50 kWh) 1455 0
Segment B Hyundai Ioniq PHEV (8.9 kWh) 1570 26
Segment C Peugeot 308 ICEV Essence 1203 139
Segment C Peugeot 308 ICEV Diesel 1320 128
Segment C Nissan Leaf BEV (62 kWh) 1791 0
Segment C Renault Mégane PHEV (9.8 kWh) 1603 28
Segment D Peugeot 508 ICEV Essence 1420 161
Segment D Peugeot 508 ICEV Diesel 1430 130
Segment D Tesla Model S BEV (72 kWh) 2100 0
Segment D Peugeot 508 PHEV (11.6 kWh) 1720 34
5. Results
The European Commission's formulas calculate the total costs and CO2 fines for
scenarios that vary engine types, segments and regulatory regimes for 2021, 2025, and 2030. In
order to assess the trade-off between producing more ZLEVs on the one hand and paying CO2
fines for non-respect of targets on the other, we separately determined the BEV and PHEV sales
29
An ICEV Diesel of Segment A does not exist. 30
Until now, a Segment A PHEV does not exist on the market. Based on Gnann (Gnann, 2015), we identified a
fictitious vehicle.

Chapter 5: Assessing the 2021-2025-2030 CO2 Standards on Automakers' Portfolio Vehicles'
Segments
199
shares for every scenario and for both case studies: minimizing the total costs and respecting
the CO2 targets. We found that BEV and PHEV sales shares for respecting CO2 targets are the
same for minimizing the total costs. Indeed, the total costs account for the production cost of
BEV/PHEV compared to ICEV of the same segment and the penalty if the CO2 standards are
not respected.
5.1. Results
5.1.1. Determining The CO2 Targets
Based on the legislative requirements mentioned in Section 3.1., car manufacturers must
set their CO2 targets for 2021 based on the weight of the newly sold passenger cars. Until 2025
(2030), a further emission reduction by 15% (37.5%) than 2021 must be achieved. Therefore,
automotive manufacturers are required to sell electrified vehicles that respect these targets.
Figure 5.8presents the determination of 2021 CO2 targets of different scenarios in gCO2/km.
Selling larger vehicles come with a trade-off: higher weight that made CO2 targets less strict,
but higher CO2 emissions, as mentioned in Table 5.4. It should be noted that we consider an
ICEV fleet composed of 60% of type Essence and 40% of type Diesel.

Chapter 5: Assessing the 2021-2025-2030 CO2 Standards on Automakers' Portfolio Vehicles'
Segments
200
Figure 5.8 The determination of 2021 CO2 Targets of Different Scenarios in gCO2/km
5.1.2. Minimizing The Total Costs
Figure 5.9 presents the evolution of the total costs for 2021 (red dots), 2025 (blue dots),
2030 (black dots), and per vehicle segment. As shown, the results are similar for all scenarios
and could be detailed with the same logic.
In the absence of ZLEVs, BEV and PHEV sales in a car manufacturer's portfolio,
maximum penalties are applicable. These penalties amount to around 1000€/vehicle for
segment A vehicles in 2021, but sharply increasing to 5000€/vehicle in 2030 for segment A
vehicles. For other vehicles segments, fines vary between 1000€/vehicle (2020) and
5000€/vehicle (2030) for Segment B, 1900€/vehicle (2020) and 8100€/vehicle (2030) for
Segment C, and 2200€/vehicle (2020) and 9500€/vehicle (2030) for Segment D. The total costs
decrease to reach an optimum for every combination of BEV and PHEV sales share. As
mentioned before, this Chapter does not consider the profitability margin of the automaker. On
the one hand, since producing a PHEV/BEV comes with an additional cost compared to an
ICEV – positive incremental costs – therefore, the total costs are all negative (Equation 2). On
the other hand, it helps the automaker achieve their CO2 targets; and, thus, eliminate the fines.
Figure 5. SEQ Figure \* ARABIC 7 The determination of 2021 CO2 targets of different scenarios in
gCO2/km
Chapter 5: Assessing the 2021-2025-2030 CO2 Standards on Automakers' Portfolio Vehicles'
Segments
201
Indeed, we determined the optimum for every segment and every year: more BEV/PHEV sales
are needed to reach the optimum for more oversized vehicles and the long term. For instance,
as mentioned in Figure 5.9, Segment A's optimums achieved vary between 90€/vehicle and 150
€/vehicle for 2020, and between 450 €/vehicle and 675 €/vehicle for 2030, compared to those
of Segment D 450 €/vehicle and 1800 €/vehicle for 2020, and between 460 €/vehicle and 2380
€/vehicle for 2030. We have various costs because these optimums are achieved for every
combination of BEV and PHEV sales share. Also, even though the battery packs price will
decrease by around 55 % in 2030 compared to 2020, more losses are recorded for higher BEV
sales share than PHEV sales.
After reaching the minimum of costs under a specific combination of BEVs and PHEVs
sales shares, the total costs will experience a downward trend with a massive diffusion of these
technologies. Indeed, more ZLEV production will come with additional costs on the
automaker's budget. As shown in Figure 5.9, for 2021, due to the high price of the battery packs
and the bigger battery capacity installed in BEV than in PHEV, a 100% BEV scenario comes
with around 8000 €/vehicle compared to 900 €/vehicle for 100% PHEV scenario. Indeed, the
total costs increased for other Segments because of the larger battery installed. For 2025 and
2030, these losses sharply decreased compared to 2021, leading to modest variation compared
to the minimum costs.
Figure 5.10 shows the best compromise of BEV and PHEV sales shares that ensure the
minimum costs of all the fleet to analyze the optimum values. Indeed, for all scenarios, a 100%
PHEV sales lowest production budget on the automaker because of the battery capacity size
and price. It is worth noting that, for Segment A and 2025 and 2030, the best compromise
accounts for 99% of PHEV sales share compared to 1% of BEVs.
5.1.3. Respecting CO2 Targets
This section determines the BEV and PHEV sales shares that ensure the CO2 target's
engagement. Figure 5.11 illustrates these results for all scenarios: the complete lines represent
the combinations of BEV and PHEV sales shares for minimizing the total costs, and the dotted
lines represent those that ensure the respect of CO2 targets. Results show that the minimum
cost comes concerning CO2 targets for all Segments and time resolutions. Therefore,
automakers must respect the CO2 targets by selling the indispensable BEV and PHEV quotas
to ensure the minimum losses.

Chapter 5: Assessing the 2021-2025-2030 CO2 Standards on Automakers' Portfolio Vehicles'
Segments
202
5.1.4. Trade-offs Analysis
In each scenario (Segment choice and year) assessed, the results of the BEV and PHEV
sales shares were determined for two case studies: (1) minimizing the total costs - i.e. BEV and
PHEV incremental costs and penalty if applicable -, and (2) respecting CO2 targets. Comparing
the results elaborated before ensures that, for all scenarios, there is no trade-off between the two
case studies: ensuring the minimum costs comes with zero fines.
Scenario: 100 % Segment A Scenario: 100 % Segment B

Chapter 5: Assessing the 2021-2025-2030 CO2 Standards on Automakers' Portfolio Vehicles'
Segments
203
Scenario : 100 % Segment C Scenario : 100 % Segment D
Figure 5. 9 Total Costs (Incremental Costs and CO2 Fines) for Four Vehicles Segments and
2021, 2025, 2030
Figure 5.10 BEV and PHEV Sales Shares That Ensure the Minimization of the Costs
0,00
10,00
20,00
30,00
40,00
50,00
60,00
70,00
0,00 0,20 0,40 0,60 0,80 1,00 1,20
PH
EV
Sal
es S
har
e (%
)
BEV Sales Share (%)
BEV and PHEV sales shares while minimizing costs
Segment A 2021 Segment A 2025 Segment A 2030 Segment B 2021 Segment B 2025 Segment B 2030
Segment C 2021 Segment C 2025 Segment C 2030 Segment D 2021 Segment D 2025 Segment D 2030

Chapter 5: Assessing the 2021-2025-2030 CO2 Standards on Automakers' Portfolio Vehicles'
Segments
204
Figure 5.11 Combinations of BEV and PHEV Sales Shares That Ensure the Minimum Cost
and the Respect of CO2 Engagement (P=0) for four Segments and 2021, 2025, 2030
5.2. Discussion
This study evaluates the assessment of European CO2 regulations on the automakers'
product portfolio, considering various scenarios: four segments of vehicles and three regime
targets. We explored combinations of BEVs and PHEVs that ensure the minimum costs for
these automakers. Under current CO2 emissions regulations, we concluded that minimum
overall cost is achieved by relying only on PHEV manufacturing, which comes with the lowest
combination of regulatory and manufacturing costs for automotive manufacturers. However,
the design of our analysis has limitations due to several reasons.
First, we only considered BEV/PHEV incremental costs - i.e. production costs - and
assumed that automakers would maintain similar profit margins within segments. We assumed
that the willingness to pay for a car in a particular segment would be insensitive to the
0
10
20
30
40
50
60
70
0 10 20 30 40 50 60 70
PH
EV S
ales
Sh
are
(%)
BEV Sales Share (%)
Segment A 2021 Minimum Cost Segment A 2021 P=0 Segment A 2025 Minimum Cost
Segment A 2025 P=0 Segment A 2030 Minimum Cost Segment A 2030 P=0
Segment B 2021 Minimum Cost Segment B 2021 P=0 Segment B 2025 Minimum Cost
Segment B 2025 P=0 Segment B 2030 Minimum Cost Segment B 2030 P=0
Segment C 2021 Minimum Cost Segment C 2021 P=0 Segment C 2025 Minimum Cost
Segment C 2025 P=0 Segment C 2030 Minimum Cost Segment C 2030 P=0
Segment D 2021 Minimum Costs Segment D 2021 P=0 Segment D 2025 Minimum Costs
Segment D 2025 P=0 Segment D 2030 Minimum Costs Segment D 2030 P=0

Chapter 5: Assessing the 2021-2025-2030 CO2 Standards on Automakers' Portfolio Vehicles'
Segments
205
powertrain choice, so production costs entirely drive profit margins. Therefore, it also assumes
that customers are not willing to pay a premium for hybrid or fully electric powertrains, which
is likely to be realistic for the majority of the population. Also, we only studied privately-
purchased vehicles of specific four segments, ignoring other types of vehicles sales, such as
Light-Duty Vehicles and buses, which are also considered in the CO2-emissions calculation
procedure. Finally, our analysis does not consider HEV nor FCEV since this type of vehicle
shares similar CO2 emissions as ICEVs (Gaton, 2018).
Based on future E.U. regulations, especially "Green Finance" (E.C., 2019b), new E.U.
rules may phase out PHEVs sooner than some automakers were speculating since these laws
may ban manufacturers from labelling PHEVs as "sustainable investments" beyond 202531.
Yet, some countries, such as France, are still defending PHEVs as a promising solution to
transition solutions towards BEVs32. Table 5.5 summarizes the reasons behind defending
PHEVs and BEVs.
On the one hand, many E.U. member states are still defending PHEV as a viable solution
to respect CO2 targets for many reasons. Regarding the drivers, PHEVs consider a bridge that
could help reach acceptability towards BEVs. Also, PHEVs present a viable solution for drivers
who travel daily long-distance trips and cannot rely on purchasing a BEV, especially that the
charging infrastructure coverage is not well spread. Concerning the automakers, some
manufacturers envisaged selling PHEVs until at least the end of this decade and will ensure
carbon neutrality by the minimum of 203033because it could convince drivers about electric
cars. Also, applying the "Green Finance regulation" will add constraints to a sector already
under pressure. Moreover, as mentioned before in this Chapter, producing PHEV comes with a
lower cost than producing a BEV due to the high battery packs price, if we consider the same
profit per vehicle for the automaker. Finally, banning PHEVs in the near term severely impacts
recruitment activity and could lead to severe job losses in Europe, especially in those who work
in internal combustion technology34.
On the other hand, other members are moving away from supporting plug-in hybrid
technology for several reasons. First, research has shown that PHEV can emit more CO2
31 https://www.electrive.com/2021/04/14/is-this-the-end-of-plug-in-hybrids-in-the-eu/ 32 https://www.automobile-propre.com/emmanuel-macron-va-defendre-la-voiture-hybride-devant-leurope/ 33 https://www.forbes.com/wheels/news/automaker-ev-plans/ 34 https://www.cleanenergywire.org/factsheets/how-many-car-industry-jobs-are-risk-shift-electric-vehicles

Chapter 5: Assessing the 2021-2025-2030 CO2 Standards on Automakers' Portfolio Vehicles'
Segments
206
emissions than their ICE counterparts. These emissions depending on the customer's driving
and charging behaviours and the energy mix used to produce the electricity used to charge the
car. Most PHEVs are equipped with a 30–60 km battery (NEDC) and could electrify up to
10,000 km a year, increasing with range (Plötz et al., 2020). While PHEV can electrify a part
of the vehicle travelled kilometres, the other part remains fossil fuel dependent. Longer trips
rely more on the fuel tank than the battery as an energy source due to the limited battery range
if the driver does not charge. Based on people's driving profiles in China, Europe, and North
America, Plötz et al. (2020) showed significant differences between theoretical and real-world
emissions. On average, PHEV fuel consumption and tail-pipe CO2 emissions in real-world
driving are two to four times higher than expected35 (Plötz et al., 2020). Also, we do not consider
a variety of usage between private and commercial drivers. Second, one of the Paris
Agreement's main objectives, in line with the E.U.'s commitment, is the European Green Deal.
Achieving a neutral climate by 2050, an economy with net-zero GHG emissions, cannot be
done with a 100% PHEV sales share, leading to the uptake of other zero-emission vehicles such
as BEVs and FCEVs (E.C., 2019b).
To sum up, our study shows that EU CO2-emission targets that manufacturers should
set to minimize both regulatory and production costs could be achieved with a scenario of 100%
PHEV sales. As such, it offers evidence that PHEVs are likely to be considered for the next few
years as a means to switch to fully electric vehicles, but that such a change towards higher levels
of BEVs will likely require policy changes. Indeed, PHEV technology is under pressure at the
European level because the E.U. policy plans to limit the transition technology by a shorter
lifespan than envisaged by some leading automakers. Therefore, European automakers will be
confronted with two ways: either fighting for PHEVs or spending their financial and political
capital accelerating BEVs and charging infrastructure. These manufacturers should rapidly
decide in order to meet the E.U. regulation.
35
https://www.which.co.uk/news/2021/03/plug-in-hybrid-cars-use-more-fuel-than-official-figures-claim/
https://www.theguardian.com/business/2021/mar/02/plug-in-hybrid-cars-burn-more-fuel-than-tests-record-says-
which

Chapter 5: Assessing the 2021-2025-2030 CO2 Standards on Automakers' Portfolio Vehicles'
Segments
207
Table 5.5 Comparing the arguments of defending PHEVs and BEVs
Defending PHEVs Defending BEVs
Who is defending? France European Commission
Arg
um
ents
PHEVs present a bridge to BEVs. No Tank-to-Wheels emissions for BEVs.
Higher autonomy for long-distance trips. Actual PHEVs CO2 emissions are higher than
expected.
Severe impacts recruitment activity and
could lead to 100,000 job losses in Europe.
European Green Deal cannot be achieved
without a 100 % BEV scenario.
Charging infrastructure is not mature.
PHEVs come with the minimum cost for
the automaker compared to BEVs (if the
profitability per vehicle remains the same
for all types of vehicles).
6. Conclusion and Future Research
Our Chapter presents an analysis of the relative contribution of electrification of an
automaker's sales portfolio - i.e. selling more BEV and PHEV - in optimizing its costs
associated with CO2 standards compliance. To perform that evaluation, we have developed a
framework for modelling the effect of the share of BEV/PHEV in the automaker's portfolio,
considering European CO2 regulations. We evaluated the trade-off between the required BEV
and PHEV sales shares that minimized the total costs and those required to avoid the fines. The
total costs account for the incremental costs – i.e. the difference in production costs between a
BEV/PHEV and an ICEV of the same Segment -, neglecting the automaker's profitability
margin the fines if CO2 engagement is not respected. Also, avoiding the fines comes with
respect of CO2 targets. We modelled 12 scenarios 4 Segments of vehicles: Segment A (small
sedan), Segment B (medium sedan), Segment C (large sedan), and Segment D (SUV), and for
2020, 2025, and 2030. As CO2 regulations become stricter with time, fines will also become
higher in the future. We used vehicles' techno-economic-environmental data from different
sources, including official brand websites.
First, results showed that with 0% BEV/PHEV sales, there is no respect for the CO2
targets, and fines may apply from 1000€/vehicle (2021) to 5000€/vehicle (2030) for Segment
A. Indeed, higher fines are applicable for larger vehicles. Also, we find different combinations
of BEV and PHEV sales for every scenario and year, which ensure the minimum cost. To
respect long-term CO2 limitations, more electrification is needed to minimize the costs. On the
one hand, an increase in BEV/PHEV sales will respect the CO2 engagement. On the other hand,

Chapter 5: Assessing the 2021-2025-2030 CO2 Standards on Automakers' Portfolio Vehicles'
Segments
208
it comes with high costs, especially with a 100% BEV scenario, rather than a 100% PHEV
scenario, since a larger (and hence costlier) battery is installed in a BEV.
Based on our assumptions, we found that the minimum costs depend on three variables:
the evolution of regulations per year, the vehicle's size, and the electrification type (BEV or
PHEV). Results suggest that automotive manufacturers respect CO2 targets for all time
resolutions. This will lead to minimizing the total cost and thus ensuring the highest
profitability. Generally, the minimum costs are achieved favouring PHEVs rather than on
BEVs, regardless of the segment, because fewer batteries are installed, leading to fewer
production costs.
Lastly, we compare the arguments defending PHEVs and BEVs, respectively. We
concluded that European automakers would be faced with two ways: either fighting for PHEVs
or spending their financial and political capital accelerating BEVs and charging infrastructure.
These manufacturers should rapidly decide in order to meet the E.U. regulation.
We suggest the following avenues for further research. First, we recommend completing
our analysis regarding the automaker's side by considering the emergence of zero and low
emissions light-duty vehicles. Besides, our analysis accounts for the worst-case scenario of
CO2 emissions; further studies are needed to evaluate Hybrid Electric Vehicles (HEVs) cost-
effectiveness diffusion in respecting the standards. Also, we recommend considering the
customer's side in the analysis. First, as mentioned before, PHEVs' CO2 emissions highly
depend on the driving and charging behaviours (Plötz et al., 2020). If the battery is not used,
the CO2 emissions of a PHEV are approximately similar or worse than those of an ICEV (Plötz
et al., 2020). Many approaches could consider the actual emissions of PHEVs: additionally, to
considering accurate data of PHEVs drivers' trips, a solution is to weigh CO2 emissions per
vehicle usage. There are two main usages for passenger cars: rural and urban ones. Since more
rural drivers' daily travelled kilometres are higher in urban usage (Haidar et al., 2020), more
CO2 emissions are expected for PHEVs. Also, future research is needed by including the
driver's cost model and willingness-to-pay in the analysis. Indeed, purchasing a PHEV does not
come with the exact cost of a BEV, and it varies with the segment's choice (Björnsson and
Karlsson, 2017; Palmer et al., 2018). We recommend future work to consider the European
Green Deal for 2050, aiming to drastically reduce GHG emissions, especially in the energy and
transportation sectors (E.C., 2019b). Meeting 2050's CO2 targets remain impossible without a
massive penetration of zero-emission vehicles: BEV and Fuel Cells Electric Vehicles (FCEVs)
(Nature Catalysis, 2020). Considering actual PHEV CO2 emissions in the regulations could
help automakers include PHEVs and BEVs in their product portfolio.

Chapter 5: Assessing the 2021-2025-2030 CO2 Standards on Automakers' Portfolio Vehicles'
Segments
209
References
Al-Alawi, B.M., Bradley, T.H., 2014. Analysis of corporate average fuel economy regulation
compliance scenarios inclusive of plug in hybrid vehicles. Applied Energy 113, 1323–
1337. https://doi.org/10.1016/j.apenergy.2013.08.081
Al-Alawi, B.M., Bradley, T.H., 2013. Total cost of ownership, payback, and consumer
preference modeling of plug-in hybrid electric vehicles. Applied Energy 103, 488–
506. https://doi.org/10.1016/j.apenergy.2012.10.009
Amjad, M., Ahmad, A., Rehmani, M.H., Umer, T., 2018. A review of E.V.s charging: From
the perspective of energy optimization, optimization approaches, and charging
techniques. Transportation Research Part D: Transport and Environment 62, 386–417.
https://doi.org/10.1016/j.trd.2018.03.006
Berckmans, G., Messagie, M., Smekens, J., Omar, N., Vanhaverbeke, L., Van Mierlo, J.,
2017. Cost Projection of State of the Art Lithium-Ion Batteries for Electric Vehicles
Up to 2030. Energies 10, 1314. https://doi.org/10.3390/en10091314
Bezdek, R.H., Wendling, R.M., 2005. Potential long-term impacts of changes in U.S. vehicle
fuel efficiency standards. Energy Policy 33, 407–419.
https://doi.org/10.1016/j.enpol.2003.08.015
BloombergNEF, 2019. A Behind the Scenes Take on Lithium-ion Battery Prices.
BloombergNEF. URL https://about.bnef.com/blog/behind-scenes-take-lithium-ion-
battery-prices/ (accessed 4.17.21).
Cheah, L., Heywood, J., 2011. Meeting U.S. passenger vehicle fuel economy standards in
2016 and beyond. Energy Policy 39, 454–466.
https://doi.org/10.1016/j.enpol.2010.10.027
Dacy, D.C., Kuenne, R.E., McCoy, P., 1992. Employment Impacts of Achieving Automobile
Efficiency Standards in the United States (Palgrave Macmillan Books). Palgrave
Macmillan.
E.C., 2019a. CO2 emission standards for passenger cars and light-commercial vehicles in the
European Union | International Council on Clean Transportation.
E.C., 2019b. E.U. climate action and the European Green Deal [WWW Document]. Action
pour le climat - European Commission. URL https://ec.europa.eu/clima/policies/eu-
climate-action_en (accessed 4.7.21).
Gadesmann, K., Kuhnert, F., 2007. The automotive industry and climate change. Framework
and dynamics of the CO2 (r)evolution.
Gaton, B., 2018. BEV, PHEV, HEV or FCEV: Choose your E.V. acronym! ReNew:
Technology for a Sustainable Future 80–83.
Goldberg, P.K., 1998. The Effects of the Corporate Average Fuel Efficiency Standards in the
U.S. The Journal of Industrial Economics 46, 1–33. https://doi.org/10.1111/1467-
6451.00059
Greene, D.L., 2007. CAFE OR PRICE?: An Analysis of the Effects of Federal Fuel Economy
Regulations and Gasoline Price on New Car MPG, 1978–89, in: Controlling
Automobile Air Pollution. Routledge.
Greene, D.L., 1998. Why CAFE worked. Energy Policy 26, 595–613.
Haidar, B., da Costa, P., Lepoutre, J., Vidal, F., 2020. Which combination of battery capacity
and charging power for battery electric vehicles: urban versus rural French case
studies (No. hal-03071656), Post-Print, Post-Print. HAL.
Hsieh, I.-Y.L., Pan, M.S., Chiang, Y.-M., Green, W.H., 2019. Learning only buys you so
much: Practical limits on battery price reduction. Applied Energy 239, 218–224.
https://doi.org/10.1016/j.apenergy.2019.01.138

Chapter 5: Assessing the 2021-2025-2030 CO2 Standards on Automakers' Portfolio Vehicles'
Segments
210
Hüls, C., Thies, C., Kieckhäfer, K., Spengler, T.S., 2020. Limiting CO2 fleet emissions in the
automotive industry – a portfolio planning approach. International Journal of
Automotive Technology and Management 20, 349–368.
IEA, 2019. Global Electric Vehicle Outlook 2019 [WWW Document]. IEA. URL
https://www.iea.org/reports/global-ev-outlook-2019 (accessed 6.17.20).
IPCC, 2018. Allen, M.R., O.P. Dube, W. Solecki, F. Aragón-Durand, W. Cramer, S.
Humphreys, M. Kainuma, J. Kala, N. Mahowald, Y. Mulugetta, R. Perez, M.Wairiu,
and K. Zickfeld, 2018: Framing and Context. In: Global Warming of 1.5°C. An IPCC
Special Report on the impacts of global warming of 1.5°C above pre-industrial levels
and related global greenhouse gas emission pathways, in the context of strengthening
the global response to the threat of climate change, sustainable development, and
efforts to eradicate poverty [Masson-Delmotte, V., P. Zhai, H.-O. Pörtner, D. Roberts,
J. Skea, P.R. Shukla, A. Pirani, W. Moufouma-Okia, C. Péan, R. Pidcock, S. Connors,
J.B.R. Matthews, Y. Chen, X. Zhou, M.I. Gomis, E. Lonnoy, T. Maycock, M. Tignor,
and T. Waterfield (eds.)]. In Press.
Islam, E., Moawad, A., Kim, N., Rousseau, A., 2018. An Extensive Study on Sizing, Energy
Consumption, and Cost of Advanced Vehicle Technologies (Technical Report) |
OSTI.GOV. Argonne National Lab., Arginne, Illionois.
Jang, J.J., Song, H.H., 2015. Well-to-wheel analysis on greenhouse gas emission and energy
use with petroleum-based fuels in Korea: gasoline and diesel. Int J Life Cycle Assess
20, 1102–1116. https://doi.org/10.1007/s11367-015-0911-x
Jeon, S., Roh, M., Heshmati, A., Kim, S., 2020. An Assessment of Corporate Average Fuel
Economy Standards for Passenger Cars in South Korea. Energies 13, 4533.
https://doi.org/10.3390/en13174533
Khan, M.I., Shahrestani, M., Hayat, T., Shakoor, A., Vahdati, M., 2019. Life cycle (well-to-
wheel) energy and environmental assessment of natural gas as transportation fuel in
Pakistan. Applied Energy 242, 1738–1752.
https://doi.org/10.1016/j.apenergy.2019.03.196
Knittel, C.R., 2011. Automobiles on Steroids: Product Attribute Trade-Offs and
Technological Progress in the Automobile Sector. American Economic Review 101,
3368–3399. https://doi.org/10.1257/aer.101.7.3368
Luk, J.M., Saville, B.A., MacLean, H.L., 2016. Vehicle attribute trade-offs to meet the 2025
CAFE fuel economy target. Transportation Research Part D: Transport and
Environment 49, 154–171. https://doi.org/10.1016/j.trd.2016.09.005
Lutsey, N., Nicholas, M., 2019. Update on electric vehicle costs in the United States through
2030 | International Council on Clean Transportation. ICCT.
MacDuffie, J.P., 2018. Response to Perkins and Murmann: Pay Attention to What Is and Isn't
Unique about Tesla. Management and Organization Review 14, 481–489.
https://doi.org/10.1017/mor.2018.32
Perkins, G., Murmann, J.P., 2018. What Does the Success of Tesla Mean for the Future
Dynamics in the Global Automobile Sector? Management and Organization Review
14, 471–480. https://doi.org/10.1017/mor.2018.31
Plötz, P., Moll, C., Li, Y., 2020. Real-world usage of plug-in hybrid electric vehicles: Fuel
consumption, electric driving, and CO2 emissions | International Council on Clean
Transportation.
Proff, H., Fojcik, T.M., 2016. Pricing and commercialization of electric mobility - dealing
with high market uncertainty. International Journal of Automotive Technology and
Management 16, 30–54.

Chapter 5: Assessing the 2021-2025-2030 CO2 Standards on Automakers' Portfolio Vehicles'
Segments
211
Wang, Y., Miao, Q., 2021. The impact of the corporate average fuel economy standards on
technological changes in automobile fuel efficiency. Resource and Energy Economics
63, 101211. https://doi.org/10.1016/j.reseneeco.2020.101211
Wavestone, 2019. Véhicules électriques : quelles incitations en France et en Europe ? [WWW
Document]. TransportShaker. URL https://www.transportshaker-
wavestone.com/vehicules-electriques-quelles-incitations-en-france-et-en-europe/
(accessed 4.22.21).

Chapter 5: Assessing the 2021-2025-2030 CO2 Standards on Automakers' Portfolio Vehicles'
Segments
212

Chapter 6: General Conclusion
213
Chapter 6: General Conclusion
This dissertation looked at the main facets of the automotive industry's energy transition.
Reaching at least a 55% net reduction in GHG emissions by 2030 and a climate-neutral EU by
2050 requires several strict policies that represent complex challenges. Switching from internal
combustion engines to electric vehicles, one of the primary keys to achieving these ambitious
environmental targets, is faced with several challenges and comes with several consequences.
On the one hand, banning thermal vehicles induces high losses for various actors due to
integrating new technology. On the other hand, fleet electrification requires ecosystem
reconfiguration by including an essential member: the charging point operator. We began by
elaborating the prominent members and their goals of the electric vehicle ecosystem: the
automotive manufacturer, the charging point operator, the vehicle owner, and the society.
Indeed, the development of synergies across the EV industry members is fundamental for the
successful development of the electric vehicle market and energy transition. Then, we evaluated
the interactions of the members by considering several case studies.
Chapter two examined the deployment strategies of the charging network and
concluded with the mandatory data to consider. Chapter three assessed the interaction of the
charging point operator and the electric vehicle owner by addressing the range anxiety barrier
for daily needs while considering their cost models and concluding with policy
recommendations regarding the charging tariffs. Chapter four considered the synergy between
the ecosystem members by evaluating France's electric vehicle purchasing activity and
identifying the main factors that could boost the transition to electrification. Chapter five
explored the influence of the European regulations imposed by public authorities - European
Union and Commission -, on the automotive manufacturers' portfolio by considering its cost
model.
This concluding chapter is divided into three sections. The first section outlines each
Chapter's results. The second section revisits the findings made in each Chapter and connects
them using transversal dimensions. The third part offers some future research perspectives.
1. Summary of Chapters
Chapter 1
The First Chapter of this thesis exposed the background. The transportation sector is
one of the first GHG emitters due to the fossil fuel dependency of transportation means.
Reaching the Green Deal by 2050 requires an urgent need to decarbonise this sector, which
could be achieved by fleet electrification. Increasing the electric vehicle market is facing several

Chapter 6: General Conclusion
214
barriers and needs various public interventions, such as a decrease in the battery packs price, a
diversification of the models proposed by car manufacturers, and a development of charging
infrastructure. We began by presenting the key information about electric vehicle's and charging
infrastructure's technical, economic, and environmental parameters. After, we detailed the main
members of the electric vehicle ecosystem: the automotive manufacturer, the charging point
operator, the vehicle owner, and the society. Also, we developed the scenarios considered in
this thesis, and we presented the thesis organisation.
Chapter 2
The Second Chapter addresses the charging point operator member interactions by
addressing the infrastructure deployment main barrier. While an essential lever in the transition
towards higher diffusion of EVs is the availability of public charging stations, our knowledge
about organising best and physically distribute these recharging networks is still emerging. A
classification scheme of 64 published articles is proposed regarding optimisation objectives
with a detailed analysis of each publication. A diversity of optimisation goals for locating
charging stations is considered: minimising technical, social, and environmental costs,
maximising coverage area, minimising the grid impact. Indeed, minimising the budget remains
one of the most used optimisation objectives since it is a severe constraint in these types of
problems: the prices of chargers and batteries remain incredibly high. Also, we highlighted
neglected, or covered too briefly, essential constraints regarding the input data and optimisation
constraints. While some constraints are considered in the optimisation procedure, such as GPS-
based geographic resolution, distribution grid constraints, driver's data (daily travelled mileage,
destinations, charging behaviour) and technical parameters, we strongly consider these factors
to be reviewed in detail. However, temporal horizon, environmental impact, new mobility
services, and external conditions were scarcely considered in studies and articles. Due to the
restricted and neglected set of parameters, charging station allocation is not yet controlled: they
are not optimally localised and used. We strongly suggest adding the environmental LCA
chargers towards minimising GHG emissions to future research studies. Additionally, since
queues can occur at stations, queuing theory can play an essential role concerning the number,
the speed of the chargers, and the service pricing.
Chapter 3
The Third Chapter looks into the interactions between the charging point operator and
the BEV owner, and concludes with policy recommendations. Despite increasing sales, techno-
economic barriers still hinder their widespread adoption. This Chapter aims at zooming into
several barriers: BEV investment and range, public infrastructure availability, at-home charger

Chapter 6: General Conclusion
215
availability, and the adaptability between charger and BEV in terms of technical constraints.
Market stakeholders are faced with a dilemma to address these barriers, especially since
different scenarios about investments in car battery capacity and recharging infrastructure
investment have different implications for who will carry the most significant investment costs.
Indeed, many households in France, assessed to 10 million today, can not charge at home: For
the moment, they are excluded from the electric vehicle market because of these barriers. To
close this gap, we explored various combinations of battery capacity size and charging power.
Then, we compare these options for both the EV owners that can not charge at home, and
infrastructure operators. Using French data, we simulate BEV-owner and charging
infrastructure-operator cost implications for 12 combinations of privately-purchased BEVs that
vary in 1) battery capacity, 2) charging power and, 3) whether or not the owner lives in a rural
or urban environment. Furthermore, we explore Pareto fronts in order to determine optimal
combinations. We find that for urban (vs. rural) areas, purchasing a 35-50-kWh (50-kWh) BEV
and deploying 22- and 50-kW chargers (50-kW) proves to be the most cost-efficient solution.
For urban areas, purchasing 35 kWh (50 kWh) BEV comes with a 600€/year (100€/year) gain
to the owner compared to buying an ICEV of the same size. Similarly, for rural areas, this gain
is around 1000€/year. Policy implications are discussed, and we recommend revising current
charging tariffs and pricing methods.
Chapter 4
The Fourth Chapter examines the interactions within all the electric vehicle ecosystem
members. Governments, automotive manufacturers, and charging infrastructure operators have
deployed market-boosting initiatives to overcome barriers hindering purchasing activity. The
main goal of this Chapter is to analyse past electric vehicle purchasing activity to conclude with
policy recommendations. Here, we analysed the influence of socio-demographic (population
density, age, unemployment rate), economic (subsidies, taxes exemption, income, gasoline
price), availability (number of BEV models, number of PHEV models), and technical (density
of slow-and-normal chargers, density of fast chargers, density of ultra-fast chargers) factors on
the electric vehicle adoption in French departments, from 2015 to 2019. We studied the case of
BEV and PHEV separately using mixed-effects regression. We find different sets of covariates
to be significantly correlated with BEV and PHEV market shares, respectively, leading to
different interpretations regarding the vehicle’s technology. The number of available
BEV/PHEV models and energy prices are positively associated with BEV and PHEV adoption.
While fast, ultrafast charger density and financial incentives boost BEV sales, more slow-and-
normal charger density leads to higher PHEV sales. On the contrary, financial incentives for

Chapter 6: General Conclusion
216
PHEVs, relative to vehicles’ prices, do not boost sales and is open for further studies. Based on
the results, policy recommendations are discussed for the automotive industry (providing
various models), the charging operator (providing public fast and ultrafast chargers, rather than
slow-and-normal speeds and revising their charging tariffs), and the local authorities
(considering economic incentives to the instalment of fast and ultrafast public chargers and
gasoline taxes).
Chapter 5
The Fifth Chapter analyses the influence of the regulations of public authorities,
namely the Regulation number (EU)2019/631 adopted by The European Union and
Commission) on the automotive manufacturer cars portfolio. Automotive manufacturers must
determine their targets for CO2 targets based on their fleets' weight in 2021. These standards,
which will become stricter by 15% in 2025 and 35% compared to 2021, cannot be achieved
without fleet electrification. This study compares ICEVs fleet replacement effects by BEVs and
PHEVs on CO2 compliance and production costs. To address this trade-off, we minimised the
production costs of replacing ICEVs with BEVs and PHEVs for 12 scenarios: 4 vehicles
Segments and three years: 2021, 2025, 2030. We only considered the newly registered
passenger cars market. Results show that for all vehicles Segments, the introduction of BEVs
and PHEVs into the vehicle fleet reduces the costs of CO2 compliance relative to a pure ICEV
scenario. Automotive manufacturers must sell the required quotas identified in this study to
ensure minimum costs, depending on the vehicle's Segment, BEVs, and PHEVs. With zero
BEV and PHEV sales shares, fines for non-respect of CO2 emissions may apply from
1000€/vehicle (2021) to 5000€/vehicle (2030) for Segment A. Indeed, higher fines are obtained
for more oversized vehicles. Also, results indicate that it is more beneficial for automakers to
respect the CO2 engagement than to pay penalties. Generally, the minimum costs are achieved
favouring PHEVs rather than on BEVs, regardless of the segment, because of fewer batteries
installed. Finally, we analysed the results and compared them to the directive of the European
Commission.
2. Transversal Considerations
This thesis comprises autonomous and heterogeneous chapters that share the same goal:
Boost the automobile sector's energy transition by eliminating the barriers stopping the electric
vehicle uptake. These findings could be analysed using a transversal approach to link the
chapters. We identify two main dimensions: Ecosystem cooperation and policies identification.
2.1. Ecosystem Cooperation
As elaborated in this dissertation: The electric vehicle ecosystem is composed of several
Chapter 6: General Conclusion
217
members or stakeholders: The automotive manufacturer, the charging point operator, the
vehicle owner, and the public authorities. These members do not share the same goals; Instead,
they have antagonist objectives. While the automotive manufacturer aims at maximising their
revenues and respecting the CO2 targets, the electric vehicle owner's objective is to minimise
their costs. Meanwhile, the charging operator's goal is to maximise their revenues and public
authorities should identify the right place to invest. This thesis encompasses different
interactions with different members: Charging operator - all members (in Chapter Two),
charging operator - electric vehicle owner (in Chapter Three), public authorities - all members
(in Chapter Four), and automaker - public authorities (in Chapter Five). In each of the studies,
we identified trade-offs that result from the interactions. In Chapter Two, through a literature
review, we saw that the deployment of charging stations should consider several data, such as
the EV owner and the EV techno-economic parameters. In Chapter Three, we identified the
trade-offs of all–power charging infrastructure and different sizes of BEVs for two case studies:
French urban and rural. We concluded with the battery capacity and the charging power that
could ensure the profitability of both members. Chapter Four concluded with policy
recommendations to all the EV ecosystem members after evaluating the EV uptake in France.
Based on Chapter Three and Chapter Four, we found that fast charging, among all other
charging powers, could boost the EV market and could ensure profitability to the charging
operator and the comfort to the BEV driver because of the low charging duration. In Chapter
Five, we evaluated the assessment of the European CO2 regulations on the automotive
industry's portfolio. This preliminary study could help governmental authorities to review their
strategies regarding the production of PHEVs.
2.2. Policies Identification
Policies are a set of ideas and roadmaps that identifies solutions for particular situations
agreed to officially by groups of people, business organisations, governments, or political
parties. This dissertation focused on policy recommendations for all the members of the EV
ecosystem, to accelerate EV uptake.
Based on the findings of Chapters Three and Five, it is recommended that the
automotive manufacturers increase their variety of BEV and PHEV models that could raise the
visibility towards the customers. Also, results showed that automotive manufacturers should
promote PHEVs rather than BEVs where higher income, daily long-distance trips and lower
population densities are recorded. Also, we concluded that promoting PHEVs during the
transition period towards is essential because it comes with the lowest cost compared to BEVs

Chapter 6: General Conclusion
218
on the automaker’s budget. Indeed, this transition period will last until the production cost of
BEV becomes equal to that of a PHEV and an ICEV of the same segment, that could be
achieved after a decrease in the battery packs price. Nevertheless, these conclusions are open
for further research that could change automaker's strategy regarding PHEVs production in the
near term.
Based on Chapter Two and Four results, we concluded with policy recommendations
for the charging point operators. To ensure a reasonable waiting time for the BEV driver who
cannot charge at-home, and are obliged to use the public charging network, higher battery
capacities require more charging stations of the same power. Results showed that deploying
fast and ultra-fast chargers (power higher than 50 kW) rather than slow and normal chargers
(power lower than 50 kW) is the key to higher EV uptake. Also, based on Pareto fronts, we
concluded that installing on-street public fast chargers (power equals 50 kW) ensures the
profitability of all-sizes BEV owners by lower charging durations and costs and that of the
charging operator. Moreover, we deducted the necessity to revise the impact of charging tariffs
on the BEV/PHEV owners, especially for 7 and 22 kW powers.
Finally, based on Chapters Three, Four, and Five, we concluded with policy guidelines
for the public authorities. We proposed a roadmap for the French government to follow the
electric mobility transition: by (1) increasing subsidies for BEVs and revising those for PHEVs,
(2) decreasing the electricity price or increasing gasoline price simultaneously, (3) offering
subsidies for charging operators to install the right charging power at the right place. We
recommend local authorities concentrate their efforts on providing and/or increasing economic
incentives (e.g. subsidies) to install fast and ultrafast public chargers for BEV-ascending cities,
and slow-and-normal public chargers for PHEV-ascending cities. However, increasing the
carbon tax led to social movements, namely the "Yellow Vests" in France, pushing the
government to suspend additional taxes on fossil fuels prices. Indeed, increasing taxes on
energy prices could have no social acceptability in some countries, especially if they are top-
taxed countries. In summary, to limit the consequences of social movements associated with an
increase in gasoline prices, governments should consider providing financial incentives for both
purchasing vehicles and instalment of charging infrastructure, decreasing electricity and
charging tariffs, and maintaining registration tax exemption.
3. Future Works
3.1. Battery Capacity and Public Charging Infrastructure Trade-Offs
The assumption of driving and charging behaviour should be considered in future work,
because the driver could change their attitudes in terms of additional trips, such as home-school

Chapter 6: General Conclusion
219
travels or other activity centres, malls, where semi-public charging stations could be available.
For this reason, the arrival rate to the charging stations may change, causing a different number
of chargers. When simulating BEV profiles, we neglected comfort parameters such as heating,
cooling, lights, radio, and data to increase BEVs' energy demand. Besides driving behaviour,
some hypotheses about the operator's cost model are not considered, such as grid expansion,
because technical problems could be resolved by smart charging and land prices due to the no-
spatial model, and the wide variety of these prices. Overall, it is vital to use real-world data that
reflect BEV drivers' driving and charging behaviours, such as trip mileage, arrival rates, and
actual charging durations. Finally, based on these real data, charging tariffs and the pricing
methods should be revised, taking into account an oligopolistic market where competition
between charging operators stakes.
3.2. Analysis of the BEV and PHEV Markets in France
While some of the findings of this Chapter were expected, and despite the high
resolution of our analysis, further studies are suggested to boost these models by taking into
account socio-techno-economic factors. Our model can only draw general conclusions since
the EV market share in France represents less than 5%. It would be helpful to perform a follow-
up study in a more developed market. Moreover, we recommend further studies to consider the
availability of at-home and at-work charging infrastructures of both the department of residence
and work, the tariffs of public charging infrastructure, and the adaptability of charging
infrastructure sockets and vehicles. We further urge upcoming research to account for local
non-financial incentives that were not considered due to the lack of data. Additionally, the
model does not capture the customer's psychological effect, which could be affected by the
marketing campaign of both automotive manufacturers and charging infrastructure operators.
The influence of additional electric mobility services is also not considered in our study, namely
Vehicle-to-Grid, smart charging, and car-sharing. Finally, the relationship between BEV and
PHEV market shares are worthy of further study and refinement.
3.3. Analysis of the CO2 Regulations on the OEM's Portfolio
Chapter 5 is still preliminary, and several additions are needed because our analysis
remains limited to various assumptions. First, we recommend completing our analysis
regarding the automaker's side by considering the emergence of zero and low emissions light-
duty vehicles. Besides, our analysis accounts for the worst-case scenario of CO2 emissions;
Further studies are needed to evaluate Hybrid Electric Vehicles (HEVs) cost-effectiveness
diffusion in respecting the standards. Also, we recommend considering the customer's side in
the analysis. As mentioned before, PHEVs' CO2 emissions highly depend on driving and

Chapter 6: General Conclusion
220
charging behaviours. If the battery is not used, the CO2 emissions of a PHEV are approximately
similar to those of an ICEV. Many approaches could consider the actual emissions:
Additionally, to consider accurate data of PHEVs drivers' trips, a solution is to weigh CO2
emissions per vehicle. There are two main usages for passenger cars: rural and urban ones.
Since more rural drivers' daily travelled kilometres are higher in urban usage, more CO2
emissions are expected for PHEVs. Also, future research is needed by including the driver's
cost model and willingness-to-pay in the analysis. Indeed, purchasing a PHEV does not come
with the exact cost of a BEV, and it varies with the segment's choice. Finally, we recommend
future work considering the European Green Deal for 2050, aiming to drastically reduce GHG
emissions, especially in the energy and transportation sectors. Meeting 2050's CO2 targets
remain impossible without a massive penetration of zero-emission vehicles: BEV and Fuel
Cells Electric Vehicles (FCEVs).
3.4. Beyond the Chapters
Several aspects were not considered in this thesis and should noteworthy be considered
in future research. First, new mobility solutions, such as autonomous vehicles, mobility as a
service (car-sharing), and charging services (booking a charger or Vehicle-to-Grid), require an
extended business model. Also, the needed charging infrastructure, customer acceptance, the
automotive manufacturer's strategy, and cost models could considerably vary. This thesis could
be extended by considering case studies and several scenarios of these new mobility services.
Also, future research should consider the temporal horizon for applying these services that meet
the long-term European targets.
Second, externalities and the environmental impact of electric vehicles examined by the
LCA, especially the battery recycling act, are not modelled since they are not the thesis's scope.
It is open for further studies to consider the economic impact of the ecological footprint of both
electric vehicles and the charging operator. Indeed, the environmental impact analysis relies on
the country's energy mix, and its associated conclusions could vary from a country to another.
Also, we did not consider externalities associated to the battery production, such as the
environmental and health cost of mining, chemical leaching, and the limited amount of raw
materials in the world.
Third, governments should strengthen several policy implications to meet the 2050
Green Deal that ensures a zero-emission road transportation sector. Future studies should
consider the impact of policies - i.e. limiting the vehicles in cities, relying on public
transportation means, banning the sales of ICEVs and HEVs, and releasing FCEV as passenger
cars. Also, a cost-efficient study that compares the trade-offs between the economic costs and

Chapter 6: General Conclusion
221
environmental benefits is mandatory to consider new mobility services and policies.
Finally, the usage of actual data that could capture the driving behaviour, charging
behaviour, and while-driving emissions are key factors for results validation.

222
Titre : Une analyse technico-économique de la transition vers les véhicules électriques : politique, infrastructure, usages
et conception
Mots clés : capacité de batterie, infrastructure de recharge, véhicule électrique, véhicule hybride rechargeable, étude
technico-économique
Résumé : Le transport routier représentant une part
importante des émissions mondiales de gaz à effet de serre.
Les véhicules électriques (VE), y compris les VE à batterie
(BEV) et les VE hybrides rechargeables (PHEV), offrent
une alternative prometteuse pour remplacer les véhicules
à moteur à combustion interne (ICEV), dépendants des
combustibles fossiles, pour une solution de transport à
émissions faibles ou nulles. Bien que l'adoption de ces
technologies ait rapidement augmenté au cours de la
dernière décennie, leur part de marché reste limitée par des
obstacles socio-technico-économiques dans la plupart des
pays. Surmonter ces barrières est une étape essentielle vers
un marché massive des véhicules électriques. Cette thèse
vise donc à étudier des modèles économiques innovants,
en examinant les transactions entre les membres de
l'écosystème des VE. Cette thèse traite de recherches
prospectives et multidisciplinaires en sciences
économiques et de gestion, et sciences de l'ingénieur, sur
l'avenir des systèmes automobiles décarbonés. Tout
d'abord, cette thèse aborde les principaux obstacles au
déploiement des infrastructures de recharge, en présentant
une revue de la littérature sur les méthodologies de
déploiement et en soulignant l'ensemble des paramètres
négligés dans la littérature, lesquels présentent des
questions de recherche que la thèse aborde par la suite.
Ensuite, cette thèse étudie les compromis entre
infrastructure de recharge de différentes puissances et
autonomie des BEV. Nous concluons sur la capacité de
la batterie du BEV la plus adaptée aux besoins urbains
et ruraux, et sur l'investissement dans les chargeurs
rapides. De plus, cette thèse analyse l'influence des
facteurs socio-démographiques, économiques et
techniques sur l'adoption des VE dans les départements
français au moyen d’une régression à effets mixtes.
Nous concluons à travers des recommandations de
politiques économiques pour accélérer la transition vers
la mobilité électrique. Enfin, cette thèse analyse
l'influence du règlement européen (EU)2019/631 sur
l’offre des constructeurs automobiles et permet de
discuter les résultats attendus par la directive de la
Commission européenne.
Title: A Techno-Economic Analysis of the Electric Vehicle Transition: Policy, Infrastructure, Usage, and design
Keywords: battery capacity, recharging infrastructure, electric vehicle, plug-in hybrid vehicle, techno-economic study
Abstract: Since road transport accounts for a high share
of global Greenhouse Gas (GHG) emissions, Electric
Vehicles (EVs), including Battery EVs (BEVs) and Plug-
in Hybrid EVs (PHEVs), offer a promising alternative to
replace fossil-fuel dependent Internal Combustion Engine
Vehicles (ICEVs), with a low-or zero-emission transport
solution. While this technology's adoption has been
rapidly increasing over the last decade, its market share
remains restrained by socio-techno-economic barriers in
most countries. Overcoming these barriers is an essential
step into a massive purchasing activity of electric vehicles.
This dissertation aims at investigating innovative business
models by examining the transactions within the members
of the EV ecosystem. This dissertation deals with future
and multidisciplinary research in economics,
management, and engineering sciences on decarbonised
car systems' future. First, this thesis addresses the main
charging infrastructure deployment barrier by presenting a
literature review about the deployment methodologies and
pointing out the neglected set of parameters that present
our research gaps. Second, it investigates the trade-offs
between the different-power charging infrastructure and
the BEV owner by considering: BEV investment and
range, public infrastructure availability, at-home
charger availability, and the adaptability between
charger and BEV in terms of technical constraints. It
also concludes with the most suitable BEV battery
capacity for urban and rural needs, and the installation
of fast chargers. Next, it analyses the influence of socio-
demographic, economic, and technical factors on
electric vehicle adoption in French departments, using
mixed-effects regression. This chapter points out policy
recommendations to accelerate the electric mobility
transition. Finally, this thesis analyses the influence of
the Regulation number (EU)2019/631 on the automotive
manufacturers’ portfolio, and compares the results with
the directive of the European Commission.
Copyright © 2022 FDOKUMEN