Understanding water delivery performance in a large-scale ...
12
IRRIGATION AND DRAINAGE Irrig. and Drain. 54: 67–78 (2005) Published online in Wiley InterScience (www.interscience.wiley.com). DOI: 10.1002/ird.152 UNDERSTANDING WATERDELIVERY PERFORMANCE IN A LARGE-SCALE IRRIGATION SYSTEM IN PERU y JEROEN VOS* Department of Environmental Sciences, Irrigation and Water Engineering Group, Wageningen University and ResearchCentre, Wageningen, The Netherlands ABSTRACT During a two-year field study the performance of the water delivery was evaluated in a large-scale irrigation system on the north coast of Peru. Flow measurements were carried out along the main canals, along two secondary canals, and in two tertiary blocks in the Chancay-Lambayeque irrigation system. The most important finding was the unexpectedly high accomplishment rate of the actual delivery at field level compared with the on-request schedule. Delivery performance ratios (DPRs) were very close to unity. Three main factors were identified contributing to this good performance: the high degree of accountability of the Water Users’ Association towards the water users, the skills and experience of the operators to deal with the—difficult to operate—undershot sliding gates, and the high degree of mutual social control among the water users and their high labour input. It is concluded that the institutional design and skills of operators made a good delivery performance possible, overcoming the difficulties caused by the irregular water supply, infrastructure and on-request schedule. Copyright # 2005 John Wiley & Sons, Ltd. key words: water delivery performance; volumetric payment; accountability; large-scale irrigation; Peru RE ´ SUME ´ Au cours d’une e ´tude de deux ans sur le terrain, la performance de la distribution d’eau d’un syste `me d’irrigation a ` grande e ´chelle de la co ˆte nord du Pe ´rou a e ´te ´e ´value ´e. Des mesures de de ´bit ont e ´te ´ effectue ´es le long des canaux principaux, de deux canaux secondaires et dans deux blocs tertiaires du syste `me d’irrigation Chancay- Lambayeque. Le re ´sultat principal a e ´te ´ le quotient e ´tonnamment e ´leve ´ de la distribution actuelle au niveau du terrain, compare ´a ` la programmation sur demande. Les coefficients de performance de distribution (en anglais: DPR, delivery performance ratios) e ´taient tre `s pre `s de l’unite ´. Cette bonne performance est due a ` trois facteurs principaux: le haut degre ´ de responsabilite ´ de l’Association des Utilisateurs d’Eau envers ces utilisateurs, la compe ´tence et l’expe ´rience des ope ´rateurs a ` faire fonctionner les re ´gulateurs d’e ´coulement infe ´rieur, difficiles a ` actionner, et le haut niveau de contro ˆle social parmi les utilisateurs d’eau ainsi que la grosse somme de travail qu’ils fournissent. En conclusion, la conception institutionnelle et les compe ´tences des ope ´rateurs ont permis de re ´aliser une bonne performance de distribution qui a vaincu les difficulte ´s cre ´e ´es par l’irre ´gularite ´ de la distribution d’eau, l’infrastructure et la programmation sur demande. Copyright # 2005 John Wiley & Sons, Ltd. mots cle ´s: performance de la distribution d’eau; taxe d’eau lie ´e au volume; responsabilite ´; irrigation a ` grande e ´chelle; Pe ´rou Received 5 March 2004 Revised 3 September 2004 Copyright # 2005 John Wiley & Sons, Ltd. Accepted 18 September 2004 *Correspondence to: J. Vos, Nieuwe Kanaal 11, 6709 PA, Wageningen, The Netherlands. E-mail: [email protected] y Protocole d’entente concernant la performance de la distribution d’eau dans un syste `me d’irrigation a ` grande e ´chelle du Pe ´rou.
-
Upload
khangminh22 -
Category
Documents
-
view
0 -
download
0
Transcript of Understanding water delivery performance in a large-scale ...

IRRIGATION AND DRAINAGE
Irrig. and Drain. 54: 67–78 (2005)
Published online in Wiley InterScience (www.interscience.wiley.com). DOI: 10.1002/ird.152
UNDERSTANDING WATER DELIVERY PERFORMANCE INA LARGE-SCALE IRRIGATION SYSTEM IN PERUy
JEROEN VOS*
Department of Environmental Sciences, Irrigation and Water Engineering Group,
Wageningen University and Research Centre, Wageningen, The Netherlands
ABSTRACT
During a two-year field study the performance of the water delivery was evaluated in a large-scale irrigation system
on the north coast of Peru. Flow measurements were carried out along the main canals, along two secondary canals,
and in two tertiary blocks in the Chancay-Lambayeque irrigation system. The most important finding was the
unexpectedly high accomplishment rate of the actual delivery at field level compared with the on-request schedule.
Delivery performance ratios (DPRs) were very close to unity. Three main factors were identified contributing to
this good performance: the high degree of accountability of the Water Users’ Association towards the water users,
the skills and experience of the operators to deal with the—difficult to operate—undershot sliding gates, and the
high degree of mutual social control among the water users and their high labour input. It is concluded that the
institutional design and skills of operators made a good delivery performance possible, overcoming the difficulties
caused by the irregular water supply, infrastructure and on-request schedule. Copyright # 2005 John Wiley &
Sons, Ltd.
key words: water delivery performance; volumetric payment; accountability; large-scale irrigation; Peru
RESUME
Au cours d’une etude de deux ans sur le terrain, la performance de la distribution d’eau d’un systeme d’irrigation a
grande echelle de la cote nord du Perou a ete evaluee. Des mesures de debit ont ete effectuees le long des canaux
principaux, de deux canaux secondaires et dans deux blocs tertiaires du systeme d’irrigation Chancay-
Lambayeque. Le resultat principal a ete le quotient etonnamment eleve de la distribution actuelle au niveau du
terrain, compare a la programmation sur demande. Les coefficients de performance de distribution (en anglais:
DPR, delivery performance ratios) etaient tres pres de l’unite. Cette bonne performance est due a trois facteurs
principaux: le haut degre de responsabilite de l’Association des Utilisateurs d’Eau envers ces utilisateurs, la
competence et l’experience des operateurs a faire fonctionner les regulateurs d’ecoulement inferieur, difficiles a
actionner, et le haut niveau de controle social parmi les utilisateurs d’eau ainsi que la grosse somme de travail
qu’ils fournissent. En conclusion, la conception institutionnelle et les competences des operateurs ont permis de
realiser une bonne performance de distribution qui a vaincu les difficultes creees par l’irregularite de la distribution
d’eau, l’infrastructure et la programmation sur demande. Copyright # 2005 John Wiley & Sons, Ltd.
mots cles: performance de la distribution d’eau; taxe d’eau liee au volume; responsabilite; irrigation a grande echelle; Perou
Received 5 March 2004
Revised 3 September 2004
Copyright # 2005 John Wiley & Sons, Ltd. Accepted 18 September 2004
*Correspondence to: J. Vos, Nieuwe Kanaal 11, 6709 PA, Wageningen, The Netherlands. E-mail: [email protected] Protocole d’entente concernant la performance de la distribution d’eau dans un systeme d’irrigation a grande echelle du Perou.
INTRODUCTION
Most large-scale irrigation systems in the world are considered to exhibit low degrees of management
performance. This includes low cost recovery and low water use efficiencies induced by area-based water
allocation and poor water delivery performance (Barnett, 1977; Pant, 1983; Repetto, 1986; Plusquellec et al., 1990;
Postel, 1992; Bottrall, 1995). The large-scale irrigation systems on the north coast of Peru are no exception and are
widely considered to perform poorly (Thobani, 1995).
A solution currently widely promoted to increase the performance of these systems is volumetric allocation,
charging, and delivery of water (Grimble, 1999). Generally, volumetric charging is supposed to increase water use
efficiency, because it gives an incentive for the farmers to save water. It is also supposed to raise fee recovery,
because payments can be enforced by only supplying the volume of water paid for. Nevertheless, most irrigation
experts believe volumetric water allocation, charging and delivery will not function in a large-scale system with
many smallholders and open canals in poor countries, because of high costs, and technical and social difficulties in
water distribution (Plusquellec et al., 1994; Horst, 1998, 1999).
This article presents an assessment of the water distribution in the large-scale Chancay-Lambayeque irrigation
system on the arid north coast of Peru. The system has a command area of over 100 000 ha and serves over 22 200
smallholders. In 1992 the management of this system was turned over to the Water Users’ Association (WUA) and
the farmers started paying per requested volume of water. The river supply is irregular, the scheduling is on request,
and the water is distributed according to the resulting complex delivery schedule with manually operated sliding
gates and only a couple of flowmeasurement structures. Many experts would qualify this as a ‘‘nightmare system’’.
However, the water delivery performance in Chancay-Lambayeque proved to be relatively good. This paper
examines how this high level of performance is possible.
FIELD RESEARCH METHODOLOGY
During a two-year field research from 1998 to 2000 the water management of the Chancay-Lambayeque irrigation
system was studied (Vos, 2002). Water measurements are presented here for the main irrigation season 1999
(January to May) and 11 days in 2000. This irrigation system is one of four large-scale irrigation systems on the
arid north coast of Peru. It was selected because it introduced volumetric irrigation service fee (ISF) payment in
1992, while the other systems (still) charge area-based fees.
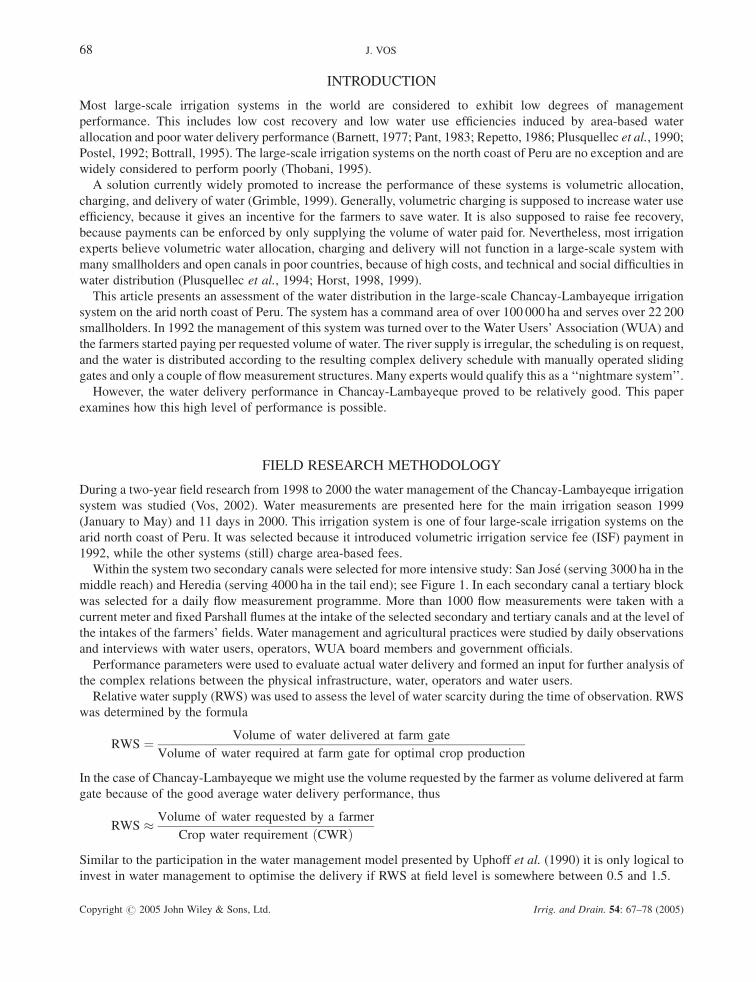
Within the system two secondary canals were selected for more intensive study: San Jose (serving 3000 ha in the
middle reach) and Heredia (serving 4000 ha in the tail end); see Figure 1. In each secondary canal a tertiary block
was selected for a daily flow measurement programme. More than 1000 flow measurements were taken with a
current meter and fixed Parshall flumes at the intake of the selected secondary and tertiary canals and at the level of
the intakes of the farmers’ fields. Water management and agricultural practices were studied by daily observations
and interviews with water users, operators, WUA board members and government officials.
Performance parameters were used to evaluate actual water delivery and formed an input for further analysis of
the complex relations between the physical infrastructure, water, operators and water users.
Relative water supply (RWS) was used to assess the level of water scarcity during the time of observation. RWS
was determined by the formula
RWS ¼ Volume of water delivered at farm gate
Volume of water required at farm gate for optimal crop production
In the case of Chancay-Lambayeque we might use the volume requested by the farmer as volume delivered at farm
gate because of the good average water delivery performance, thus
RWS � Volume of water requested by a farmer
Crop water requirement ðCWRÞSimilar to the participation in the water management model presented by Uphoff et al. (1990) it is only logical to
invest in water management to optimise the delivery if RWS at field level is somewhere between 0.5 and 1.5.
68 J. VOS
Copyright # 2005 John Wiley & Sons, Ltd. Irrig. and Drain. 54: 67–78 (2005)
The delivery performance ratio (DPR) was used to assess the performance of the actual water delivery at some
key points in the canal system. DPR is defined as the match between the actual water delivery with the planned
delivery at a certain point in the canal system
DPR ¼ Actually delivered water flow
Planned water flow
To select relatively sensitive canals and offtakes for the assessment of the delivery performance, and understand
the operation of these structures by the operators, it was important to understand the hydraulic properties of the
division structures. To predict the propagation of fluctuations in an open canal system with upstream control the
hydraulic flexibility (F) of bifurcation points can be used (Crump, 1922; Horst, 1998; Van Halsema and Murray-
Rust, 1999), determined by the formula
F ¼ Sofftaking canal
Songoing canal
where S¼ sensitivity, defined as
S ¼ �Q
Qinitial
for the unit rise of the upstream head. At F¼ 1 the fluctuations are propagated proportionally through the system;
for F> 1 the fluctuations are mostly propagated to the head end; and for F< 1 to the lower end of the system.
Hydraulic flexibility is not a static property of a bifurcation point; F also depends on upstream and downstream
water levels.
Figure 1. Map of the Chancay-Lambayeque irrigation system
WATER DELIVERY PERFORMANCE IN PERU 69
Copyright # 2005 John Wiley & Sons, Ltd. Irrig. and Drain. 54: 67–78 (2005)

SPECIFIC FEATURES OF THE CHANCAY-LAMBAYEQUE SYSTEM
Chancay-Lambayeque is an ancient irrigation system. The present-day main canal was built about 1000 years ago.
In 1970 the German-financed Tinajones Project rehabilitated the main canal and constructed a reservoir with a
capacity of 317 million m3. The project also provided a 30% increase of water in the river by tunnels bringing water
from other watersheds. With this water the command area was increased from 60 000 to 110 000 ha (Urban, 1990).
Rainfall in normal years is on average only 50mmyr�1. Only once in about 15 years does heavy rainfall occur (a
phenomenon called ‘‘El Nino’’) causing large floods. Water comes from the highly fluctuating and unpredictable
Chancay river that flows from the Andes. Discharges fluctuate from 375 to 1718million m3 yr�1 (IMAR, 1997). Peak
flow of the river coincides with the hottest summer months (January–March) that makes the cultivation of rice
possible. From July till September the river can completely dry up. In years with low river flows severe water scarcity
exists and cropped area and yields are reduced. RWS at field level is between 0.8 (normal) and 0.6 (dry year).
The system is basically a run-off-the-river system with a relative small off-river storage reservoir. The system is a
gravity open canal system with surface irrigation and no pumping. Only a small part of the canals is lined; the division
structures used are adjustable undershot vertical-sliding gates and stop logs. No groundwater is used. In the last 30 years
new drains have been constructed to counter the effect of waterlogging causing an increasing problem of salinisation.
Sugar cane is grown on 30 000 ha at the head end of the system. Rice is grown in the middle reach in an area
fluctuating between 15 000 and 40 000 ha, depending on the availability of water. Maize and beans are the main
crops in the tail-end areas of the system.
In 1969 the (approximately twelve) large estates (haciendas) were expropriated and converted into cooperatives.
At the same time the management of the irrigation system was taken over by the Ministry of Agriculture. After
1983 the cooperatives were subdivided among the workers, except for the three large sugar-cane cooperatives at
the head end of the irrigation system. Now, in total 22 200 water users have water rights (of which 12% are female).
The average landholding of the smallholders is about 5 ha. The production system has a high external input of
fertilisers and agro-chemicals. The production is high: for example on average some 5 t ha�1 of rice.
The system management was turned over to the water users in 1992 (Del Callejo and Vos, 2000). The water
users’ organisation has three tiers; see Figure 2. The main system is managed by the Junta de Usuarios (JU) and
Figure 2. Organisation chart of the Chancay-Lambayeque irrigation system
70 J. VOS
Copyright # 2005 John Wiley & Sons, Ltd. Irrig. and Drain. 54: 67–78 (2005)
their private company ETECOM. The secondary canals are managed by the Comisiones de Regantes (CRs). The
tertiary blocks are managed by Comites de Canal (CCs).
There are 13 CRs that manage the secondary canals. The members of the board of the CR are normally elected
every two years by all the water users in the secondary unit (500–4200 users). The CRs hire an engineer and the
personnel that operate the secondary canals: the sectoristas and tomeros. The CCs at tertiary block level (100–
500 ha, with 50–150 water users) are more or less informal organisations that organise water distribution and canal
cleaning in their own tertiary block.
The Administracion Tecnica (AT) is the local irrigation office of the Ministry of Agriculture. This small office
with only one engineer allocates the water rights (by controlling the register of water title holders and approving
the cropping zone plan) and has the task of resolving conflicts. The Autoridad Autonoma (AA) is also part of the
Ministry of Agriculture and has the task of coordinating multiple water uses in the entire Chancay watershed. The
AA also resolves conflicts that could not be resolved by the AT.
The operation and maintenance (O&M) of the system is paid for out of the volumetric water fees. No subsidies
for O&M come from the government. Subsidies are received in the form of emergency projects for repair of
irrigation works and training of staff. Personnel of ETECOM collect the money from the users at the offices of the
CRs. In total on average the WUA collects 2 million US dollars per year (average from 1994 to 1999). This money
is then divided by the board of the JU to the CRs, ETECOM, and the government agencies according to internal
and government regulations.
ON-REQUEST WATER SCHEDULING
The Chancay-Lambayeque irrigation system is a system that has on average a delicate balance between supply and
demand. In normal years about 80% of the crop water requirements of the officially allowed crops can be met. In
dry years severe water stress occurs.
Each water user with a water right is allocated a maximum volume of water each year by the AT. The volume
depends on the crop allowed to be grown according to the cropping zones. For each hectare of rice a water user is
allocated the right to request the maximum of 14 000m3 ha�1, for sugar cane 21 000m3 ha�1 and for maize
7000m3 ha�1. Farmers do not automatically receive these volumes. They have to buy water turns, which are
requested at the office of the CR. The unit of water delivery is the riego. One riego is one hour of water delivery
with a flow of 160 l s�1 at field level, which costs about US$2.00. The hours to fill the canals are not paid for. In
total a farmer on average buys only 16 hours per hectare per season for rice: which is only about 900mmper season
and costs US$32 per ha (see also Table I), which amounts to approximately 5% of the total production costs for
rice.
The sectoristas draw up the delivery schedule every morning according to the water availability and number of
hours of water ordered by the water users. When demand is more than supply (which is the case on average in
almost half of the irrigation season) not all requested turns can be delivered. The WUA designed a complicated
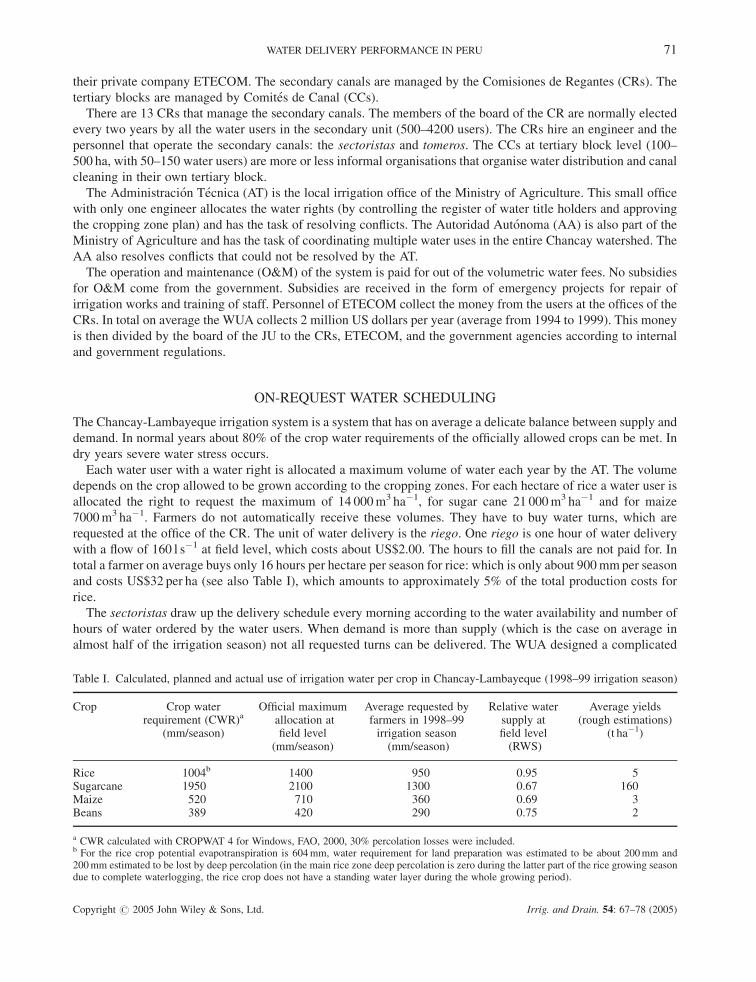
Table I. Calculated, planned and actual use of irrigation water per crop in Chancay-Lambayeque (1998–99 irrigation season)
Crop Crop water Official maximum Average requested by Relative water Average yieldsrequirement (CWR)a allocation at farmers in 1998–99 supply at (rough estimations)
(mm/season) field level irrigation season field level (t ha�1)(mm/season) (mm/season) (RWS)
Rice 1004b 1400 950 0.95 5Sugarcane 1950 2100 1300 0.67 160Maize 520 710 360 0.69 3Beans 389 420 290 0.75 2
a CWR calculated with CROPWAT 4 for Windows, FAO, 2000, 30% percolation losses were included.b For the rice crop potential evapotranspiration is 604mm, water requirement for land preparation was estimated to be about 200mm and200mm estimated to be lost by deep percolation (in the main rice zone deep percolation is zero during the latter part of the rice growing seasondue to complete waterlogging, the rice crop does not have a standing water layer during the whole growing period).
WATER DELIVERY PERFORMANCE IN PERU 71
Copyright # 2005 John Wiley & Sons, Ltd. Irrig. and Drain. 54: 67–78 (2005)
system of water allocation and scheduling rules to determine the amount of water scheduled to each user in water-
scarce periods. It is complicated because the amount of water and frequency depends on the type of water right
(two types exist), water availability, the crop officially allowed to be grown, the actual water stress of the crop, and
the size of the plot. Large plots receive water for only a part of the cropped area.
INFRASTRUCTURE AND OPERATION
The water delivery infrastructure is basic. Canals are mostly unlined and division structures are simple sliding
gates or stop logs. Most of the division works are in good operational condition. A particular feature of the canals
in Chancay-Lambayeque is that most run relatively deep. Normal ‘‘full capacity’’ flow level in most canals is still
below the level of the neighbouring fields. This makes stealing of water directly from the canal without a lifting
device impossible. The canals are cleaned of weeds and silt twice a year and this is done quite well.
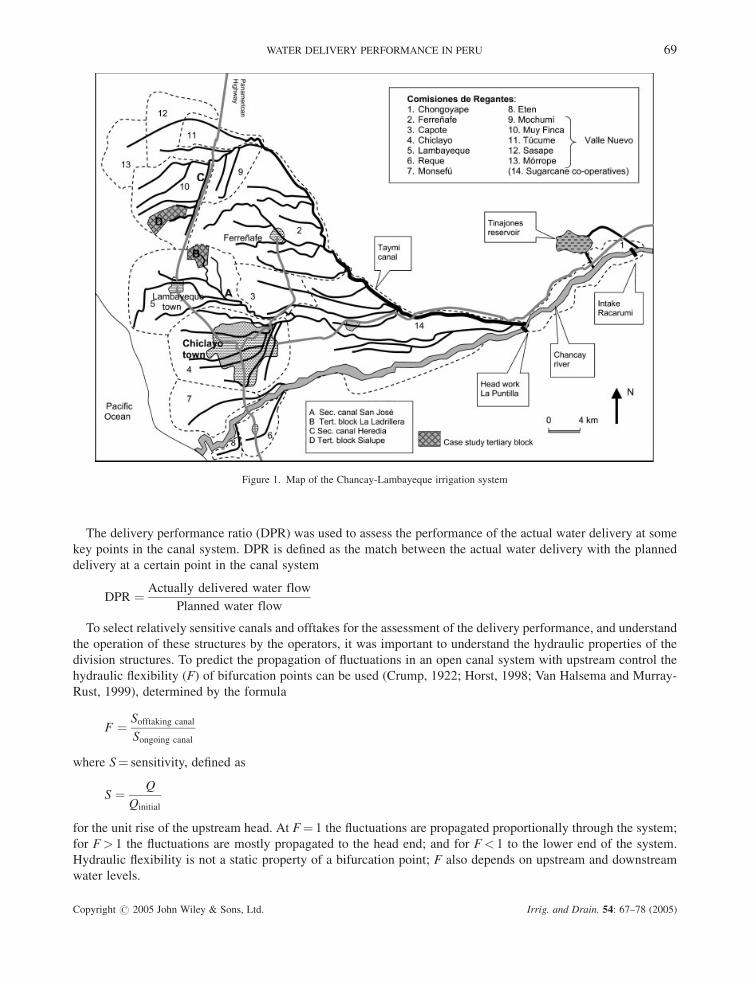
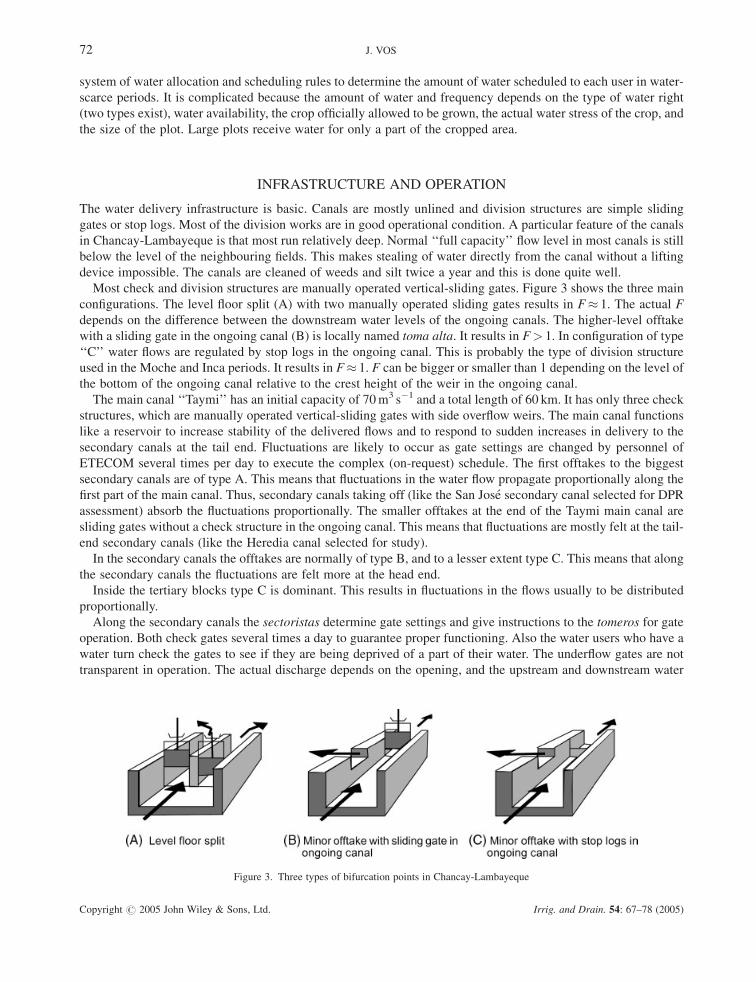
Most check and division structures are manually operated vertical-sliding gates. Figure 3 shows the three main
configurations. The level floor split (A) with two manually operated sliding gates results in F� 1. The actual F
depends on the difference between the downstream water levels of the ongoing canals. The higher-level offtake
with a sliding gate in the ongoing canal (B) is locally named toma alta. It results in F> 1. In configuration of type
‘‘C’’ water flows are regulated by stop logs in the ongoing canal. This is probably the type of division structure
used in the Moche and Inca periods. It results in F� 1. F can be bigger or smaller than 1 depending on the level of
the bottom of the ongoing canal relative to the crest height of the weir in the ongoing canal.
The main canal ‘‘Taymi’’ has an initial capacity of 70m3 s�1 and a total length of 60 km. It has only three check
structures, which are manually operated vertical-sliding gates with side overflow weirs. The main canal functions
like a reservoir to increase stability of the delivered flows and to respond to sudden increases in delivery to the
secondary canals at the tail end. Fluctuations are likely to occur as gate settings are changed by personnel of
ETECOM several times per day to execute the complex (on-request) schedule. The first offtakes to the biggest
secondary canals are of type A. This means that fluctuations in the water flow propagate proportionally along the
first part of the main canal. Thus, secondary canals taking off (like the San Jose secondary canal selected for DPR
assessment) absorb the fluctuations proportionally. The smaller offtakes at the end of the Taymi main canal are
sliding gates without a check structure in the ongoing canal. This means that fluctuations are mostly felt at the tail-
end secondary canals (like the Heredia canal selected for study).
In the secondary canals the offtakes are normally of type B, and to a lesser extent type C. This means that along
the secondary canals the fluctuations are felt more at the head end.
Inside the tertiary blocks type C is dominant. This results in fluctuations in the flows usually to be distributed
proportionally.
Along the secondary canals the sectoristas determine gate settings and give instructions to the tomeros for gate
operation. Both check gates several times a day to guarantee proper functioning. Also the water users who have a
water turn check the gates to see if they are being deprived of a part of their water. The underflow gates are not
transparent in operation. The actual discharge depends on the opening, and the upstream and downstream water
Figure 3. Three types of bifurcation points in Chancay-Lambayeque
72 J. VOS
Copyright # 2005 John Wiley & Sons, Ltd. Irrig. and Drain. 54: 67–78 (2005)
level. Water flows are only measured at the entrance of the secondary canals by the sectoristas. The measurement
structures used are Parshall flumes, most of them in good operational condition.
Inside the tertiary blocks the water users themselves are responsible for bringing their irrigation water from the
beginning of the tertiary canal to their fields. That is, prevent others from tampering with the gate settings and
prevent direct water stealing.
RESULTS OF MEASUREMENTS
Below the results of the flow measurement programme are presented. The average DPR and coefficient of variance
(CV) of the DPR at main, secondary and tertiary level are used to demonstrate the relatively good water delivery
performance.
Main canal level
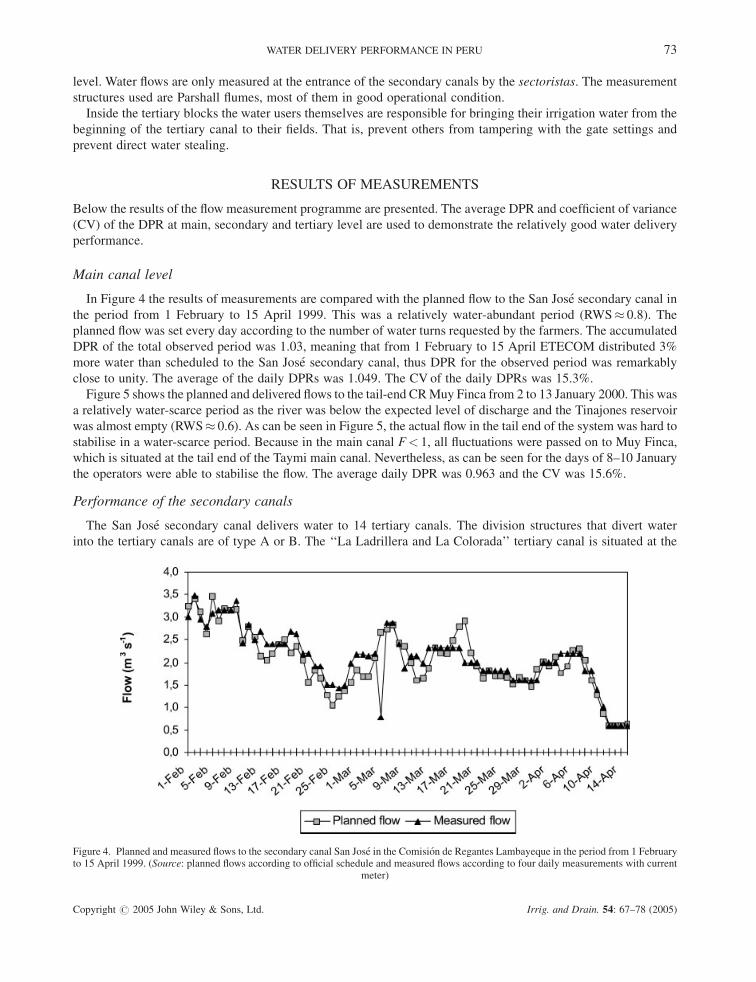
In Figure 4 the results of measurements are compared with the planned flow to the San Jose secondary canal in
the period from 1 February to 15 April 1999. This was a relatively water-abundant period (RWS� 0.8). The
planned flow was set every day according to the number of water turns requested by the farmers. The accumulated
DPR of the total observed period was 1.03, meaning that from 1 February to 15 April ETECOM distributed 3%
more water than scheduled to the San Jose secondary canal, thus DPR for the observed period was remarkably
close to unity. The average of the daily DPRs was 1.049. The CV of the daily DPRs was 15.3%.
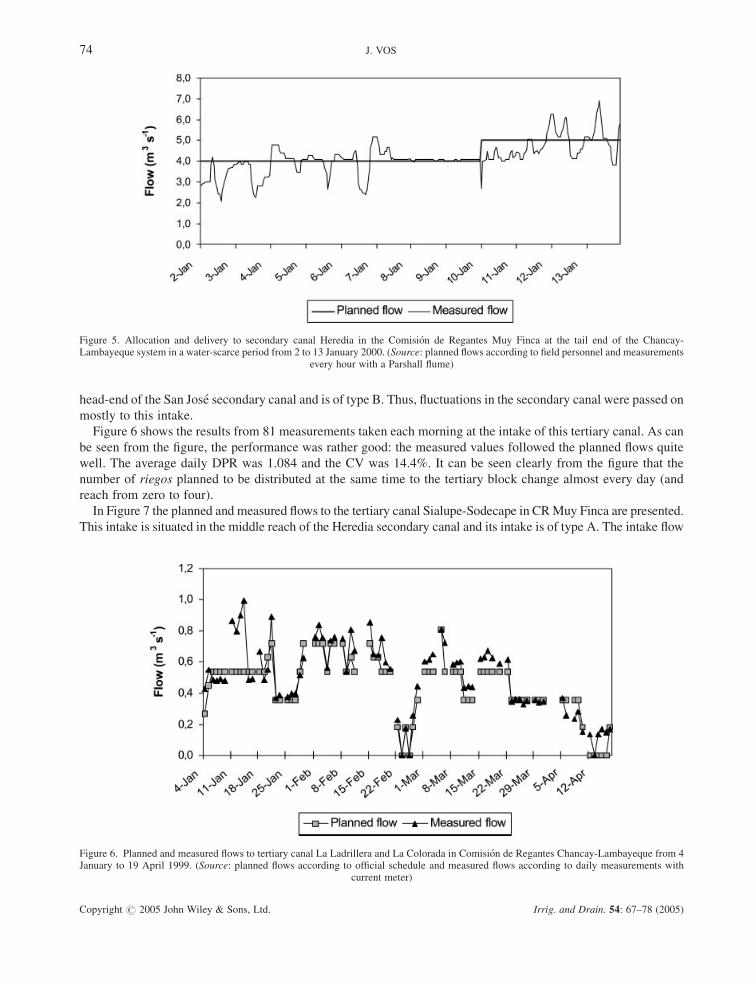
Figure 5 shows the planned and delivered flows to the tail-end CRMuy Finca from 2 to 13 January 2000. This was
a relatively water-scarce period as the river was below the expected level of discharge and the Tinajones reservoir
was almost empty (RWS� 0.6). As can be seen in Figure 5, the actual flow in the tail end of the system was hard to
stabilise in a water-scarce period. Because in the main canal F< 1, all fluctuations were passed on to Muy Finca,
which is situated at the tail end of the Taymi main canal. Nevertheless, as can be seen for the days of 8–10 January
the operators were able to stabilise the flow. The average daily DPR was 0.963 and the CV was 15.6%.
Performance of the secondary canals
The San Jose secondary canal delivers water to 14 tertiary canals. The division structures that divert water
into the tertiary canals are of type A or B. The ‘‘La Ladrillera and La Colorada’’ tertiary canal is situated at the
Figure 4. Planned and measured flows to the secondary canal San Jose in the Comision de Regantes Lambayeque in the period from 1 Februaryto 15 April 1999. (Source: planned flows according to official schedule and measured flows according to four daily measurements with current
meter)
WATER DELIVERY PERFORMANCE IN PERU 73
Copyright # 2005 John Wiley & Sons, Ltd. Irrig. and Drain. 54: 67–78 (2005)
head-end of the San Jose secondary canal and is of type B. Thus, fluctuations in the secondary canal were passed on
mostly to this intake.
Figure 6 shows the results from 81 measurements taken each morning at the intake of this tertiary canal. As can
be seen from the figure, the performance was rather good: the measured values followed the planned flows quite
well. The average daily DPR was 1.084 and the CV was 14.4%. It can be seen clearly from the figure that the
number of riegos planned to be distributed at the same time to the tertiary block change almost every day (and
reach from zero to four).
In Figure 7 the planned and measured flows to the tertiary canal Sialupe-Sodecape in CRMuy Finca are presented.
This intake is situated in the middle reach of the Heredia secondary canal and its intake is of type A. The intake flow
Figure 5. Allocation and delivery to secondary canal Heredia in the Comision de Regantes Muy Finca at the tail end of the Chancay-Lambayeque system in a water-scarce period from 2 to 13 January 2000. (Source: planned flows according to field personnel and measurements
every hour with a Parshall flume)
Figure 6. Planned and measured flows to tertiary canal La Ladrillera and La Colorada in Comision de Regantes Chancay-Lambayeque from 4January to 19 April 1999. (Source: planned flows according to official schedule and measured flows according to daily measurements with
current meter)
74 J. VOS
Copyright # 2005 John Wiley & Sons, Ltd. Irrig. and Drain. 54: 67–78 (2005)
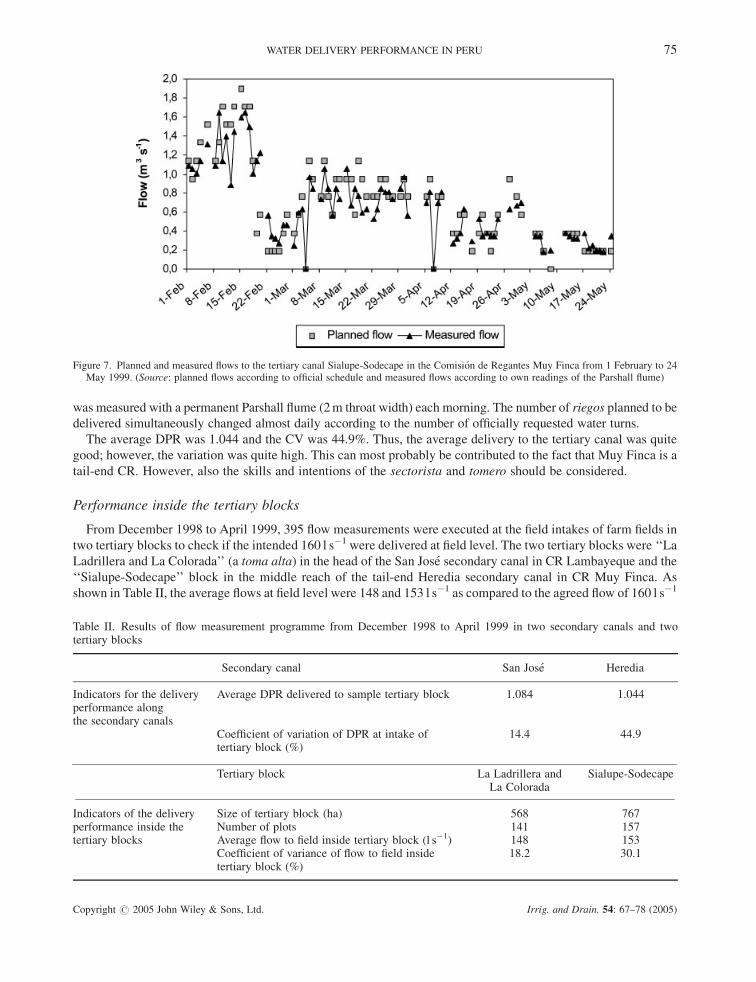
was measured with a permanent Parshall flume (2m throat width) each morning. The number of riegos planned to be
delivered simultaneously changed almost daily according to the number of officially requested water turns.
The average DPR was 1.044 and the CV was 44.9%. Thus, the average delivery to the tertiary canal was quite
good; however, the variation was quite high. This can most probably be contributed to the fact that Muy Finca is a
tail-end CR. However, also the skills and intentions of the sectorista and tomero should be considered.
Performance inside the tertiary blocks
From December 1998 to April 1999, 395 flow measurements were executed at the field intakes of farm fields in
two tertiary blocks to check if the intended 160 l s�1 were delivered at field level. The two tertiary blocks were ‘‘La
Ladrillera and La Colorada’’ (a toma alta) in the head of the San Jose secondary canal in CR Lambayeque and the
‘‘Sialupe-Sodecape’’ block in the middle reach of the tail-end Heredia secondary canal in CR Muy Finca. As
shown in Table II, the average flows at field level were 148 and 153 l s�1 as compared to the agreed flow of 160 l s�1
Figure 7. Planned and measured flows to the tertiary canal Sialupe-Sodecape in the Comision de Regantes Muy Finca from 1 February to 24May 1999. (Source: planned flows according to official schedule and measured flows according to own readings of the Parshall flume)
Table II. Results of flow measurement programme from December 1998 to April 1999 in two secondary canals and twotertiary blocks
Secondary canal San Jose Heredia
Indicators for the delivery Average DPR delivered to sample tertiary block 1.084 1.044performance alongthe secondary canals
Coefficient of variation of DPR at intake of 14.4 44.9tertiary block (%)
Tertiary block La Ladrillera and Sialupe-SodecapeLa Colorada
Indicators of the delivery Size of tertiary block (ha) 568 767performance inside the Number of plots 141 157tertiary blocks Average flow to field inside tertiary block (l s�1) 148 153
Coefficient of variance of flow to field inside 18.2 30.1tertiary block (%)
WATER DELIVERY PERFORMANCE IN PERU 75
Copyright # 2005 John Wiley & Sons, Ltd. Irrig. and Drain. 54: 67–78 (2005)
(average DPRs: 0.925 and 0.956 and CV: 18.2% and 30.1%). This can be regarded as a reasonably good
performance. The farmers in the tail-end block Sialupe-Sodecape clearly suffered more from variations in flows at
field level than the farmers in La Ladrillera and La Colorada. The large variance is clearly an effect of the large
variance (CV of 44.9%) in the DPR of the flow delivered to the Heredia secondary canal in the same period.
DISCUSSION
Skills of the operators
Plusquellec et al. (1994), Pradhan (1996) and Horst (1998) strongly advise not to use manually operated,
gradually adjustable, vertical-sliding gates, especially not in situations with flexible water scheduling. Because of
unsteady flow, lag time, tampering and lack of transparency, the unskilled operators are supposed not to be able to
deliver the water according to the schedule.
However, only a few studies have addressed actual practices of the operators and related them to the
infrastructure. Five studies that do show the capabilities of the operators are: Van der Zaag (1992), Murray-
Rust and Snellen (1993), Clemmens et al. (1994), Sloan (1997) and Godaliyadda et al. (1999). These examples
fromMexico, Argentina, Arizona and Sri Lanka show the great ability of the operators (in Arizona even better than
the computer) to control water flows with sliding gates. By experience they know under different conditions how to
change the gate settings to get the wanted discharges and water levels.
In Chancay-Lambayeque the gate settings of the main canal are determined by the head engineer of ETECOM.
As the lag time is 12 hours he uses the main canal as a buffer. The intake of the main canal is not measured. Its
regulation depends on the deliveries to the secondary canals. If all secondary canals receive the planned flow the
main intake of the main canal is adjusted in such a way that the water level of the last part of the main canal is more
or less constant. This can be regarded as a ‘‘manual feedback loop’’.
Also the sectoristas regard their secondary canal as a closed system. The sectorista receives a certain volume of
water from the main canal according to the total number of riegos to be delivered to the tertiary blocks that day. He
can monitor this inflow by reading the Parshall flume or by means of a current meter flow measurement. This flow
entering the secondary canal is divided proportionally over the tertiary canals so as to guarantee all blocks their
planned riegos of 160 l s�1. The operators use their knowledge of the hydraulic sensitivity of each tertiary intake to
regulate the flows. For example, the intake of the tertiary block ‘‘La Ladrillera and La Colorada’’ along the San
Jose secondary canal is the first to suffer from an unscheduled negative flow change from the main canal. The
intake is of type B (F> 1). The sectorista checked this toma alta first. In this way he can distribute the flow along
the secondary canal in absolute volumes without measurement at the tertiary intakes nor at field level.
The key aspect in understanding water delivery are the illegal water turns sold to the water users by the
sectoristas. They can create an illegal water turn (called riego volante) in two ways. First, they can sell water
directly to a farmer, but register the turn as a turn to fill a canal. Second, they try to deliver less than the planned
160 l s�1 per riego to a farmer in order to savewater to deliver an illegal water turn. By distributing 15 simultaneous
turns of 150 l s�1 the sectorista can create a continuous illegal flow of 150 l s�1. Two hours of riegos volantes sold
at the normal price already yield more money for the sectorista than his daily wage. It is most probable that the
illegal money made by the sectorista partly travels up to higher levels in the WUA (in a similar way as found in
India by Wade, 1982). However, the farmers know this, and they are very keen on monitoring their own official
water turns and discovering any illegal water turns. Thus, the operators as well as the farmers are constantly
monitoring the water flows.
Organisational structure results in high accountability by pressure from the users
Skills alone are not sufficient to have good water delivery performance. The operators (directly or via their
employers) should be held accountable for the water delivery by effective institutions that guarantee the delivery of
agreed volumes of water (against payment) (Malano and Van Hofwegen, 1999). The operators in Chancay-
Lambayeque are held accountable by the users by mechanisms internal to the WUA (elections, complaints, etc.)
and mechanisms of pressure external to the WUA (protests in the street, in newspapers or on the radio).
76 J. VOS
Copyright # 2005 John Wiley & Sons, Ltd. Irrig. and Drain. 54: 67–78 (2005)
These mechanisms of accountability are effective because the boards of the CRs are sensitive to the claims of the
water users since they need the support of water users to get re-elected at the next elections for the board. Being a
board member could be remunerative if money is being made by selling of water turns outside the official schedule.
In the end the social power balance between the water users, sectorista and board of the CR results in a relatively
good water delivery performance.
However, accountability enforcement could be improved if flow measurement structures were installed at the
intakes of the tertiary blocks and more complete information was available to the users about the schedule of the
water turns.
Mutual control of the users in the tertiary block
The cost of a water turn is high to a water user. They not only pay US$2 per hour of 160 l s�1, they also put a lot
of labour in requesting the turns. Therefore, they guard very closely the actual delivery of the water inside the
tertiary block. Most of the time several water users receive their water turn simultaneously. This means the water
flow has to be split up by the water users themselves. Within the tertiary block the mutual social control among the
water users is usually high.
Whether or not deprived farmers can actually correct the water stealing and get their full share depends on social
power relations. It is easier for a big landowner to steal from a small landowner without punishment than the other
way around. However, the differences in water delivery were not big and small farmers use their own ‘‘weapons of
the weak’’ to struggle for their rights. An example is a group of small farmers that set fire to a young sugar-cane
field of a big landowner who was repeatedly stealing part of their water.
CONCLUSIONS
The main purpose of this paper was to assess and understand the water delivery performance of a large-scale
irrigation system with volumetric water allocation, scheduling, payment and delivery.
The Chancay-Lambayeque irrigation system is a system that has a delicate balance between supply and demand.
In normal years the demand of the officially allowed crops can be met (RWS� 0.8). In dry years severe water stress
occurs (RWS � 0.6). Water turns are scheduled on request and paid according to volume a day in advance. From
the flow measurements at the entrance of two secondary canals (average daily DPR¼ 1.049 and 0.963; with
CV¼ 15.3 and 15.6%), at the entrance of two tertiary canals (average daily DPR¼ 1.084 and 1.044; with
CV¼ 14.4 and 44.9%), and at field level (DPR¼ 0.925 and 0.956; with CV¼ 18.2 and 30.1%) it was concluded
that the delivery performance was relatively high.
The three main factors influencing this good performance were: the high degree of accountability of the Water
Users’ Association towards the water users, the skills and experience of the operators to deal with the—difficult to
operate—sliding gates, and the high degree of mutual social control among the water users. The main conclusion
is that where some authors see the operator and water users, the human element, as a ‘‘disturbing’’, or at least
limiting factor, in this study the operators and water users were not disturbing. Rather, the human element proved
to be a very positive factor, making the system function in spite of the difficulties posed by the irregular river water
supplies, complex on-request scheduling for 22 200 smallholders, difficult to operate sliding gates, lack of
measurement structures, and low levels of formal training.
Understanding this remarkable finding is only possible if institutional factors, technical factors, and their
interaction are taken into consideration.
ACKNOWLEDGEMENTS
This article is based on a PhD research financed by the Wageningen University and Research Centre. The author
would like to thank Professor Linden Vincent, and Rutgerd Boelens, Alex Bolding, Phillipus Wester and Margreet
Zwarteveen of the Irrigation and Water Engineering Group for comments on earlier drafts of this article.
WATER DELIVERY PERFORMANCE IN PERU 77
Copyright # 2005 John Wiley & Sons, Ltd. Irrig. and Drain. 54: 67–78 (2005)
REFERENCES
Barnett T. 1977. The Gezira Scheme: An Illusion of Development. F. Cass, London.
Bottrall AF. 1995. Overview: irrigation management research—old themes, new contexts. Water Resources Development 11(1): 5–10.
Callejo I. del, Vos JMC. 2000. Institutional options for irrigation management: Chancay-Lambayeque, coastal Peru. CWP Research Paper No. 9,
Irrigation and Water Engineering Group, Wageningen University.
Clemmens AJ, Sloan G, Schuurmans J. 1994. Canal-control needs: example. Journal of Irrigation and Drainage Engineering 120(6): 1067–
1085.
Crump ES. 1922. A Note on the Moduling of Irrigation Channels (Typescript).
Godaliyadda GGA, Renault D, Hemakumara HM, Makin IW. 1999. Strategies to improve manual operation of irrigation systems in Sri Lanka.
Irrigation and Drainage Systems 13(1): 33–55.
Grimble RJ. 1999. Economic instruments for improving water use efficiency: theory and practice. Agricultural Water Management 40: 77–82.
Halsema GE. van, Murray-Rust DH. 1999. Hydraulic flexibility as a computational tool for the determination of operational strategies.
Proceedings of 1999 USCID Workshop; Modernization of Irrigation Water Delivery Systems, USCIDI, Denver; 663–679.
Horst L. 1998. The Dilemmas of Water Division: Considerations and Criteria for Irrigation System Design. International IrrigationManagement
Institute: Colombo.
Horst L. 1999. The failure of adjustable irrigation technology, the options for change and the consequences for research. Agricultural Water
Management 40(1): 101–106.
IMAR Costa Norte. 1997. Gestion del Agua de Riego en el Valle Chancay-Lambayeque, Situacion Actual. Libro de Trabajo 8, IMAR Costa
Norte, Chiclayo, Peru.
Malano HM, van Hofwegen PJM. 1999. Management of Irrigation and Drainage Systems, A Service Approach. IHE Monograph 3,
A.A.Balkema: Rotterdam.
Murray-Rust DH, Snellen WB. 1993. Irrigation System Performance: Assessment and Diagnosis. IIMI, ILRI and IHE: Colombo, Sri Lanka.
Pant N. 1983. Major and medium irrigation projects. Analysis of cost escalation and delay in completion. Economic and Political Weekly 17: 26.
Plusquellec H, Burt C, Wolter HW. 1994. Modern water control in irrigation, concepts, issues, and applications. World Bank Technical Paper,
No. 246, Irrigation and Drainage Series, Washington.
Plusquellec HL, McPhail K, Polti C. 1990. Review of irrigation system performance with respect to initial objectives. Irrigation and Drainage
Systems 4(4): 313–327.
Postel S. 1992. The Last Oasis, Facing Water Scarcity. Earthscan Publications: London.
Pradhan TMS. 1996. Gated or ungated water control in government-built irrigation systems, comparative research in Nepal. PhD thesis,
Wageningen Agricultural University.
Repetto R. 1986. Skimming the water: rent-seeking and the performance of public irrigation systems. Research Report, No. 4, World Resources
Institute.
Sloan G. 1997. Evolution from manual canal control to remote canal control. Proceedings of the International Workshop on Regulation of
Irrigation Canals: State of the Art of Research and Applications, April 1997, Marrakech, Morocco; 203–206.
Thobani M. 1995. Peru, Enfoque de la Ordenacion del Agua y el Desarrollo de la Irrigacion Basado en el Usuario. Informe No. 13642-PE,
Oficina Regional para America Latina y el Caribe, World Bank.
Uphoff N, Wickramasinghe MI, Wijayaratna CM. 1990. ‘‘Optimum’’ participation in irrigation management: issues and evidence from Sri
Lanka. Human Organization 49(1): 26–40.
Urban K. 1990. Grossbewasserungsanlagen in Peru. PhD thesis (in German), Verlag Breitenbach Publishers, Saarbrucken, Germany.
Vos JMC. 2002. Metric matters: performance and organisation of volumetric water control in large-scale irrigation in the north coast of Peru.
PhD thesis, Wageningen University.
Wade R. 1982. The system of administrative and political corruption: canal irrigation in South India. Journal of Development Studies 18(3):
287–328.
Zaag P. van der. 1992. Chicanery at the canal, changing practice in irrigation management in western Mexico. PhD thesis, Wageningen
Agricultural University.
78 J. VOS
Copyright # 2005 John Wiley & Sons, Ltd. Irrig. and Drain. 54: 67–78 (2005)