Understanding the Future of a Large Technical System
92
DEGREE PROJECT IN THE FIELD OF TECHNOLOGY MECHANICAL ENGINEERING AND THE MAIN FIELD OF STUDY INDUSTRIAL MANAGEMENT, SECOND CYCLE, 30 CREDITS STOCKHOLM, SWEDEN 2021 Understanding the Future of a Large Technical System Trends and drivers of Swedish residential water usage DELIL DÖLCÜ MARCUS ANDERSSON KTH ROYAL INSTITUTE OF TECHNOLOGY SCHOOL OF INDUSTRIAL ENGINEERING AND MANAGEMENT
-
Upload
khangminh22 -
Category
Documents
-
view
0 -
download
0
Transcript of Understanding the Future of a Large Technical System

DEGREE PROJECT IN THE FIELD OF TECHNOLOGY
MECHANICAL ENGINEERING
AND THE MAIN FIELD OF STUDY
INDUSTRIAL MANAGEMENT,
SECOND CYCLE, 30 CREDITS
STOCKHOLM, SWEDEN 2021
Understanding the Future of a Large
Technical System
Trends and drivers of Swedish residential water
usage
DELIL DÖLCÜ
MARCUS ANDERSSON
KTH ROYAL INSTITUTE OF TECHNOLOGY
SCHOOL OF INDUSTRIAL ENGINEERING AND MANAGEMENT


Understanding the Future of a Large
Technical System Trends and drivers of Swedish residential water usage
by
Delil Dölcü
Marcus Andersson
Master of Science Thesis TRITA-ITM-EX 2021:249
KTH Industrial Engineering and Management
Industrial Management
SE-100 44 STOCKHOLM

Stora Tekniska Systems Framtid Trender och drivkrafter för vattenanvändning i svenska
hushåll
av
Delil Dölcü
Marcus Andersson
Examensarbete TRITA-ITM-EX 2021:249
KTH Industriell teknik och management
Industriell ekonomi och organisation
SE-100 44 STOCKHOLM
Master of Science Thesis TRITA-ITM-EX 2021:249
Understanding the Future of a Large
Technical Systems:
Trends and drivers of Swedish residential water usage
Delil Dölcü & Marcus Andersson
Approved
26/05-2021
Examiner
Jannis Angelis
Supervisor
Pernilla Ulfvengren
Commissioner
Kommunalförbundet Norrvatten
Contact person
Daniel Hellström
Abstract Understanding the future of a Large Technical System (LTS) through a sociotechnical analysis
is a complex notion. The authors will investigate the phenomenon by studying residential water
consumption in Sweden. Although Sweden has great access to raw water, compared to many
other countries, it does not justify the fact that consumption patterns have to be unsustainable.
To perceive the future, one will need to have knowledge of history. Therefore, this thesis has
identified 11 drivers that will affect future residential water consumption. From these 11 drivers,
the authors have posed four future scenarios for residential water consumption. The top 3
identified drivers are connected to behaviour and awareness. Thus, implying individuals'
responsibility and accountability will be of greater significance for the sustainable development
of residential water consumption. For this research, the authors have adopted a framework
based on the application of LTS, Multi-Level Perspective (MLP), Scenario building, PESTLE,
and Multi-Criteria Analysis (MCA). The authors have conducted a qualitative study, gathering
data through a literature study and semi-structured interviews. The 18 interviewees covered a
broad spectrum of knowledge, experiences, and general interest in water. By understanding
the dynamics of the system and drivers, the authors will be able to present the gathered
knowledge to stakeholders for possible strategic decisions.
Keywords: Residential Water Consumption, Drivers, LTS, MLP, PESTLE, MCA

Examensarbete TRITA-ITM-EX 2021:249
Utforska de icke-tekniska utmaningarna:
Trender och drivkrafter för vattenanvändning i svenska hushåll
Delil Dölcü & Marcus Andersson
Godkänt
26/05-2021
Examinator
Jannis Angelis
Handledare
Pernilla Ulfvengren
Uppdragsgivare
Kommunalförbundet Norrvatten
Kontaktperson
Daniel Hellström
Sammanfattning Att förstå framtiden för ett stort tekniskt system (LTS) genom en socioteknisk analys innebär
stor komplexitet. Detta kommer att undersökas genom att studera hushållens
vattenförbrukning i Sverige. Även om Sverige har stor tillgång till råvatten, jämfört med många
andra länder, berättigar det inte förekommandet av ohållbara konsumtionsmönster. För att
öka förståelsen av framtiden måste en ha kunskap om historien. Därför har denna avhandling
identifierat 11 drivkrafter som kommer att påverka den framtida hushållens vattenförbrukning.
Från dessa 11 drivkrafter har författarna formulerat fyra framtida scenarier för hushållens
vattenförbrukning. De tre högst rankade identifierade drivkrafterna är kopplade till beteende
och medvetenhet. Detta antyder på att individens enskilda ansvar och skyldigheter är av större
betydelse för en hållbar utveckling av hushållens vattenförbrukning. För denna forskning har
författarna använt sig av ett teoretiskt ramverk som bygger på tillämpningen av LTS, Multi-
Level Perspective (MLP), Scenario building, PESTLE and Multi-Criteria Analysis (MCA).
Författarna har genomfört en kvalitativ studie, där insamling av data härstammar från den
genomförda litteraturstudien och 18 semi-strukturerade intervjuer. De 18 intervjukandidaterna
täckte ett brett spektrum av kunskap, erfarenhet och intresse av vatten. Genom att skapa ett
samband och förstå dynamiken i systemet och drivkrafterna, kommer författarna att kunna
presentera den samlade kunskapen till intressenter för eventuella strategiska beslut.
Nyckelord: Hushållens vattenanvändning, Drivkrafter, LTS, MLP, PESTLE, MCA
Table of Content I List of Figure I
II List of Table I
III List of Abbreviations and Acronyms III
IV Acknowledgement IV
1. Introduction 1
1.1. Purpose & Research Question 3
1.2. Expected Contribution 4
1.3. Delimitations 4
1.4. Thesis sponsor 5
1.5. Disposition of Report 5
2. Theoretical Framework 6
2.1 The Application of LTS 6
2.2 The Application of MLP 7
2.3 Understanding the Future Through Scenario Building 8
2.4 PESTLE 9
2.5 The Developed Framework 10
3. P(L)ESTE Review of the Water System 12
3.1 Political and Legislative 12
3.2 Economy 19
3.3 Sociology 20
3.4 Technology 24
3.5 Environmental 27
4. Methods 30
4.1 Research Design 30
4.2 The Research Process 31
4.3 Research Ethics & Sustainable Contribution 42
5. Results & Analysis 44
5.1 The Results of the Multi-Criteria Analysis 44
5.1 Future Political and Legislative Drivers for Residential Water 45
5.2 Future Economical Drivers for Residential Water 47
5.3 Future Sociological Drivers for Residential Water 48
5.4 Future Technological Drivers for Residential Water 49
5.5 Future Environmental Drivers for Residential Water 51
5.6 Future Drivers and Trends of the Residential Water System 52

6. Discussion 54
6.1 Significance of Drivers 54
6.2 Understanding the Future of a LTS through Sociotechnical Analysis 57
6.3 Future Scenarios of Residential Water Consumption 59
6.4 Scrutiny of Methods 61
6.5 Practical & Theoretical Contribution 62
7. Conclusions 64
7.1. Future Research 65
References 66
Web Pages 66
Literature 67
Articles 68
News articles 76

I
I List of Figure
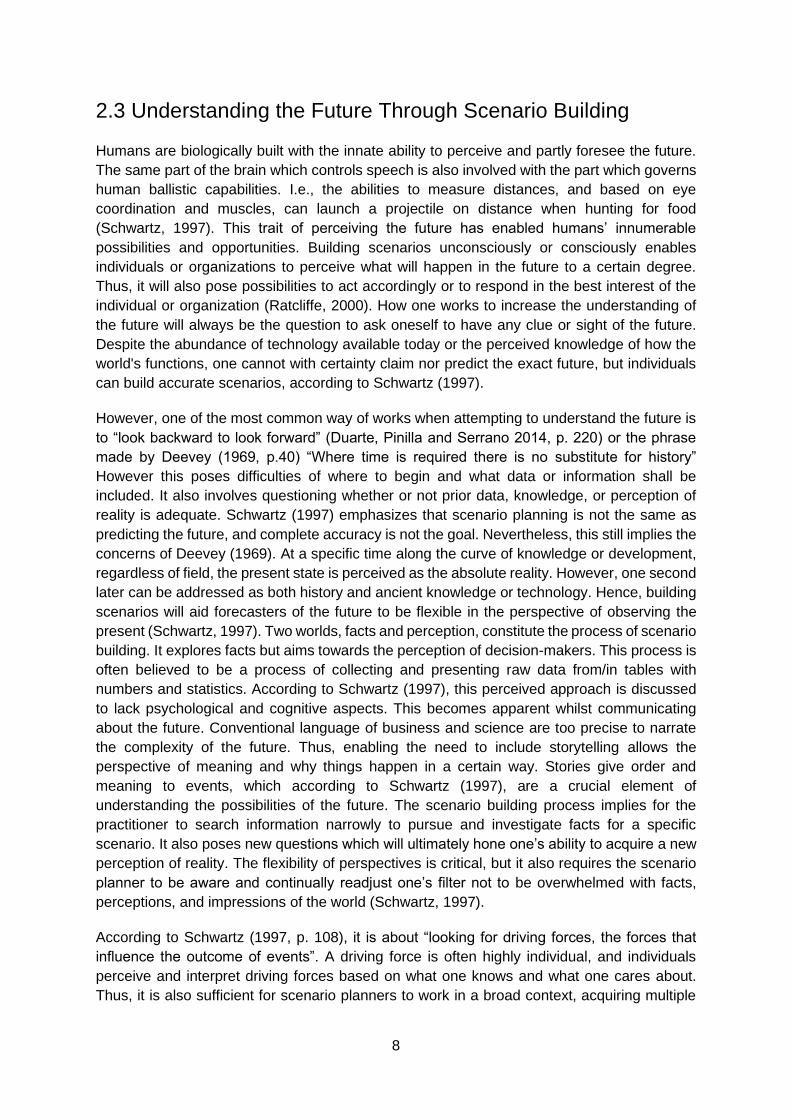
Figure 1: Distribution of water purposes/usage for households in Sweden. Data collected
from Sydvatten (Sydvatten, 2020). ........................................................................................ 2
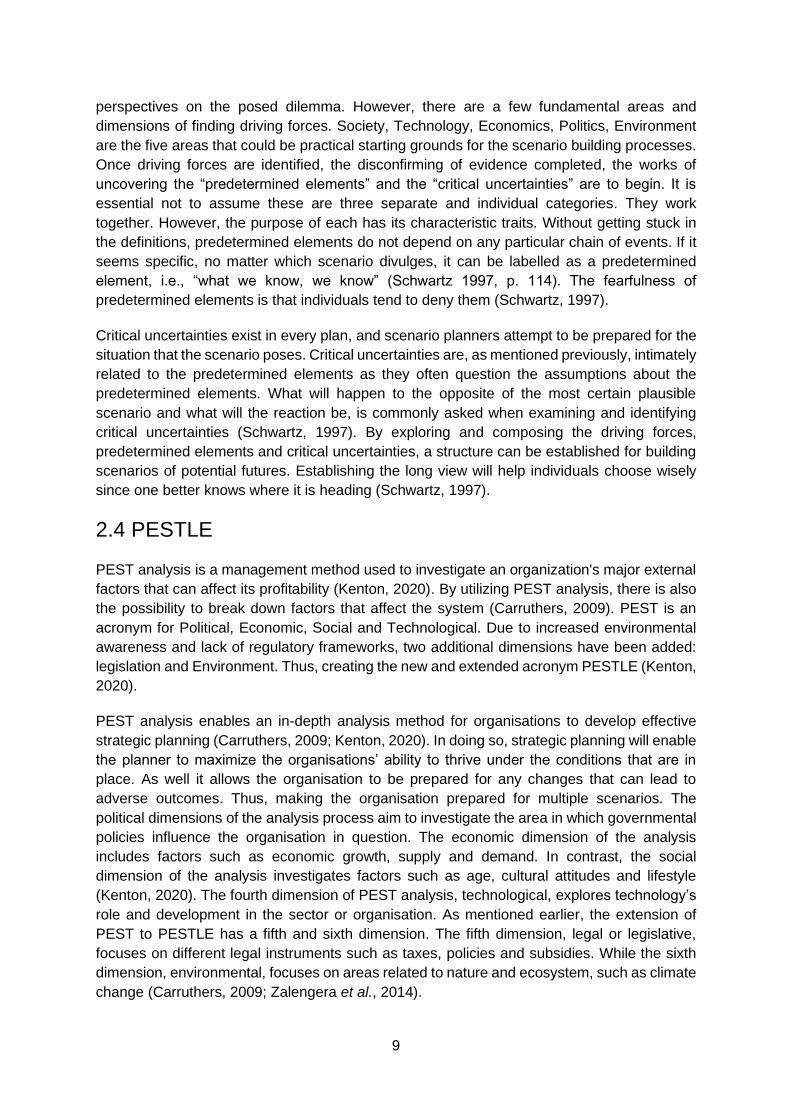
Figure 2: Equations for Mean Daily Water Consumption per Capita and Peak Daily Factor. . 3
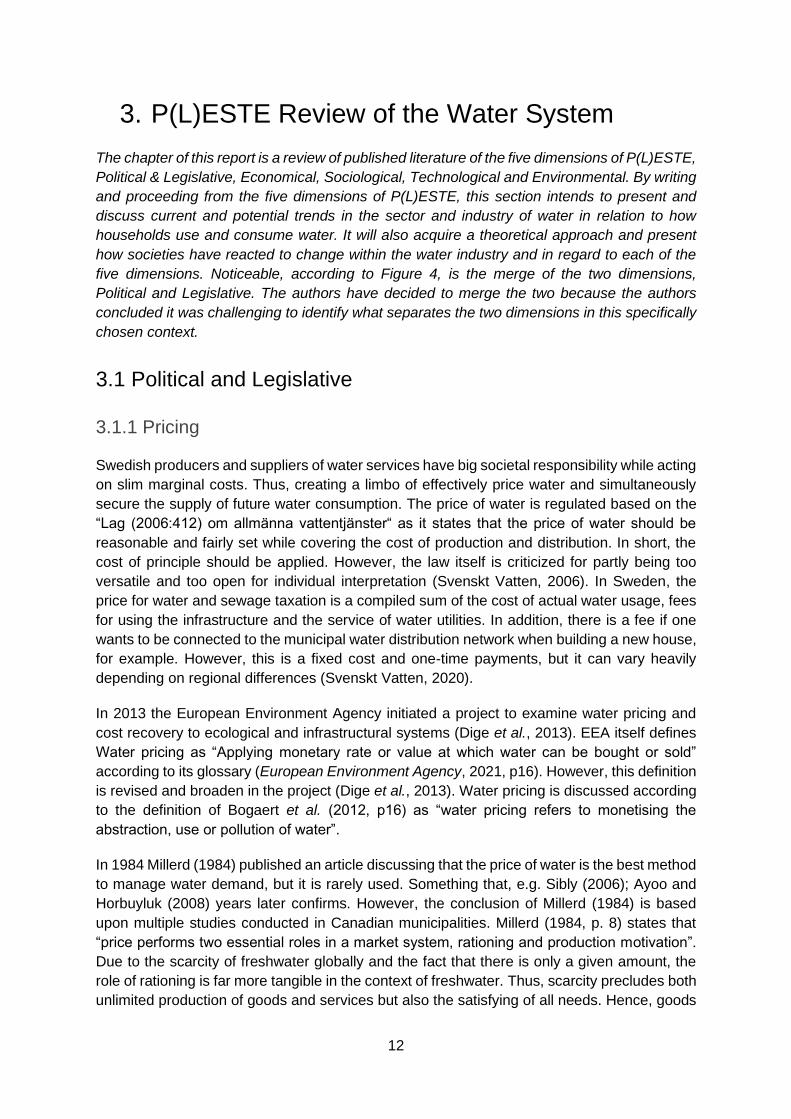
Figure 3: Mean Daily Consumption per Capita for the ten most inhabited counties in Sweden
over 20 years (SCB, no date-a; SCB, no date-b). .................................................................. 3
Figure 4: Illustration of the theoretical and practical approach to the SOI. ........................... 11
Figure 5: A complete illustration of The Research Process. ................................................ 33

II
II List of Table
Table 1: List of keywords used to identify literature in “The Research Process”. ................. 34
Table 2: Listed are the chronological order of every interview completed with additional
information. ......................................................................................................................... 37
Table 3: Presents the compiled results from MCA conducted based on literature and the
Interviews. ........................................................................................................................... 44

III
III List of Abbreviations and Acronyms
Abbreviation and Acronyms Name
IHC Industrialised Housing Construction
LCA Life cycle analysis
LTS Large Technical System
MCA Multi-Criteria Analysis
MDWC Mean Daily Water Consumption per
capita
MRQ Main Research Question
MLP Multi-Level Perspective
PDC Peak Day Consumption per capita
PDF Peak Daily Factor
PESTLE Political, Economical, Sociological,
Technological, Legislative,
Environmental
RQ Research Question
SOI System of Interest
ST-system Sociotechnical Systems
WTP Willingness to Pay

IV
IV Acknowledgement
First of all, we would like to thank Norrvatten for their supporting knowledge and trust. A special
thank you goes out to Daniel Hellström for guiding us through this thesis and the opportunity
given.
The industry has also been very welcoming, and without the interviewees' knowledge and
experience, the accomplishment of this thesis would not be possible. I hope you will find our
results and work highly valuable for the industry. Thank you for the time and knowledge you
shared with us.
We would also like to thank Pernilla Ulfvengren for your support and insight throughout this
thesis. Without your support, this thesis would not have reached the level of structure and
content. Finally, a loving thank you is directed to family and friends for motivating and
supporting us.
Stay safe.
Delil Dölcü & Marcus Andersson
Stockholm, June 2021

1
1. Introduction
Making decisions with less uncertainty of what the future beholds invites a great deal of
potential for strategic decisions. However, conducting such a study introduces a vast number
of complexities. Furthermore, acquiring knowledge of the future can be utilised to improve
current decision support for large investments. A common approach is to build scenarios to
plan for the future since the future is highly uncertain and depends on prior decisions and
outcomes. Many organisations use this to develop their “roadmaps”. However, when it comes
to systems of large scale and complexity, interwoven in society, other influences and external
aspects need to be considered more than just internal aspects. Society is built on an infinite
number of systems that interact, cooperate, and interchange, thus requiring system thinking
to understand the complexities of technical and social systems. An aspect to study, which will
be a significant theme in this thesis, is identifying drivers for consumption trends of natural
resources in a Large Technical Systems (LTS). These drivers will act as Natural Resource
Variables (NRV) within the LTS and have a degree of interchangeability depending on the
studied system. This means that drivers, or NRV, can be excluded or new ones included based
on the system.
Identifying drivers requires identifying and defining the limitations of the studied system by
breaking it down to relevant system components (Hughes, 1983; Joerges, 1988). LTS is
defined as systems containing “messy, complex, problem-solving components” (Hughes
1983, p.1), typically infrastructural and sociotechnical systems. These systems are socially
constructed and shape core societal functions, like the supply of communication,
transportation, energy, Functions with the overall goal to shape societies and enable
individuals to live decent lives. Despite the name LTS, there are other aspects of importance
than the technical. There is also the inclusion of legislative artefacts, regulatory, financial, and
economic, political. Although all of these aspects are argued to be socially constructed and
adapted in the system, it can be argued that there must be a driving reason for this. This
presents an opportunity to investigate and partially attempt to understand what this will mean
for the future. It may also enable opportunities to adjust functions and adapt to the system's
dynamics. Previous literature regarding LTS stems from historical studies and primarily
discusses change in past tense.
From this research, numerous modified models have been developed, for example, Multi-
Level Perspective (MLP). MLP originates from studies of understanding transition and regime
shifts, stemming from sociology in technology (Geels and Kemp, 2007). MLP will synthesise
the perspectives of LTS in this thesis as it is a tool to comprehend the components of the LTS.
Through these models, PESTLE analysis (Carruthers, 2009) has been identified as a
complementing tool. The synthesis of LTS, MLP, PESTLE, and Multi-Criteria Analysis (MCA)
will hopefully illuminate and educate the understanding of behavioural and consumption
patterns. As the system shapes the individuals, the individuals shape the system itself. There
is no random act of decision since individuals, functions and system owners make rational
strategic decisions given the circumstances. However, if one does not understand the
dynamics of the system, they could be perceived and interpreted as irrational and stochastic
choices of act rather than rational decisions.

2
Natural resources are also qualified as system artefacts (Hughes,1987; Joerges, 1988). For
example, water covers 71% of the globe's surface, making it a significant system artefact
(Gleick, 1993). The System Of Interest (SOI) (Walden et al., 2015) of this thesis is the
household water consumption and supply. What drives the individual's consumption of natural
resources in their everyday life will be of focus. Specific for this study is the residential water
consumption and its relation to the urban water system in Sweden. Given that the residential
water system achieves a majority of the criteria and characteristics of a LTS. The authors pose
that SOI is equal to LTS, thus be approached accordingly in this thesis.
Figure 1: Distribution of water purposes/usage for households in Sweden. Data collected from
Sydvatten (Sydvatten, 2020).
This study will observe residential water consumption as a system of the LTS of the water
utility sector. Residential water usage is the consumption of indoor and outdoor water
activities. It includes, for example, water for drinking, food preparation, washing clothes,
dishing, flushing toilets, showering, gardening, outdoor swimming pool and washing vehicles
(Holm and Schulte-Herbruggen, 2021). For distribution of water purposes in Swedish
households. See Figure 1. Residential water consumption is usually presented in the format
of water used in litres per day per capita. It is estimated to be approximately 140 litres per day
in Sweden (Svenskt Vatten, 2020). Studies of forecasting within the water sector are usually
built and compiled measurements of historical and statistical data. Two metrics commonly
used are Mean Daily Water consumption per Capita (MDWC) and Peak Daily Factor (PDF).
Collectively they give an understanding of the volume and intensity of water consumption. See
Figure 2 for the correlation between the two equations. This thesis will aim to compile the
existing knowledge of drivers through published literature and conducting interviews.
Henceforth, the authors will build scenarios to understand the future to establish new
perspectives through qualitative data rather than quantitative data (Schwartz, 1997).

3
Figure 2: Equations for Mean Daily Water Consumption per Capita and Peak Daily Factor.
As is both stated in Joerges (1988) and Geels et al. (2018), LTS are often taken for granted
and perceived as a non-compromised flow of products or services. However, its fundamental
purpose and weight to the community are not tangible or even visible until disaster erupts
(Joerges, 1988). In this research, the water system is expected to change in the future due to
environmental factors and anthropogenic pressure (Gleick, 2003; Kiparsky et al., 2013; Ercin
and Hoekstra, 2014; McCarthy et al., 2020). This incites to nurture the relationship between
humans, technology and the environment. Digitalization and urbanization are also perceived
to be contributing factors to future residential water consumption trends, adding additional
layers of uncertainty and complexity (Gleick, 2003; Kiparsky et al., 2013; Ercin and Hoekstra,
2014; McCarthy et al., 2020). See Figure 3 for the development of Swedish residential water
usage every five years from 1995 to 2015.
Figure 3: Mean Daily Consumption per Capita for the ten most inhabited counties in Sweden
over 20 years (SCB, no date-a; SCB, no date-b).
1.1. Purpose & Research Question
The purpose of this thesis is to understand how the LTS, residential water consumption, will
develop in the future. Furthermore, this research will attempt to investigate theories on
sociotechnical analysis by applying them to residential water consumption.
The answering of (Research Question) RQ1-2 will aid in the attempt to answer (Main Research
Question) MRQ:
MRQ: How is the development of LTS understood through a sociotechnical analysis?
4
RQ1: Which are the drivers for the development of MDWC and PDF?
RQ2: Which are the key drivers of significance for future residential water consumption?
1.2. Expected Contribution
This thesis is expected to contribute theoretically by adding layers to existing research of LTS
and MLP. Expecting that this may be replicated and lead to additional developed knowledge
contributing to theory and the potential application in the practical development of different
systems. As this is an uncharted territory within the Swedish water sector, this can hopefully
catapult the research for further development. Development that includes further investigation
and analysis of complex systems and its many different components. This thesis should also
be enacted as a blueprint of how to identify and map external factors on a sub-system.
Furthermore, the practical contribution of this thesis will hopefully illuminate and educate the
whole spectrum of stakeholders, ranging from consumers to producers, authorities, and
governments. Hopefully, the stakeholder will realize the consequences of their actions and
initiatives on the future of a system and the SOI. Presenting the drivers which are extracted
from the knowledge of scholars and industry professionals and compared and discussed
through published literature in a comprehensible manner will be one way of achieving this. It
is also expected that the thesis sponsor, Norrvatten, will be able to use the investigated drivers
to more accurately focus on these drivers as factors of effect on the system. Also, it will
hopefully give Norrvatten an understanding of which drivers have more significance on the
system so that an appropriate amount of time and energy is placed on these.
1.3. Delimitations
The urban water system is large, and delimitations must be made to extract the most out of
the knowledge and produce a report with valuable content to continue the research area.
Although the initial focus of the thesis was on the individual level, it is vital to include all levels
of the system perspective, including industrial and functional (Blomkvist and Hallin, 2015). The
project is set to identify and understand future residential water consumption drivers and water
trends in Sweden. This includes private houses and apartment buildings. It will focus only on
the urban water system and the 90 % of Swedish inhabitants connected to the water and
sewage system. The project will only focus on direct water consumption, i.e., consumption for
hygiene, water used in faucets and water appliances such as dishwashers and washing
machines, irrigation technology. It will not consider nor discuss virtual water consumption. See
(e.g., Matthews, 2014) for further explanation.
The study will predominantly only consider and manage qualitative data from the empirical
data collection. Therefore, simple figures and mathematical expressions are not excluded but
limited in number. This is motivated partly because most previous published literature covers
these areas and that data provided and circulated in the industry sector is sometimes deemed
inaccurate (Mårtensson et al., 2018; Hammarlund, Törneke and Siegwan, 2020). Thus, the
report will not quantify the statistical implication or probability of the drivers for future water
consumption since data will not be collected. Therefore, the authors cannot conclude nor
quantify any probabilities for scenarios or trends to happen. However, based on a thoroughly

5
conducted literature review and interviews, an elaborated discussion will be completed
discussing the implications and effects of different scenarios and drivers for the future.
1.4. Thesis sponsor
This thesis is sponsored by the municipal association Norrvatten. They are responsible for
producing and delivering fresh drinking water to their 14 member municipalities in the Northern
part of the Stockholm region. Each municipality is responsible for their water distribution
network. Approximately 700 000 people rely on the vision and deliverance of Norrvatten,
including large hospitals and the airport of Arlanda. Norrvatten is Sweden's fourth largest drink
water producer in water volume production, with approximately 60 employees.
Görvälnätverket gets its raw water from where it is located, in Mälaren, specifically in the
municipality of Järfälla. The production site has the capacity to produce 1 600 litre water per
second (Norrvatten, no date).
1.5. Disposition of Report
Introduction. An introductory chapter by framing the practical and academic context for the
phenomenon to study with additional educational knowledge regarding the research area. The
purpose to fulfil and research questions to be answered are followed. Lastly, the expected
contribution of the thesis and the thesis sponsor is presented. Theoretical Framework. A
comprehensive chapter where the theoretical foundation and framework is established. The
theoretical perspectives of LTS, MLP, Scenario Building and PESTLE are introduced.
P(L)ESTE Review of the Water System. This chapter is a thoroughly written and explored
literature study originating from the dimensions of PESTLE individually and structured
accordingly. However, the dimensions of Political and Legislative have been combined.
Methods. A descriptive chapter of the methodologies chosen and applied in the study. It
includes an overall description of the research design and structure, providing information for
each. The processes of collecting and analysing literature and the empirical data is also
described individually. A thorough description of methods applied and an explanation of MCA
is also included. The chapter is ended with a complete presentation of the research's ethical
stance and contribution. Results and Analysis. The completed MCA presents the empirical
and literary findings of the study conducted. A summary score for each driver identified can
be read with additional analysis motivating the scoring for each driver and criteria. Discussion.
The chapter discusses the scientific implication of the empirical and literary findings and the
entirety of the study. Answering the research questions of what drivers will be decisive for the
future of residential water consumption and posing potential future scenarios and a discussion
of the overarching research formulation and methods applied. Conclusions. The last chapter
concludes the thesis by outlining the main arguments of discussion and answers to the
proposed research questions. The drivers identified in the results will be concluded, and future
development of the research is also presented.
6
2. Theoretical Framework
This chapter will lay the theoretical foundation and approach of this study. This section
introduces the application LTS and MLP for this study. The often discussed dyad of LTS and
MLP will further lead to a section focusing on scenario building, specifically for the future of a
LTS. Ultimately it will lead to a section on the analytical method PESTLE. PESTLE will
complement the prior perspective of LTS, MLP and Scenario Building to further and explicitly
create a structure of potential and identified areas to investigate.
2.1 The Application of LTS
Joerges (1988) argues for LTS representing a societal dilemma, as this magnitude of a system
cannot be perceived as a non-evolutionary black box. The system cannot be taken for granted
despite the stable facade and the calm it emits since change usually happens incrementally
and radical change happens sporadically and seldomly. This partly fraudulent natural state of
mind cannot induce a satisfactory level of stability. This system of either physical or non-
physical artefacts (Hughes, 1987) is a practical constellation of basic systems theory, “the
whole is greater than the sum of the parts”. The parts can be substituted, disposed of or
redesigned (Joerges 1988, p. 27). However, if characteristics or artefacts change in the
system, the system will adjust accordingly (Hughes, 1987). Therefore, it is essential to
consider aspects of system dynamics and change since the system has an “irreducible
potential for controversy” (Joerges 1988, p. 27). The social base must remain precautious due
to reasons of structural dependency. Failure to deliver or default tends to reproduce large
scale conflicts (Joerges, 1988).
Besides the historical evidence of applying LTS and MLP in similar sectoral industries (e.g.,
Hughes, 1983; Gleick, 2003; Geels et al., 2018) and specifically in the water industry (e.g.,
Kiparsky et al., 2013; Blomkvist and Nilsson, 2017). The theories also have the advantage of
being adaptable when studying dynamics and change (Geels, 2004). The configured
approach by Geels (2004) also discusses and concludes the situational importance of
distinctively analyse Socio-technical systems (ST-systems), actors and institutions. This
argument can somewhat contradict the common practice in studies of science and technology,
where conclusions usually emphasize “seamless webs” and the complexity of reality.
However, this distinction allows exploration of the interaction between categories and entities
according to (Geels, 2004; Geels and Kemp, 2007).
The LTS perspective is discussed to be particularly useful in analysing long-term dynamics.
Creating a structured approach on how to map, understand and analyse a dynamic system.
However, according to Geels (2004), it also enables the “black box of institutions”. It
conceptualises dynamic sociological structures to understand humans’ actions while not
confining space for intelligent perception and strategic action. Conclusively studies of LTS are
complex, and the sociotechnical approach aids the process of understanding it better. It
focuses on how innovation processes often create new sociotechnical systems by co-
construction of multiple elements and technological changes. It also involves the changes in
infrastructures, markets, regulations, user practices (Geels et al., 2018).

7
2.2 The Application of MLP
In centrality, MLP is built on the claim that system changes are “governed by the interplay of
factors and actors operating at different levels of aggregation and time scale” (Blomkvist and
Nilsson 2017, p. 4). The analytically observed and examined levels are known as niches,
regimes, and landscapes (Geels, 2004; Geels and Kemp, 2007; Geels et al., 2018).
Niches refer to novelties that deviate or originate from one or more dimensions from the
existing system. The novelties can be new behavioural practice, new business models or new
technology or a combination of these. New radical innovation or technology may have
difficulties competing in existing systems due to poor cost-efficiency or other characteristics.
Meaning that specific applications, geographical areas, markets, and subsidy programs can
act as a room for incubation, referred to as niches to compete against mainstream markets
(Geels et al., 2018).
The sociotechnical regime includes the interdependent selection of industries, consumption
patterns, supply chains, policies, and infrastructure—tangible elements of the system which
actors and social groups reproduce. The perception and action of these actors and social
groups are the results of rules and institutions, routines, and social norms. Heuristic and rules-
of-thumb are additional intangible elements referred to as socio-technical regimes, resulting
in incremental change and path-dependent processes. Characteristically, lock-in effects are
evident and a consequence of sunk investments in large infrastructure, skills, and factories. In
addition, regulations could be perceived as favourable. They may shape all stakeholders'
cognitive routines, social norms, and behavioural patterns (Geels et al., 2018).
The sociotechnical landscape addresses the exogenous environment, which directly
influences and implicates the niche and regime actors. What it will mean for the systems is
not determined. It may implicate gradual changes through cultural preferences, demographic
changes, or macro-political developments. Macro-economic recessions or natural resource
depletion could also be a factor of short-term shock and could also be a source of exogenous
factors implicating the sociotechnical landscape (Geels et al., 2018).
These dimensions guide and orient activities of social groups. The key is understanding that
the dimensions presented are interrelated dynamic dimensions and flow in all directions. The
elements are co-structuring one and another. Geels and Kemp (2007) argue there is no
autonomous act of actions in social groups. It is a consequence in the context of social
structures and regulative, normative, and cognitive rules. The same way companies respond
to problems within existing technology through engineering insights and managerial lessons.
Products are embedded in consumption patterns through routines and cultural meanings
(Geels and Kemp, 2007). Infrastructure largely determines the use of economics, and
practices, in turn, are reproduced due to partly economics but also specific rules. The rules
themselves consist of the search for heuristics and the possibility for including problem
agendas, guiding principles, standards, and compliance with government regulation. It may
also mean that companies and individuals acquire and feel a certain sense of attachment. It
is shown that consumers develop certain lifestyles, routines and understandings which can be
perceived as rules. These rules do not exist independently. They are linked together by a set
of rules in a semi-coherent fashion and addressed as a regime (Geels and Kemp, 2007).
8
2.3 Understanding the Future Through Scenario Building
Humans are biologically built with the innate ability to perceive and partly foresee the future.
The same part of the brain which controls speech is also involved with the part which governs
human ballistic capabilities. I.e., the abilities to measure distances, and based on eye
coordination and muscles, can launch a projectile on distance when hunting for food
(Schwartz, 1997). This trait of perceiving the future has enabled humans’ innumerable
possibilities and opportunities. Building scenarios unconsciously or consciously enables
individuals or organizations to perceive what will happen in the future to a certain degree.
Thus, it will also pose possibilities to act accordingly or to respond in the best interest of the
individual or organization (Ratcliffe, 2000). How one works to increase the understanding of
the future will always be the question to ask oneself to have any clue or sight of the future.
Despite the abundance of technology available today or the perceived knowledge of how the
world's functions, one cannot with certainty claim nor predict the exact future, but individuals
can build accurate scenarios, according to Schwartz (1997).
However, one of the most common way of works when attempting to understand the future is
to “look backward to look forward” (Duarte, Pinilla and Serrano 2014, p. 220) or the phrase
made by Deevey (1969, p.40) “Where time is required there is no substitute for history”
However this poses difficulties of where to begin and what data or information shall be
included. It also involves questioning whether or not prior data, knowledge, or perception of
reality is adequate. Schwartz (1997) emphasizes that scenario planning is not the same as
predicting the future, and complete accuracy is not the goal. Nevertheless, this still implies the
concerns of Deevey (1969). At a specific time along the curve of knowledge or development,
regardless of field, the present state is perceived as the absolute reality. However, one second
later can be addressed as both history and ancient knowledge or technology. Hence, building
scenarios will aid forecasters of the future to be flexible in the perspective of observing the
present (Schwartz, 1997). Two worlds, facts and perception, constitute the process of scenario
building. It explores facts but aims towards the perception of decision-makers. This process is
often believed to be a process of collecting and presenting raw data from/in tables with
numbers and statistics. According to Schwartz (1997), this perceived approach is discussed
to lack psychological and cognitive aspects. This becomes apparent whilst communicating
about the future. Conventional language of business and science are too precise to narrate
the complexity of the future. Thus, enabling the need to include storytelling allows the
perspective of meaning and why things happen in a certain way. Stories give order and
meaning to events, which according to Schwartz (1997), are a crucial element of
understanding the possibilities of the future. The scenario building process implies for the
practitioner to search information narrowly to pursue and investigate facts for a specific
scenario. It also poses new questions which will ultimately hone one’s ability to acquire a new
perception of reality. The flexibility of perspectives is critical, but it also requires the scenario
planner to be aware and continually readjust one’s filter not to be overwhelmed with facts,
perceptions, and impressions of the world (Schwartz, 1997).
According to Schwartz (1997, p. 108), it is about “looking for driving forces, the forces that
influence the outcome of events”. A driving force is often highly individual, and individuals
perceive and interpret driving forces based on what one knows and what one cares about.
Thus, it is also sufficient for scenario planners to work in a broad context, acquiring multiple
9
perspectives on the posed dilemma. However, there are a few fundamental areas and
dimensions of finding driving forces. Society, Technology, Economics, Politics, Environment
are the five areas that could be practical starting grounds for the scenario building processes.
Once driving forces are identified, the disconfirming of evidence completed, the works of
uncovering the “predetermined elements” and the “critical uncertainties” are to begin. It is
essential not to assume these are three separate and individual categories. They work
together. However, the purpose of each has its characteristic traits. Without getting stuck in
the definitions, predetermined elements do not depend on any particular chain of events. If it
seems specific, no matter which scenario divulges, it can be labelled as a predetermined
element, i.e., “what we know, we know” (Schwartz 1997, p. 114). The fearfulness of
predetermined elements is that individuals tend to deny them (Schwartz, 1997).
Critical uncertainties exist in every plan, and scenario planners attempt to be prepared for the
situation that the scenario poses. Critical uncertainties are, as mentioned previously, intimately
related to the predetermined elements as they often question the assumptions about the
predetermined elements. What will happen to the opposite of the most certain plausible
scenario and what will the reaction be, is commonly asked when examining and identifying
critical uncertainties (Schwartz, 1997). By exploring and composing the driving forces,
predetermined elements and critical uncertainties, a structure can be established for building
scenarios of potential futures. Establishing the long view will help individuals choose wisely
since one better knows where it is heading (Schwartz, 1997).
2.4 PESTLE
PEST analysis is a management method used to investigate an organization's major external
factors that can affect its profitability (Kenton, 2020). By utilizing PEST analysis, there is also
the possibility to break down factors that affect the system (Carruthers, 2009). PEST is an
acronym for Political, Economic, Social and Technological. Due to increased environmental
awareness and lack of regulatory frameworks, two additional dimensions have been added:
legislation and Environment. Thus, creating the new and extended acronym PESTLE (Kenton,
2020).
PEST analysis enables an in-depth analysis method for organisations to develop effective
strategic planning (Carruthers, 2009; Kenton, 2020). In doing so, strategic planning will enable
the planner to maximize the organisations’ ability to thrive under the conditions that are in
place. As well it allows the organisation to be prepared for any changes that can lead to
adverse outcomes. Thus, making the organisation prepared for multiple scenarios. The
political dimensions of the analysis process aim to investigate the area in which governmental
policies influence the organisation in question. The economic dimension of the analysis
includes factors such as economic growth, supply and demand. In contrast, the social
dimension of the analysis investigates factors such as age, cultural attitudes and lifestyle
(Kenton, 2020). The fourth dimension of PEST analysis, technological, explores technology’s
role and development in the sector or organisation. As mentioned earlier, the extension of
PEST to PESTLE has a fifth and sixth dimension. The fifth dimension, legal or legislative,
focuses on different legal instruments such as taxes, policies and subsidies. While the sixth
dimension, environmental, focuses on areas related to nature and ecosystem, such as climate
change (Carruthers, 2009; Zalengera et al., 2014).

10
2.5 The Developed Framework
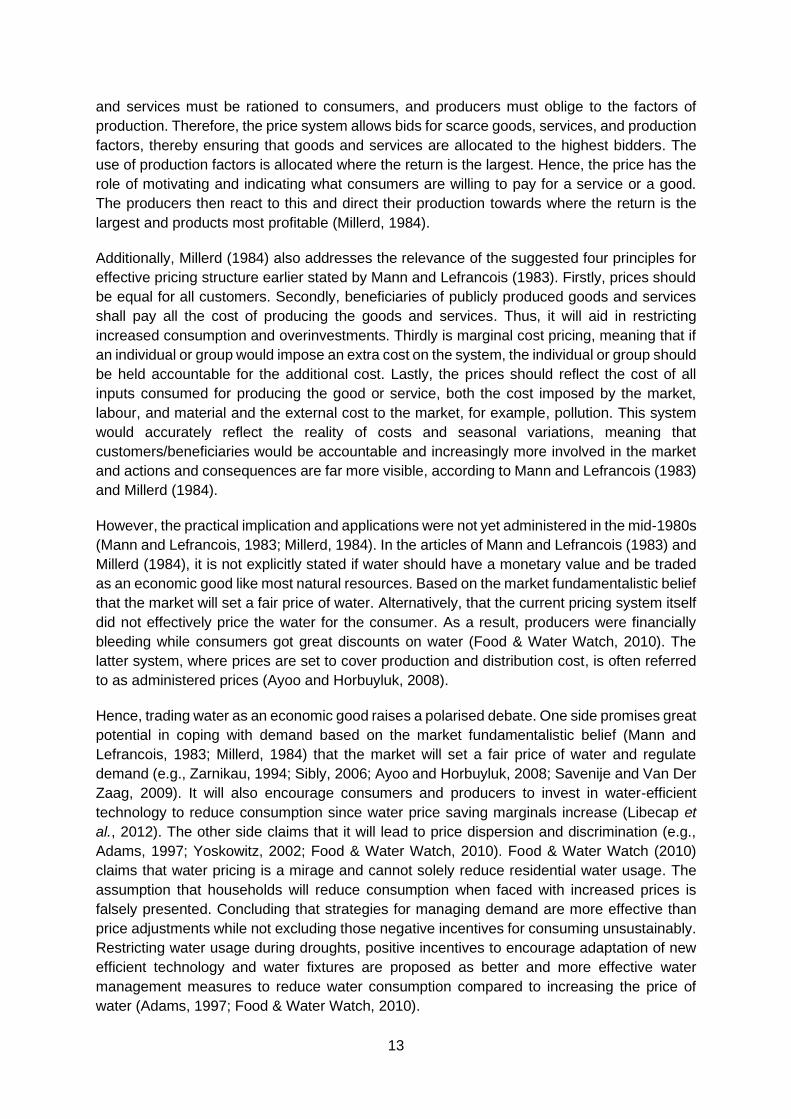
The model illustrated in figure 4 is an attempt by the authors to graphically present the
theoretical and practical approach to the SOI and how the authors have perceived the system.
The model could be described as a model with two overarching theoretical concepts, which is
illustrated with two levels of boxes distinguished with the colours light grey and white. Large
Technical System is the concept that defines the system characteristics and determines if the
SOI is suitable for the application of the theoretical framework. The Multi-Level Perspective
will highlight and support how system dynamics occur and the processes of change. Two
rectangular-shaped and vertically located boxes are found within the large white box with a
third much smaller and cubic shaped figure. The first one to the left, LTS Dimensions,
determines the more significant dimensions to investigate to determine and identify Natural
Resource Variables and categorize/structure accordingly. This model suggests that LTS
dimensions will remain static, but NRV’s are dynamic and can be substituted depending on
the SOI. However, a separation of Political and Legislative is possible if the chosen SOI
requires it given other system variables. Hence, through the LTS dimension, NRV’s are
identified. NRV’s are identified by the convergence of theory and empirical data. The NRV’s
posed in the model could be a start or source of inspiration to initiate similar studies. With the
option to add or exclude new NRV giving the specific SOI. Based on the literature findings and
the empirical interview study, the compiled qualitative data will then be analysed and
translated into quantitative data to understand better and categorise the specific NRV. In this
study, four criteria have been chosen and formulated as following (1) Driving Effect; (2)
Urgency; (3) Plausibility; (4) Evolution. Once all of the scores are summarised, the
investigator/s based on the outcome. Through reasoning, given the data collected and
quantified, determine which NRV will be of significance for the future and build scenarios
accordingly. The criteria, Urgency, will overview and partly determine the time frame of change
to happen within the system. The criteria Plausibility will determine the plausibility in
implementing the option in the current system and seen as a viable option to substitute prior
NRV. The criteria Evolution will be to uncover how much the NRV has progressed in terms of
development and implementation in the SO.

11
Figure 4: Illustration of the theoretical and practical approach to the SOI.
12
3. P(L)ESTE Review of the Water System
The chapter of this report is a review of published literature of the five dimensions of P(L)ESTE,
Political & Legislative, Economical, Sociological, Technological and Environmental. By writing
and proceeding from the five dimensions of P(L)ESTE, this section intends to present and
discuss current and potential trends in the sector and industry of water in relation to how
households use and consume water. It will also acquire a theoretical approach and present
how societies have reacted to change within the water industry and in regard to each of the
five dimensions. Noticeable, according to Figure 4, is the merge of the two dimensions,
Political and Legislative. The authors have decided to merge the two because the authors
concluded it was challenging to identify what separates the two dimensions in this specifically
chosen context.
3.1 Political and Legislative
3.1.1 Pricing
Swedish producers and suppliers of water services have big societal responsibility while acting
on slim marginal costs. Thus, creating a limbo of effectively price water and simultaneously
secure the supply of future water consumption. The price of water is regulated based on the
“Lag (2006:412) om allmänna vattentjänster“ as it states that the price of water should be
reasonable and fairly set while covering the cost of production and distribution. In short, the
cost of principle should be applied. However, the law itself is criticized for partly being too
versatile and too open for individual interpretation (Svenskt Vatten, 2006). In Sweden, the
price for water and sewage taxation is a compiled sum of the cost of actual water usage, fees
for using the infrastructure and the service of water utilities. In addition, there is a fee if one
wants to be connected to the municipal water distribution network when building a new house,
for example. However, this is a fixed cost and one-time payments, but it can vary heavily
depending on regional differences (Svenskt Vatten, 2020).
In 2013 the European Environment Agency initiated a project to examine water pricing and
cost recovery to ecological and infrastructural systems (Dige et al., 2013). EEA itself defines
Water pricing as “Applying monetary rate or value at which water can be bought or sold”
according to its glossary (European Environment Agency, 2021, p16). However, this definition
is revised and broaden in the project (Dige et al., 2013). Water pricing is discussed according
to the definition of Bogaert et al. (2012, p16) as “water pricing refers to monetising the
abstraction, use or pollution of water”.
In 1984 Millerd (1984) published an article discussing that the price of water is the best method
to manage water demand, but it is rarely used. Something that, e.g. Sibly (2006); Ayoo and
Horbuyluk (2008) years later confirms. However, the conclusion of Millerd (1984) is based
upon multiple studies conducted in Canadian municipalities. Millerd (1984, p. 8) states that
“price performs two essential roles in a market system, rationing and production motivation”.
Due to the scarcity of freshwater globally and the fact that there is only a given amount, the
role of rationing is far more tangible in the context of freshwater. Thus, scarcity precludes both
unlimited production of goods and services but also the satisfying of all needs. Hence, goods
13
and services must be rationed to consumers, and producers must oblige to the factors of
production. Therefore, the price system allows bids for scarce goods, services, and production
factors, thereby ensuring that goods and services are allocated to the highest bidders. The
use of production factors is allocated where the return is the largest. Hence, the price has the
role of motivating and indicating what consumers are willing to pay for a service or a good.
The producers then react to this and direct their production towards where the return is the
largest and products most profitable (Millerd, 1984).
Additionally, Millerd (1984) also addresses the relevance of the suggested four principles for
effective pricing structure earlier stated by Mann and Lefrancois (1983). Firstly, prices should
be equal for all customers. Secondly, beneficiaries of publicly produced goods and services
shall pay all the cost of producing the goods and services. Thus, it will aid in restricting
increased consumption and overinvestments. Thirdly is marginal cost pricing, meaning that if
an individual or group would impose an extra cost on the system, the individual or group should
be held accountable for the additional cost. Lastly, the prices should reflect the cost of all
inputs consumed for producing the good or service, both the cost imposed by the market,
labour, and material and the external cost to the market, for example, pollution. This system
would accurately reflect the reality of costs and seasonal variations, meaning that
customers/beneficiaries would be accountable and increasingly more involved in the market
and actions and consequences are far more visible, according to Mann and Lefrancois (1983)
and Millerd (1984).
However, the practical implication and applications were not yet administered in the mid-1980s
(Mann and Lefrancois, 1983; Millerd, 1984). In the articles of Mann and Lefrancois (1983) and
Millerd (1984), it is not explicitly stated if water should have a monetary value and be traded
as an economic good like most natural resources. Based on the market fundamentalistic belief
that the market will set a fair price of water. Alternatively, that the current pricing system itself
did not effectively price the water for the consumer. As a result, producers were financially
bleeding while consumers got great discounts on water (Food & Water Watch, 2010). The
latter system, where prices are set to cover production and distribution cost, is often referred
to as administered prices (Ayoo and Horbuyluk, 2008).
Hence, trading water as an economic good raises a polarised debate. One side promises great
potential in coping with demand based on the market fundamentalistic belief (Mann and
Lefrancois, 1983; Millerd, 1984) that the market will set a fair price of water and regulate
demand (e.g., Zarnikau, 1994; Sibly, 2006; Ayoo and Horbuyluk, 2008; Savenije and Van Der
Zaag, 2009). It will also encourage consumers and producers to invest in water-efficient
technology to reduce consumption since water price saving marginals increase (Libecap et
al., 2012). The other side claims that it will lead to price dispersion and discrimination (e.g.,
Adams, 1997; Yoskowitz, 2002; Food & Water Watch, 2010). Food & Water Watch (2010)
claims that water pricing is a mirage and cannot solely reduce residential water usage. The
assumption that households will reduce consumption when faced with increased prices is
falsely presented. Concluding that strategies for managing demand are more effective than
price adjustments while not excluding those negative incentives for consuming unsustainably.
Restricting water usage during droughts, positive incentives to encourage adaptation of new
efficient technology and water fixtures are proposed as better and more effective water
management measures to reduce water consumption compared to increasing the price of
water (Adams, 1997; Food & Water Watch, 2010).

14
Yoskowitz (2002) shows, based on evidence from Texas, that trading a homogeneous product
do results in price dispersion and price discrimination, puncturing some of the early arguments
raised by Mann and Lefrancois (1983) and Millerd (1984) of creating a fair market. The study
by Yoskowitz (2002) also confirms the previous research conducted by Adams (1997). Both
authors raise the concerns of the indifference in information supply and the skewed distribution
of information which can be advantageous for someone. Hence, regardless of the product
being homogenous, firms explicitly discriminate, and for consumers to understand the market
much resources must be invested for both learning the market and to search for lower
purchase prices meaning that the final cost could eventually exceed the initial price (Adams,
1997; Yoskowitz, 2002; Food & Water Watch, 2010).
Some publications oppose the evidence of Yoskowitz (2002) and Smart et al. (2017), meaning
that spot market pricing of water has increased farm productivity and the financial gains in the
markets of the Murray-Darling Basin of Australia and the Western U.S. are substantial
(Libecap et al., 2012; Wheeler et al., 2013). Important to note is the two terms agriculture and
farming, a big consumer of freshwater and industry which have for long not fully understood
the value of water (Yoskowitz, 2002). However, the water market has effectively relocated
water among users without negative environmental consequences and increased the
awareness of water scarcity in the Murray-Darling Basin. Achieve a majority of the purpose.
Still, the system also requires adjustments to fulfil its full potential. There are the implications
of strategic trade issues that can lead to market failures. The system itself must be more
flexible and adaptive, and policy changes to better support the sustainable aspiration of
Murray-Darling Basin (Wheeler et al., 2013). Tisdell (2001) agrees that the future of water
markets must be revised to achieve its full potential. The system has also aided the relocation
and purpose of water extraction, and where farming has adapted its production accordingly.
However, Tisdell (2001) opposes the environmental impact which this system has caused, to
note the gap of 12 years between the publication of the article by Tisdell (2001) and Wheeler
et al. (2013).
Observing international literature, there are implemented examples of new pricing structures
for water management and demand control. For example, there is the strategy of Willingness
to pay-principle, which has been applied and studied in the Ethiopian city of Godey. Compared
to the old structure where the government manages the taxes and transfers, the new pay
structure enabled regional management of cost recovery and better allocation of water pots.
In addition, it was predominantly preferred as it allows consumers to only pay for water which
they are consuming and according to welfare status. At the same time, it also enabled local
decision making (Kayaga et al., 2018).
In China, where water resources per capita are continuously becoming scarcer by day, Jiang
et al. (2010) proposed that urban water resource quota management will be a core strategy.
According to Jiang et al. (2010), the strategy has made remarkable contributions in
transforming the pattern of water mode. While also strengthening the water management
initiatives and integrating new and various management methods for water-saving incentives
and pollution prevention. The index quota system considers several factors such as quantified
quota indicators, a definition of a user's reasonable scale of water usage calculated from
factors as water intake per capita, or per area, or per product in unit time while also including
factors of water-saving measures. According to Jiang et al. (2010), the most optimal and
perfect water quota system is composed of six essential elements.

15
1. A multi-tiered system
2. The category
3. Grades
4. Type of water sources
5. Accounting factors
6. Accounting units.
The implementation of such a quota system has proved beneficial in both industrial and
domestic sectors. However, regarding the domestic sector, most of the cities have instead
chosen the path of the “ladder water price” as a preparatory stage before implementing the
more meticulous water quota system (Jiang et al., 2010).
Determining which pricing structure will be the most optimal and implemented will be difficult.
However, economists have concluded that water demand is relatively price inelastic. Thus,
making a complex case of water. Price inelasticity refers to water demand responding
disproportionately to price changes (Inman and Jeffrey, 2006). In practical terms, the decrease
of demand is lower than the increase in price (Corbella and Pujol, 2009). Hence, the
conclusion which Inman and Jeffrey (2006); Corbella and Pujol (2009) draws mean that price
mechanism in the context of water pricing will not results and correspond as anticipated if
consumed water is close or equivalent to the perceived quantity of water necessary for fulfilling
basic and essential needs (Corbella and Pujol, 2009). However, there is an additional
perspective of this, according to Corbella and Pujol (2009). Suppose prices do not target
consumption for basic and essential needs. Instead, it is targeted towards additional
consumption, for example, outdoor use, i.e. filling pools. In that case, water gardening tends
to be more price elastic and could be a potential area of importance when structuring new
water pricing structures (Corbella and Pujol, 2009). These examples are collected from
international literature and originate predominantly from Australia and the united state of
America, where drought is an increasing nationwide problem and consumption trends are
increasing (Food & Water Watch, 2010).
Many argue that the price of water is too cheap in Sweden and the Nordics (Mahmoudi, 2017;
Rohrdrommel, 2017; Holm and Schulte-Herbruggen, 2021; IVA, 2021) and globally (Maxwell,
2010; Dige et al., 2013; Donnelly, Christian-Smith and Cooley, 2013). Essentially there is a
need to effectively price water better for it to reflect its actual value. Hence, in most free
markets, the price reflects the value of the commodity (Maxwell, 2010). This is not the case
with water. However, it can with a high certainty be declared that the future price of water will
increase and specifically in areas where water becomes scarce as populations grow and
consumption per capita does not change drastically. Hence, the conclusion by Maxwell (2010)
despite the modest data and genuine interest in past and future water price trends, the price
of water will most certainly increase in the future partly based on the fact that water as a
commodity is heavily undervalued but also the fundamentalistic trinity that demand and supply
will adjust the price (Maxwell, 2010). Whether the price will adjust the consumption of water
per capita is highly uncertain, and net consumption will naturally increase. The potential efforts
in improved access to water as in efficiency, storage, and infrastructure will likely increase
demand and production and pressure freshwater sources (Ercin and Hoekstra, 2014).

16
3.1.2 Laws and Regulations
Changing human behaviour and perception of water can be done through many different
measures. One way may be through policy change, which could be either locally or regionally.
As policies change, they can restrict individuals in that the boundaries can be narrower (Abbott
et al., 2019). Thus, creating restrictions on how individuals can behave and consume water.
In 2013 a case study in Spain was initiated to understand the effectiveness of environmental
taxation and industrial water use further (Giménez and Zárate-Marco, 2013). The study itself
was influenced by the pilot study conducted by European Environment Agency in (2005).
According to the authors of the report, the sample size of Denmark, Estonia, France,
Netherlands, Spain, and Poland was deemed representable. Motivated by two of them did
largely comply with the directive, two that did not and two that must comply by the year 2010,
as they have only recently joined the E.U. at the time.
What could be concluded by the report by Dige et al. (2013) are plentiful, one being that
relatively few E.U. member states have implemented a transparent recovery of environmental
and resource cost. Which states they are referring to is not explicitly stated. There are member
states which have implemented environmental charges/taxes on abstraction/pollution to
internalize parts of current environmental and resource costs. However, most are financial
instruments that are instigated to generate revenue to support water policy implementation
and grid expansion. Overall, the need for growing awareness for cost recovery and incentive
pricing to harmonise. As well as create a functional concept of cost recovery implemented in
the water policy of European members state is yet unachieved. Regardless, the efforts of
Article 9 and Water framework directive to oversee and support member states to declare
KPI:s and indicators for benchmarking transparently. In the attempts to increase educational
knowledge and exhibit the importance of water as a resource and the unsustainable approach
of today (Dige et al., 2013).
Giménez and Zárate-Marco (2013) report suggest that economic instruments and specifically
environmental tax on industrial discharges were the most optimal option for protecting the
environment. It was observed that the economic instrument was superior to the command-
and-control instruments. This was also suggested and consider in the studies of (e.g., Stavins,
2001; Kraemer et al., 2003; Mattheiss, Mat and Strosser, 2009; Strosser et al., 2009; Lago
and Möller-Gulland, 2012). They were concluding that economic instruments contra
command-and-control instruments in the water industry is far more effective. Since they
internalise externalities by introducing a fee or additional costs in the price of output and
emissions (Giménez and Zárate-Marco, 2013), it statues the principles of The polluter pays
which was first introduced in 1975 by OECD (OECD, 1992) and updated and revised in recent
years (OECD, 2008).
Economic instruments are more effective in the industrial setting of water use and wastewater
removal based on the arguments and data raised by Kraemer et al. (2003); Lago & Möller-
Gulland, (2012); Mattheiss et al., (2009); Stavins, (2001); Strosser et al., (2009). However, the
same principle of behaviour may not be applicable in residential water usage, which Giménez
& Zárate-Marco (2013) highlights in their study. Giménez and Zárate-Marco (2013, p. 134)
discuss that environmental management strategies should be “utilised in a harmonized
manner”, meaning that there is not one solution that fits all and requires multiple tools

17
instruments to achieve a sustainable living, consumption, and production. Each having
strengths and weaknesses and depending on the surrounding economic, social, and
institutional circumstances and welfare. For example, the availability of monetary funds, the
status of the internal market and citizen awareness over environmental issues (Giménez and
Zárate-Marco, 2013).
Giménez & Zárate-Marco (2013) also raises a necessary differentiation between economic
and financial instruments in the context of water use. The authors utilise the previous work of
Horbulyk (2005) and Cantin, Shrubsole and Aït-Ouyahia, (2005) to distinguish between the
two instruments, economic and financial. Economic instruments, in broad, provide the
incentive to change behavioural patterns, in contrast to the orientation of financial instruments,
which are to recover cost and can therefore not significantly influence the actions and choice
of water consumers (Giménez and Zárate-Marco, 2013). Hence, Horbulyk (2005) emphasizes
the significance of differentiating between the goals behind different pricing strategies, which
means that cost recovery and efficient pricing are two objectives and may require different
types of instruments.
As there has been a rising tide of knowledge on sustainability, so has the need to affect
positive environmental outcomes directly. For water consumption, this has meant a reduction
in consumption through green buildings. There is also the incentive to build green housings
as evidence suggests greater financial returns (Devine and Kok, 2015). In the U.S., a home
certification called WaterSense is put on products to indicate that they are water-efficient (US
EPA, no date-a). Someone trained and skilled must evaluate and verify that the home can get
the verification to get a certificate. There are also updates done to the WaterSense Home
specification that the home verifier must be aware of to offer a certification(US EPA, no date-
b).
3.2.3 Informative Measures
The idea to inform the public on correct action and accountability in everyday water
consumption must be rooted in social and psychological aspects to be successful, according
to Seyranian, Sinatra and Polikoff (2015). Societal entities must understand why the different
societal patterns are in a certain way to implement appropriate informative measures for
effects. The primary strategy to communicate with consumers is through various outreach
programs. The main goal is water conservation by informing individuals of the water scarcities
and encouraging them to act sustainably. It could be sufficient to declare the difference
between water conservation and water efficiency in this section (Water Footprint, 2018;
Waterless, 2019). Water conservation is the beneficial reduction in water loss, waste, or use
(Vickers, 2001). An action that is often imposed and requested by governments or governing
bodies during droughts. However, the action is often criticized for only being applied and
utilised in short-term perspectives, but it does perform effectively in its short-term purpose
(Waterless, 2019). Water efficiency is the minimization of the amount of water used to
accomplish a function, task, or result (Vickers, 2001). Oppositely to water conservation, water
efficiency often seems as the long-term strategy of reducing water. Previously discussed in
this study, as the most applied and performance-oriented approach (Linkola, Andrews and
Schuetze, 2013; Yang et al., 2017; Water Footprint, 2018; Waterless, 2019).

18
However, there is also a gap that is occupied with mistrust between individuals in society and
governmental entities (Burgess, Harrison and Filius, 1998). This mistrust towards political
decisions and agendas regarding environmental politics is often interfered with and replaced
with suspicion through mass media coverage. Burgess, Harrison and Filius (1998) claim that
this can be counteracted through a higher knowledge of the environmental dilemma at hand,
grounded in a more profound knowledge and uncompromised coverage of what is required to
act sustainably. Thus, creating a higher understanding of the effects of water scarcities and
unsustainable daily water activities. The individuals of the society will understand the
importance of the measures communicated by governmental entities. The proper channels of
communications have to be implemented independently and accordingly to the current
environmental situation. As there are periods when water consumption is higher or higher
relative to available water, there have to be informative measures to deal accordingly because
of several factors such as higher temperature and increased risks of water depletion. There
also has to be proactive work of informative measures to prevent similar situations to occur in
the future (Burgess, Harrison and Filius, 1998). The study by Seyranian, Sinatra and Polikoff
(2015) also concluded similar thoughts as Burgess, Harrison and Filius (1998). That
informative measure alone is not sufficient for a positive effect if there is a deficit in knowledge
by the inhabitants. However, Seyranian, Sinatra and Polikoff, (2015) argue for this to be a
globally chronic misconception in how to work and approach individuals and is suggested by
the authors to be counterproductive (Seyranian, Sinatra and Polikoff, 2015). There have to be
the proper information channels to create awareness for young and older people alike. Water
Research Foundation made a study of how social media can be a channel for information
about water and wastewater utilities (The Water Research Foundation, 2017). The research
showed how social media could be used for different purposes, such as crisis communication
and the opportunities to reach consumers instantly.
Furthermore, the study by Linkola, Andrews and Schuetze (2013) showed that the agents
simulated in their research have a minimum level of consumption based on their current habits
and the technology available. The introduction of campaigns for water-saving did not show a
significant difference in consumption. To make a difference, the agents have to reduce their
showering by taking shorter ones which could be an informative measure. However, it requires
individuals to act according to the information at hand. This means that the lower the water
usage level is, relative change will decrease while it will increase the effects of the individual’s
behaviour. Another factor that affects an individual's behaviour is technology. The technology
put in place can enable the user to consume less or more water. It gives the users a set of
parameters to work within. It is essential that the water-efficient technology also appeals to
the consumer. If not, information should be communicated to shift and establish new
perceptions of default (Linkola, Andrews and Schuetze, 2013).
Another dimension of value is the reuse of wastewater and the perception of using and
consuming purified wastewater. Wastewater purification is a critical factor in conserving water
in the future while also minimising pollution. Making individuals realize that water, even if it is
waste, has some value and is an asset. With the right initiatives to include the social dimension
of the water usage problem, there can be a great outcome. The social relationship between
water and waste can be improved. It is essential to create that connection between the two
entities that is nature and mankind (Stuart, 2007). To understand that water in all forms and
sources is of value, such as rainfall or purified wastewater. If there is an evolution in the water

19
infrastructure, there can be a better understanding of how water should be treated for the
better. This, in the term, could lead to defamiliarization of infrastructure and new defaults. To
ensure this is to make society realize what the infrastructure looks like and functions, like how
wind turbines are known. It is proposing new ways of communicating with consumers and
understanding the value of the system and infrastructure. To make this familiar, information
must be available to society to devour (Svenskt Vatten, 2007). This can be enabled through
education and informative strategic measure rooting in a long-term perspective on shifting
societies perception. Education itself can be enacted as a tool for overall recognition of the
state of the water sector (Stuart, 2007; Svenskt Vatten, 2007). By increasing the education
about the state of the water sector, there can be a possibility of decentralisation and a higher
awareness of how to positively contribute (Stuart, 2007).
3.2 Economy
3.2.1 Socio-Economic
Duarte, Pinilla and Serrano, (2014) identifies multiple reasons or as he refers to, as effects
coupled to increase water usage and overall exploitation. The two most economically
prominent effects of the intensification of residential water usage. Firstly, the rapid
development of urbanization, which have increased the facilities and amenities that people
enjoy. Secondly, the increased water demand has logically and gradually increased water
provision, increasing the water consumption itself. Besides presenting this cause and
impact, Duarte, Pinilla and Serrano (2014) also explain why economic growth is a central
explanation in understanding increased water consumption trends by geographical and
temporal differences. Something observable in developed countries in Europe during the first
half of the twentieth century when industrialization was pioneering, and economic growth
was distinctive. Shifting a focus to Asia, it was not until the second half of the twentieth
century when per capita income was more decisive than population growth (Duarte, Pinilla
and Serrano, 2014). Duarte, Pinilla and Serrano (2014) also present an observation of
system change in the European industrial sector during the 1990s when capital resources
were abundant. The adoption rate of recirculating water systems showed reducing effects on
water consumption. Collard et al. (1988); Jänicke et al. (1997) continues this perspective and
reasoning of Duarte, Pinilla and Serrano (2014, p. 219) “Looking backwards to look forward”.
However, they do not discuss the resource of water, but parallels can be drawn between the
energy sector. They suggest that the economy's composition is an essential factor when
examining historical patterns, addressing structural changes in new cost structures and
policy changes, and technological developments. Hence, Duarte (2014) raises the thought
that the intensification of water consumption due to urbanization may be a phase before the
latent power of efficiency is implemented, and water consumption per capita is reduced.
Duarte, Pinilla and Serrano (2014, p. 218) present the Income effect, and wrote “increase in
per capita income has been one of the most important economic facts during the last two
centuries”. After the 1980s water withdrawal rate slowed down after years of sharp rise.
Reasons being the rapid upturn of population growth and GDP combined with the
intensification of agriculture and industrialization. A gradual increase in living standard could
also be one reason, according to Duarte (2014), while concluding that it is reasonable to
expect that the economic development and its effect or efficiency improvements can have

20
exerted influence on water use. However, Beckerman (1992) also raises the dilemma of
developed countries in the early1990s having difficulties adapting to the rapid change
caused by urbanization and exceeding population growth. Something that can be observed
in today’s developing countries, according to Duarte (2014).
Beckerman (1992) was early in discussing a positive correlation in the medium to long term
time frame of increased income and increased access to water supplies. Hence, the weight of
which water has to the economic development of nations is indisputably immense
(Beckerman, 1992; Duarte, 2014). Climate change is estimated to cost the global economy up
to 20 % yearly in the worst case. However, if a more moderate estimation of risk and impact
is considered, the annual loss due to global climate change is estimated to be 5 % of GDP
(Nordhaus et al., 2006). In a report made and published by Stockholm International Water
Institution, SIWI confirmed the positive correlation between increased national income and the
proportion of the population with access to the improved water supply. Quantifying it by a 0.3
% increase in investment in household access to safe water associated with a 1 % increase
in GDP (Sanctuary, Tropp and Haller, 2005).
However, according to multiple studies in Sweden, the big residential consumers are
individuals with good socioeconomic belonging (Nikell, 1994; Mahmoudi, 2017; Hammarlund,
Törneke and Siegwan, 2020). A Dutch study partly opposes these findings. Individuals with a
stable economic situation tend to work more, spend less time at home, eat out, or eat takeaway
while also using bathroom utilities up to 50 % less. These findings are based on the results of
Agent-based modelling, thus highly dependent on input variables and data collection points
(Linkola, Andrews and Schuetze, 2013).
3.3 Sociology
3.3.1 Housing Development
Depending on what type of house, e.g., townhouses, apartments or detached houses,
combined with the demographic dispersion of individuals that live on the property and building
year, certain assumptions can be made on how they affect water consumption. A study made
by the Market Transformation Programme (2008) in the United Kingdom concluded that the
water consumption per household in newer houses was lower compared to older houses. The
difference in consumption is discussed due to available technology and general building
techniques for resource-efficient housing (MTP, 2008).
A detached house often implies using water in a greater range and for external purposes.
External purposes are usually defined as watering gardens or lawns, car washing, refiling and
maintaining swimming pools (Randolph and Troy, 2008). Thus, giving the owners more
rationale to consume water and, therefore, habitually increase water consumption. However,
the research done by Randolph and Troy (2008) in Sydney, Australia, showed that per capita.
Therefore, there is little influence on the individual average water use depending on if the
individual lives in a house or an apartment. Another similar study made by Domene and Saurí
(2006) in the metropolitan region of Barcelona is contradictory to the one made by Randolph
and Troy (2008), as it concludes two factors having an effect on water consumption. One being
household size and the other being housing type (Domene and Saurí, 2006). The study
21
concluded that in this region, smaller families consume more per capita than bigger families.
The different conclusion can well be based on the difference in geographical location and
cultural differences where the study took place. Furthermore, the study made by Linkola,
Andrews and Schuetze (2013) showed a relatively clear pattern of how the household
consumes water depending on factors such as how many people live in the residence and
time spent at home. The study showed that individuals who spend 50% less time in their house
would use 50 % less water in their kitchen and bathroom. Regarding how many people who
live in the residence, it is often discussed that the consumption per capita usually decreases
with increased residents. This is an effect of consumption being divided between more
individuals. However, total consumption volumes are often higher (Linkola, Andrews and
Schuetze, 2013).
It is also discussed in the literature that the determination of water change patterns can be a
result of how the individuals relate to their own household and water consumption. A green
and thriving lawn, a clean house facade and windows indicate that you take care of your
property. It also increases consumption, thus requiring saving water in other instances. The
communities the individuals live in will also be a determining factor of water consumption. The
perceived and constructed social norms and how society around the individual treats water
consumption issues will affect consumption since the risk of moving from the norms and
creating feuds is not attractive. The neighbourly feeling of belonging to a community is
perceived as necessary. This relationship and community may not be duplicated in areas
where most housing consists of apartments, where it is perceived that everybody minds their
own business and little insight is offered in one’s life compared to a detached house with a
garden, for example (Gilg and Barr, 2006; Randolph and Troy, 2008).
As the population grows and urbanisation expands, adequate housing and strategically
planned urban areas combined with a supportive infrastructure will be essential (Kedir and
Hall, 2021). Life cycle analysis (LCA) is a commonly applied tool for assessing the
environmental impact of housing projects. Studies are starting to incorporate measures of
resource efficiency once the housing is established and not only during construction (Lavagna
et al., 2018; Kedir and Hall, 2021). General perceptions are that residential buildings require
more resources and space compared to commercial ones. Apartments are seen to be one of
the solutions of building more residents requiring lesser space while increasing the economies
of scale for pilot projects of sustainable and green buildings (Kedir and Hall, 2021). This has
invited many potential possibilities in Industrialized Housing Construction (IHC) concepts,
where resource efficiency is a top priority during the construction phase and through the usage
phase. The study by Kedir and Hall (2021) concluded that customers' Willingness to Pay
(WTP) is based on what the customer is paying for. Green building, i.e. building with LED
lights, water-saving technology, and general materials selected based on their sustainable
features, increases the WTP compared to prefabricated elements, which tends to lower the
WTP. Thus, it was concluded by Kedir and Hall (2016) that customers do not value resource
efficiency in the shape of industrialized production methods. Still, customers perceive value in
resource efficiency in the finished product where it is more visible. Hence, the potential of
better visualising impact and contribution through the choice of products for the end-consumer
will be an essential part of creating value for the customer (Kedir and Hall, 2021). In Sweden,
during the last 20 years, on average, two times as many apartments are built compared to
detached houses. Over the previous five years, the number has risen to approximately three
times as many apartments compared to detached houses (SCB, 2021). Hence, the concerns

22
and conclusions of Kedir and Hall (2021) are adequate to consider since it is indicated in
studies (e.g. Domene and Saurí, 2006; Randolph and Troy, 2008) that individuals living in
apartments usually have a higher per capita consumption that individuals are living in
detached houses. The MDWC difference between a single household and a four-person
household could be as high as 75% (Mudgal et al., 2009).
3.3.2 Demographic Development
There is reason to believe that the changes of a population and an ageing society will influence
water consumption (Schleich and Hillenbrand, 2009). This means that the older the age of
individuals in society becomes, there is reason to believe that individual water consumption
increases. It relates to retirement and how these older individuals are busy gardening,
increasing consumption, health reasons increasing consumption and their impaired ability to
move agile (Schleich and Hillenbrand, 2009). According to Bates et al. (2008), population
growth, which is one of the current stressors of water consumption, will be worse with climate
change. Another stressor will be urbanization, and its already damaging impact will be even
worse with climate change (Russell and Fielding, 2010). The study made by Russell and
Fielding (2010) suggests conflicting results in the literature. Some research indicates that older
people conserve water, while there is also research that presents the opposite. Some research
could not find any statistical correlation between water consumption and age, while others
referred to different age groups water consumption levels, according to Russell and Fielding
(2010). The various research suggests that identifying a clear correlation between a person’s
age and water consumption is complex. It is suggested in the study by Russell and Fielding
(2010) that the relationship between age and water conservation can not be characterized
linearly, but rather a function of demand of a person’s stage in life, its experiences within its
generation as they can vary depending on generation. Different generations may consume
water based on how they perceive technology in relation to their needs (Russell and Fielding,
2010).
3.3.3 Behavioural Changes in Water Usage
The sociological aspect of water consumption in households would mean studying human
behaviour regarding the consumption and usage of water within their households (Linkola,
Andrews and Schuetze, 2013). High water consumption within a household can be the result
of a multitude of factors, factors that can enable both positive and negative behaviour. If there
is an imbalance between the economic incentives, technological and socio-cultural, it can lead
to wasteful water consumption (Linkola, Andrews and Schuetze, 2013). The current water
infrastructure in developed countries has made it simple for individuals to take water for
granted (Stuart, 2007). People in developed countries expect drinkable water in an instant.
However, there is an overall consensus and recognition of global water scarcity (Distefano
and Kelly, 2017; Stuart, 2007). The hidden infrastructure may be the reason for this since it
conceals most of the value chain and processes from raw to drinkable water. The concealment
of the infrastructure also makes it difficult for the human eye to trace, understand and grasp
the volumes consumed. Furthermore, to uphold society's well-being and ensure that
everything runs smoothly, access to water is a prerequisite. Not only for consumption but also
for additional activities, making individuals maintain a particular lifestyle (Stuart, 2007).
23
A study made by John W. Cary (2008) in Australia suggested that demand management has
become critical for water scarcity. A way to minimize consumption is through the act of
voluntary choices (Cary, 2008). For involuntary choices, it is the opposite where individuals
have to comply with some prerequisites made by the government or other institutions. Thus,
regulating individual's behaviours through different policies and laws. However, voluntary
choices are primarily enabled through different informational campaigns for educational
purposes on the subject. Change in choices means a change in behaviour towards the water
(Cary, 2008).
There have been two broad models on human behaviour used to promote conservation in the
environmental sector (McKenzie-Mohr et al., 1995; Cary, 2008). The first being the rational-
economic model or the rational choices model as it is called. This model has the assumption
that to influence natural resource conservation decisions. In addition, there must be an
incentive of financial or performance gain. The second model, the attitude-behaviour model,
is that the attitude towards a subject affects an individual’s behaviour. Therefore, there must
be an influence and change on the individual’s attitude (McKenzie-Mohr et al., 1995; Cary,
2008). The understanding of water conservation influence can be through dividing it into
internal and external influences. Internal influences can be attitudes, values, habits, personal
norms, psychological motivation, emotion and need for status and identity. External influences
can be incentives, financial and regulatory, institutional constraints, and social practices (Cary,
2008). According to John W. Cary (2008), there are many variables that the water industry
must focus on for a reduction in residential water consumption behaviour. The variables are
the environment of the water delivery, the individual’s behavioural intention, the individual’s
capacity to act and respond, what the water industry anticipate the outcome will be of the
changed behaviour, the attitude toward water conservation, the norms of the community
towards water conservation, the amount of strength and social support for the current habits
as well getting a positive emotional response from the individuals (Cary, 2008).
Furthermore, there is a need to raise awareness and act accordingly, i.e. being resourceful
towards natural resources. Water usage can be a product of socio-economic placement since
there is a correlation between water usage and culture. The dilemma of water usage is looked
at from the perspective of living situation, the number of individuals in the household, the
individuals' occupation, and their behaviour towards water (Linkola, Andrews and Schuetze,
2013). The idea of socio-economic status places individuals in different socio-economic
categories. If individuals are in a similar category, they often act similarly. However, an
individual’s action is determined by their experiences and therefore connected to, among other
things, to their culture. Culture and economics in this context are similar. However, they have
a different perspective regarding this issue (Oosterbeek, Scheunemann and Santos, 2013). It
must be recognised that individuals act after their cultural understanding of the environment
and economics. An individual's adaptation to different circumstances regarding the
environment is based on their acquired knowledge of which culture also affects (Oosterbeek,
Scheunemann and Santos, 2013).
24
3.4 Technology
3.4.1 Household Innovations
Technological advancements for the consumers and residents can be labelled both vast and
improving. The two most notable trends in technological adoption are the installation of water-
efficient appliances and faucets, explicitly resulting in lower consumption since daily needs
and activities require less water consumed (Linkola, Andrews and Schuetze, 2013; Holm and
Schulte-Herbruggen, 2021). The second trend is the increasing adoption rate of intelligent
watering metering, which may not explicitly reduce water consumption. However, it has shown
a strong connection between awareness of water consumption and reduced consumption
(Beal and Stewart, 2014; Gurung et al., 2015; Yang et al., 2017).
Stuart (2007) reflects on humankind’s perception of “technological fixes” highlighting the active
choice of the consumer when determining which efficient product to purchase and install.
However, once installed, little reflection of its impacts when utilizing the product is reflected
upon by the consumer. On the one hand, Stuart (2007) reflects upon this topic as these
appliances have a “tendency to automate environmental improvements” (p. 422). In contrast,
Stuart (2007) highlights that the consumer did take the active choice of choosing a specific
technology over another one. These types of suboptimization are often happening across
multiple industries where the root cause is not directly addressed. However, the
implementation is partly adequate for the results and required efforts (Hitch, 1953).
Technology is mainly discussed to help humanity reduce consumption. However, it is essential
to consider the rebound effects of new technology and initiatives of the government. Examples
can be withdrawn from the agricultural industry, where water conservation has always been a
topic of discussion (e.g., Beckerman, 1992; Bogaert et al., 2012; EurEau, 2017; McCarthy et
al., 2020). Ward and Pulido-Velazquez (2008) proposed that water-efficient irrigation
technology within the agricultural industry and the constant urging matter of water
conservation may have been a zero-sum game or even having opposite effects. Meaning that
water consumption as a result of active implementation of new technology to reduce water
consumption has increased. Farmers identify new business opportunities to sow and reap
more water-intensive crops while increasing water consumption and financial returns. Water
is used more efficiently, but overall consumption increases. Same conclusions are drawn by
Berbel et al., (2015); Freire-González, (2019); Paul et al., (2019). The subject is justified to be
discussed since what would happen if similar effects of residential water consumption are
repeated. Consumers take the active choice of purchasing and installing water-efficient
appliances and faucets which consume less water per minute or water per usage. However,
it also induces and justifies in the eye of the consumer to take longer showers, being more
wasteful and reckless in the way they consume and use water. Imprinting the false delusion
that every time the consumer uses water-efficient technology, the world becomes a better
place (Stuart, 2007).
However, existing literature discussing potential rebound effects coupled with residential water
usage is non-existing despite the selection of published literature discussing water pricing and
the modest selection of how new technology will aid the management and reduction of water
consumption. In general, much innovation and technological development have been
25
introduced and adopted within the energy sector and in households. Contrary to the more
modest technological development and adoption rate within the residential water sector (Potts,
2009; Kiparsky et al., 2013; Spiller et al., 2015). The enormous sectoral and long-term
transformation of the electricity system is mainly based on renewables, and the fact that the
system capacity has reached thresholds and demand is increasing (Smith, Voß and Grin,
2010; Markard, Raven and Truffer, 2012). However, these symptoms are not industry-specific,
and the same symptoms are shown in the urban water system, but fewer initiatives are taken
in the urban water system (Gleick, 2003; Kiparsky et al., 2013).
3.4.2 System Changes
The article by Stuart (2007) claims that water is seen as a vehicle to transport waste by
consumers, as it transports domestic, industrial and agricultural waste into the sewage system.
In doing so, the water becomes viewed as waste in certain circumstances and perspectives.
As society evolves at the current pace, the need for water becomes increasingly more
significant while the amount of raw water availability. There are also ideas to achieve a
sustainable water balance, a unity between thinking ecological, local decision-making and
having the right technology (Stuart, 2007). To enable resource awareness, one must be in
touch with the current technology and understand its relationship with nature. How one can
affect the other becomes a central theme for sustainability, it can encourage ecological
consciousness. With the correct infrastructure and technology, there can be changes in the
urban consuming patterns and industrial epistemology (Danielopol et al., 2003; Stuart, 2007).
Nevertheless, it is also addressed in sparse literature that a system change will induce
additional behaviours towards economic water consumption. Besides the savings in overall
water usage, wastewater is more efficiently treated in a circular system, increasing overall
societal sustainable thinking (Stuart, 2007; Linkola, Andrews and Schuetze, 2013). Stuart
(2007) and Linkola, Andrews and Schuetze (2013) propose that practical acts of system
owners will highlight the system's inefficiency and hopefully increase sustainable awareness
and behaviours of consumers. Leakage has been a major talking point within the Swedish
water utility sector and the public awareness of water as a good. Arguments as such, since
producers and distributors do not take responsibility for fixing leaking pipes. Reducing the
amount of pure drinking water discharging into the soil due to broken pipes contributes to the
unwillingness of the consumers to take their responsibility (Jernberg, 2007; SVT, 2009;
Brantemo, 2017; Ringqvist, 2021).
Kiparsky et al. (2013) argue that this innovation deficit in urban water systems results from
multiple reasons. The inherent inertia of not wanting to change, creating a difficult path ahead
due to increased awareness of the environmental impact and distressing watermarks. The
urban water systems ability to adapt to the change is argued for only being sufficient to a
certain point. Furthermore, urbanization and increased expectations of the system will put
significant pressure on the infrastructure. According to Kiparsky et al. (2013), novel concepts
have been proposed to enable radical change in urban water systems. However, the response
of such action has historically been reluctant (Gleick, 2003; Kiparsky et al., 2013). Gleick
(2003) was the first to advocate the “soft path” solution as the proposed superior solution for
handling future demand and ecosystem changes. After the publication of Gleick (2003),
multiple authors have continued and developed the arguments (e.g., Potts, 2009; Kiparsky et
al., 2013; Spiller et al., 2015)

26
“Soft path” solutions propose a conceptual shift towards a focus of water-related services,
transitioning from the “hard path” of massive, centralized infrastructures as dams, aqueducts,
pipelines, and complex treatment plants. This infrastructure is arguably and evidently a
fundamental reason for the welfare development of the world. However, it has also caused
detrimental damage to ecosystems and unquantified economic and social costs (Gleick,
2003). This long and historical focus of the “hard path” has led to systemic damage, i.e., over-
dimensioning and overestimating consumption trends. The consequences of these have yet
not shown their true colours since the over capacity of the urban water infrastructure is
abundant. No direct problems until the millennial shift, problems started to divulge, and matters
became urgent and actual due to increased climate awareness and exponential growth in
population and social welfare. The supply and production of water could not meet the demand
(Gleick, 1998; Kiparsky et al., 2013; Spiller et al., 2015).
The ideas sparked by Gleick (2003) of a carefully planned and managed centralized
infrastructure is essential, but it must be complemented with small-scale decentralized
facilities. In order to not only meet quantitative needs but rather matching the quality and user’s
needs. Markets and pricing will be critical economic tools for encouraging efficient use and
equitable distribution of resources nationally and locally. Kiparsky et al. (2013) agree upon the
concerns and arguments raised by Gleick (2003). However, the theory is not fully developed
and understanding the response of such innovative ideas must be declared. Urban water
systems can change in two ways, through innovation and institutions, according to Kiparsky
et al. (2013). Innovation, in turn, can appear in three contexts. Firstly, new technology as (e.g.,
energy recovery from wastewater, desalination). Secondly, new approaches to management
(e.g., rate structure, new business models, regional coordination). Thirdly, efficient techniques
increase the efficiency of existing systems (e.g., sensors and controls, better understanding
of system dynamics and precise models). Institutions in broad terms can be defined as the
rules, norms and practices that govern decision-making. In this definition, formal institutions
can also be included, including regulations and laws while also acknowledging the multiplicity
of factors that shape water systems as behaviour and cultural factors (Kiparsky et al., 2013)
The case of the urban water system and other large conservative sectors has without any
doubt difficulties to adopt and transition, and solely trusting technological merits alone will not
be sufficient. A set of multiple radical technological innovations must be incorporated to cause
disruptive innovation within an industry. One core element is new industry structures emerging
from the institutional level. According to Kiparsky et al. (2013), much of the hurdles originate
from the institutional level. Uncertainties in performance and costs are challenging the
development. Resulting in risk-aversion and choosing a proven mediocre technology
compared to a potentially superior technology. This argument is partly contradictory towards
the general conception of niche markets where actors are usually willing to accept higher costs
related to improving the system's new technology and overall functionality (Markard and
Truffer, 2008).
Spiller et al. (2015) partly continue the arguments raised by both Gleick (2003) and Kiparsky
et al. (2013), meaning that besides the inherent inertia of adopting new technology and
structures. There is also a gap in understanding and identifying the actual problem. The
technical and non-technical implications are factors that will determine the trajectory and
success of implementing the technology. Risk aversion is a common threat to the water
industry. Spiller et al. (2015) raise much concern regardless of the industry. However, explicitly

27
urban water systems since difficulties in identifying the problem and initiating the innovation
process and understanding the path to successful implementation are absent. Spiller et al.
(2015) also conclude that direct regulation best stimulates innovation in drink water and
environmental standards. Regulation that requires and supports information gathering has
also shown results and, more importantly, helped identify performance gaps. Economic
regulation may not trigger innovation explicitly, but they alter the type of innovation adopted.
Influencing the choice of innovation will also be required to change historical patterns and
induce industrial transformation. Flexible regulation or frameworks have been proven effective
in guiding change towards the desired direction. Encouraging riskier projects over more
proven and traditional technological solutions to redefine old standards are essential.
Ultimately, the adaptation and configuration of innovation will be crucial for implementation
regardless of organizational or environmental circumstances. Here, institutional environment,
organization knowledge and natural physical factors will be essential and decisive influencing
factors (Spiller et al., 2015).
3.5 Environmental
3.5.1 Climate Change
Ecology is discussed to be an essential concern when it comes to water demand and usage
but also in general when discussing both the man-made systems and natural ecosystems of
our planet and its inhabitant’s health (Beckerman, 2013). Human and nature are both relying
upon the welfare and prosperity of the earth. Currently, the trajectory of the world is discussed
to be increasingly unsustainable, including individuals' perception of water (Beckerman, 2013).
However, this is not the case in Sweden as there are sufficient volumes of water in many areas
of Sweden. It is a matter of resource efficiency rather than water scarcity. (Svenskt Vatten,
2019). It has to be recognised that the exertion of the world’s resources is reaching its limits,
and this includes raw water, which encourages action to withstand the water demand
(Beckerman, 2013). It is important to recognize the importance of a stable water supply since
it relates to general public health and welfare. Improved water quality improves general health,
to which the general life quality can be improved. The significance of this is that there is a
correlation between economic growth and access to safe drinking water, and health
improvements (Beckerman, 2013; Distefano and Kelly, 2017).
There is a direct linkage between water scarcity and the climate. The multitude of climate
change impacts will have a toll on the system that is beneficial for future water necessities
(Distefano and Kelly, 2017). Specifically, there are predictions that climate change will affect
hydrological cycles to affect and shift global precipitation patterns. There will also be a higher
frequency of extreme weather events. However, it is discussed that areas that are already wet
will get wetter while dry areas will get dryer. Contributing to water reliability will lessen with a
higher frequency of precipitation over large areas. It is predicted that the consequence would
be increased flooded areas, which would affect the whole system of infrastructure and water
marks. Infrastructure that enables water storage and other facilities can be seriously damaged.
In addition, a warmer climate will ultimately result in extended summer periods, where
biological life will require more water during longer seasons. The summer season will start
earlier and shorten the spring season, while the autumn will also be shortened since summer
will be extended. The winter season is expected to be affected by the lesser precipitation and

28
will consequently mean that water reservoirs and water marks will have difficulties
replenishing. It creates a negative spiral of water scarcity and water depletion (Distefano and
Kelly, 2017). The preservation of the groundwater system will also be an essential factor to
create a stable and sustainable supply of raw water. Humans have had a costly impact on the
groundwater with its depletion lifestyle of water. One cannot elude from the fact that the raw
water quality will also lessen due to changes in the ecosystem as a whole and specifically the
groundwater (Danielopol et al., 2003). It is difficult not to include man-made interaction with
the ecology, thus human’s impact on nature and water accessibility. The interaction between
man-made creations such as local water infrastructure, i.e. surface water reservoirs, will affect
the access to water in the future as they are designed to withstand climate extremes (Mehran
et al., 2017). These systems must be built with a level of resilience to withstand the pressure
of different climate pressures caused by climate change. An example of this is the water supply
catchment in Melbourne. The water system is highly regulated as its reservoirs can withstand
climatic pressure with the help of its water storage and redistribution, despite being located in
an area highly affected by climate change (Mehran et al., 2017). However, the increased
temperature will severely decrease water resource availability, and it is estimated that 35 %
of the global population will live in areas where water stress is a fact (Schewe et al., 2014).
3.5.2 Environmental Awareness
Over the past couple of years, there has been a greater awareness of water and environmental
issues among the public (Oosterbeek, Scheunemann and Santos, 2013). However, it is
difficult for all stakeholders, the abstract “battle of sustainability” and convincing all of the
nations on earth that focus on the environmental aspects should shift and accelerate, even if
it can cause negative economic effects in the short term. Additionally, the complexity of the
change is increasing while time is sparse. Convincing people seems to be a difficult task as it
requires people to realize and understand the long-term perspective. Thus, recognizing the
improvement in life quality that this will bring in the future. However, this realization includes
sacrifices in minor everyday choices that can be met with resistance. These sacrifices could
potentially lead to an accumulation of greater prosperity as it will minimize the risk of depleting
natural resources (Beckerman, 2013; Distefano and Kelly, 2017).
During the last 50 years, there have been both ecological and socioeconomic changes that
have affected the groundwater systems. This is the result of environmental effects occurring
from anthropogenic pressures. The effects have been detrimental as changes in both the
quality and quantity of the groundwater have developed. It is forecasted that the impact will
continue until 2025 (Danielopol et al., 2003). A way to change this negative trajectory of trends
would be through new environmental policies. The new trajectory in water demand has
become a greater environmental issue, especially for developing countries. Changes in
climate have become a real factor in countries not susceptible, which means that in countries
where people rely on a specific type of climate and weather. Changes in seasonal and natural
irrigation are essential for farming, and change can interfere with overall health. In order to
create policies which, have an impact on the three dimensions of sustainability, i.e. Ecology,
Sociology and Economy, all three dimensions must be included in policy creation and
implementation (Danielopol et al., 2003; Mehran et al., 2017).
A study made by Anderson et al. (2007) in South Africa concluded that the perception of
environmental problems is related to a post-materialistic perspective. Individuals most likely

29
to be affected by water pollution would primarily see it as a problem (Anderson et al., 2007).
Suggesting that if one lives in dire environmental circumstances, they would have a greater
sense of awareness. It is suggested that education is a determinant of solving these
environmental problems in the household, also being directly linked to awareness (Anderson
et al., 2007). Moreover, the study conducted by Straughan and Roberts (1999) pointed out
that environmental awareness is higher amongst women and younger individuals. When
education rises among individuals, environmental awareness and behaviour will increase
(Straughan and Roberts, 1999).
Furthermore, the study by Li et al. (2021) on Chinese households concluded that an
awareness-behaviour gap exists, where the economic factors are the ones contributing
households to take pro-environmental consumption attitudes (Li et al., 2021). Thus, the higher
degree of environmental awareness that the consumer has will ultimately affect the willingness
to pay for eco-friendly products (Liu, Anderson and Cruz, 2012). This implies that
environmental awareness of the consumers will be a contributing factor for companies in their
launch of products. Companies' understanding of the level of environmental awareness
amongst their consumers will be a competitive factor in the market and contribute to the
success of companies (Liu, Anderson and Cruz, 2012). A study made by Bülbül et al. (2020)
concluded that most households in Turkey believed that companies were the most significant
contributors of environmental problems, shifting accountability. The study highlighted the
ignorance these individuals had toward their household consumption (Bülbül et al., 2020).

30
4. Methods
This section of the report will shortly describe and motivate the choice of a single case
research study design. The methodological approach is presented in chronological order, from
the early drafts of the pre-study and communication with stakeholders and thesis sponsors to
the final steps of the study. It will be followed by a description of the main study and building
the theoretical framework and empirical data set. It will also include how the analysis is
structured, outlining the ethics of the research process the quality of the research.
4.1 Research Design
4.1.1. The choice of a Single Case Study
A single qualitative case study has been the choice of design for this research. Since the
research intended to explore, investigate, and understand the drivers, trends, and
phenomenon of future residential water use, a single case study proved effective for this
purpose (Yin, 2009). Additionally, it also proved advantageous in a setting where several
actors are sources of information with multiple perspectives (Blomkvist & Hallin, 2015). The
arguments for choosing a single case study are also motivated by the sole fact that there has
not been a project, research or work done entirely similar to what is to be completed. Meaning
that the methods are chosen, and the results may be challenging to verify thoroughly
(Gustafsson, 2017). However, one similar comparative study was conducted in Finland
(Rohrdrommel, 2017), to the authors' knowledge, discussing drivers for residential
consumption trends. This research and project are expected to travel a different path.
Acquiring influences from the direction of the publication by De Bruin et al. (2009) to translate
qualitative data to quantitative. With the endeavour to discover and to map intact grounds,
shed light on hidden facts and new territory. Meaning that comparable initiatives are close to
none and further motivated the choice of a single case study investigation (Yin, 2009).
However, it does not mean that published literature and findings are irrelevant to the study but
somewhat scattered, and the ambition of this thesis is to compile it.
Naturally, as the research continued, new perspectives, impressions, and facts are acquired
and collected, which meant that the authors must sustain flexibility and the chosen
methodology itself. Stake (1995) and Merriam (2009) argue for case studies methodologies to
be flexible and suitable for qualitative research design since it aids the authors to clearly
formulate, firstly the research design but also the epitome, tools, and methods applied. Solberg
Søilen and Huber (2006) elaborate on this argument and argue for case studies being open-
ended where one precise solution is challenging to find. On the other hand, the purpose of a
case study research design is more about producing background material to elevate the
discussion of the posed problem. The arguments raised by Stake (1995), Solberg Søilen and
Huber (2006), Merriam (2009), Yin (2009) could be seen as advantageous. However, an open-
ended and flexible approach can dispute the scientific credibility of the results according to
Encyclopedia Britannica II (1979) and open to criticism (Gustafsson, 2017). While also
confusing the design of the case study since the conclusion can neither be illustrative or
confirmable. Thus, the concerns raised by Wells (2004) is highly accurate and justifiable that
the study should partly address and disclose the raised concerns above. But the study should
31
also have a chronological and narrative composition when presenting findings and facts and
minimize the risk of random interpretation. “Science is a story. Tell it.” (Wells 2004, p. 758).
The advantages of single case studies outweighed the negative aspects in this matter. The
sparse bank of resources, in terms of time and workforce, confined what was possible. While
the authors intended to create high-quality research, the single case study was the definite
option. It aided the authors to acquire a deeper understanding of exploring the subject, the
research field and industry. It also showed benefits when describing the phenomenon's
existence and helped the authors question old theoretical relationships and explore new ones
(Gustafsson, 2017).
The authors seek to answer the RQ and ultimately modelled the work by accomplishing the
steps presented in the chapter Methods. The MRQ was answered partly by conducting the
research, as the nature of the question is exploratory. MRQ was also confirmed by answering
RQ1-2. The creation of the theoretical framework to understand the concepts of LTS, MLP
and Scenario building was aligned with the purpose of the study. RQ1-2 are specific in the
context of SOI. However, answering the RQ’s has been done by the compiled and acquired
knowledge from the theoretical framework. RQ1-2 has been predominantly answered by
applying the analytical tools of PESTLE and MCA, which have permeated the whole report.
Answering the RQ has been accomplished through the literature review results and the data
collected from the empirical study. The MCA conducted and presented in the chapter Results
and Analysis has been based on different criteria with associated analysis. Table 3 has
quantified each criterion's implication of the identified drivers and helped the level of
discussion, which enabled the authors to answer all of the research questions. Conclusively,
all of the research questions have been addressed in the chapter Discussion, and an in-depth
review and scrutiny of the results have been disclosed and discussed.
4.2 The Research Process
In this section of the report there is a transparent presentation of the necessary steps taken to
complete the study. The study has been divided into two sections: pre- and main study. The
literature review was conducted throughout the pre-study to get a comprehensive picture of
the research area, and theoretical framework applied. The literature review would also
contribute to the results of the main study. Once the objective of the main study was declared
through the Pre-study, interviews were conducted. They would complement the results
gathered by the literature review to answer the research questions formulated. For a
chronological development of the research process, see Figure 5.
4.2.1 Pre-Study
The thesis sponsor posed an area of relevancy identified as essential for the future of their
business and society. Therefore, a significant amount of time had to be allocated to
understand the water industry and the posed problem formulation identified by the thesis
sponsor. Once the industry was fairly scoured through reading literature and meetings with
project stakeholders, narrowing down the area of study and formulating a more direct problem
formulation was initiated and completed. Thus, creating a research area accepted by all
stakeholders that include gaps to fill in previously published literature and research.
32
The first posed area of interest was related to the field of forecasting water consumption for
households. However, to the knowledge of the authors, thesis sponsor and supervisor, much
of previous literature and industry organisations interest have been directed in publishing such
information and data. Hence, it became apparent for the mentioned stakeholders that other
areas had not been thoroughly explored, and additional gaps were obvious and some
unknown. What became apparent was the lack of compiled knowledge and information
connected to the exploration of the measures Peak daily consumption (PDC) and MDWC
within the household. What drivers drive the increase or decrease of the two measures is
covered in a modest amount of international and in some Nordic literature but not in the context
of Sweden specifically. As this is an unfamiliar area of exploration, it became apparent that
studying the LTS in the context of the water sector and evaluating the dimensions of PESTLE
will be a unique way to explore what drives and partly determines residential water
consumption. The authors concluded that PESTLE was a valuable tool through the suggestion
and guidance of the supervisor. Although the suggestion was valid, it had to be evaluated by
the authors to fit the SOI. The authors had also been developing their own framework similar
to PESTLE, subconsciously creating an easy transition.
4.2.2 Main Study
As a result of the challenging times caused by the COVID-19 pandemic, the study was done
completely remote using digital communication software. This has not been deemed an issue
for the study since it mainly consisted of data gathering through reviewing literature or
conducting interviews. In hindsight, it may have resulted in better and more effective time
allocation. Additionally, interview respondents have enthusiastically accepted the author's
digital invites. In summary, the digital layout and work processes have been deemed beneficial
for the entirety of the study. The possibilities to standardize work and interviews are perceived
to be an essential part of the study.
After the processes of the pre-study, the main study could begin. Firstly, a number of areas
through the PESTLE framework were discovered to understand the research area further and
more in-depth. The discovery was enabled by scanning and reading available literature while
constantly referring to the theoretical framework constructed by the thoughts and suggestions
of LTS and MLP. The application and choice of building the theoretical framework based on
LTS and MLP originated from the supervisor's recommendation. However, the authors did not
blindly trust the recommendation without understanding the theories and their fit for the SOI.
Based on the gaps identified, the modified model of PESTLE to P(L)ESTE was constructed
through gaining inspiration from meetings between the authors and individuals with both
extensive and novel backgrounds within the industry of water and sewage management. Once
the more defined and delimited research area was established, building the theoretical
framework in combination with conducting the empirical interview study was initiated. To utilize
time and labour efficiently, interview respondents were identified through the themes of
P(L)ESTE and contacted in the early phases of the project. The authors were enthusiastically
greeted within the industry sector, however finding a time and date was problematic. While
interviews were booked and scheduled, the authors continued to write and structure the
theoretical framework and chosen methods. The P(L)ESTE framework also gave the authors
inspiration on structuring the study and carefully allocating time and focus into correct areas.
The study relied on the incorporation of a multitude of literary and empirical sources, methods
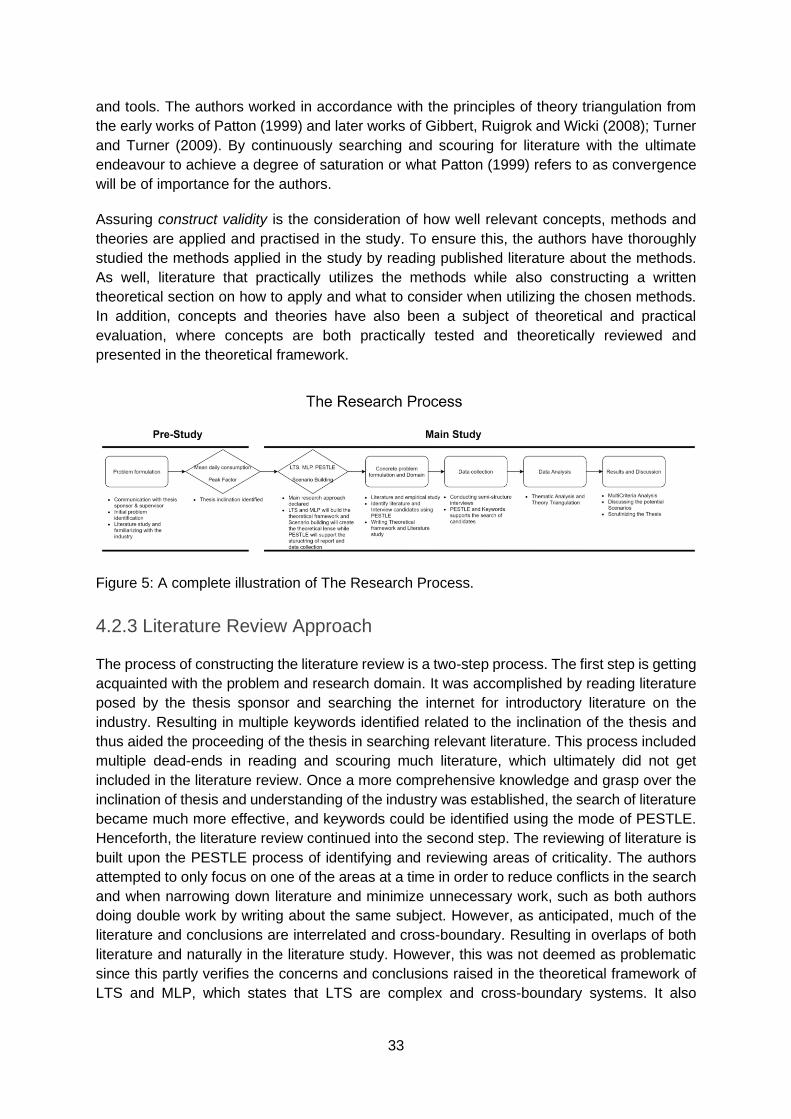
33
and tools. The authors worked in accordance with the principles of theory triangulation from
the early works of Patton (1999) and later works of Gibbert, Ruigrok and Wicki (2008); Turner
and Turner (2009). By continuously searching and scouring for literature with the ultimate
endeavour to achieve a degree of saturation or what Patton (1999) refers to as convergence
will be of importance for the authors.
Assuring construct validity is the consideration of how well relevant concepts, methods and
theories are applied and practised in the study. To ensure this, the authors have thoroughly
studied the methods applied in the study by reading published literature about the methods.
As well, literature that practically utilizes the methods while also constructing a written
theoretical section on how to apply and what to consider when utilizing the chosen methods.
In addition, concepts and theories have also been a subject of theoretical and practical
evaluation, where concepts are both practically tested and theoretically reviewed and
presented in the theoretical framework.
Figure 5: A complete illustration of The Research Process.
4.2.3 Literature Review Approach
The process of constructing the literature review is a two-step process. The first step is getting
acquainted with the problem and research domain. It was accomplished by reading literature
posed by the thesis sponsor and searching the internet for introductory literature on the
industry. Resulting in multiple keywords identified related to the inclination of the thesis and
thus aided the proceeding of the thesis in searching relevant literature. This process included
multiple dead-ends in reading and scouring much literature, which ultimately did not get
included in the literature review. Once a more comprehensive knowledge and grasp over the
inclination of thesis and understanding of the industry was established, the search of literature
became much more effective, and keywords could be identified using the mode of PESTLE.
Henceforth, the literature review continued into the second step. The reviewing of literature is
built upon the PESTLE process of identifying and reviewing areas of criticality. The authors
attempted to only focus on one of the areas at a time in order to reduce conflicts in the search
and when narrowing down literature and minimize unnecessary work, such as both authors
doing double work by writing about the same subject. However, as anticipated, much of the
literature and conclusions are interrelated and cross-boundary. Resulting in overlaps of both
literature and naturally in the literature study. However, this was not deemed as problematic
since this partly verifies the concerns and conclusions raised in the theoretical framework of
LTS and MLP, which states that LTS are complex and cross-boundary systems. It also

34
supported the purpose of the research project and indicated that the authors are heading one
of many correct paths.
Table 1: List of keywords used to identify literature in “The Research Process”.
Keywords were used to search for publications and literature in the search portal
WebOfKnowledge™, regarding each individual dimension of P(L)ESTE using the keywords
presented. See Table 1. Publications and literature were first sorted based on title and topic.
If the number of searched publications exceeded 50, publication year, the number of times
cited and relevancy was also used when sorting for publications. Once several articles were
35
identified based on the parameters mentioned above, they were downloaded. It was possible
to download through the author's student ID from KTH, giving access to many databases. The
next step was to filter the literature and deem it appropriate and suitable for the study based
on reading the abstract and conclusions. Read and categorized literature were tracked using
excel. Once all the articles were read, they were sorted and selected. Occasionally, articles
identified could be better suited for discussing another dimension of P(L)ESTE and sorted
accordingly. The final selection of literature would build the literary reviewing foundation of the
area of focus based on P(L)ESTE. Additional articles on specific topics mentioned or
referenced in one of the publications could be added along the literature review process. KTH
Primo or Google scholar™ were then used to search for literature regarding that specific topic.
It was also common to use the references in literature to get additional information on a specific
topic or model used. Once again, KTH Primo or Google scholar™ was used for the search of
the particular published literature.
To assure validity in the used literature for this study, the authors have used reputable search
engines for literary sources and journals. The number of times the literature has been cited
has also been of consideration. In addition, to not exclude any potential literature which could
interfere with the results. The authors have kept track of keywords used and saved searched
literature in cloud storage. Hence, the ability to rediscover excluded literature is possible. The
authors stayed true to the P(L)ESTE model to ensure the inclination of the thesis.
4.2.4 Interviews
One of the central parts of the research study is the empirical study and information gathering
from industry professionals and scholars to produce data for the specific context of Sweden
to give a balanced result with the acquired information from the literature review. Secondly, it
has also added additional perspectives for the study and been a central part of the report's
evolution as it has laid the foundation for it and created its uniqueness. Through the five
dimensions of P(L)ESTE, potential interview candidates were identified by searching the
internet for publications or projects. Publications and projects related to understanding water
demand, water production, water technology, water policy and economy or previously
published literature and publications closely related to understanding water consumption
trends. The keywords used in the search for literature were also applied when searching for
candidates to interview. However, the search was mainly targeted in the context of Sweden.
See table 1 for keywords used.
A few of the interview candidates were contacted based on the proposition of already
interviewed candidates. The interview candidates were contacted via standardized email
explaining the author's intentions of the interview and the purpose of the project. Additional
explanation of the report and project could appear if requested by the potential interview
candidate. Once the interview candidate accepted the interview invitation, the meeting was
booked and scheduled using Microsoft Outlook™. This principle was consistent throughout
the process of identifying interview candidates. Candidates who responded were interviewed,
which means that the original list of potential interview candidates is far more extensive than
the final list of interviewees shown in table 2. The interview respondents got the questions
beforehand to understand better and grasp the inclination of the project and the interview itself.
It also gave the interviewees time to reflect upon the questions and formulate answers in

36
advance to be effective when conducting the interview and provide well-thought answers. The
interviewee was repeatedly informed that the option of declining to answer a question or to
erase an answer of the audio recording was permitted. Furthermore, the interviewees were
informed that the answers would be made anonymous and untraceable in the report, to the
best ability of the authors. The questions asked during the interview were of semi-structured
character and were altered based on the dimensional belonging to the P(L)ESTE model. A
selection of the questions was fundamental, but to ensure that specific information was
collected from the extensive knowledge of the industry professionals and scholars, it was
deemed most effective to alter the questions based on the interviewee background and
specific area of interest. Given this, the authors decided to exclude any documents related to
the interview process, i.e., the multiple questionnaires used, since it can be a way to identify
the interviewees. It should be noted that the steps mentioned were all done in Swedish, from
first contacting the interviewee to finally interviewing them. Except for interviewee 15, where
all steps were done entirely in English due to a language barrier. See table 2.
To assure internal validity, the interviewees were selected due to their role and competence
in the areas of importance and interest identified in the literature review. Industry experience
is considered when identifying and choosing interview candidates as important. However,
candidates with novice experience are not excluded from the thesis since they will bring new
perspective and knowledge from the industry. Identified, contacted and completed interviews
were tracked using Excel™. The meetings were conducted via the communication software
Zoom™ which enables voice recording for the authors to re-listen to the audio recording. See
table 2.

37
Table 2: Listed are the chronological order of every interview completed with additional
information.
Interview Date Sector Area of Interest Length (minutes approx.)
Recorded
1 2/19/2021 Water and Sewage
Technology and Political
35 Yes
2 2/22/2021 Water and Sewage
Social and Political
30 Yes
3 2/23/2021 Water Technology
Technology 60 Yes
4 3/1/2021 Community Developer
Social and Political
30 Yes
5 3/3/2021 Industry Organisation
System perspective
55 Yes
6 3/5/2021 Innovation Matchmaking
Technology and Political
45 Yes
7 3/5/2021 Agency Environment and Political
70 Yes
8 3/8/2021 Agency Environment 25 Yes
9 3/8/2021 Water Technology
Technology 30 Yes
10 3/8/2021 Community Developer
Political and Economy
55 Yes
11 3/10/2021 Community Developer
Economy and Environmental
55 Yes
12 3/10/2021 Water and Sewage
Political and Economy
60 Yes
13 3/11/2021 Agency Environment 40 Yes
14 3/11/2021 Water and Sewage
Systems perspective
55 Yes
15 3/15/2021 Industry Organisation
Political and Economy
50 Yes
16 3/16/2021 Researcher Technology and Economy
45 Yes
17 3/17/2021 Community Developer
Social 40 Yes
18 3/17/2021 Researcher Technology and Social
45 Yes

38
4.2.5 Data Analysis
Noticeable for the project and report is the application of the P(L)ESTE model. It has
succeeded in creating a fundamental and observable perspective for the comprehensive
research area and aided the authors to explore and identify areas of interest. The data analysis
and compilation of results will stay true to the structure and continue to follow these dimensions
when identifying and discussing potential drivers for future residential consumption. As
suggested by Blomkvist and Hallin (2015) in social science, a deemed suitable analytical
approach is thematic analysis. It is an analytical approach offering accessible and theoretical
flexibility to analyse qualitative data (Braun and Clarke, 2006). The model of P(L)ESTE has
partly shaped the data collection method. However, to not ignore or disregard valuable data,
conducting a thematic analysis has helped the authors to search and identify themes and
patterns within the already stated themes of P(L)ESTE. In one aspect, the thematic review
acted as a confirmative measure to strengthen the approach of P(L)ESTE and the identified
areas within each dimension. It has also helped authors objectively identify similarities or
differences and find additional patterned responses or meaning for the research question
(Braun and Clarke, 2006; SBU, 2016). Although the flexible offerings of the thematic review,
it also includes and poses disadvantages. For example, lack of analytical narrative when
analysing the data, overlaps between themes or the inconsistency of them are common and
influential (Braun and Clarke, 2006).
Practically, the transformational process from raw data to data in a more comprehensible
and observable format followed the six-step process presented by Braun and Clarke
(2006).
1. Familiarising oneself with the data
2. Generating initial codes
3. Searching for themes
4. Reviewing themes
5. Defining and naming themes
6. Producing the report
Due to the large amount of collected raw data, the authors decided not to transcribe the entire
length of the interviews. Instead, they deemed it more time-efficient to firstly re-listen to all of
the interviews. Secondly, listen once more and only transcribe parts and sections of the
interviews where valuable knowledge and data could be extracted based on the dimensions
of P(L)ESTE and for the purpose of the study. The transcribed Swedish parts would be
translated to English and implemented in the analysis. Each paragraph has a translated part,
i.e. quote, from the interviews. To minimize the risk of extracting data out of context,
transcribed data were structured in relation to both the question asked and previous
discussion. Once data was transformed from audio recordings to written text, the data analysis
process continued by structuring the actual results of the research study.

39
4.2.6 Multi-Criteria Analysis Applicability
A MCA was conducted and applied in order to present identified drivers based on the findings
and discussions of the reviewed literature and the empirical interview study. It has also laid
the foundation of the analysis and the discussion that follows. The MCA is a method that
appraises or evaluates a given plan by investigating a wide variety of dimensions and criteria
of interest predetermined or chosen by the utilizers (Dean, 2020). MCA assists investigators
with a structured flow of work and proves its advantages for multivariate cases and problems.
It is also a method that has been utilized and applicable within a long history of different
research fields and in casual decision situation, ranking, sifting and deciding the best or most
relevant or plausible option at hand (Dean, 2020). However, there are commonly discussed
pitfalls and issues with the method. One is the multiple issues regarding choosing correct
criteria and hierarchically structure them and applying appropriate weights. Then there is the
issue of making a decision based on one single score, which partly shall reflect a complex
situation. Finding one superior, conclusive, or unique solution is often difficult due to the nature
and setting of the decision making. In general, it is rare that a single alternative is as good or
better than all other alternatives for all criteria (Kujawski, 2003). Hence, the highly complex
multidimensional decision problem translated from qualitative data to quantitative data and
reduced to a single number will impose difficulties (Kujawski, 2002).
The suitability of applying MCA on qualitative research from an empirical standpoint is the
model's ability to illuminate the complexities of the factors in the problem (Munda, Nijkamp
and Rietveld, 1995). It is suitable for research that dives deep into sustainability problems as
it incorporates a level of accuracy and precision for the measured variables. To apply MCA in
this research or similar, there has to be an effective way to standardize the evaluation of the
different criteria of the different objectives and options. When the numbers are a blurry
representation of perceived reality, the context in which the numbers represent must be well-
defined (Munda, Nijkamp and Rietveld, 1995). Commonly there are two ways to approach
qualitative research. The first approach is a “direct approach”, meaning that the acquired
qualitative information is used in the evaluation method without being transformed into
quantitative units. The “indirect approach” is the opposite in the sense that it takes the acquired
qualitative information and transforms it to cardinal information, for it to be used later on one
of the quantitative Multi-Criteria methods to be applied (Munda, Nijkamp and Rietveld, 1995).
The indirect approach has been applied for this study due to the advantages when sorting,
dissecting and managing a multitude of sources in different formats. Hence, the qualitative
information is first transformed into cardinal information, which will then be cardinalized and
evaluated using MCA. Optimally, “the data should be precise, certain, exhaustive and
unequivocal” (Munda, Nijkamp and Rietveld 1995, p. 81). However, reality is not perfect, and
it is often necessary to use information that does not possess any of those characteristics.
Thus, authors need to be aware and act accordingly to face the inbound uncertainties of
qualitative data being stochastic and or fuzzy at times (Munda, Nijkamp and Rietveld, 1995).
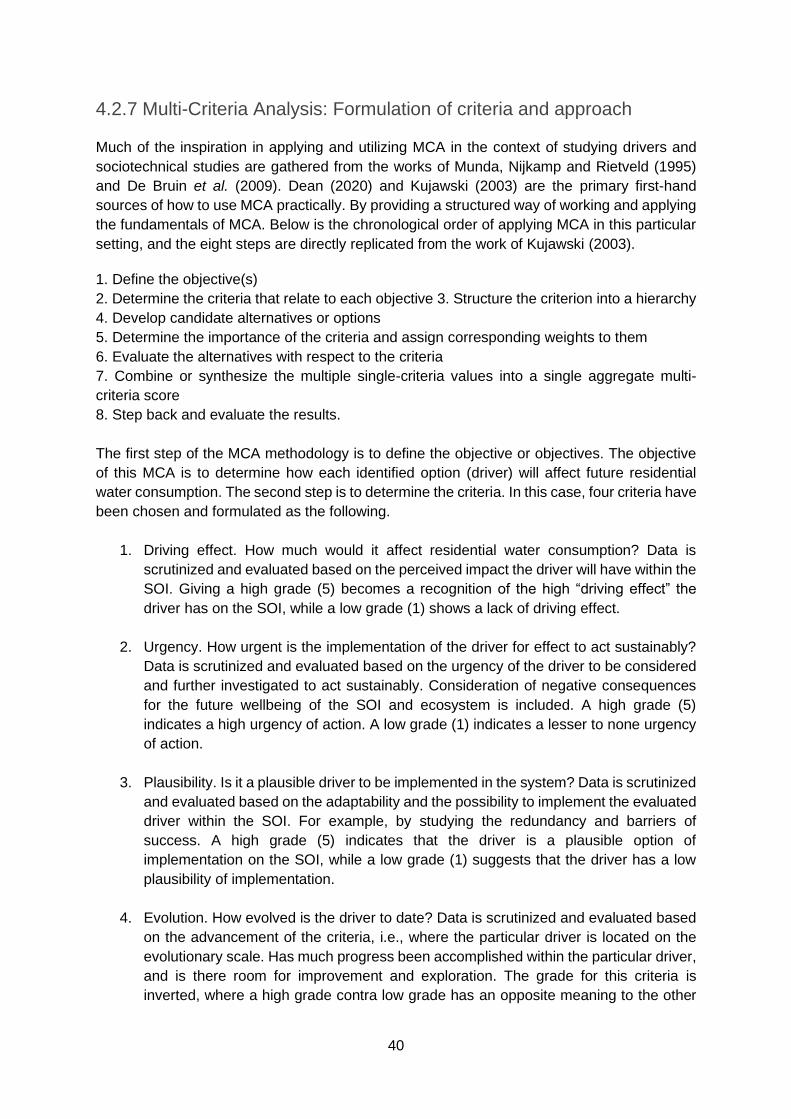
40
4.2.7 Multi-Criteria Analysis: Formulation of criteria and approach
Much of the inspiration in applying and utilizing MCA in the context of studying drivers and
sociotechnical studies are gathered from the works of Munda, Nijkamp and Rietveld (1995)
and De Bruin et al. (2009). Dean (2020) and Kujawski (2003) are the primary first-hand
sources of how to use MCA practically. By providing a structured way of working and applying
the fundamentals of MCA. Below is the chronological order of applying MCA in this particular
setting, and the eight steps are directly replicated from the work of Kujawski (2003).
1. Define the objective(s)
2. Determine the criteria that relate to each objective 3. Structure the criterion into a hierarchy
4. Develop candidate alternatives or options
5. Determine the importance of the criteria and assign corresponding weights to them
6. Evaluate the alternatives with respect to the criteria
7. Combine or synthesize the multiple single-criteria values into a single aggregate multi-
criteria score
8. Step back and evaluate the results.
The first step of the MCA methodology is to define the objective or objectives. The objective
of this MCA is to determine how each identified option (driver) will affect future residential
water consumption. The second step is to determine the criteria. In this case, four criteria have
been chosen and formulated as the following.
1. Driving effect. How much would it affect residential water consumption? Data is
scrutinized and evaluated based on the perceived impact the driver will have within the
SOI. Giving a high grade (5) becomes a recognition of the high “driving effect” the
driver has on the SOI, while a low grade (1) shows a lack of driving effect.
2. Urgency. How urgent is the implementation of the driver for effect to act sustainably?
Data is scrutinized and evaluated based on the urgency of the driver to be considered
and further investigated to act sustainably. Consideration of negative consequences
for the future wellbeing of the SOI and ecosystem is included. A high grade (5)
indicates a high urgency of action. A low grade (1) indicates a lesser to none urgency
of action.
3. Plausibility. Is it a plausible driver to be implemented in the system? Data is scrutinized
and evaluated based on the adaptability and the possibility to implement the evaluated
driver within the SOI. For example, by studying the redundancy and barriers of
success. A high grade (5) indicates that the driver is a plausible option of
implementation on the SOI, while a low grade (1) suggests that the driver has a low
plausibility of implementation.
4. Evolution. How evolved is the driver to date? Data is scrutinized and evaluated based
on the advancement of the criteria, i.e., where the particular driver is located on the
evolutionary scale. Has much progress been accomplished within the particular driver,
and is there room for improvement and exploration. The grade for this criteria is
inverted, where a high grade contra low grade has an opposite meaning to the other

41
three criteria. A high grade (5) indicates that the driver is a non-evolved driver for the
SOI, while a low grade (1) indicates it is a developed driver.
Summary is the summarized score of the four previous criteria connected to the driver. It is
meant to provide an overview of how these criteria together culminate in importance to the
SOI. Depending on the driver and the score, there can be an evaluation and discussion of the
driver. The summary of each driver's score will be in the span of 4 to 40, where 4 indicates a
low score and 40 a high score. What the total score indicates will be analysed and discussed
in the latter part of the report.
Thirdly is to structure the criteria into a hierarchy. This study has only one objective, to
understand if the drivers will determine future residential water consumption. Therefore, as a
result of one objective, the criteria are already structured in a hierarchy. Fourthly, it is to identify
and select options, which are the drivers of residential water consumption for this research.
The drivers have been selected and identified based on the categories of P(L)ESTLE. As well,
the frequency and discussed relevancy in both literature and interviews with industry
professionals and scholars have been an essential factor in the selection of drivers. See Figure
4 for a clear representation of the inspired P(L)ESTE model. The fifth step is to determine and
assign corresponding weight for each criterion. The authors have decided not to assign
weights to each criterion. This decision is based on the intention and inclination of the report
since its purpose is to elevate the research area of better understanding water consumption.
Also, to build and explore a foundation that will hopefully inspire further research. The sixth
step is to evaluate each option individually and assign grades for the four criteria. The authors
decided that the data from literature and empirical study on the drivers will be separated and
individually graded from 1 to 5. However, results will be compiled into one table.
The grading process will require a standardized evaluation process of the different
performances for each objective and option. The grading will represent the perceived reality
of the authors, based on the discussion and understanding of each driver from the literature
or the empirical data set. Through discussions, common ground could be found in grading the
different criteria for the different drivers. Thus, each criterion within each driver has been
questioned and evaluated. For the literature, this has meant investigating several relevant
literatures associated with a specific driver. Thus, giving the authors an understanding of what
the grade should be. The grading process entails a judgement based on the 18 interviewees
opinion of different drivers. For example, if all of the 18 interviewees have the same opinion
on a specific driver concerning water consumption, then a grade would reflect that. A high
grade (five points) implies that the criteria is recognised and discussed on a high level, and it
is a common area of topic within the literature or sector. Conversely, a low (one or two points)
grade does not explicitly indicate that the discussion is irrelevant but is not deemed crucial for
the investigated criteria. However, in general, a low grade will indicate that the viewpoint within
literature or the sector perceives the criteria as unimportant, or a low degree of impact and
focus should be directed to other areas. A medium grade (i.e., three points) is usually applied
when facts and arguments are polarised in the debate. Distinct agenda or arguments
regarding the specific driver and option evaluated are not clear. It will imply that the future will
be determined based on either cross-boundary decision or the development of other drivers
in this study.

42
The authors graded each driver and criteria individually by discussing and arguing for their
perception of how the literature or the collected data perceived the significance of the driver.
If unanimous, both authors assigned the same grade, and it was accepted as a satisfactory
result. However, if the decision was split, the rule of common ground was applied, which
means that each author was arguing for their individual grading. The authors had to state their
case and reasoning in the discussion. Split decisions regarding the grading happened rarely.
This could indicate that the compilation of results has reached the authors unanimously and
is mutually perceived based on the literature reviewed and data collected.
The seventh step is to combine the scores and initially observe the adequacy of the results.
The final and eighth step is to step back and analyse the results. However, after the final step,
the analysed results will be discussed further. For example, discussing how is the reasoning
behind grading each option. What this implies for the future will also be discussed and related
to the research problem and research questions.
4.3 Research Ethics & Sustainable Contribution
Research ethics considers questions about how to formulate and determine the research
topic, the design of the research and how to access, collect, process, and store the data.
Thereafter, analyse the collected data and finally compile, select and express the findings of
the thesis in a moral and responsible way (Saunders, Lewis and Thornhill, 2016). The authors
of this thesis have always intended to be as transparent and documentative as possible in the
research process by presenting extensive descriptions and fully disclosing each step of the
research process. An additional section added to the thesis where the authors are commenting
on what the implication of subjectivity could imply for the results and the research process
itself. This thesis is potentially the last academic publication of both authors. It would be
wasteful and destructive to not take the opportunity to act and contribute to academia and
society. Since the project spans across multiple boundaries, it is important to be transparent
and to preserve both the author's integrity and integrity of the research. Furthermore, the
nature of the problem and the chosen research approach will invite multiple stakeholders and
sources of information. The validity of both the thesis and results is determined by conducting
an honest, transparent, and respectful data collection, specifically through the interviews.
Nevertheless, it is important to refer to sources without interfering and altering information in
a deceptive manner.
In this thesis, regarding ethical research study will be concluded and stipulated according to
the Swedish Research Council and Swedish Engineers Code of Honor (Vetenskapsrådet,
2018), where certain criteria must be ensured when conducting research (Sveriges ingenjörer,
2019). As engineers, the authors have certain additional responsibilities regarding the
utilisation and exploitation of the results. The intention of the thesis is to enhance the prosperity
and welfare of society in the future, rather than proposing and presenting areas of vulnerability
for exploitation with negative consequences.
In terms of the contribution to a more sustainable future, the evidence is clear. The study has
heavily incorporated the three dimensions of sustainability as a fundamental perspective to

43
partly observe the problem and research area and how to solve and propose solutions. (1)
Environmental – ecological aspects. (2) Social – human health, democracy, education,
societal belonging. (3) Economical – economic growth and welfare (Baumgartner and Rauter,
2017).
Firstly, environmental, the specific research context of water has invited great discussion on
extracting, supplying, and consuming water in the future more sustainably. As raw watermarks
are getting depleted while simultaneously observing and experiencing climate change more
frequently. Secondly, the social dimension is also a central part of the discussion as society is
dependent on the urban water system. If the urban water utility system abruptly stopped the
supply of fresh drink water, society would stop in tandem. People and their health are heavily
relying upon the perpetual system of water supply. Thirdly, the economic aspect will help water
suppliers, society, and governments better understand what the future beholds and act
accordingly. This short list of sustainable contributions is mainly a result of acquiring a
systemic perspective, but there are many additional contributions listed and discussed
throughout the thesis.

44
5. Results & Analysis
This section firstly presents the table which summarizes the MCA conducted. It further and
individually analyses and motivates the choice of each score for the respective criteria. Quotes
from the interviews completed are also presented with the purpose to strengthen the
motivation of the score. The chapter is finished with a summarization of the distribution of
points and additional comments.
5.1 The Results of the Multi-Criteria Analysis
Table 3 presents the results of the conducted MCA. See table 3. It shows each area that was
investigated and the drivers within those areas with their corresponding grading. The upper
left box under each criterion represents the grading from the interviews (I), while the upper
right represents the grading from literature (L). Below these boxes is the sum for each criterion
based on the grading from interviews and literature. Finally, under the “summary section” of
the table is a summarized score of all of the criteria, for interviews and literature, and the total
score of I and L together.
Table 3: Presents the compiled results from MCA conducted based on literature and the
Interviews.

45
5.1 Future Political and Legislative Drivers for Residential Water
5.1.1 Analysis of Driver: Pricing
According to the studied data, the driver Pricing indicates that it has a great significance to the
residential water system, which can be showcased with its total summarized score of 30. It
indicates how important correct water pricing structure is for the system in order to enhance
the aspects of sustainability. Driving Effect (5) for the driver Pricing shows a relatively low
number, both from the literature and interviews. It is mainly motivated by arguments that
despite the price of water, humans need a sufficient volume of water for basic and essential
needs. The Urgency (8) and Plausibility (9) criteria score respectively shows a need to
incorporate a more efficient solution of pricing water, and there is room for it to be done. The
Evolution (8) criteria score represents that there is a need to develop it further. Mainly the need
for development is motivated through a better disposition of responsibility. Individuals
consuming water recklessly should be punished accordingly. Some form of environmental
taxation or cost recovery of water extraction could also be a plausible option for internalising
external costs. I. e. the cost consumers pay for water should cover more areas than just
production costs, and water providers should recognise this and have a supportive regulatory
framework.
“They do not care if we do right by protecting the environment, distributing water is
more important than the price of water.” - Interviewee 15
“The luxury commodity that is water should be paid for. However, it is a given right
to have drinkable water.” - Interviewee 18
5.1.2 Analysis of Driver: Laws and Regulations
The driver Laws and Regulations have the highest total score in the criteria Driving Effect (9)
and Plausibility (9). There is reason to believe from international literature and the interviewees
that there is room for improvement of existing laws and regulations. There is always an
incentive to implement and improve laws. It is a way to keep balance in society and from falling
into chaos because it is one way to regulate individual behaviour. This is also believed to be
the case for residential water consumption as there is room for improvement in current water
consumption laws. Fundamentally, there is no justified reason why water should not be better
regulated with laws, according to literature and interviewees. The same is for behaviour
towards water, and with more viable laws and regulations there can be consequences for
reckless water consumption. Thus, making the driver a driving force to achieve a high degree
of sustainability within residential water consumption. However, the score of Urgency (6) and
Evolution (7) is because there is more than enough water in Sweden, making it a commodity
highly accessible. This is reflected by the giving score lower for Urgency as there is no need
to act rash, but a need to act more reasonably with water management. The primary law
towards water consumption, “Allmänna vattentjänstlagen”, is perceived as outdated by many
scholars as it does not specify consumption sufficiently nor carefully enough. The law is open
for much interpretation and has contributed to negative consequences and may induce more
in the future. It is discussed that it should be updated in accordance with the current Swedish
water situation since the situation is constantly changing. Thus, the law which regulates it
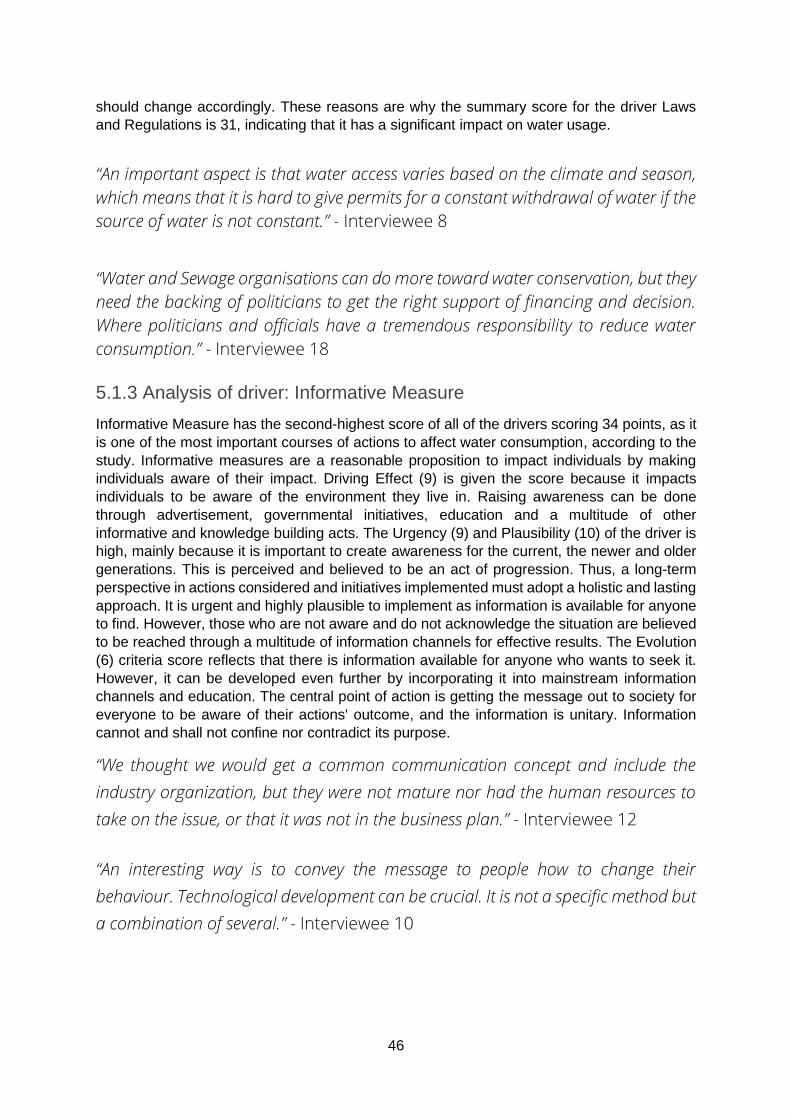
46
should change accordingly. These reasons are why the summary score for the driver Laws
and Regulations is 31, indicating that it has a significant impact on water usage.
“An important aspect is that water access varies based on the climate and season,
which means that it is hard to give permits for a constant withdrawal of water if the
source of water is not constant.” - Interviewee 8
“Water and Sewage organisations can do more toward water conservation, but they
need the backing of politicians to get the right support of financing and decision.
Where politicians and officials have a tremendous responsibility to reduce water
consumption.” - Interviewee 18
5.1.3 Analysis of driver: Informative Measure
Informative Measure has the second-highest score of all of the drivers scoring 34 points, as it
is one of the most important courses of actions to affect water consumption, according to the
study. Informative measures are a reasonable proposition to impact individuals by making
individuals aware of their impact. Driving Effect (9) is given the score because it impacts
individuals to be aware of the environment they live in. Raising awareness can be done
through advertisement, governmental initiatives, education and a multitude of other
informative and knowledge building acts. The Urgency (9) and Plausibility (10) of the driver is
high, mainly because it is important to create awareness for the current, the newer and older
generations. This is perceived and believed to be an act of progression. Thus, a long-term
perspective in actions considered and initiatives implemented must adopt a holistic and lasting
approach. It is urgent and highly plausible to implement as information is available for anyone
to find. However, those who are not aware and do not acknowledge the situation are believed
to be reached through a multitude of information channels for effective results. The Evolution
(6) criteria score reflects that there is information available for anyone who wants to seek it.
However, it can be developed even further by incorporating it into mainstream information
channels and education. The central point of action is getting the message out to society for
everyone to be aware of their actions' outcome, and the information is unitary. Information
cannot and shall not confine nor contradict its purpose.
“We thought we would get a common communication concept and include the
industry organization, but they were not mature nor had the human resources to
take on the issue, or that it was not in the business plan.” - Interviewee 12
“An interesting way is to convey the message to people how to change their
behaviour. Technological development can be crucial. It is not a specific method but
a combination of several.” - Interviewee 10

47
5.2 Future Economical Drivers for Residential Water
5.2.1 Analysis of driver: Socio-economic
The driver Socio-economic was quite divisive in the international literature with conflicting
results. This is reflected in the total summary of 16 points, the second-lowest score of the
study. The socio-economic status of individuals in relation to water consumption was not
unanimous in the literature as it was argued for being dependent on the geographical location,
and no common conclusion could be withdrawn. Meaning that individuals with higher socio-
economic status tended to consume more water in certain parts of the world, while in other
parts, the opposite was noted. The interviewees were not also confident that this was the case
in Sweden or, generally speaking. As the access to water is high for everyone and there is no
disparity, clean water in Sweden is seen as a non-privilege. It is dependent on circumstances
and environmental factors rather than socio-economic in most situations. Hence, Driving effect
(6) is motivated by the polarised discussion of whether or not it affects water consumption. For
instance, some consume more water as they have the water payment incorporated in their
rent, leading to consumers not being aware of their actual consumption since the water billing
is not disclosed. This payment structure is argued for making individuals not concerned with
their water consumption. The relatively low score of Plausibility (3) represents that it is believed
to be a low potential of actions and initiatives being implemented. Arguing that it is challenging
to shift economies in a short time period. This was strengthened by most interviewees, which
claimed water being cheap enough that it could be afforded by individuals regardless of
wealth. The criteria Urgency (6) is treated equally in literature and interviews. There is no
general perception that actions are required instantly. It was concluded that individuals with
higher incomes usually have larger properties with more bathrooms than the average home
and swimming pools. The urge of having swimming pools and maintaining green laws is in
many aspects to uphold oneself socio-economic status in society, which is not frictionless to
regulate through governmental initiatives. However, other initiatives can be done through
informative measures and better regulating the price of water according to consumption
patterns. The perception of the criteria Evolution (3) is also similar to the discussion before.
The data set could not find any significant difference other than individuals with more buying
power could be a market of introduction to water-efficient technology and water-saving
technologies (e.g., rainwater collection systems). Because of the divisiveness of the literature
and the agreement of the majority of interviewees regarding socio-economic status in relation
to water consumption, this driver does not have a high score in any of the criteria.
“It could also be the other way around, that the status of having a pool in a
residential area without water cannot look good. At the same time as in Australia,
one can see that having a clean car indicates that the individual is an environmental
culprit.” - Interviewee 6
“It is not an unreasonable assumption that water consumption is greater in
apartment buildings than in detached houses (villas). It is believed that this is the
case as the fee is included in the rent for apartments.” - Interviewee 10
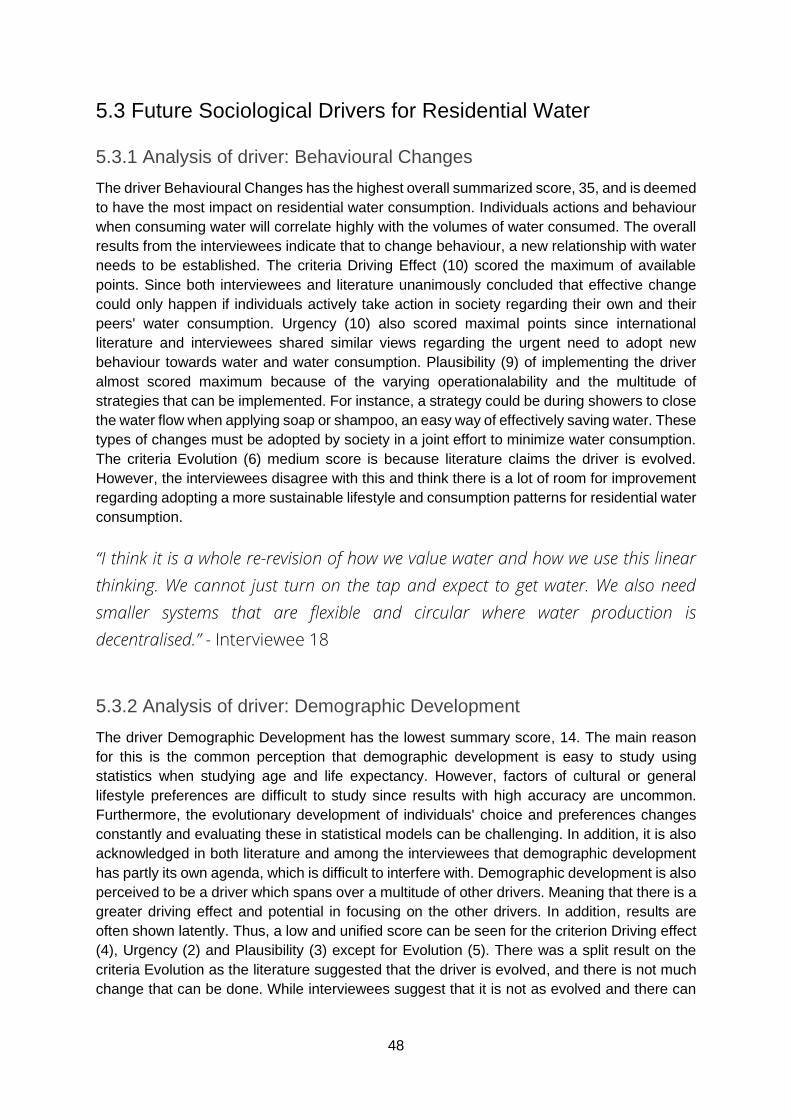
48
5.3 Future Sociological Drivers for Residential Water
5.3.1 Analysis of driver: Behavioural Changes
The driver Behavioural Changes has the highest overall summarized score, 35, and is deemed
to have the most impact on residential water consumption. Individuals actions and behaviour
when consuming water will correlate highly with the volumes of water consumed. The overall
results from the interviewees indicate that to change behaviour, a new relationship with water
needs to be established. The criteria Driving Effect (10) scored the maximum of available
points. Since both interviewees and literature unanimously concluded that effective change
could only happen if individuals actively take action in society regarding their own and their
peers' water consumption. Urgency (10) also scored maximal points since international
literature and interviewees shared similar views regarding the urgent need to adopt new
behaviour towards water and water consumption. Plausibility (9) of implementing the driver
almost scored maximum because of the varying operationalability and the multitude of
strategies that can be implemented. For instance, a strategy could be during showers to close
the water flow when applying soap or shampoo, an easy way of effectively saving water. These
types of changes must be adopted by society in a joint effort to minimize water consumption.
The criteria Evolution (6) medium score is because literature claims the driver is evolved.
However, the interviewees disagree with this and think there is a lot of room for improvement
regarding adopting a more sustainable lifestyle and consumption patterns for residential water
consumption.
“I think it is a whole re-revision of how we value water and how we use this linear
thinking. We cannot just turn on the tap and expect to get water. We also need
smaller systems that are flexible and circular where water production is
decentralised.” - Interviewee 18
5.3.2 Analysis of driver: Demographic Development
The driver Demographic Development has the lowest summary score, 14. The main reason
for this is the common perception that demographic development is easy to study using
statistics when studying age and life expectancy. However, factors of cultural or general
lifestyle preferences are difficult to study since results with high accuracy are uncommon.
Furthermore, the evolutionary development of individuals' choice and preferences changes
constantly and evaluating these in statistical models can be challenging. In addition, it is also
acknowledged in both literature and among the interviewees that demographic development
has partly its own agenda, which is difficult to interfere with. Demographic development is also
perceived to be a driver which spans over a multitude of other drivers. Meaning that there is a
greater driving effect and potential in focusing on the other drivers. In addition, results are
often shown latently. Thus, a low and unified score can be seen for the criterion Driving effect
(4), Urgency (2) and Plausibility (3) except for Evolution (5). There was a split result on the
criteria Evolution as the literature suggested that the driver is evolved, and there is not much
change that can be done. While interviewees suggest that it is not as evolved and there can

49
be ways to create the right circumstances in society to make sure the demographic evolution
evolves naturally.
“Young people are ambassadors for families. They are a medium for
communicating how useful, cheap and smart water is.” - Interviewee 12
5.3.3 Analysis of driver: Housing Development
Housing Development has a summary score of 29. The Driving factor (10) suggests that both
studies had similar results. It is suggested that new housing will enable a new set of
parameters for individuals to consume within. Meaning that if the right technology and systems
are in place, it will ensure sustainable consumption. Then the user will be confined within those
parameters, and in doing so, it will affect the individual's water consumption. This is the case
with newer built houses and apartments with new and modern technology rather than older
buildings that usually have outdated technology in terms of water efficiency and water use.
Urgency (6) and Plausibility (6) criteria have equal score and distribution, indicating conflicting
thoughts and arguments within the interviews and literature. The conflict resides in whether it
is possible to implement the driver and if it is the most urgent to focus on in relation to water
consumption. The basis of this conflict is whether there can be a sufficient amount of
development on pre-existing houses. The Evolution (7) criteria scored a, 4, from the
interviewees, and 3 from the literature. Suggesting that the driver must be more developed for
a meaningful impact.
“Had the dialogue of interest meant a greater focus on water demand, we would
have developed with sustainable water consumption in mind.” - Interviewee 4
“Municipalities and housing developers have to work together, they have not been
successful on a large scale.” - Interviewee 5
“There are also interesting ideas, you can make demands on how to use the land,
on the buildings that are erected.” - Interviewee 18
5.4 Future Technological Drivers for Residential Water
5.4.1 Analysis of driver: Household Innovation
The summary score for the driver Household Innovation is 29, indicating that it will have a
moderate effect on water consumption. The criteria Driving effect (10) getting the highest score
possible. Motivated by the reason to believe that innovative technology and innovation, in
general, will affect water consumption positively, i.e., decrease residential water consumption.
With new technology, there is a possibility to have a similar or improved lifestyle while
contributing to natural resource conservation. Urgency (7) and Plausibility (8) have similar
scores, as there is a great need to constantly improve through new technology, which is most
plausible for implementation. It is discussed that the implementation of technology will be
dependent on the type of technology and how great the investment is in terms of finance and
time. Evolution (4) has the lowest score for the particular driver. The low combined score

50
suggests that the driver is already developed and existing technology can enable a sustainable
lifestyle. The literature had contradicting arguments and remarks regarding whether or not
available technology is sufficient enough for reducing water consumption. For example, there
is technology that can transform sewage water into drinkable water. However, it is not a
standard technology and method to use since it is a common belief that technical water is as
pure as water produced from conventional methods. Water-efficient faucets are shown to
reduce water considerably and are available in most stores for a reasonable price compared
to “non-water efficient” faucets. Water monitoring instruments are also available, showing
decreased consumption for people to recognise their consumption patterns easily. To
summarize, the technology is available to be adopted, but it is a question if it will be and when,
if decided to.
“People need to be aware that water-efficient products will not mean a change in
lifestyle.” - Interviewee 3
“Water measurement is a positively contributing technology. It opens up
opportunities to study behavioural patterns and develop systems according to
them.” - Interviewee 10
5.4.2 Analysis of driver: System Change
The driver System Change has an equal summarised to the driver Household Innovation of
29. Making the two drivers of Household Innovation and System change equal in terms of
impact on water consumption. However, the distribution of criteria points differ. The score for
the criteria of driving effect (5) suggests that it will not have a considerable effect on the
residential water system. Most technologies regarding system changes are circulating or
recirculating systems, which primarily will affect the withdrawal of water rather than residential
water consumption. However, the criteria of Urgency (10) demonstrates that there is a need
to continuously change and increase the sustainability performance of the system.
Decentralised and circulating system as anticipated to be a contributing part in this
development. Plausibility (6) of applying system changes has a score indicating that although
there is possibility for change to be implemented, there are many ways to do it and finance it.
This is also reflected in the criteria Evolution (8), meaning that the system requires
development. The water sector in Sweden is generally perceived as conservative, which
means that the same foundation and infrastructure built and established many years ago,
withholds to this day. There has to be an update on the current system, but this requires a lot
of investment and driving force, making it not plausible for some regions. System change does
not exclusively mean changes to current infrastructure, but it also includes changes to better
decision-making processes and work procedures. For example, fixing leaking pipes and how
to act when natural disaster and drought inflict.
“The VA systems are very technical as it is the majority of engineers who solve
problems. Societal problems that are technically solved.” - Interviewee 14
“We see a need in developing a decentralized system since it will be less vulnerable
because a smaller number of individuals will depend on it. It will also increase the

51
involvement of consumers in the issue of sustainable consumption and what is
happening in the local area.” - Interviewee 6
5.5 Future Environmental Drivers for Residential Water
5.5.1 Analysis of driver: Climate Change
Climate change may be one of the common topics of discussion in the scientific community,
and there is a strong consensus that the climate is changing and contributing to the worse.
This is also the case for residential water consumption. The summary score is 30. Driving
effect (9), Urgency (9) and Plausibility (8) has a score that indicates the drivers' importance to
the residential water consumption. It was clear from the literature and the interviewees that
there were similar arguments and ideas of the driver. Concerning residential water
consumption, the driver has and will have a significant impact to a point where there has to be
consideration of how to deal with the driver. More importantly, have an appropriate response
to it. Climate change and environmental discussion are as important as ever and should be a
high priority of organizations and individuals regardless of societal status or impact. It is not
revolutionizing the number of various options to combat the effect of climate change. However,
the low score of the criteria Evolution (4) suggests that the driver is already developed. To be
noted is that this driver should be continuously studied as the climate constantly changes.
Although there are always new areas of research relevant for further exploration of climate
change, there is enough evidence currently to act upon, especially in connection to residential
water consumption and water extraction in general.
“The problem with Climate change is very apparent. There are changes in
precipitation and temperature that will affect the access to water.” - Interviewee 8
“Individuals are reactive with water. When individuals feel dirty they shower, as
plants become dry individuals water them. Temperature will be a highly important
factor to consider.” - Interviewee 7
5.5.2 Analysis of driver: Environmental Awareness
The driver Environmental Awareness is the driver with the third-highest score of 33 points.
Similarly, to drivers Informative measures and Behavioural change, it is about making
individuals act upon existing information. For individuals to act according to existing
information, it must be available and digested for a sustainable outcome. Driving Effect (10)
scores the maximum available points, indicating that the driver will have a considerable impact
on the outcome of residential water consumption. Urgency (9) and Plausibility (8) criteria
highlight that it has the potential not only to be considered and implemented in existing
systems, but must be done urgently and continuously in society. The Evolution (6) criteria
have a score that suggests that the driver has been evolved to a certain extent, but more work
is to be done. This driver is similar to many other drivers, where there have to be appropriate
ways of communicating and making individuals realize the severity of different actions that
directly or indirectly affect the environment. Creating awareness in its turn is to have a societal
dialogue and create different types of reforms in legislation to make people realize the
consequences of their actions. Like many of the other drivers, the driver Environmental
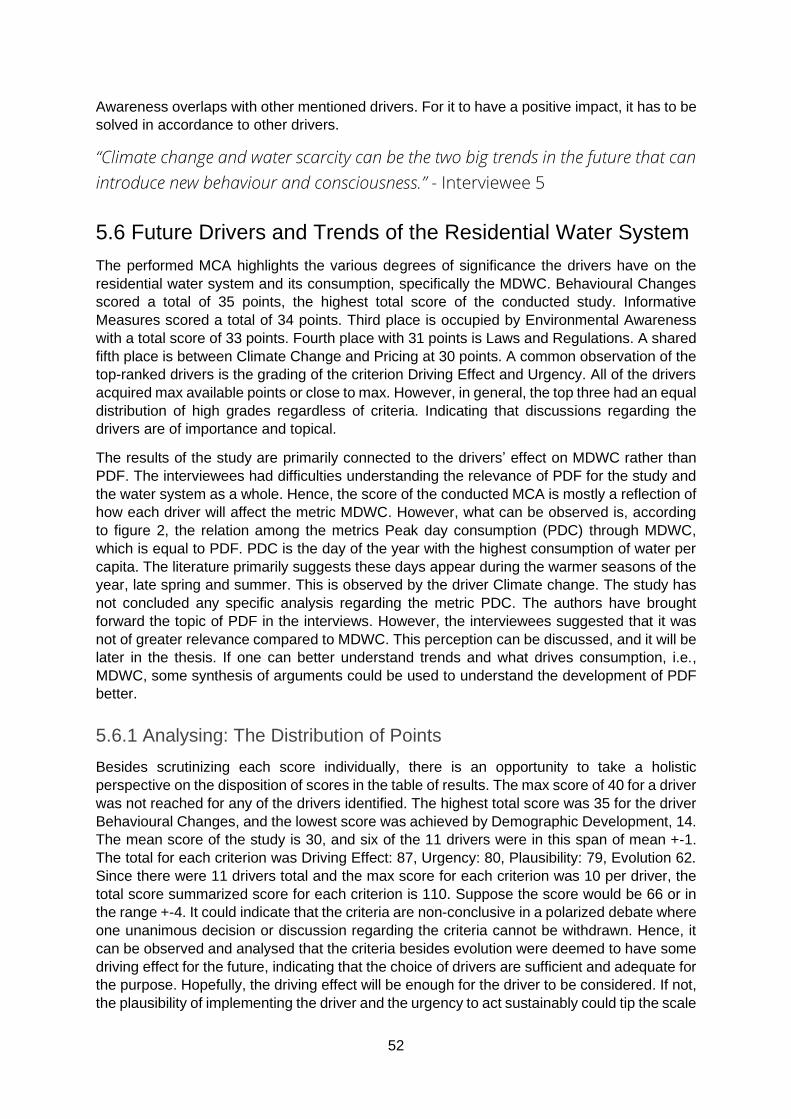
52
Awareness overlaps with other mentioned drivers. For it to have a positive impact, it has to be
solved in accordance to other drivers.
“Climate change and water scarcity can be the two big trends in the future that can
introduce new behaviour and consciousness.” - Interviewee 5
5.6 Future Drivers and Trends of the Residential Water System
The performed MCA highlights the various degrees of significance the drivers have on the
residential water system and its consumption, specifically the MDWC. Behavioural Changes
scored a total of 35 points, the highest total score of the conducted study. Informative
Measures scored a total of 34 points. Third place is occupied by Environmental Awareness
with a total score of 33 points. Fourth place with 31 points is Laws and Regulations. A shared
fifth place is between Climate Change and Pricing at 30 points. A common observation of the
top-ranked drivers is the grading of the criterion Driving Effect and Urgency. All of the drivers
acquired max available points or close to max. However, in general, the top three had an equal
distribution of high grades regardless of criteria. Indicating that discussions regarding the
drivers are of importance and topical.
The results of the study are primarily connected to the drivers’ effect on MDWC rather than
PDF. The interviewees had difficulties understanding the relevance of PDF for the study and
the water system as a whole. Hence, the score of the conducted MCA is mostly a reflection of
how each driver will affect the metric MDWC. However, what can be observed is, according
to figure 2, the relation among the metrics Peak day consumption (PDC) through MDWC,
which is equal to PDF. PDC is the day of the year with the highest consumption of water per
capita. The literature primarily suggests these days appear during the warmer seasons of the
year, late spring and summer. This is observed by the driver Climate change. The study has
not concluded any specific analysis regarding the metric PDC. The authors have brought
forward the topic of PDF in the interviews. However, the interviewees suggested that it was
not of greater relevance compared to MDWC. This perception can be discussed, and it will be
later in the thesis. If one can better understand trends and what drives consumption, i.e.,
MDWC, some synthesis of arguments could be used to understand the development of PDF
better.
5.6.1 Analysing: The Distribution of Points
Besides scrutinizing each score individually, there is an opportunity to take a holistic
perspective on the disposition of scores in the table of results. The max score of 40 for a driver
was not reached for any of the drivers identified. The highest total score was 35 for the driver
Behavioural Changes, and the lowest score was achieved by Demographic Development, 14.
The mean score of the study is 30, and six of the 11 drivers were in this span of mean +-1.
The total for each criterion was Driving Effect: 87, Urgency: 80, Plausibility: 79, Evolution 62.
Since there were 11 drivers total and the max score for each criterion was 10 per driver, the
total score summarized score for each criterion is 110. Suppose the score would be 66 or in
the range +-4. It could indicate that the criteria are non-conclusive in a polarized debate where
one unanimous decision or discussion regarding the criteria cannot be withdrawn. Hence, it
can be observed and analysed that the criteria besides evolution were deemed to have some
driving effect for the future, indicating that the choice of drivers are sufficient and adequate for
the purpose. Hopefully, the driving effect will be enough for the driver to be considered. If not,
the plausibility of implementing the driver and the urgency to act sustainably could tip the scale

53
for change. Evolution, as mentioned, scored the summarized score of 64, meaning that in
general, the drivers are discussed as non-conclusive, and there are no conclusive arguments.
The total number of points that could be assigned was 440, and 299 of them were assigned
in this particular MCA. See bottom of table 3 for a visual representation of the distributions of
points.

54
6. Discussion
In this section of the report, there will be a discussion upon the section “Results & Analysis”.
Discussing the drivers' significance on the system with a more in-depth focus on drivers with
the highest and lowest scores. Furthermore, a discussion of the implications a sociotechnical
analysis has on a LTS and the specific implications regarding the context of the sector
residential water and its future. The section will also discuss general ideas about the future of
residential water consumption and present potential scenarios. This section will also present
how different stakeholders should use this study. Finally, this section closes with scrutinizing
the methods used to give complete transparency of the research and the results of the thesis.
6.1 Significance of Drivers
6.1.1 Drivers of Greater Significance on the SOI
Three out of five of the highest-ranked scores are somewhat related to behaviour and
awareness, targeting mostly the consumer of the system. According to the results, behavioural
changes are the most important driver to pursue, but also the most important to scrutinize if
Sweden shall reach a national average per capita of 100 litres per day in water usage. Vice
versa, new behavioural changes could also increase consumption. Thus, it is important to
consider both outcomes, but trends and evidence impose a decrease in water consumption
as a natural and more likely outcome. However, for behavioural changes to happen, the right
set of parameters must be set accordingly and effectively. Based on the results, it can be
observed that Informative measures, the second highest-ranked driver, as key. It is also
confirming the conclusions of Hughes (1986) and Joerges (1988). For change to happen and
achieve its full potential, understanding the changes implemented are a prerequisite. The
authors of this thesis have not conducted and completed a quantitative study examining the
common perception of water in Sweden and cannot fully announce the following. That most
of the Swedish people are not aware of the actual water situation in Sweden or how their own
decision and behaviour will affect the present and future water system and ecosystem.
However, it is suggested that informative measures will be an enabling factor in the quest for
educational communication in the future. This statement is not to target nor discourage the
informative efforts and attempts of all of the water utilities in Sweden. They have to their best
ability and resource availability undertaken this immense task to complete. Nevertheless, it is
concluded that new strategies must be identified and formulated. It may also be a question of
source of origin. Information may need to reach customers through new platforms and
originate from other sources to better acknowledge the present unsustainable consumption
patterns of Swedish inhabitants. Change and information should also originate from regulatory
frameworks. Redefining prior regulations and sometimes discussing outdated legislation is
perceived to be an important action for the future.
The literature and interviews, in general, discussed that people have an ulterior awareness of
environmental consciousness. However, it must be better triggered and targeted for people to
act more sustainable regarding their water consumption. Many poses in both literature and
the interviews that little sacrifices must be made to act and consume water more sustainably
and sparsely. There is a lot of new water-efficient technology available which drastically
reduces water consumption when used. Individuals need to opt for these solutions when

55
investing in new water appliances and faucets. Economic measures are discussed to be key.
Individuals may also need to be charged more according to their consumption. Water in
Sweden is discussed to be too cheap, and this conversation will be continued in the future.
The price of water results in difficulties for individuals to see the actual value of water. There
is also the aspect when comparing the expenses related to water consumption, energy and
electricity, as a large portion of utility expenses are heating and electricity costs. Thus, making
it financially reluctant to reduce consumption or to invest in water-efficient technology since
the savings are marginal. This concerns both consumers and producers of water.
The problem becomes more complex since the cost of the system is based on the capacity of
the system rather than the actual cost of water. Hence, in some sense, the cost of the system
is fixed. Here the metrics of MDWC and PDF become factual since they determine the
dimensions of the production system and the distribution network. Observing the equations in
Figure 2 indicates this, specifically in the equation of PDF, which is the quota of PDC through
MDWC. Furthermore, a significant difference between MDWC and PDC will result in a system
with large capacity and unutilized capacity. Thus, contributing to a higher increase in the fixed
costs of the system. Thus, if the PDF is equal to MDWC or relatively close, it would mean
theoretically that the capacity of the system and consumption is as optimized as possible.
Observing international water pricing structures, lessons can be learned and investigated to
identify the most suitable and optimal option for the situation of Sweden. It is not a question of
restricting Swedish residents to consume something as valuable and critical as water for good
and aspiring health. It is instead a question of how to inform and make people responsible for
their actions. Spot market introduction may not be an applicable solution for Nordic countries
with a good supply of water. However, Sweden in the future could face similar climate change
problems to those of certain parts and areas of the US and Australia. Thus, the question of
implementing such or similar systems is adequate and justified by its reason. It is
acknowledged in the Swedish water industry that individuals consume more water than
necessary. The fluctuating demand for water is deemed problematic for the future both in
terms of production and distribution capacity, which is partly the reason for this thesis.
However, there is also the aspect of climate change due to increased mean global
temperatures. Inhabitants of the earth will experience new environmental challenges, and the
water cycle from raw water to sewage water will be affected in all of the steps. Water may not
always be available for production to meet demand due to increased temperatures, a shift in
precipitation patterns and catchment areas. This is also reflected in the results since the driver
Climate change got one of the highest scores in the study. Climate change is discussed to
most likely affect PDF and contribute to the system dimensioning for increased residential
water consumption.
By proactively preparing and reducing MDWC, the system and consumers become more
sustainable towards water consumption. The harsh reality in the future of lesser water
available per person and increased water scarcity globally could be a catalyst for initiatives of
water conservation since the effects are more tangible. Thus also increasing general
awareness and common perception of water. However, if the initiatives are delayed and not
proactively considered, it could prove to be too late, similarly to the progression and status of
Denmark. A country that at times had a MDWC compared to Sweden, but during the last 30
years have substantially reduced its consumption to around 100 litres (Danva, 2019). This has
been done by proactively restructuring the water pricing structure and policies, making water

56
pricier but not financially disruptive. There are also the actions and incentives formulated
towards reducing leakage, spillage, and better monetary allocation within the industry to
increase effectiveness. In addition, informing the general public of water scarcity has been
established early and has been continued, making 100 litres per person per day a natural state
of mind for Danish residents. Based on the concerns, discussions, and conclusions of Gleick
(2003); Markard, Raven and Truffer (2012); Kiparsky et al. (2013); Spiller et al. (2015), multiple
factors must be considered when opting for the best technological solution. Despite the minor
differences in how to handle and cope with innovation, the authors agreed that change is
necessary and required. The literature proposes that much resistance is embedded in the
infrastructure and stipulates hurdles for change. Hence, change will require new standards of
thinking and technological implementation. Secondly, most interviewees and some literature
agree that the linear flow of water and the existing centralized system will and have to change.
However, there is also the perspective of which the water utility system is a part of the
ecosystem since it extracts and returns water to collection areas. The water only takes the
detour into the city. Similar to the natural cycle of water, water originates from one place and
falls down in another place.
6.1.2 Drivers of Lesser Significance on the SOI
The authors have understood MLPs influence and implication on the niche and regime actors,
which primarily focus on technological and regulatory aspects (Geels and Kemp, 2007).
Extending MLP through P(L)ESTE has aided the authors in not actively or unconsciously
disregarding any potential driver from the exogenous environment (Carruthers, 2009). In the
case of the driver Demographic development, which is ranked the lowest of all drivers, it does
not mean that it is not important to discuss nor consider. The aspect of affecting water
consumption directly is relatively low, according to this performed study. Firstly, people are
inevitably getting older and living longer due to the progression of health care possibilities and
better quality of life. Secondly, older aged individuals can often be set in their ideas towards
different topics, such as water consumption. Thus, minimising the chance of influencing their
behaviour. Thirdly, cultural preferences are difficult to influence and change. However, the
authors believe that a younger generation will be more susceptible to new ideas of changes
in water consumption. Hoping that the younger and newer generation will continue to develop
a better consciousness of sustainability and attitude towards sustainable consumption.
However, to enable change in water consumption, individuals' attitudes and behaviours must
be adopted by individuals regardless of age.
The same principle of arguments is also applied to driver Socio-economic., which has the
second-lowest score. The basis of the score is that water is affordable in Sweden, and the
access to water is argued to be constant, regardless of Socio-economic status. However,
individuals with higher Socio-economic status usually are in other circumstances with greater
options of activities, including water consumption. For example, larger houses and properties
with pools could be a factor to consider. There is also the argument that these individuals often
have higher education. Thus, implying they are more aware of the consequences of their
action if they act accordingly is still debatable. There are also findings indicating that
individuals with higher education work more and spend less time at home. Therefore,
decreasing the possibilities of consuming water. Whether this is the case in Sweden is also
highly debatable. Regarding individuals in Sweden with lower Socio-economic status, it is

57
found they have fewer possibilities of activities consuming water in their household but have
a greater incentive. Incentives such as the fee for water is included in the rent.
In general, the drivers which could be labelled as originating and belonging to the
Sociotechnical Landscape have ranked low in this study. Meaning that this evolutionary
development may be difficult to affect and influence as change will happen regardless of a
particular action. Certain outcomes could be predetermined. However, they can be critically
understood to a degree where they do not induce a “short-term shock” of the system (Geels
and Kemp, 2007). However, the sector was facing a “short-term shock” of environmental and
climate change if acquiring a holistic view of the problem or occurrence. Globally and nationally
(Sweden), for the last five years, the frequency of natural disasters has increased and may
have contributed to a greater awareness of human impact. The actualisation of environmental
impact and change will hopefully contribute to positive effects. For example, reminding
individuals of their impact on the environment in general and in the question of water. However,
the naively sparse and feeble actions to combat climate change have resulted in a snowballing
effect, where the “short-term shock” has prolonged, and water becomes scarcer by day. Thus,
creating a new era of dealing with future problems related to water, where practical actions
will have to overcome theoretical possibilities.
6.2 Understanding the Future of a LTS through Sociotechnical
Analysis
Through the developed framework (see Figure 4), the authors have accomplished the task of
identifying drivers and trends of the observed system of interest with their significance
according to the studied data set. Therefore, the MRQ can be deemed possible for the given
and formulated purpose of this study. The conducted analysis gave answers to what drivers
and trends will determine the future of water consumption based on the domain knowledge of
the authors. However, this identified significance cannot fully declare future strategic
decisions. The reason is that the authors do not have the specifics of what decision will be
taken given the conducted analysis. Hence, if the conducted study would be duplicated by
other individuals with another set of domain knowledge and experiences, the drivers and
trends, including their significance, may differ. Likewise, would the scenarios which are to be
discussed later in this section be different. Given the brief experience and insights of the
industry of water professionals and the extensive knowledge among the interviewees. To their
best ability, the authors can attempt to build scenarios, given the acquired knowledge and data
from this particular study.
The study has continuously reminded the authors of the unsustainable attitude of
conservatism towards system change. The difficulty of all stakeholders is to identify the
circumstances and criticalities in a large system and specifically the system of water supply
and consumption. The fundamental thought that the system cannot be observed as a “non-
evolutionary black box” (Joerges, 1988) has shown significance when analysing the dimension
of P(L)ESTE. Change can happen indisputably and independently to other dimensions, i.e.,
system artefacts can be substituted, disposed of, or redesigned. The study has encountered
a lot of potential technology and innovation that could substitute prior technology and partly
redefine the business model and service offering of water utilities for consumers. There are a
handful of practically implemented new water pricing structures internationally, some proven

58
beneficial, others not so much. It was identified through the interviews that simple certification
on water-efficient technology or water-efficient houses, similar to what is indicated if a house
is energy efficient or a fridge, could be effective. However, if not the system perspective is
acquired, the potential risk of reaching the “irreducible potential for controversy” (Joerges,
1988) would increase. Individuals tend to be reluctant to change in a system where concurrent
systems are acceptable in the common eye. This leads to a disparity in perception of a
dysfunctional and functional system, particularly for this study of urban water supply. It has
been highlighted by this study showing a broad distribution of points when observing the
compiled and objective results. Individuals have fostered a mentality that water is an unlimited
product. Once supply seizes, the consequences are accelerated, and reactions increased.
Shown in later years where the topic and discussion of water have increased in Sweden due
to change of climate, increased periods of heat and drought, lesser and skewed precipitation
patterns making problems related to water more tangible. It may be that pre-emptive action is
the best course of action rather than acting reactively to current and future water situations.
Preemptive action could act as a deterrent to any type of water constraints, such as risks of
increased levels of water production and consumption during certain times of the year.
It can be observed and concluded that the system requires niches to happen across a
multitude of dimensions in the system (Geels and Kemp, 2007). Behavioural patterns and
practices must be in place. For it to happen, new technology and regulative structures must
set new parameters for individuals to act within and become a new setting of default. The
system cannot solely trust the change on an individual level to happen. It must also conceive
a change in the sociotechnical system to enable regimes to happen (Geels and Kemp, 2007).
Redefining and changing the perception of the value of water across all institutions could be
beneficial. The collective understanding of routines and social norms may also induce a more
sustainable and collective perception of the value of water. The study shows traces of both
understanding the requirements and urgency for this to happen, and that it does happen
across the industry. However, the initiatives are sparse and have not reached their full
potential. Reducing and potentially reconstructing the path dependency of the development of
water infrastructure and practices will be an important action. Lock-in effects (Geels and
Kemp, 2007) are evident in the industry, and the water industry has been criticized for being
conservative and reluctant to change for many years. Whether this is factual is difficult to
conclude. From an external perspective, this may be the perceived sight of reality. Internally,
the industry has been a victim of lock-in development, large, unmodern, and costly
infrastructural networks and big production sites, resulting in an abundance of sunk costs.
Water infrastructure is mostly dug and submerged below surface ground. Some of the raw
water is also extracted from ground water marks, meaning that water is visible primarily for
the average consumer when turning on the water faucets or taking a shower. Contributing to
a relatively high level of presumption and mentality of water being available around the clock
all year. The product water is relatively simple and may have contributed to the presumption
that water shall be available around the clock. Water shortages due to drought and production
faults are occasions where water supply is seized, and the value of water to consumers is
tangible. It is presumed that the climate will affect the precipitation patterns and watermarks,
thus contributing to an increased risk of water shortages.

59
6.3 Future Scenarios of Residential Water Consumption
All of the research questions have both been answered and discussed in previous sections of
this chapter. However, the opportunity would be wasted not to use the data collected and
analysed through the methods posed by this study. To not discuss what possible scenarios
will inflict in the future for the water sector. Furthermore, what this will mean for the MDWC
and PDF. Below will four different scenarios be posed and discussed with some additional
prospecting of the future. It should be noted that formulated scenarios are a few of many
possibilities. The scenarios presented are the most possible based on the results of this study.
There is a common perception and ideal reality among the water industry professionals, in this
study, that MDWC equal to 100 litres is not an unrealistic future. There is close to no evidence
that MDWC will increase from 140 litres per day. Regarding PDF, it is suggested that this
measure will not increase but could most certainly variate over the years to come due to
climate change and higher temperatures which usually drives peak consumption. However,
an important aspect of PDF is the frequency of which days the consumption is close to PDC.
The PDF quota may not be drastically impacted, but the understanding of PDF frequency
could enable a better grasp of how to deal with consumption patterns. The study also suggests
that apartments will be the major contributing factor to the MDWC, while detached houses will
primarily contribute to the PDF. Studies suggest that apartments do usually have a higher
MDWC compared to detached houses. The number of apartments is also growing rapidly,
increasing the need for sustainable and water-efficient housing. During warmer seasons,
detached houses and individuals who occupy these have a greater reason to consume water,
i.e. watering lawns and filling up pools. The difference is that although these factors should
decrease over a year, they will increase if the circumstance provokes it. Circumstances such
as climate change contribute to higher mean temperatures and lesser precipitation, increasing
the risk of droughts. It will also create reasons for individuals to consume more water.
A predetermined conclusion (Schwartz, 1997) of this study is that warmer weather increases
individuals' consumption. Individuals may consider the effect of their actions during periods of
drought and low water levels, but they may not act accordingly. The reason being individuals'
perception of the value of water and their right to consume water since they pay for it. Systemic
changes like desalination or recirculating systems will decrease the volumes of raw water
extraction. Thus the possibilities of water depletion will significantly reduce. However, it may
result in consumers thinking that consuming water will be a way to cope with their
consciousness of sustainability, resulting in negative rebound effects. It could potentially lead
to increased consumption of water among individuals since it is sustainably produced.
Increased efficiency of the grid network could also act similarly since water is treated more
efficiently. Similar to what is happening in the car industry, where cars are getting more fuel-
efficient. However, it has in some instances, resulted in individuals driving longer distances.
Efficiency increases but so does consumption. This could be detrimental to the development
of reducing water consumption and will be an important factor to consider when innovation
and new technology is implemented. A more efficient and functioning system can also show
water consumers that water is more valuable than letting it leak out through broken pipelines.
Thus, it is vital to continue the proactive work of informing consumers that reducing water
consumption should be of priority to reduce the implications and the risk of water scarcity. The
scenario where water consumption increases is deemed highly unlikely. However, maybe the
60
market is not mature enough for it to happen, and behavioural changes must happen before
systemic changes are in place and water deficiency is history.
However, it may be discussed previously that a potential scenario (a) could be labelled as
“business as usual” with a slight gradual decrease of MDWC yearly. However, the inherent
and unsustainable perception of water restraints the plausible rate of decrease. How this will
affect PDC is harder to predict, but there could be a lower average of PDC, which means that
the PDC would be significantly lower during some seasons of the year while higher during
other seasons. Imaginably it will be higher during dry summers as individuals would use water
for more activities than regularly, such as gardening, cleaning outside, washing vehicles and
using swimming pools. Regardless of whether individuals are aware of their consumption, they
would identify a need and justification for the water to be consumed. However, this scenario
could also be overacted since much more proactive initiatives, and tangible effects of climate
change are a fact. However, this reality of depleting water marks and warmer climate have not
reached the population since this is mainly issues in the southern parts of Sweden and
specifically the east coast. This scenario where individuals are not willing to change their
behaviours will significantly impact the development of water consumption and the decrease
of water consumption. Water consumption is indeed highly associated with individuals’
behaviour as it is something humans consume and use for most everyday activities. The
authors pose that no immediate changes in water behaviour will happen unless action is taken.
Informative measures will be an important part of this action.
This second scenario (b) is an extension of business as usual with the gradual rate of
decreasing MDWC yearly. However, the rate could be perceived as a more stair-like
progression. During periods of 10 years, the decrease of MDWC is noticeable. The PDF is
also expected to be constant, but the frequency of days where consumption is close to PDF
is decreasing. This is expected to result from a better water pricing structure where individuals
are responsible for their consumption and pay accordingly. Laws and Regulations are
supportive in the battle against unnecessary consumption where little to no content is a victim
of misinterpretation. Water-efficient technology for households is continuously being adopted.
The consumer can now better identify these technologies where a standardized and visible
system of certification is in place, showcasing water savings for the product similar to what
can be found on household appliances or TVs regarding energy consumption. Individuals will
continue to develop their perception of water consumption and environmental awareness. It is
a slow progress, but the development is moving forward. The water utilities are also continuing
their work as usual, and change is happening in small portions. No radical innovation is
adopted to disrupt the business model and induce system changes. Work within the water
sector consists of being proactive rather than reactive. There are better strategies for coping
with the increased possibility of scenarios and seasons where water levels are low. However,
housing contractors notice the slow progression of people getting more involved in water
questions like the politicians and similar to what happened with the industry regarding
electricity and heating in 2005 and forward. A direct focus on water-saving technologies is
being adopted in bigger housing development complexes. Slowly, but surely aiming for the
target of MDWC at 100 litres.
A third scenario (c) would also be an extension of scenario one and two. Besides these
initiatives realized there is also the adoption of smaller and decentralized re-circulating
systems in apartment complexes. The system is treating water more efficiently and using small

61
volumes of water to achieve individuals’ everyday needs, where the right water of quality is
available depending on the activity. However, this is difficult to adopt in already established
residential areas and estates. Change is happening in newly built residential areas where
economies of scale exist. Rain-water collection or smaller silo of water storage underground
are adopted in a modest amount among already established estates. However, there is still a
redundancy against the saving in adopting such systems.
The fourth scenario (d) poses a future where the water sector is solely re-circulating a given
amount of water, and water extraction is a net positive. Smaller decentralized production
facilities are a reality and means that communities rely on them to deliver. However, it will
require an extensive overarching organization that proactively ensures uptime of facilities and
people must understand and acknowledge that water quality is not compromised. It will also
mean that societies are more self-sustained and a lesser threat if disaster strikes.
6.4 Scrutiny of Methods
The authors did not initially identify nor fully understand the importance of LTS. Thus, it
became clear why the application and foundation of such a theoretical framework would prove
to be scientifically beneficial. Giving the authors the possibility to acquire a holistic perspective
in understanding the problem. The authors were also not interested in one individual's reaction
and behaviour in the system, but rather how the collective of individuals would react to
changes in the system. The interest lies in how would the behaviour of individuals change in
the system and affect the system itself. These dualities of influence and impact of the three
perspectives (industrial, functional and individual) will be crucial for achieving the objective of
the report. As the water system changes and affects other systems, the ecosystems or the
sociosystem will affect the water system. Likewise, will technology and legislation be part of
the dynamic change.
There is always a need to reflect on how the study could be performed better and where things
could have been done differently as well more efficiently. This study's complexity meant that
the research design, methods and theoretical framework were chosen based on authors'
knowledge collected from their academic background. Prior studies have not been done in
this exact setting or a similar context. Thus it has required the authors to be creative within the
frame of science to construct a methodological approach on the area of interest. The pre-study
required much time for the authors, as there was a clear objective but no clear approach. The
authors had to identify different relevant and achievable objectives that met the necessary
criterion set by the stakeholders. Although the pre-study was a difficult hurdle to overcome, it
gave the authors a clear structure to work by. However, this put the authors in a constrained
time frame. Through an established and formulated plan, the authors could work and keep up
with the time frame. Henceforth, it also allowed the authors to narrow down the scope more
effectively. This ensured the authors an effective way of allocating time for the different
components of the work, such as identifying scientific tools and methods, finding literature and
conducting interviews.
The authors also have a critical view of the results, as it may not be representable in some
aspects. For instance, the literature studied and examined for the different drivers is highly
likely, not the only available literature. Then it becomes a matter of whether the chosen
literature to study can represent a particular driver connected to residential water consumption.
62
Also, if additional excluded literature should have been incorporated to increase the accuracy
of results. Furthermore, it means that the authors must question if the chosen literature based
on the search criteria is effective for sorting literature. For example, if literature chosen on the
factor as most cited is diverse enough to bring forth and score. By choosing the most cited
literature, the authors can look at the most popular research among scholars. However,
literature was also chosen based on search criteria such as relevancy and date of publication
to increase the spectrum of knowledge. The authors also perceived that literature conducting
similar studies was sparse and difficult to find, which could be indicated by the multiple
keywords used in the study. Meaning that the authors had to acquire a broad perspective
when searching for literature available. The majority of the literature chosen has an
international origin that could question the aspect of understanding the context of Swedish
residential water consumption. However, the majority of interviewees were experts on the
Swedish water utility sector, and their answers reflected international literature, according to
the results. See table 3. Thus, it confirmed that it was valid to use the chosen literature in the
Swedish context.
This research scours uncharted territory in Sweden. It can be further explored since the results
cannot be fully confirmed. As this study is of qualitative nature, it requires objective judgement
on the decisions regarding the scoring of the criterion for each driver. The difficulty lies in
casting judgement when deciding, as there is always a factor of subjectivity in each decision.
To reduce the subjectivity, the authors can conduct a quantitative study identifying the
correlation between the factors and the development of MDWC and PDF, confirming or
disconfirming the results of this study.
Criticality must be inflicted on the interview processes in relation to the results. The authors
have to contemplate if the correct questions have been asked to fulfil the purpose.
Furthermore, if the semistructured interview process has provided enough structure for the
interviewees to answer. Meaning if the interview process affects the relevancy of their answer.
The authors also must reflect upon if the chosen interviewees represent the sector adequately.
Therefore, a wide range of field experts was interviewed to get educated answers on each
driver. The individuals interviewed in this study, within the water utility sector, could be deemed
members of eco-chambers of ideas, as many experts are familiar with each other’s work. This
creates the problem of not getting a wide range of nuance in their answers. Then it becomes
important to bring in professionals from other industries with another perspective on existing
problems, which the authors did for this study. As well there can be questions, whether the
authors gave an appropriate score regarding the empirical study. To ensure objective scoring,
the authors need to base their opinion on the facts from sources for each driver, which was
the case. However, scoring might have been more valid and representative if each driver was
scored individually by the interviewed individuals. This could be a way to give an accurate
description of the collective opinion within each criterion.
6.5 Practical & Theoretical Contribution
The result of this thesis could be used by different stakeholders depending on their different
purpose and aspiration. If the stakeholder is Norrvatten, then this report should be used as a
summary of relevant drivers that affect their production demand. The drivers should be
continuously researched, observed and adjusted given their development over time. For
example, as society evolves, Norrvatten must keep up with the development to understand

63
how to make strategic decisions most efficiently. Norrvatten can also further extend upon this
thesis to identify other drivers. This will ensure that they get an even more accurate description
of the current water sector. However, it is essential to highlight that any similar water utility
provider can use this study to its advantage or for inspiration. As this study was made based
on Sweden, additional parameters can be considered when delimiting to a particular region of
Sweden.
This study should be perceived as a different perspective to understand the development of
large infrastructural systems through LTS, MLP, Scenario Building, PESTLE and MCA.
Through this study, it should help researchers for exploration of LTS that include water or other
natural resources. It can also be used as an inspiration on how to understand trends and
factors of a system. The uniqueness of this thesis is that the setting is different, and
methodology is unique to the extent that it has not been previously performed in Sweden.
Therefore, it may open up doors for extending this research in Sweden, as well as looking at
other non-explored settings.
64
7. Conclusions
This thesis originates from the desires of understanding how residential water consumption
will develop in the future. However, this poses additional concerns to address, such as how a
LTS should be studied and understood. Furthermore, how to utilise and evaluate this
knowledge of the system domain and dynamics to build potential scenarios of the SOI. This
thesis poses one structured way to understand and build potential scenarios for a specific SOI,
given that it qualifies as a LTS. See Figure 4.
To uncover how the SOI functions, it is crucial to understand the dynamics of the system. This
is posed to be accomplished through scouring literary sources, research coverage and an
empirical interview study. Combining this with the fundamental knowledge of how a LTS
functions, and what dynamics interplay in such systems through the levels of MLP. The
authors pose that sufficient knowledge of the system domain is acquired. LTS dimensions
originate from the analytical model of PESTLE, which are posed to uncover NRV. NRV data
are to be analysed and translated into a quantitative model by the analytical ranking model of
MCA. These drivers could not only be identified but also graded through four criteria with the
purpose to quantify driving effect, urgency, plausibility, and evolution. The aspiration is to
compare how the literature perceives the driver contrary to how interviewees perceive it. From
there on, the authors have to a certain degree, attempted to formulate future scenarios for the
SOI.
In table 3, relevant drivers are presented with a summary score determining their significance
to residential water consumption and its future. If the LTS changes, the results will most
certainly differ, and the exclusion or inclusion of drivers could change, respectively. Likewise,
if the scope of the project changes, the results would most likely change. The distribution of
grades and ranking of significance for the future does not mean that other analysed drivers
will not affect the SOI. Instead, depending on how they are managed, their significance may
differ. Furthermore, it should be noted that the drivers should not be managed independently
but rather as a collective of drivers. Some of the drivers relate to each other as they overlap
and are interconnected. This research has studied the drivers' effect on the SOI independently
at first but is discussed in “Discussion” codependently.
According to the study, the most impactful drivers are connected to behaviour and awareness
of the drivers identified and analysed, i.e., the drivers' Informative Measures, Behavioural
Changes and Environmental Awareness. The attitude towards water consumption is
interlinked with awareness towards the value of water. For there to be a positive outcome of
a driver, the consumer must be aware of the significance and decide in accordance with the
driver’s effect and importance. Meaning that it all depends on how educated the consumer is
and act accordingly. Accountability could summarise initiatives required for societies to act
more sustainably in the future regarding water consumption. The study concludes and
suggests that individuals must understand and take responsibility for their actions. There is no
dispute in this study that the price of water is low in Sweden. Fundamentally, the price of water
does not reflect or even remark the actual value of water, compared to far more expensive
natural resources with lesser importance to life and health, such as gold or diamonds. Thus,
accountability and responsibility will have to increase along the value chain. This can be
achieved as discussed in multiple ways. For example, restructuring the pricing structure,

65
regulatory framework, and legislation supports the purpose of better and more effectively value
water. This will hopefully result in educating individuals in what their action implies for the
welfare of water. Positive change in consumers consumption can also be achieved more
efficiently if producers lead by example, which means that consumer accountability could
potentially increase due to identifying how the system owners take responsibility and
accountability. Technological advancements and innovation will be an important part. Most
sources deem that technology is available both for consumers and system owners. However,
both actors have difficulties in deciding what technology should be adopted and implemented.
There is uncertainty and unawareness of what the future holds, and costs are substantial.
Thus, creating a reluctance for change.
Ultimately, awareness among individuals can be achieved by a multitude of initiatives, which
is showcased in this thesis. However, by staying true to the method proposed by this thesis,
one can better understand what areas of focus could be important for consideration and steer
the future along a more sustainable path of natural resource consumption.
7.1. Future Research
Future research on the same SOI can be approached by conducting a deeper and more
detailed analysis of each driver. Details such as understanding the link between each driver
and how the different drivers affect each other. Giving more clarity and nuance in the analysis.
Studying countries comparable to Sweden, comparable in natural resources and economic
status, can confirm if the drivers for this study are the most significant for residential water
consumption. Furthermore, there could be further research to understand and identify drivers
that affect other countries' residential water consumption. Studying a country in another setting
may result in additional drivers and new perspectives to increase nuance and understanding
of the future. Another intention of this research is to pave the way for different or similar
approaches on LTS to identify drivers for the future, which means that the approach suggested
by this study is not static nor perfect. Hence, new characteristics and factors will require a
flexible approach within the frame of science.
As this study is qualitative, it has some limitations. Specifically, the identified and extracted
data has been subjected to a degree of subjectivity, which puts limits on the research. In
addition, the data collected was not in the format of numbers, where the authors could
construct statistical significance and conclusions. Instead, the data collection required the
authors to compile sentences, context and reasoning to construct valid conclusions. Adopting
a quantitative approach can be another confirmation if the drivers chosen are the most
significant. Utilising other analysis tools than MCA could also be a way to minimize the
subjectivity of the result.

66
References
Web Pages
Encyclopedia Britannica, II (1979). Chicago, I11.: Encyclopedia Britannica Inc. Collected
2021-05-03. from https://www.britannica.com.
European Environment Agency (2021). Water pricing. Available at:
https://www.eea.europa.eu/themes/water/glossary/water-pricing (Accessed: 15 March 2021).
Kenton, W (2020). PEST Analysis. Investopedia. 14 November. Available at:
https://www.investopedia.com/terms/p/pest-analysis.asp (Accessed: March 26, 2021).
Norrvatten (no date). Kortfakta Om Norrvatten. Availble at: https://www.norrvatten.se/om-
norrvatten/ (Accessed: March 26, 2021).
SCB (2021). Statistikdatabasen - Färdigställda lägenheter i nybyggda hus efter region,
lägenhetstyp och hustyp. År 1975 - 2020. Available at:
https://www.statistikdatabasen.scb.se/pxweb/sv/ssd/START__BO__BO0101__BO0101A/La
genhetNyAr/# (Accessed: 19 May 2021).
SCB (no date-a). Folkmängden efter region, civilstånd, ålder och kön. År 1968 - 2020.
Available at:
https://www.statistikdatabasen.scb.se/pxweb/sv/ssd/START__BE__BE0101__BE0101A/Bef
olkningNy/ (Accessed: May 27, 2021).
SCB (no date-b). Hushållens vattenanvändning per typ av vattenförsörjning, efter region.
Vart femte år 1995 - 2015. Available at:
https://www.statistikdatabasen.scb.se/pxweb/sv/ssd/START__MI__MI0902__MI0902E/Vatte
nAnvHus/ (Accessed: May 27, 2021).
Svenskt Vatten (2019). Dricksvattenfakta. Available at: https://www.svensktvatten.se/fakta-
om-vatten/dricksvattenfakta/ (Accessed: March 4, 2021).
Svenskt Vatten (no date). Vattenverket. Svenskt Vatten. Available at:
https://www.svensktvatten.se/fakta-om-vatten/vattenskolan/vattenskolan-start/vattnets-
vag/quiz-steg-5/ (Accessed: 19 March 2021).
Sydvatten (2020). Vattenförbrukning. Available at:
https://sydvatten.se/vattenfakta/vattenforbrukning/ (Accessed: May 19, 2021).
Sveriges ingenjörer (2019) Code of Honor. Available at:
https://www.sverigesingenjorer.se/om-forbundet/sveriges-ingenjorer/hederskodex/#14350
(Accessed: 5 October 2020).
The Water Research Foundation (2017). Social Media for Water Utilities. The Water
Research Foundation Available at: https://www.waterrf.org/research/projects/social-media-
water-utilities (Accessed: April 14, 2021).

67
US EPA (no date-a). Product Specifications. Available at:
https://www.epa.gov/watersense/product-specifications (Accessed: May 3, 2021).
US EPA (no date-b). Homes Certification Background. Available at:
https://www.epa.gov/watersense/homes-certification-background (Accessed: May 3, 2021).
Vetenskapsrådet (2018) Forskningsetiska principer inom humanistisk-samhällsvetenskaplig
forskning.
Water Footprint (2018) The Difference Between Water Conservation and Efficiency, Water
Footprint. Available at: https://www.watercalculator.org/footprint/water-conservation-
efficiency/ (Accessed: 22 March 2021).
Waterless (2019) Water Conservation, Efficiency, and the Rebound Effect. Available at:
https://www.waterless.com/blog/water-conservation-efficiency-and-the-rebound-effect
(Accessed: 22 March 2021).
Literature
Blomkvist, P., Hallin, A. (2015). Method for engineering students: Degree projects using 4-
phase Model. 1st edition. Lund: Studentlitteratur.
Collard, D. A., Pearce, D. W. and Ulph, D. (1988) Economics, Growth and Sustainable
Environments: Essays in Memory of Richard Lecomber. St. Martin’s Press, New York.
Gleick, P. H. (1993) Water in Crisis: A Guide to the World’s Fresh Water Resources.
Illustrated edition. Oxford: Oxford University Press.
Merriam, S. B. (2009). Qualitative research: A guide to design and implementation. 3rd
edition. San Francisco, CA: Jossey-Bass.
Saunders, M., Lewis, P. and Thornhill, A. (2016) Research methods for business students.
7th edn. Harlow, United Kingdom: Pearson Education Limited.
Schwartz, P. (1997) Art of the Long View - Planning for the future in an uncertain world. 1st
edition. New York: John Wiley Sons Inc.
Solberg Søilen, K. and Huber, S. (2006) 20 svenska fallstudier för små och medelstora
företag – Pedagogik och vetenskaplig metod. Lund: Studentlitteratur.
Stake, R. E. (1995). The art of case study research. Thousand Oaks, CA: Sage
Vickers, A. (2001) Handbook of Water Use and Conservation: Homes, Landscapes,
Industries, Businesses, Farms. 1st edn. WaterPlow Press.
Walden, David D., Roedler, Garry J., Forsberg, Kevin J., Hamelin, R. Douglas, and Shortell,
Thomas M. (2015) Systems Engineering Handbook: A Guide For System Life Cycle
Processes And Activities. 4th edn. New Jersey: John Wiley & Sons Inc.
Yin, R. K. (2009) Case study research: Design and methods. Thousand Oaks, CA: Sage.

68
Articles
Abbott, B. W., Bishop, K., Zarnetske, J. P., Minaudo, C., Chapin, F. S., Krause, S., Hannah,
D., M. Conner, L., Ellison, D., Godsey, S. E. Plont, S., Marçais, J., Kolbe, T., Huebner, A.,
Frei, R. J., Hampton, T., Gu, S., Buhman, M., Sara Sayedi, S., Ursache, O., Chapin, M.,
Henderson, K. D. and Pinay, G. (2019). Human domination of the global water cycle absent
from depictions and perceptions. Nature Geoscience. 12(7). pp. 533–540. doi:
10.1038/s41561-019-0374-y.
Adams, A. F. (1997) Search Costs and Price Dispersion in a Localized, Homogeneous
Product Market: Some Empirical Evidence. Review of Industrial Organization. 12(5–6). pp.
801–808. doi: 10.1023/A:1007779422525.
Anderson, B. A., Romani, J. H., Phillips, H., Wentzel, M. and Tlabela, K. (2007) Exploring
environmental perceptions, behaviors and awareness: Water and water pollution in South
Africa. Population and Environment. 28(3). pp. 133–161. doi: 10.1007/s11111-007-0038-5.
Ayoo, C. A. and Horbuyluk, T. M. (2008) The Potential and Promise of Water Pricing.
Journal of International Affairs. 61(2). pp. 91–104.
Baumgartner, R. J. and Rauter, R. (2017) Strategic perspectives of corporate sustainability
management to develop a sustainable organization. Journal of Cleaner Production.
140(January). pp. 81–92. doi: 10.1016/j.jclepro.2016.04.146.
Beal, C. D. and Stewart, R. A. (2014) Identifying Residential Water End Uses Underpinning
Peak Day and Peak Hour Demand. Journal of Water Resources Planning and Management.
140(7). doi: 10.1061/(asce)wr.1943-5452.0000357.
Beckerman, W. (1992) Economic growth and the environment: Whose growth? whose
environment?. World Development. 20(4). pp. 481–496. doi: 10.1016/0305-750X(92)90038-
W.
Beckerman, W. (2013) Economic Growth and the Environment. Encyclopedia of Biodiversity:
Second Edition. 20(4). pp. 25–30. doi: 10.1016/B978-0-12-384719-5.00433-0.
Berbel, J.,Gutiérrez-Martín, C.,Rodríguez-Díaz, J. A., Camacho, E. and Montesinos, P.
(2015) Literature Review on Rebound Effect of Water Saving Measures and Analysis of a
Spanish Case Study. Water Resources Management. 29(3). pp. 663–678. doi:
10.1007/s11269-014-0839-0.
Blomkvist, P. and Nilsson, D. (2017) On the need for system alignment in large water
infrastructure: Understanding infrastructure dynamics in Nairobi, Kenya. Water Alternatives.
10(2). pp. 283–302.
Braun, V. and Clarke, V. (2006) Using thematic analysis in psychology. Qualitative Research
in Psychology. 3(2). pp. 77–101. doi: 10.1191/1478088706qp063oa.
Bülbül, H., Büyükkeklik, A., Topal, A. and Özoğlu, B. (2020) The relationship between
environmental awareness, environmental behaviors, and carbon footprint in Turkish
69
households. Environmental Science and Pollution Research. 27(20). pp. 25009–25028. doi:
10.1007/s11356-020-08813-1.
Burgess, J., Harrison, C. M. and Filius, P. (1998) Environmental communication and the
cultural politics of environmental citizenship. Environment and Planning A. 30(8). pp. 1445–
1460. doi: 10.1068/a301445.
Cantin, B., Shrubsole, D. and Aït-Ouyahia, M. (2005) Using Economic Instruments for Water
Demand Management: Introduction. Canadian Water Resources Journal. 30(1). pp. 1–10.
doi: 10.4296/cwrj30011.
Carminati, M., Sinha, G. R., Mohdiwale, S., and Ullo, S.L. (2021) Miniaturized Pervasive
Sensors for Indoor Health Monitoring in Smart Cities. Smart Cities. 4(1). pp. 146–155. doi:
10.3390/smartcities4010008.
Carruthers, H. (2009) Using PEST analysis to improve business performance: In Practice.
31(1). pp. 37–39. doi: 10.1136/inpract.31.1.37.
Cary, J. W. (2008) Influencing attitudes and changing consumers household water
consumption behaviour. Water Science and Technology: Water Supply. 8(3). pp. 325–330.
doi: 10.2166/ws.2008.078.
Chaplin, M. F. (2001) Water: Its importance to life. Biochemistry and Molecular Biology
Education. 29(2). pp. 54–59. doi: 10.1016/S1470-8175(01)00017-0.
Corbella, H. M. and Pujol, D. S. (2009) What lies behind domestic water use? A review
essay on the drivers of domestic water consumption. Boletin de la Asociacion de Geografos
Espanoles. (50).
Creese, E. E. and Robinson, J. E. (1996) Urban water systems for sustainable development.
Canadian Water Resources Journal. 21(3). pp. 209–220. doi: 10.4296/cwrj2103209.
Danielopol, D. L., Griebler, C., Gunatilaka, A., and Notenboom, J. (2003) Present state and
future prospects for groundwater ecosystems. Environmental Conservation. 30(2), pp. 104–
130. doi: 10.1017/S0376892903000109.
De Bruin, K., Dellink, R. B., Ruijs, A., Bolwidt, L., Van Buuren, A., Graveland, J., De Groot,
R. S., Kuikman, P. J., Reinhard, S., Roetter, R. P., Tassone, V. C., Verhagen, A. and Van
Ierland, E. C. (2009) Adapting to climate change in the Netherlands: An inventory of climate
adaptation options and ranking of alternatives. Climatic Change. 95(1–2). pp. 23–45. doi:
10.1007/s10584-009-9576-4.
Dean, M. (2020) Multi-criteria analysis. Advances in Transport Policy and Planning. 1th edn.
Elsevier Inc. doi: 10.1016/bs.atpp.2020.07.001.
Deevey, E. S. (1969) Coaxing History to Conduct Experiments. BioScience. 19(1). pp. 40–
43.
70
Devine, A. and Kok, N. (2015) Green certification and building performance: Implications for
tangibles and intangibles. Journal of Portfolio Management. 41(6). pp. 151–163. doi:
10.3905/jpm.2015.41.6.151.
Dige, G., De Paoli, G., Strosser, P., Anzaldua, G., Ayres, A., Lange, M., Lago, M., Hrabar,
M. and Navrud, S. (2013) Assessment of cost recovery through water pricing. European
Environment Agency. p. 128. doi: 10.2800/93669.
Distefano, T. and Kelly, S. (2017) Are we in deep water? Water scarcity and its limits to
economic growth. Ecological Economics. 142. pp. 130–147. doi:
10.1016/j.ecolecon.2017.06.019.
Domene, E. and Saurí, D. (2006) Urbanisation and water consumption: Influencing factors in
the metropolitan region of Barcelona. Urban Studies, 43(9), pp. 1605–1623. doi:
10.1080/00420980600749969.
Donnelly, K., Christian-Smith, J. and Cooley, H. (2013) Pricing Practices in the Electricity
Sector to Promote Conservation and Efficiency: Lessons for the Water Sector. Pacific
Institute. Oakland. CA. pp. 1–26.
Duarte, R., Pinilla, V. and Serrano, A. (2014) Looking backward to look forward: water use
and economic growth from a long-term perspective. Applied Economics. 46(2). pp. 212–224.
doi: 10.1080/00036846.2013.844329.
Dumont, A., Mayor, B. and López-Gunn, E. (2013) Is the Rebound Effect or Jevons Paradox
a Useful Concept for better Management of Water Resources? Insights from the Irrigation
Modernisation Process in Spain. Aquatic Procedia. 1ed. pp. 64–76. doi:
10.1016/j.aqpro.2013.07.006.
Eisenhardt, K. M. (1989) Building Theories from Case Study Research Published by :
Academy of Management Stable. The Academy of Management Review. 14(4). pp. 532–
550.
Ercin, A. E. and Hoekstra, A. Y. (2014) Water footprint scenarios for 2050: A global analysis.
Environment International. 64. pp. 71–82. doi: 10.1016/j.envint.2013.11.019.
Freire-González, J. (2019) Does Water Efficiency Reduce Water Consumption? The
Economy-Wide Water Rebound Effect. Water Resources Management. 33(6). pp. 2191–
2202. doi: 10.1007/s11269-019-02249-0.
Geels, F. W. (2004) From sectoral systems of innovation to socio-technical systems: Insights
about dynamics and change from sociology and institutional theory. Research Policy. 33(6–
7). pp. 897–920. doi: 10.1016/j.respol.2004.01.015.
Geels, F. W. and Kemp, R. (2007) Dynamics in socio-technical systems: Typology of change
processes and contrasting case studies. Technology in Society. 29(4). pp. 441–455. doi:
10.1016/j.techsoc.2007.08.009.
Geels, F. W., Schwanen, T., Sorrell, S., Jenkins, K., and Sovacool, B. K., (2018) Reducing
energy demand through low carbon innovation: A sociotechnical transitions perspective and

71
thirteen research debates. Energy Research and Social Science. 40 (November 2017). pp.
23–35. doi: 10.1016/j.erss.2017.11.003.
Gibbert, M., Ruigrok, W. and Wicki, B. (2008) WHAT PASSES AS A RIGOROUS CASE
STUDY? Strategic Management Journal. 29(September). pp. 1465–1474. doi:
10.1002/smj.722.
Gilg, A. and Barr, S. (2006) Behavioural attitudes towards water saving? Evidence from a
study of environmental actions. Ecological Economics. 57(3). pp. 400–414. doi:
10.1016/j.ecolecon.2005.04.010.
Giménez, J. V. and Zárate-Marco, A. (2013) Environmental taxation and industrial water use
in Spain. Investigaciones Regionales. (25). pp. 133–162.
Gleick, P. H. (1998) Water in crisis: Paths to sustainable water use. Ecological Applications.
8(3). pp. 571–579. doi: 10.1890/1051-0761(1998)008[0571:WICPTS]2.0.CO;2.
Gleick, P. H. (2003) Global Freshwater Resources: Soft-Path Solutions for the 21st Century.
Science magazine. 302. pp. 1524–1528. Available at: http://science.sciencemag.org/.
Gómez, C. M. and Gutierrez, C. (2011) Enhancing Irrigation Efficiency but Increasing Water
Use : The Jevons Paradox. EAAE 2011 Congress Change and Uncertainty. Available at:
http://econpapers.repec.org/RePEc:ags:eaae11:114622.
Gurung, T. R.,Stewart, R. A., Beal, C. D., and Sharma, A.K., (2015) Smart water meter data
for improved water demand modelling of diversified water supply schemes. IWA/IWC Water
Conference New Developments in IT and Water. (February 2015).
Hightower, M. and Pierce, S. A. (2008) The energy challenge. Nature. 452(7185). pp. 285–
286. doi: 10.1038/452285a.
Hitch, C. (1953) Sub-Optimization in Operations Problems. Journal of the Operations
Research Society of America. 1(3), pp. 87–99.
Horbulyk, T. M. (2005) Markets, Policy and the Allocation of Water Resources Among
Sectors: Constraints and Opportunities. Canadian Water Resources Journal. 30(1). pp. 55–
64. doi: 10.4296/cwrj300155.
Hughes, T. P. (1983) Networks of power : electrification in Western society. Johns Hopkins.
Baltimore: John Hopkins University Press.
Hughes, T. P. (1986) The Seamless Web : Technology , Science , Etcetera , Etcetera. Social
Studies of Science. 16(2). pp. 281–292.
Hughes, T. P. (1987) The evolution of large technological systems. The social construction
of technological systems. pp. 1–47.
Inman, D. and Jeffrey, P. (2006) A review of residential water conservation tool performance
and influences on implementation effectiveness. Urban Water Journal. 3(3). pp. 127–143.
doi: 10.1080/15730620600961288.

72
IVA (2021) Svenskt företag fraktar vaccin runt hela jorden. IVA. 1th ed. pp. 28–29.
Jevons, W. (1866) The Coal Question; an Inquiry Concerning the Progress of the Nation,
and the Probable Exhaustion of Our Coalmines. Available at:
http://scholar.google.com/scholar?hl=en&btnG=Search&q=intitle:The+Coal+Question;+An+I
nquiry+concerning+the+Progress+of+the+Nation,+and+the+Probable+Exhaustion+of+our+C
oal-mines#0.
Jiang, Y., Chen, Y., Younos, T., Huang, H., and He, J. (2010) Urban water resources quota
management: The core strategy for water demand management in China. Ambio. 39(7). pp.
467–475. doi: 10.1007/s13280-010-0080-x.
Joerges, B. (1988) Large technical system: Conceps and issues. 1st edn. Boulder, Colorado:
Westview Press. pp. 9–37. Available at: 0-8133-0839-9.
Jänicke, M., Binder, M., and Mönch, H. (1997) Dirty Industries’: patterns of change in
industrial countries. Environmental and Resource Economics. 9. pp. 467-91.
Kayaga, S., Sansom, K., Godfrey, A., Takahashi, I., and Van Rooijen, D. (2018) Towards
sustainable urban water services in developing countries: tariffs based on willingness-to-pay
studies. Urban Water Journal. 15(10). pp. 974–984. doi: 10.1080/1573062X.2019.1581234.
Kedir, F. and Hall, D. M. (2021) Resource efficiency in industrialized housing construction –
A systematic review of current performance and future opportunities. Journal of Cleaner
Production. 286. p. 125443. doi: 10.1016/j.jclepro.2020.125443.
Kiparsky, M., Sedlak, D. L., Thompson, B. H., and Truffer, B. (2013) The innovation deficit in
urban water: The need for an integrated perspective on institutions, organizations, and
technology. Environmental Engineering Science. 30(8). pp. 395–408. doi:
10.1089/ees.2012.0427.
Kraemer, R. A., Castro, Z. G., Seroa da Motta, R., and Russell, C. (2003) Environment
Network Economic Instruments for Water Management: Experiences from Europe and
Implications for Latin America and the Caribbean. Integration and Regional Programs
Department Sustainable Development Department.
Kujawski, E. (2002) Selection of Technical Risk Responses for Efficient Contingencies. 5(3).
pp. 194–212.
Kujawski, E. (2003) Multi-Criteria Decision Analysis : Limitations, Pitfalls, and Practical
Difficulties.
Lavagna, M., Baldassarri, C., Campioli, A., Giorgi, S., Dalla Valle, A., Castellani, V., and
Sala, S. (2018) Benchmarks for environmental impact of housing in Europe: Definition of
archetypes and LCA of the residential building stock. Building and Environment.
145(August). pp. 260–275. doi: 10.1016/j.buildenv.2018.09.008.
Libecap, G. D., Grafton, R. Q. Edwards, E. C., O'Brien, R. J., and
73
Landry, C. (2012) A Comparative Assessment of Water Markets: Insights from the Murray-
Darling Basin of Australia and the Western US. SSRN Electronic Journal. (October 2017).
doi: 10.2139/ssrn.1858723.
Linkola, L., Andrews, C. J. and Schuetze, T. (2013) An agent based model of household
water use. Water. (Switzerland). 5(3). pp. 1082–1100. doi: 10.3390/w5031082.
Li, X., Zhang, D., Zhang, T., Ji, Q. and Lucey, B. (2021) Awareness, energy consumption
and pro-environmental choices of Chinese households. Journal of Cleaner Production. doi:
10.1016/j.jclepro.2020.123734.
Liu, Z., Anderson, T. D. and Cruz, J. M. (2012) Consumer environmental awareness and
competition in two-stage supply chains. European Journal of Operational Research. 218(3).
pp. 602–613. doi: 10.1016/j.ejor.2011.11.027.
Mann, P. C. and Lefrancois, P. R. (1983) Trends in the real price of water. 75(9). pp. 441–
443.
Markard, J. and Truffer, B. (2008) Technological innovation systems and the multi-level
perspective: Towards an integrated framework. Research Policy. 37(4). pp. 596–615. doi:
10.1016/j.respol.2008.01.004.
Markard, J., Raven, R. and Truffer, B. (2012) Sustainability transitions: An emerging field of
research and its prospects. Research Policy. 41(6). pp. 955–967. doi:
10.1016/j.respol.2012.02.013.
Matthews, J. A. (2014) Virtual Water. Encyclopedia of Environmental Change. doi:
10.4135/9781446247501.n4080.
Maxwell, S. (2010) Historical Water Price Trends. 102(4). pp. 24–26.
McCarthy, B., Anex, R., Wang, Y., Kendall, A. D. Anctil, A., Haacker, E. M.K., and Hyndman,
D. W. (2020) Trends in Water Use, Energy Consumption, and Carbon Emissions from
Irrigation: Role of Shifting Technologies and Energy Sources. Environmental Science and
Technology. 54(23). pp. 15329–15337. doi: 10.1021/acs.est.0c02897.
McKenzie-Mohr, D., Nemiroff, L. S., Beers, L., and Desmarais, S. (1995) Determinants of
responsible environmental behavior. Journal of Social Issues. 51(4). pp. 139–156. doi:
10.1111/j.1540-4560.1995.tb01352.x.
Mehran, A., Aghakouchak, A., Nakhjiri, N., Stewardson, M. J., Peel, M. C., Phillips, T. J.,
Wada, Y., and Ravalico, J.(2017) Compounding Impacts of Human-Induced Water Stress
and Climate Change on Water Availability. Scientific Reports. 7(1). pp. 1–9. doi:
10.1038/s41598-017-06765-0.
Meyer, C. B. (2001). A case in case study methodology. Field Methods. 13(4). 329-352.
Millerd, F. W. (1984) The Role of Pricing in Managing the Demand for Water. Canadian
Water Resources Journal. 9(3). pp. 7–16. doi: 10.4296/cwrj0903007.

74
MTP (2008) BNWAT28: Water consumption in new and existing homes. Market
Transformation Programme Reports. pp. 1–10.
Munda, G., Nijkamp, P. and Rietveld, P. (1995) Qualitative multicriteria methods for fuzzy
evaluation problems: An illustration of economic-ecological evaluation. European Journal of
Operational Research. 82(1). pp. 79–97. doi: 10.1016/0377-2217(93)E0250-2.
Stern, N. (2006) The “Stern Review” on The Economics Of Climate Change. Journal of
Economic Literature. 45(3). pp. 686–702. doi: 10.1257/jel.45.3.686.
OECD (1992) The Polluter-Pays Principle - OECD Analyses and Recomendations. Journal
of Chemical Information and Modeling. 4(92). p. 116.
OECD (2008) The Polluter Pays Principle. The Polluter Pays Principle. doi:
10.1787/9789264044845-en.
Oosterbeek, L., Scheunemann, I. and Santos, L. (2013) Water resources and human
behaviour: an integrated landscape management perspective. Cadernos do LEPAARQ
(UFPEL), 10(20), pp. 227–244. doi: 10.15210/lepaarq.v10i20.2326.
Patton, M. Q. (1999) Enhancing the Quality and Credibility of Qualitative Analysis. Health
Service Research. 34(5 Pt 2). pp. 1189–1208.
Paul, C., Techen, A. K., Robinson, J. S., and Helming, K., (2019) Rebound effects in
agricultural land and soil management: Review and analytical framework. Journal of Cleaner
Production. 227. pp. 1054–1067. doi: 10.1016/j.jclepro.2019.04.115.
Potts, J. (2009) The innovation deficit in public services: The curious problem of too much
efficiency and not enough waste and failure. Innovation: Management, Policy and Practice.
11(1). p. 34. doi: 10.5172/impp.453.11.1.34.
Randolph, B. and Troy, P. (2008) Attitudes to conservation and water consumption.
Environmental Science and Policy. 11(5). pp. 441–455. doi: 10.1016/j.envsci.2008.03.003.
Ratcliffe, J. (2000) Scenario building: a suitable method for strategic property planning?.
Property Management. 18(2). pp. 127–144. doi: 10.1108/02637470010328322.
Sanctuary, M., Tropp, H. and Haller, L. (2005) Making water a part of economic
development. Commission on Sustainable Development (CSD). doi:
10.4324/9780203132937.
Savenije, H. H.G., and Van Der Zaag, P. (2009) Water as an Economic Good and Demand
Management Paradigms with Pitfalls. Water international. 27:1. 98-104. DOI:
10.1080/02508060208686982
Straughan, R. D. and Roberts, J. A. (1999) Environmental segmentation alternatives: A look
at green consumer behavior in the new millennium. Journal of Consumer Marketing. 16(6).
pp. 558–575. doi: 10.1108/07363769910297506.
75
Russell, S. and Fielding, K. (2010) Water demand management research: A psychological
perspective. Water Resources Research. 46(5). pp. 1–12. doi: 10.1029/2009WR008408.
Schewe, J., Heinke, J., Gerten, D., Haddeland, I., Arnell, N. W., Clark, D. B., Dankers, R.,
Eisner, S., Fekete, B. M., Colón-González, F. J., Gosling, S. N., Kim, H., Liu, X., Masaki, Y.,
Portmann, F. T., Satoh, Y., Stacke, T., Tang, Q., Wada, Y., Wisser, D., Albrecht, T., Frieler,
K., Piontek, F., Warszawski, L., and Kabat, P. (2014) Multimodel assessment of water
scarcity under climate change. Proceedings of the National Academy of Sciences of the
United States of America. 111(9). pp. 3245–3250. doi: 10.1073/pnas.1222460110.
Schleich, J. and Hillenbrand, T. (2009) Determinants of residential water demand in
Germany. Ecological Economics. 68(6). pp. 1756–1769. doi:
10.1016/j.ecolecon.2008.11.012.
Schlosser, A. C., Strzepek, K., Gao, X., Fant, C., Blanc, É., Paltsev, S., Jacoby, H., Reilly,
J., and Gueneau A.(2014), The future of global water stress: An integrated assessment.
Earth’s Future. 2. pp. 341–361. doi:10.1002/2014EF000238.
Schnoor, J. L. (2011) Water - Energy Nexus. Environmental Science and Technology. p. 1.
doi: 10.1021/es903811p.
Seyranian, V., Sinatra, G. M. and Polikoff, M. S. (2015) Comparing communication
strategies for reducing residential water consumption. Journal of Environmental Psychology.
41(November). pp. 81–90. doi: 10.1016/j.jenvp.2014.11.009.
Sibly, H. (2006) Efficient Urban Water Pricing. The Australian Economic Review. 39(2). pp.
227–237.
Smart, P., Hemel, S., Lettice, F., Adams, R., and Evans, S. (2017) Pre-paradigmatic status
of industrial sustainability: a systematic review. International Journal of Operations &
Production Management. 37(10). pp. 144–3577. doi: 10.1108/IJOPM-02-2016-0058.
Smith, A., Voß, J. P. and Grin, J. (2010) Innovation studies and sustainability transitions: The
allure of the multi-level perspective and its challenges. Research Policy. 39(4). pp. 435–448.
doi: 10.1016/j.respol.2010.01.023.
Spiller, M., McIntosh, B. S., Seaton, R. A.F., and Jeffrey, P. J. (2015) Integrating Process
and Factor Understanding of Environmental Innovation by Water Utilities. Water Resources
Management. 29(6). pp. 1979–1993. doi: 10.1007/s11269-015-0923-0.
Stavins, R. N. (2001) Experience with Market-Based Environmental Policy Instruments
Resources for the Future. Discussion(November). pp. 1–88. doi:
10.1109/KORUS.2002.1027971.
Stuart, N. (2007) Technology and epistemology: Environmental mentalities and urban water
usage. Environmental Values. 16(4). pp. 417–431. doi: 10.3197/096327107X243213.
Tisdell, J. G. (2001) The environmental impact of water markets: An Australian case-study.
Journal of Environmental Management. 62(1). pp. 113–120. doi: 10.1006/jema.2001.0423.
76
Tsuruda, L. K., Vitor, L. R., De Castro Furtado, B., Borba Ferreira, L. G.G., Mendes Martins,
A., and Pacheco Calixto, W. (2019) Autonomous water consumption meter for evaluation of
sustainable technologies in popular housing. IEEE Industrial and Commercial Power
Systems Europe. pp. 2019–2022. doi: 10.1109/EEEIC.2019.8783231.
Turner, P. and Turner, S. (2009) Triangulation In Practice. Virtual Reality. 13. pp. 171–182.
doi: https://doi-org.focus.lib.kth.se/10.1007/s10055-009-0117-2.
Ward, F. A. and Pulido-Velazquez, M. (2008) Water conservation in irrigation can increase
water use. Proceedings of the National Academy of Sciences of the United States of
America. 105(47). pp. 18215–18220. doi: 10.1073/pnas.0805554105.
Wells, W. A. (2004). Me write pretty one day: How to write a good scientific paper. The
Journal of Cell Biology. 165(6). 757-758.
Wheeler, S., Loch, A., Zou, A., and Bjornlund, H. (2013) Reviewing the adoption and impact
of water markets in the Murray-Darling Basin, Australia. Journal of Hydrology. 518(PA). pp.
28–41. doi: 10.1016/j.jhydrol.2013.09.019.
Yang, L., Yang, S. H., Magiera, E., Froelich, W., Jach, T., and Laspidou, C. (2017) Domestic
water consumption monitoring and behaviour intervention by employing the internet of things
technologies. Procedia Computer Science. 111. pp. 367–375. doi:
10.1016/j.procs.2017.06.036.
Yin, R. K. (2013) Validity and generalization in future case study evaluations. Evaluation.
19(3). pp. 321–332. doi: 10.1177/1356389013497081.
Yoskowitz, D. W. (2002) Price dispersion and price discrimination: Empirical evidence from a
spot market for water. Review of Industrial Organization. 20(3). pp. 283–289. doi:
10.1023/A:1015099709658.
Zalengera, C., Blanchard, R. E., Eames, P. C., Juma, A. M., Chitawo, M. L., and Gondwe, K.
T. (2014) Overview of the Malawi energy situation and A PESTLE analysis for sustainable
development of renewable energy. Renewable and Sustainable Energy Reviews. 38. pp.
335–347. doi: 10.1016/j.rser.2014.05.050.
Zarnikau, J. (1994) Spot market pricing of water resources and efficient means of rationing
water during scarcity (water pricing). Resource and Energy Economics. 16(3). pp. 189–210.
doi: 10.1016/0928-7655(94)90005-1.
News articles
SVT (2009). 150 miljarder behövs till vattennätet | SVT. Available at:
https://www.svt.se/nyheter/inrikes/150-miljarder-behovs-till-vattennatet (Accessed: 23 March
2021).
77
Brantemo, A. (2017) Tre miljarder liter vatten till spillo i vattenledningar. SVT. 18 April.
Available at: https://www.svt.se/nyheter/lokalt/orebro/tre-miljarder-liter-vatten-till-spillo-i-
vattenledningar (Accessed: 23 March 2021).
Jernberg, P. (2007) Miljontals kronor rinner bort i dåliga vattenledningar - P4 Jönköping.
Sveriges Radio. 5 November. Available at: https://sverigesradio.se/artikel/1697466
(Accessed: 23 March 2021).
Reports
Bates, B., Kundzewicz W. Z., Wu, S., and Palutikof, J. (2008) Climate change and water.
Intergovernmental Panel on Climate Change. doi: 10.1029/90EO00112.
Bogaert, S., Vandenbroucke, D., Dworak, T., Berglund, M., Interwies, E., Görlitz, S.,
Schmidt, G., Herrero Álvaro, M., Lago, M., and Moeller-Gulland, J. (2012) The role of water
pricing and water allocation in agriculture in delivering sustainable water use in Europe.
Brussels: European Commission. Available at:
http://ec.europa.eu/environment/water/quantity/pdf/agriculture_report.pd.
DANVA (2019) Water in Figures 2019. Available at:
https://www.danva.dk/media/6355/2019_water-in-figures_web.pdf
EurEau (2017) Europe’s water in figures: An overview of the European drinking water and
waste water sectors. Available at:
https://www.danva.dk/media/3645/eureau_water_in_figures.pdf.
European Environment Agency (2005) Effectiveness of urban wastewater treatment policies
in selected countries: an EEA pilot study. Copenhagen: European Environment Agency
Food & Water Watch (2010) Priceless: The Market Myth of Water Pricing Reform. California:
Food & Water Watch. Available at: https://www.foodandwaterwatch.org/insight/priceless-
market-myth-water-pricing-reform.
Gustafsson, J. (2017) Single case studies vs. multiple case studies: A comparative study.
Halmstad: Halmstad University. pp. 1–15
Hammarlund, H., Törneke, K. and Siegwan, L. (2020) Dimensioneringstal för
vattenförbrukning. Stockholm: Svenskt Vatten.
Holm, C. and Schulte-Herbruggen, H. (2021) Vattenbesparande åtgärder -Exempelsamling
för kommuner och hushåll. Available at: http://www.ecoloop.se/wp-
content/uploads/2020/10/Rapport-Vattenbesparande-atgarder-Exempelsamling_210122.pdf.

78
Lago, M. and Möller-Gulland, J. (2012) Evaluating Economic Policy Instruments for
Sustainable Water Management in Europe: WP3 EX-POST Case studies D3.2 -
Comparative Analysis Report.
Mahmoudi, N. (2017) Hushållens vattenanvändning i Göteborg: Statistisk studie utifrån
utomhustemperatur, byggår och socioekonomisk påverkan. Uppsala: Sveriges
lantbruksuniversitet (SLU). Available at: http://www.w-
program.nu/filer/exjobb/Nazanin_Mahmoudi.pdf.
Mattheiss, V., Mat, O. L., and Strosser, P. (2009) Which role for economic instruments in the
management of water resources in Europe? In search for innovative ideas for application in
the Netherlands. Public Works and Water Management. (September).
Mudgal, S., Lauranson, R., Jean-Baptiste, V., Bain, J., Broutin, N., Inman, D. and Muro, M.
(2009) Study on water performance of buildings. European Commission. Available at:
http://ec.europa.eu/environment/water/quantity/pdf/Water Performance of
Buildings_Study2009.pdf.
Mårtensson, H., Malm, A., Sederholm, B., Sällström, J. and Trädgårdh, J. (2018) Svenskt
Vatten Utveckling Framtidens hållbara VA-ledningssystem. Svenskt Vatten Utveckling.
2018(10), p. 104. Available at:
https://www.svensktvatten.se/contentassets/0dfc8061928d4757a8f816f66486b31e/svur_18-
10a.pdf.
Nikell, L. (1994) Vattenförbrukningens Dygnsvariation. Stockholm. Available at:
http://vav.griffel.net/filer/VA-Forsk_94-05.pdf.
Nordhaus, William D., Barrett, Scott., Brainard, William., Dasgupta, Partha., Stavins, Robert.,
Stern, Nicholas., Weyant, John., (2006) The “Stern Review” on The Economics Of Climate
Change. Journal of Economic Literature. 45(3). pp. 686–702. doi: 10.1257/jel.45.3.686.
Ringqvist, A. (2021) Utläckage från vattennät – en betydande källa till tillskottsvatten i
spillvattennät ? Linjär regressionsanalys av VA-data från. Uppsala: Uppsala Universitet
Available at: https://www.diva-portal.org/smash/get/diva2:1524777/FULLTEXT01.pdf.
Rohrdrommel, M. (2017) Drivers of residential water demand – analysis and outlook of water
utility consumption data. Available at: https://core.ac.uk/download/pdf/92854892.pdf.
SBU (2016) Evaluation and synthesis of studies using qualitative methods of analysis.
Swedish Agency for Health Technology Assessment and Assessment of Social Services.
Stockholm: Swedish Agency for Health Technology Assessment and Assessment of Social
Services (SBU). Available at:
https://www.sbu.se/globalassets/ebm/metodbok/SBUHandbook_QualitativeMethodsOfAnaly
sis.pdf.
Strosser, P., Mattheiss, V., Defrance, P., and Hernandez, S. (2009) Economic Instruments
To Support Water Policy in Europe Paving the Way for Research and future development.
ONEMA. Available at:

79
https://professionnels.ofb.fr/sites/default/files/en/doc/documentation/MR2011_EconomicInstr
uments.pdf.
Svenskt Vatten (2006) Lagen om allmänna vattentjänster 10 år – Svenskt Vattens förslag på
vidareutveckling och förbättring. Available at: https://www.svensktvatten.se/globalassets/om-
oss/nyheter/2017/10-ar-med-lav.pdf.
Svenskt Vatten (2007) Dricksvattenförsörjning i förändrat klimat. Available at:
https://www.svensktvatten.se/globalassets/dricksvatten/ravatten/m135.pdf.
Svenskt Vatten (2020) Kommentarer till 2020 års taxestatistik. Available at:
https://www.svensktvatten.se/globalassets/organisation-och-juridik/vass/taxa/svensktvatten-
taxerapport2020.pdf.

80
TRITA -ITM-EX 2021:249
www.kth.se