Understanding Undergraduate Students' Conceptions of a Core Nanoscience Concept: Size and Scale
13
ISBN: 0-87823-193-5 ©2007 ASEE June 22 – 24, 2007, Honolulu, HI 1 st International Conference on Research in Engineering Education Page 1 of 13 Understanding Undergraduate Students’ Conceptions of a Core Nanoscience Concept: Size and Scale Gregory Light 1 , Su Swarat 2 , Eun Jung Park 3 , Denise Drane 4 , Emma Tevaarwerk 5 , and Tom Mason 6 1 Gregory Light, Searle Center for Teaching Excellence, Northwestern University. Email: [email protected] 2 Su Swarat, Searle Center for Teaching Excellence, Northwestern University 3 Eun Jung Park, Searle Center for Teaching Excellence, Northwestern University 4 Denise Drane, Searle Center for Teaching Excellence, Northwestern University 5 Emma Tevaarwerk, Department of Material Science and Engineering, Northwestern University 6 Tom Mason, Department of Material Science and Engineering, Northwestern University Abstract - The rapidly growing field of nanoscience and nanotechnology calls for the inclusion of general nano- education in our educational agenda. Student understanding of one of the key concepts in nanoscience, size and scale, serves as a prerequisite for students’ learning of more advanced nanoscale science and technology. This paper presents the findings of a small- scale qualitative study with students studying nanoscale science aimed at exploring the ways they understand the idea of “size and scale”. Results suggest wide variation in the way students understand this concept. The study identifies a preliminary typology of student conceptions of size and scale as it relates to macro and sub-macro phenomena along three key dimensions. In addition, the research identified a critical paradigmatic experience which appears to play a role in hindering the development of more complex and sophisticated understanding at each level of conception. Index Terms – Size and scale, Conceptual understanding, Nanoscience, Science education INTRODUCTION Since Feynman’s classic “plenty of room at the bottom” talk [1] scientists and engineers have extended their interest and research into increasingly small phenomena. As a consequence, the field of nanoscience has rapidly developed and received an enormous amount of attention in recent years. This is due to the expectation that “nanoscience developments offer the promise of advances within and connections across many disciplines – from physics, to chemistry, biology, materials science, and engineering” [2]. An increasing number of initiatives to support research and development in nanoscience have been undertaken by government agencies and private companies, a trend that is true not only in the United States but also in Europe, Australia and Asia [3,4]. The potential impact of nanoscience on our everyday lives and its rapidly developing nature require an adequately trained workforce that is “nano-literate” [5], which raises a fundamental question for educators – namely, how to educate future citizens to be nano-literate, and how to help young students in schools today to become scientists and engineers that are qualified to continue advancing the field of nanoscience [3,6,7]. To support these educational goals, the National Science Foundation (NSF), alone, has recently funded a range of centers, projects and networks, including the Nanoscale Science Engineering Centers (NSECs), National Nanotechnology Infrastructure Network (NNIN), Nanoscience Instructional Materials Development (NIMD) projects, and the National Center for Learning and Teaching in Nanoscale Science and Engineering (NCLT). An early challenge to the work of these groups is establishing a consensus regarding the concepts and ideas central to developing nanoscience at a range of educational levels. To this end, a series of national workshops was held in 2006 to identify the “big ideas” central to the development of nanoscience understanding. Big ideas here were described as: Big ideas form the very core of a domain. They are critical for basic competency because deeper understanding depends on these basic ideas as building blocks for future science understanding. Big ideas maybe cross disciplinary. That is they may be thought of as “big ideas” in science rather than more narrowly conceived as “big ideas” in chemistry or biology. In fact, the nature of big ideas in nanoscience is that they are interdisciplinary [8]. While the identification of the “big ideas” at the core of nanoscience is an ongoing exercise, preliminary results in both the K7-12 and the undergraduate contexts suggest a developing consensus around a number of core concepts (Table 1) As we can see in Table 1, Size and Scale is believed to be an important concept both in the context of K-12 and undergraduate education. Therefore, educators face the challenge of better helping students grasp this big idea, which first requires us to understand the ways in which students understand this concept at different educational levels. Working towards this goal, we report in this paper some preliminary results of a study currently being undertaken within the NCLT exploring how students understand and learn the idea of size and scale. The study is being conducted
-
Upload
independent -
Category
Documents
-
view
1 -
download
0
Transcript of Understanding Undergraduate Students' Conceptions of a Core Nanoscience Concept: Size and Scale

ISBN: 0-87823-193-5 ©2007 ASEE June 22 – 24, 2007, Honolulu, HI 1st International Conference on Research in Engineering Education
Page 1 of 13
Understanding Undergraduate Students’ Conceptions of a Core Nanoscience Concept: Size and Scale
Gregory Light1, Su Swarat2, Eun Jung Park3, Denise Drane4, Emma Tevaarwerk5, and Tom Mason6
1 Gregory Light, Searle Center for Teaching Excellence, Northwestern University. Email: [email protected] 2 Su Swarat, Searle Center for Teaching Excellence, Northwestern University 3 Eun Jung Park, Searle Center for Teaching Excellence, Northwestern University 4 Denise Drane, Searle Center for Teaching Excellence, Northwestern University 5 Emma Tevaarwerk, Department of Material Science and Engineering, Northwestern University 6 Tom Mason, Department of Material Science and Engineering, Northwestern University
Abstract - The rapidly growing field of nanoscience and nanotechnology calls for the inclusion of general nano-education in our educational agenda. Student understanding of one of the key concepts in nanoscience, size and scale, serves as a prerequisite for students’ learning of more advanced nanoscale science and technology. This paper presents the findings of a small-scale qualitative study with students studying nanoscale science aimed at exploring the ways they understand the idea of “size and scale”. Results suggest wide variation in the way students understand this concept. The study identifies a preliminary typology of student conceptions of size and scale as it relates to macro and sub-macro phenomena along three key dimensions. In addition, the research identified a critical paradigmatic experience which appears to play a role in hindering the development of more complex and sophisticated understanding at each level of conception. Index Terms – Size and scale, Conceptual understanding, Nanoscience, Science education
INTRODUCTION
Since Feynman’s classic “plenty of room at the bottom” talk [1] scientists and engineers have extended their interest and research into increasingly small phenomena. As a consequence, the field of nanoscience has rapidly developed and received an enormous amount of attention in recent years. This is due to the expectation that “nanoscience developments offer the promise of advances within and connections across many disciplines – from physics, to chemistry, biology, materials science, and engineering” [2]. An increasing number of initiatives to support research and development in nanoscience have been undertaken by government agencies and private companies, a trend that is true not only in the United States but also in Europe, Australia and Asia [3,4].
The potential impact of nanoscience on our everyday lives and its rapidly developing nature require an adequately trained workforce that is “nano-literate” [5], which raises a fundamental question for educators – namely, how to educate future citizens to be nano-literate, and how to help young students in schools today to become scientists and engineers
that are qualified to continue advancing the field of nanoscience [3,6,7]. To support these educational goals, the National Science Foundation (NSF), alone, has recently funded a range of centers, projects and networks, including the Nanoscale Science Engineering Centers (NSECs), National Nanotechnology Infrastructure Network (NNIN), Nanoscience Instructional Materials Development (NIMD) projects, and the National Center for Learning and Teaching in Nanoscale Science and Engineering (NCLT).
An early challenge to the work of these groups is establishing a consensus regarding the concepts and ideas central to developing nanoscience at a range of educational levels. To this end, a series of national workshops was held in 2006 to identify the “big ideas” central to the development of nanoscience understanding. Big ideas here were described as:
Big ideas form the very core of a domain. They are critical for basic competency because deeper understanding depends on these basic ideas as building blocks for future science understanding. Big ideas maybe cross disciplinary. That is they may be thought of as “big ideas” in science rather than more narrowly conceived as “big ideas” in chemistry or biology. In fact, the nature of big ideas in nanoscience is that they are interdisciplinary [8]. While the identification of the “big ideas” at the core
of nanoscience is an ongoing exercise, preliminary results in both the K7-12 and the undergraduate contexts suggest a developing consensus around a number of core concepts (Table 1)
As we can see in Table 1, Size and Scale is believed to be an important concept both in the context of K-12 and undergraduate education. Therefore, educators face the challenge of better helping students grasp this big idea, which first requires us to understand the ways in which students understand this concept at different educational levels. Working towards this goal, we report in this paper some preliminary results of a study currently being undertaken within the NCLT exploring how students understand and learn the idea of size and scale. The study is being conducted
ISBN: 0-87823-193-5 ©2007 ASEE June 22 – 24, 2007, Honolulu, HI 1st International Conference on Research in Engineering Education
Page 2 of 13
within the undergraduate engineering and materials science contexts.
TABLE 1
THE BIG IDEAS OF NANOSCIENCE [8]
Nanoscience Learning Goal Workshop (Grades 7-12)
NCLT Faculty Workshop (Grades 13-16)
Size & Scale Size & Scale Properties of Matter Size Dependent Properties Particulate Nature of Matter Tools Tools & Instrumentation/
Characterization Modeling Models & Simulations Dominant Forces Surface Dominated Behavior Technology and Society Society Impact: Public Education Self Assembly Self Assembly Surface Area to Volume Ratio Quantum Mechanics
Conceptions and Understanding We use the term “conception” to describe the ways in which someone understands “something,” a phenomenon or practice. Conceptions are “specific meanings attached to phenomena which then mediate our response to situations involving those phenomena. We form conceptions of virtually every aspect of our perceived world, and in so doing, use those abstract representations to delimit something from, and relate it to, other aspects of our world” [9]. The concept may express a general understanding of a given discipline, or of particular practices such as essay writing [10], creative writing [11], or student learning [12, 13]. A study examining how students understand statistics, for example, identified six distinct ways in which students conceive of statistics [14]. At the least sophisticated levels, students focused simply on techniques; at more sophisticated levels, students focused on using data for some purpose; and at the most sophisticated level there was a focus on generating meaning from the data. Conception has also been used in a more narrow way to describe how students understand a particular concept or idea in a syllabus such as motion in physics [15] or supply and demand in economics [16]. Different conceptions can be “defined in terms of increasing complexity, in which the different ways of experiencing the phenomenon in question can be defined as subsets of the component parts and relationships within more inclusive or complex ways of seeing the phenomenon” [17]. In this paper, we use the term “conception” in its narrow sense – that is, our focus here is on students’ understanding of a particular concept; specifically, how undergraduate students studying nanoscience understand the concept of size and scale. Size and Scale For the purpose of this paper, the “big idea” we are concerned with is described as follows: “As size and scale change, the properties of matter change, and different laws of physics are needed to explain these properties” [8]. Briefly, size, here, refers to the actual extent or amount of something, and is
required to define the nanoscale itself. Scale, on the other hand, links the size of a phenomenon to conventionally defined numerical representations of size. Properties such as length and mass, moreover, exhibit substantial difference in magnitude, often to the degree that they define ‘worlds’ (e.g. nano, micro, macro, astronomical). In addition, not only do properties of an object change with scale, so does the way in which they behave. Small linear changes in size, for example, result in larger relative changes in area and even larger relative changes in volume, which means properties dependent on volume (e.g. mass, heat capacity) will change more dramatically than properties dependent on area (e.g. absorption). This has particularly acute importance at the nano level for such concepts as surface area to volume ratio. For these reasons and other unique size-dependent characteristics of nanoscale science phenomena, size and scale is regarded as a fundamental concept of which students need to develop an understanding.
The importance of size and scale as a fundamental concept in learning science and as a unifying theme through many disciplines, grade levels, and subject areas was also pointed out in AAAS Project 2061 [18] and Benchmarks for Science literacy [19]. It is worth noting that although size and scale are, at the outset, often considered to be relatively easy concepts, Hawkins [20] argued that they represent a key example of critical barrier phenomena. Such phenomena can be exceedingly non-intuitive or unobvious, and often poorly understood despite careful explanation. A breakthrough in comprehension of these barrier phenomena can result in a highly emotional release. In addition, the failure to assimilate critical barrier phenomena concepts results in difficulty understanding and learning of related higher level science concepts.
The difficulty that size and scale presents to undergraduate students was underscored in a study [21] that evaluated the transferability of an introductory nanoscience module and examined student learning of nanoscience concepts included in the module. The study randomized students in a non-major Materials Science class into two sections for a week long unit of three lectures on nanoscience concepts and nanotechnology applications. One section was taught by a professor who was expert in nanoscience, and the other by a graduate student who was familiar with nanoscience but was not an expert. Using a pre and post test design, the study measured knowledge acquired by students over the course of the unit using a self-developed nanoconcept inventory, and no statistically significant difference in knowledge gain was observed between the two sections. An analysis of student performance on individual test items revealed that whilst moderate gains were made in areas such as color and surface area to volume ratio, students made little gain on size and scale items. Despite the fact that the inventory focused more on knowledge acquisition than conceptual understanding, items on size and scale nonetheless appeared to provide substantial trouble for students.
A recent study [22] explored student conceptions of size and scale, comparing groups of students at five
ISBN: 0-87823-193-5 ©2007 ASEE June 22 – 24, 2007, Honolulu, HI 1st International Conference on Research in Engineering Education
Page 3 of 13
educational levels ranging from elementary, high school, to graduate students. The students were asked to complete a Scale of Objects Questionnaire (SOQ) designed to assess perceived size range for a variety of specific objects from the atomic scale to the interplanetary scale. They were also individually asked to sort a series of cards on which were pictured and written the names of objects ranging in size from the subatomic to the galactic. After completing the sorting task, they were interviewed and asked to explain their reasoning for their ordering of the cards. Results (reported by group) were evaluated by analyzing the qualitative reasoning for the assignment of both absolute and relative rankings to the given objects. The study reported that conceptions of relative size comparison were more accurate than those of absolute size. In addition, it reported that students conceived scale in terms of distinct categories with associated “size landmarks” (such as celestial distance, continental distance, a sports field, a room, a person, an ant etc.), which helped them anchor their conceptions more concretely. These categories were also described along two main dimensions: directly experienced objects and distances, and indirectly experienced objects and distances. The latter were found at the extreme ends of the spectrum, and could only be experienced conceptually. Categories of size directly experienced, moreover, could be classified by four categories in a 2x2 grid: visual vs. kinesthetic experience, and sequential vs. holistic experience. More interestingly, however, for our purposes, the study found that younger students rarely had categories and size landmarks smaller than a person, and that expert students were distinguished by holding distinct categories of experience of size and scale at the indirect, conceptual ends of the spectrum. These categories appeared to result from their ability to unitize scale. They appear to have constructed conceptual categories of size at the non-visible ends of the spectrum, based on the unit (e.g. angstrom, micron, millimeter, parsec) most appropriate to measure it.
The ability to develop more sophisticated conceptual categories or conceptions of size and scale at the non-visible end of the spectrum, particularly at the sub-macro7 end, is an indispensable educational requirement of undergraduate science study, and particularly crucial to the study of nanoscale science and technology. In higher education, we are aware that students have serious problems mastering size and scale but we do not fully understand the different ways in which they conceive and approach the phenomena or the barriers they have in learning about it, let alone how we might more effectively remedy it in our teaching. Tretter and colleagues [22] provide important insights into the differences between experts and varying groups of students in grades 7-12. There is, however, an interesting gap between secondary school and PhD expertise which is left untouched –a gap of undergraduate study during which substantive progress towards achieving conceptual understanding of size and scale
7 We realize that the terms “macro” and “sub-macro” could have different interpretations. For the purpose of this paper, however, we use “macro” to refer to objects that are visible, and “sub-macro” to refer to objects that cannot normally be seen by the naked eye.
at the non-visible ends of the size spectrum should occur. This study pays specific attention to the variation in the ways undergraduate students understand scale at the sub-macro end of the size and scale spectrum. It documents the variation in the way in which students construct categories of size and scale for these phenomena, with special reference to, or use of, numerical scales or representational systems.
METHODS
Study Context To ensure a high likelihood of disclosing differences in student conceptions of size and scale in the nanoscience context, a strategy of “maximum-variation sampling” [23] was followed in the choice of study participants. Participants were undergraduate students enrolled in two engineering courses at a major Midwest University in the spring quarter of the 2006-2007 school year: one for engineering majors (Engineering Design Course, or EDC) and the other for non-majors (Materials Science for Non-majors, or MSC). Both courses address big ideas in Nanoscale science such as size & scale and surface area to volume. While the EDC course is entirely focused on nanoscience concepts, the MSC course only spends a week on similar concepts [24].These courses were not chosen for comparison reasons but rather to maximize the variation in the student sample in terms of both student background in math and science, and their ability and interest in nanoscience. An analysis of the number of semesters of high school math and science the participating students completed confirmed this sampling procedure would be expected to provide qualitative variation in background between the students taking these two courses. For example, students in EDC had taken 58% (12.0 vs 7.6) more semesters of Advanced Placement courses in these subject areas. Participants and Study Procedures I. Participant Selection To select interview participants, a self-developed nanoscience size and scale inventory was given to students enrolled in the two courses prior to the nanoscience instruction. This inventory was developed by one of the EDC course instructors, who was an expert in nanoscience, and a high school teacher who had expertise in both nanoscience and construction of concept inventories. The inventory assessed basic knowledge and conceptual relationships relevant to understanding size and scale, and surface area to volume ratio. Twenty seven multiple choice and short-answer questions were included in the inventory, which could be roughly categorized as focusing on three types of knowledge – chemistry, math skills, and intuitive ideas of size and scale (see Appendix 1 for example questions).
It should be pointed out that the inventory was in its preliminary form, and its results are not the focus of this paper. However, the results confirmed that size and scale was a problematic topic for many students. While most students

ISBN: 0-87823-193-5 ©2007 ASEE June 22 – 24, 2007, Honolulu, HI 1st International Conference on Research in Engineering Education
Page 4 of 13
performed well (defined as achieving 75% of the total points) in the areas of chemistry and math, they performed rather poorly on the size and scale questions. The average score for students on these items across both courses was 35.5%, with students in the EDC course performing significantly better than those in MSC (48% vs. 29.5%, p<0.001).
As the focus of the study was on the understanding of size and scale, students were chosen to participate in the study based on their performance on the size and scale questions only. The aim of the study was to document the variation in students’ understanding of size and scale. Therefore, in a second stage of maximum-variation sampling [23], we selected students who were likely to vary in their conceptions of size and scale. Based on their scores, we divided students into “above average”, “average”, and “below average” groups within their respective courses, and then, within each course, we randomly picked three students from each group as potential participants. These students were invited to participate in the study by one of the researchers. All of the students were then classified as “high performing” (achieving 70% or higher of the total possible points), “medium performing” (achieving between 30% and 70% of the total possible points), and “low performing” (achieving 30% or lower of the total possible points), again, based on their scores on the size and scale questions. As the students in the MSC course generally achieved lower scores on the “size and scale” questions than those in EDC, no “above average” students in the MSC group scored as “high performing” overall. They were rather classified as “medium performing”. Similarly, one of the “medium performing” students in MSC fell into the “low performing” category overall. Approximately thirty percent of the students we contacted declined to participate due to personal reasons such as scheduling conflict. Twelve students, six from each course, agreed to participant (see Table 2).
TABLE 2
PARTICIPANT INFORMATION AND VARIATION
Name
(Pseudonym)
Course enrolled
Gender Within Group
Performance
Performance on size and
scale questions
Charlie EDC Male Above average High
Ted EDC Male Above average High
Kevin EDC Male Average Medium
Wendy EDC Female Average Medium
Katie EDC Female Below average Low
Bonnie EDC Female Below average Low
Katrina MSC Female Above average Medium
Adam MSC Male Above average Medium
Sam MSC Male Average Medium
Tom MSC Male Average Low
Carrie MSC Female Below average Low
Bob MSC Male Below average Low
II. Think-aloud Interview
To examine students’ understanding of size and scale, we conducted semi-structured think-aloud interviews with a subgroup of the EDC and MSC students to gain access to how relevant knowledge is constructed and organized in their minds. The interview protocol was developed in consultation with the course instructors, and built upon previous research [22]. The interview section on which this study is focused was composed of two parts.
• Ordering objects: Participants were given a piece of paper which listed the names of seven objects (the length of a football field, the height of an elephant, the length of a typical science textbook, the width of a human hair, the diameter of a bacterium, the diameter of a virus, the diameter of a hydrogen atom). They were first asked to place the objects along a line so that the order represented the size differences. We asked participants to explain their reasons for ordering the objects as they worked on the task. Follow-up question were asked to prompt them to fully elaborate on their drawing.
• Scale and relative spacing: We then asked participants if they had a numerical scale in mind when ordering the objects. If the answer is “yes”, they were asked to explain the scale they used and the reasons for choosing it. Otherwise, they were asked to assign a scale to their drawing, and verbalize their reasoning as they completed the task. We also asked probing questions to have participants explain the pattern of spacing or distance between objects as illustrated in their scale.
Each participant was interviewed by two researchers,
with the exception of Ted who was interviewed by three. The interviewers did not know if the student was in the low, medium or high performance category on the size and scale items when they conducted the interviews. Most interviews lasted approximately 30 minutes. The interviews were both video and audio taped. The audiotapes were transcribed verbatim. Data Analysis Procedures The findings reported in this paper are mainly based on an analysis of the interview responses with the drawings participants made during the interviews. The transcripts and the drawings were first reviewed separately by two researchers to identify the general areas of interest they might contain, as well as the possible themes within each area. After agreeing on the areas of focus through discussions, the researchers coded the interview transcripts line-by-line to come up with a list of possible codes. Codes identified by individual researchers were compared, and a final set of codes was decided through multiple conversations. The final codes were then applied to all transcripts by the two researchers separately. The coding results were compared, and any discrepancy was resolved through discussions. One example

ISBN: 0-87823-193-5 ©2007 ASEE June 22 – 24, 2007, Honolulu, HI 1st International Conference on Research in Engineering Education
Page 5 of 13
of the final codes, “ordering/ranking of objects” can be seen in Table 3.
TABLE 3 CODES FOR ORDERING/RANKING OF OBJECTS
Area Sub-area Theme Code
a) Correct
i) Confusion over the size of bacterium vs. virus
Overall ordering/ranking
b) Incorrect ii) Confusion over the size of atom vs. virus/bacterium
a) No explanations
i) Kinesthetic/ visual experience b) Reference
to prior experience
ii) Prior learning experience (no qualifiers)
i) Correct
Ordering/Ranking of objects
(OR)
Reasons for ordering/ranking
c) Prior learning experience WITH qualifiers (Elaboration, justification, examples, comparison, etc.)
ii) Incorrect (Note details)
RESULTS
We report the results here according to their corresponding interview parts – that is, ordering objects, and scale and relative spacing of objects. While we will report results in both of these areas, as the focus of this study is to understand how undergraduate students develop the conception of “scale”, particularly numerical scales, and how they apply this conception, we will focus here primarily on student responses in the area of scale and relative spacing of objects. We will generally follow the format of describing themes or observations first, then presenting illustrative quotes and drawings where deemed necessary. Ordering Objects All participants ordered the objects along either a horizontal or a vertical line following the order of largest to smallest, and the choice of which end represents the largest (or smallest) seems to be solely based on personal preference. However, despite the pattern or directionality of the line, the majority of participants chose to explain their ordering starting at the larger end. It seemed that they were much more confident with the size of the larger objects – that is, the objects they can actually see, and thus were more certain about the ordering of these objects. For example, when asked to explain his ordering, Kevin said, “I know for certain that I can visualize
the football field more easily than maybe a virus…can’t see with a naked eye. But I guess I felt like it’s easier to figure the objects I know I’ve seen, and that would be larger objects, and work backwards…”
The lack of certainty about the ordering of the non-visible objects was also reflected in the fact that, while almost all participants placed the objects in the correct order, many of them voiced the concern that they were not sure about the ordering of bacterium and virus. Two participants were also uncertain about whether an atom is bigger than a virus. This indicates confusion about the size of objects in sub-macro area and a weak knowledge base about the particulate nature of matter. It should be pointed out that participants from EDC performed significantly better than those from MSC. No EDC students made errors in their ordering. They all correctly placed virus, bacterium, and atom in order, and all but two expressed confidence for their ordering. None of the MSC participants, on the other hand, were certain about the ordering of bacterium and virus, and three made ordering errors between the three smallest objects - two simply switching bacterium and virus, and the other switching atom and virus.
When asked for reasons for their ordering, participants primarily referenced two types of experience: their direct, visual/kinesthetic experience of the objects, and their prior learning experience. The former applied mainly to the visible objects – For example, Sam said, “I just kind of imagined the typical size of those objects, and sorted them accordingly.” The latter was exclusively referenced to their memory of learning the actual numerical size of the objects; the most frequently cited two examples being that the football field is 100 yards, and that an atom is one tenth of a nanometer. In addition, many students were able to extend previously gained knowledge to justify their choice of ordering. For instance, Adam explained the ordering of the sub-macro objects by saying, “Um, honestly the bacterium and the virus…I thought they were bigger…I just decided they were bigger than the hydrogen atom, um, partly because things are made up of atoms not of viruses. So therefore, a virus is probably made up of atoms and thus bigger than one atom.” Similar reasoning was also used to compare the objects’ size, as demonstrated by Charlie’s quote: “…I know virus is smaller than bacteria because virus can infect bacteria. So I put that next. And the next is the diameter of bacteria, and I figured that would be smaller than the width of a human hair. I feel like bacteria can live on a human hair, so it will be smaller…” Scale and Relative Spacing of Objects Participants’ drawings and explanations of the scales they constructed to make sense of the ordered items fell into two broad categories that we have labeled continuous and fragmented. Seven of the 12 subjects (all six EDC students and one MSC student) described scale as a consistent continuum capable of describing the phenomena for both macro and sub-macro phenomena. While they distinguished between generically ‘large’ and ‘small’ phenomena, they,

ISBN: 0-87823-193-5 ©2007 ASEE June 22 – 24, 2007, Honolulu, HI 1st International Conference on Research in Engineering Education
Page 6 of 13
nevertheless, saw them as connected through the use of scale. For example, when we asked Kevin to assign a scale to represent the size differences of all objects, he suggested the use of a logarithmic scale, and explained his choice as follows:
Kevin: “A logarithmic scale is going in steps of multiples of 10, so here you start at 100 meters, 10 times smaller would be 10 meters, 10 times smaller than that would be 1 meter. You just go down by factors of 10 until we get down to the nanometer. And this is what you were saying, like the length of a football field and the height of an elephant maybe isn’t…the difference between these two is 90 meters…so the difference between these two (referring to elephant and textbook) is 9 meters…so of course the bigger difference you can’t represent that by placing them 90 meters apart, then 9 meters apart. If you say that they’re proportionally different, you can show that using a logarithmic scale. And larger stuff is on top and the smaller stuff is at the bottom. And you could just roughly estimate how large they are.”
This quote clearly suggested that in Kevin’s mind, the logarithmic scale served as a continuous “tie” that connected the macro and sub-macro objects together.
The description of scale given by the remaining five subjects (all from MSC), however, suggested a qualitative different, and fragmented understanding of scale – that is, the scale is fractured between the “large” and “small” worlds, which usually corresponded with the distinction between macro and sub-macro phenomena but not strictly so. Sam, for example, identified the gap between “large” and “small” as between a textbook and a human hair, clumping big, visible items at one end and small, non-visible (or barely visible) items at the other. And despite probing, he was unable to either provide an explanatory basis for or any units for drawing any relationship between the two sets of items:
Interviewer: Can you explain how you worked out the differences between the... (pointing at the distance between the textbook and the hair)? Sam: I can’t honestly give you an answer for why…for the distance between the length of a typical science textbook and the width of a human hair, but I basically just decided to make a continuum, draw an enormous distances for how far it should be.
Interview: Yeah. Sam: Sort of, I mean, relative, honestly, they’re not necessarily the accurate form. Interviewer: What kind of a scale… Or did you have any kind of scale…? Sam: No, no, not really any kind of scale. Just kind of arbitrary to be honest. There is no basis for scale or any means of measuring.
Interviewer: So you haven’t got any units in mind… Sam: No units in mind, nothing, no, sorry.
It seemed that, even though Sam used the term “continuum”, he had difficulty coming up with a systematic justification for placing all the objects along a continuous scale. Later on, when asked why one scale is not sufficient to represent the size differences, Sam’s responses suggested that he might be confusing different actual sizes with different scales, which could have contributed to his fragmented conception:
Sam: There is different levels of scale. There is something like an object like a bridge, that you might refer to objects that had that scale. You might be working with things that are much smaller, like the processing chip for a computer, which is on a much smaller scale. ... (At this point, we asked him what would help him understand the idea of scale.) Sam: Eh, I think trying to determine the point where macro and micro objects are distinct would be helpful, because there is never a clear-cut example of when something moves from being existing in the macro scale to existing in the micro scale.
These excerpts, coupled with the drawing produced by Sam, provided a clear example of his fragmented view – that is, the macro and sub-macro objects exist in separate “worlds”, and cannot be reconciled using the same scale.
In addition to these two broad categories, the scales that participants assigned to their ordering of the objects could also be categorized into the following three types: an implicit basic linear scale, a hybrid of linear and logarithmic scale, and a true logarithmic scale. All but one EDC participant used the logarithmic scale, which was reflected in their drawings, and (in most cases) was also supported by correct verbal explanations. The “hybrid” scale was used by one MSC participant and one EDC participant. We use the word “hybrid” because for these students, either their drawings resembled a logarithmic scale and/or their initial explanations of the scale seemed to suggest that their choice of the scale was based on a correct understanding of the logarithmic scale, but further probing revealed that they were still thinking in terms of a basic linear scale, and only adopted the form of the logarithmic scale with remembrance from classes or textbooks. The following excerpt from Katie’s transcript is a representative example of this phenomenon:
Interviewer: So why did you choose, before you said that this is on the logarithmic scale, why did you choose the logarithmic scale here?
Katie: The diameter of a hydrogen atom, in comparison with the length of the football field,

ISBN: 0-87823-193-5 ©2007 ASEE June 22 – 24, 2007, Honolulu, HI 1st International Conference on Research in Engineering Education
Page 7 of 13
is like, you can’t use the same scale to compare them, because the hydrogen atom is so much smaller. …
Interviewer: Ok. Could you explain it a little bit, like I see between some objects the space is smaller than others? Could you explain it? Katie: I think it’s just might be my drawing of those, but I guess if I were to do it over again, these (referring to the sub-macro objects) would be much closer together, and as it gets larger, they (referring to the macro objects) would spread out.
Interviewer: Why would that be?
Katie: Because 1 meter is much bigger than 1 nanometer.
In this case, Katie produced a drawing that resembled the logarithmic scale, and introduced it as such. Even when initially probed, as we can see in the above excerpt, she seemed to be able to rationalize why the logarithmic scale was the appropriate choice. However, when further probed, Katie’s explanation suggested that her conception was actually guided by a linear scale instead.
The remaining five MSC students – the same student who exhibited a fragmented understanding of scale – claimed that they simply ordered the objects without having any scales in mind. But their drawings, as we shall see, suggested that they were implicitly following a linear scale based on the actual numerical size of the objects, which may or may not be accurate.
Connecting these two sets of categorical distinctions observed in participants’ responses, it seemed reasonable to suggest that the participants’ conceptions of scale could be grouped into the following three types (summarized in Table 4), and an additional two sub-types under Types 1 and 3 respectively. We will explain the characteristics of each type and sub-type with illustrative examples in the following section. Type-1a. The first and the most sophisticated category was what we call the “true log”, which was drawn by the four EDC students who chose the logarithmic scale for their drawings. In this case, the objects – both macro and sub-macro – were placed appropriately along a line with continuous markings in the form of powers of ten evenly spread out.
For most of these participants, this pattern of spacing (Figure 1) served as further evidence that they truly understood the logarithmic scale. They explained their choice of a logarithmic scale as a ‘convenient tool’ to represent and/or compare objects of different size. For example, Charlie said, “Like if you are doing a regular scale, millimeters and micrometers would be really, really small, and meters would
be really big… In terms of numerics…you wouldn’t be able to see everything on the same scale. All these things (referring to the sub-macro objects) would be crammed in there, and you wouldn’t be able to tell. The log scale, everything is more evenly spaced.” Similarly, Bonnie said, “It’s hard…to put any other certain numerical scale to the difference between hydrogen atom and the length of a football field”, which implied the advantage of the log scale. When completing the interview task, participants sharing this type of conception either started with a log system, drawing equally-spaced markings on a line described by the various powers of ten next to them, and then placed the objects according to the markings as they thought appropriate, or started by ordering and spacing objects in a way that was appropriate for the log system, and then added the corresponding markings.
FIGURE 1 CHARLIE’S SCALE DIAGRAM

ISBN: 0-87823-193-5 ©2007 ASEE June 22 – 24, 2007, Honolulu, HI 1st International Conference on Research in Engineering Education
Page 8 of 13
TABLE 4 TYPES OF PARTICIPANTS’ CONCEPTIONS OF SCALE
Type Type-1 Type-2 Type-3 Sub-type 1a 1b 2 3a 3b
Participant(s) Bonnie, Ted,
Charlie, Kevin Wendy Katie, Carrie Adam, Katrina Tom, Sam, Bob
Nature of Continuum
Continuous Fragmented
Categories of scale used
Logarithmic Hybrid Linear
Main characteristics
1. Understood that the logarithmic scale is a “real scale that can be applied across the macro – sub-macro continuum.
2. Able to provide correct explanation for the log scale’s construction (e.g. even spacing) and the advantage of using it.
1. Applied the logarithmic scale across the macro – sub-macro continuum.
2. Viewed the log scale as a “scientific” way of scaling, not a “real” scale.
3. Relied on memorization to construct it.
1. Understood that a scale could be applied across all sizes.
2. Applied a hybrid scale that included elements of both logarithmic and linear scales.
3. Able to provide primitive explanation for the advantage of using it; But unable to explain the log scale’s construction (e.g. even spacing).
1. Held fragmented conception of scale across all sizes; Viewed the macro and sub-macro worlds as divided.
2. Applied the linear scale based on actual sizes.
3. Attempted to assign numbers to the scale
1. Held fragmented conception of scale across all sizes; Viewed the macro and sub-macro worlds as divided.
2. Applied the linear scale based on actual sizes.
3. No attempt to assign numbers to the scale
Type-1b. Judging from the drawing alone (Figure 2), Type-1b student seemed to also have a correct understanding of the logarithmic scale. However, this is rather misleading. Even though we only had one participant in our study who exhibited this type of conception, we decided to assign her a separate type, rather than treating it as an outlier, because we suspect this type of conception may be representative of many other students’ understanding.
In this case, Wendy produced a perfect drawing and labeled it appropriately as in a log system. She did not, however, construct the drawing because of her strong understanding of the logarithmic scale, but based on memory or recall – “Yeah, I don't know how to explain it (referring to her drawing). This is the way we've been shown the scale, like I've seen this scale at least 12 or 13 times. It's always like in this way. I know down here (referring to the sub-macro end) it gets so small that you can't really see the scale any more, but even here I think to just keep the consistency and not to confuse us, they do it so that it’s synchronized.” This example points out a rather general problem for instructors. A student like Wendy could produce perfect answers on a test without understanding them, and it would be very difficult for the instructor to realize she lacks a basic understanding.
Type-2. Two students exhibited the characteristics of this type of conception. Carrie’s drawing (Figure 3), for example, shows a vertical ordering in which the spaces increased continuously and gradually from the smallest object to the largest one. This indicates the use of a basic linear scale to represent size. The diagram seems to be essentially a direct replication of her visual observation of objects’ sizes and their differences. However, when asked about her choice of scale, her responses suggested elements of the log system:
FIGURE 2 WENDY’S SCALE DIAGRAM

ISBN: 0-87823-193-5 ©2007 ASEE June 22 – 24, 2007, Honolulu, HI 1st International Conference on Research in Engineering Education
Page 9 of 13
Interviewer: so when you are, put a, drawing this line here, did you have a numerical scale in mind? Carrie: Umm….yes. I knew that this one (referring to football field), right off was the biggest with 100 yards and then, I knew this (referring to atom) was about a tenth of nanometer, so in between those, I sort of assume that they are multiples of ten because it seemed logical to me. Because a textbook I would say is about 10 inches long and I would think [elephant] could be about 10 feet or so, I know the human hair is about, I think, Professor McCormick says maybe about 10 nanometers, so I figured they’re multiples of ten. Interviewer: So if you were to draw a scale that represents this “multiple of ten” idea, would you change your line here? Carrie: Change isn’t being from vertical to horizontal (referring to the orientation of the graph)? Interviewer: No, in terms of space… (referring to the space between objects) Carrie: Eh, probably not. It maybe makes them a little bit…. Well, actually maybe, maybe do these ones (referring to the sub-macro objects) closer together. Interviewer: Why is that? Carrie: Why is that? Because they are closer in size and proportion than these ones (referring to the macro objects) would be, and then maybe spread them out a little bit more like that. I was thinking of numbers involved. Because these (referring to the sub-macro objects) are very, very close and umm….it is as far as maybe, they are all less than a millimeter even, and then you start to get in into inches or close to meters, centimeters and then meters, and then close to kilometers. Interviewer: So the logical, the power of ten here would take place during this big jump? Carrie: Yes, so in the powers, these (again, referring to the sub-macro objects) would be very, very close together, I can make them close together, probably I would, but you wouldn’t be able to read it.
As we can see from this excerpt, while Carrie seemed to understand the basic idea of “multiples of ten” or “powers of ten”, the basis for the logarithmic scale, she wasn’t able to incorporate it into her scale. In other words, she still followed the linear scale in producing and describing her drawing, despite the fact that she used log-type notations. Type-3a. The third type of conception (both Type-3a and 3b), seen in the drawings of five participants (all MSC), suggested a “separate worlds” view of size and scale – that is, the macro and sub-macro worlds are disconnected or fragmented in these students’ minds. Specifically, these participants placed macro objects and sub-macro objects at each end of the scale, with objects in each group relatively close together. But between these two groups, they put a huge “gap”, either between
textbook and hair, or between hair and bacterium, or both. The specific location of this gap depended on whether they grouped “hair” as part of the macro world or the sub-macro world.
FIGURE 3 CARRIE’S SCALE DIAGRAM
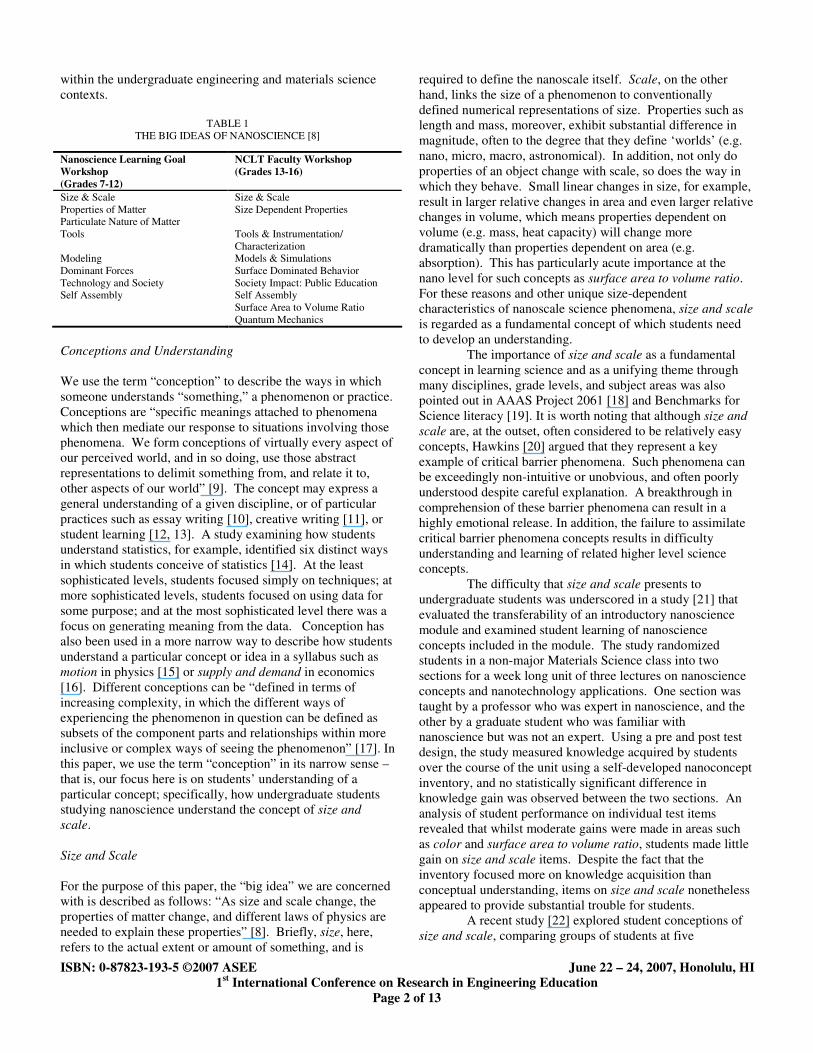
As Figure 4 shows, it seemed that these participants viewed all the macro objects being on the same scale, all the sub-macro objects being on a separate scale, and the difference between the two scales are enormous. Since we asked the student to “think aloud” as they created their drawings, in this case, Katrina explained as she constructed her scale: “Relatively…these (pointing at the hair, bacterium, virus, and atom) must be down here at the bottom ‘cause these are so small; these would be all chunked together; and these (pointing at the football field, elephant, and textbook) would be more like this…but this (pointing at the gap between hair and textbook) is not enough space in between.” This explanation, coupled with the drawing, suggested that in Katrina’s mind, the size differences among macro or sub-macro objects are negligible, but the difference between the two is so enormous that they couldn’t be compared using “the
ISBN: 0-87823-193-5 ©2007 ASEE June 22 – 24, 2007, Honolulu, HI 1st International Conference on Research in Engineering Education
Page 10 of 13
same scale”. Interestingly, as Figure 4 also illustrates, such a fragmented conception (i.e. objects within two worlds) is often accompanied by a fragmented understanding of the units used to describe objects size. These students seemed to confuse the idea of “unit” with that of “scale”. That is, several participants interpreted different units (e.g. yard, foot, meter, nanometer) as different scales. For instance, Bob said, “I know human hair’s on a micrometer scale, and then this (referring to the textbook) would be on a meter scale and/or macro – you can see it and then…These two (referring to bacterium and virus) would be on the, um, obviously atomic scale.” The combination of using the Imperial system for daily objects (mostly macro objects) and the Metric system for the scientific objects (mostly sub-macro objects) may be a particular source of confusion for American students who use two general systems of measurement – the Imperial system in everyday life and the Metric system in more formal educational contexts, which may contribute to the disconnected conception of the macro and sub-macro worlds as we have discussed here.
FIGURE 4 KATRINA’S SCALE DIAGRAM
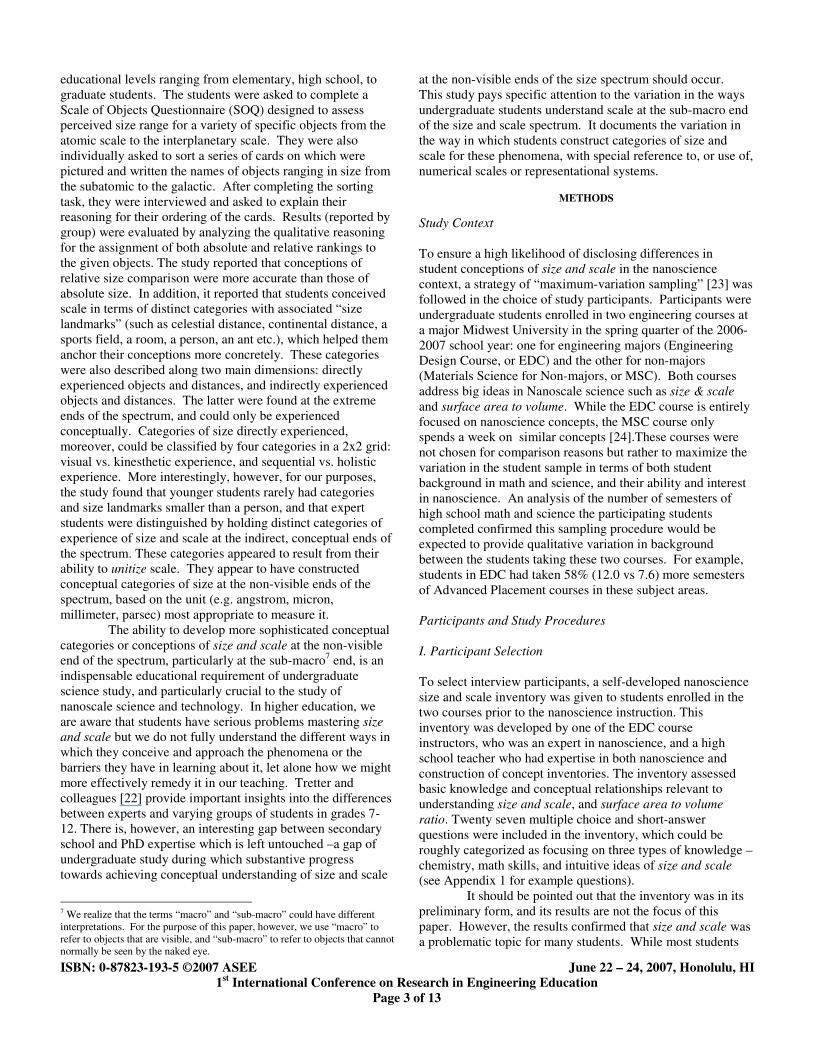
Type-3b. Type-3 conception also has a sub-type of interest. Like those sharing a Type-3 understanding, this sub-type also appeared to understand scale (at least in the range of the
objects they ordered) in terms of two disconnected scales (see Figure 5 for example).
FIGURE 5 TOM’S SCALE DIAGRAM
In this case, the object “hair” was used here as the “cut-off point” or borderline in dividing the two “worlds”. This is common among all Type-3 participants’ explanations – “Hair” was grouped by some students as part of the macro world (hence the largest gap between hair and bacterium), and by others as part of the micro world (hence the largest gap between textbook and hair).
What separated Type-3b participants from the general Type-3 conception is their apparent reluctance to use any numerical system to describe the actual or relative sizes of the objects, even within the specific disconnected worlds. All
Atom
Virus
Bacteria
Hair
Textbook
Elephant
Football field

ISBN: 0-87823-193-5 ©2007 ASEE June 22 – 24, 2007, Honolulu, HI 1st International Conference on Research in Engineering Education
Page 11 of 13
three individuals within this type did not attempt to use a numerical scale, even though their verbal explanations suggested that they were aware of the units associated with these objects. It is as if numbers are reserved for absolute sizes – not relative sizes, at least not in a formal system
DISCUSSION.
While this study is small-scale and exploratory in nature, it nevertheless yielded a number of interesting and, we believe, substantive results. In the first instance, our effort to ensure meaningful variation among the participants seemed to be quite successful, as the results revealed key conceptual distinctions within undergraduate students’ conceptions of size and scale, as it relates to macro and sub-macro phenomena. Specifically, the typology of conception identified in this study suggested a sense of “increasing complexity” – That is, different ways of understanding size and scale can be “defined as subsets of the component parts and relationships within more inclusive or complex ways of seeing the phenomenon” [17]. The “component parts”, as suggested by the results, include: nature of continuum; nature of scale type used, and nature of understanding of the particular scale used.
Nature of Continuum. This component concerns whether students understand the idea of a continuum for ordering, measuring, and scaling objects across a wide range of phenomenal sizes. As discussed earlier, while all participants could order the objects by size (although not always correctly), only some of them viewed the scale (or for some students, the line along which they ordered the objects) as continuous and consistent. Students who exhibited Type-3 conception perceived the scale as separated or fragmented, as they believed macro and sub-macro objects each demands a distinct scale.
Nature of Scale Type Used. This component concerns the nature or suitability of the scale type that students chose for the interview task. Students with a fragmented understanding of the size continuum used the linear scale, whereas students with a continuous understanding divided their choices between a logarithmic system, and a hybrid system that combines mathematical notation of powers of ten with a linearly-spaced scale.
Understanding of the Particular Scale Used. This last component concerns students’ understanding of the scale of their choice. In particular, we believe their levels of understanding could be characterized as integrated vs. detached. A good example of such distinction can be seen by comparing Type 1a and Type 1b students. The former students internally understood the relationship between the powers of ten notation and the logarithmic system for scaling, but in the latter case, the student only accepted the form of this relationship without any substantive understanding of it – that is, her understanding is detached in nature. This distinction in terms of levels of understanding also exists among the less sophisticated conceptions – Type 3a students were able to integrate their use of whole numbers with their description of the linear scale, whereas Type 3b students seemed to be missing the use of numbers in their descriptions. Even for
Type 2 students who held a “hybrid” conception, their conception could be interpreted as a detached understanding of the logarithmic system. That is, their application of only some of the components of the logarithmic system suggested that, while they might have understood it as an appropriate scale for understanding size and scale phenomena at the macro and sub-macro levels, they have not mastered it; Its use is detached from any full understanding.
In addition to the typology of conception, this study also suggested a few important issues that might underlie the observed differences between students’ conception of size and scale. Reliance on Visual Experience As in the study by Tretter and colleagues [22], this study reveals the strong influence of visual experience for students in understanding and explaining size and scale concept. However, instead of asking participants to order objects up to the distance from the earth to sun, the objects to be ordered in this study did not include any distances bigger than a football field. As such the two dimensions identified by Tretter et al. as characterizing student conceptions of scale – direct-indirect and big-small – essentially collapse into one dimension of ‘big/direct’ and ‘small/indirect’. Big, then, in this context is usually related to direct visual experience of the distance.
Visual experience seemed to be critical to understanding size and scale. In response to a question about how they learned the idea of scale, what obstacles they had, or what prerequisites they think are necessary for someone to understand this concept, the most frequent answers focused on the visual, perceptual, or any physical experience with objects of different size, or the lack of it. For instance, Ted said, “I think what is important about scale is being able to see the difference and that’s why it’s hard to picture ten to the tenth or negative tenth, because it’s very hard to see that in your mind, because you are not familiar with it.” Participants even suggested giving students opportunities to visualize things either with bare eyes or with scientific equipment, because “seeing is believing” was the only way to get students to comprehend the size of “things existing outside of eyesight” (interview with Kevin).
The reliance on visual experience is also evidenced by the fact that participants had a much easier time ordering, categorizing, and explaining the relative relationships of macro objects, compared to those in the sub-macro area. In addition, their explanations of size and scale of sub-macro objects frequently drew upon analogies with real life, visual experiences, or indirect but visual experience of pictured images (e.g. a picture of a virus). The Role of the Logarithmic Scale Again, as in Tretter and colleagues’ [22] study, the students in our study performed better in ordering the objects by size than in arranging their relative size. The findings suggest, moreover, that the ability to both order and assign relative

ISBN: 0-87823-193-5 ©2007 ASEE June 22 – 24, 2007, Honolulu, HI 1st International Conference on Research in Engineering Education
Page 12 of 13
scale between objects is conditioned to a large degree on having more advanced knowledge and understanding of the scale concept and its numerical models. For the students who began reasoning with a logarithmic scale, for example, the interview task was not particularly difficult. Knowledge of this concept permitted the construction of a scale that aided the ordering of objects, the positioning of objects by numerical size on the scale, and the justification for placing the objects along a single continuous continuum. In contrast, students who did not have access to this concept seemed to be more bound to their isolated and separate models of the physical world, either relying heavily on visual experiences (both Type 2 and Type 3 students), or attempting to apply different and incompatible systems and units of measurement – imperial vs. metric – to macro and sub-macro objects. The Separation of the “Two Worlds” The distinction between macro and sub-macro – mediated by the size of the person or a person’s ability to directly perceive visually and/or kinesthetically [22] – seems to provide an interesting barrier to understanding for some students. This conceptual construction, contrasting the idea of a “real” or “actual” linear scale from an “abstract” or “unreal” log scale, reveals itself as a hindrance across all the types of conception. Indeed, “real-linear-macro” and “science (unreal)-log-micro” appear to encompass different, conflicting paradigms for understanding the world.
This barrier is perhaps most pronounced among Type-3 students. Type-3 conceptions were characterized by an inability to connect the “two worlds” (i.e. the macro vs. the sub-macro) – they believed different scales and/or units were needed for these separate worlds. Type-2 conception recognized the importance of a formally learned log system of sorts (e.g. powers of ten notation) for use in both worlds, but was not able to fully escape the prevailing experience of using the “linear scale” in the macro world, and thus linked the log system to a linearly conceived ‘real’ macro-world scale. Even among Type 1 students, who seemed to be able to integrate the two worlds, the student in the Type 1b category still appeared to be unable to fully escape the paradigm of the “real”, visual macro world, and consequently, unable to relinquish the idea that the log scale is in some way different and not as “legitimate” as the “real” linear scale of the macro world. Limitations Although the variation and diversity in the participant pool helped in the identification of a range of conceptions of size and scale, the rather small number of students in the pool meant that the number of students exhibiting each conception type was small, with in one case, one sub-type illustrated by only one participant. Future research would expand the participant numbers and diversity to test the robustness of the typology and of its three “components of complexity” as discussed above. There may also be other important conception types and/or sub-types which were not apparent
because of small number of participants. On the other hand, the nanoscience size and scale inventory used to help select participants may not have been sensitive enough to reflect the true variation between students, especially those within the same course, which may be part of the reason why we did not identify much variation in conception within each course group.
This study also did not look at the impact of the particular course teaching and learning activities, the timing of the interviews etc. on the nature of the conceptions disclosed. While the study’s focus was simply on identifying different ways of conceiving size and scale, a study of the relationship between such contextual factors would be useful in helping to determine the potential pedagogical implications of these findings.
A third limitation concerns the nature of the think aloud protocol employed in the study. Due to practical reasons, the number of objects that the students were asked to order (leaving out the larger end of the continuum) was relatively small, and the list left out the larger end of the continuum (e.g. the earth, the sun). More items may have provided finer distinctions in the explanations and commentary the students provided with respect to their ordering and subsequent scale constructions.
CONCLUSIONS
This paper provides important data on student understanding of one of the big ideas at the heart of nanoscale science and technology education [8]. It delineates a preliminary typology of student conceptions of size and scale as it relates to macro and sub-macro phenomena. The conceptions are described in terms of increasing understanding with respect to three key dimensions: nature of the continuum the scale is applied to; nature of the scale used, and level of understanding of the scale used. In addition, the research was able to identify a critical paradigmatic experience that appears to play a role in hindering the development of more complex and sophisticated understanding – the almost visceral experience of the directly observed macro world, a world differentiated as being in some way more “real” or “actual” than the indirect, sub-macro world. Addressing and finding pedagogical ways of mediating this experience would appear to be critical to developing the critical conception underpinning the development of conceptually rich thinking at the nanoscale. To this end, one helpful strategy could simply be providing students with more opportunities and alternative ways to look at or experience small, non-visible phenomena. By doing so, students may gradually let go of the “macro/visible/real” vs. “sub-macro/invisible/unreal” distinction, gain the ability to re-calibrate their sense of “big” and “small” in accordance to the range of phenomena they are dealing with, and thus hopefully develop a continuous and sophisticated conception of size and scale.
ACKNOWLEDGMENT
The authors would like to acknowledge the National Science Foundation and the National Center for Learning and
ISBN: 0-87823-193-5 ©2007 ASEE June 22 – 24, 2007, Honolulu, HI 1st International Conference on Research in Engineering Education
Page 13 of 13
Teaching: Nanoscale Science and Engineering for support for the research reported in this paper: Grant No.: ESI-0426328/002.
REFERENCES
[1] Feynman, R.P., “There’s Plenty of Room at the Bottom,” Journal of Microelectromechanical Systems, Vol. 1, No. 1, 1992, pp. 60-66.
[2] Roco, M.C., and W.S. Bainbridge, “Nanotechnology: Societal Implications – Maximizing Benefit for Humanity,” Report of the National Nanotechnology Initiative Workshop, December 3-5, 2003, Arlington, VA.
[3] Hsi, S., N. Sabelli, J. Krajcik, R. Tinker, K. Ellenbogen, and NCLT and NISE Network researchers, “Learning at the Nanoscale: Research Questions that the Rapidly Evolving Interdisciplinarity of Science Poses for the Learning Sciences, Proceedings of the 7th International Conference on Learning Sciences, 2006, pp. 1066-1072.
[4] Uddin, M., and A.R. Chowdhury, “Integration of Nanotechnology into the Undergraduate Engineering Curriculum,” International Conference on Engineering Education, August 6-10, 2001, Oslo, Norway.
[5] Roco, M.C., and W.S. Bainbridge, “Societal Implications of Nanoscience and Nanotechnology: Maximizing Human Benefit,” Journal of Nanoparticle Research, Vol. 7, 2005, pp. 1-13.
[6] National Center for Learning and Teaching in Nanoscale Science and Engineering (NCLT), Learning and Teaching Through Inquiry and Design of Nanoscale Materials and Applications, 2005 Status Report.
[7] Foley, E.T., and M.C. Hersam, “Assessing the Need for Nanotechnology Education Reform in the United States,” Nanotechnology Law and Business, Vol. 3, 2006, pp. 467-484.
[8] Stevens, S., L. Sutherland, P. Schank, and J. Krajcik, "The Big Ideas of Nanoscience,” http://www.nclt.us/news/news_docs/Big_Ideas_of_Nanoscience-draft2.pdf.
[9] Pratt, D.D., “Conceptions of Teaching,” Adult Education Quarterly, Vol. 42, No. 4, 1992, pp. 203-220.
[10] Hounsell, D., “Contrasting Conceptions of Essay Writing,” in The Experience of Learning, F. Marton, D. Hounsell, and N. Entwistle, (eds.), Edinburgh, Scotland: Scottish Academic Press, 1997.
[11] Light, G., “From the Personal to the Public: Student Conceptions of Creative Writing in Higher Education,” The International Journal of Higher Education and Educational Planning, Vol. 43, No. 2, 2002, pp 257-276.
[12] Säljö, R., “Learning about Learning,” Higher Education, Vol. 8, 1979, pp. 443–451.
[13] Marton, F., G. Dell’Alba, and E. Beaty, “Conceptions of Learning,” International Journal of Educational Research, Vol. 19, pp. 277–300.
[14] Reid, A., and P. Petocz, “Students’ Conceptions of Statistics: A Phenomenographic Study,” Journal of Statistics Education, Vol. 10, No. 2, 2002, www.amstat.org/publications/jse/v10n2/reid.html.
[15] Svensson, L., “The Conceptualization of Cases of Physical Motion,” European Journal of Psychology in Education, Vol. 4, No. 4, 1989, pp. 529–545.
[16] Pang, M., and F. Marton, “Learning Theory as Teaching Resource: Enhancing Students Understanding of Economic Concepts,” Instructional Science, Vol. 33, 2005, pp. 159-191.
[17] Marton, F., and S. Booth, Learning and Awareness, Mahwah, NJ: Lawrence Erlbaum Associates, 1997.
[18] American Association for the Advancement of Science (AAAS), Benchmarks for Science Literacy, New York, NY: Oxford University Press, 1993.
[19] American Association for the Advancement of Science (AAAS) Project 2061, http://www.project2061.org/default.htm.
[20] Hawkins, D., “Critical Barriers to Science Learning,” Outlook, Vol. 29, 1978 pp. 3-23.
[21] Drane, D., S. Swarat, G. Light, M. Hersam, T. Mason, “An Evaluation of the Efficacy and Transferability of a Nanoscience Module,” submitted.
[22] Tretter, T.R., M.G. Jones, T. Andre, A. Negishi, and J. Minogue, “Conceptual Boundaries and Distances: Students’ and Experts’ Concepts of the Scale of Scientific Phenomena,” Journal of Research in Science Teaching, Vol. 43, No. 3, 2006, pp. 282-319.
[23] Patton, M.Q., Qualitative Research & Evaluation Methods (3rd ed.). Thousand Oaks, CA: Sage Publications, 2001.
[24] Hersam, M., “Introduction to Nanometer Scale Science and Technology Unit, National Center for Learning and Teaching (NCLT),” NanoEd Resource Portal, http://www.nanoed.org/courses/intro_to_nanometer.html.
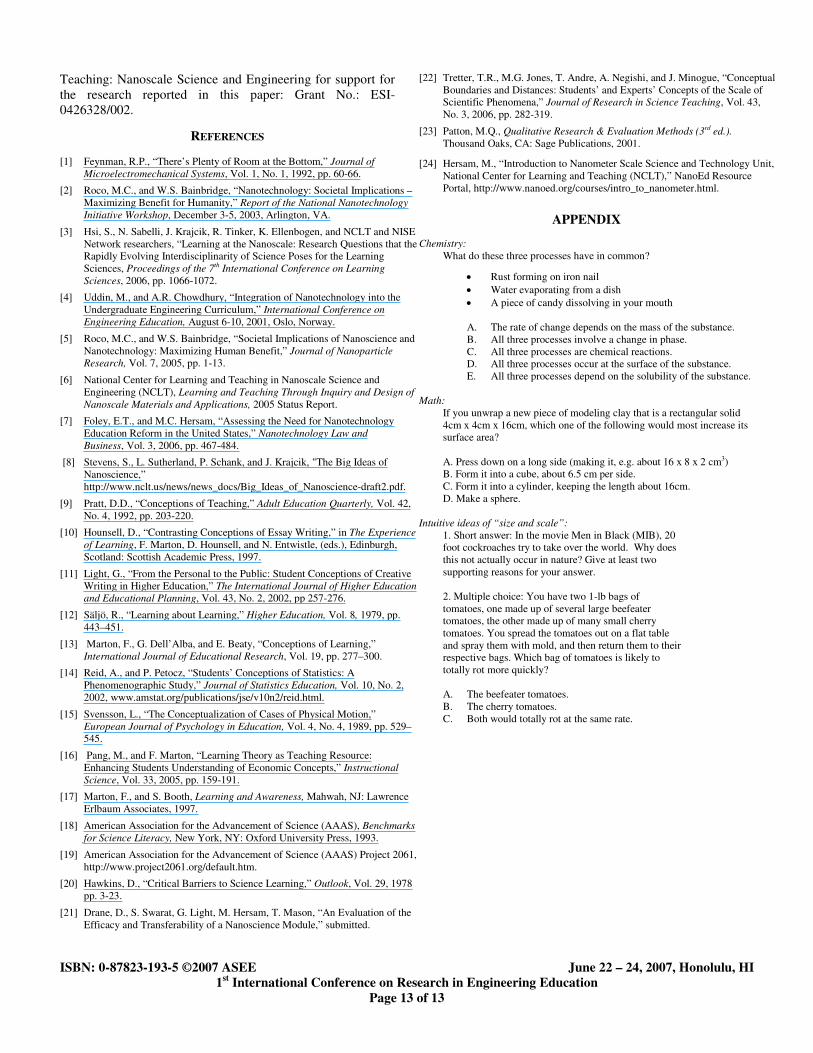
APPENDIX
Chemistry: What do these three processes have in common?
• Rust forming on iron nail
• Water evaporating from a dish • A piece of candy dissolving in your mouth
A. The rate of change depends on the mass of the substance. B. All three processes involve a change in phase. C. All three processes are chemical reactions. D. All three processes occur at the surface of the substance. E. All three processes depend on the solubility of the substance.
Math:
If you unwrap a new piece of modeling clay that is a rectangular solid 4cm x 4cm x 16cm, which one of the following would most increase its surface area? A. Press down on a long side (making it, e.g. about 16 x 8 x 2 cm3) B. Form it into a cube, about 6.5 cm per side. C. Form it into a cylinder, keeping the length about 16cm. D. Make a sphere.
Intuitive ideas of “size and scale”:
1. Short answer: In the movie Men in Black (MIB), 20 foot cockroaches try to take over the world. Why does this not actually occur in nature? Give at least two supporting reasons for your answer. 2. Multiple choice: You have two 1-lb bags of tomatoes, one made up of several large beefeater tomatoes, the other made up of many small cherry tomatoes. You spread the tomatoes out on a flat table and spray them with mold, and then return them to their respective bags. Which bag of tomatoes is likely to totally rot more quickly? A. The beefeater tomatoes. B. The cherry tomatoes. C. Both would totally rot at the same rate.