Factors influencing the distribution of epibenthic megafauna across the Peruvian oxygen minimum zone
Upload
independentCategory
view
2download
0
G Model
YJFCA-1744; No of Pages 8
Original Article
Understanding the role of potatoes in the Peruvian diet: An approach thatcombines food composition with household expenditure data
Donald Rose a,*, Gabriela Burgos b, Meredith Bonierbale b, Graham Thiele b
a Department of Community Health Sciences, School of Public Health and Tropical Medicine, Tulane University, 1440 Canal Street, New Orleans, LA 70112, USAb International Potato Center, Lima, Peru
Journal of Food Composition and Analysis xxx (2009) xxx–xxx
A R T I C L E I N F O
Article history:
Received 21 April 2008
Received in revised form 5 October 2008
Accepted 13 October 2008
Keywords:
Potato
Peru
Household expenditures
Consumption
Energy
Iron
Micronutrient deficiency
Micronutrient malnutrition
Food composition
A B S T R A C T
Agricultural research in developing countries has increasingly focused on meeting nutritional objectives.
Biofortified varieties and increased use of fertilizers have been studied to improve the nutrient profile of
staple foods and thereby reduce micronutrient malnutrition. To understand where and for which crops
this is appropriate, a better understanding of population-level consumption patterns is needed. In this
paper, we demonstrate an approach to understanding the role of the potato in the Peruvian diet, and how
it varies by geographic and socio-economic group. We combine readily available data on household
expenditures from a Peruvian living conditions survey (ENAHO) with food composition data to derive
estimates on the amount of potatoes consumed per adult equivalent, and the contribution of potatoes to
meeting the energy, protein, calcium, iron, and vitamin C needs of Peruvians. Households in the
highlands, where potatoes are often the basis of cropping systems, consume the greatest quantities of
potatoes, averaging 421 g/adult equivalent/day (g/ae/d). In this region, potatoes contribute 18%, 16%, 17%,
and 97% of the recommended needs for energy, protein, iron, and vitamin C, respectively. Sensitivity
testing using different cultivars previously examined from the Peruvian highlands shows that potatoes
could supply a range from 7–31% of the recommended intakes for iron in this population. This work gives
support for continuing agricultural research to reduce micronutrient malnutrition and provides guidance
for where and with whom such research might have the greatest impact.
� 2008 Elsevier Inc. All rights reserved.
Contents lists available at ScienceDirect
Journal of Food Composition and Analysis
journal homepage: www.e lsev ier .com/ locate / j fca
1. Introduction
Agricultural scientists are increasingly orienting their researchtowards improving human nutrition (Graham et al., 2006). Thisnew focus is well justified. Malnutrition is extensive and at the rootof many other problems of development (Bhaskaram, 2002; Masonet al., 2001; World Health Organization, 2002). In the developingworld, undernutrition is particularly prevalent among rural farmhouseholds. The need to increase the role of agriculture inaddressing malnutrition has, in fact, been persuasively arguedby various panels and authors (Lomborg, 2004; Rouse and Davis,2004; Welch and Graham, 1999).
Various agricultural strategies have been suggested forimproving nutrition (Graham et al., 2006). These include improv-ing micronutrient availability through plant breeding, also knownas bio-fortification, and increased use of fertilizers to improve the
* Corresponding author. Tel.: +1 504 988 5742; fax: +1 504 988 3540.
E-mail address: [email protected] (D. Rose).
Please cite this article in press as: Rose, D., et al., Understanding thefood composition with household expenditure data. Journal of Food
0889-1575/$ – see front matter � 2008 Elsevier Inc. All rights reserved.
doi:10.1016/j.jfca.2008.10.002
nutrient profile of staple foods (Bonierbale et al., 2007). Alteringthe cropping mix in a given food system can be used to promotediet diversity and thus introduce crops rich in nutrients previouslylacking in the diet. Increasing incomes of farmers, allowing them topurchase a more diversified diet, can also be promoted throughagricultural research that increase the yield of existing crops.
Understanding the food consumption habits of a population isessential for orienting agricultural research to improve humannutrition. The International Potato Center (CIP) in Peru, one of theresearch centers of the Consultative Group on InternationalAgricultural Research, has long conducted research to improvethe livelihood of potato farmers by increasing yields. One of theprojects at CIP, which has as a main goal to determine the potentialfor potatoes to contribute to reducing malnutrition, generated thefollowing questions. Could increasing the content and availabilityof nutrients in potatoes make a significant impact on nutritionalstatus? If so, where and among which populations should efforts befocused? For which nutrients might potato intakes be significantenough among the population, so that such research efforts wouldbe fruitful?
role of potatoes in the Peruvian diet: An approach that combinesComposition and Analysis (2009), doi:10.1016/j.jfca.2008.10.002
D. Rose et al. / Journal of Food Composition and Analysis xxx (2009) xxx–xxx2
G Model
YJFCA-1744; No of Pages 8
Studies in high-income countries which seek to estimate theconsumption habits of an entire nation typically rely on nationallyrepresentative surveys with a 24-h dietary recall component(Dwyer et al., 2001). There are well-documented problems withthe 24-h recall instrument, including its imprecision at estimatingusual intakes with data for only 1 or 2 days, as well as inaccuraciesin the linkage between the foods that the respondent reports andthose for which food composition data are available. Equallyimportant in developing countries, the 24-h recall instrument isvery costly to implement on a national basis, often requiringhuman resources (trained dietitians), infrastructure (transporta-tion, computing services), and funding beyond available capacity.The weighed food intake method may give more accurate results,but is even more difficult to implement on a national basis.
This article demonstrates an alternative approach for develop-ing countries that uses data from a household income andexpenditure survey. Since food often comprises the largest shareof household spending in low-income countries, the foodcomponent of this type of survey is usually the most detailed.Income and expenditure surveys – also referred to as livingconditions, living standards, or poverty surveys – usually collectvery detailed information on household demographics, socio-economic status, and geography. This information, as well as thelarge samples that are drawn, are important in their use forassessing poverty and orienting policy interventions to address it.They also allow for understanding where and with whom food-based interventions are most likely to succeed. In most countries,income and expenditure surveys are conducted on a periodic basis.Additional details about these surveys as well as access to data inspecific countries can be found online (World Bank, 2008).
In Peru, for women and children alike, the most importantenergy sources are rice, potatoes, and sugar. Although 80% ofwomen and 70% of children consume vegetable oil, intakes are inrelatively small quantities. In urban areas the main sources ofprotein, iron, and zinc come from legumes, meat, and fish, while inrural areas tubers and legumes are the main sources of thesenutrients (CENAN, 2003). Potatoes are a more expensive source ofcalories than rice or wheat flour for urban consumers, though withrecent increases in relative prices of these goods, potatoes havebecome more competitive. For rural consumers who grow theirown potatoes, potatoes are much more economical as a source ofcalories than these grains, providing 1.5–2 times the amount ofcalories for the same amount of money (V. Suarez, personalcommunication, August 28, 2008).
To better understand the role that potatoes play in the Peruviandiet, this article combines information from the type of surveydescribed earlier – specifically, a 2005 living-conditions survey –with data from a Peruvian food composition table. This approach isused to estimate the contribution of potatoes to the overall energyconsumption by Peruvian households. Also estimated are theconsumption amounts – both in absolute levels and as a percent ofrequirements – provided by potatoes for protein, calcium, iron andvitamin C. This approach allows a ‘‘mapping’’ of the areas, bothgeographic and socio-economic, where potatoes play an importantrole in the diet.
2. Methods
2.1. Data source and sample
Data are analyzed from the 2005 National Survey of HouseholdLiving Conditions and Poverty, known in Spanish as the EncuestaNacional de Hogares Sobre Condiciones de Vida y Pobreza(ENAHO). This is an ongoing monitoring effort by Peru’s nationalstatistical agency, the Instituto Nacional de Estadıstica e Informa-
Please cite this article in press as: Rose, D., et al., Understanding thefood composition with household expenditure data. Journal of Food
tica (INEI), to provide information to policymakers, researchersand others on the evolution of poverty, well-being and householdliving conditions in Peru (INEI, 2005).
ENAHO, which is conducted throughout the calendar year, is anationally representative survey of the non-institutionalizedresidential population of urban and rural Peru. This excludesmembers of the armed forces that live on military bases as well asothers living in collective housing, such as jails, hospitals, hotels,and religious quarters. INEI uses a stratified, multi-stage sampledesign with the 1999–2000 Pre-Census as the sampling frame. Thesample size for 2005 was 19,895 households allowing for a 95%confidence level with inferences being made down to the level ofthe departments in Peru. There are 24 departments in Peru, whichare administrative divisions analogous to states or provinces inother countries. Other details regarding sampling design have beenpublished previously (INEI, 2005).
2.2. Food consumption
ENAHO measures consumption of foods, and other householdgoods, using a detailed version of a typical living standardsexpenditure questionnaire. The respondent is asked about all foodsacquired for household consumption in the previous 15 days.Acquisition is viewed in its broadest sense to include all food that ispurchased, consumed and supplied from own production, receivedas payment for work, received as a gift, donated from a socialprogram, or acquired by other means. ENAHO uses specificprompts to ask about each of these possibilities. Purchasefrequency and amounts are also queried, as are consumptionfrequency and amounts for all non-purchased foods. ENAHO asksseparate consumption questions for the most commonly con-sumed products as well as open-ended prompts about ‘‘otherfoods’’ in each category that allow for the coding of additionalproducts. Altogether, the module captured specific quantities of 15different potato products (e.g. white potato, yellow potato, coloredpotato) and an additional dozen root and tuber products (e.g.yellow sweet potato, olluco, white cassava). For each household,we calculated total potato consumption by summing consumptionamounts from purchases and from other means of acquisition forall potato items listed in the survey.
Food expenditure surveys measure what is consumed byhouseholds, rather than what is eaten by individuals. This is theeconomist’s, rather than the nutritionist’s definition of consump-tion, i.e. that which is acquired by the household. Refuse in thepreparation of foods, plate waste, and other potential losses are notassessed, so they are not subtracted from household consumptionamounts reported here. ENAHO does not assess the content ofrestaurant and other meals (e.g. at a friend’s house) that do notcome from the household food supply. For all these reasons werefer to our measure as ‘‘apparent household consumption,’’ andlabel it as such in our main data tables.
Since households vary in size, we converted annual householdconsumption to per person amounts using the concept of adultequivalence, a common technique in consumption analysis toapportion household level amounts to the individual. A per capitameasure of consumption, obtained by dividing total householdconsumption by the number of people in the household, wouldgive an underestimate of the likely consumption of individuals,since babies would be counted the same as adults. Instead, weassessed each member’s equivalence to an adult male based ontheir relative energy needs. For example, a 1-year-old girl wascounted as 0.41 adult male equivalents (ae), since her energyrequirement was equivalent to 41% of an adult male’s requirement(1310/2797), and an adult female was counted as 0.75 ae, since herenergy requirement was equivalent to 75% of that of an adult male
role of potatoes in the Peruvian diet: An approach that combinesComposition and Analysis (2009), doi:10.1016/j.jfca.2008.10.002
D. Rose et al. / Journal of Food Composition and Analysis xxx (2009) xxx–xxx 3
G Model
YJFCA-1744; No of Pages 8
(2100/2797). Total household consumption was converted toconsumption per adult equivalent (ae) on a daily basis, by dividingtotal household consumption by the sum of adult equivalents ineach household.
2.3. Nutrient consumption
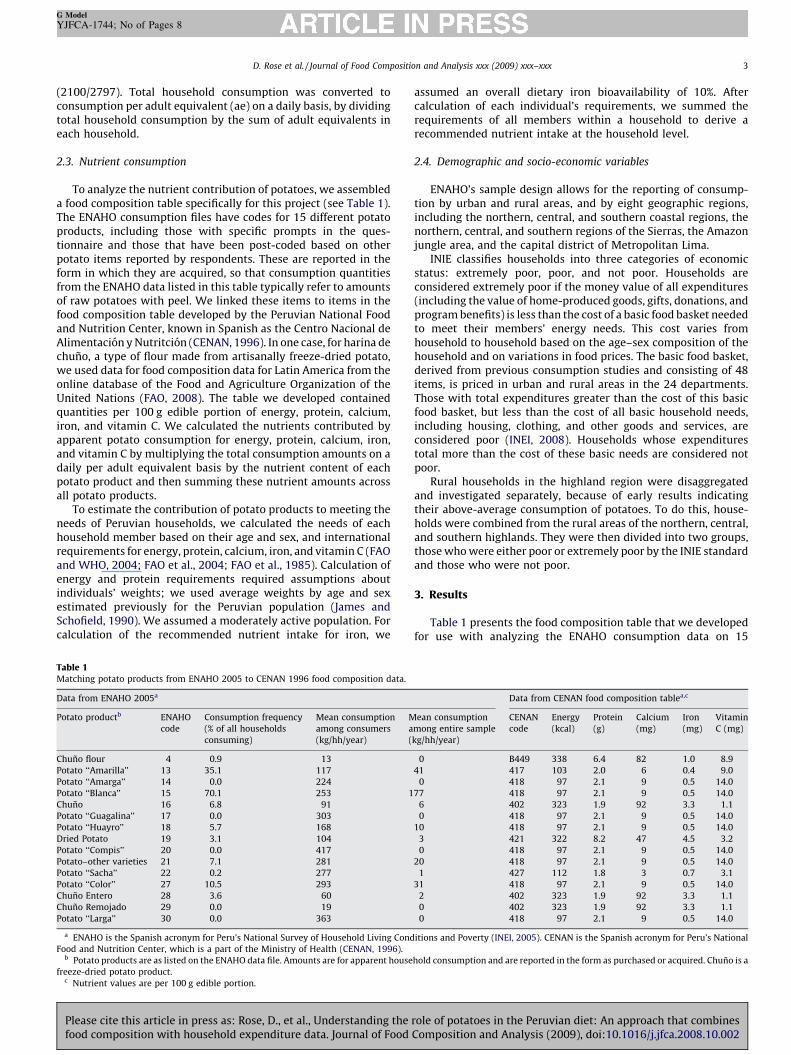
To analyze the nutrient contribution of potatoes, we assembleda food composition table specifically for this project (see Table 1).The ENAHO consumption files have codes for 15 different potatoproducts, including those with specific prompts in the ques-tionnaire and those that have been post-coded based on otherpotato items reported by respondents. These are reported in theform in which they are acquired, so that consumption quantitiesfrom the ENAHO data listed in this table typically refer to amountsof raw potatoes with peel. We linked these items to items in thefood composition table developed by the Peruvian National Foodand Nutrition Center, known in Spanish as the Centro Nacional deAlimentacion y Nutritcion (CENAN, 1996). In one case, for harina dechuno, a type of flour made from artisanally freeze-dried potato,we used data for food composition data for Latin America from theonline database of the Food and Agriculture Organization of theUnited Nations (FAO, 2008). The table we developed containedquantities per 100 g edible portion of energy, protein, calcium,iron, and vitamin C. We calculated the nutrients contributed byapparent potato consumption for energy, protein, calcium, iron,and vitamin C by multiplying the total consumption amounts on adaily per adult equivalent basis by the nutrient content of eachpotato product and then summing these nutrient amounts acrossall potato products.
To estimate the contribution of potato products to meeting theneeds of Peruvian households, we calculated the needs of eachhousehold member based on their age and sex, and internationalrequirements for energy, protein, calcium, iron, and vitamin C (FAOand WHO, 2004; FAO et al., 2004; FAO et al., 1985). Calculation ofenergy and protein requirements required assumptions aboutindividuals’ weights; we used average weights by age and sexestimated previously for the Peruvian population (James andSchofield, 1990). We assumed a moderately active population. Forcalculation of the recommended nutrient intake for iron, we
Table 1Matching potato products from ENAHO 2005 to CENAN 1996 food composition data.
Data from ENAHO 2005a
Potato productb ENAHO
code
Consumption frequency
(% of all households
consuming)
Mean consumption
among consumers
(kg/hh/year)
M
a
(
Chuno flour 4 0.9 13
Potato ‘‘Amarilla’’ 13 35.1 117
Potato ‘‘Amarga’’ 14 0.0 224
Potato ‘‘Blanca’’ 15 70.1 253 1
Chuno 16 6.8 91
Potato ‘‘Guagalina’’ 17 0.0 303
Potato ‘‘Huayro’’ 18 5.7 168
Dried Potato 19 3.1 104
Potato ‘‘Compis’’ 20 0.0 417
Potato–other varieties 21 7.1 281
Potato ‘‘Sacha’’ 22 0.2 277
Potato ‘‘Color’’ 27 10.5 293
Chuno Entero 28 3.6 60
Chuno Remojado 29 0.0 19
Potato ‘‘Larga’’ 30 0.0 363
a ENAHO is the Spanish acronym for Peru’s National Survey of Household Living Cond
Food and Nutrition Center, which is a part of the Ministry of Health (CENAN, 1996).b Potato products are as listed on the ENAHO data file. Amounts are for apparent house
freeze-dried potato product.c Nutrient values are per 100 g edible portion.
Please cite this article in press as: Rose, D., et al., Understanding thefood composition with household expenditure data. Journal of Food
assumed an overall dietary iron bioavailability of 10%. Aftercalculation of each individual’s requirements, we summed therequirements of all members within a household to derive arecommended nutrient intake at the household level.
2.4. Demographic and socio-economic variables
ENAHO’s sample design allows for the reporting of consump-tion by urban and rural areas, and by eight geographic regions,including the northern, central, and southern coastal regions, thenorthern, central, and southern regions of the Sierras, the Amazonjungle area, and the capital district of Metropolitan Lima.
INIE classifies households into three categories of economicstatus: extremely poor, poor, and not poor. Households areconsidered extremely poor if the money value of all expenditures(including the value of home-produced goods, gifts, donations, andprogram benefits) is less than the cost of a basic food basket neededto meet their members’ energy needs. This cost varies fromhousehold to household based on the age–sex composition of thehousehold and on variations in food prices. The basic food basket,derived from previous consumption studies and consisting of 48items, is priced in urban and rural areas in the 24 departments.Those with total expenditures greater than the cost of this basicfood basket, but less than the cost of all basic household needs,including housing, clothing, and other goods and services, areconsidered poor (INEI, 2008). Households whose expenditurestotal more than the cost of these basic needs are considered notpoor.
Rural households in the highland region were disaggregatedand investigated separately, because of early results indicatingtheir above-average consumption of potatoes. To do this, house-holds were combined from the rural areas of the northern, central,and southern highlands. They were then divided into two groups,those who were either poor or extremely poor by the INIE standardand those who were not poor.
3. Results
Table 1 presents the food composition table that we developedfor use with analyzing the ENAHO consumption data on 15
Data from CENAN food composition tablea,c
ean consumption
mong entire sample
kg/hh/year)
CENAN
code
Energy
(kcal)
Protein
(g)
Calcium
(mg)
Iron
(mg)
Vitamin
C (mg)
0 B449 338 6.4 82 1.0 8.9
41 417 103 2.0 6 0.4 9.0
0 418 97 2.1 9 0.5 14.0
77 418 97 2.1 9 0.5 14.0
6 402 323 1.9 92 3.3 1.1
0 418 97 2.1 9 0.5 14.0
10 418 97 2.1 9 0.5 14.0
3 421 322 8.2 47 4.5 3.2
0 418 97 2.1 9 0.5 14.0
20 418 97 2.1 9 0.5 14.0
1 427 112 1.8 3 0.7 3.1
31 418 97 2.1 9 0.5 14.0
2 402 323 1.9 92 3.3 1.1
0 402 323 1.9 92 3.3 1.1
0 418 97 2.1 9 0.5 14.0
itions and Poverty (INEI, 2005). CENAN is the Spanish acronym for Peru’s National
hold consumption and are reported in the form as purchased or acquired. Chuno is a
role of potatoes in the Peruvian diet: An approach that combinesComposition and Analysis (2009), doi:10.1016/j.jfca.2008.10.002
D. Rose et al. / Journal of Food Composition and Analysis xxx (2009) xxx–xxx4
G Model
YJFCA-1744; No of Pages 8
different potato products. To give a sense of importance in theoverall Peruvian diet of each product, we calculated consumptionfrequencies and amounts for each of them for the entire sample.The three most frequently consumed products were white potato,yellow potato, and colored potato, consumed by 70%, 35%, and 10%of the population, respectively. In Peru, white potatoes arepredominantly improved, meaning they have been developed bya scientific breeding program, whereas yellow and coloredpotatoes are mostly native potato landraces, i.e. cultivated plantsfrom farmers’ selections that have not been developed by ascientific breeding program. Average amounts consumed amongthose reporting consumption of these products were 253, 117, and293 kilograms per household per year (kg/hh/y), respectively.Some potato products were consumed in large amounts, though byonly a small percentage of the population. For example, the potatolandrace Compis, a type of Solanum andigena, was consumed byless than a 0.1% of the population, but those that did had an averageconsumption of 417 kg/hh/y. Over the entire population, whitepotato was consumed in the greatest amounts, 177 kg/hh/y.
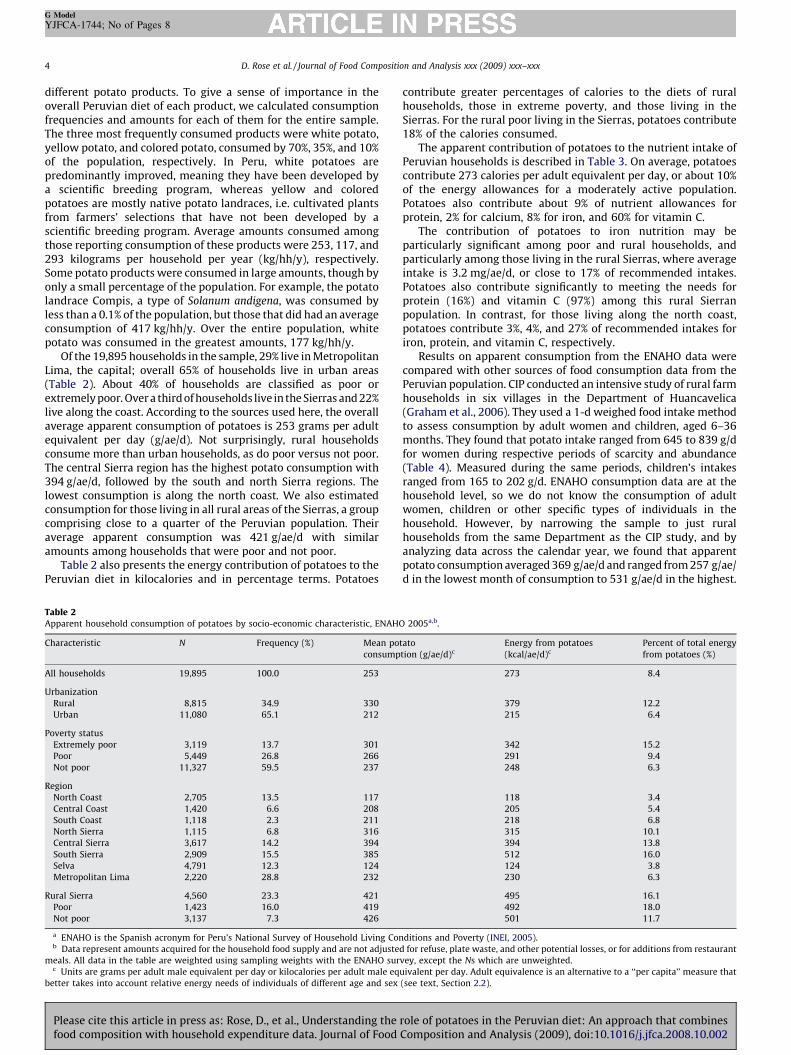
Of the 19,895 households in the sample, 29% live in MetropolitanLima, the capital; overall 65% of households live in urban areas(Table 2). About 40% of households are classified as poor orextremely poor. Over a third of households live in the Sierras and 22%live along the coast. According to the sources used here, the overallaverage apparent consumption of potatoes is 253 grams per adultequivalent per day (g/ae/d). Not surprisingly, rural householdsconsume more than urban households, as do poor versus not poor.The central Sierra region has the highest potato consumption with394 g/ae/d, followed by the south and north Sierra regions. Thelowest consumption is along the north coast. We also estimatedconsumption for those living in all rural areas of the Sierras, a groupcomprising close to a quarter of the Peruvian population. Theiraverage apparent consumption was 421 g/ae/d with similaramounts among households that were poor and not poor.
Table 2 also presents the energy contribution of potatoes to thePeruvian diet in kilocalories and in percentage terms. Potatoes
Table 2Apparent household consumption of potatoes by socio-economic characteristic, ENAHO
Characteristic N Frequency (%) Mean po
consump
All households 19,895 100.0 253
Urbanization
Rural 8,815 34.9 330
Urban 11,080 65.1 212
Poverty status
Extremely poor 3,119 13.7 301
Poor 5,449 26.8 266
Not poor 11,327 59.5 237
Region
North Coast 2,705 13.5 117
Central Coast 1,420 6.6 208
South Coast 1,118 2.3 211
North Sierra 1,115 6.8 316
Central Sierra 3,617 14.2 394
South Sierra 2,909 15.5 385
Selva 4,791 12.3 124
Metropolitan Lima 2,220 28.8 232
Rural Sierra 4,560 23.3 421
Poor 1,423 16.0 419
Not poor 3,137 7.3 426
a ENAHO is the Spanish acronym for Peru’s National Survey of Household Living Conb Data represent amounts acquired for the household food supply and are not adjuste
meals. All data in the table are weighted using sampling weights with the ENAHO surc Units are grams per adult male equivalent per day or kilocalories per adult male eq
better takes into account relative energy needs of individuals of different age and sex
Please cite this article in press as: Rose, D., et al., Understanding thefood composition with household expenditure data. Journal of Food
contribute greater percentages of calories to the diets of ruralhouseholds, those in extreme poverty, and those living in theSierras. For the rural poor living in the Sierras, potatoes contribute18% of the calories consumed.
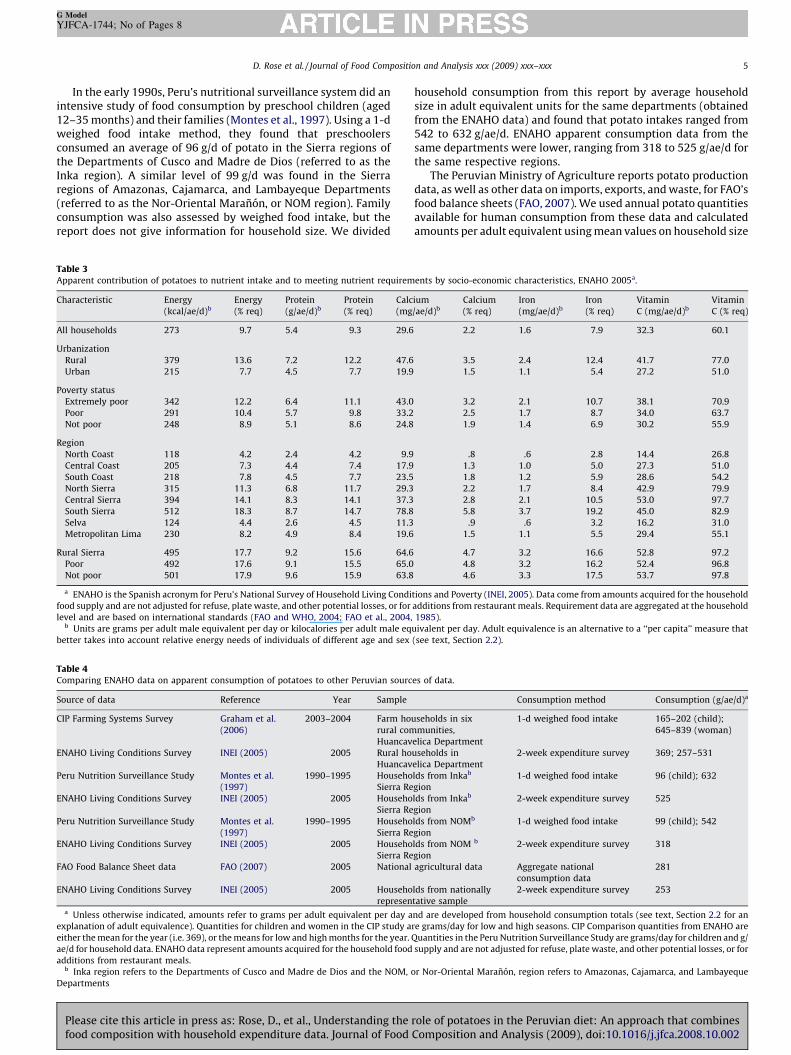
The apparent contribution of potatoes to the nutrient intake ofPeruvian households is described in Table 3. On average, potatoescontribute 273 calories per adult equivalent per day, or about 10%of the energy allowances for a moderately active population.Potatoes also contribute about 9% of nutrient allowances forprotein, 2% for calcium, 8% for iron, and 60% for vitamin C.
The contribution of potatoes to iron nutrition may beparticularly significant among poor and rural households, andparticularly among those living in the rural Sierras, where averageintake is 3.2 mg/ae/d, or close to 17% of recommended intakes.Potatoes also contribute significantly to meeting the needs forprotein (16%) and vitamin C (97%) among this rural Sierranpopulation. In contrast, for those living along the north coast,potatoes contribute 3%, 4%, and 27% of recommended intakes foriron, protein, and vitamin C, respectively.
Results on apparent consumption from the ENAHO data werecompared with other sources of food consumption data from thePeruvian population. CIP conducted an intensive study of rural farmhouseholds in six villages in the Department of Huancavelica(Graham et al., 2006). They used a 1-d weighed food intake methodto assess consumption by adult women and children, aged 6–36months. They found that potato intake ranged from 645 to 839 g/dfor women during respective periods of scarcity and abundance(Table 4). Measured during the same periods, children’s intakesranged from 165 to 202 g/d. ENAHO consumption data are at thehousehold level, so we do not know the consumption of adultwomen, children or other specific types of individuals in thehousehold. However, by narrowing the sample to just ruralhouseholds from the same Department as the CIP study, and byanalyzing data across the calendar year, we found that apparentpotato consumption averaged 369 g/ae/d and ranged from 257 g/ae/d in the lowest month of consumption to 531 g/ae/d in the highest.
2005a,b.
tato
tion (g/ae/d)c
Energy from potatoes
(kcal/ae/d)c
Percent of total energy
from potatoes (%)
273 8.4
379 12.2
215 6.4
342 15.2
291 9.4
248 6.3
118 3.4
205 5.4
218 6.8
315 10.1
394 13.8
512 16.0
124 3.8
230 6.3
495 16.1
492 18.0
501 11.7
ditions and Poverty (INEI, 2005).
d for refuse, plate waste, and other potential losses, or for additions from restaurant
vey, except the Ns which are unweighted.
uivalent per day. Adult equivalence is an alternative to a ‘‘per capita’’ measure that
(see text, Section 2.2).
role of potatoes in the Peruvian diet: An approach that combinesComposition and Analysis (2009), doi:10.1016/j.jfca.2008.10.002
D. Rose et al. / Journal of Food Composition and Analysis xxx (2009) xxx–xxx 5
G Model
YJFCA-1744; No of Pages 8
In the early 1990s, Peru’s nutritional surveillance system did anintensive study of food consumption by preschool children (aged12–35 months) and their families (Montes et al., 1997). Using a 1-dweighed food intake method, they found that preschoolersconsumed an average of 96 g/d of potato in the Sierra regions ofthe Departments of Cusco and Madre de Dios (referred to as theInka region). A similar level of 99 g/d was found in the Sierraregions of Amazonas, Cajamarca, and Lambayeque Departments(referred to as the Nor-Oriental Maranon, or NOM region). Familyconsumption was also assessed by weighed food intake, but thereport does not give information for household size. We divided
Table 3Apparent contribution of potatoes to nutrient intake and to meeting nutrient requirem
Characteristic Energy
(kcal/ae/d)b
Energy
(% req)
Protein
(g/ae/d)b
Protein
(% req)
Calc
(mg
All households 273 9.7 5.4 9.3 29.6
Urbanization
Rural 379 13.6 7.2 12.2 47.6
Urban 215 7.7 4.5 7.7 19.9
Poverty status
Extremely poor 342 12.2 6.4 11.1 43.0
Poor 291 10.4 5.7 9.8 33.2
Not poor 248 8.9 5.1 8.6 24.8
Region
North Coast 118 4.2 2.4 4.2 9.9
Central Coast 205 7.3 4.4 7.4 17.9
South Coast 218 7.8 4.5 7.7 23.5
North Sierra 315 11.3 6.8 11.7 29.3
Central Sierra 394 14.1 8.3 14.1 37.3
South Sierra 512 18.3 8.7 14.7 78.8
Selva 124 4.4 2.6 4.5 11.3
Metropolitan Lima 230 8.2 4.9 8.4 19.6
Rural Sierra 495 17.7 9.2 15.6 64.6
Poor 492 17.6 9.1 15.5 65.0
Not poor 501 17.9 9.6 15.9 63.8
a ENAHO is the Spanish acronym for Peru’s National Survey of Household Living Condi
food supply and are not adjusted for refuse, plate waste, and other potential losses, or for
level and are based on international standards (FAO and WHO, 2004; FAO et al., 2004,b Units are grams per adult male equivalent per day or kilocalories per adult male eq
better takes into account relative energy needs of individuals of different age and sex
Table 4Comparing ENAHO data on apparent consumption of potatoes to other Peruvian sourc
Source of data Reference Year Sample
CIP Farming Systems Survey Graham et al.
(2006)
2003–2004 Farm hou
rural com
Huancav
ENAHO Living Conditions Survey INEI (2005) 2005 Rural ho
Huancav
Peru Nutrition Surveillance Study Montes et al.
(1997)
1990–1995 Househo
Sierra Re
ENAHO Living Conditions Survey INEI (2005) 2005 Househo
Sierra Re
Peru Nutrition Surveillance Study Montes et al.
(1997)
1990–1995 Househo
Sierra Re
ENAHO Living Conditions Survey INEI (2005) 2005 Househo
Sierra Re
FAO Food Balance Sheet data FAO (2007) 2005 National
ENAHO Living Conditions Survey INEI (2005) 2005 Househo
represena Unless otherwise indicated, amounts refer to grams per adult equivalent per day a
explanation of adult equivalence). Quantities for children and women in the CIP study a
either the mean for the year (i.e. 369), or the means for low and high months for the year.
ae/d for household data. ENAHO data represent amounts acquired for the household food
additions from restaurant meals.b Inka region refers to the Departments of Cusco and Madre de Dios and the NOM, o
Departments
Please cite this article in press as: Rose, D., et al., Understanding thefood composition with household expenditure data. Journal of Food
household consumption from this report by average householdsize in adult equivalent units for the same departments (obtainedfrom the ENAHO data) and found that potato intakes ranged from542 to 632 g/ae/d. ENAHO apparent consumption data from thesame departments were lower, ranging from 318 to 525 g/ae/d forthe same respective regions.
The Peruvian Ministry of Agriculture reports potato productiondata, as well as other data on imports, exports, and waste, for FAO’sfood balance sheets (FAO, 2007). We used annual potato quantitiesavailable for human consumption from these data and calculatedamounts per adult equivalent using mean values on household size
ents by socio-economic characteristics, ENAHO 2005a.
ium
/ae/d)b
Calcium
(% req)
Iron
(mg/ae/d)b
Iron
(% req)
Vitamin
C (mg/ae/d)b
Vitamin
C (% req)
2.2 1.6 7.9 32.3 60.1
3.5 2.4 12.4 41.7 77.0
1.5 1.1 5.4 27.2 51.0
3.2 2.1 10.7 38.1 70.9
2.5 1.7 8.7 34.0 63.7
1.9 1.4 6.9 30.2 55.9
.8 .6 2.8 14.4 26.8
1.3 1.0 5.0 27.3 51.0
1.8 1.2 5.9 28.6 54.2
2.2 1.7 8.4 42.9 79.9
2.8 2.1 10.5 53.0 97.7
5.8 3.7 19.2 45.0 82.9
.9 .6 3.2 16.2 31.0
1.5 1.1 5.5 29.4 55.1
4.7 3.2 16.6 52.8 97.2
4.8 3.2 16.2 52.4 96.8
4.6 3.3 17.5 53.7 97.8
tions and Poverty (INEI, 2005). Data come from amounts acquired for the household
additions from restaurant meals. Requirement data are aggregated at the household
1985).
uivalent per day. Adult equivalence is an alternative to a ‘‘per capita’’ measure that
(see text, Section 2.2).
es of data.
Consumption method Consumption (g/ae/d)a
seholds in six
munities,
elica Department
1-d weighed food intake 165–202 (child);
645–839 (woman)
useholds in
elica Department
2-week expenditure survey 369; 257–531
lds from Inkab
gion
1-d weighed food intake 96 (child); 632
lds from Inkab
gion
2-week expenditure survey 525
lds from NOMb
gion
1-d weighed food intake 99 (child); 542
lds from NOM b
gion
2-week expenditure survey 318
agricultural data Aggregate national
consumption data
281
lds from nationally
tative sample
2-week expenditure survey 253
nd are developed from household consumption totals (see text, Section 2.2 for an
re grams/day for low and high seasons. CIP Comparison quantities from ENAHO are
Quantities in the Peru Nutrition Surveillance Study are grams/day for children and g/
supply and are not adjusted for refuse, plate waste, and other potential losses, or for
r Nor-Oriental Maranon, region refers to Amazonas, Cajamarca, and Lambayeque
role of potatoes in the Peruvian diet: An approach that combinesComposition and Analysis (2009), doi:10.1016/j.jfca.2008.10.002
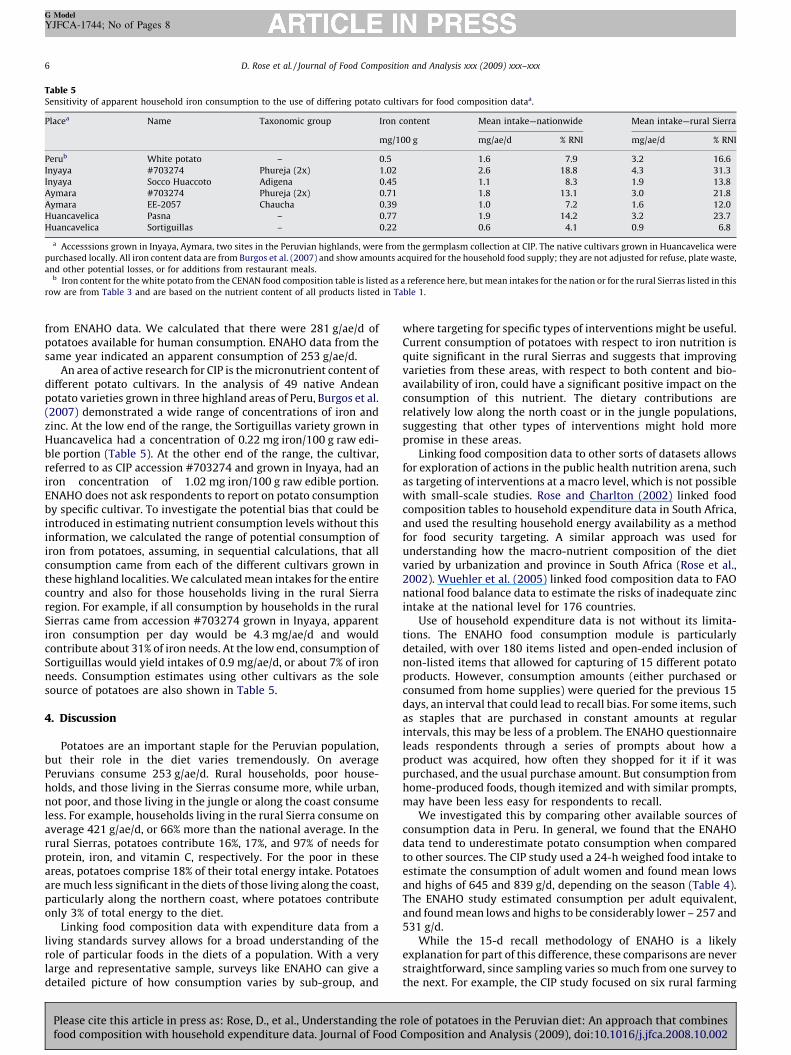
Table 5Sensitivity of apparent household iron consumption to the use of differing potato cultivars for food composition dataa.
Placea Name Taxonomic group Iron content Mean intake—nationwide Mean intake—rural Sierra
mg/100 g mg/ae/d % RNI mg/ae/d % RNI
Perub White potato – 0.5 1.6 7.9 3.2 16.6
Inyaya #703274 Phureja (2x) 1.02 2.6 18.8 4.3 31.3
Inyaya Socco Huaccoto Adigena 0.45 1.1 8.3 1.9 13.8
Aymara #703274 Phureja (2x) 0.71 1.8 13.1 3.0 21.8
Aymara EE-2057 Chaucha 0.39 1.0 7.2 1.6 12.0
Huancavelica Pasna – 0.77 1.9 14.2 3.2 23.7
Huancavelica Sortiguillas – 0.22 0.6 4.1 0.9 6.8
a Accesssions grown in Inyaya, Aymara, two sites in the Peruvian highlands, were from the germplasm collection at CIP. The native cultivars grown in Huancavelica were
purchased locally. All iron content data are from Burgos et al. (2007) and show amounts acquired for the household food supply; they are not adjusted for refuse, plate waste,
and other potential losses, or for additions from restaurant meals.b Iron content for the white potato from the CENAN food composition table is listed as a reference here, but mean intakes for the nation or for the rural Sierras listed in this
row are from Table 3 and are based on the nutrient content of all products listed in Table 1.
D. Rose et al. / Journal of Food Composition and Analysis xxx (2009) xxx–xxx6
G Model
YJFCA-1744; No of Pages 8
from ENAHO data. We calculated that there were 281 g/ae/d ofpotatoes available for human consumption. ENAHO data from thesame year indicated an apparent consumption of 253 g/ae/d.
An area of active research for CIP is the micronutrient content ofdifferent potato cultivars. In the analysis of 49 native Andeanpotato varieties grown in three highland areas of Peru, Burgos et al.(2007) demonstrated a wide range of concentrations of iron andzinc. At the low end of the range, the Sortiguillas variety grown inHuancavelica had a concentration of 0.22 mg iron/100 g raw edi-ble portion (Table 5). At the other end of the range, the cultivar,referred to as CIP accession #703274 and grown in Inyaya, had aniron concentration of 1.02 mg iron/100 g raw edible portion.ENAHO does not ask respondents to report on potato consumptionby specific cultivar. To investigate the potential bias that could beintroduced in estimating nutrient consumption levels without thisinformation, we calculated the range of potential consumption ofiron from potatoes, assuming, in sequential calculations, that allconsumption came from each of the different cultivars grown inthese highland localities. We calculated mean intakes for the entirecountry and also for those households living in the rural Sierraregion. For example, if all consumption by households in the ruralSierras came from accession #703274 grown in Inyaya, apparentiron consumption per day would be 4.3 mg/ae/d and wouldcontribute about 31% of iron needs. At the low end, consumption ofSortiguillas would yield intakes of 0.9 mg/ae/d, or about 7% of ironneeds. Consumption estimates using other cultivars as the solesource of potatoes are also shown in Table 5.
4. Discussion
Potatoes are an important staple for the Peruvian population,but their role in the diet varies tremendously. On averagePeruvians consume 253 g/ae/d. Rural households, poor house-holds, and those living in the Sierras consume more, while urban,not poor, and those living in the jungle or along the coast consumeless. For example, households living in the rural Sierra consume onaverage 421 g/ae/d, or 66% more than the national average. In therural Sierras, potatoes contribute 16%, 17%, and 97% of needs forprotein, iron, and vitamin C, respectively. For the poor in theseareas, potatoes comprise 18% of their total energy intake. Potatoesare much less significant in the diets of those living along the coast,particularly along the northern coast, where potatoes contributeonly 3% of total energy to the diet.
Linking food composition data with expenditure data from aliving standards survey allows for a broad understanding of therole of particular foods in the diets of a population. With a verylarge and representative sample, surveys like ENAHO can give adetailed picture of how consumption varies by sub-group, and
Please cite this article in press as: Rose, D., et al., Understanding thefood composition with household expenditure data. Journal of Food
where targeting for specific types of interventions might be useful.Current consumption of potatoes with respect to iron nutrition isquite significant in the rural Sierras and suggests that improvingvarieties from these areas, with respect to both content and bio-availability of iron, could have a significant positive impact on theconsumption of this nutrient. The dietary contributions arerelatively low along the north coast or in the jungle populations,suggesting that other types of interventions might hold morepromise in these areas.
Linking food composition data to other sorts of datasets allowsfor exploration of actions in the public health nutrition arena, suchas targeting of interventions at a macro level, which is not possiblewith small-scale studies. Rose and Charlton (2002) linked foodcomposition tables to household expenditure data in South Africa,and used the resulting household energy availability as a methodfor food security targeting. A similar approach was used forunderstanding how the macro-nutrient composition of the dietvaried by urbanization and province in South Africa (Rose et al.,2002). Wuehler et al. (2005) linked food composition data to FAOnational food balance data to estimate the risks of inadequate zincintake at the national level for 176 countries.
Use of household expenditure data is not without its limita-tions. The ENAHO food consumption module is particularlydetailed, with over 180 items listed and open-ended inclusion ofnon-listed items that allowed for capturing of 15 different potatoproducts. However, consumption amounts (either purchased orconsumed from home supplies) were queried for the previous 15days, an interval that could lead to recall bias. For some items, suchas staples that are purchased in constant amounts at regularintervals, this may be less of a problem. The ENAHO questionnaireleads respondents through a series of prompts about how aproduct was acquired, how often they shopped for it if it waspurchased, and the usual purchase amount. But consumption fromhome-produced foods, though itemized and with similar prompts,may have been less easy for respondents to recall.
We investigated this by comparing other available sources ofconsumption data in Peru. In general, we found that the ENAHOdata tend to underestimate potato consumption when comparedto other sources. The CIP study used a 24-h weighed food intake toestimate the consumption of adult women and found mean lowsand highs of 645 and 839 g/d, depending on the season (Table 4).The ENAHO study estimated consumption per adult equivalent,and found mean lows and highs to be considerably lower – 257 and531 g/d.
While the 15-d recall methodology of ENAHO is a likelyexplanation for part of this difference, these comparisons are neverstraightforward, since sampling varies so much from one survey tothe next. For example, the CIP study focused on six rural farming
role of potatoes in the Peruvian diet: An approach that combinesComposition and Analysis (2009), doi:10.1016/j.jfca.2008.10.002
D. Rose et al. / Journal of Food Composition and Analysis xxx (2009) xxx–xxx 7
G Model
YJFCA-1744; No of Pages 8
communities in the Department of Huancavelica in which potatoeswere central to the cropping system while the ENAHO data werecalculated on a representative selection of rural households fromall villages in the same Department and included communities inwhich potato was not the principal staple. The estimates ofpreschooler consumption by the CIP study were also higher thanthe estimates on other preschoolers, based on the same type ofweighed food intake. In the CIP study preschoolers consumed 165–202 g/d of potatoes, substantially higher than the estimatesobtained from the Peruvian surveillance system study (Monteset al., 1997) for children living in the Sierras of the Inka or NOMregions, which had mean intakes of 96 and 99 g/d, respectively. Theauthors of the latter study cautioned that their geographicgrouping of households in the Sierras was for convenience inpresentation and should not be taken to imply that results wererepresentative at that level (Montes et al., 1997). This might alsoexplain in part why household estimates of consumption fromENAHO data were lower than household estimates from theMontes study.
One obvious limitation of using household level information tomake inferences about nutrient consumption is that theindividual is the relevant unit of analysis for dietary andnutritional studies. Because ENAHO and other such living-standard studies include complete rosters with the age and sexof all household members, we are able to adjust overallconsumption to an adult equivalent basis. But using householddata, even when adjusted to an adult equivalent basis, carries theimplicit assumption that all individuals in a household eat inproportion to their nutritional needs. If certain individuals, suchas adult males, get relatively more of their energy from animalproducts and less from potatoes than adult females, then thecontribution of potatoes to meeting the energy requirements ofadult males will be overstated by our adult-equivalent measureand understated for adult females. This might also explain some ofthe discrepancy with CIP study results on adult women describedin the previous paragraph. Household-level consumption alsodoes not take into account losses in food preparation or due toplate waste.
Another limitation of our approach may be the lack ofinformation on the consumption of specific cultivars. Recentwork in highland Peru has documented the wide range ofnutrient content of potato cultivars depending on the specificvariety and where it is grown (Burgos et al., 2007). Using ENAHOexpenditure data and CENAN food composition data, we foundthat, on average, potatoes covered about 17% of the recom-mended iron intakes for those living in the rural Sierras.However, assuming that all potato consumption came from oneof the varieties studied by Burgos and co-authors, we estimatedthat potatoes could supply anywhere from 7% to 31% of theserecommendations.
Although this wide divergence in estimates is certainly alimitation of this type of approach, these results can also providecause for optimism. In research on the rice farming system of ruralBangladesh, Kennedy et al. (2005) have shown that substantialmajorities of respondents are able to give consumption informa-tion about specific cultivars. Given the appropriate data on foodcomposition, such research suggests that future work on thenutrient contribution of specific crops may benefit from inclusionof cultivar-specific information.
The range of estimates for iron intake, particularly at the highend, should also provide optimism to agronomics researchersseeking to improve nutrient intakes. Clearly these results indicatethat cultivars currently exist to make a substantial difference in theintakes of iron. What is now needed is the research to use thisdiversity to adapt and improve future cultivars. Results also
Please cite this article in press as: Rose, D., et al., Understanding thefood composition with household expenditure data. Journal of Food
suggest that a food system approach which includes potato as onecomponent of the diet is likely to be most effective. Our approachgives an indication for which population groups such efforts mayhave the most impact.
Acknowledgments
We would like to acknowledge the tremendous contributions ofNancy Hidalgo of Peru’s Instituto Nacional de Estadıstica eInformatica (INEI) to making the ENAHO survey a success. Shehas been very helpful in sharing her knowledge about the survey’smethodologies with the authors. We also thank Victor Suarez, ofthe International Potato Center, for his calculations on the relativecost of calories from three food products.
References
Bhaskaram, P., 2002. Micronutrient malnutrition, infection, and immunity: Anoverview. Nutrition Reviews 60, S40–S45.
Bonierbale, M., Amoros, W., Burgos, G., Salas, E., Juarez, H., 2007. Prospects forenhancing the nutritional value of potato by plant breeding. African PotatoAssociation Conference Proceedings 7, 26–46.
Burgos, G., Amoros, W., Morote, M., Stangoulis, J., Bonierbale, M., 2007. Iron and zincconcentration of native Andean potato cultivars from a human nutritionperspective. Journal of the Science of Food and Agriculture 87, 668–675.
Centro Nacional de Alimentacion y Nutricion, Instituto Nacional de Salud, Minis-terio de Salud, 1996. Tablas Peruanas de Composicion de Alimentos. SetimaEdicion, Lima, Peru.
Centro Nacional de Alimentacion y Nutricion, Instituto Nacional de Salud, Minis-terio de Salud, 2003. Encuesta Nacional de Consumo de Alimentos en Ninos de12 a 35 meses y Mujeres in Edad Fertil. Informe Final. CENAN, Lima, Peru.
Dwyer, J., Ellwood, K., Moshfegh, A.J., Johnson, C.L., 2001. Integration of the con-tinuing survey of food intakes by individuals and the national health andnutrition examination survey. Journal of the American Dietetic Association101, 1142–1143.
Food and Agriculture Organization, 2007. FAOSTAT—Consumption Page. Retrieved2007-7-18: <http://faostat.fao.org>.
Food and Agriculture Organization, Oficina Regional para America Latina y el Caribe,2008. Tabla de Composicion de Alimentos de America Latina. Retrieved 2008-3-21: <http://www.rlc.fao.org/es/bases/alimento/>
Food and Agriculture Organization, World Health Organization, 2004. Vitamin andMineral Requirements in Human Nutrition: Report of A Joint FAO/WHO ExpertConsultation, Bangkok, Thailand, 21–30 September 1998. World Health Orga-nization, Geneva, Switzerland.
Food and Agriculture Organization, World Health Organization, & United NationsUniversity, 1985. Energy and protein requirements: report of a joint FAO/WHO/UNU expert consultation. WHO Technical Report Series 724. Geneva, Switzer-land.
Food and Agriculture Organization, World Health Organization, & United NationsUniversity, 2004. Human Energy Requirements: Report of A Joint FAO/WHO/UNU Expert Consultation, Rome, Italy, 17–24 October 2001. Food and Agricul-ture Organization, Rome, Italy.
Graham, R.D., Welch, R.M., Saunders, D.A., Ortiz-Monasterio, I., Bouis, H.E., Bonier-bale, M., et al., 2006. Nutritious subsistence food systems. Advances inAgronomy 92, 1–74.
Instituto Nacional de Estadıstica e Informatica, 2005. Encuesta Nacional de HogaresSobre Condiciones de Vida y Pobreza, Ficha Tecnica. Retrieved 2007-7-25:<http://www.inei.gob.pe/srienaho/Consulta_por_Encuesta.asp>
Instituto Nacional de Estadıstica e Informatica, 2008. Informe Tecnico: Medicion dela Pobreza 2004, 2005 y 2006. Retrieved 2008-3-21: <http://www.se-pia.org.pe/apc-aa/img_upload/63a9a788f11e24822dcd0ba4d011c10f/Informe_Comisi_n_BM_2006_1.pdf>
James, W.P.T., Schofield, E.C., 1990. Human Energy Requirements: A Manual forPlanners and Nutritionists. Oxford University Press, Oxford, United Kingdom.
Kennedy, G., Islam, O., Eyzaguirre, P., Kennedy, S., 2005. Field testing of plant geneticdiversity indicators for nutrition surveys: Rice-based diet of rural Bangladesh asa model. Journal of Food Composition and Analysis 18, 255–268.
Lomborg, B., 2004. Global Crises, Global Solutions. Cambridge University Press,Cambridge, United Kingdom.
Mason, J.B., Lotfi, M., Dalmiya, N., Sethuraman, K., Deitchler, M., 2001. The Micro-nutrient Report: Current Progress and Trends in the Control of Vitamin A,Iodine, and Iron Deficiencies. Micronutrient Initiative, International Develop-ment Research Centre, Ottawa, Canada.
Montes, C., Segura, L., Miranda, M., Barrientos, M., Lescano, G., 1997. Consumo deAlimentos en el Peru, 1990–1995. Asociacion Benefica PRISMA, Lima, Peru.
Rose, D., Bourne, L., & Bradshaw, D., 2002. Food and nutrient availability in SouthAfrican households: Development of a nationally representative database.Technical Report. Medical Research Council of South Africa, Tygerberg, SouthAfrica.
role of potatoes in the Peruvian diet: An approach that combinesComposition and Analysis (2009), doi:10.1016/j.jfca.2008.10.002
D. Rose et al. / Journal of Food Composition and Analysis xxx (2009) xxx–xxx8
G Model
YJFCA-1744; No of Pages 8
Rose, D., Charlton, K.E., 2002. Quantitative indicators from a food expendituresurvey can be used to target the food insecure in South Africa. Journal ofNutrition 132, 3235–3243.
Rouse, T.I., Davis, D.P., 2004. Exploring a Vision: Integrating Knowledge for Food andHealth, A Workshop Summary. National Research Council, National AcademyPress, New York, USA.
Welch, R.M., Graham, R.D., 1999. A new paradigm for world agriculture: Meetinghuman needs—Productive sustainable, nutritious. Field Crops Research 60, 1–10.
Please cite this article in press as: Rose, D., et al., Understanding thefood composition with household expenditure data. Journal of Food
World Bank, 2008. Living Standards Measurement Study. Retrieved 2008-4-14:<http://go.worldbank.org/IPLXWMCNJ0>
World Health Organization, 2002. The World Health Report 2002. In: Campanini, B.(Ed.), Reducing Risks, Promoting Healthy Life. Geneva, Switzerland, WorldHealth Organization.
Wuehler, S.E., Peerson, J.M., Brown, K.H., 2005. Use of national food balance data toestimate the adequacy of zinc in national food supplies: Methodology andregional estimates. Public Health Nutrition 8, 812–819.
role of potatoes in the Peruvian diet: An approach that combinesComposition and Analysis (2009), doi:10.1016/j.jfca.2008.10.002
Copyright © 2022 FDOKUMEN


![Terracing and Irrigation in the Peruvian Highlands [and Comments and Reply]](https://static.fdokumen.com/doc/165x107/633b816ca59e31afd50e2364/terracing-and-irrigation-in-the-peruvian-highlands-and-comments-and-reply.jpg)