Molecular approaches to analysing the microbial composition of raw milk and raw milk cheese
Upload
khangminh22Category
view
16download
0
Understanding small and large milk fat globule phenotype
variation in dairy cows through milk lipidomic
characterisation
LEONIE WALTER
Bachelor of Science, Master of Science
ORCID ID: 0000-0002-7416-4185
Submitted in total fulfilment of the requirements for the degree of
Doctor of Philosophy – Agricultural Sciences
August 2019
School of Agriculture and Food
Faculty of Veterinary and Agricultural Sciences
The University of Melbourne
Parkville, Victoria
Australia

i
ABSTRACT
Milk fat globules (MFGs) are spherical structures comprising a neutral lipid core that
is surrounded by a three-layer membrane. This MFG membrane is of nutritional benefit
for infants and adult consumers. Individual variation in the size of MFGs is observed
within a herd of the same breed, and this milk production trait, if selected for through
breeding programs, could be exploited for a more targeted milk production for specific
technological streams. For example, large MFGs are desirable for butter making, whereas
small MFGs are preferred for cheese making and direct consumption due to improved
sensory properties and increased relative abundance of the beneficial membrane material.
The initial experiment of this work aimed to determine how much the average MFG
size is affected by on-farm and animal related factors within a herd subjected to the same
diet and environmental conditions. Milk fat globule size of the whole herd was repeatedly
measured over a one-year period and the effects of these parameters were estimated using
a linear mixed effect model. This analysis showed that stage of lactation, parity and milk
yield can affect MFG size, while the impact of fat yield, concentrate intake and number
of milkings per day was limited. However, the individual variation within the herd
outweighed the effect of individual factors, supporting the possibility of a genetically
determined regulation of MFG size.
Based on the data collected for the first experimental chapter, cows were selected for
the second and third experiment, which aimed to characterise the small and large MFG
phenotypes through an in-depth lipidomics analysis. This analysis included the
characterisation of the fatty acid (FA) profile of the MFG core by gas chromatography
and the identification of the whole milk lipidome through targeted liquid chromatography
tandem mass spectrometry. The analysis of the MFG core FA profile revealed that the

ii
cows with the small MFG (SMFG) phenotype produced milk with higher proportions of
unsaturated FAs compared to large MFG (LMFG) cows. This was related to an increased
uptake of preformed FAs with a chain length of ≥ 18 carbons, which are sourced directly
from the diet or from lipid mobilisation. This characteristic of the SMFG group could
potentially lead to the production of milk with an improved nutritional profile.
The results of the third experiment present the most extensive milk lipidomic analysis
in the literature to date, with 301 detected lipid species. The results also revealed, for the
first time, a potential role for ether phosphatidylethanolamine (ePE) in the regulation of
MFG size, showing a higher relative abundance of ePE in the milk from LMFG cows.
Ether PEs can reduce the fluidity of biological membranes and are predicted to promote
lipid droplet fusion. The milk from SMFG cows, on the other hand, contained higher total
phosphatidylcholine (PC) to PE ratios and a higher relative abundance of unsaturated PC
species, both attributes that are predicted to prevent lipid droplet fusion. In the final
experiment of this thesis an in vitro model using cells purified from raw milk and grown
on permeable membrane supports was established, which offers the potential to test some
of the novel findings of this thesis in future experiments.

iii
DECLARATIONS
This declaration is to certify that:
i) The thesis comprises only my original work towards the PhD except where
indicated in the preface,
ii) Due acknowledgement has been made in the text to all other material used,
iii) The thesis is fewer than 100 000 words in length, exclusive of tables, maps,
bibliographies and appendices.
Leonie Walter
28/08/2019

iv
PREFACE
This thesis comprises chapters that were performed in collaboration with the
Commonwealth Scientific and Industrial Research Organisation’s Agriculture and Food
business unit. I was the lead investigator on all of these chapters. For Chapter 4, gas
chromatography was performed by Dr Pushkar Shrestha, CSIRO Black Mountain,
Canberra, Australia, who also provided the initial data analysis, including peak
identification and calculations of area percentages of the peaks. I conducted the sample
collections, subsequent data analysis and wrote the manuscript. For Chapter 5, liquid
chromatography tandem mass spectrometry was performed by Dr Vinod Narayana and
Dr Dedreia Tull from Metabolomics Australia, who also assisted in the interpretation of
the data. Sample collection, peak area selection, data analysis, interpretation and writing
of the manuscript were my responsibility.
For all published work in this thesis the respective co-authors have completed The
University of Melbourne’s co-author authorisation form to certify that the candidate’s
contribution to the publication was greater than 50%. The candidate’s principal
supervisor, Professor Brian J. Leury has signed The University of Melbourne’s
declaration for a thesis with publication form. Manuscripts submitted or intended to be
submitted for publication are formatted according to the respective journal’s formatting
requirements. Supplemental data included in this thesis refers to supplemental files that
are intended to be published as part of the research article. Additional material that is not
intended for publication but included in this thesis is attached as an appendix at the end
of a chapter, where applicable.

v
This thesis contains the following original manuscripts, where I was the lead author:
I. Full title: The effect of physiological state, milk production traits
and environmental conditions on milk fat globule size
in cow’s milk.
Authors: Leonie Walter, Sue Finch, Brendan Cullen, Richard Fry,
Amy Logan and Brian J. Leury
Status: Accepted for publication by the Journal of Dairy Research
on 01/07/2019
Candidate’s contribution: 90%
II. Full title: Lipid metabolic differences in cows producing small or
large milk fat globules: Fatty acid origin and degree of
saturation
Authors: Leonie Walter, Pushkar Shrestha, Richard Fry, Brian J.
Leury and Amy Logan
Status: In revision following peer review by the Journal of Dairy
Science
Candidate’s contribution: 80%
III. Full title: Milk fat globule size development in the mammary
epithelial cell: a potential role for ether
phosphatidylethanolamine
Authors: Leonie Walter, Vinod K. Narayana, Richard Fry, Amy
Logan, Dedreia Tull and Brian J. Leury
Status: Submitted for publication to Scientific Reports
Candidate’s contribution: 80%
IV. Full title: Investigation on the suitability of milk derived primary
bovine mammary epithelial cells grown on permeable
membrane supports as an in vitro model for lactation
Authors: Leonie Walter, Richard Fry, Amy Logan, Brian J. Leury
Status: Unpublished material not submitted for publication
Candidate’s contribution: 95%

vi
LIST OF COMMUNICATIONS AND PRIZES
Book chapters:
Logan, A., Walter, L., Watkins, P. (accepted Nov 2019). Chapter 13 – Analytical
Methods. In Advanced Dairy Chemistry: Volume 2: Lipids. P.F. Fox and P.L.H.
McSweeney, eds. (New York, NY: Springer US).
Conference presentations and posters:
Presentation at the International Symposium on Ruminant Physiology, Leipzig, Germany,
2019: Walter, L., Narayana, V.K., Fry, R., Logan, A., Tull, D. and Leury, B.J. Lipidomic
profiles of milk from cows with consistently small or large milk fat globule size
distributions suggest underlying metabolic differences.
Poster at the International Symposium on Ruminant Physiology, Leipzig, Germany,
2019: Walter, L., Shrestha, P., Fry, R., Leury, B.J. and Logan, A. Towards the
identification of milk fat globule size as a potentially beneficial milk production trait:
small and large phenotype characterisation.
Prizes:
Best pre-confirmation award at the Faculty of Veterinary and Agricultural Sciences’
Postgraduate Symposium 2015.

vii
ACKNOWLEDGMENTS
I would like to acknowledge my supervisors Prof. Brian Leury, Dr Amy Logan and Dr
Richard Fry for their support and encouragement throughout the years of my PhD, it
wasn’t always easy but I have enjoyed working with all of you. I would also like to thank
Dr Brendan Cullen for being an excellent chair of my PhD committee.
To Brian, my principal supervisor, thank you for your enthusiasm and encouragement,
which always made me leave your office with a lot of motivation, one of the most valuable
currencies during a PhD. I would also like to thank you for trusting me to be the right
person for the project even though my training was not in animal science.
Amy, I would like to thank you for bringing the idea for the project to me in the first
place and also for trusting me to be the right person for it. Besides being an excellent
supervisor, you have also given me plenty of opportunities to grow as a researcher through
sending me to conferences, writing courses and co-authoring a book chapter.
And finally, Richard, you and Kerri taught me the basics of cell culture and you were
able to put a smile on my face even when I thought cell culture was never going to work
for me, thank you!
A special thanks also goes to Dr Vinod Narayana and Dr Dedreia Tull, who I would
like to thank for being great collaborators for a major part of this study. It has been such
a pleasure working with you. I would also like to thank Dr Sue Finch, who has been
crucial for the statistical analyses for all parts of this PhD. Sue, thank you for your
continuous support, you have been a great mentor and a real joy to work with.
To all CSIRO staff based in Werribee, thank you for your support and friendship, you
have welcomed me as a master student years ago which contributed to my decision to

viii
stay in Australia for my PhD. I was lucky to be able to do my PhD in collaboration with
CSIRO, which provided invaluable access to equipment and expertise, as well as a top-
up scholarship from the office of the chief executive. To the University of Melbourne
staff in Parkville, thank you for the lunches, chats, co-working and in general for being a
good bunch of people. There are too many to name, but I would like to give a special
thanks to Kathryn and Priya, as well as Kristy, Vanessa and Darren.
To my all my friends in the PhD office thank you for allowing me to distract you from
work when I felt the need to procrastinate and for the many hours we spent across the
road at Naughtons. To Danni, Sophia, Mee-Yung, Evan, Sameera and Thiago, you were
my motivation to get up in the morning to go to work. Our friendship goes way beyond
being students stuck on the same boat and I know it will go beyond the end of our PhD’s.
You all know what I mean…
To Jared, you have played so many roles during this PhD, you must be exhausted.
Thank you for being my partner, best friend, secret PhD advisor and my source of
expertise in biochemistry, dairy science, data science.
An Ruth und Bernd, ich habe euch so viel zu verdanken. Bernd, ich kann nun endlich
der Drohung deine Doktorarbeit lesen zu müssen etwas entgegensetzen, also viel Spass
beim Lesen! Ruth, danke dafür, dass du uns vorgelebt hast was es heisst eine
eigenständige und selbstbewusste Frau zu sein, und danke, dass du mir deine
Begeisterung fürs Schreiben vererbt hast! Carolin, du und Clelia ihr fehlt mir so. Auch
auf die Entfehrnung weisst du hoffentlich das ich immer für dich da bin und nur einen
Tag entfehrnt bin wenn es darauf ankommt. Danke auch an Hermine, die beste
Ersatzmutter der Welt. Mein Dank geht ausserdem an meine Freunde in Deutschland,
Katrin, Sophia, Martin, Lisa und Franz. Danke für eure besuche in Australien, entweder
in Zukunft oder in der Vergangenheit. Ihr seid die besten!

ix
LIST OF ABBREVIATIONS
AAG Alkylacylglycerol
ANOVA Analysis of variance
BSA Bovine serum albumin
BTN Butyrophilin
CEPT Choline/ethanolamine phosphotransferase
CDP Cytidine diphosphate
CE Cholesteryl ester
Cer Ceramide
CI Confidence interval
CN Carbon number
CSN3 Kappa-casein
D[4,3] Volume-weighted mean diameter
D[3,2] Surface-weighted mean diameter
D[v, 0.5] Volume median diameter
DG Diacylglycerol
DGAT Diacylglycerol acyltransferase
DIM Days in milk
DMEM/F12 Dulbecco's Modified Eagle Medium/Nutrient Mixture F-12
ECM Extracellular matrix
ER Endoplasmic reticulum
ePC Ether linked phosphatidylcholine
ePE Ether linked phosphatidylethanolamine
ePL Ether linked phospholipid
FA Fatty acid
FAME Fatty acid methyl ester
FBS Fetal bovine serum
FID Flame ionisation detector

x
GC Gas chromatography
KRT 8/18 Keratin 8 or 18
LC-MS/MS Lipid chromatography tandem mass spectrometry
LD Lipid droplet
LMFG Cows with the large milk fat globule phenotype
LPC Lysophosphatidylcholine
LPE Lysophosphatidylethanolamine
LPI Lysophosphatidylinositol
MEC Mammary epithelial cell
MFG Milk fat globule
MFG-E8 Milk fat globule epidermal growth factor (EGF) factor 8
MFGM Milk fat globule membrane
MUFA Monounsaturated fatty acid
NEFA Nonesterified fatty acid
PBS Phosphate buffered saline
pbMEC Primary bovine mammary epithelial cell
PC Phosphatidylcholine
PDT Population doubling time
PE Phosphatidylethanolamine
PEMT Phosphatidylethanolamine N-methyltransferase
PI Phosphatidylinositol
PL Glycerophospholipid
PLIN2 Perilipin 2
PUFA Polyunsaturated fatty acid
PS Phosphatidylserine
RM1 Primary cells from extracted from raw milk and purified by
immunomagnetic separation
RM2 Primary cells extracted from raw milk
SCD Stearoyl-coenzyme A desaturase
xi
SCDI Stearoyl-coenzyme A desaturase index
SDS-PAGE Sodium dodecyl sulfate polyacrylamide gel electrophoresis
SFA Saturated fatty acid
SMFG Cows with the small milk fat globule phenotype
SNARE Soluble N-ethylmaleimide sensitive factor (NSF) attachment
protein (SNAP) receptor
SL Sphingolipid
SM Sphingomyelin
SMS Sphingomyelin synthase
TC Primary cells extracted from bovine mammary tissue
TEER Transepithelial electrical resistance
TG/TAG Triacylglycerol
TW Cells cultured on Transwell permeable membrane supports
UFA Unsaturated fatty acid
XOR Xanthine oxidoreductase

xii
TABLE OF CONTENTS
Abstract ........................................................................................................................ i
Declarations ............................................................................................................... iii
Preface ........................................................................................................................ iv
List of Communications and Prizes ........................................................................ vi
Acknowledgments .................................................................................................... vii
List of Abbreviations ................................................................................................ ix
Table of Contents ..................................................................................................... xii
List of Tables ........................................................................................................... xvi
List of Figures ........................................................................................................ xviii
Chapter 1 .................................................................................................................... 1
Introduction ................................................................................................................. 1
General Introduction ...................................................................................... 2
Objectives and Hypotheses ............................................................................ 4
1.2.1 First experimental chapter (Chapter 3) ................................................... 6
1.2.2 Second experimental chapter (Chapter 4) ............................................... 6
1.2.3 Third experimental chapter (Chapter 5) .................................................. 7
1.2.4 Fourth experimental chapter (Chapter 6) ................................................ 8
References .................................................................................................... 10
Chapter 2 .................................................................................................................. 14
Literature Review ...................................................................................................... 14

xiii
Introduction .................................................................................................. 15
The Mammary Gland ................................................................................... 15
2.2.1 Evolution of the mammary gland ......................................................... 15
2.2.2 Mammogenesis, lactogenesis and galactopoiesis in the cow ............... 16
Milk – The Mammary Secretion .................................................................. 17
2.3.1 Milk proteins and lactose ...................................................................... 18
2.3.2 Milk lipids ............................................................................................. 21
2.3.2.1 Lipid droplet formation .................................................................... 22
2.3.2.2 Milk fat globule secretion ................................................................ 23
2.3.2.3 Structure of the MFG ....................................................................... 26
Mammary Lipid Metabolism in Ruminants ................................................. 28
2.4.1 Origin of milk fatty acids ...................................................................... 28
2.4.2 Biosynthesis of neutral lipids ................................................................ 29
2.4.3 Biosynthesis of polar lipids ................................................................... 31
MFG Size ..................................................................................................... 35
2.5.1 Environmental and farm management factors with an impact on MFG
size .............................................................................................................. 37
2.5.2 Animal factors with an impact on MFG size ........................................ 39
2.5.3 Determinants of MFG size within the mammary epithelial cell ........... 41
2.5.3.1 LD growth through LD fusion ......................................................... 41
2.5.3.2 LD growth through LD expansion ................................................... 43
2.5.4 Characteristics of small and large MFGs .............................................. 43

xiv
2.5.4.1 FA composition of small and large MFGs ....................................... 43
2.5.4.2 Composition of the MFGM in small and large MFGs ..................... 45
References .................................................................................................... 49
Chapter 3 .................................................................................................................. 59
The effect of physiological state, milk production traits and environmental conditions
on milk fat globule size in cow’s milk. ...................................................................... 59
Introduction .................................................................................................. 60
Manuscript .................................................................................................... 61
Supplementary data ...................................................................................... 81
Chapter 4 .................................................................................................................. 86
Lipid metabolic differences in cows producing small or large milk fat globules: Fatty
acid origin and degree of saturation ........................................................................... 86
Introduction .................................................................................................. 87
Manuscript .................................................................................................... 88
Appendix to Chapter 4 ............................................................................... 115
Chapter 5 ................................................................................................................ 125
Milk fat globule size development in the mammary epithelial cell: a potential role for
ether phosphatidylethanolamine ............................................................................... 125
Introduction ................................................................................................ 126
Manuscript .................................................................................................. 127
Supplementary data .................................................................................... 167
Chapter 6 ................................................................................................................ 172

xv
Investigation on the suitability of milk derived primary bovine mammary epithelial
cells grown on permeable membrane supports as an in vitro model for lactation ... 172
Introduction ................................................................................................ 173
Manuscript .................................................................................................. 174
Chapter 7 ................................................................................................................ 207
General Discussion .................................................................................................. 207
Introduction ................................................................................................ 208
On-farm factors to consider when selecting cows based on MFG size ..... 209
Lipidomic profiles of the small and large milk fat globule phenotype ...... 211
Recommended future research ................................................................... 213
7.4.1 Negative energy balance and nutrient partitioning ............................. 213
7.4.2 Stearoyl desaturase activity ................................................................ 215
7.4.3 Potential identification of genotypes and genomic selection for MFG size
............................................................................................................ 216
7.4.4 The impact of parity on FA composition and lipidomic profiles in milk .
............................................................................................................ 218
Recommended future research using primary cell culture ......................... 218
Conclusions ................................................................................................ 219
References .................................................................................................. 221

xvi
LIST OF TABLES
Chapter 2
Table 1: Fat content and milk fat globule (MFG) size distribution in milk from several
species.
Chapter 3 (in a publication)
Table 1: Environmental temperature and diet composition for the whole herd on the
sampling days in winter, spring, summer and autumn.
Table 2: Effects of selected variables on the average milk fat globule (MFG) size.
Table S1: Test statistics for variables included in the linear mixed models for single
variable and multiple variable effects.
Table S2: Effects of selected variables on the average milk fat globule (MFG) size fitted
using single variable linear mixed models.
Chapter 4 (in a manuscript)
Table 1: Milk fat globule (MFG) size, milk composition and animal production data in
cows producing milk with small or large average MFG size and across several species.
Table 2: Fatty acid (FA) origin and degree of unsaturation in the MFG core from cows
producing milk with small or large average milk fat globule size and across several
species.
Table 3: Fatty acid composition in the small and large milk fat globule phenotype in cows
and across species.
Chapter 5 (in a manuscript)
Table 1: Milk fat globule (MFG) size, milk composition and animal production data of
the selected cows.
Table 2: Lipid classes surveyed and detected in the current study.
Table 3: Relative abundance of lipid species with different degrees of saturation in the
milk lipidome of cows producing milk with small (SMFG) or large (LMFG) milk fat
globules.

xvii
Supplemental Table S1: List of identified lipid species and putative fatty acid
composition, where known, for phospholipid classes in milk.
Supplemental Table S2: List of identified lipid species for lysophospholipid classes in
milk.
Supplemental Table S3: List of identified lipid groups and putative lipid species, where
known, for sphingolipid classes in milk.
Supplemental Table S4: List of identified lipid groups and putative lipid species, where
known, for acylcarnitine (AC), cholesteryl ester (CE), diacylglycerol (DG) and
triacylglycerol (TG) classes in milk.
Chapter 6 (in a manuscript)
Table 1: Experimental design, including three primary bovine mammary epithelial cell
cultures extracted from raw milk (RM1 and RM2) or mammary tissue (TC) cultured on
three matrices and three culture media conditions.
Table 2: Primer sequences, product length, accession numbers and source for the genes
measured in the current study.
Table 3: Predicted mean viability (%) of primary bovine mammary epithelial cells
extracted from raw milk (RM1 and RM2) or mammary tissue (TC) cultured on three
matrices and three culture media conditions.
Table 4: Transepithelial electrical resistance (TEER) of primary bovine mammary
epithelial cells extracted from raw milk (RM1 and RM2) or mammary tissue (TC)
cultured on Transwell inserts and three cell culture media conditions.

xviii
LIST OF FIGURES
Chapter 2
Figure 1: Formation of lipid droplets (LDs) and mechanisms leading to the growth,
transport and secretion of LDs into milk as milk fat globules (MFGs).
Figure 2: Structure of the milk fat globule.
Figure 3: Glycerol phosphate pathway for de novo triacylglycerol synthesis.
Figure 4: Pathways for the synthesis and interconversion of phospholipids in mammalian
cells.
Figure 5: Ether phospholipid synthesis through the acyl dihydroxyacetone phosphate
(DHAP) pathway.
Chapter 3 (in a publication)
Figure 1: Impact of season on the distribution of milk fat globule (MFG) size, days in
milk (DIM), milk yield and fat yield in the studied herd.
Figure 2: Milk fat globule (MFG) size distribution for cows in different stages of
lactation and parities.
Figure S1: Relationship between selected explanatory variables used to fit the multiple
variable model.
Chapter 4 (in a manuscript)
Figure 1: Consistency in volume weighted mean diameter D4,3 of milk fat globules
(MFG) from selected cows compared to the whole herd.
Figure 2: Volume weighted milk fat globule (MFG) size distributions of the selected
SMFG and LMFG cows compared to camels, sheep and goats.
Figure 3: Degree of unsaturation (A) and origin of fatty acids (B) in the small and large
milk fat globule phenotypes.
Figure 4: Concentrations of unsaturated fatty acids in the milk fat globule core from the
small and large milk fat globule phenotypes, as well as camel, sheep and goat milk (A)
and grouped into small (≤ 3.5 µm), medium (3.5 to 4.5 µm) and large (≥ 4.5 µm) milk fat
globules (B).
xix
Additional Figure A1: Concentrations of the major milk fat globule membrane proteins
in the small and large MFG phenotypes determined by densitometry analysis (A) of SDS-
PAGE gels (B).
Additional Figure A2: Concentrations of the major milk fat globule membrane proteins
in camels, sheep and goats compared to SMFG and LMFG cows determined by
densitometry analysis (A) of SDS-PAGE gels (B).
Chapter 5 (in a manuscript)
Figure 1: Volcano plots showing the milk lipidome of cows with small (SMFG) or large
(LMFG) average milk fat globule size.
Figure 2: The difference in relative abundance of lipid classes and subclasses in milk
from cows with small average milk fat globule size (SMFG) compared to cows with large
average milk fat globule size (LMFG).
Figure 3: Possible mechanisms through which major metabolic pathways contribute to
the milk fat globule size development in the mammary epithelial cell.
Chapter 6 (in a manuscript)
Figure 1: Micrographs of primary bovine mammary epithelial cells extracted from raw
milk (RM1 and RM2) or mammary tissue (TC).
Figure 2: Keratin 8 (KRT8) gene expression in primary bovine mammary epithelial cells
extracted from raw milk (RM1 and RM2) or mammary tissue (TC), cultured on three
matrices (A) and three cell culture media conditions (B).
Figure 3: Kappa-casein (CSN3) and diacylgycerol-acyltransferase 1 (DGAT1) gene
expression in primary bovine mammary epithelial cells extracted from raw milk (RM1
and RM2) or mammary tissue (TC), cultured on three matrices (A and C) and three cell
culture media conditions (B and D).
Figure 4: Triacylglycerol (TG) content in cell lysates from primary bovine mammary
epithelial cells extracted from raw milk (RM1 and RM2) or mammary tissue (TC),
cultured on three matrices (A and C) and three cell culture media conditions (B and D).

1
CHAPTER 1
Introduction

2
General Introduction
Milk fat globule (MFG) size affects the functional, nutritional and sensory properties of
milk and milk products. The native MFG size distribution is variable and depends on a number
of endo- and exogenous factors (Martini et al., 2013). Besides its variation between different
breeds and species (Carroll et al., 2006), in cow milk it is also affected by physiological factors
like stage of lactation (Altenhofer et al., 2015; Evers, 2004) and by the cow’s diet (Argov-
Argaman et al., 2014; Avramis et al., 2003; Couvreur et al., 2007; Mesilati-Stahy et al., 2015).
Furthermore, the natural MFG size distribution can vary between individual cows (Logan et
al., 2014a). Throughout this thesis the term MFG size is used to refer to the average MFG
diameter, unless otherwise stated.
MFG size as well as casein micelle size influence milk functionality by affecting, for
example, rennet gelation properties in cheese. The microstructure of cheese comprises a three-
dimensional network of aggregated casein micelles in close association with calcium (Lucey
et al., 2003). Aggregation occurs through destabilisation of the casein micelle by enzymatic
hydrolysation (rennet gels) of κ-casein which is predominantly found on the surface of the
casein micelle or by acidic destabilisation of the casein micelle (acid gels) (Lucey et al., 2003).
Enclosed within this network are MFGs, moisture, other substances (e.g. minerals) and starter
culture bacteria (Guinee, 2011). Therefore, the rheological properties of cheese are a function
of the strength of its protein network and are further influenced by moisture content and the
microstructure of the MFGs within the gel network (Guinee, 2011). From a rheological
perspective cheese is a viscoelastic material, and the MFGs act as inert fillers, increasing its
elasticity when the fat is present in a solid state at low temperatures (Guinee, 2011; Michalski
et al., 2002). Rennet gels made from milk with small native MFGs and hence increased surface
area exhibit an increased storage module G’, a measure for the elasticity of cheese (Michalski
et al., 2002). Accordingly, if the native MFGs are larger than the pores formed by the casein

3
micelles during rennet gelation the gel network is disrupted and softer gels are the result (Logan
et al., 2014b; Michalski et al., 2002). Cheese made from milk with smaller MFGs has further
been reported to have improved sensory characteristics (Michalski et al., 2007).
It has become increasingly evident that the MFG membrane (MFGM) not only functions to
emulsify the neutral lipids of the MFG core, but also provides several health benefits that
extend from infants to children after weaning and to adult consumers (Thorning et al., 2016;
Timby et al., 2017). Thus, MFG size also influences the nutritional properties of milk and milk
products because certain components of the MFGM can have beneficial effects on human
health (Martini et al., 2013). For example, infant formula often contains vegetable oils instead
of milk derived lipids, leaving the infant deprived of MFGM material and MFGM
supplementation to infant formula has resulted in improved cognitive function in randomized
control trials (reviewed in Timby et al. (2017)). In healthy adults, dietary MFGM
supplementation has been linked to improved muscle strength when combined with regular
exercise (Soga et al., 2015) and improved resistance to diarrheagenic Escherichia Coli
infection (Ten Bruggencate et al., 2016). Moreover, the consumption of buttermilk, which
contains the MFGM material, has been shown to reduce plasma cholesterol concentrations in
adult men and women (Conway et al., 2013). Another possible health benefit of consuming
MFGM material is the potential to prevent obesity. In a mouse model, MFGM-coated lipid
droplets (LDs) in the diet of mice in early life resulted in reduced body fat accumulation later
in life when mice were exposed to a western style diet challenge (Baars et al., 2016). However,
this effect was only found in large LDs with a mode diameter of 2.9 µm, indicating a
relationship with the LD macrostructure (Baars et al., 2016). Although the bioactive compound
or combination of compounds responsible for the observed effects are often unknown, some
more specific roles have also been established. For example, butyrophilin is suggested to

4
suppress multiple sclerosis and phospholipids (PLs) are believed to prevent colorectal cancer
(Spitsberg, 2005).
The concentration of MFGM material in milk depends on the fat content but also on the size
distribution of MFGs. At a given fat content, a shift in MFG size towards smaller MFGs leads
to higher levels of MFGM material, due to an increased surface area. The size of MFGs
dispersed in milk cannot be influenced other than by on-farm cow selection, homogenisation
or fractionation methods such as microfiltration or gravity separation (Michalski et al., 2006;
O’Mahony et al., 2005). Homogenisation, however, reduces the size of MFGs by disrupting its
MFGM and therefore does not result in increased concentrations of MFGM material. Instead,
the increased surface area is covered by other milk proteins found in the skim milk phase.
Separation technologies such as microfiltration could separate the MFG population in milk into
smaller and larger groups for specific technological purposes. Large MFG milk for example
could be more suitable for butter production, because large MFGs tend to coalesce, resulting
in a more efficient process. However, these technologies would also result in increased
processing time and costs. The detailed characterisation of the small and large MFG phenotype
in dairy cows, on the other hand, could potentially lead to the identification of genotypes and
ultimately genetic selection of cows based on MFG size. Gaining knowledge about the
metabolic differences underlying the small and large MFG phenotypes is therefore of major
interest for dairy science and potentially the dairy industry.
Objectives and Hypotheses
As outlined in the previous section, MFG size is a potentially desirable milk production trait,
due to its distinctive processing properties and the health benefits associated with the MFGM.
This may be significant for the dairy industry and the gaps in our fundamental knowledge about
5
MFG size development in the mammary gland warrant an in-depth characterisation of this trait.
Some areas in this field that are currently understudied are outlined in the literature review.
Firstly, although some farm-management, environmental and physiological factors have
been shown to influence MFG size, the magnitude of their effect, and in some cases the
significance of their effect compared to the individual variability within a herd, remain
equivocal. Moreover, the biochemical processes determining the size of intracellular LDs as
well as the precise mechanism leading to their secretion as MFGs are not fully understood.
Recent advances in this field have provided answers to some of these questions. For example,
it has been conclusively shown that LD fusion is involved in MFG size development in the
mammary gland (Masedunskas et al., 2017) and that this process depends at least partly on the
polar lipid composition of the monolayer surrounding the intracellular LD (Cohen et al., 2017).
However, some questions about the relationship between MFG size and the mammary lipid
metabolism remain unanswered. For example, it has been suggested that some differences in
MFG size are independent from differences in milk production parameters, such as fat content
and milk yield (Argov-Argaman, 2019). However, it is unclear how the expression of two
distinct phenotypes of small and large MFGs is regulated when other environmental factors
and milk production parameters are similar. Likewise, the reported differences in the fatty acid
(FA) composition of MFGs with different sizes are inconsistent. It is possible that some of
these questions remain unanswered because of the complexity of the milk lipidome, with many
lipid species yet to be discovered (Liu et al., 2018). These knowledge gaps present important
barriers for the on-farm selection of cows based on their characteristic MFG size. Ultimately,
in order to select cows based on MFG size, an understanding of its heritability and the
relationship with potential genetic variants of the major lipid synthesising genes will be
necessary to achieve the selection of the small and large MFG phenotype through breeding
programs. However, to achieve this goal, an in-depth understanding of the fundamental

6
pathways and key enzymes is required to allow a more targeted search for potential genotypic
differences.
Therefore, this thesis aimed to reduce some of these barriers by identifying cows with the small
and large MFG phenotype, followed by an in-depth characterisation of the lipid metabolic
differences between these animals. This was achieved through three experimental chapters
(Chapters 3-5). An additional fourth experimental chapter (Chapter 6) focused on establishing
an in vitro primary cell culture model for future studies into the regulation of MFG size.
1.2.1 First experimental chapter (Chapter 3)
The goal of the first part of this study was to establish the MFG size distribution within our
research herd and estimate the impact of environmental, farm-management and animal-related
physiological parameters on MFG size. This was achieved by taking advantage of the extensive
daily data collection as part of the automatic milking system used to manage the herd at the
University of Melbourne Dairy. The automatic milking system records a range of factors which
have previously been shown to affect MFG size (days in milk, fat yield, fat-protein ratio) and
some that have not previously been studied (rumination minutes and somatic cell count).
Furthermore, the aim was to identify individual animals with the small and large MFG
phenotype for the two subsequent experimental chapters that are otherwise similar in major
milk production traits and are exposed to the same environmental conditions, including a
similar diet. This was important to address the hypothesis that individual variations in MFG
size distributions between cows within the same herd outweigh the effect of parameters that
could be manipulated through changes in farm management.
1.2.2 Second experimental chapter (Chapter 4)
Based on the identification of cows that consistently produced milk with small or large mean
diameters, the second experimental chapter addressed the hypothesis that observed variations
7
in MFG size distributions between individual cows with the small or large MFG phenotype are
related to physiological differences in the lipid metabolism in the mammary gland. The unique
lipid metabolism in ruminants allows an estimation of the origin of FAs incorporated into milk
from de novo synthesis (FAs with less than 16 carbons) or as preformed FAs (more than 16
carbons) from the blood circulation, which can be indicative of the metabolic state of the
animal. Differences in energy balance in early lactation are believed to be the reason for the
larger average MFG size during the transition period (Argov-Argaman, 2019). This analysis,
on the other hand, aimed to establish if the source of FAs also differed between cows that were
fed the same diet and were in a stage of their lactation cycle (> 50 days in milk) where negative
energy balance is unlikely to be the reason for the differences in MFG size. This chapter
focused on the core of the MFG because it contains the majority of all milk lipids. The MFGM
was excluded from this analysis to limit the confounding impact of the higher proportion of
membrane material needed to coat smaller MFGs. Biological membranes have a distinct FA
composition with a high proportion of unsaturated FAs and two thirds of the MFGM are
directly derived from the apical plasma membrane, which could have impacted the results.
1.2.3 Third experimental chapter (Chapter 5)
Milk contains an estimated number of around 1000 lipid species (Liu et al., 2018). However,
many of these remain unknown and species from minor lipid classes have not been studied in
relation to MFG size (Liu et al., 2018). This lack of extensive lipidomic analyses in the
literature provides an attractive avenue to study the broader lipid metabolic differences, which
could lead to more focused analyses in future studies. Therefore, fresh raw milk samples from
the selected animals, were used to compile a comprehensive snapshot of the individual animal’s
lipid metabolic profile. Because milk fat globules derive their surrounding trilayer membrane
entirely from intracellular membranes and the apical plasma membrane, the polar lipid
composition of milk, which is mostly derived from the MFGM, can non-invasively provide an
8
insight into the possible size development prior to secretion. The aim was to capture differences
in the major polar lipid classes which are believed to drive the occurrence of LD fusion (Cohen
et al., 2017), as well as their metabolic precursors. Due to the high sensitivity of the applied
targeted liquid chromatography tandem mass spectrometry (LC-MS/MS) technique, this
analysis also included minor lipid classes that have not gained much attention in relation to
MFG size, such as lysophospholipids and ceramides. Furthermore, where possible, the FA
composition within each of the major lipid classes was also determined.
1.2.4 Fourth experimental chapter (Chapter 6)
A further objective of this thesis was to explore the possibility of establishing an in vitro
cell culture model to study MFG size development in mammary epithelial cells by isolating
primary cell cultures from the raw milk sampled from individual cows (Chapter 6). To achieve
this, the aim was to apply a non-invasive technique to collect primary bovine mammary
epithelial cells from the milk of individual cows. This method, using an immunomagnetic bead-
based technique to purify epithelial cells, has been successfully used in other laboratories to
obtain cell material for gene expression analyses (Boutinaud et al., 2008, 2015). Cells derived
from the entire cell population in milk have previously been used in cell culture and are reported
to produce major milk proteins (Hillreiner et al., 2017). However, it was unknown if purified
primary cells from raw milk were functional in terms of their ability to produce LDs, as
demonstrated in primary cell cultures derived from mammary tissue (Cohen et al., 2017). The
hypothesis was that purified mammary epithelial cells may require different culture conditions
than the ones traditionally applied in mixed cultures form mammary tissue, which were also
included as controls in this final experimental chapter. Therefore, a 3D-like environment was
tested, where mammary epithelial cells extracted from raw milk were cultured on permeable
memebrane supports (Transwell inserts). Transwell inserts are frequently used for other

9
epithelial cell types such as intestinal and retinal epithelial cells (Gao et al., 2017; Sonoda et
al., 2009), but have not been used for primary mammary epithelial cells.

10
References
Argov-Argaman, N., Mesilati-Stahy, R., Magen, Y., and Moallem, U. (2014). Elevated
concentrate-to-forage ratio in dairy cow rations is associated with a shift in the
diameter of milk fat globules and remodeling of their membranes. J. Dairy Sci.
97, 6286–6295.
Altenhofer, C., Holzmüller, W., Wolfertstetter, F., Ribeiro, D.W., Kulozik, U., Pfaffl,
M.W., and Viturro, E. (2015). Temporal variation of milk fat globule diameter,
fat and cholesterol content and milk epithelial cell gene expression in dairy cows.
Int. J. Dairy Technol. 68, 519–526.
Argov-Argaman, N. (2019). Symposium review: Milk fat globule size: Practical
implications and metabolic regulation. J. Dairy Sci. 102, 2783–2795.
Argov-Argaman, N., Mesilati-Stahy, R., Magen, Y., and Moallem, U. (2014). Elevated
concentrate-to-forage ratio in dairy cow rations is associated with a shift in the
diameter of milk fat globules and remodeling of their membranes. J. Dairy Sci.
97, 6286–6295.
Avramis, C.A., Wang, H., McBride, B.W., Wright, T.C., and Hill, A.R. (2003). Physical
and processing properties of milk, butter, and Cheddar cheese from cows fed
supplemental fish meal. J. Dairy Sci. 86, 2568–2576.
Baars, A., Oosting, A., Engels, E., Kegler, D., Kodde, A., Schipper, L., Verkade, H.J.,
and van der Beek, E.M. (2016). Milk fat globule membrane coating of large lipid
droplets in the diet of young mice prevents body fat accumulation in adulthood.
Br. J. Nutr. 115, 1930–1937.
Boutinaud, M., Ben Chedly, M.H., Delamaire, E., and Guinard-Flament, J. (2008).
Milking and feed restriction regulate transcripts of mammary epithelial cells
purified from milk. J. Dairy Sci. 91, 988–998.
Boutinaud, M., Herve, L., and Lollivier, V. (2015). Mammary epithelial cells isolated
from milk are a valuable, non-invasive source of mammary transcripts. Livest.
Genomics 6, 323.

11
Carroll, S.M., DePeters, E.J., Taylor, S.J., Rosenberg, M., Perez-Monti, H., and Capps,
V.A. (2006). Milk composition of Holstein, Jersey, and Brown Swiss cows in
response to increasing levels of dietary fat. Anim. Feed Sci. Technol. 131, 451–
473.
Cohen, B.-C., Raz, C., Shamay, A., and Argov-Argaman, N. (2017). Lipid Droplet Fusion
in Mammary Epithelial Cells is Regulated by Phosphatidylethanolamine
Metabolism. J. Mammary Gland Biol. Neoplasia 22, 235–249.
Conway, V., Couture, P., Richard, C., Gauthier, S.F., Pouliot, Y., and Lamarche, B.
(2013). Impact of buttermilk consumption on plasma lipids and surrogate markers
of cholesterol homeostasis in men and women. Nutr. Metab. Cardiovasc. Dis. 23,
1255–1262.
Couvreur, S., Hurtaud, C., Marnet, P.G., Faverdin, P., and Peyraud, J.L. (2007).
Composition of milk fat from cows selected for milk fat globule size and offered
either fresh pasture or a corn silage-based diet. J. Dairy Sci. 90, 392–403.
Evers, J.M. (2004). The milkfat globule membrane—compositional and structural
changes post secretion by the mammary secretory cell. Int. Dairy J. 14, 661–674.
Gao, Y., Li, S., Wang, J., Luo, C., Zhao, S., and Zheng, N. (2017). Modulation of
Intestinal Epithelial Permeability in Differentiated Caco-2 Cells Exposed to
Aflatoxin M1 and Ochratoxin A Individually or Collectively. Toxins 10, 13.
Guinee, T.P. (2011). Cheese | Cheese Rheology. In Encyclopedia of Dairy Sciences
(Second Edition), J.W. Fuquay, ed. (San Diego: Academic Press), pp. 685–697.
Hillreiner, M., Müller, N.I., Koch, H.M., Schmautz, C., Küster, B., Pfaffl, M.W., and
Kliem, H. (2017). Establishment of a 3D cell culture model of primary bovine
mammary epithelial cells extracted from fresh milk. Vitro Cell. Dev. Biol. - Anim.
53, 706–720.
Liu, Z., Rochfort, S., and Cocks, B. (2018). Milk lipidomics: What we know and what
we don’t. Prog. Lipid Res. 71, 70–85.
Logan, A., Auldist, M., Greenwood, J., and Day, L. (2014a). Natural variation of bovine
milk fat globule size within a herd. J. Dairy Sci. 97, 4072–4082.

12
Logan, A., Leis, A., Day, L., Øiseth, S.K., Puvanenthiran, A., and Augustin, M.A.
(2014b). Rennet gelation properties of milk: Influence of natural variation in milk
fat globule size and casein micelle size. Int. Dairy J. 46, 71–77.
Lucey, J.A., Johnson, M.E., and Horne, D.S. (2003). Invited Review: Perspectives on the
Basis of the Rheology and Texture Properties of Cheese. J. Dairy Sci. 86, 2725–
2743.
Martini, M., Salari, F., and Altomonte, I. (2013). The macrostructure of milk lipids: the
fat globules. Crit. Rev. Food Sci. Nutr. 56, 1209–1221.
Masedunskas, A., Chen, Y., Stussman, R., Weigert, R., and Mather, I.H. (2017). Kinetics
of milk lipid droplet transport, growth, and secretion revealed by intravital
imaging: lipid droplet release is intermittently stimulated by oxytocin. Mol. Biol.
Cell 28, 935–946.
Mesilati-Stahy, R., Moallem, U., Magen, Y., and Argov-Argaman, N. (2015). Altered
concentrate to forage ratio in cows ration enhanced bioproduction of specific size
subpopulation of milk fat globules. Food Chem. 179, 199–205.
Michalski, M.C., Cariou, R., Michel, F., and Garnier, C. (2002). Native vs. damaged milk
fat globules: Membrane properties affect the viscoelasticity of milk gels. J. Dairy
Sci. 85, 2451–2461.
Michalski, M.C., Leconte, N., Briard-Bion, V., Fauquant, J., Maubois, J.L., and
Goudédranche, H. (2006). Microfiltration of raw whole milk to select fractions
with different fat globule size distributions: Process optimization and analysis. J.
Dairy Sci. 89, 3778–3790.
Michalski, M.-C., Camier, B., Gassi, J.-Y., Briard-Bion, V., Leconte, N., Famelart, M.-
H., and Lopez, C. (2007). Functionality of smaller vs control native milk fat
globules in Emmental cheeses manufactured with adapted technologies. Food
Res. Int. 40, 191–202.
Mulder, H., and Walstra, P. (1974). The Milk Fat Globule. (Farnham Royal, England:
Commonwealth Agricultural Bureaux), pp 1-296.

13
O’Mahony, J.A., Auty, M.A., and McSweeney, P.L. (2005). The manufacture of
miniature Cheddar-type cheeses from milks with different fat globule size
distributions. J. Dairy Res. 72, 338–348.
Soga, S., Ota, N., and Shimotoyodome, A. (2015). Dietary milk fat globule membrane
supplementation combined with regular exercise improves skeletal muscle
strength in healthy adults: a randomized double-blind, placebo-controlled,
crossover trial. Nutr. J. 14, 85.
Sonoda, S., Spee, C., Barron, E., Ryan, S.J., Kannan, R., and Hinton, D.R. (2009). A
protocol for the culture and differentiation of highly polarized human retinal
pigment epithelial cells. Nat. Protoc. 4, 662–673.
Spitsberg, V.L. (2005). Invited Review: Bovine Milk Fat Globule Membrane as a
Potential Nutraceutical. J. Dairy Sci. 88, 2289–2294.
Ten Bruggencate, S.J., Frederiksen, P.D., Pedersen, S.M., Floris-Vollenbroek, E.G.,
Lucas-van de Bos, E., van Hoffen, E., and Wejse, P.L. (2016). Dietary Milk-Fat-
Globule Membrane Affects Resistance to Diarrheagenic Escherichia coli in
Healthy Adults in a Randomized, Placebo-Controlled, Double-Blind Study. J.
Nutr. 146, 249–255.
Thorning, T.K., Raben, A., Tholstrup, T., Soedamah-Muthu, S.S., Givens, I., and Astrup,
A. (2016). Milk and dairy products: good or bad for human health? An assessment
of the totality of scientific evidence. Food Nutr. Res. 60, 32527.
Timby, N., Domellöf, M., Lönnerdal, B., and Hernell, O. (2017). Supplementation of
Infant Formula with Bovine Milk Fat Globule Membranes. Adv. Nutr. 8, 351–
355.

14
CHAPTER 2
Literature Review
15
Introduction
Milk fat globules (MFGs) supply lipids in a structure that is unique to the mammary
gland. Also unique is the wide range of sizes found in cow milk. Previous studies have
reported dynamic changes in MFG size distributions based on many factors. However,
the physiological reasons for these changes are yet to be identified. This literature review
will provide necessary background information on the known mechanisms of lactation
physiology and give a detailed account of metabolic pathways involved in MFG
formation and secretion. Furthermore, it will summarise the currently available literature
on the effect of farm-related factors as well as environmental and physiological
parameters on MFG size. Although the focus of this review will be on the lactation
physiology of cows and the properties of cow milk, other species and their milk properties
will be discussed when appropriate.
The Mammary Gland
2.2.1 Evolution of the mammary gland
The secretion of milk is one of the main characteristics of mammals and the origin of
lactation is believed to date back far beyond the appearance of mammals about 160
million years ago (Oftedal, 2012). In fact, lactation may have developed in synapsids, the
ancestral lineage to mammals, approximately 310 million years ago (Oftedal, 2012).
Oftedal (2002a, 2002b) hypothesised that mammary glands evolved from apocrine skin
glands and that milk was secreted in order to protect parchment-shelled eggs in synapsids
from drying out. He stated that both types of secretion found in mammary glands, namely
exocytosis of secretory vesicles and secretion of cellular components enveloped by the
cytoplasmic membrane, are also found in apocrine skin glands.

16
On the other hand, Vorbach et al. (2006) suggested that the mammary gland originates
from the innate immune system and that milk was developed as a secretion for immune
protection before its function to nourish the young. This hypothesis was based on the
presence of specific peptides, small proteins and enzymes in milk that are also part of the
innate immune system. Therefore, they suggested that the mammary gland evolved as a
mucous skin gland (Vorbach et al., 2006). Oftedal (2012) supported this hypothesis and
stated that the suggested theories are not contradictory, since the evolution of the innate
immune system dates back earlier than the development of apocrine-skin glands,
suggesting that the apocrine-skin gland can be considered as an intermediate stage of
evolution from the innate immune system to the mammary gland.
2.2.2 Mammogenesis, lactogenesis and galactopoiesis in the cow
As opposed to most organs, which are fully developed in the newborn, the mammary
gland in mammals changes considerably after birth. Although the processes involved in
mammary gland development, lactation and involution are similar for all mammals, this
section is focused on the dairy cow. The development of the mammary gland, also known
as mammogenesis, starts with the formation of the mammary bud and teat development
before birth and continues in the postnatal period with the formation of secondary and
tertiary ducts (Hurley and Loor, 2011). Originally consisting of ducts with limited side
branching, the mammary gland experiences a first change during puberty (Katz and
Streuli, 2007). These changes include elongation of the ducts and the development of
additional branches leading to the formation of terminal ductule lobular units (Hurley and
Loor, 2011). During pregnancy, further maturation occurs and terminal ductule lobular
units develop into clusters of alveoli forming the lobuloalveolar unit (Katz and Streuli,
2007). Complete proliferation and differentiation of mammary epithelial cells, a process
commonly referred to as lactogenesis, leads to milk secretion during lactation (Katz and

17
Streuli, 2007). The ultrastructure of the mammary epithelial cell (MEC) also changes
considerably at the onset of lactation, with an increase in cytomembranes, mainly due to
a significant growth of the rough endoplasmic reticulum (ER) and Golgi apparatus at the
basal side of the MEC (Saacke and Heald, 1974). During galactopoiesis, lactation is
maintained, through continuous milk removal and hormonal stimulation (Capuco and
Akers, 2011). Finally, the mammary gland again experiences major changes, with
involution of the tissue through apoptosis in the three to four weeks after cessation of
lactation (Hurley and Loor, 2011).
The regulation of mammogenesis, lactogenesis, galactopoiesis and involution are
under the control of several hormones, sometimes through coordinated actions. In brief,
estrogen and progesterone are responsible for mammogenesis in the post-pubertal phase
and during pregnancy. Progesterone serum concentrations are high throughout pregnancy
and estrogen blood concentrations peak towards the end of pregnancy leading to complete
proliferation and differentiation of the secretory epithelium (Hurley and Loor, 2011). The
onset and maintenance of lactation are stimulated by prolactin and growth hormone, with
the latter being directly related to milk yield in cows (Hurley and Loor, 2011).
Galactopoiesis is further maintained by insulin-like growth factor 1, glucocorticoids,
thyroid hormones and potentially placental lactogen in pregnant cows (Capuco and Akers,
2011)
Milk – The Mammary Secretion
Milk from the bovine mammary gland, like in other species, serves the nutrition of the
young but has also become a basic food for human consumption. Alveoli are the smallest
functional units of the mammary gland and the site of milk secretion. They contain a
monolayer of secretory MECs surrounded by connective tissue and myoepithelial cells

18
which, upon contraction, are responsible for milk ejection into the alveolar lumen
(McManaman and Neville, 2003). Mammary epithelial cells are polarised cells, which
take up components from the basal side and secrete products at the apical side. Several
alveoli that drain milk into the same duct are called lobules. The milk from the lobules in
turn, is drained into the mammary duct and the milk from several mammary ducts is
collected in the gland cistern and drained through the teat cistern into the streak canal,
where the milk is ejected (Lawrence et al., 2012).
The major milk constituents, although variable in concentrations between mammalian
species, are proteins, lipids, lactose, minerals and fat soluble vitamins (Fox and Kelly,
2012). Therefore, milk presents a rich source of a variety of essential nutrients which, due
to their different physical properties, are found as dispersed molecules (whey proteins),
colloidal particles (casein aggregates with minerals), emulsions (milk lipids) or
solubilised in the aqueous continuous phase (lactose, vitamins and mineral salts) (Fox et
al., 2015).
2.3.1 Milk proteins and lactose
The protein fraction in bovine milk, as in most dairy species, consists of 20% whey
proteins and 80% caseins (Fox and Kelly, 2012). The total protein content varies
depending on the influence of several factors, such as breed, diet, health, stage of lactation
and individual differences between cows, although to a lesser extent compared to their
impact on the fat content (Fox and Kelly, 2012).
Most of the proteins are uniquely found in milk and are synthesised in the mammary
secretory cell, whereas other proteins are derived from the blood stream (O’Mahony and
Fox, 2013). The site for protein biosynthesis in the mammary gland is the rough ER,
where a pool of free amino acids is used to produce the proteins that are subsequently

19
transported to the Golgi apparatus for packaging. In the Golgi they are incorporated into
secretory vesicles and later secreted from the secretory cell by fusion of the secretory
vesicle with the apical plasma membrane (Larson, 1979).
The casein fraction of bovine milk comprises αS1, αS2, β, and κ-casein, with
concentrations of 38%, 10%, 36% and 12%, respectively (Fox and Kelly, 2012). Amongst
the four caseins a number of genetic variants exist, and they are frequently subject to post-
translational modification (Huppertz, 2013). Structurally, caseins are mainly unfolded,
due to a high proline content resulting in their low percentage of secondary α-helixes and
β-sheets (O’Mahony and Fox, 2013). Furthermore, caseins are phosphorylated which
allows them to bind substantial amounts of calcium phosphate through the formation of
spherical colloidal particles of approximately 100 nm in size, called casein micelles
(Horne, 2011). If caseins were present in the form of individual proteins, the high calcium
content in milk would lead to precipitation of the αs1- , αs2- and β-caseins. However, κ-
casein on the surface of the micelles, which is soluble at the calcium concentration in
milk, protects the other caseins from precipitation (Fox and Brodkorb, 2008). This
micellar structure is responsible for many of the technological properties of milk, for
example, the scattering of light which is responsible for the white colour of milk
(O’Mahony and Fox, 2013). Other important properties of the casein micelle are that it
remains in a stable colloidal dispersion upon exposure to heat, dehydration, freezing and
homogenization - all important attributes during the initial handling and processing of
milk (Fox and Brodkorb, 2008). During cheese making, on the other hand, the casein
micelles are destabilised through the hydrolysis of κ-casein using rennet or acidification,
leading to coagulation of milk (O’Mahony and Fox, 2013).
Upon acidification at pH 4.6, the casein fraction is separated from the whey protein
fraction (Fox and Kelly, 2012). At this pH caseins are insoluble and precipitate, whilst

20
whey proteins and calcium phosphate stay in solution (O’Mahony and Fox, 2013). The
whey fraction in bovine milk contains four major proteins, β-lactoglobulin, α-
lactalbumin, immunoglobulins and blood serum albumin, with percentages of 40-50%,
20%, 10% and 10% of the whey protein fraction, respectively (Fox and Kelly, 2012).
Colostrum can contain higher proportions of immunoglobulins and the decrease in total
protein in milk one week after parturition is mainly attributed to the decrease in
immunoglobulins from 10% to 0.1% (Fox and Kelly, 2012). In contrast to the casein
fraction, which are exclusively formed in the MEC, some of the whey proteins, blood
serum albumin, immunoglobulins and some minor proteins, are derived from the blood
(Fox and Kelly, 2012). β-lactoglobulin is the major whey protein in the milk of ruminants,
however it is not found in milk from humans, rats and mice (Sawyer, 2013). Compared
to the caseins it is a highly structured protein and thus resistant to proteolysis. Therefore,
it is believed to be a major determinant of the physico-chemical properties of milk
(O’Mahony and Fox, 2013). However, its detailed biological role remains elusive,
although it has also been suggested that β-lactoglobulin has nutritional functions, such as
a possible role in retinol metabolism (Sawyer, 2013).
α-lactalbumin is a metalloprotein capable of binding calcium (Fox and Kelly, 2012).
However, the major function of α-lactalbumin in bovine milk is its involvement in lactose
synthesis in the MEC, as part of lactose synthetase, the enzyme responsible for the lactose
synthesis from galactose and glucose (Brew, 2013). The final steps of lactose synthesis
occur in the Golgi, where it is subsequently packed into secretory vesicles along with the
milk proteins (Stelwagen, 2011). Its content in milk partly determines the total milk yield,
because it creates osmotic pressure leading to the influx of water into the alveolar lumen
(Fox and Kelly, 2012). Other minor proteins in milk are enzymes and proteins of the milk

21
fat globule membrane (MFGM, 1%). Due to their role in MFG stabilisation and secretion
the latter will be discussed in more detail in Section 2.3.2.3.
2.3.2 Milk lipids
The amount of lipids in milk varies considerably between mammalian species, lying
within a range from less than 1% in the black rhinoceros to up to 60% in some seals
(Oftedal and Iverson, 1995). It is highly influenced by the habitat of the mammal and its
suckling young (Oftedal, 2012). The percentage of milk lipids in bovine milk is
approximately 3 - 5% (Singh, 2006). Amongst the lipid fraction, the majority are
triacylglycerols (TGs) (98%), with the remainder being glycerophospholipids (PLs) (1%),
di- and monoacylglycerols, sterols (cholesterol and cholesterol-ester), traces of fat-
soluble vitamins and other components (Fox and Kelly, 2012).
Most lipid synthesising tissues produce lipoproteins to make lipids soluble in an
aqueous phase, for example in blood (Argov et al., 2008). The mammary gland, however,
has developed a unique mechanism to make milk lipids water-soluble: the milk fat globule
(Argov et al., 2008; Mulder and Walstra, 1974). The intracellular precursors of MFGs,
called cytoplasmic lipid droplets (LDs), in fact have many structural similarities to
lipoproteins (McManaman, 2012). Their neutral lipid core contains approximately 95%
of TG and they are surrounded by a monolayer comprising polar lipids (PLs and
sphingolipids (SLs)) and a number of proteins (McManaman, 2012). Despite these
similarities, the mammary gland uses a secretion mechanism vastly different to the
mechanisms employed by other lipid synthesising organs (e.g. liver or adipose tissue),
leading to major differences in the structure of post-secretory MFGs compared to
lipoproteins (McManaman, 2012).

22
Lipoproteins are released from the cell by fusion of the secretory vesicles with the
plasma membrane (Vance and Vance, 1990). The same process (exocytosis) is used in
MECs to secrete caseins along with other milk proteins and substances such as water,
oligosaccharides and calcium into the alveolar lumen (McManaman and Neville, 2003).
The components are integrated in secretory vesicles in the Golgi before being transported
to the apical plasma membrane and released into the lumen through fusion of the vesicle
with the membrane (McManaman and Neville, 2003).
2.3.2.1 Lipid droplet formation
The most commonly accepted theory for the mechanism underlying MFG secretion is
that LDs, the intracellular precursors of MFGs, are formed in the ER where they are
enveloped by the outer leaflet of the ER, a monolayer of polar lipids and proteins (Heid
and Keenan, 2005; Zaczek and Keenan, 1990). Components of the monolayer derived
from the cytoplasmic half of the ER membrane, may play a role in MFG secretion by
interacting with the plasma membrane (Keenan and Mather, 2006). During transit from
the ER towards the apical plasma membrane small LDs can grow in size by fusion, which
again is influenced by the components found in the monolayer surrounding the
intracellular LD (Keenan and Mather, 2006). Recent studies have provided in vivo and in
vitro time-lapse images of LD fusion events in the MEC and provide compelling evidence
that the polar lipid fraction of the monolayer plays a regulatory role (Cohen et al., 2017;
Masedunskas et al., 2017) and are discussed in detail in Section 2.5.3.1.
Furthermore, a number of studies by Robenek and co-workers in the last decade have
revealed new insights into the potential mechanisms of LD biogenesis and secretion
(Robenek et al., 2006b, 2006a, 2009). According to their studies, LDs are potentially
formed and most probably grow in size in close proximity to the ER but not within the

23
ER bilayer membrane (Robenek et al., 2006b). In the proposed process the ER double
membrane embraces the LD like an eggcup and egg, allowing the transferal of lipids and
LD-related proteins into the droplet (Robenek et al., 2006b).
2.3.2.2 Milk fat globule secretion
After transit from the basal to the apical side of the MEC, again a widely unknown
process, LDs are secreted by a budding process, where they are enveloped by the bilayer
of the plasma membrane (Heid and Keenan, 2005). Hence, the post-secretory structure of
MFGs is a lipid core mainly consisting of TGs surrounded by a monolayer derived from
the cytoplasmic leaflet of the ER and a bilayer membrane derived from the mammary
epithelial cell. This tripartite membrane surrounding the secreted MFG is called the
MFGM and was first described by Bargmann and Knoop (1959). The suggested
mechanisms for LD formation and secretion are illustrated in Figure 1.
The mechanisms underlying milk lipid secretion on a molecular level still need to be
elucidated. A number of proteins are associated with the MFG secretion process:
Butyrophilin (BTN), an integral plasma membrane protein; xanthine oxidoreductase
(XOR), a protein found in high concentrations in the apical region of MECs during
lactation; and perilipin 2 (PLIN2), also known as adipophilin or adipose differentiation-
related protein, which is a protein associated with the surface of LDs (McManaman et al.,
2002; Robenek et al., 2006a). To date, three different models have been suggested by
different researchers, each of which attributes the major role in lipid secretion to one or
more of the above-mentioned components.
Mather and Keenan (1998) suggested that these proteins form a tripartite complex, where
PLIN2 on the surface of the LD binds to a complex between XOR and the cytoplasmic
terminus of BTN, anchoring the LD into the apical membrane of the MEC prior to

24
secretion. Even though there is scientific evidence supporting this theory (McManaman,
2012), others have challenged the tripartite model (Robenek et al., 2006a). According to
Robenek et al. (2006a), BTN plays the major role in MFG secretion through interactions
between BTN on the LD monolayer and BTN in the plasma membrane. They localised
BTN in high concentrations in the ER, in the monolayer of the LD and the plasma
membrane by freeze-fracture replica immunogold labelling electron microscopy and
argue that methods used in previous studies do not exhibit the resolution necessary to
localise the respective proteins in biological membranes (Robenek et al., 2006a).
Other researchers have reported major roles for XOR in the secretion of MFGs
(Vorbach et al., 2002). They showed that mice deficient in XOR produce LDs and
transport them to the apical membrane. However, the final secretion step is missing,
suggesting a regulatory role of XOR in the secretory process. Lastly, PLIN2 is important
for accumulation and growth of LDs in MECs (Russell et al., 2007, 2011) and Chong et
al. (2011) later hypothesised that it also involved in milk lipid secretion. They showed
that PLIN2 binds directly to the apical plasma membrane, induces its curvature and thus
results in a subsequent recruitment of BTN and XOR to the plasma membrane, suggesting
a crucial role for PLIN2 in the initiation of the lipid secretion process.
In an attempt to test these previously existing models, Jeong et al. (2013) added a new
level of controversy to the matter. They set out to study the location and mobility of BTN,
XOR and PLIN2 in LDs and in the plasma membrane of the mammary secretory cell and
reported that BTN could not be found on the surface of intracellular LDs but only on LDs
located at the plasma membrane. This fundamentally contradicts the model suggested by
Robenek et al. (2006a). The same group previously suggested that MFG secretion is
coupled with exocytosis of secretory vesicles derived from the Golgi apparatus
(Wooding, 1971) and recently provided immunocytochemical evidence for their

25
hypothesis (Wooding and Sargeant, 2015). They further reported a frequently observed
association of Golgi vesicles with LDs, suggesting that Golgi vesicle exocytosis initiates
MFG secretion and that part of the MFGM is directly derived from the Golgi vesicle
(Wooding and Sargeant, 2015).
Figure 1: Formation of lipid droplets (LDs) and mechanisms leading to the growth,
transport and secretion of LDs into milk as milk fat globules (MFGs). Two major
pathways for MFG secretion have been suggested both including several steps: I) the
process starts with accumulation of LDs in or in close proximity to the endoplasmic
reticulum (ER); II) After release from the ER, LDs can grow in size by fusion or growth
through local triglyceride and polar lipid synthesis; MFGs are secreted directly through
III) the direct envelopment of the LD with a portion of the apical plasma membrane; or
IV) the secretion of LDs is combined with the secretion of secretory vesicles (SVs), which
contain casein micelles (CMs) and other milk constituents that are released into the apical
lumen through exocytosis, where part of the membrane material surrounding the secreted
MFG is derived from the bilayer membrane surrounding the SVs.

26
2.3.2.3 Structure of the MFG
Milk fat globules are spherical structures comprising a lipid core surrounded by a
trilayer membrane of approximately 10 - 50 nm thickness, as illustrated in Figure 2
(Lopez et al., 2011). The FA composition has been extensively studied, revealing that
there are more than 400 different fatty acids, amongst them 12 with a percentage higher
than 1%. The MFGM only makes up 2 - 6% of the total weight of the MFG, with an
increasing mass in smaller MFGs (Lopez et al., 2011). The lipid core consists of more
than 95% TGs (McManaman, 2012). As previously described, the MFGM keeps milk
lipids emulsified in the aqueous phase. It also protects the lipid core from lipolysis and
prevents aggregation of the lipids and thus prevents the creaming of milk (Deeth, 1997).
Besides these crucial functions, the MFGM further provides important factors for the
immune system of the neonate, protecting it against bacteria and viruses (Fong et al.,
2007).
Due to the MFGM originating from the plasma membrane of the MEC, the composition
of the MFGM is similar to the composition of the plasma membrane (German and Dillard,
2006). It primarily contains proteins, glycoproteins, enzymes, neutral lipids (mainly TGs)
and polar lipids (mainly PLs and SLs) (Fong et al., 2007). Other components present in
smaller or trace amounts are sterols, fat-soluble vitamins and carotenoids (Lopez et al.,
2011). The protein content of the MFGM has been reported to be between 25 and 70% of
the dry matter, with the remainder being primarily PLs along with some neutral lipids,
including cholesterol and TG (Dewettinck et al., 2008; Fong et al., 2007). The quantitative
composition of the lipid fraction is also inconsistent in the literature, with some
researchers reporting the presence of neutral lipids in the MFGM in relatively high
amounts (e. g. 56% of the lipid fraction (Fong et al., 2007)) and others arguing that these
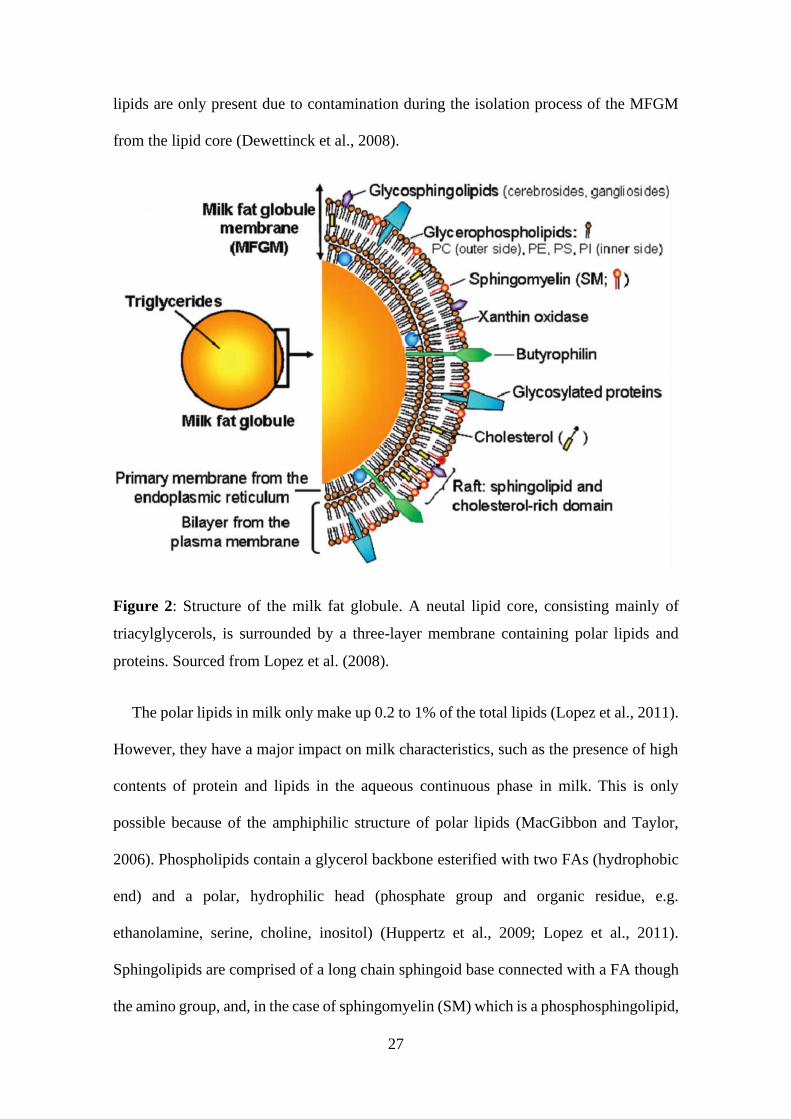
27
lipids are only present due to contamination during the isolation process of the MFGM
from the lipid core (Dewettinck et al., 2008).
Figure 2: Structure of the milk fat globule. A neutal lipid core, consisting mainly of
triacylglycerols, is surrounded by a three-layer membrane containing polar lipids and
proteins. Sourced from Lopez et al. (2008).
The polar lipids in milk only make up 0.2 to 1% of the total lipids (Lopez et al., 2011).
However, they have a major impact on milk characteristics, such as the presence of high
contents of protein and lipids in the aqueous continuous phase in milk. This is only
possible because of the amphiphilic structure of polar lipids (MacGibbon and Taylor,
2006). Phospholipids contain a glycerol backbone esterified with two FAs (hydrophobic
end) and a polar, hydrophilic head (phosphate group and organic residue, e.g.
ethanolamine, serine, choline, inositol) (Huppertz et al., 2009; Lopez et al., 2011).
Sphingolipids are comprised of a long chain sphingoid base connected with a FA though
the amino group, and, in the case of sphingomyelin (SM) which is a phosphosphingolipid,
28
it is also esterified with a phosphorylcholine group (Lopez et al., 2011). The three major
polar lipids in milk are phosphatidylcholine (PC), phosphatidylethanolamine (PE) and
SM (Huppertz et al., 2009).
Proteins in the MFGM only make up 1 - 2% of the total protein fraction in milk (Lopez
et al., 2011). Herein, the major proteins identified are BTN, XOR, the glycoproteins
mucin 1 and mucin 15, PLIN2, periodic acid schiff glycoprotein 6/7, also called
lactadherin, cluster of differentiation 36 and fatty acid binding protein (Keenan and
Mather, 2006).
Mammary Lipid Metabolism in Ruminants
2.4.1 Origin of milk fatty acids
Fatty acids are the structural subunits of all lipid species of the MFG core and the MFGM
and the FA composition of bovine milk has been extensively studied. In bovine milk, FAs
are predominantly saturated with a length of four to 18 carbons (C4 to C18), although the
monounsaturated FA oleic acid (C18:1) is also found in high proportions (Fox and Kelly,
2012). The FAs with the highest amounts in milk are palmitic acid (C16:0), oleic acid
(C18:1), stearic acid (C18:0) and myristic acid (C14:0) (Jensen, 2002). Furthermore,
butanoic acid (C4) in ruminant milk is the only FA with four carbons in length found in
natural lipids (Fox and Kelly, 2012).
Depending on the length of their carbon chain, FAs in ruminant milk are obtained from
two major sources: extracted as preformed FAs from the blood stream (> C16) or de novo
synthesised in the MEC (C4 to C14) (Huppertz et al., 2009). Some preformed FAs are
provided in the form of nonesterified FAs (NEFAs) hydrolysed from TGs stored in
adipose tissue. However, predominantly they are supplied in the form of TGs packaged
in chylomicrons or very low density lipoproteins from intestinal epithelial cells after

29
absorption from the diet (Palmquist, 2006). The only FAs that can originate from both de
novo synthesis and the blood circulation are FAs with 16 carbons in their chain (Huppertz
et al., 2009). The proportion of de novo synthesised FAs is lower in colostrum but is in
balance with the proportion of FAs taken from circulating blood, approximately one week
after parturition. In ruminants, the main carbon source for de novo FA synthesis is acetate
(92%), produced from bacteria in the rumen as an end product of fermentation (Huppertz
et al., 2009). For monogastric animals, on the other hand, glucose serves as the main
carbon source (Huppertz et al., 2009).
Importantly, in ruminants, the milk FA composition does not directly reflect the FA
profile of the dietary lipids (Palmquist, 2006). The reason is that unsaturated FAs (UFAs)
are almost completely hydrogenated by rumen bacteria and absorbed predominantly in
the form of stearic acid (C18:0). Instead, UFAs in milk are produced by desaturation of
saturated FAs (SFAs) in mammary and adipose tissue through the introduction of a cis
double bond at the Δ9 position, a reaction catalysed by stearoyl-coenzyme A desaturase
(SCD) (Kinsella, 1970). The preferred substrates for SCD are stearoyl- and palmitoyl-
CoA and the concentrations of oleic acid and palmitoleic acid, their respective products
after desaturation, partly depends on SCD activity (Miyazaki and Ntambi, 2003).
Furthermore, oleic acid can be an indicator for increased lipid mobilisation from adipose
tissue (Gross et al., 2011) and subclinical ketosis in dairy cows (Van Haelst et al., 2008).
Preformed as well as de novo synthesised FAs are subsequently incorporated into neutral
lipids or polar lipids within the MEC.
2.4.2 Biosynthesis of neutral lipids
The vast majority of lipids secreted into milk are in the form of TGs, comprising about
97% of total lipids in milk (Mather and Keenan, 1998). Structurally, TGs contain three
30
FAs connected to a glycerol backbone and their synthesis is accomplished mainly in the
ER of the MEC. All cell types have the ability to produce TGs, which is crucial for the
transport and storage of FAs in a non-toxic form (Coleman and Lee, 2004). The dominant
pathway for TG synthesis in most tissues is the glycerol phosphate pathway. An
alternative pathway, called the monoacylglycerol pathway, is only relevant in intestinal
epithelial cells (Iqbal and Hussain, 2009) and will not be discussed here.
The glycerol phosphate pathway comprises four steps and is shown in Figure 3. The
rate limiting step is catalysed by glycerol phosphate acyl transferases, which are
responsible for the acylation of glycerol-3-phosphate to form lysophosphatidic acid (Yen
et al., 2008). Another important step during TG synthesis is the final step, where
diacylglycerol (DG) is acylated to TG. This step is catalysed by diacylglycerol acyl
transferases (DGATs) and might be of particular interest for MFG size development
because DG is not only the precursor for TG synthesis but also for PL synthesis and
therefore represents a possible determinant of LD size (Wilfling et al., 2013).
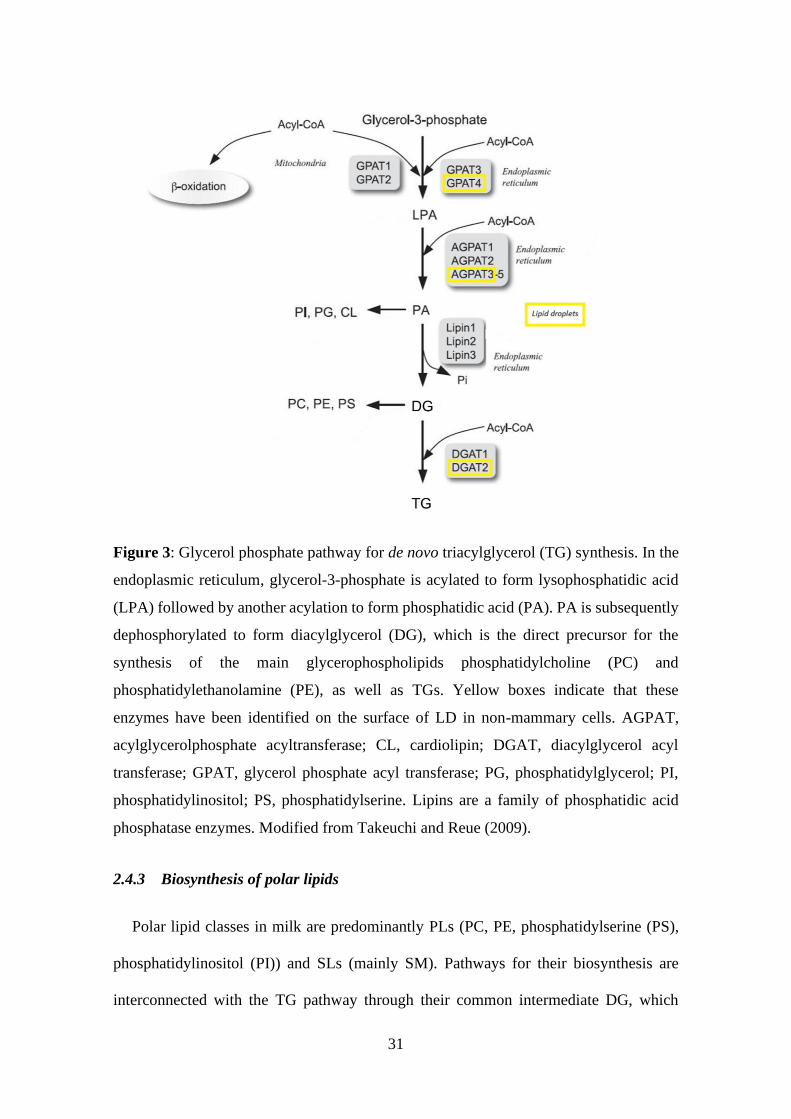
31
Figure 3: Glycerol phosphate pathway for de novo triacylglycerol (TG) synthesis. In the
endoplasmic reticulum, glycerol-3-phosphate is acylated to form lysophosphatidic acid
(LPA) followed by another acylation to form phosphatidic acid (PA). PA is subsequently
dephosphorylated to form diacylglycerol (DG), which is the direct precursor for the
synthesis of the main glycerophospholipids phosphatidylcholine (PC) and
phosphatidylethanolamine (PE), as well as TGs. Yellow boxes indicate that these
enzymes have been identified on the surface of LD in non-mammary cells. AGPAT,
acylglycerolphosphate acyltransferase; CL, cardiolipin; DGAT, diacylglycerol acyl
transferase; GPAT, glycerol phosphate acyl transferase; PG, phosphatidylglycerol; PI,
phosphatidylinositol; PS, phosphatidylserine. Lipins are a family of phosphatidic acid
phosphatase enzymes. Modified from Takeuchi and Reue (2009).
2.4.3 Biosynthesis of polar lipids
Polar lipid classes in milk are predominantly PLs (PC, PE, phosphatidylserine (PS),
phosphatidylinositol (PI)) and SLs (mainly SM). Pathways for their biosynthesis are
interconnected with the TG pathway through their common intermediate DG, which

32
therefore takes a central role in lipid metabolism. Phospholipids can also be
interconverted by headgroup exchange, which can occur in different cellular
compartments (Figure 4).
In contrast to PLs, SLs do not contain a glycerol backbone and their synthesis differs
from PL synthesis, but is connected to the TG and PL pathways through DG as an
intermediate. Sphingolipid biosynthesis starts with the formation of 3-ketosphinganine
from its two precursors L-serine and palmitoyl-CoA, which is the rate limiting step
catalysed by serine palmitoyltransferase and takes place in the ER (Deevska and
Nikolova-Karakashian, 2017). Subsequently, sphinganine is produced from 3-
ketosphinganine by a reductase and then acylated to form dihydroceramide. The enzymes
responsible for dihydroceramide production are called ceramide synthases and different
isomers of these enzymes have a specific affinity for FAs with a certain chain length and
saturation (Deevska and Nikolova-Karakashian, 2017). Desaturation of the sphinganine
base in dihydroceramide leads to the formation of ceramide. Once transported to the
Golgi, ceramide is utilised to produce SM, one of the major membrane lipids (Figure 4).
This reaction, where a choline headgroup from PC is transferred to ceramide to form SM
catalysed by SM synthase 1 (SMS1), leads to the production of DG and is the point where
the pathways for TG, PL and SL synthesis are interconnected (Deevska and Nikolova-
Karakashian, 2017). Moreover, it is believed that SL synthesis can regulate the utilisation
of DG for PC synthesis instead of TG synthesis. The reason is that SMS1, which requires
PC to produce SM from ceramide, can activate PC depletion sensing mechanisms and
thus stimulates PC synthesis (Deevska et al., 2017).

33
Figure 4: Pathways for the synthesis and interconversion of phospholipids in mammalian
cells. The pathways shown are cytidine diphosphate (CDP)-choline and CDP-
ethanolamine pathways for phosphatidylcholine (PC) and phosphatidylethanolamine
(PE) de novo synthesis, respectively. Choline or ethanolamine are first phosphorylated by
their respective choline kinase (CK) and ethanolamine kinase (EK). This step is followed
by the conversion of phosphocholine or phosphoethanolamine to CDP-choline and CDP-
ethanolamine by CTP-phosphocholine cytidylyltransferase (CT) or CTP-
phosphoethanolamine cytidylyltransferase (ET). CDP-choline and CDP-ethanolamine
are then transferred as the respective headgroups to diacylglycerol (DG) by CDP-
choline:1,2-diacylglycerol cholinephosphotransferase (CPT) or ethanolaminetransferase
(EPT). PC and ceramides can further be converted to sphingomyelin (SM) by
sphingomyelin synthase 1 (SMS1). Phosphatidylserine (PS) is synthesised through PS
synthase 1 (PSS1) from PC or by PS synthase 2 (PSS2). PS can also be converted into PE
through PS decarboxylase (PSD). Finally, PE can be transformed into PC in an alternative
pathway catalysed by the enzyme phosphoethanolamine methyl transferase (PEMT). The
dashed line indicates that this reaction is believed to occur mainly in hepatocytes. Colours
indicate the cellular compartments in which the respective reactions take place:
endoplasmic reticulum (blue), cytosol (red), nucleus (purple), mitochondria (turquoise)
and Golgi apparatus (brown). Sourced from Vance (2015).
34
The only subclass of polar membrane bound lipids that do not rely on DG as a precursor
are ether PLs (ePLs). Although the presence of ePLs in milk fat has been reported
(Contarini and Povolo, 2013), they are an understudied subclass of PL species and have
not been studied in relation to MFG size. This subclass of PLs structurally differs from
conventional PLs in the presence of an ether bond (plasmanyl- species) or vinyl ether
bond (plasmenyl- or plasmalogen species) instead of an ester bond at the sn-1 position
(Lodhi and Semenkovich, 2014). Importantly, this structural difference to their diacyl
counterparts requires alkylacylglycerol (AAG) instead of DG as an immediate precursor
and ePL synthesis involves peroxisomes (Dean and Lodhi, 2018). In peroxisomes the
alkyl-equivalent of lysophosphatidic acid is produced through the acyl dihydroxyacetone
phosphate pathway, which can also be a salvage pathway to produce lysophosphatidic
acid as a precursor for DG and subsequent TG and PL synthesis (Figure 5).
However, the transferal of the choline or ethanolamine headgroup to AAG is achieved by
the same enzymes that catalyse diacyl PC and PE synthesis (collectively called
choline/ethanolamine phosphotransferase (CEPT)) and occurs in the ER (Figure 5).
Therefore, ePL synthesis competes for the same enzymes in the final steps of synthesis
but does not compete for the same DG pool. Ether PLs show different phase behaviour in
biological membranes than their diacyl equivalents and are believed to be involved in
membrane fusion (Dean and Lodhi, 2018). There is increasing recognition of the
physiological importance of ePLs in membrane integrity and function and disorders in
peroxisomal function, which result in impaired ePL synthesis, have been linked to
diseases such as cancer, neurodegenerative diseases and metabolic disorders (Dean and
Lodhi, 2018).

35
Figure 5: Ether phospholipid synthesis through the acyl dihydroxyacetone phosphate
(DHAP) pathway. Fatty acids synthesised by fatty acid synthase (FAS) are used in a
salvage pathway to produce lysophosphatidic acid (LPA) or are reduced by fatty acyl-
CoA reductase (FAR1/2) to produce the fatty alcohol attached to the sn-1 position in ether
phospholipids. DHAP is derived from glycerol 3-phosphate (G3P) after dehydrogenation
through G3P dehydrogenase (G3PDH). Acyl-CoA is transferred to DHAP by
glyceronephosphate O-acyltransferase (GNPAT) to produce acyl-DHAP, which can
either directly be reduced to produce LPA or the acyl chain is replaced with an alkyl-
chain by alkylglycerone phosphate synthase (AGPS) connected to DHAP via an ether
bond (alkyl-DHAP). Reduction of alkyl-DHAP leads to the production of 1-O-alkyl-G3P
(AGP), which is the ether equivalent of LPA. After transport of LPA and AGP to the
endoplasmic reticulum (ER), they are acylated on the sn-2 position to produce
diacylgycerol (DG) or alkylacylglycerol (AAG), the direct precursors of diacyl and ether
PLs. In the final step, DG and AAG obtain their respective headgroup through the
enzymes of the CDP-choline and CDP-ethanolamine pathways described in Figure 4.
Modified from Dean and Lodhi (2018).
MFG Size
The size of individual MFGs varies from under 1 to over 15 m, with the majority of
the fat volume in globules between 1 and 8 m (Michalski et al., 2001; Walstra, 1969).
Furthermore, the average MFG size and its distribution varies between species, breeds

36
and individual animals (Carroll et al., 2006; Logan et al., 2014; Park et al., 2007). Jersey
cows produce milk with larger MFGs than Holstein and Brown Swiss breeds, expressed
as the volume mean diameter D[v, 0.5] (Carroll et al., 2006). Distinct MFG size
distributions between species have also been established, although comparison of MFG
sizes between studies are difficult if different methods (microscopy or dynamic light
scattering) or measures (surface or volume weighted diameters or spherical diameters of
individual particles) are used for particle size analysis. However, a study comparing the
MFG sizes of several dairy species based on scanning electron microscopy showed that
buffalos produced larger MFGs (average diameter 8.7 µm), whilst cow and sheep milk
comprised medium size distributions (both 3.8 µm) and goat and camel milk exhibited
the smallest size distributions (3.2 and 3.0 µm) (El-Zeini, 2006). These differences
between species are even more apparent, when the percentage of MFGs in different size
groups is compared (El-Zeini, 2006). For example, in buffalo milk, only 23% of all MFGs
have very small sizes between 0.1 to 4 µm in diameter, whereas in cow, sheep, goat and
camel milk 68.4, 55.3, 73.3 and 80.6% fall in this size group, respectively. Furthermore,
the percentage of MFGs falling into the group of MFGs larger than 8 µm was 44.1% for
buffalo, compared to 5.2% in cow, 1.0% in sheep 9.2% in goat and 0% in camel milk (El-
Zeini, 2006). Considering that milk fat content has been identified as one of the major
animal factors influencing MFG size, it is important to look at differences in fat content
between these species. Table 1 shows minimum and maximum values for the fat content
in milk from different species found in the literature compared to their differences in MFG
size. In some species (e.g. buffalo, horse) high or low fat content in milk appears to be
reflected in large or small MFG size distributions. However, other species that show
similar MFG size distributions (e.g. cow and sheep) are remarkably different in their fat
content, with sheep milk exhibiting a higher fat content than cow milk. For example,

37
sheep and buffalo secrete similar amounts of fat per litre of milk, however average MFG
size in buffalo milk is more than twice the diameter of average MFG size in sheep milk.
Table 1: Fat content and milk fat globule (MFG) size distribution in milk from several
species.
Species Fat content (g/L)
(Claeys et al., 2014)
MFG size1
(µm)
Reference
(For MFG size)
Buffalo 53 - 90 8.7 (El-Zeini, 2006)
Human 35 - 40 5.2
4.4
(Rüegg and Blanc, 1981)
(Michalski et al., 2005)
Cow 33 - 54 3.8 (El-Zeini, 2006)
Sheep 50 - 90 3.8 (El-Zeini, 2006)
Goat 30 - 72 3.2 (El-Zeini, 2006)
Camel 20 - 60 3.0 (El-Zeini, 2006)
Horse 3 - 42 2.8 - 2.9 (Welsch et al., 1988)
1Note that particle size measurements differ between the studies: El-Zeini (2006) used
scanning electron microscopy to measure the spherical mean diameter of individual
globules, while for Welsch et al. (1988), Michalski et al. (2005) and Rüegg and Blanc
(1981) the volume-weighted mean diameter D[4,3] is shown.
On an individual animal level, several environmental, physiological and management
factors have been linked to changes in the average MFG size in cows and other dairy
species. However, while some of the estimated effects of these impact factors have been
firmly established, others remain equivocal in the literature.
2.5.1 Environmental and farm management factors with an impact on MFG size
Amongst the possible environmental factors, season and feed composition are most
frequently reported to affect MFG size. Several studies reported that MFG size is subject
to seasonal changes, although the results are often conflicting. While some have
suggested that cows produce milk with larger MFGs in winter and autumn compared to
summer and spring (Briard et al., 2003; Logan et al., 2014), the opposite has also been

38
reported, with larger MFGs in spring milk compared to the rest of the year (Fleming et
al., 2017a). These differences may be attributed to the seasonal feed compositions
depending on the climate and management conditions in different countries. Therefore,
the role of season independently from dietary changes and stage of lactation remains
unclear. Moreover, in herds practicing seasonal calving, the effect of season cannot be
separated from stage of lactation, which represents one of the main impact factors on
MFG size and will be discussed later (Section 2.5.2).
In terms of the impact of feed composition, the balance between concentrate and forage
in the cow’s diet can also impact MFG size (Argov-Argaman et al., 2014; Mesilati-Stahy
et al., 2015). In both studies, cows fed a high-concentrate-low-forage diet produced
smaller MFGs compared to cows fed a low-concentrate-high-forage diet (Argov-
Argaman et al., 2014; Mesilati-Stahy et al., 2015). The authors attributed this to a higher
fat content in milk produced by low-concentrate-high-forage cows leading to larger
MFGs. However, overall milk yield was higher in the in the high-concentrate-low-forage
group. Accordingly, Couvreur et al. (2006) showed that replacing at least 30% of corn
silage with fresh grass in the cow’s diet led to a decrease in MFG size. However, changes
in the ratio of concentrate to forage in the cow’s diet can also lead to changes in plasma
insulin and NEFA concentrations, which are physiological factors that can also affect
MFG size (Argov-Argaman et al., 2014).
Another understudied potential impact factor is the role of the applied milking
technology (automatic milking vs. milking parlour) or the frequency and duration of
milking (once vs. twice or thrice daily). Some studies reported no effect of milking
frequency and technology on MFG size distribution (Abeni et al., 2005; Komara et al.,
2009), while others reported an increase in MFG size with increased milking frequency
(Wiking et al., 2006). In this context, it also remains unclear if a self-determined milking
39
frequency by the cows within a herd milked by an automatic milking system affects MFG
size.
2.5.2 Animal factors with an impact on MFG size
Stage of lactation is arguably the most studied and best-established animal-related
determinant of MFG size. In bovine milk, the average MFG size decreases with ongoing
lactation (Altenhofer et al., 2015; Fleming et al., 2017a), while in human milk, MFG size
decreases during the first four days of lactation and increases thereafter (Michalski et al.,
2005; Rüegg and Blanc, 1981). The reason for the inverse relationship between days in
milk and MFG size in bovine milk are not fully understood. However, it has been
suggested that it may be a reflection of the metabolic status of the animal, specifically the
occurrence of negative energy balance in early lactation, leading to increased plasma
NEFA concentrations (Argov-Argaman, 2019). Based on in vitro studies, it appears that
exposure of MECs to NEFAs instead of lipids in the form of very low density lipoprotein,
increases TG content as well as LD number and size (Mesilati-Stahy and Argov-
Argaman, 2018). The authors attributed this to increased mitochondrial activity and
remodelling of the PL components through the phosphatidylserine decarboxylase
pathway, which decreases the PC/PE ratio in these cells through headgroup exchange of
PS to PE and takes place in mitochondria. In vivo, plasma NEFA levels also appear to
play an important role in the regulation of MFG size, but the precise mechanism and
effect is still unclear (Argov-Argaman, 2019). This is at least in part due to the
correlations between milk yield, fat content, insulin levels and NEFA concentrations
which complicate the study of their individual effects on MFG size.
Cows producing milk with a higher fat content often produce larger MFGs compared
to those producing milk with a lower fat content (Altenhofer et al., 2015; Couvreur et al.,
40
2007; Mesilati-Stahy et al., 2015). However, the lower fat content in milk from cows
producing smaller MFGs could be due to a dilution effect, because these cows also often
exhibit a higher milk yield and the total quantity of milk fat secreted by cows producing
either large or small MFGs remained the same (Argov-Argaman et al., 2014; Couvreur et
al., 2007). In terms of the impact of the total fat yield on MFG size, Logan et al. (2014a)
reported no correlation between the fat yield in milk and MFG size distribution. However,
others reported larger MFGs in cows producing milk with higher fat yields and suggested
that the production of MFGM material is limited in these cows, leading to a shift in size
towards bigger MFGs, requiring less membrane material (Wiking et al., 2004). While the
available studies indicate that fat yield and fat content could impact MFG size, a recent
combined analysis of several studies revealed that the fat-protein ratio was a better
predictor of MFG size than fat content (Couvreur and Hurtaud, 2017). Endogenous
factors, such as different genotypes of enzymes involved in lipid synthesis, may also
influence fat content and hence MFG size. For example, cows exhibiting the KK genotype
of DGAT1, the gene encoding the enzyme catalysing the final step of TG synthesis,
produce larger MFGs along with an increased fat content (Argov-Argaman et al., 2013).
In summary, despite several published studies, the impact of environmental and animal
factors on MFG size remains unclear. This may be attributed to the fact that it is difficult
to study these factors independently from each other. However, it may also indicate that
individual differences between cows on a molecular level are major determinants of MFG
size (Couvreur and Hurtaud, 2007; Logan et al., 2014). Accordingly, a genetic component
in the regulation of MFG size has been suggested with moderate heritability of MFG size
as a milk production trait (Fleming et al., 2017b). This, in combination with the possible
role of the DGAT1 gene offers the potential to identify and select cows with distinct MFG
size distributions (Argov-Argaman et al., 2013).

41
2.5.3 Determinants of MFG size within the mammary epithelial cell
There are two possible ways for intracellular LDs to grow in size: LD fusion and LD
expansion (Wilfling et al., 2013). During LD fusion two LDs are combined into a larger
one with the combined volume of the two original LDs. During LD expansion, LDs grow
in size through de novo synthesis of TGs on the surface of the LD (Wilfling et al., 2013).
2.5.3.1 LD growth through LD fusion
Recent in vivo and in vitro studies have conclusively shown that LD fusion contributes
to the size development in the MEC (Cohen et al., 2017; Masedunskas et al., 2017).
Furthermore, from studies in MECs and other cell types it is known that LD fusion
depends on the composition of the monolayer surrounding the intracellular LD,
specifically its PL components but also the FA composition of its lipid classes (Arisawa
et al., 2016; Cohen et al., 2017). These effects are mainly attributed to the biophysical
properties of the monolayer compounds. Arguably the best-established relationship is the
impact of PC and PE on the stability of LDs, with PC preventing LD fusion due to its
superior surfactant properties compared to PE (Thiam et al., 2013). Briefly, on the PL
class level, fusion depends on the area taken up by the head group of the PL and the
intrinsic curvature of the molecule in a monolayer. For example, DG, PE and phosphatidic
acid have small head groups relative to the FA tail and therefore favor negative curvature,
leading to the formation of reverse micelles with the FA chains facing outwards (Thiam
et al., 2013). PLs with bigger headgroups relative to the tail ends, such as
lysophospholipids and PI, tend to form direct micelles, with the hydrophilic headgroups
facing towards the continuous phase. In the third scenario, PLs with a similar area of tail
and headgroups, such as PC, have no preferred curvature and are therefore very efficient
surfactants (Thiam et al., 2013). Complete fusion of LDs requires the LDs to be in close

42
proximity and form pores (Thiam et al., 2013). At which distance between the LDs pore
formation is achieved depends on the efficiency of the surfactant (Thiam et al., 2013).
Furthermore, the pore is stabilised if the curvature of the monolayer matches the bending
of the pore, which reduces the line tension and favors fusion. For example, if the
monolayer contains PLs with negative curvature, such as PE, and the curvature is negative
in the pore, which is the case in oil in water emulsions covered by PLs, then the pore is
stabilised and tends to expand, leading to complete fusion (Thiam et al., 2013).
In accordance with this, Cohen et al. (2015) suggested that the PL composition of
cellular membranes determine MFG size in MECs. Their study investigated the effect of
supplementing different free FAs to the cell culture media on the membrane composition
of MECs and its indirect effect on the size of MFGs secreted into the media. The results
indicate that palmitic and oleic acid treatments lead to differences in membrane PL
composition, which in turn lead to differences in the size distribution of LDs and MFGs.
Palmitic acid treatment resulted in smaller LDs and secreted MFGs compared to oleic
acid and control treatments. The authors hypothesised that this is due to an increased
content of PC stabilising the membrane and thus inhibiting intracellular LD fusion. Oleic
acid treatment, on the other hand, increased PE contents in the membrane, inducing
membrane fusion and resulting in larger LDs and MFGs (Cohen et al., 2015). In their
more recent study, Cohen et al. (2017) manipulated the metabolic pathways for the
interconversion of PC, PS and PE and found that independently from total cellular TG
synthesis, LD size was modulated by increased PC or PE concentrations. Accordingly,
studies in other cell types suggest that LDs with low PC contents are prone to LD fusion
and knockout of genes involved in PC biosynthesis results in accumulation of fewer but
larger MFGs (Guo et al., 2008; Moessinger et al., 2014).
43
2.5.3.2 LD growth through LD expansion
At least one isoenzyme from each group of enzymes catalysing the four steps of TG
synthesis have been localised to the surface of growing LDs (Wilfling et al., 2013), as
shown in Figure 3. These findings imply that LDs can acquire the capability to synthesise
TGs even after being pinched off from the ER, the major site of TG synthesis. Moreover,
Wilfling et al. (2013) showed that a subset of LDs missing TG synthesis enzymes on their
surface did not grow in size after budding from the ER. In addition to TG synthesis, LD
expansion also requires the production of PL material to cover the surface of the growing
LD. Indeed, enzymes involved in PL synthesis have also been found on the surface of
LDs and have further been connected to differences in LD size (Krahmer et al., 2011;
Moessinger et al., 2011; Wilfling et al., 2013). However, LD growth through on-surface
TG synthesis has not been demonstrated in MECs and proteomic analyses of MFGM
material have not detected all enzymes that would be required for this process (Mather et
al., 2019). It is possible that LD growth differs in MECs, which represent a special case
compared to other cell types, because LDs are not only energy storage organelles, but are
ultimately secreted.
2.5.4 Characteristics of small and large MFGs
2.5.4.1 FA composition of small and large MFGs
The literature provides evidence that the FA composition of MFGs are related to their
size. However, the reported results are conflicting, possibly due to different approaches
to obtain MFGs of different sizes. The majority of available studies use bulk or individual
milk samples and separate the population of MFGs into groups of different size fractions
by gravity separation (Mesilati-Stahy and Argov-Argaman, 2014; Mesilati-Stahy et al.,
2011), centrifugation (Lu et al., 2016; Timmen and Patton, 1988) or microfiltration

44
(Briard et al., 2003; Fauquant et al., 2005; Lopez et al., 2011). Other experimental designs
used milk samples from cows that naturally produce MFGs with small or large average
sizes (Couvreur et al., 2007) or studied the relationship between average MFG size and
FA composition without prior selection based on MFG size (Wiking et al., 2004).
Furthermore, the available studies vary in the use of either total lipids for FA analysis
(Couvreur et al., 2007; Lopez et al., 2011; Mesilati-Stahy and Argov-Argaman, 2014;
Mesilati-Stahy et al., 2011) or prior separation into the MFG core and MFGM materials
(Fauquant et al., 2005). Although not consistent across all studies, the results indicate that
MFGs with small sizes contain less stearic acid (Briard et al., 2003; Couvreur et al., 2007;
Fauquant et al., 2005; Wiking et al., 2004) and total SFAs (Lu et al., 2016), but more
polyunsaturated FAs (PUFAs) (Mesilati-Stahy and Argov-Argaman, 2014) and in some
studies more monounsaturated FAs (MUFAs) (Couvreur et al., 2007; Lu et al., 2016) than
MFGs in the large size groups. Furthermore, Couvreur and Hurtaud (2017) using a large
dataset from several studies on MFG size, related small MFGs to lower contents of SFAs
and short chain FAs, along with higher contents of MUFAs and PUFAs. Oleic acid as the
major UFA in bovine milk, was also related to smaller MFGs (Lu et al., 2016; Timmen
and Patton, 1988). However, some studies reported changes in oleic acid depending on
lactation stage with cows at 150 days in milk exhibiting higher oleic acid contents in the
large MFG fraction (Mesilati-Stahy and Argov-Argaman, 2014). Overall, these results
indicate that there are differences in the FA profile of large and small MFGs. However,
FA composition also depends on other physiological and environmental factors. While
FA profiles of MFGs from different size fractions of the same milk samples were not
consistent across the studies, the FA composition of MFGs may be characteristic for the
individual animal and reflect its lipid metabolic state (Couvreur et al., 2007).

45
2.5.4.2 Composition of the MFGM in small and large MFGs
The MFGM contains proteins and polar lipids, which are minor milk components in
terms of their absolute quantity. However, they are predicted to play a major role in the
MFG size development because of their distinct physical properties and role in LD fusion
(Thiam et al., 2013). Despite the detailed knowledge of the surfactant properties of polar
lipids and their predicted impact on membrane fusion events, reports on MFG size and
its relationship to polar lipid concentrations vary greatly.
As seen for the FA composition, a fluctuation in the polar lipid composition depending
on the stage of lactation has been reported (Mesilati-Stahy and Argov-Argaman, 2014).
The smallest size fraction was characterised by higher SM concentrations at earlier stages
of lactation and higher PC and lower PE and PS concentrations at some of the points
during the lactation cycles, although this relationship was not consistently observed
(Mesilati-Stahy and Argov-Argaman, 2014). In contrast, Lopez et al. (2011) reported
decreased PE, PC, PS and PI concentrations with an increase in MFG size. Yet another
study reported no significant differences in the proportions of the polar lipid classes and
the FA composition within these classes in MFGM material from small or large size
fractions obtained by microfiltration (Fauquant et al., 2007). Finally, Lu et al. (2016)
reported higher PE and PI concentrations in smaller MFGs, which in the case of PE is in
conflict with its proposed destabilising effect in biological membranes predicted to
stimulate LD fusion. Across species with different average MFG size distributions, the
predicted relationship between the relative proportions of PC and PE and MFG size also
does not hold true. For example, albeit a significantly larger average MFG size
distribution in buffalo milk compared to cow milk, higher PC proportions were found in
the MFGM from buffalo MFGs (Ménard et al., 2010).
46
The variation in the size dependent polar lipid composition reported in the literature
may be attributed to the different separation techniques applied in these studies, for
example gravity separation (Mesilati-Stahy and Argov-Argaman, 2014), microfiltration
(Fauquant et al., 2007; Lopez et al., 2011) or centrifugation (Lu et al., 2016), which also
resulted in substantial differences in the average MFG sizes of the separated fractions.
The MFGM also contains a number of LD associated proteins and transmembrane
proteins. Many important functions of these proteins are known, such as the postulated
roles in MFG secretion for XOR, BTN and PLIN2 (see Section 2.3.2.2) and the role of
perilipins in the regulation of lipolysis particularly in adipocytes (Itabe et al., 2017).
However, it remains unknown if the protein components of the MFGM are involved in
the size development within the MEC. As for the PL components, some of the proteins
found on the surface in other cell types are involved in LD fusion. For example, SNARE
(Soluble N-ethylmaleimide sensitive factor (NSF) attachment protein (SNAP) receptor)
proteins are believed to be the driving force for membrane fusion in many tissues, for
example the release of neurotransmitters from a synaptic vesicle (Truchet et al., 2013).
Boström et al. (2007) showed that members of the SNARE family, namely SNAP 23,
Syntaxin 5 and vesicle associated membrane protein 4, can be found on the surface of
LDs in two non-mammary cell lines and that transfection with small interfering RNA led
to a reduction in size of the LDs. Furthermore, the expression of SNARE proteins has
been reported in the mammary gland (Chat et al., 2011). In this study certain SNARE
proteins were found in close proximity to the secretory vesicles and LDs, suggesting a
potential role in casein and milk fat secretion (Chat et al., 2011).
Milk fat globule epidermal growth factor (EGF) factor 8 (MFG-E8), also known as
lactadherin, has been the subject of a study by Yasueda et al. (2015) aiming to investigate
the role of MFG-E8 in MFG fusion in milk after secretion and hence its impact on MFG
47
size distribution. The study was conducted with wild-type and MFG-E8 deficient mice.
It showed that MFG-E8 can protect MFGs from fusion by binding to PS, which is exposed
on the outer surface of the MFGM and is known to be involved in membrane fusion
especially in the presence of divalent cations (Ca2+). As a result, milk from MFG-E8
deficient mice exhibited a higher proportion of large MFGs (Yasueda et al., 2015).
Few studies have compared the protein components of small and large MFGs.
However, in conflict with the suggested function for lactadherin as an inhibitor of post-
secretory fusion, Lu et al. (2016) found higher levels of lactadherin in large MFGs.
Similarly, SNAP23, one of the SNARE proteins, also showed higher concentrations in
the small MFG fraction, which contradicts its suggested role in LD fusion (Lu et al.,
2016). However, Lu et al. (2016) also found differences between the small and large MFG
fractions in the concentrations of two major MFGM proteins, namely PLIN2 and PLIN3.
More specifically, the large MFG fraction contained higher concentrations of PLIN2,
while the smaller MFGs were characterised by higher PLIN3 concentrations. Perilipins
are a group of LD-associated proteins and contain five members PLIN1-5. While PLIN1
and PLIN4 (also known as S3-12) are exclusively found in white adipose tissue, PLIN2
and PLIN3 (also known as TIP47) are found ubiquitously (Itabe et al., 2017).
Furthermore, it has been suggested that during LD biogenesis in adipocytes, tiny LDs are
coated by PLIN3, while upon growth PLIN2 coats LDs of intermediate size and large
unilocular LDs, which are characteristic for adipocytes, are coated with PLIN1 (Wolins
et al., 2006). However, due to the different LD morphology in adipocytes, with large
unilocular LDs compared to multiple smaller LDs in other tissues, it is unknown if this
dynamic change is also found during LD development in MECs, which do not contain
PLIN1.

48
Overall, the literature is lacking studies on the polar lipid and protein composition of
milk and particularly MFGM material from cows that naturally produce MFGs of the
small and large phenotype. In contrast to the available studies, which separate individual
or bulk milk samples into different fractions, samples from cows with natural differences
in MFG size distributions comprise the entire population of MFGs produced in the MEC
of the individual animal. This could shed light on the metabolic significance of polar lipid
production in relation to MFG size development.
49
References
Abeni, F., Degano, L., Calza, F., Giangiacomo, R., and Pirlo, G. (2005). Milk Quality and
Automatic Milking: Fat Globule Size, Natural Creaming, and Lipolysis. J. Dairy
Sci. 88, 3519–3529.
Altenhofer, C., Holzmüller, W., Wolfertstetter, F., Ribeiro, D.W., Kulozik, U., Pfaffl,
M.W., and Viturro, E. (2015). Temporal variation of milk fat globule diameter,
fat and cholesterol content and milk epithelial cell gene expression in dairy cows.
Int. J. Dairy Technol. 68, 519–526.
Argov, N., Lemay, D.G., and German, J.B. (2008). Milk fat globule structure & function;
nanoscience comes to milk production. Trends Food Sci. Technol. 19, 617–623.
Argov-Argaman, N. (2019). Symposium review: Milk fat globule size: Practical
implications and metabolic regulation. J. Dairy Sci. 102, 2783–2795.
Argov-Argaman, N., Mida, K., Cohen, B.-C., Visker, M., and Hettinga, K. (2013). Milk
Fat Content and DGAT1 Genotype Determine Lipid Composition of the Milk Fat
Globule Membrane. PLoS ONE 8, e68707.
Argov-Argaman, N., Mesilati-Stahy, R., Magen, Y., and Moallem, U. (2014). Elevated
concentrate-to-forage ratio in dairy cow rations is associated with a shift in the
diameter of milk fat globules and remodeling of their membranes. J. Dairy Sci.
97, 6286–6295.
Arisawa, K., Mitsudome, H., Yoshida, K., Sugimoto, S., Ishikawa, T., Fujiwara, Y., and
Ichi, I. (2016). Saturated fatty acid in the phospholipid monolayer contributes to
the formation of large lipid droplets. Biochem. Biophys. Res. Commun. 480, 641–
647.
Bargmann, W., and Knoop, A. (1959). Über die Morphologie der Milchsekretion Licht-
und Elektronenmikroskopische Studien an der Milchdrüse der Ratte. Z. Für
Zellforsch. Mikrosk. Anat. 49, 344–388.
Boström, P., Andersson, L., Rutberg, M., Perman, J., Lidberg, U., Johansson, B.R.,
Fernandez-Rodriguez, J., Ericson, J., Nilsson, T., Borén, J., et al. (2007). SNARE
proteins mediate fusion between cytosolic lipid droplets and are implicated in
insulin sensitivity. Nat. Cell Biol. 9, 1286–1293.
Brew, K. (2013). α-Lactalbumin. In Advanced Dairy Chemistry: Volume 1A: Proteins:
Basic Aspects, 4th Edition, P.L.H. McSweeney, and P.F. Fox, eds. (Boston, MA:
Springer US), pp. 261–273.
50
Briard, V., Leconte, N., Michel, F., and Michalski, M.-C. (2003). The fatty acid
composition of small and large naturally occurring milk fat globules. Eur. J. Lipid
Sci. Technol. 105, 677–682.
Capuco, A.V., and Akers, R.M. (2011). Lactation | Galactopoiesis, Effects of Hormones
and Growth Factors. In Encyclopedia of Dairy Sciences (Second Edition), J.W.
Fuquay, ed. (San Diego: Academic Press), pp. 26–31.
Carroll, S.M., DePeters, E.J., Taylor, S.J., Rosenberg, M., Perez-Monti, H., and Capps,
V.A. (2006). Milk composition of Holstein, Jersey, and Brown Swiss cows in
response to increasing levels of dietary fat. Anim. Feed Sci. Technol. 131, 451–
473.
Chat, S., Layani, S., Mahaut, C., Henry, C., Chanat, E., and Truchet, S. (2011).
Characterisation of the potential SNARE proteins relevant to milk product release
by mouse mammary epithelial cells. Eur. J. Cell Biol. 90, 401–413.
Chong, B.M., Russell, T.D., Schaack, J., Orlicky, D.J., Reigan, P., Ladinsky, M., and
McManaman, J.L. (2011). The Adipophilin C Terminus Is a Self-folding
Membrane-binding Domain That Is Important for Milk Lipid Secretion. J. Biol.
Chem. 286, 23254–23265.
Claeys, W.L., Verraes, C., Cardoen, S., De Block, J., Huyghebaert, A., Raes, K.,
Dewettinck, K., and Herman, L. (2014). Consumption of raw or heated milk from
different species: An evaluation of the nutritional and potential health benefits.
Food Control 42, 188–201.
Cohen, B.-C., Shamay, A., and Argov-Argaman, N. (2015). Regulation of Lipid Droplet
Size in Mammary Epithelial Cells by Remodeling of Membrane Lipid
Composition—A Potential Mechanism. PLoS ONE 10, e0121645.
Cohen, B.-C., Raz, C., Shamay, A., and Argov-Argaman, N. (2017). Lipid Droplet Fusion
in Mammary Epithelial Cells is Regulated by Phosphatidylethanolamine
Metabolism. J. Mammary Gland Biol. Neoplasia 22, 235–249.
Coleman, R.A., and Lee, D.P. (2004). Enzymes of triacylglycerol synthesis and their
regulation. Prog. Lipid Res. 43, 134–176.
Contarini, G., and Povolo, M. (2013). Phospholipids in Milk Fat: Composition, Biological
and Technological Significance, and Analytical Strategies. Int. J. Mol. Sci. 14,
2808–2831.
Couvreur, S., and Hurtaud, C. (2007). Le globule gras du lait: sécrétion, composition,
fonctions et facteurs de variation. INRA Prod Anim 20, 365–382.

51
Couvreur, S., and Hurtaud, C. (2017). Relationships between milks differentiated on
native milk fat globule characteristics and fat, protein and calcium compositions.
Animal 11, 507–518.
Couvreur, S., Hurtaud, C., Lopez, C., Delaby, L., and Peyraud, J.L. (2006). The Linear
Relationship Between the Proportion of Fresh Grass in the Cow Diet, Milk Fatty
Acid Composition, and Butter Properties. J. Dairy Sci. 89, 1956–1969.
Couvreur, S., Hurtaud, C., Marnet, P.G., Faverdin, P., and Peyraud, J.L. (2007).
Composition of milk fat from cows selected for milk fat globule size and offered
either fresh pasture or a corn silage-based diet. J. Dairy Sci. 90, 392–403.
Dean, J.M., and Lodhi, I.J. (2018). Structural and functional roles of ether lipids. Protein
Cell 9, 196–206.
Deeth, H.C. (1997). The role of phospholipids in the stability of milk fat gobules. Aust.
J. Dairy Technol. 52, 44–46.
Deevska, G.M., and Nikolova-Karakashian, M.N. (2017). The expanding role of
sphingolipids in lipid droplet biogenesis. Biochim. Biophys. Acta BBA - Mol.
Cell Biol. Lipids 1862, 1155–1165.
Deevska, G.M., Dotson, P.P., Karakashian, A.A., Isaac, G., Wrona, M., Kelly, S.B.,
Merrill, A.H., and Nikolova-Karakashian, M.N. (2017). Novel Interconnections
in Lipid Metabolism Revealed by Overexpression of Sphingomyelin Synthase-1.
J. Biol. Chem. 292, 5110–5122.
Dewettinck, K., Rombaut, R., Thienpont, N., Le, T.T., Messens, K., and Camp, J.V.
(2008). Nutritional and technological aspects of milk fat globule membrane
material. Int. Dairy J. 18, 436–457.
El-Zeini, H.M. (2006). Microstructure, rheological and geometrical properties of fat
globules of milk from different animal species. Pol. J. Food Nutr. Sci. 56, 147–
153.
Fauquant, C., Briard, V., Leconte, N., and Michalski, M.-C. (2005). Differently sized
native milk fat globules separated by microfiltration: fatty acid composition of the
milk fat globule membrane and triglyceride core. Eur. J. Lipid Sci. Technol. 107,
80–86.
Fauquant, C., Briard‐Bion, V., Leconte, N., Guichardant, M., and Michalski, M.-C.
(2007). Membrane phospholipids and sterols in microfiltered milk fat globules.
Eur. J. Lipid Sci. Technol. 109, 1167–1173.
Fleming, A., Schenkel, F.S., Chen, J., Malchiodi, F., Ali, R.A., Mallard, B., Sargolzaei,
M., Corredig, M., and Miglior, F. (2017a). Variation in fat globule size in bovine

52
milk and its prediction using mid-infrared spectroscopy. J. Dairy Sci. 100, 1640–
1649.
Fleming, A., Schenkel, F.S., Koeck, A., Malchiodi, F., Ali, R.A., M. Corredig, B.
Mallard, M. Sargolzaei, and F. Miglior (2017b). Heritabilities of measured and
mid-infrared predicted milk fat globule size, milk fat and protein percentages, and
their genetic correlations. J. Dairy Sci. 100, 3735–3741.
Fong, B.Y., Norris, C.S., and MacGibbon, A.K.H. (2007). Protein and lipid composition
of bovine milk-fat-globule membrane. Int. Dairy J. 17, 275–288.
Fox, P.F., and Brodkorb, A. (2008). The casein micelle: Historical aspects, current
concepts and significance. Int. Dairy J. 18, 677–684.
Fox, P.F., and Kelly, A.L. (2012). Chemistry and Biochemistry of Milk Constituents. In
Food Biochemistry and Food Processing, B.K. Simpson, ed. (Hoboken, NJ:
Wiley-Blackwell), pp. 442–464.
Fox, P.F., Uniacke-Lowe, T., McSweeney, P.L.H., and O’Mahony, J.A. (2015).
Production and Utilization of Milk. In Dairy Chemistry and Biochemistry, P.F.
Fox, T. Uniacke-Lowe, P.L.H. McSweeney, and J.A. O’Mahony, eds. (Cham:
Springer International Publishing), pp. 1–19.
German, J.B., and Dillard, C.J. (2006). Composition, Structure and Absorption of Milk
Lipids: A Source of Energy, Fat-Soluble Nutrients and Bioactive Molecules. Crit.
Rev. Food Sci. Nutr. 46, 57–92.
Gross, J., Dorland, H.A. van, Bruckmaier, R.M., and Schwarz, F.J. (2011). Milk fatty acid
profile related to energy balance in dairy cows. J. Dairy Res. 78, 479–488.
Guo, Y., Walther, T.C., Rao, M., Stuurman, N., Goshima, G., Terayama, K., Wong, J.S.,
Vale, R.D., Walter, P., and Farese, R.V. (2008). Functional genomic screen
reveals genes involved in lipid-droplet formation and utilization. Nature 453, 657–
661.
Heid, H.W., and Keenan, T.W. (2005). Intracellular origin and secretion of milk fat
globules. Eur. J. Cell Biol. 84, 245–258.
Horne, D.S. (2011). Milk Proteins | Casein, Micellar Structure. In Encyclopedia of Dairy
Sciences (Second Edition), J.W. Fuquay, ed. (San Diego: Academic Press), pp.
772–779.
Huppertz, T. (2013). Chemistry of the Caseins. In Advanced Dairy Chemistry: Volume
1A: Proteins: Basic Aspects, 4th Edition, P.L.H. McSweeney, and P.F. Fox, eds.
(New York, NY: Springer US), pp. 135–160.

53
Huppertz, T., Kelly, A.L., and Fox, P.F. (2009). Milk lipids—composition origin and
properties. In Dairy Fats and Related Products, A.Y. Tamime, ed. (Blackwell
Publishing Ltd.), pp. 1–27.
Hurley, W.L., and Loor, J.J. (2011). Mammary Gland | Growth, Development and
Involution. In Encyclopedia of Dairy Sciences (Second Edition), J.W. Fuquay, ed.
(San Diego: Academic Press), pp. 338–345.
Iqbal, J., and Hussain, M.M. (2009). Intestinal lipid absorption. Am. J. Physiol.-
Endocrinol. Metab. 296, E1183–E1194.
Itabe, H., Yamaguchi, T., Nimura, S., and Sasabe, N. (2017). Perilipins: a diversity of
intracellular lipid droplet proteins. Lipids Health Dis. 16, 83.
Jensen, R.G. (2002). The Composition of Bovine Milk Lipids: January 1995 to December
2000. J. Dairy Sci. 85, 295–350.
Jeong, J., Lisinski, I., Kadegowda, A.K.G., Shin, H., Wooding, F.B.P., Daniels, B.R.,
Schaack, J., and Mather, I.H. (2013). A test of current models for the mechanism
of milk-lipid droplet secretion. Traffic 14, 974–986.
Katz, E., and Streuli, C.H. (2007). The extracellular matrix as an adhesion checkpoint for
mammary epithelial function. Int. J. Biochem. Cell Biol. 39, 715–726.
Keenan, T.W., and Mather, I.H. (2006). Intracellular origin of milk fat globules and the
nature of the milk fat globule membrane. In Advanced Dairy Chemistry Volume
2 Lipids, P.F. Fox, and P.L.H. McSweeney, eds. (New York, NY: Springer US),
pp. 137–171.
Kinsella, J.E. (1970). Stearic Acid Metabolism by Mammary Cells. J. Dairy Sci. 53,
1757–1765.
Komara, M., Boutinaud, M., Ben Chedly, H., Guinard-Flament, J., and Marnet, P.G.
(2009). Once-daily milking effects in high-yielding Alpine dairy goats. J. Dairy
Sci. 92, 5447–5455.
Krahmer, N., Guo, Y., Wilfling, F., Hilger, M., Lingrell, S., Heger, K., Newman, H.W.,
Schmidt-Supprian, M., Vance, D.E., Mann, M., et al. (2011). Phosphatidylcholine
Synthesis for Lipid Droplet Expansion Is Mediated by Localized Activation of
CTP:Phosphocholine Cytidylyltransferase. Cell Metab. 14, 504–515.
Larson, B.L. (1979). Biosynthesis and secretion of milk proteins: a review. J. Dairy Res.
46, 161–174.
Lawrence, T.L.J., Fowler, V.R., and Novakofski, J.E. (2012). Growth of farm animals
(Wallingford, Oxfordshire: CABI).

54
Lodhi, I.J., and Semenkovich, C.F. (2014). Peroxisomes: A Nexus for Lipid Metabolism
and Cellular Signaling. Cell Metab. 19, 380–392.
Logan, A., Auldist, M., Greenwood, J., and Day, L. (2014). Natural variation of bovine
milk fat globule size within a herd. J. Dairy Sci. 97, 4072–4082.
Lopez, C., Briard-Bion, V., Ménard, O., Beaucher, E., Rousseau, F., Fauquant, J.,
Leconte, N., and Robert, B. (2011). Fat globules selected from whole milk
according to their size: Different compositions and structure of the biomembrane,
revealing sphingomyelin-rich domains. Food Chem. 125, 355–368.
Lopez, C., Briard-Bion, V., Ménard, O., Rousseau, F., Pradel, P., and Besle, J.-M. (2008).
Phospholipid, Sphingolipid, and Fatty Acid Compositions of the Milk Fat Globule
Membrane are Modified by Diet. J. Agric. Food Chem. 56, 5226–5236.
Lu, J., Argov-Argaman, N., Anggrek, J., Boeren, S., van Hooijdonk, T., Vervoort, J., and
Hettinga, K.A. (2016). The protein and lipid composition of the membrane of milk
fat globules depends on their size. J. Dairy Sci. 99, 4726–4738.
MacGibbon, A.K.H., and Taylor, M.W. (2006). Composition and Structure of Bovine
Milk Lipids. In Advanced Dairy Chemistry Volume 2 Lipids, P.F. Fox, and P.L.H.
McSweeney, eds. (New York, NY: Springer US), pp. 1–42.
Masedunskas, A., Chen, Y., Stussman, R., Weigert, R., and Mather, I.H. (2017). Kinetics
of milk lipid droplet transport, growth, and secretion revealed by intravital
imaging: lipid droplet release is intermittently stimulated by oxytocin. Mol. Biol.
Cell 28, 935–946.
Mather, I.H., and Keenan, T.W. (1998). Origin and secretion of milk lipids. J. Mammary
Gland Biol. Neoplasia 3, 259–273.
Mather, I.H., Masedunskas, A., Chen, Y., and Weigert, R. (2019). Symposium review:
Intravital imaging of the lactating mammary gland in live mice reveals novel
aspects of milk-lipid secretion. J. Dairy Sci. 102, 2760–2782.
McManaman, J.L. (2012). Milk lipid secretion: recent biomolecular aspects. Biomol.
Concepts 3, 581–591.
McManaman, J.L., and Neville, M.C. (2003). Mammary physiology and milk secretion.
Adv. Drug Deliv. Rev. 55, 629–641.
McManaman, J.L., Palmer, C.A., Wright, R.M., and Neville, M.C. (2002). Functional
regulation of xanthine oxidoreductase expression and localization in the mouse
mammary gland: evidence of a role in lipid secretion. J. Physiol. 545, 567–579.
Ménard, O., Ahmad, S., Rousseau, F., Briard-Bion, V., Gaucheron, F., and Lopez, C.
(2010). Buffalo vs. cow milk fat globules: Size distribution, zeta-potential,

55
compositions in total fatty acids and in polar lipids from the milk fat globule
membrane. Food Chem. 120, 544–551.
Mesilati-Stahy, R., and Argov-Argaman, N. (2014). The relationship between size and
lipid composition of the bovine milk fat globule is modulated by lactation stage.
Food Chem. 145, 562–570.
Mesilati-Stahy, R., and Argov-Argaman, N. (2018). Changes in lipid droplets
morphometric features in mammary epithelial cells upon exposure to non-
esterified free fatty acids compared with VLDL. PLoS ONE 13, e0209565.
Mesilati-Stahy, R., Mida, K., and Argov-Argaman, N. (2011). Size-Dependent Lipid
Content of Bovine Milk Fat Globule and Membrane Phospholipids. J. Agric. Food
Chem. 59, 7427–7435.
Mesilati-Stahy, R., Moallem, U., Magen, Y., and Argov-Argaman, N. (2015). Altered
concentrate to forage ratio in cows ration enhanced bioproduction of specific size
subpopulation of milk fat globules. Food Chem. 179, 199–205.
Michalski, M.-C., Briard, V., and Michel, F. (2001). Optical parameters of milk fat
globules for laser light scattering measurements. Le Lait 81, 787–796.
Michalski, M.C., Briard, V., Michel, F., Tasson, F., and Poulain, P. (2005). Size
Distribution of Fat Globules in Human Colostrum, Breast Milk, and Infant
Formula. J. Dairy Sci. 88, 1927–1940.
Miyazaki, M., and Ntambi, J.M. (2003). Role of stearoyl-coenzyme A desaturase in lipid
metabolism. Prostaglandins Leukot. Essent. Fatty Acids 68, 113–121.
Moessinger, C., Kuerschner, L., Spandl, J., Shevchenko, A., and Thiele, C. (2011).
Human Lysophosphatidylcholine Acyltransferases 1 and 2 Are Located in Lipid
Droplets Where They Catalyze the Formation of Phosphatidylcholine. J. Biol.
Chem. 286, 21330–21339.
Moessinger, C., Klizaite, K., Steinhagen, A., Philippou-Massier, J., Shevchenko, A.,
Hoch, M., Ejsing, C.S., and Thiele, C. (2014). Two different pathways of
phosphatidylcholine synthesis, the Kennedy Pathway and the Lands Cycle,
differentially regulate cellular triacylglycerol storage. BMC Cell Biol. 15, 43.
Oftedal, O.T. (2002a). The Mammary Gland and Its Origin During Synapsid Evolution.
J. Mammary Gland Biol. Neoplasia 7, 225–252.
Oftedal, O.T. (2002b). The Origin of Lactation as a Water Source for Parchment-Shelled
Eggs. J. Mammary Gland Biol. Neoplasia 7, 253–266.
Oftedal, O.T. (2012). The evolution of milk secretion and its ancient origins. Animal 6,
355–368.

56
Oftedal, O.T., and Iverson, S.J. (1995). Comparative analysis of nonhuman milks: A.
Phylogenetic variation in the gross composition of milks. In Handbook of Milk
Composition, R.G. Jensen, ed. (San Diego: Academic Press), pp. 749–789.
O’Mahony, J.A., and Fox, P.F. (2013). Milk Proteins: Introduction and Historical
Aspects. In Advanced Dairy Chemistry: Volume 1A: Proteins: Basic Aspects, 4th
Edition, P.L.H. McSweeney, and P.F. Fox, eds. (New York, NY: Springer US),
pp. 43–85.
Palmquist, D.L. (2006). Milk Fat: Origin of Fatty Acids and Influence of Nutritional
Factors Thereon. In Advanced Dairy Chemistry, Volume 2: Lipids, P.F. Fox, and
P.L.H. McSweeney, eds. (New York, NY: Springer US), pp. 43–92.
Park, Y.W., Juárez, M., Ramos, M., and Haenlein, G.F.W. (2007). Physico-chemical
characteristics of goat and sheep milk. Small Rumin. Res. 68, 88–113.
Robenek, H., Hofnagel, O., Buers, I., Lorkowski, S., Schnoor, M., Robenek, M.J., Heid,
H., Troyer, D., and Severs, N.J. (2006a). Butyrophilin controls milk fat globule
secretion. Proc. Natl. Acad. Sci. 103, 10385–10390.
Robenek, H., Hofnagel, O., Buers, I., Robenek, M.J., Troyer, D., and Severs, N.J.
(2006b). Adipophilin-enriched domains in the ER membrane are sites of lipid
droplet biogenesis. J. Cell Sci. 119, 4215–4224.
Robenek, H., Buers, I., Hofnagel, O., Robenek, M.J., Troyer, D., and Severs, N.J. (2009).
Compartmentalization of proteins in lipid droplet biogenesis. Biochim. Biophys.
Acta BBA - Mol. Cell Biol. Lipids 1791, 408–418.
Rüegg, M., and Blanc, B. (1981). The fat globule size distribution in human milk.
Biochim. Biophys. Acta BBA - Lipids Lipid Metab. 666, 7–14.
Russell, T.D., Palmer, C.A., Orlicky, D.J., Fischer, A., Rudolph, M.C., Neville, M.C., and
McManaman, J.L. (2007). Cytoplasmic lipid droplet accumulation in developing
mammary epithelial cells: roles of adipophilin and lipid metabolism. J. Lipid Res.
48, 1463–1475.
Russell, T.D., Schaack, J., Orlicky, D.J., Palmer, C., Chang, B.H.-J., Chan, L., and
McManaman, J.L. (2011). Adipophilin regulates maturation of cytoplasmic lipid
droplets and alveolae in differentiating mammary glands. J. Cell Sci. 124, 3247–
3253.
Saacke, R.G., and Heald, C.W. (1974). Cytological aspects of milk formation and
secretion. In Lactation: a Comprehensive Treatise, Volume 2: Biosynthesis and
Secretion of Milk / Diseases, B.L. Larson, and V.R. Smith, eds. (New York, NY:
Academic Press), pp. 147–186.

57
Sawyer, L. (2013). β-Lactoglobulin. In Advanced Dairy Chemistry: Volume 1A:
Proteins: Basic Aspects, 4th Edition, P.L.H. McSweeney, and P.F. Fox, eds. (New
York, NY: Springer US), pp. 211–259.
Singh, H. (2006). The milk fat globule membrane—A biophysical system for food
applications. Curr. Opin. Colloid Interface Sci. 11, 154–163.
Stelwagen, K. (2011). Mammary Gland, Milk Biosynthesis and Secretion | Lactose. In
Encyclopedia of Dairy Sciences (Second Edition), J.W. Fuquay, ed. (San Diego:
Academic Press), pp. 367–372.
Takeuchi, K., and Reue, K. (2009). Biochemistry, physiology, and genetics of GPAT,
AGPAT, and lipin enzymes in triglyceride synthesis. Am. J. Physiol. - Endocrinol.
Metab. 296, E1195–E1209.
Thiam, A.R., Farese Jr, R.V., and Walther, T.C. (2013). The biophysics and cell biology
of lipid droplets. Nat. Rev. Mol. Cell Biol. 14, 775–786.
Timmen, H., and Patton, S. (1988). Milk fat globules: Fatty acid composition, size and in
vivo regulation of fat liquidity. Lipids 23, 685–689.
Truchet, S., Chat, S., and Ollivier-Bousquet, M. (2013). Milk Secretion: The Role of
SNARE Proteins. J. Mammary Gland Biol. Neoplasia 19, 119–130.
Van Haelst, Y.N.T., Beeckman, A., Van Knegsel, A.T.M., and Fievez, V. (2008). Short
Communication: Elevated Concentrations of Oleic Acid and Long-Chain Fatty
Acids in Milk Fat of Multiparous Subclinical Ketotic Cows. J. Dairy Sci. 91,
4683–4686.
Vance, J.E. (2015). Phospholipid Synthesis and Transport in Mammalian Cells. Traffic
16, 1–18.
Vance, J.E., and Vance, D.E. (1990). Lipoprotein assembly and secretion by hepatocytes.
Annu. Rev. Nutr. 10, 337–356.
Vorbach, C., Scriven, A., and Capecchi, M.R. (2002). The housekeeping gene xanthine
oxidoreductase is necessary for milk fat droplet enveloping and secretion: gene
sharing in the lactating mammary gland. Genes Dev. 16, 3223–3235.
Vorbach, C., Capecchi, M.R., and Penninger, J.M. (2006). Evolution of the mammary
gland from the innate immune system? BioEssays 28, 606–616.
Walstra, P. (1969). Studies on milk fat dispersion. The globule size distribution of cow's
milk. Neth. Milk Dairy J. 28, 3-9.

58
Welsch, U., Buchheim, W., Schumacher, U., Schinko, I., and Patton, S. (1988).
Structural, histochemical and biochemical observations on horse milk-fat-globule
membranes and casein micelles. Histochemistry 88, 357–365.
Wiking, L., Stagsted, J., Björck, L., and Nielsen, J.H. (2004). Milk fat globule size is
affected by fat production in dairy cows. Int. Dairy J. 14, 909–913.
Wiking, L., Nielsen, J.H., Båvius, A.-K., Edvardsson, A., and Svennersten-Sjaunja, K.
(2006). Impact of Milking Frequencies on the Level of Free Fatty Acids in Milk,
Fat Globule Size, and Fatty Acid Composition. J. Dairy Sci. 89, 1004–1009.
Wilfling, F., Wang, H., Haas, J.T., Krahmer, N., Gould, T.J., Uchida, A., Cheng, J.-X.,
Graham, M., Christiano, R., Fröhlich, F., et al. (2013). Triacylglycerol Synthesis
Enzymes Mediate Lipid Droplet Growth by Relocalizing from the ER to Lipid
Droplets. Dev. Cell 24, 384–399.
Wolins, N.E., Brasaemle, D.L., and Bickel, P.E. (2006). A proposed model of fat
packaging by exchangeable lipid droplet proteins. FEBS Lett. 580, 5484–5491.
Wooding, F.B.P. (1971). The Mechanism of Secretion of the Milk Fat Globule. J. Cell
Sci. 9, 805–821.
Wooding, F.B.P., and Sargeant, T.J. (2015). Immunocytochemical Evidence for Golgi
Vesicle Involvement in Milk Fat Globule Secretion. J. Histochem. Cytochem. 63,
943-951.
Yasueda, T., Oshima, K., Nakatani, H., Tabuchi, K., Nadano, D., and Matsuda, T. (2015).
A protective effect of milk fat globule EGF factor VIII (MFG-E8) on the
spontaneous fusion of milk fat globules in breast milk. J. Biochem. (Tokyo) 158,
25–35.
Yen, C.-L.E., Stone, S.J., Koliwad, S., Harris, C., and Farese, R.V. (2008). Thematic
Review Series: Glycerolipids. DGAT enzymes and triacylglycerol biosynthesis.
J. Lipid Res. 49, 2283–2301.
Zaczek, M., and Keenan, T.W. (1990). Morphological evidence for an endoplasmic
reticulum origin of milk lipid globules obtained using lipid-selective staining
procedures. Protoplasma 159, 179–183.

59
CHAPTER 3
The effect of physiological state, milk production traits and environmental
conditions on milk fat globule size in cow’s milk.
Leonie Walter1,2, Sue Finch3, Brendan Cullen1, Richard Fry1, Amy Logan2, Brian J.
Leury1
1. Faculty of Veterinary and Agricultural Sciences, The University of Melbourne,
Parkville, Victoria, Australia 3010
2. CSIRO Agriculture and Food, Werribee, Victoria, Australia 3030
3. School of Mathematics and Statistics, Statistical Consulting Centre, The University of
Melbourne, Parkville, Australia 3010

60
Introduction
Chapter 3 investigated the impact of on-farm and animal related parameters on milk
fat globule size distribution within the herd of Holstein-Friesian cows at the University
of Melbourne Dookie Dairy.
This work has been accepted for publication in the Journal of Dairy Research. It has
not been published at the time of submission of this thesis. Therefore, the paper is
included in this chapter as a manuscript. Supplementary data included in this chapter will
be published as a supplementary file as part of the publication.

61
Manuscript
SUMMARY
This research paper was carried out to quantify the effects of a range of variables on
milk fat globule (MFG) size for a herd of Holstein-Friesian cows managed through an
automatic milking system with year-round calving. We hypothesised that the overall
variation in average MFG size observed between individual animals of the same herd
cannot sufficiently be explained by the magnitude of the effects of variables that could be
manipulated on-farm. Hence, we aimed to conduct an extensive analysis of possible
determinants of MFG size, including physiological characteristics (parity, days in milk,
days pregnant, weight, age, rumination minutes, somatic cell count) and milk production
traits (number of milkings, milk yield, fat yield, protein and fat content, fat-protein ratio)
on the individual animal level; and environmental conditions (diet, weather, season) for
the whole herd. Our results show that when analysed in isolation, many of the studied
variables have a detectable effect on MFG size. However, analysis of their additive effects
identified days in milk, parity and milk yield as the most important variables. In
accordance with our hypothesis, the estimated effects of these variables, calculated using
a multiple variable linear mixed model, do not sufficiently explain the overall variation
between cows, ranging from 2.70 to 5.69 µm in average MFG size. We further show that
environmental variables, such as sampling day (across seasons) or the proportion of
pasture and silage in the diet, have limited effects on MFG size and that physiological
differences outweigh the effects of milk production traits and environmental conditions.
This presents further evidence that the selection of individual animals is more important
than the adjustment of on-farm variables to control MFG size.
Key words: automatic milking system, dairy cow, environmental parameters, milk fat
globule diameter, physiological state

62
Milk fat functions as an important energy source for the neonate and suckling calf.
Lipid and protein components of milk also have various nutritional benefits that extend
to consumers (Thorning et al. 2016). Milk lipids are enveloped by a membrane made of
polar lipids and proteins. This method of lipid packaging and secretion is unique to the
lactating mammary gland (McManaman, 2012). The resulting structure is called the milk
fat globule (MFG) and comprises a neutral lipid core surrounded by a trilayer membrane
(Fox and Kelly, 2012). The MFG membrane contains bioactive compounds with noted
health benefits (Singh and Gallier, 2017), and small MFG deliver more of this beneficial
membrane material due to an increased surface area. A variety of sizes of MFG are found
in milk, ranging from < 1 m to over 10 m (Michalski et al. 2001). In addition to its
variation between different breeds and species (Carroll et al. 2006), MFG size distribution
can be affected by stage of lactation (Evers, 2004) and nutrition (Couvreur et al. 2007).
Furthermore, MFG size distribution can vary between individual cows (Logan et al.
2014).
Amongst the physiological variables, stage of lactation is negatively correlated to
MFG size, with a decrease in size with ongoing lactation in bovine milk (Altenhofer et
al. 2015; Fleming et al. 2017). The role of milk production traits is more equivocal in the
literature, however recent evidence suggests that fat-protein ratio and fat content are
positively related to MFG size (Couvreur and Hurtaud, 2017; Martini et al. 2016).
Possible environmental determinants of MFG size are season and diet. For example,
rations with a high-concentrate-to-low-forage ratio have been shown to result in smaller
average MFG sizes compared to a low-concentrate-to-high-forage diet (Mesilati-Stahy et
al. 2015). Several studies also suggested that MFG size is subject to seasonal changes,
however the reported effects are often conflicting, mainly because the results are
confounded by the association of season with nutrition in pasture fed herds, and with
63
stage of lactation in herds that practice seasonal calving. Fleming et al. (2017) reported
larger average MFG in spring compared to the rest of the year, whereas Logan et al.
(2014) showed the opposite with smaller MFG in spring than in autumn. However, in the
study by Fleming et al. (2017) management practices and nutrition of the studied herds
were unknown and Logan et al. (2014) used a herd practicing seasonal calving. Others
have reported no effect of season on MFG size in goats (Salari et al. 2016).
This study examines on-farm and physiological determinants of MFG size, including
a broad range of animal and milk production measurements. The MFG size distribution
was measured on four sampling days over a one-year period, with one sampling day in
each season.
MATERIALS AND METHODS
Animals and Nutritional Management
The animals used in this study are part of the herd at the University of Melbourne
Dookie Dairy in northern Victoria, Australia (latitude 36°25'31.3"S, longitude
145°42'36.6"E). The farm consists of 0.41 km2 of border-check flood irrigated pasture,
divided in three grazing areas and a feed pad. Pastures are predominantly perennial
ryegrass (Lolium perenne) and white clover (Trifolium repens). The herd consists of
approximately 145 Holstein-Friesian cows, aged between 1.65 and 7.86 years. The cows
calve at variable times throughout the year. During the year of this study, 55 of the cows
had calved in autumn (32.4%), 55 (32.4%) in winter, 41(24.1%) in spring and 19 (11.1%)
in summer. The cows are milked by an automatic milking system (Lely Astronaut; Lely,
Maassluis, The Netherlands). They enter the dairy voluntarily for milking and milking is
performed with automatic cup attachment trough a laser-based teat detection system as
part of the robotic arm. The cows’ diet consists of concentrates (cereal grain-based
64
pellets) and ad libitum pasture, as well as silage and hay when there is insufficient pasture
to meet the herd’s nutritional requirements. The concentrate (Optimilk Lacta Max,
Rivalea Australia - Stockfeeds, Corowa NSW, Australia) is fed during milking in the
robot (Lely Astronaut) and cows can finish their individually allocated feed in a feeding
station (Lely Cosmix) after milking. Information about the metabolisable energy value of
pasture, silage and hay and the calculations used to determine concentrate allowance for
each individual cow are provided in the Supplementary File.
Milk Sampling
A total of 274 milk samples from 140 individual cows were taken during the afternoon
milking period (13.00 to 18.00) using an automatic sampling system (Lely Shuttle) which
samples an aliquot (20 mL) of the entire milking volume. Samples were transported to
the laboratory and stored on ice and analysed for MFG size the next day. Sampling was
performed once per season over a period of one year, with T1 in winter (n = 51 cows), T2
in spring (n = 54), T3 in summer (n = 95) and T4 in autumn (n = 74). This resulted in
sampling frequencies between one and three times for each cow, because not all cows
were in milk at all four sampling days or did not enter the dairy for afternoon milking on
some sampling days. The year-round calving pattern within our herd allowed us to study
the effect of stage of lactation independently from season. Therefore, the effect of
nutritional variables such as diet on a whole-herd level and concentrate intake of
individual animals were also included to estimate the true effects of seasonal variation on
MFG size. The analysis only includes milk samples from cows with a minimum of 10
days in milk (DIM).

65
Recording of Animal and Production Traits
All variables except MFG size (milk yield (kg), DIM, concentrate intake (kg), number
of milkings, parity, fat indication (%), protein indication (%), days pregnant, rumination
minutes, somatic cell count, weight (kg), age (years) and concentrate per 100 kg of milk)
were recorded by the T4C software (Lely), which is the operating system for the Lely
Astronaut automatic milking systems. Furthermore, fat yield and fat:protein ratios were
calculated based on these variables. This saved data was used to calculate averages for a
period of seven days prior to sampling, which was chosen as an appropriate timeframe to
allow variables such as a change in diet or temperature to be reflected in MFG size
measurements. For cow weight the maximum value recorded during the seven days prior
to MFG size analysis was used because cows frequently step outside the balance area,
leading to outliers below their actual weight. DIM and age represent the values on the day
of sampling. Minimum and maximum temperatures were defined as the lowest and
highest recorded temperatures during the seven days prior to sampling. Local weather
data was obtained from the University of Melbourne Dookie Campus weather station
(latitude E36°23'05.8"S, longitude 145°42'51.2"E) (Anonymous, 2018). Average feed
composition was calculated daily for the whole herd and is described in the
Supplementary File.
MFG Size Analysis
The distribution of MFG size was measured as previously described (Logan et al.
2014). Briefly, fresh milk samples were diluted 1:1 with 35 mM EDTA, pH 7.0 to
dissociate casein micelles and the MFG size distribution was analysed by dynamic light
scattering using a Mastersizer 2000 (Malvern Instruments, Malvern, UK). The
obscuration rate was kept between 12 to 15% and globule and water refractive indices

66
were estimated as 1.46 and 1.33, respectively (Michalski et al., 2001). The particle
absorption coefficient was 0.001. The volume-weighted mean diameter D4,3 was used as
the measure for particle size distribution in this study.
Statistical Analysis
Statistical analysis was performed using GenStat statistical analysis software (GenStat
for Windows 16th Edition, VSN International, Hemel Hempstead, UK). Linear mixed
models were fitted to predict the single variable effects of each measured variable. This
analysis identified ten potential explanatory variables that also had a statistically
significant effect on MFG size (p < 0.05, Tables S1 and S2, Supplementary File). The
variables with significant effects on MFG size included five milk production traits (milk
yield, fat percentage, fat yield, number of milkings and fat-protein ratio), four
physiological variables (DIM, parity, days pregnant, age) and concentrate intake during
milking. However, because the fixed effects are highly correlated (see Figure S1
Supplementary File), six variables were selected to study their additive effects on MFG
size. A linear mixed model fitted additive effects of six selected variables on MFG size;
this is referred to as the multiple variable model. The individual cow’s identification
numbers and time of sampling were included in the models as random effects. The only
exception was the estimation of the effect of sampling day, where only animal number
was included as a random effect. The effect of sampling day, as an indicator for seasonal
effects, stage of lactation, classified into early (< 100 DIM), mid (100 to 200 DIM) and
late (> 200 DIM) and parity were further analysed. Mean differences between factor
levels were estimated, and Fisher’s LSD method was used to calculate confidence
intervals for those differences. Graphs were produced using Minitab 17 Statistical
Software (Minitab Inc., State College, PA).

67
RESULTS
Milk fat globule size
The average MFG size for individual cows within our herd ranged from 2.70 to
5.69 µm throughout the year of this study, with around 50% of the cows producing MFG
sizes between 3.80 and 4.40 µm and 25% producing MFG smaller or larger than 3.80 and
4.40 µm, respectively (Figure 1).
Sampling day, diet, environmental temperature and milking frequency
In our study, the day of sampling did not lead to a statistically significant difference in
average MFG size (F (175.2) = 1.93, p = 0.130. The effect of sampling day was used as
an indicator for seasonal effects. Pairwise comparisons between sampling days showed
the largest shift in average MFG size between spring and autumn sampling days, with
larger globules in milk sampled on the autumn day (4.18 µm) compared to the spring day
(4.01 µm). Average MFG size on the summer and autumn sampling days tended to be
slightly higher compared to winter and spring sampling days (Figure 1).
Table 1 shows the calculated composition of the cows’ diet for each sampling day.
While average concentrate consumption for the whole herd was relatively constant across
the four sampling days, the proportion of pasture and silage varied. For example, in spring
the cows’ diet comprised 57% pasture and no silage on the spring sampling day compared
to 43% silage and 7% pasture on the winter sampling day. The proportions of silage and
pasture were more balanced on the autumn and summer sampling days (Table 1).
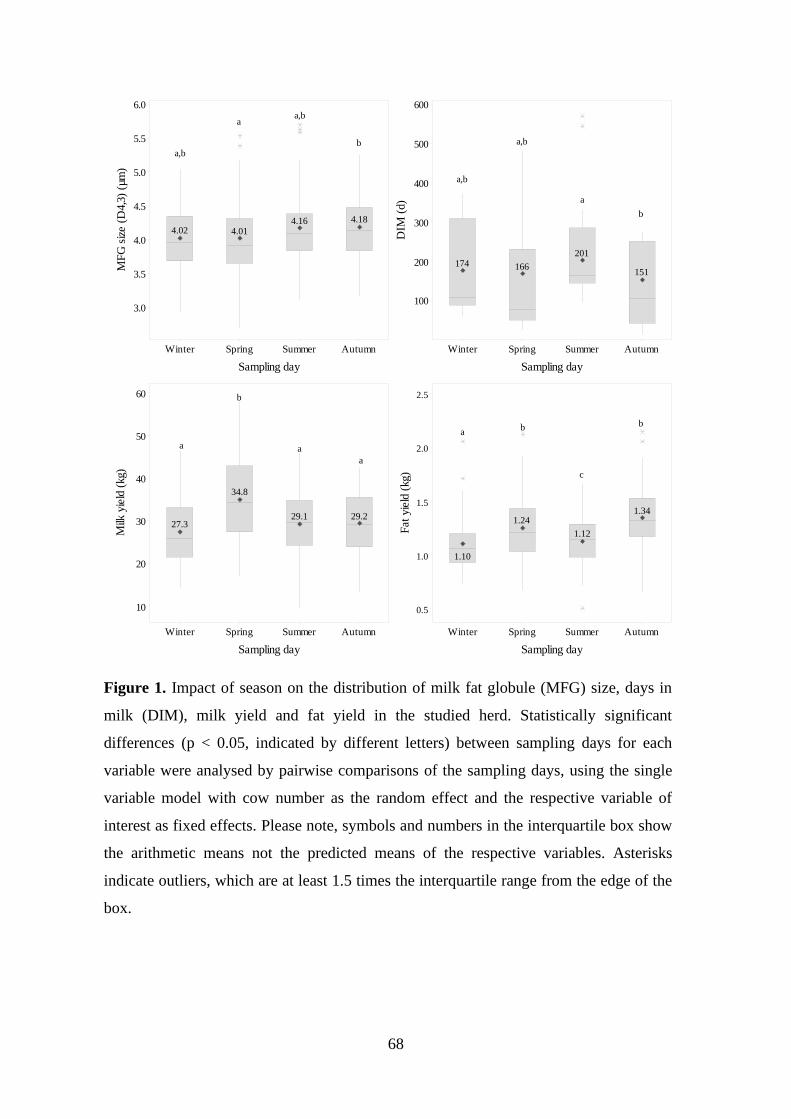
68
Figure 1. Impact of season on the distribution of milk fat globule (MFG) size, days in
milk (DIM), milk yield and fat yield in the studied herd. Statistically significant
differences (p < 0.05, indicated by different letters) between sampling days for each
variable were analysed by pairwise comparisons of the sampling days, using the single
variable model with cow number as the random effect and the respective variable of
interest as fixed effects. Please note, symbols and numbers in the interquartile box show
the arithmetic means not the predicted means of the respective variables. Asterisks
indicate outliers, which are at least 1.5 times the interquartile range from the edge of the
box.
AutumnSummerSpringWinter
6.0
5.5
5.0
4.5
4.0
3.5
3.0
Sampling day
MF
G s
ize (
D4,3
) (µ
m)
AutumnSummerSpringWinter
600
500
400
300
200
100
Sampling day
DIM
(d)
AutumnSummerSpringWinter
60
50
40
30
20
10
Sampling day
Milk
yie
ld (
kg)
AutumnSummerSpringWinter
2.5
2.0
1.5
1.0
0.5
Sampling day
Fat
yie
ld (
kg)
4.184.164.014.02
151
201
166174
29.229.1
34.8
27.3
1.34
1.12
1.24
1.10
a,b
aa,b
b
a,b
a,b
a
b
a
b
a
a
b ba
c

69
Table 1. Environmental temperature and diet composition for the whole herd on
the sampling days in winter, spring, summer and autumn
Winter
(Jun 2016)
Spring
(Oct 2016)
Summer
(Jan 2017)
Autumn
(May 2017)
Weather
Tave (°C) 6.4 12.7 24.1 10.7
Tmin (°C) -0.5 1.4 10.5 2.9
Tmax (°C) 13.2 24.7 40.3 20.3
Relative humidity (%) 95.9 68 55.4 82
Rainfall (mm) 1.8 0.5 0 0.3
Diet
Total ME intake
(MJ per cow per day)
178.5 225.9 213.9 223.1
% Concentrate 49.6 42.7 46.1 39.4
% Silage 43.1 0.0 32.9 38.4
% Pasture 7.2 57.3 21.0 22.3
All numbers are averages from the seven days prior to MFG size measurements. Tmin
and Tmax are the lowest and highest recorded temperatures in the seven days prior to
sampling.
ME = metabolisable energy.
Physiological state and milk production traits
The cows in the studied herd calve all year round, which is reflected in the wide range
of DIM for each sampling day and statistically similar average DIM (Figure 1).
Furthermore, the herd comprises cows of different ages and parities (1.65 to 7.93 years
and 1 to 6 lactations, respectively) and a variety of milk production traits (Figure 1). The
current study identified parity, stage of lactation and milk yield as main effects impacting
MFG size (Table 2). MFG size decreased with ongoing lactation by 0.20 µm per 100 DIM
(p < 0.001, Table 2). A shift towards larger MFG size by 0.16 µm between cows in second
and third lactation was also observed (p = 0.031, Table 2). Milk yield was negatively
related to MFG size with a decrease in size by 0.16 µm for every 10 additional litres of
milk per day (p = 0.047, Table 2). However, fat yield and the number of milkings per day
did not affect MFG size and only a small decrease in MFG size was observed per kg of
concentrate in the cows’ diet (-0.03 µm, p = 0.096, Table 2).

70
Table 2. Effects of selected variables on the average milk fat globule (MFG) size
Explanatory variable Mixed effect on MFG
size (µm)
95% Confidence
interval P - value
Milk yield (× 10 kg) -0.16 -0.32, -0.01 0.047
DIM (× 100 d) -0.20 -0.26, -0.14 < 0.001
Concentrate intake (kg) -0.03 -0.06, 0.01 0.096
Number of milkings 0.10 -0.07, 0.27 0.240
Fat yield (kg) 0.30 -0.06, 0.67 0.134
Parity 0.009
Comparison between adjacent factor levels for parity
Factor levels
Mean difference for
mixed effects (µm)
95% Confidence
interval P - value
2 - 1 0.16 -0.09, 0.41 0.207
3 - 2 0.16 0.01, 0.31 0.031
4 - 3 0.11 -0.04, 0.25 0.149
5 - 4 0.09 -0.16, 0.34 0.481
Cow number and sampling day are included as random effects.
DIM = days in milk.
DISCUSSION
Milk fat globule size
The considerable variation in average MFG size between individual cows is in
accordance with previous studies investigating the MFG size distribution within a herd
(Logan et al. 2014) or across several herds (Fleming et al. 2017). Logan et al. (2014)
measured the MFG size distribution within the herd once in spring and twice in autumn
over two consecutive years and the average MFG sizes ranged between 2.5 and 5.7 µm.
This considerable variation in MFG size between cows within the one herd of the same
breed, exposed to the identical environmental conditions and fed the same diet, which
was reported in the study by Logan et al. (2014), led us to hypothesise that physiological
differences between individual animals rather than management practice and
environmental conditions are in part responsible for their characteristic MFG size. This
hypothesis was confirmed by the results of our current study.

71
Sampling day, diet, environmental temperature and milking frequency
Season is often mentioned as a determinant of MFG size because of its known effect
on milk fat composition (Briard et al. 2003; Logan et al. 2014). However, there is very
little published data about the effect of season on MFG size, partly because it is tightly
associated with stage of lactation in herds that practice seasonal calving. The year-round
calving pattern in our herd allowed us to estimate the effect of sampling day, across all
seasons, more independently from the confounding effect of stage of lactation, which is
a limitation of many studies in the literature. The results indicate a limited impact of
seasonal effects. However, sampling was performed only once per season, which is a
limitation of our study.
Spring sampling stood out as a period with increased pasture intake and milk yield
(Figure 1, Table 1). Therefore, changes in milk and fat yield could possibly explain the
observed differences between the four days sampled across the seasons. However,
average MFG size on the day in winter (4.02 µm) was very similar to the one in spring
(4.01 µm), while an increase in milk yield was only observed on the spring day.
Accordingly, average fat yields were similar between the autumn and spring days despite
the difference in average MFG size (Figure 1).
While daily concentrate intake was recorded for each cow, we did not measure
individual pasture and silage intake. However, we calculated an estimated intake of
pasture and silage for the whole herd (Table 1). Based on these assumptions we suggest
that differences observed between sampling days across the four seasons cannot be
attributed to the changes in diet. For example, average MFG size was similar between
winter and spring sampling times, when the composition of the diet was markedly
different. Pasture intake on the winter day was very low (7.2%) and silage intake was
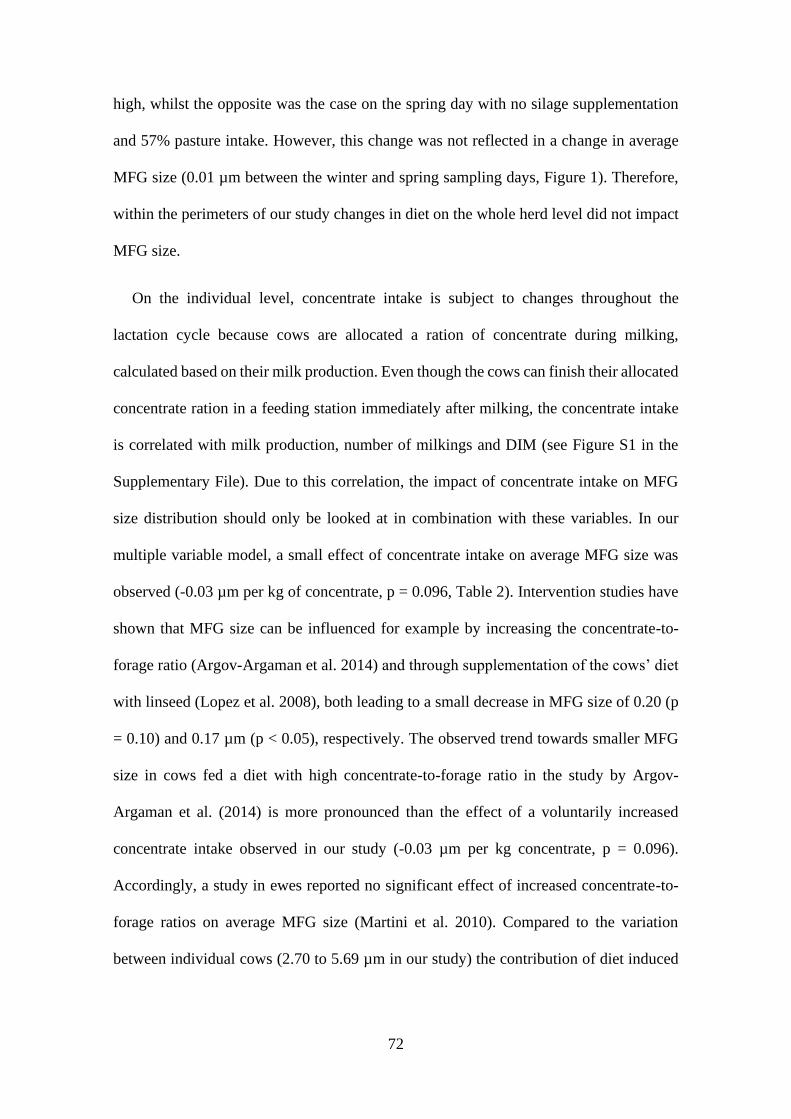
72
high, whilst the opposite was the case on the spring day with no silage supplementation
and 57% pasture intake. However, this change was not reflected in a change in average
MFG size (0.01 µm between the winter and spring sampling days, Figure 1). Therefore,
within the perimeters of our study changes in diet on the whole herd level did not impact
MFG size.
On the individual level, concentrate intake is subject to changes throughout the
lactation cycle because cows are allocated a ration of concentrate during milking,
calculated based on their milk production. Even though the cows can finish their allocated
concentrate ration in a feeding station immediately after milking, the concentrate intake
is correlated with milk production, number of milkings and DIM (see Figure S1 in the
Supplementary File). Due to this correlation, the impact of concentrate intake on MFG
size distribution should only be looked at in combination with these variables. In our
multiple variable model, a small effect of concentrate intake on average MFG size was
observed (-0.03 µm per kg of concentrate, p = 0.096, Table 2). Intervention studies have
shown that MFG size can be influenced for example by increasing the concentrate-to-
forage ratio (Argov-Argaman et al. 2014) and through supplementation of the cows’ diet
with linseed (Lopez et al. 2008), both leading to a small decrease in MFG size of 0.20 (p
= 0.10) and 0.17 µm (p < 0.05), respectively. The observed trend towards smaller MFG
size in cows fed a diet with high concentrate-to-forage ratio in the study by Argov-
Argaman et al. (2014) is more pronounced than the effect of a voluntarily increased
concentrate intake observed in our study (-0.03 µm per kg concentrate, p = 0.096).
Accordingly, a study in ewes reported no significant effect of increased concentrate-to-
forage ratios on average MFG size (Martini et al. 2010). Compared to the variation
between individual cows (2.70 to 5.69 µm in our study) the contribution of diet induced

73
changes in MFG size are limited, supporting our hypothesis that inherent physiological
differences may be more important determinants of MFG size.
The average number of milkings per day did not have a statistically significant impact
on MFG size (effect per milking 0.10 µm, p = 0.240, Table 2). Automatic milking
systems such as the one used on our research farm, have been shown to have no effect on
MFG size if the number of milkings is the same as in a conventional milking parlour
(Abeni et al. 2005). However, milking frequency is often increased in automatic milking
compared with conventional milking systems, leading to higher total milk yields, which
could in turn impact MFG size. Accordingly, Wiking et al. (2006) reported an increase in
average MFG size when milking frequency was doubled from twice to four times daily.
This is particularly interesting because the study was performed by milking one udder
half twice and the other half four times daily, allowing the authors to look at the effect of
increased milking frequency independently from individual cow effects. In our study, the
average milking frequency for individual cows on the four sampling days ranged from
1.6 to 3.9 milkings per day. However, the effect of the number of milkings per day on
MFG size were not statistically significant (0.10 µm for each additional milking,
p = 0.240, Table 2). This indicates that the reported effect of the increased milking
frequency in our study was in part due to its correlation with other explanatory variables.
For example, cows in later stages of lactation tend to come in for milking less frequently
(Figure S1 Supplementary File) and have smaller average MFG (see discussion on stage
of lactation). Overall, the number of milkings likely does not have a strong impact on
MFG size in a system where cows are free to determine their own milking frequency.
Although, a small effect might be present as shown in the study by Wiking et al. (2006),
where the average MFG size increased by 0.08 µm. Indeed, the estimated effect in our
study is of this magnitude.

74
Physiological state and milk production traits
We confirm a major role for stage of lactation in the determination of MFG size and
further suggest that parity (the number of lactations) has a significant impact on MFG
size (Figure 2, Table 2). Furthermore, we observed an inverse relationship between milk
yield and MFG size (-0.16 µm per 10 L of milk produced, p = 0.047, Table 2), whilst fat
yield did not significantly impact MFG size (0.30 µm, p = 0.134, Table 2).
Figure 2. Milk fat globule (MFG) size distribution for cows in different stages of lactation
and parities. Cows were grouped in early (< 100 DIM), mid (100 – 200 DIM) and late
(> 200 DIM) lactation for the purpose of this analysis. Statistically significant differences
(p < 0.05, indicated by different letters) in MFG size between the groups were analysed
by pairwise comparisons, using the single variable model with cow number and sampling
day as the random effects and the respective variable of interest as fixed effects. Please
note, symbols and numbers in the interquartile box show the arithmetic means not the
predicted means of the respective variables. Asterisks indicate outliers, which are at least
1.5 times the interquartile range from the edge of the box.
A higher milk yield in cows producing milk with smaller average MFG size has been
reported previously (Couvreur et al. 2007; Mesilati-Stahy et al. 2015). Furthermore,
several studies have shown that cows producing milk with a lower fat percentage also
latemidearly
6.0
5.5
5.0
4.5
4.0
3.5
3.0
Lactation stage
MF
G s
ize
(D4
,3)
(µm
)
54321
6.0
5.5
5.0
4.5
4.0
3.5
3.0
Parity
MF
G s
ize
(D4
,3)
(µm
)
4.19
3.87
4.29 4.344.234.20
3.863.94
a
b
c
a a
bb
b

75
produce smaller MFG (Altenhofer et al. 2015; Mesilati-Stahy et al. 2015). This can be
indicative of a higher total milk yield due to a dilution effect in cows secreting the same
or increased total fat yield in a larger volume of milk (Couvreur et al. 2007). More
specifically, the multiple variable model suggests that when comparing cows in the same
stage of lactation the ones producing more milk, and possibly the ones that consume more
concentrate, are predicted to exhibit smaller MFG size distributions. Conflicting results
about the relationship between MFG size and fat yield have been reported in the literature,
with some studies showing no effect of fat yield on MFG size (Couvreur et al. 2007;
Logan et al. 2014), while others report an increase in average MFG diameter with
increasing fat yields (Wiking et al. 2004).
Stage of lactation, expressed as DIM, had a statistically significant impact on MFG
size. This is consistent with previous studies, which also report a decrease in MFG size
between early and mid-lactation, however not always between mid and late lactation
(Abeni et al. 2005; Altenhofer et al. 2015; Fleming et al. 2017). The inverse relationship
between MFG size and DIM can be attributed to a limited availability of membrane
material in early and possibly mid lactation, where milk production and fat yield are high
(Wiking et al. 2004; Altenhofer et al. 2015). In our study, a steady decrease in milk and
fat yield from early-to-mid and from mid-to-late lactation was also observed (data not
shown). Therefore, the decrease in fat yield is a possible explanation for the decrease in
MFG size with ongoing lactation. However, the effect of fat yield was not statistically
significant in our study (p = 0.134, Table 2).
We hypothesise that underlying differences on a physiological and possibly molecular
level are the true determinants of MFG size and that animal and milk production traits
only account for some of the variation seen between individual cows. Overall, the
estimated change in MFG size that can be attributed to different stages of lactation is a

76
decrease of 0.60 µm over a nominal 300-day lactation cycle. This effect therefore does
not sufficiently explain the variation between individual animals, ranging from 2.70 to
5.69 µm in average MFG size.
Differences in average MFG size were also observed, when first and second parity
cows were compared to cows with three or more lactations. A similar effect of parity on
MFG size was previously shown in ewes, with first parity animals producing milk with
smaller average MFG size (Martini et al. 2004). Conversely, a recent study by (Fleming
et al. 2017) showed no significant impact of parity on MFG size distribution in dairy
cows. This extensive study also investigated additive effects of several physiological and
environmental variables on MFG size using a linear mixed model. However, 399
individual cows from 44 herds were used as opposed to a single herd in our study. A total
of 30 cows from the 140 examined in our study were sampled over two consecutive
lactation numbers. It is possible that in the study by Fleming et al. (2017) the effect of
parity was relatively small compared to between-herd and between-breed variations,
while following the same herd over a one-year period allowed us to capture the
independent effect of parity on MFG size.
Overall, the most dominant variables with impact on MFG size identified in our study
are physiological parameters. This could indicate that dynamic changes in lipid
metabolism throughout the cow’s lactation cycle (stage of lactation) and the life cycle
(different parities) could drive changes in MFG size. Furthermore, potential differences
in the lipid metabolism could also be genetically determined traits and could provide an
explanation for the variation in MFG size between individual animals. For example,
changes in the origin of fatty acids (FA) incorporated into milk are different throughout
the lactation cycle. Previous studies suggest that lipids in milk from cows in early
lactation are predominantly derived from body fat stores and circulating FA derived from

77
the cow’s diet (Gross et al. 2011). In mid and late lactation, however, FA are increasingly
derived from de novo FA synthesis.
CONCLUSION
We conclude that some of the variation in MFG size seen in dairy cows can be
attributed to changes in physiological state of the animal, i.e. stage of lactation and parity;
and, in our study, these variables outweighed the effect of seasonal changes in the diet
and weather conditions. However, the estimated effects of these variables cannot account
for the overall variation in MFG size between individual animals and the span of average
MFG size distributions observed in our herd (3 µm) exceeds the effect of stage of
lactation, the most dominant variable impacting MFG size in our study, by 5-fold. We
suggest that MFG size could be characteristic for each individual animal, possibly based
on differences in their lipid metabolism.
ACKNOWLEDGMENTS
We acknowledge Kenny Oluboyede and Ashley Gabler for their support with all
aspects of data and milk collection, as well as Dr Paula Gonzalez-Rivas and the students
at our farm for their help with sampling. We also acknowledge the Melbourne Statistical
Consulting Platform for their support with this work.

78
REFERENCES
Abeni F, Degano L, Calza F, Giangiacomo R & Pirlo G 2005 Milk Quality and
Automatic Milking: Fat Globule Size, Natural Creaming, and Lipolysis. Journal
of Dairy Science 88 3519–3529
Altenhofer C, Holzmüller W, Wolfertstetter F, Ribeiro DW, Kulozik U, Pfaffl MW
& Viturro E 2015 Temporal variation of milk fat globule diameter, fat and
cholesterol content and milk epithelial cell gene expression in dairy cows.
International Journal of Dairy Technology 68 519–526
Anonymous 2018 Dookie College Weather. Accessed March 25 2018
http://203.24.62.96/wpdookiecollege/weather/index.html
Argov-Argaman N, Mesilati-Stahy R, Magen Y & Moallem U 2014 Elevated
concentrate-to-forage ratio in dairy cow rations is associated with a shift in the
diameter of milk fat globules and remodeling of their membranes. Journal of
Dairy Science 97 6286–6295
Briard V, Leconte N, Michel F & Michalski MC 2003 The fatty acid composition of
small and large naturally occurring milk fat globules. European Journal of Lipid
Science and Technology 105 677–682
Carroll SM, DePeters EJ, Taylor SJ, Rosenberg M, Perez-Monti H & Capps VA
2006 Milk composition of Holstein, Jersey, and Brown Swiss cows in response to
increasing levels of dietary fat. Animal Feed Science and Technology, Special
Issue: Modifying Milk Composition 131 451–473
Couvreur S & Hurtaud C 2017 Relationships between milks differentiated on native
milk fat globule characteristics and fat, protein and calcium compositions. animal
11 507–518
Couvreur S, Hurtaud C, Marnet PG, Faverdin P & Peyraud JL 2007 Composition
of milk fat from cows selected for milk fat globule size and offered either fresh
pasture or a corn silage-based diet. Journal of Dairy Science 90 392–403
Evers JM 2004 The milkfat globule membrane - compositional and structural changes
post secretion by the mammary secretory cell. International Dairy Journal 14
661–674
Fleming A, Schenkel FS, Chen J, Malchiodi F, Ali RA, Mallard B, Sargolzaei M,
Corredig M & Miglior F 2017 Variation in fat globule size in bovine milk and
its prediction using mid-infrared spectroscopy. Journal of Dairy Science 100
1640–1649
79
Fox PF & Kelly AL 2012 Chemistry and Biochemistry of Milk Constituents. In Food
Biochemistry and Food Processing, pp. 442–464 (Ed. BK Simpson). Hoboken,
USA: Wiley-Blackwell
Gross J, van Dorland HA, Bruckmaier RM & Schwarz FJ 2011 Milk fatty acid profile
related to energy balance in dairy cows. Journal of Dairy Research 78 479–488
Logan A, Auldist M, Greenwood J & Day L 2014 Natural variation of bovine milk fat
globule size within a herd. Journal of Dairy Science 97 4072–4082
Lopez C, Briard-Bion V, Menard O, Rousseau F, Pradel P & Besle JM 2008
Phospholipid, Sphingolipid, and Fatty Acid Compositions of the Milk Fat Globule
Membrane are Modified by Diet. Journal of Agricultural and Food Chemistry 56
5226–5236
Martini M, Scolozzi C, Cecchi F & Abramo F 2004 Morphometric analysis of fat
globules in ewe’s milk and correlation with qualitative parameters. Italian Journal
of Animal Science 3 55–60
Martini M, Liponi GB & Salari F 2010 Effect of forage:concentrate ratio on the quality
of ewe's milk, especially on milk fat globules characteristics and fatty acids
composition. Journal of Dairy Research 77 239–244
Martini M, Altomonte I, Bortoluzzi Moro A, Caneppele C & Salari F 2016 Influence
of fat content on quality of cow's milk. Italian Journal of Food Science 29 138–
144
McManaman JL 2012 Milk lipid secretion: recent biomolecular aspects. Biomolecular
Concepts 3 581–591
Mesilati-Stahy R, Moallem U, Magen Y & Argov-Argaman N 2015 Altered
concentrate to forage ratio in cows ration enhanced bioproduction of specific size
subpopulation of milk fat globules. Food Chemistry 179 199–205
Michalski MC, Briard V & Michel F 2001 Optical parameters of milk fat globules for
laser light scattering measurements. Le Lait 81 787–796
Salari F, Altomonte I, Ribeiro NL, Ribeiro MN, Bozzi R & Martini M 2016 Effects
of season on the quality of Garfagnina goat milk. Italian Journal of Animal
Science 15 568–575
Singh H & Gallier S 2017 Nature’s complex emulsion: The fat globules of milk. Food
Hydrocolloids 68 81–89
Thorning T, Raben A, Tholstrup T, Soedamah-Muthu S, Givens I & Astrup A 2016
Milk and dairy products: good or bad for human health? An assessment of the
totality of scientific evidence. Food & Nutrition Research 60 32527

80
Wiking L, Nielsen JH, Båvius AK, Edvardsson A & Svennersten-Sjaunja K 2006
Impact of Milking Frequencies on the Level of Free Fatty Acids in Milk, Fat
Globule Size, and Fatty Acid Composition. Journal of Dairy Science 89 1004–
1009
Wiking L, Stagsted J, Björck L & Nielsen JH 2004 Milk fat globule size is affected by
fat production in dairy cows. International Dairy Journal 14 909–913

81
Supplementary data
Supplementary Methods
Metabolisable energy (ME) value of the feed
Silage (9.4 MJ ME per kg dry matter (DM), 14.1% crude protein per kg DM, 56%
neutral detergent fiber (NDF) per kg DM is fed predominately on the feed pad and cows
are offered three breaks of pasture each day. Pasture feed quality varies throughout the
year, with the lowest quality in summer (January; 9.3 MJ ME per kg DM, 18.8% crude
protein per kg DM, 55% NDF per kg DM) and the highest quality in winter (August; ME
11.8 MJ ME per kg DM, 25.3% crude protein per kg DM, 37.9% NDF per kg DM). Feed
composition of silage was previously tested by a feed testing laboratory (Feed Quality
Service at the Wagga Wagga Agricultural Institute, Wagga Wagga, NSW, Australia) and
pasture composition for each month was obtained through the Perennial Pastures
Database provided by the Department of Primary Industries Victoria (2018). The
concentrate (12.5 MJ ME per kg DM, 16% crude protein; Optimilk Lacta Max, Rivalea
Australia - Stockfeeds, Corowa NSW, Australia) is fed during milking in the robot (Lely
Astronaut) and cows can finish their individually allocated feed in a feeding station (Lely
Cosmix) after milking.
Calculations for the concentrate allowance of individual animals
Daily concentrate allowance for the individual animal is calculated based on milk
production as follows: animals > 28 days in milk (DIM) were fed up to 5 kg concentrate
per day for cows producing less than 20 kg of milk; 7 kg for cows producing 20 to 25 kg;
8 kg for cows producing 25 to 30 kg; 9 kg for cows producing 30 to 35 kg; 10 kg for cows
producing 35 to 40 kg and 11 kg for cows producing more than 40 kg of milk per day.

82
Concentrate intake for cows in the first 28 DIM is sequentially increased from 5 kg on
the first day, 7 kg per day between day 1 to day 14 and then 9 kg per day up to day 28.
Calculations for the daily average feed composition of the whole herd
The cows’ average concentrate intake was recorded by the T4C software and silage
intake was estimated based on the amount offered in the feed pad and estimated wastage
rates. Pasture intake was estimated by a back-calculation technique. The energy from
pasture intake was estimated by first calculating the animals’ total energy requirements
and then subtracting the energy supplied from concentrate and silage. The animals’ total
energy requirements were calculated according to the procedures of Primary Industries
Standing Committee (2007), using daily milk production and milk composition, body
weight and gestation.
Limitations of our study
Measurements of fat percentage in our study are based on in-line measurements using
near infrared spectroscopy, and the data obtained gives a good indication of the fat content
in raw milk. However, we observed reduced accuracy for milk with very low-fat
percentages (less than 3%), when compared to measurements made using laboratory-
based FTIR techniques (data not shown). Therefore, the results from our study only allow
us to draw limited conclusions regarding the relationship between MFG size and fat yield.

83
Supplementary Results
Table S1. Test statistics for variables included in the linear mixed models
for single variable and multiple variable effects
Explanatory variable Single variable effects Multiple variable effects
F
statistic df P-value
F
statistic df P-value
Primary variables (used in multiple variable model)
Milk yield (× 10 kg) 34.89 202.6 < 0.001 4.08 81.4 0.047
DIM (× 100 d) 75.31 179.8 < 0.001 43.71 183.9 < 0.001
Concentrate intake
(kg) 12.74 199.4 < 0.001 2.79 211.6 0.096
Number of milkings 19.49 202.0 < 0.001 1.39 230.1 0.240
Fat yield (kg) 21.23 206.4 < 0.001 2.28 107.6 0.134
Parity 23.69 133.9 < 0.001 3.50 223.5 0.009
Other variables
Fat indication (%) 21.3 196.6 <0.001 - - -
Protein indication (%) 1.2 249.6 0.266 - - -
Fat:Protein ratio 21.5 214.7 <0.001 - - -
Days pregnant 32.9 170.6 <0.001 - - -
Rumination minutes 0.5 260.4 0.480 - - -
SCC indication
(× 103 cells per mL) 0.6 218.2 0.445 - - -
Weight (kg) 0.8 205.9 0.359 - - -
Age 4.9 113.0 0.029 - - -
Concentrate (kg) per
100 kg milk 2.0 166.2 0.156 - - -
Cow number and sampling day are included as random effects.
SCC = somatic cell count.

84
Table S2. Effects of selected variables on the average milk fat globule (MFG) size
fitted using single variable linear mixed models
Explanatory variable
Single effect on MFG
size (µm)
Confidence
interval P - value
Milk yield (× 10 kg) 0.18 0.12, 0.24 < 0.001
DIM (× 100 d) -0.16 -0.19, -0.12 < 0.001
Concentrate intake (kg) 0.04 0.02, 0.06 < 0.001
Number of milkings 0.25 0.14, 0.35 < 0.001
Fat yield (kg) 0.47 0.27, 0.67 < 0.001
Parity < 0.001
Stepwise comparison between factor levels for parity
Factor levels
(number of lactations)
Mean difference for
single effect (µm)
Confidence
interval P - value
2 - 1 0.05 -0.22, 0.31 0.735
3 - 2 0.30 0.15, 0.45 < 0.001
4 - 3 0.12 -0.04, 0.28 0.144
5 - 4 0.04 -0.24, 0.31 0.801
Other variables
Fat indication (%) -0.18 -0.26, -0.10 < 0.001
Protein indication (%) -0.13 -0.36, 0.1 0.266
Fat:Protein ratio -0.75 -1.06, -0.43 < 0.001
Days pregnant -0.00 -0.00, -0.00 < 0.001
Rumination minutes 0.00 0.00, 0.00 0.480
SCC indication
(× 103 cells per mL) 0.00 0.00, 0.00 0.445
Weight (kg) 0.00 -0.00, 0.00 0.359
Age 0.06 0.01, 0.11 0.029
Concentrate (kg) per
100 kg milk -0.01 -0.01, 0.00 0.156
Cow number and sampling day are included as random effects.
DIM = days in milk.
SCC = somatic cell count.
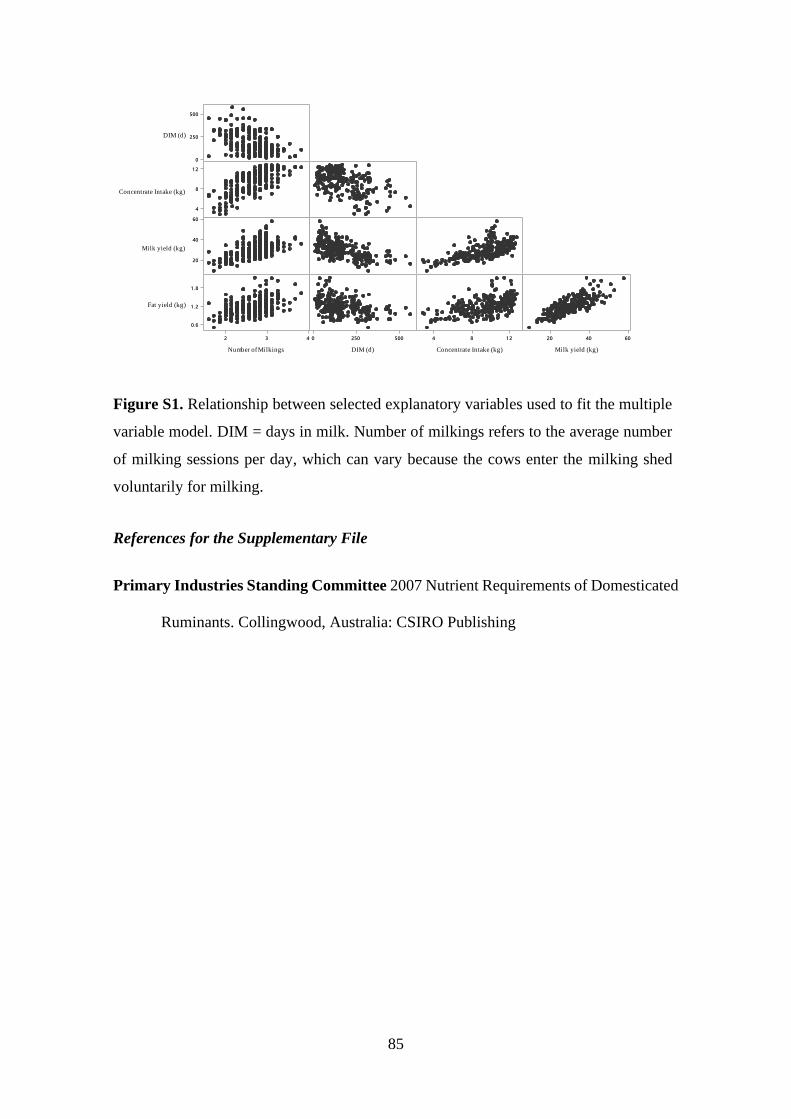
85
Figure S1. Relationship between selected explanatory variables used to fit the multiple
variable model. DIM = days in milk. Number of milkings refers to the average number
of milking sessions per day, which can vary because the cows enter the milking shed
voluntarily for milking.
References for the Supplementary File
Primary Industries Standing Committee 2007 Nutrient Requirements of Domesticated
Ruminants. Collingwood, Australia: CSIRO Publishing
500
250
0
1 2
8
4
60
40
20
432
1 .8
1 .2
0.6
5002500 1 284 604020
DIM (d)
Concentrate Intake (kg)
Milk yield (kg)
Number of Milkings
Fat yield (kg)
DIM (d) Concentrate Intake (kg) Milk yield (kg)

86
CHAPTER 4
Lipid metabolic differences in cows producing small or large milk fat globules:
Fatty acid origin and degree of saturation
Leonie Walter,1,2 Pushkar Shrestha,3 Richard Fry,1 Brian J. Leury,1 and Amy Logan2
1. Faculty of Veterinary and Agricultural Sciences, The University of Melbourne,
Parkville, Victoria, Australia 3010
2. CSIRO Agriculture and Food, Werribee, Victoria, Australia 3030
3. CSIRO Agriculture and Food, Black Mountain, Canberra, Australia 2601

87
Introduction
Chapter 4 characterised the fatty acid composition of the milk fat globule core
extracted from milk of cows that consistently produced milk with either large or small
volume weighted mean diameters in a pre-trial observation period. The milk fat globule
membrane separated from the milk fat globule core was used to measure the concentration
of the major milk fat globule membrane proteins and data obtained from this analysis is
presented in the form of an appendix.
Therefore, Chapter 4 comprises an original manuscript currently under review with the
Journal of Dairy Science, as well as addtitional experimental results and discussion in an
appendix.
88
Manuscript
ABSTRACT
This study compared cows that consistently produce milk with small (D4,3 of 2.92-3.83
µm, with an average diameter of 3.29 µm) or large (D4,3 of 4.58-5.67 µm, with an average
diameter of 4.92 µm) milk fat globule (MFG) size distributions in terms of the fatty acid
(FA) composition of the MFG core. Selected cows fell into the respective size group over
at least 3 independent measurements including an observation period prior to the
experiment. Further selection criteria were similar milk production traits between cows
(milk yield, fat yield, fat-protein ratio) and established lactation (> 50 DIM). However,
the selected groups differed in parity (parity 1-3 compared to 3-5 in the small and large
MFG groups, respectively) and the small MFG group was an average of 25 DIM later in
their lactation period. All cows were under the same nutritional management and
environmental conditions. Here we show that cows with the small or large MFG
phenotype differ in their lipid metabolism, in terms of the FA composition of the MFG
core. Our results indicate that cows with the small MFG phenotype produce milk with
higher concentrations of unsaturated FA despite being fed the same diet. We suggest that
this characteristic of the small MFG phenotype is the result of an increased uptake of long
chain FA from the blood circulation. A relationship between the degree of unsaturation
and MFG size was also identified in preliminary studies across other species, namely
camels, sheep and goats. These findings show the potential for on-farm selection of cows
(and potentially other dairy species) based on MFG size to produce milk with improved
nutrient composition. This could lead to purpose-specific separation of milk based on
MFG size and FA profile, both known to alter the milk’s technological properties.
Key words: milk fat globule size, mammalian milk, fatty acid profile

89
INTRODUCTION
Milk fat exists as milk fat globules (MFG) in the milk of mammalian species. Each
globule originates within the mammary epithelial cell (MEC) as a cytoplasmic lipid
droplet (LD) that is enveloped upon secretion with a portion of the plasma membrane of
the MEC. The result is the formation of the MFG, a lipid core surrounded by a trilayer
membrane. The LD comprises a neutral lipid core containing mainly triacylglycerols
(TAG) surrounded by a monolayer of phospholipids and proteins. Biogenesis of LD starts
either within or in close proximity to the endoplasmic reticulum (Heid and Keenan, 2005;
Robenek et al., 2009). Upon release from the endoplasmic reticulum, the LD are
transported towards the apical side of the cell and can grow in size by fusion of LD
(Masedunskas et al., 2017) or through local TAG and phospholipid synthesis on the
surface of the LD (Krahmer et al., 2011; Wilfling et al., 2013). However, the latter process
might not be relevant in MEC, because to date, the full set of enzymes required for on-
surface TAG synthesis have not been detected in proteomic analyses of the LD envelope
(Mather et al., 2019). Lipid droplet fusion, on the other hand, has been demonstrated in
the context of mammary LD growth in in vivo and in vitro studies and is believed to
depend on the polar lipid and protein composition of the LD envelope (Argov-Argaman,
2019; Mather et al., 2019). After reaching the apical plasma membrane, LD are secreted
by a budding process, which involves oxytocin stimulated contraction of the
myoepithelial cells surrounding the MEC layer (Masedunskas et al., 2017).
Differences in FA compositions between small and large MFG have been established.
For example, milk with smaller MFG tends to contain less stearic acid (C18:0), fewer de
novo synthesized FA (< C16), but higher proportions of MUFA and PUFA (Briard et al.,
2003; Couvreur and Hurtaud, 2017). Moreover, camel milk, which exhibits the smallest
MFG sizes distribution amongst the main dairy species (El-Zeini, 2006), is high in UFA

90
and contains very little short chain FA (El-Agamy, 2017). Short chain FA, on the other
hand, are more abundant in goat milk, which is also amongst the species with a smaller
average MFG size compared to cow’s milk (Park et al., 2007). The FA incorporated into
milk fat in the MEC are obtained from de novo synthesis in the mammary gland (chain
length of C4 to C16) or derived from the blood as preformed FA after hydrolysis of TAG
from the diet or adipose tissue (chain length of C16 or higher) (Palmquist, 2006). The
balance between the two pathways depends on the physiological state of the animal
(Palmquist, 2006). Therefore, the FA composition in milk provides an insight into the
origin of FA utilized for milk fat production and therefore the lipid metabolism of the
individual cow.
Here, we studied the differences between cows that consistently produce milk with
small or large MFG size distributions. To identify these animals, the whole herd was
tested over 7 sampling days across all seasons (Chapter 3 and some unpublised data).
Furthermore, many of the selected animals were sampled additional times over the year
prior to this study, resulting in 3 to 9 independent measurements per selected cow (Figure
1). The 2 groups were compared in terms of the FA composition of the MFG core, to gain
an insight into the physiological differences between animals that consistently produce
small or large MFG but are fed the same diet and are in similar stages of lactation. We
hypothesized that differences in the lipid metabolism and specifically the FA origin could
be the reason for the observed differences in MFG size between individual cows of the
same breed. In this experiment we focused on the FA composition of the LD core, because
it contains the vast majority of FA in milk and we wanted to exclude the MFGM from the
current analysis to minimize the impact of increased membrane material per unit of fat in
the small MFG phenotype. The MFGM comprises polar lipids with higher proportions of
UFA (Sánchez-Juanes et al., 2009) and the higher proportion of MFGM material in the

91
small MFG cows could therefore have impacted the interpretation of our results. A
secondary objective was to compare milks from cows with small or large MFG size
distribution to milks from sheep, goats and camels. Milks from these species generally
differ from bovine milk in their MFG size distribution, as well as their FA composition
(Park et al., 2007). We therefore compared the FA composition of the MFG core from
several mammalian species to see if these differences are universal.
MATERIALS AND METHODS
Animals and Milk Sampling
Cows. The cows selected for this study are part of the University of Melbourne Dookie
Dairy in northern Victoria, Australia (latitude 36°25'31.3"S, longitude 145°42'36.6"E).
The herd consists of approximately 145 Holstein-Friesian cows with a year-round calving
pattern and are milked using an automatic milking system (Lely Astronaut; Lely,
Maassluis, The Netherlands). The cows are pasture fed all year and are fed concentrate
(cereal grain-based pellets) during milking. When there is insufficient pasture to meet the
herd’s nutritional requirements, the cows’ diet is supplemented with silage and hay. The
12 cows selected for this study were selected based on their average MFG size, with 6
cows falling into the group with small MFG and 6 with large MFG. The experiment was
performed on 2 cohorts in separate seasons, with the first 6 cows (3 per group) sampled
in autumn and the second cohort in winter. Moreover, sampling of each cohort was
repeated approximately 2 weeks apart to obtain biological replicates for each cow. The
selected cows received the same diet during the time of this study and the concentrate
consumption was recorded for each individual cow (Table 1). Another selection criterium
was DIM, which was between 184 and 230 DIM for the first and between 57 and 135
DIM for the second cohort of cows. This selection was made based on previous
measurements of the whole herd (Chapter 3), throughout the year prior to this study. Pre-
92
trial measurements to confirm MFG size were performed on 20 mL aliquots collected
during afternoon milking (1300 to 1800h) on 7 occasions, where measurements were
performed on 50-100 animals. Additional measurements were taken for selected animals
during morning milking when milk was collected for other experimental purposes.
Particle size analysis was performed the day after milk collection following transport to
the laboratory and storage on ice. Raw milk samples (3.5 L per animal) were taken during
morning milking (0800 to 1000h) and transported to the laboratory on ice. The fat and
protein concentrations were determined using a LactoScope FTIR 20 (Delta Instruments,
Melbourne, Australia) for each cow milk sample.
Camels, Goats and Sheep. The camels selected for this study are part of the Camel
Milk Co, Kyabram, Victoria, Australia (latitude 36°21'19.7"S, longitude 144°59'53.4"E).
The goats and sheep used in this study are part of the Meredith Dairy in Meredith,
Victoria, Australia (latitude 37°50'06.9"S, longitude 143°57'51.4"E). Six camels, 6 goats
and 6 sheep were randomly selected and sampled once. Camels were wild Australian
camels, goats were a mixed breed (approximately 70% Saanen, 20% British Alpine and
10% Toggenburg) and the selected sheep included 1 Awassi, 3 East Frisian and 2
unknown mixed breeds. Raw milk samples (500 mL per animal) were taken during
morning milking for camels and during afternoon milking for goats and sheep and were
transported to the laboratory on ice. Extraction of the MFG core was performed on the
following 2 days. Proximate analysis for fat and protein concentrations in camel, sheep
and goat milk were determined according to the Australian Standard 2300 by Dairy
Technical Services, North Melbourne, Australia.
Milk Fat Globule Size Analysis

93
Laser light scattering with a Mastersizer 2000 particle analyzer (Malvern Instruments,
Malvern, UK) was used to measure MFG size distributions of the milk samples, according
to the procedure described in Logan et al. (2014). Prior to the analysis milk was diluted
1:1 with 35 mM EDTA, pH 7.0 to dissociate casein micelles. The obscuration rate was
kept between 12 to 15% and refractive indices for milk fat and water were estimated as
1.46 and 1.33, respectively. The particle absorption coefficient was 0.001. Volume-
weighted mean diameter D4,3 and surface-weighted mean diameter D3,2 were calculated
by the software and each sample was measured in duplicate.
Extraction of the MFG Core
Cows. Cow milk samples (3.2 L) were first separated into cream and skim milk, and
the cream fraction was further separated into MFGM and MFG core fractions. Whole raw
milk was centrifuged in 1 L centrifuge bottles (Nalgene, Sigma-Aldrich, Castle Hill,
NSW, Australia) at 2500 × g for 30 min at 4°C and the cream fractions were kept at 4 °C
overnight. On the next day the cream was washed thrice in 1 L of double distilled water,
using gentle agitation with a spoon for 5-10 min followed by centrifugation (2500 × g, 30
min, 4°C). The washed cream was crystallized overnight at 4 °C. On the final day, the
washed cream was churned, and the buttermilk and butter phases were separated by
filtration through a double layer of cheesecloth. The butter fraction was then heated at
70 °C for 30 min and left to solidify at 4 °C to separate the milk fat from the butter serum.
The butter serum was separated from the solid milk fat. The remaining milk fat after
separation from the butter serum represents the MFG core. The washed MFG core
fraction was kept frozen at - 80°C for FA analysis.
Camels, goats and sheep. Extraction of the MFG core fractions from whole milk
differed from the process used for cow samples, because churning was not feasible due

94
to smaller sample volumes and physical properties of camel, goat and sheep milk.
Separation of cream from skim milk was performed using 4 × 230 mL centrifuge tubes at
3500 × g for 30 min at 4 °C. Washing was performed by mixing the cream fraction with
double distilled water followed by centrifugation (3500 × g, 30 min, 4 °C). Goat and
sheep milk samples were washed thrice, while camel milk was only washed twice to
reduce losses due to the small MFG size. The washed cream was kept at 4 °C overnight.
The cream was mixed with a small volume of double distilled H2O in a 230 mL centrifuge
tube, shaken by hand for 1 min and sonicated for 5 min in a sonication water bath at room
temperature. Lastly, the tubes were placed in a water bath at 70 °C for 30 min, followed
by 15 min centrifugation at 1500 × g at 4 °C. The milk fat layer was separated from the
aqueous phase and kept at -80 °C.
Fatty Acid Analysis
The FA composition of milk fats was determined as mentioned in Shen et al. (2001)
with some modifications. Briefly, FAME of milk fat were prepared by mixing 10-20 mg
fat in a glass vial with 0.3 mL hexane and 0.3 mL 2 M potassium hydroxide in methanol
for 5 min at room temperature. After cooling down the mixture, the hexane phase was
transferred to a GC vial and was diluted four times with hexane. FAME were analyzed
by the Agilent 7890A GC (Agilent Technologies Australia, Mulgrave, VIC, Australia)
using a 30 m BPX70 Column (0.25-mm inner diameter, 0.25-µm film thickness, Trajan
Scientific and Medical, Ringwood, VIC, Australia). The column temperature was set for
3 min at 40 °C, followed by raising the temperature at a rate of 20 °C/min to 160 °C,
which was held for 16 min. The column temperature was further raised to 240 °C at a rate
of 20 °C/min and held at this temperature for 3 min. Helium was used as a carrier gas.
The injector temperature was programmed at 240 °C with 11.691 psi pressure and 55.58
mL/min flow of helium. The samples were injected in the split mode with a ratio of 50:1

95
and with a split flow of 51.549 mL/min. The FID detector temperature was 280 °C with
a flow of 40 mL /min hydrogen gas and 400 mL/min of air. FAME peaks were identified
on the basis of retention time of FAME standards (GLC-607, GLC-674 from NuChek
INC., USA and the milk fat reference CRM164 obtained from CSIRO, Agriculture and
Food). Peak areas of GLC 607 were used to determine the response factors for individual
FAME peaks in the GC and were applied to correct the area percentages of the milk
FAME peaks.
Statistical Analysis
Statistical analysis was performed using R version 3.5.1 (R Core Team, 2018). Duplicate
measurements of individual cows were averaged and a two-way ANOVA was fitted, with
group, DIM and sampling season as fixed effects. The model was fitted using the ‘lm’
function in combination with the ‘tidy’ function from the ‘broom’ package (Robinson and
Hayes, 2018). The p-values were adjusted for multiple testing using the procedure by
Benjamini and Hochberg (1995), which was applied individually per dataset, namely the
milk production data analysis (Table 1), the grouped FA analysis (Table 2) and the
individual FA analysis (Table 3). Statistical significance was assumed for p-values < 0.05
and p-values < 0.10 were defined as trends towards statistical significance. Means and
95% confidence intervals were calculated. Graphs were produced using the ‘ggplot2’
package (Wickham, 2016).
RESULTS AND DISCUSSION
Milk Fat Globule Size Distribution
Milk was collected from cows shown to consistently produce milk of either small or large
MFG size distributions, selected through an observation period prior to this study
(Chapter 3). According to the pre-trial measurements, cows were classified into 2 study

96
groups with either the small MFG (SMFG) or large MFG (LMFG) phenotype. Figure 1
shows the MFG size distributions of the selected cows during this study and the pre-trial
period. This shows the remarkable consistency in average MFG size of individual cows,
which in some cows was seen over 2 consecutive lactation cycles (Figure 1).
Figure 1: Consistency in volume weighted mean diameter D4,3 of milk fat globules (MFG)
from selected cows compared to the whole herd. Mean symbols (triangles) and individual
values (gray circles) are shown for the 12 selected cows individually, where error bars
represent 95% confidence intervals. Boxplots are shown for the SMFG and LMFG group
compared to the data collected for the whole herd including the pre-trial period. Asterisks
denote outliers 1.5 times the interquartile range above or below the upper or lower
quartile, respectively. Each selected cow was measured a minimum of 3 and a maximum
of 9 times. SMFG = cows naturally producing small MFG, LMFG = cows naturally
producing large MFG.
The average MFG size, milk composition and animal production data of both study
groups are shown in Table 1, compared with the same data, where known, for milk
97
collected from camel, goat and sheep species. The milk from cows in the SMFG and
LMFG groups varied significantly in D4,3 MFG size (p = 0.003, Table 1), with an average
diameter of 3.29 µm and 4.92µm, respectively. This confirmed that pre-trial selection
indeed led to 2 study groups with significantly different MFG size distributions.
Moreover, all cows selected for this study were in established lactation (> 50 DIM),
received the same diet and did not differ in milk production traits (milk yield, fat and
protein content, fat-protein ratio (Table 1). This was important because it is known that
factors such as the fat-protein ratio can influence MFG size (Couvreur and Hurtaud,
2017).
We hypothesized that there may be two distinct phenotypes of cows consistently
producing milk with small and large MFG within our herd, thereby allowing for on-farm
selection. To test this hypothesis, it was necessary to limit the impact of environmental
conditions and milk production traits in order to isolate physiological differences between
the SMFG and LMFG groups. While milk production parameters were similar between
the studied groups (Table 1), the selected cows differed slightly in DIM (168 in SMFG
and 143 in LMFG, p = 0.199) and parity (1-3 in SMFG and 3-5 in LMFG), the former
being known to impact MFG size (Altenhofer et al., 2015). However, we do not believe
this to contribute considerably to the differences observed between the studied groups,
because we studied the effect of DIM and parity on MFG size in a previous study using
the same herd as the present study (Chapter 3). Based on this analysis, we estimate that
25 additional DIM, observed here for the SMFG group compared to the LMFG group
would lead to a 0.05 µm decrease in MFG size. Furthermore, an increase in MFG size by
0.16 µm was observed between parity 2 and 3 (Chapter 3), which in the current study
could contribute to the difference between the SMFG (parity 1-3, average 1.8) group and
the LMFG group (parity 3-5, average 3.8). However, these results suggest that the

98
difference in average MFG diameter between the studied groups in the current study (1.63
µm) is considerably greater than the combined effect of the differences in DIM and parity
(0.21 µm). Nonetheless, DIM was included in the statistical model as a fixed effect to
control for its known impact on MFG size. Parity on the other hand was significantly
different between the studied groups (p = 0.028, Table 1) and could have contributed to
some of the observed differences in FA origin and saturation. This is a limitation of our
study as different parities are related to metabolic changes mainly in the transition period,
but also later in lactation. For example, increased milk yields in cows in later parities (4
and higher) can lead to a higher loss of body condition during early lactation (Lee and
Kim, 2006). Furthermore, in these cows, the recovery from the loss of body condition
experienced during early lactation can be delayed and can take up to 4 - 5 months into the
lactation cycle (Lee and Kim, 2006). Therefore, although the impact of parity on MFG
size remains equivocal in the literature (Martini et al., 2004; Fleming et al., 2017), we
cannot separate the observed differences in our study from the potential effect of
differences in the lipid metabolism of cows in later parities (here the LMFG group) and
earlier parities (the SMFG group).

99
Table 1: Milk fat globule (MFG) size, milk composition and animal production data in cows producing milk
with small or large average MFG size and across several species1
SMFG Cow2 LMFG Cow3 p-value4 Camel Goat Sheep
n 65 65 6 6 6
MFG size D3,2 (µm)6 2.89
(2.69, 3.10)
4.04
(3.74, 4.33) 0.003
2.76
(2.62, 2.90)
3.26
(2.98, 3.53)
3.53
(3.08, 3.99)
MFG size D4,3 (µm)7 3.29
(2.96, 3.62)
4.92
(4.58, 5.25) 0.003
3.33
(3.00, 3.66)
4.00
(3.50, 4.50)
4.13
(3.47, 4.78)
DIM 168.3
(117.0, 219.7)
143.3
(92.0, 194.7) -
188.7
(19.0, 396.4)
96.2
(90.0, 102.3)
151.2
(56.6, 245.8)
Parity 1.8
(1.1, 2.6)
3.8
(3.1, 4.6) 0.028
1.3
(0.8, 1.9)
3.0
(1.9, 4.2)
2.7
(1.1, 4.3)
Concentrate intake
(kg)
8.6
(6.2, 11.1)
8.4
(5.9, 10.9) 0.775 - - -
Milkings 2.8
(2.4, 3.2)
2.8
(2.4, 3.2) 0.854 2.0 2.0 2.0
Milk yield (kg) 27.84
(19.41, 36.27)
29.25
(20.82, 37.68) 0.854
4.87
(2.58, 7.15)
4.95
(3.71, 6.19)
1.25
(0.94, 1.56)
Fat content (%) 3.40
(2.56, 4.25)
3.77
(2.93, 4.62) 0.729
2.15
(1.26, 3.04)
4.54
(3.60, 5.48)
5.95
(4.75, 7.16)
Fat yield (kg/d) 0.92
(0.76, 1.07)
1.01
(0.86, 1.16) 0.729
0.10
(0.05, 0.15)
0.22
(0.16, 0.29)
0.07
(0.07, 0.08)
Protein content (%) 2.96
(2.76, 3.16)
3.00
(2.81, 3.20) 0.729
2.51
(2.02, 3.01)
2.92
(2.70, 3.15)
5.14
(4.72, 5.56)
Fat/protein ratio 1.15
(0.92, 1.37)
1.24
(1.01, 1.47) 0.729
0.85
(0.59, 1.12)
1.57
(1.21, 1.92)
1.16
(0.93, 1.39) 1Means (95% CI) are shown.
2SMFG = cows naturally producing small milk fat globules. 3LMFG = cows naturally producing large milk fat globules. 4P-values were calculated using a two-way ANOVA with group (SMFG or LMFG cows), days in milk and sampling season as fixed effects. P-values were
adjusted for multiple comparisons using the Benjamini and Hochberg (1995) procedure. Other species are shown for comparison purposes only. 5Six cows were sampled in biological replicates on 2 separate days, of which 3 were sampled in autumn and 3 in winter. 6MFG size D3,2 (µm) = surface-weighted mean diameter. 7MFG size D4,3 (µm) = volume-weighted mean diameter.
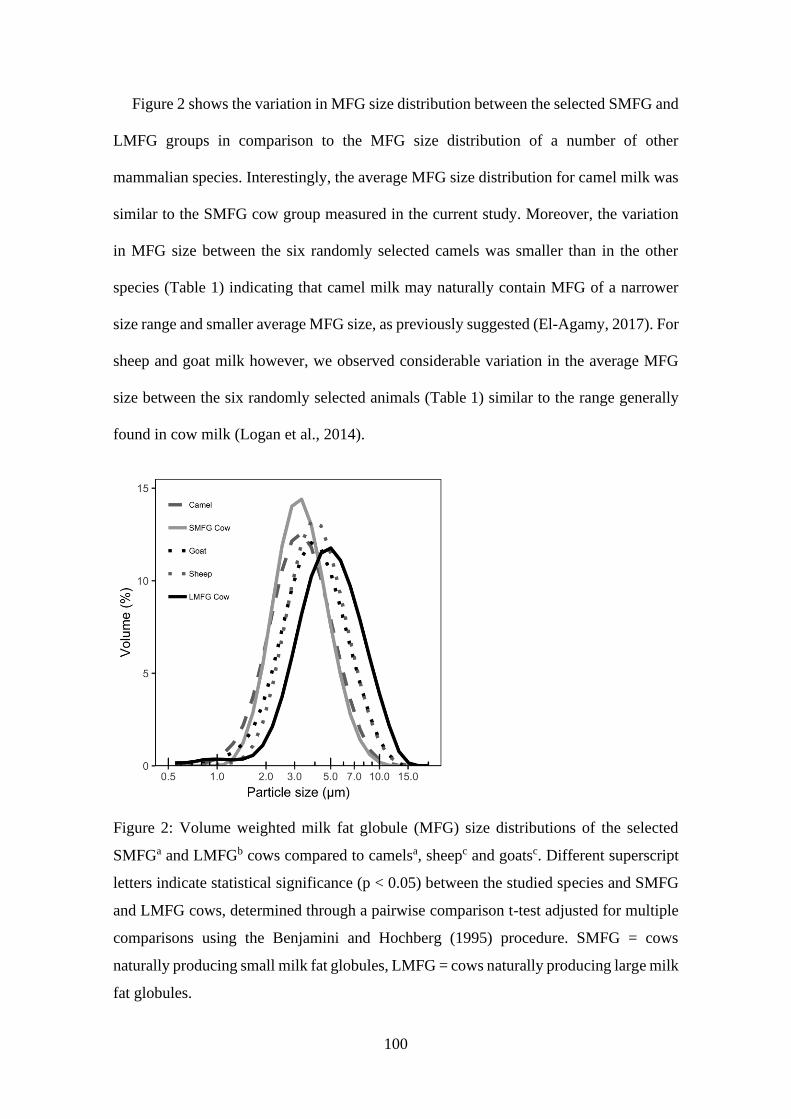
100
Figure 2 shows the variation in MFG size distribution between the selected SMFG and
LMFG groups in comparison to the MFG size distribution of a number of other
mammalian species. Interestingly, the average MFG size distribution for camel milk was
similar to the SMFG cow group measured in the current study. Moreover, the variation
in MFG size between the six randomly selected camels was smaller than in the other
species (Table 1) indicating that camel milk may naturally contain MFG of a narrower
size range and smaller average MFG size, as previously suggested (El-Agamy, 2017). For
sheep and goat milk however, we observed considerable variation in the average MFG
size between the six randomly selected animals (Table 1) similar to the range generally
found in cow milk (Logan et al., 2014).
Figure 2: Volume weighted milk fat globule (MFG) size distributions of the selected
SMFGa and LMFGb cows compared to camelsa, sheepc and goatsc. Different superscript
letters indicate statistical significance (p < 0.05) between the studied species and SMFG
and LMFG cows, determined through a pairwise comparison t-test adjusted for multiple
comparisons using the Benjamini and Hochberg (1995) procedure. SMFG = cows
naturally producing small milk fat globules, LMFG = cows naturally producing large milk
fat globules.
101
The MFG Core FA Composition Differs between SMFG and LMFG Cows
We found clear differences in the FA composition of the MFG core obtained from
SMFG and LMFG cows, even though these animals were under the same nutritional
management and produced milk of similar composition. The MFG core, comprising
predominantly but not exclusively non-polar lipids, contained a higher proportion of total
UFA (33.1% of total FAME) in the SMFG group compared to the MFG core form LMFG
cows (27.5%, Table 2, Figure 3). This was due to higher concentrations of MUFA and
PUFA in the MFG core from SMFG cows (28.4% and 4.8%, respectively) compared to
LMFG cows (23.9% and 3.6%, respectively, Figure 3).
Our results are in accordance with a study by Couvreur et al. (2007), but in conflict
with another (Mesilati-Stahy and Argov-Argaman, 2014). This could at least in part be
due to the difference in study design, with Mesilati-Stahy and Argov-Argaman (2014)
using microfiltration to separate milk into groups with different MFG sizes, while in our
study and that of Couvreur et al. (2007) the milk of small and large MFG groups was
sourced from cows with naturally occurring differences in MFG size. Comparison of
these results suggests that, while FA compositions of MFG in a certain size group can
vary, the relationship between the overall FA composition in milk and its MFG size is
also specific to the individual animal. These results supported our hypothesis that MFG
size could reflect individual differences in the cow’s lipid metabolism.
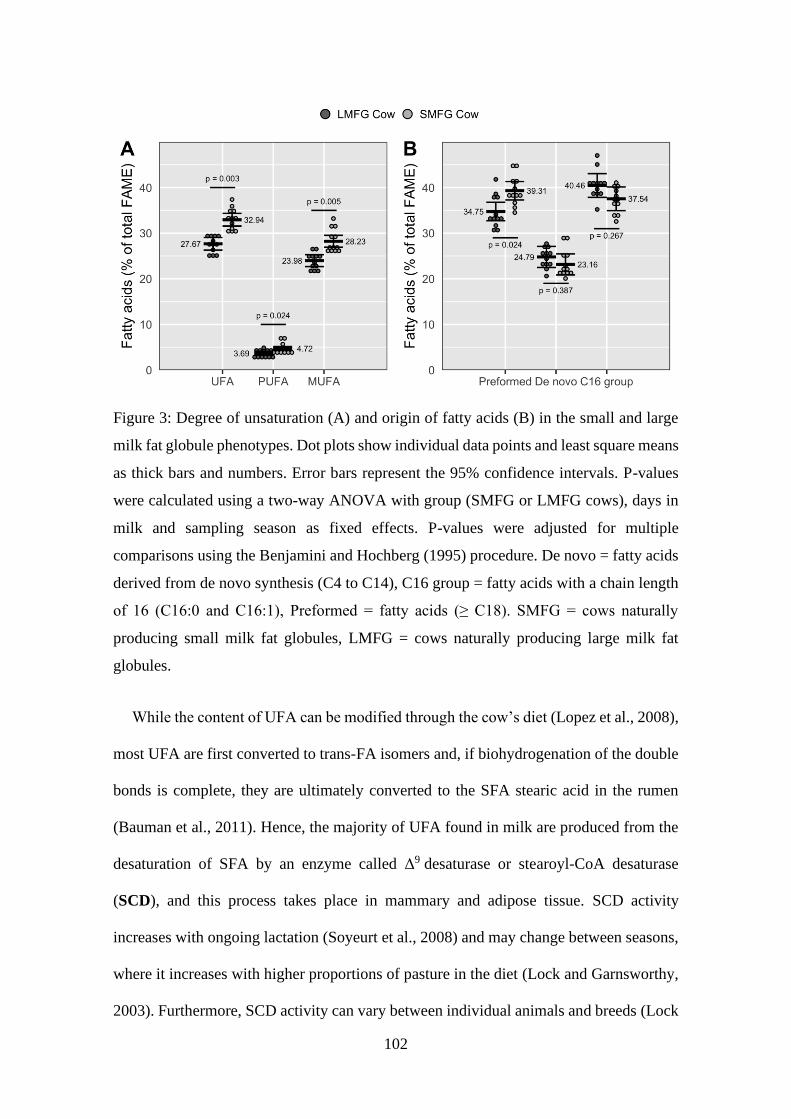
102
Figure 3: Degree of unsaturation (A) and origin of fatty acids (B) in the small and large
milk fat globule phenotypes. Dot plots show individual data points and least square means
as thick bars and numbers. Error bars represent the 95% confidence intervals. P-values
were calculated using a two-way ANOVA with group (SMFG or LMFG cows), days in
milk and sampling season as fixed effects. P-values were adjusted for multiple
comparisons using the Benjamini and Hochberg (1995) procedure. De novo = fatty acids
derived from de novo synthesis (C4 to C14), C16 group = fatty acids with a chain length
of 16 (C16:0 and C16:1), Preformed = fatty acids (≥ C18). SMFG = cows naturally
producing small milk fat globules, LMFG = cows naturally producing large milk fat
globules.
While the content of UFA can be modified through the cow’s diet (Lopez et al., 2008),
most UFA are first converted to trans-FA isomers and, if biohydrogenation of the double
bonds is complete, they are ultimately converted to the SFA stearic acid in the rumen
(Bauman et al., 2011). Hence, the majority of UFA found in milk are produced from the
desaturation of SFA by an enzyme called Δ9 desaturase or stearoyl-CoA desaturase
(SCD), and this process takes place in mammary and adipose tissue. SCD activity
increases with ongoing lactation (Soyeurt et al., 2008) and may change between seasons,
where it increases with higher proportions of pasture in the diet (Lock and Garnsworthy,
2003). Furthermore, SCD activity can vary between individual animals and breeds (Lock

103
and Garnsworthy, 2003; Soyeurt et al., 2008). Indices for SCD (SCDI), expressing each
product of SCD as a proportion of the sum of product and precursor, can be used as
indicators for SCD activity (Garnsworthy et al., 2010). Couvreur et al. (2007) reported a
higher C18:1/C18:0 ratio in SMFG cows and the use of SCDI for breeding selection
programs has already been suggested (Garnsworthy et al., 2010). In the current study,
cows in the SMFG group exhibited a higher SCDI for FA with a chain length of 14
(SCDI14, p = 0.387, Table 2), FA of 16 carbons in chain length (SCDI16, p = 0.387,
Table 2) and FA with 18 carbons (SDCI18, p = 0.298). However, this was not statistically
significant.
Others have related the K232A polymorphism on the diacylglycerol acyltransferase 1
(DGAT1) gene to changes in milk FA compositions as well as MFG size (Schennink et
al., 2007; Argov-Argaman et al., 2013). These studies reported changes in MFG size and
FA composition due to genotypic differences on the DGAT1 gene which are comparable
to the differences observed between the SMFG and LMFG groups in our study, with cows
of the KK genotype producing milk with less UFA, more C16:0 (Schennink et al., 2007)
and larger MFG (Argov-Argaman et al., 2013). However, genotypic information on the
selected cows was not available in our study and at this stage remains speculative.

104
Table 2: Fatty acid (FA) origin and degree of unsaturation in the MFG core from cows producing milk with small or large average milk fat globule
size1 and across several species2
SMFG Cow3 LMFG Cow4 p-value5 Camel Goat Sheep
n 66 66 6 6 6
Preformed FA (≥ C18)
39.31
(37.29, 41.33)
34.75
(32.73, 36.77) 0.024
49.08
(46.32, 51.84)
43.90
(40.77, 47.03)
39.49
(31.97, 47.01)
De novo FA (C4 to C14)
23.16
(20.85, 25.46)
24.79
(22.49, 27.10) 0.387
15.24
(13.1, 17.38)
26.77
(25.16, 28.38)
31.34
(25.39, 37.29)
SCFA (C4 to C8)7 2.25
(2.03, 2.47)
2.39
(2.17, 2.62) 0.387
0.11
(0.08, 0.14)
4.05
(3.72, 4.39)
4.07
(3.15, 4.99)
MCFA (C9 to C14)8 19.13
(16.97, 21.30)
20.47
(18.30, 22.63) 0.387
12.80
(10.91, 14.69)
21.33
(19.79, 22.87)
25.07
(19.69, 30.45)
C16 group (C16:0, C16:1c9)
37.54
(34.94, 40.13)
40.46
(37.86, 43.05) 0.267
35.68
(32.17, 39.19)
29.34
(27.46, 31.22)
29.17
(26.62, 31.72)
UFA 32.94
(31.56, 34.33)
27.67
(26.29, 29.06) 0.003
42.52
(39.08, 45.96)
31.78
(29.18, 34.38)
32.29
(27.81, 36.77)
SFA 67.06
(65.67, 68.44)
72.33
(70.94, 73.71) 0.003
57.48
(54.04, 60.92)
68.22
(65.62, 70.82)
67.71
(63.23, 72.19)
MUFA 28.23
(26.92, 29.53)
23.98
(22.68, 25.29) 0.005
38.84
(35.42, 42.26)
28.51
(26.16, 30.86)
27.52
(23.50, 31.54)
PUFA 4.72
(4.28, 5.16)
3.69
(3.25, 4.13) 0.024
3.68
(3.24, 4.12)
3.27
(2.88, 3.66)
4.77
(3.71, 5.82)
SCDI149 10.50
(8.91, 12.09)
9.48
(7.88, 11.07)
0.387 10.79
(10.03, 11.55)
3.26
(2.99, 3.53)
4.29
(3.05, 5.54)
SCDI169 4.21
(3.42, 5.00)
3.63
(2.84, 4.43)
0.387 19.74
(17.69, 21.79)
1.86
(1.50, 2.22)
4.08
(2.77, 5.38)
SCDI189 69.21
(64.26, 74.16)
64.23
(59.28, 69.18)
0.298 62.62
(54.8, 70.44)
66.47
(62.17, 70.77)
70.85
(63.88, 77.82) 1Least square means (95% CI) are shown for SMFG and LMFG groups. 2Means (95% CI) are shown for camel, goat and sheep. 3SMFG = cows naturally producing small milk fat globules. 4LMFG = cows naturally producing large milk fat globules. 5P-values were calculated using a two-way ANOVA with group (SMFG or LMFG cows), days in milk and sampling season as fixed effects. P-values were adjusted for multiple
comparisons using the Benjamini and Hochberg (1995) procedure. Other species are shown for comparison purposes only. 6Six cows were sampled in biological replicates on 2 separate days. 7SCFA = short chain fatty acid. 8MCFA = medium chain fatty acid. 9SCDI = Stearoyl-CoA desaturase index with SCDI14 = (C14:1c9) / (C14:0 + C14:1c9) × 100, SCDI16 = (C16:1c9) / (C16:0 + C16:1c9) × 100 and SCDI18 = (C18:1c9) / (C18:0 +
C18:1c9) × 100.

105
Possible Lipid Metabolic Differences between the SMFG and LMFG Phenotype
To gain insight into possible lipid metabolic differences between SMFG and LMFG
cows we further looked at the origin of the FA in their MFG core. Figure 3 shows the
concentrations of de novo synthesized and preformed FA in the studied groups. The
results indicate that in SMFG cows the proportion of preformed FA taken up from the
blood is higher than in LMFG cows (p = 0.024), while the proportion of de novo FA was
similar between the groups. Based on this analysis we suggest 2 possible explanations for
the observed differences between the SMFG and LMFG phenotypes: 1) long-chain SFA
in the SMFG group were utilized to produce polar lipids needed for MFGM production
and were therefore reduced in the MFG core; or 2) the observed changes could indicate
increased lipid mobilization from adipose tissue in the SMFG group.
Regarding the first suggested mechanism, Mesilati-Stahy et al. (2012) showed that
preformed long-chain SFA are preferentially incorporated into the MFGM fraction (polar
lipids) rather than the core (TAG) and suggested that this could supply the increased
membrane material needed for the formation of smaller MFG. Although we did not
determine the FA composition of the MFGM, the increased proportion of blood-derived
FA in the MFG core of the SMFG group was due to increased relative proportions of
UFA not long-chain SFA (Table 3). This could imply that long chain SFA are channeled
towards polar lipid synthesis and could partly explain their reduced proportion in the
MFG core of the SMFG group. Moreover, the study by Mesilati-Stahy et al. (2012)
suggested that MUFA were preferentially partitioned into the MFG core in cows with
higher plasma insulin concentrations, whilst cows with lower insulin levels preferentially
partitioned MUFA into the MFGM compartment, suggesting a potential hormonal
regulation of this process.
106
The second possible mechanism is based on the impact of negative energy balance on
the milk FA profile. Cows in negative energy balance, i.e. in the early stages of lactation
or during feed restriction, exhibit a FA composition similar to the FA profile of the MFG
core from SMFG cows in our study, with more oleic acid (C18:1 c9), less palmitic acid
(C16:0) and less de novo synthesized FA (Gross et al., 2011). Moreover, oleic acid has
been suggested as a potential indicator for subclinical ketosis (Van Haelst et al., 2008).
This could indicate increased lipid mobilization from adipose tissue in SMFG cows.
However, while dietary FA are derived from TAG packaged in lipoprotein particles and
require hydrolysis by lipoprotein lipase, FA from lipid mobilization reach the mammary
gland in the form of non-esterified FA (NEFA). In vitro evidence suggests that higher
NEFA supply to the mammary gland increases LD size (Mesilati-Stahy and Argov-
Argaman, 2018) which would be in conflict with the hypothesis that SMFG cows obtain
preformed long-chain FA from lipid mobilization. While we did not measure NEFA in
the current study to draw a conclusion either way, the concentrate intake, body weight,
milk yield and fat-protein measurements provided to us by the milking system suggests
that the cows were probably not in negative energy balance and indicate that the first
mechanism is more likely to have resulted in the observed differences in the FA profiles
of the SMFG and LMFG groups. However, as previously noted the impact of the observed
differences in parity between the study groups and its possible effect on body condition
recovery could have contributed to some of the observed differences.

107
Table 3: Fatty acid composition in the small and large milk fat globule phenotype in cows1 and across species2
Species SMFG Cow3 LMFG Cow4 p-value5 Camel Goat Sheep
C4:0 0.71 (0.62, 0.80) 0.74 (0.65, 0.83) 0.856 0.00 (0.00, 0.00) 1.00 (0.84, 1.17) 1.17 (0.90, 1.45)
C5:0 0.00 (0.00, 0.00) 0.00 (0.00, 0.01) 0.668 0.00 (0.00, 0.00) 0.00 (0.00, 0.01) 0.02 (0.00, 0.03)
C6:0 0.78 (0.70, 0.86) 0.83 (0.75, 0.91) 0.615 0.05 (0.03, 0.06) 1.24 (1.12, 1.36) 1.20 (0.91, 1.49)
C7:0 0.01 (0.00, 0.01) 0.01 (0.01, 0.02) 0.310 0.00 (0.00, 0.00) 0.02 (0.01, 0.03) 0.05 (0.02, 0.08)
C8:0 0.75 (0.66, 0.84) 0.80 (0.71, 0.90) 0.659 0.07 (0.04, 0.09) 1.79 (1.68, 1.89) 1.63 (1.16, 2.10)
C9:0 0.02 (0.01, 0.03) 0.03 (0.02, 0.04) 0.310 0.00 (0.00, 0.00) 0.05 (0.02, 0.09) 0.12 (0.04, 0.20)
C10:0 2.31 (1.89, 2.73) 2.56 (2.14, 2.98) 0.659 0.11 (0.07, 0.14) 7.11 (6.54, 7.68) 6.78 (4.72, 8.85)
C10:1w1 0.22 (0.19, 0.24) 0.21 (0.19, 0.24) 0.917 0.02 (0.01, 0.02) 0.16 (0.11, 0.20) 0.23 (0.15, 0.31)
C11:0 0.04 (0.02, 0.07) 0.07 (0.04, 0.10) 0.310 0.01 (0.01, 0.01) 0.09 (0.01, 0.16) 0.23 (0.05, 0.40)
C12:0 3.23 (2.61, 3.85) 3.53 (2.91, 4.15) 0.731 0.77 (0.58, 0.95) 3.29 (2.64, 3.94) 4.78 (3.17, 6.39)
C12:1w9 0.08 (0.07, 0.10) 0.08 (0.06, 0.09) 0.917 0.02 (0.02, 0.03) 0.05 (0.03, 0.07) 0.08 (0.05, 0.11)
C13:0 0.07 (0.04, 0.11) 0.11 (0.08, 0.15) 0.310 0.08 (0.06, 0.09) 0.09 (0.05, 0.13) 0.22 (0.08, 0.35)
C13:0 isomer 0.09 (0.07, 0.11) 0.09 (0.07, 0.11) 0.954 0.02 (0.01, 0.02) 0.05 (0.03, 0.08) 0.10 (0.05, 0.15)
C14:0 11.63
(10.50, 12.77)
12.39
(11.26, 13.53) 0.629
10.32
(8.79, 11.85)
10.02
(9.31, 10.73)
11.92
(10.29, 13.55)
C14:0 isomer 0.09 (0.07, 0.10) 0.09 (0.07, 0.11) 0.917 0.22 (0.18, 0.26) 0.08 (0.07, 0.10) 0.07 (0.04, 0.11)
C14:1c9 1.36 (1.15, 1.56) 1.29 (1.09, 1.50) 0.856 1.24 (1.09, 1.40) 0.34 (0.29, 0.38) 0.53 (0.36, 0.71)
C15:0 1.12 (0.87, 1.37) 1.32 (1.07, 1.57) 0.579 1.38 (1.22, 1.54) 0.93 (0.69, 1.17) 1.58 (1.14, 2.03)
C15:0 ante-isomer 0.56 (0.45, 0.66) 0.54 (0.44, 0.65) 0.917 0.88 (0.74, 1.01) 0.43 (0.33, 0.52) 0.58 (0.48, 0.68)
C15:0 isomer 0.10 (0.09, 0.11) 0.07 (0.06, 0.08) 0.020 0.08 (0.05, 0.11) 0.03 (0.02, 0.04) 0.04 (0.03, 0.05)
C16:0 35.65
(33.22, 38.08)
38.69
(36.27, 41.12) 0.310
27.74
(25.64, 29.84)
28.36
(26.43, 30.29)
27.48
(25.22, 29.74)
C16:0 isomer 0.09 (0.08, 0.11) 0.09 (0.08, 0.11) 0.930 0.23 (0.14, 0.32) 0.06 (0.05, 0.08) 0.12 (0.05, 0.19)
C16:1c7 0.22 (0.21, 0.23) 0.20 (0.19, 0.21) 0.310 0.77 (0.61, 0.92) 0.38 (0.33, 0.42) 0.37 (0.31, 0.43)
C16:1c9 1.57 (1.22, 1.93) 1.47 (1.11, 1.82) 0.856 6.94 (5.53, 8.35) 0.54 (0.45, 0.62) 1.19 (0.74, 1.65)
C17:0 0.63 (0.56, 0.70) 0.64 (0.57, 0.71) 0.917 0.74 (0.63, 0.85) 0.56 (0.5, 0.62) 0.64 (0.52, 0.77)
C17:1c9 0.31 (0.26, 0.35) 0.27(0.22, 0.31) 0.504 0.71 (0.61, 0.80) 0.29 (0.23, 0.35) 0.37 (0.26, 0.49)
C18:0 9.10 (7.27, 10.93) 9.59 (7.76, 11.42) 0.868 14.46
(10.99, 17.93)
12.69
(10.31, 15.07)
8.71
(4.75, 12.67)
C18:1c9 20.54
(19.52, 21.55)
16.81
(15.79, 17.83) 0.020
24.00
(21.70, 26.30)
25.04
(23.07, 27.01)
19.92
(15.45, 24.39)
C18:1 isomers 3.84 (3.46, 4.22) 3.57 (3.19, 3.95) 0.615 4.85 (4.38, 5.33) 1.66 (1.3, 2.01) 4.71 (2.26, 7.17)
C18:2 (11t, 15c) 0.46 (0.43, 0.49) 0.40 (0.37, 0.43) 0.201 0.31 (0.24, 0.37) 0.24 (0.19, 0.29) 0.41 (0.22, 0.61)
C18:2 (9t,12t) 0.40 (0.34, 0.45) 0.31 (0.25, 0.36) 0.310 0.25 (0.22, 0.28) 0.22 (0.15, 0.28) 0.49 (0.32, 0.66)
C18:2 2.23 (1.78, 2.69) 1.65 (1.19, 2.10) 0.310 1.69 (1.41, 1.97) 2.32 (2.15, 2.50) 2.92 (2.33, 3.51)
C18:3 0.71 (0.62, 0.80) 0.59 (0.50, 0.68) 0.310 0.68 (0.53, 0.83) 0.30 (0.26, 0.35) 0.42 (0.32, 0.51)
CLA C18:2 c9 t11 0.92 (0.78, 1.05) 0.74 (0.61, 0.87) 0.310 0.76 (0.59, 0.93) 0.19 (0.10, 0.27) 0.53 (0.27, 0.78)
C20:0 0.08 (0.04, 0.13) 0.10 (0.06, 0.15) 0.786 0.35 (0.22, 0.48) 0.32 (0.30, 0.33) 0.26 (0.13, 0.39)
C20:1d11 0.10 (0.09, 0.11) 0.08 (0.07, 0.09) 0.310 0.30 (0.19, 0.40) 0.07 (0.06, 0.08) 0.11 (0.07, 0.15)
1Least square means (95% CI) are shown for SMFG and LMFG groups. 2Means (95% CI) are shown for camel, goat and sheep. 3SMFG = cows naturally producing small milk fat globules. 4LMFG = cows naturally producing large milk fat globules. 5P-values were calculated using a two-way ANOVA with group (SMFG or LMFG cows), days in milk and sampling season as fixed
effects. P-values were adjusted for multiple comparisons using the Benjamini and Hochberg (1995) procedure. Other species are
shown for comparison purposes only.

108
Fatty Acid Composition Across Species in Relation to MFG Size
The MFG core FA profiles from SMFG and LMFG cows compared to camels, goats
and sheep showed general differences between species (Table 3). For example, the MFG
core from goat and sheep milk contained higher concentrations of C8:0 and C10:0 and
milk fat extracted from camel milk contained very low amounts of short chain FA
(Table 3). Most of these differences have been described elsewhere and are not the scope
of our study. Here, we aimed to relate certain FA groups, for example UFA and de novo
synthesized FA, to differences in the MFG size distributions observed between the camel,
goat and sheep milk compared to the milk from SMFG and LMFG cows. Concentrations
of UFA seemed to be inversely related to MFG size (Figure 4). Figure 4 shows the
concentrations of UFA across the studied species ordered according to increasing average
MFG sizes from camels to LMFG cows. Due to the broad distribution of MFG size in
goat and sheep milk, the data was analyzed further by grouping the results from all species
into small (≤ 3.5 µm) medium (3.5 to 4.5 µm) and large (≥ 4.5 µm) MFG (Figure 4) to
reveal a clear relationship between MFG size and UFA across all species (Figure 4).

109
Figure 4: Concentrations of unsaturated fatty acids in the milk fat globule core from the
small and large milk fat globule phenotypes as well as camel, sheep and goat milk (A)
and grouped into small (≤ 3.5 µm), medium (3.5 to 4.5 µm) and large (≥ 4.5 µm) MFG
(B). Dot plots show individual data points and least square means as thick bars and
numbers. Error bars represent the 95% confidence intervals. P-values were calculated
using a two-way ANOVA with group (SMFG or LMFG cows), days in milk and sampling
season as fixed effects. P-values were adjusted for multiple comparisons using the
Benjamini and Hochberg (1995) procedure. SMFG = cows naturally producing small
milk fat globules, LMFG = cows naturally producing large milk fat globules.
CONCLUSIONS
The analysis of the FA profile in cows producing milk with either small or large
average MFG size distributions revealed a possible link between the origin of FA
incorporated into LD, the desaturation activity of the individual animal and its ultimate
effect on LD fusion. More specifically, cows with the SMFG phenotype incorporated
more FA with a carbon number of 18 or higher into their LD and transformed more of
these FA into UFA. In the current study we defined the SMFG and LMFG phenotype as
the cows within a single herd that consistently produced MFG of either small or large
average size, were fed the same diet and were similar in terms of their milk production
traits. Based on this selection we showed that the SMFG phenotype could be exploited to

110
produce milk with higher nutritional value. However, further studies are needed to test
this hypothesis and should focus on the possible links between the DGAT1 gene
polymorphisms and MFG size. Further studies should also look at the identification of
the small and large MFG phenotypes in goats and sheep and investigate the reason why
camels do not seem to show the same variation in MFG size seen in the main dairy
species.
ACKNOWLEDGMENTS
We would like to thank Allison Williams, Dr Lihui Liu and Dr Amirtha Puvanenthiran
from CSIRO for technical support with this work and Kenny Oluboyede and Ashley
Gabler for their help at the University of Melbourne Dairy. We would also like to thank
Meredith Dairy for providing and Fernanda Zamuner from the University of Melbourne
for collecting goat and sheep milk and Camel Milk Co for providing and Dr Jared Raynes
from CSIRO for collecting camel milk samples. Furthermore, we would like to
acknowledge Dr Sue Finch from the Melbourne Statistical Consulting Platform for her
help with statistical analyses and Dr Xue Rong Zhou from CSIRO for his help in setting
up the GC method.
111
REFERENCES
Altenhofer, C., W. Holzmüller, F. Wolfertstetter, D. W. Ribeiro, U. Kulozik, M. W.
Pfaffl, and E. Viturro. 2015. Temporal variation of milk fat globule diameter, fat
and cholesterol content and milk epithelial cell gene expression in dairy cows. Int.
J. Dairy Technol. 68:519–526. https://doi.org/10.1111/1471-0307.12220.
Argov-Argaman, N. 2019. Symposium review: Milk fat globule size: Practical
implications and metabolic regulation. J. Dairy Sci. 102:2783–2795.
https://doi.org/10.3168/jds.2018-15240.
Argov-Argaman, N., K. Mida, B.-C. Cohen, M. Visker, and K. Hettinga. 2013. Milk Fat
Content and DGAT1 Genotype Determine Lipid Composition of the Milk Fat
Globule Membrane. PLoS ONE 8:e68707.
https://doi.org/10.1371/journal.pone.0068707.
Bauman, D. E., M. A. McGuire, and K. J. Harvatine. 2011. Mammary Gland, Milk
Biosynthesis and Secretion | Milk Fat. Pages 352–358 in Encyclopedia of Dairy
Sciences. 2nd ed. J. W. Fuquay, ed. Academic Press, San Diego, CA.
Benjamini, Y., and Y. Hochberg. 1995. Controlling the False Discovery Rate: A Practical
and Powerful Approach to Multiple Testing. J R Stat Soc Series B Stat Methodol
57:289–300.
Briard, V., Leconte, N., Michel, F., and Michalski, M.-C. (2003). The fatty acid
composition of small and large naturally occurring milk fat globules. Eur. J. Lipid
Sci. Technol. 105, 677–682.
Couvreur, S., and C. Hurtaud. 2017. Relationships between milks differentiated on native
milk fat globule characteristics and fat, protein and calcium compositions. Animal
11:507–518. https://doi.org/10.1017/S1751731116001646.
Couvreur, S., C. Hurtaud, P. G. Marnet, P. Faverdin, and J. L. Peyraud. 2007.
Composition of milk fat from cows selected for milk fat globule size and offered
either fresh pasture or a corn silage-based diet. J. Dairy Sci. 90:392–403.
https://doi.org/10.3168/jds.S0022-0302(07)72640-1.
El‐Agamy, E.-S. I. 2017. Camel Milk. Pages 409–480 in Handbook of Milk of Non-
Bovine Mammals. 2nd ed. Y. W. Park, G. F. W. Haenlein, and W. L. Wendorff,
ed. Wiley-Blackwell, Hoboken, NJ.
El-Zeini, H. M. 2006. Microstructure, rheological and geometrical properties of fat
globules of milk from different animal species. Pol. J. Food Nutr. Sci. 56:147–
153.
112
Garnsworthy, P. C., S. Feng, A. L. Lock, and M. D. Royal. 2010. Short communication:
Heritability of milk fatty acid composition and stearoyl-CoA desaturase indices
in dairy cows. J. Dairy Sci. 93:1743–1748. https://doi.org/10.3168/jds.2009-2695.
Gross, J., H. A. van Dorland, R. M. Bruckmaier, and F. J. Schwarz. 2011. Milk fatty acid
profile related to energy balance in dairy cows. J. Dairy Res. 78:479–488.
https://doi.org/10.1017/S0022029911000550.
Heid, H. W., and T. W. Keenan. 2005. Intracellular origin and secretion of milk fat
globules. Eur. J. Cell Biol. 84:245–258.
https://doi.org/10.1016/j.ejcb.2004.12.002.
Krahmer, N., Y. Guo, F. Wilfling, M. Hilger, S. Lingrell, K. Heger, H. W. Newman, M.
Schmidt-Supprian, D. E. Vance, M. Mann, R. V. Farese Jr., and T. C. Walther.
2011. Phosphatidylcholine Synthesis for Lipid Droplet Expansion Is Mediated by
Localized Activation of CTP:Phosphocholine Cytidylyltransferase. Cell Metab.
14:504–515. https://doi.org/10.1016/j.cmet.2011.07.013.
Lock, A. L., and P. C. Garnsworthy. 2003. Seasonal variation in milk conjugated linoleic
acid and Δ9-desaturase activity in dairy cows. Livest. Prod. Sci. 79:47–59.
https://doi.org/10.1016/S0301-6226(02)00118-5.
Logan, A., M. Auldist, J. Greenwood, and L. Day. 2014. Natural variation of bovine milk
fat globule size within a herd. J. Dairy Sci. 97:4072–4082.
https://doi.org/10.3168/jds.2014-8010.
Lopez, C., V. Briard-Bion, O. Menard, F. Rousseau, P. Pradel, and J.-M. Besle. 2008.
Phospholipid, Sphingolipid, and Fatty Acid Compositions of the Milk Fat Globule
Membrane are Modified by Diet. J. Agric. Food Chem. 56:5226–5236.
https://doi.org/10.1021/jf7036104.
Masedunskas, A., Y. Chen, R. Stussman, R. Weigert, and I. H. Mather. 2017. Kinetics of
milk lipid droplet transport, growth, and secretion revealed by intravital imaging:
lipid droplet release is intermittently stimulated by oxytocin. Mol. Biol. Cell
28:935–946. https://doi.org/10.1091/mbc.E16-11-0776.
Mather, I. H., A. Masedunskas, Y. Chen, and R. Weigert. 2019. Symposium review:
Intravital imaging of the lactating mammary gland in live mice reveals novel
aspects of milk-lipid secretion. J. Dairy Sci. 102:2760–2782.
https://doi.org/10.3168/jds.2018-15459.
Mesilati-Stahy, R., and N. Argov-Argaman. 2014. The relationship between size and lipid
composition of the bovine milk fat globule is modulated by lactation stage. Food
Chem 145:562–570. https://doi.org/10.1016/j.foodchem.2013.08.077.

113
Mesilati-Stahy, R., and N. Argov-Argaman. 2018. Changes in lipid droplets
morphometric features in mammary epithelial cells upon exposure to non-
esterified free fatty acids compared with VLDL. PLoS ONE 13:e0209565.
https://doi.org/10.1371/journal.pone.0209565.
Mesilati-Stahy, R., H. Malka, and N. Argov-Argaman. 2012. Association of plasma
insulin concentration to fatty acid distribution between milk fat and membrane
synthesis. J. Dairy Sci. 95:1767–1775. https://doi.org/10.3168/jds.2011-4583.
Palmquist, D. L. 2006. Milk Fat: Origin of Fatty Acids and Influence of Nutritional
Factors Thereon. Pages 43–92 in Advanced Dairy Chemistry, Volume 2: Lipids.
3rd ed. P. F. Fox and P. L. H. McSweeney, ed. Springer International Publishing,
New York, NY.
Park, Y. W., M. Juárez, M. Ramos, and G. F. W. Haenlein. 2007. Physico-chemical
characteristics of goat and sheep milk. Small Rumin. Res. 68:88–113.
https://doi.org/10.1016/j.smallrumres.2006.09.013.
R Core Team. 2018. R: A language and environment for statistical computing. R
Foundation for Statistical Computing. Vienna Austria. https://www.R-
project.org/
Robenek, H., I. Buers, O. Hofnagel, M. J. Robenek, D. Troyer, and N. J. Severs. 2009.
Compartmentalization of proteins in lipid droplet biogenesis. Biochim Biophys
Acta Mol Cell Biol Lipids 1791:408–418.
https://doi.org/10.1016/j.bbalip.2008.12.001.
Robinson, D., and A. Hayes. 2018. broom: Convert Statistical Analysis Objects into Tidy
Tibbles. R Package Version 0.5.0. https://CRAN. R-project. org/package= broom.
Sánchez-Juanes, F., J.M. Alonso, L. Zancada, and P. Hueso. 2009. Distribution and fatty
acid content of phospholipids from bovine milk and bovine milk fat globule
membranes. Int. Dairy J. 19:273–278.
https://doi.org/10.1016/j.idairyj.2008.11.006.
Schennink, A., W. M. Stoop, M. H. P. W. Visker, J. M. L. Heck, H. Bovenhuis, J. J. V.
D. Poel, H. J. F. V. Valenberg, and J. A. M. V. Arendonk. 2007. DGAT1 underlies
large genetic variation in milk-fat composition of dairy cows. Anim. Genet.
38:467–473. https://doi.org/10.1111/j.1365-2052.2007.01635.x.
Shen, Z., A. Birkett, M. A. Augustin, S. Dungey, and C. Versteeg. 2001. Melting behavior
of blends of milk fat with hydrogenated coconut and cottonseed oils. J Am Oil
Chem Soc 78:387–394. https://doi.org/10.1007/s11746-001-0273-4.

114
Soyeurt, H., F. Dehareng, P. Mayeres, C. Bertozzi, and N. Gengler. 2008. Variation of
Δ9-Desaturase Activity in Dairy Cattle. J. Dairy Sci. 91:3211–3224.
https://doi.org/10.3168/jds.2007-0518.
Wickham, H. 2016. Ggplot2: Elegant Graphics for Data Analysis. 2nd ed. Springer
International Publishing, Switzerland.
Wilfling, F., H. Wang, J. T. Haas, N. Krahmer, T. J. Gould, A. Uchida, J.-X. Cheng, M.
Graham, R. Christiano, F. Fröhlich, X. Liu, K. K. Buhman, R. A. Coleman, J.
Bewersdorf, R. V. Farese Jr., and T. C. Walther. 2013. Triacylglycerol Synthesis
Enzymes Mediate Lipid Droplet Growth by Relocalizing from the ER to Lipid
Droplets. Dev. Cell 24:384–399. https://doi.org/10.1016/j.devcel.2013.01.013.

115
Appendix to Chapter 4
ADDITIONAL MATERIALS AND METHODS
Milk fat globule membrane (MFGM) extracts
For all species, MFGM material was separated from the MFG core as described in the
main manuscript of this chapter. The combination of buttermilk and butter serum is the
MFGM extract and was frozen at -80 °C followed by freeze-drying and subsequent
storage at -20 °C.
Sodium dodecyl sulfate – polyacrylamide gel electrophoresis (SDS-PAGE) Protein
Analysis and Densitometry
The freeze-dried MFGM extracts were solubilised in 1% SDS (Sigma-Aldrich) and
incubated at 30 °C on a rotary mixer (HulaMixer, Invitrogen, Thermo Fisher Scientific
Australia Pty Ltd, Scoresby, VIC, Australia). Total protein concentrations were
determined for all samples using the Pierce™ BCA Protein Assay Kit (Thermo Scientific,
Thermo Fisher Scientific Australia Pty Ltd). Samples were standardised to the same
protein concentration and 12 µL sample were mixed with 5 µL of LDS sample buffer
(Invitrogen) and 1 µL of a standard at varying concentrations (phosphorylase b from
rabbit muscle, Sigma-Aldrich). A 2-fold dilution series of the standard was prepared to
load a concentration between 0.015 and 1.0 µg and each standard concentration was
loaded on 2 separate lanes. The samples were denatured at 95 °C for 5 min and loaded
onto Invitrogen NuPAGE 4-12% Bis-Tris Gels (1mm x 15 well, Invitrogen).
Electrophoresis was performed at 200 V for 50 min using MOPS running buffer
(Invitrogen). Staining was performed using the SimplyBlue SafeStain (Invitrogen)
according to the microwave procedure. Gel images were digitised using a GelDoc EZ
imager (Bio-Rad Laboratories Pty Ltd, Gladesville, NSW, Australia). The ImageLab 6.0
116
software (Bio-Rad Laboratories Pty Ltd) was used for densitometry analysis and the main
protein bands were quantified by absolute quantification according to the equation
obtained by linear regression of the phosphorylase b standard curve.
Major Protein Band Identification by Liquid Chromatography Tandem Mass
Spectrometry (LC-MS/MS)
Following SDS-PAGE analysis, the main bands of interest were excised from one
representative lane for each species to identify the proteins by LC-MS/MS. All chemicals
were from Sigma-Aldrich unless otherwise stated. Gel excision was performed using
clean sterile scalpel blades and the gel pieces were cut into 1 mm3 cubes. All incubations
were performed on an orbital shaker. The gel pieces were de-stained thrice with de-
staining solution (50 mM ammonium bicarbonate (AmBic), 50% acetonitrile (ACN)) for
10 min at 37 °C. This step was followed by three incubations in 100% ACN for 10 min
at 37 °C. The gel pieces were then subjected to reduction (20 mM DTT in 100 mM
AmBic) followed by alkylation in (50 mM iodoacetamide in100 mM AmBic), both at
37 °C for 30 min. After two more washing steps in de-staining solution, the gel pieces
were incubated in 100% ACN for 5 to 10 min and then air dried. This was followed by
rehydration on ice for 60 min with a trypsin digestion buffer (170 nM trypsin in 50 mM
AmBic). The excess solution was removed, and the gel pieces were covered in 50 mM
AmBic. Digestion was performed overnight at 37 °C. On the next day, the peptides were
extracted during two incubations at 37 °C for 30 min in an extraction buffer (0.1% formic
acid in 60% ACN). The extraction buffer containing the peptides was reduced to
approximately 10 µL by centrifugal lyophilisation in a vacuum centrifuge.
For peptide sequencing by LC-MS/MS, 3uL aliquots of OPT-302 digests were
separated using a two-column chromatography setup comprising a PepMap100 C18 20

117
mm × 75 μm trap and a PepMap C18 500 mm × 75 μm analytical column (Thermo
Scientific). Samples were concentrated onto the trap column at 5 μl/min for 5 min and
infused into an Orbitrap Fusion™ Lumos™ Tribrid™ mass spectrometer (Thermo
Scientific) at 300 nl/min running a 120 min gradient from 99% Buffer A (0.1% FA) to
40% Buffer B (99% acetonitrile, 0.1% FA) on a Dionex Ultimate 3000 UPLC system
(Thermo Scientific). The Lumos mass spectrometer was operated in data-dependent
mode, automatically switching between the acquisition of a single Orbitrap MS scan
(resolution, 120,000) every 3 s and the top-20 multiply charged precursors selected for
EThcD fragmentation (maximum fill time, 100 ms; AGC of 5 × 10⁴ with a resolution of
30,000 for Orbitrap MS-MS scans).
Mass spectrometry database searches for the identification of milk proteins were
performed using the Byonic™ search engine against a custom protein database containing
86 milk protein sequences. High-resolution MS/MS data were searched with non-specific
digestion allowing for carbamidomethylation of cysteine (+57Da) set as a fixed
modification and oxidation of methionine or tryptophan (+16Da), phosphorylation of
serine or threonine (+80Da) acetylation of protein N termini (+42Da) and pyroglutamate
formation of N-terminal glutamine or glutamate residues (-17Da/ -18Da) as variable
modifications. Total common max was set to 2, total rare max set to 1. The precursor
mass tolerance was set to 10 ppm and fragment mass tolerance to 20 ppm with a
maximum false discovery rate of 1.0% set for protein and peptide identifications.
Statistical Analysis
Statistical analysis was performed using a two-way ANOVA with group, days in milk
and season as fixed effects to establish differences between cows producing milk with
small (SMFG) or large MFGs (LMFG). Results from camels, sheep and goats are
118
presented as means and 95% confidence intervals and are used for comparative purposes
only. Therefore, statistical significance was not determined for the differences between
species.
ADDITIONAL RESULTS AND DISUSSION
Concentrations of the Major MFGM Proteins in SMFG and LMFG Cows
Densitometry analysis of the major bands in SDS-PAGE gels and subsequent
identification of these proteins by LC-MS/MS revealed some differences in protein
concentrations between the SMFG and LMFG groups, where MFGM extracts from the
milk of SMFG cows had lower concentrations of lactadherin (p = 0.005, Figure A1).
Moreover, MFGM extracts from the milk of SMFG cows had higher concentrations of
BTN and PLIN2 compared to LMFG cows, which in turn had higher concentrations of
xanthine oxidoreductase (XOR, Figure A1). However, these differences were not
statistically significant. We used this analysis to estimate whether MFGM protein
concentrations in general could be related to MFG size. While the use of SDS-PAGE and
densitometry analysis is not the most sensitive technique and can lead to higher variation,
obvious visual differences in the major MFGM protein bands between the groups, where
identification was confirmed via LC-MS/MS analysis, indicate that MFGM protein
concentrations could possibly be related to the MFG size development in the mammary
gland, despite a relatively small sample size.

119
Additional Figure A1: Concentrations of the major milk fat globule membrane proteins in the
small and large MFG phenotypes determined by densitometry analysis (A) of SDS-PAGE gels
(B). Dot plots show individual data points and predicted means as thick bars and numbers. Error
bars represent the 95% confidence intervals. P-values were calculated using 2-way ANOVA with
group, days in milk and season as fixed effects and were adjusted for multiple comparisons using
the Benjamini and Hochberg (1995) procedure. Proteins were identified by liquid
chromatography tandem mass spectrometry analysis. XOR = xanthine oxidoreductase, BTN =
butyrophilin, PLIN2 = perilipin 2. SMFG = cows naturally producing small milk fat globules,
LMFG = cows naturally producing large milk fat globules. Six cows per group were sampled in
biological duplicates on separate days.
The higher concentrations of lactadherin in the MFGM material extracted from LMFG
cows compared to SMFG cows (p = 0.005, Figure A1) are in agreement with the earlier
findings of Lu et al. (2016). Several possible functions of lactadherin have been
suggested, including the phagocytosis of apoptotic MEC by adjacent cells and
macrophages, as well as the clearance of secreted MFG remaining in the mammary ducts
during mammary gland involution (Hanayama and Nagata, 2005). While the role of
lactadherin in apoptosis is relatively well established, its physiological role in MEC
remains largely unknown, despite being a major component of the MFGM. To date, the

120
only evidence pointing towards a potential role for lactadherin in the regulation of MFG
size is obtained from studies in mice (Nakatani et al., 2013; Yasueda et al., 2015).
Yasueda et al. (2015) reported that lactadherin deficient mice produce milk with
abnormally large MFG and showed that lactadherin binds to PS exposed on the MFG
surface, preventing spontaneous fusion. These results seem at odds with the higher
lactadherin concentrations found in MFG from LMFG cows. However, Nakatani et al.
(2013) showed that in normal mice, bigger MFG showed a higher staining intensity for
lactadherin than smaller globules. They further showed that MFG of similar size from
mice in peak lactation had lower staining intensities for lactadherin compared to mice 3 h
after forced weaning, suggesting that MFG are coated with more lactadherin during
involution, possibly signalling the cells to take up already secreted MFG.
Combined or individual roles for BTN, PLIN2 and XOR in the MFG secretion process
have been suggested (Ogg et al., 2004; Robenek et al., 2006a; Chong et al., 2011),
although their precise involvement remains unknown. It is possible that higher
concentrations of both BTN and PLIN2 could impact the speed of the secretion process,
limiting the time for LD growth in SMFG cows. For example, Chong et al. (2011)
suggested a major role for PLIN2 in MFG secretion by initiating the secretion process
through binding to the apical plasma membrane and subsequent recruitment of BTN and
XOR to conclude the budding process. While our results somewhat align with this theory,
with higher concentrations of BTN and PLIN2 measured in the MFGM of the SMFG
group, overall the differences were not statistically significant and therefore inconclusive.
We also did not find increased concentrations of XOR in the MFGM of the SMFG group.
Moreover, Robenek et al. (2006a) further showed that BTN can be found in an even
distribution between the monolayer of the LD and the opposing bilayer of the plasma
membrane, as network forming ridges. These results indicate that BTN alone may be

121
responsible for LD secretion and that PLIN2, while being involved in LD biogenesis
(Robenek et al., 2006b), may not be involved in the final secretion step within the MEC
(Robenek et al., 2006a). In line with this, it has been suggested that PLIN2 can act as a
FA binding protein and therefore play a role in carrier mediated transport of long-chain
FAs, including SFAs, MUFAs and PUFAs, through the plasma membrane of adipocytes
(Gao and Serrero, 1999; Serrero et al., 2000). Moreover, in goat MECs, oleic acid
supplementation leads to increased colocalisation of PLIN2 with the LD envelope and
thus increases the total TAG content, possibly because it can protect TAGs from
hydrolysis by adipose triglyceride lipase (Shi et al., 2015). We hypothesise that, in
combination with higher SCD activities this could possibly explain the greater relative
abundance of UFAs in the MFG core of the SMFG group. However, studies on the role
of PLIN2 in LD accumulation in the mammary glands of mice have shown that a drastic
decrease in PLIN2 levels in PLIN2 deficient mice prevents the maturation of LD into
larger structures, due to the loss of its protective effect against hydrolysis by adipose
triglyceride lipase (Russell et al., 2007, 2011). It is important to note that we do not
dispute this crucial role for PLIN2 in LD maturation. Here we suggest, that within its
physiological range PLIN 2 could further act as a FA binding protein, as shown in
adipocytes, and therefore support the incorporation of FA from the bloodstream and at
the same time protect LD from hydrolysis by adipose triglyceride lipase, although the
results of the current study merely provide preliminary results and will have to be
confirmed through more in-depth proteomic analyses.
Across species, the main MFGM protein concentrations varied and are shown in
Figure A2. In this analysis, lactadherin content were not consistent with the average MFG
size across species. Mean PLIN2 concentrations appeared to be negatively related to MFG
size, however the differences between the species were minor possibly due to the diffuse

122
nature of the bands in the PLIN2 and lactadherin region which could not be clearly
separated.
Additional Figure A2: Concentrations of the major milk fat globule membrane proteins in camels,
sheep and goats compared to SMFG and LMFG cows determined by densitometry analysis (A) of
SDS-PAGE gels (B). Dot plots show individual data points, mean symbols as defined in the figure
legend and 95% confidence intervals. The species are presented in ascending order of their average
milk fat globule size, from smallest (camel) to the largest (LMFG cow) to show possible
relationships between the proteins and MFG size. Proteins were identified by liquid
chromatography tandem mass spectrometry analysis. XOR = xanthine oxidoreductase, BTN =
butyrophilin, PLIN2 = perilipin 2. *identified as lactadherin in camels due to incomplete
separation. Therefore, lactadherin and PLIN2 are not shown for camels. SMFG = cows naturally
producing small milk fat globules, LMFG = cows naturally producing large milk fat globules.
ADDITIONAL CONCLUSIONS
Overall, the results obtained through densitometry analysis of MFGM extracts from
the selected cows were inconclusive. However, the results indicate that MFGM protein
concentrations may differ between the selected cows and could impact the FA
composition of the MFG core and could possibly be related to MFG size. Future studies
should determine the concentrations of the major MFGM proteins using a more targeted
and more sensitive technique to establish their potential roles in MFG size development.

123
ADDITIONAL REFERENCES
Chong, B.M., Russell, T.D., Schaack, J., Orlicky, D.J., Reigan, P., Ladinsky, M., and
McManaman, J.L. (2011). The Adipophilin C Terminus Is a Self-folding
Membrane-binding Domain That Is Important for Milk Lipid Secretion. J. Biol.
Chem. 286, 23254–23265.
Gao, J., and Serrero, G. (1999). Adipose Differentiation Related Protein (ADRP)
Expressed in Transfected COS-7 Cells Selectively Stimulates Long Chain Fatty
Acid Uptake. J. Biol. Chem. 274, 16825–16830.
Hanayama, R., and Nagata, S. (2005). Impaired involution of mammary glands in the
absence of milk fat globule EGF factor 8. Proc. Natl. Acad. Sci. 102, 16886–
16891.
Lu, J., Argov-Argaman, N., Anggrek, J., Boeren, S., van Hooijdonk, T., Vervoort, J., and
Hettinga, K.A. (2016). The protein and lipid composition of the membrane of milk
fat globules depends on their size. J. Dairy Sci. 99, 4726–4738.
Nakatani, H., Yasueda, T., Oshima, K., Okajima, T., Nadano, D., Flint, D.J., and Matsuda,
T. (2013). Post-weaning increases in the milk-fat globule EGF-factor VIII on fat
globules in mouse milk and in the uptake of the fat globules by HC11 mammary
epithelial cells. J. Biochem. (Tokyo) 153, 31–41.
Ogg, S.L., Weldon, A.K., Dobbie, L., Smith, A.J.H., and Mather, I.H. (2004). Expression
of butyrophilin (Btn1a1) in lactating mammary gland is essential for the regulated
secretion of milk–lipid droplets. Proc. Natl. Acad. Sci. U.S.A. 101, 10084–10089.
Robenek, H., Hofnagel, O., Buers, I., Lorkowski, S., Schnoor, M., Robenek, M.J., Heid,
H., Troyer, D., and Severs, N.J. (2006a). Butyrophilin controls milk fat globule
secretion. Proc. Natl. Acad. Sci. U.S.A. 103, 10385–10390.
Robenek, H., Hofnagel, O., Buers, I., Robenek, M.J., Troyer, D., and Severs, N.J.
(2006b). Adipophilin-enriched domains in the ER membrane are sites of lipid
droplet biogenesis. J. Cell Sci. 119, 4215–4224.
Russell, T.D., Schaack, J., Orlicky, D.J., Palmer, C., Chang, B.H.-J., Chan, L., and
McManaman, J.L. (2011). Adipophilin regulates maturation of cytoplasmic lipid
droplets and alveolae in differentiating mammary glands. J. Cell. Sci. 124, 3247–
3253.
Serrero, G., Frolov, A., Schroeder, F., Tanaka, K., and Gelhaar, L. (2000). Adipose
differentiation related protein: expression, purification of recombinant protein in
Escherichia coli and characterization of its fatty acid binding properties. Biochim
Biophys Acta Mol Cell Biol Lipids 1488, 245–254.

124
Shi, H.B., Yu, K., Luo, J., Li, J., Tian, H.B., Zhu, J.J., Sun, Y.T., Yao, D.W., Xu, H.F.,
Shi, H.P., and Loor, J. J. (2015). Adipocyte differentiation-related protein
promotes lipid accumulation in goat mammary epithelial cells. J. Dairy Sci. 98,
6954–6964.
Yasueda, T., Oshima, K., Nakatani, H., Tabuchi, K., Nadano, D., and Matsuda, T. (2015).
A protective effect of milk fat globule EGF factor VIII (MFG-E8) on the
spontaneous fusion of milk fat globules in breast milk. J. Biochem. (Tokyo) 158,
25–35.

125
CHAPTER 5
Milk fat globule size development in the mammary epithelial cell: a potential role
for ether phosphatidylethanolamine
Leonie Walter,1,2 Vinod K. Narayana,3 Richard Fry,1 Amy Logan,2 Dedreia Tull,3 Brian
J. Leury1
1. Faculty of Veterinary and Agricultural Sciences, The University of Melbourne, Parkville,
Victoria, Australia 3010
2. CSIRO Agriculture and Food, Werribee, Victoria, Australia 3030
3. Metabolomics Australia, Bio21 Molecular Science and Biotechnology Institute, The
University of Melbourne, Parkville, Victoria, Australia 3010

126
Introduction
Chapter 5 characterised the whole milk lipidome of cows producing milk with small
or large volume weighted mean diameters across a pre-trial observation period and used
samples collected on the same days as the milk used for the experiments in Chapter 4.
This experimental chapter comprises a manuscript submitted to Scientific Reports, as
well as supplementary data that is also intended for publication.

127
Manuscript
ABSTRACT
Milk fat globule (MFG) size is a milk production trait characteristic to the individual
animal and has important effects on the functional and nutritional properties of milk.
Although the regulation of MFG size in the mammary epithelial cell is not fully
understood, lipid droplet (LD) fusion prior to secretion is believed to play a role. We
selected cows that consistently produced milk with predominantly small or large MFGs
to compare their lipidomic profiles, with focus on the polar lipid fraction. The polar lipid
composition of the monolayer surrounding the LD is believed to either promote or prevent
LD fusion. Using a targeted LC-MS/MS approach we studied the relative abundance of
301 detected species and found significant differences between the studied groups. Here
we show that the lipidomic profile of milk from small MFG cows is characterised by
higher phosphatidylcholine to phosphatidylethanolamine ratios, which is predicted to
prevent LD fusion. In contrast, the milk from large MFG cows contained more ether-
phosphatidylethanolamine species, which can disrupt biological membranes, reduce
fluidity and thus promote LD fusion. This is the first time that a role for ether-
phosphatidylethanolamine in MFG size development has been suggested.

128
INTRODUCTION
Milk lipids are secreted from the mammary epithelial cell as spherical structures
termed milk fat globules (MFGs). They comprise a neutral lipid core surrounded by a
membrane derived partially from the endoplasmic reticulum (ER, innermost layer) and
the apical plasma membrane (two outer layers) (Heid and Keenan, 2005). The MFG
membrane (MFGM) keeps lipids solubilised in milk, but also has several health benefits
for the infant and for adult consumers. For example, beneficial effects on cancer,
hypercholesterolemia, diabetes and cognitive function have been attributed to the protein,
glycerophospholipid (PL) and sphingolipid (SL) components of the MFGM in bovine
milk (Spitsberg, 2005). The amount of MFGM material in milk depends on the fat content
and MFG size, with smaller globules exhibiting a greater surface area and therefore more
surrounding membrane material per unit of fat. Moreover, the processing of milk into
butter and cheese is influenced by MFG size. Because larger MFGs are more prone to
coalescence, the efficiency of butter manufacturing could be increased by using milk with
larger MFGs. Accordingly, cheese manufacturing could benefit from the use of milk with
small MFG size distributions. For example, it has been shown that Cheddar cheese made
from milk with small MFGs exhibits a reduced springiness and chewiness (Logan et al.,
2017) and improved sensory properties of Emmental cheese were reported when it was
manufactured from small MFG milk (Michalski et al., 2007). Therefore, the textural
properties of cheeses made from milk with different MFG size distributions could be
tailored to the desired attributes of the final product.
Variations in MFG size exist between breeds and species of mammals (Carroll et al.,
2006; El-Zeini, 2006), but also between animals of the same breed of cows (Logan et al.,
2014). Moreover, the average MFG size changes throughout the lactation cycle
depending on the days in milk since the last calving and throughout the year in response

129
to changes in the diet (Fleming et al., 2017). Other suggested impact factors are fat content
(Wiking et al., 2004), fat-to-protein ratio (Couvreur and Hurtaud, 2017) and milking
period (Fleming et al., 2017). However, these effects are limited compared to the overall
variation that is seen between individual animals. The size of MFGs in cow’s milk ranges
from less than 1 µm to 15 µm (Michalski et al., 2001), with the average size ranging
between 2.5 and 5.7 µm within a herd of Holstein-Friesian cows (Logan et al., 2014).
The ultimate size of individual MFGs is determined by two growth mechanisms inside
the mammary epithelial cell: either via local triacylglycerol (TG) synthesis by enzymes
residing in the monolayer surrounding the intracellular lipid droplet (LD) or by LD fusion
(Masedunskas et al., 2017; Wilfling et al., 2013). Membrane fusion events are important
for many cellular processes and are believed to involve the action of fusion proteins
(Boström et al., 2007) but also depend on the lipid components of the monolayer (Cohen
et al., 2017). While most membrane fusion events involve membrane compartments with
a typical PL bilayer, LDs only comprise a single layer of PLs and membrane proteins.
The MFGM, which includes both the LD monolayer and a portion of the apical plasma
membrane, contains several PLs and SLs. Amongst the PLs found in the MFGM,
phosphatidylcholine (PC) and phosphatidylethanolamine (PE) are the major species
followed by phosphatidylinositol (PI) and phosphatidylserine (PS) (Dewettinck et al.,
2008). Sphingomyelin (SM) is the major SL found in milk and PC (35% of total PL), PE
(30%) and SM (25%) are the most abundant species of polar lipids in milk (Dewettinck
et al., 2008), although reports differ about whether PC or PE is the most abundant
(Contarini and Povolo, 2013).
The exact mechanisms behind LD fusion remain elusive but may depend on the PL
and fatty acid (FA) composition of the monolayer. Thiam et al. (2013) comprehensively
reviewed the biophysical properties of individual PL and their impact on LD fusion and

130
the reader is referred to this article for more detail. Briefly, PLs with smaller headgroups,
such as PE and phosphatidic acid are predicted to enhance fusion of LDs, while PC has a
more cylindrical shape and can protect LDs from fusion. Although most of the available
evidence in the literature is based on studies in non-mammary cells, this important role
of the polar lipid composition in the LD monolayer in the regulation of LD fusion has
also been demonstrated in mammary epithelial cells (Cohen et al., 2017). Moreover, not
only the type of polar lipid in the monolayer surrounding the LD determines its size, but
also the FA composition of the polar lipids (Arisawa et al., 2016). Apart from SM, which
contains predominantly saturated FAs (SFAs), most PLs are rich in unsaturated FAs
(UFAs), although PC is less unsaturated compared to PE, PI and PS (Dewettinck et al.,
2008). Using a cell line engineered to produce larger LDs, it has been shown that LDs
extracted from these cells contained less UFAs in the PE and PC fractions of the LD
monolayer compared to control cells with smaller LDs (Arisawa et al., 2016).
Previous studies suggest that MFG size depends on the physiological state of the
animal (Altenhofer et al., 2015; Fleming et al., 2017) and that the milk from cows
producing small or large MFGs also differs in the FA composition (Couvreur and
Hurtaud, 2017; Couvreur et al., 2007). We therefore hypothesised that there are
underlying differences in the mammary lipid metabolism between cows consistently
producing small or large MFGs. The current study addressed these metabolic differences
by focusing on the milk lipidome of the selected cows using triple quadrupole LC-MS/MS
analysis. The polar lipid fraction in milk originates predominantly from the MFGM. This
MFGM material is partially derived from the ER and the apical plasma membrane and
offers a snapshot of the lipid metabolic state of the mammary epithelial cell. Here, we
show differences in the polar lipid species and their FA composition between cows
producing small or large MFGs. Milk from cows with smaller average MFG size had

131
higher PC/PE ratios, while cows with larger average MFG size contained relatively more
ether-PE (ePE) species. Potential reasons for the observed difference between the studied
groups are discussed.
MATERIALS AND METHODS
Animals and nutritional management
A total of 12 Holstein-Friesian cows were selected from the main herd for this study.
Of these, six cows consistently produced milk with small average MFG size (< 3.5 µm,
expressed as the volume weighted mean diameter D[4,3]), forming the SMFG group. The
remaining six cows formed the large MFG size group (LMFG), which produced milk
with an average diameter of > 4.5 µm. The cows are part of the herd at the University of
Melbourne Dookie Dairy in Victoria, Australia (latitude 36°25'31.3"S, longitude
145°42'36.6"E). The herd comprises approximately 150 cows, which are milked by an
automatic milking system (Lely Astronaut; Lely, Maassluis, The Netherlands) and
pasture fed and kept outside all year. The cows’ diet in the paddock is supplemented with
hay and silage if needed and cereal grain-based concentrate is fed during milking. One of
the goals of this study was to select cows that consistently produce milk with average
MFG sizes on the small or large end of the spectrum observed within a herd but have
otherwise similar milk production traits and are in similar stages of lactation. Therefore,
cows were surveyed over one year prior to this study and the selected animals were
measured between three to nine times.
Milk sampling and processing
Milk from each selected cow was sampled twice on separate days approximately two
weeks apart, resulting in a total of 24 samples from 12 cows. The first cohort of six cows,
including three per study group, were sampled on two separate days in autumn (March

132
2016) and the second cohort on two days in winter (June 2016). Milk samples were
collected during morning milking (0800 to 1000h). For the lipidomic analysis, whole raw
milk samples (30 mL in 5 ml aliquots) were collected and frozen within 1 min from the
end of milking in a liquid nitrogen dry shipper and were subsequently kept at -80 °C.
MFG size measurements and proximate analysis
Fat and protein concentrations were determined using a LactoScope FTIR 20 (Delta
Instruments, Melbourne, Australia). MFG size was measured as previously described
(Logan et al., 2014) with a Mastersizer 2000 particle analyser (Malvern Instruments,
Malvern, UK). Prior to particle size analysis, milk was mixed 1:1 with 35 mM EDTA,
pH 7.0 to dissociate casein micelles and the obscuration rate was kept between 12 to 15%.
Refractive indices for milk fat and water were set to 1.46 and 1.33, respectively and the
particle absorption coefficient was 0.001. Each sample was measured in duplicate and the
volume-weighted mean diameter D4,3 was used as the measure for the average MFG size.
Lipidomic analysis and data curation
From 24 milk samples, 20 µL of each sample were used for lipid extraction using a
modified Folch extraction protocol (Folch et al., 1957). Briefly, 20 µL of milk samples
were suspended in 400 µL ice cold chloroform:methanol (2:1, v/v) containing 10 mg/L
of each internal standard. The internal standards were PC19:0/19:0, PE-d31, PG17:0/17:0
and TG-d5 19:0/12:0/19:0 (Product # 850367, 8609040, 860374, and 830456, from
Avanti Polar Lipids, Alabama, USA). Samples were vortexed and then mixed at 950 rpm
for 30 min at 27 ˚C with a Thermomixer C (Eppendorf South Pacific Pty Ltd, Macquarie
Park, Australia). Samples were centrifuged at 16,100 × g (Beckman Coulter Microfuge®
22R Refrigerated Microcentrifuge, Beckman Coulter Australia Pty Ltd, Sydney,
Australia) for 10 min and the supernatant transferred to fresh LoBind Eppendorf tubes.
133
Samples were completely dried in a vacuum concentrator (Christ® RVC 2-33, Martin
Christ Gefriertrocknungsanlagen GmbH, Osterode am Harz, Germany). The samples
were reconstituted with methanol:water-saturated butanol (100 L, 1:9, v/v). Pooled
biological quality control samples (PBQC) were prepared by pooling aliquots of the
extracts from each sample and ran after every five samples.
Extracted lipids were processed and detected by Metabolomics Australia (Bio21
Institute, Melbourne, VIC, Australia) as previously described (Huynh et al., 2018, 2019)
using an Agilent 1290 liquid chromatography (LC) system and Triple Quadrupole 6490
mass spectrometer (MS, Agilent Technologies Australia, Mulgrave, Australia). Briefly,
the lipid material (1 L) was separated using a Zorbax Eclipse Plus C-18 column (100
mm × 2.1 mm × 1.8 µm, Agilent Technologies Australia, 0.4 mL/min) with a mobile
phase solvent system of A: water/acetonitrile/isopropanol (50:30:20, v/v/v) and B:
water/acetonitrile/isopropanol (1:9:90, v/v/v), both with 10 mM ammonium formate,
using a flow rate of 400 µl/min. After equilibration with 10% B, the gradient elution used
was 10%-45% B (2.7 min), 53% B (0.10 min), 65% B (0.20 min), 89% B (0.10 min),
92% B (1.9 min), 100% B (1.9 min), then 10% B (1.1 min) and a total run time of 14 min.
The column was preconditioned with 10% B for 30 min before a batch analysis. The lipids
were detected in positive ionisation mode with dynamic scheduled multiple reaction
monitoring. The MS parameters and multiple reaction monitoring transitions of each lipid
class, subclass and individual lipid species have been previously described (Huynh et al.,
2018, 2019). Data processing was performed using Agilent’s Mass Hunter Quantitative
Analysis (QQQ) software (Agilent Technologies Australia).
134
Lipid nomenclature
Lipid species were named according to the LIPID MAPS nomenclature described in
Liebisch et al. (2013). Lipid species identified on a group level were named according to
their lipid class followed by the total number of carbons and double bonds (e.g. PC 34:1).
Where known, the individual FA composition is denoted in brackets separated by an
underscore, e.g. PC (18:0_18:1). The underscore signifies that the stereospecific position
number (sn1 or sn2) of the FA on the glycerol backbone is unknown. Furthermore, the
O- or P- in the PC and PE lipid classes as well as the lysophospholid species designates
the ether or vinyl-ether linkages in plasmanyl-and plasmenyl-species, e.g. PE (O-
18:1_18:0).
Statistical analysis
Peak areas of each detected compound were normalised by dividing the respective
peak by the aggregate median for all detected compounds (per sample). Ratios of PC/PE
and SM/ceramide (Cer) were calculated by calculating the sum of peak areas of the
respective lipid class and were not median normalised. The data was transformed using
the natural logarithm and the mean of duplicate measurements for each cow were used
for statistical analysis. Because sampling was performed across two seasons a two-way
ANOVA was used for statistical analysis including the studied groups (LMFG and SMFG
cows), days in milk and season as fixed effects using the ‘lm’ function combined with the
‘tidy’ function as part of the ‘broom’ package (Robinson and Hayes, 2018) in R version
3.5.1 (R Core Team, 2018). The procedure by Benjamini and Hochberg (1995) was used
to correct false positives for multiple comparisons and only corrected P-values are shown.
The estimated difference between the means of the two studied groups based on data
transformed using the natural logarithm, represents the fold change of SMFG cows

135
compared to that of the reference group (LMFG cows). If multiplied by 100, the estimated
difference between the groups, calculated by the linear model, can be interpreted as a
percentage (Cole, 2000). Although absolute abundance of the compounds was not
measured, sums of the median-normalised peak areas of individual lipid species within a
lipid class were calculated to estimate the difference in relative abundance of each lipid
class. The results of this analysis were transformed using the natural logarithm and
significance testing was performed using two-way ANOVA, as described for the
individual lipid species, including the correction for multiple testing. Graphs were
produced using the ‘ggplot2’ package (Wickham, 2016) in R.
RESULTS
Differences in milk production traits and MFG size between the studied groups
The average MFG size, expressed as the volume weighted mean diameter D4,3, was
1.63 µm larger in the milk from cows in the LMFG group compared to the SMFG group.
Other production traits such as milk composition, number of milkings per day and
concentrate intake were similar between the studied groups (Table 1). However, there
was a small difference in days in milk, representing the number of days since the last
calving (25 days difference, Table 1). Furthermore, cows from the SMFG group included
primiparous cows (parity 1 to 3), while the LMFG group contained only cows in later
parities (parity 3 to 5). Both these parameters can affect MFG size and could be
contributing factors to the difference in MFG size. However, we previously estimated the
effect of these parameters on MFG size within our herd (Chapter 3). Based on this
analysis we estimate that the difference between the groups attributable to the difference
in days in milk and parity is in the magnitude of 0.21 µm (0.05 µm decrease due to 25
additional days in milk for SMFG cows and an increase in MFG size of 0.16 µm that was
observed between parity 2 and 3). The difference between the selected groups (1.63 µm)

136
is therefore approximately 8 times the estimated effect of the impact of days in milk and
parity. However, days in milk was added to the statistical model as a fixed effect to control
for its impact on MFG size.
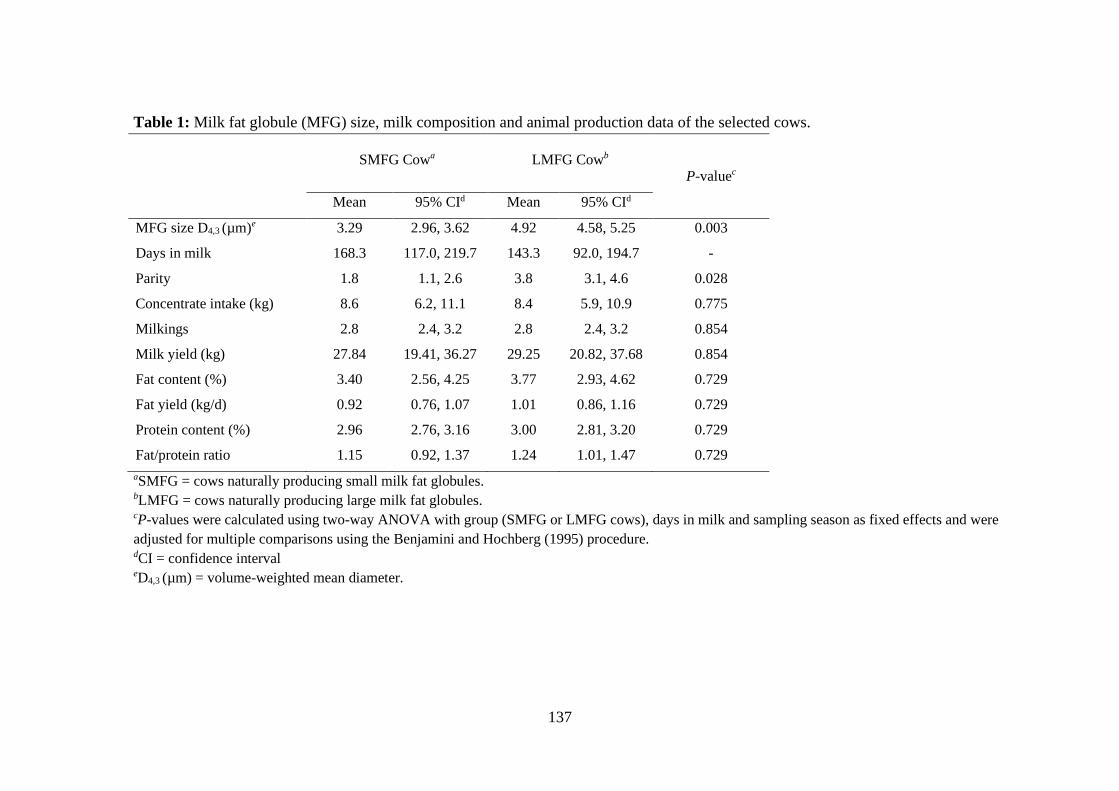
137
Table 1: Milk fat globule (MFG) size, milk composition and animal production data of the selected cows.
SMFG Cowa LMFG Cowb P-valuec
Mean 95% CId Mean 95% CId
MFG size D4,3 (µm)e 3.29 2.96, 3.62 4.92 4.58, 5.25 0.003
Days in milk 168.3 117.0, 219.7 143.3 92.0, 194.7 -
Parity 1.8 1.1, 2.6 3.8 3.1, 4.6 0.028
Concentrate intake (kg) 8.6 6.2, 11.1 8.4 5.9, 10.9 0.775
Milkings 2.8 2.4, 3.2 2.8 2.4, 3.2 0.854
Milk yield (kg) 27.84 19.41, 36.27 29.25 20.82, 37.68 0.854
Fat content (%) 3.40 2.56, 4.25 3.77 2.93, 4.62 0.729
Fat yield (kg/d) 0.92 0.76, 1.07 1.01 0.86, 1.16 0.729
Protein content (%) 2.96 2.76, 3.16 3.00 2.81, 3.20 0.729
Fat/protein ratio 1.15 0.92, 1.37 1.24 1.01, 1.47 0.729
aSMFG = cows naturally producing small milk fat globules.
bLMFG = cows naturally producing large milk fat globules.
cP-values were calculated using two-way ANOVA with group (SMFG or LMFG cows), days in milk and sampling season as fixed effects and were
adjusted for multiple comparisons using the Benjamini and Hochberg (1995) procedure. dCI = confidence interval eD4,3 (µm) = volume-weighted mean diameter.

138
Lipidomic profile of milk from the studied groups
Lipidomic analysis was performed on whole raw milk samples which were frozen
within minutes of sample collection and thus most accurately represent the metabolic state
of the animals. Using a targeted approach, we measured 445 compounds and detected 301
thereof in milk. Although previous reports have reported higher numbers of neutral lipid
species (Li et al., 2017), to the best of our knowledge, this study presents the highest
number of polar lipids detected in milk to date. These species were from a total of 14 lipid
classes, many of which had not been previously the focus of milk lipidomics (Table 2).
For example, we found 23 and 19 species of plasmenyl-PE and plasmenyl-PC,
respectively. Moreover, we detected 24 Cer species and five and seven additional
dihydroceramide (dhCer) and hexosylceramide (HexCer) species. Detected
lysophospholipid species included 18 lysophosphatidylcholine (LPC), six
lysophosphatidylethanolamine (LPE) and three lysophosphatidylinositol (LPI) species
(Table 2). A complete list of the identified lipid species is provided in the supplementary
file of this article. Amongst the detected compounds, 27 differed in relative abundance
between the SMFG and LMFG groups, of which nine species were significantly different
with P < 0.05 and 18 species with P < 0.10.
To date, about 400 lipid species have been discovered in milk, however the estimated
total number is believed to be around 1000 lipid species, with many low abundance
compounds yet to be discovered (Liu et al., 2018). The targeted method used in our study
allowed us to identify the total carbon number (CN), number of double bonds and the FA
composition of PLs which was characterised by collision induced dissociation in positive
ionization mode as reported previously (Huynh et al., 2018, 2019). However, cow’s milk
contains small chain FAs with less than 14 carbons and TG species containing these FAs,
resulting in a total CN < 48, will not be detected by this approach. This represents a

139
limitation of the present study in relation to the TG analysis since a large proportion of
TGs have total CNs < 48:1 which was the smallest CN of TG species detected in our
study (Liu et al., 2018). Therefore, the differences in the FA composition and origin of
FAs between the studied groups were not the focus of the current study. The polar lipid
components of milk, on the other hand, contain mostly medium and long chain FAs and
the lipidomic approach described here covers the major lipid species in this group.
Therefore, the focus of this study was the identification of differences in polar lipid
species.

140
Table 2: Lipid classes surveyed and detected in the current study.
Lipid class Number of
species surveyed
Number of
species detected
PC 33 25
PC-O 19 15
PC-P 18 14
PE 19 17
PE-O 10 9
PE-P 33 23
PI 16 15
PS 7 5
PG 4 3
SM 35 33
CE 27 6
oxCE 2 1
DG 20 18
TG 44 44
TG-O 3 3
Cer 42 24
dhCer 6 5
HexCer 30 7
LPC 37 14
LPC-O 10 3
LPC-P 4 1
LPE 10 5
LPE-O - -
LPE-P 4 1
LPI 4 3
AC 12 4
Sulfatide 6 1
Ganglioside 8 1
AC, acyl carnitine; oxCE, oxidised CE; PG: phosphatidylglycerol; TG-O, can include alkyl-
diacylglycerol, dialkyl-acylglycerol or trialkylglycerol.
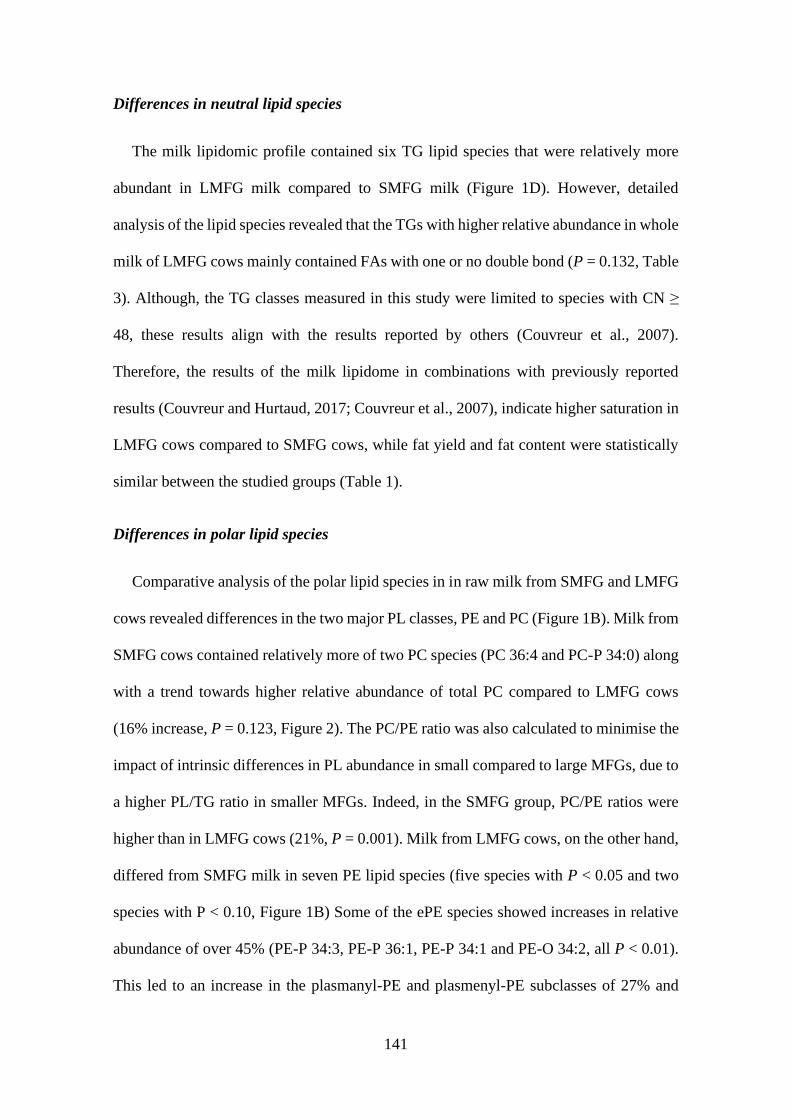
141
Differences in neutral lipid species
The milk lipidomic profile contained six TG lipid species that were relatively more
abundant in LMFG milk compared to SMFG milk (Figure 1D). However, detailed
analysis of the lipid species revealed that the TGs with higher relative abundance in whole
milk of LMFG cows mainly contained FAs with one or no double bond (P = 0.132, Table
3). Although, the TG classes measured in this study were limited to species with CN ≥
48, these results align with the results reported by others (Couvreur et al., 2007).
Therefore, the results of the milk lipidome in combinations with previously reported
results (Couvreur and Hurtaud, 2017; Couvreur et al., 2007), indicate higher saturation in
LMFG cows compared to SMFG cows, while fat yield and fat content were statistically
similar between the studied groups (Table 1).
Differences in polar lipid species
Comparative analysis of the polar lipid species in in raw milk from SMFG and LMFG
cows revealed differences in the two major PL classes, PE and PC (Figure 1B). Milk from
SMFG cows contained relatively more of two PC species (PC 36:4 and PC-P 34:0) along
with a trend towards higher relative abundance of total PC compared to LMFG cows
(16% increase, P = 0.123, Figure 2). The PC/PE ratio was also calculated to minimise the
impact of intrinsic differences in PL abundance in small compared to large MFGs, due to
a higher PL/TG ratio in smaller MFGs. Indeed, in the SMFG group, PC/PE ratios were
higher than in LMFG cows (21%, P = 0.001). Milk from LMFG cows, on the other hand,
differed from SMFG milk in seven PE lipid species (five species with P < 0.05 and two
species with P < 0.10, Figure 1B) Some of the ePE species showed increases in relative
abundance of over 45% (PE-P 34:3, PE-P 36:1, PE-P 34:1 and PE-O 34:2, all P < 0.01).
This led to an increase in the plasmanyl-PE and plasmenyl-PE subclasses of 27% and

142
33% (P = 0.104 and P < 0.01, respectively). However, these differences did not lead to a
change in the total relative abundance of the total PE lipid class between the groups
(Figure 2). These results suggest, for the first time, a possible link between ePE and MFG
size.
Ether-PLs (ePLs) contain an ether linked fatty alcohol at the sn-1 position, where their
diacyl equivalents contain an ester linked FA (Wallner and Schmitz, 2011). Among ePLs,
there are two subcategories depending on the nature of the ether bond. The so-called
plasmanyl- species contain a 1-O-alkyl ether bond, while plasmenyl- species have a vinyl-
ether bond (cis double bond at the Δ1 position adjacent to the ether bond) and are also
known as plasmalogens (Nagan and Zoeller, 2001). Plasmalogens are mainly found in the
form of PE species and their concentrations are reported to reach up to 18% of the total
PLs in membranes and can constitute up to 70% of the total PE lipid class depending on
the tissue (Nagan and Zoeller, 2001). However, information on the abundance of
plasmalogens in the lactating mammary gland is lacking and can only be estimated based
on their abundance in milk PLs, which are derived from the plasma membrane of the
mammary epithelial cell. These results suggest an abundance of plasmenyl-PE in cow’s
milk of approximately 4.5% of total PLs, which is less than in camel (6.4%) and human
(11%) milk (Garcia et al., 2012; Murgia et al., 2003). The suggested functions of
plasmenyl-PE in biological membranes are antioxidative effects (Zoeller et al., 1999),
involvement in cholesterol and membrane trafficking (Munn et al., 2003; Thai et al.,
2001), signal transduction (Brites et al., 2004) and LD fusion (Glaser, 1994).
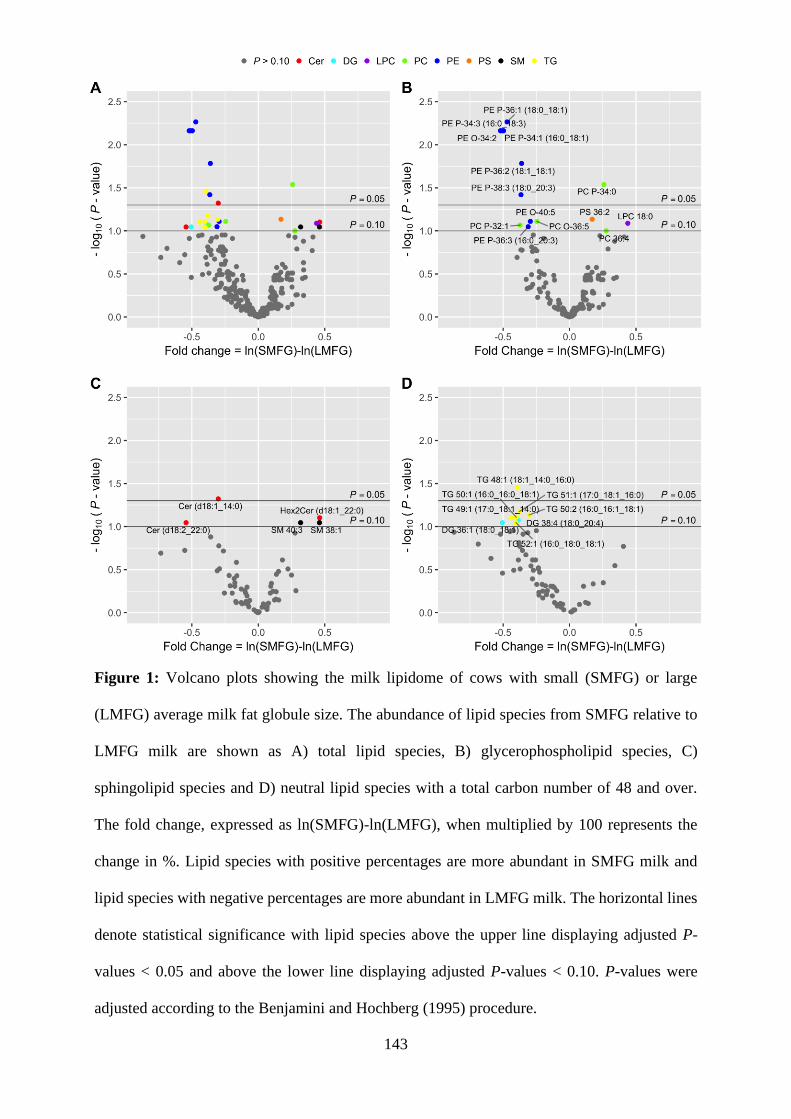
143
Figure 1: Volcano plots showing the milk lipidome of cows with small (SMFG) or large
(LMFG) average milk fat globule size. The abundance of lipid species from SMFG relative to
LMFG milk are shown as A) total lipid species, B) glycerophospholipid species, C)
sphingolipid species and D) neutral lipid species with a total carbon number of 48 and over.
The fold change, expressed as ln(SMFG)-ln(LMFG), when multiplied by 100 represents the
change in %. Lipid species with positive percentages are more abundant in SMFG milk and
lipid species with negative percentages are more abundant in LMFG milk. The horizontal lines
denote statistical significance with lipid species above the upper line displaying adjusted P-
values < 0.05 and above the lower line displaying adjusted P-values < 0.10. P-values were
adjusted according to the Benjamini and Hochberg (1995) procedure.

144
Some differences were also observed within the Cer and SM classes (Figure 1C). More
specifically, the milk of LMFG cows contained more Cer (d18:1_14:0, P < 0.05) and Cer
(d18:2_22:0, P < 0.10) than the milk of SMFG cows, while the relative abundance of total
Cer was similar between the studied groups (Figure 2). In contrast, SMFG milk contained
a higher relative abundance of Hex2Cer (d18:1_22:0, P < 0.10) and two SM species (SM
38:1and SM 40:3, P < 0.10) compared to LMFG milk (Figure 1C). Again, this was not
related to a difference in total SM abundance (Figure 2). However, SM/Cer ratios were
higher in SMFG milk compared to the LMFG group, although this did not reach statistical
significance (P = 0.132, Figure 2). Cer are SLs, made of a sphingoid base connected to a
FA through an amide bond (Bartke and Hannun, 2009). They are also the direct precursors
for SM, which is synthesised through the transfer of a choline headgroup from PC to Cer
by the enzyme sphingomyelin synthase (SMS) in the Golgi or the plasma membrane, a
process that is reversible through the action of sphingomyelinases (Bartke and Hannun,
2009). However, Cer are believed to exert some of their biological functions at low
concentrations (Silva et al., 2006), have been linked to insulin resistance (Rico et al.,
2015) and may be involved in LD biogenesis (Deevska and Nikolova-Karakashian,
2017).

145
Figure 2: The difference in relative abundance of lipid classes and subclasses in milk
from cows with small average milk fat globule size (SMFG) compared to cows with large
average milk fat globule size (LMFG). Estimated mean difference and 95% confidence
intervals are shown. Lipid classes shown in black (P < 0.10) or pink (P < 0.05) are
different between the groups after adjusting the P-values according to the Benjamini and
Hochberg (1995) procedure.
Degrees of saturation within the lipid classes
Lipid droplet fusion not only depends on the physical properties of the main PLs in its
monolayer but is also influenced by the FA composition of the acyl chains and their
impact on fluidity and packing density, with UFAs predicted to increase fluidity and
prevent LD fusion (Arisawa et al., 2016). Indeed, we found higher unsaturation in some
of the polar lipid classes in the milk from SMFG cows compared to the milk from LMFG
cows (Table 3), although the results of this analysis did not reach statistical significance
after adjustment for multiple comparisons. For this analysis, the data was categorised into

146
three groups containing no double bonds, a total of one double bond or a total of two or
more double bonds in their acyl chains. The milk from SMFG cows contained 24% more
PC species and 34% more LPC species with two or more double bonds in their acyl chains
(both P = 0.132, Table 3), while the abundance of one or no double bonds did not differ
between the studied groups. Hence, the increase in relative abundance of total PC species
in SMFG milk could be attributed to an increase in the subclass with two or more double
bonds. Similar results were observed for the PI lipid class, which tended to contain a 15%
higher relative abundance of lipid species with two or more double bonds (P = 0.132).
Amongst the neutral lipid species, LMFG milk tended to contain higher proportions of
lipid species with 2 or more double bonds within the cholesteryl ester (CE) class (57%)
and higher proportions of lipid species with at no double bonds (37%) or one double bond
(MUFAs, 40%) within the TG class (all P = 0.132, Table 3). In contrast to the polar lipids,
the neutral lipid classes are found in the LD core and are therefore less likely to affect LD
fusion.

147
Table 3: Relative abundance of lipid species with different degrees of saturation in the milk lipidome of cows producing milk with small
(SMFG) or large (LMFG) average milk fat globule size. The data is categorised based on the total number of double bonds (DBs) in the
lipid species. The relative abundance is expressed as the fold change of ln(SMFG) - ln(LMFG).
Lipid
class
SFA
1 DB
2 DBs
Fold
changea 95% CIb P-valuec
Fold
changea 95% CIb P-valuec
Fold
changea 95% CIb P-valuec
PC 0.10 -0.09, 0.30 0.533 0.07 -0.08, 0.22 0.554 0.24 0.04, 0.43 0.132
PE 0.17 -0.17, 0.51 0.550 -0.07 -0.23, 0.10 0.585 -0.04 -0.16, 0.08 0.592
PI -0.29 -0.71, 0.13 0.353 0.02 -0.26, 0.30 0.903 0.15 0.03, 0.27 0.132
PS - - - -0.01 -0.17, 0.14 0.903 0.06 -0.02, 0.15 0.353
PG - - - -0.06 -0.43, 0.31 0.823 0.15 -0.10, 0.39 0.467
SM 0.02 -0.16, 0.20 0.866 0.07 -0.12, 0.25 0.585 0.13 -0.03, 0.28 0.330
Cerd -0.27 -0.54, 0.00 0.230 0.01 -0.26, 0.28 0.946 -0.17 -0.51, 0.17 0.549
LPC 0.22 -0.33, 0.77 0.585 0.18 -0.07, 0.44 0.353 0.34 0.10, 0.58 0.132
LPE 0.03 -0.35, 0.40 0.903 0.11 -0.38, 0.61 0.727 0.30 -0.43, 1.02 0.585
LPI -0.37 -0.68, -0.06 0.132 -0.17 -0.53, 0.19 0.554 0.07 -0.19, 0.33 0.668
AC -0.16 -0.62, 0.31 0.592 - - - - - -
CE -0.36 -0.83, 0.11 0.353 -0.47 -1.15, 0.21 0.353 -0.57 -0.95, -0.19 0.132
DG -0.14 -0.50, 0.23 0.585 -0.25 -0.55, 0.05 0.330 0.11 -0.22, 0.44 0.592
TG -0.37 -0.67, -0.07 0.132 -0.40 -0.63, 0.16 0.132 -0.22 -0.48, 0.04 0.330
aIf multiplied by 100 the fold change represents the percentage difference of the SMFG compared to the LMFG group. bCI = confidence interval. cP-value represents the adjusted P-value using the procedure by Benjamini and Hochberg (1995). dIncludes the double bond present in the sphingosine base.

148
DISCUSSION
Comparative analysis of the lipidomic profiles of milk from the SMFG and LMFG
groups showed several important differences, mainly within the PC and PE lipid classes.
More specifically, the milk lipidome from LMFG cows was characterised by a higher
relative abundance of plasmanyl- and plasmenyl-ethanolamine lipid subclasses, while the
milk from SMFG cows showed higher PC/PE ratios and tended to have a higher relative
abundance of total PC species (Figure 2). Furthermore, we found that unsaturated species
with two or more double bonds within the PC class were relatively more abundant in the
milk of SMFG cows compared to LMFG cows. This provides initial evidence that the
abundance of ePE within the MFGM could impact MFG size development in the
mammary epithelial cell. The biophysical properties of PC compared to PE result in its
superior surfactant properties and increased PC/PE ratios in the monolayer surrounding
the intracellular LD are predicted to limit LD fusion (Thiam et al., 2013). Moreover, ePL
species and particularly plasmenyl-PE have been shown to reduce the fluidity of
biological membranes and have been implicated in membrane fusion events (Dean and
Lodhi, 2018; Glaser, 1994). Therefore, the milk lipidome from cows presenting small and
large phenotypes provides several differences, which could explain their characteristic
MFG phenotype.
The increased relative abundance ePE in LMFG cows suggests an involvement of
peroxisomes in the regulation of MFG size in the mammary gland
The synthesis of TG from diacylglycerol (DG) occurs in the ER or on the surface of
LDs, catalysed by an enzyme called diacylglycerol acyltransferase (DGAT). The two
forms of this enzyme are located in the ER (DGAT1) or in LDs (DGAT2) (Wilfling et
al., 2013). The pathways for diacyl-PL and ePL synthesis differ in terms of the sites and
the organelles involved in their biosynthesis, but the same enzymes are involved in both
149
pathways (see Figure 3). The dominant metabolic pathway for the synthesis of the major
diacyl-PLs, PE and PC is through de novo synthesis by the transfer of a cytidine
diphosphate (CDP)-choline or CDP-ethanolamine headgroup to DG (Kennedy pathway)
(Vance, 2015). In contrast to TG synthesis, where the final step can take place on the
surface of the LD, the transfer of the choline or ethanolamine headgroup to DG to form
PE and PC takes place in the ER and is catalysed by the enzyme diacylglycerol choline /
ethanolamine-phosphotransferase (Fagone and Jackowski, 2009). In ePL synthesis, this
enzyme also catalyses the transferal of ethanolamine and choline to alkylacylglycerol, the
ether linked equivalent of DG, leading to the formation of plasmanyl-PC and plasmanyl-
PE (Nagan and Zoeller, 2001). Plasmanyl-PE is subsequently desaturated to form
plasmenyl-PE, while plasmenyl-PC is produced by head group exchange with plasmenyl-
PE and not through desaturation of plasmanyl-PC (Braverman and Moser, 2012). Besides
these similarities, ePL synthesis requires another organelle, the peroxisome, where the
first two steps occur (Nagan and Zoeller, 2001). Peroxisomes are organelles involved in
the protection of cells from reactive oxygen species and can perform important functions
in the lipid metabolism, such as -oxidation of very long chain FAs and -oxidation of
branched FAs (Lodhi and Semenkovich, 2014). Close associations between peroxisomes
and LDs have been reported and are believed to involve the flux of very long chain FAs
and branched FAs from the core of LDs to peroxisomes for oxidation (Binns et al., 2006).
Furthermore, very long chain FAs, shortened through peroxisomal oxidation, are
subsequently used for ePL synthesis, which directly implicates peroxisomes in the
biosynthesis of PLs (Hayashi and Oohashi, 1995). This suggests, for the first time, a
possible involvement of peroxisomes in the MFG size development in the mammary
epithelial cell.
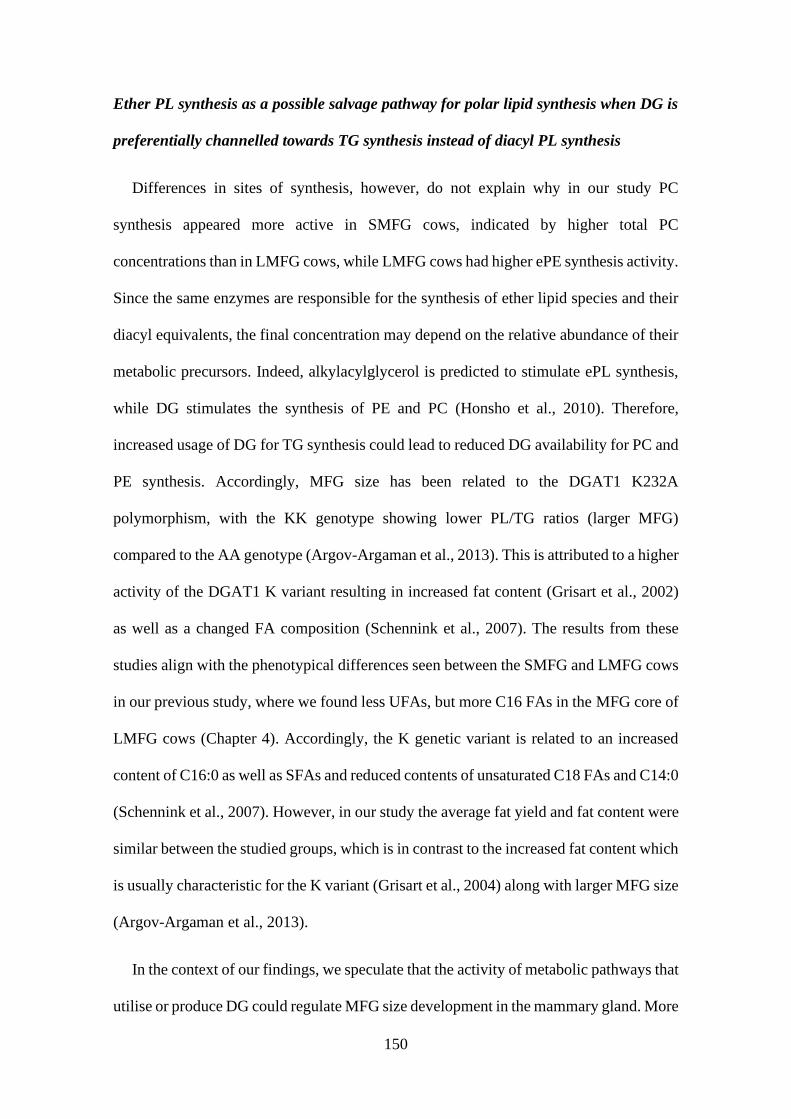
150
Ether PL synthesis as a possible salvage pathway for polar lipid synthesis when DG is
preferentially channelled towards TG synthesis instead of diacyl PL synthesis
Differences in sites of synthesis, however, do not explain why in our study PC
synthesis appeared more active in SMFG cows, indicated by higher total PC
concentrations than in LMFG cows, while LMFG cows had higher ePE synthesis activity.
Since the same enzymes are responsible for the synthesis of ether lipid species and their
diacyl equivalents, the final concentration may depend on the relative abundance of their
metabolic precursors. Indeed, alkylacylglycerol is predicted to stimulate ePL synthesis,
while DG stimulates the synthesis of PE and PC (Honsho et al., 2010). Therefore,
increased usage of DG for TG synthesis could lead to reduced DG availability for PC and
PE synthesis. Accordingly, MFG size has been related to the DGAT1 K232A
polymorphism, with the KK genotype showing lower PL/TG ratios (larger MFG)
compared to the AA genotype (Argov-Argaman et al., 2013). This is attributed to a higher
activity of the DGAT1 K variant resulting in increased fat content (Grisart et al., 2002)
as well as a changed FA composition (Schennink et al., 2007). The results from these
studies align with the phenotypical differences seen between the SMFG and LMFG cows
in our previous study, where we found less UFAs, but more C16 FAs in the MFG core of
LMFG cows (Chapter 4). Accordingly, the K genetic variant is related to an increased
content of C16:0 as well as SFAs and reduced contents of unsaturated C18 FAs and C14:0
(Schennink et al., 2007). However, in our study the average fat yield and fat content were
similar between the studied groups, which is in contrast to the increased fat content which
is usually characteristic for the K variant (Grisart et al., 2004) along with larger MFG size
(Argov-Argaman et al., 2013).
In the context of our findings, we speculate that the activity of metabolic pathways that
utilise or produce DG could regulate MFG size development in the mammary gland. More

151
specifically, we suggest that the variation in MFG size between the studied groups could
be determined by the metabolic activity of the pathways for TG, PL and possibly SL
synthesis. The possible relationship between these pathways and MFG size is illustrated
in Figure 3. A common precursor in PL and TG synthesis and a product in SL synthesis
is DG. Because PLs are mainly found on the surface of the LD and TGs make up most of
the LD core, DG represents an important cross road between PL and TG synthesis and
likely impacts the LD core (mainly TGs) to surface (partially PLs) ratio, a characteristic
parameter for MFG size. Increased activities of either of the enzymes catalysing TG or
PL synthesis from DG, directly affect the availability of DG for the other pathway and
therefore determine PL/TG ratios and likely affect LD size. For example, reduced
DGAT1 activity in SMFG cows could lead to the accumulation of DG, which promotes
the channelling of ethanolamine and choline headgroups towards diacyl-PL synthesis. In
the opposite scenario, increased DGAT1 activity in LMFG cows could lead to reduced
availability of DG for PL synthesis because it is primarily used for TG synthesis.
Consequently, the limited availability of DG as a precursor for diacyl-PL synthesis could
lead to a shift towards ePL synthesis in LMFG cows. Therefore, ePL synthesis could
represent a possible salvage pathway, when PL synthesis through the conventional
pathways is limited, for example when DG is predominantly used for TG synthesis. The
fact that plasmenyl-PE is the dominant type of plasmalogens found in most tissues and is
the precursor for plasmenyl-PC synthesis explains why mainly ePE species were
relatively more abundant in LMFG cows compared to SMFG cows and only two ePC
species differed in relative abundance between the groups.

152
The increased relative abundance of ePLs and unsaturated PC species in LMFG and
SMFG cows, respectively, is predicted to impact LD fusion
The significance of our results lies in the physical properties of ePLs, particularly
plasmenyl-PE, and their potential effect on LD fusion. Plasmenyl-PE with its vinyl-ether
bond has been shown to increase the speed of fusion in vitro in small unilamellar vesicles
(Glaser, 1994). This is attributed to the propensity of plasmenyl-PE to form so called non-
bilayer structures at lower temperatures than plasmanyl- and diacyl-PE. Phase transition
from the liquid-crystalline to the inverted hexagonal (non-bilayer) state promotes
membrane fusion (Nagan and Zoeller, 2001). It is now known that LD fusion contributes
to the ultimate MFG size in mammary cells, as shown by in vitro (Cohen et al., 2017) and
in vivo time-lapse imaging analyses (Masedunskas et al., 2017). The increased relative
abundance of ePE in LMFG cows could also impact packing density and fluidity of the
LD monolayer. Due to the missing carbonyl-oxygen at the sn-1 position, ePLs are more
lipophilic and this physical property leads to tighter packing of ether lipids in biological
membranes compared to their diacyl counterparts, decreasing membrane fluidity (Dean
and Lodhi, 2018). Membrane fluidity is also predicted to impact LD fusion (Rahmatyar
and Wiking, 2012), with reduced fluidity of the monolayer promoting LD fusion. We
therefore suggest that the higher relative abundance of plasmenyl-PE in the milk from
LMFG cows is predicted to enhance LD fusion and ultimately influence MFG size. This
is the first time that a relationship between the ePE subclass and MFG size has been
suggested and the biological role of ePLs in the mammary gland are unknown. However,
studies focusing on the pathophysiology of ePL deficiencies have revealed various
important biological functions. For example, a possible role of plasmalogens in LD
homeostasis has been suggested, characterised by smaller LDs in brown adipose tissue of
plasmalogen deficient mice (Brites et al., 2011).

153
The different physical properties of PC compared to PE, as well as some in vitro
evidence suggest that PE enhances LD fusion, while PC has a protective effect (Cohen et
al., 2017; Guo et al., 2008; Thiam et al., 2013). However, several studies on the PL
composition of MFGs with different sizes have reported conflicting results (Lopez et al.,
2011; Lu et al., 2016; Mesilati-Stahy et al., 2011) or found no difference in the PL
composition between small and large MFGs (Fauquant et al., 2007). These studies
separated MFGs from bulk raw milk or individual raw milk samples through gravity
separation, microfiltration and centrifugation. We used samples from cows naturally
different in MFG size distributions, with the aim to study the lipid metabolic differences
between the small and large phenotype. Our results support the notion that increased
relative PC abundance and more importantly the significantly increased PC/PE ratio are
related to smaller MFG size. In the SMFG group, the milk lipidomic profile showed a
trend towards increased relative abundance of total PC and an increase of PC species with
two or more double bonds (Table 3). We speculate, that this may be the result of PC
synthesis through an alternative pathway to the CDP-choline pathway, namely the
phosphatidylethanolamine N-methyltransferase (PEMT) pathway (see Figure 3). While
the CDP-choline pathway is responsible for the bulk of PC synthesis (about 70%), the
PEMT pathway can make up the remaining proportion (McManaman, 2014). Notably,
during this process PE is converted into PC, resulting in the production of PC at the
expense of PE. The PE used during this reaction is predominantly derived from
decarboxylation of PS as opposed to PE derived from the CDP-ethanolamine pathway
(Hörl et al., 2011). Moreover, the PC species produced by the conversion of PE into PC
contain more long chain and polyunsaturated FAs (PUFAs) compared to the PC species
derived through the CDP-choline pathway (DeLong et al., 1999). Although not
statistically significant, we found that the elevated PC abundance in SMFG compared to

154
LMFG milk was partly due to a trend towards higher relative abundance of PC species
with two or more double bonds (P = 0.132, Table 3). Interestingly, it has been reported
that the concentration of PC derived through the PEMT pathway is higher in the LD
monolayer compared to other cellular membrane components (Hörl et al., 2011).
Furthermore, the PEMT enzyme has been localised on the surface of LDs or in close
proximity to LDs, at sites where they are in close contact with the ER and mitochondria-
associated membranes (Hörl et al., 2011). Although, the contribution of this pathway to
the total PC content in mammary tissue is unknown, in vitro studies on primary bovine
mammary epithelial cells have shown that manipulation of the PEMT pathway can affect
intracellular LD size (Cohen et al., 2017). Whatever the reason for the increased PC
content in milk from SMFG cows, the effect of increased PC/PE ratios, and possibly PC
species with higher unsaturation, reduce the propensity of LDs to participate in LD fusion
could impact MFG size.
An alternative interpretation of our results is that LD size is determined at a stage
during its biogenesis, where LDs are still embedded in the ER. More specifically, it has
been reported that the PL composition of the ER membrane determines whether LDs
remain embedded in the ER during neutral lipid accumulation or whether budding from
the ER occurs (Ben M’barek et al., 2017). This was attributed to the effect of specific PLs
on the surface tension of the ER bilayer. For example, PC lowered the surface tension,
promoting the release of the LD from the ER, while PE increased the surface tension in
the bilayer and kept the LD embedded in the ER (Ben M’barek et al., 2017). The authors
further showed that the lipid composition of the LD core affects budding, with the
inclusion of 25% of sterol esters into the core of TG-containing LDs preventing budding,
even in the presence of PC. However, the presence of either PUFAs or saturated PLs were
able to promote the release of LDs containing sterol esters from the ER, further

155
emphasising the impact of the FA composition of PLs as well as the head group for LD
size development (Ben M’barek et al., 2017). Although this has yet to be shown in
mammary cells which actively secrete LD, these results present the possibility that large
MFGs could not only be the result of LD fusion (Cohen et al., 2017) but could also be the
result of differential PL composition in the ER, leading to extended LD growth while
attached to the ER. Extended LD growth in the embedded state could explain why milk
from LMFG cows contained higher concentrations of ePE, which require the involvement
of the ER in their final steps of biosynthesis. The final step of PC synthesis from DG also
takes place in the ER, but it has been suggested that PC could alternatively be produced
on the surface of or in close proximity to LDs by degradation of PE through the PEMT
pathway or by acylation of its precursor LPC through the enzymes of the Lands cycle,
which can localise to the surface of LDs (Moessinger et al., 2011).
Differences in SM and Cer classes between SMFG and LMFG cows
The lipidomic profile of the milk from the studied cows also revealed differences in
some Cer and SM lipid species, which could indicate further metabolic differences
between SMFG and LMFG cows. Cer are bioactive lipids with potential roles in insulin
signal transduction (Rico et al., 2017). Furthermore, they can change the biophysical
properties of the membranes in which they reside, and this has been demonstrated to occur
even at low Cer concentrations (Pinto et al., 2011; Silva et al., 2006). Increased plasma
concentrations of Cer lipid species have been related to insulin resistance in cows and
humans (Kasumov et al., 2015; Rico et al., 2015). In cows, the relationship between Cer
lipid species and insulin resistance is apparent when the animals are in negative energy
balance due to nutrient restriction or early lactation (Davis et al., 2017; Rico et al., 2017).
Cows that are in negative energy balance due to nutrient restriction, have been reported
to exhibit increased levels of C22 and C24 Cer in the liver and plasma, along with
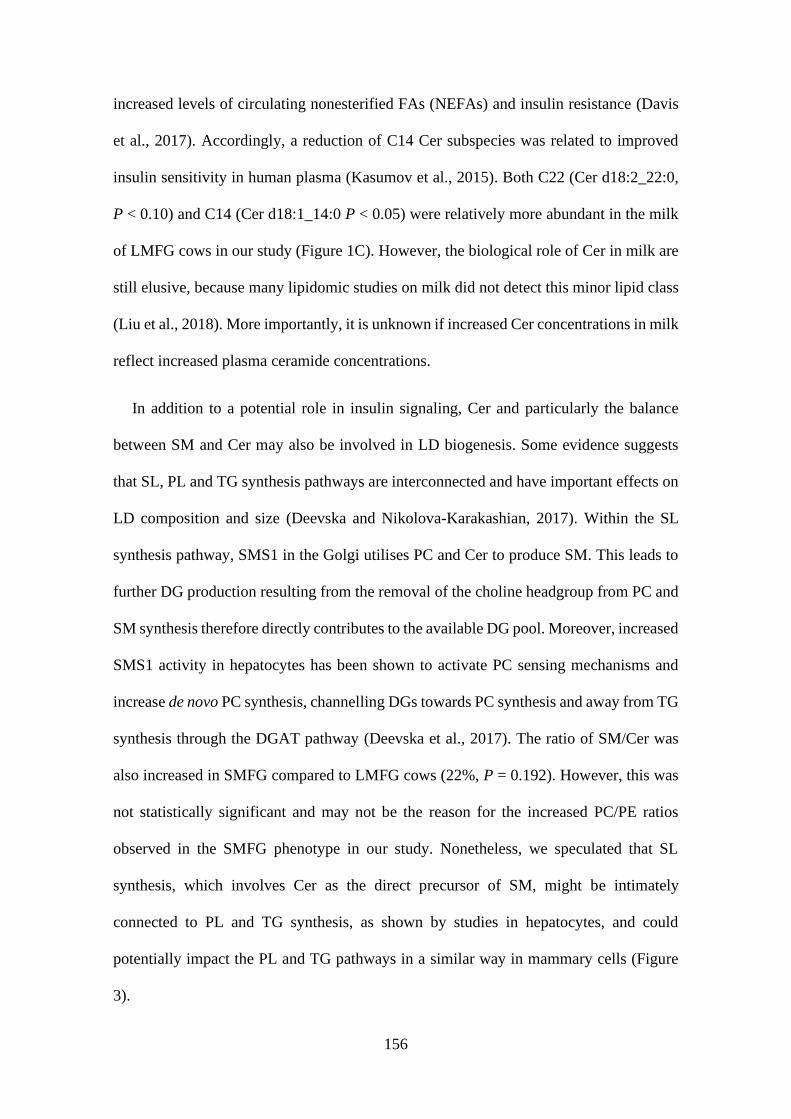
156
increased levels of circulating nonesterified FAs (NEFAs) and insulin resistance (Davis
et al., 2017). Accordingly, a reduction of C14 Cer subspecies was related to improved
insulin sensitivity in human plasma (Kasumov et al., 2015). Both C22 (Cer d18:2_22:0,
P < 0.10) and C14 (Cer d18:1_14:0 P < 0.05) were relatively more abundant in the milk
of LMFG cows in our study (Figure 1C). However, the biological role of Cer in milk are
still elusive, because many lipidomic studies on milk did not detect this minor lipid class
(Liu et al., 2018). More importantly, it is unknown if increased Cer concentrations in milk
reflect increased plasma ceramide concentrations.
In addition to a potential role in insulin signaling, Cer and particularly the balance
between SM and Cer may also be involved in LD biogenesis. Some evidence suggests
that SL, PL and TG synthesis pathways are interconnected and have important effects on
LD composition and size (Deevska and Nikolova-Karakashian, 2017). Within the SL
synthesis pathway, SMS1 in the Golgi utilises PC and Cer to produce SM. This leads to
further DG production resulting from the removal of the choline headgroup from PC and
SM synthesis therefore directly contributes to the available DG pool. Moreover, increased
SMS1 activity in hepatocytes has been shown to activate PC sensing mechanisms and
increase de novo PC synthesis, channelling DGs towards PC synthesis and away from TG
synthesis through the DGAT pathway (Deevska et al., 2017). The ratio of SM/Cer was
also increased in SMFG compared to LMFG cows (22%, P = 0.192). However, this was
not statistically significant and may not be the reason for the increased PC/PE ratios
observed in the SMFG phenotype in our study. Nonetheless, we speculated that SL
synthesis, which involves Cer as the direct precursor of SM, might be intimately
connected to PL and TG synthesis, as shown by studies in hepatocytes, and could
potentially impact the PL and TG pathways in a similar way in mammary cells (Figure
3).

157
Figure 3: Possible mechanisms through which major metabolic pathways contribute to
the milk fat globule size development in the mammary epithelial cell. Diacylglycerol
(DG) plays a central role in the lipid metabolism in the mammary gland and connects
phospholipid (PL), triacylglycerol (TG) and sphingolipid synthesis pathways. DG is
utilised to either produce TG or the major PLs, phosphatidylethanolamine (PE),
phosphatidylcholine (PC) and phosphatidylserine (PS). TG synthesis is catalysed by the
enzyme diacylglycerol-acyltransferase (DGAT), in the form of two isoenzymes DGAT1
and DGAT2 which are located in the endoplasmic reticulum (ER) or on the surface of
lipid droplets (LDs), respectively(Wilfling et al., 2013). The synthesis of PC and PE is
catalysed by DG choline/ethanolamine phosphotransferase (CEPT) found in the ER
(Fagone and Jackowski, 2009). This enzyme also catalyses the production of ether PLs
(ePLs) by transferring a choline or ethanolamine headgroup to alkylacylglycerol (AAG),
which is derived from peroxisomal production of 1-O-alkyl-glycerol-3-phosphate (AGP)
(Nagan and Zoeller, 2001). We suggest that when DG is more efficiently channelled
towards TG synthesis, for example due to increased DGAT1 activity, diacyl-PL synthesis
is limited and ePL synthesis through CEPT in the ER could present a possible salvage

158
pathway that is not reliant on DG as a precursor. This shift towards ePL synthesis
promotes LD fusion and thus contributes to the large MFG (LMFG) phenotype. In the
small MFG (SMFG) phenotype, DG is channelled more efficiently towards PL synthesis,
either due to decreased DGAT1 activity or possibly due to increased SM synthase 1
(SMS1) activity in the Golgi apparatus. SMS1 catalyses the transferal of the choline
headgroup from PC to ceramide (Cer) to produce SM and DG, thus contributing to the
DG pool. Moreover, increased SMS1 activity can stimulate PC synthesis (Deevska et al.,
2017). Another potential pathway contributing to the SMFG phenotype is the
phosphatidylethanolamine N-methyltransferase (PEMT) pathway, which converts PE
into PC and thus increases the PC/PE ratio. The PE used in the PEMT pathway is derived
mainly through decarboxylation of PS in the mitochondrion by PS decarboxylase (PSD)
and results in PC with a higher degree of unsaturation. Increased unsaturation within the
monolayer surrounding the LD and increased PC/PE ratios can prevent LD fusion,
resulting in the SMFG phenotype. Figure created with BioRender.com.
CONCLUSIONS
The results obtained from PL and SL analyses indicated several differences in the lipid
metabolism between the studied groups and we have suggested possible explanations for
the observed differences. Firstly, milk from SMFG cows contained more PC relative to
PE and the PC species were more unsaturated compared to the PC species in LMFG cows.
We hypothesise that, in SMFG cows, DG is channelled towards PL synthesis and this
process could be directly regulated by reduced DGAT1 activity leading to increased
availability of DG. We further hypothesise that the increased PC/PE ratios could be
related to the synthesis of PC through the PEMT pathway, which produces PC at the
expense of PE and results in PC species comprising more UFAs. However, the main
finding of the current study was that the lipidomic profile of milk from the LMFG group
was characterised by increased levels of plasmanyl- and plasmenyl-PE. Ether-PL
synthesis in these animals could present a salvage pathway for polar lipid synthesis to
provide membrane material through a pathway that does not require DG as a precursor.

159
We speculate that in LMFG cows DG could be channelled towards TG synthesis due to
increased DGAT1 activity. Further studies should focus on the precise role of ePL in the
mammary gland, their location within the mammary epithelial cell and their absolute
abundance, along with the required concentration to exert their suggested biological
functions.
ACKNOWLEDGMENTS
We would like to thank Dr Sue Finch from the Melbourne Statistical Consulting platform
for her assistance with the statistical analysis as well as Kenny Oluboyede and Ashley
Gabler for their help with sample collection at the University of Melbourne Dairy.

160
REFERENCES
Altenhofer, C., Holzmüller, W., Wolfertstetter, F., Ribeiro, D.W., Kulozik, U., Pfaffl,
M.W., and Viturro, E. (2015). Temporal variation of milk fat globule diameter,
fat and cholesterol content and milk epithelial cell gene expression in dairy cows.
Int. J. Dairy Technol. 68, 519–526.
Argov-Argaman, N., Mida, K., Cohen, B.-C., Visker, M., and Hettinga, K. (2013). Milk
Fat Content and DGAT1 Genotype Determine Lipid Composition of the Milk Fat
Globule Membrane. PLoS ONE 8, e68707.
Arisawa, K., Mitsudome, H., Yoshida, K., Sugimoto, S., Ishikawa, T., Fujiwara, Y., and
Ichi, I. (2016). Saturated fatty acid in the phospholipid monolayer contributes to
the formation of large lipid droplets. Biochem. Biophys. Res. Commun. 480, 641–
647.
Bartke, N., and Hannun, Y.A. (2009). Bioactive sphingolipids: metabolism and function.
J. Lipid Res. 50, S91–S96.
Ben M’barek, K., Ajjaji, D., Chorlay, A., Vanni, S., Forêt, L., and Thiam, A.R. (2017).
ER Membrane Phospholipids and Surface Tension Control Cellular Lipid Droplet
Formation. Dev. Cell 41, 591-604.e7.
Benjamini, Y., and Hochberg, Y. (1995). Controlling the False Discovery Rate: A
Practical and Powerful Approach to Multiple Testing. J. R. Stat. Soc. Ser. B
Methodol. 57, 289–300.
Binns, D., Januszewski, T., Chen, Y., Hill, J., Markin, V.S., Zhao, Y., Gilpin, C.,
Chapman, K.D., Anderson, R.G.W., and Goodman, J.M. (2006). An Intimate
Collaboration between Peroxisomes and Lipid Bodies. J. Cell Biol. 173, 719–731.
Boström, P., Andersson, L., Rutberg, M., Perman, J., Lidberg, U., Johansson, B.R.,
Fernandez-Rodriguez, J., Ericson, J., Nilsson, T., Borén, J., et al. (2007). SNARE
proteins mediate fusion between cytosolic lipid droplets and are implicated in
insulin sensitivity. Nat. Cell Biol. 9, 1286–1293.
Braverman, N.E., and Moser, A.B. (2012). Functions of plasmalogen lipids in health and
disease. Biochim. Biophys. Acta BBA - Mol. Basis Dis. 1822, 1442–1452.
Brites, P., Waterham, H.R., and Wanders, R.J.A. (2004). Functions and biosynthesis of
plasmalogens in health and disease. Biochim. Biophys. Acta BBA - Mol. Cell
Biol. Lipids 1636, 219–231.
Brites, P., Ferreira, A.S., Silva, T.F. da, Sousa, V.F., Malheiro, A.R., Duran, M.,
Waterham, H.R., Baes, M., and Wanders, R.J.A. (2011). Alkyl-Glycerol Rescues

161
Plasmalogen Levels and Pathology of Ether-Phospholipid Deficient Mice. PLoS
ONE 6, e28539.
Carroll, S.M., DePeters, E.J., Taylor, S.J., Rosenberg, M., Perez-Monti, H., and Capps,
V.A. (2006). Milk composition of Holstein, Jersey, and Brown Swiss cows in
response to increasing levels of dietary fat. Anim. Feed Sci. Technol. 131, 451–
473.
Cohen, B.-C., Raz, C., Shamay, A., and Argov-Argaman, N. (2017). Lipid Droplet Fusion
in Mammary Epithelial Cells is Regulated by Phosphatidylethanolamine
Metabolism. J. Mammary Gland Biol. Neoplasia 22, 235–249.
Cole, T.J. (2000). Sympercents: symmetric percentage differences on the 100 log(e) scale
simplify the presentation of log transformed data. Stat. Med. 19, 3109–3125.
Contarini, G., and Povolo, M. (2013). Phospholipids in Milk Fat: Composition, Biological
and Technological Significance, and Analytical Strategies. Int. J. Mol. Sci. 14,
2808–2831.
Couvreur, S., and Hurtaud, C. (2017). Relationships between milks differentiated on
native milk fat globule characteristics and fat, protein and calcium compositions.
Animal 11, 507–518.
Couvreur, S., Hurtaud, C., Marnet, P.G., Faverdin, P., and Peyraud, J.L. (2007).
Composition of milk fat from cows selected for milk fat globule size and offered
either fresh pasture or a corn silage-based diet. J. Dairy Sci. 90, 392–403.
Davis, A.N., Clegg, J.L., Perry, C.A., and McFadden, J.W. (2017). Nutrient Restriction
Increases Circulating and Hepatic Ceramide in Dairy Cows Displaying Impaired
Insulin Tolerance. Lipids 52, 771–780.
Dean, J.M., and Lodhi, I.J. (2018). Structural and functional roles of ether lipids. Protein
Cell 9, 196–206.
Deevska, G.M., and Nikolova-Karakashian, M.N. (2017). The expanding role of
sphingolipids in lipid droplet biogenesis. Biochim. Biophys. Acta BBA - Mol.
Cell Biol. Lipids 1862, 1155–1165.
Deevska, G.M., Dotson, P.P., Karakashian, A.A., Isaac, G., Wrona, M., Kelly, S.B.,
Merrill, A.H., and Nikolova-Karakashian, M.N. (2017). Novel Interconnections
in Lipid Metabolism Revealed by Overexpression of Sphingomyelin Synthase-1.
J. Biol. Chem. 292, 5110–5122.
DeLong, C.J., Shen, Y.-J., Thomas, M.J., and Cui, Z. (1999). Molecular Distinction of
Phosphatidylcholine Synthesis between the CDP-Choline Pathway and

162
Phosphatidylethanolamine Methylation Pathway. J. Biol. Chem. 274, 29683–
29688.
Dewettinck, K., Rombaut, R., Thienpont, N., Le, T.T., Messens, K., and Camp, J.V.
(2008). Nutritional and technological aspects of milk fat globule membrane
material. Int. Dairy J. 18, 436–457.
El-Zeini, H.M. (2006). Microstructure, rheological and geometrical properties of fat
globules of milk from different animal species. Pol. J. Food Nutr. Sci. 56, 147–
153.
Fagone, P., and Jackowski, S. (2009). Membrane phospholipid synthesis and endoplasmic
reticulum function. J. Lipid Res. 50, S311–S316.
Fauquant, C., Briard‐Bion, V., Leconte, N., Guichardant, M., and Michalski, M.-C.
(2007). Membrane phospholipids and sterols in microfiltered milk fat globules.
Eur. J. Lipid Sci. Technol. 109, 1167–1173.
Fleming, A., Schenkel, F.S., Chen, J., Malchiodi, F., Ali, R.A., Mallard, B., Sargolzaei,
M., Corredig, M., and Miglior, F. (2017). Variation in fat globule size in bovine
milk and its prediction using mid-infrared spectroscopy. J. Dairy Sci. 100, 1640–
1649.
Folch, J., Lees, M., and Stanley, G.H.S. (1957). A Simple Method for the Isolation and
Purification of Total Lipides from Animal Tissues. J. Biol. Chem. 226, 497–509.
Garcia, C., Lutz, N.W., Confort-Gouny, S., Cozzone, P.J., Armand, M., and Bernard, M.
(2012). Phospholipid fingerprints of milk from different mammalians determined
by 31P NMR: Towards specific interest in human health. Food Chem. 135, 1777–
1783.
Glaser, P.E. (1994). Plasmenylethanolamine Facilitates Rapid Membrane Fusion: A
Stopped-Flow Kinetic Investigation Correlating the Propensity of a Major Plasma
Membrane Constituent to Adopt an HII Phase with Its Ability to Promote
Membrane Fusion. Biochemistry 33, 5805–5812.
Grisart, B., Coppieters, W., Farnir, F., Karim, L., Ford, C., Berzi, P., Cambisano, N., Mni,
M., Reid, S., Simon, P., et al. (2002). Positional Candidate Cloning of a QTL in
Dairy Cattle: Identification of a Missense Mutation in the Bovine DGAT1 Gene
with Major Effect on Milk Yield and Composition. Genome Res. 12, 222–231.
Grisart, B., Farnir, F., Karim, L., Cambisano, N., Kim, J.-J., Kvasz, A., Mni, M., Simon,
P., Frère, J.-M., Coppieters, W., et al. (2004). Genetic and functional confirmation

163
of the causality of the DGAT1 K232A quantitative trait nucleotide in affecting
milk yield and composition. Proc. Natl. Acad. Sci. 101, 2398–2403.
Guo, Y., Walther, T.C., Rao, M., Stuurman, N., Goshima, G., Terayama, K., Wong, J.S.,
Vale, R.D., Walter, P., and Farese, R.V. (2008). Functional genomic screen
reveals genes involved in lipid-droplet formation and utilization. Nature 453, 657–
661.
Hayashi, H., and Oohashi, M. (1995). Incorporation of acetyl-CoA generated from
peroxisomal β-oxidation into ethanolamine plasmalogen of rat liver. Biochim.
Biophys. Acta BBA - Lipids Lipid Metab. 1254, 319–325.
Heid, H.W., and Keenan, T.W. (2005). Intracellular origin and secretion of milk fat
globules. Eur. J. Cell Biol. 84, 245–258.
Honsho, M., Asaoku, S., and Fujiki, Y. (2010). Posttranslational Regulation of Fatty
Acyl-CoA Reductase 1, Far1, Controls Ether Glycerophospholipid Synthesis. J.
Biol. Chem. 285, 8537–8542.
Hörl, G., Wagner, A., Cole, L.K., Malli, R., Reicher, H., Kotzbeck, P., Köfeler, H.,
Höfler, G., Frank, S., Bogner-Strauss, J.G., et al. (2011). Sequential Synthesis and
Methylation of Phosphatidylethanolamine Promote Lipid Droplet Biosynthesis
and Stability in Tissue Culture and in Vivo. J. Biol. Chem. 286, 17338–17350.
Huynh, K., Pernes, G., Mellett, N.A., Meikle, P.J., Murphy, A.J., and Lancaster, G.I.
(2018). Lipidomic Profiling of Murine Macrophages Treated with Fatty Acids of
Varying Chain Length and Saturation Status. Metabolites 8, 29.
Huynh, K., Barlow, C.K., Jayawardana, K.S., Weir, J.M., Mellett, N.A., Cinel, M.,
Magliano, D.J., Shaw, J.E., Drew, B.G., and Meikle, P.J. (2019). High-
Throughput Plasma Lipidomics: Detailed Mapping of the Associations with
Cardiometabolic Risk Factors. Cell Chem. Biol. 26, 71-84.e4.
Kasumov, T., Solomon, T.P.J., Hwang, C., Huang, H., Haus, J.M., Zhang, R., and
Kirwan, J.P. (2015). Improved insulin sensitivity after exercise training is linked
to reduced plasma C14:0 ceramide in obesity and type 2 diabetes. Obes. Silver
Spring Md 23, 1414–1421.
Li, Q., Zhao, Y., Zhu, D., Pang, X., Liu, Y., Frew, R., and Chen, G. (2017). Lipidomics
profiling of goat milk, soymilk and bovine milk by UPLC-Q-Exactive Orbitrap
Mass Spectrometry. Food Chem. 224, 302–309.

164
Liebisch, G., Vizcaíno, J.A., Köfeler, H., Trötzmüller, M., Griffiths, W.J., Schmitz, G.,
Spener, F., and Wakelam, M.J.O. (2013). Shorthand notation for lipid structures
derived from mass spectrometry. J. Lipid Res. 54, 1523–1530.
Liu, Z., Rochfort, S., and Cocks, B. (2018). Milk lipidomics: What we know and what
we don’t. Prog. Lipid Res. 71, 70–85.
Lodhi, I.J., and Semenkovich, C.F. (2014). Peroxisomes: A Nexus for Lipid Metabolism
and Cellular Signaling. Cell Metab. 19, 380–392.
Logan, A., Auldist, M., Greenwood, J., and Day, L. (2014). Natural variation of bovine
milk fat globule size within a herd. J. Dairy Sci. 97, 4072–4082.
Logan, A., Xu, M., Day, L., Singh, T., Moore, S.C., Mazzonetto, M., and Augustin, M.A.
(2017). Milk fat globule size affects Cheddar cheese properties. Int. Dairy J. 70,
46–54.
Lopez, C., Briard-Bion, V., Ménard, O., Beaucher, E., Rousseau, F., Fauquant, J.,
Leconte, N., and Robert, B. (2011). Fat globules selected from whole milk
according to their size: Different compositions and structure of the biomembrane,
revealing sphingomyelin-rich domains. Food Chem. 125, 355–368.
Lu, J., Argov-Argaman, N., Anggrek, J., Boeren, S., van Hooijdonk, T., Vervoort, J., and
Hettinga, K.A. (2016). The protein and lipid composition of the membrane of milk
fat globules depends on their size. J. Dairy Sci. 99, 4726–4738.
Masedunskas, A., Chen, Y., Stussman, R., Weigert, R., and Mather, I.H. (2017). Kinetics
of milk lipid droplet transport, growth, and secretion revealed by intravital
imaging: lipid droplet release is intermittently stimulated by oxytocin. Mol. Biol.
Cell 28, 935–946.
McManaman, J.L. (2014). Lipid Transport in the Lactating Mammary Gland. J.
Mammary Gland Biol. Neoplasia 19, 35–42.
Mesilati-Stahy, R., Mida, K., and Argov-Argaman, N. (2011). Size-Dependent Lipid
Content of Bovine Milk Fat Globule and Membrane Phospholipids. J. Agric. Food
Chem. 59, 7427–7435.
Michalski, M.-C., Briard, V., and Michel, F. (2001). Optical parameters of milk fat
globules for laser light scattering measurements. Le Lait 81, 787–796.
Michalski, M.-C., Camier, B., Gassi, J.-Y., Briard-Bion, V., Leconte, N., Famelart, M.-
H., and Lopez, C. (2007). Functionality of smaller vs control native milk fat
globules in Emmental cheeses manufactured with adapted technologies. Food
Res. Int. 40, 191–202.

165
Moessinger, C., Kuerschner, L., Spandl, J., Shevchenko, A., and Thiele, C. (2011).
Human Lysophosphatidylcholine Acyltransferases 1 and 2 Are Located in Lipid
Droplets Where They Catalyze the Formation of Phosphatidylcholine. J. Biol.
Chem. 286, 21330–21339.
Munn, N.J., Arnio, E., Liu, D., Zoeller, R.A., and Liscum, L. (2003). Deficiency in
ethanolamine plasmalogen leads to altered cholesterol transport. J. Lipid Res. 44,
182–192.
Murgia, S., Mele, S., and Monduzzi, M. (2003). Quantitative characterization of
phospholipids in milk fat via31P NMR using a monophasic solvent mixture.
Lipids 38, 585–591.
Nagan, N., and Zoeller, R.A. (2001). Plasmalogens: biosynthesis and functions. Prog.
Lipid Res. 40, 199–229.
Pinto, S.N., Silva, L.C., Futerman, A.H., and Prieto, M. (2011). Effect of ceramide
structure on membrane biophysical properties: The role of acyl chain length and
unsaturation. Biochim. Biophys. Acta BBA - Biomembr. 1808, 2753–2760.
R Core Team (2018). R: A language and environment for statistical computing. R Found.
Stat. Comput. Vienna Austria.
Rahmatyar, Z., and Wiking, L. (2012). Fatty acid composition and thermal behavior of
small and large milk fat globules. Milchwissenschaft 67, 34–38.
Rico, J.E., Bandaru, V.V.R., Dorskind, J.M., Haughey, N.J., and McFadden, J.W. (2015).
Plasma ceramides are elevated in overweight Holstein dairy cows experiencing
greater lipolysis and insulin resistance during the transition from late pregnancy
to early lactation. J. Dairy Sci. 98, 7757–7770.
Rico, J.E., Saed Samii, S., Mathews, A.T., Lovett, J., Haughey, N.J., and McFadden, J.W.
(2017). Temporal changes in sphingolipids and systemic insulin sensitivity during
the transition from gestation to lactation. PLoS ONE 12, e0176787.
Robinson, D., and Hayes, A. (2018). broom: Convert Statistical Analysis Objects into
Tidy Tibbles.
Schennink, A., Stoop, W.M., Visker, M.H.P.W., Heck, J.M.L., Bovenhuis, H., Poel,
J.J.V.D., Valenberg, H.J.F.V., and Arendonk, J.A.M.V. (2007). DGAT1 underlies
large genetic variation in milk-fat composition of dairy cows. Anim. Genet. 38,
467–473.

166
Silva, L., Almeida, R.F.M.D., Fedorov, A., Matos, A.P.A., and Prieto, M. (2006).
Ceramide-platform formation and -induced biophysical changes in a fluid
phospholipid membrane. Mol. Membr. Biol. 23, 137–148.
Spitsberg, V.L. (2005). Invited Review: Bovine Milk Fat Globule Membrane as a
Potential Nutraceutical. J. Dairy Sci. 88, 2289–2294.
Thai, T.-P., Rodemer, C., Jauch, A., Hunziker, A., Moser, A., Gorgas, K., and Just, W.W.
(2001). Impaired membrane traffic in defective ether lipid biosynthesis. Hum.
Mol. Genet. 10, 127–136.
Thiam, A.R., Farese Jr, R.V., and Walther, T.C. (2013). The biophysics and cell biology
of lipid droplets. Nat. Rev. Mol. Cell Biol. 14, 775–786.
Vance, J.E. (2015). Phospholipid Synthesis and Transport in Mammalian Cells. Traffic
16, 1–18.
Wallner, S., and Schmitz, G. (2011). Plasmalogens the neglected regulatory and
scavenging lipid species. Chem. Phys. Lipids 164, 573–589.
Wickham, H. (2016). ggplot2: elegant graphics for data analysis (Switzerland: Springer
International Publishing).
Wiking, L., Stagsted, J., Björck, L., and Nielsen, J.H. (2004). Milk fat globule size is
affected by fat production in dairy cows. Int. Dairy J. 14, 909–913.
Wilfling, F., Wang, H., Haas, J.T., Krahmer, N., Gould, T.J., Uchida, A., Cheng, J.-X.,
Graham, M., Christiano, R., Fröhlich, F., et al. (2013). Triacylglycerol Synthesis
Enzymes Mediate Lipid Droplet Growth by Relocalizing from the ER to Lipid
Droplets. Dev. Cell 24, 384–399.
Zoeller, R.A., Lake, A.C., Nagan, N., Gaposchkin, D.P., Legner, M.A., and Lieberthal,
W. (1999). Plasmalogens as endogenous antioxidants: somatic cell mutants reveal
the importance of the vinyl ether. Biochem. J. 338, 769–776.

167
Supplementary data
Milk fat globule size development in the mammary epithelial cell: a potential role
for ether phosphatidylethanolamine
Leonie Walter,1,2 Vinod K Narayana,3 Richard Fry,1 Amy Logan,2 Dedreia Tull,3 Brian
J. Leury1
1. Faculty of Veterinary and Agricultural Sciences, The University of Melbourne, Parkville,
Victoria, Australia 3010
2. CSIRO Agriculture and Food, Werribee, Victoria, Australia 3030
3. Metabolomics Australia, Bio21 Molecular Science and Biotechnology Institute, The
University of Melbourne, Parkville, Victoria, Australia 3010

168
Supplemental Table S1: List of identified lipid species and putative fatty acid composition, where known, for phospholipid classes in milk
PC-O: plasmanyl-PC, PC-P: plasmenyl-PC (plasmalogen), PE-O: plasmanyl-PE, PE-P: plasmenyl-PE (plasmalogen), PG: phosphatidylglycerol, PI:
phosphatidylinositol, PS: phosphatidylserine aShorthand notation according to Liebisch et al. (2013)
Phosphatidylcholine (PC) subclasses Phosphatidylethanolamine (PE) subclasses
PC PC-O PC-P PE PE-O PE-Pa
PC 30:0 PC O-32:0 PC P-30:0 PE 32:0 PE O-34:2 PE P-34:1 (16:0_18:1)
PC 31:1 PC O-32:1 PC P-32:0 PE 32:1 PE O-36:3 PE P-34:2 (16:0_18:2)
PC 32:0 PC O-32:2 PC P-32:1 PE 34:1 PE O-36:4 PE P-34:3 (16:0_18:3)
PC 32:1 PC O-34:1 PC P-34:0 PE 34:2 PE O-36:5 PE P-36:3 (16:0_20:3)
PC 32:2 PC O-34:2 PC P-34:1 PE 34:3 PE O-38:4 PE P- 36:4 (16:0_20:4)
PC 34:0 PC O-34:4 PC P-34:2 PE 36:0 PE O-38:5 PE P-36:5 (16:0_20:5)
PC 34:1 PC O-35:4 PC P-34:3 PE 36:1 PE O-38:6 PE P-38:4 (16:0_22:4)
PC 34:2 PC O-36:0 PC P-36:2 PE 36:2 PE O-40:5 PE P- 38:5 (16:0_22:5)
PC 34:3 PC O-36:1 PC P-36:4 PE 36:3 PE O-40:7 PE P-36:1 (18:0_18:1)
PC 34:4 PC O-36:2 PC P-36:5 PE 36:4 PE P-36:2 (18:0_18:2)
PC 34:5 PC O-36:3 PC P-38:4 PE 36:5 PE P-36:3 (18:0_18:3)
PC 36:0 PC O-36:5 PC P-38:5 PE 38:3 PE P-38:3 (18:0_20:3)
PC 36:1 PC O-38:6 PC P-40:6 PE 38:4 PE P-38:4 (18:0_20:4)
PC 36:2 PC O-40:6 PC P-40:7 PE 38:5 PE P-38:5 (18:0_20:5)
PC 36:3 PC O-40:7 PE 38:6 PE P-40:5 (18:0_22:5)
PC 36:4 PE 40:4 PE P-36:2 (18:1_18:1)
PC 36:5 PE 40:6 PE P-36:3 (18:1_18:2)
PC 37:6 PE P-38:4 (18:1_20:3)
PC 38:2 PE P-38:5 (18:1_20:4)
PC 38:3 PE P-38:6 (18:1_20:5)
PC 38:5 PE P-40:5 (18:1_22:4)
PC 38:6 PE P-40:6 (18:1_22:5)
PC 38:7 PE P-38:1 (20:0_18:1)
PC 40:5
PC 40:6
PG PI PS
PG 34:1 PI 32:0 PI 38:2 PS 36:1
PG 34:2 PI 32:1 PI 38:3 PS 36:2
PG 36:2 PI 34:0 PI 38:4 PS 38:3
PI 34:1 PI 38:5 PS 38:5
PI 36:1 PI 38:6 PS 40:5
PI 36:2 PI 40:4
PI 36:3 PI 40:5
PI 36:4

169
Supplemental Table S2: List of identified lipid species for lysophospholipid classes in milk
Lysophosphatidylcholine (LPC) subclasses Lysophosphatidylethanolamine (LPE) subclasses LPI
LPC LPC-O LPC-P LPE LPE-O LPE-P LPC 14:0 LPC O-16:0 LPC P-16:0 LPE 16:0 nd LPE P-16:0 LPI 18:0
LPC 15:0 LPC O-18:0 LPE 18:0 LPI 18:1
LPC 16:0 LPC O-20:0 LPE 18:1 LPI 18:2
LPC 16:1 LPE 18:2
LPC 18:2 LPE 20:4
LPC 18:3
LPC 18:0
LPC 18:1
LPC 20:0
LPC 20:1
LPC 20:2
LPC 20:3
LPC 20:4
LPC 20:5
LPC-O: O-alkyl-linked LPC, LPC-P: O-alk-1-enyl-linked LPC, LPE-O: O-alkyl-linked LPE,
LPE-P: O-alk-1-enyl-linked LPE, LPI: lysophosphatidylinositol

170
Supplemental Table S3: List of identified lipid groups and putative lipid species, where known, for sphingolipid classes in milk
Ceramide subclasses SM
Cer dhCer HexCer Ganglioside
Cer (d16:1_16:0) dhCer 16:0 HexCer (d16:1_18:0) GM3 (d18:1_16:0) SM 30:1
Cer (d16:1_22:0) dhCer 18:0 HexCer (d16:1_24:0) SM 31:1
Cer (d16:1_24:0) dhCer 22:0 HexCer (d18:1_22:0) SM 32:0
Cer (d16:1_24:1) dhCer 24:0 HexCer (d18:1_24:0) SM 32:1
Cer (d17:1_22:0) dhCer 24:1 HexCer (d18:1_24:1) SM 32:2
Cer (d17:1_24:0) Hex2Cer (d18:1_22:0) SM 33:1
Cer (d17:1_24:1) Hex2Cer (d18:1_24:0) SM 34:0
Cer (d18:1_14:0) SM 34:1
Cer (d18:1_16:0) SM 34:2
Cer (d18:1_18:0) SM 34:3
Cer (d18:1_20:0) SM 35:1
Cer (d18:1_22:0) SM 35:2
Cer (d18:1_24:0) SM 36:2
Cer (d18:1_24:1) SM 36:3
Cer (d18:1_26:0) SM 37:1
Cer (d18:2_16:0) SM 37:2
Cer (d18:2_22:0) SM 38:1
Cer (d18:2_24:0) SM 38:2
Cer (d19:1_16:0) SM 38:3
Cer (d19:1_18:0) SM 39:1
Cer (d19:1_22:0) SM 40:0
Cer (d19:1_24:0) SM 40:1
Cer (d19:1_24:1) SM 40:2
Cer (d20:1_24:0) SM 40:3
SM 41:0
SM 41:1
SM 41:2
SM 42:1
SM 42:2
SM 43:1
SM 44:1
SM 44:2
SM 44:3
Cer: ceramide, dhCer: dihydroceramide, HexCer: hexosylceramide, Hex2Cer: dihexosylceramide, SM: sphingomyelin
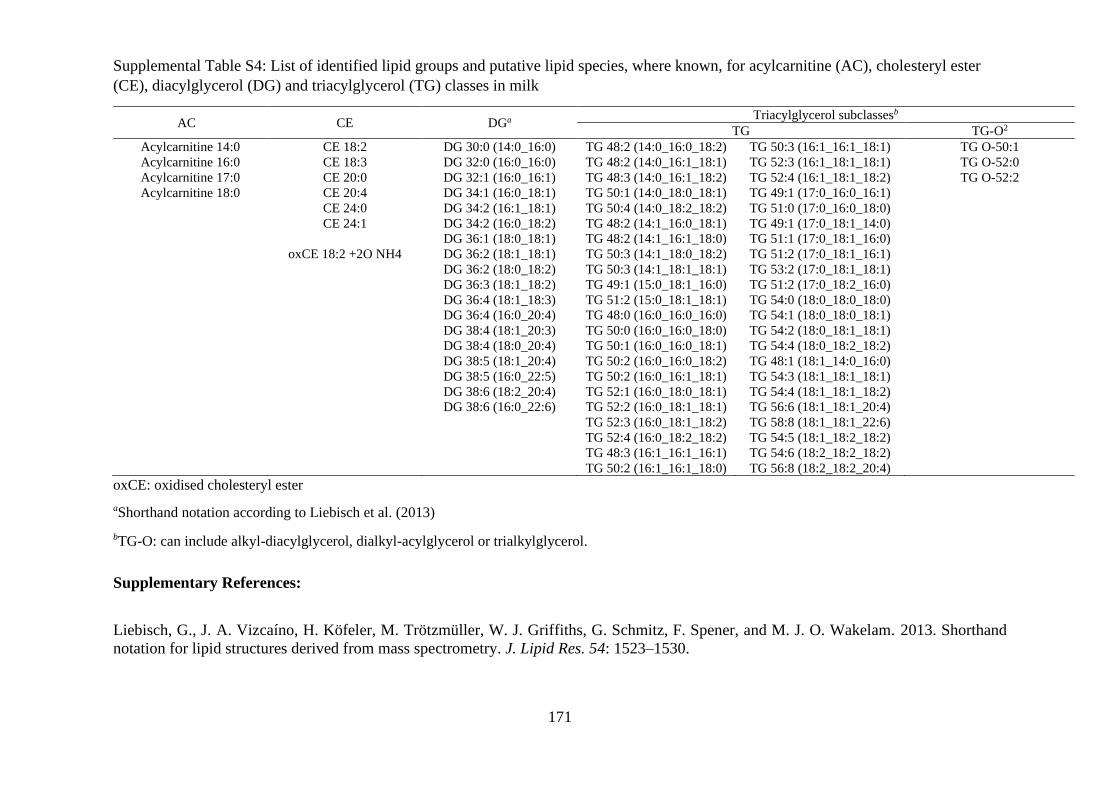
171
Supplemental Table S4: List of identified lipid groups and putative lipid species, where known, for acylcarnitine (AC), cholesteryl ester
(CE), diacylglycerol (DG) and triacylglycerol (TG) classes in milk
AC CE DGa Triacylglycerol subclassesb
TG TG-O2
Acylcarnitine 14:0 CE 18:2 DG 30:0 (14:0_16:0) TG 48:2 (14:0_16:0_18:2) TG 50:3 (16:1_16:1_18:1) TG O-50:1
Acylcarnitine 16:0 CE 18:3 DG 32:0 (16:0_16:0) TG 48:2 (14:0_16:1_18:1) TG 52:3 (16:1_18:1_18:1) TG O-52:0
Acylcarnitine 17:0 CE 20:0 DG 32:1 (16:0_16:1) TG 48:3 (14:0_16:1_18:2) TG 52:4 (16:1_18:1_18:2) TG O-52:2
Acylcarnitine 18:0 CE 20:4 DG 34:1 (16:0_18:1) TG 50:1 (14:0_18:0_18:1) TG 49:1 (17:0_16:0_16:1)
CE 24:0 DG 34:2 (16:1_18:1) TG 50:4 (14:0_18:2_18:2) TG 51:0 (17:0_16:0_18:0)
CE 24:1 DG 34:2 (16:0_18:2) TG 48:2 (14:1_16:0_18:1) TG 49:1 (17:0_18:1_14:0)
DG 36:1 (18:0_18:1) TG 48:2 (14:1_16:1_18:0) TG 51:1 (17:0_18:1_16:0)
oxCE 18:2 +2O NH4 DG 36:2 (18:1_18:1) TG 50:3 (14:1_18:0_18:2) TG 51:2 (17:0_18:1_16:1)
DG 36:2 (18:0_18:2) TG 50:3 (14:1_18:1_18:1) TG 53:2 (17:0_18:1_18:1)
DG 36:3 (18:1_18:2) TG 49:1 (15:0_18:1_16:0) TG 51:2 (17:0_18:2_16:0)
DG 36:4 (18:1_18:3) TG 51:2 (15:0_18:1_18:1) TG 54:0 (18:0_18:0_18:0)
DG 36:4 (16:0_20:4) TG 48:0 (16:0_16:0_16:0) TG 54:1 (18:0_18:0_18:1)
DG 38:4 (18:1_20:3) TG 50:0 (16:0_16:0_18:0) TG 54:2 (18:0_18:1_18:1)
DG 38:4 (18:0_20:4) TG 50:1 (16:0_16:0_18:1) TG 54:4 (18:0_18:2_18:2)
DG 38:5 (18:1_20:4) TG 50:2 (16:0_16:0_18:2) TG 48:1 (18:1_14:0_16:0)
DG 38:5 (16:0_22:5) TG 50:2 (16:0_16:1_18:1) TG 54:3 (18:1_18:1_18:1)
DG 38:6 (18:2_20:4) TG 52:1 (16:0_18:0_18:1) TG 54:4 (18:1_18:1_18:2)
DG 38:6 (16:0_22:6) TG 52:2 (16:0_18:1_18:1) TG 56:6 (18:1_18:1_20:4)
TG 52:3 (16:0_18:1_18:2) TG 58:8 (18:1_18:1_22:6)
TG 52:4 (16:0_18:2_18:2) TG 54:5 (18:1_18:2_18:2)
TG 48:3 (16:1_16:1_16:1) TG 54:6 (18:2_18:2_18:2)
TG 50:2 (16:1_16:1_18:0) TG 56:8 (18:2_18:2_20:4)
oxCE: oxidised cholesteryl ester
aShorthand notation according to Liebisch et al. (2013)
bTG-O: can include alkyl-diacylglycerol, dialkyl-acylglycerol or trialkylglycerol.
Supplementary References:
Liebisch, G., J. A. Vizcaíno, H. Köfeler, M. Trötzmüller, W. J. Griffiths, G. Schmitz, F. Spener, and M. J. O. Wakelam. 2013. Shorthand
notation for lipid structures derived from mass spectrometry. J. Lipid Res. 54: 1523–1530.

172
CHAPTER 6
Investigation on the suitability of milk derived primary bovine mammary
epithelial cells grown on permeable membrane supports as an in vitro model for
lactation
Leonie Walter,1,2 Richard Fry,1 Amy Logan,2 Brian J. Leury1
1. Faculty of Veterinary and Agricultural Sciences, The University of Melbourne, Parkville,
Victoria, Australia 3010
2. CSIRO Agriculture and Food, Werribee, Victoria, Australia 3030

173
Introduction
The aim of Chapter 6 was to establish a functional cell culture model using primary
bovine mammary epithelial cells extracted from milk and cultured on permeable
membrane inserts. The functionality of these cells was assessed in comparison to cells
extracted from bovine mammary tissue. Furthermore, culture on permeable membrane
inserts was compared to conventional 2D culture and cultivation on an extracellular
matrix gel, mimicking the 3D in vivo environment.
This chapter comprises a manuscript that has not been submitted to a journal at the
time of submission of this thesis.

174
Manuscript
ABSTRACT
This study aimed to establish an in vitro model for lipid synthesis in primary bovine
mammary epithelial cells (pbMECs) extracted from milk and cultured on Transwell
permeable supports (TW culture). The suitability of these cells as a functional model for
lactation was assessed by measuring κ-casein (CSN3) and diacylglycerol acyl transferase
1 (DGAT1) gene expression, the presence of intracellular lipid droplets and the
concentration of triacylglycerol (TG) in the cell lysates. The functionality of the milk
derived pbMECs cultured under lactogenic conditions was evaluated by comparing the
cells grown on Transwell supports to cells grown on an extracellular matrix (ECM) gel
(3D culture) or a simple plastic surface (2D culture) under three different treatment media
conditions. Furthermore, the functionality of milk derived cells was compared to pbMECs
obtained from bovine mammary tissue. Here we show that in both tissue and milk derived
pbMECs, 3D culture offered the most suitable in vitro environment and led to increased
levels of CSN3 and DGAT1 gene expression along with increased intracellular TG
content. The TW culture conditions also resulted in increased DGAT1 gene expression,
but not intracellular TG levels and CSN3 gene expression, compared to the 2D conditions.
However, milk derived pbMECs cultured on TW inserts showed the highest viability
compared to cells grown under 2D or 3D treatments. Interestingly, this was not observed
for tissue derived pbMECs, suggesting that TW culture may offer a beneficial
environment specifically for milk derived cells. Furthermore, we suggest that extended
treatment times under TW conditions could potentially result in increased TG
concentrations as indicated by upregulated DGAT1 gene expression and that with further
optimisation of the culture conditions, TW culture may present a suitable model for the
study of milk lipid synthesis in pbMECs.
175
INTRODUCTION
The fully developed lactating mammary gland contains two lineages of epithelial cells:
myoepithelial and luminal epithelial cells, with luminal epithelial cells comprising ductal
epithelial and alveolar epithelial cells (Rios et al., 2014). Ductal epithelial cells line the
ducts of the mature mammary gland and alveolar epithelial cells are the sites of milk
secretion during lactation (Van Keymeulen et al., 2011). Myoepithelial cells form a layer
of contractile cells surrounding the luminal layer in alveoli and ducts and are vital for the
ejection of milk from the milk producing alveolar luminal cells (Masedunskas et al., 2017)
and for the movement of secreted milk through the ducts into the teat cistern (Sharma and
Jeong, 2013).
The traditional approach to obtain mammary epithelial cells (MECs) for in vitro
studies, is to isolate cells from mammary tissue obtained after slaughter or from mammary
biopsies. One of the major drawbacks of this technique, besides ethical considerations, is
the contamination of primary cultures with fibroblasts from connective tissue, as well as
adipocytes from the fatty tissue surrounding the mammary gland. An alternative method
to obtain MECs is to isolate primary cells from milk (Buehring, 1990; Hillreiner et al.,
2017; Sorg et al., 2012). The isolation of cells from raw milk is a non-invasive method
and has been applied to study in vivo gene expression in lactating mammary tissue
(Boutinaud et al., 2015). Milk derived cells from human breast milk as well as bovine
milk have also successfully been cultured and used for in vitro studies (Buehring, 1990;
Danowski et al., 2013; Hillreiner et al., 2017; Sorg et al., 2012). It has been demonstrated
that these cells are viable (Boutinaud et al., 2012) and show adequate functionality in
terms of their ability to form mammospheres when cultured under 3D conditions and to
secrete the major milk proteins (Hillreiner et al., 2017; Thomas et al., 2011). In tissue
176
culture experiments it has also been reported that MECs can secrete milk fat globules
(Cohen et al., 2015).
Animal cell culture is an attractive and often more ethical alternative to in vivo studies,
especially when using cells that are extracted from raw milk. In addition, the non-
invasiveness of this method allows for the repeated sampling of the same animals without
affecting the animal’s welfare. Hence, although relationships observed in in vitro
experiments do not easily translate to the in vivo environment, their use can be preferred
for preliminary studies and cell culture is already extensively used in toxicology and
pharmaceutical experiments. Furthermore, primary cell culture has been used in the
agricultural sector to study the regulation of lipid droplet accumulation and secretion
pathways within the alveolar MEC. For example, using tissue derived primary bovine
mammary epithelial cells (pbMECs), Cohen et al. (2017) have shed light on the role of
the polar lipid composition of MECs on lipid droplet size. However, the main challenge
for animal cell culture is to mimic the in vivo environment of the cells as closely as
possible. The in vivo environment of epithelial cells is characterised by cell-cell and cell-
extracellular matrix (ECM) interactions and can be simulated by growing cells in ECM
gels (Pampaloni et al., 2007). Moreover, culturing pbMECs obtained from mammary
biopsies in ECM gels can induce the expression of genes involved in milk protein and
lipid synthesis (Riley et al., 2010). However, this technique requires the separation of the
cells from the gel matrix prior to analysis. Alternatively, porous tissue culture treated
polycarbonate or polyester membrane inserts can create an environment that also
resembles in vivo conditions. In this 3D-like technique, cells are grown on a membrane
which is suspended in tissue culture wells and creates one compartment above and one
below the cells. Thus, the cells are surrounded by cell culture media, with the bottom well
representing the basal compartment, where substrates are taken up from the extracellular
177
environment. The upper well is equivalent to the apical side, where, in the in vivo
environment, the milk is secreted into the alveolar lumen. Membrane inserts are
frequently used to study the gut barrier function and the uptake of drugs or other
components in the intestinal epithelial cell line Caco2 (Gao et al., 2017; Pereira et al.,
2015). Other applications are the use of membrane inserts to obtain polarised and fully
functional monolayers of primary retinal pigment epithelial cells (Sonoda et al., 2009). In
MEC culture, permeable membrane inserts have been used with an immortalised cell line,
MCF-10A, as well as murine primary MECs (Pai and Horseman, 2008; Stull et al., 2007).
However, the use of these inserts to obtain differentiated, polar and functional monolayers
of pbMECs extracted from milk, that can be used as an in vitro model for lactation
physiology in ruminants, is yet to be explored.
Here we intended to establish a non-invasive technique to study lipid droplet
accumulation in MECs. Furthermore, we aimed to explore the possibility to collect MECs
from cow milk and culture them on permeable membrane inserts. We hypothesised that
the use of membrane inserts could present a 3D-like environment which could have the
advantage of obtaining polarised cultures with an apical and a basal compartment. This
could be exploited to collect and analyse metabolites secreted into the apical well.
However, to date it is unknown if this model is suitable for milk derived pbMECs.
Therefore, we aimed to test the functionality of milk derived MECs against the use of
tissue derived pbMECs and the functionality of both tissue and milk derived MECs
cultured on membrane inserts against 3D culture on an ECM gel. In this experiment, the
in vitro functionality of the three pbMEC cultures was evaluated by measuring the gene
expression of κ-casein, a milk protein conserved across all mammalian species and
DGAT1, the key enzyme in TG synthesis and a regulator of milk fat content and possibly
MFG size (Argov-Argaman et al., 2013). Furthermore, lipid droplet accumulation upon

178
oleic acid supplementation to induce lipid droplet accumulation was assessed using
intracellular lipid droplet staining and quantification of the total TG content in cell lysates.
Two concentrations of oleic acid (150 and 300 µM) were chosen to determine the optimal
concentration that is able to induce lipid droplet accumulation in the pbMECs without
affecting cell viability.
MATERIALS AND METHODS
Experimental Design and Cell Culture Conditions
This experiment was set up as a 3 x 3 x 3 factorial design. Three primary cell cultures
were used, two of which were isolated from raw milk (RM1 and RM2) and one from
mammary tissue (TC). Cells were used for the experiment in passage 6, 5 and 4 for RM1,
RM2 and TC cultures, respectively. All primary cultures were grown on three different
culture matrices (2D culture, 3D culture and Transwell (TW) culture) and within each of
these under three different media conditions resulting in a total of nine different treatment
conditions per primary cell line (Table 1).
For 2D and 3D culture, 12-well cell culture plates were used to for TG, PCR and
viability analyses (Sigma, tissue culture treated, Sigma-Aldrich). The wells used for 3D
culture wells were coated with an ECM gel from Engelbreth-Holm-Swarm murine
sarcoma (growth factor reduced, without phenol red, Sigma-Aldrich) according to the ‘3D
on-top’ method described in the protocol by Lee et al. (2007), using 100 µL of ECM gel
per well and media supplemented with 10% ECM gel. TW cultures were performed in
12-well Transwell inserts (Transwell permeable supports, 0.4 µm polyester membrane,
12mm inserts, Costar, Corning Inc., Tewksbury, MA, USA), where the treatment medium
was added to the basal well and pure DMEM/F12 to the apical well. Cells for intracellular
lipid droplet and immunofluorescence staining were grown on glass coverslips (1.5
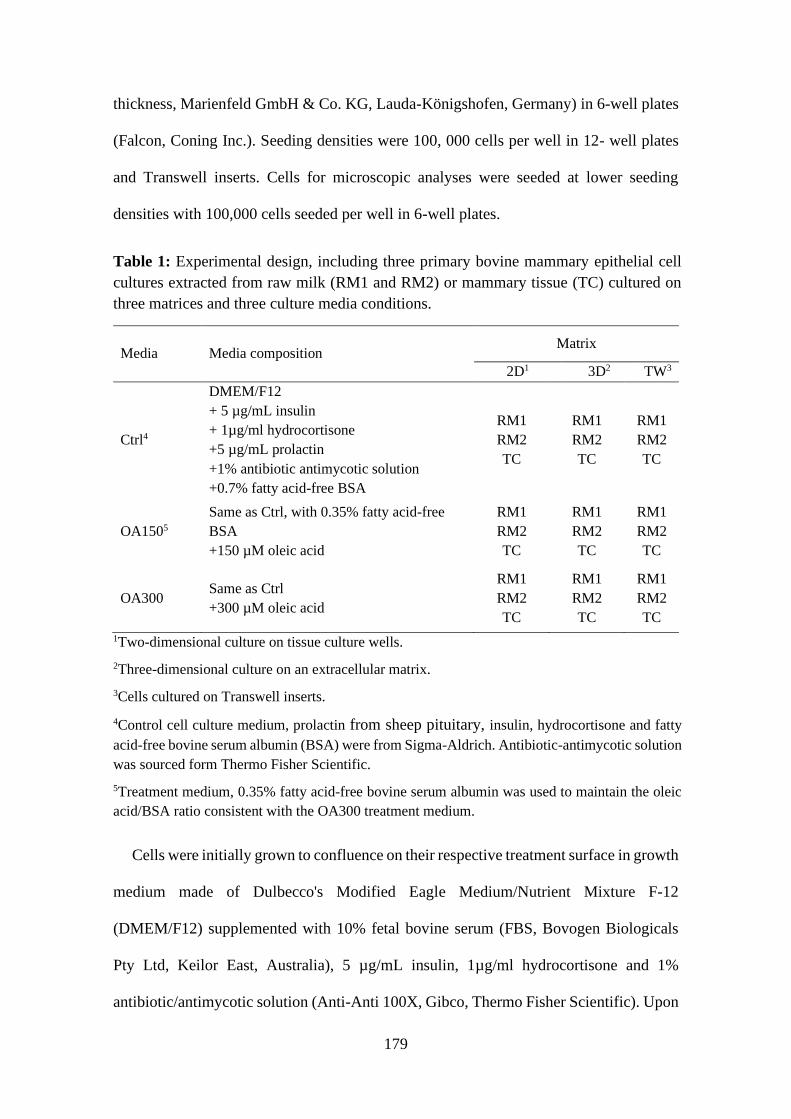
179
thickness, Marienfeld GmbH & Co. KG, Lauda-Königshofen, Germany) in 6-well plates
(Falcon, Coning Inc.). Seeding densities were 100, 000 cells per well in 12- well plates
and Transwell inserts. Cells for microscopic analyses were seeded at lower seeding
densities with 100,000 cells seeded per well in 6-well plates.
Table 1: Experimental design, including three primary bovine mammary epithelial cell
cultures extracted from raw milk (RM1 and RM2) or mammary tissue (TC) cultured on
three matrices and three culture media conditions.
Media Media composition Matrix
2D1 3D2 TW3
Ctrl4
DMEM/F12
+ 5 µg/mL insulin
+ 1µg/ml hydrocortisone
+5 µg/mL prolactin
+1% antibiotic antimycotic solution
+0.7% fatty acid-free BSA
RM1
RM2
TC
RM1
RM2
TC
RM1
RM2
TC
OA1505
Same as Ctrl, with 0.35% fatty acid-free
BSA
+150 µM oleic acid
RM1
RM2
TC
RM1
RM2
TC
RM1
RM2
TC
OA300 Same as Ctrl
+300 µM oleic acid
RM1
RM2
TC
RM1
RM2
TC
RM1
RM2
TC
1Two-dimensional culture on tissue culture wells.
2Three-dimensional culture on an extracellular matrix.
3Cells cultured on Transwell inserts.
4Control cell culture medium, prolactin from sheep pituitary, insulin, hydrocortisone and fatty
acid-free bovine serum albumin (BSA) were from Sigma-Aldrich. Antibiotic-antimycotic solution
was sourced form Thermo Fisher Scientific.
5Treatment medium, 0.35% fatty acid-free bovine serum albumin was used to maintain the oleic
acid/BSA ratio consistent with the OA300 treatment medium.
Cells were initially grown to confluence on their respective treatment surface in growth
medium made of Dulbecco's Modified Eagle Medium/Nutrient Mixture F-12
(DMEM/F12) supplemented with 10% fetal bovine serum (FBS, Bovogen Biologicals
Pty Ltd, Keilor East, Australia), 5 µg/mL insulin, 1µg/ml hydrocortisone and 1%
antibiotic/antimycotic solution (Anti-Anti 100X, Gibco, Thermo Fisher Scientific). Upon

180
confluence the media was changed to the three treatment media conditions, described in
Table 1. The treatment media were changed daily, over a treatment period of 4 d. All cells
were kept in an incubator at 37 °C and 5% CO2.
Isolation of Primary Cells from Raw Milk
Raw milk (4 L) was obtained from the University of Melbourne Dookie Dairy in
Victoria, Australia (latitude 36°25'31.3"S, longitude 145°42'36.6"E), transported to the
laboratory at room temperature and was processed on the same day. Milk was defatted by
centrifugation (1500 × g, 4 ˚C, 15 min) and the cell pellet was resuspended in phosphate
buffered saline (PBS) (without Ca, Mg, Phenol Red; Gibco, Thermo Fisher Scientific
Australia Pty Ltd, Scoresby, Australia). The collected cells were washed twice in PBS
(1500 × g, 15 min, 4 ˚C), filtered through a 100 µm cell strainer and centrifuged a final
time (1500 × g, 15 min, 4 ˚C). For the RM2 cells, the total cell pellet obtained after
washing was directly cultured on a T25 cell culture flask. For the RM1 cell line, the cells
were resuspended in 2 mL 1% bovine serum albumin (BSA) (Bovogen Biologicals Pty
Ltd, Keilor East, VIC, Australia) in PBS, divided in two 2 mL tubes and purified using
an immunomagnetic separation technique, as follows.
Magnetic beads (Dynabeads, CELLection Pan Mouse IgG Kit, Invitrogen, Thermo
Fisher Scientific) were washed in 0.1% BSA/PBS washing buffer (25 µL Dynabeads per
mL cell suspension and 1 mL of washing buffer). The bead suspension was placed in a
magnet (DynaMag – 2 Magnet, Thermo Fisher Scientific), the supernatant was discarded
and the beads were resuspended in the same volume as the initial volume of Dynabeads
(25 µL). The cell pellet was incubated with 50 µL of mouse monoclonal anti-keratin 18
antibody (sc32329, Santa Cruz Biotechnology Inc., Santa Cruz CA, USA) per 1 mL cell
suspension and incubated at 4 ̊ C for 10 min on a rotary mixer (HulaMixer Sample Mixer,

181
Thermo Fisher Scientific). The cells were washed with 2 mL 1% BSA/PBS and
centrifuged at 350 × g for 8 min to remove unbound antibodies. The supernatant was
discarded and the cells were resuspended in 1 mL 1% BSA/PBS. Washed Dynabeads
(25 µL per mL cell suspension) were added and incubated at 4 ˚C for 20 min on a rotary
mixer. The tube containing the bread bound cells was placed in the magnet for 2 min and
the supernatant was removed. The bead bound cells were washed three times by adding
1 mL 1% BSA/PBS, pipetting 2-3 times and placing in the magnet for 2 min. In the final
step the cells were resuspended in 200 µL warm complete DMEM containing
DMEM/F12 (Dulbecco's Modified Eagle Medium/Nutrient Mixture F-12 with L-
glutamine and phenol red; Gibco, Thermo Fisher Scientific) supplemented with 1% fetal
calf serum (FCS) (New-Zealand sourced, HyClone, GE Healthcare Life Sciences, Utah,
USA) and 5 mM MgCl2 (Sigma-Aldrich). The bead-bound cells were detached from the
beads by adding 4 µL release buffer (DNase 1) to the 200 µL cell suspension and were
incubated at room temperature for 15 min in a rotary mixer tilting at 90 ˚. The tube was
placed in the magnet for 2 min and the supernatant containing the cells was transferred to
a T25 cell culture dish.
Isolation of Primary Cells from Mammary Tissue
Mammary tissue from a Murray Grey heifer was obtained from a local abattoir and
transferred to the laboratory in washing buffer (2% Penicillin/Steptomycin (Sigma-
Aldrich) in PBS) immediately after slaughter. The tissue was cut into smaller pieces
which were washed twice in washing buffer and transferred to a sterile petri dish
containing 2 mL growth media (DMEM/F12 supplemented with 10% FBS (Hyclone),
100 U/mL penicillin, 100 µg/mL streptomycin, 1 µg/mL insulin (insulin from bovine
pancreas, Sigma-Aldrich) and 0.5 µg/mL hydrocortisone (Sigma-Aldrich). The washed
tissue was finely diced with two surgical blades and transferred into a 50 mL conical tube

182
containing 30 mL digestion media (growth media supplemented with 2 mg/mL
collagenase type 3 (Worthington Biochemical Corporation, Lakewood, New Jersey,
USA), 0.1 mg/mL hyaluronidase (Sigma-Aldrich) and 0.04% DNase 1 (Sigma-Aldrich).
Tissue digestion was performed by placing the tube in a rotary mixer at 37 ˚C for 3-4 h
with intermediate dissociation of bigger tissue fragments using a 25 mL pipette. After
incubation, the cell suspension was filtered through a 100 µm cell strainer and centrifuged
at 350 × g for 5 min. The supernatant was discarded, and the cell pellet was treated with
0.25% trypsin/EDTA (Gibco, Thermo Fisher Scientific). The cell suspension was once
again filtered through a 100 µm cell strainer and washed with growth medium before
being transferred to the cell culture flask.
Reverse Transcription Quantitative Polymerase Chain Reaction (RT-qPCR)
Total RNA was extracted from the cultured cells using a protocol combining TRIzol
Reagent (Invitrogen, Thermo Fisher Scientific) with the RNeasy mini kit (Qiagen Pty
Ltd, Chadstone, Australia). Briefly, cells from pooled duplicate wells in 2D and TW
cultures were lysed directly in 1 mL, and 400 µL TRIzol, respectively. Cells grown under
3D conditions were harvested with TrypLE, washed with PBS (1500 × g, 5 min, room
temperature) and the cell pellet was lysed in 600 µL TRIzol reagent. Lysed cells were
stored at -80 °C. Cell lysates were thawed on ice and homogenised by vortexing for 30 s.
The lysate was then transferred to Phasemaker tubes (Thermo Fisher Scientific), 0.2
volumes of chloroform were added per 1 volume of TRIzol and the tubes were mixed by
inversion for 30 s. The chloroform-TRIzol mixture was incubated at room temperature
for 10 min and centrifuged at 24,400 × g for 10 min at 4 °C. The upper aqueous phase
was transferred to a new tube and mixed with 1 volume of 70% ethanol. This mixture was
transferred onto a RNeasy spin column and the procedure was performed according to
the manufacturer’s instructions, omitting the initial cell lysis step. The concentrations of

183
total RNA and RNA integrity were determined using an Experion gel electrophoresis
station and the StdSens analysis kit (Bio-Rad Laboratories Pty Ltd, Gladesville,
Australia). All samples in this study had an RNA quality indicator (RQI) of 9.9 or over,
except for one RM2 sample cultured under 3D culture and control media conditions,
which had some phenol contamination as determined by Nanodrop (Thermo Fisher
Scientific) analysis.
Reverse transcription into cDNA was performed using the iScript cDNA synthesis kit
(Bio-Rad Laboratories Pty Ltd) with 1 µg of RNA for RM1 and TC cultures and 250 ng
for RM2 cultures due to limited RNA concentrations obtained from the latter samples.
The applied reverse transcription protocol was 5 min at 25 °C, 20 min at 46°C and 1 min
at 95°C and was performed on a T100 Thermal Cycler (Bio-Rad Laboratories Pty Ltd).
No reverse transcription controls were also included, and all samples were stored at
- 20 °C. The cDNA produced from the RM1 and TC cultures was diluted 1 in 4 with
sterile ddH2O. Finally, RT-qPCR was performed using the SsoAdvanced Universal
SYBR Green Supermix (Bio-Rad Laboratories Pty Ltd) containing 300 nM of forward
and reverse primers (Table 2) in a 20 µL reaction volume containing 2 µL cDNA template
for the RM1 and TC samples, and a 10 µL reaction containing 1 µL cDNA in the RM2
samples. A CFX 96 Touch real-time PCR system ((Bio-Rad Laboratories Pty Ltd) was
used and cycling conditions were as follows: polymerase activation and DNA
denaturation at 95 °C for 30 s followed by 40 cycles of amplification each including 15 s
denaturation at 95 °C and 30 s annealing at 60 °C. A melt curve analysis was also
performed. Primers were produced by Invitrogen (Thermo-Fisher Scientific) according
to published primer sequences shown in Table 2.
The data was processed for each pbMEC culture individually, where each gene of
interest was run on the same plate as the reference gene, which was chosen from three
184
reference genes that were tested in a preliminary experiment using the RM1 and TC
pbMECs and four different treatment conditions. The efficiencies of each gene of interest
and the reference gene were determined by running a pooled sample standard curve for
each primer pair on each plate along with the nine samples from each pbMEC culture
condition for the reference gene and the gene of interest. The mean efficiency corrected
cycle of quantification (mCqE) from triplicate wells per sample was obtained through the
CFX manager software and is calculated as follows using three replicate wells:
mCqE = ((CqE rep 1) + (CqE rep 2) + (CqE rep 3))/n
where CqE = Cq* (log(E) / log (2)) and E is the efficiency for the respective primer pair.
This data was used to calculate the ΔCq as follows:
ΔCq = mCqE(reference gene) - mCqE(gene of interest)
Delta Cq values were used to calculate the relative normalised differences ΔΔCq of
the sample compared to the respective control sample, which differed for the analysis of
the ‘Matrix’ or ‘Media’ effects and is described under ‘Statistical Analysis’.

185
Table 2: Primer sequences, product length, accession numbers and source for the genes measured in the current study.
Gene name NCBI accession number1
Primer sequence 5’ to 3’
Forward
Reverse
Product length (bp) Reference
Cyclophilin NM
178320.2
GGATTTATGTGCCAGGGTGGTGA 120 Boutinaud et al. (2008)
CAAGATGCCAGGACCTGTATG
DGAT12 NM
174693
CCACTGGGACCTGAGGTGTC 101 Bionaz and Loor (2008)
GCATCACCACACACCAATTCA
CSN33 NM
174294.1
TGCAATGATGAAGAGTTTTTTCCTAG 150 Sigl et al. (2012)
GATTGGGATATATTTGGCTATTTTGT
KRT84 NM
001033610.1
GCTACATTAACAACCTCCGTC 237 Sigl et al. (2012)
TCTCATCAGTCAGCCCTTCC 1NCBI: National center for biotechnology information.
2DGAT1: Diacylgycerol-acyltransferase 1.
3CSN3: κ-casein.
4KRT8: Keratin 8.

186
Immunofluorescence Staining
For immunofluorescence staining the cells were grown to 70 – 80% confluence on
glass coverslips in 6-well plates with the control medium. The cells were washed three
times with PBS and fixed with ice-cold (-20 ˚C) methanol for 10 min. Fixed cells were
again washed three times with cold PBS and blocked in a blocking solution of 1% BSA
(Sigma-Aldrich) in PBS for 1 h at room temperature. This was followed by a
permeabilisation step in PBS supplemented with 0.05% Triton-X-100 for 15 min at room
temperature. Permeabilisation was followed by an incubation with the primary antibody
(mouse monoclonal anti-cytokeratin 18 antibody RGE53 (Santa Cruz Biotechnology Inc.,
Santa Cruz, CA, USA) in a 1/50 dilution in PBS overnight at 4 ˚C. After incubation with
the primary antibody the cells were washed three times for 10 min in PBS to remove
excess antibodies. The cells were incubated with a secondary antibody (goat anti-mouse
IgG H&L Alexa Fluor 488 (Abcam, Melbourne, Australia) in a 1/200 dilution in PBS for
1 h at room temperature in the dark. After three more washing steps with PBS the cells
were counterstained in a 300 nM DAPI solution (Santa Cruz Inc.) in PBS for 30 min at
room temperature in the dark. The stained cells were then mounted on a glass slide with
Fluoroshield mounting media (F6182, Sigma-Aldrich) and visualised with a Nikon
Eclipse Ti inverted microscope (Nikon Australia Pty Ltd, Rhodes, Australia).
Intracellular Lipid Droplet Staining
Staining of intracellular lipid droplets was performed on cells grown on glass
coverslips under all three cell culture media conditions. The cells were fixed in a 3.6%
formaldehyde solution (Sigma-Aldrich) in PBS at room temperature for 20 min. Fixed
cells were washed four times with PBS and stained with Nile Red (Sigma-Aldrich) in
PBS for 15 min, which was initially dissolved in acetone (1mg/mL) and then diluted in

187
PBS to obtain a final concentration of 200 nM. The cells were washed three times in PBS
and stained with DAPI (300 nM) for 5 min before being mounted on a glass slide with
Fluoroshield mounting medium (Sigma-Aldrich). Micrographs were captured using the
Nikon Eclipse Ti inverted microscope.
Growth Curve Analysis and Viability
The growth characteristics of each primary cell line were determined by capturing
duplicate images on triplicate T75 flasks daily during the cell propagation phase prior to
this experiment. The cells on each image were counted using the ‘multi-point’ tool in
imageJ (Version 1.50i, (Schneider et al., 2012)) and the log10 of the cell number was
plotted against the hours of growth from seeding until the cells reached 80-90%
confluence. The population doubling time during the exponential growth phase was
calculated according to Bryant et al. (1958) as follows:
PDT = ((t2 – t1) / 3.32 × (log10(n2)-log10(n1)),
where PDT = population doubling time, t2 – t1 = the time period in h between the two
time points in the exponential growth phase, n2 = the number of cells counted at the
second time point, n1 = the number of cells counted at the first time point.
Viability was determined using the Trypan Blue exclusion procedure. Briefly, 5 µL of
the cells suspended in PBS for TG analysis, were mixed with 5 µL of a 0.4% Trypan Blue
solution (Sigma-Aldrich) and the total and stained cells were counted using a
hemocytometer and a Leica DM500 microscope (Leica Microsystems Pty Ltd, Macquarie
Park, Australia).

188
Transepithelial Electrical Resistance (TEER)
To determine the TEER, quadruplicate measurements were taken for each primary cell
line under each media treatment condition on the Transwell culture inserts, prior to TG
and RNA extraction after 4 d of treatment. Four blank measurements were taken using
Transwell inserts filled with the control media and the mean of the blank measurements
were deducted from each sample measurement to control for the resistance created by the
membrane insert. Transepithelial electrical resistance was measured at room temperature
using a Millicell ERS-2 Epithelial Volt-Ohm Meter fitted with an ERS STX01 probe
(Merck Pty Ltd, Bayswater, Australia). The TEER was calculate by multiplying the
normalised resistance (Ω) with the effective growth area of the Transwell insert (1.1 cm2)
to obtain the TEER in Ω × cm2.
Intracellular TG Content
Total TGs were determined using the Picoprobe Triglyceride Quantification Assay Kit
(Fluorometric, Abcam). This analysis was performed on duplicate wells and was
expressed as TG in µg per million cells, where cell numbers were determined for one of
the duplicate wells prior to TG extraction or in µg per µg total protein. The cells from
each of the three cell lines grown under the nine treatment conditions were detached using
TrypLE Express (Gibco, Thermo Fisher Scientific), washed in PBS, centrifuged at 1500
× g for 5 min at 4 °C and lysed in the triglyceride lysis buffer provided with the kit. The
cell lysates were snap frozen in liquid nitrogen and kept at -80 °C. Upon thawing, the cell
lysates were homogenised by pipetting, incubated on ice for 10 min and centrifuged for
5 min at 24,400 × g and 4 °C. The supernatant was collected and diluted 10-fold in
triglyceride buffer. The samples and standards (50 µL) were incubated with 2 µL lipase
for 20 min at 37 °C. Background control wells were incubated with 2 µL of triglyceride

189
buffer instead. All sample, standard and background wells were mixed with 50 µL
reaction mix according to the manufacturers protocol and incubated at 37 °C for 30 min.
Fluorescence was measured using a microplate reader (Varioskan Lux Multimode
Microplate Reader, Thermo Fisher Scientific) with an excitation and emission
wavelength of 535 and 587 nm, respectively. Total protein concentrations were
determined using the Pierce™ BCA Protein Assay Kit (Thermo Scientific, Thermo Fisher
Scientific Australia Pty Ltd) according to the manufacturers protocol after 10-fold
dilution of the cells lysed in triglyceride lysis buffer in double distilled water.
Statistical Analysis
Data obtained from TG quantification of duplicate samples was averaged and
transformed using the natural logarithm before statistical analysis was performed. The
data was expressed as the fold change (FC) normalised to a control sample prior to
statistical analysis (i.e. ln(FC) = ln(sample)-ln(control)). Delta Cq values obtained from
RT-qPCR analysis were also used to calculate the ΔΔCq values normalised to the
respective controls, which differed depending on the analysis of ‘Matrix’ or ‘Media’
effects, as follows:
For the analysis of the ‘Matrix’ effect, the control sample was the sample cultured with
the same treatment medium under 2D culture conditions. For the analysis of the ‘Media’
effect, the control sample was the sample cultured with the control treatment medium on
the same matrix as the respective sample of interest. Statistical analysis was subsequently
performed by fitting two linear models, one with ‘Matrix’ and ‘Cell line’ and one with
‘Media’ and ‘Cell line’ as fixed effects and with ΔΔCq values or ln(FC) as the response
variables for PCR and TG quantification data, respectively. The linear models were fitted
using the ‘lm’ function in R version 3.5.1 (R Core Team, 2018) in combination with the

190
‘tidy’ function as part of the ‘broom’ package (Robinson and Hayes, 2018). Least square
means and pairwise comparisons between factor levels were calculated using the
‘emmeans’ package in R (Lenth et al., 2019). All data is presented as mean log2 (FC) for
PCR data and mean ln(FC) for TG quantification compared to the control condition (‘2D’
for ‘Matrix’, ‘ctrl’ for ‘Media’ and ‘RM1’ for ‘Cell line’) and its 95% confidence interval.
The data were presented on the logarithmic scale so that positive and negative fold
changes are on a proportional scale, where a fold change of 2 is as far from the x-axis as
a fold change of -2, making the visualisation of the results clearer.
Transepithelial electrical resistance measurements of cells grown on TW inserts,
where analysed individually for each cell line using a linear model with ‘Media’ as the
only fixed effect. Viability measurements were also analysed for each cell line
individually, however, in this case ‘Media’ and ‘Matrix’ were both included in the linear
model as fixed effects. Graphs are presented with individual values, means and 95%
confidence intervals and were produced using the ‘ggplot2’ package in R (Wickham,
2016).
RESULTS
Viability and Growth Characteristics of Milk and Tissue Derived pbMECs
The morphology and growth characteristics differed between pbMECs extracted from
raw milk or tissue and viability changed depending on the growth media and matrix
conditions. Milk derived cells had a longer population doubling time compared to tissue
derived cells, with 32.06 h and 31.07 h for RM1 and RM2, respectively compared to
21.19 h for the TC pbMECs. This could indicate the presence of non-epithelial cells, such
as fibroblasts in the TC cells, with shorter population doubling times compared to pure
epithelial cultures. However, morphological differences were also observed between the
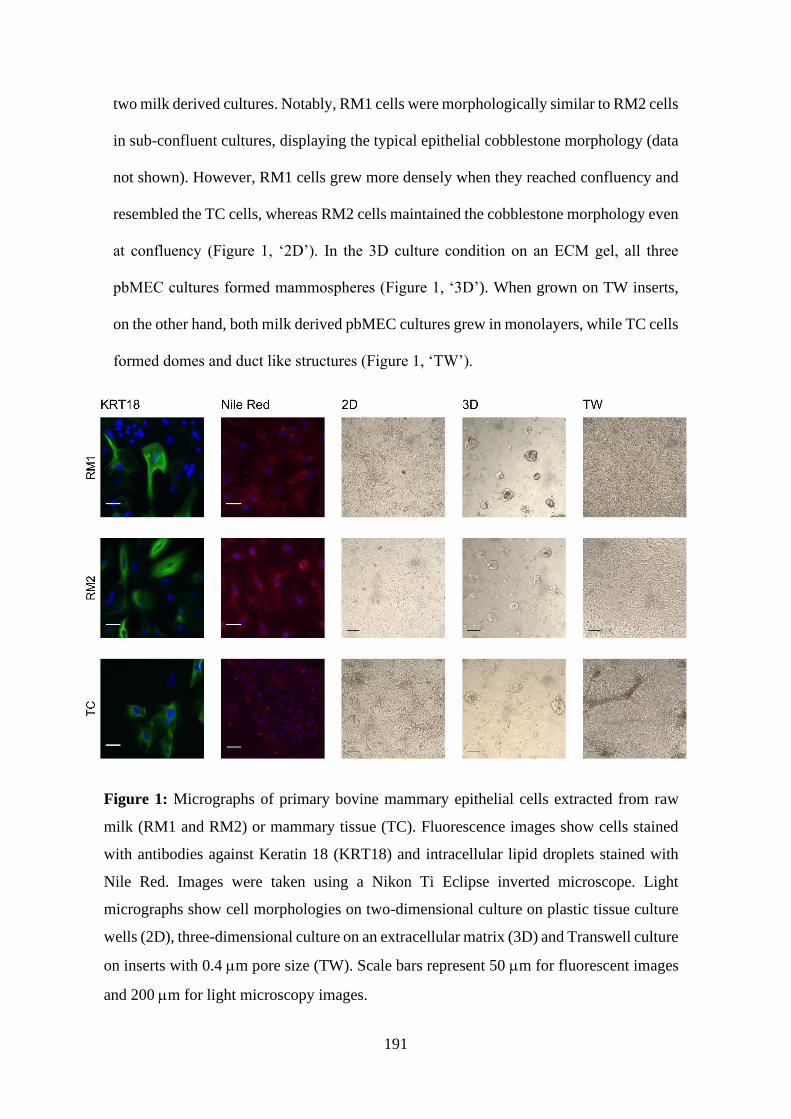
191
two milk derived cultures. Notably, RM1 cells were morphologically similar to RM2 cells
in sub-confluent cultures, displaying the typical epithelial cobblestone morphology (data
not shown). However, RM1 cells grew more densely when they reached confluency and
resembled the TC cells, whereas RM2 cells maintained the cobblestone morphology even
at confluency (Figure 1, ‘2D’). In the 3D culture condition on an ECM gel, all three
pbMEC cultures formed mammospheres (Figure 1, ‘3D’). When grown on TW inserts,
on the other hand, both milk derived pbMEC cultures grew in monolayers, while TC cells
formed domes and duct like structures (Figure 1, ‘TW’).
Figure 1: Micrographs of primary bovine mammary epithelial cells extracted from raw
milk (RM1 and RM2) or mammary tissue (TC). Fluorescence images show cells stained
with antibodies against Keratin 18 (KRT18) and intracellular lipid droplets stained with
Nile Red. Images were taken using a Nikon Ti Eclipse inverted microscope. Light
micrographs show cell morphologies on two-dimensional culture on plastic tissue culture
wells (2D), three-dimensional culture on an extracellular matrix (3D) and Transwell culture
on inserts with 0.4 m pore size (TW). Scale bars represent 50 m for fluorescent images
and 200 m for light microscopy images.
192
The viability of the pbMEC cultures was also differentially affected by the media and
matrix conditions applied in this study. The viability of milk derived pbMECs was
increased when they were cultured on TW inserts compared to the 2D cultures, with an
estimated effect of an around 17% increase in viability (P = 0.032 and P = 0.036, for RM1
and RM2, respectively, Table 3). For these cells, 3D culture conditions did not increase
the viability compared to 2D treatments. In the tissue derived pbMECs, no significant
effect of the culture matrix on cell viability was observed and only the cells grown with
OA150 medium showed reduced viability (-15.12%, P = 0.044, Table 3), although higher
oleic acid concentrations in the OA300 medium did not negatively affect cell viability (P
= 0.298). A reduction in viability with the highest oleic acid concentration was observed
for the RM2 cells (-18.03%, P = 0.035), while RM1 cells were not affected by oleic acid
in the cell culture medium (Table 3). The observed increase in viability in TW culture
compared to 2D culture in the milk derived pbMECs could indicate that this environment
more closely resembles the in vivo environment, where luminal MECs form a monolayer
as a barrier between the alveolar lumen on the apical side and the myoepithelial cells on
the basal side. A similar effect of a more in vivo like environment on cell viability would
also have been expected under the 3D culture conditions but was not observed in the
current experiment. This could possibly be related to dead cells being trapped in the ECM
gel. Moreover, cells grown on 2D and TW conditions detached more easily which may
have preserved their viability compared to a longer time needed for the detachment of
cells from the ECM matrix.

193
Table 3: Predicted mean viability (%) of primary bovine mammary epithelial cells extracted from raw milk (RM1 and RM2) or mammary
tissue (TC) cultured on three matrices and three culture media conditions. Least square means, standard error (SE), estimated effects and
P-values are shown.
Estimated effects1
P-values2
Means (%)
SE Matrix
Media
Matrix
Media
Cells 2D3 3D4 TW5 3D TW OA150 OA300 3D TW OA150 OA300
RM1
Ctrl6 76.2 76.5 93.4
3.57 0.30 17.15 -4.01 -3.24 0.938 0.032 0.406 0.479 OA1507 72.2 72.5 89.4
OA3008 73.0 73.3 90.2
RM2 Ctrl 81.4 86.2 98.3
4.10 4.80 16.91 -3.34 -18.03 0.406 0.036 0.493 0.035 OA150 78.1 82.9 95.0
OA300 63.4 68.2 80.3
TC Ctrl 90.2 83.9 83.5
4.06 -6.36 -6.73 -15.12 -6.25 0.298 0.298 0.044 0.298 OA150 75.1 68.8 68.4
OA300 84.0 77.6 77.3 1Estimated effects were calculated for each cell line individually using a linear model with ‘Media’ and ‘Matrix’ as fixed effects and represent the
change in viability of the treatment compared to the respective control condition.
2 P-values were adjusted for multiple testing using the procedure by Benjamini-Hochberg (1995).
3Two-dimensional culture on tissue culture wells.
4Three-dimensional culture on an extracellular matrix.
5Cells cultured on Transwell inserts.
6Control cell culture medium, supplemented with prolactin, insulin, hydrocortisone and bovine serum albumin.
7Treatment medium, comprising control medium supplements and 150 M oleic acid.
8Treatment medium, comprising control medium supplements and 300 M oleic acid.

194
Polarity of Cells Grown on TW Inserts Assessed Using TEER Measurements.
Transepithelial electrical resistance was reduced by the addition of 300 µM oleic acid
to the cell culture medium for all three pbMEC cultures (Table 4). For the RM2 and TC
cells, a substantial decrease in TEER was also observed with lower concentrations of
oleic acid at 150 µM (-413.84 and -303.80 cm2, for RM2 (P = 0.008) and TC
(P < 0.001), respectively, Table 4), while RM1 cells were unaffected by the lower oleic
acid concentrations. However, under control treatment conditions (‘Ctrl’, Table 4) all
pbMECs showed TEER > 400 cm2, suggesting polarisation of the cells. Moreover,
RM1 cultures showed high TEER across all treatments. Reduced TEER in the TC cultures
were likely impacted by the formation of domes and duct-like structures (Figure 1, ‘TW’).
The formation of domes on TW culture can result in gaps in the monolayer around the
forming dome and could lead to reduced TEER. The less densely packed morphology
observed in RM2 cultures can also affect their ability to form a continuous barrier and
reduced TEER in these cells upon oleic acid supplementation could indicate that tight
junctions may not have been closed between these cells. Figure 1 shows an example for
the formation of domes in TC cultures and the gaps observed in loosely packed RM2
cultures.

195
Table 4: Transepithelial electrical resistance (TEER) of primary bovine mammary
epithelial cells extracted from raw milk (RM1 and RM2) or mammary tissue (TC)
cultured on Transwell inserts and three cell culture media conditions.
Means ( cm2)
Estimated effect1
P-values
Cells Ctrl2 OA1503 OA3004 SE OA150 OA300 OA150 OA300
RM1 1695.12 1722.28 1117.76 253.67 27.16 -577.36 0.917 0.055
RM2 603.4 189.56 110.04 115.70 -413.84 -493.36 0.008 0.003
Tissue 414.12 110.32 76.73 37.59 -303.80 -337.40 < 0.001 < 0.001 1The estimated effect of different cell culture media conditions was calculated for each cell line
by fitting a linear model with ‘Media’ as a fixed effect and represent the change in TEER of the
treatment compared to the respective control condition.
2 P-values were adjusted for multiple testing using the procedure by Benjamini and Hochberg
(1995).
3Control cell culture medium, supplemented with prolactin, insulin, hydrocortisone and bovine
serum albumin.
4Treatment medium, comprising control medium supplements and 150 M oleic acid.
5Treatment medium, comprising control medium supplements and 300 M oleic acid.
Functionality of Milk and Tissue Derived pbMECs
The extracted pbMECs all expressed KRT8 (Figure 2) and stained positively for
KRT18 (Figure 1, ‘KRT18’), which are markers for the luminal epithelial cell lineage.
The gene expression of KRT8 was not significantly influenced by the addition of oleic
acid to the cell culture media. However, cells grown on 3D cultures expressed slightly
lower levels of KRT8 compared to TW and 2D cultures (P = 0.100, Figure 2). A trend
towards a reduction in keratin 8 and 18 protein expression in primary cultures of human
hepatocytes grown on extracellular matrix compared to the 2D culture environment has
previously been reported (Page et al., 2007). In our study, a trend towards reduced KRT8
gene expression was also observed for cells cultured with 150 µM oleic acid (P = 0.110,
Figure 2). However, overall our results show that independently from the origin and

196
extraction method the obtained pbMECs were indeed MECs and suitable for the intended
experiment.
Figure 2: Keratin 8 (KRT8) gene expression in primary bovine mammary epithelial cells
extracted from raw milk (RM1 and RM2) or mammary tissue (TC), cultured on three
matrices (A) and three cell culture media conditions (B). Cells were cultured on tissue
culture treated plastic wells (2D), on an extracellular matrix (3D) or on Transwell inserts
(TW). The control medium (ctrl) contained lactogenic hormones (prolactin,
hydrocortisone and insulin) and bovine serum albumin, whereas the treatment media
contained the control medium supplemented with 150 M (OA150) or 300 M (OA300)
oleic acid. The data is expressed as ΔΔCq values, representing the relative normalised
gene expression relative to the respective control condition i.e. ‘2D’ for ‘Matrix’ and ‘ctrl’
for ‘Media’. P-values were adjusted for multiple testing using the procedure by Benjamini
and Hochberg (1995).

197
All pbMEC cultures also expressed genes for κ-casein and TG synthesis (DGAT1) and
contained intracellular lipid droplets. For both DGAT1 and CSN3 gene expression, a clear
effect of the treatment medium was observed, with cultures treated with 300 µM oleic
acid showing a significant increase in these transcripts (P = 0.019, Figure 3). Furthermore,
cells cultured under 3D conditions expressed higher levels of both DGAT1 and CSN3
compared to the 2D controls (P = 0.041 and P < 0.001 for DGAT1 and CSN3,
respectively, Figure 3). In contrast, TW culture did not lead to a significant upregulation
of the CSN3 gene expression compared to 2D controls. However, DGAT1 gene
expression in TW cultures was comparable to the 3D treatments and significantly
upregulated compared to the 2D control treatment (P = 0.006, Figure 3). Intracellular Nile
Red staining showed lipid droplets were present under all culture conditions (Figure 1,
‘Nile Red’) and this was confirmed by quantifying the TG content of the cell lysates
(Figure 4). However, fluorometric quantification of the intracellular TG content only
partially confirmed the suggested effects from qRT-PCR analysis. The effect of
supplementing the cell culture media with oleic acid was in line with the observed
upregulation of the DGAT1 gene, with an increase in TG content per total protein, when
300 µM oleic acid was supplemented (P = 0.047, Figure 4). However, the observed matrix
effect for TGs quantified through the fluorometric technique only reflected the results
obtained from DGAT1 gene expression analysis in the cells grown under 3D conditions,
where the cells showed increased levels of TGs in the 3D treatment compared to the 2D
control (P < 0.001, Figure 4C). For cells grown on TW inserts, the observed increase in
DGAT1 gene expression was not reflected in the intracellular TG content (Figure 4C).

198
Figure 3: Kappa-casein (CSN3) and diacylgycerol-acyltransferase 1 (DGAT1) gene
expression in primary bovine mammary epithelial cells extracted from raw milk (RM1
and RM2) or mammary tissue (TC), cultured on three matrices (A and C) and three cell
culture media conditions (B and D). Cells were cultured on conventional tissue culture
treated plastic wells (2D), on an extracellular matrix (3D) or on Transwell inserts (TW).
The control medium (ctrl) contained lactogenic hormones (prolactin, hydrocortisone and
insulin) and bovine serum albumin, whereas the treatment media contained the control
medium supplemented with 150 M (OA150) or 300 M (OA300) oleic acid. The data
is expressed as ΔΔCq values, representing the relative normalised gene expression
relative to the respective control condition, i.e. ‘2D’ for ‘Matrix’ and ‘ctrl’ for ‘Media’.
P-values were adjusted for multiple testing using the procedure by Benjamini and
Hochberg (1995).
199
DISCUSSION
Suitability of Milk Derived Cells for the In Vitro Study of Milk Lipid Synthesis
This study confirms the suitability of milk derived cells for primary cell culture
experiments, as previously demonstrated (Danowski et al., 2013; Hillreiner et al., 2017;
Sorg et al., 2012) and is the first to use Transwell inserts to create a 3D-like environment
for pbMECs. The extracted cells expressed κ-casein and produced TGs and lipid droplets
under all applied media and matrix conditions. However, the morphology of the two milk
derived pbMEC cultures, RM1 and RM2, differed in terms of their density at 100%
confluence and TEER of the cells, which was higher in RM1 under all treatment
conditions. The reported range of TEER in the literature varies depending on the cell type
and TEER data has not been reported for pbMECs. For example, intestinal epithelial cells
(Caco-2 cell line) have reported TEER values of > 1000 Ω × cm2 (Gao et al., 2017), while
kidney cells (MDCK cell line) only reach a final TEER of around 120-130 Ω × cm2 (Butor
and Davoust, 1992). In mammary cell culture, TEER plateaus at around 800 Ω × cm2 for
mouse primary MECs and > 3000 for the immortalised MCF-10A cell line (Stull et al.,
2007). More importantly, Stull et al. (2007) observed a lag-phase of several days in the
development of TEER in both cell lines. This could indicate that, in our study, TC and
RM2 cells had not yet reached the same level of TEER as the RM1 cells after 3 d of
proliferation on growth media and 4 d under treatment conditions. In fact, RM1 cells
reached a TEER of > 1700 Ω × cm2, which was almost three and four times the observed
TEER in RM2 and TC cells, respectively (Table 4). Based on the variation of TEER
between the three pbMECs, we suggest that the suitability of milk derived cells for in
vitro studies could be tested based on TEER measurements. Moreover, treatment times
and starting points for future experiments could be optimised based on TEER
measurements.

200
Figure 4: Triacylglycerol (TG) content in cell lysates from primary bovine mammary
epithelial cells extracted from raw milk (RM1 and RM2) or mammary tissue (TC),
cultured on three matrices (A and C) and three cell culture media conditions (B and D).
The control medium (ctrl) contained lactogenic hormones (prolactin, hydrocortisone and
insulin) and bovine serum albumin, whereas the treatment media contained the control
medium supplemented with 150 M (OA150) or 300 M (OA300) oleic acid. Cells were
cultured on conventional tissue culture treated plastic wells (2D), on an extracellular
matrix (3D) or on Transwell inserts (TW). The TG concentration was normalised to the
number of cells expressed in µg per million cells (A and B) or to the total protein content
of the cell lysates expressed as µg per µg total protein (C and D). The data is expressed
as the ln of the fold change compared to the respective control condition, i.e. ‘2D’ for
‘Matrix’ and ‘ctrl’ for ‘Media’. Absolute TG concentrations were between 9.7 and118.9
ug/Mio cells and 114.9 and 1200.5 ug/ug total protein. P-values were adjusted for
multiple testing using the procedure by Benjamini and Hochberg (1995).

201
The cell morphology under 2D culture conditions also differed between the two milk
derived pbMECs. In contrast to RM2 cells, the morphology of RM1 cells, which were
extracted as purified cultures applying an immunomagnetic separation technique with
antibodies against KRT18, resembled the morphology of TC cells on 2D culture
(Figure 1, ‘2D’). Furthermore, immunofluorescence staining against KRT18 showed that
some cells in RM1 cultures did not express KRT18, which was also observed in the TC
cultures (Figure 1, ‘KRT18’). This could indicate the presence of cells from the
myoepithelial as well as the luminal epithelial lineage. This was expected in the TC
cultures but was unexpected in RM1 cultures which were extracted from milk and purified
prior to cell culture. Studies in mice have suggested that KRT18 expressing MECs contain
stem cells that are committed towards the luminal lineage, however the authors suggested
that these stem cells were rarely able to differentiate into the myoepithelial lineage (Van
Keymeulen et al., 2011). However, others have suggested that multipotent stem cells,
which are able to differentiate into both myoepithelial and luminal epithelial cells, exist
within the mammary gland (Rios et al., 2014). The contamination of pure, KRT18
expressing cultures with only a small number of multipotent stem or progenitor cells
could result in mixed cultures of both lineages. However, in the current study, we did not
analyse myoepithelial markers and therefore cannot conclusively determine the purity of
the milk and tissue derived cultures. Moreover, this study reports results from a single
experiment with cells from 3 individual cows that were isolated using different techniques
and future work is needed to confirm the reproducibility of these results.
Suitability of TW Culture as an Alternative to 3D Culture on ECM gels
Differences in TEER and viability on TW culture were also observed between the three
primary cell cultures. Notably, milk derived cells showed higher viability on TW culture
compared to 2D and 3D culture conditions. However, this was not the case for TC

202
cultures. This could again be related to the purity of the cultures, where cultures
comprising predominantly epithelial cells could prefer the environment offered by TW
inserts. In contrast to 2D cultures, where cells are forced to take up nutrients and secrete
compounds on the same side, cells on permeable membrane inserts are in contact with
the cell culture medium on the apical and basal side of the cell. This environment more
closely resembles the in vivo orientation of MECs and could promote the formation of a
polarised monolayer. This could present a possible advantage of TW culture for pbMECs
extracted from milk.
However, with respect to their overall functionality, cells cultured under 3D conditions
exhibited the highest levels of CSN3 gene expression and intracellular TG content, while
TW cultures did not differ from cells grown on conventional 2D plastic surfaces in
relation to these parameters (Figures 3 and 4). Notably, DGAT1 gene expression was
increased in the cells cultured under TW and 3D conditions compared to the 2D treatment
and showed a dose response to increased levels of oleic acid in the medium (Figure 3).
The conflicting results obtained from DGAT1 gene expression analysis compared to the
results obtained from intracellular TG quantification, demonstrate that increased gene
expression does not always translate to increased levels of the respective metabolite.
However, the fluorometric analysis of TG content is heavily reliant on appropriate
normalisation and standardisation. Therefore, we applied two strategies for TG content
normalisation, by expression the results in relation to total cell number or total protein
and obtained similar results with both strategies (Figure 4). On the other hand, these
results could indicate that TW culture had led to increased DGAT1 expression but was
not yet reflected in TG levels. In combination, with the possibility that 4 d of treatment
in our study had not yet led to the development of the desired level of TEER in RM2 and
TC cells, longer treatment times may also be required for TG synthesis in pbMECs on

203
TW inserts. Moreover, some protocols suggest coating Transwell inserts with an ECM
gel or other basement-membrane constituents, like fibronectin or collagen (Sonoda et al.,
2009). We decided to test the functionality of the pbMEC on uncoated Transwell inserts
to explore the effectiveness of the permeable membrane without the confounding effect
of the ECM coating, allowing the direct comparison between 3D culture on an ECM gel
and TW culture. Furthermore, uncoated Transwell inserts are successfully used with other
epithelial cell types, such as intestinal epithelial cells (Gao et al., 2017). The current study
demonstrates that this method could be further developed into a suitable in vitro system
to study the biochemical pathways behind lipid droplet synthesis in pbMECs. However,
at this stage, the 3D culture condition offered a more suitable environment for MEC
functionality.
CONCLUSIONS
We suggest, based on these preliminary results, that TW culture is a promising method,
particularly for the study of lipid droplet accumulation. The milk derived RM1 cultures
showed high TEER under all treatment media conditions and both milk derived pbMECs
showed the highest viability when cultured on TW inserts, suggesting that the permeable
membrane supports provided a suitable environment for pbMECs extracted from milk
and can induce the formation a polarised monolayer. However, the comparative analysis
with 2D and 3D cultures on an ECM gel also showed that at least in terms of CSN3 gene
expression and intracellular TG content, the TW cultures were not superior to 2D cultures
and were inferior to 3D cultures, which at this stage remain the gold standard for in vitro
studies.

204
REFERENCES
Argov-Argaman, N., Mida, K., Cohen, B.-C., Visker, M., and Hettinga, K. (2013). Milk
Fat Content and DGAT1 Genotype Determine Lipid Composition of the Milk Fat
Globule Membrane. PLoS ONE 8, e68707.
Benjamini, Y., and Hochberg, Y. (1995). Controlling the False Discovery Rate: A
Practical and Powerful Approach to Multiple Testing. J. R. Stat. Soc. Ser. B
Methodol. 57, 289–300.
Bionaz, M., and Loor, J.J. (2008). Gene networks driving bovine milk fat synthesis during
the lactation cycle. BMC Genomics 9, 366.
Boutinaud, M., Ben Chedly, M.H., Delamaire, E., and Guinard-Flament, J. (2008).
Milking and feed restriction regulate transcripts of mammary epithelial cells
purified from milk. J. Dairy Sci. 91, 988–998.
Boutinaud, M., Lollivier, V., Finot, L., Bruckmaier, R.M., and Lacasse, P. (2012).
Mammary cell activity and turnover in dairy cows treated with the prolactin-
release inhibitor quinagolide and milked once daily. J. Dairy Sci. 95, 177–187.
Bryant, J.C., Schilling, E.L., and Earle, W.R. (1958). Massive Fluid-Suspension Cultures
of Certain Mammalian Tissue Cells. I. General Characteristics of Growth and
Trends of Population. J. Natl. Cancer Inst. 21, 331–348.
Buehring, G.C. (1990). Culture of Mammary Epithelial Cells from Bovine Milk. J. Dairy
Sci. 73, 956–963.
Butor, C., and Davoust, J. (1992). Apical to basolateral surface area ratio and polarity of
MDCK cells grown on different supports. Exp. Cell Res. 203, 115–127.
Cohen, B.-C., Shamay, A., and Argov-Argaman, N. (2015). Regulation of Lipid Droplet
Size in Mammary Epithelial Cells by Remodeling of Membrane Lipid
Composition—A Potential Mechanism. PLoS ONE 10, e0121645.
Cohen, B.-C., Raz, C., Shamay, A., and Argov-Argaman, N. (2017). Lipid Droplet Fusion
in Mammary Epithelial Cells is Regulated by Phosphatidylethanolamine
Metabolism. J. Mammary Gland Biol. Neoplasia 22, 235–249.
Danowski, K., Gross, J.J., Meyer, H.H.D., and Kliem, H. (2013). Effects of induced
energy deficiency on lactoferrin concentration in milk and the lactoferrin reaction
of primary bovine mammary epithelial cells in vitro. J. Anim. Physiol. Anim.
Nutr. 97, 647–655.
Gao, Y., Li, S., Wang, J., Luo, C., Zhao, S., and Zheng, N. (2017). Modulation of
Intestinal Epithelial Permeability in Differentiated Caco-2 Cells Exposed to
Aflatoxin M1 and Ochratoxin A Individually or Collectively. Toxins 10, 13.

205
Hillreiner, M., Müller, N.I., Koch, H.M., Schmautz, C., Küster, B., Pfaffl, M.W., and
Kliem, H. (2017). Establishment of a 3D cell culture model of primary bovine
mammary epithelial cells extracted from fresh milk. Vitro Cell. Dev. Biol. - Anim.
53, 706-720.
Lee, G.Y., Kenny, P.A., Lee, E.H., and Bissell, M.J. (2007). Three-dimensional culture
models of normal and malignant breast epithelial cells. Nat. Methods 4, 359–365.
Lenth, R., Singmann, H., Love, J., Buerkner, P., and Herve, M. (2019). emmeans:
Estimated Marginal Means, aka Least-Squares Means. https://CRAN.R-
project.org/package=emmeans.
Masedunskas, A., Chen, Y., Stussman, R., Weigert, R., and Mather, I.H. (2017). Kinetics
of milk lipid droplet transport, growth, and secretion revealed by intravital
imaging: lipid droplet release is intermittently stimulated by oxytocin. Mol. Biol.
Cell 28, 935–946.
Page, J.L., Johnson, M.C., Olsavsky, K.M., Strom, S.C., Zarbl, H., and Omiecinski, C.J.
(2007). Gene Expression Profiling of Extracellular Matrix as an Effector of
Human Hepatocyte Phenotype in Primary Cell Culture. Toxicol. Sci. Off. J. Soc.
Toxicol. 97, 384–397.
Pai, V.P., and Horseman, N.D. (2008). Biphasic Regulation of Mammary Epithelial
Resistance by Serotonin through Activation of Multiple Pathways. J. Biol. Chem.
283, 30901–30910.
Pampaloni, F., Reynaud, E.G., and Stelzer, E.H.K. (2007). The third dimension bridges
the gap between cell culture and live tissue. Nat. Rev. Mol. Cell Biol. 8, 839–845.
Pereira, C., Costa, J., Sarmento, B., and Araújo, F. (2015). Cell-based in vitro models for
intestinal permeability studies. In Concepts and Models for Drug Permeability
Studies: Cell and Tissue Based in Vitro Culture Models, B. Sarmento, ed.
(Cambridge, UK: Woodhead Publishing), pp. 57–81.
R Core Team (2018). R: A language and environment for statistical computing. R Found.
Stat. Comput. Vienna Austria. https://www.R-project.org/.
Riley, L.G., Gardiner-Garden, M., Thomson, P.C., Wynn, P.C., Williamson, P., Raadsma,
H.W., and Sheehy, P.A. (2010). The influence of extracellular matrix and
prolactin on global gene expression profiles of primary bovine mammary
epithelial cells in vitro. Anim. Genet. 41, 55–63.
Rios, A.C., Fu, N.Y., Lindeman, G.J., and Visvader, J.E. (2014). In situ identification of
bipotent stem cells in the mammary gland. Nature 506, 322–327.

206
Robinson, D., and Hayes, A. (2018). broom: Convert Statistical Analysis Objects into
Tidy Tibbles. https://CRAN. R-project. org/package= broom. R package version
0.5. 0.
Schneider, C.A., Rasband, W.S., and Eliceiri, K.W. (2012). NIH Image to ImageJ: 25
years of image analysis. Nat. Methods 9, 671–675.
Sharma, N., and Jeong, D.K. (2013). Stem Cell Research: A Novel Boulevard towards
Improved Bovine Mastitis Management. Int. J. Biol. Sci. 9, 818–829.
Sigl, T., Meyer, H.H.D., and Wiedemann, S. (2012). Gene expression of six major milk
proteins in primary bovine mammary epithelial cells isolated from milk during
the first twenty weeks of lactation. Czech J. Anim. Sci. 57, 469–480.
Sonoda, S., Spee, C., Barron, E., Ryan, S.J., Kannan, R., and Hinton, D.R. (2009). A
protocol for the culture and differentiation of highly polarized human retinal
pigment epithelial cells. Nat. Protoc. 4, 662–673.
Sorg, D., Potzel, A., Beck, M., Meyer, H.H.D., Viturro, E., and Kliem, H. (2012). Effects
of cell culture techniques on gene expression and cholesterol efflux in primary
bovine mammary epithelial cells derived from milk and tissue. In Vitro Cell. Dev.
Biol. - Anim. 48, 550–553.
Stull, M.A., Pai, V., Vomachka, A.J., Marshall, A.M., Jacob, G.A., and Horseman, N.D.
(2007). Mammary gland homeostasis employs serotonergic regulation of
epithelial tight junctions. Proc. Natl. Acad. Sci. 104, 16708–16713.
Thomas, E., Zeps, N., Rigby, P., and Hartmann, P. (2011). Reactive oxygen species
initiate luminal but not basal cell death in cultured human mammary alveolar
structures: a potential regulator of involution. Cell Death Dis. 2, e189.
Van Keymeulen, A., Rocha, A.S., Ousset, M., Beck, B., Bouvencourt, G., Rock, J.,
Sharma, N., Dekoninck, S., and Blanpain, C. (2011). Distinct stem cells contribute
to mammary gland development and maintenance. Nature 479, 189–193.
Wickham, H. (2016). ggplot2: elegant graphics for data analysis (Switzerland: Springer
International Publishing).

207
CHAPTER 7
General Discussion

208
Introduction
Milk fat globule (MFG) size is important for the technological processing properties
and the nutritional value of milk. However, the knowledge gaps associated with the
underlying differences in cows producing milk with different average MFG size, prevent
its use as a desirable milk production trait that could be selected for in breeding programs.
The literature provides evidence for a genetic component in the determination of MFG
size in dairy cows, showing moderate heritability of this trait (Fleming et al., 2017a).
Furthermore, it has been suggested that the diacylglycerol acyltransferase 1 (DGAT1)
K232A gene polymorphism is related to the phospholipid (PL) to triacylglycerol (TG)
ratio, a proxy for MFG size (Argov-Argaman et al., 2013). The discovery of a genotype
associated with the small and large MFG phenotype would considerably advance the
potential of selective breeding based on this trait. In order to break through this next
frontier, a detailed characterisation of the small and large MFG size phenotype is needed
and farm-management and environmental factors that lead to changes in MFG size must
be established to provide management recommendations.
This study addressed some of the existing knowledge gaps. The first experimental
chapter dealt with the on-farm factors and estimated their effect on MFG size (Chapter 3)
to test the hypothesis that the natural variation in MFG size exceeds the combined effects
of environmental, physiological and milk production parameters. The two subsequent
chapters (Chapter 4 and 5) provided an overview of the differences in the mammary lipid
metabolism of cows presenting the small or large MFG phenotype. These chapters aimed
to address the hypothesis that differences in the mammary lipid metabolism between
individual cows could be responsible for the distinct small and large MFG phenotypes.
Furthermore, a fourth experimental chapter (Chapter 6) was conducted to test the
suitability of primary bovine mammary epithelial cell culture as an in vitro model which

209
could be employed to test some of the suggested mechanisms in future studies. This
experimental chapter was designed to test the use of Transwell permeable membrane
inserts to provide mammary epithelial cells extracted from milk with a 3D-like
environment. Culture on Transwell inserts was hypothesised to create an environment
resembling the in vivo conditions because it promotes growth in a monolayer, which could
be more suitable for purified milk derived mammary epithelial cultures. The TW culture
conditions were therefore compared to cell culture using an extracellular matrix gel (3D
culture) and to 2D culture conditions on conventional tissue culture plates.
On-farm factors to consider when selecting cows based on MFG size
The data presented in Chapter 3 established the most important parameters that impact
MFG size for the herd used in this work. The results suggest that the physiological state
of the cows had the most significant effect on MFG size. A decrease in size with ongoing
lactation led to a shift in MFG size of -0.60 µm over a 300-day lactation cycle. A small
increase in MFG size of 0.16 µm was also observed when cows were in later parity (≥ 3)
compared to animals in their first two lactations. However, cows in later parity reportedly
produce more milk and tend to channel more energy towards milk production rather than
replenishing fat stores (Lee and Kim, 2006), which, based on the current estimation,
would lead to a concurrent decrease in MFG size, with an additional 10 L in milk
produced resulting in a -0.16 µm reduction in MFG size. Another outcome from the
investigation on the major environmental factors was that season did not significantly
impact MFG size in the herd used for this research. This is in conflict with another study
who reported seasonal changes in MFG size (Fleming et al., 2017b). The reason could be
that in the herd studied in the current work, season is less confounded by stage of lactation
compared to herds practicing seasonal calving and some of the reported effects of season
in other herds could be related to the well-established effect of stage of lactation on MFG

210
size. Another confounding factor related to season is the cows’ diet. Dietary changes,
such as an altered concentrate to forage ratio, have been established as factors with impact
on MFG size and were not the scope of the current research (Couvreur et al., 2007;
Mesilati-Stahy et al., 2015). However, the composition of the diet for the studied herd
was estimated on a whole herd level and dietary changes that occoured throughout the
year of the initial experiment did not seem to alter MFG size. Nonetheless, potential
dietary changes might be more relevant in other countries and will have to be considered
when selecting and managing cows as distinct subpopulations to produce milk with small
and large average MFG size.
Overall, the effects of the parameters studied in the current work were minor compared
to the considerable variation in MFG size observed between individual animals (2.7 –
5.7 µm). However, these parameters should be considered when separating cows within
a herd based on MFG size. It would be feasible to include the estimated effects of these
parameters in a predictive model for selecting animals based on MFG size. This, in
combination with the possibility of monitoring MFG size in-line by mid-infrared
spectroscopy (Fleming et al., 2017a), provides the potential to combine the selection of
individual animals based on MFG size with a more dynamic approach, where animals
could further be selected based on their lactation stage and possibly parity. The fact that
the most important impact factors for the herd used in this work were related to the
physiological state of the cows, confirmed one of the primary hypotheses, which was that
distinct differences in MFG size between animals are related to the individual cow’s
mammary lipid metabolism.

211
Lipidomic profiles of the small and large milk fat globule phenotype
The main hypothesis arising from the detailed lipidomic analysis reported in Chapters
4 and 5 of this work is that cows with the small or large MFG (SMFG or LMFG)
phenotype are characterised by a differential utilisation of diacylglycerol (DG), possibly
dependent on the activity of key enzymes in the TG and PL pathways or the availability
of their precursors.
The results discussed in Chapter 4 suggest that DG takes a crucial role in the lipid
metabolism of TGs, PLs and sphingolipids and that its utilisation for either PL or TG
synthesis may regulate MFG size. It is well known that the balance between TG and PL
synthesis from their common precursor DG determines the PL/TG ratio, which is
frequently used as an indicator for MFG size. Previous work has also demonstrated that
the reason for the channelling of DG to TG instead of PL in cows with larger MFG sizes
depends on the DGAT1 genotype, which in turn determines the activity of this key
enzyme in TG synthesis (Argov-Argaman et al., 2013). Cows with the DGAT1 KK
genotype exhibit increased DGAT1 activity resulting in the production of milk with
smaller PL/TG ratios and thus larger MFG size (Argov-Argaman et al., 2013). Although
genotyping was not performed for the SMFG and LMFG cows in the present work, the
fatty acid (FA) profile of the LMFG cows in Chapter 4 aligned with the FA profile
reported for the DGAT1 K variant, showing reduced proportions of unsaturated FAs
(UFAs) (Schennink et al., 2007). It has been reported that 53% of the variation in C18
UFAs could be explained by the DGAT1 K232A polymorphism (Schennink et al., 2007).
In combination with the finding that LMFG cows exhibited a higher relative abundance
of ether PE (ePE) (Chapter 5), the possibility of higher DGAT1 activity in these cows
could lead to a reduced availability of DG for PL synthesis. This in turn could result in
the production of ether PLs (ePLs) through a salvage pathway for PL synthesis. Increased

212
relative abundance of ePE is predicted to enhance LD fusion, thus resulting in the large
MFG phenotype (Glaser, 1994). This suggested mechanism could also explain the larger
average MFG size observed in cows in early lactation in Chapter 3. It has been suggested
that during early lactation membrane material is the limiting factor for MFG
envelopment, leading to the formation of larger MFGs (Wiking et al., 2004). In line with
this, ePL synthesis could be a physiological response to this limitation, with the added
effect that increased LD fusion, due to ePE instead of diacyl PE synthesis, can
concomitantly reduce the required proportion of membrane material to cover the LD.
Thus, increasing membrane PL synthesis in the form of ePE could alleviate the animals’
high demand for membrane material during early lactation. Cows in the first 10 days in
milk were excluded from the analysis in Chapter 3. However, the few cows that were
measured in the first 10 days in milk contained the largest MFGs of all observed animals
(data not shown). Future studies should look into the abundance of ePE in cows
immediately after parturition and address their potential role in the nutrition of the calf.
The SMFG phenotype, on the other hand, was characterised by higher PC/PE ratios,
increased proportions of UFAs in the PC, PI and lyso PC (LPC) subclasses and higher
proportions of UFAs in the MFG core compared to the LMFG cows. Moreover, an inverse
relationship between MFG size and the proportion of UFAs in the MFG core was also
observed across other dairy species, namely camels, sheep and goats. This, in
combination with the naturally higher PL/TG ratios in smaller MFGs, suggests that in
these cows the balance between PL and TG synthesis is shifted towards a higher
proportion of PLs compared to the LMFG cows. Moreover, the milk from SMFG cows
showed a trend towards higher SM/ceramide (Cer) ratios. It has been suggested that
increased sphingomyelin synthase 1 (SMS1) activity in hepatocytes can stimulate de novo
PC synthesis, because a headgroup transfer from PC to Cer is needed to produce SM

213
(Deevska et al., 2017). During this reaction DG is produced, adding to the available DG
pool for PL and TG synthesis. An increase in SM synthesis in the SMFG phenotype could
also explain the observed increase in the proportion of UFAs in the MFG core, because
increased SMS1 activity was further related to an increase in UFAs in the TG fraction
(Deevska et al., 2017).
Recommended future research
7.4.1 Negative energy balance and nutrient partitioning
A reoccurring interpretation of the results obtained in the current study was that MFG
size could be related to differences in the energy balance between cows with the small or
large MFG phenotype. It is a known phenomenon that average MFG size is larger in early
lactation, where cows may be in negative energy balance and this was also observed in
the herd studied in Chapter 3. A recent study showed that intracellular LD size was
increased when FAs were delivered to primary bovine mammary epithelial cells in the
form of non-esterified FAs (NEFAs), which is the form in which FAs mobilised from fat
stores are presented to the mammary gland during negative energy balance (Mesilati-
Stahy and Argov-Argaman, 2018). Accordingly, the finding that some Cer species were
increased and more importantly the SM/Cer ratio was reduced in LMFG cows, could also
suggest a difference in energy balance between the studied groups, because increased
concentrations of some Cer species in the liver and plasma have been related to negative
energy balance in dairy cows (Davis et al., 2017). However, it is unknown if Cer
concentrations in milk can also serve as potential markers for negative energy balance.
Moreover, the hypothesis that increased relative abundance of some Cer species could be
related to negative energy balance in the LMFG group is in conflict with the FA profile
in the MFG core presented in Chapter 4 of this work, where the observed increased
214
proportion of oleic acid in the core of MFGs from SMFG cows could also indicate lipid
mobilisation in these cows (Gross et al., 2011). Furthermore, the diet was similar between
the studied groups and all cows were in established lactation (> 50 days in milk),
suggesting that negative energy balance is likely not the cause of the differences in the
FA profiles reported in the current study. Known markers for negative energy balance in
dairy cows, such as increased plasma NEFA levels were not determined in this study and
a potential difference in energy balance between the studied groups therefore remains
speculative. A possible relationship with the cows’ energy balance will need to be the
subject of further studies aiming to characterise the small and large MFG phenotype.
Another possible explanation for the differences seen in MFG size between individual
animals is that they may differ in their genetically determined ability to channel nutrients
towards either milk production or body fat stores. This trait, referred to as nutrient
partitioning, seems to be genetically and environmentally driven (Veerkamp et al., 2003).
Although it is somewhat selected for when breeding high genetic merit cows for milk
yield, Friggens et al. (2007) showed that the heritability of body energy mobilisation is
low and natural variation between individual cows exists. Increased nutrient partitioning
towards the mammary gland and away from adipose tissue makes the animal more
susceptible to negative energy balance, which can lead to reduced fertility and animal
health (Friggens and Newbold, 2007). Whilst negative energy balance can occur as a
response to environmental changes for example when there is an undersupply of energy
through the feed or reduced intake due to heat stress, the notion that this is a partly
genetically determined trait also implies that it cannot be prevented through nutritional
management (Friggens et al., 2007). Therefore, negative energy balance due to a genetic
predisposition of cows to prioritise partitioning of nutrients towards the mammary gland
can occur, even when feed availability is not limited (Veerkamp et al., 2003).

215
Interestingly, nutrient partitioning also changes during the lactation cycle and is
influenced by parity and breed (Friggens et al., 2007). The investigation on the origin of
FAs incorporated into the MFG core reported in Chapter 4 suggested a higher proportion
of preformed FAs in the milk from cows with the small MFG phenotype, which could
indicate increased nutrient partitioning towards the mammary gland. Therefore, it is
possible that the differences in the ability to partition nutrients, as a genotype which varies
between individual cows, could explain the wide range in MFG size distributions between
individual animals. To date, no link between MFG size and genetic merit for milk yield
has been reported and this possible relationship remains to be investigated.
7.4.2 Stearoyl desaturase activity
The finding that SMFG cows were able to incorporate more preformed FAs into their
milk could also be related to increased stearoyl-coenzyme A desaturation (SCD) activity.
Desaturation of FAs in the mammary gland is important for membrane and LD fluidity
in the mammary cell (Timmen and Patton, 1988). At body temperature, only TGs
containing adequate proportions of SFAs with chain lengths of C4 to C11, branched FAs
or UFAs are present in liquid form (Knothe and Dunn, 2009). The fluidity of the LD is
crucial for unimpaired physiological processes such as LD secretion, and the requirement
to maintain LD fluidity limits the ability of the mammary gland to take up long chain
SFAs from the diet. Unless the animal is in negative energy balance, long chain FAs taken
up by the mammary gland are predominantly derived directly from the diet by hydrolysis
of TGs from intestinal lipoproteins, while only small proportions are derived from
adipose tissue (Palmquist, 2006). To counteract adverse effects of FAs with higher
melting points, the animal can either limit uptake of these FAs and at the same time
increase de novo synthesis of short chain FAs or reduce the melting points of long chain
FAs by inserting a double bond through SCD activity.

216
The SMFG and LMFG groups in this work did not differ in the proportion of de novo
synthesised FAs and the main difference was an increased proportion of UFAs and
specifically oleic acid in the SMFG group. Although the results were not statistically
significant and therefore inconclusive, the data presented in Chapter 4 suggested
increased SCD indices for FAs with a chain length of 14 (SCDI14), FAs of 16 carbons in
chain length (SCDI16) and FAs with 18 carbons (SDCI18) in the SMFG group. Both,
SCDI14 and SCDI18, but not SCDI16, have moderate heritability estimates (h2 = 0.38
for SCDI14 and h2 = 0.19 for SCDI18) (Garnsworthy et al., 2010), suggesting that some
variation in SCDI14 and SCDI18 within a population can be attributed to genetic
differences. An especially important indicator of mammary gland specific SCD activity
is SCDI14 because the desaturation of FAs with a chain length of 14 carbons, i.e. C14:0
to C14:1c9, occurs predominantly in the mammary gland (Mosley and McGuire, 2007).
This provides a potential for selection through breeding programs, if it could be shown
that the cow’s SCD activity is associated with her characteristic MFG size. Our results
support a possible connection between desaturation activity and MFG size as suggested
by Couvreur et al. (2007), who reported a higher C18:1/C18:0 ratio in SMFG cows and
the use of SCDI for breeding selection programs has already been suggested
(Garnsworthy et al., 2010).
7.4.3 Potential identification of genotypes and genomic selection for MFG size
Moreover, the hypothesis that SCD activity can influence MFG size offers the
potential to identify small and large MFG genotypes based on the reported
polymorphisms on the SCD gene (Mele et al., 2007). The polymorphism on the SCD gene
with two alleles A and V has a relative frequency of 27% for the AA genetic variant, 60%
for VA and 13% for VV (Mele et al., 2007). Cows with the AA genetic variant have
higher MUFA concentrations and higher C14:1/C14:0 ratios compared to the VV cows

217
(Mele et al., 2007). The repeated measurements of the whole herd as part of this work
(Chapter 3) revealed that out of the approximately 150 cows, 50% produced milk with
MFG sizes between 3.8 and 4.4 µm and 25% produced milk with average MFG sizes
smaller or larger than 3.8 and 4.4 µm, respectively. Further examination of the top and
bottom quartiles throughout the whole sampling year showed that 49 and 50 individual
cows fell into the top and bottom quartile, respectively. Out of these cows, 16 appeared
repeatedly in the top quartile and 15 in the bottom quartile, representing about 10% each
of the total herd each, which could indicate the presence of a genetic variant.
Another gene polymorphism with impact on MFG size is the DGAT1 K232A gene
polymorphism. It has previously been suggested that this gene polymorphism could be
related to MFG size (Argov-Argaman et al., 2013) and that it can impact the FA
composition in milk (Schennink et al., 2007). Importantly, the characteristics of the small
and large MFG phenotypes, described in Chapter 4, aligned with the predicted differences
between the AA and KK genotypes and thus support the suggested relationship of the
DGAT1 polymorphism with MFG size. Furthermore, the results discussed in Chapter 5
led to the hypothesis that the increased relative ePE abundance in the LMFG group could
be related to an increased DGAT1 activity, one of the characteristics of the KK genotype
(Argov-Argaman et al., 2013). The suggested reason was that the reduced availability of
DG for PL synthesis, due to increased DGAT1 acivity, could lead to ePL synthesis as a
salvage pathway. Overall, the DGAT1 and SCD gene polymorphisms are the most
promising candidates based on the comparison of the milk lipidome from the SMFG and
LMFG phenotypes with the lipid metabolic characteristics described for these genotypes
in the literature. Future studies should further investigate their relationship to MFG size.
In addition, genomic selection based on the identification of genome wide DNA
markers has been successfully applied for other traits, for example for the selection of
218
heat tolerant dairy cows (Nguyen et al., 2016). Future studies should aim to apply
genomic selection to the selection of cows with distinct MFG phenotypes, because MFG
size may be a more complex trait that does not depend on a single gene polymorphism.
However, the identification of genome wide markers would require a more regular
measurement of MFG size on-farm, for example using mid-infrared spectroscopy as
suggested by Fleming et al. (2017b), to be able to relate MFG size to genomic data of the
respective cows.
7.4.4 The impact of parity on FA composition and lipidomic profiles in milk
The studied groups in this work differed in parity, with the SMFG group comprising
cows in earlier parities (1-3) compared to the LMFG group (3-5). This is a limitation of
this study because it is difficult to isolate a potential effect of parity from the effect of the
small and large MFG phenotype. However, the estimated effect of parity within the
studied herd was minor (0.16 µm between parity 2 and 3) (Chapter 3) compared to the
individual variation (3 µm) between cows. Parity could potentially affect nutrient
partitioning, although the differences in energy balance between parities are predicted to
be less relevant in later stages of lactation (Friggens et al., 2007). Nonetheless, some of
the results of this work could at least partly originate in the difference in parity between
the studied groups. It also emphasises that MFG size is most definitely a reflection of the
metabolic state of the cow. Therefore, future studies should look at the lipidomic
differences between animals in earlier and later parities.
Recommended future research using primary cell culture
The potential role for ePE in the determination of intracellular LD size could be further
investigated using the in vitro model described in Chapter 6 of this thesis. Due to the
novelty of this finding, first preliminary studies in primary bovine mammary epithelial

219
cell culture could shed some light on the potential role of the ePE subclass in LD
accumulation. Considerable advancements in the study of MFG size regulation have been
made using primary cell culture with cells extracted from bovine mammary tissue (Cohen
et al., 2015, 2017; Mesilati-Stahy and Argov-Argaman, 2018). Cell culture experiments
using mammary tissue or cells extracted from raw milk could equally be used to study
the relationship between LD size and ePE. For example, the effect of the supplementation
of different FAs on intracellular LD size and ePL abundance could be measured by
fluorescence microscopy and lipid chromatography tandem mass spectrometry (LC-
MS/MS). However, although visualisation of ether lipids has been achieved in cell culture
by supplementing the culture medium with polyene lyso-etherlipids which are
subsequently incorporated into ePLs (Kuerschner et al., 2012), imaging of lipids on a
class level remains challenging because available probes to visualise phospholipids in
cells are limited (Maekawa and Fairn, 2014). Moreover, the established in vitro model in
the current work will need to be further optimised in order to minimise the reduction in
viability due to FA supplementation.
Conclusions
The experimental chapters within this thesis investigated the extrinsic and intrinsic
parameters that determine MFG size in dairy cows. The main goal was to identify the
differences in the mammary lipid metabolism between cows that consistently produce
milk with small or large MFG size distributions in order to characterise the small and
large MFG phenotype. An in-depth characterisation of MFG size as a milk production
trait that could potentially be selected for through breeding programs, could lead to a more
targeted use of milk for specific processing streams or could lead to improved nutritional
value of milk and milk products.
220
The combined analysis of the FA profile in the MFG core and the analysis of the whole
milk lipidome in the selected animals revealed important differences between the small
and large MFG phenotypes. The small MFG phenotype was characterised by higher
proportions of UFAs in the MFG core, which was related to an improved ability to take
up preformed FAs from the bloodstream, possibly due to increased SCD activity or
preferential uptake of already unsaturated FAs from lipid mobilisation. The milk from
cows with the small MFG phenotype also had higher PC/PE ratios and contained more
unsaturated lipid species within the PC, LPC and PI lipid classes. Crucially, the
biophysical properties of monolayers with higher PC/PE ratios and higher degree of
unsaturation within the polar lipid classes are predicted to prevent LD fusion (Arisawa et
al., 2016). Overall, the milk lipidome of SMFG cows identified as part of this work is
therefore in good agreement with the small MFG phenotype.
The milk from cows with the large MFG phenotype, on the other hand, contained a
higher relative abundance of ePE and a tendency towards smaller SM/Cer ratios. Ether
PE species compared to diacyl PE species have been shown to enhance LD fusion (Glaser,
1994). This is in agreement with the large MFG phenotype and is the first time that a
possible involvement of ePE species in the regulation of MFG size has been suggested.
The novelty of this finding warrants future investigations into the role of ePE species
within the mammary epithelial cell and their possible role in the lipid droplet
accumulation in other cell types. Furthermore, this finding should encourage
investigations into other potential roles of ePL species in lactation physiology, for
example a potential role during the transition phase in dairy cows.
221
References
Argov-Argaman, N., Mida, K., Cohen, B.-C., Visker, M., and Hettinga, K. (2013). Milk
Fat Content and DGAT1 Genotype Determine Lipid Composition of the Milk Fat
Globule Membrane. PLoS ONE 8, e68707.
Arisawa, K., Mitsudome, H., Yoshida, K., Sugimoto, S., Ishikawa, T., Fujiwara, Y., and
Ichi, I. (2016). Saturated fatty acid in the phospholipid monolayer contributes to
the formation of large lipid droplets. Biochem. Biophys. Res. Commun. 480, 641–
647.
Cohen, B.-C., Shamay, A., and Argov-Argaman, N. (2015). Regulation of Lipid Droplet
Size in Mammary Epithelial Cells by Remodeling of Membrane Lipid
Composition—A Potential Mechanism. PLoS ONE 10, e0121645.
Cohen, B.-C., Raz, C., Shamay, A., and Argov-Argaman, N. (2017). Lipid Droplet Fusion
in Mammary Epithelial Cells is Regulated by Phosphatidylethanolamine
Metabolism. J. Mammary Gland Biol. Neoplasia 22, 235–249.
Couvreur, S., Hurtaud, C., Marnet, P.G., Faverdin, P., and Peyraud, J.L. (2007).
Composition of milk fat from cows selected for milk fat globule size and offered
either fresh pasture or a corn silage-based diet. J. Dairy Sci. 90, 392–403.
Davis, A.N., Clegg, J.L., Perry, C.A., and McFadden, J.W. (2017). Nutrient Restriction
Increases Circulating and Hepatic Ceramide in Dairy Cows Displaying Impaired
Insulin Tolerance. Lipids 52, 771–780.
Deevska, G.M., Dotson, P.P., Karakashian, A.A., Isaac, G., Wrona, M., Kelly, S.B.,
Merrill, A.H., and Nikolova-Karakashian, M.N. (2017). Novel Interconnections
in Lipid Metabolism Revealed by Overexpression of Sphingomyelin Synthase-1.
J. Biol. Chem. 292, 5110–5122.
Fleming, A., Schenkel, F.S., Koeck, A., Malchiodi, F., Ali, R.A., M. Corredig, B.
Mallard, M. Sargolzaei, and F. Miglior (2017a). Heritabilities of measured and
mid-infrared predicted milk fat globule size, milk fat and protein percentages, and
their genetic correlations. J. Dairy Sci. 100, 3735–3741.
Fleming, A., Schenkel, F.S., Chen, J., Malchiodi, F., Ali, R.A., Mallard, B., Sargolzaei,
M., Corredig, M., and Miglior, F. (2017b). Variation in fat globule size in bovine
milk and its prediction using mid-infrared spectroscopy. J. Dairy Sci. 100, 1640–
1649.
Friggens, N.C., and Newbold, J.R. (2007). Towards a biological basis for predicting
nutrient partitioning: the dairy cow as an example. Animal 1, 87–97.

222
Friggens, N.C., Berg, P., Theilgaard, P., Korsgaard, I.R., Ingvartsen, K.L., Løvendahl, P.,
and Jensen, J. (2007). Breed and Parity Effects on Energy Balance Profiles
Through Lactation: Evidence of Genetically Driven Body Energy Change. J.
Dairy Sci. 90, 5291–5305.
Glaser, P.E. (1994). Plasmenylethanolamine Facilitates Rapid Membrane Fusion: A
Stopped-Flow Kinetic Investigation Correlating the Propensity of a Major Plasma
Membrane Constituent to Adopt an HII Phase with Its Ability to Promote
Membrane Fusion. Biochemistry 33, 5805–5812.
Gross, J., Dorland, H.A. van, Bruckmaier, R.M., and Schwarz, F.J. (2011). Milk fatty acid
profile related to energy balance in dairy cows. J. Dairy Res. 78, 479–488.
Kuerschner, L., Richter, D., Hannibal-Bach, H.K., Gaebler, A., Shevchenko, A., Ejsing,
C.S., and Thiele, C. (2012). Exogenous Ether Lipids Predominantly Target
Mitochondria. PLoS ONE 7, e31342.
Lee, J.-Y., and Kim, I.-H. (2006). Advancing parity is associated with high milk
production at the cost of body condition and increased periparturient disorders in
dairy herds. J. Vet. Sci. 7, 161–166.
Maekawa, M., and Fairn, G.D. (2014). Molecular probes to visualize the location,
organization and dynamics of lipids. J. Cell Sci. 127, 4801–4812.
Mesilati-Stahy, R., and Argov-Argaman, N. (2018). Changes in lipid droplets
morphometric features in mammary epithelial cells upon exposure to non-
esterified free fatty acids compared with VLDL. PLoS ONE 13, e0209565.
Mesilati-Stahy, R., Moallem, U., Magen, Y., and Argov-Argaman, N. (2015). Altered
concentrate to forage ratio in cows ration enhanced bioproduction of specific size
subpopulation of milk fat globules. Food Chem. 179, 199–205.
Mosley, E.E., and McGuire, M.A. (2007). Methodology for the In Vivo Measurement of
the Δ9-Desaturation of Myristic, Palmitic, and Stearic Acids in Lactating Dairy
Cattle. Lipids 42, 939–945.
Nguyen, T.T.T., Bowman, P.J., Haile-Mariam, M., Pryce, J.E., and Hayes, B.J. (2016).
Genomic selection for tolerance to heat stress in Australian dairy cattle. J. Dairy
Sci. 99, 2849–2862.
Schennink, A., Stoop, W.M., Visker, M.H.P.W., Heck, J.M.L., Bovenhuis, H., Poel,
J.J.V.D., Valenberg, H.J.F.V., and Arendonk, J.A.M.V. (2007). DGAT1 underlies
large genetic variation in milk-fat composition of dairy cows. Anim. Genet. 38,
467–473.

223
Timmen, H., and Patton, S. (1988). Milk fat globules: Fatty acid composition, size and in
vivo regulation of fat liquidity. Lipids 23, 685–689.
Veerkamp, R.F., Beerda, B., and van der Lende, T. (2003). Effects of genetic selection
for milk yield on energy balance, levels of hormones, and metabolites in lactating
cattle, and possible links to reduced fertility. Livest. Prod. Sci. 83, 257–275.
Wiking, L., Stagsted, J., Björck, L., and Nielsen, J.H. (2004). Milk fat globule size is
affected by fat production in dairy cows. Int. Dairy J. 14, 909–913.

Minerva Access is the Institutional Repository of The University of Melbourne
Author/s:
Walter, Leonie
Title:
Understanding small and large milk fat globule phenotype variation in dairy cows through
milk lipidomic characterisation
Date:
2019
Persistent Link:
http://hdl.handle.net/11343/235853
File Description:
Final thesis file
Terms and Conditions:
Terms and Conditions: Copyright in works deposited in Minerva Access is retained by the
copyright owner. The work may not be altered without permission from the copyright owner.
Readers may only download, print and save electronic copies of whole works for their own
personal non-commercial use. Any use that exceeds these limits requires permission from
the copyright owner. Attribution is essential when quoting or paraphrasing from these works.
Copyright © 2022 FDOKUMEN