UNDERSTANDING MAIL SURVEY RESPONSE BEHAVIOR
28
UNDERSTANDING MAIL SURVEY RESPONSE BEHAVIOR A META-ANALYSIS FRANCIS J. YAMMARINO STEVEN J. SKINNER TERRY L CHILDERS Abstract A meta-analysis of prior studies of techniques de- signed to induce mail survey response rates was conducted. Re- search encompassing 184 effects (study outcomes) in 115 studies (articles) for 17 predictors of response rate was examined. The average effect size across all manipulations was r = .065, indicat- ing an average increase of about 6.5 percent in response rates for manipulations. Effect sizes for specific predictors and two potential moderators of effects were examined. Results indicated that repeated contacts in the form of preliminary notification and follow-ups, appeals, inclusion of a return envelope, postage, and monetary incentives, were effective in increasing survey re- sponse rates. Significant effect sizes for the predictors ranged from an increase in response of 2 percent to 31 percent. Implica- tions of the results for the conduct of mail surveys and future research on mail survey response behavior are discussed. Researchers have amassed myriad techniques to stimulate mail survey response rates, reduce item omission, speed up response, and reduce response bias. Examples include the use of preliminary notification, follow-up, sponsorship, appeals, postage, personalization, incentives, anonymity, prior commitment, and techniques affecting questionnaire Correspondence regarding this article should be addressed to FRANCIS J. YAMMARINO, School of Management and Center for Leadership Studies, State University of New York at Binghamton, P.O. Box 6000, Binghamton, NY 13902-6000. STEVEN J. SKINNER is at the College of Business and Economics, University of Kentucky, Lexington, KY. TERRY L. CHILDERS is at the Carlson School of Management, University of Minnesota, Minneapolis, MN. This research was supported in part by a New Faculty Development Award to F. J. Yammarino from the NYS/UUP Professional Development and Quality of Working Life Committee. The views expressed are ours. We gratefully acknowledge the helpful comments provided by the anonymous reviewers on an earlier version of this article. Public Opinion Quarterly Volume 55:613-639 © 1991 by the American Association for Public Opinion Research All rights nsscrved. 0033-362X/91/5504-0004$02.50
-
Upload
khangminh22 -
Category
Documents
-
view
1 -
download
0
Transcript of UNDERSTANDING MAIL SURVEY RESPONSE BEHAVIOR

UNDERSTANDING MAIL SURVEYRESPONSE BEHAVIORA META-ANALYSIS
FRANCIS J. YAMMARINOSTEVEN J. SKINNERTERRY L CHILDERS
Abstract A meta-analysis of prior studies of techniques de-signed to induce mail survey response rates was conducted. Re-search encompassing 184 effects (study outcomes) in 115 studies(articles) for 17 predictors of response rate was examined. Theaverage effect size across all manipulations was r = .065, indicat-ing an average increase of about 6.5 percent in response ratesfor manipulations. Effect sizes for specific predictors and twopotential moderators of effects were examined. Results indicatedthat repeated contacts in the form of preliminary notification andfollow-ups, appeals, inclusion of a return envelope, postage, andmonetary incentives, were effective in increasing survey re-sponse rates. Significant effect sizes for the predictors rangedfrom an increase in response of 2 percent to 31 percent. Implica-tions of the results for the conduct of mail surveys and futureresearch on mail survey response behavior are discussed.
Researchers have amassed myriad techniques to stimulate mail surveyresponse rates, reduce item omission, speed up response, and reduceresponse bias. Examples include the use of preliminary notification,follow-up, sponsorship, appeals, postage, personalization, incentives,anonymity, prior commitment, and techniques affecting questionnaire
Correspondence regarding this article should be addressed to FRANCIS J. YAMMARINO,School of Management and Center for Leadership Studies, State University of NewYork at Binghamton, P.O. Box 6000, Binghamton, NY 13902-6000. STEVEN J. SKINNERis at the College of Business and Economics, University of Kentucky, Lexington, KY.TERRY L. CHILDERS is at the Carlson School of Management, University of Minnesota,Minneapolis, MN. This research was supported in part by a New Faculty DevelopmentAward to F. J. Yammarino from the NYS/UUP Professional Development and Qualityof Working Life Committee. The views expressed are ours. We gratefully acknowledgethe helpful comments provided by the anonymous reviewers on an earlier version ofthis article.
Public Opinion Quarterly Volume 55:613-639 © 1991 by the American Association for Public Opinion ResearchAll rights nsscrved. 0033-362X/91/5504-0004$02.50

614 Yammarino, Skinner, and Childers
appearance. These methods represent manipulations or predictorswhich, at least in some instances, have served to facilitate surveyparticipation, A comprehensive list and review of studies related tothe effectiveness of these methods can be found in the work of Duncan(1979), Houston and Ford (1976), Kanuk and Berenson (1975), andLinsky (1975).
Linsky (1975), for example, found strong evidence that preliminarynotification, follow-ups, "high powered" postage, sponsorship, smallmonetary incentives, and nonmonetary incentives were very effectivefor, or had positive effects on, increasing response rates. Other manip-ulations, according to Linsky (1975), are equivocal or interact withadditional factors to affect response rates. Likewise, Kanuk and Ber-enson (1975) determined that monetary incentives (especially smallones), follow-up contacts, and perhaps preliminary notification, werethe only techniques that had strong empirical evidence for effective-ness in increasing response rates. Other techniques showed no consis-tent effect.
In a recent qualitative review, Harvey (1987) found that follow-ups,preliminary notification, stamped reply envelopes, and monetary in-centives were important factors for increasing response rates. Harvey(1987) also determined that a number of other techniques such as per-sonalization, length, sponsorship, and appeals had a more ambiguouseffect on response rates.
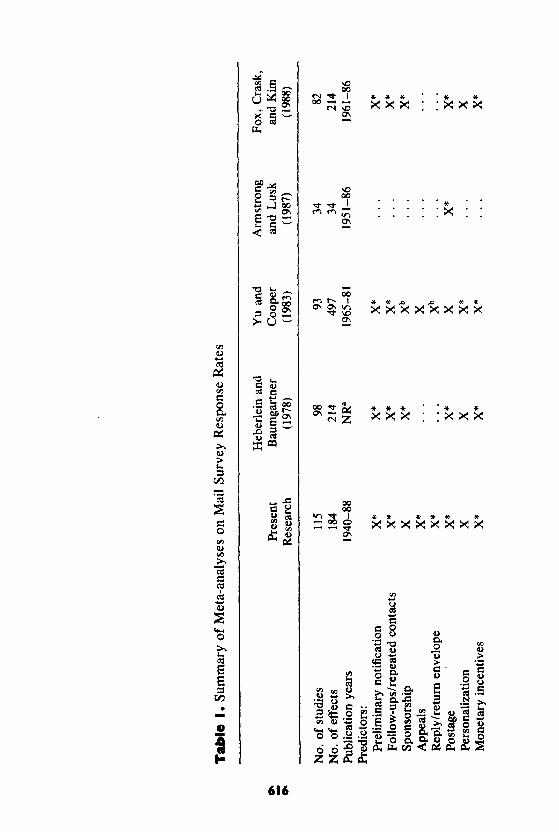
Although useful, traditional qualitative reviews are limited in thatthey do not explicitly consider differences in studies due to samplesize, sample composition, experimental executions, and effect sizes(Fox, Crask, and Kim 1988). Recently, quantitative reviews such asmeta-analysis, designed to address these limitations, have emerged.Several of these meta-analyses provide important background for thepresent study and are summarized in table 1.
In an early comprehensive review of the mail survey literature,Heberlein and Baumgartner (1978) examined nine factors affecting ini-tial and final survey response rates across 98 studies. They were ableto explain 51 percent of the variance in final response through thenumber of respondent contacts (preliminary and follow-up) and thesaliency of the survey topic. Additionally, Heberlein and Baumgartner(1978) found that sponsorship, length of the questionnaire, type ofpopulation surveyed, incentives, and postage (metered or franked)were also significant determinants of response (see table 1). Goyder(1982) replicated the Heberlein and Baumgartner (1978) study by con-ducting a meta-analysis on 145 citations. His findings were largelyconsistent with the predictive model of Heberlein and Baumgartner,finding that type of population, number of contacts, sponsorship, and

A Meta-analysis of Mail Surveys 615
monetary incentives were most important in predicting final surveyresponse rate.
In another quantitative review of 93 studies for all types of surveys(personal, telephone, and mail), Yu and Cooper (1983) examined 15factors reported potentially to affect survey participation rates. Theyfound, across method of contact, that response rates were improvedby incentives (prepaid and promised), nonmonetary premiums and re-wards, and by increasing the amount of monetary rewards. Other tech-niques that increased response were preliminary notification, foot-in-the-door approaches, personalization, and follow-up contacts (table 1).
In a recent meta-analysis. Fox, Crask, and Kim (1988) examined 82studies with respect to eight factors that have been associated acrossstudies with higher response rates to mail surveys. In their analysis,prenotification, follow-ups, and stamped return postage were found tobe significant determinants of mail survey response rates (table 1).Additionally, sponsorship and small monetary incentives enhanced re-sponse.
Two other more focused quantitative reviews examined the effectsof personalization (Worthen and Valcarce 1985) and several types ofreturn postage (Armstrong and Lusk 1987). Worthen and Valcarce(1985) reviewed 26 studies and concluded that the effect size for per-sonalization from previous research was small, and in a follow-up ex-periment found no effects on response rate due to cover letter person-alization. Armstrong and Lusk (1987) conducted their meta-analysison 34 studies and concluded that the only effect of consequence onresponse rate was first-class postage as compared to business reply,and even that effect was weak (table 1).
In synthesizing across the prior meta-analyses, a subset of the mailsurvey response determinants appears to be consistently predictive ofresponse rates. Drawing from the above studies, repeated contacts,whether they be in the form of preliminary notification of a survey ora survey follow-up, appear to have a considerable positive impact onresponse rates (Fox, Crask, and Kim 1988; Goyder 1982; Heberleinand Baumgartner 1978; Yu and Cooper 1983). Another factor that alsohas been reported to have a consistent positive effect is the use ofmonetary incentives (Fox, Crask, and Kim 1988; Goyder 1982; He-berlein and Baumgartner 1978; Yu and Cooper 1983). In addition, thesponsor of a survey, although less under the control of the researcher,has been a key determinant of survey response (Fox, Crask, and Kim1988; Goyder 1982; Heberlein and Baumgartner 1978). Finally, theinclusion of and type of outgoing and return postage has been observedconsistently to affect response rates (Armstrong and Lusk 1987; Fox,Crask, and Kim 1988).
X C
C
3
1CO
CO
z
X X X « *X X X
so00
ONX
* * js * * *
x x x x x x x x
* * *X X X
: X X X
: : 22^ x x x x x x x x
•o
6 6Z 2
si11 a; b 00 -< 0^ Pk 0k
616

X
X : X X X X X X
X : X X
X X X X X : X
—< 2 P 4>
pi I
Z-o
617
618 Yammarino, Skinner, and Childers
The present study complements and extends previous work, includ-ing the meta-analyses of Armstrong and Lusk (1987), Fox, Crask, andKim (1988), Goyder (1982), Heberlein and Baumgartner (1978), Wor-then and Valcarce (1985), and Yu and Cooper (1983), in several ways.First, a meta-analysis is used to assess more factors (17; see table 2)which influence response rate than were examined by previous re-searchers. As summarized in table 1, the present research found sev-eral of these factors to have a significant effect on survey response (seedetails below). Second, a larger number of study outcomes (184 effectsin 115 articles) than in most prior research are included in the currentmeta-analysis. Third, different from previous work, two moderatorvariables (year of publication and type of sample) which may haveaffected the results of previous studies are examined. Given previouswork (Harvey 1987; Heberlein and Baumgartner 1978; Yu and Cooper1983), the publication year of the study was included as a type ofcohort effect because of the changes in respondents' habits and journaleditors' preferences over time, and to reflect any potential accumula-tion of survey administration knowledge. The type of subject sampled(e.g., consumer, educational, industrial) was included as a potentialinfluence on response rates given work and comments on subjects andtarget populations (Goyder 1982; Harvey 1987; Heberlein and Baum-gartner 1978; Kanuk and Berenson 1975; Linsky 1975). In these ways,the purpose of this study was to enhance understanding of mail surveyresponse behavior by presenting a more comprehensive meta-analysisinvestigation of factors that affect mail survey response rates.
Meta-analysis Method
To accomplish this purpose, a quantitative review of research designeffects on mail survey response rates was conducted using meta-analysis procedures described by Glass (1977), Hunter and Schmidt(1990), and Hunter, Schmidt, and Jackson (1982). The procedures wereused to determine mean effect sizes for factors which affect responserate and whether these effects are the same for different target audi-ences and whether the effects have changed over time. Also, based onthese procedures, a determination can be made whether variation inresults across samples (studies) was due to methodological problemsand statistical artifacts (e.g., sampling error) as compared to actualsubstantive differences in subpopulation correlations of response ratesand design effects identified by underlying moderator variables (e.g.,target groups or time periods) (see details below). Response rate, thedependent variable, was defined as response as a percent of size of

A Meta-analysis of Mail Surveys 619
contacted sample (Yu and Cooper 1983). The independent variableswere the manipulated factors designed to affect response rate.
STUDY INCLUSION AND CODING
Individual studies (articles) that were included in the meta-analysiswere identified in several ways. First, reference lists of several pre-viously published review articles on mail surveys were examined (e.g..Fox, Crask, and Kim 1988; Harvey 1987; Heberlein and Baumgartner1978; Kanuk and Berenson 1975; Linsky 1975; Yu and Cooper 1983).Second, a multi-abstracting services computer research was conductedfor all available years in the data bases. These included ABI/Inform(1971+), ERIC (1966+ ), Social SciSearch (1972+ ), Sociological Ab-stracts (1963+ ), and Psylnfo (1967+ ). Key words used in the searchincluded "mail surveys," "response rates," and each of these termscombined with the names and synonyms for the various factors listedin table 1. Third, for recent work (1978+ ), a manual search of 10journals that have a history of publishing mail survey studies was per-formed (i.e., American Sociological Review, Journal of the Academyof Marketing Science, Journal of Advertising Research, Journal ofthe American Statistical Association, Journal of Applied Psychology,Journal of Marketing, Journal of Marketing Research, Journal of theMarket Research Society, Psychological Reports, and Public OpinionQuarterly). The manual search uncovered three articles not identifiedfrom previously published reference lists or from the computer search.
To be included in the meta-analysis, studies must have manipulateda factor that infiuences response rates and reported response rates forthe different experimental conditions. If more than one factor wasmanipulated in a study, each individual effect (study outcome) wasincluded as a separate "data point" for the meta-analysis. Over 25journals from disciplines such as business, education, marketing, polit-ical science, psychology, sociology, and statistics were represented.The 10 journals that yielded the most articles for the meta-analysiswere: Public Opinion Quarterly, 27 articles; Journal of Marketing Re-search, IS SirticlQs; Journal of Applied Psychology, 11 Sirticles; Journalof Marketing and Journal of the Market Research Society, 8 articleseach; Journal of Advertising Research, 1 articles; American Sociologi-cal Review and Journal of the Academy of Marketing Science, 4 arti-cles each; Journal of the American Statistical Association and Psycho-logical Reports, 3 articles each. The remaining journals produced 1 or2 articles for the meta-analysis. The time period was from 1940 toJanuary 1988, and 115 articles yielding 184 data points (effects) for 17different predictors of response rate were included. Although many

620 Yamnnarino, Skinner, and Childers
articles yielded multiple data points, the effects were always for differ-ent predictors of response rate. Thus, for any given predictor, onlyone data point per study was included in the meta-analysis. The articlesincluded in the meta-analysis are listed in the Appendix, and the 17manipulated factors of interest are identified in table 2.
All information relevant to the meta-analysis was coded from thearticles by four trained coders. Data from each article were codedby two individuals independently. The coders then compared theirinformation. In cases of disagreement, a third coder was asked to codethe article in question independently and then all three coders metto determine a consensus coding for the article. Although inter-raterreliability statistics were not calculated, there were very few instancesof nonagreement between raters.
Response rate, the factor that was manipulated (in general, a "yes/no" code was used), sample size, statistics, effect sizes, and directionof relationships were coded. The two moderator variables also werecoded. To ensure an adequate number of data points for meta-analysisfor the predictors of response rates under several conditions of themoderators, publication years were grouped as 1940-70, 1971-75, and1976-87, while sample type was classified to contrast consumers ver-sus various institutional groups (see details below).
META-ANALYSIS CALCULATIONS
To distinguish between artifactual (e.g., sampling error) and substan-tive sources of variation, the procedures developed by Glass (1977),Hunter and Schmidt (1990), and Hunter, Schmidt, and Jackson (1982)were combined in a computer program specifically designed for themeta-analysis in this study. The work of Glass (1977, p. 374) was usedto convert study statistics (e.g., t, F, X^, contingency table, Mann-Whitney U) to uncorrected product-moment correlations. Measure-ment error (reliability) and range restriction affecting these correlationswere generally not issues of concern in the present study because thevariables involved were actual counts of mailings and responses. Ex-cept for potential coding and typographical errors, therefore, reliabilityshould be 1.00 and the range should be completely unrestricted. Thefrequency-weighted mean correlation (r) across studies, the best esti-mate of the population correlation (p), and the frequency-weightedaverage squared error (5^ )̂, the corresponding uncorrected or ob-served variance of correlations across studies, were then computedusing the work of Hunter and Schmidt (1990) and Hunter, Schmidt,and Jackson (1982). Because the observed or uncorrected total vari-ance (5̂ )̂ can be confounded by variation in sample correlations pro-duced by sampling error, it was corrected by removing sampling error

A Meta-analysis of Mail Surveys 621
variance as described by Hunter and Schmidt (1990) and Hunter,Schmidt, and Jackson (1982) to derive the best estimate of the popula-tion variance (cr̂ p).
To test the significance of the variance corrected for sampling erroror unexplained variance, a x̂ statistic was used (Hunter and Schmidt1990; Hunter, Schmidt, and Jackson 1982). Because of very high statis-tical power, however, even very small amounts of variation acrossstudies will be statistically significant. That is, variation may be ofminimal magnitude and significant, but when the x̂ is nonsignificant,strong support is provided for the lack of actual variation across stud-ies. As suggested by Hunter and Schmidt (1990) and Hunter, Schmidt,and Jackson (1982), when the unexplained (corrected) variance issmall, inconsistent results across studies are due mainly to statisticalartifacts, and subpopulation correlations do not differ. Thus, it is notnecessary to research for moderator variables. In contrast, when thecorrected (unexplained) variance is large, inconsistent results acrossstudies are not artifactual, and they recommend examination of moder-ator variables (year of publication and type of sample in the presentstudy) to identify subpopulations with different correlational values.
As a general rule, a moderator search should be initiated if the ratioof unexplained (corrected) to total variance is greater than 25 percent,or in contrast, if the ratio of explained (sampling error) to total varianceis less than 75 percent. Regardless of other indicators (e.g., statisticalsignificance of mean correlations), this 75 percent rule is used to deter-mine whether a moderator search is warranted (Hunter and Schmidt1990; Hunter, Schmidt, and Jackson 1982). The above calculationsand procedures are then repeated within each condition (level) of thepotential moderator variables. If (1) the frequency-weighted mean cor-relation varies from subgroup to subgroup and (2) the average cor-rected variance for the subgroups is lower than the corrected variancefor the data set as a whole, then there is evidence for a moderatedeffect. Cle£irly, after examining one moderator, the unexplained (cor-rected) variance may still be greater than zero for each level of amoderator. This suggests that the remaining variance is due to addi-tional moderators or statistical artifacts.
Results
OVERALL RESULTS
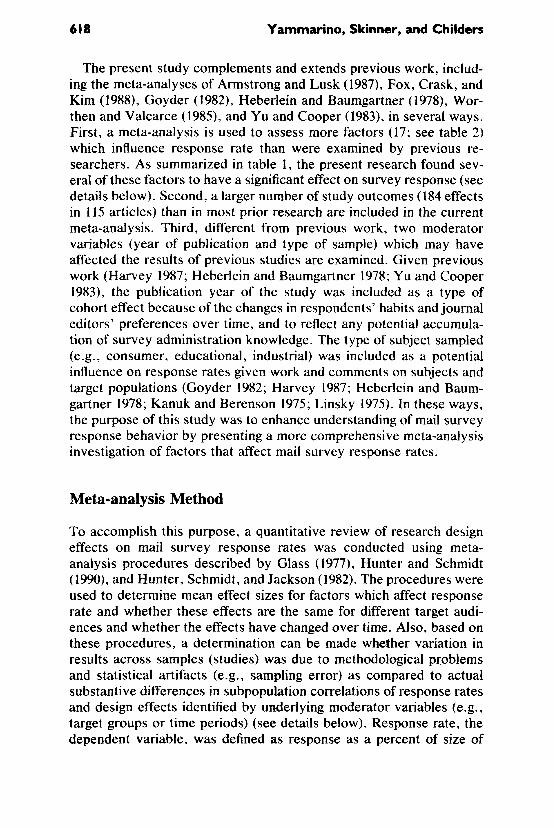
The findings of meta-analysis for each of the research design effects(predictors) on mail survey response rates are presented in table 2.

3GO
OS+->
z
c c.2 -3c3 "5.> X
fc .2o •=
c/5 .a
1/3
<uPC</3
coa
od
hou
><
s ^
vi r~i fs fM
S § 8 8 8 8
>O rn ijD ^Os Tt ^ fN
850
o
.217
446
o
106
319
o
.014
145
o
.016
074
o
.028
222
o
.029
117
o
.051
117
o
.029
244
o
197
263
o
028
434
o.025
173
o049
235
o
075
152
o
023
850
o
047
255
o
217
015
1o
122
990
o
.061
00 — —•o • * vO fNi r^ —
Os vO OS —•
Tf OS r^ w-i t -00 —• fvj r^ —
O O
— O 00
! 11 = §
g VI A
T3•a
illCO
c o o .5 c §> «J CO
c E >."̂ -a "̂
1ic8 "5 ..21 ^ S« .5
<U • - O

A Meta-analysis of Mail Surveys 623
Table 3. Distribution of 184 Correlations forMeta-analysis of Mail Survey Response Rates
Range oiCorrelations
< -.201- .200 to --.100 to -
.000 to
.101 to
.201 to
.301 to
.401 to
.501 to
.601 to
.701 to> .800
.101
.001
.100
.200
.300
.400
.500
.600
.700
.800
Number ofCorrelations
15
3284401272
1
Percent ofTotal
.52.7
17.445.721.76.53.81.1
.5
For each predictor shown in the first column of the table, the followinginformation is presented in columns 2-9: frequency-weighted meancorrelation; 95 percent confidence interval for the correlation; cor-rected (unexplained) variance (i.e., total minus sampling error vari-ance); x̂ test of corrected (unexplained) variance; number of correla-tions (effects); range of the correlations (effects); total sample size;uncorrected total or observed variance in the sample correlations; andvariance explained by sampling error (i.e., ratio of sampling error tototal variance).
Results collapsed across all design effects are shown in the first rowof table 2; that is, regardless of the manipulation in a study, the effect(correlation) was .065, which was not statistically significant (95 percentconfidence interval includes zero). The range of the correlations in thiscase was -.217 to .850. The 184 correlations were distributed asshown in table 3. With the exception of one outlier, the correlationswere generally well dispersed throughout the range and somewhat nor-mally distributed. As indicated by the remaining data in the first rowof table 2, subpopulation correlations should be examined, and thelogical starting point is with the 17 different manipulations also identi-fied in table 2.
Inspection of the distributions of the correlations for each of the 17manipulations shown in table 2 revealed two somewhat interestingresults. First, for incentives greater than $.50 and less than or equalto $1.00, the frequency-weighted mean correlation of .119 was ob-

624 Yammarino, Skinner, and Childers
tained from two significant effects (.434 and .308) and two nonsignifi-cant effects (.025 and .043). This "split" distribution and small numberof correlations may thus indicate an unstable finding. Second, for ano-nymity, the frequency-weighted mean correlation of .021 was obtainedfrom 10 effects within the - .047 to .089 range and one outlier effect(.850). But this outlier effect was based on a small number of subjects(300 out of 74,259), so the overall effect size was not inflated artifi-cially. For the remaining manipulations, the effects were fairly welldistributed across each of the ranges reported in table 2. Of the 17correlations, only the correlations for appeals (.047), reply/return en-velope (.079), incentives of $.50 or less (.184), incentives greater than$1.00 (. 122), and survey length greater than four pages ( - .078) differedsignificantly from zero (95 percent C.I.).
For appeals and survey length greater than four pages, x̂ tests ofcorrected (unexplained) variance were not significant, and more than75 percent of total (uncorrected) variance was explained by samplingerror variance. A moderator search for these two predictors of re-sponse rate was not necessary—the correlations for appeals and sur-vey length greater than four pages were significant and derived fromone population. Although x̂ tests for special delivery/air mail returnpostage, incentives greater than $1.00, and deadlines were not signifi-cant, the ratio of sampling error to total variance for each is less than75 percent. For the remaining manipulations identified in table 2, x̂tests were significant, and less than 75 percent of total variance wasexplained by sampling error variance. Therefore, except for appealsand survey length greater than four pages, the sample correlationswere derived from more than one population, and moderators need tobe investigated.
MODERATOR RESULTS
Subpopulation correlations were investigated for two potential moder-ators—year of publication and type of sample—of the relationshipbetween research design effects and mail survey response rates. Fre-quencies of correlations across all predictors of response rate for dif-ferent levels of the two moderators were examined. The final categori-zation of year of publication was 1940-70 (62 correlations), 1971-75(55 correlations), and 1976-87 (67 correlations). Type of sample wasoriginally coded as consumer (KM correlations), educational (35 corre-lations), industrial (19 correlations), health care (10 correlations), gov-ernmental (4 correlations), and other institutional (8 correlations)groups. The final categorization of type of sample was consumer andinstitutional groups (108 and 76 correlations, respectively). These finalcategorizations were chosen to ensure an adequate number of correla-

A Meta-analysis of Mail Surveys 625
tions per cell for meta-analysis of individual predictors as well as toidentify two independent moderators. Nonsignificant x̂ results (2.116)indicated that the frequencies of correlations did not differ by cell, andthe two moderator coding schemes, year of publication and type ofsample, were independent of one another (r = .093, n.s.; phi = .107).Thus, two separate ways of specifying subpopulations were identified.
Moderator analyses were conducted for all predictors of responserates for which variance explained by sampling error was less than 75percent and which had sufficient numbers of correlations (three ormore) in cells based on time periods or types of samples to performmeta-analysis. To conserve space, only results of comparisons usingthe previously described criteria for determining a significant modera-tor are presented in table 4. The same type of information about corre-lations and variances as displayed in table 2 is shown in table 4 forpredictors of mail survey response rates by year of publication and bytype of sample moderator.
For four predictors of response rate (preliminary notification, reply/return envelope, stamped/metered postage, and personalization), allthree levels of the year of publication moderator were represented. Inonly two cases, however, did there seem to be a moderated effect. Forpreliminary notification, the subgroup correlations varied from .010(1971-75) to .285 (1976-87), the latter one was significantly differentfrom zero, and the average corrected variance in the subgroups was.014 as compared to a corrected variance of .023 for the data as awhole. Although variance explained by sampling error for the sub-groups did not reach 75 percent (suggesting the presence of additionalmoderators), year of publication did appear to moderate the prelimi-nary notification-response rate relationship. For stamped/metered re-turn postage, the subgroup correlations ranged from - .008 (1971-75)to .066 (1940-70), all three differed significantly from zero, the averagecorrected variance in the subgroups was zero as compared to a cor-rected variance of .001 for the data as a whole, and variance explainedby samphng error was 100 pecent in all subgroups. Year of publication,therefore, did appear to be a significant moderator of the stamped/metered return postage-response rate relationship.
For eight design effects on response rates (preliminary notification,follow-ups/repeated contacts, stamped/metered postage, personaliza-tion, incentives less than or equal to $.50, nonmonetary incentives,survey appearance, and anonymity), both levels of the type of samplemoderator were represented. In only two cases, however, did thereseem to be a moderated effect. For follow-ups/repeated contacts, thesubgroup correlations were .073 (consumer groups) and .306 (institu-tional groups), the latter one was significantly different from zero, andthe average corrected variance in the subgroups was .002 as compared

Pi
o
CSS
c
fc .2
5 aCO . a
o "wZ fc
oU
Con
uB
.2
a> o
o o —o o o
— Qo ©
o\ r-; ^— fNl —
v-\ O v~iVO — 00— O fN
O\ —00 Tf— m
m CM•<r r^
O (N
8 8
2 2o o
J2 ^ -̂ u 1 I 1.r" \̂ ^ C .M C C
a «
^^ \O "i fli 1^ .3 ft Bl /-• .S
• u, 55
E3
Con
tio
3
Inst
i
c E
T3t« u -a
g
Va.

A Meta-analysis of Mail Surveys 627
to a corrected variance of .015 for the data as a whole. Althoughvariance explained by sampling error for the subgroups did not reach75 percent (suggesting the presence of additional moderators), type ofsample did appear to moderate the follow-ups/repeated contacts-response rate relationship. For stampedlmetered return postage, thesubgroup correlations were .009 (consumer groups) and .061 (institu-tional groups), the latter one was significantly different from zero, andthe average corrected variance in the subgroups was .000 as comparedto a corrected variance of .001 for the data as a whole. In the institu-tional (but not in the consumer) subgroup, the variance explained bysampling error exceeded 75 percent. Although weak, type of sampledid seem to moderate the stamped/metered return postage-responserate relationship.
Discussion
KEY RESULTS AND IMPLICATIONS
Four key findings can be identified from the meta-analysis results re-ported in this study. First, the relationships between appeals and re-sponse rate, and survey length greater than four pages and responserate, were statistically significant and derived from one population;that is, the relationships are generalizable across the studies investi-gated. Thus, in designing mail surveys, regardless of the target popula-tion, researchers that use a cover letter that includes appeals and asurvey of less than four pages should be able to increase their responserates.
Second, the associations between reply/return envelope and re-sponse rate, incentives less than or equal to $.50 and response rate,and incentives greater than $1.00 and response rate, were statisticallysignificant but derived from more than one population; that is, therelationships are situation specific and there is a need to examine po-tential moderators. Because the moderators in this study were notsignificant in the cases of these three predictors, to increase responserates by using one of these factors, researchers must consider othervariables that may influence individuals' willingness to respond (e.g.,situational factors, personality characteristics).
Third, for the remaining predictor-response rate relationships inves-tigated, the correlations were not statistically significant, and subgroupcorrelations identified by moderators need to be examined. Thus, with-out consideration of other variables that may influence individuals'response tendencies, these factors do not appear to enhance response.In this study, two potential moderators were examined.

628 Yammarino, Skinner, and Childers
The fourth finding pertains to the two moderators, year of publica-tion and type of sample. In terms of the meta-analysis results for theyear of publication moderator, several key findings can be specified.First, the relationship between preliminary notification and responserate varied across time periods, and for more recent times (1976-87),the correlation was statistically significant. Preliminary notification hasbeen most effective in recent time periods, suggesting that respon-dents' changing attitudes are involved. Current researchers shouldtherefore continue to use preliminary notification to enhance responserates. Although time or cohort influences appear to be significant, theresults also suggest other moderators, and thus subgroups, could beaffecting this relationship. Second, the association between stamped/metered return postage and response rate also varied with time, and allthree correlations were statistically significant. Moreover, the resultssuggest that searching for additional moderators of this relationshipmay not be necessary. Third, for the remaining predictor-response raterelationships, year of publication was not concluded to be a significantmoderator.
Several key findings also can be specified for the meta-analysis re-sults for the type of sample moderator. First, the association betweenfollow-ups/repeated contacts and response rate differed for samples ofconsumer groups and institutional groups, and the correlation for thelatter was statistically significant. Thus follow-ups/repeated contactsseemed to have a greater effect on institutional than consumer groups'response rates, and the designers of mail surveys for these differenttarget groups should be aware of such differential responses. For bothsubgroups, however, additional moderators may be influencing thisassociation. Second, the relationship between stamped/metered returnpostage and response rate differed (albeit weakly) for samples of con-sumer and institutional groups, and again, the latter correlation wasstatistically significant. There seemed to be a greater effect on theresponse rates of institutional as compared to consumer groups. How-ever, for the consumer groups, at least, additional moderators may beoperating. Third, for the remaining predictor-response rate relation-ships, type of sample was not concluded to be a significant moderator.
The statistically significant effects in this study were moderate inmagnitude. The practical implications of these findings can be illus-trated in terms of a binomial effect size display (BESD; Rosenthal1984; Wolf 1986). The predictor with the largest frequency-weightedmean correlation with response rate was incentives less than or equalto $.50 (r = .184). Using this incentive would increase mail surveyresponse rates approximately 18,4 percent, or from a response rate ofabout 40.8 percent to 59.2 percent (see Rosenthal 1984, p. 131). Incen-tives of $1.00 or more would improve response rates 12.2 percent.

A Meta-analysis of Mail Surveys 629
This is consistent with the findings of Goyder (1982), Heberlein andBaumgartner (1978), and Yu and Cooper (1983).
Preliminary notification for studies conducted between 1976 and1987 and follow-ups for institutional respondent groups were also sig-nificantly related to response rates. All previous meta-analyses, withthe exception of Armstrong and Lusk (1987), who did not examine anytype of contact, report similar findings. The present results suggestthat preliminary notification (1976-87) increased response rate by 28.5percent, while follow-ups for institutional groups increased responserate by 30.6 percent.
Like Fox, Crask, and Kim (1988) and Armstrong and Lusk (1987),in the current study, postage was an important predictor of responserate. For all time periods, stamped/mete red return postage was signifi-cantly related to response rate. Most recently (1976-87), stamped-metered postage increased response rate 2.4 percent, while in the past(1940-70), the enhanced effect on response rates was even greater (6.6percent). The negative effect obtained for the period 1971-75, how-ever, may be a statistical anomaly due to the small number of observedcorrelations (5). On the other hand, the trend over the 47-year timeperiod indicates that the affect of postage is declining and may signalan expectation on the part of respondents that postage is a surveyrequirement and its absence may only tend to deter rather than moti-vate response. Moreover, for institutional samples, stamped/meteredreturn postage increased response rates about 6.1 percent. Again, how-ever, this result is based on a small number of correlations (5).
Compatible with the work of Heberlein and Baumgartner (1978),results from the current study indicated that response rates would bereduced by 7.8 percent for survey lengths of greater than four pages.In contrast to Yu and Cooper (1983), appeals (4.7 pecent) and reply/return envelope (7.9 percent) had a positive effect on response ratesin the present investigation. Overall, the average effect size across allpredictors of response rate (r = .065) in the current study would indi-cate an increase in response rates of about 6.5 percent, or from 46.75percent to 53.25 percent (see Rosenthal 1984, p. 131).
Two current findings were not consistent with previous research.WhUe Fox, Crask, and Kim (1988), Goyder (1982), and Heberlein andBaumgartner (1978) reported a significant effect for sponsorship, thepresent results did not support this finding. One reason for this differ-ence may stem from the level of aggregation of studies used in thepresent study. By aggregating groups within the institutional category,subpopulation effects may have been obscured. For instance, He-berlein and Baumgartner (1978) found that government sponsorshipincreased response, while this study was unable to investigate thisissue because only six data points were available for analysis. Also,

630 Yammarino, Skinner, and Childers
Yu and Cooper (1983) reported a significant relationship between non-monetary incentives and response rate. Nonmonetary incentives werenot a significant predictor of response rates in the present study, al-though the overall correlation did indicate the presence of a positiveeffect on response. This result as well as those discussed earlier maydiverge from the present results, in part due to the inclusion of bothmore recent studies and a greater number of effect sizes than in pastwork.
LIMITATIONS AND FUTURE WORK
Nevertheless, the results of this investigation are generally compatiblewith and extend those of prior review (e.g., Harvey 1987; Kanuk andBerenson 1975; Linsky 1975) and meta-analysis (e.g.. Fox, Crask,and Kim 1988; Goyder 1982; Heberlein and Baumgartner 1978; Yu andCooper 1983) articles about mail surveys. The extensions involve theclarification of prior work by examining a greater number of factorsthat influence response rate through a large number of study outcomesand the investigation of moderators. The current study, however, isnot without limitations, and thus, several directions for future researchcan be suggested.
First, the moderators that were chosen for investigation did not clar-ify the relationships as much as had been expected. Perhaps this wasdue to a poor coding scheme or perhaps the choice of moderatorswhich were too global in nature. For instance, to ensure an adequatenumber of correlations for meta-analyses of individual predictors, itwas necessary to combine educational, industrial, health care, govern-mental, and other institutional samples into one subgroup. This combi-nation may have obscured or perhaps cancelled important differencesin results among the groups. With a few exceptions, predictor-responserate relationships appear to be moderated by other variables. Futurework concerning moderators might focus on characteristics of respon-dents (e.g., personality, prior knowledge, involvement, expertise), ad-ditional details about samples (e.g., academic, government, generalpublic), and the situations (e.g., work vs. home or on-site intercepts) inwhich surveys are administered and/or completed. Also, results fromcensus pretesting (Riche 1987) indicate there are significant geographicdifferences in response rates due to regional as well as metropolitanversus rural respondents. These results as well as those from BLSsurveys (Riche 1987) and the Goyder (1982) study indicate that otherpotential moderators to be examined may relate to cultural and subcul-tural (e.g., blacks, Hispanics) differences in response to surveys.
Second, the predictors of response rate were investigated in a limitedway in this study; in general, a simple "yes/no" coding scheme was

A Meta-analysis of Mail Surveys 631
used. Along the lines of the work of Worthen and Valcarce (1985)and Armstrong and Lusk (1987), future studies could investigate eachpredictor in this study in greater detail as well as focus on other andmultiple predictors of response rate simultaneously. Likewise, someof the findings from the current research may be unstable due to thesmall number of effect sizes that were available to be synthesized (e.g.,appeals, deadlines, incentives greater than $.50 and less than or equalto $1.00). As such, additional primary research on these predictorsof response rate is necessary. In these ways, more comprehensivemeta-analyses could be conducted in future work.
Third, because the 184 data points (study outcomes) for the meta-analysis were obtained from 115 studies (articles), an average of 1.6per study, there is nonindependence of study outcomes in severalcases. For any given predictor of response rate, however, only oneeffect size per study was used in the meta-analyses. Although noninde-pendence may not be of concern when an individual factor influencingresponse rate is examined, it affects the overall meta-analysis encom-passing all predictors. To address this issue, the average correlationper study across factors manipulated in that study was used in theoverall meta-analysis. In future work, various statistical adjustmentsto the correlations or limiting the number of correlations included fromany one study could be investigated as alternatives to the approachused here. Likewise, whether more than one manipulation (e.g., per-sonalization and return postage) for the same subjects in one studyreduces or enhances response rates could be investigated in futurework.
Fourth, a "file drawer problem" may exist in that inclusion of miss-ing studies could alter the results of this investigation (Rosenthal 1979).The inclusion of unpublished studies, especially in cases where resultsare based on only a few published studies or the confidence intervalsare close to zero, could affect the findings reported here. In futureinvestigations, researchers might include both published and unpub-lished work in meta-analyses to obtain more comprehensive findings.
Fifth, although guided by prior theoretical work, this investigationdid not present a complete conceptualization or test of how and whypeople respond to mail surveys. Given the results of this investigation,future work could focus on testing, with meta-analysis as well as newdata and experimental studies, a comprehensive model of mail surveyresponse behavior. Candidates for the comprehensive theory includesuch social psychological theories as attribution and self-perceptiontheory (cf. Hansen 1980; Reingen and Kernan 1977, 1979) and disso-nance theory (Furse and Stewart 1982; Hackler and Bourgette 1973)as well as the equity/exchange model (Childers 1986; Childers andSkinner 1985). In the latter, the three constructs of cooperation, com-

632 Yannmarino, Skinner, and Childers
mitment, and trust are integrated to provide an explanation for theimpact of such significant effects as preliminary notification, follow-ups, and appeals (increasing respondent outcomes) and postage/returnenvelope and questionnaire length (reducing respondent inputs) as wellas incentives and sponsorship (increasing respondent trust).
Despite some limitations, the current research incorporated severalaspects of a properly conducted meta-analysis as identified byBangert-Drowns (1986) and Bullock and Svyantek (1985). Moreover,meta-analysis procedures of Glass (1977), Hunter and Schmidt (1990),and Hunter, Schmidt, and Jackson (1982) were combined in this study.The results of this research, in conjunction with those from the sug-gested future research efforts, should clarify understanding of mailsurvey response behavior and, thus, permit the design of surveyswhich increase response rates. The current investigation was intendedas a step in that direction.
AppendixStudies Included in Meta-anaiysis
Allen, C. T., C. D. Schewe, and G. Wijk. 1980. "More on Self-perceptionTheory's Foot Technique in the Pre-call/Mail Survey Setting." Journal ofMarketing Research 17:498-501.
Anderson, J. F., and D. R. Berdie. 1975. "Effects on Response Rates ofFormal and Informal Questionnaire Follow-up Techniques." Journal of Ap-plied Psychology 60(2):255-57.
Andreasen, A. R. 1970. "Personalizing Mail Questionnaire Correspondence."Public Opinion Quarterly 34:273-77.
Armstrong, J. S. 1975. "Monetary Incentives in Mail Surveys." Public Opin-ion Quarterly 39:111-16.
. 1979. "Advocacy and Objectivity in Science." Management Science25:423-28.
Ash, P., and E. Abramson. 1952. "The Effect of Anonymity on Attitude-Questionnaire Response." Journal of Abnormal and Social Psychology47:722-23.
Berdie, D. R. 1973. "Questionnaire Length and Response Rate." Journal ofApplied Psychology 58(2):278-80.
Berry, S., and D. Kanouse. 1985. "Physician Response to a Mailed Sur-vey: An Experiment in Timing of Payment." Public Opinion Quarterly51:102-14.
Blass-Wilhelms, W. 1982. "Der einjftuss der frankierungsart auf den riicklaufvon antwortkarten." Zeitschrift fur Soziolgie 11:64-68.
Blumenfeld, W. S. 1973. "Effect of Appearance of Correspondence on Re-sponse Rate to a Mail Questionnaire Survey." Psychological Reports32(1): 178.

A Meta-analysis of Mail Surveys 633
Brennan, R. D. 1958. "Trading Stamps as an Incentive in Mail Surveys."Journal of Marketing 22(3): 306-7.
Brook, L. L. 1978. "The Effect of Different Postage Combinations on Re-sponse Levels and Speed of Reply." Journal of the Market Research Society20:238-44.
Brown, M. L. 1%5. "Use of a Postcard Query in Mail Surveys." PublicOpinion Quarterly 29:635-37.
Brunrer, A. G., and S. J. Carroll, Jr. 1967. "The Effect of Prior TelephoneAppointments on Completion Rates and Response Content." Public OpinionQuarterly 3H4):652-54.
Carpenter, E. H. 1974. "Personalizing Mail Surveys: A Replication and Reas-sessment." Public Opinion Quarterly 38:614-20.
Champion, D. J., and A. M. Sear. 1969. "Questionnaire Response Rate: AMethodological Analysis." Social Forces 47:335-39.
Childers, T. L., and O. C. Ferrell. 1979. "Response Rates and PerceivedQuestionnaire Length in Mail Surveys." Journal of Marketing Research16:429-31.
Childers, T. L., and S. Skinner. 1985. "Theoretical and Empirical Issues inthe Identification of Survey Respondents." Journal of the Market ResearchSociety 27(l):39-53.
Chromy, J. R., and D. G. Horvitz. 1978. "The Use of Monetary Incentives inNational Assessment Household Surveys." Journal of the American Statis-tical Association 73:473-78.
Clausen, J. A., and R. N. Ford. 1947. "Controlling Bias in Mail Question-naires." Journal of the American Statistical Association 42:497-511.
Cook, J., and N. Schoeps. 1985. "Program Response to Mail Surveys as aFunction of Monetary Incentives." Psychological Reports 57:366.
Corey, S. 1937. "Signed vs. Unsigned Attitude Questionnaires." Journal ofEducational Psychology 28:144-48.
Cox, E. P. Ill, W. T. Anderson, Jr., and D. G. Fulcher. 1974. "ReappraisingMail Survey Response Rates." Journal of Marketing Research 11:413-17.
Dillman, D. A., and J. H. Frey. 1973. "Contribution of Personalization to MailQuestionnaire Response as an Element of a Previously Tested Method."Journal of Applied Psychology 59(3):297-301.
Dillman, D. A., J. G. Gallegos, and J. H. Frey. 1976. "Reducing Refusal Ratesfor Telephone Reviews." Public Opinion Quarterly 40:66-78.
Dommeyer, C. J. 1985. "Does Response to an Offer of Mail Survey Resultswith Questionnaire Interest?" Journal of the Market Research Society27(l):27-38.
Down, P., and J. Kerr. 1986. "Recent Evidence on the Relationship betweenAnonymity and Response Variables for Mail Surveys." Journal of the Acad-emy of Marketing Science 14:72-82.
Erdos, P. L., and J. Regier. 1977. "Visible vs. Disguised Keying on Question-naires." Journal of Marketing Research 17:125-32.
Etzel, M. J., and B. J. Walker. 1974. "Effects of Alternative Follow-up Proce-dures on Mail Survey Response Rates." Journal of Applied Psychology59(2):219-21.

634 Yammarino, Skinner, and Childers
Ferrell, O. C , T. L. Childers, and R. Ruekert. 1984. "Effects of SituationalFactors on Mail Survey Response." In Educators' Conference Proceedings,ed. R. W. Balk et al., pp. 364-67. Chicago: American Marketing Associ-ation.
Ferris, A. L. 1951. "A Note on Stimulating Response to Questionnaires."American Sociological Review 16:247-49.
Finn, D. W. 1983. "Response Speeds, Functions, and Predictability in MailSurveys." Journal of the Academy of Marketing Science 11:61-70.
Ford, N. M. 1967. "The Advance Letter in Mail Surveys." Journal of Market-ing Research 4:202-4.
. 1%8. "Questionnaire Appearance and Response Rates in Mail Sur-veys." Journal of Advertising Research 8:43-45.
Francel, E. G. 1966. "Mail-administered Questionnaires: A Success Story."Journal of Marketing Research 3:89-92.
Frankel, L. R. 1960. "How Incentives and Subsamples Affect the Precisionof Mail Surveys." Journal of Advertising Research 1:1-5.
Frazier, G., and K. Bird. 1958. "Increasing the Response of a Mail Question-naire." Journal of Marketing 22:186—87.
Friedman, H. H., and A. J. San Augustine. 1979. "The Effects of a MonetaryIncentive and the Ethnicity of the Sponsor's Signature on the Rate andQuality of Response to a Mail Survey." Journal of the Academy of Market-ing Science7(2):95-lOl.
Fuller, C. 1974. "Effect of Anonymity on Return Rate and Response Bias ina Mail Survey." Journal of Applied Psychology 59(3):292-%.
Furst, L. G., and W. P. Blitchington. 1979. "The Use of a Descriptive CoverLetter and Secretary Pre-letter to Increase Response Rate in a Mailed Sur-vey." Personnel Psychology 32(1): 155-60.
Futrell, C M . , and J. Swan. 1977. "Anonymity and Response by Salespeopleto a Mail Questionnaire." Journal of Marketing Research 14:611-16.
Gilsan, G., and J. L. Grimm. 1982. "Improving Response Rate in an IndustrialSetting: Will Traditional Variables Work?" Southern Marketing AssociationProceedings 20:265-68.
Godwin, K. R. 1979. "The Consequences of Large Monetary Incentives inMail Surveys of Elites." Public Opinion Quarterly 43(3):378-87.
Goodman, C. S. 1961. Cited by Armstrong, J. S., and E. J. Lusk. 1987. "Re-turn Postage in Mail Surveys: A Meta-analysis." Public Opinion Quarterly51:233-48.
Goodstadt, M. S., L. Chung, R. Kronitz, and G. Cook. 1977. "Mail SurveyResponse Rates: Their Manipulation and Impact." Journal of MarketingResearch 14:391-95.
GuUahom, J., and J. GuUahorn. 1963. "An Investigation of the Effects ofThree Factors on Response to Mail Questionnaires." Public Opinion Quar-terly 27:294-%.
Hackler, J. C , and P. Bourgette. 1973. "Dollars, Dissonance, and SurveyReturns." Public Opinion Quarterly 37:276-81.
Hammond, E. C. 1959. "Inhalation in Relation to Type and Amount of Smok-ing." Journal of the American Statistical Association 54:35-49.

A Meta-analysis of Mail Surveys 635
Hancock, J. W. 1940. "An Experimental Study of Four Methods of MeasuringUnit Costs of Obtaining Attitude toward the Retail Store." Journal of Ap-plied Psychology 24:213-30.
Hansen, R. A. 1980. "A Self-perception Interpretation of the Effect of Mone-tary and Nonmonetary Incentives on Mail Survey Response Behavior."Journal of Marketing Research 17:77-83.
Hansen, R. A., and L. M. Robinson. 1980. "Testing the Effectiveness ofAlternative Foot-in-the-Door Manipulations." Journal of Marketing Re-search 17:359-64.
Hams, J. R., and H. J. Guffey. 1978. "Questionnaire Returns: Stamps versusBusiness Reply Envelopes Revisited."Jowrna/ of Marketing Research15:290-93.
Harvey, L. 1986. "A Research Note on the Impact of Class-of-Mail on Re-sponse Rates to Mailed Questionnaires." Journal of the Market ResearchSociety 29:299-300.
Hawes, J., and G. E. Kiser. 1981. "Additional Findings on the Effectiveness ofThree Response-Inducement Techniques for a Mail Survey of a CommercialPopulation." Southern Marketing Association Proceedings 19:263-65.
Hawkins, D. J. 1979. "The Impact of Sponsor Identification and Direct Disclo-sure of Respondent Rights on the Quantity and Quality of Mail SurveyData." Journal of Business 52(4):577-90.
Heaton, E. E., Jr. 1965. "Increasing Mail Questionnaire Returns with a Prelim-inary Letter." Journal of Advertising Research 5:36-39.
Hendrick, C , R. Borden, M. Giesen, E. J. Murray, and B. A. Seyfried. 1972."Effectiveness of Ingratiation Tactics in a Cover Letter on Mail Question-naire Response." Psychonomic Science 26(6):349-51.
Hensley, W. E. 1974. "Increasing Response Rate by Choice of PostageStamps." Public Opinion Quarterly 38:280-83.
Hewett, W. C. 1974. "How Different Combinations of Postage on Outgoingand Return Envelopes Affect Questionnaire Returns." Journal of the Mar-ket Research Society 16:49-50.
Hinrichs, J. R. 1975. "Factors Related to Survey Response Rates." Journalof Applied Psychology 60(2):249-51.
Horowitz, J. L., and W. E. Sedlacek. 1974. "Initial Returns on Mail Question-naires: A Literature Review and Research Note." Research in Higher Edu-cation 2:361-67.
Houston, M. J., and R. W. Jefferson. 1975. "The Negative Effects of Personal-ization on Response Patterns in Mail Surveys." Journal of Marketing Re-search 12:114-17.
Huck, S. W., and E. M. Gleason. 1974. "Using Monetary Inducements toIncrease Response Rates from Mailed Surveys." Journal of Applied Psy-chology 59(2):222-25.
Jones, W. 1979. "Generalizing Mail Survey Inducement Methods." PublicOpinion Quarterly 43( 1): 102-11.
Kephart, W. M., and M. Bressler. 1958. "Increasing the Responses to MailQuestionnaires." Public Opinion Quarterly 22:123-32.
Kerin, R. A. 1983. Cited by Armstrong, J. S., and E. J. Lusk. 1987. "Return
636 Yammariffio, Skinner, and Childers
Postage in Mail Surveys: A Meta-analysis." Public Opinion Quarterly51:233-48.
Kerin, R. A., and M. G. Harvey. 1976. "Methodological Considerations inCorporate Mail Surveys: A Research Note." Journal of Business Research4:277-81.
Keman, J. B. 1971. "Are 'Bulk-Rate Occupants' Really Unresponsive?" Pub-lic Opinion Quarterly 35:420-22.
Kimball, A. E. 1961. "Increasing the Rate of Return in Mail Surveys." Journalof Marketing 25:63-65.
Labrecque, D. P. 1978. "A Response Rate Experiment Using Mail Question-naires." Journal of Marketing 42:82-83.
Longworth, D. S. 1953. "Use of a Mailed Questionnaire." American Sociolog-ical Review 18:310-13.
Lusk, E. J., and K. S. Armstrong. 1982. Cited by Armstrong, J. S., and E. J.Lusk. 1987. "Return Postage in Mail Surveys: A Meta-analysis." PublicOpinion Quarterly 51:233-48.
McCrohan, K. F., and L. S. Lowe. 1981. "A Cost/Benefit Approach to Post-age Used on Mail Questionnaires." Journal of Marketing 45:130-33.
McDaniel, S. W., and C. P. Rao. 1981. "An Investigation of RespondentAnonymity's Effect on Mailed Questionnaire Response Rate and Quality."Journal of Marketing Research Society 23(3): 150-59.
McGinnis, M. A., and C. J. HoUon. 1977. "Mail Survey Response Rate andBias: The Effect of Home versus Work Address." Journal of MarketingResearch 14:383-84.
Martin, J. D., and J. P. McConnell. 1970. "Mail Questionnaire Response In-duction: The Effect of Four Variables on the Response of a Random Sampleto a Difficult Questionnaire." Social Science Quarterly 51:409-14.
Mason, W. S., R. J. Dressel, and R. K. Bain. 1961. "An Experimental Studyof Factors Affecting Response to a Mail Survey of Beginning Teachers."Public Opinion Quarterly 25:296-99.
Matteson, M. T. 1974. "Type of Transmittal Letter and Questionnaire Coloras Two Variables Influencing Response Rates in a Mail Survey." Journalof Applied Psychology 59:535-36.
Moore, C. C. 1941. "Increasing the Returns from Questionnaires." Journalof Educational Research 35:138-41.
Myers, J. H., and A. F. Haug. 1%9. "How a Preliminary Letter Affects MailSurvey Returns and Costs." Journal of Advertising Research 9:37-39.
Newman, S. W. 1%2. "Differences between Early and Later Respondents toa Mailed Survey." Journal of Advertising Research 2:37-39.
O'Connor, P. J., G. Sullivan, and W. Jones. 1981. "An Evaluation of theCharacteristics of Response Quality Induced by Follow-up Survey Meth-ods." Working Paper, University of Kentucky.
Parsons, R. J., and T. S. Medford. 1972. "The Effect of Advance Noticein Mail Surveys of Homogeneous Groups." Public Opinion Quarterly36:258-59.
Perry, N. 1974. "Postage Combinations in Postal Questionnaire Surveys: An-other View." Journal of the Market Research Society 16:199-210.

A Meta-analysis of Mail Surveys 637
Peterson, R. A. 1975. "An Experimental Investigation of Mail Survey Re-sponses." Journal of Business Research 3(3): 199-210.
Pressley, M. M. 1978. "Care Needed When Selecting Response Inducementsin Mail Surveys of Commercial Populations." Journal of the Academy ofMarketing Science 6(4):336-43.
Pressley, M. M.., and W. L. TuUar. 1984. "Postage as a Response InducingFactor in Mail Surveys of Commercial Populations." Working Paper, Col-lege of Business, University of New Orleans, New Orleans, LA.
Price, D. O. 1950. "On the Use of Stamped Return Envelopes with MailQuestionnaires." American Sociological Review 15:672-73.
Pucel, D. J., H. F. Nelson, and D. N. Wheeler. 1971. "Questionnaire Follow-up Returns as a Function of Incentives and Responder Characteristics."Vocational Guidance Quarterly 19:188-93.
Roberts, R. E., O. F. McCrory, and R. N. Forthofer. 1978. "Further Evidenceon Using a Deadline to Stimulate Responses to a Mail Survey." PublicOpinion Quarterly 42:407-10.
Robertson, D. H., and D. N. Bellenger. 1978. "A New Method of IncreasingMail Survey Responses: Contributions to Charity." Journal of MarketingResearch 15:632-33.
Robin, D. P., and C. G. Walters. 1976. "The Effect of Return Rate of MessagesExplaining Monetary Incentives in Mail Questionnaire Studies." Journal ofBusiness Communication 13(3):49-54.
Robinson, R. A., and P. Agisim. 1951. "Making Mail Surveys More Reliable."Journal of Marketing 15:415-24.
Roeher, G. A. 1963. "Effective Techniques in Increasing Response to MailedQuestionnaires." Public Opinion Quarterly 27:299-302.
Schewe, C. D., and N. G. Cournoyer. 1976. "Prepaid vs. Promised MonetaryIncentives to Questionnaire Response: Further Evidence." Public OpinionQuarterly 40{l):l05-7.
Sheth, J., and A. M. Roscoe, Jr. 1975. "Impact of Questionnaire Length,Follow-up Methods, and Geographical Location on Response Rate to a MailSurvey." Journal of Applied Psychology 60(2):252-54.
Simon, R. 1%7. "Responses to Personal and Form Letters in Mail Surveys."Journal of Advertising Research 7:28-30.
Sletto, R. F. 1940. "Pretesting of Questionnaires." American SociologicalReview 5:193-200.
Stafford, J. E. 1966. "Influence of Preliminary Contact on Mail Returns."Journal of Marketing Research 3:410-11.
Stevens, R. E. 1975. "Does Precoding Mail Questionnaires Affect ResponseRates?" Public Opinion Quarterly 38(4):621-22.
Triball, K. 1984. Cited by Armstrong, J. S., and E. J. Lusk. 1987. "ReturnPostage in Mail Surveys: A Meta-analysis." Public Opinion Quarterly51:233-48.
Veiga, J. F. 1974. "Getting the Mail Questionnaire Returned: Some Prac-tical Research Considerations." Journal of Applied Psychology 59(2):217-18.
Venne, R. V. 1974. "Direct Mail Announcement of Agricultural Publications."

638 Yammwino, Skinner, and Childers
Bulletin 21. Department of Agriculture Journalism, College of Agriculture,University of Wisconsin—Madison.
Vocino, T. 1977. "Three Variables in Stimulating Responses to Mailed Ques-tionnaires." Journal of Marketing 41:76-77.
Watson, J. J. 1%5. "Improving the Response Rate in Mail Research." Journalof Advertising Research 5:45-50.
Weilbacher, W., and H. R. Walsh. 1952. "Mail Questionnaires and the Person-alized Letter of Transmittal." Journal of Marketing 16:331-36.
Whitmore, W. J. 1976. "Mail Survey Premiums and Response Bias." Journalof Marketing Research 13:46-50.
Wildman, R. C. 1977. "Effects of Anonymity and Social Setting on SurveyResponses." Public Opinion Quarterly 41:74-79.
Wiseman, F. 1972. "Methodological Bias in Public Opinion Surveys." PublicOpinion Quarterly 36:105-8.
. 1973. "Factor Interaction Effects in Mail Survey Response Rates."Journal of Marketing Research 10:330-33.
Wolfe, A. C. 1979. Cited by Armstrong, J. S., and E. J. Lusk. 1987. "ReturnPostage in Mail Surveys: A Meta-analysis." Public Opinion Quarterly51:233-48.
Wolfe, A. C , and B. R. Trieman. 1979. "Postage Types and Response Ratesin Mail Surveys." Journal of Advanced Research 1:12-18.
Worthern, B. R., and R. W. Valcarce. 1985. "Relative Effectiveness of Per-sonalized and Form Covering Letters in Initial and Follow-up Mail Sur-veys." Psychological Reports 57:735-44.
Wotruba, T. R. 1%6. "Monetary Inducements and Mail Questionnaire Re-sponse." Journal of Marketing Research 3:398-400.
Wynn, G., and S. W. McDaniel. 1985. "The Effect of Alternative Foot-in-the-Door Manipulations on Mailed Questionnaires Response Rate and Quality."Journal of the Market Research Society 27:15-26.
References
Armstrong, J. S., and E. J. Lusk. 1987. "Return Postage in Mail Surveys: AMeta-analysis." Public Opinion Quarterly 51:233-48.
Bangert-Drowns, R. L. 1986. "Review of Developments in Meta-analytic Methods.Psychological Bulletin 99:388-99.
Bullock, R. J., and D. J. Svyantek. 1985. "Analyzing Meta-analysis: PotentialProblems, an Unsuccessful Replication, and Evaluation Criteria." Journal ofApplied Psychology 70:108-15.
Childers, T. L. 1986. Conceptualizing Mail Survey Response Behavior. WorkingPaper, University of Minnesota.
Childers, T. L., and S. J. Skinner. 1985. "Theoretical and Empirical Issues in theIdentification of Survey Respondents." Journal of the Market Research Society27:39-53.
Duncan, W. J. 1979. "Mail Questionnaires in Survey Research: A Review ofResponse Inducement Techniques." Journal of Management 5(1): 39-55.
Fox, R. J., M. R. Crask, and J. Kim. 1988. "Mail Survey Response Rate: AMeta-analysis of Selected Techniques for Inducing Response." Public OpinionQuarterly 52:467-91.

A Meta-analysis of Mail Surveys 639
Furse, D. H., and D. W. Stewart. 1982. "Monetary Incentives versus PromisedContribution of Charity: New Evidence on Mail Survey Response." Journal ofMarketing Research 14:375-80.
Glass, G. V. 1977. "Integrating Findings: The Meta-analysis of Research." Review ofResearch in Education 5:351—79.
Goyder, J. C. 1982. "Further Evidence on Factors Affecting Response Rates toMailed Questionnaires." American Sociological Review 47:550-53.
Hackler, J. C , and P. Bourgette. 1973. "Dollars, Dissonance, and Survey Returns."Public Opinion Quarterly 37:276-81.
Hansen, R. A. 1980. "A Self-perception Interpretation of the Effect of Monetary andNon-monetary Incentives on Mail Survey Respondent Behavior." Journal ofMarketing Research 17:77-83.
Harvey, L. 1987. "Factors Affecting Response Rates to Mailed Questionnaires: AComprehensive Literature Review." Journal of the Market Research Society29(3):341-53.
Heberlein, T. A., and R. Baumgartner. 1978. "Factors Affecting Response Rates toMailed Questionnaires: A Quantitative Analysis of the Published Literature."American Sociological Review 43:447-62.
Houston, M. J., and N. M. Ford. 1976. "Broadening the Scope of MethodologicalResearch on Mail Surveys." Journal of Marketing Research 13:397-403.
Hunter, J. E., and F. L. Schmidt. 1990. Methods of Meta-analysis: Correcting Errorand Bias in Research Findings. Newbury Park, CA: Sage.
Hunter, J. E., F. L. Schmidt, and G. B. Jackson. 1982. Meta-analysis: CumulatingResearch Findings across Studies. Beverly Hills, CA: Sage.
Kanuk, L., and C. Berenson. 1975. "Mail Surveys and Response Rates: A LiteratureReview." Journal of Marketing Research 12:440-53.
Linsky, A. S. 1975. "Stimulating Responses to Mailed Questionnaires: A Review."Public Opinion Quarterly 39:82-101.
Reingen, P. H., and J. B. Kernan. 1977. "Compliance with an Interview Request: AFoot-in-the-Door, Self-perception Interpretation." Journal of Marketing Research14:365-69.
. 1979. "More Evidence on Interpersonal Yielding." Journal of MarketingResearch 16:588-93.
Riche, M. F. 1987. "Who Says Yes." American Demographics, p. 8.Rosenthal, R. 1979. "The 'File Drawer Problem' and Tolerance for Null Results."
Psychological Bulletin 86:638-41.. 1984. Meta-analytic Procedures for Social Research. Beverly Hills, CA:
Sage.Wolf, F. M. 1986. Meta-analysis: Quantitative Methods for Research Synthesis.
Beverly Hills, CA: Sage.Worthen, B. R., and R. W. Valcarce. 1985. "Relative Effectiveness of Personalized
and Form Covering Letters in Initial and Follow-up Mail Surveys." PsychologicalReports 57:735-44.
Yu, J., and H. Cooper. 1983. "A Quantitative Review of Research Design Effects onResponse Rates to Questionnaires." Journal of Marketing Research 20:36-44.