Understanding and Detecting Mobile Ad Fraud Through the ...
17
Understanding and Detecting Mobile Ad Fraud Through the Lens of Invalid Traic Suibin Sun ∗ Shanghai Jiao Tong University sun1998@sjtu.edu.cn Le Yu ∗ Shanghai Jiao Tong University yule5100309221@sjtu.edu.cn Xiaokuan Zhang The Ohio State University zhang.5840@osu.edu Minhui Xue The University of Adelaide jason.xue@adelaide.edu.au Ren Zhou Shanghai Jiao Tong University zhouren@sjtu.edu.cn Haojin Zhu † Shanghai Jiao Tong University zhu-hj@sjtu.edu.cn Shuang Hao University of Texas at Dallas shao@utdallas.edu Xiaodong Lin University of Guelph xlin08@uoguelph.ca ABSTRACT Along with gaining popularity of Real-Time Bidding (RTB) based programmatic advertising, the click farm based invalid trac, which leverages massive real smartphones to carry out large-scale ad fraud campaigns, is becoming one of the major threats against online advertisement. In this study, we take an initial step towards the detection and large-scale measurement of the click farm based in- valid trac. Our study begins with a measurement on the device’s features using a real-world labeled dataset, which reveals a series of features distinguishing the fraudulent devices from the benign ones. Based on these features, we develop EH, a system for detecting fraudulent devices through ad bid request logs with a focus on clustering fraudulent devices. EH functions by 1) building a classier to distinguish fraudulent and benign devices; 2) clustering devices based on app usage patterns; and 3) relabeling devices in clusters through majority voting. EH demon- strates 97% precision and 95% recall on a real-world labeled dataset. By investigating a super click farm, we reveal several cheating strategies that are commonly adopted by fraudulent clusters. We further reduce the overhead of EH and discuss how to deploy the optimized EH in a real-world system. We are in partnership with a leading ad verication company to integrate EH into their industrial platform. CCS CONCEPTS • Security and privacy ! Software and application security; • Networks ! Network measurement. ∗ Co-rst authors. † Haojin Zhu ([email protected]) is the corresponding author. Permission to make digital or hard copies of all or part of this work for personal or classroom use is granted without fee provided that copies are not made or distributed for prot or commercial advantage and that copies bear this notice and the full citation on the rst page. Copyrights for components of this work owned by others than ACM must be honored. Abstracting with credit is permitted. To copy otherwise, or republish, to post on servers or to redistribute to lists, requires prior specic permission and/or a fee. Request permissions from [email protected]. CCS ’21, November 15–19, 2021, Virtual Event, Republic of Korea © 2021 Association for Computing Machinery. ACM ISBN 978-1-4503-8454-4/21/11. . . $15.00 https://doi.org/10.1145/3460120.3484547 KEYWORDS Invalid Trac; Ad Fraud; Click Farm ACM Reference Format: Suibin Sun, Le Yu, Xiaokuan Zhang, Minhui Xue, Ren Zhou, Haojin Zhu, Shuang Hao, and Xiaodong Lin. 2021. Understanding and Detecting Mobile Ad Fraud Through the Lens of Invalid Trac. In Proceedings of the 2021 ACM SIGSAC Conference on Computer and Communications Security (CCS ’21), November 15–19, 2021, Virtual Event, Republic of Korea. ACM, New York, NY, USA, 17 pages. https://doi.org/10.1145/3460120.3484547 1 INTRODUCTION Programmatic advertising (ad) has become the driving force for the growth of internet advertising in the past decades, which is beneted from the innovation of new ad technologies that bring us the eciency of automatic buying and selling of advertisements. Real-Time Bidding (RTB), one of the most signicant technologies, provides a digital marketplace, where website owners and mobile app developers (ad publishers) can sell the spare spaces (ad slots) on their websites or applications to advertisers through real-time auctions. Over the past 10 years, mobile in-app advertising has become the major increasing growth of advertising revenues. It is reported that the global RTB market size could potentially grow from $6.6 billion USD in 2019 to $27.2 billion USD by 2024 [33]. Unfortunately, this increased prominence has also attracted the attention of fraudulent ad slot sellers, who try to inate their in- comes by fabricating ad requests. This task is usually outsourced to click farm owners, who can control thousands of mobile devices or emulators and mimic normal app usage patterns to trick advertisers into believing that their ads have been seen by actual, interested users. Fig. 1 substantiates an example of a “click farm” reported by the recent news [26, 32], which leverages massive real smart- phones to carry out a large-scale ad fraud campaign. Nowadays, an advertiser usually pays money for every 1,000 impressions of a given advertisement, instead of clicks, which is commonly known as Cost Per Mille (CPM) [20]. As a result, those committing frauds within this system have evolved their technique from “click spam” into the generation of “invalid trac”. It is estimated that every year trillions of delivered ad impressions are not watched by real people, leading to losses in the tens of billions of US dollars for advertisers [12, 42].
-
Upload
khangminh22 -
Category
Documents
-
view
3 -
download
0
Transcript of Understanding and Detecting Mobile Ad Fraud Through the ...

Understanding and Detecting Mobile Ad FraudThrough the Lens of Invalid Tra�ic
Suibin Sun∗Shanghai Jiao Tong University
Le Yu∗Shanghai Jiao Tong [email protected]
Xiaokuan ZhangThe Ohio State University
Minhui XueThe University of [email protected]
Ren ZhouShanghai Jiao Tong University
Haojin Zhu†Shanghai Jiao Tong University
Shuang HaoUniversity of Texas at Dallas
Xiaodong LinUniversity of [email protected]
ABSTRACTAlong with gaining popularity of Real-Time Bidding (RTB) basedprogrammatic advertising, the click farm based invalid tra�c, whichleverages massive real smartphones to carry out large-scale ad fraudcampaigns, is becoming one of the major threats against onlineadvertisement. In this study, we take an initial step towards thedetection and large-scale measurement of the click farm based in-valid tra�c. Our study begins with a measurement on the device’sfeatures using a real-world labeled dataset, which reveals a seriesof features distinguishing the fraudulent devices from the benignones. Based on these features, we develop E���H�����, a systemfor detecting fraudulent devices through ad bid request logs with afocus on clustering fraudulent devices. E���H����� functions by1) building a classi�er to distinguish fraudulent and benign devices;2) clustering devices based on app usage patterns; and 3) relabelingdevices in clusters through majority voting. E���H����� demon-strates 97% precision and 95% recall on a real-world labeled dataset.By investigating a super click farm, we reveal several cheatingstrategies that are commonly adopted by fraudulent clusters. Wefurther reduce the overhead of E���H����� and discuss how todeploy the optimized E���H����� in a real-world system. We arein partnership with a leading ad veri�cation company to integrateE���H����� into their industrial platform.
CCS CONCEPTS• Security and privacy ! Software and application security; •Networks ! Network measurement.
∗Co-�rst authors.†Haojin Zhu ([email protected]) is the corresponding author.
Permission to make digital or hard copies of all or part of this work for personal orclassroom use is granted without fee provided that copies are not made or distributedfor pro�t or commercial advantage and that copies bear this notice and the full citationon the �rst page. Copyrights for components of this work owned by others than ACMmust be honored. Abstracting with credit is permitted. To copy otherwise, or republish,to post on servers or to redistribute to lists, requires prior speci�c permission and/or afee. Request permissions from [email protected] ’21, November 15–19, 2021, Virtual Event, Republic of Korea© 2021 Association for Computing Machinery.ACM ISBN 978-1-4503-8454-4/21/11. . . $15.00https://doi.org/10.1145/3460120.3484547
KEYWORDSInvalid Tra�c; Ad Fraud; Click Farm
ACM Reference Format:Suibin Sun, Le Yu, Xiaokuan Zhang, Minhui Xue, Ren Zhou, Haojin Zhu,Shuang Hao, and Xiaodong Lin. 2021. Understanding and Detecting MobileAd Fraud Through the Lens of Invalid Tra�c. In Proceedings of the 2021ACM SIGSAC Conference on Computer and Communications Security (CCS’21), November 15–19, 2021, Virtual Event, Republic of Korea. ACM, New York,NY, USA, 17 pages. https://doi.org/10.1145/3460120.3484547
1 INTRODUCTIONProgrammatic advertising (ad) has become the driving force forthe growth of internet advertising in the past decades, which isbene�ted from the innovation of new ad technologies that bring usthe e�ciency of automatic buying and selling of advertisements.Real-Time Bidding (RTB), one of the most signi�cant technologies,provides a digital marketplace, where website owners and mobileapp developers (ad publishers) can sell the spare spaces (ad slots)on their websites or applications to advertisers through real-timeauctions. Over the past 10 years, mobile in-app advertising hasbecome the major increasing growth of advertising revenues. It isreported that the global RTB market size could potentially growfrom $6.6 billion USD in 2019 to $27.2 billion USD by 2024 [33].
Unfortunately, this increased prominence has also attracted theattention of fraudulent ad slot sellers, who try to in�ate their in-comes by fabricating ad requests. This task is usually outsourced toclick farm owners, who can control thousands of mobile devices oremulators and mimic normal app usage patterns to trick advertisersinto believing that their ads have been seen by actual, interestedusers. Fig. 1 substantiates an example of a “click farm” reportedby the recent news [26, 32], which leverages massive real smart-phones to carry out a large-scale ad fraud campaign. Nowadays,an advertiser usually pays money for every 1,000 impressions of agiven advertisement, instead of clicks, which is commonly knownas Cost Per Mille (CPM) [20]. As a result, those committing fraudswithin this system have evolved their technique from “click spam”into the generation of “invalid tra�c”. It is estimated that everyyear trillions of delivered ad impressions are not watched by realpeople, leading to losses in the tens of billions of US dollars foradvertisers [12, 42].

(a) Software level emulation (b) Hardware level automation
Figure 1: Automated and coordinated “click farm”.
Due to the substantial �nancial loss caused by invalid ad tra�c,the problem has attracted increasing attention. However, manyprior works that focus on the problem of click spam detection [13,14, 40] or authenticated click [15, 21, 36] cannot be applied in theera of RTB, since the basic pricing model in the RTB system is CPMrather than traditional CPC (cost-per-click), indicating that fraud-sters no longer need to click on the ads, which renders detectingthe invalid tra�c more di�cult.
In the industry, tra�c veri�cation is performed by designatedcompanies/organizations, which are trusted by both ad publishersand advertisers. By removing the invalid tra�c before the billingcycles, they help advertisers minimize wrongful payment whileprotecting the rights of ad publishers. The key players in this ecosys-tem include Integral Ad Science (IAS) [3], Oracle [4], and WhiteOps [5]. The best practice of combating invalid tra�c adopted bythe mainstream tra�c veri�cation companies heavily relies on rule-based detection such as blacklists and parameter/metadata checks(e.g., IP blacklists, location validity checking, user agent (UA) check-ing). To date, little attention has been paid to the detection andmeasurement of large-scale click farms.
Challenges. Detection of click farms faces the following uniquechallenges. 1) Attackers have adopted a series of hardware/softwarelevel strategies (e.g., frequently changing the various parametersincluding IP, UA, IMEI, emulating the human behavior including themobility pattern, and even using the automated tool) to mimic thehuman behaviors and generate “seemingly organic” tra�c, whichis di�cult to detect. 2) Due to the noisy ad tra�c data and dynamicnetwork environment, the detection of invalid tra�c based on anyspeci�c fraudulent device is less reliable. 3) In practice, it is expectedto process billions of transactions per day. The amount of data thatneeds to be processed makes it challenging to design a practicaldetection system with low overhead.
E���H�����. In this study, we present E���H�����, the �rstwork to investigate click farm-oriented invalid tra�c detectionbased on the real-world mobile RTB transaction data. E���H�����handles invalid tra�c via detecting the source of tra�c, i.e., thefraudulent devices involved in the click farms. E���H����� is moti-vated by the following observation: although any individual fraudu-lent device tends to adopt strategies to mimic the organic tra�c, theattackers behind the click farm have strong incentives to camou-�age the behaviors of invalid tra�c with certain patterns in orderto lower the cost. Such group features could be used to design anovel automatic click-farm and fraudulent device detection scheme.
Based on the above insights, we �rst conduct a measurement ofthe device’s features using a real-world labeled dataset, which re-veals a series of features distinguishing the fraudulent devices from
the benign ones. To make use of the features depicted by fraudulentdevices as groups, we further propose a three-stage detection sys-tem, E���H�����: 1) Stage 1 uses the identi�ed features to build aclassi�er to �ag individual devices; 2) Stage 2 captures cluster-levelfeatures by applying the Top-App based Clustering Algorithm, whichleverages the app usage patterns of the devices to group devices; 3)Stage 3 aggregates the information produced in the previous stagesand performs majority voting to detect click farms as well as thefraudulent devices.
Our extensive evaluation shows that E���H����� is able to cap-ture real-world click farms with high accuracy and with moderateoverhead incurred. We also reveal interesting �ndings surroundingthe detected click farms, which may bene�t future research. Wehave reported all of the �ndings to a leading ad veri�cation com-pany (Company A), which has positively acknowledged our results.Based on our study, we have contributed a fraud reason code onclick farm detection in Company A’s real-world detection system,which is expected to help the ad veri�cation industry to identifylarge-scale fraudulent device clusters and �lter invalid tra�c.
Contributions.We make the following key contributions:
• New features (Sec. 4). We perform an ad fraud measurementstudy on a labeled real-world dataset, which reveals a series ofimportant characteristics of fraudulent devices.
• New system (Sec. 5). We propose E���H�����, a novel three-stage fraud detection system for automatically identifying deviceclusters and classifying the fraudulent devices in terms of theircluster-level features based on real-world ad bid logs.
• New �ndings on cheating strategies of click farms (Sec. 7). Wesuccessfully identify a group of large-scale click farms in thereal-world dataset. After focusing on the largest click farm andtracing back to the historical data in two 10-day datasets in 2018and 2019, respectively, we discover similar patterns in a largenumber of devices. We reveal a series of strategies adopted bythis super click farm to evade detection.
• Optimization and real-world deployment (Sec. 8). We propose sev-eral optimization mechanisms that greatly reduce the overheadof E���H�����, and make it practical to be used in the realworld. We evaluate E���H����� on a 1-day unlabeled datasetcontaining 53M devices. Our evaluation shows that E���H�����is able to detect 8M fraudulent devices related to click farmswithin 2 hours. The top results are con�rmed by Company A,and Company A has integrated E���H����� into its real-worldsystem.
Ethical considerations. Each time a user’s device requests an admaterial, the ad exchange will transmit the request and record it asa log. The source data in the request is collected by the ad softwaredevelopment toolkit (SDK) embedded in an app only after the user’sconsent on the app’s privacy agreement. The ad tra�c veri�cationcompany routinely collects ad bid request logs from ad exchangefor the purpose of verifying and measuring the quality of the adtra�c. The data is kept in the ad tra�c veri�cation company datacenter with access being granted only to the authors’ a�liation. Wehave obtained approval from the ad tra�c veri�cation companyfor accessing the ad bid logs. The data (such as IMEIs) provided by
the ad tra�c veri�cation company does not include any PersonalIdenti�able Information (PII).
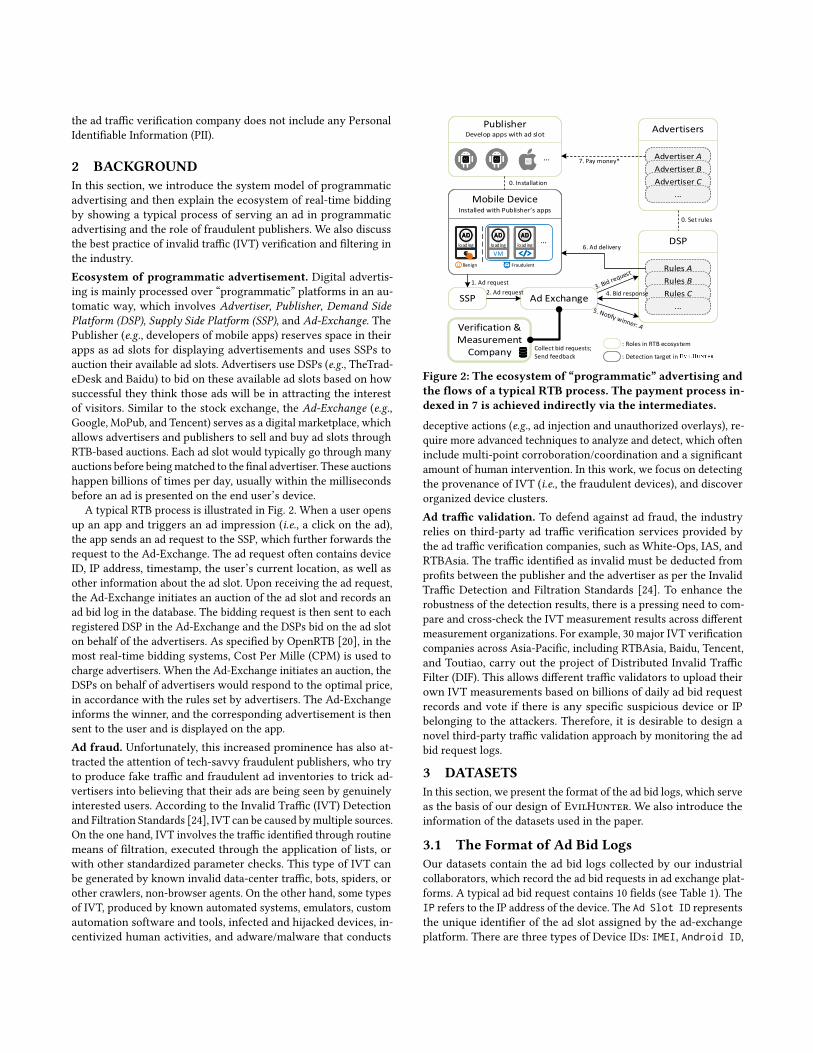
2 BACKGROUNDIn this section, we introduce the system model of programmaticadvertising and then explain the ecosystem of real-time biddingby showing a typical process of serving an ad in programmaticadvertising and the role of fraudulent publishers. We also discussthe best practice of invalid tra�c (IVT) veri�cation and �ltering inthe industry.Ecosystem of programmatic advertisement. Digital advertis-ing is mainly processed over “programmatic” platforms in an au-tomatic way, which involves Advertiser, Publisher, Demand SidePlatform (DSP), Supply Side Platform (SSP), and Ad-Exchange. ThePublisher (e.g., developers of mobile apps) reserves space in theirapps as ad slots for displaying advertisements and uses SSPs toauction their available ad slots. Advertisers use DSPs (e.g., TheTrad-eDesk and Baidu) to bid on these available ad slots based on howsuccessful they think those ads will be in attracting the interestof visitors. Similar to the stock exchange, the Ad-Exchange (e.g.,Google, MoPub, and Tencent) serves as a digital marketplace, whichallows advertisers and publishers to sell and buy ad slots throughRTB-based auctions. Each ad slot would typically go through manyauctions before beingmatched to the �nal advertiser. These auctionshappen billions of times per day, usually within the millisecondsbefore an ad is presented on the end user’s device.
A typical RTB process is illustrated in Fig. 2. When a user opensup an app and triggers an ad impression (i.e., a click on the ad),the app sends an ad request to the SSP, which further forwards therequest to the Ad-Exchange. The ad request often contains deviceID, IP address, timestamp, the user’s current location, as well asother information about the ad slot. Upon receiving the ad request,the Ad-Exchange initiates an auction of the ad slot and records anad bid log in the database. The bidding request is then sent to eachregistered DSP in the Ad-Exchange and the DSPs bid on the ad sloton behalf of the advertisers. As speci�ed by OpenRTB [20], in themost real-time bidding systems, Cost Per Mille (CPM) is used tocharge advertisers. When the Ad-Exchange initiates an auction, theDSPs on behalf of advertisers would respond to the optimal price,in accordance with the rules set by advertisers. The Ad-Exchangeinforms the winner, and the corresponding advertisement is thensent to the user and is displayed on the app.Ad fraud. Unfortunately, this increased prominence has also at-tracted the attention of tech-savvy fraudulent publishers, who tryto produce fake tra�c and fraudulent ad inventories to trick ad-vertisers into believing that their ads are being seen by genuinelyinterested users. According to the Invalid Tra�c (IVT) Detectionand Filtration Standards [24], IVT can be caused bymultiple sources.On the one hand, IVT involves the tra�c identi�ed through routinemeans of �ltration, executed through the application of lists, orwith other standardized parameter checks. This type of IVT canbe generated by known invalid data-center tra�c, bots, spiders, orother crawlers, non-browser agents. On the other hand, some typesof IVT, produced by known automated systems, emulators, customautomation software and tools, infected and hijacked devices, in-centivized human activities, and adware/malware that conducts
1. Ad request
Collect bid requests;Send feedback
6. Ad deliveryloading loading loading
VM
…
Benign
4. Bid response
Fraudulent
0. Installation
7. Pay money*
2. Ad request
0. Set rules
…
: Roles in RTB ecosystem
: Detection target in
Figure 2: The ecosystem of “programmatic” advertising andthe �ows of a typical RTB process. The payment process in-dexed in 7 is achieved indirectly via the intermediates.
deceptive actions (e.g., ad injection and unauthorized overlays), re-quire more advanced techniques to analyze and detect, which ofteninclude multi-point corroboration/coordination and a signi�cantamount of human intervention. In this work, we focus on detectingthe provenance of IVT (i.e., the fraudulent devices), and discoverorganized device clusters.Ad tra�c validation. To defend against ad fraud, the industryrelies on third-party ad tra�c veri�cation services provided bythe ad tra�c veri�cation companies, such as White-Ops, IAS, andRTBAsia. The tra�c identi�ed as invalid must be deducted frompro�ts between the publisher and the advertiser as per the InvalidTra�c Detection and Filtration Standards [24]. To enhance therobustness of the detection results, there is a pressing need to com-pare and cross-check the IVT measurement results across di�erentmeasurement organizations. For example, 30 major IVT veri�cationcompanies across Asia-Paci�c, including RTBAsia, Baidu, Tencent,and Toutiao, carry out the project of Distributed Invalid Tra�cFilter (DIF). This allows di�erent tra�c validators to upload theirown IVT measurements based on billions of daily ad bid requestrecords and vote if there is any speci�c suspicious device or IPbelonging to the attackers. Therefore, it is desirable to design anovel third-party tra�c validation approach by monitoring the adbid request logs.
3 DATASETSIn this section, we present the format of the ad bid logs, which serveas the basis of our design of E���H�����. We also introduce theinformation of the datasets used in the paper.
3.1 The Format of Ad Bid LogsOur datasets contain the ad bid logs collected by our industrialcollaborators, which record the ad bid requests in ad exchange plat-forms. A typical ad bid request contains 10 �elds (see Table 1). TheIP refers to the IP address of the device. The Ad Slot ID representsthe unique identi�er of the ad slot assigned by the ad-exchangeplatform. There are three types of Device IDs: IMEI, Android ID,

Table 1: Fields of ad bid logs.
Field Description
IP Source IPAd Slot ID A globally unique id of the requested ad slotIMEI IMEI MD5 valueAndroid ID Android ID raw/MD5 valueIDFA IDFA MD5 valueOS Operating system of the deviceLocation Real-time GPS coordinates of the deviceTimestamp The time when the request was sentBundle ID Bundle ID of the app generating the requestDevice Brand The brand of the deviceUser-Agent (UA) The user agent of the http request
Table 2: Datasets used in this paper; ⇡CA08= and ⇡C4BC are extracted from ⇡2020.
Name Labeled? Devices Log Duration Used in PurposeF B
⇡2020 Y 2M 0.2M 82M May 6 - June 5, 2020 Sec. 4 Fraudulent devices measurement
⇡CA08= Y 120k 113k 4.3M May 6 - May 15, 2020 Sec. 6 Training of E���H�����
⇡C4BC Y 125k 124k 4.9M May 16 - May 25, 2020 Sec. 6Sec. 7
E���H����� evaluationClick farm investigation
⇡2018 N 290M 290M Mar 21 - Mar 30, 2018 Sec. 7 Backtracking the largest click farm;Cheating strategy investigation
⇡2019 N 63M 63M Mar 6 - Mar 15, 2019
⇡2021 N 53M 117M Jan 13, 2021 Sec. 8 In-the-wild detection & validation
and IDFA. All of them are hashed by MD5. IMEI and Android ID
are used in Android devices while IDFA is for iOS devices. The OS in-dicates the operating system of the mobile device, either Android oriOS. The Location represents the device’s geo-location at the timeof ad request generation. The Timestamp refers to the time whenthe request is sent. The Bundle ID indicates from what app the adrequest is originated. The Device Brand represents the brand ofthe device. The User-Agent (UA) refers to the user agent of thead HTTP request. All the �elds, except for IP and Timestamp, arereported in ad request parameters by the app.
3.2 Overview of DatasetsWe use 6 di�erent datasets in this paper, which are described inTable 2. All the datasets contain ad bid logs generated by mobiledevices during a certain period. Here we brie�y introduce eachdataset, and more details will be provided in later sections wherethey are in use.J2020. ⇡2020 is a labeled dataset containing ad bid request logsrecorded from May 6, 2020, to June 5, 2020. The dataset contains82 million logs, generated by 2 million fraudulent devices and 0.19million benign devices. We use it as a ground-truth dataset to �nddistinct features for fraudulent devices (Sec. 4).Jtrain andJtest .⇡CA08= and⇡C4BC are extracted from⇡2020. Theyserve as a training set and a test set for the evaluation of E����H����� (Sec. 6). Moreover, ⇡C4BC is used to perform click farminvestigation in Sec. 7.J2018 and J2019. After identifying a few click farms in ⇡C4BC , wepick the largest click farm and trace back to two 10-day datasetsin 2018 and 2019 to identify devices that share the same charac-teristics (Sec. 7). These click farm-related devices in 2018 and 2019form ⇡2018 and ⇡2019. We use these two datasets to investigate thegeneral cheating strategies of click farms (Sec. 7).J2021. To evaluate the practicality to deploy E���H����� in thereal world, we use ⇡2021 as a validation dataset, which contains1-day’s data without labels in 2021.Ground-truth labels. In ⇡2020, the fraudulent devices are col-lected from a distributed blockchain system, where a group of lead-ing industrial tra�c veri�cation companies work together to reporthighly suspicious devices. They identify the suspicious devices withauxiliary information collected by their own SDKs. Each of thesecompanies regularly uploads fraudulent device information foundby itself to this blockchain platform for majority voting: one deviceis deemed to be fraudulent if more than two members upvote it,
and it will be added to the blacklist. Each blacklisted device will beblocked by them for several months, until being removed from theblacklist after a certain time. On the other hand, benign devices arecollected by Company A using some incentives to encourage usersto upload some evidence (e.g., photos of surroundings) to prove thatthey are human. These pieces of evidence are examined by Com-pany A manually to ensure that they are real. Both fraudulent andbenign devices are double-checked by Company A’s commercialrule-based system, which takes into consideration other aspects ofthe devices, such as the account activeness of the device in social me-dia, the physical trace of the device. We extract the involved ad bidlogs of the fraudulent devices and benign devices as dataset ⇡2020.
4 MEASURING FRAUDULENT DEVICESAd bid requests not only record the ad transaction history betweenthe organic (benign) users but also serve as snapshots of evidencerelated to ad fraud. This provides us with the opportunity to capturethe fraudulent devices and screen out the invalid tra�c. In thissection, we �rst use a real-world ad bid log dataset (⇡2020) to studythe features of fraudulent devices. These measurement results serveas the basis of E���H�����. It is observed that fraudulent devicesexhibit di�erent patterns, e.g., they are likely to adopt more IPs togenerate ad bid requests for one or two ad slots. Herewe take severalexamples to show the di�erences between fraudulent devices andbenign devices as shown in Fig. 3.
Statistical Number: # unique IP addresses.Observation 1: Fraudulent devices bind to more IP addresses.The numbers of unique IP addresses used by fraudulent devices andbenign devices are shown in Fig. 3a. As seen from Fig. 3a, fraudulentdevices bind to more IPs than benign ones. 67.9% of benign devicesuse 1 IP address, and 4.9% of them use more than 10 di�erent IPaddresses. In contrast, 48.0% of fraudulent devices use more than 5di�erent IP addresses and 3.5% of them correspond to 50 di�erentIPs. This phenomenon is perhaps due to the extensive usage ofcommercial residential IP proxy services, well aligned with theprevious study [25].
Entropy: ad slot IDs.Observation 2: Fraudulent devices have lower ad slot entropy.We compare the entropy of ad slot IDs in Fig. 3b. As shown in Fig. 3b,91.9% of fraudulent devices have an entropy of 0, meaning that theyonly had one unique ad slot ID. Intuitively, the fraudulent devicestarget the speci�c ad slot ID to make pro�ts. However, benign de-vices usually request more than one ad slot IDs to enjoy the various

(a) # of unique IPs.
0 0.1 0.2 0.3 0.4 0.5 0.6 0.7 0.8 0.9 1.0Ad Slot Entropy
0
10
20
30
40
50
60
70
80
90
100
Percentage%
Benign Device Fraudulent Device
(b) Entropy of ad slot IDs. (c) Active hours per day. (d) # of device brands. (e) Android OS version.Figure 3: The comparison of di�erent features between fraudulent devices and benign devices in⇡2020. The lines in Fig. 3b andFig. 3c represent kernel density estimations across devices.
services. This leads to an interesting phenomenon that benign usershave a higher value in terms of ad slot entropy. It is observed thatthere are 41.9% benign devices with an entropy larger than 0.5, incontrast to the fraudulent devices with the proportions of 2.2%.
Temporal: active hours.Observation 3: Fraudulent devices are more active.We extract the active hours for the devices in both labels. FromFig. 3c, we can learn that most of the benign devices (99.9%) haveless than 12 active hours per day in the dataset. In contrast, thereare 11.0% of the fraudulent devices being active for more than 15hours per day in the dataset. Even worse, 1.5% of them are activefor more than 20 hours per day, which is unbelievable for humans.The potential reason behind this is that the attackers exhibit a highincentive to generate more invalid tra�c within a speci�c periodto gain more economic revenue.
Inconsistency: # device brand names.Observation 4: Fraudulent devices use multiple brand names whilebenign devices usually use one brand.The number of device brands is shown in Fig. 3d. More than 95% ofbenign devices only used one brand name regardless of the datasets;only 16.8% used two brand names. However, 16.8% of fraudulentdevices used two brand names; roughly 5.6% of them used morethan 5 brand names. More brands for fraudulent devices may occurwhen attackers frequently change the device’s brand in lieu ofdevice IDs.
Android version.Observation 5: Fraudulent Android devices run lower OS versions.
As shown in Fig. 3e, we observe that fraudulent devices are in-stalled on lower Android versions in comparison to benign devices.9% (resp. 84%) of fraudulent (resp. benign) devices are on Android8, 9, and 10. 79.7% of fraudulent devices are running Android 4 orlower, which is not installed by any benign devices in 2020. Hence,we conclude that fraudulent devices run lower Android versionsthan benign devices do. The potential reasons are two-fold: (i) Us-ing Android phones on lower versions is more cost-e�ective forattackers to mount a larger scale mobile ad fraud campaign. (ii)The phones with earlier Android versions are much easier to gainfull access to the root permission, enabling fraudulent tasks suchas auto-clicking with ease. This resonates with the fact that somemobile phone manufacturers (such as Huawei) ban users from un-locking the bootloader on high Android version devices, serving asa requisite for root access acquisition [44].
5 EVILHUNTERIn this section, we present the detailed design and implementationof E���H�����. The basic insight of E���H����� is contingent onthe cluster-level features rather than any individual device featuresto identify the fraudulent devices. The main goal of E���H����� isto detect malicious device clusters (click farms) besides identifyingfraudulent devices.
In general, E���H����� is comprised of three stages (see Fig. 4).1) In the classi�cation stage (Stage 1), based on a series of featuresdiscussed in the previous section, E���H����� designs a deviceclassi�er to distinguish fraudulent devices and benign devices byexploiting the features extracted from the ad bid logs; 2) In theclustering stage (Stage 2), E���H����� proposes a Top-App basedClustering Algorithm, which builds the device graph based on theconnectivity features among devices, and then identi�es the closelyconnected device clusters. 3) In the aggregation stage (Stage 3),we classify each cluster by performing majority voting based onthe device labels within the cluster and then relabel the devicesbased on the cluster’s classi�cation result, i.e., all devices inside afraudulent cluster will be labeled as fraudulent. The output of E����H����� is ( [id], label) pairs, indicating which devices are groupedinto clusters and whether these clusters are fraudulent or benign.
5.1 Stage 1: Classi�cationThe device classi�er stage is a general machine learning classi�ca-tion process. The input is a bunch of ad bid logs while the outputis the predicted score B34E for each device, ranging from 0~1. 0means a high con�dential benign score of a device and 1 meansa fraudulent one. Device classi�er consists of three components:Log-Device Mapper, Device Feature Extractor, and Device Score Predictor.Module 1.1: Log-Device Mapper. Log-Device Mapper constructs thelog-device mapping from the ad bid logs. It then takes the ad bidlogs as input and outputs a device-log mappingM, which maps eachdevice ID (id) to the corresponding logs generated by this device.To retrieve the unique id for each device, given an Android device,Log-Device Mapper uses the combination of the MD5 values of IMEIand Android ID. Since both IMEI and Android ID may be an emptyvalue caused by strict permission control enforcement, we use acombination of them to cover more devices in the ecosystem. Onthe other hand, since Apple restricts the tracking for iOS devices:all iOS apps must have a user’s permission to access their IDFAsafter iOS 14.5 [7], and therefore the detection of invalid tra�c foriOS devices is beyond the scope of this paper.Module 1.2: Device Feature Extractor. The Device Feature Extractorextracts representative features that can re�ect the characteristics

Module 2.2Graph
Constructor
Module 2.1Top-App Extractor
Module 1.1Log-Device
Mapper
Module 1.2Device Feature
Extractor
Module 1.3Device Score
Predictor
Module 2.3Community
Detector
Device FeatureDevice Feature
Device GraphDevice Graph
Module 3.1Label
Voting
Device ClusterDevice Cluster
Data
Top-App FeatureTop-App Feature
Log-Device MappingLog-Device Mapping
Stage 1: Classification
Stage 2: Top-App Based Clustering
Device ScoreDevice Score
Fraudulent Device Cluster
Fraudulent Device Cluster
Refined DeviceLabel
Refined DeviceLabel
Stage 3: Aggregation
Module 3.2Device
Relabeling
Figure 4: The work�ow of E���H�����.
Table 3: Features extracted by Device Feature Extractor.Feature Categories Feature Name
(a) Statistical FeaturesNumber of logsNumber of unique IP addressesNumber of unique ad slot IDs
(b) Entropy FeaturesLog entropyIP entropyAd slot ID entropy
(c) Spatial-Temporal Features Number of active hoursMaximum speed
(d) Inconsistency FeaturesNumber of brandsFake brand ratioNon-browser UA ratio
of fraudulent devices. To achieve this, we de�ned 11 features thatcapture the nature of fraudulent devices covering all the �elds of thead bid logs (Table 1), and group these features into four categories(Table 3). These features are extracted as follows.(a) Statistical features. Device Feature Extractor extracts the statisticalfeatures of a device, including the number of log entries, unique IPaddresses, and unique ad slot IDs. Intuitively, all these numericalfeatures should be within a certain range, since a normal usercannot use too many di�erent IP addresses or generate too manyad requests.(b) Entropy features. Device Feature Extractor calculates the entropy ofthe three features shown in category (b) in Table 3, which measuresthe uncertainty of the features: higher entropy indicates higher un-certainty. Device Feature Extractor adapts the normalized entropy [29]to compute the features as follows:
[ (- ) = �=’8=1
? (G8 ) log2 (? (G8 ))log2 (# ) , (1)
where G1, . . . , G= are = possible results of a feature - (e.g., IP ad-dress); ? (G8 ) is the ratio of G8 in all # logs generated by this device.Device Feature Extractor applies Eqn. 1 on logs, IPs, and ad slot IDsto compute the normalized entropy for them.1 Note that if # = 1,[ (- ) = 0.(c) Spatial-temporal features. Spatial-temporal features are brokendown to a given device’s active hours and the maximum movingspeed. The number of active hours for a device is the total quantityof hours when there was at least one ad bid request sent during thathour. To compute the maximum speed, for each device, Device Fea-ture Extractor uses the location and timestamp �elds to computethe average speed between every two consecutive ad bid requests
1To compute the normalized entropy of logs, the logs are �rst grouped according tothe hours of occurrence.
in the logs and selects the maximum value. To avoid the in�uenceof default location values, we ignore those values including (0,0)and high-frequency locations far away from the target area.(d) Inconsistency features. Inconsistency features aim to capture theinconsistencies in the logs. The �rst feature in the category (iv) isthe number of device brands for each device. Normally, a deviceshould only have one brand name. So if a device has too manybrand names, it may be a signal of fraud. However, the brand �eldsof a device may be incorrectly reported by app developers in thead request parameter; to address this issue, Device Feature Extractorextracts another feature, called fake brand ratio, tomeasure the ratioof fake brands for each device. Device Feature Extractor compares thebrand names with two whitelists obtained online,2 which contain269 real brand names. If a brand does not appear in any of the twowhitelists, Device Feature Extractor considers it as fake. The thirdfeature is the non-browser User-Agent ratio. Normally, the UA�eld in a log re�ects the Browser or Webview information of theOS running on the device. The UA is either ‘Mozilla’ or ‘Dalvik’.However, for fraudulent devices, the UA may be forged (e.g., ‘Go-http-client’), as it is not a real device. Therefore, Device FeatureExtractor uses the non-browser UA ratio as a feature.Module 1.3: Device Score Predictor. The Device Score Predictor usestraditional machine learning models to perform the training andtesting on the features. Particularly, any feature-based classi�er (e.g.,logistic regression, decision tree, kNN, SVM, and neural network)may potentially be used. However, we note that deep learning ishard to interpret the semantics (or representation) of the featuresextracted by Device Feature Extractor. In summary, the output ofDevice Score Predictor is the predicted score B34E for every device.
5.2 Stage 2: Top-App Based ClusteringIn Sec. 5.1, we have proposed a novel classi�er to distinguish fraud-ulent devices from benign ones based on the ad bid logs. However,in practice, such individual classi�cation results may be a�ected bythe noisy data or the intentional manipulations of the attackers. Toaddress this problem, in Stage 2, we group the devices into variousclusters and then exploit the cluster-level features to determineif the clusters and their devices are fraudulent or not. The pro-posed top-app-based clustering algorithm consists of three steps:extracting top-app features, constructing device graph structure,detecting communities within the graph by applying the Louvainalgorithm [8] to cluster devices.
2gsmarena.com and kimovil.com.

Figure 5: A sample device graph constructed by 1,000 fraud-ulent vertices (in blue) and 1,000 benign vertices (in orange).
Module 2.1: Top-App Extractor. In this step, we aim at extractingthe key features that can represent the synchronicity of the devices.Here we choose the app usage patterns as the major factor thatwe consider, in that the attackers tend to deploy fraudulent de-vices at a large scale for more revenue. Thus the ad bid requestsgenerated by those fraudulent devices are primarily for the targetapp. Furthermore, the attackers have to control a huge number ofdevices automatically, which leads to a similar app usage patternfor those controlled devices. Speci�cally, the usage pattern*%34Efor a device is formulated as:
*%34E =< 5 A4@(0??1), . . . , 5 A4@(0??=) >, (2)
where 5 A4@(0??8 ) denotes the frequency of using 0??8 in one day.However, there are thousands of apps in the whole ad ecosys-
tem. Such a feature vector with thousands of elements greatlyhinders computation. To reduce the computation complexity, weonly keep the values of 5 A4@(0??8 ) for the top [ apps in*%34E . Wewill discuss the detailed parameter selection process in Sec. 6.1 andAppendix A.Module 2.2:DeviceGraphConstructor.To construct a device graphusing the above features, we de�ne the similarity between a devicepair using the cosine similarity as the following:
(8<(34E1,34E2) = *%34E1 ·*%34E2k*%34E1k · k*%34E2k
(3)
Then for each node (device) pair, we add an edge between themand use the similarity as the weight of the edge. To avoid con-structing weighted graphs with massive low-weight edges, we seta threshold (8<C⌘A and only add edges between two devices when(8<(34E1,34E2) � (8<C⌘A .Module 2.3: Community Detector.An example of the device graphis depicted in Fig. 5. A key observation is that the densely connectedclusters are mostly composed of vertices with one type, i.e., eitherwith all fraudulent ones or benign ones. Here we use the popularLouvain method [8, 46] to identify communities in the device graph.
5.3 Stage 3: AggregationWe aggregate the results of the two stages before Stage 3 via LabelVoting and Device Relabeling.
Module 3.1: Label Voting. First, we use majority voting on thelabels obtained from Stage 1 to determine whether the clustersin Stage 2 are fraudulent or benign. Speci�cally, we compute theaverage predicted score of the devices for each cluster as the scorefor the cluster (B2 ). If B2 � BC⌘A , we label the device cluster asfraudulent. Otherwise, the device cluster is benign. Here we onlyconsider the clusters that are composed of more than U# , N isthe total number of devices. For example, when U = 0.1, we onlyconsider clusters that have more than 0.1# devices for label voting.Module 3.2: Device Relabeling. A signi�cant advantage of Stage2 is the capability to calibrate the devices labeling taking place inStage 1. As mentioned in Sec. 5.2, the fraudulent devices may befalsely predicted as benign ones due to the di�erent con�gurationsof the attackers. Thus, for each cluster of size greater than U# , weuse the label of this cluster after majority voting to relabel each ofits devices.
5.4 ImplementationWe implement E���H����� on a local server equipped with 6CPU cores, 64 GB memory, and 10 TB SSD, running Windows10. In Stage 1, the Log-Device Mapper and Device Feature Extractorare implemented using the Scala programming language on theApache Spark framework. The Device Score Predictor is implementedusing Python. In Device Score Predictor, during pre-processing, thefeatures in categories (i), (iii), and (iv) are normalized using theRobustScaler in the Scikit-learn package to avoid being stretchedby some outliers. We implement 5 classi�ers, including GradientBoosting Decision Tree (GBDT), Multi-Layer Perceptron (MLP),:-nearest neighbors (kNN), Support Vector Machine (SVM), andLogistic Regression (LR). For GBDT, we use LightGBM [22]. We set20 as the number of early stopping rounds, and enable positive andnegative bagging with a bagging frequency of 3. For MLP, we useone hidden layer with 100 neurons. For kNN, the : is set to 15. ForSVM, we use LibSVM [9]. For LR, we use the default settings in thescikit-learn package [31]. In Stages II and III, we implement all thecomponents via scala on Spark.
6 EVALUATIONIn this section, we describe the parameter settings and evaluationresults. Speci�cally, for the stage 1 classi�er, we evaluate the detec-tion performance by cross-validation. Secondly, we compare thedetection results of E���H����� with those of Stage 1 alone, toshow the performance improvement introduced by Stages II and III.
6.1 Parameter SettingsTable 4 lists all the parameters we use in the system design. Tochoose the best settings which balance detection accuracy andthe computational cost, we start from an initial parameter setting.We then compare the results after tuning each of the parameters.Speci�cally, we use ⇡CA08= as the training set to train E���H�����using di�erent parameter settings and use the �rst day of⇡C4BC (30kfraudulent devices and 30k benign devices) as the test set to evaluatethe performance. The initial parameter settings are ([ = 5, (8<C⌘A =0.5, BC⌘A = 0.5,U = 10�4). The evaluation is detailed in Appendix A.Based on our evaluation, we choose the optimal parameter settings([ = 5, (8<C⌘A = 0.5, BC⌘A = 0.3,U = 10�3) in our paper.

Table 4: The parameters in E���H�����.Parameter Explanation
[ The number of top apps considered in*%34E(8<C⌘A The minimum similarity to add an edge between two nodesBC⌘A The minimum score of labeling a cluster fraudulentU The minimum size of a cluster = U# , N is the total device number
Table 5: Cross-validation results acrossmodels: mean valuesand standard deviations (in parentheses).
Model Accuracy Precision Recall F-score
LightGBM 0.9501 (0.0004) 0.9599 (0.0010) 0.9395 (0.0008) 0.9496 (0.0004)MLP 0.9496 (0.0006) 0.9603 (0.0015) 0.9379 (0.0019) 0.9490 (0.0005)kNN 0.9426 (0.0008) 0.9839 (0.0006) 0.9000 (0.0016) 0.9401 (0.0008)SVM 0.9499 (0.0005) 0.9594 (0.0012) 0.9393 (0.0014) 0.9492 (0.0004)LR 0.9465 (0.0007) 0.9623 (0.0010) 0.9294 (0.0015) 0.9456 (0.0005)
6.2 Evaluation ResultsDataset. To evaluate the e�ectiveness of E���H�����, we ran-domly select 30k fraudulent devices and 30k benign devices eachday from May 6 to May 15, 2020, from ⇡2020 as our training dataset⇡CA08= . After merging the devices with the same IDs, we have120k/112k unique fraudulent/benign devices. This dataset (⇡CA08=)serves as a balanced training dataset for the classi�er in Stage 1.Using the same method, we obtain 125k/124k unique fraudulent/be-nign devices from May 16 to May 25, 2020, as our test set ⇡C4BC .Results of Stage 1.We apply the 5 classi�ers as the Device Score Pre-dictor on our dataset to classify the fraudulent devices based on thelogs. We follow 5-fold cross-validation. The mean and one standarddeviation of the 5-fold test for accuracy, precision, recall, and F scoreare presented in Table 5. All 5 classi�ers achieve over 94% Accuracy,with a Precision rate in excess of 95%. The best model, LightGBM,achieves 95.01% Accuracy, 95.99% Precision, and 93.95% Recall. Theclassi�cation results have very small variances. We �nd that thereare approximately 3% false positives during the test. The mainreason for these false positives is that their statistical features andentropy features are similar to those of fraudulent ones. The users ofthese devices are probably stimulated by the apps such that they fre-quently browse or click on the ad contents. The quickly generatedad bid logs of such devices are mostly targeted to the apps whereusers can earn money by reading news, watching videos, or evenviewing ads. As discussed in Sec. 5.2, false negatives in this stageare mainly caused by intentional manipulations of the attackers.
To con�rm that the four sets of features are indeed useful for theclassi�cation task, we start by using features in the �rst categorypresented in Table 3 for classi�cation and adding other feature setsone by one. We use the LightGBM model for classi�cation, and plotthe ROC curves for the 4 cases in Fig. 6. As can be seen from Fig. 6,the AUC values keep increasing when more feature sets are used,indicating that all features are e�ective for the classi�cation task.Necessity of Stage 2 and Stage 3. To show that it is bene�cial toinclude Stages II and III in the system, we perform an experimenton ⇡C4BC , using 3-stage E���H����� and State I alone, respectively.Fig. 7 shows the Precision and Recall. It is observed that comparedto using State I alone, both Precision and Recall have increasedwhenusing 3-stage E���H�����. Meanwhile, the decrease in Precisionis relatively small. This demonstrates that the proposed 3-stagemechanism is more e�ective and robust in detecting real-world
Figure 6: ROC curves; [X,Y] means categories X and Y areused for classi�cation.
Figure 7: Precision and Recall comparison.
fraudulent devices compared to traditional classi�ers. Moreover,as shown in the next section, Stages II and III are important indetecting click farms.
7 CLICK FARM INVESTIGATIONIn this section, we give a detailed analysis of the identi�ed clickfarms (or fraudulent clusters) from ⇡C4BC . By selecting the largestclick farm and tracing back to datasets in 2018 (⇡2018) and 2019(⇡2019), we perform an in-depth measurement on the click farm.We introduce our �ndings and observations, which can help ushave a better understanding of how the click farms perform a large-scale and synchronized fraudulent campaign. It will also bene�tthe community on click farm detection and invalid tra�c �ltering.
We apply E���H����� to the �rst day of ⇡C4BC (May 16, 2020) toidentify the click farms, which contains 30k fraudulent devices and30k benign devices. After the 3-stage process, 176 out of a total of1069 clusters (with more than 5 devices) are �agged as fraudulentones. Among 131 clusters consisting of more than 50 devices, 38clusters are detected as fraudulent.The largest click farm.We take the largest click farm as an exam-ple to show the �ndings on the fraudulent device clusters, whichcontains 11,910 devices and 11,910 logs (1 log per device). It is im-portant to point out that many characteristics are not limited tothis largest click farm; they also widely exist in other click farms.
7.1 Cheating Strategy 1: Using IP ProxiesIt is observed that IP proxy is a widely adopted strategy for theattacker to avoid detection. However, though the attackers candynamically change the IP address, they may fail to change theirgeo-location information in some cases. This leads to our two �nd-ings: 1) Ad bid logs are located in a small region; 2) GPS and IPgeolocations are inconsistent.
Finding 1: The ad bid logs are located in a small region.

Table 6: Statistics of ⇡2018 and ⇡2019.Field ⇡2018 ⇡2019
Date Mar 21-Mar 30, 2018 Mar 6-Mar 15, 2019Log 289,912,853 63,743,968IMEI 289,850,470 61,113,865Android ID 100,001 62,774,356APP 22 9IP 778,023 249,494IP subset 8,615 37,834Location 42 33Device brand 15 338Device model 239 1817
There are 1349 devices in this click farm which created 1349ad bid logs. We �nd that the GPS coordinates of these ad bid logscan be dramatically gathered into a small area with a 1km radiuscentered at (xx.64761757174743, xxx.56548085076258). Althoughthe Location entry may be forged by tech-savvy attackers, thereis no motivation for them to manually set the coordinate to such aspeci�c area. Thus, we speculate that the fraudulent devices in theclick farm are physically located there. This o�ers us a chance totrace back and measure the historical activities of this click farm.⇡2018 and ⇡2019.We obtain two datasets spanning over 10 days in2018 and 2019 respectively, and identify the devices and logs whoseGPS coordinates are associated with this speci�c region. The twodatasets are described in Table 6. We denote the two datasets as⇡2018 and ⇡2019. The two datasets are used throughout this section.
Finding 2: GPS and IP geolocations are inconsistent.
Based on Finding 1, we further compare the GPS coordinateswith the IP geo-localization of the devices in this click farm. Wecheck the distances between the GPS coordinates (LOC) recordedin the logs and the locations corresponding to the IPs (LOCIP)recorded in the logs. First, we use a commercial IP-location queryAPI [6] to fetch the GPS coordinates of the IPs LOCIP for eachlog. Then, we compute the distance between LOC and LOCIP foreach log. The distance distributions of the fraudulent cluster and abenign cluster are shown in Fig. 8. It is clear that there is a huge gapbetween benign clusters and fraudulent clusters in terms of distancedistributions. In the benign clusters, the distances between GPScoordinates and IP locations are less than 40 km. On the contrary,over 75% of logs in the click farms have a distance greater than 400km. This �nding will bene�t the ad tra�c veri�cation industry byexploiting this feature to identify fraudulent devices.
7.2 Cheating Strategy 2: Rotating IPs andForging Device IDs
IP/ID �ltering is a widely adopted approach in the ad veri�cationindustry. Changing IP/ID is a widely adopted strategy by attackersto bypass the detection since tra�c veri�cation third parties willpay more attention to the IPs with in�ated tra�c.
Finding 3: There is a sophisticated strategy of rotating IP addressesand forging device IDs.
IP also serves as a physical �ngerprint of devices in many frauddetection methods [29]. Unlike isolated fraudulent devices heavilyrelying on IP proxies to change IP, the devices in click farms choosea more sophisticated strategy to prevent their invalid tra�c frombeing identi�ed.
Figure 8: Distance CDF between LOC and LOCIP for a benigncluster and the cluster of case study.
ANDROID_VER_CODE = ["4.4.2", "5.0.1", "5.1.1", "6.0", "7.0", "7.1.1"]DEV_BRAND = ["OPPO", "MST", "CUI", "SAMSUNG", "YUS", "ZTE", "HTC", "UMESI",
"DAXIAN", "XIAOMI", "VIVO", "YTSP", "MEIZHU", "HUAWEI"]DEV_TYPE = ["M56", "PLUS5", "Y11", "L1", "M7", "N9", "325p", "MS16", "PLUS 6",
"F10", "N11", "NOTE 3", "8US", "TUIP95", "MTS 6", "S672", "P8"]BUILD_CODE = ["KTU84P", "JOP40D", "LMY47X", "LMY48B", "JZO54K", "JDQ39",
"KOT49H", "LRX21V", "JLS36C"]UA = f"Mozilla/5.0 (Linux; Android {ANDROID_VER_CODE[randint() % 6]}; " \
f"{DEV_BRAND[randint() % 14]} {DEV_TYPE[randint() % 17]} " \f"Build/{BUILD_CODE[randint() % 9]}) " \f"AppleWebKit/537.36 (KHTML, like Gecko) Version/4.0 Chrome/30.0.0.0 " \f"Mobile Safari/537.36"
Figure 9: User-Agent generation code. The Chrome WebViewversion (in red box) is a�xed value while other variant�elds(red lines above) can be generated arbitrarily.
The �rst strategy is to in�ate the IP numbers by randomly chang-ing the IP addresses within the subnet. Speci�cally, both ⇡2018 and⇡2019 are associated with a large number of di�erent IP addresses.However, when zooming in these IP addresses, it is observed thatthese massive numbers of IP addresses belong to a limited num-ber of subnets. For example, for ⇡2018, it contains 778,023 di�erentIPs, corresponding to only 8,615 subnets, indicating that each sub-net contributed to roughly 100 IPs on average. For ⇡2019, there are249,494 IPs belonging to 37,834 subsets, showing that the IP ad-dresses were scattered across subnets to bypass tra�c veri�cation.However, frequently changing IP will make it highly suspiciousfor the generated tra�c as well as the corresponding device IDs.This motivates the click farm to adopt the second strategy: forgingenormous device IDs to reduce the average IP number per device ID.It is observed that the average IP number per device ID in ⇡2018 isless than 1. We also observe that massive devices within the clickfarm only generate a single ad bid request. The combination of thetwo strategies helps the attackers evade tra�c blocking based onIPs and device IDs.
The aforementioned discussion also largely demonstrates thevast IP resources available to the click farm operators. Furthermore,we note that it is unreliable to verify the invalid tra�c exclusivelybased on IP distributions as recommended by the recent work [29].
Finding 4: The Android IDs have a common pre�x.
As discussed before, changing Android IDs is also a strategywidely adopted by the click farm. This is because: (i) any AndroidID with too many ad bid logs is generally believed to be suspicious;(ii) changing Android IDs can make the blocking list based invalidtra�c �ltering approach fail to work. This strategy has also beenapplied to the identi�ed click farm cluster, which involves 100, 001Android IDs in ⇡2018.

Mozilla/5.0 (Linux; Android 7.1.1; SAMSUNG 8US Build/LRX21V) AppleWebKit/537.36 (KHTML, like Gecko) Version/4.0 Chrome/30.0.0.0 Mobile Safari/537.36
* ** * * * *
Figure 10: An example of the UA generated by this click farm.
Surprisingly, we �nd that in 2018, 100,000 out of 100,001 AndroidIDs show a common pattern: they are the MD5 values of a determi-nate string B = B1kB2, where B1 = “ad4b0d3f5fd” and B2 =“00000”,. . . ,“99999”; the only exception is IDx = “ad4b0d3f5fdacd9b”. It is de-rived that IDx is the Android ID of a real device, and all otherAndroid IDs were created by changing the last 5 digits of it andcomputing the MD5 values. We con�rmed this by looking into thelocations recorded in the logs, which showed that these deviceswere in close proximity to each other. After discussing with Com-pany A, one possible explanation is that the attackers intentionallyused this unique Android ID pre�x in 2018 as a piece of evidence torequest payment from the fraudulent publisher who endorses themto launch the ad fraud campaign. However, in 2019, the AndroidIDs did not exhibit such a pattern, indicating that the strategiesadopted by the attackers have evolved.
7.3 Cheating Strategy 3: Forging User AgentsUser-Agent also includes much critical end-device system informa-tion (e.g., Android version, device brand, build code, browser kernelversion), which can be exploited to �ngerprint the fraudulent de-vices. This observation drives the click farm devices to generate fakeUA �elds to conceal their real system information through modi-fying system con�guration �les, “/system/build.prop” [43], andthus bypass the detection. As the �rst step towards understandinghow to generate the fake UAs, we try to simulate fake User-Agentgeneration in Python to enumerate all possible combinations ofUAs, as shown in Fig. 9. The attackers select items from prede�nedsmall sets for the 4 �elds (Android version, device brand, devicetype, and build code [2]) to conceal their critical system informationand avoid being blocked.
Finding 5: 3 types of UA fraud are identi�ed.
We then perform a comprehensive analysis of the UA �elds offraudulent devices in ⇡2018 and ⇡2019. We have detected the follow-ing three UA frauds due to inconsistencies of the �elds, which canhelp us combat fraudulent devices in the future. In the following,we use a real-world UA as an example, which was generated at2:22:50 AM on March 23, 2018. As shown in Fig. 10, the Androidversion is 7.1.1, the device brand is “SAMSUNG”, the device type is“8US”, and the build code is “LRX21V”.1) Chrome WebView vs. Android version. Chrome WebView is anembedded edition of Chrome browser as a non-degradable systemcomponent in each version of the Android system. The version(30.0.0.0) was born with Android 4.4 [1] and the updated WebViewshipped with Android 4.4.3 has version number 33.0.0.0. It is indi-cated in [1] that WebView will auto-update for mobile devices withAndroid L (Android 5.0) and above. In other words, a new Androidversion with an old Chrome WebView version is highly suspicious.This serves as a strong indicator to identify the fraudulent devicesby checking the inconsistency of UA and Android versions. In theexample of click farm UA, Android 7.1.1 corresponds to WebView
(a) 2018 (b) 2019Figure 11: Log number proportions of the apps in 2018 and2019. For each day, the height of the dashed lines separatedby di�erent colors represents the log numbers belonging todi�erent apps. There are no overlapping apps between twoyears.
version 52.0.2743.100, which is inconsistent with the old WebViewversion 30.0.0.0 (Fig. 10).2) Device brand vs. device type. The second observation is that thedevice brand and type �elds in the click farm UAs are randomlygenerated, which leads to non-existent device brand/type pairs,such as “SAMSUNG 8US” in the example click farm UA showed inFig. 10. Importantly, we ascertain that, in the identi�ed click farms,most of the UA �elds are evidenced to be forged, such as “HTCM56”, “DAXIAN Y11”, “UMESI 325p”.3) Android version vs. build code. Android version and build codeare in a one-to-many relationship, which can be used to checkthe forged UAs. In the UA example above, “LRX21V” is the buildcode for “android-5.0.0_r7” according to the list [2], which falselycombines with the Android version of 7.1.1.
In summary, UA provides a plethora of useful information todetermine the nature of a device to be either benign or fraudulent.
7.4 Cheating Strategy 4: Rotating AppsTo avoid massive ad bid requests targeting only one app and beingbanned by the ad platform, the fraudsters have developed dozensof apps and dynamically changed the apps to run the ad campaign,which will provide economic incentives for the fraudsters.
Finding 6: The apps are uniformly rotated after 3⇠4 days.We investigate the proportion of log numbers for 18 apps in-
volved (9 selected apps in 2018 and all the 9 apps in 2019) and plottheir transition �ows, which are shown in Fig. 11a and Fig. 11b.It is observed that click farms do not generate invalid tra�c fora �xed app. Instead, ad spam campaigns have been intentionallylaunched on di�erent apps from one to another. It regularly takes acertain period to run the ad spam campaign (or rotating period) foreach app. Averagely, the length of the period is about 3⇠5 days. Forexample, 2 apps were activated on March 21, 2018, and deactivated3 days later, meanwhile, 3 new apps were activated on March 23,2018. The remaining 13 apps in 2018 and all the 9 apps in 2019show the same characteristics. We checked the Android app market

and, interestingly, all of these apps were developed by the commondeveloper. After our manual check, all of these apps do not haveany special or practical functionality. It is reasonable to assume thatthe only purpose of these apps is to run the ad spam campaign. Thisis also supported by another fact that these apps have not receivedany updates since being published on the market.
We also apply E���H����� to the full datasets containing ⇡2018,to investigate how invalid tra�c impacts top 50 apps in the 10-daydataset of 2018 (Appendix C).
8 REAL-WORLD DEPLOYMENTIn this section, we will discuss how to implement E���H����� inreal-world applications. As we mentioned in the introduction, inthe industry, the major challenge comes from how to address themassive data (e.g., over 50M devices and 100M logs per day) in areasonable period (e.g., less than 1 day for daily clearance). We pro-pose several techniques to speed up the execution of E���H�����,in order to support the veri�cation of billions of ad bid requests inan industrial environment. After applying optimization, we applyE���H����� to an in-the-wild dataset ⇡2021 and compare the resultwith state-of-the-art industry methods. The acknowledgments fromour industrial collaborator show that E���H����� can complementexisting industry methods, and is practical to be used in real-worldscenarios.
8.1 System OptimizationIn the tra�c veri�cation industry, it is required to process and detectinvalid tra�c on a daily basis. Thus, the time cost of processingdaily data should be within several hours. In the implementation ofStage 2, a naive method is to compute similarities between each pairof devices and then construct a complete graph. However, such apair-wise comparison su�ers from the scalability issue. Consideringhundreds of millions of active devices in the advertising systemevery day, if we are going to apply the naive method, we need toperform$ (1015) computation to construct the whole graph, whichis unacceptable in practice.
8.1.1 Optimization techniques. In the following, we proposethree optimization techniques corresponding to the three steps instage 2 to address the computation challenges.1) Merging devices. In Module 2.1 Top-App Extractor, since all devicesare represented by their top-app features, we can naturally put thefocus on distinct features instead of distinct devices. It is observedthat in ⇡2020, only a very small proportion of devices (0.25%) havedi�erent labels but share the same top-app features. Meanwhile,the number of distinct features is much smaller than the numberof devices (<0.5%). To utilize this characteristic, we merge deviceswith the same feature into a single vertex.
For example, suppose two devices id=bed4f2... and id=beed4c...have the same top-app features: {0e16f25bd0 : 1} (i.e., one ad bid logfor app id e16f25bd); then we combine the two devices and otherdevices with the same feature as one single vertex, indexed by aunique vertex id. In this way, the vertex number in our graph issigni�cantly reduced, while it does not impact the correctness ofthe �nal result. As in ⇡2021, there are 53M devices, which can bemerged into 0.25M vertices. The compression rate is over 200x. The
Figure 12: The CDF of pair-wise device similarities.
pairwise similarity computational time complexity can be decreasedfrom $ (1015) to $ (1010).2) Pruning in similarity computation. While merging devices candecrease the number of vertices to compute, we also �nd in Module2.2 Device Graph Constructor that many pair-wise similarity com-putations are not necessary. Since we only build edges betweenvertices with high similarities (� 0.5), we can omit many similaritycomputations if the estimated similarity is small (i.e., < 0.5). Recallthat we use cosine similarity in our computation. If two verticeshave di�erent top-1 apps, then the cosine similarity is very likelyto be lower than 0.5. In that case, it is unnecessary to compute thesimilarity, since it is too small to add an edge between them.
Fig. 12 shows the distribution of similarities between randomlysampled 10,000 device pairs, half of which have di�erent top-1 appswhile the other half have identical top-1 apps. The curve in orangeshows that there are over 94% of the vertex pairs with di�erenttop-1 apps whose similarities are less than 0.5. The computationof such similarities is unnecessary for the subsequent steps. Thus,we only perform similarity computations between two vertices ifthey share the same top-1 app. In practice, this pruning methodcan eliminate over 99.7% of the operation each day. Note that thispruning process may in�uence the detection results since it willresult in di�erent device graphs.3) Dividing graphs for parallel computing. Unfortunately, the com-plexity of the community detection algorithm (Louvain method) inModule 3.1 Community Detector is $ (=;>62=), which is not e�cientenough for large-scale applications. Therefore, we need to �ndways to speed up the computation. The input of Community Detectoris all the vertices and edges. It is observed that in a large graph,the results of disconnected sub-graphs do not in�uence each other.We make use of this and divide the problem into sub-problems,and solve them in parallel to increase e�ciency. After pruning insimilarity computation, the result is a collection of graphs. First, weseparate the graphs into groups that have the same top-1 app: eachgroup contains multiple graphs, and all the nodes in graphs of thesame group have the same top-1 app. Then, we process the groupsin parallel, since there is no dependency among them. Finally, wecollect the community detection results from all the groups. Thishelps us to reduce the processing time from over 48 hours to 40minutes in daily data processing.
8.1.2 Evaluation after optimization. We study how the opti-mization improves the performance of E���H�����, and how itimpacts the correctness of E���H�����.

1) Performance improvement. We evaluate the performance of E����H����� prior to and post-optimization using ⇡2021, which con-tains 1-day data (53M devices and 117M logs) in 2021. Stage 1 takesroughly 10 minutes; Stage 3 takes 30 seconds. For Stage 2, Module2.1 Top-App Extractor takes 4 minutes. For Module 2.2 Device GraphConstructor and Module 2.3 Community Detector, before optimiza-tion, each of them cannot terminate within 48 hours, respectively;after optimization, they are able to produce results after 48 minutesand 40 minutes, respectively. Therefore, E���H����� can process1-day’s data within 2 hours after optimization, which meets thepractical requirement for daily execution. The performance speedupis more than 28x.
2) Correctness.We also evaluate the potential impact of the optimiza-tion with regard to correctness. We randomly select 1,000 vertices(including 21,191 devices) from ⇡2021 and apply E���H����� priorto and post-optimization. The �nal detection results show thatthere are only 48 devices (0.22%) with di�erent labels. Therefore,the optimization steps increase the system e�ciency by more than28x, while incurring little loss (0.22%) on the potential correctness,which is acceptable.
8.2 Result ValidationBy following the IVT Detection and Filtration Standard [24], indus-try leaders develop their own detection systems to detect severalknown types of invalid tra�c. The di�erent types of invalid tra�care labeled by di�erent fraud reason codes. To date, there is no spe-ci�c fraud reason code for detecting click farms, which is the majoradvantage of E���H�����. We deploy E���H����� on 1-day’s real-world ad tra�c data in order to test the practicality of E���H�����.
Dataset. We use the ad bid logs in one day (Jan 13, 2021) collectedfrom the real world as our dataset ⇡2021. This dataset contains 53Mdevices and 117M logs in total.
Results. E���H����� detects around 8 million (15%) fraudulentdevices out of totally 53 million active devices in ⇡2021. Thesedevices generate 37 million (31%) fake bid requests. After Stage 3,there are 23,604 clusters, wherein 5,164 clusters have more than 50devices, and 491 of them are fraudulent clusters.
Comparison with the detection results of Company A. Sincethere is no existing industrial system targeting click farm detec-tion, here we use the detection result of the industrial system ofCompany A, to compare and analyze our result. We �nd that 93%of the detected invalid tra�c by E���H����� is not detected byCompany A’s existing detection system. This undetected invalidtra�c is originated from click farms. We have manually checkedthe top 30 click farms containing 5,941,433 devices in total, whichcontribute to more than 74% of the detected fraudulent devices.We �nd similar cheating strategies from them as revealed in Sec. 7.Among the 30 click farms, there are 9 click farms that only use IPsfrom small centralized areas, which contain 329,287 devices (5.5%)in total; there are 14 click farms (3,434,208 devices, 57.8%) rotatingIPs and device IDs to evade IP/ID �ltering. Note that there are 4 clickfarms (299,186 devices, 5.0%) that use both two strategies. These19 click farms are con�rmed by Company A, who has adopted ourproposed algorithm as a new fraud reason code in their platform.
We also investigate the other 11 detected fraudulent device clus-ters. Among them, there are potentially 5 falsely detected clusters:1) 4 of them contain only Android TV devices, which exhibit di�er-ent behaviors from Android phones; 2) another cluster has di�erentUA �elds compared to the normal ones. These UAs are from trueAndroid devices but start with speci�c values (e.g., bundle ID) in-stead of Mozilla or Dalvik. So they are �agged by E���H�����.There remain 6 detected device clusters whose cheating patternsare not so obvious. They are expected to be double-checked byCompany A using auxiliary information.Consensuswith other companies. In addition, we have reportedthe device IDs and IPs of the detected click farms to the blockchain-based consensus system. They are expected to be cross-checked byother companies in the future.
9 DISCUSSIONE���H����� update. To deploy E���H����� and ensure that itcaptures state-of-the-art ad fraud, we need to periodically collectnew ground truth data and retrain the Stage 1 classi�er of E����H�����. This can be achieved by integrating E���H����� with anactive learning approach. For example, we can periodically collectthe prediction results of new devices and reuse them with two op-tions: 1) For the devices with high prediction con�dence, we candirectly use them as the training dataset to retrain the classi�ca-tion model. 2) For the other devices with low con�dence, we canmanually label the devices using auxiliary information or otherexisting tools. We show a simpli�ed update process using ⇡2020in Appendix B to demonstrate the practicality and e�ectiveness ofupdating E���H����� per week.Impact of privacy regulations. To enhance privacy and adhereto General Data Protection Regulation (GDPR), more �elds of thead transaction data are expected to be encrypted or removed, ren-dering the tra�c veri�cation to be more challenging due to a lackof necessary data. However, we argue that completely removingall �elds of the ad data is less likely to happen in the near futurebecause it challenges the current user pro�le based Internet adecosystem. Therefore, it is desirable to have a more strict data au-thorization and access control and limit the data to a small numberof highly quali�ed tra�c veri�cation companies and their trustedresearch partners. We also attempt to investigate di�erentially pri-vate programmatic ad auctions and this deserves separate research.Open-source datasets. We are in the process of negotiation withour industrial collaborator to release the datasets used in the paper.Once approved, we will release the ad bid logs of fraudulent devicesto facilitate future research.Limitations. E���H����� shows a good performance in detect-ing fraudulent devices generating invalid tra�c, but E���H�����mainly focuses on performing the tra�c analysis towards the adbid network; there might exist approaches that can perfectly mimicthe tra�c originating from the benign devices, which can be usedto evade our detection. However, in order to create such “perfect”invalid tra�c, the attackers need to invest a signi�cant amount ofresources to make all features undetectable, which makes it hardto make a pro�t. It is important to note that the e�ectiveness ofE���H����� can be further improved if we combine it with other

ad fraud mitigation techniques, such as tra�c authentication, hon-eypots, and dynamic fraud testing.
Additionally, E���H����� can only be used to detect fraudulentAndroid devices. Detecting fraudulent devices running iOS is hardfor two reasons: 1) Apple has restricted the IDFA permission sinceiOS 14, which makes it harder to uniquely trace an iOS device inthe ad ecosystem; 2) the invalid tra�c samples originated from iOSdevices are relatively small, due to the di�culty of jail-breakingand hijacking iOS devices. We leave a thorough study of invalidtra�c from iOS devices as our future work.
10 RELATEDWORKAd fraud measurement and detection. Over the past few years,click spam has been extensively studied in the context of web adver-tising, mobile advertising, and search advertising. The research [30]proposed the characterization of one of the largest click fraud bot-nets. Researchers also proposed several types of design and analysisof click spam threats [10, 11, 16, 39, 41]. To defend against clickspam, many approaches have been proposed to avoid or detect clickspam in advertising [13, 14, 17, 27, 38, 40, 45]. Springborn et al. [37]leveraged tra�c collected from honeypot websites to identify andanalyze a new type of ad fraud, called pay-per-view (PPV) networks.They examined the click spam issue as well. However, we high-light that the industry focus, driven by advertising monetization,has been shifted from click spamming to invalid tra�c-enabledcoordinated attacks.
To the best of our knowledge, there is only one recent study inves-tigating invalid tra�c [29]. The researchers designed a con�dencescore for each domain, based on the IP entropy. The con�dencescore o�ered for each app domain is useful for DSP to determinehow to treat the upcoming bid requests. However, this methodcannot ascertain what session of ad tra�c is invalid; neither canbe used to measure the ad tra�c at a �ner granularity. Instead, themethodology developed in this paper is able to identify the sourcesof invalid tra�c (i.e., fraudulent devices).System-level ad fraud prevention. Some researchers proposedauthentication-based methods to eliminate fraudulent activities inadvertising. For example, Juels et al. [21] proposed an authenticationmethod to validate benign users. In [15] and [36], researchers usedHMAC-based signatures to check ad click fraud. Li et al. [23] usedTrustZone to verify ad clicks and display. However, these solutionsrely on the client side’s ability to detect anomalies and thus havereduced scalability.
To prevent various types of counterfeit inventories across theadvertising ecosystem, by boosting transparency in the supplychain, Interactive Advertising Bureau (IAB) Tech Lab launched theauthorized digital sellers (ads.txt) project [18]. The project is aimedat publishers and distributors to declare who is authorized to selltheir inventory. Furthermore, there are several extended versionsof ads.txt, including app-ads.txt [19] and ads.cert [20] to extendto more scenarios. Recently, Pastor et al. [28] proposed anotherextended version, called ads.chain, to resolve the limitations of theprevious protocols. However, all of those solutions are designed toincrease the transparency in the ecosystem, which is orthogonal toinvalid tra�c detection proposed in this paper.
11 CONCLUSIONIn this paper, we �rst conduct a measurement study on a labeledad fraud dataset to distinguish the nature of mobile devices eitherfraudulent or benign through feature engineering. We then proposeand develop E���H�����, the �rst mobile ad fraud detection systembased on ad bid request logs, which can identify fraudulent deviceswith high accuracy and automatically identify fraudulent clusters.We reveal several cheating strategies adopted by click farms basedon the results of E���H�����. We further deploy optimized E����H����� on a 1-day’s real-world dataset, which demonstrates itspracticality. The results and �ndings developed in this paper havebeen acknowledged, and the proposed E���H����� will be inte-grated into the platform of our industry partner, a leading ad tra�cveri�cation company (Company A), to combat the current burgeon-ing mobile ad fraud.
ACKNOWLEDGEMENTSWe are grateful to the anonymous reviewers for their constructivefeedback. We also thank RTBAsia and China Advertising Associa-tion for the long term support. The authors a�liated with Shang-hai Jiao Tong University were, in part, supported by the NationalNatural Science Foundation of China under Grants 61972453 and62132013. Xiaokuan Zhang was supported in part by the Norton-LifeLock Research Group Graduate Fellowship. Minhui Xue was,in part, supported by the Australian Research Council (ARC) Dis-covery Project (DP210102670) and the Research Center for CyberSecurity at Tel Aviv University established by the State of Israel,the Prime Minister’s O�ce and Tel Aviv University.
REFERENCES[1] 2015. WebView for Android. https://developer.chrome.com/multidevice/
webview/overview.[2] 2020. Codenames, Tags, and Build Numbers. https://source.android.com/setup/
start/build-numbers. (Accessed on 09/02/2020).[3] 2020. Integral Ad Science. https://integralads.com/.[4] 2020. Oracle Data Cloud. https://www.oracle.com/data-cloud/.[5] 2020. White Ops. https://www.whiteops.com/.[6] 2021. IP-API.com - Geolocation API. https://ip-api.com/. (Accessed on
01/21/2021).[7] Apple. 2021. Upcoming AppTrackingTransparency requirements. https://
developer.apple.com/news/?id=ecvrtzt2. (Accessed on 04/21/2021).[8] Vincent D Blondel, Jean-Loup Guillaume, Renaud Lambiotte, and Etienne Lefeb-
vre. 2008. Fast unfolding of communities in large networks. Journal of Sta-tistical Mechanics: Theory and Experiment 2008, 10 (2008), P10008. https://doi.org/10.1088/1742-5468/2008/10/p10008
[9] Chih-Chung Chang and Chih-Jen Lin. 2011. LIBSVM: A library for sup-port vector machines. ACM Transactions on Intelligent Systems and Technol-ogy (2011). https://doi.org/10.1145/1961189.1961199 Software available athttp://www.csie.ntu.edu.tw/~cjlin/libsvm.
[10] Geumhwan Cho, Junsung Cho, Youngbae Song, Donghyun Choi, and Hyoung-shick Kim. 2016. Combating online fraud attacks in mobile-based advertising.EURASIP Journal on Information Security 2016 (2016). https://doi.org/10.1186/s13635-015-0027-7
[11] Geumhwan Cho, Junsung Cho, Youngbae Song, and Hyoungshick Kim. 2015.An empirical study of click fraud in mobile advertising networks. In 2015 10thInternational Conference on Availability, Reliability and Security. 382–388. https://doi.org/10.1109/ARES.2015.62
[12] CNBC. 2017. Businesses could lose $16.4 billion to online advert fraud in2017. https://www.cnbc.com/2017/03/15/businesses-could-lose-164-billion-to-online-advert-fraud-in-2017.html. (Accessed on 08/08/2020).
[13] Vacha Dave, Saikat Guha, and Yin Zhang. 2012. Measuring and �ngerprintingclick-spam in ad networks. In Proceedings of the ACM SIGCOMM 2012 conferenceon Applications, technologies, architectures, and protocols for computer communi-cation. 175–186. https://doi.org/10.1145/2342356.2342394
[14] Vacha Dave, Saikat Guha, and Yin Zhang. 2013. ViceROI: Catching click-spamin search ad networks. In Proceedings of the 2013 ACM SIGSAC conference on

Computer & Communications Security (CCS ’13). 765–776. https://doi.org/10.1145/2508859.2516688
[15] Michael Dietz, Shashi Shekhar, Yuliy Pisetsky, Anhei Shu, and Dan S Wallach.2011. QUIRE: Lightweight provenance for smart phone operating systems. In20th USENIX Security Symposium (USENIX Security 11).
[16] Google, White Ops. 2018. The Hunt for 3ve, Taking down a major ad fraudoperation through industry collaboration. https://services.google.com/fh/�les/blogs/3ve_google_whiteops_whitepaper_�nal_nov_2018.pdf.
[17] Hamed Haddadi. 2010. Fighting Online Click-Fraud Using Blu� Ads. SIG-COMM Comput. Commun. Rev. 40, 2 (April 2010), 21–25. https://doi.org/10.1145/1764873.1764877
[18] IAB Tech Lab. 2019. IAB OpenRTB Ads.txt Public Speci�cation Ver-sion 1.0.2. https://iabtechlab.com/wp-content/uploads/2019/03/IAB-OpenRTB-Ads.txt-Public-Spec-1.0.2.pdf. (Accessed on 08/30/2020).
[19] IAB Tech Lab. 2019. IAB Tech Lab Authorized Sellers for Apps (app-ads.txt). https://iabtechlab.com/wp-content/uploads/2019/03/app-ads.txt-v1.0-�nal- .pdf. (Ac-cessed on 08/30/2020).
[20] IAB Tech Lab. 2020. OpenRTB, Speci�cation Version 3.0.[21] Ari Juels, Sid Stamm, and Markus Jakobsson. 2007. Combating click fraud via
premium clicks. In 16th USENIX Security Symposium (USENIX Security 07).[22] Guolin Ke, QiMeng, Thomas Finley, TaifengWang,Wei Chen,WeidongMa, Qiwei
Ye, and Tie-Yan Liu. 2017. Lightgbm: A highly e�cient gradient boosting decisiontree. In Proceedings of the 31st International Conference on Neural InformationProcessing Systems (NIPS’17). 3149–3157.
[23] Wenhao Li, Haibo Li, Haibo Chen, and Yubin Xia. 2015. AdAttester: Secureonline mobile advertisement attestation using TrustZone. In Proceedings of the13th Annual International Conference on Mobile Systems, Applications, and Services(MobiSys ’15). https://doi.org/10.1145/2742647.2742676
[24] Media Rating Council. 2020. Invalid Tra�c Detection and Filtration Stan-dards Addendum. http://mediaratingcouncil.org/MRC%20Invalid%20Tra�c%20Detection%20and%20Filtration.pdf. (Accessed on 07/18/2020).
[25] Xianghang Mi, Xuan Feng, Xiaojing Liao, Baojun Liu, XiaoFeng Wang, FengQian, Zhou Li, Sumayah Alrwais, Limin Sun, and Ying Liu. 2019. Resident evil:Understanding residential IP proxy as a dark service. In 2019 IEEE Symposium onSecurity and Privacy (SP). 1185–1201. https://doi.org/10.1109/SP.2019.00011
[26] Mirror. 2017. The bizarre ‘click farm’ of 10,000 phones that give FAKE ‘likes’to our most-loved apps. https://www.mirror.co.uk/news/world-news/bizarre-click-farm-10000-phones-10419403. (Accessed on 08/26/2020).
[27] Richard Oentaryo, Ee-Peng Lim, Michael Finegold, David Lo, Feida Zhu, CliftonPhua, Eng-Yeow Cheu, Ghim-Eng Yap, Kelvin Sim, Minh Nhut Nguyen, KasunPerera, Bijay Neupane, Mustafa Faisal, Zeyar Aung, Wei Lee Woon, Wei Chen,Dhaval Patel, and Daniel Berrar. 2014. Detecting click fraud in online advertising:A data mining approach. Journal of Machine Learning Research 15 (2014), 99–140.
[28] Antonio Pastor, Rubén Cuevas, Ángel Cuevas, and Arturo Azcorra. 2021. Estab-lishing Trust in Online Advertising With Signed Transactions. IEEE Access 9(2021), 2401–2414. https://doi.org/10.1109/ACCESS.2020.3047343
[29] Antonio Pastor, Matti Pärssinen, Patricia Callejo, Pelayo Vallina, Rubén Cuevas,Ángel Cuevas, Mikko Kotila, and Arturo Azcorra. 2019. Nameles: An intelligentsystem for Real-Time Filtering of Invalid Ad Tra�c. In The World Wide WebConference (WWW ’19). 1454–1464.
[30] Paul Pearce, Vacha Dave, Chris Grier, Kirill Levchenko, Saikat Guha, DamonMcCoy, Vern Paxson, Stefan Savage, and Geo�reyMVoelker. 2014. Characterizinglarge-scale click fraud in ZeroAccess. In Proceedings of the 2014 ACM SIGSACConference on Computer and Communications Security (CCS ’14). 141–152. https://doi.org/10.1145/2660267.2660369
[31] Fabian Pedregosa, Gaël Varoquaux, Alexandre Gramfort, Vincent Michel,Bertrand Thirion, Olivier Grisel, Mathieu Blondel, Peter Prettenhofer, RonWeiss, Vincent Dubourg, Jake Vanderplas, Alexandre Passos, David Cournapeau,Matthieu Brucher, Matthieu Perrot, and Édouard Duchesnay. 2011. Scikit-learn:Machine learning in Python. Journal of Machine Learning Research 12 (2011),2825–2830.
[32] PPC Protect. 2019. What Is a Click Farm? The Quick Way to Thousands of Likes.https://ppcprotect.com/what-is-a-click-farm/. (Accessed on 08/26/2020).
[33] Research and Markets. 2019. Worldwide Analysis on the Real-time BiddingMarket, 2019 to 2024 - Anticipated to Record a CAGR of 32.9% During theForecast Period. https://www.prnewswire.com/news-releases/worldwide-analysis-on-the-real-time-bidding-market-2019-to-2024---anticipated-to-record-a-cagr-of-32-9-during-the-forecast-period-300811841.html. (Accessedon 07/21/2020).
[34] Neil Rubens, Mehdi Elahi, Masashi Sugiyama, and Dain Kaplan. 2015. ActiveLearning in Recommender Systems. Springer US, Boston, MA, 809–846.
[35] Burr Settles. 2010. Active Learning Literature Survey. University of Wisconsin,Madison 52 (07 2010).
[36] Shashi Shekhar, Michael Dietz, and Dan S Wallach. 2012. AdSplit: Separatingsmartphone advertising from applications. In 21st USENIX Security Symposium(USENIX Security 12). 553–567.
[37] Kevin Springborn and Paul Barford. 2013. Impression fraud in on-line advertisingvia pay-per-view networks. In 22nd USENIX Security Symposium (USENIX Security13). 211–226.
[38] Ori Stitelman, Claudia Perlich, Brian Dalessandro, Rod Hook, Troy Raeder, andFoster Provost. 2013. Using co-visitation networks for detecting large scale onlinedisplay advertising exchange fraud. In Proceedings of the 19th ACM SIGKDDInternational Conference on Knowledge Discovery and Data Mining (KDD ’13).1240–1248. https://doi.org/10.1145/2487575.2488207
[39] Brett Stone-Gross, Ryan Stevens, Apostolis Zarras, Richard Kemmerer, ChrisKruegel, and Giovanni Vigna. 2011. Understanding fraudulent activities in on-line ad exchanges. In Proceedings of the 2011 ACM SIGCOMM Conference onInternet Measurement Conference (IMC ’11). 279–294. https://doi.org/10.1145/2068816.2068843
[40] Tian Tian, Jun Zhu, Fen Xia, Xin Zhuang, and Tong Zhang. 2015. Crowd frauddetection in internet advertising. In Proceedings of the 24th International Con-ference on World Wide Web (WWW ’15). 1100–1110. https://doi.org/10.1145/2736277.2741136
[41] Elliott Wen, Jiannong Cao, Jiaxing Shen, and Xuefeng Liu. 2018. Fraus: Launchingcost-e�cient and scalable mobile click fraud has never been so easy. In 2018IEEE Conference on Communications and Network Security (CNS). 1–9. https://doi.org/10.1109/CNS.2018.8433126
[42] White Ops and ANA. 2019. 2018-2019 Bot Baseline: Fraud in Digital Advertising.https://www.ana.net/miccontent/show/id/rr-2019-bot-baseline. (Accessed on07/29/2020).
[43] Songyang Wu, Wenqi Sun, Xin Liu, and Yong Zhang. 2018. Forensics on Twitterand WeChat using a customised android emulator. In 2018 IEEE 4th InternationalConference on Computer and Communications (ICCC). 602–608. https://doi.org/10.1109/CompComm.2018.8781056
[44] XDA Developers. 2018. Huawei will stop providing bootloader unlockingfor all new devices. https://www.xda-developers.com/huawei-stop-providing-bootloader-unlock-codes/. (Accessed on 09/03/2020).
[45] Haitao Xu, Daiping Liu, Aaron Koehl, Haining Wang, and Angelos Stavrou. 2014.Click fraud detection on the advertiser side. In European Symposium on Researchin Computer Security (ESORICS 2014). 419–438.
[46] Haizhong Zheng, Minhui Xue, Hao Lu, Shuang Hao, Haojin Zhu, Xiaohui Liang,and Keith W. Ross. 2018. Smoke screener or straight shooter: Detecting elite sybilattacks in user-review social networks. In Proceedings of 25th Annual Networkand Distributed System Security Symposium, NDSS.
APPENDIXA SENSITIVITY OF PARAMETERSWe evaluate the sensitivity of parameter settings of E���H�����(Sec. 6.1, Table 4). The parameters are listed in Table 4. We startfrom an initial setting ([ = 5, (8<C⌘A = 0.5, BC⌘A = 0.5,U = 10�4)and change one parameter at a time to �nd the best parametersettings. All the experiments are conducted 5 times, and we reportthe mean values in this section. Note that the standard deviationsare very small (<1%) in all the experiments.(. We have found that [ does not impact the �nal result too much(in Fig. 13). Meanwhile, the larger [ is, the longer the total time costwill be. However, we cannot simply choose the minimum value (1)for [: much information would be discarded if we only keep thetop-1 app. Here we de�ne the ;>BB (:) as the ratio of discarded ad bidlogs compared to [ = 1 when setting [ = : . As shown in Fig. 13,there is a tradeo� between loss and the time cost when [ increases;loss is decreased to 0.4% when [ = 5. Therefore, we choose [ = 5 asthe optimal setting.Y imthr . Similar to [, we also �nd that (8<C⌘A has little e�ect onthe accuracy (Fig. 14). Recall that the main goal of (8<C⌘A is to dropedges with low weight. The value of it has a huge impact on theclustering result: if a large (8<C⌘A (e.g., 0.9) is chosen, many edgeswith a lower weight will be deleted, which will lower the size ofindividual clusters. Therefore, we evaluate the number of devices(=D<) in the biggest cluster using di�erent (8<C⌘A to make surethat a reasonable (8<C⌘A is chosen. The result in Fig. 14 shows that

Figure 13: [ Experiment Figure 14: (8<C⌘A Experiment Figure 15: BC⌘A Experiment
Figure 16: U Experiment
once (8<C⌘A >= 0.7, =D< starts to decrease, which means the clus-tering result is negatively impacted by (8<C⌘A . Moreover, the timecost starts to decrease when (8<C⌘A >= 0.2; it plateaus between(8<C⌘A = 0.5 and (8<C⌘A = 0.6. Based on the above observations,we choose (8<C⌘A = 0.5.sthr and " . We use similar methods to choose the best valuesof BC⌘A and U . Because they are only involved in the aggregationstage (Stage 3), their impact on the time cost is negligible. WhenBC⌘A increases, the accuracy and precision increase while the recalldrops (Fig. 15). BC⌘A = 0.3 is the turning point, so we choose BC⌘A =0.3 as our setting. For U (Fig. 16), when U increases, accuracy andprecision �rst increase until U reaches 10�3, then decrease afterthat. Meanwhile, recall drops slowly all the time. Therefore, wechoose U = 10�3.Summary. Based on our evaluation, we use ([ = 5, (8<C⌘A =0.5, BC⌘A = 0.3,U = 10�3) as the optimal settings, and use the set-tings in the paper.
B SYSTEM UPDATEIn practice, attackers will keep evolving their cheating strategiesto avoid detection. Therefore, E���H����� must be able to updateperiodically. In this section, we present a simpli�ed update scheme,which updates E���H����� per week.Methodology. In Stage 1, we periodically retrain the classi�erusing an active learning approach [34, 35]. At the end of each week,we collect the devices labeled by E���H����� in the last week (7days) and use them to retrain the classi�er if the con�dence of theprediction is high, e.g., the predicted score is within [0, 0.1] (forbenign devices) or [0.9, 1.0] (for fraudulent devices). Alternatively,new datasets can be obtained using other means (e.g., from othercompanies) to retrain the classi�er. For the threshold parametersused in Stages II and III, we keep these parameters as �xed valuesfor incoming new datasets until the result of o�ine cross-validation
Figure 17: Accuracy with and without updating.
Figure 18: Log number distribution of the top 50 apps.
signi�cantly drops. Once it happens, we search for the thresholdparameters as we did in Appendix A.Evaluation. We use ⇡2020 to perform an evaluation of our weeklyupdating scheme. We compare the accuracy with and without up-dating in Fig. 17. The �rst model (M1, in blue) is trained with thedata of day 0. The second model (M2, in yellow) is an updatedversion of M1, retrained using the labels of the �rst week at thebeginning of the second week (7th day). M2 is then tested on thedataset since the 7th day. Similarly, the third model (M3, in green)is trained with the dataset of the �rst two weeks, and tested usingthe data of the last two weeks; the fourth model (M4, in red) istrained with the data of the �rst three weeks and tested using thelast week’s data. The results suggest that our updating scheme canindeed improve the accuracy.
C PROFILING TOP 50 APPSTo have a deeper insight into the ad fraud caused by invalid tra�cin 2018, we use the following method to build suitable versions ofE���H����� in 2018 and pro�le top 50 apps.Methodology.
Since fraudulent devices may exhibit di�erent features in di�er-ent years, we can not directly apply the trained model in 2020 topredict the old devices in 2018. Thus we retrieve the device IDs ofthe labeled devices in 2020 from the full bid logs of 2018. As a result,we found a total of 3,840 fraudulent and 5,070 benign devices in 2018.

Figure 19: The distribution of fraudulent log ratios (FLR)and fraudulent device ratios (FDR) of the top 50 apps.
Then we use these devices as the training dataset and then trainthe device classi�er. The classi�er achieves 80.7% accuracy, 78.5%precision, and 86.1% recall in the 2018 dataset. To study the topapps sending the largest number of ad bid requests, we use 300,000random sampled Android devices in the 2018 dataset, predict themwith E���H�����, and extract the bundle IDs contained in theirlogs. We then calculate the number of logs for each app, as well asthe number of fraudulent logs, i.e., logs generated by fraudulentdevices. We de�ne the following metrics (Eqns. 4–6), including afraudulent device ratio (FDR), a fraudulent log ratio (FLR, identical
to a previous invalid tra�c ratio), and an app fraudulent degree(AFD) to represent the fraud degree for each app.
FDRi =# Fraudulent devices of app 8
# Total devices of app 8, (4)
FLRi =# Fraudulent logs of app 8
# Total logs of app 8, (5)
AFDi =
8>>><>>>:
low, FLRi 2 [0, 0.33),medium, FLRi 2 [0.33, 0.66),high, FLRi 2 [0.66, 1] .
(6)
The results of the top 50 apps, with respect to log numbers, anddetailed statistics of the top 5 apps are shown in Fig. 18 and Table 7,respectively. From Fig. 18 and Table 7, we can see that the top appsgenerated 4,974,027 ad bid requests, and 1,925,669 requests wereinvalid; the top 5 apps all together generated more than 200,000requests. We further studied FLR and FDR, as shown in Fig. 19. Wecan see that 14 out of the top 50 apps exhibited high FLR (>50%),wherein 6 apps had an FDR higher than 30%. This indicates thata relatively small number of fraudulent devices generate a largernumber of ad requests.

Table 7: Statistics of the top 50 apps sendingmost ad bid requests in the 2018 sampled dataset (300,000 devices). FLR is the fraud-ulent log ratio (invalid tra�c ratio); FDR is the fraudulent device ratio; AFD is the app fraud degree (de�ned in Appendix C).The results are derived from E���H�����. The daily loss is the estimation based on the average eCPM value ($2). # 19, # 22,and # 48 are iOS apps with unknown numbers of downloads. # 49 is unavailable in any market.Rank App Bundle ID Version # Downloads Latest Update # Logs FLR # Devices FDR Available AFD Daily Loss
1 com.cl*********.********* 6.03.5 5 B 2020/07/31 1,102,014 42.72% 17,455 7.44% Yes Medium $303,4612 com.xu****.**************** 5.55.2 2 B 2020/07/31 411,661 2.13% 7,929 0.88% Yes Low $5,6453 com.ij******.************** 5.3.3 528 M 2019/10/23 372,631 70.51% 785 22.55% Yes High $169,3604 com.cl*********.*********** 4.2.3 760 M 2020/07/11 303,726 55.13% 3,776 20.68% Yes High $107,9205 com.co********** 5.1.2 211 M 2019/08/09 209,332 87.11% 613 43.39% Yes High $117,5286 com.co****.*********** 6.6.0 674 M 2020/07/12 204,402 33.93% 1,122 7.22% Yes Medium $44,6987 com.ji***.***** 2.8.26 3 B 2020/07/29 166,085 16.75% 6,816 9.26% Yes Low $17,9298 com.an*****.******* 12.7.10 12 B 2020/08/07 150,159 18.12% 768 3.26% Yes Low $17,5349 net.mo******.************* 2.6.2 69 M 2020/05/15 133,471 51.25% 50 14.00% No Medium $44,08810 com.sh**.******* 2.4.602 534 M 2020/07/31 132,317 44.26% 797 6.02% Yes Medium $37,74211 com.qi***.********* 2.6.2 104 M 2020/07/27 115,721 30.84% 2,500 4.64% Yes Low $23,00012 com.ou*****.********** 2.0.3 32 M 2013/08/16 88,555 45.38% 30 20.00% No Medium $25,90413 com.so******.******** 2.0.2 397 M 2019/12/27 86,111 33.00% 1,094 10.05% Yes Low $18,31814 do****.****** 7.5.3 367 M 2020/02/13 77,829 6.55% 756 1.19% Yes Low $3,28715 com.wa***** 3.5.7 14 M 2019/06/04 72,880 0.00% 43 0.00% No Low $016 com.ca********* 3.1.2 262 M 2020/07/20 72,562 14.56% 1,751 7.08% Yes Low $6,81017 com.ma****.****** 2.4.76 737 M 2020/07/30 71,844 37.42% 777 14.93% Yes Medium $17,32618 com.tv******.**** 5.2.3 43 M 2020/05/09 70,479 30.38% 322 12.73% Yes Low $13,79919 com.mo**.********** 1.1 - 2020/06/24 70,073 93.74% 68 76.47% No High $42,33920 com.ne*****.**********.******** 33.1 3 B 2020/07/29 66,937 0.05% 5,417 0.02% Yes Low $1921 com.zx**.****** 2.4.1 1 M 2017/09/12 61,161 74.25% 171 25.73% No High $29,27022 com.ne*****.**** 33.1 - 2020/07/22 55,420 77.70% 1,637 69.40% Yes High $27,75623 com.sh**********.******** 8.6.4 7 B 2020/07/31 50,700 7.38% 8,776 4.49% Yes Low $2,41124 com.le***.**** 2.4.6 1 B 2020/07/23 50,392 2.66% 3,291 1.37% Yes Low $86225 com.yd**.**** 1.0 1 K 2018/01/23 46,092 0.71% 4,906 1.04% No Low $21226 com.hu***.************* 1.1.1 1 K 2019/07/26 45,040 47.12% 19 31.58% No Medium $13,67827 com.ly.********** 1.1.8 36 M 2019/12/11 42,581 20.07% 90 12.22% Yes Low $5,50728 �********.***************** 1.0 10 K 2017/03/29 40,328 29.72% 955 11.10% No Low $7,72529 com.wt***.******* 3.6.2 1 M 2016/01/26 39,662 39.07% 133 11.28% No Medium $9,98730 com.du****.*****.***** 3.6.5 1 B 2020/08/04 39,005 0.16% 1,234 0.57% Yes Low $3931 com.sh**.******* 2.1.4 3 M 2019/06/15 38,694 77.24% 88 27.27% No High $19,26332 com.zx**.****** 3.7.702 63 M 2020/05/07 34,975 61.28% 236 12.71% Yes Medium $13,81533 com.du****.******* 2.7.5 20 M 2017/06/28 33,671 42.04% 2,599 7.58% No Medium $9,12434 com.fo******.********** 5.0.5 17 M 2019/09/17 29,673 42.72% 46 13.04% Yes Medium $8,16935 com.hu**.***** 7.0.21 203 M 2020/07/25 28,223 35.41% 544 10.48% Yes Medium $6,44236 com.pa****.********************* 1.19 1 K 2018/01/19 27,328 50.60% 3,463 24.86% No Medium $8,91237 com.pa****.*********.**** 3.9.11 4 K 2018/01/03 27,201 50.27% 3,480 24.77% No Medium $8,81338 com.bl*******.*********** 2.3.6 109 M 2020/08/03 26,869 0.06% 293 0.34% Yes Low $939 com.ba***.***** 8.2.0 1 B 2020/08/03 26,689 1.43% 1,513 1.12% Yes Low $24540 com.po**.********* 0.9 668 K 2018/11/10 26,004 41.60% 83 13.25% No Medium $6,97241 com.ba***.*********** 7.13.0 - 2020/07/27 24,767 75.36% 1,399 54.11% Yes High $12,03042 com.ca***.******* 3.0.1 52 2017/11/24 24,274 100.00% 2 100.00% No High $15,64543 com.lg*******.***************** 2.0.0 7 M 2019/09/20 24,117 4.96% 720 3.61% Yes Low $77144 com.ub******.*******.******* 3.5.2 206 M 2020/06/12 24,108 1.87% 317 1.89% Yes Low $29045 com.ln**.**** 1.0 1 K 2018/01/12 23,915 0.84% 5,360 1.19% No Low $12846 com.cl***.****** 5.1.2 2 M 2019/09/23 21,411 2.61% 703 2.42% No Low $35947 com.mo****.************ 1.0.0 1 M 2019/03/11 21,363 23.40% 3,430 6.68% No Low $3,22248 com.ru****.**** 7.1.3 180 M 2020/08/06 21,148 35.17% 629 10.97% Yes Medium $4,79449 com.li*******.*** - - - 20,599 55.76% 41 21.95% - Medium $7,40350 com.an*****.******* 1.0.0 8 M 2018/03/27 19,828 4.71% 773 3.49% No Low $602